Embed Size (px)
Citation preview
2018
and Annual Report
REGISTRATION DOCUMENT
Contents
Key fi gures 5
1.1 Quarterly and annual consolidated sales 6
1.2 Sales by platform 7
1.3 Sales by geographic region 8
Group presentation 9
2.1 Group profi le and strategy 10
2.2 History 10
2.3 Financial year highlights 11
2.4 Subsidiaries and equity investments 12
2.5 Research and development, investment and fi nancing policy 15
2.6 2017/2018 performance review (non-IFRS data) 17
2.7 Outlook 20
Risks and internal control 21
3.1 Risk factors 22
3.2 Risk management and internal control procedure 29
Corporate governance report 35
4.1 Corporate governance 36
4.2 Compensation for the administrative and management bodies 67
4.3 Auditors 108
3
4
2
1
Message from the Chairman 3
Statement by the person responsible for the Registration Document 4
Corporate social responsibility 109
5.1 Methodology note on employee-related, environmental and societal reporting 110
5.2 Corporate Social Responsibility strategy 113
5.3 Employee-related indicators 113
5.4 Environmental indicators 125
5.5 Societal indicators 132
5.6 Duty of Care 137
5.7 Independent third party’s report 138
Financial statements 141
6.1 Consolidated fi nancial statements as at March 31, 2018 142
6.2 Statutory Auditors’ report on the consolidated fi nancial statements 204
6.3 Separate fi nancial statements of Ubisoft Entertainment SA for the year ended March 31, 2018 209
6.4 Statutory Auditors’ report on the separate fi nancial statements 240
6.5 Statutory Auditors’ special report on regulated agreements and commitments 244
6.6 Ubisoft (parent company) results for the past fi ve fi nancial years 246
Information on the Company and its Capital 247
7.1 Legal information 248
7.2 Share capital 251
7.3 Share ownership 258
7.4 Securities market 264
7.5 Financial communication 267
Cross-reference tables 269
Registration Document cross-reference table 270
Management report cross-reference table 272
CSR cross-reference table 273
Annual report cross-reference table 275
5
7
6
8
The French version of this Registration Document was fi led on June 6, 2018 with the Autorité des Marchés Financiers (AMF) in accordance with Article 212-13 of its General Regulation. It may be used in connection with a fi nancial transaction if accompanied by a memorandum approved by the Autorité des Marchés Financiers. This document has been prepared by the issuer and is binding upon its signatories.
Pursuant to Article 28 of Commission Regulation (EC) No. 809/2004, the following information is incorporated by reference in this Registration Document:
♦ the consolidated and separate fi nancial statements and the relevant Statutory auditors’ reports for the fi nancial year ended March 31, 2017, presented in the Registration Document fi led on July 21, 2017 under No. D.17-0787, pages 125 to 219;
♦ the consolidated and separate fi nancial statements and the relevant Statutory auditors’ reportsfor the fi nancial year ended March 31, 2016, presented in the Registration Document fi led on July 22, 2016 under No. D.16-0729, pages 103 to 181.
and Annual Report
2018Registration Document
- 2018 Registration Document 1

- 2018 Registration Document2
Message from the Chairman
Dear Shareholders and Partners,
Ubisoft performed extremely well across the board during the previous fi nancial year. Following the comeback of Assassin’s Creed® Origins, the success of Mario + Rabbids® Kingdom Battle and the continued excellent performance of multiplayer games Rainbow Six® Siege, The Division® and Ghost Recon® Wildlands, our last release of the year, Far Cry® 5, became the second most successful launch in the Company’s entire history. Players, who are the key to our strategy, have hailed of the quality of our games and our ever-growing engagement with the communities. These results refl ect the determination of the Ubisoft teams to continuously improve player experience post-release.
Accordingly, we exceeded our objectives regarding sales, up by 19% at €1,732 million, and non-IFRS operating profi t, which reached a record level of €300 million. The Group’s digital transformation continues to grow at a pace exceeding our expectations and now represents 58% of our total sales. This success has resulted in much greater visibility than in the past, reduced our dependence on new releases and has had a very positive impact on our profi tability. Our games now benefi t from longer development periods, which have had a positive impact on their quality and fi nancial contribution, as demonstrated by the success of Assassin’s Creed® Origins and Far Cry 5.
This performance is the result of our long term strategy based on the creation and ownership of our brands and on continued investment in our teams and their skills. We have established an organization for our production on which we can rely to deliver both high quality games and solid online services. We are building a Group that is increasingly adaptable and responsive, relying on the sustained and acknowledged commitment of player communities, which are real partners for our teams. These differentiating factors will be major assets for Ubisoft in the years to come, enabling it to seize all opportunities created by future changes in the industry.
The short and medium terms are indeed exciting both in terms of growth potential and the increase in our profi tability. Opportunities abound: from our growth capacity in the digital realm to our potential in the promising PC and mobile segments, particularly in China, without forgetting our progress in esports.
In the longer term, new types of games, particularly those involving streaming, should signifi cantly increase our addressable market and permit our fl agship brands to become playable on all media and, potentially, accessible to half of the world’s population. Through our investments in Ubisoft Club, our online services platform, and in artifi cial intelligence, which is undergoing exponential growth, we will be able to adapt game experiences according to player profi les, with the objective of providing ever-richer experiences. To develop our expertise in these areas of excellence, we are opening new studios in regions that offer both special access to universities on the cutting edge of these fi elds and to a dynamic talent pool. This strategy is possible thanks to our multi-studio organization, which facilitates a collaboration among our different teams that is unparalleled in the industry, with particular attention paid to the sharing of knowledge, expertise and technologies.
I would also like to once again note the change in our stock ownership over the past year. It has specifi cally resulted in two new long term shareholders who are true experts in the video game industry and the world of technology. This positive change was made possible by the excellent execution of our strategy and the decisive support of our talent pool, our players and our shareholders. I would like to extend my warmest thanks to each of you.
Yves Guillemot
Chairman and Chief Executive Offi cer
- 2018 Registration Document 3
Statement by the person responsible for the Registration Document
I confi rm, after having taken all reasonable measures to this effect, that the information contained in this Registration Document is, to my knowledge, accurate and free from any omission likely to affect its import.
I confi rm that, to my knowledge, the fi nancial statements have been prepared in accordance with the applicable accounting standards and provide a true and fair view of the assets and liabilities, fi nancial position and results of the Group and all companies consolidated therein, and that the management report information listed on page 272 of Chapter 8 is a true presentation of the evolution of the business activity, revenue and fi nancial position of the Group and all companies consolidated therein, as well as a description of the main risks and uncertainties facing them.
I have obtained a completion letter from the Statutory auditors in which they confi rm that they have examined the information relating to the fi nancial position and statements presented in this Registration Document, and that they have read the document in its entirety.
The historical fi nancial information presented in this Registration Document was the object of Statutory auditor’s reports which appear on pages 152 to 153 and 185 to 186 of the 2016 and 2017 Registration Documents.
The Statutory auditors’ report on the consolidated fi nancial statements for the fi nancial year ended March 31, 2016 appears on pages 152 to 153 of the 2016 Registration Document. It includes an observation drawing the attention of the reader to the “comparability of fi nancial statements” note in the “Accounting principles and measurement methods” section of the notes to the consolidated fi nancial statements which sets out the impacts of IFRIC 21 on levies.
The Statutory auditors’ report on the consolidated fi nancial statements for the fi nancial year ended March 31, 2017 appears on pages 185 and 186 of the 2017 Registration Document.
The Statutory auditors’ report on the consolidated fi nancial statements for the fi nancial year ended March 31, 2018 appears on pages 204 and 208 of this Registration Document. It contains an observation drawing the attention of the reader to the “Comparability of fi nancial statements” note in the Notes to the consolidated fi nancial statements which shows the impact of the early application of IFRS 9 as of April 1, 2017.
The Statutory auditors have certifi ed without reservation the consolidated fi nancial statements of the past three fi nancial years.
The Statutory auditors’ report on the separate fi nancial statements for the fi nancial year ended March 31, 2016 (pages 180 and 181 of this Registration Document) contains no comment.
The Statutory auditors’ report on the separate fi nancial statements for the fi nancial year ended March 31, 2017 (pages 216 and 217 of this Registration Document) contains no comment.
The Statutory Auditors’ report on the separate fi nancial statements for the fi nancial year ended March 31, 2018 (pages 240 and 243 of this Registration Document) contains an observation drawing the attention of the reader to the “Comparability of fi nancial statements” note of the Notes to the separate fi nancial statements regarding the fi rst application of ANC [Accounting Standards Commission] rule No. 2015-05 regarding the accounting of forward fi nancial instruments and hedging transactions beginning on April 1, 2017.
The Statutory auditors have certifi ed without reservation the separate fi nancial statements of the past three fi nancial years.
Yves GUILLEMOT,
Chairman and Chief Executive Offi cer
This is a free translation into English of the person responsible for the Registration Document issued in French language and it is provided solely for the convenience of English speaking readers.
Sir,
- 2018 Registration Document4
1.1 QUARTERLY AND ANNUAL CONSOLIDATED SALES 6
1.2 SALES BY PLATFORM 7
1.3 SALES BY GEOGRAPHIC REGION 8
Key fi gures1
- 2018 Registration Document 55- 2018 Registration Document
Key fi gures1Quarterly and annual consolidated sales
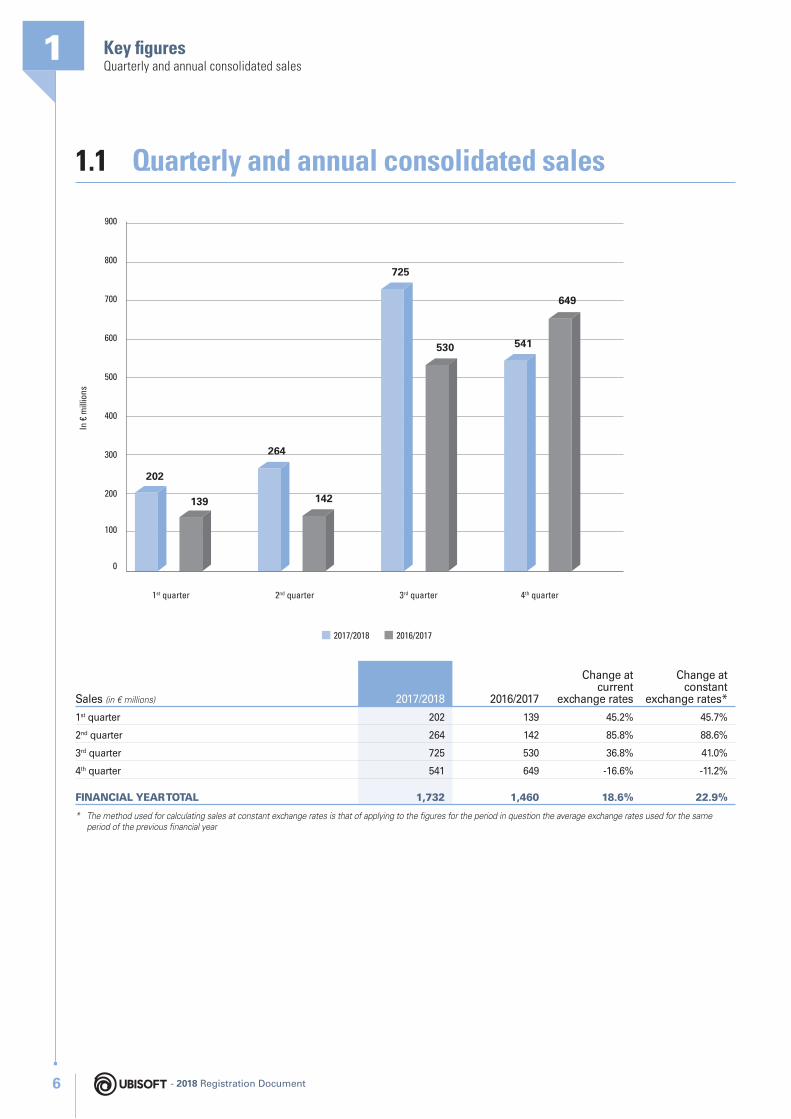
1.1 Quarterly and annual consolidated sales
1st quarter
In €
mill
ions
2nd quarter 3rd quarter 4th quarter
264
530
2017/2018 2016/2017
202
142
725
0
100
200
300
400
500
600
700
800
900
139
541
649
Sales (in € millions) 2017/2018 2016/2017
Change at current
exchange rates
Change at constant
exchange rates*
1st quarter 202 139 45.2% 45.7%
2nd quarter 264 142 85.8% 88.6%
3rd quarter 725 530 36.8% 41.0%
4th quarter 541 649 -16.6% -11.2%
FINANCIAL YEAR TOTAL 1,732 1,460 18.6% 22.9%
* The method used for calculating sales at constant exchange rates is that of applying to the fi gures for the period in question the average exchange rates used for the same period of the previous fi nancial year
- 2018 Registration Document6
Key fi gures
1
Sales by platform
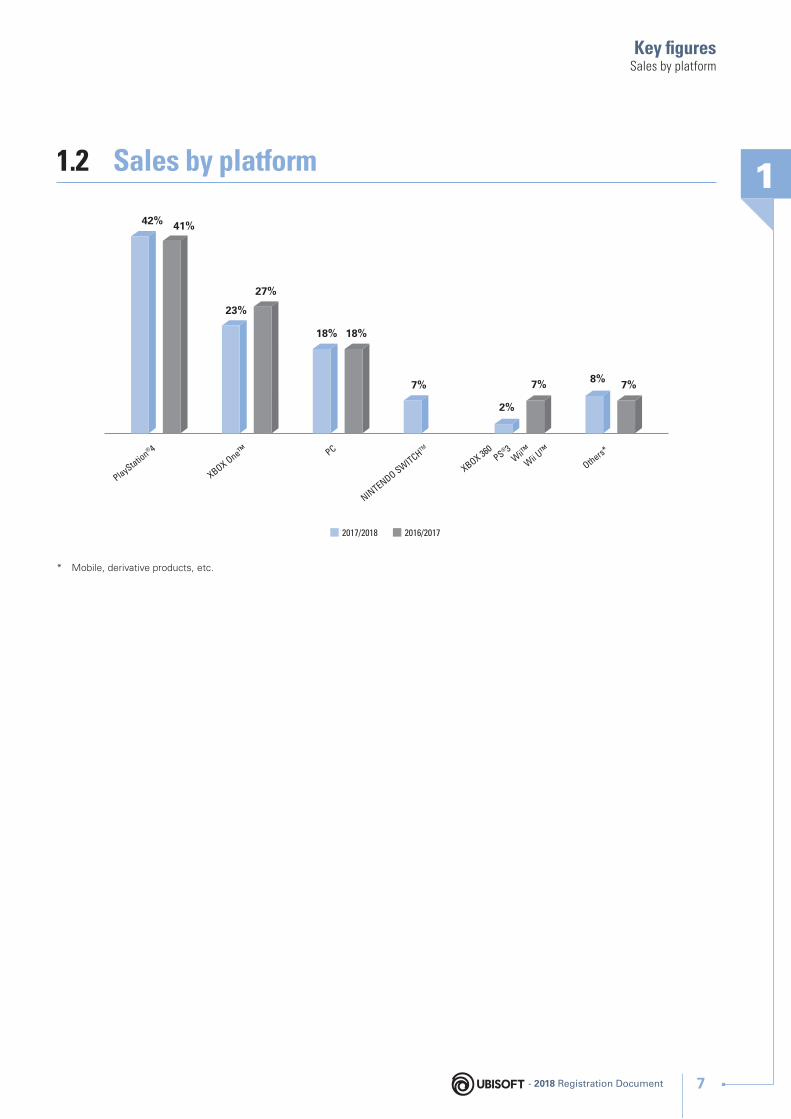
1.2 Sales by platform
PC
NINTENDO SW
ITCHTM
PlayStation® 4
XBOX 360PS
® 3W
ii™
Wii U
™
XBOX One™
Others*
2017/2018 2016/2017
42% 41%
23%
27%
18% 18%
2%
7% 7% 8% 7%
* Mobile, derivative products, etc.
- 2018 Registration Document 7
Key fi gures1Sales by geographic region
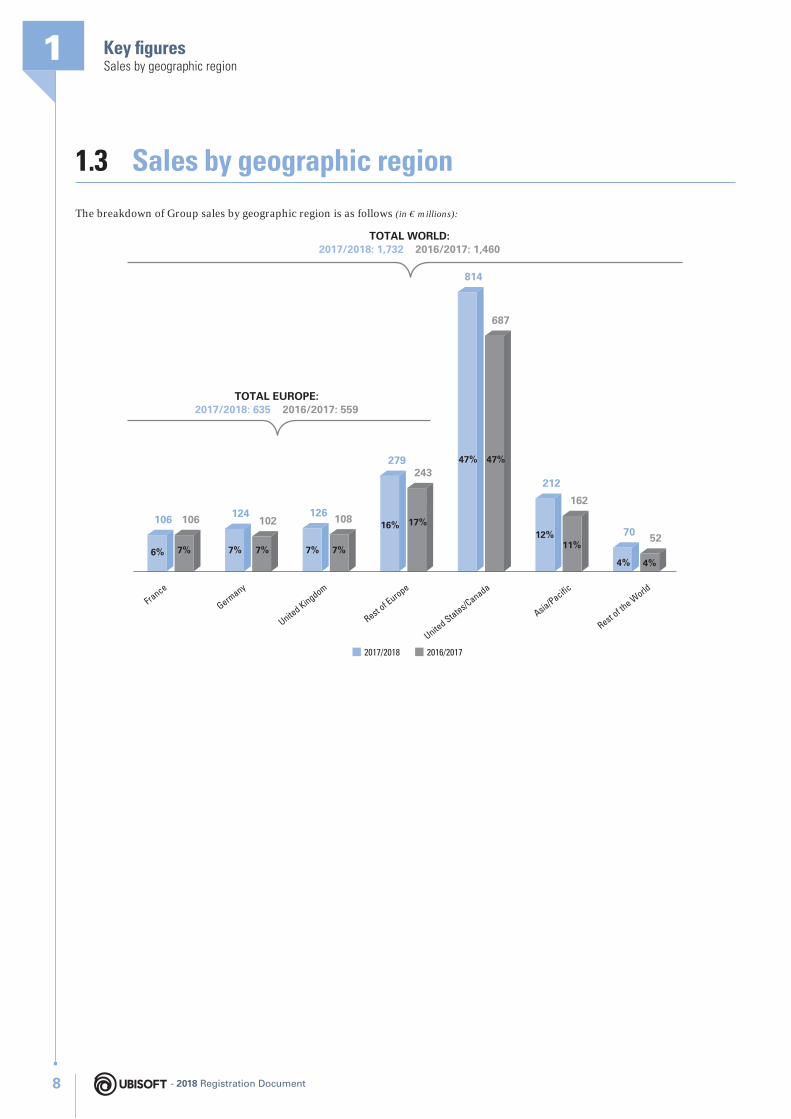
1.3 Sales by geographic region
The breakdown of Group sales by geographic region is as follows (in € millions):
France
Germany
United Kingdom
Rest of E
urope
United States/Canada
Asia/Pacific
Rest of th
e World
106 106 124102
126 108
279
TOTAL EUROPE:2017/2018: 635 2016/2017: 559
TOTAL WORLD:2017/2018: 1,732 2016/2017: 1,460
243
814
687
212
162
70 52
2017/2018 2016/2017
6% 7% 7% 7% 7% 7%
16% 17%
47%47%
12%11%
4% 4%
- 2018 Registration Document8
2.1 GROUP PROFILE AND STRATEGY 10
2.2 HISTORY 10
2.3 FINANCIAL YEAR HIGHLIGHTS 11
2.4 SUBSIDIARIES AND EQUITY INVESTMENTS 12
2.4.1 Investments during the fi nancial year 12
2.4.2 Business activities of subsidiaries 12
2.4.3 Simplifi ed organization chart 14
2.5 RESEARCH AND DEVELOPMENT, INVESTMENT AND FINANCING POLICY 15
2.5.1 Research and development policy 15
2.5.2 Investment policy 15
2.5.3 Financing policy 16
2.6 2017/2018 PERFORMANCE REVIEW (NON-IFRS DATA) 17
2.6.1 Defi nition of fi nancial indicators that are not strictly accounting-related 17
2.6.2 Changes in the income statement 18
2.6.3 Change in WCR and debt levels 18
2.7 OUTLOOK 20
Group presentation2
- 2018 Registration Document 99- 2018 Registration Document
Group presentation2Group profi le and strategy
2.1 Group profile and strategy
Ubisoft’s main business activities are centered around the production, publishing and distribution of video games for consoles, PC, smartphones and tablets in both physical and digital formats.
Ubisoft stands out from its direct competitors due to its unique ability to keep on developing new brands organically. The Group now benefi ts from an expanded portfolio of strong franchises that are more geared to player commitment over the long-term: Assassin’s Creed, Far Cry, For Honor®, Tom Clancy’s Ghost Recon, The Crew®, Tom Clancy’s Rainbow Six, Tom Clancy’s The Division and Watch Dogs®.
Ubisoft owns its brands along with the technologies and knowhow needed to develop them, thus offering long-term visibility on
the Company’s growth. Today, video game franchises have an increasingly signifi cant impact within the entertainment industry as a whole. Owning its own brands is, therefore, an essential advantage when it comes to maximizing their potential and reaching an even wider audience.
Thanks to the strong growth of its digital activities over the last few fi nancial years, Ubisoft has succeeded in transforming its business model to focus on more profi table and recurring business. Player communities and their commitment over time have grown signifi cantly. This has fed into a sharp rise in back catalog sales and player recurring investment.
2.2 History
(1) Source: NPD, GFK chart Track, internal estimates
1986: Creation of Ubisoft
by the fi ve Guillemot brothers.
1989-1995: International expansion
Ubisoft opens its fi rst sales and marketing subsidiaries in the United States, Germany and the United Kingdom and its fi rst internal development studios in France and Romania.
Launch in 1995 of Rayman®, Ubisoft’s fi rst major franchise.
1996-2001: Organic growth and strategic acquisitions
Flotation on the Paris stock exchange in 1996.
Opening of new studios including Shanghai in 1996 and Montreal in 1997. Acquisition in 2000 of Red Storm Entertainment (Tom Clancy games) and acquisition in 2001 of Blue Byte Software (The Settlers®). This strategy powered Ubisoft into the world’s top 10 independent publishers in 2001.
2002-2006: A development strategy for owned franchises
Launch of Tom Clancy’s Ghost Recon, Prince of Persia® and Tom Clancy’s Splinter Cell®, acquisition of Driver® and Far Cry franchises.
2007/2018: A real creator of franchises and acceleration of the digital business
Ubisoft maintains its reputation as a key player. With Assassin’s Creed, Watch Dogs and Tom Clancy’s The Division, Ubisoft claims three of the four most successful new brand launches in the history of video gaming, including Tom Clancy’s The Division in the number one spot (1). Over this period, Ubisoft also developed the Just Dance music game series.
The Group is part of a signifi cant movement towards multiplayer franchises with the successful comeback of Tom Clancy’s Ghost Recon and Tom Clancy’s Rainbow Six and creations of For Honor, Steep®, The Crew and Tom Clancy’s The Division.
2012 launch of Ubisoft Club (Uplay), an online (PC and consoles) and distribution (PC) services platform.
Between 2012 and 2018, the percentage of digital sales rose from 11.7% to 58%.
Studios opened in Chengdu (China) in 2007, Singapore and Kiev in 2008 and Toronto in 2009. Launch in 2011 of the Motion Pictures business. Opening of studios in the Philippines and in Belgrade in 2016, in Bordeaux, Berlin, Saguenay and Stockholm in 2017, and in India and Ukraine in 2018.
Acquisitions:
♦ the Tom Clancy name for video games and ancillary products, the Massive Entertainment studio (Sweden) and Pune (India) in 2008;
♦ Nadeo studio in 2009;
- 2018 Registration Document10
Group presentation
2
Financial year highlights
♦ Owlient studio, specializing in Free-to-Play games, and RedLynx, specializing in downloadable games in 2011;
♦ THQ Montreal and two specialists in Free-to-Play games: Digital Chocolate (Barcelona) and Future Games of London in 2013;
♦ Ivory Tower studio (France) and the assets of Longtail Halifax (Canada) in 2015;
♦ the publisher of the Free-to-Play Ketchapp mobile games and the assets of the Leamington studio in 2016;
♦ Free-to-Play mobile game Growtopia® in 2017;
♦ 1492 Studio and Blue Mammoth Games studios, specialists in Free-to-Play games in 2018.
2.3 Financial year highlights
April 2017 – Ubisoft partners with Tencent and Playcrab to develop and publish a new mobile game
Ubisoft announced a partnership with Tencent to develop and publish a new mobile game in China. Tencent, the internet services leader in China, published Might and Magic® Heroes/Era of Chaos®, a new mobile game license developed exclusively for China and operating a traditional Ubisoft franchise. Developed by Playcrab, an Ourpalm subsidiary specializing in action and strategy games, this new mobile game, available in China in iOS and Android stores since June 2017, has already generated more than €100 million in gross income in China.
April 2017 – Announcement of the opening of two new studios in Berlin and Bordeaux
Ubisoft increased its creative capacity in Europe with the opening of studios in Berlin and Bordeaux, which will take part in the development of AAA games on some of the largest Ubisoft franchises.
August 2017 – Announcement of the opening of a studio in Stockholm
Ubisoft opened a studio in Stockholm, Sweden, which will collaborate with the Massive studio on the development of AAA games.
September 2017 – Extension of the partnership with the government of Quebec until 2027 and creation of the studio in Saguenay
In addition to the announcement of Ubisoft’s expansion in Quebec, which calls for an additional investment of CAD 780 million and the creation of 1,000 new jobs by 2027, the Group has announced the opening of a new studio dedicated to online development in Saguenay.
General Meeting of September 22, 2017: overwhelming support of Ubisoft’s strategy and management by its shareholders
The shareholders expressed overwhelming support for Ubisoft’s strategy and management, voting in favor of all of the resolutions on the agenda at the Ordinary General Meeting.
The shareholders also approved the resolutions of the Extraordinary General Meeting, particularly the possibility, for employees, based on the decision of the Board of Directors, to participate in capital increases. Due to the automatic abstention of Vivendi, as in 2016, resolution 31 regarding the compensation of the talent pool was not approved.
December 2017 – On the strength of the success of the releases and the back catalog, Ubisoft decided to increase the development time of three games
In a particularly favorable context for Ubisoft, based on the continued outstanding momentum of its back catalog in November and new releases, Ubisoft announced that three games would receive additional development time. In order to take into account the adjustment in its lineup and the confi rmation of these positive trends, Ubisoft updated its 2017/2018 fi nancial objectives, particularly through an increase in profi tability.
January 2018 – Partnership between Tencent and Ketchapp
Ubisoft and Tencent established a strategic partnership in order to provide a selection of Ketchapp’s games on Weixin mini-games, a mobile application launched by Tencent. Weixin is the equivalent of WeChat for Continental China’s population, with 980 million monthly active users (MAUs).
- 2018 Registration Document 11
Group presentation2Subsidiaries and equity investments
January 2018 – €500 million bond issue
Ubisoft successfully completed a bond issue totaling €500 million with a fi ve-year maturity (January 2023) and an annual coupon of 1.289%. The order book exceeded €2.2 billion, i.e. an over-subscription of more than 4.4x.
February 2018 – Acquisition of 1492 Studio, specializing in Free-to-Play mobile games
Ubisoft acquired “1492 Studio”, a game development studio specializing in the creation of Free-to-Play episodic and interactive stories on mobiles.
March 2018 – Acquisition of Studio Blue Mammoth Games, specializing in multiplayer Free-to-Play games for PCs and PS4
With this acquisition, Ubisoft added Brawlhalla® to its portfolio, the combat game that is currently the most played on Steam, and expanded its digital expertise.
March 2018 – Announcement of the opening of new studios in India and Ukraine
Ubisoft stated that its creative capacities will increase thanks to the opening of new studios in India and Ukraine. These studios in Mumbai and Odessa will concentrate their activities on the development of AAA games and on game support post-launch.
March 2018 – Signature of a strategic partnership with Tencent and disposal of Vivendi’s investment in Ubisoft
Ubisoft signed a strategic partnership agreement with Tencent, which will help its brands to grow on the Chinese market and to reach millions of new players on mobiles and PCs. This partnership was signed at the time of the disposal of the entirety of Vivendi’s investment in Ubisoft, thereby permitting equity investments by Tencent and Ontario Teachers’ Pension Plan (“Ontario Teachers’”) as long-term shareholders.
2.4 Subsidiaries and equity investments
❙ 2.4.1 INVESTMENTS DURING THE FINANCIAL YEAR
Opening of new companies
♦ April 2017: Ubisoft Bordeaux SAS, production studio,
♦ July 2017: Script Movie Inc., United States.
Acquisition
♦ November 2017: Acquisition of Krysalide SAS
On November 1, 2017, Ubisoft acquired 100% of Krysalide SAS, which joined its international studio network.
♦ February 2018: Acquisition of 1492 Studio SAS
On February 28, 2018, Ubisoft SA acquired 100% of 1492 Studio SAS, a game development studio specializing in the creation of free-to-play interactive episodic stories on mobiles. Founded in 2014 and based in France, 1492 Studio SAS created the successful mobile franchise “Is it Love? ™”.
♦ March 2018: Acquisition of Blue Mammoth Games LLC
On March 1, 2018, Ubisoft acquired 100% of the development studio Blue Mammoth Games LLC, as well as its wholly-owned subsidiary BGM Europe BV. Based in the United States, the studio developed and published Brawlhalla, a free-to-play combat game.
Mergers
♦ June 2017: merger of Ubisoft Motion Pictures SARL with Ubisoft Motion Pictures Assassin’s Creed SAS and Ubisoft Motion Pictures Splinter Cell SAS.
♦ December 2017: merger of Krysalide SAS with Ivory Art & Design SARL.
❙ 2.4.2 BUSINESS ACTIVITIES OF SUBSIDIARIES
Production subsidiaries
These are responsible, under the supervision and within the framework set out by the parent company, for the design and development of the software, including in particular the scenarios, layouts and game rules, as well as the development of design tools and game engines.
The Group is continuing to adapt to industry trends and is developing its expertise in online and mobile gaming.
- 2018 Registration Document12
Group presentation
2
Subsidiaries and equity investments
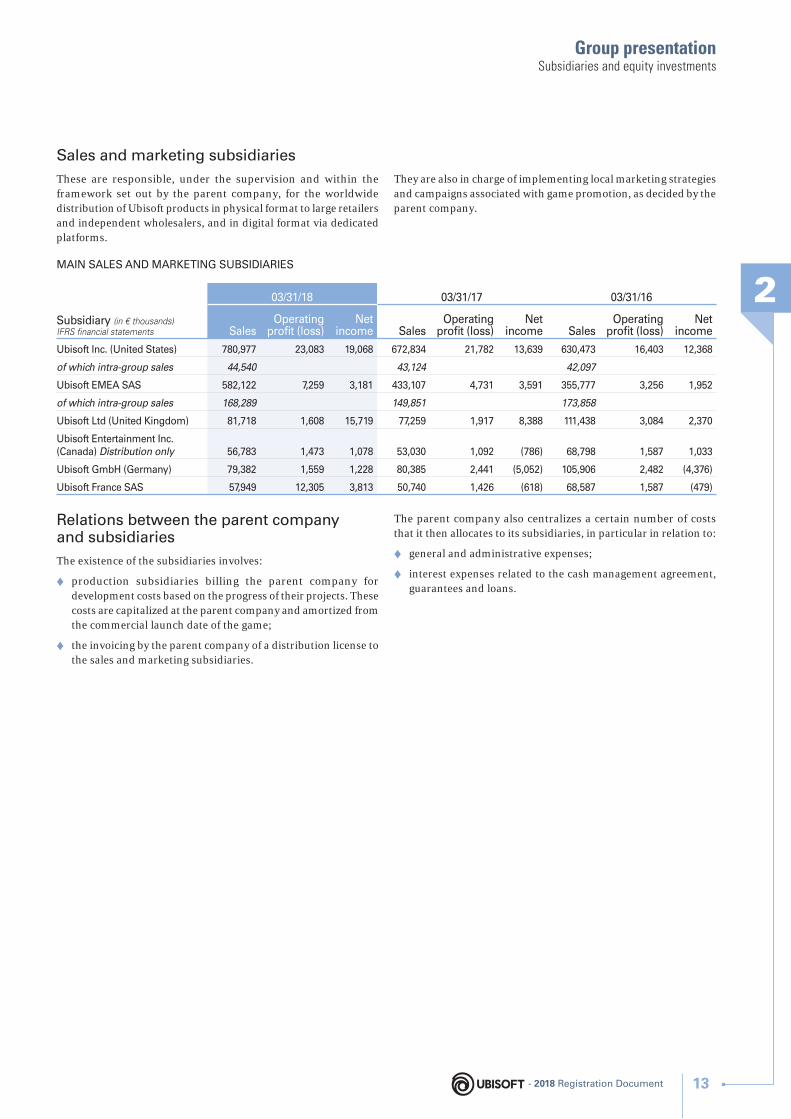
Sales and marketing subsidiaries
These are responsible, under the supervision and within the framework set out by the parent company, for the worldwide distribution of Ubisoft products in physical format to large retailers and independent wholesalers, and in digital format via dedicated platforms.
They are also in charge of implementing local marketing strategies and campaigns associated with game promotion, as decided by the parent company.
MAIN SALES AND MARKETING SUBSIDIARIES
Subsidiary (in € thousands)IFRS fi nancial statements
03/31/18 03/31/17 03/31/16
SalesOperating
profi t (loss)Net
income SalesOperating
profi t (loss)Net
income SalesOperating
profi t (loss)Net
income
Ubisoft Inc. (United States) 780,977 23,083 19,068 672,834 21,782 13,639 630,473 16,403 12,368
of which intra-group sales 44,540 43,124 42,097
Ubisoft EMEA SAS 582,122 7,259 3,181 433,107 4,731 3,591 355,777 3,256 1,952
of which intra-group sales 168,289 149,851 173,858
Ubisoft Ltd (United Kingdom) 81,718 1,608 15,719 77,259 1,917 8,388 111,438 3,084 2,370
Ubisoft Entertainment Inc. (Canada) Distribution only 56,783 1,473 1,078 53,030 1,092 (786) 68,798 1,587 1,033
Ubisoft GmbH (Germany) 79,382 1,559 1,228 80,385 2,441 (5,052) 105,906 2,482 (4,376)
Ubisoft France SAS 57,949 12,305 3,813 50,740 1,426 (618) 68,587 1,587 (479)
Relations between the parent company and subsidiaries
The existence of the subsidiaries involves:
♦ production subsidiaries billing the parent company for development costs based on the progress of their projects. These costs are capitalized at the parent company and amortized from the commercial launch date of the game;
♦ the invoicing by the parent company of a distribution license to the sales and marketing subsidiaries.
The parent company also centralizes a certain number of costs that it then allocates to its subsidiaries, in particular in relation to:
♦ general and administrative expenses;
♦ interest expenses related to the cash management agreement, guarantees and loans.
- 2018 Registration Document 13
Group presentation2Subsidiaries and equity investments
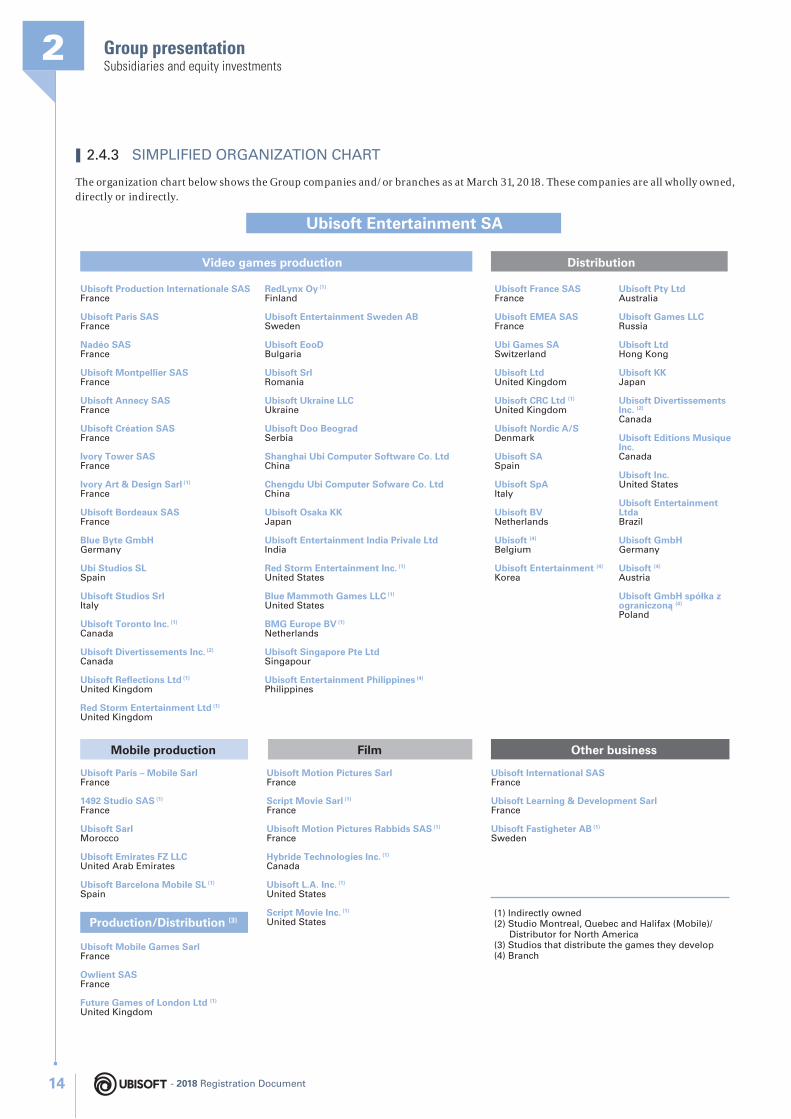
❙ 2.4.3 SIMPLIFIED ORGANIZATION CHART
The organization chart below shows the Group companies and/or branches as at March 31, 2018. These companies are all wholly owned, directly or indirectly.
Video games production
Mobile production Film Other business
Distribution
Ubisoft Entertainment SA
RedLynx Oy (1)
Finland
Ubisoft Entertainment Sweden ABSweden
Ubisoft EooDBulgaria
Ubisoft SrlRomania
Ubisoft Ukraine LLCUkraine
Ubisoft Doo BeogradSerbia
Shanghai Ubi Computer Software Co. LtdChina
Chengdu Ubi Computer Sofware Co. Ltd China
Ubisoft Osaka KKJapan
Ubisoft Entertainment India Privale LtdIndia
Red Storm Entertainment Inc. (1)
United States
Blue Mammoth Games LLC (1)
United States
BMG Europe BV (1)
Netherlands
Ubisoft Singapore Pte LtdSingapour
Ubisoft Entertainment Philippines (4)
Philippines
Ubisoft Production Internationale SASFrance
Ubisoft Paris SASFrance
Nadéo SASFrance
Ubisoft Montpellier SASFrance
Ubisoft Annecy SASFrance
Ubisoft Création SASFrance
Ivory Tower SASFrance
Ivory Art & Design Sarl (1)
France
Ubisoft Bordeaux SASFrance
Blue Byte GmbHGermany
Ubi Studios SLSpain
Ubisoft Studios SrlItaly
Ubisoft Toronto Inc. (1)
Canada
Ubisoft Divertissements Inc. (2)
Canada
Ubisoft Reflections Ltd (1)
United Kingdom
Red Storm Entertainment Ltd (1)
United Kingdom
Ubisoft Pty LtdAustralia
Ubisoft Games LLCRussia
Ubisoft LtdHong Kong
Ubisoft KKJapan
Ubisoft Divertissements Inc. (2)
Canada
Ubisoft Editions Musique Inc.Canada
Ubisoft Inc.United States
Ubisoft Entertainment LtdaBrazil
Ubisoft GmbHGermany
Ubisoft (4)
Austria
Ubisoft GmbH spółka z ograniczoną (4)
Poland
Ubisoft Paris – Mobile SarlFrance
1492 Studio SAS (1)
France
Ubisoft SarlMorocco
Ubisoft Emirates FZ LLCUnited Arab Emirates
Ubisoft Barcelona Mobile SL (1)
Spain
Production/Distribution (3)
Ubisoft Mobile Games Sarl France
Owlient SASFrance
Future Games of London Ltd (1)
United Kingdom
Ubisoft Motion Pictures SarlFrance
Script Movie Sarl (1)
France
Ubisoft Motion Pictures Rabbids SAS (1)
France
Hybride Technologies Inc. (1)
Canada
Ubisoft L.A. Inc. (1)
United States
Script Movie Inc. (1)
United States
Ubisoft International SASFrance
Ubisoft Learning & Development SarlFrance
Ubisoft Fastigheter AB (1)
Sweden
(1) Indirectly owned(2) Studio Montreal, Quebec and Halifax (Mobile)/ Distributor for North America(3) Studios that distribute the games they develop(4) Branch
Ubisoft France SASFrance
Ubisoft EMEA SAS France
Ubi Games SASwitzerland
Ubisoft LtdUnited Kingdom
Ubisoft CRC Ltd (1)
United Kingdom
Ubisoft Nordic A/S Denmark
Ubisoft SASpain
Ubisoft SpAItaly
Ubisoft BVNetherlands
Ubisoft (4)
Belgium
Ubisoft Entertainment (4)
Korea
- 2018 Registration Document14
Group presentation
2
Research and development, investment and fi nancing policy
2.5 Research and development, investment and financing policy
❙ 2.5.1 RESEARCH AND DEVELOPMENT POLICY
In order to develop exceptional video games, Ubisoft has established a project-led R&D policy for tools and technologies using the most recent technological advances.
The technical decisions of a game are made very early in the creative process, years before its release, so as to align innovative efforts, both in terms of human resources and funding. Thanks to its acquisition of teams of engineers having mastered the best existing technologies, Ubisoft currently employs a very pragmatic approach to its projects: depending of the problems and expected results for a game, the choice of tools will either focus on specifi c internal developments or on existing software on the market, or most commonly, on a combination of both. Research is thus focused on innovation and functionality using technologies that are suited to a high-quality product.
In a sector where technological innovation is a constant, a culture of knowledge-sharing is essential to the performance of the teams. A collaborative approach (1) is favored to encourage the sharing and transfer of technological knowledge within the Group’s different teams (production, support, IT) and to contribute to ongoing advances in tools and production processes.
Different initiatives have been implemented over the years, driven mainly by the Knowledge Management and Technology Group departments, to develop various tools and sharing platforms to support knowledge capitalization. On the other hand, the re-use of the technological building blocks that are vital to the creation of a video game is encouraged and allows the production team to focus on their research and development work on the non-generic parts of the games, thus maximizing their added value. These advances, associated with promoting networking between the Group’s studios, have enabled the Company to master the development of new products, particularly with regard to the transition toward new generations of consoles and the exploration of new technologies like virtual, and augmented, reality.
Although the Group does not conduct any basic research, it has worked closely with a variety of research partners for many years in order to collaborate with researchers in fi elds connected to game development. For example, the Montreal studio collaborates with the academic research community (2) by jointly developing innovative prototypes to fi nd out more about player behavior. In addition, the Strategic Innovation Lab, which reports to General Management, and whose mission is to anticipate the future and to help the organization
prepare itself for it, supports these research efforts and strategic recommendations with prototypes and open innovation projects with the academic world, industrial partners and startups. Lastly, specifi c collaborations are also taking place with external software providers to improve the productivity of the tools and methods used by Ubisoft in game production.
Alongside its work focused on the production of high quality games, Ubisoft also invests in the fi elds of animation and fi lm via its entity Ubisoft Motion Pictures, which produces the animated television series “Raving Rabbids” broadcast on France Télévision in France, and primarily on Netfl ix for the rest of the world. Advances in both the production methods inspired by the world of fi lm and cutting edge imaging technology have also been made in these domains and contributed, through exchanges with game production teams, to the development of innovative products.
These different initiatives have enabled Ubisoft to complement its internal software developments while still encouraging openness to the many technological fi elds that now comprise the creation of increasingly advanced and immersive interactive experiences and content. Thanks to this openness and its active participation in various technical events and conferences (Games Developers Conference, Dice, Siggraph, etc.), Ubisoft contributes to the infl uence of the video game sector for the whole industry.
With regard to the 2017/2018 fi nancial year, commercial software and movie costs reached €679 million, 18% higher than the previous year.
❙ 2.5.2 INVESTMENT POLICY
The vast majority of Ubisoft’s production is in-house, thereby affording it full control over its expertise in game development and the ability to share this knowledge between its various studios. This approach is crucial for the development of open-world games – which involve large teams and therefore require close collaboration between the different studios – and for live games, as well as for the development of additional game content.
Ubisoft has continued its investment expenditure policy to enable the Company to gain traction in new platforms, develop its online business and more generally increase its market share and improve its fi nancial performance. Studio production costs, fi nanced by the parent company, increased in 2017/2018.
(1) See section 5.3.2.4
(2) See section 5.5.2.1 on Ubisoft’s involvement in research
- 2018 Registration Document 15
Group presentation2Research and development, investment and fi nancing policy
2017/2018 2016/2017 2015/2016
Internal production-related capex (in € millions) €671M €568M €514M
Capex per member of production staff €61,217 €59,578 €59,700
❙ 2.5.3 FINANCING POLICY
Ubisoft has broadly two kinds of cash fl ows:
♦ cash fl ows for fi nancing development costs, which are spread evenly throughout the year;
♦ cash fl ows linked to the highly seasonal nature of games marketing.
These cash fl ows include a lag between production costs and cash infl ows. The Company must fi rst fi nance product manufacturing, which is payable at 30 days on average, as well as the marketing costs before collecting cash infl ows, on average 70 days after games are released. The Group must therefore fi nance signifi cant cash fl ow peaks linked to the game release dates.
However, progress in the development of digital activity is easing fi nancing requirements associated with the physical production of marketed products.
Equity fi nancing
The video game business line requires substantial capital expenditure in development, over average periods of between 24 and 36 months, which publishers must be able to fi nance out of their own resources.
In addition, publishers are required to launch new releases on a regular basis, and their levels of success cannot always be guaranteed.
For these reasons, signifi cant capitalization is essential to guarantee the continuous fi nancing of capital expenditure and to deal with contingencies stemming from the success or failure of games without endangering the future of the Company.
With equity of €889 million, the Ubisoft Group fi nanced investment expenditure on internal and external production of games and fi lms to the tune of €720 million for the 2017/2018 fi nancial year.
Other sources of fi nance
Over the 2017/2018 fi nancial year, the Ubisoft Group used the following resources to meet its operating cash requirements:
♦ a €300 million syndicated loan signed in July 2017, over fi ve years with the option of a one-year extension, renewable once;
♦ a Schuldschein type loan of €50 million granted in March 2015 (maturing in March 2020); €150 million having been repaid on the total €200 million initially issued;
♦ two Euro PP type bonds of €20 million and €40 million issued in December 2012 (maturing in December 2018) and May 2013 (maturing in May 2018) respectively;
♦ a €400 million OCEANE bond (maturing in September 2021);
♦ a bond issue of €500 million (maturing in January 2023);
♦ bilateral credit lines of €45 million (maturing in less than one year);
♦ a loan of €5 million (maturing in September 2018);
♦ three loans with scheduled refunds:
• €3.8 million due in March 2021,
• €0.9 million due in September 2019,
• €1.3 million due in December 2018;
♦ a commercial paper program with a maximum of €300 million.
The Group may also use:
♦ disposals of receivables on rights to Canadian multimedia title credits (CTMM) in Canada, as one-time transactions. During the fi nancial year, no disposals took place under a contract;
♦ invoice discounting and receivables factoring in Germany and the United Kingdom.
FACTORING COMMITMENT AND DISCOUNT ON THE CLOSING DATE
(in € millions) 03/31/18 03/31/17 03/31/16
United Kingdom - 13.8 25
Germany - 31.3 37.5
FACTORING COMMITMENT - 45.1 62.5
France - - 2.7
DISCOUNT - - 2.7
However, Ubisoft does not use securitization agreements, Dailly assignment agreements or sale and repurchase agreements.
Covenant management
With regard to the syndicated loan, the Schuldschein type loan and the bilateral credit lines, Ubisoft must comply with the following ratios calculated on the basis of the IFRS consolidated annual fi nancial statements:
♦ the “Net debt restated for assigned receivables/equity restated for goodwill” ratio must be below 0.8;
♦ the “Net debt restated for assigned receivables/EBITDA over the last 12 months” ratio must be below 1.5.
As at March 31, 2018, the Ubisoft Group was in compliance with these ratios and expects to remain so during the 2018/2019 fi nancial year.
- 2018 Registration Document16
Group presentation
2
2017/2018 performance review (non-IFRS data)
Financing in 2018/2019
For the 2018/2019 fi nancial year, and unless the Company makes a major acquisition, Ubisoft should be able to fi nance its operations from cash and the facilities at its disposal, including at least €1,250 million in lines of credit of more than one year.
2.6 2017/2018 performance review (non-IFRS data)
❙ 2.6.1 DEFINITION OF FINANCIAL INDICATORS THAT ARE NOT STRICTLY ACCOUNTING-RELATED
Ubisoft has concluded that these indicators, which are not strictly accounting measures, provide pertinent additional information for analyzing the Group’s operating and fi nancial performance. Management uses these measures since they are the best refl ection of business performance and exclude the majority of non-operating and non-recurring items.
Alternative performance indicators, not presented in the fi nancial statements, are:
♦ net bookings correspond to historical sales;
♦ non-IFRS operating profi t, which corresponds to operating profi t after deduction of:
• share-based compensation expense arising on free share plans, Group savings plans and stock options,
• impairment of acquired intangible assets with an indefi nite useful life,
• non-operating profi t linked to the Group’s organizational restructuring;
♦ non-IFRS operating margin, which corresponds to the ratio between non-IFRS operating profi t and sales. This ratio refl ects economic performance;
♦ non-IFRS net income corresponds to net income after deduction of:
• restatements included in the non-IFRS operating profi t above,
• income and expenses relating to the remeasurement after the measurement period of any variable compensation granted in connection with business combinations,
• interest on the OCEANE bond under IAS 39,
• tax impacts on these adjustments;
♦ non-IFRS diluted EPS corresponds to non-IFRS net income divided by the weighted average number of shares after exercise of the rights of dilutive instruments.
The adjusted cash fl ow statement includes:
♦ non-IFRS cash fl ows from operations, which includes:
• the cost of internal development and development of licenses presented under IFRS in cash fl ow from investing activities, these costs being integral to the Group’s business,
• current and deferred taxes;
♦ the net change in non-IFRS working capital, including movements in deferred tax, thus offsetting the deferred tax income or expense presented in non-IFRS cash fl ow from operations;
♦ non-IFRS cash fl ow from operating activities, which includes the cost of internal development and development of licenses presented under IFRS in cash fl ow from investing activities, restated in non-IFRS cash fl ow from operations;
♦ non-IFRS cash fl ow from investing activities, which excludes the cost of internal development and development of licenses presented in non-IFRS cash fl ow from operations;
♦ free cash fl ow corresponds to cash fl ow from operating activities after disbursements and receipts relating to the disposal/acquisition of other intangible assets and property, plant and equipment;
♦ free cash fl ow before working capital corresponds to cash fl ow from operations after disbursements and receipts relating to the disposal/acquisition of other intangible assets and property, plant and equipment;
♦ net cash corresponds to current investments and cash and cash from operations after disbursements and receipts relating to equivalents, net of borrowings and excluding derivatives.
- 2018 Registration Document 17
Group presentation22017/2018 performance review (non-IFRS data)
RECONCILIATION OF IFRS NET INCOME AND NON-IFRS NET INCOME
(in € million, except per share data)
2017/2018 2016/2017
IFRS Adjustments Non-IFRS IFRS Adjustments Non-IFRS
SALES 1,731.9 - 1,731.9 1,459.9 - 1,459.9
Total operating expenses (1,509.6) 77.8 (1,431.8) (1,284.1) 61.9 (1,222.2)
Stock-based compensation (39.6) 39.6 - (36.8) 36.8 -
Goodwill/brand impairment (38.2) 38.2 - (25.1) 25.1 -
OPERATING PROFIT (LOSS) 222.3 77.8 300.1 175.8 61.9 237.7
Net fi nancial income (13.4) 7.7 (5.7) (16.2) 7.2 (9.0)
Share in profi t of associates (0.2) - (0.2) (0.3) - (0.3)
Total income tax (69.2) (4.4) (73.6) (51.4) (2.6) (54.0)
Profi t (loss) for the period 139.5 81.1 220.6 107.8 66.5 174.3
Diluted earnings per share 1.18 0.62 1.80 0.92 0.54 1.46
❙ 2.6.2 CHANGES IN THE INCOME STATEMENT
(in € thousands) 03/31/18 03/31/17
Sales 1,731,894 1,459,874
Gross profi t 1,435,074 1,188,987
Non-IFRS R&D costs (661,090) (521,723)
Non-IFRS SG&A costs (473,867) (429,520)
Non-IFRS current operating profi t 300,117 237,743
Non-IFRS net financial income (5,687) (9,013)
Share of profi t of associates (224) (338)
Non-IFRS income tax (credit) (73,640) (54,095)
NON-IFRS NET INCOME 220,566 174,297
Equity 889,330 1,133,816
Investment expenditure on internal and external game and fi lm production 720,173 610,496
Staff 13,742 11,907
Gross profit as a percentage of sales grew to 82.9%, or €1,435.1 million in absolute terms, compared with a gross profi t of 81.4% (€1,189.0 million) in 2016/2017.
Non-IFRS operating profi t amounted to €300.1 million, up 26.2% from the €237.7 million generated in 2016/2017.
The change in operating profi t breaks down as follows:
♦ €246.1 million increase in gross profi t;
♦ R&D costs rose by €139.4 million, to stand at €661.1 million (38.2% of sales), compared with €521.7 million for 2016/2017 (35.7%);
♦ SG&A costs were also up, by €44.3 million, at €473.9 million (27.4% of sales), compared with €429.5 million (29.4%) for the previous year:
• variable marketing expenses stood at €233.2 million (13.5% of sales), an increase over the €218.5 million (15.0%) for 2016/17,
• structure costs totaled €240.7 million (13.9% of sales) compared with €211.1 million (14.5%) in 2016/2017.
Non-IFRS net income totaled €220.6 million, corresponding to non-IFRS (diluted) net earnings per share of €1.80, compared with a non-IFRS net income of €174.3 million for 2016/2017, or €1.46 per share.
❙ 2.6.3 CHANGE IN WCR AND DEBT LEVELS
Based on the non-IFRS cash fl ow statement, the working capital requirement increased by €45.0 million compared to a decrease of €38.9 million during the previous fi nancial year, primarily due to the lack of factoring on trade receivables for the year.
Cash fl ows generated from operating activities stood at €169.9 million (compared with the €149.1 million used in 2016/2017).
- 2018 Registration Document18
Group presentation
2
2017/2018 performance review (non-IFRS data)
This refl ects cash fl ows from operations of €214.9 million (compared with €110.2 million for 2016/2017) and an increase in WCR of €45.0 million.
Net debt stood at €(548.1) million at March 31, 2018, versus net debt of €(80.4) million at March 31, 2017. This change is the result of the following:
♦ cash fl ow generation: €169.9 million;
♦ receipts and disbursements relating to other intangible assets and property, plant and equipment: €(59.3) million;
♦ receipts and disbursements relating to non-current fi nancial assets: €(101.7) million;
♦ acquisitions: €(77.6) million (including 1492 Studio and Blue Mammoth Games);
♦ exercise of stock options and employee stock ownership: €49.0 million;
♦ purchases/sales of own shares: €(411.5) million;
♦ Change in the option value of the convertible bond: €(8.4) million;
♦ Effect of foreign exchange gains and losses: €(27.9) million.
NON-IFRS CASH FLOW STATEMENT (UNAUDITED)
(in € thousands) 03/31/18 03/31/17
Non-IFRS cash fl ows from operating activities
Consolidated profi t (loss) 139,452 107,813
+/- Share of profi t of associates 224 338
+/- Net depreciation and amortization of gaming software & movies 462,207 407,816
+/- Other net depreciation and amortization of non-current assets 81,824 66,819
+/- Net provisions 4,052 (2,563)
+/- Cost of stock-based compensation 39,558 36,836
+/- Gains/losses on disposals 308 408
+/- Other income and expenses calculated 8,578 (10,655)
+/- Internal development and license development costs (521,290) (496,588)
Non-IFRS cash flows from operations 214,914 110,223
Inventory 229 (5,381)
Customers (61,544) 31,934
Other assets (78,567) 3,113
Trade payables 15,243 (45,082)
Other liabilities 79,591 54,315
+/- Change in non-IFRS WCR (45,048) 38,899
Total non-IFRS cash flow generated by operating activities 169,865 149,122
Non-IFRS cash fl ows from investing activities
- Payments for other intangible assets and property, plant and equipment (59,366) (62,914)
+ Proceeds from the disposal of intangible assets and property, plant and equipment 20 603
- Payments for the acquisition of fi nancial assets (131,493) (44,374)
+ Repayment of loans and other fi nancial assets 29,790 43,322
+/- Changes in scope * (77,589) (105,642)
Total non-IFRS cash flow used by investing activities (238,638) (169,005)
Cash fl ows from fi nancing activities
+ New borrowings 894,598 669,147
+ New fi nance leases contracted 5,054 1,416
- Repayment of fi nance leases (1,672) (898)
- Repayment of borrowings (487,677) (214,663)
+ Proceeds from shareholders in capital increases 48,951 9,465
+/- Sales/purchases of own shares (411,498) (67,844)
Cash generated by financing activities 47,756 396,623
NET CHANGE IN CASH AND CASH EQUIVALENTS (21,017) 376,740
Cash and cash equivalents at the beginning of the period 632,314 255,688
Foreign exchange, losses/gains (27,943) (114)
CASH AND CASH EQUIVALENTS AT THE END OF THE PERIOD* 583,354 632,314
* Including cash in companies acquired and disposed of 4,738 26,421
- 2018 Registration Document 19
Group presentation2Outlook
2.7 Outlook
In 2017, the console and PC video games market grew by 10% (Europe, Australia and North America -source: NPD, GFK). Growth is set to continue in 2018, still due to the sharp increase in digital revenues and a dynamic console and PC market.
In mid-May 2018, the Group updated its 2018/2019 objectives:
♦ sales per IFRS 15 of around €2,000 million (1);
♦ net bookings of approximately €2,050 million to be compared with the prior objective of €2,100 million, on the basis of:
• 3 new AAA launches (The Crew 2, The Division 2 and an unannounced franchise) for 19 million units, compared to the previously expected 4 AAA and 23 million units. In keeping with previous practices, and on the strength of the acceleration in digital transformation, back catalog growth and the excellent
momentum of recent releases, the Company has decided to allocate more development time to Skulls & Bones, thereby offering an even more engaging experience for players. Skull & Bones™ is now expected during the 2019-2020 fi nancial year,
• expected digital sales of around 65% of net bookings (compared with approximately 60% previously), PRI of around 30% of net bookings (compared to over 25% previously),
• an expected back catalog at roughly 50% of net bookings (compared to over 45% previously);
♦ non-IFRS operating profi t (loss) (calculated based on net bookings) confi rmed at around €440 million;
♦ confi rmed free cash fl ow of around €300 million.
(1) Based on our IFRS 15 analysis to date (unaudited)
- 2018 Registration Document20

3.1 RISK FACTORS 223.1.1 The Group’s business risks 22
3.1.2 Legal risks 26
3.1.3 Market risks 27
3.2 RISK MANAGEMENT AND INTERNAL CONTROL PROCEDURE 29
3.2.1 Defi nition and objectives of internal control and risk management 29
3.2.2 Organization of internal control 29
3.2.3 Control activities 31
3.2.4 Ongoing supervision of the internal control system 33
3.2.5 Insurance and risk coverage 33
Risks and internal control3
- 2018 Registration Document 2121- 2018 Registration Document
Risks and internal control3Risk factors
3.1 Risk factors
In the course of its business, the Group is exposed to a series of risks that could affect its performance, the achievement of its strategic and fi nancial goals and its share price.
This chapter presents the material risks identifi ed by the Audit Committee, to which Ubisoft may be exposed. These are broken down into three main categories: risks associated with the Group’s business, legal risks and market risks. Other risks and uncertainties, not yet identifi ed or considered immaterial as at the date of this Registration Document, could also become signifi cant risk factors and have an adverse effect on the Group’s business, its fi nancial position or its earnings.
Ubisoft has introduced a risk management policy as well as an internal control system to pre-empt, identify and address the main risks that could have a negative impact on the Group’s business and performance. However, these measures cannot provide an absolute guarantee that objectives will be met and that the following risks will be controlled.
❙ 3.1.1 THE GROUP’S BUSINESS RISKS
Risks associated with market changes
Ubisoft operates on a market that is becoming increasingly competitive and selective and is subject to concentration and economic fl uctuations, marked by rapid technological changes and economic models requiring signifi cant R&D investment.
The Group endeavors to anticipate new challenges such as the dematerialization of physical media, the second-hand market, piracy, online and mobile games, the progressive ramp-up of streaming and the emergence of new competitors in Asia. Digital distribution in particular could have a long-term impact on the average price of games, considering that a fall in prices would probably be accompanied by an increase in sales.
In a sector of constant technological innovation, Ubisoft must continually adapt by developing new products and by investing in new video game platforms long before their success has been proven. Signifi cant levels of revenue are required in order to absorb the substantial cost of these investments. Should sales not reach expected levels, the Group’s earnings could be negatively affected. Similarly, in order to remain competitive, it is essential for a publisher to choose the development format for a game wisely as an inappropriate choice could have an adverse impact on the expected sales and profi tability.
The increasing presence of Free-to-Play (FTP), in the mobile segment in particular, means the Group is exposed to the risks of these new models, including the risk of dependency where a small number of consumers represent a large portion of the revenue of these games.
In the development of these new business models, Ubisoft becomes exposed to new risks, becomes increasingly dependent on its ability to develop and make money from its games, and faces heightened competition.
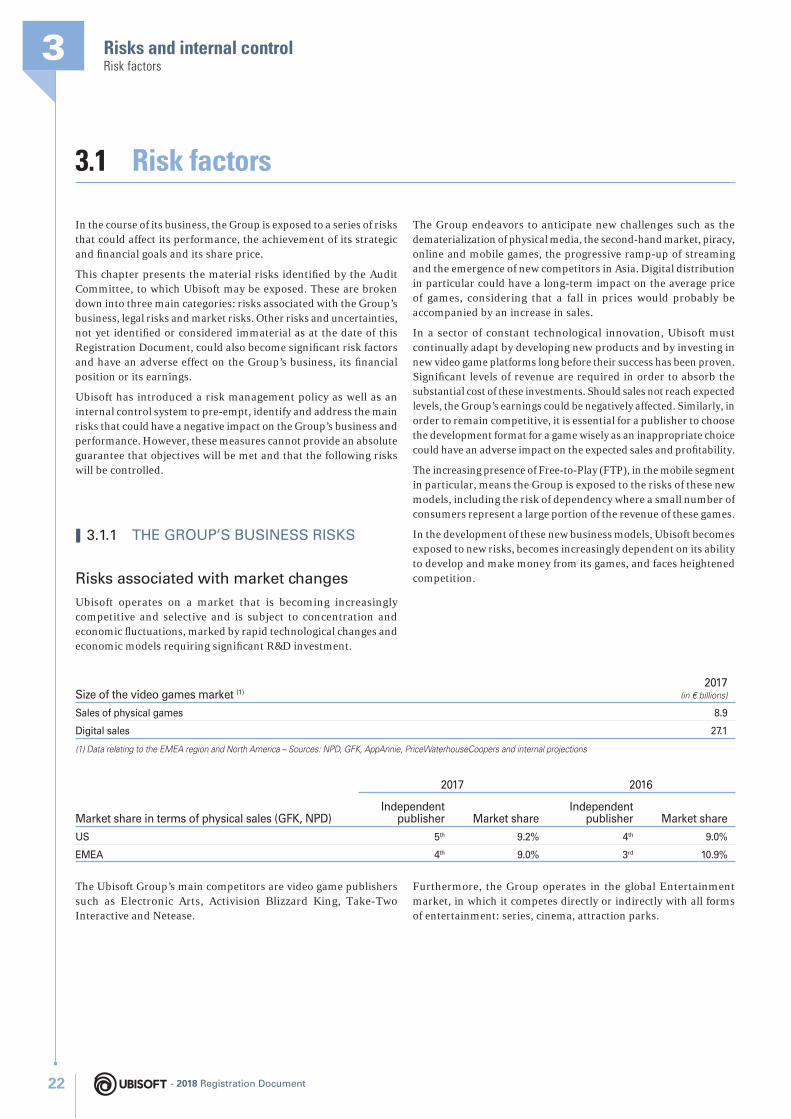
Market share in terms of physical sales (GFK, NPD)
2017 2016
Independent publisher Market share
Independent publisher Market share
US 5th 9.2% 4th 9.0%
EMEA 4th 9.0% 3rd 10.9%
The Ubisoft Group’s main competitors are video game publishers such as Electronic Arts, Activision Blizzard King, Take-Two Interactive and Netease.
Furthermore, the Group operates in the global Entertainment market, in which it competes directly or indirectly with all forms of entertainment: series, cinema, attraction parks.
Size of the video games market (1)2017
(in € billions)
Sales of physical games 8.9
Digital sales 27.1
(1) Data relating to the EMEA region and North America – Sources: NPD, GFK, AppAnnie, PriceWaterhouseCoopers and internal projections
- 2018 Registration Document22
Risks and internal control
3
Risk factors
Risks associated with product strategy, positioning and brand management
Ubisoft, like all publishers, is dependent on the success of its product catalogue and the suitability of its offering with regard to consumer demand. In this context, launching new brands offers less visibility than that of established franchises. The success of Ubisoft games may also be impacted by the performance of the competition’s titles, since its customers only have a certain amount of time and purchasing power.
In order to meet market demand, Ubisoft takes particular care in building its product catalogue by concentrating on:
♦ reinforcing its existing franchises on a regular basis and launching new brands with strong potential for consoles and PC;
♦ developing its digital business, notably though Live services and its mobile offering.
In order to diversify and enrich its brand portfolio and thus ensure steady income in the long term, Ubisoft favors a strategy of creating its own brands and producing internally, underpinned by a targeted acquisition strategy.
The Company also allocates the necessary marketing and sales resources to showcase its products via a worldwide distribution network. Its position among the top fi ve independent publishers provides the Group with a high-performance distribution platform for its products.
Finally, the Company has embarked on a market expansion strategy, promoting its brands in other segments of the entertainment market, especially cinema. As part of its strategy to develop its brands beyond video games, the Company may decide, on a case-by-case basis, to invest in fi lms derived from its franchises. The Company’s ability to recoup its investment will partly depend on the fi lm’s success and profi tability, as well as the ability of the production company to keep to the original budget. To maximize the chances of success and limit the risks of a budget overrun, Ubisoft works with major fi lm studios.
Nevertheless, the success of these strategies cannot be guaranteed and the poor positioning of a product could also have a material effect on the Group’s performance and earnings.
Risks of a delay or poor start to the release of a fl agship game
Ubisoft may have to delay the launch of a video game for any of the following reasons:
♦ diffi culty in accurately estimating the time required to develop or test it;
♦ requirements imposed by the creative process;
♦ challenges in the coordination of large development teams, often based in different countries;
♦ the increasing technological complexity of video game products and platforms;
♦ the desire to continue to improve the quality of the game prior to launch. The marketing of a game that lacks the level of quality required to realize its potential could have a negative impact on the Group’s brand and its earnings.
Similarly, if a competitor brings out a game with signifi cant technological or artistic innovations, the Group might also have to postpone the release dates of some of its games to boost their chances of commercial success in a competitive environment where players are very sensitive to the quality and content of games.
However, in a very competitive and seasonal market, the announcement of a delay in the release of a highly anticipated game could have a negative impact on the Group’s income and future earnings, and could potentially lead to a drop in its share price. Failure to meet production and product release schedules could lead to increased development and marketing expenses which could in turn result in an operating profi t signifi cantly lower than its targets. To mitigate these risks, the Group continually strives to improve its development processes, both in the organization of its teams and through leveraging synergies and/or cultivating its in-house expertise. Moreover, the increasing share of the back catalogue and digital, offering a larger recurrence in revenues and better profi tability, enable it to be less reliant on game launches.
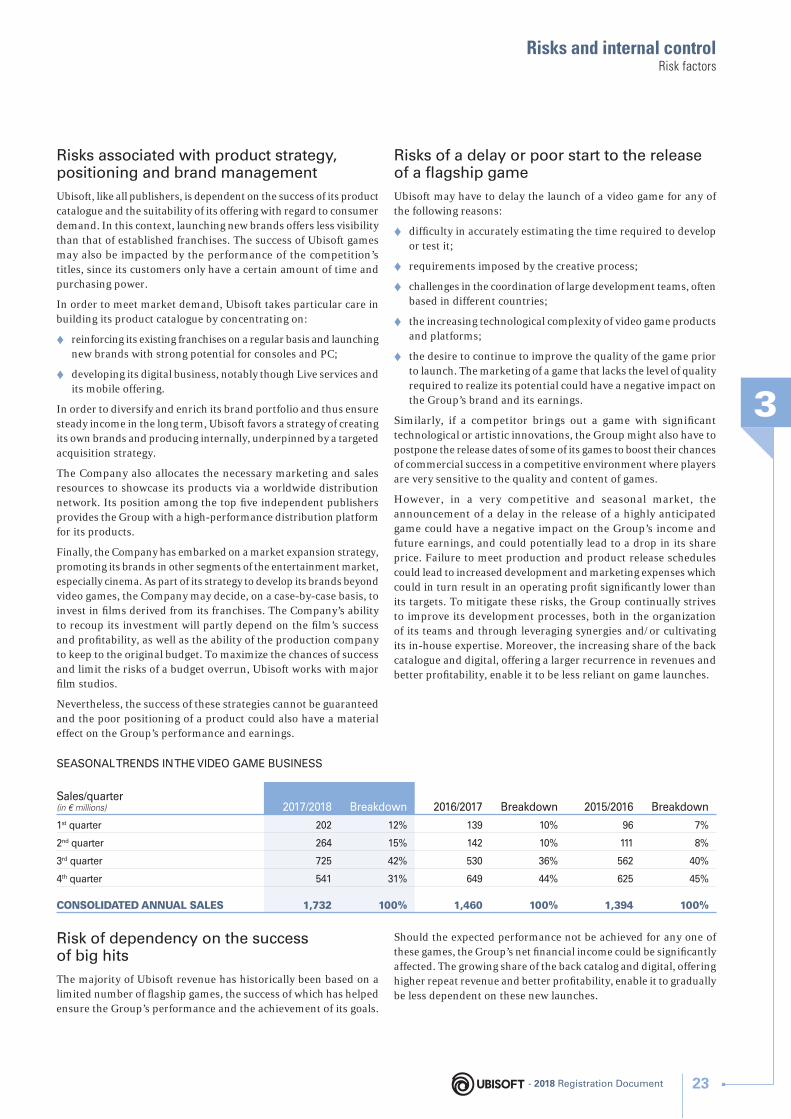
SEASONAL TRENDS IN THE VIDEO GAME BUSINESS
Sales/quarter(in € millions) 2017/2018 Breakdown 2016/2017 Breakdown 2015/2016 Breakdown
1st quarter 202 12% 139 10% 96 7%
2nd quarter 264 15% 142 10% 111 8%
3rd quarter 725 42% 530 36% 562 40%
4th quarter 541 31% 649 44% 625 45%
CONSOLIDATED ANNUAL SALES 1,732 100% 1,460 100% 1,394 100%
Risk of dependency on the success of big hits
The majority of Ubisoft revenue has historically been based on a limited number of fl agship games, the success of which has helped ensure the Group’s performance and the achievement of its goals.
Should the expected performance not be achieved for any one of these games, the Group’s net fi nancial income could be signifi cantly affected. The growing share of the back catalog and digital, offering higher repeat revenue and better profi tability, enable it to gradually be less dependent on these new launches.
- 2018 Registration Document 23
Risks and internal control3Risk factors
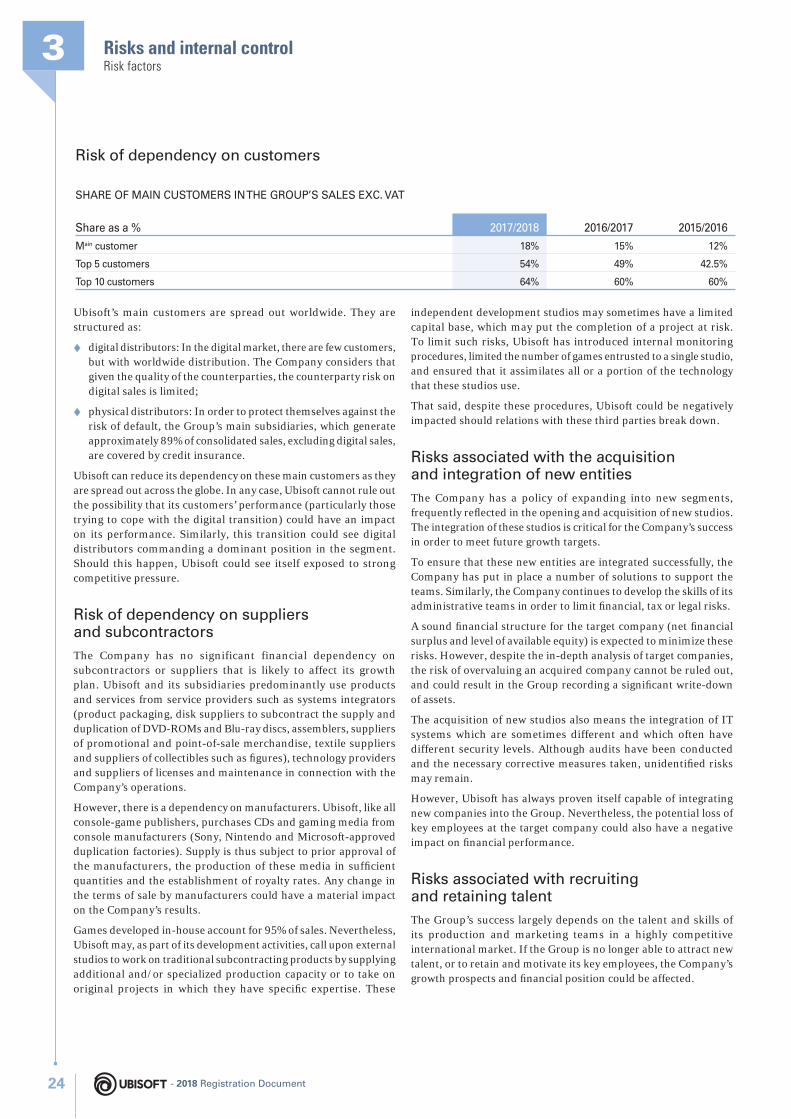
Risk of dependency on customers
SHARE OF MAIN CUSTOMERS IN THE GROUP’S SALES EXC. VAT
Share as a % 2017/2018 2016/2017 2015/2016
Main customer 18% 15% 12%
Top 5 customers 54% 49% 42.5%
Top 10 customers 64% 60% 60%
Ubisoft’s main customers are spread out worldwide. They are structured as:
♦ digital distributors: In the digital market, there are few customers, but with worldwide distribution. The Company considers that given the quality of the counterparties, the counterparty risk on digital sales is limited;
♦ physical distributors: In order to protect themselves against the risk of default, the Group’s main subsidiaries, which generate approximately 89% of consolidated sales, excluding digital sales, are covered by credit insurance.
Ubisoft can reduce its dependency on these main customers as they are spread out across the globe. In any case, Ubisoft cannot rule out the possibility that its customers’ performance (particularly those trying to cope with the digital transition) could have an impact on its performance. Similarly, this transition could see digital distributors commanding a dominant position in the segment. Should this happen, Ubisoft could see itself exposed to strong competitive pressure.
Risk of dependency on suppliers and subcontractors
The Company has no significant financial dependency on subcontractors or suppliers that is likely to affect its growth plan. Ubisoft and its subsidiaries predominantly use products and services from service providers such as systems integrators (product packaging, disk suppliers to subcontract the supply and duplication of DVD-ROMs and Blu-ray discs, assemblers, suppliers of promotional and point-of-sale merchandise, textile suppliers and suppliers of collectibles such as fi gures), technology providers and suppliers of licenses and maintenance in connection with the Company’s operations.
However, there is a dependency on manufacturers. Ubisoft, like all console-game publishers, purchases CDs and gaming media from console manufacturers (Sony, Nintendo and Microsoft-approved duplication factories). Supply is thus subject to prior approval of the manufacturers, the production of these media in suffi cient quantities and the establishment of royalty rates. Any change in the terms of sale by manufacturers could have a material impact on the Company’s results.
Games developed in-house account for 95% of sales. Nevertheless, Ubisoft may, as part of its development activities, call upon external studios to work on traditional subcontracting products by supplying additional and/or specialized production capacity or to take on original projects in which they have specifi c expertise. These
independent development studios may sometimes have a limited capital base, which may put the completion of a project at risk. To limit such risks, Ubisoft has introduced internal monitoring procedures, limited the number of games entrusted to a single studio, and ensured that it assimilates all or a portion of the technology that these studios use.
That said, despite these procedures, Ubisoft could be negatively impacted should relations with these third parties break down.
Risks associated with the acquisition and integration of new entities
The Company has a policy of expanding into new segments, frequently refl ected in the opening and acquisition of new studios. The integration of these studios is critical for the Company’s success in order to meet future growth targets.
To ensure that these new entities are integrated successfully, the Company has put in place a number of solutions to support the teams. Similarly, the Company continues to develop the skills of its administrative teams in order to limit fi nancial, tax or legal risks.
A sound fi nancial structure for the target company (net fi nancial surplus and level of available equity) is expected to minimize these risks. However, despite the in-depth analysis of target companies, the risk of overvaluing an acquired company cannot be ruled out, and could result in the Group recording a signifi cant write-down of assets.
The acquisition of new studios also means the integration of IT systems which are sometimes different and which often have different security levels. Although audits have been conducted and the necessary corrective measures taken, unidentifi ed risks may remain.
However, Ubisoft has always proven itself capable of integrating new companies into the Group. Nevertheless, the potential loss of key employees at the target company could also have a negative impact on fi nancial performance.
Risks associated with recruiting and retaining talent
The Group’s success largely depends on the talent and skills of its production and marketing teams in a highly competitive international market. If the Group is no longer able to attract new talent, or to retain and motivate its key employees, the Company’s growth prospects and fi nancial position could be affected.
- 2018 Registration Document24
Risks and internal control
3
Risk factors
The Company follows an active policy of recruitment, training and retention, particularly through the following initiatives:
♦ partnerships with leading universities in the various countries in which the Group operates;
♦ multiplication of collaborative tools and forums to encourage skills sharing;
♦ implementation of various high-level training programs tailored to the video game sector.
Furthermore, all of the programs introduced by human resources at local and international levels are fi rst and foremost designed to attract, train, retain and motivate employees with strong technical and/or managerial skills: development opportunities, share purchase plans, stock option plans, personal development plans, etc.
In spite of these measures, the risk of events occurring that could have an impact on internal organization or the motivation or retention of employees cannot be ruled out. Such circumstances could do signifi cant and long-lasting damage to the operational and fi nancial performance of the Group.
Risks associated with information security and infrastructure
Ubisoft is faced with risks that could compromise the personal data of players and their game play experience, the personal data of its employees and partners, and its own fi nancial information and intellectual property. These risk factors primarily concern:
♦ loss or theft of data: the majority of online games require Ubisoft to handle a large quantity of data relating to players, employees and partners, as well as information relating to products, services and activation keys. Ubisoft is conscious of the strategic value of this data and the fact that the loss or theft thereof could do signifi cant damage to the Group;
♦ unavailability of IT systems: online gaming systems require the permanent availability of IT systems. However, an attack on the systems (denial of service attack, malware, etc.), a defect in the IT infrastructure, or a natural or environmental disaster could result in the temporary or permanent unavailability of systems or team members. Situations such as these could cause considerable damage to Ubisoft;
♦ piracy of products and services whereby the hackers’ objective is to gain a fi nancial benefi t, more prominence or any other benefi t;
♦ any form of cheat tools enabling dishonest players to gain a competitive advantage over other players. This could lead to an imbalance in the player experience and distorted data;
♦ identity theft: social engineering type attacks could cause signifi cant fi nancial damage and harm Ubisoft’s reputation;
♦ an error by or the unavailability of an external partner on which Ubisoft relies. This predominantly relates to cloud infrastructures and applications (SaaS, IaaS, PaaS), external development teams and suppliers of technological services and equipment.
In this context, the Security and Risk Management Department develops innovative security programs to appropriately anticipate and protect against all of these risks. This Department is also committed to ensuring the confi dentiality, integrity and availability of all information processed by Ubisoft. To this end, its main work involves:
♦ the development of innovative IT system monitoring programs;
♦ the enhancement during the fi nancial year of the monitoring capacity of IT systems against sophisticated attacks using more advanced correlation techniques (including in particular Machine Learning) and by increasing the processing capacity;
♦ the installation of security operation automation tools that enable an improved response to incidents;
♦ the implementation of a crisis management organization including an alert tool for physical threats or risks to employees, as well as crisis cells in each site and at headquarters;
♦ compliance with the General Data Protection Regulation (GDPR) on personal data protection within the European Union, notably with regard to the reduction of the dissemination of private data;
♦ the reinforcement of the vulnerability management program to control and limit IT system risks;
♦ the implementation of a tool to ensure the security of work stations, which can identify advanced threats thanks to a more detailed analysis of system activity;
♦ the reinforcement of the level of security of games and services through the implementation of anti-cheat systems, anti-piracy, and other measures such as the use of ethical hacking services to combat all types of improper use. In particular, for connected games (which represent the majority of Ubisoft games), the Group has developed a “Live Services” solution to continually offer new experiences to players (new content, animations, ongoing community management, etc.). Only players holding an active license can take advantage of these live services, thereby reducing any form of piracy. Moreover, the integration of “anti-piracy” and “anti-cheat” tools enables new gamers to be attracted and retained;
♦ the regular performance of internal and external audits to adapt and improve risk management procedures: Ubisoft carries out network and system intrusion testing, and social engineering tests, and continuously evaluates the physical security of its material assets;
♦ the establishment of business continuity and disaster recovery plans;
- 2018 Registration Document 25
Risks and internal control3Risk factors
♦ employee and partner training on incident prevention and security, using innovative information campaigns.
Despite all of the measures put in place to ensure the security of information and infrastructure, Ubisoft cannot rule out the risk of intrusion or piracy of its systems which could have a material impact on the activity of the Group.
Industrial and environmental related risks
The Group’s own activities do not present any signifi cant industrial and environmental risks since the Group does not manufacture the video games (and associated ancillary products) it publishes and distributes. Nevertheless, the Group remains alert to regulatory changes in countries where it is present.
The Group currently has no knowledge of any industrial or environmental risk (1).
❙ 3.1.2 LEGAL RISKS
Risks associated with intellectual property rights
Ubisoft has chosen to develop its brands in-house, meaning that it holds all intellectual property rights to these games and can offer them via any type of device, product or service. This strategy also enables Ubisoft to limit the risk of third-party infringement.
Aware of the importance and value of its portfolio of intellectual property rights (brands, copyright and patents), Ubisoft has a team of lawyers dedicated to these rights and protecting them. This team oversees the registration of industrial property rights, continually monitors brands identical or similar to its own registered by third parties on an international level and, where required, effi ciently fi ghts all forms of piracy and copyright infringement (removal procedures in relation to contested products, legal action, etc.).
In spite of these precautions and vigilance on the part of Ubisoft, the Group cannot of course rule out any copyright infringement or piracy risks in relation to its intellectual property rights.
Risks associated with regulations
Through its external and organic growth policy, Ubisoft has expanded its presence abroad and stepped up the diversifi cation of its activities. As a result, the Group is now subject to a wide range of rapidly-changing and complex laws and regulations. These regulations mainly relate to the general conduct of business, competition, personal data processing, information confi dentiality, consumer protection (the classifi cation of games according to age-rating systems) and local and international tax systems.
Ubisoft continually monitors regulatory changes in the various countries in which it operates and is careful to comply with current rules and practices. To this end, the Group has implemented a number of internal control procedures to ensure that it complies with all relevant regulations.
A) THE COLLECTION AND PROCESSING OF PERSONAL DATA
Ubisoft ensures that it complies with applicable regulations in terms of collecting, using, storing and transferring personal data relating to players, its partners and its employees. In particular, it ensures that only information strictly necessary for its business purposes is collected. The Group includes the same rules relating to security and control in all agreements with its partners. Ubisoft takes the utmost care in collecting personal data from children under 13 and has established parental consent procedures.
Despite all of these measures and a strong determination to protect players, its partners and its employees, there are still risks inherent in the collection and processing of personal data. Risks of fraud, piracy and fl aws in IT system security in particular could result in the loss and/or theft of confi dential data and legal action being taken by those involved.
Regulations on the processing of personal data are constantly and signifi cantly changing. For example, the General Data Protection Regulation (EU) 2016/679, which strengthens and unifi es data protection for individuals in the European Union, entered into force on May 25, 2018. Similarly, the “Privacy Shield” agreement, which became effective in August 2016, authorizes data transfer from the European Union to a company in the United States, provided that this company processes the data in compliance with a set of rules and guarantees pertaining to data protection.
Ubisoft endeavors to put in place the necessary measures to comply with these current applicable measures but cannot guarantee that these changes will not affect its business.
B) INFORMATION CONFIDENTIALITYUbisoft endeavors to protect the confi dentiality of all information shared within the Group. In this regard, it works hard to raise employee and partner awareness on this matter. Internal rules on the dissemination and protection of information are established according to the level of confi dentiality. Specifi c procedures are implemented to ensure that confi dential information is only distributed to or accessible by authorized persons who require it for their work (“need to know” principle), in conjunction with encryption and segmentation procedures, internal control procedures and, where appropriate, specifi c confi dentiality agreements, etc.
Despite all of these precautions, the risk of disclosure of confi dential information may not be completely ruled out and could naturally have a detrimental effect on the Company.
(1) See paragraphs 5.4.2 and 5.4.3 of the section on “Corporate social responsibility”
- 2018 Registration Document26
Risks and internal control
3
Risk factors
C) CONSUMER PROTECTIONUbisoft ensures that it complies with applicable regulations relating to consumer protection, in particular the information given to consumers on the rules of use and content of games, the classifi cation of games in accordance with the age-rating systems of PEGI (Pan European Game Information) in Europe and ESRB (Entertainment Software Rating Board) in the United States. Committed to protecting its players and complying with video game industry practices and policies, the Group is actively involved in the work conducted by a number of organizations: the ISFE (Interactive Software Federation of Europe), SELL (Syndicat des éditeurs de logiciels de loisirs) in France, and the ESA (Entertainment Software Association) in the United States and Canada.
Notwithstanding these measures and precautions, a risk of breaching consumer protection laws still exists.
D) POLICIES SUPPORTING THE SECTORThe Group benefi ts from public policies that support the sector, particularly in France, Canada, the United Kingdom and Singapore. Under these policies, Ubisoft benefi ts from substantial grants and any change in government policy could have a signifi cant impact on the Company’s production costs and profi tability. As a result, Ubisoft ensures that it regularly renegotiates these agreements so as to limit, as much as possible, any risks associated with a change in public policies. The amount and geographical distribution of the grants are detailed in Note 13 to the consolidated fi nancial statements.
E) FISCAL POLICIESThe modifi cation of fi scal rules, tax rates and regulations in terms of transfer prices are important risk factors for the Group. Ubisoft strives to anticipate these risks and limit the impact thereof through the continuous monitoring of possible developments.
Risks associated with administrative and legal proceedings
There is no government, legal or arbitration proceedings pending that are likely to have or that, over the past 12 months, have had a material impact on the Group’s fi nancial position or profi tability.
The Group is subject to regular tax inspections by the tax authorities in the countries where it is present. Current tax audits are detailed in Note 32 to the consolidated fi nancial statements.
❙ 3.1.3 MARKET RISKS
Financial risks
In the course of its business, the Group is exposed to varying degrees of fi nancial risk (foreign-exchange, fi nancing, liquidity, interest-rate), counterparty risk and equity risk.
Group policy consists of:
♦ minimizing the impact of its exposure to market risks on both its results and, to a lesser extent, its statement of fi nancial position;
♦ tracking and managing this exposure centrally whenever regulatory and monetary circumstances allow;
♦ using derivatives for hedging purposes only.
The risk management policy is described in the section on the Treasury Department in section 3.2.3 “Control activities”. Additional information and fi gures, notably on exposure to these different risks, are also detailed in the consolidated fi nancial statements. (see 6.1.2.18).
FOREIGN EXCHANGE RISKIn light of its international presence, the Group may be exposed to exchange-rate fl uctuations, in the following three circumstances in particular:
♦ in the course of its operating activities: sales and operating expenses of Group subsidiaries are largely denominated in local currency. However, some transactions such as license agreements and intercompany invoicing are denominated in another currency. The operating margin of the subsidiaries concerned may therefore be exposed to fl uctuations in exchange rates involving their operational currency;
♦ in the course of its fi nancing activities: in line with its policy of centralizing risks, the Group has to manage fi nancing and cash in various currencies;
♦ during the process of translating the accounts of its subsidiaries from foreign currencies into euros: operating profi t (loss) from continuing operations may be generated in currencies other than the euro. As a result, fl uctuations in foreign currency exchange rates against the euro may have an impact on the Group’s income statement. These fl uctuations also affect the carrying amount of assets and liabilities denominated in foreign currencies and appearing in the consolidated statement of fi nancial position.
The Group fi rst uses natural hedges provided by transactions in the other direction (development costs in foreign currency offset by royalties from subsidiaries in the same currency). The parent company uses foreign currency borrowings, forward sales or foreign-exchange options to hedge any residual exposures and noncommercial transactions (such as intercompany loans in foreign currencies).
The sensitivity of Group earnings to changes in the value of its main currencies is described in Note 41 to the consolidated fi nancial statements.
- 2018 Registration Document 27
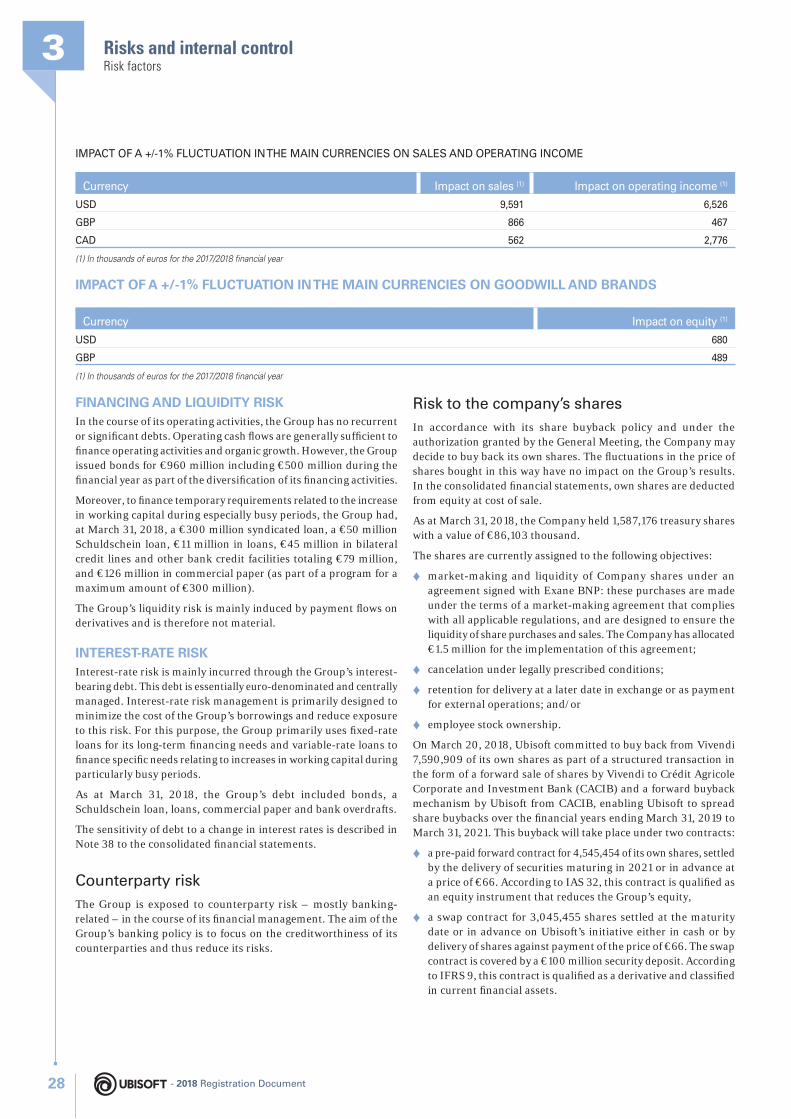
Risks and internal control3Risk factors
IMPACT OF A +/-1% FLUCTUATION IN THE MAIN CURRENCIES ON SALES AND OPERATING INCOME
Currency Impact on sales (1) Impact on operating income (1)
USD 9,591 6,526
GBP 866 467
CAD 562 2,776
(1) In thousands of euros for the 2017/2018 fi nancial year
IMPACT OF A +/-1% FLUCTUATION IN THE MAIN CURRENCIES ON GOODWILL AND BRANDS
Currency Impact on equity (1)
USD 680
GBP 489
(1) In thousands of euros for the 2017/2018 fi nancial year
FINANCING AND LIQUIDITY RISKIn the course of its operating activities, the Group has no recurrent or signifi cant debts. Operating cash fl ows are generally suffi cient to fi nance operating activities and organic growth. However, the Group issued bonds for €960 million including €500 million during the fi nancial year as part of the diversifi cation of its fi nancing activities.
Moreover, to fi nance temporary requirements related to the increase in working capital during especially busy periods, the Group had, at March 31, 2018, a €300 million syndicated loan, a €50 million Schuldschein loan, €11 million in loans, €45 million in bilateral credit lines and other bank credit facilities totaling €79 million, and €126 million in commercial paper (as part of a program for a maximum amount of €300 million).
The Group’s liquidity risk is mainly induced by payment fl ows on derivatives and is therefore not material.
INTEREST-RATE RISKInterest-rate risk is mainly incurred through the Group’s interest-bearing debt. This debt is essentially euro-denominated and centrally managed. Interest-rate risk management is primarily designed to minimize the cost of the Group’s borrowings and reduce exposure to this risk. For this purpose, the Group primarily uses fi xed-rate loans for its long-term fi nancing needs and variable-rate loans to fi nance specifi c needs relating to increases in working capital during particularly busy periods.
As at March 31, 2018, the Group’s debt included bonds, a Schuldschein loan, loans, commercial paper and bank overdrafts.
The sensitivity of debt to a change in interest rates is described in Note 38 to the consolidated fi nancial statements.
Counterparty risk
The Group is exposed to counterparty risk – mostly banking-related – in the course of its fi nancial management. The aim of the Group’s banking policy is to focus on the creditworthiness of its counterparties and thus reduce its risks.
Risk to the company’s shares
In accordance with its share buyback policy and under the authorization granted by the General Meeting, the Company may decide to buy back its own shares. The fl uctuations in the price of shares bought in this way have no impact on the Group’s results. In the consolidated fi nancial statements, own shares are deducted from equity at cost of sale.
As at March 31, 2018, the Company held 1,587,176 treasury shares with a value of €86,103 thousand.
The shares are currently assigned to the following objectives:
♦ market-making and liquidity of Company shares under an agreement signed with Exane BNP: these purchases are made under the terms of a market-making agreement that complies with all applicable regulations, and are designed to ensure the liquidity of share purchases and sales. The Company has allocated €1.5 million for the implementation of this agreement;
♦ cancelation under legally prescribed conditions;
♦ retention for delivery at a later date in exchange or as payment for external operations; and/or
♦ employee stock ownership.
On March 20, 2018, Ubisoft committed to buy back from Vivendi 7,590,909 of its own shares as part of a structured transaction in the form of a forward sale of shares by Vivendi to Crédit Agricole Corporate and Investment Bank (CACIB) and a forward buyback mechanism by Ubisoft from CACIB, enabling Ubisoft to spread share buybacks over the fi nancial years ending March 31, 2019 to March 31, 2021. This buyback will take place under two contracts:
♦ a pre-paid forward contract for 4,545,454 of its own shares, settled by the delivery of securities maturing in 2021 or in advance at a price of €66. According to IAS 32, this contract is qualifi ed as an equity instrument that reduces the Group’s equity,
♦ a swap contract for 3,045,455 shares settled at the maturity date or in advance on Ubisoft’s initiative either in cash or by delivery of shares against payment of the price of €66. The swap contract is covered by a €100 million security deposit. According to IFRS 9, this contract is qualifi ed as a derivative and classifi ed in current fi nancial assets.
- 2018 Registration Document28
Risks and internal control
3
Risk management and internal control procedure
Thus, over FY 2017-2018, Ubisoft disbursed:
♦ €303 million in relation to the prepaid forward contract, of which €300 million for the 4,545,454 shares at €66 per share and €3 million for the expenses stemming from the acquisition of said shares;
♦ €100 million for the security deposit relating to the swap contract.
To prevent the risk of non-recovery of the deposit once the obligations of the swap contract are fulfi lled and the risk of non-delivery of shares on the expiration date or during an early unwinding of the forward contract, Ubisoft has concluded these contracts with a fi rst-rate banking institution.
3.2 Risk management and internal control procedure
This section is based on information and control methods reported by the various parties involved in internal control within Ubisoft and its subsidiaries, as well as the internal audit work performed at the request of the general management and the Audit Committee.
❙ 3.2.1 DEFINITION AND OBJECTIVES OF INTERNAL CONTROL AND RISK MANAGEMENT
Defi nition of internal control
Ubisoft has drawn up this section in accordance with the reference framework of the Autorité des Marchés Financiers (AMF) (initially published in January 2007, and updated and revised in July 2010) and the principles of the application guide. The Group also uses this reference framework to improve its internal control procedures.
Under this framework, internal control is defi ned as a system designed to ensure:
♦ compliance with laws and regulations;
♦ application of the instructions and policies set down by the general management and the Audit Committee;
♦ proper functioning of the Company’s internal processes, particularly those involving the security of its assets;
♦ reliability of the fi nancial information published.
With a view to achieving each of these objectives, Ubisoft has defi ned and implemented its general principles of internal control that, for the most part, are based on the guidelines set out in the COSO (Committee of Sponsoring Organization of the Treadway Commission) report published in 1992 and updated in 2013, as well as on the internal control reference framework and recommendations published by the Autorité des Marchés Financiers (AMF).
This system also aims to help the Company maintain control over its activities, the effi ciency of its operations and effi cient use of its resources, while enabling it to adequately take into account signifi cant operational, fi nancial or compliance risks. Therefore, the internal control system plays a key role in conducting and monitoring its activities.
Since 2007, Ubisoft has used a proactive approach in order to continuously assess the adequacy and effectiveness of its internal control system. The internal control system thus continued to adapt to the constraints and specifi c features of the Group and its subsidiaries, and to changes in its external environment. The creation of an Audit Committee on November 20, 2013 strengthened this approach.
However, the Group is aware that the internal control system cannot provide an absolute guarantee that the Company’s objectives will be met and that all the potential risks it may face will be controlled.
Defi nition of risk management
Risk management is a tool for Company management that serves to:
♦ create and preserve the value, assets and reputation of the Company;
♦ secure the Company’s decision-making and processes to help it achieve its objectives;
♦ promote consistency of actions with Company values;
♦ involve Company employees in a common vision of the principal risks.
The risk management system is a component of internal control. It allows the Company to anticipate and identify the key internal or external risks that could pose a threat and prevent the Company from achieving its objectives.
❙ 3.2.2 ORGANIZATION OF INTERNAL CONTROL
The internal control system relies on a solid foundation of autonomy and collaboration within the Group’s teams, encouraging the alignment of goals, resources and mechanisms deployed. It is based on the clear identifi cation of goals and responsibilities, a human resources policy ensuring that resources and skill levels are suffi cient, information systems and tools that are adapted to each team and/or subsidiary. Each subsidiary is responsible for implementing the relevant strategies to achieve these objectives, although the
- 2018 Registration Document 29
Risks and internal control3Risk management and internal control procedure
monitoring and verifi cation of the internal control system and risk management is highly centralized by the operational departments.
The internal control systems of each subsidiary include both the application of Group procedures and the defi nition and application of procedures specifi c to each business line in terms of its organization, culture, risk factors and operational characteristics. With regard to the parent company, Ubisoft monitors the existence and adequacy of internal control systems and specifi cally the accounting and fi nancial procedures implemented by fully consolidated entities.
Organization
The key parties involved in the internal control system are as follows:
♦ the general management: The general management is responsible for managing all of the Group’s activities and deals specifi cally with aspects relating to Group strategy and development. As part of its role, the general management is responsible for establishing the procedures and mechanisms employed to ensure both the functioning and monitoring of the internal control system;
♦ the Board of Directors assisted by the Audit Committee: the Board of Directors has defi ned governance regulations in its internal rules specifying the role of the Board of Directors assisted to this end by its committees; the Audit Committee in particular is responsible for ensuring the quality of internal control. The Audit Committee ensures that the Group has reliable procedures that enable the internal control system and the risk identifi cation, assessment and management system to be monitored. The Audit Committee annually defi nes the priority internal control objectives that it communicates to the Internal Control Department;
♦ the Internal Control Department: prepares and implements the risk management assessment methodology based on an approach focused on the processes that enable risks and key controls to be identifi ed. The Internal Control Department formalizes the risk mapping and provides support to operational employees through the implementation of internal control tools and software. It organizes activity monitoring through the defi nition of key indicators to assess the relevance of the internal control system and facilitate decision making;
♦ the Group’s managers and employees: the major policies and goals are determined by the general management in each area in consultation with Group general management and are passed on to the subsidiaries. Each subsidiary has its own general management and management team and is responsible for implementing the strategies designed to ensure that these goals are achieved;
♦ operational management: in collaboration with general management, operational managers are involved in setting the key accounting, fi nance, legal, fi scal, IT and human resources policies, and supporting the subsidiaries with their implementation.
Specifi c visits are made to the subsidiaries in order to carry out audits and training and to make recommendations so as to ensure that the internal control system is satisfactory.
These procedures are presented in detail under “Control activities”;
♦ the fi nance and accounting teams: present in all Group subsidiaries, they are responsible for performing analysis and control functions, including budgeting and the preparation of the fi nancial statements.
Clear goals and responsibilities
The division of powers and responsibilities is clearly defi ned by the organization charts.
In order to enable the various operational teams to achieve their goals, temporary and permanent operational and banking authorizations are granted. These are frequently reviewed by the Treasury Department assisted by the Administration Department and are updated to refl ect any changes in roles and responsibilities. General management defi nes the rules for delegating power to subsidiaries.
Consequently, at an individual level, each major subsidiary has local internal control procedures (delegation of bank signing authority, verifi cation of day-to-day transactions, segregation of duties between the signatory and the person preparing the payment, limitation of payments by check, etc.) to minimize the risk of fraud.
Similarly, budgetary goals are defi ned annually by the general management and monitored in each subsidiary by the accounting and fi nance teams. Business performance is monitored by management audit teams: at subsidiary level, these teams provide relevant cost analyses to operational managers so that they can make the necessary management decisions. This information is periodically reported in a standard format and is consolidated by head offi ce teams, who analyze the differences between objectives and actual performance.
Adapted solutions and operating methods
The IT teams provide the different business lines with solutions that are adapted to their activities. They defi ne, implement and operate these solutions. The range of solutions used includes commercial software as well as tools developed internally. This range is constantly evolving in line with the ever increasing requirements in managing and analyzing information, while ensuring compliance with the security standards in place at Ubisoft.
Similarly, each subsidiary and team strives to continuously improve processes and documentation. This also involves frequently reviewing and updating procedures to ensure uniform application. These procedures are made available to the relevant teams through collaborative tools developed by the Group.
Procedures associated with the preparation of accounting and fi nancial information are described in paragraph 3.2.3.
- 2018 Registration Document30
Risks and internal control
3
Risk management and internal control procedure
❙ 3.2.3 CONTROL ACTIVITIES
In addition to the risk management system, the Group has many control processes at all levels of the Company. Operational departments at registered offi ce play a crucial role in ensuring that subsidiaries’ initiatives comply with Group guidelines and providing support for risk management, especially when local teams lack suffi cient expertise.
The centralized organization of these support functions enables consistent dissemination of the major policies and goals of the general management:
♦ the Financial Planning Department monitors the Company’s performance using operational monitoring based on monthly reports from all Group subsidiaries. It also coordinates meetings between the general management and the Operational and Finance Departments at which the various reporting indicators are reviewed and the differences between actual performance and initial forecasts are analyzed, enabling the quarterly, interim, annual and multiannual forecasts to be fi ne-tuned on the basis of actual fi gures and market outlooks as received from local and operational teams. The fi nancial controllers monitor the whole fi nancial reporting cycle and constantly query subsidiaries on their performance levels, earnings and business activity. They then defi ne and distribute the fi nancial objectives for the current fi nancial year. The Financial Planning Department also carries out an annual in-depth review of the multiannual forecasts (3 or 5 years), ensuring consistency with the strategic decisions made by the Group. These processes taken together represent a major component of the Group’s internal control system and an ideal tool for monitoring the operations of subsidiaries. They allow the Management Audit Department to have the role of alerting the general management to the fi nancial consequences and the levels of performance of the different operations undertaken whenever necessary. Furthermore, the Management Audit Department regularly performs an alignment of management processes and improves its management tools, in addition to establishing defi ned management standards with the Information Systems Department so as to provide a common, clear language for all employees to work with;
♦ the role of the Consolidation Department is to monitor standards, to defi ne the Group’s accounting policies, to produce and analyze the consolidated fi nancial statements and to prepare the accounting and fi nancial information. This department is the main point of contact with the Statutory auditors during annual and half-yearly audits.
The IFRS accounting standards applicable to the Group are identifi ed by the Consolidation Department and systematically distributed via the online accounting policies manual accessible by all accounting and fi nancial services. Technical monitoring is carried out by the team that organizes and manages the updating process via instructions and/or training.
The Consolidation Department centralizes all expertise on the preparation and analysis of the Group’s monthly, interim and separate consolidated fi nancial statements. It audits the
accounting information received from subsidiaries, checks its compliance with the accounting policies manual and performs reconciliations to ensure the standardization of procedures. A detailed report is sent to the management team each month so that the Group’s performance may be monitored and analyzed. It ensures compliance with applicable standards and regulations so as to provide a true picture of the Group’s business activities and position;
♦ the Treasury Department checks the suitability and compatibility of exchange rate and liquidity risk management policies, as well as the fi nancial information published. It arranges foreign exchange derivative contracts and coordinates cash fl ow management at French and foreign subsidiaries, in particular by overseeing the dissemination of cash pooling solutions and cash fl ow projections. It centralizes and verifi es the authorization granted to a limited number of employees, who are exclusively authorized by the general management to handle certain fi nancial transactions, subject to pre-defi ned thresholds and authorization procedures. The Treasury department provides support to the Group’s subsidiaries in the implementation of tools for enhancing controls and the security of means of payment;
♦ acquisitions are managed by the Acquisitions Department, which reports to the Finance Department in close collaboration with the Legal Department. The Acquisitions Department examines and assesses the strategic interest of the planned total or partial takeover of a company and submits the relevant proposal to the general management, which makes the fi nal decision. No Group subsidiary can make this decision on its own;
♦ the Legal Departments are specialists in all legal business matters and particularly in acquisition law, company law, contract law, tax law, employment law and intellectual property law. They are responsible for developing innovative legal solutions that comply with current regulations in the various countries in which Ubisoft operates. Working in close partnership with the operational teams, the lawyers work upstream to identify the best strategy, to assess and manage risks and to provide support in implementing said solutions. The legal teams provide support to all subsidiaries with regard to their legal issues and are involved at every stage of their projects (from concept and production to marketing and distribution). They coordinate external growth operations, prepare and implement strategies and contractual relations (particularly in the development of new products, the hiring of new staff in France or abroad, and negotiations with new partners). They manage the portfolio of industrial property, handle any disputes and continually monitor regulatory changes in the various countries in which Ubisoft operates;
♦ the Tax Department assists and advises the Group’s French and foreign companies with the analysis of the tax aspects of their projects. In coordination with the various internal departments, it ensures the Group’s tax security by organizing risk prevention, identifi cation and management. It determines the Group’s transfer pricing policy and ensures compliance with reporting requirements;
- 2018 Registration Document 31
Risks and internal control3Risk management and internal control procedure
♦ the Information Systems Department is involved in selecting IT solutions, ensures their consistency, and monitors their technical and functional compatibility. The IT Department monitors the progress of IT projects and ensures that they are compatible with requirements, existing systems, budgets, etc. A periodic review of medium-term projects is also carried out to take into account changes in the Company, priorities and constraints.
The Risk Security and Management Department is responsible for ensuring and organizing the protection of Ubisoft activities, which include but are not limited to the security of applications, information systems, online games, human resources and property. To this end, rules and control measures are established with the aim of preventing and managing risks. These internal policies and procedures are reviewed regularly, circulated and adapted to maximize their effi ciency.
Internal control of the preparation of fi nancial and accounting information
The internal control procedures relating to the preparation and processing of fi nancial and accounting information are mainly implemented by the various accounting, fi nance and IT departments.
ORGANIZATION OF INFORMATION SYSTEMSWith a view to continually improving its information system and ensure the integrity of accounting and fi nancial data, the Company invests in implementing and updating IT solutions and procedures to meet the requirements and constraints both of the local teams and of the Group.
Most of the subsidiaries are integrated in PeopleSoft – Oracle for the accounting and management of operational fl ows (procurement, manufacturing, logistics, etc.). This centralized application, which uses a single database, allows the sharing of frameworks and transaction formats (product database, customer and supplier fi les, etc.). This ERP was installed as an attempt to respond to issues relating to growth of Ubisoft’s activity.
With a view to integrating and automating accounting and fi nancial solutions, the Group implements PeopleSoft – Oracle in its new subsidiaries. The computerization of data exchange (interfaces between accounting systems and the consolidation system, daily integration of banking entries, automated payment issuing, etc.) optimizes and improves processing and guarantees greater reliability of accounting processes.
The consolidation and management forecasting applications are used by all Group companies, providing an exhaustive and standardized view of business activities, and accounting and fi nancial data. They thus help improve the effectiveness of information processing.
Similarly, special attention is paid to the security of IT data and processing. The Risk Security and Management Department is constantly working with IT to improve levels of control to ensure:
♦ availability of online services and systems;
♦ data availability, confi dentiality, integrity and traceability;
♦ protection of online services from unauthorized access;
♦ monitoring of the network against internal and external threats;
♦ data security and recovery.
These systems are mainly housed in our internal data centers but also at partners providing cloud-based services and software as a service (SaaS). Security audits are carried out both upstream and downstream within the context of our quality audit to ensure the security of the information system.
FINANCIAL STATEMENT PREPARATION AND CONSOLIDATION PROCESSESThe fi nancial statements of each subsidiary are drawn up, under the responsibility of their manager, by the local accounting departments, which ensure compliance with country-specifi c tax and regulatory constraints. These fi nancial statements are subject to a limited review for the interim fi nancial statements of the key subsidiaries and a complete audit carried out by the auditors for the majority of the subsidiaries at the year-end.
Reporting of accounting information, in standardized monthly reports, is carried out on the basis of a schedule established by the Consolidation Department and approved by the Administration Department. Each subsidiary must apply existing Group procedures to the recording of accounting data for monthly reporting, interim and annual fi nancial statements and quarterly forecasts.
The reporting of subsidiaries is established according to the accounting policies of the Group, which are formalized in a Group policies manual distributed to all the subsidiaries. The consolidation statements are subject to an audit or a limited review with regard to this Group accounting policies manual.
The subsidiaries’ accounting information is uploaded, reconciled and then consolidated in a central software solution, HFM from Oracle, under the responsibility of the Consolidation Department. This software supports automatic verifi cation and consistency checking of fl ows, the statement of fi nancial position, specifi c line items in the income statement, etc. It also allows fast, reliable data reporting and is designed to make the consolidated fi nancial statements secure.
The Company has taken measures to shorten the process of preparing the consolidated fi nancial statements and to make it more reliable. For example, the Consolidation Department has drawn up procedures, which are updated periodically, enabling subsidiaries to optimize understanding and effectiveness of the solutions, and to guarantee the standardization of published accounting and fi nancial data:
♦ drawing up a Group chart of accounts;
♦ implementing automatic mapping between the separate fi nancial statements and the consolidated fi nancial statements;
♦ drawing up a user manual for the consolidation statement;
♦ drawing up a consolidation manual;
♦ drawing up an accounting policies manual.
The Consolidation Department also carries out ongoing monitoring so as to track and anticipate changes to the regulatory framework applicable to Group companies.
- 2018 Registration Document32
Risks and internal control
3
Risk management and internal control procedure
ACCOUNTING AND FINANCIAL INFORMATION VALIDATION PROCEDURESUbisoft’s accounting and fi nancial information is prepared by the Administrative Department under the supervision of the Chairman and Chief Executive Offi cer, with the Board of Directors responsible for fi nal approval, based on a presentation by the Audit Committee.
The consolidated fi nancial statements are subject to a limited review as at September 30 and an audit as at March 31 by the Group’s auditors. The Administrative Department works in constant collaboration with the Statutory auditors to coordinate the year-end process and to anticipate signifi cant accounting treatments.
One-off assignments during the fi nancial year such as pre-closing reviews prior to each interim and annual closing date make it possible to forecast and assess specifi c accounting issues in advance. This systematic review eases fi nalization at the balance sheet date and reduces the time needed to prepare the consolidated fi nancial statements.
At international level, the audit of the fi nancial statements in certain subsidiaries is carried out by the KPMG and Mazars networks, co-auditors for the holding company. Their local representative does everything required of him in the respective country as regards Statutory auditors. This organization helps to standardize audit procedures.
The Group announces its sales on a quarterly basis and its earnings every six months.
The Consolidation Department checks and delivers the accounting information included in the Group’s fi nancial releases that relate to the consolidated fi nancial statements.
EXTERNAL FINANCIAL INFORMATION MANAGEMENT PROCESSThe Financial Communications Department distributes the fi nancial information required for the Group’s strategy to be understood to shareholders, fi nancial analysts, investors, etc.
All fi nancial and strategic releases are reviewed and approved by the general management. Financial information is published in strict compliance with market regulations and in keeping with the principle of equal treatment of shareholders.
❙ 3.2.4 ONGOING SUPERVISION OF THE INTERNAL CONTROL SYSTEM
The introduction of an overall formalized approach to internal control thus allows:
♦ the quality of controls in subsidiaries to be understood, particularly by means of:
• ensuring that risk levels associated with their business and functional organization are taken into account,
• ensuring that activities carried out locally are in line with Group strategy and guidelines,
• justifying investments and expenditure,
• evaluating the effi cient utilization of resources (human, material or fi nancial);
♦ the improvement of operational and fi nancial practices by means of corrective and optimization initiatives to remedy shortcomings;
♦ effective monitoring of compliance with these procedures and controls.
2017/2018 was focused on the standardization of the internal control system, i.e.:
♦ the development of a shared risk assessment methodology;
♦ the deployment of the risk assessment methodology for processes associated with cash outfl ows for a sample of the Group’s signifi cant subsidiaries in terms of sales or capitalized production;
♦ the implementation of periodic key, standardized controls, in coordination with Statutory Auditors, in order to increase the effectiveness of external audits, focused notably on general IT controls for a selection of key applications (accounting basis management, time management, ERP), personnel costs, etc.
For 2018/2019, the Audit Committee formulated the following internal control objectives:
♦ continued deployment of the risk assessment methodology for cash outfl ows for new subsidiaries;
♦ the implementation of IT tools for greater effi ciency of internal control for process mapping and monitoring of action and control plans;
♦ the human development of the Internal Control Department, in order to increase its intervention capacities.
❙ 3.2.5 INSURANCE AND RISK COVERAGE
The insurance management policy falls under the general scope of risk management. It aims to protect the Group and its staff against the consequences of certain potential and identifi ed events that could have an impact on it or them.
So as to take advantage of its international presence, Ubisoft combines the standardized coverage of global risks with the specifi c management of local risks.
The main insurance programs coordinated by the Group relate to:
♦ commercial liability insurance: this worldwide program offers coverage for:
• operations liability,
• product liability – including the removal of goods,
• professional liability.
- 2018 Registration Document 33
Risks and internal control3Risk management and internal control procedure
This program provides standardized and coordinated coverage for all Ubisoft subsidiaries;
♦ transport and storage insurance: the Group acts as a service platform offering arranged coverage, up to a maximum limit. All European and Canadian subsidiaries are covered;
♦ civil liability insurance for corporate offi cers: this is in place to cover any claims made against de jure or de facto executives, as well as defense and ancillary costs;
♦ customer credit insurance: to protect itself against the risk of default, the Group has taken out a comprehensive policy that pools risks to which a large majority of the sales subsidiaries (1) have subscribed;
♦ property damage and trading loss insurance: this type of insurance is managed directly by local subsidiaries so as to take account of the specifi c nature of their businesses and any local insurance opportunities;
♦ specifi c coverage such as vehicle and health insurance, employee pension funds and coverage for business travel or expatriates. These are managed locally in accordance with requirements and local regulations.
Through these programs, the Group aims to offer comprehensive and extensive coverage for risks and pays particular attention to the fi nancial conditions offered.
Total premiums paid on insurance policies in force during the fi nancial year ended March 31, 2018 amounted to €1,621 thousand excluding credit insurance.
(1) Representing 89% of non-digital Group sales as at the end of March 2018
- 2018 Registration Document34
4.1 CORPORATE GOVERNANCE 364.1.1 Corporate Governance Code 36
4.1.2 Current governance structure 36
4.1.3 Organization and operation of the Board of Directors 55
4.1.4 Other information 64
4.2 COMPENSATION FOR THE ADMINISTRATIVE AND MANAGEMENT BODIES 67
4.2.1 Compensation for directors – directors’ fees 67
4.2.2 Compensation of C orporate E xecutive O ffi cers 70
4.2.3 Reports on the allocation of options or free shares 96
4.3 AUDITORS 108
Corporate governance report4
- 2018 Registration Document 3535- 2018 Registration Document
Corporate governance report4Corporate governance
This chapter contains the report of the Board of Directors on corporate governance which was presented to the Shareholders’ General Meeting, in accordance with the provisions of Articles L. 225-37, paragraph 6, and L. 225-37-2 to L. 225-37-5 of the French Commercial Code.
It was presented to the Nomination and Compensation Committee prior to its adoption by the Board of Directors at its meeting of May 17, 2018.
The main parties involved in preparing and drawing up the report are the Chairman and Chief Executive Offi cer, the members of the Board of Directors and of the c ommittees, working in close collaboration with the Human Resources Department and the Administration Department in charge of its preparation.
4.1 Corporate governance
❙ 4.1.1 CORPORATE GOVERNANCE CODE
The Company refers to the AFEP-MEDEF corporate governance Code for listed companies as revised in November 2016 (the “AFEP-MEDEF Code”) which is available on the AFEP website (www.afep.com).
In accordance with the provisions of Article L. 225-37-4, 8° of the French Commercial Code, the following table indicates the AFEP-MEDEF Code recommendations that were not taken into consideration by the Company and the reasons for this.
Provisions of the AFEP-MEDEF Code Explanation
17.1 Composition (of the Committee in charge of compensation)“It is recommended [...] that one of its members be an employee director.”
Since Lionel Bouchet, a director that represents employees, was elected on March 7, 2018, his appointment as a member of the Nomination and Compensation Committee has not been reviewed to date.
17.3 Operating procedures (of the Committee in charge of compensation)“When the report on the work of the Compensation Committee is presented, the Board should deliberate on issues relating to the compensation of the Corporate Executive Offi cers in the absence of the latter.”
The Corporate Executive Offi cers attend sessions at which discussions on the components of their compensation are discussed, but do not participate in these discussions and do not vote on their respective compensation.
25.1 Ongoing information“All of the Corporate Executive Offi cers’ compensation components, whether potential or vested, must be publicly disclosed immediately after the meeting of the Board approving the relevant decisions.”
The potential or vested compensation components are not made public after a decision is made by the Board of Directors but are set out in section 4.2.2 of the Registration Document on the compensation of Corporate Executive Offi cers (ex-post or ex-ante vote).
❙ 4.1.2 CURRENT GOVERNANCE STRUCTURE
4.1.2.1 Chairman and General Management
Based on the recommendations of the Nomination and Compensation Committee, the Company’s Board of Directors makes every effort to establish a governance structure that can meet the demands of the functions that are entrusted to it, while being able to meet the challenges specifi c to the Ubisoft Group, and following best market practices in this area.
CHAIRMANFrom among its members, and in accordance with relevant legal requirements, the Board of Directors elects a Chairman , an individual who organizes and supervises the work of the Board, on which he reports at the General Meeting. The Chairman of the Board of Directors ensures that the Company’s management bodies
function properly, and that the directors are able to perform their duties. He provides the Board of Directors and its committees with the information they need and reports on the highlights of the Group’s activities. He implements the decisions taken by the Board of Directors.
GENERAL MANAGEMENT (“G5”)In accordance with relevant legal provisions, the Board of Directors entrusts the Company’s general management to the Chairman of the Board or another individual, who may or may not be a director, holding the title of Chief Executive Offi cer.
Shareholders and third parties are informed of this decision under the conditions established by current legal and regulatory provisions.
When the Company’s general management is undertaken by the Chairman of the Board of Directors, the following provisions relating to the Chief Executive Offi cer also apply to the Chairman.
- 2018 Registration Document36
Corporate governance report
4
Corporate governance
In addition, in accordance with legal and statutory provisions, the Board of Directors may, based on a proposal by the Chief Executive Offi cer, appoint Executive Vice Presidents, who are individuals, and who may or may not be directors, to assist the Chief Executive Offi cer; there can be no more than fi ve of them.
Yves Guillemot is assisted in his duties as Chief Executive Offi cer by Claude Guillemot, Executive Vice President in charge of Operations, Michel Guillemot, Executive Vice President in charge of Development, Strategy and Finance, Gérard Guillemot, Executive Vice President in charge of Publishing, and Christian Guillemot, Executive Vice President in charge of Administration. As founding shareholders, each Executive Vice President has extensive knowledge of the Group.
The G5 (the Chief Executive Offi cer and four Executive Vice Presidents) meets biweekly for an update on strategic cross-cutting issues requiring their specifi c expertise in the areas of operations, development and strategy, publishing and fi nance, thereby assisting the Chief Executive Offi cer to perform his duties. The G5 reports to the Board of Directors once a year on its activities carried out in the past year.
The Board of Directors determines the compensation of the Chief Executive Offi cer and Executive Vice Presidents in accordance with the provisions of Article L. 225-37-2 of the French Commercial Code. The term of offi ce of the Chief Executive Offi cer and Executive Vice Presidents may not exceed, as applicable, the term of their directorship .
COMBINATION OF POSITIONS OF CHAIRMAN AND CHIEF EXECUTIVE OFFICERThe AFEP-MEDEF Code states that “companies with a Board of Directors can choose between separation of the offi ces of Chairman and Chief Executive Offi cer and the aggregation of such duties. The law does not favor either formula and allows the Board of Directors to choose between the two forms of exercise of executive management.”
In accordance with Article L. 225-51-1 of the French Commercial Code, the Board, at its meeting on October 22, 2001, decided not to separate the positions of Chairman of the Board of Directors and of Chief Executive Offi cer, mainly to encourage close relations between managers and shareholders. At its meetings of September 2 and 6, 2016, the Board of Directors assessed the terms and impact of the combination or separation of the positions of Chairman and Chief Executive Offi cer on the organization in the short and medium terms of the Company and of the Group. The Board unanimously decided during these meetings that the combination of the positions of Chairman and Chief Executive Offi cer suits the organization and operation of the Company. The Board considered that the combination of these positions favors responsive and effective decision-making in a changing and highly competitive environment, strengthening the cohesion of the entire organization (strategy and operations), and thus facilitating and streamlining the decision-making process. This choice was reaffi rmed upon the re-election of Yves Guillemot by the Board of Directors at its meeting of September 29, 2016.
LIMITATIONS IMPOSED BY THE BOARD OF DIRECTORS ON THE POWERS OF THE CHIEF EXECUTIVE OFFICERSubject to the internal provisions, unenforceable against third parties, that the Board of Directors may impose on the powers of the Chief Executive Offi cer in the internal rules of the Board of Directors, the Chief Executive Offi cer has a broad mandate to act in all circumstances on behalf of the Company. He represents the Company in its dealings with third parties. He exercises these powers within the limit of the corporate purpose and without prejudice to the powers expressly granted by law to shareholders’ meetings and to the Board of Directors in accordance with the internal rules of the Board.
The internal rules specify that strategic investment projects – pertaining to external growth operations likely to have a material impact on the Group’s earnings, the structure of its statement of fi nancial position or its risk profi le – are subject to the prior approval of the Board of Directors. Accordingly, the Chairman and Chief Executive Offi cer must obtain the prior authorization of the Board of Directors for external investments that involve shareholdings or assets totaling more than €100 million each and not previously approved by the Board.
In addition, at its meeting on May 16, 2017, the Board of Directors set out the scope of the Chairman and Chief Executive Offi cer’s powers as regards granting deposits, endorsements and guarantees by setting the overall authorized amount at €150 million for a legal term of one year in accordance with Article R. 225-28 of the French Commercial Code. This authorization was renewed on May 17, 2018 with the same limits and conditions.
4.1.2.2 Lead Director
The choice to combine the positions of Chairman and Chief Executive Offi cer is exercised in compliance with the prerogatives of the various bodies. As part of the drive to improve governance, the position of lead director was created on March 3, 2016 and the Board elected Didier Crespel to fi ll this position. The internal rules of the Board of Directors require that a lead director be appointed, whose responsibilities, resources and powers are described in section 4.1.3.3. , when the positions of Chairman and Chief Executive Offi cer are held by the same person. The powers of the lead director include the option to hold meetings with the independent directors.
4.1.2.3 Group Management (“Executive Committee”)
The members of the Executive Committee are the operational managers of the Group. Each member makes proposals in terms of strategy and organization. They implement policies and procedures that apply generally to the entire Group and are decided on by the general management.
The Executive Committee members are:
Alain Corre Executive Director, EMEA
Laurent Detoc Executive Director, NCSA
Christine Burgess-Quémard Executive Director, worldwide production
Serge Hascoët Chief Creative Offi cer
- 2018 Registration Document 37
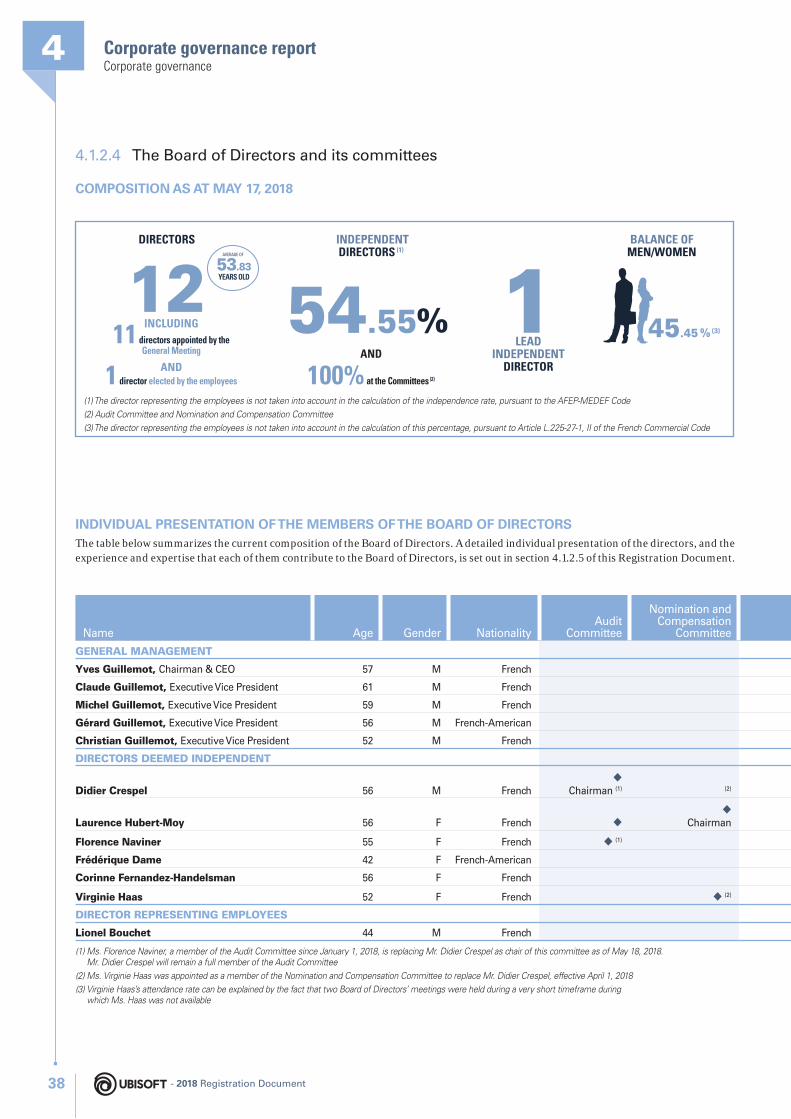
Corporate governance report4Corporate governance
4.1.2.4 The Board of Directors and its committees
COMPOSITION AS AT MAY 17, 2018
INDIVIDUAL PRESENTATION OF THE MEMBERS OF THE BOARD OF DIRECTORSThe table below summarizes the current composition of the Board of Directors. A detailed individual presentation of the directors, and the experience and expertise that each of them contribute to the Board of Directors, is set out in section 4.1.2.5 of this Registration Document.
(1) The director representing the employees is not taken into account in the calculation of the independence rate, pursuant to the AFEP- MEDEF Code
(2) Audit Committee and Nomination and Compensation Committee
(3) The director representing the employees is not taken into account in the calculation of this percentage, pursuant to Article L.225-27-1, II of the French Commercial Code
LEADINDEPENDENT
DIRECTOR
1 INDEPENDENT DIRECTORS (1)
AND
100% at the Committees (2)
54.55 %
BALANCE OFMEN/WOMEN
45.45 % (3)
53.83 YEARS OLD
AVERAGE OF
DIRECTORS
12INCLUDING
11 directors appointed by the General Meeting
AND1 director elected by the employees
Name Age Gender NationalityAudit
Committee
Nomination and Compensation
Committee
GENERAL MANAGEMENT
Yves Guillemot, Chairman & CEO 57 M French
Claude Guillemot, Executive Vice President 61 M French
Michel Guillemot, Executive Vice President 59 M French
Gérard Guillemot, Executive Vice President 56 M French-American
Christian Guillemot, Executive Vice President 52 M French
DIRECTORS DEEMED INDEPENDENT
Didier Crespel 56 M French◆
Chairman (1) (2)
Laurence Hubert-Moy 56 F French ◆◆
Chairman
Florence Naviner 55 F French ◆ (1)
Frédérique Dame 42 F French-American
Corinne Fernandez-Handelsman 56 F French
Virginie Haas 52 F French ◆ (2)
DIRECTOR REPRESENTING EMPLOYEES
Lionel Bouchet 44 M French
(1) Ms. Florence Naviner, a member of the Audit Committee since January 1, 2018, is replacing Mr. Didier Crespel as chair of this committee as of May 18, 2018. Mr. Didier Crespel will remain a full member of the Audit Committee
(2) Ms. Virginie Haas was appointed as a member of the Nomination and Compensation Committee to replace Mr. Didier Crespel, effective April 1, 2018
(3) Virginie Haas’s attendance rate can be explained by the fact that two Board of Directors’ meetings were held during a very short timeframe during which Ms. Haas was not available
- 2018 Registration Document38
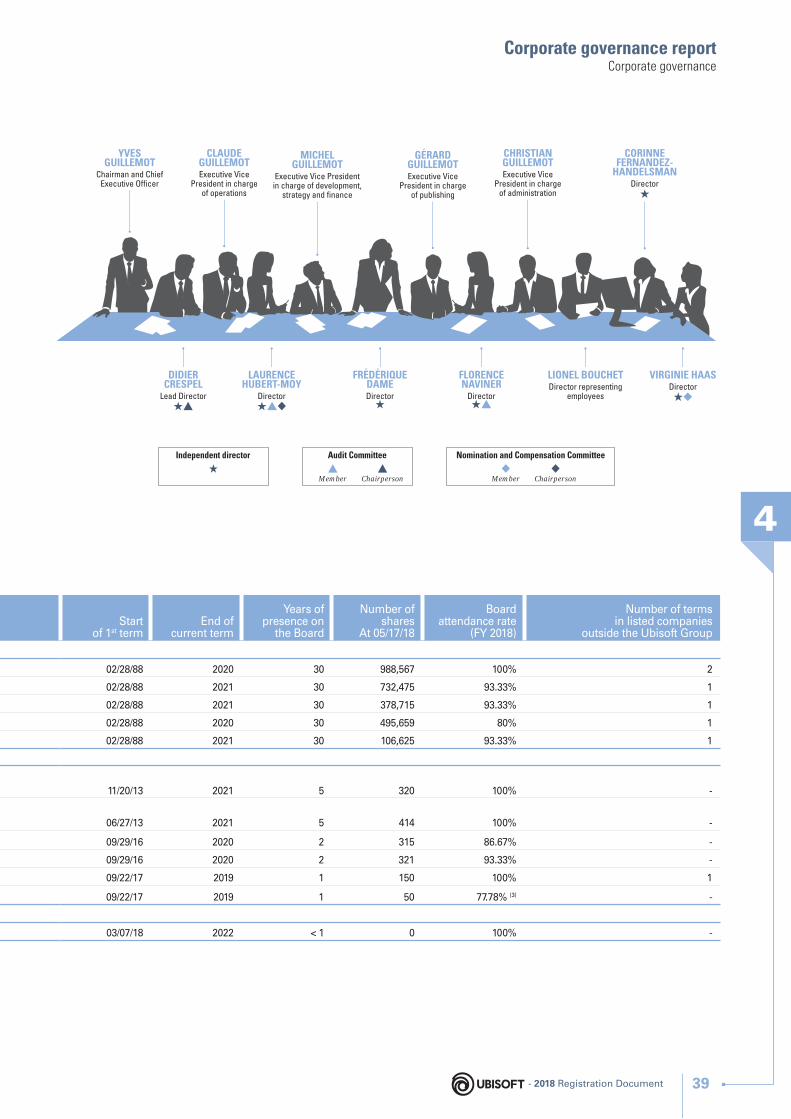
Corporate governance report
4
Corporate governance
CLAUDE GUILLEMOTExecutive Vice
President in chargeof operations
MICHELGUILLEMOT
Executive Vice President in charge of development,
strategy and fi nance
YVES GUILLEMOT
Chairman and Chief Executive Offi cer
GÉRARDGUILLEMOTExecutive Vice
President in chargeof publishing
CHRISTIAN GUILLEMOTExecutive Vice
President in charge of administration
CORINNE FERNANDEZ-
HANDELSMANDirector
★
LIONEL BOUCHET Director representing
employees
VIRGINIE HAASDirector★◆
FLORENCENAVINER
Director★▲
FRÉDÉRIQUEDAMEDirector
★
DIDIER CRESPEL
Lead Director★▲
LAURENCE HUBERT-MOY
Director★▲◆
Independent director
★Member
▲Chairperson
▲
Audit Committee
Member◆
Chairperson◆
Nomination and Compensation Committee
Start of 1st term
End of current term
Years of presence on
the Board
Number of shares
At 05/17/18
Board attendance rate
(FY 2018)
Number of terms in listed companies
outside the Ubisoft Group
02/28/88 2020 30 988,567 100% 2
02/28/88 2021 30 732,475 93.33% 1
02/28/88 2021 30 378,715 93.33% 1
02/28/88 2020 30 495,659 80% 1
02/28/88 2021 30 106,625 93.33% 1
11/20/13 2021 5 320 100% -
06/27/13 2021 5 414 100% -
09/29/16 2020 2 315 86.67% -
09/29/16 2020 2 321 93.33% -
09/22/17 2019 1 150 100% 1
09/22/17 2019 1 50 77.78% (3) -
03/07/18 2022 < 1 0 100% -
- 2018 Registration Document 39
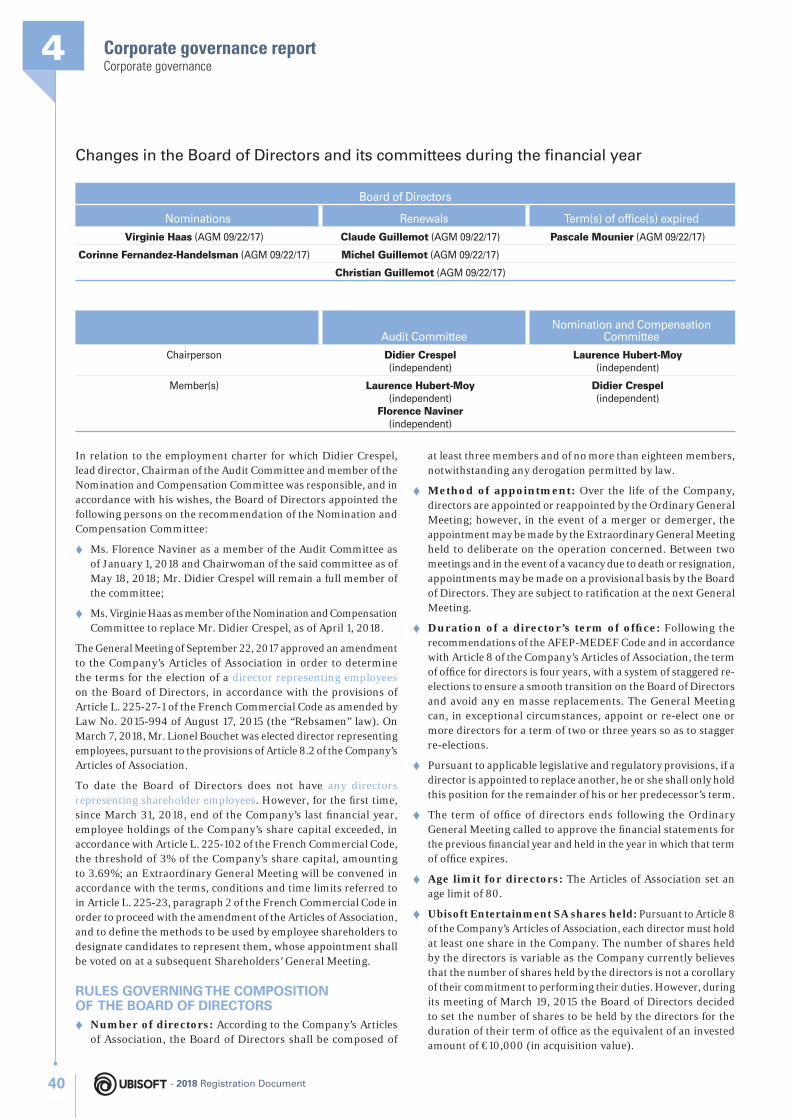
Corporate governance report4Corporate governance
Changes in the Board of Directors and its c ommittees during the fi nancial year
Board of Directors
Nominations Renewals Term(s) of offi ce(s) expired
Virginie Haas (AGM 09/22/17) Claude Guillemot (AGM 09/22/17) Pascale Mounier (AGM 09/22/17)
Corinne Fernandez-Handelsman (AGM 09/22/17) Michel Guillemot (AGM 09/22/17)
Christian Guillemot (AGM 09/22/17)
Audit CommitteeNomination and Compensation
Committee
Chairperson Didier Crespel(independent)
Laurence Hubert-Moy(independent)
Member(s) Laurence Hubert-Moy(independent)
Florence Naviner(independent)
Didier Crespel(independent)
In relation to the employment charter for which Didier Crespel, lead director, Chairman of the Audit Committee and member of the Nomination and Compensation Committee was responsible, and in accordance with his wishes, the Board of Directors appointed the following persons on the recommendation of the Nomination and Compensation Committee:
♦ Ms. Florence Naviner as a member of the Audit Committee as of January 1, 2018 and Chairwoman of the said committee as of May 18, 2018; Mr. Didier Crespel will remain a full member of the committee;
♦ Ms. Virginie Haas as member of the Nomination and Compensation Committee to replace Mr. Didier Crespel, as of April 1, 2018.
The General Meeting of September 22, 2017 approved an amendment to the Company’s Articles of Association in order to determine the terms for the election of a director representing employees on the Board of Directors, in accordance with the provisions of Article L. 225-27-1 of the French Commercial Code as amended by Law No. 2015-994 of August 17, 2015 (the “Rebsamen” law). On March 7, 2018, Mr. Lionel Bouchet was elected director representing employees, pursuant to the provisions of Article 8.2 of the Company’s Articles of Association.
To date the Board of Directors does not have any directors representing shareholder employees. However, for the fi rst time, since March 31, 2018, end of the C ompany’s last fi nancial year, employee holdings of the Company’s share capital exceeded, in accordance with Article L. 225-102 of the French Commercial Code, the threshold of 3% of the Company’s share capital, amounting to 3.69%; an Extraordinary General Meeting will be convened in accordance with the terms, conditions and time limits referred to in Article L. 225-23, paragraph 2 of the French Commercial Code in order to proceed with the amendment of the Articles of Association, and to defi ne the methods to be used by employee shareholders to designate candidates to represent them, whose appointment shall be voted on at a subsequent Shareholders’ General Meeting.
RULES GOVERNING THE COMPOSITION OF THE BOARD OF DIRECTORS
♦ Number of directors: According to the Company’s Articles of Association, the Board of Directors shall be composed of
at least three members and of no more than eighteen members, notwithstanding any derogation permitted by law.
♦ Method of appointment: Over the life of the Company, directors are appointed or reappointed by the Ordinary General Meeting; however, in the event of a merger or demerger, the appointment may be made by the Extraordinary General Meeting held to deliberate on the operation concerned. Between two meetings and in the event of a vacancy due to death or resignation, appointments may be made on a provisional basis by the Board of Directors. They are subject to ratifi cation at the next General Meeting.
♦ Duration of a director’s term of offi ce: Following the recommendations of the AFEP-MEDEF Code and in accordance with Article 8 of the Company’s Articles of Association, the term of offi ce for directors is four years, with a system of staggered re-elections to ensure a smooth transition on the Board of Directors and avoid any en masse replacements. The General Meeting can, in exceptional circumstances, appoint or re-elect one or more directors for a term of two or three years so as to stagger re-elections.
♦ Pursuant to applicable legislative and regulatory provisions, if a director is appointed to replace another, he or she shall only hold this position for the remainder of his or her predecessor’s term.
♦ The term of offi ce of directors ends following the Ordinary General Meeting called to approve the fi nancial statements for the previous fi nancial year and held in the year in which that term of offi ce expires.
♦ Age limit for directors: The Articles of Association set an age limit of 80.
♦ Ubisoft Entertainment SA shares held: Pursuant to Article 8 of the Company’s Articles of Association, each director must hold at least one share in the Company. The number of shares held by the directors is variable as the Company currently believes that the number of shares held by the directors is not a corollary of their commitment to performing their duties. However, during its meeting of March 19, 2015 the Board of Directors decided to set the number of shares to be held by the directors for the duration of their term of offi ce as the equivalent of an invested amount of €10,000 (in acquisition value).
- 2018 Registration Document40
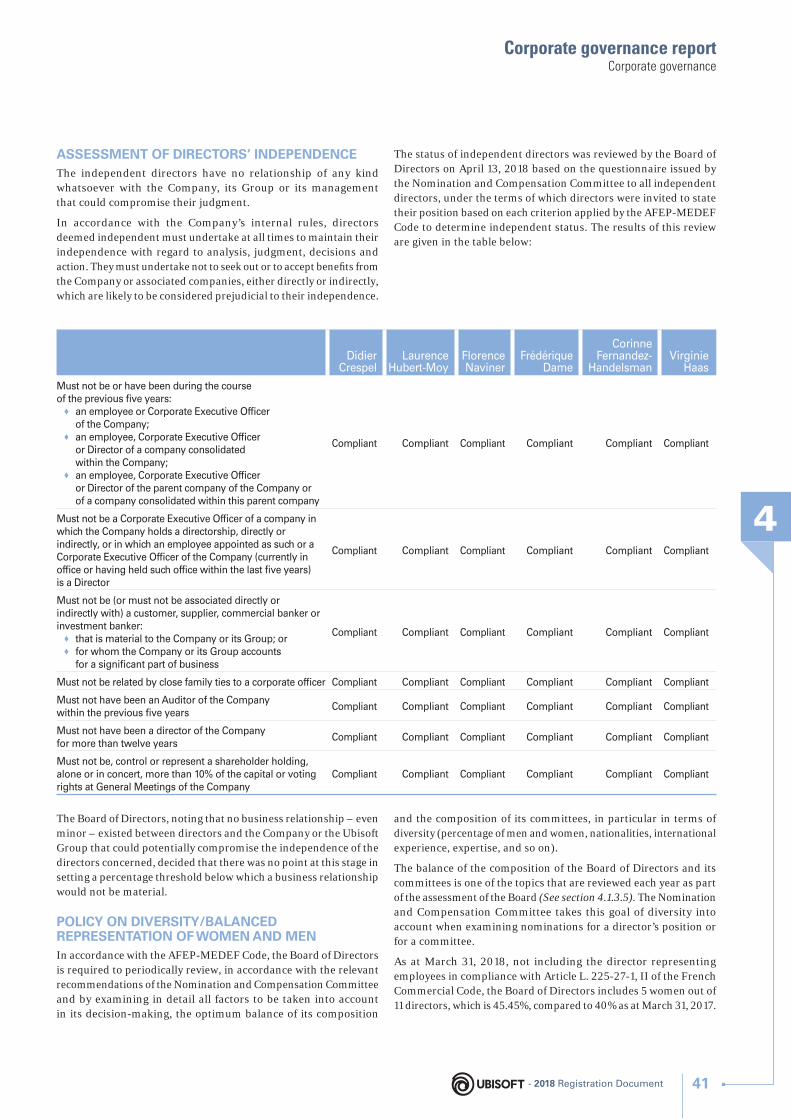
Corporate governance report
4
Corporate governance
ASSESSMENT OF DIRECTORS’ INDEPENDENCEThe independent directors have no relationship of any kind whatsoever with the Company, its Group or its management that could compromise their judgment.
In accordance with the Company’s internal rules, directors deemed independent must undertake at all times to maintain their independence with regard to analysis, judgment, decisions and action. They must undertake not to seek out or to accept benefi ts from the Company or associated companies, either directly or indirectly, which are likely to be considered prejudicial to their independence.
The status of independent directors was reviewed by the Board of Directors on April 13, 2018 based on the questionnaire issued by the Nomination and Compensation Committee to all independent directors, under the terms of which directors were invited to state their position based on each criterion applied by the AFEP-MEDEF Code to determine independent status. The results of this review are given in the table below:
Didier Crespel
Laurence Hubert-Moy
Florence Naviner
Frédérique Dame
Corinne Fernandez-
HandelsmanVirginie
Haas
Must not be or have been during the course of the previous fi ve years:
♦ an employee or Corporate Executive Offi cer of the Company;
♦ an employee, Corporate Executive Offi cer or Director of a company consolidated within the Company;
♦ an employee, Corporate Executive Offi cer or Director of the parent company of the Company or of a company consolidated within this parent company
Compliant Compliant Compliant Compliant Compliant Compliant
Must not be a Corporate Executive Offi cer of a company in which the Company holds a directorship, directly or indirectly, or in which an employee appointed as such or a Corporate Executive Offi cer of the Company (currently in offi ce or having held such offi ce within the last fi ve years) is a Director
Compliant Compliant Compliant Compliant Compliant Compliant
Must not be (or must not be associated directly or indirectly with) a customer, supplier, commercial banker or investment banker:
♦ that is material to the Company or its Group; or ♦ for whom the Company or its Group accounts
for a signifi cant part of business
Compliant Compliant Compliant Compliant Compliant Compliant
Must not be related by close family ties to a corporate offi cer Compliant Compliant Compliant Compliant Compliant Compliant
Must not have been an Auditor of the Company within the previous fi ve years
Compliant Compliant Compliant Compliant Compliant Compliant
Must not have been a director of the Company for more than twelve years
Compliant Compliant Compliant Compliant Compliant Compliant
Must not be, control or represent a shareholder holding, alone or in concert, more than 10% of the capital or voting rights at General Meetings of the Company
Compliant Compliant Compliant Compliant Compliant Compliant
The Board of Directors, noting that no business relationship – even minor – existed between directors and the Company or the Ubisoft Group that could potentially compromise the independence of the directors concerned, decided that there was no point at this stage in setting a percentage threshold below which a business relationship would not be material.
POLICY ON DIVERSITY/BALANCED REPRESENTATION OF WOMEN AND MENIn accordance with the AFEP- MEDEF Code, the Board of Directors is required to periodically review, in accordance with the relevant recommendations of the Nomination and Compensation Committee and by examining in detail all factors to be taken into account in its decision-making, the optimum balance of its composition
and the composition of its committees, in particular in terms of diversity (percentage of men and women, nationalities, international experience, expertise, and so on).
The balance of the composition of the Board of Directors and its committees is one of the topics that are reviewed each year as part of the assessment of the Board (See section 4.1.3.5). The Nomination and Compensation Committee takes this goal of diversity into account when examining nominations for a director’s position or for a committee.
As at March 31, 2018, not including the director representing employees in compliance with Article L. 225-27-1, II of the French Commercial Code, the Board of Directors includes 5 women out of 11 directors, which is 45.45%, compared to 40% as at March 31, 2017.
- 2018 Registration Document 41
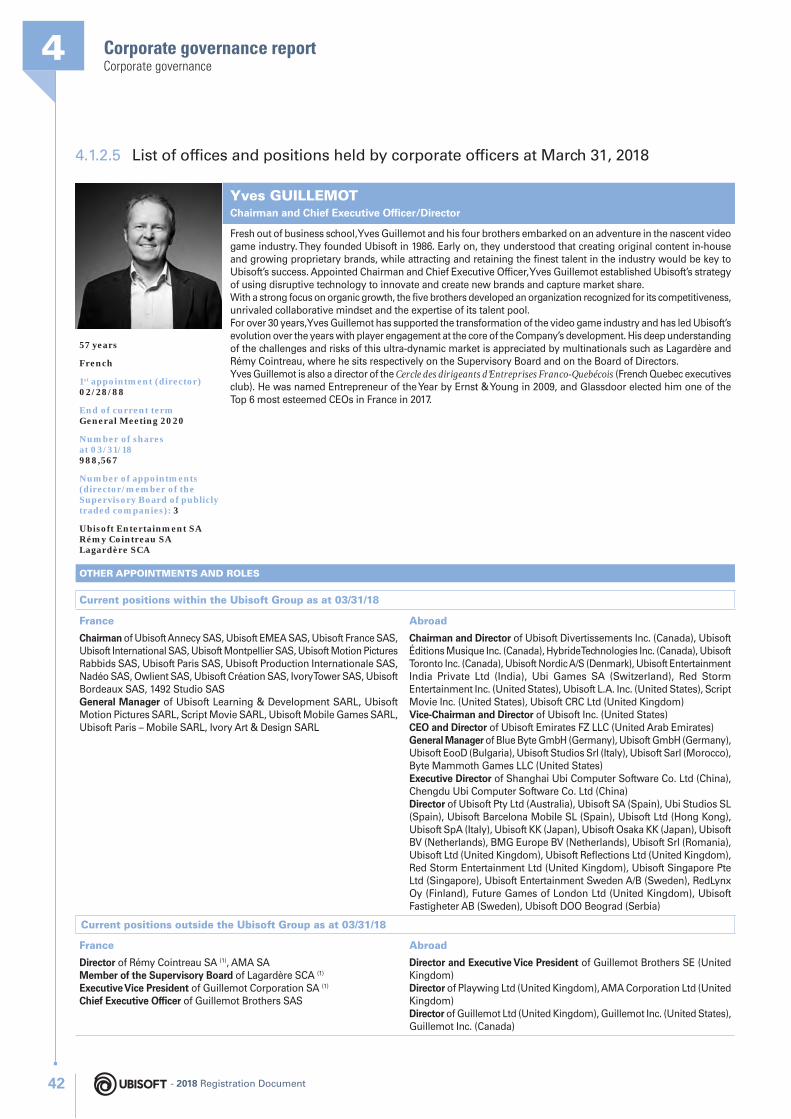
Corporate governance report4Corporate governance
4.1.2.5 List of offi ces and positions held by corporate offi cers at March 31, 2018
Yves GUILLEMOTChairman and Chief Executive Offi cer/Director
Fresh out of business school, Yves Guillemot and his four brothers embarked on an adventure in the nascent video game industry. They founded Ubisoft in 1986. Early on, they understood that creating original content in-house and growing proprietary brands, while attracting and retaining the fi nest talent in the industry would be key to Ubisoft’s success. Appointed Chairman and Chief Executive Offi cer, Yves Guillemot established Ubisoft’s strategy of using disruptive technology to innovate and create new brands and capture market share.With a strong focus on organic growth, the fi ve brothers developed an organization recognized for its competitiveness, unrivaled collaborative mindset and the expertise of its talent pool.For over 30 years, Yves Guillemot has supported the transformation of the video game industry and has led Ubisoft’s evolution over the years with player engagement at the core of the Company’s development. His deep understanding of the challenges and risks of this ultra-dynamic market is appreciated by multinationals such as Lagardère and Rémy Cointreau, where he sits respectively on the Supervisory Board and on the Board of Directors.Yves Guillemot is also a director of the Cercle des dirigeants d’Entreprises Franco-Quebécois (French Quebec executives club). He was named Entrepreneur of the Year by Ernst & Young in 2009, and Glassdoor elected him one of the Top 6 most esteemed CEOs in France in 2017.
57 years
French
1st appointment (director)02/28/88
End of current termGeneral Meeting 2020
Number of shares at 03/31/18988,567
Number of appointments (director/member of the Supervisory Board of publicly traded companies): 3
Ubisoft Entertainment SARémy Cointreau SALagardère SCA
OTHER APPOINTMENTS AND ROLES
Current positions within the Ubisoft Group as at 03/31/18
France Abroad
Chairman of Ubisoft Annecy SAS, Ubisoft EMEA SAS, Ubisoft France SAS, Ubisoft International SAS, Ubisoft Montpellier SAS, Ubisoft Motion Pictures Rabbids SAS, Ubisoft Paris SAS, Ubisoft Production Internationale SAS, Nadéo SAS, Owlient SAS, Ubisoft Création SAS, Ivory Tower SAS, Ubisoft Bordeaux SAS, 1492 Studio SASGeneral Manager of Ubisoft Learning & Development SARL, Ubisoft Motion Pictures SARL, Script Movie SARL, Ubisoft Mobile Games SARL, Ubisoft Paris – Mobile SARL, Ivory Art & Design SARL
Chairman and Director of Ubisoft Divertissements Inc. (Canada), Ubisoft Éditions Musique Inc. (Canada), Hybride Technologies Inc. (Canada), Ubisoft Toronto Inc. (Canada), Ubisoft Nordic A/S (Denmark), Ubisoft Entertainment India Private Ltd (India), Ubi Games SA (Switzerland), Red Storm Entertainment Inc. (United States), Ubisoft L.A. Inc. (United States), Script Movie Inc. (United States), Ubisoft CRC Ltd (United Kingdom)Vice-Chairman and Director of Ubisoft Inc. (United States)CEO and Director of Ubisoft Emirates FZ LLC (United Arab Emirates)General Manager of Blue Byte GmbH (Germany), Ubisoft GmbH (Germany), Ubisoft EooD (Bulgaria), Ubisoft Studios Srl (Italy), Ubisoft Sarl (Morocco), Byte Mammoth Games LLC (United States)Executive Director of Shanghai Ubi Computer Software Co. Ltd (China), Chengdu Ubi Computer Software Co. Ltd (China)Director of Ubisoft Pty Ltd (Australia), Ubisoft SA (Spain), Ubi Studios SL (Spain), Ubisoft Barcelona Mobile SL (Spain), Ubisoft Ltd (Hong Kong), Ubisoft SpA (Italy), Ubisoft KK (Japan), Ubisoft Osaka KK (Japan), Ubisoft BV (Netherlands), BMG Europe BV (Netherlands), Ubisoft Srl (Romania), Ubisoft Ltd (United Kingdom), Ubisoft Refl ections Ltd (United Kingdom), Red Storm Entertainment Ltd (United Kingdom), Ubisoft Singapore Pte Ltd (Singapore), Ubisoft Entertainment Sweden A/B (Sweden), RedLynx Oy (Finland), Future Games of London Ltd (United Kingdom), Ubisoft Fastigheter AB (Sweden), Ubisoft DOO Beograd (Serbia)
Current positions outside the Ubisoft Group as at 03/31/18
France Abroad
Director of Rémy Cointreau SA (1), AMA SAMember of the Supervisory Board of Lagardère SCA (1)
Executive Vice President of Guillemot Corporation SA (1)
Chief Executive Officer of Guillemot Brothers SAS
Director and Executive Vice President of Guillemot Brothers SE (United Kingdom)Director of Playwing Ltd (United Kingdom), AMA Corporation Ltd (United Kingdom)Director of Guillemot Ltd (United Kingdom), Guillemot Inc. (United States), Guillemot Inc. (Canada)
- 2018 Registration Document42
Corporate governance report
4
Corporate governance
Expired positions within the Ubisoft Group (last 5 fi nancial years)
France Abroad
Chairman of Ubisoft Motion Pictures Far Cry SAS, Ubisoft Motion Pictures Ghost Recon SAS, Ketchapp SAS, Ubisoft Motion Pictures Assassin’s Creed SAS, Ubisoft Motion Pictures Splinter Cell SAS, Krysalide SAS
Chairman and Director of Ubisoft Canada Inc. (Canada), L’Atelier Ubi Inc. (Canada), Technologies Quazal Inc. (Canada), Ubisoft Musique Inc. (Canada), 9275-8309 Quebec Inc. (Canada), Studio Ubisoft Saint-Antoine Inc. (Canada)Chairman of Ubisoft LLC (United States)General Manager of Spieleentwicklungskombinat GmbH (Germany), Related Designs Software GmbH (Germany), Ubisoft Entertainment SARL (Luxembourg)
Expired positions outside the Ubisoft Group (last 5 fi nancial years)
France Abroad
Executive Vice President and Director of Guillemot Brothers SE, Gameloft SE (2)
Director of Guillemot Corporation SA (1)
Director of Gameloft Divertissements Inc. (Canada), Gameloft Live Développements Inc. (Canada)
(1) Publicly traded company
(2) Publicly traded company delisted from Euronext Paris on July 26, 2016
- 2018 Registration Document 43
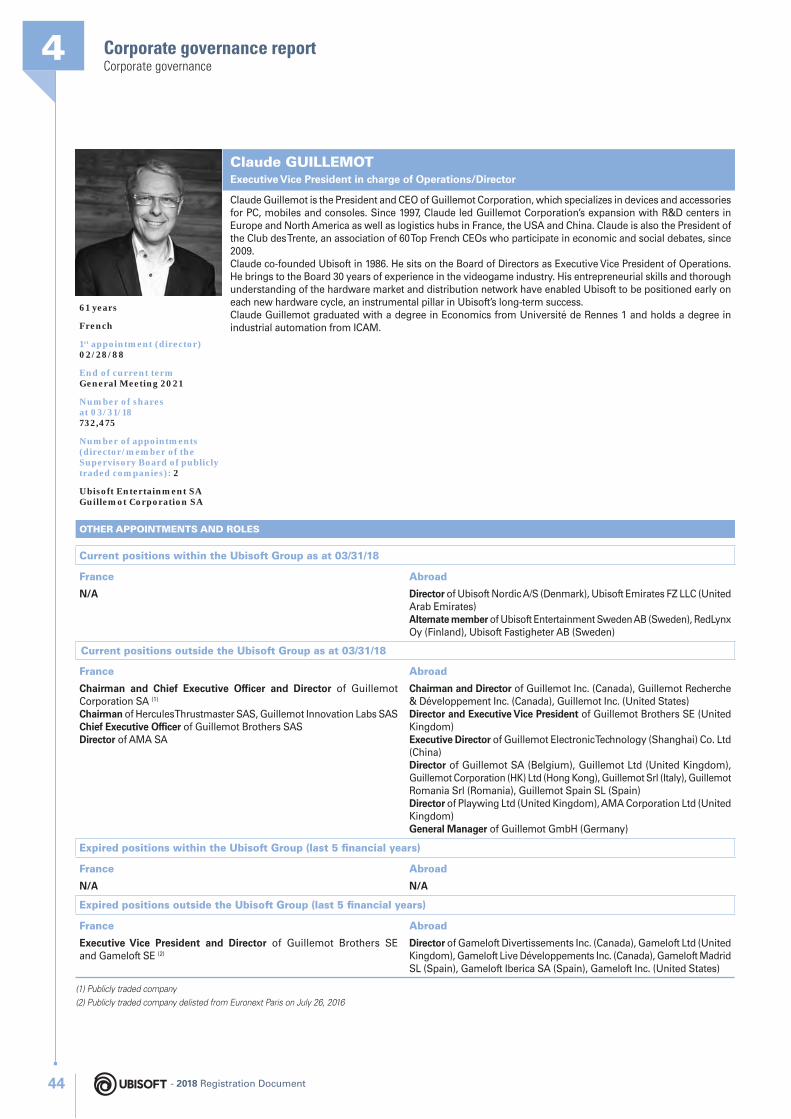
Corporate governance report4Corporate governance
Claude GUILLEMOTExecutive Vice President in charge of Operations/Director
Claude Guillemot is the President and CEO of Guillemot Corporation, which specializes in devices and accessories for PC, mobiles and consoles. Since 1997, Claude led Guillemot Corporation’s expansion with R&D centers in Europe and North America as well as logistics hubs in France, the USA and China. Claude is also the President of the Club des Trente, an association of 60 Top French CEOs who participate in economic and social debates, since 2009.Claude co-founded Ubisoft in 1986. He sits on the Board of Directors as Executive Vice President of Operations. He brings to the Board 30 years of experience in the videogame industry. His entrepreneurial skills and thorough understanding of the hardware market and distribution network have enabled Ubisoft to be positioned early on each new hardware cycle, an instrumental pillar in Ubisoft’s long-term success.Claude Guillemot graduated with a degree in Economics from Université de Rennes 1 and holds a degree in industrial automation from ICAM.
61 years
French
1st appointment (director)02/28/88
End of current termGeneral Meeting 2021
Number of shares at 03/31/18732,475
Number of appointments (director/member of the Supervisory Board of publicly traded companies): 2
Ubisoft Entertainment SAGuillemot Corporation SA
OTHER APPOINTMENTS AND ROLES
Current positions within the Ubisoft Group as at 03/31/18
France Abroad
N/A Director of Ubisoft Nordic A/S (Denmark), Ubisoft Emirates FZ LLC (United Arab Emirates)Alternate member of Ubisoft Entertainment Sweden AB (Sweden), RedLynx Oy (Finland), Ubisoft Fastigheter AB (Sweden)
Current positions outside the Ubisoft Group as at 03/31/18
France Abroad
Chairman and Chief Executive Officer and Director of Guillemot Corporation SA (1)
Chairman of Hercules Thrustmaster SAS, Guillemot Innovation Labs SASChief Executive Officer of Guillemot Brothers SASDirector of AMA SA
Chairman and Director of Guillemot Inc. (Canada), Guillemot Recherche & Développement Inc. (Canada), Guillemot Inc. (United States)Director and Executive Vice President of Guillemot Brothers SE (United Kingdom)Executive Director of Guillemot Electronic Technology (Shanghai) Co. Ltd (China)Director of Guillemot SA (Belgium), Guillemot Ltd (United Kingdom), Guillemot Corporation (HK) Ltd (Hong Kong), Guillemot Srl (Italy), Guillemot Romania Srl (Romania), Guillemot Spain SL (Spain)Director of Playwing Ltd (United Kingdom), AMA Corporation Ltd (United Kingdom)General Manager of Guillemot GmbH (Germany)
Expired positions within the Ubisoft Group (last 5 fi nancial years)
France Abroad
N/A N/A
Expired positions outside the Ubisoft Group (last 5 fi nancial years)
France Abroad
Executive Vice President and Director of Guillemot Brothers SE and Gameloft SE (2)
Director of Gameloft Divertissements Inc. (Canada), Gameloft Ltd (United Kingdom), Gameloft Live Développements Inc. (Canada), Gameloft Madrid SL (Spain), Gameloft Iberica SA (Spain), Gameloft Inc. (United States)
(1) Publicly traded company
(2) Publicly traded company delisted from Euronext Paris on July 26, 2016
- 2018 Registration Document44
Corporate governance report
4
Corporate governance
Michel GUILLEMOTExecutive Vice President in charge of Development, Strategy and Finance/Director
Passionate about programming, Michel Guillemot joined the family business after completing his studies, and with his brothers reoriented the company’s activities towards the video game industry. Guillemot International Software, the distributor and importer of video games that they created in 1984, became the leader in France the following year.Michel Guillemot then worked with his brother Gérard Guillemot in setting up the fi rst Ubisoft studios and their fi rst production: Rayman. Michel Guillemot also co-founded Gameloft and was its Chairman and Chief Executive Offi cer from 2001 to 2016. Under his management, Gameloft, a pioneer in the development of mobile games, saw extensive growth and became one of the biggest mobile developers in the world.Michel Guillemot co-founded Ubisoft in 1986. He is a member of the Board of Directors and Executive Vice President of Development, Strategy and Finance. He brings to the Board 30 years of experience in the videogame industry. With his entrepreneurial skills and his deep knowledge of the mobile industry, Michel acts as a reference for the Board to discuss the industry’s present and future and, specifi cally, the company’s ability to attract and engage a more mass-market audience.Michel Guillemot graduated from EDHEC business school and holds a degree (DECS) in accounting.
59 years
French
1st appointment (director02/28/88
End of current termGeneral Meeting 2021
Number of shares at 03/31/18378,715
Number of appointments (director/member of the Supervisory Board of publicly traded companies): 2
Ubisoft Entertainment SAGuillemot Corporation SA
OTHER APPOINTMENTS AND ROLES
Current positions within the Ubisoft Group as at 03/31/18
France Abroad
N/A N/A
Current positions outside the Ubisoft Group as at 03/31/18
France Abroad
Executive Vice President and Director of Guillemot Corporation SA (1)
Chief Executive Officer of Guillemot Brothers SASDirector of AMA SA
Director and Executive Vice President of Guillemot Brothers SE (United Kingdom)Director of Playwing Ltd (United Kingdom), Artifi cial Intelligence Research Lab Ltd (United Kingdom), AMA Corporation Ltd (United Kingdom)Director of Guillemot SA (Belgium), Guillemot Ltd (United Kingdom), Guillemot Inc. (United States), Guillemot Inc. (Canada), Ariann Finance Inc. (Canada), Playwing Inc. (Canada), Laboratoire de recherche sur l’intelligence artifi cielle (AIRLAB) Inc. (Canada), Playwing Ltd (Bulgaria)
Expired positions within the Ubisoft Group (last 5 fi nancial years)
France Abroad
N/A N/A
- 2018 Registration Document 45
Corporate governance report4Corporate governance
Expired positions outside the Ubisoft Group (last 5 fi nancial years)
France Abroad
Chairman and Chief Executive Officer of Gameloft SE (2)
Executive Vice President and Director of Guillemot Brothers SEChairman of Gameloft Distribution SAS, Gameloft Partnerships SAS, Ludigames SASGeneral Manager of Gameloft Rich Games Production France SARL
Chairman of Gameloft Srl (Romania), Gameloft Computer (Beijing) Company Ltd (China), Gameloft Computer (Chengdu) Company Ltd (China), Gameloft Argentina SA (Argentina ), Gameloft Computer (Shenzhen) Company Ltd (China)Chairman and Director of Gameloft Inc. (United States), Gameloft Divertissements Inc. (Canada), Gameloft Live Développements Inc. (Canada), Gameloft Entertainment Toronto Inc. (Canada), Gameloft Limited (United Kingdom), Gameloft KK (Japan), Gameloft Company Ltd (Vietnam), Gameloft Iberica SA (Spain), Gameloft Private India Ltd (India), Gameloft Co. Ltd (Korea), Gameloft Ltd (Hong Kong), Gameloft Philippines Inc. (Philippines), Gameloft Pte Limited (Singapore), PT Gameloft Indonesia (Indonesia), Gameloft New Zealand Ltd (New Zealand), Gameloft Hungary Software Development and Promotion kft (Hungary), Gameloft SDN BHD (Malaysia), Gameloft FZ-LLC (United Arab Emirates), Gameloft Madrid SL (Spain), Gameloft OY (Finland), Gameloft LLC (Russia), LLC Gameloft (Belarus), Gameloft Uruguay SA (Uruguay)General Manager of Gameloft GmbH (Germany), Gameloft Srl (Italy), Gameloft EOOD (Bulgaria), Gameloft S. de R.L. de C.V. (Mexico), Gameloft S.r.o. (Czech Republic)Director of Gameloft Australia Pty Ltd (Australia), Gameloft de Venezuela SA (Venezuela)
(1) Publicly traded company
(2) Publicly traded company delisted from Euronext Paris on July 26, 2016
- 2018 Registration Document46
Corporate governance report
4
Corporate governance
Gérard GUILLEMOTExecutive Vice President in charge of P ublishing/D irectorCEO of Ubisoft’s fi lm business
Gérard Guillemot is the President and CEO of Longtail Studios, which he founded in 2003. Longtail Studios develops console games for a family-oriented audience. In 2000, Gérard founded the game developer Gameloft, whose initial focus was to operate a platform for the emerging PC online gaming community. When Ubisoft was created, Gérard led its editorial content and managed the development teams. He actively encouraged the company to create its own franchises – now a key differentiator for Ubisoft, which offers long-term visibility and security to shareholders. He was also responsible for Ubisoft’s expansion into North America, one of the world’s biggest video-game markets.Gérard Guillemot co-founded Ubisoft in 1986. He is head of Ubisoft Motion Pictures, the fi lm division of Ubisoft. He also sits on the Board of Directors and is Executive Vice President of Publishing for Ubisoft Entertainment SA. He brings to the Board 30 years of experience in the videogame industry. Deeply rooted in the USA, he brings to the Board his understanding of emerging opportunities such as social media and online communities.Gérard Guillemot graduated from EDHEC business school. He has lived in the USA for over 15 years.
56 years
French-American
1st appointment (director)02/28/88
End of current termGeneral Meeting 2020
Number of shares at 03/31/18495,659
Number of appointments (director/member of the Supervisory Board of publicly traded companies): 2
Ubisoft Entertainment SAGuillemot Corporation SA
OTHER APPOINTMENTS AND ROLES
Current positions within the Ubisoft Group as at 03/31/18
France Abroad
N/A N/A
Current positions outside the Ubisoft Group as at 03/31/18
France Abroad
Executive Vice President and Director of Guillemot Corporation SA (1)
Chief Executive Officer of Guillemot Brothers SASDirector of AMA SA
Chairman of Longtail Studios Inc. (United States), Longtail Studios Halifax Inc. (Canada), Longtail Studios PEI Inc. (Canada)Director and Executive Vice President of Guillemot Brothers SE (United Kingdom)Director of Playwing Ltd (United Kingdom), AMA Corporation Ltd (United Kingdom)Director of Guillemot Ltd (United Kingdom), Guillemot Inc. (United States), Guillemot Inc. (Canada)
Expired positions within the Ubisoft Group (last 5 fi nancial years)
France Abroad
N/A N/A
Expired positions outside the Ubisoft Group (last 5 fi nancial years)
France Abroad
Executive Vice President and Director of Guillemot Brothers SE and Gameloft SE (2)
Chairman of Studios Longtail Québec Inc. (Canada)Director of Gameloft Divertissements Inc. (Canada), Gameloft Live Développements Inc. (Canada), Gameloft Inc. (United States)
(1) Publicly traded company
(2) Publicly traded company delisted from Euronext Paris on July 26, 2016
- 2018 Registration Document 47
Corporate governance report4Corporate governance
Christian GUILLEMOTExecutive Vice President in charge of Administration/Director
Christian Guillemot is Chairman and Chief Executive Offi cer of AMA SA, which he co-founded in 2004 with his brothers. AMA SA, which is enjoying rapid growth, specializes in the Internet of t hings, and over the past few years has become a world leader in new uses in the fi eld of telehealth and remote help using connected eyeglasses.Like his brothers, Christian Guillemot is passionate about innovation and emerging trends, and is also involved in the creation of the French Tech digital accelerator program.He is also Chairman and Chief Executive Offi cer of Guillemot Brothers SE, the family holding company of the Guillemot group.Christian Guillemot co-founded Ubisoft in 1986. He is a member of the Board of Directors and Executive Vice President of Administration. He brings to the Board 30 years of experience in the videogame industry. Christian Guillemot managed the creation, consolidation and integration of international subsidiaries for Ubisoft and played a leading role when the company listed on the stock exchange in 1996. As a result of his in-depth knowledge of new technological uses and expertise in fi nance, accounting and legal matters, he is an essential voice on the Board.Christian Guillemot graduated from the European Business School of London.
52 years
French
1st appointment (director)02/28/88
End of current termGeneral Meeting 2021
Number of shares at 03/31/17106,625
Number of appointments (director/member of the Supervisory Board of publicly traded companies): 2
Ubisoft Entertainment SAGuillemot Corporation SA
OTHER APPOINTMENTS AND ROLES
Current positions within the Ubisoft Group as at 03/31/18
France Abroad
N/A Director of Ubisoft Nordic A/S (Denmark)
Current positions outside the Ubisoft Group as at 03/31/18
France Abroad
Chairman and Chief Executive Officer and Director of AMA SAChairman of Guillemot Brothers SAS, AMA Opérations SAS, AMA Research and Development SAS, SAS du Corps de GardeExecutive Vice President and Director of Guillemot Corporation SA (1)
General Manager of Guillemot Administration et Logistique SARL
Chairman and Chief Executive Officer and Director of AMA Xperteye Inc. (United States), AMA l’Oeil de l’Expert Inc. (Canada)Chairman and Chief Executive Officer and Director of Guillemot Brothers SE (United Kingdom)Chairman and Director of Playwing Ltd (United Kingdom)Chairman and Director of Playwing Entertainment SL (Spain)Director of AMA Corporation Ltd (United Kingdom)Chairman of Playwing Srl (Romania)Director of Laboratoire de recherche sur l’intelligence artifi cielle (AIRLAB) Inc. (Canada), AMA Xperteye Ltd (United Kingdom), AMA Xperteye Srl (Romania), Guillemot SA (Belgium), Guillemot Inc. (Canada), Guillemot Recherche & Développement Inc. (Canada), Guillemot Inc. (United States), Guillemot Ltd (United Kingdom), Guillemot Corporation (HK) Ltd (Hong Kong)General Manager of AMA Xpert Eye GmbH (Germany)
Expired positions within the Ubisoft Group (last 5 fi nancial years)
France Abroad
N/A N/A
Expired positions outside the Ubisoft Group (last 5 fi nancial years)
France Abroad
Chairman and Chief Executive Officer and Director of Guillemot Brothers SEExecutive Vice President and Director of Gameloft SE (2)
Chairman of Studio AMA Bretagne SASJoint General Manager of Studio AMA Bretagne SARL
Director of Gameloft Divertissements Inc. (Canada), Gameloft Live Développements Inc. (Canada), Gameloft Ltd (United Kingdom), Gameloft Iberica SA (Spain), Gameloft Inc. (United States)Chairman and Director of Advanced Mobile Advertisement Inc. (United States)Chairman of AMA Studios SA (Belgium)
(1) Publicly traded company
(2) Publicly traded company delisted from Euronext Paris on July 26, 2016
- 2018 Registration Document48
Corporate governance report
4
Corporate governance
Didier CRESPELIndependent Lead DirectorChairman of the Audit Committee (1)
Member of the Nomination and Compensation Committee (2)
Didier Crespel has over 30 years of experience as a senior fi nancial manager and entrepreneur. He is the President of Crespel & Associates, a consulting fi rm he founded in 2013 that specializes in business strategy and equity investment. He is also the majority shareholder and President of Mecamen, an industrial group.Mr. Crespel is the former General Manager of Shapers (2000/2012) – an international subsidiary of the Arkk Group that is listed on the Tokyo Stock Exchange. Thanks to his proven reporting expertise, Didier contributed to Arkk Group’s compliance project by implementing J-SOX rules. From 1984 to 2000, Mr. Crespel also served as Finance Director and General Manager for Valeo’s German subsidiary – a world-leading automotive industry supplier. At Valeo, Mr. Crespel dealt with international fi nancial transactions such as major mergers and acquisitions.Mr. Crespel sits on Ubisoft’s Board of Directors as an independent director since 2013. He chairs the Audit Committee and is a member of the Nomination and Compensation Committee. His understanding of fi nance as well as business strategy are true assets for Ubisoft’s exploration of new and emerging markets, especially Asia. The Board of Directors also benefi ts from his entrepreneurial and international mindset to assess the company’s diversifi cation strategy and identify new opportunities in our fast-paced and growing industry.Mr. Crespel holds a Master in Management from the EDHEC Business School.
56 years
French
1st appointment (director)11/20/13
End of current termGeneral Meeting 2021
Number of shares as at 03/31/18320
Number of appointments (director/member of the Supervisory Board of publicly traded companies): 1
Ubisoft Entertainment SA
OTHER APPOINTMENTS AND ROLES
Current positions within the Ubisoft Group as at 03/31/18
France Abroad
N/A N/A
Current positions outside the Ubisoft Group as at 03/31/18
France Abroad
General Manager of the Mecamen GroupChairman of Mecamen, AMPM, AMS
Chairman of Mecamen Polska (Poland)
Expired positions within the Ubisoft Group (last 5 fi nancial years)
France Abroad
N/A N/A
Expired positions outside the Ubisoft Group (last 5 fi nancial years)
France Abroad
N/A N/A
(1) Chairman of the Audit Committee until May 17, 2018, replaced by Ms. Florence Naviner
(2) Member of the Nomination and Compensation Committee until March 31, 2018
- 2018 Registration Document 49
Corporate governance report4Corporate governance
Laurence HUBERT-MOYIndependent DirectorChairwoman of the Nomination and Compensation CommitteeMember of the Audit Committee
Laurence Hubert-Moy is a Professor at the University of Rennes. Since 2013, she has been President of one of the two scientifi c committees of the French National Center of Spatial Studies (CNES), the TOSCA Committee. She is also the Scientifi c Manager of the ENVAM Digital Campus, a French consortium of four universities and schools. Thanks to these positions, Mrs. Hubert-Moy is in constant and direct relation with scientifi c teams and academics from around the world while benefi ting from access to the latest modeling and spatial analysis. Her current research involves collaborations with scientists in China, Brazil and India, among others. Over the past 20 years, she has published numerous scientifi c research papers on space remote sensing and its application in the environment. In 2003, she was awarded a bronze medal by the French National Center for Scientifi c Research (CNRS).Mrs. Hubert-Moy sits on Ubisoft’s Board of Directors as an independent member since 2013. She chairs the Nomination and Compensation committee and sits on the Audit committee. Her extensive research on space observation and big data puts R&D, innovation, analytics and open worlds at the heart of the Board’s agenda.Mrs. Hubert-Moy holds a Ph.D. and completed post-doctorate studies at Boston University. She also holds a certifi cate in business administration from the IFA-Sciences Po Paris.
56 years
French
1st appointment (director)06/27/13
End of current termGeneral Meeting 2021
Number of shares as at 03/31/18414
Number of appointments (director/member of the Supervisory Board of publicly traded companies): 1
Ubisoft Entertainment SA
OTHER APPOINTMENTS AND ROLES
Current positions within the Ubisoft Group as at 03/31/18
France Abroad
N/A N/A
Current positions outside the Ubisoft Group as at 03/31/18
France Abroad
Professor at the University of Rennes 2Chairwoman of the TOSCA (Terre, Océans, Surfaces Continentales, Atmosphère) Committee of the CNESScientific Director of the ENVAM digital campus
N/A
Expired positions within the Ubisoft Group (last 5 fi nancial years)
France Abroad
N/A N/A
Expired positions outside the Ubisoft Group (last 5 fi nancial years)
France Abroad
N/A N/A
- 2018 Registration Document50
Corporate governance report
4
Corporate governance
Florence NAVINERIndependent DirectorMember of the Audit Committee since January 1, 2018 (1)
Florence Naviner is currently Chief Financial Offi cer and Senior Vice-President of Mars Wrigley Confectionery, an American multinational and subsidiary of Mars, Incorporated. Florence Naviner joined Mars in 1992 and brings to Ubisoft more than 30 years of experience in different fi nancial and strategic management positions in the consumer goods industry.Based in Chicago, after having spent fi ve years as Wrigley’s global CFO, she has been very involved in the global integration of Mars Chocolate and Wrigley. In July 2017 she became Global CFO of the new merged entity, Mars Wrigley Confectionery, the world leader in confectionery products. In this position, she manages the global fi nance team and copilots the implementation of its strategy and operations. From 2011 to 2012, as Mars Financial Services Vice President, she designed and implemented a global strategy to deploy a shared fi nancial services center for Mars, Incorporated.Florence Naviner has also gained a solid international experience, having served as Chief Financial Offi cer of Mars Petcare for Europe, Finance Vice President of Mars in China between 2006 and 2008 as well as Finance Vice President of Mars Petcare in the USA from 2008 to 2011. She has particularly driven business turnarounds, piloted cost competitiveness programs and oversaw the creation of synergies in post-acquisition periods. Florence Naviner started her career at Arthur Andersen in Paris in 1985.Florence Naviner graduated from the HEC Business School Paris and possesses a DESCF degree in accounting.
55 years
French
1st appointment (director)09/29/16
End of current termGeneral Meeting 2020
Number of shares as at 03/31/18315
Number of appointments (director/member of the Supervisory Board of publicly traded companies): 1
Ubisoft Entertainment SA
OTHER APPOINTMENTS AND ROLES
Current positions within the Ubisoft Group as at 03/31/18
France Abroad
N/A N/A
Current positions outside the Ubisoft Group as at 03/31/18
France Abroad
N/A Chief Financial Officer and Senior Vice-President of Wrigley Junior Company (United States)
Expired positions within the Ubisoft Group (last 5 fi nancial years)
France Abroad
N/A N/A
Expired positions outside the Ubisoft Group (last 5 fi nancial years)
France Abroad
N/A N/A
(1) Chairperson of the Audit Committee as of May 18, 2018
- 2018 Registration Document 51
Corporate governance report4Corporate governance
Frédérique DAMEIndependent Director
At Ubisoft, Frédérique Dame can draw upon her 15 years of experience at some of the world’s most innovative and cutting-edge companies, such as Uber, which she joined in its very beginnings. Today, Frédérique Dame is a business angel and investor in Silicon Valley, investing in start-ups and digital technologies.Throughout her career at different US-based digital companies, Frédérique Dame has developed a unique expertise for launching consumer products and services. Between 2012 and 2016, she helped scale Uber from 80 people to over 7,000 and expand the company from 14 cities in four countries to over 400 in 68 countries. She spearheaded two strategic programs at Uber: the “Driver Experience”, which allows private drivers to become part of Uber’s network on a global scale, as well as the “Employee Experience”, aimed at automating internal systems to improve the productivity and collaboration of its international teams.Previously, Frédérique Dame contributed to the development of Yahoo!, while managing their products’ social strategy between 2004 and 2008. She joined Photobucket in 2009, then Smugmug, two online photo-sharing products for which she implemented monetization and audience growth strategies.Frédérique Dame holds a Master in Spacecraft Technology and Satellite Communications from University College London and a Bachelor and Master in Telecommunications Engineering from Télécom SudParis. She is based in San Francisco.
42 years
French-American
1st appointment (director)09/29/16
End of current termGeneral Meeting 2020
Number of shares as at 03/31/18321
Number of appointments (director/member of the Supervisory Board of publicly traded companies): 1
Ubisoft Entertainment SA
OTHER APPOINTMENTS AND ROLES
Current positions within the Ubisoft Group as at 03/31/18
France Abroad
N/A N/A
Current positions outside the Ubisoft Group as at 03/31/18
France Abroad
N/A Founder, President and Chief Executive Officer of Frede Technologies, Inc.Independent Director of Les Mills International (New Zealand)
Expired positions within the Ubisoft Group (last 5 fi nancial years)
France Abroad
N/A N/A
Expired positions outside the Ubisoft Group (last 5 fi nancial years)
France Abroad
N/A N/A
- 2018 Registration Document52
Corporate governance report
4
Corporate governance
Corinne FERNANDEZ-HANDELSMANIndependent Director
Corinne Fernandez-Handelsman is currently an Industrial & Technology Practice Leader, Partner at Progress, specializing in senior executive recruitment. Progress is a member of IIC Partners’ international network, which brings together independent, market-leading recruitment agencies. Corinne Fernandez-Handelsman has managed the Technology, Digital Media and Telecommunications practice within this network.She brings 30 years’ experience to Ubisoft, with more than 15 years’ expertise in recruitment and valuable knowledge in sourcing, attracting and retaining talent in the digital and technology sectors. Corinne Fernandez-Handelsman started her career at SNCF before joining the Boston Consulting Group as a consultant in 1986. In 1988, she joined GSI, a digital services company that was purchased by ATOS in 1997, where she held consecutive positions as Director of Marketing and Communications, Manager for business units, and Global Account Manager. She joined Progress in 1999. Since 2016, Corinne Fernandez-Handelsman has also been a director of Coheris, a leading CRM & Business Analytics solutions provider, listed on Euronext. Corinne Fernandez-Handelsman is a graduate of HEC Paris.
56 years
French
1st appointment (director)09/22/17
End of current termGeneral Meeting 2019
Number of shares as at 03/31/18150
Number of appointments (director/member of the Supervisory Board of publicly traded companies): 2
Ubisoft Entertainment SACoheris SA
OTHER APPOINTMENTS AND ROLES
Current positions within the Ubisoft Group as at 03/31/18
France Abroad
N/A N/A
Current positions outside the Ubisoft Group as at 03/31/18
France Abroad
Executive Search Consultant and Partner at Progress SADirector of Coheris SA (1)
Director of IIC Partners
Expired positions within the Ubisoft Group (last 5 fi nancial years)
France Abroad
N/A N/A
Expired positions outside the Ubisoft Group (last 5 fi nancial years)
France Abroad
N/A N/A
(1) Publicly traded company
- 2018 Registration Document 53
Corporate governance report4Corporate governance
Virginie HAASIndependent Director (1)
Virginie Haas brings Ubisoft almost 30 years of experience in the fi eld of new technologies and IT services. She spent the majority of her career at IBM, where she held various management positions. In 2006, she joined the Steering Committee of IBM France as Director of Operations, before becoming Vice President, Global Technology Services Sales of IBM France. In 2010, she began her international career, becoming IBM’s Vice President of Worldwide Cloud Services Sales, helping the company to become one of the market leaders for the sector.In 2016, she changed course and joined Shift Technology as Chief Revenue Offi cer. A start-up founded in 2014, Shift Technology is developing a SaaS solution to detect insurance fraud by relying on artifi cial intelligence technologies and Big Data. At Shift Technology, Virginie Haas is in charge of developing and supporting the company’s rapid growth and international expansion. Virginie Haas has signifi cant experience in issues relating to transforming and managing hyper-growth, and will provide Ubisoft her knowledge of the worldwide cloud computing market, and more broadly the market for new technologies, which are vectors of digital transformation. She graduated from the ESCEM Business School.
52 years
French
1st appointment (director)09/22/17
End of current termGeneral Meeting 2019
Number of shares as at 03/31/1850
Number of appointments (director/member of the Supervisory Board of publicly traded companies): 1
Ubisoft Entertainment SA
OTHER APPOINTMENTS AND ROLES
Current positions within the Ubisoft Group as at 03/31/18
France Abroad
N/A N/A
Current positions outside the Ubisoft Group as at 03/31/18
France Abroad
Chief Revenue Officer at Shift Technology N/A
Expired positions within the Ubisoft Group (last 5 fi nancial years)
France Abroad
N/A N/A
Expired positions outside the Ubisoft Group (last 5 fi nancial years)
France Abroad
N/A N/A
(1) Member of the Nomination and Compensation Committee as of April 1, 2018
- 2018 Registration Document54
Corporate governance report
4
Corporate governance
Lionel BOUCHETDirector representing employees
Lionel Bouchet joined the Board of Directors as a director representing employees.Currently Senior Lead Programmer, Lionel has spent most of his career with Ubisoft, which he joined in 1996 after earning a computer engineering degree from the EERIE in Nîmes. Lionel fi rst worked on POD, the fi rst racing game developed by Ubisoft, and then on several Formula 1 games before focusing his energies on the increasingly successful franchise Ghost Recon, since 2005. Today, he is responsible for the development of the brand’s engine and production pipeline, an ambitious project co-developed in France by three studios: Ubisoft Paris, Ubisoft Montpellier and Ubisoft Bordeaux. With over 20 years of experience in production studios in Paris and Montpellier, he is able to clearly identify the challenges facing production teams, with a particular focus on technological issues, a central topic in the video game industry.As an Ubisoft employee with a thorough understanding of the Group, Lionel also provides the Board of Directors with an operational perspective on the Group’s entities.
44 years
French
Election (director representing employees)03/07/18
End of current term03/07/22
Number of shares as at 03/31/180
Number of appointments (director/member of the Supervisory Board of publicly traded companies): 1
Ubisoft Entertainment SA
OTHER APPOINTMENTS AND ROLES
Current positions within the Ubisoft Group as at 03/31/18
France Abroad
N/A N/A
Current positions outside the Ubisoft Group as at 03/31/18
France Abroad
N/A N/A
Expired positions within the Ubisoft Group (last 5 fi nancial years)
France Abroad
N/A N/A
Expired positions outside the Ubisoft Group (last 5 fi nancial years)
France Abroad
N/A N/A
❙ 4.1.3 ORGANIZATION AND OPERATION OF THE BOARD OF DIRECTORS
The preparation and organization of the Board of Directors come within the scope defi ned by the statutory and regulatory provisions applicable to French corporations (sociétés anonymes) and the Company’s Articles of Association, and the provisions of the internal rules of the Board of Directors and its committees updated on Thursday, April 27, 2017. Over and above the expertise and powers of the Board, the internal rules of the Board prescribe the principle of confi dentiality for information disclosed to members, and state that the offi ce of director shall be held in accordance with the rules on independence, ethics and integrity. Moreover, the internal rules of the Board of Directors stipulate the requirement that each of the directors shall inform the Board in the event of a real or potential confl ict of interests in which he/she may be directly or indirectly involved.
- 2018 Registration Document 55
Corporate governance report4Corporate governance
4.1.3.1 Internal Rules of the Board of Directors
The internal rules of the Board of Directors, in conjunction with and/or in addition to legal, regulatory and statutory provisions, intended in particular to specify details of the composition, organization and operation of the Board of Directors and committees created therein, were adopted during the meeting of the Board of Directors on July 27, 2004. The internal rules of the Board also constitute the directors’ governance charter.
They are examined and updated at regular intervals by the Board of Directors – the most recent update was made on April 27, 2017.
The internal rules of the Audit Committee and of the Nomination and Compensation Committee are annexed to the internal rules of the Board of Directors.
The internal rules of the Board of Directors, published on the Company’s website, set all the principles, which, without being set up as strict rules, should guide the composition of the Board of Directors.
4.1.3.2 Organization of the Board of Directors
The Board of Directors has the broadest possible powers to determine business policies and ensure their implementation within the limits of the Company’s corporate purpose and the powers expressly granted by law to the General Meeting.
The internal rules referred to above defi ne or specify the content and the procedures governing the exercise of the prerogatives of the Board of Directors, of the specialized committees created within the Board, of the Chairman and Chief Executive Offi cer and of the lead director.
The Board of Directors represents the shareholders. With the exception of the Chairman and Chief Executive Offi cer and the Executive Vice Presidents, the directors have no individual power and must therefore act and decide by conferring with other members of the Board.
The two committees, the Audit Committee and the Nomination and Compensation Committee, are tasked with reviewing and documenting the matters that the Board has decided to discuss and to present it at a plenary session with recommendations on the issues within the areas of their respective purview. The committees are advisory bodies and do not have the authority to make decisions themselves. Their members and their Chairperson are appointed by the Board and are selected exclusively from among the directors. Since members are personally appointed, they may not under any circumstances be represented by others at meetings of the committee(s) of which they are members. The Board reserves the right to change at any time the number and/or the composition of these committees as well as the scope of their duties. Finally, it should be noted that the internal rules of each committee – as well as any change that a committee may ultimately suggest – must receive the Board’s formal approval. The responsibilities and the composition of the committees are described in section 4.1.3.4.
In his capacity as Chairman of the Board of Directors, the Chairman and Chief Executive Offi cer prepares, organizes and supervises the
work of the Board, sets the agenda for its meetings, advises the directors of any information required for the performance of their duties, ensures the proper functioning of the Company’s bodies, the proper execution of decisions made by the Board and compliance with the rules of proper conduct adopted by the Company. He chairs the Shareholders’ General Meeting and reports to it on the functioning, work and decisions of the Board of Directors.
If the positions of Chairman and Chief Executive Offi cer are held by the same person, a lead director is appointed. The role and prerogatives of the lead director are detailed in section 4.1.3.3.
THE BOARD’S POWERS AND RESPONSIBILITIESIn accordance with the provisions of Article L. 225-35 of the French Commercial Code and its internal rules, the Board of Directors decides the Company’s policies and oversees their implementation.
In particular, the Board of Directors gives its opinion on all decisions relating to major strategic, economic, corporate, fi nancial and technological policies of the Company and oversees their implementation by the general management, particularly in accordance with the Board’s internal rules.
Subject to the powers expressly bestowed on Shareholders’ Meetings and within the limit of the corporate purpose, the Board of Directors may discuss any issue affecting the proper functioning of the Company and make decisions to resolve matters that concern it. It also carries out the verifi cations and controls it deems appropriate.
Consequently, the Board of Directors:
♦ chooses the organizational arrangements for the general management (separation of the offi ces of Chairman and Chief Executive Offi cer, or combination of such offi ces);
♦ implements, where it sees fi t, the delegations of authority and/or authorizations granted to it by the Shareholders’ Meeting;
♦ examines and approves the fi nancial statements;
♦ monitors the quality of the information provided to shareholders and to the markets in the fi nancial statements or when major transactions are carried out.
In addition, the Board of Directors contributes to the determination of the Group’s objectives and strategy in line with its culture and values.
OPERATION OF THE BOARD OF DIRECTORSIt meets as often as required by the Company’s business, at the registered offi ce or at any other place chosen by the Chairman. No special form is required for meeting notices. As a collegial body, its decisions are binding on all its members.
The internal rules of the Board of Directors provide an opportunity for directors to participate in the Board’s deliberations via videoconference or telecommunications, which enable them to be identifi ed and which guarantee their effective participation, under the conditions determined by the regulations in force. Directors who participate in the Board’s deliberations in this way are deemed to be present for quorum purposes, except for Board of Directors’ meetings relating to the establishment of the annual consolidated and separate fi nancial statements, and the management report.
- 2018 Registration Document56
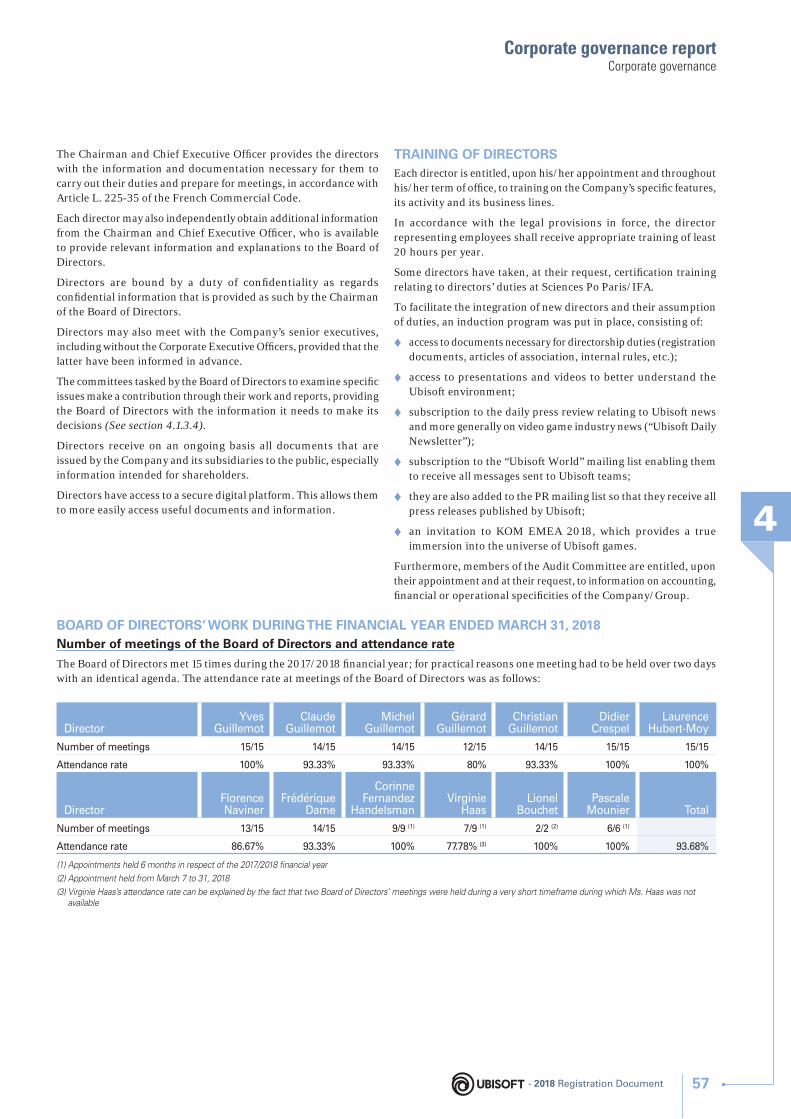
Corporate governance report
4
Corporate governance
The Chairman and Chief Executive Offi cer provides the directors with the information and documentation necessary for them to carry out their duties and prepare for meetings, in accordance with Article L. 225-35 of the French Commercial Code.
Each director may also independently obtain additional information from the Chairman and Chief Executive Offi cer, who is available to provide relevant information and explanations to the Board of Directors.
Directors are bound by a duty of confi dentiality as regards confi dential information that is provided as such by the Chairman of the Board of Directors.
Directors may also meet with the C ompany’s senior executives, including without the Corporate Executive Offi cers, provided that the latter have been informed in advance.
The committees tasked by the Board of Directors to examine specifi c issues make a contribution through their work and reports, providing the Board of Directors with the information it needs to make its decisions (See section 4.1.3.4).
Directors receive on an ongoing basis all documents that are issued by the Company and its subsidiaries to the public, especially information intended for shareholders.
Directors have access to a secure digital platform. This allows them to more easily access useful documents and information.
TRAINING OF DIRECTORSEach director is entitled, upon his/her appointment and throughout his/her term of offi ce, to training on the Company’s specifi c features, its activity and its business lines.
In accordance with the legal provisions in force, the director representing employees shall receive appropriate training of least 20 hours per year.
Some directors have taken, at their request, certifi cation training relating to directors’ duties at Sciences Po Paris/IFA.
To facilitate the integration of new directors and their assumption of duties, an induction program was put in place, consisting of:
♦ access to documents necessary for directorship duties (registration documents, articles of association, internal rules, etc.);
♦ access to presentations and videos to better understand the Ubisoft environment;
♦ subscription to the daily press review relating to Ubisoft news and more generally on video game industry news (“Ubisoft Daily Newsletter”);
♦ subscription to the “Ubisoft World” mailing list enabling them to receive all messages sent to Ubisoft teams;
♦ they are also added to the PR mailing list so that they receive all press releases published by Ubisoft;
♦ an invitation to KOM EMEA 2018, which provides a true immersion into the universe of Ubisoft games.
Furthermore, members of the Audit Committee are entitled, upon their appointment and at their request, to information on accounting, fi nancial or operational specifi cities of the Company/Group.
BOARD OF DIRECTORS’ WORK DURING THE FINANCIAL YEAR ENDED MARCH 31, 2018Number of meetings of the Board of Directors and attendance rate
The Board of Directors met 15 times during the 2017/2018 fi nancial year; for practical reasons one meeting had to be held over two days with an identical agenda. The attendance rate at meetings of the Board of Directors was as follows:
DirectorYves
GuillemotClaude
GuillemotMichel
GuillemotGérard
GuillemotChristian
GuillemotDidier
CrespelLaurence
Hubert-Moy
Number of meetings 15/15 14/15 14/15 12/15 14/15 15/15 15/15
Attendance rate 100% 93.33% 93.33% 80% 93.33% 100% 100%
DirectorFlorence Naviner
Frédérique Dame
Corinne Fernandez
HandelsmanVirginie
HaasLionel
BouchetPascale
Mounier Total
Number of meetings 13/15 14/15 9/9 (1) 7/9 (1) 2/2 (2) 6/6 (1)
Attendance rate 86.67% 93.33% 100% 77.78% (3) 100% 100% 93.68%
(1) Appointments held 6 months in respect of the 2017/2018 fi nancial year
(2) Appointment held from March 7 to 31, 2018
(3) Virginie Haas’s attendance rate can be explained by the fact that two Board of Directors’ meetings were held during a very short timeframe during which Ms. Haas was not available
- 2018 Registration Document 57
Corporate governance report4Corporate governance
MAIN TOPICS ADDRESSED BY THE BOARD OF DIRECTORS DURING THE 2018 FINANCIAL YEARThe agenda of meetings of the Board of Directors is determined pursuant to applicable laws and regulations.
During the fi nancial year, the Board of Directors mainly focused on:
♦ considering the Ubisoft Group’s strategic issues;
♦ examining and approving the separate and consolidated fi nancial statements for the year ended March 31, 2017 and relevant reports, as well as the interim consolidated fi nancial statements at September 30, 2017;
♦ fi nancial information/fi nancial reports;
♦ establishing management forecasts;
♦ preparing for the Combined General Meeting of September 22, 2017 (agenda, draft resolutions, reports for this meeting);
♦ implementing the delegations of authority and authorizations granted by the Shareholders’ Meeting, particularly as regards employee stock ownership and “fi nancial” authorizations;
♦ renewing the authorization granted to the Chief Executive Offi cer to provide deposits, endorsements and guarantees on behalf of the Company;
♦ implementing the share buyback program, including decisions to cancel own shares;
♦ issuing ordinary bonds;
♦ complying with the principles of corporate governance, in particular:
• updating the internal rules of the Board of Directors and its committees,
• reading the reports of the work of the lead director and committees as set out in sections 4.1.3.3 and 4.1.3.4,
• reviewing the status of independent director,
• evaluating the operating procedures of the Board and its committees (summary);
♦ approval of the proposals of the Nomination and Compensation Committee in relation to:
• employee stock ownership: approval of the fulfi llment of performance conditions and/or implementation of new employee stock ownership plans,
• the compensation of the Chairman and Chief Executive Offi cer and/or Executive Vice Presidents,
• re-election of the Corporate Executive Offi cers,
• succession plan(s) for the Corporate Executive Offi cers, the Executive Committee and the lead director,
• the composition of the committees,
• inclusion of the director representing employees: training, time allocation;
♦ establishing quantifi able and qualitative criteria, as proposed by the Nomination and Compensation Committee, in relation to the compensation of the Chairman and Chief Executive Offi cer and Executive Vice Presidents, and assessment of achievement of the said criteria;
♦ transactions associated with the buyback of all of its equity interest in Vivendi SA.
The Board of Directors has also received presentations on specifi c topics requested by its members.
Pursuant to Article L. 823-17 of the French Commercial Code, the Statutory Auditors were invited to attend the Board meetings approving or examining the fi nancial statements.
4.1.3.3 Lead Director
Pursuant to the internal rules of the Board and of its Committees, a lead director, chosen from among the independent directors, may be appointed by the Board of Directors, following a proposal of the Nomination and Compensation Committee, where the positions of Chairman and Chief Executive Offi cer are held by the same person.
The lead director is appointed for a period of two years, which must not exceed the term of his or her directorship. The lead director may be re-elected following a proposal from the Nomination and Compensation Committee.
In this context and acting on a proposal from the Nomination and Compensation Committee, the Board of Directors appointed Didier Crespel as the fi rst lead director on March 3, 2016.
RESPONSIBILITIESThe main responsibility of the lead director is to oversee the proper functioning of the Company’s management bodies. In this regard, he:
♦ chairs the meetings of the Board of Directors in the event that the Chairman is unavailable and following a proposal from the latter in accordance with the provisions of the Articles of Association;
♦ temporarily assumes the chair of the Board of Directors in the event that the Chairman is unavailable;
♦ chairs, convenes and organizes at least one meeting per year for the independent directors during which they can discuss topics of their choice outside of a plenary meeting of the Board of Directors;
♦ maintains ongoing dialogue with the directors and, where required, acts as their spokesman with the Chairman of the Board of Directors and in particular acts as a liaison if required between the independent directors and the Chairman of the Board of Directors;
♦ ensures that all shareholder questions are answered, is available to communicate with shareholders at the request of the Chairman of the Board of Directors and keeps the Board informed of these exchanges;
♦ oversees the evaluation of the Board of Directors’ operating procedures where required.
- 2018 Registration Document58
Corporate governance report
4
Corporate governance
RESOURCESWhile performing his duties, the lead director can:
♦ suggest that the Chairman add items to the agenda of Board meetings, where necessary;
♦ request that the Chairman convene or, if appropriate, himself convene an Extraordinary Board Meeting where justifi ed by an urgent or crucial agenda;
♦ assume, in conjunction with legal and regulatory provisions, the duties of the Chairman of the Board of Directors in the event that the latter is unavailable (temporarily chair meetings);
♦ meet with the independent directors under terms and conditions and at times that he may deem appropriate;
♦ attend and/or participate in any meetings with Company shareholders upon request of the Chairman of the Board of Directors;
♦ make recommendations of any kind in relation to the evaluation of the Board.
The lead director ensures that the directors have the opportunity to meet and speak with the executive managers and the Statutory Auditors, in accordance with the provisions of the internal rules.
More generally, the lead director ensures that the directors are provided with the information required to perform their duties under optimum conditions, in accordance with the provisions of the internal rules.
The lead director may be the Chairman or a member of one or more of the committees of the Board of Directors.
The lead director reports once a year to the Board of Directors. During General Meetings, the Chairman may invite the lead director to report on his work.
WORK DURING THE 2017/2018 FINANCIAL YEARSince his appointment as lead director on March 3, 2016, Didier Crespel has been in frequent contact with the Company’s shareholders in order to provide an overview of “Governance” activities and in particular the operating procedures and activities of the administrative and management bodies.
The lead director also invited the independent directors to meet on May 11, 2017 to discuss the advisability of submitting to a vote of the General Meeting scheduled for September 22, 2017 whether to proceed with a dividend distribution, review the status of ongoing training, discuss the feedback from the fi rm Spencer Stuart as part of the formal evaluation of the Board and the committees, and prepare the governance roadshow.
The lead director also presented the changes in the Company’s governance to the General Meeting of September 22, 2017, highlighting the role of independent directors.
The lead director also keeps regular contacts with the Company’s consultants in particular regarding issues of governance and best practice within the Board of Directors.
In accordance with the internal rules of the Board of Directors, the lead director reported on his activities over the past fi nancial year at the meeting of the Board of Directors on April 13, 2018.
4.1.3.4 Committees of the Board of Directors
Under its internal rules, the Board of Directors has the option of creating one or more committees to assist it:
♦ the Audit Committee;
♦ the Nomination and Compensation Committee.
COMMITTEES ROLES AND OPERATING PROCEDURESThe committees act in an advisory capacity. Their particular responsibilities include reviewing matters that the Board or its Chairman submits for their consideration and reporting their fi ndings to the Board in the form of minutes, proposals or recommendations. Members chosen from among the directors are appointed by the Board of Directors, which also designates each committee’s Chairperson . The responsibilities and operating procedures of each committee were specifi ed by the Board when they were established and were added to the internal rules.
The committees may not unilaterally decide to discuss issues beyond the scope of their mission. They have no decision-making power but only that of making recommendations to the Board of Directors.
The committees meet at the behest of their Chairperson and may be called by any means. The committees may meet at any place and in any way, including by videoconferencing and teleconferencing. They may only meet if a quorum of at least half of their members are present – if committees only comprise two members, all members must participate in meetings. As members are personally appointed, they may not be represented by others. The Nomination and Compensation Committee must meet at least once a year and the Audit Committee at least three times a year.
The agenda of committee meetings is set by their Chairperson . The committees report on their work to the subsequent Board meeting in the form of oral statements, opinions, proposals, recommendations or written reports.
- 2018 Registration Document 59
Corporate governance report4Corporate governance
WORK DURING THE 2017/2018 FINANCIAL YEAR
Audit Committee Created on November 20, 2013
Composition as at 03/31/18
♦ Mr. Didier Crespel, Chairman (1)
♦ Ms. Laurence Hubert-Moy ♦ Ms. Florence Naviner (since January 1, 2018) (1)
Operating procedures
The internal rules of the Audit Committee, which are attached to the internal rules of the Board of Directors, describe its responsibilities and operating procedures in particular.The internal rules of the Audit Committee were updated on April 27, 2017 in response to Order No. 2016-315 issued March 17, 2016, which came into effect on June 17, 2016 concerning audit reform and/or the AFEP-MEDEF Code as revised in November 2016.The committee is chaired by Didier Crespel (1) who brings his fi nancial and accounting expertise to the committee, together with precision and an analytical spirit.Laurence Hubert-Moy has held and still holds a number of management positions in a variety of research organizations giving her years of technical experience in the management of substantial budgets and in risk mapping.In addition to her skills in the fi elds of fi nance, accounting and tax, Ms. Florence Naviner brings a pragmatic international approach to the Audit Committee.
Responsibilities The Audit Committee is responsible for monitoring the preparation of accounting and fi nancial information, the effectiveness of internal control and risk management systems, statutory audits of the separate fi nancial statements and consolidated fi nancial statements by the Statutory Auditors and the independence of the latter. It prepares and facilitates the work of the Board of Directors with regard to these matters.More specifi cally, it is responsible for:
♦ examining the pertinence of the accounting basis chosen, the sustainability of the accounting methods applied, the accounting policies used and the estimates made in order to process material transactions, and the scope of consolidation;
♦ examining certain accounting and fi nancial information documents issued by the Company before they are made public; ♦ reviewing and monitoring the effectiveness of internal control and risk management systems and the security of information
systems; ♦ examining risks, litigation and material off-statement of fi nancial position commitments; ♦ formulating proposals to be made to the Board of Directors regarding the appointment of the Statutory Auditors and
validation of the fees paid; ♦ approval of the provision by the Statutory Auditors or their network, of services other than the certifi cation of the fi nancial
statements mentioned in Article L. 822-11-2 of the French Commercial Code, pursuant to the Audit Committee Charter; and
♦ evaluating the quality of the work of the Statutory Auditors and monitoring its independence. Within the context of this monitoring, details of the fees for auditing and non-auditing services paid by the Company and other Group companies to the fi rms and networks of the Company’s Statutory Auditors are communicated annually to the committee when the separate fi nancial statements are prepared.
Work during 2017/2018
The Audit Committee met fi ve times during the fi nancial year, with an attendance rate of 100%. In particular it addressed the following issues:
♦ the Company’s results: ♦ review of the separate and consolidated fi nancial statements as at March 31, 2017 and the consolidated management
report, ♦ review of the half-year consolidated fi nancial statements as at September 30, 2017 and the half-year fi nancial report, ♦ review of the work of the Statutory Auditors as at March 31, 2017 and September 30, 2017, ♦ review of the fi gures contained in the fi nancial press release relating to the annual and interim consolidated fi nancial
statements; ♦ risk management and internal control:
♦ review of the Group’s risk management approach, the risk management, audit and internal control system and the related organizations and resources,
♦ review of the report of the Chairman of the Board of Directors on corporate governance, risk management and internal control,
♦ review and monitoring of risk mapping, ♦ review of work undertaken in relation to anti-corruption in view of regulatory developments (Law No. 2016-1691 of
December 9, 2016, the so-called “Sapin II” law); ♦ audit and relations with external auditors:
♦ internal audit: 2017 summary and review of the 2018 audit plan, ♦ review of the assignments of external auditors, including additional assignments, ♦ review of the fee budget for external auditors, ♦ update on the new additional report of the Statutory Auditors to the Audit Committee (Article L. 823-16, III of the French
Commercial Code/Order No. 2016-315 of March 17, 2016); ♦ other:
♦ evaluation of requirements for internal control resources, ♦ consideration of the composition of the committee, ♦ implementation and application of the audit charter.
2017/2018 attendance rate 100%
(1) As of May 18, 2018, the Audit Committee will be chaired by Ms. Florence Naviner
- 2018 Registration Document60
Corporate governance report
4
Corporate governance
Nomination and Compensation Committee
Composition as at 03/31/18
♦ Laurence Hubert-Moy, Chairwoman ♦ Mr. Didier Crespel (1)
Operating procedures
The committee has been chaired since September 30, 2016 by Ms. Laurence Hubert-Moy who, fi rstly, due to the executive positions she holds or has held in various research entities, has experience of compensation for high-level managerial teams (researchers and engineers) and, secondly, thanks to her current and prior experience, is well versed in recruitment and analysis techniques. Thanks to his professional experience working for major international groups, Didier Crespel is an expert in business strategy. He brings a pragmatic and rational approach to the committee and the issues it addresses.The AFEP-MEDEF Code provides, on the one hand, that the N omination and/or C ompensation C ommittee(s) must mostly consist of independent directors and no Corporate Executive Offi cers, and also recommends that the Chairperson of the Compensation Committee be independent. The composition of the Nomination and Compensation Committee complies with this recommendation with an independence rate of 100%.The Nomination and Compensation Committee has decided to invite Yves Guillemot and Cécile Cornet, Chief Talent and Communications Offi cer to certain meetings.
Composition as at 04/01/18
♦ Ms. Laurence Hubert-Moy, Chairwoman ♦ Ms. Virginie Haas
In view of her varied and valuable experience in various management positions that she has held at IBM and her current duties at the start-up Shift Technology, Virginie Haas will bring to the committee a structured vision and thorough analysis of the various topics and will therefore be able to make on detailed proposals on a case-by-case basis.
- 2018 Registration Document 61
Corporate governance report4Corporate governance
Responsibilities The Nomination and Compensation Committee, fi rstly, puts forward recommendations, in consultation with the Chairman and Chief Executive Offi cer, regarding the succession plan for corporate offi cers, the re-election of directors and the selection of new directors. It is kept informed of the succession plan relating to members of the Group’s Executive Committee. Secondly it is responsible for examining the compensation and benefi ts granted to directors and Corporate Executive Offi cers and for providing the Board of Directors with comparisons and metrics with regard to international practices.More particularly, it is responsible for:
♦ Nominations: ♦ Concerning the Board of Directors:
- making proposals to the Board, after examining in detail all factors to be taken into account in its decision-making, the optimum balance of the composition of the Board of Directors and its committees (gender balance, nationalities, international expertise, etc.): the search for potential candidates and their vetting, the timing of renewals of terms of offi ce and, in particular, the procedure for selecting future directors;
- making proposals on the establishment and membership of the Board’s committees; - periodically evaluating the structure, size and membership of the Board of Directors and recommending any changes; - periodically reviewing the criteria applied by the Board to classify a director is independent; once a year, it examines
on a case-by-case basis the position of each director or candidate for directorship according to the criteria applied, and makes its proposals to the Board of Directors, particularly in view of the information to be disclosed in the Registration Document.
♦ Concerning the Chairman and Chief Executive Offi cer, the Chief Executive Offi cer or the Executive Vice President(s), as applicable: - considering, where necessary, and specifi cally upon the expiry of their term of offi ce, the re-election of the Chairman-
Chief Executive Offi cer, or of the Chairman and the Chief Executive Offi cer, and/or of the Executive Vice Presidents; - examining the succession plan of Corporate Executive Offi cers, particularly in the event of an unforeseen vacancy; - more generally, ensuring that the Chairman and Chief Executive Offi cer (or the Chief Executive Offi cer) keeps it
informed of the succession plan for the Executive Committee. ♦ Compensations:
♦ of the Corporate Executive Offi cers (Chairman and Chief Executive Offi cer and Executive Vice Presidents): - examining and making recommendations as regards the compensation thereof, concerning both (i) the variable and
fi xed components of said compensation and (ii) any benefi ts in kind, share subscription or purchase options received from any Group company, provisions regarding their pensions and any other benefi ts of any kind;
- verifying the application of these rules; - ensuring that the Company complies with its obligations in terms of transparency of compensation information and
in particular prepares an annual report on the activity of the Nomination and Compensation Committee to be included in the Annual Report, and ensuring that all information required by law and relating to compensation appears in the Annual Report.
♦ of the Chairman and Chief Executive Offi cer: - defi ning the rules under which the variable component is set, ensuring the consistency of these rules with the annual
evaluation of the performance of the Chairman and Chief Executive Offi cer and with the Company’s strategy and its creation of long-term value.
♦ of directors: - making recommendations to the Board of Directors as regards the rules for distributing directors’ fees and individual
payments to be made to the directors in this respect, taking account of the directors’ attendance at Board and committee meetings, in accordance with the internal rules of the Board;
- making recommendations to the Board of Directors as regards the overall amount of directors’ fees proposed to the Company’s General Meeting.
♦ share purchase and/or subscription option plans and/or any other form of compensation based on shares or index-linked or otherwise connected to shares: - providing the Board of Directors with an opinion on the general policy for granting share subscription and/or purchase
options, which should be reasonable and appropriate, and on the option plan(s) established by the Group’s general management, advising the Board of its recommendation as regards the allocation of share subscription or purchase options and explaining the reasoning behind its choice as well as the consequences thereof; predetermining the frequency of such allocations;
- examining any matter referred to it by the Chairman and Chief Executive Offi cer concerning the aforementioned points and any proposals relating to employee stock ownership.
♦ of the teams and the Executive Committee: - making inquiries and preparing recommendations so as to ensure consistency between the fi xed and variable
compensation of executive teams with the business strategy, and implementation of performance conditions.
- 2018 Registration Document62
Corporate governance report
4
Corporate governance
Work during 2017/2018
The Nomination and Compensation Committee met seven times. The attendance rate at each of committee meetings was 100%.In particular the committee addressed the following issues:
♦ Compensations: ♦ Corporate Executive Offi cers (Chairman and Chief Executive Offi cer and Executive Vice Presidents):
- review of the overall compensation structure; - defi nition of the general allocation policy (share purchase and/or subscription options and free shares) and proposal
of performance criteria in relation to resolutions to be submitted to a shareholder vote; - calculation of compensation for the 2018 fi nancial year (FY 2017/2018) and 2019 (FY 2018/2019); - assess whether the quantitative and/or qualitative criteria relating to the variable compensation of the Chairman and
Chief Executive Offi cer have been achieved for the 2017 fi nancial year (FY 2016/2017); - analysis of the compensation of the Chairman and Chief Executive Offi cer for fi nancial years 2018 (FY 2017/2018) and
2019 (FY 2018/2019): review of the fi xed component, defi nition of the target, quantitative (fi nancial) and/or qualitative (non-fi nancial) criteria and their weighting and fulfi llment conditions for the short-term variable component, defi nition of the LTI plan and performance conditions associated with it for the long-term variable component;
- validate the annual information included in the Registration Document relating to the compensation of Corporate Executive Offi cers, particularly the information relating to “say on pay” (FY 2016/2017) and the ex-post vote (FY 2017/2018);
- defi ne the compensation policy that is required to be submitted to an ex-ante shareholders’ vote (FY 2017/2018 and FY 2018/2019).
♦ Executive Committee and/or employees: - gain an overview of the teams and key people at Ubisoft; - ascertain whether the attendance and/or performance conditions for the long-term incentive plans for Group employees
have been achieved; - review and proposal of the implementation of the 28th, 29th and 30th resolutions of the General Meeting of September 22,
2017: (i) a share capital increase as part of the Group savings plan via a collective investment fund with a leverage formula and (ii) a share capital increase/stock appreciation rights ;
- analysis of the terms and conditions of the 2017 Ubisoft key people plan; - put forward resolutions relating to employee stock ownership.
♦ Other: - examination of the impact of legislative changes on the taxation of compensation and/or free share allocations or
share subscription options; - study of alternative arrangements to the free allocation of shares and/or preference shares; - study of the impact of the new performance management system on individual performance conditions associated
with free share allocation plans. ♦ Nominations:
♦ Review of the internal rules of the Board of Directors and of its committees in order to take into account the revised version of the AFEP- MEDEF Code of November 2016 as well as the changes that have been made to the organization and operating procedures of the Board of Directors and its committees.
♦ Defi nition of a recruitment procedure for new directors, examination of applications for the position of director. ♦ Proposal on the duration of the term of new directors so as to result in a staggered system of re-elections. ♦ Review and/or formalization of succession plans for the Executive Committee, the Chairman and Chief Executive Offi cer,
the Executive Vice Presidents and the lead director. ♦ Review of the independence criteria in accordance with the AFEP-MEDEF Code for each director concerned. ♦ Proposal relating to the director representing employees (Rebsamen Law): time allocation, training, directors’ fees. ♦ Refl ection on the implementation of the provisions of Article L. 225-23 of the French Commercial Code (Director
representing employee shareholders). ♦ Implementation by means of individual questionnaires of an annual assessment of the Board and its committees in
order to conduct a discussion on their operation. ♦ Monitoring the training of directors in offi ce and of the plan to add new members and analysis of applications. ♦ Revision of the status of independent director in the light of the circularization of attestations. ♦ Examination of the composition of committees of the Board of Directors and proposal for reorganization and/or
establishment of a new committee. ♦ Proposal of a new name for the steering committee (Chairman and Chief Executive Offi cer and the Executive Vice
Presidents). ♦ Review of the employees’ satisfaction survey.
2017/2018 attendance rate
100%
(1) Ms. Virginie Haas replaced Mr. Didier Crespel as a member of the Nomination and Compensation Committee effective April 1, 2018
- 2018 Registration Document 63
Corporate governance report4Corporate governance
4.1.3.5 Assessment of the work of the Board of Directors and the c ommittees
The internal rules of the Board provide that the Board of Directors must discuss its operation at least once a year in order to improve the effectiveness of its work and to arrange for a formalized assessment of its operation to be conducted at least once every three years by an external fi rm (the “External Assessment”).
In addition, in the years where no External Assessment is conducted, the Board of Directors carries out a formal evaluation of its operation and the operation of its committees under the aegis of the Nomination
and Compensation Committee, by means of a detailed questionnaire sent to each director (the “Internal Assessment”) which contributes to the annual discussion concerning the Board’s operation.
The last External Assessment was conducted in March 2017. The analysis of the responses was summarized in an assessment report presented by the Nomination and Compensation Committee to the entire Board of Directors.
An Internal Assessment was conducted for the 2018 fi nancial year by the Nomination and Compensation Committee. The responses have been reviewed by the Nomination and Compensation Committee and have enabled the committee to take stock of the actions that were implemented after the External Assessment.
The main conclusions of the Internal Assessment are as follows:
Overall assessment ♦ Proper operation of the Board and the committees ♦ Continual and regular development of governance
Progress made
♦ Succession plans for Corporate Executive Offi cers, the Executive Committee and the lead director
♦ Reorganization of the composition of committees
Areas for improvement
♦ Establishment of a CSR Committee ♦ Communication upstream for signifi cant M&A transactions ♦ Increase the frequency of independent directors’ meetings ♦ Further mobilize directors’ skills
❙ 4.1.4 OTHER INFORMATION
4.1.4.1 Additional information on corporate offi cers
DECLARATIONS RELATING TO THE CORPORATE OFFICERSTo the Company’s knowledge, based on the information provided by the members of the Board of Directors in response to the individual questionnaire sent to each director by the Nomination and Compensation Committee (the “Declaration”), no member of the Board of Directors has, over the past fi ve years:
♦ been convicted of fraud or received an offi cial reprimand and/or charges from statutory or regulatory authorities;
♦ been involved as a director in a bankruptcy, receivership or liquidation;
♦ been disqualifi ed by a court from serving as a member of an administrative, management or supervisory body of an issuer, or from participating in the management or conduct of the business of an issuer.
It is also evident from the Declaration completed by each director that:
♦ there are no arrangements or agreements with shareholders, customers, suppliers or other party whereby a member of the Board of Directors was appointed on that basis;
♦ there are no service agreements between members of the Board of Directors and the Company or any of its subsidiaries granting benefi ts under the terms of such agreement;
♦ regarding independent directors, no family ties between them and other members of the Board of Directors.
CONFLICTS OF INTERESTIn accordance with the internal rules of the Board of Directors, all Company directors must – whenever a confl ict of interest exists or could potentially arise between the corporate interests of the Company and their direct or indirect personal interests, or the interests of the shareholder or group of shareholders they represent – abstain from voting on the corresponding resolution. In addition, to minimize the risk of confl icts of interest and to allow the Board of Directors to provide shareholders and the markets with accurate information, each director is required to complete the above-mentioned Declaration, provided each year by the Nomination and Compensation Committee, and notify the Board of Directors in the event of a change, as soon as they become aware of any situation in which they have a confl ict of interest, potential or otherwise.
To the Company’s knowledge, and based on the Declaration completed by each director, there is currently no confl ict of interest between the duties of members of the Board of Directors and their private interests or other obligations.
Yves, Michel, Claude, Gérard and Christian Guillemot are brothers and serve on the General Management and/or the Board of Directors of their respective companies. The potential confl icts of interest that could exist are therefore essentially those resulting from agreements between the Company or its subsidiaries with one of the companies of Michel, Claude, Gérard and Christian Guillemot or their subsidiaries. Entering into such agreements would therefore be subject to the regulated agreements procedure that is required by Articles L. 225-38 et seq. of the French Commercial Code.
- 2018 Registration Document64
Corporate governance report
4
Corporate governance
INFORMATION ON SHAREHOLDINGSIn accordance with Article L. 225-37-4, 2° of the French Commercial Code, the corporate governance report must mention, except for normal business transactions entered into at arm’s length, agreements made directly or through an intermediary by, on the one hand, the Chief Executive Offi cer, an Executive Vice President, a director (“Corporate Offi cers”) or a shareholder with more than 10% of the voting rights of the Company (a “Shareholder”), and, on the other hand, a company in which the Company directly or indirectly owns more than half of the share capital.
The Company is not aware of the existence, for the fi nancial year ended March 31, 2018, of any such agreements having been entered into between the Corporate Offi cers or a Shareholder and any subsidiary whatsoever of the Ubisoft Group referred to in Article L. 225-37-4, 2° of the French Commercial Code.
With respect to the agreements and commitments subject to prior authorization in accordance with the provisions of Articles L. 225-38 et seq. of the French Commercial Code:
♦ the Board of Directors has noted, where appropriate, that there was no need for review or approval, in accordance with Article L. 225-40-1 of the French Commercial Code, of regulated agreements entered into during previous fi nancial years that are in effect during the fi nancial year ended March 31, 2018;
♦ the special report of the Statutory Auditors required by the provisions of Article L. 225-40 of the French Commercial Code identifi es the new agreements entered into during the past fi nancial year having received the Board of Directors’ prior approval.
LOANS AND GUARANTEES GRANTED TO MEMBERS OF THE BOARD OF DIRECTORSThe Company has not granted any loans or guarantees to any member of the Board of Directors.
4.1.4.2 Other information
FINANCIAL AUTHORIZATIONSA table summarizing the current valid delegations granted by the Shareholders’ General Meeting to the Board of Directors in the area of capital increases and showing how these delegations were used during the 2018 fi nancial year is set out in chapter 7, section 7.2.3 of this Registration Document.
RULES RELATING TO SHAREHOLDERS’ ATTENDANCE AT GENERAL MEETINGSAll shareholders have the right to attend General Meetings under legally prescribed conditions. Information on the access to, and attendance and voting at, General Meetings appears in Articles 7 and 13 of the Company’s Articles of Association. Details can be found in chapter, 7, section 7.1.2 of this Registration Document. This information is provided again in the notice of meeting and the convening notice published by the Company before any General Meeting.
INFORMATION LISTED IN ARTICLE L. 225-37-5 OF THE FRENCH COMMERCIAL CODEInformation concerning the factors likely to have an impact in the event of a public tender offer or public exchange offer are included, if applicable, in chapter 7, section 7.1.3 of this Registration Document.
PREVENTION OF INSIDER TRADINGThe internal rules defi ne the rules applicable to trading in the Company’s securities, in accordance with European and French regulations on insider trading and abstention obligations (in particular the regulation on Market Abuse, the French Monetary and Financial Code (Article L. 621-18-2) and AMF’s General Regulations (Articles 223-1 A et seq.)).
Permanent insiders (directors and persons discharging managerial responsibilities, treated as Corporate Executive Offi cers, and any person having permanent access to any inside information of the Company and designated as such by the Chairman and Chief Executive Offi cer) are subject to obligations of confi dentiality and abstention from carrying out transactions on Company securities when they hold inside information and during blackout periods:
♦ for the announcement of half-year (consolidated fi nancial statements) and annual (consolidated fi nancial statements) results: during a period of thirty calendar days before publication. As regards free shares (AGA ), the blackout period is extended by three trading days following the publication of the results;
♦ for the announcement of quarterly results (non-consolidated fi nancial statements): for a period of 15 calendar days prior to the publication of the results.
The provisional schedule of periods of abstention is sent to all permanent insiders for every current fi nancial year.
The Company keeps an updated list of permanent insiders. It sends everyone a code of ethics regarding trading, informing them of their status, their registration on the list of permanent insiders and their confi dentiality and abstention obligations under the applicable regulations. Each permanent insider is required to sign this code of ethics and to comply with it.
Furthermore, occasional insiders who have one-off access to inside information of the Company are subject to the same obligations of confi dentiality and abstention from carrying out transactions on Company securities when they have inside information and during the blackout periods referred to above. Where applicable, the Company keeps an updated list of occasional insiders. It sends everyone a code of ethics regarding trading, informing them of their status, their registration on the list of occasional insiders and their confi dentiality and abstention obligations under the applicable regulations. Each occasional insider is required to sign this code of ethics and to comply with it, until he/she no longer has the status of occasional insider.
In addition to the obligations of confi dentiality and abstention described above, the corporate offi cers of the Company (more specifi cally, directors and persons discharging managerial responsibilities, treated as Corporate Executive Offi cers) and persons closely related to them, are required to declare their transactions to the Company and to the AMF in accordance with the very strict procedures set out in the code of ethics for trading intended for permanent insiders and provided to them by the Company.
- 2018 Registration Document 65
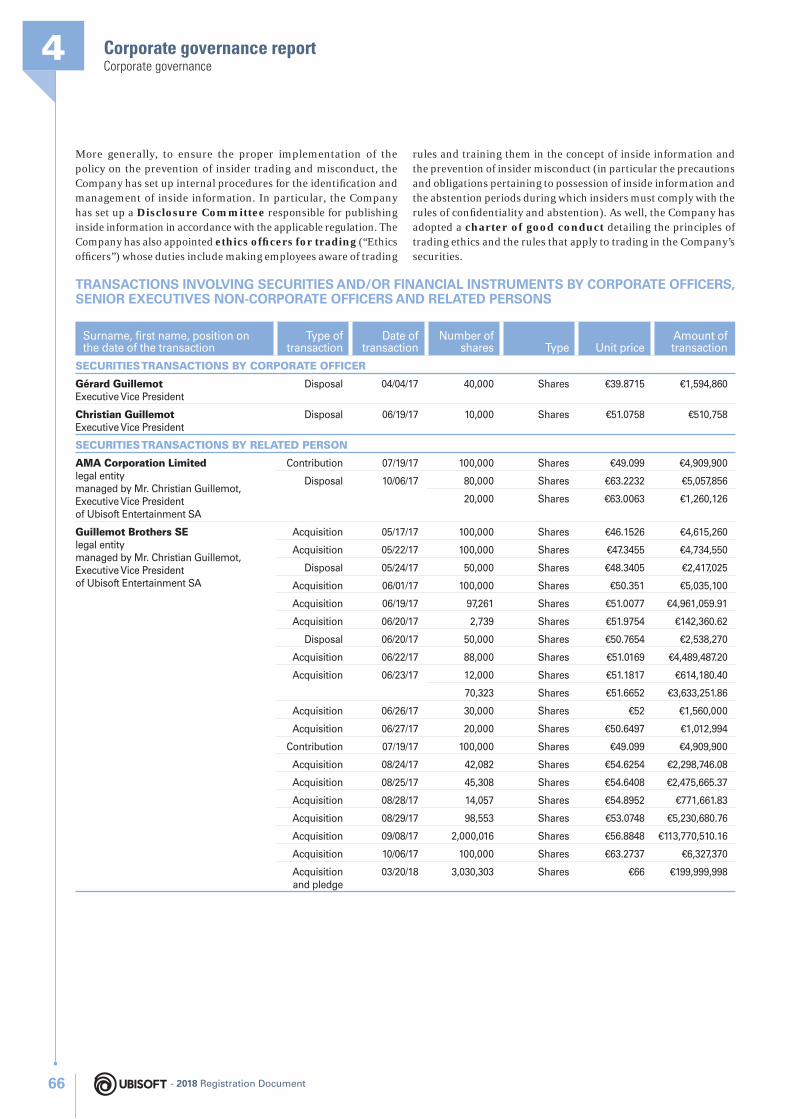
Corporate governance report4Corporate governance
More generally, to ensure the proper implementation of the policy on the prevention of insider trading and misconduct, the Company has set up internal procedures for the identifi cation and management of inside information. In particular, the Company has set up a Disclosure Committee responsible for publishing inside information in accordance with the applicable regulation. The Company has also appointed ethics offi cers for trading (“Ethics offi cers”) whose duties include making employees aware of trading
rules and training them in the concept of inside information and the prevention of insider misconduct (in particular the precautions and obligations pertaining to possession of inside information and the abstention periods during which insiders must comply with the rules of confi dentiality and abstention). As well, the Company has adopted a charter of good conduct detailing the principles of trading ethics and the rules that apply to trading in the Company’s securities.
TRANSACTIONS INVOLVING SECURITIES AND/OR FINANCIAL INSTRUMENTS BY CORPORATE OFFICERS, SENIOR EXECUTIVES NON-CORPORATE OFFICERS AND RELATED PERSONS
Surname, fi rst name, position on the date of the transaction
Type of transaction
Date of transaction
Number of shares Type Unit price
Amount of transaction
SECURITIES TRANSACTIONS BY CORPORATE OFFICER
Gérard GuillemotExecutive Vice President
Disposal 04/04/17 40,000 Shares €39.8715 €1,594,860
Christian GuillemotExecutive Vice President
Disposal 06/19/17 10,000 Shares €51.0758 €510,758
SECURITIES TRANSACTIONS BY RELATED PERSON
AMA Corporation Limitedlegal entitymanaged by Mr. Christian Guillemot,Executive Vice Presidentof Ubisoft Entertainment SA
Contribution 07/19/17 100,000 Shares €49. 099 €4,909,900
Disposal 10/06/17 80,000 Shares €63.2232 €5,057,856
20,000 Shares €63.0063 €1,260,126
Guillemot Brothers SElegal entitymanaged by Mr. Christian Guillemot,Executive Vice Presidentof Ubisoft Entertainment SA
Acquisition 05/17/17 100,000 Shares €46.1526 €4,615,260
Acquisition 05/22/17 100,000 Shares €47.3455 €4,734,550
Disposal 05/24/17 50,000 Shares €48.3405 €2,417,025
Acquisition 06/01/17 100,000 Shares €50.351 €5,035,100
Acquisition 06/19/17 97,261 Shares €51.0077 €4,961,059.91
Acquisition 06/20/17 2,739 Shares €51.9754 €142,360.62
Disposal 06/20/17 50,000 Shares €50.7654 €2,538,270
Acquisition 06/22/17 88,000 Shares €51.0169 €4,489,487.20
Acquisition 06/23/17 12,000 Shares €51.1817 €614,180.40
70,323 Shares €51.6652 €3,633,251.86
Acquisition 06/26/17 30,000 Shares €52 €1,560,000
Acquisition 06/27/17 20,000 Shares €50.6497 €1,012,994
Contribution 07/19/17 100,000 Shares €49.099 €4,909,900
Acquisition 08/24/17 42,082 Shares €54.6254 €2,298,746.08
Acquisition 08/25/17 45,308 Shares €54.6408 €2,475,665.37
Acquisition 08/28/17 14,057 Shares €54.8952 €771,661.83
Acquisition 08/29/17 98,553 Shares €53.0748 €5,230,680.76
Acquisition 09/08/17 2,000,016 Shares €56.8848 €113,770,510.16
Acquisition 10/06/17 100,000 Shares €63.2737 €6,327,370
Acquisition and pledge
03/20/18 3,030,303 Shares €66 €199,999,998
- 2018 Registration Document66
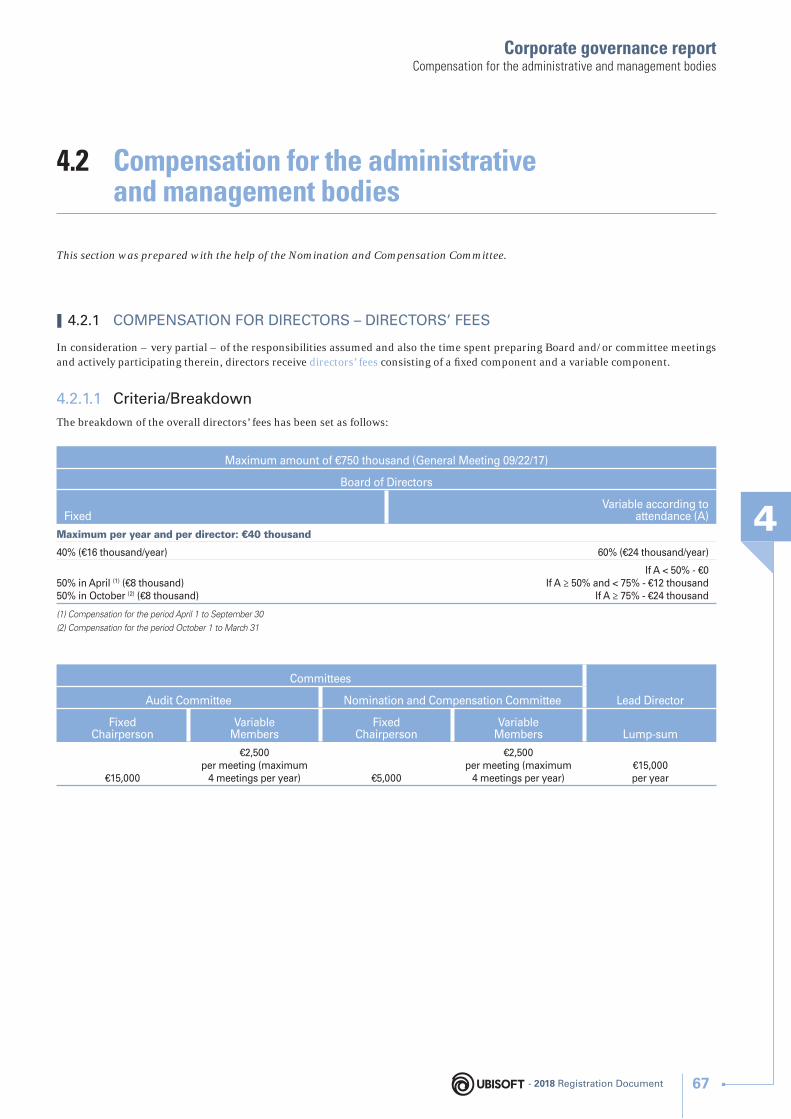
Corporate governance report
4
Compensation for the administrative and management bodies
4.2 Compensation for the administrative and management bodies
This section was prepared with the help of the Nomination and Compensation Committee.
❙ 4.2.1 COMPENSATION FOR DIRECTORS – DIRECTORS’ FEES
In consideration – very partial – of the responsibilities assumed and also the time spent preparing Board and/or committee meetings and actively participating therein, directors receive directors’ fees consisting of a fi xed component and a variable component.
4.2.1.1 Criteria/Breakdown
The breakdown of the overall directors’ fees has been set as follows:
Maximum amount of €750 thousand (General Meeting 09/22/17)
Board of Directors
FixedVariable according to
attendance (A)
Maximum per year and per director: €40 thousand
40% (€16 thousand/year) 60% (€24 thousand/year)
50% in April (1) (€8 thousand)50% in October (2) (€8 thousand)
If A < 50% - €0If A ≥ 50% and < 75% - €12 thousand
If A ≥ 75% - €24 thousand
(1) Compensation for the period April 1 to September 30
(2) Compensation for the period October 1 to March 31
Committees
Lead DirectorAudit Committee Nomination and Compensation Committee
FixedChairperson
VariableMembers
FixedChairperson
VariableMembers Lump-sum
€15,000
€2,500per meeting (maximum
4 meetings per year) €5,000
€2,500per meeting (maximum
4 meetings per year)€15,000per year
- 2018 Registration Document 67
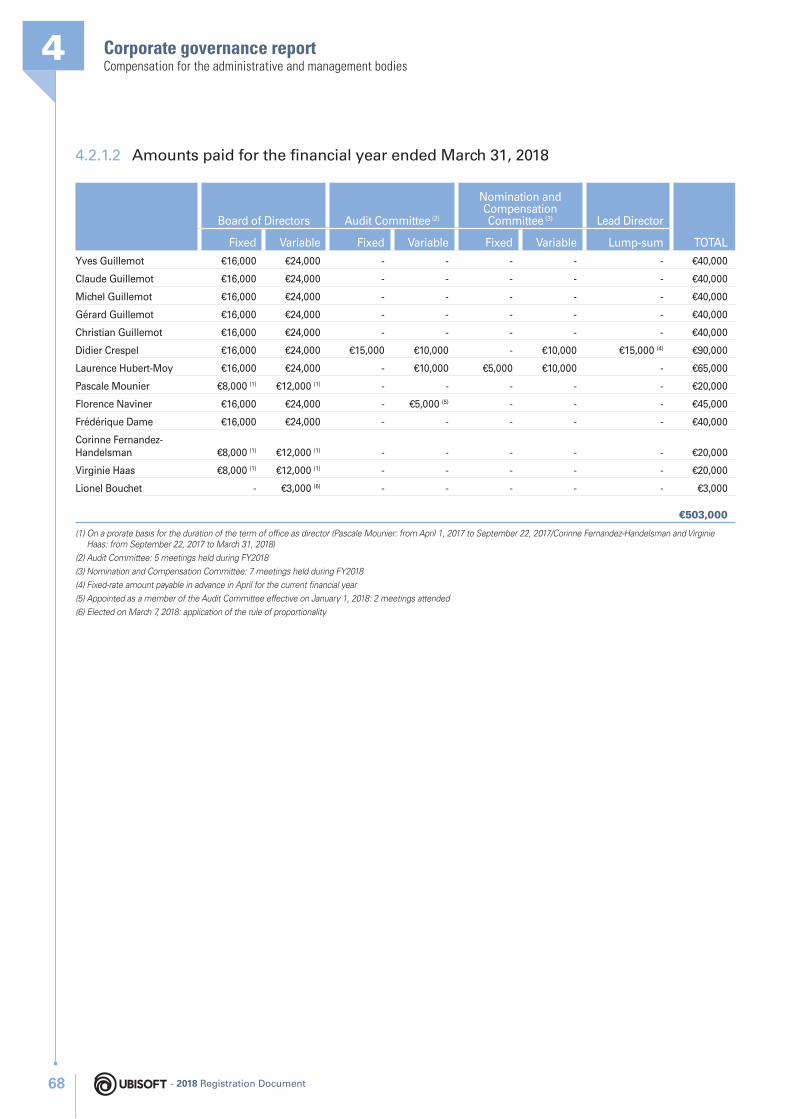
Corporate governance report4Compensation for the administrative and management bodies
4.2.1.2 Amounts paid for the fi nancial year ended March 31, 2018
Board of Directors Audit Committee (2)
Nomination and Compensation Committee (3) Lead Director
TOTALFixed Variable Fixed Variable Fixed Variable Lump-sum
Yves Guillemot €16,000 €24,000 - - - - - €40,000
Claude Guillemot €16,000 €24,000 - - - - - €40,000
Michel Guillemot €16,000 €24,000 - - - - - €40,000
Gérard Guillemot €16,000 €24,000 - - - - - €40,000
Christian Guillemot €16,000 €24,000 - - - - - €40,000
Didier Crespel €16,000 €24,000 €15,000 €10,000 - €10,000 €15,000 (4) €90,000
Laurence Hubert-Moy €16,000 €24,000 - €10,000 €5,000 €10,000 - €65,000
Pascale Mounier €8,000 (1) €12,000 (1) - - - - - €20,000
Florence Naviner €16,000 €24,000 - €5,000 (5) - - - €45,000
Frédérique Dame €16,000 €24,000 - - - - - €40,000
Corinne Fernandez-Handelsman €8,000 (1) €12,000 (1) - - - - - €20,000
Virginie Haas €8,000 (1) €12,000 (1) - - - - - €20,000
Lionel Bouchet - €3,000 (6) - - - - - €3,000
€503,000
(1) On a prorate basis for the duration of the term of offi ce as director (Pascale Mounier: from April 1, 2017 to September 22, 2017/Corinne Fernandez-Handelsman and Virginie Haas: from September 22, 2017 to March 31, 2018)
(2) Audit Committee: 5 meetings held during FY2018
(3) Nomination and Compensation Committee: 7 meetings held during FY2018
(4) Fixed-rate amount payable in advance in April for the current fi nancial year
(5) Appointed as a member of the Audit Committee effective on January 1, 2018: 2 meetings attended
(6) Elected on March 7, 2018: application of the rule of proportionality
- 2018 Registration Document68
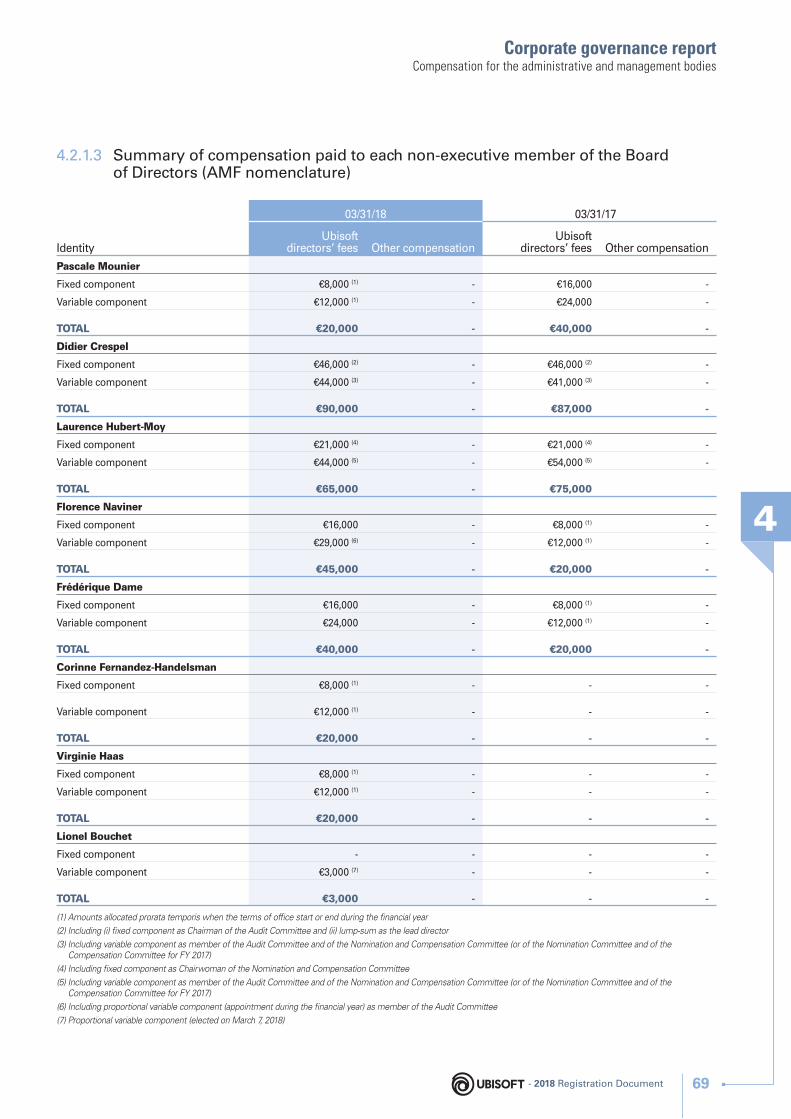
Corporate governance report
4
Compensation for the administrative and management bodies
4.2.1.3 Summary of compensation paid to each non-executive member of the Board of Directors (AMF nomenclature)
Identity
03/31/18 03/31/17
Ubisoft directors’ fees Other compensation
Ubisoft directors’ fees Other compensation
Pascale Mounier
Fixed component €8,000 (1) - €16,000 -
Variable component €12,000 (1) - €24,000 -
TOTAL €20,000 - €40,000 -
Didier Crespel
Fixed component €46,000 (2) - €46,000 (2) -
Variable component €44,000 (3) - €41,000 (3) -
TOTAL €90,000 - €87,000 -
Laurence Hubert-Moy
Fixed component €21,000 (4) - €21,000 (4) -
Variable component €44,000 (5) - €54,000 (5) -
TOTAL €65,000 - €75,000
Florence Naviner
Fixed component €16,000 - €8,000 (1) -
Variable component €29,000 (6) - €12,000 (1) -
TOTAL €45,000 - €20,000 -
Frédérique Dame
Fixed component €16,000 - €8,000 (1) -
Variable component €24,000 - €12,000 (1) -
TOTAL €40,000 - €20,000 -
Corinne Fernandez-Handelsman
Fixed component €8,000 (1) - - -
Variable component €12,000 (1) - - -
TOTAL €20,000 - - -
Virginie Haas
Fixed component €8,000 (1) - - -
Variable component €12,000 (1) - - -
TOTAL €20,000 - - -
Lionel Bouchet
Fixed component - - - -
Variable component €3,000 (7) - - -
TOTAL €3,000 - - -
(1) Amounts allocated prorata temporis when the terms of offi ce start or end during the fi nancial year
(2) Including (i) fi xed component as Chairman of the Audit Committee and (ii) lump-sum as the lead director
(3) Including variable component as member of the Audit Committee and of the Nomination and Compensation Committee (or of the Nomination Committee and of the Compensation Committee for FY 2017)
(4) Including fi xed component as Chairwoman of the Nomination and Compensation Committee
(5) Including variable component as member of the Audit Committee and of the Nomination and Compensation Committee (or of the Nomination Committee and of the Compensation Committee for FY 2017)
(6) Including proportional variable component (appointment during the fi nancial year) as member of the Audit Committee
(7) Proportional variable component (elected on March 7, 2018)
- 2018 Registration Document 69
Corporate governance report4Compensation for the administrative and management bodies
❙ 4.2.2 COMPENSATION OF C ORPORATE E XECUTIVE O FFICERS
Law no. 2016-1691 of December 9, 2016 (“Sapin II” law) stipulates that companies whose securities are listed on a regulated market must submit to the shareholders’ vote:
♦ at least once a year, since General Meetings held in 2017, the principles and criteria for determining, allocating and awarding the fi xed, variable and exceptional components of the total compensation and benefi ts in kind that may be awarded to the Chairman and Chief Executive Offi cer and to the Executive Vice Presidents in respect of their corporate offi ces (the “Ex Ante” vote);
♦ the fi xed, variable and exceptional components of the total compensation and benefi ts in kind paid or allocated in respect of the previous year by separate resolutions to the Chairman and Chief Executive Offi cer and the Executive Vice Presidents (the “Ex Post” vote) as from General Meetings held in 2018.
4.2.2.1 Principles of compensation for the Chairman and Chief Executive Offi cer and the Executive Vice Presidents (“Ex Ante” vote)
10th and 11th resolutions of the Combined General Meeting of June 27, 2018.
The Board of Directors that met on March 30 and May 17, 2018 approved, based on the recommendations of the Nomination and Compensation Committee, the principles of determination and the structure of the compensation of the Chairman and Chief Executive Offi cer and of the Executive Vice Presidents in respect of the fi nancial year ending March 31, 2019.
GENERAL PRINCIPLESThe Board of Directors refers to the principles of determination of the compensation of Corporate Executive Offi cers set out in the AFEP-MEDEF Code and, to guide its own deliberations, relies on studies and fi ndings by external experts that inform the Board and its Nomination and Compensation Committee on best market practices. The Board of Directors ensures that the compensation policy is aligned with the corporate interests of the Group and the interests of its shareholders and stakeholders. The performance conditions chosen for the annual and long-term variable compensation are aligned with the Group’s strategy.
PRINCIPLES REGARDING THE COMPENSATION OF THE CHAIRMAN AND CHIEF EXECUTIVE OFFICERPillars of the compensation policy for the Chairman and Chief Executive Offi cer
The compensation policy for the Chairman and Chief Executive Offi cer proposed by the Nomination and Compensation Committee and approved by the Board of Directors is based on the following pillars:
1. Reflect the strategic choices conducive to the Group’s growth
The Nomination and Compensation Committee ensures that there is a correlation between the compensation of the Chairman and Chief Executive Offi cer and the Group’s strategy. Thus, the major challenges to come are refl ected in the performance conditions of the variable compensation, for which the targets to achieve are aligned with the Group’s value creation objectives.
2. Be directly linked to the medium and long-term financial results
The structure of the total compensation for the Chairman and Chief Executive Offi cer is mainly based on the annual and long-term variable components. The payment of the variable components is subject to the achievement of precise, coherent and demanding performance conditions.
3. Ensure direct alignment with the interests of investors
In order to align the compensation of the Chairman and Chief Executive Offi cer with investors’ interests, part of the total compensation is linked to the Ubisoft Entertainment SA share price on Euronext Paris (the “Ubisoft S hare”), either via an allocation of shares in the form of performance shares (1) or share purchase/subscription options (2), or via multi-annual compensation indexed to the Ubisoft S hare price.
4. Guarantee the competitiveness of the total compensation compared to practices in companies with comparable performance to that of the Group
The Nomination and Compensation Committee ensures that the total compensation of the Chairman and Chief Executive Offi cer is competitive. To assess this competitiveness, compensation studies are regularly carried out based on a stable and coherent panel.
(1) Pursuant to the provisions of Articles L. 225-197-1 et seq. of the French Commercial Code and subject to approval by the shareholders’ General Meeting
(2) Pursuant to the provisions of Articles L. 225-177 et seq. of the French Commercial Code and subject to approval by the shareholders’ General Meeting
This panel comprises European (mainly French) companies, operating in sectors or industries where the economic, technological and competitive challenges are similar to those of the Group, as set out below:
ALTEN HAVAS JCDECAUX SAGE GROUP PLC/THE
EDENRED HERMES INTL. LOGITECH INTERNATIONAL SA TECHNICOLOR
COMPUTACENTER PLC ILIAD MERLIN ENTERTAINMENTS PLC TF1
DASSAULT SYSTEMES SE IPSEN METROPOLE TV UNITED INTERNET AG
GFK IPSOS NEOPOST WORLDLINE
- 2018 Registration Document70
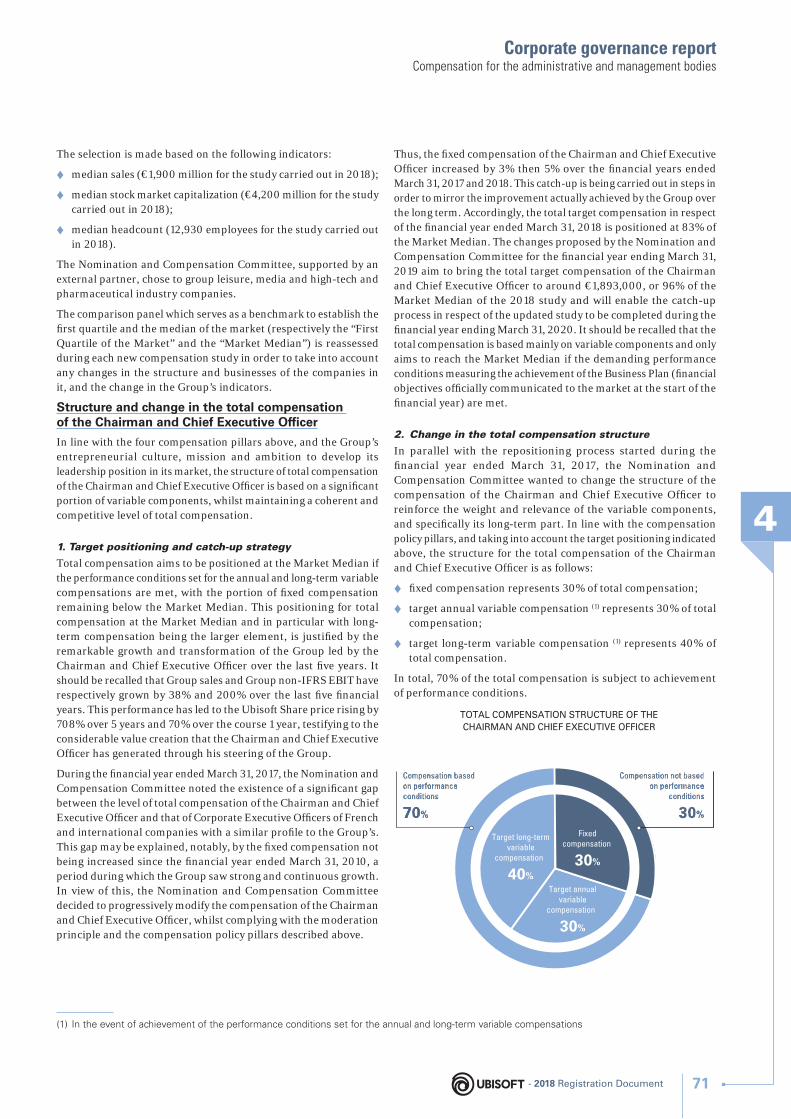
Corporate governance report
4
Compensation for the administrative and management bodies
The selection is made based on the following indicators:
♦ median sales (€1,900 million for the study carried out in 2018);
♦ median stock market capitalization (€4,200 million for the study carried out in 2018);
♦ median headcount (12,930 employees for the study carried out in 2018).
The Nomination and Compensation Committee, supported by an external partner, chose to group leisure, media and high-tech and pharmaceutical industry companies.
The comparison panel which serves as a benchmark to establish the fi rst quartile and the median of the market (respectively the “First Quartile of the Market” and the “Market Median”) is reassessed during each new compensation study in order to take into account any changes in the structure and businesses of the companies in it, and the change in the Group’s indicators.
Structure and change in the total compensation of the Chairman and Chief Executive Offi cer
In line with the four compensation pillars above, and the Group’s entrepreneurial culture, mission and ambition to develop its leadership position in its market, the structure of total compensation of the Chairman and Chief Executive Offi cer is based on a signifi cant portion of variable components, whilst maintaining a coherent and competitive level of total compensation.
1. Target positioning and catch-up strategy
Total compensation aims to be positioned at the Market Median if the performance conditions set for the annual and long-term variable compensations are met, with the portion of fi xed compensation remaining below the Market Median. This positioning for total compensation at the Market Median and in particular with long-term compensation being the larger element, is justifi ed by the remarkable growth and transformation of the Group led by the Chairman and Chief Executive Offi cer over the last fi ve years. It should be recalled that Group sales and Group non-IFRS EBIT have respectively grown by 38% and 200% over the last fi ve fi nancial years. This performance has led to the Ubisoft S hare price rising by 708% over 5 years and 70% over the course 1 year, testifying to the considerable value creation that the Chairman and Chief Executive Offi cer has generated through his steering of the Group.
During the fi nancial year ended March 31, 2017, the Nomination and Compensation Committee noted the existence of a signifi cant gap between the level of total compensation of the Chairman and Chief Executive Offi cer and that of Corporate Executive Offi cers of French and international companies with a similar profi le to the Group’s. This gap may be explained, notably, by the fi xed compensation not being increased since the fi nancial year ended March 31, 2010, a period during which the Group saw strong and continuous growth. In view of this, the Nomination and Compensation Committee decided to progressively modify the compensation of the Chairman and Chief Executive Offi cer, whilst complying with the moderation principle and the compensation policy pillars described above.
Thus, the fi xed compensation of the Chairman and Chief Executive Offi cer increased by 3% then 5% over the fi nancial years ended March 31, 2017 and 2018. This catch-up is being carried out in steps in order to mirror the improvement actually achieved by the Group over the long term. Accordingly, the total target compensation in respect of the fi nancial year ended March 31, 2018 is positioned at 83% of the Market Median. The changes proposed by the Nomination and Compensation Committee for the fi nancial year ending March 31, 2019 aim to bring the total target compensation of the Chairman and Chief Executive Offi cer to around €1,893,000, or 96% of the Market Median of the 2018 study and will enable the catch-up process in respect of the updated study to be completed during the fi nancial year ending March 31, 2020. It should be recalled that the total compensation is based mainly on variable components and only aims to reach the Market Median if the demanding performance conditions measuring the achievement of the Business Plan (fi nancial objectives offi cially communicated to the market at the start of the fi nancial year) are met.
2. Change in the total compensation structure
In parallel with the repositioning process started during the fi nancial year ended March 31, 2017, the Nomination and Compensation Committee wanted to change the structure of the compensation of the Chairman and Chief Executive Offi cer to reinforce the weight and relevance of the variable components, and specifi cally its long-term part. In line with the compensation policy pillars, and taking into account the target positioning indicated above, the structure for the total compensation of the Chairman and Chief Executive Offi cer is as follows:
♦ fi xed compensation represents 30% of total compensation;
♦ target annual variable compensation (1) represents 30% of total compensation;
♦ target long-term variable compensation (1) represents 40% of total compensation.
In total, 70% of the total compensation is subject to achievement of performance conditions.
TOTAL COMPENSATION STRUCTURE OF THECHAIRMAN AND CHIEF EXECUTIVE OFFICER
Fixedcompensation
30%
Target long-termvariable
compensation
40%Target annual
variablecompensation
30%
Compensation not basedon performance
conditions
30%
Compensation not basedCompensation not basedon performanceon performance
conditionsconditions
3030%%
Compensation basedon performanceconditions
70%
Compensation basedCompensation basedon performanceon performanceconditions conditions
7070%%
(1) In the event of achievement of the performance conditions set for the annual and long-term variable compensations
- 2018 Registration Document 71
Corporate governance report4Compensation for the administrative and management bodies
Summary of the structure
Components of fi xed compensation Components of compensation subject to performance conditions
Fixed compensation Annual variable compensation Long-term variable compensation
Based on level of responsibility and experience
Annual performance conditions (one quantitative criterion and one qualitative
criterion as a minimum)
Internal and external performance conditions over at least
3 fi nancial years and/or yearsVesting period: minimum 4 years
Cash CashUbisoft S hares (1) or cash (allocation value
indexed to the Ubisoft S hare price)
(1) Allocation of performance shares or share purchase options or share subscription options in application of current legal provisions and subject to approval of the corresponding resolutions by the shareholders’ General Meeting
Directors’ fees made up of a fi xed component (40%) and a variable component based on attendance rate at meetings (60%) may also be paid to the Chairman and Chief Executive Offi cer.
Fixed compensation
The Nomination and Compensation Committee takes into account the components of the compensation study and the Group’s results and ensures that the fi xed compensation is positioned between the First Quartile and the Market Median.
At April 1, 2018, the fi xed compensation of Mr. Yves Guillemot was set at €567,790 i.e. an increase of 5%. This increase was proposed by the Nomination and Compensation Committee as part of the catch-up process started during the fi nancial year ended March 31, 2017 in order to ensure the competitiveness of the fi xed compensation of Mr. Yves Guillemot compared to the fi xed compensation of Corporate Executive Offi cers of the companies comprising the comparison panel, and in line with the structure presented above. Thus, for the fi nancial year ended March 31, 2018, fi xed compensation is set at 74% of the Market Median.
The Group’s growth, combined with a context of strategic technological innovation and increased competition, leads to an increase in the Chairman and Chief Executive Offi cer’s responsibilities, which is refl ected in the fi xed compensation.
Annual variable compensation
Annual variable compensation is aligned with the Group’s economic performance. The quantitative criteria used are designed to refl ect each year the achievement of the annual Business Plan. The qualitative criteria(on) enrich(es) this view and enable(s) the achievement of the strategic choices required for the growth of Ubisoft Group to be taken into account.
The target value for annual variable compensation is 100% of the fi xed compensation (i.e. 30% of the total compensation), and the maximum is set at 150% of the fi xed compensation. For each criterion, if the achievement of the performance conditions is less than 80%, no annual variable compensation will be paid. The annual variable compensation follows a tiered increase up to the target, and then increases proportionally between the target and the maximum. The level of targets defi ned for each criterion is consistent with the Group’s objectives.
For the fi nancial year ended March 31, 2019, the following criteria were selected:
♦ non-IFRS Group EBIT, for 60%;
♦ Group N et Booking (1) Digital Sales, for 30%;
♦ increase in the number of players in certain strategic territories, for 10%.
On the proposal of the Nomination and Compensation Committee, it was decided that only one criterion relating to sales in value terms would be kept, and only the Group’s Net Booking Digital Sales would be retained, the latter being more of a value creator and representing a greater share of total revenues. Consequently, the “non-IFRS Group EBIT” criterion is henceforth assessed in absolute-value terms. These modifi cations enable the Group’s real value creation and profi tability to be taken into account.
Moreover, the Nomination and Compensation Committee decided to signifi cantly reinforce the requirement in relation to performance criteria, with payment of respectively 30% and 50% of the target amount upon reaching 1st and 2nd threshold, rather than the 80% previously paid.
(1) Corresponds to the prior sales standard
- 2018 Registration Document72
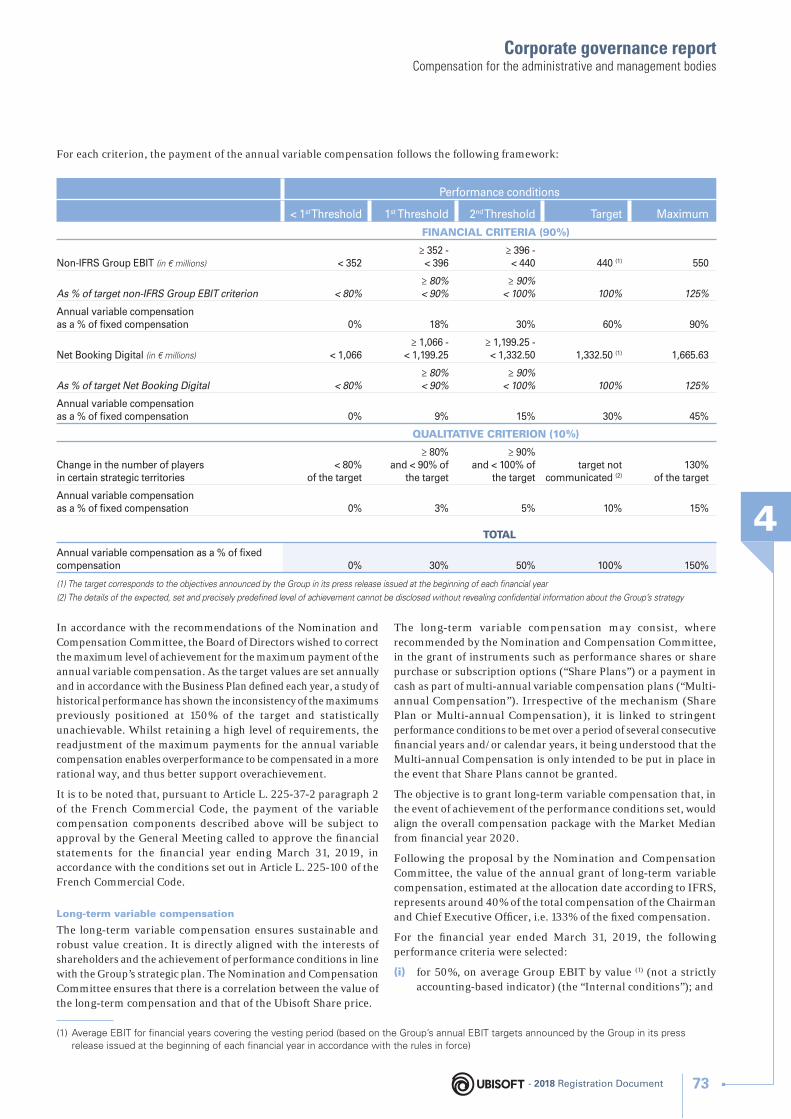
Corporate governance report
4
Compensation for the administrative and management bodies
For each criterion, the payment of the annual variable compensation follows the following framework:
Performance conditions
< 1st Threshold 1st Threshold 2nd Threshold Target Maximum
FINANCIAL CRITERIA (90%)
Non-IFRS Group EBIT (in € millions) < 352≥ 352 -
< 396≥ 396 -
< 440 440 (1) 550
As % of target non-IFRS Group EBIT criterion < 80%≥ 80%< 90%
≥ 90%< 100% 100% 125%
Annual variable compensation as a % of fi xed compensation 0% 18% 30% 60% 90%
Net Booking Digital (in € millions) < 1,066≥ 1,066 -
< 1,199.25≥ 1,199.25 -< 1, 332.50 1,332.50 (1) 1,665.63
As % of target Net Booking Digital < 80%≥ 80%< 90%
≥ 90%< 100% 100% 125%
Annual variable compensation as a % of fi xed compensation 0% 9% 15% 30% 45%
QUALITATIVE CRITERION (10%)
Change in the number of players in certain strategic territories
< 80% of the target
≥ 80%and < 90% of
the target
≥ 90%and < 100% of
the targettarget not
communicated (2)
130% of the target
Annual variable compensation as a % of fi xed compensation 0% 3% 5% 10% 15%
TOTAL
Annual variable compensation as a % of fi xed compensation 0% 30% 50% 100% 150%
(1) The target corresponds to the objectives announced by the Group in its press release issued at the beginning of each fi nancial year
(2) The details of the expected, set and precisely predefi ned level of achievement cannot be disclosed without revealing confi dential information about the Group’s strategy
In accordance with the recommendations of the Nomination and Compensation Committee, the Board of Directors wished to correct the maximum level of achievement for the maximum payment of the annual variable compensation. As the target values are set annually and in accordance with the Business Plan defi ned each year, a study of historical performance has shown the inconsistency of the maximums previously positioned at 150% of the target and statistically unachievable. Whilst retaining a high level of requirements, the readjustment of the maximum payments for the annual variable compensation enables overperformance to be compensated in a more rational way, and thus better support overachievement.
It is to be noted that, pursuant to Article L. 225-37-2 paragraph 2 of the French Commercial Code, the payment of the variable compensation components described above will be subject to approval by the General Meeting called to approve the fi nancial statements for the fi nancial year ending March 31, 2019, in accordance with the conditions set out in Article L. 225-100 of the French Commercial Code.
Long-term variable compensation
The long-term variable compensation ensures sustainable and robust value creation. It is directly aligned with the interests of shareholders and the achievement of performance conditions in line with the Group’s strategic plan. The Nomination and Compensation Committee ensures that there is a correlation between the value of the long-term compensation and that of the Ubisoft S hare price.
The long-term variable compensation may consist, where recommended by the Nomination and Compensation Committee, in the grant of instruments such as performance shares or share purchase or subscription options (“Share Plans”) or a payment in cash as part of multi-annual variable compensation plans (“Multi-annual Compensation”). Irrespective of the mechanism (Share Plan or Multi-annual Compensation), it is linked to stringent performance conditions to be met over a period of several consecutive fi nancial years and/or calendar years, it being understood that the Multi-annual Compensation is only intended to be put in place in the event that Share Plans cannot be granted.
The objective is to grant long-term variable compensation that, in the event of achievement of the performance conditions set, would align the overall compensation package with the Market Median from fi nancial year 2020.
Following the proposal by the Nomination and Compensation Committee, the value of the annual grant of long-term variable compensation, estimated at the allocation date according to IFRS, represents around 40% of the total compensation of the Chairman and Chief Executive Offi cer, i.e. 133% of the fi xed compensation.
For the fi nancial year ended March 31, 2019, the following performance criteria were selected:
(i) for 50%, on average Group EBIT by value (1) (not a strictly accounting-based indicator) (the “Internal conditions”); and
(1) Average EBIT for financial years covering the vesting period (based on the Group’s annual EBIT targets announced by the Group in its press release issued at the beginning of each financial year in accordance with the rules in force)
- 2018 Registration Document 73
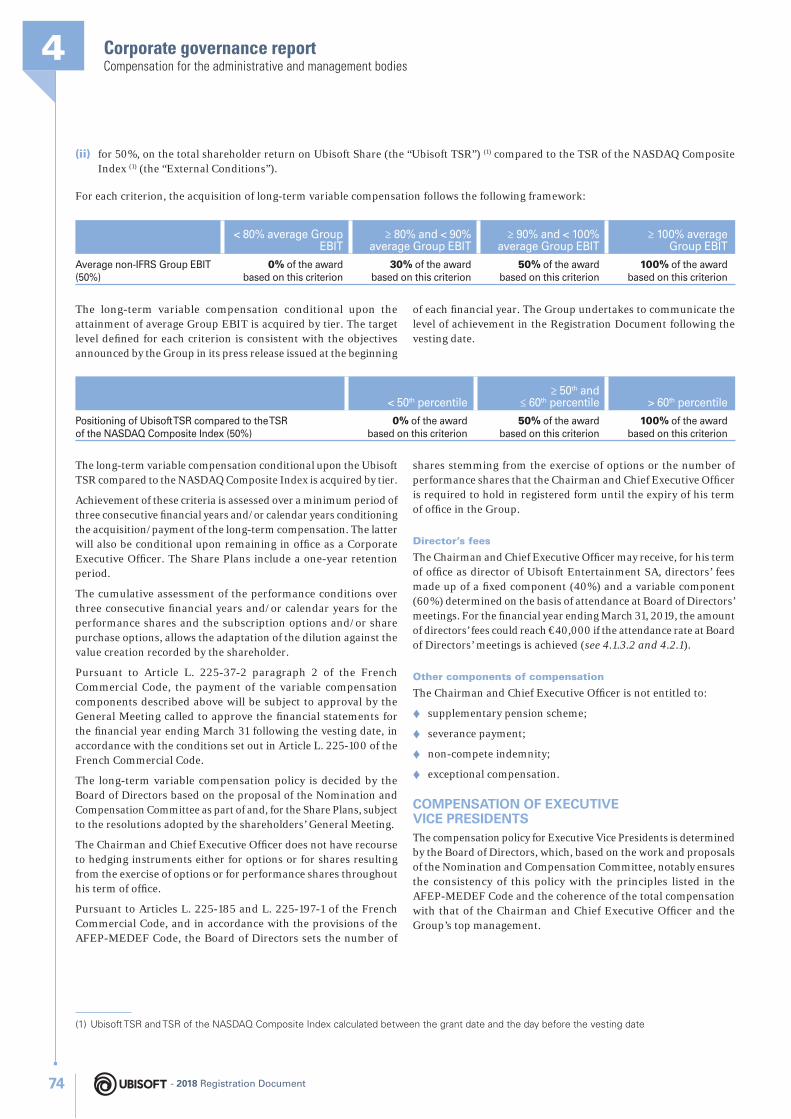
Corporate governance report4Compensation for the administrative and management bodies
(ii) for 50%, on the total shareholder return on Ubisoft Share (the “Ubisoft TSR”) (1 ) compared to the TSR of the NASDAQ Composite Index (1 ) (the “External Conditions”).
(1) Ubisoft TSR and TSR of the NASDAQ Composite Index calculated between the grant date and the day before the vesting date
For each criterion, the acquisition of long-term variable compensation follows the following framework:
< 80% average Group EBIT
≥ 80% and < 90% average Group EBIT
≥ 90% and < 100% average Group EBIT
≥ 100% average Group EBIT
Average non-IFRS Group EBIT (50%)
0% of the award based on this criterion
30% of the award based on this criterion
50% of the award based on this criterion
100% of the award based on this criterion
The long-term variable compensation conditional upon the attainment of average Group EBIT is acquired by tier. The target level defi ned for each criterion is consistent with the objectives announced by the Group in its press release issued at the beginning
of each fi nancial year. The Group undertakes to communicate the level of achievement in the Registration Document following the vesting date.
< 50th percentile≥ 50th and
≤ 60th percentile > 60th percentile
Positioning of Ubisoft TSR compared to the TSR of the NASDAQ Composite Index (50%)
0% of the award based on this criterion
50% of the award based on this criterion
100% of the award based on this criterion
The long-term variable compensation conditional upon the Ubisoft TSR compared to the NASDAQ Composite Index is acquired by tier.
Achievement of these criteria is assessed over a minimum period of three consecutive fi nancial years and/or calendar years conditioning the acquisition/payment of the long-term compensation. The latter will also be conditional upon remaining in offi ce as a Corporate Executive Offi cer. The Share Plans include a one-year retention period.
The cumulative assessment of the performance conditions over three consecutive fi nancial years and/or calendar years for the performance shares and the subscription options and/or share purchase options, allows the adaptation of the dilution against the value creation recorded by the shareholder.
Pursuant to Article L. 225-37-2 paragraph 2 of the French Commercial Code, the payment of the variable compensation components described above will be subject to approval by the General Meeting called to approve the fi nancial statements for the fi nancial year ending March 31 following the vesting date, in accordance with the conditions set out in Article L. 225-100 of the French Commercial Code.
The long-term variable compensation policy is decided by the Board of Directors based on the proposal of the Nomination and Compensation Committee as part of and, for the Share Plans, subject to the resolutions adopted by the shareholders’ General Meeting.
The Chairman and Chief Executive Offi cer does not have recourse to hedging instruments either for options or for shares resulting from the exercise of options or for performance shares throughout his term of offi ce.
Pursuant to Articles L. 225-185 and L. 225-197-1 of the French Commercial Code, and in accordance with the provisions of the AFEP-MEDEF Code, the Board of Directors sets the number of
shares stemming from the exercise of options or the number of performance shares that the Chairman and Chief Executive Offi cer is required to hold in registered form until the expiry of his term of offi ce in the Group.
Director’s fees
The Chairman and Chief Executive Offi cer may receive, for his term of offi ce as director of Ubisoft Entertainment SA, directors’ fees made up of a fi xed component (40%) and a variable component (60%) determined on the basis of attendance at Board of Directors’ meetings. For the fi nancial year ending March 31, 2019, the amount of directors’ fees could reach €40,000 if the attendance rate at Board of Directors’ meetings is achieved (see 4.1.3.2 and 4.2.1).
Other components of compensation
The Chairman and Chief Executive Offi cer is not entitled to:
♦ supplementary pension scheme;
♦ severance payment;
♦ non-compete indemnity;
♦ exceptional compensation.
COMPENSATION OF EXECUTIVE VICE PRESIDENTSThe compensation policy for Executive Vice Presidents is determined by the Board of Directors, which, based on the work and proposals of the Nomination and Compensation Committee, notably ensures the consistency of this policy with the principles listed in the AFEP-MEDEF Code and the coherence of the total compensation with that of the Chairman and Chief Executive Offi cer and the Group’s top management.
- 2018 Registration Document74
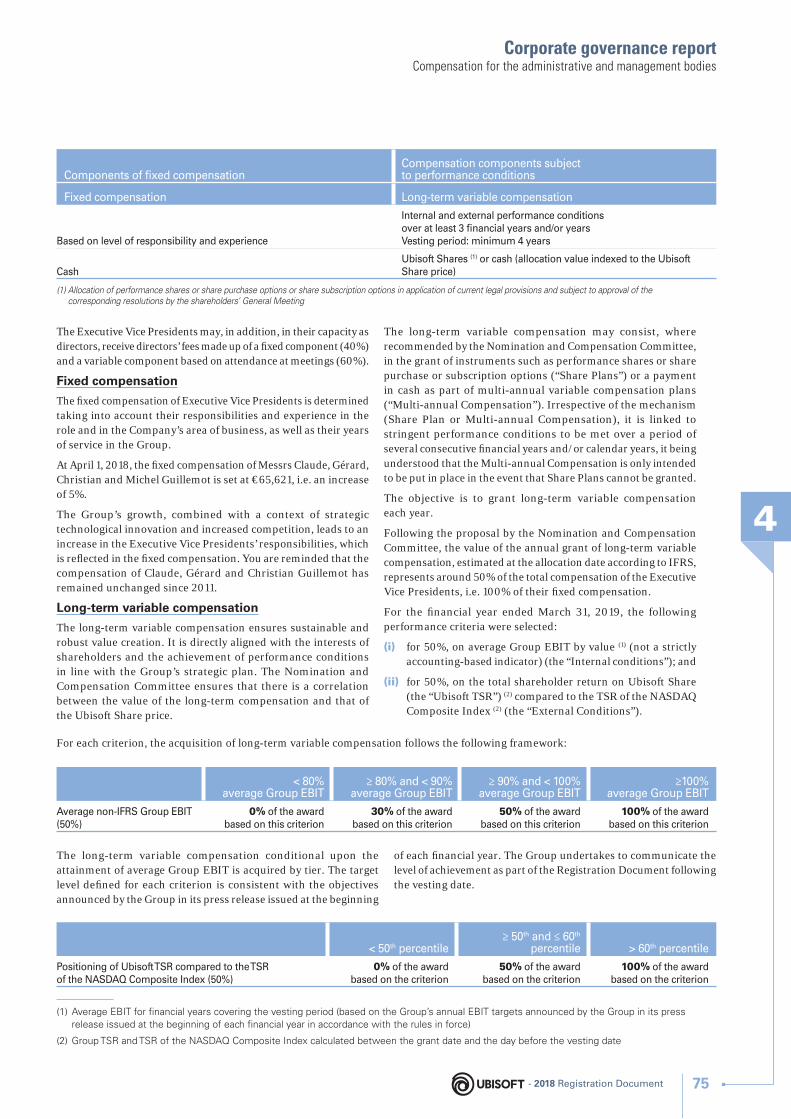
Corporate governance report
4
Compensation for the administrative and management bodies
Components of fi xed compensationCompensation components subject to performance conditions
Fixed compensation Long-term variable compensation
Based on level of responsibility and experience
Internal and external performance conditions over at least 3 fi nancial years and/or yearsVesting period: minimum 4 years
CashUbisoft S hares (1) or cash (allocation value indexed to the Ubisoft S hare price)
(1) Allocation of performance shares or share purchase options or share subscription options in application of current legal provisions and subject to approval of the corresponding resolutions by the shareholders’ General Meeting
The Executive Vice Presidents may, in addition, in their capacity as directors, receive directors’ fees made up of a fi xed component (40%) and a variable component based on attendance at meetings (60%).
Fixed compensation
The fi xed compensation of Executive Vice Presidents is determined taking into account their responsibilities and experience in the role and in the Company’s area of business, as well as their years of service in the Group.
At April 1, 2018, the fi xed compensation of Messrs Claude, Gérard, Christian and Michel Guillemot is set at €65,621, i.e. an increase of 5%.
The Group’s growth, combined with a context of strategic technological innovation and increased competition, leads to an increase in the Executive Vice Presidents’ responsibilities, which is refl ected in the fi xed compensation. You are reminded that the compensation of Claude, Gérard and Christian Guillemot has remained unchanged since 2011.
Long-term variable compensation
The long-term variable compensation ensures sustainable and robust value creation. It is directly aligned with the interests of shareholders and the achievement of performance conditions in line with the Group’s strategic plan. The Nomination and Compensation Committee ensures that there is a correlation between the value of the long-term compensation and that of the Ubisoft S hare price.
The long-term variable compensation may consist, where recommended by the Nomination and Compensation Committee, in the grant of instruments such as performance shares or share purchase or subscription options (“Share Plans”) or a payment in cash as part of multi-annual variable compensation plans (“Multi-annual Compensation”). Irrespective of the mechanism (Share Plan or Multi-annual Compensation), it is linked to stringent performance conditions to be met over a period of several consecutive fi nancial years and/or calendar years, it being understood that the Multi-annual Compensation is only intended to be put in place in the event that Share Plans cannot be granted.
The objective is to grant long-term variable compensation each year.
Following the proposal by the Nomination and Compensation Committee, the value of the annual grant of long-term variable compensation, estimated at the allocation date according to IFRS, represents around 50% of the total compensation of the Executive Vice Presidents, i.e. 100% of their fi xed compensation.
For the fi nancial year ended March 31, 2019, the following performance criteria were selected:
(i) for 50%, on average Group EBIT by value (1) (not a strictly accounting-based indicator) (the “Internal conditions”); and
(ii) for 50%, on the total shareholder return on Ubisoft Share (the “Ubisoft TSR”) (2) compared to the TSR of the NASDAQ Composite Index (2) (the “External Conditions”).
(1) Average EBIT for financial years covering the vesting period (based on the Group’s annual EBIT targets announced by the Group in its press release issued at the beginning of each financial year in accordance with the rules in force)
(2) Group TSR and TSR of the NASDAQ Composite Index calculated between the grant date and the day before the vesting date
For each criterion, the acquisition of long-term variable compensation follows the following framework:
< 80% average Group EBIT
≥ 80% and < 90% average Group EBIT
≥ 90% and < 100% average Group EBIT
≥100% average Group EBIT
Average non-IFRS Group EBIT (50%)
0% of the award based on this criterion
30% of the award based on this criterion
50% of the award based on this criterion
100% of the award based on this criterion
The long-term variable compensation conditional upon the attainment of average Group EBIT is acquired by tier. The target level defi ned for each criterion is consistent with the objectives announced by the Group in its press release issued at the beginning
of each fi nancial year. The Group undertakes to communicate the level of achievement as part of the Registration Document following the vesting date.
< 50th percentile≥ 50th and ≤ 60th
percentile > 60th percentile
Positioning of Ubisoft TSR compared to the TSR of the NASDAQ Composite Index (50%)
0% of the award based on the criterion
50% of the award based on the criterion
100% of the award based on the criterion
- 2018 Registration Document 75
Corporate governance report4Compensation for the administrative and management bodies
The long-term variable compensation conditional upon the Ubisoft TSR compared to the NASDAQ Composite Index is acquired by tier.
Achievement of these criteria is assessed over a minimum period of three consecutive fi nancial years and/or calendar years conditioning the acquisition/payment of the long-term compensation. The latter will also be conditional upon remaining in offi ce as a Corporate Executive Offi cer. The Share Plans include a one-year retention period.
The cumulative assessment of the performance conditions over three consecutive fi nancial years and/or calendar years for the performance shares and the subscription options and/or share purchase options, allows the adaptation of the dilution against the value creation recorded by the shareholder.
Pursuant to Article L. 225-37-2 paragraph 2 of the French Commercial Code, the payment of the variable compensation components described above will be subject to approval by the General Meeting called to approve the fi nancial statements for the fi nancial year ending March 31 following the vesting date, in accordance with the conditions set out in Article L. 225-100 of the French Commercial Code.
The long-term variable compensation policy is decided by the Board of Directors based on the proposal of the Nomination and Compensation Committee as part of and, for the Share Plans, subject to the resolutions adopted by the shareholders’ General Meeting.
The Executive Vice Presidents do not have recourse to hedging instruments either for options or for shares arising from the exercise of options or for performance shares throughout their term of offi ce.
Pursuant to Articles L. 225-185 and L. 225-197-1 of the French Commercial Code, and in accordance with the provisions of the AFEP-MEDEF Code, the Board of Directors sets the number of shares stemming from the exercise of options or the number of performance shares that the Executive Vice Presidents are required to hold in registered form until the expiry of their term of offi ce in the Group.
Director’s fees
The Executive Vice Presidents may receive, for their term of offi ce as directors of Ubisoft Entertainment SA, directors’ fees made up of a fi xed component (40%) and a variable component (60%) determined on the basis of attendance at Board of Directors’ meetings. For the fi nancial year ending March 31, 2019, the amount of directors’ fees could reach €40,000 for each Executive Vice President if the attendance rate at Board of Directors’ meetings is achieved (see 4.1.3.2 and 4.2.1).
Other components of compensation
The Executive Vice Presidents are not entitled to:
♦ annual variable compensation;
♦ supplementary pension scheme;
♦ severance payment;
♦ non-compete indemnity;
♦ exceptional compensation.
4.2.2.2 Compensation of the Chairman and Chief Executive Offi cer and of the Executive Vice Presidents due or payable in respect of the fi nancial year ended March 31, 2018
COMPENSATION OF THE CHAIRMAN AND CHIEF EXECUTIVE OFFICERBreakdown of compensation of the Chairman and Chief Executive Offi cer for the fi nancial year ended March 31, 2018
The compensation of Mr. Yves Guillemot, Chairman and Chief Executive Offi cer, for the fi nancial year ended March 31, 2018, comprises the following components:
Fixed compensation
The fi xed compensation of the Chairman and Chief Executive Offi cer amounts to €540,750, representing a 5% increase year-on-year.
This increase is primarily based on the rationale of bringing Mr. Yves Guillemot’s fi xed compensation in line with that offered by groups of a similar size.
The Group’s growth also generates greater responsibilities on the part of the Chairman and Chief Executive Offi cer, which is in turn refl ected in his fi xed compensation.
The Nomination and Compensation Committee also referred to the study carried out by Willis Towers Watson in January 2017. This study shows the gap between Mr. Yves Guillemot’s fi xed compensation and that offered by companies in the selected panel. This observation, identifi ed last year, prompted the Nomination and Compensation Committee to undertake efforts to close that gap during the fi nancial year ended March 31, 2017. The gradual closure of the gap continued this year, with the ongoing aim of raising the fi xed compensation of the Chairman and Chief Executive Offi cer to a level that is competitive and consistent with the Group’s economic and stock market performance. With the increase applied during the year ended March 31, 2018, the fi xed compensation of Mr. Yves Guillemot is now in the F irst Q uartile of the M arket.
Annual variable compensation
The target for annual variable compensation corresponds to 100% of fi xed compensation with a maximum corresponding to 150% of fi xed compensation. It is based on three quantitative criteria and one qualitative criterion.
♦ Quantitative criteria: 90% of fi xed compensation in the event that the performance conditions are attained, and a maximum 135% of fi xed compensation, increasing proportionately between the minimum threshold and the target, then between the target and the maximum.
- 2018 Registration Document76
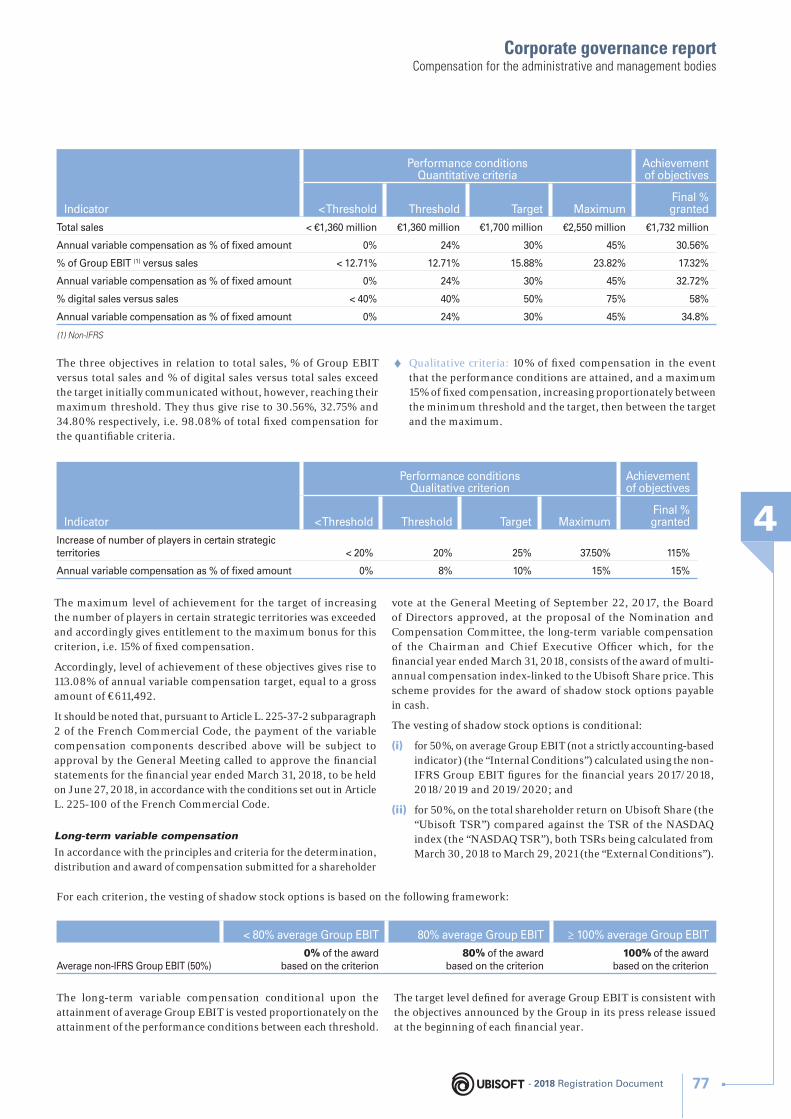
Corporate governance report
4
Compensation for the administrative and management bodies
Indicator
Performance conditionsQuantitative criteria
Achievement of objectives
< Threshold Threshold Target MaximumFinal % granted
Total sales < €1,360 million €1,360 million €1,700 million €2,550 million €1,732 million
Annual variable compensation as % of fi xed amount 0% 24% 30% 45% 30.56%
% of Group EBIT (1) versus sales < 12.71% 12.71% 15.88% 23.82% 17.32%
Annual variable compensation as % of fi xed amount 0% 24% 30% 45% 32.72%
% digital sales versus sales < 40% 40% 50% 75% 58%
Annual variable compensation as % of fi xed amount 0% 24% 30% 45% 34.8%
(1) Non-IFRS
The three objectives in relation to total sales, % of Group EBIT versus total sales and % of digital sales versus total sales exceed the target initially communicated without, however, reaching their maximum threshold. They thus give rise to 30.56%, 32.75% and 34.80 % respectively, i.e. 98.08% of total fi xed compensation for the quantifi able criteria.
♦ Qualitative criteria: 10% of fi xed compensation in the event that the performance conditions are attained, and a maximum 15% of fi xed compensation, increasing proportionately between the minimum threshold and the target, then between the target and the maximum.
Indicator
Performance conditionsQualitative criterion
Achievement of objectives
< Threshold Threshold Target MaximumFinal % granted
Increase of number of players in certain strategic territories < 20% 20% 25% 37.50% 115%
Annual variable compensation as % of fi xed amount 0% 8% 10% 15% 15%
The maximum level of achievement for the target of increasing the number of players in certain strategic territories was exceeded and accordingly gives entitlement to the maximum bonus for this criterion, i.e. 15% of fi xed compensation.
Accordingly, level of achievement of these objectives gives rise to 113.08% of annual variable compensation target, equal to a gross amount of €611,492.
It should be noted that, pursuant to Article L. 225-37-2 subparagraph 2 of the French Commercial Code, the payment of the variable compensation components described above will be subject to approval by the General Meeting called to approve the fi nancial statements for the fi nancial year ended March 31, 2018, to be held on June 27, 2018, in accordance with the conditions set out in Article L. 225-100 of the French Commercial Code.
Long-term variable compensation
In accordance with the principles and criteria for the determination, distribution and award of compensation submitted for a shareholder
vote at the General Meeting of September 22, 2017, the Board of Directors approved, at the proposal of the Nomination and Compensation Committee, the long-term variable compensation of the Chairman and Chief Executive Offi cer which, for the fi nancial year ended March 31, 2018, consists of the award of multi-annual compensation index-linked to the Ubisoft S hare price. This scheme provides for the award of shadow stock options payable in cash.
The vesting of shadow stock options is conditional:
(i) for 50%, on average Group EBIT (not a strictly accounting-based indicator) (the “Internal Conditions”) calculated using the non-IFRS Group EBIT fi gures for the fi nancial years 2017/2018, 2018/2019 and 2019/2020; and
(ii) for 50%, on the total shareholder return on Ubisoft Share (the “Ubisoft TSR”) compared against the TSR of the NASDAQ index (the “NASDAQ TSR”), both TSRs being calculated from March 30, 2018 to March 29, 2021 (the “External Conditions”).
For each criterion, the vesting of shadow stock options is based on the following framework:
< 80% average Group EBIT 80% average Group EBIT ≥ 100% average Group EBIT
Average non-IFRS Group EBIT (50%)0% of the award
based on the criterion80% of the award
based on the criterion100% of the award
based on the criterion
The long-term variable compensation conditional upon the attainment of average Group EBIT is vested proportionately on the attainment of the performance conditions between each threshold.
The target level defi ned for average Group EBIT is consistent with the objectives announced by the Group in its press release issued at the beginning of each fi nancial year.
- 2018 Registration Document 77
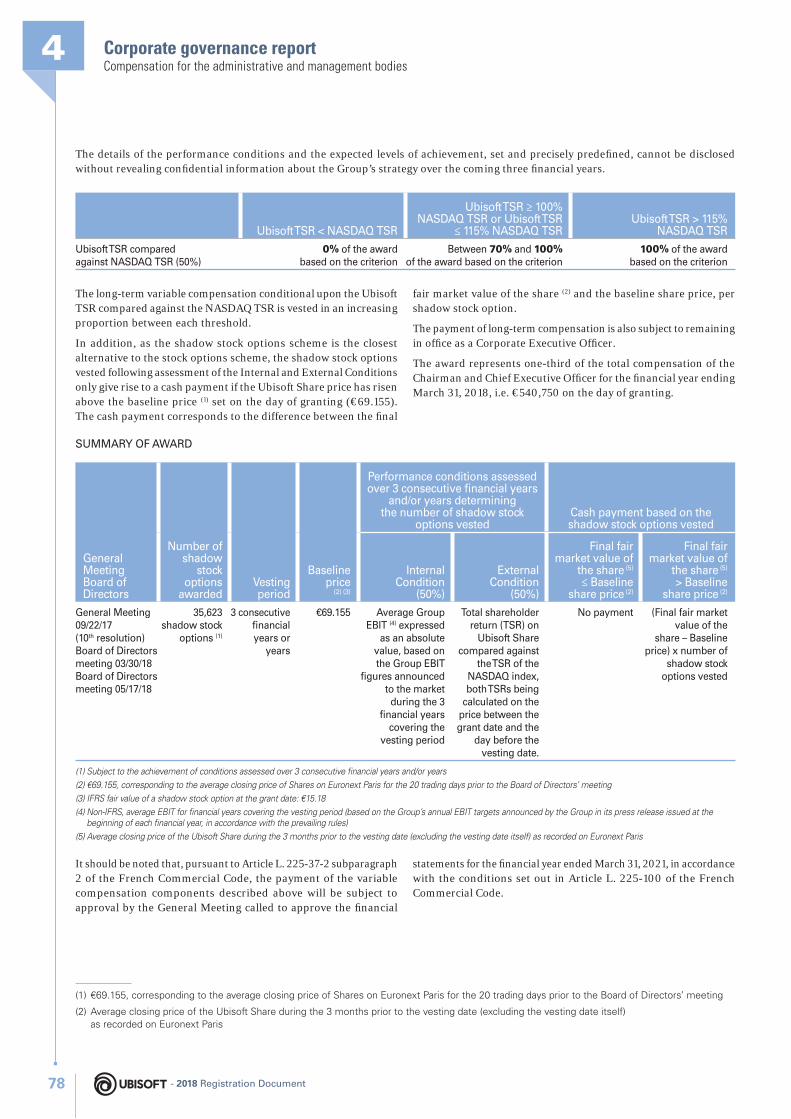
Corporate governance report4Compensation for the administrative and management bodies
The details of the performance conditions and the expected levels of achievement, set and precisely predefi ned, cannot be disclosed without revealing confi dential information about the Group’s strategy over the coming three fi nancial years.
Ubisoft TSR < NASDAQ TSR
Ubisoft TSR ≥ 100% NASDAQ TSR or Ubisoft TSR
≤ 115% NASDAQ TSRUbisoft TSR > 115%
NASDAQ TSR
Ubisoft TSR compared against NASDAQ TSR (50%)
0% of the award based on the criterion
Between 70% and 100% of the award based on the criterion
100% of the award based on the criterion
The long-term variable compensation conditional upon the Ubisoft TSR compared against the NASDAQ TSR is vested in an increasing proportion between each threshold.
In addition, as the shadow stock options scheme is the closest alternative to the stock options scheme, the shadow stock options vested following assessment of the Internal and External Conditions only give rise to a cash payment if the Ubisoft S hare price has risen above the baseline price (1) set on the day of granting (€69.155). The cash payment corresponds to the difference between the fi nal
fair market value of the share (2) and the baseline share price, per shadow stock option.
The payment of long-term compensation is also subject to remaining in offi ce as a Corporate Executive Offi cer.
The award represents one-third of the total compensation of the Chairman and Chief Executive Offi cer for the fi nancial year ending March 31, 2018, i.e. €540,750 on the day of granting.
(1) €69. 155, corresponding to the average closing price of S hares on Euronext Paris for the 20 trading days prior to the Board of Directors’ meeting
(2) Average closing price of the Ubisoft S hare during the 3 months prior to the vesting date (excluding the vesting date itself) as recorded on Euronext Paris
SUMMARY OF AWARD
General MeetingBoard of Directors
Number of shadow
stock options
awardedVesting period
Baseline price
(2) (3)
Performance conditions assessed over 3 consecutive fi nancial years
and/or years determining the number of shadow stock
options vestedCash payment based on the shadow stock options vested
Internal Condition
(50%)
External Condition
(50%)
Final fair market value of
the share (5) ≤ Baseline
share price (2)
Final fair market value of
the share (5) > Baseline
share price (2)
General Meeting 09/22/17(10th resolution)Board of Directors meeting 03/30/18Board of Directors meeting 05/17/18
35,623shadow stock
options (1)
3 consecutive fi nancialyears or
years
€69. 155 Average Group EBIT (4) expressed
as an absolute value, based on the Group EBIT
fi gures announced to the market
during the 3 fi nancial years
covering the vesting period
Total shareholder return (TSR) on
Ubisoft Share compared against
the TSR of the NASDAQ index, both TSRs being
calculated on the price between the grant date and the
day before the vesting date.
No payment (Final fair market value of the
share – Baseline price) x number of
shadow stock options vested
(1) Subject to the achievement of conditions assessed over 3 consecutive fi nancial years and/or years
(2) €69.155, corresponding to the average closing price of S hares on Euronext Paris for the 20 trading days prior to the Board of Directors’ meeting
(3) IFRS fair value of a shadow stock option at the grant date: €15.18
(4) Non-IFRS, average EBIT for fi nancial years covering the vesting period (based on the Group’s annual EBIT targets announced by the Group in its press release issued at the beginning of each fi nancial year, in accordance with the prevailing rules)
(5) Average closing price of the Ubisoft S hare during the 3 months prior to the vesting date (excluding the vesting date itself) as recorded on Euronext Paris
It should be noted that, pursuant to Article L. 225-37-2 subparagraph 2 of the French Commercial Code, the payment of the variable compensation components described above will be subject to approval by the General Meeting called to approve the fi nancial
statements for the fi nancial year ended March 31, 2021, in accordance with the conditions set out in Article L. 225-100 of the French Commercial Code.
- 2018 Registration Document78
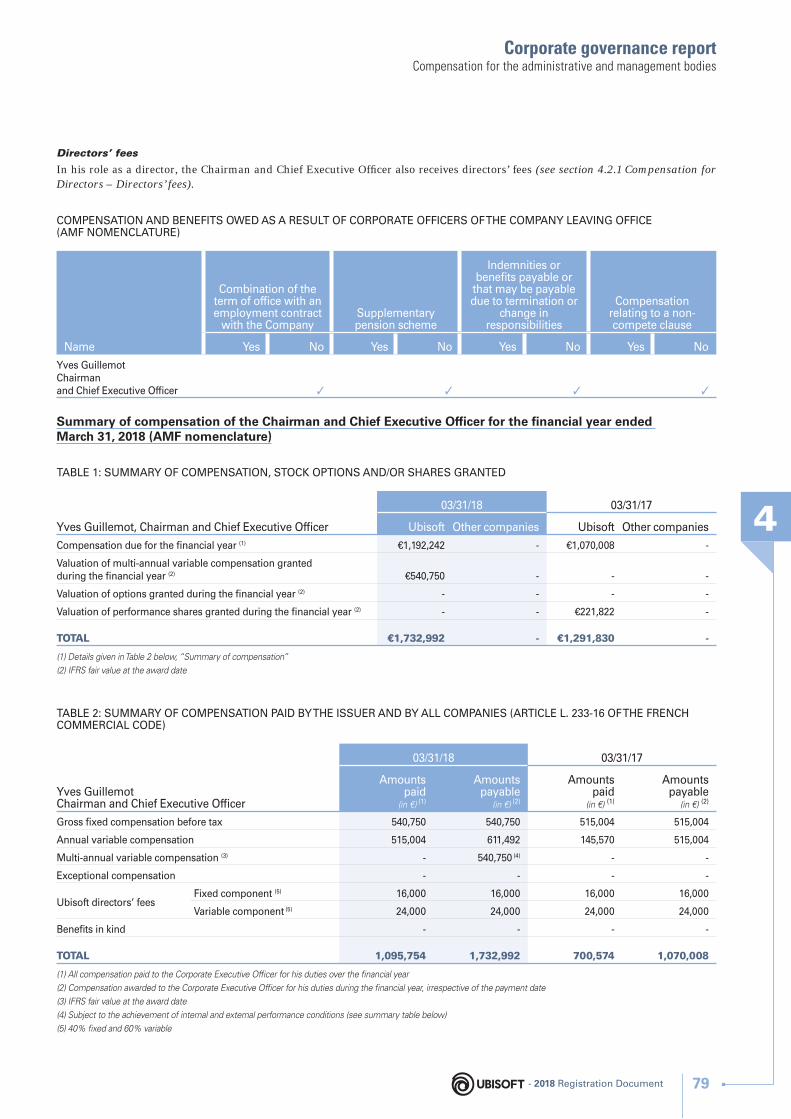
Corporate governance report
4
Compensation for the administrative and management bodies
Directors’ fees
In his role as a director, the Chairman and Chief Executive Offi cer also receives directors’ fees (see section 4.2.1 Compensation for Directors – Directors’ fees).
COMPENSATION AND BENEFITS OWED AS A RESULT OF CORPORATE OFFICERS OF THE COMPANY LEAVING OFFICE (AMF NOMENCLATURE)
Name
Combination of the term of offi ce with an employment contract
with the CompanySupplementary pension scheme
Indemnities or benefi ts payable or
that may be payable due to termination or
change in responsibilities
Compensation relating to a non-compete clause
Yes No Yes No Yes No Yes No
Yves GuillemotChairman and Chief Executive Offi cer ✓ ✓ ✓ ✓
Summary of compensation of the Chairman and Chief Executive Offi cer for the fi nancial year ended March 31, 2018 (AMF nomenclature)
TABLE 1: SUMMARY OF COMPENSATION, STOCK OPTIONS AND/OR SHARES GRANTED
Yves Guillemot, Chairman and Chief Executive Offi cer
03/31/18 03/31/17
Ubisoft Other companies Ubisoft Other companies
Compensation due for the fi nancial year (1) €1,192,242 - €1,070,008 -
Valuation of multi-annual variable compensation granted during the fi nancial year (2) €540,750 - - -
Valuation of options granted during the fi nancial year (2) - - - -
Valuation of performance shares granted during the fi nancial year (2) - - €221,822 -
TOTAL €1,732,992 - €1,291,830 -
(1) Details given in Table 2 below, “Summary of compensation”
(2) IFRS fair value at the award date
TABLE 2: SUMMARY OF COMPENSATION PAID BY THE ISSUER AND BY ALL COMPANIES (ARTICLE L. 233-16 OF THE FRENCH COMMERCIAL CODE)
Yves GuillemotChairman and Chief Executive Offi cer
03/31/18 03/31/17
Amounts paid
(in €) (1)
Amounts payable
(in €) (2)
Amounts paid
(in €) (1)
Amounts payable
(in €) (2)
Gross fi xed compensation before tax 540,750 540,750 515,004 515,004
Annual variable compensation 515,004 611,492 145,570 515,004
Multi-annual variable compensation (3) - 540,750 (4) - -
Exceptional compensation - - - -
Ubisoft directors’ feesFixed component (5) 16,000 16,000 16,000 16,000
Variable component (5) 24,000 24,000 24,000 24,000
Benefi ts in kind - - - -
TOTAL 1,095,754 1,732,992 700,574 1,070,008
(1) All compensation paid to the Corporate Executive Offi cer for his duties over the fi nancial year
(2) Compensation awarded to the Corporate Executive Offi cer for his duties during the fi nancial year, irrespective of the payment date
(3) IFRS fair value at the award date
(4) Subject to the achievement of internal and external performance conditions (see summary table below)
(5) 40% fi xed and 60% variable
- 2018 Registration Document 79
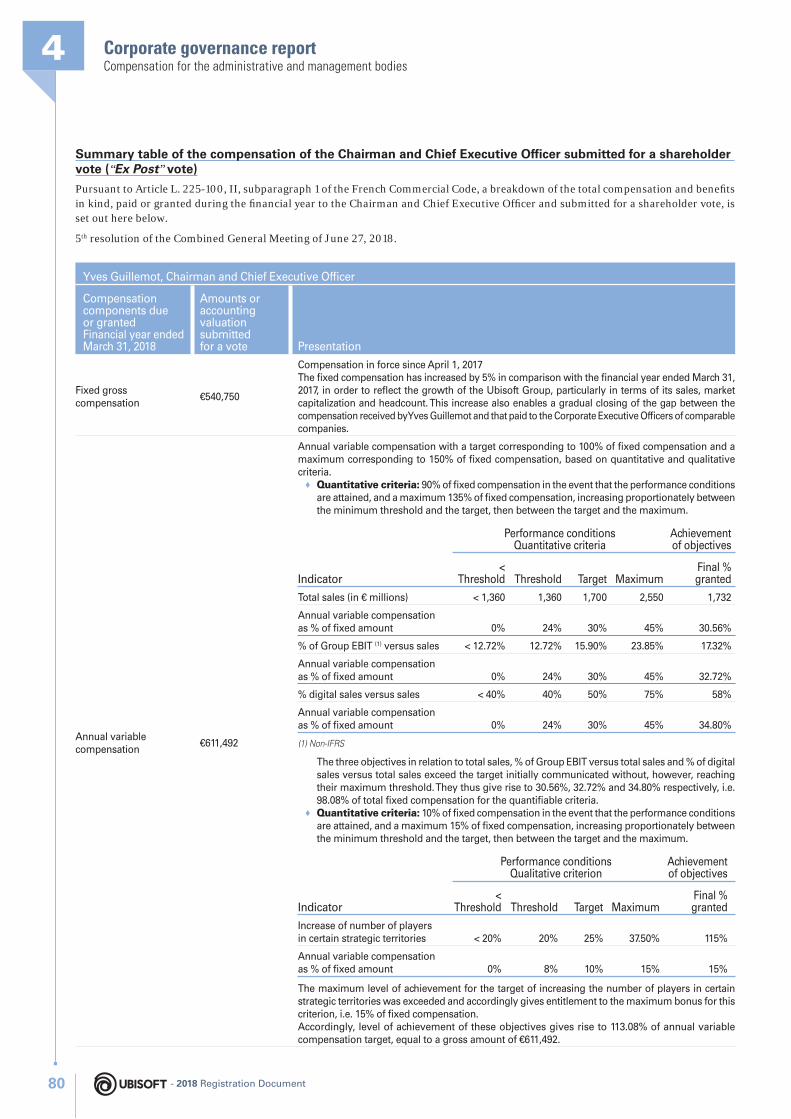
Corporate governance report4Compensation for the administrative and management bodies
Summary table of the compensation of the Chairman and Chief Executive Offi cer submitted for a shareholder vote (“Ex Post” vote)
Pursuant to Article L. 225-100, II, subparagraph 1 of the French Commercial Code, a breakdown of the total compensation and benefi ts in kind, paid or granted during the fi nancial year to the Chairman and Chief Executive Offi cer and submitted for a shareholder vote, is set out here below.
5th resolution of the Combined General Meeting of June 27, 2018.
Yves Guillemot, Chairman and Chief Executive Offi cer
Compensation components due or granted Financial year ended March 31, 2018
Amounts or accounting valuation submitted for a vote Presentation
Fixed gross compensation
€540,750
Compensation in force since April 1, 2017The fi xed compensation has increased by 5% in comparison with the fi nancial year ended March 31, 2017, in order to refl ect the growth of the Ubisoft Group, particularly in terms of its sales, market capitalization and headcount. This increase also enables a gradual closing of the gap between the compensation received by Yves Guillemot and that paid to the Corporate Executive Offi cers of comparable companies.
Annual variable compensation
€611,492
Annual variable compensation with a target corresponding to 100% of fi xed compensation and a maximum corresponding to 150% of fi xed compensation, based on quantitative and qualitative criteria.
♦ Quantitative criteria: 90% of fi xed compensation in the event that the performance conditions are attained, and a maximum 135% of fi xed compensation, increasing proportionately between the minimum threshold and the target, then between the target and the maximum.
Indicator
Performance conditionsQuantitative criteria
Achievement of objectives
< Threshold Threshold Target Maximum
Final % granted
Total sales (in € millions) < 1,360 1,360 1,700 2,550 1,732
Annual variable compensation as % of fi xed amount 0% 24% 30% 45% 30.56%
% of Group EBIT (1) versus sales < 12.72% 12.72% 15.90% 23.85% 17.32%
Annual variable compensation as % of fi xed amount 0% 24% 30% 45% 32.72%
% digital sales versus sales < 40% 40% 50% 75% 58%
Annual variable compensation as % of fi xed amount 0% 24% 30% 45% 34.80%
(1) Non-IFRS
The three objectives in relation to total sales, % of Group EBIT versus total sales and % of digital sales versus total sales exceed the target initially communicated without, however, reaching their maximum threshold. They thus give rise to 30.56%, 32.72 % and 34.80% respectively, i.e. 98.08% of total fi xed compensation for the quantifi able criteria.
♦ Quantitative criteria: 10% of fi xed compensation in the event that the performance conditions are attained, and a maximum 15% of fi xed compensation, increasing proportionately between the minimum threshold and the target, then between the target and the maximum.
Indicator
Performance conditionsQualitative criterion
Achievement of objectives
< Threshold Threshold Target Maximum
Final % granted
Increase of number of players in certain strategic territories < 20% 20% 25% 37.50% 115%
Annual variable compensation as % of fi xed amount 0% 8% 10% 15% 15%
The maximum level of achievement for the target of increasing the number of players in certain strategic territories was exceeded and accordingly gives entitlement to the maximum bonus for this criterion, i.e. 15% of fi xed compensation.Accordingly, level of achievement of these objectives gives rise to 113.08% of annual variable compensation target, equal to a gross amount of €611,492.
- 2018 Registration Document80
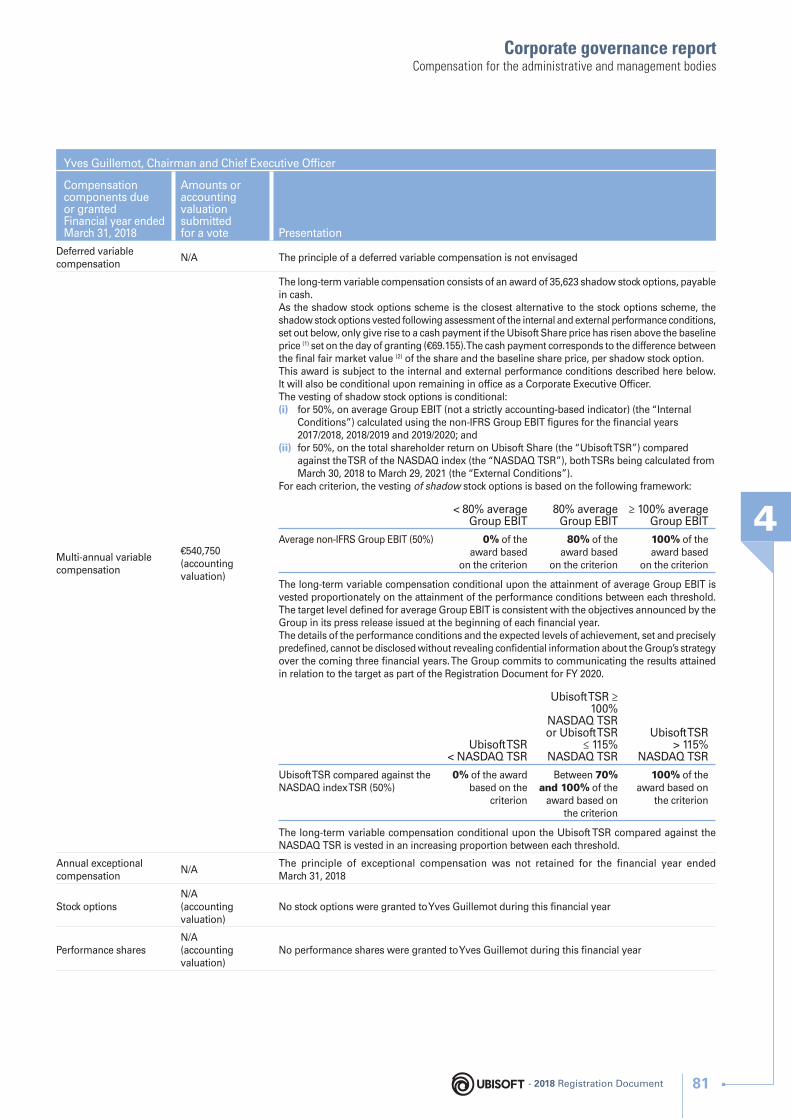
Corporate governance report
4
Compensation for the administrative and management bodies
Yves Guillemot, Chairman and Chief Executive Offi cer
Compensation components due or granted Financial year ended March 31, 2018
Amounts or accounting valuation submitted for a vote Presentation
Deferred variable compensation
N/A The principle of a deferred variable compensation is not envisaged
Multi-annual variable compensation
€540,750(accounting valuation)
The long-term variable compensation consists of an award of 35,623 shadow stock options, payable in cash.As the shadow stock options scheme is the closest alternative to the stock options scheme, the shadow stock options vested following assessment of the i nternal and e xternal p erformance c onditions, set out below, only give rise to a cash payment if the Ubisoft S hare price has risen above the baseline price (1) set on the day of granting (€69.155). The cash payment corresponds to the difference between the fi nal fair market value (2) of the share and the baseline share price, per shadow stock option.This award is subject to the internal and external performance conditions described here below. It will also be conditional upon remaining in offi ce as a Corporate Executive Offi cer.The vesting of shadow stock options is conditional:(i) for 50%, on average Group EBIT (not a strictly accounting-based indicator) (the “Internal
Conditions”) calculated using the non-IFRS Group EBIT fi gures for the fi nancial years 2017/2018, 2018/2019 and 2019/2020; and
(ii) for 50%, on the total shareholder return on Ubisoft Share (the “Ubisoft TSR”) compared against the TSR of the NASDAQ index (the “NASDAQ TSR”), both TSRs being calculated from March 30, 2018 to March 29, 2021 (the “External Conditions”).
For each criterion, the vesting of shadow stock options is based on the following framework:
< 80% average Group EBIT
80% average Group EBIT
≥ 100% average Group EBIT
Average non-IFRS Group EBIT (50%) 0% of the award based
on the criterion
80% of the award based
on the criterion
100% of the award based
on the criterion
The long-term variable compensation conditional upon the attainment of average Group EBIT is vested proportionately on the attainment of the performance conditions between each threshold. The target level defi ned for average Group EBIT is consistent with the objectives announced by the Group in its press release issued at the beginning of each fi nancial year.The details of the performance conditions and the expected levels of achievement, set and precisely predefi ned, cannot be disclosed without revealing confi dential information about the Group’s strategy over the coming three fi nancial years. The Group commits to communicating the results attained in relation to the target as part of the Registration Document for FY 2020.
Ubisoft TSR < NASDAQ TSR
Ubisoft TSR ≥ 100%
NASDAQ TSR or Ubisoft TSR
≤ 115% NASDAQ TSR
Ubisoft TSR > 115%
NASDAQ TSR
Ubisoft TSR compared against the NASDAQ index TSR (50%)
0% of the award based on the
criterion
Between 70% and 100% of the
award based on the criterion
100% of the award based on
the criterion
The long-term variable compensation conditional upon the Ubisoft TSR compared against the NASDAQ TSR is vested in an increasing proportion between each threshold.
Annual exceptional compensation
N/AThe principle of exceptional compensation was not retained for the fi nancial year ended March 31, 2018
Stock optionsN/A(accounting valuation)
No stock options were granted to Yves Guillemot during this fi nancial year
Performance sharesN/A(accounting valuation)
No performance shares were granted to Yves Guillemot during this fi nancial year
- 2018 Registration Document 81
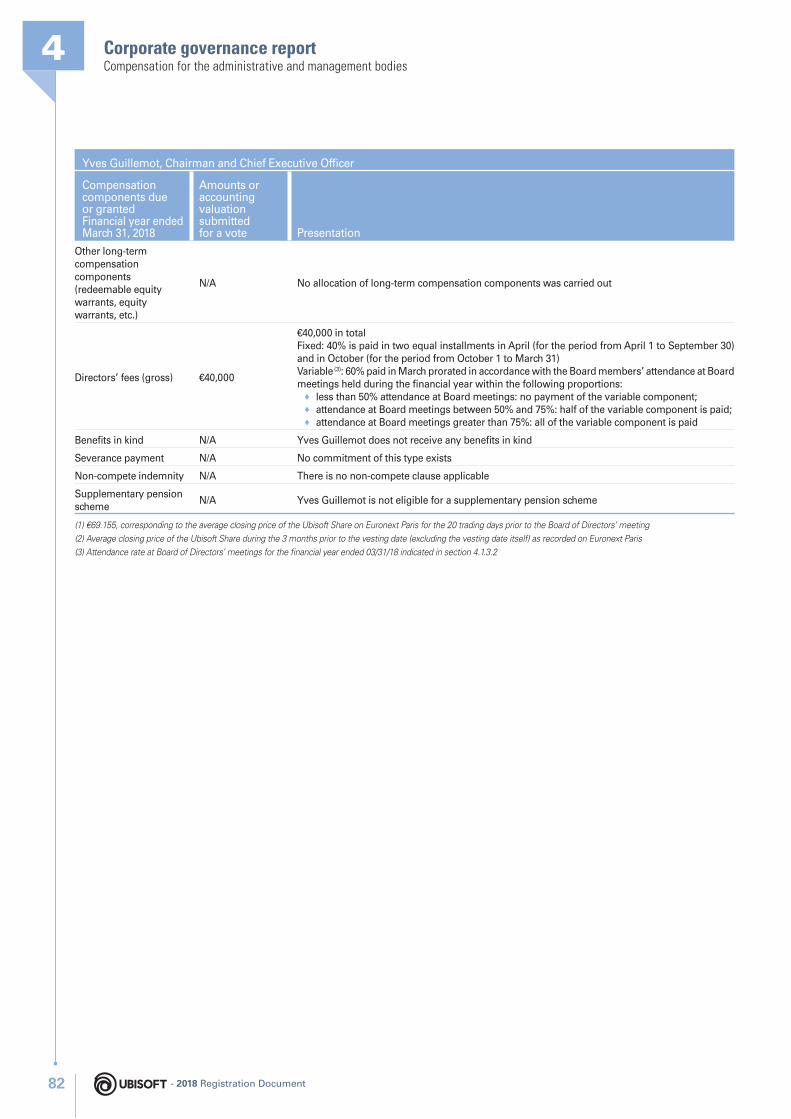
Corporate governance report4Compensation for the administrative and management bodies
Yves Guillemot, Chairman and Chief Executive Offi cer
Compensation components due or granted Financial year ended March 31, 2018
Amounts or accounting valuation submitted for a vote Presentation
Other long-term compensation components (redeemable equity warrants, equity warrants, etc.)
N/A No allocation of long-term compensation components was carried out
Directors’ fees (gross) €40,000
€40,000 in totalFixed: 40% is paid in two equal installments in April (for the period from April 1 to September 30) and in October (for the period from October 1 to March 31)Variable (3): 60% paid in March prorated in accordance with the Board members’ attendance at Board meetings held during the fi nancial year within the following proportions:
♦ less than 50% attendance at Board meetings: no payment of the variable component; ♦ attendance at Board meetings between 50% and 75%: half of the variable component is paid; ♦ attendance at Board meetings greater than 75%: all of the variable component is paid
Benefi ts in kind N/A Yves Guillemot does not receive any benefi ts in kind
Severance payment N/A No commitment of this type exists
Non-compete indemnity N/A There is no non-compete clause applicable
Supplementary pension scheme
N/A Yves Guillemot is not eligible for a supplementary pension scheme
(1) €69.155, corresponding to the average closing price of the Ubisoft S hare on Euronext Paris for the 20 trading days prior to the Board of Directors’ meeting
(2) Average closing price of the Ubisoft S hare during the 3 months prior to the vesting date (excluding the vesting date itself) as recorded on Euronext Paris
(3) Attendance rate at Board of Directors’ meetings for the fi nancial year ended 03/31/18 indicated in section 4.1.3.2
- 2018 Registration Document82
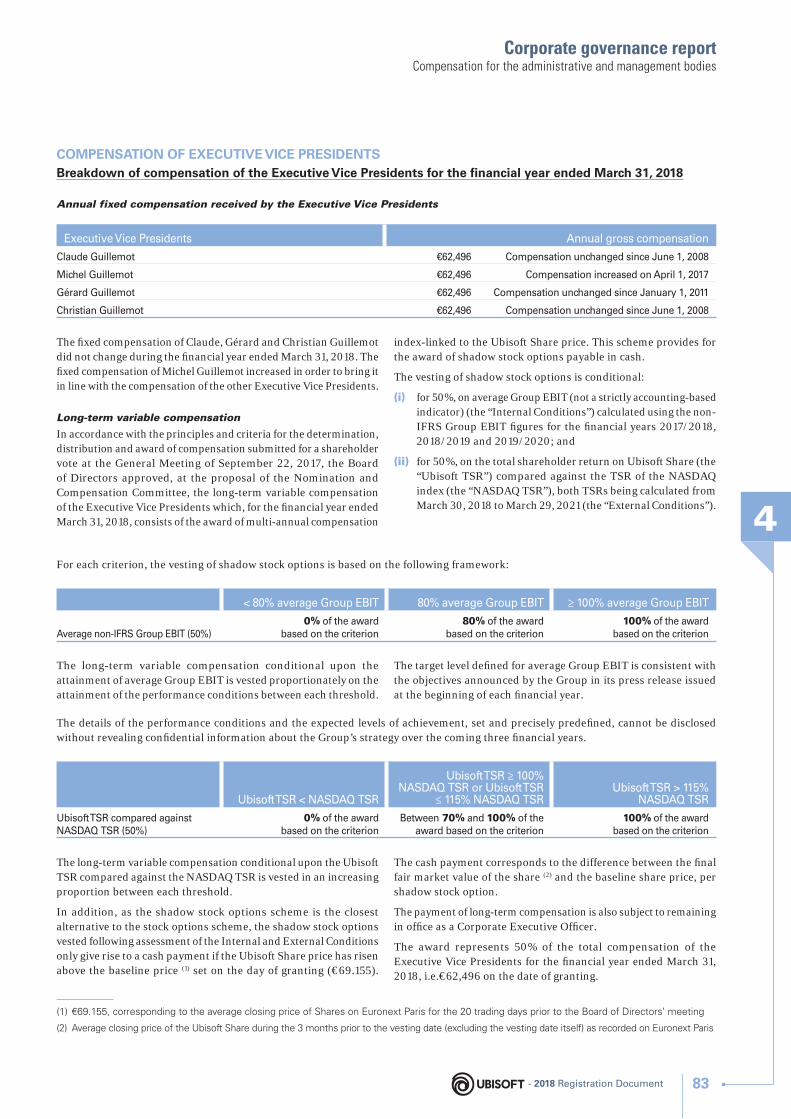
Corporate governance report
4
Compensation for the administrative and management bodies
For each criterion, the vesting of shadow stock options is based on the following framework:
< 80% average Group EBIT 80% average Group EBIT ≥ 100% average Group EBIT
Average non-IFRS Group EBIT (50%)0% of the award
based on the criterion80% of the award
based on the criterion100% of the award
based on the criterion
COMPENSATION OF EXECUTIVE VICE PRESIDENTSBreakdown of compensation of the Executive Vice Presidents for the fi nancial year ended March 31, 2018
Annual fixed compensation received by the Executive Vice Presidents
Executive Vice Presidents Annual gross compensation
Claude Guillemot €62,496 Compensation unchanged since June 1, 2008
Michel Guillemot €62,496 Compensation increased on April 1, 2017
Gérard Guillemot €62,496 Compensation unchanged since January 1, 2011
Christian Guillemot €62,496 Compensation unchanged since June 1, 2008
The fi xed compensation of Claude, Gérard and Christian Guillemot did not change during the fi nancial year ended March 31, 2018. The fi xed compensation of Michel Guillemot increased in order to bring it in line with the compensation of the other Executive Vice Presidents.
Long-term variable compensation
In accordance with the principles and criteria for the determination, distribution and award of compensation submitted for a shareholder vote at the General Meeting of September 22, 2017, the Board of Directors approved, at the proposal of the Nomination and Compensation Committee, the long-term variable compensation of the Executive Vice Presidents which, for the fi nancial year ended March 31, 2018, consists of the award of multi-annual compensation
index-linked to the Ubisoft S hare price. This scheme provides for the award of shadow stock options payable in cash.
The vesting of shadow stock options is conditional:
(i) for 50%, on average Group EBIT (not a strictly accounting-based indicator) (the “Internal Conditions”) calculated using the non-IFRS Group EBIT fi gures for the fi nancial years 2017/2018, 2018/2019 and 2019/2020; and
(ii) for 50%, on the total shareholder return on Ubisoft Share (the “Ubisoft TSR”) compared against the TSR of the NASDAQ index (the “NASDAQ TSR”), both TSRs being calculated from March 30, 2018 to March 29, 2021 (the “External Conditions”).
The long-term variable compensation conditional upon the attainment of average Group EBIT is vested proportionately on the attainment of the performance conditions between each threshold.
The target level defi ned for average Group EBIT is consistent with the objectives announced by the Group in its press release issued at the beginning of each fi nancial year.
The details of the performance conditions and the expected levels of achievement, set and precisely predefi ned, cannot be disclosed without revealing confi dential information about the Group’s strategy over the coming three fi nancial years.
Ubisoft TSR < NASDAQ TSR
Ubisoft TSR ≥ 100% NASDAQ TSR or Ubisoft TSR
≤ 115% NASDAQ TSRUbisoft TSR > 115%
NASDAQ TSR
Ubisoft TSR compared against NASDAQ TSR (50%)
0% of the award based on the criterion
Between 70% and 100% of the award based on the criterion
100% of the award based on the criterion
The long-term variable compensation conditional upon the Ubisoft TSR compared against the NASDAQ TSR is vested in an increasing proportion between each threshold.
In addition, as the shadow stock options scheme is the closest alternative to the stock options scheme, the shadow stock options vested following assessment of the Internal and External Conditions only give rise to a cash payment if the Ubisoft S hare price has risen above the baseline price (1) set on the day of granting (€69.155).
The cash payment corresponds to the difference between the fi nal fair market value of the share (2) and the baseline share price, per shadow stock option.
The payment of long-term compensation is also subject to remaining in offi ce as a Corporate Executive Offi cer.
The award represents 50% of the total compensation of the Executive Vice Presidents for the fi nancial year ended March 31, 2018, i.e.€62,496 on the date of granting.
(1) €69. 155, corresponding to the average closing price of S hares on Euronext Paris for the 20 trading days prior to the Board of Directors’ meeting
(2) Average closing price of the Ubisoft S hare during the 3 months prior to the vesting date (excluding the vesting date itself) as recorded on Euronext Paris
- 2018 Registration Document 83
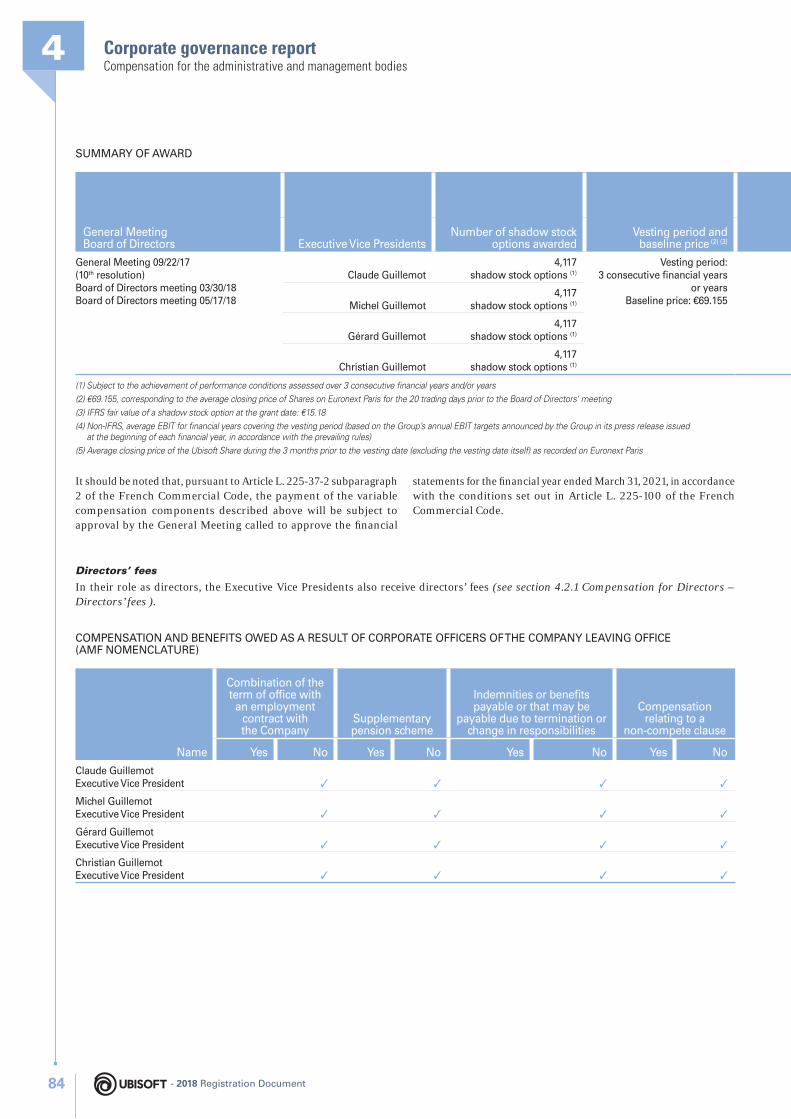
Corporate governance report4Compensation for the administrative and management bodies
SUMMARY OF AWARD
General MeetingBoard of Directors Executive Vice Presidents
Number of shadow stock options awarded
Vesting period and baseline price (2) (3)
General Meeting 09/22/17(10th resolution)Board of Directors meeting 03/30/18Board of Directors meeting 05/17/18
Claude Guillemot4,117
shadow stock options (1)
Vesting period:3 consecutive fi nancial years
or yearsBaseline price: €69. 155Michel Guillemot
4,117shadow stock options (1)
Gérard Guillemot4,117
shadow stock options (1)
Christian Guillemot4,117
shadow stock options (1)
(1) Subject to the achievement of performance conditions assessed over 3 consecutive fi nancial years and/or years
(2) €69.155, corresponding to the average closing price of S hares on Euronext Paris for the 20 trading days prior to the Board of Directors’ meeting
(3) IFRS fair value of a shadow stock option at the grant date: €15.18
(4) Non-IFRS, average EBIT for fi nancial years covering the vesting period (based on the Group’s annual EBIT targets announced by the Group in its press release issued at the beginning of each fi nancial year, in accordance with the prevailing rules)
(5) Average closing price of the Ubisoft S hare during the 3 months prior to the vesting date (excluding the vesting date itself) as recorded on Euronext Paris
It should be noted that, pursuant to Article L. 225-37-2 subparagraph 2 of the French Commercial Code, the payment of the variable compensation components described above will be subject to approval by the General Meeting called to approve the fi nancial
statements for the fi nancial year ended March 31, 2021, in accordance with the conditions set out in Article L. 225-100 of the French Commercial Code.
Directors’ fees
In their role as directors, the Executive Vice Presidents also receive directors’ fees (see section 4.2.1 Compensation for Directors – Directors’ fees ).
COMPENSATION AND BENEFITS OWED AS A RESULT OF CORPORATE OFFICERS OF THE COMPANY LEAVING OFFICE (AMF NOMENCLATURE)
Name
Combination of the term of offi ce with
an employment contract with the Company
Supplementary pension scheme
Indemnities or benefi ts payable or that may be
payable due to termination or change in responsibilities
Compensation relating to a
non-compete clause
Yes No Yes No Yes No Yes No
Claude GuillemotExecutive Vice President ✓ ✓ ✓ ✓
Michel GuillemotExecutive Vice President ✓ ✓ ✓ ✓
Gérard GuillemotExecutive Vice President ✓ ✓ ✓ ✓
Christian GuillemotExecutive Vice President ✓ ✓ ✓ ✓
- 2018 Registration Document84
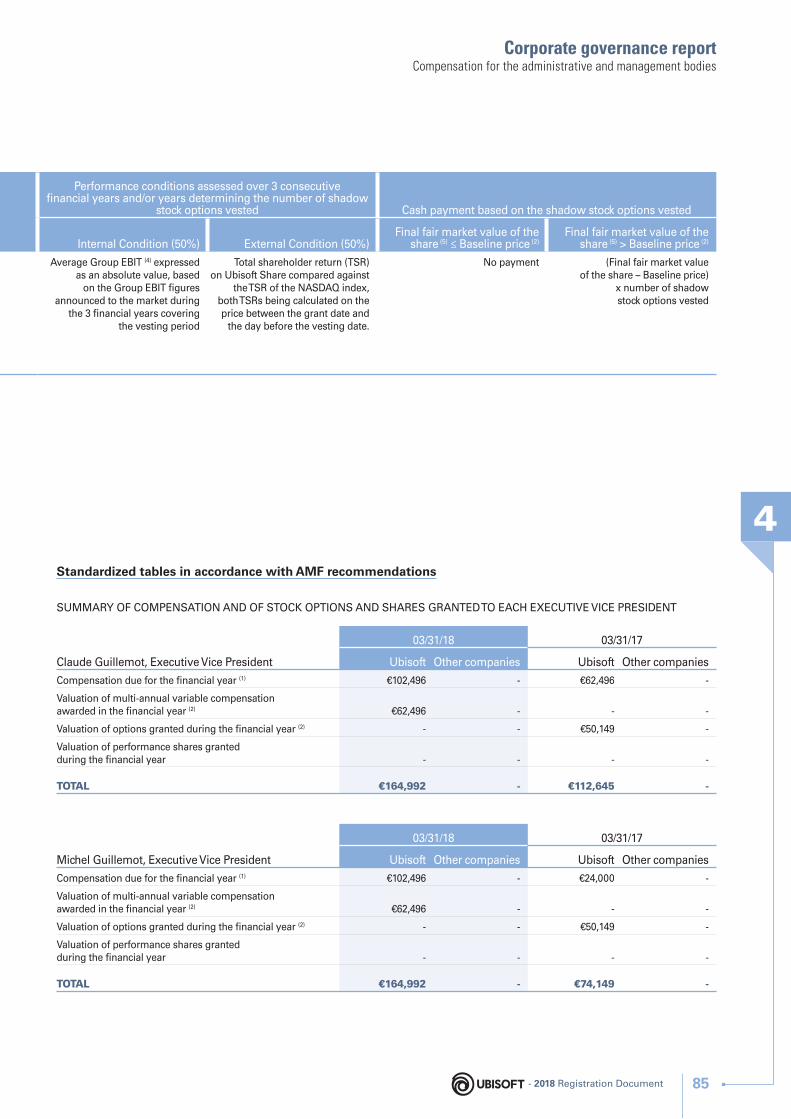
Corporate governance report
4
Compensation for the administrative and management bodies
Performance conditions assessed over 3 consecutive fi nancial years and/or years determining the number of shadow
stock options vested Cash payment based on the shadow stock options vested
Internal Condition (50%) External Condition (50%)Final fair market value of the
share (5) ≤ Baseline price (2)Final fair market value of the
share (5) > Baseline price (2)
Average Group EBIT (4) expressed as an absolute value, based
on the Group EBIT fi gures announced to the market during
the 3 fi nancial years covering the vesting period
Total shareholder return (TSR) on Ubisoft Share compared against
the TSR of the NASDAQ index, both TSRs being calculated on the price between the grant date and
the day before the vesting date.
No payment (Final fair market value of the share – Baseline price)
x number of shadow stock options vested
Standardized tables in accordance with AMF recommendations
SUMMARY OF COMPENSATION AND OF STOCK OPTIONS AND SHARES GRANTED TO EACH EXECUTIVE VICE PRESIDENT
Claude Guillemot, Executive Vice President
03/31/18 03/31/17
Ubisoft Other companies Ubisoft Other companies
Compensation due for the fi nancial year (1) €102,496 - €62,496 -
Valuation of multi-annual variable compensationawarded in the fi nancial year (2) €62,496 - - -
Valuation of options granted during the fi nancial year (2) - - €50,149 -
Valuation of performance shares granted during the fi nancial year - - - -
TOTAL €164,992 - €112,645 -
Michel Guillemot, Executive Vice President
03/31/18 03/31/17
Ubisoft Other companies Ubisoft Other companies
Compensation due for the fi nancial year (1) €102,496 - €24,000 -
Valuation of multi-annual variable compensationawarded in the fi nancial year (2) €62,496 - - -
Valuation of options granted during the fi nancial year (2) - - €50,149 -
Valuation of performance shares granted during the fi nancial year - - - -
TOTAL €164,992 - €74,149 -
- 2018 Registration Document 85
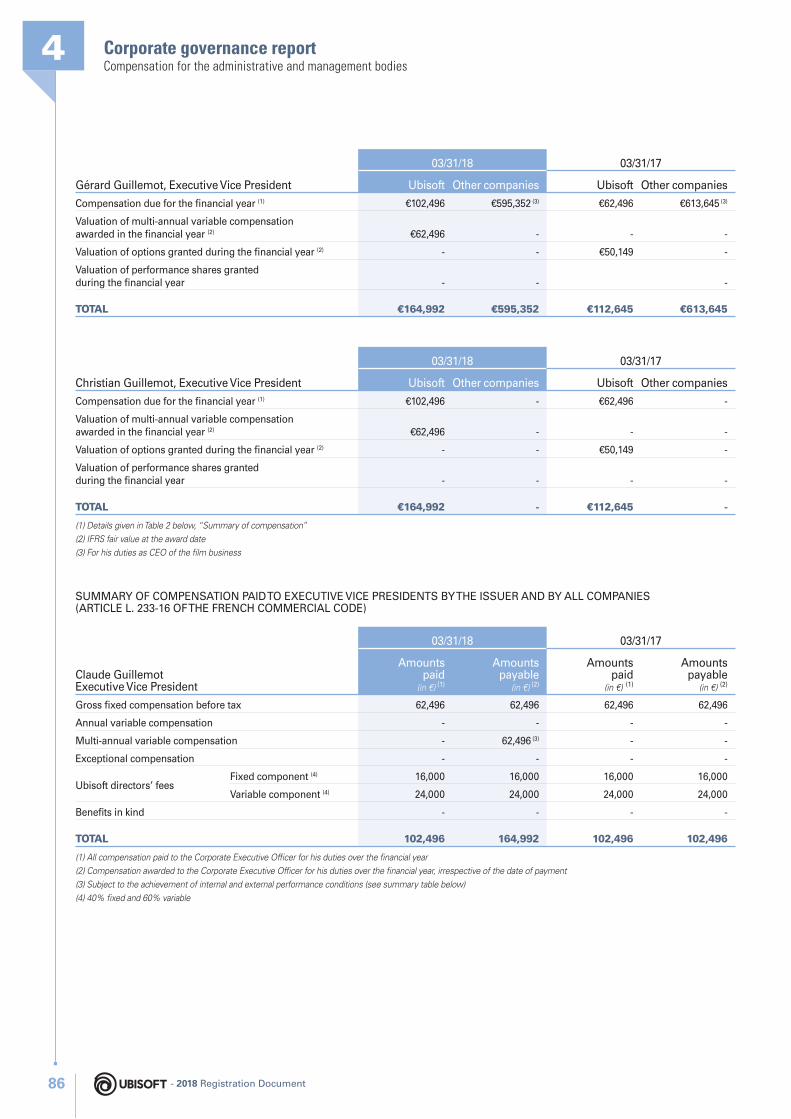
Corporate governance report4Compensation for the administrative and management bodies
Gérard Guillemot, Executive Vice President
03/31/18 03/31/17
Ubisoft Other companies Ubisoft Other companies
Compensation due for the fi nancial year (1) €102,496 €595,352 (3) €62,496 €613,645 (3)
Valuation of multi-annual variable compensationawarded in the fi nancial year (2) €62,496 - - -
Valuation of options granted during the fi nancial year (2) - - €50,149 -
Valuation of performance shares granted during the fi nancial year - - -
TOTAL €164,992 €595,352 €112,645 €613,645
Christian Guillemot, Executive Vice President
03/31/18 03/31/17
Ubisoft Other companies Ubisoft Other companies
Compensation due for the fi nancial year (1) €102,496 - €62,496 -
Valuation of multi-annual variable compensationawarded in the fi nancial year (2) €62,496 - - -
Valuation of options granted during the fi nancial year (2) - - €50,149 -
Valuation of performance shares granted during the fi nancial year - - - -
TOTAL €164,992 - €112,645 -
(1) Details given in Table 2 below, “Summary of compensation”
(2) IFRS fair value at the award date
(3) For his duties as CEO of the fi lm business
SUMMARY OF COMPENSATION PAID TO EXECUTIVE VICE PRESIDENTS BY THE ISSUER AND BY ALL COMPANIES (ARTICLE L. 233-16 OF THE FRENCH COMMERCIAL CODE)
Claude GuillemotExecutive Vice President
03/31/18 03/31/17
Amounts paid
(in €) (1)
Amounts payable
(in €) (2)
Amounts paid
(in €) (1)
Amounts payable
(in €) (2)
Gross fi xed compensation before tax 62,496 62,496 62,496 62,496
Annual variable compensation - - - -
Multi-annual variable compensation - 62,496 (3) - -
Exceptional compensation - - - -
Ubisoft directors’ feesFixed component (4) 16,000 16,000 16,000 16,000
Variable component (4) 24,000 24,000 24,000 24,000
Benefi ts in kind - - - -
TOTAL 102,496 164,992 102,496 102,496
(1) All compensation paid to the Corporate Executive Offi cer for his duties over the fi nancial year
(2) Compensation awarded to the Corporate Executive Offi cer for his duties over the fi nancial year, irrespective of the date of payment
(3) Subject to the achievement of internal and external performance conditions (see summary table below)
(4) 40% fi xed and 60% variable
- 2018 Registration Document86
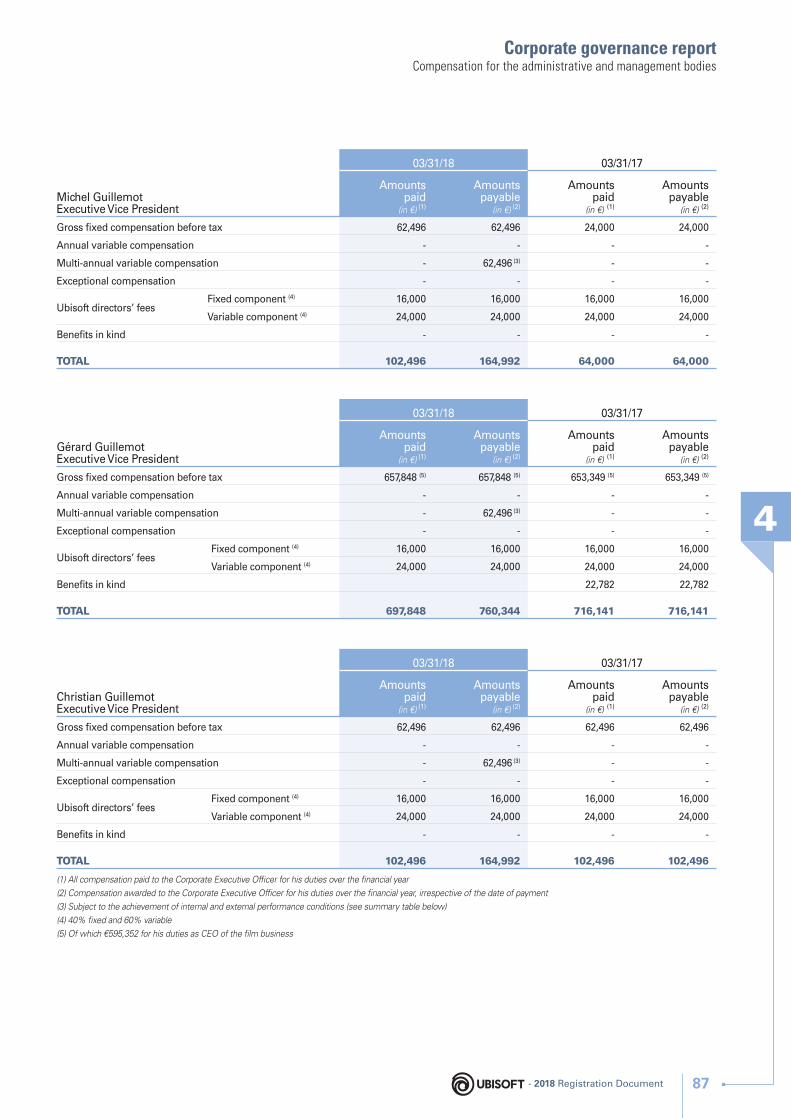
Corporate governance report
4
Compensation for the administrative and management bodies
Michel GuillemotExecutive Vice President
03/31/18 03/31/17
Amounts paid
(in €) (1)
Amounts payable
(in €) (2)
Amounts paid
(in €) (1)
Amounts payable
(in €) (2)
Gross fi xed compensation before tax 62,496 62,496 24,000 24,000
Annual variable compensation - - - -
Multi-annual variable compensation - 62,496 (3) - -
Exceptional compensation - - - -
Ubisoft directors’ feesFixed component (4) 16,000 16,000 16,000 16,000
Variable component (4) 24,000 24,000 24,000 24,000
Benefi ts in kind - - - -
TOTAL 102,496 164,992 64,000 64,000
Gérard GuillemotExecutive Vice President
03/31/18 03/31/17
Amounts paid
(in €) (1)
Amounts payable
(in €) (2)
Amounts paid
(in €) (1)
Amounts payable
(in €) (2)
Gross fi xed compensation before tax 657,848 (5) 657,848 (5) 653,349 (5) 653,349 (5)
Annual variable compensation - - - -
Multi-annual variable compensation - 62,496 (3) - -
Exceptional compensation - - - -
Ubisoft directors’ feesFixed component (4) 16,000 16,000 16,000 16,000
Variable component (4) 24,000 24,000 24,000 24,000
Benefi ts in kind 22,782 22,782
TOTAL 697,848 760,344 716,141 716,141
Christian GuillemotExecutive Vice President
03/31/18 03/31/17
Amounts paid
(in €) (1)
Amounts payable
(in €) (2)
Amounts paid
(in €) (1)
Amounts payable
(in €) (2)
Gross fi xed compensation before tax 62,496 62,496 62,496 62,496
Annual variable compensation - - - -
Multi-annual variable compensation - 62,496 (3) - -
Exceptional compensation - - - -
Ubisoft directors’ feesFixed component (4) 16,000 16,000 16,000 16,000
Variable component (4) 24,000 24,000 24,000 24,000
Benefi ts in kind - - - -
TOTAL 102,496 164,992 102,496 102,496
(1) All compensation paid to the Corporate Executive Offi cer for his duties over the fi nancial year
(2) Compensation awarded to the Corporate Executive Offi cer for his duties over the fi nancial year, irrespective of the date of payment
(3) Subject to the achievement of internal and external performance conditions (see summary table below)
(4) 40% fi xed and 60% variable
(5) Of which €595,352 for his duties as CEO of the fi lm business
- 2018 Registration Document 87
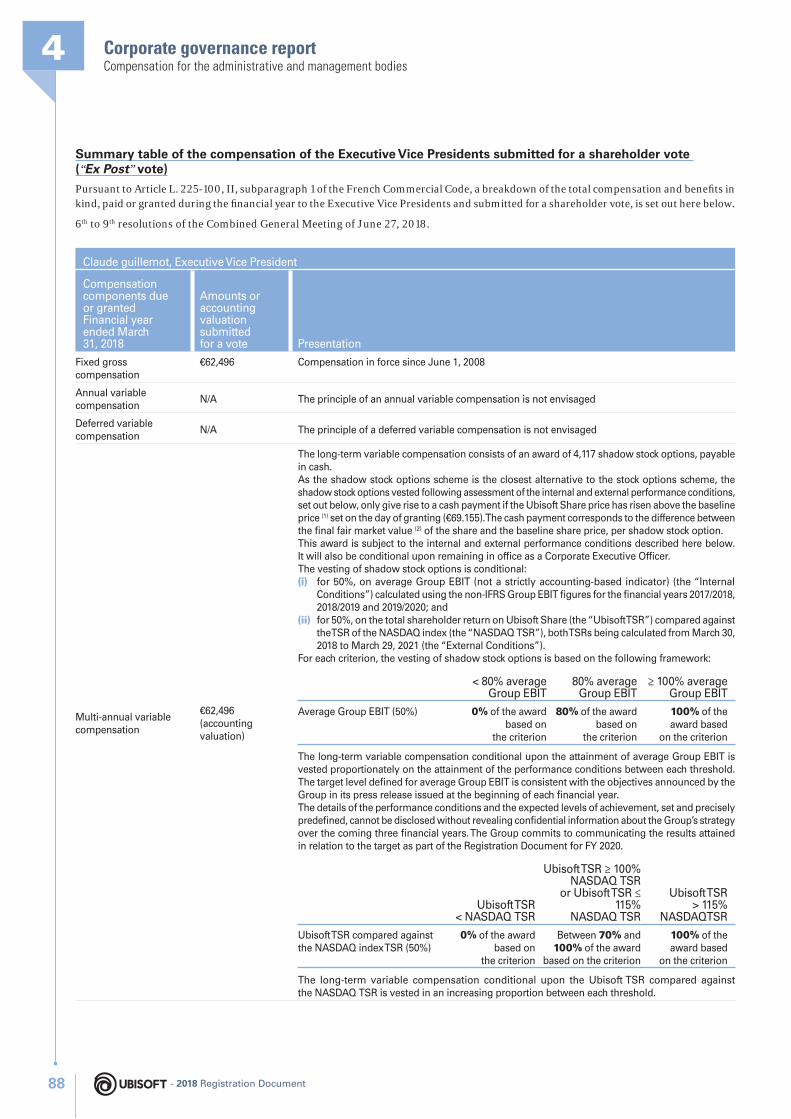
Corporate governance report4Compensation for the administrative and management bodies
Summary table of the compensation of the Executive Vice Presidents submitted for a shareholder vote (“Ex Post” vote)
Pursuant to Article L. 225-100, II, subparagraph 1 of the French Commercial Code, a breakdown of the total compensation and benefi ts in kind, paid or granted during the fi nancial year to the Executive Vice Presidents and submitted for a shareholder vote, is set out here below.
6th to 9th resolutions of the Combined General Meeting of June 27, 2018.
Claude guillemot, Executive Vice President
Compensation components due or granted Financial year ended March 31, 2018
Amounts or accounting valuation submitted for a vote Presentation
Fixed gross compensation
€62,496 Compensation in force since June 1, 2008
Annual variable compensation
N/A The principle of an annual variable compensation is not envisaged
Deferred variable compensation
N/A The principle of a deferred variable compensation is not envisaged
Multi-annual variable compensation
€62,496(accounting valuation)
The long-term variable compensation consists of an award of 4,117 shadow stock options, payable in cash.As the shadow stock options scheme is the closest alternative to the stock options scheme, the shadow stock options vested following assessment of the i nternal and e xternal p erformance c onditions, set out below, only give rise to a cash payment if the Ubisoft S hare price has risen above the baseline price (1) set on the day of granting (€69.155). The cash payment corresponds to the difference between the fi nal fair market value (2) of the share and the baseline share price, per shadow stock option.This award is subject to the internal and external performance conditions described here below. It will also be conditional upon remaining in offi ce as a Corporate Executive Offi cer.The vesting of shadow stock options is conditional:(i) for 50%, on average Group EBIT (not a strictly accounting-based indicator) (the “Internal
Conditions”) calculated using the non-IFRS Group EBIT fi gures for the fi nancial years 2017/2018, 2018/2019 and 2019/2020; and
(ii) for 50%, on the total shareholder return on Ubisoft Share (the “Ubisoft TSR”) compared against the TSR of the NASDAQ index (the “NASDAQ TSR”), both TSRs being calculated from March 30, 2018 to March 29, 2021 (the “External Conditions”).
For each criterion, the vesting of shadow stock options is based on the following framework:
< 80% average Group EBIT
80% average Group EBIT
≥ 100% average Group EBIT
Average Group EBIT (50%) 0% of the award based on
the criterion
80% of the award based on
the criterion
100% of the award based
on the criterion
The long-term variable compensation conditional upon the attainment of average Group EBIT is vested proportionately on the attainment of the performance conditions between each threshold. The target level defi ned for average Group EBIT is consistent with the objectives announced by the Group in its press release issued at the beginning of each fi nancial year.The details of the performance conditions and the expected levels of achievement, set and precisely predefi ned, cannot be disclosed without revealing confi dential information about the Group’s strategy over the coming three fi nancial years. The Group commits to communicating the results attained in relation to the target as part of the Registration Document for FY 2020.
Ubisoft TSR < NASDAQ TSR
Ubisoft TSR ≥ 100% NASDAQ TSR
or Ubisoft TSR ≤ 115%
NASDAQ TSR
Ubisoft TSR > 115%
NASDAQTSR
Ubisoft TSR compared against the NASDAQ index TSR (50%)
0% of the award based on
the criterion
Between 70% and 100% of the award
based on the criterion
100% of the award based
on the criterion
The long-term variable compensation conditional upon the Ubisoft TSR compared against the NASDAQ TSR is vested in an increasing proportion between each threshold.
- 2018 Registration Document88
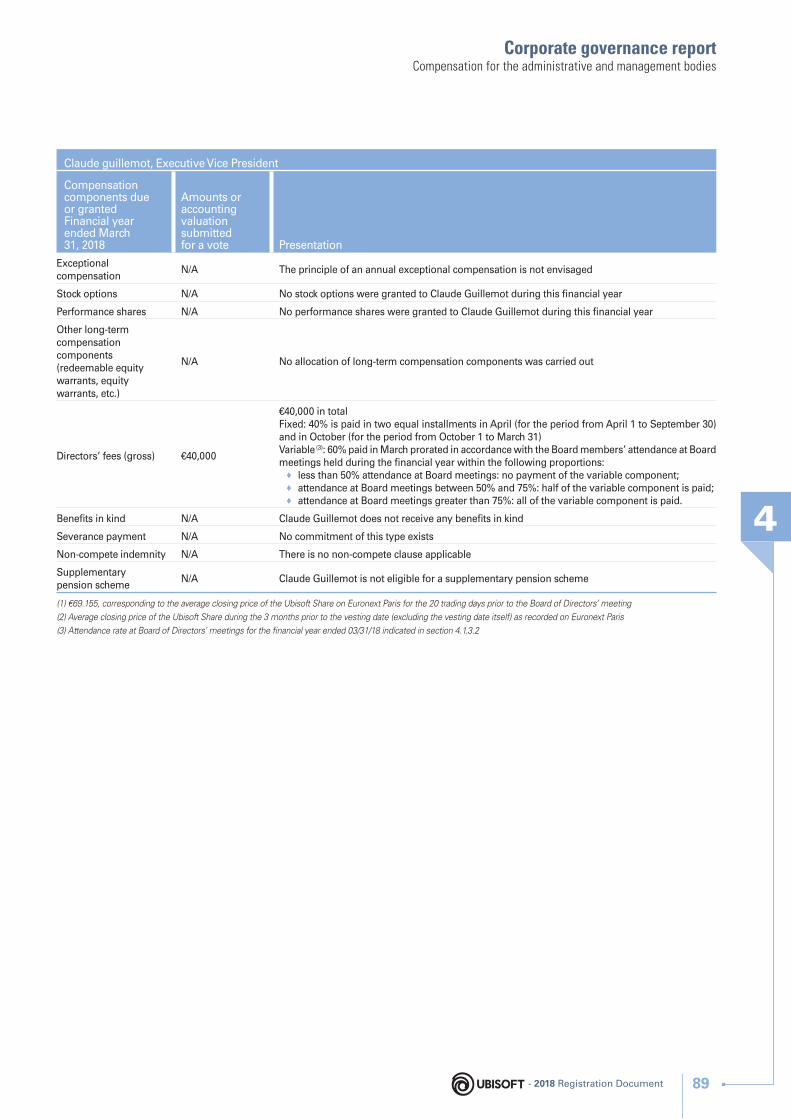
Corporate governance report
4
Compensation for the administrative and management bodies
Claude guillemot, Executive Vice President
Compensation components due or granted Financial year ended March 31, 2018
Amounts or accounting valuation submitted for a vote Presentation
Exceptional compensation
N/A The principle of an annual exceptional compensation is not envisaged
Stock options N/A No stock options were granted to Claude Guillemot during this fi nancial year
Performance shares N/A No performance shares were granted to Claude Guillemot during this fi nancial year
Other long-term compensation components (redeemable equity warrants, equity warrants, etc.)
N/A No allocation of long-term compensation components was carried out
Directors’ fees (gross) €40,000
€40,000 in totalFixed: 40% is paid in two equal installments in April (for the period from April 1 to September 30) and in October (for the period from October 1 to March 31)Variable (3): 60% paid in March prorated in accordance with the Board members’ attendance at Board meetings held during the fi nancial year within the following proportions:
♦ less than 50% attendance at Board meetings: no payment of the variable component; ♦ attendance at Board meetings between 50% and 75%: half of the variable component is paid; ♦ attendance at Board meetings greater than 75%: all of the variable component is paid.
Benefi ts in kind N/A Claude Guillemot does not receive any benefi ts in kind
Severance payment N/A No commitment of this type exists
Non-compete indemnity N/A There is no non-compete clause applicable
Supplementary pension scheme
N/A Claude Guillemot is not eligible for a supplementary pension scheme
(1) €69.155, corresponding to the average closing price of the Ubisoft S hare on Euronext Paris for the 20 trading days prior to the Board of Directors’ meeting
(2) Average closing price of the Ubisoft S hare during the 3 months prior to the vesting date (excluding the vesting date itself) as recorded on Euronext Paris
(3) Attendance rate at Board of Directors’ meetings for the fi nancial year ended 03/31/18 indicated in section 4.1.3.2
- 2018 Registration Document 89

Corporate governance report4Compensation for the administrative and management bodies
Michel Guillemot, Executive Vice President
Compensation components due or granted Financial year ended March 31, 2018
Amounts or accounting valuation submitted for a vote Presentation
Fixed gross annual compensation
€62,496Fixed compensation increased from April 1, 2017 in order to bring it in line with the compensation of the other Executive Vice Presidents.
Annual variable compensation
N/A The principle of an annual variable compensation is not envisaged
Deferred variable compensation
N/A The principle of a deferred variable compensation is not envisaged
Multi-annual variable compensation
€62,496(accounting valuation)
The long-term variable compensation consists of an award of 4,117 shadow stock options, payable in cash.As the shadow stock options scheme is the closest alternative to the stock options scheme, the shadow stock options vested following assessment of the i nternal and e xternal p erformance c onditions, set out below, only give rise to a cash payment if the Ubisoft S hare price has risen above the baseline price (1) set on the day of granting (€69.155). The cash payment corresponds to the difference between the fi nal fair market value (2) of the share and the baseline share price, per shadow stock option.This award is subject to the internal and external performance conditions described here below. It will also be conditional upon remaining in offi ce as a Corporate Executive Offi cer.The vesting of shadow stock options is conditional:(i) for 50%, on average Group EBIT (not a strictly accounting-based indicator) (the “Internal
Conditions”) calculated using the non-IFRS Group EBIT fi gures for the fi nancial years 2017/2018, 2018/2019 and 2019/2020; and
(ii) for 50%, on the total shareholder return on Ubisoft Share (the “Ubisoft TSR”) compared against the TSR of the NASDAQ index (the “NASDAQ TSR”), both TSRs being calculated from March 30, 2018 to March 29, 2021 (the “External Conditions”).
For each criterion, the vesting of shadow stock options is based on the following framework:
< 80% average Group EBIT
80% average Group EBIT
≥ 100% average Group EBIT
Average Group EBIT (50%) 0% of the award based on
the criterion
80% of the award based on
the criterion
100% of the award based
on the criterion
The long-term variable compensation conditional upon the attainment of average Group EBIT is vested proportionately on the attainment of the performance conditions between each threshold. The target level defi ned for average Group EBIT is consistent with the objectives announced by the Group in its press release issued at the beginning of each fi nancial year.The details of the performance conditions and the expected levels of achievement, set and precisely predefi ned, cannot be disclosed without revealing confi dential information about the Group’s strategy over the coming three fi nancial years. The Group commits to communicating the results attained in relation to the target as part of the Registration Document for FY 2020.
Ubisoft TSR < NASDAQ TSR
Ubisoft TSR ≥ 100% NASDAQ TSR or
Ubisoft TSR ≤ 115% NASDAQ TSR
Ubisoft TSR > 115%
NASDAQ TSR
Ubisoft TSR compared against the NASDAQ index TSR (50%)
0% of the award based on the
criterion
Between 70% and 100% of the award
based on the criterion
100% of the award based on
the criterion
The long-term variable compensation conditional upon the Ubisoft TSR compared against the NASDAQ TSR is vested in an increasing proportion between each threshold.
Exceptional compensation
N/A The principle of an annual exceptional compensation is not envisaged
Stock options N/A No stock options were granted to Michel Guillemot during this fi nancial year
Performance shares N/A No performance shares were granted to Michel Guillemot during this fi nancial year
- 2018 Registration Document90
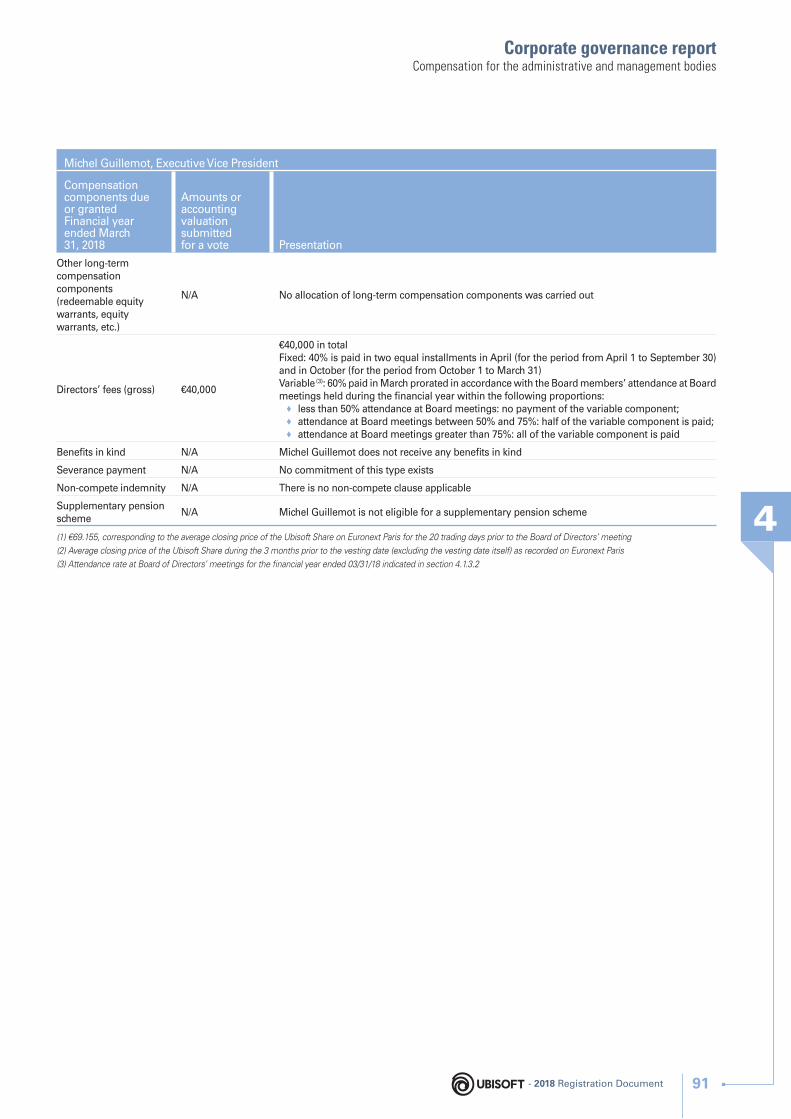
Corporate governance report
4
Compensation for the administrative and management bodies
Michel Guillemot, Executive Vice President
Compensation components due or granted Financial year ended March 31, 2018
Amounts or accounting valuation submitted for a vote Presentation
Other long-term compensation components (redeemable equity warrants, equity warrants, etc.)
N/A No allocation of long-term compensation components was carried out
Directors’ fees (gross) €40,000
€40,000 in totalFixed: 40% is paid in two equal installments in April (for the period from April 1 to September 30) and in October (for the period from October 1 to March 31)Variable (3): 60% paid in March prorated in accordance with the Board members’ attendance at Board meetings held during the fi nancial year within the following proportions:
♦ less than 50% attendance at Board meetings: no payment of the variable component; ♦ attendance at Board meetings between 50% and 75%: half of the variable component is paid; ♦ attendance at Board meetings greater than 75%: all of the variable component is paid
Benefi ts in kind N/A Michel Guillemot does not receive any benefi ts in kind
Severance payment N/A No commitment of this type exists
Non-compete indemnity N/A There is no non-compete clause applicable
Supplementary pension scheme
N/A Michel Guillemot is not eligible for a supplementary pension scheme
(1) €69.155, corresponding to the average closing price of the Ubisoft S hare on Euronext Paris for the 20 trading days prior to the Board of Directors’ meeting
(2) Average closing price of the Ubisoft S hare during the 3 months prior to the vesting date (excluding the vesting date itself) as recorded on Euronext Paris
(3) Attendance rate at Board of Directors’ meetings for the fi nancial year ended 03/31/18 indicated in section 4.1.3.2
- 2018 Registration Document 91
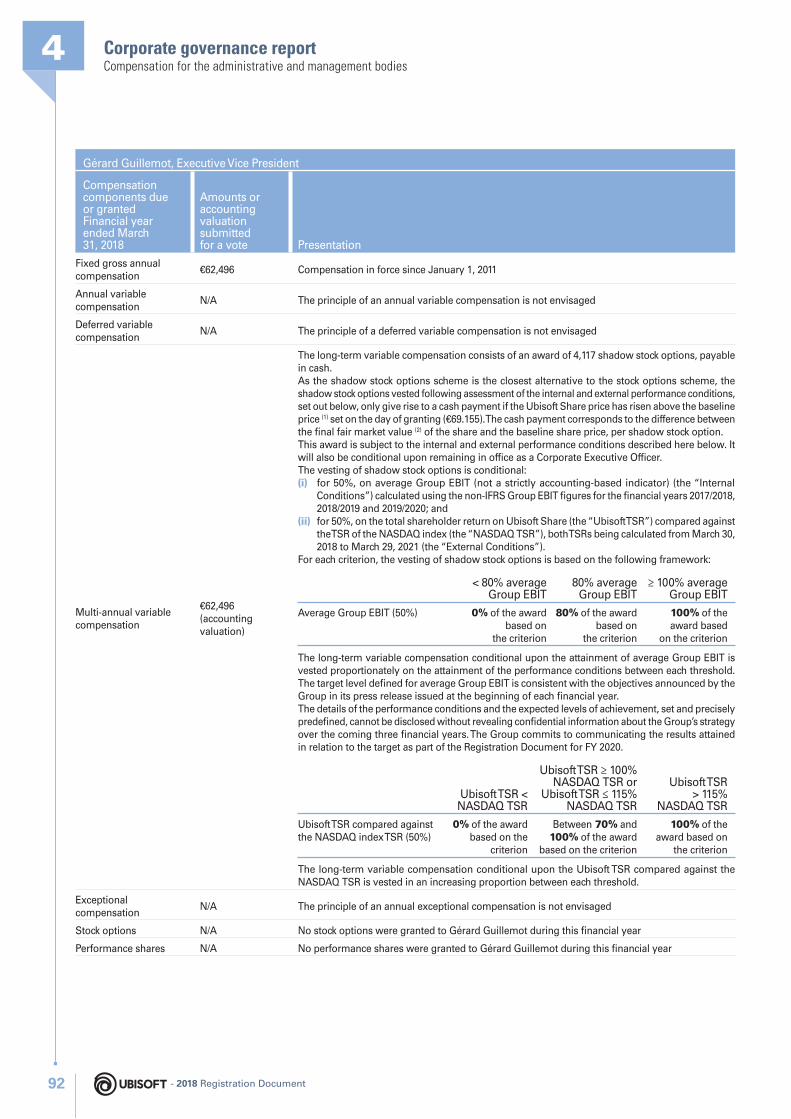
Corporate governance report4Compensation for the administrative and management bodies
Gérard Guillemot, Executive Vice President
Compensation components due or granted Financial year ended March 31, 2018
Amounts or accounting valuation submitted for a vote Presentation
Fixed gross annual compensation
€62,496 Compensation in force since January 1, 2011
Annual variable compensation
N/A The principle of an annual variable compensation is not envisaged
Deferred variable compensation
N/A The principle of a deferred variable compensation is not envisaged
Multi-annual variable compensation
€62,496(accounting valuation)
The long-term variable compensation consists of an award of 4,117 shadow stock options, payable in cash.As the shadow stock options scheme is the closest alternative to the stock options scheme, the shadow stock options vested following assessment of the i nternal and e xternal p erformance c onditions, set out below, only give rise to a cash payment if the Ubisoft S hare price has risen above the baseline price (1) set on the day of granting (€69.155). The cash payment corresponds to the difference between the fi nal fair market value (2) of the share and the baseline share price, per shadow stock option.This award is subject to the internal and external performance conditions described here below. It will also be conditional upon remaining in offi ce as a Corporate Executive Offi cer.The vesting of shadow stock options is conditional:(i) for 50%, on average Group EBIT (not a strictly accounting-based indicator) (the “Internal
Conditions”) calculated using the non-IFRS Group EBIT fi gures for the fi nancial years 2017/2018, 2018/2019 and 2019/2020; and
(ii) for 50%, on the total shareholder return on Ubisoft Share (the “Ubisoft TSR”) compared against the TSR of the NASDAQ index (the “NASDAQ TSR”), both TSRs being calculated from March 30, 2018 to March 29, 2021 (the “External Conditions”).
For each criterion, the vesting of shadow stock options is based on the following framework:
< 80% average Group EBIT
80% average Group EBIT
≥ 100% average Group EBIT
Average Group EBIT (50%) 0% of the award based on
the criterion
80% of the award based on
the criterion
100% of the award based
on the criterion
The long-term variable compensation conditional upon the attainment of average Group EBIT is vested proportionately on the attainment of the performance conditions between each threshold. The target level defi ned for average Group EBIT is consistent with the objectives announced by the Group in its press release issued at the beginning of each fi nancial year.The details of the performance conditions and the expected levels of achievement, set and precisely predefi ned, cannot be disclosed without revealing confi dential information about the Group’s strategy over the coming three fi nancial years. The Group commits to communicating the results attained in relation to the target as part of the Registration Document for FY 2020.
Ubisoft TSR < NASDAQ TSR
Ubisoft TSR ≥ 100% NASDAQ TSR or
Ubisoft TSR ≤ 115% NASDAQ TSR
Ubisoft TSR > 115%
NASDAQ TSR
Ubisoft TSR compared against the NASDAQ index TSR (50%)
0% of the award based on the
criterion
Between 70% and 100% of the award
based on the criterion
100% of the award based on
the criterion
The long-term variable compensation conditional upon the Ubisoft TSR compared against the NASDAQ TSR is vested in an increasing proportion between each threshold.
Exceptional compensation
N/A The principle of an annual exceptional compensation is not envisaged
Stock options N/A No stock options were granted to Gérard Guillemot during this fi nancial year
Performance shares N/A No performance shares were granted to Gérard Guillemot during this fi nancial year
- 2018 Registration Document92
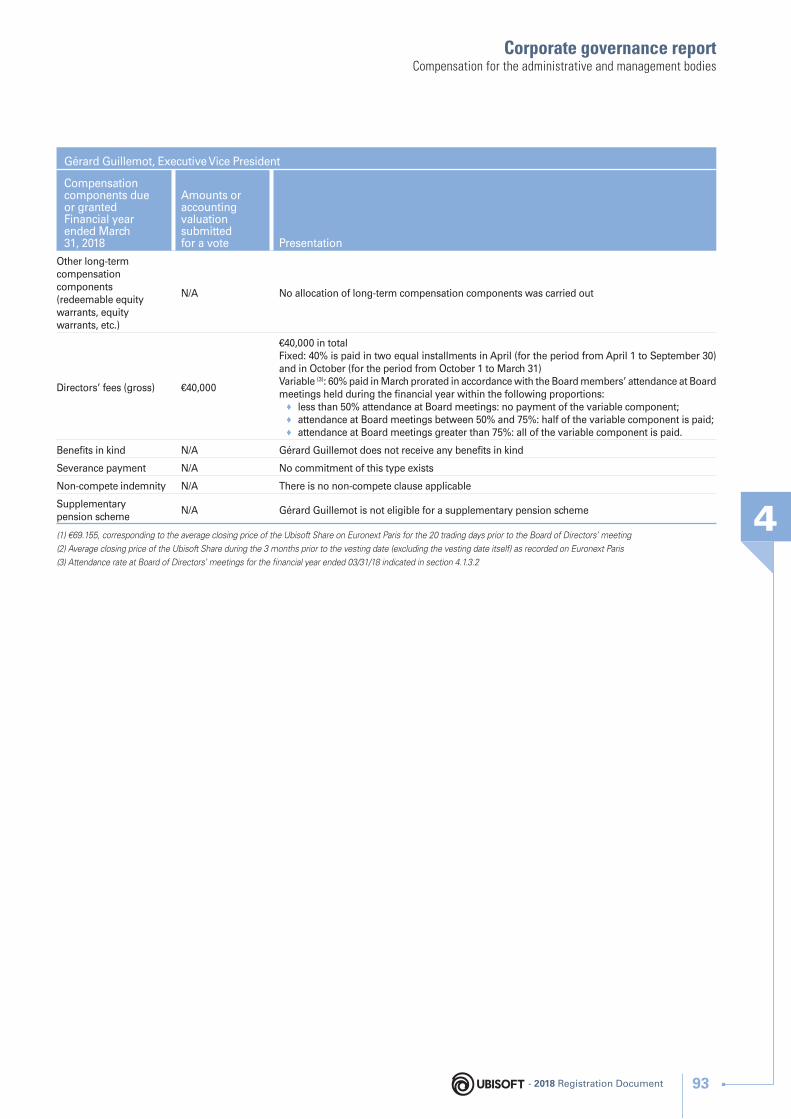
Corporate governance report
4
Compensation for the administrative and management bodies
Gérard Guillemot, Executive Vice President
Compensation components due or granted Financial year ended March 31, 2018
Amounts or accounting valuation submitted for a vote Presentation
Other long-term compensation components (redeemable equity warrants, equity warrants, etc.)
N/A No allocation of long-term compensation components was carried out
Directors’ fees (gross) €40,000
€40,000 in totalFixed: 40% is paid in two equal installments in April (for the period from April 1 to September 30) and in October (for the period from October 1 to March 31)Variable (3): 60% paid in March prorated in accordance with the Board members’ attendance at Board meetings held during the fi nancial year within the following proportions:
♦ less than 50% attendance at Board meetings: no payment of the variable component; ♦ attendance at Board meetings between 50% and 75%: half of the variable component is paid; ♦ attendance at Board meetings greater than 75%: all of the variable component is paid.
Benefi ts in kind N/A Gérard Guillemot does not receive any benefi ts in kind
Severance payment N/A No commitment of this type exists
Non-compete indemnity N/A There is no non-compete clause applicable
Supplementary pension scheme
N/A Gérard Guillemot is not eligible for a supplementary pension scheme
(1) €69.155, corresponding to the average closing price of the Ubisoft S hare on Euronext Paris for the 20 trading days prior to the Board of Directors’ meeting
(2) Average closing price of the Ubisoft S hare during the 3 months prior to the vesting date (excluding the vesting date itself) as recorded on Euronext Paris
(3) Attendance rate at Board of Directors’ meetings for the fi nancial year ended 03/31/18 indicated in section 4.1.3.2
- 2018 Registration Document 93

Corporate governance report4Compensation for the administrative and management bodies
Christian Guillemot, Executive Vice President
Compensation components due or granted Financial year ended March 31, 2018
Amounts or accounting valuation submitted for a vote Presentation
Fixed gross annual compensation
€62,496 Compensation in force since June 1, 2008
Annual variable compensation
N/A The principle of an annual variable compensation is not envisaged
Deferred variable compensation
N/A The principle of a deferred variable compensation is not envisaged
Multi-annual variable compensation
€62,496(accounting valuation)
The long-term variable compensation consists of an award of 4,117 shadow stock options, payable in cash.As the shadow stock options scheme is the closest alternative to the stock options scheme, the shadow stock options vested following assessment of the i nternal and e xternal p erformance c onditions, set out below, only give rise to a cash payment if the Ubisoft S hare price has risen above the baseline price (1) set on the day of granting (€69.155). The cash payment corresponds to the difference between the fi nal fair market value (2) of the share and the baseline share price, per shadow stock option.This award is subject to the internal and external performance conditions described here below. It will also be conditional upon remaining in offi ce as a Corporate Executive Offi cer.The vesting of shadow stock options is conditional:(i) for 50%, on average Group EBIT (not a strictly accounting-based indicator) (the “Internal
Conditions”) calculated using the non-IFRS Group EBIT fi gures for the fi nancial years 2017/2018, 2018/2019 and 2019/2020; and
(ii) for 50%, on the total shareholder return on Ubisoft Share (the “Ubisoft TSR”) compared against the TSR of the NASDAQ index (the “NASDAQ TSR”), both TSRs being calculated from March 30, 2018 to March 29, 2021 (the “External Conditions”).
For each criterion, the vesting of shadow stock options is based on the following framework:
< 80% average Group EBIT
80% average Group EBIT
≥ 100% average Group EBIT
Average Group EBIT (50%) 0% of the award based on
the criterion
80% of the award based on
the criterion
100% of the award based
on the criterion
The long-term variable compensation conditional upon the attainment of average Group EBIT is vested proportionately on the attainment of the performance conditions between each threshold. The target level defi ned for average Group EBIT is consistent with the objectives announced by the Group in its press release issued at the beginning of each fi nancial year.The details of the performance conditions and the expected levels of achievement, set and precisely predefi ned, cannot be disclosed without revealing confi dential information about the Group’s strategy over the coming three fi nancial years. The Group commits to communicating the results attained in relation to the target as part of the Registration Document for FY 2020.
Ubisoft TSR < NASDAQ TSR
Ubisoft TSR ≥ 100% NASDAQ TSR or
Ubisoft TSR ≤ 115% NASDAQ TSR
Ubisoft TSR > 115%
NASDAQ TSR
Ubisoft TSR compared against the NASDAQ index TSR (50%)
0% of the award based
on the criterion
Between 70% and 100% of the award
based on the criterion
100% of the award based
on the criterion
The long-term variable compensation conditional upon the Ubisoft TSR compared against the NASDAQ TSR is vested in an increasing proportion between each threshold.
Exceptional compensation
N/A The principle of an annual exceptional compensation is not envisaged
Stock options N/A No stock options were granted to Christian Guillemot during this fi nancial year
Performance sharesN/A(accounting valuation)
No performance shares were granted to Christian Guillemot during this fi nancial year
- 2018 Registration Document94

Corporate governance report
4
Compensation for the administrative and management bodies
Christian Guillemot, Executive Vice President
Compensation components due or granted Financial year ended March 31, 2018
Amounts or accounting valuation submitted for a vote Presentation
Other long-term compensation components (redeemable equity warrants, equity warrants, etc.)
N/A No allocation of long-term compensation components was carried out
Directors’ fees (gross) €40,000
€40,000 in totalFixed: 40% is paid in two equal installments in April (for the period from April 1 to September 30) and in October (for the period from October 1 to March 31)Variable (3): 60% paid in March prorated in accordance with the Board members’ attendance at Board meetings held during the fi nancial year within the following proportions:
♦ less than 50% attendance at Board meetings: no payment of the variable component; ♦ attendance at Board meetings between 50% and 75%: half of the variable component is paid; ♦ attendance at Board meetings greater than 75%: all of the variable component is paid.
Benefi ts in kind N/A Christian Guillemot does not receive any benefi ts in kind
Severance payment N/A No commitment of this type exists
Non-compete indemnity N/A There is no non-compete clause applicable
Supplementary pension scheme
N/A Christian Guillemot is not eligible for a supplementary pension scheme
(1) €69.155, corresponding to the average closing price of the Ubisoft S hare on Euronext Paris for the 20 trading days prior to the Board of Directors’ meeting
(2) Average closing price of the Ubisoft S hare during the 3 months prior to the vesting date (excluding the vesting date itself) as recorded on Euronext Paris
(3) Attendance rate at Board of Directors’ meetings for the fi nancial year ended 03/31/18 indicated in section 4.1.3.2
- 2018 Registration Document 95
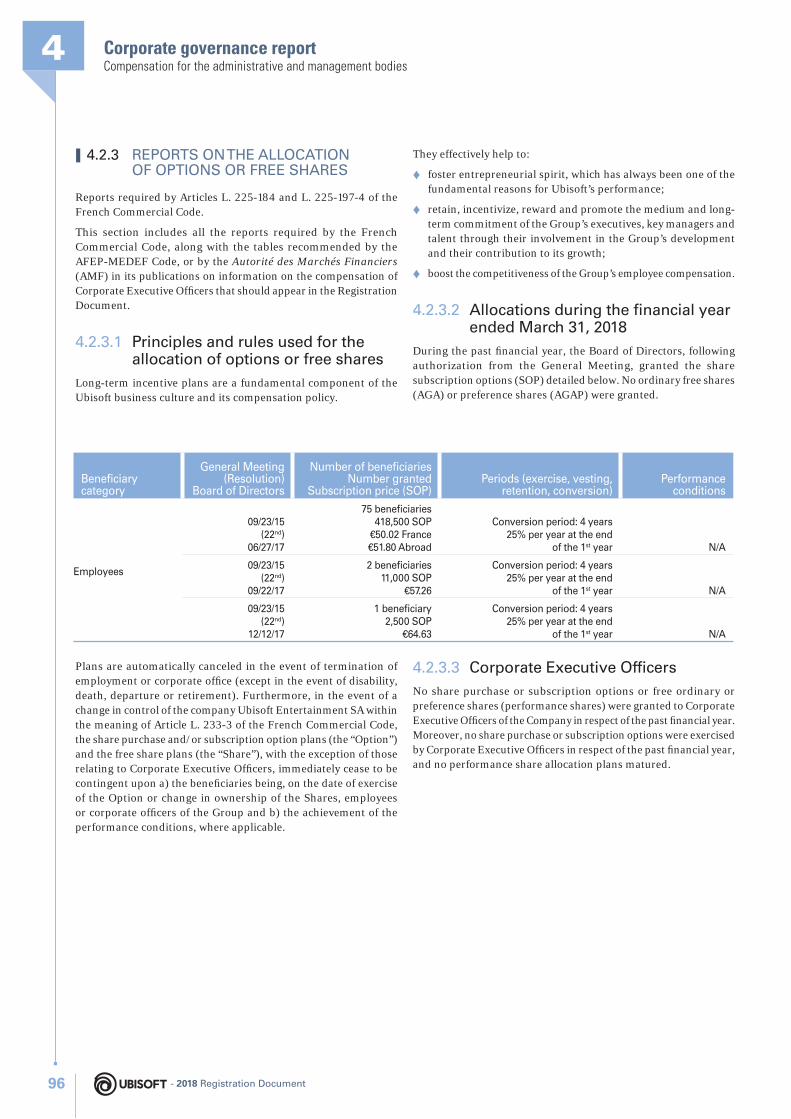
Corporate governance report4Compensation for the administrative and management bodies
❙ 4.2.3 REPORTS ON THE ALLOCATION OF OPTIONS OR FREE SHARES
Reports required by Articles L. 225-184 and L. 225-197-4 of the French Commercial Code.
This section includes all the reports required by the French Commercial Code, along with the tables recommended by the AFEP-MEDEF Code, or by the Autorité des Marchés Financiers (AMF) in its publications on information on the compensation of Corporate Executive Offi cers that should appear in the Registration Document.
4.2.3.1 Principles and rules used for the allocation of options or free shares
Long-term incentive plans are a fundamental component of the Ubisoft business culture and its compensation policy.
They effectively help to:
♦ foster entrepreneurial spirit, which has always been one of the fundamental reasons for Ubisoft’s performance;
♦ retain, incentivize, reward and promote the medium and long-term commitment of the Group’s executives, key managers and talent through their involvement in the Group’s development and their contribution to its growth;
♦ boost the competitiveness of the Group’s employee compensation.
4.2.3.2 Allocations during the fi nancial year ended March 31, 2018
During the past fi nancial year, the Board of Directors, following authorization from the General Meeting, granted the share subscription options (SOP) detailed below. No ordinary free shares (AGA) or preference shares (AGAP) were granted.
Benefi ciary category
General Meeting(Resolution)
Board of Directors
Number of benefi ciariesNumber granted
Subscription price (SOP)Periods (exercise, vesting,
retention, conversion)Performance
conditions
Employees
09/23/15(22nd)
06/27/17
75 benefi ciaries418,500 SOP
€50.02 France€51.80 Abroad
Conversion period: 4 years25% per year at the end
of the 1st year N/A
09/23/15(22nd)
09/22/17
2 benefi ciaries11,000 SOP
€57.26
Conversion period: 4 years25% per year at the end
of the 1st year N/A
09/23/15(22nd)
12/12/17
1 benefi ciary2,500 SOP
€64.63
Conversion period: 4 years25% per year at the end
of the 1st year N/A
Plans are automatically canceled in the event of termination of employment or corporate offi ce (except in the event of disability, death, departure or retirement). Furthermore, in the event of a change in control of the company Ubisoft Entertainment SA within the meaning of Article L. 233-3 of the French Commercial Code, the share purchase and/or subscription option plans (the “Option”) and the free share plans (the “Share”), with the exception of those relating to Corporate Executive Offi cers, immediately cease to be contingent upon a) the benefi ciaries being, on the date of exercise of the Option or change in ownership of the Shares, employees or corporate offi cers of the Group and b) the achievement of the performance conditions, where applicable.
4.2.3.3 Corporate Executive Offi cers
No share purchase or subscription options or free ordinary or preference shares (performance shares) were granted to Corporate Executive Offi cers of the Company in respect of the past fi nancial year. Moreover, no share purchase or subscription options were exercised by Corporate Executive Offi cers in respect of the past fi nancial year, and no performance share allocation plans matured.
- 2018 Registration Document96
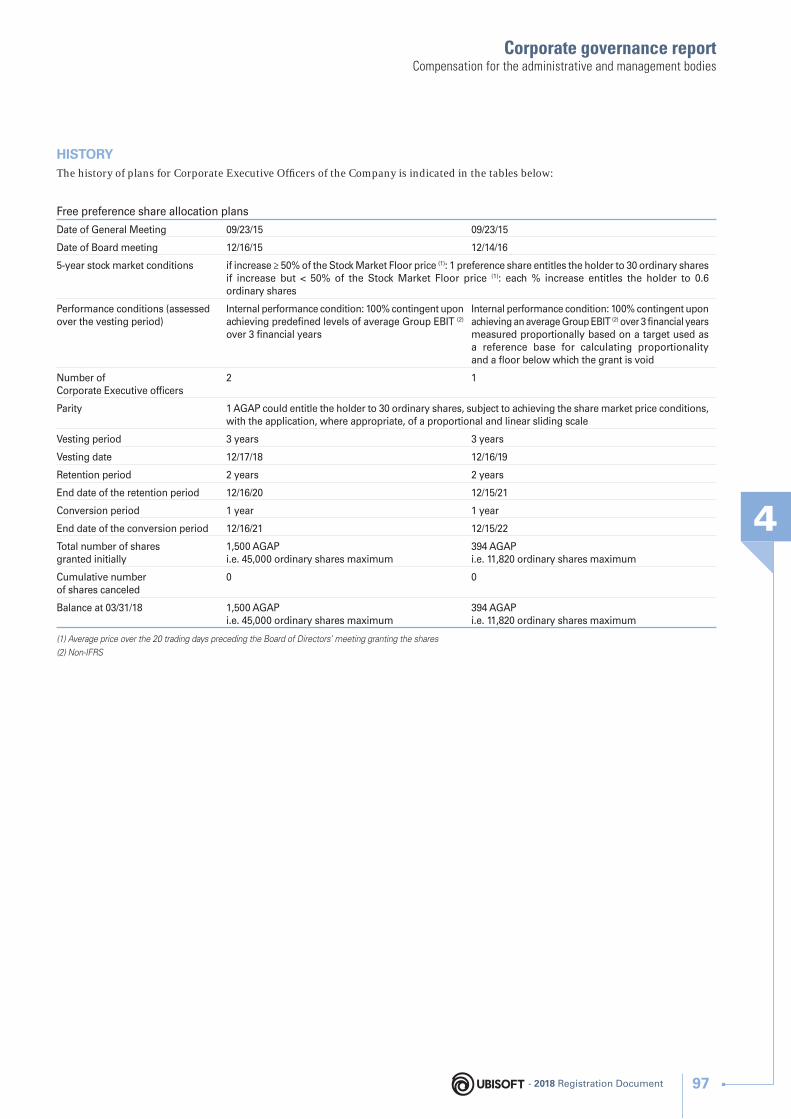
Corporate governance report
4
Compensation for the administrative and management bodies
HISTORYThe history of plans for Corporate Executive Offi cers of the Company is indicated in the tables below:
Free preference share allocation plans
Date of General Meeting 09/23/15 09/23/15
Date of Board meeting 12/16/15 12/14/16
5-year stock market conditions if increase ≥ 50% of the Stock Market Floor price (1): 1 preference share entitles the holder to 30 ordinary sharesif increase but < 50% of the Stock Market Floor price (1): each % increase entitles the holder to 0.6 ordinary shares
Performance conditions (assessed over the vesting period)
Internal performance condition: 100% contingent upon achieving predefi ned levels of average Group EBIT (2) over 3 fi nancial years
Internal performance condition: 100% contingent upon achieving an average Group EBIT (2) over 3 fi nancial years measured proportionally based on a target used as a reference base for calculating proportionality and a fl oor below which the grant is void
Number of Corporate Executive offi cers
2 1
Parity 1 AGAP could entitle the holder to 30 ordinary shares, subject to achieving the share market price conditions, with the application, where appropriate, of a proportional and linear sliding scale
Vesting period 3 years 3 years
Vesting date 12/17/18 12/16/19
Retention period 2 years 2 years
End date of the retention period 12/16/20 12/15/21
Conversion period 1 year 1 year
End date of the conversion period 12/16/21 12/15/22
Total number of shares granted initially
1,500 AGAPi.e. 45,000 ordinary shares maximum
394 AGAPi.e. 11,820 ordinary shares maximum
Cumulative number of shares canceled
0 0
Balance at 03/31/18 1,500 AGAPi.e. 45,000 ordinary shares maximum
394 AGAPi.e. 11,820 ordinary shares maximum
(1) Average price over the 20 trading days preceding the Board of Directors’ meeting granting the shares
(2) Non-IFRS
- 2018 Registration Document 97
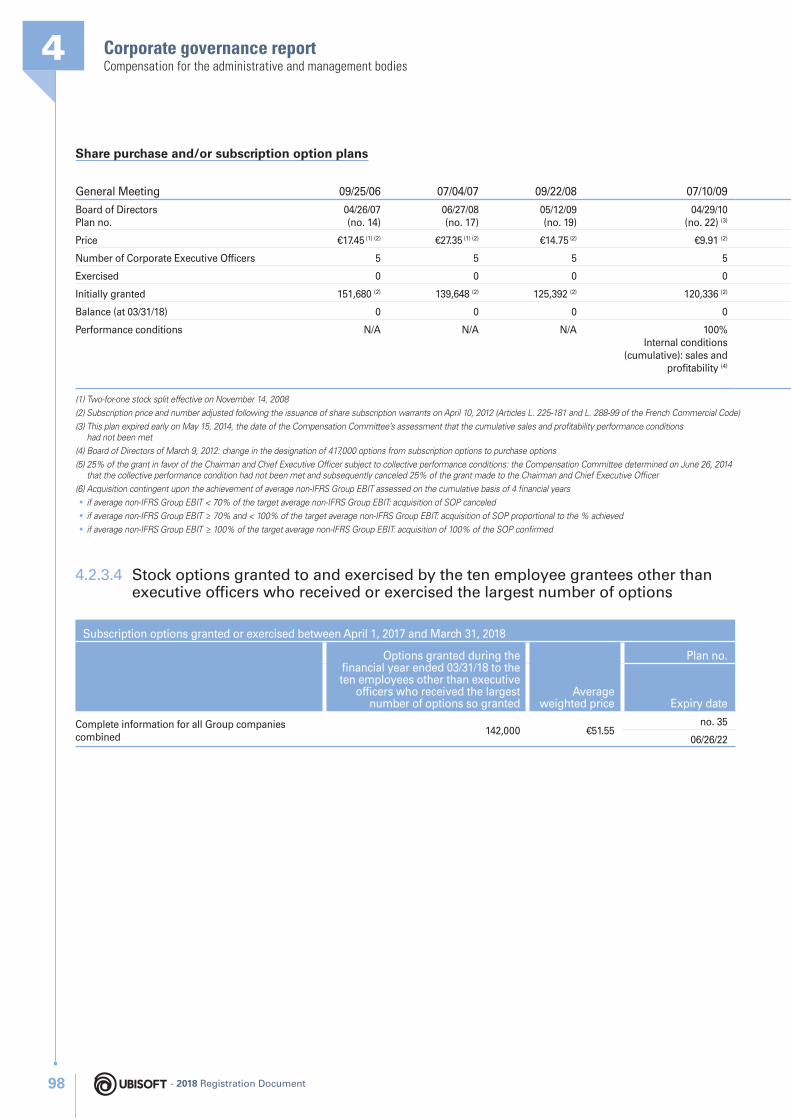
Corporate governance report4Compensation for the administrative and management bodies
Share purchase and/or subscription option plans
General Meeting 09/25/06 07/04/07 09/22/08 07/10/09
Board of DirectorsPlan no.
04/26/07 (no. 14)
06/27/08(no. 17)
05/12/09(no. 19)
04/29/10(no. 22) (3)
Price €17.45 (1) (2) €27.35 (1) (2) €14.75 (2) €9.91 (2)
Number of Corporate Executive O ffi cers 5 5 5 5
Exercised 0 0 0 0
Initially granted 151,680 (2) 139,648 (2) 125,392 (2) 120,336 (2)
Balance (at 03/31/18) 0 0 0 0
Performance conditions N/A N/A N/A 100%Internal conditions
(cumulative): sales and profi tability (4)
(1) Two-for-one stock split effective on November 14, 2008
(2) Subscription price and number adjusted following the issuance of share subscription warrants on April 10, 2012 (Articles L. 225-181 and L. 288-99 of the French Commercial Code)
(3) This plan expired early on May 15, 2014, the date of the Compensation Committee’s assessment that the cumulative sales and profi tability performance conditions had not been met
(4) Board of Directors of March 9, 2012: change in the designation of 417,000 options from subscription options to purchase options
(5) 25% of the grant in favor of the Chairman and Chief Executive Offi cer subject to collective performance conditions: the Compensation Committee determined on June 26, 2014 that the collective performance condition had not been met and subsequently canceled 25% of the grant made to the Chairman and Chief Executive Offi cer
(6) Acquisition contingent upon the achievement of average non-IFRS Group EBIT assessed on the cumulative basis of 4 fi nancial years
• if average non-IFRS Group EBIT < 70% of the target average non-IFRS Group EBIT: acquisition of SOP canceled
• if average non-IFRS Group EBIT ≥ 70% and < 100% of the target average non-IFRS Group EBIT: acquisition of SOP proportional to the % achieved
• if average non-IFRS Group EBIT ≥ 100% of the target average non-IFRS Group EBIT: acquisition of 100% of the SOP confi rmed
4.2.3.4 Stock options granted to and exercised by the ten employee grantees other than executive offi cers who received or exercised the largest number of options
Subscription options granted or exercised between April 1, 2017 and March 31, 2018
Options granted during the fi nancial year ended 03/31/18 to the ten employees other than executive
offi cers who received the largest number of options so granted
Average weighted price
Plan no.
Expiry date
Complete information for all Group companies combined
142,000 €51.55no. 35
06/26/22
- 2018 Registration Document98
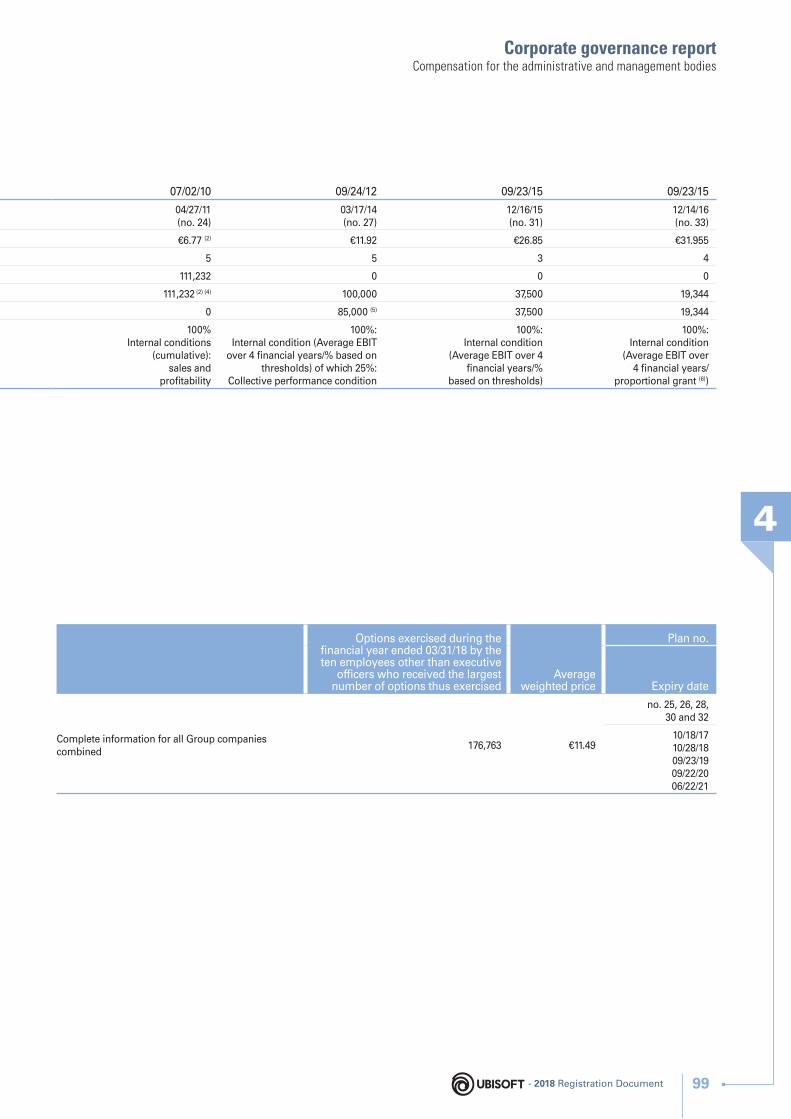
Corporate governance report
4
Compensation for the administrative and management bodies
07/02/10 09/24/12 09/23/15 09/23/15
04/27/11(no. 24)
03/17/14(no. 27)
12/16/15(no. 31)
12/14/16(no. 33)
€6.77 (2) €11.92 €26.85 €31.955
5 5 3 4
111,232 0 0 0
111,232 (2) (4) 100,000 37,500 19,344
0 85,000 (5) 37,500 19,344
100%Internal conditions
(cumulative):sales and
profi tability
100%:Internal condition (Average EBIT
over 4 fi nancial years/% based on thresholds) of which 25%:
Collective performance condition
100%:Internal condition
(Average EBIT over 4 fi nancial years/%
based on thresholds)
100%:Internal condition
(Average EBIT over 4 fi nancial years/
proportional grant (6))
Options exercised during the fi nancial year ended 03/31/18 by the ten employees other than executive
offi cers who received the largest number of options thus exercised
Average weighted price
Plan no.
Expiry date
Complete information for all Group companies combined
176,763 €11.49
no. 25, 26, 28, 30 and 32
10/18/1710/28/1809/23/1909/22/2006/22/21
- 2018 Registration Document 99
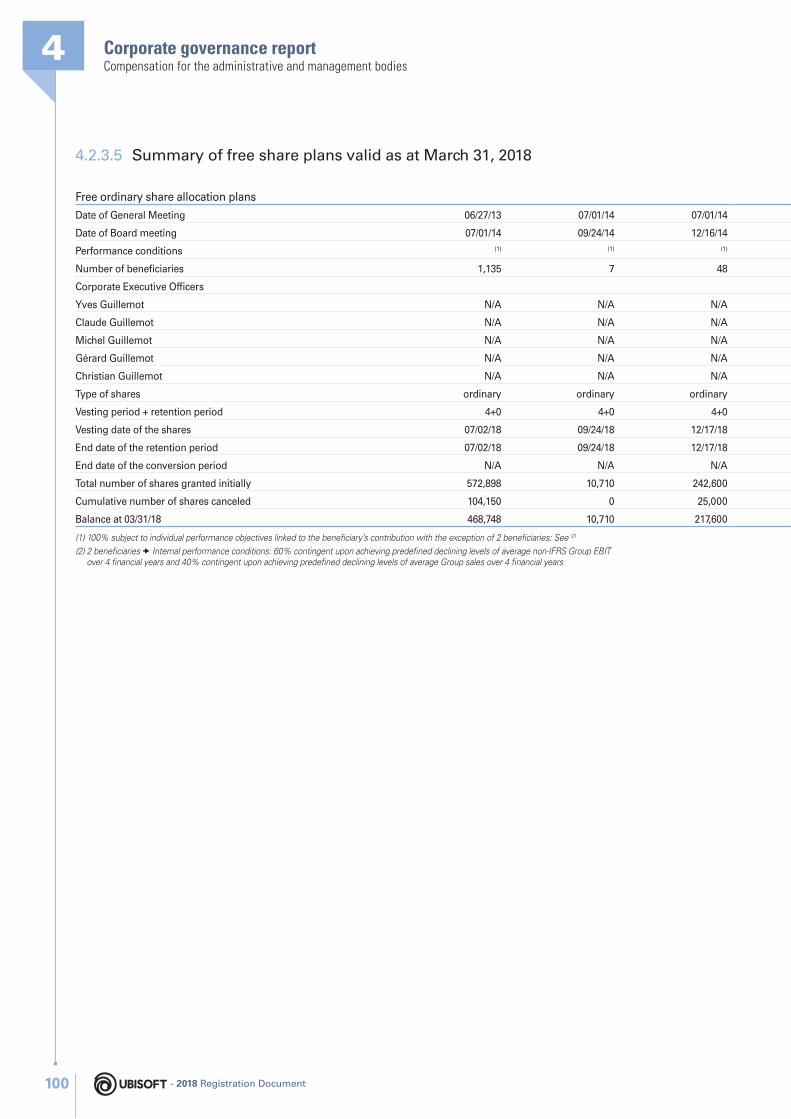
Corporate governance report4Compensation for the administrative and management bodies
4.2.3.5 Summary of free share plans valid as at March 31, 2018
Free ordinary share allocation plans
Date of General Meeting 06/27/13 07/01/14 07/01/14
Date of Board meeting 07/01/14 09/24/14 12/16/14
Performance conditions (1) (1) (1)
Number of benefi ciaries 1,135 7 48
Corporate Executive Offi cers
Yves Guillemot N/A N/A N/A
Claude Guillemot N/A N/A N/A
Michel Guillemot N/A N/A N/A
Gérard Guillemot N/A N/A N/A
Christian Guillemot N/A N/A N/A
Type of shares ordinary ordinary ordinary
Vesting period + retention period 4+0 4+0 4+0
Vesting date of the shares 07/02/18 09/24/18 12/17/18
End date of the retention period 07/02/18 09/24/18 12/17/18
End date of the conversion period N/A N/A N/A
Total number of shares granted initially 572,898 10,710 242,600
Cumulative number of shares canceled 104,150 0 25,000
Balance at 03/31/18 468,748 10,710 217,600
(1) 100% subject to individual performance objectives linked to the benefi ciary’s contribution with the exception of 2 benefi ciaries: See (2)
(2) 2 benefi ciaries Internal performance conditions: 60% contingent upon achieving predefi ned declining levels of average non-IFRS Group EBIT over 4 fi nancial years and 40% contingent upon achieving predefi ned declining levels of average Group sales over 4 fi nancial years
- 2018 Registration Document100
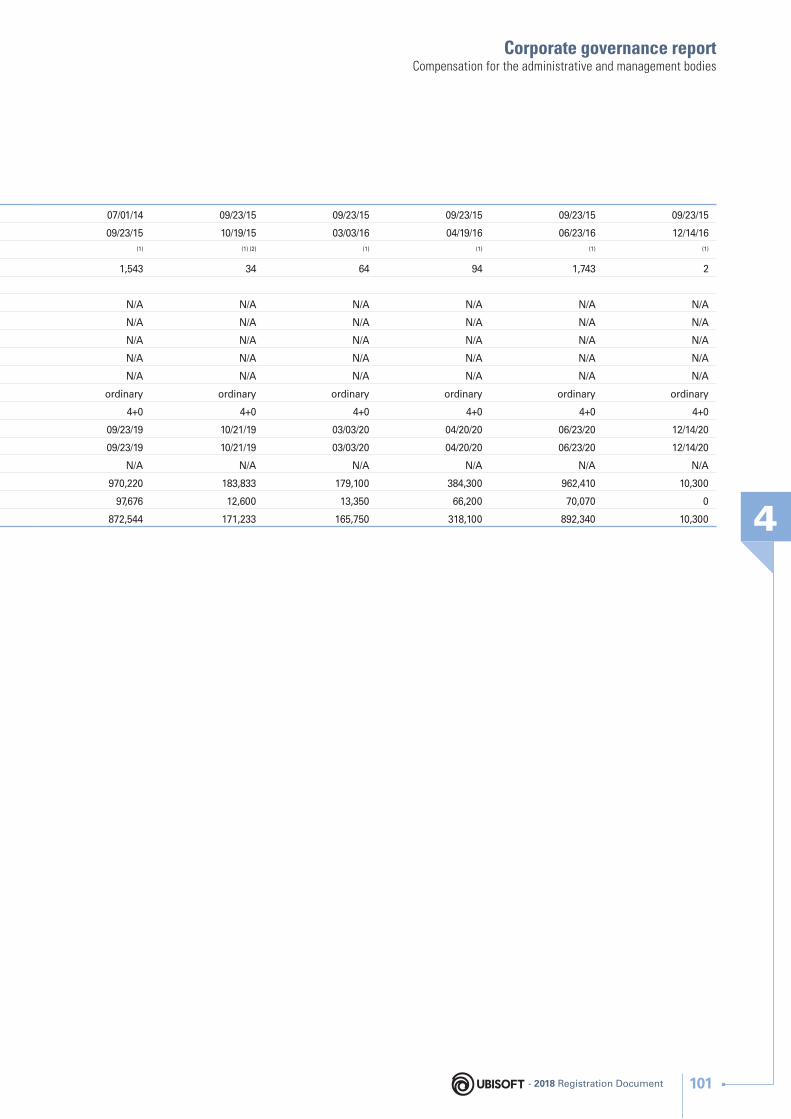
Corporate governance report
4
Compensation for the administrative and management bodies
07/01/14 09/23/15 09/23/15 09/23/15 09/23/15 09/23/15
09/23/15 10/19/15 03/03/16 04/19/16 06/23/16 12/14/16
(1) (1) (2) (1) (1) (1) (1)
1,543 34 64 94 1,743 2
N/A N/A N/A N/A N/A N/A
N/A N/A N/A N/A N/A N/A
N/A N/A N/A N/A N/A N/A
N/A N/A N/A N/A N/A N/A
N/A N/A N/A N/A N/A N/A
ordinary ordinary ordinary ordinary ordinary ordinary
4+0 4+0 4+0 4+0 4+0 4+0
09/23/19 10/21/19 03/03/20 04/20/20 06/23/20 12/14/20
09/23/19 10/21/19 03/03/20 04/20/20 06/23/20 12/14/20
N/A N/A N/A N/A N/A N/A
970,220 183,833 179,100 384,300 962,410 10,300
97,676 12,600 13,350 66,200 70,070 0
872,544 171,233 165,750 318,100 892,340 10,300
- 2018 Registration Document 101
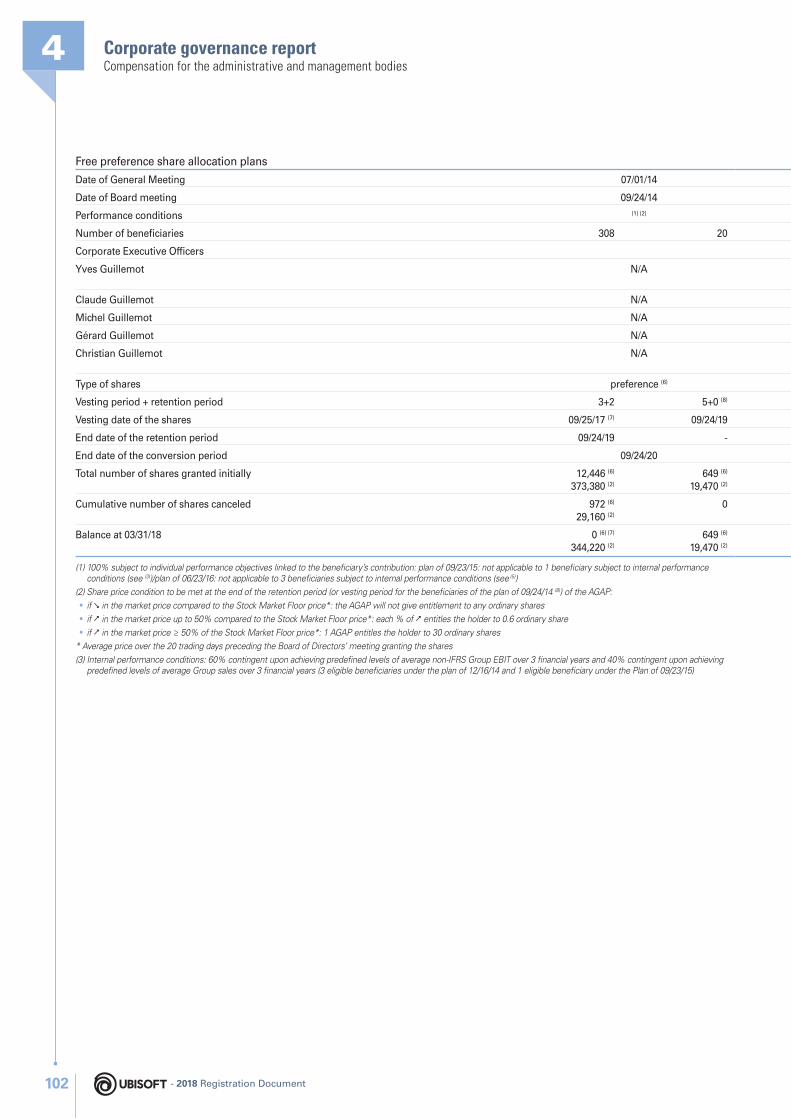
Corporate governance report4Compensation for the administrative and management bodies
Free preference share allocation plans
Date of General Meeting 07/01/14
Date of Board meeting 09/24/14
Performance conditions (1) (2)
Number of benefi ciaries 308 20
Corporate Executive Offi cers
Yves Guillemot N/A
Claude Guillemot N/A
Michel Guillemot N/A
Gérard Guillemot N/A
Christian Guillemot N/A
Type of shares preference (6)
Vesting period + retention period 3+2 5+0 (8)
Vesting date of the shares 09/25/17 (7) 09/24/19
End date of the retention period 09/24/19 -
End date of the conversion period 09/24/20
Total number of shares granted initially 12,446 (6)
373,380 (2)
649 (6)
19,470 (2)
Cumulative number of shares canceled 972 (6)
29,160 (2)
0
Balance at 03/31/18 0 (6) (7)
344,220 (2)
649 (6)
19,470 (2)
(1) 100% subject to individual performance objectives linked to the benefi ciary’s contribution: plan of 09/23/15: not applicable to 1 benefi ciary subject to internal performance conditions (see (3))/plan of 06/23/16: not applicable to 3 benefi ciaries subject to internal performance conditions (see (5))
(2) Share price condition to be met at the end of the retention period (or vesting period for the benefi ciaries of the plan of 09/24/14 (8)) of the AGAP:
• if in the market price compared to the Stock Market Floor price*: the AGAP will not give entitlement to any ordinary shares
• if in the market price up to 50% compared to the Stock Market Floor price*: each % of entitles the holder to 0.6 ordinary share
• if in the market price ≥ 50% of the Stock Market Floor price*: 1 AGAP entitles the holder to 30 ordinary shares
* Average price over the 20 trading days preceding the Board of Directors’ meeting granting the shares
(3) Internal performance conditions: 60% contingent upon achieving predefi ned levels of average non-IFRS Group EBIT over 3 fi nancial years and 40% contingent upon achieving predefi ned levels of average Group sales over 3 fi nancial years (3 eligible benefi ciaries under the plan of 12/16/ 14 and 1 eligible benefi ciary under the Plan of 09/ 23/ 15)
- 2018 Registration Document102
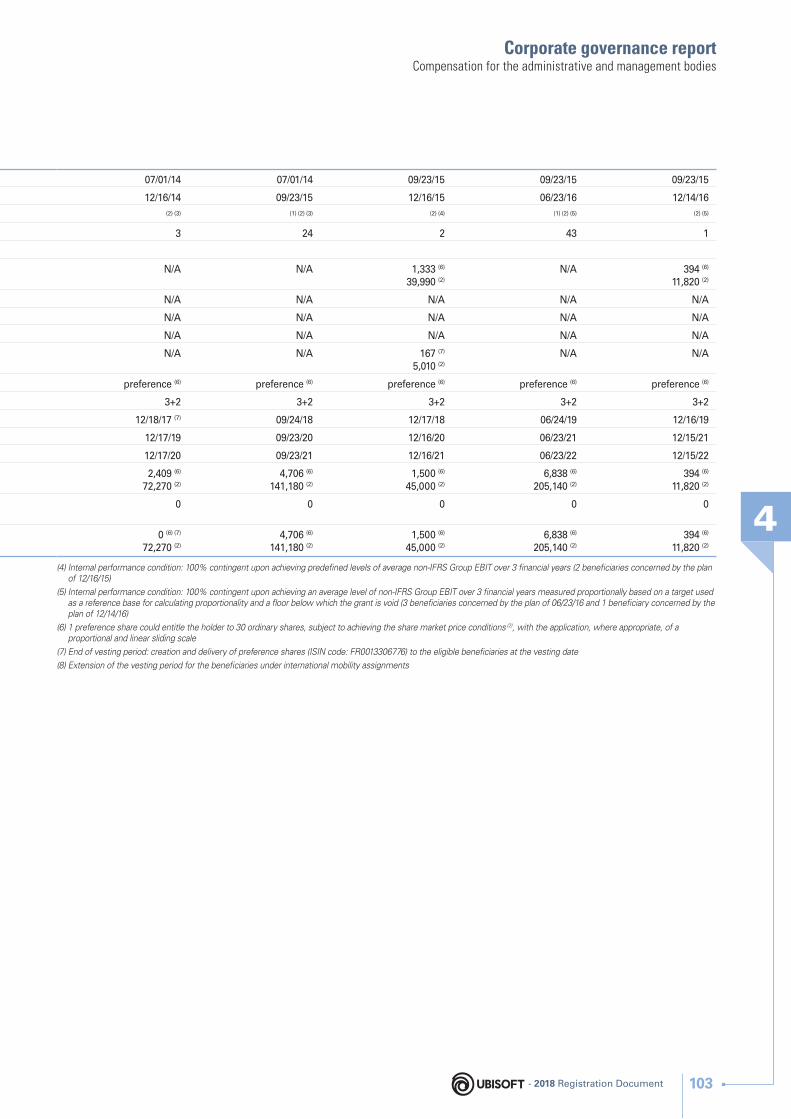
Corporate governance report
4
Compensation for the administrative and management bodies
07/01/14 07/01/14 09/23/15 09/23/15 09/23/15
12/16/14 09/23/15 12/16/15 06/23/16 12/14/16
(2) (3) (1) (2) (3) (2) (4) (1) (2) (5) (2) (5)
3 24 2 43 1
N/A N/A 1,333 (6)
39,990 (2)
N/A 394 (6)
11,820 (2)
N/A N/A N/A N/A N/A
N/A N/A N/A N/A N/A
N/A N/A N/A N/A N/A
N/A N/A 167 (7)
5,010 (2)
N/A N/A
preference (6) preference (6) preference (6) preference (6) preference (6)
3+2 3+2 3+2 3+2 3+2
12/18/17 (7) 09/24/18 12/17/18 06/24/19 12/16/19
12/17/19 09/23/20 12/16/20 06/23/21 12/15/21
12/17/20 09/23/21 12/16/21 06/23/22 12/15/22
2,409 (6)
72,270 (2)
4,706 (6)
141,180 (2)
1,500 (6)
45,000 (2)
6,838 (6)
205,140 (2)
394 (6)
11,820 (2)
0 0 0 0 0
0 (6) (7)
72,270 (2)
4,706 (6)
141,180 (2)
1,500 (6)
45,000 (2)
6,838 (6)
205,140 (2)
394 (6)
11,820 (2)
(4) Internal performance condition: 100% contingent upon achieving predefi ned levels of average non-IFRS Group EBIT over 3 fi nancial years (2 benefi ciaries concerned by the plan of 12/16/15)
(5) Internal performance condition: 100% contingent upon achieving an average level of non-IFRS Group EBIT over 3 fi nancial years measured proportionally based on a target used as a reference base for calculating proportionality and a fl oor below which the grant is void (3 benefi ciaries concerned by the plan of 06/23/16 and 1 benefi ciary concerned by the plan of 12/14/16)
(6) 1 preference share could entitle the holder to 30 ordinary shares, subject to achieving the share market price conditions (2), with the application, where appropriate, of a proportional and linear sliding scale
(7) End of vesting period: creation and delivery of preference shares (ISIN code: FR0013306776) to the eligible benefi ciaries at the vesting date
(8) Extension of the vesting period for the benefi ciaries under international mobility assignments
- 2018 Registration Document 103
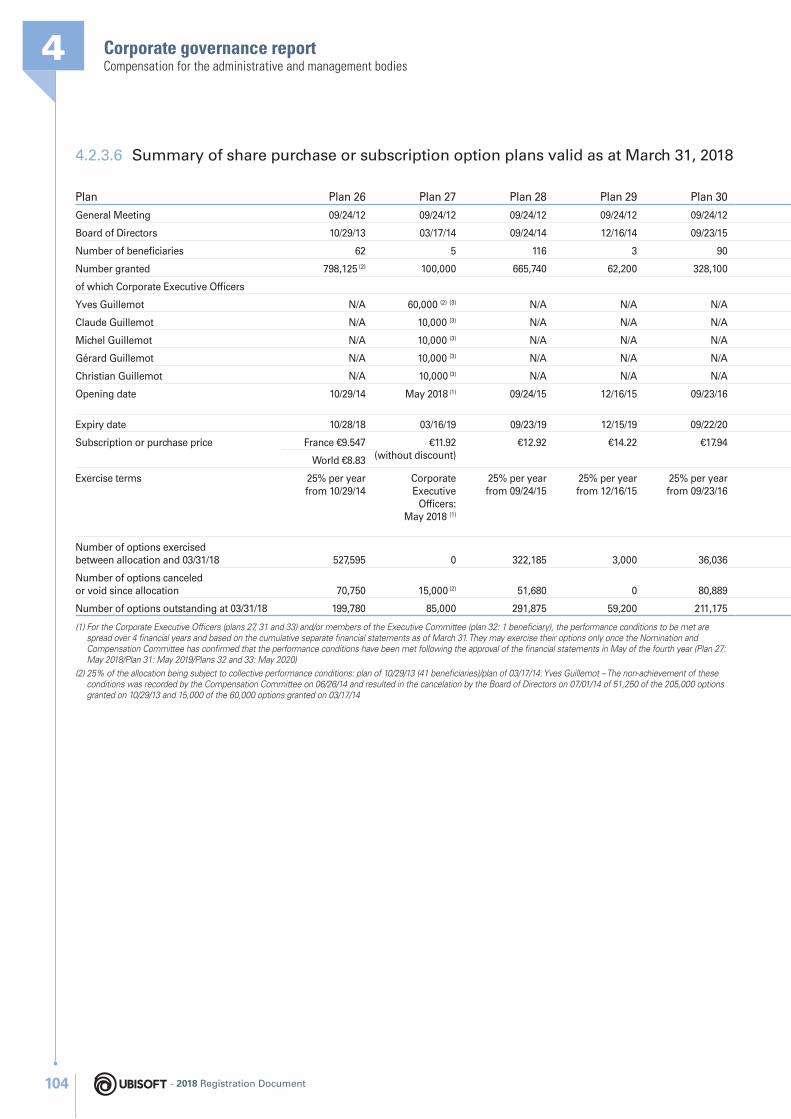
Corporate governance report4Compensation for the administrative and management bodies
4.2.3.6 Summary of share purchase or subscription option plans valid as at March 31, 2018
Plan Plan 26 Plan 27 Plan 28 Plan 29 Plan 30
General Meeting 09/24/12 09/24/12 09/24/12 09/24/12 09/24/12
Board of Directors 10/29/13 03/17/14 09/24/14 12/16/14 09/23/15
Number of benefi ciaries 62 5 116 3 90
Number granted 798,125 (2) 100,000 665,740 62,200 328,100
of which C orporate Executive O ffi cers
Yves Guillemot N/A 60,000 (2) (3) N/A N/A N/A
Claude Guillemot N/A 10,000 (3) N/A N/A N/A
Michel Guillemot N/A 10,000 (3) N/A N/A N/A
Gérard Guillemot N/A 10,000 (3) N/A N/A N/A
Christian Guillemot N/A 10,000 (3) N/A N/A N/A
Opening date 10/29/14 May 2018 (1) 09/24/15 12/16/15 09/23/16
Expiry date 10/28/18 03/16/19 09/23/19 12/15/19 09/22/20
Subscription or purchase price France €9.547 €11. 92 (without discount)
€12.92 €14.22 €17.94
World €8.83
Exercise terms 25% per year from 10/29/14
Corporate Executive
O ffi cers: May 2018 (1)
25% per year from 09/24/15
25% per year from 12/16/15
25% per year from 09/23/16
Number of options exercised between allocation and 03/31/18 527,595 0 322,185 3,000 36,036
Number of options canceled or void since allocation 70,750 15,000 (2) 51,680 0 80,889
Number of options outstanding at 03/31/18 199,780 85,000 291,875 59,200 211,175
(1) For the C orporate Executive O ffi cers (plans 27, 31 and 33) and/or members of the Executive Committee (plan 32: 1 benefi ciary), the performance conditions to be met are spread over 4 fi nancial years and based on the cumulative separate fi nancial statements as of March 31. They may exercise their options only once the Nomination and Compensation Committee has confi rmed that the performance conditions have been met following the approval of the fi nancial statements in May of the fourth year ( Plan 27: May 2018/Plan 31: May 2019/Plans 32 and 33: May 2020)
(2) 25% of the allocation being subject to collective performance conditions: plan of 10/29/13 (41 benefi ciaries)/plan of 03/17/14: Yves Guillemot – The non-achievement of these conditions was recorded by the Compensation Committee on 06/26/14 and resulted in the cancelation by the Board of Directors on 07/01/14 of 51,250 of the 205,000 options granted on 10/29/13 and 15,000 of the 60,000 options granted on 03/17/14
- 2018 Registration Document104
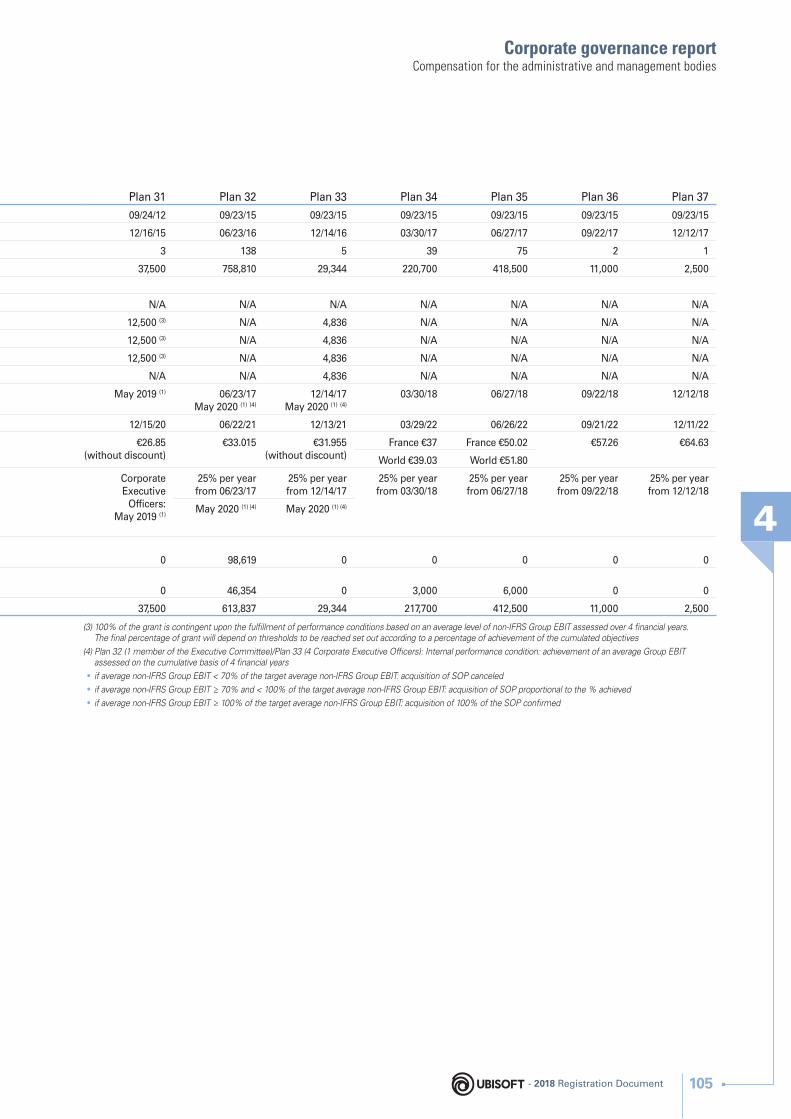
Corporate governance report
4
Compensation for the administrative and management bodies
Plan 31 Plan 32 Plan 33 Plan 34 Plan 35 Plan 36 Plan 37
09/24/12 09/23/15 09/23/15 09/23/15 09/23/15 09/23/15 09/23/15
12/16/15 06/23/16 12/14/16 03/30/17 06/27/17 09/22/17 12/12/17
3 138 5 39 75 2 1
37,500 758,810 29,344 220,700 418,500 11,000 2,500
N/A N/A N/A N/A N/A N/A N/A
12,500 (3) N/A 4,836 N/A N/A N/A N/A
12,500 (3) N/A 4,836 N/A N/A N/A N/A
12,500 (3) N/A 4,836 N/A N/A N/A N/A
N/A N/A 4,836 N/A N/A N/A N/A
May 2019 (1) 06/23/17 May 2020 (1) (4)
12/14/17 May 2020 (1) (4)
03/30/18 06/27/18 09/22/18 12/12/18
12/15/20 06/22/21 12/13/21 03/29/22 06/26/22 09/21/22 12/11/22
€26.85 (without discount)
€33.015 €31.955 (without discount)
France €37 France €50.02 €57.26 €64.63
World €39.03 World €51.80
Corporate Executive
O ffi cers:May 2019 (1)
25% per year from 06/23/17
25% per year from 12/14/17
25% per year from 03/30/18
25% per year from 06/27/18
25% per year from 09/22/18
25% per year from 12/12/18
May 2020 (1) (4) May 2020 (1) (4)
0 98,619 0 0 0 0 0
0 46,354 0 3,000 6,000 0 0
37,500 613,837 29,344 217,700 412,500 11,000 2,500
(3) 100% of the grant is contingent upon the fulfi llment of performance conditions based on an average level of non-IFRS Group EBIT assessed over 4 fi nancial years. The fi nal percentage of grant will depend on thresholds to be reached set out according to a percentage of achievement of the cumulated objectives
(4) Plan 32 (1 member of the Executive Committee)/Plan 33 (4 Corporate Executive Offi cers): Internal performance condition: achievement of an average Group EBIT assessed on the cumulative basis of 4 fi nancial years
• if average non-IFRS Group EBIT < 70% of the target average non-IFRS Group EBIT: acquisition of SOP canceled
• if average non-IFRS Group EBIT ≥ 70% and < 100% of the target average non-IFRS Group EBIT: acquisition of SOP proportional to the % achieved
• if average non-IFRS Group EBIT ≥ 100% of the target average non-IFRS Group EBIT: acquisition of 100% of the SOP confi rmed
- 2018 Registration Document 105
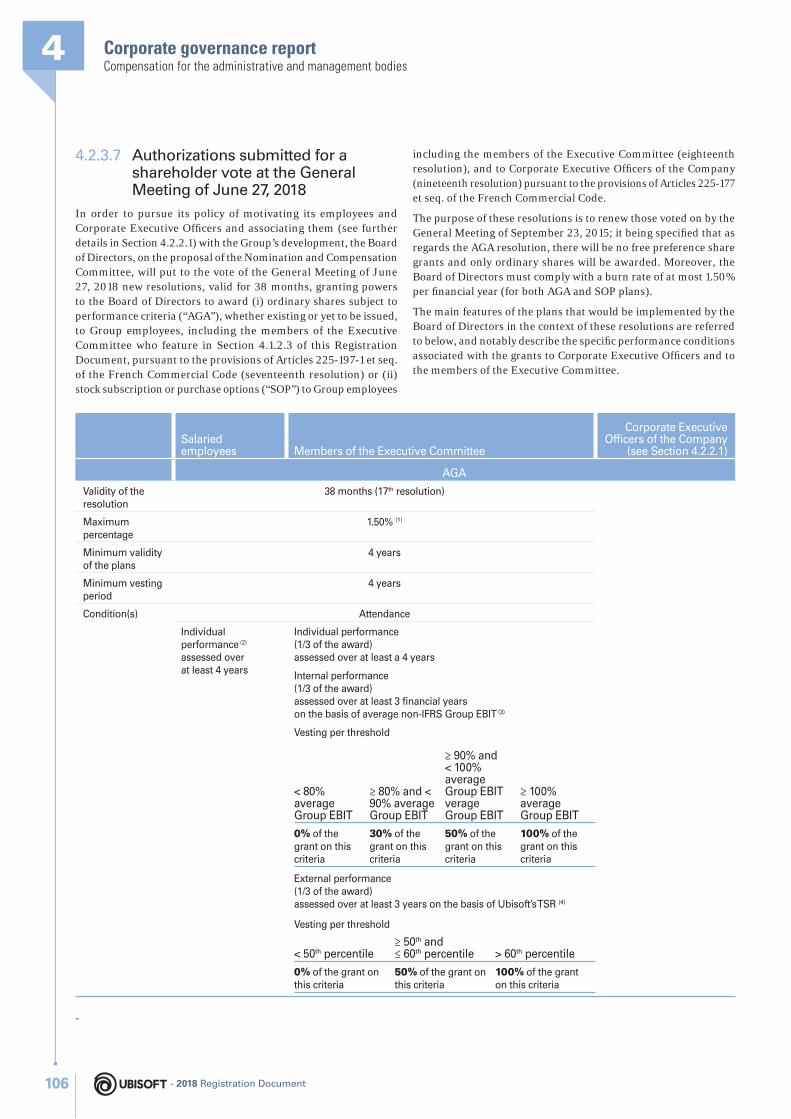
Corporate governance report4Compensation for the administrative and management bodies
4.2.3.7 Authorizations submitted for a shareholder vote at the General Meeting of June 27, 2018
In order to pursue its policy of motivating its employees and Corporate Executive Offi cers and associating them (see further details in Section 4.2.2.1) with the Group’s development, the Board of Directors, on the proposal of the Nomination and Compensation Committee, will put to the vote of the General Meeting of June 27, 2018 new resolutions, valid for 38 months, granting powers to the Board of Directors to award (i) ordinary shares subject to performance criteria (“AGA”), whether existing or yet to be issued, to Group employees, including the members of the Executive Committee who feature in Section 4.1.2.3 of this Registration Document, pursuant to the provisions of Articles 225-197-1 et seq. of the French Commercial Code (seventeenth resolution) or (ii) stock subscription or purchase options (“SOP”) to Group employees
including the members of the Executive Committee (eighteenth resolution), and to Corporate Executive Offi cers of the Company (nineteenth resolution) pursuant to the provisions of Articles 225- 177 et seq. of the French Commercial Code.
The purpose of these resolutions is to renew those voted on by the General Meeting of September 23, 2015; it being specifi ed that as regards the AGA resolution, there will be no free preference share grants and only ordinary shares will be awarded. Moreover, the Board of Directors must comply with a burn rate of at most 1.50% per fi nancial year (for both AGA and SOP plans).
The main features of the plans that would be implemented by the Board of Directors in the context of these resolutions are referred to below, and notably describe the specifi c performance conditions associated with the grants to Corporate Executive Offi cers and to the members of the Executive Committee.
Salaried employees Members of the Executive Committee
Corporate Executive Offi cers of the Company
(see Section 4.2.2.1)
AGA
Validity of the resolution
38 months (17th resolution)
Maximum percentage
1.50% (1)
Minimum validity of the plans
4 years
Minimum vesting period
4 years
Condition(s) Attendance
Individual performance (2) assessed over at least 4 years
Individual performance(1/3 of the award) a ssessed over at least a 4 years
Internal performance(1/3 of the award) assessed over at least 3 financial years on the basis of average non-IFRS Group EBIT (3)
Vesting per threshold
< 80% average Group EBIT
≥ 80% and < 90% average Group EBIT
≥ 90% and < 100% average Group EBIT verage Group EBIT
≥ 100% average Group EBIT
0% of the grant on this criteria
30% of the grant on this criteria
50% of the grant on this criteria
100% of the grant on this criteria
External performance(1/3 of the award)assessed over at least 3 years on the basis of Ubisoft’s TSR (4)
Vesting per threshold
< 50th percentile≥ 50th and ≤ 60th percentile > 60th percentile
0% of the grant on this criteria
50% of the grant on this criteria
100% of the grant on this criteria
-
- 2018 Registration Document106
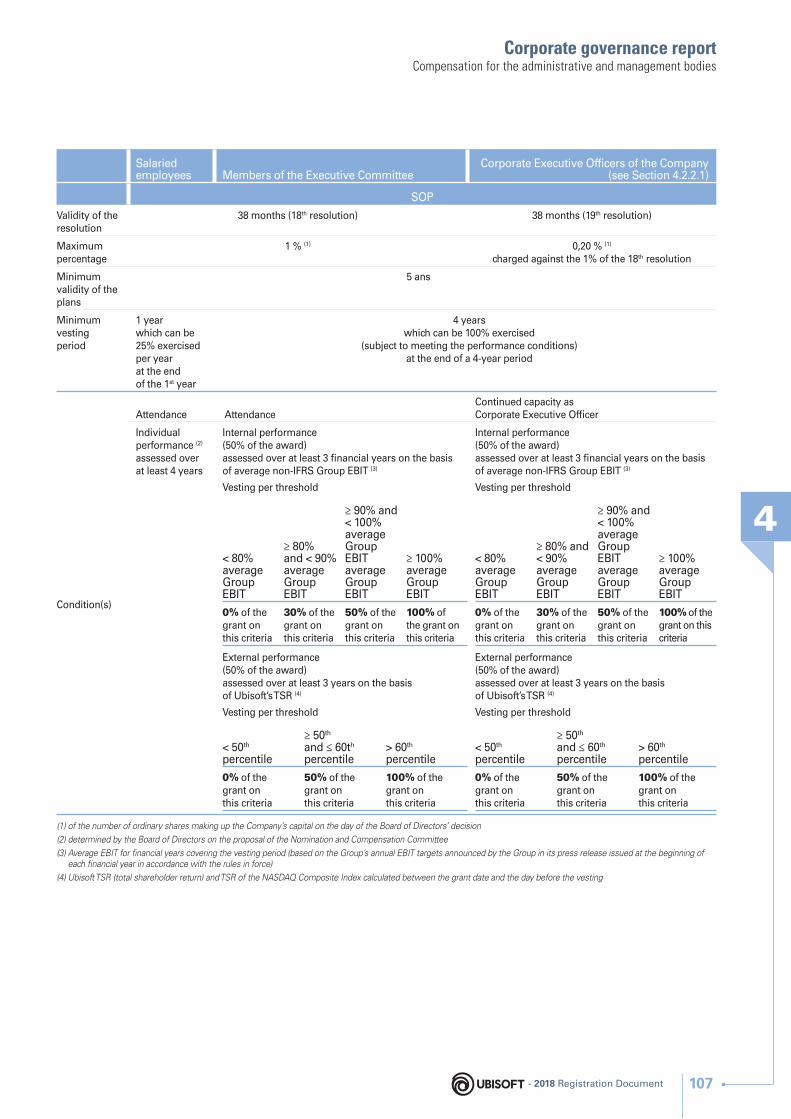
Corporate governance report
4
Compensation for the administrative and management bodies
Salaried employees Members of the Executive Committee
Corporate Executive Offi cers of the Company(see Section 4.2.2.1)
SOP
Validity of the resolution
38 months (18th resolution) 38 months (19th resolution)
Maximum percentage
1 % (1) 0,20 % (1)
charged against the 1% of the 18th resolution
Minimum validity of the plans
5 ans
Minimum vesting period
1 yearwhich can be 25% exercised per year at the end of the 1st year
4 yearswhich can be 100% exercised
(subject to meeting the performance conditions) at the end of a 4-year period
Condition(s)
Attendance AttendanceContinued capacity asCorporate Executive Offi cer
Individual performance (2)
assessed over at least 4 years
Internal performance(50% of the award)assessed over at least 3 fi nancial years on the basis of average non-IFRS Group EBIT (3)
Vesting per threshold
< 80% average Group EBIT
≥ 80% and < 90% average Group EBIT
≥ 90% and < 100% average Group EBIT average Group EBIT
≥ 100% average Group EBIT
0% of the grant on this criteria
30% of the grant on this criteria
50% of the grant on this criteria
100% of the grant on this criteria
External performance(50% of the award)assessed over at least 3 years on the basis of Ubisoft’s TSR (4)
Vesting per threshold
< 50th percentile
≥ 50th and ≤ 60th percentile
> 60th percentile
0% of the grant on this criteria
50% of the grant on this criteria
100% of the grant on this criteria
(1) of the number of ordinary shares making up the Company’s capital on the day of the Board of Directors’ decision
(2) determined by the Board of Directors on the proposal of the Nomination and Compensation Committee
(3) Average EBIT for fi nancial years covering the vesting period (based on the Group’s annual EBIT targets announced by the Group in its press release issued at the beginning of each fi nancial year in accordance with the rules in force)
(4) Ubisoft TSR (total shareholder return) and TSR of the NASDAQ Composite Index calculated between the grant date and the day before the vesting
- 2018 Registration Document 107
Corporate governance report4Auditors
4.3 Auditors
NameDate of original
appointment Expiration of current term
Primary auditor:KPMG SA represented by Vincent BroyéParc Edonia,Rue de la Terre-VictoriaCS 46806F-35768 Saint-Grégoire Cedex 2003 2019
Alternate auditor:KPMG AUDIT ISParc Edonia,Rue de la Terre-VictoriaCS 46806F-35768 Saint-Grégoire Cedex 2013 2019
Primary auditor:MAZARS represented by Arnaud Le Néen4, rue Édith PiafImmeuble AsturiaF-44800 Saint-Herblain 2016 2022
Alternate auditor:CBA61, rue Henri RegnaultTour ExaltisF-92400 Courbevoie 2016 2022
Professional fees of the Statutory auditors and members of their networks
(Document prepared in compliance with Article L. 820-3, I of the French Commercial Code)
Professional fees for the period between: April 1, 2017 and March 31, 2018 are detailed under Financial Statements in § 6.1.2.22.
- 2018 Registration Document108
5.1 METHODOLOGY NOTE ON EMPLOYEE-RELATED, ENVIRONMENTAL AND SOCIETAL REPORTING 110
5.1.1 Indicator framework 1105.1.2 Reporting period 1105.1.3 Scope of reporting 1105.1.4 Change in method/
conditions compared with the previous year 110
5.1.5 Reporting principle 1115.1.6 Methodological
clarifi cation of indicators 1125.1.7 Methodological limits
of the indicators 113
5.2 CORPORATE SOCIAL RESPONSIBILITY STRATEGY 113
5.3 EMPLOYEE-RELATED INDICATORS 113
5.3.1 Employment 1135.3.2 Developing skills and
facilitating performance 1165.3.3 Diversity and inclusion 1185.3.4 Well-being, health and
labor relations 1225.3.5 Promotion of and
compliance with the provisions of the fundamental conventions of the International Labor Organization 124
5.4 ENVIRONMENTAL INDICATORS 125
5.4.1 General environmental policy 1255.4.2 Preventing environmental
risks and pollution 1265.4.3 Provisions and guarantees 1265.4.4 Climate change 1265.4.5 Circular economy 1295.4.6 Combating pollution 131
5.5 SOCIETAL INDICATORS 1325.5.1 Support for local economic
growth 1325.5.2 Supporting causes linked
to our business 1335.5.3 Sharing social events
with local communities 1345.5.4 Developing long-term
relationships with stakeholders 135
5.5.5 Subcontractors and suppliers 1355.5.6 Fair operating practices 136
5.6 DUTY OF CARE 137
5.7 INDEPENDENT THIRD PARTY’S REPORT 138
Responsibility of the Company 138
Independence and quality control 138
Responsibility of the independent third party 138
Corporate social responsibility5
- 2018 Registration Document 109109- 2018 Registration Document
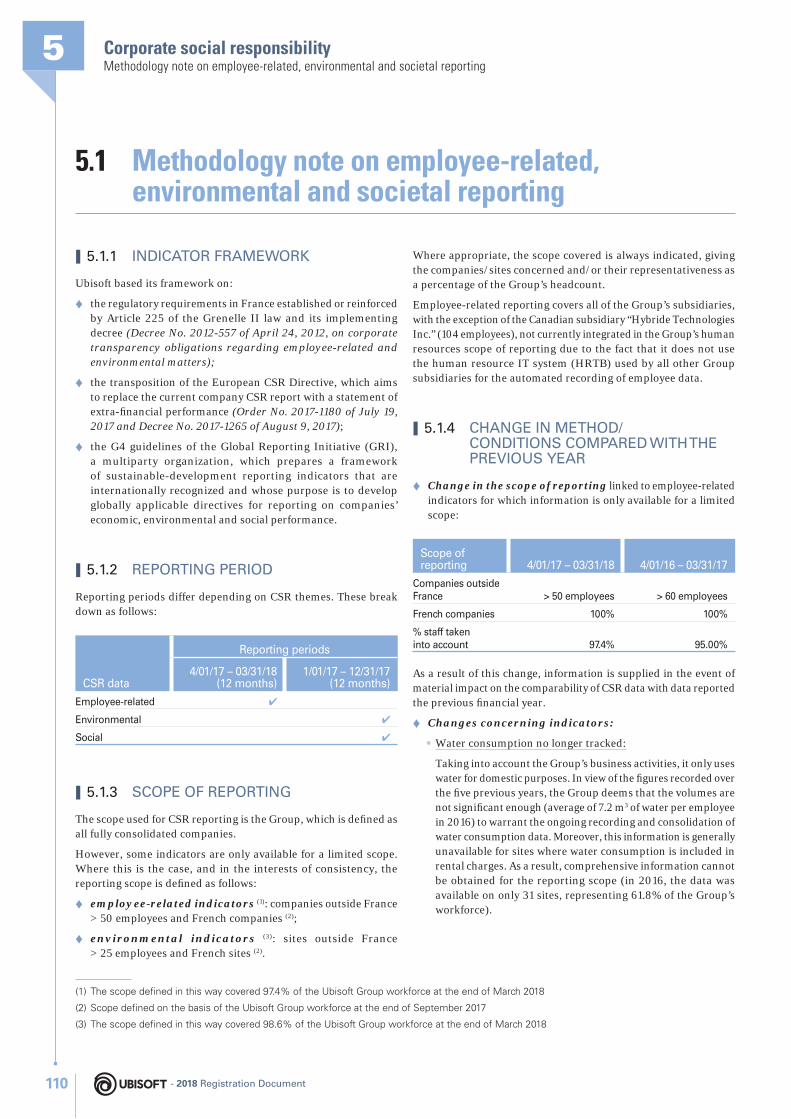
Corporate social responsibility5Methodology note on employee-related, environmental and societal reporting
5.1 Methodology note on employee-related, environmental and societal reporting
❙ 5.1.1 INDICATOR FRAMEWORK
Ubisoft based its framework on:
♦ the regulatory requirements in France established or reinforced by Article 225 of the Grenelle II law and its implementing decree (Decree No. 2012-557 of April 24, 2012, on corporate transparency obligations regarding employee-related and environmental matters);
♦ the transposition of the European CSR Directive, which aims to replace the current company CSR report with a statement of extra -fi nancial performance (Order No. 2017-1180 of July 19, 2017 and Decree No. 2017-1265 of August 9, 2017);
♦ the G4 guidelines of the Global Reporting Initiative (GRI), a multiparty organization, which prepares a framework of sustainable-development reporting indicators that are internationally recognized and whose purpose is to develop globally applicable directives for reporting on companies’ economic, environmental and social performance.
❙ 5.1.2 REPORTING PERIOD
Reporting periods differ depending on CSR themes. These break down as follows:
CSR data
Reporting periods
4/01/17 – 03/31/18(12 months)
1/01/17 – 12/31/17(12 months)
Employee-related ✔
Environmental ✔
Social ✔
❙ 5.1.3 SCOPE OF REPORTING
The scope used for CSR reporting is the Group, which is defi ned as all fully consolidated companies.
However, some indicators are only available for a limited scope. Where this is the case, and in the interests of consistency, the reporting scope is defi ned as follows:
♦ employee-related indicators (1): companies outside France > 50 employees and French companies (2);
♦ environmental indicators (3): sites outside France > 25 employees and French sites (2).
Where appropriate, the scope covered is always indicated, giving the companies/sites concerned and/or their representativeness as a percentage of the Group’s headcount.
Employee-related reporting covers all of the Group’s subsidiaries, with the exception of the Canadian subsidiary “Hybride Technologies Inc.” (104 employees), not currently integrated in the Group’s human resources scope of reporting due to the fact that it does not use the human resource IT system (HRTB) used by all other Group subsidiaries for the automated recording of employee data.
❙ 5.1.4 CHANGE IN METHOD/CONDITIONS COMPARED WITH THE PREVIOUS YEAR
♦ Change in the scope of reporting linked to employee-related indicators for which information is only available for a limited scope:
Scope of reporting 4/01/17 – 03/31/18 4/01/16 – 03/31/17
Companies outside France > 50 employees > 60 employees
French companies 100% 100%
% staff taken into account 97.4% 95.00%
As a result of this change, information is supplied in the event of material impact on the comparability of CSR data with data reported the previous fi nancial year.
♦ Changes concerning indicators:
• Water consumption no longer tracked:
Taking into account the Group’s business activities, it only uses water for domestic purposes. In view of the fi gures recorded over the fi ve previous years, the Group deems that the volumes are not signifi cant enough (average of 7.2 m3 of water per employee in 2016) to warrant the ongoing recording and consolidation of water consumption data. Moreover, this information is generally unavailable for sites where water consumption is included in rental charges. As a result, comprehensive information cannot be obtained for the reporting scope (in 2016, the data was available on only 31 sites, representing 61.8% of the Group’s workforce).
(1) The scope defined in this way covered 97.4% of the Ubisoft Group workforce at the end of March 2018
(2) Scope defi ned on the basis of the Ubisoft Group workforce at the end of September 2017
(3) The scope defi ned in this way covered 98.6% of the Ubisoft Group workforce at the end of March 2018
- 2018 Registration Document110
Corporate social responsibility
5
Methodology note on employee-related, environmental and societal reporting
In addition, as water is supplied directly by local water distribution networks, the Group complies with applicable water supply regulations in the countries where it operates.
As a result, these indicators – which are deemed non-relevant – are no longer tracked.
Change in the travel-related indicator: Up until 2016, to measure the carbon footprint of business trips, the Group monitored the total number of kilometers traveled per means of transport (plane and train). However, since the number of
kilometers traveled by train remains low (less than 4% of the total number of kilometers traveled in 2016) and the resulting carbon footprint is negligible compared with that of air transport (namely, 0.1% of Airplane metric tons of CO2 eq), the Group deems that the recording and consolidation of train-related data is no longer warranted.
As a result, the carbon footprint of business trips is now exclusively based on the total number of kilometers traveled by plane, with the impact of train travel remaining marginal.
• Other indicators deemed non-relevant by the Group, not examined in this report:
Themes of the CSR Directive covered by Decree No. 2017-1265 of August 9, 2017 Ubisoft comments
♦ Actions to prevent food waste The Ubisoft Group is committed to the fi ght against food waste. However, given the nature of its business and since there is no company cafeteria at many of its sites, it only handles a small quantity of food waste.
♦ Land use The Group has a limited impact in relation to land use due to the vertical installation of its sites, which are mainly located in urban areas.
♦ Measures taken to preserve/restore biodiversity
All Ubisoft sites are located in urban areas. Consequently, none of the sites are located in or beside protected areas or areas that are rich in biodiversity.
❙ 5.1.5 REPORTING PRINCIPLE
The Group’s Administration Department, in conjunction with the Sustainable Development Department, is responsible for steering and coordinating CSR reporting. It has therefore drawn up a reporting protocol that:
♦ defi nes a list of quantitative and qualitative indicators and their correspondence to the GRI framework;
♦ specifi es the defi nitions of indicators so that they are uniform for the whole Group and leave no room for interpretation;
♦ specifi es the methods for collecting and calculating indicators;
♦ specifi es the scope used.
This protocol serves as a reference for the Sustainable Development Department in charge of collecting and consolidating data. To that end, its role is to:
♦ tell its local representatives or contacts what information they need to collect;
♦ ensure that the information collected is available, uniform and documented;
♦ check the completeness, consistency and plausibility of data, notably by analyzing the main changes compared with the previous period;
♦ ensure that the absence of data collection has been justifi ed and explained.
Once the collected data have been validated and consolidated, the Administration Department gets involved, making sure that the reporting protocol was followed and checking the plausibility of the data.
The Sustainable Development Department then drafts this section of the Annual Report, focusing on CSR indicators as a whole.
Specifi cations on the methods for collecting data
♦ Regarding employee-related indicators, these are collected:
• either directly, using the Microstrategy reporting tool, which makes it possible to exploit data from the human resources management software program (HRTB) used by all the Group’s subsidiaries;
• or using a qualitative and quantitative questionnaire designed to supplement data not available in the HRTB.
The human resources indicators collected in this manner conform to the defi nitions defi ned jointly by the Human Resources Department and the Administration Department, as indicated in the reporting protocol.
♦ Data for environmental and societal indicators is collected from:
• each site, using a qualitative and quantitative questionnaire prepared in line with the reporting protocol;
• cross-functional departments for the collection of global data at Group level.
Consolidation and verifi cation
The subsidiaries submit their employee-related, environmental and social data to the Sustainable Development Department in charge of collecting and ensuring the consistency of data.
On the basis of all the consolidated data, the Administration Department conducts various controls (analytical data review, consistency checks, spot checks on documentation, etc.) to improve the reliability of the information published.
- 2018 Registration Document 111
Corporate social responsibility5Methodology note on employee-related, environmental and societal reporting
❙ 5.1.6 METHODOLOGICAL CLARIFICATION OF INDICATORS
Regarding employee-related data
Staff are defi ned as all employees registered at the end of the period, regardless of the type of employment (full- or part-time), with an open-ended or fi xed-term contract. Casual workers, seasonal workers, freelancers, the self-employed, interns, those on work-study contracts, sub-contractors and temporary workers are not included.
♦ A hire is defi ned as any individual who joins the workforce during the period in question. Fixed-term contract renewals are not included in new hires.
♦ The male-female pay ratio, based on the total workforce, is calculated by level of responsibility within each subsidiary for which both men and women are represented. This ratio is weighted by the corresponding headcount, then consolidated by country.
♦ To determine the number of training hours, consideration is given to training activities undertaken on site by an internal or external trainer, attendance at specialist conferences included in the training plan, and e-learning with an automated system for monitoring completed sessions. Other activities (such as other e-learning courses, team meetings, etc.) are therefore excluded.
Furthermore, only training hours relating to sessions undertaken and completed during the fi nancial year are taken into account, irrespective of their duration. Logged training hours also include training given to employees present during the period but who had left the Group as of the reporting date.
♦ In order to determine the number of employees trained, an employee who takes part in several training programs is only counted once.
♦ A manager is defi ned as someone who is hierarchically responsible for at least one person (also including interns not counted as staff).
♦ A top manager is defi ned as a member of the Executive Committee or a Director reporting directly to the Executive Committee.
Regarding environmental data
♦ The reporting includes data on the environmental impact of consumables used by the Group’s main suppliers to manufacture games and ancillary products.
♦ The current reporting system does not provide quantitative data for waste electrical and electronic equipment (WEEE) at the Group’s main sites. Only qualitative data is published at present. However, the Group is gradually introducing a WEEE quantifi cation method and has undertaken to publish quantitative data within 1 year.
♦ To determine its CO2 emissions, the Group has opted for the following procedures:
Datacenters (energy) Recording of electricity consumption throughout 2017.Application of emission factors according to the energy mix
Datacenters (non-current assets) Application of emission factors to the number of servers over their useful lives
Visitors Application of a factor provided by an external expert in 2015 on the total number of employees
Freight – Upstream Recording of kg/km per means of transport, and application of ADEME factors
Sea freight partly included
Freight – Downstream Estimation or recording of kg/km per means of transport, and application of ADEME factors.
Employee commuting Local recording of means of transport used.Calculation according to the number of days worked and region where the site is based
IT assets (excluding servers) Application of emission factors to the number of devices over their useful lives (or depreciation periods for devices returned to fi rst parties before the end of their useful lives).
Buildings (energy) Local recording of electricity consumption throughout 2017.Application of emission factors according to the use of renewable energies for French and Canadian sites.Application of national emission factors on other sites (source: ADEME – the French Environment and Energy Management Agency)
Buildings (air conditioned) Estimation of the amounts of substances based on the information provided by an external expert in 2015. Application of ADEME factors
Buildings (non-current assets) Local recording of the number of m² in the buildings and number of parking spaces. Emission factor applied to the surface area and useful life
Purchase of services Breakdown of service purchases into 3 categories, use of ADEME factors
Business trips Local recording of fl ights booked for the entity’s staff and guests in 2017.Application of an ADEME factor
Manufacturing Recording or estimation of the composition and quantities of products, application of emission factors to quantities of various materials
- 2018 Registration Document112
Corporate social responsibility
5
Employee-related indicators
❙ 5.1.7 METHODOLOGICAL LIMITS OF THE INDICATORS
The indicators may present methodological limits due to:
♦ a lack of standardization in national/international defi nitions and legislation;
♦ the representativeness of the measurements and estimates made;
♦ the practical methods of collecting and entering information.
5.2 Corporate Social Responsibility strategy
Ubisoft is committed to developing a positive and long-lasting impact for all its stakeholders, both internal and external. Its strategy is four-pronged: developing a safe and positive gaming experience for players, allowing each employee to be their authentic self and fulfill their full potential, supporting local communities, and optimizing our impact on the planet.
♦ Developing a safe and positive gaming experience: actions, such as the introduction of a Code of Conduct in games, are being undertaken to improve the player experience and restrain any toxic behaviors.
In addition, Ubisoft has been experimenting with new types of games having a societal impact. The game “Assassin’s Creed Origin” has just launched a discovery mode enabling players to learn about historical facts on ancient Egypt. Moreover, the Group has undertaken to make all of its games accessible to people with disabilities by 2020.
♦ Allowing each employee to be their authentic self and fulfill their full potential: This involves a friendly and supportive work environnement , 98% approved by Ubisoft employees in the latest internal satisfaction survey, conducted in 2017. Furthermore, we are convinced that diversity promotes creativity and performance. Our fi rst objective is thus to increase diversity within our development teams. In addition, a main focus of our human resource policy is to provide training and support to employees throughout their careers at Ubisoft.
♦ Supporting local communities through charitable initiatives and events that bring joy to our surroundings. Ubisoft is also a company that gives preference to local suppliers for employee services, thereby stimulating the local economic fabric. For example, in France, according to a study conducted by an external expert, 80% of the socio-economic impact of Ubisoft’s activity is concentrated at the micro-local level around the Group’s main sites.
♦ Optimizing our impact on the planet, in particular our direct carbon footprint, while supporting staff and business growth.
5.3 Employee-related indicators
Ubisoft brings together diverse talents to develop original games in a friendly environment. Each employee has the possibility of growing and getting ahead, surrounded by people who are passionate
about their particular fi eld of work. The teams’ constant creativity is expressed in the content of our new games, as well as in the day-to-day work environment.
❙ 5.3.1 EMPLOYMENT
5.3.1.1 Dynamic growth in the Group’s teams
Attracting, developing and retaining the fi nest talent in the industry is one of the key factors determining Ubisoft’s success. The Group is committed to providing the resources that its teams need in order to progress, learn and develop their skills and expertise. This enables
the best games of the future to be created, today. With over 11,700 employees in game development, Ubisoft is one of the leading fi gures in the video game industry and wins numerous awards every year for its teams’ creative abilities.
- 2018 Registration Document 113
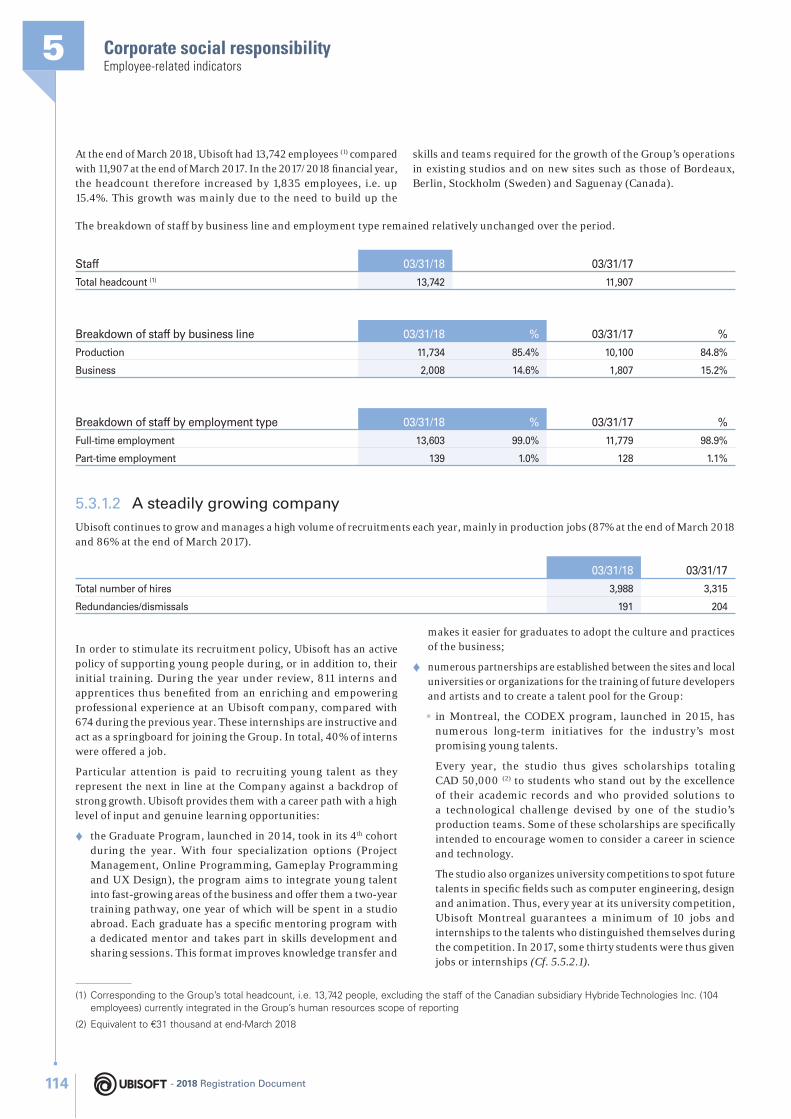
Corporate social responsibility5Employee-related indicators
At the end of March 2018, Ubisoft had 13,742 employees (1) compared with 11,907 at the end of March 2017. In the 2017/2018 fi nancial year, the headcount therefore increased by 1,835 employees, i.e. up 15.4%. This growth was mainly due to the need to build up the
skills and teams required for the growth of the Group’s operations in existing studios and on new sites such as those of Bordeaux, Berlin, Stockholm (Sweden) and Saguenay (Canada).
The breakdown of staff by business line and employment type remained relatively unchanged over the period.
Staff 03/31/18 03/31/17
Total headcount (1) 13,742 11,907
Breakdown of staff by business line 03/31/18 % 03/31/17 %
Production 11,734 85.4% 10,100 84.8%
Business 2,008 14.6% 1,807 15.2%
Breakdown of staff by employment type 03/31/18 % 03/31/17 %
Full-time employment 13,603 99.0% 11,779 98.9%
Part-time employment 139 1.0% 128 1.1%
5.3.1.2 A steadily growing company
Ubisoft continues to grow and manages a high volume of recruitments each year, mainly in production jobs (87% at the end of March 2018 and 86% at the end of March 2017).
03/31/18 03/31/17
Total number of hires 3,988 3,315
Redundancies/dismissals 191 204
(1) Corresponding to the Group’s total headcount, i.e. 13,742 people, excluding the staff of the Canadian subsidiary Hybride Technologies Inc. (104 employees) currently integrated in the Group’s human resources scope of reporting
(2) Equivalent to €31 thousand at end-March 2018
In order to stimulate its recruitment policy, Ubisoft has an active policy of supporting young people during, or in addition to, their initial training. During the year under review, 811 interns and apprentices thus benefi ted from an enriching and empowering professional experience at an Ubisoft company, compared with 674 during the previous year. These internships are instructive and act as a springboard for joining the Group. In total, 40% of interns were offered a job.
Particular attention is paid to recruiting young talent as they represent the next in line at the Company against a backdrop of strong growth. Ubisoft provides them with a career path with a high level of input and genuine learning opportunities:
♦ the Graduate Program, launched in 2014, took in its 4th cohort during the year. With four specialization options (Project Management, Online Programming, Gameplay Programming and UX Design), the program aims to integrate young talent into fast-growing areas of the business and offer them a two-year training pathway, one year of which will be spent in a studio abroad. Each graduate has a specifi c mentoring program with a dedicated mentor and takes part in skills development and sharing sessions. This format improves knowledge transfer and
makes it easier for graduates to adopt the culture and practices of the business;
♦ numerous partnerships are established between the sites and local universities or organizations for the training of future developers and artists and to create a talent pool for the Group:
• in Montreal, the CODEX program, launched in 2015, has numerous long-term initiatives for the industry’s most promising young talents.
Every year, the studio thus gives scholarships totaling CAD 50,000 (2) to students who stand out by the excellence of their academic records and who provided solutions to a technological challenge devised by one of the studio’s production teams. Some of these scholarships are specifi cally intended to encourage women to consider a career in science and technology.
The studio also organizes university competitions to spot future talents in specifi c fi elds such as computer engineering, design and animation. Thus, every year at its university competition, Ubisoft Montreal guarantees a minimum of 10 jobs and internships to the talents who distinguished themselves during the competition. In 2017, some thirty students were thus given jobs or internships (Cf. 5.5.2.1).
- 2018 Registration Document114
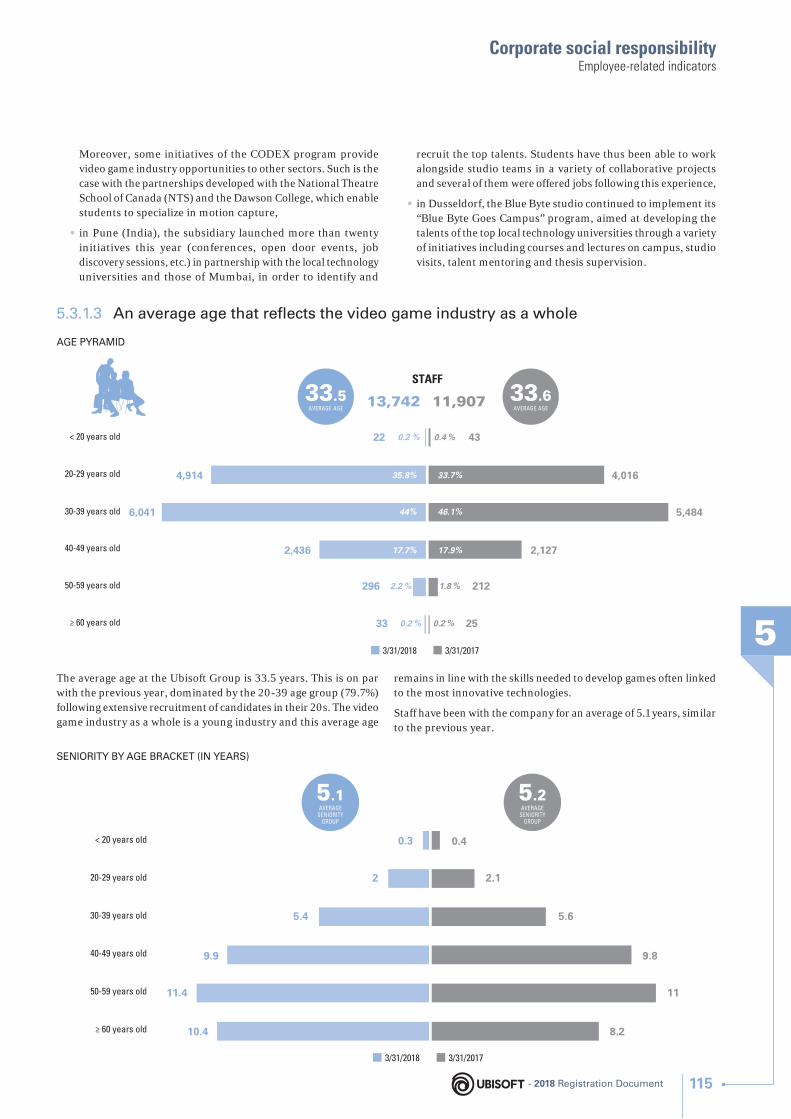
Corporate social responsibility
5
Employee-related indicators
Moreover, some initiatives of the CODEX program provide video game industry opportunities to other sectors. Such is the case with the partnerships developed with the National Theatre School of Canada (NTS) and the Dawson College, which enable students to specialize in motion capture,
• in Pune (India), the subsidiary launched more than twenty initiatives this year (conferences, open door events, job discovery sessions, etc.) in partnership with the local technology universities and those of Mumbai, in order to identify and
recruit the top talents. Students have thus been able to work alongside studio teams in a variety of collaborative projects and several of them were offered jobs following this experience,
• in Dusseldorf, the Blue Byte studio continued to implement its “Blue Byte Goes Campus” program, aimed at developing the talents of the top local technology universities through a variety of initiatives including courses and lectures on campus, studio visits, talent mentoring and thesis supervision.
5.3.1.3 An average age that refl ects the video game industry as a whole
AGE PYRAMID
33 25
296 212
3/31/2018 3/31/2017
≥ 60 years old
50-59 years old
40-49 years old
30-39 years old
20-29 years old
< 20 years old
0.2 %0.2 %
22 430.4 %0.2 %
2,436 2,12717.9%17.7%
6,041 5,48446.1%44%
4,914 4,01633.7%35.8%
1.8 %2.2 %
13,742 11,907 33.6AVERAGE AGE
33.5AVERAGE AGE
STAFF
The average age at the Ubisoft Group is 33.5 years. This is on par with the previous year, dominated by the 20-39 age group (79.7%) following extensive recruitment of candidates in their 20s. The video game industry as a whole is a young industry and this average age
remains in line with the skills needed to develop games often linked to the most innovative technologies.
Staff have been with the company for an average of 5.1 years, similar to the previous year.
SENIORITY BY AGE BRACKET (IN YEARS)
10.4 8.2
11.4 11
3/31/2018 3/31/2017
≥ 60 years old
50-59 years old
40-49 years old
30-39 years old
20-29 years old
< 20 years old 0.3 0.4
9.9 9.8
5.4 5.6
2 2.1
5.2AVERAGE
SENIORITYGROUP
5.1AVERAGE
SENIORITYGROUP
- 2018 Registration Document 115
Corporate social responsibility5Employee-related indicators
❙ 5.3.2 DEVELOPING SKILLS AND FACILITATING PERFORMANCE
To enable its teams to grow, Ubisoft pays particular attention to developing their skills and motivation with a customized HR policy and a friendly, collaborative work environment.
5.3.2.1 Personalized guidance
Ubisoft provides an environment that allows every employee to develop their skills, advance their careers and fulfi ll their potential in their jobs and in the company. Dedicated HR managers at each site offer each individual one-to-one guidance. In addition, managers are involved in the day-to-day monitoring of their teams.
Employees who have been with the company for more than a year receive an annual appraisal. This equated to 86% of staff in 2017/2018, like in the previous fi nancial year. The annual appraisal is an important moment in the year for each employee. The employees meet with their managers to review their year’s performance and discuss their career development goals. These exchanges give employees greater visibility over future prospects in their positions and at Ubisoft. They also enable managers to assess the satisfaction, commitment and aspirations of their team members.
The new performance management system announced during the last fi nancial year has been rolled out across the Group since April 1, 2017. In 2017/2018, this new system had already been adopted by 34% of the workforce. The performance management philosophy was redefi ned within the Group in order to improve the teams’ grasp of the impact of their work on Ubisoft’s strategy, thereby reinforcing the meaning of each person’s work. In addition, a toolbox was developed to enable them to manage their own performance and development with clear and ambitious targets, transparent and continuous feedback and facilitated career interviews.
Moreover, since January 2018, pulse surveys have been introduced in several Group entities to keep closer track of the satisfaction of employees in their jobs, teams and companies, as well as identify more rapidly the actions that will improve their motivation and loyalty.
Lastly, the Group currently offers numerous possibilities for advancement in France and abroad, within specifi c fi elds and cross-functional roles. Overall, 14% of our employees changed positions at least once during the fi nancial year, amounting to over 1,800 transfers. In terms of international mobility, the Group recorded 185 transfers during the period. International mobility takes place initially to support business needs, but also responds to a genuine objective to support employees’ development by providing them with an international perspective. These mobility assignments encourage multicultural exchanges and contribute to collaborative work.
5.3.2.2 A compensation policy aimed at recognizing performance
Ubisoft’s compensation policy aims to recognize skills, stimulate creativity, encourage employees’ performance and retain talent.
Annual salary increases are dependent on the individual, the level of performance they have achieved and the skill they display in their position. Close attention is paid to ensuring that the compensation policy is in line with market practices.
Employee share ownership is another excellent way for Ubisoft to let employees participate in the Company’s success. Employee share ownership initiatives regularly take place. During the year, a leveraged employee share ownership scheme was offered to staff in 15 countries where Ubisoft is based. This type of operation reinforces the commitment of staff and gives them the chance to profi t from the Company’s growth. Over 40% of the staff thus took part in the operation.
As at the end of March 2018, the total number of shares held by employees through a Company mutual fund (FCPE) and/or a Group savings plan amounted to 3.69% of the share capital.
Medium-term compensation is also granted to the top performing employees in order to ensure loyalty. This takes the form of stock options or preference or free share grants. As at the end of March 2018, 16.7% of the Group’s employees received such options or shares from all plans combined.
Details of payroll taxes can be found in Note 13 of the fi nancial statements.
5.3.2.3 A training policy adapted to the challenges of the sector
Ubisoft recruits talented people who are passionate and proud of the brands created or acquired by the Ubisoft Group and have the technical skills and expertise required for the specifi c characteristics of the video game industry. Responsibility, initiative, innovation and creativity are the skills sought. Team players are vital to the Group’s business and the capacity to work as a team has become an added focus of team development.
- 2018 Registration Document116
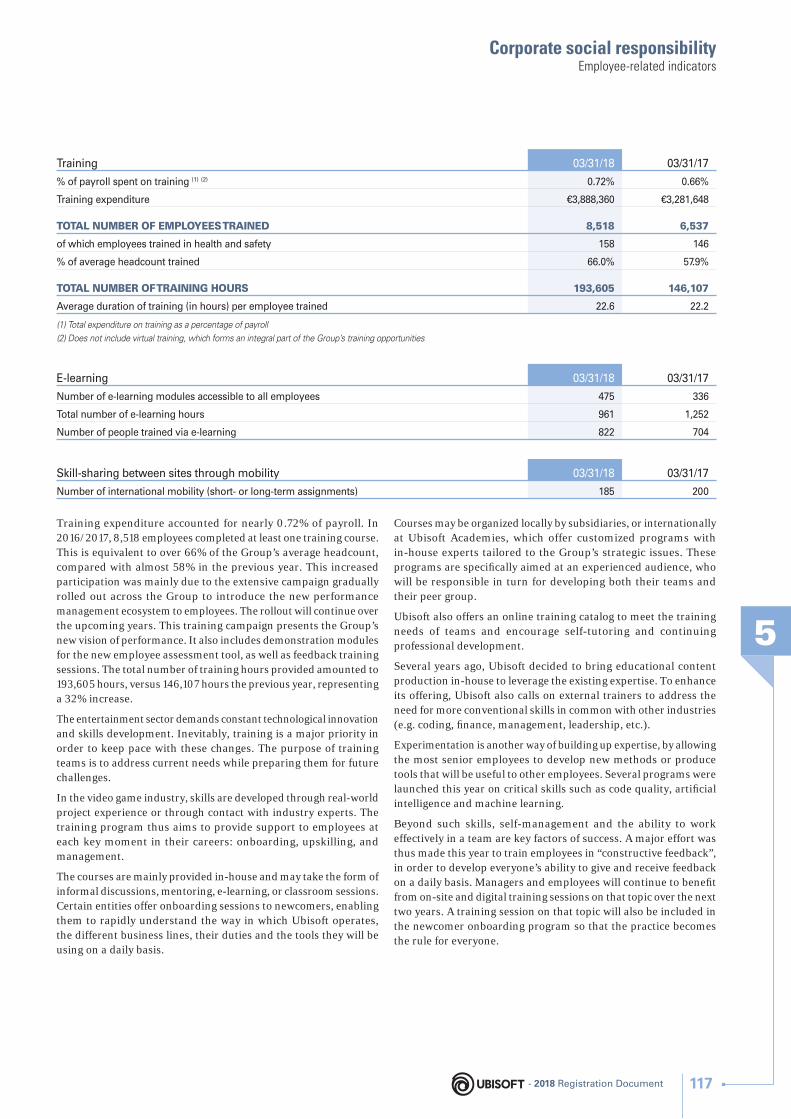
Corporate social responsibility
5
Employee-related indicators
Training 03/31/18 03/31/17
% of payroll spent on training (1) (2) 0.72% 0.66%
Training expenditure €3,888,360 €3,281,648
TOTAL NUMBER OF EMPLOYEES TRAINED 8,518 6,537
of which employees trained in health and safety 158 146
% of average headcount trained 66.0% 57.9%
TOTAL NUMBER OF TRAINING HOURS 193,605 146,107
Average duration of training (in hours) per employee trained 22.6 22.2
(1) Total expenditure on training as a percentage of payroll
(2) Does not include virtual training, which forms an integral part of the Group’s training opportunities
E-learning 03/31/18 03/31/17
Number of e-learning modules accessible to all employees 475 336
Total number of e-learning hours 961 1,252
Number of people trained via e-learning 822 704
Skill-sharing between sites through mobility 03/31/18 03/31/17
Number of international mobility (short- or long-term assignments) 185 200
Training expenditure accounted for nearly 0.72% of payroll. In 2016/2017, 8,518 employees completed at least one training course. This is equivalent to over 66% of the Group’s average headcount, compared with almost 58% in the previous year. This increased participation was mainly due to the extensive campaign gradually rolled out across the Group to introduce the new performance management ecosystem to employees. The rollout will continue over the upcoming years. This training campaign presents the Group’s new vision of performance. It also includes demonstration modules for the new employee assessment tool, as well as feedback training sessions. The total number of training hours provided amounted to 193,605 hours, versus 146,107 hours the previous year, representing a 32% increase.
The entertainment sector demands constant technological innovation and skills development. Inevitably, training is a major priority in order to keep pace with these changes. The purpose of training teams is to address current needs while preparing them for future challenges.
In the video game industry, skills are developed through real-world project experience or through contact with industry experts. The training program thus aims to provide support to employees at each key moment in their careers: onboarding, upskilling, and management.
The courses are mainly provided in-house and may take the form of informal discussions, mentoring, e-learning, or classroom sessions. Certain entities offer onboarding sessions to newcomers, enabling them to rapidly understand the way in which Ubisoft operates, the different business lines, their duties and the tools they will be using on a daily basis.
Courses may be organized locally by subsidiaries, or internationally at Ubisoft Academies, which offer customized programs with in-house experts tailored to the Group’s strategic issues. These programs are specifi cally aimed at an experienced audience, who will be responsible in turn for developing both their teams and their peer group.
Ubisoft also offers an online training catalog to meet the training needs of teams and encourage self-tutoring and continuing professional development.
Several years ago, Ubisoft decided to bring educational content production in-house to leverage the existing expertise. To enhance its offering, Ubisoft also calls on external trainers to address the need for more conventional skills in common with other industries (e.g. coding, fi nance, management, leadership, etc.).
Experimentation is another way of building up expertise, by allowing the most senior employees to develop new methods or produce tools that will be useful to other employees. Several programs were launched this year on critical skills such as code quality, artifi cial intelligence and machine learning.
Beyond such skills, self-management and the ability to work effectively in a team are key factors of success. A major effort was thus made this year to train employees in “constructive feedback”, in order to develop everyone’s ability to give and receive feedback on a daily basis. Managers and employees will continue to benefi t from on-site and digital training sessions on that topic over the next two years. A training session on that topic will also be included in the newcomer onboarding program so that the practice becomes the rule for everyone.
- 2018 Registration Document 117
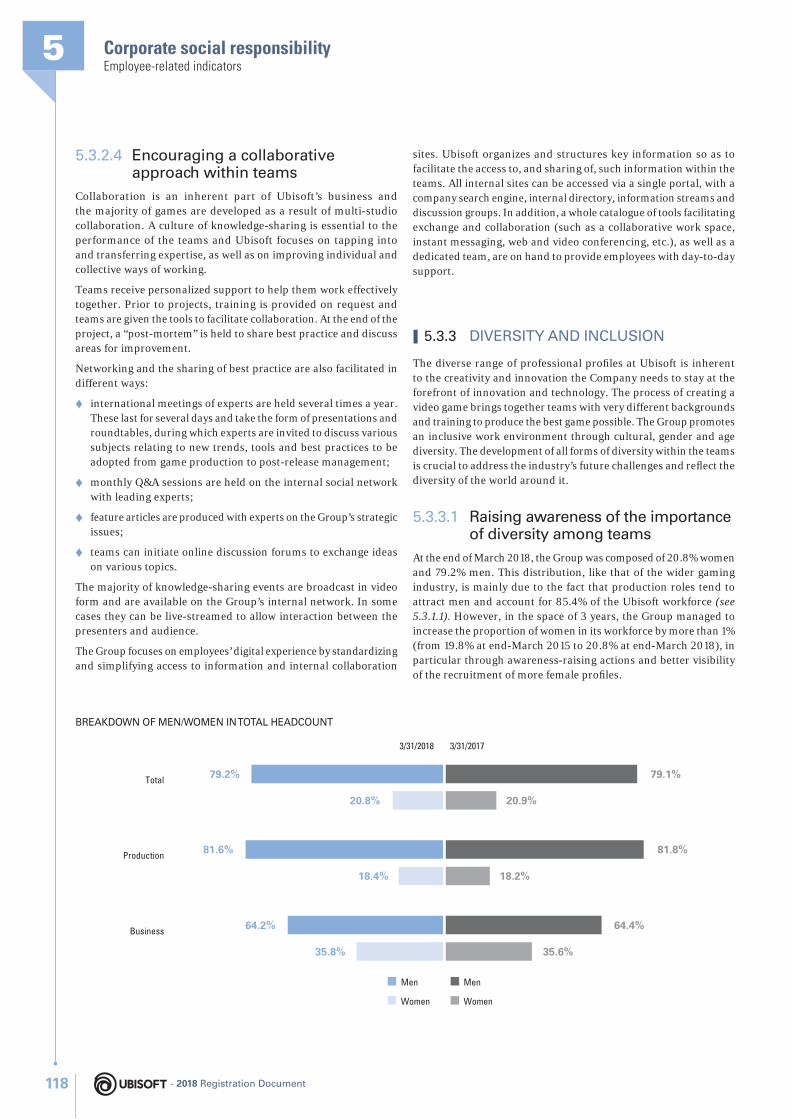
Corporate social responsibility5Employee-related indicators
5.3.2.4 Encouraging a collaborative approach within teams
Collaboration is an inherent part of Ubisoft’s business and the majority of games are developed as a result of multi-studio collaboration. A culture of knowledge-sharing is essential to the performance of the teams and Ubisoft focuses on tapping into and transferring expertise, as well as on improving individual and collective ways of working.
Teams receive personalized support to help them work effectively together. Prior to projects, training is provided on request and teams are given the tools to facilitate collaboration. At the end of the project, a “post-mortem” is held to share best practice and discuss areas for improvement.
Networking and the sharing of best practice are also facilitated in different ways:
♦ international meetings of experts are held several times a year. These last for several days and take the form of presentations and roundtables, during which experts are invited to discuss various subjects relating to new trends, tools and best practices to be adopted from game production to post-release management;
♦ monthly Q&A sessions are held on the internal social network with leading experts;
♦ feature articles are produced with experts on the Group’s strategic issues;
♦ teams can initiate online discussion forums to exchange ideas on various topics.
The majority of knowledge-sharing events are broadcast in video form and are available on the Group’s internal network. In some cases they can be live-streamed to allow interaction between the presenters and audience.
The Group focuses on employees’ digital experience by standardizing and simplifying access to information and internal collaboration
sites. Ubisoft organizes and structures key information so as to facilitate the access to, and sharing of, such information within the teams. All internal sites can be accessed via a single portal, with a company search engine, internal directory, information streams and discussion groups. In addition, a whole catalogue of tools facilitating exchange and collaboration (such as a collaborative work space, instant messaging, web and video conferencing, etc.), as well as a dedicated team, are on hand to provide employees with day-to-day support.
❙ 5.3.3 DIVERSITY AND INCLUSION
The diverse range of professional profi les at Ubisoft is inherent to the creativity and innovation the Company needs to stay at the forefront of innovation and technology. The process of creating a video game brings together teams with very different backgrounds and training to produce the best game possible. The Group promotes an inclusive work environment through cultural, gender and age diversity. The development of all forms of diversity within the teams is crucial to address the industry’s future challenges and reflect the diversity of the world around it.
5.3.3.1 Raising awareness of the importance of diversity among teams
At the end of March 2018, the Group was composed of 20.8% women and 79.2% men. This distribution, like that of the wider gaming industry, is mainly due to the fact that production roles tend to attract men and account for 85.4% of the Ubisoft workforce (see 5.3.1.1). However, in the space of 3 years, the Group managed to increase the proportion of women in its workforce by more than 1% (from 19.8% at end-March 2015 to 20.8% at end-March 2018), in particular through awareness-raising actions and better visibility of the recruitment of more female profi les.
BREAKDOWN OF MEN/WOMEN IN TOTAL HEADCOUNT
35.8% 35.6%
64.2% 64.4%
3/31/2018 3/31/2017
Business
Production
Total
Men
Women
Men
Women
79.2% 79.1%
18.4% 18.2%
81.6% 81.8%
20.8% 20.9%
- 2018 Registration Document118
Corporate social responsibility
5
Employee-related indicators
With 23.4% of women managers and 23.7% of women in top management, the percentage of women in management is higher than the average percentage of women in the Group. This refl ects the attention paid to equal treatment in the development process
and the Group’s ability to provide an inclusive work environment. Today, just as many women as men are in a senior management role and report directly to the chairman and Chief Executive Offi cer.
Women in management 03/31/18 03/31/17
% of women in top management (1) and/or in the Executive Committee (3) 23.7% 23.1%
% of women in management (2) (3) 23.4% 24.1%
(1) A top manager is defi ned as a member of the Executive Committee or a Director reporting directly to the Executive Committee
(2) A manager is defi ned as someone who is hierarchically responsible for at least one person (also including interns not counted as staff)
(3) Number of women in (top) management in relation to the total number of employees in (top) management
Employment 03/31/18 03/31/17
Female hire rate (1) 22.1% 23.0%
(1) Number of women hired as a percentage of the total number of hires
The stepping-up of efforts to increase diversity within the teams is a fi rst step to open up the teams to new profi les. Thus, throughout the Group, a pilot training course was provided during the fi nancial year to raise the awareness of the human resource teams of some ten Group studios of the infl uence of unconscious biases on HR processes (recruitments, promotions, etc.). More than 80 recruiters and HR managers benefi ted from a 7-week course aimed at reducing the impact of their personal biases on decision-making, and thus opening up the Company to a greater diversity of profi les.
The outcome is particularly visible at the local level, on sites which have undertaken additional actions, both in-house and externally:
♦ the display of an equal opportunities policy at French sites, as well as at the San Francisco, Toronto and Newcastle sites;
♦ the organization of diversity support groups by certain studios. In Sweden, the Massive studio thus continued to support its “Equal Opportunity Group” – an internal community where concrete measures are discussed to encourage employees from disadvantaged or under-represented communities to gain access to the same opportunities as all other employees. This year, the
Newcastle studio launched Diversity Workshops focusing on various themes concerning the respect of differences;
♦ many studios are continuing to partner with associations that advocate for a greater role for women in the industry, particularly among the next generation. The San Francisco and Red Storm studios thus continue to support the national association Girls Make Games, both fi nancially and through team volunteering. This year, the San Francisco studio thus hosted a summer camp in its premises, introducing girls to programming and the creation of video games. The Montreal and Toronto studios are continuing their respective collaborations with the non-profi t organizations Pixelles and Ladies Learning Code. Ubisoft’s French sites took part in this year’s launch of Women in Games France, a network which brings together the industry’s most infl uential female talents to promote the feminization and diversifi cation of the sector.
Moreover, the intranet site launched in 2016 and dedicated to the sharing of good local practices is regularly enhanced with new initiatives conducted by different subsidiaries to promote diversity and inclusion within the Group.
- 2018 Registration Document 119
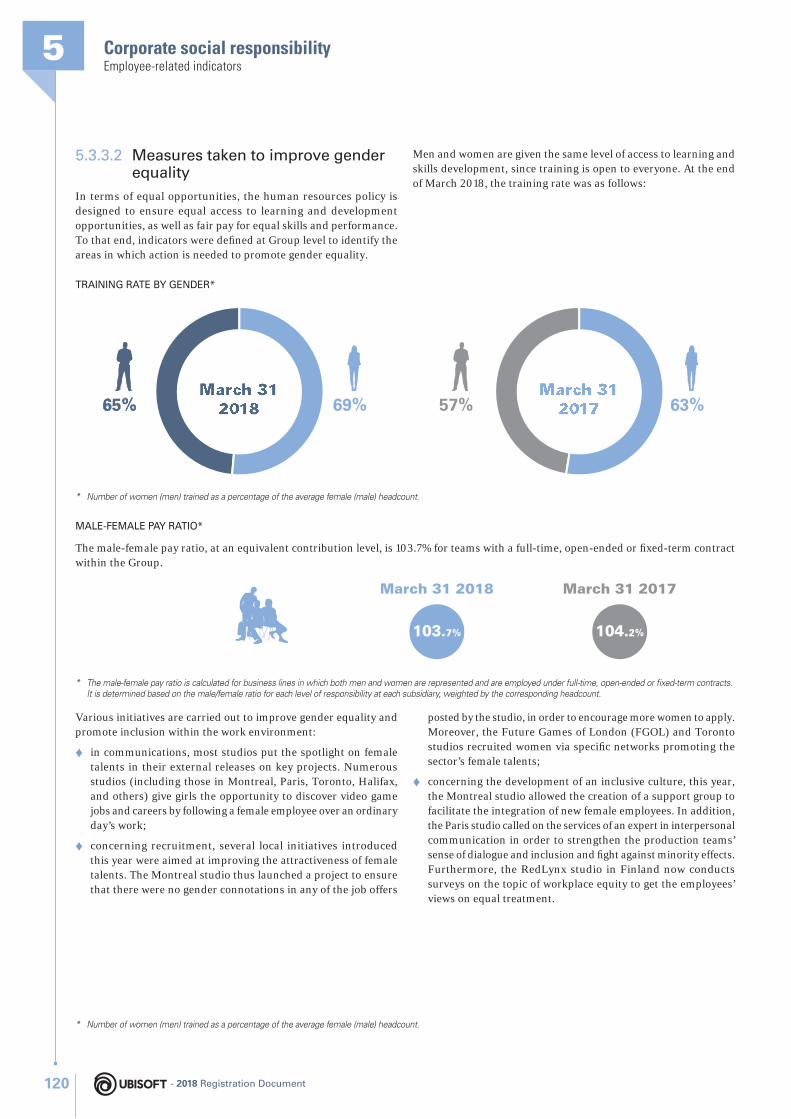
Corporate social responsibility5Employee-related indicators
5.3.3.2 Measures taken to improve gender equality
In terms of equal opportunities, the human resources policy is designed to ensure equal access to learning and development opportunities, as well as fair pay for equal skills and performance. To that end, indicators were defi ned at Group level to identify the areas in which action is needed to promote gender equality.
Men and women are given the same level of access to learning and skills development, since training is open to everyone. At the end of March 2018, the training rate was as follows:
TRAINING RATE BY GENDER*
57% 63%65%65%65% 69%March 31
2018March 31
2018March 31
2017March 31
2017
* Number of women (men) trained as a percentage of the average female (male) headcount.
MALE-FEMALE PAY RATIO*
The male-female pay ratio, at an equivalent contribution level, is 103.7% for teams with a full-time, open-ended or fi xed-term contract within the Group.
March 31 2017
104.2%
March 31 2018
103.7%
* The male-female pay ratio is calculated for business lines in which both men and women are represented and are employed under full-time, open-ended or fi xed-term contracts. It is determined based on the male/female ratio for each level of responsibility at each subsidiary, weighted by the corresponding headcount.
* Number of women (men) trained as a percentage of the average female (male) headcount.
Various initiatives are carried out to improve gender equality and promote inclusion within the work environment:
♦ in communications, most studios put the spotlight on female talents in their external releases on key projects. Numerous studios (including those in Montreal, Paris, Toronto, Halifax, and others) give girls the opportunity to discover video game jobs and careers by following a female employee over an ordinary day’s work;
♦ concerning recruitment, several local initiatives introduced this year were aimed at improving the attractiveness of female talents. The Montreal studio thus launched a project to ensure that there were no gender connotations in any of the job offers
posted by the studio, in order to encourage more women to apply. Moreover, the Future Games of London (FGOL) and Toronto studios recruited women via specifi c networks promoting the sector’s female talents;
♦ concerning the development of an inclusive culture, this year, the Montreal studio allowed the creation of a support group to facilitate the integration of new female employees. In addition, the Paris studio called on the services of an expert in interpersonal communication in order to strengthen the production teams’ sense of dialogue and inclusion and fi ght against minority effects. Furthermore, the RedLynx studio in Finland now conducts surveys on the topic of workplace equity to get the employees’ views on equal treatment.
- 2018 Registration Document120
Corporate social responsibility
5
Employee-related indicators
5.3.3.3 Cultural diversity
Ubisoft is present in 31 countries across all continents. With 95 different nationalities, Ubisoft cultivates the cultural diversity required for a good understanding of the gamers and improved adaptation of games to cultural differences.
BREAKDOWN OF STAFF BY GEOGRAPHIC REGION
Geographic region 03/31/18 % 03/31/17 %
Americas 5,070 36.9% 4,627 38.9%
EMEA/Pacifi c 8,672 63.1% 7,280 61.1%
TOTAL 13,742 11,907
Number of countries 31 31
5.3.3.4 Measures to support the employment and professional integration of people with disabilities
The employment rate of disabled persons within the Group is 0.53%. Its offi cial disclosure is optional or prohibited in most of the countries where the Group operates. HR Managers thus provide data on offi ce facilities to the persons who request it, yet without disclosing a specifi c employment rate.
The Group is attentive to the development of an inclusive work environment for persons with disabilities. This notably involves better accessibility of the premises. During the fi nancial year, 64.4% of employees worked in a building accessible to mobility-impaired persons. Certain sites, such as the Toronto site, are working on making the whole of their buildings accessible over the coming years.
In France, the “Boost!” initiative, launched at the end of 2017, offers personalized support to all employees with disabilities. This initiative enables these employees to benefi t from dedicated arrangements (ergonomic workstations, equipment, working time fl exibility, etc.) and obtain help in all of the required administrative procedures to get their disabled employee status recognized. Moreover, this disability team actively shares information with all French employees to overcome prejudices concerning disabilities and promote the inclusion of disabled workers in the Company.
Lastly, several Group sites (1) have established partnerships to promote the employment and professional integration of persons with disabilities: fi rstly, in the recruitment process in order to identify job applications from persons with disabilities and, secondly, by calling on companies from the protected and adapted work sector for offi ce supply contracts and recycling initiatives.
(1) Applicable to the sites in France, Montreal and Bucharest, accounting for 56% of the Group’s workforce at the end of March 2018
Employment of people with disabilities (1) 03/31/18 03/31/17
Number of disabled workers at the end of the period 36 33
Employment rate of people with disabilities 0.53% 0.56%
(1) Information from companies with over 50 employees based in countries other than France where the local legislation imposes a quota on French fi rms and companies (accounting for 49.1% of the Group’s workforce at the end of March 2018)
- 2018 Registration Document 121
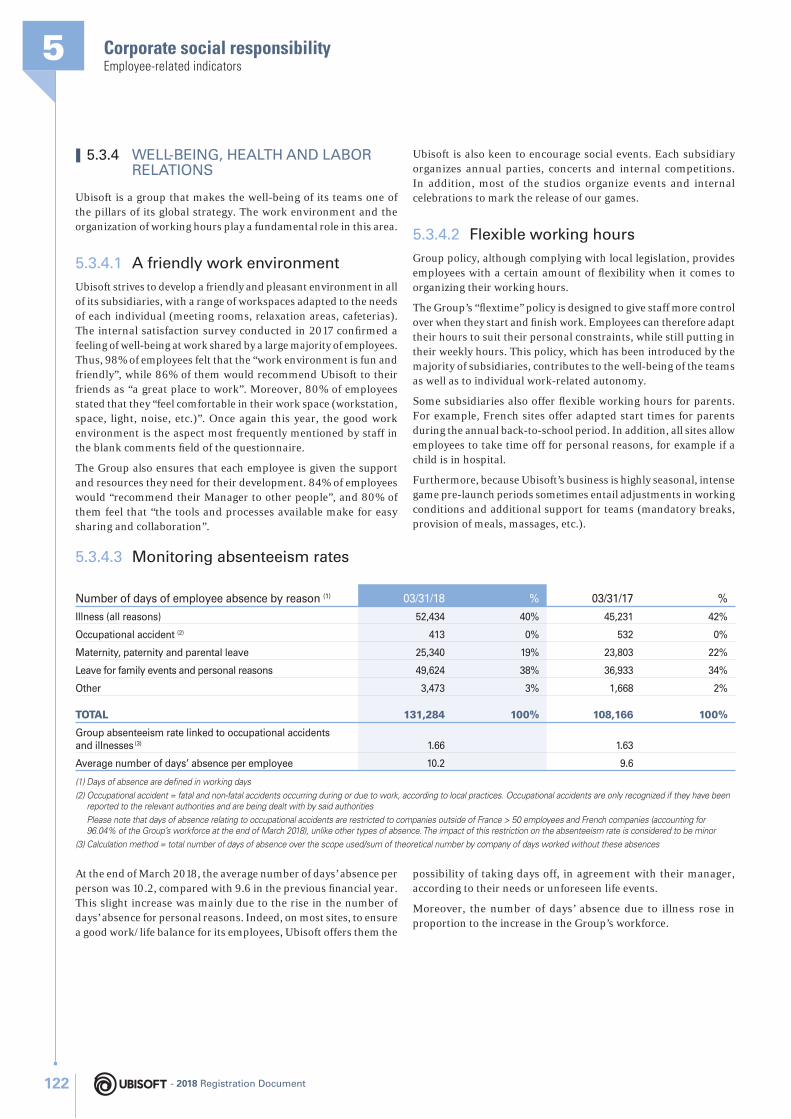
Corporate social responsibility5Employee-related indicators
❙ 5.3.4 WELL-BEING, HEALTH AND LABOR RELATIONS
Ubisoft is a group that makes the well-being of its teams one of the pillars of its global strategy. The work environment and the organization of working hours play a fundamental role in this area.
5.3.4.1 A friendly work environment
Ubisoft strives to develop a friendly and pleasant environment in all of its subsidiaries, with a range of workspaces adapted to the needs of each individual (meeting rooms, relaxation areas, cafeterias). The internal satisfaction survey conducted in 2017 confi rmed a feeling of well-being at work shared by a large majority of employees. Thus, 98% of employees felt that the “work environment is fun and friendly”, while 86% of them would recommend Ubisoft to their friends as “a great place to work”. Moreover, 80% of employees stated that they “feel comfortable in their work space (workstation, space, light, noise, etc.)”. Once again this year, the good work environment is the aspect most frequently mentioned by staff in the blank comments fi eld of the questionnaire.
The Group also ensures that each employee is given the support and resources they need for their development. 84% of employees would “recommend their Manager to other people”, and 80% of them feel that “the tools and processes available make for easy sharing and collaboration”.
Ubisoft is also keen to encourage social events. Each subsidiary organizes annual parties, concerts and internal competitions. In addition, most of the studios organize events and internal celebrations to mark the release of our games.
5.3.4.2 Flexible working hours
Group policy, although complying with local legislation, provides employees with a certain amount of fl exibility when it comes to organizing their working hours.
The Group’s “fl extime” policy is designed to give staff more control over when they start and fi nish work. Employees can therefore adapt their hours to suit their personal constraints, while still putting in their weekly hours. This policy, which has been introduced by the majority of subsidiaries, contributes to the well-being of the teams as well as to individual work-related autonomy.
Some subsidiaries also offer fl exible working hours for parents. For example, French sites offer adapted start times for parents during the annual back-to-school period. In addition, all sites allow employees to take time off for personal reasons, for example if a child is in hospital.
Furthermore, because Ubisoft’s business is highly seasonal, intense game pre-launch periods sometimes entail adjustments in working conditions and additional support for teams (mandatory breaks, provision of meals, massages, etc.).
5.3.4.3 Monitoring absenteeism rates
Number of days of employee absence by reason (1) 03/31/18 % 03/31/17 %
Illness (all reasons) 52,434 40% 45,231 42%
Occupational accident (2) 413 0% 532 0%
Maternity, paternity and parental leave 25,340 19% 23,803 22%
Leave for family events and personal reasons 49,624 38% 36,933 34%
Other 3,473 3% 1,668 2%
TOTAL 131,284 100% 108,166 100%
Group absenteeism rate linked to occupational accidents and illnesses (3) 1.66 1.63
Average number of days’ absence per employee 10.2 9.6
(1) Days of absence are defi ned in working days
(2) Occupational accident = fatal and non-fatal accidents occurring during or due to work, according to local practices. Occupational accidents are only recognized if they have been reported to the relevant authorities and are being dealt with by said authorities
Please note that days of absence relating to occupational accidents are restricted to companies outside of France > 50 employees and French companies (accounting for 96.04% of the Group’s workforce at the end of March 2018), unlike other types of absence. The impact of this restriction on the absenteeism rate is considered to be minor
(3) Calculation method = total number of days of absence over the scope used/sum of theoretical number by company of days worked without these absences
At the end of March 2018, the average number of days’ absence per person was 10.2, compared with 9.6 in the previous fi nancial year. This slight increase was mainly due to the rise in the number of days’ absence for personal reasons. Indeed, on most sites, to ensure a good work/life balance for its employees, Ubisoft offers them the
possibility of taking days off, in agreement with their manager, according to their needs or unforeseen life events.
Moreover, the number of days’ absence due to illness rose in proportion to the increase in the Group’s workforce.
- 2018 Registration Document122
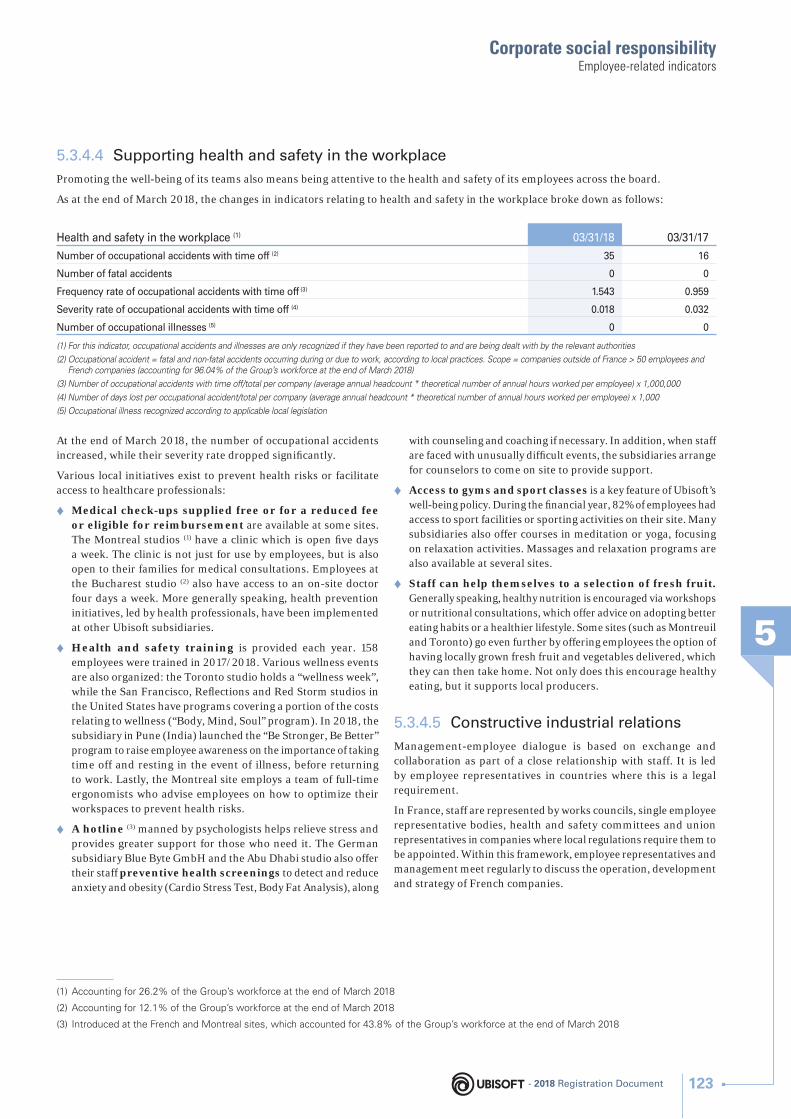
Corporate social responsibility
5
Employee-related indicators
5.3.4.4 Supporting health and safety in the workplace
Promoting the well-being of its teams also means being attentive to the health and safety of its employees across the board.
As at the end of March 2018, the changes in indicators relating to health and safety in the workplace broke down as follows:
Health and safety in the workplace (1) 03/31/18 03/31/17
Number of occupational accidents with time off (2) 35 16
Number of fatal accidents 0 0
Frequency rate of occupational accidents with time off (3) 1.543 0.959
Severity rate of occupational accidents with time off (4) 0.018 0.032
Number of occupational illnesses (5) 0 0
(1) For this indicator, occupational accidents and illnesses are only recognized if they have been reported to and are being dealt with by the relevant authorities
(2) Occupational accident = fatal and non-fatal accidents occurring during or due to work, according to local practices. Scope = companies outside of France > 50 employees and French companies (accounting for 96.04% of the Group’s workforce at the end of March 2018)
(3) Number of occupational accidents with time off/total per company (average annual headcount * theoretical number of annual hours worked per employee) x 1,000,000
(4) Number of days lost per occupational accident/total per company (average annual headcount * theoretical number of annual hours worked per employee) x 1,000
(5) Occupational illness recognized according to applicable local legislation
At the end of March 2018, the number of occupational accidents increased, while their severity rate dropped signifi cantly.
Various local initiatives exist to prevent health risks or facilitate access to healthcare professionals:
♦ Medical check-ups supplied free or for a reduced fee or eligible for reimbursement are available at some sites. The Montreal studios (1) have a clinic which is open fi ve days a week. The clinic is not just for use by employees, but is also open to their families for medical consultations. Employees at the Bucharest studio (2) also have access to an on-site doctor four days a week. More generally speaking, health prevention initiatives, led by health professionals, have been implemented at other Ubisoft subsidiaries.
♦ Health and safety training is provided each year. 158 employees were trained in 2017/2018. Various wellness events are also organized: the Toronto studio holds a “wellness week”, while the San Francisco, Refl ections and Red Storm studios in the United States have programs covering a portion of the costs relating to wellness (“Body, Mind, Soul” program). In 2018, the subsidiary in Pune (India) launched the “Be Stronger, Be Better” program to raise employee awareness on the importance of taking time off and resting in the event of illness, before returning to work. Lastly, the Montreal site employs a team of full-time ergonomists who advise employees on how to optimize their workspaces to prevent health risks.
♦ A hotline (3) manned by psychologists helps relieve stress and provides greater support for those who need it. The German subsidiary Blue Byte GmbH and the Abu Dhabi studio also offer their staff preventive health screenings to detect and reduce anxiety and obesity (Cardio Stress Test, Body Fat Analysis), along
with counseling and coaching if necessary. In addition, when staff are faced with unusually diffi cult events, the subsidiaries arrange for counselors to come on site to provide support.
♦ Access to gyms and sport classes is a key feature of Ubisoft’s well-being policy. During the fi nancial year, 82% of employees had access to sport facilities or sporting activities on their site. Many subsidiaries also offer courses in meditation or yoga, focusing on relaxation activities. Massages and relaxation programs are also available at several sites.
♦ Staff can help themselves to a selection of fresh fruit. Generally speaking, healthy nutrition is encouraged via workshops or nutritional consultations, which offer advice on adopting better eating habits or a healthier lifestyle. Some sites (such as Montreuil and Toronto) go even further by offering employees the option of having locally grown fresh fruit and vegetables delivered, which they can then take home. Not only does this encourage healthy eating, but it supports local producers.
5.3.4.5 Constructive industrial relations
Management-employee dialogue is based on exchange and collaboration as part of a close relationship with staff. It is led by employee representatives in countries where this is a legal requirement.
In France, staff are represented by works councils, single employee representative bodies, health and safety committees and union representatives in companies where local regulations require them to be appointed. Within this framework, employee representatives and management meet regularly to discuss the operation, development and strategy of French companies.
(1) Accounting for 26.2% of the Group’s workforce at the end of March 2018
(2) Accounting for 12.1% of the Group’s workforce at the end of March 2018
(3) Introduced at the French and Montreal sites, which accounted for 43.8% of the Group’s workforce at the end of March 2018
- 2018 Registration Document 123
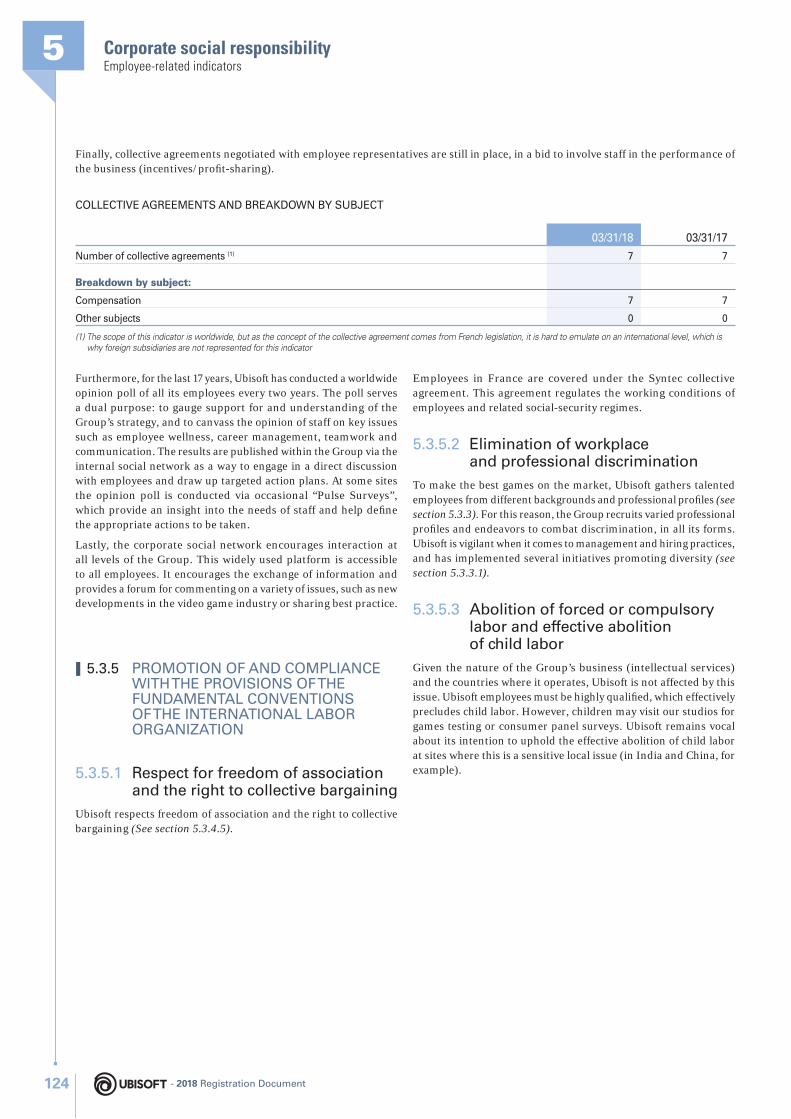
Corporate social responsibility5Employee-related indicators
Finally, collective agreements negotiated with employee representatives are still in place, in a bid to involve staff in the performance of the business (incentives/profi t-sharing).
COLLECTIVE AGREEMENTS AND BREAKDOWN BY SUBJECT
03/31/18 03/31/17
Number of collective agreements (1) 7 7
Breakdown by subject:
Compensation 7 7
Other subjects 0 0
(1) The scope of this indicator is worldwide, but as the concept of the collective agreement comes from French legislation, it is hard to emulate on an international level, which is why foreign subsidiaries are not represented for this indicator
Furthermore, for the last 17 years, Ubisoft has conducted a worldwide opinion poll of all its employees every two years. The poll serves a dual purpose: to gauge support for and understanding of the Group’s strategy, and to canvass the opinion of staff on key issues such as employee wellness, career management, teamwork and communication. The results are published within the Group via the internal social network as a way to engage in a direct discussion with employees and draw up targeted action plans. At some sites the opinion poll is conducted via occasional “Pulse Surveys”, which provide an insight into the needs of staff and help defi ne the appropriate actions to be taken.
Lastly, the corporate social network encourages interaction at all levels of the Group. This widely used platform is accessible to all employees. It encourages the exchange of information and provides a forum for commenting on a variety of issues, such as new developments in the video game industry or sharing best practice.
❙ 5.3.5 PROMOTION OF AND COMPLIANCE WITH THE PROVISIONS OF THE FUNDAMENTAL CONVENTIONS OF THE INTERNATIONAL LABOR ORGANIZATION
5.3.5.1 Respect for freedom of association and the right to collective bargaining
Ubisoft respects freedom of association and the right to collective bargaining (See section 5.3.4.5).
Employees in France are covered under the Syntec collective agreement. This agreement regulates the working conditions of employees and related social-security regimes.
5.3.5.2 Elimination of workplace and professional discrimination
To make the best games on the market, Ubisoft gathers talented employees from different backgrounds and professional profi les (see section 5.3.3). For this reason, the Group recruits varied professional profi les and endeavors to combat discrimination, in all its forms. Ubisoft is vigilant when it comes to management and hiring practices, and has implemented several initiatives promoting diversity (see section 5.3.3.1).
5.3.5.3 Abolition of forced or compulsory labor and effective abolition of child labor
Given the nature of the Group’s business (intellectual services) and the countries where it operates, Ubisoft is not affected by this issue. Ubisoft employees must be highly qualifi ed, which effectively precludes child labor. However, children may visit our studios for games testing or consumer panel surveys. Ubisoft remains vocal about its intention to uphold the effective abolition of child labor at sites where this is a sensitive local issue (in India and China, for example).
- 2018 Registration Document124
Corporate social responsibility
5
Environmental indicators
5.4 Environmental indicators
❙ 5.4.1 GENERAL ENVIRONMENTAL POLICY
5.4.1.1 Key areas of progress
The Ubisoft Group’s environmental actions revolve around 4 major axes.
1. The digitization of video games provides Ubisoft with an opportunity to optimize its impact on the environment. The downloading of a game in digital format emits six (1) times less greenhouse gases than the packaging of a DVD and its transport to its point of sale.
2. The optimization of business trips has been identifi ed as an avenue for progress. Indeed, the game development strategy is based on an organizational structure involving several countries. The international teams work in close collaboration to produce high-quality games. As a result, business trips constitute a major source of greenhouse gas emissions for the Ubisoft Group.
3. Improving energy effi ciency is a way for Ubisoft to progress at an environmental level. The Group strives to improve its energy effi ciency through eco-responsible choices in the renovation and construction of buildings. Opting for renewable energy sources for its electricity contracts is another major focus of attention. In this regard, the proportion of renewable energies used by Ubisoft amounted to 78% in 2017.
4. Encouraging employees to adopt eco-friendly habits is another avenue for improvement for Ubisoft. In order to optimize its impact on the planet at all levels, Ubisoft strives to increase its efforts to raise its employees’ awareness of environmental issues.
5.4.1.2 General organization
The CSR Department is tasked with assessing the Group’s environmental impact. It is responsible for leading and coordinating the action plans identifi ed.
The carbon audit carried out in early 2015 with an external consulting fi rm identifi ed the main sources of the Group’s greenhouse gas emissions (see section 5.4.4 – Climate Change). The results were then used to defi ne environmental priorities and launch employee awareness initiatives.
In addition, the IT purchasing policy is centralized at Group level. This means that more powerful hardware can be chosen without compromising on energy effi ciency.
Data on the Group’s environmental impact solely covers its direct video game production, publishing and distribution activities and those relating to ancillary products.
5.4.1.3 Employee awareness-raising and training
Employee awareness and training are carried out both Group-wide in order to reach all teams, and locally by each subsidiary.
These actions focus on various environment-related topics, such as prompting employees to switch off their computers at the end of the day, and raising their awareness of recycling waste in accordance with local rules. They can also focus on broader issues, such as the implications of sustainable development, or the eco-friendly habits to be adopted by employees on a daily basis.
♦ The Group’s internal CRS site provides the teams with information on the Group’s main environmental impacts, its footprint reduction targets, and the initiatives undertaken Group-wide and within individual subsidiaries. A site dedicated to eco-friendly practices is also available, focusing on the simple habits that employees can adopt in their working lives. The Code of Conduct, which includes a page to help employees adopt a more sustainable approach in decision-making, is also available via this page. The internal social network also has a “green” community. In addition, an e-mail address is available to contact the CSR team for advice or assistance with various environmental initiatives.
♦ In Canada, Ubisoft’s Montreal studio proposed events open to all employees during the Earth Day week. Training sessions were offered on eco-friendly practices such as “Cultivating your balcony” to encourage employees to grow their own vegetables on their balconies, and “Repairing your bike” to encourage them to use this green mode of transport. On a more sustainable level, the studio has developed a web page dedicated to the environment. It enables everyone to fi nd out about and share information on the ecological initiatives taking place in Montreal (2).
♦ Similarly, “Ubi Green” – a day event dedicated to sustainable development – was organized for the Montreuil premises in France. Employees were invited to take part in activities focused on waste sorting, the production of home-made hygiene products, or the repair of IT equipment. On that occasion, the CSR Management presented Ubisoft’s carbon footprint to all employees, through a conference broadcast live to the various Ubisoft sites and subsequently available on replay on the Group’s intranet.
(1) The six-to-one ratio stems from a study conducted by a green IT consultant in 2017. This study includes the greenhouse gas emissions generated by the activities of Ubisoft and its gamers (excluding games and equipment at the end of their life cycles)
(2) http://montreal.ubisoft.com/fr/ubisoft-et-lenvironnement/
- 2018 Registration Document 125
Corporate social responsibility5Environmental indicators
♦ In Toronto, a Green Committee was set up on the employees’ initiative. It consists of 11 employees from the studio’s various business lines. This committee undertakes a variety of initiatives such as organizing the collection of electronic waste, setting up a bike sharing system for employees, and installing motion detectors to manage the lighting of buildings. This committee also raises the awareness of employees by putting up posters on environmental issues such as recycling, and the habits they should adopt to reduce their impact on the planet.
♦ In Australia, a designated team is tasked with questioning employees on the objects amassed in their work space. As a result, the teams must adjust their orders of materials, and think up solutions to avoid any future accumulation and dispose of any waste in a responsible way.
♦ The teams in Kiev (Ukraine) have continued to participate in the “Ukraine without waste” program, aimed at reducing the country’s waste and raising the awareness of employees. To this effect, posters supplied by “Ukraine without waste” have been put up in the premises, as well as recycling bins to encourage waste sorting.
♦ Other initiatives are conducted in the Ubisoft Group’s various studios and offi ces. These awareness-raising actions stress the importance of complying with local recycling rules, while reiterating the principles of reduction of energy consumption (switching off one’s computer when leaving the offi ce, switching off lights, etc.). They also encourage employees to reduce offi ce waste, for example by using a personal cup rather than disposable cups.
Awareness-raising campaigns are run at least every 2 years. As a result, 42 sites (1) conducted at least one awareness-raising campaign between January 1, 2016 and December 31, 2017. In 2017, 32 sites conducted at least one awareness-raising campaign.
❙ 5.4.2 PREVENTING ENVIRONMENTAL RISKS AND POLLUTION
Ubisoft’s defi nition of environmental risk is based on the GRI defi nition contained in the G4 guidelines (2).
The Group’s own activities do not present any signifi cant industrial and environmental risks since the Group does not manufacture the video games, audiovisual products or associated ancillary products it publishes and distributes.
Nevertheless, the Group remains alert to regulatory changes in countries where it is present.
The Group’s main expenses and actions for the protection of the environment are further examined and detailed in this report’s Climate Change and Circular Economy sections.
❙ 5.4.3 PROVISIONS AND GUARANTEES
The Group currently has no knowledge of any industrial or environmental risk. Ubisoft did not record any provision, purchase any insurance to cover potential environmental risks, or pay any compensation in this regard during the fi nancial year.
❙ 5.4.4 CLIMATE CHANGE
5.4.4.1 Greenhouse gas emissions
To measure its environmental footprint and defi ne the measures to be put in place to reduce greenhouse gas (GHG) emissions, at the end of January 2015 the Ubisoft Group hired an external service provider to carry out a carbon audit. The approach used was both quantitative – measuring the carbon footprint according to the latest standards (Bilan Carbone® and Greenhouse Gas Protocol®) and semi-quantitative, measuring other environmental impacts in terms of resources (energy, water, raw materials).
For 2017, Ubisoft’s GHG emissions amounted to 86.1 kilotons of CO2 eq. The scope (3) taken into account was extended in comparison with 2015.
The main sources of greenhouse gas emissions from Ubisoft’s business activities are as follows:
♦ the manufacture, shipment to warehouses and distribution of video game cases/DVDs and ancillary products, activities that have been subcontracted by the Group;
♦ business travel by employees;
♦ the energy consumed by buildings, heating and air conditioning systems, and servers;
♦ IT equipment;
♦ purchase of services.
(1) Representing 71% of the workforce at March 31, 2018
(2) “An environmental risk refers to the possibility of incidents or accidents occurring that are caused by the activities of a company, which may have harmful and signifi cant repercussions for the environment. Environmental risk is measured by considering the probability of occurrence of an event (risk) and the level of danger.”
(3) Increase in the categories of IT equipment taken into account
- 2018 Registration Document126
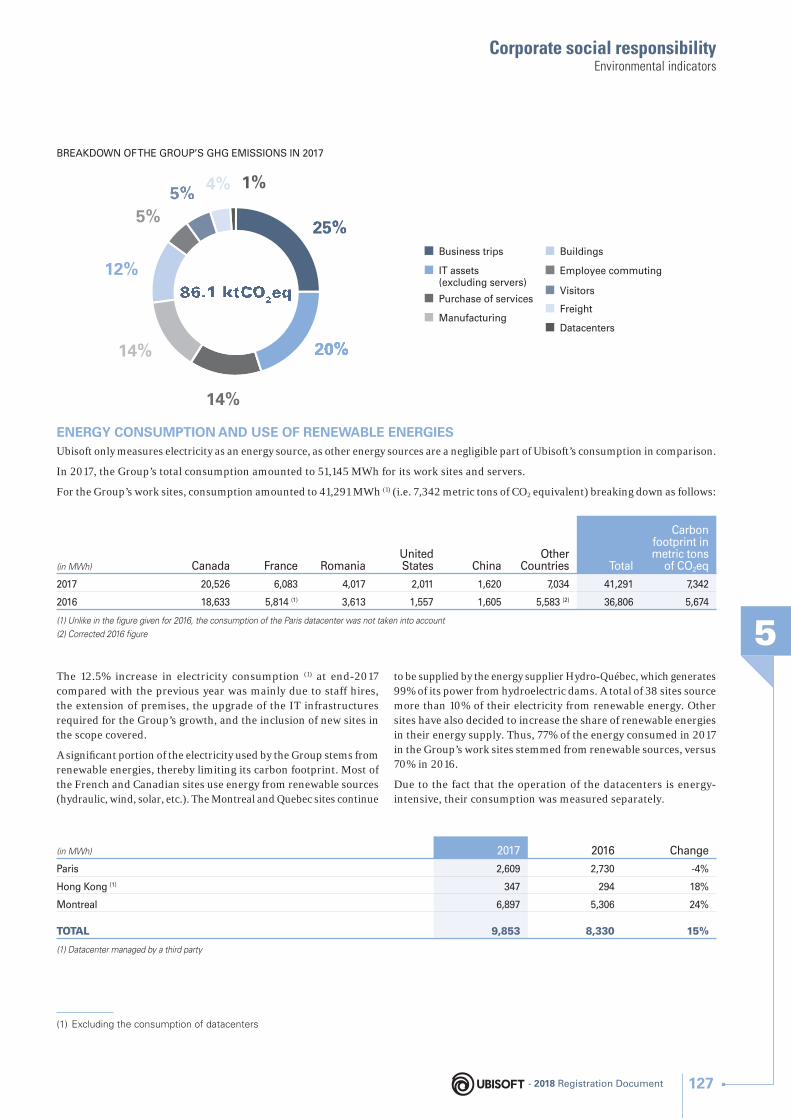
Corporate social responsibility
5
Environmental indicators
BREAKDOWN OF THE GROUP’S GHG EMISSIONS IN 2017
Purchase of services
Business trips
IT assets(excluding servers)
Datacenters
Employee commuting
Manufacturing
Buildings
Visitors
Freight
5%5% 4% 1%
14%
12%
25%25%25%25%
20%20%20%
14%
5%
86.1 ktCO2eq86.1 ktCO2eq
ENERGY CONSUMPTION AND USE OF RENEWABLE ENERGIESUbisoft only measures electricity as an energy source, as other energy sources are a negligible part of Ubisoft’s consumption in comparison.
In 2017, the Group’s total consumption amounted to 51,145 MWh for its work sites and servers.
For the Group’s work sites, consumption amounted to 41,291 MWh (1) (i.e. 7,342 metric tons of CO2 equivalent) breaking down as follows:
(in MWh) Canada France RomaniaUnited States China
Other Countries Total
Carbon footprint in metric tons
of CO2eq
2017 20,526 6,083 4,017 2,011 1,620 7,034 41,291 7,342
2016 18,633 5,814 (1) 3,613 1,557 1,605 5,583 (2) 36,806 5,674
(1) Unlike in the fi gure given for 2016, the consumption of the Paris datacenter was not taken into account
(2) Corrected 2016 fi gure
The 12.5% increase in electricity consumption (1) at end-2017 compared with the previous year was mainly due to staff hires, the extension of premises, the upgrade of the IT infrastructures required for the Group’s growth, and the inclusion of new sites in the scope covered.
A signifi cant portion of the electricity used by the Group stems from renewable energies, thereby limiting its carbon footprint. Most of the French and Canadian sites use energy from renewable sources (hydraulic, wind, solar, etc.). The Montreal and Quebec sites continue
to be supplied by the energy supplier Hydro-Québec, which generates 99% of its power from hydroelectric dams. A total of 38 sites source more than 10% of their electricity from renewable energy. Other sites have also decided to increase the share of renewable energies in their energy supply. Thus, 77% of the energy consumed in 2017 in the Group’s work sites stemmed from renewable sources, versus 70% in 2016.
Due to the fact that the operation of the datacenters is energy-intensive, their consumption was measured separately.
(1) Excluding the consumption of datacenters
(in MWh) 2017 2016 Change
Paris 2,609 2,730 -4%
Hong Kong (1) 347 294 18%
Montreal 6,897 5,306 24%
TOTAL 9,853 8,330 15%
(1) Datacenter managed by a third party
- 2018 Registration Document 127
Corporate social responsibility5Environmental indicators
In 2017, the increase in electricity consumption was due to the replacement of servers with more powerful versions and their more intensive use to support the growth of the online and digital business. The datacenters’ greenhouse gas emissions amounted to 434 metric tons of CO2eq (1). In the French and Canadian datacenters, 99% of the energy consumed is from renewable sources, thereby greatly limiting those centers’ environmental footprint.
Their power consumption is closely monitored. To cut back on the energy consumed by servers, the Group’s largest server rooms have been using “freecooling” technology since 2015. This technique consists of using the outside air to cool the room, thereby reducing the overall energy consumption of the infrastructures. The Paris center also has an Optimized Management Interface (OMI) to regulate the air-conditioning system in real time, according to server workload, thereby optimizing electricity consumption. The OMI was optimized in March 2017 to further reduce energy consumption.
Other actions are also undertaken to improve the centers’ energy effi ciency (more effi cient servers, densifi cation).
At the same time, the vast majority of Group servers are virtual, given that a virtual server consumes approximately 10 times less electricity than a physical server with the same confi guration. At end-December 2017, the Paris and Montreal server rooms continued to have a signifi cant virtualization rate of 72%.
In 2017, the Group continued to identify and encourage measures to reduce overall energy consumption. These initiatives are decentralized and vary depending on the site. Some have chosen to limit their consumption, while others have adapted their installations to use less power:
♦ many sites have introduced measures to limit the consumption of their air conditioning and lighting systems:
• as mentioned in section 5.4.1.3 – Employee awareness and training – in 2017, 32 sites conducted communication campaigns to remind employees of the daily habits to adopt to avoid electricity wastage. For example, staff are encouraged to switch off lights and computers when leaving work, or to turn on heaters or air conditioning only when necessary,
• smart devices for air conditioning systems to avoid using air conditioning when there is no one in the offi ces,
• some sites have movement sensors or systems that automatically switch off lights when not in use, so that lighting can be adjusted to suit employees’ needs;
♦ other sites are investing in optimizing their installations to reduce consumption:
• by renovating buildings, along with their heating and air conditioning systems.
For example: the eco-energy retrofi t project which began in 2014 for buildings at the Montreal site is still ongoing. Workspaces have been redesigned for optimum sun exposure, while effi cient insulation systems reduce energy consumption,
• in France, the Ivory Tower premises in Lyon were recently renovated, including the installation of solar panels. The building’s electricity contract, like for all of the Group’s French buildings, provides for 100% renewable energies. This work also involved the improvement of the building’s insulation, the installation of electrochromic glass to help regulate light and heat in the premises, and the replacement of light fi xtures with LED lights to reduce electricity consumption,
• the use of low-energy light bulbs is increasing within the Group. Numerous sites use LED lighting due to its energy-effi cient properties and longer life, thereby reducing the environmental impact and providing more effi cient lighting.
PRODUCT MANUFACTURING AND TRANSPORTATIONThe Group’s GHG emissions mainly stem from our suppliers’ use of raw materials for the manufacturing of our standard products (video game cases, DVDs, etc.) and non-standard products (ancillary products such as fi gurines, printed materials, etc.), and the transportation of these products from the production sites to the sales outlets.
In 2017, the CSR Department improved its data collection process and its assessment of the GHG footprint of the manufacturing and transportation of Ubisoft products.
As the manufacturing is outsourced, it has an indirect footprint for Ubisoft. The GHG footprint of the manufacturing of physical video games and ancillary products was evaluated at 11.7 ktons of CO2 eq, compared with 10.8 ktons of CO2eq in 2016. This increase is due to the expansion of the Group’s business. More detailed information on the consumption of raw materials is available in section 5.4.5.2 – Sustainable use of resources – of this report.
The transportation of the products from their manufacturing sites to their sales outlets accounts for 3.9 kilotons of CO2eq, representing 5% of the Group’s total GHG emissions.
GROUP TRAVEL POLICY AND IMPACT OF BUSINESS TRIPSThe Group’s travel policy is aimed at controlling the environmental impact of employee travel, which is one of the main sources of greenhouse gas emissions, accounting for 26% of the carbon footprint in 2017. The increase in the carbon footprint is proportional to the increase in the distance traveled.
(1) 355 metric tons of CO2 in 2016. 18% increase in 2017
- 2018 Registration Document128
Corporate social responsibility
5
Environmental indicators
The 9.6% increase in the distance traveled – i.e. from 87.1 million kilometers in 2016 to 95.5 million in 2017 – is due to the growing number and size of game development projects requiring international inter-studio collaboration. This increase is lower than the staff increase (1), confi rming Ubisoft’s rationalization of business trips.
Due to the Group’s international scale, employees frequently have to travel to other sites. Consequently, the Group seeks to optimize travel wherever possible. To this end, several measures have been put in place:
♦ videoconferencing is recommended whenever possible to avoid travel. The criteria taken into account for the use of such facilities include, on the one hand, the number of participants, the number of regions, the importance of the meeting and its duration, and, on the other hand, the total travel cost for all participants, and the savings made by using such facilities. To this effect, numerous sites stated that they had videoconference rooms. All of the Group’s subsidiaries have computers with the Skype for Business application;
♦ in 2017, a business trip guide was sent to all Ubisoft subsidiaries. This guide includes advice to make business trips more environmentally friendly. When videoconferencing is impossible, employees are encouraged to travel by train rather than by plane whenever possible, and use clean, safe, ecological, affordable means of transport once on site. In general, preference is given to the least expensive and most environmentally friendly means of transport. Train travel is also the means of transport favored in certain European countries (France, Germany, UK) for short and domestic trips;
♦ effi cient management of employees’ appointments so that their travel is limited to the absolute minimum (policy of reducing travel). For example, the travel policies implemented in sites such as those of Toronto and Newcastle encourage employees to schedule several business meetings during the same trip in order to optimize their travel.
EMPLOYEE COMMUTINGEmployee commuting accounts for 5% of Ubisoft’s GHG footprint. Hence, numerous sites have introduced measures to enable their employees to travel to work in an environment-friendly way. Initiatives include the following:
♦ the use of public transport and carpooling to reduce emissions. The Sydney studio encourages employees to use public transport by paying for part of their subscriptions;
♦ the Toronto subsidiary has subscribed to Smart Commute, a platform operated by the city of Toronto to facilitate ride-sharing among city dwellers;
♦ certain studios encourage staff to commute to work by bike. The Blue Byte studio in Germany is a certifi ed “eco-friendly employer” because of the way it promotes cycling as a form of transport among its employees. Montreuil employees can borrow bikes
free of charge up to 3 times a week for commuting purposes. Bikes are also available to employees on the Toronto and Malmö sites. In addition, numerous sites have installed bike racks to encourage employees to use their own bikes.
5.4.4.2 Adapting to climate change
Due to the nature of its business activities and the location of its sites, Ubisoft is not directly affected by the consequences of climate change.
Every time Ubisoft chooses a new building or has one built or renovated, the environmental dimension is taken into account. As mentioned in the section on energy consumption and use of renewable energies, the Ivory premises in Lyon underwent major renovations in 2017, involving the improvement of the building’s insulation and lighting system, and installation of solar panels on the roof.
5.4.4.3 Group’s GHG reduction objectives
Ubisoft strives to optimize its carbon footprint in a high-growth business. In 2017, its GHG footprint per employee was thus reduced from 7.1 metric tons of CO2eq (as appraised by an external consultant in 2015) to 6.4 metric tons. Ubisoft’s objective is to maintain that ratio.
❙ 5.4.5 CIRCULAR ECONOMY
5.4.5.1 Waste prevention and management
The Group has identifi ed four categories of waste linked to its business activities:
♦ waste electrical and electronic equipment (WEEE);
♦ paper;
♦ products that cannot be sold on distribution platforms (marketing items, promotional items, etc.);
♦ other consumables (batteries, ink cartridges, capsules, etc.).
WASTE ELECTRICAL AND ELECTRONIC EQUIPMENT (WEEE)Ubisoft actively participates in the sorting and recycling of WEEE, mainly consisting of IT equipment at the end of its useful life. In 2017, the number of sites who stated that they recycled this type of waste amounted to 51 (2).
The sites manage WEEE by calling on external service providers, organizations or companies specialized in the dismantling of IT equipment, with whom they sign a recovery/dismantling/recycling contract. All WEEE treatment operations are carried out in compliance with applicable laws and standards.
(1) 15% increase in the average headcount between 1/01/17 and 12/31/17, compared with the average headcount between 1/01/16 and 12/31/16
(2) Representing 93% of the Group’s workforce at 03/31/18. In 2016, 42 sites, representing 88.4% of the Group’s workforce at 3/31/17, stated that they recycled WEEE
- 2018 Registration Document 129
Corporate social responsibility5Environmental indicators
Moreover, part of the discarded IT and electronic equipment is donated to schools or non-profi t organizations, or sold or given out to employees. Some studios, like those in Montreal and Montpellier, have adopted a community-minded approach, as they entrust their used equipment to charities who either distribute it to people in need or sell it to them at a very low price. In Barcelona, this is valid for all waste recycled by the site.
PAPERIn 2017, 47 sites (1), recycled or sorted their waste paper.
Mindful of the environmental impact of paper consumption, the sites are continuing to recycle their paper through waste sorting at their premises or collection areas or by outsourcing to specialist companies as in Canada, the United States and France.
PRODUCTS THAT CANNOT BE SOLDThis product category includes non-distributed promotional goodies, posters, trade show stands and promotional tools. When such products cannot be donated or re-used, the stocks remaining in distribution platforms are scrapped under the direct responsibility of the warehouses (external service providers except in Italy). This is organized by suppliers or sites’ warehouse managers. The various destruction tasks are carried out under the supervision of offi cial bodies and are outsourced to external companies to be recycled, burnt or buried.
OTHER CONSUMABLESMost sites also organize the collection and sorting of waste consumables such as batteries and ink cartridges. In 2017, 47 sites stated that they recycled this type of products (2).
The collection of this waste may be organized by the entity’s IT team, or be done via on-site waste collection facilities. This waste is then treated by specialized external service providers, organizations or companies, in compliance with applicable laws.
OTHER WASTE SORTING PRACTICESMost sites have collection points for recycling and sorting waste.
Several subsidiaries place recycling bins in prominent locations on site, labeled by type of waste. These recycling points are used to sort paper, aluminum, plastic and food waste. These collection points are generally situated in offi ces, communal areas or at the entrance to each fl oor. In France, employees at the Montreuil site can also drop off certain used items – such as batteries, light bulbs and mobile phones – at reception for recycling. Organic waste is also handled in a specifi c way on certain sites.
Several sites have launched initiatives to reduce or even eliminate the use of plastic and paper cups in their buildings. The Montreal studio has introduced a “zero disposable cup” policy in its premises and has been eliminating them gradually since February 2017. Employees are encouraged to bring their own cups and therefore benefi t from a reduced price on coffee. The Annecy studio in France no longer offers disposable cups. Other sites such as those of Buccinasco, Barcelona and Morrisville have given fl asks to all of their employees to replace the disposable cups.
Numerous sites also strive to give their waste a new lease of life by repairing what can be repaired in order to reduce waste. For example, the Madrid subsidiary has teamed up with the SEUR Foundation, sending part of its plastic waste so that this can be used to make prostheses for children with special orthopedic needs. In Sweden, by collecting redeemable cans and bottles, 22,000kr was raised for the non-profi t organization Hungerprojektet, which participates in women’s literacy initiatives in Malawi.
5.4.5.2 Sustainable use of resources
CONSUMPTION OF RAW MATERIALSThe carbon audit carried out in early 2015 made it possible to measure the carbon footprint resulting from consumables used by our suppliers to manufacture standard products (physical video game media such as cases, DVDs, etc.) and non-standard products (ancillary products such as action fi gures, posters, etc.). The 2017 carbon footprint update has made it possible to measure the impact of the manufacture of physical products on Ubisoft’s footprint. This outsourced activity has an indirect impact for Ubisoft. The tonnages and CO2 equivalent of raw materials used break down as follows by type of products and materials:
(1) Representing 84% of the Group’s workforce at 03/31/18. In 2016, 43 sites, representing 91.4% of the Group’s workforce at 3/31/17, stated that they recycled paper
(2) Representing 85% of the Group’s workforce at 03/31/18
Standard products PP (1) Paper Polycarbonate
In metric tons 2,488 1,152 459
In metric tons of CO2eq 4,977 1,520 3,555
(1) Polypropylene, a semi-crystalline thermoplastic polymer
- 2018 Registration Document130
Corporate social responsibility
5
Environmental indicators
For standard products, total emissions amounting to 10,052 metric tons of CO2eq in 2017, and 8,647 metric tons in 2016.
Non-standard products ABS (1) PVC (2) Cardboard Paper Fiberglass MDF (3)
In metric tons 41 148 261 285 9 21
In metric tons of CO2eq 154 861 277 373 30 25
(1) Acrylonitrile butadiene styrene, a thermoplastic polymer
(2) Polyvinyl chloride, a thermoplastic polymer
(3) Medium Density Fiberboard
For non-standard products, total emissions amounting to 1,721 metric tons of CO2eq in 2017, and 2,134 metric tons in 2016.
The Group is continuing its digitalization policy for its video games business. This accounted for 56% of sales at the end of December 2017, compared with 47% in 2016. This policy allows the optimization of material consumption in relation to business growth.
Furthermore, the actions taken in the past to reduce the consumption of paper and ink cartridges continued in 2017. Thus, 36 sites (accounting for 67% of the Group’s workforce (1) stated that they promote the purchase of recycled or FSC/PEFC certifi ed paper.
Energy consumption
Detailed information on these consumptions and emissions are available in the “Climate Change” section of this report.
❙ 5.4.6 COMBATING POLLUTION
5.4.6.1 Discharges into the air
The Group’s transport activities, generated by the distribution of physical video games, are responsible for a certain amount of air pollution as a result of greenhouse gas emissions.
Likewise, business trips by Ubisoft staff, as well as employee commuting, are also responsible for a certain amount of air pollution from greenhouse gas emissions.
Further information on these emissions, which are monitored, is available in the “Greenhouse Gas Emissions” section of this report.
5.4.6.2 Discharges into water or soil, and other forms of pollution
Due to the nature of Ubisoft’s core business, the likelihood of the Group producing organoleptic nuisances or air, water or soil emissions is very low. Indeed:
♦ the waste generated by the Group is not classed as hazardous under applicable legislation, except for certain WEEE classed as such;
♦ the Group is not affected by accidental spills, given the nature of its business;
♦ water is only used for domestic purposes.
Ubisoft’s activities generate little noise or light pollution.
(1) Headcount at 03/31/18. In 2016, 32 sites (accounting for 64.2% of the Group’s workforce at 3/31/17) stated that they promote the purchase of recycled or FSC/PEFC certified paper
- 2018 Registration Document 131
Corporate social responsibility5Societal indicators
5.5 Societal indicators
As a company which is fi rmly rooted in its local environment, Ubisoft prioritizes local economic development and is committed to forging sustainable links with communities. The Group focuses on three key areas:
1. supporting local economic growth (section 5.5.1);
2. supporting causes linked to our business (section 5.5.2);
3. sharing social events with local populations (section 5.5.3).
In 2017, the 46 (1) subsidiaries surveyed took part in at least one economic, academic or cultural initiative for the benefi t of local communities.
To strengthen its links to the local community, in December 2016 the CSR Department launched a website open to teams to publicize the Group’s main societal goals and promote the sharing of inspirational ideas for local engagement.
❙ 5.5.1 SUPPORT FOR LOCAL ECONOMIC GROWTH
Ubisoft contributes to local economic development by creating direct jobs, supporting local employment, and giving preference to local companies for its local service needs.
CREATING JOBSUbisoft contributes to local economic development by creating jobs in the districts and cities where the Group has chosen to set up premises.
For a solid assessment of the Group’s impact on local employment, in 2017, the CSR Department launched a pilot project to calculate Ubisoft’s local socio-economic footprint in France, via an external service provider. The study, which used 2016 as its reference period, deems that Ubisoft’s presence in France supports over 8,000 full-time jobs across the country. Moreover, 80% of the economic impacts of Ubisoft’s sites are regional, thereby boosting local economic development.
On Ubisoft’s Montreal site, which is celebrating its 20th anniversary this year, nearly 3,000 direct jobs have been created since the site’s opening. In view of ongoing growth, 1,000 additional jobs are expected at Ubisoft in Quebec over the next 10 years.
At the end of December 2017, local employees accounted for 80.9% of the Group’s workforce, in line with that of the previous fi nancial year. In line with its diversity policy, the Ubisoft Group encourages multiculturalism within its subsidiaries by locally recruiting different nationalities and by sending employees on international secondments. This only happens in the case of rare skills not available locally.
EMPLOYMENT SUPPORTThe Group generates signifi cant economic and social vitality in the districts, cities and regions where it operates. This year, David Polfeldt, Director of the studio of Malmö (Sweden), was thus awarded the title of “Scandinavian Manager of the Year” for the company’s efforts in terms of inclusion and reduction of social inequalities in the city. For almost three years now, Good Malmö – the studio’s spearhead program of initiatives to promote equal opportunities – has been offering enriching work experience to young job-seekers, with various partner companies.
Similarly, the Newcastle studio is a member of Dynamo North East, an initiative aiming to turn the local region into an emerging high-tech hub. The Refl ections studio plays an active role in this endeavor, as Skills Developer, by offering local residents the opportunity to discover the various jobs in the technology and IT industry.
PROMOTING LOCAL COMPANIESUbisoft also contributes to local economic development by calling on local companies to provide a wide variety of services to ensure its employees’ occupational wellbeing. In 2017, almost all of the subsidiaries surveyed, i.e. 42 (2) of them, offered this type of service to their teams.
Moreover, a number of subsidiaries gave preference to local suppliers who took account of social and/or environmental criteria, thereby increasing the sustainability of the local economic fabric:
♦ certain French sites (Annecy and Lyon) call on organizations dedicated to the integration of persons with physical or mental disabilities for their food/catering requirements for various events;
♦ at the Montreal, Montreuil, San Francisco and Toronto sites, employees are offered baskets of fresh fruits and vegetables from local organic growers.
(1) Accounting for 99.2% of the Group’s total headcount in March 2018
(2) Accounting for 95.6% of the Group’s workforce at the end of March 2018
- 2018 Registration Document132
Corporate social responsibility
5
Societal indicators
❙ 5.5.2 SUPPORTING CAUSES LINKED TO OUR BUSINESS
Every year, Ubisoft engages with local communities by offering innovative pathways to train the next generation of competent, passionate workers, and put the power of play at the service of the most deprived populations.
5.5.2.1 Offering new learning pathways
In 2017, Ubisoft upheld its commitment to train the next generation in new technologies and gaming. With the growing interest of young students, entrepreneurs and schools in the opportunities offered by subsidiaries, the range of initiatives conducted by the Group has been greatly enhanced over recent years.
♦ The CODEX program, launched two years ago, consists of a variety of initiatives catering for all educational backgrounds. The idea is to promote video games as a source of motivation and learning, which in turn will shape the next generation of technical creatives in Quebec. In 2017, the program’s initiatives were supplemented with new opportunities:
• the Ubisoft Game Lab Competition gives students 10 weeks to develop a playable 3D video-game prototype with the support of mentors from the Montreal and Quebec studios, based on specifi cations provided by a panel of Ubisoft experts. Some thirty internships and jobs were offered to the Competition’s most promising talents. In addition, prizes totaling CAD 22,000 (1) were awarded to the winning teams;
• via CODEX, the Montreal Museum of Fine Arts was granted fi nancing for its interactive app “What a History!” for digital tablets. This new e-learning tool enables school groups to browse through the Museum’s collection of Quebec and Canadian art. Ubisoft Montreal also contributes to the Museum’s support program “Coup de pouce aux familles” which distributes 15,000 passes per year to 60,000 parents and children from underprivileged backgrounds to enable them to discover the many benefi ts of art: self-discovery, openness to the world and the development of creativity.
As part of this program, initiated in 2015, Ubisoft Montreal has committed to invest more than CAD 8 million (2) over fi ve years, including more than a thousand hours a year of mentoring by Ubisoft employees.
♦ In France, the Montreuil site organized two events to bring out creative young talents and foster innovative video game ideas:
• the Game Developers day: “The Next Generation” brought together, in Ubisoft premises, groups of students with innovative projects to create tomorrow’s video games or play them in an even more immersive way. Spotted by Ubisoft’s editorial teams, these young talents stem from the best interactive design and
video game schools. They presented their prototypes using the latest augmented reality (AR) and virtual reality (VR) tools and techniques;
• in partnership with the Simplon Foundation, which offers digital design training to the most deprived, Ubisoft organized Pimp the Data, a collaborative hackathon involving employees and students from the two organizations to come up with innovative ways of using the data collected during video game sessions and optimizing the gamer experience.
♦ In the Philippines, the Binan studio has committed to turning the expansion of the digital sector into a growth lever for the most deprived. Via the Passerelles Numériques (Digital Gateways) non-profi t organization, it fi nances a higher-education high-tech course in the digital sector for ten young people from disadvantaged backgrounds, most of whom live in areas that are frequently hit by climate-related disasters. According to the NGO’s estimates, this training program of almost 3 years enables future graduates to fi nd a steady job in less than 2 months and earn 2 to 4 times the average local salary, thereby providing support to these deprived families.
Furthermore, Ubisoft supports the growth and maturing of new entrepreneurs in the video game industry. Several studios now assist technology start-ups and provide them with the tools and expertise they need to grow. In 2017, the Group partnered Station F – the world’s biggest startup campus – to oversee the Video Games and Entertainment program. This program involves stimulating get-togethers of Ubisoft teams, entrepreneurs, and external experts to shape tomorrow’s entertainment. Each participating startup works with Ubisoft to defi ne its goals and meet experts to measure its progress.
In Canada, in 2017, the Quebec, Montreal and Toronto studios launched the Ubisoft Indie Series, an annual competition aimed at independent Canadian video game development studios. In 2017, the three winning teams each received fi nancing of US$ 50,000 (3). They also benefi ted from mentoring by Ubisoft experts in their development (artistic guidance, creative guidance, programming advice, etc.), as well as help with the marketing and commercial promotion of their games.
5.5.2.2 Promoting the power of play alongside local NGOs
As a major player in the entertainment industry, Ubisoft is convinced that playing is an essential requirement for everyone’s development and fulfi llment. Playing is a fantastic way of alleviating suffering, promoting social ties, and encouraging self-development. For this reason, since November 2017, the Group has chosen to combine all of its sponsorship actions under the Play for Good program, aimed at supporting play and its benefi ts for disadvantaged people, by increasing its teams’ engagement with communities.
(1) Equivalent to €14.2 thousand at end-March 2018
(2) Equivalent to €5.2 million at end-March 2018
(3) Equivalent to €41.6 thousand at end-March 2018
- 2018 Registration Document 133
Corporate social responsibility5Societal indicators
BRINGING PLAY AND ITS BENEFITS TO DISADVANTAGED POPULATIONSNumerous Group subsidiaries are actively involved with non-profi t organizations who use play to entertain and brighten up the daily lives of disadvantaged, isolated or sick people. Ubisoft’s Australian subsidiary thus partners two complementary NGOs who recognize the numerous benefi ts of play:
♦ the Starlight Foundation, which offers games, shows and entertainment to children in hospitals. In 2017, the Australian subsidiary donated US$ 35,000 (1) to the Foundation, in particular by involving staff in fund raising via sports challenges, and via Ubisoft fans at video game trade shows in Sydney;
♦ the Checkpoint non-profi t organization, which uses play to help young people suffering from mental problems (depression, isolation, pervasive developmental disorders, etc.). By joining a caring community of players, any person suffering from psychological disorders can forge ties with others and thus regain self-confi dence.
In the UK, the Newcastle studio and the Future Games of London studio both partner non-profi t organizations that enable people with disabilities to play games on tablets or consoles. By developing innovative improvements (specially adapted joysticks, eye control, etc.), the Special Effect non-profi t organization, fi nancially supported by the Newcastle studio, makes the pleasure of play accessible to these people. Playing is benefi cial for their rehabilitation and self-confi dence. The Lifelites non-profi t organization, which has been supported by the Future Games of London studio for the past three years, supplies digital tools and devices to children in hospitals, in order to make their stay more pleasurable. In 2017, more than 10,000 children in hospitals were thus given access to digital devices.
Furthermore, the French studios as a whole continue to make the dreams of sick children come true via the Petits Princes non-profi t organization. In 2017, the studios of Annecy, Paris and Montpellier thus welcomed ten children and their families to show them the hidden aspects of the creation of a video game and play our games with them. In addition, the French subsidiaries donated €20,000 to the organization to enable other children to achieve their dreams.
FOSTERING COMMUNITY ENGAGEMENT AMONG TEAMSThrough the Play for Good program, Ubisoft also wants to give employees effective new tools to engage with their communities. Since November 2017, the Group has thus allowed its employees to use up to 3 paid workdays per year for community activities. This new program is gradually being rolled out across all sites and will be fully operational in 2018.
In addition to giving time, the Group also allows the teams, via the Good Game initiative, to donate Ubisoft computer games to non-profi t organizations and public bodies working with disadvantaged populations or isolated persons. This initiative allows each employee to give disadvantaged people the pleasure of playing games to which they would otherwise have no access, and to share pleasurable moments with them.
USING GAMING TO SUPPORT CAUSESUbisoft increasingly uses gaming as a way of supporting good causes. Gaming acts as a fund-raising tool to help populations in precarious or crisis situations, or to raise awareness among gaming communities of such issues.
Tom Clancy’s The Division thus organized a 24-hour gamer livestream on the Twitch site, during which fans were invited to make donations to the Multiple Sclerosis International Federation. Incidentally, one of the gaming community’s developers suffers from the disease.
Following the humanitarian crisis suffered by survivors of Hurricane Maria in Puerto Rico, Just Dance also donated US$ 50,000 (2) to support the fund-raising initiative of Puerto Rican artist Daddy Yankee, one of the stars of the 2018 version of the game.
Furthermore, in the UK, the partnership between the Future Games of London studio and the OCEANA non-profi t organization entered its third consecutive year: the studio now offers the purchase of functionalities in its Hungry Shark game, and all profi ts from these sales are donated to OCEANA, dedicated to the protection of sharks and marine fauna. In 2017, the purchase of functionalities raised more than €56,000 for the non-profi t organization. Moreover, OCEANA invited the game development teams to take part in a week’s efforts to protect endangered marine species in the Atlantic ocean. On the strength of this success, in 2017, the studio also partnered the Oceanic Global non-profi t organization, providing it with a VR version of the Hungry Shark game, as well as the required high-tech equipment to raise the awareness of some one hundred young people on the impacts of climate change on the marine ecosystem.
❙ 5.5.3 SHARING SOCIAL EVENTS WITH LOCAL COMMUNITIES
Entertainment is at the heart of Ubisoft’s business. Numerous subsidiaries have therefore hosted or participated in a variety of local events. These are all opportunities to strengthen bonds and increase exchanges among teams, fans and local communities.
To celebrate its 20th anniversary, the Montreal studio has thus chosen to harness the power of play for the benefi t of local residents by organizing The Mile-End Summer, a 2-kilometer fun course open during the three summer months, celebrating play in all its forms: outdoor games (infl atable castles, hopscotch, etc.), collective games (free-access sports grounds), giant board games, leisure and culture spaces (such as open-air libraries), etc. Furthermore, dedicated areas called game boxes call on local residents’ community spirit by asking them to bring games that other people will be able to discover free of charge. The Mile-End Summer is the biggest playground ever set up in Montreal. It obtained the support of 25 local businesses and organizations (canteens, local tradesmen, sports clubs, etc.). A total of over 15,000 people benefi ted from the attractions offered.
(1) Equivalent to €21.8 thousand at end-March 2018
(2) Equivalent to €41.6 thousand at end-March 2018
- 2018 Registration Document134
Corporate social responsibility
5
Societal indicators
❙ 5.5.4 DEVELOPING LONG-TERM RELATIONSHIPS WITH STAKEHOLDERS
The Group considers all people and organizations directly or indirectly affected by the Company’s business activities to be stakeholders.
By ensuring effective dialog with each stakeholder, Ubisoft establishes a long-term relationship which respects the interests of each of them. The Group’s decentralized organization can be adapted to each local situation. The main methods of dialog with these stakeholders are presented below:
Stakeholder Methods of dialogue
Customers ♦ Online communication (for online games) ♦ Consumer get-togethers (focus groups) ♦ Publication of information about our products ♦ Networking events during promotional tours (R6 invitational) or video game industry events
(E3, Gamescom, etc.)
Trade payables ♦ Buyer/supplier meetings ♦ Supplier selection process
Shareholders and investors ♦ Telephone conferences for presentation of results, meetings and plenary meetings
Employees ♦ Biannual employee satisfaction surveys ♦ Dialog with employee representation bodies (if applicable) ♦ Organization of Sharetimes and other teamworking initiatives
Research facilities and companies ♦ Collaborative approach, creation of and participation in R&D programs, university chairs, open innovation events
Communities, NGOs ♦ Partnerships with local NGOs and/or non-profi ts on local issues
Local businesses ♦ Partnerships with local businesses (local retailers, etc.)
State, public organizations, etc. ♦ Participation in working groups and local and international organizations on the challenges facing our industry
♦ Local meetings with town councils or local government concerning local issues
❙ 5.5.5 SUBCONTRACTORS AND SUPPLIERS
5.5.5.1 Considering employee-related and environmental issues in the purchasing policy
The Purchasing teams work in a proactive way to ensure that relations with suppliers are managed in a coordinated manner. A procedure is thus being rolled out to appraise and monitor supplier performance in order to ensure long-term relationships with key partners, based on the identifi cation of areas for improvement and the monitoring of joint progress charts. This procedure integrates sustainability criteria (respect for fundamental rights, labor rights, risks & safety, the environment, detection of corruption, etc.) in procurements, as well as relationships with suppliers. On both local and global scales, the Purchasing departments highlight the benefi ts of those criteria on a daily basis. In 2017, the studio of Malmö (Sweden) thus opted for environment-friendly promotional items by using biodegradable products. Likewise, the long-term relationship with the suppliers of the Ubisoft head offi ce implies the appraisal of their own CSR policy.
5.5.5.2 Production of games and ancillary products: dedicated management of CSR risks
For these two categories of purchases, the management of risks – in terms of respect for human rights and fundamental liberties, the health and safety of people, and the environment – is closely monitored due to the large volumes of purchases involved, the exposure of these products and the countries in which they are produced.
The production of video games (DVDs, cases) is overseen by the “First Parties” – Microsoft, Sony and Nintendo – who send Ubisoft their specifi cations, which include criteria concerning respect for human rights and the environment.
Nearly all of the production facilities of Ubisoft’s assemblers and logistics providers are ISO 9001 certifi ed, which means that they comply with the “Safety and quality” process, or ISO 14001 certifi ed, relating specifi cally to the environment.
Concerning other types of products related to video games (ancillary products), a compliance team dedicated to the EMEA region is tasked with selecting subcontractors who comply with Ubisoft’s specifi cations in terms of quality, pricing and CSR.
- 2018 Registration Document 135
Corporate social responsibility5Societal indicators
For this purpose, a process was introduced to rank the risks according to the type of products (volumes, exposure) and the country in which they are produced.
The regulations applicable, such as the French law on the Duty of Care, have thus been reiterated to all subcontractors concerned. They have also been asked to sign Quality Guidelines wherein they undertake to comply with a number of criteria, in particular concerning fundamental human rights, health and safety in the workplace, and the protection of the environment. Compliance with fundamental rights is also a requirement of the contracts signed with the main service providers.
Furthermore, since 2017, all new subcontractors, as well as existing subcontractors with whom a new order is placed and who are identifi ed as “high-risk”, undergo on-site social audits conducted by an independent third party. These audits are based on the SA 8000 standard, which includes the standards of the UN and those of the International Labor Organization on child labor, forced labor, working time, health and safety, etc.
Following these audits and according to their fi ndings, corrective action plans may be sent to the subcontractors. These plans are monitored and traced by the quality assurance team to ensure that practices are improved and meet Ubisoft standards.
This quality assurance process, currently in place in the EMEA region, is gradually being applied by the teams in the NCSA region.
5.5.5.3 Outsourcing
As part of its video game production, publishing and distribution business, Ubisoft occasionally outsources services, in particular pertaining to IT support, external/freelance development and related activities. In 2017, this accounted for 18% of the Group’s external purchases and charges.
❙ 5.5.6 FAIR OPERATING PRACTICES
5.5.6.1 Preventing corruption
Ubisoft is committed to the fair treatment of its suppliers, employees and service providers. It condemns any type of fraud, wrongdoing or confl ict of interest likely to taint the relationship with its various partners.
Since 2017, the Group has been applying a method to identify operational risks on outgoing fi nancial fl ows. These analyses are gradually providing the Group with operational risk maps, enabling it to prioritize action plans and defi ne risk control plans. The analyses also help to identify situations involving corruption risks.
Other more specifi c procedures are used across the Group:
♦ formal expenditure processes defi ne the principles for authorizing and signing off on expenditure, depending on the amount
involved. In the case of the most signifi cant purchase fl ows, these processes are realized directly within tools, such as “Peoplesoft”, for purchases relating to the production of fi nished products, or “Mint”, for marketing purchases;
♦ the code of ethics for purchasing managed by the Group summarizes the guidelines (fairness, impartiality, integrity, legality, loyalty, honesty) and illustrates situations that could give rise to confl icts of interest, together with Ubisoft’s policy on buyers (e.g. refusing gifts from suppliers above a certain amount);
♦ a strict transparency policy in the purchasing department is based on systematic transaction monitoring and an ordering system involving several members of staff who sign off on the various stages of the transaction.
Additional procedures are also implemented locally:
♦ implementation of tendering procedures that systematically require at least three supplier tenders to be received above a certain purchasing threshold, or that require several approval levels in order to validate tenders (Quebec, Pune, Newcastle);
♦ insertion of anti-corruption clauses in contracts and confi dentiality agreements signed by partners (Toronto, Abu Dhabi).
A Code of Conduct, produced in 2017, was disseminated among employees (1) and efforts to disseminate it Group-wide are continuing, in particular via the publication of a French version of the document. This Code of Conduct serves as a decision-making tool for any sensitive situations in which employees may fi nd themselves on a daily basis. It includes a section on corruption risks and provides references and key contacts to enable everyone to comply with the procedures (systematic use of open and competitive tendering, identical information guaranteed for all suppliers, limitation on the value of gifts offered by a supplier, etc.).
5.5.6.2 Consumer health and safety
Ubisoft pursues its commitment to consumer health and safety through its involvement with trade associations for the gaming industry, such as SELL (2) and the PédaGoJeux website in France, and ESA (3) in the United States.
The Group’s Code of Conduct, published in early 2017 and disseminated to all employees, sets out Ubisoft’s responsibility to players in three key areas:
♦ the protection of users’ personal data: To protect its users’ personal data, Ubisoft only collects information relevant to the gaming experience. It does not sell the data to third parties without users’ consent, and only keeps the data for the necessary period of time. The Group also routinely informs users of the type of data collected, and how the data are used. In addition, the personal details of minors are only collected with the written consent of his or her legal representative;
(1) 20 entities representing 72.2% of the workforce at March 31, 2018
(2) SELL: Syndicat des éditeurs de logiciels de loisirs (French union of entertainment software publishers)
(3) ESA: Entertainment Software Association
- 2018 Registration Document136
Corporate social responsibility
5
Duty of Care
♦ respect for the age classifi cation of games: During the life cycle of a game, the production and distribution teams work closely with ratings and consumer protection organizations, the most important of which are:
• PEGI (Pan European Game Information) for Europe,
• ESRB (Entertainment Software Rating Board) for the United States,
• OFLC (Offi ce of Film and Literature Classifi cation) or COB for Australia,
• USK (Unterhaltungssoftware Selbstkontrolle – in English, Entertainment Software Self-Regulation) for Germany,
• CERO (Computer Entertainment Rating Organization) for Japan.
Through these organizations, consumers are informed about the nature of the products and their recommended age based on classifi cation systems designed to guarantee clear and transparent labeling of the video game content according to its age rating;
♦ the prevention of toxic behaviors in gaming communities: all Ubisoft games are subject to Codes of Conduct which set out prohibited behaviors, applicable safety rules and possible sanctions. These Codes of Conduct are available on the game websites, on forums, and on the Customer Support site. A dedicated professional team is tasked with moderating the forums and the content created by gamers. A sanction system has been introduced. Each alert is investigated and may give rise to sanctions, depending on the seriousness of the misconduct. Such sanctions can go up to a temporary or permanent ban from a game.
Our “Consumer Relationship Centers” in Europe and North America also encourage players who witness harmful behaviors to report them immediately so that the appropriate action can be taken (warning, sanctions, etc.).
Moreover, Ubisoft has strengthened its commitment to accessibility in order to offer a lasting, positive gaming experience to all, irrespective of their physical or mental condition.
A project was launched on the accessibility of video games to people with disabilities. It is managed via a dedicated work group. This project has two objectives:
♦ compliance with the US Communication and Video Accessibility Act, which aims to increase the accessibility of video game communication services (chat, voice and video) to persons with disabilities;
♦ achieving a basic level of accessibility in all games by 2020 via the integration of functionalities such as: large or adjustable subtitles, the reconfi guration of controls to be able to play with one hand, compatibility with third-party devices such as Tobii EyeTracking, options for color-blind people, etc.
The project is being deployed within the production teams and via external consultants. In addition, associations of disabled gamers (CapGame in France, SpecialEffect in the UK, AbleGamers in the USA) are regularly consulted. Furthermore, gamers with disabilities were queried via an online questionnaire to fi nd out which functionalities were the most important for them.
All of these exchanges have enabled Ubisoft to establish a reference base of functionalities in order to assess, for each game, the level of accessibility achieved for each type of disability (physical, cognitive, visual, hearing). Levels range from “Low” to “Barrier-free”, with each level corresponding to a more or less complete gaming experience.
5.6 Duty of Care
Pursuant to the French law on the Duty of Care, the mapping of the risks of serious infringements on human rights, the health and safety of persons, and the protection of the environment is under way. Group purchases are analyzed, taking into account the risks inherent in each category of purchases, manufacturing countries, and budgets. This analysis makes it possible to prioritize the purchasing categories that involve the highest risks and introduce appropriate actions for
the suppliers concerned: sending of CSR questionnaires, integration of contract clauses, signing of guidelines, and conduct of audits. The main actions implemented to date are detailed in section 5.5.5.2. A vigilance plan will be published in the next Registration Document.
- 2018 Registration Document 137
Corporate social responsibility5Independent third party’s report
5.7 Independent third party’s report
This is a free translation into English of one of the auditors, appointed independent third party, on the employee-related, environmental and social information report issued in French language and it is provided solely for the convenience of English speaking readers.
This report should be read in conjunction with, and construed in accordance with French law and professional auditing standards applicable in France.
To the shareholders,
In our capacity as Statutory Auditors of Ubisoft Entertainment SA, the appointed independent third party, accredited by COFRAC under number 3-1049 (1), we hereby present our report on the consolidated employee-related, environmental and societal information for the year ended March 31, 2018, set forth in the management report (hereinafter the “CSR Information”), pursuant to the provisions of Article L. 225-102-1 of the French Commercial Code.
❙ RESPONSIBILITY OF THE COMPANY
The Board of Directors of Ubisoft Entertainment SA is responsible for preparing a management report including CSR information provided for in Article R. 225-105-1 of the French Commercial Code, prepared according to the reporting guidelines used by the Company (hereinafter “the Guidelines”), summarized in the management report and available on request from the Company’s head offi ce.
❙ INDEPENDENCE AND QUALITY CONTROL
Our independence is defi ned by regulatory texts, our professional code of ethics and the provisions of Article L. 822-11-3 of the French Commercial Code. Furthermore, we have set up a quality control system that includes documented policies and procedures that aim to ensure compliance with ethical rules and applicable laws and regulations.
❙ RESPONSIBILITY OF THE INDEPENDENT THIRD PARTY
Based on our work, our responsibility is to:
♦ certify that the required CSR information is presented in the management report or, in the event of an omission, that an explanation is provided pursuant to the third paragraph of Article R. 225-105 of the French Commercial Code (Attestation of completeness of the CSR Information);
♦ express a conclusion of moderate assurance on the fact that CSR information, taken as a whole, are presented fairly, in all material respects, in accordance with the Guidelines (Reasoned opinion on the fairness of CSR Information).
However, it is not our responsibility to express an opinion on the information’s compliance with any other applicable legal provisions, in particular those of Article L. 225-102-4 of the French Commercial Code (Vigilance Plan) and law No. 2016-1691 of December 9, 2016 known as the Sapin II Law (on the fi ght against corruption).
Our audit called upon the expertise of fi ve individuals and took place over a total period of around three weeks between October 2017 and May 2018. We called upon the assistance of our CSR experts in performing our audit.
We performed the work described below in accordance with the decision of May 13, 2013 defi ning the conditions under which the independent third party performs its mission, and the professional standards of the Compagnie nationale des Commissaires aux comptes relating to this assignment and ISAE 3000 concerning the reasoned opinion on the fairness of the CSR Information (2).
(1) The scope of which is available at www.cofrac.fr
(2) ISAE 3000 – Assurance engagements other than audits or reviews of historical fi nancial information
- 2018 Registration Document138
Corporate social responsibility
5
Independent third party’s report
1. Attestation of completeness of CSR Information
NATURE AND SCOPE OF WORKBased on our interviews with the heads of the relevant departments, we familiarized ourselves with the overview of the guidelines on sustainable development in relation to the social and environmental consequences of the Company’s activities, its societal commitments and, where appropriate, any related initiatives or programs.
We compared the CSR information presented in the management report with the list provided for in Article R. 225-105-1 of the French Commercial Code.
If any consolidated information was missing, we verifi ed that explanations were provided in accordance with Article R. 225-105, paragraph 3 of the French Commercial Code.
We verifi ed that the CSR information covered the scope of consolidation, i.e. the Company and its subsidiaries within the meaning of Article L. 233-1 and the companies it controls within the meaning of Article L. 233-3 of the French Commercial Code, with the limits specifi ed in the section “Methodology note on employee-related, environmental and societal reporting” in the management report.
IN CONCLUSIONOn the basis of this work and taking into account the above-mentioned limitations, we certify that the management report contains the required CSR information.
2. Reasoned opinion on the fairness of the CSR information
NATURE AND SCOPE OF WORKWe conducted a dozen or so interviews with individuals responsible for preparing the CSR Information by liaising with the departments in charge of the information collection process and, where relevant, the internal control procedures and risk management in order to:
♦ assess the appropriateness of the Guidelines with respect to their relevance, completeness, reliability, neutrality and understandability, taking into account industry best practice where relevant;
♦ verify the implementation of a process to collect, compile, process and control the completeness and consistency of CSR information and obtain an understanding of internal control and risk management procedures relating to the preparation of CSR information.
We determined the nature and extent of our tests and controls depending on the nature and importance of CSR information in relation to the characteristics of the Company, the social and environmental challenges of its business activities, its sustainable development guidelines and best industry practices.
For the CSR Information we considered most important (3):
♦ at the level of the parent entity, we consulted documentary sources and conducted interviews to corroborate the qualitative information (organization, policies, actions). We implemented analytical procedures on the quantitative information and verifi ed, on a test basis, the calculations and data consolidation and verifi ed its consistency and its similarity with the other information contained in the management report;
(3) Employee-related indicators: Total number of employees and distribution by age, gender, geographic area, type of contract and business line, number of hires, number of redundancies/dismissals, number of days’ absence, percentage of women in management, total number of training hours.
Environmental indicators: electricity consumption on work sites, greenhouse gas emissions from electricity consumption on work sites.
Societal indicators: Percentage of local employees registered at the end of the period.
Qualitative information: Health and safety conditions in the workplace; hires and lay-offs; measures in favor of gender equality; waste prevention, recycling and disposal measures; signifi cant sources of greenhouse gas emissions from the Company’s operations, in particular through the use of the goods and services it produces; territorial, economic and social impact of the Company’s operations in terms of regional development and employment.
- 2018 Registration Document 139
Corporate social responsibility5Independent third party’s report
♦ with respect to the representative sample of sites that we selected (4) based on their activity, their contribution to the consolidated indicators, their location and a risk analysis, we conducted interviews to verify the proper application of procedures and to identify any omissions. We performed detailed tests using sampling to verify the calculations and reconcile data with source documents. The selected sample covers 29% of the workforce, considered representative of the employee-related element, between 24% and 25% of the environmental data considered representative (2) of the environmental element, and 100% of the societal data considered representative of the societal element (5).
For other consolidated CSR information, we assessed its consistency in light of our knowledge of the Company.
Finally, we assessed the relevance of any explanations as to why certain information was incomplete or missing.
We believe that the sampling methods and sizes that we selected using our best professional judgment make it possible for us to express an opinion of moderate assurance; a higher level of assurance would have required a more extensive review. Because of the use of sampling techniques as well as others inherent limits in the operation of any information and internal control system, the risk of not detecting a material misstatement in the CSR information cannot be totally eliminated.
IN CONCLUSIONBased on this work, we did not identify any material misstatement likely to call into question the fact that the CSR Information, taken as a whole, is presented fairly, in accordance with the Guidelines.
(4) Social: Ubisoft International HQ (France), Ubisoft Divertissements (Canada).
Environment: Montreuil-Lagny (France), Montréal-Saint-Laurent (Canada).
(5) See the list of environmental and societal indicators in the footnote on page 3 of this report
Paris La Défense, May 23, 2018
KPMG SA
Anne GaransPartner
Sustainability Services
Vincent BroyéPartner
- 2018 Registration Document140
6.1 CONSOLIDATED FINANCIAL STATEMENTS AS AT MARCH 31, 2018 142
6.1.1 Summary statements 142
6.1.2 Notes to the consolidated fi nancial statements 147
6.1.3 Other accounting principles 203
6.2 STATUTORY AUDITORS’ REPORT ON THE CONSOLIDATED FINANCIAL STATEMENTS 204
6.3 SEPARATE FINANCIAL STATEMENTS OF UBISOFT ENTERTAINMENT SA FOR THE YEAR ENDED MARCH 31, 2018 209
6.3.1 Statement of fi nancial position 209
6.3.2 Income statement 210
6.3.3 Financing statement 211
6.3.4 Notes to the separate fi nancial statements 212
6.4 STATUTORY AUDITORS’ REPORT ON THE SEPARATE FINANCIAL STATEMENTS 240
6.5 STATUTORY AUDITORS’ SPECIAL REPORT ON REGULATED AGREEMENTS AND COMMITMENTS 244
6.6 UBISOFT (PARENT COMPANY) RESULTS FOR THE PAST FIVE FINANCIAL YEARS 246
Financial statements6
- 2018 Registration Document 141141- 2018 Registration Document
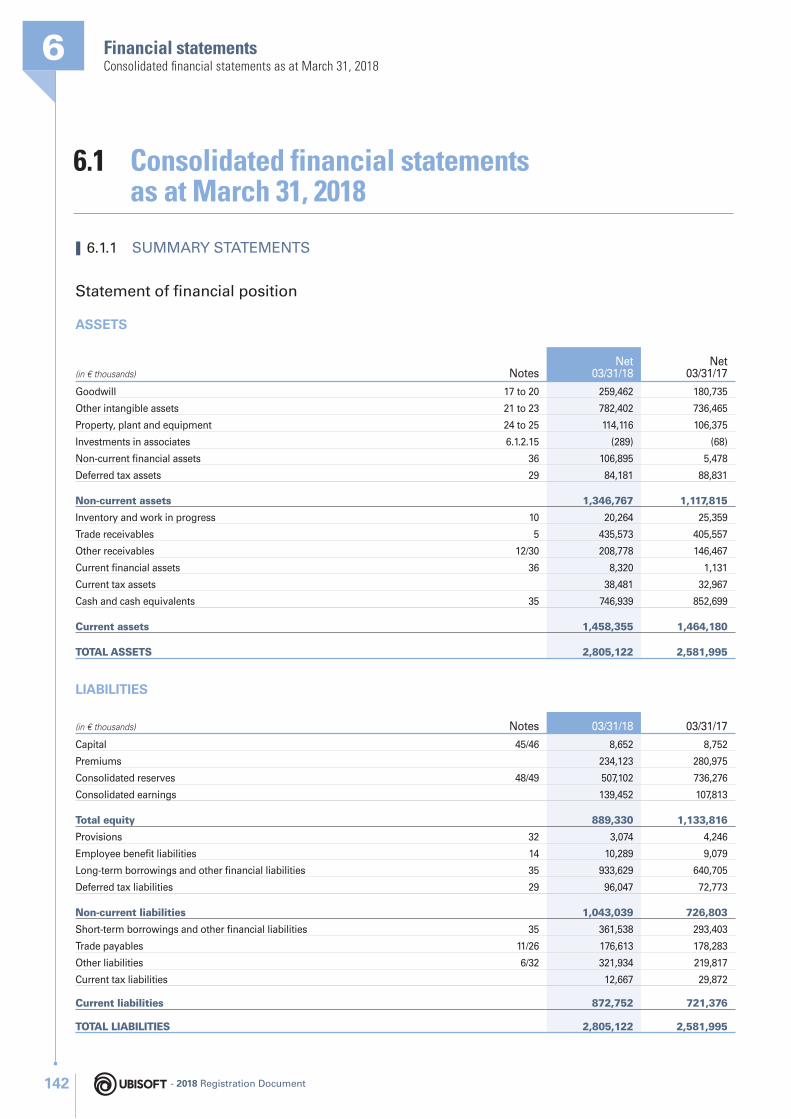
Financial statements6Consolidated fi nancial statements as at March 31, 2018
6.1 Consolidated financial statements as at March 31, 2018
❙ 6.1.1 SUMMARY STATEMENTS
Statement of fi nancial position
ASSETS
(in € thousands) NotesNet
03/31/18Net
03/31/17
Goodwill 17 to 20 259,462 180,735
Other intangible assets 21 to 23 782,402 736,465
Property, plant and equipment 24 to 25 114,116 106,375
Investments in associates 6.1.2.15 (289) (68)
Non-current fi nancial assets 36 106,895 5,478
Deferred tax assets 29 84,181 88,831
Non-current assets 1,346,767 1,117,815
Inventory and work in progress 10 20,264 25,359
Trade receivables 5 435,573 405,557
Other receivables 12/30 208,778 146,467
Current fi nancial assets 36 8,320 1,131
Current tax assets 38,481 32,967
Cash and cash equivalents 35 746,939 852,699
Current assets 1,458,355 1,464,180
TOTAL ASSETS 2,805,122 2,581,995
LIABILITIES
(in € thousands) Notes 03/31/18 03/31/17
Capital 45/46 8,652 8,752
Premiums 234,123 280,975
Consolidated reserves 48/49 507,102 736,276
Consolidated earnings 139,452 107,813
Total equity 889,330 1,133,816
Provisions 32 3,074 4,246
Employee benefi t liabilities 14 10,289 9,079
Long-term borrowings and other fi nancial liabilities 35 933,629 640,705
Deferred tax liabilities 29 96,047 72,773
Non-current liabilities 1,043,039 726,803
Short-term borrowings and other fi nancial liabilities 35 361,538 293,403
Trade payables 11/26 176,613 178,283
Other liabilities 6/32 321,934 219,817
Current tax liabilities 12,667 29,872
Current liabilities 872,752 721,376
TOTAL LIABILITIES 2,805,122 2,581,995
- 2018 Registration Document142
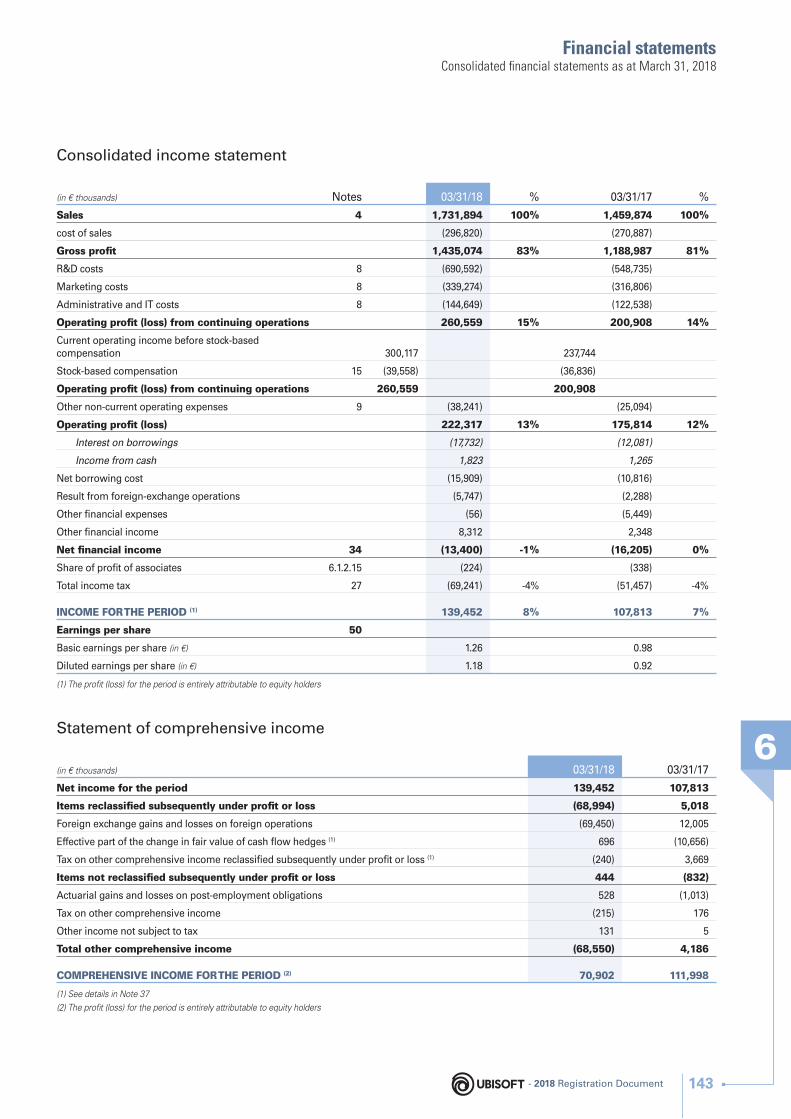
Financial statements
6
Consolidated fi nancial statements as at March 31, 2018
Consolidated income statement
(in € thousands) Notes 03/31/18 % 03/31/17 %
Sales 4 1,731,894 100% 1,459,874 100%
cost of sales (296,820) (270,887)
Gross profi t 1,435,074 83% 1,188,987 81%
R&D costs 8 (690,592) (548,735)
Marketing costs 8 (339,274) (316,806)
Administrative and IT costs 8 (144,649) (122,538)
Operating profi t (loss) from continuing operations 260,559 15% 200,908 14%
Current operating income before stock-based compensation 300,117 237,744
Stock-based compensation 15 (39,558) (36,836)
Operating profi t (loss) from continuing operations 260,559 200,908
Other non-current operating expenses 9 (38,241) (25,094)
Operating profi t (loss) 222,317 13% 175,814 12%
Interest on borrowings (17,732) (12,081)
Income from cash 1,823 1,265
Net borrowing cost (15,909) (10,816)
Result from foreign-exchange operations (5,747) (2,288)
Other fi nancial expenses (56) (5,449)
Other fi nancial income 8,312 2,348
Net fi nancial income 34 (13,400) -1% (16,205) 0%
Share of profi t of associates 6.1.2.15 (224) (338)
Total income tax 27 (69,241) -4% (51,457) -4%
INCOME FOR THE PERIOD (1) 139,452 8% 107,813 7%
Earnings per share 50
Basic earnings per share (in €) 1.26 0.98
Diluted earnings per share (in €) 1.18 0.92
(1) The profi t (loss) for the period is entirely attributable to equity holders
Statement of comprehensive income
(in € thousands) 03/31/18 03/31/17
Net income for the period 139,452 107,813
Items reclassifi ed subsequently under profi t or loss (68,994) 5,018
Foreign exchange gains and losses on foreign operations (69,450) 12,005
Effective part of the change in fair value of cash fl ow hedges (1) 696 (10,656)
Tax on other comprehensive income reclassifi ed subsequently under profi t or loss (1) (240) 3,669
Items not reclassifi ed subsequently under profi t or loss 444 (832)
Actuarial gains and losses on post-employment obligations 528 (1,013)
Tax on other comprehensive income (215) 176
Other income not subject to tax 131 5
Total other comprehensive income (68,550) 4,186
COMPREHENSIVE INCOME FOR THE PERIOD (2) 70,902 111,998
(1) See details in Note 37
(2) The profi t (loss) for the period is entirely attributable to equity holders
- 2018 Registration Document 143
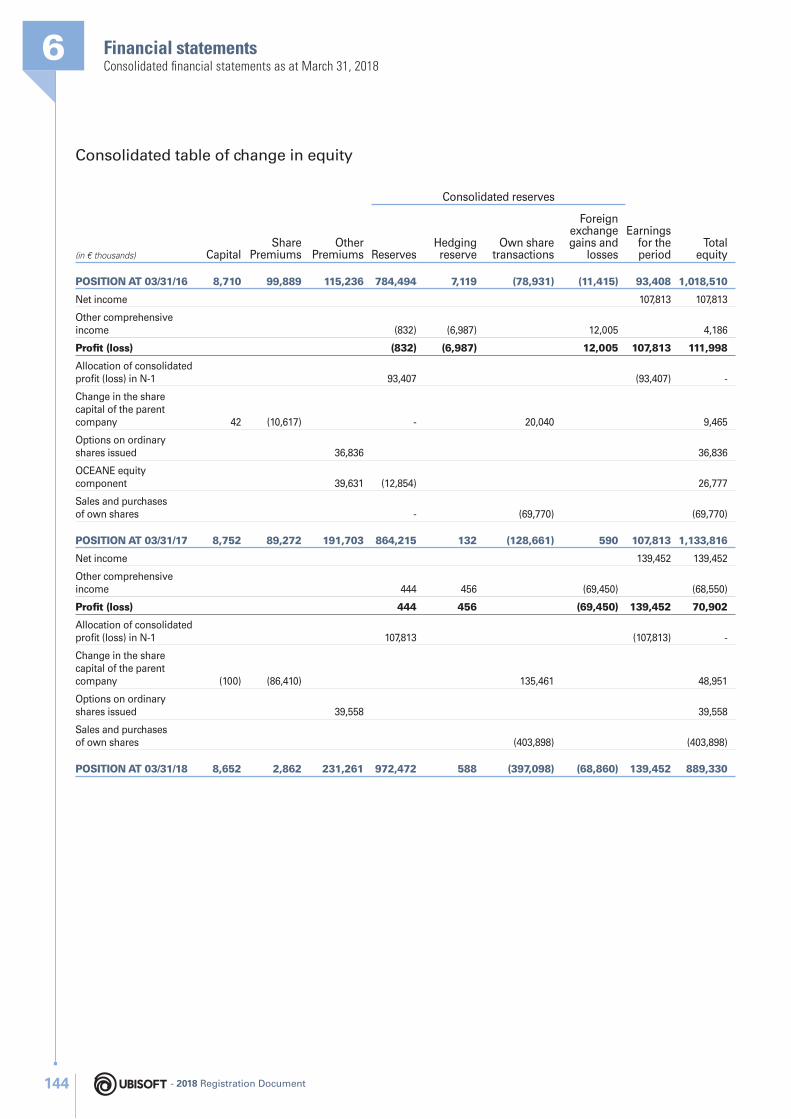
Financial statements6Consolidated fi nancial statements as at March 31, 2018
Consolidated table of change in equity
(in € thousands) CapitalShare
PremiumsOther
Premiums
Consolidated reserves
Earnings for the period
Total equityReserves
Hedging reserve
Own share transactions
Foreign exchange gains and
losses
POSITION AT 03/31/16 8,710 99,889 115,236 784,494 7,119 (78,931) (11,415) 93,408 1,018,510
Net income 107,813 107,813
Other comprehensive income (832) (6,987) 12,005 4,186
Profi t (loss) (832) (6,987) 12,005 107,813 111,998
Allocation of consolidated profi t (loss) in N-1 93,407 (93,407) -
Change in the share capital of the parent company 42 (10,617) - 20,040 9,465
Options on ordinary shares issued 36,836 36,836
OCEANE equity component 39,631 (12,854) 26,777
Sales and purchases of own shares - (69,770) (69,770)
POSITION AT 03/31/17 8,752 89,272 191,703 864,215 132 (128,661) 590 107,813 1,133,816
Net income 139,452 139,452
Other comprehensive income 444 456 (69,450) (68,550)
Profi t (loss) 444 456 (69,450) 139,452 70,902
Allocation of consolidated profi t (loss) in N-1 107,813 (107,813) -
Change in the share capital of the parent company (100) (86,410) 135,461 48,951
Options on ordinary shares issued 39,558 39,558
Sales and purchases of own shares (403,898) (403,898)
POSITION AT 03/31/18 8,652 2,862 231,261 972,472 588 (397,098) (68,860) 139,452 889,330
- 2018 Registration Document144
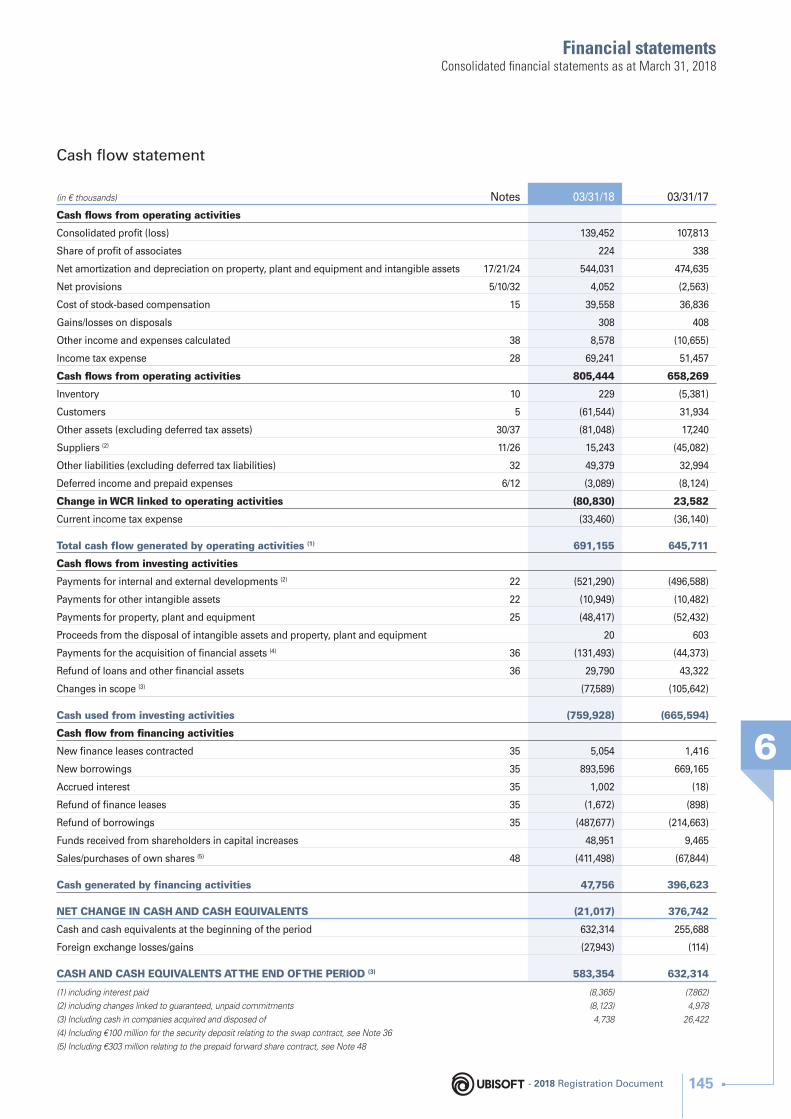
Financial statements
6
Consolidated fi nancial statements as at March 31, 2018
Cash fl ow statement
(in € thousands) Notes 03/31/18 03/31/17
Cash fl ows from operating activities
Consolidated profi t (loss) 139,452 107,813
Share of profi t of associates 224 338
Net amortization and depreciation on property, plant and equipment and intangible assets 17/21/24 544,031 474,635
Net provisions 5/10/32 4,052 (2,563)
Cost of stock-based compensation 15 39,558 36,836
Gains/losses on disposals 308 408
Other income and expenses calculated 38 8,578 (10,655)
Income tax expense 28 69,241 51,457
Cash fl ows from operating activities 805,444 658,269
Inventory 10 229 (5,381)
Customers 5 (61,544) 31,934
Other assets (excluding deferred tax assets) 30/37 (81,048) 17,240
Suppliers (2) 11/26 15,243 (45,082)
Other liabilities (excluding deferred tax liabilities) 32 49,379 32,994
Deferred income and prepaid expenses 6/12 (3,089) (8,124)
Change in WCR linked to operating activities (80,830) 23,582
Current income tax expense (33,460) (36,140)
Total cash flow generated by operating activities (1) 691,155 645,711
Cash fl ows from investing activities
Payments for internal and external developments (2) 22 (521,290) (496,588)
Payments for other intangible assets 22 (10,949) (10,482)
Payments for property, plant and equipment 25 (48,417) (52,432)
Proceeds from the disposal of intangible assets and property, plant and equipment 20 603
Payments for the acquisition of fi nancial assets (4) 36 (131,493) (44,373)
Refund of loans and other fi nancial assets 36 29,790 43,322
Changes in scope (3) (77,589) (105,642)
Cash used from investing activities (759,928) (665,594)
Cash fl ow from fi nancing activities
New fi nance leases contracted 35 5,054 1,416
New borrowings 35 893,596 669,165
Accrued interest 35 1,002 (18)
Refund of fi nance leases 35 (1,672) (898)
Refund of borrowings 35 (487,677) (214,663)
Funds received from shareholders in capital increases 48,951 9,465
Sales/purchases of own shares (5) 48 (411,498) (67,844)
Cash generated by financing activities 47,756 396,623
NET CHANGE IN CASH AND CASH EQUIVALENTS (21,017) 376,742
Cash and cash equivalents at the beginning of the period 632,314 255,688
Foreign exchange losses/gains (27,943) (114)
CASH AND CASH EQUIVALENTS AT THE END OF THE PERIOD (3) 583,354 632,314
(1) including interest paid
(2) including changes linked to guaranteed, unpaid commitments
(3) Including cash in companies acquired and disposed of
(4) Including €100 million for the security deposit relating to the swap contract, see Note 36
(5) Including €303 million relating to the prepaid forward share contract, see Note 48
(8,365)
(8,123)
4,738
(7,862)
4,978
26,422
- 2018 Registration Document 145
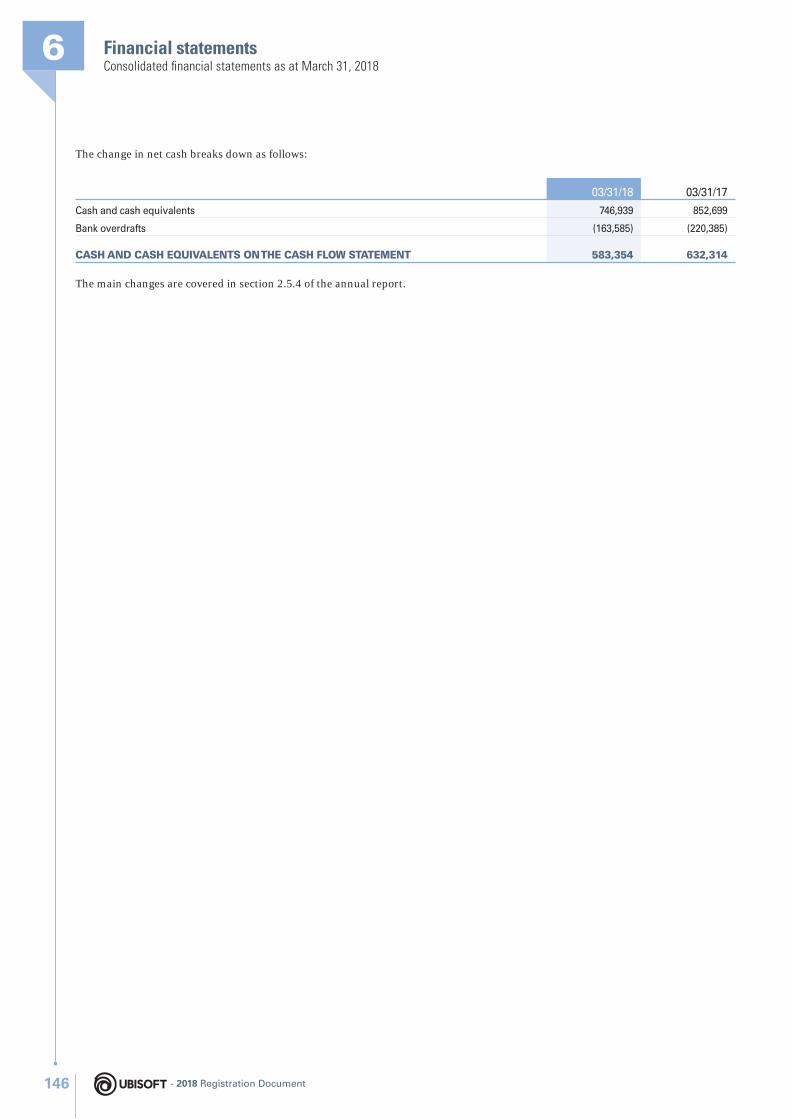
Financial statements6Consolidated fi nancial statements as at March 31, 2018
The change in net cash breaks down as follows:
03/31/18 03/31/17
Cash and cash equivalents 746,939 852,699
Bank overdrafts (163,585) (220,385)
CASH AND CASH EQUIVALENTS ON THE CASH FLOW STATEMENT 583,354 632,314
The main changes are covered in section 2.5.4 of the annual report.
- 2018 Registration Document146
Financial statements
6
Consolidated fi nancial statements as at March 31, 2018
Note 1 Highlights and general principles 148Note 2 Main changes in scope 152Note 3 Scope of consolidation 153Note 4 Sales 153Note 5 Trade receivables 154Note 6 Deferred income 155Note 7 Segment reporting 155Note 8 Operating expenses by destination 157Note 9 Other non-current operating
expenses 158Note 10 Inventory 159Note 11 Trade payables 159Note 12 Prepaid expenses 160Note 13 Personnel costs 160Note 14 Employee benefits 161Note 15 Compensation in shares and
equivalents 162Note 16 Compensation of corporate officers
(related party transaction) 166Note 17 Goodwill impairment 167Note 18 Goodwill 168Note 19 Key assumptions used to calculate
recoverable values 169Note 20 Sensitivity of recoverable amounts 170Note 21 Amortization and impairment
of intangible assets 171Note 22 Inventory value and changes
in intangible assets during the financial year 172
Note 23 Brands 175Note 24 Depreciation, amortization
and impairment of property, plant and equipment 175
Note 25 Inventory value and changes in property, plant and equipment during the financial year 176
Note 26 Amounts due to suppliers of non-current assets 178
Note 27 Analysis of tax expenses/savings 178Note 28 Reconciliation between the
theoretical income tax liability and the recognized income tax liability 179
Note 29 Deferred tax 180Note 30 Other receivables 183Note 31 Transfers of financial assets 184Note 32 Other liabilities 185Note 33 Related party transactions 186Note 34 Gains and losses relating to
financial assets and liabilities 186Note 35 Net financial debt 187Note 36 Financial assets 189Note 37 Cash flow hedging and other
derivatives 191Note 38 Interest rate risk 192Note 39 Liquidity risk 192Note 40 Covenants 193Note 41 Foreign exchange risk 193Note 42 Credit and counterparty risk 195Note 43 Securities risk 195Note 44 Fair value hierarchy of financial
assets and liabilities 196Note 45 Capital 197Note 46 Number of Ubisoft Entertainment Sa
shares 197Note 47 Dividends 197Note 48 Own shares 197Note 49 Translation reserve 198Note 50 Earnings per share 199Note 51 Off-balance sheet commitments
related to the financing of the company 200
Note 52 Off-balance sheet commitments towards company employees 201
Note 53 Leases 201Note 54 Other commitments 201
CONTENTS
❙ 6.1.2 NOTES TO THE CONSOLIDATED FINANCIAL STATEMENTS
- 2018 Registration Document 147
Financial statements6Consolidated fi nancial statements as at March 31, 2018
The notes and tables that follow are presented in thousands of euros, unless expressly stated otherwise.
NOTE 1 HIGHLIGHTS AND GENERAL PRINCIPLES
Financial year highlights
♦ June 2017: “MMO” employee stock ownership plan
The Board of Directors of February 8, 2017 decided to carry out, on the one hand, a share disposal reserved for members of the Group savings scheme in accordance with the provisions of Article L. 3332-24 of the French Labor Code, and, on the other, a capital increase reserved for employees outside of the Group savings schemes. Benefi ciaries were offered the option of acquiring company shares with a 15% discount through a Company mutual fund (FCPE) or stock appreciation rights (SAR) as part of a leverage formula. They benefi ted from an additional contribution equal to 300% of their personal contribution, capped at €900 per holder. After a fi ve-year period, or before the end of this period in the event of early release, each benefi ciary is also guaranteed to receive their initial investment in euros (comprising his/her personal contribution increased by the additional contribution) as well as a multiple of the possible average protected increase in the share price.
On July 27, 2017, Ubisoft Entertainment delivered 1,345,423 shares (FCPE formula) and created 967,480 shares (SAR formula) at a price of €41.77.
♦ July 2017: Signature of a new syndicated loan
A new syndicated loan was signed on July 18, 2017, for an amount of €300 million over 5 years, with the option of one year’s extension, renewable once. This line enables the refi nancing of the €250 million syndicated loan in place since 2014, with better fi nancing conditions and extended maturity.
♦ October 2017: Share buyback program
On October 4, 2017, Ubisoft SA granted a mandate to an investment service provider for the purchase by the Company of its own shares, with maturity on December 29, 2017. The purchased shares are intended for cancellation.
1,337,572 shares were purchased at a price of €64.34.
♦ January 2018: Bond issue
The Board of Directors authorized the issue of bonds for a total amount of €500 million. These bonds, with a unit value of €100,000 were admitted for trading on the regulated market of Euronext Paris on January 30, 2018. This 5-year bond issue has an annual coupon of 1.289%.
♦ March 2018: Early loan repayment
On March 20, 2018, Ubisoft Entertainment SA proceeded with the early repayment of €150 million of the Schuldschein-type loan contracted in March 2015.
♦ March 2018: Share buyback from Vivendi
Ubisoft committed to buy back from Vivendi 7,590,909 of its own shares as part of a structured transaction in the form of a
forward sale of shares by Vivendi to Crédit Agricole Corporate and Investment Bank (CACIB) and a forward buyback mechanism by Ubisoft from CACIB, enabling Ubisoft to spread share buybacks over the fi nancial years ending March 31, 2019 to March 31, 2021. This buyback will take place under two contracts: a prepaid forward sale contract for 4,545,454 shares, to be settled by the delivery of securities at maturity in 2021 or in advance, and a swap contract for 3,045,455 shares, to be settled at the maturity date or in advance on Ubisoft’s initiative either in cash, Ubisoft benefi ting from or bearing the valuation differences of the securities concerned, or by delivery of said securities against payment of the sale price. The swap contract is covered by a €100 million security deposit. All these acquisitions will be made at a price of €66 per share.
Thus, over FY 2017-2018, Ubisoft disbursed:
• €303 million in relation to the prepaid forward contract, of which €300 million for the 4,545,454 shares at €66 and €3 million for the expenses stemming from the acquisition of said shares (see Note 48);
• €100 million for the security deposit relating to the swap contract (see Note 36).
Company presenting the consolidated fi nancial statements
Ubisoft Entertainment is domiciled in France at 107, avenue Henri Fréville, 35207 Rennes.
The consolidated fi nancial statements of Ubisoft Entertainment for the year ended March 31, 2018 cover Ubisoft Entertainment SA and the entities it controls or over which it exerts signifi cant infl uence (collectively referred to as “the Group”).
The fi nancial statements were approved by the Board of Directors, which authorized their publication on May 17, 2018. They will be presented for approval at the General Meeting.
6.1.2.2 Basis of preparation for the Financial statements of March 31, 2018
The consolidated fi nancial statements for the fi nancial year ended March 31, 2018 have been prepared in accordance with the International Financial Reporting Standards (IFRS) applicable at March 31, 2018, as adopted by the European Union.
Over the periods presented, the standards and interpretations adopted by the European Union are similar to the compulsory application standards published by the IASB, with the exception of texts currently being adopted, for which Ubisoft does not anticipate their application to have a signifi cant impact. Consequently, the Group’s fi nancial statements are prepared in accordance with IFRS standards and interpretations, as published by the IASB.
6.1.2.1 Description of the business and the basis of preparation for the fi nancial statements
- 2018 Registration Document148
Financial statements
6
Consolidated fi nancial statements as at March 31, 2018
The principles retained for the preparation of the fi nancial statements at March 31, 2018 are the result of the application:
♦ of all the standards approved by the European Commission and published in its offi cial journal prior to March 31, 2018 and which have been mandatory since April 1, 2017;
♦ the early application of IFRS 9 on April 1, 2017;
♦ recognition and measurement options available under IFRS:
Standard Option used
IAS 2 Inventory Measurement of inventories according to the weighted average unit cost
IAS 16 Property, plant and equipment Measurement at historical amortized cost
IAS 36 Intangible assets Measurement at historical amortized cost
6.1.2.3 Texts for which application is not mandatory for fi nancial years beginning after April 1, 2017 and applied early
IFRS 9 – Financial Instruments was applied early retrospectively at April 1, 2017.
Standards(date of application)
Standards(date of application by the Group) Consequences for the Group
IFRS 9(January 1, 2018)
Financial instruments (applicable to fi nancial years beginning on or after April 1, 2017, applied early)
IFRS 9 outlines a single method for determining whether a fi nancial asset must be measured at amortized cost or at fair value, a single, forward-looking impairment model based on expected loss and a new approach to hedge accounting.
The impacts of the application of IFRS 9 are presented in Note 6.1.2.6.
6.1.2.4 Texts with mandatory application after April 1, 2017 and not applied early
With the exception of IFRS 9 applied early on April 1, 2017, Ubisoft has not opted for the early application of the new standards, amendments or interpretations published at March 31, 2018 (adopted or being adopted by the European Union).
The main texts that could have an impact on future consolidated fi nancial statements are:
Standards(date of application)
Standards(date of application by the Group) Consequences for the Group
IFRS 15(January 1, 2018)
Revenue from contracts with customers (applicable to fi nancial years beginning on or after April 1, 2018)
This standard specifi es the principles for the recognition of revenue that relates to contracts entered into with customers and provides a 5-step model to be applied to the recognition of fi nancial years beginning on or such revenue. This standard presents the basic principle of recognizing revenue to depict the transfer of control of goods or services to a customer, for an amount which refl ects the consideration to which the entity expects to be entitled in exchange for said goods or services. The new standard will also require additional information to be provided in the Notes.
IFRS 16(January 1, 2019)
Leases (applicable to fi nancial years beginning on or after April 1, 2019)
This standard results in a fairer presentation of lessee’s assets and liabilities by eliminating the distinction between operating and fi nance leases. It provides a new defi nition of the term “lease”.
IFRS 15 standard is mandatory on April 1, 2018.
During the fi nancial year ended March 31, 2018, the Company fi nalized the analysis of the modalities for the fi rst-time adoption of IFRS 15 standard. The decisions resulting from these analyses mainly dealt with the choice of transitory provisions that will be applied by the Group and the modalities for the transfer of control of the service obligation (with regard to players) embedded in the games with substantial online components.
The Group intends to opt for the cumulative catch-up method with an impact on equity for the fi rst-time adoption, i.e. on April 1, 2018.
The Group considers that IFRS 15 standard will have a signifi cant impact on the recognition of revenue from video games with a service component, i.e. “Live Services” games, which give players access to online services. Under IFRS 15, all of these services, which are accessible at no extra cost for users, constitute a distinct obligation.
- 2018 Registration Document 149
Financial statements6Consolidated fi nancial statements as at March 31, 2018
As a result, Ubisoft identifi es two obligations on this type of game:
♦ an initial obligation associated with the digital or physical delivery of the software, where revenue associated with this initial obligation is recognized at the date of content delivery;
♦ a service obligation to players, including in particular rights over unspecifi ed future content (updates, corrections, improvements, maintenance and any delivery of free content) and functionalities enabling the player to connect. This obligation is evaluated by game category depending on the service provided by Ubisoft. The revenue associated with this service obligation is spread out over the game’s expected lifetime for the fi nal users.
Under the currently-applicable revenue recognition standard (IAS18), the service component is not separated out and the full amount of the revenue received for the game is recognized when the game is delivered. Consequently, the application of IFRS 15 will result in a portion of the revenue generated on these games being deferred beyond their initial delivery date.
IFRS 15 standard also has an impact on the recognition of some licensing agreements which represent a right spread over time or a right to use recognized at a given date, eading to defer some revenue.
The impact assessment for application of this standard during the fi nancial year just ended is being fi nalised, due to the launches of games with substantial online functionalities during Q4, and subject to an audit by Group auditors on Q1 FY19 before the release of Q1 sales.
6.1.2.5 Use of estimates
Preparation of consolidated fi nancial statements in accordance with IFRS requires the Group’s management to make estimates and assumptions that affect the application of the accounting principles and the amounts recognized in the fi nancial statements.
These estimates and the underlying assumptions are established and reviewed continuously on the basis of past experience and other factors considered reasonable in light of the circumstances. They therefore serve as a basis for the calculation of the carrying amounts of assets and liabilities that cannot be obtained from other sources. Actual values may differ from estimates.
The General Management uses its judgment to defi ne the accounting treatment of certain transactions.
Relevant Note Key sources of estimation
Note 2 Main acquisitions, disposals and changes in consolidation scope
The key sources of estimation are for the estimation of earnouts which are most often conditional on a future level of performance over a multi-year period.
Notes 19-20-23 Impairment losses Main assumptions used to determine the recoverable value of assets with indefi nite useful lives.
Note 21 Depreciation on commercial software Future sales projections used to calculate expected cash fl ows.
Note 14 Employee benefi ts Discount rate, infl ation, return on plan assets and wage growth.
Note 15 Payments in shares Model and underlying assumptions used to determine fair values.
Note 32 Provisions Underlying assumptions made to appraise and estimate risks.
Note 4 Sales The assumptions used for provisions for returns and price reductions made on physical retail sales are based on expected inventory sell-off over the 6 to 12 months after closing and any reductions in the unit selling price granted by the Company.
Note 29 Corporation tax Assumptions used to recognize deferred tax assets and methods of applying tax legislation.
The accounting principles outlined below were applied:
♦ on a permanent basis to all periods presented in the consolidated fi nancial statements;
♦ consistently by all Group entities.
6.1.2.6 Comparability of fi nancial statements
CHANGE IN CONSOLIDATION METHOD, MEASUREMENT AND PRESENTATIONEarly adoption of IFRS 9
IFRS 9 – Financial Instruments was applied early retrospectively at April 1, 2017.
IFRS 9 defi nes new rules on the classifi cation and assessment of fi nancial instruments, impairment and the credit risk of fi nancial assets and hedging accounting, without restatement of comparative fi nancial statements.
- 2018 Registration Document150
Financial statements
6
Consolidated fi nancial statements as at March 31, 2018
The comparison between IAS 39/IFRS 9 for each class of non-derivative assets and liabilities is as follows:
IAS 39 IFRS 9
CATEGORIES UBISOFT CATEGORIES UBISOFT
Held for tradingassets (HFT)
Cash and equivalent:- demand deposits- short-term investments (SICAV/UCITS)
Assets held tomaturity (HTM)
Non applicable to Group
Available for selectifsassets (AFS)
- fixed securities
Loans and receivables
- guarantees and deposits- subsidies- trade receivables
Liabilities at theiramortized cost
- bank loans and overdraft- trade and other payables
Liabilities at fair valuethrough profit and loss
Non applicable to Group
Assets at fair valuethrough profit and loss
(HFT)
Cash and equivalent:- demand deposits (paid or unpaid)- term deposits- short-term investments (SICAV/UCITS)- fixed securities (non-consolidated)
Option : Assets at fairvalue through OCI
- fixed securities (non-consolidated)*
Assets at theiramortized cost
- guarantees and deposits- subsidies- trade receivables
Liabilities at theiramortized cost
- bank loans and overdraft- trade and other payables
Liabilities at fair valuethrough profit and loss
Non applicable to Group
* case-by-case analysis according to the intent with which the securities are held
Non-derivative fi nancial instruments
These provisions do not have an impact on the assessment of the Group’s non-derivative fi nancial assets and liabilities.
Derivatives
The impact is €199 thousand on equity at April 1, 2017 due to the restatement of the swap points on forward contracts documented as hedging items. This impact only concerns the hedging of future fl ows; IFRS 9 offers the possibility of recognizing the ineffective portion of derivatives designated as cash fl ow hedges in OCI between the derivative subscription date and the recognition date of the hedged transaction in order to avoid volatility of the ineffective portion in the income statement between the two dates.
At March 31, 2018, the impact of the adoption of IFRS 9 is €363 thousand on equity and €363 thousand on net fi nancial income.
Impairment of commercial receivables
The Group uses the simplifi ed model for the impairment of commercial receivables based on the analysis of expected losses over the receivable’s lifetime. After analyzing the probability of default of creditors, certain commercial receivables may be subject to impairment.
In view of the quality of the counterparties relating to digital sales and of the credit insurance covering 89% of physical sales, the expected impairment loss on trade receivables is limited as regards the Group.
CHANGE IN ESTIMATIONN/A.
OTHER ITEMS AFFECTING COMPARABILITYN/A.
- 2018 Registration Document 151
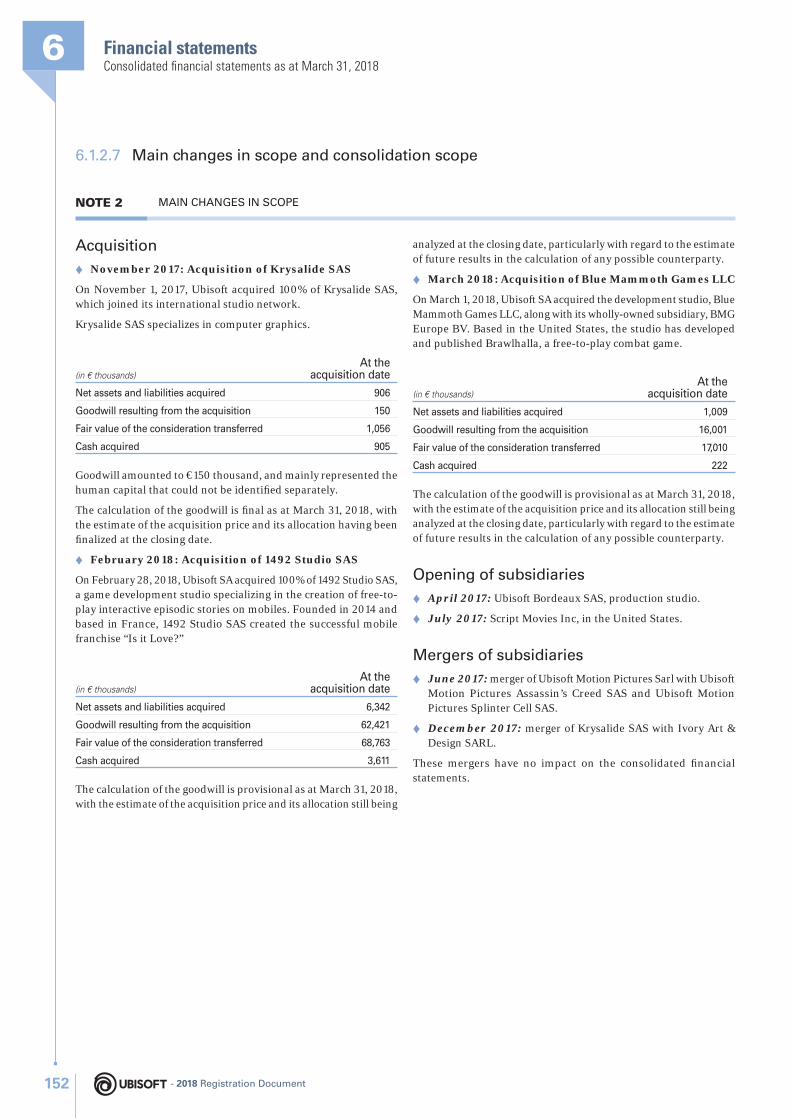
Financial statements6Consolidated fi nancial statements as at March 31, 2018
6.1.2.7 Main changes in scope and consolidation scope
NOTE 2 MAIN CHANGES IN SCOPE
Acquisition
♦ November 2017: Acquisition of Krysalide SAS
On November 1, 2017, Ubisoft acquired 100% of Krysalide SAS, which joined its international studio network.
Krysalide SAS specializes in computer graphics.
(in € thousands)At the
acquisition date
Net assets and liabilities acquired 906
Goodwill resulting from the acquisition 150
Fair value of the consideration transferred 1,056
Cash acquired 905
Goodwill amounted to €150 thousand, and mainly represented the human capital that could not be identifi ed separately.
The calculation of the goodwill is fi nal as at March 31, 2018, with the estimate of the acquisition price and its allocation having been fi nalized at the closing date.
♦ February 2018: Acquisition of 1492 Studio SAS
On February 28, 2018, Ubisoft SA acquired 100% of 1492 Studio SAS, a game development studio specializing in the creation of free-to-play interactive episodic stories on mobiles. Founded in 2014 and based in France, 1492 Studio SAS created the successful mobile franchise “Is it Love?”
(in € thousands)At the
acquisition date
Net assets and liabilities acquired 6,342
Goodwill resulting from the acquisition 62,421
Fair value of the consideration transferred 68,763
Cash acquired 3,611
The calculation of the goodwill is provisional as at March 31, 2018, with the estimate of the acquisition price and its allocation still being
analyzed at the closing date, particularly with regard to the estimate of future results in the calculation of any possible counterparty.
♦ March 2018: Acquisition of Blue Mammoth Games LLC
On March 1, 2018, Ubisoft SA acquired the development studio, Blue Mammoth Games LLC, along with its wholly-owned subsidiary, BMG Europe BV. Based in the United States, the studio has developed and published Brawlhalla, a free-to-play combat game.
(in € thousands)At the
acquisition date
Net assets and liabilities acquired 1,009
Goodwill resulting from the acquisition 16,001
Fair value of the consideration transferred 17,010
Cash acquired 222
The calculation of the goodwill is provisional as at March 31, 2018, with the estimate of the acquisition price and its allocation still being analyzed at the closing date, particularly with regard to the estimate of future results in the calculation of any possible counterparty.
Opening of subsidiaries
♦ April 2017: Ubisoft Bordeaux SAS, production studio.
♦ July 2017: Script Movies Inc, in the United States.
Mergers of subsidiaries
♦ June 2017: merger of Ubisoft Motion Pictures Sarl with Ubisoft Motion Pictures Assassin’s Creed SAS and Ubisoft Motion Pictures Splinter Cell SAS.
♦ December 2017: merger of Krysalide SAS with Ivory Art & Design SARL.
These mergers have no impact on the consolidated fi nancial statements.
- 2018 Registration Document152
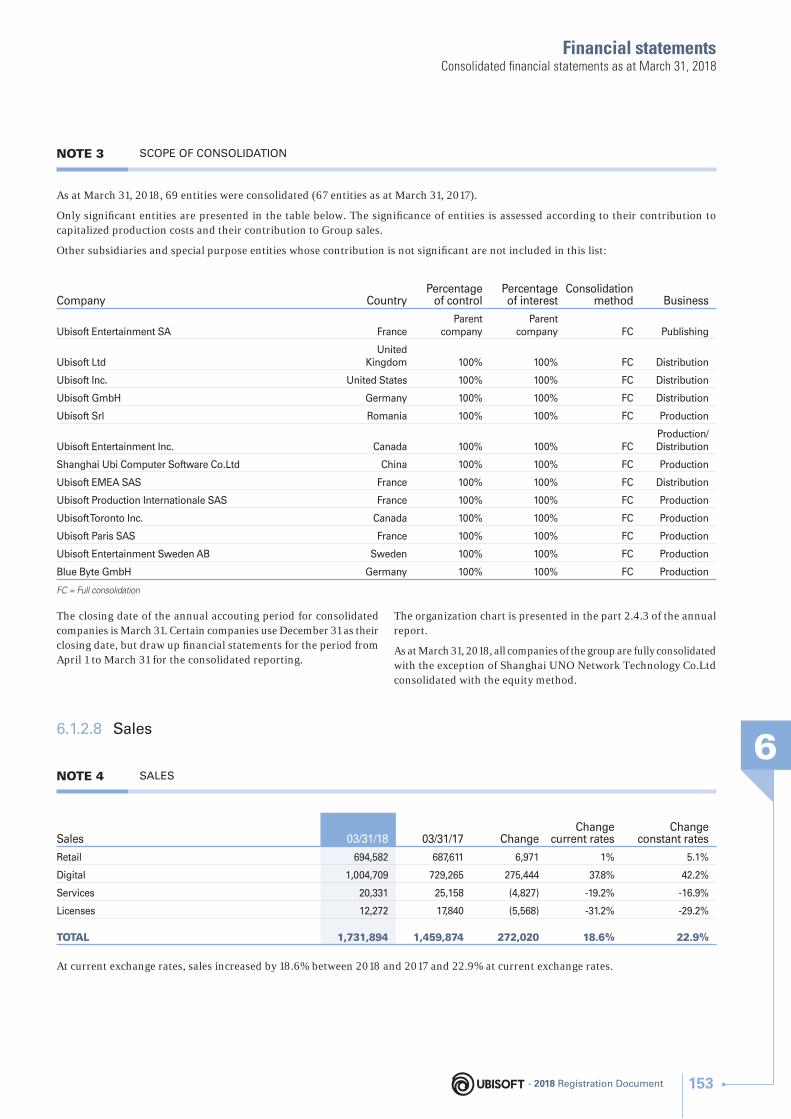
Financial statements
6
Consolidated fi nancial statements as at March 31, 2018
NOTE 3 SCOPE OF CONSOLIDATION
As at March 31, 2018, 69 entities were consolidated (67 entities as at March 31, 2017).
Only signifi cant entities are presented in the table below. The signifi cance of entities is assessed according to their contribution to capitalized production costs and their contribution to Group sales.
Other subsidiaries and special purpose entities whose contribution is not signifi cant are not included in this list:
Company CountryPercentage
of controlPercentage of interest
Consolidation method Business
Ubisoft Entertainment SA FranceParent
companyParent
company FC Publishing
Ubisoft LtdUnited
Kingdom 100% 100% FC Distribution
Ubisoft Inc. United States 100% 100% FC Distribution
Ubisoft GmbH Germany 100% 100% FC Distribution
Ubisoft Srl Romania 100% 100% FC Production
Ubisoft Entertainment Inc. Canada 100% 100% FCProduction/Distribution
Shanghai Ubi Computer Software Co.Ltd China 100% 100% FC Production
Ubisoft EMEA SAS France 100% 100% FC Distribution
Ubisoft Production Internationale SAS France 100% 100% FC Production
Ubisoft Toronto Inc. Canada 100% 100% FC Production
Ubisoft Paris SAS France 100% 100% FC Production
Ubisoft Entertainment Sweden AB Sweden 100% 100% FC Production
Blue Byte GmbH Germany 100% 100% FC Production
FC = Full consolidation
The closing date of the annual accouting period for consolidated companies is March 31. Certain companies use December 31 as their closing date, but draw up fi nancial statements for the period from April 1 to March 31 for the consolidated reporting.
The organization chart is presented in the part 2.4.3 of the annual report.
As at March 31, 2018, all companies of the group are fully consolidated with the exception of Shanghai UNO Network Technology Co.Ltd consolidated with the equity method.
6.1.2.8 Sales
NOTE 4 SALES
Sales 03/31/18 03/31/17 ChangeChange
current ratesChange
constant rates
Retail 694,582 687,611 6,971 1% 5.1%
Digital 1,004,709 729,265 275,444 37.8% 42.2%
Services 20,331 25,158 (4,827) -19.2% -16.9%
Licenses 12,272 17,840 (5,568) -31.2% -29.2%
TOTAL 1,731,894 1,459,874 272,020 18.6% 22.9%
At current exchange rates, sales increased by 18.6% between 2018 and 2017 and 22.9% at current exchange rates.
- 2018 Registration Document 153
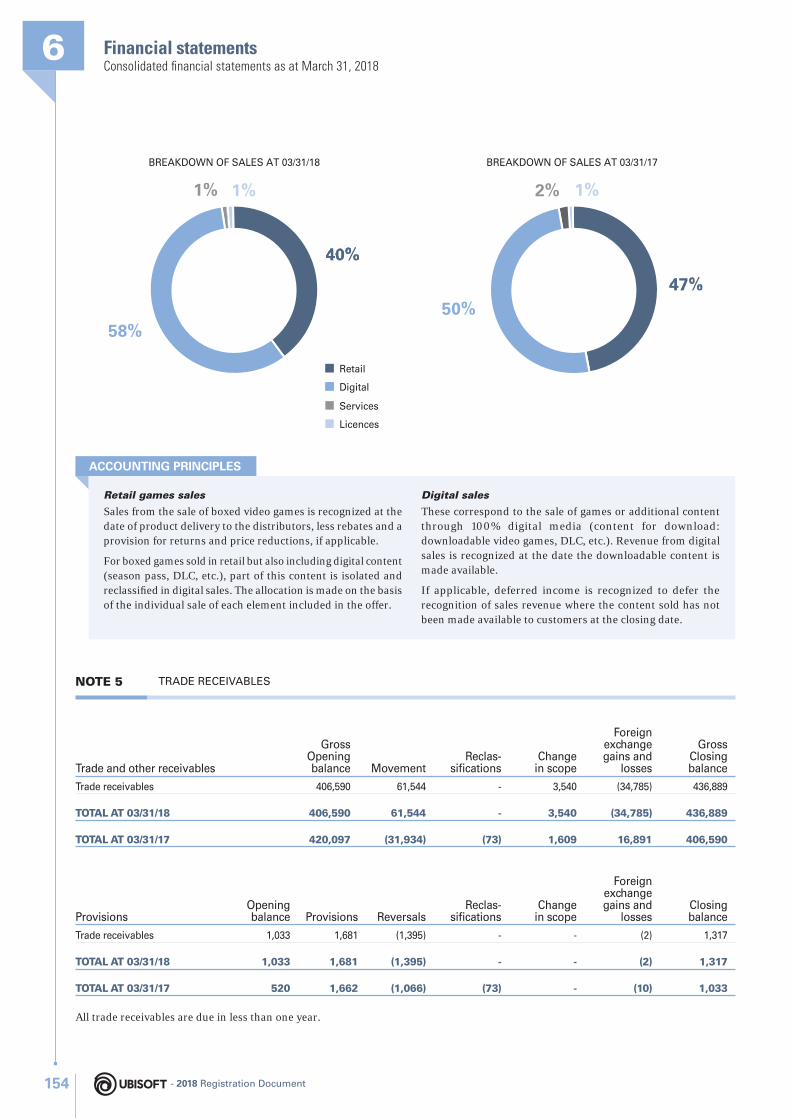
Financial statements6Consolidated fi nancial statements as at March 31, 2018
BREAKDOWN OF SALES AT 03/31/18 BREAKDOWN OF SALES AT 03/31/17
Services
Licences
Retail
Digital
58%50%
1%
40%40%40%40%
1% 2% 1%
47%47%47%47%
Retail games sales
Sales from the sale of boxed video games is recognized at the date of product delivery to the distributors, less rebates and a provision for returns and price reductions, if applicable.
For boxed games sold in retail but also including digital content (season pass, DLC, etc.), part of this content is isolated and reclassifi ed in digital sales. The allocation is made on the basis of the individual sale of each element included in the offer.
Digital sales
These correspond to the sale of games or additional content through 100% digital media (content for download: downloadable video games, DLC, etc.). Revenue from digital sales is recognized at the date the downloadable content is made available.
If applicable, deferred income is recognized to defer the recognition of sales revenue where the content sold has not been made available to customers at the closing date.
ACCOUNTING PRINCIPLES
NOTE 5 TRADE RECEIVABLES
Trade and other receivables
Gross Opening balance Movement
Reclas-sifi cations
Change in scope
Foreign exchange gains and
losses
Gross Closing balance
Trade receivables 406,590 61,544 - 3,540 (34,785) 436,889
TOTAL AT 03/31/18 406,590 61,544 - 3,540 (34,785) 436,889
TOTAL AT 03/31/17 420,097 (31,934) (73) 1,609 16,891 406,590
ProvisionsOpening balance Provisions Reversals
Reclas-sifi cations
Change in scope
Foreign exchange gains and
lossesClosing balance
Trade receivables 1,033 1,681 (1,395) - - (2) 1,317
TOTAL AT 03/31/18 1,033 1,681 (1,395) - - (2) 1,317
TOTAL AT 03/31/17 520 1,662 (1,066) (73) - (10) 1,033
All trade receivables are due in less than one year.
- 2018 Registration Document154
Financial statements
6
Consolidated fi nancial statements as at March 31, 2018
Credit risk
Ubisoft’s main customers are spread out worldwide. They are structured as:
♦ Digital distributors:
In the digital market, there are few customers, but with worldwide distribution. The Company considers that given the quality of the counterparties, the counterparty risk on digital sales is limited.
♦ Physical distributors:
In order to protect itself against the risk of default, the Group’s main subsidiaries, which generate around 89% of sales excluding digital sales are covered by credit insurance.
Ubisoft’s largest customer accounts for 18% of Group sales excluding tax, the top 5 account for 54% and the top 10 for 64%.
Following the early adoption of IFRS 9, the Group uses the simplifi ed model for the impairment of commercial receivables based on the analysis of expected losses over the receivable’s lifetime. After analyzing the probability of default of creditors, certain commercial receivables were subject to impairment.
The adoption of IFRS 9 on the valuation of commercial receivables has not had an impact on the Group’s equity on opening.
Trade and other receivables linked to operating activity are recorded at amortized cost – in most cases the same as nominal value – minus any loss of value recorded in a special impairment account. As receivables are due in under a year, they are not discounted.
Following the early adoption of IFRS 9, the Group uses the simplifi ed model for the impairment of commercial receivables based on the analysis of expected losses over the receivable’s lifetime. After analyzing the probability of default of creditors, certain commercial receivables were subject to impairment.
According to IFRS 9, value adjustments for losses due to expected credit losses correspond either to:
♦ expected credit losses for the twelve months after the closing date;
♦ expected credit losses for the lifetime.
The assessment of expected credit losses for the lifetime applies if the credit risk for a fi nancial asset at the closing date has signifi cantly increased since its initial recognition. Otherwise, the assessment is made according to the expected credit losses for the coming twelve months.
The difference between the carrying amount and recoverable value is recorded as operating income. Impairment may be reversed if the asset regains its value in future. Reversals are recognized in the same item as provisions. Impairment is deemed permanent when the receivable itself is considered to be permanently irrecoverable and written off.
ACCOUNTING PRINCIPLES
NOTE 6 DEFERRED INCOME
NOTE 7 SEGMENT REPORTING
03/31/17 ChangeForeign exchange
gains and losses Change in scope 03/31/18
Deferred income 40,691 3,453 (3,215) (38) 40,891
TOTAL AT 03/31/18 40,691 3,453 (3,215) (38) 40,891
TOTAL AT 03/31/17 41,992 (2,738) 1,437 40,691 40,691
In accordance with IFRS 8, the Group produces segment reports.
The operating segments reported correspond to the publication/production activities and to geographical areas of distribution at which operational decisions are made.
The breakdown by geographic region is given for two segments, according to the distribution of the Group’s assets:
♦ EMEA distribution zone (corresponding to APAC zone and Europe);
♦ North America distribution zone (including Central and Latin America).
Deferred income mainly comprises deferred income on revenue from downloadable content sales not yet made available to users at the closing date for €35,740 thousand compared to €33,800 thousand
the previous year. Revenue from digital sales is recognized at the date the downloadable content is made available.
- 2018 Registration Document 155
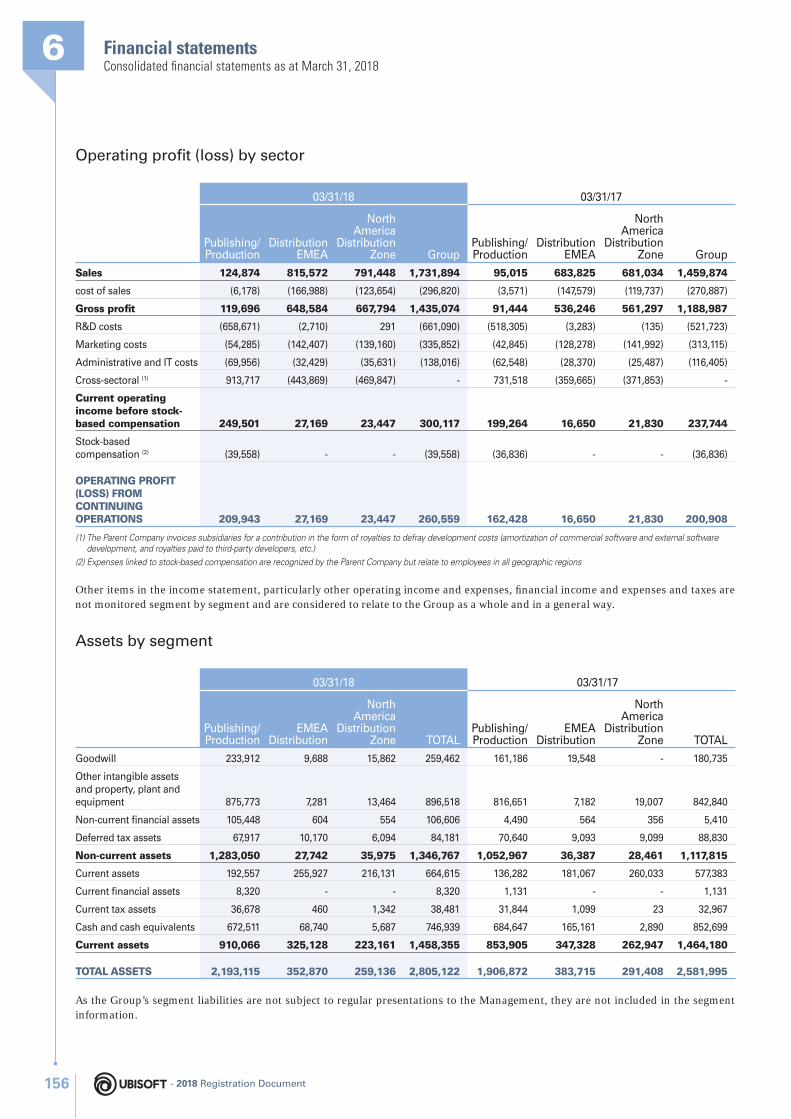
Financial statements6Consolidated fi nancial statements as at March 31, 2018
Operating profi t (loss) by sector
03/31/18 03/31/17
Publishing/Production
Distribution EMEA
North America
Distribution Zone Group
Publishing/Production
Distribution EMEA
North America
Distribution Zone Group
Sales 124,874 815,572 791,448 1,731,894 95,015 683,825 681,034 1,459,874
cost of sales (6,178) (166,988) (123,654) (296,820) (3,571) (147,579) (119,737) (270,887)
Gross profi t 119,696 648,584 667,794 1,435,074 91,444 536,246 561,297 1,188,987
R&D costs (658,671) (2,710) 291 (661,090) (518,305) (3,283) (135) (521,723)
Marketing costs (54,285) (142,407) (139,160) (335,852) (42,845) (128,278) (141,992) (313,115)
Administrative and IT costs (69,956) (32,429) (35,631) (138,016) (62,548) (28,370) (25,487) (116,405)
Cross-sectoral (1) 913,717 (443,869) (469,847) - 731,518 (359,665) (371,853) -
Current operating income before stock-based compensation 249,501 27,169 23,447 300,117 199,264 16,650 21,830 237,744
Stock-based compensation (2) (39,558) - - (39,558) (36,836) - - (36,836)
OPERATING PROFIT (LOSS) FROM CONTINUING OPERATIONS 209,943 27,169 23,447 260,559 162,428 16,650 21,830 200,908
(1) The Parent Company invoices subsidiaries for a contribution in the form of royalties to defray development costs (amortization of commercial software and external software development, and royalties paid to third-party developers, etc.)
(2) Expenses linked to stock-based compensation are recognized by the Parent Company but relate to employees in all geographic regions
Other items in the income statement, particularly other operating income and expenses, fi nancial income and expenses and taxes are not monitored segment by segment and are considered to relate to the Group as a whole and in a general way.
Assets by segment
03/31/18 03/31/17
Publishing/Production
EMEA Distribution
North America
Distribution Zone TOTAL
Publishing/Production
EMEA Distribution
North America
Distribution Zone TOTAL
Goodwill 233,912 9,688 15,862 259,462 161,186 19,548 - 180,735
Other intangible assets and property, plant and equipment 875,773 7,281 13,464 896,518 816,651 7,182 19,007 842,840
Non-current fi nancial assets 105,448 604 554 106,606 4,490 564 356 5,410
Deferred tax assets 67,917 10,170 6,094 84,181 70,640 9,093 9,099 88,830
Non-current assets 1,283,050 27,742 35,975 1,346,767 1,052,967 36,387 28,461 1,117,815
Current assets 192,557 255,927 216,131 664,615 136,282 181,067 260,033 577,383
Current fi nancial assets 8,320 - - 8,320 1,131 - - 1,131
Current tax assets 36,678 460 1,342 38,481 31,844 1,099 23 32,967
Cash and cash equivalents 672,511 68,740 5,687 746,939 684,647 165,161 2,890 852,699
Current assets 910,066 325,128 223,161 1,458,355 853,905 347,328 262,947 1,464,180
TOTAL ASSETS 2,193,115 352,870 259,136 2,805,122 1,906,872 383,715 291,408 2,581,995
As the Group’s segment liabilities are not subject to regular presentations to the Management, they are not included in the segment information.
- 2018 Registration Document156
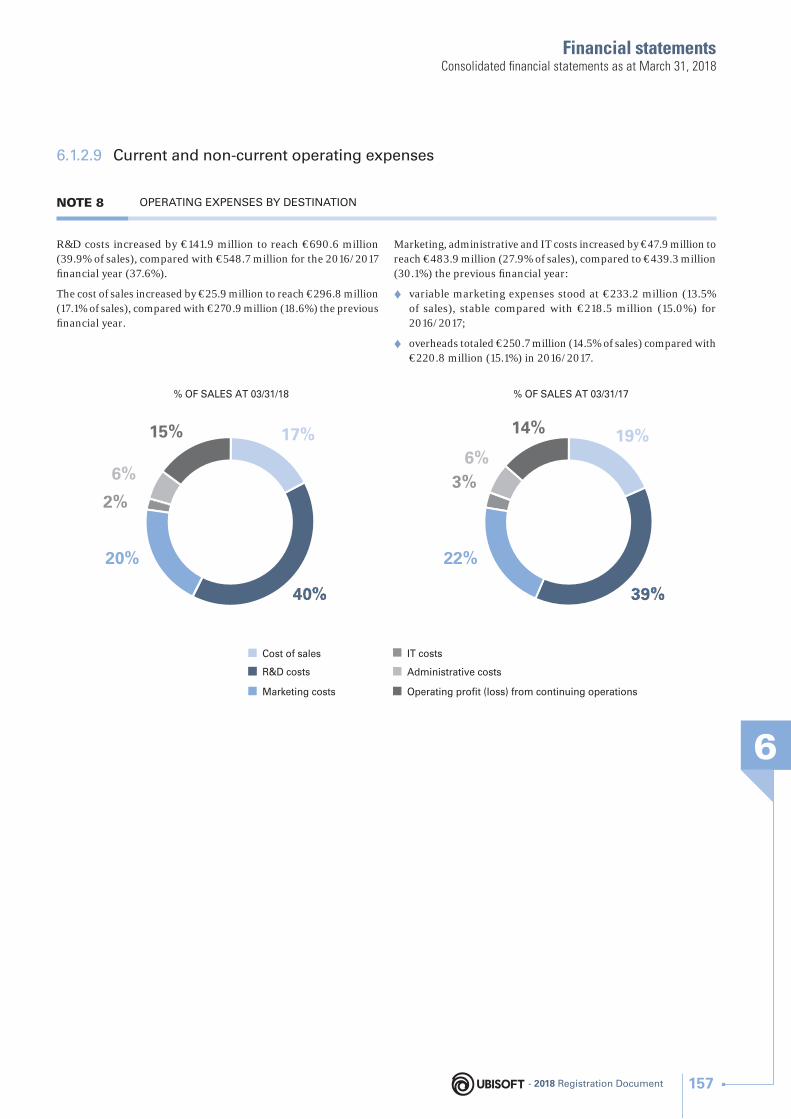
Financial statements
6
Consolidated fi nancial statements as at March 31, 2018
6.1.2.9 Current and non-current operating expenses
NOTE 8 OPERATING EXPENSES BY DESTINATION
R&D costs increased by €141.9 million to reach €690.6 million (39.9% of sales), compared with €548.7 million for the 2016/2017 fi nancial year (37.6%).
The cost of sales increased by €25.9 million to reach €296.8 million (17.1% of sales), compared with €270.9 million (18.6%) the previous fi nancial year.
Marketing, administrative and IT costs increased by €47.9 million to reach €483.9 million (27.9% of sales), compared to €439.3 million (30.1%) the previous fi nancial year:
♦ variable marketing expenses stood at €233.2 million (13.5% of sales), stable compared with €218.5 million (15.0%) for 2016/2017;
♦ overheads totaled €250.7 million (14.5% of sales) compared with €220.8 million (15.1%) in 2016/2017.
% OF SALES AT 03/31/17
Marketing costs
IT costs
Administrative costs
Operating profit (loss) from continuing operations
Cost of sales
R&D costs
22%
19%
39%39%39%39%
3%6%
14%
% OF SALES AT 03/31/18
20%
17%
40%40%40%40%
2%
6%
15%
- 2018 Registration Document 157
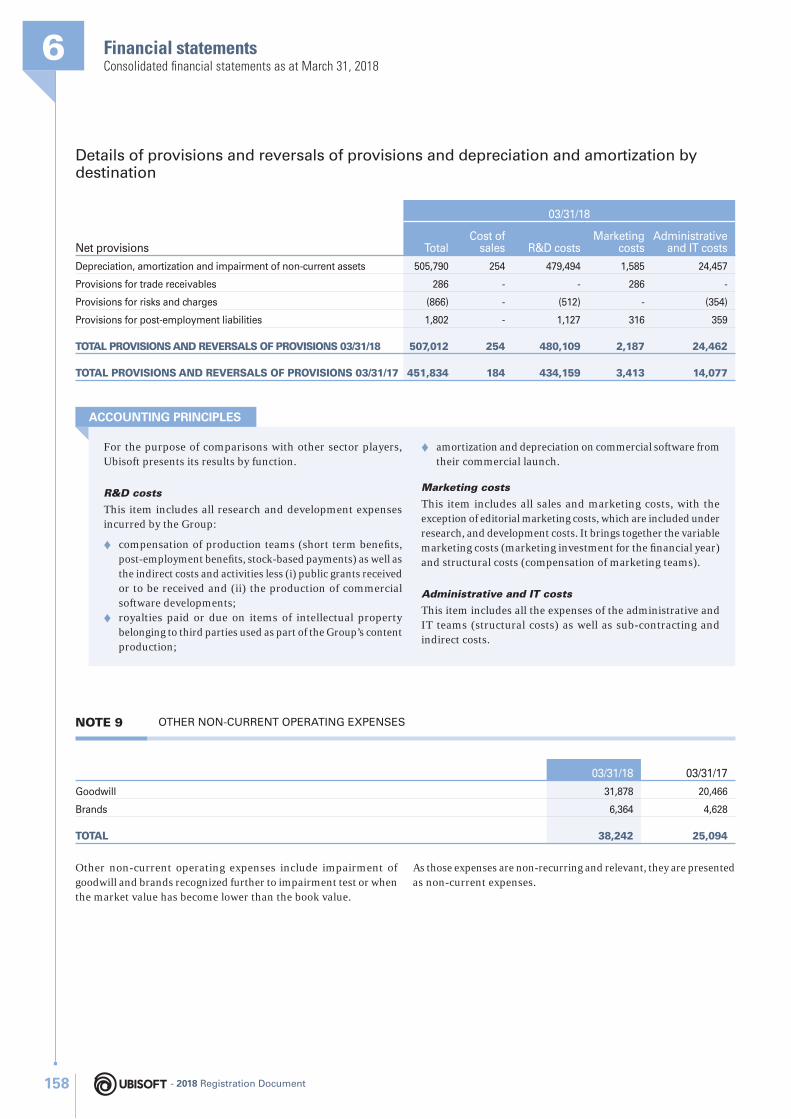
Financial statements6Consolidated fi nancial statements as at March 31, 2018
Details of provisions and reversals of provisions and depreciation and amortization by destination
Net provisions
03/31/18
TotalCost of
sales R&D costsMarketing
costsAdministrative
and IT costs
Depreciation, amortization and impairment of non-current assets 505,790 254 479,494 1,585 24,457
Provisions for trade receivables 286 - - 286 -
Provisions for risks and charges (866) - (512) - (354)
Provisions for post-employment liabilities 1,802 - 1,127 316 359
TOTAL PROVISIONS AND REVERSALS OF PROVISIONS 03/31/18 507,012 254 480,109 2,187 24,462
TOTAL PROVISIONS AND REVERSALS OF PROVISIONS 03/31/17 451,834 184 434,159 3,413 14,077
For the purpose of comparisons with other sector players, Ubisoft presents its results by function.
R&D costs
This item includes all research and development expenses incurred by the Group:
♦ compensation of production teams (short term benefi ts, post-employment benefi ts, stock-based payments) as well as the indirect costs and activities less (i) public grants received or to be received and (ii) the production of commercial software developments;
♦ royalties paid or due on items of intellectual property belonging to third parties used as part of the Group’s content production;
♦ amortization and depreciation on commercial software from their commercial launch.
Marketing costs
This item includes all sales and marketing costs, with the exception of editorial marketing costs, which are included under research, and development costs. It brings together the variable marketing costs (marketing investment for the fi nancial year) and structural costs (compensation of marketing teams).
Administrative and IT costs
This item includes all the expenses of the administrative and IT teams (structural costs) as well as sub-contracting and indirect costs.
ACCOUNTING PRINCIPLES
NOTE 9 OTHER NON-CURRENT OPERATING EXPENSES
03/31/18 03/31/17
Goodwill 31,878 20,466
Brands 6,364 4,628
TOTAL 38,242 25,094
Other non-current operating expenses include impairment of goodwill and brands recognized further to impairment test or when the market value has become lower than the book value.
As those expenses are non-recurring and relevant, they are presented as non-current expenses.
- 2018 Registration Document158
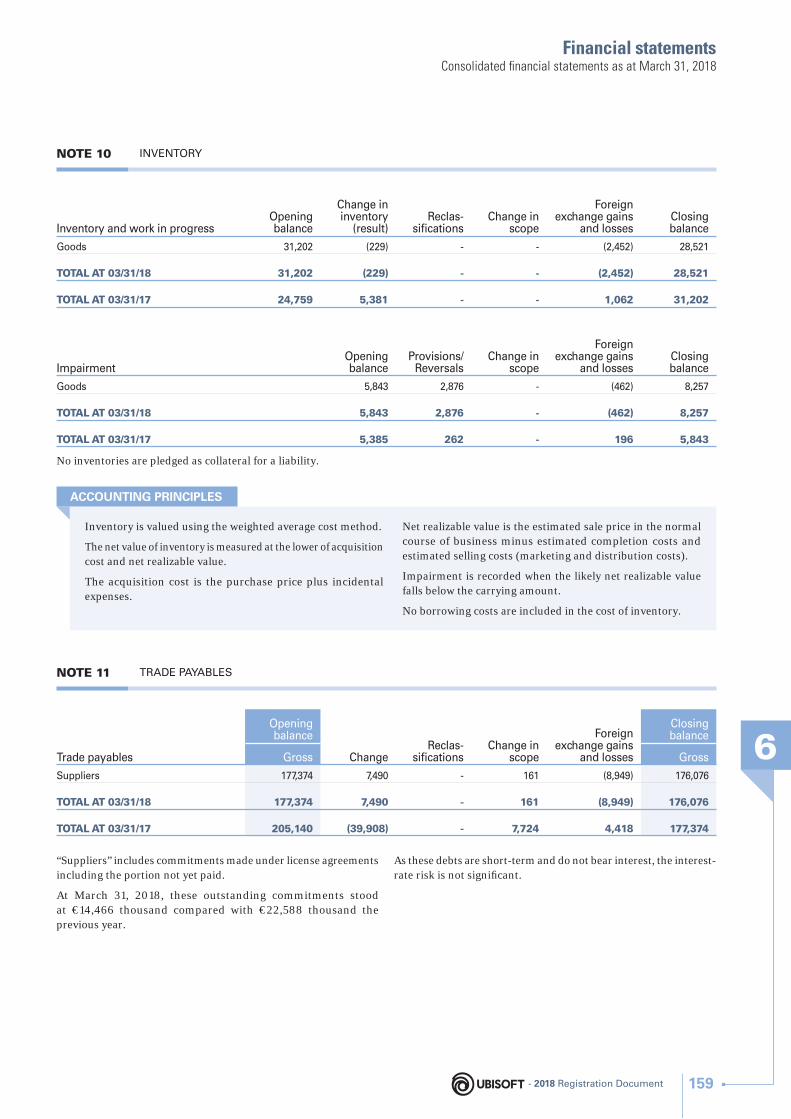
Financial statements
6
Consolidated fi nancial statements as at March 31, 2018
NOTE 10 INVENTORY
Inventory and work in progressOpening balance
Change in inventory
(result)Reclas-
sifi cationsChange in
scope
Foreign exchange gains
and lossesClosing balance
Goods 31,202 (229) - - (2,452) 28,521
TOTAL AT 03/31/18 31,202 (229) - - (2,452) 28,521
TOTAL AT 03/31/17 24,759 5,381 - - 1,062 31,202
ImpairmentOpening balance
Provisions/Reversals
Change in scope
Foreign exchange gains
and lossesClosing balance
Goods 5,843 2,876 - (462) 8,257
TOTAL AT 03/31/18 5,843 2,876 - (462) 8,257
TOTAL AT 03/31/17 5,385 262 - 196 5,843
No inventories are pledged as collateral for a liability.
NOTE 11 TRADE PAYABLES
Inventory is valued using the weighted average cost method.
The net value of inventory is measured at the lower of acquisition cost and net realizable value.
The acquisition cost is the purchase price plus incidental expenses.
Net realizable value is the estimated sale price in the normal course of business minus estimated completion costs and estimated selling costs (marketing and distribution costs).
Impairment is recorded when the likely net realizable value falls below the carrying amount.
No borrowing costs are included in the cost of inventory.
ACCOUNTING PRINCIPLES
Trade payables
Opening balance
ChangeReclas-
sifi cationsChange in
scope
Foreign exchange gains
and losses
Closing balance
Gross Gross
Suppliers 177,374 7,490 - 161 (8,949) 176,076
TOTAL AT 03/31/18 177,374 7,490 - 161 (8,949) 176,076
TOTAL AT 03/31/17 205,140 (39,908) - 7,724 4,418 177,374
“Suppliers” includes commitments made under license agreements including the portion not yet paid.
At March 31, 2018, these outstanding commitments stood at €14,466 thousand compared with €22,588 thousand the previous year.
As these debts are short-term and do not bear interest, the interest-rate risk is not signifi cant.
- 2018 Registration Document 159
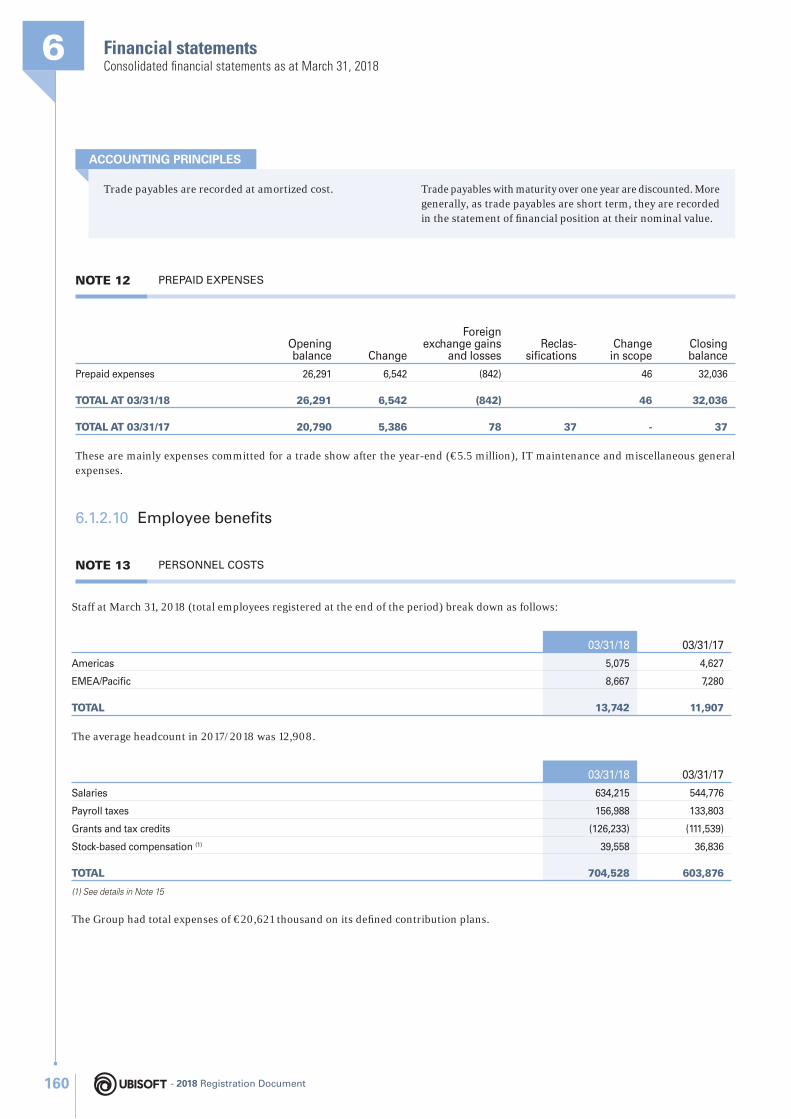
Financial statements6Consolidated fi nancial statements as at March 31, 2018
Trade payables are recorded at amortized cost. Trade payables with maturity over one year are discounted. More generally, as trade payables are short term, they are recorded in the statement of fi nancial position at their nominal value.
ACCOUNTING PRINCIPLES
NOTE 12 PREPAID EXPENSES
Opening balance Change
Foreign exchange gains
and lossesReclas-
sifi cationsChange
in scopeClosing balance
Prepaid expenses 26,291 6,542 (842) 46 32,036
TOTAL AT 03/31/18 26,291 6,542 (842) 46 32,036
TOTAL AT 03/31/17 20,790 5,386 78 37 - 37
These are mainly expenses committed for a trade show after the year-end (€5.5 million), IT maintenance and miscellaneous general expenses.
6.1.2.10 Employee benefi ts
NOTE 13 PERSONNEL COSTS
Staff at March 31, 2018 (total employees registered at the end of the period) break down as follows:
03/31/18 03/31/17
Americas 5,075 4,627
EMEA/Pacifi c 8,667 7,280
TOTAL 13,742 11,907
The average headcount in 2017/2018 was 12,908.
03/31/18 03/31/17
Salaries 634,215 544,776
Payroll taxes 156,988 133,803
Grants and tax credits (126,233) (111,539)
Stock-based compensation (1) 39,558 36,836
TOTAL 704,528 603,876
(1) See details in Note 15
The Group had total expenses of €20,621 thousand on its defi ned contribution plans.
- 2018 Registration Document160
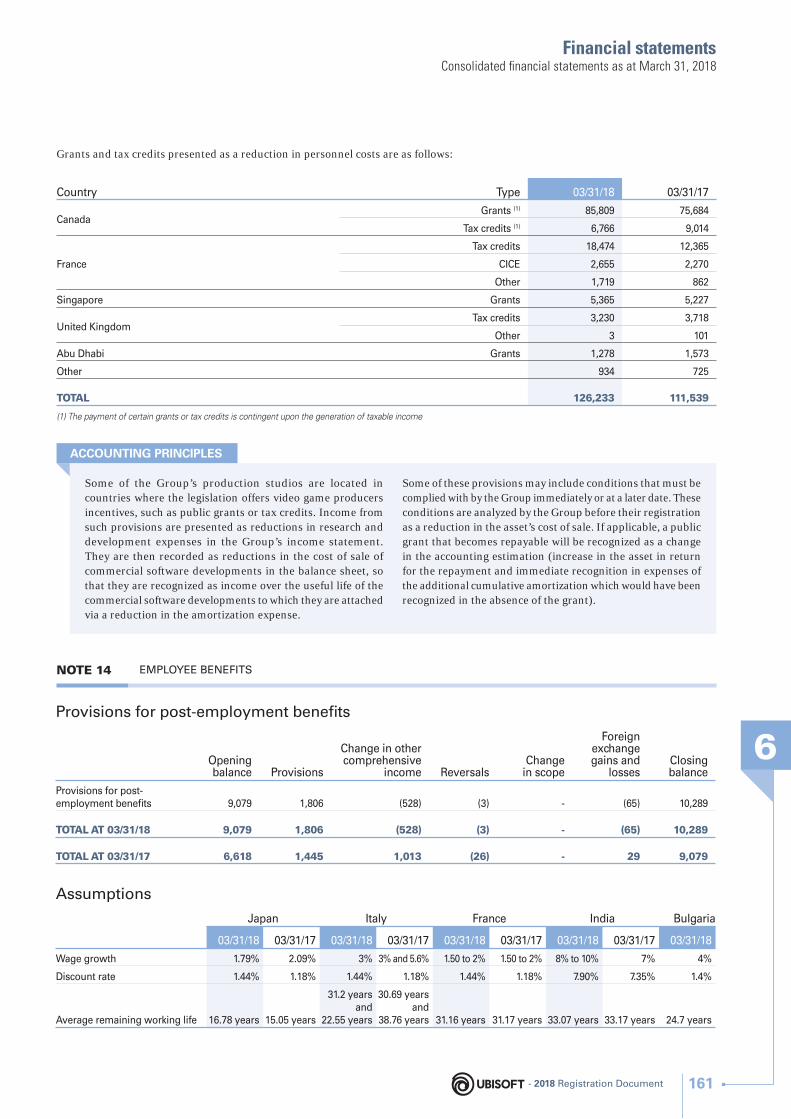
Financial statements
6
Consolidated fi nancial statements as at March 31, 2018
Grants and tax credits presented as a reduction in personnel costs are as follows:
Country Type 03/31/18 03/31/17
CanadaGrants (1) 85,809 75,684
Tax credits (1) 6,766 9,014
France
Tax credits 18,474 12,365
CICE 2,655 2,270
Other 1,719 862
Singapore Grants 5,365 5,227
United KingdomTax credits 3,230 3,718
Other 3 101
Abu Dhabi Grants 1,278 1,573
Other 934 725
TOTAL 126,233 111,539
(1) The payment of certain grants or tax credits is contingent upon the generation of taxable income
Some of the Group’s production studios are located in countries where the legislation offers video game producers incentives, such as public grants or tax credits. Income from such provisions are presented as reductions in research and development expenses in the Group’s income statement. They are then recorded as reductions in the cost of sale of commercial software developments in the balance sheet, so that they are recognized as income over the useful life of the commercial software developments to which they are attached via a reduction in the amortization expense.
Some of these provisions may include conditions that must be complied with by the Group immediately or at a later date. These conditions are analyzed by the Group before their registration as a reduction in the asset’s cost of sale. If applicable, a public grant that becomes repayable will be recognized as a change in the accounting estimation (increase in the asset in return for the repayment and immediate recognition in expenses of the additional cumulative amortization which would have been recognized in the absence of the grant).
ACCOUNTING PRINCIPLES
NOTE 14 EMPLOYEE BENEFITS
Provisions for post-employment benefi ts
Opening balance Provisions
Change in other comprehensive
income ReversalsChange
in scope
Foreign exchange gains and
lossesClosing balance
Provisions for post-employment benefi ts 9,079 1,806 (528) (3) - (65) 10,289
TOTAL AT 03/31/18 9,079 1,806 (528) (3) - (65) 10,289
TOTAL AT 03/31/17 6,618 1,445 1,013 (26) - 29 9,079
Assumptions
Japan Italy France India Bulgaria
03/31/18 03/31/17 03/31/18 03/31/17 03/31/18 03/31/17 03/31/18 03/31/17 03/31/18
Wage growth 1.79% 2.09% 3% 3% and 5.6% 1.50 to 2% 1.50 to 2% 8% to 10% 7% 4%
Discount rate 1.44% 1.18% 1.44% 1.18% 1.44% 1.18% 7.90% 7.35% 1.4%
Average remaining working life 16.78 years 15.05 years
31.2 years and
22.55 years
30.69 years and
38.76 years 31.16 years 31.17 years 33.07 years 33.17 years 24.7 years
- 2018 Registration Document 161
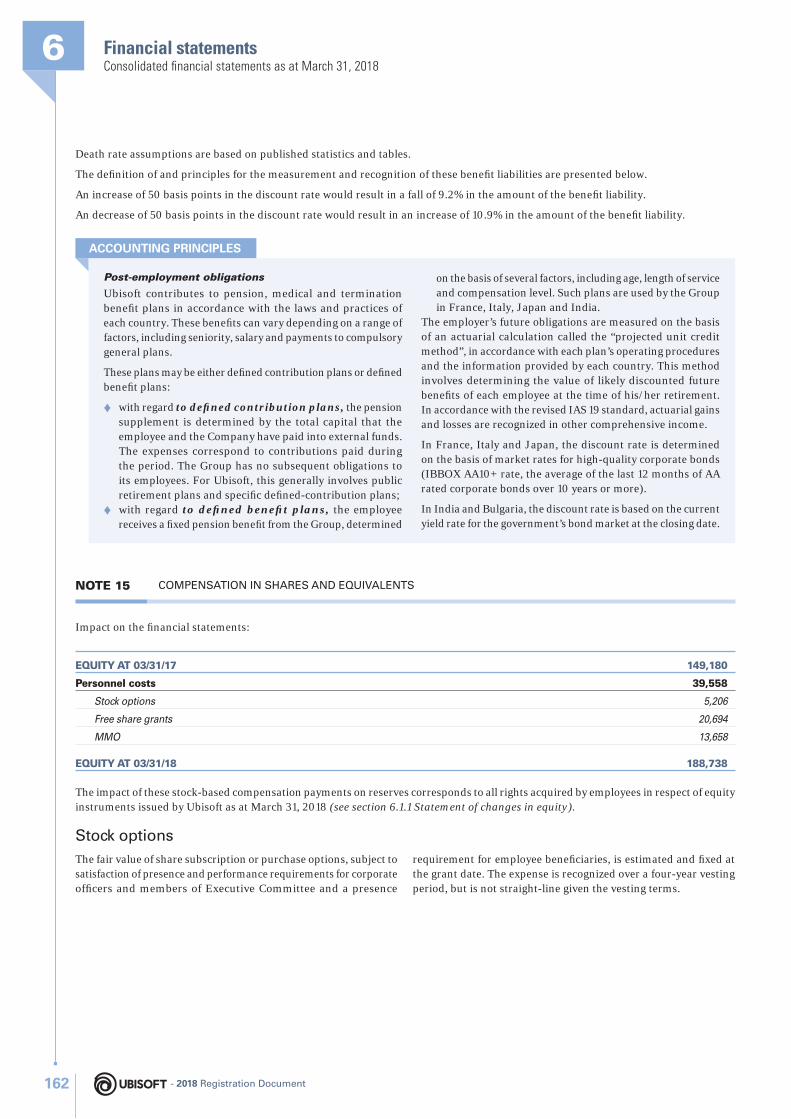
Financial statements6Consolidated fi nancial statements as at March 31, 2018
Death rate assumptions are based on published statistics and tables.
The defi nition of and principles for the measurement and recognition of these benefi t liabilities are presented below.
An increase of 50 basis points in the discount rate would result in a fall of 9.2% in the amount of the benefi t liability.
An decrease of 50 basis points in the discount rate would result in an increase of 10.9% in the amount of the benefi t liability.
Post-employment obligations
Ubisoft contributes to pension, medical and termination benefi t plans in accordance with the laws and practices of each country. These benefi ts can vary depending on a range of factors, including seniority, salary and payments to compulsory general plans.
These plans may be either defi ned contribution plans or defi ned benefi t plans:
♦ with regard to defi ned contribution plans, the pension supplement is determined by the total capital that the employee and the Company have paid into external funds. The expenses correspond to contributions paid during the period. The Group has no subsequent obligations to its employees. For Ubisoft, this generally involves public retirement plans and specifi c defi ned-contribution plans;
♦ with regard to defi ned benefi t plans, the employee receives a fi xed pension benefi t from the Group, determined
on the basis of several factors, including age, length of service and compensation level. Such plans are used by the Group in France, Italy, Japan and India.
The employer’s future obligations are measured on the basis of an actuarial calculation called the “projected unit credit method”, in accordance with each plan’s operating procedures and the information provided by each country. This method involves determining the value of likely discounted future benefi ts of each employee at the time of his/her retirement. In accordance with the revised IAS 19 standard, actuarial gains and losses are recognized in other comprehensive income.
In France, Italy and Japan, the discount rate is determined on the basis of market rates for high-quality corporate bonds (IBBOX AA10+ rate, the average of the last 12 months of AA rated corporate bonds over 10 years or more).
In India and Bulgaria, the discount rate is based on the current yield rate for the government’s bond market at the closing date.
ACCOUNTING PRINCIPLES
NOTE 15 COMPENSATION IN SHARES AND EQUIVALENTS
Impact on the fi nancial statements:
EQUITY AT 03/31/17 149,180
Personnel costs 39,558
Stock options 5,206
Free share grants 20,694
MMO 13,658
EQUITY AT 03/31/18 188,738
The impact of these stock-based compensation payments on reserves corresponds to all rights acquired by employees in respect of equity instruments issued by Ubisoft as at March 31, 2018 (see section 6.1.1 Statement of changes in equity).
Stock options
The fair value of share subscription or purchase options, subject to satisfaction of presence and performance requirements for corporate offi cers and members of Executive Committee and a presence
requirement for employee benefi ciaries, is estimated and fi xed at the grant date. The expense is recognized over a four-year vesting period, but is not straight-line given the vesting terms.
- 2018 Registration Document162
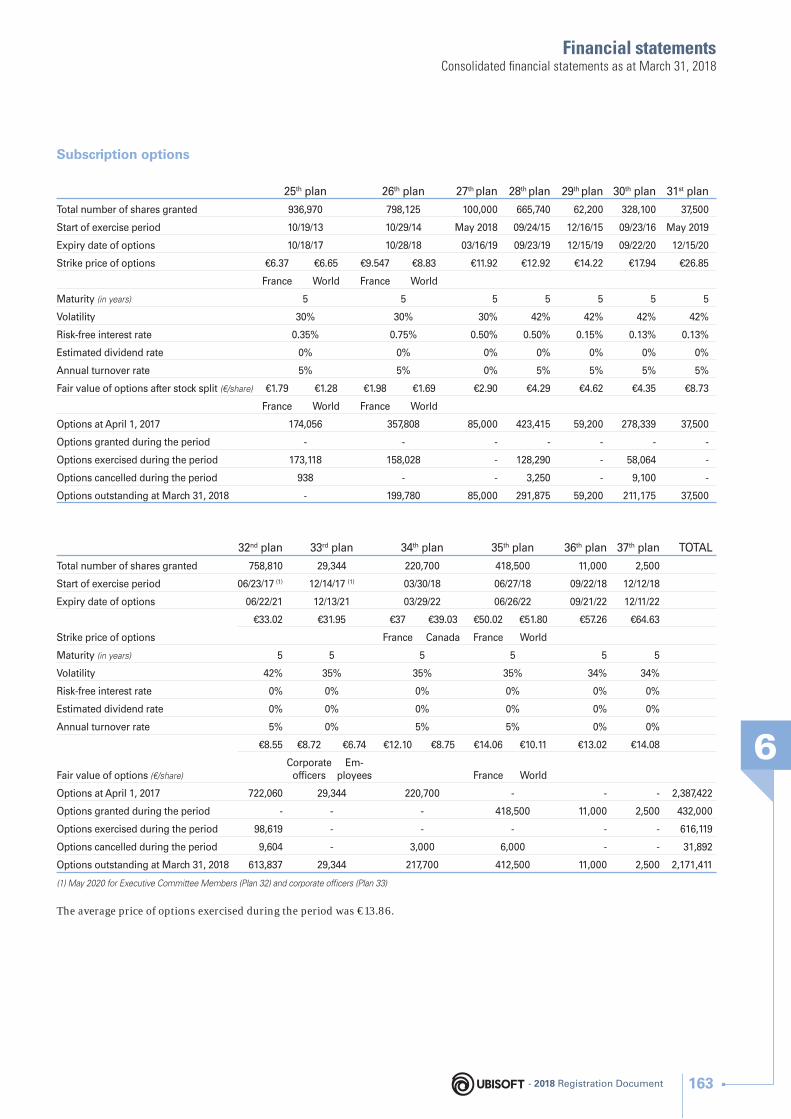
Financial statements
6
Consolidated fi nancial statements as at March 31, 2018
Subscription options
25th plan 26th plan 27th plan 28th plan 29th plan 30th plan 31st plan
Total number of shares granted 936,970 798,125 100,000 665,740 62,200 328,100 37,500
Start of exercise period 10/19/13 10/29/14 May 2018 09/24/15 12/16/15 09/23/16 May 2019
Expiry date of options 10/18/17 10/28/18 03/16/19 09/23/19 12/15/19 09/22/20 12/15/20
Strike price of options €6.37 €6.65 €9.547 €8.83 €11.92 €12.92 €14.22 €17.94 €26.85
France World France World
Maturity (in years) 5 5 5 5 5 5 5
Volatility 30% 30% 30% 42% 42% 42% 42%
Risk-free interest rate 0.35% 0.75% 0.50% 0.50% 0.15% 0.13% 0.13%
Estimated dividend rate 0% 0% 0% 0% 0% 0% 0%
Annual turnover rate 5% 5% 0% 5% 5% 5% 5%
Fair value of options after stock split (€/share) €1.79 €1.28 €1.98 €1.69 €2.90 €4.29 €4.62 €4.35 €8.73
France World France World
Options at April 1, 2017 174,056 357,808 85,000 423,415 59,200 278,339 37,500
Options granted during the period - - - - - - -
Options exercised during the period 173,118 158,028 - 128,290 - 58,064 -
Options cancelled during the period 938 - - 3,250 - 9,100 -
Options outstanding at March 31, 2018 - 199,780 85,000 291,875 59,200 211,175 37,500
32nd plan 33rd plan 34th plan 35th plan 36th plan 37th plan TOTAL
Total number of shares granted 758,810 29,344 220,700 418,500 11,000 2,500
Start of exercise period 06/23/17 (1) 12/14/17 (1) 03/30/18 06/27/18 09/22/18 12/12/18
Expiry date of options 06/22/21 12/13/21 03/29/22 06/26/22 09/21/22 12/11/22
Strike price of options
€33.02 €31.95 €37 €39.03 €50.02 €51.80 €57.26 €64.63
France Canada France World
Maturity (in years) 5 5 5 5 5 5
Volatility 42% 35% 35% 35% 34% 34%
Risk-free interest rate 0% 0% 0% 0% 0% 0%
Estimated dividend rate 0% 0% 0% 0% 0% 0%
Annual turnover rate 5% 0% 5% 5% 0% 0%
Fair value of options (€/share)
€8.55 €8.72 €6.74 €12.10 €8.75 €14.06 €10.11 €13.02 €14.08
Corporate offi cers
Em-ployees France World
Options at April 1, 2017 722,060 29,344 220,700 - - - 2,387,422
Options granted during the period - - - 418,500 11,000 2,500 432,000
Options exercised during the period 98,619 - - - - - 616,119
Options cancelled during the period 9,604 - 3,000 6,000 - - 31,892
Options outstanding at March 31, 2018 613,837 29,344 217,700 412,500 11,000 2,500 2,171,411
(1) May 2020 for Executive Committee Members (Plan 32) and corporate offi cers (Plan 33)
The average price of options exercised during the period was €13.86.
- 2018 Registration Document 163
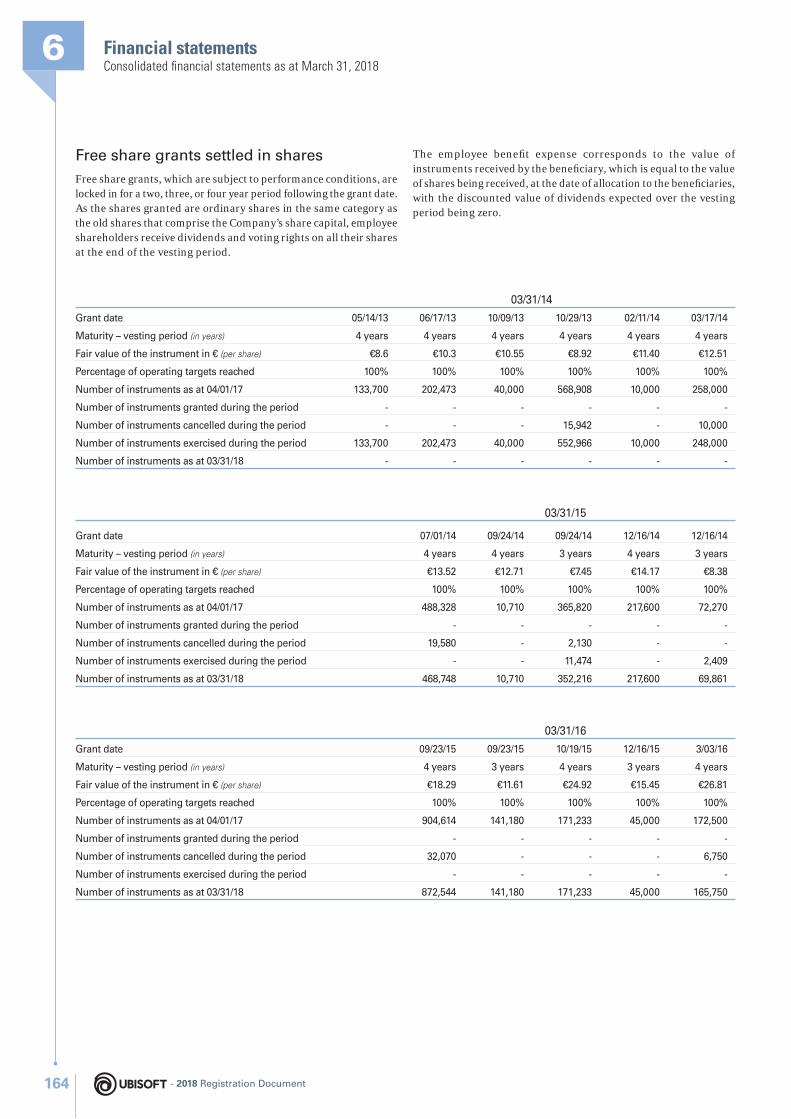
Financial statements6Consolidated fi nancial statements as at March 31, 2018
Free share grants settled in shares
Free share grants, which are subject to performance conditions, are locked in for a two, three, or four year period following the grant date. As the shares granted are ordinary shares in the same category as the old shares that comprise the Company’s share capital, employee shareholders receive dividends and voting rights on all their shares at the end of the vesting period.
The employee benefi t expense corresponds to the value of instruments received by the benefi ciary, which is equal to the value of shares being received, at the date of allocation to the benefi ciaries, with the discounted value of dividends expected over the vesting period being zero.
03/31/14
Grant date 05/14/13 06/17/13 10/09/13 10/29/13 02/11/14 03/17/14
Maturity – vesting period (in years) 4 years 4 years 4 years 4 years 4 years 4 years
Fair value of the instrument in € (per share) €8.6 €10.3 €10.55 €8.92 €11.40 €12.51
Percentage of operating targets reached 100% 100% 100% 100% 100% 100%
Number of instruments as at 04/01/17 133,700 202,473 40,000 568,908 10,000 258,000
Number of instruments granted during the period - - - - - -
Number of instruments cancelled during the period - - - 15,942 - 10,000
Number of instruments exercised during the period 133,700 202,473 40,000 552,966 10,000 248,000
Number of instruments as at 03/31/18 - - - - - -
03/31/15
Grant date 07/01/14 09/24/14 09/24/14 12/16/14 12/16/14
Maturity – vesting period (in years) 4 years 4 years 3 years 4 years 3 years
Fair value of the instrument in € (per share) €13.52 €12.71 €7.45 €14.17 €8.38
Percentage of operating targets reached 100% 100% 100% 100% 100%
Number of instruments as at 04/01/17 488,328 10,710 365,820 217,600 72,270
Number of instruments granted during the period - - - - -
Number of instruments cancelled during the period 19,580 - 2,130 - -
Number of instruments exercised during the period - - 11,474 - 2,409
Number of instruments as at 03/31/18 468,748 10,710 352,216 217,600 69,861
03/31/16
Grant date 09/23/15 09/23/15 10/19/15 12/16/15 3/03/16
Maturity – vesting period (in years) 4 years 3 years 4 years 3 years 4 years
Fair value of the instrument in € (per share) €18.29 €11.61 €24.92 €15.45 €26.81
Percentage of operating targets reached 100% 100% 100% 100% 100%
Number of instruments as at 04/01/17 904,614 141,180 171,233 45,000 172,500
Number of instruments granted during the period - - - - -
Number of instruments cancelled during the period 32,070 - - - 6,750
Number of instruments exercised during the period - - - - -
Number of instruments as at 03/31/18 872,544 141,180 171,233 45,000 165,750
- 2018 Registration Document164
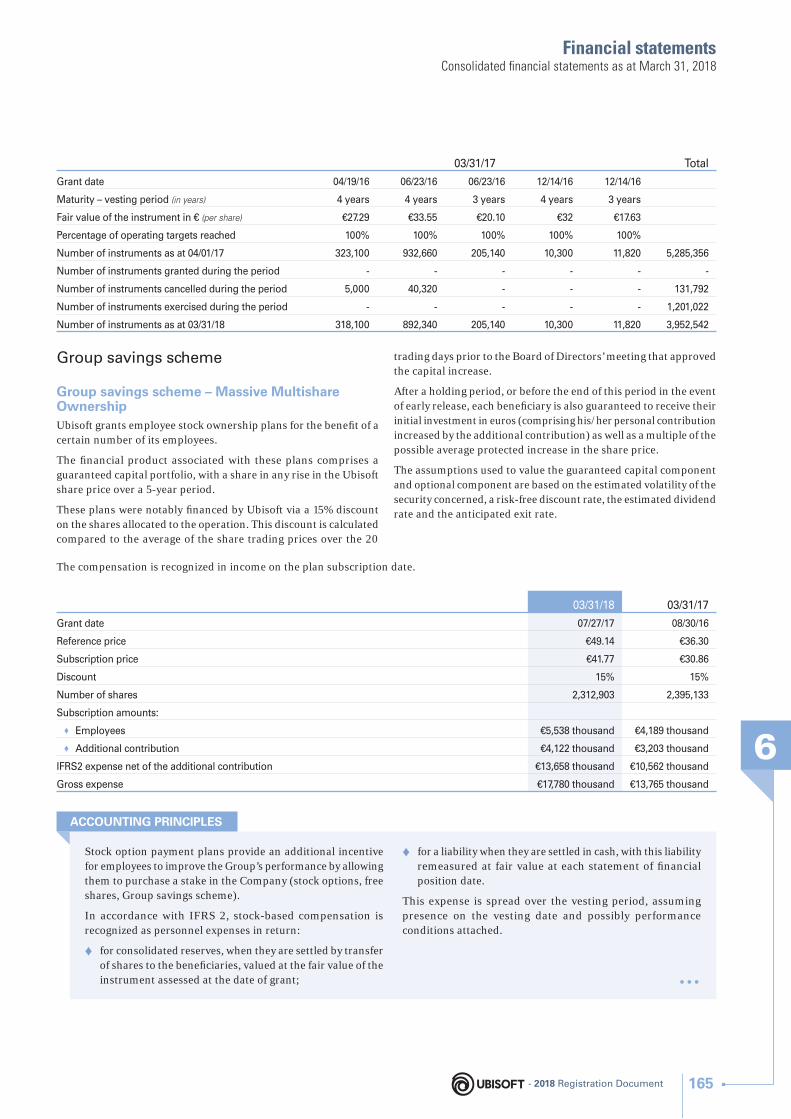
Financial statements
6
Consolidated fi nancial statements as at March 31, 2018
03/31/17 Total
Grant date 04/19/16 06/23/16 06/23/16 12/14/16 12/14/16
Maturity – vesting period (in years) 4 years 4 years 3 years 4 years 3 years
Fair value of the instrument in € (per share) €27.29 €33.55 €20.10 €32 €17.63
Percentage of operating targets reached 100% 100% 100% 100% 100%
Number of instruments as at 04/01/17 323,100 932,660 205,140 10,300 11,820 5,285,356
Number of instruments granted during the period - - - - - -
Number of instruments cancelled during the period 5,000 40,320 - - - 131,792
Number of instruments exercised during the period - - - - - 1,201,022
Number of instruments as at 03/31/18 318,100 892,340 205,140 10,300 11,820 3,952,542
Group savings scheme
Group savings scheme – Massive Multishare OwnershipUbisoft grants employee stock ownership plans for the benefi t of a certain number of its employees.
The fi nancial product associated with these plans comprises a guaranteed capital portfolio, with a share in any rise in the Ubisoft share price over a 5-year period.
These plans were notably fi nanced by Ubisoft via a 15% discount on the shares allocated to the operation. This discount is calculated compared to the average of the share trading prices over the 20
trading days prior to the Board of Directors’ meeting that approved the capital increase.
After a holding period, or before the end of this period in the event of early release, each benefi ciary is also guaranteed to receive their initial investment in euros (comprising his/her personal contribution increased by the additional contribution) as well as a multiple of the possible average protected increase in the share price.
The assumptions used to value the guaranteed capital component and optional component are based on the estimated volatility of the security concerned, a risk-free discount rate, the estimated dividend rate and the anticipated exit rate.
The compensation is recognized in income on the plan subscription date.
03/31/18 03/31/17
Grant date 07/27/17 08/30/16
Reference price €49.14 €36.30
Subscription price €41.77 €30.86
Discount 15% 15%
Number of shares 2,312,903 2,395,133
Subscription amounts:
♦ Employees €5,538 thousand €4,189 thousand
♦ Additional contribution €4,122 thousand €3,203 thousand
IFRS2 expense net of the additional contribution €13,658 thousand €10,562 thousand
Gross expense €17,780 thousand €13,765 thousand
Stock option payment plans provide an additional incentive for employees to improve the Group’s performance by allowing them to purchase a stake in the Company (stock options, free shares, Group savings scheme).
In accordance with IFRS 2, stock-based compensation is recognized as personnel expenses in return:
♦ for consolidated reserves, when they are settled by transfer of shares to the benefi ciaries, valued at the fair value of the instrument assessed at the date of grant;
♦ for a liability when they are settled in cash, with this liability remeasured at fair value at each statement of fi nancial position date.
This expense is spread over the vesting period, assuming presence on the vesting date and possibly performance conditions attached.
...
ACCOUNTING PRINCIPLES
- 2018 Registration Document 165
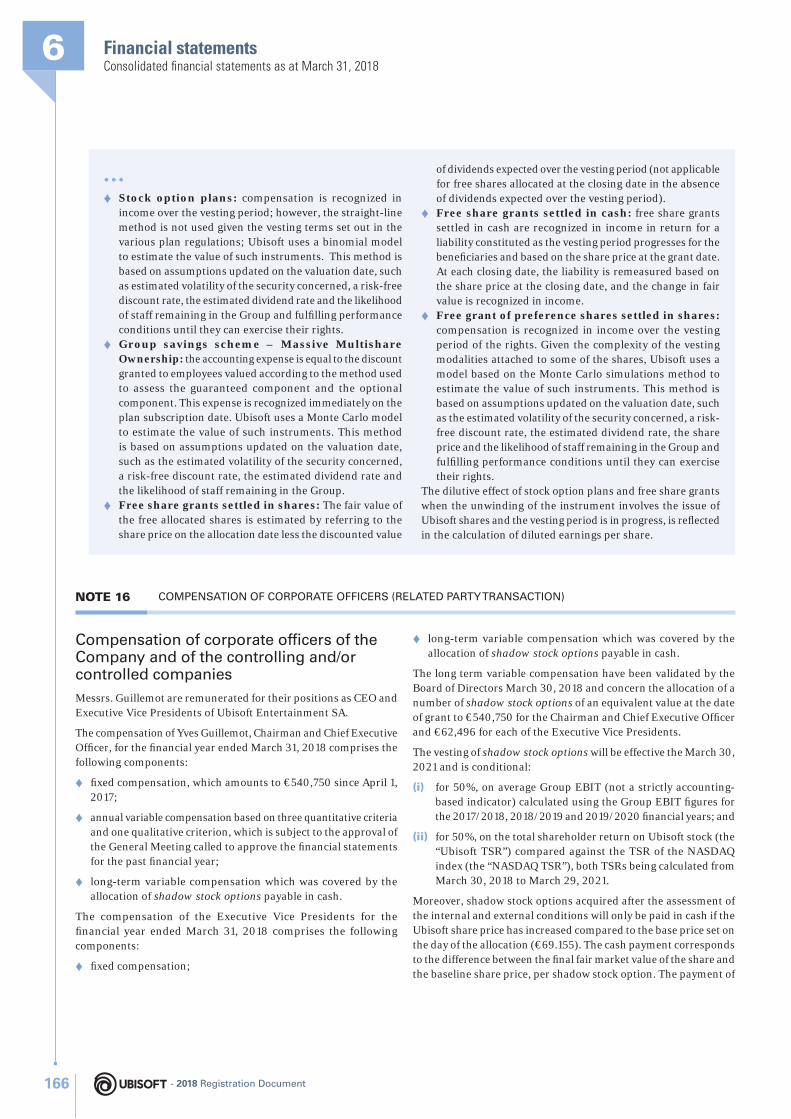
Financial statements6Consolidated fi nancial statements as at March 31, 2018
NOTE 16 COMPENSATION OF CORPORATE OFFICERS (RELATED PARTY TRANSACTION)
Compensation of corporate offi cers of the Company and of the controlling and/or controlled companies
Messrs. Guillemot are remunerated for their positions as CEO and Executive Vice Presidents of Ubisoft Entertainment SA.
The compensation of Yves Guillemot, Chairman and Chief Executive Offi cer, for the fi nancial year ended March 31, 2018 comprises the following components:
♦ fi xed compensation, which amounts to €540,750 since April 1, 2017;
♦ annual variable compensation based on three quantitative criteria and one qualitative criterion, which is subject to the approval of the General Meeting called to approve the fi nancial statements for the past fi nancial year;
♦ long-term variable compensation which was covered by the allocation of shadow stock options payable in cash.
The compensation of the Executive Vice Presidents for the fi nancial year ended March 31, 2018 comprises the following components:
♦ fi xed compensation;
♦ long-term variable compensation which was covered by the allocation of shadow stock options payable in cash.
The long term variable compensation have been validated by the Board of Directors March 30, 2018 and concern the allocation of a number of shadow stock options of an equivalent value at the date of grant to €540,750 for the Chairman and Chief Executive Offi cer and €62,496 for each of the Executive Vice Presidents.
The vesting of shadow stock options will be effective the March 30, 2021 and is conditional:
(i) for 50%, on average Group EBIT (not a strictly accounting-based indicator) calculated using the Group EBIT fi gures for the 2017/2018, 2018/2019 and 2019/2020 fi nancial years; and
(ii) for 50%, on the total shareholder return on Ubisoft stock (the “Ubisoft TSR”) compared against the TSR of the NASDAQ index (the “NASDAQ TSR”), both TSRs being calculated from March 30, 2018 to March 29, 2021.
Moreover, shadow stock options acquired after the assessment of the internal and external conditions will only be paid in cash if the Ubisoft share price has increased compared to the base price set on the day of the allocation (€69.155). The cash payment corresponds to the difference between the fi nal fair market value of the share and the baseline share price, per shadow stock option. The payment of
... ♦ Stock option plans: compensation is recognized in
income over the vesting period; however, the straight-line method is not used given the vesting terms set out in the various plan regulations; Ubisoft uses a binomial model to estimate the value of such instruments. This method is based on assumptions updated on the valuation date, such as estimated volatility of the security concerned, a risk-free discount rate, the estimated dividend rate and the likelihood of staff remaining in the Group and fulfi lling performance conditions until they can exercise their rights.
♦ Group savings scheme – Massive Multishare Ownership: the accounting expense is equal to the discount granted to employees valued according to the method used to assess the guaranteed component and the optional component. This expense is recognized immediately on the plan subscription date. Ubisoft uses a Monte Carlo model to estimate the value of such instruments. This method is based on assumptions updated on the valuation date, such as the estimated volatility of the security concerned, a risk-free discount rate, the estimated dividend rate and the likelihood of staff remaining in the Group.
♦ Free share grants settled in shares: The fair value of the free allocated shares is estimated by referring to the share price on the allocation date less the discounted value
of dividends expected over the vesting period (not applicable for free shares allocated at the closing date in the absence of dividends expected over the vesting period).
♦ Free share grants settled in cash: free share grants settled in cash are recognized in income in return for a liability constituted as the vesting period progresses for the benefi ciaries and based on the share price at the grant date. At each closing date, the liability is remeasured based on the share price at the closing date, and the change in fair value is recognized in income.
♦ Free grant of preference shares settled in shares: compensation is recognized in income over the vesting period of the rights. Given the complexity of the vesting modalities attached to some of the shares, Ubisoft uses a model based on the Monte Carlo simulations method to estimate the value of such instruments. This method is based on assumptions updated on the valuation date, such as the estimated volatility of the security concerned, a risk-free discount rate, the estimated dividend rate, the share price and the likelihood of staff remaining in the Group and fulfi lling performance conditions until they can exercise their rights.
The dilutive effect of stock option plans and free share grants when the unwinding of the instrument involves the issue of Ubisoft shares and the vesting period is in progress, is refl ected in the calculation of diluted earnings per share.
- 2018 Registration Document166
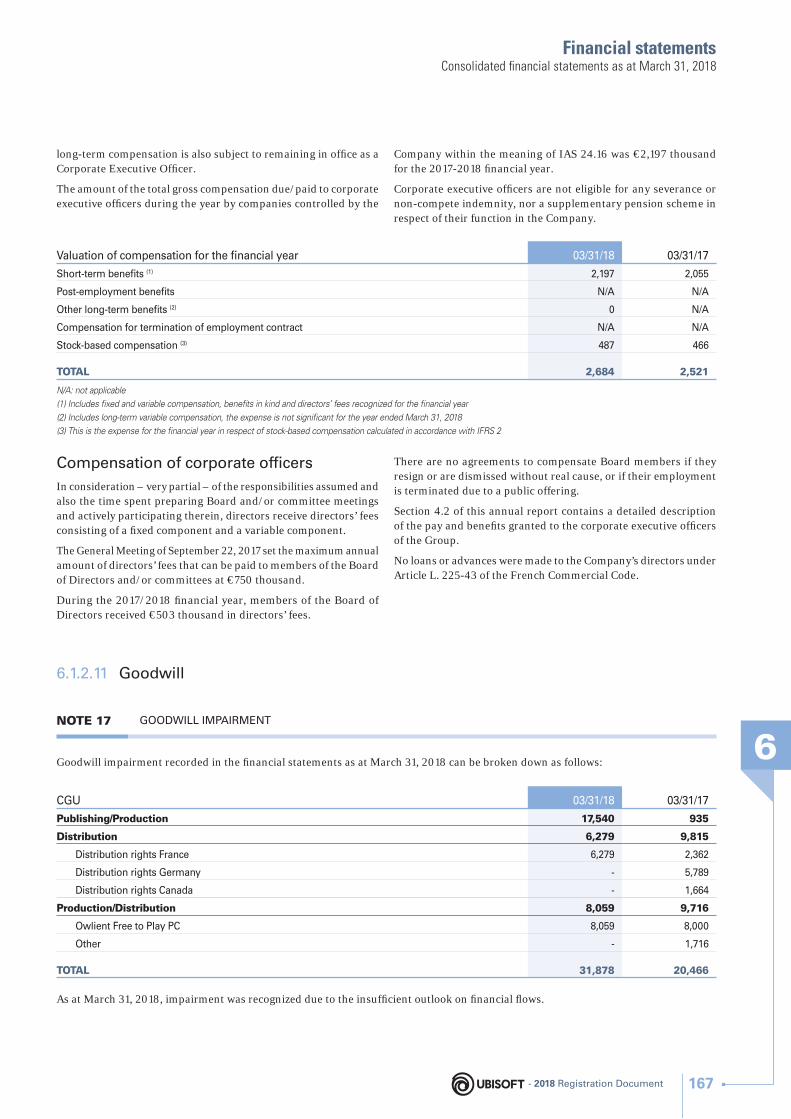
Financial statements
6
Consolidated fi nancial statements as at March 31, 2018
long-term compensation is also subject to remaining in offi ce as a Corporate Executive Offi cer.
The amount of the total gross compensation due/paid to corporate executive offi cers during the year by companies controlled by the
Company within the meaning of IAS 24.16 was €2,197 thousand for the 2017-2018 fi nancial year.
Corporate executive offi cers are not eligible for any severance or non-compete indemnity, nor a supplementary pension scheme in respect of their function in the Company.
Valuation of compensation for the fi nancial year 03/31/18 03/31/17
Short-term benefi ts (1) 2,197 2,055
Post-employment benefi ts N/A N/A
Other long-term benefi ts (2) 0 N/A
Compensation for termination of employment contract N/A N/A
Stock-based compensation (3) 487 466
TOTAL 2,684 2,521
N/A: not applicable
(1) Includes fi xed and variable compensation, benefi ts in kind and directors’ fees recognized for the fi nancial year
(2) Includes long-term variable compensation, the expense is not signifi cant for the year ended March 31, 2018
(3) This is the expense for the fi nancial year in respect of stock-based compensation calculated in accordance with IFRS 2
Compensation of corporate offi cers
In consideration – very partial – of the responsibilities assumed and also the time spent preparing Board and/or committee meetings and actively participating therein, directors receive directors’ fees consisting of a fi xed component and a variable component.
The General Meeting of September 22, 2017 set the maximum annual amount of directors’ fees that can be paid to members of the Board of Directors and/or committees at €750 thousand.
During the 2017/2018 fi nancial year, members of the Board of Directors received €503 thousand in directors’ fees.
There are no agreements to compensate Board members if they resign or are dismissed without real cause, or if their employment is terminated due to a public offering.
Section 4.2 of this annual report contains a detailed description of the pay and benefi ts granted to the corporate executive offi cers of the Group.
No loans or advances were made to the Company’s directors under Article L. 225-43 of the French Commercial Code.
6.1.2.11 Goodwill
NOTE 17 GOODWILL IMPAIRMENT
Goodwill impairment recorded in the fi nancial statements as at March 31, 2018 can be broken down as follows:
CGU 03/31/18 03/31/17
Publishing/Production 17,540 935
Distribution 6,279 9,815
Distribution rights France 6,279 2,362
Distribution rights Germany - 5,789
Distribution rights Canada - 1,664
Production/Distribution 8,059 9,716
Owlient Free to Play PC 8,059 8,000
Other - 1,716
TOTAL 31,878 20,466
As at March 31, 2018, impairment was recognized due to the insuffi cient outlook on fi nancial fl ows.
- 2018 Registration Document 167
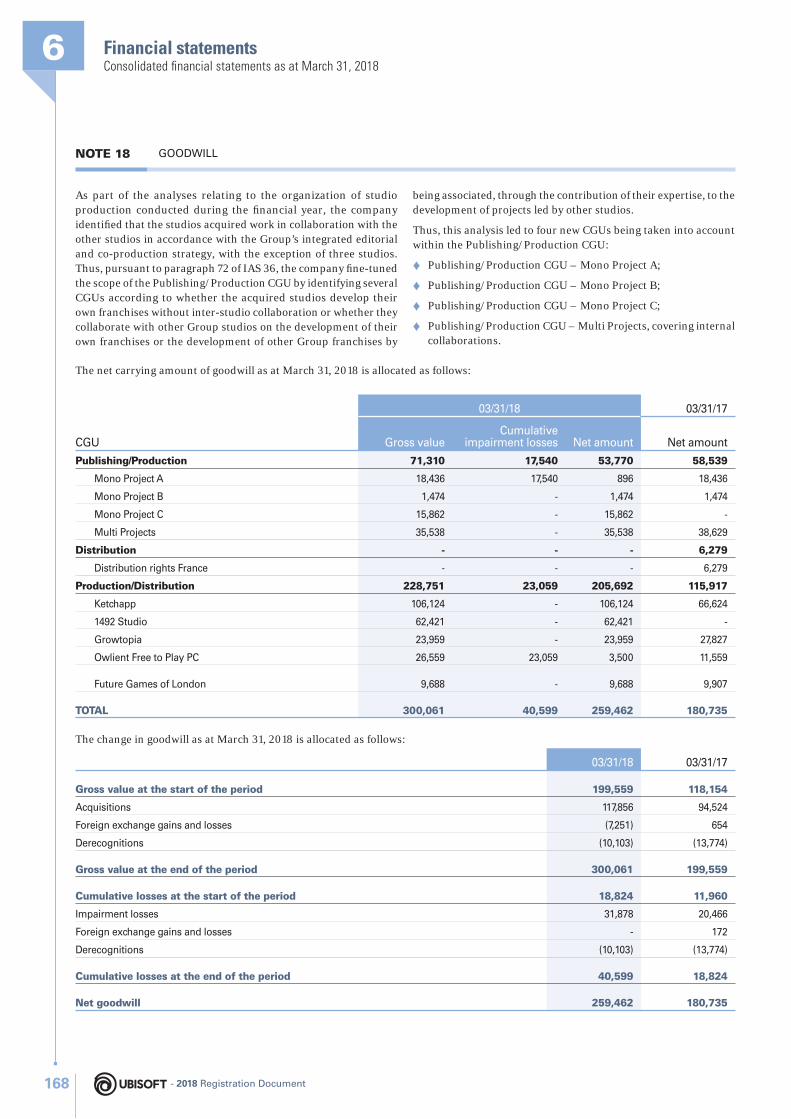
Financial statements6Consolidated fi nancial statements as at March 31, 2018
NOTE 18 GOODWILL
As part of the analyses relating to the organization of studio production conducted during the fi nancial year, the company identifi ed that the studios acquired work in collaboration with the other studios in accordance with the Group’s integrated editorial and co-production strategy, with the exception of three studios. Thus, pursuant to paragraph 72 of IAS 36, the company fi ne-tuned the scope of the Publishing/Production CGU by identifying several CGUs according to whether the acquired studios develop their own franchises without inter-studio collaboration or whether they collaborate with other Group studios on the development of their own franchises or the development of other Group franchises by
being associated, through the contribution of their expertise, to the development of projects led by other studios.
Thus, this analysis led to four new CGUs being taken into account within the Publishing/Production CGU:
♦ Publishing/Production CGU – Mono Project A;
♦ Publishing/Production CGU – Mono Project B;
♦ Publishing/Production CGU – Mono Project C;
♦ Publishing/Production CGU – Multi Projects, covering internal collaborations.
The net carrying amount of goodwill as at March 31, 2018 is allocated as follows:
CGU
03/31/18 03/31/17
Gross valueCumulative
impairment losses Net amount Net amount
Publishing/Production 71,310 17,540 53,770 58,539
Mono Project A 18,436 17,540 896 18,436
Mono Project B 1,474 - 1,474 1,474
Mono Project C 15,862 - 15,862 -
Multi Projects 35,538 - 35,538 38,629
Distribution - - - 6,279
Distribution rights France - - - 6,279
Production/Distribution 228,751 23,059 205,692 115,917
Ketchapp 106,124 - 106,124 66,624
1492 Studio 62,421 - 62,421 -
Growtopia 23,959 - 23,959 27,827
Owlient Free to Play PC 26,559 23,059 3,500 11,559
Future Games of London 9,688 - 9,688 9,907
TOTAL 300,061 40,599 259,462 180,735
The change in goodwill as at March 31, 2018 is allocated as follows:
03/31/18 03/31/17
Gross value at the start of the period 199,559 118,154
Acquisitions 117,856 94,524
Foreign exchange gains and losses (7,251) 654
Derecognitions (10,103) (13,774)
Gross value at the end of the period 300,061 199,559
Cumulative losses at the start of the period 18,824 11,960
Impairment losses 31,878 20,466
Foreign exchange gains and losses - 172
Derecognitions (10,103) (13,774)
Cumulative losses at the end of the period 40,599 18,824
Net goodwill 259,462 180,735
- 2018 Registration Document168
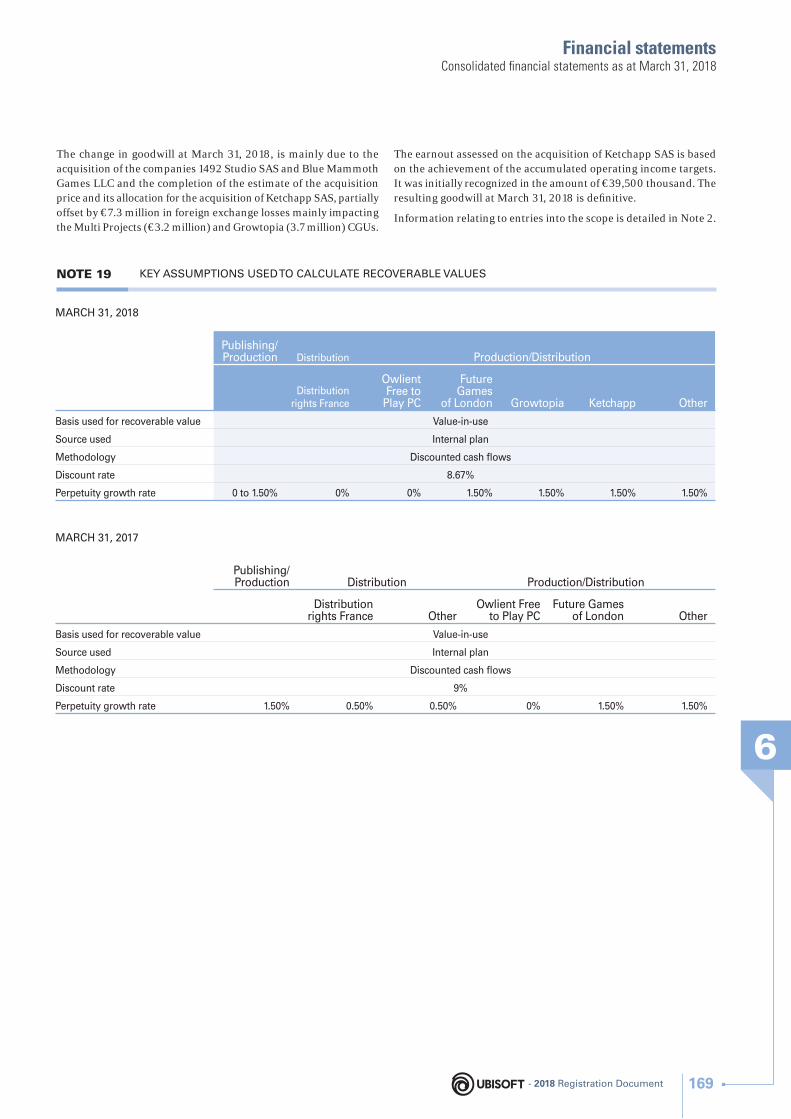
Financial statements
6
Consolidated fi nancial statements as at March 31, 2018
The change in goodwill at March 31, 2018, is mainly due to the acquisition of the companies 1492 Studio SAS and Blue Mammoth Games LLC and the completion of the estimate of the acquisition price and its allocation for the acquisition of Ketchapp SAS, partially offset by €7.3 million in foreign exchange losses mainly impacting the Multi Projects (€3.2 million) and Growtopia (3.7 million) CGUs.
The earnout assessed on the acquisition of Ketchapp SAS is based on the achievement of the accumulated operating income targets. It was initially recognized in the amount of €39,500 thousand. The resulting goodwill at March 31, 2018 is defi nitive.
Information relating to entries into the scope is detailed in Note 2.
NOTE 19 KEY ASSUMPTIONS USED TO CALCULATE RECOVERABLE VALUES
MARCH 31, 2018
Publishing/Production Distribution Production/Distribution
Distribution rights France
Owlient Free to
Play PC
Future Games
of London Growtopia Ketchapp Other
Basis used for recoverable value Value-in-use
Source used Internal plan
Methodology Discounted cash fl ows
Discount rate 8.67%
Perpetuity growth rate 0 to 1.50% 0% 0% 1.50% 1.50% 1.50% 1.50%
MARCH 31, 2017
Publishing/Production Distribution Production/Distribution
Distribution rights France Other
Owlient Free to Play PC
Future Games of London Other
Basis used for recoverable value Value-in-use
Source used Internal plan
Methodology Discounted cash fl ows
Discount rate 9%
Perpetuity growth rate 1.50% 0.50% 0.50% 0% 1.50% 1.50%
- 2018 Registration Document 169
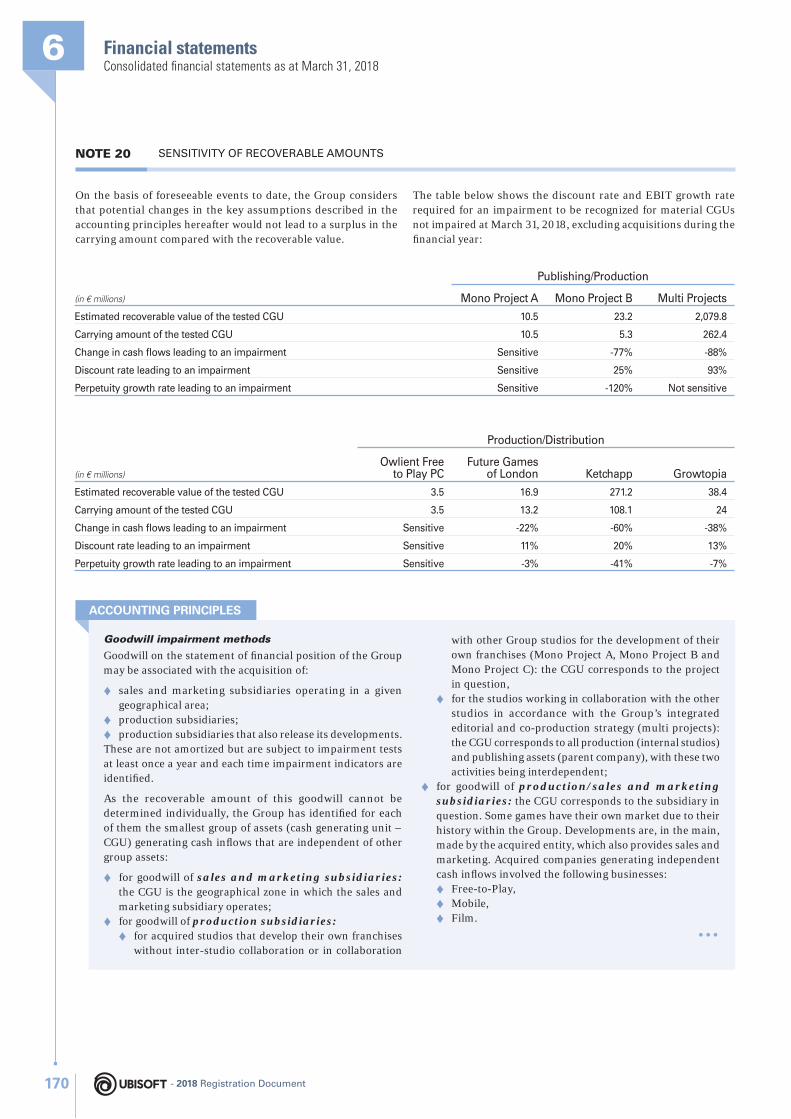
Financial statements6Consolidated fi nancial statements as at March 31, 2018
NOTE 20 SENSITIVITY OF RECOVERABLE AMOUNTS
Goodwill impairment methods
Goodwill on the statement of fi nancial position of the Group may be associated with the acquisition of:
♦ sales and marketing subsidiaries operating in a given geographical area;
♦ production subsidiaries;
♦ production subsidiaries that also release its developments.These are not amortized but are subject to impairment tests at least once a year and each time impairment indicators are identifi ed.
As the recoverable amount of this goodwill cannot be determined individually, the Group has identifi ed for each of them the smallest group of assets (cash generating unit – CGU) generating cash infl ows that are independent of other group assets:
♦ for goodwill of sales and marketing subsidiaries: the CGU is the geographical zone in which the sales and marketing subsidiary operates;
♦ for goodwill of production subsidiaries: ♦ for acquired studios that develop their own franchises
without inter-studio collaboration or in collaboration
with other Group studios for the development of their own franchises (Mono Project A, Mono Project B and Mono Project C): the CGU corresponds to the project in question,
♦ for the studios working in collaboration with the other studios in accordance with the Group’s integrated editorial and co-production strategy (multi projects): the CGU corresponds to all production (internal studios) and publishing assets (parent company), with these two activities being interdependent;
♦ for goodwill of production/sales and marketing subsidiaries: the CGU corresponds to the subsidiary in question. Some games have their own market due to their history within the Group. Developments are, in the main, made by the acquired entity, which also provides sales and marketing. Acquired companies generating independent cash infl ows involved the following businesses:
♦ Free-to-Play,
♦ Mobile,
♦ Film....
ACCOUNTING PRINCIPLES
On the basis of foreseeable events to date, the Group considers that potential changes in the key assumptions described in the accounting principles hereafter would not lead to a surplus in the carrying amount compared with the recoverable value.
The table below shows the discount rate and EBIT growth rate required for an impairment to be recognized for material CGUs not impaired at March 31, 2018, excluding acquisitions during the fi nancial year:
(in € millions)
Publishing/Production
Mono Project A Mono Project B Multi Projects
Estimated recoverable value of the tested CGU 10.5 23.2 2,079.8
Carrying amount of the tested CGU 10.5 5.3 262.4
Change in cash fl ows leading to an impairment Sensitive -77% -88%
Discount rate leading to an impairment Sensitive 25% 93%
Perpetuity growth rate leading to an impairment Sensitive -120% Not sensitive
(in € millions)
Production/Distribution
Owlient Free to Play PC
Future Gamesof London Ketchapp Growtopia
Estimated recoverable value of the tested CGU 3.5 16.9 271.2 38.4
Carrying amount of the tested CGU 3.5 13.2 108.1 24
Change in cash fl ows leading to an impairment Sensitive -22% -60% -38%
Discount rate leading to an impairment Sensitive 11% 20% 13%
Perpetuity growth rate leading to an impairment Sensitive -3% -41% -7%
- 2018 Registration Document170
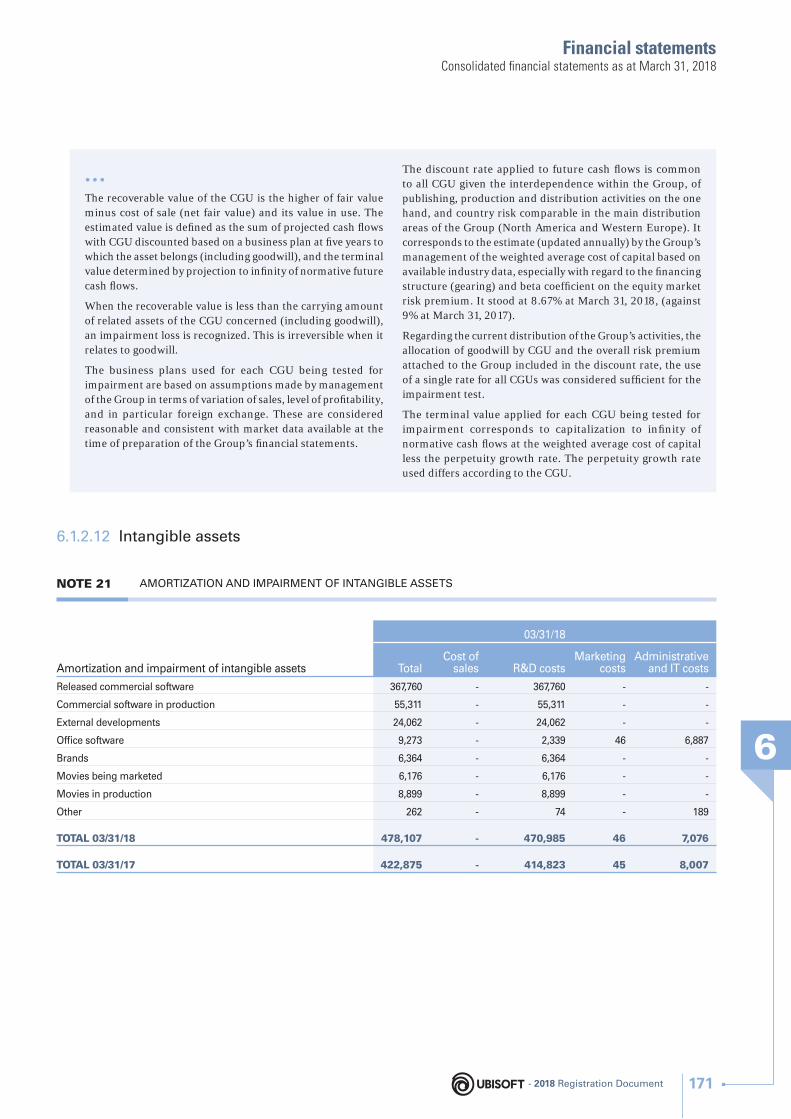
Financial statements
6
Consolidated fi nancial statements as at March 31, 2018
6.1.2.12 Intangible assets
...The recoverable value of the CGU is the higher of fair value minus cost of sale (net fair value) and its value in use. The estimated value is defi ned as the sum of projected cash fl ows with CGU discounted based on a business plan at fi ve years to which the asset belongs (including goodwill), and the terminal value determined by projection to infi nity of normative future cash fl ows.
When the recoverable value is less than the carrying amount of related assets of the CGU concerned (including goodwill), an impairment loss is recognized. This is irreversible when it relates to goodwill.
The business plans used for each CGU being tested for impairment are based on assumptions made by management of the Group in terms of variation of sales, level of profi tability, and in particular foreign exchange. These are considered reasonable and consistent with market data available at the time of preparation of the Group’s fi nancial statements.
The discount rate applied to future cash fl ows is common to all CGU given the interdependence within the Group, of publishing, production and distribution activities on the one hand, and country risk comparable in the main distribution areas of the Group (North America and Western Europe). It corresponds to the estimate (updated annually) by the Group’s management of the weighted average cost of capital based on available industry data, especially with regard to the fi nancing structure (gearing) and beta coeffi cient on the equity market risk premium. It stood at 8.67% at March 31, 2018, (against 9% at March 31, 2017).
Regarding the current distribution of the Group’s activities, the allocation of goodwill by CGU and the overall risk premium attached to the Group included in the discount rate, the use of a single rate for all CGUs was considered suffi cient for the impairment test.
The terminal value applied for each CGU being tested for impairment corresponds to capitalization to infi nity of normative cash fl ows at the weighted average cost of capital less the perpetuity growth rate. The perpetuity growth rate used differs according to the CGU.
NOTE 21 AMORTIZATION AND IMPAIRMENT OF INTANGIBLE ASSETS
Amortization and impairment of intangible assets
03/31/18
TotalCost of
sales R&D costsMarketing
costsAdministrative
and IT costs
Released commercial software 367,760 - 367,760 - -
Commercial software in production 55,311 - 55,311 - -
External developments 24,062 - 24,062 - -
Offi ce software 9,273 - 2,339 46 6,887
Brands 6,364 - 6,364 - -
Movies being marketed 6,176 - 6,176 - -
Movies in production 8,899 - 8,899 - -
Other 262 - 74 - 189
TOTAL 03/31/18 478,107 - 470,985 46 7,076
TOTAL 03/31/17 422,875 - 414,823 45 8,007
- 2018 Registration Document 171
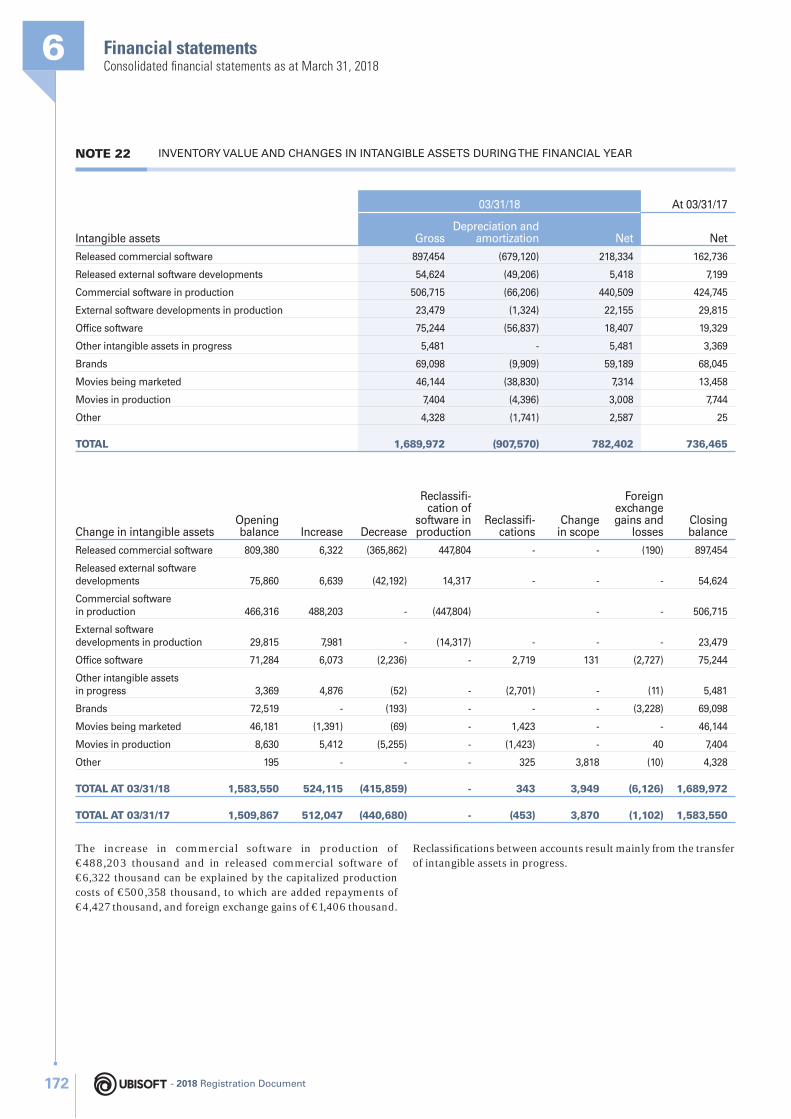
Financial statements6Consolidated fi nancial statements as at March 31, 2018
NOTE 22 INVENTORY VALUE AND CHANGES IN INTANGIBLE ASSETS DURING THE FINANCIAL YEAR
Intangible assets
03/31/18 At 03/31/17
GrossDepreciation and
amortization Net Net
Released commercial software 897,454 (679,120) 218,334 162,736
Released external software developments 54,624 (49,206) 5,418 7,199
Commercial software in production 506,715 (66,206) 440,509 424,745
External software developments in production 23,479 (1,324) 22,155 29,815
Offi ce software 75,244 (56,837) 18,407 19,329
Other intangible assets in progress 5,481 - 5,481 3,369
Brands 69,098 (9,909) 59,189 68,045
Movies being marketed 46,144 (38,830) 7,314 13,458
Movies in production 7,404 (4,396) 3,008 7,744
Other 4,328 (1,741) 2,587 25
TOTAL 1,689,972 (907,570) 782,402 736,465
Change in intangible assetsOpening balance Increase Decrease
Reclassifi -cation of
software in production
Reclassifi -cations
Change in scope
Foreign exchange gains and
lossesClosing balance
Released commercial software 809,380 6,322 (365,862) 447,804 - - (190) 897,454
Released external software developments 75,860 6,639 (42,192) 14,317 - - - 54,624
Commercial software in production 466,316 488,203 - (447,804) - - 506,715
External software developments in production 29,815 7,981 - (14,317) - - - 23,479
Offi ce software 71,284 6,073 (2,236) - 2,719 131 (2,727) 75,244
Other intangible assets in progress 3,369 4,876 (52) - (2,701) - (11) 5,481
Brands 72,519 - (193) - - - (3,228) 69,098
Movies being marketed 46,181 (1,391) (69) - 1,423 - - 46,144
Movies in production 8,630 5,412 (5,255) - (1,423) - 40 7,404
Other 195 - - - 325 3,818 (10) 4,328
TOTAL AT 03/31/18 1,583,550 524,115 (415,859) - 343 3,949 (6,126) 1,689,972
TOTAL AT 03/31/17 1,509,867 512,047 (440,680) - (453) 3,870 (1,102) 1,583,550
The increase in commercial software in production of €488,203 thousand and in released commercial software of €6,322 thousand can be explained by the capitalized production costs of €500,358 thousand, to which are added repayments of €4,427 thousand, and foreign exchange gains of €1,406 thousand.
Reclassifi cations between accounts result mainly from the transfer of intangible assets in progress.
- 2018 Registration Document172
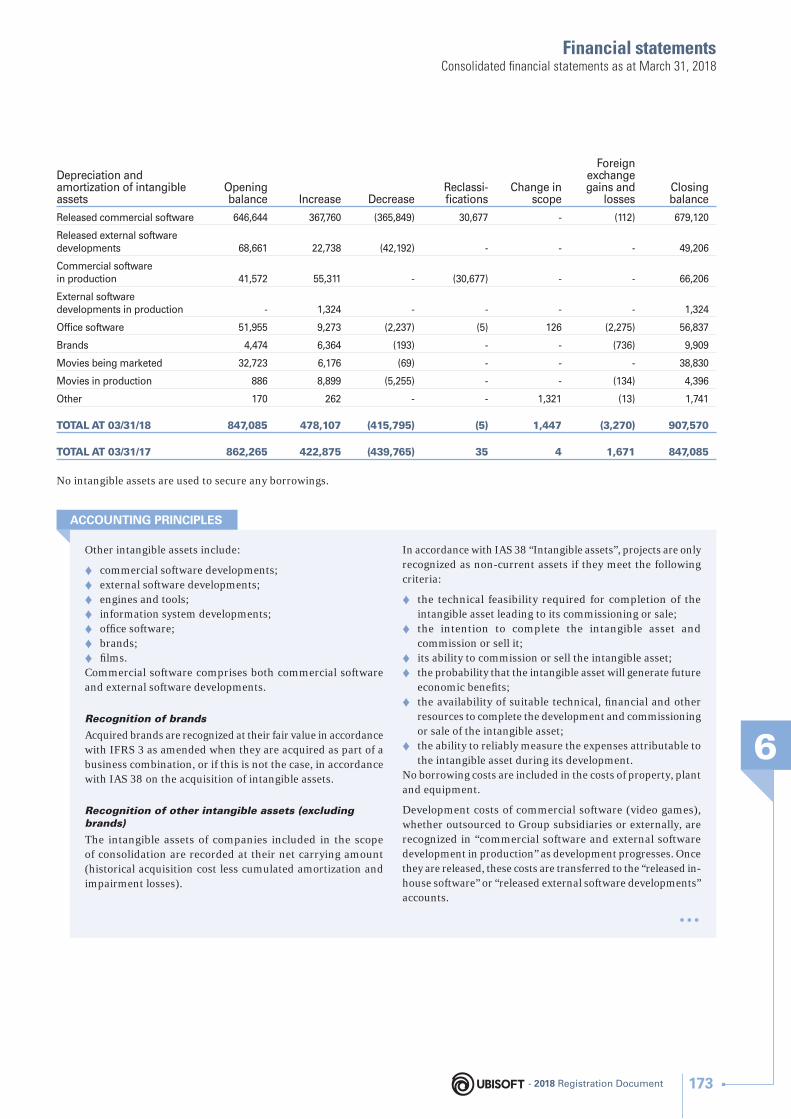
Financial statements
6
Consolidated fi nancial statements as at March 31, 2018
Depreciation and amortization of intangible assets
Opening balance Increase Decrease
Reclassi-fi cations
Change in scope
Foreign exchange gains and
lossesClosing balance
Released commercial software 646,644 367,760 (365,849) 30,677 - (112) 679,120
Released external software developments 68,661 22,738 (42,192) - - - 49,206
Commercial software in production 41,572 55,311 - (30,677) - - 66,206
External software developments in production - 1,324 - - - - 1,324
Offi ce software 51,955 9,273 (2,237) (5) 126 (2,275) 56,837
Brands 4,474 6,364 (193) - - (736) 9,909
Movies being marketed 32,723 6,176 (69) - - - 38,830
Movies in production 886 8,899 (5,255) - - (134) 4,396
Other 170 262 - - 1,321 (13) 1,741
TOTAL AT 03/31/18 847,085 478,107 (415,795) (5) 1,447 (3,270) 907,570
TOTAL AT 03/31/17 862,265 422,875 (439,765) 35 4 1,671 847,085
No intangible assets are used to secure any borrowings.
Other intangible assets include:
♦ commercial software developments;
♦ external software developments;
♦ engines and tools;
♦ information system developments;
♦ offi ce software;
♦ brands;
♦ fi lms.Commercial software comprises both commercial software and external software developments.
Recognition of brands
Acquired brands are recognized at their fair value in accordance with IFRS 3 as amended when they are acquired as part of a business combination, or if this is not the case, in accordance with IAS 38 on the acquisition of intangible assets.
Recognition of other intangible assets (excluding brands)
The intangible assets of companies included in the scope of consolidation are recorded at their net carrying amount (historical acquisition cost less cumulated amortization and impairment losses).
In accordance with IAS 38 “Intangible assets”, projects are only recognized as non-current assets if they meet the following criteria:
♦ the technical feasibility required for completion of the intangible asset leading to its commissioning or sale;
♦ the intention to complete the intangible asset and commission or sell it;
♦ its ability to commission or sell the intangible asset;
♦ the probability that the intangible asset will generate future economic benefi ts;
♦ the availability of suitable technical, fi nancial and other resources to complete the development and commissioning or sale of the intangible asset;
♦ the ability to reliably measure the expenses attributable to the intangible asset during its development.
No borrowing costs are included in the costs of property, plant and equipment.
Development costs of commercial software (video games), whether outsourced to Group subsidiaries or externally, are recognized in “commercial software and external software development in production” as development progresses. Once they are released, these costs are transferred to the “released in-house software” or “released external software developments” accounts.
...
ACCOUNTING PRINCIPLES
- 2018 Registration Document 173
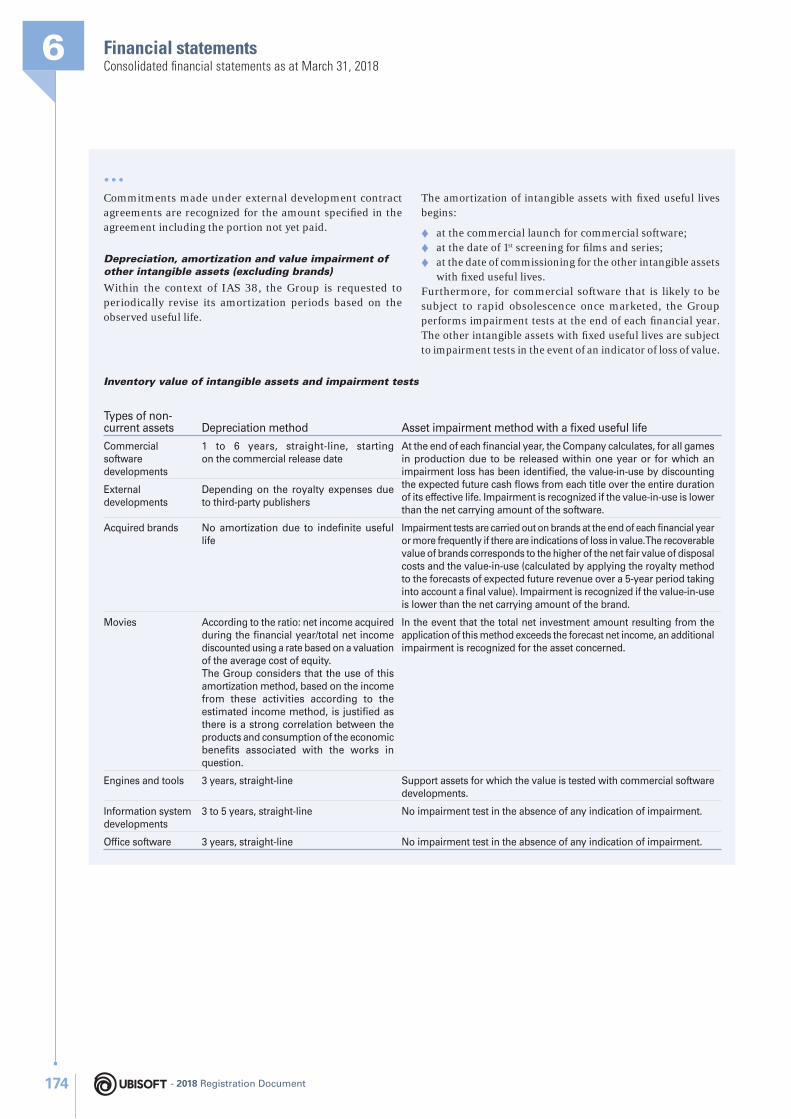
Financial statements6Consolidated fi nancial statements as at March 31, 2018
...Commitments made under external development contract agreements are recognized for the amount specifi ed in the agreement including the portion not yet paid.
Depreciation, amortization and value impairment of other intangible assets (excluding brands)
Within the context of IAS 38, the Group is requested to periodically revise its amortization periods based on the observed useful life.
The amortization of intangible assets with fi xed useful lives begins:
♦ at the commercial launch for commercial software;
♦ at the date of 1st screening for fi lms and series;
♦ at the date of commissioning for the other intangible assets with fi xed useful lives.
Furthermore, for commercial software that is likely to be subject to rapid obsolescence once marketed, the Group performs impairment tests at the end of each fi nancial year. The other intangible assets with fi xed useful lives are subject to impairment tests in the event of an indicator of loss of value.
Inventory value of intangible assets and impairment tests
Types of non-current assets Depreciation method Asset impairment method with a fi xed useful life
Commercial software developments
1 to 6 years, straight-line, starting on the commercial release date
At the end of each fi nancial year, the Company calculates, for all games in production due to be released within one year or for which an impairment loss has been identifi ed, the value-in-use by discounting the expected future cash fl ows from each title over the entire duration of its effective life. Impairment is recognized if the value-in-use is lower than the net carrying amount of the software.
External developments
Depending on the royalty expenses due to third-party publishers
Acquired brands No amortization due to indefi nite useful life
Impairment tests are carried out on brands at the end of each fi nancial year or more frequently if there are indications of loss in value. The recoverable value of brands corresponds to the higher of the net fair value of disposal costs and the value-in-use (calculated by applying the royalty method to the forecasts of expected future revenue over a 5-year period taking into account a fi nal value). Impairment is recognized if the value-in-use is lower than the net carrying amount of the brand.
Movies According to the ratio: net income acquired during the fi nancial year/total net income discounted using a rate based on a valuation of the average cost of equity.The Group considers that the use of this amortization method, based on the income from these activities according to the estimated income method, is justifi ed as there is a strong correlation between the products and consumption of the economic benefi ts associated with the works in question.
In the event that the total net investment amount resulting from the application of this method exceeds the forecast net income, an additional impairment is recognized for the asset concerned.
Engines and tools 3 years, straight-line Support assets for which the value is tested with commercial software developments.
Information system developments
3 to 5 years, straight-line No impairment test in the absence of any indication of impairment.
Offi ce software 3 years, straight-line No impairment test in the absence of any indication of impairment.
- 2018 Registration Document174
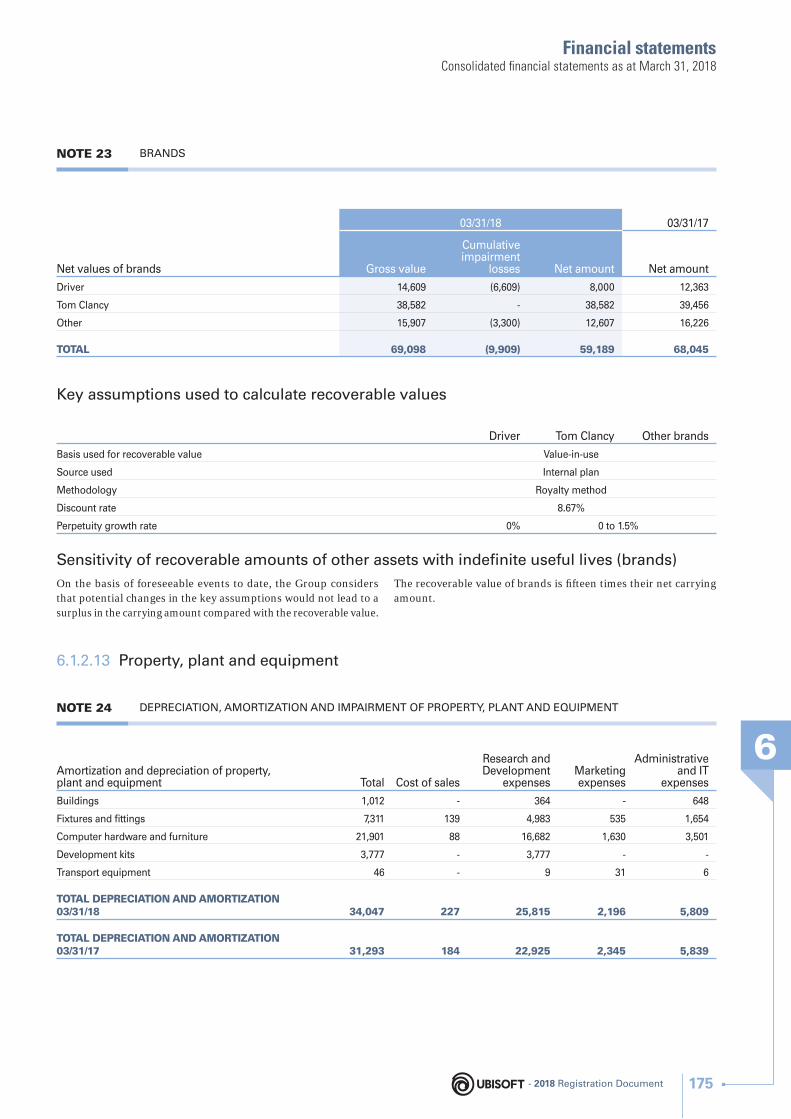
Financial statements
6
Consolidated fi nancial statements as at March 31, 2018
NOTE 23 BRANDS
Net values of brands
03/31/18 03/31/17
Gross value
Cumulative impairment
losses Net amount Net amount
Driver 14,609 (6,609) 8,000 12,363
Tom Clancy 38,582 - 38,582 39,456
Other 15,907 (3,300) 12,607 16,226
TOTAL 69,098 (9,909) 59,189 68,045
Key assumptions used to calculate recoverable values
Driver Tom Clancy Other brands
Basis used for recoverable value Value-in-use
Source used Internal plan
Methodology Royalty method
Discount rate 8.67%
Perpetuity growth rate 0% 0 to 1.5%
Sensitivity of recoverable amounts of other assets with indefi nite useful lives (brands)
On the basis of foreseeable events to date, the Group considers that potential changes in the key assumptions would not lead to a surplus in the carrying amount compared with the recoverable value.
The recoverable value of brands is fi fteen times their net carrying amount.
6.1.2.13 Property, plant and equipment
NOTE 24 DEPRECIATION, AMORTIZATION AND IMPAIRMENT OF PROPERTY, PLANT AND EQUIPMENT
Amortization and depreciation of property, plant and equipment Total Cost of sales
Research and Development
expensesMarketing expenses
Administrative and IT
expenses
Buildings 1,012 - 364 - 648
Fixtures and fi ttings 7,311 139 4,983 535 1,654
Computer hardware and furniture 21,901 88 16,682 1,630 3,501
Development kits 3,777 - 3,777 - -
Transport equipment 46 - 9 31 6
TOTAL DEPRECIATION AND AMORTIZATION 03/31/18 34,047 227 25,815 2,196 5,809
TOTAL DEPRECIATION AND AMORTIZATION 03/31/17 31,293 184 22,925 2,345 5,839
- 2018 Registration Document 175
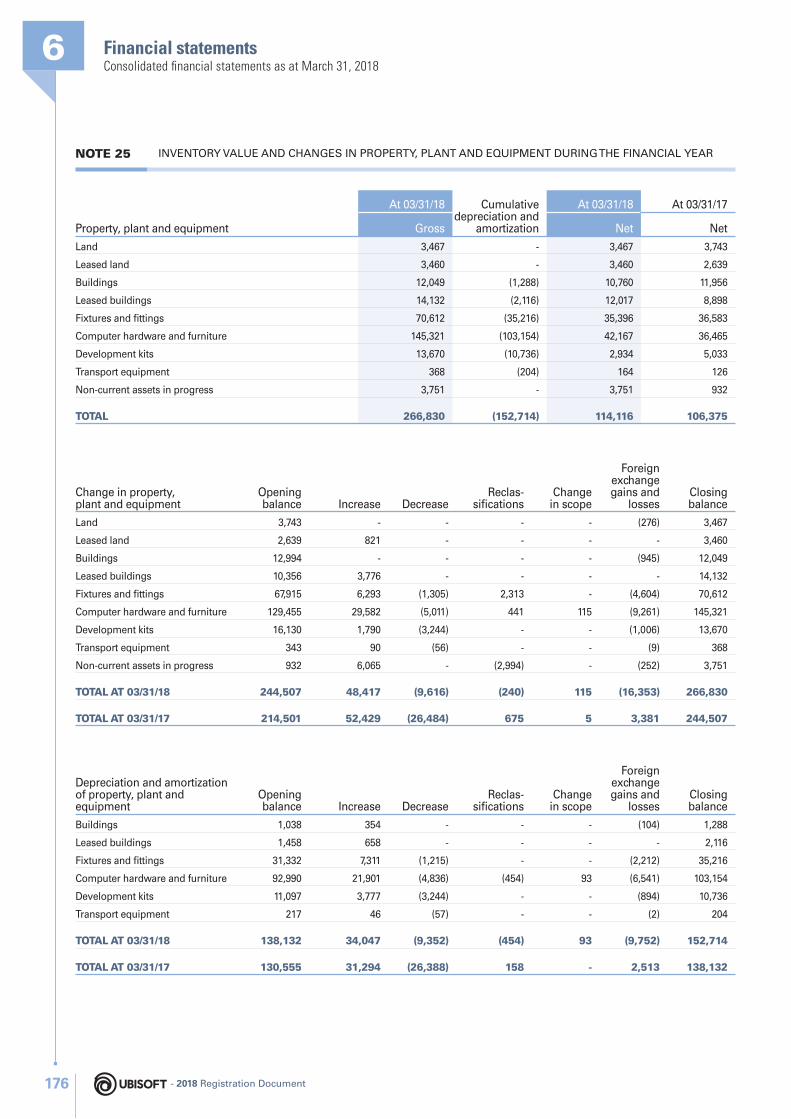
Financial statements6Consolidated fi nancial statements as at March 31, 2018
NOTE 25 INVENTORY VALUE AND CHANGES IN PROPERTY, PLANT AND EQUIPMENT DURING THE FINANCIAL YEAR
Property, plant and equipment
At 03/31/18 Cumulative depreciation and
amortization
At 03/31/18 At 03/31/17
Gross Net Net
Land 3,467 - 3,467 3,743
Leased land 3,460 - 3,460 2,639
Buildings 12,049 (1,288) 10,760 11,956
Leased buildings 14,132 (2,116) 12,017 8,898
Fixtures and fi ttings 70,612 (35,216) 35,396 36,583
Computer hardware and furniture 145,321 (103,154) 42,167 36,465
Development kits 13,670 (10,736) 2,934 5,033
Transport equipment 368 (204) 164 126
Non-current assets in progress 3,751 - 3,751 932
TOTAL 266,830 (152,714) 114,116 106,375
Change in property, plant and equipment
Opening balance Increase Decrease
Reclas-sifi cations
Change in scope
Foreign exchange gains and
lossesClosing balance
Land 3,743 - - - - (276) 3,467
Leased land 2,639 821 - - - - 3,460
Buildings 12,994 - - - - (945) 12,049
Leased buildings 10,356 3,776 - - - - 14,132
Fixtures and fi ttings 67,915 6,293 (1,305) 2,313 - (4,604) 70,612
Computer hardware and furniture 129,455 29,582 (5,011) 441 115 (9,261) 145,321
Development kits 16,130 1,790 (3,244) - - (1,006) 13,670
Transport equipment 343 90 (56) - - (9) 368
Non-current assets in progress 932 6,065 - (2,994) - (252) 3,751
TOTAL AT 03/31/18 244,507 48,417 (9,616) (240) 115 (16,353) 266,830
TOTAL AT 03/31/17 214,501 52,429 (26,484) 675 5 3,381 244,507
Depreciation and amortization of property, plant and equipment
Opening balance Increase Decrease
Reclas-sifi cations
Change in scope
Foreign exchange gains and
lossesClosing balance
Buildings 1,038 354 - - - (104) 1,288
Leased buildings 1,458 658 - - - - 2,116
Fixtures and fi ttings 31,332 7,311 (1,215) - - (2,212) 35,216
Computer hardware and furniture 92,990 21,901 (4,836) (454) 93 (6,541) 103,154
Development kits 11,097 3,777 (3,244) - - (894) 10,736
Transport equipment 217 46 (57) - - (2) 204
TOTAL AT 03/31/18 138,132 34,047 (9,352) (454) 93 (9,752) 152,714
TOTAL AT 03/31/17 130,555 31,294 (26,388) 158 - 2,513 138,132
- 2018 Registration Document176
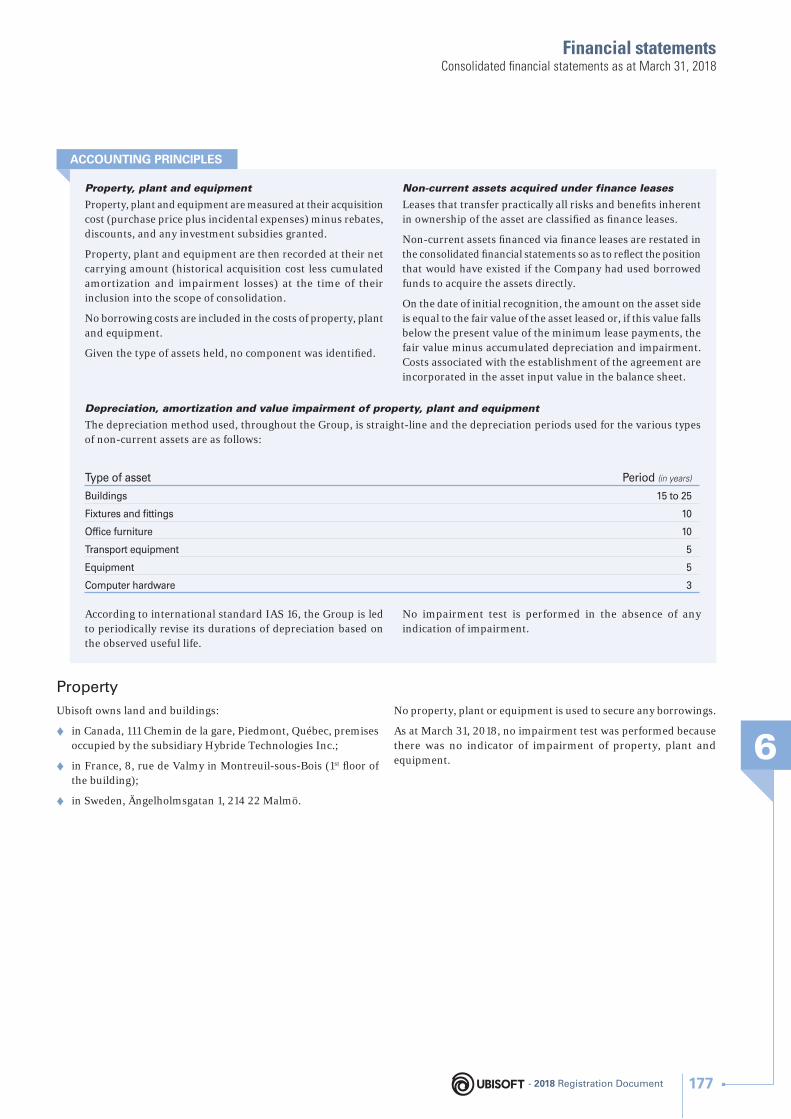
Financial statements
6
Consolidated fi nancial statements as at March 31, 2018
Property
Ubisoft owns land and buildings:
♦ in Canada, 111 Chemin de la gare, Piedmont, Québec, premises occupied by the subsidiary Hybride Technologies Inc.;
♦ in France, 8, rue de Valmy in Montreuil-sous-Bois (1st fl oor of the building);
♦ in Sweden, Ängelholmsgatan 1, 214 22 Malmö.
No property, plant or equipment is used to secure any borrowings.
As at March 31, 2018, no impairment test was performed because there was no indicator of impairment of property, plant and equipment.
Property, plant and equipment
Property, plant and equipment are measured at their acquisition cost (purchase price plus incidental expenses) minus rebates, discounts, and any investment subsidies granted.
Property, plant and equipment are then recorded at their net carrying amount (historical acquisition cost less cumulated amortization and impairment losses) at the time of their inclusion into the scope of consolidation.
No borrowing costs are included in the costs of property, plant and equipment.
Given the type of assets held, no component was identifi ed.
Non-current assets acquired under finance leases
Leases that transfer practically all risks and benefi ts inherent in ownership of the asset are classifi ed as fi nance leases.
Non-current assets fi nanced via fi nance leases are restated in the consolidated fi nancial statements so as to refl ect the position that would have existed if the Company had used borrowed funds to acquire the assets directly.
On the date of initial recognition, the amount on the asset side is equal to the fair value of the asset leased or, if this value falls below the present value of the minimum lease payments, the fair value minus accumulated depreciation and impairment. Costs associated with the establishment of the agreement are incorporated in the asset input value in the balance sheet.
Depreciation, amortization and value impairment of property, plant and equipment
The depreciation method used, throughout the Group, is straight-line and the depreciation periods used for the various types of non-current assets are as follows:
Type of asset Period (in years)
Buildings 15 to 25
Fixtures and fi ttings 10
Offi ce furniture 10
Transport equipment 5
Equipment 5
Computer hardware 3
According to international standard IAS 16, the Group is led to periodically revise its durations of depreciation based on the observed useful life.
No impairment test is performed in the absence of any indication of impairment.
ACCOUNTING PRINCIPLES
- 2018 Registration Document 177
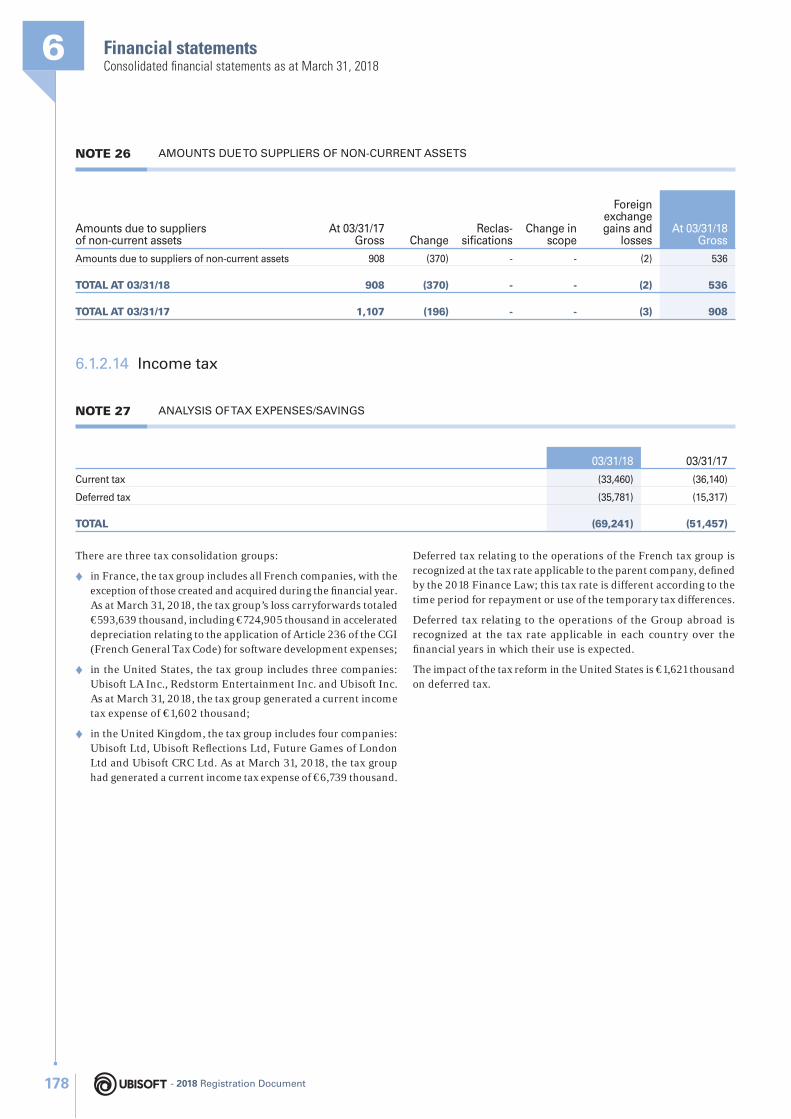
Financial statements6Consolidated fi nancial statements as at March 31, 2018
NOTE 26 AMOUNTS DUE TO SUPPLIERS OF NON-CURRENT ASSETS
Amounts due to suppliers of non-current assets
At 03/31/17Gross Change
Reclas-sifi cations
Change in scope
Foreign exchange gains and
lossesAt 03/31/18
Gross
Amounts due to suppliers of non-current assets 908 (370) - - (2) 536
TOTAL AT 03/31/18 908 (370) - - (2) 536
TOTAL AT 03/31/17 1,107 (196) - - (3) 908
6.1.2.14 Income tax
NOTE 27 ANALYSIS OF TAX EXPENSES/SAVINGS
03/31/18 03/31/17
Current tax (33,460) (36,140)
Deferred tax (35,781) (15,317)
TOTAL (69,241) (51,457)
There are three tax consolidation groups:
♦ in France, the tax group includes all French companies, with the exception of those created and acquired during the fi nancial year. As at March 31, 2018, the tax group’s loss carryforwards totaled €593,639 thousand, including €724,905 thousand in accelerated depreciation relating to the application of Article 236 of the CGI (French General Tax Code) for software development expenses;
♦ in the United States, the tax group includes three companies: Ubisoft LA Inc., Redstorm Entertainment Inc. and Ubisoft Inc. As at March 31, 2018, the tax group generated a current income tax expense of €1,602 thousand;
♦ in the United Kingdom, the tax group includes four companies: Ubisoft Ltd, Ubisoft Refl ections Ltd, Future Games of London Ltd and Ubisoft CRC Ltd. As at March 31, 2018, the tax group had generated a current income tax expense of €6,739 thousand.
Deferred tax relating to the operations of the French tax group is recognized at the tax rate applicable to the parent company, defi ned by the 2018 Finance Law; this tax rate is different according to the time period for repayment or use of the temporary tax differences.
Deferred tax relating to the operations of the Group abroad is recognized at the tax rate applicable in each country over the fi nancial years in which their use is expected.
The impact of the tax reform in the United States is €1,621 thousand on deferred tax.
- 2018 Registration Document178
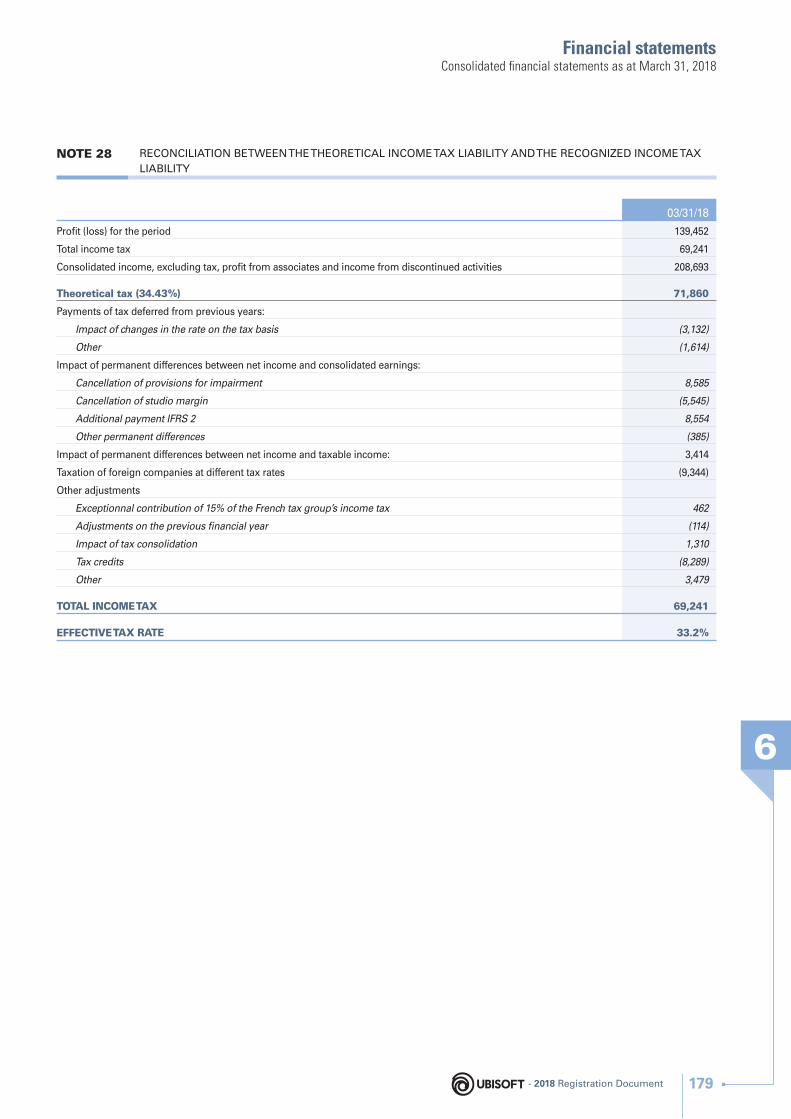
Financial statements
6
Consolidated fi nancial statements as at March 31, 2018
NOTE 28 RECONCILIATION BETWEEN THE THEORETICAL INCOME TAX LIABILITY AND THE RECOGNIZED INCOME TAX
LIABILITY
03/31/18
Profi t (loss) for the period 139,452
Total income tax 69,241
Consolidated income, excluding tax, profi t from associates and income from discontinued activities 208,693
Theoretical tax (34.43%) 71,860
Payments of tax deferred from previous years:
Impact of changes in the rate on the tax basis (3,132)
Other (1,614)
Impact of permanent differences between net income and consolidated earnings:
Cancellation of provisions for impairment 8,585
Cancellation of studio margin (5,545)
Additional payment IFRS 2 8,554
Other permanent differences (385)
Impact of permanent differences between net income and taxable income: 3,414
Taxation of foreign companies at different tax rates (9,344)
Other adjustments
Exceptionnal contribution of 15% of the French tax group’s income tax 462
Adjustments on the previous fi nancial year (114)
Impact of tax consolidation 1,310
Tax credits (8,289)
Other 3,479
TOTAL INCOME TAX 69,241
EFFECTIVE TAX RATE 33.2%
- 2018 Registration Document 179
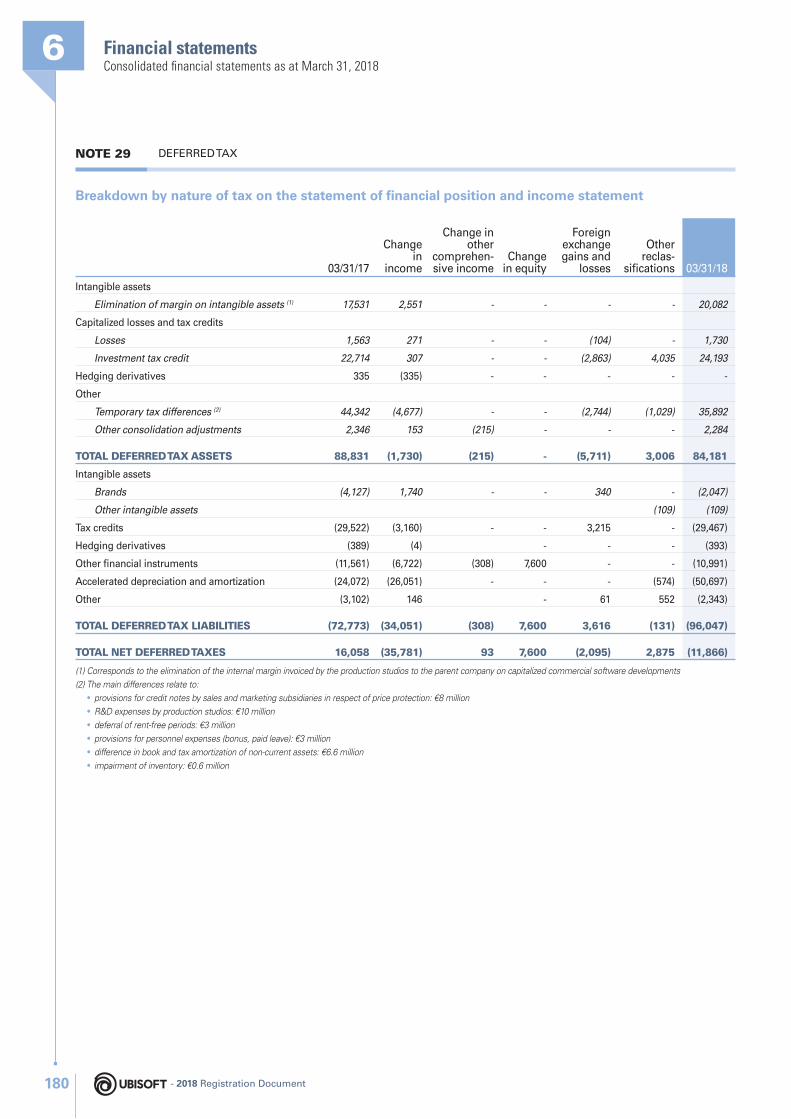
Financial statements6Consolidated fi nancial statements as at March 31, 2018
NOTE 29 DEFERRED TAX
Breakdown by nature of tax on the statement of fi nancial position and income statement
03/31/17
Change in
income
Change in other
comprehen-sive income
Change in equity
Foreign exchange gains and
losses
Other reclas-
sifi cations 03/31/18
Intangible assets
Elimination of margin on intangible assets (1) 17,531 2,551 - - - - 20,082
Capitalized losses and tax credits
Losses 1,563 271 - - (104) - 1,730
Investment tax credit 22,714 307 - - (2,863) 4,035 24,193
Hedging derivatives 335 (335) - - - - -
Other
Temporary tax differences (2) 44,342 (4,677) - - (2,744) (1,029) 35,892
Other consolidation adjustments 2,346 153 (215) - - - 2,284
TOTAL DEFERRED TAX ASSETS 88,831 (1,730) (215) - (5,711) 3,006 84,181
Intangible assets
Brands (4,127) 1,740 - - 340 - (2,047)
Other intangible assets (109) (109)
Tax credits (29,522) (3,160) - - 3,215 - (29,467)
Hedging derivatives (389) (4) - - - (393)
Other fi nancial instruments (11,561) (6,722) (308) 7,600 - - (10,991)
Accelerated depreciation and amortization (24,072) (26,051) - - - (574) (50,697)
Other (3,102) 146 - 61 552 (2,343)
TOTAL DEFERRED TAX LIABILITIES (72,773) (34,051) (308) 7,600 3,616 (131) (96,047)
TOTAL NET DEFERRED TAXES 16,058 (35,781) 93 7,600 (2,095) 2,875 (11,866)
(1) Corresponds to the elimination of the internal margin invoiced by the production studios to the parent company on capitalized commercial software developments
(2) The main differences relate to:
• provisions for credit notes by sales and marketing subsidiaries in respect of price protection: €8 million
• R&D expenses by production studios: €10 million
• deferral of rent-free periods: €3 million
• provisions for personnel expenses (bonus, paid leave): €3 million
• difference in book and tax amortization of non-current assets: €6.6 million
• impairment of inventory: €0.6 million
- 2018 Registration Document180
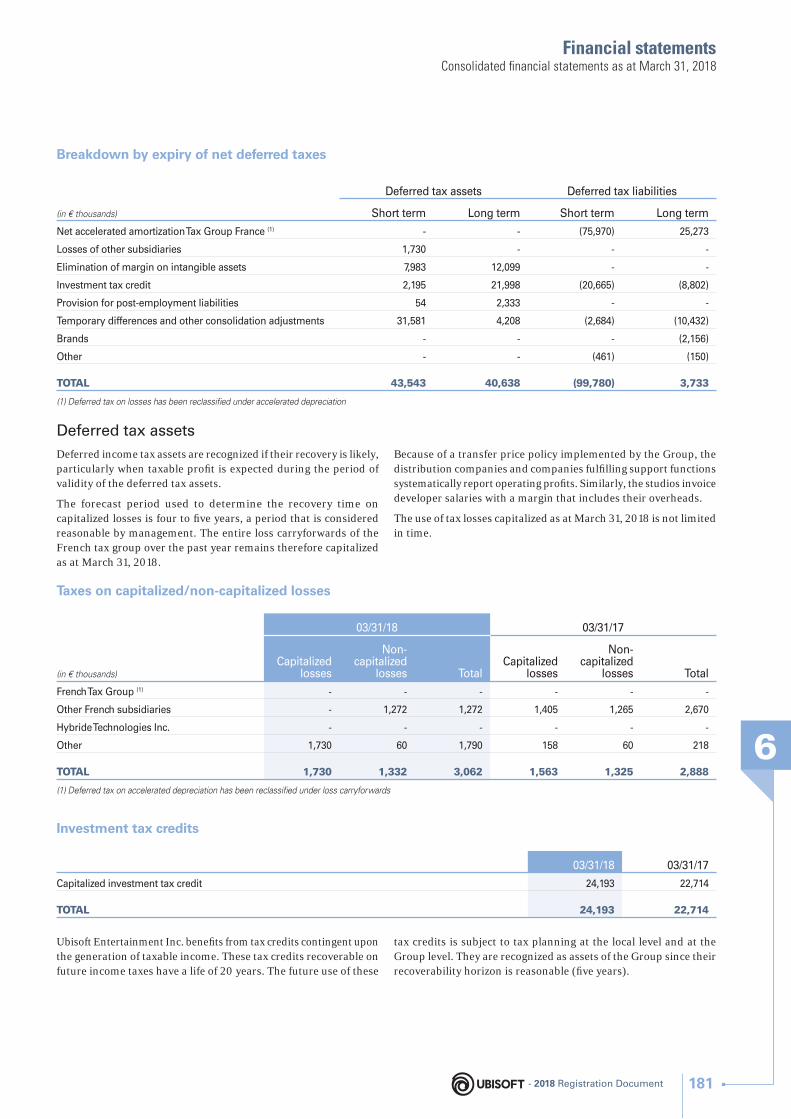
Financial statements
6
Consolidated fi nancial statements as at March 31, 2018
Breakdown by expiry of net deferred taxes
(in € thousands)
Deferred tax assets Deferred tax liabilities
Short term Long term Short term Long term
Net accelerated amortization Tax Group France (1) - - (75,970) 25,273
Losses of other subsidiaries 1,730 - - -
Elimination of margin on intangible assets 7,983 12,099 - -
Investment tax credit 2,195 21,998 (20,665) (8,802)
Provision for post-employment liabilities 54 2,333 - -
Temporary differences and other consolidation adjustments 31,581 4,208 (2,684) (10,432)
Brands - - - (2,156)
Other - - (461) (150)
TOTAL 43,543 40,638 (99,780) 3,733
(1) Deferred tax on losses has been reclassifi ed under accelerated depreciation
Deferred tax assets
Deferred income tax assets are recognized if their recovery is likely, particularly when taxable profi t is expected during the period of validity of the deferred tax assets.
The forecast period used to determine the recovery time on capitalized losses is four to fi ve years, a period that is considered reasonable by management. The entire loss carryforwards of the French tax group over the past year remains therefore capitalized as at March 31, 2018.
Because of a transfer price policy implemented by the Group, the distribution companies and companies fulfi lling support functions systematically report operating profi ts. Similarly, the studios invoice developer salaries with a margin that includes their overheads.
The use of tax losses capitalized as at March 31, 2018 is not limited in time.
Taxes on capitalized/non-capitalized losses
(in € thousands)
03/31/18 03/31/17
Capitalized losses
Non-capitalized
losses TotalCapitalized
losses
Non-capitalized
losses Total
French Tax Group (1) - - - - - -
Other French subsidiaries - 1,272 1,272 1,405 1,265 2,670
Hybride Technologies Inc. - - - - - -
Other 1,730 60 1,790 158 60 218
TOTAL 1,730 1,332 3,062 1,563 1,325 2,888
(1) Deferred tax on accelerated depreciation has been reclassifi ed under loss carryforwards
Investment tax credits
03/31/18 03/31/17
Capitalized investment tax credit 24,193 22,714
TOTAL 24,193 22,714
Ubisoft Entertainment Inc. benefi ts from tax credits contingent upon the generation of taxable income. These tax credits recoverable on future income taxes have a life of 20 years. The future use of these
tax credits is subject to tax planning at the local level and at the Group level. They are recognized as assets of the Group since their recoverability horizon is reasonable (fi ve years).
- 2018 Registration Document 181
Financial statements6Consolidated fi nancial statements as at March 31, 2018
The Group shall ensure that, at each annual accounting period, the deferred tax assets relating to tax losses and tax credits recoverable only by deduction from future tax, shall be recovered within a reasonable timeframe based on its estimates of future taxable income. The assumptions used for tax planning are consistent with those of the business plans made by management of the Group for the implementation of impairment testing of intangible assets with indefi nite lives.
Deferred tax liabilities
Grants and tax creditsUbisoft Entertainment Inc. benefi ts from multimedia credits and investment tax credits.
The multimedia credits are taxable during the year of their receipt or use, but are recognized on a fi nancial year basis. The Company recognizes a future tax liability for this item.
The investment tax credits are taxable during the year following their use, but are recognized on a fi nancial year basis. The Company recognizes a future tax liability for this item.
Accelerated depreciation (Article 236 of the French General Tax Code – CGI)In accordance with the provisions of Article 236 of the French General Tax Code (CGI), the Company may opt to either amortize expenses for the development of software or deduct them from the income for the fi nancial year in which they occur. At March 31, 2018, a provision for commercial software of €86.4 million and €0.5 million for external software was recognized. In accordance with IAS 12, the cancellation of the accelerated tax depreciation generates a deferred tax liability, which is then reclassifi ed under loss carryforwards.
Income tax (income or expense) includes the current tax expense (or income) and deferred tax expense (or income). Tax is recognized in profi t or loss, unless it relates to items that are recognized directly in other comprehensive income, in which case it is recognized in other comprehensive income.
Current tax
Current tax is the estimated amount of tax owed on taxable income for an accounting period. It is determined using the tax rates applicable at the closing date.
Deferred tax
Deferred income tax is measured using the statement of fi nancial position liability method for all temporary differences between the carrying amount of the assets and liabilities and their tax value.
The following situations do not lead to recognition of deferred tax:
♦ the recognition of an asset or liability in a transaction that is not a business combination and which affects neither accounting profi t nor taxable profi t;
♦ temporary differences linked to subsidiary holdings insofar as these are unlikely to be reversed in the foreseeable future.
Measurement of deferred tax assets and liabilities depends on the way in which the Group expects to recover or settle the carrying amount of the assets and liabilities using the tax rates applicable at the statement of fi nancial position date.
A deferred tax asset is only recognized where it is likely that the Group will have future taxable income against which the asset may be utilized. Otherwise, deferred tax assets are reduced.
The impact of possible changes in tax rates on previously recorded deferred tax is recognized in profi t or loss except where it relates to an item recognized in other comprehensive income.
Deferred tax is shown in the statement of fi nancial position separately from current tax assets and liabilities and is classifi ed as a non-current item.
Deferred tax relating to tax loss carry forwards is capitalized when it is likely that it will be utilized within a reasonable timeframe, assessed on the basis of tax forecasts.
ACCOUNTING PRINCIPLES
- 2018 Registration Document182
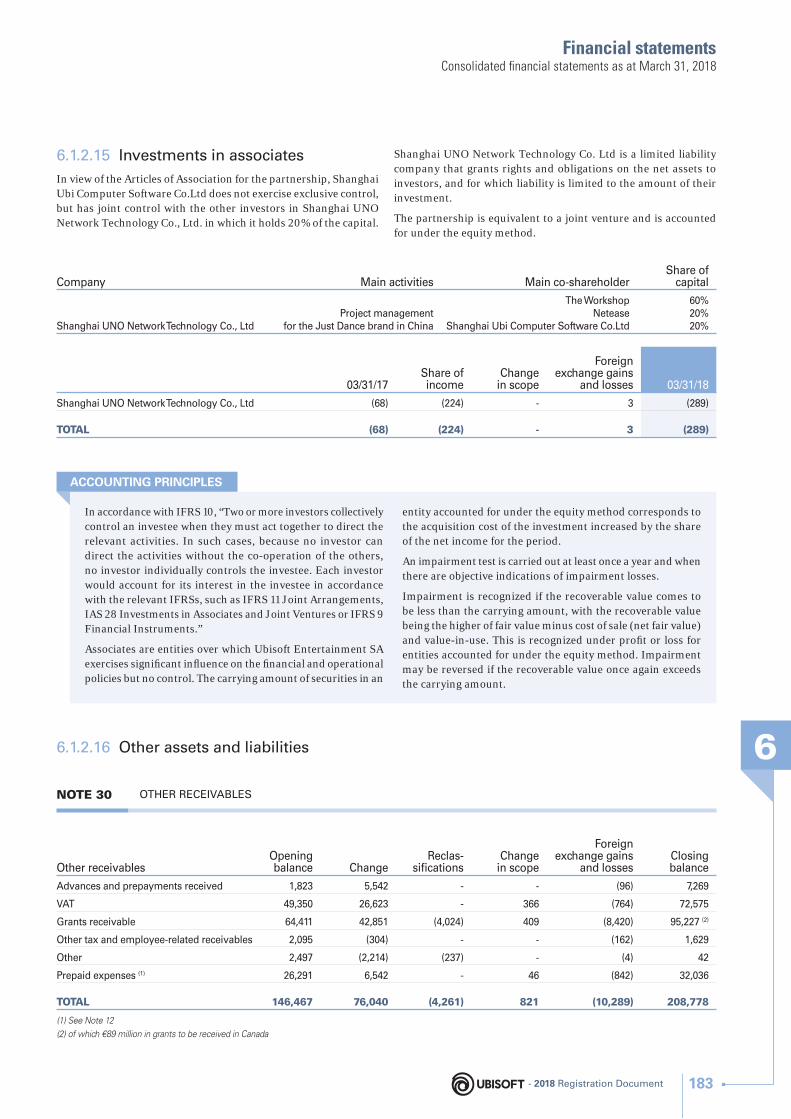
Financial statements
6
Consolidated fi nancial statements as at March 31, 2018
6.1.2.15 Investments in associates
In view of the Articles of Association for the partnership, Shanghai Ubi Computer Software Co.Ltd does not exercise exclusive control, but has joint control with the other investors in Shanghai UNO Network Technology Co., Ltd. in which it holds 20% of the capital.
Shanghai UNO Network Technology Co. Ltd is a limited liability company that grants rights and obligations on the net assets to investors, and for which liability is limited to the amount of their investment.
The partnership is equivalent to a joint venture and is accounted for under the equity method.
Company Main activities Main co-shareholderShare of
capital
Shanghai UNO Network Technology Co., LtdProject management
for the Just Dance brand in China
The WorkshopNetease
Shanghai Ubi Computer Software Co.Ltd
60%20%20%
03/31/17Share of income
Change in scope
Foreign exchange gains
and losses 03/31/18
Shanghai UNO Network Technology Co., Ltd (68) (224) - 3 (289)
TOTAL (68) (224) - 3 (289)
In accordance with IFRS 10, “Two or more investors collectively control an investee when they must act together to direct the relevant activities. In such cases, because no investor can direct the activities without the co-operation of the others, no investor individually controls the investee. Each investor would account for its interest in the investee in accordance with the relevant IFRSs, such as IFRS 11 Joint Arrangements, IAS 28 Investments in Associates and Joint Ventures or IFRS 9 Financial Instruments.”
Associates are entities over which Ubisoft Entertainment SA exercises signifi cant infl uence on the fi nancial and operational policies but no control. The carrying amount of securities in an
entity accounted for under the equity method corresponds to the acquisition cost of the investment increased by the share of the net income for the period.
An impairment test is carried out at least once a year and when there are objective indications of impairment losses.
Impairment is recognized if the recoverable value comes to be less than the carrying amount, with the recoverable value being the higher of fair value minus cost of sale (net fair value) and value-in-use. This is recognized under profi t or loss for entities accounted for under the equity method. Impairment may be reversed if the recoverable value once again exceeds the carrying amount.
ACCOUNTING PRINCIPLES
6.1.2.16 Other assets and liabilities
NOTE 30 OTHER RECEIVABLES
Other receivablesOpening balance Change
Reclas-sifi cations
Change in scope
Foreign exchange gains
and lossesClosing balance
Advances and prepayments received 1,823 5,542 - - (96) 7,269
VAT 49,350 26,623 - 366 (764) 72,575
Grants receivable 64,411 42,851 (4,024) 409 (8,420) 95,227 (2)
Other tax and employee-related receivables 2,095 (304) - - (162) 1,629
Other 2,497 (2,214) (237) - (4) 42
Prepaid expenses (1) 26,291 6,542 - 46 (842) 32,036
TOTAL 146,467 76,040 (4,261) 821 (10,289) 208,778
(1) See Note 12
(2) of which €89 million in grants to be received in Canada
- 2018 Registration Document 183
Financial statements6Consolidated fi nancial statements as at March 31, 2018
Ubisoft Entertainment Inc. did not dispose of receivables in respect of the CTMM grant in the second half of the fi nancial year ended March 31, 2018 (see Note 31).
All other receivables are due in less than one year.
None were subject to impairment.
Other receivables (excluding grants)
Other receivables linked to operating activity are recorded at amortized cost – in most cases the same as nominal value – minus any loss of value recorded in a special impairment account. As receivables are due in under a year, they are not discounted.
Grants receivable
In some countries, video game production operations qualify for public grants.
These grants are presented in the fi nancial statements of the studios as a reduction in production costs for commercial software developments or the R&D costs to which they are attached.
Any claims on the public body that awarded the grant are classifi ed as “loans and receivables” as per IFRS 9.
ACCOUNTING PRINCIPLES
NOTE 31 TRANSFERS OF FINANCIAL ASSETS
Transferred fi nancial assets not derecognized in their entirety
In March 2011, the production subsidiary Ubisoft Entertainment Inc. concluded a factoring agreement for claims relating to the unvested rights of Investissement Québec under the so-called “CTMM” grant (income tax credit for the production of multi-media titles).
The risks associated with these receivables are transferred to the counterparty of the factoring agreement; the receivables are derecognized from the statement of fi nancial position of the Group.
Following an amendment made in March 2014, Ubisoft Entertainment Inc. receives 85% of the sale price of the receivables transferred at the transfer date. The remaining 15% is collected at the time of actual payment of the grant by Investissement Québec, the counterparty of the factoring agreement. As the risks and benefi ts associated with 15% of transferred receivables were retained by the Group, a portion of 15% of outstanding claims relating to unvested rights of the organization Investissement Québec under the so-called “CTMM” grant remains on the Group’s balance sheet.
This agreement has not been used on the fi nancial year.
Financial assets derecognized in their entirety
In December 2013, the British and German sales and marketing subsidiaries concluded a factoring agreement on trade receivables from subsidiaries domiciled in their respective countries.
The risks associated with these receivables are transferred to the counterparty of the factoring agreement; the receivables are fully derecognized from the statement of fi nancial position of the Group.
However, these two subsidiaries operate a collection service on behalf of the counterparty, a service that is constitutive of the continuing involvement of the Group in trade receivables transferred under these factoring contracts.
There are no commitments related to these factoring agreements at the fi nancial year-end.
- 2018 Registration Document184
Financial statements
6
Consolidated fi nancial statements as at March 31, 2018
NOTE 32 OTHER LIABILITIES
Other payables are recorded at amortized cost.
Cash fl ows linked to short-term recoverable amounts are not discounted.
ACCOUNTING PRINCIPLES
Other liabilities
Opening balance Change
Change in scope
Foreign exchange gains
and lossesClosing balance
Advances and prepayments received 113 (50) - (11) 52
Employee-related liabilities 113,417 57,030 608 (8,593) 162,462
Other tax liabilities 43,144 13,898 226 (762) 56,506
Other liabilities 22,451 40,930 - (1,358) 62,023
Deferred income (1) 40,691 3,453 (38) (3,215) 40,891
TOTAL 219,817 115,260 796 (13,939) 321,934
(1) See Note 6
Other liabilities mainly include:
♦ €1.2 million in earnouts provisioned for the acquisition of Related Designs Software GmbH with an expiry date over one year;
♦ €39.5 million in earnouts provisioned for the acquisition of Ketchapp SAS with an expiry date over one year;
♦ €7.8 million of liabilities corresponding to the retention of part of the acquisition price of 1492 Studio SAS;
♦ €2.6 million of liabilities corresponding to the retention of part of the acquisition price of Blue Mammoth Game Inc;
♦ incentive rental income (payments received by the tenant from the lessor or periods of free rent to perform leasehold improvements) and rental debt at Ubisoft Entertainment Inc. for €9.4 million.
Provisions
ProvisionsOpening balance Provisions
Reversals (Provision
used)
Reversals (Provision
unused)
Foreign exchange gains
and lossesClosing balance
Provision for other fi nancial risks 2,704 489 (812) - (259) 2,122
Other provisions for risks 1,542 180 (770) - - (952)
TOTAL AT 03/31/18 4,246 669 (1,582) - (259) 3,074
TOTAL AT 03/31/17 8,888 476 (199) (5,119) (200) 4,246
Other provisions for risks relate to commercial disputes in progress.
A provision is recorded when:
♦ the Company has a current obligation (legal or implicit) resulting from a past event;
♦ it is likely that an outfl ow of resources (without counterparty) representing economic benefi ts will be required to settle the obligation;
♦ the amount of the obligation can be measured reliably.
If these conditions are not met, no provision is recorded.
ACCOUNTING PRINCIPLES
- 2018 Registration Document 185
Financial statements6Consolidated fi nancial statements as at March 31, 2018
Contingent liabilities
Tax audits underway for which proposed adjustments have been received:
♦ Ubisoft Entertainment India Pvt. Ltd (India) for the period from April 1, 2010 to March 31, 2012. The Company contests all the proposed adjustments relating to the transfer pricing policy and consequently no provision has been recognized in the fi nancial statements;
♦ Ubisoft Entertainment Inc.: the audit began in June 2017 and relates to the transfer price policy for the FY2014 to FY2016 fi nancial years. Discussions are underway between the Canadian
and French administrations in order to avaoid any double taxation problems within the Ubisoft Group. To date the Group considers that the risk of fi nal adjustment is very low and, therefore, has not recognized a provision in the fi nancial statements.
Tax audits underway for which no proposed adjustments have been received:
♦ Ubisoft GmbH and Blue Byte GmbH: the audit began in March 2017 and relates to the corporation tax and the transfer price policy for the fi nancial years FY2012 to FY2015;
♦ Ubisoft Entertainment Sweden AB: a tax audit began in April 2018 in respect of FY2017 and 2018.
NOTE 33 RELATED PARTY TRANSACTIONS
The services provided by the parent company to related parties are conducted according to normal market conditions:
♦ production subsidiaries billing the parent company for development costs based on the progress of their projects;
♦ the parent company invoicing sales and marketing subsidiaries for a contribution to development costs;
♦ the implementation of cash agreements allowing for centralized management at parent company level of the bank accounts of the majority of the Group companies.
The transactions invoiced by related parties are conducted according to normal competition conditions.
No transactions exist with the corporate offi cers, with the exception of their compensation for their duties as Chief Executive Offi cer and Executive Vice Presidents (see Note 16 “Compensation of the corporate offi cers”).
Ubisoft Entertainment SA has not bought own shares from related parties.
There are no other signifi cant transactions with related parties.
6.1.2.17 Financial assets, fi nancial liabilities and net fi nancial income
NOTE 34 GAINS AND LOSSES RELATING TO FINANCIAL ASSETS AND LIABILITIES
03/31/18 03/31/17
Income from cash 1,823 1,265
Interest on borrowings (17,732) (12,081)
Net borrowing cost (15,909) (10,816)
Foreign exchange gains 52,673 63,325
Foreign exchange losses (58,420) (65,613)
Result from foreign-exchange operations (5,747) (2,288)
Other fi nancial income 1,101 2,348
Fair value of the share swap agreement (1) 7,211 -
Financial income 8,312 2,348
Other fi nancial expenses (56) (5,449)
Financial expenses (56) (5,449)
TOTAL (13,400) (16,205)
(1) Change in the fair value of the share swap agreement in respect of Ubisoft shares
- 2018 Registration Document186
Financial statements
6
Consolidated fi nancial statements as at March 31, 2018
NOTE 35 NET FINANCIAL DEBT
Financing costs and other financial income and expenses
The cost of net fi nancial debt includes income and expenses linked to cash and cash equivalents, interest expenses on borrowings which include the sale of investment securities, creditor interest and the cost of ineffective currency hedging.
Other fi nancial income and expenses include the sale of non-consolidated securities, capital gains or losses on disposals and impairment of fi nancial assets (other than trade receivables), income and expenses linked to the discounting of assets and liabilities, and foreign exchange gains and losses on unhedged items.
The impact on profi t and loss of measuring fi nancial instruments used:
♦ in the management of foreign exchange risks is recognized in operating income;
♦ in respect of the share swap agreement is recognized in net fi nancial income.
The changes related to the estimates of future results included in the potential return for the acquisition price, after the business combination’s evaluation period, are recognized in other fi nancial income and expenses.
ACCOUNTING PRINCIPLES
Net fi nancial debt is part of the indicators used by the group. This aggregate, which is not defi ned in the IFRS repository, may not be comparable to the indicators referred to by other companies. This is an additional information that should not be considered as a substitute for analysis of all of the assets and liabilities of the group.
As at March 31, 2018, the fi nancial debt represents €1,295 million and due to cash and values of available short term investments, net fi nancial debt amounts to €(548.1) million.
03/31/18 03/31/17
CurrentNon-
Current Total CurrentNon-
Current Total
Bank borrowings 8,164 54,358 62,522 3,746 211,014 214,760
Bond issuance 62,370 867,186 929,557 1,324 420,695 422,019
Euro PP-type bonds 61,293 - 61,293 1,324 59,868 61,192
OCEANE - 369,210 369,210 - 360,827 360,827
Bonds 1,077 497,976 499,053 - - -
Borrowings resulting from the restatement of fi nance-leases 1,268 12,085 13,353 976 8,996 9,972
Commercial papers 126,000 - 126,000 66,000 - 66,000
Bank overdrafts and short-term loans 163,118 - 163,118 219,900 - 219,900
Accrued interest 466 - 466 485 - 485
Foreign exchange derivatives (1) 151 - 151 972 - 972
Total borrowings (A) 361,538 933,629 1,295,167 293,403 640,705 934,109
Cash and bank balances 736,052 - 736,052 840,940 - 840,940
Investments of less than 3 months (2) 10,887 - 10,887 11,759 - 11,759
Total positive cash and cash equivalents (B) 746,939 - 746,939 852,699 - 852,699
TOTAL NET DEBT (A-B) 548,228 81,410
TOTAL NET DEBT (EXCLUDING DERIVATIVES) 548,077 80,438
Fixed-rate debt 1,114,621 549,478
Variable-rate debt 180,545 384,631
(1) Measured at fair value (level 2, IFRS 7 hierarchy)
(2) UCITS measured at fair value (level 1, IFRS 7 hierarchy)
- 2018 Registration Document 187
Financial statements6Consolidated fi nancial statements as at March 31, 2018
♦ Main characteristics of the bond issuance: OCEANE
On September 19, 2016, the Board of Directors, acting on the authorization of the Extraordinary General Meeting of September 23, 2015, approved the issuance of bonds with a conversion and/or exchange option for new or existing Company shares for €399,999,959.80.
Number and nominal amount: 7,307,270 bonds with a par value of €54.74
Each bond carries entitlement to the conversion into one new or existing share
Issue price: €54.74
Date of dividend entitlement and settlement: September 27, 2021
Bond duration: 5 years
Interest: zero coupon
♦ Main characteristics of the bond issued in January 2018:
The Board of Directors’ meeting of January 24, 2018, acting on the authorization of the Extraordinary General Meeting of September 22, 2017, approved the issuance of bonds amounting to €500,000,000. These bonds were admitted to trading on Euronext Paris.
Number and nominal amount: 5,000 bonds with a par value of €100,000
Date of dividend entitlement and settlement: January 30, 2023
Bond duration: 5 years
Interest: 1.289%
Change in borrowings
Current and non-current fi nancial liabilitiesOpening balance Increase Decrease
Change in scope
Foreign exchange gains
and lossesClosing balance
Bank borrowings 214,760 1,444 (153,677) - (5) 62,522
Bond issuance 422,019 507,537 - - - 929,557
Borrowings resulting from the restatement of fi nance-leases 9,972 5,054 (1,672) - (1) 13,353
Commercial papers 66,000 394,000 (334,000) - - 126,000
Bank overdrafts and short-term loans 219,901 - (56,749) 34 (67) 163,118
Accrued interest 485 - (18) - - 466
Foreign exchange derivatives 972 - (822) - - 151
TOTAL AT 03/31/18 934,109 908,035 (546,938) 34 (73) 1,295,167
TOTAL AT 03/31/17 505,601 645,610 (217,143) - 42 934,109
Financial liabilities include:
♦ bank borrowings, equity and bonds;
♦ commercial paper;
♦ obligations relating to fi nance lease agreements;
♦ bank overdrafts and short-term loans;
♦ derivatives with a negative market value;
♦ trade payables.Financial liabilities are presented as “non current” except those with a maturity of less than 12 months from the closing date, which are classifi ed as “current liabilities”.
Bank overdrafts are included in cash and cash equivalents as they are an integral part of the Company’s cash management. They are presented in liabilities, but are also offset against cash in the cash fl ow statement.
Recognition and measurement of financial liabilities
Borrowings and other financial liabilities
Bank borrowings, bond issues without an equity component and other fi nancial liabilities are measured at amortized cost calculated using the effective interest rate. Financial interests accrued on borrowings are included in “Current fi nancial liabilities” in the balance sheet.
Bond issuance with an equity component
In accordance with IAS 32 – “Financial Instruments: Presentation”, if a fi nancial instrument includes different components which relate for certain characteristics to liabilities and for other characteristics to equity, these different component parts must be accounted for and presented separately according to their type.
...
ACCOUNTING PRINCIPLES
- 2018 Registration Document188
Financial statements
6
Consolidated fi nancial statements as at March 31, 2018
...The component presented in fi nancial debt is assessed, at the date of issue, on the basis of the future contractual cash fl ows discounted at the market rate (taking into account the issuer’s credit risk) for a debt with similar characteristics but not including an option for conversion or repayment in shares.
The value of the conversion option is calculated by the difference between the bond’s issue price and the fair value of the liability component. This amount is recognized in “Consolidated reserves” in equity (see section 5.1.1 Change in equity).
At each closing date, an interest expense is calculated according to the market interest rate for a similar bond, but without a conversion option, with, in return, an increase in the fi nancial
liability representing the bond. Thus, at the maturity date, the carrying amount of the bond will be equal to its repayment value.
Derivatives
The Group holds fi nancial derivatives:
♦ to manage its exposure to foreign exchange risks. To this end, Ubisoft Entertainment SA hedges these risks with forward sale contracts and currency options;
♦ as part of the treasury share buyback from Vivendi, Ubisoft Entertainment SA took out a swap contract.
Derivatives are recognized at fair value and those with a negative market value are presented in fi nancial liabilities.
NOTE 36 FINANCIAL ASSETS
Non-current fi nancial assets
At 03/31/18Cumulative impairment
At 03/31/18 At 03/31/17
Gross Net Net
Equity investments in non-consolidated companies - - - 1
Deposits and sureties 105,940 - 105,940 5,362
Other long-term fi nancial assets 832 832 -
Other non-current receivables 123 - 123 115
TOTAL 106,895 - 106,895 5,478
Non-current fi nancial assetsOpening balance Increase Decrease
Reclas-sifi cations
Change in scope
Foreign exchange gains and
lossesClosing balance
Equity investments in non-consolidated companies 1 - - - (1) - -
Deposits and sureties (1) 5,362 101,983 (1,153) - 10 (263) 105,940
Other long-term fi nancial assets - 860 - - 20 (48) 832
Other non-current receivables (2) 115 28,650 (28,637) - - (5) 123
TOTAL AT 03/31/18 5,478 131,493 (29,790) - (9) (316) 106,895
TOTAL AT 03/31/17 4,339 44,373 (43,322) - 6 82 5,478
(1) The increase refl ects the payment of €100 million as guarantee of swap agreement on Ubisoft shares
(2) The change refl ects purchases and sales of own shares held under the liquidity agreement
- 2018 Registration Document 189
Financial statements6Consolidated fi nancial statements as at March 31, 2018
Current fi nancial assets
03/31/18 03/31/17
Gross Impairment Net Net
Foreign exchange derivatives (1) 1,109 - 1,109 1,131
Ubisoft share derivatives (1) 7,211 7,211 -
TOTAL 8,320 - 8,320 1,131
(1) Derivatives whose market value at the year-end is positive are reported at fair value (level 2, IFRS 7 hierarchy, see analysis in Note 44)
The fi nancial assets below are presented in more detail in specifi c notes:
♦ trade receivables in Note 5;
♦ inventory in Note 10.
Financial assets include:
♦ short-term and long-term loans and advances;
♦ derivatives with a positive market value;
♦ investment securities;
♦ positive cash and cash equivalents;
♦ deposits and sureties;
♦ trade receivables.Financial assets are presented as “non current”, except those with a maturity of less than 12 months from the year-end date. These are presented as “current assets” or “cash equivalents”.
Recognition and measurement of financial assets
In accordance with IFRS 9 – “Financial Instruments: Classifi cation”, fi nancial assets held by the Group are analyzed according to the economic model and their objectives:
♦ assets measured at amortized cost: fi nancial assets held with a view to receiving contractual cash fl ows;
♦ assets measured at fair value: fi nancial assets held for resale and with a view to receiving contractual cash fl ows.
Classifi cation depends on the nature and objective of each fi nancial asset, and is determined when fi rst recognized.
The breakdown of fi nancial assets by category is as follows:
Assets measured at amortized cost
They include security deposits and trade receivables.
These assets are recognized at amortized cost using the effective interest rate method.
Impairment is recognized as of initial recognition in order to materialize the credit losses expected at one year, then a review is carried out at the end of each reporting period to analyze whether the risk has changed signifi cantly and to set aside a provision for the expected credit losses over the residual life of the fi nancial instrument, if any.
Assets measured at fair value
♦ Cash and cash equivalents
Cash and cash equivalents include cash on hand and deposit accounts with maturity generally under three months which can be easily liquidated or sold on very short notice, can be converted into cash and present negligible risks of change in value. Short-term investments are measured at net asset value at each statement of fi nancial position date. Changes in this market value are recognized in fi nancial profi t or loss.
♦ Derivatives
The Group holds fi nancial derivatives:
♦ with a view to managing its exposure to foreign exchange risk. To this end, Ubisoft Entertainment SA hedges these risks with forward sale contracts and currency options;
♦ as part of the treasury share buyback from Vivendi, Ubisoft Entertainment SA took out a share swap contract.
Derivatives are recognized at fair value and those with a positive market value are presented in fi nancial assets. Changes in fair value are recognized in net fi nancial income.
ACCOUNTING PRINCIPLES
- 2018 Registration Document190
Financial statements
6
Consolidated fi nancial statements as at March 31, 2018
NOTE 37 CASH FLOW HEDGING AND OTHER DERIVATIVES
Equity impacts of the hedge accounting
The hedging reserve includes the effective and ineffective part of the cumulative net change in the fair value of cash fl ow hedge instruments attributable to hedged transactions that have not yet
materialized. For hedged transactions that have materialized, the amounts are reclassifi ed in income.
The portion reclassifi ed under profi t or loss is recognized under current operating income for the effective portion and net fi nancial income for the effective portion.
AT 03/31/17 132
Gains/losses on cash fl ow hedging (hedging reserve)
Foreign exchange hedges 897
Effective portion 534
Ineffective portion 363
Deferred tax (309)
Reclassifi cation under profi t or loss
Foreign exchange hedges (201)
Effective portion (201)
Ineffective portion -
Deferred tax 69
AT 03/31/18 588
Recognition and measurement of financial derivatives
The Group holds fi nancial derivatives exclusively to manage its exposure to foreign exchange risks. To this end, Ubisoft Entertainment SA hedges these risks with forward sale contracts and currency options.
Derivatives are initially recorded at fair value; associated transaction costs are recognized in profi t or loss when incurred. After initial recognition, derivatives are measured at fair value while resulting changes are recorded using the principles outlined below.
♦ Cash fl ow hedging
The Group applies hedge accounting (Cash Flow Hedge model) for transactions in US dollars, Canadian dollars and Pound sterling. Management believes this method better refl ects its hedging policy in the fi nancial statements.
Hedge accounting applies if:
♦ the hedging relationship is clearly defi ned and documented on the date it is established;
♦ the effectiveness of the hedging relationship is proven from the outset and for as long as it lasts.
Application of cash fl ow hedge accounting under IFRS 9 has the following consequences:
♦ the effective and ineffective portion of the change in fair value of the hedging instrument is recognized in other comprehensive income until the hedged item is recognized;
♦ when reclassifi ed under profi t or loss, the ineffective portion of the change in fair value is recognized in fi nancial income.
When the hedging instrument no longer meets the criteria for hedge accounting, reaches maturity, is sold, canceled or exercised, hedge accounting is no longer applied. The profi t or loss accumulated is held in others items of comprehensive income until the completion of the planned transaction. When the hedged item is a non-fi nancial asset, the profi t or loss accumulated is removed from other comprehensive income and included in the initial cost. In other cases, related profi ts and losses that have been recognized directly in other comprehensive income are reclassifi ed under profi t or loss for the period in which the hedged item impacts the result.
The fair value of assets, liabilities and derivatives is determined on the basis of market prices at the closing date.
Hierarchy and levels of fair value
In accordance with IFRS 7 (revised), fi nancial assets and liabilities held by the Group and measured at fair value have been classifi ed according to the fair value levels specifi ed by the standard:
♦ Level 1: the fair value corresponds to the market value of instruments listed on an active market;
♦ Level 2: the fair value is determined on the basis of observable inputs.
Note 44 specifi es the fair value level for each category of assets and liabilities measured at fair value.
The Group did not carry out any transfers between levels 1 and 2 during the fi nancial year.
ACCOUNTING PRINCIPLES
- 2018 Registration Document 191
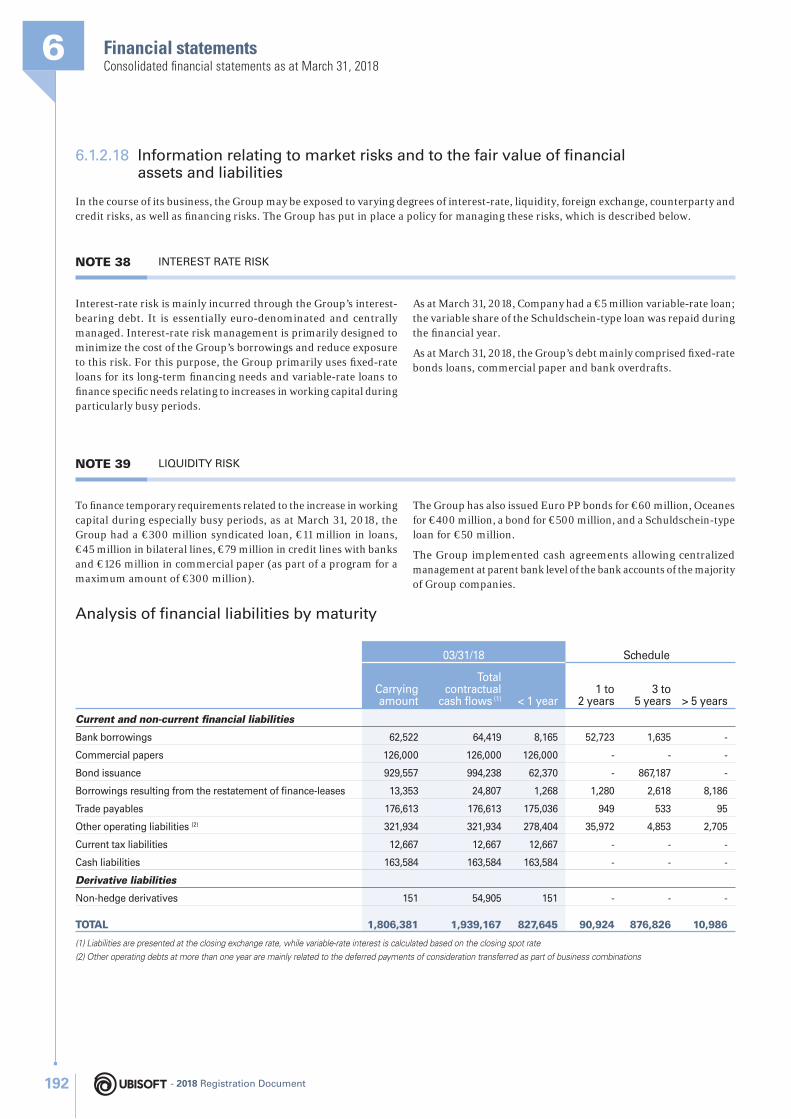
Financial statements6Consolidated fi nancial statements as at March 31, 2018
6.1.2.18 Information relating to market risks and to the fair value of fi nancial assets and liabilities
In the course of its business, the Group may be exposed to varying degrees of interest-rate, liquidity, foreign exchange, counterparty and credit risks, as well as fi nancing risks. The Group has put in place a policy for managing these risks, which is described below.
NOTE 38 INTEREST RATE RISK
Interest-rate risk is mainly incurred through the Group’s interest-bearing debt. It is essentially euro-denominated and centrally managed. Interest-rate risk management is primarily designed to minimize the cost of the Group’s borrowings and reduce exposure to this risk. For this purpose, the Group primarily uses fi xed-rate loans for its long-term fi nancing needs and variable-rate loans to fi nance specifi c needs relating to increases in working capital during particularly busy periods.
As at March 31, 2018, Company had a €5 million variable-rate loan; the variable share of the Schuldschein-type loan was repaid during the fi nancial year.
As at March 31, 2018, the Group’s debt mainly comprised fi xed-rate bonds loans, commercial paper and bank overdrafts.
NOTE 39 LIQUIDITY RISK
To fi nance temporary requirements related to the increase in working capital during especially busy periods, as at March 31, 2018, the Group had a €300 million syndicated loan, €11 million in loans, €45 million in bilateral lines, €79 million in credit lines with banks and €126 million in commercial paper (as part of a program for a maximum amount of €300 million).
The Group has also issued Euro PP bonds for €60 million, Oceanes for €400 million, a bond for €500 million, and a Schuldschein-type loan for €50 million.
The Group implemented cash agreements allowing centralized management at parent bank level of the bank accounts of the majority of Group companies.
Analysis of fi nancial liabilities by maturity
03/31/18 Schedule
Carrying amount
Total contractual
cash fl ows (1) < 1 year1 to
2 years3 to
5 years > 5 years
Current and non-current fi nancial liabilities
Bank borrowings 62,522 64,419 8,165 52,723 1,635 -
Commercial papers 126,000 126,000 126,000 - - -
Bond issuance 929,557 994,238 62,370 - 867,187 -
Borrowings resulting from the restatement of fi nance-leases 13,353 24,807 1,268 1,280 2,618 8,186
Trade payables 176,613 176,613 175,036 949 533 95
Other operating liabilities (2) 321,934 321,934 278,404 35,972 4,853 2,705
Current tax liabilities 12,667 12,667 12,667 - - -
Cash liabilities 163,584 163,584 163,584 - - -
Derivative liabilities
Non-hedge derivatives 151 54,905 151 - - -
TOTAL 1,806,381 1,939,167 827,645 90,924 876,826 10,986
(1) Liabilities are presented at the closing exchange rate, while variable-rate interest is calculated based on the closing spot rate
(2) Other operating debts at more than one year are mainly related to the deferred payments of consideration transferred as part of business combinations
- 2018 Registration Document192
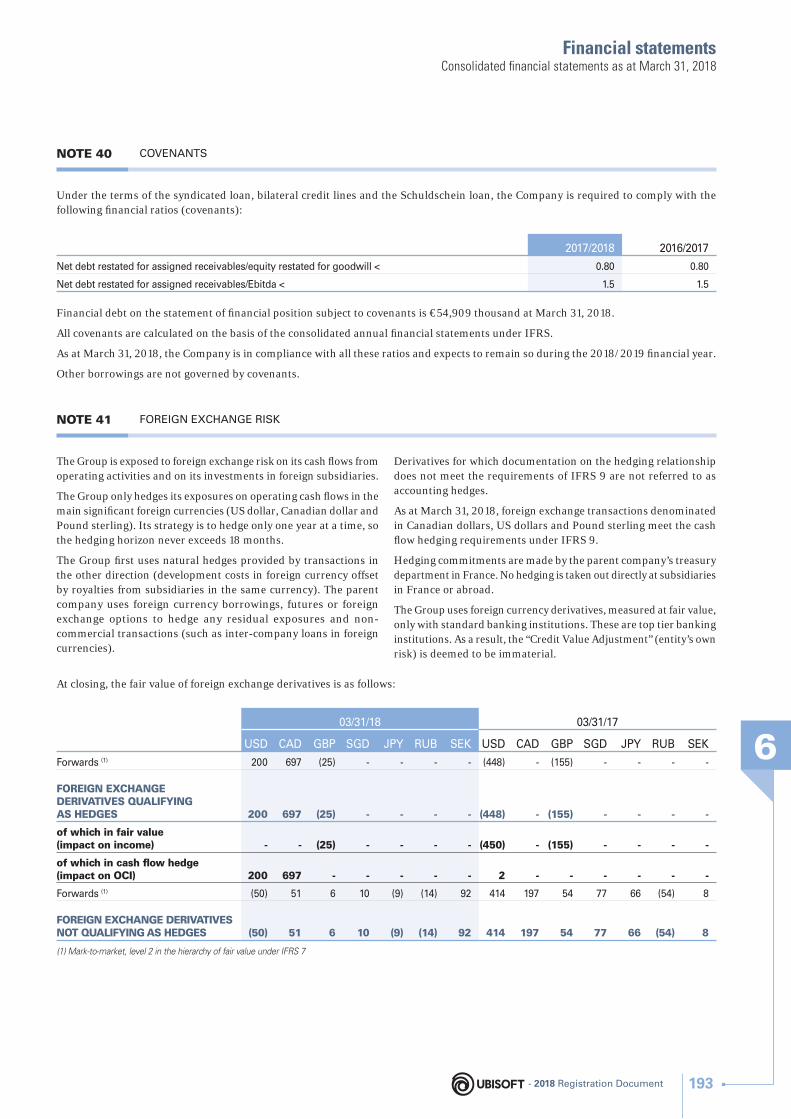
Financial statements
6
Consolidated fi nancial statements as at March 31, 2018
NOTE 40 COVENANTS
Under the terms of the syndicated loan, bilateral credit lines and the Schuldschein loan, the Company is required to comply with the following fi nancial ratios (covenants):
2017/2018 2016/2017
Net debt restated for assigned receivables/equity restated for goodwill < 0.80 0.80
Net debt restated for assigned receivables/Ebitda < 1.5 1.5
Financial debt on the statement of fi nancial position subject to covenants is €54,909 thousand at March 31, 2018.
All covenants are calculated on the basis of the consolidated annual fi nancial statements under IFRS.
As at March 31, 2018, the Company is in compliance with all these ratios and expects to remain so during the 2018/2019 fi nancial year.
Other borrowings are not governed by covenants.
NOTE 41 FOREIGN EXCHANGE RISK
The Group is exposed to foreign exchange risk on its cash fl ows from operating activities and on its investments in foreign subsidiaries.
The Group only hedges its exposures on operating cash fl ows in the main signifi cant foreign currencies (US dollar, Canadian dollar and Pound sterling). Its strategy is to hedge only one year at a time, so the hedging horizon never exceeds 18 months.
The Group fi rst uses natural hedges provided by transactions in the other direction (development costs in foreign currency offset by royalties from subsidiaries in the same currency). The parent company uses foreign currency borrowings, futures or foreign exchange options to hedge any residual exposures and non-commercial transactions (such as inter-company loans in foreign currencies).
Derivatives for which documentation on the hedging relationship does not meet the requirements of IFRS 9 are not referred to as accounting hedges.
As at March 31, 2018, foreign exchange transactions denominated in Canadian dollars, US dollars and Pound sterling meet the cash fl ow hedging requirements under IFRS 9.
Hedging commitments are made by the parent company’s treasury department in France. No hedging is taken out directly at subsidiaries in France or abroad.
The Group uses foreign currency derivatives, measured at fair value, only with standard banking institutions. These are top tier banking institutions. As a result, the “Credit Value Adjustment” (entity’s own risk) is deemed to be immaterial.
At closing, the fair value of foreign exchange derivatives is as follows:
03/31/18 03/31/17
USD CAD GBP SGD JPY RUB SEK USD CAD GBP SGD JPY RUB SEK
Forwards (1) 200 697 (25) - - - - (448) - (155) - - - -
FOREIGN EXCHANGE DERIVATIVES QUALIFYING AS HEDGES 200 697 (25) - - - - (448) - (155) - - - -
of which in fair value (impact on income) - - (25) - - - - (450) - (155) - - - -
of which in cash fl ow hedge (impact on OCI) 200 697 - - - - - 2 - - - - - -
Forwards (1) (50) 51 6 10 (9) (14) 92 414 197 54 77 66 (54) 8
FOREIGN EXCHANGE DERIVATIVES NOT QUALIFYING AS HEDGES (50) 51 6 10 (9) (14) 92 414 197 54 77 66 (54) 8
(1) Mark-to-market, level 2 in the hierarchy of fair value under IFRS 7
- 2018 Registration Document 193
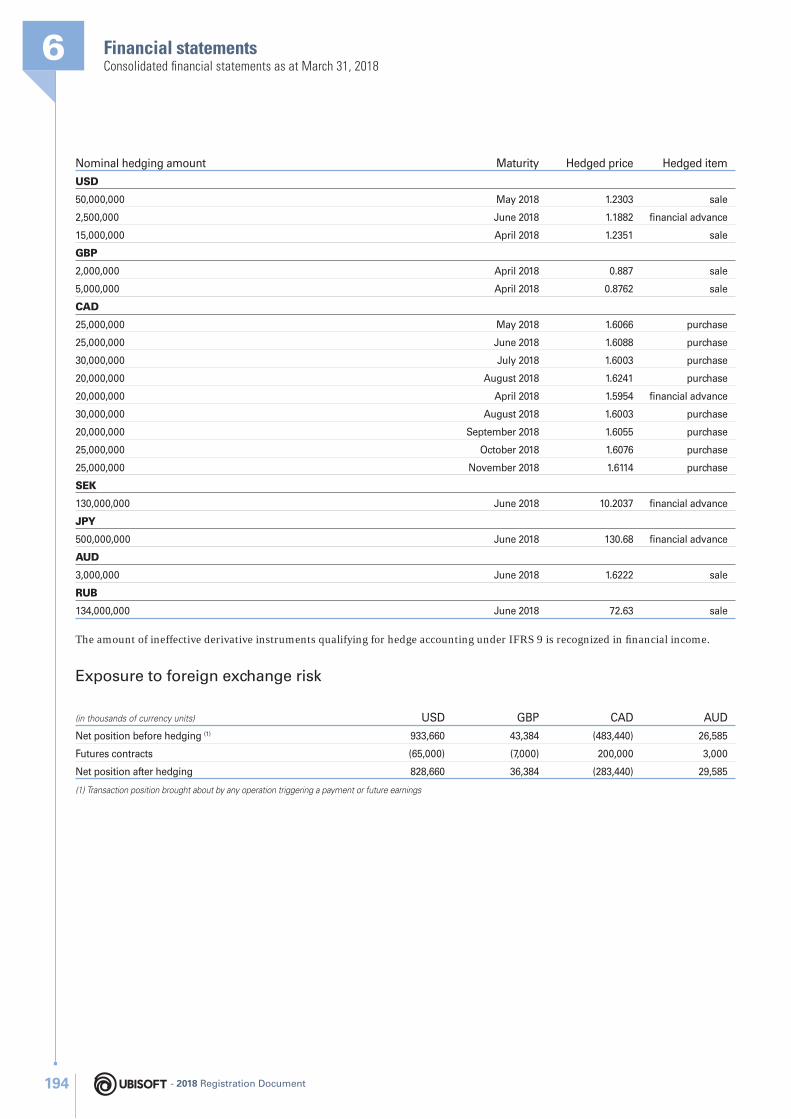
Financial statements6Consolidated fi nancial statements as at March 31, 2018
Nominal hedging amount Maturity Hedged price Hedged item
USD
50,000,000 May 2018 1.2303 sale
2,500,000 June 2018 1.1882 fi nancial advance
15,000,000 April 2018 1.2351 sale
GBP
2,000,000 April 2018 0.887 sale
5,000,000 April 2018 0.8762 sale
CAD
25,000,000 May 2018 1.6066 purchase
25,000,000 June 2018 1.6088 purchase
30,000,000 July 2018 1.6003 purchase
20,000,000 August 2018 1.6241 purchase
20,000,000 April 2018 1.5954 fi nancial advance
30,000,000 August 2018 1.6003 purchase
20,000,000 September 2018 1.6055 purchase
25,000,000 October 2018 1.6076 purchase
25,000,000 November 2018 1.6114 purchase
SEK
130,000,000 June 2018 10.2037 fi nancial advance
JPY
500,000,000 June 2018 130.68 fi nancial advance
AUD
3,000,000 June 2018 1.6222 sale
RUB
134,000,000 June 2018 72.63 sale
The amount of ineffective derivative instruments qualifying for hedge accounting under IFRS 9 is recognized in fi nancial income.
Exposure to foreign exchange risk
(in thousands of currency units) USD GBP CAD AUD
Net position before hedging (1) 933,660 43,384 (483,440) 26,585
Futures contracts (65,000) (7,000) 200,000 3,000
Net position after hedging 828,660 36,384 (283,440) 29,585
(1) Transaction position brought about by any operation triggering a payment or future earnings
- 2018 Registration Document194
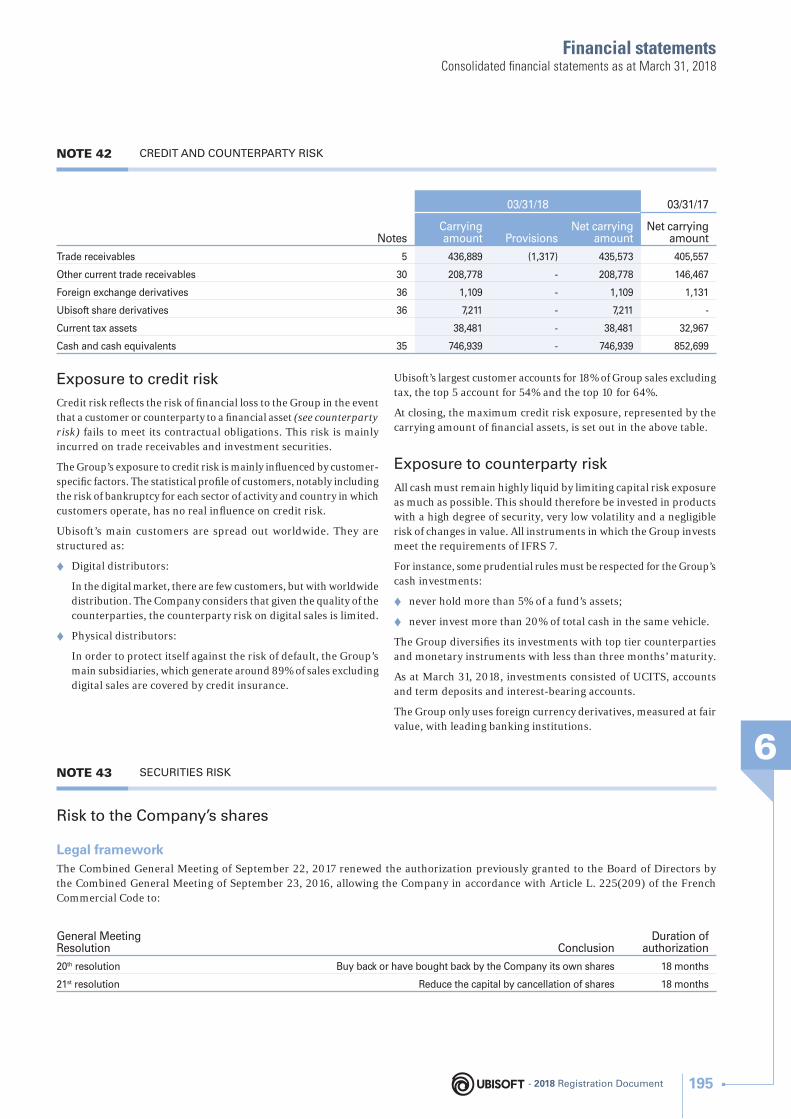
Financial statements
6
Consolidated fi nancial statements as at March 31, 2018
NOTE 42 CREDIT AND COUNTERPARTY RISK
Notes
03/31/18 03/31/17
Carrying amount Provisions
Net carrying amount
Net carrying amount
Trade receivables 5 436,889 (1,317) 435,573 405,557
Other current trade receivables 30 208,778 - 208,778 146,467
Foreign exchange derivatives 36 1,109 - 1,109 1,131
Ubisoft share derivatives 36 7,211 - 7,211 -
Current tax assets 38,481 - 38,481 32,967
Cash and cash equivalents 35 746,939 - 746,939 852,699
Exposure to credit risk
Credit risk refl ects the risk of fi nancial loss to the Group in the event that a customer or counterparty to a fi nancial asset (see counterparty risk) fails to meet its contractual obligations. This risk is mainly incurred on trade receivables and investment securities.
The Group’s exposure to credit risk is mainly infl uenced by customer-specifi c factors. The statistical profi le of customers, notably including the risk of bankruptcy for each sector of activity and country in which customers operate, has no real infl uence on credit risk.
Ubisoft’s main customers are spread out worldwide. They are structured as:
♦ Digital distributors:
In the digital market, there are few customers, but with worldwide distribution. The Company considers that given the quality of the counterparties, the counterparty risk on digital sales is limited.
♦ Physical distributors:
In order to protect itself against the risk of default, the Group’s main subsidiaries, which generate around 89% of sales excluding digital sales are covered by credit insurance.
Ubisoft’s largest customer accounts for 18% of Group sales excluding tax, the top 5 account for 54% and the top 10 for 64%.
At closing, the maximum credit risk exposure, represented by the carrying amount of fi nancial assets, is set out in the above table.
Exposure to counterparty risk
All cash must remain highly liquid by limiting capital risk exposure as much as possible. This should therefore be invested in products with a high degree of security, very low volatility and a negligible risk of changes in value. All instruments in which the Group invests meet the requirements of IFRS 7.
For instance, some prudential rules must be respected for the Group’s cash investments:
♦ never hold more than 5% of a fund’s assets;
♦ never invest more than 20% of total cash in the same vehicle.
The Group diversifi es its investments with top tier counterparties and monetary instruments with less than three months’ maturity.
As at March 31, 2018, investments consisted of UCITS, accounts and term deposits and interest-bearing accounts.
The Group only uses foreign currency derivatives, measured at fair value, with leading banking institutions.
NOTE 43 SECURITIES RISK
Risk to the Company’s shares
Legal frameworkThe Combined General Meeting of September 22, 2017 renewed the authorization previously granted to the Board of Directors by the Combined General Meeting of September 23, 2016, allowing the Company in accordance with Article L. 225(209) of the French Commercial Code to:
General Meeting Resolution Conclusion
Duration of authorization
20th resolution Buy back or have bought back by the Company its own shares 18 months
21st resolution Reduce the capital by cancellation of shares 18 months
- 2018 Registration Document 195
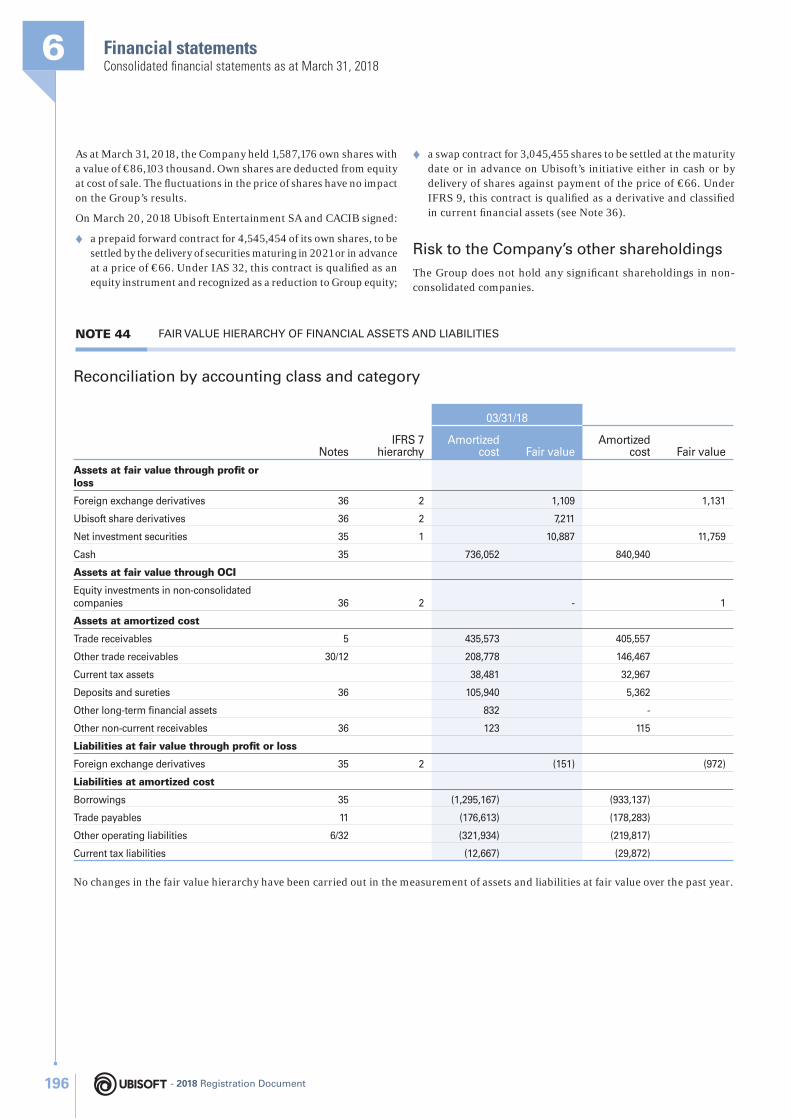
Financial statements6Consolidated fi nancial statements as at March 31, 2018
As at March 31, 2018, the Company held 1,587,176 own shares with a value of €86,103 thousand. Own shares are deducted from equity at cost of sale. The fl uctuations in the price of shares have no impact on the Group’s results.
On March 20, 2018 Ubisoft Entertainment SA and CACIB signed:
♦ a prepaid forward contract for 4,545,454 of its own shares, to be settled by the delivery of securities maturing in 2021 or in advance at a price of €66. Under IAS 32, this contract is qualifi ed as an equity instrument and recognized as a reduction to Group equity;
♦ a swap contract for 3,045,455 shares to be settled at the maturity date or in advance on Ubisoft’s initiative either in cash or by delivery of shares against payment of the price of €66. Under IFRS 9, this contract is qualifi ed as a derivative and classifi ed in current fi nancial assets (see Note 36).
Risk to the Company’s other shareholdings
The Group does not hold any signifi cant shareholdings in non-consolidated companies.
NOTE 44 FAIR VALUE HIERARCHY OF FINANCIAL ASSETS AND LIABILITIES
Reconciliation by accounting class and category
NotesIFRS 7
hierarchy
03/31/18 03/31/17
Amortized cost Fair value
Amortized cost Fair value
Assets at fair value through profi t or loss
Foreign exchange derivatives 36 2 1,109 1,131
Ubisoft share derivatives 36 2 7,211
Net investment securities 35 1 10,887 11,759
Cash 35 736,052 840,940
Assets at fair value through OCI
Equity investments in non-consolidated companies 36 2 - 1
Assets at amortized cost
Trade receivables 5 435,573 405,557
Other trade receivables 30/12 208,778 146,467
Current tax assets 38,481 32,967
Deposits and sureties 36 105,940 5,362
Other long-term fi nancial assets 832 -
Other non-current receivables 36 123 115
Liabilities at fair value through profi t or loss
Foreign exchange derivatives 35 2 (151) (972)
Liabilities at amortized cost
Borrowings 35 (1,295,167) (933,137)
Trade payables 11 (176,613) (178,283)
Other operating liabilities 6/32 (321,934) (219,817)
Current tax liabilities (12,667) (29,872)
No changes in the fair value hierarchy have been carried out in the measurement of assets and liabilities at fair value over the past year.
- 2018 Registration Document196
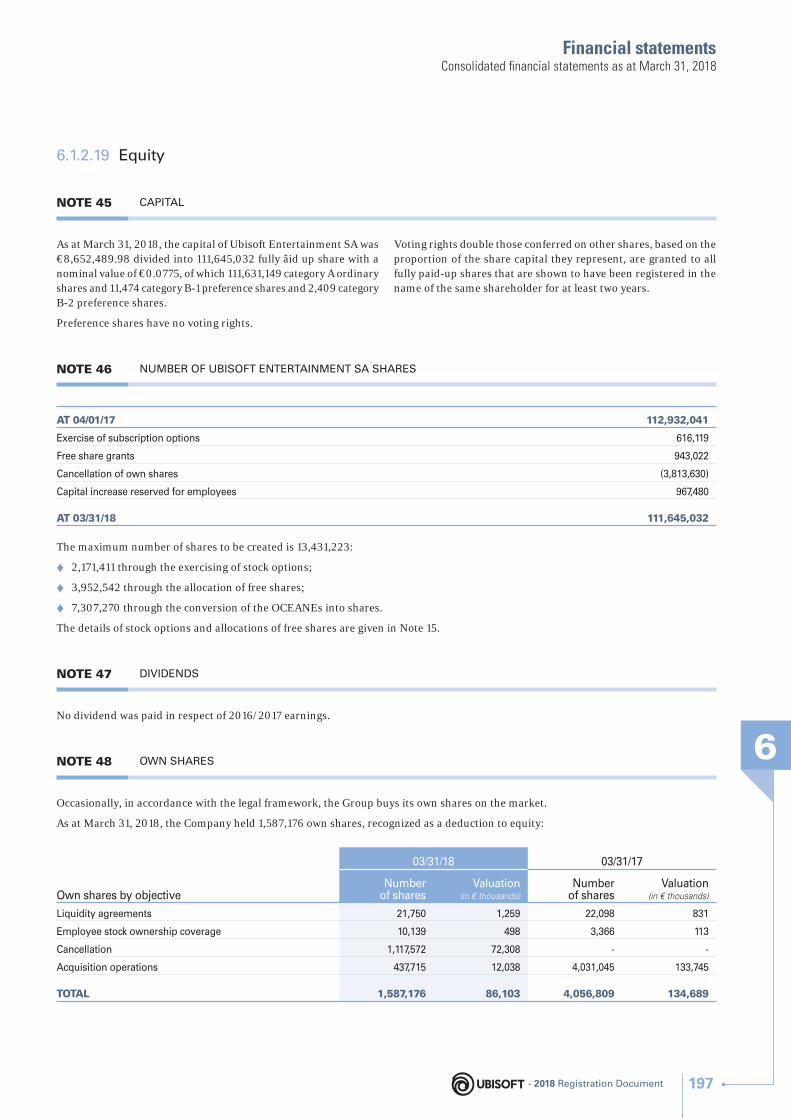
Financial statements
6
Consolidated fi nancial statements as at March 31, 2018
6.1.2.19 Equity
NOTE 45 CAPITAL
As at March 31, 2018, the capital of Ubisoft Entertainment SA was €8,652,489.98 divided into 111,645,032 fully âid up share with a nominal value of €0.0775, of which 111,631,149 category A ordinary shares and 11,474 category B-1 preference shares and 2,409 category B-2 preference shares.
Preference shares have no voting rights.
Voting rights double those conferred on other shares, based on the proportion of the share capital they represent, are granted to all fully paid-up shares that are shown to have been registered in the name of the same shareholder for at least two years.
NOTE 46 NUMBER OF UBISOFT ENTERTAINMENT SA SHARES
AT 04/01/17 112,932,041
Exercise of subscription options 616,119
Free share grants 943,022
Cancellation of own shares (3,813,630)
Capital increase reserved for employees 967,480
AT 03/31/18 111,645,032
The maximum number of shares to be created is 13,431,223:
♦ 2,171,411 through the exercising of stock options;
♦ 3,952,542 through the allocation of free shares;
♦ 7,307,270 through the conversion of the OCEANEs into shares.
The details of stock options and allocations of free shares are given in Note 15.
NOTE 47 DIVIDENDS
No dividend was paid in respect of 2016/2017 earnings.
NOTE 48 OWN SHARES
Occasionally, in accordance with the legal framework, the Group buys its own shares on the market.
As at March 31, 2018, the Company held 1,587,176 own shares, recognized as a deduction to equity:
Own shares by objective
03/31/18 03/31/17
Number of shares
Valuation (in € thousands)
Number of shares
Valuation (in € thousands)
Liquidity agreements 21,750 1,259 22,098 831
Employee stock ownership coverage 10,139 498 3,366 113
Cancellation 1,117,572 72,308 - -
Acquisition operations 437,715 12,038 4,031,045 133,745
TOTAL 1,587,176 86,103 4,056,809 134,689
- 2018 Registration Document 197
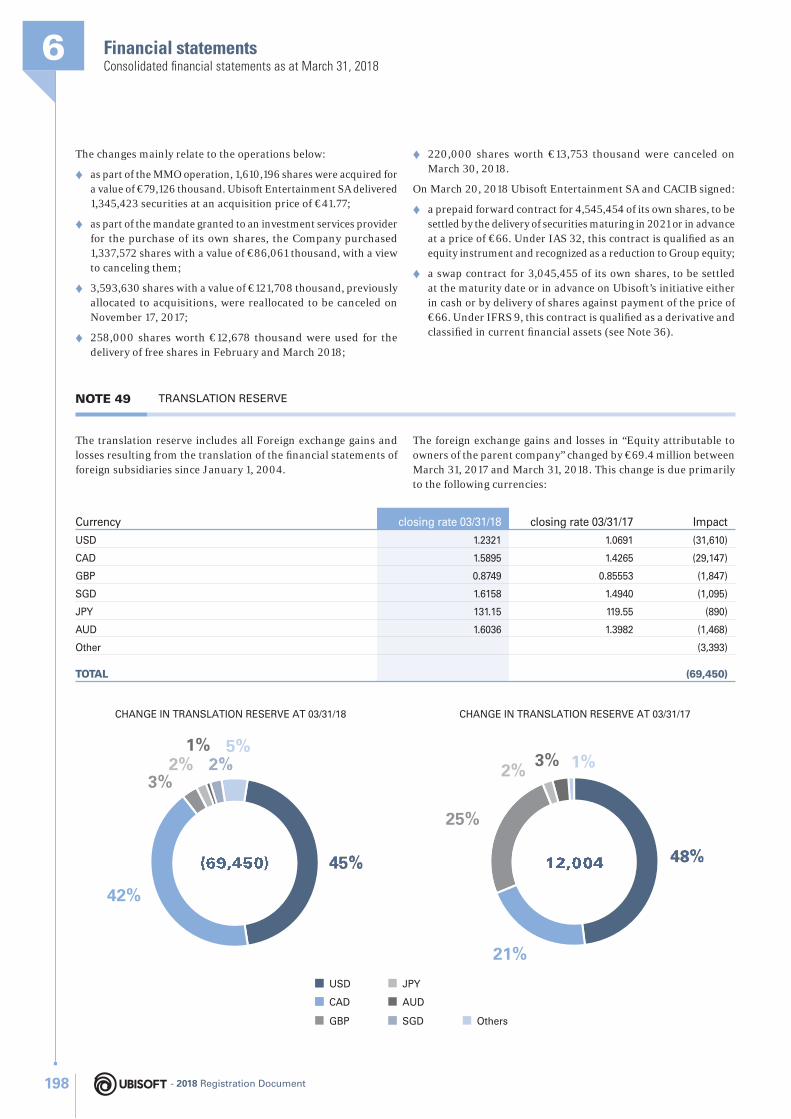
Financial statements6Consolidated fi nancial statements as at March 31, 2018
The changes mainly relate to the operations below:
♦ as part of the MMO operation, 1,610,196 shares were acquired for a value of €79,126 thousand. Ubisoft Entertainment SA delivered 1,345,423 securities at an acquisition price of €41.77;
♦ as part of the mandate granted to an investment services provider for the purchase of its own shares, the Company purchased 1,337,572 shares with a value of €86,061 thousand, with a view to canceling them;
♦ 3,593,630 shares with a value of €121,708 thousand, previously allocated to acquisitions, were reallocated to be canceled on November 17, 2017;
♦ 258,000 shares worth €12,678 thousand were used for the delivery of free shares in February and March 2018;
♦ 220,000 shares worth €13,753 thousand were canceled on March 30, 2018.
On March 20, 2018 Ubisoft Entertainment SA and CACIB signed:
♦ a prepaid forward contract for 4,545,454 of its own shares, to be settled by the delivery of securities maturing in 2021 or in advance at a price of €66. Under IAS 32, this contract is qualifi ed as an equity instrument and recognized as a reduction to Group equity;
♦ a swap contract for 3,045,455 of its own shares, to be settled at the maturity date or in advance on Ubisoft’s initiative either in cash or by delivery of shares against payment of the price of €66. Under IFRS 9, this contract is qualifi ed as a derivative and classifi ed in current fi nancial assets (see Note 36).
NOTE 49 TRANSLATION RESERVE
The translation reserve includes all Foreign exchange gains and losses resulting from the translation of the fi nancial statements of foreign subsidiaries since January 1, 2004.
The foreign exchange gains and losses in “Equity attributable to owners of the parent company” changed by €69.4 million between March 31, 2017 and March 31, 2018. This change is due primarily to the following currencies:
Currency closing rate 03/31/18 closing rate 03/31/17 Impact
USD 1.2321 1.0691 (31,610)
CAD 1.5895 1.4265 (29,147)
GBP 0.8749 0.85553 (1,847)
SGD 1.6158 1.4940 (1,095)
JPY 131.15 119.55 (890)
AUD 1.6036 1.3982 (1,468)
Other (3,393)
TOTAL (69,450)
CHANGE IN TRANSLATION RESERVE AT 03/31/18 CHANGE IN TRANSLATION RESERVE AT 03/31/17
GBP
USD
CAD
OthersSGD
JPY
AUD
2% 1%
48%48%48%48%
42%
21%
2%2%2%2%5%
45%45%45%45%
3%
25%
2%
1%3%
(69,450)(69,450) 12,00412,004
- 2018 Registration Document198
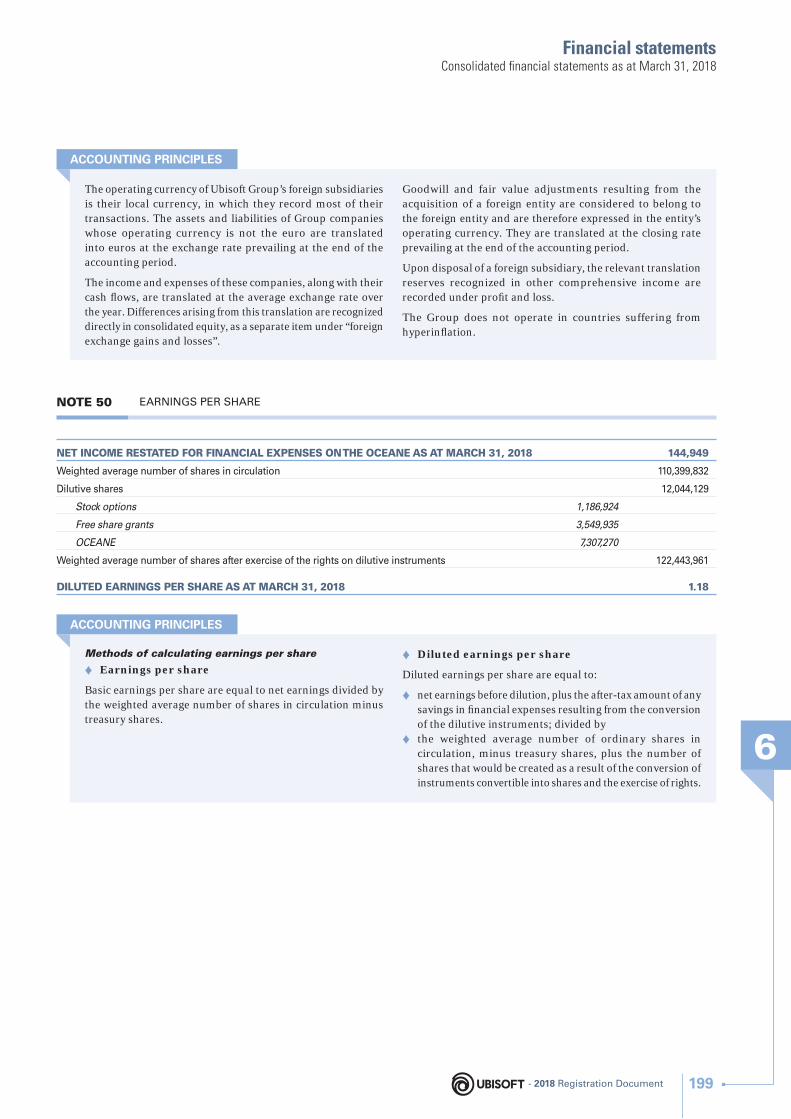
Financial statements
6
Consolidated fi nancial statements as at March 31, 2018
NOTE 50 EARNINGS PER SHARE
The operating currency of Ubisoft Group’s foreign subsidiaries is their local currency, in which they record most of their transactions. The assets and liabilities of Group companies whose operating currency is not the euro are translated into euros at the exchange rate prevailing at the end of the accounting period.
The income and expenses of these companies, along with their cash fl ows, are translated at the average exchange rate over the year. Differences arising from this translation are recognized directly in consolidated equity, as a separate item under “foreign exchange gains and losses”.
Goodwill and fair value adjustments resulting from the acquisition of a foreign entity are considered to belong to the foreign entity and are therefore expressed in the entity’s operating currency. They are translated at the closing rate prevailing at the end of the accounting period.
Upon disposal of a foreign subsidiary, the relevant translation reserves recognized in other comprehensive income are recorded under profi t and loss.
The Group does not operate in countries suffering from hyperinfl ation.
Methods of calculating earnings per share
♦ Earnings per share
Basic earnings per share are equal to net earnings divided by the weighted average number of shares in circulation minus treasury shares.
♦ Diluted earnings per share
Diluted earnings per share are equal to:
♦ net earnings before dilution, plus the after-tax amount of any savings in fi nancial expenses resulting from the conversion of the dilutive instruments; divided by
♦ the weighted average number of ordinary shares in circulation, minus treasury shares, plus the number of shares that would be created as a result of the conversion of instruments convertible into shares and the exercise of rights.
ACCOUNTING PRINCIPLES
ACCOUNTING PRINCIPLES
NET INCOME RESTATED FOR FINANCIAL EXPENSES ON THE OCEANE AS AT MARCH 31, 2018 144,949
Weighted average number of shares in circulation 110,399,832
Dilutive shares 12,044,129
Stock options 1,186,924
Free share grants 3,549,935
OCEANE 7,307,270
Weighted average number of shares after exercise of the rights on dilutive instruments 122,443,961
DILUTED EARNINGS PER SHARE AS AT MARCH 31, 2018 1.18
- 2018 Registration Document 199
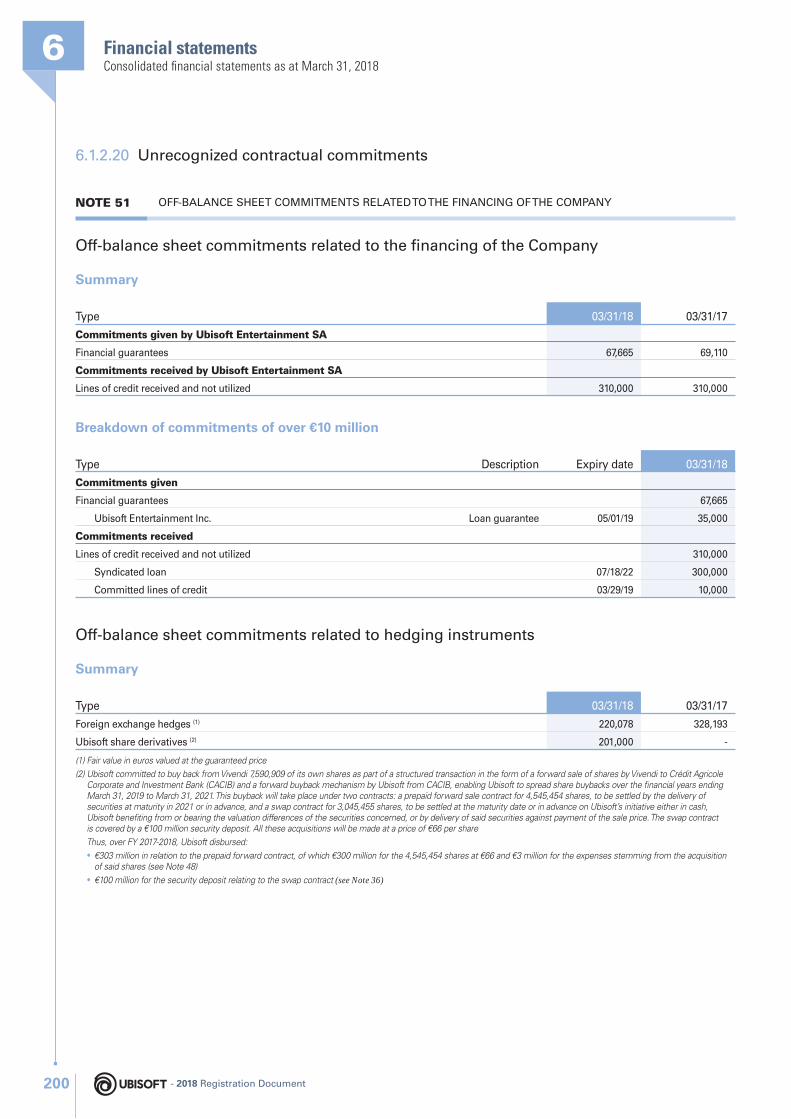
Financial statements6Consolidated fi nancial statements as at March 31, 2018
6.1.2.20 Unrecognized contractual commitments
NOTE 51 OFF-BALANCE SHEET COMMITMENTS RELATED TO THE FINANCING OF THE COMPANY
Off-balance sheet commitments related to the fi nancing of the Company
Summary
Type 03/31/18 03/31/17
Commitments given by Ubisoft Entertainment SA
Financial guarantees 67,665 69,110
Commitments received by Ubisoft Entertainment SA
Lines of credit received and not utilized 310,000 310,000
Breakdown of commitments of over €10 million
Type Description Expiry date 03/31/18
Commitments given
Financial guarantees 67,665
Ubisoft Entertainment Inc. Loan guarantee 05/01/19 35,000
Commitments received
Lines of credit received and not utilized 310,000
Syndicated loan 07/18/22 300,000
Committed lines of credit 03/29/19 10,000
Off-balance sheet commitments related to hedging instruments
Summary
Type 03/31/18 03/31/17
Foreign exchange hedges (1) 220,078 328,193
Ubisoft share derivatives (2) 201,000 -
(1) Fair value in euros valued at the guaranteed price
(2) Ubisoft committed to buy back from Vivendi 7,590,909 of its own shares as part of a structured transaction in the form of a forward sale of shares by Vivendi to Crédit Agricole Corporate and Investment Bank (CACIB) and a forward buyback mechanism by Ubisoft from CACIB, enabling Ubisoft to spread share buybacks over the fi nancial years ending March 31, 2019 to March 31, 2021. This buyback will take place under two contracts: a prepaid forward sale contract for 4,545,454 shares, to be settled by the delivery of securities at maturity in 2021 or in advance, and a swap contract for 3,045,455 shares, to be settled at the maturity date or in advance on Ubisoft’s initiative either in cash, Ubisoft benefi ting from or bearing the valuation differences of the securities concerned, or by delivery of said securities against payment of the sale price. The swap contract is covered by a €100 million security deposit. All these acquisitions will be made at a price of €66 per share
Thus, over FY 2017-2018, Ubisoft disbursed:
• €303 million in relation to the prepaid forward contract, of which €300 million for the 4,545,454 shares at €66 and €3 million for the expenses stemming from the acquisition of said shares (see Note 48)
• €100 million for the security deposit relating to the swap contract (see Note 36)
- 2018 Registration Document200
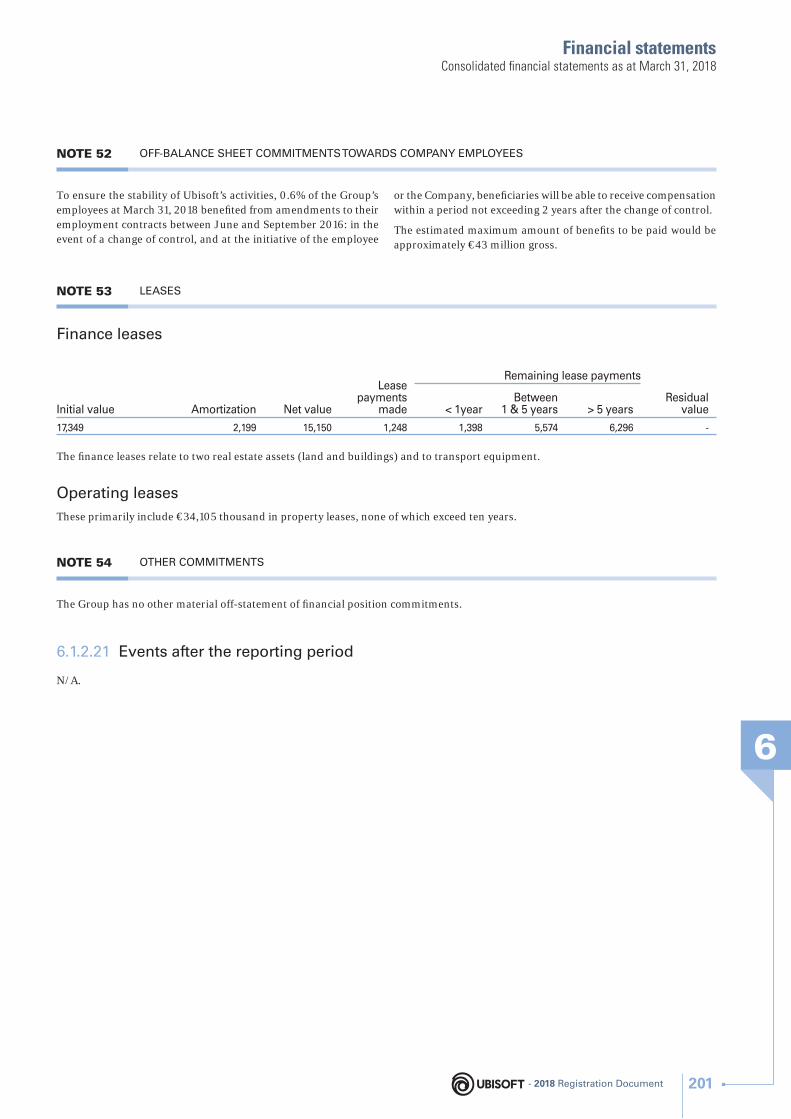
Financial statements
6
Consolidated fi nancial statements as at March 31, 2018
NOTE 52 OFF-BALANCE SHEET COMMITMENTS TOWARDS COMPANY EMPLOYEES
To ensure the stability of Ubisoft’s activities, 0.6% of the Group’s employees at March 31, 2018 benefi ted from amendments to their employment contracts between June and September 2016: in the event of a change of control, and at the initiative of the employee
or the Company, benefi ciaries will be able to receive compensation within a period not exceeding 2 years after the change of control.
The estimated maximum amount of benefi ts to be paid would be approximately €43 million gross.
NOTE 53 LEASES
Finance leases
Initial value Amortization Net value
Lease payments
made
Remaining lease payments
Residual value< 1year
Between 1 & 5 years > 5 years
17,349 2,199 15,150 1,248 1,398 5,574 6,296 -
The fi nance leases relate to two real estate assets (land and buildings) and to transport equipment.
Operating leases
These primarily include €34,105 thousand in property leases, none of which exceed ten years.
NOTE 54 OTHER COMMITMENTS
The Group has no other material off-statement of fi nancial position commitments.
6.1.2.21 Events after the reporting period
N/A.
- 2018 Registration Document 201
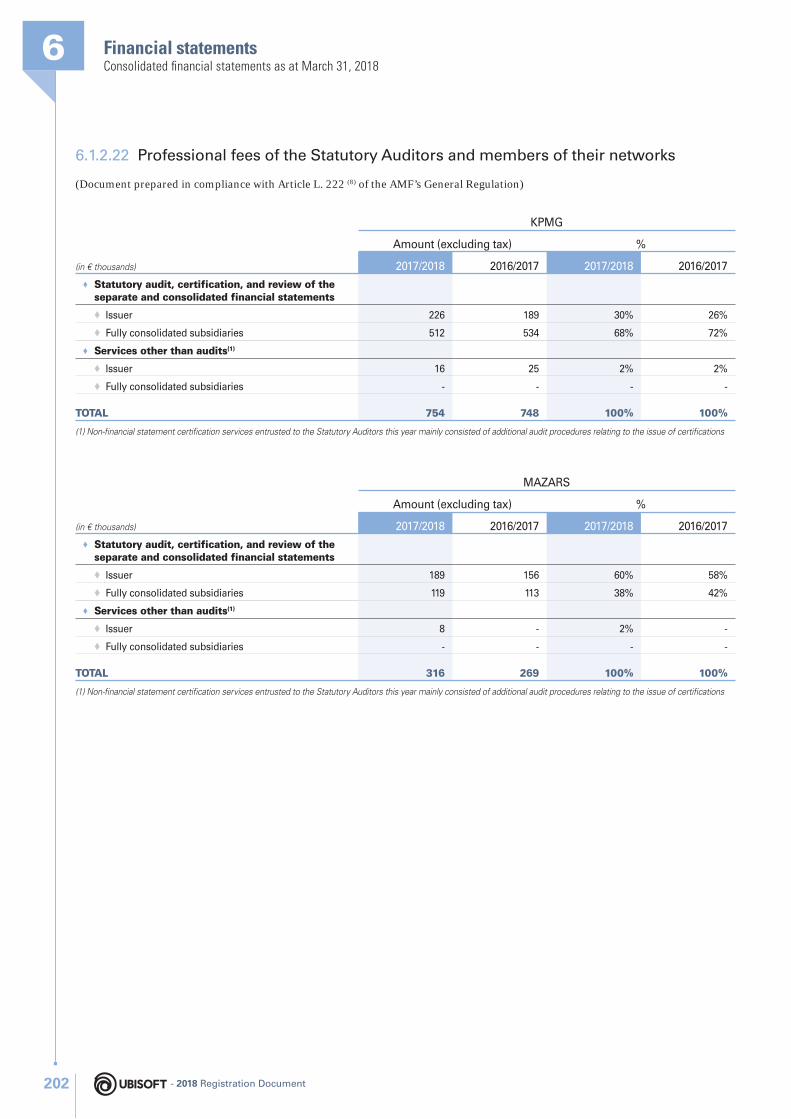
Financial statements6Consolidated fi nancial statements as at March 31, 2018
6.1.2.22 Professional fees of the Statutory Auditors and members of their networks
(Document prepared in compliance with Article L. 222 (8) of the AMF’s General Regulation)
(in € thousands)
KPMG
Amount (excluding tax) %
2017/2018 2016/2017 2017/2018 2016/2017
♦ Statutory audit, certification, and review of the separate and consolidated financial statements
♦ Issuer 226 189 30% 26%
♦ Fully consolidated subsidiaries 512 534 68% 72%
♦ Services other than audits(1)
♦ Issuer 16 25 2% 2%
♦ Fully consolidated subsidiaries - - - -
TOTAL 754 748 100% 100%
(1) Non-fi nancial statement certifi cation services entrusted to the Statutory Auditors this year mainly consisted of additional audit procedures relating to the issue of certifi cations
(in € thousands )
MAZARS
Amount (excluding tax) %
2017/2018 2016/2017 2017/2018 2016/2017
♦ Statutory audit, certification, and review of the separate and consolidated financial statements
♦ Issuer 189 156 60% 58%
♦ Fully consolidated subsidiaries 119 113 38% 42%
♦ Services other than audits(1)
♦ Issuer 8 - 2% -
♦ Fully consolidated subsidiaries - - - -
TOTAL 316 269 100% 100%
(1) Non-fi nancial statement certifi cation services entrusted to the Statutory Auditors this year mainly consisted of additional audit procedures relating to the issue of certifi cations
- 2018 Registration Document202
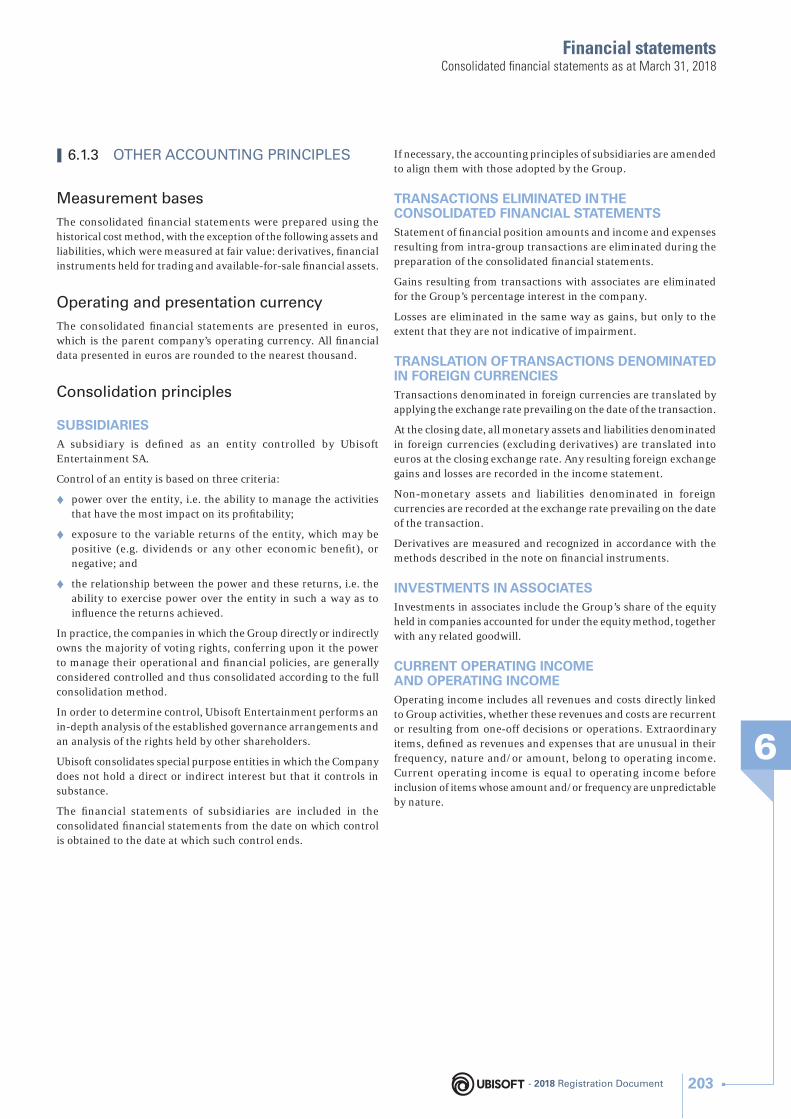
Financial statements
6
Consolidated fi nancial statements as at March 31, 2018
❙ 6.1.3 OTHER ACCOUNTING PRINCIPLES
Measurement bases
The consolidated fi nancial statements were prepared using the historical cost method, with the exception of the following assets and liabilities, which were measured at fair value: derivatives, fi nancial instruments held for trading and available-for-sale fi nancial assets.
Operating and presentation currency
The consolidated fi nancial statements are presented in euros, which is the parent company’s operating currency. All fi nancial data presented in euros are rounded to the nearest thousand.
Consolidation principles
SUBSIDIARIESA subsidiary is defi ned as an entity controlled by Ubisoft Entertainment SA.
Control of an entity is based on three criteria:
♦ power over the entity, i.e. the ability to manage the activities that have the most impact on its profi tability;
♦ exposure to the variable returns of the entity, which may be positive (e.g. dividends or any other economic benefi t), or negative; and
♦ the relationship between the power and these returns, i.e. the ability to exercise power over the entity in such a way as to infl uence the returns achieved.
In practice, the companies in which the Group directly or indirectly owns the majority of voting rights, conferring upon it the power to manage their operational and fi nancial policies, are generally considered controlled and thus consolidated according to the full consolidation method.
In order to determine control, Ubisoft Entertainment performs an in-depth analysis of the established governance arrangements and an analysis of the rights held by other shareholders.
Ubisoft consolidates special purpose entities in which the Company does not hold a direct or indirect interest but that it controls in substance.
The fi nancial statements of subsidiaries are included in the consolidated fi nancial statements from the date on which control is obtained to the date at which such control ends.
If necessary, the accounting principles of subsidiaries are amended to align them with those adopted by the Group.
TRANSACTIONS ELIMINATED IN THE CONSOLIDATED FINANCIAL STATEMENTSStatement of fi nancial position amounts and income and expenses resulting from intra-group transactions are eliminated during the preparation of the consolidated fi nancial statements.
Gains resulting from transactions with associates are eliminated for the Group’s percentage interest in the company.
Losses are eliminated in the same way as gains, but only to the extent that they are not indicative of impairment.
TRANSLATION OF TRANSACTIONS DENOMINATED IN FOREIGN CURRENCIESTransactions denominated in foreign currencies are translated by applying the exchange rate prevailing on the date of the transaction.
At the closing date, all monetary assets and liabilities denominated in foreign currencies (excluding derivatives) are translated into euros at the closing exchange rate. Any resulting foreign exchange gains and losses are recorded in the income statement.
Non-monetary assets and liabilities denominated in foreign currencies are recorded at the exchange rate prevailing on the date of the transaction.
Derivatives are measured and recognized in accordance with the methods described in the note on fi nancial instruments.
INVESTMENTS IN ASSOCIATESInvestments in associates include the Group’s share of the equity held in companies accounted for under the equity method, together with any related goodwill.
CURRENT OPERATING INCOME AND OPERATING INCOMEOperating income includes all revenues and costs directly linked to Group activities, whether these revenues and costs are recurrent or resulting from one-off decisions or operations. Extraordinary items, defi ned as revenues and expenses that are unusual in their frequency, nature and/or amount, belong to operating income. Current operating income is equal to operating income before inclusion of items whose amount and/or frequency are unpredictable by nature.
- 2018 Registration Document 203
Financial statements6Statutory Auditors’ report on the consolidated fi nancial statements
6.2 Statutory Auditors’ report on the consolidated financial statements
This is a free translation into English of one of the statutory auditors’ report on the consolidated fi nancial statements issued in French language and it is provided solely for the convenience of English speaking readers.
This report should be read in conjunction with, and construed in accordance with French law and professional auditing standards applicable in France.
To the General Meeting of the company Ubisoft Entertainment,
❙ OPINION
As mandated by your General Meetings, we conducted the audit of the consolidated fi nancial statements of Ubisoft Entertainment in respect of the fi nancial year ended March 31, 2018, as attached to this report.
We hereby certify that, from the standpoint of IFRS standards as adopted in the European Union, the consolidated fi nancial statements give a true and fair view of the operations for the fi nancial year just ended, as well as the assets, fi nancial position and results of the Group comprising the consolidated persons and entities.
The opinion formulated above is consistent with the content of our report to the Audit Committee.
❙ BASIS FOR THE OPINION
Audit Guidelines
We conducted our audit in accordance with accepted professional standards in France. It is our view that the elements that we collected are suffi cient and adapted to base our opinion.
Our responsibilities under these standards are indicated in the section “Responsibilities of the Statutory Auditors relating to the audit of the consolidated fi nancial statements” in this report.
Independence
We conducted our audit in accordance with the applicable rules of independence, over the period from April 1, 2017 to the date of issue of our report, and notably, did not provide services prohibited by Article 5, paragraph 1 of the (EU) Regulation No. 537/2014 or by the Statutory Auditors’ Code of Ethics.
Comments
Without calling into question the opinion expressed above, we draw your attention to the following item presented in the note “Comparability of fi nancial statements” in the notes to the consolidated fi nancial statements where the impact of the early application of IFRS 9 on April 1, 2017 is presented.
❙ BASIS FOR OUR ASSESSMENT – KEY POINTS OF THE AUDIT
Pursuant to the provisions of Articles L. 823-9 and R. 823-7 of the French Commercial Code regarding the basis for our assessments, we call your attention to the key points of the audit regarding the risks of material misstatements which, in our professional judgment, were the most signifi cant for the audit of the consolidated fi nancial statements for the fi nancial year, together with the responses we provided to these risks.
- Document de référence 2018204
Financial statements
6
Statutory Auditors’ report on the consolidated fi nancial statements
Our assessments were made within the context of our audit of the consolidated fi nancial statements as a whole and provided a basis for the opinion expressed previously. We do not express an opinion on the items in the consolidated fi nancial statements taken separately.
Assessment of the commercial software developed internally – impairment testsNote 22 of the notes to the consolidated fi nancial statements
Risk identifi ed Response provided
As at March 31, 2018, the net carrying amount for the commercial software developed internally amounted to €659 million for a total statement of fi nancial position of €2,805 million.
The intangible assets resulting from the development of commercial software, once released, are amortized on a straight-line basis starting on the commercial release date for a duration of 1 to 6 years.
Moreover, as indicated in Note 22 “Inventory value and changes in intangible assets during the fi nancial year”, in the notes to the consolidated fi nancial statements, the Group subjects the released commercial software to an impairment test at each closing date. Commercial software in production with a planned release date within 12 months after the closing date, or for which an impairment loss indicator is identifi ed is also subject to an impairment test. These tests involve comparing the net carrying amount of the commercial software (after normally recognized linear depreciation) to the expected future cash fl ows from the sale of the game. Impairment is recognized if the value-in-use is lower than the net carrying amount of the commercial software.
We have considered the impairment tests on commercial software developed internally as a key point of the audit, given the particularly signifi cant amount and the signifi cant degree of judgment required by the Group to determine the value-in-use bases on forecasts of discounted cash fl ows for which achievement is inherently uncertain.
We have examined the procedures for conducting these impairment tests. Our work notably consisted in:(1) Taking note of the internal control relating to the implementation of
these impairment tests and testing by survey the key controls implemented by the Group for these processes. Our procedure tests consisted in:
♦ assessing the implementation of editorial control by the Group’s Executive Management;
♦ assessing the portfolio review of software in production which aims to control the exhaustive accounting translation of editorial discontinuation decisions;
♦ ensuring that the Board of Directors has approved the 3 year business plan.
(2) Our substance tests mainly consisted in: ♦ conducting a retrospective analysis of the impairment tests carried
out by the Group over the previous fi nancial years; ♦ comparing sales and profi tability forecasts for the commercial
software used in the impairment tests with those underlying the Group’s 3 year business plan approved by the Board of Directors;
♦ assessing the consistency of the future sales forecasts with regard to available data or comparables (previous opus within the same franchise, another similar commercial software with the same comparable levels of functions, taking into account the level of pre-orders for example).
We also assessed the relevant nature of the information provided in Note 22 “Inventory value and changes in intangible assets during the fi nancial year” in the notes to the consolidated fi nancial statements.
Assessment of goodwill and brandsNotes 17 to 23 of the notes to the consolidated fi nancial statements
Risk identifi ed Response provided
Goodwill and brands present signifi cant net carrying amounts at March 31, 2018 of respectively €259 million and €59 million. All brands indicated as assets in the Group’s statement of fi nancial position have an indefi nite life.
At least once a year, and more regularly in the event of impairment loss indicators, the Group ensures that the net carrying amount of these assets does not exceed their recoverable value.
The procedures for the impairment tests implemented by the Group are described in Notes 20 “Goodwill” and 22 “Brands” in the notes to the consolidated fi nancial statements; they include a signifi cant number of judgments and assumptions, notably covering:
♦ future cash fl ow forecasts;
♦ the perpetuity growth rates selected for the forecast fl ows;
♦ the discount rate applied to the estimated cash fl ows.
Consequently, a change in these assumptions would signifi cantly affect the recoverable value of these assets and require an impairment to be recognized.
We consider the assessment of goodwill and brands to be a key point of the audit, due to the high degree of judgment required by the Group in the choice of the assumptions required to determine their recoverable value, based on discounted cash fl ow forecasts for which achievement is inherently uncertain.
We have analyzed the compliance of the methodologies applied by the Group with current accounting standards, and specifi cally those used to estimate the recoverable value.(1) We have also conducted a critical assessment of the way in which
this methodology is implemented, and have specifi cally: ♦ assessed the effective implementation of the internal approval and
validation process for the business plans prepared by the Group and used for the impairment tests;
♦ checked the implementation of the reconciliation of the business plans used for the impairment tests with the Group business plan approved by the Board of Directors;
♦ tested the implementation of the consistency control between the equity value from the Group’s business plan with the stock market capitalization.
(2) Our substance tests mainly consisted in: ♦ conducting a critical review of the business plans based notably
on discussions with the Administration Department; ♦ checking the arithmetical accuracy of the impairment tests of
goodwill and brands; ♦ analyzing the perpetuity growth rates and the discount rate of the
future cash fl ows by our own experts; ♦ measuring the sensitivity of the impairment tests to the discount
rate and growth rate of sales; ♦ assessing the relevant nature of the information provided in the
notes to the consolidated fi nancial statements.
- Document de référence 2018 205
Financial statements6Statutory Auditors’ report on the consolidated fi nancial statements
Contingent liabilities associated with the transfer price policy between Ubisoft Entertainment Inc. and Ubisoft EntertainmentNote 32 of the notes to the consolidated fi nancial statements
Risk identifi ed Response provided
The transfer price policy between the Company and its production subsidiary located in Canada, Ubisoft Entertainment Inc., is regularly the subject of discussions between French and Canadian tax authorities.
The note “Contingent liabilities” in Note 32 “Other liabilities” in the notes to the consolidated fi nancial statements indicates that:
♦ the Canadian tax authorities opened a tax audit in June 2017 on the 2014 – 2016 fi nancial years and issued an adjustment proposal for the period concerned;
♦ discussions are ongoing between the Canadian and French tax authorities to avoid the double taxation issue within the Ubisoft Group for the audited period.
The estimate of the risks, and if applicable, the associated provisions require the exercise of judgment by the Group based on the probability of resolution of the ongoing discussions between the Canadian and French tax authorities. The Ubisoft Group considers that it is probable that the discussions between the two tax authorities will be resolved without double taxation for the Group, and in this respect, provides information in the notes to the consolidated fi nancial statements on contingent liabilities.
Given the inherent uncertainties in respect of the resolution of these discussions, we consider that the assessment of the accounting treatment of this contingent liability by the Group is a key point of the audit.
To assess the reasonable nature of the risk estimate on the contingent liability for the transfer price policy between Ubisoft Entertainment Inc. and Ubisoft Entertainment by the Group, our work mainly consisted in:
♦ meeting with the Group’s Administration Department in order to identify the changes in the procedure on both the Canadian and French sides, and understanding its corresponding risk assessment;
♦ obtaining documentation supporting these changes in procedure; ♦ involving, where required, the Canadian auditors of Ubisoft
Entertainment Inc. to understand the points of the Canadian tax procedure;
♦ meeting with the Company’s tax consultants and analyzing the opinions and information on the ongoing procedures and their probable fi nancial consequences communicated by them in response to our written confi rmation requests.
❙ VERIFICATION OF THE GROUP’S MANAGEMENT REPORT
In accordance with the professional standards applicable in France, we have also carried out the specifi c verifi cation required by law of the information on the Group provided in the Group’s Management report.
We have no matters to report regarding the accuracy of this information and its consistency with the consolidated fi nancial statements.
❙ INFORMATION RESULTING FROM OTHER LEGAL AND REGULATORY OBLIGATIONS
Appointment of the Statutory Auditors
We were appointed as Statutory Auditors for Ubisoft Entertainment by your General Meeting of June 27, 2003 for KPMG Audit and of September 29, 2016 for MAZARS.
As at March 31, 2018, KPMG Audit was in its 15th year of uninterrupted work, including 15 years since the Company’s securities were admitted to trading in a regulated market, and MAZARS in its 2nd year of uninterrupted work.
- Document de référence 2018206
Financial statements
6
Statutory Auditors’ report on the consolidated fi nancial statements
❙ RESPONSIBILITIES OF THE MANAGEMENT TEAM AND THE PEOPLE COMPRISING THE CORPORATE GOVERNANCE WITH REGARD TO THE CONSOLIDATED FINANCIAL STATEMENTS
The management team is responsible for preparing consolidated fi nancial statements that present a true and fair view, in accordance with the IFRS standards as adopted by the European Union, and implementing the internal control it considers necessary for preparing consolidated fi nancial statements that do not include material misstatements, resulting either from fraud or errors.
When preparing the consolidated fi nancial statements, the management team is responsible for assessing the Company’s ability to continue its operations, and presenting in these fi nancial statements, if applicable, the information on the continuation of operations, and applying the accounting going-concern convention, unless it plans to liquidate the Company or cease its activity.
The Audit Committee is responsible for monitoring the fi nancial information preparation process and the effectiveness of the internal control and risk management systems, as well as, if applicable, internal audit, with respect to the procedures for the preparation and processing of accounting and fi nancial information.
The consolidated fi nancial statements have been approved by the Board of Directors.
❙ RESPONSIBILITIES OF THE STATUTORY AUDITORS RELATING TO THE AUDIT OF THE CONSOLIDATED FINANCIAL STATEMENTS
Audit objective and approach
We are responsible for preparing a report on the consolidated fi nancial statements. Our aim is to obtain reasonable assurance that the consolidated fi nancial statements taken as a whole do not include material misstatements. Reasonable assurance corresponds to a high level of assurance, without, however, guaranteeing that an audit conducted in accordance with professional standards would systematically detect all material misstatements. Misstatements from fraud or resulting from errors are considered to be material when we can reasonably expect that they may, taken individually or cumulatively, infl uence economic decisions that users of the fi nancial statements may take based on them.
As specifi ed in Article L. 823-10-1 of the French Commercial Code, our assignment to certify the fi nancial statements does not consist in guaranteeing the viability or the management quality of your Company.
As part of an audit conducted in accordance with the professional standards applicable in France, the Statutory Auditor exercises his/her professional judgment throughout the audit. Moreover:
♦ he/she identifi es and assesses the risks that the consolidated fi nancial statements include material misstatements from fraud or resulting from errors, defi nes and implements audit procedures faced with these risks and collects the elements that he/she considers suffi cient and appropriate on which to base his/her opinion. The risk of non-detection of a material misstatement resulting from fraud is higher than that of a misstatement resulting from an error, as the fraud may involve collusion, falsifi cation, voluntary omissions, false declarations or circumvention of internal control;
♦ he/she takes note of the relevant internal control for the audit in order to defi ne the relevant audit procedures, and not with the aim of expressing an opinion on the effectiveness of the internal control;
♦ he/she assesses the appropriate nature of the selected accounting principles and the reasonable nature of the accounting estimates made by the management team, as well as the information on them provided in the consolidated fi nancial statements;
♦ he/she assesses the relevant nature of the application of the going-concern accounting convention by the management team, and, depending on the elements collected, the existence of a signifi cant uncertainty with regard to the events or circumstances likely to call into question the Company’s ability to continue its operations. This assessment is based on the elements collected up to the date of his/her report, it being recalled that subsequent circumstances or events may call into question the continuation of operations. If he/she concludes that there is a signifi cant uncertainty, he/she calls the readers’ attention to the information provided in the consolidated fi nancial statements on the subject of this uncertainty, or, if this information is not provided or is not relevant, he/she formulates a certifi cation with reserves or refuses to certify;
♦ he/she assesses the overall presentation of the consolidated fi nancial statements and assesses if the consolidated fi nancial statements refl ect the underlying operations and events, in order to provide a true and fair view;
♦ with regard to the fi nancial information of the scope of consolidation comprising the consolidated persons and entities, he/she collects the elements that he/she considers suffi cient and appropriate in order to express an opinion on the consolidated fi nancial statements. He/she is responsible for managing, supervising and conducting the audit of the consolidated fi nancial statements as well as the opinion expressed on these fi nancial statements.
- Document de référence 2018 207
Financial statements6Statutory Auditors’ report on the consolidated fi nancial statements
Report to the Audit Committee
We provide a report to the Audit Committee presenting notably the scope of the audit work and the work program implemented, as well as the conclusions resulting from our work. We also draw its attention, if applicable, to the signifi cant weaknesses of the internal control that we have identifi ed with respect to the procedures for the preparation and processing of accounting and fi nancial information.
Amongst the elements communicated to the Audit Committee are the risks of material misstatements that we have considered to be the most important for the audit of the consolidated fi nancial statements, and that constitute as such the key points of the audit, which we are responsible for describing in this report.
We also provide the Audit Committee with the declaration provided for by Article 6 of (EU) Regulation No. 537-2014 confi rming our independence under the meaning of the rules applicable in France as set notably by Articles L. 822-10 to L. 822-14 of the French Commercial Code, and the Statutory Auditors’ Code of Ethics. If applicable, we discuss with the Audit Committee the risks weighing on our independence and the safeguard measures applied.
Rennes and Nantes, May 30, 2018
Statutory Auditors
KPMG AuditVincent Broyé
MAZARSArnaud Le Néen
- Document de référence 2018208
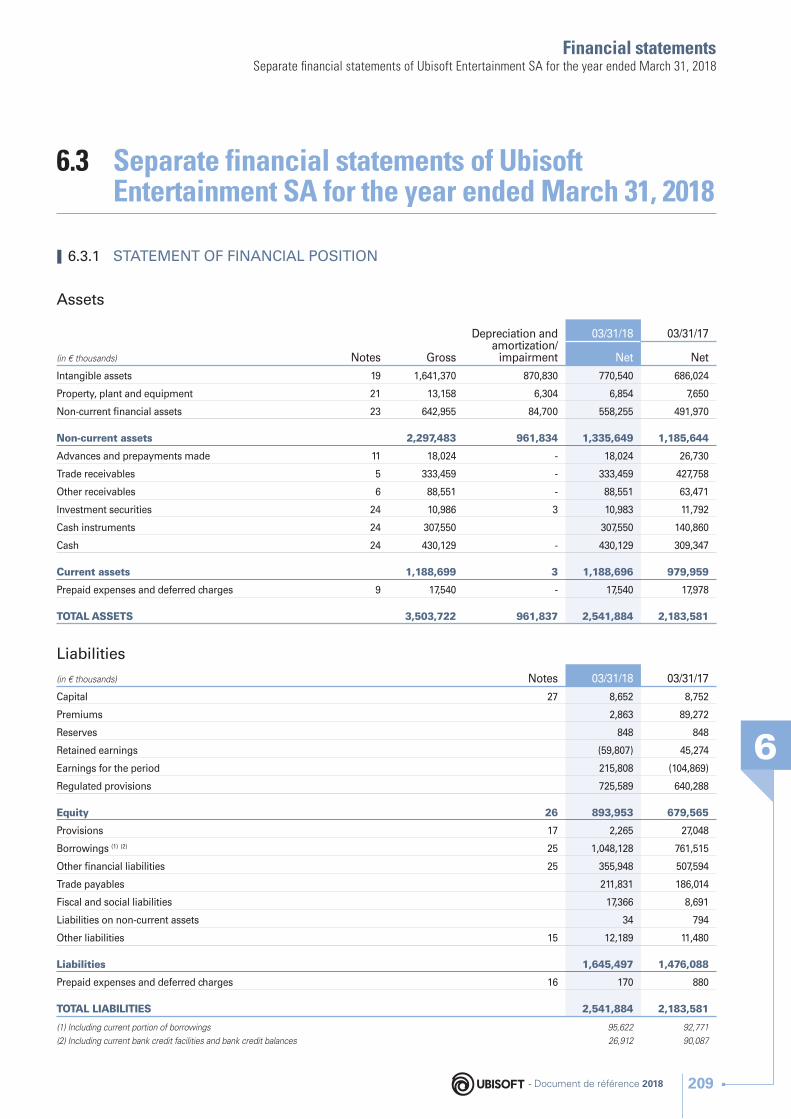
Financial statements
6
Separate fi nancial statements of Ubisoft Entertainment SA for the year ended March 31, 2018
6.3 Separate financial statements of Ubisoft Entertainment SA for the year ended March 31, 2018
❙ 6.3.1 STATEMENT OF FINANCIAL POSITION
Assets
(in € thousands) Notes Gross
Depreciation and amortization/
impairment
03/31/18 03/31/17
Net Net
Intangible assets 19 1,641,370 870,830 770,540 686,024
Property, plant and equipment 21 13,158 6,304 6,854 7,650
Non-current fi nancial assets 23 642,955 84,700 558,255 491,970
Non-current assets 2,297,483 961,834 1,335,649 1,185,644
Advances and prepayments made 11 18,024 - 18,024 26,730
Trade receivables 5 333,459 - 333,459 427,758
Other receivables 6 88,551 - 88,551 63,471
Investment securities 24 10,986 3 10,983 11,792
Cash instruments 24 307,550 307,550 140,860
Cash 24 430,129 - 430,129 309,347
Current assets 1,188,699 3 1,188,696 979,959
Prepaid expenses and deferred charges 9 17,540 - 17,540 17,978
TOTAL ASSETS 3,503,722 961,837 2,541,884 2,183,581
Liabilities
(in € thousands) Notes 03/31/18 03/31/17
Capital 27 8,652 8,752
Premiums 2,863 89,272
Reserves 848 848
Retained earnings (59,807) 45,274
Earnings for the period 215,808 (104,869)
Regulated provisions 725,589 640,288
Equity 26 893,953 679,565
Provisions 17 2,265 27,048
Borrowings (1) (2) 25 1,048,128 761,515
Other fi nancial liabilities 25 355,948 507,594
Trade payables 211,831 186,014
Fiscal and social liabilities 17,366 8,691
Liabilities on non-current assets 34 794
Other liabilities 15 12,189 11,480
Liabilities 1,645,497 1,476,088
Prepaid expenses and deferred charges 16 170 880
TOTAL LIABILITIES 2,541,884 2,183,581
(1) Including current portion of borrowings
(2) Including current bank credit facilities and bank credit balances
95,622
26,912
92,771
90,087
- Document de référence 2018 209
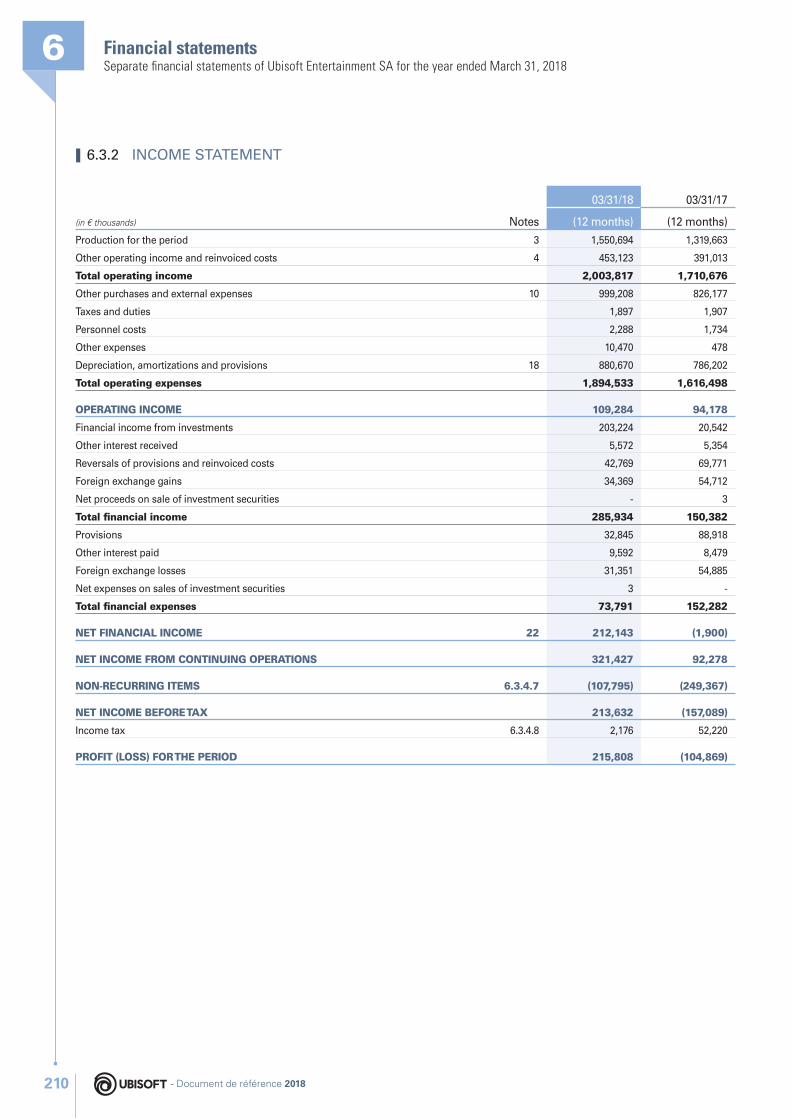
Financial statements6Separate fi nancial statements of Ubisoft Entertainment SA for the year ended March 31, 2018
❙ 6.3.2 INCOME STATEMENT
(in € thousands) Notes
03/31/18 03/31/17
(12 months) (12 months)
Production for the period 3 1,550,694 1,319,663
Other operating income and reinvoiced costs 4 453,123 391,013
Total operating income 2,003,817 1,710,676
Other purchases and external expenses 10 999,208 826,177
Taxes and duties 1,897 1,907
Personnel costs 2,288 1,734
Other expenses 10,470 478
Depreciation, amortizations and provisions 18 880,670 786,202
Total operating expenses 1,894,533 1,616,498
OPERATING INCOME 109,284 94,178
Financial income from investments 203,224 20,542
Other interest received 5,572 5,354
Reversals of provisions and reinvoiced costs 42,769 69,771
Foreign exchange gains 34,369 54,712
Net proceeds on sale of investment securities - 3
Total fi nancial income 285,934 150,382
Provisions 32,845 88,918
Other interest paid 9,592 8,479
Foreign exchange losses 31,351 54,885
Net expenses on sales of investment securities 3 -
Total fi nancial expenses 73,791 152,282
NET FINANCIAL INCOME 22 212,143 (1,900)
NET INCOME FROM CONTINUING OPERATIONS 321,427 92,278
NON-RECURRING ITEMS 6.3.4.7 (107,795) (249,367)
NET INCOME BEFORE TAX 213,632 (157,089)
Income tax 6.3.4.8 2,176 52,220
PROFIT (LOSS) FOR THE PERIOD 215,808 (104,869)
- Document de référence 2018210
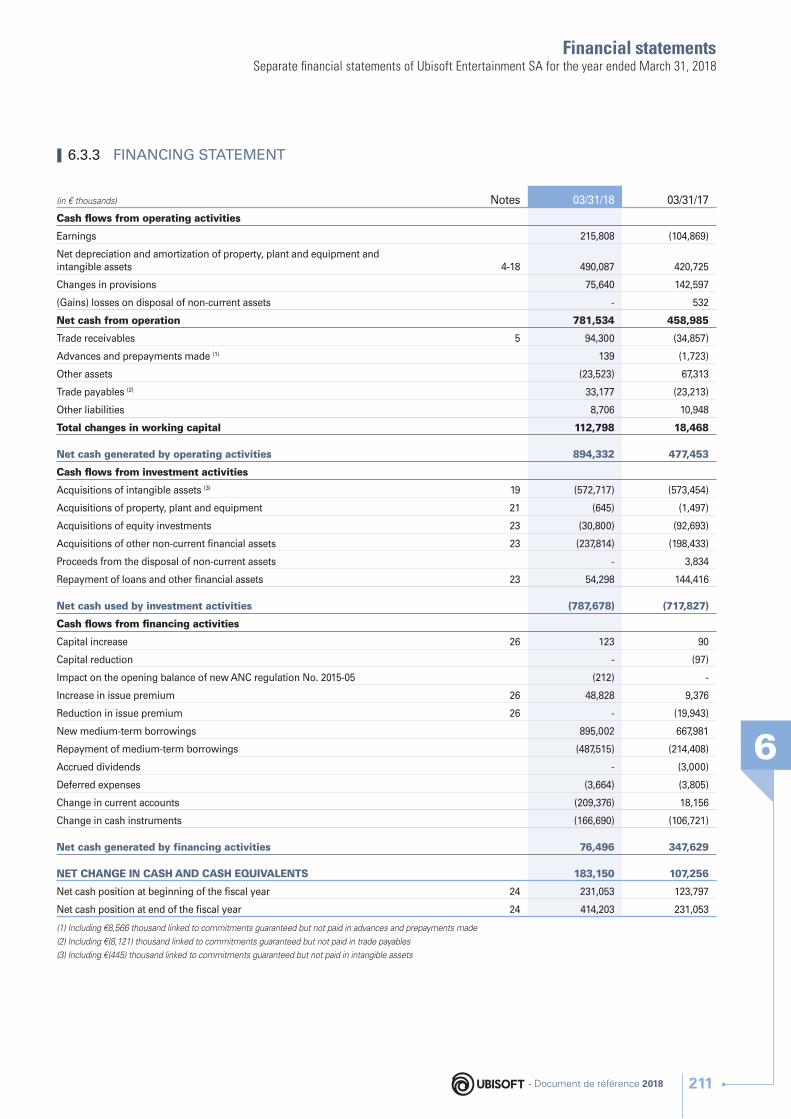
Financial statements
6
Separate fi nancial statements of Ubisoft Entertainment SA for the year ended March 31, 2018
❙ 6.3.3 FINANCING STATEMENT
(in € thousands) Notes 03/31/18 03/31/17
Cash fl ows from operating activities
Earnings 215,808 (104,869)
Net depreciation and amortization of property, plant and equipment and intangible assets 4-18 490,087 420,725
Changes in provisions 75,640 142,597
(Gains) losses on disposal of non-current assets - 532
Net cash from operation 781,534 458,985
Trade receivables 5 94,300 (34,857)
Advances and prepayments made (1) 139 (1,723)
Other assets (23,523) 67,313
Trade payables (2) 33,177 (23,213)
Other liabilities 8,706 10,948
Total changes in working capital 112,798 18,468
Net cash generated by operating activities 894,332 477,453
Cash fl ows from investment activities
Acquisitions of intangible assets (3) 19 (572,717) (573,454)
Acquisitions of property, plant and equipment 21 (645) (1,497)
Acquisitions of equity investments 23 (30,800) (92,693)
Acquisitions of other non-current fi nancial assets 23 (237,814) (198,433)
Proceeds from the disposal of non-current assets - 3,834
Repayment of loans and other fi nancial assets 23 54,298 144,416
Net cash used by investment activities (787,678) (717,827)
Cash fl ows from fi nancing activities
Capital increase 26 123 90
Capital reduction - (97)
Impact on the opening balance of new ANC regulation No. 2015-05 (212) -
Increase in issue premium 26 48,828 9,376
Reduction in issue premium 26 - (19,943)
New medium-term borrowings 895,002 667,981
Repayment of medium-term borrowings (487,515) (214,408)
Accrued dividends - (3,000)
Deferred expenses (3,664) (3,805)
Change in current accounts (209,376) 18,156
Change in cash instruments (166,690) (106,721)
Net cash generated by financing activities 76,496 347,629
NET CHANGE IN CASH AND CASH EQUIVALENTS 183,150 107,256
Net cash position at beginning of the fi scal year 24 231,053 123,797
Net cash position at end of the fi scal year 24 414,203 231,053
(1) Including €8,566 thousand linked to commitments guaranteed but not paid in advances and prepayments made
(2) Including €(8,121) thousand linked to commitments guaranteed but not paid in trade payables
(3) Including €(445) thousand linked to commitments guaranteed but not paid in intangible assets
- Document de référence 2018 211
Financial statements6Separate fi nancial statements of Ubisoft Entertainment SA for the year ended March 31, 2018
Note 1 Highlights and general principles 213Note 2 Comparability of financial statements 214Note 3 Production for the period 215Note 4 Other operating income and reinvoiced costs 215Note 5 Trade receivables 216Note 6 Other receivables 216Note 7 Statement of receivables 217Note 8 Accrued income 217Note 9 Prepaid expenses and deferred charges 217Note 10 Other purchases and external expenses 218Note 11 Advances and prepayments made 218Note 12 Supplier payment terms 219Note 13 Statement of liabilities 219Note 14 Accrued expenses 219Note 15 Other liabilities 220Note 16 Prepaid expenses and deferred charges 220Note 17 Provisions in the statement of financial position 220Note 18 Depreciation & amortization, impairment and provisions 221Note 19 Inventory value and changes during the financial year 221Note 20 Depreciation & amortization, impairment and provisions 223Note 21 Inventory value and changes during the financial year 224Note 22 Net financial income 225Note 23 Non-current financial assets 226Note 24 Investment securities, cash instruments and cash 227Note 25 Borrowings 227Note 26 Statement of change in equity 230Note 27 Capital 231Note 28 Financial commitments and other information 234Note 29 Related-party transactions 237
CONTENTS
❙ 6.3.4 NOTES TO THE SEPARATE FINANCIAL STATEMENTS
- Document de référence 2018212
Financial statements
6
Separate fi nancial statements of Ubisoft Entertainment SA for the year ended March 31, 2018
6.3.4.1 Description of the business and the basis of preparation for the fi nancial statements
NOTE 1 HIGHLIGHTS AND GENERAL PRINCIPLES
Financial year highlights
Financing ♦ July 2017: Signature of a new syndicated loan
A new syndicated loan was signed on July 18, 2017, for an amount of €300 million over 5 years, with the option of a one-year extension, renewable once. This line enables the refi nancing of the €250 million syndicated loan in place since 2014, with better fi nancing conditions and extended maturity.
♦ January 2018: Bond issue
The Company Board of Directors authorized the issue of bonds for a total amount of €500 million. These bonds, with a unit value of €100,000, were admitted for trading on the regulated market of Euronext Paris on January 30, 2018. This 5-year bond issue has an annual coupon of 1.289%.
♦ March 2018: Early loan repayment
On March 20, 2018, Ubisoft Entertainment SA carried out the early repayment of €150 million of the Schuldschein-type loan contracted in March 2015.
Other highlights ♦ June 2017: “MMO” employee stock ownership plan
The Company’s Board of Directors meeting of February 8, 2017 decided to carry out, on the one hand, a share disposal reserved for members of the Group savings scheme in accordance with the provisions of Article L. 3332-24 of the French Labor Code, and, on the other, a capital increase reserved for employees outside of the Group savings schemes. Benefi ciaries were offered the option of acquiring Company shares with a 15% discount as part of a leveraged Group savings scheme via a company mutual fund (FCPE) or stock appreciation rights (SAR). They benefi ted from an additional contribution equal to 300% of their personal contribution, capped at €900 per holder. After a fi ve-year period, or before the end of this period in the event of early release, each benefi ciary is also guaranteed to receive their initial investment in euros (comprising his/her personal contribution increased by the additional contribution) as well as a multiple of the possible average protected increase in the share price.
On July 27, 2017, Ubisoft Entertainment delivered 1,345,423 shares (FCPE formula) and created 967,480 shares (SAR formula) at a price of €41.77.
♦ November 2017: Capital reduction through the cancellation of treasury shares
During its meeting on November 17, 2017, the Board of Directors of Ubisoft Entertainment SA decided to reallocate 3,593,630 shares from the “external growth” objective to the “cancellation” objective, and to cancel these 3,593,630 shares, pursuant to the authorization of the Combined General Meeting of September 22, 2017 in its 21st resolution.
♦ January to March 2018: Prepayments received on dividends
Certain French and foreign subsidiaries carried out the prepayment of dividends to Ubisoft Entertainment SA for a total of €203 million.
♦ March 2018: Share buyback from Vivendi
Ubisoft committed to buy back from Vivendi 7,590,909 of its own shares as part of a structured transaction in the form of a forward sale of shares by Vivendi to Crédit Agricole Corporate and Investment Bank (CACIB) and a forward buyback mechanism by Ubisoft from CACIB, enabling Ubisoft’s share buybacks to be spread over the fi nancial years ending March 31, 2019 to March 31, 2021. This buyback will take place under two contracts: a prepaid forward sale contract for 4,545,454 shares, to be settled by the delivery of securities at maturity in 2021 or in advance, and a swap contract for 3,045,455 shares, to be settled at the maturity date or in advance on Ubisoft’s initiative either in cash, Ubisoft benefi ting from or bearing the valuation differences of the securities concerned, or by delivery of said securities against payment of the sale price. The swap contract is covered by a €100 million security deposit. All these acquisitions will be made at a price of €66 per share.
Thus, over the 2017/2018 fi nancial year, Ubisoft disbursed:
• €(303) million in relation to the prepaid forward contract, of which €300 million for the 4,545,454 shares at €66 and €3 million for the expenses stemming from the acquisition of said shares (see Note 24);
• €(100) million for the security deposit relating to the swap contract (see Note 23).
General information
The fi nancial year is a 12-month period from April 1, 2017 to March 31, 2018.
General principles
Ubisoft Entertainment SA’s separate fi nancial statements have been prepared in accordance with the ANC’s accounting regulation 2014-03, amended by regulation 2015-05 of July 2, 2015, regulation 2015-06 of November 23, 2015 and regulation 2016-07 of November 4, 2016.
The general accounting conventions were applied in accordance with the principle of fi nancial prudence and the following basic rules: going-concern assumption, continuity of accounting principles from one fi nancial year to the next, independence of fi nancial years, fair presentation, consistency and accuracy, and in accordance with the general rules governing the preparation and presentation of separate fi nancial statements.
The basic method used to measure items in the fi nancial statements was historical cost.
The accounting methods applied are consistent with industry practice.
- Document de référence 2018 213
Financial statements6Separate fi nancial statements of Ubisoft Entertainment SA for the year ended March 31, 2018
NOTE 2 COMPARABILITY OF FINANCIAL STATEMENTS
Change in estimation
None.
Change in method
First application of ANC regulation No. 2015-05 on forward fi nancial instruments and hedging transactions beginning on April 1, 2017
The principle of hedge accounting is now mandatory when a hedging relationship is identifi ed.
With respect to carry-back/carry-forward foreign exchanges, for the hedging of future transactions, the Group has chosen to recognize them in income symmetrically to the income of the element hedged when the hedging relationship reduces almost all of the risk.
Items affecting comparability
From April 1, 2017, the date of the fi rst application of ANC regulation No. 2015-05, the new accounting methods and the associated impacts are as follows:
Recognized item
Accounting method before ANC regulation No. 2015-05
Accounting method after ANC regulation No. 2015-05 Impact on the fi nancial statements
Result from foreign-exchange operations
The result from foreign-exchange operations is recognized in net fi nancial income.
The result from foreign-exchange operations is recognized in the same section of the income statement (operating or financial), symmetrically to the accounting method for the underlying income and expenses.
Reclassifi cation from fi nancial to operating for the result from foreign-exchange operations of operating receivables and liabilities in foreign currencies.The impact on the presentation of the fi nancial statements at 03/31/18 is as follows:€(416) thousand on net fi nancial income+ €416 thousand on operating income
Hedging result The result from hedging is recognized in net fi nancial income.
In line with the principle of symmetry in hedge accounting, income from hedging follows the same classifi cation as that of the hedged item and is presented in the same section of the income statement (operating or fi nancial)
Reclassifi cation from fi nancial to operating for the result from hedging of operating receivables and liabilities in foreign currencies.The impact on the presentation of the fi nancial statements at 03/31/18 is as follows:€(82) thousand on net fi nancial income+ €82 thousand on operating income
Non-hedged liabilities and debts in foreign currencies
Initial recognition at the invoicing rate and revaluation at the closing rate per foreign exchange gains and losses counterpart (#476/477).Foreign exchange gains and losses in assets are provisioned in net fi nancial income.
Initial recognition at the invoicing rate and revaluation at the closing rate per foreign exchange gains and losses counterpart (#476/477).Foreign exchange gains and losses in assets are provisioned in the same section of the income statement as the hedged item (i.e. in operating for trade receivables and liabilities).
Reclassifi cation of the provision for operating foreign exchange losses for trade receivables and liabilities.The impact on the presentation of the fi nancial statements at 03/31/18 is as follows:+ €262 thousand on net fi nancial income€(262) thousand on operating income
Hedged receivables and liabilities in foreign currencies
Recognition at the hedged rate without revaluation at the closing date.
Initial recognition at the invoicing rate and revaluation at the closing rate per hedging instruments counterpart (#52).The resulting component of the hedged item is revalued at the hedged price per hedging instruments counterpart (#52).
Revaluation of hedged receivables and liabilities at the closing rate per hedging instruments counterpart (#52).There is no impact on the fi nancial statements at 03/31/18.Impact on the statement of fi nancial position of the revaluation of the resulting component at the hedged price.The impact on the statement of fi nancial position at 03/31/18 is €(31) thousand.
Isolated open positions
Indication of the fair value in off-statement of fi nancial position commitments.Provisioning of negative fair values in order to show impairment losses on hedging instruments in the fi nancial statements
Recognition of the fair value on the statement of fi nancial position: other receivables (#46 D) per other liabilities counterpart (#46 C).Provisioning of negative fair values in order to show impairment losses on hedging instruments in the fi nancial statements.
Recognition of fair value of hedging instruments designated as isolated open positions in the statement of fi nancial position.The impact on the statement of fi nancial position at 03/31/18 is €86 thousand.
- Document de référence 2018214
Financial statements
6
Separate fi nancial statements of Ubisoft Entertainment SA for the year ended March 31, 2018
6.3.4.2 Sales
NOTE 3 PRODUCTION FOR THE PERIOD
Production for the period comprises:
♦ sales, essentially made up of intra-group invoicing of contributions;
♦ capitalized production refl ecting development costs outsourced to subsidiaries and external developers.
03/31/18 03/31/17
Sales 974,536 777,546
Capitalized production costs for commercial software developments 571,008 530,926
Capitalized production costs for external software developments 5,150 11,191
PRODUCTION FOR THE PERIOD 1,550,694 1,319,663
The breakdown of sales by geographic region was as follows:
03/31/18 03/31/17
(in € thousands) (as a %) (in € thousands) (as a %)
Europe 446,795 46% 352,391 45%
North America 491,770 50% 382,309 49%
Asia 32,559 3% 37,213 5%
Rest of the world 3,412 1% 5,633 1%
SALES 974,536 100% 777,546 100%
NOTE 4 OTHER OPERATING INCOME AND REINVOICED COSTS
03/31/18 03/31/17
Reversals of provisions for impairment of commercial software developments (1) 384,088 363,996
Reversals of provisions for impairment of external software developments 6,199 828
Reversal of provisions for brand impairment - 221
Reversal on provisions for operating foreign exchange risk (2) 189 -
Reinvoiced costs 52,103 25,968
Foreign exchange gains on forward instruments and commercial transactions (2) 10,460 -
Miscellaneous operating income 84 -
TOTAL 453,123 391,013
(1) See Note 18 for details
(2) Associated with the fi rst application of ANC regulation No. 2015-05
Reinvoiced costs essentially correspond to the rebilling of development kits, payments received under agreements with third parties, general expenses, etc.
- Document de référence 2018 215
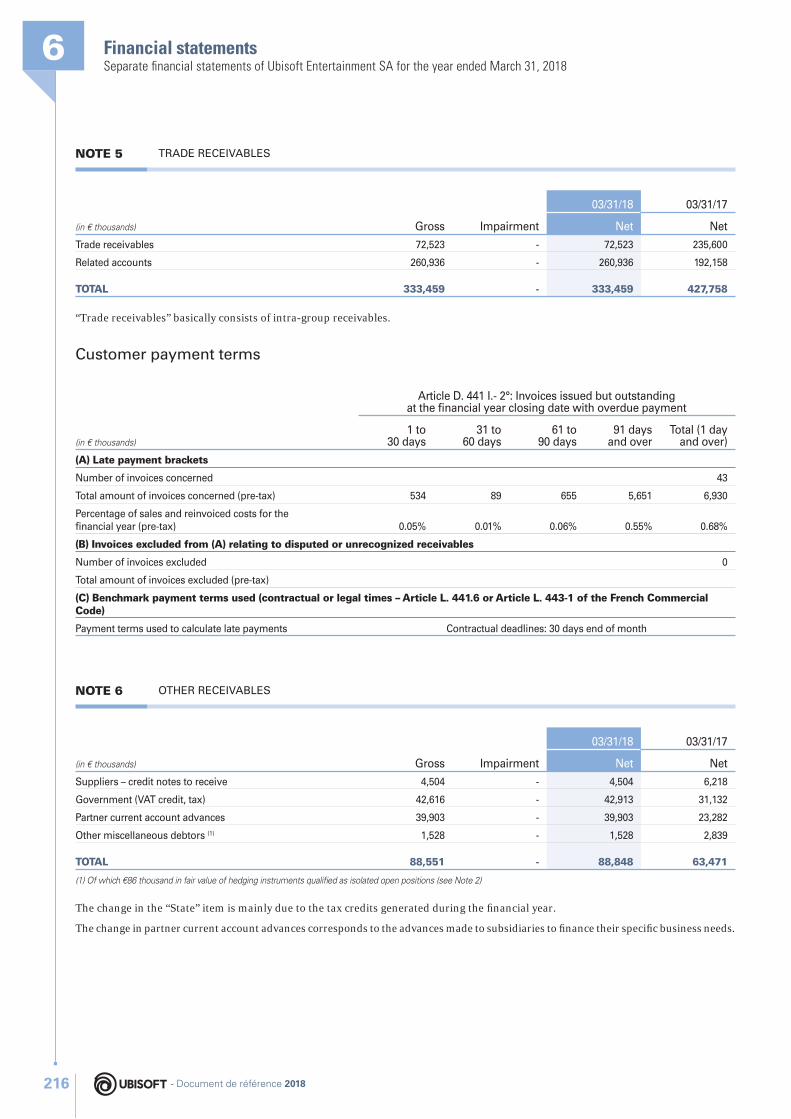
Financial statements6Separate fi nancial statements of Ubisoft Entertainment SA for the year ended March 31, 2018
NOTE 5 TRADE RECEIVABLES
(in € thousands) Gross Impairment
03/31/18 03/31/17
Net Net
Trade receivables 72,523 - 72,523 235,600
Related accounts 260,936 - 260,936 192,158
TOTAL 333,459 - 333,459 427,758
“Trade receivables” basically consists of intra-group receivables.
Customer payment terms
(in € thousands)
Article D. 441 I.- 2°: Invoices issued but outstanding at the fi nancial year closing date with overdue payment
1 to 30 days
31 to 60 days
61 to 90 days
91 days and over
Total (1 day and over)
(A) Late payment brackets
Number of invoices concerned 43
Total amount of invoices concerned (pre-tax) 534 89 655 5,651 6,930
Percentage of sales and reinvoiced costs for the fi nancial year (pre-tax) 0.05% 0.01% 0.06% 0.55% 0.68%
(B) Invoices excluded from (A) relating to disputed or unrecognized receivables
Number of invoices excluded 0
Total amount of invoices excluded (pre-tax)
(C) Benchmark payment terms used (contractual or legal times – Article L. 441.6 or Article L. 443-1 of the French Commercial Code)
Payment terms used to calculate late payments Contractual deadlines: 30 days end of month
NOTE 6 OTHER RECEIVABLES
(in € thousands) Gross Impairment
03/31/18 03/31/17
Net Net
Suppliers – credit notes to receive 4,504 - 4,504 6,218
Government (VAT credit, tax) 42,616 - 42,913 31,132
Partner current account advances 39,903 - 39,903 23,282
Other miscellaneous debtors (1) 1,528 - 1,528 2,839
TOTAL 88,551 - 88,848 63,471
(1) Of which €86 thousand in fair value of hedging instruments qualifi ed as isolated open positions (see Note 2)
The change in the “State” item is mainly due to the tax credits generated during the fi nancial year.
The change in partner current account advances corresponds to the advances made to subsidiaries to fi nance their specifi c business needs.
- Document de référence 2018216
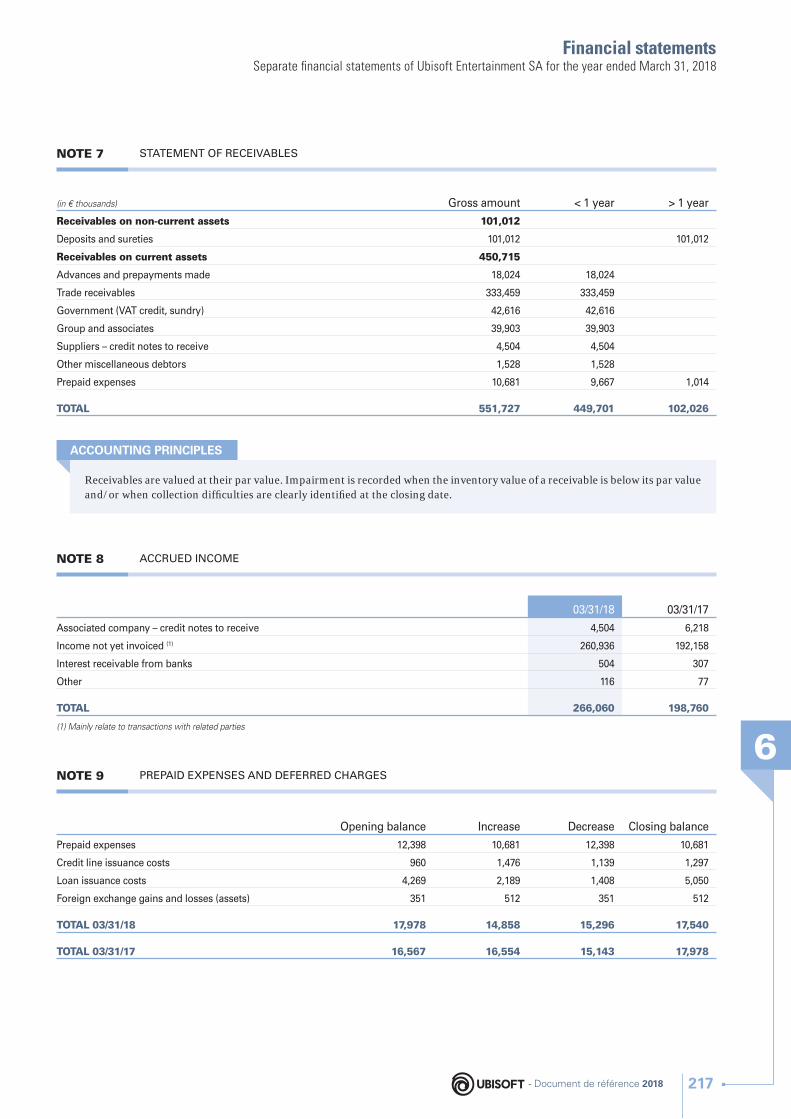
Financial statements
6
Separate fi nancial statements of Ubisoft Entertainment SA for the year ended March 31, 2018
NOTE 7 STATEMENT OF RECEIVABLES
(in € thousands) Gross amount < 1 year > 1 year
Receivables on non-current assets 101,012
Deposits and sureties 101,012 101,012
Receivables on current assets 450,715
Advances and prepayments made 18,024 18,024
Trade receivables 333,459 333,459
Government (VAT credit, sundry) 42,616 42,616
Group and associates 39,903 39,903
Suppliers – credit notes to receive 4,504 4,504
Other miscellaneous debtors 1,528 1,528
Prepaid expenses 10,681 9,667 1,014
TOTAL 551,727 449,701 102,026
Receivables are valued at their par value. Impairment is recorded when the inventory value of a receivable is below its par value and/or when collection diffi culties are clearly identifi ed at the closing date.
ACCOUNTING PRINCIPLES
NOTE 8 ACCRUED INCOME
03/31/18 03/31/17
Associated company – credit notes to receive 4,504 6,218
Income not yet invoiced (1) 260,936 192,158
Interest receivable from banks 504 307
Other 116 77
TOTAL 266,060 198,760
(1) Mainly relate to transactions with related parties
NOTE 9 PREPAID EXPENSES AND DEFERRED CHARGES
Opening balance Increase Decrease Closing balance
Prepaid expenses 12,398 10,681 12,398 10,681
Credit line issuance costs 960 1,476 1,139 1,297
Loan issuance costs 4,269 2,189 1,408 5,050
Foreign exchange gains and losses (assets) 351 512 351 512
TOTAL 03/31/18 17,978 14,858 15,296 17,540
TOTAL 03/31/17 16,567 16,554 15,143 17,978
- Document de référence 2018 217
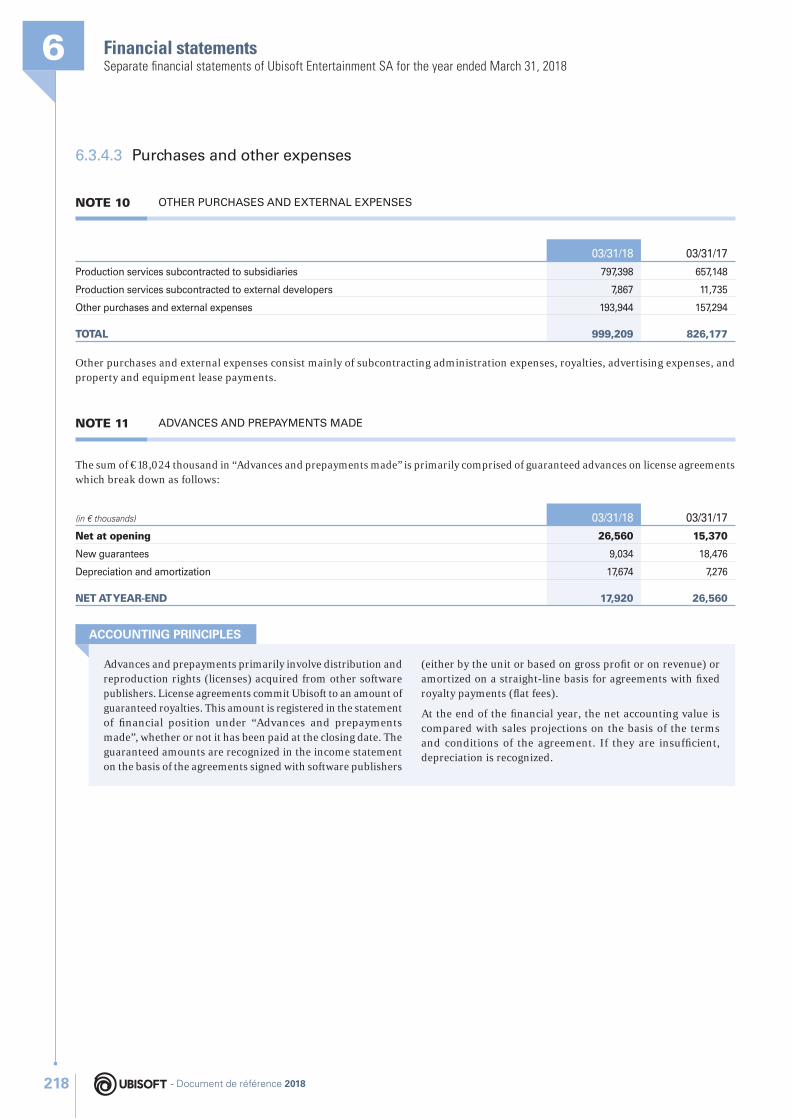
Financial statements6Separate fi nancial statements of Ubisoft Entertainment SA for the year ended March 31, 2018
6.3.4.3 Purchases and other expenses
NOTE 10 OTHER PURCHASES AND EXTERNAL EXPENSES
03/31/18 03/31/17
Production services subcontracted to subsidiaries 797,398 657,148
Production services subcontracted to external developers 7,867 11,735
Other purchases and external expenses 193,944 157,294
TOTAL 999,209 826,177
Other purchases and external expenses consist mainly of subcontracting administration expenses, royalties, advertising expenses, and property and equipment lease payments.
NOTE 11 ADVANCES AND PREPAYMENTS MADE
The sum of €18,024 thousand in “Advances and prepayments made” is primarily comprised of guaranteed advances on license agreements which break down as follows:
(in € thousands) 03/31/18 03/31/17
Net at opening 26,560 15,370
New guarantees 9,034 18,476
Depreciation and amortization 17,674 7,276
NET AT YEAR-END 17,920 26,560
Advances and prepayments primarily involve distribution and reproduction rights (licenses) acquired from other software publishers. License agreements commit Ubisoft to an amount of guaranteed royalties. This amount is registered in the statement of fi nancial position under “Advances and prepayments made”, whether or not it has been paid at the closing date. The guaranteed amounts are recognized in the income statement on the basis of the agreements signed with software publishers
(either by the unit or based on gross profi t or on revenue) or amortized on a straight-line basis for agreements with fi xed royalty payments (fl at fees).
At the end of the fi nancial year, the net accounting value is compared with sales projections on the basis of the terms and conditions of the agreement. If they are insuffi cient, depreciation is recognized.
ACCOUNTING PRINCIPLES
- Document de référence 2018218
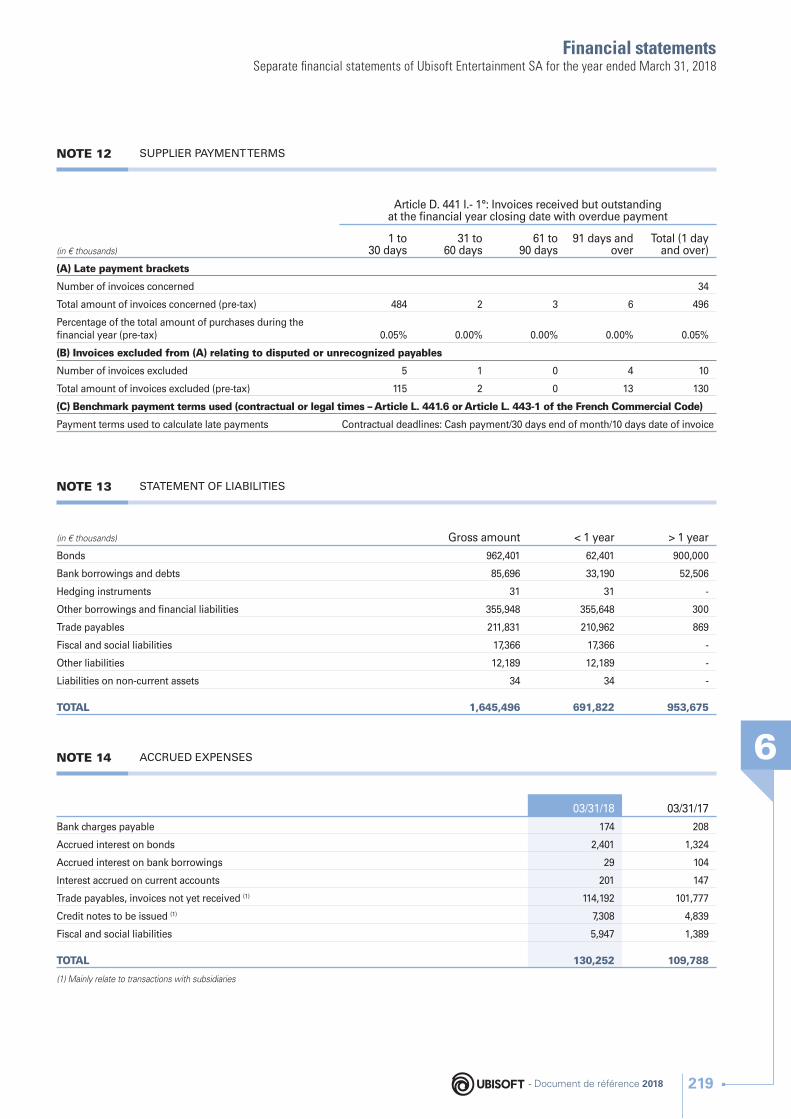
Financial statements
6
Separate fi nancial statements of Ubisoft Entertainment SA for the year ended March 31, 2018
NOTE 12 SUPPLIER PAYMENT TERMS
(in € thousands)
Article D. 441 I.- 1°: Invoices received but outstanding at the fi nancial year closing date with overdue payment
1 to 30 days
31 to 60 days
61 to 90 days
91 days and over
Total (1 day and over)
(A) Late payment brackets
Number of invoices concerned 34
Total amount of invoices concerned (pre-tax) 484 2 3 6 496
Percentage of the total amount of purchases during the fi nancial year (pre-tax) 0.05% 0.00% 0.00% 0.00% 0.05%
(B) Invoices excluded from (A) relating to disputed or unrecognized payables
Number of invoices excluded 5 1 0 4 10
Total amount of invoices excluded (pre-tax) 115 2 0 13 130
(C) Benchmark payment terms used (contractual or legal times – Article L. 441.6 or Article L. 443-1 of the French Commercial Code)
Payment terms used to calculate late payments Contractual deadlines: Cash payment/30 days end of month/10 days date of invoice
NOTE 13 STATEMENT OF LIABILITIES
(in € thousands) Gross amount < 1 year > 1 year
Bonds 962,401 62,401 900,000
Bank borrowings and debts 85,696 33,190 52,506
Hedging instruments 31 31 -
Other borrowings and fi nancial liabilities 355,948 355,648 300
Trade payables 211,831 210,962 869
Fiscal and social liabilities 17,366 17,366 -
Other liabilities 12,189 12,189 -
Liabilities on non-current assets 34 34 -
TOTAL 1,645,496 691,822 953,675
NOTE 14 ACCRUED EXPENSES
03/31/18 03/31/17
Bank charges payable 174 208
Accrued interest on bonds 2,401 1,324
Accrued interest on bank borrowings 29 104
Interest accrued on current accounts 201 147
Trade payables, invoices not yet received (1) 114,192 101,777
Credit notes to be issued (1) 7,308 4,839
Fiscal and social liabilities 5,947 1,389
TOTAL 130,252 109,788
(1) Mainly relate to transactions with subsidiaries
- Document de référence 2018 219
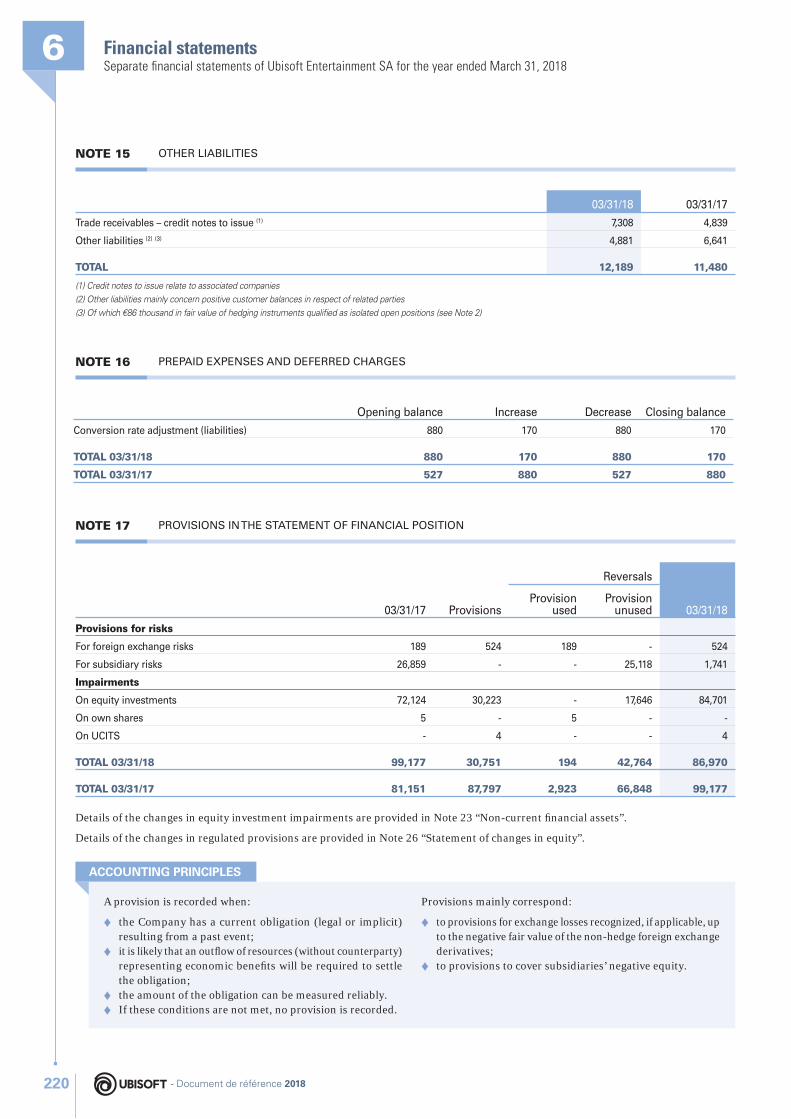
Financial statements6Separate fi nancial statements of Ubisoft Entertainment SA for the year ended March 31, 2018
NOTE 15 OTHER LIABILITIES
03/31/18 03/31/17
Trade receivables – credit notes to issue (1) 7,308 4,839
Other liabilities (2) (3) 4,881 6,641
TOTAL 12,189 11,480
(1) Credit notes to issue relate to associated companies
(2) Other liabilities mainly concern positive customer balances in respect of related parties
(3) Of which €86 thousand in fair value of hedging instruments qualifi ed as isolated open positions (see Note 2)
NOTE 16 PREPAID EXPENSES AND DEFERRED CHARGES
Opening balance Increase Decrease Closing balance
Conversion rate adjustment (liabilities) 880 170 880 170
TOTAL 03/31/18 880 170 880 170
TOTAL 03/31/17 527 880 527 880
NOTE 17 PROVISIONS IN THE STATEMENT OF FINANCIAL POSITION
03/31/17 Provisions
Reversals
03/31/18Provision
usedProvision
unused
Provisions for risks
For foreign exchange risks 189 524 189 - 524
For subsidiary risks 26,859 - - 25,118 1,741
Impairments
On equity investments 72,124 30,223 - 17,646 84,701
On own shares 5 - 5 - -
On UCITS - 4 - - 4
TOTAL 03/31/18 99,177 30,751 194 42,764 86,970
TOTAL 03/31/17 81,151 87,797 2,923 66,848 99,177
Details of the changes in equity investment impairments are provided in Note 23 “Non-current fi nancial assets”.
Details of the changes in regulated provisions are provided in Note 26 “Statement of changes in equity”.
A provision is recorded when:
♦ the Company has a current obligation (legal or implicit) resulting from a past event;
♦ it is likely that an outfl ow of resources (without counterparty) representing economic benefi ts will be required to settle the obligation;
♦ the amount of the obligation can be measured reliably.
♦ If these conditions are not met, no provision is recorded.
Provisions mainly correspond:
♦ to provisions for exchange losses recognized, if applicable, up to the negative fair value of the non-hedge foreign exchange derivatives;
♦ to provisions to cover subsidiaries’ negative equity.
ACCOUNTING PRINCIPLES
- Document de référence 2018220
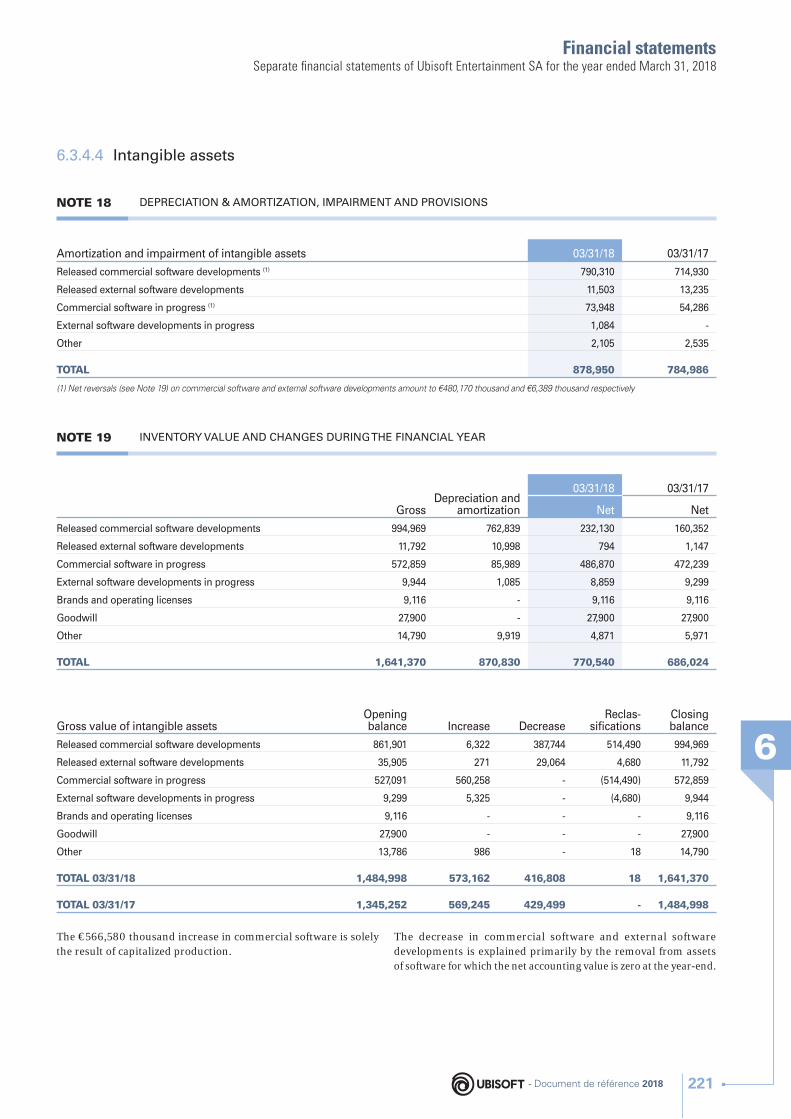
Financial statements
6
Separate fi nancial statements of Ubisoft Entertainment SA for the year ended March 31, 2018
6.3.4.4 Intangible assets
NOTE 18 DEPRECIATION & AMORTIZATION, IMPAIRMENT AND PROVISIONS
Amortization and impairment of intangible assets 03/31/18 03/31/17
Released commercial software developments (1) 790,310 714,930
Released external software developments 11,503 13,235
Commercial software in progress (1) 73,948 54,286
External software developments in progress 1,084 -
Other 2,105 2,535
TOTAL 878,950 784,986
(1) Net reversals (see Note 19) on commercial software and external software developments amount to €480,170 thousand and €6,389 thousand respectively
NOTE 19 INVENTORY VALUE AND CHANGES DURING THE FINANCIAL YEAR
GrossDepreciation and
amortization
03/31/18 03/31/17
Net Net
Released commercial software developments 994,969 762,839 232,130 160,352
Released external software developments 11,792 10,998 794 1,147
Commercial software in progress 572,859 85,989 486,870 472,239
External software developments in progress 9,944 1,085 8,859 9,299
Brands and operating licenses 9,116 - 9,116 9,116
Goodwill 27,900 - 27,900 27,900
Other 14,790 9,919 4,871 5,971
TOTAL 1,641,370 870,830 770,540 686,024
Gross value of intangible assetsOpening balance Increase Decrease
Reclas-sifi cations
Closing balance
Released commercial software developments 861,901 6,322 387,744 514,490 994,969
Released external software developments 35,905 271 29,064 4,680 11,792
Commercial software in progress 527,091 560,258 - (514,490) 572,859
External software developments in progress 9,299 5,325 - (4,680) 9,944
Brands and operating licenses 9,116 - - - 9,116
Goodwill 27,900 - - - 27,900
Other 13,786 986 - 18 14,790
TOTAL 03/31/18 1,484,998 573,162 416,808 18 1,641,370
TOTAL 03/31/17 1,345,252 569,245 429,499 - 1,484,998
The €566,580 thousand increase in commercial software is solely the result of capitalized production.
The decrease in commercial software and external software developments is explained primarily by the removal from assets of software for which the net accounting value is zero at the year-end.
- Document de référence 2018 221
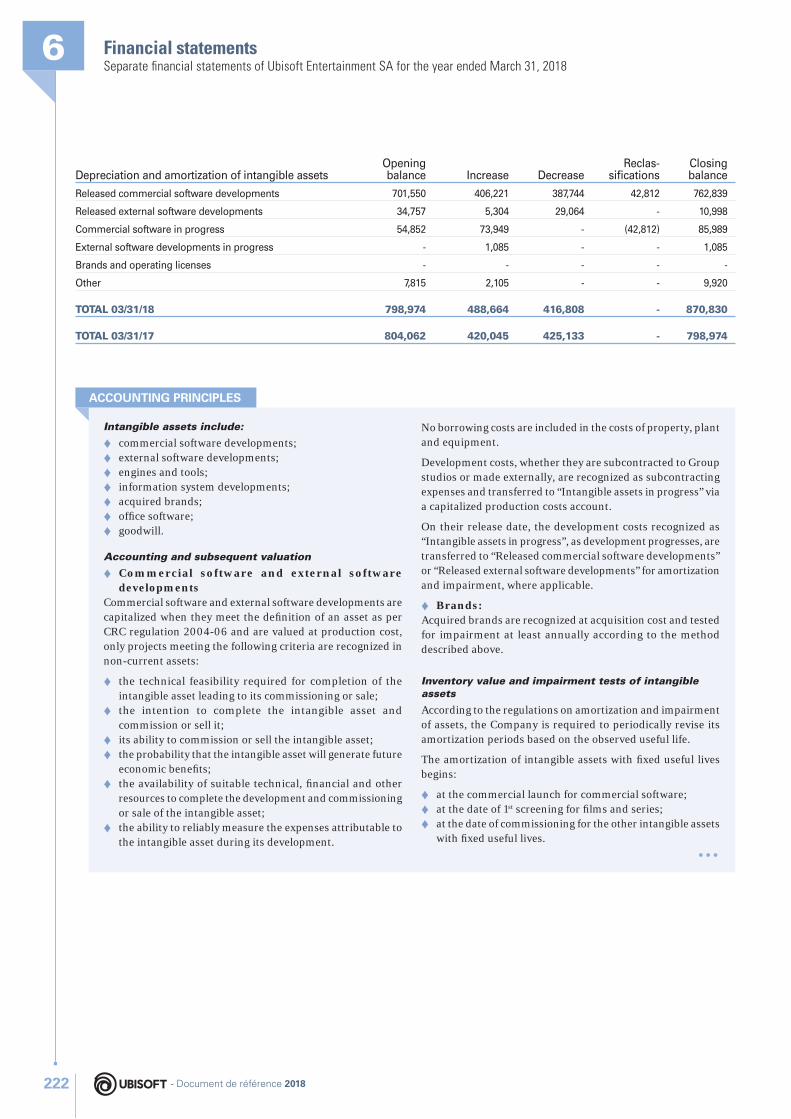
Financial statements6Separate fi nancial statements of Ubisoft Entertainment SA for the year ended March 31, 2018
Depreciation and amortization of intangible assetsOpening balance Increase Decrease
Reclas-sifi cations
Closing balance
Released commercial software developments 701,550 406,221 387,744 42,812 762,839
Released external software developments 34,757 5,304 29,064 - 10,998
Commercial software in progress 54,852 73,949 - (42,812) 85,989
External software developments in progress - 1,085 - - 1,085
Brands and operating licenses - - - - -
Other 7,815 2,105 - - 9,920
TOTAL 03/31/18 798,974 488,664 416,808 - 870,830
TOTAL 03/31/17 804,062 420,045 425,133 - 798,974
Intangible assets include:
♦ commercial software developments;
♦ external software developments;
♦ engines and tools;
♦ information system developments;
♦ acquired brands;
♦ offi ce software;
♦ goodwill.
Accounting and subsequent valuation
♦ Commercial software and external software developments
Commercial software and external software developments are capitalized when they meet the defi nition of an asset as per CRC regulation 2004-06 and are valued at production cost, only projects meeting the following criteria are recognized in non-current assets:
♦ the technical feasibility required for completion of the intangible asset leading to its commissioning or sale;
♦ the intention to complete the intangible asset and commission or sell it;
♦ its ability to commission or sell the intangible asset;
♦ the probability that the intangible asset will generate future economic benefi ts;
♦ the availability of suitable technical, fi nancial and other resources to complete the development and commissioning or sale of the intangible asset;
♦ the ability to reliably measure the expenses attributable to the intangible asset during its development.
No borrowing costs are included in the costs of property, plant and equipment.
Development costs, whether they are subcontracted to Group studios or made externally, are recognized as subcontracting expenses and transferred to “Intangible assets in progress” via a capitalized production costs account.
On their release date, the development costs recognized as “Intangible assets in progress”, as development progresses, are transferred to “Released commercial software developments” or “Released external software developments” for amortization and impairment, where applicable.
♦ Brands:Acquired brands are recognized at acquisition cost and tested for impairment at least annually according to the method described above.
Inventory value and impairment tests of intangible assets
According to the regulations on amortization and impairment of assets, the Company is required to periodically revise its amortization periods based on the observed useful life.
The amortization of intangible assets with fi xed useful lives begins:
♦ at the commercial launch for commercial software;
♦ at the date of 1st screening for fi lms and series;
♦ at the date of commissioning for the other intangible assets with fi xed useful lives.
...
ACCOUNTING PRINCIPLES
- Document de référence 2018222
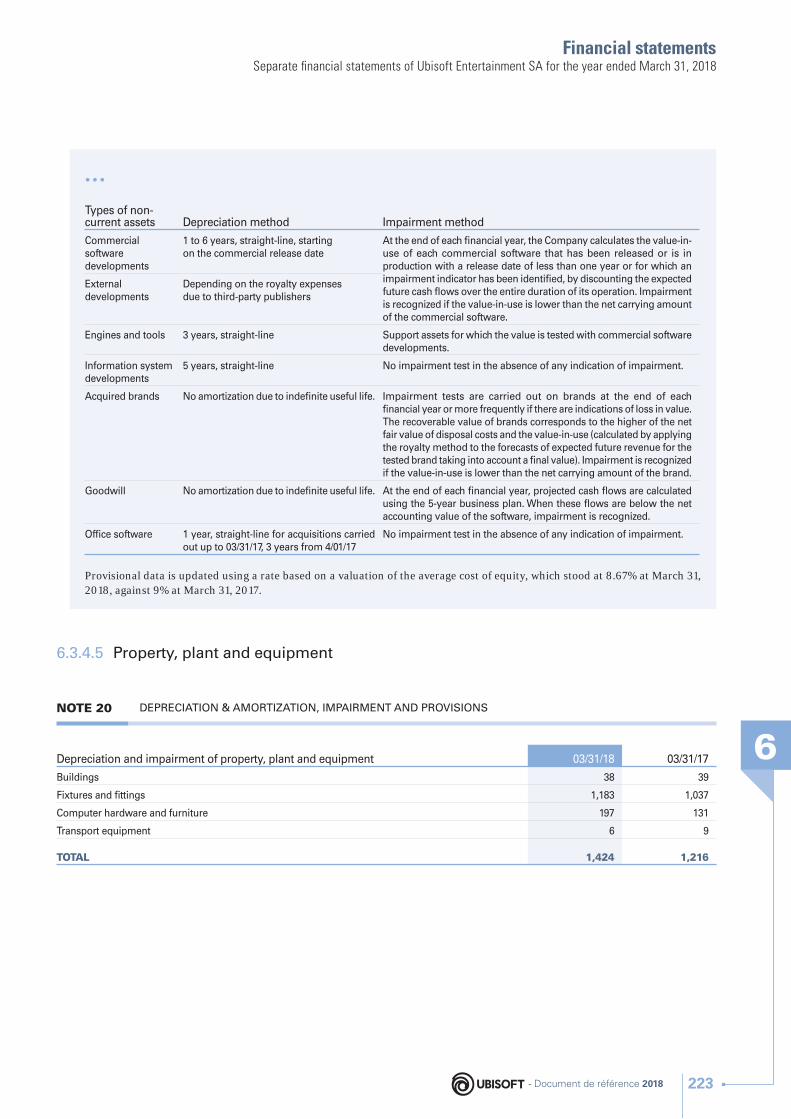
Financial statements
6
Separate fi nancial statements of Ubisoft Entertainment SA for the year ended March 31, 2018
...
Types of non-current assets Depreciation method Impairment method
Commercial software developments
1 to 6 years, straight-line, starting on the commercial release date
At the end of each fi nancial year, the Company calculates the value-in-use of each commercial software that has been released or is in production with a release date of less than one year or for which an impairment indicator has been identifi ed, by discounting the expected future cash fl ows over the entire duration of its operation. Impairment is recognized if the value-in-use is lower than the net carrying amount of the commercial software.
External developments
Depending on the royalty expenses due to third-party publishers
Engines and tools 3 years, straight-line Support assets for which the value is tested with commercial software developments.
Information system developments
5 years, straight-line No impairment test in the absence of any indication of impairment.
Acquired brands No amortization due to indefi nite useful life. Impairment tests are carried out on brands at the end of each fi nancial year or more frequently if there are indications of loss in value. The recoverable value of brands corresponds to the higher of the net fair value of disposal costs and the value-in-use (calculated by applying the royalty method to the forecasts of expected future revenue for the tested brand taking into account a fi nal value). Impairment is recognized if the value-in-use is lower than the net carrying amount of the brand.
Goodwill No amortization due to indefi nite useful life. At the end of each fi nancial year, projected cash fl ows are calculated using the 5-year business plan. When these fl ows are below the net accounting value of the software, impairment is recognized.
Offi ce software 1 year, straight-line for acquisitions carried out up to 03/31/17, 3 years from 4/01/17
No impairment test in the absence of any indication of impairment.
Provisional data is updated using a rate based on a valuation of the average cost of equity, which stood at 8.67% at March 31, 2018, against 9% at March 31, 2017.
6.3.4.5 Property, plant and equipment
NOTE 20 DEPRECIATION & AMORTIZATION, IMPAIRMENT AND PROVISIONS
Depreciation and impairment of property, plant and equipment 03/31/18 03/31/17
Buildings 38 39
Fixtures and fi ttings 1,183 1,037
Computer hardware and furniture 197 131
Transport equipment 6 9
TOTAL 1,424 1,216
- Document de référence 2018 223
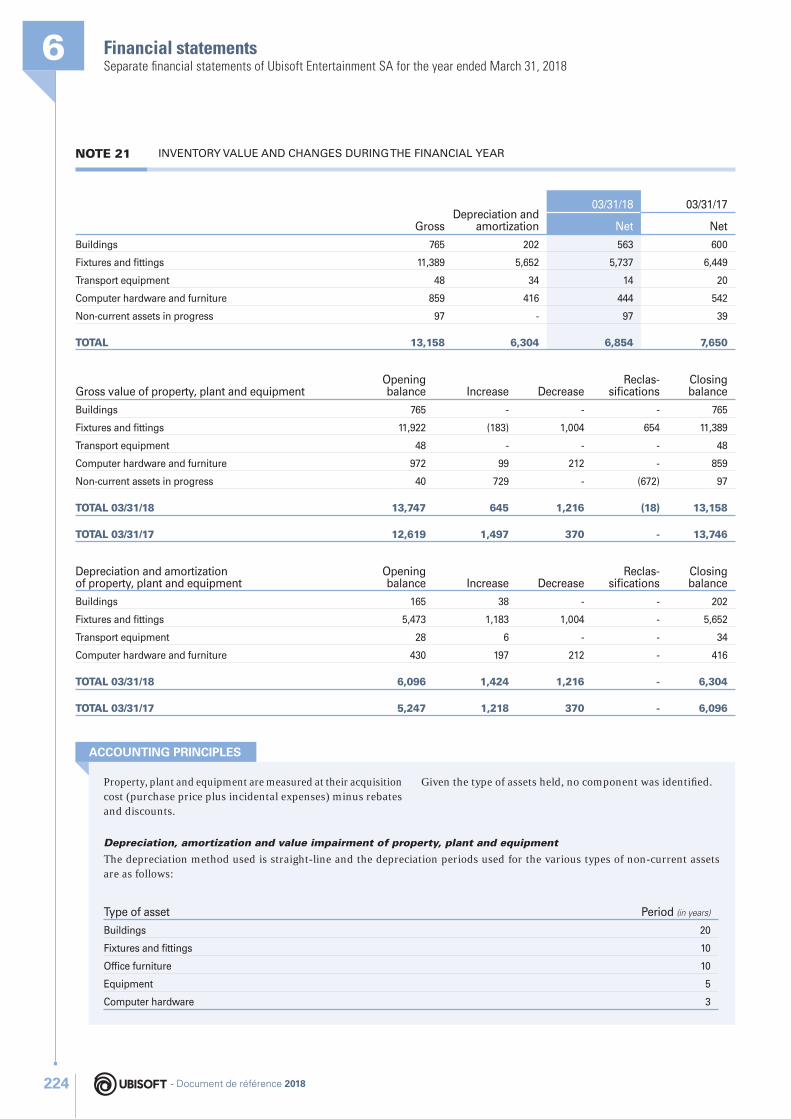
Financial statements6Separate fi nancial statements of Ubisoft Entertainment SA for the year ended March 31, 2018
NOTE 21 INVENTORY VALUE AND CHANGES DURING THE FINANCIAL YEAR
GrossDepreciation and
amortization
03/31/18 03/31/17
Net Net
Buildings 765 202 563 600
Fixtures and fi ttings 11,389 5,652 5,737 6,449
Transport equipment 48 34 14 20
Computer hardware and furniture 859 416 444 542
Non-current assets in progress 97 - 97 39
TOTAL 13,158 6,304 6,854 7,650
Gross value of property, plant and equipmentOpening balance Increase Decrease
Reclas-sifi cations
Closing balance
Buildings 765 - - - 765
Fixtures and fi ttings 11,922 (183) 1,004 654 11,389
Transport equipment 48 - - - 48
Computer hardware and furniture 972 99 212 - 859
Non-current assets in progress 40 729 - (672) 97
TOTAL 03/31/18 13,747 645 1,216 (18) 13,158
TOTAL 03/31/17 12,619 1,497 370 - 13,746
Depreciation and amortization of property, plant and equipment
Opening balance Increase Decrease
Reclas-sifi cations
Closing balance
Buildings 165 38 - - 202
Fixtures and fi ttings 5,473 1,183 1,004 - 5,652
Transport equipment 28 6 - - 34
Computer hardware and furniture 430 197 212 - 416
TOTAL 03/31/18 6,096 1,424 1,216 - 6,304
TOTAL 03/31/17 5,247 1,218 370 - 6,096
Property, plant and equipment are measured at their acquisition cost (purchase price plus incidental expenses) minus rebates and discounts.
Given the type of assets held, no component was identifi ed.
Depreciation, amortization and value impairment of property, plant and equipment
The depreciation method used is straight-line and the depreciation periods used for the various types of non-current assets are as follows:
Type of asset Period (in years)
Buildings 20
Fixtures and fi ttings 10
Offi ce furniture 10
Equipment 5
Computer hardware 3
ACCOUNTING PRINCIPLES
- Document de référence 2018224
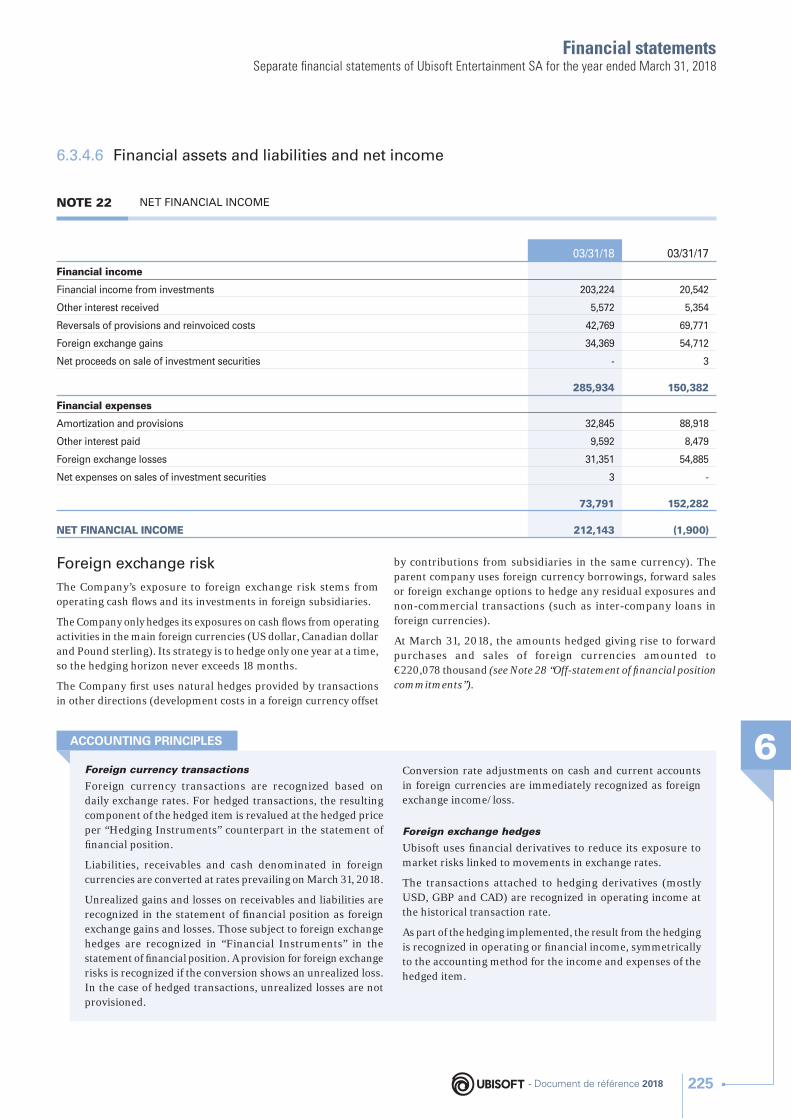
Financial statements
6
Separate fi nancial statements of Ubisoft Entertainment SA for the year ended March 31, 2018
6.3.4.6 Financial assets and liabilities and net income
NOTE 22 NET FINANCIAL INCOME
03/31/18 03/31/17
Financial income
Financial income from investments 203,224 20,542
Other interest received 5,572 5,354
Reversals of provisions and reinvoiced costs 42,769 69,771
Foreign exchange gains 34,369 54,712
Net proceeds on sale of investment securities - 3
285,934 150,382
Financial expenses
Amortization and provisions 32,845 88,918
Other interest paid 9,592 8,479
Foreign exchange losses 31,351 54,885
Net expenses on sales of investment securities 3 -
73,791 152,282
NET FINANCIAL INCOME 212,143 (1,900)
Foreign exchange risk
The Company’s exposure to foreign exchange risk stems from operating cash fl ows and its investments in foreign subsidiaries.
The Company only hedges its exposures on cash fl ows from operating activities in the main foreign currencies (US dollar, Canadian dollar and Pound sterling). Its strategy is to hedge only one year at a time, so the hedging horizon never exceeds 18 months.
The Company fi rst uses natural hedges provided by transactions in other directions (development costs in a foreign currency offset
by contributions from subsidiaries in the same currency). The parent company uses foreign currency borrowings, forward sales or foreign exchange options to hedge any residual exposures and non-commercial transactions (such as inter-company loans in foreign currencies).
At March 31, 2018, the amounts hedged giving rise to forward purchases and sales of foreign currencies amounted to €220,078 thousand (see Note 28 “Off-statement of fi nancial position commitments”).
Foreign currency transactions
Foreign currency transactions are recognized based on daily exchange rates. For hedged transactions, the resulting component of the hedged item is revalued at the hedged price per “Hedging Instruments” counterpart in the statement of fi nancial position.
Liabilities, receivables and cash denominated in foreign currencies are converted at rates prevailing on March 31, 2018.
Unrealized gains and losses on receivables and liabilities are recognized in the statement of fi nancial position as foreign exchange gains and losses. Those subject to foreign exchange hedges are recognized in “Financial Instruments” in the statement of fi nancial position. A provision for foreign exchange risks is recognized if the conversion shows an unrealized loss. In the case of hedged transactions, unrealized losses are not provisioned.
Conversion rate adjustments on cash and current accounts in foreign currencies are immediately recognized as foreign exchange income/loss.
Foreign exchange hedges
Ubisoft uses fi nancial derivatives to reduce its exposure to market risks linked to movements in exchange rates.
The transactions attached to hedging derivatives (mostly USD, GBP and CAD) are recognized in operating income at the historical transaction rate.
As part of the hedging implemented, the result from the hedging is recognized in operating or fi nancial income, symmetrically to the accounting method for the income and expenses of the hedged item.
ACCOUNTING PRINCIPLES
- Document de référence 2018 225
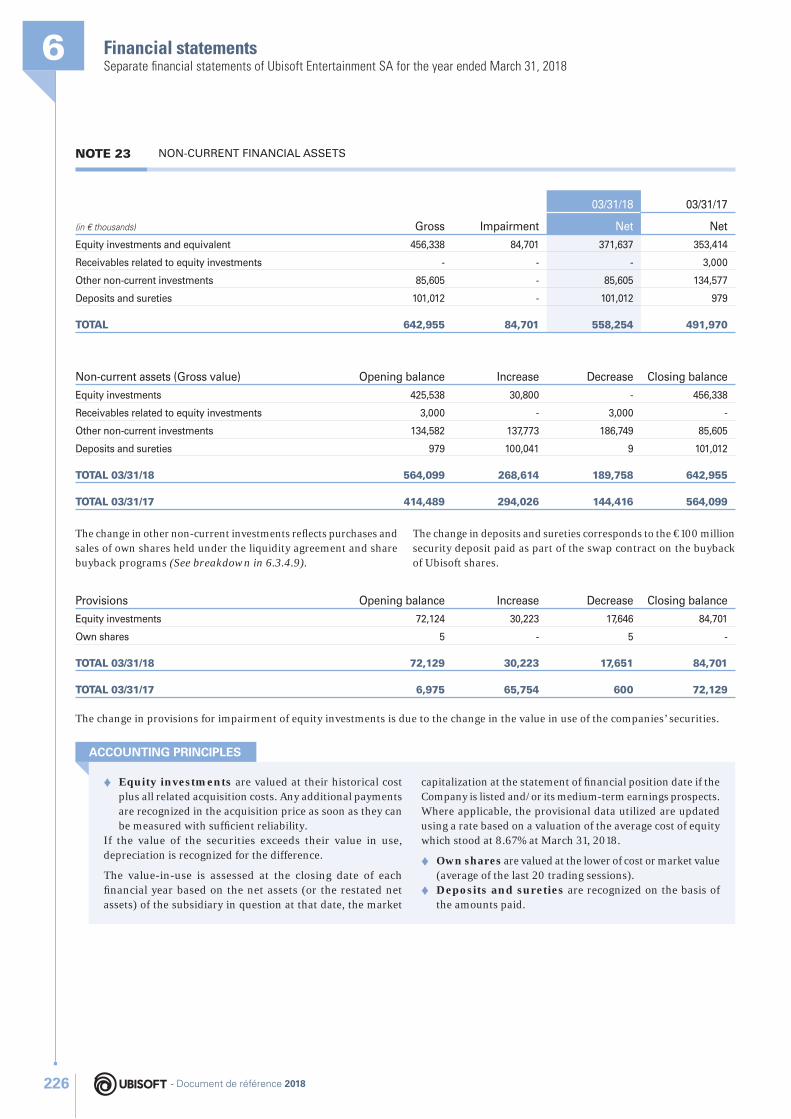
Financial statements6Separate fi nancial statements of Ubisoft Entertainment SA for the year ended March 31, 2018
NOTE 23 NON-CURRENT FINANCIAL ASSETS
(in € thousands) Gross Impairment
03/31/18 03/31/17
Net Net
Equity investments and equivalent 456,338 84,701 371,637 353,414
Receivables related to equity investments - - - 3,000
Other non-current investments 85,605 - 85,605 134,577
Deposits and sureties 101,012 - 101,012 979
TOTAL 642,955 84,701 558,254 491,970
Non-current assets (Gross value) Opening balance Increase Decrease Closing balance
Equity investments 425,538 30,800 - 456,338
Receivables related to equity investments 3,000 - 3,000 -
Other non-current investments 134,582 137,773 186,749 85,605
Deposits and sureties 979 100,041 9 101,012
TOTAL 03/31/18 564,099 268,614 189,758 642,955
TOTAL 03/31/17 414,489 294,026 144,416 564,099
The change in other non-current investments refl ects purchases and sales of own shares held under the liquidity agreement and share buyback programs (See breakdown in 6.3.4.9).
The change in deposits and sureties corresponds to the €100 million security deposit paid as part of the swap contract on the buyback of Ubisoft shares.
Provisions Opening balance Increase Decrease Closing balance
Equity investments 72,124 30,223 17,646 84,701
Own shares 5 - 5 -
TOTAL 03/31/18 72,129 30,223 17,651 84,701
TOTAL 03/31/17 6,975 65,754 600 72,129
The change in provisions for impairment of equity investments is due to the change in the value in use of the companies’ securities.
♦ Equity investments are valued at their historical cost plus all related acquisition costs. Any additional payments are recognized in the acquisition price as soon as they can be measured with suffi cient reliability.
If the value of the securities exceeds their value in use, depreciation is recognized for the difference.
The value-in-use is assessed at the closing date of each fi nancial year based on the net assets (or the restated net assets) of the subsidiary in question at that date, the market
capitalization at the statement of fi nancial position date if the Company is listed and/or its medium-term earnings prospects. Where applicable, the provisional data utilized are updated using a rate based on a valuation of the average cost of equity which stood at 8.67% at March 31, 2018.
♦ Own shares are valued at the lower of cost or market value (average of the last 20 trading sessions).
♦ Deposits and sureties are recognized on the basis of the amounts paid.
ACCOUNTING PRINCIPLES
- Document de référence 2018226
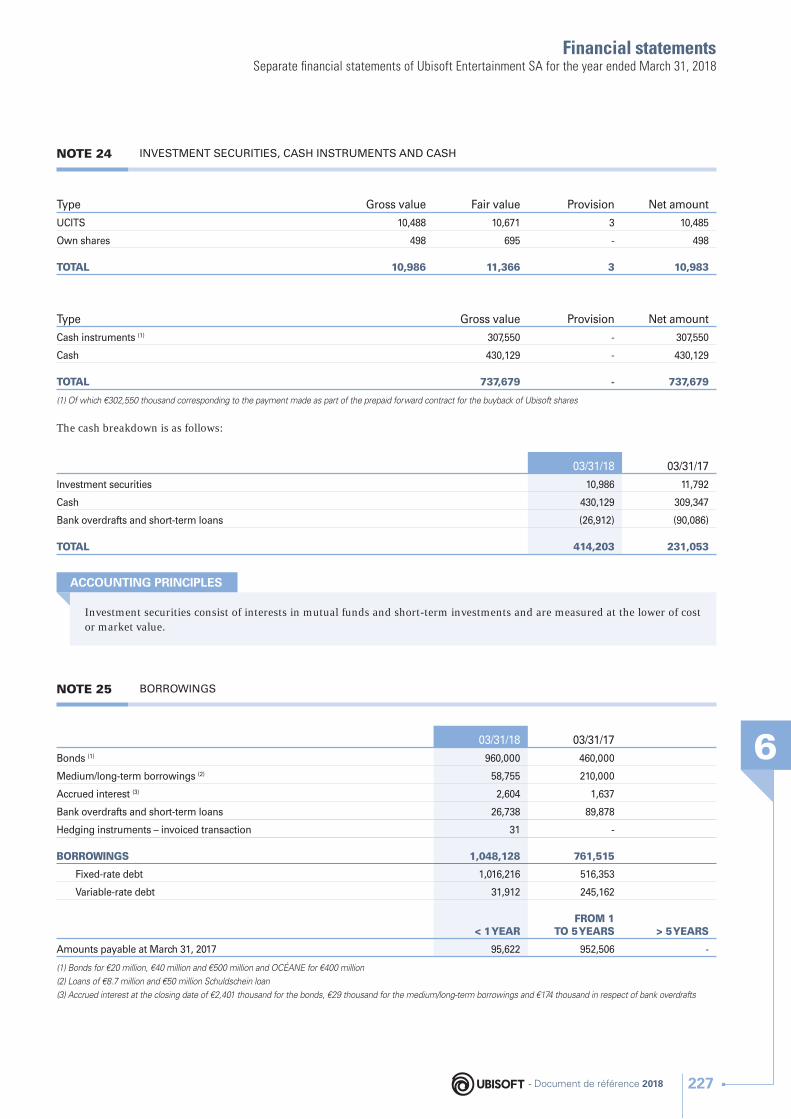
Financial statements
6
Separate fi nancial statements of Ubisoft Entertainment SA for the year ended March 31, 2018
NOTE 24 INVESTMENT SECURITIES, CASH INSTRUMENTS AND CASH
Type Gross value Fair value Provision Net amount
UCITS 10,488 10,671 3 10,485
Own shares 498 695 - 498
TOTAL 10,986 11,366 3 10,983
Type Gross value Provision Net amount
Cash instruments (1) 307,550 - 307,550
Cash 430,129 - 430,129
TOTAL 737,679 - 737,679
(1) Of which €302,550 thousand corresponding to the payment made as part of the prepaid forward contract for the buyback of Ubisoft shares
The cash breakdown is as follows:
03/31/18 03/31/17
Investment securities 10,986 11,792
Cash 430,129 309,347
Bank overdrafts and short-term loans (26,912) (90,086)
TOTAL 414,203 231,053
Investment securities consist of interests in mutual funds and short-term investments and are measured at the lower of cost or market value.
ACCOUNTING PRINCIPLES
NOTE 25 BORROWINGS
03/31/18 03/31/17
Bonds (1) 960,000 460,000
Medium/long-term borrowings (2) 58,755 210,000
Accrued interest (3) 2,604 1,637
Bank overdrafts and short-term loans 26,738 89,878
Hedging instruments – invoiced transaction 31 -
BORROWINGS 1,048,128 761,515
Fixed-rate debt 1,016,216 516,353
Variable-rate debt 31,912 245,162
< 1 YEARFROM 1
TO 5 YEARS > 5 YEARS
Amounts payable at March 31, 2017 95,622 952,506 -
(1) Bonds for €20 million, €40 million and €500 million and OCÉANE for €400 million
(2) Loans of €8.7 million and €50 million Schuldschein loan
(3) Accrued interest at the closing date of €2,401 thousand for the bonds, €29 thousand for the medium/long-term borrowings and €174 thousand in respect of bank overdrafts
- Document de référence 2018 227
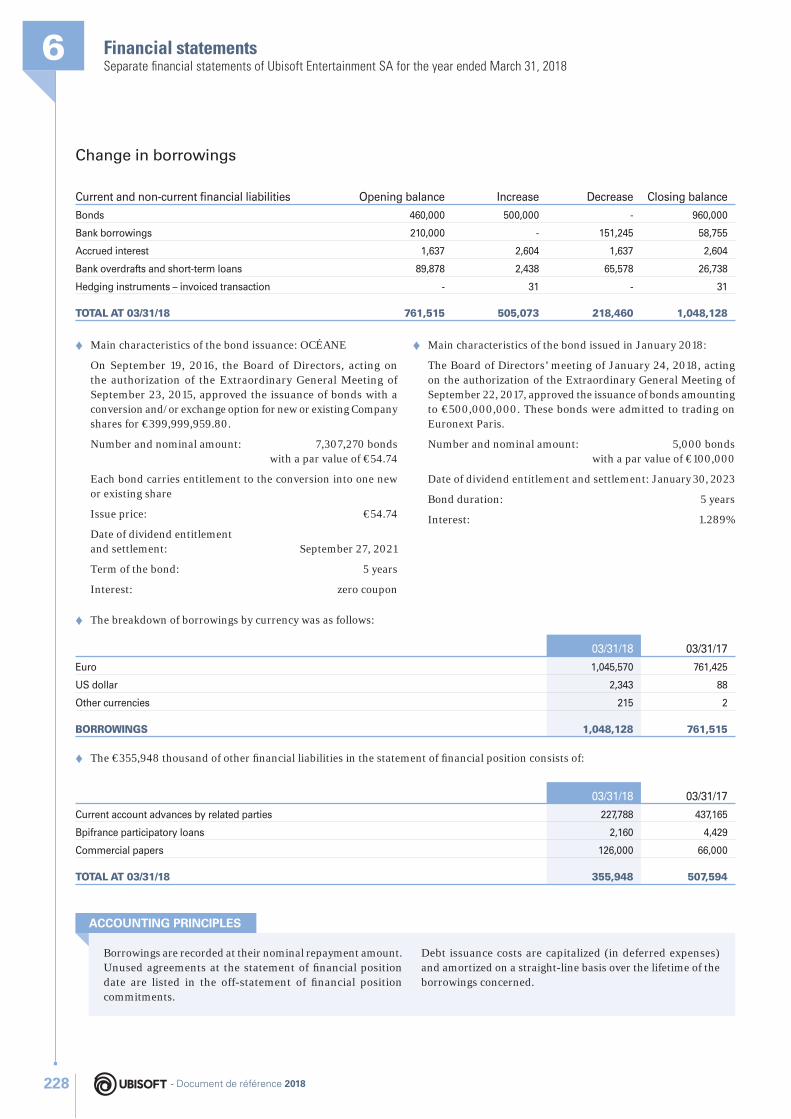
Financial statements6Separate fi nancial statements of Ubisoft Entertainment SA for the year ended March 31, 2018
Change in borrowings
Current and non-current fi nancial liabilities Opening balance Increase Decrease Closing balance
Bonds 460,000 500,000 - 960,000
Bank borrowings 210,000 - 151,245 58,755
Accrued interest 1,637 2,604 1,637 2,604
Bank overdrafts and short-term loans 89,878 2,438 65,578 26,738
Hedging instruments – invoiced transaction - 31 - 31
TOTAL AT 03/31/18 761,515 505,073 218,460 1,048,128
♦ Main characteristics of the bond issuance: OCÉANE
On September 19, 2016, the Board of Directors, acting on the authorization of the Extraordinary General Meeting of September 23, 2015, approved the issuance of bonds with a conversion and/or exchange option for new or existing Company shares for €399,999,959.80.
Number and nominal amount: 7,307,270 bonds with a par value of €54.74
Each bond carries entitlement to the conversion into one new or existing share
Issue price: €54.74
Date of dividend entitlement and settlement: September 27, 2021
Term of the bond: 5 years
Interest: zero coupon
♦ Main characteristics of the bond issued in January 2018:
The Board of Directors’ meeting of January 24, 2018, acting on the authorization of the Extraordinary General Meeting of September 22, 2017, approved the issuance of bonds amounting to €500,000,000. These bonds were admitted to trading on Euronext Paris.
Number and nominal amount: 5,000 bonds with a par value of €100,000
Date of dividend entitlement and settlement: January 30, 2023
Bond duration: 5 years
Interest: 1.289%
♦ The breakdown of borrowings by currency was as follows:
03/31/18 03/31/17
Euro 1,045,570 761,425
US dollar 2,343 88
Other currencies 215 2
BORROWINGS 1,048,128 761,515
♦ The €355,948 thousand of other fi nancial liabilities in the statement of fi nancial position consists of:
03/31/18 03/31/17
Current account advances by related parties 227,788 437,165
Bpifrance participatory loans 2,160 4,429
Commercial papers 126,000 66,000
TOTAL AT 03/31/18 355,948 507,594
Borrowings are recorded at their nominal repayment amount. Unused agreements at the statement of fi nancial position date are listed in the off-statement of fi nancial position commitments.
Debt issuance costs are capitalized (in deferred expenses) and amortized on a straight-line basis over the lifetime of the borrowings concerned.
ACCOUNTING PRINCIPLES
- Document de référence 2018228
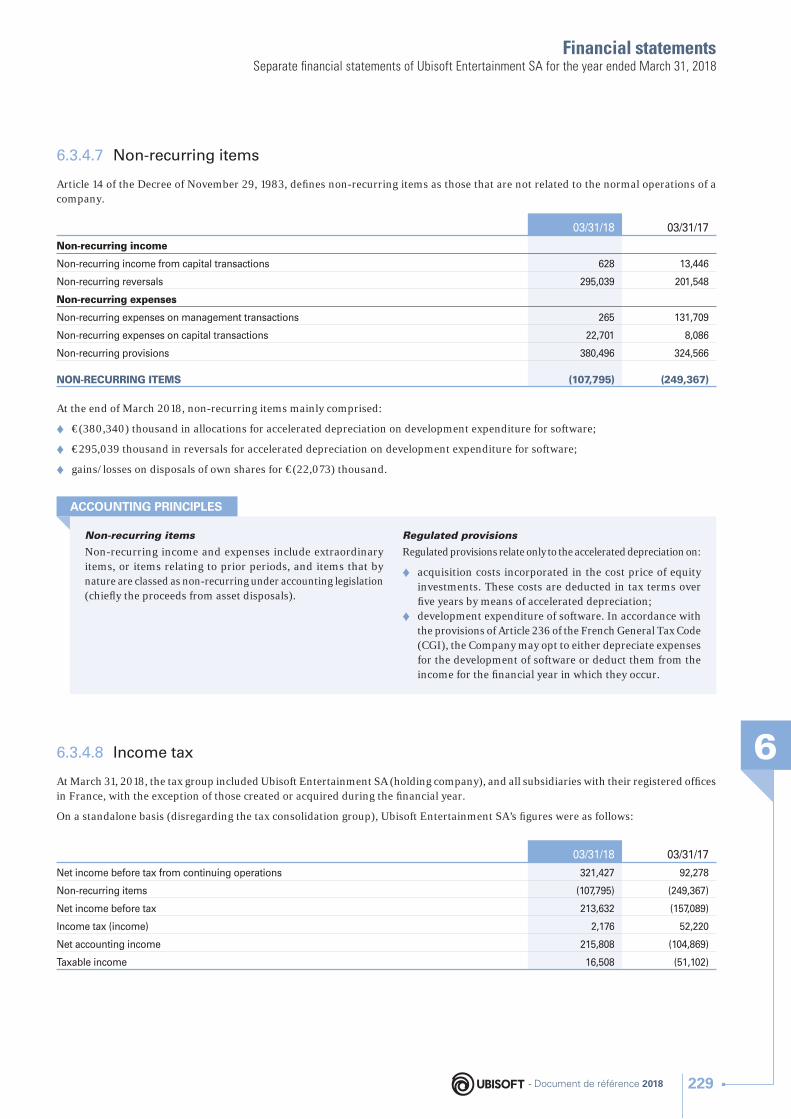
Financial statements
6
Separate fi nancial statements of Ubisoft Entertainment SA for the year ended March 31, 2018
6.3.4.7 Non-recurring items
Article 14 of the Decree of November 29, 1983, defi nes non-recurring items as those that are not related to the normal operations of a company.
03/31/18 03/31/17
Non-recurring income
Non-recurring income from capital transactions 628 13,446
Non-recurring reversals 295,039 201,548
Non-recurring expenses
Non-recurring expenses on management transactions 265 131,709
Non-recurring expenses on capital transactions 22,701 8,086
Non-recurring provisions 380,496 324,566
NON-RECURRING ITEMS (107,795) (249,367)
At the end of March 2018, non-recurring items mainly comprised:
♦ €(380,340) thousand in allocations for accelerated depreciation on development expenditure for software;
♦ €295,039 thousand in reversals for accelerated depreciation on development expenditure for software;
♦ gains/losses on disposals of own shares for €(22,073) thousand.
Non-recurring items
Non-recurring income and expenses include extraordinary items, or items relating to prior periods, and items that by nature are classed as non-recurring under accounting legislation (chiefl y the proceeds from asset disposals).
Regulated provisions
Regulated provisions relate only to the accelerated depreciation on:
♦ acquisition costs incorporated in the cost price of equity investments. These costs are deducted in tax terms over fi ve years by means of accelerated depreciation;
♦ development expenditure of software. In accordance with the provisions of Article 236 of the French General Tax Code (CGI), the Company may opt to either depreciate expenses for the development of software or deduct them from the income for the fi nancial year in which they occur.
ACCOUNTING PRINCIPLES
6.3.4.8 Income tax
At March 31, 2018, the tax group included Ubisoft Entertainment SA (holding company), and all subsidiaries with their registered offi ces in France, with the exception of those created or acquired during the fi nancial year.
On a standalone basis (disregarding the tax consolidation group), Ubisoft Entertainment SA’s fi gures were as follows:
03/31/18 03/31/17
Net income before tax from continuing operations 321,427 92,278
Non-recurring items (107,795) (249,367)
Net income before tax 213,632 (157,089)
Income tax (income) 2,176 52,220
Net accounting income 215,808 (104,869)
Taxable income 16,508 (51,102)
- Document de référence 2018 229
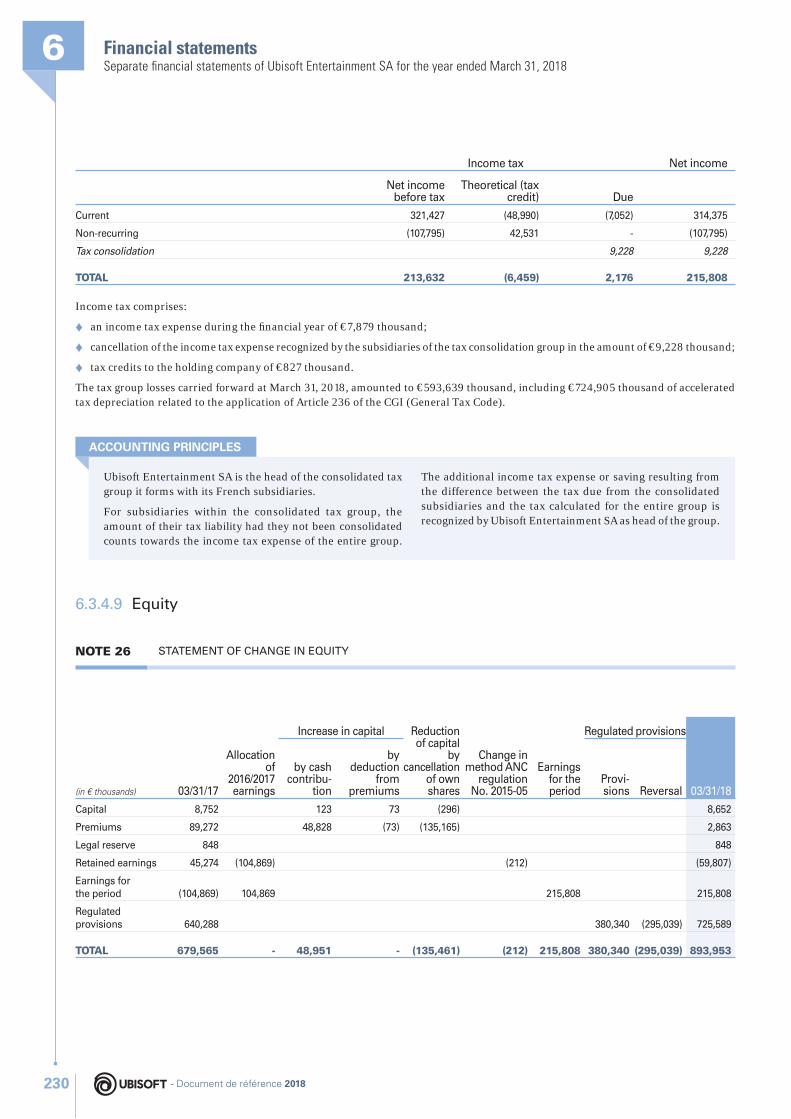
Financial statements6Separate fi nancial statements of Ubisoft Entertainment SA for the year ended March 31, 2018
Income tax Net income
Net income before tax
Theoretical (tax credit) Due
Current 321,427 (48,990) (7,052) 314,375
Non-recurring (107,795) 42,531 - (107,795)
Tax consolidation 9,228 9,228
TOTAL 213,632 (6,459) 2,176 215,808
Income tax comprises:
♦ an income tax expense during the fi nancial year of €7,879 thousand;
♦ cancellation of the income tax expense recognized by the subsidiaries of the tax consolidation group in the amount of €9,228 thousand;
♦ tax credits to the holding company of €827 thousand.
The tax group losses carried forward at March 31, 2018, amounted to €593,639 thousand, including €724,905 thousand of accelerated tax depreciation related to the application of Article 236 of the CGI (General Tax Code).
Ubisoft Entertainment SA is the head of the consolidated tax group it forms with its French subsidiaries.
For subsidiaries within the consolidated tax group, the amount of their tax liability had they not been consolidated counts towards the income tax expense of the entire group.
The additional income tax expense or saving resulting from the difference between the tax due from the consolidated subsidiaries and the tax calculated for the entire group is recognized by Ubisoft Entertainment SA as head of the group.
ACCOUNTING PRINCIPLES
6.3.4.9 Equity
NOTE 26 STATEMENT OF CHANGE IN EQUITY
(in € thousands) 03/31/17
Allocation of
2016/2017 earnings
Increase in capital Reduction of capital
by cancellation
of own shares
Change in method ANC
regulation No. 2015-05
Earnings for the period
Regulated provisions
03/31/18
by cash contribu-
tion
by deduction
from premiums
Provi-sions Reversal
Capital 8,752 123 73 (296) 8,652
Premiums 89,272 48,828 (73) (135,165) 2,863
Legal reserve 848 848
Retained earnings 45,274 (104,869) (212) (59,807)
Earnings for the period (104,869) 104,869 215,808 215,808
Regulated provisions 640,288 380,340 (295,039) 725,589
TOTAL 679,565 - 48,951 - (135,461) (212) 215,808 380,340 (295,039) 893,953
- Document de référence 2018230
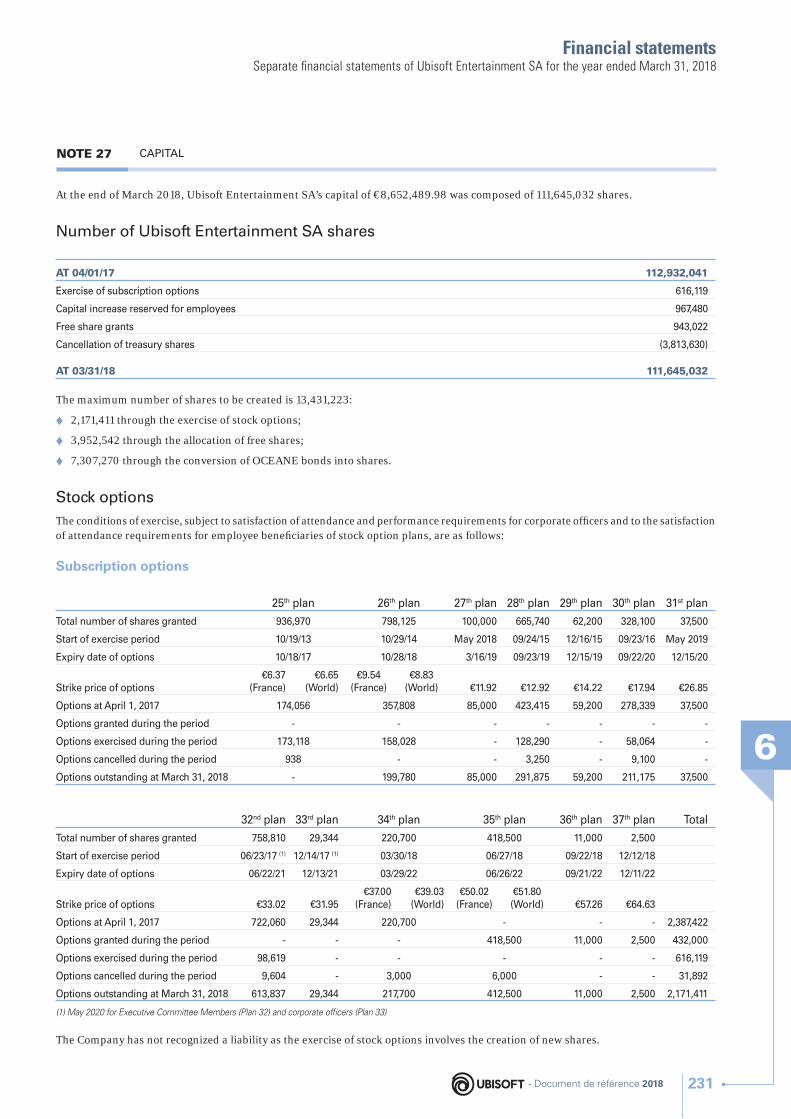
Financial statements
6
Separate fi nancial statements of Ubisoft Entertainment SA for the year ended March 31, 2018
NOTE 27 CAPITAL
At the end of March 2018, Ubisoft Entertainment SA’s capital of €8,652,489.98 was composed of 111,645,032 shares.
Number of Ubisoft Entertainment SA shares
AT 04/01/17 112,932,041
Exercise of subscription options 616,119
Capital increase reserved for employees 967,480
Free share grants 943,022
Cancellation of treasury shares (3,813,630)
AT 03/31/18 111,645,032
The maximum number of shares to be created is 13,431,223:
♦ 2,171,411 through the exercise of stock options;
♦ 3,952,542 through the allocation of free shares;
♦ 7,307,270 through the conversion of OCEANE bonds into shares.
Stock options
The conditions of exercise, subject to satisfaction of attendance and performance requirements for corporate offi cers and to the satisfaction of attendance requirements for employee benefi ciaries of stock option plans, are as follows:
Subscription options
25th plan 26th plan 27th plan 28th plan 29th plan 30th plan 31st plan
Total number of shares granted 936,970 798,125 100,000 665,740 62,200 328,100 37,500
Start of exercise period 10/19/13 10/29/14 May 2018 09/24/15 12/16/15 09/23/16 May 2019
Expiry date of options 10/18/17 10/28/18 3/16/19 09/23/19 12/15/19 09/22/20 12/15/20
Strike price of options€6.37
(France)€6.65
(World)€9.54
(France)€8.83
(World) €11.92 €12.92 €14.22 €17.94 €26.85
Options at April 1, 2017 174,056 357,808 85,000 423,415 59,200 278,339 37,500
Options granted during the period - - - - - - -
Options exercised during the period 173,118 158,028 - 128,290 - 58,064 -
Options cancelled during the period 938 - - 3,250 - 9,100 -
Options outstanding at March 31, 2018 - 199,780 85,000 291,875 59,200 211,175 37,500
32nd plan 33rd plan 34th plan 35th plan 36th plan 37th plan Total
Total number of shares granted 758,810 29,344 220,700 418,500 11,000 2,500
Start of exercise period 06/23/17 (1) 12/14/17 (1) 03/30/18 06/27/18 09/22/18 12/12/18
Expiry date of options 06/22/21 12/13/21 03/29/22 06/26/22 09/21/22 12/11/22
Strike price of options €33.02 €31.95€37.00
(France)€39.03
(World)€50.02
(France)€51.80 (World) €57.26 €64.63
Options at April 1, 2017 722,060 29,344 220,700 - - - 2,387,422
Options granted during the period - - - 418,500 11,000 2,500 432,000
Options exercised during the period 98,619 - - - - - 616,119
Options cancelled during the period 9,604 - 3,000 6,000 - - 31,892
Options outstanding at March 31, 2018 613,837 29,344 217,700 412,500 11,000 2,500 2,171,411
(1) May 2020 for Executive Committee Members (Plan 32) and corporate offi cers (Plan 33)
The Company has not recognized a liability as the exercise of stock options involves the creation of new shares.
- Document de référence 2018 231
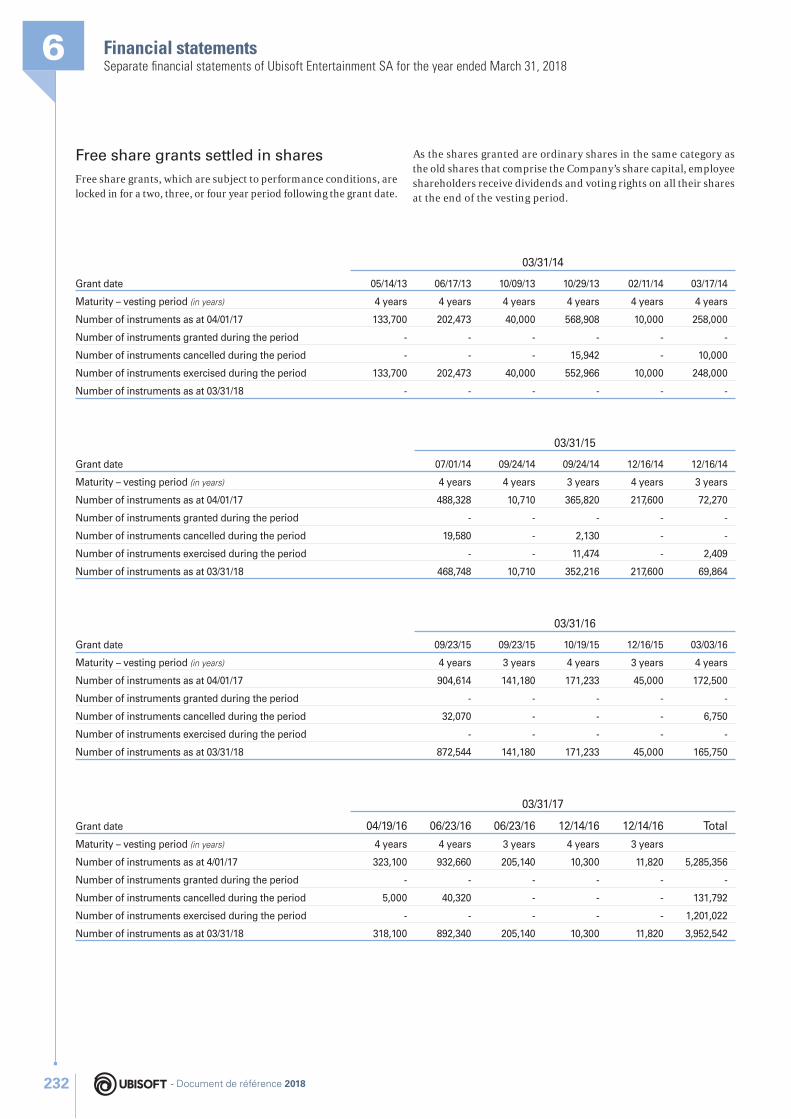
Financial statements6Separate fi nancial statements of Ubisoft Entertainment SA for the year ended March 31, 2018
Free share grants settled in shares
Free share grants, which are subject to performance conditions, are locked in for a two, three, or four year period following the grant date.
As the shares granted are ordinary shares in the same category as the old shares that comprise the Company’s share capital, employee shareholders receive dividends and voting rights on all their shares at the end of the vesting period.
Grant date
03/31/14
05/14/13 06/17/13 10/09/13 10/29/13 02/11/14 03/17/14
Maturity – vesting period (in years) 4 years 4 years 4 years 4 years 4 years 4 years
Number of instruments as at 04/01/17 133,700 202,473 40,000 568,908 10,000 258,000
Number of instruments granted during the period - - - - - -
Number of instruments cancelled during the period - - - 15,942 - 10,000
Number of instruments exercised during the period 133,700 202,473 40,000 552,966 10,000 248,000
Number of instruments as at 03/31/18 - - - - - -
Grant date
03/31/15
07/01/14 09/24/14 09/24/14 12/16/14 12/16/14
Maturity – vesting period (in years) 4 years 4 years 3 years 4 years 3 years
Number of instruments as at 04/01/17 488,328 10,710 365,820 217,600 72,270
Number of instruments granted during the period - - - - -
Number of instruments cancelled during the period 19,580 - 2,130 - -
Number of instruments exercised during the period - - 11,474 - 2,409
Number of instruments as at 03/31/18 468,748 10,710 352,216 217,600 69,864
Grant date
03/31/16
09/23/15 09/23/15 10/19/15 12/16/15 03/03/16
Maturity – vesting period (in years) 4 years 3 years 4 years 3 years 4 years
Number of instruments as at 04/01/17 904,614 141,180 171,233 45,000 172,500
Number of instruments granted during the period - - - - -
Number of instruments cancelled during the period 32,070 - - - 6,750
Number of instruments exercised during the period - - - - -
Number of instruments as at 03/31/18 872,544 141,180 171,233 45,000 165,750
Grant date
03/31/17
04/19/16 06/23/16 06/23/16 12/14/16 12/14/16 Total
Maturity – vesting period (in years) 4 years 4 years 3 years 4 years 3 years
Number of instruments as at 4/01/17 323,100 932,660 205,140 10,300 11,820 5,285,356
Number of instruments granted during the period - - - - - -
Number of instruments cancelled during the period 5,000 40,320 - - - 131,792
Number of instruments exercised during the period - - - - - 1,201,022
Number of instruments as at 03/31/18 318,100 892,340 205,140 10,300 11,820 3,952,542
- Document de référence 2018232
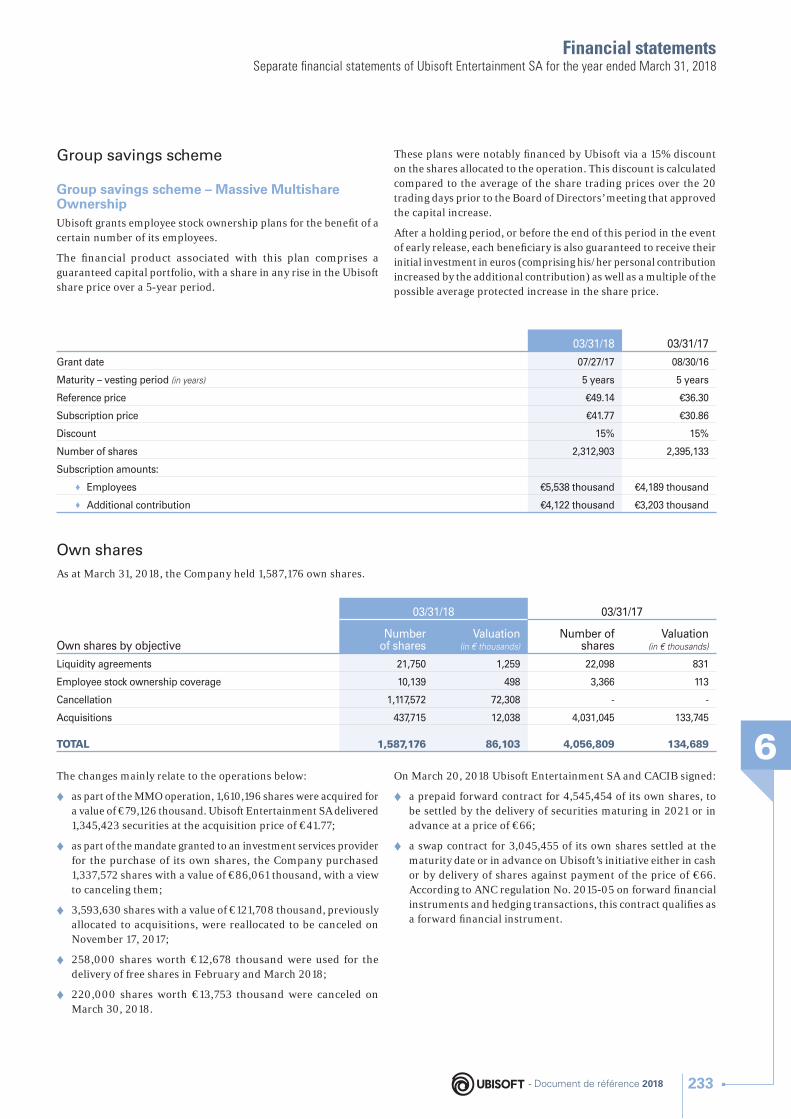
Financial statements
6
Separate fi nancial statements of Ubisoft Entertainment SA for the year ended March 31, 2018
Group savings scheme
Group savings scheme – Massive Multishare OwnershipUbisoft grants employee stock ownership plans for the benefi t of a certain number of its employees.
The fi nancial product associated with this plan comprises a guaranteed capital portfolio, with a share in any rise in the Ubisoft share price over a 5-year period.
These plans were notably fi nanced by Ubisoft via a 15% discount on the shares allocated to the operation. This discount is calculated compared to the average of the share trading prices over the 20 trading days prior to the Board of Directors’ meeting that approved the capital increase.
After a holding period, or before the end of this period in the event of early release, each benefi ciary is also guaranteed to receive their initial investment in euros (comprising his/her personal contribution increased by the additional contribution) as well as a multiple of the possible average protected increase in the share price.
03/31/18 03/31/17
Grant date 07/27/17 08/30/16
Maturity – vesting period (in years) 5 years 5 years
Reference price €49.14 €36.30
Subscription price €41.77 €30.86
Discount 15% 15%
Number of shares 2,312,903 2,395,133
Subscription amounts:
♦ Employees €5,538 thousand €4,189 thousand
♦ Additional contribution €4,122 thousand €3,203 thousand
Own shares
As at March 31, 2018, the Company held 1,587,176 own shares.
Own shares by objective
03/31/18 03/31/17
Number of shares
Valuation (in € thousands)
Number of shares
Valuation (in € thousands)
Liquidity agreements 21,750 1,259 22,098 831
Employee stock ownership coverage 10,139 498 3,366 113
Cancellation 1,117,572 72,308 - -
Acquisitions 437,715 12,038 4,031,045 133,745
TOTAL 1,587,176 86,103 4,056,809 134,689
The changes mainly relate to the operations below:
♦ as part of the MMO operation, 1,610,196 shares were acquired for a value of €79,126 thousand. Ubisoft Entertainment SA delivered 1,345,423 securities at the acquisition price of €41.77;
♦ as part of the mandate granted to an investment services provider for the purchase of its own shares, the Company purchased 1,337,572 shares with a value of €86,061 thousand, with a view to canceling them;
♦ 3,593,630 shares with a value of €121,708 thousand, previously allocated to acquisitions, were reallocated to be canceled on November 17, 2017;
♦ 258,000 shares worth €12,678 thousand were used for the delivery of free shares in February and March 2018;
♦ 220,000 shares worth €13,753 thousand were canceled on March 30, 2018.
On March 20, 2018 Ubisoft Entertainment SA and CACIB signed:
♦ a prepaid forward contract for 4,545,454 of its own shares, to be settled by the delivery of securities maturing in 2021 or in advance at a price of €66;
♦ a swap contract for 3,045,455 of its own shares settled at the maturity date or in advance on Ubisoft’s initiative either in cash or by delivery of shares against payment of the price of €66. According to ANC regulation No. 2015-05 on forward fi nancial instruments and hedging transactions, this contract qualifi es as a forward fi nancial instrument.
- Document de référence 2018 233
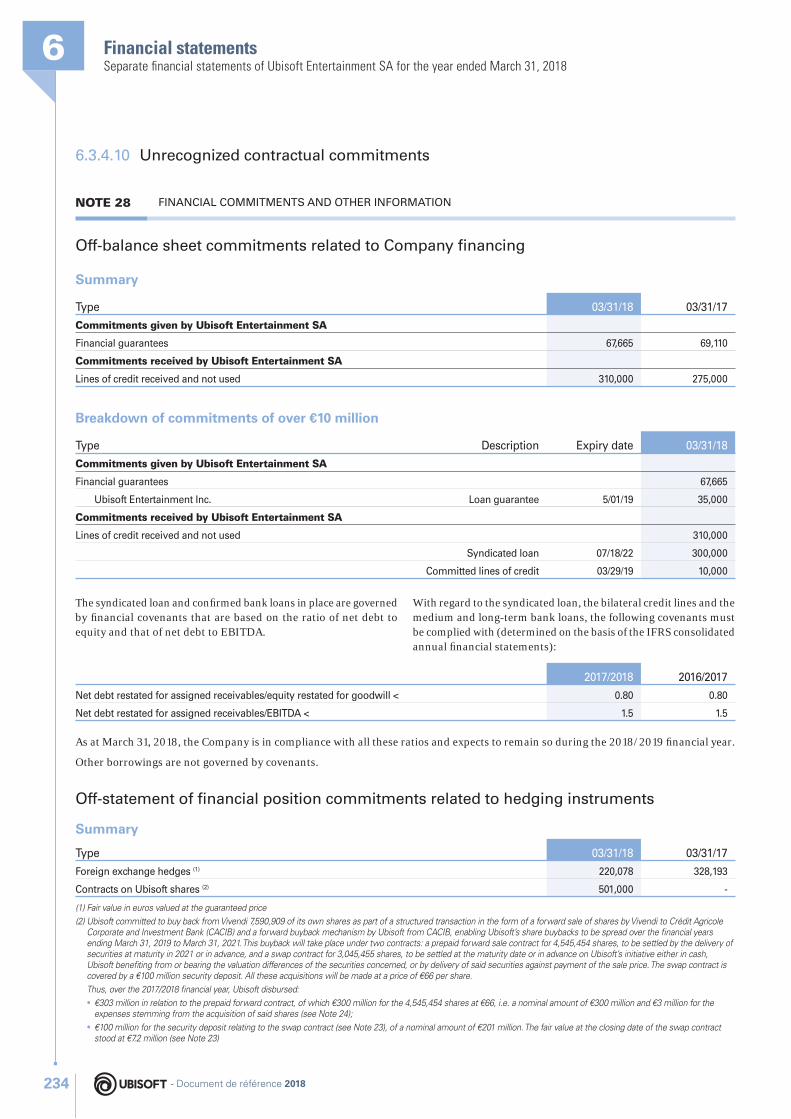
Financial statements6Separate fi nancial statements of Ubisoft Entertainment SA for the year ended March 31, 2018
6.3.4.10 Unrecognized contractual commitments
NOTE 28 FINANCIAL COMMITMENTS AND OTHER INFORMATION
Off-balance sheet commitments related to Company fi nancing
Summary
Type 03/31/18 03/31/17
Commitments given by Ubisoft Entertainment SA
Financial guarantees 67,665 69,110
Commitments received by Ubisoft Entertainment SA
Lines of credit received and not used 310,000 275,000
Breakdown of commitments of over €10 million
Type Description Expiry date 03/31/18
Commitments given by Ubisoft Entertainment SA
Financial guarantees 67,665
Ubisoft Entertainment Inc. Loan guarantee 5/01/19 35,000
Commitments received by Ubisoft Entertainment SA
Lines of credit received and not used 310,000
Syndicated loan 07/18/22 300,000
Committed lines of credit 03/29/19 10,000
The syndicated loan and confi rmed bank loans in place are governed by fi nancial covenants that are based on the ratio of net debt to equity and that of net debt to EBITDA.
With regard to the syndicated loan, the bilateral credit lines and the medium and long-term bank loans, the following covenants must be complied with (determined on the basis of the IFRS consolidated annual fi nancial statements):
2017/2018 2016/2017
Net debt restated for assigned receivables/equity restated for goodwill < 0.80 0.80
Net debt restated for assigned receivables/EBITDA < 1.5 1.5
As at March 31, 2018, the Company is in compliance with all these ratios and expects to remain so during the 2018/2019 fi nancial year.
Other borrowings are not governed by covenants.
Off-statement of fi nancial position commitments related to hedging instruments
Summary
Type 03/31/18 03/31/17
Foreign exchange hedges (1) 220,078 328,193
Contracts on Ubisoft shares (2) 501,000 -
(1) Fair value in euros valued at the guaranteed price
(2) Ubisoft committed to buy back from Vivendi 7,590,909 of its own shares as part of a structured transaction in the form of a forward sale of shares by Vivendi to Crédit Agricole Corporate and Investment Bank (CACIB) and a forward buyback mechanism by Ubisoft from CACIB, enabling Ubisoft’s share buybacks to be spread over the fi nancial years ending March 31, 2019 to March 31, 2021. This buyback will take place under two contracts: a prepaid forward sale contract for 4,545,454 shares, to be settled by the delivery of securities at maturity in 2021 or in advance, and a swap contract for 3,045,455 shares, to be settled at the maturity date or in advance on Ubisoft’s initiative either in cash, Ubisoft benefi ting from or bearing the valuation differences of the securities concerned, or by delivery of said securities against payment of the sale price. The swap contract is covered by a €100 million security deposit. All these acquisitions will be made at a price of €66 per share.
Thus, over the 2017/2018 fi nancial year, Ubisoft disbursed:
• €303 million in relation to the prepaid forward contract, of which €300 million for the 4,545,454 shares at €66, i.e. a nominal amount of €300 million and €3 million for the expenses stemming from the acquisition of said shares (see Note 24);
• €100 million for the security deposit relating to the swap contract (see Note 23), of a nominal amount of €201 million. The fair value at the closing date of the swap contract stood at €7.2 million (see Note 23)
- Document de référence 2018234
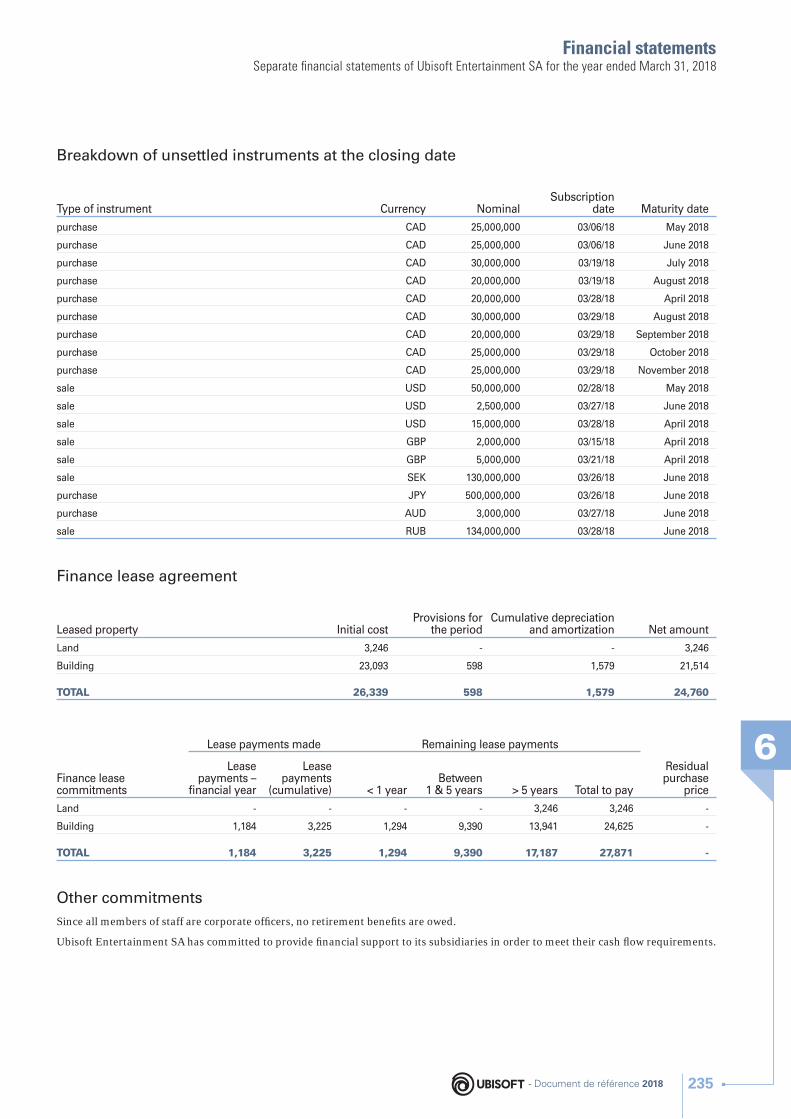
Financial statements
6
Separate fi nancial statements of Ubisoft Entertainment SA for the year ended March 31, 2018
Breakdown of unsettled instruments at the closing date
Type of instrument Currency NominalSubscription
date Maturity date
purchase CAD 25,000,000 03/06/18 May 2018
purchase CAD 25,000,000 03/06/18 June 2018
purchase CAD 30,000,000 03/19/18 July 2018
purchase CAD 20,000,000 03/19/18 August 2018
purchase CAD 20,000,000 03/28/18 April 2018
purchase CAD 30,000,000 03/29/18 August 2018
purchase CAD 20,000,000 03/29/18 September 2018
purchase CAD 25,000,000 03/29/18 October 2018
purchase CAD 25,000,000 03/29/18 November 2018
sale USD 50,000,000 02/28/18 May 2018
sale USD 2,500,000 03/27/18 June 2018
sale USD 15,000,000 03/28/18 April 2018
sale GBP 2,000,000 03/15/18 April 2018
sale GBP 5,000,000 03/21/18 April 2018
sale SEK 130,000,000 03/26/18 June 2018
purchase JPY 500,000,000 03/26/18 June 2018
purchase AUD 3,000,000 03/27/18 June 2018
sale RUB 134,000,000 03/28/18 June 2018
Finance lease agreement
Leased property Initial costProvisions for
the periodCumulative depreciation
and amortization Net amount
Land 3,246 - - 3,246
Building 23,093 598 1,579 21,514
TOTAL 26,339 598 1,579 24,760
Finance lease commitments
Lease payments made Remaining lease payments
Residual purchase
price
Lease payments –
fi nancial year
Lease payments
(cumulative) < 1 yearBetween
1 & 5 years > 5 years Total to pay
Land - - - - 3,246 3,246 -
Building 1,184 3,225 1,294 9,390 13,941 24,625 -
TOTAL 1,184 3,225 1,294 9,390 17,187 27,871 -
Other commitments
Since all members of staff are corporate offi cers, no retirement benefi ts are owed.
Ubisoft Entertainment SA has committed to provide fi nancial support to its subsidiaries in order to meet their cash fl ow requirements.
- Document de référence 2018 235
Financial statements6Separate fi nancial statements of Ubisoft Entertainment SA for the year ended March 31, 2018
Staff
At March 31, 2018, the staff consisted of fi ve corporate offi cers.
Management compensation
Compensation of corporate executive offi cersThe compensation of Yves Guillemot, Chairman and Chief Executive Offi cer, for the fi nancial year ended March 31, 2018, comprises the following components:
♦ fi xed compensation, which amounts to €540,750 since April 1, 2017;
♦ annual variable compensation based on three quantitative criteria and one qualitative criterion, which is subject to the approval of the General Meeting called to approve the fi nancial statements for the past fi nancial year;
♦ long-term variable compensation through the allocation of shadow stock options payable in cash.
The compensation of the Executive Vice Presidents for the fi nancial year ended March 31, 2018 comprises the following components:
♦ fi xed compensation;
♦ long-term variable compensation through the allocation of shadow stock options payable in cash.
The long-term variable compensation was validated on March 30, 2018 by the Board of Directors, and relates to the allocation of a number of shadow stock options of an equivalent value at the allocation date of €540,750 for the Chairman and Chief Executive Offi cer and €62,496 for each of the Executive Vice Presidents.
The acquisition of the shadow stock options will take effect on March 30, 2021 and is based:
(i) for 50%, on average Group EBIT (not a strictly accounting-based indicator) calculated using the Group EBIT fi gures for the 2017/2018, 2018/2019 and 2019/2020 fi nancial years; and
(ii) for 50%, on the total shareholder return on Ubisoft stock (the “Ubisoft TSR”) compared against the TSR of the NASDAQ index (the “NASDAQ TSR”), both TSRs being calculated from March 30, 2018 to March 29, 2021.
Moreover, shadow stock options acquired after the assessment of the internal and external conditions will only be paid in cash if the Ubisoft share price has increased compared to the base price set on the day of the allocation (€69.155). The cash payment corresponds to the difference between the fi nal fair market value of the share and the baseline share price, per shadow stock option. The payment of long-term compensation is also subject to remaining in offi ce as a Corporate Executive Offi cer.
The total gross compensation paid/owed by the Company to Corporate Executive Offi cers during the fi nancial year was €1,602 thousand.
Corporate Executive Offi cers are not eligible for any severance or non-compete indemnity, nor a supplementary pension scheme in respect of their function in the Company.
Compensation of corporate offi cersIn consideration – very partial – of the responsibilities assumed and also the time spent preparing Board and/or committee meetings and actively participating therein, directors receive directors’ fees consisting of a fi xed component and a variable component.
The General Meeting of September 22, 2017 set the maximum annual amount of directors’ fees that can be paid to members of the Board of Directors and/or committees at €750 thousand.
During the 2017/2018 fi nancial year, members of the Board of Directors received €503 thousand in directors’ fees.
There are no agreements to compensate Board members if they resign or are dismissed without real cause, or if their employment is terminated due to a public offering.
No loans or advances were made to the Company’s directors under Article L. 225-43 of the French Commercial Code.
Contingent assets and liabilities
In accordance with Article No. 624-11 of French General Accounting Plan (PCG), the breakdown of free shares that have not been exercised at the closing date is provided in Note 27.
Events after the reporting period
None.
- Document de référence 2018236
Financial statements
6
Separate fi nancial statements of Ubisoft Entertainment SA for the year ended March 31, 2018
NOTE 29 RELATED-PARTY TRANSACTIONS
Two main categories are identifi ed:
♦ relationships between the parent company and its subsidiaries the main transactions of which relate to:
• production subsidiaries billing the parent company for development costs based on the progress of their projects,
• the parent company invoicing sales and marketing subsidiaries for a contribution to development costs,
• the implementation of cash agreements allowing for centralized management at parent company level of the bank accounts of the majority of the Group companies;
♦ transactions with corporate offi cers.
The fi ve corporate offi cers of the Company hold management roles for which they receive annual and long-term compensation and are granted free preference shares and/or stock options. Information on these transactions can be found above.
- Document de référence 2018 237
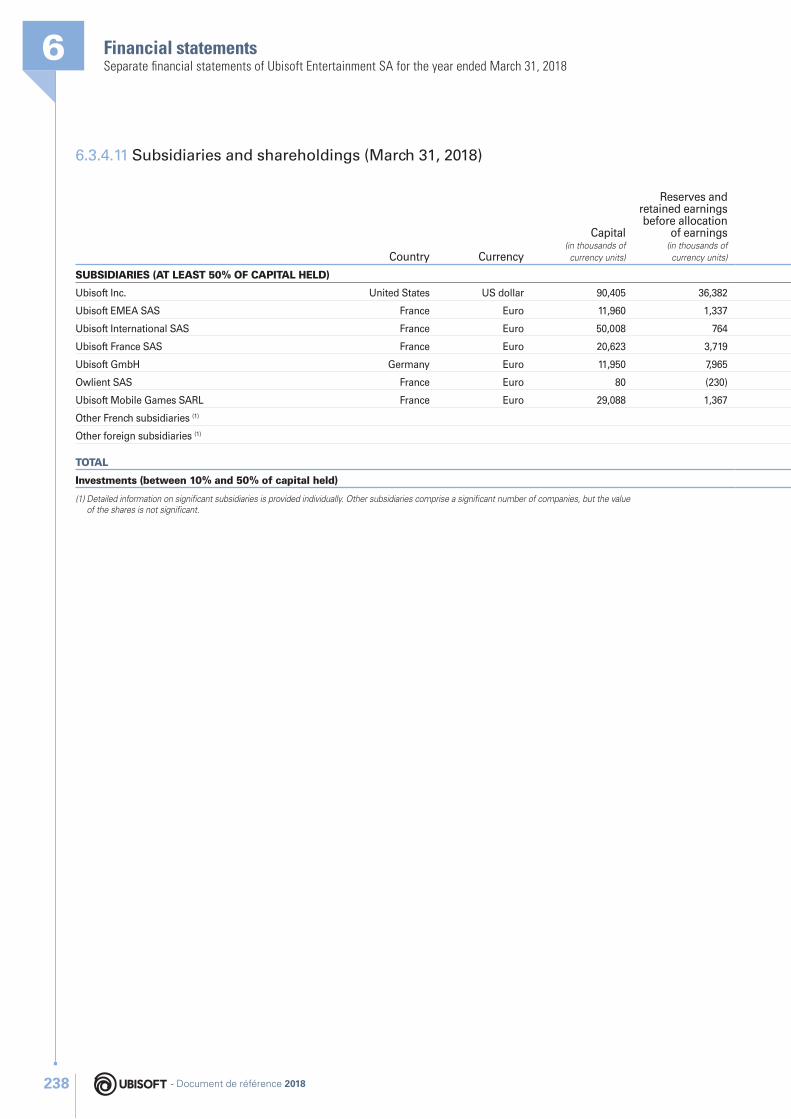
Financial statements6Separate fi nancial statements of Ubisoft Entertainment SA for the year ended March 31, 2018
6.3.4.11 Subsidiaries and shareholdings (March 31, 2018)
Country Currency
Capital (in thousands of
currency units)
Reserves and retained earnings before allocation
of earnings (in thousands of
currency units)
SUBSIDIARIES (AT LEAST 50% OF CAPITAL HELD)
Ubisoft Inc. United States US dollar 90,405 36,382
Ubisoft EMEA SAS France Euro 11,960 1,337
Ubisoft International SAS France Euro 50,008 764
Ubisoft France SAS France Euro 20,623 3,719
Ubisoft GmbH Germany Euro 11,950 7,965
Owlient SAS France Euro 80 (230)
Ubisoft Mobile Games SARL France Euro 29,088 1,367
Other French subsidiaries (1)
Other foreign subsidiaries (1)
TOTAL
Investments (between 10% and 50% of capital held)
(1) Detailed information on signifi cant subsidiaries is provided individually. Other subsidiaries comprise a signifi cant number of companies, but the value of the shares is not signifi cant.
- Document de référence 2018238
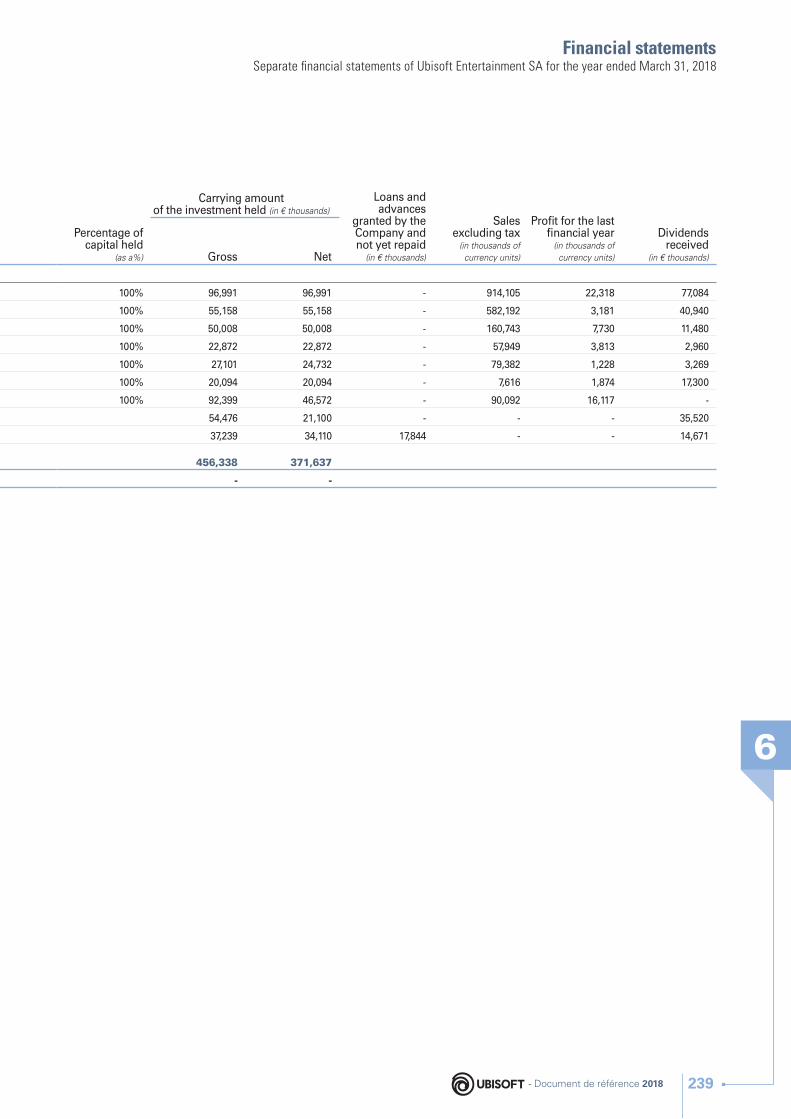
Financial statements
6
Separate fi nancial statements of Ubisoft Entertainment SA for the year ended March 31, 2018
Percentage of capital held
(as a%)
Carrying amount of the investment held (in € thousands)
Loans and advances
granted by the Company and not yet repaid
(in € thousands)
Sales excluding tax
(in thousands of currency units)
Profi t for the last fi nancial year
(in thousands of currency units)
Dividends received
(in € thousands)Gross Net
100% 96,991 96,991 - 914,105 22,318 77,084
100% 55,158 55,158 - 582,192 3,181 40,940
100% 50,008 50,008 - 160,743 7,730 11,480
100% 22,872 22,872 - 57,949 3,813 2,960
100% 27,101 24,732 - 79,382 1,228 3,269
100% 20,094 20,094 - 7,616 1,874 17,300
100% 92,399 46,572 - 90,092 16,117 -
54,476 21,100 - - - 35,520
37,239 34,110 17,844 - - 14,671
456,338 371,637
- -
- Document de référence 2018 239
Financial statements6Statutory Auditors’ report on the separate fi nancial statements
6.4 Statutory Auditors’ report on the separate financial statements
This is a free translation into English of one of the statutory auditors’ general report issued in French language and it is provided solely for the convenience of English speaking readers.
This report should be read in conjunction with, and construed in accordance with French law and professional auditing standards applicable in France.
To the General Meeting of the company Ubisoft Entertainment,
❙ OPINION
As mandated by your General Meetings, we conducted the audit of the separate fi nancial statements of Ubisoft Entertainment in respect of the fi nancial year ended March 31, 2018, as attached to this report.
We hereby certify that, from the standpoint of French accounting rules and principles, the separate fi nancial statements give a true and fair view of the results obtained for the fi nancial year in question and of the Company’s fi nancial position and assets at the end of this year.
The opinion formulated above is consistent with the content of our report to the Audit Committee.
❙ BASIS FOR THE OPINION
Audit Guidelines
We conducted our audit in accordance with accepted professional standards in France. It is our view that the elements that we collected are suffi cient and adapted to base our opinion.
Our responsibilities under these standards are indicated in the section “Responsibilities of the Statutory Auditors relating to the audit of the separate fi nancial statements” in this report.
Independence
We conducted our audit in accordance with the applicable rules of independence, over the period from April 1, 2017 to the date of issue of our report, and notably, did not provide services prohibited by Article 5, paragraph 1 of the (EU) Regulation No. 537/2014 or by the Statutory Auditors’ Code of Ethics.
Comments
Without calling into question the opinion expressed above, we draw your attention to the following item presented in Note 2 “Comparability of fi nancial statements” in the notes to the separate fi nancial statements regarding the fi rst application of ANC Regulation No. 2015-05 regarding the recognition of forward fi nancial instruments and hedging transactions beginning April 1, 2017.
❙ BASIS FOR OUR ASSESSMENT – KEY POINTS OF THE AUDIT
Pursuant to the provisions of Articles L. 823-9 and R. 823-7 of the French Commercial Code regarding the basis for our assessments, we call your attention to the key points of the audit regarding the risks of material misstatements which, in our professional judgment, were the most signifi cant for the audit of the separate fi nancial statements for the fi nancial year, together with the responses we provided to these risks.
Our assessments were made within the context of our audit of the separate fi nancial statements as a whole and provided a basis for the opinion expressed previously. We do not express an opinion on the items in the separate fi nancial statements taken separately.
- Document de référence 2018240
Financial statements
6
Statutory Auditors’ report on the separate fi nancial statements
Assessment of the commercial software developed internally – impairment testsNote 19 of the notes to the separate fi nancial statements
Risk identifi ed Response provided
As at March 31, 2018, the net carrying amount for the commercial software developed internally amounted to €719 million for a total statement of fi nancial position of €2,542 million.
The intangible assets resulting from the development of commercial software, once released, are amortized on a straight-line basis starting on the commercial release date for a duration of 1 to 6 years.
Moreover, as indicated in Note 19 “Inventory value and changes during the fi nancial year” in the note “Intangible assets” in the notes to the separate fi nancial statements, the Company subjects the released commercial software to an impairment test at each closing date. Commercial software in production with a planned release date within 12 months after the closing date, or for which an impairment loss indicator is identifi ed is also subject to an impairment test. These tests involve comparing the net carrying amount of the commercial software (after normally recognized linear depreciation) to the expected future cash fl ows from the sale of the game. Impairment is recognized if the value-in-use is lower than the net carrying amount of the commercial software.
We have considered the impairment tests on commercial software developed internally as a key point of the audit, given the particularly signifi cant amount and the signifi cant degree of judgment required by the Company to determine the value-in-use most often based on forecasts of discounted cash fl ows for which achievement is inherently uncertain.
We have examined the procedures for conducting these impairment tests. Our work notably consisted in:(1) Taking note of the internal control relating to the implementation of
these impairment tests and testing by survey the key controls implemented by the Company for these processes. Our procedure tests consisted in:
♦ assessing the implementation of editorial control by the Company’s Executive Management;
♦ assessing the portfolio review of software in production which aims to control the exhaustive accounting translation of editorial discontinuation decisions;
♦ ensuring that the Board of Directors has approved the 3 year business plan.
(2) Our substance tests mainly consisted in: ♦ conducting a retrospective analysis of the impairment tests carried
out by the Company over the previous fi nancial years; ♦ comparing sales and profi tability forecasts for the commercial
software used in the impairment tests with those underlying the Group’s 3 year business plan approved by the Board of Directors;
♦ assessing the consistency of the future sales forecasts with regard to available data or comparables (previous opus within the same franchise, another similar commercial software with the same comparable levels of functions, taking into account the level of pre-orders for example).
We also assessed the relevant nature of the information provided in Note 19 “Inventory value and changes during the fi nancial year” in the note “Intangible assets” in the notes to the separate fi nancial statements.
Assessment of equity investmentsNotes 17 and 23 of the notes to the separate fi nancial statements
Risk identifi ed Response provided
At March 31, 2018, the equity investments are recorded in the statement of fi nancial position for a net carrying amount of €372 million, or 15% of the total assets.
As indicated in Note 23, equity investments are subject to impairment tests at each closing date to check that their net carrying amounts do not exceed their value-in-use.
The estimate of the value-in-use of the equity investments is calculated according to the net position (possibly restated) of the subsidiary at that date, the stock market value at the closing date if the Company is listed, and/or taking into account medium-term profi tability forecasts.
Moreover, Note 17 indicates that provisions are recognized where risks and charges have a clearly defi ned purpose but are not certain to arise, made likely by events that have occurred or are in progress. Thus, provisions are recognized to cover subsidiaries’ negative equity.
Due to the particularly signifi cant net carrying amount of equity investments in the total statement of fi nancial position, and the high degree of judgment exercised by the Company as part of the estimate of value-in-use, especially when it is based on forecast elements, we have considered that the assessment of equity investments, and by extension the associated provisions for risks are a key point in our audit.
In order to assess the amount of value in use of the equity investments determined by the Company, our work notably consisted in:
♦ assessing the relevance of the methodology used to determine the value in use;
♦ comparing the proportions of net positions used to determine the value in use of equity investments with the fi nancial statements for the investments, which were subject to an audit or analytical procedures;
♦ via interviews with the management team, assessing the main assumptions and modalities selected to estimate value in use, particularly the long-term growth rate and the discount rate, by referring to our experts where necessary;
♦ checking the arithmetical accuracy of the value in use calculations made by your Company;
♦ noting the recognition of a provision for risks if your Company has committed to covering the losses of a subsidiary with negative equity.
❙ VERIFICATION OF THE MANAGEMENT REPORT AND THE OTHER DOCUMENTS SENT TO SHAREHOLDERS
We have also carried out the specifi c verifi cations required by law, pursuant to professional standards applicable in France.
- Document de référence 2018 241
Financial statements6Statutory Auditors’ report on the separate fi nancial statements
Information provided in the management report and the other documents sent to shareholders on the fi nancial position and the separate fi nancial statements
We have no comments regarding the accuracy and consistency with the separate fi nancial statements of the information provided in the management report prepared by the Board of Directors or in the other documents sent to shareholders concerning the fi nancial position and separate fi nancial statements.
Corporate governance report
We certify the existence in the Board of Directors’ report on corporate governance of the information required by Articles L. 225-37-3 and L. 225-37-4 of the French Commercial Code.
With regard to the information provided pursuant to the provisions of Article L. 225-37-3 of the French Commercial Code, on the compensation and benefi ts paid to corporate offi cers and on the commitments made in their favor, we verifi ed their consistency with the fi nancial statements and with the data used in the preparation of these fi nancial statements and, where appropriate, with items collected by your Company from the companies controlling your Company, or controlled by it. Based on this work, we attest the accuracy and truthfulness of such information.
Regarding the information on elements that your Company considered likely to have an impact in the event of a public takeover or swap bid, provided pursuant to the provisions of Article L. 225-37-5 of the French Commercial Code, we have checked compliance with the source documents provided to us. Based on this work, we have no comments to make on this information.
Other information
As required by law, we have ensured that the various information relating to equity and control investments and to the identity of the holders of share capital or voting rights was provided to you in the management report.
❙ INFORMATION RESULTING FROM OTHER LEGAL AND REGULATORY OBLIGATIONS
Appointment of the Statutory Auditors
We were appointed as Statutory Auditors for Ubisoft Entertainment by your General Meeting of June 27, 2003 for KPMG Audit and of September 29, 2016 for Mazars.
As at March 31, 2018, KPMG Audit was in its 15th year of uninterrupted work, including 15 years since the Company’s securities were admitted to trading in a regulated market, and Mazars in its 2nd year of uninterrupted work.
❙ RESPONSIBILITIES OF THE MANAGEMENT TEAM AND THE PEOPLE COMPRISING THE CORPORATE GOVERNANCE WITH REGARD TO THE SEPARATE FINANCIAL STATEMENTS
The management team is responsible for preparing separate fi nancial statements that present a true and fair view, in accordance with French accounting rules and principles, and implementing the internal control it considers necessary for preparing separate fi nancial statements that do not include material misstatements resulting either from fraud or errors.
When preparing the separate fi nancial statements, the management team is responsible for assessing the Company’s ability to continue its operations, and presenting in these fi nancial statements, if applicable, the information on the continuation of operations, and applying the accounting going-concern convention, unless it plans to liquidate the Company or cease its activity.
The Audit Committee is responsible for monitoring the fi nancial information preparation process and the effectiveness of the internal control and risk management systems, as well as, if applicable, internal audit, with respect to the procedures for the preparation and processing of accounting and fi nancial information.
The annual fi nancial statements have been prepared by the Board of Directors.
- Document de référence 2018242
Financial statements
6
Statutory Auditors’ report on the separate fi nancial statements
❙ RESPONSIBILITIES OF THE STATUTORY AUDITORS RELATING TO THE AUDIT OF THE SEPARATE FINANCIAL STATEMENTS
Audit objective and approach
We are responsible for preparing a report on the separate fi nancial statements. Our aim is to obtain reasonable assurance that the separate fi nancial statements taken as a whole do not include material misstatements. Reasonable assurance corresponds to a high level of assurance, without, however, guaranteeing that an audit conducted in accordance with professional standards would systematically detect all material misstatements. Misstatements from fraud or resulting from errors are considered to be material when we can reasonably expect that they may, taken individually or cumulatively, infl uence economic decisions that users of the fi nancial statements may take based on them.
As specifi ed in Article L. 823-10-1 of the French Commercial Code, our assignment to certify the fi nancial statements does not consist in guaranteeing the viability or the management quality of your Company.
As part of an audit conducted in accordance with the professional standards applicable in France, the Statutory Auditor exercises his/her professional judgment throughout the audit. Moreover:
♦ he/she identifi es and assesses the risks that the separate fi nancial statements include material misstatements from fraud or resulting from errors, defi nes and implements audit procedures faced with these risks and collects the elements that he/she considers suffi cient and appropriate on which to base his/her opinion. The risk of non-detection of a material misstatement resulting from fraud is higher than that of a misstatement resulting from an error, as the fraud may involve collusion, falsifi cation, voluntary omissions, false declarations or circumvention of internal control;
♦ he/she takes note of the relevant internal control for the audit in order to defi ne the relevant audit procedures, and not with the aim of expressing an opinion on the effectiveness of the internal control;
♦ he/she assesses the appropriate nature of the selected accounting principles and the reasonable nature of the accounting estimates made by the management team, as well as the information on them provided in the separate fi nancial statements;
♦ he/she assesses the relevant nature of the application of the going-concern accounting convention by the management team, and, depending on the elements collected, the existence of a signifi cant uncertainty with regard to the events or circumstances likely to call into question the Company’s ability to continue its operations. This assessment is based on the elements collected up to the date of his/her report, it being recalled that subsequent circumstances or events may call into question the continuation of operations. If he/she concludes that there is a signifi cant uncertainty, he/she calls the readers’ attention to the information provided in the separate fi nancial statements on the subject of this uncertainty, or, if this information is not provided or is not relevant, he/she formulates a certifi cation with reserves or refuses to certify;
♦ he/she assesses the overall presentation of the separate fi nancial statements and assesses if the separate fi nancial statements refl ect the underlying operations and events, in order to provide a true and fair view.
Report to the Audit Committee
We provide a report to the Audit Committee presenting notably the scope of the audit work and the work program implemented, as well as the conclusions resulting from our work. We also draw its attention, if applicable, to the signifi cant weaknesses of the internal control that we have identifi ed with respect to the procedures for the preparation and processing of accounting and fi nancial information.
Amongst the elements communicated to the Audit Committee are the risks of material misstatements that we have considered to be the most important for the audit of the separate fi nancial statements for the fi nancial year, and that constitute as such the key points of the audit, which we are responsible for describing in this report.
We also provide the Audit Committee with the declaration provided for by Article 6 of (EU) Regulation No. 537-2014 confi rming our independence under the meaning of the rules applicable in France as set notably by Articles L. 822-10 to L. 822-14 of the French Commercial Code, and the Statutory Auditors’ Code of Ethics. If applicable, we discuss with the Audit Committee the risks weighing on our independence and the safeguard measures applied.
Rennes and Nantes, May 30, 2018
Statutory Auditors
KPMG AuditVincent Broyé
MAZARSArnaud Le Néen
- Document de référence 2018 243

Financial statements6Statutory Auditors’ special report on regulated agreements and commitments
6.5 Statutory Auditors’ special report on regulated agreements and commitments
This is a free translation into English of one of the statutory auditors’ report on regulated agreements and commitments issued in French language and it is provided solely for the convenience of English speaking readers.
This report should be read in conjunction with, and construed in accordance with French law and professional auditing standards applicable in France.
To the General Meeting of the company Ubisoft Entertainment,
In our capacity as Statutory Auditors of your company, we hereby report to you on regulated agreements and commitments.
We are required to inform you, based on the information provided to us, of the principal terms and conditions as well as the reasons explaining their interest for the Company of the agreements and commitments brought to our attention or which we may have discovered during the course of our mission, without expressing an opinion on their usefulness and appropriateness or identifying such other agreements and commitments, if any. It is your responsibility, under the terms of Article R. 225-31 of the French Commercial Code, to assess the interest in entering into such agreements and commitments for the purpose of approving them.
Furthermore, we are required to provide you with the information stipulated in Article R. 225-31 of the French Commercial Code relating to the performance, during the past fi nancial year, of agreements and commitments previously approved by the General Meeting, if any.
We conducted the procedures we deemed necessary in accordance with the professional guidelines of the French National Institute of Statutory Auditors (Compagnie Nationale des Commissaires aux Comptes) relating to this assignment. These procedures consisted in verifying the consistency of the information we were provided with the source documents.
❙ AGREEMENTS AND COMMITMENTS SUBMITTED FOR THE APPROVAL OF THE GENERAL MEETING
Pursuant to Article L. 225-40 of the French Commercial Code, we were informed of the following agreements and commitments which were subject to prior authorization from your Board of Directors.
Prepaid forward contract signed with Crédit Agricole Corporate and Investment Bank (CACIB)
♦ Co-contracting entity: Crédit Agricole Corporate and Investment Bank (CACIB).
♦ Indirectly involved legal entity: Vivendi SA, shareholder holding over 10% of the voting rights in the Company at the time the contract was signed.
♦ Purpose and type: Prepaid forward contract concerning the acquisition by Ubisoft Entertainment SA of 4,545,454 own shares at the price of €66 per share, to be settled by the delivery of securities – the said shares being subject to a structured transaction in the form of a forward sale signed by Vivendi SA to CACIB at the price of €66 per share maturing on October 1, 2018.
♦ Terms and conditions: Contract signed on March 20, 2018 maturing on March 22, 2021 (or earlier on Ubisoft Entertainment SA’s initiative).
♦ Reasons selected by the Board to justify its interest in the Company: Puts an end to an uncertain situation and disagreement prejudicial to the Company, its shareholders and its employees.
Swap contract on Ubisoft Entertainment SA shares signed with Crédit Agricole Corporate and Investment Bank (CACIB)/Agreement for cash assignment by way of a security
♦ Co-contracting entity: Crédit Agricole Corporate and Investment Bank (CACIB).
♦ Indirectly involved legal entity: Vivendi SA, shareholder holding over 10% of the voting rights in the Company at the time the contract was signed.
♦ Purpose and type: Swap contract concerning 3,045,455 Ubisoft Entertainment SA shares at the price of €66 per share, to be settled either in cash (Ubisoft Entertainment SA benefi ting or bearing the valuation differences), or by the delivery of securities against payment of the price – the said shares being subject to a structured transaction in the form of a forward sale signed by Vivendi SA to CACIB at the price of €66 per share maturing October 1, 2018. The swap contract includes an agreement for cash assignment guaranteeing the correct execution by Ubisoft Entertainment SA of its obligations.
- Document de référence 2018244
Financial statements
6
Statutory Auditors’ special report on regulated agreements and commitments
♦ Terms and conditions: Contract signed on March 20, 2018 maturing on March 22, 2021 (or earlier on Ubisoft Entertainment SA’s initiative).
♦ Reasons selected by the Board to justify its interest in the Company: Puts an end to an uncertain situation and disagreement prejudicial to the Company, its shareholders and its employees.
“Standstill” agreement signed with Vivendi SA
♦ Co-contracting entity: Vivendi SA.
♦ Involved legal entity: Vivendi SA, shareholder holding over 10% of the voting rights in the Company at the time the contract was signed.
♦ Purpose and type: Agreement stipulating that Vivendi SA and/or any individual or legal entity, controlling (alone or in concert) or controlled, directly or indirectly by Vivendi SA, shall refrain from (i) acquiring, proposing or agreeing to acquire shares or securities giving access, directly or indirectly, to the capital of Ubisoft Entertainment SA, (ii) announcing or ensuring that a third party announces a public takeover bid for Ubisoft Entertainment SA as well as all groupings or extraordinary transactions concerning the capital or assets of Ubisoft Entertainment SA or any company, controlling or controlled, directly or indirectly by Ubisoft Entertainment SA and (iii) undertaking any discussions, negotiations, arrangements or understandings with any third parties or making any public announcements with regard to (i) and (ii) above.
♦ Agreement signed on March 20, 2018 for a duration of 5 years (normal maturity of the agreement planned for March 22, 2023).
♦ Reasons selected by the Board to justify its interest in the Company: Ensures a context of stability and positive momentum for the Company, its shareholders and its employees.
❙ AGREEMENTS AND COMMITMENTS ALREADY APPROVED BY THE GENERAL MEETING
We hereby inform you that we have not been advised of any agreement or commitment previously approved by the General Meeting that remained in effect during the fi nancial year.
Rennes and Nantes, May 30, 2018
Statutory Auditors
KPMG AuditVincent Broyé
MAZARSArnaud Le Néen
- Document de référence 2018 245
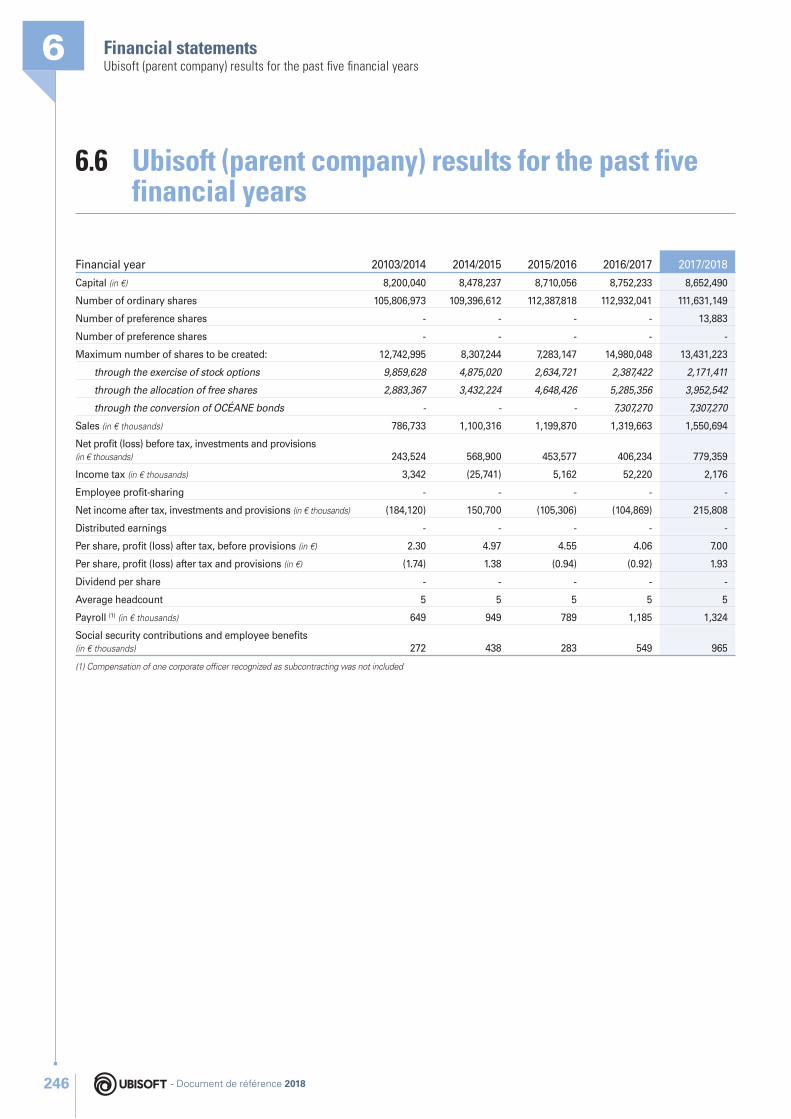
Financial statements6Ubisoft (parent company) results for the past fi ve fi nancial years
6.6 Ubisoft (parent company) results for the past five financial years
Financial year 20103/2014 2014/2015 2015/2016 2016/2017 2017/2018
Capital (in €) 8,200,040 8,478,237 8,710,056 8,752,233 8,652,490
Number of ordinary shares 105,806,973 109,396,612 112,387,818 112,932,041 111,631,149
Number of preference shares - - - - 13,883
Number of preference shares - - - - -
Maximum number of shares to be created: 12,742,995 8,307,244 7,283,147 14,980,048 13,431,223
through the exercise of stock options 9,859,628 4,875,020 2,634,721 2,387,422 2,171,411
through the allocation of free shares 2,883,367 3,432,224 4,648,426 5,285,356 3,952,542
through the conversion of OCÉANE bonds - - - 7,307,270 7,307,270
Sales (in € thousands) 786,733 1,100,316 1,199,870 1,319,663 1,550,694
Net profi t (loss) before tax, investments and provisions (in € thousands) 243,524 568,900 453,577 406,234 779,359
Income tax (in € thousands) 3,342 (25,741) 5,162 52,220 2,176
Employee profi t-sharing - - - - -
Net income after tax, investments and provisions (in € thousands) (184,120) 150,700 (105,306) (104,869) 215,808
Distributed earnings - - - - -
Per share, profi t (loss) after tax, before provisions (in €) 2.30 4.97 4.55 4.06 7.00
Per share, profi t (loss) after tax and provisions (in €) (1.74) 1.38 (0.94) (0.92) 1.93
Dividend per share - - - - -
Average headcount 5 5 5 5 5
Payroll (1) (in € thousands) 649 949 789 1,185 1,324
Social security contributions and employee benefi ts (in € thousands) 272 438 283 549 965
(1) Compensation of one corporate offi cer recognized as subcontracting was not included
- Document de référence 2018246
7.1 LEGAL INFORMATION 2487.1.1 Information about the
company 248
7.1.2 Articles of Association 248
7.1.3 Factors likely to have an impact in the event of a public offering 250
7.2 SHARE CAPITAL 2517.2.1 Capital as at March 31, 2018 251
7.2.2 Potential capital as at March 31, 2018 252
7.2.3 Financial authorizations 252
7.2.4 Share buyback 254
7.3 SHARE OWNERSHIP 2587.3.1 Changes in capital in the
last three fi nancial years and up to May 17, 2018 258
7.3.2 Employee stock ownership through the company mutual fund (FCPE) 259
7.3.3 Breakdown of capital and voting rights 260
7.4 SECURITIES MARKET 2647.4.1 Provider of securities
services 264
7.4.2 Ubisoft share data 264
7.4.3 Change in the share price over the last 24 months 265
7.4.4 OCÉANE bonds and bonds 266
7.5 FINANCIAL COMMUNICATION 267
7.5.1 Documents available to the public 267
7.5.2 Financial reporting calendar for the 2018/2019 fi nancial year 267
Information on the Company and its Capital7
- 2018 Registration Document 247247- 2018 Registration Document
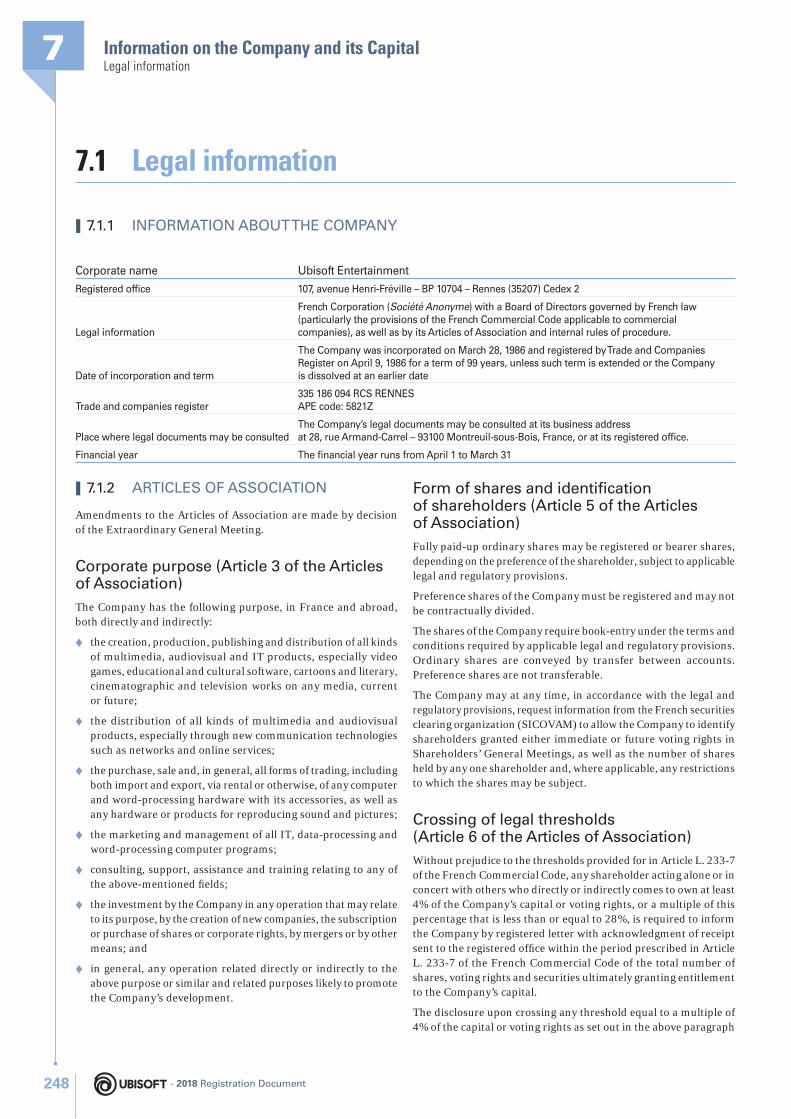
Information on the Company and its Capital7Legal information
7.1 Legal information
❙ 7.1.2 ARTICLES OF ASSOCIATION
Amendments to the Articles of Association are made by decision of the Extraordinary General Meeting.
Corporate purpose (Article 3 of the Articles of Association)
The Company has the following purpose, in France and abroad, both directly and indirectly:
♦ the creation, production, publishing and distribution of all kinds of multimedia, audiovisual and IT products, especially video games, educational and cultural software, cartoons and literary, cinematographic and television works on any media, current or future;
♦ the distribution of all kinds of multimedia and audiovisual products, especially through new communication technologies such as networks and online services;
♦ the purchase, sale and, in general, all forms of trading, including both import and export, via rental or otherwise, of any computer and word-processing hardware with its accessories, as well as any hardware or products for reproducing sound and pictures;
♦ the marketing and management of all IT, data-processing and word-processing computer programs;
♦ consulting, support, assistance and training relating to any of the above-mentioned fi elds;
♦ the investment by the Company in any operation that may relate to its purpose, by the creation of new companies, the subscription or purchase of shares or corporate rights, by mergers or by other means; and
♦ in general, any operation related directly or indirectly to the above purpose or similar and related purposes likely to promote the Company’s development.
Form of shares and identifi cation of shareholders (Article 5 of the Articles of Association)
Fully paid-up ordinary shares may be registered or bearer shares, depending on the preference of the shareholder, subject to applicable legal and regulatory provisions.
Preference shares of the Company must be registered and may not be contractually divided.
The shares of the Company require book-entry under the terms and conditions required by applicable legal and regulatory provisions. Ordinary shares are conveyed by transfer between accounts. Preference shares are not transferable.
The Company may at any time, in accordance with the legal and regulatory provisions, request information from the French securities clearing organization (SICOVAM) to allow the Company to identify shareholders granted either immediate or future voting rights in Shareholders’ General Meetings, as well as the number of shares held by any one shareholder and, where applicable, any restrictions to which the shares may be subject.
Crossing of legal thresholds (Article 6 of the Articles of Association)
Without prejudice to the thresholds provided for in Article L. 233-7 of the French Commercial Code, any shareholder acting alone or in concert with others who directly or indirectly comes to own at least 4% of the Company’s capital or voting rights, or a multiple of this percentage that is less than or equal to 28%, is required to inform the Company by registered letter with acknowledgment of receipt sent to the registered offi ce within the period prescribed in Article L. 233-7 of the French Commercial Code of the total number of shares, voting rights and securities ultimately granting entitlement to the Company’s capital.
The disclosure upon crossing any threshold equal to a multiple of 4% of the capital or voting rights as set out in the above paragraph
❙ 7.1.1 INFORMATION ABOUT THE COMPANY
Corporate name Ubisoft Entertainment
Registered offi ce 107, avenue Henri-Fréville – BP 10704 – Rennes (35207) Cedex 2
Legal information
French Corporation (Société Anonyme) with a Board of Directors governed by French law (particularly the provisions of the French Commercial Code applicable to commercial companies), as well as by its Articles of Association and internal rules of procedure.
Date of incorporation and term
The Company was incorporated on March 28, 1986 and registered by Trade and Companies Register on April 9, 1986 for a term of 99 years, unless such term is extended or the Company is dissolved at an earlier date
Trade and companies register335 186 094 RCS RENNESAPE code: 5821Z
Place where legal documents may be consultedThe Company’s legal documents may be consulted at its business address at 28, rue Armand-Carrel – 93100 Montreuil-sous-Bois, France, or at its registered offi ce.
Financial year The fi nancial year runs from April 1 to March 31
- 2018 Registration Document248
Information on the Company and its Capital
7
Legal information
should also be made when the interest in the capital or voting rights falls below one of the aforementioned thresholds.
Shareholders who fail to disclose that they have crossed such thresholds will forfeit their voting rights under the conditions set forth in Article L. 233-14 of the French Commercial Code, upon request – recorded in the minutes of the General Meeting – of one or more shareholders who together own at least 5% of the capital or voting rights in the Company.
Rights and obligations attached to shares (Article 7 of the Articles of Association)
I. Rights attached to ordinary shares: Each ordinary share gives rights to ownership of the corporate assets and the liquidation dividend equal to the proportion of the capital that it represents.
Voting rights double those conferred on other shares, based on the proportion of the share capital they represent, are granted to all fully paid-up shares that are shown to have been registered in the name of the same shareholder for at least two years. In the event of a share capital increase via the capitalization of reserves, profi ts or issue premiums, this right is also conferred at the date of issue on registered shares granted free of charge to a shareholder on the basis of ownership of existing shares that enjoy this right.
II. Rights attached to preference shares: Preference shares do not have a preferential subscription right for any capital increase or transaction with a right to ordinary shares. However, the conversion ratio referred to in section 2.2 below will be adjusted to preserve the rights of holders of preference shares.
III. Features of preference shares
1. Right to the liquidation dividend and right to dividends: Each preference share gives right, up until the Conversion Date, to a liquidation dividend equal to the to the proportion of the share capital that it represents. Each preference share will have a dividend distribution right equal to 1% of the distribution right.
2. Conversion:
2.1 Conversion Date: As preference shares may only be issued in the context of a free share grant, the conversion date (“Conversion Date”) is directly linked to the vesting or retention periods provided for in the free share plan. Under no circumstances may this take place until a minimum period of four years has elapsed.
2.2 Conversion conditions: The number of ordinary shares that may result from conversion is calculated using a conversion ratio determined by the Board of Directors based on the volume-weighted average trading price of the Company’s shares over a period to be defi ned by the Board of Directors (“Weighted Share Price”) on the Conversion Date (“Conversion Ratio”). It is specifi ed that the Board of Directors will determine, on the date of allocation:
• the Weighted Share Price on the basis of which preference shares may give rights to conversion (“Minimum Share Price”), which may not be lower than:
- the opening price of ordinary shares on Euronext Paris on the date of allocation (“Daily Price”),
- or the average opening price of ordinary shares over the 20 trading days prior to their allocation (“20-day Average”);
• the target share price on the Conversion Date beyond which the number of ordinary shares resulting from conversion does not increase any further (“Maximum Share Price”). This may not be lower than the Daily Price or the 20-day Average, plus a percentage to be defi ned by the Board of Directors based on the resolutions of the General Meeting authorizing bonus allocations of preference shares.
2.3 Conversion methods: Subject to fulfi llment of the conversion conditions, preference shares will be converted into ordinary shares by the Company on the Conversion Date using one of the following methods determined by the Board of Directors when they were allocated:
• either automatically on the Conversion Date;
• or at the request of the holder from the Conversion Date up until a deadline determined by the Board of Directors, after which the preference shares will be converted automatically if the holder has not initiated conversion during this period. Conversion at the initiative of the holder must comply with legal rules and regulations relating to insider trading.
All preference shares converted will be fully fungible with ordinary shares on their Conversion Date and will carry immediate dividend rights.
3. Voting rights
Preference shares have no voting rights in Ordinary and Extraordinary Meetings of the holders of ordinary shares, it being specifi ed that they have voting rights in Special Meetings of holders of preference shares.
General Meetings (Article 13 of the Articles of Association)
General Meetings will consist of all shareholders of Ubisoft Entertainment SA, with the exception of the Company itself. They represent the totality of shareholders.
They will be convened and deliberate under the conditions prescribed by the French Commercial Code. General Meetings are held at the registered offi ce or at any other venue indicated in the convening notice. They are chaired by the Chairman of the Board of Directors or, in his absence, by a director appointed for this purpose by the General Meeting.
The right to participate in Shareholders’ General Meetings is subject to fulfi llment of the formalities provided for under applicable regulations in force. Shareholders may vote by postal form or by proxy form subject to the requirements of legal and regulatory provisions.
- 2018 Registration Document 249
Information on the Company and its Capital7Legal information
In accordance with the decision of the Board of Directors published in the notice of meeting and/or convening notice, shareholders may participate in Shareholders’ General Meetings (by means of video-conferencing or vote using all means of telecommunication or remote transmission, including internet), under the conditions prescribed by the applicable regulations in force.
In the event of such a decision by the Board of Directors, shareholders may send their proxy forms or postal voting forms, either on paper or by means of telecommunications or remote transmission, in compliance with the deadlines applicable under laws and regulations. When remote transmission is used (including electronic means), the electronic signature may take the form of a process that meets the requirements set out in the fi rst sentence of the second paragraph of Article 1316-4 of the French Civil Code.
Distribution of earnings (Article 16 of the Articles of Association)
Earnings consist of income for the fi nancial year after deduction of operating expenses, allowances for depreciation and amortization and provisions. The following are deducted from earnings for the fi nancial year after deducting any prior-period losses:
♦ amounts to be allocated to reserves in accordance with the law and the Articles of Association and, in particular, at least 5% to make up the legal reserve. This allocation is no longer required once the legal reserve reaches one tenth of the share capital but resumes if, for any reason, the legal reserve falls below this fraction; and
♦ any amounts which the General Meeting, on a proposal from the Board of Directors, deems appropriate to allocate to any extraordinary or special reserves or to carry forward as retained earnings.
The balance will be distributed to the shareholders. However, except in the event of capital reductions, no distribution may be made to shareholders where the shareholders’ equity is, or would be if such distribution were to take place, less than the amount of the capital plus reserves that are non-distributable under the law or the Articles of Association.
The General Meeting may, in accordance with the provisions of Article L. 232-18 of the French Commercial Code, propose the option of payment of the interim or fi nal dividend in new shares of the Company.
❙ 7.1.3 FACTORS LIKELY TO HAVE AN IMPACT IN THE EVENT OF A PUBLIC OFFERING
Pursuant to Article L. 225-37-5 of the French Commercial Code, the following factors may have an impact in the event of a public offering.
Structure of the Company’s share capital and direct or indirect shareholdings known to the Company
The structure of the Company’s share capital, as well as the investments of which the Company is aware pursuant to Articles L. 233-7 and L. 233-12 of the French Commercial Code, are presented respectively in section 7.3 – Share ownership.
Restrictions on exercising voting rights and transferring shares set forth in the Articles of Association – Clauses of agreements brought to the Company’s attention
Article 6 of the Articles of Association, referred to in section 7.1.2 above, states that shareholders who fail to notify the Company that the threshold of 4% (or any multiple thereof) of the capital or voting rights has been crossed will forfeit their voting rights.
In application of Article L. 233-11 of the French Commercial Code, the Autorité des Marchés Financiers (AMF) has made public the main clauses of the investment agreement signed on March 20, 2018 between Tencent Mobility Limited (Tencent) and the Company (Decision and information No. 218C0646) as stipulated in 2° of Article L. 225-37-5 of the French Commercial Code.
Owners of securities conferring special rights of control over the Company
Article 7 of the Articles of Association, referred to in section 7.1.2 above, stipulates that a double voting right is assigned to all ordinary shares registered in the name of the same shareholder for at least two years. Subject to this caveat, there are no securities conferring special rights of control as referred to in 4° of Article L. 225-37-5 of the French Commercial Code.
Control mechanisms under employee stock ownership plans, if any, where the employees do not exercise control themselves
Under the rules of the mutual funds Ubi Actions and Ubi Share Ownership (the “FCPE”), the Supervisory Boards will exercise voting rights at the Company’s General Meetings and decide on the contribution of securities, particularly in the case of a public offering.
At March 31, 2018, the mutual funds held 3.475% of the share capital and 3.452% of the theoretical voting rights, or 3.504% of the voting rights that can be exercised at the General Meeting.
Shareholder agreements known to the Company that could lead to restrictions on transferring shares or exercising voting rights
The Company has no knowledge of any shareholder agreement referred to in 6° of Article L. 225-37-5 of the French Commercial Code that could lead to restrictions on transferring shares or exercising voting rights.
Rules governing the appointment and replacement of members of the Board of Directors and amendment of the Articles of Association
The rules governing the appointment and removal of members of the Board of Directors and amendments to the Articles of Association are consistent with the law and the Articles of Association.
- 2018 Registration Document250
Information on the Company and its Capital
7
Share capital
Powers of the Board of Directors in the event of a public offering
In accordance with the resolution adopted by the General Meeting on September 22, 2017, the Board of Directors may not implement the Company’s share buyback program during a public offering on the Company’s shares. A proposal tabled before the General Meeting on June 27, 2018 will seek to maintain this restriction.
Furthermore, following the amendment of Article L. 233-32 of the French Commercial Code by Law No. 2014-384 of March 29, 2014 on reclaiming the real economy (the “Florange Law”), the authorization to issue shares and securities with or without preferential subscription rights, submitted for approval to the General Meeting of September 22, 2017, prohibited the Board of Directors from initiating such issuance during a public offering for the Company’s shares.
Agreements made by the Company that are amended or terminated upon a change in control
There are certain agreements made by the Company that would be amended or terminated in the event of a change in control at
the Company, but for reasons of confi dentiality it seems unwise to specify the nature of these contracts.
As regards the share purchase and/or subscription option plans (the “Option”) and the free share plans (the “Shares”), with the exception of those relating to Corporate Executive Offi cers, in the event of a change of control of Ubisoft Entertainment SA within the meaning of Article L. 233-3 of the French Commercial Code, these plans shall immediately cease to be contingent upon of, on the one hand, the benefi ciaries being, on the date of exercise of the Option(s) or change in ownership of the Shares, employees, and, on the other hand, the achievement of the performance conditions, where applicable.
Agreement to compensate Board members if they resign or are unfairly dismissed, or if their employment is terminated due to a public offering
There are no specifi c agreements providing for compensation in the event of termination of the appointment of corporate offi cers of Ubisoft Entertainment SA.
7.2 Share capital
❙ 7.2.1 CAPITAL AS AT MARCH 31, 2018
As at March 31, 2018, the number of shares outstanding totaled 111,645,032 fully paid-up shares with a par value of €0.0775 each,
of which 111,631,149 category A ordinary shares and 11,474 category B-1 preference shares and 2,409 category B-2 preference shares, equivalent to a share capital of €8,652,489.98. Preference shares have no voting rights.
The following table shows the number of shares created and/or canceled between April 1, 2017, and March 31, 2018:
AT 04/01/17 112,932,041 SHARES
Exercise of subscription options 616,119 shares
Free ordinary share grants 929,139 shares
Free preference share grants 13,883 shares
Capital increase reserved for employees 967,480 shares
Cancellation of own shares (see 7.2.4.2) (3,813,630) shares
AT 03/31/18 111,645,032 SHARES
- 2018 Registration Document 251
Information on the Company and its Capital7Share capital
❙ 7.2.2 POTENTIAL CAPITAL AS AT MARCH 31, 2018
Free share grants (see 4.2.3.5) Number of potential shares Potential dilution
Attendance and/or performance conditions 3,952,542 3.42%
Share subscription options (see 4.2.3.6) Number of potential shares Potential dilution
Open and not openPlans 26, 27, 28, 29, 30, 31, 32, 33, 34,
35, 36 and 37 2,171,411 1.91%
OCEANE bonds (see 7.4.4.1) (1) Number of potential shares Potential dilution
Number of OCEANE bonds 7,307,270 6.41%
(1) Issuance on September 27, 2016 of bonds with the option of conversion into and/or exchange for new or existing shares (OCEANE), maturing in 2021, admitted to trading on the open market (Freiverkehr)
❙ 7.2.3 FINANCIAL AUTHORIZATIONS
7.2.3.1 Authorizations in force or used during the fi nancial year ended March 31, 2018
The table below summarizes (notably in application of the provisions of Article L. 225-37-4, 3° of the French Commercial Code), the current valid delegations in respect of the past fi nancial year or those that expired and that were used during the past fi nancial year.
TypeDate of the Meeting Resolution
DurationExpiry date Maximum use
Date of use (12)
2017/2018
Issuance or cancelation
from 04/01/17 at 03/31/18
Share buyback
09/29/1617th resolution (1)
18 months03/28/18
10% of the share capitalMaximum purchase price: €60
See 7.2.409/22/1720th resolution
18 months03/21/19
10% of the share capitalMaximum purchase price: €75
Reduction in capitalby cancelation oftreasury shares
09/22/1721st resolution
18 months03/21/19
10% of the share capital per 24 month period
See 7.2.411/17/1703/30/18
(3,813,630)
Capital increase by capitalization of reserves, earnings, premiums or other
09/23/1512th resolution (1)
26 months11/22/17
€10 million 05/09/17 (9)
06/15/17 (9)
336,173 (2)
09/22/1722nd resolution
26 months11/21/19
€10 million 09/25/17 (10)
10/05/17 (9)
10/25/17 (9)
12/12/17 (10)
606,849
Capital increase with preferential subscription rights preserved
09/22/1723rd resolution (2)
26 months11/21/19
In capital: €1,450 thousandDebt securities: €400 million (8)
N/A N/A
Capital increase with waiving of preferential subscription rights by way of a public offering
09/22/1724th resolution (2)
26 months11/21/19
In capital: €850 thousand (5)
Debt securities: €400 million (8)
N/A N/A
Capital increase with waiver of preferential subscription rights by way of a private placement
09/22/1725th resolution (2)
26 months11/21/19
In capital: €850 thousand (5)
Debt securities: €400 million (8)
N/A N/A
- 2018 Registration Document252
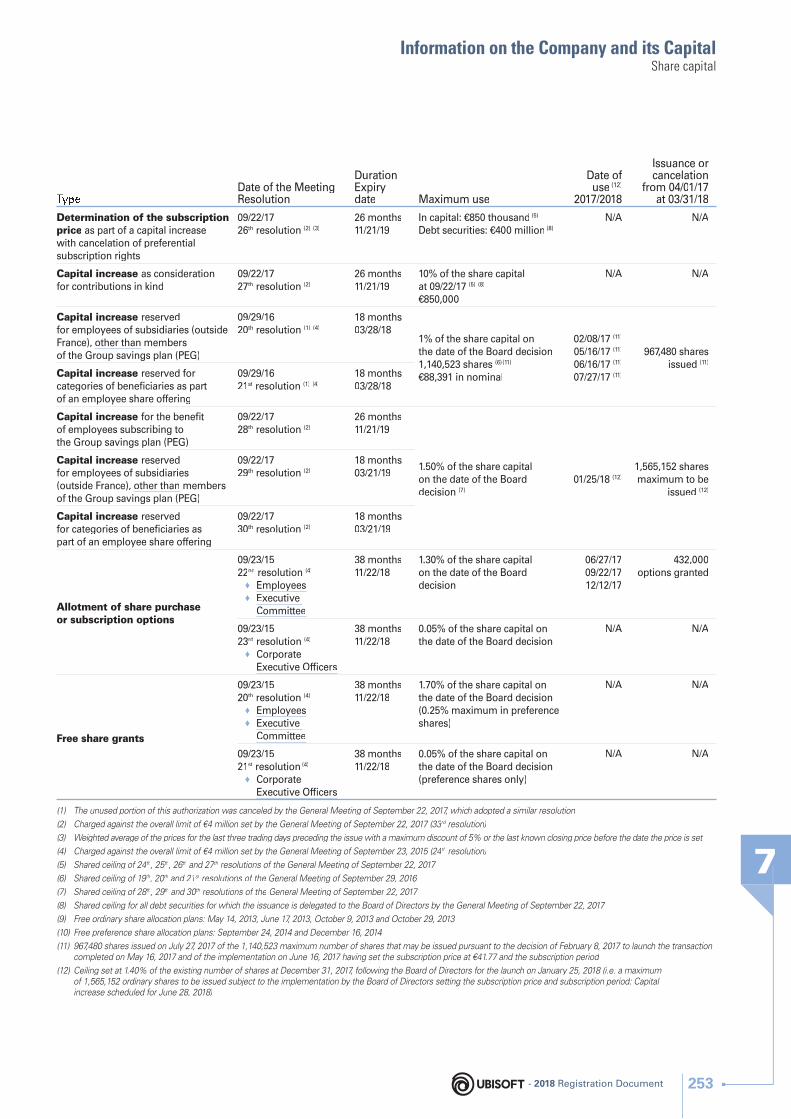
Information on the Company and its Capital
7
Share capital
Date of the Meeting Resolution
DurationExpiry date Maximum use
Date of use (12)
2017/2018
Issuance or cancelation
from 04/01/17 at 03/31/18
Determination of the subscriptionprice as part of a capital increase with cancelation of preferentialsubscription rights
09/22/1726th resolution (2) (3)
26 months11/21/19
In capital: €850 thousand (5)
Debt securities: €400 million (8)
N/A N/A
Capital increase as consideration for contributions in kind
09/22/1727th resolution (2)
26 months11/21/19
10% of the share capital at 09/22/17 (5) (8)
€850,000
N/A N/A
Capital increase reserved for employees of subsidiaries (outsideFrance), other than members of the Group savings plan (PEG)
09/29/1620th resolution (1) (4)
18 months03/28/18
1% of the share capital on the date of the Board decision1,140,523 shares (6) (11)
€88,391 in nominal
02/08/17 (11)
05/16/17 (11)
06/16/17 (11)
07/27/17 (11)
967,480 sharesissued (11)
Capital increase reserved forcategories of benefi ciaries as partof an employee share offering
09/29/1621st resolution (1) (4)
18 months03/28/18
Capital increase for the benefi t of employees subscribing tothe Group savings plan (PEG)
09/22/1728th resolution (2)
26 months11/21/19
1.50% of the share capital on the date of the Boarddecision (7)
01/25/18 (12)
1,565,152 shares maximum to be
issued (12)
Capital increase reserved for employees of subsidiaries(outside France), other than membersof the Group savings plan (PEG)
09/22/1729th resolution (2)
18 months03/21/19
Capital increase reserved for categories of benefi ciaries aspart of an employee share offering
09/22/1730th resolution (2)
18 months03/21/19
Allotment of share purchaseor subscription options
09/23/1522nd resolution (4)
♦ Employees ♦ Executive
Committee
38 months11/22/18
1.30% of the share capital on the date of the Board decision
06/27/1709/22/1712/12/17
432,000options granted
09/23/1523rd resolution (4)
♦ Corporate Executive Offi cers
38 months11/22/18
0.05% of the share capital on the date of the Board decision
N/A N/A
Free share grants
09/23/1520th resolution (4)
♦ Employees ♦ Executive
Committee
38 months11/22/18
1.70% of the share capital on the date of the Board decision(0.25% maximum in preferenceshares)
N/A N/A
09/23/1521st resolution (4)
♦ CorporateExecutive Offi cers
38 months11/22/18
0.05% of the share capital on the date of the Board decision (preference shares only)
N/A N/A
(1) The unused portion of this authorization was canceled by the General Meeting of September 22, 2017, which adopted a similar resolution
(2) Charged against the overall limit of €4 million set by the General Meeting of September 22, 2017 (33r33 drr resolution)d
(3) Weighted average of the prices for the last three trading days preceding the issue with a maximum discount of 5% or the last known closing price before the date the price is set
(4) Charged against the overall limit of €4 million set by the General Meeting of September 23, 2015 (24thtt resolution)h
(5) Shared ceiling of 24thtt , 25th55 , 26th66 and 27h th77 resolh utions of the General Meeting of September 22, 2017r
(6) Shared ceiling of 19th, 20th and 21h st resolt utions of the General Meeting of Septembere 29, 2016r
(7) Shared ceiling of 28th88 , 29th and 30h th resolh utions of the General Meeting of Septembere 22, 2017r
(8) Shared ceiling for all debt securities for which the issuance is delegated to the Board of Directors by the General Meeting of September 22, 2017
(9) Free ordinary share allocation plans: May 14, 2013, June 17, 2013, October 9, 2013 and October 29, 2013
(10) Free preference share allocation plans: September 24, 2014 and December 16, 2014
(11) 967,480 shares issued on July 27, 2017 of the 1,140,523 maximum number of shares that may be issued pursuant to the decision of February 8, 2017 to launch the transaction completed on May 16, 2017 and of the implementation on June 16, 2017 having set the subscription price at €41.77 and the subscription period
(12) Ceiling set at 1.40% of the existing number of shares at December 31, 2017, following the Board of Directors for the launch on January 25, 2018 (i.e. a maximum of 1,565,152 ordinary shares to be issued subject to the implementation by the Board of Directors setting the subscription price and subscription period: Capital increase scheduled for June 28, 2018)
- 2018 Registration Document 253

Information on the Company and its Capital7Share capital
7.2.3.2 Authorizations submitted to the vote of the Shareholders’ General Meeting of June 27, 2018
Type
Date of the Meeting Resolution
DurationExpiry date
Maximum authorized(Par value)
Share buyback (1) 06/27/1812th resolution
18 months12/26/19
10% of the share capitalMaximum purchase price: €120
Reduction in capital by cancelation of treasury shares 06/27/1813th resolution
18 months12/26/19
10% of the share capital per 24 month period
Capital increase for the benefi t of employees subscribing to the Group savings plan (PEG) (6)
06/27/1814th resolution
26 months08/26/20 1.50% of the number of shares comprising the
Company’s share capital at the date of the Board of Directors’ decision to proceed with the capital increase(s)Maximum discount: 15%
Capital increase reserved for employees of subsidiaries (outside France), other than members of the Group savings plan (PEG) (6)
06/27/1815th resolution
18 months12/26/19
Capital increase reserved for categories of benefi ciaries as part of an employee share offering (6)
06/27/1816th resolution
18 months12/26/19
Free performance share grants (6)
♦ Employees (2)
♦ Executive Committee (3)
06/27/1817th resolution
38 months08/26/21
1.50% of the number of shares comprising the Company’s share capital at the date of the Board of Directors’ allocation decision
Allotment of share purchase or subscription options (6)
♦ Employees ♦ Executive Committee (4)
06/27/1818th resolution
38 months08/26/21
1% of the number of shares comprising the Company’s share capital at the date of the Board of Directors’ allocation decisionShared ceiling with the 19th resolution
Allotment of share purchase or subscription options (6)
♦ Corporate Executive Offi cers of the Company (5)
06/27/1819th resolution
38 months08/26/21
0.20% of the number of shares comprising the Company’s share capital at the date of the Board of Directors’ allocation decisionCeiling charged against the overall limit of the 18th resolution
(1) Except during a public offering period
(2) Subject to individual attendance and performance conditions assessed over at least 4 years/vesting period: 4 years
(3) Subject to internal attendance and individual performance (1/3) assessed over at least 4 years, internal performance condition assessed over at least 3 fi nancial years (1/3 on the basis of the average Group non-IFRS EBIT) and external performance condition assessed over at least 3 years (1/3 according to the performance of the Ubisoft S hare compared to a panel of companies)/vesting period: 4 years
(4) Subject to internal attendance and internal performance condition assessed over at least 3 fi nancial years (50% on the basis of the average Group non-IFRS EBIT) and external performance condition assessed over at least 3 years (50% according to the performance of the Ubisoft S hare compared to a panel of companies)/exercise period at the earliest after 4 years
(5) Subject to continued capacity as Corporate Executive Offi cer and internal performance condition assessed over at least 3 fi nancial years (50% on the basis of an average Group non-IFRS EBIT) and external performance condition assessed over at least 3 years (50% according to the performance of the Ubisoft S hare compared to a panel of companies)/exercise period at the earliest after 4 years
(6) Charged against the overall limit of €4 million set by the General Meeting of September 22, 2017 (33rd resolution)
❙ 7.2.4 SHARE BUYBACK
This section includes the information required under Article L. 225-211 of the French -Commercial Code, together with the information to be included in the description of the share buyback program pursuant to Articles 241-2 and 241-3 of the General Regulations of the Autorité des Marchés Financiers (AMF).
7.2.4.1 Legal framework
The Combined General Meeting of September 22, 2017 (the “2017 General Meeting”) renewed the authorizations previously granted to the Board of Directors by the Combined General Meeting of
September 29, 2016 (the “2016 General Meeting”) allowing the Company, in accordance with Article L. 225-209 of the French Commercial Code, to purchase, on or off the market, a number of shares representing up to 10% of the Company’s share capital on the purchase date, for the purposes stipulated by European Regulation no. 2273/2003 of December 22, 2003 (2016 General Meeting) or by European Regulation no. 596/2014 (2017 General Meeting) as well as the framework for market practices authorized by the Autorité des Marchés Financiers (AMF) (the “Share buyback program(s)”).
The 2016 and 2017 General Meetings also authorized the Board of Directors to reduce the share capital by cancelation of the shares purchased under the Share Buyback Programs.
7.2.4.2 Situation at March 31, 2018
Percentage of own shares held directly and indirectly 1.42%
Number of shares in portfolio (1) 1,587,176
Portfolio book value €86,103,219.54
Portfolio market value (2) €108,753,299.52
(1) Breakdown by purpose below
(2) Closing price at 03/29/18 (market closed on 03/30 and 03/31/18): €68.52
- 2018 Registration Document254
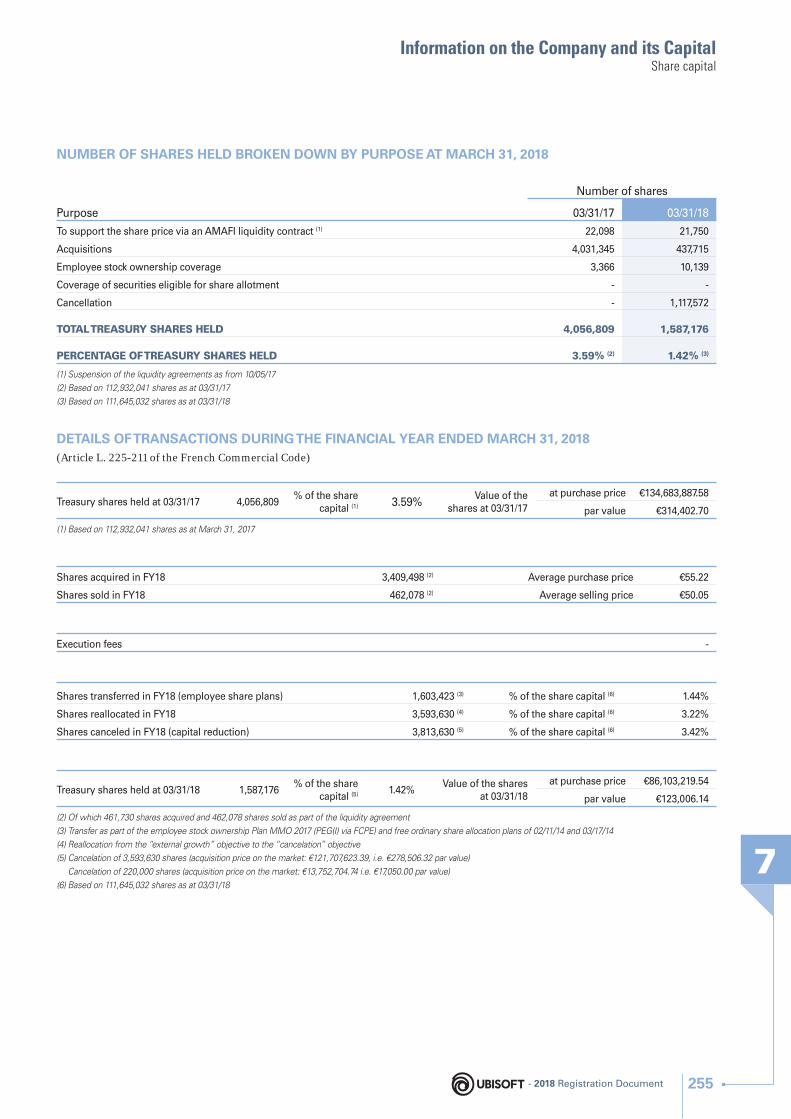
Information on the Company and its Capital
7
Share capital
NUMBER OF SHARES HELD BROKEN DOWN BY PURPOSE AT MARCH 31, 2018
Purpose
Number of shares
03/31/17 03/31/18
To support the share price via an AMAFI liquidity contract (1) 22,098 21,750
Acquisitions 4,031,345 437,715
Employee stock ownership coverage 3,366 10,139
Coverage of securities eligible for share allotment - -
Cancellation - 1,117,572
TOTAL TREASURY SHARES HELD 4,056,809 1,587,176
PERCENTAGE OF TREASURY SHARES HELD 3.59% (2) 1.42% (3)
(1) Suspension of the liquidity agreements as from 10/05/17
(2) Based on 112,932,041 shares as at 03/31/ 17
(3) Based on 111,645,032 shares as at 03/31/ 18
DETAILS OF TRANSACTIONS DURING THE FINANCIAL YEAR ENDED MARCH 31, 2018(Article L. 225-211 of the French Commercial Code)
Treasury shares held at 03/31/17 4,056,809% of the share
capital (1) 3.59%Value of the
shares at 03/31/17
at purchase price €134,683,887.58
par value €314,402.70
(1) Based on 112,932,041 shares as at March 31, 2017
Shares acquired in FY18 3,409,498 (2) Average purchase price €55.22
Shares sold in FY18 462,078 (2) Average selling price €50.05
Execution fees -
Shares transferred in FY18 (employee share plans) 1,603,423 (3) % of the share capital (6) 1.44%
Shares reallocated in FY18 3,593,630 (4) % of the share capital (6) 3.22%
Shares canceled in FY18 (capital reduction) 3,813,630 (5) % of the share capital (6) 3.42%
Treasury shares held at 03/31/18 1,587,176% of the share
capital (5) 1.42%Value of the shares
at 03/31/18
at purchase price €86,103,219.54
par value €123,006.14
(2) Of which 461,730 shares acquired and 462,078 shares sold as part of the liquidity agreement
(3) Transfer as part of the employee stock ownership Plan MMO 2017 (PEG(I) via FCPE) and free ordinary share allocation plans of 02/11/14 and 03/17/14
(4) Reallocation from the “external growth” objective to the “cancelation” objective
(5) Cancelation of 3,593,630 shares (acquisition price on the market: €121,707,623.39, i.e. €278,506.32 par value)
Cancelation of 220,000 shares (acquisition price on the market: €13,752,704.74 i.e. €17,050.00 par value)
(6) Based on 111,645,032 shares as at 03/31/ 18
- 2018 Registration Document 255
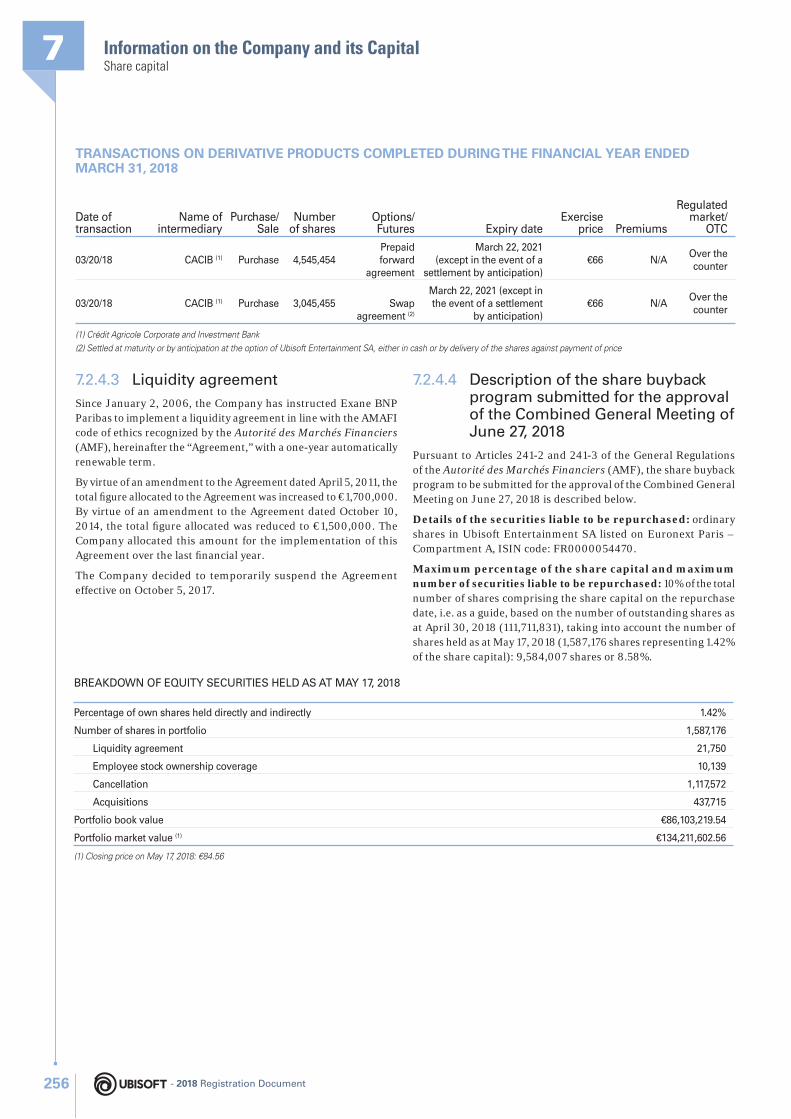
Information on the Company and its Capital7Share capital
TRANSACTIONS ON DERIVATIVE PRODUCTS COMPLETED DURING THE FINANCIAL YEAR ENDED MARCH 31, 2018
Date of transaction
Name of intermediary
Purchase/Sale
Number of shares
Options/Futures Expiry date
Exercise price Premiums
Regulated market/
OTC
03/20/18 CACIB (1) Purchase 4,545,454Prepaid forward
agreement
March 22, 2021(except in the event of a
settlement by anticipation)€66 N/A
Over the counter
03/20/18 CACIB (1) Purchase 3,045,455 Swap agreement (2)
March 22, 2021 (except in the event of a settlement
by anticipation)€66 N/A
Over the counter
(1) Crédit Agricole Corporate and Investment Bank
(2) Settled at maturity or by anticipation at the option of Ubisoft Entertainment SA, either in cash or by delivery of the shares against payment of price
7.2.4.3 Liquidity agreement
Since January 2, 2006, the Company has instructed Exane BNP Paribas to implement a liquidity agreement in line with the AMAFI code of ethics recognized by the Autorité des Marchés Financiers (AMF), hereinafter the “Agreement,” with a one-year automatically renewable term.
By virtue of an amendment to the Agreement dated April 5, 2011, the total fi gure allocated to the Agreement was increased to €1,700,000. By virtue of an amendment to the Agreement dated October 10, 2014, the total fi gure allocated was reduced to €1,500,000. The Company allocated this amount for the implementation of this Agreement over the last fi nancial year.
The Company decided to temporarily suspend the Agreement effective on October 5, 2017.
7.2.4.4 Description of the share buyback program submitted for the approval of the Combined General Meeting of June 27, 2018
Pursuant to Articles 241-2 and 241-3 of the General Regulations of the Autorité des Marchés Financiers (AMF), the share buyback program to be submitted for the approval of the Combined General Meeting on June 27, 2018 is described below.
Details of the securities liable to be repurchased: ordinary shares in Ubisoft Entertainment SA listed on Euronext Paris – Compartment A, ISIN code: FR0000054470.
Maximum percentage of the share capital and maximum number of securities liable to be repurchased: 10% of the total number of shares comprising the share capital on the repurchase date, i.e. as a guide, based on the number of outstanding shares as at April 30, 2018 (111,711,831), taking into account the number of shares held as at May 17, 2018 (1,587,176 shares representing 1.42% of the share capital): 9,584,007 shares or 8.58%.
BREAKDOWN OF EQUITY SECURITIES HELD AS AT MAY 17, 2018
Percentage of own shares held directly and indirectly 1.42%
Number of shares in portfolio 1,587,176
Liquidity agreement 21,750
Employee stock ownership coverage 10,139
Cancellation 1,117,572
Acquisitions 437,715
Portfolio book value €86,103,219.54
Portfolio market value (1) €134,211,602.56
(1) Closing price on May 17, 2018: €84.56
- 2018 Registration Document256
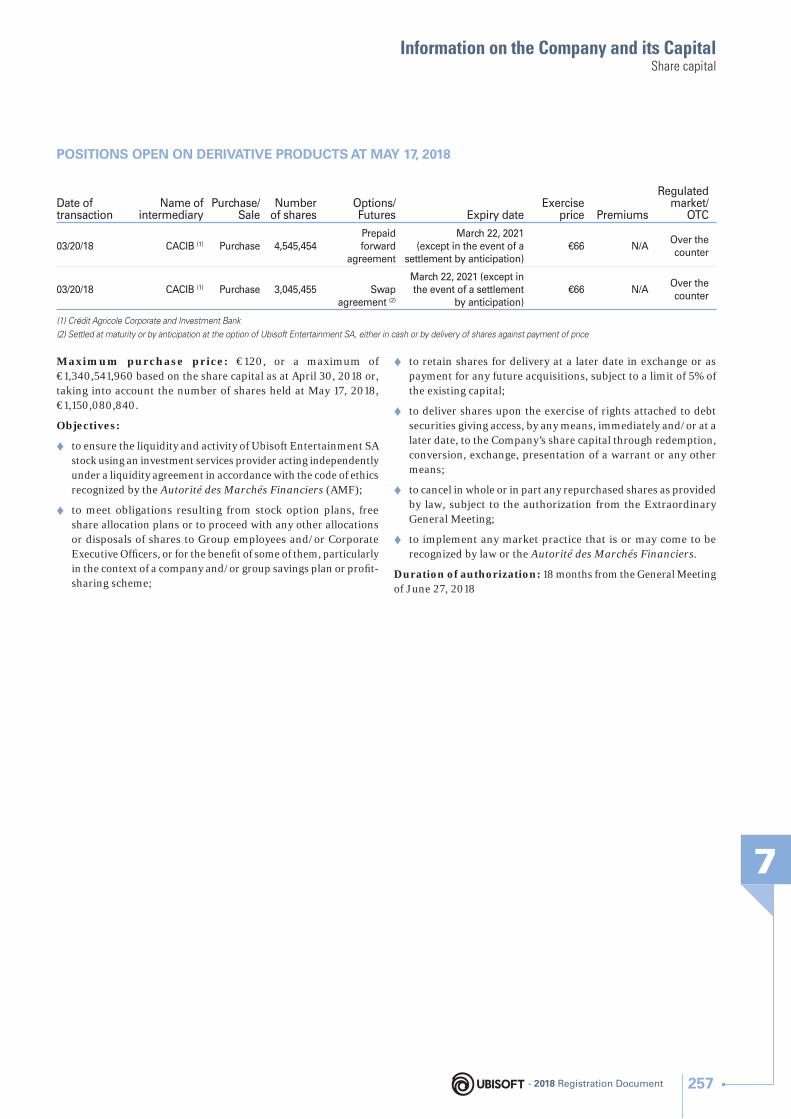
Information on the Company and its Capital
7
Share capital
POSITIONS OPEN ON DERIVATIVE PRODUCTS AT MAY 17, 2018
Date of transaction
Name of intermediary
Purchase/Sale
Number of shares
O ptions/Futures Expiry date
Exercise price Premiums
Regulated market/
OTC
03/20/18 CACIB (1) Purchase 4,545,454Prepaid forward
agreement
March 22, 2021(except in the event of a
settlement by anticipation)€66 N/A
Over the counter
03/20/18 CACIB (1) Purchase 3,045,455 Swap agreement (2)
March 22, 2021 (except in the event of a settlement
by anticipation)€66 N/A
Over the counter
(1) Crédit Agricole Corporate and Investment Bank
(2) Settled at maturity or by anticipation at the option of Ubisoft Entertainment SA, either in cash or by delivery of shares against payment of price
Maximum purchase price: €120, or a maximum of €1,340,541,960 based on the share capital as at April 30, 2018 or, taking into account the number of shares held at May 17, 2018, €1,150,080,840.
Objectives:
♦ to ensure the liquidity and activity of Ubisoft Entertainment SA stock using an investment services provider acting independently under a liquidity agreement in accordance with the code of ethics recognized by the Autorité des Marchés Financiers (AMF);
♦ to meet obligations resulting from stock option plans, free share allocation plans or to proceed with any other allocations or disposals of shares to Group employees and/or Corporate Executive Offi cers, or for the benefi t of some of them, particularly in the context of a company and/or group savings plan or profi t-sharing scheme;
♦ to retain shares for delivery at a later date in exchange or as payment for any future acquisitions, subject to a limit of 5% of the existing capital;
♦ to deliver shares upon the exercise of rights attached to debt securities giving access, by any means, immediately and/or at a later date, to the Company’s share capital through redemption, conversion, exchange, presentation of a warrant or any other means;
♦ to cancel in whole or in part any repurchased shares as provided by law, subject to the authorization from the Extraordinary General Meeting;
♦ to implement any market practice that is or may come to be recognized by law or the Autorité des Marchés Financiers.
Duration of authorization: 18 months from the General Meeting of June 27, 2018
- 2018 Registration Document 257
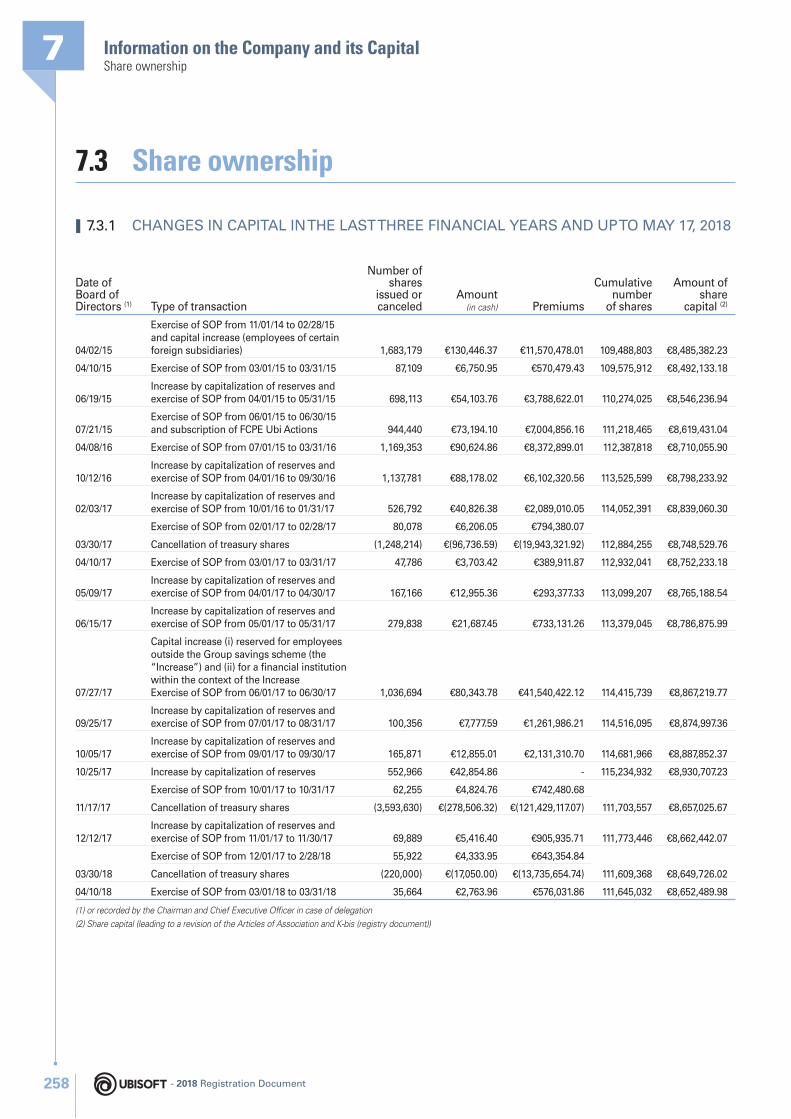
Information on the Company and its Capital7Share ownership
7.3 Share ownership
❙ 7.3.1 CHANGES IN CAPITAL IN THE LAST THREE FINANCIAL YEARS AND UP TO MAY 17, 2018
Date of Board of Directors (1) Type of transaction
Number of shares
issued or canceled
Amount (in cash) Premiums
Cumulative number
of shares
Amount of share
capital (2)
04/02/15
Exercise of SOP from 11/01/14 to 02/28/15 and capital increase (employees of certain foreign subsidiaries) 1,683,179 €130,446.37 €11,570,478.01 109,488,803 €8,485,382.23
04/10/15 Exercise of SOP from 03/01/15 to 03/31/15 87,109 €6,750.95 €570,479.43 109,575,912 €8,492,133.18
06/19/15Increase by capitalization of reserves and exercise of SOP from 04/01/15 to 05/31/15 698,113 €54,103.76 €3,788,622.01 110,274,025 €8,546,236.94
07/21/15Exercise of SOP from 06/01/15 to 06/30/15 and subscription of FCPE Ubi Actions 944,440 €73,194.10 €7,004,856.16 111,218,465 €8,619,431.04
04/08/16 Exercise of SOP from 07/01/15 to 03/31/16 1,169,353 €90,624.86 €8,372,899.01 112,387,818 €8,710,055.90
10/12/16Increase by capitalization of reserves and exercise of SOP from 04/01/16 to 09/30/16 1,137,781 €88,178.02 €6,102,320.56 113,525,599 €8,798,233.92
02/03/17Increase by capitalization of reserves and exercise of SOP from 10/01/16 to 01/31/17 526,792 €40,826.38 €2,089,010.05 114,052,391 €8,839,060.30
03/30/17
Exercise of SOP from 02/01/17 to 02/28/17 80,078 €6,206.05 €794,380.07
112,884,255 €8,748,529.76Cancellation of treasury shares (1,248,214) €(96,736.59) €(19,943,321.92)
04/10/17 Exercise of SOP from 03/01/17 to 03/31/17 47,786 €3,703.42 €389,911.87 112,932,041 €8,752,233.18
05/09/17Increase by capitalization of reserves and exercise of SOP from 04/01/17 to 04/30/17 167,166 €12,955.36 €293,377.33 113,099,207 €8,765,188.54
06/15/17Increase by capitalization of reserves and exercise of SOP from 05/01/17 to 05/31/17 279,838 €21,687.45 €733,131.26 113,379,045 €8,786,875.99
07/27/17
Capital increase (i) reserved for employees outside the Group savings scheme (the “Increase”) and (ii) for a fi nancial institution within the context of the IncreaseExercise of SOP from 06/01/17 to 06/30/17 1,036,694 €80,343.78 €41,540,422.12 114,415,739 €8,867,219.77
09/25/17Increase by capitalization of reserves and exercise of SOP from 07/01/17 to 08/31/17 100,356 €7,777.59 €1,261,986.21 114,516,095 €8,874,997.36
10/05/17Increase by capitalization of reserves and exercise of SOP from 09/01/17 to 09/30/17 165,871 €12,855.01 €2,131,310.70 114,681,966 €8,887,852.37
10/25/17 Increase by capitalization of reserves 552,966 €42,854.86 - 115,234,932 €8,930,707.23
11/17/17
Exercise of SOP from 10/01/17 to 10/31/17 62,255 €4,824.76 €742,480.68
111,703,557 €8,657,025.67Cancellation of treasury shares (3,593,630) €(278,506.32) €(121,429,117.07)
12/12/17Increase by capitalization of reserves and exercise of SOP from 11/01/17 to 11/30/17 69,889 €5,416.40 €905,935.71 111,773,446 €8,662,442.07
03/30/18
Exercise of SOP from 12/01/17 to 2/28/18 55,922 €4,333.95 €643,354.84
111,609,368 €8,649,726.02Cancellation of treasury shares (220,000) €(17,050.00) €(13,735,654.74)
04/10/18 Exercise of SOP from 03/01/18 to 03/31/18 35,664 €2,763.96 €576,031.86 111,645,032 €8,652,489.98
(1) or recorded by the Chairman and Chief Executive Offi cer in case of delegation
(2) Share capital (leading to a revision of the Articles of Association and K-bis (registry document))
- 2018 Registration Document258
Information on the Company and its Capital
7
Share ownership
As at March 31, 2018, employees held 3,879,192 shares, or 3.475% of the capital, through the Company mutual funds.
This ownership is the result of capital increase transactions reserved for employees of companies (associated with the Company under the terms stipulated in Article L. 225-180 of the French Commercial Code) belonging to the Ubisoft Group savings scheme pursuant to the delegations granted to the Board of Directors by the Shareholders’ General Meeting, or of share disposals, in application
of the provisions of Article L. 3332-24 of the French Labor Code, within the context of the share buyback programs approved by the Shareholders’ General Meeting.
During the fi nancial year ended March 31, 2018, on July 27, 2017, a sale of shares took place as stipulated in the paragraph above, as part of the share buyback program approved by the General Meeting of September 29, 2016 (See sections 7.2.3.1 and 7.2.4).
❙ 7.3.2 EMPLOYEE STOCK OWNERSHIP THROUGH THE COMPANY MUTUAL FUND (FCPE)
- 2018 Registration Document 259
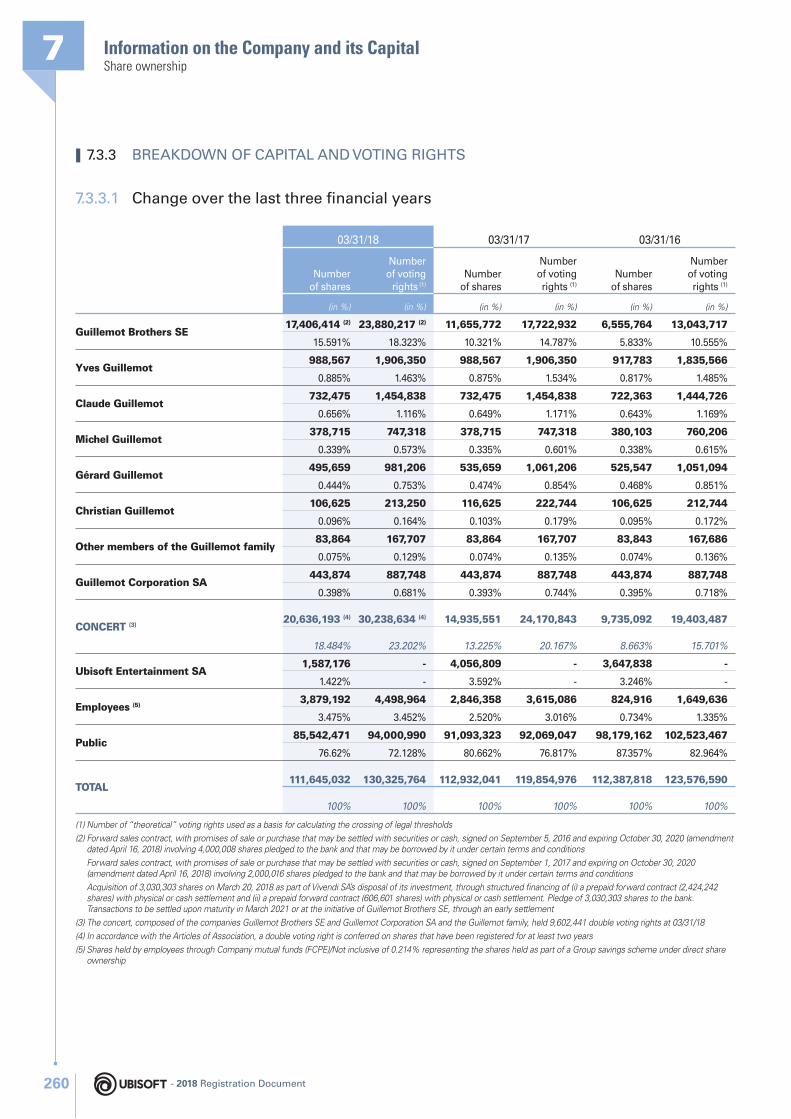
Information on the Company and its Capital7Share ownership
❙ 7.3.3 BREAKDOWN OF CAPITAL AND VOTING RIGHTS
7.3.3.1 Change over the last three fi nancial years
03/31/18 03/31/17 03/31/16
Number of shares
Number of voting
rights (1)
Number of shares
Number of voting rights (1)
Number of shares
Number of voting rights (1)
(in %) (in %) (in %) (in %) (in %) (in %)
Guillemot Brothers SE17,406,414 (2) 23,880,217 (2) 11,655,772 17,722,932 6,555,764 13,043,717
15.591% 18.323% 10.321% 14.787% 5.833% 10.555%
Yves Guillemot988,567 1,906,350 988,567 1,906,350 917,783 1,835,566
0.885% 1.463% 0.875% 1.534% 0.817% 1.485%
Claude Guillemot732,475 1,454,838 732,475 1,454,838 722,363 1,444,726
0.656% 1.116% 0.649% 1.171% 0.643% 1.169%
Michel Guillemot378,715 747,318 378,715 747,318 380,103 760,206
0.339% 0.573% 0.335% 0.601% 0.338% 0.615%
Gérard Guillemot495,659 981,206 535,659 1,061,206 525,547 1,051,094
0.444% 0.753% 0.474% 0.854% 0.468% 0.851%
Christian Guillemot106,625 213,250 116,625 222,744 106,625 212,744
0.096% 0.164% 0.103% 0.179% 0.095% 0.172%
Other members of the Guillemot family83,864 167,707 83,864 167,707 83,843 167,686
0.075% 0.129% 0.074% 0.135% 0.074% 0.136%
Guillemot Corporation SA443,874 887,748 443,874 887,748 443,874 887,748
0.398% 0.681% 0.393% 0.744% 0.395% 0.718%
CONCERT (3)20,636,193 (4) 30,238,634 (4) 14,935,551 24,170,843 9,735,092 19,403,487
18.484% 23.202% 13.225% 20.167% 8.663% 15.701%
Ubisoft Entertainment SA1,587,176 - 4,056,809 - 3,647,838 -
1.422% - 3.592% - 3.246% -
Employees (5)3,879,192 4,498,964 2,846,358 3,615,086 824,916 1,649,636
3.475% 3.452% 2.520% 3.016% 0.734% 1.335%
Public85,542,471 94,000,990 91,093,323 92,069,047 98,179,162 102,523,467
76.62% 72.128% 80.662% 76.817% 87.357% 82.964%
TOTAL111,645,032 130,325,764 112,932,041 119,854,976 112,387,818 123,576,590
100% 100% 100% 100% 100% 100%
(1) Number of “theoretical” voting rights used as a basis for calculating the crossing of legal thresholds
(2) Forward sales contract, with promises of sale or purchase that may be settled with securities or cash, signed on September 5, 2016 and expiring October 30, 2020 (amendment dated April 16, 2018) involving 4,000,008 shares pledged to the bank and that may be borrowed by it under certain terms and conditions
Forward sales contract, with promises of sale or purchase that may be settled with securities or cash, signed on September 1, 2017 and expiring on October 30, 2020 (amendment dated April 16, 2018) involving 2,000,016 shares pledged to the bank and that may be borrowed by it under certain terms and conditions
Acquisition of 3,030,303 shares on March 20, 2018 as part of Vivendi SA’s disposal of its investment, through structured fi nancing of (i) a prepaid forward contract (2,424,242 shares) with physical or cash settlement and (ii) a prepaid forward contract (606,601 shares) with physical or cash settlement. Pledge of 3,030,303 shares to the bank. Transactions to be settled upon maturity in March 2021 or at the initiative of Guillemot Brothers SE, through an early settlement
(3) The concert, composed of the companies Guillemot Brothers SE and Guillemot Corporation SA and the Guillemot family, held 9,602,441 double voting rights at 03/31/ 18
(4) In accordance with the Articles of Association, a double voting right is conferred on shares that have been registered for at least two years
(5) Shares held by employees through Company mutual funds (FCPE)/Not inclusive of 0.214% representing the shares held as part of a Group savings scheme under direct share ownership
- 2018 Registration Document260
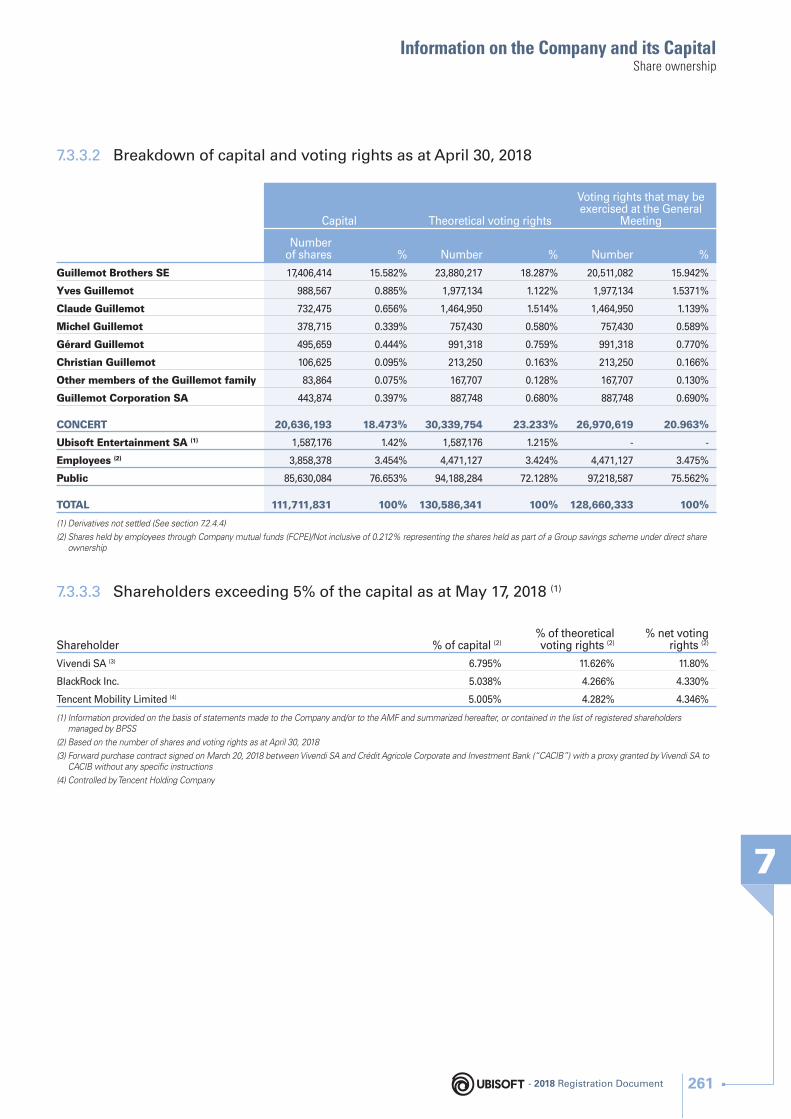
Information on the Company and its Capital
7
Share ownership
7.3.3.2 Breakdown of capital and voting rights as at April 30, 2018
Capital Theoretical voting rights
Voting rights that may be exercised at the General
Meeting
Number of shares % Number % Number %
Guillemot Brothers SE 17,406,414 15.582% 23,880,217 18.287% 20,511,082 15.942%
Yves Guillemot 988,567 0.885% 1,977,134 1.122% 1,977,134 1.5371%
Claude Guillemot 732,475 0.656% 1,464,950 1.514% 1,464,950 1.139%
Michel Guillemot 378,715 0.339% 757,430 0.580% 757,430 0.589%
Gérard Guillemot 495,659 0.444% 991,318 0.759% 991,318 0.770%
Christian Guillemot 106,625 0.095% 213,250 0.163% 213,250 0.166%
Other members of the Guillemot family 83,864 0.075% 167,707 0.128% 167,707 0.130%
Guillemot Corporation SA 443,874 0.397% 887,748 0.680% 887,748 0.690%
CONCERT 20,636,193 18.473% 30,339,754 23.233% 26,970,619 20.963%
Ubisoft Entertainment SA (1) 1,587,176 1.42% 1,587,176 1.215% - -
Employees (2) 3,858,378 3.454% 4,471,127 3.424% 4,471,127 3.475%
Public 85,630,084 76.653% 94,188,284 72.128% 97,218,587 75.562%
TOTAL 111,711,831 100% 130,586,341 100% 128,660,333 100%
(1) Derivatives not settled (See section 7.2.4.4)
(2) Shares held by employees through Company mutual funds (FCPE)/Not inclusive of 0.212% representing the shares held as part of a Group savings scheme under direct share ownership
7.3.3.3 Shareholders exceeding 5% of the capital as at May 17, 2018 (1)
Shareholder % of capital (2)% of theoretical voting rights (2)
% net voting rights (2)
Vivendi SA (3) 6.795% 11.626% 11.80%
BlackRock Inc. 5.038% 4.266% 4.330%
Tencent Mobility Limited (4) 5.005% 4.282% 4.346%
(1) Information provided on the basis of statements made to the Company and/or to the AMF and summarized hereafter, or contained in the list of registered shareholders managed by BPSS
(2) Based on the number of shares and voting rights as at April 30, 2018
(3) Forward purchase contract signed on March 20, 2018 between Vivendi SA and Crédit Agricole Corporate and Investment Bank (“CACIB”) with a proxy granted by Vivendi SA to CACIB without any specifi c instructions
(4) Controlled by Tencent Holding Company
- 2018 Registration Document 261
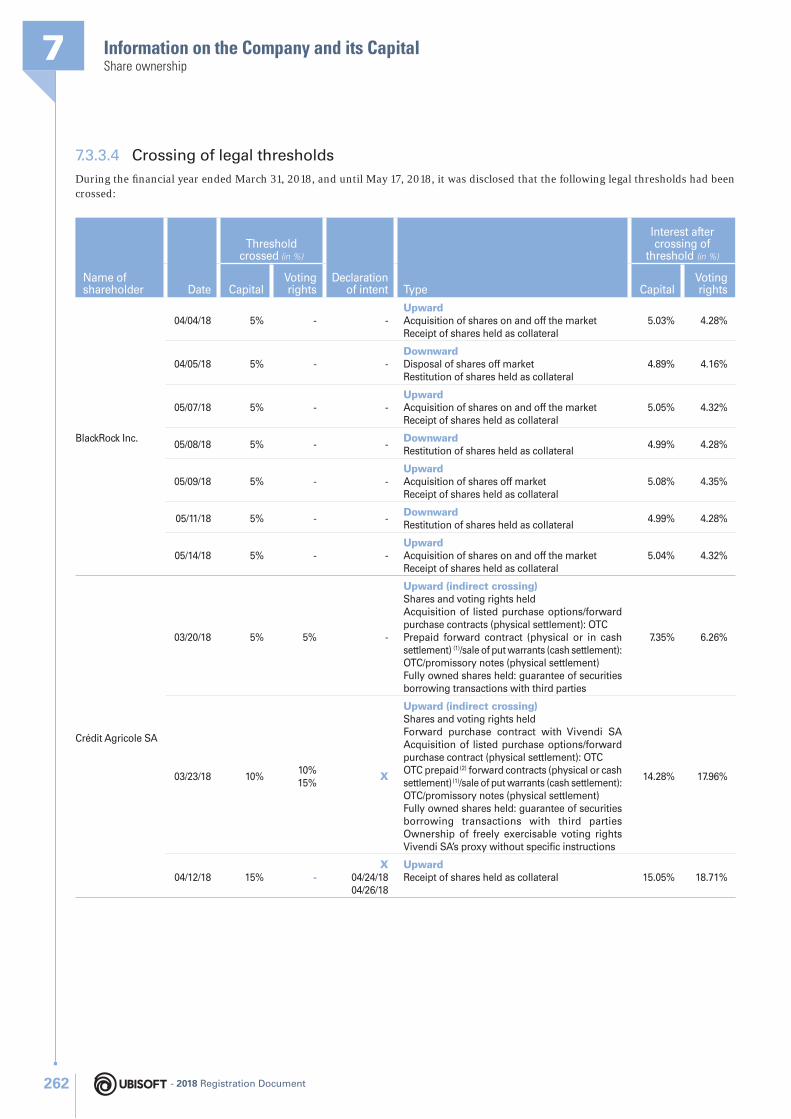
Information on the Company and its Capital7Share ownership
7.3.3.4 Crossing of legal thresholds
During the fi nancial year ended March 31, 2018, and until May 17, 2018, it was disclosed that the following legal thresholds had been crossed:
Name of shareholder Date
Threshold crossed (in %)
Declaration of intent Type
Interest after crossing of
threshold (in %)
CapitalVoting rights Capital
Voting rights
BlackRock Inc.
04/04/18 5% - -UpwardAcquisition of shares on and off the marketReceipt of shares held as collateral
5.03% 4.28%
04/05/18 5% - -DownwardDisposal of shares off marketRestitution of shares held as collateral
4.89% 4.16%
05/07/18 5% - -UpwardAcquisition of shares on and off the marketReceipt of shares held as collateral
5.05% 4.32%
05/08/18 5% - -DownwardRestitution of shares held as collateral
4.99% 4.28%
05/09/18 5% - -UpwardAcquisition of shares off marketReceipt of shares held as collateral
5.08% 4.35%
05/11/18 5% - -DownwardRestitution of shares held as collateral
4.99% 4.28%
05/14/18 5% - -UpwardAcquisition of shares on and off the marketReceipt of shares held as collateral
5.04% 4.32%
Crédit Agricole SA
03/20/18 5% 5% -
Upward (indirect crossing)Shares and voting rights heldAcquisition of listed purchase options/forward purchase contracts (physical settlement): OTCPrepaid forward contract (physical or in cash settlement) (1)/sale of put warrants (cash settlement): OTC/promissory notes (physical settlement)Fully owned shares held: guarantee of securities borrowing transactions with third parties
7.35% 6.26%
03/23/18 10%10%15%
X
Upward (indirect crossing)Shares and voting rights heldForward purchase contract with Vivendi SA Acquisition of listed purchase options/forward purchase contract (physical settlement): OTCOTC prepaid (2) forward contracts (physical or cash settlement) (1)/sale of put warrants (cash settlement): OTC/promissory notes (physical settlement)Fully owned shares held: guarantee of securities borrowing transactions with third parties Ownership of freely exercisable voting rights Vivendi SA’s proxy without specifi c instructions
14.28% 17.96%
04/12/18 15% -X
04/24/1804/26/18
UpwardReceipt of shares held as collateral 15.05% 18.71%
- 2018 Registration Document262
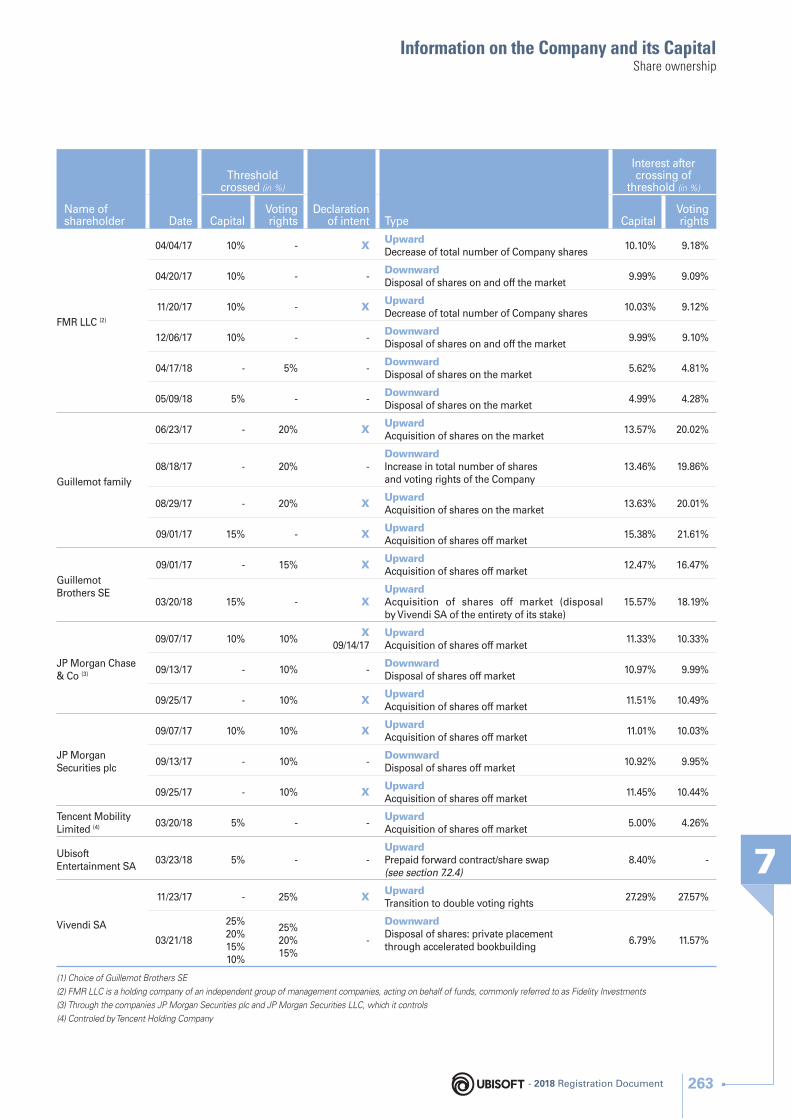
Information on the Company and its Capital
7
Share ownership
Name of shareholder Date
Threshold crossed (in %)
Declaration of intent Type
Interest after crossing of
threshold (in %)
CapitalVoting rights Capital
Voting rights
FMR LLC (2)
04/04/17 10% - X UpwardDecrease of total number of Company shares
10.10% 9.18%
04/20/17 10% - -DownwardDisposal of shares on and off the market
9.99% 9.09%
11/20/17 10% - X UpwardDecrease of total number of Company shares
10.03% 9.12%
12/06/17 10% - -DownwardDisposal of shares on and off the market
9.99% 9.10%
04/17/18 - 5% -DownwardDisposal of shares on the market
5.62% 4.81%
05/09/18 5% - -DownwardDisposal of shares on the market
4.99% 4.28%
Guillemot family
06/23/17 - 20% X UpwardAcquisition of shares on the market
13.57% 20.02%
08/18/17 - 20% -DownwardIncrease in total number of shares and voting rights of the Company
13.46% 19.86%
08/29/17 - 20% X UpwardAcquisition of shares on the market
13.63% 20.01%
09/01/17 15% - X UpwardAcquisition of shares off market
15.38% 21.61%
Guillemot Brothers SE
09/01/17 - 15% X UpwardAcquisition of shares off market
12.47% 16.47%
03/20/18 15% - XUpwardAcquisition of shares off market (disposal by Vivendi SA of the entirety of its stake)
15.57% 18.19%
JP Morgan Chase & Co (3)
09/07/17 10% 10%X
09/14/17UpwardAcquisition of shares off market
11.33% 10.33%
09/13/17 - 10% -DownwardDisposal of shares off market
10.97% 9.99%
09/25/17 - 10% X UpwardAcquisition of shares off market
11.51% 10.49%
JP Morgan Securities plc
09/07/17 10% 10% X UpwardAcquisition of shares off market
11.01% 10.03%
09/13/17 - 10% -DownwardDisposal of shares off market
10.92% 9.95%
09/25/17 - 10% X UpwardAcquisition of shares off market
11.45% 10.44%
Tencent Mobility Limited (4) 03/20/18 5% - -
UpwardAcquisition of shares off market
5.00% 4.26%
Ubisoft Entertainment SA
03/23/18 5% - -UpwardPrepaid forward contract/share swap (see section 7.2.4)
8.40% -
Vivendi SA
11/23/17 - 25% X UpwardTransition to double voting rights
27.29% 27.57%
03/21/18
25%20%15%10%
25%20%15%
-
DownwardDisposal of shares: private placement through accelerated bookbuilding
6.79% 11.57%
(1) Choice of Guillemot Brothers SE
(2) FMR LLC is a holding company of an independent group of management companies, acting on behalf of funds, commonly referred to as Fidelity Investments
(3) Through the companies JP Morgan Securities plc and JP Morgan Securities LLC, which it controls
(4) Controled by Tencent Holding Company
- 2018 Registration Document 263
Information on the Company and its Capital7Securities market
7.4 Securities market
❙ 7.4.1 PROVIDER OF SECURITIES SERVICES
BNP PARIBAS
Grands Moulins de Pantin
Shareholder Relations – 9, rue du Débarcadère – 93761 PANTIN Cedex
❙ 7.4.2 UBISOFT SHARE DATA
ISIN code FR0000054470
Place listed Euronext Paris – Compartment A
Par value €0.0775
Number of shares outstanding as at 03/31/18 111,645,032
Closing price on 03/29/18 (1) €68.52
Market capitalization as at 03/31/18 €7,649,917,592.64
Flotation price on 07/01/96 €38.11
Five-for-one stock split on 11/11/00 €7.62
Two-for-one stock split on 12/11/06 €3.81
Two-for-one stock split on 11/14/08 €1.90
(1) Market closed on 03/30 and 03/31/18 – Source Euronext
- 2018 Registration Document264
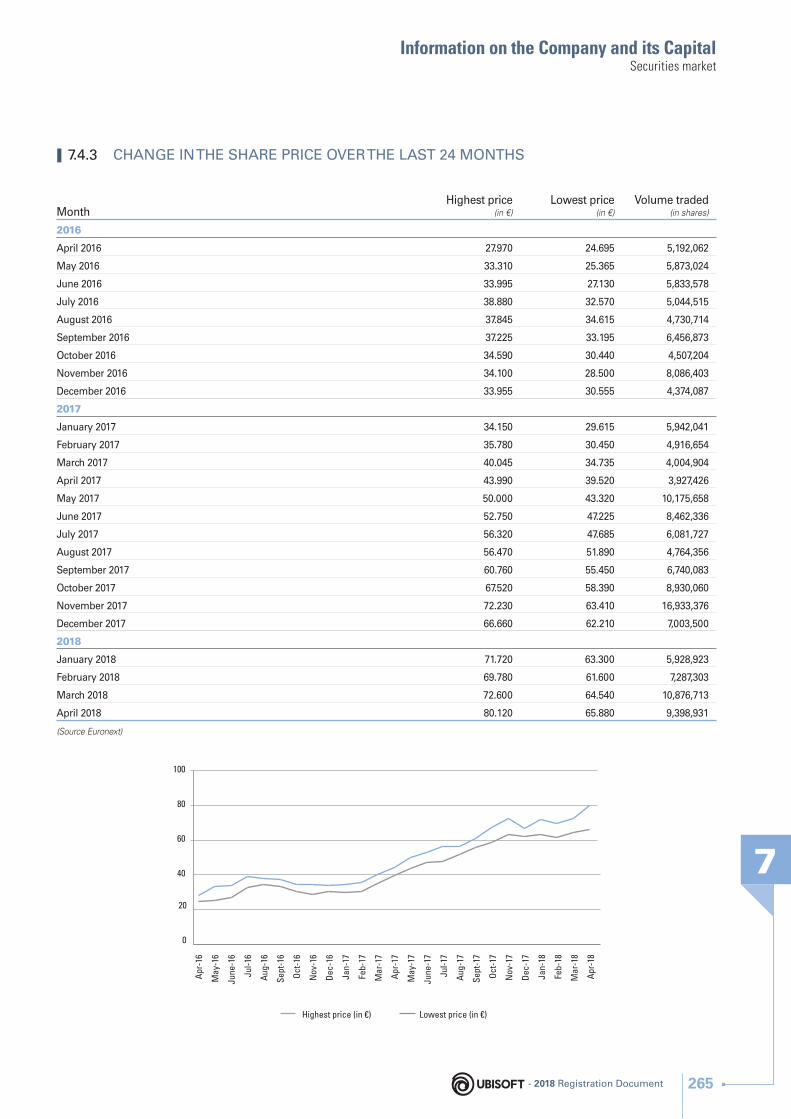
Information on the Company and its Capital
7
Securities market
❙ 7.4.3 CHANGE IN THE SHARE PRICE OVER THE LAST 24 MONTHS
MonthHighest price
(in €)Lowest price
(in €)Volume traded
(in shares)
2016
April 2016 27.970 24.695 5,192,062
May 2016 33.310 25.365 5,873,024
June 2016 33.995 27.130 5,833,578
July 2016 38.880 32.570 5,044,515
August 2016 37.845 34.615 4,730,714
September 2016 37.225 33.195 6,456,873
October 2016 34.590 30.440 4,507,204
November 2016 34.100 28.500 8,086,403
December 2016 33.955 30.555 4,374,087
2017
January 2017 34.150 29.615 5,942,041
February 2017 35.780 30.450 4,916,654
March 2017 40.045 34.735 4,004,904
April 2017 43.990 39.520 3,927,426
May 2017 50.000 43.320 10,175,658
June 2017 52.750 47.225 8,462,336
July 2017 56.320 47.685 6,081,727
August 2017 56.470 51.890 4,764,356
September 2017 60.760 55.450 6,740,083
October 2017 67.520 58.390 8,930,060
November 2017 72.230 63.410 16,933,376
December 2017 66.660 62.210 7,003,500
2018
January 2018 71.720 63.300 5,928,923
February 2018 69.780 61.600 7,287,303
March 2018 72.600 64.540 10,876,713
April 2018 80.120 65.880 9,398,931
(Source Euronext)
Apr
-16
May
-16
June
-16
Jul-
16
Aug
-16
Sep
t-16
Oct
-16
Nov
-16
Dec
-16
Jan-
17
Feb-
17
Mar
-17
Apr
-17
May
-17
June
-17
Jul-
17
Aug
-17
Sep
t-17
Oct
-17
Nov
-17
Dec
-17
Jan-
18
Feb-
18
Mar
-18
Apr
-18
Highest price (in €) Lowest price (in €)
0
20
40
60
80
100
- 2018 Registration Document 265
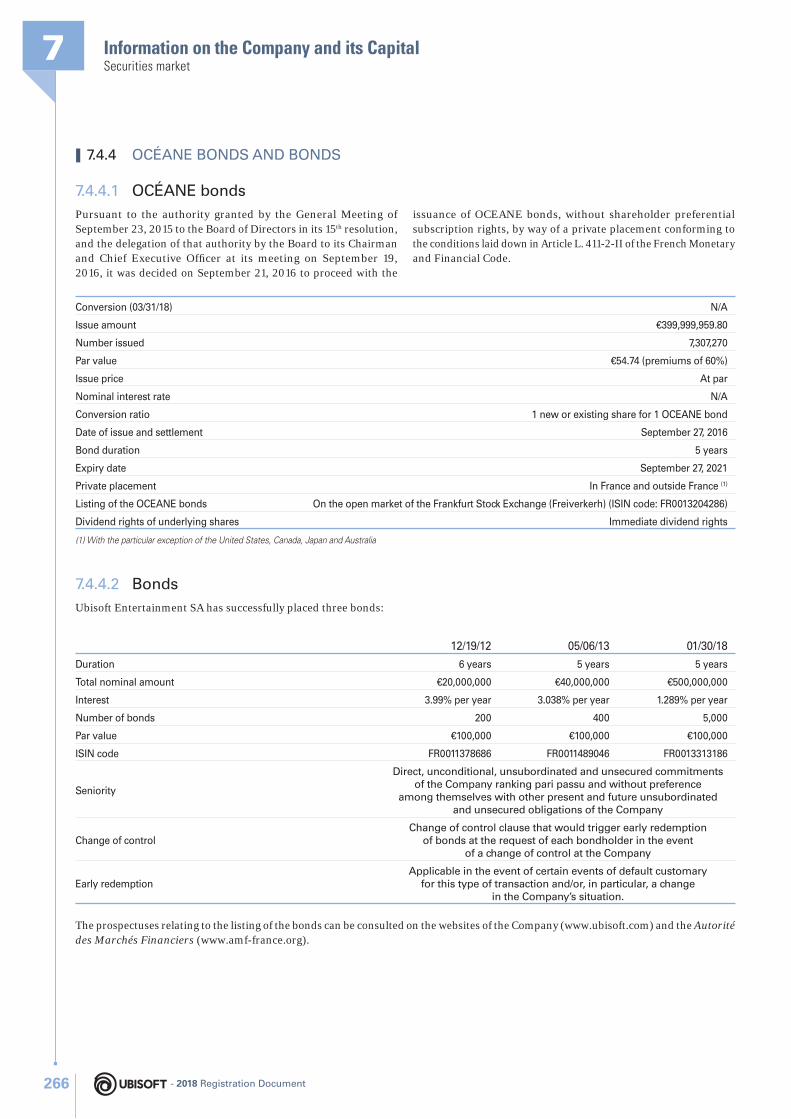
Information on the Company and its Capital7Securities market
❙ 7.4.4 OCÉANE BONDS AND BONDS
7.4.4.1 OCÉANE bonds
Pursuant to the authority granted by the General Meeting of September 23, 2015 to the Board of Directors in its 15th resolution, and the delegation of that authority by the Board to its Chairman and Chief Executive Offi cer at its meeting on September 19, 2016, it was decided on September 21, 2016 to proceed with the
issuance of OCEANE bonds, without shareholder preferential subscription rights, by way of a private placement conforming to the conditions laid down in Article L. 411-2-II of the French Monetary and Financial Code.
Conversion (03/31/18) N/A
Issue amount €399,999,959.80
Number issued 7,307,270
Par value €54.74 (premiums of 60%)
Issue price At par
Nominal interest rate N/A
Conversion ratio 1 new or existing share for 1 OCEANE bond
Date of issue and settlement September 27, 2016
Bond duration 5 years
Expiry date September 27, 2021
Private placement In France and outside France (1)
Listing of the OCEANE bonds On the open market of the Frankfurt Stock Exchange (Freiverkerh) (ISIN code: FR0013204286)
Dividend rights of underlying shares Immediate dividend rights
(1) With the particular exception of the United States, Canada, Japan and Australia
7.4.4.2 Bonds
Ubisoft Entertainment SA has successfully placed three bonds:
12/19/12 05/06/13 01/30/18
Duration 6 years 5 years 5 years
Total nominal amount €20,000,000 €40,000,000 €500,000,000
Interest 3.99% per year 3.038% per year 1.289% per year
Number of bonds 200 400 5,000
Par value €100,000 €100,000 €100,000
ISIN code FR0011378686 FR0011489046 FR0013313186
Seniority
Direct, unconditional, unsubordinated and unsecured commitments of the Company ranking pari passu and without preference
among themselves with other present and future unsubordinated and unsecured obligations of the Company
Change of controlChange of control clause that would trigger early redemption
of bonds at the request of each bondholder in the event of a change of control at the Company
Early redemptionApplicable in the event of certain events of default customary
for this type of transaction and/or, in particular, a change in the Company’s situation.
The prospectuses relating to the listing of the bonds can be consulted on the websites of the Company (www.ubisoft .com) and the Autorité des Marchés Financiers (www.amf-france.org).
- 2018 Registration Document266
Information on the Company and its Capital
7
Financial communication
7.5 Financial communication
❙ 7.5.1 DOCUMENTS AVAILABLE TO THE PUBLIC
During the period of validity of this R egistration D ocument, the Company’s Articles of Association, minutes of General Meetings, Statutory Auditors’ reports, valuations and declarations drawn up, where applicable, at the Company’s request, some of which are included or referred to in this Registration Document, the historical fi nancial information of the Company and its subsidiaries for each of the two fi nancial years preceding the publication of this Registration Document and, more generally, all documents that must be sent or made available to shareholders in accordance with the laws in effect may be consulted at the Company’s registered offi ce or business address (28, rue Armand-Carrel – 93100 Montreuil-sous-Bois, France). In addition, some of these documents are available on the Company’s website (www.ubisoft .com), which also contains the Group’s press releases and fi nancial information.
This Registration Document may also be consulted on the Autorité des Marchés Financiers (AMF) website (www.amf-france.org).
Regulatory information is available on the company’s website (www.ubisoft .com).
Person responsible for information:Yves GuillemotChairman and Chief Executive Offi cer28, rue Armand-Carrel93108 Montreuil-sous-Bois CedexTel.: (33) 01 48 18 50 00www.ubisoft .com
❙ 7.5.2 FINANCIAL REPORTING CALENDAR FOR THE 2018/2019 FINANCIAL YEAR
Date
Q1 sales Week commencing July 16, 2018
H1 results Week of November 5, 2018
Q3 sales Week of February 11, 2019
Year-end results Week of May 13, 2019
These dates are provided for information purposes only and will be confi rmed during the year.
- 2018 Registration Document 267

- 2018 Registration Document268
REGISTRATION DOCUMENT CROSS-REFERENCE TABLE 270
MANAGEMENT REPORT CROSS-REFERENCE TABLE 272
CSR CROSS-REFERENCE TABLE 273
ANNUAL REPORT CROSS-REFERENCE TABLE 275
Cross-reference tables8
- 2018 Registration Document 269269- 2018 Registration Document
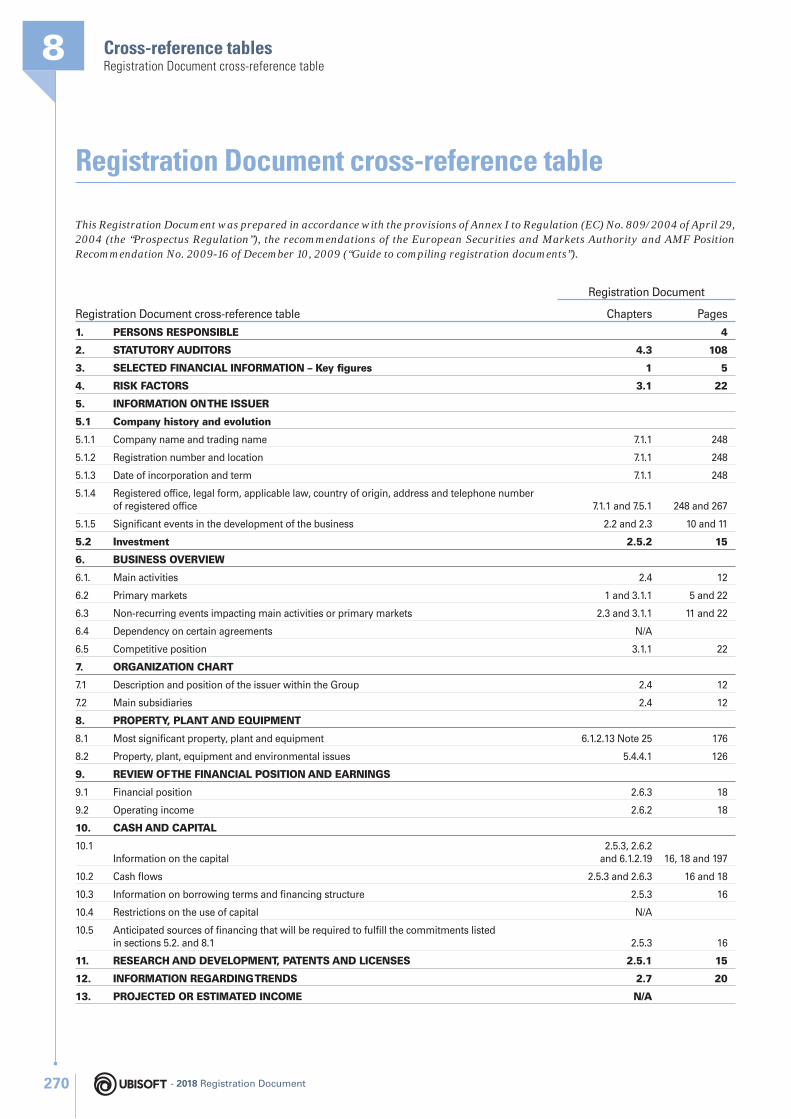
Cross-reference tables8Registration Document cross-reference table
Registration Document cross-reference table
This Registration Document was prepared in accordance with the provisions of Annex I to Regulation (EC) No. 809/2004 of April 29, 2004 (the “Prospectus Regulation”), the recommendations of the European Securities and Markets Authority and AMF Position Recommendation No. 2009-16 of December 10, 2009 (“Guide to compiling registration documents”).
Registration Document cross-reference table
Registration Document
Chapters Pages
1. PERSONS RESPONSIBLE 4
2. STATUTORY AUDITORS 4.3 108
3. SELECTED FINANCIAL INFORMATION – Key fi gures 1 5
4. RISK FACTORS 3.1 22
5. INFORMATION ON THE ISSUER
5.1 Company history and evolution
5.1.1 Company name and trading name 7.1.1 248
5.1.2 Registration number and location 7.1.1 248
5.1.3 Date of incorporation and term 7.1.1 248
5.1.4 Registered offi ce, legal form, applicable law, country of origin, address and telephone number of registered offi ce 7.1.1 and 7.5.1 248 and 267
5.1.5 Signifi cant events in the development of the business 2.2 and 2.3 10 and 11
5.2 Investment 2.5.2 15
6. BUSINESS OVERVIEW
6.1. Main activities 2.4 12
6.2 Primary markets 1 and 3.1.1 5 and 22
6.3 Non-recurring events impacting main activities or primary markets 2.3 and 3.1.1 11 and 22
6.4 Dependency on certain agreements N/A
6.5 Competitive position 3.1.1 22
7. ORGANIZATION CHART
7.1 Description and position of the issuer within the Group 2.4 12
7.2 Main subsidiaries 2.4 12
8. PROPERTY, PLANT AND EQUIPMENT
8.1 Most signifi cant property, plant and equipment 6.1.2.13 Note 25 176
8.2 Property, plant, equipment and environmental issues 5.4.4.1 126
9. REVIEW OF THE FINANCIAL POSITION AND EARNINGS
9.1 Financial position 2.6.3 18
9.2 Operating income 2.6.2 18
10. CASH AND CAPITAL
10.1Information on the capital
2.5.3, 2.6.2 and 6.1.2.19 16, 18 and 197
10.2 Cash fl ows 2.5.3 and 2.6.3 16 and 18
10.3 Information on borrowing terms and fi nancing structure 2.5.3 16
10.4 Restrictions on the use of capital N/A
10.5 Anticipated sources of fi nancing that will be required to fulfi ll the commitments listed in sections 5.2. and 8.1 2.5.3 16
11. RESEARCH AND DEVELOPMENT, PATENTS AND LICENSES 2.5.1 15
12. INFORMATION REGARDING TRENDS 2.7 20
13. PROJECTED OR ESTIMATED INCOME N/A
- 2018 Registration Document270
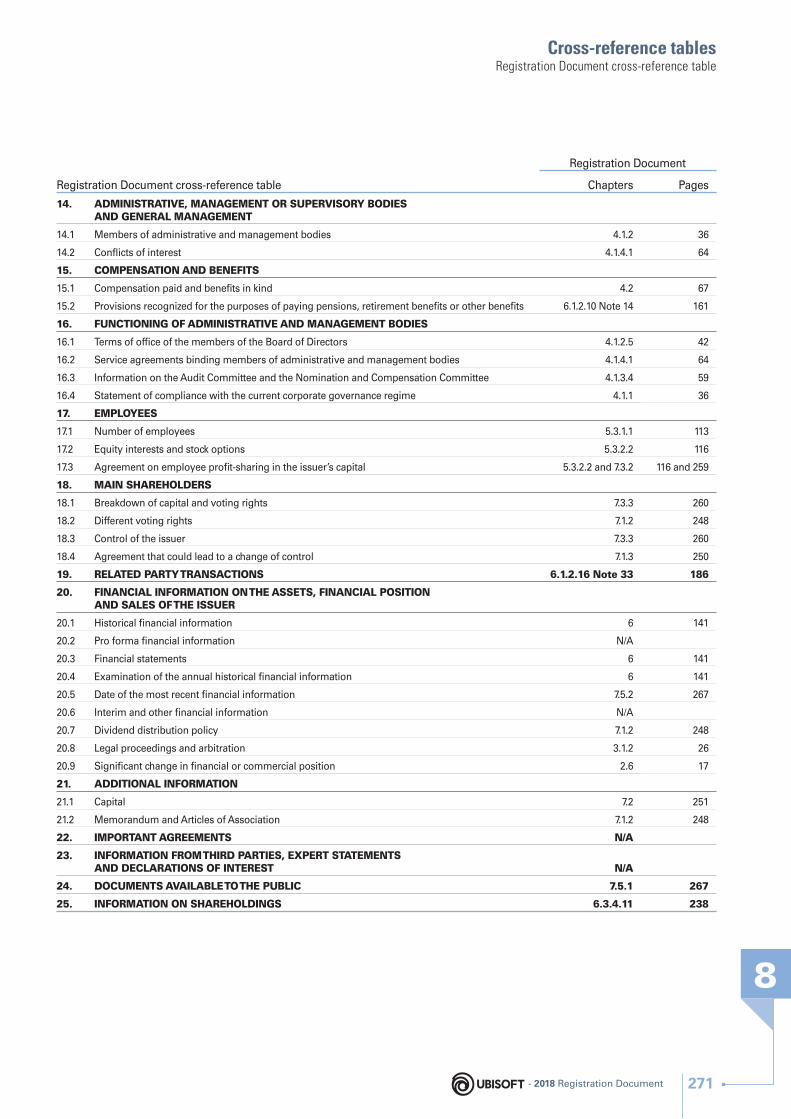
Cross-reference tables
8
Registration Document cross-reference table
Registration Document cross-reference table
Registration Document
Chapters Pages
14. ADMINISTRATIVE, MANAGEMENT OR SUPERVISORY BODIES AND GENERAL MANAGEMENT
14.1 Members of administrative and management bodies 4.1.2 36
14.2 Confl icts of interest 4.1.4.1 64
15. COMPENSATION AND BENEFITS
15.1 Compensation paid and benefi ts in kind 4.2 67
15.2 Provisions recognized for the purposes of paying pensions, retirement benefi ts or other benefi ts 6.1.2.10 Note 14 161
16. FUNCTIONING OF ADMINISTRATIVE AND MANAGEMENT BODIES
16.1 Terms of offi ce of the members of the Board of Directors 4.1.2.5 42
16.2 Service agreements binding members of administrative and management bodies 4.1.4.1 64
16.3 Information on the Audit Committee and the Nomination and Compensation Committee 4.1.3.4 59
16.4 Statement of compliance with the current corporate governance regime 4.1.1 36
17. EMPLOYEES
17.1 Number of employees 5.3.1.1 113
17.2 Equity interests and stock options 5.3.2.2 116
17.3 Agreement on employee profi t-sharing in the issuer’s capital 5.3.2.2 and 7.3.2 116 and 259
18. MAIN SHAREHOLDERS
18.1 Breakdown of capital and voting rights 7.3.3 260
18.2 Different voting rights 7.1.2 248
18.3 Control of the issuer 7.3.3 260
18.4 Agreement that could lead to a change of control 7.1.3 250
19. RELATED PARTY TRANSACTIONS 6.1.2.16 Note 33 186
20. FINANCIAL INFORMATION ON THE ASSETS, FINANCIAL POSITION AND SALES OF THE ISSUER
20.1 Historical fi nancial information 6 141
20.2 Pro forma fi nancial information N/A
20.3 Financial statements 6 141
20.4 Examination of the annual historical fi nancial information 6 141
20.5 Date of the most recent fi nancial information 7.5.2 267
20.6 Interim and other fi nancial information N/A
20.7 Dividend distribution policy 7.1.2 248
20.8 Legal proceedings and arbitration 3.1.2 26
20.9 Signifi cant change in fi nancial or commercial position 2.6 17
21. ADDITIONAL INFORMATION
21.1 Capital 7.2 251
21.2 Memorandum and Articles of Association 7.1.2 248
22. IMPORTANT AGREEMENTS N/A
23. INFORMATION FROM THIRD PARTIES, EXPERT STATEMENTS AND DECLARATIONS OF INTEREST N/A
24. DOCUMENTS AVAILABLE TO THE PUBLIC 7.5.1 267
25. INFORMATION ON SHAREHOLDINGS 6.3.4.11 238
- 2018 Registration Document 271
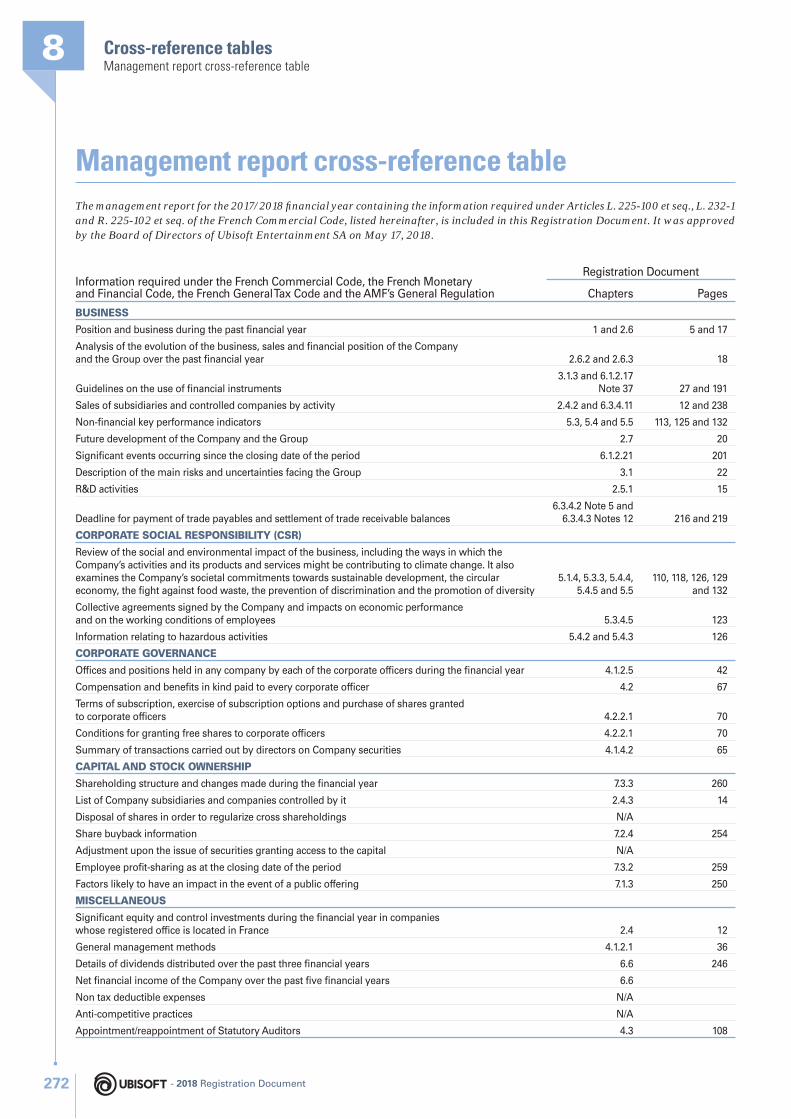
Cross-reference tables8Management report cross-reference table
Management report cross-reference tableThe management report for the 2017/2018 fi nancial year containing the information required under Articles L. 225-100 et seq., L. 232-1 and R. 225-102 et seq. of the French Commercial Code, listed hereinafter, is included in this Registration Document. It was approved by the Board of Directors of Ubisoft Entertainment SA on May 17, 2018.
Information required under the French Commercial Code, the French Monetary and Financial Code, the French General Tax Code and the AMF’s General Regulation
Registration Document
Chapters Pages
BUSINESS
Position and business during the past fi nancial year 1 and 2.6 5 and 17
Analysis of the evolution of the business, sales and fi nancial position of the Company and the Group over the past fi nancial year 2.6.2 and 2.6.3 18
Guidelines on the use of fi nancial instruments3.1.3 and 6.1.2.17
Note 37 27 and 191
Sales of subsidiaries and controlled companies by activity 2.4.2 and 6.3.4.11 12 and 238
Non-fi nancial key performance indicators 5.3, 5.4 and 5.5 113, 125 and 132
Future development of the Company and the Group 2.7 20
Signifi cant events occurring since the closing date of the period 6.1.2.21 201
Description of the main risks and uncertainties facing the Group 3.1 22
R&D activities 2.5.1 15
Deadline for payment of trade payables and settlement of trade receivable balances6.3.4.2 Note 5 and
6.3.4.3 Notes 12 216 and 219
CORPORATE SOCIAL RESPONSIBILITY (CSR)
Review of the social and environmental impact of the business, including the ways in which the Company’s activities and its products and services might be contributing to climate change. It also examines the Company’s societal commitments towards sustainable development, the circular economy, the fi ght against food waste, the prevention of discrimination and the promotion of diversity
5.1.4, 5.3.3, 5.4.4, 5.4.5 and 5.5
110, 118, 126, 129 and 132
Collective agreements signed by the Company and impacts on economic performance and on the working conditions of employees 5.3.4.5 123
Information relating to hazardous activities 5.4.2 and 5.4.3 126
CORPORATE GOVERNANCE
Offi ces and positions held in any company by each of the corporate offi cers during the fi nancial year 4.1.2.5 42
Compensation and benefi ts in kind paid to every corporate offi cer 4.2 67
Terms of subscription, exercise of subscription options and purchase of shares granted to corporate offi cers 4.2.2.1 70
Conditions for granting free shares to corporate offi cers 4.2.2.1 70
Summary of transactions carried out by directors on Company securities 4.1.4.2 65
CAPITAL AND STOCK OWNERSHIP
Shareholding structure and changes made during the fi nancial year 7.3.3 260
List of Company subsidiaries and companies controlled by it 2.4.3 14
Disposal of shares in order to regularize cross shareholdings N/A
Share buyback information 7.2.4 254
Adjustment upon the issue of securities granting access to the capital N/A
Employee profi t-sharing as at the closing date of the period 7.3.2 259
Factors likely to have an impact in the event of a public offering 7.1.3 250
MISCELLANEOUS
Signifi cant equity and control investments during the fi nancial year in companies whose registered offi ce is located in France 2.4 12
General management methods 4.1.2.1 36
Details of dividends distributed over the past three fi nancial years 6.6 246
Net fi nancial income of the Company over the past fi ve fi nancial years 6.6
Non tax deductible expenses N/A
Anti-competitive practices N/A
Appointment/reappointment of Statutory Auditors 4.3 108
- 2018 Registration Document272
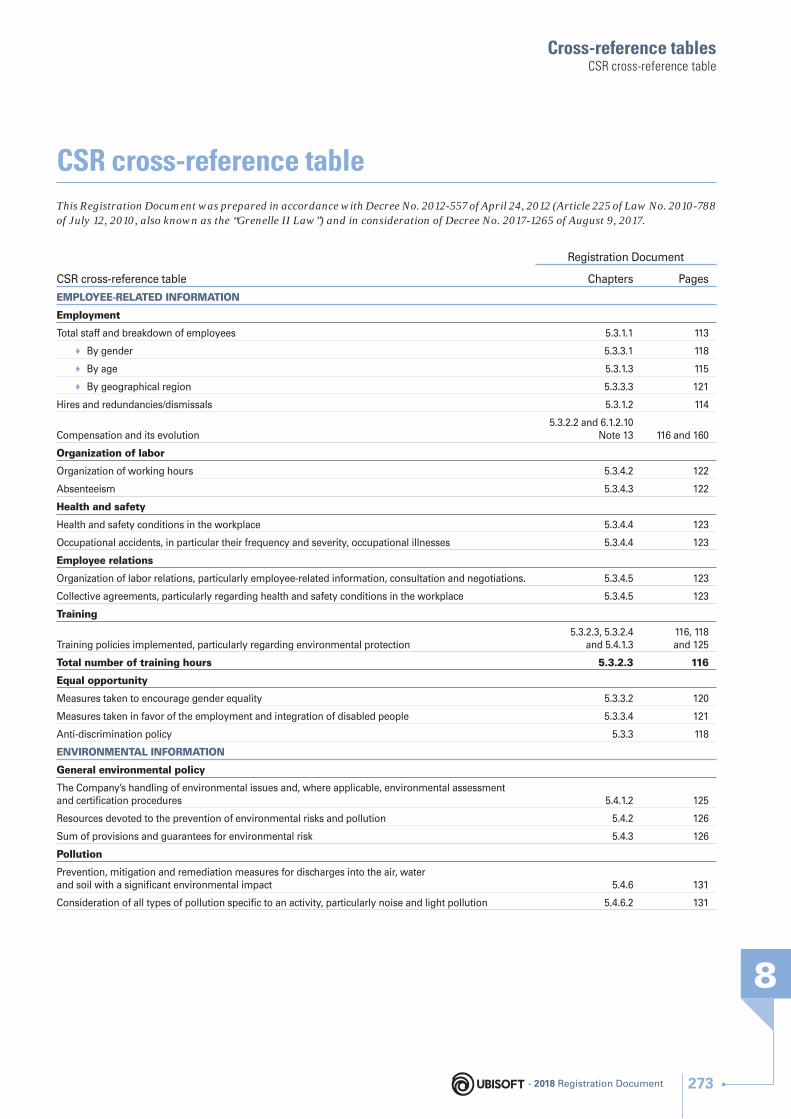
Cross-reference tables
8
CSR cross-reference table
CSR cross-reference tableThis Registration Document was prepared in accordance with Decree No. 2012-557 of April 24, 2012 (Article 225 of Law No. 2010-788 of July 12, 2010, also known as the “Grenelle II Law”) and in consideration of Decree No. 2017-1265 of August 9, 2017.
CSR cross-reference table
Registration Document
Chapters Pages
EMPLOYEE-RELATED INFORMATION
Employment
Total staff and breakdown of employees 5.3.1.1 113
♦ By gender 5.3.3.1 118
♦ By age 5.3.1.3 115
♦ By geographical region 5.3.3.3 121
Hires and redundancies/dismissals 5.3.1.2 114
Compensation and its evolution5.3.2.2 and 6.1.2.10
Note 13 116 and 160
Organization of labor
Organization of working hours 5.3.4.2 122
Absenteeism 5.3.4.3 122
Health and safety
Health and safety conditions in the workplace 5.3.4.4 123
Occupational accidents, in particular their frequency and severity, occupational illnesses 5.3.4.4 123
Employee relations
Organization of labor relations, particularly employee-related information, consultation and negotiations. 5.3.4.5 123
Collective agreements, particularly regarding health and safety conditions in the workplace 5.3.4.5 123
Training
Training policies implemented, particularly regarding environmental protection5.3.2.3, 5.3.2.4
and 5.4.1.3116, 118 and 125
Total number of training hours 5.3.2.3 116
Equal opportunity
Measures taken to encourage gender equality 5.3.3.2 120
Measures taken in favor of the employment and integration of disabled people 5.3.3.4 121
Anti-discrimination policy 5.3.3 118
ENVIRONMENTAL INFORMATION
General environmental policy
The Company’s handling of environmental issues and, where applicable, environmental assessment and certifi cation procedures 5.4.1.2 125
Resources devoted to the prevention of environmental risks and pollution 5.4.2 126
Sum of provisions and guarantees for environmental risk 5.4.3 126
Pollution
Prevention, mitigation and remediation measures for discharges into the air, water and soil with a signifi cant environmental impact 5.4.6 131
Consideration of all types of pollution specifi c to an activity, particularly noise and light pollution 5.4.6.2 131
- 2018 Registration Document 273
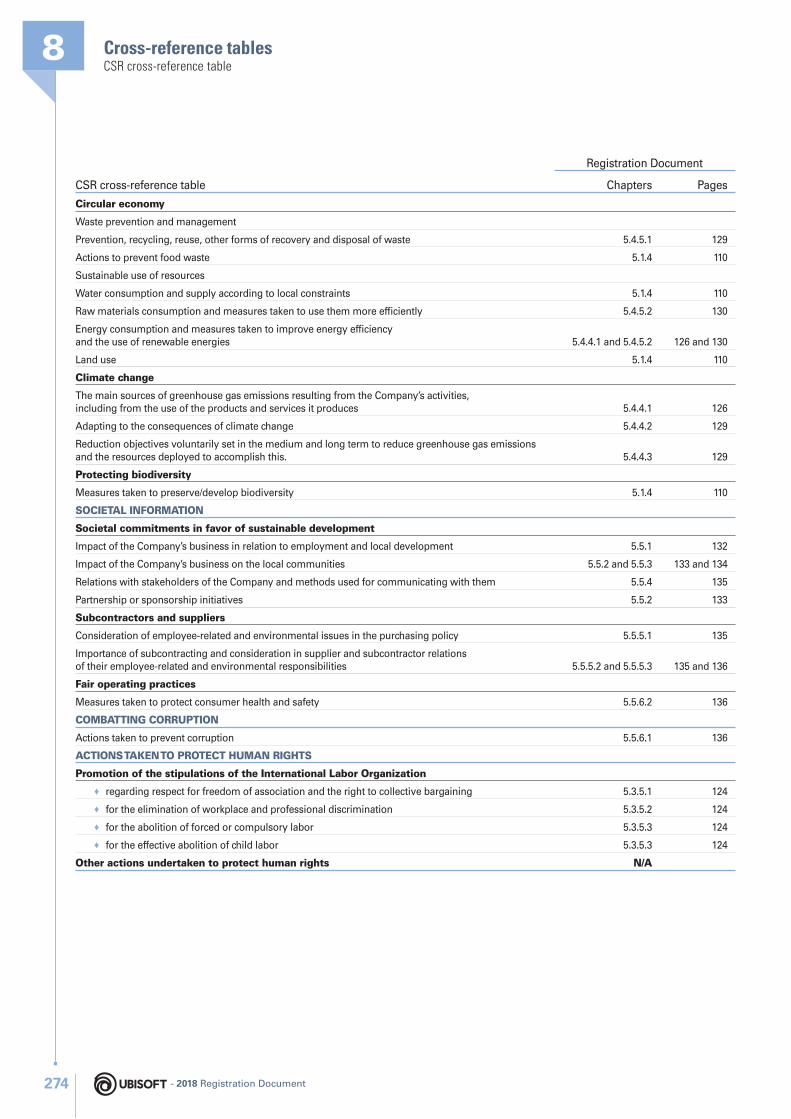
Cross-reference tables8CSR cross-reference table
CSR cross-reference table
Registration Document
Chapters Pages
Circular economy
Waste prevention and management
Prevention, recycling, reuse, other forms of recovery and disposal of waste 5.4.5.1 129
Actions to prevent food waste 5.1.4 110
Sustainable use of resources
Water consumption and supply according to local constraints 5.1.4 110
Raw materials consumption and measures taken to use them more effi ciently 5.4.5.2 130
Energy consumption and measures taken to improve energy effi ciency and the use of renewable energies 5.4.4.1 and 5.4.5.2 126 and 130
Land use 5.1.4 110
Climate change
The main sources of greenhouse gas emissions resulting from the Company’s activities, including from the use of the products and services it produces 5.4.4.1 126
Adapting to the consequences of climate change 5.4.4.2 129
Reduction objectives voluntarily set in the medium and long term to reduce greenhouse gas emissions and the resources deployed to accomplish this. 5.4.4.3 129
Protecting biodiversity
Measures taken to preserve/develop biodiversity 5.1.4 110
SOCIETAL INFORMATION
Societal commitments in favor of sustainable development
Impact of the Company’s business in relation to employment and local development 5.5.1 132
Impact of the Company’s business on the local communities 5.5.2 and 5.5.3 133 and 134
Relations with stakeholders of the Company and methods used for communicating with them 5.5.4 135
Partnership or sponsorship initiatives 5.5.2 133
Subcontractors and suppliers
Consideration of employee-related and environmental issues in the purchasing policy 5.5.5.1 135
Importance of subcontracting and consideration in supplier and subcontractor relations of their employee-related and environmental responsibilities 5.5.5.2 and 5.5.5.3 135 and 136
Fair operating practices
Measures taken to protect consumer health and safety 5.5.6.2 136
COMBATTING CORRUPTION
Actions taken to prevent corruption 5.5.6.1 136
ACTIONS TAKEN TO PROTECT HUMAN RIGHTS
Promotion of the stipulations of the International Labor Organization
♦ regarding respect for freedom of association and the right to collective bargaining 5.3.5.1 124
♦ for the elimination of workplace and professional discrimination 5.3.5.2 124
♦ for the abolition of forced or compulsory labor 5.3.5.3 124
♦ for the effective abolition of child labor 5.3.5.3 124
Other actions undertaken to protect human rights N/A
- 2018 Registration Document274
Cross-reference tables
8
Annual report cross-reference table
Annual report cross-reference tableThis Registration Document incorporates all the items of an annual report referred to in Article L. 451-1-2 of the French Monetary and Financial Code and Article 222-3 of the AMF’s General Regulation. The following table refers to sections of the Registration Document corresponding to various parts of the annual report.
Sections
Registration Document
Chapters Pages
Annual fi nancial statements of the Company 6.3 209
Consolidated fi nancial statements of the Group 6.1 142
Statutory Auditors’ general report on the annual fi nancial statements 6.4 240
Statutory Auditors’ report on the consolidated fi nancial statements 6.2 204
Management report containing at least the information mentioned in Articles L. 225-100, L. 225-100-2, L. 225-100-3 and L. 225-211 of the French Commercial Code
See Management report cross-reference table
Statement by the person responsible for the information contained in the Registration Document 4
Statutory Auditors’ fees 6.1.2.22 202
- 2018 Registration Document 275

- 2018 Registration Document276
© 2018 Ubisoft Entertainment. All Rights Reserved. Ubisoft and the Ubisoft logo are registered or unregistered trademarks of Ubisoft Entertainment in the U.S. and/or other countries.
Microsoft, XBOX 360, XBOX ONE are trademarks of the Microsoft group of companies and are used under license from Microsoft.
“PlayStation” is a registered trademark of Sony Interactive Entertainment Inc.
Nintendo, Wii, Wii U, Nintendo Switch, Nintendo DS and Nintendo 3DS are trademarks of Nintendo.
This statement may contain targets, information on future projects and transactions and on future economic results/performance. Such valuations are provided for estimation purposes only. They are subject to market risks and uncertainties and may vary
signifi cantly with the actual results that shall be published.
The targets have been presented to the Board of Directors and have not been audited by the Auditors.
Copies of this document are available upon request from Ubisoft’s business address
28, rue Armand-Carrel – 93108 Montreuil-sous-Bois Cedex – France
Ubisoft EntertainmentFrench corporation (Société Anonyme) with a Board of Directors
and share capital of €8,652,489.98Registered offi ce: 107, avenue Henri Fréville
BP 10704 – 35207 RENNES CEDEX 2335 186 094 RCS RENNES
This document was printed in France by an Imprim’Vert certifi ed printer on PEFC certifi ed paper sourced from controlled and sustainably managed resources.
REGISTERED OFFICEUbisoft Entertainment
107, avenue Henri Fréville35207 Rennes Cedex 2
BUSINESS ADDRESSUbisoft Entertainment28, rue Armand Carrel
93108 Montreuil-sous-Bois Cedex Tel.: 33 (0)1 48 18 50 00Fax: 33 (0)1 48 57 07 41
AUSTRALIAAUSTRIABELGIUMBRAZILBULGARIACANADACHINADENMARKFINLANDFRANCEGERMANYHONG KONGINDIAITALYJAPANKOREAMEXICONETHERLANDSPHILIPPINESPOLANDROMANIARUSSIASERBIASINGAPORESPAINSWEDENUKRAINEUNITED ARAB EMIRATESUNITED KINGDOMUNITED STATES


