Embed Size (px)
Citation preview
FRENCH RETAIL BANKING - INTERNATIONAL RETAIL BANKING, FINANCIAL SERVICES AND INSURANCE - CORPORATE & INVESTMENT BANKING, PRIVATE BANKING, ASSET MANAGEMENT AND SECURITIES SERVICES
2014 REGISTRAT IONDOCUMENT
A N N U A L F I N A N C I A L R E P O R T 2 0 1 3
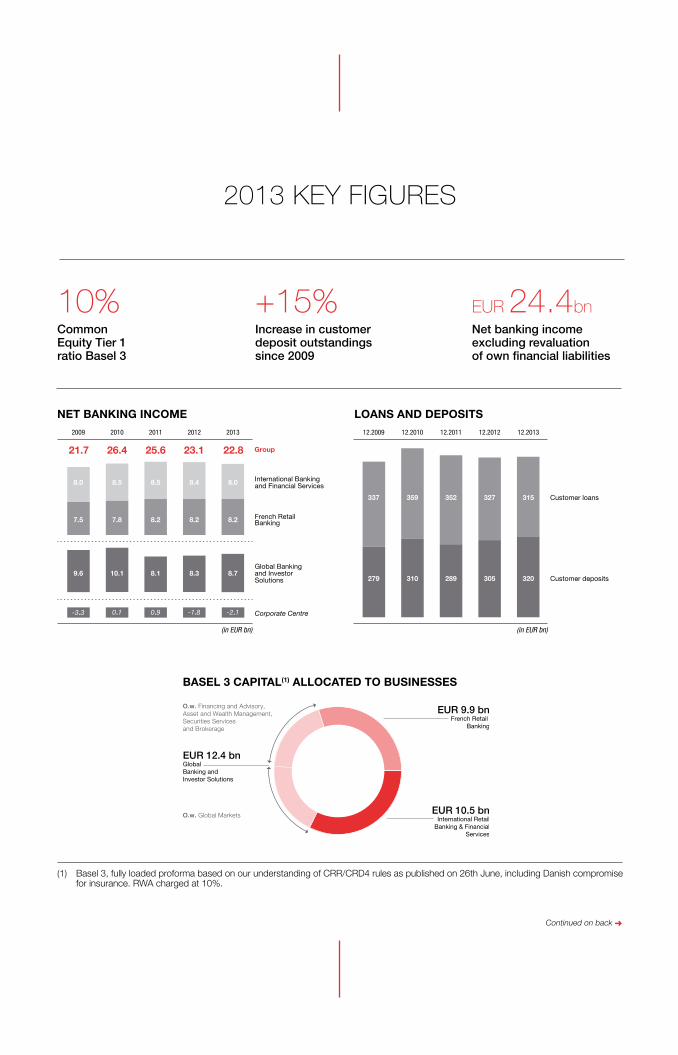
10%Common Equity Tier 1 ratio Basel 3
+15%Increase in customer deposit outstandings since 2009
EUR 24.4bnNet banking income excluding revaluation of own financial liabilities
2013 KEY FIGURES
0
10
0
10
0
10
Global Banking and Investor Solutions
Corporate Centre-3.3 0.1 0.9 -1.8
8.28.27.87.5
8.0
10.1
8.5
8.1
8.5
8.3
8.4
9.6
-2.1
8.2
8.7
8.0
2009 2010 2011 2012 2013
International Banking and Financial Services
French Retail Banking
21.7 26.4 25.6 23.1 22.8
Customer deposits305289310279
337 359 352 327
320
315
12.2009 12.2010 12.2011 12.2012 12.2013
Customer loans
(in EUR bn) (in EUR bn)
0
10
0
10
0
10
Global Banking and Investor Solutions
Corporate Centre-3.3 0.1 0.9 -1.8
8.28.27.87.5
8.0
10.1
8.5
8.1
8.5
8.3
8.4
9.6
-2.1
8.2
8.7
8.0
2009 2010 2011 2012 2013
International Banking and Financial Services
French Retail Banking
21.7 26.4 25.6 23.1 22.8
Customer deposits305289310279
337 359 352 327
320
315
12.2009 12.2010 12.2011 12.2012 12.2013
Customer loans
(in EUR bn) (in EUR bn)
EUR 12.4 bn
EUR 9.9 bnFrench Retail
Banking
EUR 10.5 bnInternational Retail
Banking & FinancialServices
Global Banking andInvestor Solutions
O.w. Financing and Advisory, Asset and Wealth Management, Securities Services and Brokerage
O.w. Global Markets
BASEL 3 CAPITAL(1) ALLOCATED TO BUSINESSES
LOANS AND DEPOSITSNET BANKING INCOME
(1) Basel 3, fully loaded proforma based on our understanding of CRR/CRD4 rules as published on 26th June, including Danish compromise for insurance. RWA charged at 10%.
Continued on back ➜
A N N U A L F I N A N C I A L R E P O R T 2 0 1 3
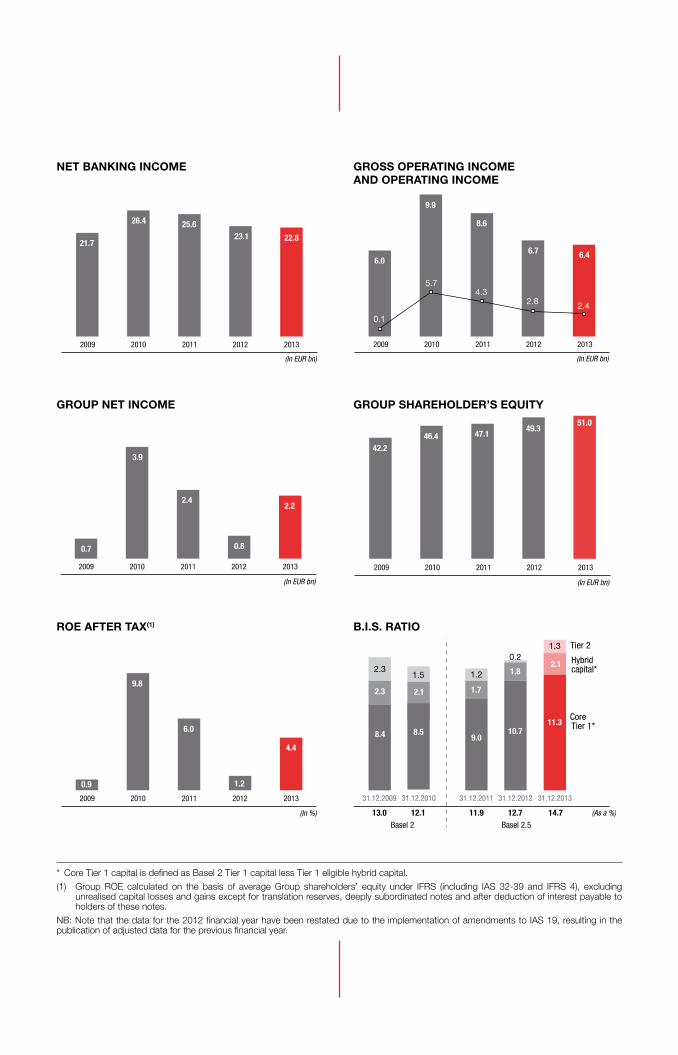
NET BANKING INCOME GROSS OPERATING INCOME AND OPERATING INCOME
1.2
4.4
6.0
9.8
0.9
2.2
0.8
2.4
3.9
0.7
22.823.125.626.4
21.76.46.7
8.6
9.9
6.0
51.049.3
47.146.442.2
2.3
2.3
8.4 8.5
2.1
9.0
1.7
1.2
10.7
1.8
0.2 Hybridcapital*
11.3
Basel 2.5Basel 2
2.1
1.3
12.113.0 11.9 12.7 14.7
(In EUR bn)
(In EUR bn)
(In EUR bn)
(In EUR bn)
(In %) (As a %)
1.5
0.1
5.74.3
2.8 2.4
1.2
4.4
6.0
9.8
0.9
2.2
0.8
2.4
3.9
0.7
22.823.125.626.4
21.76.46.7
8.6
9.9
6.0
51.049.3
47.146.442.2
2.3
2.3
8.4 8.5
2.1
9.0
1.7
1.2
10.7
1.8
0.2 Hybridcapital*
11.3
Basel 2.5Basel 2
2.1
1.3
12.113.0 11.9 12.7 14.7
(In EUR bn)
(In EUR bn)
(In EUR bn)
(In EUR bn)
(In %) (As a %)
1.5
0.1
5.74.3
2.8 2.4
GROUP NET INCOME GROUP SHAREHOLDER’S EQUITY
1.2
4.4
6.0
9.8
0.9
2.2
0.8
2.4
3.9
0.7
22.823.125.626.4
21.76.46.7
8.6
9.9
6.0
51.049.3
47.146.442.2
2.3
2.3
8.4 8.5
2.1
9.0
1.7
1.2
10.7
1.8
0.2 Hybridcapital*
11.3
Basel 2.5Basel 2
2.1
1.3
12.113.0 11.9 12.7 14.7
(In EUR bn)
(In EUR bn)
(In EUR bn)
(In EUR bn)
(In %) (As a %)
1.5
0.1
5.74.3
2.8 2.4
1.2
4.4
6.0
9.8
0.9
2.2
0.8
2.4
3.9
0.7
22.823.125.626.4
21.76.46.7
8.6
9.9
6.0
51.049.3
47.146.442.2
2.3
2.3
8.4 8.5
2.1
9.0
1.7
1.2
10.7
1.8
0.2 Hybridcapital*
11.3
Basel 2.5Basel 2
2.1
1.3
12.113.0 11.9 12.7 14.7
(In EUR bn)
(In EUR bn)
(In EUR bn)
(In EUR bn)
(In %) (As a %)
1.5
0.1
5.74.3
2.8 2.4
ROE AFTER TAX(1) B.I.S. RATIO
1.2
4.4
6.0
9.8
0.9
2.2
0.8
2.4
3.9
0.7
22.823.125.626.4
21.76.46.7
8.6
9.9
6.0
51.049.3
47.146.442.2
2.3
2.3
8.4 8.5
2.1
9.0
1.7
1.2
10.7
1.8
0.2 Hybridcapital*
11.3
Basel 2.5Basel 2
2.1
1.3
12.113.0 11.9 12.7 14.7
(In EUR bn)
(In EUR bn)
(In EUR bn)
(In EUR bn)
(In %) (As a %)
1.5
0.1
5.74.3
2.8 2.4
1.2
4.4
6.0
9.8
0.9
2.2
0.8
2.4
3.9
0.7
22.823.125.626.4
21.76.46.7
8.6
9.9
6.0
51.049.3
47.146.442.2
2.3
2.3
8.4 8.5
2.1
9.0
1.7
1.2
10.7
1.8
0.2 Hybridcapital*
11.3
Basel 2.5Basel 2
2.1
1.3
12.113.0 11.9 12.7 14.7
(In EUR bn)
(In EUR bn)
(In EUR bn)
(In EUR bn)
(In %) (As a %)
1.5
0.1
5.74.3
2.8 2.4
* Core Tier 1 capital is defined as Basel 2 Tier 1 capital less Tier 1 eligible hybrid capital.
(1) Group ROE calculated on the basis of average Group shareholders’ equity under IFRS (including IAS 32-39 and IFRS 4), excluding unrealised capital losses and gains except for translation reserves, deeply subordinated notes and after deduction of interest payable to holders of these notes.
NB: Note that the data for the 2012 financial year have been restated due to the implementation of amendments to IAS 19, resulting in the publication of adjusted data for the previous financial year.
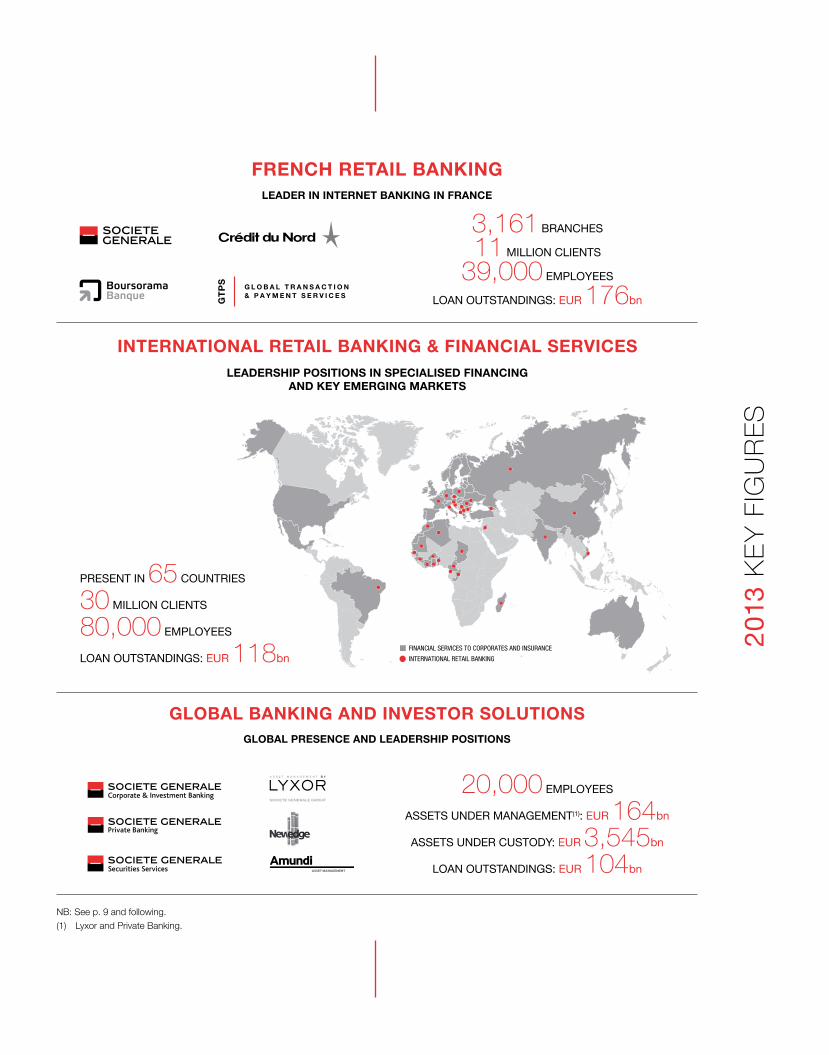
FINANCIAL SERVICES TO CORPORATES AND INSURANCE
INTERNATIONAL RETAIL BANKING
3,161 BRANCHES
11 MILLION CLIENTS
39,000 EMPLOYEES
LOAN OUTSTANDINGS: EUR 176bn
FRENCH RETAIL BANKINGLEADER IN INTERNET BANKING IN FRANCE
20,000 EMPLOYEES
ASSETS UNDER MANAGEMENT(1): EUR 164bn
ASSETS UNDER CUSTODY: EUR 3,545bn
LOAN OUTSTANDINGS: EUR 104bn
GLOBAL BANKING AND INVESTOR SOLUTIONSGLOBAL PRESENCE AND LEADERSHIP POSITIONS
INTERNATIONAL RETAIL BANKING & FINANCIAL SERVICESLEADERSHIP POSITIONS IN SPECIALISED FINANCING
AND KEY EMERGING MARKETS
NB: See p. 9 and following.
(1) Lyxor and Private Banking.
PRESENT IN 65 COUNTRIES
30 MILLION CLIENTS
80,000 EMPLOYEES
LOAN OUTSTANDINGS: EUR 118bn
2013
KE
Y F
IGU
RES
This registration document was filed with the Autorité des Marchés Financiers (AMF) on March 4, 2014, pursuant to Article 212-13 of the AMF General Regulation. It may be used to support a financial transaction if completed by a transaction note approved by the AMF. This document was prepared by the issuer and is the responsibility of its signatories.
REGISTRAT ION DOCUMENT 2014
This Registration Document is available online at www.societegenerale.com
A N N U A L F I N A N C I A L R E P O R T 2 0 1 3
This label recognizes the most transparent Registration Documents according to the criteria of the Annual Transparency Ranking.
2014 REGISTRATION DOCUMENT I SOCIETE GENERALE GROUP
TA B L E O F C O N T E N T S1 HISTORY AND PROFILE OF
SOCIETE GENERALE 3
1. History 42. Profile of Societe Generale 53. A strategy of profitable growth, based on a
robust universal banking model 64. The Group’s core businesses 9
2 GROUP MANAGEMENT REPORT 21
1. Societe Generale Group main activities 222. Group activity and results 243. Activity and results of the Core Businesses 274. Significant new products or services 465. Analysis of the consolidated balance sheet 496. Financial Policy 517. Major investments and disposals 548. Pending acquisitions and important contracts 559. Property and equipment 5510. Pillar 3 report 5611. Post-closing events 5612. Recent developments and outlook 57
3 CORPORATE GOVERNANCE 59
1. Corporate Governance structure and main bodies 602. Chairman’s report on corporate governance 713. Remuneration of Group senior Management 824. Statutory auditors’ special report on related party agreements and commitments 105
5. Report of the Chairman on internal control and risk management 107
6. Statutory auditors’ special report on the report of the Chairman on internal control and risk management 121
4 RISKS AND CAPITAL ADEQUACY 123
1. Introduction 1242. Governance and risk management organisation 1353. Capital management and capital adequacy 1404. Credit risks 1515. Securitisation 1616. Market Risks 1747. Operational Risks 1818. Structural interest rate and exchange rate risks 1869. Liquidity risk 19010. Compliance, reputational and legal risks 19711. Other risks 20512. Specific financial information 208
5 CORPORATE SOCIAL RESPONSIBILITY 215
CSR governance and management 2161. Responsible finance 2202. Solidarity and environmental products,
services and financing 2263. Responsible employer 2344. Environment for its own account & responsible sourcing 2475. Societe Generale in civil society 2536. Appendices 257
6 FINANCIAL INFORMATION 263
1. Consolidated financial statements 2662. Notes to the consolidated financial statements 2743. Statutory auditor’s report on the consolidated
financial statements 3764. Societe Generale management report 3805. Parent company financial statements 3856. Notes to the parent company financial statements 3887. Statutory auditors’ report on the financial statements 4348. Statutory Auditors 436
7 SHARE, SHARE CAPITAL AND LEGAL INFORMATION 437
1. The Societe Generale share 4382. Information on share capital 4423. Additional information 4484. By-laws 4505. Internal rules of the Board of Directors 4556. Director’s Charter 4597. List of regulated information published
in the last 12 months 461
8 PERSON RESPONSIBLE FOR THE REGISTRATION DOCUMENT 463
1. Person responsible for the Registration Document 4642. Statement of the person responsible for the Registration Document and the annual financial report 464
3. Person responsible for the audit of the financial statements 465
9 CROSS REFERENCE TABLES 467Registration Document cross reference table 468Annual financial report and management report cross reference table 470Cross reference table of Pillar 3 report 471Cross reference table with the recommendations made by the enhanced disclosure task force 473CSR concordance table (Article 225 - Grenelle II) 475
GLOSSARY OF MAIN TECHNICAL TERMS 477
Abbreviations used: Million of euros: EUR m Billions of euros: EUR bn
Rankings: the sources for all references to rankings are given explicitly. Where they are not, rankings are based on internal sources.
SOCIETE GENERALE GROUP I 2014 REGISTRATION DOCUMENT I 3
1H I S T O R Y A N D P R O F I L E O F S O C I E T E G E N E R A L E
1. History ................................................................................................................4
2. Profile of Societe Generale .............................................5
3. A strategy of profitable growth, based on a robust universal banking model .....................................................................................6
4. The Group’s core businesses ...................................9French Retail Banking …………………………………………………………………10International Retail Banking & Financial Services (IBFS) ………………13Global Banking and Investor Solutions (GBIS) ………………………………16
1 I HISTORY AND PROFILE OF SOCIETE GENERALE I HISTORY
4 I 2014 REGISTRATION DOCUMENT I SOCIETE GENERALE GROUP
1 . H I S T O R Y
On 4 May 1864 Napoleon III signed Societe Generale’s founding decree. Founded by a group of industrialists and financiers driven by the ideals of progress, the bank’s mission has always been ‘‘fostering business and industrial growth.’’
Since its beginnings, Societe Generale has worked to modernise the economy, following the model of a universal bank at the cutting edge of financial innovation. Its branch network grew rapidly throughout the French territory, increasing from 32 to 1,500 branches between 1870 and 1940. During the interwar period, it became the leading French credit institution in terms of deposits.
At the same time, Societe Generale began to build its international reach by financing infrastructure essential to the economic development of a number of countries in Latin America, Europe and Africa. This expansion was accompanied by the establishment of an international retail network. In 1871, the bank opened its London branch. On the eve of World War I, Societe Generale already had a presence in 14 countries, either directly or through one of its subsidiaries, especially in Russia. This network was then expanded by opening branches in New York, Buenos Aires, Abidjan and Dakar and by acquiring stakes in financial institutions in central Europe.
Societe Generale was nationalised by the act of 2 December 1945 and played an active role in financing the reconstruction of French territory. It thrived during the prosperous post-war decades. The Bank contributed to the promulgation of banking techniques by launching innovative products for companies, including medium-term discountable credit and lease financing agreements, for which it is a market leader.
Societe Generale demonstrated its ability to adapt to its new environment by taking advantage of the banking reforms that followed the Debré laws of 1966-1967. While continuing to support the businesses with which it was partnered, it wasted no time in focusing its business on individual customers. In this way, it supported the emergence of a consumer society by diversifying the credit and savings products it offered households.
In July 1987, Societe Generale was privatised. It had a successful IPO, and shares were offered to Group employees. In an economic environment undergoing profound transformation, the bank reaffirmed its identity and demonstrated its strength. In France it expanded its networks by founding Fimatex (1995), which later became Boursorama, now a leading online bank, and acquiring Crédit du Nord (1997). Internationally, it established itself in central and eastern Europe (Komerčni Banka in the Czech Republic and BRD in Romania) and in Russia (Rosbank). It has 148,000 employees active in 76 countries and supports more than 32 million clients. It is continuing its transformation by adopting a sustainable growth strategy driven by its core values of professionalism, team spirit and innovation. Backed by 150 years of expertise and a commitment to developing the real economy, the Group continues to place client satisfaction at the heart of its business.
SOCIETE GENERALE GROUP I 2014 REGISTRATION DOCUMENT I 5
PROFILE OF SOCIETE GENERALE I HISTORY AND PROFILE OF SOCIETE GENERALE I 1
2 . P R O F I L E O F S O C I E T E G E N E R A L E
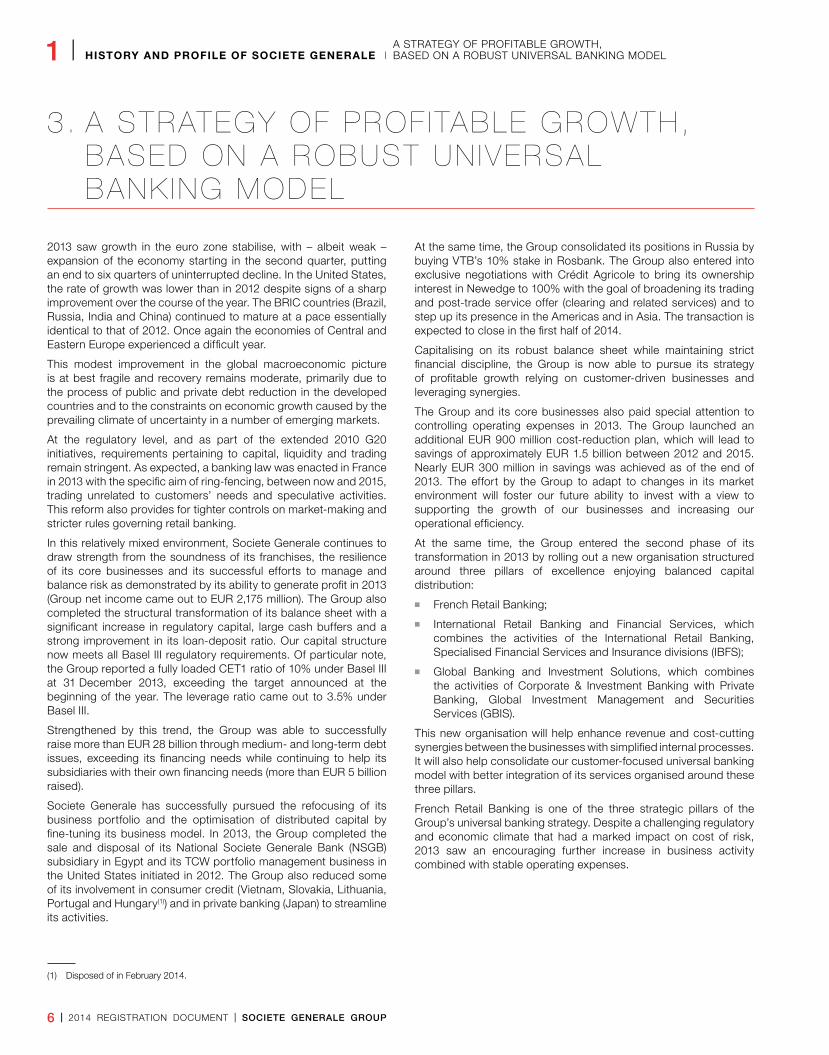
Societe Generale is one of the leading financial services groups in Europe. Based on a diversified universal banking model, the Group combines financial strength with a strategy of sustainable growth, putting its resources to work to finance the economy and its customers’ plans.
With a solid position in Europe and a presence in countries with strong potential, more than 148,000 employees in 76 countries support 32 million individual customers(1), large corporates and institutional investors worldwide by offering a wide range of advisory services and tailored financial solutions. The Group relies on three complementary core businesses:
n French Retail Banking, which encompasses the Societe Generale, Crédit du Nord and Boursorama brands. Each offers a full range of financial services with multi-channel products that are on the cutting edge of digital innovation;
n International Retail Banking, Financial Services and Insurance, with networks in developing regions and specialised businesses that are leaders in their markets;
n Corporate and Investment Banking, Private Banking, Asset and Wealth Management and Securities Services, which offer well-known expertise, key international positions and integrated solutions.
On 4 March 2014, Societe Generale was rated AA(low) by DBRS, A by FitchRatings, A2 by Moody’s and A by Standard & Poor’s.
Societe Generale is included in the main socially-responsible investment indices: Dow Jones Sustainability Index (Europe), FSTE4Good (Global and Europe), Euronext Vigeo (Global, Europe, Eurozone and France) and 5 of the STOXX ESG Leaders indices.
(1) 32 million, excluding insurance subsidiaries.
| KEY FIGURES
(in millions of euros) 2013 2012 2011 2010 2009
Net banking income 22,831 23,110 25,636 26,418 21,730
o.w. French Retail Banking 8,235 8,161 8,165 7,791 7,466
o.w. International Retail Banking & Financial Services 8,012 8,432 8,460 8,469 7,988
o.w. Global Banking and Investor Solutions 8,710 8,349 8,149 10,106 9,562
o.w. Corporate Centre (2,126) (1,832) 862 52 (3,286)
Gross operating income 6,432 6,672 8,600 9,873 5, 964
Operating income 2,380 2,737 4,270 5,713 116
Group net income 2,175 774 2,385 3,917 678
Equity (in EUR bn)
Group shareholders’ equity 51.0 49.3 47.1 46.4 42.2
Total consolidated equity 54.1 53.5 51.1 51.0 46.8
ROE after tax(1) 4.4% 1.2% 6.0% 9.8% 0.9%
B.I.S. RATIO(2) 14.7% 12.7% 11.9% 12.1% 13.0%
(1) Group ROE calculated on the basis of average Group shareholders’ equity under IFRS (including IAS 32-39 and IFRS 4), excluding unrealised capital losses and gains except
for translation reserves, deeply subordinated notes, undated subordinated notes and after deduction of interest payable to holders of these notes.
(2) From 2011 to 2013: Basel 2.5; from 2009 to 2010 Basel 2.
NB : the data for the 2012 financial year have been restated due to the implementation of amendments to IAS 19, resulting in the publication of adjusted data for the previous financial year.
6 I 2014 REGISTRATION DOCUMENT I SOCIETE GENERALE GROUP
1 I HISTORY AND PROFILE OF SOCIETE GENERALE IA STRATEGY OF PROFITABLE GROWTH, BASED ON A ROBUST UNIVERSAL BANKING MODEL
3. A STRATEGY OF PROF ITABLE GROWTH, BASED ON A ROBUST UN IVERSAL BANK ING MODEL
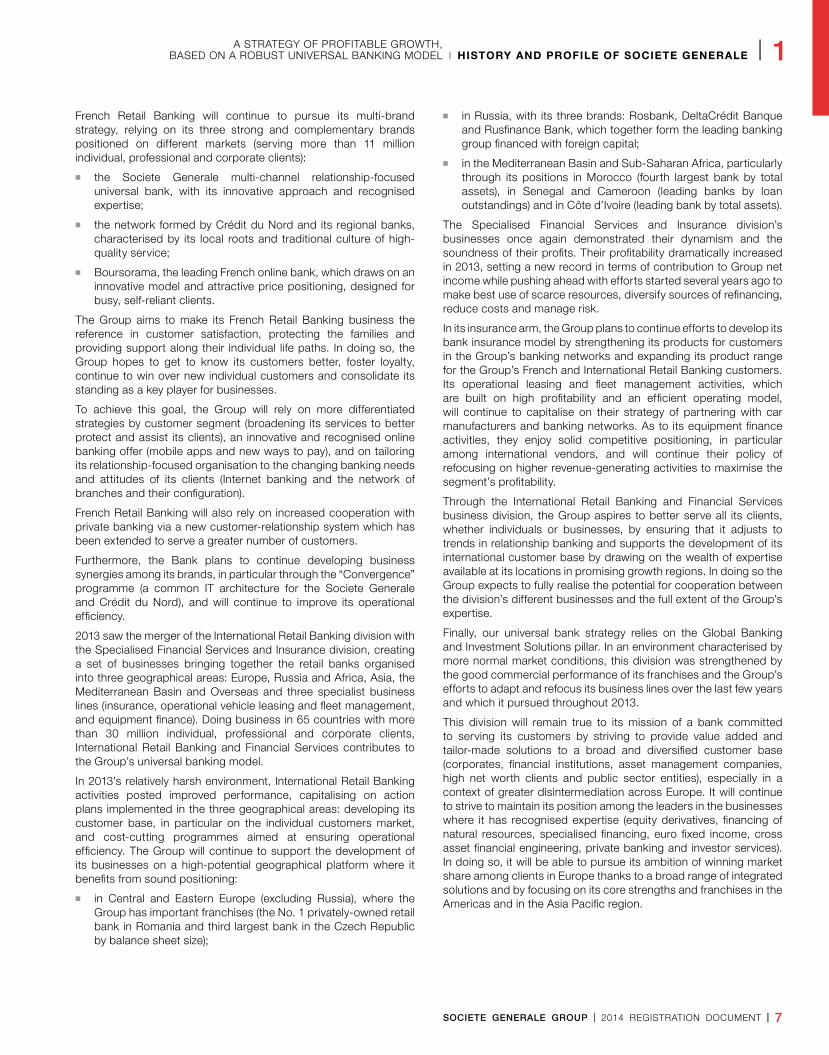
2013 saw growth in the euro zone stabilise, with – albeit weak – expansion of the economy starting in the second quarter, putting an end to six quarters of uninterrupted decline. In the United States, the rate of growth was lower than in 2012 despite signs of a sharp improvement over the course of the year. The BRIC countries (Brazil, Russia, India and China) continued to mature at a pace essentially identical to that of 2012. Once again the economies of Central and Eastern Europe experienced a difficult year.
This modest improvement in the global macroeconomic picture is at best fragile and recovery remains moderate, primarily due to the process of public and private debt reduction in the developed countries and to the constraints on economic growth caused by the prevailing climate of uncertainty in a number of emerging markets.
At the regulatory level, and as part of the extended 2010 G20 initiatives, requirements pertaining to capital, liquidity and trading remain stringent. As expected, a banking law was enacted in France in 2013 with the specific aim of ring-fencing, between now and 2015, trading unrelated to customers’ needs and speculative activities. This reform also provides for tighter controls on market-making and stricter rules governing retail banking.
In this relatively mixed environment, Societe Generale continues to draw strength from the soundness of its franchises, the resilience of its core businesses and its successful efforts to manage and balance risk as demonstrated by its ability to generate profit in 2013 (Group net income came out to EUR 2,175 million). The Group also completed the structural transformation of its balance sheet with a significant increase in regulatory capital, large cash buffers and a strong improvement in its loan-deposit ratio. Our capital structure now meets all Basel III regulatory requirements. Of particular note, the Group reported a fully loaded CET1 ratio of 10% under Basel III at 31 December 2013, exceeding the target announced at the beginning of the year. The leverage ratio came out to 3.5% under Basel III.
Strengthened by this trend, the Group was able to successfully raise more than EUR 28 billion through medium- and long-term debt issues, exceeding its financing needs while continuing to help its subsidiaries with their own financing needs (more than EUR 5 billion raised).
Societe Generale has successfully pursued the refocusing of its business portfolio and the optimisation of distributed capital by fine-tuning its business model. In 2013, the Group completed the sale and disposal of its National Societe Generale Bank (NSGB) subsidiary in Egypt and its TCW portfolio management business in the United States initiated in 2012. The Group also reduced some of its involvement in consumer credit (Vietnam, Slovakia, Lithuania, Portugal and Hungary(1)) and in private banking (Japan) to streamline its activities.
At the same time, the Group consolidated its positions in Russia by buying VTB’s 10% stake in Rosbank. The Group also entered into exclusive negotiations with Crédit Agricole to bring its ownership interest in Newedge to 100% with the goal of broadening its trading and post-trade service offer (clearing and related services) and to step up its presence in the Americas and in Asia. The transaction is expected to close in the first half of 2014.
Capitalising on its robust balance sheet while maintaining strict financial discipline, the Group is now able to pursue its strategy of profitable growth relying on customer-driven businesses and leveraging synergies.
The Group and its core businesses also paid special attention to controlling operating expenses in 2013. The Group launched an additional EUR 900 million cost-reduction plan, which will lead to savings of approximately EUR 1.5 billion between 2012 and 2015. Nearly EUR 300 million in savings was achieved as of the end of 2013. The effort by the Group to adapt to changes in its market environment will foster our future ability to invest with a view to supporting the growth of our businesses and increasing our operational efficiency.
At the same time, the Group entered the second phase of its transformation in 2013 by rolling out a new organisation structured around three pillars of excellence enjoying balanced capital distribution:
n French Retail Banking;
n International Retail Banking and Financial Services, which combines the activities of the International Retail Banking, Specialised Financial Services and Insurance divisions (IBFS);
n Global Banking and Investment Solutions, which combines the activities of Corporate & Investment Banking with Private Banking, Global Investment Management and Securities Services (GBIS).
This new organisation will help enhance revenue and cost-cutting synergies between the businesses with simplified internal processes. It will also help consolidate our customer-focused universal banking model with better integration of its services organised around these three pillars.
French Retail Banking is one of the three strategic pillars of the Group’s universal banking strategy. Despite a challenging regulatory and economic climate that had a marked impact on cost of risk, 2013 saw an encouraging further increase in business activity combined with stable operating expenses.
(1) Disposed of in February 2014.
SOCIETE GENERALE GROUP I 2014 REGISTRATION DOCUMENT I 7
A STRATEGY OF PROFITABLE GROWTH, BASED ON A ROBUST UNIVERSAL BANKING MODEL I HISTORY AND PROFILE OF SOCIETE GENERALE I 1
French Retail Banking will continue to pursue its multi-brand strategy, relying on its three strong and complementary brands positioned on different markets (serving more than 11 million individual, professional and corporate clients):
n the Societe Generale multi-channel relationship-focused universal bank, with its innovative approach and recognised expertise;
n the network formed by Crédit du Nord and its regional banks, characterised by its local roots and traditional culture of high-quality service;
n Boursorama, the leading French online bank, which draws on an innovative model and attractive price positioning, designed for busy, self-reliant clients.
The Group aims to make its French Retail Banking business the reference in customer satisfaction, protecting the families and providing support along their individual life paths. In doing so, the Group hopes to get to know its customers better, foster loyalty, continue to win over new individual customers and consolidate its standing as a key player for businesses.
To achieve this goal, the Group will rely on more differentiated strategies by customer segment (broadening its services to better protect and assist its clients), an innovative and recognised online banking offer (mobile apps and new ways to pay), and on tailoring its relationship-focused organisation to the changing banking needs and attitudes of its clients (Internet banking and the network of branches and their configuration).
French Retail Banking will also rely on increased cooperation with private banking via a new customer-relationship system which has been extended to serve a greater number of customers.
Furthermore, the Bank plans to continue developing business synergies among its brands, in particular through the “Convergence” programme (a common IT architecture for the Societe Generale and Crédit du Nord), and will continue to improve its operational efficiency.
2013 saw the merger of the International Retail Banking division with the Specialised Financial Services and Insurance division, creating a set of businesses bringing together the retail banks organised into three geographical areas: Europe, Russia and Africa, Asia, the Mediterranean Basin and Overseas and three specialist business lines (insurance, operational vehicle leasing and fleet management, and equipment finance). Doing business in 65 countries with more than 30 million individual, professional and corporate clients, International Retail Banking and Financial Services contributes to the Group’s universal banking model.
In 2013’s relatively harsh environment, International Retail Banking activities posted improved performance, capitalising on action plans implemented in the three geographical areas: developing its customer base, in particular on the individual customers market, and cost-cutting programmes aimed at ensuring operational efficiency. The Group will continue to support the development of its businesses on a high-potential geographical platform where it benefits from sound positioning:
n in Central and Eastern Europe (excluding Russia), where the Group has important franchises (the No. 1 privately-owned retail bank in Romania and third largest bank in the Czech Republic by balance sheet size);
n in Russia, with its three brands: Rosbank, DeltaCrédit Banque and Rusfinance Bank, which together form the leading banking group financed with foreign capital;
n in the Mediterranean Basin and Sub-Saharan Africa, particularly through its positions in Morocco (fourth largest bank by total assets), in Senegal and Cameroon (leading banks by loan outstandings) and in Côte d’Ivoire (leading bank by total assets).
The Specialised Financial Services and Insurance division’s businesses once again demonstrated their dynamism and the soundness of their profits. Their profitability dramatically increased in 2013, setting a new record in terms of contribution to Group net income while pushing ahead with efforts started several years ago to make best use of scarce resources, diversify sources of refinancing, reduce costs and manage risk.
In its insurance arm, the Group plans to continue efforts to develop its bank insurance model by strengthening its products for customers in the Group’s banking networks and expanding its product range for the Group’s French and International Retail Banking customers. Its operational leasing and fleet management activities, which are built on high profitability and an efficient operating model, will continue to capitalise on their strategy of partnering with car manufacturers and banking networks. As to its equipment finance activities, they enjoy solid competitive positioning, in particular among international vendors, and will continue their policy of refocusing on higher revenue-generating activities to maximise the segment’s profitability.
Through the International Retail Banking and Financial Services business division, the Group aspires to better serve all its clients, whether individuals or businesses, by ensuring that it adjusts to trends in relationship banking and supports the development of its international customer base by drawing on the wealth of expertise available at its locations in promising growth regions. In doing so the Group expects to fully realise the potential for cooperation between the division’s different businesses and the full extent of the Group’s expertise.
Finally, our universal bank strategy relies on the Global Banking and Investment Solutions pillar. In an environment characterised by more normal market conditions, this division was strengthened by the good commercial performance of its franchises and the Group’s efforts to adapt and refocus its business lines over the last few years and which it pursued throughout 2013.
This division will remain true to its mission of a bank committed to serving its customers by striving to provide value added and tailor-made solutions to a broad and diversified customer base (corporates, financial institutions, asset management companies, high net worth clients and public sector entities), especially in a context of greater disintermediation across Europe. It will continue to strive to maintain its position among the leaders in the businesses where it has recognised expertise (equity derivatives, financing of natural resources, specialised financing, euro fixed income, cross asset financial engineering, private banking and investor services). In doing so, it will be able to pursue its ambition of winning market share among clients in Europe thanks to a broad range of integrated solutions and by focusing on its core strengths and franchises in the Americas and in the Asia Pacific region.
8 I 2014 REGISTRATION DOCUMENT I SOCIETE GENERALE GROUP
1 I HISTORY AND PROFILE OF SOCIETE GENERALE IA STRATEGY OF PROFITABLE GROWTH, BASED ON A ROBUST UNIVERSAL BANKING MODEL
The division will also pursue its growth strategy, which includes taking advantage of the merger of its Corporate and Investment Banking business with its Private Banking, Global Investment Management and Securities Services activities, on the one hand promoting revenue-generating synergies among the different business lines, thanks in particular to a more efficient cross-company sales organisation, and on the other hand improving operational efficiency by setting up common processing centres and arranging resource sharing wherever possible. Simultaneously, in line with its strategy of providing greater support to its clients and their needs and in compliance with the new and stricter regulatory climate, it is forging on with its efforts to achieve optimal allocation of scarce resources (capital, assets and liquidity) and careful risk management.
The deal to acquire the remaining 50% of Newedge is a perfect example of this strategy. In preparation for regulatory changes leading to increased use of listed derivatives and centralised clearing of OTC instruments, this transaction is expected to enable GBIS to deliver a more integrated service offer to investors, ranging from market activities to post trade services.
Lastly, the division will continue to work toward its goal of promoting greater Group synergies through enhanced cooperation and structures better integrated into our other Group businesses in France, Central and Eastern Europe, Africa and the Middle East and into our private banking activities.
The second phase of our structural transformation is in full swing, organised around our three pillars of excellence. Buoyed by its strengths, its customer base and its solid earnings, Societe Generale will be in a position to deliver growth and higher earnings in the medium term with the aim of increasing return on equity to 10% by end-2015.
SOCIETE GENERALE GROUP I 2014 REGISTRATION DOCUMENT I 9
THE GROUP’S CORE BUSINESSES I HISTORY AND PROFILE OF SOCIETE GENERALE I 1
4 . T H E G R O U P ’ S C O R E B U S I N E S S E S
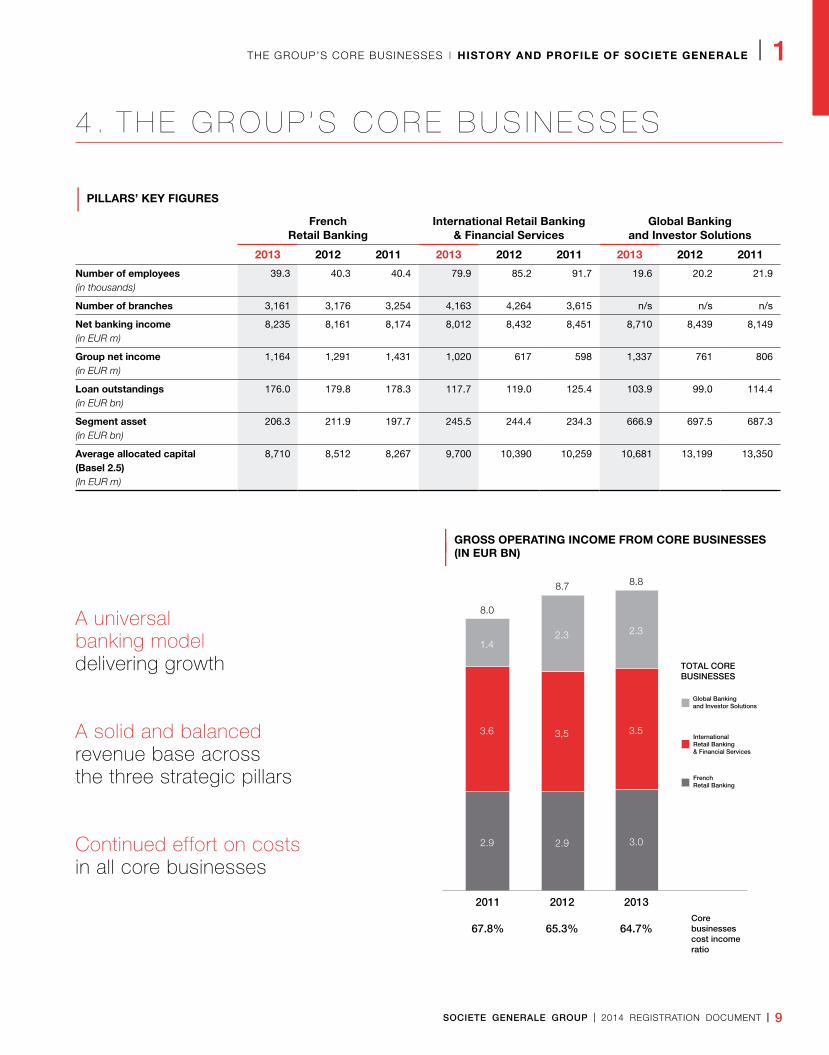
| PILLARS’ KEY FIGURES
French Retail Banking
International Retail Banking & Financial Services
Global Banking and Investor Solutions
2013 2012 2011 2013 2012 2011 2013 2012 2011
Number of employees(in thousands)
39.3 40.3 40.4 79.9 85.2 91.7 19.6 20.2 21.9
Number of branches 3,161 3,176 3,254 4,163 4,264 3,615 n/s n/s n/s
Net banking income (in EUR m)
8,235 8,161 8,174 8,012 8,432 8,451 8,710 8,439 8,149
Group net income (in EUR m)
1,164 1,291 1,431 1,020 617 598 1,337 761 806
Loan outstandings (in EUR bn)
176.0 179.8 178.3 117.7 119.0 125.4 103.9 99.0 114.4
Segment asset (in EUR bn)
206.3 211.9 197.7 245.5 244.4 234.3 666.9 697.5 687.3
Average allocated capital (Basel 2.5) (In EUR m)
8,710 8,512 8,267 9,700 10,390 10,259 10,681 13,199 13,350
A universal banking model delivering growth
A solid and balanced revenue base across the three strategic pillars
Continued effort on costs in all core businesses
| GROSS OPERATING INCOME FROM CORE BUSINESSES
| (IN EUR BN)
Global Banking and Investor Solutions
International Retail Banking & Financial Services
French Retail Banking
2011
67.8%
2012
65.3%
2013
64.7%
2.9 2.9 3.0
3.6 3,5 3.5
1.4 2.3 2.3
8.0
8.7 8.8
Corebusinesses cost income ratio
TOTAL COREBUSINESSES
10 I 2014 REGISTRATION DOCUMENT I SOCIETE GENERALE GROUP
1 I HISTORY AND PROFILE OF SOCIETE GENERALE I THE GROUP’S CORE BUSINESSES
FRENCH RETAIL BANKING
Societe Generale’s French Retail Banking networks offer a wide range of products and services suited to the needs of a diversified base of 10.7 million individual customers and nearly 624,000 professional and business customers (excluding associations, financial institutions and local authorities).
Drawing on the expertise of a team of over 39,000 professionals (i.e. 34,050 FTE(1)), an efficient multi-channel distribution system, including 3,161 branches, the pooling of best practices and simplification of processes, French Retail Banking combines the strengths of three complementary brands: Societe Generale, the renowned national bank; Crédit du Nord, a group of regional banks; and Boursorama Banque, a major online bank. These networks are backed by Global Transaction and Payment Services (GTPS) for the management of flows and payments.
The French Retail Banking networks are innovating to build the relationship-focused banking group of tomorrow. They are working across all customer markets not only to improve customer satisfaction and maintain their leading position in online banking, but also to develop more value-added services and support the international growth of businesses. Through its three major brands, Societe Generale enjoys solid positions on the French market, both in individual customer loans and deposits and life insurance, with overall market share of more than 7%, and in non-financial business customer deposits and loans (over 11% and over 8%, respectively)(2).
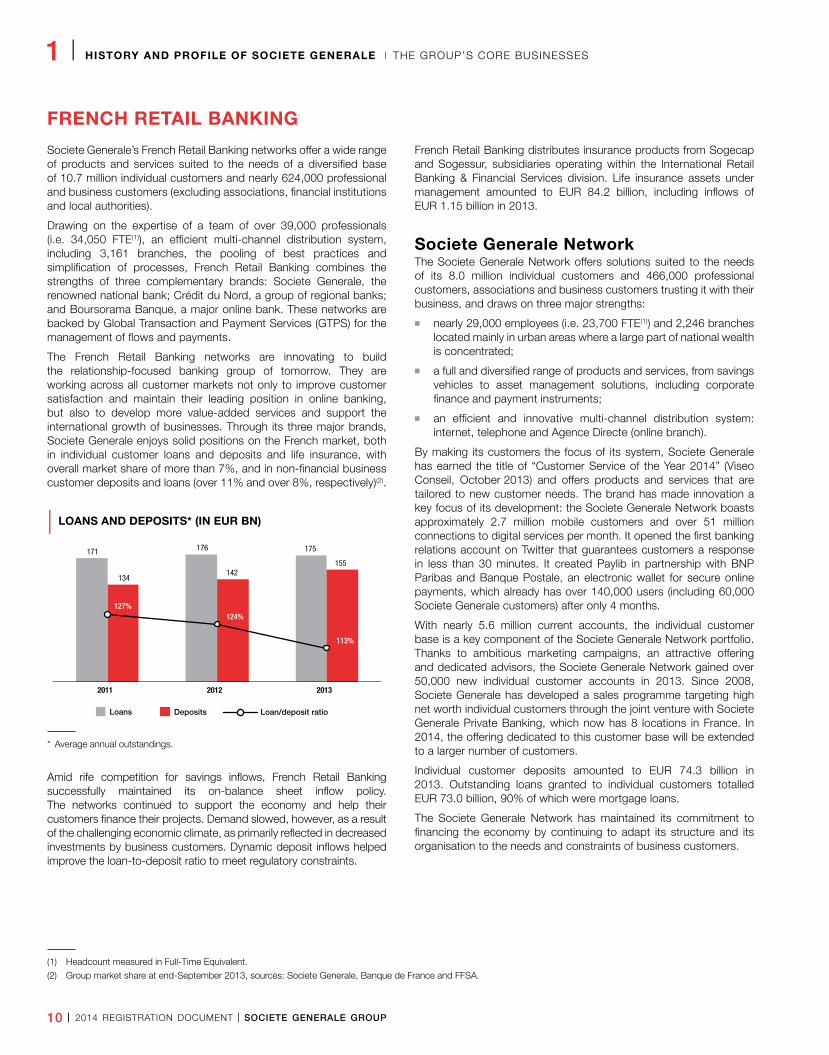
| LOANS AND DEPOSITS* (IN EUR BN)
171 176 175
134 142
155
113%
124%127%
2011 2012 2013
Loans Deposits Loan/deposit ratio
* Average annual outstandings.
Amid rife competition for savings inflows, French Retail Banking successfully maintained its on-balance sheet inflow policy. The networks continued to support the economy and help their customers finance their projects. Demand slowed, however, as a result of the challenging economic climate, as primarily reflected in decreased investments by business customers. Dynamic deposit inflows helped improve the loan-to-deposit ratio to meet regulatory constraints.
French Retail Banking distributes insurance products from Sogecap and Sogessur, subsidiaries operating within the International Retail Banking & Financial Services division. Life insurance assets under management amounted to EUR 84.2 billion, including inflows of EUR 1.15 billion in 2013.
Societe Generale NetworkThe Societe Generale Network offers solutions suited to the needs of its 8.0 million individual customers and 466,000 professional customers, associations and business customers trusting it with their business, and draws on three major strengths:
n nearly 29,000 employees (i.e. 23,700 FTE(1)) and 2,246 branches located mainly in urban areas where a large part of national wealth is concentrated;
n a full and diversified range of products and services, from savings vehicles to asset management solutions, including corporate finance and payment instruments;
n an efficient and innovative multi-channel distribution system: internet, telephone and Agence Directe (online branch).
By making its customers the focus of its system, Societe Generale has earned the title of “Customer Service of the Year 2014” (Viseo Conseil, October 2013) and offers products and services that are tailored to new customer needs. The brand has made innovation a key focus of its development: the Societe Generale Network boasts approximately 2.7 million mobile customers and over 51 million connections to digital services per month. It opened the first banking relations account on Twitter that guarantees customers a response in less than 30 minutes. It created Paylib in partnership with BNP Paribas and Banque Postale, an electronic wallet for secure online payments, which already has over 140,000 users (including 60,000 Societe Generale customers) after only 4 months.
With nearly 5.6 million current accounts, the individual customer base is a key component of the Societe Generale Network portfolio. Thanks to ambitious marketing campaigns, an attractive offering and dedicated advisors, the Societe Generale Network gained over 50,000 new individual customer accounts in 2013. Since 2008, Societe Generale has developed a sales programme targeting high net worth individual customers through the joint venture with Societe Generale Private Banking, which now has 8 locations in France. In 2014, the offering dedicated to this customer base will be extended to a larger number of customers.
Individual customer deposits amounted to EUR 74.3 billion in 2013. Outstanding loans granted to individual customers totalled EUR 73.0 billion, 90% of which were mortgage loans.
The Societe Generale Network has maintained its commitment to financing the economy by continuing to adapt its structure and its organisation to the needs and constraints of business customers.
(1) Headcount measured in Full-Time Equivalent.
(2) Group market share at end-September 2013, sources: Societe Generale, Banque de France and FFSA.
SOCIETE GENERALE GROUP I 2014 REGISTRATION DOCUMENT I 11
THE GROUP’S CORE BUSINESSES I HISTORY AND PROFILE OF SOCIETE GENERALE I 1
The growth of the customer base illustrates the relevance of this strategy: having gained close to 418 new SME customers in 2013, the portfolio comprised over 91,000 companies at end-2013. The professionalism and responsiveness of the Bank’s dedicated advisors have helped to build a close relationship with customers.
The chief purpose of the Mid Cap Investment Banking joint venture with Corporate and Investment Banking is to assist the development and speed up the growth of business customers. The team of 80 employees, a dozen of whom are based outside Paris, is divided into four business lines so as to meet the needs of business customers at the different stages of their growth in terms of strategy and wealth. The four business lines cover growth financing (acquisition financing, LBO financing), mergers and acquisitions (external growth, disposals, private capital increases, valuation), primary equity and bond markets (initial public offerings, quasi equity and capital increases, reclassifications of block shares, public offers, bond issues, private debt placements, securitisations, syndicated loans, etc.) and private equity (non-controlling interests in unlisted companies). In a deteriorated economic climate where companies remained undecided about the future, business customer outstandings amounted to EUR 42.2 billion and EUR 59.6 billion in deposits and loans, respectively, at end-2013.
Societe Generale also previously offered “Jeunes Avenir” loans for young adults. These loans are issued with the active support of the Caisses d’Allocations Familiales (family welfare agencies) and are designed for young adults aged 18-24 to help pay for the expenses of securing a new job. Since they were launched at the end of 2007, Societe Generale has helped over 2,500 young adults enter the workforce with the “Jeunes Avenir” loan. As the budget allocated by Caisse des Dépôts was fully used up over the course of 2010 and was not renewed, Societe Generale no longer offers this type of loan. At the end of 2013, more than 500 loans were still being repaid, representing outstandings of EUR 422,564.
Crédit du Nord NetworkCrédit du Nord Group consists of eight regional banks (Courtois, Kolb, Laydernier, Nuger, Rhone-Alpes, Tarneaud, Crédit du Nord and Societe Marseillaise de Crédit) and a brokerage firm (Gilbert Dupont). For more than 160 years, it has developed a relationship based on close customer relations, professionalism and innovation. Its customers enjoy the advantage of both a regional bank and a nationwide group.
The Group’s banks are staffed by advisors with an in-depth knowledge of the local economic market. They are structured as veritable SMEs with considerable autonomy in managing their business. As such, they are able to make quick decisions and expediently respond to customer requests. Each bank focuses on building strong individual ties with its customers to make each of them a partner in a lasting relationship based on trust.
The 9,530 employees of Crédit du Nord Group and its network of 915 branches are on hand to serve 2.2 million individual customers, 228,000 professional customers and nearly 84,000 business and institutional customers.
Professional customers are a priority. The Crédit du Nord Network has therefore established a system to meet their specific business requirements in order to assist them on a daily basis and advise them on their plans. All customer needs, both private and professional, are handled by the same branch and under the authority of the same person.
The excellent quality of the relationships built every day by the banks in this network, which are based on personal attention and advisory services, is reflected in the competition surveys(1) conducted by CSA with the customers of major French banking groups. [Conducted in spring 2013 on representative samples, these surveys once again ranked Crédit du Nord as a leader in its three markets: the next survey will be conducted in spring 2014].
Gilbert Dupont and Corporate and Investment Banking (via Societe Generale Mid Cap Investment Banking) entered into a capital market cooperation agreement for Societe Generale’s SME customers with a valuation or market capitalisation below EUR 200 million(2). The transactions falling under this agreement are initial public offerings, capital increases, and secondary placement of securities and convertible bond issues. Drawing on its rich historic presence and renowned expertise in this segment of the market, Gilbert Dupont handles distribution while Societe Generale Mid Cap Investment Banking structures the transactions. This agreement is proof of the Group’s determination to promote synergies between its businesses and confirms its commitment to financing the economy and business customers.
Boursorama Created in 1995, Boursorama is a major online broker in Europe, with nearly 5.5 million orders executed at 31 December 2013, over 500,000 customers in France and total financial investment outstandings of EUR 4.8 billion at 31 December 2013.
Boursorama Group offers a full range of banking products and services based on four pillars: simplicity (opening an account in just a few clicks), innovation (exclusive tools to simplify money management, such as MoneyCenter, a free account consolidation and management service, including accounts with several banks, launched in France in 2010), transparency (free debit card and 15 types of no-fee transactions), and quality (advisors available until 10 p.m. and secure transactions).
Boursorama operates in four countries (France, Germany, the United Kingdom and Spain) as:
n a key player in online banking in France under the Boursorama Banque brand via the website www.boursorama-banque.com, with a full range of innovative and efficient banking solutions ranging from conventional banking products (debit card, savings accounts, mortgage loans, personal loans) to investment products such as UCITS and life insurance vehicles. In 2013, Boursorama Banque was voted “Best Online Bank” by L’internaute.com (March 2013) for the second consecutive year. It won similar awards from Mieux Vivre Votre Argent (June 2013) and Le Revenu (September 2013). Boursorama Banque was also voted “Most Affordable Bank” by Capital and Le Monde Argent
(1) The competition survey measuring customer satisfaction was conducted in spring 2013 on representative samples of customer in all markets and on several themes: overall customer satisfaction, image, branch, products and services.
(2) Excluding the technology and biotech/medtech sectors.
12 I 2014 REGISTRATION DOCUMENT I SOCIETE GENERALE GROUP
1 I HISTORY AND PROFILE OF SOCIETE GENERALE I THE GROUP’S CORE BUSINESSES
in February 2013 (according to the “executive” profile of Capital, and the “employee” and “executive” profiles of Le Monde Argent). The success of the online banking offer (the 500,000 customer mark was reached in December 2013) was reflected by the popularity of the boursorama.com website, the leading financial and economic news website with over 27 million visits and nearly 257 million hits per month (September 2013). Boursorama.com was voted French users’ favourite website in the finance category according to the NetObserver survey (Harris Interactive, July 2013);
n a major player in online brokerage and savings in Europe. The Boursorama Group offers private investors an opportunity to manage their online savings independently thanks to a full range of investment products and services and access to the main international financial markets. This offer is available in France at www.boursorama.com, in Germany at www.onvista-bank.de, in Spain at www.selftrade.es and in the United Kingdom at www.selftrade.co.uk;
n the leader in online financial information in France and Germany with the websites www.boursorama.com and www.onvista.de.
Global Transaction and Payment Services Part of the French Networks, Global Transaction and Payment Services (GTPS) is the payment specialist of Societe Generale serving the entire Group and its distribution networks.
Operating in France and in 25 countries, GTPS targets all types of customers: individuals, associations, professionals, businesses and financial institutions.
With over 1,247 employees, GTPS is divided into two activities:
Global Transaction Banking (GTB) offers a range of services to business customers in France and abroad seeking assistance in managing flows (sales and banking) and payments. This range encompasses:
n cash management;
n trade;
n correspondent banking;
n factoring;
n foreign exchange services.
Global Payment Services (GPS) is in charge of internal provider services, which covers the development of payment and cash management products, banking solution engineering (management of projects and developments in the processing system), flow management and transaction processing.
SOCIETE GENERALE GROUP I 2014 REGISTRATION DOCUMENT I 13
THE GROUP’S CORE BUSINESSES I HISTORY AND PROFILE OF SOCIETE GENERALE I 1
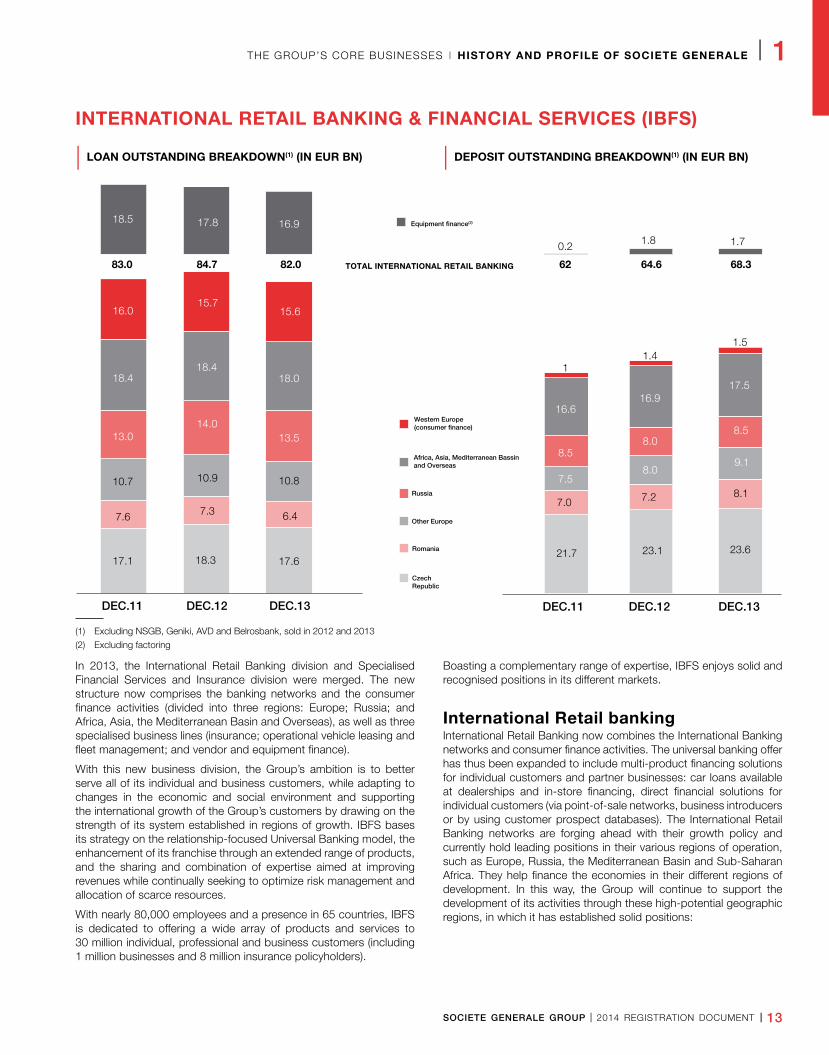
INTERNATIONAL RETAIL BANKING & FINANCIAL SERVICES (IBFS)
| LOAN OUTSTANDING BREAKDOWN(1) (IN EUR BN) | DEPOSIT OUTSTANDING BREAKDOWN(1) (IN EUR BN)
Equipment finance(2)
TOTAL INTERNATIONAL RETAIL BANKING
Western Europe (consumer finance)
Africa, Asia, Mediterranean Bassinand Overseas
Russia
Other Europe
Romania
Czech Republic
21.7 23.1 23.6
7.0 7.2 8.1 7.5
8.0 9.1
8.5 8.0
8.5
16.6 16.9
17.5
1 1.4
1.5
62
0.2 1.8 1.7
64.6 68.3
DEC.13 DEC.12 DEC.11
17.1
7.6
10.7
13.0
18.4
16.0
83.0
18.5
18.3
7.3
10.9
14.0
18.4
15.7
84.7
17.8
17.6
6.4
10.8
13.5
18.0
15.6
82.0
16.9
DEC.13 DEC.12 DEC.11
(1) Excluding NSGB, Geniki, AVD and Belrosbank, sold in 2012 and 2013
(2) Excluding factoring
In 2013, the International Retail Banking division and Specialised Financial Services and Insurance division were merged. The new structure now comprises the banking networks and the consumer finance activities (divided into three regions: Europe; Russia; and Africa, Asia, the Mediterranean Basin and Overseas), as well as three specialised business lines (insurance; operational vehicle leasing and fleet management; and vendor and equipment finance).
With this new business division, the Group’s ambition is to better serve all of its individual and business customers, while adapting to changes in the economic and social environment and supporting the international growth of the Group’s customers by drawing on the strength of its system established in regions of growth. IBFS bases its strategy on the relationship-focused Universal Banking model, the enhancement of its franchise through an extended range of products, and the sharing and combination of expertise aimed at improving revenues while continually seeking to optimize risk management and allocation of scarce resources.
With nearly 80,000 employees and a presence in 65 countries, IBFS is dedicated to offering a wide array of products and services to 30 million individual, professional and business customers (including 1 million businesses and 8 million insurance policyholders).
Boasting a complementary range of expertise, IBFS enjoys solid and recognised positions in its different markets.
International Retail bankingInternational Retail Banking now combines the International Banking networks and consumer finance activities. The universal banking offer has thus been expanded to include multi-product financing solutions for individual customers and partner businesses: car loans available at dealerships and in-store financing, direct financial solutions for individual customers (via point-of-sale networks, business introducers or by using customer prospect databases). The International Retail Banking networks are forging ahead with their growth policy and currently hold leading positions in their various regions of operation, such as Europe, Russia, the Mediterranean Basin and Sub-Saharan Africa. They help finance the economies in their different regions of development. In this way, the Group will continue to support the development of its activities through these high-potential geographic regions, in which it has established solid positions:
14 I 2014 REGISTRATION DOCUMENT I SOCIETE GENERALE GROUP
1 I HISTORY AND PROFILE OF SOCIETE GENERALE I THE GROUP’S CORE BUSINESSES
EUROPE (EXCLUDING RUSSIA)In Western Europe, where the Group is established in France, Germany and Italy, predominantly in consumer finance activities, outstanding loans were stable in 2013 at EUR 15.6 billion despite the economic slowdown. Having consolidated its competitive positioning and strengthened its partnerships with auto manufacturers, the division holds the No. 2 spot in automobile financing both in France and Germany (Journal de l’Automobile, May 2013).
In the Czech Republic, Komerční Banka is ranked 3rd among the country’s banks in terms of balance sheet size, with outstanding loans of EUR 17.6 billion, nearly 400 branches and 8,277 employees. KB, which was created in 1990 and became a subsidiary of Societe Generale in 2001, has developed its universal banking activities for individual customers and expanded its traditionally significant presence with business customers and municipalities. The KB Group also offers a range of consumer loans with ESSOX as well as financial and investment services via a joint venture with SG CIB. Komerční Banka was ranked No. 2 in “The Best Bank 2013” category (study by Hospodarské Noviny, IBM, KPMG).
In Romania, BRD is still the leading private banking network in the country, with 883 branches and market share of around 15% in loans and deposits. The Societe Generale Group became BRD’s main shareholder in 1999, with a 60.2% stake in 2013. The BRD Group’s activity is divided into 3 major business lines: Retail Banking with BRD (individual and professional customers, SMEs), Corporate and Investment Banking via a joint venture with SG CIB, and Consumer Finance with BRD Finance. BRD received the “e-Mobile Banking” award for its mobile banking solution, MyBRD Mobile, launched in November 2013 (e-Fin@nce, January 2014).
Other Europe. The Societe Generale Group operates in 13 Central and Eastern European countries, with strong competitive positions: in terms of balance sheet size, the bank is 4th in Serbia, 6th in Croatia and 9th in Bulgaria. Outstanding deposits grew substantially in 2013 (+14.7%* to EUR 9.1 billion), while outstanding loans held steady at EUR 10.8 billion. In Slovenia, SKB was named “Bank of the Year 2013” by The Banker for the third year running (28 November 2013). In Poland, Eurobank topped the ranking in the “Best Banking Pocket App 2013” category (Symetria, November 2013).
RUSSIAThe Rosbank Group is the leading foreign-capital banking group in Russia, the No. 3 banking network in the country by number of branches, and the No. 1 private banking network by outstanding loans to individual customers. Its universal banking base covers all individual and business customer markets, drawing on the expertise of specialised entities (consumer finance with Rusfinance Bank, housing loans with DeltaCredit Bank, leasing with Rosbank Leasing, and corporate and investment banking via a joint venture with SG CIB). In 2013, the Group bought out a minority shareholder with a 10% stake in Rosbank. This acquisition increased its holding to 92.4% of Rosbank’s share capital and strengthened its commitment to the Russian market. DeltaCredit Bank ranks 4th in terms of the number
of housing loans granted to Russian households. Furthermore, the Rosbank Group is No. 1 in automobile financing in Russia.
Overall, SG Russia, comprised of Rosbank, DeltaCredit Bank, Rusfinance Bank, Societe Generale Insurance, ALD Automotive and their consolidated subsidiaries, contributed EUR 165 million to Group net income in 2013.
AFRICA, ASIA, MEDITERRANEAN BASIN, AND OVERSEAS In the Mediterranean Basin, the Group has operated in Morocco since 1962, Lebanon since 1969, Algeria since 1999 and Tunisia since 2002, in addition to Jordan and Cyprus with the 2010 acquisition by Societe Generale de Banque au Liban. Overall, these operations cover 718 branches and a 2.2 million-strong customer base. At 31 December 2013, outstanding deposits in the region came to EUR 8.1 billion and outstanding loans to EUR 9.0 billion, mainly carried by the subsidiaries in Morocco, where the Group holds the No. 4 position in private banking and No. 2 in consumer finance.
In Sub-Saharan Africa, the Group enjoys a historic presence in 12 major countries, with solid local positions, particularly in Côte d’Ivoire (leader in loans and deposits), Senegal (No. 2 in loans and deposits) and Cameroon (No. 1 in terms of outstanding loans). The Group’s operations in this region saw robust growth in their customer base (8% in the customer portfolio during 2013) and network of branches (+11 branches over 1 year, bringing the total number of branches to 286 in 2013).
Financial Services to corporates and InsuranceFinancial Services to corporates and Insurance comprises a set of business lines able to meet the specific needs of individual, professional and business customers alike in France and abroad. It offers insurance solutions (Societe Generale Insurance), financing and management solutions for automobile fleets (ALD Automotive), and vendor and equipment financing solutions for professionals (Societe Generale Equipment Finance).
These three specialised business lines complement the Group’s universal banking services, with which it generates significant synergies, while at the same time diversifying their distribution networks through such mechanisms as partnerships and business introducer agreements.
In 2013, Financial Services to corporates and Insurance once again demonstrated the momentum and solidity of its model, with substantially improved profitability reaching a record level in terms of contribution to Group net income.
INSURANCE (SGI)Societe Generale Insurance covers the needs of individual, professional and business customers for life insurance investment solutions, retirement savings schemes, health insurance, personal protection and non-life insurance.
(1) Headcount measured in Full-Time Equivalent excluding temporary personnel.
SOCIETE GENERALE GROUP I 2014 REGISTRATION DOCUMENT I 15
THE GROUP’S CORE BUSINESSES I HISTORY AND PROFILE OF SOCIETE GENERALE I 1
The business line employs over 1,700(1) people in 16 countries.
In accordance with an integrated bank insurance model, the life and non-life insurance companies of Societe Generale Insurance offer the Group’s French and international networks a full range of insurance products and services in six product categories: life insurance investment solutions, retirement savings schemes, personal protection (including health insurance), payment protection insurance and collective protection, non-life insurance and various risks.
In 2013, Societe Generale Insurance cemented its positioning in life insurance investment solutions across all of its markets, with a historic level of assets under management totalling EUR 84 billion. At the same time, it stepped up the development of its protection insurance activities (personal protection and non-life insurance), generating strong revenue growth in France and abroad.
Societe Generale Insurance also continued to build synergies with the Group’s distribution networks in France and abroad, becoming the main insurance partner of Eurobank in Poland for example. The business line expanded its range of products by launching a new supplementary health insurance activity in France for individual and professional customers of the Societe Generale Group.
At Societe Generale Insurance, constant consideration is given to customer satisfaction, as shown by the awards that it regularly receives from the specialised press for the quality of its products and customer service. In 2013, for example, Komerční Pojistovna in the Czech Republic was named “The Most Client-Friendly Life Insurance Company 2013” and took second place in “The Best Life Insurance Company 2013” category (awarded by the daily Hospodarské Noviny, september 2013). In France, Sogecap, Sogessur and Oradéa-Vie were ISO 9001 certified for all of their portfolio management processes and customer service.
OPERATIONAL VEHICLE LEASING AND FLEET MANAGEMENT (ALD)ALD Automotive offers operational vehicle leasing and fleet management solutions for businesses of all sizes in both local and international markets. This business line combines the financial benefits of operational leasing with a complete range of high-quality services, including in particular maintenance, tyre management, fuel consumption, insurance and vehicle replacement.
ALD Automotive has broad geographic coverage and is active in 37 countries on four continents. It has unique knowledge of the BRIC markets (Brazil, Russia, India and China) and is partnered with Wheels, Inc. in North America and FleetPartners in Australia and New Zealand. For many years, the entity has ranked No. 2 in Europe and No. 3 worldwide in operational vehicle leasing.
At 31 December 2013, ALD Automotive had passed the milestone of one million managed vehicles. For the sixth year in a row, ALD Automotive France won the “2014 Customer Service” award on the operational vehicle leasing market (Inference Operations-Viséo Conseil survey conducted in May/July).
VENDOR AND EQUIPMENT FINANCE (SGEF)Societe Generale Equipment Finance is specialised in vendor and professional equipment finance. This business is conducted through partnership agreements with business introducers (professional equipment manufacturers and distributors), with banking networks and also directly. Societe Generale Equipment Finance develops its expertise in three major sectors: transport, industrial equipment and high-tech.
As the leading company in Europe and No. 5 worldwide, SGEF operates in 23 countries, employs over 2,500 people(1) and manages a portfolio of EUR 17.6 billion in outstandings. It has a broadly diverse customer base, ranging from large international companies to SMEs, to which it offers a varied range of products (financial leasing, loans, leasing, purchase of receivables, etc.) and services (insurance, truck leasing with services).
In 2013, SGEF reinforced its competitive positions and its solid partnerships relationships with its international vendors.
Often recognized by the leasing industry, Societe Generale Equipment Finance was named “SME Champion of the Year” for the second straight year at the Leasing Life Awards ceremony on 6 December 2013 in Berlin.
(1) Headcount measured in Full-Time Equivalent excluding temporary personnel.
16 I 2014 REGISTRATION DOCUMENT I SOCIETE GENERALE GROUP
1 I HISTORY AND PROFILE OF SOCIETE GENERALE I THE GROUP’S CORE BUSINESSES
GLOBAL BANKING AND INVESTOR SOLUTIONS (GBIS)
The Societe Generale Global Banking and Investor Solutions (GBIS) division is dedicated to major clients and investor solutions.
Created in September 2013, GBIS is an integral part of the Societe Generale Group, comprising 18,000(1) employees in 36 countries, and covering the global activities of Corporate and Investment Banking, Asset and Wealth Management, and Securities Services and Brokerage.
GBIS is a major growth driver for the Group, and a key pillar of its universal banking model. It serves as a hub for economic flows between issuers and investors, and provides long-term support to business customers, financial institutions, wealth managers and private customers through it range of diverse and integrated solutions that are adapted to their specific needs.
Corporate and Investment BankingWith nearly 10,500(1) employees in 31 countries, Societe Generale Corporate & Investment Banking (SG CIB) is present in the main financial markets in the Group’s regions of operation, with extensive European coverage and representative offices in Central and Eastern Europe, the Middle East, Africa, the Americas and the Asia-Pacific region. The business line offers its customers bespoke financial solutions combining innovation, advisory services and high execution quality in three areas of expertise: investment banking, financing and market activities.
n SG CIB offers its issuer customers (large corporates, financial institutions, sovereigns and the public sector) strategic advisory services on their development as well as market access to finance this development;
n SG CIB also offers services for investors managing savings investments according to set risk/return targets. Whether they are asset managers, pension funds, family offices, hedge funds, sovereign funds, public agencies, private banks, insurance companies or dealers, the bank provides comprehensive access to the equity, fixed income, credit, foreign exchange, commodity and alternative investment markets as well a range of unique cross-asset solutions and advisory services, drawing on top market expertise.
The business line’s ambition is to be among the leading euro zone corporate and investment banks, adopting a model balanced between business lines and regions, while at the same time continuing to transform its model in order to improve its operational efficiency and risk profile and, as its main objective, to always offer the best customer service. Despite the highly competitive environment, SG CIB maintained its market share across the entire sector at 3.6%(2) in 2013 (based on revenues of a panel of 14 banks).
In order to strengthen its positions and facilitate cross-selling, SG CIB is divided into two business lines:
n Global Markets combines the “Equities” and “Fixed Income, Currencies and Commodities” market activities in a single and global platform, offering a multi-product view and optimised cross-asset solutions; Financing and Advisory covers strategic hedging activities for major customers, mergers & acquisitions advisory services, as well as global finance activities combining structured financing, vanilla financing, fund-raising (debt or equity), financial engineering and hedging solutions for issuers.
GLOBAL MARKETSTo assist its customers in an environment where financial markets are increasingly interconnected, SG CIB has united its experts – financial engineers, salespeople, traders and specialist advisors – within an integrated platform providing global access to the equity, fixed income, credit, forex, commodity and alternative investment markets. SG CIB’s experts use all of these underlyings to offer bespoke solutions, suited to the specific needs and risks of each customer.
EQUITIES
Thanks to its historic presence on all the world’s major primary and secondary equity markets and its longstanding tradition of innovation, SG CIB is a leader in a comprehensive range of varied solutions covering every cash, derivative and equity research activity.
– Equity derivatives are one of SG CIB’s areas of excellence. For several years, SG CIB has received awards for its expertise, which is recognised both by the banking profession and customers. Once again this year and for the eighth time in eight consecutive years, SG CIB was ranked No. 1 in Equities in the Risk Interdealer Rankings 2013. The Bank’s leadership in this field is also illustrated by its innovation for which it was named “Most Innovative Investment Bank in Structured Investor Products” (The Banker 2013). SG CIB also holds leading positions in flow activities: with increased market share of 13.1% at end-2013, the Bank is the global leader in warrants. It has also maintained its number three ranking on the European ETF (Exchange Traded Funds) market, with a market share of 11.2%.
– Lyxor Asset Management, Lyxor Asset Management, a wholly-owned subsidiary of Societe Generale, boasts a wide range of innovative and high-performance investment products and services enabling it to offer structured, index fund and alternative investment solutions. In 2013, Lyxor’s managed account platform received nine awards from leading hedge fund publications including “Best Managed Account Platform” (The Hedge Fund Journal, January 2013; HedgeWeek, March 2013; HFMWeek, April 2013; Hedge Funds Review, November 2013, among others). At 31 December 2013, Lyxor’s assets under management totalled EUR 80 billion.
In 2014, Lyxor Asset management’s activity will be merged with the Asset and Wealth Management business lines.
(1) Headcount measured in Full-Time Equivalent excluding temporary personnel.
(2) Based on income excluding non recurring items. Panel consisting of JP Morgan, Citibank, Goldman Sachs, Morgan Stanley, Bank of America, Nomura, Deutsche Bank, UBS, Crédit Suisse, Barclay’s Capital, HSBC, BNP Paribas, CA CIB, SG CIB.
SOCIETE GENERALE GROUP I 2014 REGISTRATION DOCUMENT I 17
THE GROUP’S CORE BUSINESSES I HISTORY AND PROFILE OF SOCIETE GENERALE I 1
FIXED INCOME, CURRENCIES AND COMMODITIES
Fixed income activities cover a comprehensive range of products and services ensuring the liquidity, pricing and hedging of risks related to the fixed income, forex and commodity activities of SG CIB’s customers.
– Fixed income and currencies: the fixed income and currencies teams, based in London, Paris, Madrid and Milan as well as the United States and the Asia-Pacific region, offer a wide range of flow and derivative products. They provide Societe Generale’s customers with personalised solutions to meet asset and liability management, risk management and revenue optimisation needs, and have also been regularly recognised. Once again, SG CIB gained recognition in this field in 2013 by earning first place in securities lending/borrowing in euros (Risk Interdealer Rankings, December 2013), and being named “Best FX Provider in CEE” (Global Finance, December 2013).
– Commodities: with more than 20 years of experience, SG CIB is a major player on the energy markets (oil, refined products, natural gas, coal, carbon emissions, liquefied natural gas, etc.), metals (base and precious) and has developed an agricultural commodities offer targeting producers. SG CIB is active with businesses and institutional investors, providing them with hedging and investment solutions. As a category 1 member of the London Metal Exchange, SG CIB also offers clearing and execution services for futures and options contracts. In 2013, SG CIB was named “best establishment of the year for commodities and especially base metals, oil and index products” (Risk & Energy Risk commodities ranking, 2013).
Moreover, SG CIB has continued to develop its business by forming a Cross-Asset Research team comprised of analysts all over the world to carry out many thematic and multi-product analyses covering all asset classes. These analyses are used to decipher market trends and develop market strategies, and are an excellent decision-making tool for investors, and as such regularly receive awards. In 2013, Societe Generale was awarded for “Best Overall Trade Ideas” and “Best Overall Credit Strategy” in a fixed income research poll (Euromoney, 2013).
FINANCING AND ADVISORYThe Financing and Advisory business line combines the Coverage & Investment Banking and Global Finance activities.
COVERAGE & INVESTMENT BANKING
The Coverage & Investment Banking teams offer their customers, which include businesses, financial institutions and the public sector, an integrated, comprehensive and tailor-made approach based on:
n extensive strategy advisory services, covering mergers and acquisitions and Initial Public Offering structuring, as well as debt and capital restructuring and Asset and Liability Management; and
n access to optimised fund-raising solutions, notably through the creation of joint ventures with Global Finance and Market Activities.
GLOBAL FINANCE
The Global Finance teams rely on global expertise and sector knowledge to provide issuer customers with a comprehensive offering and integrated solutions in three key areas: fund-raising, structured financing and hedging of interest rate, foreign exchange and inflation risks.
The capital, debt and equity fund-raising solutions offered by SG CIB are made possible by its ability to offer issuers access to all of the global markets and to create innovative strategic financing and acquisition or LBO financing solutions.
SG CIB holds a leading position in the equity capital markets (No. 2 in “Equity, Equity-Related Issues in France”, according to Thomson Reuters, December 2013).
SG CIB offers its customers its world-renowned structured financing expertise in many sectors: natural resources and energy, international trade, infrastructure and assets. Against a backdrop of growing disintermediation and given new forthcoming regulations, SG CIB has begun its repositioning with, notably, the strengthening of distribution capacities and a reduction in businesses that do not generate significant synergies.
The Group continued to roll out its “Originate-to-Distribute” model, carrying out significant transactions such as the issue of Project Bonds sponsored by the European Investment Bank, Project Bonds to finance a bypass in Marseille, the financing of an Airbus A-380 for Thai Airways, and the private placement of Steria bonds. The Group also set up a partnership with Amundi to finance French companies. In 2013, Global Trade Review named SG CIB “Best Global Export Finance Arranger”, and Trade Finance named SG CIB “Best Commodity Finance Bank” for the fifth consecutive year.
LEGACY ASSETSAssets made illiquid as a result of the credit crisis, because of their nature (certain CDOs -Collateralised Debt Obligations of RMBS -Residential Mortgage Backed Securities-, RMBS, CMBS -Commercial Mortgage Backed Securities and other European and US ABS -Asset backed Securities) from 2008-2009 or Australian ABS, etc.) or their structure (assets hedged by monolines, exotic credit derivatives, etc.) are no longer in line with the bank’s strategic objectives and risk profile. They were identified in 2008 and have been ringfenced and entrusted to a dedicated team, responsible for managing them until they are run off. In accordance with the risk reduction target and the objective of reallocating resources to Corporate and Investment Banking’s strategic activities. It is subject to a specific governance approach optimising interaction between the Corporate and Investment Banking, Risk and Finance Divisions.
In 2013, the non-investment grade portion of this portfolio was only EUR 0.7 billion versus EUR 3.1bn at end-2012. The size of the portfolio was significantly reduced from EUR 8.8 billion at 31 December 2012 to EUR 5.1 billion at end-2013.
18 I 2014 REGISTRATION DOCUMENT I SOCIETE GENERALE GROUP
1 I HISTORY AND PROFILE OF SOCIETE GENERALE I THE GROUP’S CORE BUSINESSES
Asset and wealth management This business line encompasses Asset Management with Amundi and Private Banking with Societe Generale Private Banking.
At end-2013, the business line’s assets under management, excluding assets managed by Lyxor Asset Management (a subsidiary consolidated within Corporate and Investment Banking’s Global Markets business line), and customer assets managed directly by the French Networks, amounted to EUR 84 billion for Private Banking.
ASSET MANAGEMENTFollowing the sale of TCW, Societe Generale will conduct its asset management business primarily through Amundi, which is 25%-held by Societe Generale and 75%-held by Credit Agricole S.A. (Societe Generale’s stake should decrease to 20% in 2014. See Brokerage section below).
This entity offers a comprehensive range of products covering all asset classes and the major currencies. Amundi offers investment solutions to meet the needs of more than 100 million individual customers throughout the world and designs innovative, effective and bespoke solutions for institutional customers suited to their business and risk profile. With the support of two major banking groups (Credit Agricole and Societe Generale), Amundi ranks No. 1 in Europe and among the world’s top nine global asset management companies (IPE Ranking “Top 400 Global Asset Managers active in the European marketplace”, published in June 2013, December 2012 data), with more than EUR 777 billion in assets under management at 31 December 2013.
PRIVATE BANKINGRanked among the world’s leaders in Private Banking, the Societe Generale Private Banking business line offers wealth management services to high net worth customers with a financial net worth of more than EUR 1 million, drawing on the expertise of its specialists in wealth engineering and investment and financial advisory services. Societe Generale has embarked on a deep transformation of its relationship-focused private banking model in France by extending its offering to its individual customers with more than EUR 500,000 in financial assets as of January 2014.
At 31 December 2013, Societe Generale Private Banking employed 2,400(1) people and totalled EUR 84 billion in assets under management.
Societe Generale Private Banking operates in 11 countries. In the past few years it has expanded its business in France and the United Kingdom by opening regional centres for high net worth individuals. Societe Generale Private Banking is also active in fast-growing regions in the Middle East and strives to attract emerging country customers by setting up teams dedicated to Russian, Latin American, Arab, Indian and African customers.
In addition, synergies have been created with the rest of the Group’s business lines, including the French Networks, International Banking and Financial Services, Global Banking and Investor Solutions, and Securities Services.
On 24 July 2013, Societe Generale Private Banking confirmed the disposal of its subsidiary in Japan, Sumitomo Mitsui Banking Corporation (SMBC). This transaction is in line with efforts to simplify Societe Generale Private Banking’s operations, and focus its development in markets where it is best positioned to pursue its growth, and in respect of its strengths and competitive advantages.
The know-how and expertise of its employees make Societe Generale Private Banking a major player in wealth management that is recognised worldwide, as evidenced by the awards handed out in 2013 for “Outstanding Wealth Planning & Trust Provider” (Private Banker International), “Best Wealth Planning Team at a European base private bank” (WealthBriefing), and “Best Private Bank for Structured Products in Europe” for the ninth year running (Euromoney). Societe Generale Private Banking was also named “Best Private Bank in France” (Euromoney), “Best Private Bank in Morocco” (Euromoney) and “Best Private Bank in the United Kingdom (FT/Investors Chronicle).
Securities Services and BrokerageAt 31 December 2013, the Securities Services and Brokerage business lines posted income of EUR 945 million for the full year.
SECURITIES SERVICESWith 18 operations around the world employing more than 3,500(1) people, Societe Generale Securities Services (SGSS) offers a comprehensive range of cutting-edge services following the latest trends in the financial markets as well as regulatory changes, including the following:
– clearing services, combining the sophisticated and flexible management of securities back-office sub-contracting solutions with a clearing service range that leads the market;
– the custody and depository bank activity, which provides financial intermediaries (commercial and private banks, brokers and investment banks, global custodians) and institutional investors (asset managers, insurers and mutual insurance companies, pension schemes and pension funds, national and supranational institutions) with local and international custody services, covering all asset classes;
– fund administration and asset servicing services manage the valuation and middle office operations for complex derivative products (OTC and structured) and calculate the performance and the risk related to portfolios for promoters of mutual funds, asset management and investment companies, banks and institutional investors;
– issuer services, comprising primarily the administration of stock option plans or free share plans, the management of registered securities accounts, financial services, and the organisation of Annual General Meetings;
– liquidity management services (cash and securities) provide flow optimisation solutions ranging from securities lending/borrowing to the hedging of forex risk; transfer agent activities, from our two off-shore centres located in Luxembourg and Dublin, provide us will a full range of services, from support to fund distribution, dedicated to institutional and private customers.
(1) Headcount measured in Full-Time Equivalent excluding temporary personnel.
SOCIETE GENERALE GROUP I 2014 REGISTRATION DOCUMENT I 19
THE GROUP’S CORE BUSINESSES I HISTORY AND PROFILE OF SOCIETE GENERALE I 1
With EUR 3,545 billion in assets under custody at year-end 2013, SGSS ranks No. 8 among global custodians and No. 2 in Europe. It also offers depository services to 3,200 mutual funds and provides the valuation of more than 4,000 mutual funds totalling EUR 494 billion in assets under administration in Europe.
SGSS confirmed the expertise of its teams by being named “Sub-Custodian of the Year, Eastern Europe” for 2013 by Custody Risk magazine and receiving the “Europe, Middle East and Africa Lender” award at the 2013 Equity Lending Awards organised by Global Investor/ISF.
Furthermore, amid structural changes, SGSS has embarked on a competitiveness and development plan to revitalise its commercial approach for all its businesses and strengthen its core operations in Western Europe.
BROKERAGENewedge, a 50/50 joint venture between Societe Generale and Crédit Agricole CIB, is the result of the merger of two brokerage specialists, Fimat and Calyon Financial. Newedge offers its customers a highly extensive and innovative range of clearing and execution services for listed derivative contracts (in financial instruments and commodities) and OTC contracts (interest rate, foreign exchange, equity, index and commodities).
With a strong presence in North America, Europe and Asia, Newedge offers its customers a single point of entry for access to more than 85 financial markets worldwide. This extensive international presence allows Newedge to handle substantial volumes and to position itself as a leading Futures Commission Merchant player in the United States in 2013.
On 7 November 2013, Societe Generale entered into exclusive negotiations with Crédit Agricole to acquire its 50% stake in the capital of Newedge, a jointly-held derivatives brokerage subsidiary, giving Societe Generale a 100% stake. This full ownership of Newedge is in line with Societe Generale’s strategy to strengthen its core businesses and build synergies, and represents a key development in the market activities business, particularly in view of regulatory changes which advocate a more centralised clearing of over-the-counter (OTC) products. The combination of the two complementary platforms enhanced the customer base and geographic presence of the Global Banking and Investor Solutions division, and stimulated synergies.
The concurrent sale of a 5% stake in Amundi to Crédit Agricole reduced Societe Generale’s stake in the banks’ jointly-owned asset management company to 20%. This disposal had no effect on the company’s structure of governance, and Amundi remains the leading provider of savings solutions across Societe Generale’s retail banking networks.

20 I 2014 REGISTRATION DOCUMENT I SOCIETE GENERALE GROUP
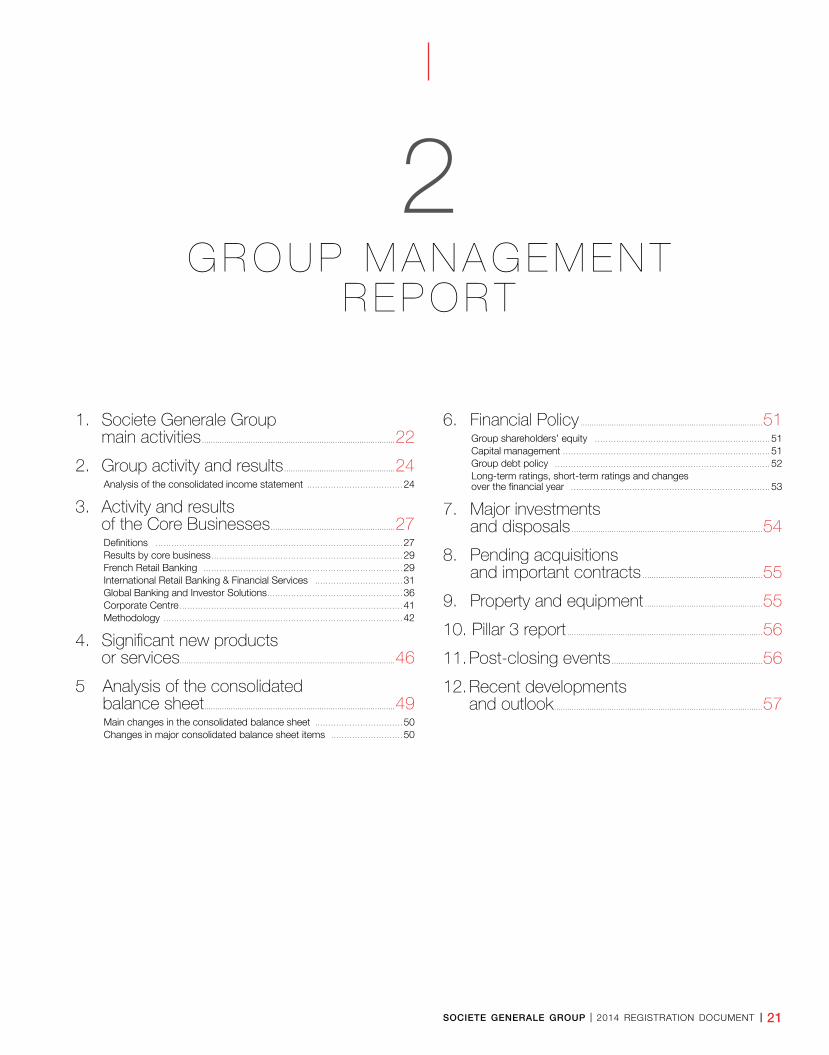
SOCIETE GENERALE GROUP I 2014 REGISTRATION DOCUMENT I 21
2G R O U P M A N A G E M E N T
R E P O R T
1. Societe Generale Group main activities .......................................................................................22
2. Group activity and results ..................................................24Analysis of the consolidated income statement ������������24
3. Activity and results of the Core Businesses ........................................................27Definitions �������������������������������27Results by core business ������������������������29French Retail Banking �������������������������29International Retail Banking & Financial Services �����������31Global Banking and Investor Solutions �����������������36Corporate Centre ����������������������������41Methodology ������������������������������42
4. Significant new products or services.................................................................................................46
5 Analysis of the consolidated balance sheet ......................................................................................49Main changes in the consolidated balance sheet �����������50Changes in major consolidated balance sheet items ���������50
6. Financial Policy ..................................................................................51Group shareholders’ equity ����������������������51Capital management ��������������������������51Group debt policy ���������������������������52Long-term ratings, short-term ratings and changes over the financial year �������������������������53
7. Major investments and disposals ......................................................................................54
8. Pending acquisitions and important contracts ......................................................55
9. Property and equipment .....................................................55
10. Pillar 3 report ........................................................................................56
11. Post-closing events ....................................................................56
12. Recent developments and outlook ..............................................................................................57
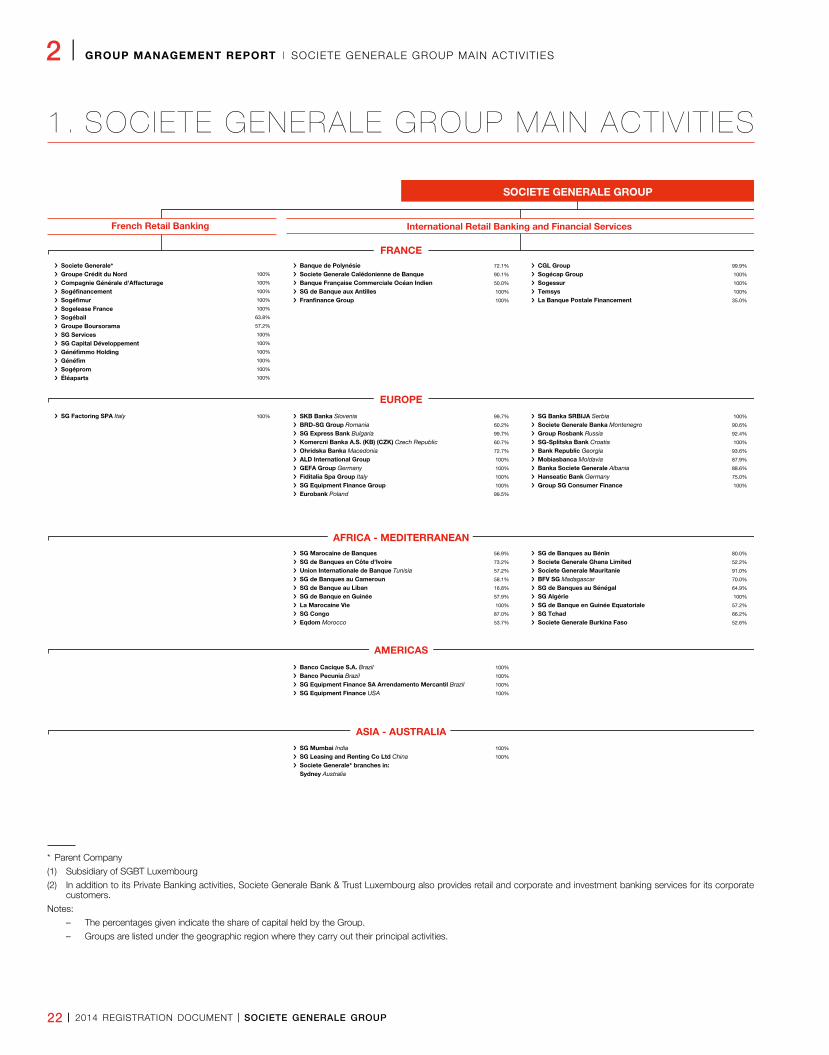
2 I GROUP MANAGEMENT REPORT I SOCIETE GENERALE GROUP MAIN ACTIVITIES
22 I 2014 REGISTRATION DOCUMENT I SOCIETE GENERALE GROUP
1. SOCIETE GENERALE GROUP MAIN ACTIV IT IES
SOCIETE GENERALE GROUP
French Retail Banking Global Banking and Investor SolutionsInternational Retail Banking and Financial Services
EUROPE
ASIA - AUSTRALIA ASIA - AUSTRALIA
AMERICAS AMERICAS
AFRICA - MEDITERRANEAN AFRICA - MEDITERRANEAN
EUROPE
FRANCE FRANCE
100%
100%
100%
100%
100%
63.8%
57.2%
100%
100%
100%
100%
100%
100%
› Societe Generale*› Groupe Crédit du Nord› Compagnie Générale d'Affacturage › Sogéfinancement› Sogéfimur› Sogelease France › Sogébail› Groupe Boursorama› SG Services› SG Capital Développement› Généfimmo Holding› Généfim› Sogéprom› Éléaparts
100%› SG Factoring SPA Italy
72.1%
90.1%
50.0%
100%
100%
› Banque de Polynésie› Societe Generale Calédonienne de Banque› Banque Française Commerciale Océan Indien› SG de Banque aux Antilles› Franfinance Group
99.9%
100%
100%
100%
35.0%
› CGL Group› Sogécap Group› Sogessur› Temsys› La Banque Postale Financement
99.7%
60.2%
99.7%
60.7%
72.7%
100%
100%
100%
100%
99.5%
› SKB Banka Slovenia › BRD-SG Group Romania › SG Express Bank Bulgaria› Komercni Banka A.S. (KB) (CZK) Czech Republic› Ohridska Banka Macedonia› ALD International Group› GEFA Group Germany› Fiditalia Spa Group Italy› SG Equipment Finance Group› Eurobank Poland
100%
90.6%
92.4%
100%
93.6%
87.9%
88.6%
75.0%
100%
› SG Banka SRBIJA Serbia› Societe Generale Banka Montenegro› Group Rosbank Russia› SG-Splitska Bank Croatia › Bank Republic Georgia › Mobiasbanca Moldavia› Banka Societe Generale Albania› Hanseatic Bank Germany› Group SG Consumer Finance
56.9%
73.2%
57.2%
58.1%
16.8%
57.9%
100%
87.0%
53.7%
› SG Marocaine de Banques› SG de Banques en Côte d’Ivoire › Union Internationale de Banque Tunisia› SG de Banques au Cameroun› SG de Banque au Liban› SG de Banque en Guinée› La Marocaine Vie› SG Congo› Eqdom Morocco
80.0%
52.2%
91.0%
70.0%
64.9%
100%
57.2%
66.2%
52.6%
› SG de Banques au Bénin› Societe Generale Ghana Limited› Societe Generale Mauritanie› BFV SG Madagascar› SG de Banques au Sénégal› SG Algérie › SG de Banque en Guinée Equatoriale› SG Tchad› Societe Generale Burkina Faso
100%
100%
100%
100%
› Banco Cacique S.A. Brazil› Banco Pecunia Brazil› SG Equipment Finance SA Arrendamento Mercantil Brazil› SG Equipment Finance USA
100%
100%
› SG Mumbai India› SG Leasing and Renting Co Ltd China› Societe Generale* branches in: Sydney Australia
50%
100%
100%
25%
› Societe Generale*› Newedge Group› Parel› SGSS France› Amundi Group
100 %
100 %
100 %
100 %
100 %
› Societe Generale*› CALIF› SG Securities (Paris) SAS› Lyxor Asset Management› SG Option Europe› Inter Europe Conseil (IEC)
100%
100%
100%
100%
100%
100%
› Societe Generale Bank & Trust Luxembourg(2)
› SG Private Banking Suisse SA(1)
› SG Private Banking Belgium› SG Hambros Bank Limited United kingdom› SG Private Banking Monaco(1)
› SG Immobel Belgium› Societe Generale* branches in: Milan Italy Frankfurt Germany Madrid Spain London United Kingdom
100%
100%
100%
50%
100%
100%
› SGSS Spa Italy› Societe Generale Securities Services UK Ltd United Kingdom› SGSS Deutschland Kapitalanlagegesellschaft mbH Germany› Newedge UK Financial Ltd Londres United Kingdom› SG Bank Nederland N.V. Netherlands› SG Investments (U.K.) Ltd United Kingdom
50%
50%
100%
100%
100%
› Newedge USA, LLC› Newedge Canada Inc› SG Americas, Inc. United States› SG Americas Securities, LLC United States› SG Canada
100%› Banco SG Brazil SA› Societe Generale* branches in: New York United States Montreal Canada
50%
50%
100%
100%
100%
100%
100%
› Newedge Japan Inc› Newedge Group Hong Kong Branch› SG Securities Asia International Holdings Ltd Hong Kong› SG Securities North Pacific, Tokyo Branch Japan› SG Asia Ltd Hong Kong› SG Australia Holding Ltd› Lyxor Asset Management Japan Co Ltd
100%
49.0%
100.0%
› Societe Generale Ltd China› Fortune SG Fund Management China› SGCIB Corporation South Korea› Societe Generale* branches in: Singapore Tokyo Japan Seoul South Korea Hong Kong Taipei Taïwan
* Parent Company
(1) Subsidiary of SGBT Luxembourg
(2) In addition to its Private Banking activities, Societe Generale Bank & Trust Luxembourg also provides retail and corporate and investment banking services for its corporate customers.
Notes:
– The percentages given indicate the share of capital held by the Group.
– Groups are listed under the geographic region where they carry out their principal activities.
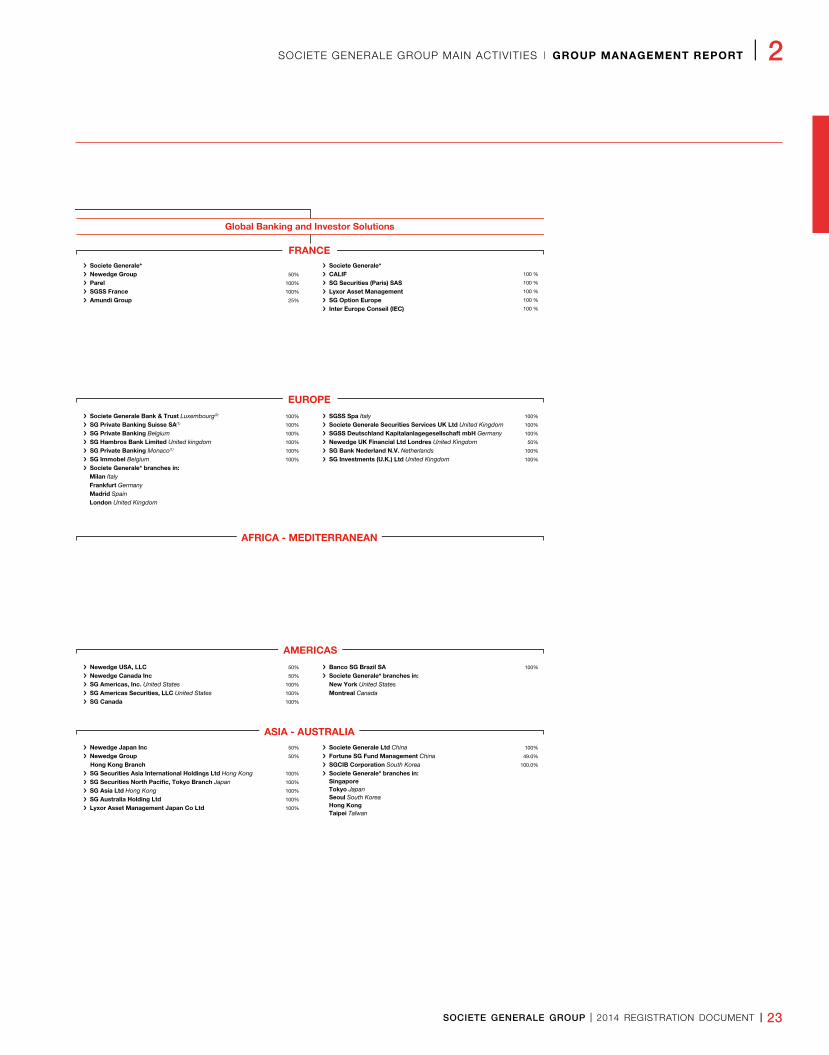
SOCIETE GENERALE GROUP MAIN ACTIVITIES I GROUP MANAGEMENT REPORT I 2
SOCIETE GENERALE GROUP I 2014 REGISTRATION DOCUMENT I 23
SOCIETE GENERALE GROUP
French Retail Banking Global Banking and Investor SolutionsInternational Retail Banking and Financial Services
EUROPE
ASIA - AUSTRALIA ASIA - AUSTRALIA
AMERICAS AMERICAS
AFRICA - MEDITERRANEAN AFRICA - MEDITERRANEAN
EUROPE
FRANCE FRANCE
100%
100%
100%
100%
100%
63.8%
57.2%
100%
100%
100%
100%
100%
100%
› Societe Generale*› Groupe Crédit du Nord› Compagnie Générale d'Affacturage › Sogéfinancement› Sogéfimur› Sogelease France › Sogébail› Groupe Boursorama› SG Services› SG Capital Développement› Généfimmo Holding› Généfim› Sogéprom› Éléaparts
100%› SG Factoring SPA Italy
72.1%
90.1%
50.0%
100%
100%
› Banque de Polynésie› Societe Generale Calédonienne de Banque› Banque Française Commerciale Océan Indien› SG de Banque aux Antilles› Franfinance Group
99.9%
100%
100%
100%
35.0%
› CGL Group› Sogécap Group› Sogessur› Temsys› La Banque Postale Financement
99.7%
60.2%
99.7%
60.7%
72.7%
100%
100%
100%
100%
99.5%
› SKB Banka Slovenia › BRD-SG Group Romania › SG Express Bank Bulgaria› Komercni Banka A.S. (KB) (CZK) Czech Republic› Ohridska Banka Macedonia› ALD International Group› GEFA Group Germany› Fiditalia Spa Group Italy› SG Equipment Finance Group› Eurobank Poland
100%
90.6%
92.4%
100%
93.6%
87.9%
88.6%
75.0%
100%
› SG Banka SRBIJA Serbia› Societe Generale Banka Montenegro› Group Rosbank Russia› SG-Splitska Bank Croatia › Bank Republic Georgia › Mobiasbanca Moldavia› Banka Societe Generale Albania› Hanseatic Bank Germany› Group SG Consumer Finance
56.9%
73.2%
57.2%
58.1%
16.8%
57.9%
100%
87.0%
53.7%
› SG Marocaine de Banques› SG de Banques en Côte d’Ivoire › Union Internationale de Banque Tunisia› SG de Banques au Cameroun› SG de Banque au Liban› SG de Banque en Guinée› La Marocaine Vie› SG Congo› Eqdom Morocco
80.0%
52.2%
91.0%
70.0%
64.9%
100%
57.2%
66.2%
52.6%
› SG de Banques au Bénin› Societe Generale Ghana Limited› Societe Generale Mauritanie› BFV SG Madagascar› SG de Banques au Sénégal› SG Algérie › SG de Banque en Guinée Equatoriale› SG Tchad› Societe Generale Burkina Faso
100%
100%
100%
100%
› Banco Cacique S.A. Brazil› Banco Pecunia Brazil› SG Equipment Finance SA Arrendamento Mercantil Brazil› SG Equipment Finance USA
100%
100%
› SG Mumbai India› SG Leasing and Renting Co Ltd China› Societe Generale* branches in: Sydney Australia
50%
100%
100%
25%
› Societe Generale*› Newedge Group› Parel› SGSS France› Amundi Group
100 %
100 %
100 %
100 %
100 %
› Societe Generale*› CALIF› SG Securities (Paris) SAS› Lyxor Asset Management› SG Option Europe› Inter Europe Conseil (IEC)
100%
100%
100%
100%
100%
100%
› Societe Generale Bank & Trust Luxembourg(2)
› SG Private Banking Suisse SA(1)
› SG Private Banking Belgium› SG Hambros Bank Limited United kingdom› SG Private Banking Monaco(1)
› SG Immobel Belgium› Societe Generale* branches in: Milan Italy Frankfurt Germany Madrid Spain London United Kingdom
100%
100%
100%
50%
100%
100%
› SGSS Spa Italy› Societe Generale Securities Services UK Ltd United Kingdom› SGSS Deutschland Kapitalanlagegesellschaft mbH Germany› Newedge UK Financial Ltd Londres United Kingdom› SG Bank Nederland N.V. Netherlands› SG Investments (U.K.) Ltd United Kingdom
50%
50%
100%
100%
100%
› Newedge USA, LLC› Newedge Canada Inc› SG Americas, Inc. United States› SG Americas Securities, LLC United States› SG Canada
100%› Banco SG Brazil SA› Societe Generale* branches in: New York United States Montreal Canada
50%
50%
100%
100%
100%
100%
100%
› Newedge Japan Inc› Newedge Group Hong Kong Branch› SG Securities Asia International Holdings Ltd Hong Kong› SG Securities North Pacific, Tokyo Branch Japan› SG Asia Ltd Hong Kong› SG Australia Holding Ltd› Lyxor Asset Management Japan Co Ltd
100%
49.0%
100.0%
› Societe Generale Ltd China› Fortune SG Fund Management China› SGCIB Corporation South Korea› Societe Generale* branches in: Singapore Tokyo Japan Seoul South Korea Hong Kong Taipei Taïwan
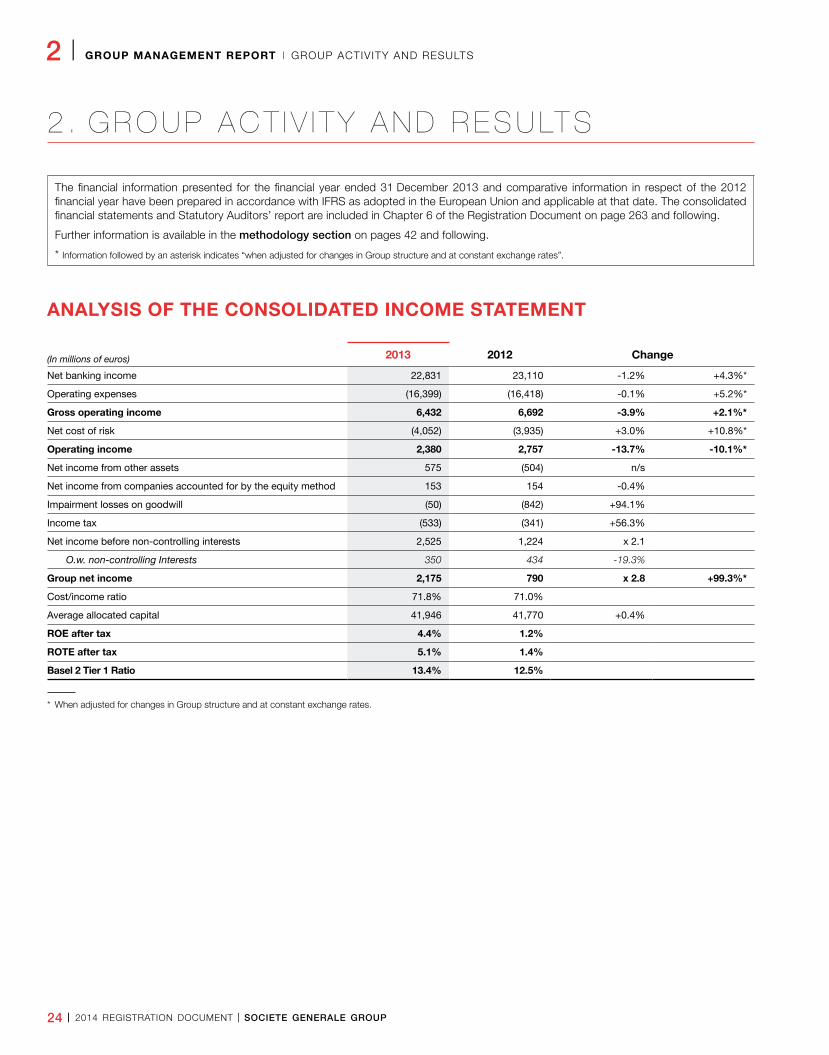
24 I 2014 REGISTRATION DOCUMENT I SOCIETE GENERALE GROUP
2 I GROUP MANAGEMENT REPORT I GROUP ACTIVITY AND RESULTS
2 . G R O U P A C T I V I T Y A N D R E S U LT S
The financial information presented for the financial year ended 31 December 2013 and comparative information in respect of the 2012 financial year have been prepared in accordance with IFRS as adopted in the European Union and applicable at that date. The consolidated financial statements and Statutory Auditors’ report are included in Chapter 6 of the Registration Document on page 263 and following.
Further information is available in the methodology section on pages 42 and following.
* Information followed by an asterisk indicates “when adjusted for changes in Group structure and at constant exchange rates”.
ANALYSIS OF THE CONSOLIDATED INCOME STATEMENT
(In millions of euros) 2013 2012 Change
Net banking income 22,831 23,110 -1.2% +4.3%*
Operating expenses (16,399) (16,418) -0.1% +5.2%*
Gross operating income 6,432 6,692 -3.9% +2.1%*
Net cost of risk (4,052) (3,935) +3.0% +10.8%*
Operating income 2,380 2,757 -13.7% -10.1%*
Net income from other assets 575 (504) n/s
Net income from companies accounted for by the equity method 153 154 -0.4%
Impairment losses on goodwill (50) (842) +94.1%
Income tax (533) (341) +56.3%
Net income before non-controlling interests 2,525 1,224 x 2.1
O.w. non-controlling Interests 350 434 -19.3%
Group net income 2,175 790 x 2.8 +99.3%*
Cost/income ratio 71.8% 71.0%
Average allocated capital 41,946 41,770 +0.4%
ROE after tax 4.4% 1.2%
ROTE after tax 5.1% 1.4%
Basel 2 Tier 1 Ratio 13.4% 12.5%
* When adjusted for changes in Group structure and at constant exchange rates.
SOCIETE GENERALE GROUP I 2014 REGISTRATION DOCUMENT I 25
GROUP ACTIVITY AND RESULTS I GROUP MANAGEMENT REPORT I 2
2013 net banking income and Group net income amounted to respectively EUR 22,831 million (+4.3%* vs. 2012) and EUR 2,175 million (multiplied by a factor of 2.8 vs. the 2012 result). When restated for non-economic items, non-recurring items and legacy assets(1), net banking income and Group net income amounted to respectively EUR 24,345 million and EUR 3,862 million, generating ROE of 8.4% (See methodology section No.8,p. 45).
In view of these results, the Board of Directors has decided to propose the payment of a dividend of EUR 1.00 per share, payable in cash, to the Annual General Meeting. Dividend detachment will take place on 27 May 2014 and the dividend will be paid on 30 May 2014, subject to approval by the Annual General Meeting on 20 May 2014.
The Group delivered a robust operating performance in all its businesses, with a solid revenue base that is evenly balanced between its three strategic pillars. Business revenues rose +2.8% when adjusted for changes in Group structure and at constant exchange rates between 2012 and 2013, thanks to the strong performance of French Retail Banking, the improved revenues of
Russian activities and a consistently solid within the International retail Banking & Financial Services pillar. There was a significant increase* in the revenues of Global Banking & Investor Solutions, particularly in Corporate and Investment Banking and in Asset Management and Private Banking activities.
The non-investment grade assets in the legacy assets portfolio were reduced to EUR 709 million at 31 December 2013 and now represent a minimal proportion of the Bank’s assets. They will no longer have an impact on its results as from 2014.
There was a limited increase (+0.9%*) in operating expenses when restated for the EUR 220 million in one-off costs recorded in relation to the cost-savings programme launched in 2013. This programme has now helped secure EUR 350 million in recurring savings for the coming years.
The commercial cost of risk, measured in basis points(2) stood at 75 basis points for 2013, stable vs. 2012. In 2014, the Group enhanced its coverage of credit commitments and legal risks.
NET BANKING INCOMEThe Group’s net banking income totalled EUR 22,831 million in 2013.
If non-economic items, non-recurring items and legacy assets are stripped out, revenues amounted to EUR 24,345 million (see methodology No.8, p. 45).
Revenues were up +5.5%* in 2013 excluding the effect of the revaluation of the Group’s own financial liabilities:
n French Retail Banking revenues rose +1.5% excluding PEL/CEL effect on the back of strong deposit inflows, despite low interest rates and sluggish credit demand.
n in International Retail Banking & Financial Services (IBFS), revenues were up +2.9%* when adjusted for changes in Group structure and at constant exchange rates. Revenues rose in Russia, and stabilised in Romania, with the economic environment
remaining unfavourable in the rest of Europe for International Retail Banking activities. Financial Services to Corporates and Insurance continued to expand, with revenue growth of nearly 10% year-on-year.
n in Global Banking & Investor Solutions (GBIS), revenues were up +10.9%* overall, with mixed performances: an increase in SG CIB revenues (excluding legacy assets) of +6.6%*, a significant pick-up in Private Banking revenues (+19.0%*), and persistently weak Brokerage activity.
The accounting impact of the revaluation of the Group’s own financial liabilities was EUR -1,594 million in 2013, and represents the bulk of the Corporate Centre’s net banking income. In 2012, this revaluation had an impact of EUR -1,255 million for the year.
(1) Non-economic items, non-recurring items and legacy assets: EUR -1,514 million in net banking income in 2013 (including the revaluation of own financial liabilities for EUR -1,594 million, legacy assets for EUR +150 million); in operating expenses: EUR -510 million in 2013 (legacy assets EUR -64 million, agreement with the European Commission EUR -446 million); cost of risk in 2013: EUR -782 million, including a collective provision for litigation issues of EUR -400 million and legacy assets of EUR -382 million; disposals, write-downs and capital losses with no effect on net banking income: EUR +549 million, notably disposal of the subsidiary NSGB and a Private Banking subsidiary. In Q4 13, total in net banking income: EUR -288 million (including EUR -379 million for the revaluation of own financial liabilities); operating expenses: EUR -458 million, including EUR -446 million in respect of the agreement with the European Commission; EUR +116 million for disposals, write-downs and capital losses; EUR -62 million in cost of risk for legacy assets. Details and 2012 data in methodology section No. 8.
(2) Annualised, excluding litigation issues and legacy assets, in respect of assets at the beginning of the period and including operating leases.
26 I 2014 REGISTRATION DOCUMENT I SOCIETE GENERALE GROUP
2 I GROUP MANAGEMENT REPORT I GROUP ACTIVITY AND RESULTS
OPERATING EXPENSESThe cost savings plan announced at the beginning of the year has helped secure EUR 350 million in recurring savings out of a total target of EUR 900 million by 2015, with one-off restructuring costs of EUR 220 million in 2013.
Without the restatement of these effects, the Group’s cost to income ratio stood at 65.3% excluding non-economic items, non-recurring items and legacy assets for 2013, a slight improvement vs. 2012 (65.6%). The improvement is more marked in absolute terms (-0.8 points to 71.0%).
Overall, operating expenses were stable in 2013 in absolute terms, at EUR 16,399 million. When adjusted for changes in Group structure and at constant exchange rates, restated for the non-recurring costs related to the rollout of the cost savings plan (EUR 220 million) and the charge resulting from the agreement with the European Commission regarding the resolution of the Euribor litigation issue (EUR 446 million), they were higher (+0.9%*).
There have been significant efforts to control operating expenses in all the businesses, with stable costs in French Retail Banking and International Retail Banking & Financial Services. They were slightly higher in Global Banking & Investor Solutions, where they included the resolution of the Euribor litigation issue. When restated for this charge, this pillar’s operating expenses were down -2.0%.
OPERATING INCOMEThe Group’s gross operating income was up +2.1%* at EUR 6,432 million in 2013 (EUR 6,692 million in 2012).
The gross operating income of the businesses rose +5.4%* between 2012 and 2013 to EUR 8,809 million.
The Group’s net cost of risk amounted to EUR 4,052 million for 2013, up +3.0% vs. 2012. It includes in particular an additional collective provision in respect of the litigation risk amounting to EUR -400 million. This provision amounted to EUR 700 million at end-2013 and reflects the level of risk identified to date.
The Group’s commercial cost of risk (expressed as a fraction of outstanding loans) was stable at 75(1) basis points in 2013, (75 basis points in 2012), in a still challenging economic environment.
n In French Retail Banking, it increased to 62 basis points (vs. 50 basis points in 2012). After declining sequentially during the first three quarters of 2013, the commercial cost of risk amounted to 69 basis points in Q4 due notably to the increased NPL coverage ratio for both business and individual customers.
n At 153 basis points (vs. 158 basis points in 2012), International Retail Banking & Financial Services’ cost of risk was stable year-on-year, with mixed trends according to region. In the Czech Republic, the situation continued to be satisfactory. In Russia, the increase in the cost of risk remained contained, marked in Q4 13 by provisions on a property portfolio that was originated prior to the acquisition of Rosbank. Substantial provisioning was carried out in Romania, essentially in Q4 13, leading to a significant increase in the gross NPL coverage ratio to 69% in Q4 13 vs. Q4 12. The cost of risk of the Financial Services to Corporates business line was stable vs. 2012.
n Global Banking & Investor Solutions’ cost of risk remained low at 13 basis points (vs. 26 basis points in 2012), confirming the quality of the loan portfolio. Legacy assets’ net cost of risk amounted to EUR -382 million in 2013.
The Group’s NPL coverage ratio amounted to 83%(2) at end-2013 (+5 points vs. end-2012).
The Group’s operating income totalled EUR 2,380 million in 2013, vs. EUR 2,757 million in 2012, and EUR 252 million in Q4 13 vs. EUR -315 million in Q4 12. These variations can be explained in Q4 principally by the impact of the revaluation of the Group’s own financial liabilities, and litigation provisions, which had a greater negative effect in Q4 12 than in Q4 13.
GROUP NET INCOMEAfter taking tax into account (the Group’s effective tax rate was 18.1% in 2013 and 15.1% in 2012) and the contribution of non-controlling interests, Group net income totalled EUR 2,175 million in 2013 (EUR 790 million in 2012).
When corrected for non-economic items, non-recurring items and legacy assets(3), Group net income amounted to EUR 3,862 million in 2013, up +15.4% vs. 2012.
The Group’s ROE, excluding non-economic items, non-recurring items and legacy assets stood at 8.4% for 2013 (4.4% in absolute terms). ROTE based on the same structure was 9.9% (5.1% in absolute terms).
Earnings per share amounted to EUR 2.40 for 2013, after deducting interest payable to holders of deeply subordinated notes and undated subordinated notes(4). Excluding the revaluation of own financial liabilities, and DVA (Debit Value Adjustment as a result of the implementation of IFRS 13), earnings per share amounted to EUR 3.69, after deducting interest payable to holders of deeply subordinated notes and undated subordinated notes(4).
(1) Annualised, excluding litigation issues and legacy assets, in respect of assets at the beginning of the period and including operating leases.
(2) Operating lease outstandings have been included in the NPL coverage ratio calculation for EUR 10.8 bn in 2013 and EUR 10.4 bn in 2012.
(3) See methodology section No. 8, p. 45.
(4) The interest, net of tax effect, payable to holders of deeply subordinated notes and undated subordinated notes amounted to respectively EUR -267 million and EUR -49 million for 2013, with a capital loss net of tax effect on partial buybacks of EUR -19 million, see methodology section No. 3, p. 42.
SOCIETE GENERALE GROUP I 2014 REGISTRATION DOCUMENT I 27
ACTIVITY AND RESULTS OF THE CORE BUSINESSES I GROUP MANAGEMENT REPORT I 2
3 . A C T I V I T Y A N D R E S U LT S OF THE CORE BUS INESSES
DEFINITIONS
The financial statements of each core business are drawn up in accordance with those of the Group in order to:
n determine the results of each core business as if it were a stand-alone entity;
n present a true and fair view of each business’ results and profitability over the period.
The core businesses reflect the Group’s management method, through its strategic pillars:
n French Retail Banking, which includes the domestic networks Societe Generale, Crédit du Nord and Boursorama;
n International Retail Banking & Financial Services
This pillar consists of:
– International Retail Banking including consumer finance activities
– Financial Services to corporates and Insurance (operational vehicle leasing and fleet management, equipment finance and insurance activities);
n Global Banking and Investor Solutions encompassing:
– Corporate and Investment Banking via the “Global Markets” and “Financing & Advisory” business lines
– Asset and Wealth Management
– Securities Services and Brokerage
These strategic pillars are supplemented by the Corporate Centre which acts as the Group’s central funding department. As such, it recognises the cost of carry of equity investments in subsidiaries and related dividend payments, as well as income and expenses stemming from the Group’s ALM and income from the Group’s management of its assets (management of its industrial and bank equity portfolio and of its real estate assets). Income and expenses that do not relate directly to the activity of the core businesses are also allocated to the Corporate Centre. This means that the debt revaluation differences linked to own credit risk and the revaluation differences of the credit derivative instruments hedging the loans and receivables portfolios are allocated to this division. In 2011 and 2012, the Corporate Centre also reflected the cost of risk booked with respect to the Group’s Greek sovereign exposure.
The principles used to determine the income and profitability of each core business are outlined below.
CAPITAL ALLOCATIONSince 1 January 2013, the general principle adopted by the Group is to allocate normative capital to the core businesses corresponding to 9% of Basel 2 average risk-weighted assets (vs. 7% previously) and supplemented by the consumption of Tier 1 capital(1) chargeable to each core business, after taking into account non-controlling interests and the adjustment of capital consumption related to the insurance activities.
From 1 January 2014, the allocation of normative capital to the core businesses on the basis of their capital consumption is determined in accordance with CRR rules (10% of their risk weighted assets, supplemented by the consumption of Common Equity Tier 1 capital chargeable to each core business, after taking into account non-controlling interests and the adjustment of capital consumption related to the insurance activities). This capital allocation rule therefore applies to the Group’s 3 corporate businesses (French Retail Banking, International Retail Banking & Financial Services and Global Banking and Investor Solutions) and allows an evaluation of capital consumption by activity as well as their level of profitability on an autonomous and uniform basis, by taking account of the Group’s regulatory constraints.
NET BANKING INCOMENet banking income (NBI) for each core business includes:
n revenues generated by its activity;
n the yield on normative capital allocated to the core businesses, which is the yield on normative capital allocated to the core businesses, which is calculated on the basis of a long-term rate by currency. On the other hand, in order to facilitate the comparability of performances between the Group’s different business lines, book capital is reassigned to the Corporate Centre at the same rate.
Moreover, capital losses and gains generated by the core businesses on the disposal of shares in non-consolidated entities, and income from the management of the Group’s industrial and bank equity portfolios, are booked under NBI, as these securities are classified as available-for-sale financial assets.
OPERATING EXPENSESEach core business’ operating expenses include its direct expenses, its management overheads and a share of the head-office expenses, which are in principle almost fully redistributed between the core businesses. The Corporate Centre only books costs relating to its activity, along with certain technical adjustments.
(1) Initial securitisation losses, non-consolidated bank shareholding > 10%, EL – portfolio-based provisions, EL on Equity portfolio, etc. (see glossary p. 477 and following).
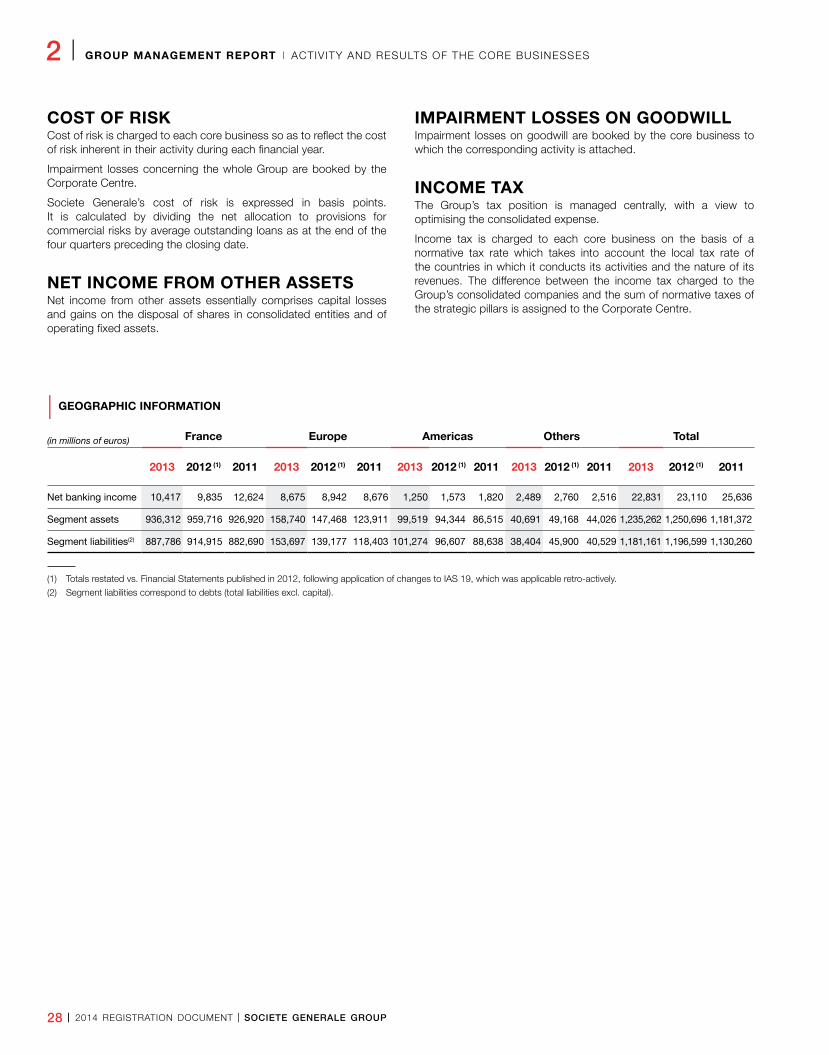
28 I 2014 REGISTRATION DOCUMENT I SOCIETE GENERALE GROUP
2 I GROUP MANAGEMENT REPORT I ACTIVITY AND RESULTS OF THE CORE BUSINESSES
COST OF RISKCost of risk is charged to each core business so as to reflect the cost of risk inherent in their activity during each financial year.
Impairment losses concerning the whole Group are booked by the Corporate Centre.
Societe Generale’s cost of risk is expressed in basis points. It is calculated by dividing the net allocation to provisions for commercial risks by average outstanding loans as at the end of the four quarters preceding the closing date.
NET INCOME FROM OTHER ASSETSNet income from other assets essentially comprises capital losses and gains on the disposal of shares in consolidated entities and of operating fixed assets.
IMPAIRMENT LOSSES ON GOODWILLImpairment losses on goodwill are booked by the core business to which the corresponding activity is attached.
INCOME TAXThe Group’s tax position is managed centrally, with a view to optimising the consolidated expense.
Income tax is charged to each core business on the basis of a normative tax rate which takes into account the local tax rate of the countries in which it conducts its activities and the nature of its revenues. The difference between the income tax charged to the Group’s consolidated companies and the sum of normative taxes of the strategic pillars is assigned to the Corporate Centre.
| GEOGRAPHIC INFORMATION
(in millions of euros) France Europe Americas Others Total
2013 2012 (1) 2011 2013 2012 (1) 2011 2013 2012 (1) 2011 2013 2012 (1) 2011 2013 2012 (1) 2011
Net banking income 10,417 9,835 12,624 8,675 8,942 8,676 1,250 1,573 1,820 2,489 2,760 2,516 22,831 23,110 25,636
Segment assets 936,312 959,716 926,920 158,740 147,468 123,911 99,519 94,344 86,515 40,691 49,168 44,026 1,235,262 1,250,696 1,181,372
Segment liabilities(2) 887,786 914,915 882,690 153,697 139,177 118,403 101,274 96,607 88,638 38,404 45,900 40,529 1,181,161 1,196,599 1,130,260
(1) Totals restated vs. Financial Statements published in 2012, following application of changes to IAS 19, which was applicable retro-actively.
(2) Segment liabilities correspond to debts (total liabilities excl. capital).
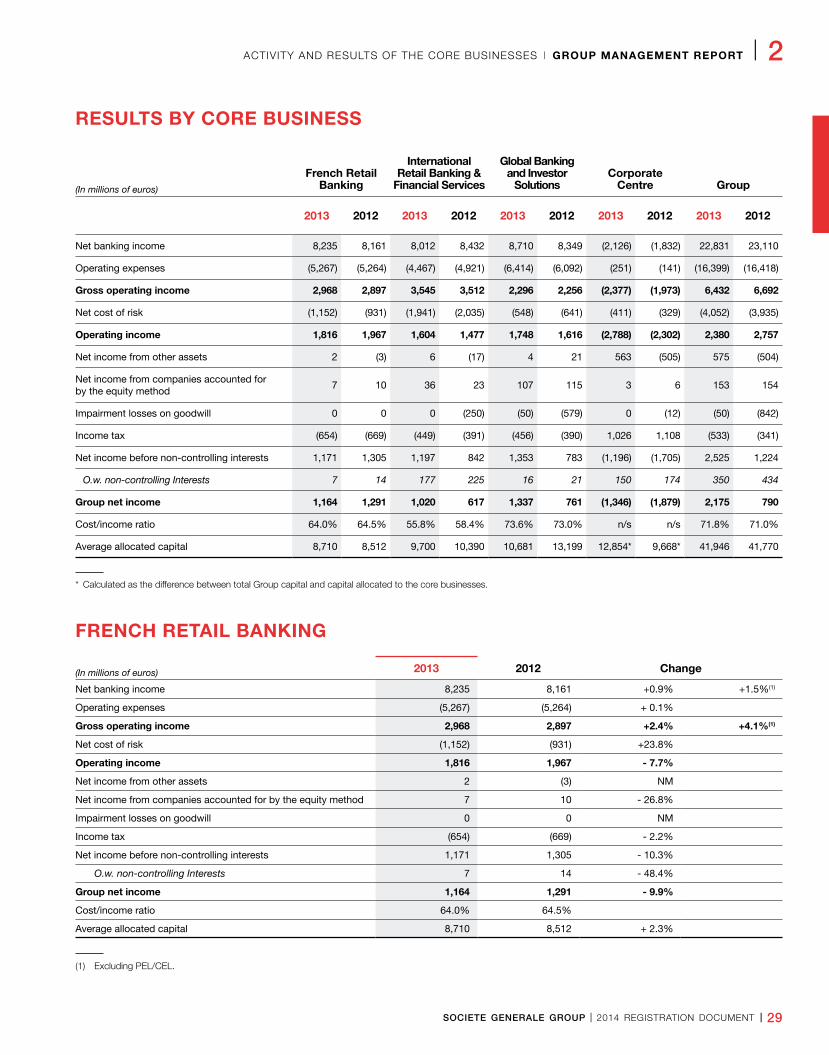
SOCIETE GENERALE GROUP I 2014 REGISTRATION DOCUMENT I 29
ACTIVITY AND RESULTS OF THE CORE BUSINESSES I GROUP MANAGEMENT REPORT I 2
RESULTS BY CORE BUSINESS
(In millions of euros)
French Retail Banking
International Retail Banking &
Financial Services
Global Banking and Investor
SolutionsCorporate
Centre Group
2013 2012 2013 2012 2013 2012 2013 2012 2013 2012
Net banking income 8,235 8,161 8,012 8,432 8,710 8,349 (2,126) (1,832) 22,831 23,110
Operating expenses (5,267) (5,264) (4,467) (4,921) (6,414) (6,092) (251) (141) (16,399) (16,418)
Gross operating income 2,968 2,897 3,545 3,512 2,296 2,256 (2,377) (1,973) 6,432 6,692
Net cost of risk (1,152) (931) (1,941) (2,035) (548) (641) (411) (329) (4,052) (3,935)
Operating income 1,816 1,967 1,604 1,477 1,748 1,616 (2,788) (2,302) 2,380 2,757
Net income from other assets 2 (3) 6 (17) 4 21 563 (505) 575 (504)
Net income from companies accounted for by the equity method
7 10 36 23 107 115 3 6 153 154
Impairment losses on goodwill 0 0 0 (250) (50) (579) 0 (12) (50) (842)
Income tax (654) (669) (449) (391) (456) (390) 1,026 1,108 (533) (341)
Net income before non-controlling interests 1,171 1,305 1,197 842 1,353 783 (1,196) (1,705) 2,525 1,224
O.w. non-controlling Interests 7 14 177 225 16 21 150 174 350 434
Group net income 1,164 1,291 1,020 617 1,337 761 (1,346) (1,879) 2,175 790
Cost/income ratio 64.0% 64.5% 55.8% 58.4% 73.6% 73.0% n/s n/s 71.8% 71.0%
Average allocated capital 8,710 8,512 9,700 10,390 10,681 13,199 12,854* 9,668* 41,946 41,770
* Calculated as the difference between total Group capital and capital allocated to the core businesses.
FRENCH RETAIL BANKING
(In millions of euros) 2013 2012 Change
Net banking income 8,235 8,161 +0.9% +1.5%(1)
Operating expenses (5,267) (5,264) + 0.1%
Gross operating income 2,968 2,897 +2.4% +4.1%(1)
Net cost of risk (1,152) (931) +23.8%
Operating income 1,816 1,967 - 7.7%
Net income from other assets 2 (3) NM
Net income from companies accounted for by the equity method 7 10 - 26.8%
Impairment losses on goodwill 0 0 NM
Income tax (654) (669) - 2.2%
Net income before non-controlling interests 1,171 1,305 - 10.3%
O.w. non-controlling Interests 7 14 - 48.4%
Group net income 1,164 1,291 - 9.9%
Cost/income ratio 64.0% 64.5%
Average allocated capital 8,710 8,512 + 2.3%
(1) Excluding PEL/CEL.
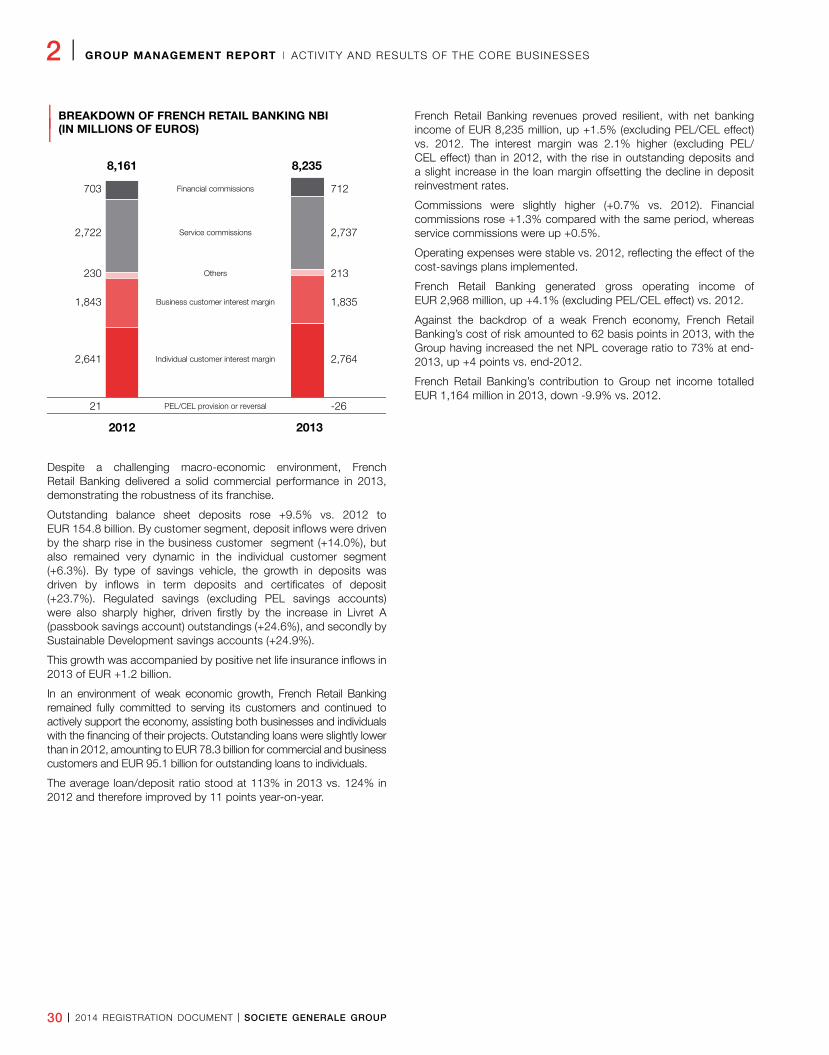
30 I 2014 REGISTRATION DOCUMENT I SOCIETE GENERALE GROUP
2 I GROUP MANAGEMENT REPORT I ACTIVITY AND RESULTS OF THE CORE BUSINESSES
| BREAKDOWN OF FRENCH RETAIL BANKING NBI
| (IN MILLIONS OF EUROS)
Despite a challenging macro-economic environment, French Retail Banking delivered a solid commercial performance in 2013, demonstrating the robustness of its franchise.
Outstanding balance sheet deposits rose +9.5% vs. 2012 to EUR 154.8 billion. By customer segment, deposit inflows were driven by the sharp rise in the business customer segment (+14.0%), but also remained very dynamic in the individual customer segment (+6.3%). By type of savings vehicle, the growth in deposits was driven by inflows in term deposits and certificates of deposit (+23.7%). Regulated savings (excluding PEL savings accounts) were also sharply higher, driven firstly by the increase in Livret A (passbook savings account) outstandings (+24.6%), and secondly by Sustainable Development savings accounts (+24.9%).
This growth was accompanied by positive net life insurance inflows in 2013 of EUR +1.2 billion.
In an environment of weak economic growth, French Retail Banking remained fully committed to serving its customers and continued to actively support the economy, assisting both businesses and individuals with the financing of their projects. Outstanding loans were slightly lower than in 2012, amounting to EUR 78.3 billion for commercial and business customers and EUR 95.1 billion for outstanding loans to individuals.
The average loan/deposit ratio stood at 113% in 2013 vs. 124% in 2012 and therefore improved by 11 points year-on-year.
French Retail Banking revenues proved resilient, with net banking income of EUR 8,235 million, up +1.5% (excluding PEL/CEL effect) vs. 2012. The interest margin was 2.1% higher (excluding PEL/CEL effect) than in 2012, with the rise in outstanding deposits and a slight increase in the loan margin offsetting the decline in deposit reinvestment rates.
Commissions were slightly higher (+0.7% vs. 2012). Financial commissions rose +1.3% compared with the same period, whereas service commissions were up +0.5%.
Operating expenses were stable vs. 2012, reflecting the effect of the cost-savings plans implemented.
French Retail Banking generated gross operating income of EUR 2,968 million, up +4.1% (excluding PEL/CEL effect) vs. 2012.
Against the backdrop of a weak French economy, French Retail Banking’s cost of risk amounted to 62 basis points in 2013, with the Group having increased the net NPL coverage ratio to 73% at end-2013, up +4 points vs. end-2012.
French Retail Banking’s contribution to Group net income totalled EUR 1,164 million in 2013, down -9.9% vs. 2012.0
1000
2000
3000
4000
5000
6000
2012
21 -26
8,235
2,764
1,835
213
2,737
712
2,641
1,843
230
2,722
703
8,161
2013
Financial commissions
Service commissions
Others
Business customer interest margin
Individual customer interest margin
PEL/CEL provision or reversal
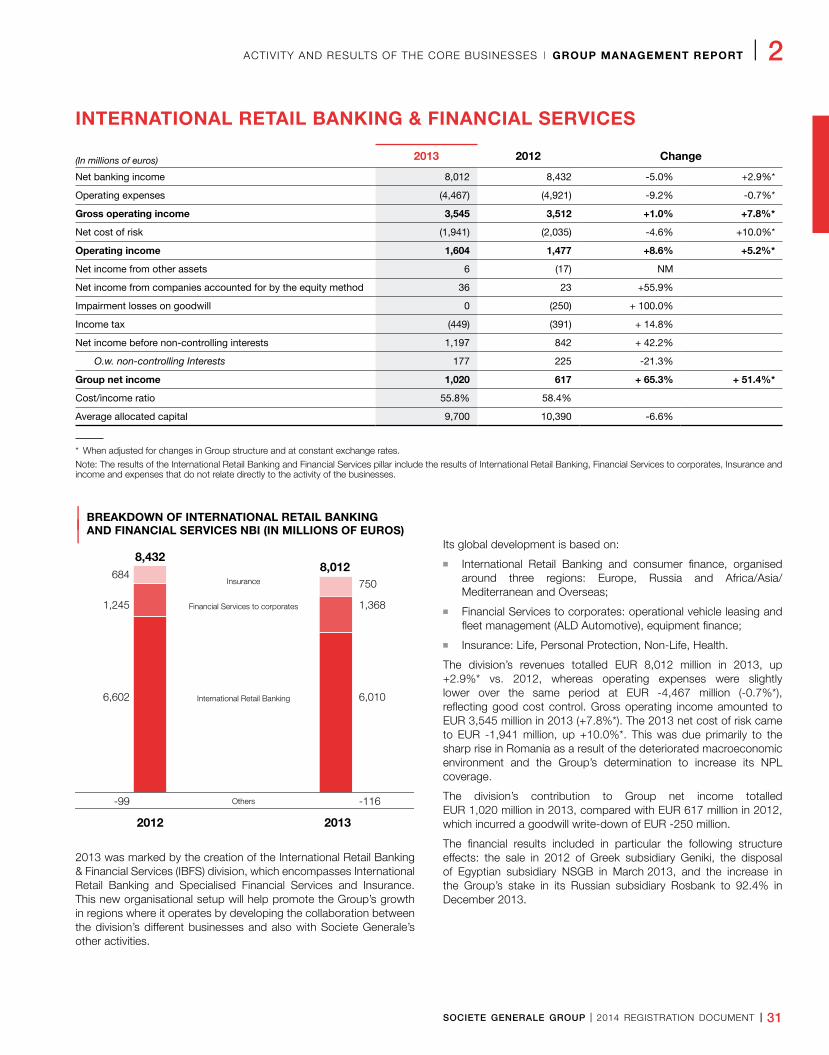
SOCIETE GENERALE GROUP I 2014 REGISTRATION DOCUMENT I 31
ACTIVITY AND RESULTS OF THE CORE BUSINESSES I GROUP MANAGEMENT REPORT I 2
INTERNATIONAL RETAIL BANKING & FINANCIAL SERVICES
(In millions of euros) 2013 2012 Change
Net banking income 8,012 8,432 -5.0% +2.9%*
Operating expenses (4,467) (4,921) -9.2% -0.7%*
Gross operating income 3,545 3,512 +1.0% +7.8%*
Net cost of risk (1,941) (2,035) -4.6% +10.0%*
Operating income 1,604 1,477 +8.6% +5.2%*
Net income from other assets 6 (17) NM
Net income from companies accounted for by the equity method 36 23 +55.9%
Impairment losses on goodwill 0 (250) + 100.0%
Income tax (449) (391) + 14.8%
Net income before non-controlling interests 1,197 842 + 42.2%
O.w. non-controlling Interests 177 225 -21.3%
Group net income 1,020 617 + 65.3% + 51.4%*
Cost/income ratio 55.8% 58.4%
Average allocated capital 9,700 10,390 -6.6%
* When adjusted for changes in Group structure and at constant exchange rates.
Note: The results of the International Retail Banking and Financial Services pillar include the results of International Retail Banking, Financial Services to corporates, Insurance and income and expenses that do not relate directly to the activity of the businesses.
| BREAKDOWN OF INTERNATIONAL RETAIL BANKING
| AND FINANCIAL SERVICES NBI (IN MILLIONS OF EUROS)
2013 was marked by the creation of the International Retail Banking & Financial Services (IBFS) division, which encompasses International Retail Banking and Specialised Financial Services and Insurance. This new organisational setup will help promote the Group’s growth in regions where it operates by developing the collaboration between the division’s different businesses and also with Societe Generale’s other activities.
Its global development is based on:
n International Retail Banking and consumer finance, organised around three regions: Europe, Russia and Africa/Asia/ Mediterranean and Overseas;
n Financial Services to corporates: operational vehicle leasing and fleet management (ALD Automotive), equipment finance;
n Insurance: Life, Personal Protection, Non-Life, Health.
The division’s revenues totalled EUR 8,012 million in 2013, up +2.9%* vs. 2012, whereas operating expenses were slightly lower over the same period at EUR -4,467 million (-0.7%*), reflecting good cost control. Gross operating income amounted to EUR 3,545 million in 2013 (+7.8%*). The 2013 net cost of risk came to EUR -1,941 million, up +10.0%*. This was due primarily to the sharp rise in Romania as a result of the deteriorated macroeconomic environment and the Group’s determination to increase its NPL coverage.
The division’s contribution to Group net income totalled EUR 1,020 million in 2013, compared with EUR 617 million in 2012, which incurred a goodwill write-down of EUR -250 million.
The financial results included in particular the following structure effects: the sale in 2012 of Greek subsidiary Geniki, the disposal of Egyptian subsidiary NSGB in March 2013, and the increase in the Group’s stake in its Russian subsidiary Rosbank to 92.4% in December 2013.
0
1000
2000
3000
4000
5000
6000
2012
-99 -116
8,012
6,010
1,368
750
6,602
1,245
684
8,432
2013
Insurance
Financial Services to corporates
International Retail Banking
Others
32 I 2014 REGISTRATION DOCUMENT I SOCIETE GENERALE GROUP
2 I GROUP MANAGEMENT REPORT I ACTIVITY AND RESULTS OF THE CORE BUSINESSES
International Retail Banking
(In millions of euros) 2013 2012 Change
Net banking income 6,010 6,602 -9.0% +1.1%*
Operating expenses (3,455) (3,884) -11.0% +0.1%*
Gross operating income 2,555 2,718 -6.0% +2.6%*
Net cost of risk (1,826) (2,003) -8.8% +5.2%*
Operating income 729 716 +1.9% -3.6%*
Net income from other assets 7 (4) NM
Net income from companies accounted for by the equity method 14 (14) NM
Impairment losses on goodwill 0 (250) +100.0%
Income tax (177) (156) +13.4%
Net income before non-controlling interests 573 291 +96.8%
O.w. non-controlling Interests 170 224 -24.3%
Group net income 403 67 x6.0 x 2.9*
Cost/income ratio 57.5% 58.8%
Average allocated capital 5,859 6,616 -11.4%
* When adjusted for changes in Group structure and at constant exchange rates.
At end-December 2013, International Retail Banking’s outstanding loans totalled EUR 82.0 billion. This was slightly higher (+1.3%*) than in 2012 and reflects mixed trends: firstly, according to the type of customers served by the Group (-2.1%* decline in outstandings for individual customers but +6.2%* increase in outstandings for business customers); and secondly, between the regions where the Group operates, with substantially higher outstanding loans in Russia, the Czech Republic, Germany and Sub-Saharan Africa.
However, growth in outstanding deposits was particularly robust (+11.4%* vs. 2012) at EUR 68.3 billion, with very strong inflows for both business and individual customers and positive trends in most countries.
International Retail Banking revenues rose +1.1%* vs. 2012 to EUR 6,010 million, driven by activity in Russia, despite the decline in the Czech Republic and Romania in conjunction with the continuing low interest rate environment in Europe. Operating expenses were stable vs. 2012 (+0.1%*), reflecting rigorous cost control. International Retail Banking’s gross operating income came to EUR 2,555 million, up +2.6%* vs. 2012. The contribution to Group net income totalled EUR 403 million in 2013 vs. EUR 67 million in 2012, which was penalised by a EUR -250 million goodwill write-down.
In Western Europe, where the Group has operations in France, Germany and Italy, essentially in consumer finance, commercial activity was stable in 2013 with outstanding loans of EUR 15.6 billion against the backdrop of an economic slowdown. Growth in outstandings in Germany was offset by declines in France and Italy. Revenues amounted to EUR 823 million and gross operating income to EUR 417 million in 2013. The contribution to Group net income came to EUR 66 million vs. EUR -130 million in 2012.
In the Czech Republic, Komercni Banka (KB) enjoyed solid commercial momentum despite increased competition. Innovation efforts underpinned growth in outstanding loans (+4.9%* to EUR 17.6 billion) and outstanding deposits (+11.4%* to EUR 23.6 billion) vs. end-December 2012. Despite this positive volume effect, revenues were lower in 2013 (-6.7%*) at EUR 1,075 million, due primarily to the decline in deposit margins in 2013. Over the same period, operating expenses were slightly lower at EUR -531 million (-0.2%*) and the contribution to Group net income remained high at EUR 223 million in 2013 (vs. EUR 271 million in 2012, which benefited in particular from a capital gain on the disposal of securities).
In Romania, where credit demand remained low, BRD’s outstanding loans were down -11.6%* (to EUR 6.4 billion) vs. end-December 2012, adversely affected by the sharp decline in the business customer segment. Outstandings for individual customers rose +8.4%*, driven by the momentum of the “Prima Casa” programme (government scheme to subsidise property loans to first-time buyers): BRD also enjoyed a solid market share of 33% on the back of this programme. Outstanding deposits were sharply higher (+13.5%*) in 2013 at EUR 8.1 billion. Revenues were slightly lower (-1.5%) at EUR 587 million in 2013. At the same time, rigorous cost control resulted in operating expenses falling -4.8%* to EUR 323 million. The Group’s determination to increase NPL coverage at the end of the year resulted in a sharp rise in provisions in Q4 (+46.1%*), leading BRD to post a net loss of EUR -99 million in 2013 (EUR -85 million in 2012).
In the other European countries, the Group strengthened its franchise and increased its deposit inflows in 2013 (outstandings up +14.7%* to EUR 9.1 billion). Outstanding loans remained stable in 2013 (-0.2%* to EUR 10.8 billion). Revenues were down -7.2%* to EUR 645 million, operating expenses were slightly lower at EUR -445 million (-0.2%*) and the net result was a loss of EUR -33 million in 2013.
SOCIETE GENERALE GROUP I 2014 REGISTRATION DOCUMENT I 33
ACTIVITY AND RESULTS OF THE CORE BUSINESSES I GROUP MANAGEMENT REPORT I 2
In Russia, 2013 saw the Group increase its stake in Russian subsidiary Rosbank to 92.4% in December 2013 through the acquisition of VTB Group’s 10% holding.
2013 provided further evidence of the entity’s recovery. The Group maintained a healthy commercial momentum: outstanding loans were up +8.2%* vs. end-2012 (to EUR 13.5 billion), driven by the rise in the individual customer segment. Over the same period, outstanding deposits enjoyed robust growth in both customer segments (up +19.9% at EUR 8.5 billion overall), reflecting the success of the inflow strategy. The loan/deposit ratio continued to improve (115% at end-2013 vs. 125% at end-2012 for Rosbank). Societe Generale is ranked No. 1 for syndicated loans in Russia (sources: IFR, Euroweek and Cbonds, December 2013).
Net banking income rose +16.9%* to EUR 1.3 billion in 2013, boosted in particular by a capital gain on the disposal of assets. Over the same period, costs remained under control (+1.2%*) despite high inflation of 6.7%(1) in 2013. The contribution to Group net income came to EUR 128 million vs. a loss of EUR -180 million in 2012, which incurred a EUR -250 million goodwill write-down.
Overall the SG Russia(2) operation made a EUR 165 million contribution to 2013 Group net income. The SG Russia entity’s ROE was 12.7% in 2013, based on normative capital.
In the other regions where the Group operates (Africa, Asia, Mediterranean Basin and Overseas), outstanding loans were slightly higher in 2013 at EUR 18 billion (+0.4%*), despite healthy commercial momentum in Africa (+5.6%*) and the Mediterranean Basin (+2.9%*). Outstanding deposits were up +5.4%*. Revenues came to EUR 1,556 million in 2013, stable vs. 2012 (+0.2%*). Over the same period, operating expenses rose +3.4%*, in conjunction with the growth of the network (17 new branches in the Mediterranean Basin and 11 new branches in Africa). The contribution to Group net income totalled EUR 118 million vs. EUR 203 million in 2012. The difference can be explained primarily by the disposal of the NSGB subsidiary in Egypt in March 2013.
(1) Source IMF, October 2013.
(2) SG Russia’s result: contribution of Rosbank, Delta Credit Bank, Rusfinance Bank, Societe Generale Insurance, ALD automotive and their consolidated subsidiaries to the businesses’ results.
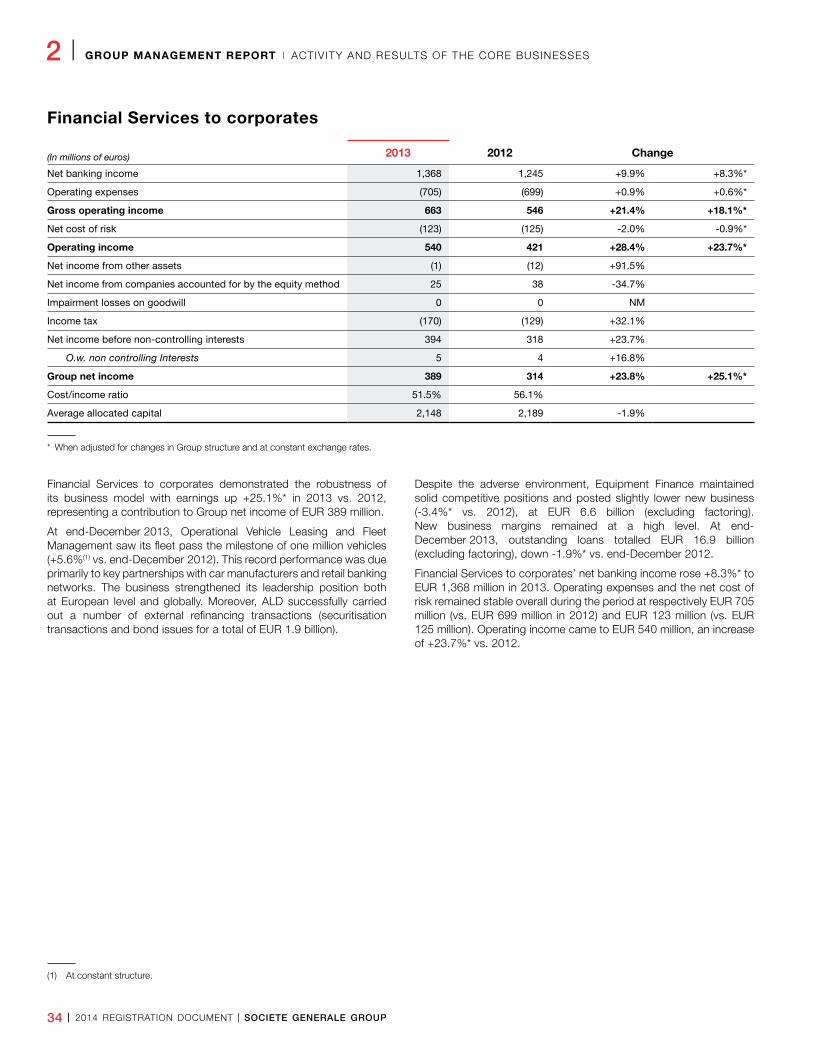
34 I 2014 REGISTRATION DOCUMENT I SOCIETE GENERALE GROUP
2 I GROUP MANAGEMENT REPORT I ACTIVITY AND RESULTS OF THE CORE BUSINESSES
Financial Services to corporates
(In millions of euros) 2013 2012 Change
Net banking income 1,368 1,245 +9.9% +8.3%*
Operating expenses (705) (699) +0.9% +0.6%*
Gross operating income 663 546 +21.4% +18.1%*
Net cost of risk (123) (125) -2.0% -0.9%*
Operating income 540 421 +28.4% +23.7%*
Net income from other assets (1) (12) +91.5%
Net income from companies accounted for by the equity method 25 38 -34.7%
Impairment losses on goodwill 0 0 NM
Income tax (170) (129) +32.1%
Net income before non-controlling interests 394 318 +23.7%
O.w. non controlling Interests 5 4 +16.8%
Group net income 389 314 +23.8% +25.1%*
Cost/income ratio 51.5% 56.1%
Average allocated capital 2,148 2,189 -1.9%
* When adjusted for changes in Group structure and at constant exchange rates.
Financial Services to corporates demonstrated the robustness of its business model with earnings up +25.1%* in 2013 vs. 2012, representing a contribution to Group net income of EUR 389 million.
At end-December 2013, Operational Vehicle Leasing and Fleet Management saw its fleet pass the milestone of one million vehicles (+5.6%(1) vs. end-December 2012). This record performance was due primarily to key partnerships with car manufacturers and retail banking networks. The business strengthened its leadership position both at European level and globally. Moreover, ALD successfully carried out a number of external refinancing transactions (securitisation transactions and bond issues for a total of EUR 1.9 billion).
Despite the adverse environment, Equipment Finance maintained solid competitive positions and posted slightly lower new business (-3.4%* vs. 2012), at EUR 6.6 billion (excluding factoring). New business margins remained at a high level. At end-December 2013, outstanding loans totalled EUR 16.9 billion (excluding factoring), down -1.9%* vs. end-December 2012.
Financial Services to corporates’ net banking income rose +8.3%* to EUR 1,368 million in 2013. Operating expenses and the net cost of risk remained stable overall during the period at respectively EUR 705 million (vs. EUR 699 million in 2012) and EUR 123 million (vs. EUR 125 million). Operating income came to EUR 540 million, an increase of +23.7%* vs. 2012.
(1) At constant structure.
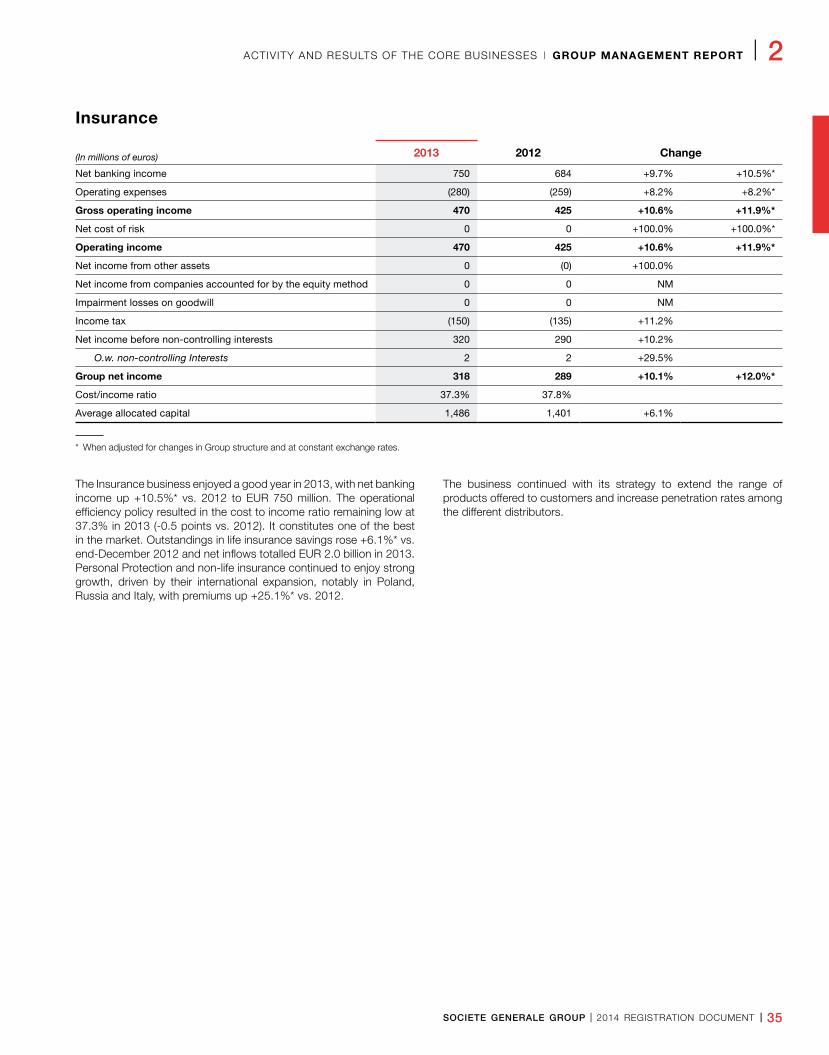
SOCIETE GENERALE GROUP I 2014 REGISTRATION DOCUMENT I 35
ACTIVITY AND RESULTS OF THE CORE BUSINESSES I GROUP MANAGEMENT REPORT I 2
Insurance
(In millions of euros) 2013 2012 Change
Net banking income 750 684 +9.7% +10.5%*
Operating expenses (280) (259) +8.2% +8.2%*
Gross operating income 470 425 +10.6% +11.9%*
Net cost of risk 0 0 +100.0% +100.0%*
Operating income 470 425 +10.6% +11.9%*
Net income from other assets 0 (0) +100.0%
Net income from companies accounted for by the equity method 0 0 NM
Impairment losses on goodwill 0 0 NM
Income tax (150) (135) +11.2%
Net income before non-controlling interests 320 290 +10.2%
O.w. non-controlling Interests 2 2 +29.5%
Group net income 318 289 +10.1% +12.0%*
Cost/income ratio 37.3% 37.8%
Average allocated capital 1,486 1,401 +6.1%
* When adjusted for changes in Group structure and at constant exchange rates.
The Insurance business enjoyed a good year in 2013, with net banking income up +10.5%* vs. 2012 to EUR 750 million. The operational efficiency policy resulted in the cost to income ratio remaining low at 37.3% in 2013 (-0.5 points vs. 2012). It constitutes one of the best in the market. Outstandings in life insurance savings rose +6.1%* vs. end-December 2012 and net inflows totalled EUR 2.0 billion in 2013. Personal Protection and non-life insurance continued to enjoy strong growth, driven by their international expansion, notably in Poland, Russia and Italy, with premiums up +25.1%* vs. 2012.
The business continued with its strategy to extend the range of products offered to customers and increase penetration rates among the different distributors.
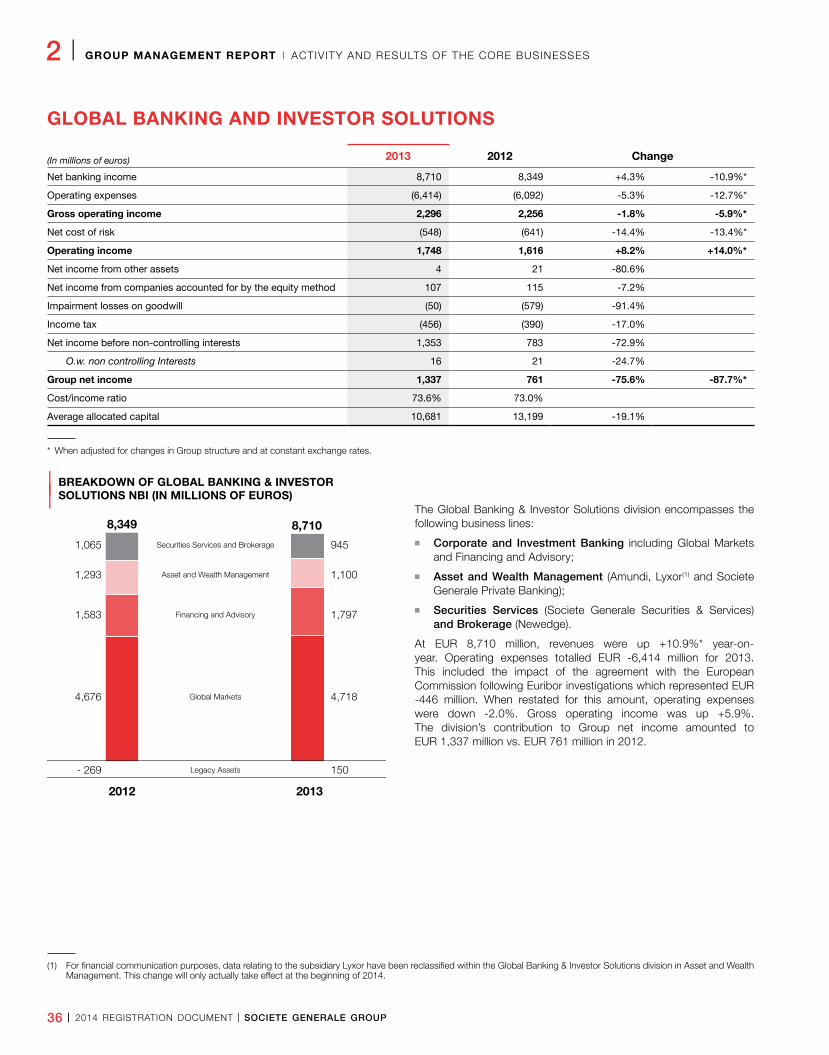
36 I 2014 REGISTRATION DOCUMENT I SOCIETE GENERALE GROUP
2 I GROUP MANAGEMENT REPORT I ACTIVITY AND RESULTS OF THE CORE BUSINESSES
GLOBAL BANKING AND INVESTOR SOLUTIONS
(In millions of euros) 2013 2012 Change
Net banking income 8,710 8,349 +4.3% -10.9%*
Operating expenses (6,414) (6,092) -5.3% -12.7%*
Gross operating income 2,296 2,256 -1.8% -5.9%*
Net cost of risk (548) (641) -14.4% -13.4%*
Operating income 1,748 1,616 +8.2% +14.0%*
Net income from other assets 4 21 -80.6%
Net income from companies accounted for by the equity method 107 115 -7.2%
Impairment losses on goodwill (50) (579) -91.4%
Income tax (456) (390) -17.0%
Net income before non-controlling interests 1,353 783 -72.9%
O.w. non controlling Interests 16 21 -24.7%
Group net income 1,337 761 -75.6% -87.7%*
Cost/income ratio 73.6% 73.0%
Average allocated capital 10,681 13,199 -19.1%
* When adjusted for changes in Group structure and at constant exchange rates.
| BREAKDOWN OF GLOBAL BANKING & INVESTOR
| SOLUTIONS NBI (IN MILLIONS OF EUROS)The Global Banking & Investor Solutions division encompasses the following business lines:
n Corporate and Investment Banking including Global Markets and Financing and Advisory;
n Asset and Wealth Management (Amundi, Lyxor(1) and Societe Generale Private Banking);
n Securities Services (Societe Generale Securities & Services) and Brokerage (Newedge).
At EUR 8,710 million, revenues were up +10.9%* year-on-year. Operating expenses totalled EUR -6,414 million for 2013. This included the impact of the agreement with the European Commission following Euribor investigations which represented EUR -446 million. When restated for this amount, operating expenses were down -2.0%. Gross operating income was up +5.9%. The division’s contribution to Group net income amounted to EUR 1,337 million vs. EUR 761 million in 2012.
0
1000
2000
3000
4000
5000
6000
2012
- 269 150
8,710
4,718
1,797
1,100
945
4,676
1,583
1,293
1,065
8,349
2013
Securities Services and Brokerage
Asset and Wealth Management
Financing and Advisory
Global Markets
Legacy Assets
(1) For financial communication purposes, data relating to the subsidiary Lyxor have been reclassified within the Global Banking & Investor Solutions division in Asset and Wealth Management. This change will only actually take effect at the beginning of 2014.
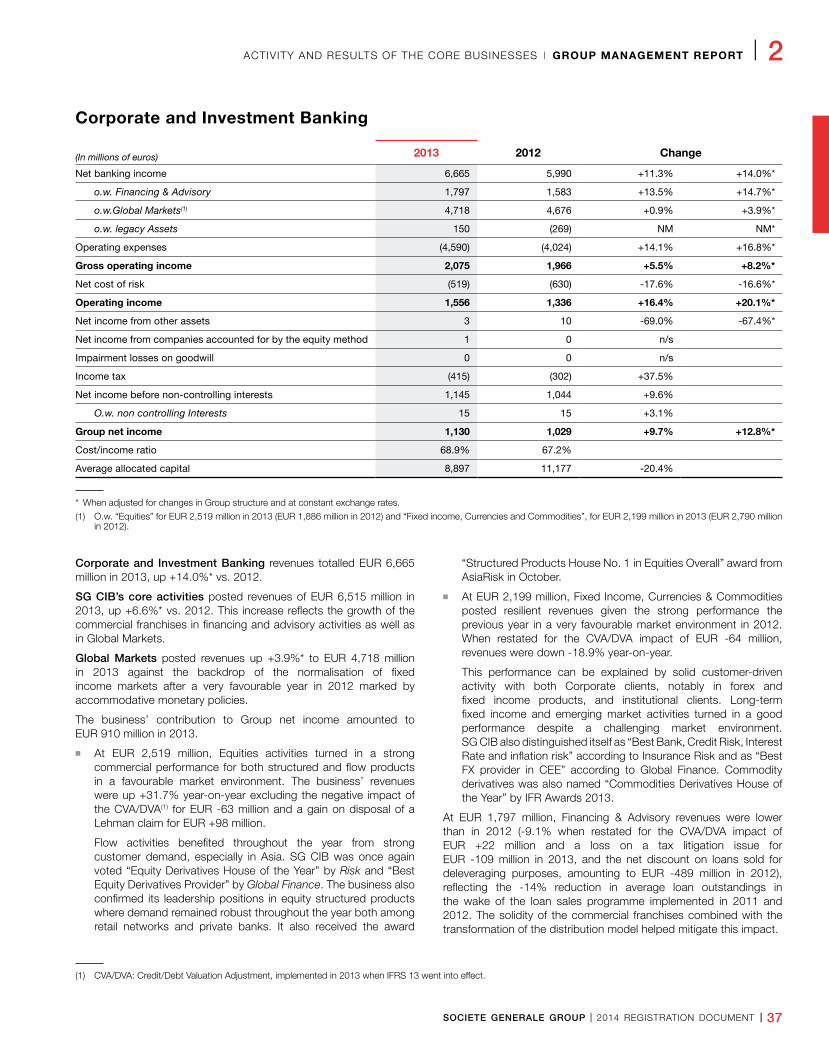
SOCIETE GENERALE GROUP I 2014 REGISTRATION DOCUMENT I 37
ACTIVITY AND RESULTS OF THE CORE BUSINESSES I GROUP MANAGEMENT REPORT I 2
Corporate and Investment Banking
(In millions of euros) 2013 2012 Change
Net banking income 6,665 5,990 +11.3% +14.0%*
o.w. Financing & Advisory 1,797 1,583 +13.5% +14.7%*
o.w.Global Markets(1) 4,718 4,676 +0.9% +3.9%*
o.w. legacy Assets 150 (269) NM NM*
Operating expenses (4,590) (4,024) +14.1% +16.8%*
Gross operating income 2,075 1,966 +5.5% +8.2%*
Net cost of risk (519) (630) -17.6% -16.6%*
Operating income 1,556 1,336 +16.4% +20.1%*
Net income from other assets 3 10 -69.0% -67.4%*
Net income from companies accounted for by the equity method 1 0 n/s
Impairment losses on goodwill 0 0 n/s
Income tax (415) (302) +37.5%
Net income before non-controlling interests 1,145 1,044 +9.6%
O.w. non controlling Interests 15 15 +3.1%
Group net income 1,130 1,029 +9.7% +12.8%*
Cost/income ratio 68.9% 67.2%
Average allocated capital 8,897 11,177 -20.4%
* When adjusted for changes in Group structure and at constant exchange rates.
(1) O.w. “Equities” for EUR 2,519 million in 2013 (EUR 1,886 million in 2012) and “Fixed income, Currencies and Commodities”, for EUR 2,199 million in 2013 (EUR 2,790 million in 2012).
Corporate and Investment Banking revenues totalled EUR 6,665 million in 2013, up +14.0%* vs. 2012.
SG CIB’s core activities posted revenues of EUR 6,515 million in 2013, up +6.6%* vs. 2012. This increase reflects the growth of the commercial franchises in financing and advisory activities as well as in Global Markets.
Global Markets posted revenues up +3.9%* to EUR 4,718 million in 2013 against the backdrop of the normalisation of fixed income markets after a very favourable year in 2012 marked by accommodative monetary policies.
The business’ contribution to Group net income amounted to EUR 910 million in 2013.
n At EUR 2,519 million, Equities activities turned in a strong commercial performance for both structured and flow products in a favourable market environment. The business’ revenues were up +31.7% year-on-year excluding the negative impact of the CVA/DVA(1) for EUR -63 million and a gain on disposal of a Lehman claim for EUR +98 million.
Flow activities benefited throughout the year from strong customer demand, especially in Asia. SG CIB was once again voted “Equity Derivatives House of the Year” by Risk and “Best Equity Derivatives Provider” by Global Finance. The business also confirmed its leadership positions in equity structured products where demand remained robust throughout the year both among retail networks and private banks. It also received the award
“Structured Products House No. 1 in Equities Overall” award from AsiaRisk in October.
n At EUR 2,199 million, Fixed Income, Currencies & Commodities posted resilient revenues given the strong performance the previous year in a very favourable market environment in 2012. When restated for the CVA/DVA impact of EUR -64 million, revenues were down -18.9% year-on-year.
This performance can be explained by solid customer-driven activity with both Corporate clients, notably in forex and fixed income products, and institutional clients. Long-term fixed income and emerging market activities turned in a good performance despite a challenging market environment. SG CIB also distinguished itself as “Best Bank, Credit Risk, Interest Rate and inflation risk” according to Insurance Risk and as “Best FX provider in CEE” according to Global Finance. Commodity derivatives was also named “Commodities Derivatives House of the Year” by IFR Awards 2013.
At EUR 1,797 million, Financing & Advisory revenues were lower than in 2012 (-9.1% when restated for the CVA/DVA impact of EUR +22 million and a loss on a tax litigation issue for EUR -109 million in 2013, and the net discount on loans sold for deleveraging purposes, amounting to EUR -489 million in 2012), reflecting the -14% reduction in average loan outstandings in the wake of the loan sales programme implemented in 2011 and 2012. The solidity of the commercial franchises combined with the transformation of the distribution model helped mitigate this impact.
(1) CVA/DVA: Credit/Debt Valuation Adjustment, implemented in 2013 when IFRS 13 went into effect.
38 I 2014 REGISTRATION DOCUMENT I SOCIETE GENERALE GROUP
2 I GROUP MANAGEMENT REPORT I ACTIVITY AND RESULTS OF THE CORE BUSINESSES
The solid results produced by structured financing were driven by export and infrastructure financing and to a lesser extent by natural resources financing. SG CIB was also named “Best Global Export Finance Bank 2013” by Global Trade Review. Capital market activities turned in a good performance for DCM and saw their market share increase (6.1% in 2013 vs. 5.3% in 2012), whereas ECM and M&A experienced a mixed performance in a sluggish market.
Legacy assets made a positive revenue contribution of EUR 150 million in 2013. During the year, the Group continued its policy of reducing the size of the portfolio of non-investment grade assets whose net exposure declined EUR 3.1 billion to EUR 0.7 billion. Non-investment grade assets in the legacy assets portfolio now represent a minimal proportion of the Bank’s assets. They will no longer have an impact on its results as from 2014.
Corporate and Investment Banking’s operating expenses amounted to EUR -4,590 million in 2013, impacted primarily by the agreement with the European Commission following the Euribor investigations which represented EUR -446 million. When restated for this amount, expenses were up +3.0% year-on-year.
Corporate and Investment Banking’s net cost of risk amounted to EUR -519 million, down -16.6%* year-on-year. Core activities’ net cost of risk remained low at EUR -137 million, down -62.0%* vs. 2012. Legacy assets’ net cost of risk came to EUR -382 million. This was higher than in 2012 due largely to the programme to reduce the size of the portfolio, mainly in order to have only minimal exposure to US RMBS CDOs.
The business line’s contribution to Group net income totalled EUR 1,130 million in 2013 vs. EUR 1,029 million in 2012.
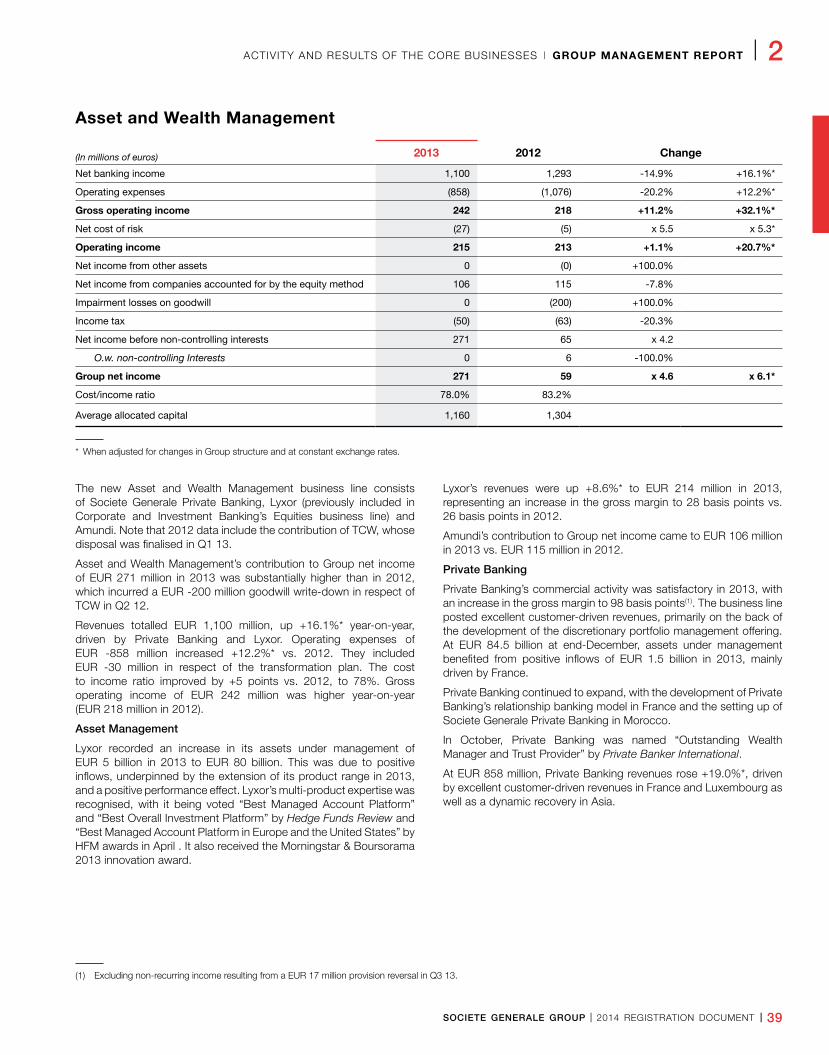
SOCIETE GENERALE GROUP I 2014 REGISTRATION DOCUMENT I 39
ACTIVITY AND RESULTS OF THE CORE BUSINESSES I GROUP MANAGEMENT REPORT I 2
Asset and Wealth Management
(In millions of euros) 2013 2012 Change
Net banking income 1,100 1,293 -14.9% +16.1%*
Operating expenses (858) (1,076) -20.2% +12.2%*
Gross operating income 242 218 +11.2% +32.1%*
Net cost of risk (27) (5) x 5.5 x 5.3*
Operating income 215 213 +1.1% +20.7%*
Net income from other assets 0 (0) +100.0%
Net income from companies accounted for by the equity method 106 115 -7.8%
Impairment losses on goodwill 0 (200) +100.0%
Income tax (50) (63) -20.3%
Net income before non-controlling interests 271 65 x 4.2
O.w. non-controlling Interests 0 6 -100.0%
Group net income 271 59 x 4.6 x 6.1*
Cost/income ratio 78.0% 83.2%
Average allocated capital 1,160 1,304
* When adjusted for changes in Group structure and at constant exchange rates.
The new Asset and Wealth Management business line consists of Societe Generale Private Banking, Lyxor (previously included in Corporate and Investment Banking’s Equities business line) and Amundi. Note that 2012 data include the contribution of TCW, whose disposal was finalised in Q1 13.
Asset and Wealth Management’s contribution to Group net income of EUR 271 million in 2013 was substantially higher than in 2012, which incurred a EUR -200 million goodwill write-down in respect of TCW in Q2 12.
Revenues totalled EUR 1,100 million, up +16.1%* year-on-year, driven by Private Banking and Lyxor. Operating expenses of EUR -858 million increased +12.2%* vs. 2012. They included EUR -30 million in respect of the transformation plan. The cost to income ratio improved by +5 points vs. 2012, to 78%. Gross operating income of EUR 242 million was higher year-on-year (EUR 218 million in 2012).
Asset Management
Lyxor recorded an increase in its assets under management of EUR 5 billion in 2013 to EUR 80 billion. This was due to positive inflows, underpinned by the extension of its product range in 2013, and a positive performance effect. Lyxor’s multi-product expertise was recognised, with it being voted “Best Managed Account Platform” and “Best Overall Investment Platform” by Hedge Funds Review and “Best Managed Account Platform in Europe and the United States” by HFM awards in April . It also received the Morningstar & Boursorama 2013 innovation award.
Lyxor’s revenues were up +8.6%* to EUR 214 million in 2013, representing an increase in the gross margin to 28 basis points vs. 26 basis points in 2012.
Amundi’s contribution to Group net income came to EUR 106 million in 2013 vs. EUR 115 million in 2012.
Private Banking
Private Banking’s commercial activity was satisfactory in 2013, with an increase in the gross margin to 98 basis points(1). The business line posted excellent customer-driven revenues, primarily on the back of the development of the discretionary portfolio management offering. At EUR 84.5 billion at end-December, assets under management benefited from positive inflows of EUR 1.5 billion in 2013, mainly driven by France.
Private Banking continued to expand, with the development of Private Banking’s relationship banking model in France and the setting up of Societe Generale Private Banking in Morocco.
In October, Private Banking was named “Outstanding Wealth Manager and Trust Provider” by Private Banker International.
At EUR 858 million, Private Banking revenues rose +19.0%*, driven by excellent customer-driven revenues in France and Luxembourg as well as a dynamic recovery in Asia.
(1) Excluding non-recurring income resulting from a EUR 17 million provision reversal in Q3 13.
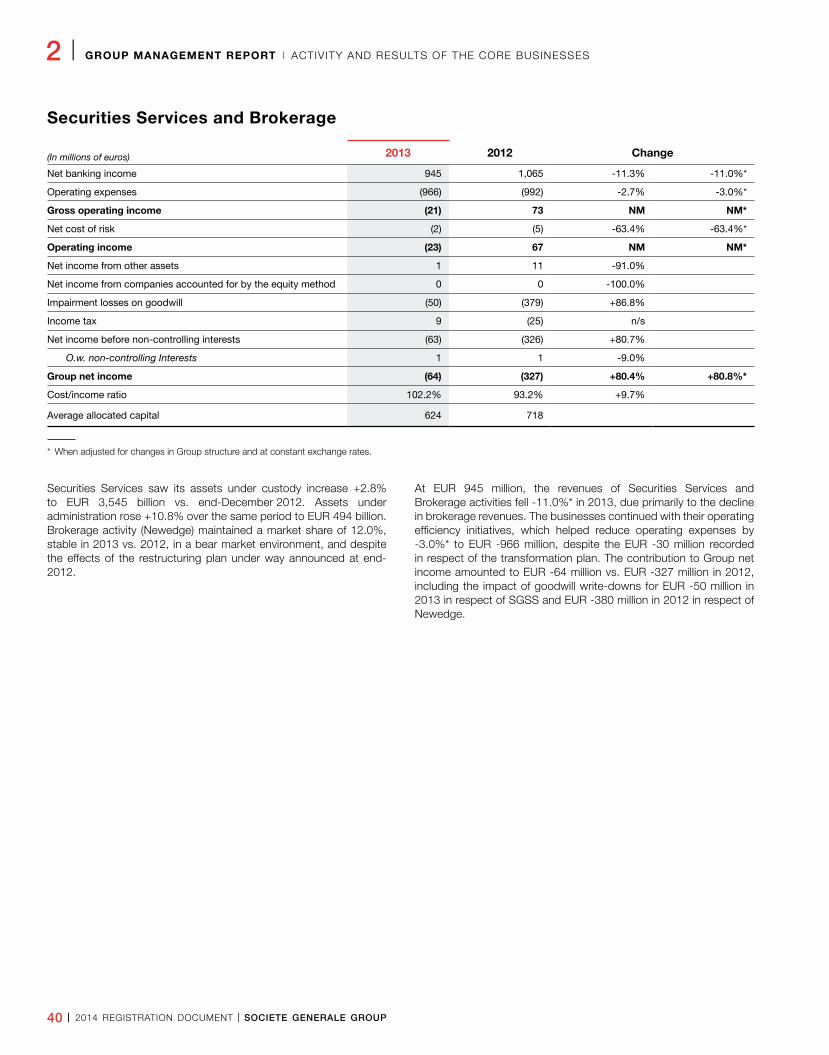
40 I 2014 REGISTRATION DOCUMENT I SOCIETE GENERALE GROUP
2 I GROUP MANAGEMENT REPORT I ACTIVITY AND RESULTS OF THE CORE BUSINESSES
Securities Services and Brokerage
(In millions of euros) 2013 2012 Change
Net banking income 945 1,065 -11.3% -11.0%*
Operating expenses (966) (992) -2.7% -3.0%*
Gross operating income (21) 73 NM NM*
Net cost of risk (2) (5) -63.4% -63.4%*
Operating income (23) 67 NM NM*
Net income from other assets 1 11 -91.0%
Net income from companies accounted for by the equity method 0 0 -100.0%
Impairment losses on goodwill (50) (379) +86.8%
Income tax 9 (25) n/s
Net income before non-controlling interests (63) (326) +80.7%
O.w. non-controlling Interests 1 1 -9.0%
Group net income (64) (327) +80.4% +80.8%*
Cost/income ratio 102.2% 93.2% +9.7%
Average allocated capital 624 718
* When adjusted for changes in Group structure and at constant exchange rates.
Securities Services saw its assets under custody increase +2.8% to EUR 3,545 billion vs. end-December 2012. Assets under administration rose +10.8% over the same period to EUR 494 billion. Brokerage activity (Newedge) maintained a market share of 12.0%, stable in 2013 vs. 2012, in a bear market environment, and despite the effects of the restructuring plan under way announced at end-2012.
At EUR 945 million, the revenues of Securities Services and Brokerage activities fell -11.0%* in 2013, due primarily to the decline in brokerage revenues. The businesses continued with their operating efficiency initiatives, which helped reduce operating expenses by -3.0%* to EUR -966 million, despite the EUR -30 million recorded in respect of the transformation plan. The contribution to Group net income amounted to EUR -64 million vs. EUR -327 million in 2012, including the impact of goodwill write-downs for EUR -50 million in 2013 in respect of SGSS and EUR -380 million in 2012 in respect of Newedge.
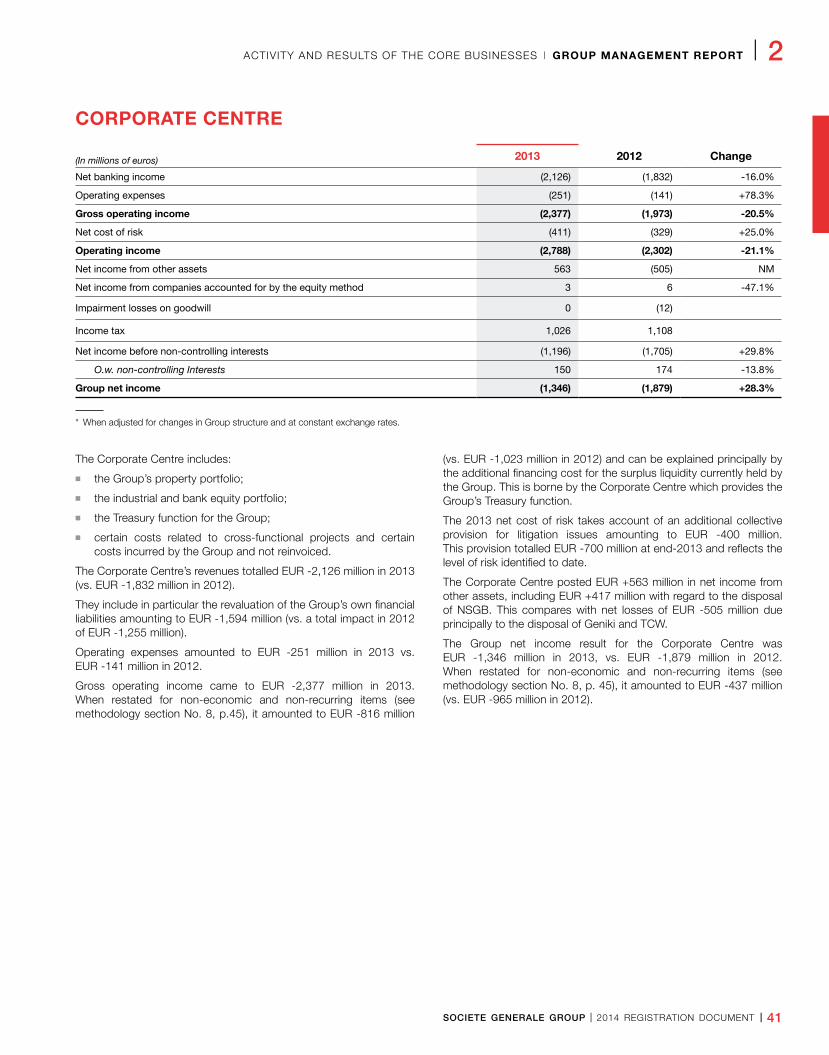
SOCIETE GENERALE GROUP I 2014 REGISTRATION DOCUMENT I 41
ACTIVITY AND RESULTS OF THE CORE BUSINESSES I GROUP MANAGEMENT REPORT I 2
CORPORATE CENTRE
(In millions of euros) 2013 2012 Change
Net banking income (2,126) (1,832) -16.0%
Operating expenses (251) (141) +78.3%
Gross operating income (2,377) (1,973) -20.5%
Net cost of risk (411) (329) +25.0%
Operating income (2,788) (2,302) -21.1%
Net income from other assets 563 (505) NM
Net income from companies accounted for by the equity method 3 6 -47.1%
Impairment losses on goodwill 0 (12)
Income tax 1,026 1,108
Net income before non-controlling interests (1,196) (1,705) +29.8%
O.w. non-controlling Interests 150 174 -13.8%
Group net income (1,346) (1,879) +28.3%
* When adjusted for changes in Group structure and at constant exchange rates.
The Corporate Centre includes:
n the Group’s property portfolio;
n the industrial and bank equity portfolio;
n the Treasury function for the Group;
n certain costs related to cross-functional projects and certain costs incurred by the Group and not reinvoiced.
The Corporate Centre’s revenues totalled EUR -2,126 million in 2013 (vs. EUR -1,832 million in 2012).
They include in particular the revaluation of the Group’s own financial liabilities amounting to EUR -1,594 million (vs. a total impact in 2012 of EUR -1,255 million).
Operating expenses amounted to EUR -251 million in 2013 vs. EUR -141 million in 2012.
Gross operating income came to EUR -2,377 million in 2013. When restated for non-economic and non-recurring items (see methodology section No. 8, p.45), it amounted to EUR -816 million
(vs. EUR -1,023 million in 2012) and can be explained principally by the additional financing cost for the surplus liquidity currently held by the Group. This is borne by the Corporate Centre which provides the Group’s Treasury function.
The 2013 net cost of risk takes account of an additional collective provision for litigation issues amounting to EUR -400 million. This provision totalled EUR -700 million at end-2013 and reflects the level of risk identified to date.
The Corporate Centre posted EUR +563 million in net income from other assets, including EUR +417 million with regard to the disposal of NSGB. This compares with net losses of EUR -505 million due principally to the disposal of Geniki and TCW.
The Group net income result for the Corporate Centre was EUR -1,346 million in 2013, vs. EUR -1,879 million in 2012. When restated for non-economic and non-recurring items (see methodology section No. 8, p. 45), it amounted to EUR -437 million (vs. EUR -965 million in 2012).
42 I 2014 REGISTRATION DOCUMENT I SOCIETE GENERALE GROUP
2 I GROUP MANAGEMENT REPORT I ACTIVITY AND RESULTS OF THE CORE BUSINESSES
METHODOLOGY1- The Group’s consolidated results as at 31 December 2013 were approved by the Board of Directors on 11 February 2014
The financial information presented for the financial year ended 31 December 2013 has been prepared in accordance with IFRS as adopted in the European Union and applicable at that date.
Note that the data for the 2012 financial year have been restated due to the implementation of the revised IAS 19, resulting in the publication of adjusted data for the previous financial year. Similarly, the restructuring that has taken place has led to modifications in the results of certain strategic pillars, generating in particular a variation in the tax rates applicable to the new entities.
For financial communication purposes, data relating to the subsidiary Lyxor have been reclassified within the Global Banking & Investor Solutions division in Asset and Wealth Management. This change will only actually take effect at the beginning of 2014.
2- Group ROE is calculated on the basis of average Group shareholders’ equity under IFRS excluding (i) unrealised or deferred capital gains or losses booked directly under shareholders’ equity excluding translation reserves, (ii) deeply subordinated notes, (iii) undated subordinated notes reclassified as shareholders’ equity, and deducting (iv) interest payable to holders of deeply subordinated notes and of the reclassified, undated subordinated notes. The net income used to calculate ROE is based on Group net income excluding interest, net of tax impact, payable to holders of deeply subordinated notes for the period and, since 2006, holders of deeply subordinated notes and reclassified, undated subordinated notes (EUR 316 million for 2013).
As from 1 January 2012, the allocation of capital to the different businesses is based on 9% of risk-weighted assets at the beginning of the period, vs. 7% previously. The published quarterly data related to allocated capital have been adjusted accordingly. At the same time, the normative capital remuneration rate has been adjusted for a neutral combined effect on the businesses’ historic revenues.
3- For the calculation of earnings per share, “Group net income for the period” is corrected (reduced in the case of a profit and increased in the case of a loss) for capital gains/losses realised on partial buybacks (EUR -19 million for 2013), interest, net of tax impact, to be paid to holders of:
n deeply subordinated notes (EUR -267 million for 2013);
n undated subordinated notes reclassified as shareholders’ equity (EUR -49 million for 2013).
Earnings per share is therefore calculated as the ratio of corrected Group net income for the period to the average number of ordinary shares outstanding, excluding own shares and treasury shares but including (a) trading shares held by the Group and (b) shares held under the liquidity contract.
4- Net assets are comprised of Group shareholders’ reclassified equity, excluding (i) deeply subordinated notes (EUR 6.6 billion), undated subordinated notes (EUR 0.4 billion) and (ii) interest payable to holders of deeply subordinated notes and undated subordinated notes, but reinstating the book value of trading shares held by the Group and shares held under the liquidity contract. Tangible net assets are corrected for net goodwill in the assets and goodwill under
the equity method. In order to calculate Net Asset Value Per Share or Tangible Net Asset Value Per Share, the number of shares used to calculate book value per share is the number of shares issued at 31 December 2013, excluding own shares and treasury shares but including (a) trading shares held by the Group and (b) shares held under the liquidity contract.
5- The Societe Generale Group’s Core Tier 1 capital is defined as Tier 1 capital minus the outstandings of hybrid instruments eligible for Tier 1 and a share of Basel 2 deductions. This share corresponds to the ratio between Core Tier 1 capital excluding hybrid instruments eligible for Tier 1 capital and Core Tier 1 capital.
As from 31 December 2011, Core Tier 1 capital is defined as Basel 2 Tier 1 capital minus Tier 1 eligible hybrid capital and after application of the Tier 1 deductions provided for by the Regulations.
6- The Group’s ROTE is calculated on the basis of tangible capital, i.e. excluding cumulative average book capital (Group share), average net goodwill in the assets and underlying average goodwill relating to shareholdings in companies accounted for by the equity method. The net income used to calculate ROTE is based on Group net income excluding interest, interest net of tax on deeply subordinated notes for the period (including issuance fees paid, for the period, to external parties and the discount charge related to the issue premium for deeply subordinated notes) and interest net of tax on undated subordinated notes reclassified as shareholders’ equity for the current period (including issuance fees paid, for the period, to external parties and the discount charge related to the issue premium for undated subordinated notes).
7- Funded balance sheet, loan/deposit ratio, liquidity reserve
The funded balance sheet gives a representation of the Group’s balance sheet excluding the contribution of insurance subsidiaries and after netting derivatives, repurchase agreements and accruals.
The standards and definitions applicable to the funded balance sheet changed in 2013. There is no change in the assets between the old and new presentation of the funded balance sheet. In liabilities, the reclassifications essentially consisted in redefining the “short-term financing”, “medium/long-term financing” and “customer deposits” line items.
At 31 December 2013, the IFRS balance sheet excluding the assets and liabilities of insurance subsidiaries, after netting repurchase agreements and securities lending/borrowing, derivatives and accruals, has been restated to include:
a) the reclassification under customer deposits of SG Euro CT outstandings (included in customer repurchase agreements), as well as the share of issues placed by French Retail Banking networks (recorded in medium/long-term financing), and certain transactions carried out with counterparties equivalent to customer deposits (previously included in short-term financing). However, certain transactions equivalent to market resources are deducted from customer deposits and reintegrated in short-term financing. The net amount of transfers from:
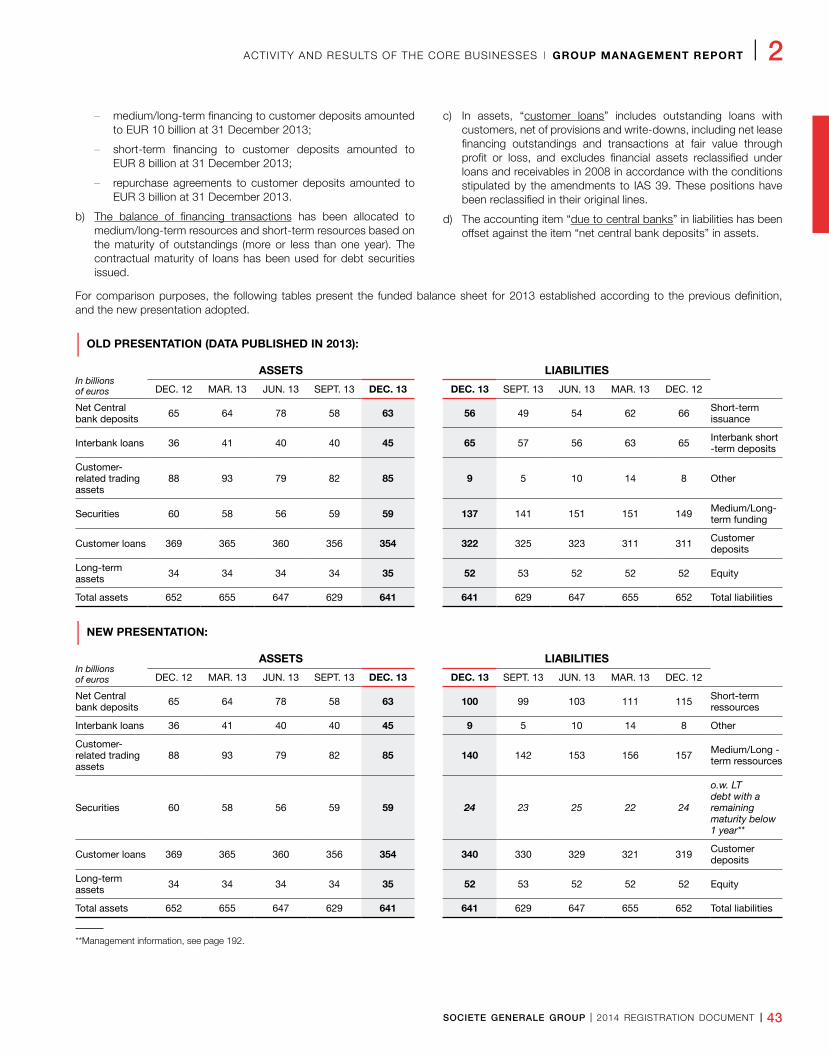
SOCIETE GENERALE GROUP I 2014 REGISTRATION DOCUMENT I 43
ACTIVITY AND RESULTS OF THE CORE BUSINESSES I GROUP MANAGEMENT REPORT I 2
– medium/long-term financing to customer deposits amounted to EUR 10 billion at 31 December 2013;
– short-term financing to customer deposits amounted to EUR 8 billion at 31 December 2013;
– repurchase agreements to customer deposits amounted to EUR 3 billion at 31 December 2013.
b) The balance of financing transactions has been allocated to medium/long-term resources and short-term resources based on the maturity of outstandings (more or less than one year). The contractual maturity of loans has been used for debt securities issued.
c) In assets, “customer loans” includes outstanding loans with customers, net of provisions and write-downs, including net lease financing outstandings and transactions at fair value through profit or loss, and excludes financial assets reclassified under loans and receivables in 2008 in accordance with the conditions stipulated by the amendments to IAS 39. These positions have been reclassified in their original lines.
d) The accounting item “due to central banks” in liabilities has been offset against the item “net central bank deposits” in assets.
For comparison purposes, the following tables present the funded balance sheet for 2013 established according to the previous definition, and the new presentation adopted.
| OLD PRESENTATION (DATA PUBLISHED IN 2013):
In billions of euros
ASSETS LIABILITIES
DEC. 12 MAR. 13 JUN. 13 SEPT. 13 DEC. 13 DEC. 13 SEPT. 13 JUN. 13 MAR. 13 DEC. 12
Net Central bank deposits 65 64 78 58 63 56 49 54 62 66 Short-term
issuance
Interbank loans 36 41 40 40 45 65 57 56 63 65 Interbank short -term deposits
Customer- related trading assets
88 93 79 82 85 9 5 10 14 8 Other
Securities 60 58 56 59 59 137 141 151 151 149 Medium/Long- term funding
Customer loans 369 365 360 356 354 322 325 323 311 311 Customer deposits
Long-term assets 34 34 34 34 35 52 53 52 52 52 Equity
Total assets 652 655 647 629 641 641 629 647 655 652 Total liabilities
| NEW PRESENTATION:
In billions of euros
ASSETS LIABILITIES
DEC. 12 MAR. 13 JUN. 13 SEPT. 13 DEC. 13 DEC. 13 SEPT. 13 JUN. 13 MAR. 13 DEC. 12
Net Central bank deposits 65 64 78 58 63 100 99 103 111 115 Short-term
ressources
Interbank loans 36 41 40 40 45 9 5 10 14 8 Other
Customer- related trading assets
88 93 79 82 85 140 142 153 156 157 Medium/Long - term ressources
Securities 60 58 56 59 59 24 23 25 22 24
o.w. LT debt with a remaining maturity below 1 year**
Customer loans 369 365 360 356 354 340 330 329 321 319 Customer deposits
Long-term assets 34 34 34 34 35 52 53 52 52 52 Equity
Total assets 652 655 647 629 641 641 629 647 655 652 Total liabilities
**Management information, see page 192.
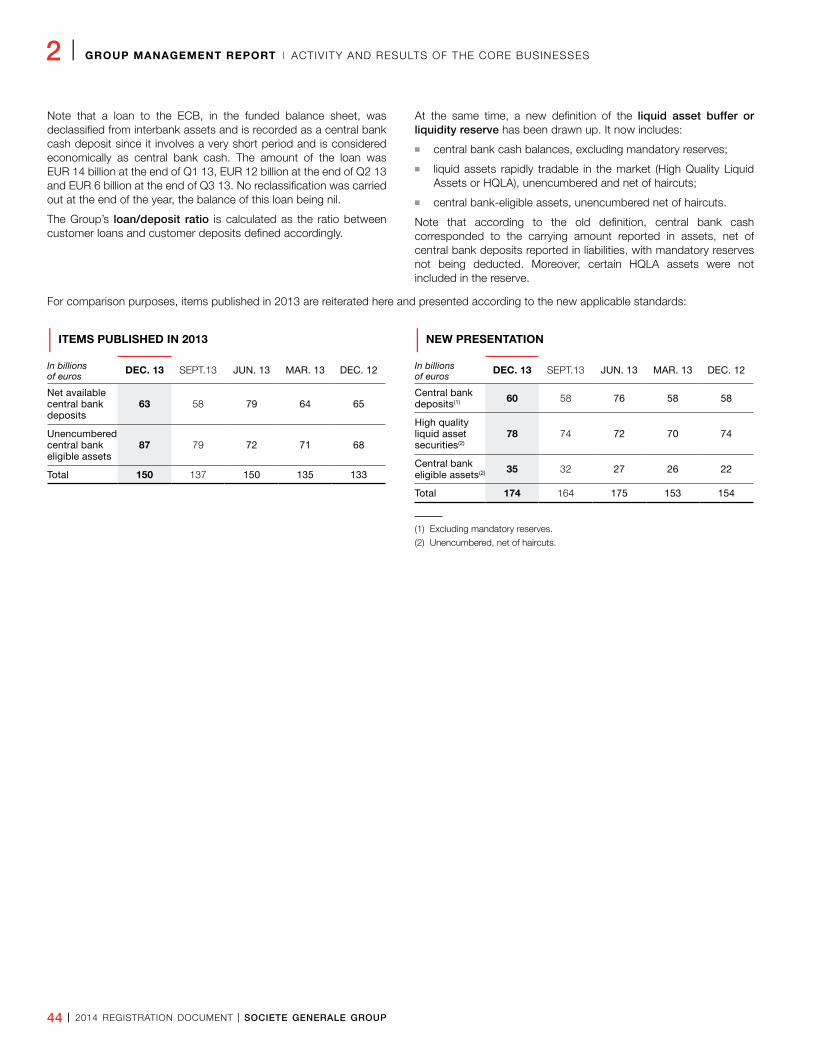
44 I 2014 REGISTRATION DOCUMENT I SOCIETE GENERALE GROUP
2 I GROUP MANAGEMENT REPORT I ACTIVITY AND RESULTS OF THE CORE BUSINESSES
Note that a loan to the ECB, in the funded balance sheet, was declassified from interbank assets and is recorded as a central bank cash deposit since it involves a very short period and is considered economically as central bank cash. The amount of the loan was EUR 14 billion at the end of Q1 13, EUR 12 billion at the end of Q2 13 and EUR 6 billion at the end of Q3 13. No reclassification was carried out at the end of the year, the balance of this loan being nil.
The Group’s loan/deposit ratio is calculated as the ratio between customer loans and customer deposits defined accordingly.
At the same time, a new definition of the liquid asset buffer or liquidity reserve has been drawn up. It now includes:
n central bank cash balances, excluding mandatory reserves;
n liquid assets rapidly tradable in the market (High Quality Liquid Assets or HQLA), unencumbered and net of haircuts;
n central bank-eligible assets, unencumbered net of haircuts.
Note that according to the old definition, central bank cash corresponded to the carrying amount reported in assets, net of central bank deposits reported in liabilities, with mandatory reserves not being deducted. Moreover, certain HQLA assets were not included in the reserve.
For comparison purposes, items published in 2013 are reiterated here and presented according to the new applicable standards:
| ITEMS PUBLISHED IN 2013
In billions of euros
DEC. 13 SEPT.13 JUN. 13 MAR. 13 DEC. 12
Net available central bank deposits
63 58 79 64 65
Unencumbered central bank eligible assets
87 79 72 71 68
Total 150 137 150 135 133
| NEW PRESENTATION
In billions of euros
DEC. 13 SEPT.13 JUN. 13 MAR. 13 DEC. 12
Central bank deposits(1) 60 58 76 58 58
High quality liquid asset securities(2)
78 74 72 70 74
Central bank eligible assets(2) 35 32 27 26 22
Total 174 164 175 153 154
(1) Excluding mandatory reserves.
(2) Unencumbered, net of haircuts.
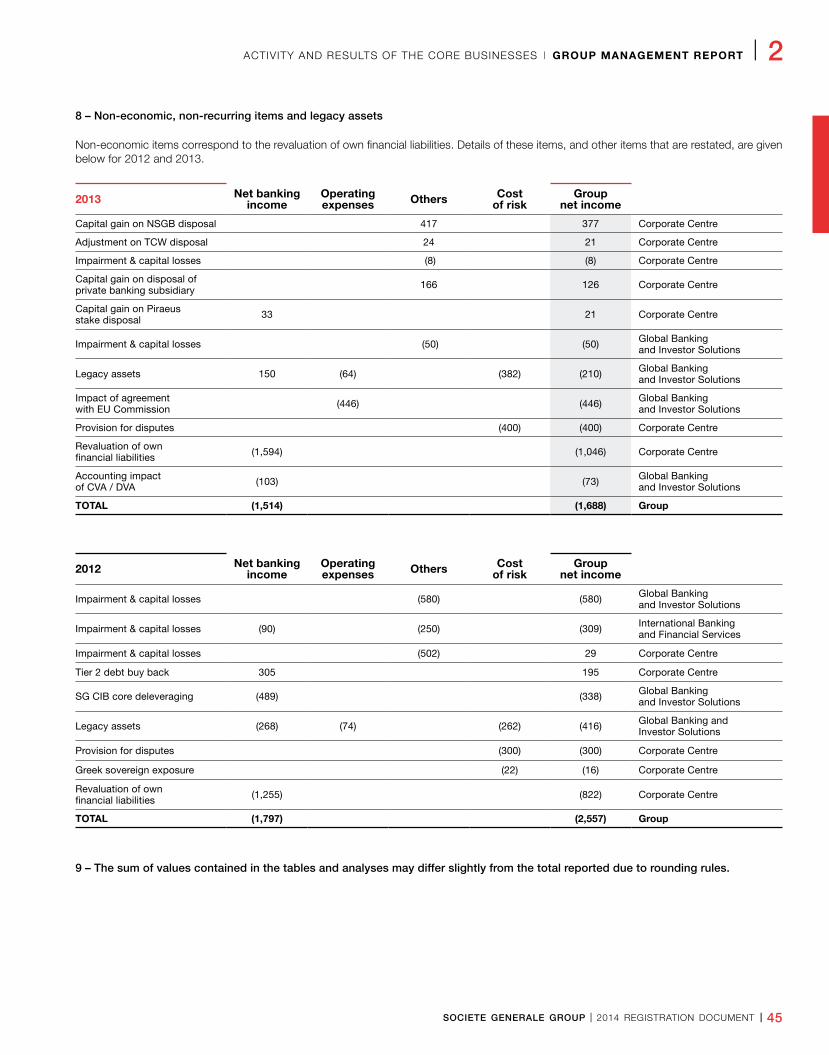
SOCIETE GENERALE GROUP I 2014 REGISTRATION DOCUMENT I 45
ACTIVITY AND RESULTS OF THE CORE BUSINESSES I GROUP MANAGEMENT REPORT I 2
8 – Non-economic, non-recurring items and legacy assets
Non-economic items correspond to the revaluation of own financial liabilities. Details of these items, and other items that are restated, are given below for 2012 and 2013.
2013 Net banking income
Operating expenses Others Cost
of riskGroup
net income
Capital gain on NSGB disposal 417 377 Corporate Centre
Adjustment on TCW disposal 24 21 Corporate Centre
Impairment & capital losses (8) (8) Corporate Centre
Capital gain on disposal of private banking subsidiary 166 126 Corporate Centre
Capital gain on Piraeus stake disposal 33 21 Corporate Centre
Impairment & capital losses (50) (50) Global Banking and Investor Solutions
Legacy assets 150 (64) (382) (210) Global Banking and Investor Solutions
Impact of agreement with EU Commission (446) (446) Global Banking
and Investor Solutions
Provision for disputes (400) (400) Corporate Centre
Revaluation of own financial liabilities (1,594) (1,046) Corporate Centre
Accounting impact of CVA / DVA (103) (73) Global Banking
and Investor Solutions
TOTAL (1,514) (1,688) Group
2012 Net banking income
Operating expenses Others Cost
of riskGroup
net income
Impairment & capital losses (580) (580) Global Banking and Investor Solutions
Impairment & capital losses (90) (250) (309) International Banking and Financial Services
Impairment & capital losses (502) 29 Corporate Centre
Tier 2 debt buy back 305 195 Corporate Centre
SG CIB core deleveraging (489) (338) Global Banking and Investor Solutions
Legacy assets (268) (74) (262) (416) Global Banking and Investor Solutions
Provision for disputes (300) (300) Corporate Centre
Greek sovereign exposure (22) (16) Corporate Centre
Revaluation of own financial liabilities (1,255) (822) Corporate Centre
TOTAL (1,797) (2,557) Group
9 – The sum of values contained in the tables and analyses may differ slightly from the total reported due to rounding rules.
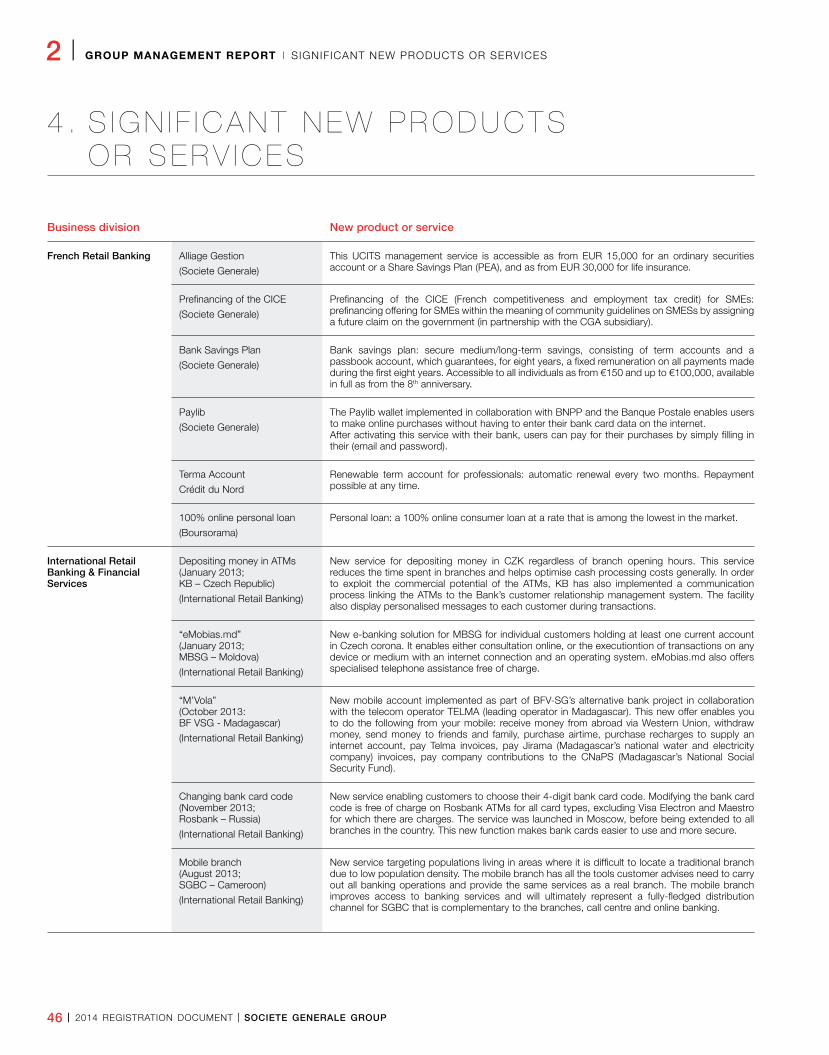
46 I 2014 REGISTRATION DOCUMENT I SOCIETE GENERALE GROUP
2 I GROUP MANAGEMENT REPORT I SIGNIFICANT NEW PRODUCTS OR SERVICES
4 . S I G N I F I C A N T N E W P R O D U C T S OR SERV ICES
Business division New product or service
French Retail Banking Alliage Gestion
(Societe Generale)
This UCITS management service is accessible as from EUR 15,000 for an ordinary securities account or a Share Savings Plan (PEA), and as from EUR 30,000 for life insurance.
Prefinancing of the CICE
(Societe Generale)
Prefinancing of the CICE (French competitiveness and employment tax credit) for SMEs: prefinancing offering for SMEs within the meaning of community guidelines on SMESs by assigning a future claim on the government (in partnership with the CGA subsidiary).
Bank Savings Plan
(Societe Generale)
Bank savings plan: secure medium/long-term savings, consisting of term accounts and a passbook account, which guarantees, for eight years, a fixed remuneration on all payments made during the first eight years. Accessible to all individuals as from €150 and up to €100,000, available in full as from the 8th anniversary.
Paylib
(Societe Generale)
The Paylib wallet implemented in collaboration with BNPP and the Banque Postale enables users to make online purchases without having to enter their bank card data on the internet.After activating this service with their bank, users can pay for their purchases by simply filling in their (email and password).
Terma Account
Crédit du Nord
Renewable term account for professionals: automatic renewal every two months. Repayment possible at any time.
100% online personal loan
(Boursorama)
Personal loan: a 100% online consumer loan at a rate that is among the lowest in the market.
International Retail Banking & Financial Services
Depositing money in ATMs (January 2013; KB – Czech Republic)
(International Retail Banking)
New service for depositing money in CZK regardless of branch opening hours. This service reduces the time spent in branches and helps optimise cash processing costs generally. In order to exploit the commercial potential of the ATMs, KB has also implemented a communication process linking the ATMs to the Bank’s customer relationship management system. The facility also display personalised messages to each customer during transactions.
“eMobias.md” (January 2013; MBSG – Moldova)
(International Retail Banking)
New e-banking solution for MBSG for individual customers holding at least one current account in Czech corona. It enables either consultation online, or the executiontion of transactions on any device or medium with an internet connection and an operating system. eMobias.md also offers specialised telephone assistance free of charge.
“M’Vola” (October 2013: BF VSG - Madagascar)
(International Retail Banking)
New mobile account implemented as part of BFV-SG’s alternative bank project in collaboration with the telecom operator TELMA (leading operator in Madagascar). This new offer enables you to do the following from your mobile: receive money from abroad via Western Union, withdraw money, send money to friends and family, purchase airtime, purchase recharges to supply an internet account, pay Telma invoices, pay Jirama (Madagascar’s national water and electricity company) invoices, pay company contributions to the CNaPS (Madagascar’s National Social Security Fund).
Changing bank card code (November 2013; Rosbank – Russia)
(International Retail Banking)
New service enabling customers to choose their 4-digit bank card code. Modifying the bank card code is free of charge on Rosbank ATMs for all card types, excluding Visa Electron and Maestro for which there are charges. The service was launched in Moscow, before being extended to all branches in the country. This new function makes bank cards easier to use and more secure.
Mobile branch (August 2013; SGBC – Cameroon)
(International Retail Banking)
New service targeting populations living in areas where it is difficult to locate a traditional branch due to low population density. The mobile branch has all the tools customer advises need to carry out all banking operations and provide the same services as a real branch. The mobile branch improves access to banking services and will ultimately represent a fully-fledged distribution channel for SGBC that is complementary to the branches, call centre and online banking.
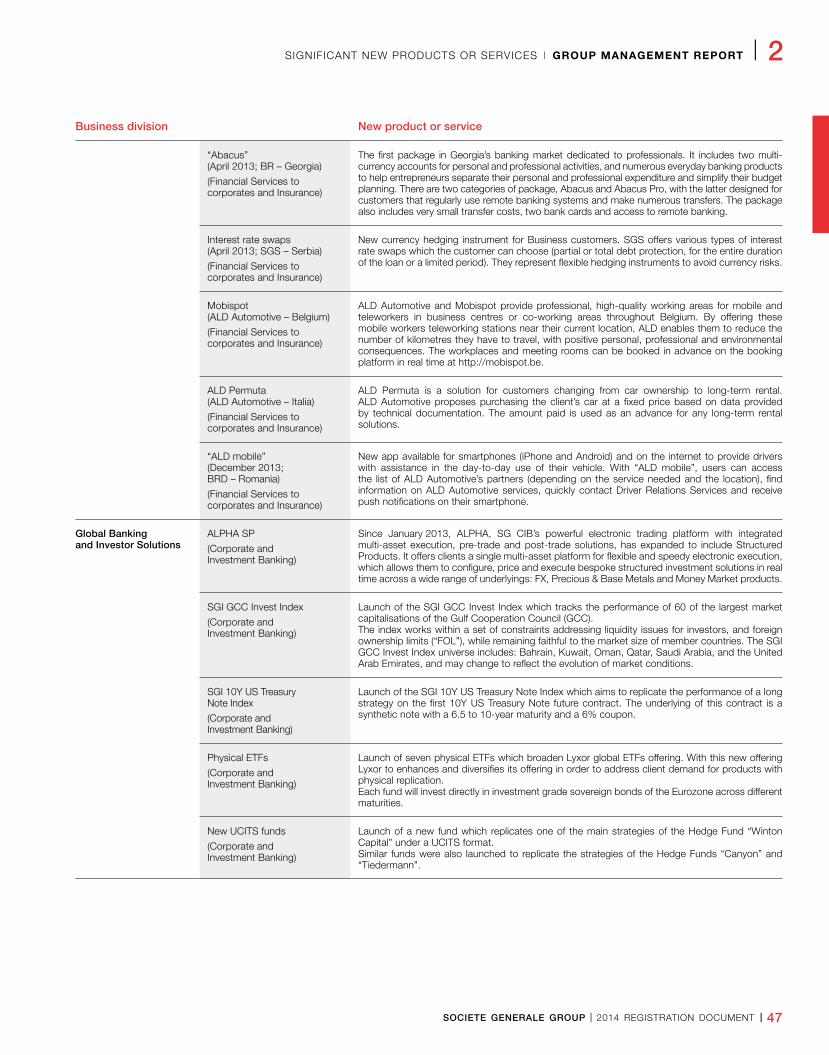
SOCIETE GENERALE GROUP I 2014 REGISTRATION DOCUMENT I 47
SIGNIFICANT NEW PRODUCTS OR SERVICES I GROUP MANAGEMENT REPORT I 2
Business division New product or service
“Abacus” (April 2013; BR – Georgia)
(Financial Services to corporates and Insurance)
The first package in Georgia’s banking market dedicated to professionals. It includes two multi-currency accounts for personal and professional activities, and numerous everyday banking products to help entrepreneurs separate their personal and professional expenditure and simplify their budget planning. There are two categories of package, Abacus and Abacus Pro, with the latter designed for customers that regularly use remote banking systems and make numerous transfers. The package also includes very small transfer costs, two bank cards and access to remote banking.
Interest rate swaps (April 2013; SGS – Serbia)
(Financial Services to corporates and Insurance)
New currency hedging instrument for Business customers. SGS offers various types of interest rate swaps which the customer can choose (partial or total debt protection, for the entire duration of the loan or a limited period). They represent flexible hedging instruments to avoid currency risks.
Mobispot (ALD Automotive – Belgium)
(Financial Services to corporates and Insurance)
ALD Automotive and Mobispot provide professional, high-quality working areas for mobile and teleworkers in business centres or co-working areas throughout Belgium. By offering these mobile workers teleworking stations near their current location, ALD enables them to reduce the number of kilometres they have to travel, with positive personal, professional and environmental consequences. The workplaces and meeting rooms can be booked in advance on the booking platform in real time at http://mobispot.be.
ALD Permuta (ALD Automotive – Italia)
(Financial Services to corporates and Insurance)
ALD Permuta is a solution for customers changing from car ownership to long-term rental. ALD Automotive proposes purchasing the client’s car at a fixed price based on data provided by technical documentation. The amount paid is used as an advance for any long-term rental solutions.
“ALD mobile” (December 2013; BRD – Romania)
(Financial Services to corporates and Insurance)
New app available for smartphones (iPhone and Android) and on the internet to provide drivers with assistance in the day-to-day use of their vehicle. With “ALD mobile”, users can access the list of ALD Automotive’s partners (depending on the service needed and the location), find information on ALD Automotive services, quickly contact Driver Relations Services and receive push notifications on their smartphone.
Global Banking and Investor Solutions
ALPHA SP
(Corporate and Investment Banking)
Since January 2013, ALPHA, SG CIB’s powerful electronic trading platform with integrated multi-asset execution, pre-trade and post-trade solutions, has expanded to include Structured Products. It offers clients a single multi-asset platform for flexible and speedy electronic execution, which allows them to configure, price and execute bespoke structured investment solutions in real time across a wide range of underlyings: FX, Precious & Base Metals and Money Market products.
SGI GCC Invest Index
(Corporate and Investment Banking)
Launch of the SGI GCC Invest Index which tracks the performance of 60 of the largest market capitalisations of the Gulf Cooperation Council (GCC).The index works within a set of constraints addressing liquidity issues for investors, and foreign ownership limits (“FOL”), while remaining faithful to the market size of member countries. The SGI GCC Invest Index universe includes: Bahrain, Kuwait, Oman, Qatar, Saudi Arabia, and the United Arab Emirates, and may change to reflect the evolution of market conditions.
SGI 10Y US Treasury Note Index
(Corporate and Investment Banking)
Launch of the SGI 10Y US Treasury Note Index which aims to replicate the performance of a long strategy on the first 10Y US Treasury Note future contract. The underlying of this contract is a synthetic note with a 6.5 to 10-year maturity and a 6% coupon.
Physical ETFs
(Corporate and Investment Banking)
Launch of seven physical ETFs which broaden Lyxor global ETFs offering. With this new offering Lyxor to enhances and diversifies its offering in order to address client demand for products with physical replication.Each fund will invest directly in investment grade sovereign bonds of the Eurozone across different maturities.
New UCITS funds
(Corporate and Investment Banking)
Launch of a new fund which replicates one of the main strategies of the Hedge Fund “Winton Capital” under a UCITS format.Similar funds were also launched to replicate the strategies of the Hedge Funds “Canyon” and “Tiedermann”.
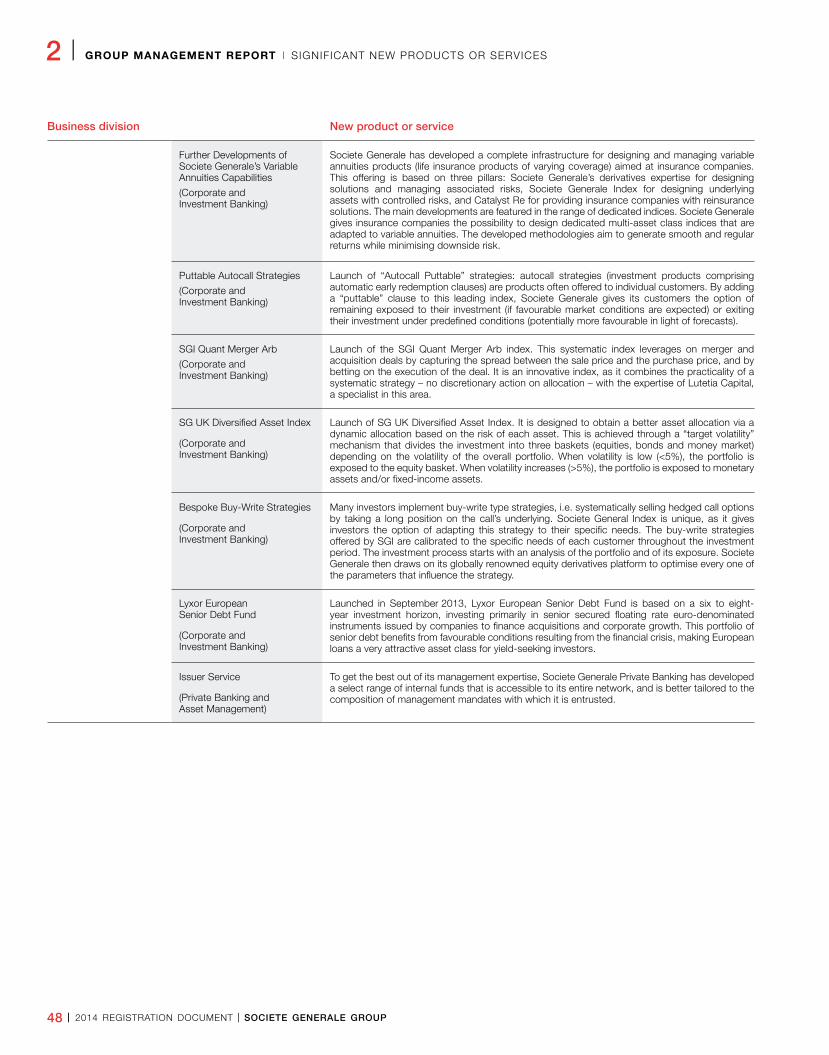
48 I 2014 REGISTRATION DOCUMENT I SOCIETE GENERALE GROUP
2 I GROUP MANAGEMENT REPORT I SIGNIFICANT NEW PRODUCTS OR SERVICES
Business division New product or service
Further Developments of Societe Generale’s Variable Annuities Capabilities
(Corporate and Investment Banking)
Societe Generale has developed a complete infrastructure for designing and managing variable annuities products (life insurance products of varying coverage) aimed at insurance companies. This offering is based on three pillars: Societe Generale’s derivatives expertise for designing solutions and managing associated risks, Societe Generale Index for designing underlying assets with controlled risks, and Catalyst Re for providing insurance companies with reinsurance solutions. The main developments are featured in the range of dedicated indices. Societe Generale gives insurance companies the possibility to design dedicated multi-asset class indices that are adapted to variable annuities. The developed methodologies aim to generate smooth and regular returns while minimising downside risk.
Puttable Autocall Strategies
(Corporate and Investment Banking)
Launch of “Autocall Puttable” strategies: autocall strategies (investment products comprising automatic early redemption clauses) are products often offered to individual customers. By adding a “puttable” clause to this leading index, Societe Generale gives its customers the option of remaining exposed to their investment (if favourable market conditions are expected) or exiting their investment under predefined conditions (potentially more favourable in light of forecasts).
SGI Quant Merger Arb
(Corporate and Investment Banking)
Launch of the SGI Quant Merger Arb index. This systematic index leverages on merger and acquisition deals by capturing the spread between the sale price and the purchase price, and by betting on the execution of the deal. It is an innovative index, as it combines the practicality of a systematic strategy – no discretionary action on allocation – with the expertise of Lutetia Capital, a specialist in this area.
SG UK Diversified Asset Index
(Corporate and Investment Banking)
Launch of SG UK Diversified Asset Index. It is designed to obtain a better asset allocation via a dynamic allocation based on the risk of each asset. This is achieved through a “target volatility” mechanism that divides the investment into three baskets (equities, bonds and money market) depending on the volatility of the overall portfolio. When volatility is low (<5%), the portfolio is exposed to the equity basket. When volatility increases (>5%), the portfolio is exposed to monetary assets and/or fixed-income assets.
Bespoke Buy-Write Strategies
(Corporate and Investment Banking)
Many investors implement buy-write type strategies, i.e. systematically selling hedged call options by taking a long position on the call’s underlying. Societe General Index is unique, as it gives investors the option of adapting this strategy to their specific needs. The buy-write strategies offered by SGI are calibrated to the specific needs of each customer throughout the investment period. The investment process starts with an analysis of the portfolio and of its exposure. Societe Generale then draws on its globally renowned equity derivatives platform to optimise every one of the parameters that influence the strategy.
Lyxor European Senior Debt Fund
(Corporate and Investment Banking)
Launched in September 2013, Lyxor European Senior Debt Fund is based on a six to eight-year investment horizon, investing primarily in senior secured floating rate euro-denominated instruments issued by companies to finance acquisitions and corporate growth. This portfolio of senior debt benefits from favourable conditions resulting from the financial crisis, making European loans a very attractive asset class for yield-seeking investors.
Issuer Service
(Private Banking and Asset Management)
To get the best out of its management expertise, Societe Generale Private Banking has developed a select range of internal funds that is accessible to its entire network, and is better tailored to the composition of management mandates with which it is entrusted.
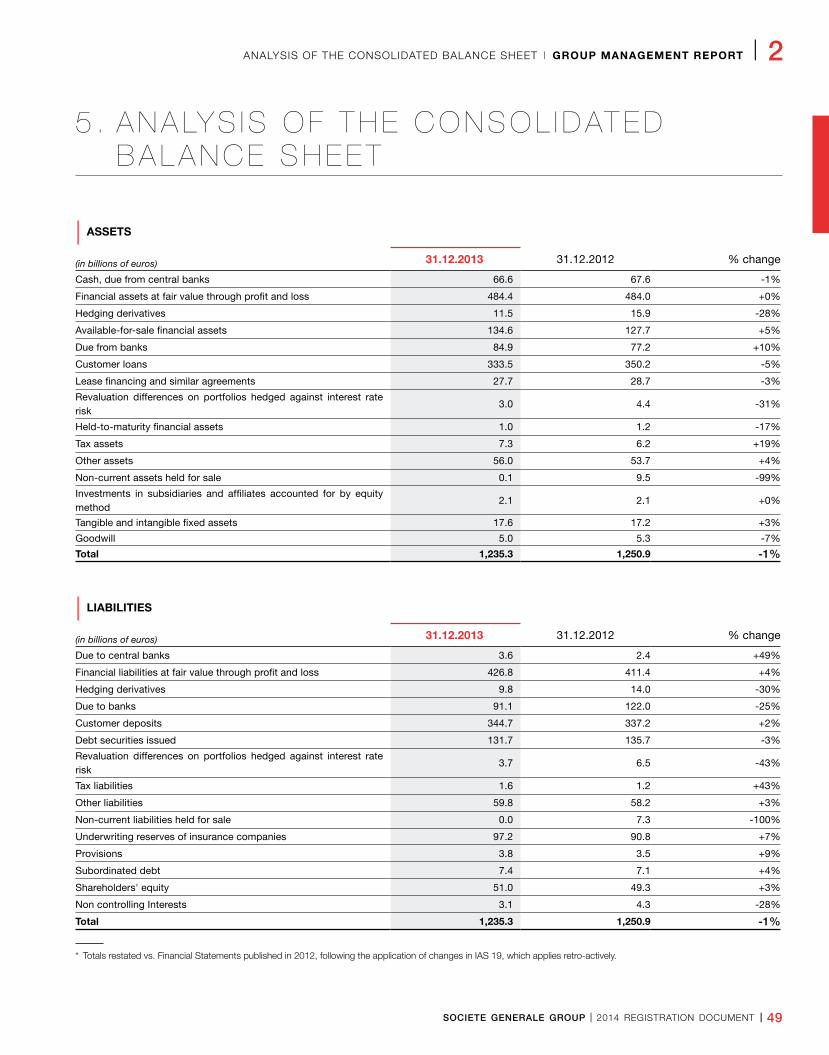
SOCIETE GENERALE GROUP I 2014 REGISTRATION DOCUMENT I 49
ANALYSIS OF THE CONSOLIDATED BALANCE SHEET I GROUP MANAGEMENT REPORT I 2
5 . �ANALYS I S �OF � THE �CONSOL IDATED�BALANCE �SHEET
| ASSETS
(in billions of euros) 31.12.2013 31.12.2012 % change
Cash, due from central banks 66.6 67.6 -1%
Financial assets at fair value through profit and loss 484.4 484.0 +0%
Hedging derivatives 11.5 15.9 -28%
Available-for-sale financial assets 134.6 127.7 +5%
Due from banks 84.9 77.2 +10%
Customer loans 333.5 350.2 -5%
Lease financing and similar agreements 27.7 28.7 -3%
Revaluation differences on portfolios hedged against interest rate risk
3.0 4.4 -31%
Held-to-maturity financial assets 1.0 1.2 -17%
Tax assets 7.3 6.2 +19%
Other assets 56.0 53.7 +4%
Non-current assets held for sale 0.1 9.5 -99%
Investments in subsidiaries and affiliates accounted for by equity method
2.1 2.1 +0%
Tangible and intangible fixed assets 17.6 17.2 +3%
Goodwill 5.0 5.3 -7%
Total 1,235.3 1,250.9 -1%
| LIABILITIES
(in billions of euros) 31.12.2013 31.12.2012 % change
Due to central banks 3.6 2.4 +49%
Financial liabilities at fair value through profit and loss 426.8 411.4 +4%
Hedging derivatives 9.8 14.0 -30%
Due to banks 91.1 122.0 -25%
Customer deposits 344.7 337.2 +2%
Debt securities issued 131.7 135.7 -3%
Revaluation differences on portfolios hedged against interest rate risk
3.7 6.5 -43%
Tax liabilities 1.6 1.2 +43%
Other liabilities 59.8 58.2 +3%
Non-current liabilities held for sale 0.0 7.3 -100%
Underwriting reserves of insurance companies 97.2 90.8 +7%
Provisions 3.8 3.5 +9%
Subordinated debt 7.4 7.1 +4%
Shareholders' equity 51.0 49.3 +3%
Non controlling Interests 3.1 4.3 -28%
Total 1,235.3 1,250.9 -1%
* Totals restated vs. Financial Statements published in 2012, following the application of changes in IAS 19, which applies retro-actively.
50 I 2014 REGISTRATION DOCUMENT I SOCIETE GENERALE GROUP
2 I GROUP MANAGEMENT REPORT I ANALYSIS OF THE CONSOLIDATED BALANCE SHEET
At 31 December 2013, the Group’s consolidated balance sheet totalled EUR 1,235.3 billion, down EUR 15.6 billion (-1.2%) vs. 31 December 2012 (EUR 1,250.9 billion).
MAIN CHANGES IN THE CONSOLIDATED BALANCE SHEETThe main changes to the consolidated scope impacting the consolidated balance sheet are as follows:
n the Group completed the sale of its stake in TCW Group Inc., i.e. 89.56%, to Carlyle Group and to TCW’s Management;
n the Group’s equity interest in Banque Tarneaud increased from 97.57% to 100% following Crédit du Nord’s purchase of shares held by minority shareholders;
n the Group complete the sale of its stake in National Societe Generale Bank, i.e. 77.17%, to Qatar National Bank. No assets were transferred from National Societe Generale Bank to the Societe Generale Group within the framework of this transaction. The income before tax from this disposal was recorded in Net income/expense from other assets in the income statement for an amount of EUR 417 million;
n the Group’s stake in Societe Generale Banque au Liban decreased
from 19% to 16.80% following a capital increase not subscribed to by the Group;
n the Group sold its entire stake in Societe Generale Private Banking (Japan) ltd, i.e. 100%;
n the Group bought out a minority shareholder in Rosbank, increasing its holding in the entity’s share capital from 82.40% to 92.40%. Consequently, the Group’s equity interests in LLC Rusfinance, LLC Rusfinance Bank and Commercial Bank DeltaCredit also increased from 82.40% to 92.40% and its equity interests in SG Strakhovanie LLC and Societe Generale Strakhovanie Zhizni LLC increased from 96.66% to 98.56%.
In accordance with IFRS 5 “Non-current assets held for sale and discontinued operations”, the main items classified in “Non-current assets held for sale” and “Non-current liabilities held for sale” are assets and liabilities relating to the consumer finance activity in Hungary and Turkey.
CHANGES IN MAJOR CONSOLIDATED BALANCE SHEET ITEMS
Cash, due from central banks (EUR 66.6 billion at 31 December 2013) decreased by EUR 1 billion ( 1.5%) vs. 31 December 2012.
Financial assets and liabilities at fair value through profit or loss increased by EUR 0.4 billion (+0.1%) and EUR 15.4 billion (+3.7%), respectively, compared to 31 December 2012.
Financial instruments at fair value through profit or loss mainly comprise:
n debt and equity instruments;
n trading derivatives;
n securities sold under repurchase agreements and securities purchased under resale agreements;
n securities lending agreements and amounts payable on borrowed securities.
The change in financial assets and liabilities at fair value through profit or loss are mainly attributable to increased activity in debt issues measured at fair value through profit or loss and in securities lending/borrowing. The equity market rally also caused these items to increase, but to a more limited extent, offset in particular by the rise in long-term interest rates.
The impact of exchange rate fluctuations on the valuation of financial instruments is the same on the assets and liabilities sides of the balance sheet.
Customer loans, including securities purchased under resale agreements recognised at amortised cost, were down EUR 16.7 billion (-4.8%) compared to 31 December 2012.
This decline reflected weaker demand for short-term loans and equipment loans in a persistently challenging economic environment, as well as a decrease in securities purchased under resale agreements due to the drop in customer USD funding requirements.
Customer deposits, including securities sold under repurchase
agreements recognised at amortised cost, rose by EUR 7.5 billion (+2.2%) compared to 31 December 2012, reflecting the solid momentum of regulated savings account inflows, demand deposits and term deposits.
Due from banks, including securities purchased under resale agreement recognised at amortised cost, increased by EUR 7.7 billion (+10%) relative to 31 December 2012, in line with the easing of interbank market rates.
Due to banks, including securities sold under repurchase agreements recognised at amortised cost, fell by EUR 30.9 billion (-25.3%) compared with 31 December 2012.
The upturn in customer term deposits and debt issues measured at fair value through profit or loss reduced the Group’s bank debt.
Available-for-sale financial assets were up EUR 6.9 billion (+5.4%) over 31 December 2012, mainly because of solid insurance inflows and increased capitalisation linked to the equity market rally.
Debt securities issued decreased by EUR 4.1 billion (-3%) compared to 31 December 2012 due to a decline in new short-term debt issues, partially offset by increased longer-term debt issues.
Group shareholders’ equity came to EUR 51 billion at 31 December 2013 versus EUR 49.3 billion at 31 December 2012, mainly as a result of:
n net income for the financial year at 31 December 2013: EUR +2.2 billion;
n the dividend payment in respect of the 2012 financial year: EUR -0.6 billion;
n the decrease in unrealised or deferred capital gains and losses: EUR -0.9 billion.
After taking into account non-controlling interests (EUR 3.1 billion), Group shareholders’ equity amounted to EUR 54.1 billion at 31 December 2013.
SOCIETE GENERALE GROUP I 2014 REGISTRATION DOCUMENT I 51
FINANCIAL POLICY I GROUP MANAGEMENT REPORT I 2
6 . F I N A N C I A L P O L I C Y
The objective of the Group’s policy with regard to capital management is to optimise the use of shareholders’ equity in order to maximize short- and long-term return for shareholders, while maintaining a level of capital (Tier 1 ratio and Core Tier 1 ratio) consistent with the market status of Societe Generale and the Group’s target
rating. Since 2010, the Group has launched a major realignment programme, strengthening capital and focusing on the rigorous management of scarce resources (capital and liquidity) and proactive risk management in order to anticipate the regulatory changes related to the implementation of new “Basel 3” regulations.
GROUP SHAREHOLDERS’ EQUITY
Group shareholders’ equity totalled EUR 51.0 billion at 31 December 2013, net asset value per share was EUR 56.63 and net tangible asset value per share was EUR 48.99. Book capital includes EUR 6.6 billion in deeply subordinated notes and EUR 0.4 billion in perpetual subordinated notes(1).
At 31 December 2013, Societe Generale possessed, directly or indirectly, 22.5 million Societe Generale shares (including 9.0 million treasury shares), representing 2.82% of the capital (excluding shares held for trading purposes). At this date, the Group also held
1.4 million purchase options on its own shares to cover stock option plans allocated to its employees. In 2013, the Group acquired 22.7 million Societe Generale shares under the liquidity contract concluded on 22 August 2011 with an external investment services provider. Over this period, Societe Generale also proceeded to dispose of 23 million Societe Generale shares via the liquidity contract.
The information concerning the Group’s shareholding structure is available in Chapter 7 of this Registration Document, p. 442 and 444.
CAPITAL MANAGEMENT
In accordance with Basel 2.5, the Group’s Tier 1 ratio was 13.4% at 31 December 2013 versus 12.5% at 31 December 2012. The Core Tier 1 ratio came to 11.3% at end-2013 versus 10.7% at end 2012, reflecting the Group’s efforts to strengthen its capital since 2011.
In accordance with Basel 3, the fully-loaded pro forma CRR Common Equity Tier 1 ratio was 10.0% at 31 December 2013. The Group has thus achieved its target capital of 10%. The Group considers this level adequate for its capital management.
The transitional Common Equity Tier 1 ratio came to 10.9% at 1 January 2014.
The leverage ratio, estimated under Basel 3 CRR rules – using fully-loaded Tier 1 capital in the numerator – was 3.5% at 31 December 2013. This estimate does not incorporate the regulatory changes proposed by the Basel Committee in January 2014; however, these changes should not have a material impact on the level of the leverage ratio.
For capital management purposes, the Group ensures that its solvency level is always compatible with its strategic objectives and regulatory obligations.
The Group ensures that its overall capital ratio (Common Equity Tier 1 + hybrid securities recognised in additional Tier 1 and Tier 2) offers a sufficient safety buffer for unsecured senior lenders, particularly with a view to implementing resolution rules (see Chapter 4). The Group’s aim is to reach an overall capital ratio of 14% to 15% by end-2015 under CRR conditions.
Detailed information on capital management and controls is provided in Chapter 4 of this Registration Document, page 140 and following.
(1) See methodology No 3, p. 42.
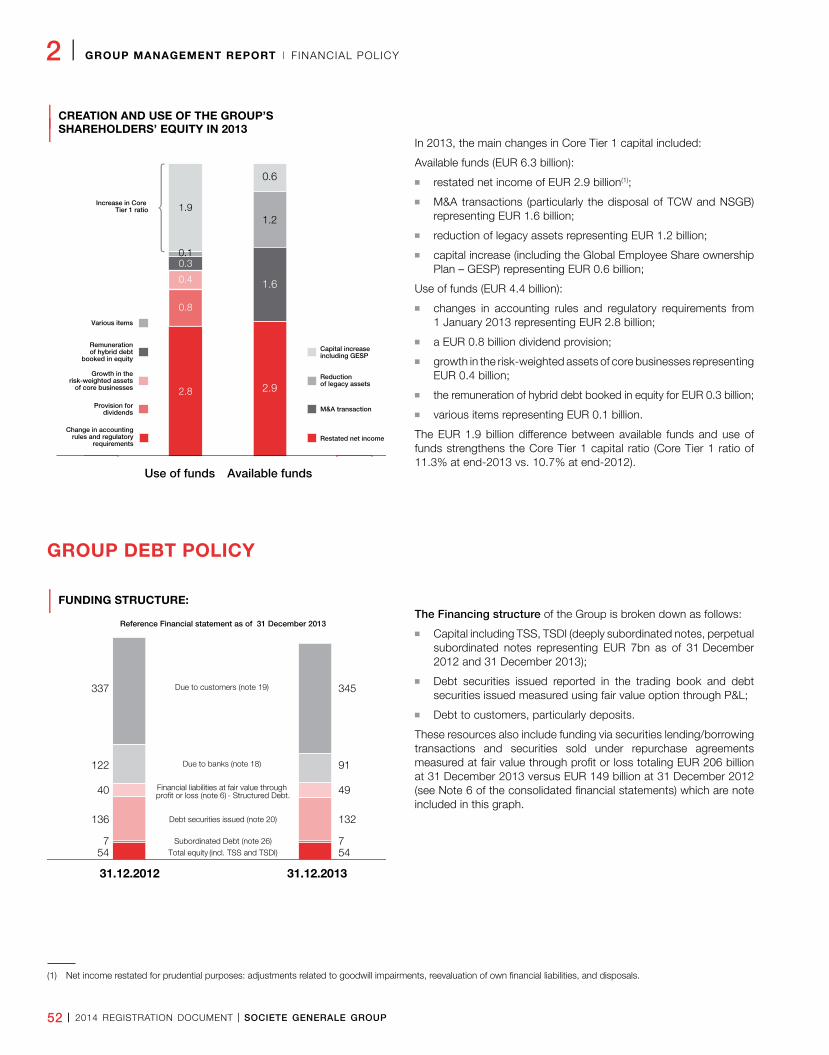
52 I 2014 REGISTRATION DOCUMENT I SOCIETE GENERALE GROUP
2 I GROUP MANAGEMENT REPORT I FINANCIAL POLICY
| CREATION AND USE OF THE GROUP’S
| SHAREHOLDERS’ EQUITY IN 2013In 2013, the main changes in Core Tier 1 capital included:
Available funds (EUR 6.3 billion):
n restated net income of EUR 2.9 billion(1);
n M&A transactions (particularly the disposal of TCW and NSGB) representing EUR 1.6 billion;
n reduction of legacy assets representing EUR 1.2 billion;
n capital increase (including the Global Employee Share ownership Plan – GESP) representing EUR 0.6 billion;
Use of funds (EUR 4.4 billion):
n changes in accounting rules and regulatory requirements from 1 January 2013 representing EUR 2.8 billion;
n a EUR 0.8 billion dividend provision;
n growth in the risk-weighted assets of core businesses representing EUR 0.4 billion;
n the remuneration of hybrid debt booked in equity for EUR 0.3 billion;
n various items representing EUR 0.1 billion.
The EUR 1.9 billion difference between available funds and use of funds strengthens the Core Tier 1 capital ratio (Core Tier 1 ratio of 11.3% at end-2013 vs. 10.7% at end-2012).
GROUP DEBT POLICY
| FUNDING STRUCTURE:The Financing structure of the Group is broken down as follows:
n Capital including TSS, TSDI (deeply subordinated notes, perpetual subordinated notes representing EUR 7bn as of 31 December 2012 and 31 December 2013);
n Debt securities issued reported in the trading book and debt securities issued measured using fair value option through P&L;
n Debt to customers, particularly deposits.
These resources also include funding via securities lending/borrowing transactions and securities sold under repurchase agreements measured at fair value through profit or loss totaling EUR 206 billion at 31 December 2013 versus EUR 149 billion at 31 December 2012 (see Note 6 of the consolidated financial statements) which are note included in this graph.
Use of funds Available funds
Capital increase including GESP
M&A transaction
Reduction of legacy assets
Restated net income
Provision fordividends
Remunerationof hybrid debt
booked in equity
Growth in therisk-weighted assets
of core businesses
Increase in Core Tier 1 ratio
2.8
1.9
0.1
0.8
0.3
0.4
1.2
1.6
0.6
2.9
Change in accountingrules and regulatory
requirements
Various items
0,000000
83,333333
166,666667
250,000000
333,333333
416,666667
500,000000
31.12.2012
5454
31.12.2013
Total equity (incl. TSS and TSDI)77 Subordinated Debt (note 26)
132136 Debt securities issued (note 20)
91122 Due to banks (note 18)
345337 Due to customers (note 19)
Reference Financial statement as of 31 December 2013
4940 Financial liabilities at fair value through profit or loss (note 6) - Structured Debt.
(1) Net income restated for prudential purposes: adjustments related to goodwill impairments, reevaluation of own financial liabilities, and disposals.
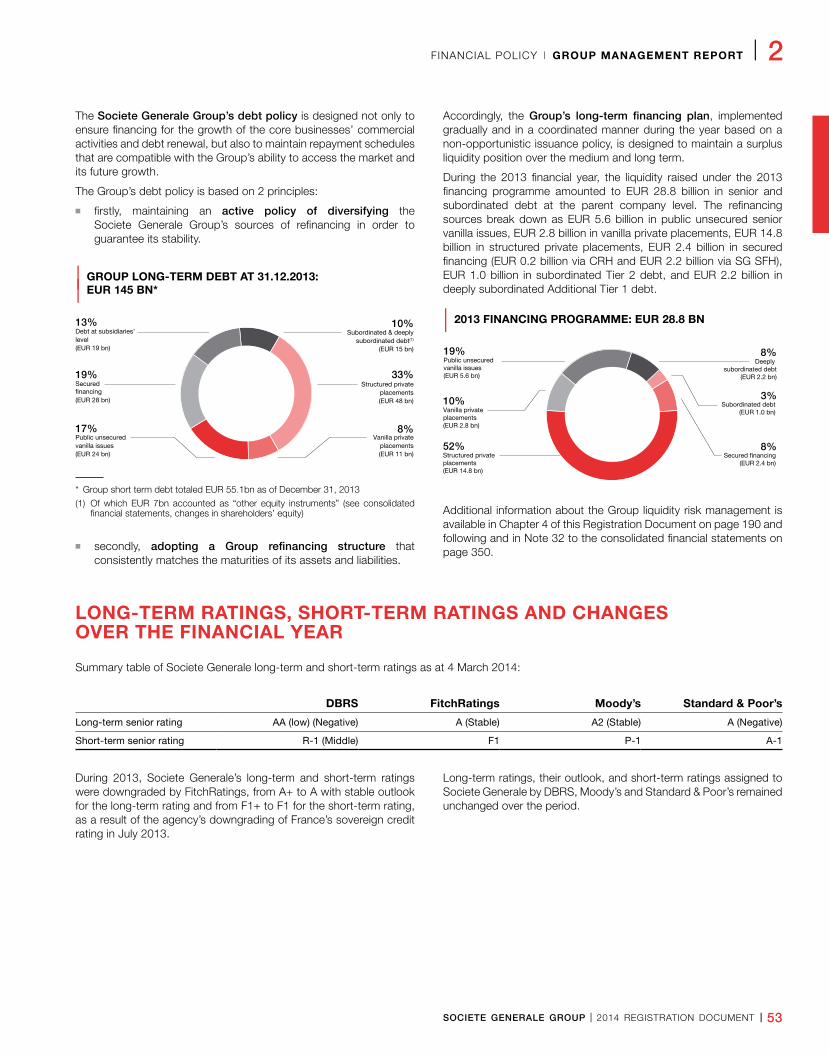
SOCIETE GENERALE GROUP I 2014 REGISTRATION DOCUMENT I 53
FINANCIAL POLICY I GROUP MANAGEMENT REPORT I 2
The Societe Generale Group’s debt policy is designed not only to ensure financing for the growth of the core businesses’ commercial activities and debt renewal, but also to maintain repayment schedules that are compatible with the Group’s ability to access the market and its future growth.
The Group’s debt policy is based on 2 principles:
n firstly, maintaining an active policy of diversifying the Societe Generale Group’s sources of refinancing in order to guarantee its stability.
| GROUP LONG-TERM DEBT AT 31.12.2013:
| EUR 145 BN*
Subordinated & deeplysubordinated debt(1)
(EUR 15 bn)
Structured privateplacements(EUR 48 bn)
Vanilla privateplacements(EUR 11 bn)
Public unsecuredvanilla issues(EUR 24 bn)
Securedfinancing (EUR 28 bn)
Debt at subsidiaries’level (EUR 19 bn)
13%
19%
8%
33%
10%
17%
* Group short term debt totaled EUR 55.1bn as of December 31, 2013
(1) Of which EUR 7bn accounted as “other equity instruments” (see consolidated financial statements, changes in shareholders’ equity)
n secondly, adopting a Group refinancing structure that consistently matches the maturities of its assets and liabilities.
Accordingly, the Group’s long-term financing plan, implemented gradually and in a coordinated manner during the year based on a non-opportunistic issuance policy, is designed to maintain a surplus liquidity position over the medium and long term.
During the 2013 financial year, the liquidity raised under the 2013 financing programme amounted to EUR 28.8 billion in senior and subordinated debt at the parent company level. The refinancing sources break down as EUR 5.6 billion in public unsecured senior vanilla issues, EUR 2.8 billion in vanilla private placements, EUR 14.8 billion in structured private placements, EUR 2.4 billion in secured financing (EUR 0.2 billion via CRH and EUR 2.2 billion via SG SFH), EUR 1.0 billion in subordinated Tier 2 debt, and EUR 2.2 billion in deeply subordinated Additional Tier 1 debt.
| 2013 FINANCING PROGRAMME: EUR 28.8 BN
Additional information about the Group liquidity risk management is available in Chapter 4 of this Registration Document on page 190 and following and in Note 32 to the consolidated financial statements on page 350.
LONG-TERM RATINGS, SHORT-TERM RATINGS AND CHANGES OVER THE FINANCIAL YEAR
Summary table of Societe Generale long-term and short-term ratings as at 4 March 2014:
DBRS FitchRatings Moody’s Standard & Poor’s
Long-term senior rating AA (low) (Negative) A (Stable) A2 (Stable) A (Negative)
Short-term senior rating R-1 (Middle) F1 P-1 A-1
During 2013, Societe Generale’s long-term and short-term ratings were downgraded by FitchRatings, from A+ to A with stable outlook for the long-term rating and from F1+ to F1 for the short-term rating, as a result of the agency’s downgrading of France’s sovereign credit rating in July 2013.
Long-term ratings, their outlook, and short-term ratings assigned to Societe Generale by DBRS, Moody’s and Standard & Poor’s remained unchanged over the period.
19%
10%
8%
3%
8%
52%Secured financing
(EUR 2.4 bn)Structured private placements(EUR 14.8 bn)
Vanilla private placements(EUR 2.8 bn)
Subordinated debt(EUR 1.0 bn)
Deeply subordinated debt
(EUR 2.2 bn)
Public unsecured vanilla issues(EUR 5.6 bn)
54 I 2014 REGISTRATION DOCUMENT I SOCIETE GENERALE GROUP
2 I GROUP MANAGEMENT REPORT I MAJOR INVESTMENTS AND DISPOSALS
7 . M A J O R I N V E S T M E N T S A N D D I S P O S A L S
The Group has maintained in 2013 a targeted acquisition and disposal policy in line with its strategy focused on its core businesses and management of its resources.
Business division Description of the investments
2013
International Retail Banking and Financial Services
Acquisition of 10% of Rosbank, increasing the Group’s stake to 92.4%.
French Retail Banking Increase from 97.6% to 100% of the stake held in Banque Tarneaud following a squeeze-out by Crédit du Nord.
2012
French Retail Banking Increase from 79.5% to approximately 97.6% of the stake held in Banque Tarneaud following a tender offer by Crédit du Nord.
2011
International Retail Banking and Financial Services
Acquisition by Rosbank of Rusfinance and DeltaCredit (entities already held by the Group) followed by the merger of Rosbank and BSGV. As a result of these transactions, the Group now holds 82.4% of its opera-tions in Russia.
Global Banking and Investor Solutions Acquisition in the United States of certain assets and the RBS Sempra Commodities teams in the natural gas and electricity sectors.
Business division Description of disposals
2013
International Retail Banking and Financial Services
Disposal of a 77.17% stake in NSGB in Egypt for USD 1,974 million.
Global Banking and Investor Solutions Disposal of the SGHP-held stake in TCW (United States)
Global Banking and Investor Solutions Disposal of SG Private Banking Japan.
2012
International Retail Banking and Financial Services
Disposal of a 99.1% stake in Geniki Bank in Greece.
Global Banking and Investor Solutions The stake held in TCW changed from 100% down to approximately 89.6% due to the execution of the employee share ownership plan as well as of an earn-out clause granted in the context of the acquisition of Metropolitan West Asset Management in 2010.
Corporate centre Disposal of 51.4% of Salvepar.
2011
Global Banking and Investor Solutions Disposal of a 50% stake in orbéo.
SOCIETE GENERALE GROUP I 2014 REGISTRATION DOCUMENT I 55
PROPERTY AND EQUIPMENT I GROUP MANAGEMENT REPORT I 2
8 . P E N D I N G A C Q U I S I T I O N S A N D I M P O R TA N T C O N T R A C T S
Financing of the main investments underwayThe main investments currently underway will be financed using the Group’s usual sources of funds.
NewedgeSociete Generale Group entered exclusive negotiations with Crédit Agricole to acquire the remaining 50% stake in Newedge’s capital, a brokerage joint venture, bringing Societe Generale’s stake to 100%. In line with the Group’s strategy of strengthening core businesses and developing synergies, the full take-over of Newedge would be a key development in the area of market activities, particularly given future regulatory changes that will move towards greater centralisation of OTC products.
The financial transactions discussed during the exclusive talks between Societe Generale and Crédit Agricole include the following:
n the acquisition by Societe Generale of Crédit Agricole CIB’s 50% stake in Newedge, for a total amount of EUR 275 million;
n the simultaneous sale to Crédit Agricole SA of 5% of Amundi’s capital, for an amount of EUR 337.5 million, reducing Societe Generale’s holding to 20%. This disposal would not affect the governance structure of the company. Amundi would continue to be the leading provider of savings and investment solutions for Societe Generale’s retail banking networks; the transaction would also include an extension of the distribution agreement until end-2019 when the current agreement expires at end-2014.
At closing, these two transactions would have a positive net impact on Group net income and a negative impact of approximately 10bp on the Basel 3 Core Tier One ratio of the Group.
The deal must be approved by the relevant parties and regulatory authorities, and would also be submitted to staff representative groups for their consultation.
Important contractsNo important contracts were signed as at 31 December 2013.
9 . P R O P E R T Y A N D E Q U I P M E N T
The gross book value of Societe Generale Group’s tangible operating fixed assets amounted to EUR 25.9 billion at 31 December 2013. This figure essentially comprises land and buildings (EUR 5.3 billion), assets leased by specialised financing companies (EUR 14.9 billion) and other tangible assets (EUR 5.4 billion).
The gross book value of the Group’s investment property amounted to EUR 677 million at 31 December 2013.
The net book value of tangible operating assets and investment property amounted to EUR 16 billion, representing just 1.29% of the consolidated balance sheet at 31 December 2013, which is in line with the nature of the Group’s activities.
56 I 2014 REGISTRATION DOCUMENT I SOCIETE GENERALE GROUP
2 I GROUP MANAGEMENT REPORT I POST-CLOSING EVENTS
1 0 . P I L L A R 3 R E P O R T
Societe Generale’s Pillar 3 Annual Report has been published on its institutional website since 2009, in accordance with the banking supervision regulations laid down by the Basel Committee in 2004 (Basel 2 regulations). This report is also included in the first update of the Registration Document.
Constituting Basel 2’s third pillar, the “Solvency and Risk Management Report” promotes market discipline by establishing a set of quantitative and qualitative disclosure requirements. These allow market participants to more effectively assess capital levels, risk exposures and risk management processes and therefore, the
capital adequacy of an institution, in accordance with the Basel 2.5 Pillar 1 rules (CRD3). For the first time, the key information relative to the Pillar 3 Report has been included in this Registration Document in the “Risks and Capital Adequacy” chapter. In March 2014, this information will be updated with information on the Group’s credit risk, and will be included in the first update of the Registration Document, published in May 2014.
A cross-reference table linking information published in this Registration Document and CRD requirements is available in chapter 9 on page 471.
1 1 . P O S T- C L O S I N G E V E N T S
No post-closing event occurred after 31 December 2013 that could significantly affect the group’s financial or commercial position.
SOCIETE GENERALE GROUP I 2014 REGISTRATION DOCUMENT I 57
RECENT DEVELOPMENTS AND OUTLOOK I GROUP MANAGEMENT REPORT I 2
12. RECENT DEVELOPMENTS AND OUTLOOK
Over recent months, economic indicators have pointed to an improvement in global business activity. However, this recovery will be modest in 2014, as a number of obstacles dominating the economic environment need to be addressed.
The euro zone and, in particular France are very gradually moving towards recovery: the budget adjustments and deleveraging of the private sector continue to limit the possibilities of a rebound in a context of high unemployment. Furthermore, the improved economic climate in the United States remains contingent on how the country will make an exit from its quantitative and fiscal monetary policies. In the countries, markets are contending with a surge in capital flight due to shifts in the United States’ monetary policy, renewed fears regarding the slowdown in China, and heightened political risk in certain countries, likely to depreciate the currencies in countries with current account deficits or currently in a downturn (India, Indonesia, Brazil, Turkey, and South Africa). However, to date, other countries such as Central and Eastern European countries, Korea and Mexico, have been less affected by these developments, thus indicating a degree of differentiation within emerging markets. Current developments could weigh on emerging country growth, but not to the extent of triggering systemic financial crises akin to those observed in the 1990s.
At the end of 2010, the Basel Committee published its recommendations for strengthening capital and liquidity requirements in order to promote a more solid banking sector. The Group is already able to meet new regulatory requirements with a fully-loaded Common Equity Tier One ratio of 10% at end-2013. In addition, a new indicative ratio is currently being defined in Europe: the leverage ratio calculates the ratio of capital requirements to the balance sheet and off-balance sheet total, after factoring in certain adjustments. While European regulatory authorities (EBA(1) and European Commission) still need to specify how exactly this new requirement will be implemented, there is currently a minimum requirement of 3% by 2018. Banks are required to announce their ratio by 2015. With an indicative leverage ratio of 3.5% at end-2013, the Group is already able to meet this new European regulatory requirement.
As regards liquidity, the Basel Committee proposed two standard ratios based on harmonised parameters:
n the Liquidity Coverage Ratio (LCR), in the short term (1 month), aims to ensure that financial institutions have a sufficient buffer of high-quality liquid assets in order to survive a severe stress scenario (combining a market crisis and a specific crisis) for a period of 30 days;
n the Net Stable Funding Ratio (NSFR), in the longer term, encourages longer financing of banking activities, including off-balance sheet activities and capital market activities;
n the definition of the LCR is stabilised under Basel regulations. The European Capital Requirements Directive (CRD4) defines the principles of the LCR, and the EBA is responsible for drawing up the technical standards with regards to defining and adjusting the ratio during the observation period. The exact definition of the LCR will be adopted by delegated act of the Commission by 30 June 2014 at the latest, and as per the technical standards recommended by the EBA. The minimum ratio is set at 60% in 2015 with a gradual increase of 10 points per year, reaching 100% by 1 January 2018. At 31 December 2013, Societe Generale’s LCR ratio was above 100%, reflecting the significant efforts undertaken to strengthen the Group’s liquidity reserve since the crisis and extend the average maturity of its short-term liabilities.
The definition of the NSFR is still under review by the Basel Committee, and analyses will be finalised in 2014 following consultation. In Europe, the European Commission will present new regulations to the Parliament and Council by 31 December 2016, following approval by the EBA.
As part of the project of the European Banking Union project initiated in 2012, the text on euro zone banking supervision by the ECB(2) was adopted in October 2013 by the European authorities in order to strengthen the resilience of the financial system, sustainably restore investor confidence, and support economic recovery by breaking the links and contagion risks between banks and national governments. The ECB will take up its responsibilities from 4 November 2014, following an ECB review of bank balance sheets (Asset Quality Review), and stress tests conducted by the EBA in cooperation with the ECB. This process should further strengthen confidence in the euro zone.
In addition to this project, the European Commission proposed in July 2013 a single resolution mechanism for the euro zone banking sector to be phased in gradually from 2015. Constituting the second pillar of the Banking Union, this mechanism will be used to address banking defaults by way of a single resolution fund financed by banks, rather than burdening taxpayers of the countries in question. France has already transposed in its Monetary and Financial Code part of the provisions France has already transposed in its Monetary and Financial Code part of the bank resolution provisions included in the European Bank Recovery and Resolution Directive. This directive should be voted on during the first half of 2014, particularly the requirement on banks to draw up the necessary plans, and the new powers given to the French Prudential Supervisory and Resolution Authority (ACPR) to efficiently liquidate failing banks.
The European Union has also continued to review banking structures following the Liikanen report in Europe recommending the legal separation of secondary market activities from proprietary trading and market-making activities. On 29 January 2014, the European Commission published a draft regulation on banking structural reform. The draft regulation is currently under review by the various stakeholders with the aim of maintaining the specific characteristics of the French separation law adopted in 2013.
(1) European Banking Authority.
(2) European Central Bank
58 I 2014 REGISTRATION DOCUMENT I SOCIETE GENERALE GROUP
2 I GROUP MANAGEMENT REPORT I RECENT DEVELOPMENTS AND OUTLOOK
In keeping with the 2010 G20 initiatives, several regulations on market activity operations are continuing to come into effect in Europe and the United States. Following the adoption in 2012 of the European Market Infrastructure Regulation (EMIR), which sets out to further standardise and secure the derivatives market, the revision of the Markets in Financial Instruments Directive (MIFID) will improve transparency on derivatives and commodity markets, and has a target implementation date of 2017.
In addition, a financial transactions tax, with a larger tax base than the one in effect in the United Kingdom and France since 2012 and in Italy since 2013, is under review by the 11 Member States of the European Union.
In addition, in the United States the Dodd-Frank Act laid the groundwork for the supervision of systemic risk and of some Corporate and Investment banking activities (in particular through the Volcker Rule on market-making activities). The final text calls for gradual implementation from 2015 for the most active banks.
Furthermore, the Societe Generale Group will be rethinking its operations in the United States in the wake of the “Tarullo” rules applicable to non-US financial institutions.
In addition to organisational rules for banks and market activities, new fundamental developments in retail banking are also expected. As a reminder, the retail banking payment systems in Europe must follow the European Single Euro Payments Area (SEPA) regulation.
In a restrictive macro-economic environment, the major goal of market place discussions is to produce a sustainable growth model for the financial sector which maintains banks’ ability to finance the economy amid more restrictive budget policies. However, it is clear that the addition of new regulatory constraints, compounded by potential competitive bias between countries, will weigh significantly on the profitability of some activities. They may therefore influence the development model of certain players in the banking sector.
The Societe Generale Group is ready and determined to continue to adapt the structure of its business lines and address changes in the banking industry. To this end, the Group embarked on the second step of its transformation plan to refocus its structure on three pillars of excellence:
n French Retail Banking;
n International Retail Banking and Financial Services (IBFS);
n Global Banking and Investor Solutions (GBIS).
Created in 1864 to finance the development of the French economy, Societe General Group will celebrate 150 years of service to its customers through innovation and its commitment to supporting their development. This anniversary is also an opportunity for the Group to reflect on its future and reaffirm its commitment to serving its customers and the economy.
SOCIETE GENERALE GROUP I 2014 REGISTRATION DOCUMENT I 59
1. Corporate Governance structure and main bodies ...........................................60Presentation of Governance and structure of supervision committees ����������� 60Board of Directors ��������������������� 61General Management ������������������� 67Additional information about the members of the Board and the deputy Chief Executive Officers ����� 69Executive Committee ������������������� 69Group Management Committee ��������������� 70
2. Chairman’s report on corporate governance ..............................................71Corporate Governance declaration ������������������71Board of Directors ���������������������������71Vice-chairman’s report on his role and activities in 2013 ���� 76The Board’s work in 2013 �����������������������76The Committees’ activities in 2013 �������������� 77Appraisal of the Board of Directors and Chief Executive Officers �80Training ���������������������������������81Specific conditions relating to the participation of shareholders in the General Meeting ���������������81Attendance fees paid to Company Directors ������������81Compensation and benefits in kind awarded to Chief Executive officers, and the disclosure of information as provided for in Article L. 225-100-3 of the French Commercial Code �������������������81
3. Remuneration of Group senior Management ........................................82Remuneration of Chief Executive Officers ����������� 82Remuneration of the other members of the Executive Committee who are not Chief Executive Officers �� 86Transactions carried out by Chief Executive Officers and Directors in Societe Generale shares ����������� 87Standard tables in accordance with AMF recommendations ��� 88Remuneration components due or granted for 2013 fiscal year to Chief Executive Officers and submitted to the vote of shareholders ���������� 96Plans for employees ������������������� 104
4. Statutory auditors’ special report on related party agreements and commitments .................................................................105
5. Report of the Chairman on internal control and risk management ............................107
6. Statutory auditors’ special report on the report of the Chairman on internal control and risk management .....................................................121
3C O R P O R AT E
G O V E R N A N C E
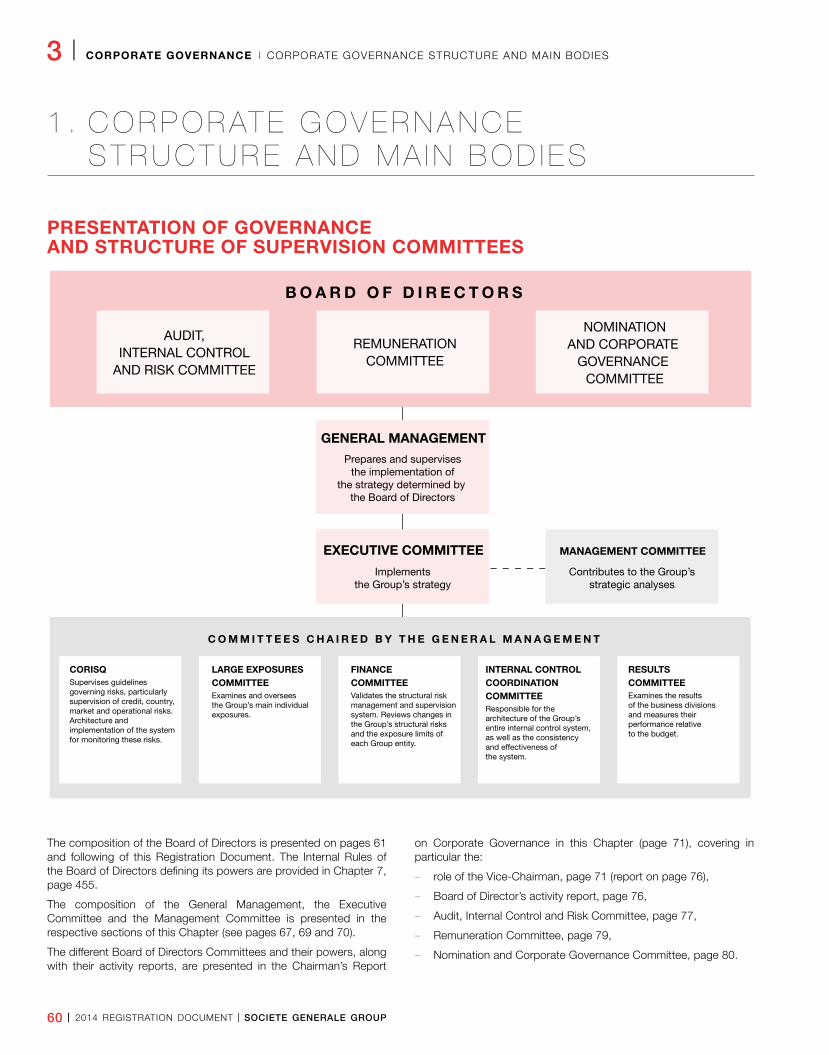
3 I CORPORATE GOVERNANCE I CORPORATE GOVERNANCE STRUCTURE AND MAIN BODIES
60 I 2014 REGISTRATION DOCUMENT I SOCIETE GENERALE GROUP
1 . C O R P O R AT E G O V E R N A N C E S T R U C T U R E A N D M A I N B O D I E S
PRESENTATION OF GOVERNANCE AND STRUCTURE OF SUPERVISION COMMITTEES
AUDIT,INTERNAL CONTROL
AND RISK COMMITTEE
REMUNERATIONCOMMITTEE
Prepares and supervisesthe implementation of
the strategy determined by the Board of Directors
GENERAL MANAGEMENT
Implementsthe Group’s strategy
CORISQSupervises guidelinesgoverning risks, particularly supervision of credit, country, market and operational risks. Architecture and implementation of the system for monitoring these risks.
LARGE EXPOSURES COMMITTEEExamines and oversees the Group’s main individual exposures.
FINANCE COMMITTEEValidates the structural risk management and supervision system. Reviews changes in the Group’s structural risks and the exposure limits of each Group entity.
INTERNAL CONTROL COORDINATION COMMITTEEResponsible for the architecture of the Group’s entire internal control system, as well as the consistency and effectiveness of the system.
RESULTS COMMITTEEExamines the results of the business divisions and measures their performance relative to the budget.
EXECUTIVE COMMITTEE
Contributes to the Group’sstrategic analyses
MANAGEMENT COMMITTEE
B O A R D O F D I R E C T O R S
C O M M I T T E E S C H A I R E D B Y T H E G E N E R A L M A N A G E M E N T
NOMINATIONAND CORPORATE
GOVERNANCE COMMITTEE
The composition of the Board of Directors is presented on pages 61 and following of this Registration Document. The Internal Rules of the Board of Directors defining its powers are provided in Chapter 7, page 455.
The composition of the General Management, the Executive Committee and the Management Committee is presented in the respective sections of this Chapter (see pages 67, 69 and 70).
The different Board of Directors Committees and their powers, along with their activity reports, are presented in the Chairman’s Report
on Corporate Governance in this Chapter (page 71), covering in particular the:
– role of the Vice-Chairman, page 71 (report on page 76),
– Board of Director’s activity report, page 76,
– Audit, Internal Control and Risk Committee, page 77,
– Remuneration Committee, page 79,
– Nomination and Corporate Governance Committee, page 80.
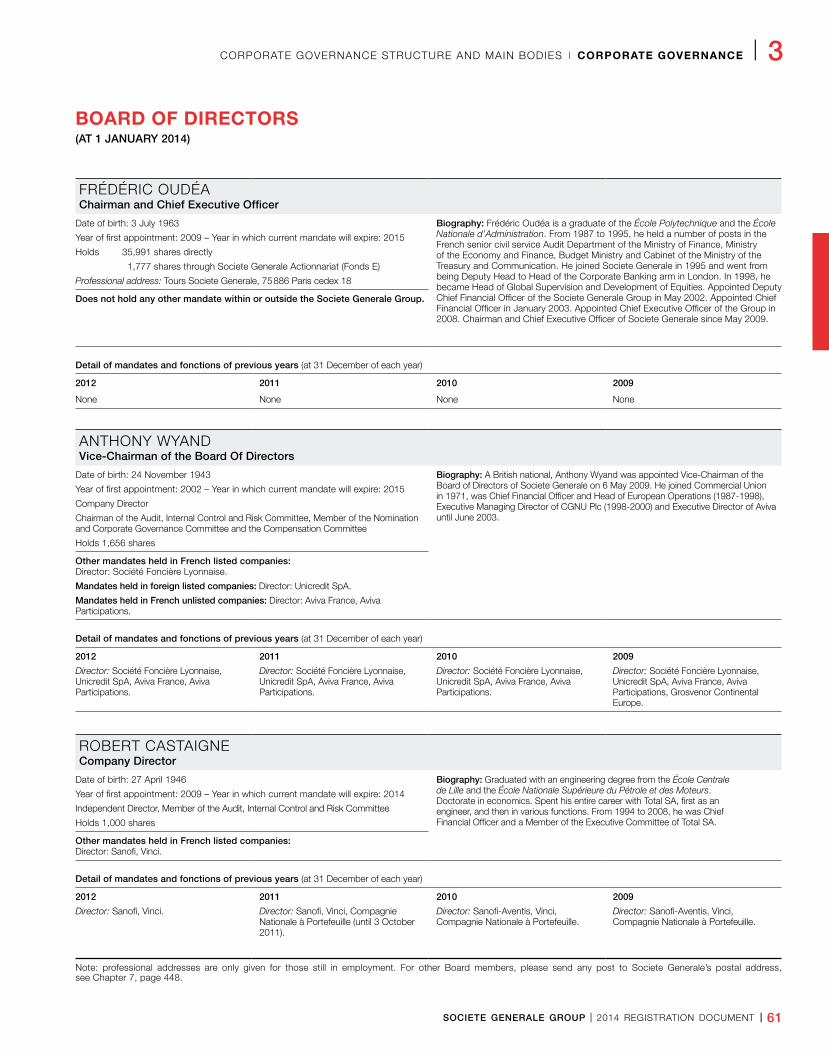
CORPORATE GOVERNANCE STRUCTURE AND MAIN BODIES I CORPORATE GOVERNANCE I 3
SOCIETE GENERALE GROUP I 2014 REGISTRATION DOCUMENT I 61
BOARD OF DIRECTORS(AT 1 JANUARY 2014)
FRÉDÉRIC OUDÉAChairman and Chief Executive Officer
Date of birth: 3 July 1963
Year of first appointment: 2009 – Year in which current mandate will expire: 2015
Holds 35,991 shares directly
1,777 shares through Societe Generale Actionnariat (Fonds E)
Professional address: Tours Societe Generale, 75 886 Paris cedex 18
Biography: Frédéric Oudéa is a graduate of the École Polytechnique and the École Nationale d’Administration. From 1987 to 1995, he held a number of posts in the French senior civil service Audit Department of the Ministry of Finance, Ministry of the Economy and Finance, Budget Ministry and Cabinet of the Ministry of the Treasury and Communication. He joined Societe Generale in 1995 and went from being Deputy Head to Head of the Corporate Banking arm in London. In 1998, he became Head of Global Supervision and Development of Equities. Appointed Deputy Chief Financial Officer of the Societe Generale Group in May 2002. Appointed Chief Financial Officer in January 2003. Appointed Chief Executive Officer of the Group in 2008. Chairman and Chief Executive Officer of Societe Generale since May 2009.
Does not hold any other mandate within or outside the Societe Generale Group.
Detail of mandates and fonctions of previous years (at 31 December of each year)
2012
None
2011
None
2010
None
2009
None
ANTHONY WYANDVice-Chairman of the Board Of Directors
Date of birth: 24 November 1943
Year of first appointment: 2002 – Year in which current mandate will expire: 2015
Company Director
Chairman of the Audit, Internal Control and Risk Committee, Member of the Nomination and Corporate Governance Committee and the Compensation Committee
Holds 1,656 shares
Biography: A British national, Anthony Wyand was appointed Vice-Chairman of the Board of Directors of Societe Generale on 6 May 2009. He joined Commercial Union in 1971, was Chief Financial Officer and Head of European Operations (1987-1998), Executive Managing Director of CGNU Plc (1998-2000) and Executive Director of Aviva until June 2003.
Other mandates held in French listed companies: Director: Société Foncière Lyonnaise.
Mandates held in foreign listed companies: Director: Unicredit SpA.
Mandates held in French unlisted companies: Director: Aviva France, Aviva Participations.
Detail of mandates and fonctions of previous years (at 31 December of each year)
2012
Director: Société Foncière Lyonnaise, Unicredit SpA, Aviva France, Aviva Participations.
2011
Director: Société Foncière Lyonnaise, Unicredit SpA, Aviva France, Aviva Participations.
2010
Director: Société Foncière Lyonnaise, Unicredit SpA, Aviva France, Aviva Participations.
2009
Director: Société Foncière Lyonnaise, Unicredit SpA, Aviva France, Aviva Participations, Grosvenor Continental Europe.
ROBERT CASTAIGNECompany Director
Date of birth: 27 April 1946
Year of first appointment: 2009 – Year in which current mandate will expire: 2014
Independent Director, Member of the Audit, Internal Control and Risk Committee
Holds 1,000 shares
Biography: Graduated with an engineering degree from the École Centrale de Lille and the École Nationale Supérieure du Pétrole et des Moteurs. Doctorate in economics. Spent his entire career with Total SA, first as an engineer, and then in various functions. From 1994 to 2008, he was Chief Financial Officer and a Member of the Executive Committee of Total SA.
Other mandates held in French listed companies: Director: Sanofi, Vinci.
Detail of mandates and fonctions of previous years (at 31 December of each year)
2012
Director: Sanofi, Vinci.
2011
Director: Sanofi, Vinci, Compagnie Nationale à Portefeuille (until 3 October 2011).
2010
Director: Sanofi-Aventis, Vinci, Compagnie Nationale à Portefeuille.
2009
Director: Sanofi-Aventis, Vinci, Compagnie Nationale à Portefeuille.
Note: professional addresses are only given for those still in employment. For other Board members, please send any post to Societe Generale’s postal address, see Chapter 7, page 448.
3 I CORPORATE GOVERNANCE I CORPORATE GOVERNANCE STRUCTURE AND MAIN BODIES
62 I 2014 REGISTRATION DOCUMENT I SOCIETE GENERALE GROUP
MICHEL CICURELChairman of Michel Cicurel Conseil
Date of birth: 5 September 1947
Year of first appointment: 2004 – Year in which current mandate will expire: 2016
Independent Director, Member of the Nomination and Corporate Governance Committee and the Compensation Committee
Holds 1,118 shares
Professional address: 46, rue Pierre Charron, 75008 Paris
Biography: After a career at the French Treasury from 1973 to 1982, Michel Cicurel was appointed project director and then Deputy Chief Executive Officer of the Compagnie Bancaire from 1983 to 1988 and Cortal from 1983 to 1989. Deputy Director of Galbani (BSN Group) from 1989 to 1991. Director and Chief Executive Officer, and subsequently Vice-Chairman and Chief Executive Officer, of CERUS from 1991 to 1999. Chairman of the Management Board of La Compagnie Financière Edmond De Rothschild and of Compagnie Financière Saint-Honoré from 1999 to June 2012. Michel Cicurel is Chairman of Michel Cicurel Conseil.
Other mandates held in French listed companies: Member of the Supervisory Board: Publicis.
Mandates held in French unlisted companies not belonging to the Director’s group: Chairman of the Board of Directors: Bank Leonardo. Director: Bouygues Telecom, Cogepa.
Detail of mandates and fonctions of previous years (at 31 December of each year)
2012
Chairman of the Management Board: La Compagnie Financière Edmond de Rothschild, Compagnie Financière Saint-Honoré (until June 2012).
Member of the Supervisory Board: Publicis.
Director: Bouygues Telecom.
2011
Chairman of the Management Board: La Compagnie Financière Edmond de Rothschild Banque, Compagnie Financière Saint-Honoré.
Chairman of the Supervisory Board: Edmond de Rothschild Corporate Finance.
Vice-Chairman of the Supervisory Board: Edmond de Rothschild Private Equity Partners.
Member of the Supervisory Board: Publicis, Siaci Saint-Honoré, Newstone Courtage (until 1st December 2011), Milestone (since 4 July 2011).
Chairman of the Board of Directors: ERS, Edmond de Rothschild SGR Spa (Italy), Edmond de Rothschild SIM Spa (Italy) (Until 21 April 2011), Edmond de Rothschild Investment Services Ltd. (Israel).
Director: Edmond de Rothschild Ltd. (London), Banque privée Edmond de Rothschild SA (Geneva), Bouygues Telecom.
Permanent representative of La Compagnie Financière Edmond de Rothschild Banque: Edmond de Rothschild Asset Management (Chairman of the Supervisory Board), Edrim Solutions.
Permanent representative of Compagnie Financière Saint-Honoré: Cogifrance.
Non-Voting Director: Paris-Orléans.
2010
Member of the Supervisory Board: Publicis.
Director: Banque privée Edmond de Rothschild SA, (Geneva), Edmond de Rothschild Ltd. (London), Bouygues Telecom.
Chairman of the Management Board: La Compagnie Financière Edmond de Rothschild Banque SA, Compagnie Financière Saint-Honoré.
Permanent representative of Compagnie Financière Edmond de Rothschild Banque: Edmond de Rothschild Asset Management, Edmond de Rothschild Financial Services, Equity Vision.
Chairman of the Supervisory Board: Edmond de Rothschild Asset Management (SAS).
Member of the Supervisory Board: Siaci Saint-Honoré, Newstone Courtage.
Permanent representative of La Compagnie Financière Edmond de Rothschild: Edrim Solutions.
Vice-Chairman of the Supervisory Board: Edmond de Rothschild Private Equity. Partners (SAS), Edmond de Rothschild Corporate Finance (SAS).
Chairman of the Board of Directors: Edmond de Rothschild SGR Spa (Italy) Edmond de Rothschild SIM Spa (Italy), ERS.
Permanent representative of Compagnie Financière Saint-Honoré: Cogifrance.
Non-Voting Director: Paris-Orléans.
2009
Member of the Supervisory Board: Publicis.
Non-Voting Director: Paris-Orléans.
Director: Banque privée Edmond de Rothschild SA, (Geneva), Edmond de Rothschild Ltd. (London), Bouygues Telecom.
Chairman of the Management Board: La Compagnie Financière Edmond de Rothschild Banque SA, Compagnie Financière Saint- Honoré.
Chairman of the Supervisory Board: Edmond de Rothschild Multi Management (SAS) (until July 3, 2009), Edmond de Rothschild Corporate Finance (SAS) (since 10 November 2009).
Member of the Supervisory Board: Siaci Saint-Honoré, Newstone Courtage.
Vice-Chairman of the Supervisory Board: Edmond de Rothschild Private Equity Partners (SAS).
Chairman of the Board of Directors: ERS.
Permanent representative of Compagnie Financière Saint- Honoré: Cogifrance.
Permanent representative of Compagnie Financière Edmond de Rothschild Banque: Edmond de Rothschild Asset Management, Edmond de Rothschild Financial Services, Equity Vision.
Chairman of the Board of Directors: Edmond de Rothschild SGR Spa (Italy), Edmond de Rothschild SIM Spa (Italy), ERS, LCF Holding Benjamin (until 26 November 2009).
Note: professional addresses are only given for those still in employment. For other Board members, please send any post to Societe Generale’s postal address, see Chapter 7, page 448.
CORPORATE GOVERNANCE STRUCTURE AND MAIN BODIES I CORPORATE GOVERNANCE I 3
SOCIETE GENERALE GROUP I 2014 REGISTRATION DOCUMENT I 63
YANN DELABRIÈREChairman and Chief Executive Officer of Faurecia
Date of birth: 19 December 1950
Year of first appointment: 2012 – Year in which current mandate will expire: 2016
Independent Director
Holds 1,000 shares
Professional address: 2 rue Hennape, 92735 Nanterre cedex
Biography: A graduate of École Normale Supérieure and École Nationale d’Administration, with an advanced degree in Mathematics. He began his career at Cour des Comptes (Court of Auditors). He became Chief Financial Officer of Coface (1982-1987) then Printemps Group (1987-1990) before becoming Chief Financial Officer of PSA Peugeot Citroën from 1990 to 2007. He was also Chairman and Chief Executive Officer of Banque PSA Finance. Member of the Board and Chairman of the Audit Committee of Cap Gemini since 2003. Mr. Delabrière has been CEO and Chairman of Faurecia since 2007.Other mandates held in French listed companies:
Chariman and Chief Executive Officer: Faurecia, Director: Cap Gemini.
Detail of mandates and fonctions of previous years (at 31 December of each year)
2012
Director: Cap Gemini, Faurecia.
2011
Director: Cap Gemini, Faurecia.
2010
Director: Cap Gemini, Faurecia.
2009
Director: Cap Gemini, Faurecia.
JEAN-MARTIN FOLZCompany Director
Date of birth: 11 January 1947
Year of first appointment: 2007 – Year in which current mandate will expire: 2015
Independent Director, Chairman of the Nomination and Corporate Governance Committee and the Compensation Committee.
Holds 2,011 shares
Biography: Served as Chairman of the PSA Peugeot Citroën group from 1997 to February 2007, after holding management, then executive management, positions with the Rhône-Poulenc group, Schneider group, Péchiney group and Eridania-Beghin-Say.
Other mandates held in French listed companies: Director: Alstom, AXA, Saint-Gobain, Eutelsat.
Mandates held in foreign listed companies: Director: Solvay (Belgium).
Detail of mandates and fonctions of previous years (at 31 December of each year)
2012
Director: Alstom, Axa, Saint-Gobain, Eutelsat, Solvay (Belgium).
2011
Director: Alstom, Axa, Saint-Gobain, Eutelsat, Solvay (Belgium).
Member of the Board: ONF Participations (SAS).
2010
Director: Alstom, Axa, Carrefour, Saint-Gobain, Solvay (Belgium).
2009
Director: Alstom, Carrefour, Saint-Gobain, Solvay (Belgium).
Member of the Supervisory Board: Axa.
KYRA HAZOUIndependent Director
Date of birth: 13 December 1956
Year of first appointment: 2011 – Year in which current mandate will expire: 2015
Independent Director, Member of the Audit, Internal Control and Risk Committee
Holds 1,000 shares
Biography: A British and US national, Kyra Hazou was Managing Director and Group Legal Counsel for Salomon Smith Barney/ Citibank from 1985 to 2000, after practising as a lawyer in both London and New York. From 2001 to 2007, she was non-executive Director, Member of the Audit Committee and the Risk Committee of the Financial Services Authority in the United Kingdom.
Detail of mandates and fonctions of previous years (at 31 December of each year)
2012
None
2011
None
2010
None
2009
None
Note: professional addresses are only given for those still in employment. For other Board members, please send any post to Societe Generale’s postal address, see Chapter 7, page 448.
3 I CORPORATE GOVERNANCE I CORPORATE GOVERNANCE STRUCTURE AND MAIN BODIES
64 I 2014 REGISTRATION DOCUMENT I SOCIETE GENERALE GROUP
JEAN-BERNARD LÉVYChairman and Chief Executive Officer of Thalès
Date of birth: 18 March 1955
Year of first appointment: 2009 – Year in which current mandate will expire: 2017
Independent Director, Member of the Nomination and Corporate Governance Committee and the Compensation Committee.
Holds 1,000 shares
Professional address: 45 rue de Villiers, 92526 Neuilly-sur-Seine cedex
Biography: Graduate of the École Polytechnique and Télécom Paris Tech. Chairman and Chief Executive Officer of Thalès since 20 December 2012. Chairman of the Management Board of Vivendi from 2005 to 2012. Jean-Bernard Lévy was Managing Partner responsible for Corporate Finance of Oddo et Cie from 1998 to 2002. From 1995 to 1998, he was Chairman and Chief Executive Officer of Matra Communication. From 1993 to 1994, he was Director of the Cabinet of Mr. Gérard Longuet, French Minister for Industry, the Postal Service, Telecommunications and Foreign Trade. From 1988 to 1993, he was Head of Telecommunication Satellites at Matra Marconi Space. From 1986 to 1988, Jean-Bernard Lévy was technical advisor to the Cabinet of Mr. Gérard Longuet, Deputy Minister for the Postal Service and Telecommunications, and from 1978 to 1986 he was an engineer at France Télécom.
Other mandates held in French listed companies: Chairman and CEO: Thalès. Director: Vinci.
Mandates held in French unlisted companies: Chairman of the Supervisory Board: Viroxis. Chairman: JBL Consulting & Investment SAS. Director: DCNS.
Detail of mandates and fonctions of previous years (at 31 December of each year)
2012
Chairman and CEO: SFR (until 28 June 2012)
Chairman: JBL Consulting & Investment SAS.
Chairman of the Management Board: Vivendi (until 28 June 2012).
Chairman of the Board of Directors: Activision Blizzard Inc (until 28 June 2012), GVT Brazil (until 28 June 2012).
Chairman of the Supervisory Board: Groupe Canal + (until 28 June 2012), Canal + France (until 28 June 2012), Viroxis.
Vice-Chairman of the Supervisory Board: Maroc Télécom (until 28 June 2012).
Director: Vinci
2011
Chairman of the Board of Directors: Activision Blizzard Inc, GVT (Brazil), Institut Télécom.
Chairman of the Supervisory Board: Groupe Canal +, Canal + France, Viroxis.
Vice-Chairman of the Supervisory Board: Maroc Télécom
Director: Vinci, SFR.
2010
Chairman of the Board of Directors: Activision Blizzard, GVT (Brazil), Institut Télécom.
Vice-Chairman of the Supervisory Board: Groupe Canal+, Maroc Télécom.
Director: Vinci, Vivendi Games Inc., Activision Blizzard Inc., NBC Universal Inc.
2009
Chairman of the Board of Directors: Activision Blizzard, GVT (Brazil).
Vice-Chairman of the Supervisory Board: Groupe Canal+, Maroc Télécom.
Director: Vinci, Vivendi Games Inc., Activision Blizzard Inc., NBC Universal Inc.
ANA MARIA LLOPIS RIVASFounder, Chairman and Chief Executive Officer of Ideas4all
Date of birth: 5 August 1950
Year of first appointment: 2011 – Year in which current mandate will expire: 2015
Independent Director
Holds 1,000 shares
Biography: A Spanish national, Ana Maria Llopis Rivas spent 11 years working in the Spanish banking sector (Banesto and Santander Group) where she notably founded an online bank and broker; Executive Chairman of Razona, a financial consulting firm, she was then appointed Executive Vice President of Financial and Insurance Markets for the consultancy Indra, as well as non-executive Director and Member of the Audit Committee of Reckitt-Benckiser, and then member of the Supervisory Board of ABN AMRO. She is currently Founder, Chairman and Chief Executive Officer of Ideas4all, Director and Chairman of the Appointments and Remuneration Committee of Service Point Solutions, and Director and Member of the Nominations, Remuneration and Corporate Social Responsibility Committees of British American Tobacco.
Other mandates held in foreign listed companies: Director: British American Tobacco.
Mandates held in foreign unlisted companies: Chairman of the Board of Directors: DIA.
Mandates held in French unlisted companies: Director: Service Point Solutions.
Detail of mandates and fonctions of previous years (at 31 December of each year)
2012
Chairman of the Board of Directors: DIA.
Member of the Supervisory Board: ABN Amro.
Director: Service Point Solutions, British American Tobacco.
2011
Member of the Supervisory Board: ABN Amro.
Director: Service Point Solutions, British American Tobacco.
2010
Member of the Supervisory Board: ABN Amro.
Director: Service Point Solutions, British American Tobacco.
2009
Member of the Supervisory Board: ABN Amro.
Director: Service Point Solutions, British American Tobacco.
Note: professional addresses are only given for those still in employment. For other Board members, please send any post to Societe Generale’s postal address, see Chapter 7, page 448.
CORPORATE GOVERNANCE STRUCTURE AND MAIN BODIES I CORPORATE GOVERNANCE I 3
SOCIETE GENERALE GROUP I 2014 REGISTRATION DOCUMENT I 65
GIANEMILIO OSCULATICompany Director
Date of birth: 19 May 1947
Year of first appointment: 2006 – Year in which current mandate will expire: 2014
Independent Director, Member of the Audit, Internal Control and Risk Committee
Holds 6,526 shares
Biography: An Italian national, Gianemilio Osculati was CEO, Managing Director and Chairman at McKinsey Italy, where he specialised in the banking and financial sector. He was Chief Executive Officer of Banca d’America e d’Italia, a subsidiary of Deutsche Bank Group, for six years.
Other mandates held in foreign listed companies: Director: Italmobiliare SpA.
Mandates held in foreign unlisted companies: Chairman: Intesa Sanpaolo Assicura SpA. Deputy Director: Intesa Sanpaolo Previdenza SpA, Intesa Sanpaolo Vita SpA. Director: Ariston Thermo SpA, Intesa Sanpaolo Life Ltd., Intesa Sanpaolo Private Banking SpA, Miroglio SpA.
Detail of mandates and fonctions of previous years (at 31 December of each year)
2012
Chairman: Osculati & Partners SpA (until November 2012), Eurizon Capital SpA, Intesa Sanpaolo Assicura, Valore SpA (until November 2012).
Deputy Director: Intesa Sanpaolo Vita SpA, Intesa Sanpaolo Previdenza SpA, Centrovita SpA.
Director: Ariston Thermo SpA, Intesa Sanpaolo Life Ltd., Gas Plus SpA, Miroglio SpA, Italmobiliare SpA.
2011
Chairman: Osculati & Partners SpA, Eurizon Capital SpA, Intesa Sanpaolo Assicura, Valore SpA.
Chairman and Deputy Director: Eurizon Vita SpA.
Deputy Director: Intesa Sanpaolo Vita SpA, Intesa Sanpaolo Previdenza SpA, Centrovita SpA.
Director: Ariston Thermo SpA, Intesa Sanpaolo Life Ltd., Gas Plus SpA, Miroglio SpA, Sud Polo Vita SpA.
2010
Chairman: Osculati & Partners SpA, Eurizon Capital SpA, Eurizon Tutela SpA, Valore SpA.
Chairman and Deputy Director: Eurizon Vita SpA.
Director: Ariston Thermo SpA, Banque de crédit et de dépôts SA, Eurizon Life, Gas Plus SpA, Miroglio SpA.
2009
Chairman: Osculati & Partners SpA.
Chairman and CEO: Eurizon Vita SpA.
Director: Ariston Thermo SpA, Banque de crédit et de dépôts SA, Eurizon Capital SpA, Eurizon Tutela SpA, Eurizon Life, Gas Plus SpA, Miroglio SpA, MTS Group, Fideuram Spa, (until 7 April 2009), Seves Spa (until 7 January 2009).
NATHALIE RACHOUFounder and Chief Executive Officer of Topiary Finance Ltd.
Date of birth: 7 April 1957
Year of first appointment: 2008 – Year in which current mandate will expire: 2016
Independent Director, Member of the Audit, Internal Control and Risk Committee
Holds 1,048 shares
Professional address: 11 Elvaston Place, London SW7 5QG, Royaume-Uni
Biography: A French national and HEC graduate. From 1978 to 1999, Nathalie Rachou held a number of positions at Banque Indosuez and Crédit Agricole Indosuez: foreign exchange dealer, Head of Asset/Liability Management, founder then CEO of Carr Futures International Paris (brokerage subsidiary of Banque Indosuez trading on the Paris Futures Exchange), Corporate Secretary of Banque Indosuez and Global Head of Foreign Exchange and Currency Options at Crédit Agricole Indosuez. In 1999, she founded Topiary Finance Ltd., an asset management company based in London. She has also been a Foreign Trade Advisor for France since 2001.
Other Mandates held in French listed companies: Director: Véolia Environnement, Altran.
Other Mandates held in French unlisted companies: Director: Topiary Finance, Liautaud et Cie (until 21 November 2013)
Detail of mandates and fonctions of previous years (at 31 December of each year)
2012
Director: Liautaud et Cie, Veolia Environnement, Altran.
2011
Director: Liautaud et Cie.
2010
Director: Liautaud et Cie.
2009
Director: Liautaud et Cie.
ALEXANDRA SCHAAPVELDIndependent Director
Date of birth: 5 September 1958
Year of first appointment: 2013 – Year in which current mandate will expire: 2017
Holds 1,000 shares
Biography: A Dutch national, she is graduated from the University of Oxford in politics, economy and philosophy and holds a Master in Development Economics from the University Erasmus. Mrs Alexandra Schaapveld began her career at ABN AMRO where she held various positions from 1984 to 2007 in the Investment Bank. She was particularly responsible for the monitoring of major bank customers. In 2008, she was Director for Western Europe of investment banking at Royal bank of Scotland. Today, she is a member of the supervisory boards of FMO and Holland Casino (Netherlands), Bumi (Malaysia). She has no professional activity outside the exercise of non-executive mandates.
Mandates held in foreign listed companies: Member of the Supervisory Board: Bumi Armada (Malaysia)
Mandates held in foreign unlisted companies: Member of the Supervisory Board: Holland Casino and FMO (Netherlands).
Detail of mandates and fonctions of previous years (at 31 December of each year)
2012
Member of the Supervisory Board: Vallourec (France), FMO and Holland Casino (Netherlands), Burmi Armada (Malaysia)
2011
Member of the Supervisory Board: Vallourec (France), Holland Casino (Netherlands), Burmi Armada (Malaysia)
2010
Member of the Supervisory Board: Vallourec (France), Holland Casino (Netherlands)
2009
Member of the Supervisory Board: Holland Casino (Netherlands)
Note: professional addresses are only given for those still in employment. For other Board members, please send any post to Societe Generale’s postal address, see Chapter 7, page 448.
3 I CORPORATE GOVERNANCE I CORPORATE GOVERNANCE STRUCTURE AND MAIN BODIES
66 I 2014 REGISTRATION DOCUMENT I SOCIETE GENERALE GROUP
FRANCE HOUSSAYEProduct and partnership coordinator at the Rouen branch (Normandie)
Date of birth: 27 July 1967
Year of first appointment: 2009 – Year in which current mandate will expire: 2015
Director elected by employees
Professional address: Tours Société Générale, 75 886 Paris Cedex 18
Biography: Societe Generale employee since 1989.
Detail of mandates and fonctions of previous years (at 31 December of each year)
2012
None
2011
None
2010
None
2009
None
BÉATRICE LEPAGNOLPrivate Client Advisor at Eauze branch (Gers)
Date of birth: 11 October 1970
Year of first appointment: 2012 – Year in which current mandate will expire: 2015
Director elected by employees
Professional address: Tours Société Générale, 75 886 Paris Cedex 18
Biography: Societe Generale employee since 1990.
Detail of mandates and fonctions of previous years (at 31 December of each year)
2012
None
2011
None
2010
None
2009
None
NON-VOTING DIRECTOR
KENJI MATSUOChairman of Meiji Yasuda Life Insurance
Date of birth: 22 June 1949
Year of first appointment: 18 January 2006 – Year in which current mandate will expire: 17 January 2014
Biography: A Japanese national, Kenji Matsuo joined Meiji Life in 1973 and was appointed Chairman of Meiji Yasuda Life from 2005 to July 2013.
Note: professional addresses are only given for those still in employment. For other Board members, please send any post to Societe Generale’s postal address, see Chapter 7, page 448.
Directors whose mandate expires in 2014
ROBERT CASTAIGNEDate of birth: 27 April 1946
COMPANY DIRECTOR
Independent Director, Member of the Audit, Internal Control and Risk Committee
Year of first appointment: 2009 — Year in which current mandate will expire: 2014
GIANEMILIO OSCULATIDate of birth: 19 May 1947
COMPANY DIRECTOR
Independent Director, Member of the Audit, Internal Control and Risk Committee
Year of first appointment: 2006 – Year in which current mandate will expire: 2014
CORPORATE GOVERNANCE STRUCTURE AND MAIN BODIES I CORPORATE GOVERNANCE I 3
SOCIETE GENERALE GROUP I 2014 REGISTRATION DOCUMENT I 67
GENERAL MANAGEMENT(AT 1 JANUARY 2014)
FRÉDÉRIC OUDÉADate of birth: 3 July 1963
CHAIRMAN AND CHIEF EXECUTIVE OFFICER
See page 61.
SÉVERIN CABANNESDate of birth: 21 July 1958
DEPUTY CHIEF EXECUTIVE OFFICER
Holds 14,366 shares directly
1,280 shares through “Societe Generale Actionnariat (Fonds E)”
Other mandates held in French unlisted companies belonging to the Societe Generale Group: Director: Amundi Group, Crédit du Nord.
Mandates held in foreign unlisted companies belonging to the Societe Generale Group: Director: TCW Group Inc (until 6th February 2013).
Mandates held in French unlisted companies not belonging to the Societe Generale Group: Member of the Supervisory Board: Steria Group Sca.
Biography: Worked for Crédit National, Elf Atochem, then the La Poste Group (1983-2001). Joined Societe Generale in 2001 as Group Chief Financial Officer until 2002. Deputy CEO responsible for the Steria Group’s strategy and finance, then CEO (2002-2007). In January 2007, Séverin Cabannes became Societe Generale Group’s Head of Corporate Resources and has been a Deputy Chief Executive Officer since May 2008.
JEAN-FRANÇOIS SAMMARCELLIDate of birth: 19 November 1950
DEPUTY CHIEF EXECUTIVE OFFICER
Holds 21,814 shares directly
2,478 shares through “Societe Generale Actionnariat (Fonds E)”
Other mandates held in French listed companies belonging to the Societe Generale Group: Director: Boursorama, Banque Tarneaud.
Mandates held in French listed companies not belonging to the Societe Generale Group: Director: Sopra Group.
Mandates held in French unlisted companies belonging to the Societe Generale Group: Chairman of the Board of Directors: Crédit du Nord. Director: Amundi Group, Sogecap, Sogeprom. Non-voting Director: Ortec Expansion. Permanent representative of Crédit du Nord on the Supervisory Board: Banque Rhône Alpes, Société Marseillaise de Crédit.
Mandates held in foreign unlisted companies belonging to the Societe Generale Group: Member of the Supervisory Board: SG Marocaine de Banques.
Biography: Joined Societe Generale in 1974, held various positions in the Paris branches of the French Network until 1987. From 1987 to 1991 he was Head of the Dijon branch, then Head of the Water and Metal Industry construction division of Corporate Banking until 1995. Jean-François Sammarcelli was subsequently made Head of the Real Estate Division, before being appointed Chief Operating Officer, then Chief Financial Officer of SG CIB. In 2002 he became Corporate and Investment Banking’s Head of Corporates and Institutions. He was Head of the French Network in 2005 and in 2006 became Head of Retail Banking. Since 1 January 2010, he has held the posts of Deputy Chief Executive Officer and Head of Retail Banking.
BERNARDO SANCHEZ INCERADate of birth: 9 March 1960
DEPUTY CHIEF EXECUTIVE OFFICER
Holds 4,167 shares
Other mandates held in foreign listed companies belonging to the Societe Generale Group: Director: Banque Roumaine de Développement, National Societe Generale Bank (until 28 March 2013), Rosbank, Societe Generale de Banques en Côte d’Ivoire. Member of the Supervisory Board: Komerčni Banka A.S.
Mandates held in French unlisted companies belonging to the Societe Generale Group: Director: Franfinance, Sogecap, Compagnie Générale de Location d’Equipements.
Mandates held in foreign unlisted companies belonging to the Societe Generale Group: Director: ALD Automotive Group Plc, Societe Generale de Banques au Cameroun, Societe Generale de Banques au Sénégal. Member of the Supervisory Board: Societe Generale Marocaine de Banques.
Biography: A Spanish national. From 1984 to 1992, Bernardo Sanchez Incera was a corporate relationship manager and Deputy Head of the Corporate Business Branch of Crédit Lyonnais La Défense. From 1992 to 1994, he was a Director and CEO of Crédit Lyonnais Belgium. From 1994 to 1996, he was Deputy Director of Banca Jover Spain. From 1996 to 1999, he was CEO of Zara France. From 1999 to 2001, he was Head of International Operations for the Inditex Group, then Chairman of LVMH Mode et Maroquinerie Europe and of LVMH Fashion Group France from 2001 to 2003. From 2003 to 2004, he was Chief Executive Officer of Vivarte France, then in 2004, Executive Managing Director of Monoprix France until 2009. He joined Societe Generale in November 2009, where he has been a Deputy Chief Executive Officer since 1 January 2010.
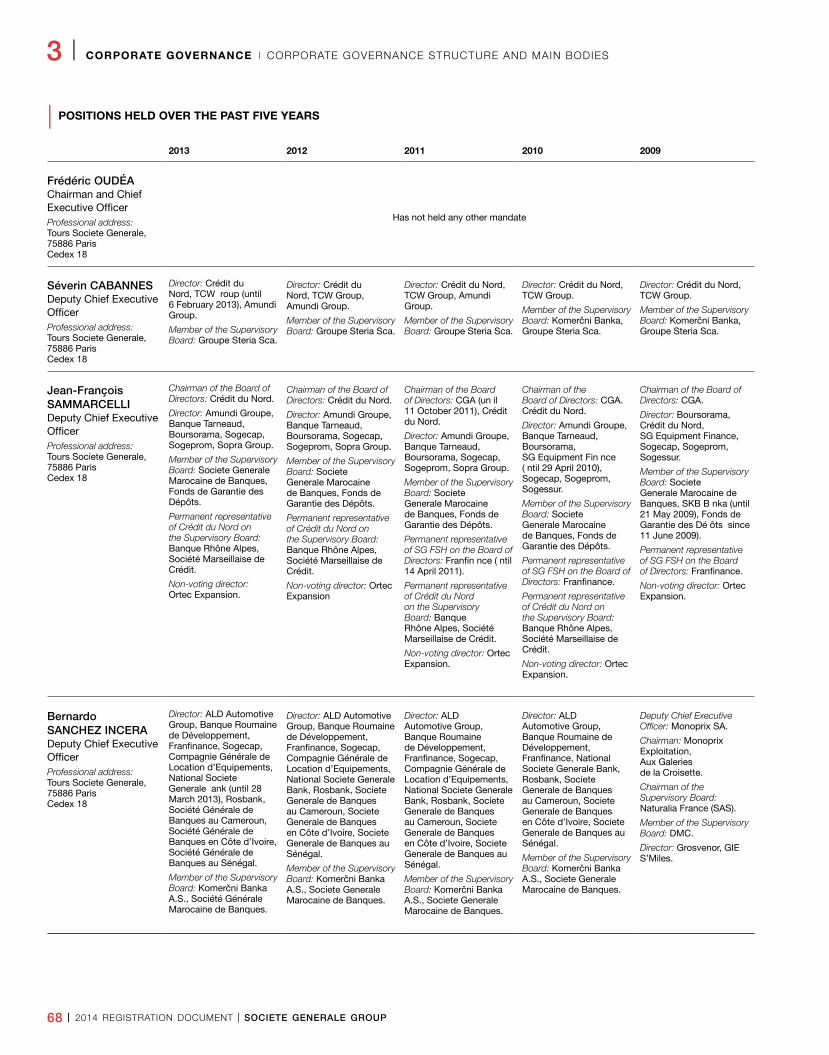
3 I CORPORATE GOVERNANCE I CORPORATE GOVERNANCE STRUCTURE AND MAIN BODIES
68 I 2014 REGISTRATION DOCUMENT I SOCIETE GENERALE GROUP
| POSITIONS HELD OVER THE PAST FIVE YEARS
2013 2012 2011 2010 2009
Frédéric OUDÉAChairman and Chief Executive OfficerProfessional address: Tours Societe Generale, 75886 Paris Cedex 18
Has not held any other mandate
Séverin CABANNESDeputy Chief Executive OfficerProfessional address: Tours Societe Generale, 75886 Paris Cedex 18
Director: Crédit du Nord, TCW roup (until 6 February 2013), Amundi Group.
Member of the Supervisory Board: Groupe Steria Sca.
Director: Crédit du Nord, TCW Group, Amundi Group.
Member of the Supervisory Board: Groupe Steria Sca.
Director: Crédit du Nord, TCW Group, Amundi Group.
Member of the Supervisory Board: Groupe Steria Sca.
Director: Crédit du Nord, TCW Group.
Member of the Supervisory Board: Komerčni Banka, Groupe Steria Sca.
Director: Crédit du Nord, TCW Group.
Member of the Supervisory Board: Komerčni Banka, Groupe Steria Sca.
Jean-François SAMMARCELLIDeputy Chief Executive OfficerProfessional address: Tours Societe Generale, 75886 Paris Cedex 18
Chairman of the Board of Directors: Crédit du Nord.
Director: Amundi Groupe, Banque Tarneaud, Boursorama, Sogecap, Sogeprom, Sopra Group.
Member of the Supervisory Board: Societe Generale Marocaine de Banques, Fonds de Garantie des Dépôts.
Permanent representative of Crédit du Nord on the Supervisory Board: Banque Rhône Alpes, Société Marseillaise de Crédit.
Non-voting director: Ortec Expansion.
Chairman of the Board of Directors: Crédit du Nord.
Director: Amundi Groupe, Banque Tarneaud, Boursorama, Sogecap, Sogeprom, Sopra Group.
Member of the Supervisory Board: Societe Generale Marocaine de Banques, Fonds de Garantie des Dépôts.
Permanent representative of Crédit du Nord on the Supervisory Board: Banque Rhône Alpes, Société Marseillaise de Crédit.
Non-voting director: Ortec Expansion
Chairman of the Board of Directors: CGA (un il 11 October 2011), Crédit du Nord.
Director: Amundi Groupe, Banque Tarneaud, Boursorama, Sogecap, Sogeprom, Sopra Group.
Member of the Supervisory Board: Societe Generale Marocaine de Banques, Fonds de Garantie des Dépôts.
Permanent representative of SG FSH on the Board of Directors: Franfin nce ( ntil 14 April 2011).
Permanent representative of Crédit du Nord on the Supervisory Board: Banque Rhône Alpes, Société Marseillaise de Crédit.
Non-voting director: Ortec Expansion.
Chairman of the Board of Directors: CGA. Crédit du Nord.
Director: Amundi Groupe, Banque Tarneaud, Boursorama, SG Equipment Fin nce ( ntil 29 April 2010), Sogecap, Sogeprom, Sogessur.
Member of the Supervisory Board: Societe Generale Marocaine de Banques, Fonds de Garantie des Dépôts.
Permanent representative of SG FSH on the Board of Directors: Franfinance.
Permanent representative of Crédit du Nord on the Supervisory Board: Banque Rhône Alpes, Société Marseillaise de Crédit.
Non-voting director: Ortec Expansion.
Chairman of the Board of Directors: CGA.
Director: Boursorama, Crédit du Nord, SG Equipment Finance, Sogecap, Sogeprom, Sogessur.
Member of the Supervisory Board: Societe Generale Marocaine de Banques, SKB B nka (until 21 May 2009), Fonds de Garantie des Dé ôts since 11 June 2009).
Permanent representative of SG FSH on the Board of Directors: Franfinance.
Non-voting director: Ortec Expansion.
Bernardo SANCHEZ INCERADeputy Chief Executive OfficerProfessional address: Tours Societe Generale, 75886 Paris Cedex 18
Director: ALD Automotive Group, Banque Roumaine de Développement, Franfinance, Sogecap, Compagnie Générale de Location d’Equipements, National Societe Generale ank (until 28 March 2013), Rosbank, Société Générale de Banques au Cameroun, Société Générale de Banques en Côte d’Ivoire, Société Générale de Banques au Sénégal.
Member of the Supervisory Board: Komerčni Banka A.S., Société Générale Marocaine de Banques.
Director: ALD Automotive Group, Banque Roumaine de Développement, Franfinance, Sogecap, Compagnie Générale de Location d’Equipements, National Societe Generale Bank, Rosbank, Societe Generale de Banques au Cameroun, Societe Generale de Banques en Côte d’Ivoire, Societe Generale de Banques au Sénégal.
Member of the Supervisory Board: Komerčni Banka A.S., Societe Generale Marocaine de Banques.
Director: ALD Automotive Group, Banque Roumaine de Développement, Franfinance, National Societe Generale Bank, Rosbank, Societe Generale de Banques au Cameroun, Societe Generale de Banques en Côte d’Ivoire, Societe Generale de Banques au Sénégal.
Member of the Supervisory Board: Komerčni Banka A.S., Societe Generale Marocaine de Banques.
Deputy Chief Executive Officer: Monoprix SA.
Chairman: Monoprix Exploitation, Aux Galeries de la Croisette.
Chairman of the Supervisory Board: Naturalia France (SAS).
Member of the Supervisory Board: DMC.
Director: Grosvenor, GIE S’Miles.
CORPORATE GOVERNANCE STRUCTURE AND MAIN BODIES I CORPORATE GOVERNANCE I 3
SOCIETE GENERALE GROUP I 2014 REGISTRATION DOCUMENT I 69
EXECUTIVE COMMITTEE(AT 1 JANUARY 2014)
The Executive Committee is responsible for the strategic management of the Group, under the authority of the Chairman and Chief Executive Officer.
Frédéric OUDÉAChairman and Chief Executive Officer
Séverin CABANNESDeputy Chief Executive Officer
Jean-François SAMMARCELLIDeputy Chief Executive Officer
Bernardo SANCHEZ INCERADeputy Chief Executive Officer
Caroline GUILLAUMINHead of Group Communication
Didier HAUGUELCo-Head of International Banking and Financial Services
Philippe HEIMGroup Chief Financial Officer
Edouard-Malo HENRYGroup Head of Human Resources
Françoise MERCADAL-DELASALLESGroup Head of Corporate Resources and Innovation
Benoît OTTENWAELTERGroup Chief Risk Officer
Jean-Luc PARERCo-Head of International Banking and Financial Services
Patrick SUETCorporate Secretary and Group Chief Compliance Officer
Didier VALETHead of Corporate & Investment Banking, Private Banking, Asset Management, Securities Services
ADDITIONAL INFORMATION ABOUT THE MEMBERS OF THE BOARD AND THE DEPUTY CHIEF EXECUTIVE OFFICERS
Absence of conflicts of interestTo the best of the Board of Directors’ knowledge:
n there are no potential conflicts of interest between the Board of Directors’ and the Deputy Chief Executive Officers’ obligations towards Societe Generale and their professional or private interests. Should the case arise, conflicts of interest are governed by article 10 of the Board of Directors’ Internal Rules;
n none of the persons referred to above has been selected pursuant to an arrangement or understanding with shareholders, customers, suppliers or other parties;
n there is no family relationship between any of the persons referred to above;
n no restrictions other than legal have been agreed to by any of the persons referred to above with regard to the disposal of their stake in Societe Generale’s capital.
Absence of criminal convictionsTo the best of the Board of Directors’ knowledge:
n no convictions for involvement in fraud have been delivered against any of its members or any of the Deputy Chief Executive Officers in the past five years;
n none of its members, nor any of the Deputy Chief Executive Officers, has been involved (in their capacity as members of the Boards of Directors, Management Board or Supervisory Board, or as senior executives) in bankruptcy, sequestration or liquidation proceedings in the past five years;
n none of its members, nor any of the Deputy Chief Executive Officers, has received criminal charges and/or an official public sanction from a statutory or legal authority (including professional organisations);
n none of its members, nor any of the Deputy Chief Executive Officers, has been prevented by a court from acting as a member of the administrative, management or supervisory body of an issuer or from taking part in the management or conduct of an issuer’s business in the past five years.
3 I CORPORATE GOVERNANCE I CORPORATE GOVERNANCE STRUCTURE AND MAIN BODIES
70 I 2014 REGISTRATION DOCUMENT I SOCIETE GENERALE GROUP
GROUP MANAGEMENT COMMITTEE(AT 1 JANUARY 2014)
The Group Management Committee, which is made up of around fifty of the Group’s senior executives, meets to discuss Group strategy and other issues of general interest to the Group.
Frédéric Oudéa, Chairman and Chief Executive Officer
Séverin Cabannes, Deputy Chief Executive Officer
Jean-François Sammarcelli, Deputy Chief Executive Officer
Bernardo Sanchez Incera, Deputy Chief Executive Officer
Caroline Guillaumin, Head of Group Communication
Didier Hauguel, Co-Head of International Banking and Financial Services
Philippe Heim, Group Chief Financial Officer
Edouard-Malo Henry, Group Head of Human Resources
Françoise Mercadal-Delasalles, Group Head of Corporate Resources and Innovation
Benoît Ottenwaelter, Group Chief Risk Officer
Jean-Luc Parer, Co-Head of International Banking and Financial Services
Patrick Suet, Corporate Secretary & Group Chief Compliance Officer
Didier Valet, Head of Corporate & Investment Banking, Private Banking, Asset Management, Securities Services
Pascal Augé, Head of Global Transaction and Payment Services
Thierry Aulagnon, Head of the Coverage and Investment Banking,
Philippe Aymerich, Chief Executive Officer of Crédit du Nord
Alain Benoist, Head of Group Processes & Information Systems
Albert Boclé, Head of Sales and Marketing of Societe Generale Retail Banking in France
François Boucher, Head of Information Systems and Process Automation of Retail Banking in France
Gilles Briatta, Group Deputy Corporate Secretary
Marie Cheval, Chairman and Chief Executive Officer of Boursorama
Thierry D’Argent, Global Head of Corporate Finance, Societe Generale Corporate & Investment Banking
Véronique de La Bachelerie, Chief Executive Officer of Societe Generale Bank & Trust
Pierre-Yves Demoures, Chief Operating Officer of International Banking and Financial Services
Marie-Christine Ducholet, Head of the Equipment and Vendor Finance businesses, Societe Generale Equipment Finance
Claire Dumas, Chief Operational Risk Officer and Enterprise Risk Management (ERM) Program Director
Daniel Fields, Head of Global Markets
Ian Fisher, Group Country Head for the United Kingdom
Patrick Folléa, Deputy Head of Societe Generale Private Banking and Head of Societe Generale Private Banking France
Olivier Garnier, Group Chief Economist
Jean-Marc Giraud, Head of inspection and Audit Division
Donato Gonzalez-Sanchez, Head of Corporate & Investment Banking, Private Banking, Asset Management, Securities Services and Group Country Head for Spain and Portugal
Laurent Goutard, Head of Societe Generale Retail Banking in France
Eric Groven, Deputy Head of Societe Generale Retail Banking in France
Xavier Jacquemain, Deputy Head of Group Human Resources and Head of Human Resources for the Corporate Functions
Arnaud Jacquemin, Deputy Group Chief Risk Officer
William Kadouch-Chassaing, Deputy Chief Financial Officer and Head of Group Strategy
Slawomir Krupa, Deputy Head of Global Finance and CEO of Central and Eastern Europe, Middle East and Africa, Corporate & Investment Banking, Private Banking, Asset Management, Securities Services
Albert Le Dirac’h, Chairman of the Board of Directors and CEO of Komerční Banka and Group Country Head for the Czech Republic and Slovakia
Christophe Leblanc, Chief Operating Officer, Corporate & Investment Banking, Private Banking, Asset Management, Securities Services
Diony Lebot, Deputy Head of the Coverage and Investment Banking and CEO for Western Europe, Corporate & Investment Banking, Private Banking, Asset Management, Securities Services
Philippe Lhotte, Chairman and Chief Executive Officer of the Banque Roumaine de Développement (Romania)
Anne Marion-Bouchacourt, Group Chief Country Officer for China
Mike Masterson, Head of the Car Renting and Fleet Management businesses (ALD Automotive)
Laetitia Maurel, Head of Group Media Relations
Alexandre Maymat, Head of the Africa/Asia/Mediterranean Basin & Overseas region, International Banking and Financial Services
Jean-François Mazaud, Head of Private Banking
Christophe Mianné, Deputy Head, Corporate & Investment Banking, Private Banking, Asset Management, Securities Services
Hikaru Ogata, CEO, Asia Pacific, Corporate & Investment Banking, Private Banking, Asset Management, Securities Services
Dmitry Olyunin, Chief Executive Officer of Rosbank
Craig Overlander, CEO, Societe Generale Americas, Corporate & Investment Banking, Private Banking, Asset Management, Securities Services
Pierre Palmieri, Head of Global Finance
Philippe Perret, Head of the Insurance businesses
Bruno Prigent, Global Head of Societe Generale Securities Services
Sylvie Rémond, Deputy Group Chief Risk Officer
Giovanni-Luca Soma, Head of the Europe region, International Banking and Financial Services division
Catherine Théry, Head of Group Internal Control Coordination
Guido Zoeller, Group Country Head for Germany and Head of Societe Generale Corporate & Investment Banking activities in Germany
SOCIETE GENERALE GROUP I 2014 REGISTRATION DOCUMENT I 71
CHAIRMAN’S REPORT ON CORPORATE GOVERNANCE I CORPORATE GOVERNANCE I 3
2 . C H A I R M A N ’ S R E P O R T O N C O R P O R AT E G O V E R N A N C E
CORPORATE GOVERNANCE DECLARATION
The operating method of the Board of Directors and of the Committees has been governed by Internal Rules since early 2000. The Board of Directors will redraft the internal rules in 2014, in order to include the provisions resulting from Directive CRD IV, which is currently being transposed, and the updates to the AFEP-MEDEF Code, with a view to including the Director’s Charter, so as to improve understanding of that Charter. The Internal Rules and the Director’s Charter are included in the Registration Document, together with the Company’s by-laws (see Chapter 7).
BOARD OF DIRECTORS
Societe Generale is a French public limited company (société anonyme) managed by a Board of Directors. In accordance with the law and the Company’s by-laws, it is up to the Board to decide whether the roles of Chairman and Chief Executive Officer are performed by the same person or separated.
Chairman’s Office and General ManagementFrom 13 May 2008 until Daniel Bouton resigned from his office as Chairman on 6 May 2009, the roles of Chairman and Chief Executive Officer were separate. On 6 May 2009, the Board of Directors decided to merge the roles of Chairman and Chief Executive Officer, in order to ensure a tighter and more responsive governance structure, and appointed Frédéric Oudéa. The merger of the roles entered into effect on 24 May 2009.
The Board of Directors also decided to create a position of Vice-Chairman of the Board of Directors on 6 May 2009. This position was assigned to Anthony Wyand, who is also Chairman of the Audit, Internal Control and Risk Committee, and a member of the two other Committees.
Extract from Article 2 of the Internal Rules of the Board of Directors:
Frédéric Oudéa is assisted by three Deputy Chief Executive Officers: Séverin Cabannes, since May 2009, and Jean-François Sammarcelli and Bernardo Sanchez Incera, who were appointed as from 1 January 2010.
Upon the renewal of Frédéric Oudéa’ mandate as a Director in 2011, the Board of Directors maintained this structure.
At the 2012 General Meeting, shareholders submitted a draft resolution aimed at changing the Company’s administrative and management structure into a Supervisory Board and a Management Board.
On 13 April 2012, the Board of Directors unanimously:
n considered the Company’s governance structure to be an essential matter and deemed it appropriate to adapt the Company’s current circumstances;
n recalled that the Company had changed its governance structure twice since 2008, switching from a system with a separate Chairman to a system with a Chairman and Chief Executive Officer;
Societe Generale refers to the most recent version of the AFEP-MEDEF Corporate Governance Code for listed companies (June 2013 – document available on the www.medef.fr website). In accordance with the «comply or explain» principle, Societe Generale would point out that it applies all the recommendations except for the formal evaluation of the individual contribution of each Director, which is not deemed relevant, since the positive assessment of the collective operating method of the Board can only result in satisfactory individual contributions. Nonetheless, the Board of Directors has decided that the Vice-Chairman would hold an individual meeting with each Director every year, in order to increase their involvement.
The Board of Directors may appoint a Vice-Chairman to assist the Chairman with their tasks, primarily the organization and correct operation of the Board of Directors and of its Committees, and the supervision of corporate governance, internal control, and risk management.
Consequently, the Vice-Chairman chairs the Audit, Internal Control and Risk Committee and is a member of the Corporate Governance Committee and the Compensation Committee. He may question the members of the Group Executive Committee and the managers responsible for drawing up the financial statements, and for internal control, risk management, compliance, and internal audits, and
more generally the Group’s management executives and Statutory Auditors. He is provided with the information and documents he deems necessary to accomplish his assignment.
At least once a year he holds a meeting with the Directors who are not employees of the Group, from which the Chairman and Chief Executive Officer is excluded, notably to evaluate the Chief Executive Officers.
In agreement with the Chairman and Chief Executive Officer, he may represent the Company during meetings with third parties regarding corporate governance, internal control and risk management.
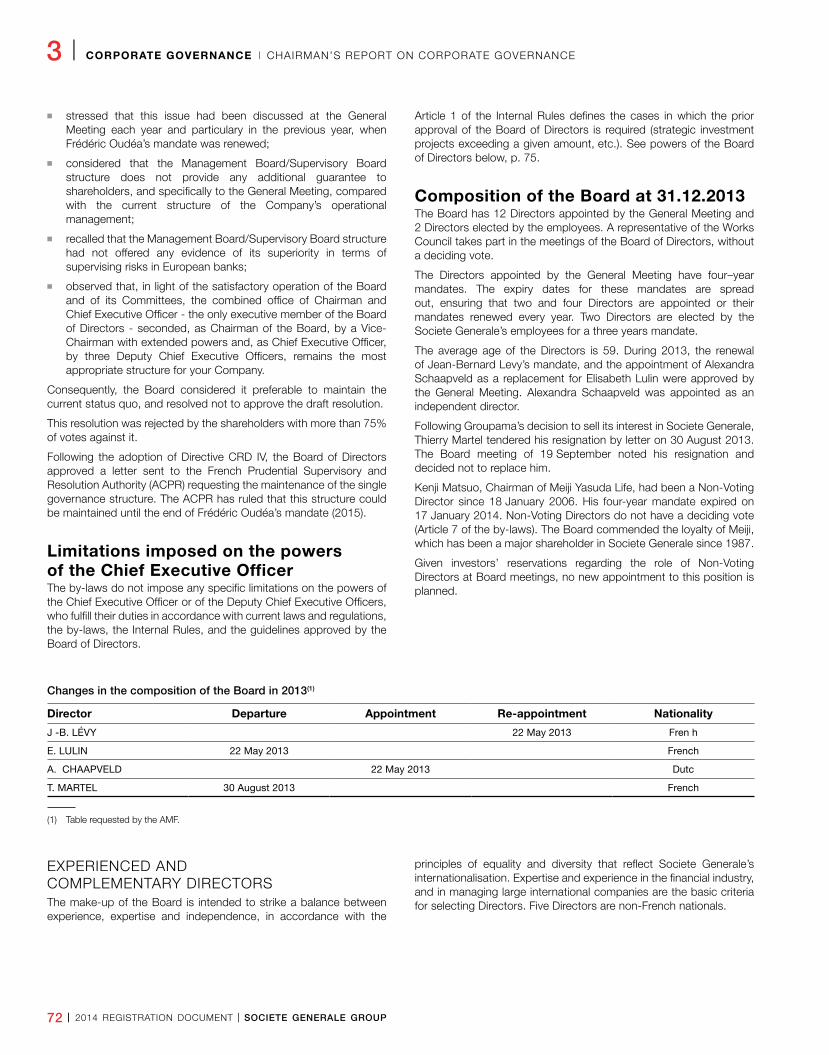
72 I 2014 REGISTRATION DOCUMENT I SOCIETE GENERALE GROUP
3 I CORPORATE GOVERNANCE I CHAIRMAN’S REPORT ON CORPORATE GOVERNANCE
n stressed that this issue had been discussed at the General Meeting each year and particulary in the previous year, when Frédéric Oudéa’s mandate was renewed;
n considered that the Management Board/Supervisory Board structure does not provide any additional guarantee to shareholders, and specifically to the General Meeting, compared with the current structure of the Company’s operational management;
n recalled that the Management Board/Supervisory Board structure had not offered any evidence of its superiority in terms of supervising risks in European banks;
n observed that, in light of the satisfactory operation of the Board and of its Committees, the combined office of Chairman and Chief Executive Officer - the only executive member of the Board of Directors - seconded, as Chairman of the Board, by a Vice-Chairman with extended powers and, as Chief Executive Officer, by three Deputy Chief Executive Officers, remains the most appropriate structure for your Company.
Consequently, the Board considered it preferable to maintain the current status quo, and resolved not to approve the draft resolution.
This resolution was rejected by the shareholders with more than 75% of votes against it.
Following the adoption of Directive CRD IV, the Board of Directors approved a letter sent to the French Prudential Supervisory and Resolution Authority (ACPR) requesting the maintenance of the single governance structure. The ACPR has ruled that this structure could be maintained until the end of Frédéric Oudéa’s mandate (2015).
Limitations imposed on the powers of the Chief Executive OfficerThe by-laws do not impose any specific limitations on the powers of the Chief Executive Officer or of the Deputy Chief Executive Officers, who fulfill their duties in accordance with current laws and regulations, the by-laws, the Internal Rules, and the guidelines approved by the Board of Directors.
Article 1 of the Internal Rules defines the cases in which the prior approval of the Board of Directors is required (strategic investment projects exceeding a given amount, etc.). See powers of the Board of Directors below, p. 75.
Composition of the Board at 31.12.2013The Board has 12 Directors appointed by the General Meeting and 2 Directors elected by the employees. A representative of the Works Council takes part in the meetings of the Board of Directors, without a deciding vote.
The Directors appointed by the General Meeting have four–year mandates. The expiry dates for these mandates are spread out, ensuring that two and four Directors are appointed or their mandates renewed every year. Two Directors are elected by the Societe Generale’s employees for a three years mandate.
The average age of the Directors is 59. During 2013, the renewal of Jean-Bernard Levy’s mandate, and the appointment of Alexandra Schaapveld as a replacement for Elisabeth Lulin were approved by the General Meeting. Alexandra Schaapveld was appointed as an independent director.
Following Groupama’s decision to sell its interest in Societe Generale, Thierry Martel tendered his resignation by letter on 30 August 2013. The Board meeting of 19 September noted his resignation and decided not to replace him.
Kenji Matsuo, Chairman of Meiji Yasuda Life, had been a Non-Voting Director since 18 January 2006. His four-year mandate expired on 17 January 2014. Non-Voting Directors do not have a deciding vote (Article 7 of the by-laws). The Board commended the loyalty of Meiji, which has been a major shareholder in Societe Generale since 1987.
Given investors’ reservations regarding the role of Non-Voting Directors at Board meetings, no new appointment to this position is planned.
Changes in the composition of the Board in 2013(1)
Director Departure Appointment Re-appointment Nationality
J -B. LÉVY 22 May 2013 Fren h
E. LULIN 22 May 2013 French
A. CHAAPVELD 22 May 2013 Dutc
T. MARTEL 30 August 2013 French
(1) Table requested by the AMF.
EXPERIENCED AND COMPLEMENTARY DIRECTORSThe make-up of the Board is intended to strike a balance between experience, expertise and independence, in accordance with the
principles of equality and diversity that reflect Societe Generale’s internationalisation. Expertise and experience in the financial industry, and in managing large international companies are the basic criteria for selecting Directors. Five Directors are non-French nationals.
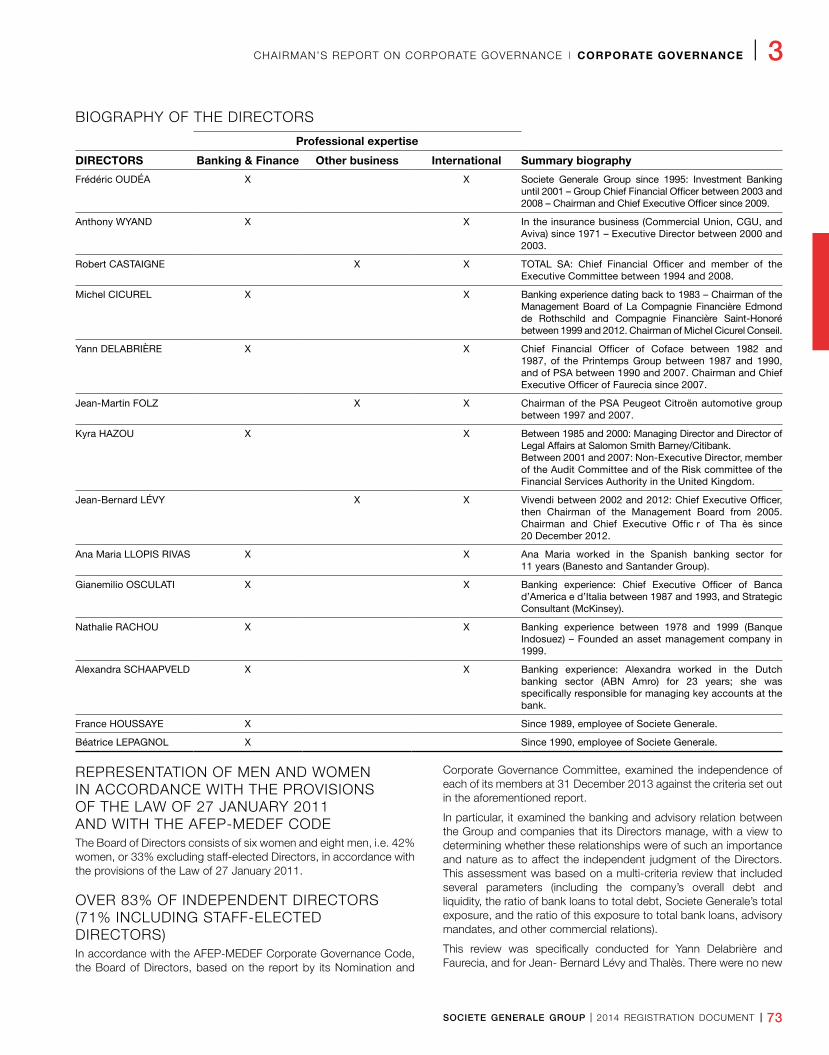
SOCIETE GENERALE GROUP I 2014 REGISTRATION DOCUMENT I 73
CHAIRMAN’S REPORT ON CORPORATE GOVERNANCE I CORPORATE GOVERNANCE I 3
BIOGRAPHY OF THE DIRECTORS
Professional expertise
DIRECTORS Banking & Finance Other business International Summary biography
Frédéric OUDÉA X X Societe Generale Group since 1995: Investment Banking until 2001 – Group Chief Financial Officer between 2003 and 2008 – Chairman and Chief Executive Officer since 2009.
Anthony WYAND X X In the insurance business (Commercial Union, CGU, and Aviva) since 1971 – Executive Director between 2000 and 2003.
Robert CASTAIGNE X X TOTAL SA: Chief Financial Officer and member of the Executive Committee between 1994 and 2008.
Michel CICUREL X X Banking experience dating back to 1983 – Chairman of the Management Board of La Compagnie Financière Edmond de Rothschild and Compagnie Financière Saint-Honoré between 1999 and 2012. Chairman of Michel Cicurel Conseil.
Yann DELABRIÈRE X X Chief Financial Officer of Coface between 1982 and 1987, of the Printemps Group between 1987 and 1990, and of PSA between 1990 and 2007. Chairman and Chief Executive Officer of Faurecia since 2007.
Jean-Martin FOLZ X X Chairman of the PSA Peugeot Citroën automotive group between 1997 and 2007.
Kyra HAZOU X X Between 1985 and 2000: Managing Director and Director of Legal Affairs at Salomon Smith Barney/Citibank.Between 2001 and 2007: Non-Executive Director, member of the Audit Committee and of the Risk committee of the Financial Services Authority in the United Kingdom.
Jean-Bernard LÉVY X X Vivendi between 2002 and 2012: Chief Executive Officer, then Chairman of the Management Board from 2005. Chairman and Chief Executive Offic r of Tha ès since 20 December 2012.
Ana Maria LLOPIS RIVAS X X Ana Maria worked in the Spanish banking sector for 11 years (Banesto and Santander Group).
Gianemilio OSCULATI X X Banking experience: Chief Executive Officer of Banca d’America e d’Italia between 1987 and 1993, and Strategic Consultant (McKinsey).
Nathalie RACHOU X X Banking experience between 1978 and 1999 (Banque Indosuez) – Founded an asset management company in 1999.
Alexandra SCHAAPVELD X X Banking experience: Alexandra worked in the Dutch banking sector (ABN Amro) for 23 years; she was specifically responsible for managing key accounts at the bank.
France HOUSSAYE X Since 1989, employee of Societe Generale.
Béatrice LEPAGNOL X Since 1990, employee of Societe Generale.
REPRESENTATION OF MEN AND WOMEN IN ACCORDANCE WITH THE PROVISIONS OF THE LAW OF 27 JANUARY 2011 AND WITH THE AFEP-MEDEF CODEThe Board of Directors consists of six women and eight men, i.e. 42% women, or 33% excluding staff-elected Directors, in accordance with the provisions of the Law of 27 January 2011.
OVER 83% OF INDEPENDENT DIRECTORS (71% INCLUDING STAFF-ELECTED DIRECTORS)In accordance with the AFEP-MEDEF Corporate Governance Code, the Board of Directors, based on the report by its Nomination and
Corporate Governance Committee, examined the independence of each of its members at 31 December 2013 against the criteria set out in the aforementioned report.
In particular, it examined the banking and advisory relation between the Group and companies that its Directors manage, with a view to determining whether these relationships were of such an importance and nature as to affect the independent judgment of the Directors. This assessment was based on a multi-criteria review that included several parameters (including the company’s overall debt and liquidity, the ratio of bank loans to total debt, Societe Generale’s total exposure, and the ratio of this exposure to total bank loans, advisory mandates, and other commercial relations).
This review was specifically conducted for Yann Delabrière and Faurecia, and for Jean- Bernard Lévy and Thalès. There were no new
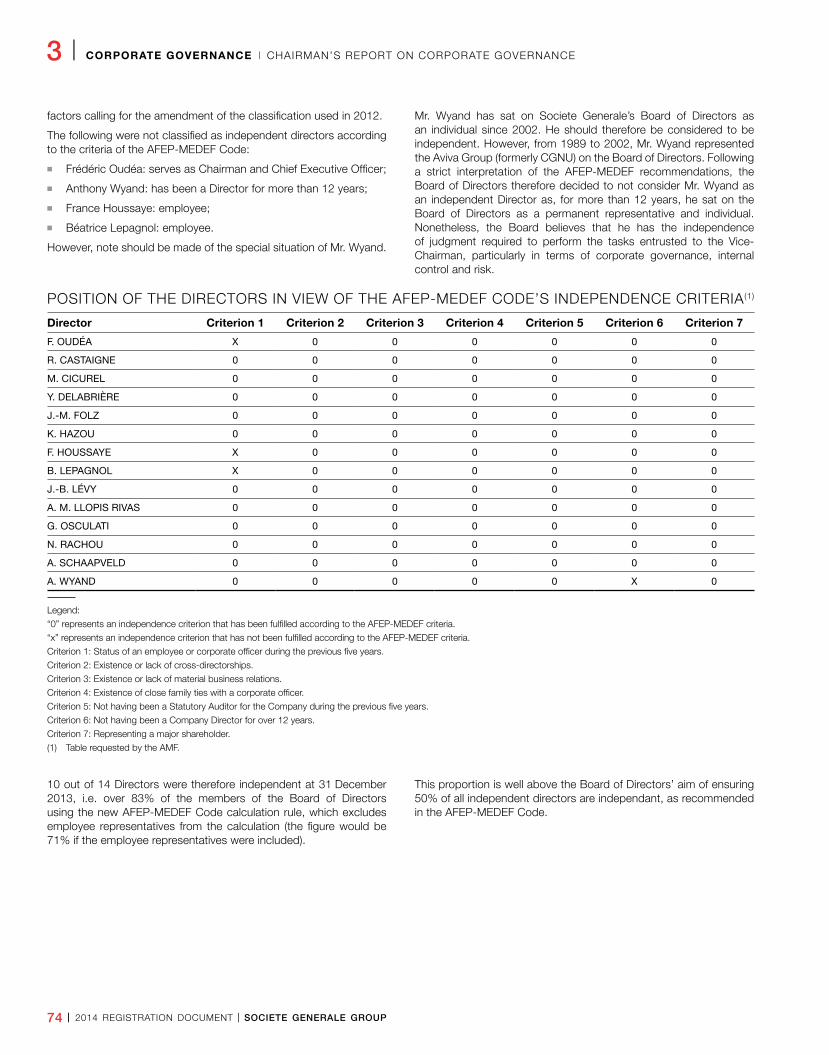
74 I 2014 REGISTRATION DOCUMENT I SOCIETE GENERALE GROUP
3 I CORPORATE GOVERNANCE I CHAIRMAN’S REPORT ON CORPORATE GOVERNANCE
factors calling for the amendment of the classification used in 2012.
The following were not classified as independent directors according to the criteria of the AFEP-MEDEF Code:
n Frédéric Oudéa: serves as Chairman and Chief Executive Officer;
n Anthony Wyand: has been a Director for more than 12 years;
n France Houssaye: employee;
n Béatrice Lepagnol: employee.
However, note should be made of the special situation of Mr. Wyand.
Mr. Wyand has sat on Societe Generale’s Board of Directors as an individual since 2002. He should therefore be considered to be independent. However, from 1989 to 2002, Mr. Wyand represented the Aviva Group (formerly CGNU) on the Board of Directors. Following a strict interpretation of the AFEP-MEDEF recommendations, the Board of Directors therefore decided to not consider Mr. Wyand as an independent Director as, for more than 12 years, he sat on the Board of Directors as a permanent representative and individual. Nonetheless, the Board believes that he has the independence of judgment required to perform the tasks entrusted to the Vice-Chairman, particularly in terms of corporate governance, internal control and risk.
POSITION OF THE DIRECTORS IN VIEW OF THE AFEP-MEDEF CODE’S INDEPENDENCE CRITERIA (1)
Director Criterion 1 Criterion 2 Criterion 3 Criterion 4 Criterion 5 Criterion 6 Criterion 7
F. OUDÉA X 0 0 0 0 0 0
R. CASTAIGNE 0 0 0 0 0 0 0
M. CICUREL 0 0 0 0 0 0 0
Y. DELABRIÈRE 0 0 0 0 0 0 0
J.-M. FOLZ 0 0 0 0 0 0 0
K. HAZOU 0 0 0 0 0 0 0
F. HOUSSAYE X 0 0 0 0 0 0
B. LEPAGNOL X 0 0 0 0 0 0
J.-B. LÉVY 0 0 0 0 0 0 0
A. M. LLOPIS RIVAS 0 0 0 0 0 0 0
G. OSCULATI 0 0 0 0 0 0 0
N. RACHOU 0 0 0 0 0 0 0
A. SCHAAPVELD 0 0 0 0 0 0 0
A. WYAND 0 0 0 0 0 X 0
Legend:
“0” represents an independence criterion that has been fulfilled according to the AFEP-MEDEF criteria.
“x” represents an independence criterion that has not been fulfilled according to the AFEP-MEDEF criteria.
Criterion 1: Status of an employee or corporate officer during the previous five years.
Criterion 2: Existence or lack of cross-directorships.
Criterion 3: Existence or lack of material business relations.
Criterion 4: Existence of close family ties with a corporate officer.
Criterion 5: Not having been a Statutory Auditor for the Company during the previous five years.
Criterion 6: Not having been a Company Director for over 12 years.
Criterion 7: Representing a major shareholder.
(1) Table requested by the AMF.
10 out of 14 Directors were therefore independent at 31 December 2013, i.e. over 83% of the members of the Board of Directors using the new AFEP-MEDEF Code calculation rule, which excludes employee representatives from the calculation (the figure would be 71% if the employee representatives were included).
This proportion is well above the Board of Directors’ aim of ensuring 50% of all independent directors are independant, as recommended in the AFEP-MEDEF Code.
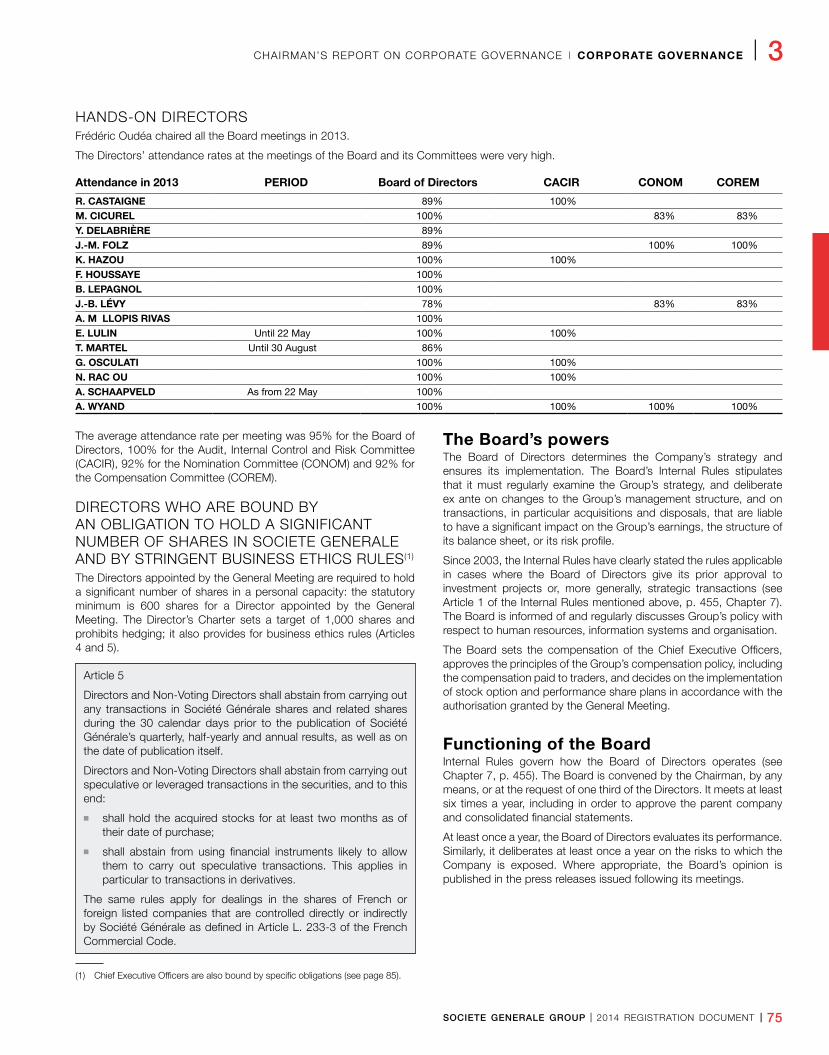
SOCIETE GENERALE GROUP I 2014 REGISTRATION DOCUMENT I 75
CHAIRMAN’S REPORT ON CORPORATE GOVERNANCE I CORPORATE GOVERNANCE I 3
HANDS-ON DIRECTORSFrédéric Oudéa chaired all the Board meetings in 2013.
The Directors’ attendance rates at the meetings of the Board and its Committees were very high.
Attendance in 2013 PERIOD Board of Directors CACIR CONOM COREM
R. CASTAIGNE 89% 100%M. CICUREL 100% 83% 83%Y. DELABRIÈRE 89%J.-M. FOLZ 89% 100% 100%K. HAZOU 100% 100%F. HOUSSAYE 100%B. LEPAGNOL 100%J.-B. LÉVY 78% 83% 83%A. M LLOPIS RIVAS 100%E. LULIN Until 22 May 100% 100%T. MARTEL Until 30 August 86%G. OSCULATI 100% 100%N. RAC OU 100% 100%A. SCHAAPVELD As from 22 May 100%A. WYAND 100% 100% 100% 100%
The average attendance rate per meeting was 95% for the Board of Directors, 100% for the Audit, Internal Control and Risk Committee (CACIR), 92% for the Nomination Committee (CONOM) and 92% for the Compensation Committee (COREM).
DIRECTORS WHO ARE BOUND BY AN OBLIGATION TO HOLD A SIGNIFICANT NUMBER OF SHARES IN SOCIETE GENERALE AND BY STRINGENT BUSINESS ETHICS RULES(1) The Directors appointed by the General Meeting are required to hold a significant number of shares in a personal capacity: the statutory minimum is 600 shares for a Director appointed by the General Meeting. The Director’s Charter sets a target of 1,000 shares and prohibits hedging; it also provides for business ethics rules (Articles 4 and 5).
The Board’s powersThe Board of Directors determines the Company’s strategy and ensures its implementation. The Board’s Internal Rules stipulates that it must regularly examine the Group’s strategy, and deliberate ex ante on changes to the Group’s management structure, and on transactions, in particular acquisitions and disposals, that are liable to have a significant impact on the Group’s earnings, the structure of its balance sheet, or its risk profile.
Since 2003, the Internal Rules have clearly stated the rules applicable in cases where the Board of Directors give its prior approval to investment projects or, more generally, strategic transactions (see Article 1 of the Internal Rules mentioned above, p. 455, Chapter 7). The Board is informed of and regularly discusses Group’s policy with respect to human resources, information systems and organisation.
The Board sets the compensation of the Chief Executive Officers, approves the principles of the Group’s compensation policy, including the compensation paid to traders, and decides on the implementation of stock option and performance share plans in accordance with the authorisation granted by the General Meeting.
Functioning of the BoardInternal Rules govern how the Board of Directors operates (see Chapter 7, p. 455). The Board is convened by the Chairman, by any means, or at the request of one third of the Directors. It meets at least six times a year, including in order to approve the parent company and consolidated financial statements.
At least once a year, the Board of Directors evaluates its performance. Similarly, it deliberates at least once a year on the risks to which the Company is exposed. Where appropriate, the Board’s opinion is published in the press releases issued following its meetings.
Article 5
Directors and Non-Voting Directors shall abstain from carrying out any transactions in Société Générale shares and related shares during the 30 calendar days prior to the publication of Société Générale’s quarterly, half-yearly and annual results, as well as on the date of publication itself.
Directors and Non-Voting Directors shall abstain from carrying out speculative or leveraged transactions in the securities, and to this end:
n shall hold the acquired stocks for at least two months as of their date of purchase;
n shall abstain from using financial instruments likely to allow them to carry out speculative transactions. This applies in particular to transactions in derivatives.
The same rules apply for dealings in the shares of French or foreign listed companies that are controlled directly or indirectly by Société Générale as defined in Article L. 233-3 of the French Commercial Code.
(1) Chief Executive Officers are also bound by specific obligations (see page 85).
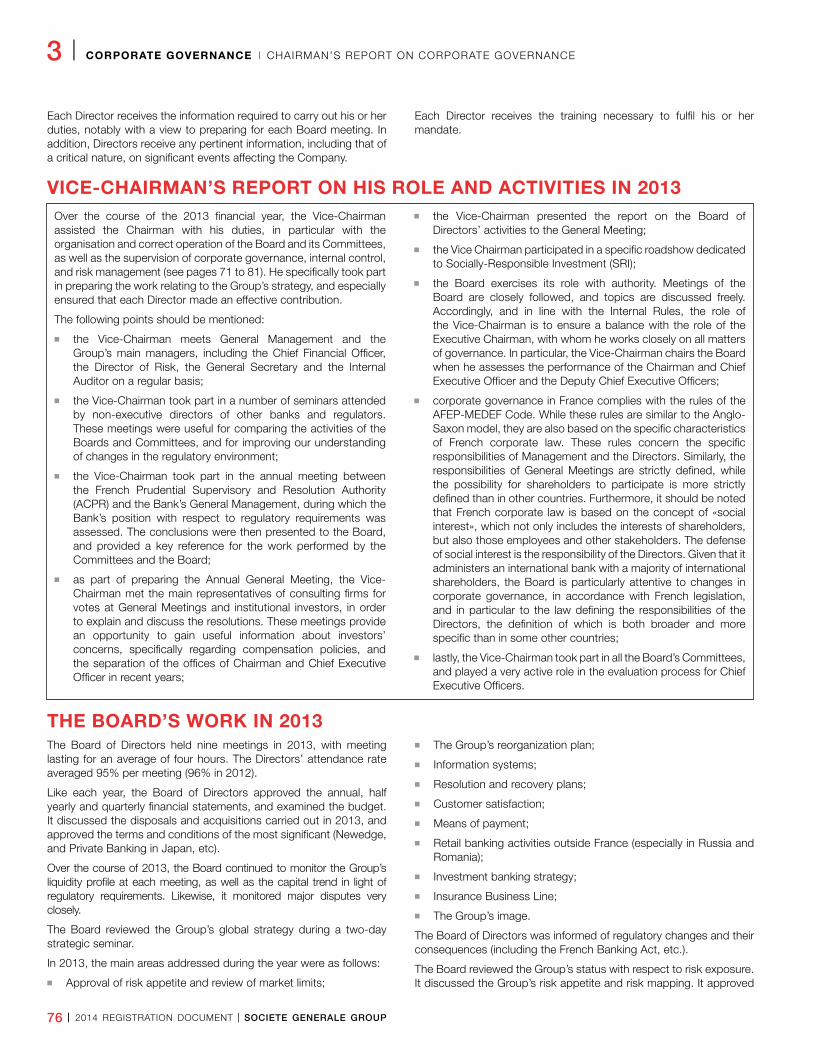
76 I 2014 REGISTRATION DOCUMENT I SOCIETE GENERALE GROUP
3 I CORPORATE GOVERNANCE I CHAIRMAN’S REPORT ON CORPORATE GOVERNANCE
Each Director receives the information required to carry out his or her duties, notably with a view to preparing for each Board meeting. In addition, Directors receive any pertinent information, including that of a critical nature, on significant events affecting the Company.
Each Director receives the training necessary to fulfil his or her mandate.
VICE-CHAIRMAN’S REPORT ON HIS ROLE AND ACTIVITIES IN 2013
THE BOARD’S WORK IN 2013The Board of Directors held nine meetings in 2013, with meeting lasting for an average of four hours. The Directors’ attendance rate averaged 95% per meeting (96% in 2012).
Like each year, the Board of Directors approved the annual, half yearly and quarterly financial statements, and examined the budget. It discussed the disposals and acquisitions carried out in 2013, and approved the terms and conditions of the most significant (Newedge, and Private Banking in Japan, etc).
Over the course of 2013, the Board continued to monitor the Group’s liquidity profile at each meeting, as well as the capital trend in light of regulatory requirements. Likewise, it monitored major disputes very closely.
The Board reviewed the Group’s global strategy during a two-day strategic seminar.
In 2013, the main areas addressed during the year were as follows:
n Approval of risk appetite and review of market limits;
n The Group’s reorganization plan;
n Information systems;
n Resolution and recovery plans;
n Customer satisfaction;
n Means of payment;
n Retail banking activities outside France (especially in Russia and Romania);
n Investment banking strategy;
n Insurance Business Line;
n The Group’s image.
The Board of Directors was informed of regulatory changes and their consequences (including the French Banking Act, etc.).
The Board reviewed the Group’s status with respect to risk exposure. It discussed the Group’s risk appetite and risk mapping. It approved
Over the course of the 2013 financial year, the Vice-Chairman assisted the Chairman with his duties, in particular with the organisation and correct operation of the Board and its Committees, as well as the supervision of corporate governance, internal control, and risk management (see pages 71 to 81). He specifically took part in preparing the work relating to the Group’s strategy, and especially ensured that each Director made an effective contribution.
The following points should be mentioned:
n the Vice-Chairman meets General Management and the Group’s main managers, including the Chief Financial Officer, the Director of Risk, the General Secretary and the Internal Auditor on a regular basis;
n the Vice-Chairman took part in a number of seminars attended by non-executive directors of other banks and regulators. These meetings were useful for comparing the activities of the Boards and Committees, and for improving our understanding of changes in the regulatory environment;
n the Vice-Chairman took part in the annual meeting between the French Prudential Supervisory and Resolution Authority (ACPR) and the Bank’s General Management, during which the Bank’s position with respect to regulatory requirements was assessed. The conclusions were then presented to the Board, and provided a key reference for the work performed by the Committees and the Board;
n as part of preparing the Annual General Meeting, the Vice-Chairman met the main representatives of consulting firms for votes at General Meetings and institutional investors, in order to explain and discuss the resolutions. These meetings provide an opportunity to gain useful information about investors’ concerns, specifically regarding compensation policies, and the separation of the offices of Chairman and Chief Executive Officer in recent years;
n the Vice-Chairman presented the report on the Board of Directors’ activities to the General Meeting;
n the Vice Chairman participated in a specific roadshow dedicated to Socially-Responsible Investment (SRI);
n the Board exercises its role with authority. Meetings of the Board are closely followed, and topics are discussed freely. Accordingly, and in line with the Internal Rules, the role of the Vice-Chairman is to ensure a balance with the role of the Executive Chairman, with whom he works closely on all matters of governance. In particular, the Vice-Chairman chairs the Board when he assesses the performance of the Chairman and Chief Executive Officer and the Deputy Chief Executive Officers;
n corporate governance in France complies with the rules of the AFEP-MEDEF Code. While these rules are similar to the Anglo-Saxon model, they are also based on the specific characteristics of French corporate law. These rules concern the specific responsibilities of Management and the Directors. Similarly, the responsibilities of General Meetings are strictly defined, while the possibility for shareholders to participate is more strictly defined than in other countries. Furthermore, it should be noted that French corporate law is based on the concept of «social interest», which not only includes the interests of shareholders, but also those employees and other stakeholders. The defense of social interest is the responsibility of the Directors. Given that it administers an international bank with a majority of international shareholders, the Board is particularly attentive to changes in corporate governance, in accordance with French legislation, and in particular to the law defining the responsibilities of the Directors, the definition of which is both broader and more specific than in some other countries;
n lastly, the Vice-Chairman took part in all the Board’s Committees, and played a very active role in the evaluation process for Chief Executive Officers.
SOCIETE GENERALE GROUP I 2014 REGISTRATION DOCUMENT I 77
CHAIRMAN’S REPORT ON CORPORATE GOVERNANCE I CORPORATE GOVERNANCE I 3
the overall market risk limits. It examined the annual reports submitted to the French Prudential Supervisor Authority (ACP) on risks and internal control, as well as the responses to the follow-up letters drafted after the Authority’s audits.
The Board evaluated the performance of the Chief Executive Officers and set their compensation. It also defined the Group’s strategy in terms of the remuneration of traders in accordance with CRD3. It decided on performance share plans, as well as on a capital increase reserved for employees as part of the Global Employee
Share Ownership Plan of spring 2013. It discussed the policy regarding professional and wage equality.
The Board of Directors prepared the resolutions submitted to the Annual General Meeting.
Likewise, it discussed the General Management succession plan.
Each year, the Board conducts a review of its operation, every three years the review is carried out by an external expert. The conclusions of this 2013 review are mentioned in the evaluation section in this report (see p. 80).
THE COMMITTEES’ ACTIVITIES IN 2013
Audit, Internal Control and Risk CommitteeSociete Generale has had an Audit Committee since 1995. This Committee, which in 2010 was renamed the Audit, Internal Control and Risk Committee, fulfils all the duties given to an Audit Committee by Directive 2006/43/EC, applicable laws and banking regulations, as well as the AMF Recommendation of 22 July 2010, which applied in 2013. During the course of 2014, the Committee will be required to be split into an Audit Committee and a Risk
Committee in accordance with Directive CRD4, which is currently being transposed.
The Committee consisted of five Directors at 31 December 2013: Mrs. Hazou, who replaced Mrs. Lulin in May 2013, Mrs. Rachou, and Messrs. Castaigne, Osculati and Wyand, four of whom are independent. It is chaired by Mr. Wyand. All its members are particularly qualified in the financial and accounting fields, risk analysis, and internal control, as they hold, or have held positions as bankers, chief financial officers, auditors, or bank legal affairs directors.
The duties of the Audit, Internal Control and Risk Committee are set forth in Article 9 of the Internal Rules:
Audit, Internal Control and Risk Committee’s mission is to monitor issues concerning the production and control of accounting and financial information, and to monitor the efficiency of the internal control, risk assessment, monitoring and management systems.
It is particularly in charge of:
n ensuring monitoring of the process for drawing up financial information, particularly examining the quality and reliability of the systems in place, and making suggestions for their improvement, and verifying that corrective actions have been implemented if fault are found in the process;
n analyzing the draft financial statements to be submitted to the Board, in order in particular to verify the clarity of the information provided, and to offer an assessment of the relevance and consistency of the accounting methods used to draw up the parent company and consolidated financial statements;
n ensuring the independence of the Statutory Auditors, in particular by reviewing the breakdown of the fees paid by the Group to them, as well as of the network to which they may belong, and through prior approval of all assignment that do not fall within the framework of the statutory audit of accounts, but which may be the consequence of, or a supplement to, the same, all others assignments being prohibited, implementing the procedure for selecting the Statutory Auditors, and submitting an opinion to the Board of Directors concerning the appointment or renewal of such as well as their remuneration.
n examining the work program of the Statutory Auditors, and more generally ensuring the supervision of account monitoring by the Statutory Auditors;
n offering an assessment of the quality of internal control, in particular the consistency of risk assessment, monitoring and management systems and proposing additional actions where appropriate.
To this end, the Committee is responsible primarily:
– reviewing the Group’s internal audit program and the Annual Report on Internal Control drawn up in accordance with banking regulations, as well as formulating an opinion on the organisation and operation of the internal control departments;
– reviewing the follow-up letters sent by the French Banking Commission (Commission bancaire) and issuing an opinion on draft responses to these letters;
– examining the market risk and structural interest rate risk control procedures and being consulted about setting risk limits;
– formulating an opinion on the Group’s global provisioning policy, as well as on specific provisions relating to large sums;
– examining the annual risk assessment and control procedures report drawn up in accordance with the French banking regulations;
– reviewing the policy concerning risk management and off-balance sheet commitment monitoring, in particular in the light of memoranda drafted to this end by the Finance Division, the Risk Division and the Statutory Auditors.
It gives the Board of Directors its opinion on the section of the Registration Document dealing with these issues and produces an Annual Activity Report, submitted to the Board for its approval, which is then inserted in the Registration Document.
The Committee may interview, under conditions it shall establish, the Statutory Auditors and the managers in charge of drawing up financial statements, internal control, risk management, compliance and internal audits.
The Statutory Auditors shall be invited to the meetings of the Audit, Internal Control and Risk Committee unless the Committee decides otherwise.
78 I 2014 REGISTRATION DOCUMENT I SOCIETE GENERALE GROUP
3 I CORPORATE GOVERNANCE I CHAIRMAN’S REPORT ON CORPORATE GOVERNANCE
ACTIVITY REPORT OF THE AUDIT, INTERNAL CONTROL AND RISK COMMITTEE (CACIR) FOR 2013The Committee met 12 times in 2013, and the attendance rate of 100%, as in 2012.
At each account closing period, the Committee interviews the Statutory Auditors without the presence of management, before hearing the presentation of the financial statements made by the Finance Division, and the comments of the Risk Division on risks of all kinds. Since 2002, one of the Chief Executive Officers has attended part of the meetings called to approve the accounts, and has discussed the highlights of the quarter with the Committee. More in-depth presentations are given by others managers on certain subjects, notably the principal risks, asset and liability management, internal control and the financial aspects of planned acquisitions. Training and information sessions are organized in response to internal needs and any outside developments.
In 2013, the Committee reviewed the draft annual, half yearly and quarterly consolidated financial statements before their presentation to the Board, and submitted its opinion to the Board on these statements. It reviewed the 2010-2015 strategic and financial plan. The Committee reviewed the liquidity position and the level of equity capital, particularly in the light of the planned changes to the prudential rules. It monitored the risks relating to disputes particularly closely.
As part of its risk control responsibilities, the Committee adopted a broad approach to the various risk factors and discussed the Group’s risk appetite. It reviewed the Group’s risk mapping and the suggested approach for defining risk appetite.
As such, it ensures that adequate provisions are booked for the principal identified risks and closely monitors the evolution of major risks, such as credit risk, market risk, structural interest rate, exchange rate or liquidity risk, and legal risk, as well as changes in significant on- and off-balance sheet items. It also reviews the operational risk control structure. The Committee reviews the procedures used to control market risks and is consulted on the annual revision of market risk limits. Notably, it regularly monitors hedge fund risks and examines the annual report on risk assessment and monitoring procedures. It also gives the Compensation Committee its opinion on the incorporation of risk within the compensation structure for regulated employees (financial market professionals and others). Finally, the Committee discussed the Group’s IT security.
In 2013, the Committee spent several meetings discussing issues pertaining to compliance control.
The Committee regularly reviewed the work performed by General Inspection Department and the Internal Control Division. It was kept informed of the significant incidents observed in the compliance area. It examined the Annual Report on internal control. It reviewed the schedule for the General Inspection Department, and audit
teams, and the procedures for following up audit recommendations. It reviewed the activities of the subsidiaries’ Audit Committees within the framework of the rules that the Group has determined in this area. The Committee monitored the start of the Enterprise Risk Management project, intended to strengthen operational risk management throughout the bank.
The Committee followed the bank’s liquidity situation very closely. It was also consulted on the draft responses by the Group to the follow-up letters from the French Prudential Supervisory Authority.
The main topics addressed during the year were as follows:
n review of acquisitions & disposals;
n the Private Banking business’ risk and internal control;
n the implementation of FATCA;
n risks relating to IT security (including social networks and Cloud computing, etc.);
n combating money laundering;
n property risk;
n project-related risk;
n new product committees;
n embargoes and financial sanctions;
n recovery and resolution plans;
n country risk (North Africa & Middle East);
n application of social and environmental responsibility policies;
n tax management;
n customer protection;
n monitoring of outsourced services;
n monitoring of the SSG portfolio;
n regulatory developments in the United-States;
n controls on the business activities in London, New York and Russia;
n risks relating to French Overseas Departments and territories;
n dispute management.
The Committee travelled to Russia, and conducted a full review of business activities in that country.
The Committee receives a financial benchmark setting out the Group’s performance in its various business lines compared with its main competitors. This benchmark is presented to the Board once a year.
The Committee discussed the audit program and the 2013 budget for the Statutory Auditors’ fees.
SOCIETE GENERALE GROUP I 2014 REGISTRATION DOCUMENT I 79
CHAIRMAN’S REPORT ON CORPORATE GOVERNANCE I CORPORATE GOVERNANCE I 3
The Compensation Committee’s activities in 2013As at 31 December 2013, the Compensation Committee consisted of four Directors, Messrs. Cicurel, Folz, Lévy and Wyand, three of whom are independent. It is chaired by Mr. Folz, who is an independent director. Its members have the skills required to assess the compensation policies and practices with regard to all the relevant criteria, including the Group’s risk policy.
Since 1 January 2014, in accordance with the provisions of directive CRD IV, which is currently being transposed, and the recommendations of the AFEP-MEDEF Code, the Board of Directors has appointed a salaried employee. namely Mrs. France Houssaye, as a member of the Compensation Committee.
THE COMPENSATION COMMITTEE’S ACTIVITY REPORT FOR 2013The Compensation Committee met six times during the financial year. The attendance rate of its members was 92% (92% in 2012).
During its meetings, the Committee prepared the Board’s decisions on the status and remuneration of the Chief Executive Officers. It prepared the decisions regarding multi-year or deferred compensation.
The Committee prepared the appraisals of the Executive Corporate Officers. It recommended the annual targets for the Chief Executive Officers to the Board.
In accordance with CRD3 and its transposition into French law, the Compensation Committee ensures that the Group’s remuneration policies comply not only with regulations, but also with the company’s risk management policy as well as its capital targets.
The Committee reviewed the principles of the remuneration policy applicable within the Group, and particularly concerning employees whose activities have a significant impact on the Group’s risk profile, in accordance with the new regulations in force. It dedicated several
meetings to this examination and to verifying that the structure proposed for regulated employees complied with the new, particularly complex, rules. It above all ensured that the remuneration policy effectively takes into account the risks generated by the activities and adherence by employees to risk management policies and professional standards and consulted the Audit, Internal Control and Risk Committee in this regard. The Committee also drew on work by external and internal control bodies. Lastly, it reviewed the Annual Report on remuneration.
The remuneration policy defined in this way is described in detail on page 82 and following.
In addition, it reviewed the terms of the capital increase reserved for employees. Lastly, the Committee proposed the share (or shares equivalent) allocation plans to the Board.
The Committee prepared the Board’s work on gender equality within the Company.
In accordance with Article 7 of the Internal Rules, the Compensation Committee:
n proposes to the Board, in accordance with the guidelines given by the AFEP-MEDEF Corporate Governance Code and with the professional standards, the policy governing the remuneration of the Chief Executive Officers and Directors, and particularly the determination criteria, structure and amount of this remuneration, including allowances and benefits in kind, personal protection insurance or pension benefits, as well as any compensation received from Group companies, and ensures that the policy is properly applied;
n prepares the annual performance appraisal of the Chief Executive Officers;
n submits a proposal to the Board of Directors for the performance share and stock option award policy and formulates an opinion on the list of beneficiaries;
n prepares the decisions of the Board relating to the employee savings plan;
n examines each year and gives the Board of Directors its opinion on the General Management’s proposals for the remuneration policy principles applicable within the Group, the policy for the compensation of employees referred to by regulation No. 97-02 on internal control, particularly employees whose activities have
a significant impact on the Group’s risk profile, and makes sure with the General Management that the policy is being implemented. It also ensures that the General Management and Risk Management and Compliance do in fact cooperate in the definition and application of this policy, as required by professional standards, and that due consideration is given to the opinions of Risk Management and Compliance;
n checks that the report made to it by the General Management complies with regulation No. 97-02 and is consistent with the applicable professional standards. It receives all the information necessary for it to complete its mission and particularly the annual report sent to the French Prudential Control Authority (Autorité de contrôle prudentiel) and compensation for individual amounts above a threshold that it determines. It shall call on the internal audit departments or outside experts where necessary. It reports to the Board on its activities. It may perform the same tasks for the Group companies monitored by the French Prudential Control Authority (Autorité de contrôle prudentiel) on a consolidated or sub-consolidated basis;
n gives the Board of Directors its opinion on the section of the Registration Document dealing with these issues and produces an Annual Activity Report, submitted to the Board for its approval, which is then inserted in the Registration Document.
80 I 2014 REGISTRATION DOCUMENT I SOCIETE GENERALE GROUP
3 I CORPORATE GOVERNANCE I CHAIRMAN’S REPORT ON CORPORATE GOVERNANCE
Nomination and Corporate Governance CommitteeAs at 31 December 2013, the Nomination and Corporate Governance Committee was made up of four Directors: Messrs. Cicurel, Folz,
Lévy, and Wyand, three of whom are independent. It is chaired by Mr. Folz, who is an independent director. Its members have the skills required to assess the Nomination and corporate governance policies and practices with regard to all the relevant criteria.
APPOINTMENTS AND CORPORATE GOVERNANCE COMMITTEE’S ACTIVITY REPORT FOR 2013The Appointments and Corporate Governance Committee held six meetings in 2013; the attendance rate was 92% (94% in 2012).
It prepared the Board’s review of the Corporate Governance section of the 2013 Annual Report, in particular the section concerning the assessment of Directors’ independence. The Committee prepared the conclusions of the Board of Directors’ self-assessment of the
Board’s operation. Lastly, it reviewed the potential consequences of Directive CRD IV on the Bank’s governance.
The Committee prepared proposals for the appointment of Chief Executive Officers and Directors to be submitted at the 2013 General Meeting. To this end, it relied on the recommendations of a consulting firm. It prepared the Board’s decision on whether to maintain a Non-Voting Director position.
It examined the succession plan for the Chief Executive Officers and Directors in order to be in a position to make a proposal to the Board at the appropriate time. It was also kept informed of the planned changes to the Executive Committee and Management Committee.
APPRAISAL OF THE BOARD OF DIRECTORS AND CHIEF EXECUTIVE OFFICERS
Since 2000, the Board of Directors has devoted part of a meeting to debating the scope of its operation based on an assessment performed by the Directors themselves. This evaluation is performed either by a member of the Board or by the Secretary of the Board, or by a specialized external consultant, based on an interview guide or questionnaire approved by the Nomination and Corporate Governance Committee. In both cases, the answers are presented on an anonymous basis in a summary document that serves as a basis for the Board’s discussions.
For 2013, the assessment was guided by the Nomination and Corporate Governments Committee, on the basis of a report prepared by a consultancy firm. All the Directors took part in the process via an interview. The Board of Directors discussed this evaluation on 6 November 2013.
The general opinion on the Board and its operation is largely positive.
Governance has improved over the past few years, and the Directors place great trust in the Chairman.
The main points addressed were as follows:
n the number of Directors; the renewal of mandates that are expiring, and the number of mandates. It was decided not to replace the vacant mandate. The size of the Board (14 mandates) was considered to be appropriate;
n employee representation on the Board; it was decided to appoint a salaried Director to the Compensation Committee. In addition, the possible changes following a new law adopted in 2013 will be assessed by the Board in 2014;
n “Sessions without the Executive Managers”. This practice already exists for the assessment process and setting remuneration. It extends to other issues in some countries. The Board considers that it is appropriate to stick to the current policy;
n “Strategy Seminar”: this annual session is particularly popular. The Board believes that it is important to be involved in its preparation at an early stage;
n coordination between the Committees and the Board: a longer timeframe for the feedback on the work performed by the Committees would be desirable;
n progress is still expected for the presentations made to the Board, and the timeframe for forwarding the documents;
n initial training for the Directors. A more systematic program would be desirable;
n regular indicators (e.g. for risks) are popular and could be extended to other areas;
Under the terms of Article 8 of the Internal Rules, the Nomination and Corporate Governance Committee:
n is assigned the task of submitting proposals to the Board for the nomination of Directors and for the appointment of successors to the Chief Executive Officers, especially where a position becomes vacant unexpectedly, after carrying out any necessary inquiries.
n provides the Board with proposals for appointments to the Board’s Committees.
n may propose the appointment of a Vice-Chairman.
n carries out preparatory work for the examination by the Board of Directors of corporate governance issues. It is responsible for
the evaluation of the Board of Directors’ performance, which is carried out each year.
n submits a proposal to the Board of Directors for the presentation of the Board of Directors to be included in the Registration Document and notably the list of independent Directors.
n gives the Board of Directors its opinion on the section of the Registration Document dealing with these issues and produces an Annual Activity Report, submitted to the Board for its approval, which is then inserted in the Registration Document.
n is informed prior to the appointment of any member of the Group’s Executive Committee and any corporate department heads who do not sit on this Committee. It is informed of the list of replacements for these senior managers
SOCIETE GENERALE GROUP I 2014 REGISTRATION DOCUMENT I 81
CHAIRMAN’S REPORT ON CORPORATE GOVERNANCE I CORPORATE GOVERNANCE I 3
n instead of an individual evaluation for the Directors, the Board has chosen to arrange regular individual meetings with the Vice-Chairman.
The Chief Executive Officers have been the subject of an annual
evaluation prepared by the Compensation Committee since 2003. The evaluation covers Chief executive Officers’ fulfillment of the annual goals assigned to them by the Board of Directors at the beginning of the financial year.
TRAINING
A training session was organised in 2013. The session dealt with weighted credit risk (RWA credit).
SPECIFIC CONDITIONS RELATING TO THE PARTICIPATION OF SHAREHOLDERS IN THE GENERAL MEETING
The by-laws (see Chapter 7) define the conditions for shareholders’ participation in the General Meeting. A summary of these rules can be found in Chapter 7 of the Registration Document.
Any shareholder may vote at the General Meeting via the Internet under the conditions disclosed in the notice of meeting published in the Bulletin des Annonces Légales Obligatoires (French Mandatory Legal Announcements Gazette).
ATTENDANCE FEES PAID TO COMPANY DIRECTORS
The amount of the attendance fees was set at EUR 1,250,000 by the General Meeting of 24 May 2011.
The rules governing the distribution of attendance fees between the Directors are determined by Article 11 of the Internal Rules.
COMPENSATION AND BENEFITS IN KIND AWARDED TO CHIEF EXECUTIVE OFFICERS, AND THE DISCLOSURE OF INFORMATION AS PROVIDED FOR IN ARTICLE L. 225-100-3 OF THE FRENCH COMMERCIAL CODE
The information in the Chairman’ Report that describes the principles and rules approved by the Board of Directors to calculate the compensation and benefits in kind awarded to the Chief Executive Officers is included in this Chapter under the “Remuneration principles” heading below p. 82.
The section entitled «Information about Article L. 225-100-03 of the French Commercial Code» is included in Chapter 7 on p. 445.
The Chairman and Chief Executive Officer do not receive any attendance fees.
The overall amount of the attendance fee is divided into two portions: one fixed portion equal to one third of the overall amount and one variable portion equal to two-thirds of the overall amount.
The Vice-Chairman receives 35% of the fixed portion of the annual attendance fee as a special attendance fee, calculated pro-rata to the duration of his mandate over the period.
After allocation of the Vice-Chairman’s share, the fixed portion of the attendance fee allocated to the other Directors, calculated pro-rata to the duration of their mandate over the period, is split as follows:
– four shares for the Chairman of the Audit, Internal Control and Risk Committee;
– three shares for the members of the Audit, Internal Control and Risk Committee;
– two shares for the Chairman of the Nomination and Corporate Governance and Compensation Committees;
– one share for the other Directors.
The variable portion of the attendance fee is shared between the Directors at the end of the year according to the number of Board meetings or working meetings of the Board and Committee meetings that they have attended. However, meetings of the Compensation Committee and the Nomination and Corporate Governance Committee held on the same day are taken into account as one unit for members of both Committees.
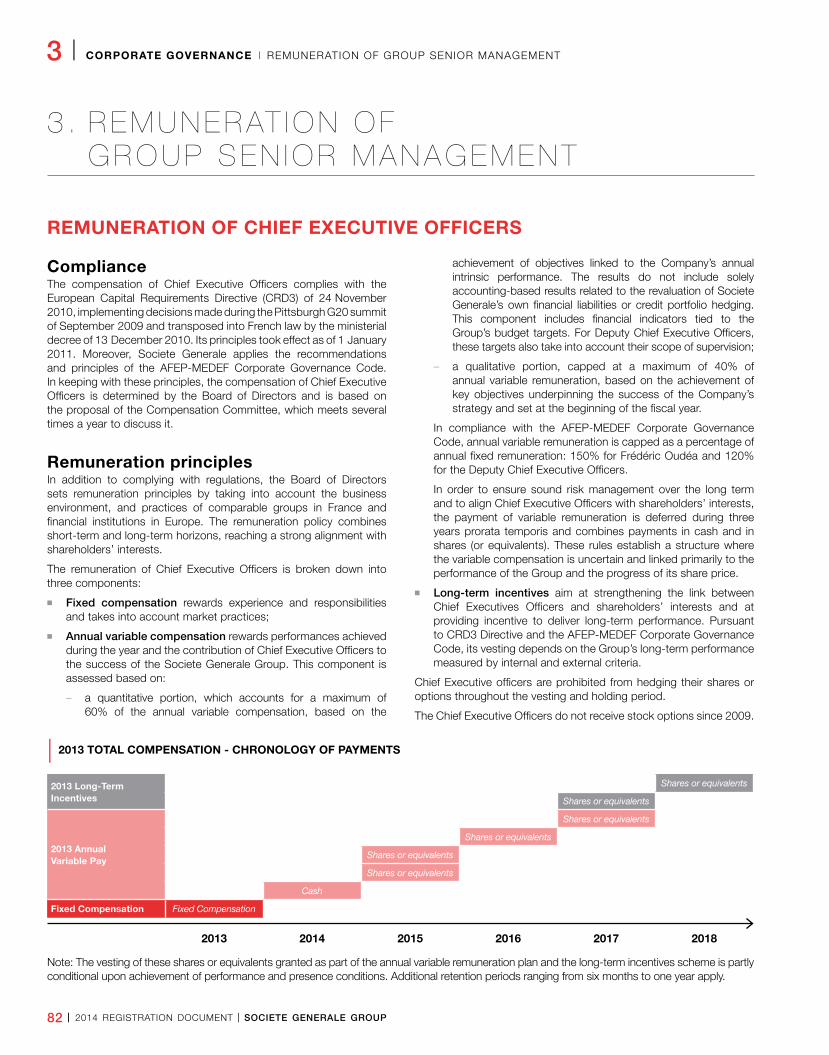
82 I 2014 REGISTRATION DOCUMENT I SOCIETE GENERALE GROUP
3 I CORPORATE GOVERNANCE I REMUNERATION OF GROUP SENIOR MANAGEMENT
3 . R E M U N E R AT I O N O F G R O U P S E N I O R M A N A G E M E N T
REMUNERATION OF CHIEF EXECUTIVE OFFICERS
ComplianceThe compensation of Chief Executive Officers complies with the European Capital Requirements Directive (CRD3) of 24 November 2010, implementing decisions made during the Pittsburgh G20 summit of September 2009 and transposed into French law by the ministerial decree of 13 December 2010. Its principles took effect as of 1 January 2011. Moreover, Societe Generale applies the recommendations and principles of the AFEP-MEDEF Corporate Governance Code. In keeping with these principles, the compensation of Chief Executive Officers is determined by the Board of Directors and is based on the proposal of the Compensation Committee, which meets several times a year to discuss it.
Remuneration principlesIn addition to complying with regulations, the Board of Directors sets remuneration principles by taking into account the business environment, and practices of comparable groups in France and financial institutions in Europe. The remuneration policy combines short-term and long-term horizons, reaching a strong alignment with shareholders’ interests.
The remuneration of Chief Executive Officers is broken down into three components:
n Fixed compensation rewards experience and responsibilities and takes into account market practices;
n Annual variable compensation rewards performances achieved during the year and the contribution of Chief Executive Officers to the success of the Societe Generale Group. This component is assessed based on:
– a quantitative portion, which accounts for a maximum of 60% of the annual variable compensation, based on the
achievement of objectives linked to the Company’s annual intrinsic performance. The results do not include solely accounting-based results related to the revaluation of Societe Generale’s own financial liabilities or credit portfolio hedging. This component includes financial indicators tied to the Group’s budget targets. For Deputy Chief Executive Officers, these targets also take into account their scope of supervision;
– a qualitative portion, capped at a maximum of 40% of annual variable remuneration, based on the achievement of key objectives underpinning the success of the Company’s strategy and set at the beginning of the fiscal year.
In compliance with the AFEP-MEDEF Corporate Governance Code, annual variable remuneration is capped as a percentage of annual fixed remuneration: 150% for Frédéric Oudéa and 120% for the Deputy Chief Executive Officers.
In order to ensure sound risk management over the long term and to align Chief Executive Officers with shareholders’ interests, the payment of variable remuneration is deferred during three years prorata temporis and combines payments in cash and in shares (or equivalents). These rules establish a structure where the variable compensation is uncertain and linked primarily to the performance of the Group and the progress of its share price.
n Long-term incentives aim at strengthening the link between Chief Executives Officers and shareholders’ interests and at providing incentive to deliver long-term performance. Pursuant to CRD3 Directive and the AFEP-MEDEF Corporate Governance Code, its vesting depends on the Group’s long-term performance measured by internal and external criteria.
Chief Executive officers are prohibited from hedging their shares or options throughout the vesting and holding period.
The Chief Executive Officers do not receive stock options since 2009.
| 2013 TOTAL COMPENSATION - CHRONOLOGY OF PAYMENTS
2013 Long-Term Incentives
Shares or equivalents
Shares or equivalents
2013 Annual Variable Pay
Shares or equivalents
Shares or equivalents
Shares or equivalents
Shares or equivalents
Cash
Fixed Compensation Fixed Compensation
2013 2014 2015 2016 2017 2018
Note: The vesting of these shares or equivalents granted as part of the annual variable remuneration plan and the long-term incentives scheme is partly conditional upon achievement of performance and presence conditions. Additional retention periods ranging from six months to one year apply.
SOCIETE GENERALE GROUP I 2014 REGISTRATION DOCUMENT I 83
REMUNERATION OF GROUP SENIOR MANAGEMENT I CORPORATE GOVERNANCE I 3
Individual remunerationThe standardised presentation of the remuneration of Chief Executive Officers is given on pages 88 to 95.
CHAIRMAN AND CHIEF EXECUTIVE OFFICERThe fixed salary of Frédéric Oudéa was revised on 1 January 2011 for the first time since his appointment as Chairman and Chief Executive Officer in May 2009. It remains a priori unchanged in 2014 at EUR 1,000,000 per year.
His variable compensation for the 2013 fiscal year was approved by the Board on 11 February 2014 in accordance with predefined rules:
n the quantitative portion was measured based on the achievement of Group targets in terms of earnings per share, gross operating income and cost/income ratio;
n the qualitative portion was evaluated in relation to specific targets covering different areas such as Group and business division’s strategy, balance sheet management, cost control and optimization of the structure, internal control and risk management, human resources, and Corporate and Social Responsibility.
The Board of Directors, upon the recommendation of the Compensation Committee, recorded the quantitative performance achievement rate of 96%. Regarding the qualitative objectives assigned to Frédéric Oudéa, the Board estimated that his performance was excellent and set its level of achievement at 90%, considering that the Group confirmed in 2013 its capacity of adaptation in a fast-changing environment, with a Group net income multiplied by a factor of 2.8 vs 2012, a good performance in all its businesses, the achievement of a far-reaching transformation of its balance sheet, a simplified organisation that was successfully launched and a cost-savings plan in progress. The markets have indeed recognized these solid results granting Societe Generale with one of the best performances of the financial sector.
As a consequence, his gross annual variable compensation for the 2013 fiscal year totalled EUR 1,406,070, for an overall achievement rate of 94%.
Going further than the strict application of the standards applicable to banks’ senior management (European Directive CRD3), the Board of Directors laid down the vesting and payment conditions pertaining to annual variable compensation as follows:
n a March 2014 vested portion, representing 40% of the total amount granted, half of this amount being converted into a number of shares or equivalents non-transferable for one year;
n an unvested portion, representing 60% of the total amount granted, converted in shares or equivalents and submitted to the achievement of profitability and core tier one level conditions. The final amount is thus conditional and depends on Societe Generale share price at the end of a 3.5-year period.
Additional remuneration was granted to Frédéric Oudéa to compensate for the loss of benefits from the supplementary pension plan to which he was entitled as a salaried manager of Societe Generale. Mr. Oudéa lost these benefits when he was appointed Chairman and Chief Executive Officer and terminated his employment contract, in accordance with the principle against combining an employment contract with a corporate office. This additional compensation, subject to income tax and social security contributions, amounts to EUR 300,000 per year. It is paid monthly in addition to his fixed salary, but it is not included in the calculation of his annual variable compensation.
Frédéric Oudéa does not receive any attendance fees.
DEPUTY CHIEF EXECUTIVE OFFICERSThe fixed salaries of the Deputy Chief Executive Officers were set in March 2011 at EUR 650,000 for Messrs. Cabannes and Sammarcelli and at EUR 700,000 for Mr. Sanchez Incera. These salaries remain a priori unchanged in 2014.
The variable compensations awarded to the Deputy Chief Executive officers for the 2013 fiscal year were approved by the Board of Directors on 11 February 2014 in accordance with the rules previously defined in March 2013.
n the quantitative portion of the annual variable remuneration was measured for 50% based on the achievement of Group’s budget targets in terms of earnings per share, gross operating income and cost/income ratio, and for the other 50%, based on the fulfilment of the Deputy Chief Executive Officer’s scope of supervision budget targets in terms of gross operating income, Group net income before tax and cost/income ratio;
n the qualitative component was appraised based on the realization of specific predefined objectives, in line with those for the Chairman and Chief Executive Officer (see supra).
Gross annual variable compensation for the 2013 fiscal year amounted to EUR 705,120 for Mr. Cabannes for an overall achievement rate of 90%, to EUR 704,964 for Mr. Sammarcelli, for an overall achievement rate of 90%, and EUR 619,718 for Mr. Sanchez Incera, for an overall achievement rate of 74%.
The payment conditions set by the Board of Directors are equal to those defined for the Chairman and Chief Executive Officer. Therefore, variable compensation is for a large part converted into shares or equivalents and submitted for 60% to profitability and core tier one level conditions.
The variable compensation paid to Deputy Chief Executive Officers is reduced by the amount of any attendance fees they may receive both from Societe Generale companies and companies outside the Group of which they are Directors.
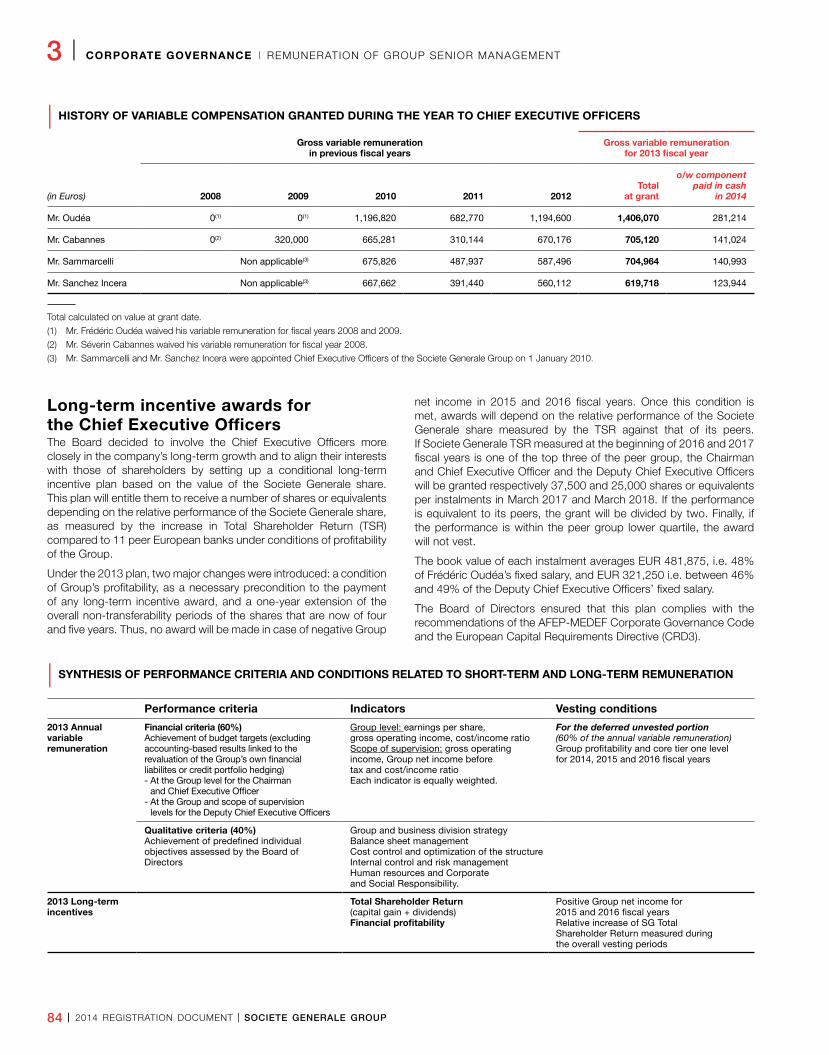
84 I 2014 REGISTRATION DOCUMENT I SOCIETE GENERALE GROUP
3 I CORPORATE GOVERNANCE I REMUNERATION OF GROUP SENIOR MANAGEMENT
| HISTORY OF VARIABLE COMPENSATION GRANTED DURING THE YEAR TO CHIEF EXECUTIVE OFFICERS
(in Euros)
Gross variable remuneration in previous fiscal years
Gross variable remuneration for 2013 fiscal year
2008 2009 2010 2011 2012Total
at grant
o/w component paid in cash
in 2014
Mr. Oudéa 0(1) 0(1) 1,196,820 682,770 1,194,600 1,406,070 281,214
Mr. Cabannes 0(2) 320,000 665,281 310,144 670,176 705,120 141,024
Mr. Sammarcelli Non applicable(3) 675,826 487,937 587,496 704,964 140,993
Mr. Sanchez Incera Non applicable(3) 667,662 391,440 560,112 619,718 123,944
Total calculated on value at grant date.
(1) Mr. Frédéric Oudéa waived his variable remuneration for fiscal years 2008 and 2009.
(2) Mr. Séverin Cabannes waived his variable remuneration for fiscal year 2008.
(3) Mr. Sammarcelli and Mr. Sanchez Incera were appointed Chief Executive Officers of the Societe Generale Group on 1 January 2010.
Long-term incentive awards for the Chief Executive OfficersThe Board decided to involve the Chief Executive Officers more closely in the company’s long-term growth and to align their interests with those of shareholders by setting up a conditional long-term incentive plan based on the value of the Societe Generale share. This plan will entitle them to receive a number of shares or equivalents depending on the relative performance of the Societe Generale share, as measured by the increase in Total Shareholder Return (TSR) compared to 11 peer European banks under conditions of profitability of the Group.
Under the 2013 plan, two major changes were introduced: a condition of Group’s profitability, as a necessary precondition to the payment of any long-term incentive award, and a one-year extension of the overall non-transferability periods of the shares that are now of four and five years. Thus, no award will be made in case of negative Group
net income in 2015 and 2016 fiscal years. Once this condition is met, awards will depend on the relative performance of the Societe Generale share measured by the TSR against that of its peers. If Societe Generale TSR measured at the beginning of 2016 and 2017 fiscal years is one of the top three of the peer group, the Chairman and Chief Executive Officer and the Deputy Chief Executive Officers will be granted respectively 37,500 and 25,000 shares or equivalents per instalments in March 2017 and March 2018. If the performance is equivalent to its peers, the grant will be divided by two. Finally, if the performance is within the peer group lower quartile, the award will not vest.
The book value of each instalment averages EUR 481,875, i.e. 48% of Frédéric Oudéa’s fixed salary, and EUR 321,250 i.e. between 46% and 49% of the Deputy Chief Executive Officers’ fixed salary.
The Board of Directors ensured that this plan complies with the recommendations of the AFEP-MEDEF Corporate Governance Code and the European Capital Requirements Directive (CRD3).
| SYNTHESIS OF PERFORMANCE CRITERIA AND CONDITIONS RELATED TO SHORT-TERM AND LONG-TERM REMUNERATION
Performance criteria Indicators Vesting conditions
2013 Annual variable remuneration
Financial criteria (60%)Achievement of budget targets (excluding accounting-based results linked to the revaluation of the Group’s own financial liabilites or credit portfolio hedging)- At the Group level for the Chairman
and Chief Executive Officer- At the Group and scope of supervision
levels for the Deputy Chief Executive Officers
Group level: earnings per share,gross operating income, cost/income ratioScope of supervision: gross operating income, Group net income before tax and cost/income ratioEach indicator is equally weighted.
For the deferred unvested portion(60% of the annual variable remuneration)Group profitability and core tier one level for 2014, 2015 and 2016 fiscal years
Qualitative criteria (40%)Achievement of predefined individual objectives assessed by the Board of Directors
Group and business division strategyBalance sheet managementCost control and optimization of the structureInternal control and risk managementHuman resources and Corporate and Social Responsibility.
2013 Long-term incentives
Total Shareholder Return(capital gain + dividends)Financial profitability
Positive Group net income for 2015 and 2016 fiscal yearsRelative increase of SG Total Shareholder Return measured during the overall vesting periods
SOCIETE GENERALE GROUP I 2014 REGISTRATION DOCUMENT I 85
REMUNERATION OF GROUP SENIOR MANAGEMENT I CORPORATE GOVERNANCE I 3
Shareholding and ownership obligations(1)
In 2002, the Board of Directors decided that the Group’s Chief Executive Officers must hold a minimum number of Societe Generale shares. In order to comply with AMF recommendations and align the interests of the Executive Officers with those of the business, the Board of Directors increased the required minimum number of shares at its meeting of 7 March 2011, respectively raising it to:
n 80,000 shares for the Chairman and Chief Executive Officer;
n 40,000 shares for the Deputy Chief Executive Officers.
Chief Executive Officers who are also former employees may hold shares directly or indirectly through the Company Savings Plan.
This minimum must be reached by the end of a five-year term of office. Until then, the Chief Executive Officer must keep 50% of the vested shares granted through Societe Generale free share plans and all shares resulting from the exercise of stock options, after deducting the cost of exercising said options and the corresponding social security charges and taxes.
In addition, and in accordance with the law, Chief Executive Officers are required to hold a certain percentage of vested shares granted through Societe Generale performance share plans or resulting from the exercise of stock options in a registered account until the end of their term of office. For shares, this percentage has been set by the Board at 20% of the vested shares of each grant and, for stock options, at 40% of the capital gains made on exercising the options, net of tax and any other mandatory deductions and minus any capital gains used to finance the vesting of the shares.
The Chief Executive Officers are therefore required to hold a large and increasing number of shares and are prohibited from hedging their shares or options throughout the vesting and holding period.
Each year, the Chief Executive Officers must provide the Board of Directors with the necessary information to ensure that these obligations are met in full.
Post employment benefitsPENSIONSAs Frédéric Oudéa terminated his employment contract by resigning when he was appointed Chairman and Chief Executive Officer, he no longer enjoys the right to any supplementary pension from Societe Generale.
SUPPLEMENTARY PENSION PLAN(2)
Regarding benefits awarded after the end of their terms of office, Mr. Sammarcelli retains the supplementary pension plan for the Company’s senior managers (“Outside Classification” status) which applied to him as an employee prior to his initial appointment as Chief Executive Officer.
This plan, closed in 1991, entitled its beneficiaries, upon claiming their pension benefits from French Social Security, to a pension payment equal to a percentage of their pensionable earnings, calculated according to the number of annuities taken into account and capped at 70% of said remuneration in the event of retirement after the legal retirement age set by Social Security.
The total amount of the pension is increased for beneficiaries who have raised at least three children, as well as for those who retire after the legal retirement age set by Social Security. The annuities taken into account by virtue of their years of professional service extend as much to their years of service as employees as to their terms of office as Chief Executive Officers. Their base compensation is their last annual fixed salary as an employee. The pension paid by the Company is equal to the difference between the total pension defined above and all other retirement pensions or similar paid by French Social Security as well as any other retirement benefits linked to the salaried status of the beneficiaries. 60% of said pension shall be paid to any surviving spouse in the event of the death of a beneficiary.
At 31 December 2013, Mr. Sammarcelli’s pension rights to be covered by Societe Generale amounted to EUR 235,000 per year representing 17% of his current remuneration (fixed salary and variable compensation for 2013 fiscal year). The pension rights increase between 2012 and 2013 is equal to 2% of this remuneration.
SUPPLEMENTARY PENSION ALLOCATION PLAN(3)
Mr. Cabannes and Mr. Sanchez Incera retain the benefits of the supplementary pension allocation plan for senior managers which applied to them as employees prior to their appointment as Chief Executive Officers.
This supplementary plan was introduced in 1991. It provides beneficiaries, upon claiming their French Social Security pension, with a total pension equal to the product of the following:
n the average, over the last ten years of their career, of the proportion of fixed salaries exceeding “Tranche B” of the AGIRC pension increased by the performance-linked component limited to 5% of their fixed salary;
n the rate equal to a number of annuities (corresponding to their years of professional service at Societe Generale) divided by 60 corresponding to an acquisition of potential rights of 1.67% a year.
The AGIRC “Tranche C” pension acquired in respect of their professional service at Societe Generale is deducted from this total pension. The supplementary amount covered by Societe Generale is increased for beneficiaries who have raised at least three children, as well as for those who retire after the legal retirement age set by Social Security. It may not be less than one-third of the full-rate service value of the AGIRC “Tranche B” points acquired by the senior manager in question since gaining “Outside Classification” status.
The rights are subject to the employees being employed by the Company upon claiming their pension.
Each year, potential rights are calculated as a function of seniority and projected salary at the age of retirement, according to recognized actuarial principles.
As of 31 December 31 2013, potential pension rights represent 18% of Mr. Cabannes’s fixed remuneration and 14% of Mr. Sanchez Incera’s fixed remuneration.
SEVERANCE PAYThe Chairman and Chief Executive Officer is not entitled to severance pay.
Messrs. Cabannes, Sammarcelli and Sanchez Incera do not enjoy any provision for compensation in the event they are required to step down
(1) AFEP-MEDEF Corporate Governance Code.
(2) Related-party agreement with M. Sammarcelli approved at the General Meeting in 2010.
(3) Related-party agreement with M. Cabannes and M. Sanchez Incera approved at the General Meeting in 2009-2010.
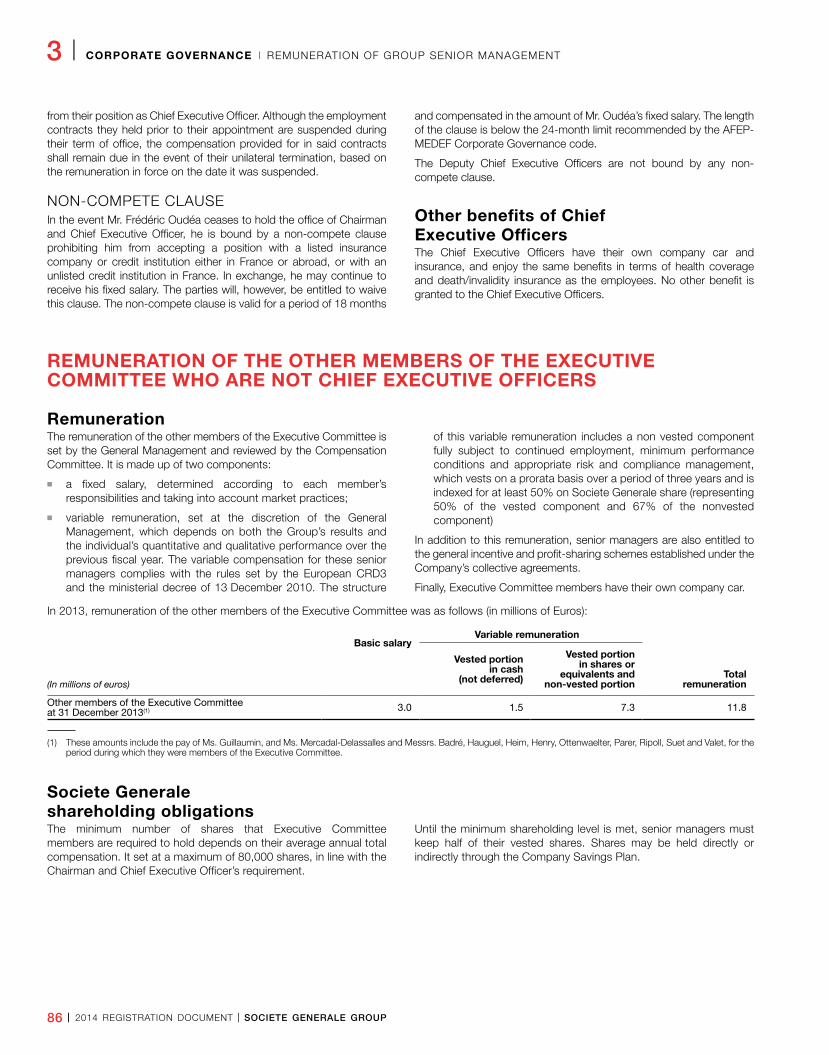
86 I 2014 REGISTRATION DOCUMENT I SOCIETE GENERALE GROUP
3 I CORPORATE GOVERNANCE I REMUNERATION OF GROUP SENIOR MANAGEMENT
from their position as Chief Executive Officer. Although the employment contracts they held prior to their appointment are suspended during their term of office, the compensation provided for in said contracts shall remain due in the event of their unilateral termination, based on the remuneration in force on the date it was suspended.
NON-COMPETE CLAUSEIn the event Mr. Frédéric Oudéa ceases to hold the office of Chairman and Chief Executive Officer, he is bound by a non-compete clause prohibiting him from accepting a position with a listed insurance company or credit institution either in France or abroad, or with an unlisted credit institution in France. In exchange, he may continue to receive his fixed salary. The parties will, however, be entitled to waive this clause. The non-compete clause is valid for a period of 18 months
and compensated in the amount of Mr. Oudéa’s fixed salary. The length of the clause is below the 24-month limit recommended by the AFEP-MEDEF Corporate Governance code.
The Deputy Chief Executive Officers are not bound by any non-compete clause.
Other benefits of Chief Executive OfficersThe Chief Executive Officers have their own company car and insurance, and enjoy the same benefits in terms of health coverage and death/invalidity insurance as the employees. No other benefit is granted to the Chief Executive Officers.
REMUNERATION OF THE OTHER MEMBERS OF THE EXECUTIVE COMMITTEE WHO ARE NOT CHIEF EXECUTIVE OFFICERS
RemunerationThe remuneration of the other members of the Executive Committee is set by the General Management and reviewed by the Compensation Committee. It is made up of two components:
n a fixed salary, determined according to each member’s responsibilities and taking into account market practices;
n variable remuneration, set at the discretion of the General Management, which depends on both the Group’s results and the individual’s quantitative and qualitative performance over the previous fiscal year. The variable compensation for these senior managers complies with the rules set by the European CRD3 and the ministerial decree of 13 December 2010. The structure
of this variable remuneration includes a non vested component fully subject to continued employment, minimum performance conditions and appropriate risk and compliance management, which vests on a prorata basis over a period of three years and is indexed for at least 50% on Societe Generale share (representing 50% of the vested component and 67% of the nonvested component)
In addition to this remuneration, senior managers are also entitled to the general incentive and profit-sharing schemes established under the Company’s collective agreements.
Finally, Executive Committee members have their own company car.
In 2013, remuneration of the other members of the Executive Committee was as follows (in millions of Euros):
Basic salaryVariable remuneration
(In millions of euros)
Vested portion in cash
(not deferred)
Vested portion in shares or
equivalents and non-vested portion
Total remuneration
Other members of the Executive Committee at 31 December 2013(1) 3.0 1.5 7.3 11.8
(1) These amounts include the pay of Ms. Guillaumin, and Ms. Mercadal-Delassalles and Messrs. Badré, Hauguel, Heim, Henry, Ottenwaelter, Parer, Ripoll, Suet and Valet, for the period during which they were members of the Executive Committee.
Societe Generale shareholding obligationsThe minimum number of shares that Executive Committee members are required to hold depends on their average annual total compensation. It set at a maximum of 80,000 shares, in line with the Chairman and Chief Executive Officer’s requirement.
Until the minimum shareholding level is met, senior managers must keep half of their vested shares. Shares may be held directly or indirectly through the Company Savings Plan.
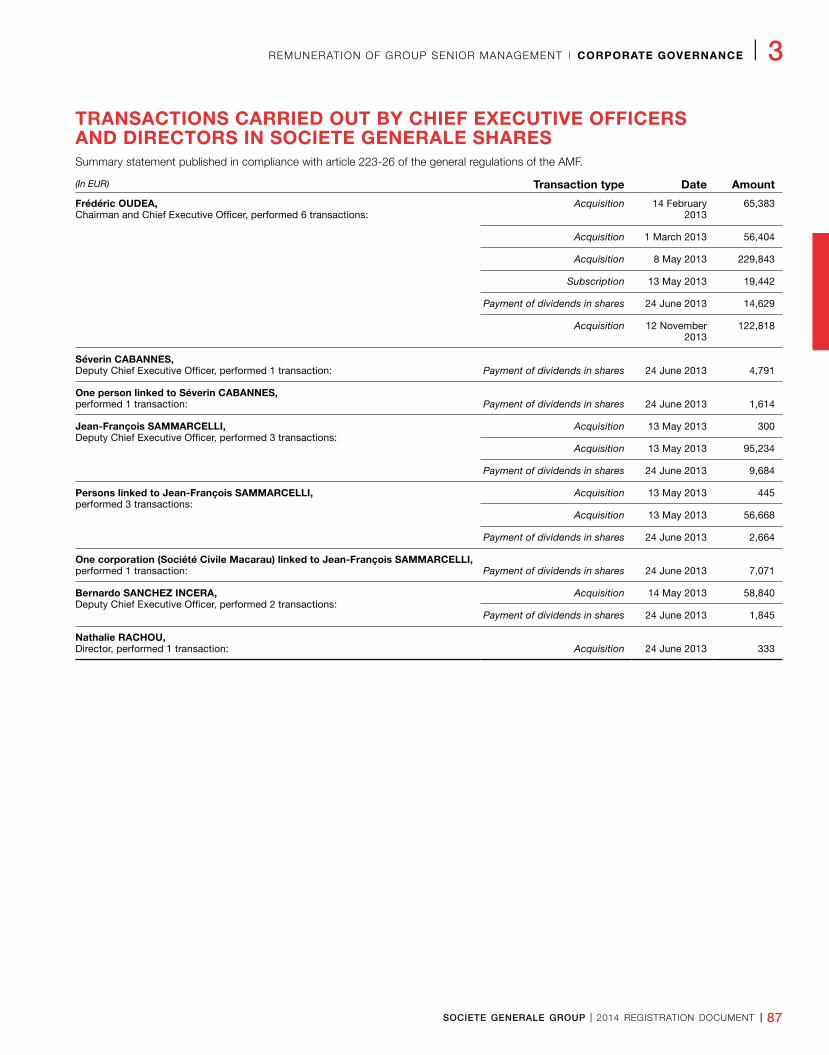
SOCIETE GENERALE GROUP I 2014 REGISTRATION DOCUMENT I 87
REMUNERATION OF GROUP SENIOR MANAGEMENT I CORPORATE GOVERNANCE I 3
TRANSACTIONS CARRIED OUT BY CHIEF EXECUTIVE OFFICERS AND DIRECTORS IN SOCIETE GENERALE SHARESSummary statement published in compliance with article 223-26 of the general regulations of the AMF.
(In EUR) Transaction type Date Amount
Frédéric OUDEA, Chairman and Chief Executive Officer, performed 6 transactions:
Acquisition 14 February 2013
65,383
Acquisition 1 March 2013 56,404
Acquisition 8 May 2013 229,843
Subscription 13 May 2013 19,442
Payment of dividends in shares 24 June 2013 14,629
Acquisition 12 November 2013
122,818
Séverin CABANNES, Deputy Chief Executive Officer, performed 1 transaction: Payment of dividends in shares 24 June 2013 4,791
One person linked to Séverin CABANNES, performed 1 transaction: Payment of dividends in shares 24 June 2013 1,614
Jean-François SAMMARCELLI, Deputy Chief Executive Officer, performed 3 transactions:
Acquisition 13 May 2013 300
Acquisition 13 May 2013 95,234
Payment of dividends in shares 24 June 2013 9,684
Persons linked to Jean-François SAMMARCELLI, performed 3 transactions:
Acquisition 13 May 2013 445
Acquisition 13 May 2013 56,668
Payment of dividends in shares 24 June 2013 2,664
One corporation (Société Civile Macarau) linked to Jean-François SAMMARCELLI, performed 1 transaction: Payment of dividends in shares 24 June 2013 7,071
Bernardo SANCHEZ INCERA, Deputy Chief Executive Officer, performed 2 transactions:
Acquisition 14 May 2013 58,840
Payment of dividends in shares 24 June 2013 1,845
Nathalie RACHOU, Director, performed 1 transaction: Acquisition 24 June 2013 333
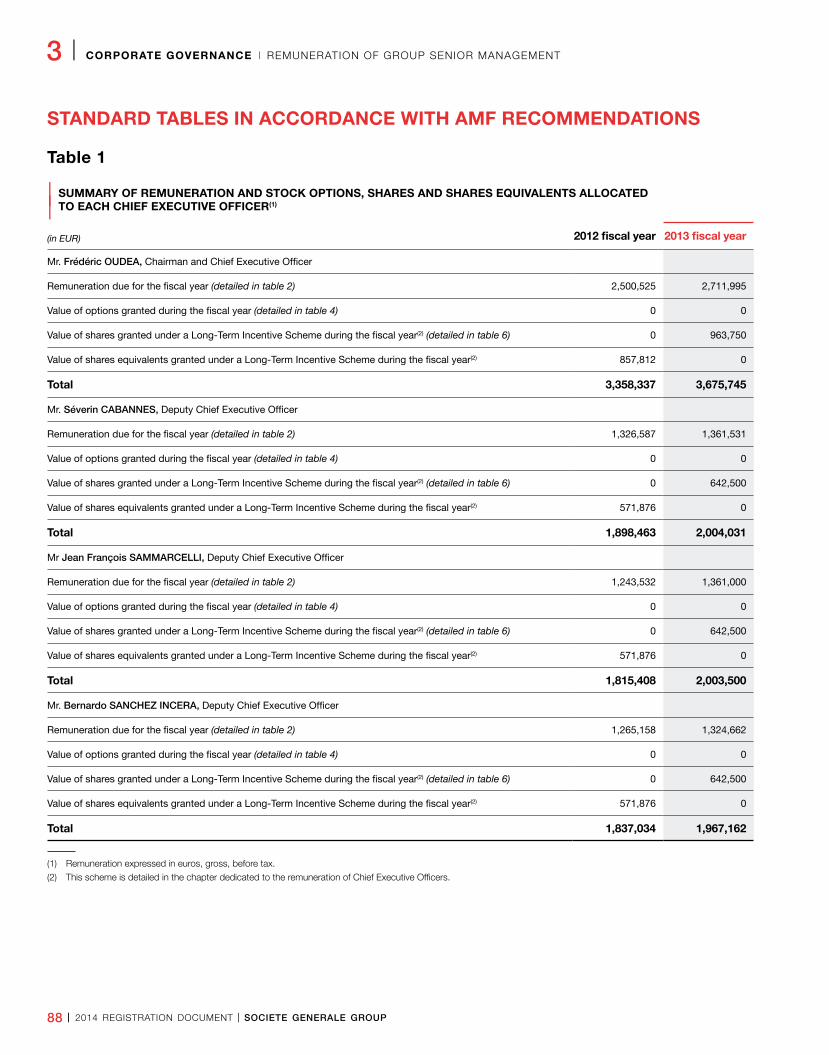
88 I 2014 REGISTRATION DOCUMENT I SOCIETE GENERALE GROUP
3 I CORPORATE GOVERNANCE I REMUNERATION OF GROUP SENIOR MANAGEMENT
STANDARD TABLES IN ACCORDANCE WITH AMF RECOMMENDATIONS
Table 1
| SUMMARY OF REMUNERATION AND STOCK OPTIONS, SHARES AND SHARES EQUIVALENTS ALLOCATED
| TO EACH CHIEF EXECUTIVE OFFICER(1)
(in EUR) 2012 fiscal year 2013 fiscal year
Mr. Frédéric OUDEA, Chairman and Chief Executive Officer
Remuneration due for the fiscal year (detailed in table 2) 2,500,525 2,711,995
Value of options granted during the fiscal year (detailed in table 4) 0 0
Value of shares granted under a Long-Term Incentive Scheme during the fiscal year(2) (detailed in table 6) 0 963,750
Value of shares equivalents granted under a Long-Term Incentive Scheme during the fiscal year(2) 857,812 0
Total 3,358,337 3,675,745
Mr. Séverin CABANNES, Deputy Chief Executive Officer
Remuneration due for the fiscal year (detailed in table 2) 1,326,587 1,361,531
Value of options granted during the fiscal year (detailed in table 4) 0 0
Value of shares granted under a Long-Term Incentive Scheme during the fiscal year(2) (detailed in table 6) 0 642,500
Value of shares equivalents granted under a Long-Term Incentive Scheme during the fiscal year(2) 571,876 0
Total 1,898,463 2,004,031
Mr Jean François SAMMARCELLI, Deputy Chief Executive Officer
Remuneration due for the fiscal year (detailed in table 2) 1,243,532 1,361,000
Value of options granted during the fiscal year (detailed in table 4) 0 0
Value of shares granted under a Long-Term Incentive Scheme during the fiscal year(2) (detailed in table 6) 0 642,500
Value of shares equivalents granted under a Long-Term Incentive Scheme during the fiscal year(2) 571,876 0
Total 1,815,408 2,003,500
Mr. Bernardo SANCHEZ INCERA, Deputy Chief Executive Officer
Remuneration due for the fiscal year (detailed in table 2) 1,265,158 1,324,662
Value of options granted during the fiscal year (detailed in table 4) 0 0
Value of shares granted under a Long-Term Incentive Scheme during the fiscal year(2) (detailed in table 6) 0 642,500
Value of shares equivalents granted under a Long-Term Incentive Scheme during the fiscal year(2) 571,876 0
Total 1,837,034 1,967,162
(1) Remuneration expressed in euros, gross, before tax.
(2) This scheme is detailed in the chapter dedicated to the remuneration of Chief Executive Officers.
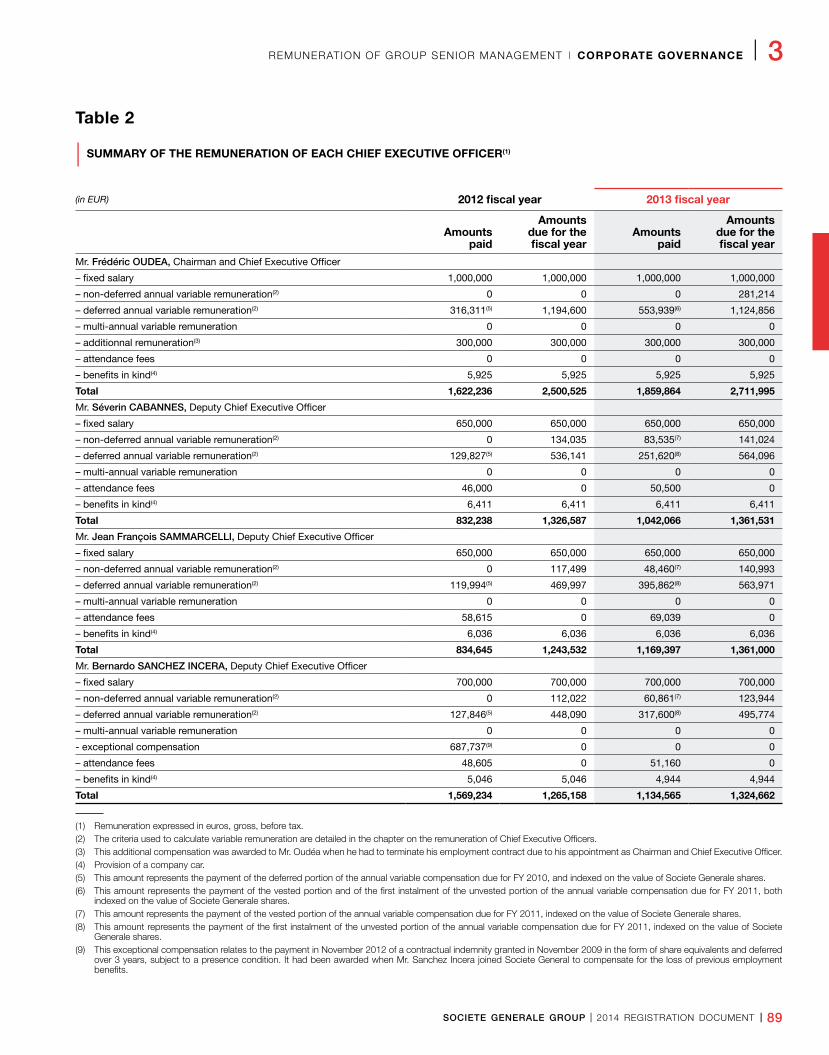
SOCIETE GENERALE GROUP I 2014 REGISTRATION DOCUMENT I 89
REMUNERATION OF GROUP SENIOR MANAGEMENT I CORPORATE GOVERNANCE I 3
Table 2
| SUMMARY OF THE REMUNERATION OF EACH CHIEF EXECUTIVE OFFICER(1)
(in EUR) 2012 fiscal year 2013 fiscal year
Amounts paid
Amounts due for the fiscal year
Amounts paid
Amounts due for the fiscal year
Mr. Frédéric OUDEA, Chairman and Chief Executive Officer
– fixed salary 1,000,000 1,000,000 1,000,000 1,000,000
– non-deferred annual variable remuneration(2) 0 0 0 281,214
– deferred annual variable remuneration(2) 316,311(5) 1,194,600 553,939(6) 1,124,856
– multi-annual variable remuneration 0 0 0 0
– additionnal remuneration(3) 300,000 300,000 300,000 300,000
– attendance fees 0 0 0 0
– benefits in kind(4) 5,925 5,925 5,925 5,925
Total 1,622,236 2,500,525 1,859,864 2,711,995
Mr. Séverin CABANNES, Deputy Chief Executive Officer
– fixed salary 650,000 650,000 650,000 650,000
– non-deferred annual variable remuneration(2) 0 134,035 83,535(7) 141,024
– deferred annual variable remuneration(2) 129,827(5) 536,141 251,620(8) 564,096
– multi-annual variable remuneration 0 0 0 0
– attendance fees 46,000 0 50,500 0
– benefits in kind(4) 6,411 6,411 6,411 6,411
Total 832,238 1,326,587 1,042,066 1,361,531
Mr. Jean François SAMMARCELLI, Deputy Chief Executive Officer
– fixed salary 650,000 650,000 650,000 650,000
– non-deferred annual variable remuneration(2) 0 117,499 48,460(7) 140,993
– deferred annual variable remuneration(2) 119,994(5) 469,997 395,862(8) 563,971
– multi-annual variable remuneration 0 0 0 0
– attendance fees 58,615 0 69,039 0
– benefits in kind(4) 6,036 6,036 6,036 6,036
Total 834,645 1,243,532 1,169,397 1,361,000
Mr. Bernardo SANCHEZ INCERA, Deputy Chief Executive Officer
– fixed salary 700,000 700,000 700,000 700,000
– non-deferred annual variable remuneration(2) 0 112,022 60,861(7) 123,944
– deferred annual variable remuneration(2) 127,846(5) 448,090 317,600(8) 495,774
– multi-annual variable remuneration 0 0 0 0
- exceptional compensation 687,737(9) 0 0 0
– attendance fees 48,605 0 51,160 0
– benefits in kind(4) 5,046 5,046 4,944 4,944
Total 1,569,234 1,265,158 1,134,565 1,324,662
(1) Remuneration expressed in euros, gross, before tax.(2) The criteria used to calculate variable remuneration are detailed in the chapter on the remuneration of Chief Executive Officers.(3) This additional compensation was awarded to Mr. Oudéa when he had to terminate his employment contract due to his appointment as Chairman and Chief Executive Officer.(4) Provision of a company car.(5) This amount represents the payment of the deferred portion of the annual variable compensation due for FY 2010, and indexed on the value of Societe Generale shares.(6) This amount represents the payment of the vested portion and of the first instalment of the unvested portion of the annual variable compensation due for FY 2011, both
indexed on the value of Societe Generale shares.(7) This amount represents the payment of the vested portion of the annual variable compensation due for FY 2011, indexed on the value of Societe Generale shares.(8) This amount represents the payment of the first instalment of the unvested portion of the annual variable compensation due for FY 2011, indexed on the value of Societe
Generale shares.(9) This exceptional compensation relates to the payment in November 2012 of a contractual indemnity granted in November 2009 in the form of share equivalents and deferred
over 3 years, subject to a presence condition. It had been awarded when Mr. Sanchez Incera joined Societe General to compensate for the loss of previous employment benefits.
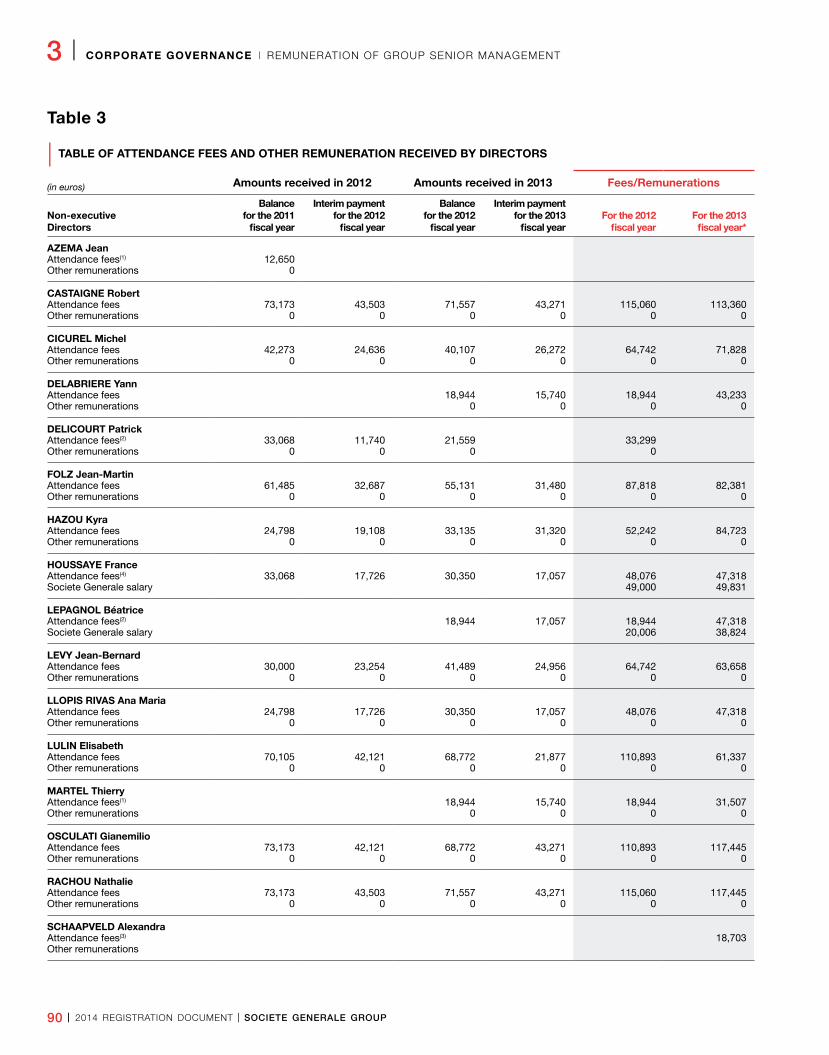
90 I 2014 REGISTRATION DOCUMENT I SOCIETE GENERALE GROUP
3 I CORPORATE GOVERNANCE I REMUNERATION OF GROUP SENIOR MANAGEMENT
Table 3
| TABLE OF ATTENDANCE FEES AND OTHER REMUNERATION RECEIVED BY DIRECTORS
(in euros) Amounts received in 2012 Amounts received in 2013 Fees/Remunerations
Non-executive Directors
Balance for the 2011
fiscal year
Interim payment for the 2012
fiscal year
Balance for the 2012
fiscal year
Interim payment for the 2013
fiscal yearFor the 2012
fiscal yearFor the 2013
fiscal year*
AZEMA JeanAttendance fees(1) 12,650Other remunerations 0
CASTAIGNE RobertAttendance fees 73,173 43,503 71,557 43,271 115,060 113,360Other remunerations 0 0 0 0 0 0
CICUREL MichelAttendance fees 42,273 24,636 40,107 26,272 64,742 71,828Other remunerations 0 0 0 0 0 0
DELABRIERE YannAttendance fees 18,944 15,740 18,944 43,233Other remunerations 0 0 0 0
DELICOURT PatrickAttendance fees(2) 33,068 11,740 21,559 33,299Other remunerations 0 0 0 0
FOLZ Jean-MartinAttendance fees 61,485 32,687 55,131 31,480 87,818 82,381Other remunerations 0 0 0 0 0 0
HAZOU KyraAttendance fees 24,798 19,108 33,135 31,320 52,242 84,723Other remunerations 0 0 0 0 0 0
HOUSSAYE FranceAttendance fees(4) 33,068 17,726 30,350 17,057 48,076 47,318Societe Generale salary 49,000 49,831
LEPAGNOL BéatriceAttendance fees(2) 18,944 17,057 18,944 47,318Societe Generale salary 20,006 38,824
LEVY Jean-BernardAttendance fees 30,000 23,254 41,489 24,956 64,742 63,658Other remunerations 0 0 0 0 0 0
LLOPIS RIVAS Ana MariaAttendance fees 24,798 17,726 30,350 17,057 48,076 47,318Other remunerations 0 0 0 0 0 0
LULIN ElisabethAttendance fees 70,105 42,121 68,772 21,877 110,893 61,337Other remunerations 0 0 0 0 0 0
MARTEL ThierryAttendance fees(1) 18,944 15,740 18,944 31,507Other remunerations 0 0 0 0
OSCULATI GianemilioAttendance fees 73,173 42,121 68,772 43,271 110,893 117,445Other remunerations 0 0 0 0 0 0
RACHOU NathalieAttendance fees 73,173 43,503 71,557 43,271 115,060 117,445Other remunerations 0 0 0 0 0 0
SCHAAPVELD AlexandraAttendance fees(3) 18,703Other remunerations
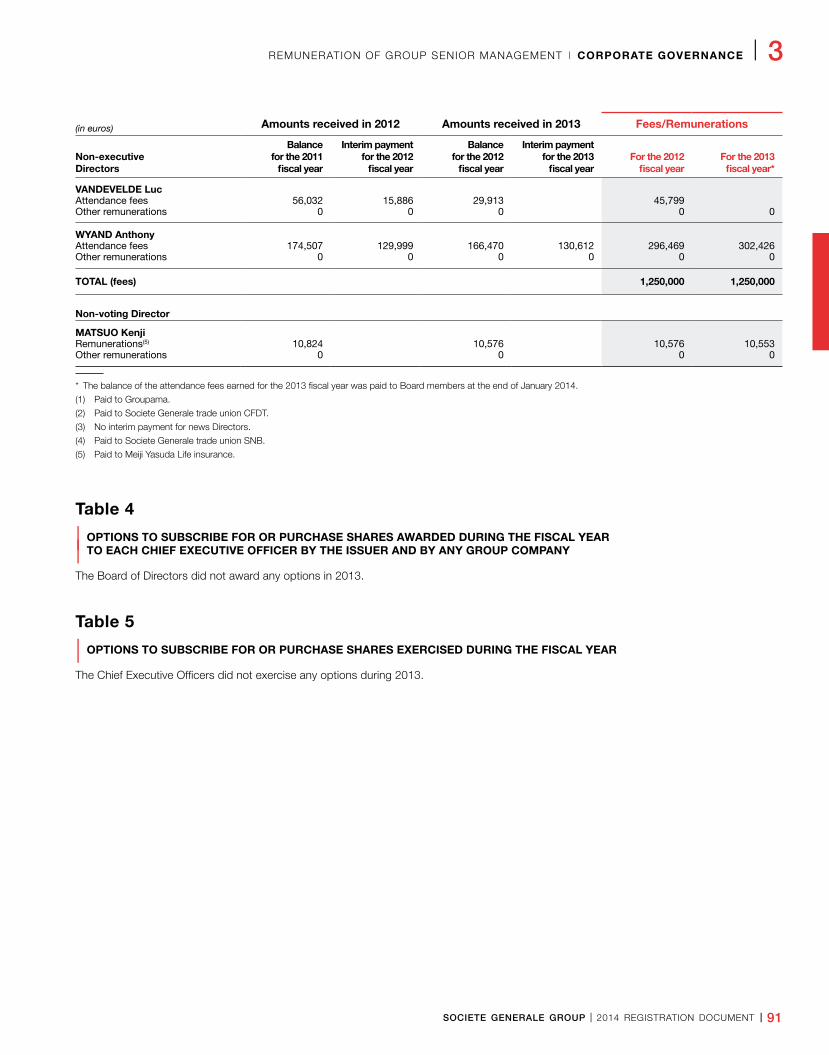
SOCIETE GENERALE GROUP I 2014 REGISTRATION DOCUMENT I 91
REMUNERATION OF GROUP SENIOR MANAGEMENT I CORPORATE GOVERNANCE I 3
(in euros) Amounts received in 2012 Amounts received in 2013 Fees/Remunerations
Non-executive Directors
Balance for the 2011
fiscal year
Interim payment for the 2012
fiscal year
Balance for the 2012
fiscal year
Interim payment for the 2013
fiscal yearFor the 2012
fiscal yearFor the 2013
fiscal year*
VANDEVELDE LucAttendance fees 56,032 15,886 29,913 45,799Other remunerations 0 0 0 0 0
WYAND AnthonyAttendance fees 174,507 129,999 166,470 130,612 296,469 302,426Other remunerations 0 0 0 0 0 0
TOTAL (fees) 1,250,000 1,250,000
Non-voting Director
MATSUO KenjiRemunerations(5) 10,824 10,576 10,576 10,553Other remunerations 0 0 0 0
* The balance of the attendance fees earned for the 2013 fiscal year was paid to Board members at the end of January 2014.
(1) Paid to Groupama.
(2) Paid to Societe Generale trade union CFDT.
(3) No interim payment for news Directors.
(4) Paid to Societe Generale trade union SNB.
(5) Paid to Meiji Yasuda Life insurance.
Table 4
| OPTIONS TO SUBSCRIBE FOR OR PURCHASE SHARES AWARDED DURING THE FISCAL YEAR
| TO EACH CHIEF EXECUTIVE OFFICER BY THE ISSUER AND BY ANY GROUP COMPANY
The Board of Directors did not award any options in 2013.
Table 5
| OPTIONS TO SUBSCRIBE FOR OR PURCHASE SHARES EXERCISED DURING THE FISCAL YEAR
The Chief Executive Officers did not exercise any options during 2013.
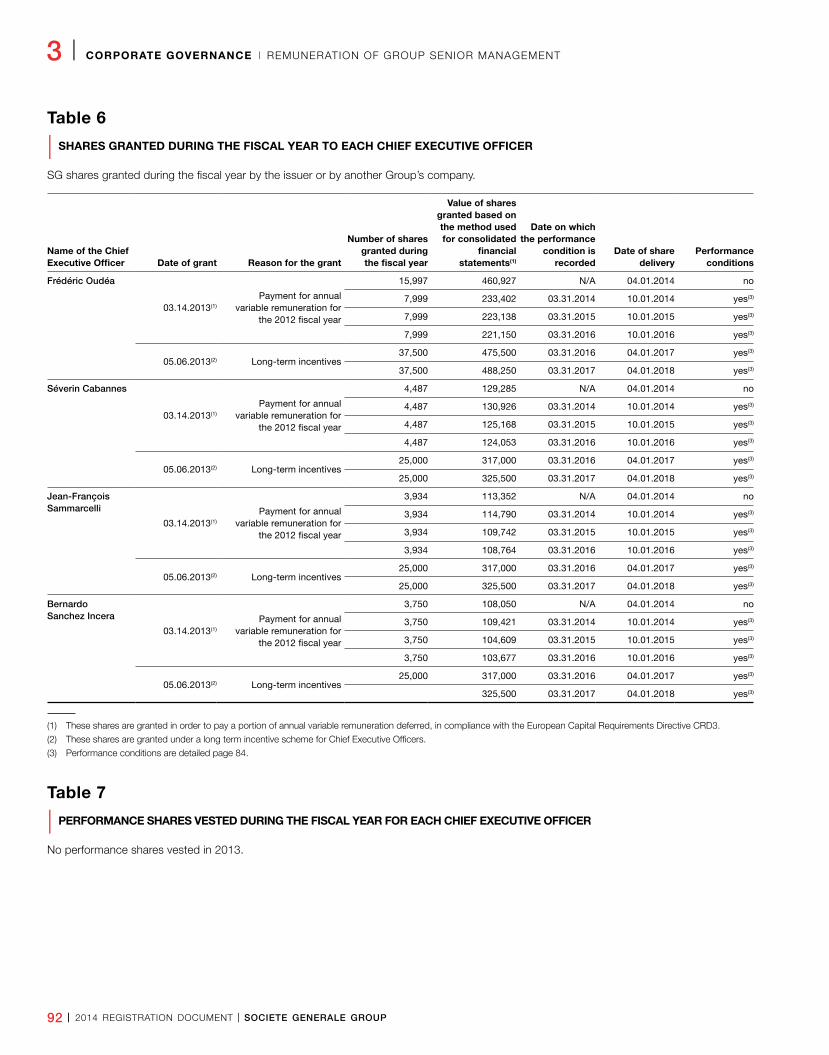
92 I 2014 REGISTRATION DOCUMENT I SOCIETE GENERALE GROUP
3 I CORPORATE GOVERNANCE I REMUNERATION OF GROUP SENIOR MANAGEMENT
Table 6
| SHARES GRANTED DURING THE FISCAL YEAR TO EACH CHIEF EXECUTIVE OFFICER
SG shares granted during the fiscal year by the issuer or by another Group’s company.
Name of the Chief Executive Officer Date of grant Reason for the grant
Number of shares granted during the fiscal year
Value of shares granted based on the method used for consolidated
financial statements(1)
Date on which the performance
condition is recorded
Date of share delivery
Performance conditions
Frédéric Oudéa
03.14.2013(1)
Payment for annual variable remuneration for
the 2012 fiscal year
15,997 460,927 N/A 04.01.2014 no
7,999 233,402 03.31.2014 10.01.2014 yes(3)
7,999 223,138 03.31.2015 10.01.2015 yes(3)
7,999 221,150 03.31.2016 10.01.2016 yes(3)
05.06.2013(2) Long-term incentives37,500 475,500 03.31.2016 04.01.2017 yes(3)
37,500 488,250 03.31.2017 04.01.2018 yes(3)
Séverin Cabannes
03.14.2013(1)
Payment for annual variable remuneration for
the 2012 fiscal year
4,487 129,285 N/A 04.01.2014 no
4,487 130,926 03.31.2014 10.01.2014 yes(3)
4,487 125,168 03.31.2015 10.01.2015 yes(3)
4,487 124,053 03.31.2016 10.01.2016 yes(3)
05.06.2013(2) Long-term incentives25,000 317,000 03.31.2016 04.01.2017 yes(3)
25,000 325,500 03.31.2017 04.01.2018 yes(3)
Jean-François Sammarcelli
03.14.2013(1)
Payment for annual variable remuneration for
the 2012 fiscal year
3,934 113,352 N/A 04.01.2014 no
3,934 114,790 03.31.2014 10.01.2014 yes(3)
3,934 109,742 03.31.2015 10.01.2015 yes(3)
3,934 108,764 03.31.2016 10.01.2016 yes(3)
05.06.2013(2) Long-term incentives25,000 317,000 03.31.2016 04.01.2017 yes(3)
25,000 325,500 03.31.2017 04.01.2018 yes(3)
Bernardo Sanchez Incera
03.14.2013(1)
Payment for annual variable remuneration for
the 2012 fiscal year
3,750 108,050 N/A 04.01.2014 no
3,750 109,421 03.31.2014 10.01.2014 yes(3)
3,750 104,609 03.31.2015 10.01.2015 yes(3)
3,750 103,677 03.31.2016 10.01.2016 yes(3)
05.06.2013(2) Long-term incentives25,000 317,000 03.31.2016 04.01.2017 yes(3)
325,500 03.31.2017 04.01.2018 yes(3)
(1) These shares are granted in order to pay a portion of annual variable remuneration deferred, in compliance with the European Capital Requirements Directive CRD3.
(2) These shares are granted under a long term incentive scheme for Chief Executive Officers.
(3) Performance conditions are detailed page 84.
Table 7
| PERFORMANCE SHARES VESTED DURING THE FISCAL YEAR FOR EACH CHIEF EXECUTIVE OFFICER
No performance shares vested in 2013.
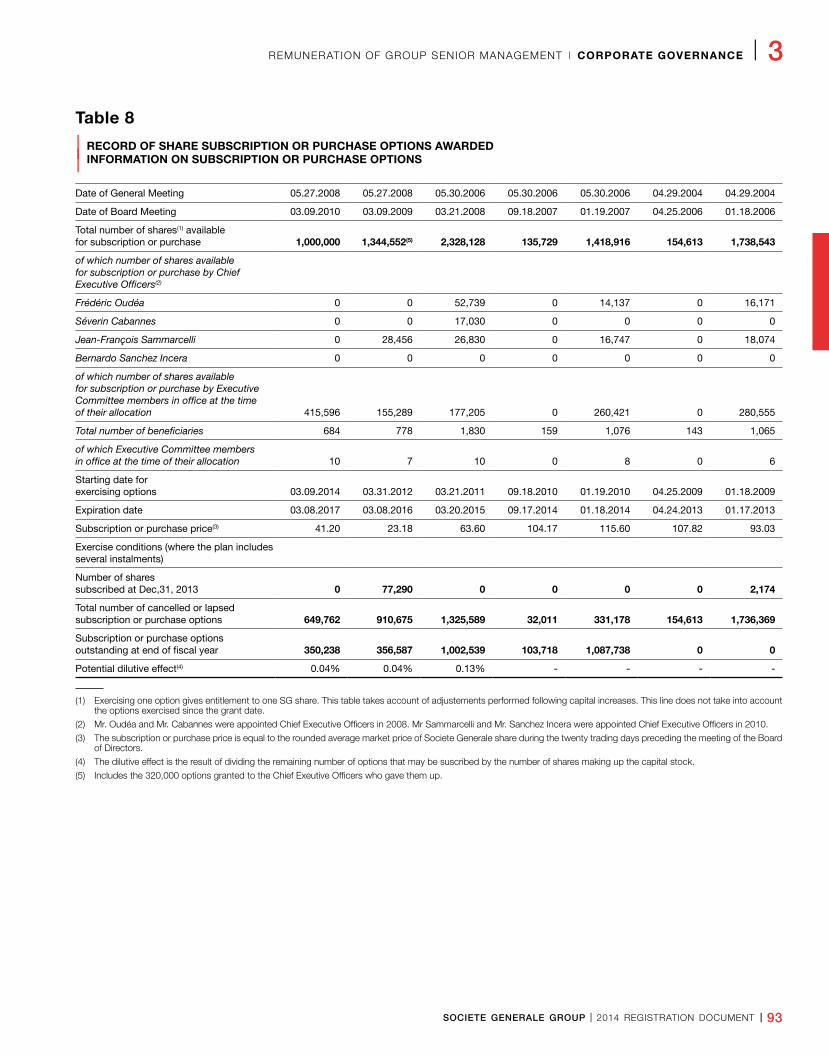
SOCIETE GENERALE GROUP I 2014 REGISTRATION DOCUMENT I 93
REMUNERATION OF GROUP SENIOR MANAGEMENT I CORPORATE GOVERNANCE I 3
Table 8
| RECORD OF SHARE SUBSCRIPTION OR PURCHASE OPTIONS AWARDED
| INFORMATION ON SUBSCRIPTION OR PURCHASE OPTIONS
Date of General Meeting 05.27.2008 05.27.2008 05.30.2006 05.30.2006 05.30.2006 04.29.2004 04.29.2004
Date of Board Meeting 03.09.2010 03.09.2009 03.21.2008 09.18.2007 01.19.2007 04.25.2006 01.18.2006
Total number of shares(1) available for subscription or purchase 1,000,000 1,344,552(5) 2,328,128 135,729 1,418,916 154,613 1,738,543
of which number of shares available for subscription or purchase by Chief Executive Officers(2)
Frédéric Oudéa 0 0 52,739 0 14,137 0 16,171
Séverin Cabannes 0 0 17,030 0 0 0 0
Jean-François Sammarcelli 0 28,456 26,830 0 16,747 0 18,074
Bernardo Sanchez Incera 0 0 0 0 0 0 0
of which number of shares available for subscription or purchase by Executive Committee members in office at the time of their allocation 415,596 155,289 177,205 0 260,421 0 280,555
Total number of beneficiaries 684 778 1,830 159 1,076 143 1,065
of which Executive Committee members in office at the time of their allocation 10 7 10 0 8 0 6
Starting date for exercising options 03.09.2014 03.31.2012 03.21.2011 09.18.2010 01.19.2010 04.25.2009 01.18.2009
Expiration date 03.08.2017 03.08.2016 03.20.2015 09.17.2014 01.18.2014 04.24.2013 01.17.2013
Subscription or purchase price(3) 41.20 23.18 63.60 104.17 115.60 107.82 93.03
Exercise conditions (where the plan includes several instalments)
Number of shares subscribed at Dec,31, 2013 0 77,290 0 0 0 0 2,174
Total number of cancelled or lapsed subscription or purchase options 649,762 910,675 1,325,589 32,011 331,178 154,613 1,736,369
Subscription or purchase options outstanding at end of fiscal year 350,238 356,587 1,002,539 103,718 1,087,738 0 0
Potential dilutive effect(4) 0.04% 0.04% 0.13% - - - -
(1) Exercising one option gives entitlement to one SG share. This table takes account of adjustements performed following capital increases. This line does not take into account the options exercised since the grant date.
(2) Mr. Oudéa and Mr. Cabannes were appointed Chief Executive Officers in 2008. Mr Sammarcelli and Mr. Sanchez Incera were appointed Chief Executive Officers in 2010.
(3) The subscription or purchase price is equal to the rounded average market price of Societe Generale share during the twenty trading days preceding the meeting of the Board of Directors.
(4) The dilutive effect is the result of dividing the remaining number of options that may be suscribed by the number of shares making up the capital stock.
(5) Includes the 320,000 options granted to the Chief Exeutive Officers who gave them up.
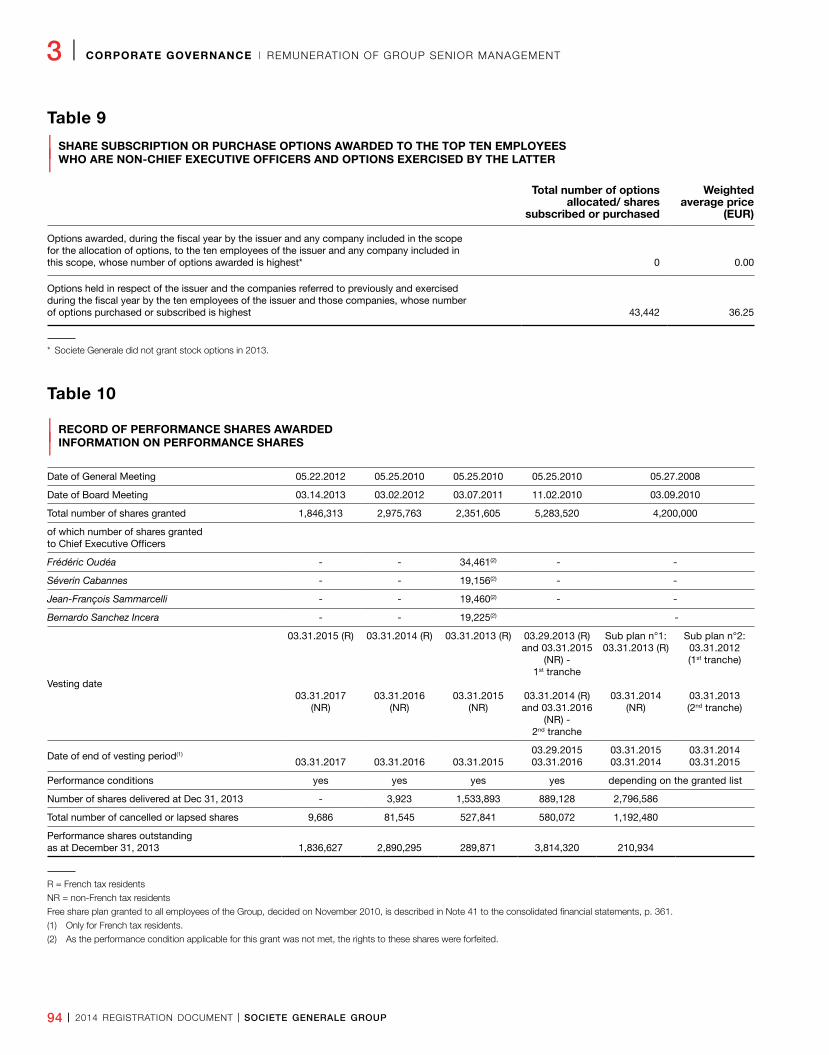
94 I 2014 REGISTRATION DOCUMENT I SOCIETE GENERALE GROUP
3 I CORPORATE GOVERNANCE I REMUNERATION OF GROUP SENIOR MANAGEMENT
Table 9
| SHARE SUBSCRIPTION OR PURCHASE OPTIONS AWARDED TO THE TOP TEN EMPLOYEES
| WHO ARE NON-CHIEF EXECUTIVE OFFICERS AND OPTIONS EXERCISED BY THE LATTER
Total number of options allocated/ shares
subscribed or purchased
Weighted average price
(EUR)
Options awarded, during the fiscal year by the issuer and any company included in the scope for the allocation of options, to the ten employees of the issuer and any company included in this scope, whose number of options awarded is highest* 0 0.00
Options held in respect of the issuer and the companies referred to previously and exercised during the fiscal year by the ten employees of the issuer and those companies, whose number of options purchased or subscribed is highest 43,442 36.25
* Societe Generale did not grant stock options in 2013.
Table 10
| RECORD OF PERFORMANCE SHARES AWARDED
| INFORMATION ON PERFORMANCE SHARES
Date of General Meeting 05.22.2012 05.25.2010 05.25.2010 05.25.2010 05.27.2008
Date of Board Meeting 03.14.2013 03.02.2012 03.07.2011 11.02.2010 03.09.2010
Total number of shares granted 1,846,313 2,975,763 2,351,605 5,283,520 4,200,000
of which number of shares granted to Chief Executive Officers
Frédéric Oudéa - - 34,461(2) - -
Séverin Cabannes - - 19,156(2) - -
Jean-François Sammarcelli - - 19,460(2) - -
Bernardo Sanchez Incera - - 19,225(2) -
Vesting date
03.31.2015 (R)
03.31.2017 (NR)
03.31.2014 (R)
03.31.2016 (NR)
03.31.2013 (R)
03.31.2015 (NR)
03.29.2013 (R) and 03.31.2015
(NR) -1st tranche
03.31.2014 (R) and 03.31.2016
(NR) - 2nd tranche
Sub plan n°1:03.31.2013 (R)
03.31.2014 (NR)
Sub plan n°2:03.31.2012(1st tranche)
03.31.2013(2nd tranche)
Date of end of vesting period(1)
03.31.2017 03.31.2016 03.31.201503.29.2015 03.31.2016
03.31.2015 03.31.2014
03.31.2014 03.31.2015
Performance conditions yes yes yes yes depending on the granted list
Number of shares delivered at Dec 31, 2013 - 3,923 1,533,893 889,128 2,796,586
Total number of cancelled or lapsed shares 9,686 81,545 527,841 580,072 1,192,480
Performance shares outstanding as at December 31, 2013 1,836,627 2,890,295 289,871 3,814,320 210,934
R = French tax residents
NR = non-French tax residents
Free share plan granted to all employees of the Group, decided on November 2010, is described in Note 41 to the consolidated financial statements, p. 361.
(1) Only for French tax residents.
(2) As the performance condition applicable for this grant was not met, the rights to these shares were forfeited.
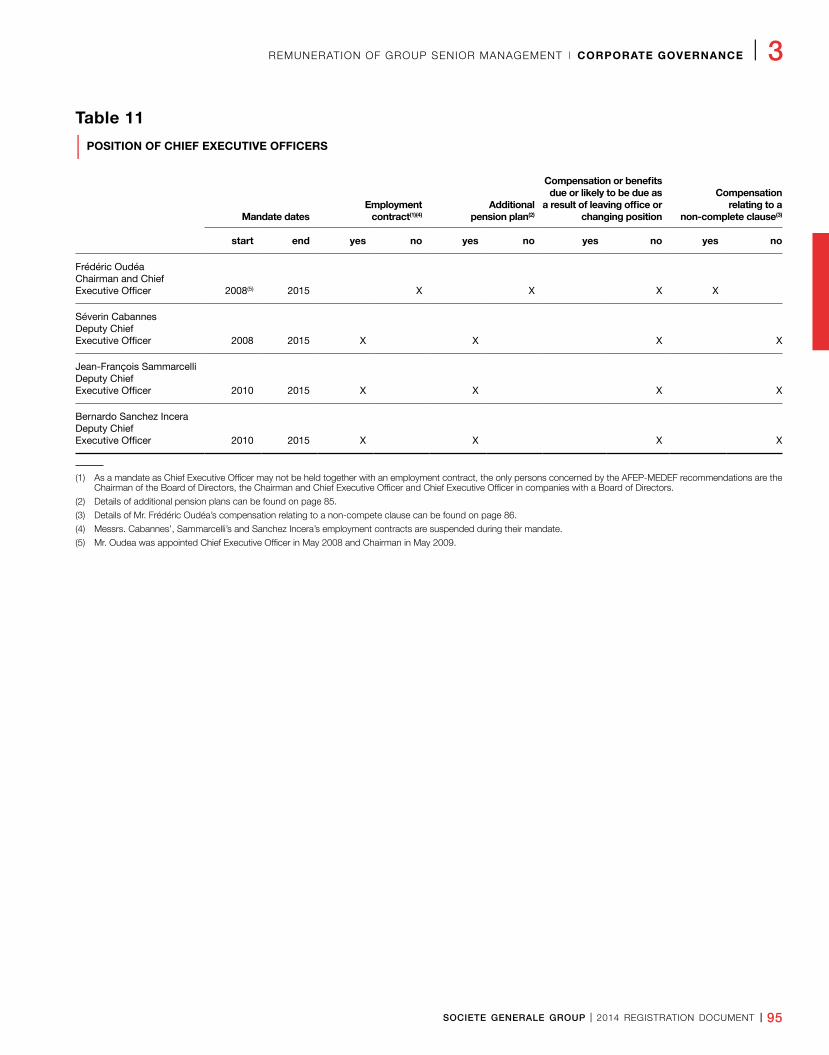
SOCIETE GENERALE GROUP I 2014 REGISTRATION DOCUMENT I 95
REMUNERATION OF GROUP SENIOR MANAGEMENT I CORPORATE GOVERNANCE I 3
Table 11
| POSITION OF CHIEF EXECUTIVE OFFICERS
Mandate datesEmployment
contract(1)(4)Additional
pension plan(2)
Compensation or benefits due or likely to be due as
a result of leaving office or changing position
Compensation relating to a
non-complete clause(3)
start end yes no yes no yes no yes no
Frédéric Oudéa Chairman and Chief Executive Officer 2008(5) 2015 X X X X
Séverin Cabannes Deputy Chief Executive Officer 2008 2015 X X X X
Jean-François Sammarcelli Deputy Chief Executive Officer 2010 2015 X X X X
Bernardo Sanchez Incera Deputy Chief Executive Officer 2010 2015 X X X X
(1) As a mandate as Chief Executive Officer may not be held together with an employment contract, the only persons concerned by the AFEP-MEDEF recommendations are the Chairman of the Board of Directors, the Chairman and Chief Executive Officer and Chief Executive Officer in companies with a Board of Directors.
(2) Details of additional pension plans can be found on page 85.
(3) Details of Mr. Frédéric Oudéa’s compensation relating to a non-compete clause can be found on page 86.
(4) Messrs. Cabannes’, Sammarcelli’s and Sanchez Incera’s employment contracts are suspended during their mandate.
(5) Mr. Oudea was appointed Chief Executive Officer in May 2008 and Chairman in May 2009.
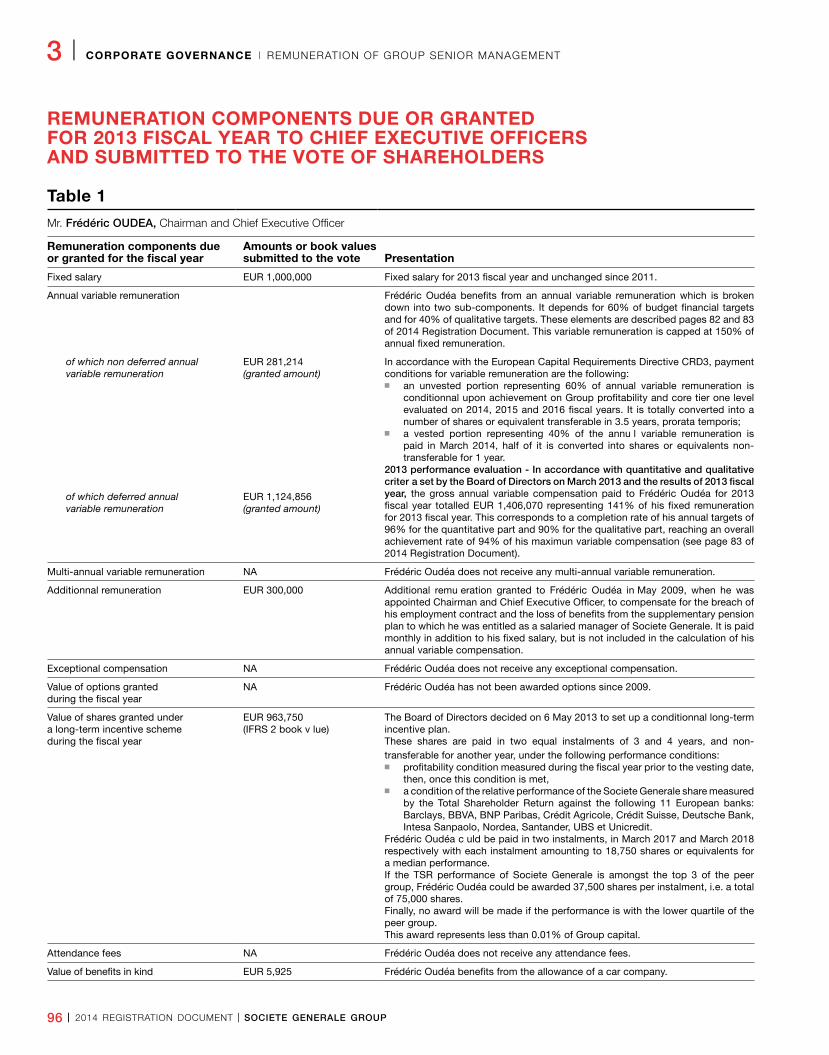
96 I 2014 REGISTRATION DOCUMENT I SOCIETE GENERALE GROUP
3 I CORPORATE GOVERNANCE I REMUNERATION OF GROUP SENIOR MANAGEMENT
REMUNERATION COMPONENTS DUE OR GRANTED FOR 2013 FISCAL YEAR TO CHIEF EXECUTIVE OFFICERS AND SUBMITTED TO THE VOTE OF SHAREHOLDERS
Table 1
Mr. Frédéric OUDEA, Chairman and Chief Executive Officer
Remuneration components due or granted for the fiscal year
Amounts or book values submitted to the vote Presentation
Fixed salary EUR 1,000,000 Fixed salary for 2013 fiscal year and unchanged since 2011.
Annual variable remuneration Frédéric Oudéa benefits from an annual variable remuneration which is broken down into two sub-components. It depends for 60% of budget financial targets and for 40% of qualitative targets. These elements are described pages 82 and 83 of 2014 Registration Document. This variable remuneration is capped at 150% of annual fixed remuneration.
of which non deferred annual variable remuneration
EUR 281,214 (granted amount)
In accordance with the European Capital Requirements Directive CRD3, payment conditions for variable remuneration are the following:
n an unvested portion representing 60% of annual variable remuneration is conditionnal upon achievement on Group profitability and core tier one level evaluated on 2014, 2015 and 2016 fiscal years. It is totally converted into a number of shares or equivalent transferable in 3.5 years, prorata temporis;
n a vested portion representing 40% of the annu l variable remuneration is paid in March 2014, half of it is converted into shares or equivalents non-transferable for 1 year.
2013 performance evaluation - In accordance with quantitative and qualitative criter a set by the Board of Directors on March 2013 and the results of 2013 fiscal year, the gross annual variable compensation paid to Frédéric Oudéa for 2013 fiscal year totalled EUR 1,406,070 representing 141% of his fixed remuneration for 2013 fiscal year. This corresponds to a completion rate of his annual targets of 96% for the quantitative part and 90% for the qualitative part, reaching an overall achievement rate of 94% of his maximun variable compensation (see page 83 of 2014 Registration Document).
of which deferred annual variable remuneration
EUR 1,124,856 (granted amount)
Multi-annual variable remuneration NA Frédéric Oudéa does not receive any multi-annual variable remuneration.
Additionnal remuneration EUR 300,000 Additional remu eration granted to Frédéric Oudéa in May 2009, when he was appointed Chairman and Chief Executive Officer, to compensate for the breach of his employment contract and the loss of benefits from the supplementary pension plan to which he was entitled as a salaried manager of Societe Generale. It is paid monthly in addition to his fixed salary, but is not included in the calculation of his annual variable compensation.
Exceptional compensation NA Frédéric Oudéa does not receive any exceptional compensation.
Value of options granted during the fiscal year
NA Frédéric Oudéa has not been awarded options since 2009.
Value of shares granted under a long-term incentive scheme during the fiscal year
EUR 963,750 (IFRS 2 book v lue)
The Board of Directors decided on 6 May 2013 to set up a conditionnal long-term incentive plan.These shares are paid in two equal instalments of 3 and 4 years, and non-transferable for another year, under the following performance conditions:
n profitability condition measured during the fiscal year prior to the vesting date, then, once this condition is met,
n a condition of the relative performance of the Societe Generale share measured by the Total Shareholder Return against the following 11 European banks: Barclays, BBVA, BNP Paribas, Crédit Agricole, Crédit Suisse, Deutsche Bank, Intesa Sanpaolo, Nordea, Santander, UBS et Unicredit.
Frédéric Oudéa c uld be paid in two instalments, in March 2017 and March 2018 respectively with each instalment amounting to 18,750 shares or equivalents for a median performance.If the TSR performance of Societe Generale is amongst the top 3 of the peer group, Frédéric Oudéa could be awarded 37,500 shares per instalment, i.e. a total of 75,000 shares.Finally, no award will be made if the performance is with the lower quartile of the peer group.This award represents less than 0.01% of Group capital.
Attendance fees NA Frédéric Oudéa does not receive any attendance fees.
Value of benefits in kind EUR 5,925 Frédéric Oudéa benefits from the allowance of a car company.
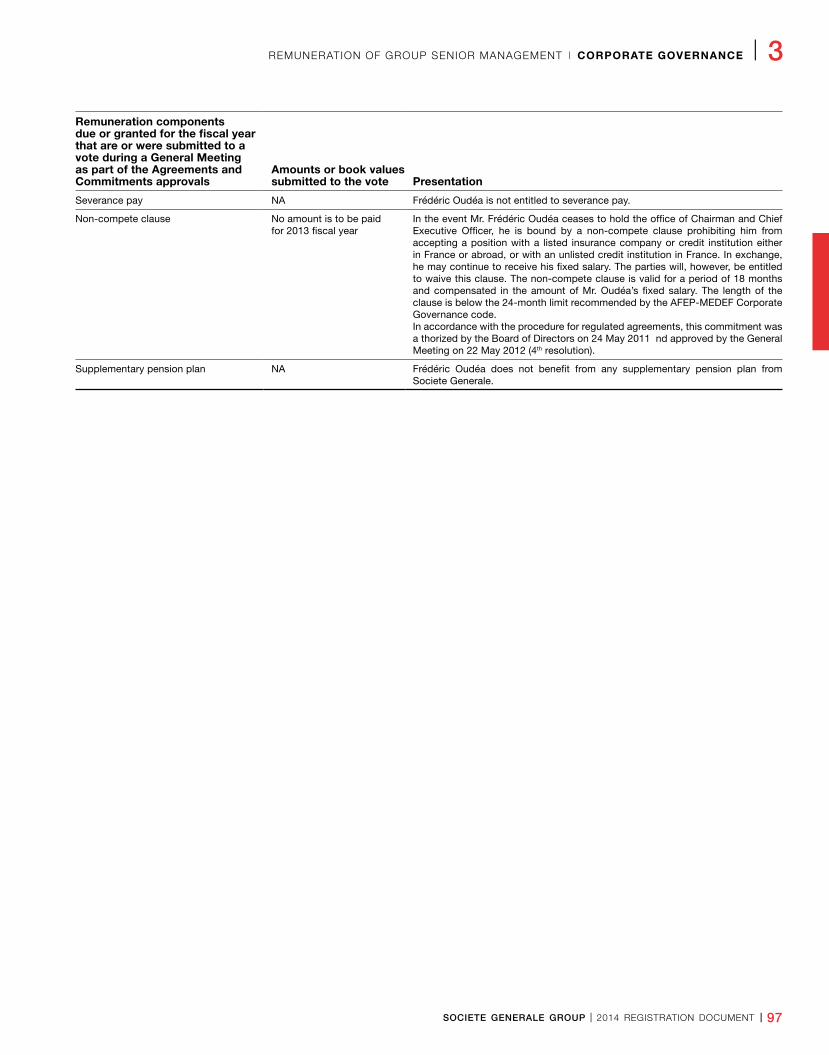
SOCIETE GENERALE GROUP I 2014 REGISTRATION DOCUMENT I 97
REMUNERATION OF GROUP SENIOR MANAGEMENT I CORPORATE GOVERNANCE I 3
Remuneration components due or granted for the fiscal year that are or were submitted to a vote during a General Meeting as part of the Agreements and Commitments approvals
Amounts or book values submitted to the vote Presentation
Severance pay NA Frédéric Oudéa is not entitled to severance pay.
Non-compete clause No amount is to be paid for 2013 fiscal year
In the event Mr. Frédéric Oudéa ceases to hold the office of Chairman and Chief Executive Officer, he is bound by a non-compete clause prohibiting him from accepting a position with a listed insurance company or credit institution either in France or abroad, or with an unlisted credit institution in France. In exchange, he may continue to receive his fixed salary. The parties will, however, be entitled to waive this clause. The non-compete clause is valid for a period of 18 months and compensated in the amount of Mr. Oudéa’s fixed salary. The length of the clause is below the 24-month limit recommended by the AFEP-MEDEF Corporate Governance code.In accordance with the procedure for regulated agreements, this commitment was a thorized by the Board of Directors on 24 May 2011 nd approved by the General Meeting on 22 May 2012 (4th resolution).
Supplementary pension plan NA Frédéric Oudéa does not benefit from any supplementary pension plan from Societe Generale.
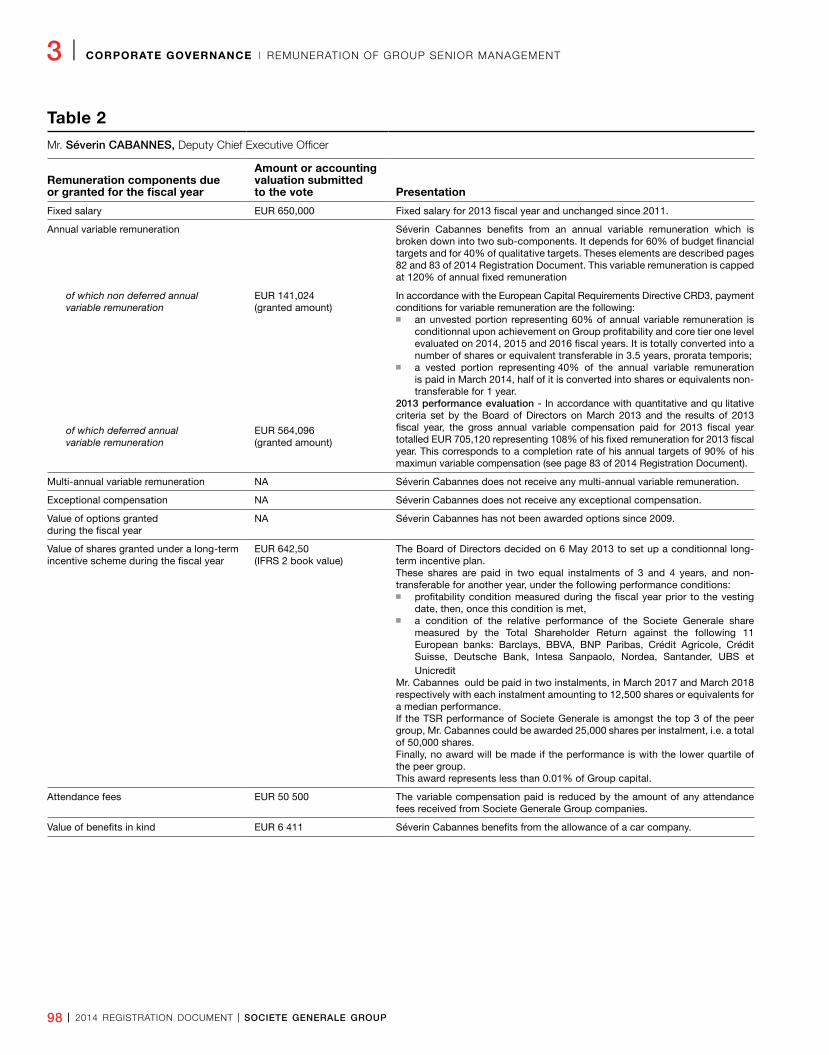
98 I 2014 REGISTRATION DOCUMENT I SOCIETE GENERALE GROUP
3 I CORPORATE GOVERNANCE I REMUNERATION OF GROUP SENIOR MANAGEMENT
Table 2
Mr. Séverin CABANNES, Deputy Chief Executive Officer
Remuneration components due or granted for the fiscal year
Amount or accounting valuation submitted to the vote Presentation
Fixed salary EUR 650,000 Fixed salary for 2013 fiscal year and unchanged since 2011.
Annual variable remuneration Séverin Cabannes benefits from an annual variable remuneration which is broken down into two sub-components. It depends for 60% of budget financial targets and for 40% of qualitative targets. Theses elements are described pages 82 and 83 of 2014 Registration Document. This variable remuneration is capped at 120% of annual fixed remuneration
of which non deferred annual variable remuneration
EUR 141,024 (granted amount)
In accordance with the European Capital Requirements Directive CRD3, payment conditions for variable remuneration are the following:
n an unvested portion representing 60% of annual variable remuneration is conditionnal upon achievement on Group profitability and core tier one level evaluated on 2014, 2015 and 2016 fiscal years. It is totally converted into a number of shares or equivalent transferable in 3.5 years, prorata temporis;
n a vested portion representing 40% of the annual variable remuneration is paid in March 2014, half of it is converted into shares or equivalents non-transferable for 1 year.
2013 performance evaluation - In accordance with quantitative and qu litative criteria set by the Board of Directors on March 2013 and the results of 2013 fiscal year, the gross annual variable compensation paid for 2013 fiscal year totalled EUR 705,120 representing 108% of his fixed remuneration for 2013 fiscal year. This corresponds to a completion rate of his annual targets of 90% of his maximun variable compensation (see page 83 of 2014 Registration Document).
of which deferred annual variable remuneration
EUR 564,096 (granted amount)
Multi-annual variable remuneration NA Séverin Cabannes does not receive any multi-annual variable remuneration.
Exceptional compensation NA Séverin Cabannes does not receive any exceptional compensation.
Value of options granted during the fiscal year
NA Séverin Cabannes has not been awarded options since 2009.
Value of shares granted under a long-term incentive scheme during the fiscal year
EUR 642,50 (IFRS 2 book value)
The Board of Directors decided on 6 May 2013 to set up a conditionnal long-term incentive plan.These shares are paid in two equal instalments of 3 and 4 years, and non-transferable for another year, under the following performance conditions:
n profitability condition measured during the fiscal year prior to the vesting date, then, once this condition is met,
n a condition of the relative performance of the Societe Generale share measured by the Total Shareholder Return against the following 11 European banks: Barclays, BBVA, BNP Paribas, Crédit Agricole, Crédit Suisse, Deutsche Bank, Intesa Sanpaolo, Nordea, Santander, UBS et Unicredit
Mr. Cabannes ould be paid in two instalments, in March 2017 and March 2018 respectively with each instalment amounting to 12,500 shares or equivalents for a median performance.If the TSR performance of Societe Generale is amongst the top 3 of the peer group, Mr. Cabannes could be awarded 25,000 shares per instalment, i.e. a total of 50,000 shares.Finally, no award will be made if the performance is with the lower quartile of the peer group.This award represents less than 0.01% of Group capital.
Attendance fees EUR 50 500 The variable compensation paid is reduced by the amount of any attendance fees received from Societe Generale Group companies.
Value of benefits in kind EUR 6 411 Séverin Cabannes benefits from the allowance of a car company.
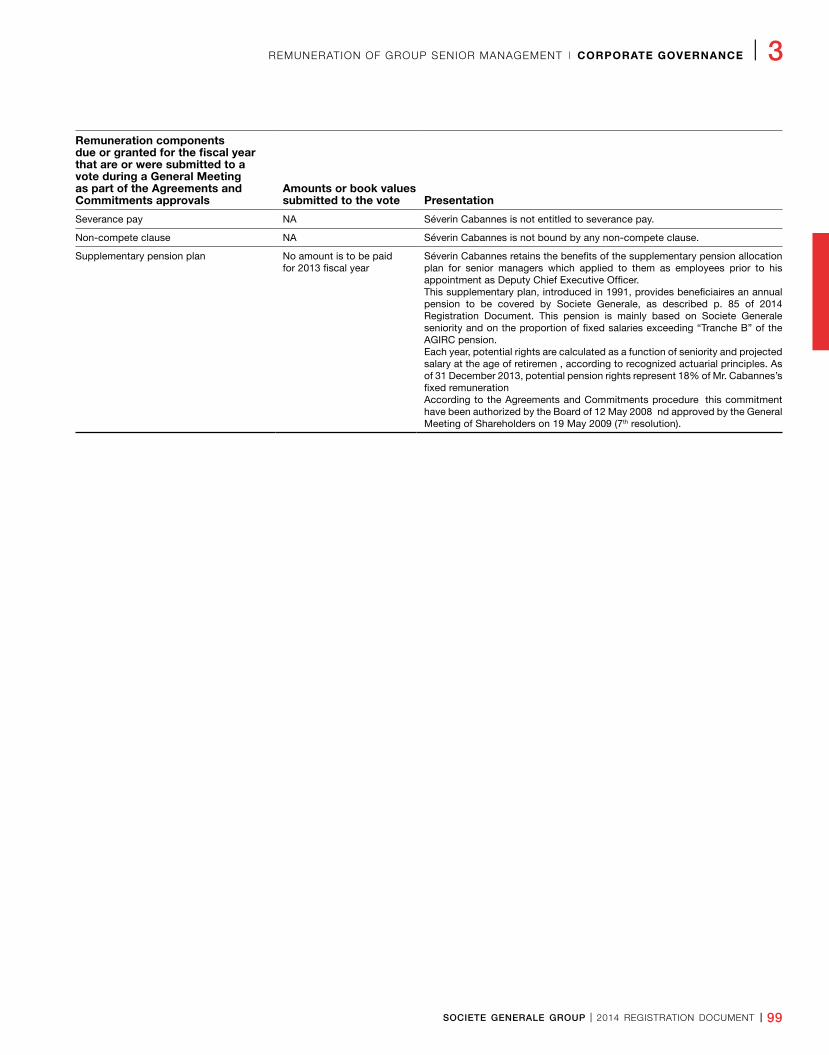
SOCIETE GENERALE GROUP I 2014 REGISTRATION DOCUMENT I 99
REMUNERATION OF GROUP SENIOR MANAGEMENT I CORPORATE GOVERNANCE I 3
Remuneration components due or granted for the fiscal year that are or were submitted to a vote during a General Meeting as part of the Agreements and Commitments approvals
Amounts or book values submitted to the vote Presentation
Severance pay NA Séverin Cabannes is not entitled to severance pay.
Non-compete clause NA Séverin Cabannes is not bound by any non-compete clause.
Supplementary pension plan No amount is to be paid for 2013 fiscal year
Séverin Cabannes retains the benefits of the supplementary pension allocation plan for senior managers which applied to them as employees prior to his appointment as Deputy Chief Executive Officer.This supplementary plan, introduced in 1991, provides beneficiaires an annual pension to be covered by Societe Generale, as described p. 85 of 2014 Registration Document. This pension is mainly based on Societe Generale seniority and on the proportion of fixed salaries exceeding “Tranche B” of the AGIRC pension.Each year, potential rights are calculated as a function of seniority and projected salary at the age of retiremen , according to recognized actuarial principles. As of 31 December 2013, potential pension rights represent 18% of Mr. Cabannes’s fixed remunerationAccording to the Agreements and Commitments procedure this commitment have been authorized by the Board of 12 May 2008 nd approved by the General Meeting of Shareholders on 19 May 2009 (7th resolution).
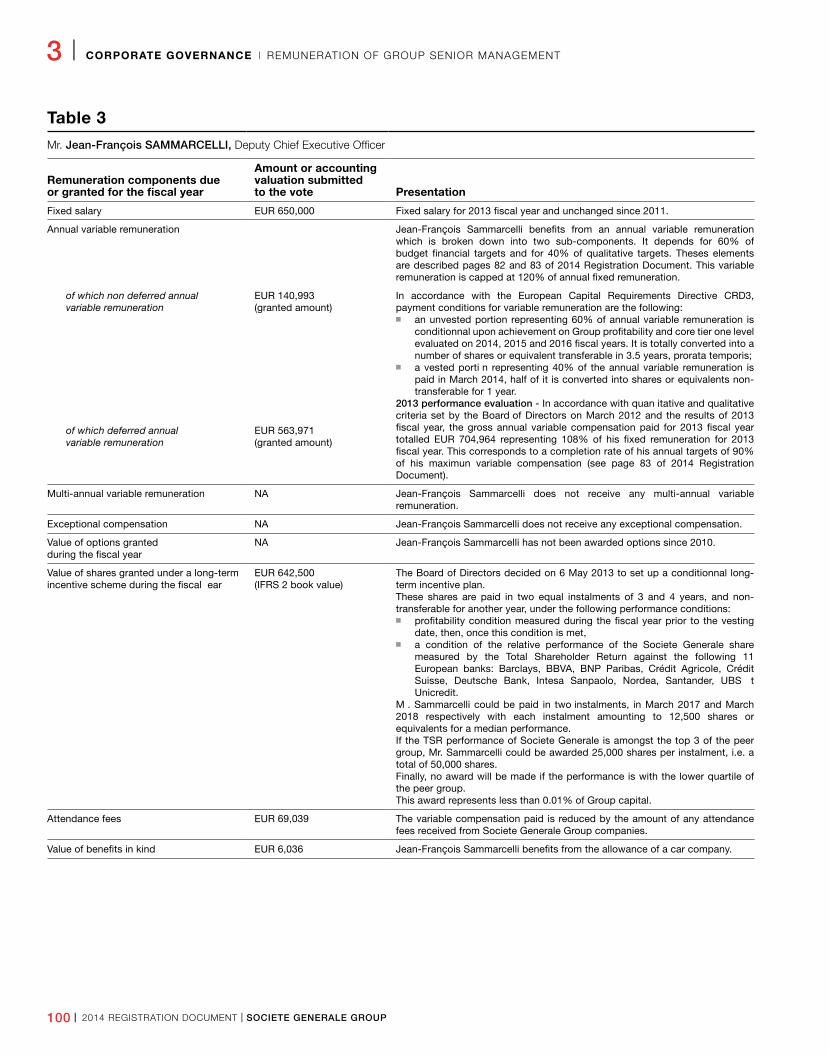
100 I 2014 REGISTRATION DOCUMENT I SOCIETE GENERALE GROUP
3 I CORPORATE GOVERNANCE I REMUNERATION OF GROUP SENIOR MANAGEMENT
Table 3
Mr. Jean-François SAMMARCELLI, Deputy Chief Executive Officer
Remuneration components due or granted for the fiscal year
Amount or accounting valuation submitted to the vote Presentation
Fixed salary EUR 650,000 Fixed salary for 2013 fiscal year and unchanged since 2011.
Annual variable remuneration Jean-François Sammarcelli benefits from an annual variable remuneration which is broken down into two sub-components. It depends for 60% of budget financial targets and for 40% of qualitative targets. Theses elements are described pages 82 and 83 of 2014 Registration Document. This variable remuneration is capped at 120% of annual fixed remuneration.
of which non deferred annual variable remuneration
EUR 140,993(granted amount)
In accordance with the European Capital Requirements Directive CRD3, payment conditions for variable remuneration are the following:
n an unvested portion representing 60% of annual variable remuneration is conditionnal upon achievement on Group profitability and core tier one level evaluated on 2014, 2015 and 2016 fiscal years. It is totally converted into a number of shares or equivalent transferable in 3.5 years, prorata temporis;
n a vested porti n representing 40% of the annual variable remuneration is paid in March 2014, half of it is converted into shares or equivalents non-transferable for 1 year.
2013 performance evaluation - In accordance with quan itative and qualitative criteria set by the Board of Directors on March 2012 and the results of 2013 fiscal year, the gross annual variable compensation paid for 2013 fiscal year totalled EUR 704,964 representing 108% of his fixed remuneration for 2013 fiscal year. This corresponds to a completion rate of his annual targets of 90% of his maximun variable compensation (see page 83 of 2014 Registration Document).
of which deferred annual variable remuneration
EUR 563,971(granted amount)
Multi-annual variable remuneration NA Jean-François Sammarcelli does not receive any multi-annual variable remuneration.
Exceptional compensation NA Jean-François Sammarcelli does not receive any exceptional compensation.
Value of options granted during the fiscal year
NA Jean-François Sammarcelli has not been awarded options since 2010.
Value of shares granted under a long-term incentive scheme during the fiscal ear
EUR 642,500(IFRS 2 book value)
The Board of Directors decided on 6 May 2013 to set up a conditionnal long-term incentive plan.These shares are paid in two equal instalments of 3 and 4 years, and non-transferable for another year, under the following performance conditions:
n profitability condition measured during the fiscal year prior to the vesting date, then, once this condition is met,
n a condition of the relative performance of the Societe Generale share measured by the Total Shareholder Return against the following 11 European banks: Barclays, BBVA, BNP Paribas, Crédit Agricole, Crédit Suisse, Deutsche Bank, Intesa Sanpaolo, Nordea, Santander, UBS t Unicredit.
M . Sammarcelli could be paid in two instalments, in March 2017 and March 2018 respectively with each instalment amounting to 12,500 shares or equivalents for a median performance.If the TSR performance of Societe Generale is amongst the top 3 of the peer group, Mr. Sammarcelli could be awarded 25,000 shares per instalment, i.e. a total of 50,000 shares.Finally, no award will be made if the performance is with the lower quartile of the peer group.This award represents less than 0.01% of Group capital.
Attendance fees EUR 69,039 The variable compensation paid is reduced by the amount of any attendance fees received from Societe Generale Group companies.
Value of benefits in kind EUR 6,036 Jean-François Sammarcelli benefits from the allowance of a car company.
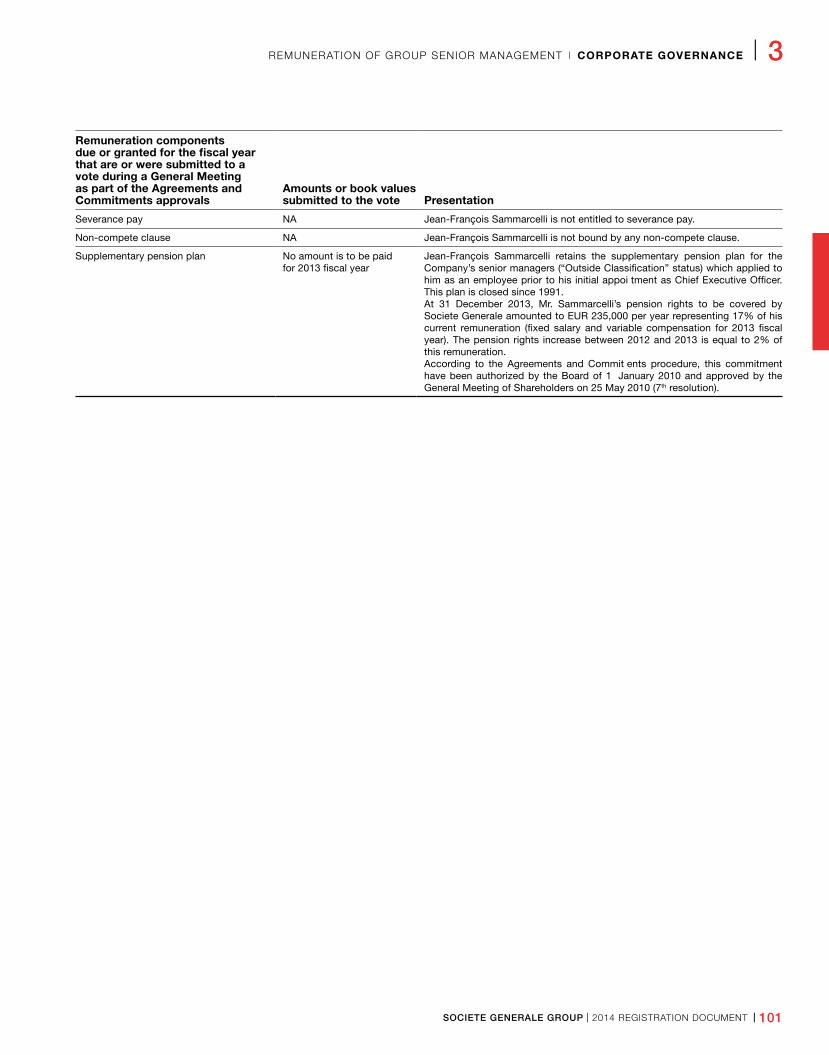
SOCIETE GENERALE GROUP I 2014 REGISTRATION DOCUMENT I 101
REMUNERATION OF GROUP SENIOR MANAGEMENT I CORPORATE GOVERNANCE I 3
Remuneration components due or granted for the fiscal year that are or were submitted to a vote during a General Meeting as part of the Agreements and Commitments approvals
Amounts or book values submitted to the vote Presentation
Severance pay NA Jean-François Sammarcelli is not entitled to severance pay.
Non-compete clause NA Jean-François Sammarcelli is not bound by any non-compete clause.
Supplementary pension plan No amount is to be paid for 2013 fiscal year
Jean-François Sammarcelli retains the supplementary pension plan for the Company’s senior managers (“Outside Classification” status) which applied to him as an employee prior to his initial appoi tment as Chief Executive Officer. This plan is closed since 1991.At 31 December 2013, Mr. Sammarcelli’s pension rights to be covered by Societe Generale amounted to EUR 235,000 per year representing 17% of his current remuneration (fixed salary and variable compensation for 2013 fiscal year). The pension rights increase between 2012 and 2013 is equal to 2% of this remuneration.According to the Agreements and Commit ents procedure, this commitment have been authorized by the Board of 1 January 2010 and approved by the General Meeting of Shareholders on 25 May 2010 (7th resolution).
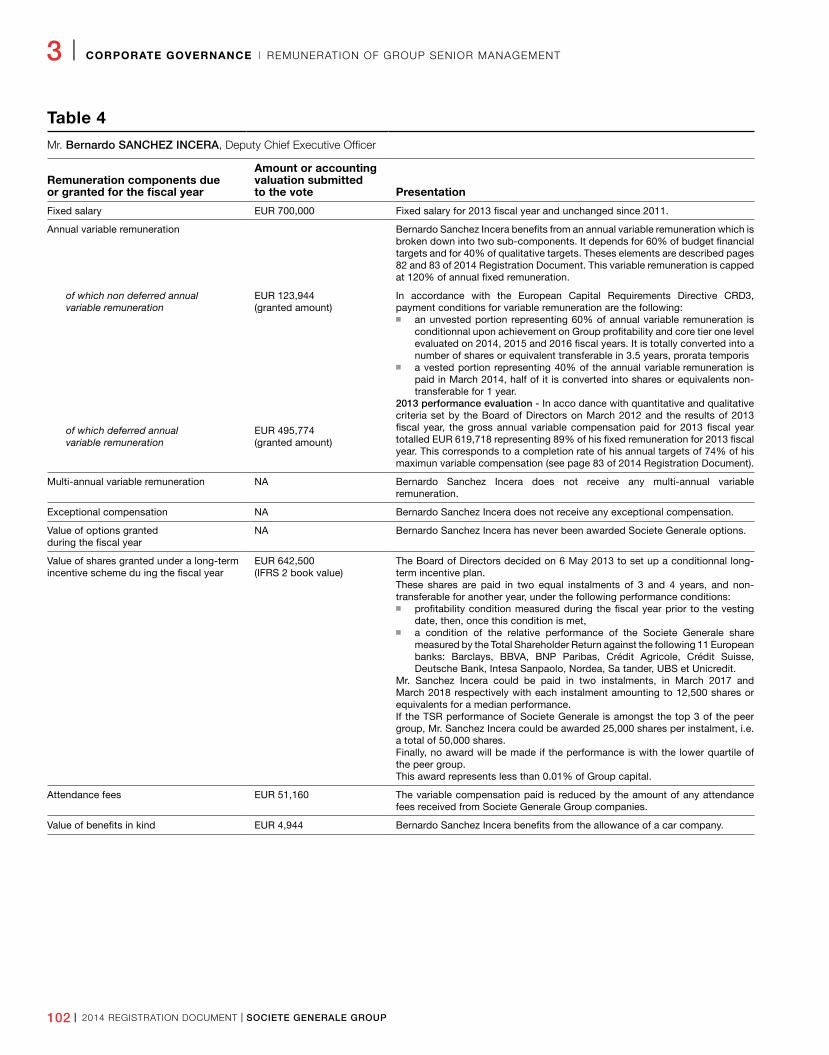
102 I 2014 REGISTRATION DOCUMENT I SOCIETE GENERALE GROUP
3 I CORPORATE GOVERNANCE I REMUNERATION OF GROUP SENIOR MANAGEMENT
Table 4
Mr. Bernardo SANCHEZ INCERA, Deputy Chief Executive Officer
Remuneration components due or granted for the fiscal year
Amount or accounting valuation submitted to the vote Presentation
Fixed salary EUR 700,000 Fixed salary for 2013 fiscal year and unchanged since 2011.
Annual variable remuneration Bernardo Sanchez Incera benefits from an annual variable remuneration which is broken down into two sub-components. It depends for 60% of budget financial targets and for 40% of qualitative targets. Theses elements are described pages 82 and 83 of 2014 Registration Document. This variable remuneration is capped at 120% of annual fixed remuneration.
of which non deferred annual variable remuneration
EUR 123,944(granted amount)
In accordance with the European Capital Requirements Directive CRD3, payment conditions for variable remuneration are the following:
n an unvested portion representing 60% of annual variable remuneration is conditionnal upon achievement on Group profitability and core tier one level evaluated on 2014, 2015 and 2016 fiscal years. It is totally converted into a number of shares or equivalent transferable in 3.5 years, prorata temporis
n a vested portion representing 40% of the annual variable remuneration is paid in March 2014, half of it is converted into shares or equivalents non-transferable for 1 year.
2013 performance evaluation - In acco dance with quantitative and qualitative criteria set by the Board of Directors on March 2012 and the results of 2013 fiscal year, the gross annual variable compensation paid for 2013 fiscal year totalled EUR 619,718 representing 89% of his fixed remuneration for 2013 fiscal year. This corresponds to a completion rate of his annual targets of 74% of his maximun variable compensation (see page 83 of 2014 Registration Document).
of which deferred annual variable remuneration
EUR 495,774(granted amount)
Multi-annual variable remuneration NA Bernardo Sanchez Incera does not receive any multi-annual variable remuneration.
Exceptional compensation NA Bernardo Sanchez Incera does not receive any exceptional compensation.
Value of options granted during the fiscal year
NA Bernardo Sanchez Incera has never been awarded Societe Generale options.
Value of shares granted under a long-term incentive scheme du ing the fiscal year
EUR 642,500(IFRS 2 book value)
The Board of Directors decided on 6 May 2013 to set up a conditionnal long-term incentive plan.These shares are paid in two equal instalments of 3 and 4 years, and non-transferable for another year, under the following performance conditions:
n profitability condition measured during the fiscal year prior to the vesting date, then, once this condition is met,
n a condition of the relative performance of the Societe Generale share measured by the Total Shareholder Return against the following 11 European banks: Barclays, BBVA, BNP Paribas, Crédit Agricole, Crédit Suisse, Deutsche Bank, Intesa Sanpaolo, Nordea, Sa tander, UBS et Unicredit.
Mr. Sanchez Incera could be paid in two instalments, in March 2017 and March 2018 respectively with each instalment amounting to 12,500 shares or equivalents for a median performance.If the TSR performance of Societe Generale is amongst the top 3 of the peer group, Mr. Sanchez Incera could be awarded 25,000 shares per instalment, i.e. a total of 50,000 shares.Finally, no award will be made if the performance is with the lower quartile of the peer group.This award represents less than 0.01% of Group capital.
Attendance fees EUR 51,160 The variable compensation paid is reduced by the amount of any attendance fees received from Societe Generale Group companies.
Value of benefits in kind EUR 4,944 Bernardo Sanchez Incera benefits from the allowance of a car company.
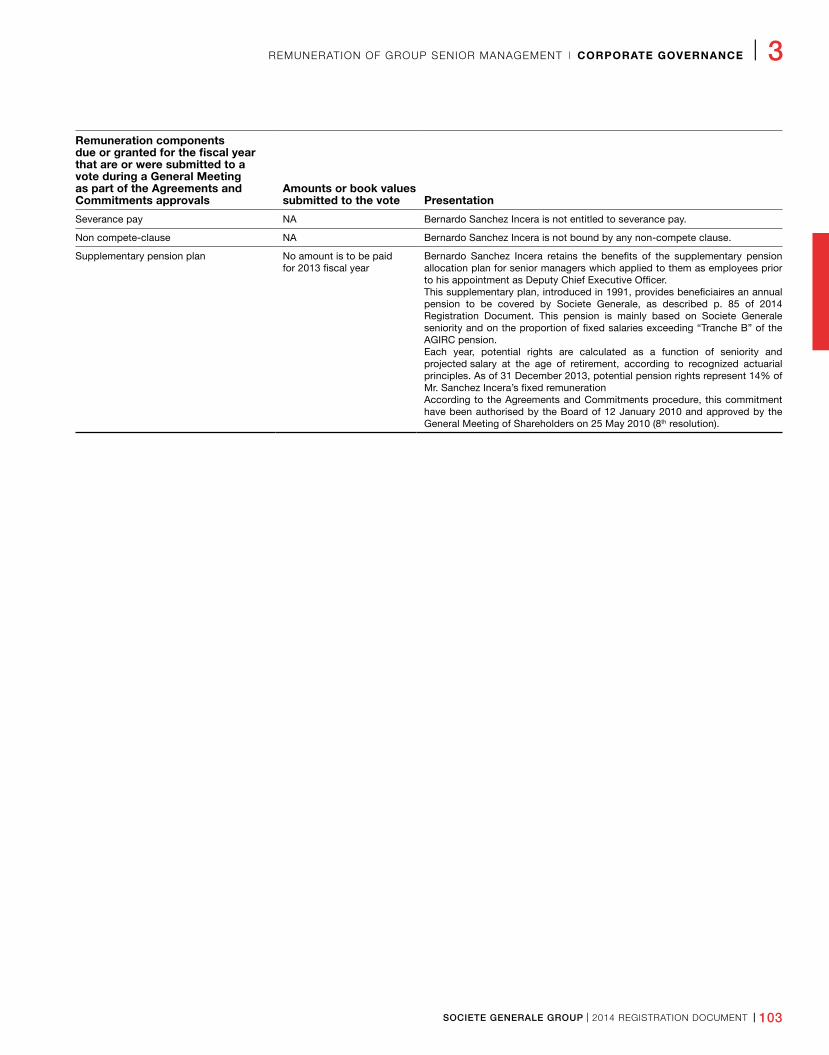
SOCIETE GENERALE GROUP I 2014 REGISTRATION DOCUMENT I 103
REMUNERATION OF GROUP SENIOR MANAGEMENT I CORPORATE GOVERNANCE I 3
Remuneration components due or granted for the fiscal year that are or were submitted to a vote during a General Meeting as part of the Agreements and Commitments approvals
Amounts or book values submitted to the vote Presentation
Severance pay NA Bernardo Sanchez Incera is not entitled to severance pay.
Non compete-clause NA Bernardo Sanchez Incera is not bound by any non-compete clause.
Supplementary pension plan No amount is to be paid for 2013 fiscal year
Bernardo Sanchez Incera retains the benefits of the supplementary pension allocation plan for senior managers which applied to them as employees prior to his appointment as Deputy Chief Executive Officer.This supplementary plan, introduced in 1991, provides beneficiaires an annual pension to be covered by Societe Generale, as described p. 85 of 2014 Registration Document. This pension is mainly based on Societe Generale seniority and on the proportion of fixed salaries exceeding “Tranche B” of the AGIRC pension.Each year, potential rights are calculated as a function of seniority and projected salary at the age of retirement, according to recognized actuarial principles. As of 31 December 2013, potential pension rights represent 14% of Mr. Sanchez Incera’s fixed remunerationAccording to the Agreements and Commitments procedure, this commitment have been authorised by the Board of 12 January 2010 and approved by the General Meeting of Shareholders on 25 May 2010 (8th resolution).
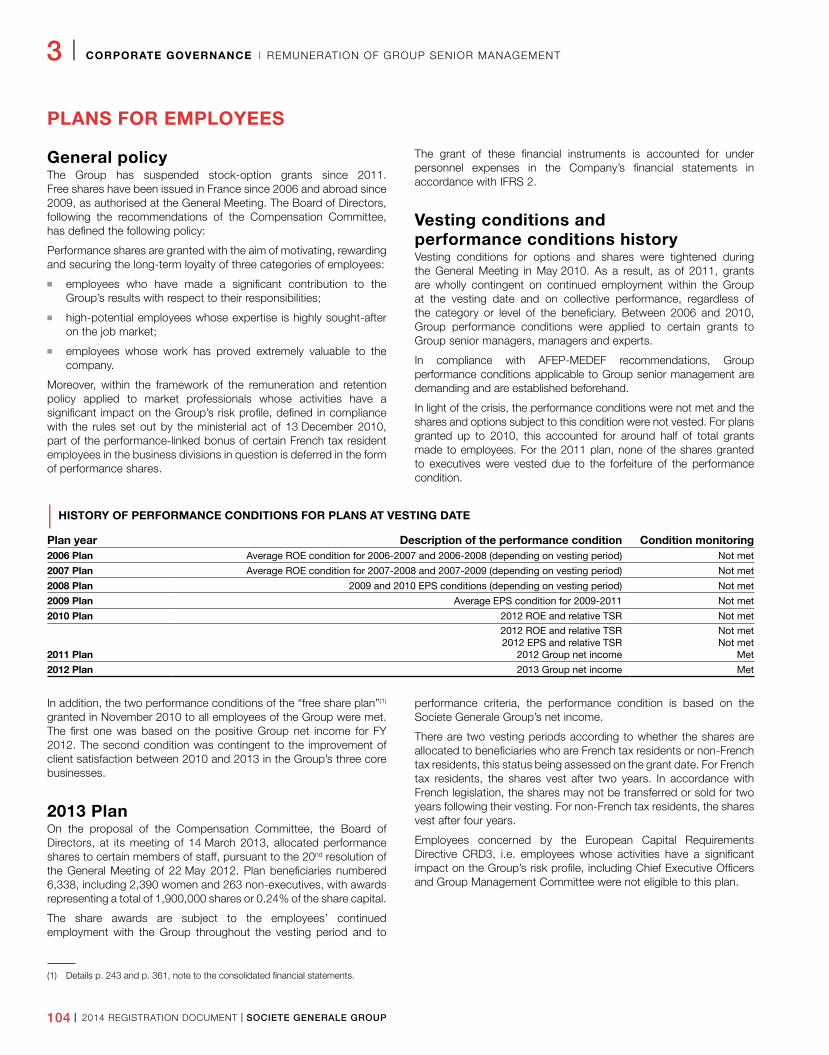
104 I 2014 REGISTRATION DOCUMENT I SOCIETE GENERALE GROUP
3 I CORPORATE GOVERNANCE I REMUNERATION OF GROUP SENIOR MANAGEMENT
PLANS FOR EMPLOYEES
General policyThe Group has suspended stock-option grants since 2011. Free shares have been issued in France since 2006 and abroad since 2009, as authorised at the General Meeting. The Board of Directors, following the recommendations of the Compensation Committee, has defined the following policy:
Performance shares are granted with the aim of motivating, rewarding and securing the long-term loyalty of three categories of employees:
n employees who have made a significant contribution to the Group’s results with respect to their responsibilities;
n high-potential employees whose expertise is highly sought-after on the job market;
n employees whose work has proved extremely valuable to the company.
Moreover, within the framework of the remuneration and retention policy applied to market professionals whose activities have a significant impact on the Group’s risk profile, defined in compliance with the rules set out by the ministerial act of 13 December 2010, part of the performance-linked bonus of certain French tax resident employees in the business divisions in question is deferred in the form of performance shares.
The grant of these financial instruments is accounted for under personnel expenses in the Company’s financial statements in accordance with IFRS 2.
Vesting conditions and performance conditions historyVesting conditions for options and shares were tightened during the General Meeting in May 2010. As a result, as of 2011, grants are wholly contingent on continued employment within the Group at the vesting date and on collective performance, regardless of the category or level of the beneficiary. Between 2006 and 2010, Group performance conditions were applied to certain grants to Group senior managers, managers and experts.
In compliance with AFEP-MEDEF recommendations, Group performance conditions applicable to Group senior management are demanding and are established beforehand.
In light of the crisis, the performance conditions were not met and the shares and options subject to this condition were not vested. For plans granted up to 2010, this accounted for around half of total grants made to employees. For the 2011 plan, none of the shares granted to executives were vested due to the forfeiture of the performance condition.
| HISTORY OF PERFORMANCE CONDITIONS FOR PLANS AT VESTING DATE
Plan year Description of the performance condition Condition monitoring2006 Plan Average ROE condition for 2006-2007 and 2006-2008 (depending on vesting period) Not met
2007 Plan Average ROE condition for 2007-2008 and 2007-2009 (depending on vesting period) Not met
2008 Plan 2009 and 2010 EPS conditions (depending on vesting period) Not met
2009 Plan Average EPS condition for 2009-2011 Not met
2010 Plan 2012 ROE and relative TSR Not met
2011 Plan
2012 ROE and relative TSR 2012 EPS and relative TSR
2012 Group net income
Not met Not met
Met
2012 Plan 2013 Group net income Met
In addition, the two performance conditions of the “free share plan”(1) granted in November 2010 to all employees of the Group were met. The first one was based on the positive Group net income for FY 2012. The second condition was contingent to the improvement of client satisfaction between 2010 and 2013 in the Group’s three core businesses.
2013 PlanOn the proposal of the Compensation Committee, the Board of Directors, at its meeting of 14 March 2013, allocated performance shares to certain members of staff, pursuant to the 20nd resolution of the General Meeting of 22 May 2012. Plan beneficiaries numbered 6,338, including 2,390 women and 263 non-executives, with awards representing a total of 1,900,000 shares or 0.24% of the share capital.
The share awards are subject to the employees’ continued employment with the Group throughout the vesting period and to
performance criteria, the performance condition is based on the Societe Generale Group’s net income.
There are two vesting periods according to whether the shares are allocated to beneficiaries who are French tax residents or non-French tax residents, this status being assessed on the grant date. For French tax residents, the shares vest after two years. In accordance with French legislation, the shares may not be transferred or sold for two years following their vesting. For non-French tax residents, the shares vest after four years.
Employees concerned by the European Capital Requirements Directive CRD3, i.e. employees whose activities have a significant impact on the Group’s risk profile, including Chief Executive Officers and Group Management Committee were not eligible to this plan.
(1) Details p. 243 and p. 361, note to the consolidated financial statements.
SOCIETE GENERALE GROUP I 2014 REGISTRATION DOCUMENT I 105
STATUTORY AUDITORS’ SPECIAL REPORT ON RELATED PARTY AGREEMENTS AND COMMITMENTS I CORPORATE GOVERNANCE I 3
4 . S TAT U T O R Y A U D I T O R S ’ S P E C I A L R E P O R T O N R E L AT E D PA R T Y A G R E E M E N T S A N D C O M M I T M E N T S
This is a free translation into English of a report issued in French and it is provided solely for the convenience of English speaking users. This report should be read in conjunction with, and construed in accordance with, French law and professional standards applicable in France.
ERNST & YOUNG et Autres
1/2, place des Saisons 92400 Courbevoie - Paris-La Défense 1
DELOITTE & ASSOCIÉS
185, avenue Charles-de-Gaulle 92524 Neuilly-sur-Seine Cedex
SOCIETE GENERALESociété Anonyme 17, cours Valmy
92972 Paris-La Défense
General Meeting of Shareholders to approve the financial statements for the year ended December 31, 2013To the Shareholders,
In our capacity as statutory auditors of your company, we hereby report on certain related party agreements and commitments.
We are required to inform you, on the basis of the information provided to us, of the terms and conditions of those agreements and commitments indicated to us, or that we may have identified in the performance of our engagement. We are not required to comment as to whether they are beneficial or appropriate or to ascertain the existence of any such agreements and commitments. It is your responsibility, in accordance with Article R. 225-31 of the French commercial code (Code de Commerce), to evaluate the benefits resulting from these agreements and commitments prior to their approval.
In addition, we are required, where applicable, to inform you in accordance with Article R. 225-31 of the French commercial code (Code de Commerce) concerning the implementation, during the year, of the agreements and commitments already approved by the General Meeting of Shareholders.
We performed those procedures which we considered necessary to comply with professional guidance issued by the national auditing body (Compagnie Nationale des Commissaires aux Comptes) relating to this type of engagement. These procedures consisted in verifying that the information provided to us is consistent with the documentation from which it has been extracted.
Agreements and commitments submitted for approval by the general meeting of shareholders
AGREEMENTS AND COMMITMENTS AUTHORIZED DURING THE YEARWe hereby inform you that we have not been advised of any agreements or commitments authorized in the course of the year to be submitted to the General Meeting of Shareholders for approval in accordance with article L. 225-38 of the French commercial code (Code de Commerce).
Agreements and commitments already approved by the general meeting of shareholdersAgreements and commitments approved in prior years which were not implemented during the year.
In addition, we have been advised that the following agreements and commitments which were approved by the General Meeting of Shareholders in prior years were not implemented during the year.
106 I 2014 REGISTRATION DOCUMENT I SOCIETE GENERALE GROUP
3 I CORPORATE GOVERNANCE ISTATUTORY AUDITOR’S SPECIAL REPORT ON RELATED PARTY AGREEMENTS AND COMMITMENTS
1. With Mr. Frédéric Oudéa, Chairman and Chief Executive OfficerNature and purpose
Non-compete clause for Mr. Frédéric Oudéa.
Conditions
The non-compete clause for Mr. Frédéric Oudéa, had been authorized by your board of directors on May 24, 2011 and approved by the General Meeting of Shareholders on May 22, 2012.
Under the condition that he will not be employed for an eighteen-month period following the termination of his terms of office, in a listed bank or insurance Company in or outside France, or in a non-listed bank in France, Mr. Frédéric Oudéa will be entitled, during the same period, to a compensation to be paid on a monthly basis, equal to his basic salary. Parties will however have a right to waive such clause.
2. With Messrs. Bernardo Sanchez Incera and Séverin Cabannes, Deputy Chief Executive OfficersNature and purpose
Supplementary pension plan for Messrs. Bernardo Sanchez Incera and Séverin Cabannes.
Conditions
Under the terms of this plan, Messrs. Bernardo Sanchez Incera and Séverin Cabannes retain the benefits of the supplementary pension allocation plan for senior managers which applied to them as employees prior to their initial appointment as Deputy Chief Executive Officers. This supplementary plan was introduced in 1991. It provides its beneficiaries, upon the liquidation of their French Social Security pension, with a total pension equal to the product of the followings:
n The average, over the last ten years of the career, of the proportion of basic salaries exceeding “Tranche B” of the AGIRC pension increased by a variable part limited to 5% of the basic fixed salary.
n The rate equal to the ratio between a number of annuities corresponding to the years of professional services within your Company and 60.
The AGIRC “Tranche C” pension vested in respect of his professional services within your Company is deducted from this total pension. The additional allocation to be paid by your Company is increased for beneficiaries who have brought up at least three children, as well as for those retiring after the legal retirement age set by French Social Security. It may not be less than a third of the full rate service value of the AGIRC “Tranche B” points vested by the manager since his appointment in the “Outside Classification” category of your company.
The rights are subject to the employee being present in the Company upon liquidation of his pension.
3. With Mr. Jean-François Sammarcelli, Deputy Chief Executive OfficerNature and purpose
Supplementary pension plan for Mr. Jean-François Sammarcelli.
Conditions
Under the terms of this plan, Mr. Jean-François Sammarcelli retains the benefits of the supplementary pension allocation plan for senior managers set up on January 1, 1986. This plan applied to him as employee prior to its initial appointment as Deputy Chief Executive Officer. This plan, closed in 1991, entitles its beneficiaries to a total amount of pension payments equal to a percentage of the base remuneration, calculated according to the number of years of service, capped at a maximum of 70% of this remuneration for a settlement at the legal retirement age set by French Social Security. The additional allocation to be paid by your Company is increased for beneficiaries who have brought up at least three children, as well as for those retiring after the legal retirement age set by French Social Security. The annuities to be taken into account through the period of their professional activities include both services provided as employee as well as Deputy Chief Executive Officers. The base remuneration is the last basic salary as employee. The cost for your company is equal to the difference between the total pension as defined above and all other retirement pensions or similar paid by French Social Security as well as any other retirement benefits in consideration of salaried activities of the beneficiaries. 60% of said pension shall be paid to any surviving spouse in the event of the death of a beneficiary.
Paris-La Défense and Neuilly-sur-Seine, March 4, 2014 The statutory auditors
French original signed by
DELOITTE & ASSOCIÉS Represented by
Jean-Marc MICKELER
ERNST & YOUNG et Autres Represented by
Isabelle SANTENAC
SOCIETE GENERALE GROUP I 2014 REGISTRATION DOCUMENT I 107
CHAIRMAN’S REPORT I CORPORATE GOVERNANCE I 3
5 . R E P O R T O F T H E C H A I R M A N O N I N T E R N A L C O N T R O L A N D R I S K M A N A G E M E N T
This report has been prepared in compliance with article L. 225-37 of the French commercial code(1). It summarises the internal controls of the consolidated Societe Generale Group and is in no way intended to give a detailed description of the situation of the Group’s activities and subsidiaries or of the practical implementation of the procedures. The Chairman of each French limited liability company carrying out a public offering, and that is a subsidiary of the Group, is required to draft a specific report.
Given the extent and diversity of the risks inherent in banking, internal control is a vital instrument in risk management policy that plays an important role in ensuring the sustainability of activities. It forms
part of a strict regulatory framework defined at a national level, and is also the focus of various projects at an international level (Basel Committee, European Union). Internal control concerns all personnel in all areas of the Group. While the primary responsibility therein lies with the operational staff, a number of Corporate Divisions are also involved, notably the Risk Division, the Group Corporate Secretary (notably in charge of Compliance and its control), all of the Group’s finance departments and the Internal Audit Division. These entities all contributed to the production of this report. The report was approved by the Board of Directors after being examined by the Audit, Internal Control and Risk Committee.
RISK MANAGEMENT
Banking activities are exposed to various types of risksGiven the diversity and evolution of the Group’s activities, risk management involves the following main categories:
n credit and counterparty risk (including country risk): risk of losses arising from the inability of the Group’s customers, issuers or other counterparties to meet their financial commitments. Credit risk includes counterparty risk linked to market transactions (replacement risk) and as well as securitisation activities. In addition, credit risk may be further amplified by concentration risk, which arises from a large exposure to a given risk, to one or more counterparties, or to one or more homogeneous groups of counterparties;
n market risk: risk of a loss of value on financial instruments arising from changes in market parameters, volatility of these parameters and correlations between them. These parameters include but are not limited to exchange rates, interest rates, and the price of securities (equity, bonds), commodities, derivatives and other assets, including real estate assets;
n structural interest and exchange rate risk: risk of loss or of write-downs in the Group’s assets arising from variations in interest or exchange rates. Structural interest and exchange rate risk arises from commercial activities and from transactions entered into by the Corporate Centre (operations involving equity capital, investments and bond issues);
n liquidity risk: risk of the Group not being able to meet its cash or collateral requirements as they arise and at a reasonable cost;
n operational risks (including accounting and environmental risks): risk of losses or sanctions due in particular to inadequacies or failures in internal procedures or systems, human error or external events;
n non-compliance risk (including legal and tax risks): risk of legal, administrative or disciplinary sanction, material financial losses or reputational damage arising from failure to comply with the provisions governing the Group’s activities;
n reputational risk: risk arising from a negative perception on the part of customers, counterparties, shareholders, investors or regulators that could negatively impact the Group’s ability to maintain or engage in business relationships and to sustain access to sources of financing;
n strategic risk: risks inherent to the choice of a given business strategy or resulting from the Group’s inability to execute its strategy;
n business risk: risk of losses if costs exceed revenues;
n risk related to insurance activities: through its insurance subsidiaries, the Group is also exposed to a variety of risks linked to the insurance business. In addition to balance sheet management risks (interest rate, valuation, counterparty and exchange rate risk), those include premium pricing risk, mortality risk and structural risk of life and non-life insurance activities, including pandemics, accidents and catastrophic events (such as earthquakes, hurricanes, industrial disasters, acts of terrorism or military conflicts).
The Group is also exposed to the following risks:
n investment portfolio risk: risk of unfavourable changes in the value of the Group’s investment portfolio;
n risk related to specialised finance activities: through its Specialised Financial Services activities, mainly in its operational vehicle leasing subsidiary, the Group is exposed to residual value risk (when the net resale value of an asset at the end of the lease is less than estimated).
(1) The Corporate Governance section of this report is on pages 71 to 81.
108 I 2014 REGISTRATION DOCUMENT I SOCIETE GENERALE GROUP
3 I CORPORATE GOVERNANCE I CHAIRMAN’S REPORT
Managing and assessing risksThe implementation of a high-performance and efficient risk management structure is a critical undertaking for the Societe Generale Group, in all businesses, markets and regions in which the bank operates, as well as the balance between strong risk culture and the development of its activities.
THE ENTERPRISE RISK MANAGEMENT PROGRAMME (ERM)
The ERM project, launched in January 2011 and closely monitored by members of Executive Committee and members of Audit, Internal Control and Risk Committee, aims to improve the consistency and effectiveness of the Group’s risk management system by fully integrating risk prevention and control with the day-to-day management of the bank’s businesses. This project is centered on three principles: (i) taking greater account of risk in the bank’s strategic management (in particular, by continually improving oversight of the Group’s «Risk Appetite» - see section below); (ii) optimizing permanent control measures (see chapter on Internal Control); and (iii) strengthening risk culture among all Group employees.
Carrying on from 2012, General Management declared promoting a strong risk culture as a strategic objective in 2013. The measures put in place combine awareness-building and training with a focus on the quality of risk management in the day-to-day management of the Group’s employees.
THE GROUP’S RISK APPETITE
Societe Generale defines risk appetite as the level of risk, by type and by business that the Group is prepared to incur given its strategic targets. Risk appetite is defined using both quantitative and qualitative criteria.
Since 2009, the Risk Division and the Finance Division, in coordination with the operating divisions, have jointly carried out measures as part of the Group Risk Appetite exercise, consisting in formally defining a three-year overview including:
n targets for certain key Group indicators (financial solidity, profitability, solvency, leverage and liquidity);
n risk/return ratios for the different Group businesses; and
n the Group’s risk profile, by risk type (credit, market, operational and structural).
To determine these factors and develop the Risk Appetite approach, earnings sensitivities to business cycles and credit, market and operational events are taken into account under both a core budgetary macroeconomic scenario and a macroeconomic scenario of severe but plausible stress.
The Risk Appetite exercise is one of the strategic oversight tools available to the Group governing bodies. It is fully integrated with the budgeting process and draws on the global stress test system (details below), which is also used to ensure capital adequacy under stressed economic scenarios.
It is discussed by governing bodies at various key moments:
n during preliminary budget preparation with a view to allocating scarce resources to the business;
The positioning of the various businesses in terms of the risk/return ratio as well as the Group’s risk profile by type of risk, are analysed and approved by the Audit, Internal Control and Risk Committee. Simultaneously, three-year targets suggested by the Executive Committee for the Group’s key indicators are approved by the Board of Directors after being examined by the Audit, Internal Control and Risk Committee;
n during the finalisation of the budget process, the Board of Directors, based on the Executive Committee’s recommendations and after examination by the Audit, Internal Control and Risk Committee, approves the trajectory in relation to various Group key indicators and their adequacy given the established targets.
The Group’s risk appetite strategy is implemented by General Management in collaboration with the Executive Committee and applied by the various corporate and operating divisions through an appropriate operational steering system for risks, covering:
n governance (decision-making, management and supervisory bodies);
n management (identification of risk areas, authorisation and risk-taking processes, risk management policies through the use of limits and guidelines, resource management); and
n supervision (budgetary monitoring, reporting, leading risk indicators, permanent controls and internal audits).
Essential indicators for determining Risk Appetite and their various adaptations are regularly supervised over the year in order to detect any events that may result in unfavourable developments on the Group’s risk profile. Such events may give rise to remedial action, up to the deployment of the recovery plan in the most severe cases.
PREVENTIVE RECOVERY AND RESOLUTION PLANS
In accordance with the applicable regulation, the Group has specified preventive recovery and resolution plans:
n recovery plan describes, in a preventive manner, provisions that should allow the Group to deal autonomously with a severe stress situation: watchfulness and alert system, crisis management system, crisis communication, list of recovery options enabling the bank to re-establish its financial soundness. This plan is updated on an annual basis;
n resolution plan includes information necessary to resolution authorities in order to think-out possible strategies and actions in order to limit the impact of an hypothetical failure of the Group. The resolution plan should allow to maintain activities fundamental to driving the economy (first of all, deposits and means of payment), and to preserve at best Group’s components values.
STRESS TEST FRAMEWORK
Stress tests or crisis simulations are used to measure the potential impact of a downturn in activity on the behavior of a portfolio, activity, entity or the Group. At Societe Generale, they are used to help identify, measure and manage risk and to assess the Group’s capital adequacy. They are an important measure of the resilience of the Group and its activities and portfolios, and a core component in the definition of its risk appetite.
SOCIETE GENERALE GROUP I 2014 REGISTRATION DOCUMENT I 109
CHAIRMAN’S REPORT I CORPORATE GOVERNANCE I 3
The Group’s stress test framework covers credit risk, market risk, operational risk, liquidity risk and structural interest rate and exchange rate risk. Stress tests are based on extreme but plausible hypothetical economic scenarios by the Group’s economists. These scenarios are translated into impact on the Group’s activities, taking into account the activities’ potential counter-measures and systematically combining quantitative methods with expert judgment (risk, finance or business lines).
The stress test methodology defined by the Group in 2013 sets out the guiding principles for stress test exercises, the methods to be applied Group-wide and serves as a platform for discussion for those who actually carry out the tests.
CREDIT RISK
Validation of credit risk is part of the Group’s risk management strategy in accordance with its risk appetite. Societe Generale’s credit policy is based on the principle that any credit risk undertaking must be based on sound knowledge of the client and the client’s business, an understanding of the purpose and structure of the transaction and the sources of repayment of the debt. Credit decisions must also ensure that the structure of the transaction will minimise the risk of loss in the event the counterparty defaults.
Limits are set for certain countries, geographical regions, sectors, products or types of customers with a view to minimising the most significant risks. In addition, major concentration risks are analysed periodically for the entire Group.
The Risk Division has defined a control and monitoring system, in conjunction with the Group’s business divisions and based on the credit risk policy, to provide a framework for the Group’s credit risk management. The credit risk policy is periodically reviewed by the Audit, Internal Control and Risk Committee.
Credit risk supervision is organised by division (French Networks, International Banking & Financial Services, Global Banking and investor Solutions) and is supplemented by departments with a more cross-business approach (monitoring of country risk and risk linked to financial institutions). The team that handles counterparty risk on market transactions reports to the Market Risk Department.
Within the Risk Division, each of these departments is responsible for:
n setting global and individual credit limits by client, client group or transaction type;
n authorising transactions submitted by the sales departments;
n validating credit score or internal client rating criteria;
n monitoring and supervision of large exposures and various specific credit portfolios;
n approving specific and general provisioning policies.
In addition, a specific department performs comprehensive portfolio analyses and provides the associated reports, including those for the supervisory authorities. A monthly report on the Risk Division’s activity is presented to the Risk Committee and specific analyses are submitted to the General Management.
MARKET RISKS
Although primary responsibility for managing risk exposure lies with the front office managers, the supervision system is based on an independent structure, the Market Risk Department of the Risk Division. This Department carries out the following tasks:
n ensuring the existence and the implementation of an effective market risks framework based on suitable limits;
n assessment of the limit applications submitted by the different businesses within the framework of the overall set of limits authorised by the Board of Directors and the General Management, and based on their consumptions;
n proposal to the Group Risk Committee of appropriate market risks limits by Group activity;
n definition of risk measurement methods, approval of the valuation models used to calculate risks and results, and definition of provisions for market risks (reserves and adjustments to earnings).
To carry out these different tasks, the Market Risk Department uses the data and analysis provided by the Finance Department of GBIS (FIND), which monitors the Group’s market positions on a permanent, daily and independent basis, notably via:
n daily calculation and certification of market risk indicators based on formal and secure procedures;
n reporting and first-level analysis of these indicators;
n daily monitoring of the limits set for each activity;
n verification of the market parameters used to calculate risks and results in line with the methodologies defined by the Market Risk Department;
n monitoring and control of the gross nominal value of positions. This system is based on alert levels applied to all instruments and desks which are defined in collaboration with the Market Risk Department, and contributes to the detection of possible rogue trading operations.
Accordingly, the Finance Department of GBIS, in conjunction with the Market Risk Department, defines the architecture and functionalities of the information system used to produce the risk indicators for market operations to ensure it meets the needs of the different business lines.
A daily report on use of limits on VaR (Value at Risk) and stress tests (extreme scenarios) is submitted to the General Management and the managers of the business lines, in addition to a monthly report which summarises the key events in the area of market risk management.
STRUCTURAL AND LIQUIDITY RISKS
The general principle for the Group is to minimise structural interest rate and exchange rate risks as much as possible within consolidated entities. Wherever possible, commercial transactions are therefore hedged against interest rate and exchange rate risks. Any structural interest rate risk exposure must comply with the sensitivity limits set for each entity and for the overall Group in accordance with the structural risk appetite, as validated by the COMEX. As for exchange rates, the Group’s policy is to immunise its solvency ratio against fluctuations of the major currencies in which it operates.
110 I 2014 REGISTRATION DOCUMENT I SOCIETE GENERALE GROUP
3 I CORPORATE GOVERNANCE I CHAIRMAN’S REPORT
Given that liquidity is a scarce resource, the Group’s objective is to finance its activities at the best possible rates under normal conditions. The plan for short- and long-term financing, in addition to resources gathered from clients, is sized conservatively while ensuring diversification in terms of products and issuing areas.
Targets are validated by the Board of Directors in accordance with the Risk Appetite exercise.
In compliance with the regulatory principles that advocate the segregation of risk oversight and control functions, liquidity risk monitoring and management have been provided by two distinct entities:
n the Balance Sheet and Global Treasury Management Department, responsible for structural risk oversight and the supervision and coordination of all of the Group’s treasury functions (external Group financing, internal entity financing and centralised collateral management). It also manages the Group’s central funding department, and implements financial deals;
n the Structural Risk Monitoring and Control Department, which is dedicated to Group structural risk control, and in particular verification of models and monitoring of compliance with limits and management practices by the Group’s core businesses divisions, business lines and entities.
Each entity carries out the Level 1 control of structural risks and is responsible for performing the periodic assessment of risks incurred, risk reporting, developing hedging proposals and implementing decisions taken. Each entity is required to comply with Group standards and the limits assigned to it.
The Finance Departments of the core businesses must ensure compliance with these principles for each entity within their remit.
OPERATIONAL RISK
Societe Generale has no appetite for operational risks, only a tolerance level. As such, the Group has an active prevention policy which consists of securing operational processes as well as the promotion of a risk culture within the organization. The limit in terms of operational losses is set as a percentage of NBI.
The Operational Risk Department ensures the cross-business monitoring and management of these risks within the Group and is responsible for all reporting to the General Management, Board of Directors and the banking supervisory authorities. It also endeavors to improve the consistency and integrity of the system. Procedures and tools have been rolled out within the Group in order to identify, evaluate (both quantitatively and qualitatively) and manage its operational risk:
n Risk and Control Self-Assessment, the aim of which is to identify and measure the Group’s exposure to the different categories of operational risk in order to accurately map the levels of intrinsic and residual risk, having taken into account the quality of risk prevention and control systems;
n Key Risk Indicators (KRIs), which provide upstream alerts as to the risks of operating losses;
n Scenario analyses, which consist in estimating infrequent but severe potential losses to which the Group could be exposed;
n data collection and analysis on internal losses and losses incurred in the banking industry following the materialisation of operational risks;
n monitoring of major action plans within the Group, based on the deployment of an IT application.
The Business Continuity Management (BCM) function reports to the Operational Risk Department. It is committed to improving the Group’s business continuity plans, notably by testing them on a regular basis.
A Crisis Management function strengthens the incorporation of this specific issue within the Group and the implementation of appropriate tools and measures.
COMPENSATION POLICY AND RISK
Since the end of 2010, within the regulatory framework defined by the European Capital Requirements Directive CRD3, Societe Generale has implemented specific governance to determine variable compensation. In addition to financial market professionals, the rules established by this directive now also apply to all persons whose activity is liable to have a material impact on the risk profile of the institutions that employ them, including those carrying out control functions.
According to the principles approved by the Board of Directors, based on the proposal of the Compensation Committee, the mechanisms and processes relating to the compensation of such employees take into account not only the financial result generated by the transactions they perform, but also the way this result is generated through the control and management of all risks as well as the observance of risk and compliance policies. The compensation paid to employees performing control functions is independent of the results of the transactions they control, but is rather based on criteria specific to their activity.
The variable part of the compensation includes a non-deferred portion and a deferred portion awarded over three years prorata temporis under conditions of performance and possible claw- back. Fifty per cent at least of this compensation is awarded in the form of equity or equity-equivalent instruments. These terms of payment aim to align the compensation with the company’s performance and risk horizon.
The Risk Division and Compliance Division contribute to the definition and application of this policy.
SOCIETE GENERALE GROUP I 2014 REGISTRATION DOCUMENT I 111
CHAIRMAN’S REPORT I CORPORATE GOVERNANCE I 3
REPUTATIONAL RISK
Every quarter, the Compliance Department, using information coming from core businesses and Corporate Divisions, in particular the Group Communication Division, draws up a risk reputation dashboard. This dashboard is distributed quarterly to the members of COMEX and twice a year to AICRC members.
Moreover, the Compliance Officers participate as required in various events (new product committees, ad hoc committees, etc.) organised to approve the new types of transactions, products, projects or clients and must prepare a written notice of their assessment of the level of reputational risk.
RISK QUANTIFICATION PROCEDURES AND METHODOLOGIESSociete Generale has been authorised by its supervisory authorities to calculate its capital requirements:
n for credit risk by using the internal ratings-based approach (IRB method) for most of its exposures to credit risk;
Only selected activities and exposures currently use the standard approach, and they have a limited impact on the Group’s regulatory capital;
The system for monitoring rating models is operational, as required by Basel 2. This system is described in detail in Chapter 9 of this Registration Document;
n for market risk by using internal models (VaR – Value at Risk, Stressed VaR, IRC – Incremental Risk Charge and CRM – Comprehensive Risk Measure);
These models cover almost all of the transactions involved. Only some transactions are still calculated using the standard method. Over the last several years, the Group has completed significant projects to improve its calculation system, which have been approved by the Autorité de Contrôle Prudentiel et de Résolution (ACPR – French Prudential and Resolution Supervisory Authority);
n for counterparty risk on market transactions by using the internal model since 2012 to calculate the EEPE (Effective Expected Positive Exposure) indicator. This new method is used for 90% of transactions. The Group uses the marked- to-market valuation method for the rest of these transactions;
n for operational risks by using the Advanced Measurement Approach (AMA);
Lastly, its information systems are regularly upgraded to accommodate changes in the products processed and the associated risk management techniques, both locally (within the banking entities) and centrally (Risk Division).
The players involved in risk management and controlRISK MANAGEMENT ORGANISATION AND PROCEDURES ARE DEFINED AT THE HIGHEST MANAGEMENT LEVELGroup risk management is governed by two main bodies: the Board of Directors and General Management.
The procedures for managing, preventing and evaluating risks are regularly analysed in depth by the Board of Directors and, in particular, its Audit, Internal Control and Risk Committee.
First and foremost, the Board of Directors defines the Company’s strategy by assuming and controlling risks, and ensures that it is applied. A risk dashboard is submitted to it. In particular, the Board of Directors ensures the adequacy of the Group’s risk management infrastructure, monitors changes in the cost of risk and approves the risk limits for market risks. Presentations on the main aspects of, and notable changes to, the Group’s risk management strategy are made to the Board of Directors by the General Management at least once a year (more often if circumstances require it), including the Group’s Code of Tax Conduct.
Within the Board of Directors, the Audit, Internal Control and Risk Committee is responsible for examining the consistency of the internal framework for monitoring risks as well as ensuring compliance with this framework and with existing laws and regulations.
112 I 2014 REGISTRATION DOCUMENT I SOCIETE GENERALE GROUP
3 I CORPORATE GOVERNANCE I CHAIRMAN’S REPORT
THE ROLE OF THE BOARD OF DIRECTORS’ AUDIT, INTERNAL CONTROL AND RISK COMMITTEE(1)
This Committee’s mission is to monitor issues concerning the production and control of accounting and financial information, and to monitor the efficiency of the internal control and risk assessment, monitoring and management systems.
It is particularly in charge of:
n ensuring monitoring of the process for drawing up financial information, particularly examining the quality and reliability of the systems in place and making suggestions for their improvement, and verifying that corrective actions have been implemented if faults are found in the procedure;
n analysing the draft financial statements to be submitted to the Board in order, in particular, to verify the clarity of the information provided and to offer an assessment of the relevance and consistency of the accounting methods used to draw up parent company and consolidated financial statements;
n ensuring the independence of Statutory Auditors, in particular by reviewing the breakdown of the fees paid by the Group to them as well as to the network to which they may belong and through prior approval of all assignments that do not fall within the framework of a statutory audit of accounts, but which may be the consequence of, or a supplement to, the same, all other assignments being prohibited; implementing the procedure for selecting the Statutory Auditors and submitting an opinion to the Board of Directors concerning the appointment or renewal of such as well as their remuneration;
n examining the work programme of the Statutory Auditors and more generally ensuring the supervision of account monitoring by the Statutory Auditors;
n offering an assessment of the quality of internal control, in particular the consistency of risk assessment, monitoring and management systems, and proposing additional actions where appropriate.
To this end, the Committee is responsible primarily for:
n reviewing the Group’s internal audit programme and the Annual Report on Internal Control drawn up in accordance with banking regulations, as well as formulating an opinion on the organisation and operation of the internal control departments;
n reviewing the follow-up letters sent by the Autorité de Contrôle Prudentiel et de Résolution (ACPR – French Prudential and Resolution Supervisory Authority) and issuing an opinion on draft responses to these letters;
n examining the market risk and structural interest rate risk control procedures and being consulted about setting risk limits;
n formulating an opinion on the Group’s global provisioning policy, as well as on specific provisions relating to large sums;
n examining the annual risk assessment and control procedures report in accordance with the French banking regulations;
n reviewing the policy concerning risk management and off-balance sheet commitment monitoring, in particular in the light of memoranda drafted to this end by the Finance Division, the Risk Division and the Statutory Auditors.
Aside from the persons referred to in Article 6, the Committee may interview, under conditions it shall establish, the Statutory Auditors and the managers in charge of drawing up financial statements, internal control, risk management, compliance and internal audits. The Statutory Auditors shall be invited to the meetings of the Audit, Internal Control and Risk Committee unless the Committee decides otherwise.
The Committee met 10 times in 2013.
It gives the Board of Directors its opinion on the section of the Registration Document dealing with these issues and produces an Annual Activity Report, submitted to the Board for its approval, which is then inserted in the Registration Document.
Chaired by General Management, three specialised committees of the Group Executive Committee are responsible for central oversight of internal control and risk management:
n the Risk Committee, which met 15 times in 2013, discusses the Group’s risk strategy, particularly management of the different risks (credit, country, market and operational risks) as well as the structure and implementation of the risk monitoring system. The Group also has a Large Exposures Committee, which focuses on reviewing large individual exposures;
n the Finance Committee, which, as part of its oversight of the Group’s financial policy, validates the structural risk monitoring and control system and reviews changes in the Group’s structural risks through reports consolidated by the Finance Division;
n the Group Internal Control Coordination Committee (GICCC), which manages the consistency and effectiveness of the internal control mechanism as a whole.
(1) The Internal Rules of the Board of Directors are available on page 455 of the Registration Document.
SOCIETE GENERALE GROUP I 2014 REGISTRATION DOCUMENT I 113
CHAIRMAN’S REPORT I CORPORATE GOVERNANCE I 3
UNDER THE AUTHORITY OF GENERAL MANAGEMENT, THE GROUP’S CORPORATE DIVISIONS, WHICH ARE INDEPENDENT FROM THE CORE BUSINESSES, CONTRIBUTE TO THE MANAGEMENT AND INTERNAL CONTROL OF RISKS.The Corporate Divisions provide the Group’s Executive Committee with all the information needed to assume its role of managing the Group’s strategy, under the authority of the Chief Executive Officer.
With the exception of the core businesses Finance Departments, all the Corporate Divisions report directly to the Group’s General Management or to the Group Corporate Secretary (who in turn reports directly to the General Management), also responsible for compliance within the Group.
n The main responsibility of the Risk Division is to contribute to the development of the activities and the profitability of Societe Generale Group by working under the aegis of the General Management and in connection with the Finance department and the pillars to define the Group’s risk Appetite (broken down among the Group’s various businesses), and to establish a risk management and monitoring system. In exercising its functions, the Risk Division reconciles independence from and close cooperation with the core businesses, these being responsible first and foremost for the transactions they initiate.
Accordingly, the Risk Division is responsible for:
– providing hierarchical and functional supervision of the Group’s Risk structure; to this end, the Head of Risk Management is responsible for the Group’s Risk function as defined by Regulation No. 97-02 of the French Banking and Financial Regulation Committee (CRBF), as amended by the decree of 19 January 2010;
– alongside the Finance Division, setting the Group’s risk appetite which is then submitted to the executive body and to the Boards of Directors for their approval;
– identifying all Group risks;
– putting into practice a governance and monitoring system for these risks, including cross-business risks, and submitting regular reports on their nature and their extent to the General Management, the Board of Directors and the supervisory authorities;
– contributing to the definition of risk policies, taking into account the aims of the pillars and the corresponding risk issues;
– defining or validating risk analysis, assessment, approval and monitoring methods and procedures;
– validating transactions and limits proposed by the business managers;
– defining the risk monitoring information system, and ensuring its suitability for the needs of the businesses and its consistency with the Group’s information system.
n the Group Finance Division, which, in addition to its financial management responsibilities, also carries out extensive accounting and finance controls (structural risk related to interest rates, exchange rates and liquidity); as such:
– the Balance Sheet and Global Treasury Management Department within the Group Finance Division is responsible for defining its policy for interest rate, exchange rate and liquidity risks, and, in particular, evaluating and planning for the Group’s financing needs. It also defines steering indicators and global stress test scenarios for different structural risks, sets the main limits for core businesses and entities, analyses Group exposure to structural risks, defines hedging actions and provides regulatory monitoring for structural risks,
– the Accounting Affaires Department attends to the proper running of accounting closings and the quality of financial statements and Group regulatory reports.
– the Structural Risk Monitoring and Control Department is responsible for identifying the Group’s structural risks; monitoring
limits; defining principles and validating models applied by the Group’s entities; consolidating and reporting on structural risks, and defining and monitoring the structural risk measurement standards framework while periodically reviewing the structure of asset-liability management of the Group’s entities.
Reporting to the Group Chief Financial Officer, the Structural Risk Monitoring and Control Department (liquidity, interest rate and exchange rate risk) is also functionally supervised by the Head of the Risk Division, to whom it gives a summary of its activity and who validates its work plan jointly with the Chief Financial Officer. It is included in the governance of the Group’s risk structure as defined by Regulation No. 97-02 of the French Banking and Financial Regulation Committee (CRBF). Furthermore, several Risk Division departments are involved on various levels in supervising ALM risks (reviewing models related to market activities, contributing to validating all of the Group’s liquidity models, giving opinions on limits set by liquidity indicators, and monitoring potential limit overruns as part of escalation procedures). Their actions are coordinated by the cross-business risk monitoring department for the Head of the Risk Division;
RISK RELATED TO NEW PRODUCTS AND ACTIVITIES
Each division submits all new products, businesses or activities to a New Product committee. This committee, which is jointly managed by the Risk Division and the business divisions, aims to ensure that, prior to the launch of a new product, business or activity:
n all associated risks are fully identified, understood and correctly addressed;
n compliance is assessed with respect to the laws and regulations in force, codes of good professional conduct and risks to the reputation and image of the Group;
n all the support functions are committed and have no reservations, or no longer have any.
This procedure is underpinned by a very broad definition of a New Product, which applies to the creation of a new product, the outsourcing of essential or important services, the adaptation of an existing product to a new environment or the transfer of activities involving new teams or new systems.
Throughout the whole Group, 646 New Product Committee meetings were held in 2013.
114 I 2014 REGISTRATION DOCUMENT I SOCIETE GENERALE GROUP
3 I CORPORATE GOVERNANCE I CHAIRMAN’S REPORT
n the Finance Departments of the core businesses, which are hierarchically attached to the managers of the core businesses and functionally attached to the Group Finance Division. They make sure that accounts are prepared correctly at the local level and control the quality of the information in the consolidated financial reports submitted to the Group;
n the Group Compliance Division, which reports to the Corporate Secretary, who is also Head of Compliance, ensures that all laws, rules and ethical principles applicable to the Group’s banking and investment activities are compliant with. It also provides reputational risk protection;
n the Group Legal Department, which reports to the Corporate Secretary, monitors the security and legal compliance of the Group’s activities in collaboration with the legal departments of its subsidiaries and branches;
n the Group Tax Department, which reports to the Corporate Secretary, monitors compliance with all applicable tax laws;
n the Group Human Resources Division, which notably monitors the implementation of compensation policies;
n the Group Corporate Resources Division, which is specifically responsible for information system security;
n the Group Internal Audit Division, which is in charge of internal audits, under the authority of the Head of Group Internal Audit.
Internal controlFRAMEWORKINTERNAL CONTROL IS PART OF A STRICT REGULATORY FRAMEWORK APPLICABLE TO ALL BANKING ESTABLISHMENTS
In France, the conditions for conducting internal controls in banking establishments are defined in the amended Regulation No. 97- 02 of the French Banking and Financial Regulation Committee (CRBF), which is updated regularly. This text, which applies to all credit institutions and investment companies, defines the concept of internal control, together with a number of specific requirements relating to the assessment and supervision of the various risks inherent to the activities of the companies in question, and the procedures under which the deliberating body must assess and evaluate how internal control is carried out.
In June 2004, the Basel Committee defined the four principles – independence, universality, impartiality, and sufficient resources – which must form the basis of internal control carried out by credit institutions.
At Societe Generale, these principles have been applied primarily through various directives, one of which establishes the general framework for the Group’s internal control, another of which constitutes the Group Audit Charter, while the others relate to the work of the Risk Division, management of credit risks, market risks, operational risks, structural risks (interest rate, exchange rate, liquidity), compliance control and reputational risk control.
Internal control covers all resources that enable the Group’s General Management to ascertain whether the transactions carried out and the organisation and procedures in place within the Company are compliant with the legal and regulatory provisions in force, professional and ethical practices, internal regulations and the policies defined by the Company’s executive body. Internal control is designed to:
n ensure that the risks incurred by the company are adequately controlled;
n guarantee the reliability, completeness and accuracy of financial and management information;
n verify the integrity and availability of information and communication systems.
THE INTERNAL CONTROL SYSTEM IS BASED ON FOUR KEY PRINCIPLES
n The comprehensiveness of the scope of controls, which cover all types of risks and are applicable to all Group entities;
n Operational staff responsibilities in terms of controlling the risks that they take and the transactions they process;
n The proportionality of controls to the scale of risks incurred;
n Independent internal audits.
Its predominant features are:
n the distinction between internal audits and permanent controls;
n the balance of the permanent control approach, which combines a multi-risk operational control with interventions by functions specialised by type of risk.
INTERNAL CONTROL IS BASED ON A BODY OF STANDARDS AND PROCEDURES
All Societe Generale Group activities are governed by rules and procedures covered by a set of documents referred to collectively as the “Normative Documentation”. This documentation includes any documents:
n setting forth rules for action and behaviour applicable to Group staff;
n defining the structures of the businesses and the sharing of roles and responsibilities;
n describing the management rules and internal procedures specific to each business and activity.
The Normative Documentation primarily includes:
n Directives, which define the governance of the Societe Generale Group, the structures and duties of its Business and Corporate Divisions, as well as the operating principles of cross-business systems and processes (Code of Conduct, Charters, etc.);
n Instructions, which set out the operating framework of an activity and the management principles and rules applicable to products and services rendered, and also define internal procedures.
The Normative Documentation has force of law within the Group. It falls under the responsibility of the Group Corporate Secretary, who serves as Group Head of Compliance vis-à-vis supervisory bodies in France and abroad.
In addition to the Normative Documentation, operating procedures specific to each Group activity are applied. The regulations and procedures in force are designed to follow basic rules of internal control such as:
n segregation of functions;
n immediate, irrevocable recording of all transactions;
n reconciliation of information from various sources.
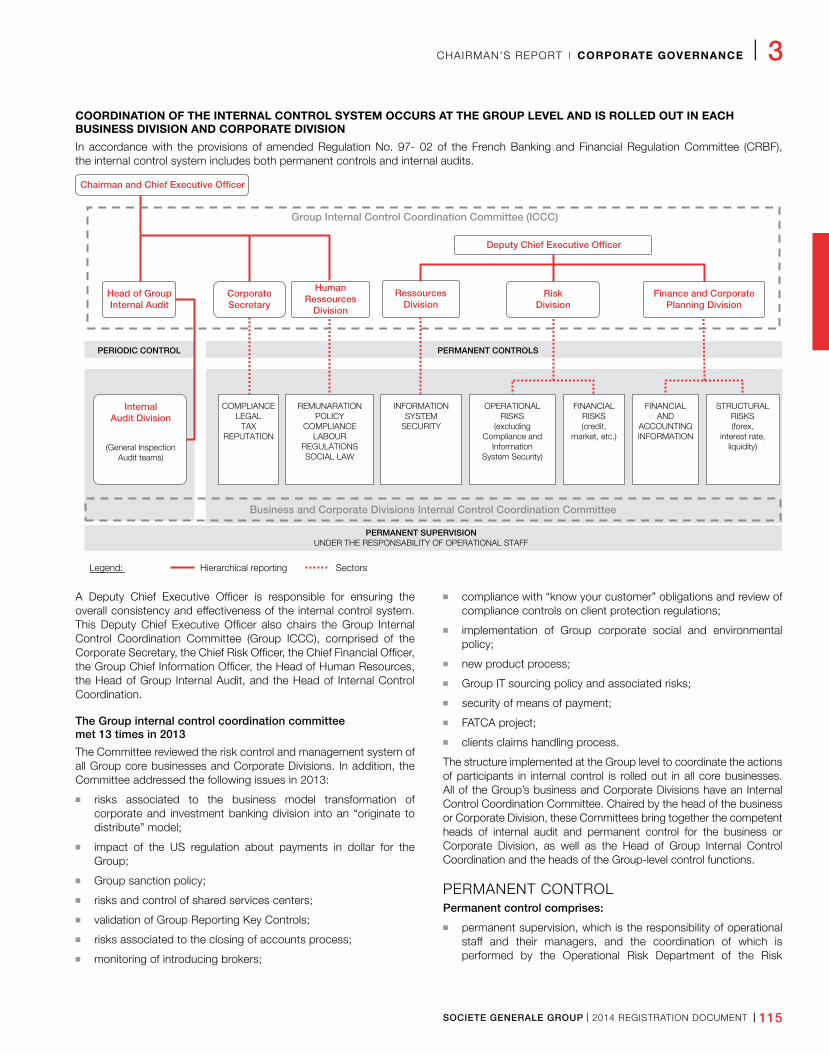
SOCIETE GENERALE GROUP I 2014 REGISTRATION DOCUMENT I 115
CHAIRMAN’S REPORT I CORPORATE GOVERNANCE I 3
COORDINATION OF THE INTERNAL CONTROL SYSTEM OCCURS AT THE GROUP LEVEL AND IS ROLLED OUT IN EACH BUSINESS DIVISION AND CORPORATE DIVISION
In accordance with the provisions of amended Regulation No. 97- 02 of the French Banking and Financial Regulation Committee (CRBF), the internal control system includes both permanent controls and internal audits.
A Deputy Chief Executive Officer is responsible for ensuring the overall consistency and effectiveness of the internal control system. This Deputy Chief Executive Officer also chairs the Group Internal Control Coordination Committee (Group ICCC), comprised of the Corporate Secretary, the Chief Risk Officer, the Chief Financial Officer, the Group Chief Information Officer, the Head of Human Resources, the Head of Group Internal Audit, and the Head of Internal Control Coordination.
The Group internal control coordination committee met 13 times in 2013
The Committee reviewed the risk control and management system of all Group core businesses and Corporate Divisions. In addition, the Committee addressed the following issues in 2013:
n risks associated to the business model transformation of corporate and investment banking division into an “originate to distribute” model;
n impact of the US regulation about payments in dollar for the Group;
n Group sanction policy;
n risks and control of shared services centers;
n validation of Group Reporting Key Controls;
n risks associated to the closing of accounts process;
n monitoring of introducing brokers;
n compliance with “know your customer” obligations and review of compliance controls on client protection regulations;
n implementation of Group corporate social and environmental policy;
n new product process;
n Group IT sourcing policy and associated risks;
n security of means of payment;
n FATCA project;
n clients claims handling process.
The structure implemented at the Group level to coordinate the actions of participants in internal control is rolled out in all core businesses. All of the Group’s business and Corporate Divisions have an Internal Control Coordination Committee. Chaired by the head of the business or Corporate Division, these Committees bring together the competent heads of internal audit and permanent control for the business or Corporate Division, as well as the Head of Group Internal Control Coordination and the heads of the Group-level control functions.
PERMANENT CONTROLPermanent control comprises:
n permanent supervision, which is the responsibility of operational staff and their managers, and the coordination of which is performed by the Operational Risk Department of the Risk
Legend:
PERMANENT CONTROLS
INFORMATIONSYSTEM
SECURITY
FINANCIALRISKS(credit,
market, etc.)
OPERATIONALRISKS
(excludingCompliance and
InformationSystem Security)
REMUNARATIONPOLICY
COMPLIANCELABOUR
REGULATIONSSOCIAL LAW
FINANCIALAND
ACCOUNTINGINFORMATION
STRUCTURALRISKS(forex,
interest rate,liquidity)
PERIODIC CONTROL
PERMANENT SUPERVISIONUNDER THE RESPONSABILITY OF OPERATIONAL STAFF
Business and Corporate Divisions Internal Control Coordination Committee
Group Internal Control Coordination Committee (ICCC)
COMPLIANCELEGAL
TAXREPUTATION
RessourcesDivision
RiskDivision
HumanRessources
Division
Finance and CorporatePlanning Division
(General InspectionAudit teams)
InternalAudit Division
Head of GroupInternal Audit
Deputy Chief Executive Officer
Chairman and Chief Executive Officer
CorporateSecretary
Hierarchical reporting Sectors
116 I 2014 REGISTRATION DOCUMENT I SOCIETE GENERALE GROUP
3 I CORPORATE GOVERNANCE I CHAIRMAN’S REPORT
Division. The permanent supervision system itself is supplemented by numerous other operational controls (for example, automated controls in IT processing chains, organisational controls implementing the segregation of functions within the structure, etc.);
n Level 2 control function, a combined system including hierarchic controls performed at the appropriate level, and transversal controls performed by corporate functions, each of them dedicated to one type of risk (or, in the case of Credit du Nord, by a dedicated permanent control staff);
n governance specific to certain types of risks, which notably draws on dedicated Group-level committees, enabling regular reviews at the appropriate managerial level to be carried out.
THE FIRST LEVEL OF RESPONSIBILITY FOR PERMANENT CONTROL LIES WITH THE GROUP’S OPERATIONAL STAFF
The permanent supervision of activities by operational staff themselves forms the cornerstone of the permanent control process. This is defined as all of the measures taken on a permanent basis to ensure the compliance, security and validity of transactions performed at the operational level. Its two components are:
n day-to-day security: all operational staff are required to perform operational controls planned in the procedures, in order to monitor the compliance with the applicable rules and procedures governing all transactions carried out;
n formal supervision: Management is required to make regular checks using written procedures to verify that staff are complying with the rules and procedures for processing transactions and for ensuring effective day-to-day security by performing operational controls.
To achieve this, operating methods are formally defined and transmitted to all staff.
AT THE SAME TIME, THE CORPORATE DIVISIONS, WITH THE SUPPORT OF THE FUNCTIONS UNDER THEIR RESPONSIBILITY, CONTRIBUTE TO THE PERMANENT CONTROL OF THE GROUP’S TRANSACTIONS
The Risk Division, with agents in the Group’s core businesses and subsidiaries, is responsible for implementing the credit, market and operational risk control system and ensuring risks are monitored in a consistent fashion across the Group.
According to the latest voluntary census (at the end of December 2013), Group Risk function dedicated to risk management and permanent control was staffed by around 4,900 people* (including 770 within the Group Risk Division itself at the end of December 2013).
*measured in full-time equivalent (FTE).
The Head of Information System Security and Operational Risk Management coordinates the management of information system risks at the Group level.
The system for management, monitoring and communication related to information system security and risks is coordinated at the Group level by the Head of Information System Security and Operational
Risk Management. This system has been rolled out within each of the core businesses, business lines and entities. At the operating level, the Group has a CERT (Computer Emergency Response Team) that manages incidents, monitors developments in information system security and combats cybercrime using a multitude of information and supervision sources both internal and external to the Group.
The information system risk management and security system is governed by the “Strategic Security Initiatives” validated by General Management and all businesses which are part of the Corporate Divisions Supervisory Committee. It is regularly updated to keep up with technological developments, new threats (such as targeted attacks) or new applications (for example, cloud computing).
In 2013, an Information Security Masterplan has been developed by the Information Security function in the context of the Digital transition and the improvement of cybercrime threats. Other, the project of applications ranking for sensitivity to InfoSec breaches has delivered the list of the 150 more sensitive applications. In 2014, the controls will be focused on those most important applications.
The new Group security action plan for the 4 next year has been determined, including the monitoring of the major InfoSec risks. He will be deployed from 2014.
Within the Group Finance Division, the Balance Sheet and Global Treasury Management Department is responsible for defining principles and approving Group standards governing structural interest rate and liquidity risks (maturity standards, risk monitoring indicators and tools) to be applied by all entities included in the Group’s scope of consolidation.
The organisational structure for Level 1 and Level 2 controls was formally defined jointly by the Balance Sheet Management Department and the Finance Departments of the core businesses. These documents describe the responsibilities of different players for a given process.
The entities’ Finance Departments are responsible for controlling structural risk. Structural risk managers are in charge of drafting quarterly reports and carrying out Level 1 controls before publishing them.
The Balance Sheet Management Department performs Level 2 structural risk controls at entities, and consolidates Group entity positions.
The Group’s Corporate Secretary is responsible for monitoring Group compliance. He also ensures Group legal and tax security and compliance.
He is assisted in these tasks by:
n the Compliance Department, which verifies that all laws, regulations and ethical principles applicable to the Group’s banking and investment services activities are observed, and that all staff respect codes of good conduct and individual compliance. To do so, it coordinates the compliance function. It also monitors the prevention of reputational risk.
Established in February 2011, the Compliance Department has been reorganized this year in three transversal departments (financial security, standards and governance, steering and control) and four teams dedicated to business lines compliance and hierarchically attached to head of the Department. Compliance Department focuses on building the compliance function by
SOCIETE GENERALE GROUP I 2014 REGISTRATION DOCUMENT I 117
CHAIRMAN’S REPORT I CORPORATE GOVERNANCE I 3
relying on a coordinated network of compliance officers covering all of the Group’s entities, to providing the function with a consistent framework of standards, to raising awareness and training its participants in preventing non compliance risks and to starting the deployment of standard checks in the whole Group for major non-compliance risks;
n the Group Compliance Committee, which meets monthly and includes the Compliance officers from core businesses and Corporate Divisions, as well as the heads of Internal Control Coordination, Internal Audit, the Operational Risk Department and the Legal Department. The Committee examines current compliance issues, keeps up to date with the major changes in regulation and makes sure that compliance discrepancies, reported in accordance with the collecting procedure in the whole Group, are covered by appropriate corrective actions;
n the Legal and Tax Departments, which monitor the legal and tax compliance and security of all of the Group’s activities.
These Corporate Divisions are represented by local staff within each operating entity and, in certain subsidiaries and branches, by departments exercising the same type of function. The Corporate Division teams are responsible for compliance monitoring and training as well as for the distribution of relevant information throughout the Group.
INTERNAL AUDITThe Internal Audit Division comprises, under the authority of the Head of Group Internal audit, all internal audit teams, whose main purpose is to adopt an objective, thorough and impartial approach to verify the compliance of operations, the level of risk effectively incurred the proper application of procedures, and the effectiveness and relevance of the permanent control system.
The Group’s internal audit system is independent of the Group’s operating entities. It covers all Group entities and activities and may focus on any aspect of their operation, without restriction.
Each Internal Audit Department regularly identifies the areas of risk to which its core business is exposed. It then defines an annual schedule of audits to make sure that the exposure is covered in full. The internal audit teams then put forward recommendations based on their findings, and follow these up to check that they are implemented correctly.
Given the risks at stake, the Group’s internal audit teams are provided with the requisite resources, from both a qualitative and quantitative point of view, to carry out their functions effectively.
The Group’s internal audit departments comprise some 1 300 members of staff. The system is made up of:
n the Internal Audit teams, which report to the Head of Group Internal Audit and functionally depend on the heads of the core businesses and Corporate Divisions;
n the General Inspection department.
The Internal Audit Division has a matrix-based structure, with:
n a regional scope (primary): the auditable scope is divided into three regions, ensuring full coverage of their geographical scope, regardless of the type of activity performed;
n a business scope (secondary): each head of a core business, Corporate Division or business line, has been appointed a single Auditor, whose role is to ensure the proper coverage of the relevant scope, meet the requests of the relevant operational manager, who must be kept informed of the progress made in the implementation of recommendations within the scope;
n the Internal Audit Division also has specialised audit teams: an accounting audit team, legal audit team, tax audit team, IT infrastructure and security audit team and modelled risks audit team. The specialised audit teams provide expertise to support the general audit teams. They may also carry out independent assignments based on their areas of specialisation. The specialised audit teams are not responsible for covering a given scope, with the exception of the IT infrastructure and security audit team;
n the General Inspection department audits all aspects of the business activities and operations of entities within the Group. It reports its findings, conclusions and recommendations to the General Management. The department’s activity is defined by an audit plan validated annually by General Management, and covers all Group entities without exception. In the course of its assignments, it makes a certain number of recommendations, the implementation of which is monitored on a quarterly basis by the Group Executive Committee.
AUDIT COMMITTEES
The Audit Committees, comprising auditors and operational managers, meet at least once a year to examine the Internal Audit operating conditions and activity. They mainly address the assignments carried out over the course of the year, the audit plan for the subsequent year, and the implementation of recommendations.
As part of his role, the Head of Group Internal Audit is required to meet regularly with the Audit, Internal Control and Risk Committee of the Board of Directors. During these meetings, he presents the internal audit section of the Annual Report on the internal control system, as specified in article 42 of amended French Banking and Financial Regulation Committee (CRBF) regulation No. 97- 02, as well as the most important recommendations which are behind schedule. The Audit, Internal Control and Risk Committee examines the Group annual internal audit plan and comments on the organisation and operations of the internal audit department.
The Head of Group Internal Audit also maintains regular, organised contact with the Statutory Auditors and representatives of the supervisory authorities.
CHANGE IN CONTROL SYSTEMIn July 2013, the Executive Committee has defined a reinforced control system whose progressive implementation has been launched during the current exercise. The control system relies on the following principles:
n a first level permanent control, operating within business lines, remains the basis of Group permanent control system. Its objective is to guarantee, at an operational level, transactions’ security, quality, compliance and validity.
118 I 2014 REGISTRATION DOCUMENT I SOCIETE GENERALE GROUP
3 I CORPORATE GOVERNANCE I CHAIRMAN’S REPORT
The first level permanent control is enhanced by:
– a review of relevance of controls based on a end-to-end process analysis and a declination of standard controls defined by risk functions,
– performance of controls, eventually by staff dedicated to this task under the operational managers’ responsibility, to secure the most critical process,
– a reinforced operational framework for elaborating, performing and reporting results of controls,
– the roll-out of a control certification system.
n a second level permanent control, independent from business divisions, is developed and attached to Compliance, Finance and Risk functions.
The Group Internal Control Coordination Committee role is reinforced as responsible of the overall internal control structure, its consistency and efficiency, and its means are enhanced.
Control of the production and publication of financial and management informationTHE PLAYERS INVOLVEDThere are many participants in the production of financial data:
n the Board of Directors’ Audit, Internal Control and Risk Committee has the task of examining the draft financial statements which are to be submitted to the Board, as well as verifying the conditions under which they were prepared and ensuring not only the relevance but also the consistency of the accounting principles and methods applied. The Statutory Auditors meet with the Audit, Internal Control and Risk Committee during the course of their assignment;
n the Group Finance Division gathers all accounting and management data compiled by the subsidiaries and core businesses in a series of standardised reports. It consolidates and verifies this information so that it can be used in the overall management of the Group and disclosed to third parties (supervisory bodies, investors, etc.);
n the Finance Divisions of subsidiaries and core businesses carry out controls on the accounting data and entries booked by the back offices and on the management data submitted by the front offices. They compile the financial statements and regulatory information required at the local level and submit reports (accounting data, finance control, regulatory reports, etc.) to the Group Finance Division. Within the Finance Department of Global Investment and Banking Solutions, Product Control departments are more specifically responsible for guaranteeing, independently of the businesses, the production and validation of market activities’ income statement and balance sheet. In particular, they are in charge of validating the valuations of the financial instruments traded and the reconciliation of the economic results produced by the front office with the accounting results produced by the back office;
n the Risk Division consolidates the risk monitoring data from the Group’s core businesses and subsidiaries in order to
control credit, market and operational risks. This information is used in Group communications to the Group’s governing bodies and to third parties. Furthermore, in collaboration with the Group Finance Division, it is responsible for the Basel 2 approval process, including producing solvency ratios;
n the back offices are responsible for all support functions to front-offices and ensure contractual settlements and deliveries. They check that financial transactions are economically justified, book transactions and manage means of payment.
Beyond consolidating accounting and financial information as described above, the Group Finance Division is charged with significant control responsibilities: it monitors the financial aspects of the Group’s capital transactions and its financial structure, manages its assets and liabilities, and consequently defines, manages and controls the Group’s financial position and structural risks. Furthermore, it ensures that the regulatory financial ratios are respected, defines accounting standards, frameworks, principles and procedures for the Group, ensures they are observed and verifies the accuracy of all financial and accounting data published by the Group.
ACCOUNTING STANDARDSLocal financial statements are drawn up in accordance with local accounting standards, and the consolidated Group financial statements are prepared in accordance with the standards defined by the Group Finance Division, which are based on IFRS as adopted by the European Union. The Group Finance Division has its own standards unit, which monitors the applicable regulations and drafts new internal standards to comply with any changes in the regulatory framework.
PROCEDURES FOR PRODUCING FINANCIAL AND ACCOUNTING DATAEach entity within the Group prepares its own accounting and management statements on a monthly basis. This information is then consolidated each month at the Group level and published for the markets on a quarterly basis. Data reported are subject to analytical reviews and consistency checks performed by core business Finance Departments and sent to the Group Finance Division. The Group Finance Division transmits the consolidated financial statements, management reports and regulatory statements to General Management and any interested third parties.
In practice, procedures have been tailored to the growing complexity of products and regulations. Moreover, specific action plans can be implemented where necessary.
INTERNAL CONTROL PROCEDURES GOVERNING THE PRODUCTION OF FINANCIAL AND ACCOUNTING DATAACCOUNTING DATA ARE COMPILED INDEPENDENTLY OF THE FRONT OFFICES
Accounting and management data are compiled by the back and middle offices and product control teams independently of the sales teams, thereby guaranteeing that information is both accurate and objective. These teams carry out a series of controls defined by Group procedures on financial and accounting data:
SOCIETE GENERALE GROUP I 2014 REGISTRATION DOCUMENT I 119
CHAIRMAN’S REPORT I CORPORATE GOVERNANCE I 3
n daily verification of the economic justification of all of the reported information;
n reconciliation, within the specified deadlines, of accounting and management data using specific procedures.
Given the increasing complexity of the Group’s financial activities and organisation, staff training and IT tools are upgraded on a permanent basis to make sure the production and verification of accounting and management data are effective and reliable.
SCOPE OF CONTROL
In practice, the internal control procedures implemented in the Group’s businesses are designed to guarantee the quality of financial and accounting information, and notably to:
n ensure that the transactions entered in the Group’s accounts are exhaustive and accurate;
n validate the valuation methods used for certain transactions;
n ensure that transactions are correctly assigned to the corresponding fiscal period and recorded in the accounts in accordance with the applicable accounting regulations, and that the accounting aggregates used to prepare the Group financial statements are compliant with the regulations in force;
n ensure the inclusion of all entities that must be consolidated in accordance with Group regulations;
n check that the operational risks associated with the production and transmission of accounting data through the IT system are correctly controlled, that the necessary adjustments are accurately performed, that the reconciliation of accounting and management data is satisfactory, and that the flows of cash payments and other items generated by transactions are exhaustive and adequate.
CONTROL BY THE FINANCE DEPARTMENTS OF CORE BUSINESSES
The Finance Department of each subsidiary verifies the accuracy and consistency of the financial statements with respect to the relevant accounting frameworks (local standards and IFRS for subsidiaries as well as French standards for branches). It performs Level 1 and 2 controls to guarantee the accuracy of disclosed information.
The data received for consolidation from each subsidiary are supplied from corporate accounting data by the subsidiaries, after they are locally brought into compliance with Group accounting principles. Each subsidiary must be able to explain the transition from the parent company financial statements to the financial statements reported through the consolidation tool.
Finance departments of core business contribute also to ensure the quality and accuracy of financial statements relevant from their scope of activity. As such, their main assignments in terms of accounting control are:
n to ensure the adequacy of means that disposes each accounting data producer to stakes involved;
n to oversight the set up of audit recommendations and the advance of associated action plans;
n to define key control’s implementation modalities and certify on a quarterly basis the issued results.
SUPERVISION BY THE GROUP FINANCE DIVISION
Once the statements produced by the various entities have been restated according to Group standards, they are entered into a central database and processed to produce the consolidated statements.
The department in charge of consolidation checks that the consolidation scope is compliant with the applicable accounting standards and performs multiple checks on data received for consolidation. These checks include confirming that gathered data is properly aggregated, verification of recurrent and non-recurrent consolidation entries, exhaustive treatment of critical points in the consolidation process, and treatment of any residual differences in reciprocal/intercompany accounts. Ultimately, the department ensures the overall consolidation process was correct by carrying out analytical reviews of the summary data and checking the consistency of the main aggregates in the financial statements. Changes in shareholders’ equity, goodwill, provisions and any deferred taxes consolidated in the fiscal year in question are also analysed.
The Group Finance Division also has a team dedicated to accounting supervision. This team performs controls to ensure that Group accounting standards are correctly applied by taking part in acquisitions or in audits of accounting data on specific issues to verify the consistency of accounting treatment at the cross-business level. This team is also in charge of organising and coordinating the permanent accounting control certification system.
THE ACCOUNTING AUDIT SYSTEM
CONTROLS BY ALL OPERATIONAL STAFF INVOLVED IN THE PRODUCTION OF ACCOUNTING, FINANCIAL AND MANAGEMENT DATA
The operational staff monitor their activities via a permanent supervision process, under the direct responsibility of their management teams, repeatedly verifying the quality of the controls carried out on accounting data and the associated accounting treatment.
CONTROLS BY THE GENERAL AUDIT TEAMS AND THE ACCOUNTING AUDIT TEAM OF THE INTERNAL AUDIT DIVISION
In the course of their assignments, the general audit teams verify the quality of the accounting and management data produced by the audited entities. They check certain accounts, assess the reconciliations between accounting and management data, and the quality of the permanent supervision procedures for the production and control of accounting data. They also identify any areas where manual processing may be required to make up for gaps in the IT tools and which therefore need to be closely checked.
The Accounting Audit Team is mainly responsible for:
n providing its expertise in identifying the Group’s main accounting risks;
n carrying out audits to verify the proper application of the Group’s accounting standards in areas deemed to be the most significant for the accuracy of the Group’s accounting information;
120 I 2014 REGISTRATION DOCUMENT I SOCIETE GENERALE GROUP
3 I CORPORATE GOVERNANCE I CHAIRMAN’S REPORT
n undertaking training initiatives and creating methodologies to help disseminate expertise in the auditing of accounting risks to the general audit teams and the General Inspection department.
The departments then issue recommendations to the parties involved in the production and control of accounting, financial and management data in order to improve this process through more specific initiatives aimed at particular entities or activities.
CONTROLS CARRIED OUT BY THE GENERAL INSPECTION DEPARTMENT
The Group General Inspection department generally carries out accounting audits as part of its assignments, but also conducts specific audits to check the quality of the controls carried out by the staff responsible for producing accounting, financial and management data.
SOCIETE GENERALE GROUP I 2014 REGISTRATION DOCUMENT I 121
STATUTORY AUDITORS’ SPECIAL REPORT ON THE REPORT OF THE CHAIRMAN ON INTERNAL CONTROL AND RISK MANAGEMENT I CORPORATE GOVERNANCE I 3
6 . S TAT U T O R Y A U D I T O R S ’ S P E C I A L R E P O R T O N T H E R E P O R T O F T H E C H A I R M A N O N I N T E R N A L C O N T R O L A N D R I S K M A N A G E M E N T
This is a free translation into English of a report issued in French and it is provided solely for the convenience of English-speaking users. This report should be read in conjunction with, and construed in accordance with, French law and professional standards applicable in France.
DELOITTE & ASSOCIÉS
185, avenue Charles-de-Gaulle 92524 Neuilly-sur-Seine Cedex S.A. au capital de € 1 723 040
Commissaire aux Comptes Membre de la compagnie régionale de Versailles
ERNST & YOUNG ET AUTRES
1/2, place des Saisons 92400 Courbevoie - Paris-La-Défense 1
S.A.S. à capital variable
Commissaire aux Comptes Membre de la compagnie régionale de Versailles
Statutory auditors’ report, prepared in accordance with article L. 225-235 of the French commercial code (Code de commerce), on the report prepared by the chairman of the board of directors of Societe GeneraleTo the Shareholders,
In our capacity as statutory auditors of Societe Generale and in accordance with article L. 225-235 of the French commercial code (Code de commerce), we hereby report on the report prepared by the chairman of your company in accordance with article L. 225-37 of the French commercial code (Code de commerce) for the year ended December 31, 2013.
It is the chairman’s responsibility to prepare and submit for the board of directors’ approval a report on internal control and risk management procedures implemented by the company and to provide the other information required by article L. 225-37 of the French commercial code (Code de commerce) relating to matters such as corporate governance.
Our role is to:
n report on any matters as to the information contained in the chairman’s report in respect of the internal control and risk management procedures relating to the preparation and processing of the accounting and financial information, and
n confirm that the report also includes the other information required by article L. 225-37 of the French commercial code (Code de commerce). It should be noted that our role is not to verify the fairness of this other information.
We conducted our work in accordance with professional standards applicable in France.
Information on internal control and risk management procedures relating to the preparation and processing of accounting and financial information
The professional standards require that we perform the necessary procedures to assess the fairness of the information provided in the chairman’s report in respect of the internal control and risk management procedures relating to the preparation and processing of the accounting and financial information. These procedures consist mainly in:
n obtaining an understanding of the internal control and risk management procedures relating to the preparation and processing of the accounting and financial information on which the information presented in the chairman’s report is based and of the existing documentation;
n obtaining an understanding of the work involved in the preparation of this information and of the existing documentation;
122 I 2014 REGISTRATION DOCUMENT I SOCIETE GENERALE GROUP
3 I CORPORATE GOVERNANCE ISTATUTORY AUDITORS’ SPECIAL REPORT ON THE REPORT OF THE CHAIRMAN ON INTERNAL CONTROL AND RISK MANAGEMENT
n determining if any material weaknesses in the internal control procedures relating to the preparation and processing of the accounting and financial information that we would have noted in the course of our work are properly disclosed in the chairman’s report.
On the basis of our work, we have no matters to report on the information relating to the company’s internal control and risk management procedures relating to the preparation and processing of the accounting and financial information contained in the report prepared by the Chairman of the Board of Directors in accordance with article L. 225-37 of the French commercial code (Code de commerce).
Other informationWe confirm that the report prepared by the chairman of the board of directors also contains the other information required by article L. 225-37 of the French commercial code (Code de commerce).
Neuilly-sur-Seine and Paris-La Défense, March 4, 2014 The statutory auditors
French original signed by
DELOITTE & ASSOCIÉS Represented by
Jean-Marc MICKELER
ERNST & YOUNG et Autres Represented by
Isabelle SANTENAC
SOCIETE GENERALE GROUP I 2014 REGISTRATION DOCUMENT I 123
4R I S K S A N D C A P I TA L
A D E Q U A C Y1. Introduction ......................................................................................124
Key figures ������������������������������ 124Types of risks ���������������������������� 126Risk factors ����������������������������� 127
2. Governance and risk management organisation ....................................135Introduction ����������������������������� 135Risk management governance, control and organisation principles ��������������������� 136Enterprise Risk Management (ERM) programme ��������� 137Risk appetite ����������������������������� 138Stress test framework ������������������������ 138Group risk mapping ������������������������� 139
3. Capital management and capital adequacy .....................................................140Basel 2.5 regulatory framework ������������������ 140Scope of application – Prudential scope �������������� 140Regulatory capital �������������������������� 142Capital requirements ������������������������ 146Capital management ������������������������ 149Ratio of large exposures ���������������������� 150Regulatory changes ������������������������� 150
4. Credit risks ........................................................................................151Credit risk management: organisation and structure ������� 151Credit policy ����������������������������� 151Risk supervision and monitoring system �������������� 151Replacement risk �������������������������� 153Hedging of credit risk ������������������������ 154Risk measurement and internal ratings �������������� 155Scope of application of capital evaluation methods �������� 157Credit risk: quantitative informations ���������������� 157
5. Securitisation .................................................................................161Securitisations and regulatory framework ������������� 161Accounting methods ������������������������ 161Treatment of special purpose vehicles (SPV) ����������� 162Monitoring of securitisation risks ������������������ 162Societe Generale’s securisation activities ������������� 162Prudential treatment of securitisation positions ���������� 168
6. Market Risks ...................................................................................174Organisation ����������������������������� 174Independent pricing verification ������������������ 174Methods for measuring market risk and defining limits ������ 17599% Value at Risk (VaR) ����������������������� 175Stress test assessment ����������������������� 178
7. Operational Risks ...................................................................181Operational risk management: organisation and governance �������������������� 181Operational risk measurement ������������������� 181Operational risk monitoring process ���������������� 182Operational risk modelling ��������������������� 184Operational risk insurance ��������������������� 185
8. Structural interest rate and exchange rate risks .............................................186Organisation of the management of structural interest rate and exchange rate risks ��������������� 186Structural interest rate risk ��������������������� 187Structural exchange rate risk �������������������� 188
9. Liquidity risk .....................................................................................190Governance and organisation ������������������� 190Group’s principles and approach to liquidity risk management 191Refinancing strategy ������������������������� 191Liquidity reserve ��������������������������� 193Regulatory ratios �������������������������� 193Balance sheet schedule ����������������������� 195
10. Compliance, reputational and legal risks ..............................................................................197Compliance ����������������������������� 197Risks and litigation ������������������������� 202
11. Other risks .........................................................................................205Equity risk ������������������������������ 205Strategic risks ���������������������������� 207Business risks ���������������������������� 207Risks related to insurance activities ���������������� 207Environmental and social risks ������������������� 207
12. Specific financial information ...............................208Provisions for assets affected by the financial crisis in 2008 ��� 208Unhedged positions in CDO (collateralised debt obligations) tranches exposed to the us real estate sector ���������������� 208Protection acquired to hedge exposure to CDOs or other assets ����������������� 209Exposure to us residential mortgage market: residential loans and RMBS ��������������������� 210Exposure to residential mortgage markets in Spain and the United Kingdom ����������������� 211Exotic credit derivatives ����������������������� 213
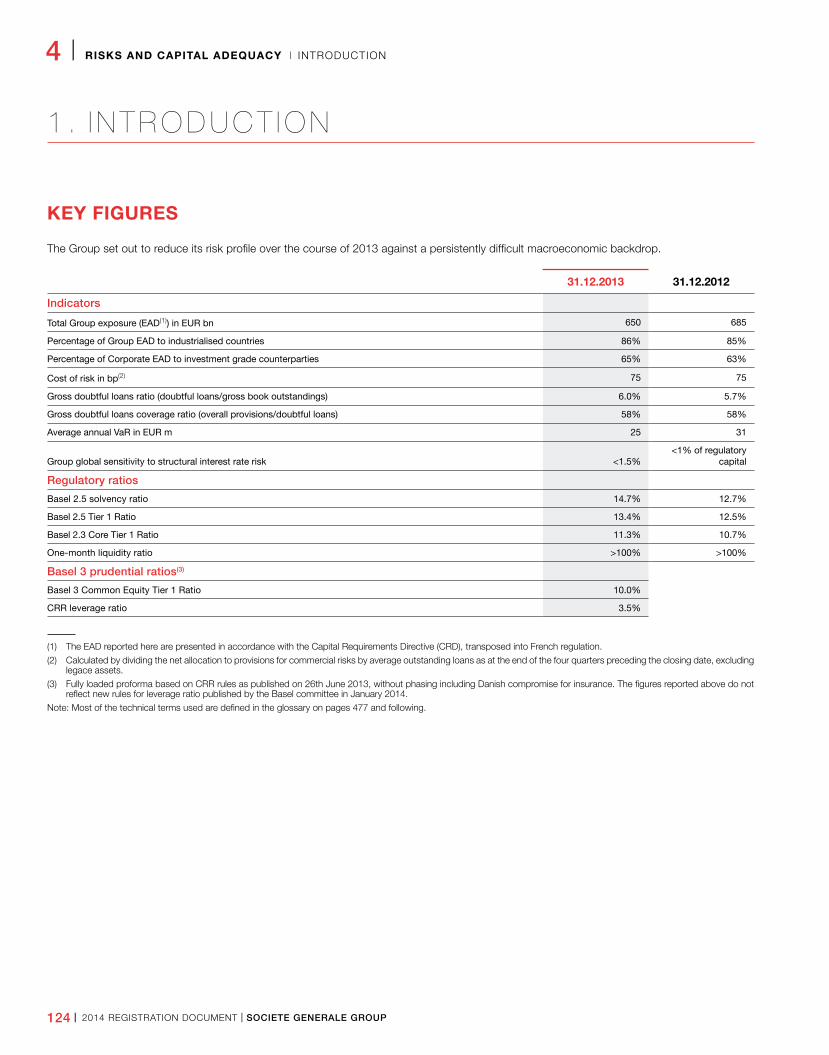
4 I RISKS AND CAPITAL ADEQUACY I INTRODUCTION
124 I 2014 REGISTRATION DOCUMENT I SOCIETE GENERALE GROUP
1 . I N T R O D U C T I O N
KEY FIGURES
The Group set out to reduce its risk profile over the course of 2013 against a persistently difficult macroeconomic backdrop.
31.12.2013 31.12.2012
Indicators
Total Group exposure (EAD(1)) in EUR bn 650 685
Percentage of Group EAD to industrialised countries 86% 85%
Percentage of Corporate EAD to investment grade counterparties 65% 63%
Cost of risk in bp(2) 75 75
Gross doubtful loans ratio (doubtful loans/gross book outstandings) 6.0% 5.7%
Gross doubtful loans coverage ratio (overall provisions/doubtful loans) 58% 58%
Average annual VaR in EUR m 25 31
Group global sensitivity to structural interest rate risk <1.5%<1% of regulatory
capital
Regulatory ratios
Basel 2.5 solvency ratio 14.7% 12.7%
Basel 2.5 Tier 1 Ratio 13.4% 12.5%
Basel 2.3 Core Tier 1 Ratio 11.3% 10.7%
One-month liquidity ratio >100% >100%
Basel 3 prudential ratios(3)
Basel 3 Common Equity Tier 1 Ratio 10.0%
CRR leverage ratio 3.5%
(1) The EAD reported here are presented in accordance with the Capital Requirements Directive (CRD), transposed into French regulation.
(2) Calculated by dividing the net allocation to provisions for commercial risks by average outstanding loans as at the end of the four quarters preceding the closing date, excluding legace assets.
(3) Fully loaded proforma based on CRR rules as published on 26th June 2013, without phasing including Danish compromise for insurance. The figures reported above do not reflect new rules for leverage ratio published by the Basel committee in January 2014.
Note: Most of the technical terms used are defined in the glossary on pages 477 and following.
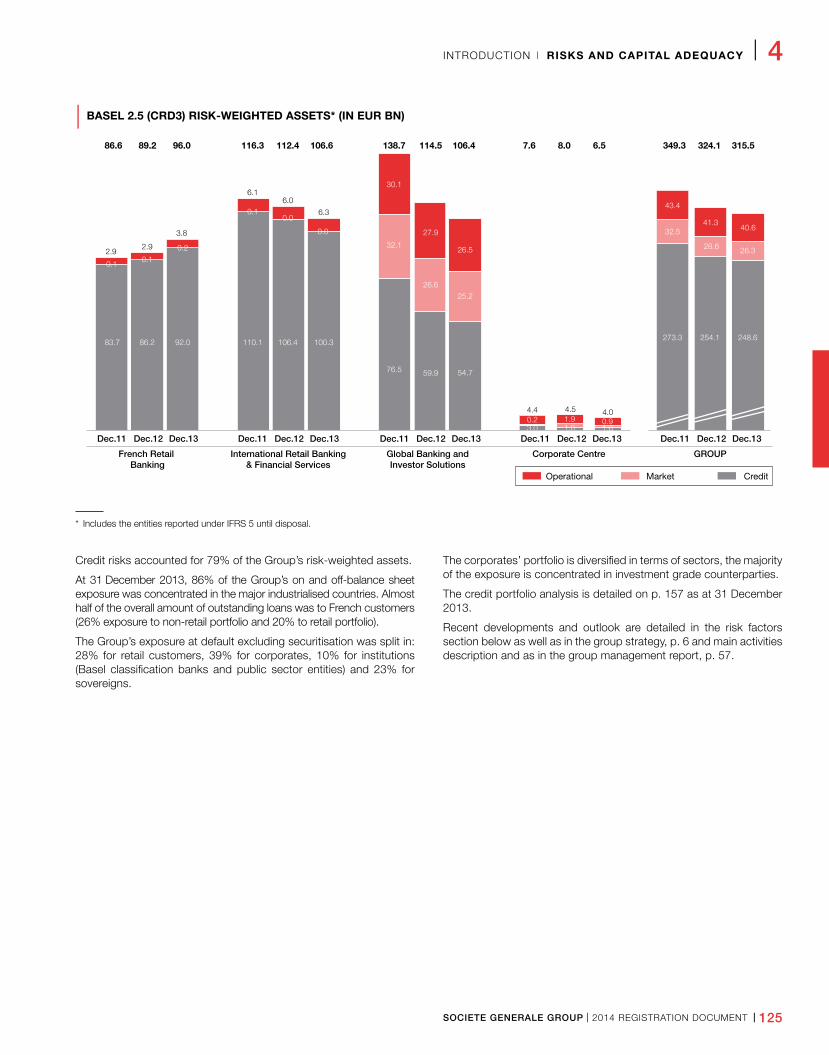
INTRODUCTION I RISKS AND CAPITAL ADEQUACY I 4
SOCIETE GENERALE GROUP I 2014 REGISTRATION DOCUMENT I 125
| BASEL 2.5 (CRD3) RISK-WEIGHTED ASSETS* (IN EUR BN)
French Retail Banking
International Retail Banking& Financial Services
Global Banking andInvestor Solutions
Corporate Centre GROUP
Dec.11 Dec.12 Dec.13 Dec.11 Dec.12 Dec.13 Dec.11 Dec.12 Dec.13 Dec.11 Dec.12 Dec.13 Dec.11 Dec.12 Dec.13
83.7 86.2 92.0
0.10.1
0.2
106.4110.1 100.3
76.5 59.9 54.7
32.1
26.625.2
30.1
3.0 1.60.24.4 4.5 4.0
1.9 0.9
6.16.0
6.30.10.0
0.0 27.9
26.5
86.6
2.9 2.9
3.8
89.2 96.0 116.3 112.4 106.6 138.7 114.5 106.4 7.6 8.0 6.5
273.3 254.1 248.6
32.5
43.4
41.340.6
28.6 26.3
349.3 324.1 315.5
Operational Market Credit
1.6
* Includes the entities reported under IFRS 5 until disposal.
Credit risks accounted for 79% of the Group’s risk-weighted assets.
At 31 December 2013, 86% of the Group’s on and off-balance sheet exposure was concentrated in the major industrialised countries. Almost half of the overall amount of outstanding loans was to French customers (26% exposure to non-retail portfolio and 20% to retail portfolio).
The Group’s exposure at default excluding securitisation was split in: 28% for retail customers, 39% for corporates, 10% for institutions (Basel classification banks and public sector entities) and 23% for sovereigns.
The corporates’ portfolio is diversified in terms of sectors, the majority of the exposure is concentrated in investment grade counterparties.
The credit portfolio analysis is detailed on p. 157 as at 31 December 2013.
Recent developments and outlook are detailed in the risk factors section below as well as in the group strategy, p. 6 and main activities description and as in the group management report, p. 57.
4 I RISKS AND CAPITAL ADEQUACY I INTRODUCTION
126 I 2014 REGISTRATION DOCUMENT I SOCIETE GENERALE GROUP
TYPES OF RISKS
The Group is exposed to the risks inherent in its core businesses. Given the diversity and changes in the Group’s activities, its risk management focuses on the following main categories of risks, any of which could adversely affect its business, results of operations and financial condition:
n credit and counterparty risk (including country risk): risk of losses arising from the inability of the Group’s customers, issuers or other counterparties to meet their financial commitments. Credit risk includes the counterparty risk linked to market transactions (replacement risk), as well as securitisation activities. In addition, credit risk may be further amplified by concentration risk, which arises from a large exposure to a given risk, to one or more counterparties, or to one or more homogeneous groups of counterparties.
Country risk arises when an exposure can be negatively affected by changing political, economic, social and financial conditions in the country of operation.
Validation of credit risk is part of the Group’s risk management strategy based on its risk appetite. Societe Generale’s credit policy is based on the principle that approval of any credit risk undertaking must be based on sound knowledge of the client and the client’s business, an understanding of the purpose and structure of the transaction and the sources of repayment of the debt. Credit decisions must also ensure that the structure of the transaction will minimise the risk of loss in the event the counterparty defaults.
Limits are set for certain countries, geographical regions, sectors, products or types of customers with a view to minimising the most significant risks. In addition, major concentration risks are analysed periodically for the entire Group.
n market risk: risk of decline in the value of financial instruments arising from changes in market parameters, the volatility of these parameters and correlations between them. These parameters include, but are not limited to exchange rates, interest rates, and the price of securities (equities, bonds), commodities, derivatives and other assets, including real estate assets.
Positions and risks are subject to daily controls and compared to predefined limits that, for major positions, are validated by the Board of Directors on the advice of the Audit, Internal Control and Risk Committee, in accordance with the risk appetite defined by the Board of Directors;
n operational risks (including accounting and environmental risks): risk of losses or sanctions due in particular to failures in internal procedures or systems, human error or external events; Societe Generale has no appetite for operational risks, only a tolerance level. As such, the Group has an active prevention policy which consists of securing operational processes and promoting of a risk culture throughout the Group. The limit in terms of operational losses is set as a percentage of NBI;
n structural interest and exchange rate risk: risk of loss or write-downs in the Group’s assets arising from variations in interest or exchange rates. Structural interest and exchange rate risk arises from commercial activities and from transactions entered into by the Corporate Centre.
The general principle for the Group is to minimise structural interest rate and exchange rate risks as much as possible within consolidated entities. Wherever possible, commercial transactions are therefore hedged against interest rate and exchange rate risks. Any residual structural interest rate risk exposure is contained by sensitivity limits set for each entity and for the overall Group in accordance with the structural risk appetite as validated by the Finance Policy Committee. As for exchange rates, the Group’s policy is to immunise its solvency ratio against fluctuations of the major currencies in which it operates;
n liquidity risk: risk of the Group not being able to meet its cash or collateral requirements as they arise and at reasonable cost.
Given that liquidity is a scarce resource, the Group’s objective is to finance its activities at the best possible rates under normal conditions whilst maintaining adequate buffers to cover outflows in periods of stress. The scope of the Group’s short and long- term financing plan, which supplements customer deposits, is conservative with reduced concentration in the short term while ensuring diversification in terms of products and regions. Targets are validated by the Board of Directors in accordance with Risk Appetite;
n non-compliance risk (including legal and tax risks): risk of legal, administrative or disciplinary sanction, material financial losses or reputational damage arising from failure to comply with the provisions governing the Group’s activities;
n reputational risk: risk arising from negative perception by customers, counterparties, shareholders investors or regulators, which could adversely affect the Group’s ability to maintain or establish business relations and its access to funding sources.
Compliance and adherence to ethical rules that meet the profession’s highest standards are part of the Societe Generale Group’s core values. It is not just the responsibility of a select few, but concerns the culture of its entire staff. Moreover, those rules even go beyond the strict application of current regulatory provisions, particularly as there are countries in which said provisions fall short of Societe Generale’s ethical standards.
The Group is also exposed to the following risks:
n strategic risk: risk tied to the choice of a given business strategy or resulting from the Group’s inability to execute its strategy;
n business risk: risk of losses if costs exceed revenues;
n risk related to insurance activities: through its insurance subsidiaries, the Group is also exposed to a variety of risks
INTRODUCTION I RISKS AND CAPITAL ADEQUACY I 4
SOCIETE GENERALE GROUP I 2014 REGISTRATION DOCUMENT I 127
linked to the insurance business. In addition to balance sheet management risks (interest rate, valuation, counterparty and exchange rate risk), those include premium pricing risk, mortality risk and structural risk of life and non-life insurance activities, including pandemics, accidents and catastrophic events (such as earthquakes, hurricanes, industrial disasters, acts of terrorism or military conflicts);
Moreover, the Group is also exposed to the following risks:
n risk related to specialised finance activities: through its Specialised Financial Services activities, mainly in its operational vehicle leasing subsidiary, the Group is exposed to residual value risk (when the net resale value of an asset at the end of the lease is less than estimated);
n investment portfolio risk: risk of unfavourable changes in the value of the Group’s investment portfolio.
RISK FACTORS
1. The global economy and financial markets continue to display high levels of uncertainty, which may materially and adversely affect the Group’s business, financial condition and results of operations.
As part of a global financial institution, the Group’s businesses are highly sensitive to changes in financial markets and economic conditions generally in Europe, the United States and elsewhere around the world. The Group could be confronted with a significant deterioration of market and economic conditions resulting from, in particular, crises affecting capital or credit markets, liquidity constraints, regional or global recessions, sharp fluctuations in commodity prices (including oil), currency exchange rates or interest rates, inflation or deflation, sovereign debt rating downgrades, restructurings or defaults, or adverse geopolitical events (including acts of terrorism and military conflicts). Such occurrences, which may develop quickly and hence may not be hedged, could affect the operating environment for financial institutions for short or extended periods and have a material adverse effect on the Group’s financial condition, results of operations or cost of risk.
Financial markets have in recent years experienced significant disruptions as a result of concerns regarding the sovereign debt of various Eurozone countries. The elevated debt levels of some European sovereigns and the restructuring of Greek sovereign debt in 2012, which required investors to incur substantial writedowns, have given rise to concerns about sovereign defaults and the Eurozone. The outcome of this situation cannot yet be predicted. In the recent past, these concerns generated disruptions that contributed to increasing the volatility in the exchange rate of the euro against other major currencies, negatively affecting stock prices, deteriorating the funding conditions of financial institutions and created uncertainty regarding the near-term economic prospects of European Union countries, as well as the quality of credits extended to sovereign debtors in the European Union. Austerity and other measures introduced by public or private sector actors in order to address these issues may themselves lead to economic contraction and adversly affect for the Group. Moreover, the prolonged and severe recession experienced by some Eurozone countries has weakened the financial situation of business and households in these countries, which could translate into a further increase in the default rate of borrowers.
The Group is exposed to the risk of substantial losses if sovereign states, financial institutions or other credit counterparties become insolvent or are no longer able to fulfil their obligations to the Group. The Group holds sovereign obligations issued by certain of the countries that have been most significantly affected by the ongoing Eurozone crisis. In addition, the erosion of a sovereign state’s perceived credit quality will often negatively affect the market perception of financial institutions located in that state. A worsening of the Eurozone crisis may trigger a significant decline in the Group’s asset quality and an increase in its loan losses in the affected countries. The Group’s inability to recover the value of its assets in accordance with the estimated percentages of recoverability based on past historical trends (which could prove inaccurate) could further adversely affect its performance. It may also become necessary for the Group to invest resources to support the recapitalisation of its businesses and/or subsidiaries in the Eurozone or in countries closely connected to the Eurozone such as those in Central and Eastern Europe. The Group’s local activities in certain countries could become subject to emergency legal initiatives or restrictions imposed by local authorities, which could adversely affect its business, financial condition and results of operations.
2. A number of exceptional measures taken by governments, central banks and regulators have recently been or could soon be completed or terminated, and measures at the European level face implementation risks.
In response to the financial crisis, governments, central banks and regulators implemented measures intended to support financial institutions and sovereign states and thereby stabilise financial markets. Central banks took measures to facilitate financial institutions’ access to liquidity, in particular by lowering interest rates to historic lows for a prolonged period.
Various central banks decided to substantially increase the amount and duration of liquidity provided to banks, loosen collateral requirements and, in some cases, implement “non-conventional” measures to inject substantial liquidity into the financial system, including direct market purchases of government bonds, corporate commercial paper and mortgage-backed securities. These central banks may decide, acting alone or in coordination, to modify their monetary policies or to tighten their policies regarding access to liquidity, which could substantially
4 I RISKS AND CAPITAL ADEQUACY I INTRODUCTION
128 I 2014 REGISTRATION DOCUMENT I SOCIETE GENERALE GROUP
and abruptly decrease the flow of liquidity in the financial system. For example, the US Federal Reserve has expressed an intention to begin tapering its quantitative easing programme in 2014, but the pace and the magnitude of this adjustment remains uncertain. Such changes, or concerns about their potential impact, could increase volatility in the financial markets and push interest rates significantly higher. Given the uncertainty of the nascent economic recovery, such changes could have an adverse effect on operating conditions for financial institutions and, hence, on the Group’s business, financial condition and results of operations.
Steps taken in 2012 to support the Eurozone, including short-term stability measures adopted by the European Council in June 2012, the European Central Bank’s (ECB) announcement in August 2012 that it would undertake outright monetary transactions in sovereign bond markets, and advances made by the European Council and European Parliament in 2012 and 2013 toward adopting a general approach for the establishment of a single supervisory mechanism for the oversight of credit institutions, have contributed to a tangible easing of financial stability stress since mid-2012. These steps were reinforced in 2013 by additional measures, including the ECB’s decisions to reduce its main lending rate to a new low of 0.25% and extend its undertaking to provide banks with unlimited amounts of short-term funding until mid-2015. Nevertheless the agreed policy measures remain subject to implementation risks both at the national and EU level and, even if implemented, could be terminated. At the same time, the functioning of money and debt markets has remained fragmented, amplifying funding strains in countries under stress. These strains could give rise to national policies restricting cross-border flows of liquidity, and ultimately undermine market integration within the monetary union.
3. The Group’s results may be affected by regional market exposures.
The Group’s performance is significantly affected by economic, financial and political conditions in the principal markets in which it operates, such as France and other European Union countries. In France, the Group’s principal market, stagnant economic and financial activity, reduced levels of consumer spending and an unfavourable evolution of the real estate market have had, and could continue to have, a material adverse impact on its business, resulting in decreased demand for loans, higher rates of non-performing loans and, decreased asset values. In the other European Union countries, economic stagnation or a deteriorating economic environment could result in increased loan losses or higher levels of provisioning.
The Group is involved in commercial banking and investment banking operations in emerging markets, in particular in Russia and other Central and Eastern European countries as well as in North Africa. Capital markets and securities trading activities in emerging markets may be more volatile than those in developed markets and more vulnerable to certain risks, such as political uncertainty and currency volatility. It is likely that these markets will continue to be characterised by higher levels of uncertainty and therefore risk.
Unfavourable developments in the political or economic conditions affecting these markets may adversely affect the Group’s business, results of operations or financial condition.
4. The Group operates in highly competitive industries, including in its home market.
The Group is subject to intense competition in the global and local markets in which it operates. On a global level, it competes with its peers principally in its core businesses (French Networks, International Banking and Financial Services, and Global Banking and Investor Solutions). In local markets, including, France, the Group faces substantial competition from locally-established banks, financial institutions, businesses providing financial and other services and, in some instances, governmental agencies. This competition exists in all of the Group’s lines of business.
In France, the presence of large domestic competitors in the banking and financial services sector, as well as emerging competitors such as online retail banking and financial services providers, has resulted in intense competition for virtually all of the Group’s products and services. The French market is a mature market and one in which the Group already holds significant market share in most of its lines of business. Its business and results of operations may be adversely affected if it is unable to maintain or increase its market share in key lines of business. The Group also faces competition from local participants in other geographic markets in which it has a significant presence. The level of competition on a global level, as well as on a local level in France and its other key markets, could have a material adverse effect on the Group’s business, results of operations and financial condition.
Over time, certain sectors of the financial services industry have become more concentrated, as institutions involved in a broad range of financial services have been acquired by or merged into other firms, or have declared bankruptcy. Such changes could result in our remaining competitors gaining greater capital and other resources, such as the ability to offer a broader range of products and services and geographic diversity. We have experienced, and may continue to experience, pricing pressures as a result of these factors, and as some of our competitors seek to increase market share by reducing prices.
5. Reputational damage could harm the Group’s competitive position.
The financial services industry is highly competitive and the Group’s reputation for financial strength and integrity is critical to its ability to attract and retain customers and counterparties.
Its reputation could be harmed by events attributable to it and the decisions of its management, as well as by events and actions of others outside its control. Independent of the merit of information being disseminated, negative developments concerning the Group could have adverse effects on its business and its competitive position.
The Group’s reputation could be adversely affected by a weakness in its management of conflicts of interests or other similar procedures or as a result of employee misconduct, misconduct
INTRODUCTION I RISKS AND CAPITAL ADEQUACY I 4
SOCIETE GENERALE GROUP I 2014 REGISTRATION DOCUMENT I 129
by other market participants, a decline in, a restatement of, or corrections to its financial results, as well as any adverse legal or regulatory action, especially if any of these events becomes the focus of extensive media reporting. Reputational damage could translate into a loss of business that could have a material adverse effect on the Group’s results of operations and financial position.
6. The protracted decline of financial markets or reduced liquidity in such markets may make it harder to sell assets and could lead to material losses.
In a number of the Group’s businesses, protracted market movements, particularly asset price declines, can reduce the level of activity in the financial markets or reduce market liquidity. These developments can lead to material losses if the Group is not able to close out deteriorating positions in a timely way or adjust the hedge of its positions. This is especially true for the assets the Group holds for which the markets are relatively illiquid by nature. Assets that are not traded on regulated markets or other public trading markets, such as derivatives contracts between banks, are valued based on the Group’s internal models rather than publicly-quoted prices. Monitoring the deterioration of prices of assets like these is difficult and could lead to losses that the Group did not anticipate.
7. The Group depends on access to financing and other sources of liquidity, which may be restricted for reasons beyond its control.
The ability to access short-term and long-term funding is essential to the Group’s businesses. We fund ourselves on an unsecured basis, by accepting deposits at our bank subsidiaries, by issuing long-term debt, promissory notes and commercial paper and by obtaining bank loans or lines of credit. We also seek to finance many of our assets on a secured basis, including by entering into repurchase agreements. If the Group is unable to access secured or unsecured debt markets on terms it considers acceptable or if it experiences unforeseen outflows of cash or collateral, including a material decrease in customer deposits, the Group’s liquidity could be impaired. In particular, if the Group does not continue to successfully attract customer deposits (because, for example, competitors raise the interest rates that they are willing to pay to depositors, and accordingly, customers move their deposits elsewhere), the Group may need to replace such funding with more expensive funding, which would reduce the Group’s net interest margin and net interest income.
The Group’s liquidity could be adversely affected by factors the Group cannot control, such as general market disruptions, operational difficulties affecting third parties, negative views about the financial services industry in general, the Group’s short-term or long-term financial prospects, changes in credit ratings or even the perception among market participants of the Group or other financial institutions. The Group is also subject to changes in the ECB’s policies with respect to providing liquidity to banks in the Eurozone.
The Group’s credit ratings can have a significant impact on the Group’s access to funding and also on certain trading revenues. We may be required to provide additional collateral to certain counterparties in the event of a credit ratings downgrade, in connection with certain OTC trading agreements and certain other agreements associated with the Institutional Securities business segment. The rating agencies continue to monitor certain issuer-specific factors that are important to the determination of the Group’s credit ratings, including governance, the level and quality of earnings, capital adequacy, funding and liquidity, risk appetite and management, asset quality, strategic direction, and business mix. Additionally, the rating agencies look at other industry-wide factors, such as regulatory or legislative changes, the macro-economic environment and perceived levels of government support, and it is possible that such factors could result in downgrades of the Group’s ratings and those of similar institutions.
Some of the Group’s debts may be accelerated by lenders upon the occurrence of certain events, including the Group’s failure to provide the necessary collateral following a downgrade of its credit rating below a certain threshold, and other events of default set out in the terms of such indebtedness. If the relevant lenders declare all amounts outstanding due and payable due to a default, the Group may be unable to find sufficient alternative financing on acceptable terms, or at all, and the Group’s assets might not be sufficient to repay in full its outstanding indebtedness.
Moreover, the Group’s ability to access the capital markets and its cost of obtaining long-term unsecured funding is directly related to its credit spreads in both the cash bond and derivatives markets, which are also outside of its control. Liquidity constraints may have a material adverse effect on the Group’s business, financial condition, results of operations and ability to meet its obligations to its counterparties.
8. The volatility of the financial markets may cause the Group to suffer significant losses on its trading and investment activities.
Market instability could adversely affect the Group’s trading and investment positions in the debt, currency, commodity and equity markets, and in private equity, property and other assets. Severe market disruptions and extreme market volatility have occurred in recent years and may occur again in the future, which could result in significant losses for the Group’s capital markets activities. Such losses may extend to a broad range of trading and hedging products, including swaps, forward and future contracts, options and structured products.
Market volatility makes it difficult to predict trends and implement effective trading strategies and increases risk of losses from net long positions when prices decline and, conversely, from net short positions when prices rise. Such losses, if significant, could adversely affect the Group’s results of operations and financial condition.
4 I RISKS AND CAPITAL ADEQUACY I INTRODUCTION
130 I 2014 REGISTRATION DOCUMENT I SOCIETE GENERALE GROUP
9. Changes in interest rates may adversely affect the Group’s banking and asset management businesses.
The Group’s performance is influenced by the evolution and fluctuation of interest rates in Europe and in the other markets in which it operates. The amount of net interest earned during any given period may significantly affect the Group’s overall revenues and profitability. The Group’s management of interest rate sensitivity may also affect its results of operations. Interest rate sensitivity refers to the relationship between changes in market interest rates and changes in applicable interest margins and balance sheet values. Any mismatch between interest owed by the Group and interest due to it (in the absence of suitable protection against such mismatch) could have adverse material effects on the Group’s business, financial condition and results of operations.
10. Fluctuations in exchange rates could adversely affect the Group’s results of operations.
The Group’s main operating currency is the euro. However, a significant portion of the Group’s business is carried out in currencies other than the euro, such as, the US dollar, the British pound sterling, the Czech crown, the Romanian lei, the Russian rouble and the Japanese yen. The Group is exposed to exchange rate movements to the extent its revenues and expenses or its assets and liabilities are in different currencies.
Because the Group publishes its consolidated financial statements in euros, which is the currency of most of its liabilities, the Group is also subject to translation risk in the preparation of its financial statements. Fluctuations in the rate of exchange of these currencies into euros may have a negative impact on the Group’s consolidated results of operations, financial position and cash flows from year to year, despite any hedges that may be implemented by the Group to limit its foreign exchange exposure. Exchange rate fluctuations may also affect the value (denominated in euros) of the Group’s investments in its subsidiaries outside the Eurozone.
11. The Group is subject to extensive supervisory and regulatory regimes in the countries in which it operates and changes in these regimes could have a significant effect on the Group’s business.
The Group is subject to extensive regulation and supervision in all jurisdictions in which it operates. The rules applicable to banks seek principally to limit their risk exposure, preserve their stability and financial solidity and protect depositors, creditors and investors. The rules applicable to financial services providers govern, among other things, the sale, placement and marketing of financial instruments. The banking entities of the Group must also comply with requirements as to capital adequacy and liquidity in the countries in which they operate. Compliance with these rules and regulations requires significant resources. Non-compliance with applicable laws and regulations could lead to fines, damage to the Group’s reputation, forced suspension of its operations or the withdrawal of operating licenses.
Since the onset of the financial crisis, a variety of measures have been proposed, discussed and adopted by numerous national and international legislative and regulatory bodies, as well as other entities. Certain of these measures have already been
implemented, while others are still under discussion. It therefore remains difficult to accurately estimate the future impacts or, in some cases, to evaluate the likely consequences of these measures.
In particular, the Basel 3 reforms are being implemented in the European Union through the Capital Requirements Regulation 1 (CRR1) and Capital Requirements Directive 4 (CRD4) which came into effect on 1 January 2014, with certain requirements being phased in over a period of time, until 2019. Basel 3 is an international regulatory framework to strengthen capital and liquidity regulations with the goal of promoting a more resilient banking sector. Recommendations and measures addressing systemic risk exposure of global banks, including additional loss absorbency requirements, were adopted by the Basel Committee and by the Financial Stability Board, which was established following the G20 London summit in 2009. Societe Generale, among other global banks, has been named by the Financial Stability Board as a “systemically important financial institution” and as a result will be subject to additional capital buffer requirements. Specific rules related to the application of these measures have not yet been fully defined at the European level.
The ECB announced in October 2013 that it would commence a comprehensive assessment, including stress tests and an asset quality review, of certain large European banks, including the Group. The findings from this assessment, expected to be published in November 2014, may result in recommendations for additional supervisory measures, steps to increase capital ratios and other corrective actions affecting the Group and the banking sector generally. In addition, from November 2014, Societe Generale, along with all other significant financial institutions in the Eurozone, will fall under the direct supervision of the European Central Bank through implementation of the planned “banking union” framework. It is not yet possible to assess the impact of such measures, if any, on the Group; however, the prospect of such recommendations and the implementation of additional measures may be a source of additional uncertainty and volatility in the financial markets.
In France, the banking law of 26 July 2013 requires, among other things:
(i) that banks whose balance sheet exceeds a certain threshold must develop and communicate to the Autorité de Contrôle Prudentiel et de Résolution (ACPR - French Prudential and Resolution Supervisory Authority) a preventative recovery plan outlining expected recovery measures in case of significant deterioration of their financial situation. This law expands the powers of the Prudential Supervision and Resolution Authority over these institutions in times of financial difficulty. However, the Autorité de Contrôle Prudentiel et de Résolution (ACPR - French Prudential and Resolution Supervisory Authority) powers could be superseded by a European regulator if a European resolution framework is adopted (a proposal to this effect was adopted by the European Council on 18 December 2013).
(ii) the separation or ring-fencing of market activities considered “speculative” (i.e., not useful for the purpose of financing the economy) undertaken by financial institutions. Only activities undertaken by banks for their proprietary accounts fall within this obligation.
INTRODUCTION I RISKS AND CAPITAL ADEQUACY I 4
SOCIETE GENERALE GROUP I 2014 REGISTRATION DOCUMENT I 131
By 1 July 2014, all institutions subject to the separation obligation must have identified the relevant activities to be separated and eventually transferred to a dedicated subsidiary. The actual transfer of such activities must occur no later than 1 July 2015.
(iii) greater transparency concerning activities in non-cooperative tax countries, as well as the limitation of certain bank charges.
These reforms could impact the Group and its structure in ways that cannot currently be estimated.
The Dodd-Frank Wall Street Reform and Consumer Protection Act (“Dodd-Frank”), enacted in the United States in 2010, will affect the Group and some of its businesses. Dodd-Frank calls for significant structural reforms affecting the financial services industry, including non-US banks, by addressing, in particular, systemic risk oversight, bank capital standards, the orderly liquidation of failing systemically significant financial institutions, over-the-counter derivatives, and the ability of banking entities to engage in proprietary trading activities and sponsor and invest in hedge funds and private equity funds (which was the subject of the final “Volcker rule” adopted in December 2013 by the Federal Reserve and other financial regulators in the United States). While certain provisions of Dodd-Frank were effective immediately on enactment, other provisions are subject to transition periods and a lengthy rulemaking process, or benefit from significant delays in their application, making it difficult at this time to assess the overall impact (including extraterritorial impacts) any final rules could have on the Group or on the financial services industry as a whole.
The European Market Infrastructure Regulation (EMIR) published in 2012 places new constraints on derivatives market participants in order to improve the stability and transparency of this market. Specifically, the EMIR requires the use of central counterparties for products deemed sufficiently liquid and standardised, the reporting of all derivative products transactions to a trade repository, and the implementation of risk mitigation procedures (e.g., exchange of collateral) for OTC derivatives not cleared by central counterparties. Some of these measures are already in effect, while others are expected come into force in 2015, making it difficult to accurately estimate their impact.
In Europe, the regulation of employee compensation, including rules related to bonuses and other incentive-based compensation, clawback requirements and deferred payments may increase the Group’s proportion of fixed compensation costs relative to variable costs and may reduce its ability to recruit or retain key employees, either of which could adversely affect its profitability.
Finally, additional reforms are being considered that seek to further reduce the risks to the stability of the financial system posed by the default of systemically important banks. For example, in October 2013 the Basel Trading Book Group published a consultation paper (Fundamental Review of Trading Book)
proposing revised methods for calculating capital requirements in evaluating market risks. This and other proposals for banking sector reform may have a significant impact on the Group, particularly in term of the cost of capital allocated to each type of banking activity, although it is too early to estimate their impact at this time.
12. The Group is exposed to counterparty risk and concentration risk.
The Group is exposed to credit risk with respect to numerous counterparties in the ordinary course of its trading, lending, deposit-taking, clearance and settlement and other activities. These counterparties include institutional clients, brokers and dealers, commercial and investment banks and sovereign states. The Group may realise losses if a counterparty defaults on its obligations and the collateral that it holds does not represent a value equal to, or is liquidated at prices not sufficient to recover, the full amount of the loan or derivative exposure it is intended to cover. Many of the Group’s hedging and other risk management strategies also involve transactions with financial services counterparties. The weakness or insolvency of these counterparties may impair the effectiveness of the Group’s hedging and other risk management strategies, which could in turn materially adversely affect its business, results of operations and financial condition.
The Group may also have concentrated exposure to a particular counterparty, borrower or issuer (including sovereign issuers), or to a particular country or industry. A ratings downgrade, default or insolvency affecting such a counterparty, or a deterioration of economic conditions in such a country or industry, could have a particularly adverse effect on the Group’s business, results of operations and financial condition. The systems the Group uses to limit and monitor the level of its credit exposure to individual entities, industries and countries may not be effective to prevent concentration of credit risk. Because of a concentration of risk, the Group may suffer losses even when economic and market conditions are generally favourable for its competitors.
13. The financial soundness and conduct of other financial institutions and market participants could adversely affect the Group.
The Group’s ability to engage in funding, investment and derivative transactions could be adversely affected by the soundness of other financial institutions or market participants. Financial services institutions are interrelated as a result of trading, clearing, counterparty, funding and other relationships. As a result, defaults by, or even rumours or questions about, one or more financial services institutions, or the loss of confidence in the financial services industry generally, may lead to market-wide liquidity scarcity and could lead to further losses or defaults. The Group has exposure to many counterparties in the financial industry, directly and indirectly, including brokers and dealers, commercial
4 I RISKS AND CAPITAL ADEQUACY I INTRODUCTION
132 I 2014 REGISTRATION DOCUMENT I SOCIETE GENERALE GROUP
banks, investment banks, mutual and hedge funds, and other institutional clients with which it regularly executes transactions. Many of these transactions expose the Group to credit risk in the event of default by counterparties or clients. In addition, the Group’s credit risk may be exacerbated if the collateral it holds cannot be realised for any reason or is not sufficient to recover the full amount of the Group’s exposure.
14. The Group’s hedging strategies may not prevent all risk of losses.
If any of the variety of instruments and strategies that the Group uses to hedge its exposure to various types of risk in its businesses is not effective, it may incur significant losses. Many of its strategies are based on historical trading patterns and correlations and may not be effective in the future.
For example, if the Group holds a long position in an asset, it may hedge that position by taking a short position in another asset whose value has historically moved in an offsetting direction. However, the hedge may only cover a part of its exposure to the long position, and the strategies used may not protect against all future risks or may not be fully effective in mitigating its risk exposure in all market environments or against all types of risk in the future. Unexpected market developments may also reduce the effectiveness of the Group’s hedging strategies.
15. The Group’s results of operations and financial condition could be adversely affected by a significant increase in new provisions or by inadequate provisioning.
The Group regularly sets aside provisions for loan losses in connection with its lending activities. Its overall level of loan loss provisions, recorded as “cost of risk” in its income statement, is based on its assessment of the recoverability of the relevant loans. This assessment relies on an analysis of various factors, including prior loss experience, the volume and type of lending being conducted, industry standards, past due loans, certain economic conditions and the amount and type of any guarantees and collateral. Notwithstanding the care with which the Group carries out such assessments, it has had to increase its provisions for loan losses in the past and may have to substantially increase its provisions in the future following the rise in defaults or for other reasons. Moreover, the ECB announced in October 2013 that it would commence a comprehensive assessment, including stress tests and an asset quality review, of certain large European banks (including the Group), with the findings to be published in November 2014. It is not yet possible to assess the potential impacts this review or any resulting corrective measures may have on defaulted loans and/or loan loss provisions. Significant increases in loan loss provisions, a substantial change in the Group’s estimate of its risk of loss with respect to loans for which no provision has been recorded, or the occurrence of loan losses in excess of its provisions, could have a material adverse effect on its results of operations and financial condition.
16. The Group relies on assumptions and estimates which, if incorrect, could have a significant impact on its financial statements.
When applying the IFRS accounting principles disclosed in Financial Information (Chapter 6) for the purpose of preparing the Group’s consolidated financial statements, management makes assumptions and estimates that may have an impact on items in the income statement, on the valuation of assets and liabilities in the balance sheet, and on information disclosed in the notes to the consolidated financial statements.
In order to make these assumptions and estimates, management exercises judgment and uses information available at the time the consolidated financial statements are prepared.
By nature, valuations based on estimates involve risks and uncertainties. Actual future results may differ from these estimates, which could have a significant impact on the Group’s financial statements.
The use of estimates principally relates to the following valuations:
n fair value of financial instruments not quoted in an active market presented in the balance sheet or the notes to the financial statements;
n the amount of impairment of financial assets (Loans and receivables, Available-for-sale financial assets, Held-to-maturity financial assets), lease financing and similar agreements, tangible or intangible fixed assets and goodwill;
n provisions recognised under liabilities, including provisions for employee benefits or underwriting reserves of insurance companies, as well as deferred profit-sharing on the asset side of the balance sheet;
n the amount of deferred tax assets recognised in the balance sheet;
n initial value of goodwill determined for each business combination; and
n in the event of the loss of control of a consolidated subsidiary, fair value of the entity’s interest retained by the Group, where applicable.
17. The Group is exposed to legal risks that could negatively affect its financial condition or results of operations.
The Group and certain of its former and current representatives may be involved in various types of litigation including civil, administrative and criminal proceedings. The large majority of such proceedings can be considered part of the Group’s ordinary course of business. There has been an increase in investor litigation and regulatory actions against intermediaries such as banks and investment advisors in recent years, in part due to the challenging market environment. This has increased the risk, for the Group as well as for other financial institutions, of losses or reputational harm deriving from litigation and other proceedings. Such proceedings or regulatory enforcement actions could also lead to civil or criminal penalties that adversely affect the Group’s business, financial condition and results of operations.
INTRODUCTION I RISKS AND CAPITAL ADEQUACY I 4
SOCIETE GENERALE GROUP I 2014 REGISTRATION DOCUMENT I 133
It is inherently difficult to predict the outcome of litigation, regulatory proceedings and other adversarial proceedings involving the Group’s businesses, particularly those cases in which the matters are brought on behalf of various classes of claimants, cases where claims for damages are of unspecified or indeterminate amounts or cases involving novel legal claims.
In preparing the Group’s financial statements, management makes estimates regarding the outcome of legal, regulatory and arbitration matters and records a provision when losses with respect to such matters are probable and can be reasonably estimated. Should such estimates prove inaccurate or the provisions set aside by the Group to cover such risks inadequate, its financial condition or results of operations could be materially and adversely affected. See “Compliance, reputational and legal risks” section.
18. If the Group makes an acquisition, it may be unable to manage the integration process in a cost-effective manner or achieve the expected benefits.
The selection of an acquisition target is carried out by the Group following a careful analysis of the business or assets to be acquired. However, such analyses often cannot be exhaustive due to various factors. As a result, certain acquired businesses may include undesiderable assets or expose the Group to increased risks, particularly if the Group was unable to conduct full and comprehensive due diligence prior to the acquisition.
The successful integration of a new business typically requires effectively coordinating business development and marketing initiatives retaining key managers, recruitment and training, and consolidating information technology systems. These tasks may prove more difficult than anticipated, require more management time and resources than expected, and the Group may experience higher integration costs and lower savings or earn lower revenues than expected. The pace and degree of synergy building is also uncertain.
19. The Group’s risk management system may not be effective and may expose the Group to unidentified or unanticipated risks, which could lead to significant losses.
The Group has devoted significant resources to develop its risk management policies, procedures and assessment methods, and intends to continue to do so in the future. Nonetheless, its risk management techniques and strategies may not be fully effective in mitigating its risk exposure in all economic market environments or against all types of risk, including risks that it fails to identify or anticipate. Some of its qualitative tools and metrics for managing risk are based upon observed historical market behaviour. The Group applies statistical and other tools to these observations in order to assess its risk exposures. These tools and metrics may fail to predict accurate future risk exposures that arise from factors the Group did not anticipate or correctly
evaluate in its statistical models. Failure to anticipate or accurately estimates could significantly affect the Group’s business, financial condition and results of operations.
20. Operational failure, termination or capacity constraints affecting institutions we do business with, or failure or breach of the Group’s information technology systems, could result in losses.
The Group is exposed to the risk of operational failure, termination or capacity constraints of third parties, including financial intermediaries that we use to facilitate cash settlement or securities transactions (such as clearing agents, exchanges and clearing houses), clients and other market participants. An increasing number of derivative transactions are now or will be in the near future cleared on exchanges, which has increased our exposure to these risks, and could affect our ability to find adequate and cost-effective alternatives in the event of any such failure, termination or constraint. The interconnectivity of multiple financial institutions with clearing agents, exchanges and clearing houses, and the increased centrality of these entities, increases the risk that an operational failure at one institution or entity may cause an industry-wide operational failure that could materially impact our ability to conduct business. Industry consolidation, whether among market participants or financial intermediaries, can exacerbate these risks as disparate complex systems need to be integrated, often on an accelerated basis. We also face the risk of operational failure with respect to our clients’ information and communication systems as we become more interconnected with our clients. Any failure, termination or constraint could adversely affect our ability to effect transactions, service our clients, manage our exposure to risk or expand our businesses or result in financial loss or liability to our clients, impairment of our liquidity, disruption of our businesses, regulatory intervention or reputational damage.
In addition, an increasing number of companies, including financial institutions, have experienced intrusion attempts or even breaches of their information technology security, some of which have involved sophisticated and highly targeted attacks on their computer networks and resulted in confidential data. Because the techniques used to obtain unauthorised access, disable or degrade service or sabotage information systems change frequently and often are not recognised until launched against a target, the Group may be unable to anticipate these techniques or to implement in a timely manner effective countermeasures.
The Group relies heavily on communications and information systems to conduct its business. Any failure, interruption or breach in security of these systems, even if only brief and temporary, could result in failures or interruptions to its business leading to additional costs related to information retrieval and verification, reputational harm and a potential loss of business.
4 I RISKS AND CAPITAL ADEQUACY I INTRODUCTION
134 I 2014 REGISTRATION DOCUMENT I SOCIETE GENERALE GROUP
A failure, interruption or security breach of its information systems could have a material adverse effect on its business, results of operations and financial condition.
21. The Group may incur losses as a result of unforeseen or catastrophic events, including the emergence of a pandemic, terrorist attacks or natural disasters.
The occurrence of unforeseen or catastrophic events, including the emergence of a pandemic or other widespread health emergencies (or concerns over the possibility of such emergencies), terrorist attacks or natural disasters, could create economic and financial disruptions, lead to operational difficulties (including travel limitations or relocation of affected employees) that could impair the Group’s ability to manage its businesses, and expose its insurance activities to significant losses and increased costs (such as re-insurance premiums).
22. The Group may generate lower revenues from brokerage and other commission and fee-based businesses during market downturns.
During the recent market downturn, the Group experienced a decline in the volume of transactions that it executed for its clients, resulting in lower revenues from this activity. There is no guarantee that the Group will not experience a similar trend in future market downturns, which may occur periodically and unexpectedly. Furthermore, changes in applicable regulations, such as the adoption of a financial transaction tax, could also
impact the volume of transactions that the Group executes for its clients, resulting in lower revenues from these activities. In addition, because the fees that the Group charges for managing its clients’ portfolios are in many cases based on the value or performance of those portfolios, a market downturn that reduces the value of its clients’ portfolios or increases the amount of withdrawals would reduce the revenues the Group generates from its asset management, custodial and private banking businesses.
23. Our ability to retain and attract qualified employees is critical to the success of our business, and the failure to do so may materially adversely affect our performance.
Our people are our most important resource, and industry competition for qualified personnel is intense. In order to attract, retain and engage qualified employees, we must offer career paths, training and development opportunities and compensation levels in line with our competitors and market practices. If we are unable to continue to engage highly-qualified employees, our performance, including our competitive position and client satisfaction, could be materially adversely affected. Furthermore, the financial industry in Europe will continue to experience more stringent regulation of employee compensation, including rules related to bonuses and other incentive-based compensation, clawback requirements and deferred payments, and we, like most participants in the financial industry, will need to adapt to this changing environment in order to attract and retain qualified employees.
The Group has undertaken a review of the risks that could have a material adverse effect on its business, financial condition and results of operations or on its ability to achieve its objectives, and does not consider there to be other significant risks beyond those presented in the “Types of risks” and “Risk factors” sections.
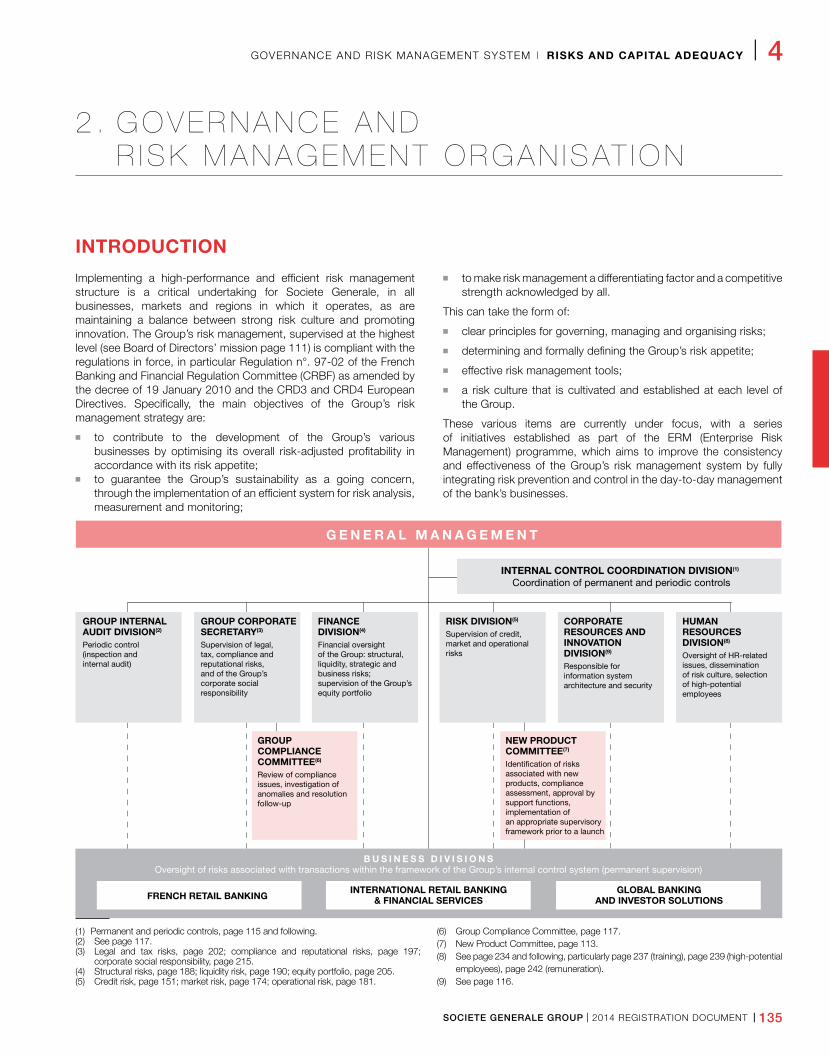
SOCIETE GENERALE GROUP I 2014 REGISTRATION DOCUMENT I 135
GOVERNANCE AND RISK MANAGEMENT SYSTEM I RISKS AND CAPITAL ADEQUACY I 4
2 . G O V E R N A N C E A N D R I SK MANAGEMENT ORGAN I SAT ION
INTRODUCTION
Implementing a high-performance and efficient risk management structure is a critical undertaking for Societe Generale, in all businesses, markets and regions in which it operates, as are maintaining a balance between strong risk culture and promoting innovation. The Group’s risk management, supervised at the highest level (see Board of Directors’ mission page 111) is compliant with the regulations in force, in particular Regulation n°. 97-02 of the French Banking and Financial Regulation Committee (CRBF) as amended by the decree of 19 January 2010 and the CRD3 and CRD4 European Directives. Specifically, the main objectives of the Group’s risk management strategy are:
n to contribute to the development of the Group’s various businesses by optimising its overall risk-adjusted profitability in accordance with its risk appetite;
n to guarantee the Group’s sustainability as a going concern, through the implementation of an efficient system for risk analysis, measurement and monitoring;
n to make risk management a differentiating factor and a competitive strength acknowledged by all.
This can take the form of:
n clear principles for governing, managing and organising risks;
n determining and formally defining the Group’s risk appetite;
n effective risk management tools;
n a risk culture that is cultivated and established at each level of the Group.
These various items are currently under focus, with a series of initiatives established as part of the ERM (Enterprise Risk Management) programme, which aims to improve the consistency and effectiveness of the Group’s risk management system by fully integrating risk prevention and control in the day-to-day management of the bank’s businesses.
GROUP INTERNAL AUDIT DIVISION(2)
Periodic control (inspection and internal audit)
GROUP CORPORATE SECRETARY(3)
Supervision of legal,tax, compliance and reputational risks, and of the Group’s corporate social responsibility
GROUPCOMPLIANCECOMMITTEE(6)
Review of complianceissues, investigation ofanomalies and resolutionfollow-up
NEW PRODUCT COMMITTEE(7)
Identification of risksassociated with newproducts, complianceassessment, approval bysupport functions,implementation ofan appropriate supervisoryframework prior to a launch
B U S I N E S S D I V I S I O N SOversight of risks associated with transactions within the framework of the Group’s internal control system (permanent supervision)
FINANCE DIVISION(4)
Financial oversightof the Group: structural,liquidity, strategic andbusiness risks;supervision of the Group’sequity portfolio
RISK DIVISION(5)
Supervision of credit,market and operationalrisks
CORPORATE RESOURCES ANDINNOVATIONDIVISION(9)
Responsible forinformation systemarchitecture and security
HUMAN RESOURCESDIVISION(8) Oversight of HR-relatedissues, disseminationof risk culture, selectionof high-potentialemployees
G E N E R A L M A N A G E M E N T
INTERNAL CONTROL COORDINATION DIVISION(1) Coordination of permanent and periodic controls
INTERNATIONAL RETAIL BANKING& FINANCIAL SERVICES
GLOBAL BANKINGAND INVESTOR SOLUTIONSFRENCH RETAIL BANKING
(1) Permanent and periodic controls, page 115 and following.(2) See page 117.(3) Legal and tax risks, page 202; compliance and reputational risks, page 197;
corporate social responsibility, page 215.(4) Structural risks, page 188; liquidity risk, page 190; equity portfolio, page 205.(5) Credit risk, page 151; market risk, page 174; operational risk, page 181.
(6) Group Compliance Committee, page 117.(7) New Product Committee, page 113.(8) See page 234 and following, particularly page 237 (training), page 239 (high-potential
employees), page 242 (remuneration).(9) See page 116.
136 I 2014 REGISTRATION DOCUMENT I SOCIETE GENERALE GROUP
4 I RISKS AND CAPITAL ADEQUACY I GOVERNANCE AND RISK MANAGEMENT SYSTEM
RISK MANAGEMENT GOVERNANCE, CONTROL AND ORGANISATION PRINCIPLES
The Group’s risk management governance is based on:
n strong managerial involvement in the risk management system and promotion of risk culture, throughout the entire organisational structure, from the Board of Directors down to operational teams;
n clearly defined internal rules and procedures;
n continuous supervision by an independent body to monitor risks and to enforce rules and procedures.
The Group’s risk management is based on two key principles:
n risk assessment departments must be independent from the operating divisions;
n the risk management approach and risk monitoring must be consistent throughout the Group.
Compliance with these principles forms part of the consolidation plans for subsidiaries acquired by the Group.
Group risk management is governed by two main bodies: the Board of Directors, via the Audit, Internal Control and Risk Committee, and the Risk Committee. The Group’s Corporate Divisions, such as the Risk Division and some departments of the Finance Division, which are independent from the business divisions, are dedicated to permanent risk management and control under the authority of the General Management.
BOARD OF DIRECTORSThe Board of Directors defines the Group’s strategy, by assuming and controlling risks, and ensures its implementation. In particular, the Board of Directors ensures the adequacy of the Group’s risk management infrastructure, monitors changes in the portfolio and particularly in the cost of risk, and approves the market risk limits. Presentations on the main aspects and notable changes of the Group’s risk management strategy are made to the Board of Directors by the General Management at least once a year (more often if circumstances so require), as part of the Risk Appetite exercise.
AUDIT, INTERNAL CONTROL AND RISK COMMITTEE (CACIR)Within the Board of Directors, the Audit, Internal Control and Risk Committee plays a crucial role in the assessment of the quality of the Group’s internal control. More specifically it is responsible for examining the internal framework for risk monitoring to ensure its consistency and compliance with procedures, laws and regulations in force. Specific presentations are made by Relevant managers to the Committee, which reviews the procedures for controlling certain market risks as well as the structural interest rate risks, and is consulted about the setting of risk limits. It also issues an opinion on the Group’s overall provisioning policy as well as on large specific provisions. Finally, the Group’s risk map and risk appetite indicators are presented to the Committee annually, and every year it examines the Annual Report on Internal Control, which is submitted to the Board of Directors and the French Prudential Supervisory and Resolution Authority (ACPR).
RISK COMMITTEE (CORISQ) AND LARGE EXPOSURES (CGR) COMMITTEEChaired by the General Management, the Group Risk Committee is made up of members of the Group Executive Committee, managers from the Risk Division and, where necessary, representatives from the different Divisions affected by its agenda. It meets at least once a month in order to discuss the Group’s core risk strategy.
The CORISQ is generally responsible, upon the advice of the Risk Division (RISQ), for making key decisions on managing framework of each types of risk (credit risk, country risk, market and operational risks).
The Large Exposures Committee (CGR) is an ad hoc committee which is chaired by the General Management and made up of the operational and RISQ managers in charge of analysing and overseeing the Group’s main individual exposures.
FINANCE POLICY COMMITTEEThe Finance Policy Committee is chaired by the General Management and validates the system used to analyse and measure structural risks as well as the exposure limits for each Group entity. It also serves an advisory role for the business divisions and entities.
NEW PRODUCT COMMITTEEEach division submits all new products, businesses or activities to the New Product Committee.
This Committee, which is jointly managed by the Risk Division and the business divisions, aims to ensure that, prior to the launch of a new product, business or activity:
n all associated risks are fully identified, understood and correctly addressed;
n compliance is assessed with respect to the laws and regulations in force, codes of good professional conduct and risks to the image and reputation of the Group;
n all the support functions are committed and have no, or no longer have, any reservations.
This process is underpinned by a very broad definition of a new product, which ranges from the creation of a new product, to the adaptation of an existing product to a new environment or the transfer of activities involving new teams or new systems.
RISK DIVISIONThe main responsibility of the Risk Division is to contribute to the development of the activities and the profitability of Societe Generale Group by defining under the aegis of the General Management and in connection with the Finance department and the pillars, the Group’s risk Appetite (deployed within the Group’s various businesses), and establishing a risk management and monitoring system. In exercising its functions, the Risk Division reconciles independence from and close cooperation with the business divisions, which are
SOCIETE GENERALE GROUP I 2014 REGISTRATION DOCUMENT I 137
GOVERNANCE AND RISK MANAGEMENT SYSTEM I RISKS AND CAPITAL ADEQUACY I 4
responsible first and foremost for the transactions they initiate.
Accordingly, the Risk Division is responsible for:
n providing hierarchical and functional supervision of the Group’s Risk structure;
n alongside the Finance Division, setting the Group’s risk appetite which is then submitted to the executive body and to the Boards of Directors for their approval;
n identifying the risks borne by the Group;
n putting into practice a governance and monitoring system for these risks across all business lines, and regularly reporting on their nature and extent to the General Management, the Board of Directors and the supervisory authorities;
n contributing to the definition of risk policies, taking into account the aims of the pillars and the corresponding risk issues;
n defining or validating risk analysis, assessment, approval and monitoring methods and procedures;
n validating the transactions and limits proposed by the business managers;
n defining the “risk” information system, and ensuring its suitability for the needs of the businesses and its consistency with the Group’s information system.
FINANCE DIVISIONThe finance Division is responsable for assessing and managing structural interest and exchange rate risks, liquidity risks as well as strategic and business risks. In accordance with regulatory principles that advocate the separation of oversight and control functions, two different entities manage and monitor structural risks:
n the Balance Sheet and Global Treasury Management Department is dedicated to structural risk management. It also monitors and
coordinates all Group treasury functions (external Group financing, internal entity financing, centralised collateral management). Moreover, it manages the Financial Centre and executes financial transactions;
n the ALM Risk Control Department is responsible for supervising structural risk for the entire Group. In particular, it validates structural risks models and monitors compliance with limits and management practices by the Group’s divisions, business lines and entities. This Department is functionally overseen by the Risk Division.
Within the Finance Division, the steering of scarce resources (capital and liquidity) and performance has been the responsibility of the new Strategic and Financial Steering department since 1st January 2013.
In 2013, a department was created to maintain and further develop the Group’s recovery and resolution plans in line with banking regulations. The recovery plan helps strengthen the Group’s resilience, providing preventive measures that the Group can take independently in the event of a very severe crisis. The resolution plan provides the information required by the authorities to develop strategies that can be implemented to mitigate the impact of a hypothetical default by the Group on the economy and the markets.
OTHER DIVISIONSThe respective roles of the Divisions in the risk management are described in the diagram p. 135. It should be noted that the bank’s risk management principles, procedures and infrastructures and their implementation are monitored by the Inspection and Audit Division. The Inspection and Audit Division carries out regular risk audits, including credit application reviews, spanning all Group divisions, whose conclusions are sent to the heads of the operating divisions, the Risk Division and the General Management for certain scopes.
ENTERPRISE RISK MANAGEMENT (ERM) PROGRAMME
Effectively launched in January 2011, the ERM project aims to improve the consistency and effectiveness of the Group’s risk management system by fully integrating risk prevention and control with the day-to-day management of the Bank’s businesses. This project is centred on three principles:
n taking greater account of risk in the Bank’s strategic management (in particular, by continually improving oversight of the Group’s Risk Appetite—see paragraph below);
n reinforcing permanent control measures (see chapter 3 on Internal Control);
n strengthening risk culture among all Group employees.
To ensure that this approach is effective, the ERM project is closely monitored at the highest levels of the Group’s structure. It is supervised by General Management, reviewed by members of the Executive Committee and regularly audited by the Board of Directors’ Audit, Internal Control and Risk Committee.
A dedicated team is responsible for managing and implementing the initiatives Group-wide, facilitating the management of projects within the Group’s various businesses and Departments.
Carrying on from 2012, General Management declared the embedding of a strong risk culture a strategic objective in 2013. The measures put in place combine awareness-building and training(1) with a focus on the quality of risk management in the day-to-day management of the Group’s employees (recruitment, target-setting, etc.). Examples include:
n greater emphasis on risk awareness in the employee recruitment process;
n the inclusion of risk management practices in employee target-setting and performance evaluations, reflecting the specific risks to which they are exposed.
(1) 60% of strategic managers and close to 45,000 employees received training on the importance of a sound risk culture.
138 I 2014 REGISTRATION DOCUMENT I SOCIETE GENERALE GROUP
4 I RISKS AND CAPITAL ADEQUACY I GOVERNANCE AND RISK MANAGEMENT SYSTEM
RISK APPETITE
Societe Generale defines risk appetite as the level of risk, by type and by business, that the Group is prepared to incur in view of its strategic targets. Risk appetite is defined using both quantitative and qualitative criteria.
Since 2009, the Risk Division and the Finance Division, in coordination with the operating divisions, have jointly carried out measures as part of the Group Risk Appetite exercise, consisting in formally defining a three-year overview including:
n targets for certain key Group indicators (financial solidity, profitability, solvency, leverage and liquidity);
n risk/return ratios for the different Group businesses; and
n the Group’s risk profile, by risk type (credit, market, operational and structural).
To determine these factors and develop the Risk Appetite approach, earnings sensitivities to business cycles and credit, market and operational events are taken into account under both a core budgetary macroeconomic scenario and a macroeconomic scenario of severe but plausible stress.
The Risk Appetite exercise is one of the strategic oversight tools available to the Group governing bodies. It is fully integrated with the budgeting process and draws on the global stress test system (details below), which is also used to ensure capital adequacy under stressed economic scenarios.
It is discussed by governing bodies at various key moments:
n during preliminary budget preparation with a view to allocating scarce resources to the business;
n the positioning of the various businesses in terms of the risk/return ratio as well as the Group’s risk profile by type of risk, are analysed and approved by the Audit, Internal Control and Risk Committee, Simultaneously, three-year targets suggested by the Executive Committee for the Group’s key indicators are approved by the Board of Directors after being reviewed by the Audit, Internal Control and Risk Committee;
n during the finalisation of the budget process, the Board of Directors, based on the Executive Committee’s recommendations and after review by the Audit, Internal Control and Risk Committee, approves the trajectory in relation to various Group key indicators and their adequacy given the set targets.
The Group’s risk appetite strategy is implemented by General Management in collaboration with the Executive Committee and applied by the various corporate and operating divisions through an appropriate operational steering system for risks, covering:
n governance (decision-making, management and supervisory bodies);
n management (identification of risk areas, authorisation and risk-taking processes, risk management policies through the use of limits and guidelines, resource management); and
n supervision (budgetary monitoring, reporting, leading risk indicators, permanent controls and internal audits).
Essential indicators for determining Risk Appetite and their various adaptations are regularly supervised over the year in order to detect any events that may result in unfavourable developments on the Group’s risk profile. Such events may give rise to remedial action, up to the implementation of the recovery plan in the most severe cases.
STRESS TEST FRAMEWORK
Stress tests or crisis simulations are used to measure the potential impact of a downturn in activity on the behaviour of a portfolio, activity, entity or the Group. At Societe Generale, they are used to help identify, measure and manage risk and to assess the Group’s capital adequacy. They are an important measure of the resilience of the Group and its activities and portfolios, and a core component in the definition of its risk appetite. The Group’s stress test framework covers credit risk, market risk, operational risk, liquidity risk and structural interest rate and exchange rate risk. Stress tests are based on extreme but plausible hypothetical economic defined by the Group’s economists. These scenarios are translated into impacts on the Group’s activities, taking into account the activities’ potential counter-measures and systematically combining quantitative methods with expert judgement (risk, finance or business lines).
The stress test methodology defined by the Group in 2013 sets out the guidelines for stress test exercises, the methods to be applied Group-wide and serves as a platform for discussion for those who actually carry out the tests.
In concrete terms, the stress test framework in place includes:
n an annual global stress test which is incorporated into the budget process as part of the group Risk Appetite exercise and Internal Capital Adequacy Assessment Process ICAAP(1) for the Autorité de Contrôle Prudentiel et de Résolution (ACPR-French Prudential Supervision and Resolution Authority). It enables to check the Group compliance with the prudential ratios. It covers the entire Group and is based on two global three-year horizon macroeconomic scenarios: a core budgetary macroeconomic scenario and a macroeconomic scenario of severe but plausible stress. For each scenario, (core and stressed), potential losses relating to credit, market and operational risks are estimated over three years.
n specific credit stress tests (on portfolios, countries, activities, etc.), both recurrent or on request, which complement the global analysis with a more granular approach and allow for the identification, measurement and operational management of risk.
(1) ICAAP: Internal Capital Adequacy Assessment Process, corresponds to the Pillar II process required under the Basel Accord that enables the Group to ensure capital adequacy to support all incurred risks.
SOCIETE GENERALE GROUP I 2014 REGISTRATION DOCUMENT I 139
GOVERNANCE AND RISK MANAGEMENT SYSTEM I RISKS AND CAPITAL ADEQUACY I 4
Credit risk is modelled based on the historical relationship between portfolio performance and relevant economic variables (Gross Domestic Product, unemployment, exchange rate, property prices, etc.). In line with the regulatory Pillar, stress tests systematically factor in the potential impact of the performance of the Group’s main counterparties against a stressed market backdrop:
n market stress tests using internal models (VaR, EEPE, CVA, etc.) as well as forecast market variables indexes, credit spreads, etc.) that are consistent with the chosen economic scenarios and are also used to revalue available-for-sale assets. Set out in greater detail on section 6 Market risks in this chapter, this stress test assessment is based on 26 historical scenarii and 8 theoretical scenarii that factor in exceptional market occurrences;
n operational risk stress tests which use scenario analyses and the modelling of losses to calibrate the Group’s capital in terms of operational risk, and which are used to ascertain the exposure to operational loss linked to the severity of economic scenarios,
including exposure to rare and extreme losses not covered by the historical period;
n stress tests to analyse the Group’s sensitivity to structural interest rate and exchange rate risks. Societe Generale Group measures the sensitivity of its fixed-rate position to different yield curve configurations (steepening and flattening). The measurement of the net interest income sensitivity is also used by the Group to quantify the structural interest rate risk of significant entities. With respect to exchange rate risk, stress scenarios are applied to various currencies, major or peripheral;
n liquidity stress tests to ensure that the time period during which the Group may continue to operate during periods of liquidity stress is respected in any market environment.
Along with the internal stress test exercises, the Group is part of a selection of European banks that participate in the large-scale international stress tests supervised by the EBA (European Banking Authority) and ECB (European Central Bank).
GROUP RISK MAPPING
This procedure aims to identify and estimate the main risks of potential loss expected for the year to come, in all risk categories: credit risks, market risks, operational and structural risks. These risks are placed on a grid relating impact and probability of occurrence for each risk. A loss level is assigned to each scenario, combining statistical approaches that use historical data, and independent expert analyses. These scenarios are categorised on a scale representing three distinct levels of stress: base case, stress and extreme stress.
It may relate to isolated losses that are material because of their extent (for example, the default of a major counterparty), or of events involving many counterparties (for example, contagion affecting a sector of activity or several sectors).
The risk map is presented annually to the members of the Audit, Internal Control and Risk Committee as well as the Board of Directors.
RECOVERY AND RESOLUTION PLANS In November 2011, the G20 countries adopted the principles which must be transposed into their national legislation to allow for the development and long-term success of credible resolution and recovery plans for systemic banks. The corresponding European Directive, which is expected to be approved by the European Parliament in April 2014, defines a common framework for the recovery and resolution of credit institutions and investment firms across the European Union, and the rules governing its coordination between countries. The Directive should be transposed into national law by no later than 31 December 2014, and the European Banking Authority will complement the framework with a set of technical standards.
Following the request by French authorities in 2011 that the Group work on the preliminary versions of the recovery and resolution plan, a number of strictly confidential drafts have been submitted for review and analysis by the Group’s competent authorities. By July 2013, France had already introduced certain powers and processes required by the European framework, hence the decision to transform the Autorité de Contrôle Prudentiel (ACP-
French Prudential Supervisory Authority) into the Autorité de Contrôle Prudentiel et de Résolution (ACPR-French Prudential and Resolution Supervisory Authority) in 2013.
Societe Generale’s recovery plan defines a series of preventative measures to strengthen the Group’s ability to autonomously withstand an extremely severe crisis alone. It sets out all of the elements required for the effective management of a serious financial crisis: vigilance and alert measures, crisis management, crisis communication, list of recovery options to restore a healthy financial position on a case by case basis. This plan is updated every year.
The resolution plan includes the information required by the relevant authorities to devise the appropriate strategies and action to limit the impact of the Group’s hypothetical default on the economy. Its aim is to limit the systemic impact of this type of event by reducing the need for specific government support. It must protect those activities that are vital to the economy, starting, for example, with deposits and payment methods, whilst at the same time safeguarding the value of the Group’s different components in order to limit the end losses borne by investors and shareholders.
140 I 2014 REGISTRATION DOCUMENT I SOCIETE GENERALE GROUP
4 I RISKS AND CAPITAL ADEQUACY I CAPITAL MANAGEMENT AND ADEQUACY
3 . �CAP I TA L �MANAGEMENT�AND CAP I TA L ADEQUACY
BASEL 2.5 REGULATORY FRAMEWORK
Following the first Basel Accord, known as Basel 1 (1988), the Basel Committee on Banking Supervision proposed a new set of recommendations in 2004 in order to more accurately measure credit risk. They include, in particular, taking into account the borrower’s credit profile through, in particular, a financial rating system specific to each credit institution. These recommendations, known as Basel 2, are based on the following three pillars:
n Pillar 1 sets minimum solvency requirements and defines the rules that banks must use to measure risks and calculate associated capital requirements, according to standard or more advanced methods;
n Pillar 2 relates to the discretionary supervision implemented by national banking supervisors, which allows them – based on a constant dialogue with supervised credit institutions – to assess the adequacy of capital requirements as calculated under Pillar 1, and to calibrate additional capital requirements with regard to risks;
n Pillar 3 encourages market discipline by developing a set of qualitative or quantitative disclosure requirements which will allow market participants to make a better assessment of capital, risk exposure, risk assessment processes and hence capital adequacy of the institution.
The Basel 2 framework was incorporated into European legislation with the enactment of the Capital Requirements Directive (CRD), which was transposed into French law by the decree of 20 February 2007.
More stringent requirements regarding market risk were included in the CRD3 European Directive, in force since end-2011. One of the purposes of these requirements is to better account for default and rating migration risk for assets in the trading book in order to reduce the procyclicality of Value at Risk (VaR).
Lastly, Societe Generale Group is classified as a financial conglomerate and is therefore subject to additional supervision by l’Autorité de Contrôle Prudentiel et de Résolution (ACPR - French Prudential Supervision and Resolution Authority).
Regulatory changes and the new framework in which the Group operates from 2014 are briefly explained on p. 150.
SCOPE OF APPLICATION – PRUDENTIAL SCOPE
The Group’s prudential reporting scope includes all fully and proportionally consolidated subsidiaries, the list of which is included in Note 46 of Chapter 6 of this Registration Document, with the exception of insurance subsidiaries, which are subject to a separate capital supervision.
| TABLE 1: DIFFERENCE BETWEEN ACCOUNTING SCOPE AND PRUDENTIAL REPORTING SCOPE
Type of entity Accounting treatment Prudential treatment under Basel 2
Subsidiaries with a finance activity Full or proportional consolidation Capital requirement based on the subsidiary’s activities
Subsidiaries with an Insurance activity Full or proportional consolidation Deduction of capital from the difference of the equity method and weighting of
the historical cost of securities
Holdings, joint ventures with a finance activity by nature
Equity method Capital deduction (50% Tier 1 and 50% Tier 2)
SOCIETE GENERALE GROUP I 2014 REGISTRATION DOCUMENT I 141
CAPITAL MANAGEMENT AND ADEQUACY I RISKS AND CAPITAL ADEQUACY I 4
The following table provides a reconciliation of the consolidated balance sheet and the accounting balance sheet within the prudential scope. The amounts presented are accounting data and not a measure of risk-weighted assets, EAD or prudential capital. This table therefore cannot be used for comparison purposes with the tables that follow.
| TABLE 2: RECONCILIATION OF THE CONSOLIDATED BALANCE SHEET AND THE ACCOUNTING BALANCE SHEET
| WITHIN THE PRUDENTIAL SCOPE
ASSETS at 31.12.2013 (in EUR m)
Consolidated balance sheet
Prudential restatements(1)
Accounting balance sheet within the
prudential scope
Cash and amounts due from Central Banks 66,602 - 66,602
Financial assets at fair value through profit or loss 484,386 (14,256) 470,130
Hedging derivatives 11,483 (256) 11,227
Available-for-sale assets 134,564 (74,334) 60,230
Non-current assets held for sale 116 - 116
Loans and advances to credit institutions 84,842 (8,348 ) 76,494
Loans and advances to clients 333,535 1,599 335,134
Lease financing and equivalent transactions 27,741 - 27,741
Revaluation of macro-hedged items 3,047 - 3,047
Financial assets held to maturity 989 - 989
Tax assets 7,337 207 7,544
Other assets 55,895 (998) 54,897
Deferred profit-sharing
Investments in subsidiaries and affiliates accounted for by the equity method 2,129 3,174 5,303
Tangible and intangible assets 17,624 (471) 17,153
Goodwill 4,972 - 4,972
TOTAL ASSETS 1,235,262 (93,683) 1,141,579
LIABILITIES at 31.12.2013 (in EUR m)
Consolidated balance sheet
Prudential restatements(1)
Accounting balance sheet within the
prudential scope
Central banks 3,566 - 3,566
Liabilities at fair value through profit or loss 426,756 847 427,603
Hedging derivatives 9,819 - 9,819
Debts related to Non-current assets held for sale 4 - 4
Amounts owed to credit institutions 91,098 (1,362) 89,736
Amounts owed to clients 344,687 1,973 346,660
Debt securities 131,734 4,237 135,971
Revaluation reserve of interest-rate-hedged portfolios 3,706 - 3,706
Tax liabilities 1,639 (268) 1,371
Other Liabilities 59,761 (2,160) 57,601
Technical provisions of insurance companies 97,167 (97,167) -
Provisions 3,829 (20) 3,809
Subordinated debts 7,395 233 7,628
Total debts 1,181,161 (93,687) 1,087,474
EQUITY
Equity, Group share 51,008 - 51,008
Total minority interests 3,093 4 3,097
Total equity 54,101 4 54,105
TOTAL LIABILITIES 1,235,262 (93,683) 1,141,579
(1) Restatement of subsidiaries excluded from the prudential scope and reconsolidation of intragroup transactions related to its subsidiaries.
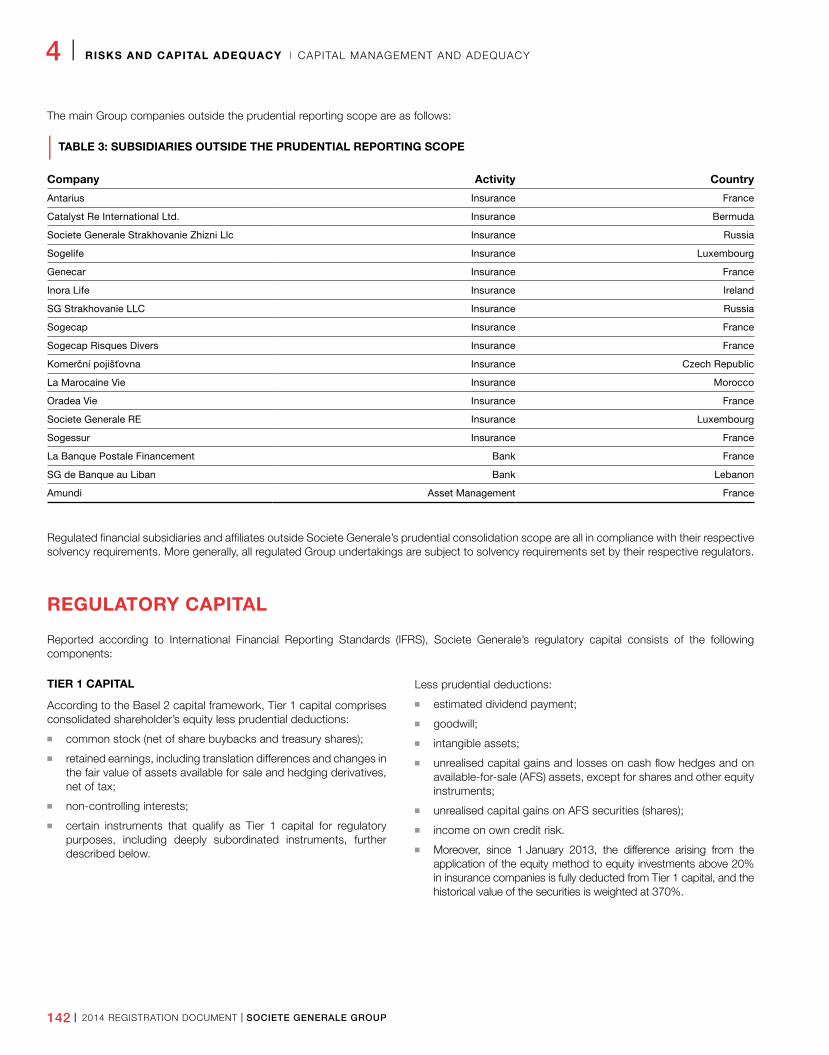
142 I 2014 REGISTRATION DOCUMENT I SOCIETE GENERALE GROUP
4 I RISKS AND CAPITAL ADEQUACY I CAPITAL MANAGEMENT AND ADEQUACY
The main Group companies outside the prudential reporting scope are as follows:
| TABLE 3: SUBSIDIARIES OUTSIDE THE PRUDENTIAL REPORTING SCOPE
Company Activity Country
Antarius Insurance France
Catalyst Re International Ltd. Insurance Bermuda
Societe Generale Strakhovanie Zhizni Llc Insurance Russia
Sogelife Insurance Luxembourg
Genecar Insurance France
Inora Life Insurance Ireland
SG Strakhovanie LLC Insurance Russia
Sogecap Insurance France
Sogecap Risques Divers Insurance France
Komerční pojišťovna Insurance Czech Republic
La Marocaine Vie Insurance Morocco
Oradea Vie Insurance France
Societe Generale RE Insurance Luxembourg
Sogessur Insurance France
La Banque Postale Financement Bank France
SG de Banque au Liban Bank Lebanon
Amundi Asset Management France
Regulated financial subsidiaries and affiliates outside Societe Generale’s prudential consolidation scope are all in compliance with their respective solvency requirements. More generally, all regulated Group undertakings are subject to solvency requirements set by their respective regulators.
REGULATORY CAPITAL
Reported according to International Financial Reporting Standards (IFRS), Societe Generale’s regulatory capital consists of the following components:
TIER 1 CAPITAL
According to the Basel 2 capital framework, Tier 1 capital comprises consolidated shareholder’s equity less prudential deductions:
n common stock (net of share buybacks and treasury shares);
n retained earnings, including translation differences and changes in the fair value of assets available for sale and hedging derivatives, net of tax;
n non-controlling interests;
n certain instruments that qualify as Tier 1 capital for regulatory purposes, including deeply subordinated instruments, further described below.
Less prudential deductions:
n estimated dividend payment;
n goodwill;
n intangible assets;
n unrealised capital gains and losses on cash flow hedges and on available-for-sale (AFS) assets, except for shares and other equity instruments;
n unrealised capital gains on AFS securities (shares);
n income on own credit risk.
n Moreover, since 1 January 2013, the difference arising from the application of the equity method to equity investments above 20% in insurance companies is fully deducted from Tier 1 capital, and the historical value of the securities is weighted at 370%.
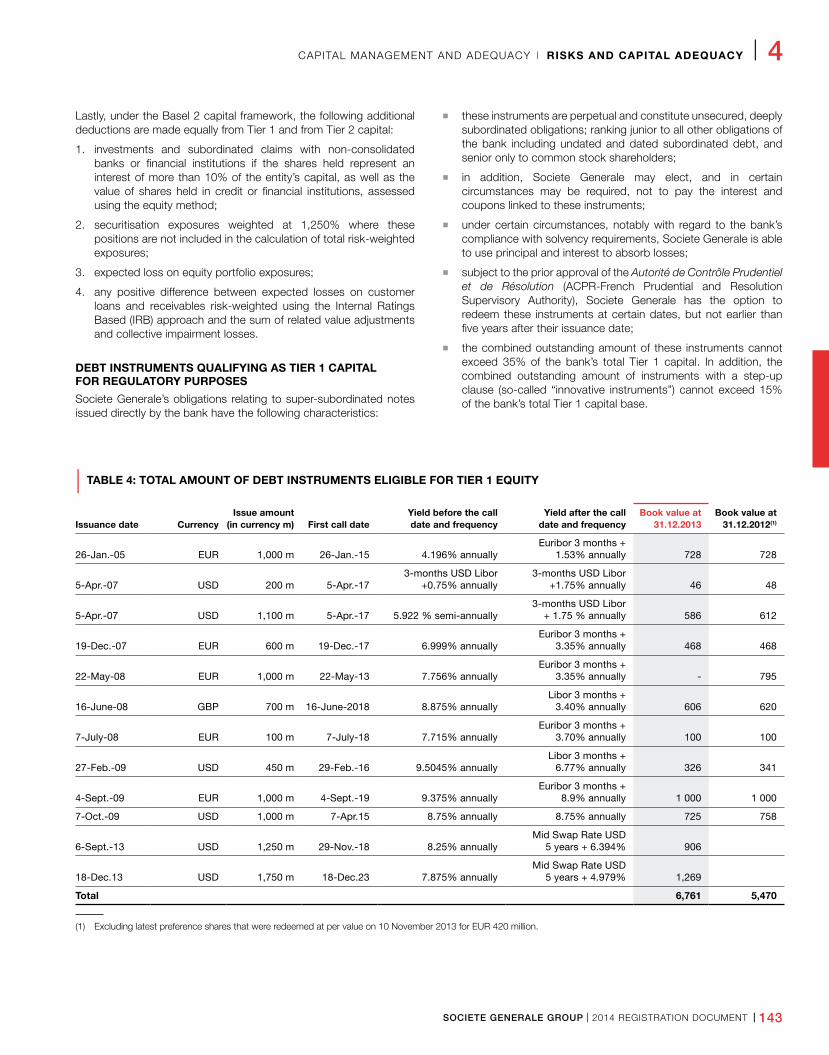
SOCIETE GENERALE GROUP I 2014 REGISTRATION DOCUMENT I 143
CAPITAL MANAGEMENT AND ADEQUACY I RISKS AND CAPITAL ADEQUACY I 4
Lastly, under the Basel 2 capital framework, the following additional deductions are made equally from Tier 1 and from Tier 2 capital:
1. investments and subordinated claims with non-consolidated banks or financial institutions if the shares held represent an interest of more than 10% of the entity’s capital, as well as the value of shares held in credit or financial institutions, assessed using the equity method;
2. securitisation exposures weighted at 1,250% where these positions are not included in the calculation of total risk-weighted exposures;
3. expected loss on equity portfolio exposures;
4. any positive difference between expected losses on customer loans and receivables risk-weighted using the Internal Ratings Based (IRB) approach and the sum of related value adjustments and collective impairment losses.
DEBT INSTRUMENTS QUALIFYING AS TIER 1 CAPITAL FOR REGULATORY PURPOSES
Societe Generale’s obligations relating to super-subordinated notes issued directly by the bank have the following characteristics:
n these instruments are perpetual and constitute unsecured, deeply subordinated obligations; ranking junior to all other obligations of the bank including undated and dated subordinated debt, and senior only to common stock shareholders;
n in addition, Societe Generale may elect, and in certain circumstances may be required, not to pay the interest and coupons linked to these instruments;
n under certain circumstances, notably with regard to the bank’s compliance with solvency requirements, Societe Generale is able to use principal and interest to absorb losses;
n subject to the prior approval of the Autorité de Contrôle Prudentiel et de Résolution (ACPR-French Prudential and Resolution Supervisory Authority), Societe Generale has the option to redeem these instruments at certain dates, but not earlier than five years after their issuance date;
n the combined outstanding amount of these instruments cannot exceed 35% of the bank’s total Tier 1 capital. In addition, the combined outstanding amount of instruments with a step-up clause (so-called “innovative instruments”) cannot exceed 15% of the bank’s total Tier 1 capital base.
| TABLE 4: TOTAL AMOUNT OF DEBT INSTRUMENTS ELIGIBLE FOR TIER 1 EQUITY
Issuance date CurrencyIssue amount
(in currency m) First call dateYield before the call date and frequency
Yield after the call date and frequency
Book value at 31.12.2013
Book value at 31.12.2012(1)
26-Jan.-05 EUR 1,000 m 26-Jan.-15 4.196% annuallyEuribor 3 months +
1.53% annually 728 728
5-Apr.-07 USD 200 m 5-Apr.-173-months USD Libor
+0.75% annually3-months USD Libor
+1.75% annually 46 48
5-Apr.-07 USD 1,100 m 5-Apr.-17 5.922 % semi-annually3-months USD Libor
+ 1.75 % annually 586 612
19-Dec.-07 EUR 600 m 19-Dec.-17 6.999% annuallyEuribor 3 months +
3.35% annually 468 468
22-May-08 EUR 1,000 m 22-May-13 7.756% annuallyEuribor 3 months +
3.35% annually - 795
16-June-08 GBP 700 m 16-June-2018 8.875% annuallyLibor 3 months +
3.40% annually 606 620
7-July-08 EUR 100 m 7-July-18 7.715% annuallyEuribor 3 months +
3.70% annually 100 100
27-Feb.-09 USD 450 m 29-Feb.-16 9.5045% annuallyLibor 3 months +
6.77% annually 326 341
4-Sept.-09 EUR 1,000 m 4-Sept.-19 9.375% annuallyEuribor 3 months +
8.9% annually 1 000 1 000
7-Oct.-09 USD 1,000 m 7-Apr.15 8.75% annually 8.75% annually 725 758
6-Sept.-13 USD 1,250 m 29-Nov.-18 8.25% annuallyMid Swap Rate USD
5 years + 6.394% 906
18-Dec.13 USD 1,750 m 18-Dec.23 7.875% annuallyMid Swap Rate USD
5 years + 4.979% 1,269
Total 6,761 5,470
(1) Excluding latest preference shares that were redeemed at per value on 10 November 2013 for EUR 420 million.
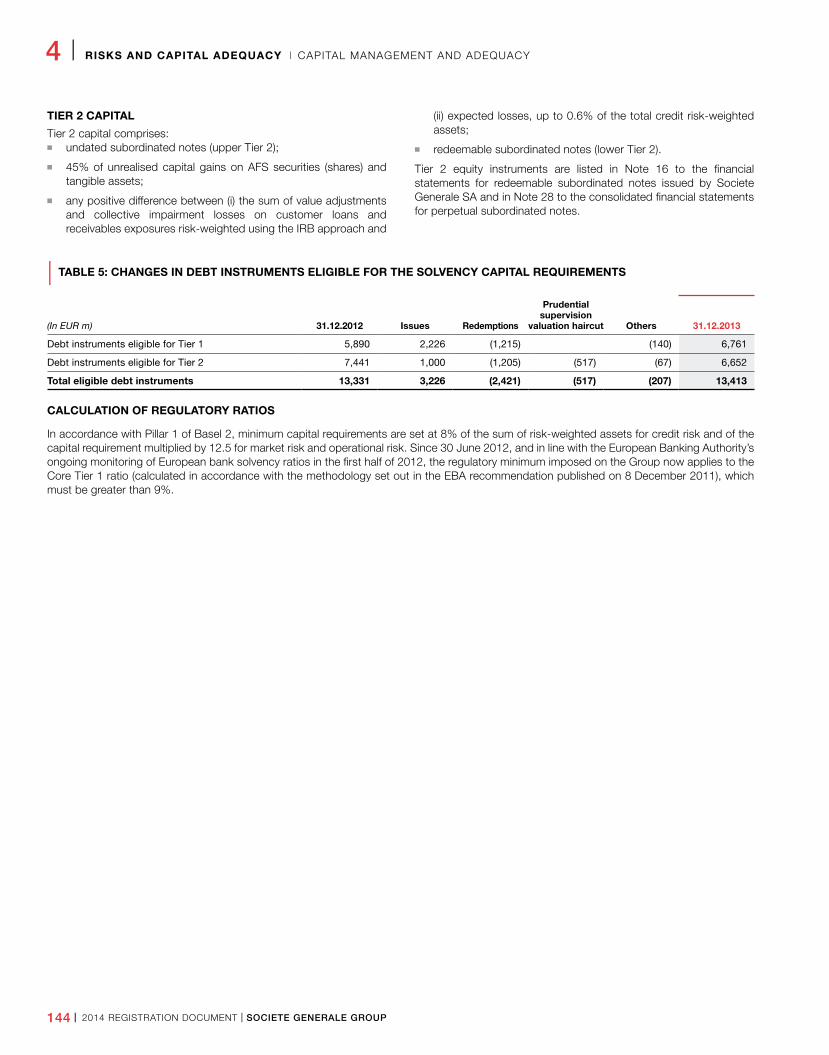
144 I 2014 REGISTRATION DOCUMENT I SOCIETE GENERALE GROUP
4 I RISKS AND CAPITAL ADEQUACY I CAPITAL MANAGEMENT AND ADEQUACY
TIER 2 CAPITAL
Tier 2 capital comprises: n undated subordinated notes (upper Tier 2);
n 45% of unrealised capital gains on AFS securities (shares) and tangible assets;
n any positive difference between (i) the sum of value adjustments and collective impairment losses on customer loans and receivables exposures risk-weighted using the IRB approach and
(ii) expected losses, up to 0.6% of the total credit risk-weighted assets;
n redeemable subordinated notes (lower Tier 2).
Tier 2 equity instruments are listed in Note 16 to the financial statements for redeemable subordinated notes issued by Societe Generale SA and in Note 28 to the consolidated financial statements for perpetual subordinated notes.
| TABLE 5: CHANGES IN DEBT INSTRUMENTS ELIGIBLE FOR THE SOLVENCY CAPITAL REQUIREMENTS
(In EUR m) 31.12.2012 Issues Redemptions
Prudential supervision
valuation haircut Others 31.12.2013
Debt instruments eligible for Tier 1 5,890 2,226 (1,215) (140) 6,761
Debt instruments eligible for Tier 2 7,441 1,000 (1,205) (517) (67) 6,652
Total eligible debt instruments 13,331 3,226 (2,421) (517) (207) 13,413
CALCULATION OF REGULATORY RATIOS
In accordance with Pillar 1 of Basel 2, minimum capital requirements are set at 8% of the sum of risk-weighted assets for credit risk and of the capital requirement multiplied by 12.5 for market risk and operational risk. Since 30 June 2012, and in line with the European Banking Authority’s ongoing monitoring of European bank solvency ratios in the first half of 2012, the regulatory minimum imposed on the Group now applies to the Core Tier 1 ratio (calculated in accordance with the methodology set out in the EBA recommendation published on 8 December 2011), which must be greater than 9%.
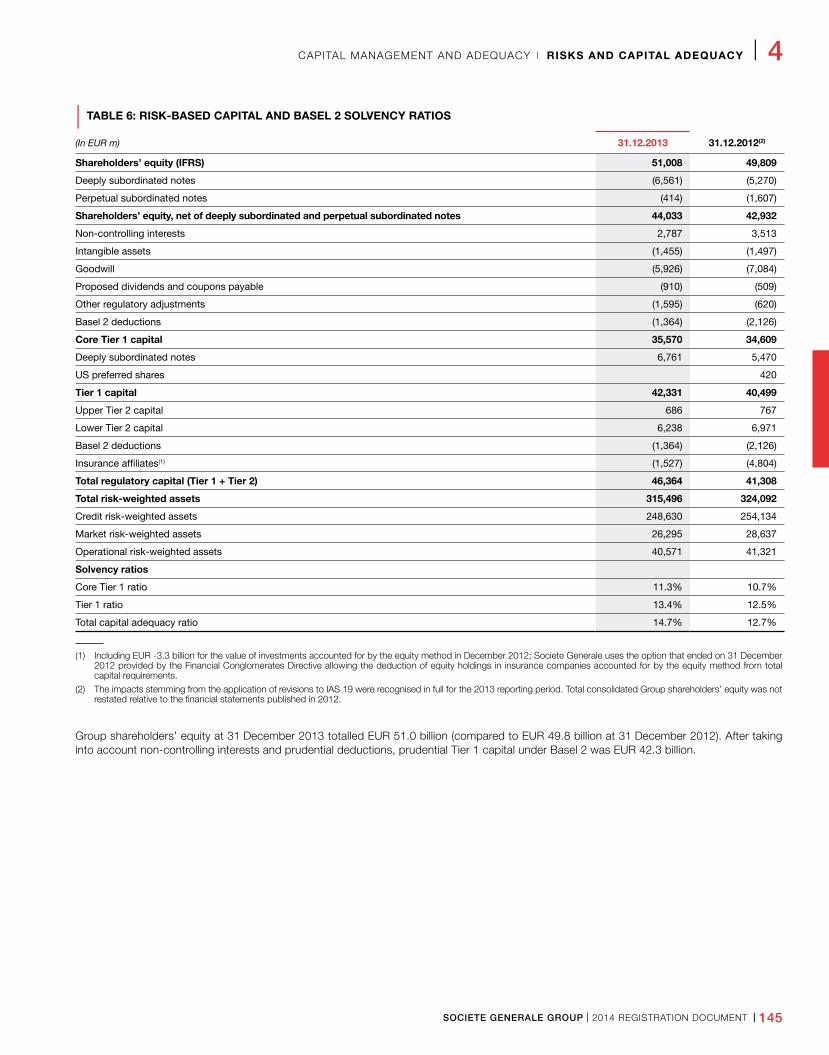
SOCIETE GENERALE GROUP I 2014 REGISTRATION DOCUMENT I 145
CAPITAL MANAGEMENT AND ADEQUACY I RISKS AND CAPITAL ADEQUACY I 4
| TABLE 6: RISK-BASED CAPITAL AND BASEL 2 SOLVENCY RATIOS
(In EUR m) 31.12.2013 31.12.2012(2)
Shareholders’ equity (IFRS) 51,008 49,809
Deeply subordinated notes (6,561) (5,270)
Perpetual subordinated notes (414) (1,607)
Shareholders’ equity, net of deeply subordinated and perpetual subordinated notes 44,033 42,932
Non-controlling interests 2,787 3,513
Intangible assets (1,455) (1,497)
Goodwill (5,926) (7,084)
Proposed dividends and coupons payable (910) (509)
Other regulatory adjustments (1,595) (620)
Basel 2 deductions (1,364) (2,126)
Core Tier 1 capital 35,570 34,609
Deeply subordinated notes 6,761 5,470
US preferred shares 420
Tier 1 capital 42,331 40,499
Upper Tier 2 capital 686 767
Lower Tier 2 capital 6,238 6,971
Basel 2 deductions (1,364) (2,126)
Insurance affiliates(1) (1,527) (4,804)
Total regulatory capital (Tier 1 + Tier 2) 46,364 41,308
Total risk-weighted assets 315,496 324,092
Credit risk-weighted assets 248,630 254,134
Market risk-weighted assets 26,295 28,637
Operational risk-weighted assets 40,571 41,321
Solvency ratios
Core Tier 1 ratio 11.3% 10.7%
Tier 1 ratio 13.4% 12.5%
Total capital adequacy ratio 14.7% 12.7%
(1) Including EUR -3.3 billion for the value of investments accounted for by the equity method in December 2012; Societe Generale uses the option that ended on 31 December 2012 provided by the Financial Conglomerates Directive allowing the deduction of equity holdings in insurance companies accounted for by the equity method from total capital requirements.
(2) The impacts stemming from the application of revisions to IAS 19 were recognised in full for the 2013 reporting period. Total consolidated Group shareholders’ equity was not restated relative to the financial statements published in 2012.
Group shareholders’ equity at 31 December 2013 totalled EUR 51.0 billion (compared to EUR 49.8 billion at 31 December 2012). After taking into account non-controlling interests and prudential deductions, prudential Tier 1 capital under Basel 2 was EUR 42.3 billion.
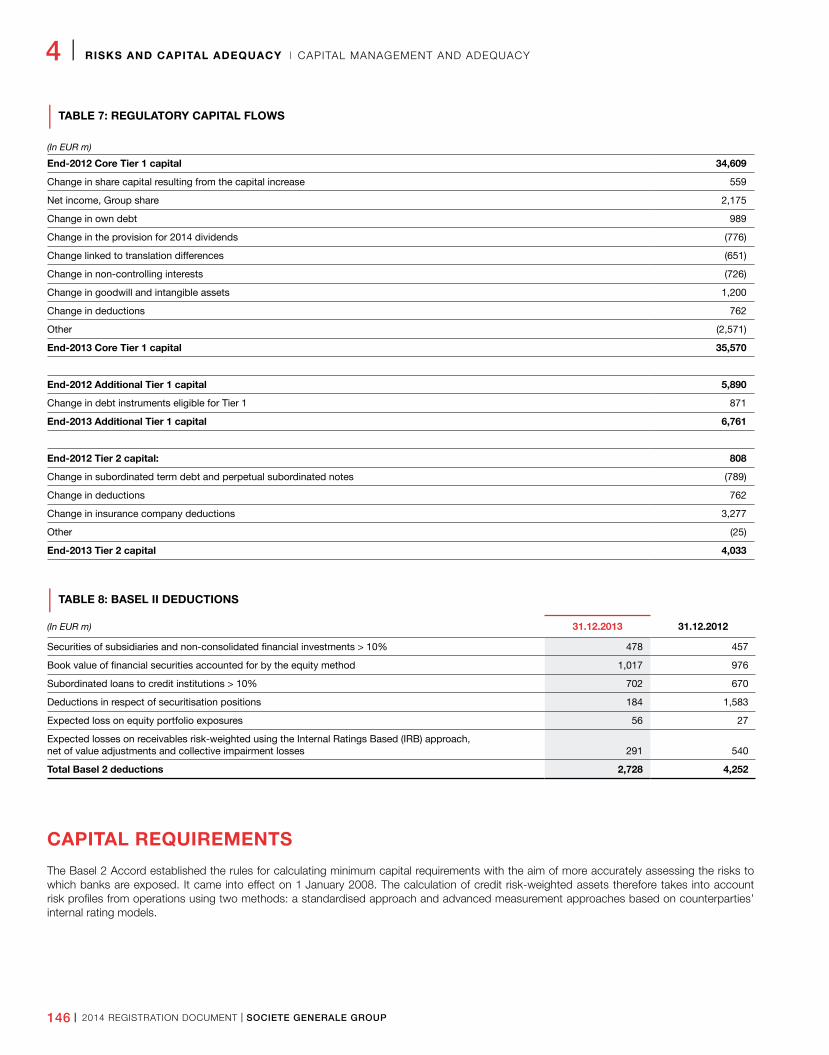
146 I 2014 REGISTRATION DOCUMENT I SOCIETE GENERALE GROUP
4 I RISKS AND CAPITAL ADEQUACY I CAPITAL MANAGEMENT AND ADEQUACY
| TABLE 7: REGULATORY CAPITAL FLOWS
(In EUR m)
End-2012 Core Tier 1 capital 34,609
Change in share capital resulting from the capital increase 559
Net income, Group share 2,175
Change in own debt 989
Change in the provision for 2014 dividends (776)
Change linked to translation differences (651)
Change in non-controlling interests (726)
Change in goodwill and intangible assets 1,200
Change in deductions 762
Other (2,571)
End-2013 Core Tier 1 capital 35,570
End-2012 Additional Tier 1 capital 5,890
Change in debt instruments eligible for Tier 1 871
End-2013 Additional Tier 1 capital 6,761
End-2012 Tier 2 capital: 808
Change in subordinated term debt and perpetual subordinated notes (789)
Change in deductions 762
Change in insurance company deductions 3,277
Other (25)
End-2013 Tier 2 capital 4,033
| TABLE 8: BASEL II DEDUCTIONS
(In EUR m) 31.12.2013 31.12.2012
Securities of subsidiaries and non-consolidated financial investments > 10% 478 457
Book value of financial securities accounted for by the equity method 1,017 976
Subordinated loans to credit institutions > 10% 702 670
Deductions in respect of securitisation positions 184 1,583
Expected loss on equity portfolio exposures 56 27
Expected losses on receivables risk-weighted using the Internal Ratings Based (IRB) approach, net of value adjustments and collective impairment losses 291 540
Total Basel 2 deductions 2,728 4,252
CAPITAL REQUIREMENTS
The Basel 2 Accord established the rules for calculating minimum capital requirements with the aim of more accurately assessing the risks to which banks are exposed. It came into effect on 1 January 2008. The calculation of credit risk-weighted assets therefore takes into account risk profiles from operations using two methods: a standardised approach and advanced measurement approaches based on counterparties’ internal rating models.
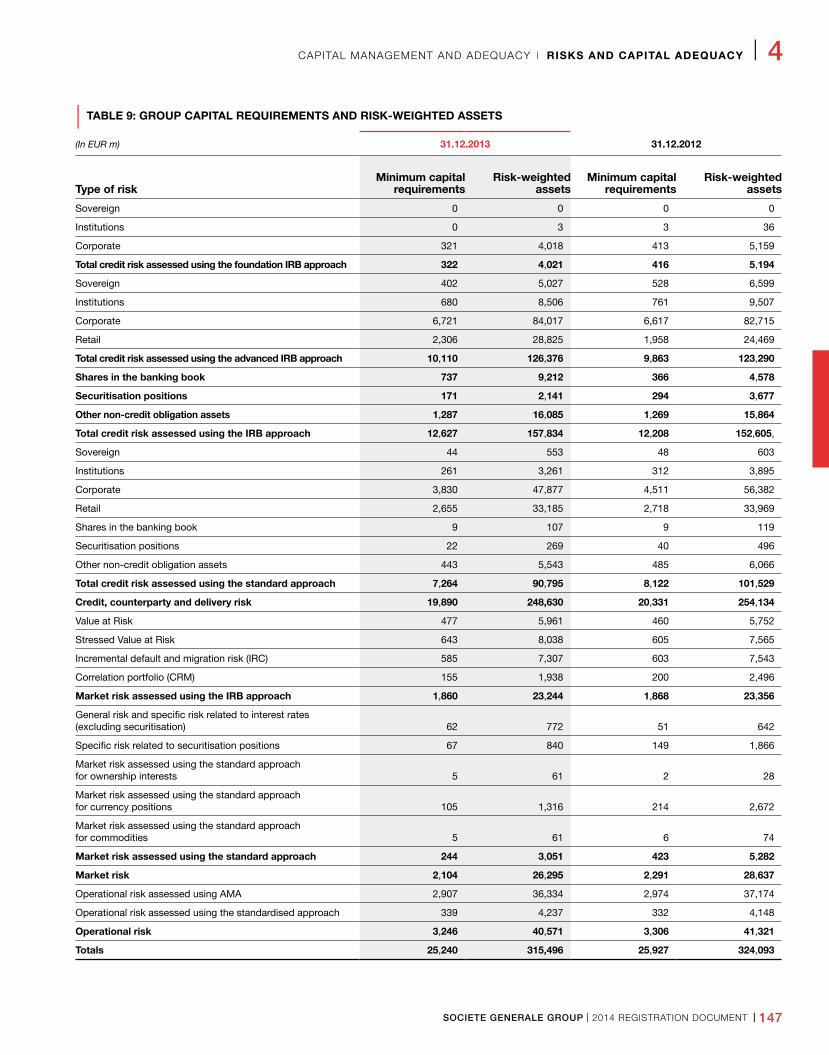
SOCIETE GENERALE GROUP I 2014 REGISTRATION DOCUMENT I 147
CAPITAL MANAGEMENT AND ADEQUACY I RISKS AND CAPITAL ADEQUACY I 4
| TABLE 9: GROUP CAPITAL REQUIREMENTS AND RISK-WEIGHTED ASSETS
(In EUR m) 31.12.2013 31.12.2012
Type of riskMinimum capital
requirementsRisk-weighted
assetsMinimum capital
requirementsRisk-weighted
assets
Sovereign 0 0 0 0
Institutions 0 3 3 36
Corporate 321 4,018 413 5,159
Total credit risk assessed using the foundation IRB approach 322 4,021 416 5,194
Sovereign 402 5,027 528 6,599
Institutions 680 8,506 761 9,507
Corporate 6,721 84,017 6,617 82,715
Retail 2,306 28,825 1,958 24,469
Total credit risk assessed using the advanced IRB approach 10,110 126,376 9,863 123,290
Shares in the banking book 737 9,212 366 4,578
Securitisation positions 171 2,141 294 3,677
Other non-credit obligation assets 1,287 16,085 1,269 15,864
Total credit risk assessed using the IRB approach 12,627 157,834 12,208 152,605,
Sovereign 44 553 48 603
Institutions 261 3,261 312 3,895
Corporate 3,830 47,877 4,511 56,382
Retail 2,655 33,185 2,718 33,969
Shares in the banking book 9 107 9 119
Securitisation positions 22 269 40 496
Other non-credit obligation assets 443 5,543 485 6,066
Total credit risk assessed using the standard approach 7,264 90,795 8,122 101,529
Credit, counterparty and delivery risk 19,890 248,630 20,331 254,134
Value at Risk 477 5,961 460 5,752
Stressed Value at Risk 643 8,038 605 7,565
Incremental default and migration risk (IRC) 585 7,307 603 7,543
Correlation portfolio (CRM) 155 1,938 200 2,496
Market risk assessed using the IRB approach 1,860 23,244 1,868 23,356
General risk and specific risk related to interest rates (excluding securitisation) 62 772 51 642
Specific risk related to securitisation positions 67 840 149 1,866
Market risk assessed using the standard approach for ownership interests 5 61 2 28
Market risk assessed using the standard approach for currency positions 105 1,316 214 2,672
Market risk assessed using the standard approach for commodities 5 61 6 74
Market risk assessed using the standard approach 244 3,051 423 5,282
Market risk 2,104 26,295 2,291 28,637
Operational risk assessed using AMA 2,907 36,334 2,974 37,174
Operational risk assessed using the standardised approach 339 4,237 332 4,148
Operational risk 3,246 40,571 3,306 41,321
Totals 25,240 315,496 25,927 324,093
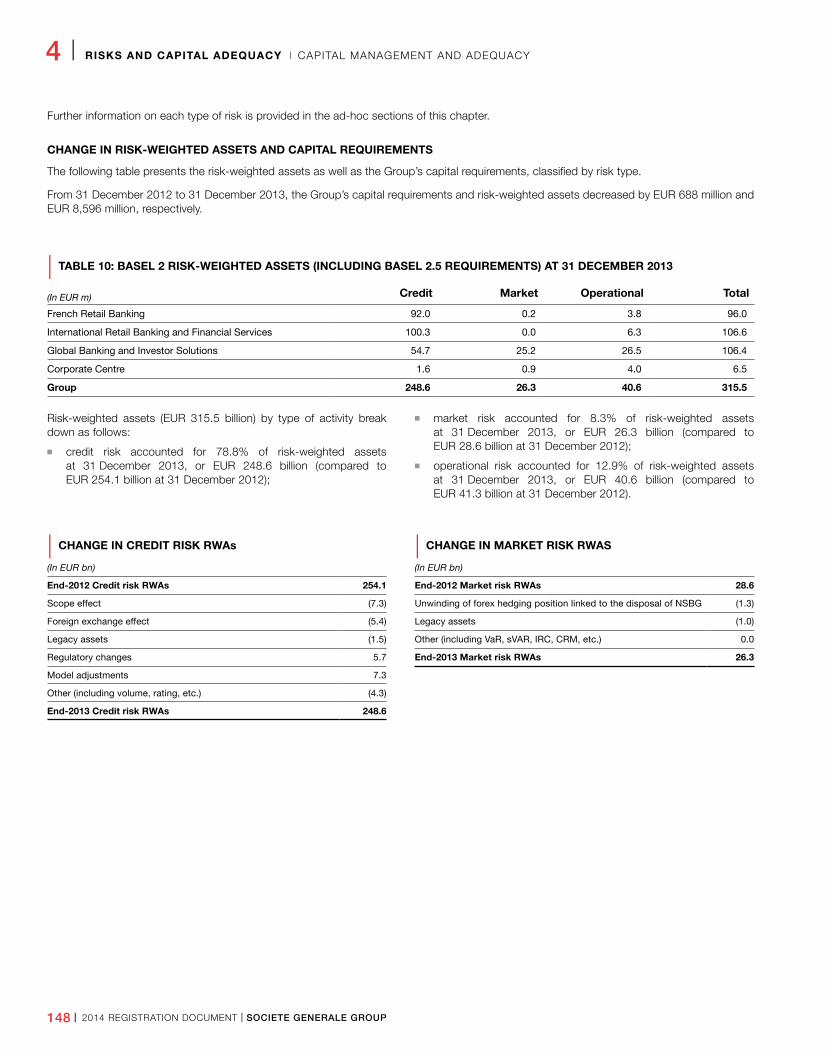
148 I 2014 REGISTRATION DOCUMENT I SOCIETE GENERALE GROUP
4 I RISKS AND CAPITAL ADEQUACY I CAPITAL MANAGEMENT AND ADEQUACY
Further information on each type of risk is provided in the ad-hoc sections of this chapter.
CHANGE IN RISK-WEIGHTED ASSETS AND CAPITAL REQUIREMENTS
The following table presents the risk-weighted assets as well as the Group’s capital requirements, classified by risk type.
From 31 December 2012 to 31 December 2013, the Group’s capital requirements and risk-weighted assets decreased by EUR 688 million and EUR 8,596 million, respectively.
| TABLE 10: BASEL 2 RISK-WEIGHTED ASSETS (INCLUDING BASEL 2.5 REQUIREMENTS) AT 31 DECEMBER 2013
(In EUR m) Credit Market Operational Total
French Retail Banking 92.0 0.2 3.8 96.0
International Retail Banking and Financial Services 100.3 0.0 6.3 106.6
Global Banking and Investor Solutions 54.7 25.2 26.5 106.4
Corporate Centre 1.6 0.9 4.0 6.5
Group 248.6 26.3 40.6 315.5
Risk-weighted assets (EUR 315.5 billion) by type of activity break down as follows:
n credit risk accounted for 78.8% of risk-weighted assets at 31 December 2013, or EUR 248.6 billion (compared to EUR 254.1 billion at 31 December 2012);
n market risk accounted for 8.3% of risk-weighted assets at 31 December 2013, or EUR 26.3 billion (compared to EUR 28.6 billion at 31 December 2012);
n operational risk accounted for 12.9% of risk-weighted assets at 31 December 2013, or EUR 40.6 billion (compared to EUR 41.3 billion at 31 December 2012).
| CHANGE IN CREDIT RISK RWAs
(In EUR bn)
End-2012 Credit risk RWAs 254.1
Scope effect (7.3)
Foreign exchange effect (5.4)
Legacy assets (1.5)
Regulatory changes 5.7
Model adjustments 7.3
Other (including volume, rating, etc.) (4.3)
End-2013 Credit risk RWAs 248.6
| CHANGE IN MARKET RISK RWAS
(In EUR bn)
End-2012 Market risk RWAs 28.6
Unwinding of forex hedging position linked to the disposal of NSBG (1.3)
Legacy assets (1.0)
Other (including VaR, sVAR, IRC, CRM, etc.) 0.0
End-2013 Market risk RWAs 26.3
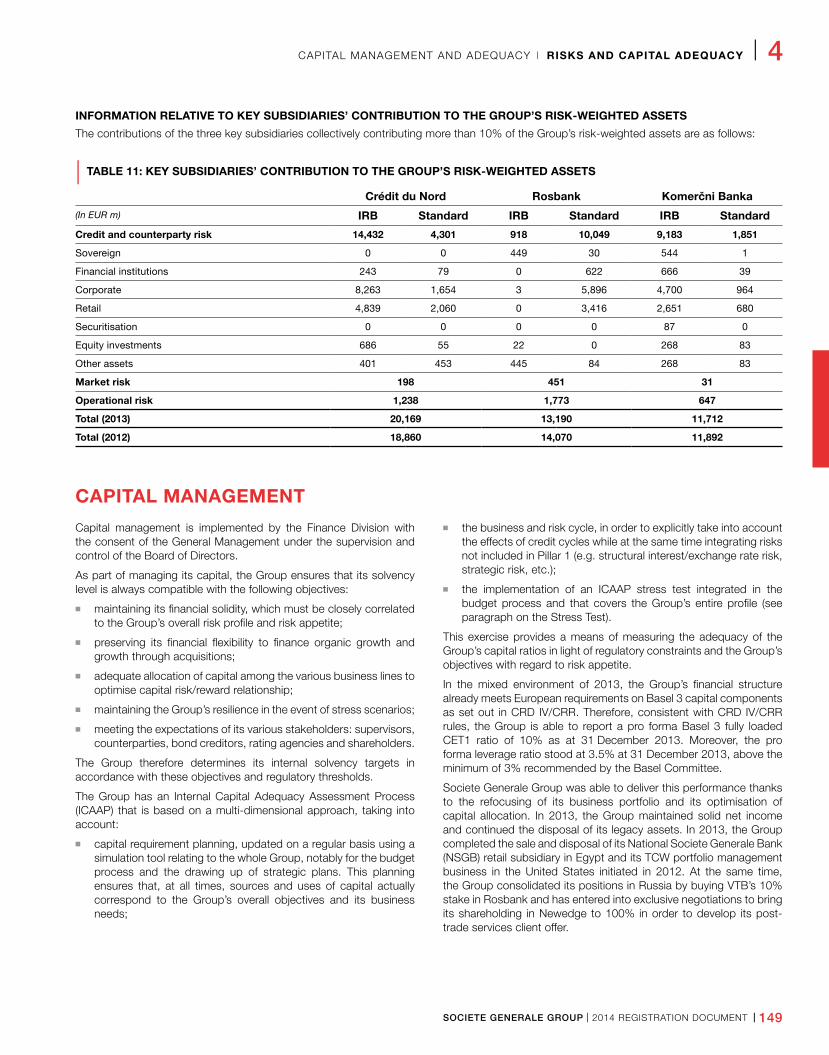
SOCIETE GENERALE GROUP I 2014 REGISTRATION DOCUMENT I 149
CAPITAL MANAGEMENT AND ADEQUACY I RISKS AND CAPITAL ADEQUACY I 4
INFORMATION RELATIVE TO KEY SUBSIDIARIES’ CONTRIBUTION TO THE GROUP’S RISK-WEIGHTED ASSETS
The contributions of the three key subsidiaries collectively contributing more than 10% of the Group’s risk-weighted assets are as follows:
| TABLE 11: KEY SUBSIDIARIES’ CONTRIBUTION TO THE GROUP’S RISK-WEIGHTED ASSETS
Crédit du Nord Rosbank Komerčni Banka
(In EUR m) IRB Standard IRB Standard IRB Standard
Credit and counterparty risk 14,432 4,301 918 10,049 9,183 1,851
Sovereign 0 0 449 30 544 1
Financial institutions 243 79 0 622 666 39
Corporate 8,263 1,654 3 5,896 4,700 964
Retail 4,839 2,060 0 3,416 2,651 680
Securitisation 0 0 0 0 87 0
Equity investments 686 55 22 0 268 83
Other assets 401 453 445 84 268 83
Market risk 198 451 31
Operational risk 1,238 1,773 647
Total (2013) 20,169 13,190 11,712
Total (2012) 18,860 14,070 11,892
CAPITAL MANAGEMENT
Capital management is implemented by the Finance Division with the consent of the General Management under the supervision and control of the Board of Directors.
As part of managing its capital, the Group ensures that its solvency level is always compatible with the following objectives:
n maintaining its financial solidity, which must be closely correlated to the Group’s overall risk profile and risk appetite;
n preserving its financial flexibility to finance organic growth and growth through acquisitions;
n adequate allocation of capital among the various business lines to optimise capital risk/reward relationship;
n maintaining the Group’s resilience in the event of stress scenarios;
n meeting the expectations of its various stakeholders: supervisors, counterparties, bond creditors, rating agencies and shareholders.
The Group therefore determines its internal solvency targets in accordance with these objectives and regulatory thresholds.
The Group has an Internal Capital Adequacy Assessment Process (ICAAP) that is based on a multi-dimensional approach, taking into account:
n capital requirement planning, updated on a regular basis using a simulation tool relating to the whole Group, notably for the budget process and the drawing up of strategic plans. This planning ensures that, at all times, sources and uses of capital actually correspond to the Group’s overall objectives and its business needs;
n the business and risk cycle, in order to explicitly take into account the effects of credit cycles while at the same time integrating risks not included in Pillar 1 (e.g. structural interest/exchange rate risk, strategic risk, etc.);
n the implementation of an ICAAP stress test integrated in the budget process and that covers the Group’s entire profile (see paragraph on the Stress Test).
This exercise provides a means of measuring the adequacy of the Group’s capital ratios in light of regulatory constraints and the Group’s objectives with regard to risk appetite.
In the mixed environment of 2013, the Group’s financial structure already meets European requirements on Basel 3 capital components as set out in CRD IV/CRR. Therefore, consistent with CRD IV/CRR rules, the Group is able to report a pro forma Basel 3 fully loaded CET1 ratio of 10% as at 31 December 2013. Moreover, the pro forma leverage ratio stood at 3.5% at 31 December 2013, above the minimum of 3% recommended by the Basel Committee.
Societe Generale Group was able to deliver this performance thanks to the refocusing of its business portfolio and its optimisation of capital allocation. In 2013, the Group maintained solid net income and continued the disposal of its legacy assets. In 2013, the Group completed the sale and disposal of its National Societe Generale Bank (NSGB) retail subsidiary in Egypt and its TCW portfolio management business in the United States initiated in 2012. At the same time, the Group consolidated its positions in Russia by buying VTB’s 10% stake in Rosbank and has entered into exclusive negotiations to bring its shareholding in Newedge to 100% in order to develop its post-trade services client offer.
150 I 2014 REGISTRATION DOCUMENT I SOCIETE GENERALE GROUP
4 I RISKS AND CAPITAL ADEQUACY I CAPITAL MANAGEMENT AND ADEQUACY
Furthermore, the Group entered the second phase of its transformation in 2013 by rolling out a new organisation structured around three pillars of excellence with a balanced capital distribution:
n French Retail Banking;
n International Retail Banking and Financial Services (IBFS), which combines the activities of the International Retail Banking, Specialised Financial Services and Insurance divisions;
n Global Banking and Investment Solutions (GBIS), which combines the activities of Corporate & Investment Banking with Private Banking, Global Investment Management and Securities Services.
Each of the Group’s divisions accounts for almost a third of all prudential obligations, with French and International Retail Banking (approximately 65% of total business line loans and receivables) and credit risks (representing nearly 80% of the Group’s risk-weighted assets) taking predominance. At the same time, the Group was committed to reducing its risk exposure in a slightly improving but nonetheless weak macroeconomic context. At 31 December 2013,
the Group’s risk-weighted assets (as determined using Basel 2.5 rules) were down 2.7% to EUR 315.5 billion compared to EUR 324.1 billion as at 31 December 2012.
| TABLE OF BASEL 2.5 RWAS BY DIVISION (IN EUR BN)
2012 2013
French Retail Banking 89.2 96.0
International Retail Banking & Financial Services 112.4 106.6
Global Banking and Investor Solutions 114.5 106.4
Corporate Centre 8.0 6.5
Total 324.1 315.5
The Group ended 2013 in a far-reaching process of transforming its balance sheet and is now in a position, from 2014 and going forward, to seize growth opportunities building on a focused model and activities concentrating on customer satisfaction and innovation.
RATIO OF LARGE EXPOSURES
The European Directive (CRD2) enacted into French law in August 2010 and applicable as from 31 December 2010 amended the calculation of the ratio of large exposures (tougher interbank weighting rules, extended definition of affiliated customers, etc.). Each quarter, Societe Generale Group checks that the total net
risk incurred in respect of a given debtor does not exceed 25% of consolidated equity. As part of the implementation of the Capital Requirements Directive IV and the Capital Requirements Regulation, from 2019, the capital used to calculate this limit will be made up of Tier 1 capital and Tier 2 capital limited to 33% of Tier 1.
REGULATORY CHANGES
BASEL 3 – CAPITAL REGULATION
In December 2010, the Basel Committee published two documents: “Basel 3: “A global regulatory framework for more resilient banks and banking systems”, and an “International framework for liquidity risk measurement, standards and monitoring”, in which it issued recommendations aiming at strengthening capital requirements and liquidity rules in order to promote a more solid banking sector.
Since 1 January 2014, the European Capital Requirements Directive (CRD IV) and Capital Requirements Regulation (CRR) have enforced the proposals of the Basel Committee. The objective of this prudential framework reform is to reinforce the sector’s financial stability through the following measures:
n the complete revision and harmonisation of the definition of capital, particularly with the amendment of the deduction rules, the definition of a standardised Common Equity Tier 1 ratio, and new Tier 1 capital eligibility criteria for hybrid securities;
n new capital requirements for counterparty risk related to derivatives to better incorporate the risk of changes in CVAs (Credit Value Adjustments), and an incentive to clear derivatives through clearing houses;
n additional capital requirements, with the introduction of buffers to limit procyclicality: “capital conservation buffers” to limit the amounts that can be distributed (dividends, share buybacks, performance-linked pay, etc.) and “countercyclical buffers” to limit excessive growth in lending during periods of strong economic growth;
n on 19 July 2011, the Basel Committee published the proposed rules for calculating the capital surcharge applicable to SIFIs (Systemically Important Financial Institutions). The G20 adopted these rules at the November 2011 summit. The additional capital requirement for SIFIs will be applied gradually starting from 1 January 2016, becoming fully effective on 1 January 2019, for banks identified as systemic in November 2014. For information purposes, in November 2013 (based on data at end-2012), the Group’s additional capital was estimated at 1%.
LEVERAGE RATIO
The Basel Committee has proposed a step-by-step implementation of a leverage ratio. The European Capital Requirements Regulation (CRR) contains these recommendations and determines the leverage ratio by dividing Tier 1 capital by assets and off-balance sheet accounting items, with restatements for derivatives, pensions, trade finance and certain credit lines.
n An initial implementation of Pillar 2.
n Data collection based on regulatory status reports from 1 January 2014.
n Public notification from 1 January 2015.
n A report from the European Commission before the end of 2016, with the possible inclusion of a legislative proposal to make the leverage ratio mandatory in Pillar 1 from 2018.
SOCIETE GENERALE GROUP I 2014 REGISTRATION DOCUMENT I 151
CREDIT RISKS I RISKS AND CAPITAL ADEQUACY I 4
4 . C R E D I T R I S K S
CREDIT RISK MANAGEMENT: ORGANISATION AND STRUCTURE
The Risk Division has defined a control and monitoring system, in conjunction with the business divisions and based on the credit risk policy, to provide a framework for the Group’s credit risk management. This framework is periodically reviewed and validated by the Audit, Internal Control and Risk Committee.
Credit risk supervision is organised by business division (French Networks, International Banking & Financial Services, Global Banking and Investor Solutions) and is supplemented by departments with a more cross-business approach (monitoring of country risk and risk linked to financial institutions). The team that handles counterparty risk on market transactions reports to the Market Risk Department.
Within the Risk Division, each of these departments is responsible for:
n setting global and individual credit limits by client, client group or transaction type;
n authorising transactions submitted by the sales departments;
n validating ratings or internal client rating criteria;
n monitoring and supervision of large exposures and various specific credit portfolios;
n approving specific and general provisioning policies.
In addition, a specific department performs comprehensive portfolio analyses and provides the associated reports, including those for the supervisory authorities. A monthly report on the Risk Division’s activity is presented to CORISQ and specific analyses are submitted to the General Management.
CREDIT POLICY
Societe Generale’s credit policy is based on the principle that approval of any credit risk undertaking must be based on sound knowledge of the client and the client’s business, an understanding of the purpose and structure of the transaction and the sources of repayment of the debt. Credit decisions must also ensure that the structure of the transaction will minimise the risk of loss in the event the counterparty defaults. Furthermore, the credit approval process takes into consideration the overall commitment of the group to which the client belongs. Risk approval forms part of the Group’s risk management strategy in line with its risk appetite.
The risk approval process is based on four core principles:
n all transactions involving credit risk (debtor risk, settlement/ delivery risk, issuer risk and replacement risk) must be pre- authorised;
n responsibility for analysing and approving transactions lies with dedicated primary customer relation unit and risk unit. The primary customer relation unit and the risk unit examine all authorisation requests relating to a specific client or client group, to ensure a consistent approach to risk management;
n the primary customer relation unit and the risk unit must be independent from each other;
n credit decisions must be systematically based on internal risk ratings (obligor rating), as provided by the primary customer relation unit and approved by the Risk Division.
The Risk Division submits recommendations to CORISQ on the limits it deems appropriate for certain countries, geographic regions, sectors, products or customer types, in order to reduce risks with strong correlations. The allocation of limits is subject to final approval by the Group’s General Management and is based on a process that involves the Business Divisions exposed to risk and the Risk Division.
RISK SUPERVISION AND MONITORING SYSTEM
Portfolio review and sector risk monitoringAuthorisation limits are set by counterparty and the credit approval process must comply with the overall authorisation limit for the group to which the counterparty belongs.
Individual large exposures are reviewed by the Large Exposures Committee (CGR: Comité Grands Risques).
Concentrations are measured using an internal model and individual concentration limits are defined for larger exposures. Any concentration limit breach is managed over time by reducing exposures, and/or hedging positions using credit derivatives.
Concentration targets are defined for the biggest counterparties at Concentration Committee meetings.
152 I 2014 REGISTRATION DOCUMENT I SOCIETE GENERALE GROUP
4 I RISKS AND CAPITAL ADEQUACY I CREDIT RISKS
In addition, the Group regularly reviews its entire credit portfolio through analysis by type of counterparty or business sector. In addition to industry research and regular sector concentration analysis, sector research and more specific business portfolio analyses are carried out at the request of the bank’s General Management and/or Risk Division and/or business divisions.
Monitoring of Country RiskCountry risk arises when an exposure (loan, security, guarantee or derivative) becomes liable to negative impact from changing political, economic, social and financial conditions in the country of exposure.
It includes exposure to any kind of counterparty, including a sovereign state (sovereign risk is also controlled by the system of counterparty risk limits).
Country risk breaks down into two major categories:
n political and non-transfer risk covers the risk of non- payment resulting from either actions or measures taken by local government authorities (decision to prohibit the debtor from meeting its commitments, nationalisation, expropriation, non-convertibility, etc.), domestic events (riots, civil war, etc.) or external events (war, terrorism, etc.);
n commercial risk occurs when the credit quality of all counterparties in a given country deteriorates due to a national economic or financial crisis, independently of each counterparty’s individual financial situation. This could be macroeconomic shock (sharp slowdown in activity, systemic banking crisis, etc.) or currency depreciation, or sovereign default on external debt possibly entailing other defaults.
Overall limits and strengthened monitoring of exposures have been established for countries based on their internal ratings and governance indicators. Supervision is not limited to emerging markets.
Country limits are validated annually by General Management. They can also be revised downward at any time if the country’s situation deteriorates or is expected to deteriorate.
All Group exposures (securities, derivatives, loans and guarantees) are taken into account by this monitoring.
The Country Risk methodology determines an initial country of risk and a final country of risk (after the effects of any guarantees). The latter is governed by country limits.
Specific monitoring of hedge fundsHedge funds are important counterparties for the Group. Because they are not regulated, hedge funds pose specific risks: they are able to use significant leverage as well as investment strategies that involve illiquid financial instruments, which leads to a strong correlation between credit risk and market risk.
Activities carried out in the hedge fund sector are governed by a set of global limits established by the General Management:
n a Credit VaR limit which controls the maximum replacement risk that may be taken in this segment;
n a stress test limit governing market risks and the risks associated with financing transactions guaranteed by shares in hedge funds.
Credit stress testsWith the aim of identifying, monitoring and managing credit risk, the Risk Division works with the business divisions to conduct a set of specific stress tests relating to a country, a subsidiary or an activity. These specific stress tests combine both recurring stress tests, conducted on those portfolios identified as structurally carrying risk, and occasional stress tests, designed to recognise emerging risks. Some of these stress tests are presented to the Risk Committee and used to determine how to govern the activities concerned.
Like global stress tests, specific stress tests draw on a central scenario and a stressed scenario that are defined by the Group’s sector experts and economists. The central scenario draws on an in-depth analysis of the situation surrounding the activity or the country concerned. The stressed scenario describes triggering events and assumptions about the sequence of a crisis, both in quantitative terms (changes in a country’s GDP, the unemployment rate, deterioration in a sector) and qualitative terms.
Structured around the portfolio analysis function, the Risk Division teams translate these economic scenarios into impacts on risk parameters (default exposure, default rate, provisioning rate at entry into default, etc.). To do this, the leading methods are based in particular on the historical relationship between economic conditions and risk parameters. Like in global stress tests, in connection with the regulatory Pillar, stress tests routinely take into account the possible effect of counterparty performance for counterparties in which the Group is most highly concentrated in a stressed environment.
ImpairmentImpairment break down into impairments on groups of homogeneous assets, which cover performing loans, and specific impairment, which cover counterparties in default.
n Impairment on groups of homogeneous assets
Impairments on groups of homogeneous assets are collective impairments booked for portfolios that are homogenous and have a deteriorated risk profile although no objective evidence of default can be observed at an individual level.
These homogeneous groups can include sensitive counterparties, sectors or countries. They are identified through regular analyses of the portfolio by sector, country or counterparty type.
These impairments are calculated on the basis of assumptions on default rates and loss rates after default. These assumptions are calibrated by homogeneous group based on their specific characteristics, sensitivity to economic environment and historical data. They are reviewed periodically by the Risk Division.
n Specific impairment
Decisions to book individual impairments on certain counterparties are taken where there is objective evidence of default. The amount of impairment depends on the probability of recovering the amounts due. The expected cash flows are based on the financial position of the counterparty, its economic prospects and the guarantees called up or that may be called up.
SOCIETE GENERALE GROUP I 2014 REGISTRATION DOCUMENT I 153
CREDIT RISKS I RISKS AND CAPITAL ADEQUACY I 4
A counterparty is deemed to be in default when at least one of the following conditions is verified:
n a significant decline in the counterparty’s financial condition leads to a high probability of it being unable to fulfil its overall commitments (credit obligations) hence a risk of loss to the bank whether or not the debt is restructured; and/or
n one or more payments past due by more than 90 days are recorded; (excepted for retail loans secured by real estate and those relating to local authorities); and/or
n an out of court settlement procedure is initiated, and/or
n a legal proceeding such as a bankruptcy, legal settlement or compulsory liquidation is in progress.
The Group applies the default contagion principle to all of a counterparty’s outstandings: when a transaction exposure is assessed as defaulted, all of a counterparty’s outstandings are assessed as defaulted. When a debtor belongs to a group, all of the group’s outstandings are generally defaulted as well.
REPLACEMENT RISK
Counterparty risk associated with derivative transactions is a type of credit risk (potential loss in the event the counterparty defaults) that is also called replacement risk. It represents the current cost to the Group of replacing transactions with a positive value should the counterparty default. Transactions giving rise to a replacement risk are, inter alia, security repurchase agreements, securities lending and borrowing and over-the-counter derivative contracts such as swaps, options and futures.
Management of counterparty risk linked to market transactionsSociete Generale places great emphasis on carefully monitoring its credit and counterparty risk exposure in order to minimise its losses in case of default. Counterparty limits are assigned to all counterparties (banks, other financial institutions, corporates and public institutions).
In order to quantify the potential replacement risk, Societe Generale uses an internal model: the future fair value of trading transactions with counterparties is modelled, taking into account any netting and correlation effects. Estimates are derived from Monte-Carlo models developed by the Risk Division, based on a historical analysis of market risk factors, and take into account guarantees and collateral.
Societe Generale uses two indicators to describe the subsequent distribution resulting from the Monte-Carlo simulations:
n current average risk, suited to analysing the risk exposure for a portfolio of customers;
n credit VaR (or CVaR): the largest loss that would be incurred after eliminating the top 1% of the most adverse occurrences, used to set the risk limits for individual counterparties.
Societe Generale has also developed a series of stress test scenarios used to calculate the exposure linked to changes in the fair value of transactions with all of its counterparties in the event of an extreme shock to market parameters.
Setting individual counterparty limitsThe credit profile of counterparties is reviewed on a regular basis and limits are set both according to the type and maturity of the instruments concerned. The intrinsic creditworthiness of counterparties and the reliability of the associated legal documentation are two factors considered when setting these limits. Fundamental credit analysis is also supplemented by relevant peer comparisons and a market watch.
Information technology systems allow both traders and the Risk Division to ensure on a day-to-day basis that counterparty limits are not exceeded and that incremental authorisations are requested as needed.
Any significant weakening in the bank’s counterparties also prompts urgent internal rating reviews. A specific supervision and approval process is put in place for more sensitive counterparties or more complex financial instruments.
Calculation of Exposure at Default(1) within the regulatory frameworkIn 2012 then in 2013, the Autorité de contrôle Prudentiel et de Résolution (ACPR - French Prudential and Resolution Supervisory Authority approved the use of the internal model described above to determine the Effective Expected Positive Exposure (EEPE) indicator used in calculating counterparty risk-adjusted capital. Since December 2013, the EAD relative to the counterparty risk calculated since June 2012 on the basis of this new indicator for the simplest products has also been calculated for the most complex derivative products. This new method is used for 90% of transactions.
For other purposes, the Group uses the marked-to-market valuation method. In this method, the EAD relative to the bank’s counterparty risk is determined by aggregating the positive market values of all transactions (replacement cost) and increasing the sum with an add-on. This add-on, which is calculated in line with the CRD (Capital Requirement Directive) guidelines, is a fixed percentage according to the type of transaction and the residual maturity, which is applied to the transaction’s nominal value.
(1) Exposure at default (EAD) of a loan is equal to its nominal amount. The potential loss amount of a derivative product is its marked-to-market valuation when the counterparty defaults, which can be only statistically approximated. Therefore, two methods for the calculation of the EAD of derivative products are allowed, one using the marked-to-market valuation and one using the internal model approach (see above).
154 I 2014 REGISTRATION DOCUMENT I SOCIETE GENERALE GROUP
4 I RISKS AND CAPITAL ADEQUACY I CREDIT RISKS
In both cases, the effects of netting agreements and collateral are factored in by applying the netting rules as defined by the marked-to-market method and subtracting guarantees or collateral. Regulatory capital requirements also depend on the internal rating of the debtor counterparty.
Credit adjustmentReserve policies are recognised on CVA (Credit Value Adjustments) on the over-the-counter trading portfolio per counterparty in order to take into account counterparty risk.
Since the start of 2013, the Group has fine-tuned its method of taking credit risk into account in the pricing of derivatives products.
Wrong-way risk adjustmentWrong-way risk is the risk that Group exposure strongly increases when the probability that the counterparty defaults also increases.
Two separate cases exist:
n specific wrong-way risk, where the amount of exposure is directly related to the counterparty’s credit quality;
n general wrong-way risk, where there is a significant correlation between some market factors and the counterparty’s creditworthiness.
Wrong-way risk is subject to identification procedures, calculation of exposures as well as specific and regular monitoring of identified counterparties.
HEDGING OF CREDIT RISK
Guarantees and collateralThe Group uses credit risk mitigation techniques both for market and commercial banking activities. These techniques provide partial or full protection against the risk of debtor insolvency.
There are two main techniques:
n personal guarantees correspond to the commitment made by a third party to substitute for the primary debtor in the event of the latter’s default. Guarantees encompass the protection commitments and mechanisms provided by banks and similar credit institutions, specialised institutions such as mortgage guarantors (such as Crédit Logement in France), monoline or multiline insurers, export credit agencies, etc. By extension, credit insurance and credit derivatives (purchase of protection) also belong to this category;
n collateral can consist of physical assets in the form of property, commodities or precious metals, as well as financial instruments such as cash, high-quality investments and securities and also insurance policies.
Appropriate haircuts are applied to the value of collateral, reflecting its quality and liquidity.
The Group proactively manages its risks by diversifying guarantees: physical collateral, personal guarantees and others (including CDS).
During the credit approval process, an assessment of the value of guarantees and collateral, their legal enforceability and the guarantor’s ability to meet its obligations is undertaken. This process also ensures that the collateral or guarantee successfully meets the criteria set forth in the Capital Requirements Directive (CRD).
Guarantor ratings are reviewed internally at least once a year and collateral is subject to revaluation at least once a year.
The Risk Department is responsible for validating the operating procedures established by the business divisions for the regular valuation of guarantees and collateral, either automatically or based on an expert opinion, both during the approval phase for a new loan or upon the annual renewal of the credit application.
The total amount of guarantees and collateral related to on and off-balance sheet assets, allocated for the calculation of Group capital requirements was EUR 156.5 billion as at 31 December 2013 of which EUR 137.9 billion related to on-balance sheets assets. The total amount is split between EUR 91.8 billion for retail customers and EUR 64.7 billion for non-retail customers (versus EUR 92.8 billion and EUR 70 billion, respectively as at 31 December 2012).
Alongside the regulatory calculation of Group capital requirements, a data collection process is in place for guarantees and collateral related to past due loans not individually impaired as well as individually impaired loans. The amount of guarantees and collateral related to past due not individually impaired loans was EUR 3.1 billion (EUR 1.8 billion for retail customers and EUR 1.3 billion for non-retail customers) as at 31 December 2013. The amount of guarantees and collateral related to individually impaired loans was EUR 7.3 billion (EUR 3.3 billion for retail customers and EUR 4 billion for non-retail customers) as at 31 December 2013. These amounts are capped to the individually impaired loan outstanding amount.
Use of credit derivatives to manage corporate concentration riskWithin Corporate and Investment Banking, it is the responsibility of the Credit Portfolio Management (CPM) department to work in close cooperation with the Risk Division and the core businesses to reduce excessive portfolio concentrations and react quickly to any deterioration in the creditworthiness of a particular counterparty. CPM has now been merged with the department responsible for managing scarce resources for the credit and loan portfolio.
SOCIETE GENERALE GROUP I 2014 REGISTRATION DOCUMENT I 155
CREDIT RISKS I RISKS AND CAPITAL ADEQUACY I 4
The Group uses credit derivatives in the management of its Corporate credit portfolio, primarily to reduce individual, sector and geographic concentration and to implement a proactive risk and capital management approach. Individual protection is essentially purchased under the over-concentration management policy. For example, the ten most hedged names account for 98% of the total amount of individual protections purchased.
The notional value of Corporate credit derivatives (Credit Default Swaps, CDS) purchased for this purpose is booked in off-balance sheet commitments under guarantee commitments received.
Total outstanding purchases of protection through Corporate credit derivatives is stable at EUR 1.4 billion at end-December (compared to EUR 1.9 billion at end-December 2012).
In 2013, the spreads on Credit Default Swaps (CDS) from European investment-grade issuances (Itraxx index) narrowed, reducing the portfolio’s sensitivity to tightening spreads. Consequently, the credit derivatives transactions implemented in prior years to limit the earnings volatility generated by this CDS portfolio (these positions are valued at marked-to-market) have not needed to be renewed.
Almost all protection was purchased from bank counterparties with ratings of BBB+ or above, the average being A/A-. Concentration with any particular counterparty is also carefully monitored.
Mitigation of counterparty risk linked to market transactionsSociete Generale uses different techniques to reduce this risk. With regard to trading counterparties, it seeks to implement master agreements with termination-clearing clause wherever it can. In the event of default, they allow netting of all due and payable amounts. The contracts usually call for the revaluation of required collateral at regular time intervals (often on a daily basis) and for the payment of the corresponding margin calls. Collateral is largely composed of cash and high-quality liquid assets such as government bonds with a good rating. Other tradable assets are also accepted, provided that the appropriate haircuts are made to reflect the lower quality and/or liquidity of the asset.
At 31 December 2013, most over-the-counter (OTC) transactions were secured: by amount, 59% of transactions with positive mark to market (collateral received by Societe Generale) and 75% of transactions with negative mark to market (collateral posted by Societe Generale).
Management of OTC collateral is monitored on an ongoing basis in order to minimise operational risk:
n the exposure value of each collateralised transaction is certified on a daily basis;
n specific controls are conducted to make sure the process goes smoothly (settlement of collateral, cash or securities; monitoring of suspended transactions, etc.);
n all outstanding secured transactions are reconciled with those of the counterparty according to a frequency set by the regulator (mainly on a daily basis) in order to prevent and/or resolve any disputes on margin calls;
n any legal disputes are monitored daily and reviewed by a committee.
Credit insuranceIn addition to using export credit agencies (for example Coface and Exim) and multilateral organisations (for example the EBRD), Societe Generale has been developing relationships with private insurers over the last several years in order to hedge some of its loans against commercial and political non-payment risks.
This activity is performed within a risk framework and monitoring system validated by the Group’s General Management. This system is based on an overall limit for the activity, along with sub-limits by maturity, and individual limits for each insurance counterparty which must meet strict eligibility criteria.
The implementation of such a policy contributes overall to sound risk reduction.
RISK MEASUREMENT AND INTERNAL RATINGS
The Group’s rating system relies on a quantitative analysis of the credit risks based on models that estimate the internal Basel parameters. In this regard, these models are used to calculate the Group’s regulatory capital requirements. They also comply with the Group’s risk management objectives and operational activities. As such, they are used as a tool to structure, price and approve transactions and help to determine the limits for approval decisions assigned to the operational teams and the Risk function.
In calculating capital requirements according to the IRBA (Internal Ratings Based Approach) method, Societe Generale uses the Basel parameters below:
n Exposure at Default (EAD): EAD is defined as the Group’s exposure in the event the counterparty should default. EAD includes exposures recorded on balance sheet (loans, receivables, income receivable, market transactions, etc.), and off-balance sheet exposures converted into a balance-sheet equivalent using internal or regulatory credit conversion factors (CCF) (drawdown assumption);
n Probability of Default (PD): the probability that a counterparty of the bank will default within one year;
n Loss Given Default (LGD): the ratio between the loss incurred on an exposure in the event a counterparty defaults and the exposure amount at the time of default.
These three parameters help to estimate regulatory capital requirements by calculating risk-weighted assets (RWA) and expected losses (EL), the losses likely to be incurred considering the quality of the transaction arrangement and all the measures taken to mitigate the risk.
For guarantees and credit derivatives, the Group takes into account their impact by substituting the guarantor’s PD, LGD and risk-weighting formula for that of the borrower (the exposure is considered as a direct exposure to the guarantor) where the guarantor’s risk-weighting is more favourable than the borrower’s.
For exposures under the internal approach, the Group takes into account the collateral (physical or financial) in the LGD calculation.
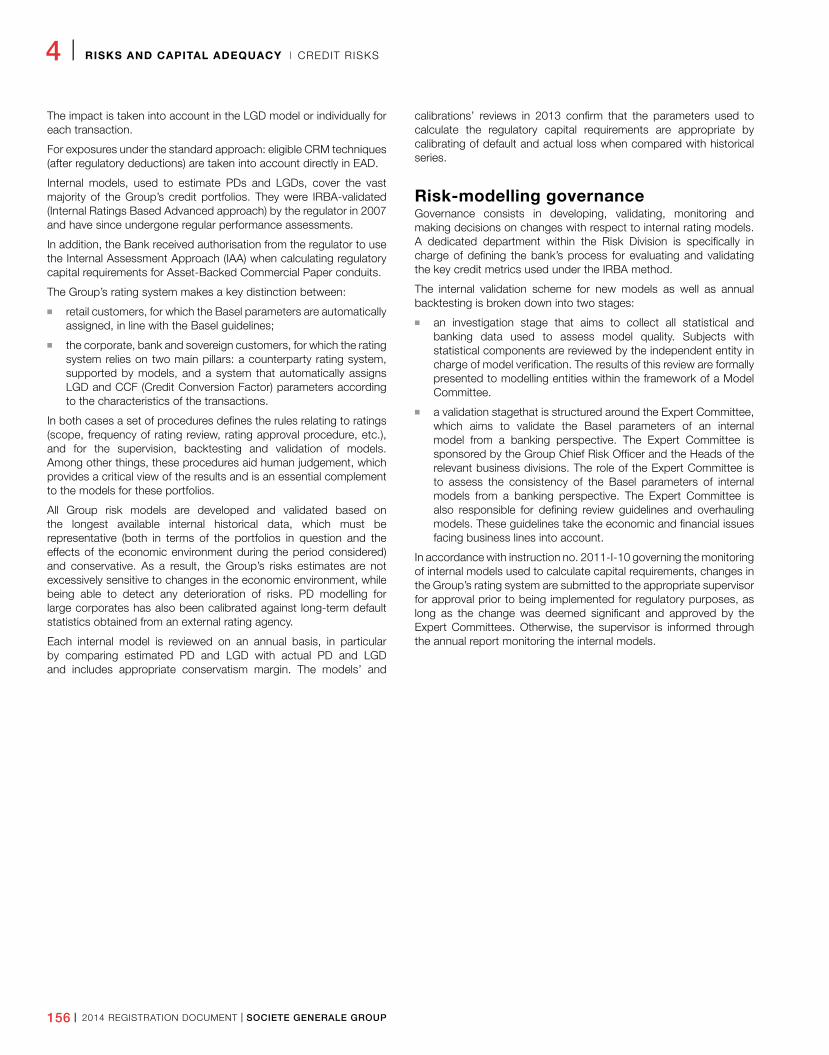
156 I 2014 REGISTRATION DOCUMENT I SOCIETE GENERALE GROUP
4 I RISKS AND CAPITAL ADEQUACY I CREDIT RISKS
The impact is taken into account in the LGD model or individually for each transaction.
For exposures under the standard approach: eligible CRM techniques (after regulatory deductions) are taken into account directly in EAD.
Internal models, used to estimate PDs and LGDs, cover the vast majority of the Group’s credit portfolios. They were IRBA-validated (Internal Ratings Based Advanced approach) by the regulator in 2007 and have since undergone regular performance assessments.
In addition, the Bank received authorisation from the regulator to use the Internal Assessment Approach (IAA) when calculating regulatory capital requirements for Asset-Backed Commercial Paper conduits.
The Group’s rating system makes a key distinction between:
n retail customers, for which the Basel parameters are automatically assigned, in line with the Basel guidelines;
n the corporate, bank and sovereign customers, for which the rating system relies on two main pillars: a counterparty rating system, supported by models, and a system that automatically assigns LGD and CCF (Credit Conversion Factor) parameters according to the characteristics of the transactions.
In both cases a set of procedures defines the rules relating to ratings (scope, frequency of rating review, rating approval procedure, etc.), and for the supervision, backtesting and validation of models. Among other things, these procedures aid human judgement, which provides a critical view of the results and is an essential complement to the models for these portfolios.
All Group risk models are developed and validated based on the longest available internal historical data, which must be representative (both in terms of the portfolios in question and the effects of the economic environment during the period considered) and conservative. As a result, the Group’s risks estimates are not excessively sensitive to changes in the economic environment, while being able to detect any deterioration of risks. PD modelling for large corporates has also been calibrated against long-term default statistics obtained from an external rating agency.
Each internal model is reviewed on an annual basis, in particular by comparing estimated PD and LGD with actual PD and LGD and includes appropriate conservatism margin. The models’ and
calibrations’ reviews in 2013 confirm that the parameters used to calculate the regulatory capital requirements are appropriate by calibrating of default and actual loss when compared with historical series.
Risk-modelling governanceGovernance consists in developing, validating, monitoring and making decisions on changes with respect to internal rating models. A dedicated department within the Risk Division is specifically in charge of defining the bank’s process for evaluating and validating the key credit metrics used under the IRBA method.
The internal validation scheme for new models as well as annual backtesting is broken down into two stages:
n an investigation stage that aims to collect all statistical and banking data used to assess model quality. Subjects with statistical components are reviewed by the independent entity in charge of model verification. The results of this review are formally presented to modelling entities within the framework of a Model Committee.
n a validation stagethat is structured around the Expert Committee, which aims to validate the Basel parameters of an internal model from a banking perspective. The Expert Committee is sponsored by the Group Chief Risk Officer and the Heads of the relevant business divisions. The role of the Expert Committee is to assess the consistency of the Basel parameters of internal models from a banking perspective. The Expert Committee is also responsible for defining review guidelines and overhauling models. These guidelines take the economic and financial issues facing business lines into account.
In accordance with instruction no. 2011-I-10 governing the monitoring of internal models used to calculate capital requirements, changes in the Group’s rating system are submitted to the appropriate supervisor for approval prior to being implemented for regulatory purposes, as long as the change was deemed significant and approved by the Expert Committees. Otherwise, the supervisor is informed through the annual report monitoring the internal models.
SOCIETE GENERALE GROUP I 2014 REGISTRATION DOCUMENT I 157
CREDIT RISKS I RISKS AND CAPITAL ADEQUACY I 4
SCOPE OF APPLICATION OF CAPITAL EVALUATION METHODS
Since 2007, Societe Generale has obtained authorisation from its supervisory authorities to apply the internal ratings (IRB) method for most of its exposures for calculating capital requirements in respect of credit risk.
The Group will selectively transition to the IRB method for some of its activities and exposures that currently use the standard approach. These transitions will have a marginal impact on the Group’s regulatory capital.
| BREAKDOWN OF EAD(1) BY BASEL APPROACH(2)
31.12.2013 31.12.2012
IRB 83% 82%
Standard 17% 18%
Total 100% 100%
(1) The EAD reported here are presented in accordance with the Capital Requirements Directive (CRD), transposed into French regulation.
(2) Excluding equity investments, fixed assets and accruals.
CREDIT RISK: QUANTITATIVE INFORMATIONS
Credit Risk exposureThe measurement used for credit exposures in this section is EAD—Exposure At Default (on-balance sheet and off-balance sheet), excluding fixed assets, equity investments, and accruals.
At 31 December 2013, the Group’s Exposure at Default (EAD) amounted to EUR 650 billion (including EUR 531 billion in on-balance sheet) and to EUR 635 billion excluding securitisation.
| CREDIT RISK EXPOSURE BY EXPOSURE CLASS
| EXCLUDING SECURITISATION (EAD)
Global portfolio (In millions of euros) 31.12.2013 31.12.2012(1)
Exposure Class
Sovereign 143,041 143,422
Institutions* 61,113 71,585
Corporate 250,248 266,682
Retail 180,646 184,282
TOTAL 635,048 665,971
* Institutions: Basel classification banks and public sector entities.
| RETAIL CREDIT RISK EXPOSURE BY EXPOSURE CLASS
| (EAD)
Retail portfolio (In millions of euros) 31.12.2013 31.12.2012(1)
Exposure Class
Residential mortgages 93,640 94,565
Revolving credit 8,896 9,686
Other credit to individuals 53,268 54,081
Very small enterprises and self-employed 24,841 25,950
TOTAL 180,646 184,282
(1) EAD under Standard Approach calculated net of collateral.
| SECTOR BREAKDOWN OF GROUP CORPORATE
| EXPOSURE AT 31 DECEMBER 2013
| (BASEL CORPORATE PORTFOLIO,
| EUR 250 BILLION IN EAD)
The Group’s Corporate portfolio (Large Corporates, SMEs and Specialised Financing) is highly diversified in terms of sectors.
Only the Finance and Insurance sector accounts for more than 10% of the portfolio.
The Group’s exposure to its ten largest corporate counterparties accounts for 6% of this portfolio.
Telecoms
Personnel &domestic services
Collective services
Business services
Health, social services
Oil and gas
Media
Metals, minerals
Forestry, papers
Machinery and equipment
Automobiles
Hotels & Catering
Finance & insurance
Transport & logistics
Real estate
Public administration
Food andagriculture
Consumergoods
Chemicals, rubber,plastics
Retail trade
Wholesale trade
Construction
Education, associations
Transport equip. manuf.
2.4%
0.1%
7.1%
8.8%
1.0%
6.4%
1.0%
3.7%
0.6%
3.4%
1.7%
1.6%
17.1%
8.1%
9.0%
0.1%
4.6%
2.2%
1.9%
5.1%
8.7%
4.2%
0.5%
0.9%
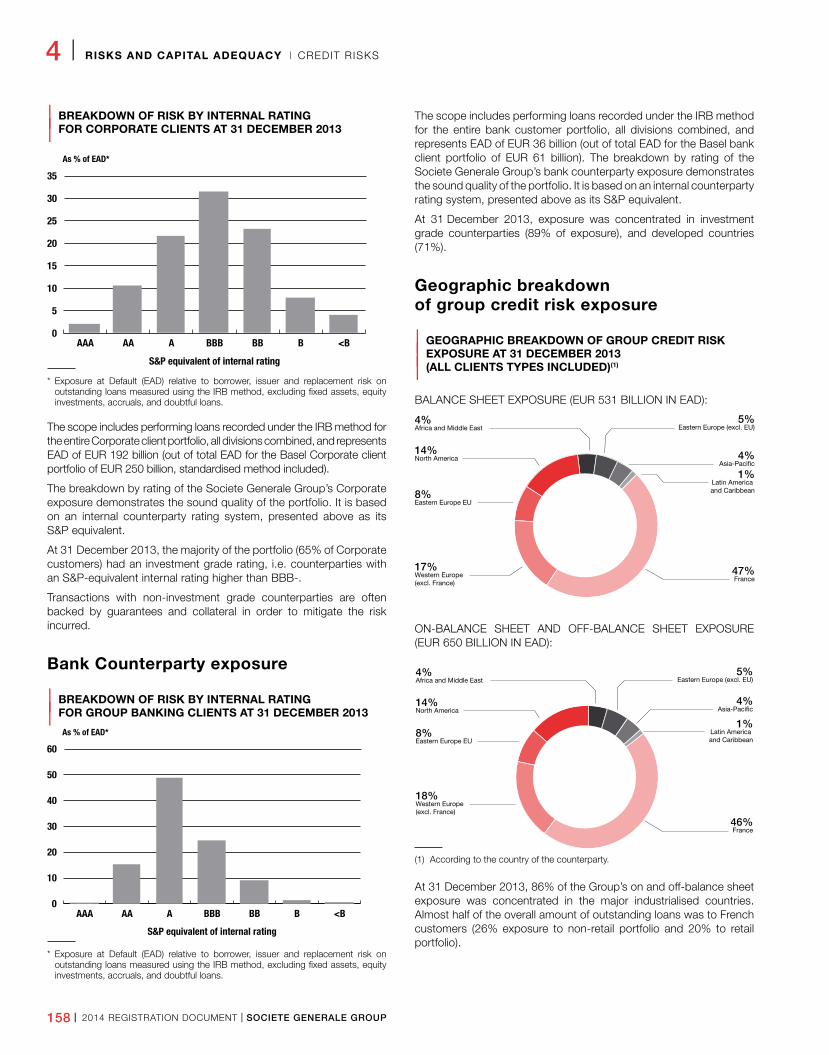
158 I 2014 REGISTRATION DOCUMENT I SOCIETE GENERALE GROUP
4 I RISKS AND CAPITAL ADEQUACY I CREDIT RISKS
| BREAKDOWN OF RISK BY INTERNAL RATING
| FOR CORPORATE CLIENTS AT 31 DECEMBER 2013
<BBBBBBBAAAAAA
As % of EAD*
S&P equivalent of internal rating
35
30
25
20
15
10
5
0
* Exposure at Default (EAD) relative to borrower, issuer and replacement risk on outstanding loans measured using the IRB method, excluding fixed assets, equity investments, accruals, and doubtful loans.
The scope includes performing loans recorded under the IRB method for the entire Corporate client portfolio, all divisions combined, and represents EAD of EUR 192 billion (out of total EAD for the Basel Corporate client portfolio of EUR 250 billion, standardised method included).
The breakdown by rating of the Societe Generale Group’s Corporate exposure demonstrates the sound quality of the portfolio. It is based on an internal counterparty rating system, presented above as its S&P equivalent.
At 31 December 2013, the majority of the portfolio (65% of Corporate customers) had an investment grade rating, i.e. counterparties with an S&P-equivalent internal rating higher than BBB-.
Transactions with non-investment grade counterparties are often backed by guarantees and collateral in order to mitigate the risk incurred.
Bank Counterparty exposure
| BREAKDOWN OF RISK BY INTERNAL RATING
| FOR GROUP BANKING CLIENTS AT 31 DECEMBER 2013
0
10
20
30
60
40
50
<BBBBBBBAAAAAA
As % of EAD*
S&P equivalent of internal rating
* Exposure at Default (EAD) relative to borrower, issuer and replacement risk on outstanding loans measured using the IRB method, excluding fixed assets, equity investments, accruals, and doubtful loans.
The scope includes performing loans recorded under the IRB method for the entire bank customer portfolio, all divisions combined, and represents EAD of EUR 36 billion (out of total EAD for the Basel bank client portfolio of EUR 61 billion). The breakdown by rating of the Societe Generale Group’s bank counterparty exposure demonstrates the sound quality of the portfolio. It is based on an internal counterparty rating system, presented above as its S&P equivalent.
At 31 December 2013, exposure was concentrated in investment grade counterparties (89% of exposure), and developed countries (71%).
Geographic breakdown of group credit risk exposure
| GEOGRAPHIC BREAKDOWN OF GROUP CREDIT RISK
| EXPOSURE AT 31 DECEMBER 2013
| (ALL CLIENTS TYPES INCLUDED)(1)
BALANCE SHEET EXPOSURE (EUR 531 BILLION IN EAD):
Latin America and Caribbean
France
Eastern Europe EU
Western Europe(excl. France)
17%
North America14%
5%
1%
Africa and Middle East4%
47%
8%
Eastern Europe (excl. EU)
4%Asia-Pacific
Latin America and Caribbean
France
Eastern Europe EU
Western Europe(excl. France)
18%
North America14%
5%
1%
Africa and Middle East4%
46%
8%
Eastern Europe (excl. EU)
4%Asia-Pacific
ON-BALANCE SHEET AND OFF-BALANCE SHEET EXPOSURE (EUR 650 BILLION IN EAD):
Latin America and Caribbean
France
Eastern Europe EU
Western Europe(excl. France)
17%
North America14%
5%
1%
Africa and Middle East4%
47%
8%
Eastern Europe (excl. EU)
4%Asia-Pacific
Latin America and Caribbean
France
Eastern Europe EU
Western Europe(excl. France)
18%
North America14%
5%
1%
Africa and Middle East4%
46%
8%
Eastern Europe (excl. EU)
4%Asia-Pacific
(1) According to the country of the counterparty.
At 31 December 2013, 86% of the Group’s on and off-balance sheet exposure was concentrated in the major industrialised countries. Almost half of the overall amount of outstanding loans was to French customers (26% exposure to non-retail portfolio and 20% to retail portfolio).
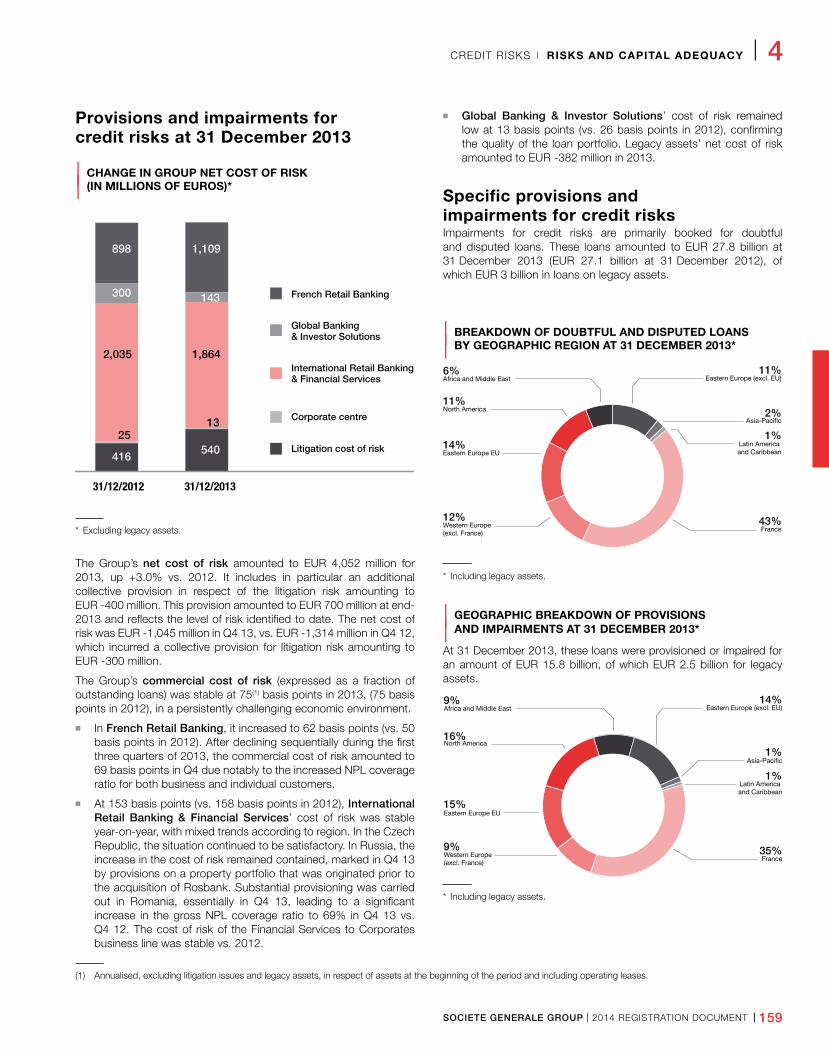
SOCIETE GENERALE GROUP I 2014 REGISTRATION DOCUMENT I 159
CREDIT RISKS I RISKS AND CAPITAL ADEQUACY I 4
Provisions and impairments for credit risks at 31 December 2013
| CHANGE IN GROUP NET COST OF RISK
| (IN MILLIONS OF EUROS)*
Global Banking & Investor Solutions
French Retail Banking
International Retail Banking& Financial Services
Corporate centre
Litigation cost of risk
31/12/2012
416 540
25 13
2,035 1,864
898 1,109
300 143
31/12/2013
* Excluding legacy assets.
The Group’s net cost of risk amounted to EUR 4,052 million for 2013, up +3.0% vs. 2012. It includes in particular an additional collective provision in respect of the litigation risk amounting to EUR -400 million. This provision amounted to EUR 700 million at end-2013 and reflects the level of risk identified to date. The net cost of risk was EUR -1,045 million in Q4 13, vs. EUR -1,314 million in Q4 12, which incurred a collective provision for litigation risk amounting to EUR -300 million.
The Group’s commercial cost of risk (expressed as a fraction of outstanding loans) was stable at 75(1) basis points in 2013, (75 basis points in 2012), in a persistently challenging economic environment.
n In French Retail Banking, it increased to 62 basis points (vs. 50 basis points in 2012). After declining sequentially during the first three quarters of 2013, the commercial cost of risk amounted to 69 basis points in Q4 due notably to the increased NPL coverage ratio for both business and individual customers.
n At 153 basis points (vs. 158 basis points in 2012), International Retail Banking & Financial Services’ cost of risk was stable year-on-year, with mixed trends according to region. In the Czech Republic, the situation continued to be satisfactory. In Russia, the increase in the cost of risk remained contained, marked in Q4 13 by provisions on a property portfolio that was originated prior to the acquisition of Rosbank. Substantial provisioning was carried out in Romania, essentially in Q4 13, leading to a significant increase in the gross NPL coverage ratio to 69% in Q4 13 vs. Q4 12. The cost of risk of the Financial Services to Corporates business line was stable vs. 2012.
n Global Banking & Investor Solutions’ cost of risk remained low at 13 basis points (vs. 26 basis points in 2012), confirming the quality of the loan portfolio. Legacy assets’ net cost of risk amounted to EUR -382 million in 2013.
Specific provisions and impairments for credit risksImpairments for credit risks are primarily booked for doubtful and disputed loans. These loans amounted to EUR 27.8 billion at 31 December 2013 (EUR 27.1 billion at 31 December 2012), of which EUR 3 billion in loans on legacy assets.
| BREAKDOWN OF DOUBTFUL AND DISPUTED LOANS
| BY GEOGRAPHIC REGION AT 31 DECEMBER 2013*
* Including legacy assets.
| GEOGRAPHIC BREAKDOWN OF PROVISIONS
| AND IMPAIRMENTS AT 31 DECEMBER 2013*
At 31 December 2013, these loans were provisioned or impaired for an amount of EUR 15.8 billion, of which EUR 2.5 billion for legacy assets.
* Including legacy assets.
12%
11%
11%
1%
6%
43%
14%
2%
9%
16%
14%
1%
9%
35%
15%
1%
Latin America and Caribbean
France
Eastern Europe EU
Western Europe(excl. France)
North America
Africa and Middle East Eastern Europe (excl. EU)
Asia-Pacific
Latin America and Caribbean
France
Eastern Europe EU
Western Europe(excl. France)
North America
Africa and Middle East Eastern Europe (excl. EU)
Asia-Pacific
(1) Annualised, excluding litigation issues and legacy assets, in respect of assets at the beginning of the period and including operating leases.
160 I 2014 REGISTRATION DOCUMENT I SOCIETE GENERALE GROUP
4 I RISKS AND CAPITAL ADEQUACY I CREDIT RISKS
Impairments for groups of homogeneous assetsAt 31 December 2013, the Group’s provisions for groups of homogeneous assets amounted to EUR 1.2 billion.
Doubtful loans coverage ratio
31.12.2013 31.12.2012
Gross book outstandings in EUR bn* 416.7 417.6
Doubtful loans in EUR bn* 24.9 23.8
– Collateral relating to doubtful loans in EUR bn* 7.3 6.1
– Provisionable commitments in EUR bn* 17.5 17.7
Net doubtful loans ratio (provisionable commitments / gross book outstandings*) 4.2% 4.2%
Gross doubtfu loans ratio (doubtful loans / gross book outstandings*) 6.0% 5.7%
Specific impairments nts in EUR bn* 13.3 12.7
Specific impairments/Provisionable commitments* 76% 72%
Impairment for groups of homogenous assets in EUR bn* 1.2 1.1
Net doubtful loans coverage ratio (overall provisions / provisionable commitments) 83% 78%
Gross doubtful loans coverage ratio (overall provisions / doubtful loans) 58% 58%
* Excluding legacy assets (provisions of EUR 2.5bn as of 31 December 2013, and EUR 2.3bn as of 31 December 2012).
Customer loans, deposits at banks and loans due from banks and leasing. Including lease assets (outstandings of EUR 10.8bn as of 3 December 2013; EUR 10.4bn as of 31 December 2012).
SOCIETE GENERALE GROUP I 2014 REGISTRATION DOCUMENT I 161
SECURITISATION I RISKS AND CAPITAL ADEQUACY I 4
5 . S E C U R I T I S AT I O N
SECURITISATIONS AND REGULATORY FRAMEWORK
This chapter presents information on Societe Generale’s securitisation activities, acquired or carried out for proprietary purposes or for its customers. It describes the risks associated with these activities and the management of said risks. Finally, it contains some quantitative information to describe these activities during 2013 as well as the capital requirements for the Group’s regulatory banking book and trading book within the scope defined by prudential regulations.
As defined in prudential regulations, the term securitisation refers to a transaction or scheme, whereby the credit risk associated with an exposure or pool of exposures is tranched, having the following characteristics:
n the transaction achieves significant risk transfer;
n payments in the transaction or scheme are contingent on the performance of the exposure or pool of exposures;
n the subordination of tranches determines the distribution of losses during the ongoing life of the transaction or risk transfer scheme.
Securitisation positions are subject to the regulatory accounting treatment defined in the CRD, as transposed into French law through Title V of the 20 February 2007 Decree on capital requirements applicable to credit institutions and investment firms (European regulation 575/2013, applicable from 1 January 2014, does not change the calculation methods). Such positions held in the regulatory banking book or trading book are given weightings ranging from 7% to 1,250% depending on their credit quality and subordination rank.
ACCOUNTING METHODS
The securitisation transactions that Societe Generale invests in are recognised in accordance with Group accounting principles, as set forth in the notes to the consolidated financial statements (“Significant accounting principles”).
After initial recognition, securitisation positions booked to “Loans and receivables” are measured at amortised cost using the effective interest rate method and impairment may be recorded if appropriate.
Securitisation positions booked to “Available-for-sale financial assets” are measured at their fair value at the closing date. Interest accrued or paid on fixed-income securities is recognised in the income statement using the effective interest rate method under “Interest and similar income – Transactions in financial instruments”. Changes in fair value other than income are recorded in shareholders’ equity under “Gains and losses recognised directly in equity”.
The Group only records these changes in fair value in the income statement when the asset is sold or impaired, in which case they are reported as “Net gains or losses on available-for-sale financial assets”. When a decline in the fair value of an Available-for-sale financial asset has been recognised directly in shareholders’ equity under “Gains and losses recognised directly in equity” and subsequent objective evidence of impairment emerges, the Group recognises the total accumulated unrealised loss previously booked to shareholders’ equity in the income statement under “Cost of risk” for debt instruments and under “Net gains and losses on available for-sale financial assets” for equity securities.
This cumulative loss is measured as the difference between
acquisition cost (net of any repayments of principal and amortisation) and the current fair value, less any impairment of the financial asset that has already been booked through profit or loss.
For assets transferred from another accounting category, amortised cost is determined based on estimated future cash flows determined at the date of reclassification. The estimated future cash flows are reviewed at each closing. In the event of an increase in estimated future cash flows, as a result of an increase in their recoverability, the effective interest rate is adjusted prospectively. However, where there is objective evidence of impairment due to an event occurring after the reclassification of the financial assets under consideration, and said event has an adverse impact on initially estimated future cash flows, an impairment on the asset in question is booked to “Cost of risk” on the income statement.
Synthetic securitisations in the form of Credit Default Swaps follow accounting recognition rules specific to trading derivatives.
The securitisation transactions are derecognised when the contractual rights to the cash flows on the asset expire or when the Group has transferred the contractual rights to receive the cash flows and substantially all of the risks and rewards linked to the ownership of the asset. Where the Group has transferred the cash flows of a financial asset but has neither transferred nor retained substantially all the risks and rewards of its ownership and has effectively not retained control of the financial asset, the Group derecognises it and, where necessary, recognises a separate asset or liability to cover any rights and obligations created or retained as a result of the asset’s transfer. If the Group has
162 I 2014 REGISTRATION DOCUMENT I SOCIETE GENERALE GROUP
4 I RISKS AND CAPITAL ADEQUACY I SECURITISATION
retained control of the asset, it continues to recognise it in the balance sheet to the extent of its continuing involvement in that asset.
When a financial asset is derecognised in its entirety, a gain or loss on disposal is recorded in the income statement for an amount equal to the difference between the carrying value of the asset and the
payment received for it, adjusted where necessary for any unrealised profit or loss previously recognised directly in equity.
The originated loans awaiting for securitisation remains in their intial classification.
TREATMENT OF SPECIAL PURPOSE VEHICLES (SPV)
Special Purpose Vehicles are independent legal entities that are set up specifically to manage a transaction or group of similar transactions. They are consolidated whenever they are effectively controlled by the Group, even in cases where the Group has no equity in the entities.
Control of a special purpose vehicle is generally considered to exist if any one of the following criteria applies:
n The SPV is acting exclusively on behalf of, and for the benefit of the Group;
n The Group effectively controls the SPV so that it can obtain the majority of the benefits of the SPV, whether or not this control has been delegated through an “autopilot” mechanism;
n The Group receives the majority of the benefits of the SPV;
n The Group retains the majority of the risks of the SPV.
In consolidating SPVs considered to be effectively controlled by the
Group, those shares of entities not held by the Group are recognized as debt in the balance sheet.
When customers loans are securitised and partially sold to external investors, the SPV carrying the loans are consolidated if the Group remains exposed to the majority of the risks and benefits associated with these loans. Furthermore, such loans can neither be used as collateral nor sold outright in other transactions.
The new standard IFRS 10 “Consolidated Financial Statements” modifies the definition of control in a way that will imply a more judgmental approach to assess the control over an entity. The new definition of control includes all of the following elements: power over the investee, rights or exposure to variable returns of the investee and ability to use the power over the investee to affect the amount of the investor’s returns. Following this new definition of control, two securitisation vehicles, Barton and Antalis, structured on behalf of third parties will be consolidated from 1 January 2014.
MONITORING OF SECURITISATION RISKS
Securitisation risks are monitored according to the rules established by the Group, depending on whether the assets are recorded in the regulatory banking book (via credit risk and counterparty risk) or in the trading book (via market risk and counterparty risk).
Structural risks and liquidity riskStructural risks and foreign exchange risk associated with securitisation activities are monitored in the same way as for other Group assets. Oversight of structural interest rate risks is described in section 8 of this chapter, p. 186.
However, liquidity risk linked to securitisation activities is subject to more specific monitoring, both at the level of the responsible
business lines and centrally at the Finance Division level. The internal liquidity monitoring model is used primarily to measure the impact of these activities on the Group’s liquidity ratios, stress tests and liquidity gaps. The organisation and oversight of liquidity risk is described in section 9 of this chapter, p. 190.
Operational riskSecuritisation activities are monitored specifically for operational risk. Reports targeting zero tolerance for operational risk in the Group’s originator and sponsor activities are established and checked on a monthly basis. Oversight of operational risk is described in section 7 of this chapter, p. 181.
SOCIETE GENERALE’S SECURISATION ACTIVITIES
Securitisation activities allow the Group to raise liquidity or manage risk exposures, for proprietary or customers’ purposes. Within the framework of these activities, the Group can act as originator, sponsor/arranger or investor.
n As an originator, the Group directly or indirectly participates in the initial agreement on assets which subsequently serve as underlying in securitisation transactions, primarily for refinancing purposes;
n as a sponsor, the Group establishes and manages a securitisation programme used to refinance customers’ assets, mainly via the non-consolidated vehicles Antalis and Barton and via certain other special purpose vehicles;
n as an investor, the Group invests directly in certain securitisation positions, is a liquidity provider or a counterparty of derivative exposures.
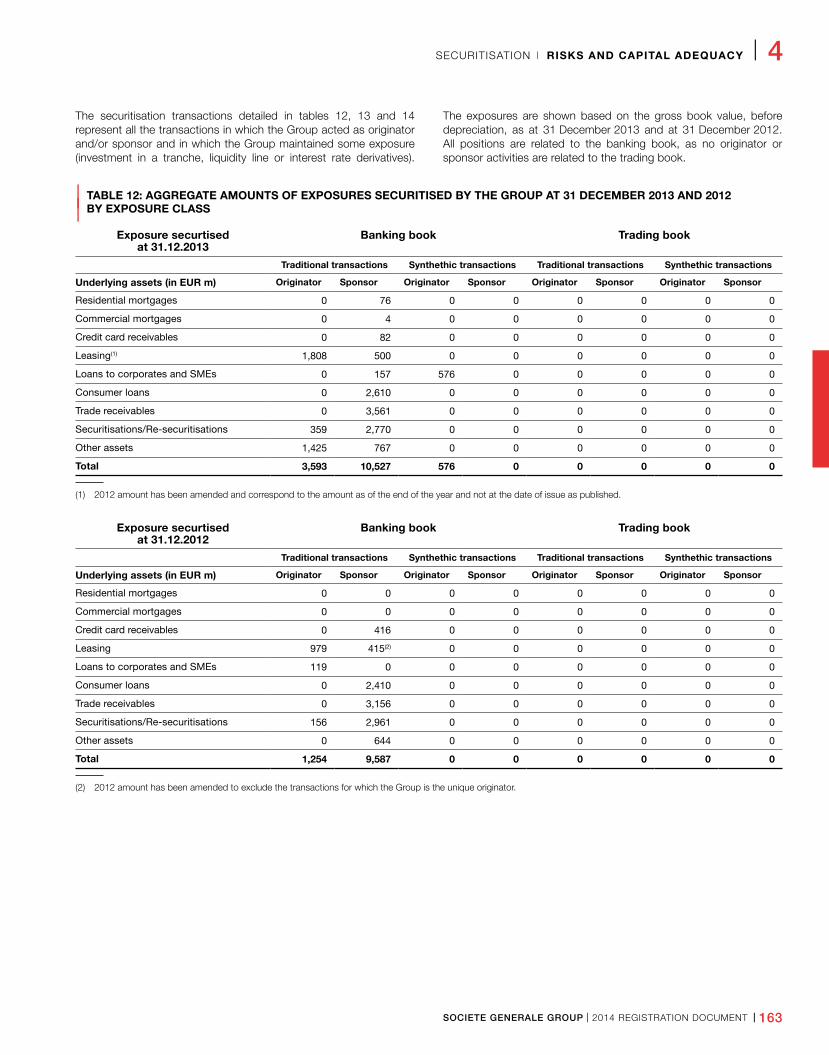
SOCIETE GENERALE GROUP I 2014 REGISTRATION DOCUMENT I 163
SECURITISATION I RISKS AND CAPITAL ADEQUACY I 4
The securitisation transactions detailed in tables 12, 13 and 14 represent all the transactions in which the Group acted as originator and/or sponsor and in which the Group maintained some exposure (investment in a tranche, liquidity line or interest rate derivatives).
The exposures are shown based on the gross book value, before depreciation, as at 31 December 2013 and at 31 December 2012. All positions are related to the banking book, as no originator or sponsor activities are related to the trading book.
| TABLE 12: AGGREGATE AMOUNTS OF EXPOSURES SECURITISED BY THE GROUP AT 31 DECEMBER 2013 AND 2012
| BY EXPOSURE CLASS
Exposure securtised at 31.12.2013
Banking book Trading book
Traditional transactions Synthethic transactions Traditional transactions Synthethic transactions
Underlying assets (in EUR m) Originator Sponsor Originator Sponsor Originator Sponsor Originator Sponsor
Residential mortgages 0 76 0 0 0 0 0 0
Commercial mortgages 0 4 0 0 0 0 0 0
Credit card receivables 0 82 0 0 0 0 0 0
Leasing(1) 1,808 500 0 0 0 0 0 0
Loans to corporates and SMEs 0 157 576 0 0 0 0 0
Consumer loans 0 2,610 0 0 0 0 0 0
Trade receivables 0 3,561 0 0 0 0 0 0
Securitisations/Re-securitisations 359 2,770 0 0 0 0 0 0
Other assets 1,425 767 0 0 0 0 0 0
Total 3,593 10,527 576 0 0 0 0 0
(1) 2012 amount has been amended and correspond to the amount as of the end of the year and not at the date of issue as published.
Exposure securtised at 31.12.2012
Banking book Trading book
Traditional transactions Synthethic transactions Traditional transactions Synthethic transactions
Underlying assets (in EUR m) Originator Sponsor Originator Sponsor Originator Sponsor Originator Sponsor
Residential mortgages 0 0 0 0 0 0 0 0
Commercial mortgages 0 0 0 0 0 0 0 0
Credit card receivables 0 416 0 0 0 0 0 0
Leasing 979 415(2) 0 0 0 0 0 0
Loans to corporates and SMEs 119 0 0 0 0 0 0 0
Consumer loans 0 2,410 0 0 0 0 0 0
Trade receivables 0 3,156 0 0 0 0 0 0
Securitisations/Re-securitisations 156 2,961 0 0 0 0 0 0
Other assets 0 644 0 0 0 0 0 0
Total 1,254 9,587 0 0 0 0 0 0
(2) 2012 amount has been amended to exclude the transactions for which the Group is the unique originator.
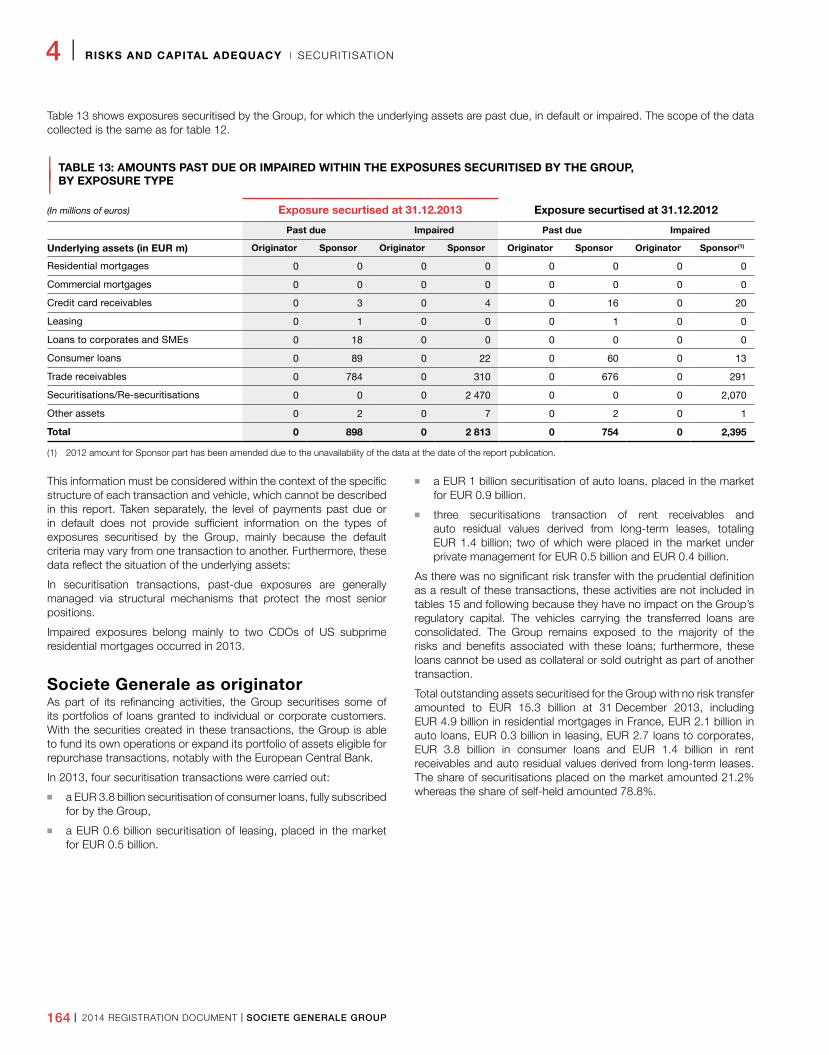
164 I 2014 REGISTRATION DOCUMENT I SOCIETE GENERALE GROUP
4 I RISKS AND CAPITAL ADEQUACY I SECURITISATION
Table 13 shows exposures securitised by the Group, for which the underlying assets are past due, in default or impaired. The scope of the data collected is the same as for table 12.
| TABLE 13: AMOUNTS PAST DUE OR IMPAIRED WITHIN THE EXPOSURES SECURITISED BY THE GROUP,
| BY EXPOSURE TYPE
(In millions of euros) Exposure securtised at 31.12.2013 Exposure securtised at 31.12.2012
Past due Impaired Past due Impaired
Underlying assets (in EUR m) Originator Sponsor Originator Sponsor Originator Sponsor Originator Sponsor(1)
Residential mortgages 0 0 0 0 0 0 0 0
Commercial mortgages 0 0 0 0 0 0 0 0
Credit card receivables 0 3 0 4 0 16 0 20
Leasing 0 1 0 0 0 1 0 0
Loans to corporates and SMEs 0 18 0 0 0 0 0 0
Consumer loans 0 89 0 22 0 60 0 13
Trade receivables 0 784 0 310 0 676 0 291
Securitisations/Re-securitisations 0 0 0 2 470 0 0 0 2,070
Other assets 0 2 0 7 0 2 0 1
Total 0 898 0 2 813 0 754 0 2,395
(1) 2012 amount for Sponsor part has been amended due to the unavailability of the data at the date of the report publication.
This information must be considered within the context of the specific structure of each transaction and vehicle, which cannot be described in this report. Taken separately, the level of payments past due or in default does not provide sufficient information on the types of exposures securitised by the Group, mainly because the default criteria may vary from one transaction to another. Furthermore, these data reflect the situation of the underlying assets:
In securitisation transactions, past-due exposures are generally managed via structural mechanisms that protect the most senior positions.
Impaired exposures belong mainly to two CDOs of US subprime residential mortgages occurred in 2013.
Societe Generale as originatorAs part of its refinancing activities, the Group securitises some of its portfolios of loans granted to individual or corporate customers. With the securities created in these transactions, the Group is able to fund its own operations or expand its portfolio of assets eligible for repurchase transactions, notably with the European Central Bank.
In 2013, four securitisation transactions were carried out:
n a EUR 3.8 billion securitisation of consumer loans, fully subscribed for by the Group,
n a EUR 0.6 billion securitisation of leasing, placed in the market for EUR 0.5 billion.
n a EUR 1 billion securitisation of auto loans, placed in the market for EUR 0.9 billion.
n three securitisations transaction of rent receivables and auto residual values derived from long-term leases, totaling EUR 1.4 billion; two of which were placed in the market under private management for EUR 0.5 billion and EUR 0.4 billion.
As there was no significant risk transfer with the prudential definition as a result of these transactions, these activities are not included in tables 15 and following because they have no impact on the Group’s regulatory capital. The vehicles carrying the transferred loans are consolidated. The Group remains exposed to the majority of the risks and benefits associated with these loans; furthermore, these loans cannot be used as collateral or sold outright as part of another transaction.
Total outstanding assets securitised for the Group with no risk transfer amounted to EUR 15.3 billion at 31 December 2013, including EUR 4.9 billion in residential mortgages in France, EUR 2.1 billion in auto loans, EUR 0.3 billion in leasing, EUR 2.7 loans to corporates, EUR 3.8 billion in consumer loans and EUR 1.4 billion in rent receivables and auto residual values derived from long-term leases. The share of securitisations placed on the market amounted 21.2% whereas the share of self-held amounted 78.8%.
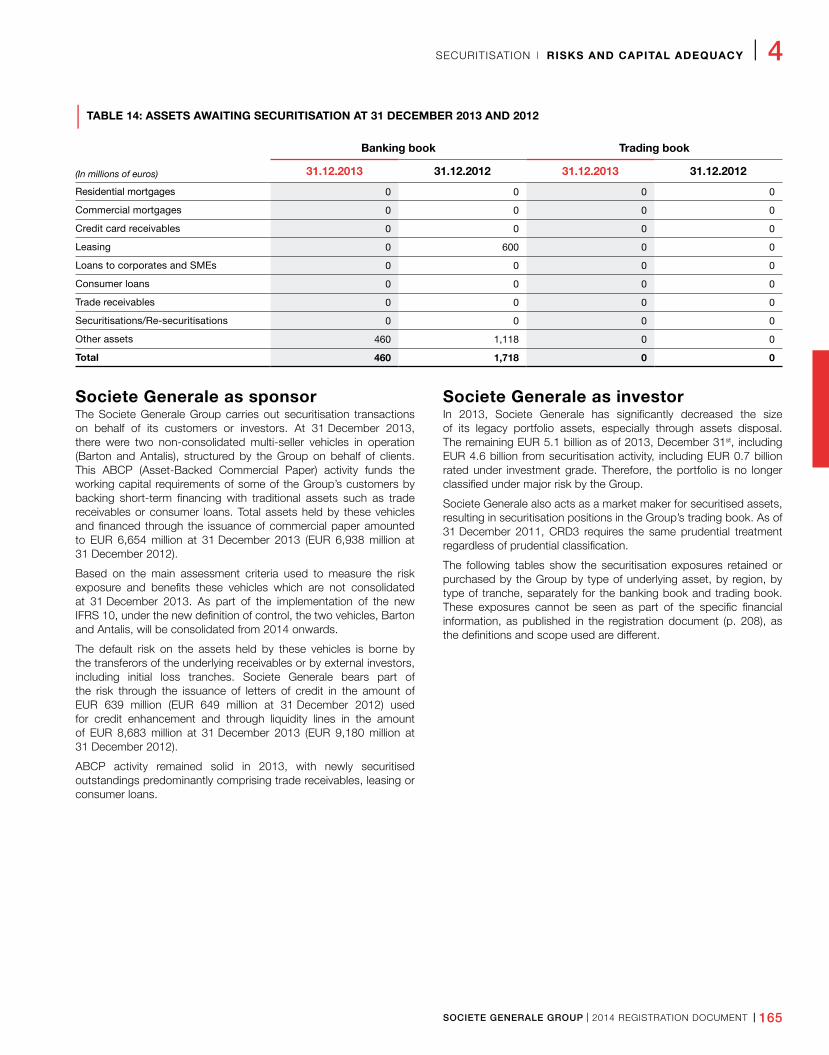
SOCIETE GENERALE GROUP I 2014 REGISTRATION DOCUMENT I 165
SECURITISATION I RISKS AND CAPITAL ADEQUACY I 4
| TABLE 14: ASSETS AWAITING SECURITISATION AT 31 DECEMBER 2013 AND 2012
Banking book Trading book
(In millions of euros) 31.12.2013 31.12.2012 31.12.2013 31.12.2012
Residential mortgages 0 0 0 0
Commercial mortgages 0 0 0 0
Credit card receivables 0 0 0 0
Leasing 0 600 0 0
Loans to corporates and SMEs 0 0 0 0
Consumer loans 0 0 0 0
Trade receivables 0 0 0 0
Securitisations/Re-securitisations 0 0 0 0
Other assets 460 1,118 0 0
Total 460 1,718 0 0
Societe Generale as sponsorThe Societe Generale Group carries out securitisation transactions on behalf of its customers or investors. At 31 December 2013, there were two non-consolidated multi-seller vehicles in operation (Barton and Antalis), structured by the Group on behalf of clients. This ABCP (Asset-Backed Commercial Paper) activity funds the working capital requirements of some of the Group’s customers by backing short-term financing with traditional assets such as trade receivables or consumer loans. Total assets held by these vehicles and financed through the issuance of commercial paper amounted to EUR 6,654 million at 31 December 2013 (EUR 6,938 million at 31 December 2012).
Based on the main assessment criteria used to measure the risk exposure and benefits these vehicles which are not consolidated at 31 December 2013. As part of the implementation of the new IFRS 10, under the new definition of control, the two vehicles, Barton and Antalis, will be consolidated from 2014 onwards.
The default risk on the assets held by these vehicles is borne by the transferors of the underlying receivables or by external investors, including initial loss tranches. Societe Generale bears part of the risk through the issuance of letters of credit in the amount of EUR 639 million (EUR 649 million at 31 December 2012) used for credit enhancement and through liquidity lines in the amount of EUR 8,683 million at 31 December 2013 (EUR 9,180 million at 31 December 2012).
ABCP activity remained solid in 2013, with newly securitised outstandings predominantly comprising trade receivables, leasing or consumer loans.
Societe Generale as investorIn 2013, Societe Generale has significantly decreased the size of its legacy portfolio assets, especially through assets disposal. The remaining EUR 5.1 billion as of 2013, December 31st, including EUR 4.6 billion from securitisation activity, including EUR 0.7 billion rated under investment grade. Therefore, the portfolio is no longer classified under major risk by the Group.
Societe Generale also acts as a market maker for securitised assets, resulting in securitisation positions in the Group’s trading book. As of 31 December 2011, CRD3 requires the same prudential treatment regardless of prudential classification.
The following tables show the securitisation exposures retained or purchased by the Group by type of underlying asset, by region, by type of tranche, separately for the banking book and trading book. These exposures cannot be seen as part of the specific financial information, as published in the registration document (p. 208), as the definitions and scope used are different.
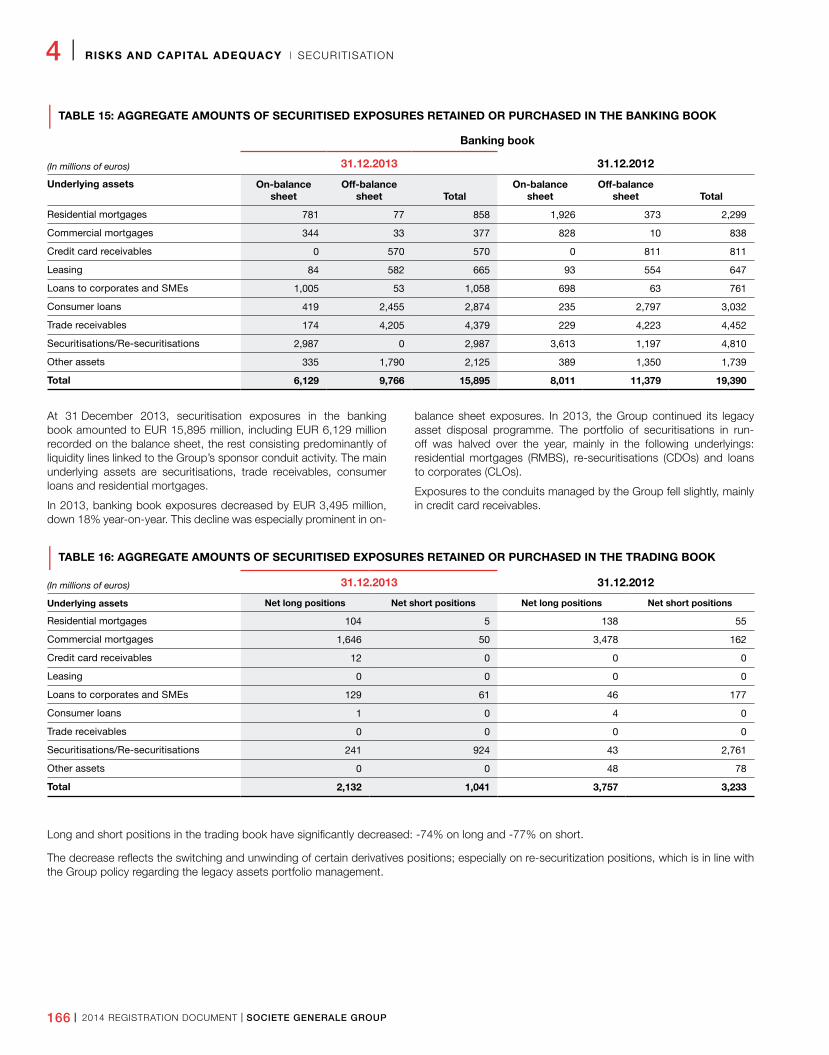
166 I 2014 REGISTRATION DOCUMENT I SOCIETE GENERALE GROUP
4 I RISKS AND CAPITAL ADEQUACY I SECURITISATION
| TABLE 15: AGGREGATE AMOUNTS OF SECURITISED EXPOSURES RETAINED OR PURCHASED IN THE BANKING BOOK
Banking book
(In millions of euros) 31.12.2013 31.12.2012
Underlying assets On-balance sheet
Off-balance sheet Total
On-balance sheet
Off-balance sheet Total
Residential mortgages 781 77 858 1,926 373 2,299
Commercial mortgages 344 33 377 828 10 838
Credit card receivables 0 570 570 0 811 811
Leasing 84 582 665 93 554 647
Loans to corporates and SMEs 1,005 53 1,058 698 63 761
Consumer loans 419 2,455 2,874 235 2,797 3,032
Trade receivables 174 4,205 4,379 229 4,223 4,452
Securitisations/Re-securitisations 2,987 0 2,987 3,613 1,197 4,810
Other assets 335 1,790 2,125 389 1,350 1,739
Total 6,129 9,766 15,895 8,011 11,379 19,390
At 31 December 2013, securitisation exposures in the banking book amounted to EUR 15,895 million, including EUR 6,129 million recorded on the balance sheet, the rest consisting predominantly of liquidity lines linked to the Group’s sponsor conduit activity. The main underlying assets are securitisations, trade receivables, consumer loans and residential mortgages.
In 2013, banking book exposures decreased by EUR 3,495 million, down 18% year-on-year. This decline was especially prominent in on-
balance sheet exposures. In 2013, the Group continued its legacy asset disposal programme. The portfolio of securitisations in run-off was halved over the year, mainly in the following underlyings: residential mortgages (RMBS), re-securitisations (CDOs) and loans to corporates (CLOs).
Exposures to the conduits managed by the Group fell slightly, mainly in credit card receivables.
| TABLE 16: AGGREGATE AMOUNTS OF SECURITISED EXPOSURES RETAINED OR PURCHASED IN THE TRADING BOOK
(In millions of euros) 31.12.2013 31.12.2012
Underlying assets Net long positions Net short positions Net long positions Net short positions
Residential mortgages 104 5 138 55
Commercial mortgages 1,646 50 3,478 162
Credit card receivables 12 0 0 0
Leasing 0 0 0 0
Loans to corporates and SMEs 129 61 46 177
Consumer loans 1 0 4 0
Trade receivables 0 0 0 0
Securitisations/Re-securitisations 241 924 43 2,761
Other assets 0 0 48 78
Total 2,132 1,041 3,757 3,233
Long and short positions in the trading book have significantly decreased: -74% on long and -77% on short.
The decrease reflects the switching and unwinding of certain derivatives positions; especially on re-securitization positions, which is in line with the Group policy regarding the legacy assets portfolio management.
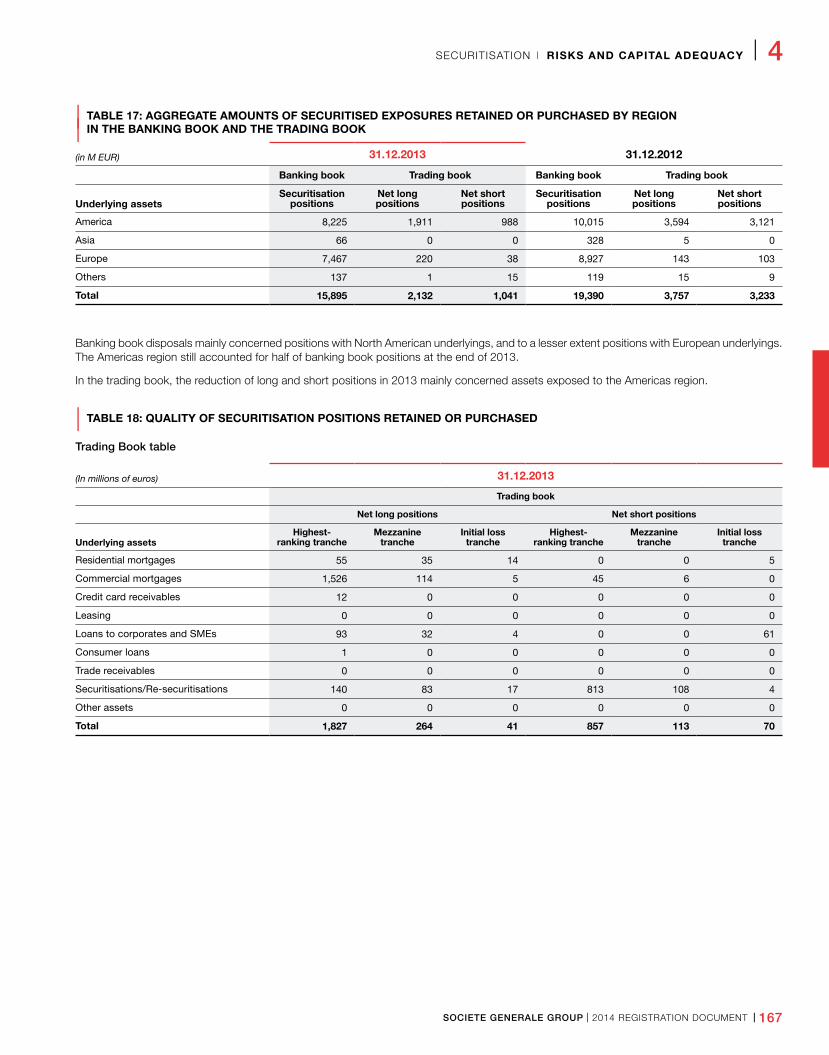
SOCIETE GENERALE GROUP I 2014 REGISTRATION DOCUMENT I 167
SECURITISATION I RISKS AND CAPITAL ADEQUACY I 4
| TABLE 17: AGGREGATE AMOUNTS OF SECURITISED EXPOSURES RETAINED OR PURCHASED BY REGION
| IN THE BANKING BOOK AND THE TRADING BOOK
(in M EUR) 31.12.2013 31.12.2012
Banking book Trading book Banking book Trading book
Underlying assetsSecuritisation
positionsNet long positions
Net short positions
Securitisation positions
Net long positions
Net short positions
America 8,225 1,911 988 10,015 3,594 3,121
Asia 66 0 0 328 5 0
Europe 7,467 220 38 8,927 143 103
Others 137 1 15 119 15 9
Total 15,895 2,132 1,041 19,390 3,757 3,233
Banking book disposals mainly concerned positions with North American underlyings, and to a lesser extent positions with European underlyings. The Americas region still accounted for half of banking book positions at the end of 2013.
In the trading book, the reduction of long and short positions in 2013 mainly concerned assets exposed to the Americas region.
| TABLE 18: QUALITY OF SECURITISATION POSITIONS RETAINED OR PURCHASED
Trading Book table
(In millions of euros) 31.12.2013
Trading book
Net long positions Net short positions
Underlying assetsHighest-
ranking trancheMezzanine
trancheInitial loss
trancheHighest-
ranking trancheMezzanine
trancheInitial loss
tranche
Residential mortgages 55 35 14 0 0 5
Commercial mortgages 1,526 114 5 45 6 0
Credit card receivables 12 0 0 0 0 0
Leasing 0 0 0 0 0 0
Loans to corporates and SMEs 93 32 4 0 0 61
Consumer loans 1 0 0 0 0 0
Trade receivables 0 0 0 0 0 0
Securitisations/Re-securitisations 140 83 17 813 108 4
Other assets 0 0 0 0 0 0
Total 1,827 264 41 857 113 70
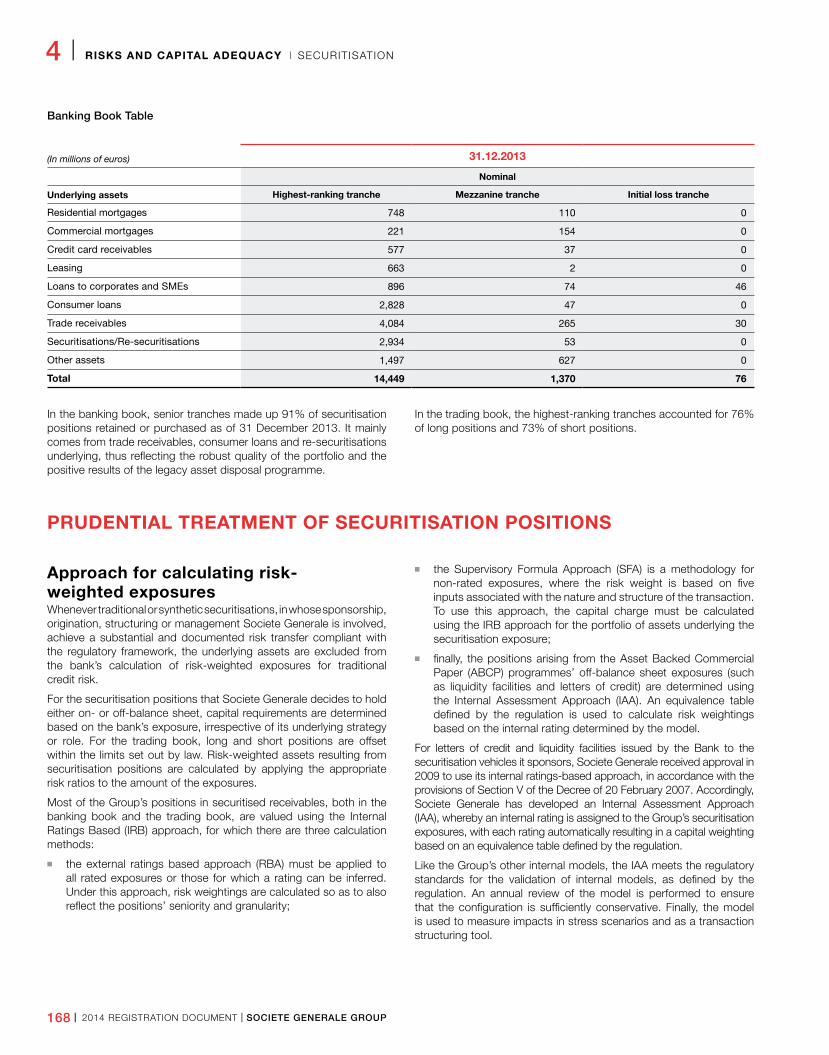
168 I 2014 REGISTRATION DOCUMENT I SOCIETE GENERALE GROUP
4 I RISKS AND CAPITAL ADEQUACY I SECURITISATION
Banking Book Table
(In millions of euros) 31.12.2013
Nominal
Underlying assets Highest-ranking tranche Mezzanine tranche Initial loss tranche
Residential mortgages 748 110 0
Commercial mortgages 221 154 0
Credit card receivables 577 37 0
Leasing 663 2 0
Loans to corporates and SMEs 896 74 46
Consumer loans 2,828 47 0
Trade receivables 4,084 265 30
Securitisations/Re-securitisations 2,934 53 0
Other assets 1,497 627 0
Total 14,449 1,370 76
In the banking book, senior tranches made up 91% of securitisation positions retained or purchased as of 31 December 2013. It mainly comes from trade receivables, consumer loans and re-securitisations underlying, thus reflecting the robust quality of the portfolio and the positive results of the legacy asset disposal programme.
In the trading book, the highest-ranking tranches accounted for 76% of long positions and 73% of short positions.
PRUDENTIAL TREATMENT OF SECURITISATION POSITIONS
Approach for calculating risk-weighted exposuresWhenever traditional or synthetic securitisations, in whose sponsorship, origination, structuring or management Societe Generale is involved, achieve a substantial and documented risk transfer compliant with the regulatory framework, the underlying assets are excluded from the bank’s calculation of risk-weighted exposures for traditional credit risk.
For the securitisation positions that Societe Generale decides to hold either on- or off-balance sheet, capital requirements are determined based on the bank’s exposure, irrespective of its underlying strategy or role. For the trading book, long and short positions are offset within the limits set out by law. Risk-weighted assets resulting from securitisation positions are calculated by applying the appropriate risk ratios to the amount of the exposures.
Most of the Group’s positions in securitised receivables, both in the banking book and the trading book, are valued using the Internal Ratings Based (IRB) approach, for which there are three calculation methods:
n the external ratings based approach (RBA) must be applied to all rated exposures or those for which a rating can be inferred. Under this approach, risk weightings are calculated so as to also reflect the positions’ seniority and granularity;
n the Supervisory Formula Approach (SFA) is a methodology for non-rated exposures, where the risk weight is based on five inputs associated with the nature and structure of the transaction. To use this approach, the capital charge must be calculated using the IRB approach for the portfolio of assets underlying the securitisation exposure;
n finally, the positions arising from the Asset Backed Commercial Paper (ABCP) programmes’ off-balance sheet exposures (such as liquidity facilities and letters of credit) are determined using the Internal Assessment Approach (IAA). An equivalence table defined by the regulation is used to calculate risk weightings based on the internal rating determined by the model.
For letters of credit and liquidity facilities issued by the Bank to the securitisation vehicles it sponsors, Societe Generale received approval in 2009 to use its internal ratings-based approach, in accordance with the provisions of Section V of the Decree of 20 February 2007. Accordingly, Societe Generale has developed an Internal Assessment Approach (IAA), whereby an internal rating is assigned to the Group’s securitisation exposures, with each rating automatically resulting in a capital weighting based on an equivalence table defined by the regulation.
Like the Group’s other internal models, the IAA meets the regulatory standards for the validation of internal models, as defined by the regulation. An annual review of the model is performed to ensure that the configuration is sufficiently conservative. Finally, the model is used to measure impacts in stress scenarios and as a transaction structuring tool.
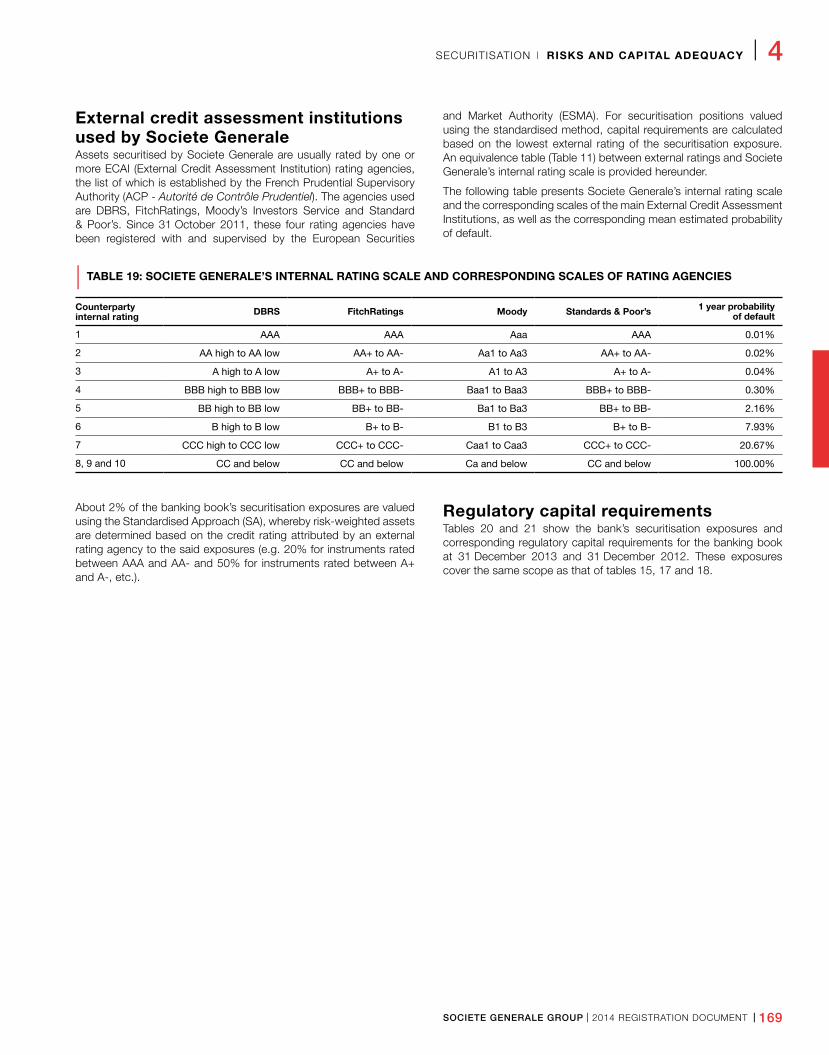
SOCIETE GENERALE GROUP I 2014 REGISTRATION DOCUMENT I 169
SECURITISATION I RISKS AND CAPITAL ADEQUACY I 4
External credit assessment institutions used by Societe GeneraleAssets securitised by Societe Generale are usually rated by one or more ECAI (External Credit Assessment Institution) rating agencies, the list of which is established by the French Prudential Supervisory Authority (ACP - Autorité de Contrôle Prudentiel). The agencies used are DBRS, FitchRatings, Moody’s Investors Service and Standard & Poor’s. Since 31 October 2011, these four rating agencies have been registered with and supervised by the European Securities
and Market Authority (ESMA). For securitisation positions valued using the standardised method, capital requirements are calculated based on the lowest external rating of the securitisation exposure. An equivalence table (Table 11) between external ratings and Societe Generale’s internal rating scale is provided hereunder.
The following table presents Societe Generale’s internal rating scale and the corresponding scales of the main External Credit Assessment Institutions, as well as the corresponding mean estimated probability of default.
| TABLE 19: SOCIETE GENERALE’S INTERNAL RATING SCALE AND CORRESPONDING SCALES OF RATING AGENCIES
Counterparty internal rating DBRS FitchRatings Moody Standards & Poor’s 1 year probability
of default
1 AAA AAA Aaa AAA 0.01%
2 AA high to AA low AA+ to AA- Aa1 to Aa3 AA+ to AA- 0.02%
3 A high to A low A+ to A- A1 to A3 A+ to A- 0.04%
4 BBB high to BBB low BBB+ to BBB- Baa1 to Baa3 BBB+ to BBB- 0.30%
5 BB high to BB low BB+ to BB- Ba1 to Ba3 BB+ to BB- 2.16%
6 B high to B low B+ to B- B1 to B3 B+ to B- 7.93%
7 CCC high to CCC low CCC+ to CCC- Caa1 to Caa3 CCC+ to CCC- 20.67%
8, 9 and 10 CC and below CC and below Ca and below CC and below 100.00%
About 2% of the banking book’s securitisation exposures are valued using the Standardised Approach (SA), whereby risk-weighted assets are determined based on the credit rating attributed by an external rating agency to the said exposures (e.g. 20% for instruments rated between AAA and AA- and 50% for instruments rated between A+ and A-, etc.).
Regulatory capital requirementsTables 20 and 21 show the bank’s securitisation exposures and corresponding regulatory capital requirements for the banking book at 31 December 2013 and 31 December 2012. These exposures cover the same scope as that of tables 15, 17 and 18.
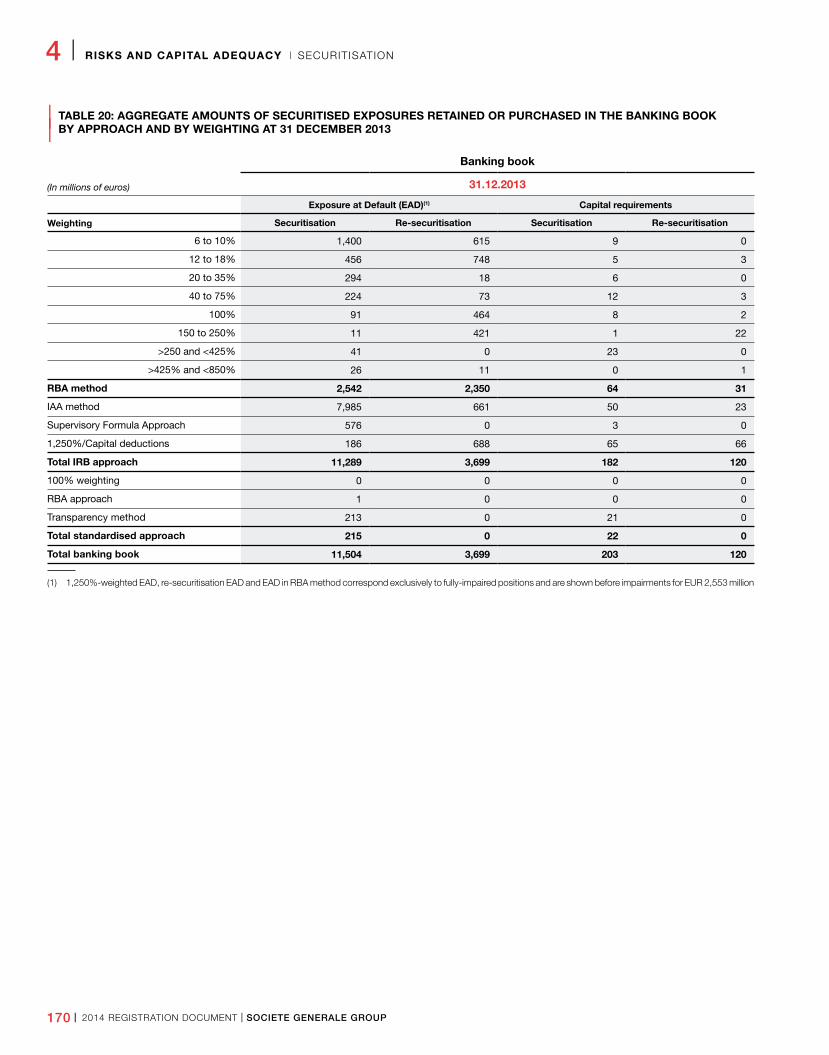
170 I 2014 REGISTRATION DOCUMENT I SOCIETE GENERALE GROUP
4 I RISKS AND CAPITAL ADEQUACY I SECURITISATION
| TABLE 20: AGGREGATE AMOUNTS OF SECURITISED EXPOSURES RETAINED OR PURCHASED IN THE BANKING BOOK
| BY APPROACH AND BY WEIGHTING AT 31 DECEMBER 2013
Banking book
(In millions of euros) 31.12.2013
Exposure at Default (EAD)(1) Capital requirements
Weighting Securitisation Re-securitisation Securitisation Re-securitisation
6 to 10% 1,400 615 9 0
12 to 18% 456 748 5 3
20 to 35% 294 18 6 0
40 to 75% 224 73 12 3
100% 91 464 8 2
150 to 250% 11 421 1 22
>250 and <425% 41 0 23 0
>425% and <850% 26 11 0 1
RBA method 2,542 2,350 64 31
IAA method 7,985 661 50 23
Supervisory Formula Approach 576 0 3 0
1,250%/Capital deductions 186 688 65 66
Total IRB approach 11,289 3,699 182 120
100% weighting 0 0 0 0
RBA approach 1 0 0 0
Transparency method 213 0 21 0
Total standardised approach 215 0 22 0
Total banking book 11,504 3,699 203 120
(1) 1,250%-weighted EAD, re-securitisation EAD and EAD in RBA method correspond exclusively to fully-impaired positions and are shown before impairments for EUR 2,553 million
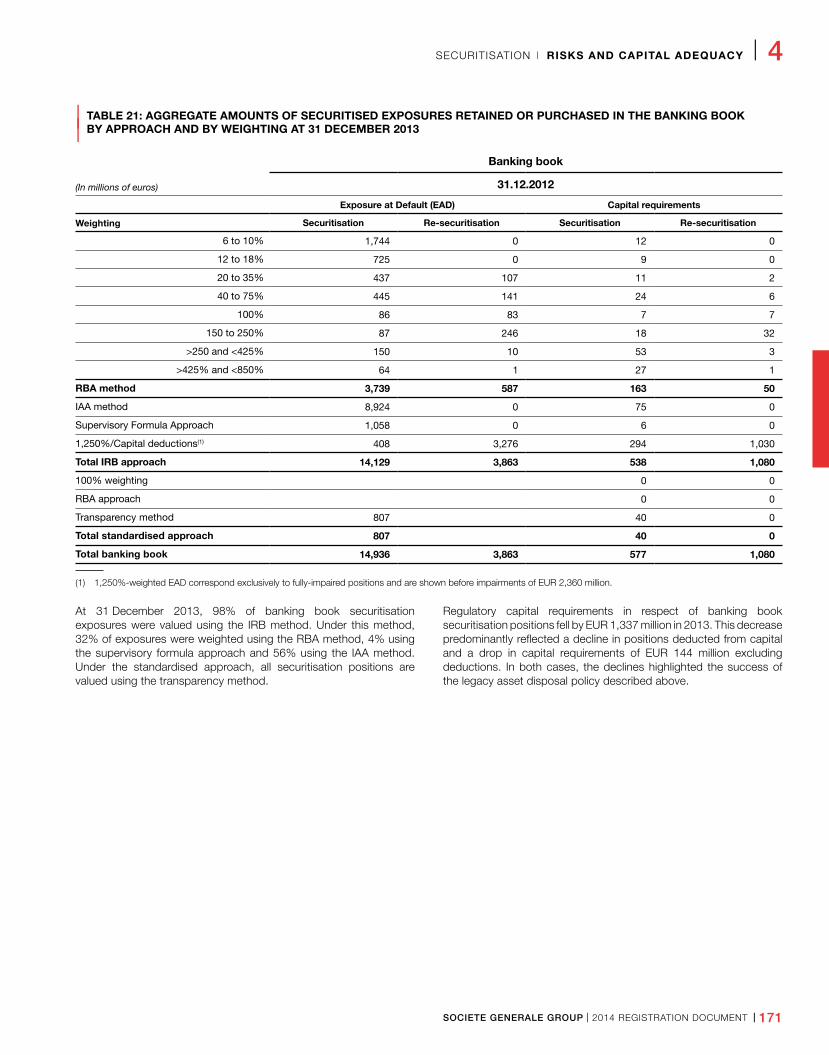
SOCIETE GENERALE GROUP I 2014 REGISTRATION DOCUMENT I 171
SECURITISATION I RISKS AND CAPITAL ADEQUACY I 4
| TABLE 21: AGGREGATE AMOUNTS OF SECURITISED EXPOSURES RETAINED OR PURCHASED IN THE BANKING BOOK
| BY APPROACH AND BY WEIGHTING AT 31 DECEMBER 2013
Banking book
(In millions of euros) 31.12.2012
Exposure at Default (EAD) Capital requirements
Weighting Securitisation Re-securitisation Securitisation Re-securitisation
6 to 10% 1,744 0 12 0
12 to 18% 725 0 9 0
20 to 35% 437 107 11 2
40 to 75% 445 141 24 6
100% 86 83 7 7
150 to 250% 87 246 18 32
>250 and <425% 150 10 53 3
>425% and <850% 64 1 27 1
RBA method 3,739 587 163 50
IAA method 8,924 0 75 0
Supervisory Formula Approach 1,058 0 6 0
1,250%/Capital deductions(1) 408 3,276 294 1,030
Total IRB approach 14,129 3,863 538 1,080
100% weighting 0 0
RBA approach 0 0
Transparency method 807 40 0
Total standardised approach 807 40 0
Total banking book 14,936 3,863 577 1,080
(1) 1,250%-weighted EAD correspond exclusively to fully-impaired positions and are shown before impairments of EUR 2,360 million.
At 31 December 2013, 98% of banking book securitisation exposures were valued using the IRB method. Under this method, 32% of exposures were weighted using the RBA method, 4% using the supervisory formula approach and 56% using the IAA method. Under the standardised approach, all securitisation positions are valued using the transparency method.
Regulatory capital requirements in respect of banking book securitisation positions fell by EUR 1,337 million in 2013. This decrease predominantly reflected a decline in positions deducted from capital and a drop in capital requirements of EUR 144 million excluding deductions. In both cases, the declines highlighted the success of the legacy asset disposal policy described above.
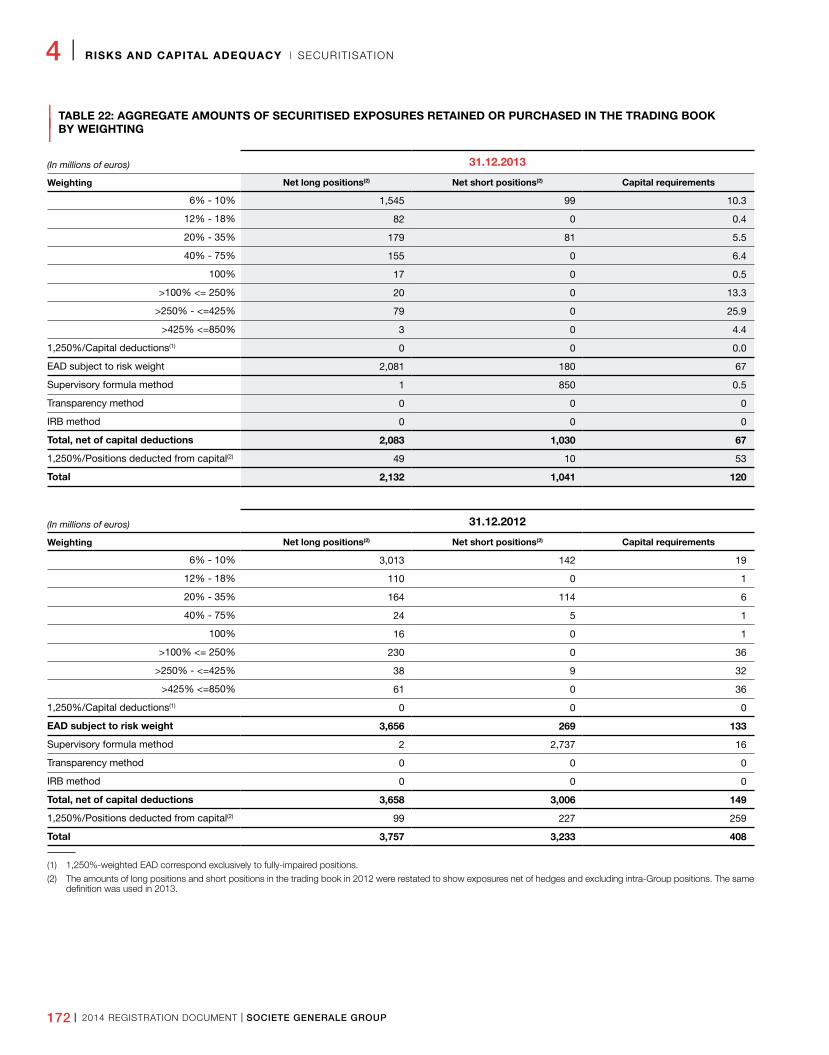
172 I 2014 REGISTRATION DOCUMENT I SOCIETE GENERALE GROUP
4 I RISKS AND CAPITAL ADEQUACY I SECURITISATION
| TABLE 22: AGGREGATE AMOUNTS OF SECURITISED EXPOSURES RETAINED OR PURCHASED IN THE TRADING BOOK
| BY WEIGHTING
(In millions of euros) 31.12.2013
Weighting Net long positions(2) Net short positions(2) Capital requirements
6% - 10% 1,545 99 10.3
12% - 18% 82 0 0.4
20% - 35% 179 81 5.5
40% - 75% 155 0 6.4
100% 17 0 0.5
>100% <= 250% 20 0 13.3
>250% - <=425% 79 0 25.9
>425% <=850% 3 0 4.4
1,250%/Capital deductions(1) 0 0 0.0
EAD subject to risk weight 2,081 180 67
Supervisory formula method 1 850 0.5
Transparency method 0 0 0
IRB method 0 0 0
Total, net of capital deductions 2,083 1,030 67
1,250%/Positions deducted from capital(2) 49 10 53
Total 2,132 1,041 120
(In millions of euros) 31.12.2012
Weighting Net long positions(2) Net short positions(2) Capital requirements
6% - 10% 3,013 142 19
12% - 18% 110 0 1
20% - 35% 164 114 6
40% - 75% 24 5 1
100% 16 0 1
>100% <= 250% 230 0 36
>250% - <=425% 38 9 32
>425% <=850% 61 0 36
1,250%/Capital deductions(1) 0 0 0
EAD subject to risk weight 3,656 269 133
Supervisory formula method 2 2,737 16
Transparency method 0 0 0
IRB method 0 0 0
Total, net of capital deductions 3,658 3,006 149
1,250%/Positions deducted from capital(2) 99 227 259
Total 3,757 3,233 408
(1) 1,250%-weighted EAD correspond exclusively to fully-impaired positions.
(2) The amounts of long positions and short positions in the trading book in 2012 were restated to show exposures net of hedges and excluding intra-Group positions. The same definition was used in 2013.
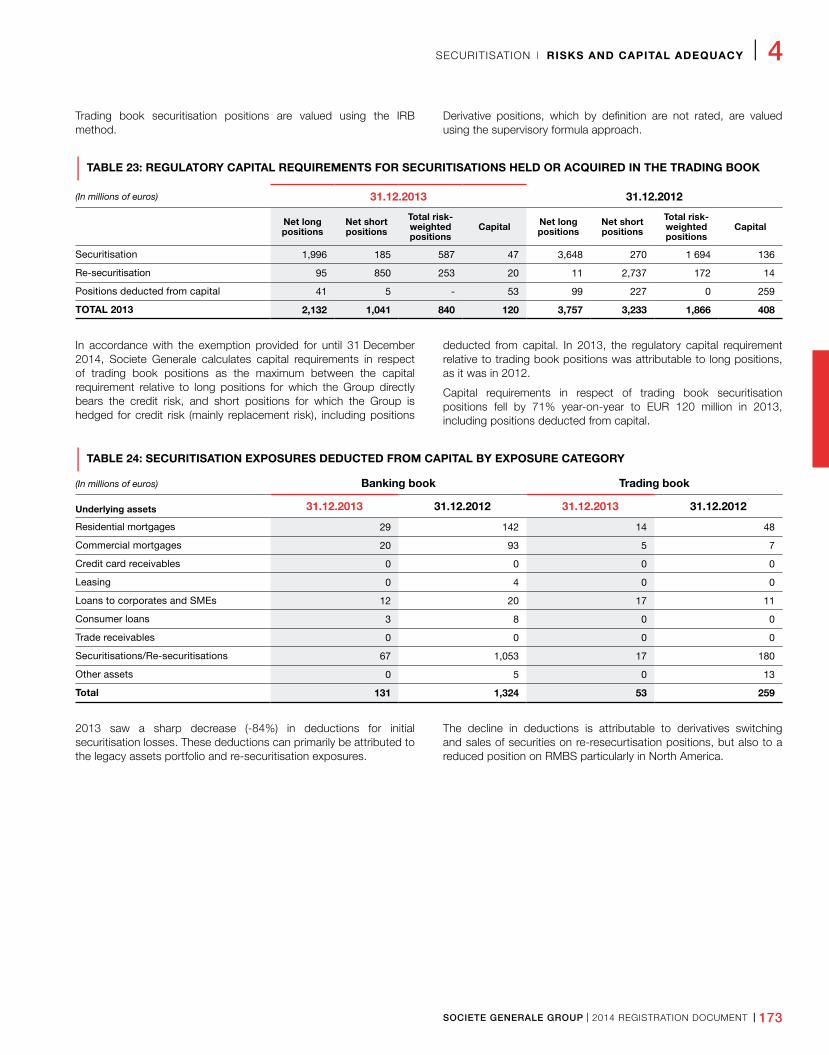
SOCIETE GENERALE GROUP I 2014 REGISTRATION DOCUMENT I 173
SECURITISATION I RISKS AND CAPITAL ADEQUACY I 4
Trading book securitisation positions are valued using the IRB method.
Derivative positions, which by definition are not rated, are valued using the supervisory formula approach.
| TABLE 23: REGULATORY CAPITAL REQUIREMENTS FOR SECURITISATIONS HELD OR ACQUIRED IN THE TRADING BOOK
(In millions of euros) 31.12.2013 31.12.2012
Net long positions
Net short positions
Total risk- weighted positions
Capital Net long positions
Net short positions
Total risk- weighted positions
Capital
Securitisation 1,996 185 587 47 3,648 270 1 694 136
Re-securitisation 95 850 253 20 11 2,737 172 14
Positions deducted from capital 41 5 - 53 99 227 0 259
TOTAL 2013 2,132 1,041 840 120 3,757 3,233 1,866 408
In accordance with the exemption provided for until 31 December 2014, Societe Generale calculates capital requirements in respect of trading book positions as the maximum between the capital requirement relative to long positions for which the Group directly bears the credit risk, and short positions for which the Group is hedged for credit risk (mainly replacement risk), including positions
deducted from capital. In 2013, the regulatory capital requirement relative to trading book positions was attributable to long positions, as it was in 2012.
Capital requirements in respect of trading book securitisation positions fell by 71% year-on-year to EUR 120 million in 2013, including positions deducted from capital.
| TABLE 24: SECURITISATION EXPOSURES DEDUCTED FROM CAPITAL BY EXPOSURE CATEGORY
(In millions of euros) Banking book Trading book
Underlying assets 31.12.2013 31.12.2012 31.12.2013 31.12.2012
Residential mortgages 29 142 14 48
Commercial mortgages 20 93 5 7
Credit card receivables 0 0 0 0
Leasing 0 4 0 0
Loans to corporates and SMEs 12 20 17 11
Consumer loans 3 8 0 0
Trade receivables 0 0 0 0
Securitisations/Re-securitisations 67 1,053 17 180
Other assets 0 5 0 13
Total 131 1,324 53 259
2013 saw a sharp decrease (-84%) in deductions for initial securitisation losses. These deductions can primarily be attributed to the legacy assets portfolio and re-securitisation exposures.
The decline in deductions is attributable to derivatives switching and sales of securities on re-resecurtisation positions, but also to a reduced position on RMBS particularly in North America.
174 I 2014 REGISTRATION DOCUMENT I SOCIETE GENERALE GROUP
4 I RISKS AND CAPITAL ADEQUACY I MARKET RISKS
6 . MARKET �R I SKS
Market risks are the risks of losses resulting from unfavourable changes in market parameters.
They concern all the trading book transactions as well as some of the banking book portfolios.
ORGANISATION
Although primary responsibility for managing risk exposure lies with the front office managers, the supervision system is based on an independent structure, the Market Risk Department of the Risk Division.
This Department duties include:
n ensuring the existence and the implementation of an effective market risks framework based on suitable limits;
n approving of the limit requests submitted by the different businesses within the framework of the overall limits set by the Board of Directors and the General Management, and based on the use of these limits;
n proposal to the Group Risk Committee of appropriate market risks limits by Group activity;
n definition of risk measurement methods, approval of the valuation models used to calculate risks and results, and definition of provisions for market risks (reserves and adjustments to earnings).
To carry out these different duties, the Market Risk Department uses the data and analysis provided by the Finance Department of GBIS, which monitors the Group’s market positions on a permanent, daily and independent basis, notably via:
n daily calculation and certification of market risk indicators based on formal and secure procedures;
n reporting and first-level analysis of these indicators;
n daily monitoring of the limits set for each activity;
n verification of the market parameters used to calculate risks and results in line with the methodologies defined by the Market Risk Department;
n monitoring and control of the gross nominal value of positions. This system is based on alert levels applied to all instruments and desks which are defined in collaboration with the Market Risk Department, and contributes to the detection of possible rogue trading operations.
Accordingly, the Finance Department of GBIS, in conjunction with the Market Risk Department, defines the architecture and functionalities of the information system used to produce the risk indicators for market operations to ensure it meets the needs of the different business lines.
A daily report on use of limits on VaR (Value at Risk) and stress tests (extreme scenarios) is submitted to the General Management and the managers of the business lines, in addition to a monthly report which summarises the key events in the area of market risk management.
INDEPENDENT PRICING VERIFICATION
Market products are marked to market, when such market prices exist. Otherwise, they are valued using parameter-based models.
Firstly, each valuation model is independently validated by the Market Risk Department.
Secondly, the parameter values are subject to regular comparison with external sources:
n if there is a difference between the values used and the external sources, and if the sources are deemed reliable by the Market
Risk Department, the values are aligned with the external data. This process, known as IPV (Independent Pricing Verification), contributes to the internal certification of the accounts;
n if there are no reliable external sources, a conservative valuation is made based on reserves whose calculation methods have been validated by the Market Risk Department.
SOCIETE GENERALE GROUP I 2014 REGISTRATION DOCUMENT I 175
MARKET RISKS I RISKS AND CAPITAL ADEQUACY I 4
METHODS FOR MEASURING MARKET RISK AND DEFINING LIMITS
The Group’s market risk assessment is based on three main indicators, which are monitored through limits:
n the 99% Value-at-Risk (VaR) method: in accordance with the regulatory internal model, this global indicator is used for the day-to-day monitoring of the market risks incurred by the Bank, on the scope of its trading activities;
n a stress test measurement, based on a decennial shock-type indicator. Stress Test measurements allow to restrict and monitor the Group’s exposure to systemic risk and exceptional market shocks;
n complementary metrics (sensitivity, nominal, concentration or holding period, etc.), which ensure consistency between the overall risk limits and the operational thresholds used by the front office. These limits also allow to oversee risks that are only partially detected by VaR or Stress Test measurements.
In accordance with CRD 3 (Capital Requirement Directive), the following indicators are also calculated on a weekly basis: stressed VaR, IRC (Incremental Risk Charge) and CRM (Comprehensive Risk Measure). The capital charges arising from these internal models complement the previous measure (VaR) so as to better take into account extreme risks (in particular rating migration and default) and to limit the procyclical nature of capital requirements.
99% VALUE AT RISK (VAR)
The Internal VaR Model was introduced at the end of 1996 and has been approved by the French regulator within the scope of the Regulatory Capital requirements.
The method used is the “historical simulation” method, which implicitly takes into account the correlation between all risk factors and is based on the following principles:
n storage in a database of the risk factors that are representative of Societe Generale’s positions (i.e. interest rates, share prices, exchange rates, commodity prices, volatility, credit spreads, etc.);
n definition of 260 scenarios, corresponding to one-day variations in these market parameters over a rolling one-year period;
n application of these 260 scenarios to the market parameters of the day;
n revaluation of daily positions, on the basis of the 260 sets of adjusted daily market parameters.
The 99% Value-at-Risk is the largest loss that would occur after eliminating the top 1% of the most adverse occurrences over a one-year historical period. Within the framework described above, it corresponds to the average of the second and third largest losses computed. The VaR assessment is based on a model and a certain number of conventional assumptions whose main limitations are as follows:
n the use of “1-day” shocks assumes that all positions can be unwound or hedged within one day, which is not the case for certain products and crisis situations;
n the use of the 99% confidence interval does not take into account losses arising beyond this point; VaR is therefore an indicator of losses under normal market conditions and does not take into account exceptionally large fluctuations;
n VaR is computed using closing prices, so intra-day fluctuations are not taken into account;
n there are a number of approximations in the VaR calculation. For example, benchmark indices are used instead of more detailed risk factors and not all of the relevant risk factors are taken into account, in particular due to difficulties in obtaining historical daily data.
The Market Risk Department of the Risk Division mitigates the limitations of the VaR model by:
n performing stress tests and other additional measurements;
n assessing the relevance of the model through ongoing backtesting to verify whether the number of days for which the negative result exceeds the VaR complies with the 99% confidence interval.
Daily profit and loss used for backtesting includes in particular the change in value of the portfolio (book value) and the impact of new transactions and of transactions modified during the day (including their sales margins), refinancing costs, the various related commissions (brokerage fees, custody fees, etc.), as well as provisions and parameters adjustments made for market risk. Some components calculated at various frequencies (for example, some adjustements for market risk) are allocated on a daily basis.
The following histograms show the distribution of this daily P&L over the last year, as well as the difference between daily P&L and VaR (negative values corresponding to any backtesting breaches): in 2013, losses were observed 7 times and daily P&L exceeded VaR once on the beginning of May 2013 due to a loss on a hedge position on MBIA.
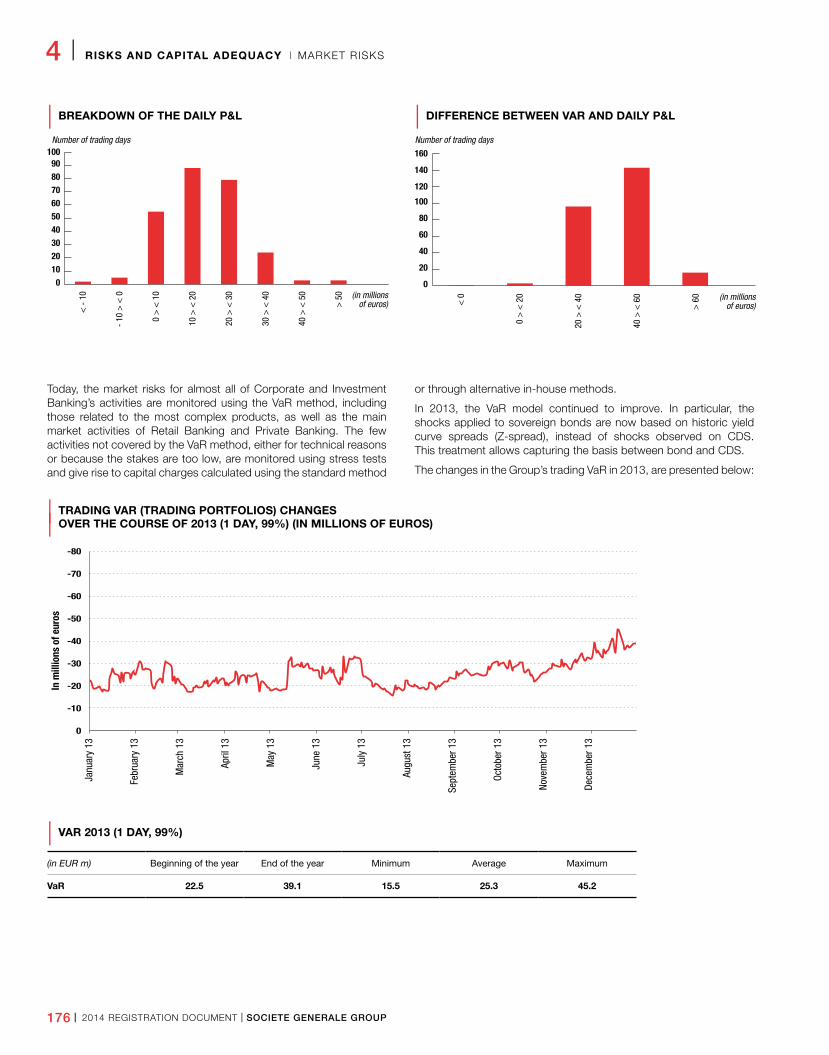
176 I 2014 REGISTRATION DOCUMENT I SOCIETE GENERALE GROUP
4 I RISKS AND CAPITAL ADEQUACY I MARKET RISKS
| BREAKDOWN OF THE DAILY P&L
0102030405060708090
100Number of trading days
(in millionsof euros)
< -
10
- 10
> <
0
0 >
< 1
0
10 >
< 2
0
20 >
< 3
0
30 >
< 4
0
40 >
< 5
0
> 5
0
| DIFFERENCE BETWEEN VAR AND DAILY P&L
(in millionsof euros)
0
20
40
60
80
100
120
140
160Number of trading days
< 0
0 >
< 2
0
20 >
< 4
0
40 >
< 6
0
> 6
0
Today, the market risks for almost all of Corporate and Investment Banking’s activities are monitored using the VaR method, including those related to the most complex products, as well as the main market activities of Retail Banking and Private Banking. The few activities not covered by the VaR method, either for technical reasons or because the stakes are too low, are monitored using stress tests and give rise to capital charges calculated using the standard method
or through alternative in-house methods.
In 2013, the VaR model continued to improve. In particular, the shocks applied to sovereign bonds are now based on historic yield curve spreads (Z-spread), instead of shocks observed on CDS. This treatment allows capturing the basis between bond and CDS.
The changes in the Group’s trading VaR in 2013, are presented below:
| TRADING VAR (TRADING PORTFOLIOS) CHANGES
| OVER THE COURSE OF 2013 (1 DAY, 99%) (IN MILLIONS OF EUROS)
0
-20
-10
-40
-30
-60
-50
-80
-70
In m
illio
ns o
f eur
os
Janu
ary
13
Febr
uary
13
Mar
ch 1
3
April
13
May
13
June
13
July
13
Augu
st 1
3
Sept
embe
r 13
Octo
ber 1
3
Nove
mbe
r 13
Dece
mbe
r 13
| VAR 2013 (1 DAY, 99%)
(in EUR m) Beginning of the year End of the year Minimum Average Maximum
VaR 22.5 39.1 15.5 25.3 45.2
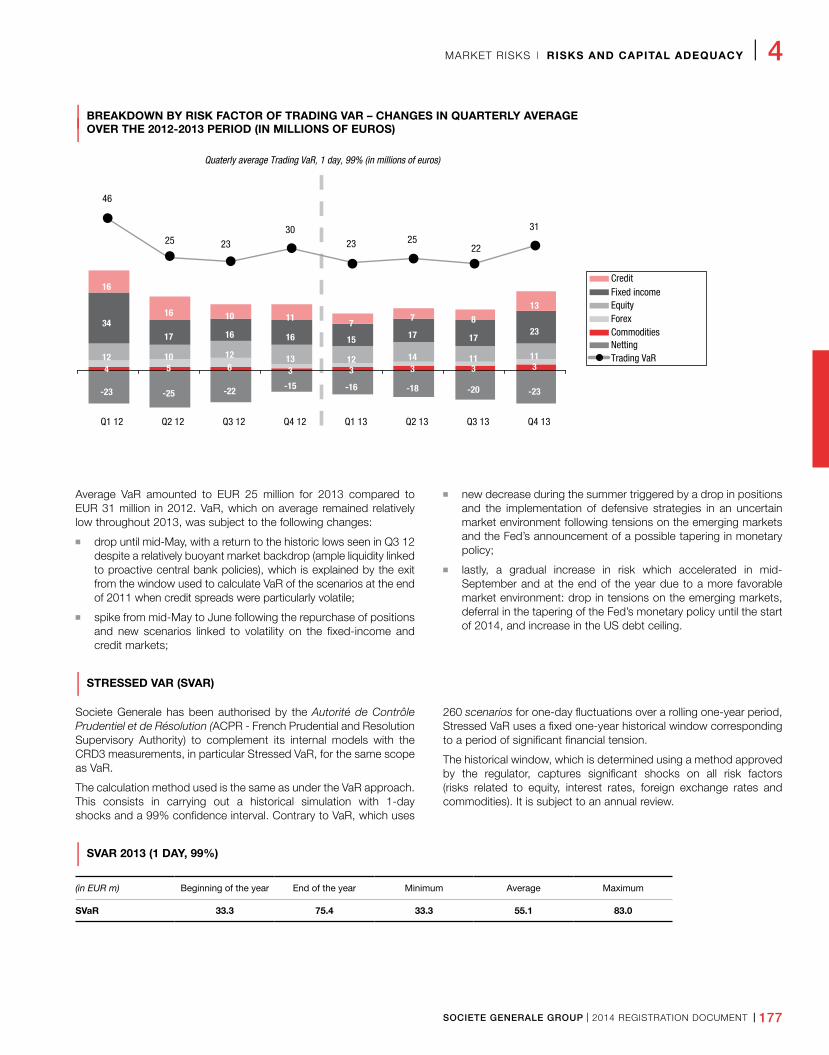
SOCIETE GENERALE GROUP I 2014 REGISTRATION DOCUMENT I 177
MARKET RISKS I RISKS AND CAPITAL ADEQUACY I 4
| BREAKDOWN BY RISK FACTOR OF TRADING VAR – CHANGES IN QUARTERLY AVERAGE
| OVER THE 2012-2013 PERIOD (IN MILLIONS OF EUROS)
-23 -25 -22 -15 -16 -18 -20 -23
4 5 6 3 3 3 3 3 12 10 12 13 12 14 11 11
34 17 16 16 15 17 17
23
16
16 10 11 7
7 8
13
46
25 23 30
23 25 22
31
Q1 12 Q2 12 Q3 12 Q4 12 Q1 13 Q2 13 Q3 13 Q4 13
Quaterly average Trading VaR, 1 day, 99% (in millions of euros)
Fixed incomeCredit
EquityForexCommodities
Trading VaRNetting
Average VaR amounted to EUR 25 million for 2013 compared to EUR 31 million in 2012. VaR, which on average remained relatively low throughout 2013, was subject to the following changes:
n drop until mid-May, with a return to the historic lows seen in Q3 12 despite a relatively buoyant market backdrop (ample liquidity linked to proactive central bank policies), which is explained by the exit from the window used to calculate VaR of the scenarios at the end of 2011 when credit spreads were particularly volatile;
n spike from mid-May to June following the repurchase of positions and new scenarios linked to volatility on the fixed-income and credit markets;
n new decrease during the summer triggered by a drop in positions and the implementation of defensive strategies in an uncertain market environment following tensions on the emerging markets and the Fed’s announcement of a possible tapering in monetary policy;
n lastly, a gradual increase in risk which accelerated in mid-September and at the end of the year due to a more favorable market environment: drop in tensions on the emerging markets, deferral in the tapering of the Fed’s monetary policy until the start of 2014, and increase in the US debt ceiling.
| STRESSED VAR (SVAR)
Societe Generale has been authorised by the Autorité de Contrôle Prudentiel et de Résolution (ACPR - French Prudential and Resolution Supervisory Authority) to complement its internal models with the CRD3 measurements, in particular Stressed VaR, for the same scope as VaR.
The calculation method used is the same as under the VaR approach. This consists in carrying out a historical simulation with 1-day shocks and a 99% confidence interval. Contrary to VaR, which uses
260 scenarios for one-day fluctuations over a rolling one-year period, Stressed VaR uses a fixed one-year historical window corresponding to a period of significant financial tension.
The historical window, which is determined using a method approved by the regulator, captures significant shocks on all risk factors (risks related to equity, interest rates, foreign exchange rates and commodities). It is subject to an annual review.
| SVAR 2013 (1 DAY, 99%)
(in EUR m) Beginning of the year End of the year Minimum Average Maximum
SVaR 33.3 75.4 33.3 55.1 83.0
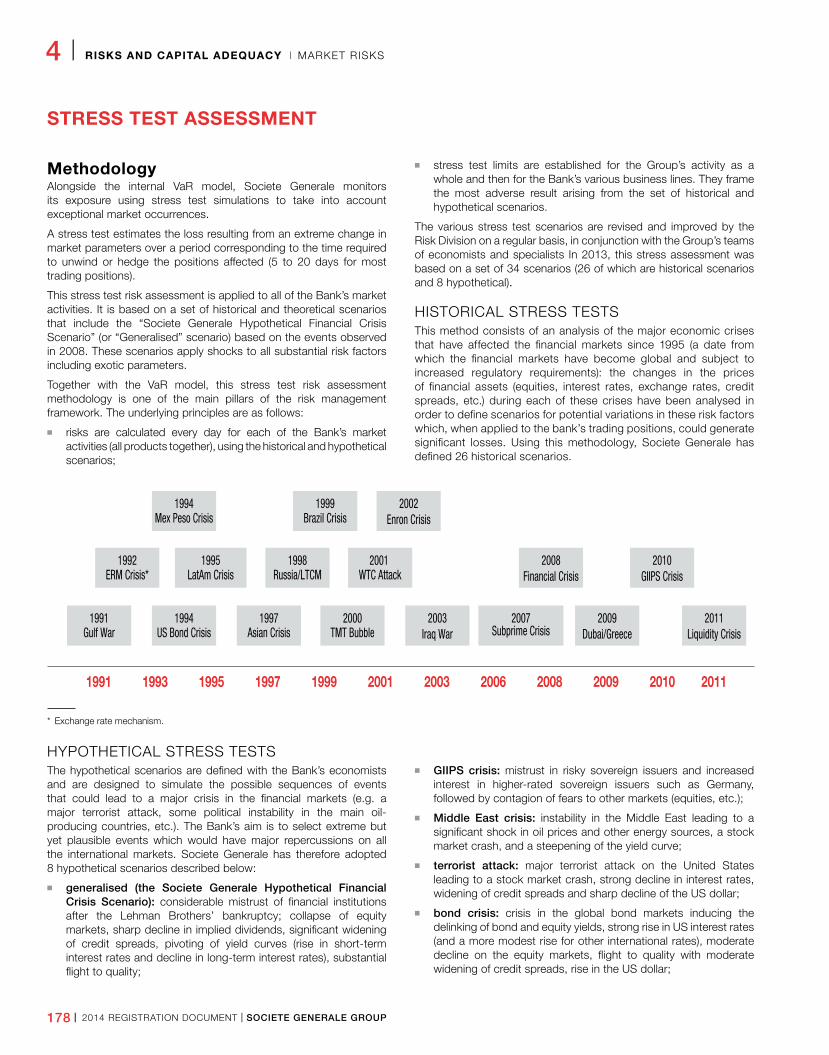
178 I 2014 REGISTRATION DOCUMENT I SOCIETE GENERALE GROUP
4 I RISKS AND CAPITAL ADEQUACY I MARKET RISKS
STRESS TEST ASSESSMENT
MethodologyAlongside the internal VaR model, Societe Generale monitors its exposure using stress test simulations to take into account exceptional market occurrences.
A stress test estimates the loss resulting from an extreme change in market parameters over a period corresponding to the time required to unwind or hedge the positions affected (5 to 20 days for most trading positions).
This stress test risk assessment is applied to all of the Bank’s market activities. It is based on a set of historical and theoretical scenarios that include the “Societe Generale Hypothetical Financial Crisis Scenario” (or “Generalised” scenario) based on the events observed in 2008. These scenarios apply shocks to all substantial risk factors including exotic parameters.
Together with the VaR model, this stress test risk assessment methodology is one of the main pillars of the risk management framework. The underlying principles are as follows:
n risks are calculated every day for each of the Bank’s market activities (all products together), using the historical and hypothetical scenarios;
n stress test limits are established for the Group’s activity as a whole and then for the Bank’s various business lines. They frame the most adverse result arising from the set of historical and hypothetical scenarios.
The various stress test scenarios are revised and improved by the Risk Division on a regular basis, in conjunction with the Group’s teams of economists and specialists In 2013, this stress assessment was based on a set of 34 scenarios (26 of which are historical scenarios and 8 hypothetical).
HISTORICAL STRESS TESTSThis method consists of an analysis of the major economic crises that have affected the financial markets since 1995 (a date from which the financial markets have become global and subject to increased regulatory requirements): the changes in the prices of financial assets (equities, interest rates, exchange rates, credit spreads, etc.) during each of these crises have been analysed in order to define scenarios for potential variations in these risk factors which, when applied to the bank’s trading positions, could generate significant losses. Using this methodology, Societe Generale has defined 26 historical scenarios.
* Exchange rate mechanism.
HYPOTHETICAL STRESS TESTSThe hypothetical scenarios are defined with the Bank’s economists and are designed to simulate the possible sequences of events that could lead to a major crisis in the financial markets (e.g. a major terrorist attack, some political instability in the main oil-producing countries, etc.). The Bank’s aim is to select extreme but yet plausible events which would have major repercussions on all the international markets. Societe Generale has therefore adopted 8 hypothetical scenarios described below:
n generalised (the Societe Generale Hypothetical Financial Crisis Scenario): considerable mistrust of financial institutions after the Lehman Brothers’ bankruptcy; collapse of equity markets, sharp decline in implied dividends, significant widening of credit spreads, pivoting of yield curves (rise in short-term interest rates and decline in long-term interest rates), substantial flight to quality;
n GIIPS crisis: mistrust in risky sovereign issuers and increased interest in higher-rated sovereign issuers such as Germany, followed by contagion of fears to other markets (equities, etc.);
n Middle East crisis: instability in the Middle East leading to a significant shock in oil prices and other energy sources, a stock market crash, and a steepening of the yield curve;
n terrorist attack: major terrorist attack on the United States leading to a stock market crash, strong decline in interest rates, widening of credit spreads and sharp decline of the US dollar;
n bond crisis: crisis in the global bond markets inducing the delinking of bond and equity yields, strong rise in US interest rates (and a more modest rise for other international rates), moderate decline on the equity markets, flight to quality with moderate widening of credit spreads, rise in the US dollar;
1991 1993 1995 1997 1999 2001 2003 2006 2008 2009 2010 2011
1991Gulf War
1994US Bond Crisis
1994Mex Peso Crisis
1999Brazil Crisis
2002Enron Crisis
1997Asian Crisis
2000TMT Bubble
1992ERM Crisis*
1998Russia/LTCM
2001 WTC Attack
2008Financial Crisis
2010GIIPS Crisis
1995LatAm Crisis
2003Iraq War
2007Subprime Crisis
2009Dubai/Greece
2011Liquidity Crisis
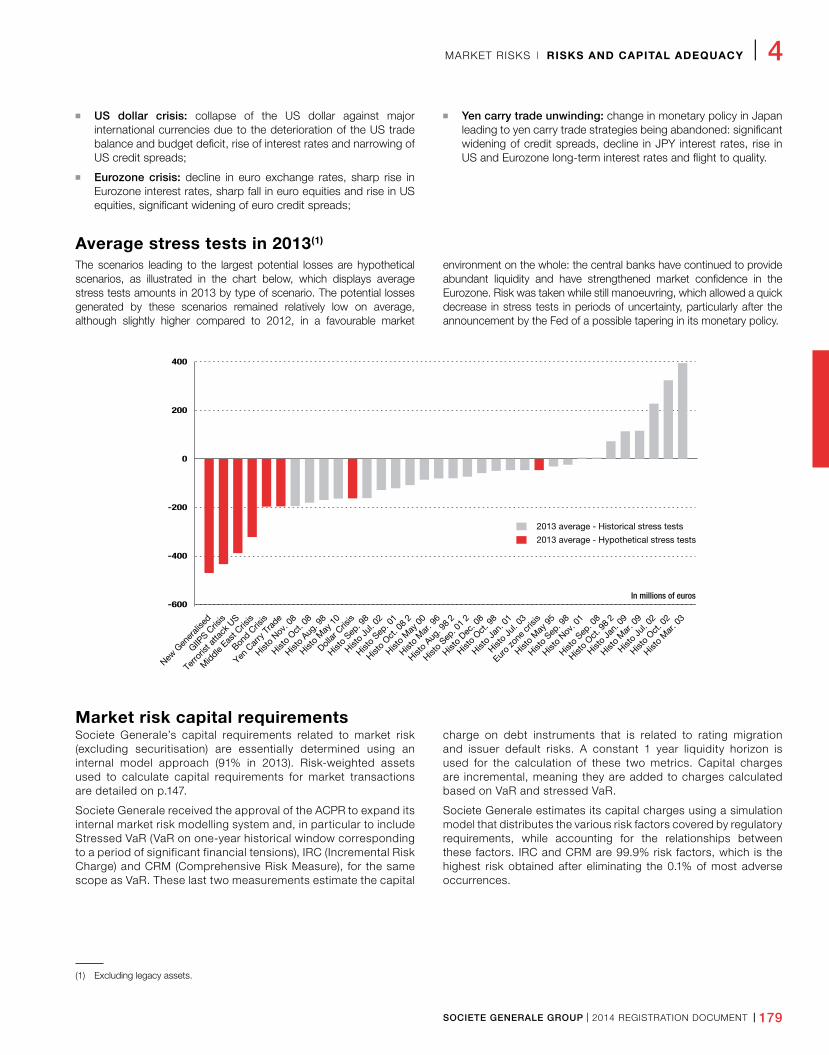
SOCIETE GENERALE GROUP I 2014 REGISTRATION DOCUMENT I 179
MARKET RISKS I RISKS AND CAPITAL ADEQUACY I 4
n US dollar crisis: collapse of the US dollar against major international currencies due to the deterioration of the US trade balance and budget deficit, rise of interest rates and narrowing of US credit spreads;
n Eurozone crisis: decline in euro exchange rates, sharp rise in Eurozone interest rates, sharp fall in euro equities and rise in US equities, significant widening of euro credit spreads;
n Yen carry trade unwinding: change in monetary policy in Japan leading to yen carry trade strategies being abandoned: significant widening of credit spreads, decline in JPY interest rates, rise in US and Eurozone long-term interest rates and flight to quality.
Average stress tests in 2013(1)
The scenarios leading to the largest potential losses are hypothetical scenarios, as illustrated in the chart below, which displays average stress tests amounts in 2013 by type of scenario. The potential losses generated by these scenarios remained relatively low on average, although slightly higher compared to 2012, in a favourable market
environment on the whole: the central banks have continued to provide abundant liquidity and have strengthened market confidence in the Eurozone. Risk was taken while still manoeuvring, which allowed a quick decrease in stress tests in periods of uncertainty, particularly after the announcement by the Fed of a possible tapering in its monetary policy.
Market risk capital requirementsSociete Generale’s capital requirements related to market risk (excluding securitisation) are essentially determined using an internal model approach (91% in 2013). Risk-weighted assets used to calculate capital requirements for market transactions are detailed on p.147.
Societe Generale received the approval of the ACPR to expand its internal market risk modelling system and, in particular to include Stressed VaR (VaR on one-year historical window corresponding to a period of significant financial tensions), IRC (Incremental Risk Charge) and CRM (Comprehensive Risk Measure), for the same scope as VaR. These last two measurements estimate the capital
charge on debt instruments that is related to rating migration and issuer default risks. A constant 1 year liquidity horizon is used for the calculation of these two metrics. Capital charges are incremental, meaning they are added to charges calculated based on VaR and stressed VaR.
Societe Generale estimates its capital charges using a simulation model that distributes the various risk factors covered by regulatory requirements, while accounting for the relationships between these factors. IRC and CRM are 99.9% risk factors, which is the highest risk obtained after eliminating the 0.1% of most adverse occurrences.
New G
ener
alise
d
GIIPS C
risis
Terro
rist a
ttack
US
Middle
East C
risis
Bond C
risis
Yen C
arry
Trad
e
Histo
Nov. 0
8
Histo
Oct. 0
8
Histo
Aug. 9
8
Histo
May
10
Dollar
Cris
is
Histo
Sep. 9
8
Histo
Jul. 0
2
Histo
Sep. 0
1
Histo
Oct. 0
8 2
Histo
May
00
Histo
Mar
. 96
Histo
Aug. 9
8 2
Histo
Sep. 0
1 2
Histo
Dec. 0
8
Histo
Oct. 9
8
Histo
Jan.
01
Histo
Jul. 0
3
Euro
zone
crisi
s
Histo
May
95
Histo
Sep. 9
8
Histo
Nov. 0
1
Histo
Sep. 0
8
Histo
Oct. 9
8 2
Histo
Jan.
09
Histo
Mar
. 09
Histo
Jul. 0
2
Histo
Oct. 0
2
Histo
Mar
. 03
2013 average - Hypothetical stress tests
2013 average - Historical stress tests
In millions of euros
400
200
0
-200
-400
-600
(1) Excluding legacy assets.
180 I 2014 REGISTRATION DOCUMENT I SOCIETE GENERALE GROUP
4 I RISKS AND CAPITAL ADEQUACY I MARKET RISKS
These internal models are subject to the same governance as other internal models that meet the regulatory Pillar 1 requirements.
In particular:
n a weekly analysis is performed on these metrics;
n they are then compared with standard stress tests as defined by the regulator (25 historical scenarios);
n a review of model assumptions at least once a year and an ex-post consistency control are carried out;
n the methodology and its implementation were approved by the Group Internal Audit Division and the ACPR.
In accordance with the regulations, IRC is applied to debt instruments already measured using internal models other than securitisation and the correlation portfolio. In particular, this includes bonds, CDS and related derivative products.
CRM exclusively covers the correlation portfolio, i.e., CDO tranches for liquid issuers and “first-to-default” products as well as their hedging using CDS and indices. Aside from the credit-migration and default risk, the CRM also covers any other pricing risks (for example, spread, collection and correlation risks). Ultimately, the capital charge corresponds to the largest value between the charge calculated by the internal model and 8% of the charge calculated using the standard method for market risks.
2013 Figures
(In millions of euros) Beginning of the year End of the year Minimum Average Maximum
IRC 601.2 569.2 542.5 621.2 743.5
CRM 198.6 155.1 110.5 140.7 203.3
| TABLE 25: CAPITAL REQUIREMENTS BY RISK FACTOR
Capital requirement RWA
(In millions of euros) 31.12.2013 31.12.2012 31.12.2013 31.12.2012
Market risks assessed by internal model 1,860 1,868 23,244 23,356
VaR 477 460 5,961 5,752
Stressed VaR 643 605 8,038 7,565
Incremental risk charge (IRC) 585 603 7,307 7,543
Correlation portfolio (CRM) 155 200 1,938 2,496
Market risks assessed by standard approach 244 423 3,051 5,282
Specific risk on securitisation exposures on the trading book 67 149 840 1,866
Forex risk 105 214 1,316 2,672
Interest rate risk 62 51 772 642
Risk on securities 5 2 61 28
Risk on exposure to base product 5 6 61 74
Total 2,104 2,291 26,295 28,637
SOCIETE GENERALE GROUP I 2014 REGISTRATION DOCUMENT I 181
OPERATIONAL RISKS I RISKS AND CAPITAL ADEQUACY I 4
7 . O P E R AT I O N A L R I S K S
OPERATIONAL RISK MANAGEMENT: ORGANISATION AND GOVERNANCE
Over the last few years, Societe Generale has developed processes, management tools and a control infrastructure to enhance the control and management across the Group of the operational risks that are inherent to its various activities. These include, among others, general and specific procedures, permanent supervision, business continuity plans(1), New Product Committees(2) and functions dedicated to the oversight and management of specific types of operational risks, such as fraud, risks related to payment systems, legal risks(3), information system security risks(4) and non-compliance risks(5).
The Operational Risk DepartmentThe Operational Risk Department within the Group’s Risk Division works in close cooperation with operational risk staff in the Core Businesses and Corporate Divisions.
The Operational Risk Department is notably responsible for:
n running the Operational Risk function;
n devising and implementing Societe Generale’s operational risk control strategy, in cooperation with the Core Businesses and Corporate Divisions;
n promoting an operational risk culture throughout the Group;
n defining, at Group level, methods for identifying, measuring, monitoring, reducing and/or transferring operational risk, in cooperation with the Core Businesses and Corporate Divisions, in order to ensure consistency across the Group;
n preparing a global Group business continuity plan (BCP) and crisis management policy, managing the policy and coordinating its implementation.
The operational risk functionIn addition to the Operational Risk Department, the operational risk function includes Operational Risk Managers (ORMs) in the Core Businesses and Corporate Divisions, who are under the operational authority of the Group’s Chief Operational Risk Officer.
ORMs operate throughout the Group’s entities and are responsible for implementing the Group’s procedures and guidelines, and for monitoring and managing operational risks, with the support of dedicated operational risk staff in the business lines and entities and in close collaboration with the respective entities’ line management.
Operational Risk Committees have been set up at Group level, as well as at Business Division, Corporate Division and subsidiary levels.
OPERATIONAL RISK MEASUREMENT
Since 2004, Societe Generale has used the Advanced Measurement Approach (AMA), as proposed by the Capital Requirements Directive, to measure operational risk. This approach notably makes it possible to:
n identify i) the businesses that have the greatest risk exposures and, ii) the types of risk that have the greatest impact on the Group’s risk profile and overall capital requirements;
n enhance the Group’s operational risk culture and overall management, by introducing a virtuous circle of risk identification, improved risk management and risk mitigation and reduction;
n in 2007, the Autorité de Contrôle Prudentiel (ACP - French Prudential Supervisory Authority) conducted an in-depth review of the system in place at Societe Generale. As a result, it authorised the Group to use the most advanced measurement approach, as defined by the Basel 2 Accord (i.e. the AMA or Advanced Measurement Approach) to calculate the Group’s capital requirements for operational risks, starting from 1 January 2008. This authorisation covers more than 90% of the Societe Generale Group’s total net banking income.
A few subsidiaries still use the standardised approach. A gradual transition to the advanced measurement approach is in place for some of them.
(1) See Chapter 3, page 110 and Chapter 4, page 184.
(2) See Chapter 3, page 113.
(3) See Chapter 4, page 197 and following.
(4) See Chapter 3, page 115-116.
(5) See Chapter 4, page 197 and following.
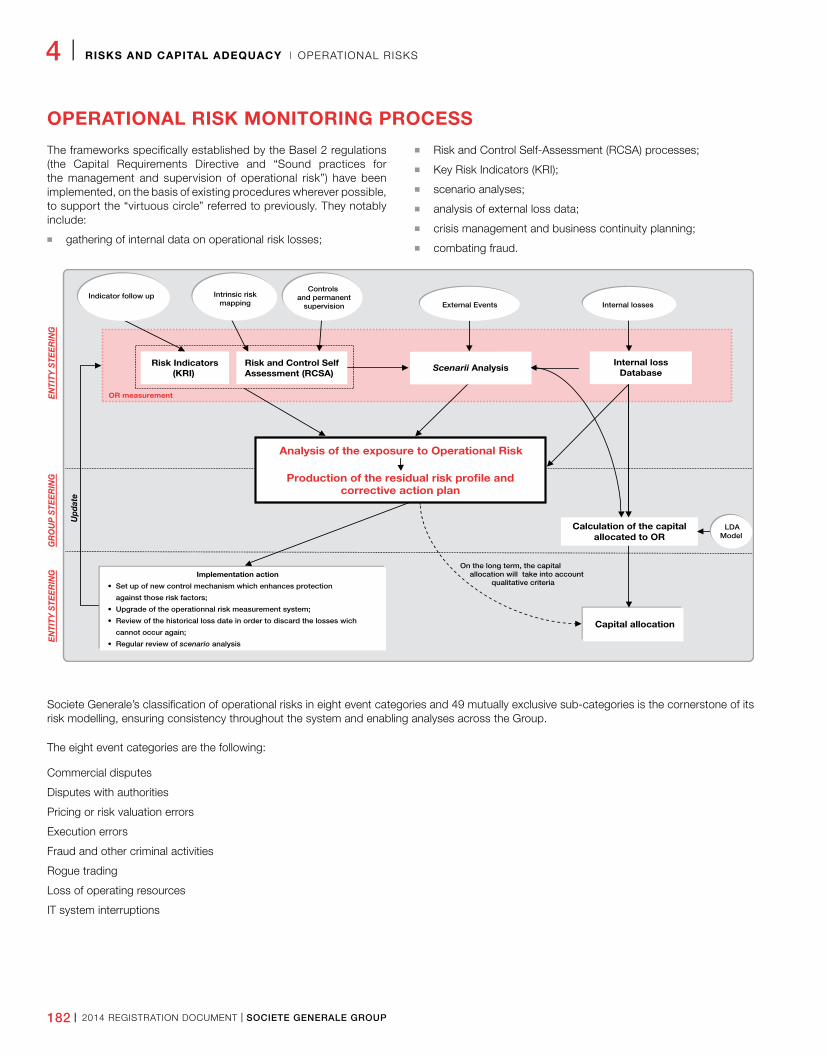
182 I 2014 REGISTRATION DOCUMENT I SOCIETE GENERALE GROUP
4 I RISKS AND CAPITAL ADEQUACY I OPERATIONAL RISKS
OPERATIONAL RISK MONITORING PROCESS
The frameworks specifically established by the Basel 2 regulations (the Capital Requirements Directive and “Sound practices for the management and supervision of operational risk”) have been implemented, on the basis of existing procedures wherever possible, to support the “virtuous circle” referred to previously. They notably include:
n gathering of internal data on operational risk losses;
n Risk and Control Self-Assessment (RCSA) processes;
n Key Risk Indicators (KRI);
n scenario analyses;
n analysis of external loss data;
n crisis management and business continuity planning;
n combating fraud.
Societe Generale’s classification of operational risks in eight event categories and 49 mutually exclusive sub-categories is the cornerstone of its risk modelling, ensuring consistency throughout the system and enabling analyses across the Group.
The eight event categories are the following:
Commercial disputes
Disputes with authorities
Pricing or risk valuation errors
Execution errors
Fraud and other criminal activities
Rogue trading
Loss of operating resources
IT system interruptions
OR measurement
Analysis of the exposure to Operational Risk
Production of the residual risk profile andcorrective action plan
Implementation action
• Set up of new control mechanism which enhances protection
against those risk factors;
• Upgrade of the operationnal risk measurement system;
• Review of the historical loss date in order to discard the losses wich
cannot occur again;
• Regular review of scenario analysis
On the long term, the capitalallocation will take into account
qualitative criteria
EN
TITY
STE
ER
ING
GR
OU
P S
TEE
RIN
GE
NTI
TY S
TEE
RIN
G
Risk Indicators(KRI)
Indicator follow up
Risk and Control SelfAssessment (RCSA)
Intrinsic riskmapping
Calculation of the capitalallocated to OR
LDAModel
Capital allocation
Upd
ate
External Events
Internal lossDatabase
Internal losses
Scenarii Analysis
Controls and permanent
supervision
SOCIETE GENERALE GROUP I 2014 REGISTRATION DOCUMENT I 183
OPERATIONAL RISKS I RISKS AND CAPITAL ADEQUACY I 4
Internal loss data collectionInternal loss data has been compiled throughout the Group since 2003, enabling operational staff to:
n define and implement the appropriate corrective actions (changes to activities or processes, strengthening of controls, etc.);
n build expertise in operational risk management concepts and tools;
n achieve a deeper understanding of their risk areas;
n help foster an operational risk culture throughout the Group.
The minimum threshold above which a loss is recorded is EUR 10,000 throughout the Group, except for Corporate and Investment Banking, where this threshold is EUR 20,000 due to the scope of its activity, the volumes involved and the relevance of regulatory capital modelling points. Below these thresholds, loss information is collected by the Group’s various divisions but is not identified by the Operational Risk Department.
Risk and Control Self-Assessment (RCSA)The purpose of Risk and Control Self-Assessment (RCSA) is to assess the Group’s exposure to operational risks in order to improve their monitoring. Based on the results of other operational risk management frameworks (internal losses, KRI, etc.), risk areas identified by functions for their respective fields of expertise, and interviews with Group experts, its objectives are as follows:
n identifying and assessing the major operational risks to which each business is inherently exposed (the “intrinsic” risks), while disregarding prevention and control systems. Where necessary, risk mapping established by the functions (e.g. Compliance, Information Systems Security, etc.) contribute to the evaluation of intrinsic risks;
n assessing the quality of major risk prevention and mitigation measures, including their existence and effectiveness in detecting and preventing major risks and/or their capacity to reduce their financial impact;
n assessing the major risk exposure of each business that remains once the risk prevention and mitigation measures are taken into account (the “residual risk”), while disregarding insurance coverage;
n correcting any deficiencies in risk prevention and mitigation measures and implementing corrective action plans;
n facilitating and/or supporting the implementation of key risk indicators;
n adapting the risk insurance strategy, if necessary.
As part of this exercise, major risks of a given scope are described using a double scale of severity and frequency.
Key risk indicators (KRI)KRIs supplement the overall operational risk management system, by providing a dynamic view of changes in business line risk profiles as well as a warning system. Regular KRI monitoring assists managers of the entities in their assessment of the Group’s operational risk exposure obtained from the RCSA, the analysis of internal losses and scenario analyses, by providing them with:
n a quantitative, verifiable risk measurement;
n a regular assessment of the improvements or deteriorations in the risk profile and the control and prevention environment which require particular attention or an action plan.
KRIs that may have a significant impact on the entire Group are reported to the Group’s General Management via a relevant KRI dashboard.
Scenario analysesScenario analyses serve two purposes: informing the Group about potential significant areas of risk and contributing to the calculation of the capital required to cover operational risks.
For the calculation of capital requirements, the Group uses scenario analyses to:
n measure its exposure to potential losses arising from low frequency/very high severity events;
n provide an expert’s opinion of loss distribution for event categories whose internal loss data history is insufficient.
In practice, various scenarios are reviewed by experts, who gauge severity and frequency of the potential impacts for the Bank by factoring in internal and external loss data as well as the internal framework (controls and prevention systems) and the external environment (regulatory, business, etc.).
Analyses are undertaken for two types of scenarios:
n major Group stress scenarios, involving very severe events that cut across businesses and departments, having an external cause in most cases and requiring, if necessary, a business continuity plan (BCP). The scenarios of this type analysed so far have helped to develop the Business Impact Analysis aspects of the BCPs;
n business line scenarios that do not, strictly speaking, fall into the category of business continuity, but are used to measure the unexpected losses to which the businesses may be exposed. Specific actions are performed in order to prevent the portfolio from being diluted over too many scenarios and to maintain the system’s focus on risks that could severely impact the Group.
n Governance is established in order to, notably:
– allow the approval of the annual scenario update programme by the Risk Committee (CORISQ)
– allow validation of the internal loss scenarios and frequency by the senior management of core businesses and Corporate Divisions, through internal control coordination committees (CCCI) for the departments involved or through ad hoc meetings;
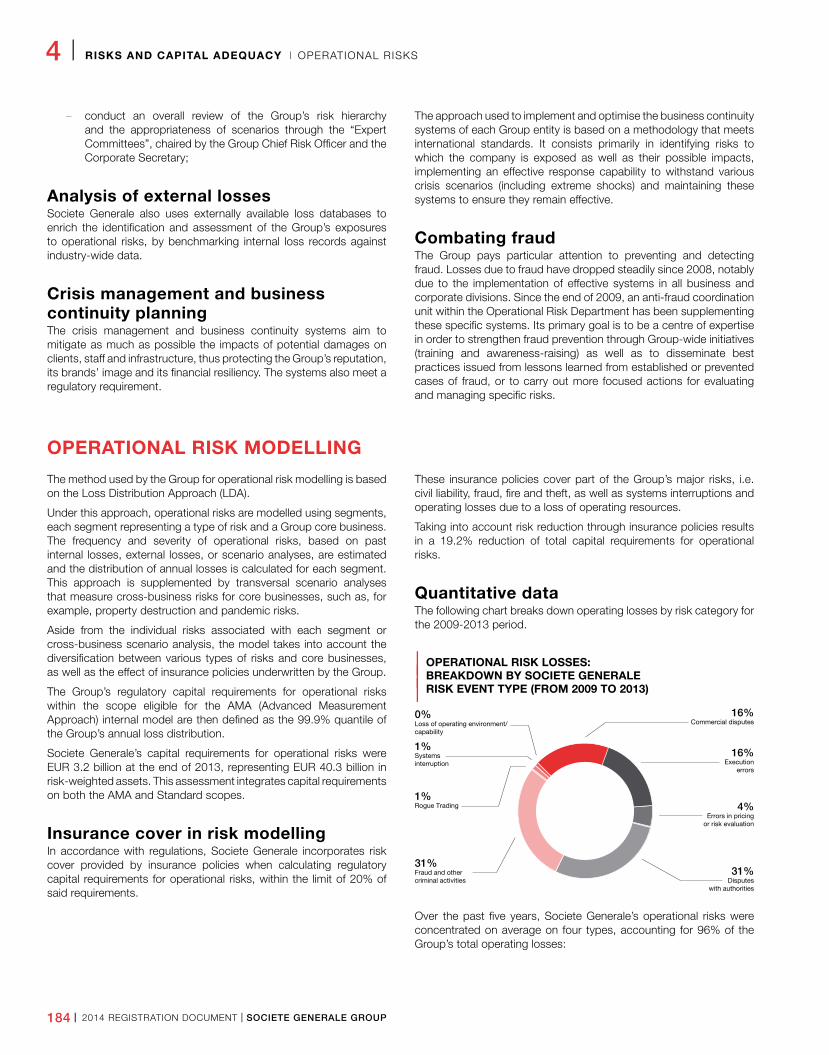
184 I 2014 REGISTRATION DOCUMENT I SOCIETE GENERALE GROUP
4 I RISKS AND CAPITAL ADEQUACY I OPERATIONAL RISKS
– conduct an overall review of the Group’s risk hierarchy and the appropriateness of scenarios through the “Expert Committees”, chaired by the Group Chief Risk Officer and the Corporate Secretary;
Analysis of external lossesSociete Generale also uses externally available loss databases to enrich the identification and assessment of the Group’s exposures to operational risks, by benchmarking internal loss records against industry-wide data.
Crisis management and business continuity planningThe crisis management and business continuity systems aim to mitigate as much as possible the impacts of potential damages on clients, staff and infrastructure, thus protecting the Group’s reputation, its brands’ image and its financial resiliency. The systems also meet a regulatory requirement.
The approach used to implement and optimise the business continuity systems of each Group entity is based on a methodology that meets international standards. It consists primarily in identifying risks to which the company is exposed as well as their possible impacts, implementing an effective response capability to withstand various crisis scenarios (including extreme shocks) and maintaining these systems to ensure they remain effective.
Combating fraudThe Group pays particular attention to preventing and detecting fraud. Losses due to fraud have dropped steadily since 2008, notably due to the implementation of effective systems in all business and corporate divisions. Since the end of 2009, an anti-fraud coordination unit within the Operational Risk Department has been supplementing these specific systems. Its primary goal is to be a centre of expertise in order to strengthen fraud prevention through Group-wide initiatives (training and awareness-raising) as well as to disseminate best practices issued from lessons learned from established or prevented cases of fraud, or to carry out more focused actions for evaluating and managing specific risks.
OPERATIONAL RISK MODELLING
The method used by the Group for operational risk modelling is based on the Loss Distribution Approach (LDA).
Under this approach, operational risks are modelled using segments, each segment representing a type of risk and a Group core business. The frequency and severity of operational risks, based on past internal losses, external losses, or scenario analyses, are estimated and the distribution of annual losses is calculated for each segment. This approach is supplemented by transversal scenario analyses that measure cross-business risks for core businesses, such as, for example, property destruction and pandemic risks.
Aside from the individual risks associated with each segment or cross-business scenario analysis, the model takes into account the diversification between various types of risks and core businesses, as well as the effect of insurance policies underwritten by the Group.
The Group’s regulatory capital requirements for operational risks within the scope eligible for the AMA (Advanced Measurement Approach) internal model are then defined as the 99.9% quantile of the Group’s annual loss distribution.
Societe Generale’s capital requirements for operational risks were EUR 3.2 billion at the end of 2013, representing EUR 40.3 billion in risk-weighted assets. This assessment integrates capital requirements on both the AMA and Standard scopes.
Insurance cover in risk modellingIn accordance with regulations, Societe Generale incorporates risk cover provided by insurance policies when calculating regulatory capital requirements for operational risks, within the limit of 20% of said requirements.
These insurance policies cover part of the Group’s major risks, i.e. civil liability, fraud, fire and theft, as well as systems interruptions and operating losses due to a loss of operating resources.
Taking into account risk reduction through insurance policies results in a 19.2% reduction of total capital requirements for operational risks.
Quantitative dataThe following chart breaks down operating losses by risk category for the 2009-2013 period.
| OPERATIONAL RISK LOSSES:
| BREAKDOWN BY SOCIETE GENERALE
| RISK EVENT TYPE (FROM 2009 TO 2013)
4%Errors in pricing
or risk evaluation
16%Execution
errors
31% Fraud and othercriminal activities
1%
0%
Systemsinterruption
16%Commercial disputes
31%Disputes
with authorities
1% Rogue Trading
Loss of operating environment/capability
Over the past five years, Societe Generale’s operational risks were concentrated on average on four types, accounting for 96% of the Group’s total operating losses:
SOCIETE GENERALE GROUP I 2014 REGISTRATION DOCUMENT I 185
OPERATIONAL RISKS I RISKS AND CAPITAL ADEQUACY I 4
n Disputes with authorities represented 31% of losses over the period. These became the main cause of losses (along with fraud) primarily due to the 2013 Euribor transaction, which alone accounted for 56% of total losses within this category. Other disputes with authorities were largely related to tax reassessments. The share of disputes with authorities in operating losses is expected to rise in a more challenging regulatory environment;
n Fraud also represented 31% of losses on average over the 2009-2013 period. These were distributed among several isolated cases involving large sums and a combination of much smaller losses, mostly involving forged documents approval process for the purposes of obtaining loans. Fraud was only the fourth most frequent source of new losses in 2013; in 2011 and 2012, it had been the most frequent. Special action plans have been undertaken in the various businesses, particularly since 2011. However, one must remain cautious given the challenging economic context, with tightened credit conditions, a rise in cybercrime and an increase in international and domestic payment fraud across distribution channels;
n Execution errors represented 16% of operating losses and were the third most frequent source of losses for the Group over the period. Although down since 2011, total losses from execution errors remain volatile, depending largely on transaction volumes and market instability;
n While commercial disputes only represented 16% of losses over the 2009-2013 period, they nonetheless were up from 2011 and became the second most frequent source of losses in 2013, after disputes with authorities. Disputes experienced by other banks (especially in the UK and US) call for constant vigilance, particularly regarding the selection of products sold, their compliance and the quality of their documentation.
The other categories of Group operational risks (rogue trading, IT system interruptions, pricing or risk valuation errors and loss of operating resources) were still fairly insignificant, representing barely 6% of the Group’s losses on average over the 2009 to 2013 period.
OPERATIONAL RISK INSURANCE
Description of insurance policies
GENERAL POLICYSince 1993, Societe Generale has implemented a global policy of hedging Group operational risks through insurance. This consists in looking on the market for the broadest and highest levels of guarantee with regard to the risks incurred and enabling all entities to benefit from these guarantees wherever possible. Coverage is taken out with leading insurers. Where required by local legislation, local policies are taken out, which are then reinsured by insurers that are part of the global programme.
In addition, special insurance policies may be taken out by entities which perform specific activities.
A Group internal reinsurance company intervenes in several policies in order to pool high frequency, low-level risks between entities. This approach contributes to the improvement of the Group’s knowledge and management of its risks.
Description of coverage
GENERAL RISKSBuildings and their contents, including IT equipment, are insured at their replacement value. The guarantee covering acts of terrorism abroad has been renewed.
Liability other than professional liability (i.e. relating to operations, Chief Executive Officers and Directors, vehicles, etc.) is covered by insurance policies around the world. The amounts insured vary from country to country to meet operating requirements.
RISKS ARISING FROM OPERATIONSInsurance is only one of the measures to offset the consequences of the risks inherent in the Group’s activity. It complements the risk monitoring policy led by the Group.
THEFT/FRAUD
These risks are included in the “Bankers Blanket Bond” policy that insures all the Bank’s financial activities around the world. Fraudulent actions by an employee or by a third party acting on its own or with the aid of an employee with the intent to obtain illicit personal gain or through malice (which implies intent to harm the Group) are covered.
PROFESSIONAL LIABILITY
The consequences of any legal action against staff or managers as a result of their professional activity are insured under a global policy.
OPERATING LOSSES
The consequences of any accidental interruption to activity are insured under a global policy. This policy supplements the business continuity plans. The amounts insured are designed to cover losses incurred between the time of the event and the implementation of an emergency solution.
186 I 2014 REGISTRATION DOCUMENT I SOCIETE GENERALE GROUP
4 I RISKS AND CAPITAL ADEQUACY I STRUCTURAL INTEREST AND EXCHANGE RATE RISKS
8 . S T R U C T U R A L I N T E R E S T R AT E AND EXCHANGE �RATE �R I SKS
Structural exposure to interest rate risks encompasses exposures resulting from commercial activities and their hedging transactions and corporate centre for each of the Group’s consolidated entities.
The interest rate and exchange rate risks linked to trading activities are excluded from the structural risk measurement scope as they belong to the category of market risks. The structural and market exposures constitute the total interest rate and exchange rate exposure of the Group.
The general principle is to reduce structural interest rate and exchange rate risks to the greatest extent possible within the
consolidated entities. Wherever possible, commercial transactions are hedged against interest rate and exchange rate risks, either through micro-hedging (individual hedging of each commercial transaction) or macro-hedging techniques (hedging of portfolios of similar commercial transactions within a treasury department). Interest rate and exchange rate risks linked to corporate centre must also be hedged as far as possible excepted for some foreign exchange positions kept to immunise the solvency ratio.
ORGANISATION OF THE MANAGEMENT OF STRUCTURAL INTEREST RATE AND EXCHANGE RATE RISKS
The principles and standards for managing these risks are defined at the Group level. The entities are first and foremost responsible for managing these risks. The ALM (Asset and Liability Management) Risks Control Departments of the Group Business divisions conduct Level 2 controls of the entities’ structural risk management.
The Group Finance Committee, a General Management body:
n validates and oversees the structural risk monitoring, management and supervision system;
n reviews changes in the Group’s structural risks through consolidated reporting by the Finance Division;
n examines and validates the measures proposed by the Group Finance Division.
The ALM Risk Control Department, which is part of the Finance Division is responsible for:
n defining the structural risks policies for the Group;
n defining the steering indicators and overall stress test scenarii of the different types of structural risks and setting the main limits for the business divisions and the entities;
n analysing the Group’s structural risk exposure and defining hedging strategies;
n monitoring the regulatory environment concerning structural risk;
n defining of the ALM principles for the Group;
n defining the normative environment of the structural risk metrics;
n validating the models used by the Group entities with regard to structural risks;
n inventorying, consolidating and reporting on Group structural risks;
n performing controls of structural risk limits.
The ALM Risk Control Department reports to the Chief Financial Officer of the Group and is functionally supervised by the Chief Risk Officer, to whom it reports its activities and who validates its working plan jointly with the Chief Finance Officer. The ALM Risk Control Department is integrated in the Group Risk function in compliance with CRBF 97-02.
Entities are responsible for structural risk managementIn this respect, entities apply the standards defined at the Group level, develop their models, measure their risk exposure and implement the required hedges.
Each entity has its own structural risk manager, who reports to the entity’s Finance Department and is responsible for conducting first level controls and for reporting the entity’s structural risk exposure to the Group Finance Division via a shared IT system.
Retail banking entities both in France and abroad generally have an ad-hoc ALM (Asset Liability Management) Committee responsible for validating the models used, managing their exposures to interest rate and exchange rate risks and implementing the hedging programmes in compliance with the principles set out by the Group and the limits validated by the Finance Committee.
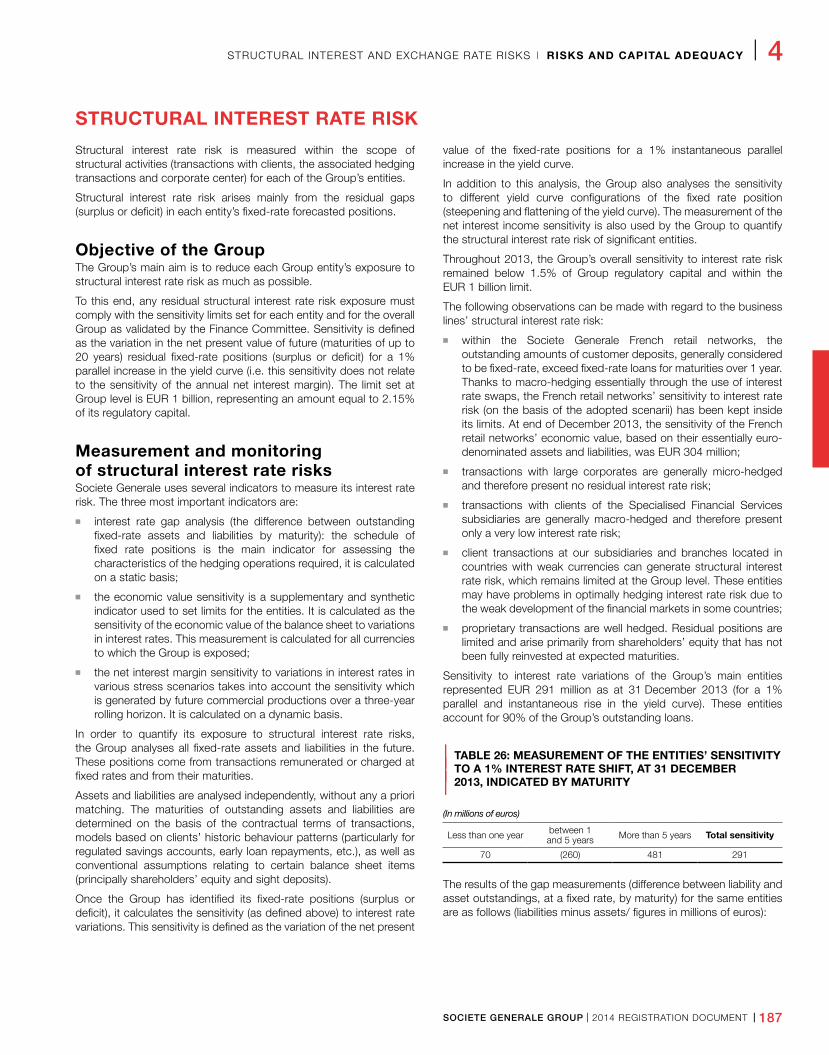
SOCIETE GENERALE GROUP I 2014 REGISTRATION DOCUMENT I 187
STRUCTURAL INTEREST AND EXCHANGE RATE RISKS I RISKS AND CAPITAL ADEQUACY I 4
STRUCTURAL INTEREST RATE RISK
Structural interest rate risk is measured within the scope of structural activities (transactions with clients, the associated hedging transactions and corporate center) for each of the Group’s entities.
Structural interest rate risk arises mainly from the residual gaps (surplus or deficit) in each entity’s fixed-rate forecasted positions.
Objective of the GroupThe Group’s main aim is to reduce each Group entity’s exposure to structural interest rate risk as much as possible.
To this end, any residual structural interest rate risk exposure must comply with the sensitivity limits set for each entity and for the overall Group as validated by the Finance Committee. Sensitivity is defined as the variation in the net present value of future (maturities of up to 20 years) residual fixed-rate positions (surplus or deficit) for a 1% parallel increase in the yield curve (i.e. this sensitivity does not relate to the sensitivity of the annual net interest margin). The limit set at Group level is EUR 1 billion, representing an amount equal to 2.15% of its regulatory capital.
Measurement and monitoring of structural interest rate risksSociete Generale uses several indicators to measure its interest rate risk. The three most important indicators are:
n interest rate gap analysis (the difference between outstanding fixed-rate assets and liabilities by maturity): the schedule of fixed rate positions is the main indicator for assessing the characteristics of the hedging operations required, it is calculated on a static basis;
n the economic value sensitivity is a supplementary and synthetic indicator used to set limits for the entities. It is calculated as the sensitivity of the economic value of the balance sheet to variations in interest rates. This measurement is calculated for all currencies to which the Group is exposed;
n the net interest margin sensitivity to variations in interest rates in various stress scenarios takes into account the sensitivity which is generated by future commercial productions over a three-year rolling horizon. It is calculated on a dynamic basis.
In order to quantify its exposure to structural interest rate risks, the Group analyses all fixed-rate assets and liabilities in the future. These positions come from transactions remunerated or charged at fixed rates and from their maturities.
Assets and liabilities are analysed independently, without any a priori matching. The maturities of outstanding assets and liabilities are determined on the basis of the contractual terms of transactions, models based on clients’ historic behaviour patterns (particularly for regulated savings accounts, early loan repayments, etc.), as well as conventional assumptions relating to certain balance sheet items (principally shareholders’ equity and sight deposits).
Once the Group has identified its fixed-rate positions (surplus or deficit), it calculates the sensitivity (as defined above) to interest rate variations. This sensitivity is defined as the variation of the net present
value of the fixed-rate positions for a 1% instantaneous parallel increase in the yield curve.
In addition to this analysis, the Group also analyses the sensitivity to different yield curve configurations of the fixed rate position (steepening and flattening of the yield curve). The measurement of the net interest income sensitivity is also used by the Group to quantify the structural interest rate risk of significant entities.
Throughout 2013, the Group’s overall sensitivity to interest rate risk remained below 1.5% of Group regulatory capital and within the EUR 1 billion limit.
The following observations can be made with regard to the business lines’ structural interest rate risk:
n within the Societe Generale French retail networks, the outstanding amounts of customer deposits, generally considered to be fixed-rate, exceed fixed-rate loans for maturities over 1 year. Thanks to macro-hedging essentially through the use of interest rate swaps, the French retail networks’ sensitivity to interest rate risk (on the basis of the adopted scenarii) has been kept inside its limits. At end of December 2013, the sensitivity of the French retail networks’ economic value, based on their essentially euro-denominated assets and liabilities, was EUR 304 million;
n transactions with large corporates are generally micro-hedged and therefore present no residual interest rate risk;
n transactions with clients of the Specialised Financial Services subsidiaries are generally macro-hedged and therefore present only a very low interest rate risk;
n client transactions at our subsidiaries and branches located in countries with weak currencies can generate structural interest rate risk, which remains limited at the Group level. These entities may have problems in optimally hedging interest rate risk due to the weak development of the financial markets in some countries;
n proprietary transactions are well hedged. Residual positions are limited and arise primarily from shareholders’ equity that has not been fully reinvested at expected maturities.
Sensitivity to interest rate variations of the Group’s main entities represented EUR 291 million as at 31 December 2013 (for a 1% parallel and instantaneous rise in the yield curve). These entities account for 90% of the Group’s outstanding loans.
| TABLE 26: MEASUREMENT OF THE ENTITIES’ SENSITIVITY
| TO A 1% INTEREST RATE SHIFT, AT 31 DECEMBER
| 2013, INDICATED BY MATURITY
(In millions of euros)
Less than one year between 1 and 5 years More than 5 years Total sensitivity
70 (260) 481 291
The results of the gap measurements (difference between liability and asset outstandings, at a fixed rate, by maturity) for the same entities are as follows (liabilities minus assets/ figures in millions of euros):
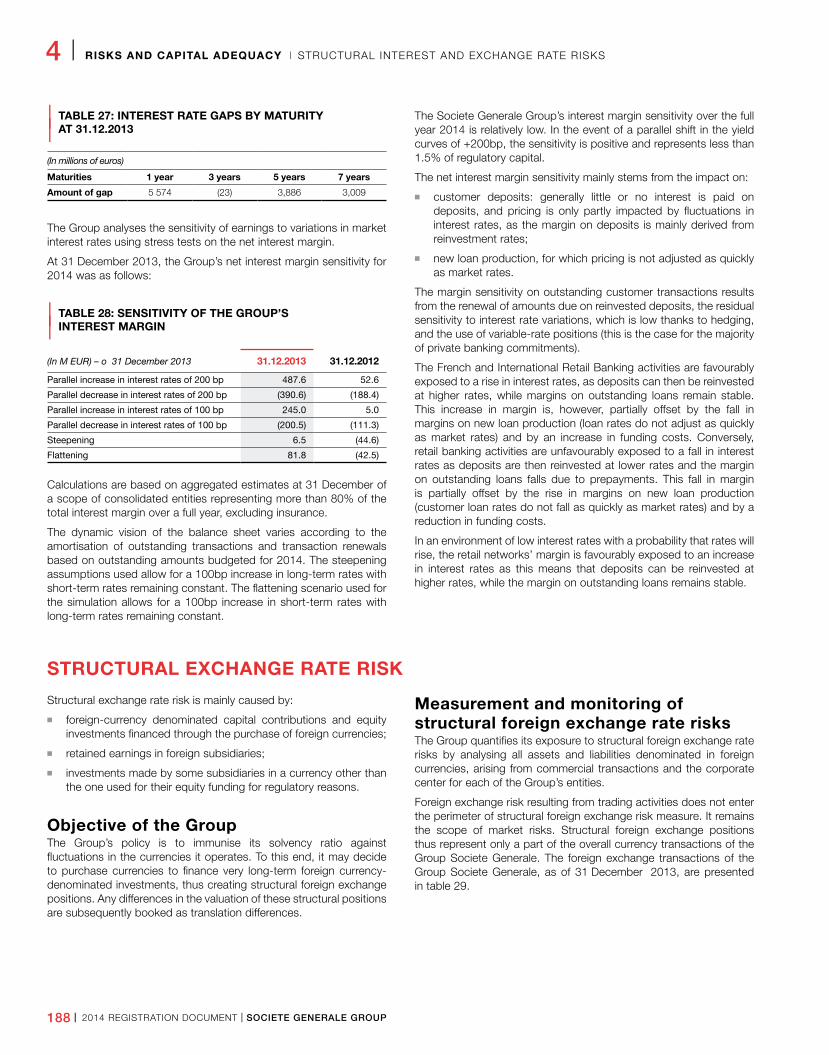
188 I 2014 REGISTRATION DOCUMENT I SOCIETE GENERALE GROUP
4 I RISKS AND CAPITAL ADEQUACY I STRUCTURAL INTEREST AND EXCHANGE RATE RISKS
| TABLE 27: INTEREST RATE GAPS BY MATURITY
| AT 31.12.2013
(In millions of euros)
Maturities 1 year 3 years 5 years 7 years
Amount of gap 5 574 (23) 3,886 3,009
The Group analyses the sensitivity of earnings to variations in market interest rates using stress tests on the net interest margin.
At 31 December 2013, the Group’s net interest margin sensitivity for 2014 was as follows:
| TABLE 28: SENSITIVITY OF THE GROUP’S
| INTEREST MARGIN
(In M EUR) – o 31 December 2013 31.12.2013 31.12.2012
Parallel increase in interest rates of 200 bp 487.6 52.6
Parallel decrease in interest rates of 200 bp (390.6) (188.4)
Parallel increase in interest rates of 100 bp 245.0 5.0
Parallel decrease in interest rates of 100 bp (200.5) (111.3)
Steepening 6.5 (44.6)
Flattening 81.8 (42.5)
Calculations are based on aggregated estimates at 31 December of a scope of consolidated entities representing more than 80% of the total interest margin over a full year, excluding insurance.
The dynamic vision of the balance sheet varies according to the amortisation of outstanding transactions and transaction renewals based on outstanding amounts budgeted for 2014. The steepening assumptions used allow for a 100bp increase in long-term rates with short-term rates remaining constant. The flattening scenario used for the simulation allows for a 100bp increase in short-term rates with long-term rates remaining constant.
The Societe Generale Group’s interest margin sensitivity over the full year 2014 is relatively low. In the event of a parallel shift in the yield curves of +200bp, the sensitivity is positive and represents less than 1.5% of regulatory capital.
The net interest margin sensitivity mainly stems from the impact on:
n customer deposits: generally little or no interest is paid on deposits, and pricing is only partly impacted by fluctuations in interest rates, as the margin on deposits is mainly derived from reinvestment rates;
n new loan production, for which pricing is not adjusted as quickly as market rates.
The margin sensitivity on outstanding customer transactions results from the renewal of amounts due on reinvested deposits, the residual sensitivity to interest rate variations, which is low thanks to hedging, and the use of variable-rate positions (this is the case for the majority of private banking commitments).
The French and International Retail Banking activities are favourably exposed to a rise in interest rates, as deposits can then be reinvested at higher rates, while margins on outstanding loans remain stable. This increase in margin is, however, partially offset by the fall in margins on new loan production (loan rates do not adjust as quickly as market rates) and by an increase in funding costs. Conversely, retail banking activities are unfavourably exposed to a fall in interest rates as deposits are then reinvested at lower rates and the margin on outstanding loans falls due to prepayments. This fall in margin is partially offset by the rise in margins on new loan production (customer loan rates do not fall as quickly as market rates) and by a reduction in funding costs.
In an environment of low interest rates with a probability that rates will rise, the retail networks’ margin is favourably exposed to an increase in interest rates as this means that deposits can be reinvested at higher rates, while the margin on outstanding loans remains stable.
STRUCTURAL EXCHANGE RATE RISK
Structural exchange rate risk is mainly caused by:
n foreign-currency denominated capital contributions and equity investments financed through the purchase of foreign currencies;
n retained earnings in foreign subsidiaries;
n investments made by some subsidiaries in a currency other than the one used for their equity funding for regulatory reasons.
Objective of the GroupThe Group’s policy is to immunise its solvency ratio against fluctuations in the currencies it operates. To this end, it may decide to purchase currencies to finance very long-term foreign currency-denominated investments, thus creating structural foreign exchange positions. Any differences in the valuation of these structural positions are subsequently booked as translation differences.
Measurement and monitoring of structural foreign exchange rate risksThe Group quantifies its exposure to structural foreign exchange rate risks by analysing all assets and liabilities denominated in foreign currencies, arising from commercial transactions and the corporate center for each of the Group’s entities.
Foreign exchange risk resulting from trading activities does not enter the perimeter of structural foreign exchange risk measure. It remains the scope of market risks. Structural foreign exchange positions thus represent only a part of the overall currency transactions of the Group Societe Generale. The foreign exchange transactions of the Group Societe Generale, as of 31 December 2013, are presented in table 29.
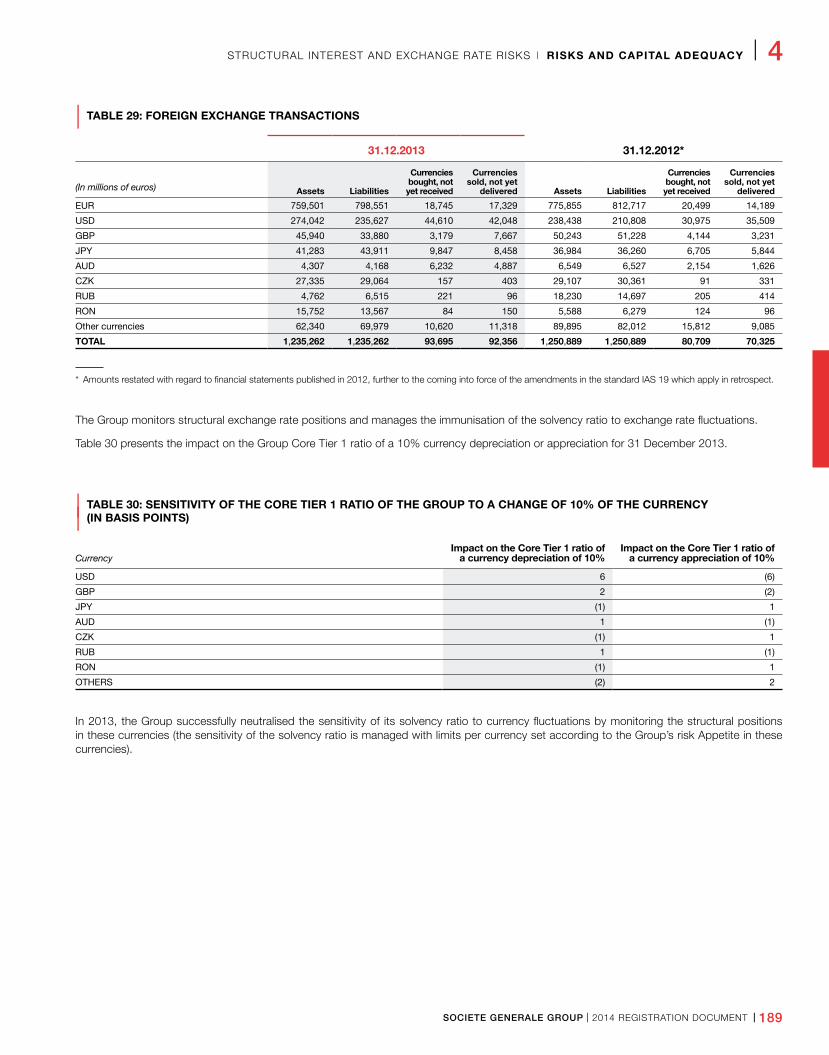
SOCIETE GENERALE GROUP I 2014 REGISTRATION DOCUMENT I 189
STRUCTURAL INTEREST AND EXCHANGE RATE RISKS I RISKS AND CAPITAL ADEQUACY I 4
| TABLE 29: FOREIGN EXCHANGE TRANSACTIONS
31.12.2013 31.12.2012*
(In millions of euros) Assets Liabilities
Currencies bought, not yet received
Currencies sold, not yet
delivered Assets Liabilities
Currencies bought, not yet received
Currencies sold, not yet
delivered
EUR 759,501 798,551 18,745 17,329 775,855 812,717 20,499 14,189
USD 274,042 235,627 44,610 42,048 238,438 210,808 30,975 35,509
GBP 45,940 33,880 3,179 7,667 50,243 51,228 4,144 3,231
JPY 41,283 43,911 9,847 8,458 36,984 36,260 6,705 5,844
AUD 4,307 4,168 6,232 4,887 6,549 6,527 2,154 1,626
CZK 27,335 29,064 157 403 29,107 30,361 91 331
RUB 4,762 6,515 221 96 18,230 14,697 205 414
RON 15,752 13,567 84 150 5,588 6,279 124 96
Other currencies 62,340 69,979 10,620 11,318 89,895 82,012 15,812 9,085
TOTAL 1,235,262 1,235,262 93,695 92,356 1,250,889 1,250,889 80,709 70,325
* Amounts restated with regard to financial statements published in 2012, further to the coming into force of the amendments in the standard IAS 19 which apply in retrospect.
The Group monitors structural exchange rate positions and manages the immunisation of the solvency ratio to exchange rate fluctuations.
Table 30 presents the impact on the Group Core Tier 1 ratio of a 10% currency depreciation or appreciation for 31 December 2013.
| TABLE 30: SENSITIVITY OF THE CORE TIER 1 RATIO OF THE GROUP TO A CHANGE OF 10% OF THE CURRENCY
| (IN BASIS POINTS)
CurrencyImpact on the Core Tier 1 ratio of
a currency depreciation of 10%Impact on the Core Tier 1 ratio of
a currency appreciation of 10%
USD 6 (6)
GBP 2 (2)
JPY (1) 1
AUD 1 (1)
CZK (1) 1
RUB 1 (1)
RON (1) 1
OTHERS (2) 2
In 2013, the Group successfully neutralised the sensitivity of its solvency ratio to currency fluctuations by monitoring the structural positions in these currencies (the sensitivity of the solvency ratio is managed with limits per currency set according to the Group’s risk Appetite in these currencies).
190 I 2014 REGISTRATION DOCUMENT I SOCIETE GENERALE GROUP
4 I RISKS AND CAPITAL ADEQUACY I LIQUIDITY RISK
9 . L I Q U I D I T Y R I S K
Liquidity risk is defined as the risk of not being able to meet cash flow or collateral requirements when they fall due and at a reasonable price.
GOVERNANCE AND ORGANISATION
The principles and standards applicable to the management of liquidity risks are defined by the Group’s governing bodies, whose duties in the area of liquidity are listed below:
n The Group’s Board of Directors:
– meets on a quarterly basis to examine the Group’s liquidity risk situation,
– conducts an annual review of the liquidity risk management and steering system,
– establishes the level of liquidity risk tolerance, including the time period during which the Group can operate under conditions of stress (“survival horizon”) for the purpose of determining the Group’s Risk Appetite,
– monitors adherence to the main liquidity limits.
n General Management:
– presents a framework of Group-wide liquidity risk tolerance levels to the Board of Directors for validation in line with the Group’s risk appetite,
– sets liquidity limits for each business division and major Group entity,
– monitors adherence to liquidity limits for the Group and for each business division,
– validates remedial action plans in the event that liquidity limits are exceeded at the Group or business division level.
n The Finance Committee:
– meets at least quarterly under the chairmanship of the Chairman and Chief Executive Officer or a Deputy Chief Executive Officer with the representatives from the Risk Division and business divisions,
– prepares the decisions of General Management in the areas of general policy, liquidity risk tolerance and liquidity limits,
– ensures the adequacy of the risk management and control system,
– examines and validates the measures proposed by the Departments,
– monitors developments in the liquidity situation within the Group’s scope of management.
The business divisions and major Group entities manage liquidity under the direct supervision of the Group Finance Division. The other operating entities are responsible for managing their own liquidity and for adhering to applicable regulatory constraints, under the supervision of the business division to which they report. The entities submit reports on their structural liquidity risk to the Group via a shared IT system.
The Group Finance Division provides liquidity risk management, steering and monitoring via three distinct entities in compliance with
the principles advocating a separation of risk steering, execution and control functions.
n The Strategic and Financial Steering Department, responsible for:
– establishing the Group’s liquidity framework in compliance with its strategic objectives, regulatory requirements and market expectations,
– ensuring that liquidity steering is in line with the Group’s other objectives in terms of profitability and scarce resources,
– adapting targets and limits for the businesses and monitoring their compliance,
– monitoring the regulatory environment and developing liquidity steering standards for the business divisions.
n The Balance Sheet and Global Treasury Management Department, responsible for:
– the operational implementation of the Group’s financing through management of programmes and long-term issues,
– supervising and coordinating the Group’s Treasury functions,
– monitoring the market and contributing its operational expertise to the establishment of liquidity steering objectives,
– managing the collateral used in refinancing operations (central banks, covered bonds, securitisations, secured fundings),
– managing the Group’s central funding department (management of liquidity and shareholders’ equity within the Group).
n The Structural Risk Monitoring and Control Department, responsible for:
– supervising and managing the structural risks (interest rates, foreign exchange rates, liquidity) to which the Group is exposed;
– defining the modelling standard and validating models, monitoring compliance with limit restrictions and management practices by the divisions, business lines and entities of the Group,
– reporting hierarchically to the Chief Financial Officer and reporting functionally to the Group Chief Risk Officer.
In addition, several Risk Division departments contribute, together with the Finance Division, to the operational supervision of liquidity risk. Their actions are coordinated by the Cross-Business Risk Monitoring Department under the direction of the Group Chief Risk Officer. Specifically, they relate to:
n the independent review of capital market models;
n the validation of all the Group’s liquidity models within the framework of centralised governance;
n the examination of requests for risk limits relating to liquidity risk metrics and the monitoring of any limit breaches.
SOCIETE GENERALE GROUP I 2014 REGISTRATION DOCUMENT I 191
LIQUIDITY RISK I RISKS AND CAPITAL ADEQUACY I 4
GROUP’S PRINCIPLES AND APPROACH TO LIQUIDITY RISK MANAGEMENT
The Group’s primary objective is to ensure the funding of its activities in the most cost-effective way by managing liquidity risk and adhering to regulatory constraints. The liquidity steering system is aimed at organising the balance sheet around a target structure for assets and liabilities that is consistent with the risk appetite defined by the Board of Directors.
n the assets structure should allow the businesses to develop their activities in a way that is liquidity-efficient and compatible with the target liabilities structure. This development must comply with the liquidity gaps defined at the Group level (under static and stress scenarios) as well as regulatory requirements;
n the liabilities structure is based on the ability of the businesses to collect financial resources from customers and the ability of the Group to sustainably raise financial resources on the markets, in accordance with its risk appetite.
This steering system calls for measuring and determining the businesses’ liquidity gaps under reference and stress scenarios, their Group funding needs, the funds raised by the Group on the market, eligible assets and the businesses’ contribution to regulatory ratios. Accordingly, the principles of liquidity management are as follows:
1. The businesses must observe low to nil static liquidity gaps within the operating limits of their activities by using to the Group’s Central Treasury, which can, if needed, run a (anti) transformation position and manage it within the framework of the established risk limits.
2. Internal liquidity stress tests, established on the basis of the systemic, specific or combined scenarios, are controlled on the Group level. They are used to ensure compliance with the survival horizon established by the Board of Directors and to calibrate liquidity reserves. They are accompanied by a Contingency
Funding Plan that foresees measures to be taken in the event of a liquidity crisis.
3. The businesses’ funding needs (short-term and long-term) are determined on the basis of the development objectives for the franchise and in line with the Group’s fund raising targets and capabilities.
4. A plan for long-term funding, which complements the resources raised by the business divisions, is designed to ensure the repayments of upcoming maturities and finance the growth of the businesses. It takes into account the Group’s investment capabilities and aims to optimise the cost of fund-raising while complying with limits in terms of market concentration. Diversification in terms of issuers and investor pools is also examined and managed.
5. The Group’s short-term resources are sized to finance the short-term needs of the businesses over periods appropriate to their management and in line with market concentration limits. As outlined above, they are proportioned with respect to the liquidity reserve on the assets side based on the established stress survival horizon as well as the Group’s LCR target.
6. The Group’s liquidity steering takes into account compliance with the target regulatory ratios (LCR, ACP liquidity ratio), as the businesses are supervised regarding their contribution to these ratios.
Finally, liquidity is framed in terms of cost via the Group’s internal transfer pricing scheme. Funding allocated to the businesses is charged to them based on scales that must reflect the average liquidity cost for the Group. This system is aimed at optimising the use of external financing sources by businesses and is used to monitor the balance of funding on the balance sheet.
Societe Generale has undertaken a specific review of its liquidity risks and believes that it is able to meet its upcoming maturities.
REFINANCING STRATEGY
The Group’s financing strategy is based on the following principles:
n the Group’s stable funding resources (including shareholders’ equity, customer deposits and medium/long-term market resources) finance the long-term needs of the businesses (including tangible and intangible assets, customer loans and the portfolio of available-for-sale or held-to-maturity securities);
n short-term market resources finance the Group’s liquid assets, which are predominantly carried by GBIS’ Global Markets business line;
n the Group maintains a liquidity reserve to cover ouflows in situations of stress.
192 I 2014 REGISTRATION DOCUMENT I SOCIETE GENERALE GROUP
4 I RISKS AND CAPITAL ADEQUACY I LIQUIDITY RISK
MARKET FINANCINGThe Group’s market resources totalled EUR 240 billion at 31 December 2013. Of this total, EUR 124 billion have a remaining maturity of less than one year, of which EUR 24 billion correspond to debt securities issued with an initial medium/long-term maturity (more than one year).
The table below details the Group’s market resources at 31 December 2013 according to their remaining maturities based on contractual management schedules.
31.12.2013
(In billions of euros) <3M 3-6M 6-12MSub-total
< 1 YR 1-2 YRS 2-5 YRS > 5 YRS TOTAL
Interbank deposits 25 2 3 31 3 5 4 42
Other customer deposits 14 0 0 15 0 0 0 15
Short-term issues 38 7 10 55 1 0 0 56
Public senior vanilla issues 1 1 2 4 8 7 5 24
Vanilla private placements 0 0 0 1 1 5 3 10
Covered bonds, CRH, SFEF 2 2 1 5 0 7 16 28
Structured issues(1), other 2 2 4 9 4 15 15 42
Subordinated debt(2) 0 0 0 1 1 3 3 7
LT debt of the business divisions(1) 1 1 2 5 6 4 1 15
TOTAL 84 17 23 124 24 46 46 240
(1) Net of the portion invested in the Group’s retail banking networks. Structured debts scheduled according to likely redemption dates.
(2) Tier 2 debt instruments.
Group short-term market resources consist of unsecured notes issued under the Group’s short-term programmes (Certificates of Deposit, promissory notes and commercial paper), and deposits from banks and financial customers. The majority of the short-term market resources are issued by the Group’s Central Treasury to international institutional investors. The Group’s Central Treasury adheres to diversification thresholds on its funding sources by counterparty and by currency.
Medium/long-term market resources (including the portion of securities originally issued with a maturity of more than one year and maturing within the year) totalled EUR 140 billion at 31 December 2013. These consist of long-term interbank liabilities (long-term credit lines granted by banks and international financial institutions, etc.), and medium/long-term debt securities, the breakdown of which reflects the Group’s policy concerning the diversification of funding sources. The Group has access to large and complementary investor pools via:
n senior vanilla issues in the form of public issues or private placements;
n mortgage bonds issued by SG SFH and SG SCF vehicles and by Caisse du Refinancement de l’Habitat;
n senior structured issues issued by Societe Generale SA and distributed to institutional investors and, to a large extent, to individual customers (via retail and private banking networks belonging to the Group or its partners);
n subordinated debt (Tier 2 debt instruments) issued by Societe Generale SA, in addition to Group Tier 2 and Tier 1 issues booked to equity.
Furthermore, access to diversified investor pools is ensured by a wide array of Group issuers: Societe Generale SA, Crédit du Nord and the IBFS subsidiaries issuing secured (securitisations, mortgage bonds) and unsecured notes. IBFS issues, along with its deposit inflows and bilateral borrowings, are aimed specifically at increasing the financing independence of its subsidiaries as part of a strategy that has been stepped up since 2010.
With respect to market financing, the Group closely monitors the proportion of collateralised financing and the associated overcollateralisation rate. The objectives are to optimise the use of collateral available within the Group, comply with existing obligations and reduce overall refinancing costs.
SOCIETE GENERALE GROUP I 2014 REGISTRATION DOCUMENT I 193
LIQUIDITY RISK I RISKS AND CAPITAL ADEQUACY I 4
Collateralised financing, recorded under market financing of the balance sheet, and the associated collateral are shown in the table below. This table does not include collateral used in repurchase agreements or securities lending transactions, or for funding obtained from central banks.
31.12.2013 31.12.2012
(In billions of euros)Collateral
usedFunds raised
Collateral used/total
outstanding loans
Collateral used
Funds raised
Collateral used/total
outstanding loans
Residential mortgages 28 20 31% 25 18 28%
Public sector loans 11 8 71% 10 8 58%
Loans to businesses 12 11 7% 11 9 6%
Other loans 5 3 7% 2 2 4%
Total 55 42 16% 49 38 14%
LIQUIDITY RESERVE
The Group’s liquidity reserve (see methodology section No. 7 page 44) contains cash and assets that can be used to cover liquidity outflows under a stress scenario. The reserve assets are available, i.e. not used as a guarantee or as collateral on any transaction. They are included in the reserve after applying a haircut to reflect their expected valuation under stress. The Group’s liquidity reserve contains assets that can be freely transferred within the Group or used to cover subsidiaries’ liquidity outflows in the event of a crisis.
The liquidity reserve includes:
n Central Bank deposits, excluding mandatory reserves;
n High-Quality Liquid Assets (HQLAs), which are securities that are quickly transferable on the market via sale or repurchase transactions; these include government bonds, corporate bonds and equities listed on major indices (after haircuts). These HQLAs essentially meet the Basel Committee’s eligibility criteria for the LCR, according to the most recent standards known and published by regulators. The haircuts applied to HQLA securities are in line with those indicated in the most recent known texts on determining the numerator of the LCR;
n Non-HQLA Group assets that are central bank-eligible, including
receivables and securitisations of Group receivables held by the Group.
The composition of the liquidity reserve is reviewed regularly by a special committee comprising the Finance Division, the Risk Division and the Management of the GBIS business division, and is adjusted by authorisation of the Finance Committee.
(In billions of euros) 31.12.2013 31.12.2012
Central bank deposits (excluding mandatory reserves)
60 58
HQLA securities available and transferable on the market (after haircut)
78 74
Other available central bank-eligible assets (after haircut)
35 22
Total 174 154
The Group’s liquidity reserve covered 140% of short-term funding needs at 31 December 2013 (market resources with residual maturities of less than one year).
REGULATORY RATIOS
Changes in liquidity management regulations are proposed by the Basel Committee at the international level.
The Basel Committee has prescribed the implementation of two standard ratios with harmonised parameters which are intended to regulate bank liquidity positions:
n The Liquidity Coverage Ratio (LCR) aims to ensure that banks have enough liquid assets or cash to survive for one month in a combined stress scenario of a market crisis and another specific crisis. This ratio is scheduled to come into force on 1 January 2015. The minimum ratio is set at 60% by 1 January 2015 with a gradual increase of 10% per year, reaching 100% by 1 January 2019;
n the Net Stable Funding Ratio (NSFR) compares funding needs with stable resources over a one-year period subject to a specific stress scenario. This ratio is scheduled to come into force on 1 January 2019.
The Basel Committee finalised most of its work on the revision and calibration of the LCR and published the revised text on 7 January 2013. The NSFR, however, is in the process of being reworked, and consultations with the profession on the proposed new definition of the ratio are planned for the first quarter of 2014.
194 I 2014 REGISTRATION DOCUMENT I SOCIETE GENERALE GROUP
4 I RISKS AND CAPITAL ADEQUACY I LIQUIDITY RISK
The transposition of the Basel 3 accords, CRD4 and CRR1 into EU law was published on 27 June 2013 for implementation at 1 January 2014.
While the European Commission text confirms important items concerning the calculation of the LCR, it leaves the EBA to establish technical standards with regard to the definition and calibration of the ratio. The precise definition of the LCR will be adopted by a Commission delegated act no later than 30 June 2014, on the basis of the technical standards recommended by the EBA. With respect to the NSFR, the Commission is expected to present a new regulation to the Parliament and Council, after consulting the EBA, by 31 December 2016.
In 2013, Societe Generale actively continued its efforts to transpose the Basel text and implement it through Groupwide steering standards. The automation and monitoring of the LCR calculation has been ongoing since 2013 via the Group Liquidity IS.
Societe Generale’s LCR was above 100% at 31 December 2013 and remained above 100% in each quarter of 2013. This reflects the significant efforts made to reinforce the Group’s liquidity reserve since the crisis and the extension of the average maturity of its short-term liabilities. It also demonstrates the Group’s ability to withstand a severe combined, specific and widespread liquidity crisis.
The Group’s liquidity steering incorporates compliance with the ACP standard liquidity ratio (defined under French regulations in force), which remained systematically higher than the minimum requirements of 100% in 2013.
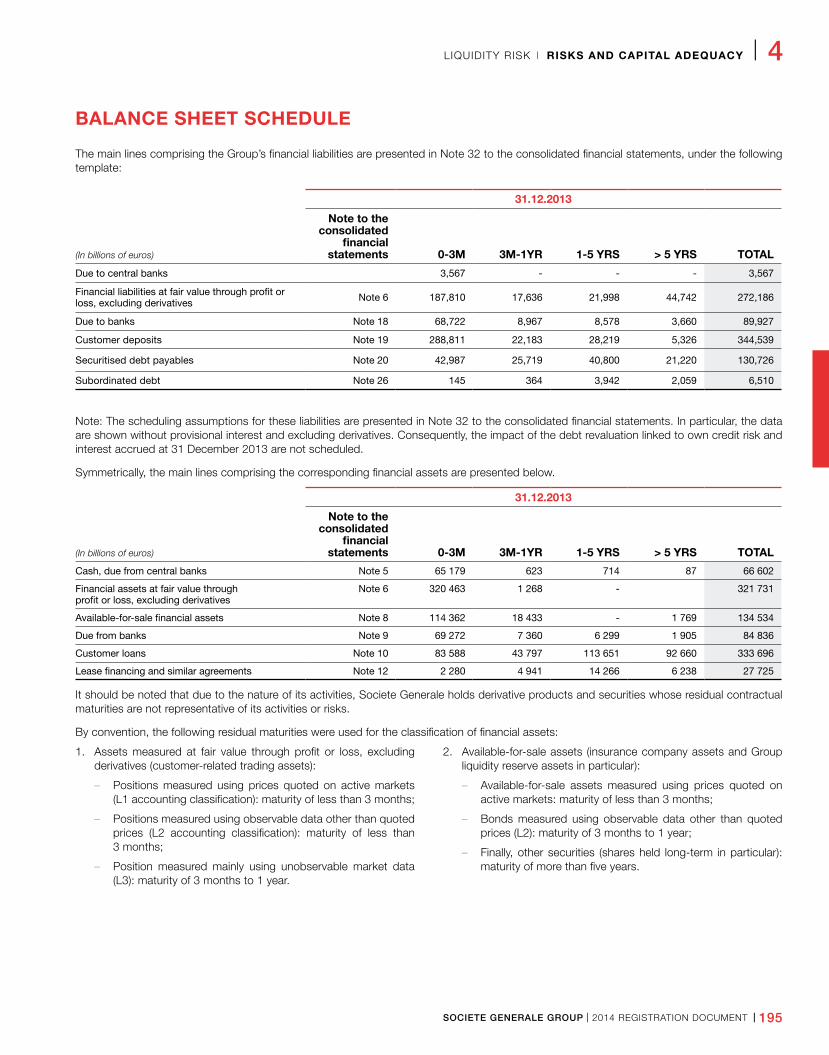
SOCIETE GENERALE GROUP I 2014 REGISTRATION DOCUMENT I 195
LIQUIDITY RISK I RISKS AND CAPITAL ADEQUACY I 4
BALANCE SHEET SCHEDULE
The main lines comprising the Group’s financial liabilities are presented in Note 32 to the consolidated financial statements, under the following template:
31.12.2013
(In billions of euros)
Note to the consolidated
financial statements 0-3M 3M-1YR 1-5 YRS > 5 YRS TOTAL
Due to central banks 3,567 - - - 3,567
Financial liabilities at fair value through profit or loss, excluding derivatives Note 6 187,810 17,636 21,998 44,742 272,186
Due to banks Note 18 68,722 8,967 8,578 3,660 89,927
Customer deposits Note 19 288,811 22,183 28,219 5,326 344,539
Securitised debt payables Note 20 42,987 25,719 40,800 21,220 130,726
Subordinated debt Note 26 145 364 3,942 2,059 6,510
Note: The scheduling assumptions for these liabilities are presented in Note 32 to the consolidated financial statements. In particular, the data are shown without provisional interest and excluding derivatives. Consequently, the impact of the debt revaluation linked to own credit risk and interest accrued at 31 December 2013 are not scheduled.
Symmetrically, the main lines comprising the corresponding financial assets are presented below.
31.12.2013
(In billions of euros)
Note to the consolidated
financial statements 0-3M 3M-1YR 1-5 YRS > 5 YRS TOTAL
Cash, due from central banks Note 5 65 179 623 714 87 66 602
Financial assets at fair value through profit or loss, excluding derivatives
Note 6 320 463 1 268 - 321 731
Available-for-sale financial assets Note 8 114 362 18 433 - 1 769 134 534
Due from banks Note 9 69 272 7 360 6 299 1 905 84 836
Customer loans Note 10 83 588 43 797 113 651 92 660 333 696
Lease financing and similar agreements Note 12 2 280 4 941 14 266 6 238 27 725
It should be noted that due to the nature of its activities, Societe Generale holds derivative products and securities whose residual contractual maturities are not representative of its activities or risks.
By convention, the following residual maturities were used for the classification of financial assets:
1. Assets measured at fair value through profit or loss, excluding derivatives (customer-related trading assets):
– Positions measured using prices quoted on active markets (L1 accounting classification): maturity of less than 3 months;
– Positions measured using observable data other than quoted prices (L2 accounting classification): maturity of less than 3 months;
– Position measured mainly using unobservable market data (L3): maturity of 3 months to 1 year.
2. Available-for-sale assets (insurance company assets and Group liquidity reserve assets in particular):
– Available-for-sale assets measured using prices quoted on active markets: maturity of less than 3 months;
– Bonds measured using observable data other than quoted prices (L2): maturity of 3 months to 1 year;
– Finally, other securities (shares held long-term in particular): maturity of more than five years.
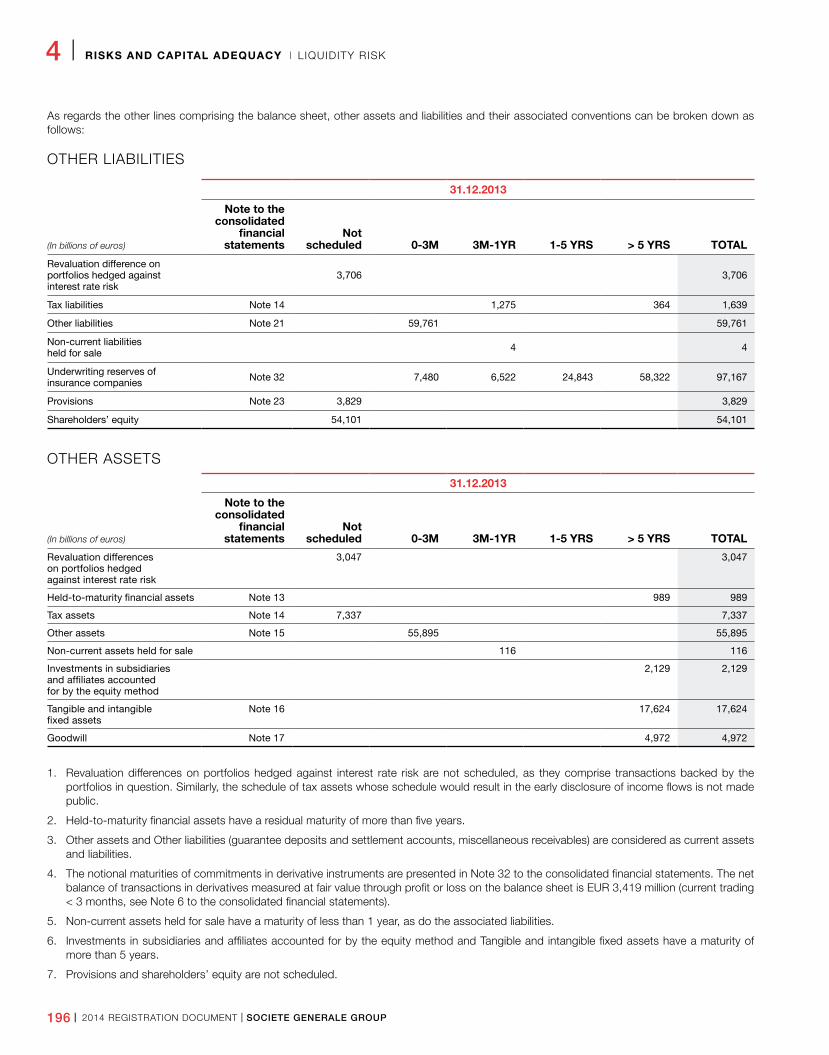
196 I 2014 REGISTRATION DOCUMENT I SOCIETE GENERALE GROUP
4 I RISKS AND CAPITAL ADEQUACY I LIQUIDITY RISK
As regards the other lines comprising the balance sheet, other assets and liabilities and their associated conventions can be broken down as follows:
OTHER LIABILITIES
31.12.2013
(In billions of euros)
Note to the consolidated
financial statements
Not scheduled 0-3M 3M-1YR 1-5 YRS > 5 YRS TOTAL
Revaluation difference on portfolios hedged against interest rate risk
3,706 3,706
Tax liabilities Note 14 1,275 364 1,639
Other liabilities Note 21 59,761 59,761
Non-current liabilities held for sale 4 4
Underwriting reserves of insurance companies Note 32 7,480 6,522 24,843 58,322 97,167
Provisions Note 23 3,829 3,829
Shareholders’ equity 54,101 54,101
OTHER ASSETS
31.12.2013
(In billions of euros)
Note to the consolidated
financial statements
Not scheduled 0-3M 3M-1YR 1-5 YRS > 5 YRS TOTAL
Revaluation differences on portfolios hedged against interest rate risk
3,047 3,047
Held-to-maturity financial assets Note 13 989 989
Tax assets Note 14 7,337 7,337
Other assets Note 15 55,895 55,895
Non-current assets held for sale 116 116
Investments in subsidiaries and affiliates accounted for by the equity method
2,129 2,129
Tangible and intangible fixed assets
Note 16 17,624 17,624
Goodwill Note 17 4,972 4,972
1. Revaluation differences on portfolios hedged against interest rate risk are not scheduled, as they comprise transactions backed by the portfolios in question. Similarly, the schedule of tax assets whose schedule would result in the early disclosure of income flows is not made public.
2. Held-to-maturity financial assets have a residual maturity of more than five years.
3. Other assets and Other liabilities (guarantee deposits and settlement accounts, miscellaneous receivables) are considered as current assets and liabilities.
4. The notional maturities of commitments in derivative instruments are presented in Note 32 to the consolidated financial statements. The net balance of transactions in derivatives measured at fair value through profit or loss on the balance sheet is EUR 3,419 million (current trading < 3 months, see Note 6 to the consolidated financial statements).
5. Non-current assets held for sale have a maturity of less than 1 year, as do the associated liabilities.
6. Investments in subsidiaries and affiliates accounted for by the equity method and Tangible and intangible fixed assets have a maturity of more than 5 years.
7. Provisions and shareholders’ equity are not scheduled.
SOCIETE GENERALE GROUP I 2014 REGISTRATION DOCUMENT I 197
COMPLIANCE, LEGAL AND REPUTATIONAL RISKS I RISKS AND CAPITAL ADEQUACY I 4
1 0 . �COMPL I ANCE , � REPUTAT IONAL�AND L EGAL �R I SKS
COMPLIANCE
Compliance means to act in accordance with the applicable banking and financial rules, whether these are legal or regulatory, or relevant professional, ethical or internal standards.
Fair treatment of customers and, from a more general standpoint, the integrity of banking and financial practices contribute decisively to the reputation of our institution.
By ensuring that these rules are observed, the Group is working to enhance a key asset, namely the trust of its customers, other counterparties and employees, as well as the various regulatory authorities to which it answers.
The Compliance SystemIndependent compliance structures have been set up within the Group’s different businesses around the world in order to identify and prevent any risks of non-compliance.
The Group’s Corporate Secretary is the Chief Compliance Officer.
He is assisted in these duties by the Compliance Department, the Group Compliance Committee, and a compliance function consisting of a coordinated network of Compliance Officers operating in all Group entities.
THE COMPLIANCE DEPARTMENTIn September 2013, the Compliance Department was reorganised into three cross-business departments responsible for: (i) the Group’s financial security (prevention of money laundering, terrorism financing and tax fraud; “know your customer” obligations; embargoes and financial sanctions; the fight against corruption), (ii) the development and maintenance of consistent standards for the function and for spreading compliance values, (iii) the management of IT tools and the system of compliance controls within the Group.
The Compliance Department verifies that all laws and regulations as well as compliance rules and principles applicable to the Group’s banking and investment services activities are observed, and that all staff respect codes of good conduct and individual compliance. It also monitors the prevention of reputational risk. It provides expertise and performs controls at the highest level for the Group and assists the Corporate Secretary with the day-to-day operation of the function.
Its main tasks are namely: to define, in accordance with the regulators’ requests and legal or regulatory requirements, the policies, principles and procedures applicable to compliance and financial security, and to manage their implementation and monitor their application:
n to ensure that professional and financial market regulations are respected;
n to prevent and manage conflicts of interest;
n to propose the ethical rules to be respected by all Group employees;
n to train and advise employees and raise their awareness of compliance issues;
n to ensure that the role of Head Compliance Officer (RCO) is performed under adequate conditions, by setting out the RCO’s prerogatives, ensuring that they have the necessary resources, tools and normative framework while monitoring their correct implementation;
n to build and implement steering and organisation tools for the structure: dashboards, forum to share best practices, bimonthly meetings of the Core Business Head Compliance Officers committee;
n to coordinate relations between Group entities and French and foreign regulators on matters relating to compliance;
n to generally monitor issues likely to be harmful to the Group’s reputation.
THE GROUP COMPLIANCE COMMITTEEThe Group Compliance Committee meets once a month and is chaired by the Group’s Corporate Secretary. The Committee examines current topics pertaining to compliance, reviews the most significant incidents that occurred over the period across the entire Group and decides on the actions to be taken, and monitors any changes in regulations. Aside from representatives from the Compliance function, the Head of Group Internal Control Coordination and representatives from General Inspection, the operational Risk Department and the Legal Department take part in the Committee.
THE COMPLIANCE FUNCTIONThe Compliance function is carried out in the business and corporate divisions by dedicated teams operating under the authority of Compliance Officers. The Compliance Department supervises the function within its own governance framework.
The 2013 reorganisation tightened the compliance control system for the businesses, which now comprises four dedicated teams: Group Retail Banking, Private Banking, Investment Banking and Investor Services and Insurance. These teams are under the hierarchical authority of the Head of the Compliance Department, except for Insurance, which remains under the Head’s operational authority. French and international subsidiaries continue to be under the Head’s operational authority, but under closer supervision. Hierarchical authority over French Retail Banking will come into effect in 2014.
198 I 2014 REGISTRATION DOCUMENT I SOCIETE GENERALE GROUP
4 I RISKS AND CAPITAL ADEQUACY I COMPLIANCE, LEGAL AND REPUTATIONAL RISKS
The Compliance Officers implement the governance and principles defined at Group level within their remit. They contribute to the identification and prevention of compliance risks, the validation of new products, the analysis and reporting of compliance anomalies, the implementation of corrective measures, staff training and the promotion of compliance values throughout the Group. They notably rely on a pyramid structure of business line or subsidiary RCOs under their hierarchical or operational authority.
The objectives of the compliance function’s structure are:
n centralising the Group’s compliance specialists with the goal of developing expertise in this area;
n setting up cross-business functions aimed at disseminating and harmonising compliance values throughout the Group, covering all the Group’s business and corporate divisions;
n establishing a clear separation between the advisory and control functions;
n simplifying the system in order to improve information flow and decision-making.
GROUP FINANCIAL SECURITY SYSTEMThe Group Financial Security Department relies on the Head Compliance Officers for the businesses and also on an organised network of FCOs (Financial Crime Officers). It is responsible for:
n defining the standards and policy applied at the Group level, in cooperation with the legal department, monitoring its implementation and circulating new regulatory provisions while providing guidelines for operational departments, particularly through a dedicated compliance portal;
n organising and managing the Financial Security system within the Group, as well as raising the awareness of the compliance function and business lines regarding these particularly complex and evolving topics;
n reporting suspicious activity to TRACFIN for all of the Group’s French entities (except Crédit du Nord and Boursorama Banque), as well as reporting asset freezes to and requesting approval from the French Treasury for Societe Generale SA. For entities established outside France, the FCOs report suspicious activity to the local authorities.
Compliance valuesCompliance and adherence to ethical rules that meet the profession’s highest standards are part of the Societe Generale Group’s core values. These values are shared by all of its staff and not just by a handful of experts.
The Group has developed a strict body of compliance procedures and rules of good conduct. The Group’s Code of Conduct was rewritten in the form of a directive in January 2013. These rules go beyond applicable legal and regulatory provisions, particularly in countries that do not meet Societe Generale’s own ethical standards.
In the banking sector, compliance values are primarily about:
n refusing to work with customers or counterparties for which it is not possible to gather enough information to meet due diligence standards;
n knowing how to assess the economic legitimacy of a transaction;
n being able to justify an adopted position under any circumstances.
Accordingly, the Group:
n does not carry out transactions within countries, and does not enter into relations with individuals or businesses, whose activities fall outside of the law or are contrary to the principles of responsible banking;
n refuses to conduct transactions for clients or counterparties if it is unable to determine the economic legitimacy of these transactions, or where the lack of transparency suggests they may be contrary to accounting and compliance principles;
n provides information that is accurate, clear and not misleading on the products and services it proposes and verifies that said products and services are suited to customer needs;
n has established whistleblowing rights which can be exercised by any employees who believe they have good reason to think that an instruction received, a transaction under review or, in general, a given situation is not in compliance with the rules that govern the conduct of the Group’s activities.
Societe Generale has very strict rules on the prevention of corruption, which are included in the Code of Conduct and comply fully with the strictest regulation on the matter, particularly the UK’s Bribery Act. Their implementation is closely monitored. Information concerning obligatory measures and controls has been disseminated and applied throughout the Group since 2001 in the form of instructions, which are updated on a regular basis.
IT applications dedicated to complianceVarious IT applications have been developed with the aim of ensuring compliance with current regulations and detection abuses or situations requiring special attention:
n profiling/scenario management tools that trigger alerts on identifying unusual account flows or transactions, particularly for retail banking. They particularly apply in the prevention of terrorism financing and money laundering, and in the detection of market abuse, price manipulation and insider trading;
n tools used to filter data based on pre-defined lists (internal lists, external databases, etc.) that trigger alerts on detecting people, countries or activities targeted by sanctions and embargoes;
n risk reporting/evaluation tools that provide reports/statements on specific characteristics of an entity, core business, business line or client in order to notify the relevant authorities (management, senior management, regulators, etc.). Of particular note: a tool for mapping and assessing compliance risks and for following up on action plans, a reporting tool for personal transactions, a set of tools for managing lists of persons holding inside information and conflicts of interests, a cross-business tool for meeting the Group’s regulatory obligations, particularly regarding disclosure when share ownership thresholds have been exceeded.
SOCIETE GENERALE GROUP I 2014 REGISTRATION DOCUMENT I 199
COMPLIANCE, LEGAL AND REPUTATIONAL RISKS I RISKS AND CAPITAL ADEQUACY I 4
These tools are regularly updated to incorporate regulatory changes and improve their efficiency.
2013 Initiatives
LAUNCH OF A MAP OF THE GROUP’S COMPLIANCE TOOLSThese tools were mapped in 2013 throughout Group scope. The map is intended to improve coverage of matters relating to compliance by using proven tools and standards and to minimise costs by giving preference to standardisation and pooling when applicable. This approach will lead to a convergence plan in mid-2014.
FURTHER INITIATIVES TO SPREAD THE GROUP’S COMPLIANCE VALUESKey examples include:
n in terms of training, the focus was on e-learning. Of particular note was the ongoing distribution of the “anti-corruption” training module, and the rollout of new training on “preventing reputational risk”. In terms of the prevention of money laundering
and terrorism financing, a module reviewing key concepts was prepared in order to round out the existing system. Furthermore, case studies intended for the employees directly involved were designed and rolled out;
n the Group, as steered by the Corporate Secretary and Group Chief Compliance Officer, continued its initiative to upgrade the documentation system for standards and guidelines and establish consistency between documents. This project covered all standard-setting documentation, particularly with the mandatory integration of the major standards and procedures issued by Core Businesses and Corporate Divisions into the central system. It also ensured that the Group structure was fully covered by the directives issued by General Management; 185 standard-setting documents (directives, instructions, manuals…) were issued in 2013, compared to 211 in 2012 and 148 in 2011. Finally, the project to overhaul the central application for managing and producing standard-setting documents was completed;
n ongoing adaptation to new national and supranational regulations continued in 2013, with special emphasis on the DFA (Dodd-Frank Act), EMIR (European Market Infrastructure regulation) and FATCA (Foreign Account Tax Compliance Act) (see box below).
DFA (Dodd-Frank Act)
The US Dodd-Frank Act (DFA) reforms, especially its Title VII section, aims to regulate trading of most over-the-counter derivatives on organised markets and electronic platforms as well as how they are cleared through clearing houses. The European equivalent of this new regulatory system was launched with the MiFID system in 2007 and is ongoing, especially with the EMIR, Market Abuse II and MiFID II reforms.
DFA follows commitments made by the G20 at the Pittsburgh summit in September 2009. In particular, these obligations are imposed on “swap dealers”, i.e. financial institutions whose dealings in over-the-counter derivatives with US counterparties are above a certain threshold. Societe Generale and all of its branches are registered as “swap dealers” with the US authorities. The first provisions of the Act came into force on 31 December 2012, with the rest scheduled to come into effect over the course of 2013 and 2014.
For more than three years, Societe Generale has been conducting an overhaul of trading and transaction processing procedures
in all of its branches to ensure they comply with the new DFA requirements.
In this respect, Societe Generale is implementing and rolling out processes and new rules intended to:
– ensure clients are protected by offering products adapted to their needs, by sending them complete information on products and, in general, by implementing an advanced compliance programme;
– direct and execute orders on organised markets or platforms;
– transmit executed orders to central clearing houses, which will then carry out daily margin calls;
– ensure that transactions that are not cleared by a clearing house are secured bilaterally;
– declare all over-the-counter derivative transactions in real time;
– maintain an audit trail for all stages of negotiating and processing transactions.
200 I 2014 REGISTRATION DOCUMENT I SOCIETE GENERALE GROUP
4 I RISKS AND CAPITAL ADEQUACY I COMPLIANCE, LEGAL AND REPUTATIONAL RISKS
FATCA (Foreign Account Tax Compliance Act)
FATCA, which is scheduled to come into force on 1 July 2014, makes non-US financial intermediaries responsible for identifying US taxpayers in their client databases in order to report income that directly or indirectly benefits these taxpayers to the US Internal Revenue Service (IRS). This law has a vast extra-territorial reach, as it imposes obligations on a broad assortment of financial intermediaries.
Since the end of 2012, FATCA has progressed according to an alternative approach using intergovernmental agreements between the United States and other countries, with the goal of resolving national legal obstacles (banking secrecy, data protection) and making it easier for financial intermediaries to implement the regulation.
A dozen countries, including France, have already signed this type of agreement, which will be enacted in national legislation to make FATCA implementation obligatory. This approach taken by US authorities is the subject of ongoing negotiations with many other countries.
The Societe Generale Group will ensure that all of its relevant financial institutions fully comply with FATCA using an internal control system structured around Core Business Compliance Officers.
271 Group entities have been identified as having more or less broad regulatory obligations depending on their locations.
ENHANCEMENT OF THE NON-COMPLIANCE RISK IDENTIFICATION AND MANAGEMENT SYSTEM:2013 saw continued progress in our approach to non-compliance risks:
n the identification and classification of main risk areas by reviewing all regulations in force and carrying out initiatives to promote compliance with them (training, distribution of instructions, implementation of related procedures and controls, etc.), a process already implemented by Investment Banking, has gradually expanded in 2013 to include International Retail Banking;
n the “normative controls” for non-compliance risks, which correspond to general cross-business controls for the whole Group, have now been widely deployed. A tool for consolidating results has been established and led to several tests being carried out in 2013. A report on this system’s effectiveness has been planned for the second half of 2014;
n in addition, the Group’s most significant anomalies are reported to the Group Compliance Committee as part of a structured framework, using an application redefined in 2012 and enhanced with new information in 2013. This is an opportunity to exchange and share best practices. The sanctions that may be imposed on the Group are analysed in depth and systematically give rise to corrective measures;
n finally, the Group’s reputational risk is monitored each quarter using a specific dashboard that since 2012 has been distributed to members of the Executive Committee on a quarterly basis, and to the Board of Director’s Audit, Internal Control and Risk Committee twice annually. In 2013 this dashboard was enhanced with a CSR component and now focuses on three major topics: relations with regulators, public opinion and the quality of internal processes.
EMIR (European Market Infrastructure Regulation)
EMIR is the European equivalent of the US Dodd-Frank Act in terms of provisions governing post-trade activities. The EMIR regulation, passed on 4 July 2012, entered into force on 16 August 2012, but its effective application depends on the gradual adoption of a certain number of technical standards by European regulatory authorities. Like the Dodd-Frank Act, EMIR was adopted after the 2008 financial crisis and the G20 summit in Pittsburgh aimed at creating a framework for over-the-counter (OTC) derivatives. EMIR imposes three kinds of obligations:
– Clearing for OTC derivatives considered by ESMA to be eligible for clearing (this should not come into effect before the second half of 2014);
– Establishment of measures to reduce risks on derivatives not cleared by a central counterparty. Some of these obligations entered into force on 15 March and 15 September 2013. The most important of these is related to the exchange of collateral for non-cleared derivatives,and should only enter into force in December 2015.
– Reporting OTC derivatives or derivatives negotiated on execution platforms to central repositories. This obligation will enter into force on 12 February 2014.
All EMIR obligations will apply to financial counterparties. They will also apply to non-financial counterparties that have exceeded certain clearing thresholds. Non-financial counterparties that have not exceeded these clearing thresholds will be subject to neither the clearing nor the collateral exchange obligations.
For those active in the derivatives market, such as Societe Generale, EMIR imposes requirements regarding operational and IT development, customer classification and contractual documents.
Although some items need further clarification, Societe Generale has already taken the necessary measures to comply with the new regulatory framework. Furthermore, we have sent several notifications to our clients in order to make it easier for them to comply with the new regulation.
SOCIETE GENERALE GROUP I 2014 REGISTRATION DOCUMENT I 201
COMPLIANCE, LEGAL AND REPUTATIONAL RISKS I RISKS AND CAPITAL ADEQUACY I 4
IMPLEMENTATION OF COMPLIANCE POLICIES
THE GROUP’S FINANCIAL SECURITY
Prevention of money laundering, terrorism financing and tax fraud
The main events in 2013 were:
n the overhaul of the Group Instruction on the fight against money laundering, terrorism financing and tax fraud in Societe Generale Group outside France;
n various adjustments made to adapt to regulatory changes:
– a project was launched to establish systematic reporting of information (COSI) to TRACFIN,
– the prevention of tax fraud is a major part of the the Financial Security department’s activity.
Know Your Customer
Group standards established in 2012 continue to be operationally implemented in all of the bank’s businesses. The implementation process provided the opportunity to review the Know Your Customer system. Integrating data gathered from information systems through this process is a major challenge for the future and structural projects have been launched in conjunction with all of the departments involved.
Embargoes and financial sanctions
The main events in 2013 were:
n a training campaign on embargoes and financial sanctions, particularly in French Retail Banking;
n the standardisation of controls and filtering tools was begun, along with their deployment throughout the Group.
EMPLOYEE TRANSACTIONS
Observation of the Compliance Charters is a constant obligation within the Societe Generale rules of conduct. Procedures and their proper application are constantly monitored. In 2013, emphasis was placed on supervision of external personnel.
BREACH OF SHARE OWNERSHIP THRESHOLDS
The cross-business tool for monitoring share ownership thresholds, SSD, ensures worldwide (90 countries) compliance with regulations regarding the breach of share ownership thresholds (legal, statutory, or during public offer periods). It monitors holdings of shares and derivatives for which the underlying securities are shares in Societe Generale Group, calculated according to the rules outlined by each country’s laws.
FIGHT AGAINST CORRUPTION
The application of the instruction published at the end of 2011 was closely monitored during the compliance reviews of each business presented at Group Compliance Committee meetings. E-learning modules continued to be distributed in 2013. Finally, a systematic review of contracts was launched in order to identify any shortcomings in this regard.
CONFLICTS OF INTEREST
The 2012 publication of an instruction on the prevention and management of conflicts of interest provided an opportunity to identify the principles and mechanisms that need to be implemented for their appropriate management. The policy included the mapping of conflict of interest risks, involving the Group on the one hand and customers or employees on the other. In 2013 a register of conflicts of interest was established in Investment Banking.
MARKET ABUSES
In order to adapt to technological change (the development of new trading platforms) and the expansion of areas that can be manipulated (particularly indices), and incorporate regulatory developments already known to the Group, special efforts are made to raise employee awareness—including the staff of the retail banking arm—of procedures and their application in all business divisions, continued developments in detection and analysis tools, and harmonisation of controls.
CUSTOMER PROTECTION
Customer protection is crucial for the development of quality customer relations. As such, it is a key consideration for the Group. Among the initiatives undertaken in 2012 was the Compliance function’s contribution to the definition of products through its participation in the New Product Committee meetings, where it establishes pre-requisites if needed. In addition, Compliance closely monitors customer complaints in order to identify inappropriate procedures or products. Finally, our approach to vulnerable customers was reviewed in 2013 in order to better comply with regulations.
202 I 2014 REGISTRATION DOCUMENT I SOCIETE GENERALE GROUP
4 I RISKS AND CAPITAL ADEQUACY I COMPLIANCE, LEGAL AND REPUTATIONAL RISKS
RISKS AND LITIGATION n In October 2005, the official receivers in charge of the restructuring
plans of Moulinex and Brandt, companies that were put into bankruptcy in 2001, initiated a lawsuit against member banks of syndicated loans granted to Moulinex in 1997 and to Brandt in 1998. They are seeking compensatory damages to indemnify the creditors for the banks’ alleged improper financial support to the aforementioned companies. The compensatory damages sought against Societe Generale and Credit du Nord amount to respectively EUR 192.4 million and EUR 51.7 million.
Societe Generale and Credit du Nord only held a share of the syndicated loans. They vigorously oppose the claims since after attempting to support Moulinex and Brandt based on serious and credible recovery plans, the banks have been the first victims of the collapse of Moulinex and Brandt. By decisions dated 28 June 2013, the Nanterre Commercial Court dismissed all the claims of the receivers in charge of the restructuring plans. The receivers have appealed this decision.
n Societe Generale, along with numerous other banks, financial institutions, and brokers, is subject to investigations in the United States by the Internal Revenue Service, the Securities and Exchange Commission, the Antitrust Division of the Department of Justice, and the attorneys general of several states for alleged non-compliance with various laws and regulations relating to their conduct in the provision to governmental entities of Guaranteed Investment Contracts (GICs) and related products in connection with the issuance of tax-exempt municipal bonds. Societe Generale is cooperating fully with the investigating authorities.
Several lawsuits were initiated in US courts in 2008 against Societe Generale and numerous other banks, financial institutions, and brokers, alleging violation of US antitrust laws in connection with the bidding and sale of GICs and derivatives to municipalities. These lawsuits have been consolidated in the US District Court for the Southern District of New York in Manhattan. Some of these lawsuits are proceeding under a consolidated class action complaint. In April 2009, the court granted the defendants’ joint motion to dismiss the consolidated class action complaint against Societe Generale and all the other defendants except three. A second consolidated and amended class action complaint was filed in June 2009. Societe Generale’s motion to dismiss the second consolidated and amended class action complaint was denied and the proceeding is continuing as to Societe Generale and numerous other providers and brokers. The class plaintiffs filed a third amended class action complaint in March 2013, to which Societe Generale has not yet responded. The parties are conducting pre-trial discovery. In addition, there are other actions that are proceeding separately from the consolidated class action complaint, including another purported class action under the US antitrust laws and California state law as well as lawsuits brought by individual local governmental agencies. Motions to dismiss the complaints have been filed in these related proceedings. The motions to dismiss have been denied in their entirety or in part, and discovery is now proceeding.
n On 24 October 2012 the Court of Appeal of Paris confirmed the first judgment delivered on 5 October 2010, finding Jérôme Kerviel guilty of breach of trust, fraudulent insertion of data into a computer system, forgery and use of forged documents. Jérôme Kerviel was sentenced to serve a prison sentence of five years two years, of which are suspended, and was ordered to pay EUR 4.9 billion as compensation for the financial loss suffered by the bank. Jérôme Kerviel has filed an appeal before the Supreme Court.
n Since 2003, Societe Generale had set up “gold consignment” lines with the Turkish group Goldas. In February 2008, Societe Generale was alerted to a risk of fraud and embezzlement of gold reserves held at Goldas. These suspicions were rapidly confirmed following the failed payment (EUR 466.4 million) of gold purchased. In order to recover the sums owed by the Goldas Group and to protect its interests, Societe Generale brought civil proceedings in Turkey against its insurance carriers and Goldas Group entities. Goldas, for its part, has recently launched various proceedings in Turkey against Societe Generale who intends to vigorously oppose the claims articulated against it. Societe Generale also brought proceedings against its insurers in the United Kingdom. The action has been discontinued by consent, without any admission of liability by any party. A provision has been made.
n In 1990 as part of a refinancing, Australian and European banks, including Societe Generale Australia Limited which is a subsidiary of Societe Generale, received security from certain companies in the Bell Group to cover unsecured loans previously granted to companies within the Bell Group. This security was realised when the Bell Group companies subsequently went into liquidation. The liquidator demanded that the banks reimburse the amounts realised from the exercise of the security and made other claims. In October 2008, the trial judge in Australia ordered the banks to pay the total principal amount of the claim plus compound interest. In December 2009, pursuant to court order, Societe Generale Australia Limited deposited approximately AUD 192.9 million (including interest) into court pending the result of an appeal. The Court of appeal entered into judgment on 17 August 2012, confirming the first judgment in part and awarded the payment by the banks of a higher amount of interest than had been ordered initially. On 15 March 2013, the High Court granted the banks special leave to appeal on the two grounds submitted by the banks: the directors’ fiduciary duties and calculation of interest. During the month of September 2013, the parties reached a settlement, which will become binding subject to the fulfilment of various conditions precedent.
n Societe Generale Algeria (SGA) and several of its branch managers have been prosecuted for breach of Algerian laws on exchange rates and capital transfers with other countries. The defendants are accused of having failed to make complete or accurate statements to the Bank of Algeria on movements of capital in connection with exports or imports made by clients of SGA. The events were discovered during investigations by the Bank of Algeria who subsequently filed claims. Sentences were delivered by the court of appeal against SGA and its employees in some proceedings while charges were dropped in other ones. All the proceedings went to the Supreme Court. To date, six cases have been terminated in favor of SGA and thirteen remain pending at the Supreme Court level for a cumulative amount of EUR 107.97 million.
n In the early 2000s, the French banking industry decided the transition towards a new digital system for clearing checks in order to rationalise their processing.
SOCIETE GENERALE GROUP I 2014 REGISTRATION DOCUMENT I 203
COMPLIANCE, LEGAL AND REPUTATIONAL RISKS I RISKS AND CAPITAL ADEQUACY I 4
To support this reform (known as EIC – Echange d’Images Chèques) which has contributed to the improvement of cheque payments security and to the fight against fraud, the banks established several interbank fees (including the CEIC which was abolished in 2007). These fees were implemented under the aegis of the banking sector supervisory authorities, and to the knowledge of the public authorities.
On 20 September 2010, after several years of investigation, the French competition authority considered that the joint implementation and the fixing of the amount of the CEIC and of two additional fees for “related services” were in breach of competition law rules. The authority fined all the participants to the agreement (including the Banque de France) a total of around EUR 385 million. Societe Generale was ordered to pay a fine of EUR 53.5 million and Crédit du Nord, its affiliate, a fine of EUR 7.0 million.
However, in its 23 February 2012 order, the French Court of Appeal upheld the absence of any competition law infringement, allowing the banks to recoup the fines paid. The French competition authority has filed an appeal before the Supreme Court.
n SG Private Bank (Suisse), S.A., along with several other financial institutions, has been named as a defendant in a putative class action that is pending in the US District Court for the Northern District of Texas. Plaintiffs seek to represent a class of individuals who were customers of Stanford International Bank Ltd. (“SIBL”), with money on deposit at SIBL and/or holding Certificates of Deposit issued by SIBL as of 16 February 2009.
n Plaintiffs allege that they suffered losses as a result of fraudulent activity at SIBL and the Stanford Financial Group or related entities, and that the defendants bear some responsibility for those alleged losses. Plaintiffs further seek to recoup payments made through or to the defendants on behalf of SIBL or related entities on the basis that they are alleged to have been fraudulent transfers.
Connected with the allegations in this litigation, SG Private Bank (Suisse), S.A., and Societe Generale have also received requests for documents and other information from the US Department of Justice. SG Private Bank (Suisse), S.A., and Societe Generale are cooperating with these requests.
n Societe Generale, along with other financial institutions, has received formal requests for information from several authorities in Europe, the United States and Asia, in connection with investigations regarding submissions to the British Bankers Association for setting certain London Interbank Offered Rates (“LIBOR”) and submissions to the European Banking Federation for setting the Euro Interbank Offered Rate (“EURIBOR”), as well as trading in derivatives indexed to various benchmark rates. Societe Generale is cooperating fully with the investigating authorities.
Societe Generale, along with other financial institutions, has been named as a defendant in two putative class actions in the United States alleging violations of, among other laws, United States antitrust laws and the United States Commodity Exchange Act in connection with its involvement in the setting of US Dollar LIBOR
rates and trading in derivatives indexed to LIBOR. These actions, which have been brought by purchasers of certain over the counter derivative contracts and purchasers of certain exchange-listed derivatives contracts, respectively, are pending before a single judge in the United States District Court in Manhattan. Société Générale has also been named as a defendant in several actions by “opt out” plaintiffs that make substantially the same allegations as those made in the class actions.
Societe Generale, along with other financial institutions, also has been named as a defendant in three other putative class actions in United States District Court in Manhattan: the first alleges violations of, among other laws, US antitrust laws and the US Commodity Exchange Act, and is brought on behalf of individuals who purchased or sold Euroyen derivative contracts on the Chicago Mercantile Exchange which are alleged to have traded at artificial levels due to alleged manipulation of Yen Libor and Euroyen Tibor rates; the second alleges violations of various state antitrust laws, and is brought on behalf of those who owned preferred equity securities on which dividends were payable at a rate linked to US Dollar LIBOR rates which are alleged to have been manipulated; and the third alleges violations of, among other laws, US antitrust laws and the US Commodity Exchange Act, and is brought on behalf of individuals who purchased or sold EURIBOR-linked futures contracts on the NYSE LIFFE exchange or Euro currency futures contracts on the Chicago Mercantile Exchange which are alleged to have traded at artificial levels due to alleged manipulation of EURIBOR rates.
On 4 December 2013, the European Commission issued a decision further to its investigation into the EURIBOR rate, that provides for the payment by Societe Generale of an amount of EUR 445.9 million in relation to events that occurred between March 2006 and May 2008.
Societe Generale has filed an appeal with the Luxembourg Court regarding the method used to determine the value of the sales that served as a basis for the calculation of the fine.
n In September 2011, the Federal Housing Finance Authority (“FHFA”) brought seventeen separate lawsuits, as conservator of Fannie Mae and Freddie Mac (collectively, the Government Sponsored Entities, or “GSEs”) against various financial institutions in an effort to recover for alleged losses in residential mortgage backed securities (“RMBS”) that the GSEs purchased over several years. One of the proceedings is directed against certain Societe Generale Group entities (SG Mortgage Finance Corp., SG Mortgage Securities, LLC (“SGMS”), SG Americas Securities, LLC, SG Americas, Inc., and SG Americas Securities Holdings, LLC) and certain Officers and Directors of SGMS. The complaint alleges that the GSEs purchased approximately USD 1.3 billion in RMBS certificates in connection with three issuances between May 2006 and December 2006. Societe Generale disputes the allegations and will defend the claims vigorously.
On 27 February 2014 a USD 122 million settlement was reached with FHFA.
204 I 2014 REGISTRATION DOCUMENT I SOCIETE GENERALE GROUP
4 I RISKS AND CAPITAL ADEQUACY I COMPLIANCE, LEGAL AND REPUTATIONAL RISKS
n A former affiliate of Societe Generale, Cowen and Company, has been sued by a group of plaintiffs in California state court in connection with alleged negligence by Cowen in 1998 in the course of an investment banking transaction. Cowen had been engaged by an entity that was acquired in a stock for stock transaction. Plaintiffs, who were shareholders of the acquired entity or its majority shareholder, allege that Cowen acted negligently in the engagement, including by making misrepresentations or omissions about the acquiring entity, and that they suffered financial harm as a result of the acquiror’s subsequent bankruptcy. The litigation survived two motions to dismiss and discovery is proceeding.
n On 10 December 2012, the Council of State made a ruling on the lawfulness of withholding tax (précompte), a tax which has now been abolished. It concluded that this tax violated EC law and defined the conditions pursuant to which the amounts levied towards the withholding tax should be restituted to companies. The conditions for restitution defined by the Council of State significantly reduce the amount of restitution. In 2005, two companies assigned their rights to restitution to Societe Generale with a limited right of recourse against the assignors. The Council of State’s ruling concerns one of the two companies in question (Rhodia). Societe Generale will continue to defend its rights in the proceedings that are currently pending against the French tax authorities including through available judicial remedies before the European authorities.
n Societe Generale has engaged in discussions with the US Office of Foreign Assets Control in relation to US dollar transfers made by Societe Generale on behalf of entities based in countries that are the subject of economic sanctions ordered by the US authorities. In connection with these discussions, Societe Generale has begun an internal review and is cooperating with the US authorities.
n Vladimir Golubkov, CEO of Rosbank at the time of the events, and an employee of the bank are under criminal investigation in the Russian Federation on a suspicion of corruption.
n On 22 May 2013, the ACPR launched disciplinary proceedings against Societe Generale in relation to the resources and procedures deployed by it pursuant to the legal requirements relating to the “right to a bank account” (“Droit au compte”).
SOCIETE GENERALE GROUP I 2014 REGISTRATION DOCUMENT I 205
OTHER RISKS I RISKS AND CAPITAL ADEQUACY I 4
1 1 . OTHER �R I SKS
EQUITY RISK
Investment strategies and purposeSociete Generale’s exposure to its non-trading equity portfolio relates to several of the bank’s activities and strategies. It includes equities and equity instruments, mutual fund units invested in equities, and holdings in the Group’s subsidiaries and affiliates which are not deducted from shareholders’ equity for the purpose of calculating solvency ratios. Generally speaking, due to their unfavourable treatment under regulatory capital, the Group’s future policy is to limit these investments.
n First, the Group has a portfolio of industrial holdings which mainly reflect its historical or strategic relations with these companies;
n It also has small minority holdings in certain banks for strategic purposes, with a view to developing its cooperation with these establishments;
n In addition, the equities that are not part of the trading book include Group shares in small subsidiaries which operate in France and outside of France, and which are not included in its consolidation scope. This includes various investments and holdings that are ancillary to the Group’s main banking activities, particularly its Corporate and Investment Banking, Retail Banking and Securities Services (stock market bodies, brokerages, etc.) activities;
n Lastly, Societe Generale and certain of its subsidiaries may hold equity investments related to their asset management activities (particularly seed capital for mutual funds promoted by Societe Generale), in France and outside of France.
Monitoring of banking book equity investments and holdingsThe portfolio of industrial holdings is monitored on a monthly basis by the Group’s Finance division, and where necessary value adjustments
are recognised quarterly in accordance with the Group’s provisioning policy. An annual review of the portfolio is also conducted by a special committee comprising representatives of the Group’s Executive Committee, Risk division and Finance division. The purpose of this review is to validate the portfolio strategies and monitor the strategic nature of the holdings, as well as sale opportunities. Investment decisions are also submitted to this Committee for approval.
The holdings that are ancillary to the corporate and investment banking activity are monitored on a quarterly basis by the Group’s Finance division, and where necessary value adjustments are recognized quarterly in accordance with the Group’s provisioning policy. Decisions on the buying and selling of shares are subject to the approval of an Investment Committee comprising representatives of the Executive Committee, the Risk division, the Finance division and the Compliance division. They are also reviewed by the Corporate and Investment Banking activity’s Finance division and the Group Finance division. The decision-making criteria used include the financial position and the contribution of the holdings to the Corporate and Investment Banking activities.
Valuation of banking book equitiesFrom an accounting perspective, Societe Generale’s exposure to equities that are not part of its trading book is classified under shares held for sale insofar as the equities may be held for an indefinite period or they may be sold at any time.
Societe Generale’s exposure to equities that are not part of the trading book is equal to their book value net of provisions.
The table below shows the Bank’s exposure at the end of December 2013 and 2012 for both the accounting and the regulatory scope. The regulatory data is not reconciled with the data in the Registration Document notably because the regulatory scope excludes shares held by the Group’s insurance subsidiaries on behalf of clients.
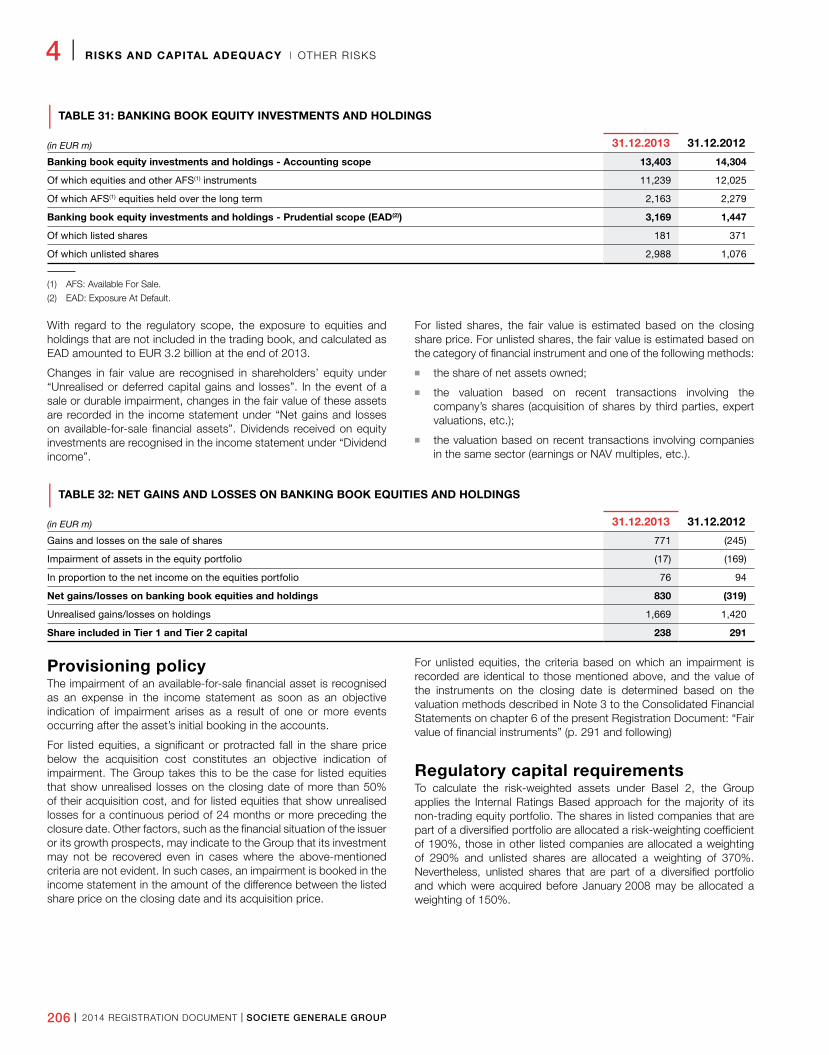
206 I 2014 REGISTRATION DOCUMENT I SOCIETE GENERALE GROUP
4 I RISKS AND CAPITAL ADEQUACY I OTHER RISKS
| TABLE 31: BANKING BOOK EQUITY INVESTMENTS AND HOLDINGS
(in EUR m) 31.12.2013 31.12.2012
Banking book equity investments and holdings - Accounting scope 13,403 14,304
Of which equities and other AFS(1) instruments 11,239 12,025
Of which AFS(1) equities held over the long term 2,163 2,279
Banking book equity investments and holdings - Prudential scope (EAD(2)) 3,169 1,447
Of which listed shares 181 371
Of which unlisted shares 2,988 1,076
(1) AFS: Available For Sale.
(2) EAD: Exposure At Default.
With regard to the regulatory scope, the exposure to equities and holdings that are not included in the trading book, and calculated as EAD amounted to EUR 3.2 billion at the end of 2013.
Changes in fair value are recognised in shareholders’ equity under “Unrealised or deferred capital gains and losses”. In the event of a sale or durable impairment, changes in the fair value of these assets are recorded in the income statement under “Net gains and losses on available-for-sale financial assets”. Dividends received on equity investments are recognised in the income statement under “Dividend income”.
For listed shares, the fair value is estimated based on the closing share price. For unlisted shares, the fair value is estimated based on the category of financial instrument and one of the following methods:
n the share of net assets owned;
n the valuation based on recent transactions involving the company’s shares (acquisition of shares by third parties, expert valuations, etc.);
n the valuation based on recent transactions involving companies in the same sector (earnings or NAV multiples, etc.).
| TABLE 32: NET GAINS AND LOSSES ON BANKING BOOK EQUITIES AND HOLDINGS
(in EUR m) 31.12.2013 31.12.2012
Gains and losses on the sale of shares 771 (245)
Impairment of assets in the equity portfolio (17) (169)
In proportion to the net income on the equities portfolio 76 94
Net gains/losses on banking book equities and holdings 830 (319)
Unrealised gains/losses on holdings 1,669 1,420
Share included in Tier 1 and Tier 2 capital 238 291
Provisioning policyThe impairment of an available-for-sale financial asset is recognised as an expense in the income statement as soon as an objective indication of impairment arises as a result of one or more events occurring after the asset’s initial booking in the accounts.
For listed equities, a significant or protracted fall in the share price below the acquisition cost constitutes an objective indication of impairment. The Group takes this to be the case for listed equities that show unrealised losses on the closing date of more than 50% of their acquisition cost, and for listed equities that show unrealised losses for a continuous period of 24 months or more preceding the closure date. Other factors, such as the financial situation of the issuer or its growth prospects, may indicate to the Group that its investment may not be recovered even in cases where the above-mentioned criteria are not evident. In such cases, an impairment is booked in the income statement in the amount of the difference between the listed share price on the closing date and its acquisition price.
For unlisted equities, the criteria based on which an impairment is recorded are identical to those mentioned above, and the value of the instruments on the closing date is determined based on the valuation methods described in Note 3 to the Consolidated Financial Statements on chapter 6 of the present Registration Document: “Fair value of financial instruments” (p. 291 and following)
Regulatory capital requirementsTo calculate the risk-weighted assets under Basel 2, the Group applies the Internal Ratings Based approach for the majority of its non-trading equity portfolio. The shares in listed companies that are part of a diversified portfolio are allocated a risk-weighting coefficient of 190%, those in other listed companies are allocated a weighting of 290% and unlisted shares are allocated a weighting of 370%. Nevertheless, unlisted shares that are part of a diversified portfolio and which were acquired before January 2008 may be allocated a weighting of 150%.
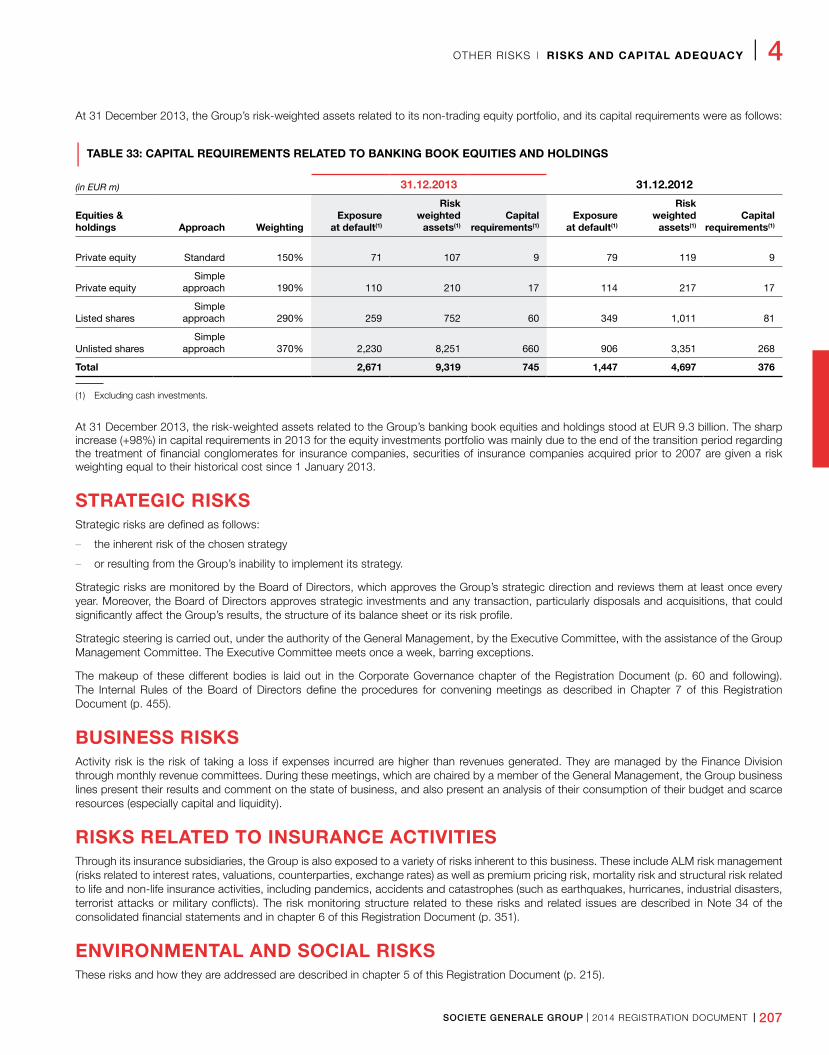
SOCIETE GENERALE GROUP I 2014 REGISTRATION DOCUMENT I 207
OTHER RISKS I RISKS AND CAPITAL ADEQUACY I 4
At 31 December 2013, the Group’s risk-weighted assets related to its non-trading equity portfolio, and its capital requirements were as follows:
| TABLE 33: CAPITAL REQUIREMENTS RELATED TO BANKING BOOK EQUITIES AND HOLDINGS
(in EUR m) 31.12.2013 31.12.2012
Equities & holdings Approach Weighting
Exposure at default(1)
Risk weighted
assets(1)Capital
requirements(1)Exposure
at default(1)
Risk weighted
assets(1)Capital
requirements(1)
Private equity Standard 150% 71 107 9 79 119 9
Private equitySimple
approach 190% 110 210 17 114 217 17
Listed sharesSimple
approach 290% 259 752 60 349 1,011 81
Unlisted sharesSimple
approach 370% 2,230 8,251 660 906 3,351 268
Total 2,671 9,319 745 1,447 4,697 376
(1) Excluding cash investments.
At 31 December 2013, the risk-weighted assets related to the Group’s banking book equities and holdings stood at EUR 9.3 billion. The sharp increase (+98%) in capital requirements in 2013 for the equity investments portfolio was mainly due to the end of the transition period regarding the treatment of financial conglomerates for insurance companies, securities of insurance companies acquired prior to 2007 are given a risk weighting equal to their historical cost since 1 January 2013.
STRATEGIC RISKSStrategic risks are defined as follows:
– the inherent risk of the chosen strategy
– or resulting from the Group’s inability to implement its strategy.
Strategic risks are monitored by the Board of Directors, which approves the Group’s strategic direction and reviews them at least once every year. Moreover, the Board of Directors approves strategic investments and any transaction, particularly disposals and acquisitions, that could significantly affect the Group’s results, the structure of its balance sheet or its risk profile.
Strategic steering is carried out, under the authority of the General Management, by the Executive Committee, with the assistance of the Group Management Committee. The Executive Committee meets once a week, barring exceptions.
The makeup of these different bodies is laid out in the Corporate Governance chapter of the Registration Document (p. 60 and following). The Internal Rules of the Board of Directors define the procedures for convening meetings as described in Chapter 7 of this Registration Document (p. 455).
BUSINESS RISKSActivity risk is the risk of taking a loss if expenses incurred are higher than revenues generated. They are managed by the Finance Division through monthly revenue committees. During these meetings, which are chaired by a member of the General Management, the Group business lines present their results and comment on the state of business, and also present an analysis of their consumption of their budget and scarce resources (especially capital and liquidity).
RISKS RELATED TO INSURANCE ACTIVITIESThrough its insurance subsidiaries, the Group is also exposed to a variety of risks inherent to this business. These include ALM risk management (risks related to interest rates, valuations, counterparties, exchange rates) as well as premium pricing risk, mortality risk and structural risk related to life and non-life insurance activities, including pandemics, accidents and catastrophes (such as earthquakes, hurricanes, industrial disasters, terrorist attacks or military conflicts). The risk monitoring structure related to these risks and related issues are described in Note 34 of the consolidated financial statements and in chapter 6 of this Registration Document (p. 351).
ENVIRONMENTAL AND SOCIAL RISKSThese risks and how they are addressed are described in chapter 5 of this Registration Document (p. 215).
208 I 2014 REGISTRATION DOCUMENT I SOCIETE GENERALE GROUP
4 I RISKS AND CAPITAL ADEQUACY I SPECIFIC FINANCIAL INFORMATION
12 . �SPEC I F I C � F I NANC I A L � I N FORMAT ION
Since June 2008 and in accordance with the recommendations of the Financial Stability Board, Societe Generale has disclosed the information on its exposure with regard to its assets affected by the global financial crisis.
In 2013, the Group continued to actively manage its exposure to risky
assets by selling off part of its RMBS CDO portfolio and its CMBS portfolio.
There have been no reclassifications from the trading portfolio to the loans and receivables portfolio following the reclassifications in October 2008.
PROVISIONS FOR ASSETS AFFECTED BY THE FINANCIAL CRISIS IN 2008
Assets reclassified on 1 October 2008On 1 October 2008 the Group reclassified some of its non-derivative financial assets from the “financial assets at fair value through profit or loss” and “available-for-sale financial assets” categories to the “available-for-sale financial assets” and “loans and receivables” portfolios, in accordance with the amendments to IAS 39 and IFRS 7.
In the case of structured products, the asset write-down process is triggered by events affecting the underlying assets: outstanding payments, defaults or losses. Generally, this situation occurs before the actual asset default is recorded (for example CDOs - Collateralised Debt Obligations).
Since 2009, the Group has carried out quarterly impairment tests on these assets. These tests are designed to estimate the total incurred
loss after netting of protection. They are based on estimates of expected future cash flows which take account of:
n the performances observed for underlying assets; and
n estimated of incurred losses on underlying assets based on a statistical approach.
The resulting total impairment is booked under net allocation to provisions.
This is one of the main procedures for monitoring reclassified assets.
At 31 December 2013, provisions for reclassified financial assets amounted to EUR 2.5 billion versus EUR 2.3 billion at 31 December 2012.
UNHEDGED POSITIONS IN CDO (COLLATERALISED DEBT OBLIGATIONS) TRANCHES EXPOSED TO THE US REAL ESTATE SECTOR
Societe Generale holds unhedged positions in super senior and senior CDO tranches which are exposed to the US residential real estate sector.
The valuation of the CDOs was based on the marked-to-market value of the underlying assets as since 31 December 2012.
At 31 December 2013, gross exposure to super senior and senior RMBS CDO tranches classified as held for trading totalled EUR 1.08 billion (compared with EUR 1.56 billion at 31 December 2012). These assets were subject to an average haircut of 99%.
For the record, part of the portfolio was transferred from the trading portfolio to Loans and Receivables on 1 October 2008. Gross exposure held in the Loans and Receivables portfolios totalled EUR 4.35 billion at 31 December 2013 (compared with EUR 5.08 billion at 31 December 2012).
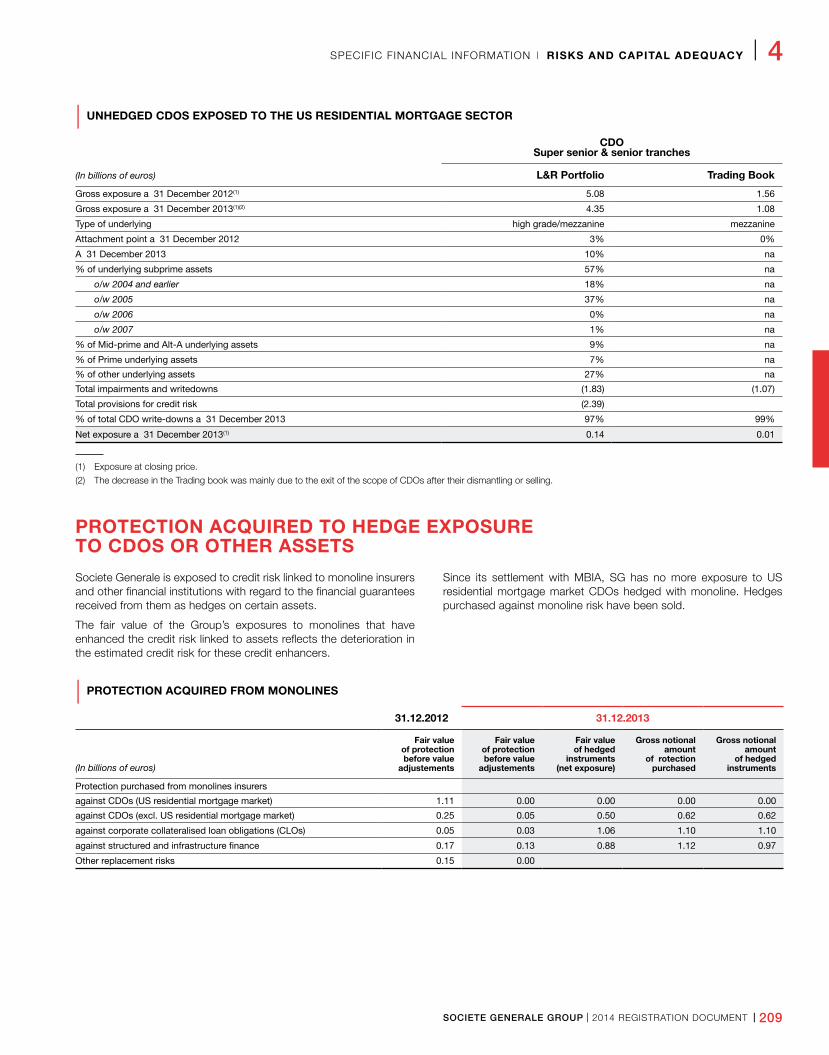
SOCIETE GENERALE GROUP I 2014 REGISTRATION DOCUMENT I 209
SPECIFIC FINANCIAL INFORMATION I RISKS AND CAPITAL ADEQUACY I 4
| UNHEDGED CDOS EXPOSED TO THE US RESIDENTIAL MORTGAGE SECTOR
CDOSuper senior & senior tranches
(In billions of euros) L&R Portfolio Trading Book
Gross exposure a 31 December 2012(1) 5.08 1.56
Gross exposure a 31 December 2013(1)(2) 4.35 1.08
Type of underlying high grade/mezzanine mezzanine
Attachment point a 31 December 2012 3% 0%
A 31 December 2013 10% na
% of underlying subprime assets 57% na
o/w 2004 and earlier 18% na
o/w 2005 37% na
o/w 2006 0% na
o/w 2007 1% na
% of Mid-prime and Alt-A underlying assets 9% na
% of Prime underlying assets 7% na
% of other underlying assets 27% na
Total impairments and writedowns (1.83) (1.07)
Total provisions for credit risk (2.39)
% of total CDO write-downs a 31 December 2013 97% 99%
Net exposure a 31 December 2013(1) 0.14 0.01
(1) Exposure at closing price.
(2) The decrease in the Trading book was mainly due to the exit of the scope of CDOs after their dismantling or selling.
PROTECTION ACQUIRED TO HEDGE EXPOSURE TO CDOS OR OTHER ASSETS
Societe Generale is exposed to credit risk linked to monoline insurers and other financial institutions with regard to the financial guarantees received from them as hedges on certain assets.
The fair value of the Group’s exposures to monolines that have enhanced the credit risk linked to assets reflects the deterioration in the estimated credit risk for these credit enhancers.
Since its settlement with MBIA, SG has no more exposure to US residential mortgage market CDOs hedged with monoline. Hedges purchased against monoline risk have been sold.
| PROTECTION ACQUIRED FROM MONOLINES
31.12.2012 31.12.2013
(In billions of euros)
Fair value of protection before value
adjustements
Fair value of protection before value
adjustements
Fair value of hedged
instruments (net exposure)
Gross notional amount
of rotection purchased
Gross notional amount
of hedged instruments
Protection purchased from monolines insurers
against CDOs (US residential mortgage market) 1.11 0.00 0.00 0.00 0.00
against CDOs (excl. US residential mortgage market) 0.25 0.05 0.50 0.62 0.62
against corporate collateralised loan obligations (CLOs) 0.05 0.03 1.06 1.10 1.10
against structured and infrastructure finance 0.17 0.13 0.88 1.12 0.97
Other replacement risks 0.15 0.00
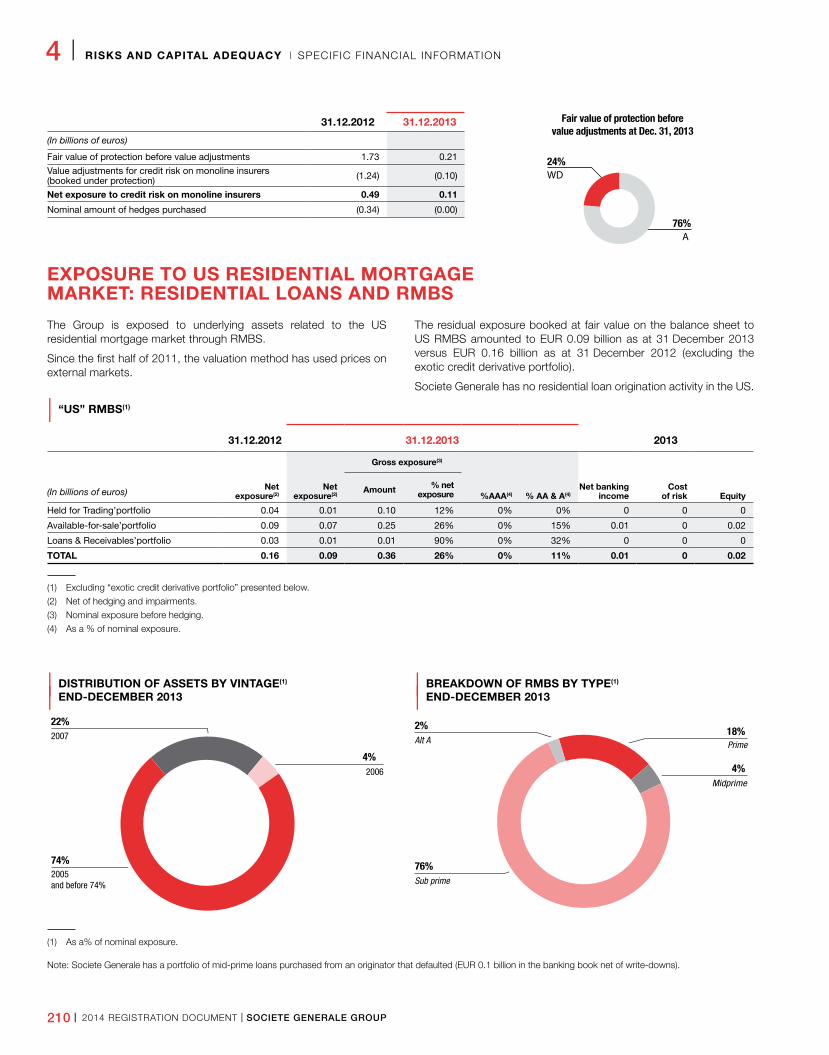
210 I 2014 REGISTRATION DOCUMENT I SOCIETE GENERALE GROUP
4 I RISKS AND CAPITAL ADEQUACY I SPECIFIC FINANCIAL INFORMATION
31.12.2012 31.12.2013
(In billions of euros)
Fair value of protection before value adjustments 1.73 0.21
Value adjustments for credit risk on monoline insurers (booked under protection) (1.24) (0.10)
Net exposure to credit risk on monoline insurers 0.49 0.11
Nominal amount of hedges purchased (0.34) (0.00)
Fair value of protection beforevalue adjustments at Dec. 31, 2013
76%A
24%WD
EXPOSURE TO US RESIDENTIAL MORTGAGE MARKET: RESIDENTIAL LOANS AND RMBS
The Group is exposed to underlying assets related to the US residential mortgage market through RMBS.
Since the first half of 2011, the valuation method has used prices on external markets.
The residual exposure booked at fair value on the balance sheet to US RMBS amounted to EUR 0.09 billion as at 31 December 2013 versus EUR 0.16 billion as at 31 December 2012 (excluding the exotic credit derivative portfolio).
Societe Generale has no residential loan origination activity in the US.
| “US” RMBS(1)
31.12.2012 31.12.2013 2013
(In billions of euros)Net
exposure(2)Net
exposure(2)
Gross exposure(3)
%AAA(4) % AA & A(4)Net banking
incomeCost
of risk EquityAmount % net
exposure
Held for Trading’portfolio 0.04 0.01 0.10 12% 0% 0% 0 0 0
Available-for-sale’portfolio 0.09 0.07 0.25 26% 0% 15% 0.01 0 0.02
Loans & Receivables’portfolio 0.03 0.01 0.01 90% 0% 32% 0 0 0
TOTAL 0.16 0.09 0.36 26% 0% 11% 0.01 0 0.02
(1) Excluding “exotic credit derivative portfolio” presented below.
(2) Net of hedging and impairments.
(3) Nominal exposure before hedging.
(4) As a % of nominal exposure.
| DISTRIBUTION OF ASSETS BY VINTAGE(1)
| END-DECEMBER 2013
22%
4%
74%2005 and before 74%
2007
2006
| BREAKDOWN OF RMBS BY TYPE(1)
| END-DECEMBER 2013
Prime
Sub prime
18%
76%
Midprime
4%
Alt A
2%
(1) As a% of nominal exposure.
Note: Societe Generale has a portfolio of mid-prime loans purchased from an originator that defaulted (EUR 0.1 billion in the banking book net of write-downs).
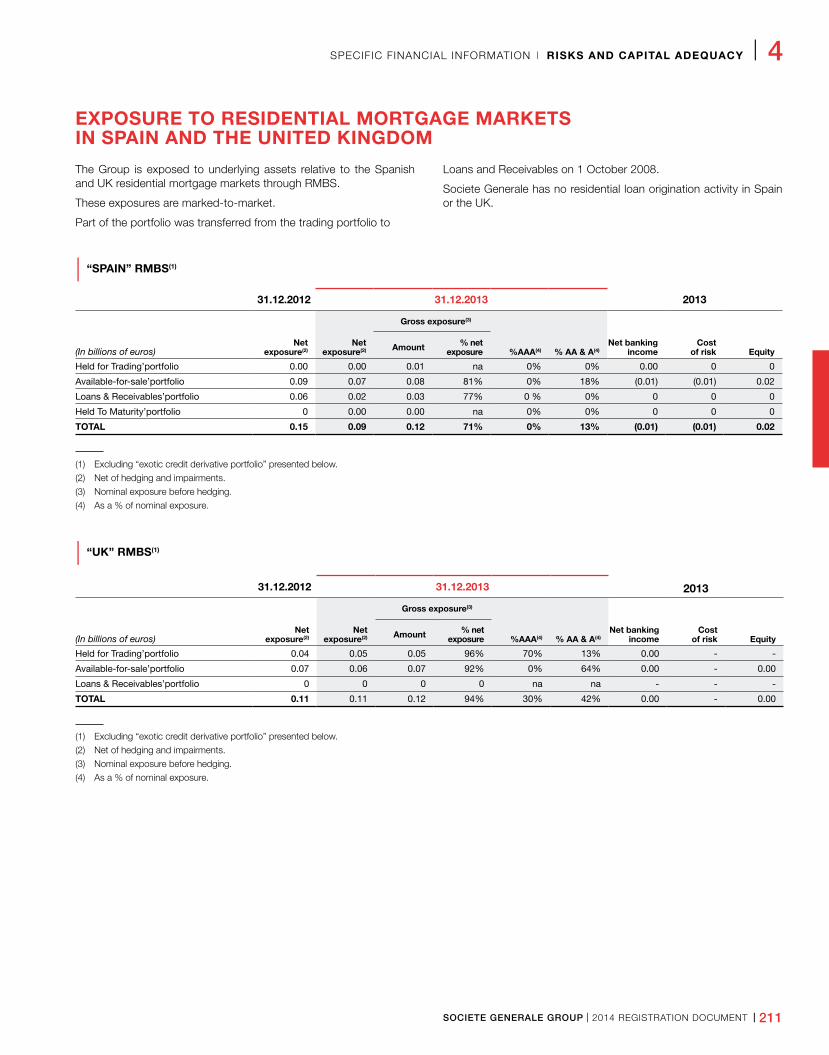
SOCIETE GENERALE GROUP I 2014 REGISTRATION DOCUMENT I 211
SPECIFIC FINANCIAL INFORMATION I RISKS AND CAPITAL ADEQUACY I 4
EXPOSURE TO RESIDENTIAL MORTGAGE MARKETS IN SPAIN AND THE UNITED KINGDOM
The Group is exposed to underlying assets relative to the Spanish and UK residential mortgage markets through RMBS.
These exposures are marked-to-market.
Part of the portfolio was transferred from the trading portfolio to
Loans and Receivables on 1 October 2008.
Societe Generale has no residential loan origination activity in Spain or the UK.
| “SPAIN” RMBS(1)
31.12.2012 31.12.2013 2013
Net exposure(2)
Net exposure(2)
Gross exposure(3)
%AAA(4) % AA & A(4)Net banking
incomeCost
of risk Equity(In billions of euros) Amount % net exposure
Held for Trading’portfolio 0.00 0.00 0.01 na 0% 0% 0.00 0 0
Available-for-sale’portfolio 0.09 0.07 0.08 81% 0% 18% (0.01) (0.01) 0.02
Loans & Receivables’portfolio 0.06 0.02 0.03 77% 0 % 0% 0 0 0
Held To Maturity’portfolio 0 0.00 0.00 na 0% 0% 0 0 0
TOTAL 0.15 0.09 0.12 71% 0% 13% (0.01) (0.01) 0.02
(1) Excluding “exotic credit derivative portfolio” presented below.
(2) Net of hedging and impairments.
(3) Nominal exposure before hedging.
(4) As a % of nominal exposure.
| “UK” RMBS(1)
31.12.2012 31.12.2013 2013
Net exposure(2)
Net exposure(2)
Gross exposure(3)
%AAA(4) % AA & A(4)Net banking
incomeCost
of risk Equity(In billions of euros) Amount % net exposure
Held for Trading’portfolio 0.04 0.05 0.05 96% 70% 13% 0.00 - -
Available-for-sale’portfolio 0.07 0.06 0.07 92% 0% 64% 0.00 - 0.00
Loans & Receivables’portfolio 0 0 0 0 na na - - -
TOTAL 0.11 0.11 0.12 94% 30% 42% 0.00 - 0.00
(1) Excluding “exotic credit derivative portfolio” presented below.
(2) Net of hedging and impairments.
(3) Nominal exposure before hedging.
(4) As a % of nominal exposure.
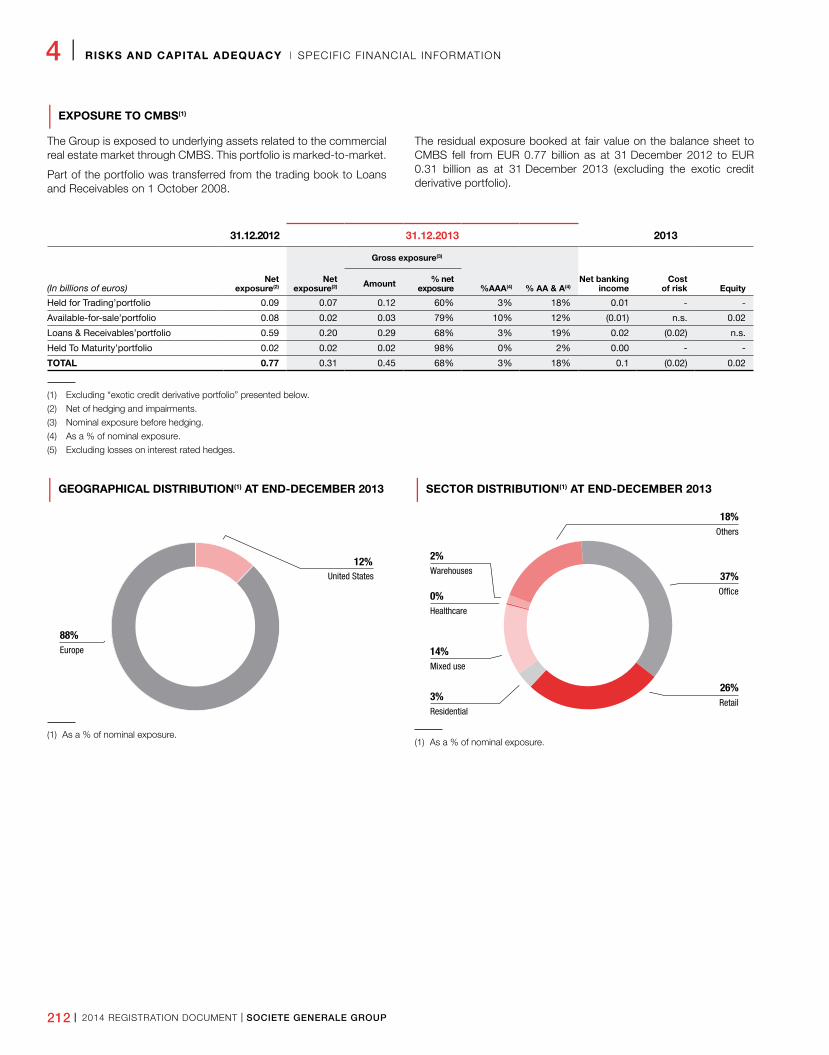
212 I 2014 REGISTRATION DOCUMENT I SOCIETE GENERALE GROUP
4 I RISKS AND CAPITAL ADEQUACY I SPECIFIC FINANCIAL INFORMATION
| EXPOSURE TO CMBS(1)
The Group is exposed to underlying assets related to the commercial real estate market through CMBS. This portfolio is marked-to-market.
Part of the portfolio was transferred from the trading book to Loans and Receivables on 1 October 2008.
The residual exposure booked at fair value on the balance sheet to CMBS fell from EUR 0.77 billion as at 31 December 2012 to EUR 0.31 billion as at 31 December 2013 (excluding the exotic credit derivative portfolio).
31.12.2012 31.12.2013 2013
Net exposure(2)
Net exposure(2)
Gross exposure(3)
%AAA(4) % AA & A(4)Net banking
incomeCost
of risk Equity(In billions of euros) Amount % net exposure
Held for Trading’portfolio 0.09 0.07 0.12 60% 3% 18% 0.01 - -
Available-for-sale’portfolio 0.08 0.02 0.03 79% 10% 12% (0.01) n.s. 0.02
Loans & Receivables’portfolio 0.59 0.20 0.29 68% 3% 19% 0.02 (0.02) n.s.
Held To Maturity’portfolio 0.02 0.02 0.02 98% 0% 2% 0.00 - -
TOTAL 0.77 0.31 0.45 68% 3% 18% 0.1 (0.02) 0.02
(1) Excluding “exotic credit derivative portfolio” presented below.
(2) Net of hedging and impairments.
(3) Nominal exposure before hedging.
(4) As a % of nominal exposure.
(5) Excluding losses on interest rated hedges.
| GEOGRAPHICAL DISTRIBUTION(1) AT END-DECEMBER 2013
12%United States
88%Europe
(1) As a % of nominal exposure.
| SECTOR DISTRIBUTION(1) AT END-DECEMBER 2013
Office
RetailResidential
37%
Others
18%
26%3%
Mixed use
14%
Healthcare
0%
2%Warehouses
(1) As a % of nominal exposure.
SOCIETE GENERALE GROUP I 2014 REGISTRATION DOCUMENT I 213
SPECIFIC FINANCIAL INFORMATION I RISKS AND CAPITAL ADEQUACY I 4
EXOTIC CREDIT DERIVATIVES
The exotic credit derivatives portfolio is linked to a customer activity which consists in selling securities indexed on the credit quality of ABS portfolios.
The Group hedges the credit protection generated in its books by purchasing underlying ABS portfolios and selling indices, and actively
manages its hedging based on the changes in credit spreads by adjusting the ABS portfolio held, index positions on indices and marketed securities.
The five-year long risk-equivalent net position at 31 December 2013 was EUR 9 million.
| FIVE-YEAR LONG RISK-EQUIVALENT NET POSITION
(In billions of euros) 31.12.2013 31.12.2012
ABS américains 9 (55)
RMBS 0 9
dont Prime 0 (0)
dont Midprime 0 (0)
dont Subprime 0 9
CMBS(1) (9) (83)
Autres 18 19
(1) Net exposure corresponding to delta exposure of a hedged underlying portfolio of EUR 1 million at 31 December 2013.

214 I 2014 REGISTRATION DOCUMENT I SOCIETE GENERALE GROUP
SOCIETE GENERALE GROUP I 2014 REGISTRATION DOCUMENT I 215
CSR governance and management �������������������2161. Responsible finance ����������������������������������������������������������220
Environmental and social commitments …………………………………… 220Implementation of E&S commitments in business lines ……………… 221Economic and social impacts of our activities …………………………… 222Loyalty of practices and financial transparency ………………………… 223
2� Solidarity and environmental products, services and financing ���������������������������������������������������226Microfinance …………………………………………………………………………… 226Solidarity products and services in French Retail Banking ………… 227Solidarity products and services in International Retail Banking and financial services …………………… 228Positive impact finance …………………………………………………………… 228Solidarity insurance in France …………………………………………………… 229Environmental banking and green financing ……………………………… 229Financial inclusion …………………………………………………………………… 231Socially responsible investment (SRI) ……………………………………… 232
3� Responsible employer ���������������������������������������������������234Teams of the Societe Generale group at the end of 2013 ………… 234Develop the employability and skills of employees …………………… 236Promoting diversity ………………………………………………………………… 239Caring about the working conditions of employees …………………… 242
4� Environment for its own account & responsible sourcing �������������������������������������������������247General policy and achievements regarding the environment …… 247General policy and achievements in sourcing …………………………… 250
5. Societe Generale in civil society �������������������253Accessibility for persons with disabilities …………………………………… 253Societal and civic actions ………………………………………………………… 253Cultural sponsorship ……………………………………………………………… 255Sports sponsorship and partnerships ……………………………………… 256
6� Appendices��������������������������������������������������������������������������������������257Methodology …………………………………………………………………………… 257Independent verifier’s report on consolidated social, environmental and societal information presented in the management report ……………………………………………………… 260
5C O R P O R AT E S O C I A L
R E S P O N S I B I L I T Y
The CSR concordance table (Article 225 – Grenelle II) is on pages 475-476
5 I CORPORATE SOCIAL RESPONSIBILITY I GOVERNANCE AND MANAGEMENT OF THE RSE
216 I 2014 REGISTRATION DOCUMENT I SOCIETE GENERALE GROUP
C S R G O V E R N A N C E A N D M A N A G E M E N T
Message from Frédéric Oudéa:“Corporate responsibility in all of its aspects – be it economic, social, societal or environmental – has been an integral part of our profession as bankers for many years now. Upholding this means respecting, wherever we are in the world, each of the commitments that we undertake and that bear the hallmark of the exacting principles the Group has set itself over the past decade and has formally defined in a set of internal directives.
Societe Generale’s first responsibility as a company is to be a benchmark bank for its customers, to cater to their financial needs in a responsible manner and, in doing so, to help finance the economy. If we are to earn the trust on which our very business depends, our focus must be to forge lasting relationships with our customers, to provide a professional and ethical solution to their needs, to constantly seek their satisfaction and feedback, and to support them through good times and bad.
Steadfastly committed to progress at every level, our success depends on each Group employee as they embody our duties as a company. Mobilising and developing their talent in a responsible
manner, Societe Generale’s ambition is to constantly enrich the wealth of its human capital to better serve its customers. Ever attentive to the well-being and professional development of its staff, the Bank seeks to nurture the types of behaviour that will ensure the creation of value over the long term. Our aim is also to encourage our employees to commit to today’s society alongside the Group’s various partnerships and sponsorship programmes.
Being a responsible bank also means carefully managing the Environmental and Social impact of our own consumption and of our products and services. Wherever possible, we will continue to strive to reduce the Group’s ecological footprint and to promote social inclusion, as much through our purchasing, our policies as an employer and our sponsorship, as through our financial solidarity service offer, which is adapted to the needs of our most vulnerable customers.
I am confident that our corporate responsibility will cement our position as a benchmark bank for our customers and for society, and rate us amongst the first quartile of the world’s banks for their CSR policies and initiatives.”
CSR GOVERNANCE AND MANAGEMENT
Societe Generale Group conducts its business with the respect for fundamental human and workers’ rights and for the environment – wherever it is in the world.
It complies in full with the obligations of France’s Grenelle 2 Law governing the commitment of national companies to the environment, including those relating to Article 225, which requires businesses to report on the environmental and social consequences of their activities, and Article 75, which requires them to carry out a greenhouse gas (GHG) emissions inventory.
In 2011, the Group published its Social and Environmental Guidelines which apply to all its business activities. They are based on the commitments made by the Group under:
n OECD Guidelines for Multinational Enterprises;
n UNEP Statement by Financial Institutions on the Environment & Sustainable Development (UNEP-FI);
n Global Compact’s Ten Principles, which are integrated within the Group’s strategy, its culture and operations;
n Diversity Charter in France;
n Wolfsberg Group Principles;
n Equator Principles.
Strategy and policySociete Generale’s aim is to become a benchmark reference in Corporate Social Responsibility (CSR) amongst Europe’s leading financial institutions.
Its global CSR policy ensures that the Group upholds each of its commitments and makes sustainable progress according to five strategic priorities, set out below:
n developing responsible finance, notably through enforcement of the Environmental and Social General Guidelines in all business activities;
n rolling out a responsible and solidarity-based banking offer;
n strengthening its role as a responsible employer;
n exemplifying management of its environmental impact and purchasing policy;
n reinforcing its role as a responsible actor at the heart of today’s society.
Organisation and governanceCSR management at Societe Generale forms an integral part of the Group’s organisation and is implemented by various resources and structures at all levels (governance, compliance and internal control functions, risk committees, new product committees, internal regulations, Code of Conduct, Audit Charter, Tax Code of Conduct, etc.).
The Executive Committee defines the broad outlines of the Group’s CSR policy and periodically validates any action plans based on the reporting made by the Sustainable Development Department.
GOVERNANCE AND MANAGEMENT OF THE RSE I CORPORATE SOCIAL RESPONSIBILITY I 5
SOCIETE GENERALE GROUP I 2014 REGISTRATION DOCUMENT I 217
The Group’s business lines and corporate divisions are responsible for adjusting and implementing this policy to the specific characteristics of their respective activities. Each entity appoints its own “CSR contributors” (around sixty Group-wide), whose role is to oversee the implementation of this policy at an operating level, i.e. to actively participate in drawing up plans and monitoring their execution.
The Sustainable Development Department reports to the General Management through the Group Corporate Secretary. It is in charge of defining and promoting CSR policy throughout the Group as well as coordinating the activities of its contributors and all related initiatives. It also provides practical assistance to the different entities and encourages both the exchange and dissemination of best practices.
To evaluate its overall CSR performance, the Group has defined a series of quantitative indicators, which are grouped into five categories:
n corporate governance indicators: governance, compliance, ethics, risk culture;
n business indicators: social and environmental assessment of counterparties/projects, product innovation for sustainable development, customer satisfaction, contribution to local development, etc.;
n social indicators: employment, career and skills management, remuneration, working hours, internal feedback, health and safety, etc.;
n environmental indicators: environmental management system, environmental awareness, water and energy consumption, transport, paper, waste, etc.;
n sponsorship indicators.
Each year, the corresponding values are entered, consolidated and analysed using a dedicated reporting system that was introduced by the Group in 2005.
Employee training and awareness activitiesA training programme on sustainable development and CSR (e-learning and classroom training) has been available for Group employees and managers since 2009 via a dedicated intranet. A website (in French and English) enables employees to find out more about sustainable development issues in general, and within the banking sector in particular, and about the initiatives taken by Societe Generale in this area.
Since 2008, the Group has organised the Societe Generale Climate Change Week every year in December. This event, which coincides with the conferences taking place under the United Nations Framework Convention on Climate Change, is an opportunity to raise employee awareness of major environmental issues and the Group’s initiatives. In 2013, this week provided an opportunity to promote internal energy-saving initiatives through the launch of the first-ever Environmental Efficiency Awards based on redistribution of the internal carbon tax, thus creating an innovative incentive that allows all Bank entities to participate in the efforts to reduce CO2 emissions. (See section 4 p. 247 “General policy and achievements regarding the environment”)
Audits and extra-financial ratingsSince 2012, Societe Generale’s Statutory Auditor (Independent Third Party Organisation -ITPO- under the Grenelle law) has certified in the Registration Document the presence of extra-financial information under Article 225 of the “Grenelle 2” Law, as well as the nature of its audit work.
In addition, the Group attaches great importance to its extra-financial ratings and strives to obtain ratings that best reflect its CSR actions by ensuring the quality and transparency of the data provided.
A component stock of a number of sustainable development indexes (FTSE4Good, DJSI Europe, Euronext Vigeo, ASPI, STOXX – Sustainalytics, etc.), Societe Generale’s stock is a popular choice amongst a large number of French SRI (Socially Responsible Investment) funds.
Each year, Societe Generale is rated by extra-financial rating agencies. It currently appears in the main sustainable development indexes and is a recognised player for its defined CSR strategy. The transparency of its actions and its good positioning among the sustainable development indexes have placed it in the top quartile of banks for its CSR actions since 2001.
(See Group website)
Dialogue with stakeholdersAt Societe Generale, corporate and social responsibility means understanding and integrating the needs and expectations of the Group’s different stakeholders.
CUSTOMERSSociete Generale’s ambition is to be the reference relationship bank on its markets, close to its customers and chosen for the quality and commitment of its teams. It has therefore naturally made this challenge one of the major focuses of its strategy. As part of this strategy, all of the Group’s business lines have undertaken to launch “Customer Satisfaction” action plans.
Customer satisfaction
Within each of the main customer segments serviced by our Retail Banking in France network (individuals, professionals and corporates), Societe Generale, its specialised subsidiaries (Sogecap, Sogessur, Franfinance, etc.) and Crédit du Nord have been surveying their respective customers as well as those of their competitors for some ten years now in order to assess their level of satisfaction. The survey covers the level of overall customer satisfaction, but also the level of satisfaction as regards the different aspects of banking relations (branch, advisor, telephone and internet banking, products, pricing policy).
These nationwide surveys are further complemented by the annual customer satisfaction surveys carried out locally – each year, 120,000 individual clients, 14,500 professional clients and 5,000 SMEs are surveyed by Societe Generale – which focus on how customers rate the bank’s welcome and their relationship with their account managers. “Mystery Visits” are also made to Societe Generale branches which are an excellent means of gathering accurate feedback on the quality of the welcome and advice given, and of identifying areas for improvement.
These two measures are at the heart of a Quality certification programme for its branches, launched in 2013 by Societe Generale to make its resolutely customer-focused strategic orientation a reality.
At Crédit du Nord, 40,000 clients are surveyed. Each branch manager is personally responsible for improving customer satisfaction ratings,
5 I CORPORATE SOCIAL RESPONSIBILITY I GOVERNANCE AND MANAGEMENT OF THE RSE
218 I 2014 REGISTRATION DOCUMENT I SOCIETE GENERALE GROUP
a criterion that is taken into account in their personal appraisals.
Within Societe Generale’s specialised subsidiaries, customer satisfaction is measured as close to the field as possible, with each entity adapting their surveys to their recurrent or specific needs (activity, customers, products and organisation). Each entity uses the internal or external resources and methodologies that are best suited to the level of analysis required. Each business line within Societe Generale’s Specialised Financial Services and Insurance division has also implemented its own “Customer Satisfaction” action plan.
In addition, awards have been presented to a number of its subsidiaries. For example, Societe Generale Equipment Finance has been awarded twice for the quality of its commitments with European SME customers as well as for its continuing role to finance the real economy in the United Kingdom. In France, Sogecap received the silver award in insurance for the quality of its health insurance services, and SKB was named bank of the year in Slovenia for the 3rd consecutive time by The Banker.
All Group employees are conscious of the importance of customer satisfaction through the Free Share Plan. The fulfilment of two following conditions will trigger the Plan:
n the first, that the Group generate a net profit for the 2012 financial year;
n the second, that customer satisfaction increase between 2010 and 2013 on the three main business lines worldwide: French and International Retail Banking and Corporate and Investment Banking.
(See section 3 p. 243 “Free Share Plan”)
Claims and ombudsman
See section 1 p. 225 “Mediation”
INVESTORS AND SHAREHOLDERSSociete Generale’s department in charge of institutional investor and individual shareholder relations is responsible for overseeing the Group’s financial communications and disclosure and for ensuring that investors and shareholders are kept up to date regarding its strategy and results.
In 2013, 100 days of roadshows/conferences were organised with analysts and investors around the world (55 days in Europe, including 10 days in Paris; 27 days in the United States and Canada; 16 days in Asia; and 2 days in the Middle East).
In July 2013, Antony Wyand, Vice-Chairman of the Group, took part in the second SRI road show organised by the Group in less than 12 months. The first was held in Paris in November 2012 in the presence of Frédéric Oudéa. This meeting, organised within the Group’s offices in London specifically on the theme of governance, brought together very large management firms. The presentations given at the meeting can be downloaded from the Societe Generale website.
In addition to the General Meeting in Paris attended by 800 shareholders on 22 May 2013, three meetings organised in collaboration with the Retail Banking in France network provided an opportunity to meet with 750 individual shareholders in Lille (in March), 800 in Strasbourg (in September) and 600 in Paris (in November). Societe Generale also took part in three information meetings in partnership with other issuers in Bordeaux in April, Brussels in June and Annecy in October, each of which was attended by 200 to 300 participants.
Each quarter, the Group publishes its Letter to Shareholders (140,000 copies) and keeps its shareholders informed through a variety of channels: Shareholders Club, toll-free number, letters, dedicated website, etc.
To make sure it continues to meet the needs and expectations of its individual shareholders, the Group has had a Shareholders’ Consultative Committee since 1988, whose primary role is to advise on the Group’s individual shareholder relations and communications policy.
In November 2013, the Grand Prize for Shareholder Relations was awarded to Societe Generale.
Societe Generale’s financial communication was also distinguished during the 2013 Transparency Awards (October 2013). This award, organised by Labrador and with the guidance of an independent scientific committee, recognises easy access to regulated information for all categories of readers. Societe Generale ranks third among financial institutions according to the criteria defined by this committee (www.grandsprixtransparence.com).
Lastly, in December 2013, Societe Generale received third prize for “Best investor relations by a CEO”, an award given by IR-Intelligence to investor relations managers of companies listed on Euronext based on a survey of sell side, buy side, and independent financial analysts conducted by the SFAF (French Society of Financial Analysts) and IR-Intelligence (www.forum-ir.com/trophees).
EMPLOYEES(See section 3 p. 244 “Feedback and employee satisfaction survey” and “Collective bargaining”)
RATING AGENCIES(See paragraph “Audits and extra-financial ratings” p. 217)
NON-GOVERNMENTAL ORGANISATIONS (NGOS)The Group is attentive to listen to and engage in dialogue with NGOs that can help it to take controversial situations into account or change its policies in a progress-oriented approach.
Societe Generale makes every effort to promote constructive talks and exchange best practices with stakeholders (NGOs, the OECD, the UNEP-FI, the ORSE, Export Credit agencies, the IFC, the EBRD, the World Bank, the French National Contact Point, etc.), and to factor in recommendations or alerts by NGOs regarding projects, sectors or companies in its decision-making processes. Within the UNEP-FI, Societe Generale participates in discussions with the GHG Protocol (Greenhouse Gas Protocol) to develop a specific methodology of GHG emissions measurement for the financial sector’s activities (own account and business).
GOVERNANCE AND MANAGEMENT OF THE RSE I CORPORATE SOCIAL RESPONSIBILITY I 5
SOCIETE GENERALE GROUP I 2014 REGISTRATION DOCUMENT I 219
In 2013, Societe Generale attended various work and discussion meetings with some 15 NGOs (BankTrack, Amis de la Terre, Greenpeace, Oxfam, Profundo, EcoDéfence, WWF, Transparency International, etc.) either through bilateral meetings and emails or during consultation meetings organised by the OECD (Responsible Business Forum, etc.).
These exchanges gave rise to investigation and/or documented responses or measures taken into account in the drafting of certain sectoral policies. Societe Generale monitors its Environmental and Social (E&S) projects in the sectors covered by sectoral policies (see section 1 p. 220).
In 2013, it participated in the Cross-Sector Biodiversity Initiative (CSBI) alongside a few other banks and companies of the extractive industries sector.
Societe Generale organised meetings with various NGOs on the topics of human rights, corruption, financial transparency and tax havens in order to address their specific concerns and respond to their questionnaires, bearing in mind that the Group is not present in any countries that are classed as uncooperative by the OECD or under French or European law.
OECD: Organisation for Economic Co-operation and Development.
UNEP-FI: United Nations Environment Programme – Finance Initiative.
ORSE: Observatoire de la Responsabilité Sociétale des Entreprises (French Study Centre for Corporate Social Responsibility).
IFC: International Finance Corporation.
EBRD: European Bank for Reconstruction and Development.
OTHER STAKEHOLDERSThe Group maintains regular, constructive contact with CRESUS (a network of associations specialising in providing assistance to individuals with excessive or poorly structured debt) through its partnerships with Group entities (CGI, Franfinance, BDDF) as well as a dialogue on the role of lending institutions in preventing individuals from getting too far into debt and assisting people in difficulty.
Also in 2013, more than 100 employees were paired up with members of CRESUS to promote skills sponsorship for a pilot financial education project for young apprentices ages 16 to 25.
In November 2013, 18 months after the initial assessment, the French standards body AFNOR performed a follow-up audit of CGI’s CSR approach and issued an opinion on the sustainability and effectiveness of the approach. In 2012, two entities, CGI-CGL and ALD France, prepared for ISO 26000 evaluation by AFNOR Certification, placing them amongst the first French companies to seek external certification for their corporate social responsibility.
The Group has also set up a number of partnerships with various associations. (See section 5 p. 254 “Partnerships and corporate sponsorship”)
220 I 2014 REGISTRATION DOCUMENT I SOCIETE GENERALE GROUP
5 I CORPORATE SOCIAL RESPONSIBILITY I RESPONSIBLE FINANCE
1 . R E S P O N S I B L E F I N A N C E
ENVIRONMENTAL AND SOCIAL COMMITMENTS
General guidelinesSociete Generale’s proactive role in financing the real economy requires that it lend sufficient importance to environmental, social and economic convergence factors at play within its sphere of influence.
The Environmental and Social (E&S) General Guidelines and the E&S sector and cross-sector policies appended to them set out Societe Generale’s commitments in this area. These commitments have a status of Internal Directive, which is signed by the Chairman and Chief Executive Officer. They provide a global framework based on the Group’s institutional commitments and specify the standards that Societe Generale deems most relevant in certain sensitive sectors, or in connection with specific problems, based on international initiatives (United Nations Global Compact, Equator Principles, etc.) and best practices.
These Principles are to be found in the Group’s communications and on its website.
Sector and cross-sector E&S policiesThe E&S sector and cross-sector policies now cover around ten sectors in which the Group played an active role in 2013. Two new sector policies (palm oil, forest exploitation and products) have enriched the already existing (civil nuclear, defence, shipping, thermal power plants, mining and metals, oil and gas, dams and hydropower) in addition to the cross-sector policy on biodiversity.
Developed by cross-business working groups, these policies are approved by the Executive Committee.
The defence sector policy particularly specifies that the Group shall not knowingly provide banking and financial services to businesses, parent companies or subsidiaries of companies that produce, manufacture, store or sell antipersonnel mines or cluster bombs. Regarding the transactional funding of military and defence equipment, very strict rules are also imposed.
In the ongoing improvement process, sectoral monitoring makes it possible to assess the need to update existing policies. New sector and cross-sector policies are being developed.
These policies are public and accessible on the Group’s website.
Equator PrinciplesFor more than ten years, the credit risk management policies and processes have gradually incorporated the assessment of
environmental risks. This commitment was formally defined in 2007 with the adoption of the Equator Principles (EP) in the project finance sector. Since then, Societe Generale has been an active member of the Equator Principles, participating in several working groups.
Backed by its experience and internal processes already firmly in place, Societe Generale lent its support to the revision of the Equator Principles (EP3) and approved their adoption in June 2013.
Human rightsSociete Generale conducts its business with the utmost respect for fundamental human and workers’ rights, wherever it is in the world.
As part of its E&S General Guidelines, the bank is committed to carrying out all of its activities in accordance with the values and principles of:
n the Universal Declaration of Human Rights and associated covenants (namely, the International Covenant on Civil and Political Rights and the International Covenant on Economic, Social and Cultural Rights);
n the main conventions of the lnternational Labour Organisation;
n the UNESCO World Heritage Convention;
n the OECD Guidelines for Multinational Enterprises.
The Group acts and cooperates in compliance with the international programmes to which it is signatory, such as the United Nations Global Compact and the Statement by Financial Institutions on the Environment & Sustainable Development (United Nations Environment Programme), the new due diligence process proposed by the OECD.
Currently, in E&S assessments of customers and transactions, particular attention is paid to the Performance Standards of IFC (International Financial Corporation) World Bank Group, particularly with regard to labour and working conditions.
As part of its responsible purchasing policy, Societe Generale is careful to ensure that all of its service providers comply with its commitments, including Human Rights. (See section “General policy and achievements in sourcing”, p. 250).
As an employer, Societe Generale is committed to carrying out an employee policy that respects Human Rights and the main conventions of the lnternational Labour Organisation for employees. (See section 3 “Employer-employee dialogue and respect for human rights”, p. 244).
SOCIETE GENERALE GROUP I 2014 REGISTRATION DOCUMENT I 221
RESPONSIBLE FINANCE I CORPORATE SOCIAL RESPONSIBILITY I 5
IMPLEMENTATION OF E&S COMMITMENTS IN BUSINESS LINES
In April 2013, the Group published its instruction on E&S assessment as part of its activities. This instruction provides the framework for procedures to assess and handle E&S impacts associated with transactions or customers to whom the Group provides financial services. It aims to ensure that all of the Group’s entities implement the commitments made within an integrated, consistent framework.
Three categories of procedures are deployed:
An E&S watch list based on sector policies and requests from Non-Governmental Organisations (NGOs)This list consists of transactions, sectors or companies, whether or not financed by Societe Generale, that are the subject of controversy or public campaigns on the part of NGOs or Civil Society for environmental or social reasons. It aims to warn teams upstream about the financial activities or sectors concerned.
Transaction E&S assessment proceduresThe main steps of the implementation process including the Equator Principles (EP) are the following:
n the categorisation of the project is the first step in its E&S assessment (A = strong potential risk, B = average and C = weak);
n E&S requirements vary based on the project’s categorisation. The relevant information about the project’s E&S aspects is collected from the customer for a project (and some category B projects where applicable). The E&S documentation provided is reviewed by an independent E&S expert. Where necessary, an action plan is drawn up based on the expert’s conclusions as to the measures that need to be implemented in order to limit or reduce any potential E&S risks. The plan is then included in the appropriate credit file along with any other clauses that the customer must respect, in addition to local and international E&S rules and regulations, all of which must comply with the Equator Principles. Where customers do not meet the necessary standards, Societe Generale may decide to withdraw its financing;
n the E&S assessment of the documentation as well as the E&S criteria best suited to the level of risk of a given project is carried out by a dedicated team. Additional information may be requested from the customer and/or independent E&S expert. Besides the assessment by the dedicated team, Societe Generale’s Risk Division has a team of internal consultants who provide an opinion on the technical and environmental aspects of the said financing;
n the approval procedure of a category A or B project is therefore dependent on a positive assessment of the main E&S criteria at stake and its compliance with the Equator Principles.
The Group has extended these procedures beyond the requirements of the Equator Principles: For other types of transactions with identified purpose, Societe Generale has introduced relevant E&S assessments for every type of financial commitment.
In 2013, a total of 51 projects (60 in 2012, 71 in 2011, 57 in 2010, 50 in 2009) were assessed and categorised according to the Equator Principles, including advisory mandates.
These projects covered all categories and all geographical regions, notably non-high income OECD countries where the application of the Equator Principles necessarily implies compliance with the IFC Performance Standards.
Customer E&S assessment proceduresThese procedures aim to identify, evaluate and help to resolve E&S problems encountered by customers in order to minimise the risks for Societe Generale.
In corporate and investment banking, this E&S assessment procedure is incorporated into the new relationship/customer review process. It follows the regular credit KYC (Know Your Customer) process and feeds the credit process. Since late 2010, a team within the KYC department has been dedicated to customer E&S assessments.
As of the end of December 2013, approximately 150 KYC analysts have been trained in the customer E&S assessment procedures, and nearly 3,600 customers have been evaluated, representing more than 75% of the client group in sensitive sectors.
The customer E&S assessment is conducted based on publicly available information collected using computer search tools and databases as well as information provided by the business lines and the KYC analysts.
The systematic integration of an E&S assessment in customer reviews is gradually being extended to all Group entities.
222 I 2014 REGISTRATION DOCUMENT I SOCIETE GENERALE GROUP
5 I CORPORATE SOCIAL RESPONSIBILITY I RESPONSIBLE FINANCE
ECONOMIC AND SOCIAL IMPACTS OF OUR ACTIVITIES
Supporting business and individual customers in low- or middle-income countriesThrough its network of subsidiaries, the Group plays a leading role in the development of the regions and/or countries where it operates. Its subsidiaries or branches actively contribute in their respective country, fully assume their social and environmental responsibilities and undertake initiatives supporting progress. The bank reinforces its actions as a socially responsible bank by offering employment, supporting the creation and development of businesses and assisting local authorities with their projects.
At the end of 2013, 60.6% of the staff are located outside of mainland France, including 9.7% in low- or lower-middle-income countries (according to the World Bank’s definition) (Burkina Faso, Cameroon, Ivory Coast, Ghana, Georgia, India, Madagascar, Morocco, Senegal, etc.) and 12% in middle-income countries (according to the World Bank’s definition) (Algeria, Brazil, Bulgaria, China, Romania, Serbia, Tunisia, etc.).
Societe Generale constantly adapts its range of products and services to the maturity of each market, proposing new and innovative solutions in countries where access to banking is extremely limited, i.e. most countries in Sub-Saharan Africa and to a lesser extent Eastern Europe.
The bank’s strategy is a long-term strategy. In each of these countries, the bank’s ambition is to remain a local bank but with a universal banking model.
After marking the 50th anniversary of its presence in Senegal and Ivory Coast in 2012, the bank again celebrated its 50 years in Cameroon in October 2013, where Societe Generale Cameroon is the top bank in terms of lending (with 23% market share).
Societe Generale has also established partnerships and associations to offer solutions tailored to the local environment.
The successful cooperation of its subsidiaries with the EBRD (European Bank for Reconstruction and Development) continued in 2013, with 13 financing contracts signed for a total of EUR 214 million.
Among the major transactions of the year was the establishment of a “Partnership for Growth” line for SGEB in Bulgaria (EUR 75 million), in line with the partnerships previously signed by Serbia (EUR 150 million), a pioneer in 2011, then Croatia (EUR 75 million) in 2012.
In addition, the EBRD continued to support Delta Credit in Russia with a line of USD 85 million dedicated to home loans for individuals.
Credit lines to promote energy efficiency were put in place in Macedonia (FYROM) and Moldova for both SMEs and individuals. Lastly, 2013 saw the development of the EBRD’s cooperation with the leasing subsidiaries, particularly in Bulgaria (EUR 10 million), Serbia (EUR 20 million) and Russia (EUR 12 million, in RUB).
In September 2013, Bank Republic, the Group’s Georgian subsidiary, teamed up with the IFC to develop mortgage loans in Georgia and expand access to quality banking products and services.
In August 2013, Societe Generale Ghana arranged a USD 10 million credit facility with PROPARCO, a subsidiary of the French Development Agency (AFD), which will enable it to strengthen its long-term financial resources and support the country’s growth.
SGEB in Bulgaria and the EIB entered into an agreement in June 2013 for a large EUR 100 million credit line to support SMEs.
Support for start-ups and SMEsIn 2013, Societe Generale entered into relationships with 23,312 new businesses that were set up less than one year ago in France (i.e. 66% of new professional customers at 31 December 2013), to which it granted approximately 4,600 medium/long term loans amounting to EUR 427 million.
The Group is a leading player in the distribution of Start-Up Loans (PCE) with 11.3% market share (source: BPIFRANCE at the end of 2013).
Providing start-ups with a specialist network to support their business substantially boosts their chances of survival (three-year survival rate of 87% and five-year survival rate of 84% versus an overall national survival rate of 51.5% (Source: INSEE – 2011)).
For its part, Societe Generale relies on these networks to ensure tailored help for its customers. It includes among its partners: CCI Entreprendre en France; Initiative France; Réseau des BGE (Boutiques de Gestion); Moovjee (Mouvement pour les Jeunes et les Étudiants Entrepreneurs); Adie (Association pour le droit à l’initiative économique) and Fondation de la 2e chance.
The bank is a partner of 149 local Initiative France platforms, which permitted the creation or takeover of 11,240 companies in 2012, generating more than 25,000 direct jobs starting in the first year. In addition to the loans on trust (interest-free, unsecured) of the 231 platforms, the bank granted 964 loans (+3% on 2011) for EUR 64 million to entrepreneurs approved by Initiative France in 2012 (+22% on 2011). (figures provided by Initiative France in June 2013).
Launched in 2012, the Collection Business entrepreneurs card allows the chosen support network (Initiative France or Moovjee) to receive financial support but especially benefit from joint actions involving the expertise of bank employees. (See section 2 “Charity cards” p. 227, 228).
In the Czech Republic, Komerčni banka (KB), in cooperation with the association of small and medium-sized enterprises and local crafts, launched “START UP”, a subsidies program to promote and encourage young entrepreneurs to venture into business creation.
In Morocco, Societe Generale Morocco (SGMA) and the Maroc Entreprendre network entered into a partnership to benefit SMEs being started up, launched or taken over. SGMA makes an interest-free financial package available to the Maroc Entreprendre network to fund loans on trust granted to those creating and/or taking over companies, thus promoting their access to bank credit. (See also “Societe Generale initiatives for employment and education”, section 5 p. 253).
SOCIETE GENERALE GROUP I 2014 REGISTRATION DOCUMENT I 223
RESPONSIBLE FINANCE I CORPORATE SOCIAL RESPONSIBILITY I 5
Financing for states and local authoritiesIn France, for over twenty years now, Societe Generale has provided loans to the public and parapublic sectors to finance public interest investments, particularly among Public Economy players and in the social housing sector. At 31 December 2013, the Group’s commitments across the market amounted to approximately EUR 17 billion.
In the Czech Republic, a new partnership signed in October 2013 with the Council of Europe Development Bank (CEB) allows Komerčni banka (KB) to offer more advantageous loans to municipalities as part of a new program, EuroMuni. This is the opportunity for customer municipalities to reduce the costs of financing their projects. There are various types of funded projects, ranging from development and maintenance of infrastructure to reconstruction following natural disasters in the country as well as environmental projects.
The Group is also present in the private/public partnerships (PPP) sector. Certain PPP deals are classified as having a positive impact on
the environment and/or the needs of the population and/or economic development. (See section 2 “Positive Impact Finance” p. 228).
In France as abroad, the Group respects the principles of GISSLER charter in its transactions with public authorities.
Financing of the association system in FranceAssociations are important players in the French economy because of their production of intrinsic wealth, the jobs created and the services rendered.
For many years, Societe Generale has developed close relationships with the world of associations across the country. With an overall market share of 10% and 120,000 customer associations, Societe Generale provides to know-how to allow them to achieve their objectives, by financing their projects, helping them to manage their assets and facilitating their day-to-day management.
LOYALTY OF PRACTICES AND FINANCIAL TRANSPARENCY
The loyalty shown to its customers and, more generally, the integrity of the banking and financial practices decisively contribute to Societe Generale reputation.
By ensuring the respect of these rules, the Group helps to develop a key asset: the trust of customers, other counterparties, employees and regulatory authorities on which it depends.
Anti-corruption initiativesBy 2000, Societe Generale had already taken on a series of commitments linked to the Wolfsberg Group as well as, in 2003, the United Nations Global Compact. Its anti-money laundering measures include monitoring potential abuse of the banking system for the purposes of corruption.
Societe Generale has very strict principles on the prevention of corruption which are set in its Code of Conduct and complies with the provisions of the most stringent regulations on the subject, in particular the UK Bribery Act. Close monitoring of their implementation has been put in place. Information concerning obligatory measures and controls has been disseminated and applied throughout the Group since 2001 in the form of instructions which are updated on a regular basis.
Societe Generale Code of ConductThe Group’s Code of Conduct was reviewed and published in January 2013 in the form of directive signed by the Chairman and Chief Executive Officer. It continues on from the prior version and is the basis of the Group’s professional ethics.
It is part of the Normative Documentation on which the governance system is based.
It is available in the eight most used languages and applicable to all Group employees. It will be rolled out in other languages gradually. These rules go beyond strict application of the legal and regulatory provisions in force and constitute a uniform base within the Group.
The new version of the Code clarifies the rights and duties of employees, customers, suppliers and shareholders in the relationship with Societe Generale. It promotes social and environmental responsibility and reminds them of the main commitments made by the Group, such as the Global Compact and the UNEP-FI, and the sparing use of natural and energy resources.
Details are added to the fundamentals: respect for fundamental commitments (such as Human Rights, respect for the environment, etc.), the prevention of conflicts of interest, corruption and money laundering, the gift policy, responsible sourcing and the escalation procedure in the event of non-compliance.
It thus contributes to the prevention of risks in order to strengthen the company’s reputation and responsible approach.
The Code of Conduct is available on the Group’s website. (See chapter 4 section 9 p. 198).
Tax Code of ConductThe Group’s Tax Code of Conduct, approved by the Board of Directors in November 2010, is part of the worldwide developments to fight harmful tax practices, particularly at the request of the OECD.
The tax Code of Conduct is available on the Group’s website.
224 I 2014 REGISTRATION DOCUMENT I SOCIETE GENERALE GROUP
5 I CORPORATE SOCIAL RESPONSIBILITY I RESPONSIBLE FINANCE
Proactive actions to protect customersSociete Generale’s ambition is to be the reference relationship bank on its markets, close to its customers and chosen for the quality and commitment of its teams. As part of the Group’s strategy, all of the Group’s business lines have made a commitment to implement Customer Satisfaction action plans.
For more details about customer satisfaction, see the section “Dialogue with stakeholders” p. 217.
REMUNERATION FOR CUSTOMER ADVISORSSociete Generale Group’s remuneration policy is devised to avoid there being any incentives that might provoke a conflict of interest between its employees and its customers. The principles and rules of governance applying to remuneration are set out in the normative documentation linked to the Group’s policy for managing conflicts of interest.
A company agreement signed in June 2013 eliminates the individual commission system for the retail banking and private banking sales forces in France, replacing it with gross global annual remuneration and the variable share. This agreement is applicable as from 1 January 2014. (See section 3 “Remuneration policy” p. 242).
RESPONSIBLE LENDING APPROACHSociete Generale Group has a “Responsible lending” policy that ensures borrowing customers are respected at every stage in the life of a loan, from the day it is granted right up until repayment. It applies as much to consumer loans as to mortgage lending for individual customers and will be rolled out to the entire Group. The aim of the policy is to go beyond legal requirements, such as the Lagarde Act in France, and to identify and assist people over-indebtedness.
Since 2010, Societe Generale’s consumer loan subsidiaries have adopted the common charter for “Successful Lending”, inspired by a pilot initiative led by Franfinance in France. These subsidiaries undertake to respect six win-win responsible commitments: to examine all credit applications carefully and professionally, to know when to say no, to recommend insurance to protect against the unexpected, to be flexible, to be clear, and to accompany each customer throughout the life of a loan.
An internal referential was built on the basis of the definition of Responsible Lending. It identifies “best practices” in 24 areas. A practice is considered a “best practice” if it goes beyond the local regulations. By relying on this referential, a campaign of self-assessment of practices across all retail banking networks and consumer credit subsidiaries was launched, contributing to continuous progress approach.
The referential will be enriched over time with identified best practices.
OVER-INDEBTEDNESSThe Societe Generale France network is necessarily affected by the phenomenon of over-indebtedness and, since 2004, has set in place the resources needed to quickly identify this category of customer in order to be able to offer them a responsible solution.
The law governing consumer credit that entered into effect in November 2010 and that altered the regulatory framework for over-indebted people with no major changes to procedures in place within the Group was precursory in this respect.
A PROCESS DEDICATED TO OVER-INDEBTEDNESS
Societe Generale introduced a dedicated process to ensure the responsible management of over-indebted customers as early as 2004.
It maintains the service of bank accounts in which income is domiciled, except in special cases, and informs over-indebted customers of alternative payment methods to cheques. The debtor continues to benefit from the overdraft that had been granted.
Management of the customer relationship is based on a complementary system:
n account managers ensure the everyday monitoring of the account;
n back-office operators who monitor the outstanding credit prior to acceptation of the file and the repayment schedule once it has been approved.
Thanks to this procedure, the bank is able to avoid any increase in loans borne by an over-indebted customer whilst still ensuring day-to-day personalised monitoring.
SYSTEMATIC SUPPORT FOR VULNERABLE CUSTOMERS TO PREVENT OVER-INDEBTEDNESS
The organisation for vulnerable customers, operational across the entire network of branches since mid-2013, is based on:
n the identification of all customers meeting certain vulnerability criteria (authorisations overruns, overdue outstanding repayments, etc.);
n the systematic transfer of these customers to a platform of specialist advisers who temporarily take over relationship from the branch;
n the search, with the supported customers, for solutions for gradual discharge of outstanding payments, favouring a path back to a healthy situation rather than litigation as much as possible;
n resumption of the customer relationship with their branch at the end of the discharge period.
Franfinance, the Group’s subsidiary which specialises in consumer loans, has also introduced various measures to prevent over-indebtedness.
An over-indebted person is vulnerable and should not be granted any further credit. Having said that, access to a bank account and adapted means of payment should enable maintenance of a social life.
PARTNERSHIP WITH CRÉSUS
In 2010, Franfinance and CGI signed a partnership agreement with CRESUS, a network of associations founded in 1992 that assists individuals with excessive or poorly structured debt. Today, the Group’s two French subsidiaries specialising in consumer loans recommend that financially vulnerable clients contact their local CRESUS association. A charter, signed by the association and the voluntary client, leads to the implementation of a budget and a social evaluation followed by a special support to strengthen his financial balance.
SOCIETE GENERALE GROUP I 2014 REGISTRATION DOCUMENT I 225
RESPONSIBLE FINANCE I CORPORATE SOCIAL RESPONSIBILITY I 5
FINANCIAL EDUCATIONAware that the intelligent use of bank products and services requires a financial “education” and access to clear information on these products and services, Societe Generale’s network looks to develop the tools that can be used to improve the financial awareness of customers.
In France, Societe Generale and CRESUS worked together in 2013 on an experimental four-month pilot budget education program conducted as part of a skills sponsorship initiative. This Financial Education project was intended to make young people more aware of the issues of good budget management and included joint voluntary involvement in Apprentice Training Centres (CFA – Centres de Formation d’Apprenti(e)s) of four regions of France that accepted the proposal from Societe Generale and CRESUS. In this initial experimental phase, the high demand from the field reflecting the real interest in such cooperation made it possible to reach 85 classes in 14 schools, train 1,500 young apprentices ages 16 to 25 and mobilise, alongside 11 CRESUS members, 70 Societe Generale employees (of the 100 volunteers) around a unifying project.
Societe Generale has launched abcbanque.fr, a fun and educational website designed to teach children between the ages of 6 and 10 more about money: the basics, what is it for, how is it made, etc. The website also has an online dictionary containing simple and clear definitions to money-related terms: what is an overdraft, what are shares, how do loans work, etc.
In Morocco, SGMA participated in a global banking access and financial education programme: banking institutions made a concerted effort to initiate various actions to familiarise an uninformed public – including young people – with some basic financial concepts. This initiative included visits by college and high school students organised within bank branches and a training tour of high schools, in all regions of Morocco. For its part, SGMA organised visits in 40 branches for 4,000 junior high school students and provided training to 2,000 high school students in various Moroccan cities.
The Group’s subsidiaries specialising in consumer credit undertook other initiatives intended to enhance the financial understanding of their customers and improve the transparency behind the services and information provided, such as in Poland, Brazil, Russia, as well as at CGI and Franfinance.
MEDIATIONIn France, Societe Generale Group is committed to finding a rapid if not immediate solution to complaints or problems linked to its Retail Banking network as soon as a branch is duly informed by its customer. However, should the bank and its customer disagree on the action to be taken, customers may file a complaint with the Societe Generale Customer Relations Department and, where applicable (i.e. if the dispute is still not resolved), request the intervention of the ombudsman whose services are entirely free of charge. Exceptional circumstances aside, customers are systematically sent a reply from Societe Generale within 10 days or from the ombudsman within two months.
The free and amicable ombudsman services to which Societe Generale customers have had access since 1996, and which were institutionalised by the legislator in 2002, are broadly publicised by the bank to clients and are even outlined in the permanent insert on the back of account statements.
The bank has undertaken to comply in full with all decisions taken by independent ombudsman, Ms Christiane Scrivener who also acts as ombudsman for the Crédit du Nord Group.
The number of cases that were the subject of a mediation increased by 47% compared with 2012. This development results from two factors in addition to the increase in written claims: i) more information about the principle of mediation, ii) systematic addition in letters from Customer Relations, when they are partially or totally unfavourable to the customer, of the possible recourse to mediation. Disputes linked to loans represent 25% of claims presented to medication, while those related to financial investments increased to 23%.
Customers of Societe Generale’s other business divisions in France may also request the intervention of Group ombudsman, Ms Scrivener, or other public ombudsmen (AMF, FFSA, etc.). For its subsidiaries overseas, customers have recourse to a local ombudsmen appointed by the bank (where required by local legislation) or to a local ombudsman appointed by a professional body.
The ombudsman’s report to Societe Generale is available on the Group’s website for individual customers.
226 I 2014 REGISTRATION DOCUMENT I SOCIETE GENERALE GROUP
5 I CORPORATE SOCIAL RESPONSIBILITY I SERVICES PRODUCTS AND FINANCING SECURED ENVIRONMENTAL
2 . S O L I D A R I T Y A N D E N V I R O N M E N TA L P R O D U C T S , S E R V I C E S A N D F I N A N C I N G
MICROFINANCE
Beyond its impact in terms of jobs and regional development, Societe Generale has spent several years developing tools and products that contribute to the social cohesion of the communities and regions in which it is present with more than EUR 80 million in microfinance credit lines.
Abroad
REFINANCING OF MICROFINANCE FINANCIAL INSTITUTIONSCommitted to professional integration and providing entrepreneurs and start-ups with all the support they need, the Group’s overseas networks make it one of French leaders in microfinance and a contributor to development in the countries where it is established.
Societe Generale has chosen to focus its microfinance activities in those countries in which it provides universal banking products and services. Its strategy is implemented via its overseas network of subsidiaries, which provide funding to different microfinance institutions (MFIs) of the countries in which they are located, primarily through refinancing, but also through minority investments in their share capital. The Group’s solutions give MFIs the crucial access they need to local credit facilities in their own currencies, which protects them against exchange rate risks.
The MFIs supported by Societe Generale are able to offer communities that are unable to open a bank account access to credit and, in doing so, feed their local economies. At the end of 2013, 24 MFIs benefited from refinancing lines, mainly in the local currency, totalling more than EUR 75 million in valid authorisations, primarily on the African continent: Sub-Saharan Africa (Benin, Cameroon, Ghana, Guinea, Madagascar, Senegal and Chad), Middle East, North Africa (MENA) (Morocco, Tunisia, Jordan and Lebanon) but also in Eastern Europe (Albania, Georgia, Moldova and Serbia) and Asia (India).
ACQUISITION OF EQUITY HOLDINGS IN MICROFINANCE INSTITUTIONSThrough its subsidiaries in Africa, Societe Generale also holds a stake in five MFIs through active minority interests, seeking commercial synergies. These investments are made with internationally recognised microfinance groups (Advans Cameroun, Advans Ghana, Advans Côte d’Ivoire, AccesBanque Madagascar, ACEP Burkina).
Societe Generale is one of the founding shareholders of the microfinance holding company MicroCred, created by the NGO PlanetFinance in 2005. The initial investment was EUR 3 million for a 7.5% share in the holding company. In mid-2013, the MicroCred group was made up of seven operational subsidiaries in Africa and China, serving nearly 210,000 customers.
In 2013, the Group continued to expand its microfinance activities in three countries:
n in Serbia, SGS teamed up with the NGO Agroinvest (created by Vision International) in March to engage in rural microcredit operations. More than 2,000 applications have been processed to date;
n in Moldova, Mobiasbanca has put a direct microcredit initiative in place for rural areas through the bank’s sales agents who spend part of their time in the field (“Simplu Finance”). It has granted approximately EUR 1.1 million for 1,400 credit applications.
MICRO-INSURANCE IN MOROCCOA partnership between La Marocaine Vie and the INMAA was established in 2010. This partnership led to the launch of ADE (Assurance Des Emprunteurs), a micro-insurance policy that covers the repayment of a loan in the event of the death or permanent disability of the policyholder.
As at the end of December 2013, approximately 9,300 members have enrolled.
In France
ADIE (FRENCH ASSOCIATION FOR THE RIGHT TO ECONOMIC INITIATIVE)Societe Generale has been an active supporter of Adie since 2006, providing refinancing lines for its microfinance activity in mainland France and the overseas departments and contributing to the financing of its accompanying actions.
In 2013, the credit line amounted to EUR 4.5 million for mainland France (up EUR 1 million on 2012), including a EUR 2 million line for professional loans and a EUR 2 million line for personal loans, supplemented by a EUR 0.4 million credit line granted by the Banque de Polynésie for Polynesia.
For 2014, the refinancing line granted to Adie for personal and professional micro-loans in mainland France has been increased to EUR 5.2 million.
All in all, since 2006, the Group has refinanced 6,837 micro-loans for a total of EUR 20 million with an average granted loan amount of EUR 2,920.
In 2013, Adie also received an operating grant of EUR 125,000, supplemented by EUR 12,000 for its “Microcredit Week”, which Societe Generale has partnered for several years now. In 2014, the bank supplements this envelop with EUR 13,000.
SOCIETE GENERALE GROUP I 2014 REGISTRATION DOCUMENT I 227
SERVICES PRODUCTS AND FINANCING SECURED ENVIRONMENTAL I CORPORATE SOCIAL RESPONSIBILITY I 5
PERSONAL MICROCREDITSince 2010, Societe Generale in mainland France introduced a micro-loans offer in partnership with two French associations, Restaurants du Cœur and CRESUS.
SOLIDARITY PRODUCTS AND SERVICES IN FRENCH RETAIL BANKING
As one of the first banks to develop a range of solidarity products, Societe Generale’s aim is to encourage dialogue, forge closer links between its customers and social entrepreneurs, and enable its customers to support their chosen charities and association. In 2013, the bank continued to increase the number of its partner associations and enhance its range of products and services. Its solidarity banking offer is now open to all customers, enabling individuals, professionals and corporates to make contributions to a number of general and public interest associations.
In 2013, three Group products, “Services d’épargne solidaire” (solidarity savings services), “Cartes Collection caritatives” (charity bank card collection) and “Programme de fidélisation Filigrane” (Filigrane loyalty programme), allowed more than EUR 1.4 million in such contributions to be made (70% by Societe Generale, 30% by customers), up 9% on 2012. These contributions went to 48 different partner associations.
Solidarity savings serviceThe solidarity savings service allows customers to contribute all or part (25, 50, 75, or 100%) of the interest on their savings passbooks (Livret A, Livret Développement Durable, Livret Jeune, CSL, Livret Épargne Plus, Livret BFM Avenir) to one or more charities or foundations supporting a humanitarian or social cause and acting for health and the environment. In 2013, EUR 311,297 in interest was contributed, including matching contributions from Societe Generale, broken down as follows:
n EUR 272,690 in customer donations (including EUR 47,723 from customers of BFM - Banque Fédérale Mutualiste);
n EUR 27,269 in employer matching contributions (including EUR 4,773 in BFM matching contributions);
n EUR 11,336 in Societe Generale donations as part of the Solidarity CRCM (Centre de Relation Clientèle Multimedia - multimedia customer relations center) operation.
Charity cardsFor each payment made with one of these cards, Societe Generale pays 5 euro cents to the charity concerned.
Since the launch of these cards in May 2008, EUR 2,516,996 has been contributed to partner charities, including EUR 739,302 in 2013.
What’s new in 2013:
n new Charity Collection card in 2013 with La Chaîne de l’Espoir, which helps to improve living conditions for thousands of children in developing countries, allowing them access to health care and education;
n launched in June 2012 with Initiative France, the Collection of Business Entrepreneurs cards added the Moovjee card in 2013. This card was recognised for its support for young creators with the 2013 Publi-News Innovative Card Award in the “affinity card” category. The bank also shows its support through joint actions involving the expertise of its employees demonstrating its desire to work closely with those who undertake initiatives.
Filigrane programmeFiligrane, associated with the JAZZ offer, raised nearly EUR 442,610 in 2013 for Restaurants du Cœur and Handicap International.
Under the regulations governing sales with premiums, Societe Generale donates a financial contribution of EUR 0.25 on each gift in equal parts to Restaurants du Cœur and Handicap International. This action raised nearly EUR 180,370 for these two charities in 2013.
Members of this loyalty programme can also convert their loyalty points into donations to Restaurants du Cœur or Handicap International, while Societe Generale matches 40% of point donations made by customers. In 2013, overall contribution to the charities amounted to EUR 262,240.
SPEAR partnershipA partnership agreement with SPEAR (society for actively responsible savings, certified by Finansol) was signed in June 2012. SPEAR is a cooperative that allows companies or charities wishing to carry out a solidarity project to obtain a bank loan thanks to savers who want to give meaning to their savings. Its activity is based on the search for projects responding to social, environmental and cultural issues in order to allow them to secure attractive financing by raising the necessary capital from individuals who wish to see their money put to good use.
Through its online platform (http://www.spear.fr/) dedicated to bringing savers together around responsible projects, SPEAR is an easy-access tool providing a powerful solution for solidarity savings and ethical investment. Through this platform, Societe Generale’s customers funded a first project in 2013 for EUR 250,000 and enabled its clients to ensure knowledge as to the use of their savings.
228 I 2014 REGISTRATION DOCUMENT I SOCIETE GENERALE GROUP
5 I CORPORATE SOCIAL RESPONSIBILITY I SERVICES PRODUCTS AND FINANCING SECURED ENVIRONMENTAL
SOLIDARITY PRODUCTS AND SERVICES IN INTERNATIONAL RETAIL BANKING AND FINANCIAL SERVICES
Outside of mainland France, Societe Generale’s retail branches offer their customers products and services that meet the highest international standards and that are adapted to suit their needs.
In seeking out new customers, they contribute to the number of banking products and services available to and used by local communities in countries where the level of “financial inclusion” is still relatively low. The innovative products and services they frequently launch on their domestic markets also make them a source of positive competition for clients.
Societe Generale’s International Retail Banking division constantly seeks to enhance the specific expertise needed in financing small and micro-businesses, which are often vital to the economic and social development of their countries but which, up until now, have had very little access to banking services. (See “Financial inclusion” paragraph, p. 231).
Products and services for migrant customers
YOUR BANK: HERE & THEREIntroduced in 2007, Societe Generale’s “Your Bank: Here & There” service is designed for foreigners or French citizens of foreign origin living in France who still have very close links with their native country, a group estimated to include five million people in France.
The principle behind the offer is that customers benefit from the banking products and services of two entities, one “here” and the other “there”.
“Here”, for the day-to-day needs of customers in France (current account, bank card for payments or withdrawals, remote banking services (voice or internet), bank details for direct debits, etc.).
And “there”, for any products or services needed in their country of origin, since most customers still have very strong links (money transfers, access to banking services, real estate loans and body repatriation).
The concept was developed thanks to the Societe Generale Group’s presence in countries where migratory flows to France are significant. It benefits from the synergy between the France Networks and the International Networks.
Charity cards in MoroccoModelled after the cards offered in France, SGMA gives its customers the opportunity to sign up for an SOS Villages d’Enfants (SOS Children’s Villages) Electron card for an annual fee of MAD 130, approximately EUR 11.5 (MAD 60 of which is contributed to the charity). To date, the programme has seen:
n enrolment of 2,000 cardholders, gradually growing in number;
n tuition for 50 children covered thanks to SOS card contributions;
n the remarkable work done by SOS Villages d’Enfants charity founded by Mr Gad El Maleh;
n increasingly strong, promising relations with SOS Villages d’Enfants.
POSITIVE IMPACT FINANCE
Through the Positive Impact Finance project, Societe Generale wishes to promote the financing of investments or programmes that have a demonstrated positive impact(1) on the needs of the population, the environment or the economic development of the poorest countries while ensuring a suited management (complying to international standards) of issues related to biodiversity and displacement of population, linked to the development of the project.
In 2013, as in 2012, Societe Generale’s Corporate and Investment Banking division approved EUR 619 million in new positive impact financing transactions.
Societe Generale put several internal and external initiatives in place to share the developed tools and thus promote and expand positive impact financing.
Examples of positive impact financing:
n PPP financing for five secondary schools in the Loiret region (France) with DV Construction (Bouygues Group). This project covers the design, construction and maintenance of five secondary schools, for accommodating more than 3,000 students. In addition, the consortium has made energy performance commitments targeting a consumption level 30% lower than the regulatory requirements of the RT2012 (thermal regulatory requirement for buildings applicable in France);
n during 2013, Societe Generale continued to fund the construction of the Chaglla hydroelectric dam in Peru. This dam, located in the Huanacco region, will provide electricity to 4 million people, thus representing a significant renewable energy resource, essential to the country’s economic development.
(1) The Environmental and Social management of these projects aims to demonstrate existing positive impact and to verify that appropriate corrective measures are put in place for potential negative impacts.
SOCIETE GENERALE GROUP I 2014 REGISTRATION DOCUMENT I 229
SERVICES PRODUCTS AND FINANCING SECURED ENVIRONMENTAL I CORPORATE SOCIAL RESPONSIBILITY I 5
SOLIDARITY INSURANCE IN FRANCE
Sogecap France’s “Hard Blow” affinity insuranceSogecap, the Group’s insurance subsidiary, offers various operators (particularly players on the automobile market, real estate, water, energy) a white-label affinity insurance product that they can associate with an asset during a credit or cash sale, guaranteeing lump-sum monthly compensation to customers/insured persons in the event of a personal setback (loss of employment or work stoppage).
This product capitalises on the business line’s know-how regarding income maintenance product.
In France, this product has already attracted two recognised real estate developers as well as a major brokerage player and offers a new area for development of insurance activities in France and internationally.
Sogecap and its offer as regards dependenceTo meet the customer expectations regarding dependency, Societe Generale now offers a new life insurance annuity solution, the Annuity with Dependency Cover.
Sogecap and support for public healthSince 2012, Sogecap France has sold supplementary health products for self-employed professionals (TNS-Travailleurs Non Salariés) and individual customers through the Societe Generale network.
This “solidarity and responsibility” product gives customers access to a wide range of cover and services (assistance in case of hospitalisation, medical advice, etc).
Sogecap and its retirement offerTo address the concerns of its customers, Societe Generale is taking an innovative new approach to retirement. This innovative, reassuring approach, based on a personalised estimated retirement budget constructed with the customer, stands out from traditional retirement approaches that are based on replacement rate (difference between the retirement benefit amount and the last income level) without taking the changing needs associated with this new stage of life into account.
ENVIRONMENTAL BANKING AND GREEN FINANCING
Responsible use of automobile fleets
ALD INTERNATIONAL’S PRODUCTS AND SERVICES
ALD AUTOMOTIVE ENRICHES ITS ALD PRODUCTS AND SERVICES NEWMOBILITY, A LABEL REFLECTING THE MOBILITY OF TOMORROW
ALD Automotive, the Group’s vehicle leasing subsidiary, is a leader in mobility solutions and has always placed ecological mobility at the heart of its development policy. In 2012, ALD Automotive launched the “ALD newmobility” programme to offer current solutions adapted to meet the mobility needs of tomorrow. As part of this programme, ALD Automotive relies on its “mobility laboratories” in Western and Northern Europe to roll out concrete, innovative actions to meet its customers’ new mobility expectations by developing company car-sharing (ALD sharing), flexibility (ALD switch), and multi-mode (ALD Railease, ALD companybike, etc.) solutions.
ALD AUTOMOTIVE CONTINUES TO DEVELOP ALD BLUEFLEET PRODUCTS AND SERVICES
As an international player in individual mobility, ALD Automotive promotes a responsible, professional approach to everyday reduction of the CO2 emissions and fuel consumption of its fleets.
ALD bluefleet offers a range of international actions associated with practical, effective local products and services adapted to each country.
ALD AUTOMOTIVE’S EXTERNAL AND INTERNAL INCENTIVESALD Automotive remains as committed as ever to the initiatives it has launched in previous years such as the MPG Marathon in England and the ALD Fuel Race in Sweden. These “fuel races” are designed to show people how the way they drive can affect how much fuel they use.
In 2013, ALD Automotive UK put the Ecoreward incentive in place to reduce the fuel consumption of vehicles and promote the replacement of these vehicles with low CO2 emission models.
In Belgium and the Netherlands, ALD Automotive and Mobispot have joined forces to offer a novel solution to the growing issue of mobility by making work spaces available to mobile workers, providing all of the benefits of telework. Since its launch in March 2013, more than 140 users have subscribed to ALD Automotive Belgium’s Mobispot, attracting a new customer base in the process.
ALD AUTOMOTIVE PIONEERING IN ELECTRIC (OR HYBRID) MOBILITYAs at the end of 2013, ALD Automotive maintains a fleet of nearly 4,000 electric vehicles, undoubtedly the world’s largest fleet. With the addition of hybrid vehicles, the fleet of new-technology vehicles managed by ALD Automotive climbs to more than 12,600 new-technology vehicles, or a 70% increase over one year (twice the number in one year and 10 times in three years).
In addition, several subsidiaries offer services to assist companies in bringing electric vehicles into their fleets. For example, showrooms have been put in place in both France and Belgium.
230 I 2014 REGISTRATION DOCUMENT I SOCIETE GENERALE GROUP
5 I CORPORATE SOCIAL RESPONSIBILITY I SERVICES PRODUCTS AND FINANCING SECURED ENVIRONMENTAL
The ALD electric showroom features the latest electric and hybrid vehicles available and the different charging methods. In France, ALD Automotive also works with ALD experienZE to introduce next-generation vehicles by organising on-site tests for companies. This benefits not only fleet managers but also drivers. In the Netherlands, ALD eDrive allows a customer to try out an electric vehicle for 10 days.
Green products and loans in France
SUSTAINABLE DEVELOPMENT PASSBOOKS (LDD)The cap on the LDD (Livret Développement Durable which replaced the CODEVI) has increased from EUR 6,000 to EUR 12,000 since October 2012.
The interest rate since August 2013 is 1.25% net per year. Savings placed in an LDD are partly used by the CDC to grant financing to SMEs and to fund “sustainable development” projects, such as energy isolation and protection of the environment.
ECO-PTZ AND OTHER LOANS GENERATING ENERGY SAVINGSIn France, following the adoption of the interest-free Eco-loan (Eco-PTZ) under the 2009 Finance Law, Societe Generale introduced this loan allowing individual customers to borrow up to EUR 30,000 over a period of 10 years to finance work to allow for energy savings in their homes (primary residence or rental residence of the borrower). In 2013, 1,391 interest-free eco-loans were granted for an amount equivalent to EUR 24.50 million, i.e. 12,987 loans totalling EUR 221.83 million granted since the programme began.
In addition, Societe Generale offers two types of loans depending on the amount of the funded works: the “Prêt Expresso Développement Durable” and the “Prêt Développement Durable”. They are used to fund equipment and work generating energy savings in homes completed more than two years ago.
In 2013, 997 sustainable development loans were granted for EUR 12.64 million, i.e., since 2007, 11,387 loans granted for a total amount of EUR 141.47 million.
PARTNERSHIP WITH CHÈQUES TRAVAUX: ENCOURAGING CUSTOMERS TO INVEST IN THE ENERGY RENOVATION OF THEIR HOMESIn 2012, a Regional Division of Societe Generale in France was chosen to test a system with the company Chèques Travaux.
Energy savings certificates (cheques) can be used to cover part of the cost of eligible energy saving works (insulation, boiler, etc.). For more information and to estimate the amount of your premium, please visit chequestravaux.com. The application fee (EUR 30) will be waived for Societe Generale customers. In 2013, the partnership with Chèques Travaux was extended to all of France.
LOANS TO PURCHASE ELECTRIC OR HYBRID VEHICLESEstablished in September 2012, “Clean Vehicles” preferential rates are reserved for our customers who wish to finance the purchase of a new or used electric or hybrid vehicle with an Expresso loan.
In 2013, 1,340 Expresso loans totalling EUR 18.35 million were granted, bringing the total to 1,623 “Clean Vehicles” Expresso loans amounting to EUR 22.67 million since these special rates were put in place.
At the same time, our customers can receive a 5% discount on their motor insurance premium (for vehicles emitting less than 120 g of CO2/km) for the entire duration of their contract, regardless of the chosen package.
ENVIRONMENT BUSINESS CARD WITH THE ONFAt the end of 2013, Societe Generale and the French National Forestry Bureau (ONF) decided to continue their partnership launched in 2010 by renewing the sponsorship agreement uniting them around reforestation and accessibility projects. Through its Environment business card dedicated to corporate customers, the bank is reiterating its commitment until 2016 by contributing 5 euro cents for each payment made with the card.
Two new reforestation projects, scheduled for late 2013 and early 2014 in Northern region in the Raisme-Saint-Amandè-Wallers state forest and in Aude region in the Fourtou state forest, will be funding using contributions made in 2013.
This commitment also allows it to support the accessibility to natural environments for people with disabilities thanks to two dedicated path funding projects in Pyrénées Orientales in 2014.
Contributions to the ONF between 1 October 2012 and 30 September 2013 amounted to EUR 63,584.
Green finance and servicesIn 2013, the Group’s “green financing” in public/private sector amounted to EUR 627 million.
As for “green financing” in favour of individual customers, it amounts to EUR 247 million (EUR 101 million for the purchase of green vehicles in Brazil Banco Cacique, EUR 18.35 million for clean vehicles in France and Euro 6 million in Germany, EUR 24.5 million EcoPTZ and EUR 97 million for energy improvement projects through Franfinance.
For Societe Generale, green finance refers to the financing of wind farms, solar panel power production facilities, hydraulic energy production facilities, production of energy from other renewable energies, waste recovery projects, “polluting” emission reduction projects, mass transit projects, vehicles running on NGV (natural gas for vehicles) or recycled gas and hybrid or electric vehicles, alternative fuel production plants, etc.
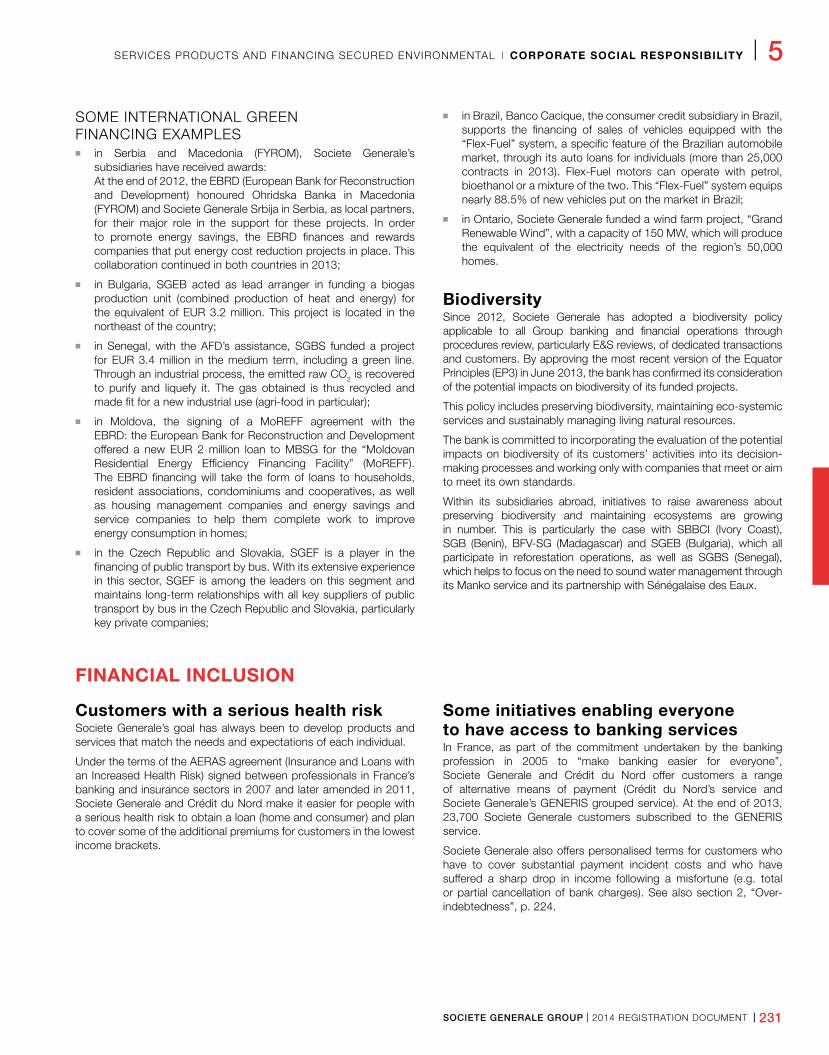
SOCIETE GENERALE GROUP I 2014 REGISTRATION DOCUMENT I 231
SERVICES PRODUCTS AND FINANCING SECURED ENVIRONMENTAL I CORPORATE SOCIAL RESPONSIBILITY I 5
SOME INTERNATIONAL GREEN FINANCING EXAMPLES
n in Serbia and Macedonia (FYROM), Societe Generale’s subsidiaries have received awards: At the end of 2012, the EBRD (European Bank for Reconstruction and Development) honoured Ohridska Banka in Macedonia (FYROM) and Societe Generale Srbija in Serbia, as local partners, for their major role in the support for these projects. In order to promote energy savings, the EBRD finances and rewards companies that put energy cost reduction projects in place. This collaboration continued in both countries in 2013;
n in Bulgaria, SGEB acted as lead arranger in funding a biogas production unit (combined production of heat and energy) for the equivalent of EUR 3.2 million. This project is located in the northeast of the country;
n in Senegal, with the AFD’s assistance, SGBS funded a project for EUR 3.4 million in the medium term, including a green line. Through an industrial process, the emitted raw CO2 is recovered to purify and liquefy it. The gas obtained is thus recycled and made fit for a new industrial use (agri-food in particular);
n in Moldova, the signing of a MoREFF agreement with the EBRD: the European Bank for Reconstruction and Development offered a new EUR 2 million loan to MBSG for the “Moldovan Residential Energy Efficiency Financing Facility” (MoREFF). The EBRD financing will take the form of loans to households, resident associations, condominiums and cooperatives, as well as housing management companies and energy savings and service companies to help them complete work to improve energy consumption in homes;
n in the Czech Republic and Slovakia, SGEF is a player in the financing of public transport by bus. With its extensive experience in this sector, SGEF is among the leaders on this segment and maintains long-term relationships with all key suppliers of public transport by bus in the Czech Republic and Slovakia, particularly key private companies;
n in Brazil, Banco Cacique, the consumer credit subsidiary in Brazil, supports the financing of sales of vehicles equipped with the “Flex-Fuel” system, a specific feature of the Brazilian automobile market, through its auto loans for individuals (more than 25,000 contracts in 2013). Flex-Fuel motors can operate with petrol, bioethanol or a mixture of the two. This “Flex-Fuel” system equips nearly 88.5% of new vehicles put on the market in Brazil;
n in Ontario, Societe Generale funded a wind farm project, “Grand Renewable Wind”, with a capacity of 150 MW, which will produce the equivalent of the electricity needs of the region’s 50,000 homes.
BiodiversitySince 2012, Societe Generale has adopted a biodiversity policy applicable to all Group banking and financial operations through procedures review, particularly E&S reviews, of dedicated transactions and customers. By approving the most recent version of the Equator Principles (EP3) in June 2013, the bank has confirmed its consideration of the potential impacts on biodiversity of its funded projects.
This policy includes preserving biodiversity, maintaining eco-systemic services and sustainably managing living natural resources.
The bank is committed to incorporating the evaluation of the potential impacts on biodiversity of its customers’ activities into its decision-making processes and working only with companies that meet or aim to meet its own standards.
Within its subsidiaries abroad, initiatives to raise awareness about preserving biodiversity and maintaining ecosystems are growing in number. This is particularly the case with SBBCI (Ivory Coast), SGB (Benin), BFV-SG (Madagascar) and SGEB (Bulgaria), which all participate in reforestation operations, as well as SGBS (Senegal), which helps to focus on the need to sound water management through its Manko service and its partnership with Sénégalaise des Eaux.
FINANCIAL INCLUSION
Customers with a serious health riskSociete Generale’s goal has always been to develop products and services that match the needs and expectations of each individual.
Under the terms of the AERAS agreement (Insurance and Loans with an Increased Health Risk) signed between professionals in France’s banking and insurance sectors in 2007 and later amended in 2011, Societe Generale and Crédit du Nord make it easier for people with a serious health risk to obtain a loan (home and consumer) and plan to cover some of the additional premiums for customers in the lowest income brackets.
Some initiatives enabling everyone to have access to banking servicesIn France, as part of the commitment undertaken by the banking profession in 2005 to “make banking easier for everyone”, Societe Generale and Crédit du Nord offer customers a range of alternative means of payment (Crédit du Nord’s service and Societe Generale’s GENERIS grouped service). At the end of 2013, 23,700 Societe Generale customers subscribed to the GENERIS service.
Societe Generale also offers personalised terms for customers who have to cover substantial payment incident costs and who have suffered a sharp drop in income following a misfortune (e.g. total or partial cancellation of bank charges). See also section 2, “Over-indebtedness”, p. 224.
232 I 2014 REGISTRATION DOCUMENT I SOCIETE GENERALE GROUP
5 I CORPORATE SOCIAL RESPONSIBILITY I SERVICES PRODUCTS AND FINANCING SECURED ENVIRONMENTAL
In Africa, three initiatives were successfully launched in 2013:
n in Senegal, Societe Generale established its Manko service in early 2013, a new banking concept fully accessible by mobile phone, in partnership with SGBS. Manko, a wholly owned subsidiary of Societe Generale, offers a unique range of banking products and services tailored to populations with modest regular incomes but with little or no access to the traditional banking system. Manko relies on the Yoban’tel technology developed by SGBS in 2011. The opening of the first Manko branch has complemented these products and service with encouraging results. Free financial education course have been put in place to help customers in hardship. Looking beyond the experiment with this new model, the plan is to roll out Manko in Senegal and then in other African countries;
n in Cameroon, in order to foster access to banking services for people living in areas where low population density makes the presence of a traditional branch difficult, SGC developed its mobile branch concept in 2013, bringing the bank to its customers on the road. This mobile branch, a vehicle with a completely new look and the latest information and communications technologies, contains tools to allow the customer advisor to perform all banking transactions and provide the same services as a traditional branch;
n in Chad, SGT has developed a voice push SMS solution to inform and alert all of its customers, particularly illiterate people (78% of Chad’s population) by sending voice SMS messages instead of written messages. This innovative project, the result of creative workshops within the bank, permits total accessibility for both illiterate customers and visually impaired customers.
SOCIALLY RESPONSIBLE INVESTMENT (SRI)
SRI researchSociete Generale offers its customers dedicated research on Environmental, Social and Governance (or ESG) issues. Its SRI team is made up of three analysts based in Paris and London and is an integral part of the Corporate and Investment Bank’s financial research department. Societe Generale ranked third in the SRI Research category of the Thomson Extel Survey for the third year running.
Societe Generale’s primary aim is to assist investors and asset manager clients in better integrating ESG criteria in their investment decisions. When it comes to research, the SRI team has three objectives:
n to investigate and develop its own resources and tools;
n to co-produce thematic, sectorial and stock market research;
n and, in the longer term, work with the research teams to offer SGCIB customers specific, tailored advice and assistance with their research and investment projects.
In 2013, in addition to enriching the “SRI: Beyond Integration – Introducing Quantitative ESG ratings” study combining ESG assessments with the financial recommendations of financial analysts with the aim of proposing an integrated, practical view of the entire universe covered by SGCIB, the SRI team drafted and led some ten multi-sectoral studies that were presented to numerous international investors.
As part of its “corporate access” activities, numerous conferences and roadshows for investors and listed companies on the themes of sustainable development and social responsibility were organised in
Paris, London, Brussels, Amsterdam, Geneva, Zurich, Frankfurt, Milan and New York. In December 2013, for the first time, 19 companies presented ESG topics related to their activities to institutional investors at the Premium Review.
Lastly, SRI research is used to underpin several indexes and baskets of listed stocks, via the issue of financial products in the SRI thematic sectors of ESG, renewable energies, CO2 and sustainable development (list of products and methodologies available on www.sgbourse.fr).
Green Bonds for institutional investorsIn November 2013, EDF SA launched a EUR 1,400 million issue of green bonds maturing in April 2021, with Societe Generale acting as a joint bookrunner. EDF has committed to ensure that the proceeds from this bond issue will fund only the new renewable energy projects (off-shore and on-shore wind, solar panels, biogas, ocean energy, etc.) of its subsidiary EDF Energies Nouvelles (100% owned by EDF), according to eligibility criteria confirmed by Vigeo, the French extra-financial rating agency. Project eligibility and fund allocation will audited each year by Deloitte & Associés. EDF is one of the first companies to issue this type of bond. This issue, twice oversubscribed, was placed primarily with socially responsible investors.
In 2012, Societe Generale participated as bookrunner and lead manager responsible for placing the first private sector SRI bond from Air Liquide with investors.
SOCIETE GENERALE GROUP I 2014 REGISTRATION DOCUMENT I 233
SERVICES PRODUCTS AND FINANCING SECURED ENVIRONMENTAL I CORPORATE SOCIAL RESPONSIBILITY I 5
SRI products for individual investors
SRI FUNDSSociete Generale is committed to meeting investor demand for socially responsible investment (SRI) products by offering several types of investments (equities, bonds and money market products), particularly through three investment funds grouping together the most advanced companies based on these three ESG criteria. At the end of 2013, Societe Generale’s SRI assets under management in these three funds totalled EUR 469 million.
SRI LIFE INSURANCETo meet the needs of savers looking to diversify and invest in a socially responsible manner, Sogecap and Oradéa Vie’s investment-backed life insurance policies offer money market, bond or equity SRI vehicles, depending on the investment duration and level of risk desired by the customer.
In 2013, total SRI assets under management on Sogecap and Oradéa Vie policies reached EUR 23.2 million.
SRI CERTIFICATEIn 2013, for Socially Responsible Investment Week, Societe Generale launched the first Certificate 100% on the Euronext Vigeo France 20 index in partnership with NYSE Euronext.
SRI-CERTIFIED SAVINGS FOR SOCIETE GENERALE EMPLOYEESSociete Generale’s employee savings plan offers employees the opportunity to invest in various company mutual funds (FCPE) certified SRI by the CIES (Inter-union Committee on Employee Savings).
As at 31 December 2013, the collection of SRI funds in savings plans (the various Company Savings Plans, Group Savings Plans and Collective Retirement Savings Plans) invested in SRI represented EUR 364 million in assets under management (versus EUR 304 million at the end of 2012), including EUR 3.3 million for Crédit du Nord for an average of approximately 23,500 unitholders (including approximately 1,300 for Crédit du Nord). See section 3 “Employee Savings” p 243.
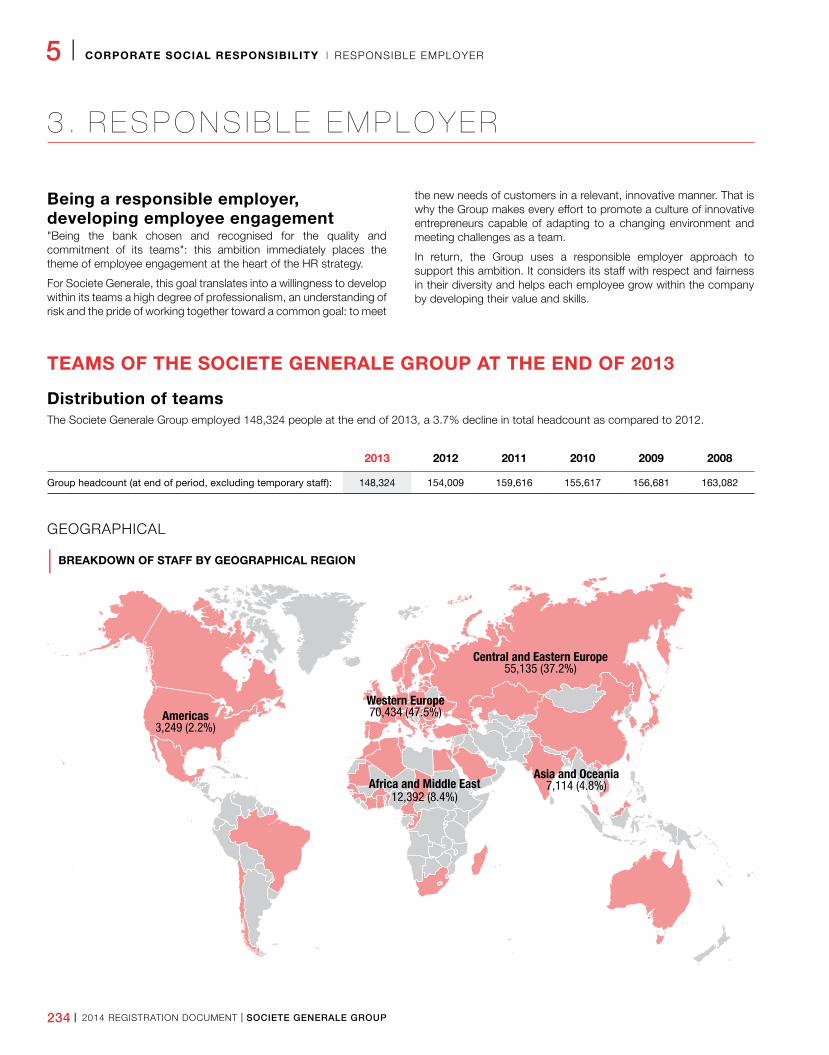
234 I 2014 REGISTRATION DOCUMENT I SOCIETE GENERALE GROUP
5 I CORPORATE SOCIAL RESPONSIBILITY I RESPONSIBLE EMPLOYER
3 . R E S P O N S I B L E E M P L O Y E R
Being a responsible employer, developing employee engagement"Being the bank chosen and recognised for the quality and commitment of its teams": this ambition immediately places the theme of employee engagement at the heart of the HR strategy.
For Societe Generale, this goal translates into a willingness to develop within its teams a high degree of professionalism, an understanding of risk and the pride of working together toward a common goal: to meet
the new needs of customers in a relevant, innovative manner. That is why the Group makes every effort to promote a culture of innovative entrepreneurs capable of adapting to a changing environment and meeting challenges as a team.
In return, the Group uses a responsible employer approach to support this ambition. It considers its staff with respect and fairness in their diversity and helps each employee grow within the company by developing their value and skills.
TEAMS OF THE SOCIETE GENERALE GROUP AT THE END OF 2013
Distribution of teamsThe Societe Generale Group employed 148,324 people at the end of 2013, a 3.7% decline in total headcount as compared to 2012.
2013 2012 2011 2010 2009 2008
Group headcount (at end of period, excluding temporary staff): 148,324 154,009 159,616 155,617 156,681 163,082
GEOGRAPHICAL
| BREAKDOWN OF STAFF BY GEOGRAPHICAL REGION
Americas3,249 (2.2%)
Central and Eastern Europe55,135 (37.2%)
Western Europe70,434 (47.5%)
Asia and Oceania7,114 (4.8%)Africa and Middle East
12,392 (8.4%)
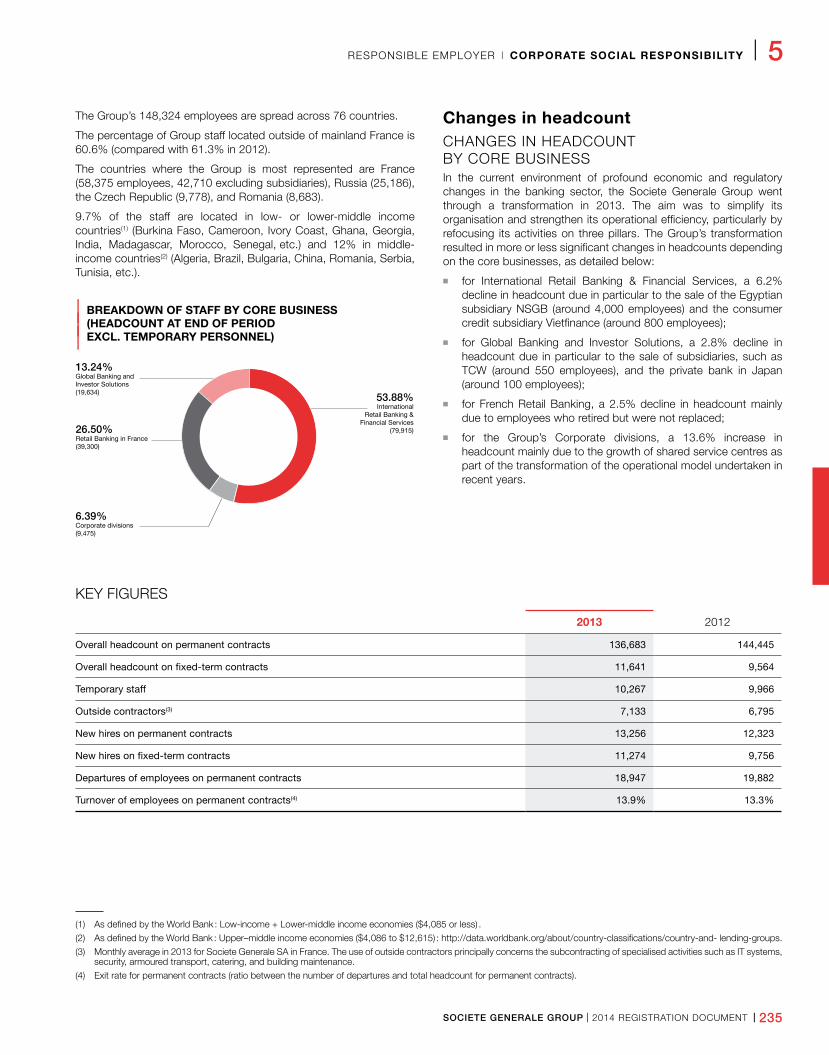
SOCIETE GENERALE GROUP I 2014 REGISTRATION DOCUMENT I 235
RESPONSIBLE EMPLOYER I CORPORATE SOCIAL RESPONSIBILITY I 5
The Group’s 148,324 employees are spread across 76 countries.
The percentage of Group staff located outside of mainland France is 60.6% (compared with 61.3% in 2012).
The countries where the Group is most represented are France (58,375 employees, 42,710 excluding subsidiaries), Russia (25,186), the Czech Republic (9,778), and Romania (8,683).
9.7% of the staff are located in low- or lower-middle income countries(1) (Burkina Faso, Cameroon, Ivory Coast, Ghana, Georgia, India, Madagascar, Morocco, Senegal, etc.) and 12% in middle-income countries(2) (Algeria, Brazil, Bulgaria, China, Romania, Serbia, Tunisia, etc.).
| BREAKDOWN OF STAFF BY CORE BUSINESS
| (HEADCOUNT AT END OF PERIOD
| EXCL. TEMPORARY PERSONNEL)
Changes in headcountCHANGES IN HEADCOUNT BY CORE BUSINESSIn the current environment of profound economic and regulatory changes in the banking sector, the Societe Generale Group went through a transformation in 2013. The aim was to simplify its organisation and strengthen its operational efficiency, particularly by refocusing its activities on three pillars. The Group’s transformation resulted in more or less significant changes in headcounts depending on the core businesses, as detailed below:
n for International Retail Banking & Financial Services, a 6.2% decline in headcount due in particular to the sale of the Egyptian subsidiary NSGB (around 4,000 employees) and the consumer credit subsidiary Vietfinance (around 800 employees);
n for Global Banking and Investor Solutions, a 2.8% decline in headcount due in particular to the sale of subsidiaries, such as TCW (around 550 employees), and the private bank in Japan (around 100 employees);
n for French Retail Banking, a 2.5% decline in headcount mainly due to employees who retired but were not replaced;
n for the Group’s Corporate divisions, a 13.6% increase in headcount mainly due to the growth of shared service centres as part of the transformation of the operational model undertaken in recent years.
KEY FIGURES
2013 2012
Overall headcount on permanent contracts 136,683 144,445
Overall headcount on fixed-term contracts 11,641 9,564
Temporary staff 10,267 9,966
Outside contractors(3) 7,133 6,795
New hires on permanent contracts 13,256 12,323
New hires on fixed-term contracts 11,274 9,756
Departures of employees on permanent contracts 18,947 19,882
Turnover of employees on permanent contracts(4) 13.9% 13.3%
53.88%International
Retail Banking &Financial Services
(79,915)
13.24%Global Banking andInvestor Solutions(19,634)
6.39%Corporate divisions(9,475)
26.50%Retail Banking in France(39,300)
(1) As defined by the World Bank : Low-income + Lower-middle income economies ($4,085 or less) .
(2) As defined by the World Bank : Upper–middle income economies ($4,086 to $12,615) : http://data.worldbank.org/about/country-classifications/country-and- lending-groups.
(3) Monthly average in 2013 for Societe Generale SA in France. The use of outside contractors principally concerns the subcontracting of specialised activities such as IT systems, security, armoured transport, catering, and building maintenance.
(4) Exit rate for permanent contracts (ratio between the number of departures and total headcount for permanent contracts).
236 I 2014 REGISTRATION DOCUMENT I SOCIETE GENERALE GROUP
5 I CORPORATE SOCIAL RESPONSIBILITY I RESPONSIBLE EMPLOYER
DEPARTURES
In 2013, a total of 18,947 staff on permanent contracts left the Group. The main reasons for departure were, in descending order of importance: resignations (12,334), redundancies (3,417), and retirements (2,390).
In France, retirements were up this year, with a total of 1,770 Societe Generale SA and Crédit du Nord staff retiring (as compared to 1,185 in 2012).
SUPPORT FOR EMPLOYEES IN SALES OF SUBSIDIARIES
When subsidiaries were sold during the financial year, the Societe Generale Group supported its former employees to ensure
that the transition took place under the best possible conditions for both them and the customers.
In Egypt, upon the announcement of the QNB Group’s offer to buy NSGB in August 2012, several measures were put in place to inform the subsidiary’s employees, raise their awareness and establish a dialogue with all employees on a regular and transparent basis.
In Greece, after the sale of the subsidiary Geniki(1) in mid-December 2012, and in accordance with the agreement signed with Piraeus Bank, an expatriate senior executive of Societe Generale was maintained at the location throughout the first half of 2013 to facilitate the transition for the buyer and coordinate discussions with employees and their representatives.
DEVELOP THE EMPLOYABILITY AND SKILLS OF EMPLOYEES
Recruitment and integration
RECRUITMENTIn the 2013 financial year, the Group recruited in total:
n 13,256 permanent contracts (up 7.6% as compared to 2012), including nearly 57% women;
n 11,274 fixed-term contracts, including 68.8% women.
Societe Generale SA in France recruited:
n 2,100 permanent contracts (CDI), 47.5% of which are executives;
n 2,118 fixed-term contracts (CDD, including work-study contracts).
These recruitments (CDI and CDD), primarily within the French networks, have helped to balance the age distribution of staff.
The recruitment and talent attraction policy is adapted to the specific characteristics of each core business, activity and region.
Since July 2013, the recruitment site "careers.societegenerale.com" has been completely redesigned and presents a simplified and unified recruitment process for the Group. Users now have increased options to personalise the site in order to tailor it based on their needs and interests. The Careers website also offers better integration of social networks, which have become the preferred channels of dialogue between the company and candidates. It meets the digital accessibility requirements and has been optimised for mobile use.
At the same time, in France, Societe Generale launched the site MyCoachingRoom.com in April 2013. This site is intended to support candidates in all stages of their job search in the banking sector, whether they apply for a position at Societe Generale or elsewhere. Through interviews with experts, fact sheets, and dedicated tools, this interactive website allows candidates to learn about the labour market and optimise their processes. MyCoachingRoom thus illustrates the bank’s commitment as a player in civil society. (see also Initiatives for employment and education, p. 253).
TAILORED INITIATIVES FOR STUDENTS AND RECENT GRADUATESSociete Generale is committed to a proactive approach in terms of professional integration of young people and, in particular, has set a goal to recruit 500 people under age 26 on permanent contracts in France in 2013 (see p. 241 "generations").
In 2013, Societe Generale (including subsidiaries) recruited 3,140 employees on permanent contracts in France, a majority of whom are recent graduates. Societe Generale’s former interns, Volunteers for International Experience (VIE) and work-study participants represent a priority recruiting pool among recent graduates.
The Group is also continuing its dynamic work-study policy developed over several years on apprenticeship and professional training contracts in order to develop the employability of young people. At the end of 2013, more than 1,716 work-study participants and VIEs (Volunteers for International Experience) were stationed within the Group’s French entities (excluding subsidiaries). In the 2013 financial year, 3,773 interns were welcomed in France (including subsidiaries). These training courses, which are mandatory for graduation, allow students to be immersed in the business world, while benefiting from the support and supervision of their training supervisor. Globally, the Group welcomed 11,588 interns in 2013.
With the development and continuity of the Societe Generale Group’s 80 school partnerships across France and Europe (university, engineering or business training), this dynamic strategy has been implemented to attract, convince and recruit students and recent graduates whose academic experience is in line with the Group’s skill requirements. In total, nearly 300 actions were carried out in 2013, including:
n organisation of more than 50 permanent contract recruitment sessions across France for Bac to Bac+2/3 graduates for entry-level positions in retail banking (client services representative and multimedia client advisor);
n promotion of the entry exam to join the Group’s General Inspection Department. The 2013 edition of this entry exam enabled 34 recent graduates of 11 different nationalities to join the Group’s General Inspection Department;
(1) The decrease in headcount resulting from the sale of Geniki was accounted for at the end of the 2012 financial year.

SOCIETE GENERALE GROUP I 2014 REGISTRATION DOCUMENT I 237
RESPONSIBLE EMPLOYER I CORPORATE SOCIAL RESPONSIBILITY I 5
n organisation of a recruitment event dedicated to academic profiles seeking work-study contracts;
n funding of research through academic partnerships. Some examples include sponsorship by Societe Generale of the Organisations, Leadership and Society Chair of ESCP Europe and by SG CIB of the Energy & Finance Chair of HEC;
n participation in recruitment forums, round tables, CV or interview coaching workshops.
Lastly, in 2013, Corporate and Investment Banking launched the "GeneratioNext" programme at the global level for its interns, work-study participants and VIEs. It offers intensive support in terms of both integration and development. If their contract is converted to a permanent contract, beneficiaries of this programme enter the "Junior Programme", which offers recent graduates intensive support during the first two years of their contract.
These initiatives demonstrate the Group’s determination to attract and recruit talented individuals by raising their awareness, from their very first contact with the company, of the challenges and responsibilities of the banking sector and its professional realities. The aim is also to guide students as they formulate their professional goals and give them the keys to understanding their future working environment.
INDUCTION“Starting” is the welcome and induction programme that offers each new employee a consistent introduction to the Societe Generale Group. The 12- to 18-month programme is activated as soon as the new employee arrives to give him or her a better understanding of the Group, its strategy, its core businesses and functions, its values, and the career prospects available to employees, through specific support and dedicated tools (e-learning, intranet, etc.).
Training and skills development
TRAINING WITHIN THE GROUPSociete Generale invests significantly in training to enable its employees to develop their skills and employability, taking into account the needs of the company, its customers and their future development. To that end, Societe Generale offers business-specific training programmes tailored to each type of position and level of experience, drawing on innovative educational tools, as well as professional development courses (professional promotion courses, managerial training and skills development programmes).
In 2013, 74% of the Group’s employees were able to complete at least one training programme, for a total of 3,273,654 hours, and 242,275 e-learning modules were given out worldwide by the Group’s training teams.
In 2013, the Group’s Training Department made a further commitment to the digital transition of its areas of expertise, with a view to transforming its training base beyond the now traditional channels of in-class training and e-learning. As such, Societe Generale tested a Massive Open Online Course (MOOC) on financial analysis for the first time with certain employees. The integration of video conference
and Web conference modules (conferences with sharing of secure documents via Internet) into certain training sessions is also in the experimentation process. Moreover, emphasis was placed on two priority training themes disseminated abroad: risk culture and managerial development (see p. 239).
In France specifically, certain training sessions are real tools for internal promotion. This is the case for "Cursus Cadre" and the "Passerell’E" programme:
n the “Cursus Cadre”, a 18-month training programme, which enables high-potential employees to obtain “cadre” (executive) status, thereby preparing them for greater responsibility and, in some cases, team leadership;
n Passerell’E, a 10-month qualifying course, designed to help employees with their skills development in order to achieve France’s banking classification Level E.
These two programmes are an effective vector for employee development: in 2013, a total of 456 employees of Societe Generale SA in France completed the Cursus Cadre and Passerell’E.
DEVELOPMENT AND PROFESSIONAL TRAINING OF FUNCTIONSDevelopment and professional training programmes for the functions experienced a real surge in 2013. Designed to strengthen skills and knowledge, they help to align practices worldwide.
Are in place:
n the HR Academy, which offers a dedicated programme for “HR Business Partners” (HRD, HR managers and administrators);
n the Group Internal Audit Division’s academy, which offers training courses for auditors from the entire Group;
n the Private Banking Academy which relies on internal Private Banking experts to propose thirty-four training modules adapted to the local specific characteristics of each entity.
A Risk Academy will be launched in 2014. Its objective is to offer all Group employees a foundation of harmonised knowledge on the various types of risks to which the Group is or may be exposed, as well as on the reinforcement of their prevention and control. The Risk Academy will also contribute to the further development of the Culture Risk, continuing on from the actions conducted since 2011, as part of the “Enterprise Risk Management” programme.
SCHOOL BRANCHESWithin the retail banking networks, in addition to theoretical knowledge, the training teams use dedicated educational tools to facilitate the preparation of learners to take on positions.
School branches have been created in certain retail banking subsidiaries abroad. They allow learners to be placed in customer relations scenarios in a near-real work environment. The first school branch was created in 1975 in Morocco. To date, International Retail Banking has around thirty school branches, located in Eastern Europe, the Mediterranean Basin, Africa and Asia.
238 I 2014 REGISTRATION DOCUMENT I SOCIETE GENERALE GROUP
5 I CORPORATE SOCIAL RESPONSIBILITY I RESPONSIBLE EMPLOYER
In France, Retail Banking has also established training courses for branch salesperson profiles: “FAC” (Favouring Acquisition of Competence). One month after taking their position, new joiners can acquire all of the knowledge necessary for their duties by being placed in scenarios on concrete cases, covering both behavioural and technical aspects, as well as knowledge of the core businesses and the risks associated with them. The first FAC was created in 2009 for Reception Officers; today, there are five, covering all branch salesperson professions.
COACHING AND OTHER SUPPORTSociete Generale also puts in place additional support and development approaches, particularly through a structured coaching approach within the company. Coaching actions are guided by a team of internal coaches, supported by an international community of employees trained in the coaching techniques; they also occasionally call on selected external coaches. Within the Group, coaching is governed by a specific ethical charter that guarantees the confidentiality of exchanges and lays the foundations of confidence between the employee and the voluntarily chosen coach. The coaching programme includes individual and team coaching actions and potentially co-development, mentoring and change management actions.
Job evolution and mobilityThe Societe Generale Group’s goal is to develop an active mobility policy in order to promote the ongoing adaptation of employee skills to the rapid changes in the economic, regulatory or technological environment.
AGREEMENT ON THE EVOLUTION OF PROFESSIONS, SKILLS AND EMPLOYMENTFor Societe Generale SA in France, an “agreement on the evolution of professions, skills and employment” was signed in February 2013 with all Union Organisations. This agreement legitimised the establishment of an ongoing social dialogue about the prospects for evolution and development of professions as well as the major trends that could arise in employment. It reflects a forward-looking approach, materialised by:
n the affirmation of mobility as a central point of the adaptability of employees;
n strategic workfoce planning structured around the development of job mobility pathways (see below);
n integration of the intergenerational contract (see p. 241 "generations").
This agreement also provided a framework and set for three years the social support measures relating to the Group’s adaptation projects to avoid any forced redundancies in case of job eliminations for economic reasons:
n as a priority, a reinforced internal mobility plan with the creation of a dedicated team, the "Campus Métiers Mobilité" (Job Mobility Campus), and increased training efforts to facilitate internal transfers;
n where appropriate, different terms of departure from the company, particularly arrangements for employees who have external development, business start-up or professional training (payment of dedicated aid) projects or business transaction measures.
STRATEGIC WORKFORCE PLANNINGThe agreement signed in February 2013 put in place the initial foundation of the strategic workfoce planning for Societe Generale, with the qualification of all functions and studies about possible job mobility pathways between the different core businesses.
A job trends observatory was put in place. This joint forum for exchange and discussion about changes in the main professions and skills within the company relies on the work carried out by the Branch Profession Observatory (AFB) and by Societe Generale’s functions, core businesses and corporate divisions. It allows the bank to discuss these topics with the Union Organisations.
In order for these various initiatives to be shared with the employees, a new intranet site "Métiers" (jobs) was launched in September 2013. This site gives employees the means to compare their motivations and ambitions with the job evolutions in the banking sector.
MOBILITYWith the agreement on employment signed in February, internal mobility has more than ever been placed at the heart of the Group’s HR policy.
In France (excluding Retail Banking), internal mobility is now steered by the “Campus Métiers Mobilité” (Job Mobility Campus). This new centre of expertise is a platform that centralises the positions to be filled for the core businesses and corporate divisions. It offers employees greater visibility on internal opportunities and gives them priority for filling positions. Since its creation at the end of February 2013, nearly 2,000 employees were moved internally thanks to the Campus; one third of these moves were from one core business to another.
The Group also opens up opportunities for cross-border mobility. The objective of international mobility is to support Societe Generale’s international development strategy and promote the company’s intercultural dimension. Thus, at the end of 2013, the Group had approximately 1,000 expatriates (all origin and destination countries combined), including 60% within Global Banking and Investor Solutions (London, New York, Singapore, Hong Kong, etc.), 30% within International Retail Banking & Financial Services (mainly on the African continent and in Eastern Europe) and 10% in the Corporate Divisions.
Performance management
COMPETENCY REFERENCE STANDARDTo guide the teams and support the company’s transformation, Societe Generale has developed a common vision for the entire Group of the components of performance. As such, the expected behaviours for delivering sustainable results on three key issues – developing the business, preparing the future and working together – are explained to employees and managers.
A common reference standard thus gives each person prospects for progress in his or her current and future position, emphasising the search for behaviours that will create value over the long term. It is at the heart of the various components of the managerial cycle and particularly employee evaluations.
SOCIETE GENERALE GROUP I 2014 REGISTRATION DOCUMENT I 239
RESPONSIBLE EMPLOYER I CORPORATE SOCIAL RESPONSIBILITY I 5
EVALUATION PROCESSESA uniform evaluation process has been rolled out within the Group so that all employees, regardless of their function, core business, geographic region or classification, have an annual evaluation based on the same model, assessing not only the achievement of operational results but also the manner in which these results are obtained. Its purpose is to recognise, using common criteria, each employee’s skills and foster employee development and the emergence of Strategic Talents.
In 2013, a total of nearly 107,000 Group employees had an evaluation interview.
Preparing the next generation of managers
DEVELOPMENT OF MANAGERIAL COMMUNITIESDeveloping and supporting its managers is a major strategic objective for the Societe Generale Group. That is why it is committed to developing the leadership skills of its managers to support the shift from a transactional model to a relationship-based model.
With this in mind, the Group establishes development courses for managers: courses specially dedicated to managers to guide them during their first management experience and courses dedicated to more experienced managers. The modules that make up these courses develop the various components of leadership, from change support to skills assessment as well as people development.
DETECTION AND DEVELOPMENT OF STRATEGIC TALENTSThe aim of the Strategic Talent approach is to detect, develop and build the loyalty of high-potential employees with the objective of identifying and preparing the next generation of managers. A Strategic Talent is defined as an employee who embodies the Group’s values, performs well over the long term, and has strong potential for advancement. With its systematic approach, the Strategic Talent policy identifies individuals around the world on an objective basis, gives them the same chances to bring out their potential and enables them to advance within the Group. This policy was formally defined in 2010 and is now an integral part of the managerial and HR cycle.
The diversity of Strategic Talent profiles reflects the diversity of the Group: today, 39% are women and 45% are international (non-French).
CORPORATE UNIVERSITYThe Corporate University is an internal centre of expertise launched at the end of 2010. Its main purpose is to ensure the managerial development of the bank’s most senior leaders and its Strategic Talents. The programmes it offers focus on the development of behavioural skills in a teaching environment that promotes cooperation and teamwork.
To supplement the Strategic Talent programmes, the Corporate University offering includes programmes for the Group’s most senior managers and its strategic managers, as well as a series of professional development programmes for women, created in 2012 and designed to acknowledge and recognise women with the ambition and potential to advance within the Group.
In total, nearly 3,000 managers and strategic talents have been able to participate in the Corporate University programmes since its creation.
PROMOTING DIVERSITY
Diversity policy
DRIVER FOR ADAPTATION TO CHANGEFor the Societe Generale Group, diversity is reflected first and foremost in its 148,324 employees, working in 76 different countries, with 121 nationalities represented.
Societe Generale believes diversity is a major performance driver. This diversity of backgrounds and sharing of ideas and points of view are what allow the company to adapt and react quickly, by picking up the weak signals that alert it to both risks and opportunities. The diversity represented in the teams embodies the diversity of the functions, customers, countries and communities in which the Group operates worldwide. The intelligence, creativity and energy of the teams in all their diversity help the Group to adapt to the changing environment and form an intensely people-oriented bank, as close as possible to its customers.
Recognising and taking all employees into account in their diversities is also one of the primary factors of engagement. This recognition makes it possible to build loyalty among the range of talents present
in the company as well as attract new talents in order to always be in tune with the company’s environment on its various markets.
PROACTIVE MEASURESIn terms of diversity, the Group has made it a priority to promote women and international profiles to positions of responsibility and seats within the bank’s management bodies. To do this, since the end of 2013, the Group has established a Diversity Board, composed of Executive Committee and Management Committee members, aiming to place diversity issues at the heart of core business challenges. This committee will also ensure the progression of gender balance and internationalisation, considering quantified targets that have been set for 2015 and 2017.
Since 2011, the bank has also established actions to raise awareness of unconscious biases, those cultural or intrinsic prejudices and stereotypes that employees and managers may have about diversities. The approach and content of dedicated training sessions on this topic were revised in 2013 to precisely meet the needs of managers from 2014.
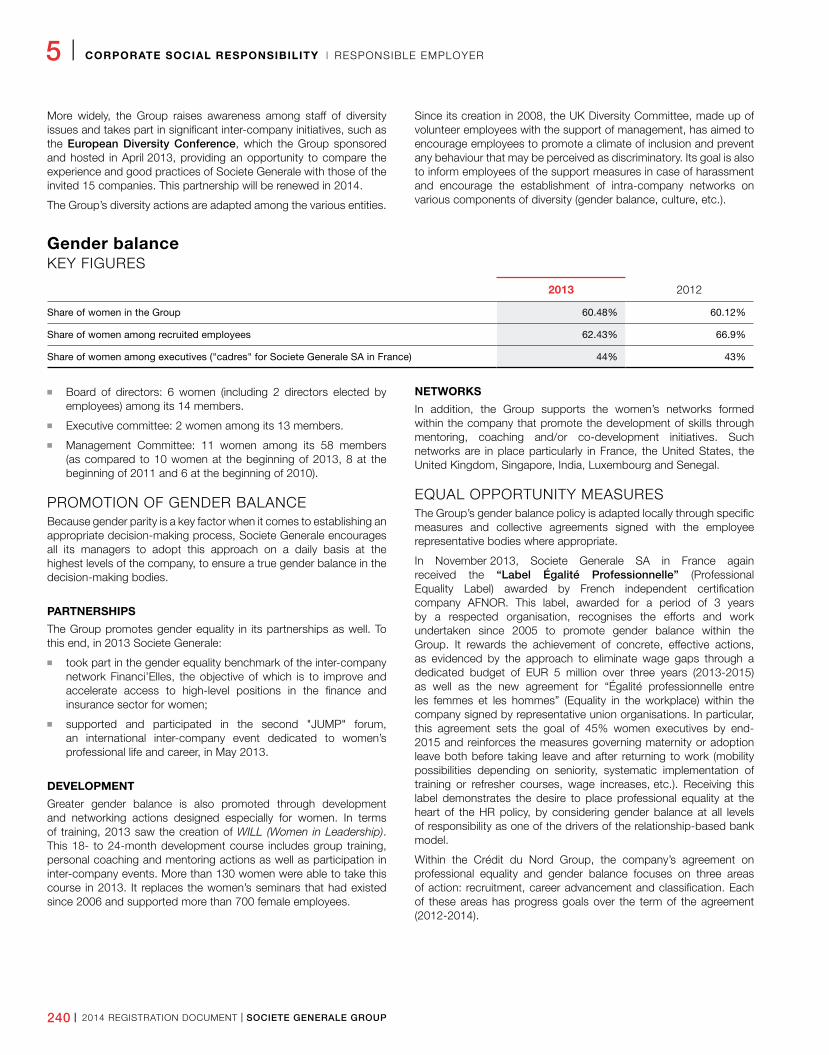
240 I 2014 REGISTRATION DOCUMENT I SOCIETE GENERALE GROUP
5 I CORPORATE SOCIAL RESPONSIBILITY I RESPONSIBLE EMPLOYER
More widely, the Group raises awareness among staff of diversity issues and takes part in significant inter-company initiatives, such as the European Diversity Conference, which the Group sponsored and hosted in April 2013, providing an opportunity to compare the experience and good practices of Societe Generale with those of the invited 15 companies. This partnership will be renewed in 2014.
The Group’s diversity actions are adapted among the various entities.
Since its creation in 2008, the UK Diversity Committee, made up of volunteer employees with the support of management, has aimed to encourage employees to promote a climate of inclusion and prevent any behaviour that may be perceived as discriminatory. Its goal is also to inform employees of the support measures in case of harassment and encourage the establishment of intra-company networks on various components of diversity (gender balance, culture, etc.).
Gender balanceKEY FIGURES
2013 2012
Share of women in the Group 60.48% 60.12%
Share of women among recruited employees 62.43% 66.9%
Share of women among executives ("cadres" for Societe Generale SA in France) 44% 43%
n Board of directors: 6 women (including 2 directors elected by employees) among its 14 members.
n Executive committee: 2 women among its 13 members.
n Management Committee: 11 women among its 58 members (as compared to 10 women at the beginning of 2013, 8 at the beginning of 2011 and 6 at the beginning of 2010).
PROMOTION OF GENDER BALANCEBecause gender parity is a key factor when it comes to establishing an appropriate decision-making process, Societe Generale encourages all its managers to adopt this approach on a daily basis at the highest levels of the company, to ensure a true gender balance in the decision-making bodies.
PARTNERSHIPS
The Group promotes gender equality in its partnerships as well. To this end, in 2013 Societe Generale:
n took part in the gender equality benchmark of the inter-company network Financi’Elles, the objective of which is to improve and accelerate access to high-level positions in the finance and insurance sector for women;
n supported and participated in the second "JUMP" forum, an international inter-company event dedicated to women’s professional life and career, in May 2013.
DEVELOPMENT
Greater gender balance is also promoted through development and networking actions designed especially for women. In terms of training, 2013 saw the creation of WILL (Women in Leadership). This 18- to 24-month development course includes group training, personal coaching and mentoring actions as well as participation in inter-company events. More than 130 women were able to take this course in 2013. It replaces the women’s seminars that had existed since 2006 and supported more than 700 female employees.
NETWORKS
In addition, the Group supports the women’s networks formed within the company that promote the development of skills through mentoring, coaching and/or co-development initiatives. Such networks are in place particularly in France, the United States, the United Kingdom, Singapore, India, Luxembourg and Senegal.
EQUAL OPPORTUNITY MEASURESThe Group’s gender balance policy is adapted locally through specific measures and collective agreements signed with the employee representative bodies where appropriate.
In November 2013, Societe Generale SA in France again received the “Label Égalité Professionnelle” (Professional Equality Label) awarded by French independent certification company AFNOR. This label, awarded for a period of 3 years by a respected organisation, recognises the efforts and work undertaken since 2005 to promote gender balance within the Group. It rewards the achievement of concrete, effective actions, as evidenced by the approach to eliminate wage gaps through a dedicated budget of EUR 5 million over three years (2013-2015) as well as the new agreement for “Égalité professionnelle entre les femmes et les hommes” (Equality in the workplace) within the company signed by representative union organisations. In particular, this agreement sets the goal of 45% women executives by end-2015 and reinforces the measures governing maternity or adoption leave both before taking leave and after returning to work (mobility possibilities depending on seniority, systematic implementation of training or refresher courses, wage increases, etc.). Receiving this label demonstrates the desire to place professional equality at the heart of the HR policy, by considering gender balance at all levels of responsibility as one of the drivers of the relationship-based bank model.
Within the Crédit du Nord Group, the company’s agreement on professional equality and gender balance focuses on three areas of action: recruitment, career advancement and classification. Each of these areas has progress goals over the term of the agreement (2012-2014).
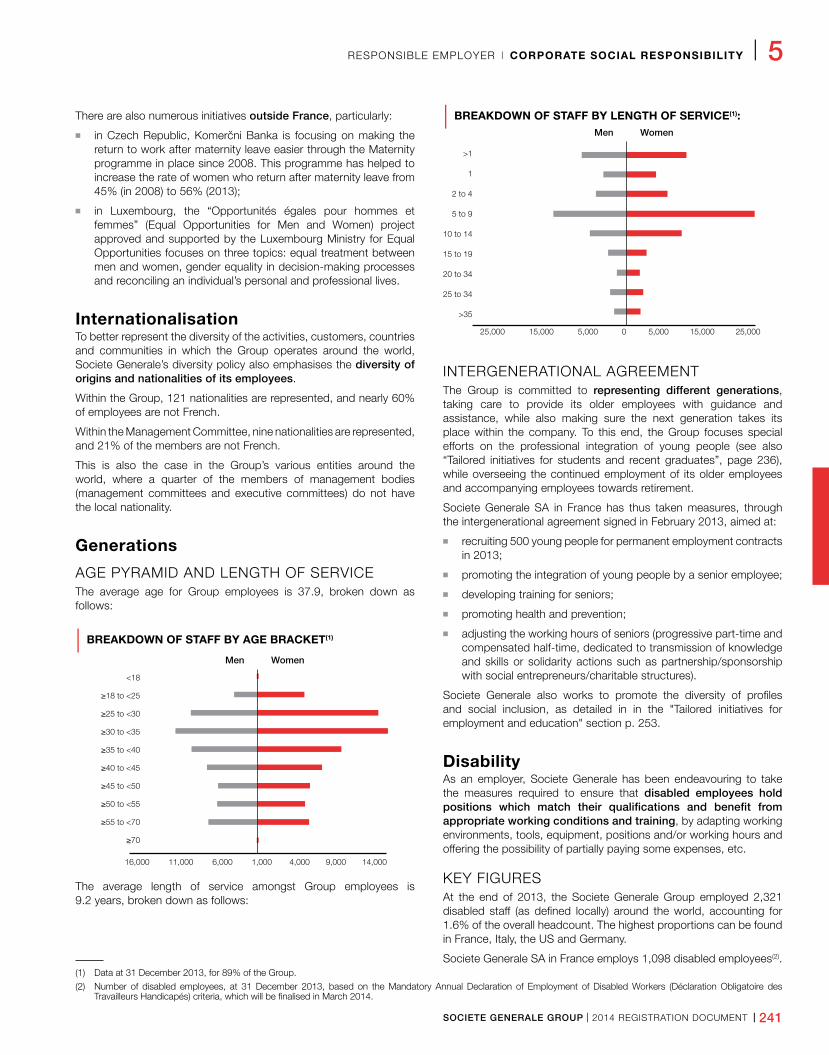
SOCIETE GENERALE GROUP I 2014 REGISTRATION DOCUMENT I 241
RESPONSIBLE EMPLOYER I CORPORATE SOCIAL RESPONSIBILITY I 5
There are also numerous initiatives outside France, particularly:
n in Czech Republic, Komerčni Banka is focusing on making the return to work after maternity leave easier through the Maternity programme in place since 2008. This programme has helped to increase the rate of women who return after maternity leave from 45% (in 2008) to 56% (2013);
n in Luxembourg, the “Opportunités égales pour hommes et femmes” (Equal Opportunities for Men and Women) project approved and supported by the Luxembourg Ministry for Equal Opportunities focuses on three topics: equal treatment between men and women, gender equality in decision-making processes and reconciling an individual’s personal and professional lives.
InternationalisationTo better represent the diversity of the activities, customers, countries and communities in which the Group operates around the world, Societe Generale’s diversity policy also emphasises the diversity of origins and nationalities of its employees.
Within the Group, 121 nationalities are represented, and nearly 60% of employees are not French.
Within the Management Committee, nine nationalities are represented, and 21% of the members are not French.
This is also the case in the Group’s various entities around the world, where a quarter of the members of management bodies (management committees and executive committees) do not have the local nationality.
Generations
AGE PYRAMID AND LENGTH OF SERVICEThe average age for Group employees is 37.9, broken down as follows:
| BREAKDOWN OF STAFF BY AGE BRACKET(1)
16,000 11,000 6,000 1,000 4,000 9,000 14,000
<18
≥18 to <25
≥25 to <30
≥30 to <35
≥35 to <40
≥40 to <45
≥45 to <50
≥50 to <55
≥55 to <70
≥70
Men Women
The average length of service amongst Group employees is 9.2 years, broken down as follows:
| BREAKDOWN OF STAFF BY LENGTH OF SERVICE(1):
25,000 15,000 5,000 0 5,000 15,000 25,000
>1
1
2 to 4
5 to 9
10 to 14
15 to 19
20 to 34
25 to 34
>35
Men Women
INTERGENERATIONAL AGREEMENTThe Group is committed to representing different generations, taking care to provide its older employees with guidance and assistance, while also making sure the next generation takes its place within the company. To this end, the Group focuses special efforts on the professional integration of young people (see also “Tailored initiatives for students and recent graduates”, page 236), while overseeing the continued employment of its older employees and accompanying employees towards retirement.
Societe Generale SA in France has thus taken measures, through the intergenerational agreement signed in February 2013, aimed at:
n recruiting 500 young people for permanent employment contracts in 2013;
n promoting the integration of young people by a senior employee;
n developing training for seniors;
n promoting health and prevention;
n adjusting the working hours of seniors (progressive part-time and compensated half-time, dedicated to transmission of knowledge and skills or solidarity actions such as partnership/sponsorship with social entrepreneurs/charitable structures).
Societe Generale also works to promote the diversity of profiles and social inclusion, as detailed in in the "Tailored initiatives for employment and education" section p. 253.
DisabilityAs an employer, Societe Generale has been endeavouring to take the measures required to ensure that disabled employees hold positions which match their qualifications and benefit from appropriate working conditions and training, by adapting working environments, tools, equipment, positions and/or working hours and offering the possibility of partially paying some expenses, etc.
KEY FIGURESAt the end of 2013, the Societe Generale Group employed 2,321 disabled staff (as defined locally) around the world, accounting for 1.6% of the overall headcount. The highest proportions can be found in France, Italy, the US and Germany.
Societe Generale SA in France employs 1,098 disabled employees(2).(1) Data at 31 December 2013, for 89% of the Group.
(2) Number of disabled employees, at 31 December 2013, based on the Mandatory Annual Declaration of Employment of Disabled Workers (Déclaration Obligatoire des Travailleurs Handicapés) criteria, which will be finalised in March 2014.
242 I 2014 REGISTRATION DOCUMENT I SOCIETE GENERALE GROUP
5 I CORPORATE SOCIAL RESPONSIBILITY I RESPONSIBLE EMPLOYER
More than 170 disabled employees were hired over the last three years, exceeding the original goal of 150 recruitments over the period covered by the agreement for 2011-2013.
LOCAL INITIATIVES FOR THE DISABLEDAmong the concrete actions coordinated in 2013 by Societe Generale’s Mission Handicap for Societe Generale SA in France are:
n the organisation, in partnership with ADAPT, of the fifth “Pass pour l’emploi” forum, one of the main recruitment forums in the Paris region for disabled people. During the 2013 forum, 85 Societe Generale volunteers accompanied nearly 1,500 candidates;
n actions to increase awareness among employees, such as the visual impairment immersion serious game organised during the Employment of People with Disabilities Week in November 2013;
n availability of the “Handiproline” hotline, which all employees can call anonymously and at no cost to talk and seek advice about disability;
n development of work-study programmes enabling disabled persons to obtain necessary job skills (“HandiFormaBanques”);
n 350 job retention actions taken for disabled Societe Generale employees;
n initiatives to promote the use of companies of the protected sector (see "responsible sourcing commitment" p. 250).
In addition, a new agreement governing the recruitment and professional integration of disabled employees was signed in October 2013, covering the 2014-2016 period. Expanding on the actions implemented by Mission Handicap since the first agreement in 2007, it reaffirms the Group’s lasting commitment to disabled employees in an approach of non-discrimination and equal opportunity. In particular, the agreement sets a goal to recruit a minimum of 150 new employees over three years, with emphasis on the recruitment of young people and experts with disabilities. Its major concrete innovation will be to focus on prevention and career management for employees in a declared or potential disability situation.
In 2013, the Group’s international initiatives included:
n in Serbia, the “Inclusive Academy” initiative, with the aim of helping young disabled people to enter the job market by giving them new skills. Led by volunteer employees of Societe Generale Srbija, each year the programme allows several participants to be recruited, either within the bank or in other businesses in Serbia;
n in Spain, Romania, the Czech Republic, Italy, Turkey and Japan, recruitment and support programmes dedicated to disabled employees are rolled out.
CARING ABOUT THE WORKING CONDITIONS OF EMPLOYEES
Compensation and benefitsThe Societe Generale Group recognises the performance of its employees by leading a motivating and consistent remuneration policy, in compliance with prevailing standards and regulations. The Group regularly communicates on this policy.
REMUNERATION POLICYTo keep pace with its development, the Group needs to attract, motivate and retain high-quality professionals by offering competitive pay packages consisting of a salary, reflecting each individual’s contribution to the Group’s development, and employee benefits. The Group also offers a long-term profit-sharing programme aimed at motivating and increasing the loyalty of certain categories of employees, in particular key executives and Strategic Talents. Lastly, an active employee share ownership policy is in place with the aim of involving employees in the Group’s development and promoting cohesion.
Monetary remuneration includes a fixed salary, which rewards the ability to satisfactorily hold a position using the requisite skills, and, where applicable, variable remuneration based on collective and individual performance and the achievement of results, but also the behaviour adopted in order to achieve the objectives set at the beginning of the year, based on Group-wide standards and according
to the context (see «Performance management» p. 238). A company agreement signed in June 2013 eliminates the individual commission system for the Retail Banking and Private Banking sales forces in France, replacing it with gross overall annual pay and the variable portion. This agreement is applicable as from 1 January 2014.
The Group’s monetary remuneration policy is based on Group-wide principles applied in all the countries and is adjusted to the economic, social and competitive environment of the local markets as well as to the legal and regulatory obligations in force. Where the size of the workforces permit, a cross-business review between core businesses and functions is carried out to ensure consistent, objective remuneration levels between the Group’s different core businesses and facilitate cross-business co-operation. All Societe Generale Group entities meet their commitments with regard to the payment of taxes and social security charges on salaries and staff benefits.
For the 2013 financial year, personnel expenses for the Group totalled EUR 9,225 million (see note 40 p. 358). For Societe Generale SA in France, the average gross annual remuneration(1) amounted to EUR 52,692, an increase of 0.9% as compared to 2012, showing controlled growth in remuneration.
(1) Average overal remuneration includes fixed and variable items as well as bonuses, excluding financial remuneration (employer contribution, profit sharing and incentives).
SOCIETE GENERALE GROUP I 2014 REGISTRATION DOCUMENT I 243
RESPONSIBLE EMPLOYER I CORPORATE SOCIAL RESPONSIBILITY I 5
REGULATORY COMPLIANCE
The principles governing the remuneration policy, in particular for the categories of staff whose professional activities are liable to have a significant impact on the Group’s risk profile, as per the European Capital Requirement Directive (CRD III), are detailed in the compensation policy report. It will be published, as last year, prior to the General Meeting and transmitted to the Autorité de Contrôle Prudentiel et de Résolution (ACPR-French Prudential Supervisory Authority and Resolution), in accordance with the ministerial decree of 13 December 2010 and with the professional standards of the French Banking Federation(1). In addition to this report, detailed qualitative and quantitative information is also provided to the ACPR on staff whose activities are liable to have a significant impact on the Group’s risk profile.
EMPLOYEE SHARE OWNERSHIPSince 1988, Societe Generale has offered its employees worldwide the opportunity to become involved in its development by pursuing a proactive employee share ownership policy. Each year, it proposes a capital increase reserved for current and retired employees. The resulting employee share ownership rate is high, stable and ranks the Societe Generale Group number 6 in employee share ownership out of the CAC 40 French companies, thus demonstrating the ongoing commitment of its employees.
In 2013, more than 130,000 current and retired employees in nearly 250 entities and 59 countries were offered the chance to take part in the capital increase. In total, nearly 40,000 people subscribed for a total amount of EUR 184.5 million. In France, nearly one out of two beneficiaries participated in the operation, and nearly one out of seven abroad.
The average individual shareholding for Societe Generale France employees was approximately 860 shares per employee shareholder at the end of 2013. With the exception of the fund reserved for Crédit du Nord staff, the holders of units invested in Societe Generale shares have a voting right at the General Meeting. At 31 December 2013, under the Company and Group Savings Plans, the staff of Societe Generale France and its subsidiaries and branches held a total of 7.45% of the share capital and 12.64% of the voting rights(2).
FREE SHARE PLANWith the approval of the General Meeting of 25 May 2010, the Board of Directors implemented a “free share plan granted to all employees”(3) on 2 November 2010, with the ambition of involving each employees closely in the earnings and future of Societe Generale. The Group thus granted 40 shares to all employees present at 2 November 2010. The acquisition of these shares, planned to take place in two instalments, was subject to conditions of presence and performance.
The Free Share Plan’s two performance conditions were fully satisfied. The first was for the Group to generate a net profit for the 2012 financial year, and the second was for customer satisfaction to increase between 2012 and 2013, on the three main customer segments at the global level: French Retail Banking customers, International Retail Banking customers, and corporate and institutional clients.
The 1st instalment of 16 shares has been delivered to all employees who are French residents for tax purposes present in the Group at the end of March 2013. For non-residents of France for tax purposes, the delivery of these 16 shares is scheduled for the end of March 2015. The remaining 24 shares, which were conditional on the growth in customer satisfaction, will be delivered at the end of March 2014 for French residents for tax purposes who are present on this date and at the end of March 2016 for non-French residents for tax purposes who are present.
MANDATORY EMPLOYER CONTRIBUTIONS, VOLUNTARY PROFIT-SHARING AND COMPANY SAVINGS PLANIn France, employees are involved in the long-term development of the Group and receive a share of its earnings via profit-sharing and/or employer contribution schemes. These schemes enable employees to finance projects or earn additional income. They are tied to the company’s overall performance and regulated by Societe Generale agreements signed with the union organisations every three years.
The company savings plan proposes medium- and long-term savings offering employees the opportunity to build up assets under preferential financial conditions(4) and tax rates through tailored management of a diversified portfolio of investment securities. It comprises a diversified range of eight funds, including the employee share ownership fund (Fonds E). Financial remuneration (consisting of the employer contribution and profit sharing(5)) may be invested in the company savings plan.
See also p. 233, "SRI employee savings".
INFORMATION ABOUT THE SOCIETE GENERALE EMPLOYEE SHARE OWNERSHIP FUND NAMED “SOCIETE GENERALE ACTIONNARIAT (FONDS E)”
Under the terms of the rules governing the Societe Generale mutual fund, the voting rights attached to the Societe Generale shares included in the Fund’s assets belong individually to the holders of fund units in proportion to the respective shares they hold. The Fund’s Supervisory Board, which is composed of an equal number of unit-holding employee representatives and representatives of the Management, exercises voting rights for fractional shares and voting rights not exercised by unit holders.
In the event of a public purchase or exchange offer, the Supervisory Board decides, based on the relative majority of the votes cast, whether or not to tender shares to the offer. If there is no relative majority, the decision is put before the vote of the unit holders, who decide according to the relative majority of the votes cast.
(1) The 2012 compensation policy report was transmitted to the ACPR in April 2013 and simultaneously published on Societe Generale’s corporate website.
(2) Information in accordance with Article L. 225-102 of the French Commercial Code.
(3) See details in Note 41 on p. 361, Notes to the consolidated financial statements.
(4) Employer matching contribution and discount on the Societe Generale share during the reserved capital increase.
(5) In addition to Societe Generale SA in France, for which the amounts of financial remuneration paid in 2013 are detailed in Note 24 (page 413), most French subsidiaries belonging to the Group Savings Plan are subject to an employer contribution and/or profit sharing agreement.
244 I 2014 REGISTRATION DOCUMENT I SOCIETE GENERALE GROUP
5 I CORPORATE SOCIAL RESPONSIBILITY I RESPONSIBLE EMPLOYER
TOTAL REWARD STATEMENTIn 2013, a pilot edition of Total Reward Statement was distributed to more than 5,000 employees of corporate divisions of Societe Generale SA in France. This personalised HR informational document allowed employees to have a complete view of the components of their overall remuneration for 2012 (fixed and variable remuneration, employee savings, social protection as well as all non-monetary benefits offered by the company). This pilot will be renewed in 2014 for the 2013 financial year over a broader scope.
Other Group entities have provided their teams with such a document for several years, such as Crédit du Nord and certain Societe Generale branches abroad.
Listening to employees
EMPLOYEE SATISFACTION SURVEY AND IMPLEMENTATION OF ACTION PLANSThe employee satisfaction survey reflects Societe Generale’s desire to create a reliable listening environment in which each employee can express his or her expectations, perceptions of the company and experiences to date. This internal, anonymous survey is conducted every two years and allows action plans for improvement to be put in place the following year.
In spring 2013, the third edition of the employee satisfaction survey was submitted in 28 languages to 131,000 Group employees in 76 countries; the participation rate was 67% (an increase of 6 points as compared to 2011). The results were communicated to all employees.
On this basis, team managers and HR business partners are developing action plans to be rolled out during 2014. The main working topics are strategic vision, employee commitment, inter-team cooperation and organisational efficiency. Each action plan will be monitored.
RISE OF COLLABORATIVE APPROACHESFor several years, the Group’s entities have put in place collaborative, interactive initiatives, tools and services allowing employees to become proactive agents of change with respect to changes in the way work is done within the company.
The innovation approach within the Group is an example, with a participatory, mobilising approach to innovation: a network of 650 "Innov’actors" encourage innovation and the exchange of best practices beyond borders and the bank’s various businesses. This system offers employees the opportunity to become personally involved in the success of their innovative projects, around fifteen of which are awarded Innov’Group trophies each year.
In addition, the development of the collaborative approach within the company is tangible through the rapid spread of the corporate social network "SG Communities". Launched in 2011, it had 23,000 users in 65 countries at the end of 2013. In addition to the creation of enriched profiles, discussions or events, it has allowed more than 600 user groups to be put in place on work and non-work topics and has increased the opportunities for discussion between employees. In particular, in 2013, SG Communities was the catalyst for the Digital Transition Challenge: this unique collaborative experience involved
all employees in a large-scale joint construction approach on the challenges represented by the company’s digital transition. More than 1,000 ideas were proposed in 19 countries. After a collective vote, around thirty suggestions were chosen and are now being studied or are the subject of projects in which the employees who submitted them can participate.
Employee relations and respect for human rights
SOCIAL DIALOGUESocial dialogue is a collaborative process between employer and employees (or their representatives) on common-interest issues relating to a company’s economic and social policy. Applied at a Group-wide or individual entity level, it can take various forms, from the simple exchange of information to consultation and negotiations.
Societe Generale’s by-laws provide for the inclusion of a staff-elected representative on its Board of Directors. In France, the Employee Representative Bodies have been set up by Societe Generale SA, in accordance with the French Labour Code. These include the union representation, Works Councils and the Central Works Council, the staff delegates, the Hygiene, Safety, and Working Conditions Committee, the Group Committee and the European Works Council. The employer-employee dialogue is also exercised through ad hoc commissions, particularly the dialogue and consultation body, which addresses the company’s strategic and economic directions with the union organisations.
Throughout the rest of the world, the Group works to maintain dialogue with its employees in various ways, depending on the size and structure of local teams and the applicable laws in each country. For example, where local laws in the countries in which the International Retail Banking Division operates do not provide for staff representation or representation is possible but not mandatory(1), the subsidiaries organise employer-employee dialogue according to formal, detailed procedures that vary by country. Each entity must ensure that employees have an ad hoc procedure for voicing their concerns or grievances and that they are taken into account. Employer-employee dialogue can also take the form of regular meetings which are an opportunity for department managers and the Human Resources Department to initiate discussions with staff. Employees and their managers are informed of the existence and implementation of these procedures, particularly during the induction of new employees.
COLLECTIVE BARGAININGIn 2013, 341 agreements were signed within the Group. These agreements mainly involved remuneration, equality in the workplace, the generation contract, working hours and employee benefits; 23 agreements focused specifically on health and safety.
In France, 115 agreements were signed in 2013, including 17 agreements for Societe Generale SA. These agreements mainly concerned employment, disability, remote working, remuneration and employee benefits, professional equality, social protection schemes and support for restructuring projects.
(1) Ex.: Albania, Bulgaria, Ivory Coast, Georgia, Serbia.
SOCIETE GENERALE GROUP I 2014 REGISTRATION DOCUMENT I 245
RESPONSIBLE EMPLOYER I CORPORATE SOCIAL RESPONSIBILITY I 5
RESPECT FOR HUMAN RIGHTS AND THE MAIN CONVENTIONS OF THE INTERNATIONAL LABOUR ORGANISATIONThe Societe Generale Group conducts its business with the utmost respect for fundamental human and workers’ rights, wherever it is in the world. Its responsibility is particularly reflected in its commitment to the values and principles set forth in:
n the Universal Declaration of Human Rights and associated covenants (namely, the International Covenant on Civil and Political Rights and the International Covenant on Economic, Social and Cultural Rights);
n the main conventions of the lnternational Labour Organisation;
n the UNESCO World Heritage Convention;
n the OECD Guidelines for Multinational Enterprises.
Each Group entity ensures respect for rules related to freedom of association and working conditions and is prohibited from using forced labour, compulsory labour, or child labour, as defined by the International Labour Organisation, even when permitted by local law. It also fights against any form of discrimination, whether through its diversity policy (see "promoting diversity" p. 239) or its solidarity initiatives to encourage social inclusion, improve professional integration and combat illiteracy (see "Initiatives for employment and education" p. 253).
In addition, the Group ensures observance of Human Rights in its operations (see "Human rights" p. 220).
Employee health and safety
SOCIAL PROTECTIONThe Societe Generale Group fulfils its social responsibility by actively contributing to the social protection of all its employees, particularly in terms of healthcare, pension, death, invalidity and incapacity benefits.
As the characteristics of compulsory benefit plans may vary widely from one country to the next, each Group entity defines the level of additional coverage it wishes to provide, within its local context. Wherever possible, it ensures that the level of coverage in place is at least comparable to that provided by local competitors. Working alongside their regulatory authorities (and potentially with other Societe Generale entities in the same country), Group entities must also factor in their development strategy, remuneration policies, and financial position when defining employee cover.
In France, the Societe Generale Group health plan covers nearly 115,000 people (participating members and beneficiaries). International Retail Banking continued its existing healthcare and personal protection insurance regimes at its subsidiaries and continued to institute social protection for its employees (improved access to healthcare, implementation of death and disability coverage, complementary pension plans). As such, at the end of 2013, almost 12,000 employees in the Mediterranean Basin (Algeria, Morocco and Tunisia) and Sub-Saharan Africa (in addition to 19,000 beneficiaries – spouses and children) had access to healthcare coverage, which guarantees that the company will contribute to their healthcare expenses.
INTERNATIONAL TRAVELLERSIn order to effectively protect the health and safety of its international travellers and employees who move between countries, Societe Generale has established a security and safety policy based on and structured around three major components:
n information through a monitoring service making it possible to receive and exploit all security and safety alerts in the world and formulate appropriate recommendations;
n international security and safety audits intended to refine the geopolitical and security analyses of countries and establish mechanisms to improve the security of expatriates or personnel on business travel;
n a "Health, Safety, Security" global assistance programme with the support of a global leader in international health and safety services.
PREVENTION ACTIONSThe Societe Generale Group is committed to contributing to the well-being of its employees, which it considers to be a critical aspect of its attractiveness, effectiveness and sustainability. It continually monitors the possibility of any risks liable to affect the health of its staff, anywhere in the world.
Societe Generale’s yearly seasonal flu vaccination campaigns were carried out again in 2013 in a large number of Group entities, notably in France, the United States, Brazil, Russia, Morocco, Tunisia, the United Kingdom and Germany.
In France, the Group’s campaign to prevent cardiovascular diseases continued in 2013 in the Paris region and elsewhere, particularly with the involvement of the Societe Generale Group health plan.
In January 2013, Societe Generale participated in the creation of two banking professional inter-company occupational health services in Lille and Marseilles.
At a local level, the Mediterranean and Sub-Saharan International Retail Banking subsidiaries continue to play an active role in raising awareness amongst communities and employees on the prevention of pandemics, particularly malaria and HIV/AIDS. The programme dedicated to HIV/AIDS is open to all employees and their families in each of the countries where it is rolled out.
Societe Generale’s subsidiaries carried out a number of other health-related initiatives. Thus:
n in 2013, Societe Generale Algeria continued and extended its breast cancer screening campaign offered to employees and their wives;
n in November 2013, Societe Generale Benin organised its first "women’s workshop", which brought together mothers or future mothers around issues of health and more widely education of children.
STRESS IN THE WORKPLACESince 2008, Societe Generale has committed to take action to prevent and manage psycho-social risks with all of the company’s stakeholders. As part of this, various actions are carried out to inform, train and support employees likely to encounter conflicts, such as, for Societe Generale SA in France:
246 I 2014 REGISTRATION DOCUMENT I SOCIETE GENERALE GROUP
5 I CORPORATE SOCIAL RESPONSIBILITY I RESPONSIBLE EMPLOYER
n a “stress observatory” established in January 2009, a partnership set up with a consultancy firm which works closely with the company’s independent inter-company medical officer;
n qualitative actions (diagnosis followed by action plans), carried out with the Agence Nationale pour l’Amélioration des Conditions de Travail (French National Agency for the Improvement of Working Conditions, ANACT);
n training modules on psycho-social risks management;
n a personalised system for listening and support established for employees of the central services in Paris, with the support of an outside firm, an anonymous, confidential system allowing a team of psychologists trained to listen to provide support remotely;
n a company agreement signed in 2008 on the prevention and management of aggression, with the deployment of a number of measures (mandatory e-learning for all personnel in contact with the public in order to deal with conflict situations; a partnership with the Institut National d’Aide aux Victimes et de Médiation -National Institute for Victim Support and Mediation, INAVEM- to carry out psychological post-trauma support for employees who have been victims of armed assault or aggression).
Outside France, local initiatives are also underway, for instance in Brazil, Germany, the United States and the United Kingdom; personnel are offered employee assistance programmes, free of charge, implemented by healthcare or insurance partners. These professionals can advise for prevention measures or provide support and guidance for employees exposed to stressful situations.
INDICATORSNumber of accidents in the workplace (Group): 934 for a frequency rate of 3.7. The rate of accident severity is not considered so far an indicator with a follow-up, considering the type of activities of the Group.
The rate of absenteeism (number of paid days absent/total number of days paid, as a percentage) for the Group overall in 2013 was 3.90% (main causes: illness 2.19%, maternity 1.18%). For Societe Generale SA in France, it was 5.03% (2.47% for illness and 2.4% for maternity).
Balance and well-being
ORGANISATION OF WORKING HOURS
FULL TIME
The organisation of working hours depends on the regulations applicable in each country where the Group operates and the employee’s function. As a result, practices vary significantly (number of working hours, flexible working hours, organisation, etc.).
Societe Generale SA France, for its part, signed an agreement on the reduction and organisation of working hours on 12 October 2000, implemented as of 2001 and later amended in 2002, 2004, 2006, and 2008. For hourly-paid staff (banking technicians and executives), the agreement provides for 1,607 working hours per year; for salaried executives, the number of work days over the year is 209 (or 206 based on the length of service and age of the employees when the agreement came into force).
PART TIME
Employees of Societe Generale SA in France also qualify for schemes that reduce the number of working hours to 90% (introduced by amendment in May 2008), 80%, 70%, 60% or 50% (introduced by agreement in June 2004).
Several of the Group’s French subsidiaries have signed special agreements, as have many foreign entities.
Group-wide, 10,303 staff (i.e. 6.95% of the workforce) work part-time (including 6,177 in France and 4,874 for Societe Generale SA in France).
OVERTIME
The definition of overtime is taken from French law, which means that the reporting scope for this indicator is therefore limited to France.
The number of overtime hours recorded in the Group’s French entities in 2013 totalled 84,076 (or 0.61 hour on average per employee), including 48,821 hours for Societe Generale SA (or 1.22 hour on average per employee).
INITIATIVES ON REMOTE WORK AND FLEXIBILITY OF WORKING HOURSConcerned with improving working conditions and agility within the company and capitalising on the rise of new technologies, several Group entities have put remote work solutions in place.
In France, since October 2013, Societe Generale SA has launched a telework experiment as part of an agreement signed with the Union Organisations. Phased in for a fixed period of one year, it involves around 500 people who have volunteered to work remotely one to two days per week. In particular, the goal of this experiment is to assess the impact of telework on the organisation of work and the relationship between the employee and the company. It also involves evaluating the benefits with regard to reconciling the demands of work life and private life and in terms of sustainable development, particularly for employees with substantial commute times.
In the Czech Republic, Komerčni Banka has put flexible working arrangements in place since 2008. In 2013, 5% of KB employees benefited from such measures, including 91% women.
In Romania, BRD has put innovative options in place to introduce teleworking, for example "Project Day": occasional working at home, from one to five days, with no possible connection to the company’s IT systems.
ACTIONS FOR WELL-BEINGThrough various local programmes, the Societe Generale entities offer their employees non-monetary benefits that promote their work/life balance. Benefits are thus offered to facilitate actions related to family life (in particular for childcare and/or elderly care), especially in France, the United Kingdom, Romania, Germany and India.
SOCIETE GENERALE GROUP I 2014 REGISTRATION DOCUMENT I 247
ENVIRONMENTAL AND RESPONSIBLE PROCUREMENT I CORPORATE SOCIAL RESPONSIBILITY I 5
4 . E N V I R O N M E N T F O R I T S O W N A C C O U N T & R E S P O N S I B L E S O U R C I N G
GENERAL POLICY AND ACHIEVEMENTS REGARDING THE ENVIRONMENT
Faced with the many climatic and ecological changes, one of the challenges of this century will undoubtedly be the preservation of environmental balances. The interdependence of activities to address these increased risks shows that comprehensive, coordinated action is necessary.
At the heart of the system, the bank also generates impacts on the environment through its activity. Aware of this responsibility, Societe Generale wishes to pursue its sustainable development policy, which involves the control and improvement of its impacts on society and the environment in association with its various stakeholders:
n in its operations by including environmental criteria in its advisory, financial and investment activities and by promoting products and services that help protect the environment;
n in its internal activities.
This policy is fully managed and coordinated by the Group’s Corporate and Social Responsibility (CSR) Division, reporting directly to the Group Corporate Secretary.
Similarly, the Buildings and IT Infrastructures divisions incorporate and steer the environmental aspects of their activities within the Group.
At the same time, each division and business seeks to contribute to the Group’s environmental policy by developing its own initiatives, including within its business lines. This policy strives to meet three major objectives:
n to reduce and minimise the impact of the Group’s activities on the environment;
n to decrease the costs associated with the consumption of natural and energy resources through rational, optimised use;
n to constantly ensure customer satisfactory reception and staff well-being satisfaction.
Since 2007, with the launch of its 2008-2012 carbon neutrality programme, Societe Generale’s implicit commitment has been to foster an environmental culture that includes fight against climate change as a focus of its environmental policy.
The Group therefore made a commitment to reduce its CO2 emissions by 11% per occupant over the 2008-2012 period (constant and like-for-like basis) and to gradually offset its CO2 emissions in order to achieve carbon neutrality… Five years later, the goals were achieved or even exceeded.
Since achieving carbon neutrality in 2012, the Group has not only strengthened its ambitions through a new three-year carbon-reduction plan but has also decided to improve its energy efficiency.
Carbon reduction programme for 2012-2015After a first phase from 2008 to 2012 towards carbon neutrality, the Group adopted a new strategy in July 2012 to reduce its carbon impact. The Executive Committee approved the new three-year programme, which takes over from the previous programme and strengthens its ambitions with the following two objectives:
n to reduce greenhouse gas (GHG) emissions per occupant by 26% compared to 2007 (excluding the purchase of green electricity);
n to increase energy efficiency by 24% compared to 2007.
The carbon reduction programme is based on a twofold incentive:
n the internal carbon tax paid by each business line and the corporate divisions, based on their carbon footprint;
n the allocation of proceeds from this tax to internal environmental efficiency projects, which can be submitted by any entity (subsidiary or corporate division) and demonstrate both environmental additionality and an economic interest.
Since 2005, the Group has performed an inventory of greenhouse gas emissions, in accordance with the GHG Protocol (international standard).
Oversight of environmental indicators was improved with the implementation of a CSR reporting tool. The scope of the indicators was further expanded and now covers:
n the electricity consumption of the Group’s data centres in France;
n the total volume of paper consumption (office paper, envelopes, account statements, paper for customers, etc.),
n business travel and transport of goods in France;
n fluorinated gas emissions by the central departments.
The Russian subsidiary Rosbank is now included in the carbon-reduction programme and gradually integrated into the reporting (in 2012, integration of the Moscow region, and in 2013, integration of nearly 75% of the subsidiary’s scope). The goal is to reach 100% coverage of this subsidiary in 2014.
On this new scope, most of the Group’s GHG emissions are attributable to IT and real estate, accounting for 73% in 2013.
The 2013 total emissions (on a scope covering 93% of employees) are estimated at 336,322 tonnes, or 2.40 tonnes of CO2 per occupant.
248 I 2014 REGISTRATION DOCUMENT I SOCIETE GENERALE GROUP
5 I CORPORATE SOCIAL RESPONSIBILITY I ENVIRONMENTAL AND RESPONSIBLE PROCUREMENT
On the basis of 2007, the goals for 2015 are:
n 1.91 t CO2/occupant (-26% compared to 2007) for GHG emissions;
n 5,154 KWh/occupant (-24% compared to 2007) for energy efficiency.
Given the 2013 results, the remaining efforts to be made to achieve these goals are:
n 20% for the reduction of CO2 emissions;
n 16% for energy efficiency per occupant.
Carbon tax schemeIn 2011, the Group was one of the first banks to establish an “internal carbon tax”, a mechanism that is now at the heart of its strategy to reduce its carbon footprint.
Each year, an amount is collected from the business lines based on their carbon emissions (EUR 10/t CO2). The resulting proceeds are used to fund internal environmental efficiency initiatives. This internal redistribution incentive programme thus encourages each entity to reduce its carbon emissions.
Initiatives are selected through a committee that ensures that each initiative has demonstrated its environmental additionality and an economic interest for the Group. Only initiatives put in place between January 2012 and June 2013 were eligible for funding. Beyond its environmental interest, the goal of this programme is to show that environmental measures are also opportunities for the bank.
As of the end of 2013, out of the 53 internal environmental efficiency initiatives put together, 28 have been rewarded with a total of EUR 2.6 million. The actions undertaken relate to real estate, IT, transport and paper. Together, these initiatives resulted in a reduction of 2,574 tonnes of CO2, or nearly 1% of the Group’s GHG emissions in 2012. These energy reductions have led to annual recurring savings of EUR 2.5 million.
In 2014, a further EUR 3.2 million will be allocated to the internal environmental efficiency initiative fund.
Buildings/energy efficiency
MEASURES TAKEN TO IMPROVE ENERGY EFFICIENCYSociete Generale is committed to an ongoing search for energy performance within its buildings. With 8,356 buildings in 60 countries, representing 3,925,155 m2 in 2013, the bank is aware of the impacts of its energy consumption on climate change.
Since 2007, total energy consumption, based on the number of occupants and the number of m2, has reduced. The goal of the new strategy is to accelerate this decrease. The Group has set the goal of a 15% increase (in three years) in the energy performance of its buildings.
In early 2014, the Real Estate function will roll out an energy management tool and initiate a campaign to gather environmental profiles on buildings over 5,000 m2 operated on behalf of the Group. The analysis of these data will give rise to a set of action plans for each country and for each entity in order to achieve a 5% energy consumption reduction within the year.
The Real Estate function is maintaining and reinforcing its effort to reduce the environmental impact of branches and buildings occupied by the Group. With this in mind, the Basalt building, constructed under HQE (Haute Qualité Environnementale - High Environmental Quality) certification, is dedicated to trading (previously housed in the Alicante and Chassagne towers). It will significantly reduce the portion of energy consumption devoted to this activity. This objective is in line with Societe Generale’s accession to the Manifesto of the World Business Council for Sustainable Development (WBCSD), which works for better energy efficiency of buildings.
Since the reference year, 2007, consumption has fallen by 9.3% per occupant and by 1% per m2 to 226 kWh/m2/year. The aim of the new strategy is to accelerate this decline.
The measurement and remote meter reading systems being installed provide a better breakdown of consumption and thus make it easier to control consumption.
A device for detecting and correcting excessive water and energy consumption, connected to the Group’s maintenance software, has been installed in France in a hundred branches, in addition to the company headquarters. The resulting water savings represent approximately 2,500 m3 over one month. Over the first year, energy consumption savings were estimated at 1.4 million KWh, equivalent to 7.4% of the total annual consumption of these 100 branches. In Serbia, a building energy cost management system (Building Managerial System) has also been implemented throughout the network of branches.
Building renovations as well as equipment replacements (installation of heat pumps, LED) have helped to improve the energy performance of buildings in France and in certain subsidiaries abroad (Senegal, Montenegro, etc.). In addition, a new generation of BREEAM, LEED and HQE certified constructions in the Czech Republic, India and France are also helping to reduce energy consumption and, more generally, the environmental footprint of the Group’s buildings.
Lastly, the streamlining of IT centres and the establishment of low-energy ultralight workstations are initiatives helping to improve the bank’s energy efficiency.
The Group also uses renewable energies. In 2013, 19% of electricity consumed by the Group was green electricity from renewable sources. Thanks to solar panels on the roofs and facades of some of its buildings (Burkina Faso, France, French Polynesia, Germany) and the anaerobic digestion of the food waste of some of its company restaurants (France), it produced 455 MWh of electricity.
DECREASED WATER USEThe Group’s water consumption was 1.79 million m3 in 2013. Some entities were unable to determine their water consumption. This is notably the case for jointly-owned buildings, as the cost of water consumption is included in building management charges.
Overall average consumption increased by 9.4% compared to 2012. This change is mainly explained by increased integration of the subsidiary Rosbank (75% in 2013 versus 25% in 2012) into the reporting scope in 2013.
SOCIETE GENERALE GROUP I 2014 REGISTRATION DOCUMENT I 249
ENVIRONMENTAL AND RESPONSIBLE PROCUREMENT I CORPORATE SOCIAL RESPONSIBILITY I 5
In the buildings, water management is done in conjunction with energy management. In addition, water-saving devices or push faucets, motion detectors near the taps, and dual-flush toilets have been installed, and the number of evaporative air conditioners has been decreased.
TransportFor several years, Societe Generale has sought to reduce its employees’ business travel through several actions. It also strives to take action on the transport of goods.
BUSINESS TRAVELThe internal instruction encouraging staff to limit business trips and to favour train travel over airplane travel, distance permitting, was updated in 2012. As a result, short-haul air travel has been reduced in favour of rail transport.
Despite this instruction, Group employees travelled 447 million km by train, airplane and car in 2013, representing 3,070 km per occupant. The Group therefore posted a 23% increase in travel per occupant compared to 2012, largely attributable to more long-haul air travel.
In partnership with its automobile leasing subsidiary, ALD Automotive, Societe Generale has been making efforts to reduce the carbon content of its vehicle fleet since 2009. At the end of 2013, the average of Societe Generale’s existing fleet in France amounted to 117 g/km of CO2 and 135 g/km of CO2 worldwide. The use of electric vehicles has emerged, accompanied by the establishment of recharging stations.
Audio and video conferencing systems are also encouraged. A new range of remote collaborative offers was established in 2012 (Team@nywhere or E-whiteBoard deployed in North America) and includes an instant messaging offer, an audio and web conference offer, and a video conference offer, thus helping to reduce business travel and therefore the environmental impact. This alternative offer continues to grow.
COMMUTINGProximity to a public transport hub (La Défense, Val de Fontenay) was a key factor when determining the location of Societe Generale’s head offices. Societe Generale is part of an inter-company travel plan created by the French Chamber of Commerce and Industry. In addition, a carpool service is in place for its employees in the La Défense central departments in the Paris region.
The Group has also established a pilot telework initiative with around 500 employees participating (see section 3 “Initiatives on telework and flexibility of working hours” p. 246).
In the Czech Republic, 116 employees participated in the “Cycle to Work” competition organised by the company Automat, whose main objective was to be actively involved in the protection of the environment. Through this action, the employees of KB managed to reduce their CO2 emissions by 1.84 tonnes.
TRANSPORT OF GOODS“Transport of goods” includes:
n bank transport: Transport of mail and parcels as well as mail shuttles between the sites of the central departments;
n fund transport: transport services, counting, packaging, as well as the management of ATMs.
Following the “Transport” decree in France (decree 2011-1336 of 24 October 2011), requiring service providers, starting from 2013, to provide to their customers the amount of CO2 emitted by the transport mean(s) used, measures to raise supplier awareness were established by asking service providers starting in 2012 for the kilometres travelled and the CO2 impact on behalf of the Group. Since 2012, these data have been included in the Group’s carbon profile (scope 3).
Various collaborative projects to review our transport of goods flows have already contributed to reducing the environmental footprint. Thus, bank transport flows and fund transport flows have been pooled and optimised between the Crédit du Nord and Societe Generale networks. For its offices in Paris, Societe Generale chose in 2013 to entrust the delivery of its sales brochures and documents to a small business using electric three-wheeled scooters.
PaperPaper is the top consumable used by the service activities. It represents a significant economic issue and a sensitive environmental theme (waste management, fight against climate change and pollution).
Efforts have been made across the Group to streamline its consumption, which amounted to 14,725 tonnes in 2013. It includes all types of paper (forms, envelopes, copy paper, paper for customers, account statements). Consumption of office paper totalled 7,062 tonnes in 2013, i.e. 49.8 kg per occupant, down 5% year-on-year in absolute value terms.
OPTIMISING PAPER CONSUMPTIONOffice paper consumption has decreased since 2007, and the share of recycled paper has increased at the same time, contributing to the decrease in the Group’s environmental impact. Use of eco-certified office paper has reached 100% in France and 62% throughout the world.
As part of its environmental commitments, Societe Generale not only joined EcoFolio(1) but also supported its creation by becoming a shareholder alongside other companies representing different sectors of the economy. It has been on the Board of Directors of this eco-organisation since 2012.
(1) In 2006, new French legislation imposed that issuers of unsolicited printing for business purposes (publicity, free advertisement publications, etc.) contribute to the financing of recycling, reclamation, and destruction by local authorities. EcoFolio, a state-approved privately-owned company, was set up in 2007 to enable companies to uphold this obligation.
250 I 2014 REGISTRATION DOCUMENT I SOCIETE GENERALE GROUP
5 I CORPORATE SOCIAL RESPONSIBILITY I ENVIRONMENTAL AND RESPONSIBLE PROCUREMENT
The progress achieved is the result of various projects and action plans implemented across the Group and its entities, both for internal consumption and consumption for customers, such as good use of printers, conversion of paper materials to digital materials, and use of recycled paper.
WasteSociete Generale makes sure to minimise the direct impact of its waste on the environment through its reclamation. At the Group level, waste production is estimated at 16,766 tonnes in 2013.
At this stage, the goal is to gain a better understanding of its flows, hence the emphasis on reporting, which is constantly improving. Many actions ranging from the organisation of sorting and recycling of waste to its valorisation exist:
n anaerobic digestion of 183 tonnes of food waste at the three head office towers permitted the production of 64 MWh of thermal energy;
n establishment of WEEE management (waste electrical and electronic equipment) through the publication of a Group instruction in 2008 and in France by using ESATs to manage all waste;
n management of the central departments’ equipment through the use of a company from the waste management sector for the treatment and recycling of the equipment concerned (donations, resale of equipment in good condition or material reclamation), but also upstream through the establishment of an eco-design plan with the producer to ensure that products have a limited environmental impact.
GENERAL POLICY AND ACHIEVEMENTS IN SOURCING
Responsible sourcing commitmentsThe Group’s total purchases in 2013 amounted to EUR 5.9 billion.
Societe Generale’s responsible sourcing policy is implemented through a series of multi-year action plans that seek the proactive involvement of all stakeholders in the value chain (purchasers, contractors and suppliers). These actions plans, known as the Ethical Sourcing Program (ESP 2006-2010) and then the Sustainable Sourcing Program (SSP 2011-2015), demonstrate determination to make CSR a fundamental part of its processes. This commitment is reflected in different key initiatives:
n compliance rules governing purchasing signed by 100% of purchasers;
n the inclusion of a sustainable development clause in all contracts that commits all suppliers to uphold any employment laws (and where no such laws apply, to at least comply with the provisions of the ILO) or environmental legislation in force in the countries in which they operate;
n environmental and social risk mapping on products and services purchased (31 out of 62 purchasing categories are classed as presenting a risk);
n the assessment of suppliers prior to each purchase which has a minimum weighting of 3% in the selection criteria;
n in France, the incorporation of CSR objectives by all purchasers in a CSR initiative specific to their purchasing category (contracts with protected sector companies, inclusion of environmental criteria in specifications);
n the launch of a CSR-specific “Purchasing and Sustainable Development” training module in in-house training (100% of purchasers undergo this training course).
Societe Generale’s socially responsible purchasing policy is based on three core pillars:
n economic pillar: commitment to SMEs, with the goal of making it less difficult for them to win Societe Generale procurement contracts and establishing a framework of mutual trust with suppliers.
n social pillar: use of the protected sector, with the goal of promoting this sector by using subcontractors within the protected and adapted enterprise sectors (EA/ESAT).
The subsidiary Sogessur has delegated its outbound calls to Handicall, a Protected Sector company (ISO 9001 certified “inbound and outbound calls” since March 2009 and, in 2013, obtained the NF 345 certification for all of its sites).
n environmental pillar: Carbon reduction plan, with the goal of participating in the Group’s carbon reduction plan through specific sourcing actions.
CSR evaluation of suppliers and products and servicesAll suppliers invited to participate in an invitation of tenders are asked by Ecovadis, an independent player recognised for its expertise in sustainable development, about their CSR commitments and actions. Once the evaluation is complete, the CSR rating is factored into the selection criteria with a minimum weighting of 3%.
Since 2011, 1,582 suppliers have been invited to take part in the Ecovadis CSR evaluation, i.e. a purchasing scope of EUR 3.4 billion. In 2013, the average rating for suppliers was 45.4/100.
Suppliers with a rating less than or equal to 30/100 are considered at risk (i.e. 90 suppliers in 2013).
SOCIETE GENERALE GROUP I 2014 REGISTRATION DOCUMENT I 251
ENVIRONMENTAL AND RESPONSIBLE PROCUREMENT I CORPORATE SOCIAL RESPONSIBILITY I 5
SUPPLIER SOURCING AUDITSEach sourcing category underwent a CSR risk evaluation according to four families: Environment, Social, Business Ethics, and Suppliers. The categories identified as presenting a risk become priorities for CSR action. Of the 62 sourcing categories, 31 were identified as presenting a risk in 2013, representing 67% of spending.
The Group encourages suppliers in a process of continuous progress by urging those identified as presenting a risk to implement a corrective action plan (in 2013, 25 suppliers).
At the same time, an on-site audit approach supplements the plan for suppliers identified as at-risk and belonging to a high-risk sourcing category with regard to CSR (in 2013, in collaboration with an independent body, an on-site audit was performed and the implementation of two other entities was set in motion).
Committing to Small BusinessesWith 60% of the Group’s purchases made in 2013 from SMEs (Small and Medium-sized Enterprises) and mid-cap suppliers, Societe Generale facilitates access for these companies to the Group’s procurement contracts and establishes a climate of mutual trust with its suppliers.
SME PACTSociete Generale, which was the first bank to sign the SME Pact in December 2007, continues to reinforce its commitment to supporting innovative SMEs.
Various actions are carried out within the Group with SME PACT:
n calls for skills
– proposals for solutions by SMEs on a predefined topic presented to all of the Group’s decision-makers;
– since 2008, 10 calls for skills have been carried out and have allowed more than 70 innovative SMEs to present their offerings. Fifteen of them were able to develop new business streams.
n sponsorship
– presentation of SME suppliers to other Large Corporate members of the SME Pact (in 2013, 15 sponsorships undertaken).
n win/win partnerships
– presentation of a representative collaboration between Societe Generale and a SME supplier. The announcement is made on French radio Radio Classique and economic newspaper Les Échos (since 2011, seven SMEs in these media).
n supplier satisfaction survey
– annual evaluation of the quality of relations between Societe Generale and its SME suppliers;
– in 2013, 500 SME suppliers were invited to respond to the satisfaction survey. Societe Generale achieved a score of 50/100, placing us in the middle of the banking/insurance industry;
– the results were presented by web conference to thirty suppliers.
“RESPONSIBLE SUPPLIER RELATIONS” CHARTER AND CERTIFICATIONThe Group has been a signatory of the Charter of the “Responsible Supplier Relations” charter since 2010. In line with the Charter’s 10 commitments to responsible sourcing, its main signatories undertake to improve their relations with suppliers.
In 2012, the Group received the Responsible Supplier Relations certification from Médiation Inter-entreprises. This certification guarantees that the Group meets the 10 commitments described in the Charter based on an on-site audit of our practices by the evaluation agency Vigéo. It was confirmed by Vigéo in 2013 following a new audit.
In September 2013, Societe Generale became a founding member of the Charter of Best Practices in Procurement of Private Security Services (security, transport of funds, remote monitoring). Under this Charter, created under the guidance of the French Interior Ministry, signatories make a commitment to respect a set of best practices on the complete sourcing life cycle.
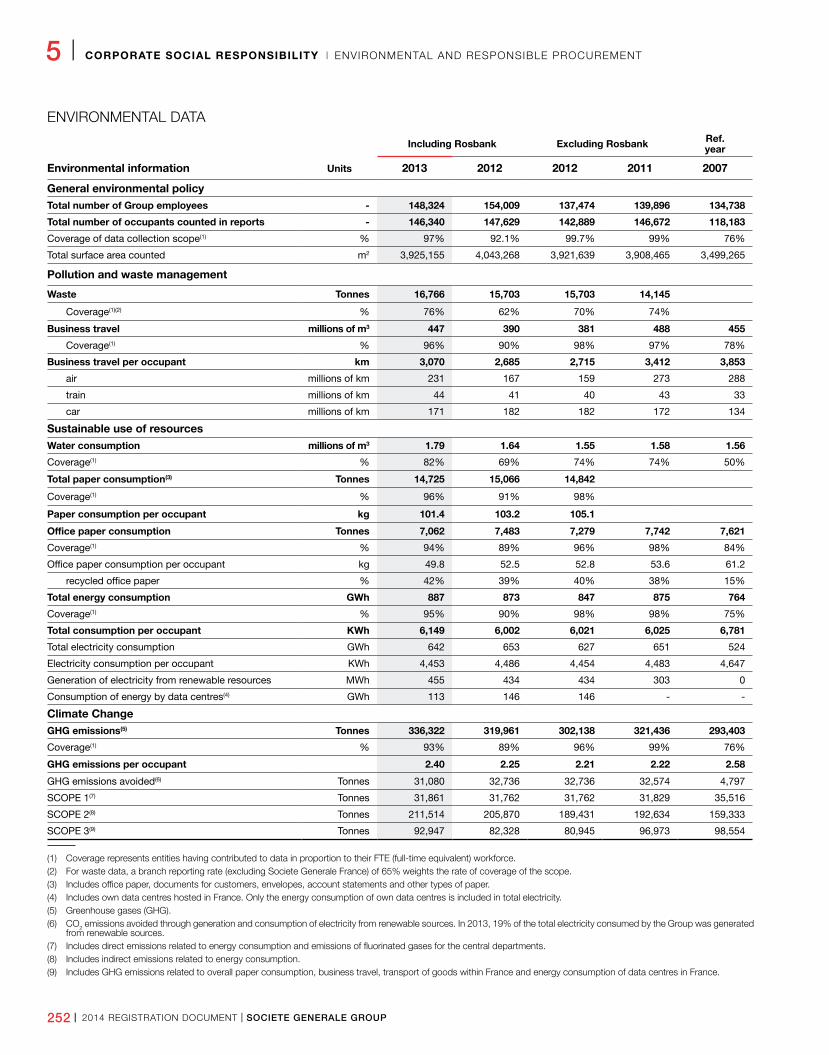
252 I 2014 REGISTRATION DOCUMENT I SOCIETE GENERALE GROUP
5 I CORPORATE SOCIAL RESPONSIBILITY I ENVIRONMENTAL AND RESPONSIBLE PROCUREMENT
ENVIRONMENTAL DATA
Environmental information Units
Including Rosbank Excluding Rosbank Ref. year
2013 2012 2012 2011 2007
General environmental policyTotal number of Group employees - 148,324 154,009 137,474 139,896 134,738
Total number of occupants counted in reports - 146,340 147,629 142,889 146,672 118,183
Coverage of data collection scope(1) % 97% 92.1% 99.7% 99% 76%
Total surface area counted m2 3,925,155 4,043,268 3,921,639 3,908,465 3,499,265
Pollution and waste management
Waste Tonnes 16,766 15,703 15,703 14,145
Coverage(1)(2) % 76% 62% 70% 74%
Business travel millions of m3 447 390 381 488 455
Coverage(1) % 96% 90% 98% 97% 78%
Business travel per occupant km 3,070 2,685 2,715 3,412 3,853
air millions of km 231 167 159 273 288
train millions of km 44 41 40 43 33
car millions of km 171 182 182 172 134
Sustainable use of resourcesWater consumption millions of m3 1.79 1.64 1.55 1.58 1.56
Coverage(1) % 82% 69% 74% 74% 50%
Total paper consumption(3) Tonnes 14,725 15,066 14,842
Coverage(1) % 96% 91% 98%
Paper consumption per occupant kg 101.4 103.2 105.1
Office paper consumption Tonnes 7,062 7,483 7,279 7,742 7,621
Coverage(1) % 94% 89% 96% 98% 84%
Office paper consumption per occupant kg 49.8 52.5 52.8 53.6 61.2
recycled office paper % 42% 39% 40% 38% 15%
Total energy consumption GWh 887 873 847 875 764
Coverage(1) % 95% 90% 98% 98% 75%
Total consumption per occupant KWh 6,149 6,002 6,021 6,025 6,781
Total electricity consumption GWh 642 653 627 651 524
Electricity consumption per occupant KWh 4,453 4,486 4,454 4,483 4,647
Generation of electricity from renewable resources MWh 455 434 434 303 0
Consumption of energy by data centres(4) GWh 113 146 146 - -
Climate ChangeGHG emissions(5) Tonnes 336,322 319,961 302,138 321,436 293,403
Coverage(1) % 93% 89% 96% 99% 76%
GHG emissions per occupant 2.40 2.25 2.21 2.22 2.58
GHG emissions avoided(6) Tonnes 31,080 32,736 32,736 32,574 4,797
SCOPE 1(7) Tonnes 31,861 31,762 31,762 31,829 35,516
SCOPE 2(8) Tonnes 211,514 205,870 189,431 192,634 159,333
SCOPE 3(9) Tonnes 92,947 82,328 80,945 96,973 98,554
(1) Coverage represents entities having contributed to data in proportion to their FTE (full-time equivalent) workforce.(2) For waste data, a branch reporting rate (excluding Societe Generale France) of 65% weights the rate of coverage of the scope.(3) Includes office paper, documents for customers, envelopes, account statements and other types of paper.(4) Includes own data centres hosted in France. Only the energy consumption of own data centres is included in total electricity.(5) Greenhouse gases (GHG).(6) CO2 emissions avoided through generation and consumption of electricity from renewable sources. In 2013, 19% of the total electricity consumed by the Group was generated
from renewable sources.(7) Includes direct emissions related to energy consumption and emissions of fluorinated gases for the central departments.(8) Includes indirect emissions related to energy consumption.(9) Includes GHG emissions related to overall paper consumption, business travel, transport of goods within France and energy consumption of data centres in France.
SOCIETE GENERALE GROUP I 2014 REGISTRATION DOCUMENT I 253
SOCIETE GENERALE CITIZENSHIP I CORPORATE SOCIAL RESPONSIBILITY I 5
5 . �SOC I E TE GENERALE � I N �C I V I L � SOC I E TY
ACCESSIBILITY FOR PERSONS WITH DISABILITIES
In France, in accordance with the Disability Act of 11 February 11 2005 governing equal rights and opportunities and the participation and citizenship of disabled persons, Societe Generale has introduced a number of measures throughout its network of retail branches in France to improve the accessibility of its services:
For the visually impaired: n systematic fitting of voice guidance systems and digital keyboards
with raised characters on new ATMs and upgrading of existing machines. At the end of 2013, close to 91% of Societe Generale ATMs - i.e. 5,073 out of 5,650 total ATMs - and 95% Crédit du Nord ATMs have been adapted to accommodate the visually impaired;
n since June 2012, the Societe Generale iPhone application, with its overhauled compatibility with the screen reading software VoiceOver, is the first French banking application to be completely accessible to the visually impaired;
n a toll free phone number (0 810 810 850) that puts visually impaired customers in direct contact with a customer call centre;
n braille account statements: 560 customers have benefited to date.
For people with reduced mobility: n at the end of December 2013, three years before the deadline
set by the Disability Act of 11 February 2005, more than 76% of Societe Generale branches in France are accessible to people with reduced mobility, i.e. 1,748 branches out of a total network of 2,294. All new premises are now fully accessible for the disabled as of the time they are opened.
At the same time, Societe Generale’s Mission Handicap, set up in 2008, is committed to heightening awareness amongst the Group’s managers and employees of the importance of integrating disabled persons, and has implemented a whole series of initiatives linked to the recruitment, integration, training and long-term employment of disabled staff. (See section 3, p. 241 “Disabled workers”).
At the international level, accessibility for persons with disabilities, and particularly for those with limited mobility, is above all a matter of legislation and local regulations. The initiatives are less systematic and more heterogeneous.
SOCIETAL AND CIVIC ACTIONS
Societe Generale Corporate Foundation for SolidarityThe aim of the Societe Generale Foundation is to promote access to employment for those who are or risk being distanced from the labour market, particularly among young people. It thus favours projects that will serve as effective relays or stepping stones: support in finding employment, integration projects or initiatives, exploration of the business world, etc. All of these are gateways to sustainable integration into working life. Successful professional integration is inseparable from a strong knowledge base. Some lack mastery of the most basic knowledge: the Foundation strives to address these inequalities by supporting actions to fight illiteracy for people in hardship. This means restoring the desire for learning and strengthening the relationships between learners, volunteers and trainers. The goal is to allow these people to gain access to long-term employment or training that is consistent with their career plans.
Since its creation in 2006, the Foundation has supported 565 projects. In 2013, 91 projects, including 27 in countries where Societe Generale is present, and 40 renewals were supported.
Overseas, Societe Generale’s subsidiaries continued to develop their citizen commitment, setting up new programmes and solidarity projects, and/or supporting local associations and their projects in collaboration with the Foundation and its areas of focus.
Certain subsidiaries also set up their own foundations, for example the Societe Generale Institute in Brazil, the Jistota Foundation in the Czech Republic and the SG UK Group Charitable Trust in the United Kingdom.
All in all, including the initiatives launched by the Foundation and those implemented at a local level, the Group donated over EUR 8.15 million to different solidarity projects in 2013, including approximately EUR 2.4 million for the Societe Generale Foundation.
Initiatives for employment and educationBelow are just some examples of the partnerships that the Group has set up to promote employment and give young people with high potential access to a variety of positions.
n in France:
Over the past four years, Societe Generale has been steadfastly committed to developing a range of initiatives in underprivileged urban areas, forging lasting relations with talented young people who would like to become part of the Group, as well as with elected officials and associations in order to strengthen its roots
254 I 2014 REGISTRATION DOCUMENT I SOCIETE GENERALE GROUP
5 I CORPORATE SOCIAL RESPONSIBILITY I SOCIETE GENERALE CITIZENSHIP
within local communities. On 20 June 2013, the Group signed the “Entreprises et Quartiers” (Businesses and Neighbourhoods) Charter with France’s Ministry for Labour and Ministry for Urban Affairs alongside some forty other companies. Under this charter, companies make a commitment to promote access to employment or business start-ups and to take action for the economic, social and cultural development of the priority neighbourhoods of the city’s policy. Taking its commitment a step further, at the end of the year, Societe Generale signed a partnership agreement with the French Ministry of Urban Affairs, setting out its commitments regarding education, school guidance, employment and economic development until 2015.
This new national commitment complements the “Charte d’engagement territorial” (Territorial Commitment Charter) signed with the towns of Nanterre and Fontenay-sous-Bois in the Paris region.
n each year since 2009, the bank has continued its commitment through the “Coup de Pouce pour l’insertion” (Helping Hand for Employment) programme, which aims to successfully integrate lower-skilled young people, mainly from underprivileged neighbourhoods of the city, within Societe Generale. In 2013, the programme was renewed in the cities and suburbs of Lyon and the Paris region. Its aim is to promote equal opportunities on the job market for young people with no academic qualifications, regardless of where they live. In 2013, Societe Generale took on 20 young apprentices over a period of 12 months and offered 23 permanent contracts to members of the 2012 group for an 80% transformation rate.
n ALD Automotive France is continuing its partnership established in 2011 with “École de la 2e Chance” (Second-Chance School), which works to reintegrate young adults aged 18 to 25 with no qualifications or diploma of any kind in the city of Clichy-la-Garenne, by offering internships to participants throughout the year.
n Societe Generale has also been a partner of French association “Nos Quartiers ont des Talents” since 2008 and is the largest provider of professional employee mentors. In just four years, 365 Societe Generale mentors have helped more than 1,423 young graduates from underprivileged areas in the Paris region, Aquitaine, Nord Pas de Calais, Picardie, Rhône Alpes, and Provence Alpes Cote d’Azur. Drawing on their invaluable advice, 699 graduates were able to find a permanent contract that matches their qualifications in under six months. In November 2013, the association rewarded Societe Generale with an Equal Opportunity Award to recognise the Group’s actions and commitment in this area.
n in Brazil:
The Gol de Trabalho programme emphasises training and employability of young people and adults in the field of administration. The project works to support the Gol de Letra Foundation in acquiring equipment and developing educational and cultural activities to improve the training of young people and increase their knowledge. Hiring interviews are carried out through partnerships with companies.
The Luciole programme offers 90 young people and adults from São Paulo’s shanty towns the opportunity to participate in gastronomy vocational training or in a preparatory course for
entry into university or technical school. In 2013, 13 young people and adults were able to enter a university, including eight with a full scholarship, and 29 found employment. In 2014, the goal is to further facilitate access for this disadvantaged group.
The Societe Generale Institute also contributes to the “Jovem Aprendiz” (Young Apprentice) government programme, which aims to help young people enter the job market and targets medium-sized companies and large corporations that are able to guarantee a rate of 5% to 15% of young apprentices in their total headcount. At the end of 2013, 38 young apprentices had an internship with a Group entity in Brazil.
Employee commitment
MENTORING
For an employee of the company, mentoring involves providing support to a person who is socially marginalised or far removed from the labour market in his or her schooling, orientation or job search by sharing experience and advice.
In 2013, 300 Societe Generale employees in France acted as mentors within the Foundation’s six partner associations.
Examples of associations dedicated to mentoring: Proxité, Nos Quartiers ont des Talents, Solidarités Nouvelles face au Chômage, Frateli, Mozaïk RH, Capital Filles.
SKILLS SPONSORSHIP
Skills sponsorship allows the Group to make its employees available occasionally to associations that are partners of the Foundation or supported by Societe Generale.
All told, the initiatives by the Foundation and local Group entities in 2013 represented 2,326 working days during which Group employees were able to devote their time to charity work. Nearly 250 people participated in one of the offered skills sponsorship opportunities.
n Financial Education project: This joint programme between Societe Generale and CRÉSUS allowed 70 bank employees, accompanied by 11 members of CRÉSUS, to meet with 1,500 young apprentices between the ages of 16 and 25. (See also Sect. 1, “Financial Education”, page 225)
n Pro Bono Days: These are one-off skills sponsorship events during which Societe Generale allows several employees to volunteer professional services to one or more public-interest associations. During one day, Societe Generale employees lend their professional skills to support an association on an issue identified in advance.
n “Value of Education” initiative: in Romania, 40,000 young people do not attend school regularly, and 40% of children under age 15 do not write and speak Romanian fluently. More than 100 employees of BRD have volunteered to participate in the “Value of Education” programme, which aims to convince young people not to drop out of school. These volunteers will receive training and guidance on how to present themselves before they go to 60 schools to explain to 1,500 students how their schooling has helped them in life, particularly with regard to the social integration.
SOCIETE GENERALE GROUP I 2014 REGISTRATION DOCUMENT I 255
SOCIETE GENERALE CITIZENSHIP I CORPORATE SOCIAL RESPONSIBILITY I 5
CITIZEN COMMITMENT WEEK
The Citizen Commitment Week is an important event dedicated to solidarity within the Societe Generale group around the world. The Group’s entities take part in charity work over a week, particularly as part of the charity challenge and local events like in Paris with the Paris to London Bike Ride and the Special Olympics. This week highlights the commitment to associations and partners of the solidarity sector.
Solidarity Challenge
In 2013, emphasis was placed on mentoring job seekers. Through the “La boîte à conseils” (Advice Box) programme, employees had the opportunity to donate their time to answer questions from job seekers supported by partner associations. Partner associations were given 1,100 tips.
Citizen Commitment Awards
In 2013, more than 5,100 Societe Generale employees around the world honoured the following three projects supported by the Group from among 10 pre-selected projects:
2013 winners:
n the Romanian project to fight illiteracy for young people and adults coordinated by Fondation Inocenti, supported by BRD, the Group’s Romanian subsidiary;
n the Moroccan project to promote professional integration of young people coordinated by the association Sidi Bernoussi, supported by SGMA, Societe Generale’s subsidiary in Morocco;
n the project to promote professional integration and fight illiteracy coordinated by Espace 19, supported by Talents & Partage, the association of employees and retirees of the Group.
TALENTS & PARTAGE: THE EMPLOYEES AND RETIREES GROUP’S CHARITY
Founded in 1994 by Societe Generale employees and retirees, this charity seeks to organise, carry out and support humanitarian actions with employees of the Group or their spouses and children invested in the value of solidarity. It is growing internationally.
CULTURAL SPONSORSHIP
Classical music and contemporary art are the two foundations of Societe Generale’s cultural sponsorship. Societe Generale relies on strong commitments to support its communication policy and the development of its businesses. Conducted centrally or locally by the Group’s subsidiaries, the partnerships primarily focus on culture and sport.
In 2013, more than EUR 8.8 million was devoted to cultural sponsorship and patronage.
Contemporary art
Since it first began in 1995, Societe Generale’s contemporary art collection has grown to feature some 350 original works. Structured around three main media - painting, sculpture, photography - it combines the works of both established and new artists. Open to all audiences, emphasis is also placed on fun and educational guided tours for younger visitors. Outside of the Group’s walls, the works are regularly loaned to museums in France’s largest towns and cities, as well as to foreign institutions.
Classical music
The Societe Generale group has become one of the key players in classical music, particularly through the association Mécénat Musical Societe Generale, created in 1987. With an annual budget of EUR 1.5 million, the association supports orchestras and ensembles, purchases and lends instruments to young talented musicians, allocates scholarships to students, or funds educational projects introducing children to classical music. In addition, Societe Generale is a supporter of symbolic venues such as the Salle Pleyel in Paris, the Glyndebourne Festival (UK), the National Theatre of Prague, and the Festival d’Aix-en-Provence.
In 2013, Societe Generale started “Playing for Salle Pleyel”, a musical ensemble gathering some Societe Generale employees and the Les Siècles orchestra. Open to any employee, whether experienced performer or a beginner, the project brought together 180 singers and 45 instrumentalists and was a big hit. A new edition is planned for 2014 for Societe Generale’s 150th anniversary. Beyond classical artistic sponsorship, this operation allows employees to be directly involved with the Group’s artistic sponsorship approach.
256 I 2014 REGISTRATION DOCUMENT I SOCIETE GENERALE GROUP
5 I CORPORATE SOCIAL RESPONSIBILITY I SOCIETE GENERALE CITIZENSHIP
SPORTS SPONSORSHIP AND PARTNERSHIPS
Societe Generale is committed to forging sports partnerships alongside its other activities around the world. A fervent supporter of today’s sporting heroes and international competitions, and committed to bringing sports to younger generations, Societe Generale is a privileged partner of national federations and local clubs alike. Primarily involved in rugby, golf and disabled sports, the Group allocated EUR 17 million to its sports partnerships in 2013, including EUR 0.432 million to disabled sports alone.
Rugby
As an international Group, Societe Generale is not only a devoted partner of rugby at the local level, involved in more than 450 amateur clubs, a partner of professional rugby, and a partner of France’s team. Through its subsidiaries, the group also supports rugby in many countries around the world, from Luxembourg to China, from Senegal to Serbia. Every four years since 2007, Societe Generale has been the major partner of the Rugby World Cup, the impact of which allows the 120 member nations of the international federation to structure and promote rugby in their countries. Rugby sevens, which has been supported and cheered on by Societe Generale since 2001 and will become an Olympic sport in 2016, will allow the group to spread rugby awareness to new populations, school children or students.
Golf
The partnership with the French Golf Federation began in 2001. The Group also became a partner in 2008 of the only major tournament now taking place in continental Europe, the Evian Championship.
Disabled sports
Since 2003, Societe Generale has worked with the Paralympic movement. Professionalism, team spirit and dynamism are values shared by the French Disabled Sports Federation (FFH – Fédération Française Handisport) and the French Adaptive Sports Federation (FFSA - Fédération Française du Sport Adapté), two French federations for sports dedicated to people with disabilities. The partnership celebrated its 10-year anniversary in 2013.
In 2013, in partnership with the associations Secours Populaire and Sport dans la Ville, Societe Generale invited 200 young people from Lyon to a “disabled sport discovery” day during the Paralympic Athletics World Championships.
SOCIETE GENERALE GROUP I 2014 REGISTRATION DOCUMENT I 257
APPENDICES I CORPORATE SOCIAL RESPONSIBILITY I 5
6 . A P P E N D I C E S
METHODOLOGY
The purpose of this note is to explain the reporting methodology used by the Societe Generale Group for matters relating to Corporate Social Responsibility (CSR).
Reporting protocolThe information contained in this Registration Document, on the Group’s website and in other communication media, as well as in the Group’s activity and sustainable development report, whether pertaining to the 2013 fiscal year or to previous years, was prepared on the basis of contributions from the Group’s internal network of sustainable development officers and in accordance with the Group’s CSR reporting protocol and CSR initiatives programme. It is also prepared on the basis of data from the “Planethic Reporting” tool, used for the standardised collection of the indicators used to keep track of the various initiatives. The entire reporting protocol is coordinated by the Group’s CSR Department, reporting to the Corporate Secretary, which has distributed an Internal Instruction defining the procedure for collecting and reporting CSR information and indicators.
Regular efforts are made to bring contributors and managers on board and familiarise them with the reporting protocol and the tool in the interest of increasing data reliability.
Reporting Period
SOCIAL DATA:
Subject to exceptions, quantitative indicators are calculated for the period running from 1 January 2013 to 31 December 2013 (12 months), with data taken at 31 December 2013.
SPONSORSHIP DATA:
Subject to exceptions, quantitative indicators are calculated for the period running from 1 December 2012 to 30 November 2013 (12 months), with data taken at 30 November 2013.
ENVIRONMENTAL AND BUSINESS DATA:
Subject to exceptions, quantitative indicators are calculated for the period running from 1 December 2012 to 30 November 2013 (12 months), with data taken at 30 November 2013.
CSR Consolidation ScopeEntities included in the reporting scope meet at least one of the following criteria:
n entities in which the parent company, Societe Generale SA (SGSA), directly or indirectly holds a controlling interest exceeding 50%. All branches are wholly owned;
n entities in which SGSA holds a controlling interest of at least 20% and no more than 50% and has a clear influence on its subsidiary’s management and financial policy, particularly when the entity’s management team is appointed by Societe Generale and when the entity is regularly monitored by the Group’s business divisions.
The CSR consolidation includes 123 companies within the Group’s financial consolidation scope at 31 December 2013.
Data CollectionThe following data collection methods are used for the scope defined above:
n for social, environmental and sponsorship data, most quantitative indicators are collected by each Group entity via the “Planethic Reporting” tool, then consolidated at Group level by the Sustainable Development Department;
n other data are collected by the Group’s CSR Department directly from CSR contributors of the business divisions or from the relevant departments (Purchasing Department, Risk Division, Human Resources Department).
Reporting ToolThe vast majority of data is collected via the “Planethic Reporting” tool, available to all Societe Generale Group subsidiaries. The tool is used to input social, environmental and societal data.
Planethic Reporting has several levels of control:
n collectors enter data from their subsidiary;
n validators check and validate the data entered from their entity;
n administrators check and validate the data from their business division;
n central administrators perform final checks at Group level before consolidation.
IndicatorsDuring a formal communication campaign, all contributors were informed of the data collection schedule, a Group Instruction and a protocol for each category of indicators. The protocol serves as a reminder of indicator definitions and application criteria. “Planethic Reporting” contributors and the Group’s CSR Department reviewed the indicators during conference calls held for this purpose.
258 I 2014 REGISTRATION DOCUMENT I SOCIETE GENERALE GROUP
5 I CORPORATE SOCIAL RESPONSIBILITY I APPENDICES
The 2013 indicators were chosen particularly in respect of information requirements under the “Grenelle II” Law (in accordance with Article L. 225-102-1 of the French Commercial Code).
These indicators are provided for a global scope. However, some of these indicators cannot be consistently applied to a global scope. In such cases, the indicators were analysed for the scope of France or Societe Generale SA in France (excluding subsidiaries).
Scope and main management rules for calculation of social indicatorsThe frequency rate of accidents in the workplace is the ratio of the number of accidents in the workplace (as defined by local regulations) to the total number of hours worked, multiplied by 1,000,000.
The rate of absenteeism is the ratio of the number of days absent paid to the total number of days paid, as a percentage. It is counted in calendar days and is calculated based on total number of employees (multiplied by 335).
The scope of the charts “Breakdown of staff by age bracket” and “Breakdown of staff by length of service” (page 241) is the CSR consolidation scope as defined above, to which should be added the headcount of the shared service centres in Bucharest and Bangalore but excluding the headcount of entities in Germany (GEFA, PEMA GmbH, KAG Munich, On Vista), South Korea (SG Securities), India (ALD), Morocco (Sogelease, Eqdom), Mauritania (SG Mauritania) and Russia (Delta Credit), for which this information is not consolidated.
Scope and main management rules for environmental indicatorsIn 2013, the data collection scope was adjusted because of greater integration of Rosbank (75%). In 2012, only the Moscow region was taken into account. The goal is to reach 100% coverage for this structure in 2014.
Coverage of the total data collection scope corresponds to the ratio of the headcount of all entities that participated in the data collection campaign to the total headcount of Societe Generale. With 148,324 employees counted, Societe Generale estimates that the total data collection scope – i.e. accounting for at least the data on occupants and surface area – covers approximately 97% of the workforce, which is higher than in 2012.
The data table lists the data for the reference year 2007, and for the years 2011, 2012 without the incorporation of Rosbank, 2012 with the incorporation of Rosbank (i.e. the Moscow region) and 2013.
Environmental data: general rulesEnvironmental data are calculated on the basis of invoices, direct readings, information received from suppliers and estimates.
In 2013, checks on variation compared to last year were performed for all environmental indicators. Contributors received alerts asking them to check the recorded data (+/-30%).
The data collected on energy, office paper and transport were compared to the number of occupants declared by entity.
Wherever possible, the number of occupants concerned corresponds to the average number of Societe Generale employees or contractors working on-site during the reporting period or at 30 November 2013.
Coverage of the data collection scope for each indicator is the ratio of the headcount of all entities having completed the indicator to the total headcount of Societe Generale.
With the exception of Societe Generale’s French Network, most subsidiaries consolidate their data in the reporting tool. In order to complete the picture provided by the centralised data, the reporting rate on waste data for about 5,100 branches (excluding the French Network) was estimated. Such data are often very difficult to obtain either because there is no measurement or because branches generate low volumes of waste that are treated by local authorities.
The data collection rate for a sample of 90 branches was 65%. The coverage rate of the scope given in the waste data report was therefore weighted by this reporting rate.
New indicators were added in 2013:
n business travel by air (short-, medium- and long-haul for business class);
n CO2 equivalent emissions from fluorinated gases;
n CO2 emissions related to the transport of goods.
Numerous indicators were eliminated in 2013: air-conditioned areas and many types of waste (fluorescent bulbs, toner cartridges, food industry grease, frying oils, batteries, plastics, wood, glass and scrap iron).
QUALITATIVE ENVIRONMENTAL DATA:
In the interest of continually improving the reliability of data, qualitative questions (answers in multiple-choice or written form) are used to identify different scopes of data and best practices and to understand year-to-year variations.
CENTRALISED ENVIRONMENTAL DATA:
Transport and paper consumption data for France are centralised by the CSR Department via the Purchasing Department:
Transport data: n business travel by car: ALD Automotive is the long-term vehicle
leasing supplier for the Group’s entities in the countries where ALD Automotive operates. Since 2011, ALD Automotive has reported on mileage (in km), consumption and type of fuel used as well as CO2 emissions for France. ALD Automotive also provides emission data for the entire fleet outside France according to three criteria:
– Societe Generale ALD fleet data by subsidiary or by country;
– average data for ALD Automotive customer fleets by country;
SOCIETE GENERALE GROUP I 2014 REGISTRATION DOCUMENT I 259
APPENDICES I CORPORATE SOCIAL RESPONSIBILITY I 5
– the previous year’s fleet data in Planethic Reporting by subsidiary or by country.
n business travel by train: for each entity, the Group-approved travel agency in France provided data on the main destinations of employees working in France. The data is included in the reporting process. Outside France, subsidiaries report data directly via the reporting process.
n business travel by air: for each entity, the Group-approved travel agency in France provided data on air mileage as per the definitions used by Societe Generale (short-, medium- and long-haul and business/economy class). For some entities (particularly outside France), the definition of short-, medium- and long-haul air travel mileage differs from the reporting protocol definition (<500 km, <1,600 km, >1,600 km).
Paper consumption:
In 2013, the reporting scope on paper consumption covered photocopy paper, paper for customers, account statements, envelopes and other types of paper.
The Group-approved office supplier, Lyreco, provided data on the quantities of office paper and blank envelopes purchased in 2013 in France and by entity.
Calculation of CO2 emissionsCalculation of the Group’s CO2 emissions is broken down into three categories:
n scope 1 includes direct emissions related to energy consumption and fugitive emissions of fluorinated gases by the central departments;
n scope 2 includes indirect emissions related to energy consumption (external electricity, steam and chilled water);
n scope 3 includes GHG emissions related to office paper consumption and business travel. Since 2012, the scope has been expanded to include paper, transport of goods within France and the energy consumption of data centres in France.
CO2 emissions are calculated according to the GHG Protocol method.
260 I 2014 REGISTRATION DOCUMENT I SOCIETE GENERALE GROUP
5 I CORPORATE SOCIAL RESPONSIBILITY I APPENDICES
INDEPENDENT VERIFIER’S REPORT ON CONSOLIDATED SOCIAL, ENVIRONMENTAL AND SOCIETAL INFORMATION PRESENTED IN THE MANAGEMENT REPORTSociete Generale - Year ended 31 December 2013Independent verifier’s report on consolidated social, environmental and societal information presented in the management report.
To the shareholders,
In our quality as an independent verifier of which the admissibility of the application for accreditation has been accepted by the COFRAC, under the number n° 3-1050, and as a member of the network of one of the statutory auditors of the company Societe Generale, we present our report on the consolidated social, environmental and societal information established for the year ended on the 31 December 2013, presented in chapter 5 of the management report, hereafter referred to as the “CSR Information,” pursuant to the provisions of the article L.225-102-1 of the French Commercial Code (Code de commerce).
RESPONSIBILITY OF THE COMPANY
It is the responsibility of the Executive Board to establish a management report including CSR Information referred to in the article R. 225-105-1 of the French Commercial Code (Code de commerce), in accordance with the protocols used by the company (hereafter referred to as the “Criteria”), and of which a summary is included in chapter 5 of the management report (the “Methodology Note”).
INDEPENDENCE AND QUALITY CONTROL
Our independence is defined by regulatory requirements, the Code of Ethics of our profession as well as the provisions in the article L. 822-11 of the French Commercial Code (Code de commerce). In addition, we have implemented a quality control system, including documented policies and procedures to ensure compliance with ethical standards, professional standards and applicable laws and regulations.
RESPONSIBILITY OF THE INDEPENDENT VERIFIER
It is our role, based on our work:
n to attest whether the required CSR Information is present in the management report or, in the case of its omission, that an appropriate explanation has been provided, in accordance with the third paragraph of R. 225-105 of the French Commercial Code (Code de commerce) (Attestation of presence of CSR Information);
n to express a limited assurance conclusion, that the CSR Information, overall, is fairly presented, in all material aspects, in according with the Criteria;
Our verification work was undertaken by a team of seven people between October 2013 and February 2014 for an estimated duration of five months.
We conducted the work described below in accordance with the professional standards applicable in France and the Order of 13 May
2013 determining the conditions under which an independent third-party verifier conducts its mission, and in relation to the opinion of fairness and the reasonable assurance report, in accordance with the international standard ISAE 3000(1).
1. Attestation of presence of CSR InformationWe obtained an understanding of the company’s CSR issues, based on interviews with the management of relevant departments, a presentation of the company’s strategy on sustainable development based on the social and environmental consequences linked to the activities of the company and its societal commitments, as well as, where appropriate, resulting actions or programmes.
We have compared the information presented in the management report with the list as provided for in the Article R. 225-105-1 of the French Commercial Code (Code de commerce).
In the absence of certain consolidated information, we have verified that the explanations were provided in accordance with the provisions in Article R. 225-105-1, paragraph 3, of the French Commercial Code (Code de commerce).
We verified that the information covers the consolidated perimeter, namely the entity and its subsidiaries, as aligned with the meaning of the Article L.233-1 and the entities which it controls, as aligned with the meaning of the Article L.233-3 of the French Commercial Code (Code de commerce) with the limitations specified in the Methodological Note in chapter 5 of the management report.
Based on this work, and given the limitations mentioned above, we confirm the presence in the management report of the required CSR information.
2. Limited assurance on CSR Information
NATURE AND SCOPE OF THE WORK
We undertook about 30 interviews with the people responsible for the preparation of the CSR Information in the different departments BDDF, IBFS and GBIS, Sustainability, Conformity, Human Resources and Purchasing, in charge of the data collection process and, if applicable, the people responsible for internal control processes and risk management, in order to:
n assess the suitability of the Criteria for reporting, in relation to their relevance, completeness, reliability, neutrality, and understandability, taking into consideration, if relevant, industry standards;
n verify the implementation of the process for the collection, compilation, processing and control for completeness and consistency of the CSR Information and identify the procedures for internal control and risk management related to the preparation of the CSR Information.
(1) ISAE 3000 – Assurance engagements other than audits or reviews of historical information.
SOCIETE GENERALE GROUP I 2014 REGISTRATION DOCUMENT I 261
APPENDICES I CORPORATE SOCIAL RESPONSIBILITY I 5
We determined the nature and extent of our tests and inspections based on the nature and importance of the CSR Information, in relation to the characteristics of the Company, its social and environmental issues, its strategy in relation to sustainable development and industry best practices.
For the CSR Information which we considered the most important(2):
n at the level of the consolidated entity, we consulted documentary sources and conducted interviews to corroborate the qualitative information (organisation, policies, actions, etc.), we implemented analytical procedures on the quantitative information and verified, on a test basis, the calculations and the compilation of the information, and also verified their coherence and consistency with the other information presented in the management report;
n at the level of the representative selection sites that we selected (3), based on their activity, their contribution to the consolidated indicators, their location and a risk analysis, we undertook interviews to verify the correct application of the procedures and undertook detailed tests on the basis of samples, consisting in verifying the calculations made and linking them with supporting documentation. The sample of selected sites therefore represented 42% of the total workforce.
For the other consolidated CSR information, we assessed their consistency in relation to our knowledge of the company.
Finally, we assessed the relevance of the explanations provided, if appropriate, in the partial or total absence of certain information.
We consider that the sample methods and sizes of the samples that we considered by exercising our professional judgment allow us to express a limited assurance conclusion; an assurance of a higher level would have required more extensive verification work. Due to the necessary use of sampling techniques and other limitations inherent in the functioning of any information and internal control system, the risk of non-detection of a significant anomaly in the CSR Information cannot be entirely eliminated.
CONCLUSION
Based on our work, we have not identified any significant misstatement that causes us to believe that the CSR Information, taken together, has not been fairly presented, in compliance with the Criteria.
OBSERVATIONS
Without qualifying our conclusion above, we draw your attention to the following point:
n for HR indicators, non-significant adjustments had to be made during the consolidation, reflecting non-exhaustive controls throughout the reporting process.
Paris-La Défense, the 4 of March 2014
French original signed by:
Independent Verifier
ERNST & YOUNG et Associés
Partner, Sustainable Development
Eric Duvaud
Partner
Hassan Baaj
(2) Societal and business information: economic and social territorial impact (employment, regional development), business ethics (actions undertaken to prevent bribery and corruption, measures undertaken in favour of consumers’ health and safety especially consumer protection), environmental and social Group engagements in its activities (sectorial policies, Equator Principles and their implementation), Responsible Lending approach, Positive Impact Finance approach, Financial education, Financial Inclusion, Solidarity Banking Products in France, Microfinance, Green financing for companies, support to Small and Medium-sized Enterprises.
Environmental information: GHG emissions.
Social information: employment (total headcount, hiring and dismissals), remuneration policies, absenteeism, training policies, number of hours of training.
(3) Selected sites are Crédit du Nord Group (France), Eqdom (Morocco), FRANFINANCE (France), SGEB (Bulgaria), SGMA (Morocco) and SGPM (France).
This is a free translation into English of a report issued in French and it is provided solely for the convenience of English-speaking users. This report should be read in conjunction with, and construed in accordance with, French law and professional standards applicable in France.

262 I 2014 REGISTRATION DOCUMENT I SOCIETE GENERALE GROUP
SOCIETE GENERALE GROUP I 2014 REGISTRATION DOCUMENT I 263
1. Consolidated financial statements ���������������266
2. Notes to the consolidated financial statements ��������������������������������������������������������������274
3� Statutory auditor’s report on the consolidated financial statements ����������������376
4. Societe Generale management report �����380
5. Parent company financial statements ����385
6. Notes to the parent company financial statements ��������������������������������������������������������������388
7� Statutory auditors’ report on the financial statements �������������������������������������������������434
8� Statutory Auditors ��������������������������������������������������������������������436
6F I N A N C I A L I N F O R M AT I O N

6 I FINANCIAL INFORMATION I
264 I 2014 REGISTRATION DOCUMENT I SOCIETE GENERALE GROUP
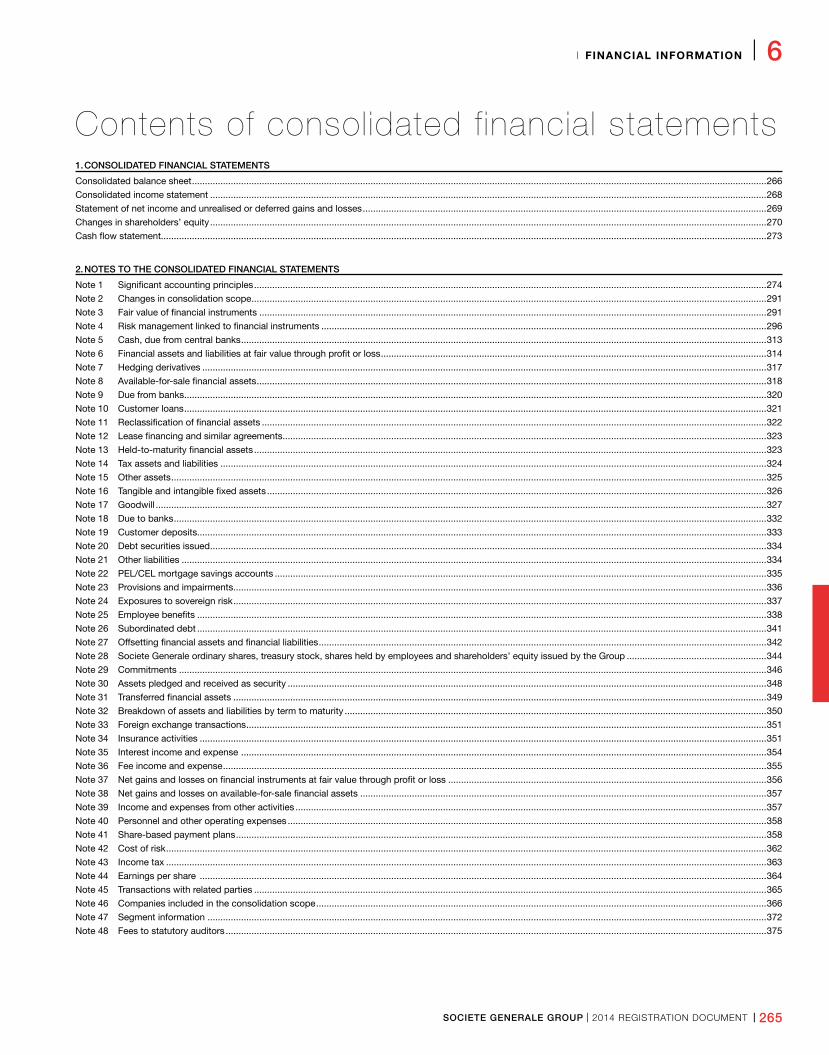
I FINANCIAL INFORMATION I 6
SOCIETE GENERALE GROUP I 2014 REGISTRATION DOCUMENT I 265
Contents of consol idated f inancial statements 1. CONSOLIDATED FINANCIAL STATEMENTS
Consolidated balance sheet ������������������������������������������������������������������������������������������������������������������������������������������������������������������������������������������������������������������������������266Consolidated income statement �����������������������������������������������������������������������������������������������������������������������������������������������������������������������������������������������������������������������268Statement of net income and unrealised or deferred gains and losses ������������������������������������������������������������������������������������������������������������������������������������������������������������269Changes in shareholders’ equity �����������������������������������������������������������������������������������������������������������������������������������������������������������������������������������������������������������������������270Cash flow statement������������������������������������������������������������������������������������������������������������������������������������������������������������������������������������������������������������������������������������������273
2. NOTES TO THE CONSOLIDATED FINANCIAL STATEMENTS
Note 1 Significant accounting principles ������������������������������������������������������������������������������������������������������������������������������������������������������������������������������������������������������274Note 2 Changes in consolidation scope �������������������������������������������������������������������������������������������������������������������������������������������������������������������������������������������������������291Note 3 Fair value of financial instruments ����������������������������������������������������������������������������������������������������������������������������������������������������������������������������������������������������291Note 4 Risk management linked to financial instruments ����������������������������������������������������������������������������������������������������������������������������������������������������������������������������296Note 5 Cash, due from central banks �����������������������������������������������������������������������������������������������������������������������������������������������������������������������������������������������������������313Note 6 Financial assets and liabilities at fair value through profit or loss �����������������������������������������������������������������������������������������������������������������������������������������������������314Note 7 Hedging derivatives ��������������������������������������������������������������������������������������������������������������������������������������������������������������������������������������������������������������������������317Note 8 Available-for-sale financial assets �����������������������������������������������������������������������������������������������������������������������������������������������������������������������������������������������������318Note 9 Due from banks ���������������������������������������������������������������������������������������������������������������������������������������������������������������������������������������������������������������������������������320Note 10 Customer loans ���������������������������������������������������������������������������������������������������������������������������������������������������������������������������������������������������������������������������������321Note 11 Reclassification of financial assets ���������������������������������������������������������������������������������������������������������������������������������������������������������������������������������������������������322Note 12 Lease financing and similar agreements�������������������������������������������������������������������������������������������������������������������������������������������������������������������������������������������323Note 13 Held-to-maturity financial assets ������������������������������������������������������������������������������������������������������������������������������������������������������������������������������������������������������323Note 14 Tax assets and liabilities �������������������������������������������������������������������������������������������������������������������������������������������������������������������������������������������������������������������324Note 15 Other assets ��������������������������������������������������������������������������������������������������������������������������������������������������������������������������������������������������������������������������������������325Note 16 Tangible and intangible fixed assets �������������������������������������������������������������������������������������������������������������������������������������������������������������������������������������������������326Note 17 Goodwill ��������������������������������������������������������������������������������������������������������������������������������������������������������������������������������������������������������������������������������������������327Note 18 Due to banks �������������������������������������������������������������������������������������������������������������������������������������������������������������������������������������������������������������������������������������332Note 19 Customer deposits����������������������������������������������������������������������������������������������������������������������������������������������������������������������������������������������������������������������������333Note 20 Debt securities issued �����������������������������������������������������������������������������������������������������������������������������������������������������������������������������������������������������������������������334Note 21 Other liabilities ����������������������������������������������������������������������������������������������������������������������������������������������������������������������������������������������������������������������������������334Note 22 PEL/CEL mortgage savings accounts ����������������������������������������������������������������������������������������������������������������������������������������������������������������������������������������������335Note 23 Provisions and impairments ��������������������������������������������������������������������������������������������������������������������������������������������������������������������������������������������������������������336Note 24 Exposures to sovereign risk ��������������������������������������������������������������������������������������������������������������������������������������������������������������������������������������������������������������337Note 25 Employee benefits ����������������������������������������������������������������������������������������������������������������������������������������������������������������������������������������������������������������������������338Note 26 Subordinated debt ����������������������������������������������������������������������������������������������������������������������������������������������������������������������������������������������������������������������������341Note 27 Offsetting financial assets and financial liabilities �����������������������������������������������������������������������������������������������������������������������������������������������������������������������������342Note 28 Societe Generale ordinary shares, treasury stock, shares held by employees and shareholders’ equity issued by the Group ������������������������������������������������������344Note 29 Commitments �����������������������������������������������������������������������������������������������������������������������������������������������������������������������������������������������������������������������������������346Note 30 Assets pledged and received as security �����������������������������������������������������������������������������������������������������������������������������������������������������������������������������������������348Note 31 Transferred financial assets ��������������������������������������������������������������������������������������������������������������������������������������������������������������������������������������������������������������349Note 32 Breakdown of assets and liabilities by term to maturity �������������������������������������������������������������������������������������������������������������������������������������������������������������������350Note 33 Foreign exchange transactions ���������������������������������������������������������������������������������������������������������������������������������������������������������������������������������������������������������351Note 34 Insurance activities ���������������������������������������������������������������������������������������������������������������������������������������������������������������������������������������������������������������������������351Note 35 Interest income and expense �����������������������������������������������������������������������������������������������������������������������������������������������������������������������������������������������������������354Note 36 Fee income and expense ������������������������������������������������������������������������������������������������������������������������������������������������������������������������������������������������������������������355Note 37 Net gains and losses on financial instruments at fair value through profit or loss ���������������������������������������������������������������������������������������������������������������������������356Note 38 Net gains and losses on available-for-sale financial assets �������������������������������������������������������������������������������������������������������������������������������������������������������������357Note 39 Income and expenses from other activities ��������������������������������������������������������������������������������������������������������������������������������������������������������������������������������������357Note 40 Personnel and other operating expenses �����������������������������������������������������������������������������������������������������������������������������������������������������������������������������������������358Note 41 Share-based payment plans �������������������������������������������������������������������������������������������������������������������������������������������������������������������������������������������������������������358Note 42 Cost of risk ����������������������������������������������������������������������������������������������������������������������������������������������������������������������������������������������������������������������������������������362Note 43 Income tax ����������������������������������������������������������������������������������������������������������������������������������������������������������������������������������������������������������������������������������������363Note 44 Earnings per share ���������������������������������������������������������������������������������������������������������������������������������������������������������������������������������������������������������������������������364Note 45 Transactions with related parties ������������������������������������������������������������������������������������������������������������������������������������������������������������������������������������������������������365Note 46 Companies included in the consolidation scope ������������������������������������������������������������������������������������������������������������������������������������������������������������������������������366Note 47 Segment information ������������������������������������������������������������������������������������������������������������������������������������������������������������������������������������������������������������������������372Note 48 Fees to statutory auditors �����������������������������������������������������������������������������������������������������������������������������������������������������������������������������������������������������������������375
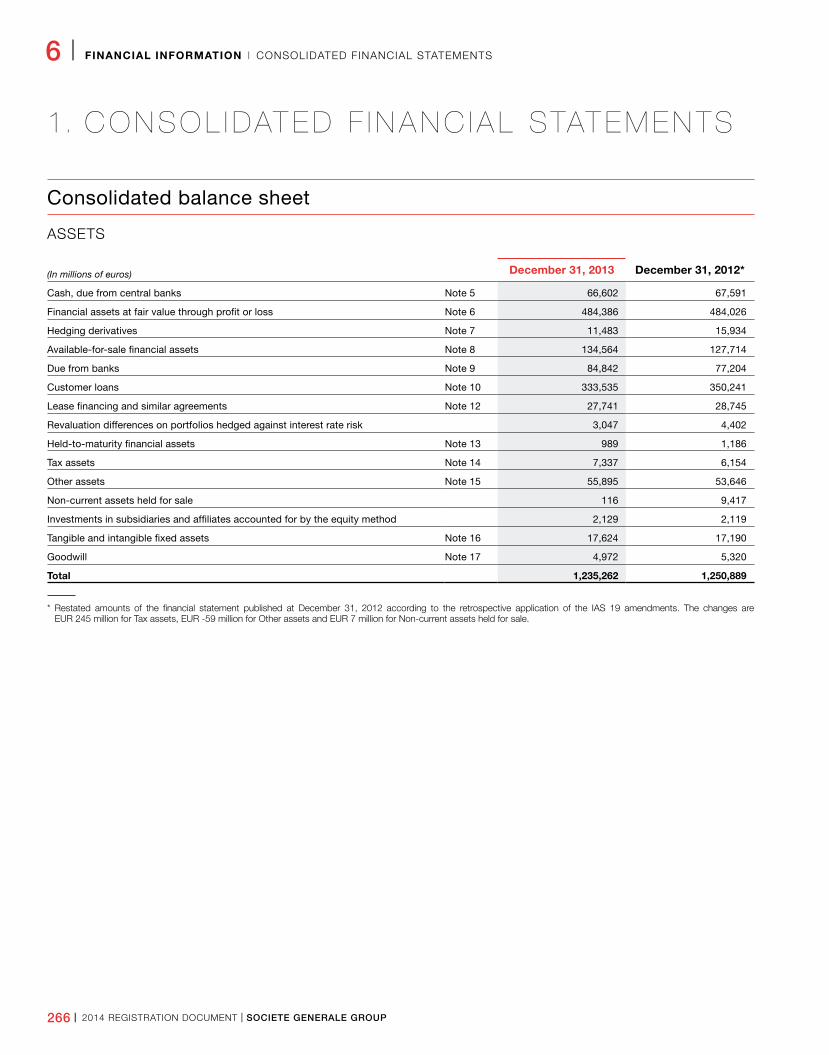
266 I 2014 REGISTRATION DOCUMENT I SOCIETE GENERALE GROUP
6 I FINANCIAL INFORMATION I CONSOLIDATED FINANCIAL STATEMENTS
1. C O N SO L I DAT E D F I N A N C I A L STAT E M E N TS
Consolidated balance sheet
ASSETS
(In millions of euros) December 31, 2013 December 31, 2012*
Cash, due from central banks Note 5 66,602 67,591
Financial assets at fair value through profit or loss Note 6 484,386 484,026
Hedging derivatives Note 7 11,483 15,934
Available-for-sale financial assets Note 8 134,564 127,714
Due from banks Note 9 84,842 77,204
Customer loans Note 10 333,535 350,241
Lease financing and similar agreements Note 12 27,741 28,745
Revaluation differences on portfolios hedged against interest rate risk 3,047 4,402
Held-to-maturity financial assets Note 13 989 1,186
Tax assets Note 14 7,337 6,154
Other assets Note 15 55,895 53,646
Non-current assets held for sale 116 9,417
Investments in subsidiaries and affiliates accounted for by the equity method 2,129 2,119
Tangible and intangible fixed assets Note 16 17,624 17,190
Goodwill Note 17 4,972 5,320
Total 1,235,262 1,250,889
* Restated amounts of the financial statement published at December 31, 2012 according to the retrospective application of the IAS 19 amendments. The changes are EUR 245 million for Tax assets, EUR -59 million for Other assets and EUR 7 million for Non-current assets held for sale.
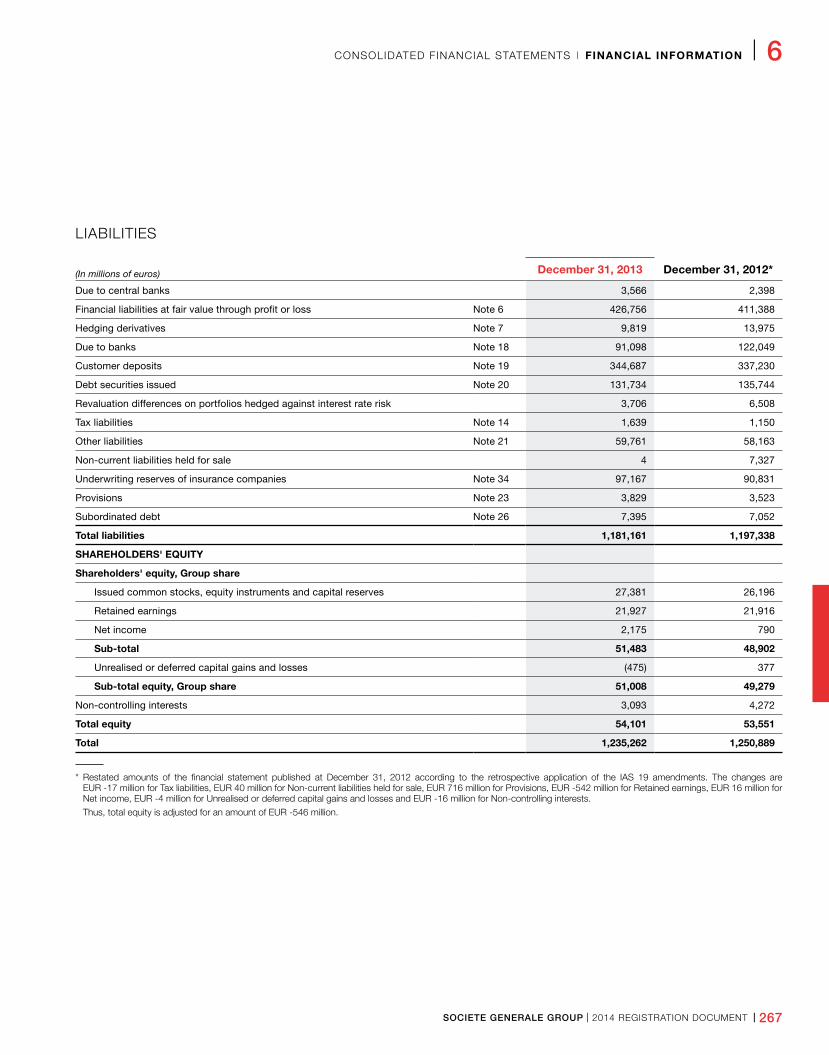
SOCIETE GENERALE GROUP I 2014 REGISTRATION DOCUMENT I 267
CONSOLIDATED FINANCIAL STATEMENTS I FINANCIAL INFORMATION I 6
LIABILITIES
(In millions of euros) December 31, 2013 December 31, 2012*
Due to central banks 3,566 2,398
Financial liabilities at fair value through profit or loss Note 6 426,756 411,388
Hedging derivatives Note 7 9,819 13,975
Due to banks Note 18 91,098 122,049
Customer deposits Note 19 344,687 337,230
Debt securities issued Note 20 131,734 135,744
Revaluation differences on portfolios hedged against interest rate risk 3,706 6,508
Tax liabilities Note 14 1,639 1,150
Other liabilities Note 21 59,761 58,163
Non-current liabilities held for sale 4 7,327
Underwriting reserves of insurance companies Note 34 97,167 90,831
Provisions Note 23 3,829 3,523
Subordinated debt Note 26 7,395 7,052
Total liabilities 1,181,161 1,197,338
SHAREHOLDERS' EQUITY
Shareholders' equity, Group share
Issued common stocks, equity instruments and capital reserves 27,381 26,196
Retained earnings 21,927 21,916
Net income 2,175 790
Sub-total 51,483 48,902
Unrealised or deferred capital gains and losses (475) 377
Sub-total equity, Group share 51,008 49,279
Non-controlling interests 3,093 4,272
Total equity 54,101 53,551
Total 1,235,262 1,250,889
* Restated amounts of the financial statement published at December 31, 2012 according to the retrospective application of the IAS 19 amendments. The changes are EUR -17 million for Tax liabilities, EUR 40 million for Non-current liabilities held for sale, EUR 716 million for Provisions, EUR -542 million for Retained earnings, EUR 16 million for Net income, EUR -4 million for Unrealised or deferred capital gains and losses and EUR -16 million for Non-controlling interests.
Thus, total equity is adjusted for an amount of EUR -546 million.
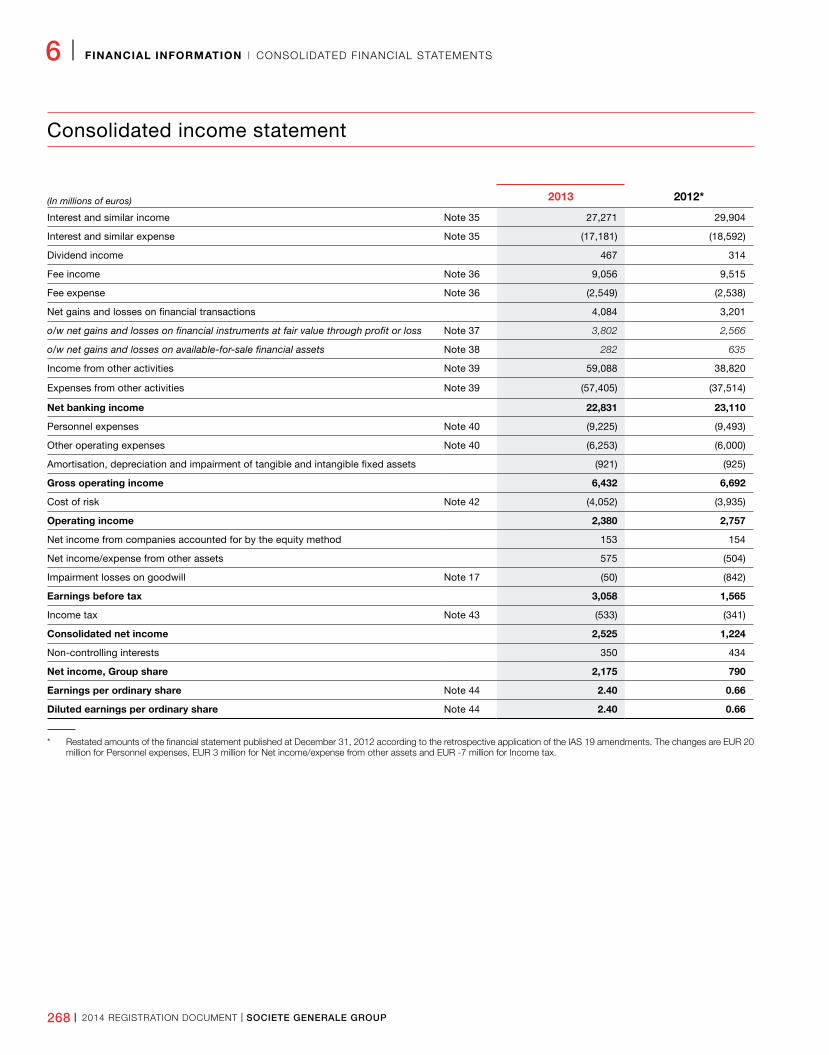
268 I 2014 REGISTRATION DOCUMENT I SOCIETE GENERALE GROUP
6 I FINANCIAL INFORMATION I CONSOLIDATED FINANCIAL STATEMENTS
Consolidated income statement
(In millions of euros) 2013 2012*
Interest and similar income Note 35 27,271 29,904
Interest and similar expense Note 35 (17,181) (18,592)
Dividend income 467 314
Fee income Note 36 9,056 9,515
Fee expense Note 36 (2,549) (2,538)
Net gains and losses on financial transactions 4,084 3,201
o/w net gains and losses on financial instruments at fair value through profit or loss Note 37 3,802 2,566
o/w net gains and losses on available-for-sale financial assets Note 38 282 635
Income from other activities Note 39 59,088 38,820
Expenses from other activities Note 39 (57,405) (37,514)
Net banking income 22,831 23,110
Personnel expenses Note 40 (9,225) (9,493)
Other operating expenses Note 40 (6,253) (6,000)
Amortisation, depreciation and impairment of tangible and intangible fixed assets (921) (925)
Gross operating income 6,432 6,692
Cost of risk Note 42 (4,052) (3,935)
Operating income 2,380 2,757
Net income from companies accounted for by the equity method 153 154
Net income/expense from other assets 575 (504)
Impairment losses on goodwill Note 17 (50) (842)
Earnings before tax 3,058 1,565
Income tax Note 43 (533) (341)
Consolidated net income 2,525 1,224
Non-controlling interests 350 434
Net income, Group share 2,175 790
Earnings per ordinary share Note 44 2.40 0.66
Diluted earnings per ordinary share Note 44 2.40 0.66
* Restated amounts of the financial statement published at December 31, 2012 according to the retrospective application of the IAS 19 amendments. The changes are EUR 20 million for Personnel expenses, EUR 3 million for Net income/expense from other assets and EUR -7 million for Income tax.
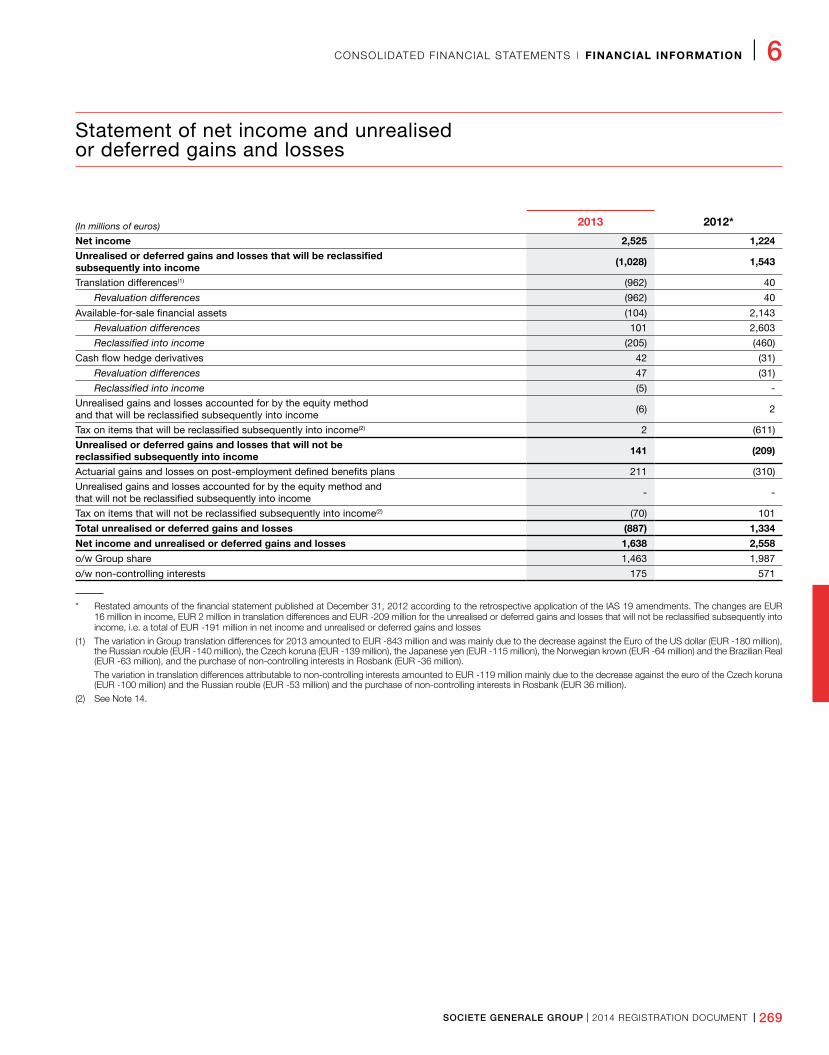
SOCIETE GENERALE GROUP I 2014 REGISTRATION DOCUMENT I 269
CONSOLIDATED FINANCIAL STATEMENTS I FINANCIAL INFORMATION I 6
Statement of net income and unrealised or deferred gains and losses
(In millions of euros) 2013 2012*
Net income 2,525 1,224Unrealised or deferred gains and losses that will be reclassified subsequently into income (1,028) 1,543
Translation differences(1) (962) 40
Revaluation differences (962) 40
Available-for-sale financial assets (104) 2,143
Revaluation differences 101 2,603
Reclassified into income (205) (460)
Cash flow hedge derivatives 42 (31)
Revaluation differences 47 (31)
Reclassified into income (5) -
Unrealised gains and losses accounted for by the equity method and that will be reclassified subsequently into income
(6) 2
Tax on items that will be reclassified subsequently into income(2) 2 (611)
Unrealised or deferred gains and losses that will not be reclassified subsequently into income 141 (209)
Actuarial gains and losses on post-employment defined benefits plans 211 (310)
Unrealised gains and losses accounted for by the equity method and that will not be reclassified subsequently into income
- -
Tax on items that will not be reclassified subsequently into income(2) (70) 101
Total unrealised or deferred gains and losses (887) 1,334
Net income and unrealised or deferred gains and losses 1,638 2,558
o/w Group share 1,463 1,987
o/w non-controlling interests 175 571
* Restated amounts of the financial statement published at December 31, 2012 according to the retrospective application of the IAS 19 amendments. The changes are EUR 16 million in income, EUR 2 million in translation differences and EUR -209 million for the unrealised or deferred gains and losses that will not be reclassified subsequently into income, i.e. a total of EUR -191 million in net income and unrealised or deferred gains and losses
(1) The variation in Group translation differences for 2013 amounted to EUR -843 million and was mainly due to the decrease against the Euro of the US dollar (EUR -180 million), the Russian rouble (EUR -140 million), the Czech koruna (EUR -139 million), the Japanese yen (EUR -115 million), the Norwegian krown (EUR -64 million) and the Brazilian Real (EUR -63 million), and the purchase of non-controlling interests in Rosbank (EUR -36 million).
The variation in translation differences attributable to non-controlling interests amounted to EUR -119 million mainly due to the decrease against the euro of the Czech koruna (EUR -100 million) and the Russian rouble (EUR -53 million) and the purchase of non-controlling interests in Rosbank (EUR 36 million).
(2) See Note 14.
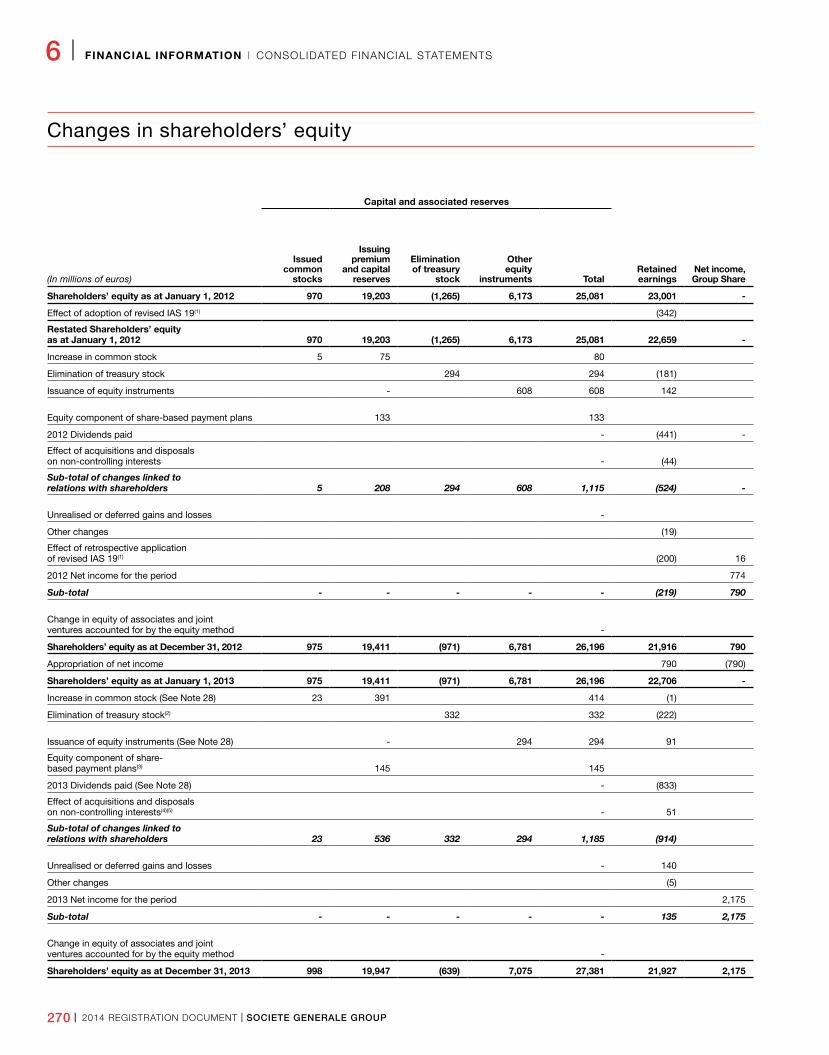
270 I 2014 REGISTRATION DOCUMENT I SOCIETE GENERALE GROUP
6 I FINANCIAL INFORMATION I CONSOLIDATED FINANCIAL STATEMENTS
Changes in shareholders’ equity
Capital and associated reserves
Retained earnings
Net income, Group Share(In millions of euros)
Issued common
stocks
Issuing premium
and capital reserves
Elimination of treasury
stock
Other equity
instruments Total
Shareholders’ equity as at January 1, 2012 970 19,203 (1,265) 6,173 25,081 23,001 -
Effect of adoption of revised IAS 19(1) (342)
Restated Shareholders’ equity as at January 1, 2012 970 19,203 (1,265) 6,173 25,081 22,659 -
Increase in common stock 5 75 80
Elimination of treasury stock 294 294 (181)
Issuance of equity instruments - 608 608 142
Equity component of share-based payment plans 133 133
2012 Dividends paid - (441) -
Effect of acquisitions and disposals on non-controlling interests - (44)
Sub-total of changes linked to relations with shareholders 5 208 294 608 1,115 (524) -
Unrealised or deferred gains and losses -
Other changes (19)
Effect of retrospective application of revised IAS 19(1) (200) 16
2012 Net income for the period 774
Sub-total - - - - - (219) 790
Change in equity of associates and joint ventures accounted for by the equity method -
Shareholders’ equity as at December 31, 2012 975 19,411 (971) 6,781 26,196 21,916 790
Appropriation of net income 790 (790)
Shareholders’ equity as at January 1, 2013 975 19,411 (971) 6,781 26,196 22,706 -
Increase in common stock (See Note 28) 23 391 414 (1)
Elimination of treasury stock(2) 332 332 (222)
Issuance of equity instruments (See Note 28) - 294 294 91
Equity component of share-based payment plans(3) 145 145
2013 Dividends paid (See Note 28) - (833)
Effect of acquisitions and disposals on non-controlling interests(4)(5) - 51
Sub-total of changes linked to relations with shareholders 23 536 332 294 1,185 (914)
Unrealised or deferred gains and losses - 140
Other changes (5)
2013 Net income for the period 2,175
Sub-total - - - - - 135 2,175
Change in equity of associates and joint ventures accounted for by the equity method -
Shareholders’ equity as at December 31, 2013 998 19,947 (639) 7,075 27,381 21,927 2,175
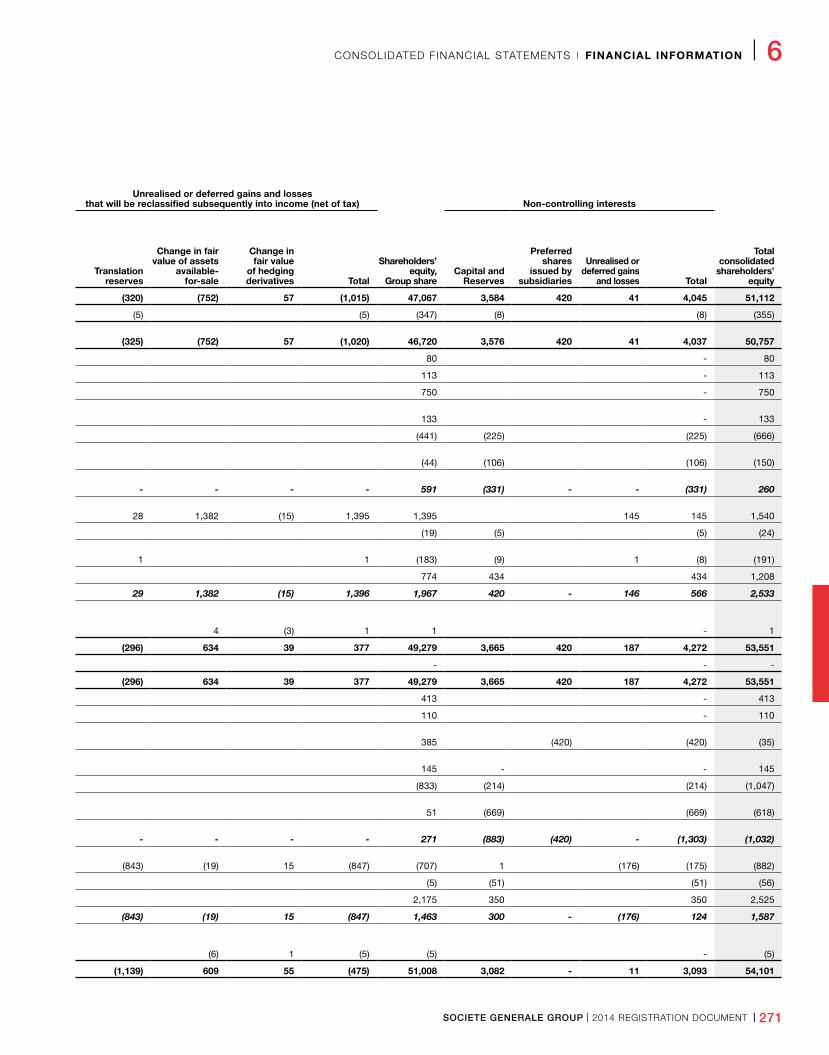
SOCIETE GENERALE GROUP I 2014 REGISTRATION DOCUMENT I 271
CONSOLIDATED FINANCIAL STATEMENTS I FINANCIAL INFORMATION I 6
Unrealised or deferred gains and losses that will be reclassified subsequently into income (net of tax)
Shareholders’ equity,
Group share
Non-controlling interests
Translation reserves
Change in fair value of assets
available-for-sale
Change in fair value
of hedging derivatives Total
Capital and Reserves
Preferred shares
issued by subsidiaries
Unrealised or deferred gains
and losses Total
Total consolidated
shareholders’ equity
(320) (752) 57 (1,015) 47,067 3,584 420 41 4,045 51,112
(5) (5) (347) (8) (8) (355)
(325) (752) 57 (1,020) 46,720 3,576 420 41 4,037 50,757
80 - 80
113 - 113
750 - 750
133 - 133
(441) (225) (225) (666)
(44) (106) (106) (150)
- - - - 591 (331) - - (331) 260
28 1,382 (15) 1,395 1,395 145 145 1,540
(19) (5) (5) (24)
1 1 (183) (9) 1 (8) (191)
774 434 434 1,208
29 1,382 (15) 1,396 1,967 420 - 146 566 2,533
4 (3) 1 1 - 1
(296) 634 39 377 49,279 3,665 420 187 4,272 53,551
- - -
(296) 634 39 377 49,279 3,665 420 187 4,272 53,551
413 - 413
110 - 110
385 (420) (420) (35)
145 - - 145
(833) (214) (214) (1,047)
51 (669) (669) (618)
- - - - 271 (883) (420) - (1,303) (1,032)
(843) (19) 15 (847) (707) 1 (176) (175) (882)
(5) (51) (51) (56)
2,175 350 350 2,525
(843) (19) 15 (847) 1,463 300 - (176) 124 1,587
(6) 1 (5) (5) - (5)
(1,139) 609 55 (475) 51,008 3,082 - 11 3,093 54,101
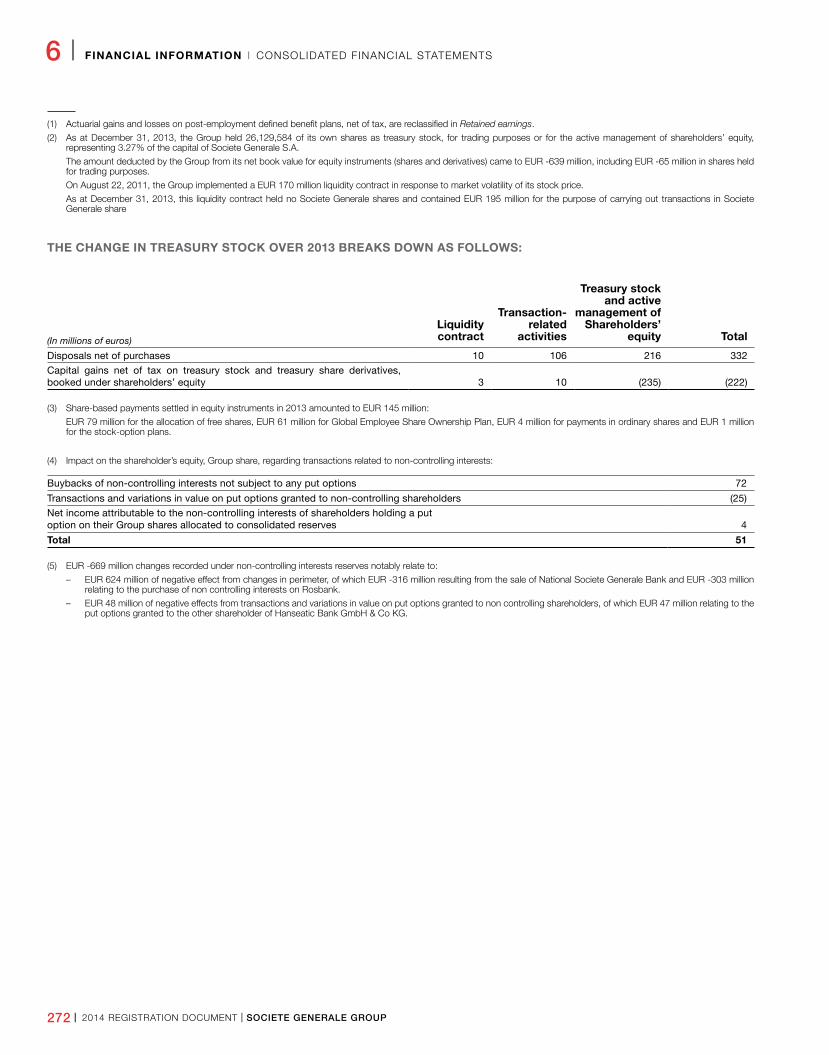
272 I 2014 REGISTRATION DOCUMENT I SOCIETE GENERALE GROUP
6 I FINANCIAL INFORMATION I CONSOLIDATED FINANCIAL STATEMENTS
(1) Actuarial gains and losses on post-employment defined benefit plans, net of tax, are reclassified in Retained earnings.
(2) As at December 31, 2013, the Group held 26,129,584 of its own shares as treasury stock, for trading purposes or for the active management of shareholders’ equity, representing 3.27% of the capital of Societe Generale S.A.
The amount deducted by the Group from its net book value for equity instruments (shares and derivatives) came to EUR -639 million, including EUR -65 million in shares held for trading purposes.
On August 22, 2011, the Group implemented a EUR 170 million liquidity contract in response to market volatility of its stock price.
As at December 31, 2013, this liquidity contract held no Societe Generale shares and contained EUR 195 million for the purpose of carrying out transactions in Societe Generale share
THE CHANGE IN TREASURY STOCK OVER 2013 BREAKS DOWN AS FOLLOWS:
(In millions of euros)
Liquidity contract
Transaction-related
activities
Treasury stock and active
management of Shareholders’
equity Total
Disposals net of purchases 10 106 216 332Capital gains net of tax on treasury stock and treasury share derivatives, booked under shareholders’ equity 3 10 (235) (222)
(3) Share-based payments settled in equity instruments in 2013 amounted to EUR 145 million:
EUR 79 million for the allocation of free shares, EUR 61 million for Global Employee Share Ownership Plan, EUR 4 million for payments in ordinary shares and EUR 1 million for the stock-option plans.
(4) Impact on the shareholder’s equity, Group share, regarding transactions related to non-controlling interests:
Buybacks of non-controlling interests not subject to any put options 72
Transactions and variations in value on put options granted to non-controlling shareholders (25)Net income attributable to the non-controlling interests of shareholders holding a put option on their Group shares allocated to consolidated reserves 4
Total 51
(5) EUR -669 million changes recorded under non-controlling interests reserves notably relate to:
– EUR 624 million of negative effect from changes in perimeter, of which EUR -316 million resulting from the sale of National Societe Generale Bank and EUR -303 million relating to the purchase of non controlling interests on Rosbank.
– EUR 48 million of negative effects from transactions and variations in value on put options granted to non controlling shareholders, of which EUR 47 million relating to the put options granted to the other shareholder of Hanseatic Bank GmbH & Co KG.
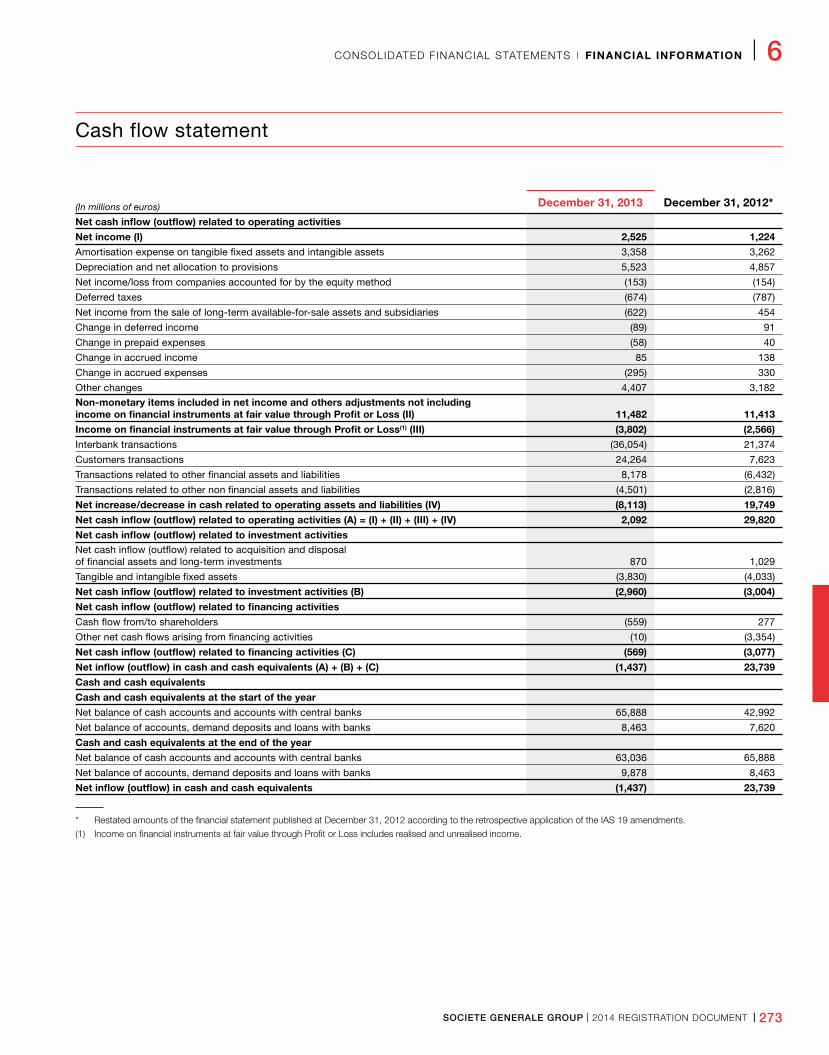
SOCIETE GENERALE GROUP I 2014 REGISTRATION DOCUMENT I 273
CONSOLIDATED FINANCIAL STATEMENTS I FINANCIAL INFORMATION I 6
Cash flow statement
(In millions of euros) December 31, 2013 December 31, 2012*
Net cash inflow (outflow) related to operating activities
Net income (I) 2,525 1,224
Amortisation expense on tangible fixed assets and intangible assets 3,358 3,262
Depreciation and net allocation to provisions 5,523 4,857
Net income/loss from companies accounted for by the equity method (153) (154)
Deferred taxes (674) (787)
Net income from the sale of long-term available-for-sale assets and subsidiaries (622) 454
Change in deferred income (89) 91
Change in prepaid expenses (58) 40
Change in accrued income 85 138
Change in accrued expenses (295) 330
Other changes 4,407 3,182Non-monetary items included in net income and others adjustments not including income on financial instruments at fair value through Profit or Loss (II) 11,482 11,413
Income on financial instruments at fair value through Profit or Loss(1) (III) (3,802) (2,566)
Interbank transactions (36,054) 21,374
Customers transactions 24,264 7,623
Transactions related to other financial assets and liabilities 8,178 (6,432)
Transactions related to other non financial assets and liabilities (4,501) (2,816)
Net increase/decrease in cash related to operating assets and liabilities (IV) (8,113) 19,749
Net cash inflow (outflow) related to operating activities (A) = (I) + (II) + (III) + (IV) 2,092 29,820
Net cash inflow (outflow) related to investment activitiesNet cash inflow (outflow) related to acquisition and disposal of financial assets and long-term investments 870 1,029
Tangible and intangible fixed assets (3,830) (4,033)
Net cash inflow (outflow) related to investment activities (B) (2,960) (3,004)
Net cash inflow (outflow) related to financing activities
Cash flow from/to shareholders (559) 277
Other net cash flows arising from financing activities (10) (3,354)
Net cash inflow (outflow) related to financing activities (C) (569) (3,077)
Net inflow (outflow) in cash and cash equivalents (A) + (B) + (C) (1,437) 23,739
Cash and cash equivalents
Cash and cash equivalents at the start of the year
Net balance of cash accounts and accounts with central banks 65,888 42,992
Net balance of accounts, demand deposits and loans with banks 8,463 7,620
Cash and cash equivalents at the end of the year
Net balance of cash accounts and accounts with central banks 63,036 65,888
Net balance of accounts, demand deposits and loans with banks 9,878 8,463
Net inflow (outflow) in cash and cash equivalents (1,437) 23,739
* Restated amounts of the financial statement published at December 31, 2012 according to the retrospective application of the IAS 19 amendments.
(1) Income on financial instruments at fair value through Profit or Loss includes realised and unrealised income.
274 I 2014 REGISTRATION DOCUMENT I SOCIETE GENERALE GROUP
6 I FINANCIAL INFORMATION I NOTES TO THE CONSOLIDATED FINANCIAL STATEMENTS I NOTE 1
2. N OT ES TO T H E C O N SO L I DAT E D F I N A N C I A L STAT E M E N TS
The consolidated financial statements were approved by the Board of Directors on February 11, 2014.
Note 1
SIGNIFICANT ACCOUNTING PRINCIPLES n Introduction
n 1. Consolidation principles
n 2. Accounting policies and valuation methods
n 3. Presentation of financial statements
n 4. Accounting standards and interpretations to be applied by the Group in the future
INTRODUCTION
In accordance with European Regulation 1606/2002 of July 19, 2002 on the application of International Accounting Standards, the
Societe Generale Group (“the Group”) prepared its consolidated financial statements for the year ended December 31, 2013 in accordance with International Financial Reporting Standards (IFRS) as adopted by the European Union and in force at that date (these standards are available on the European Commission website at: http://ec.europa.eu/internal_market/accounting/ias/index_en.htm).
The standards comprise IFRS 1 to 8, IFRS 13 and International Accounting Standards (IAS) 1 to 41, as well as the interpretations of these standards adopted by the European Union as at December 31, 2013.
The Group also continued to make use of the provisions of IAS 39, as adopted by the European Union, for applying macro-fair value hedge accounting (IAS 39 “carve-out”).
The consolidated financial statements are presented in euros.
IFRS AND IFRIC INTERPRETATIONS APPLIED BY THE GROUP AS OF JANUARY 1, 2013
Accounting standards, amendments or Interpretations:Publication
dates by IASB
Adoption dates by European
Union
Amendments to IAS 1 “Presentation of Items of Other Comprehensive Income” June 16, 2011 June 5, 2012
Amendments to IAS 19 “Employee Benefits” June 16, 2011 June 5, 2012
IFRS 13 “Fair Value Measurement” May 12, 2011 December 11, 2012
Amendments to IAS 12 “Deferred Tax: Recovery of Underlying Assets” December 20, 2010 December 11, 2012
Amendments to IFRS 7 “Disclosures - Offsetting Financial Assets and Financial Liabilities” December 16, 2011 December 13, 2012
Improvements to IFRSs (2009-2011) - May 2012 May 17, 2012 March 27, 2013
n Amendments to IAS 1 “Presentation of Items of Other Comprehensive Income”Amendments to IAS 1 “Presentation of Financial Statements” modify the presentation of the statement of net income and unrealised or deferred gains and losses to distinguish items that will be reclassified subsequently into income from those that will not be reclassified subsequently into income. In addition, the amount, net of tax, of actuarial gains and losses on post-employment defined benefit plans, recognised during the period and that will not be reclassified subsequently into income, is directly transferred in Retained earnings at the end of the financial year.
n Amendments to IAS 19 “Employee Benefits”The amendments to IAS 19 “Employee Benefits” trigger the immediate recognition of actuarial gains and losses on post-employment
defined benefit plans under Unrealised or deferred capital gains and losses, without subsequent reclassification into income. Furthermore, the amendments imply the immediate recognition in the income statement of past service costs when a plan is amended, whether or not the benefits have been vested. These amendments have been applied retrospectively and their effects on the previous financial years have been recorded into equity. The opening equity of 2012 and the comparative figures for 2012 have been restated, the amounts of these restatements are disclosed at the bottom of the consolidated financial statements.
n IFRS 13 “Fair Value measurement”IFRS 13 “Fair value measurement” defines fair value as the price that would be received to sell an asset or paid to transfer a liability in an orderly transaction between market participants at the measurement
SOCIETE GENERALE GROUP I 2014 REGISTRATION DOCUMENT I 275
NOTE 1 I NOTES TO THE CONSOLIDATED FINANCIAL STATEMENTS I FINANCIAL INFORMATION I 6
date. IFRS 13 does not change when the fair value is required to be used but specifies how to measure fair value of financial and non-financial assets and liabilities when required or permitted by IFRS and adds information to be disclosed in the notes to financial statements. The consequences of this standard mainly concern how the Group incorporates its own credit risk in the fair value measurement of derivative financial liabilities (Debt Value Adjustment – DVA). Furthermore, the clarifications provided by this standard have led the Group to adjust how it incorporates the counterparty risk in the fair value measurement of derivative financial assets (Credit Value Adjustment – CVA).
IFRS 13 have been applied prospectively as from January 1, 2013. Accordingly, the impact of these amendments on the Group’s consolidated financial statements has been recorded in the income of the period (See Note 37).
n Amendments to IAS 12 “Deferred Tax: Recovery of Underlying Assets”The measurement of deferred tax depends on whether the entity expects to recover the carrying amount of the asset through use or sale. The amendment introduces a presumption that the carrying amount will be recovered through sale unless the entity has clearly decided otherwise. This presumption applies to investment properties carried at fair value. These amendments have no impact on consolidated financial statements of the Group.
n Amendments to IFRS 7 “Disclosures - Offsetting Financial Assets and Financial Liabilities”These amendments require the disclosure of information about rights of set-off and related similar agreements for financial instruments. The new disclosures are required for all financial instruments that are offset in the balance sheet in accordance with IAS 32 (gross amounts of financial assets and liabilities that are offset, amounts that are offset and net amounts presented in the balance sheet). Additional information must also be disclosed for recognised financial instruments that are subject to an enforceable master netting agreement or similar agreement, irrespective of whether they are offset in accordance with IAS 32. These additional disclosures are presented in Note 27 “Offsetting Financial Assets and Financial Liabilities”
n Improvements to IFRSs (2009-2011) - May 2012As part of the annual Improvements to International Financial Reporting Standards, the IASB has published amendments to six minor accounting standards. These amendments have no impact on the Group’s consolidated financial statements.
The main valuation and presentation rules used in drawing up the consolidated financial statements are disclosed below. These accounting methods and principles were applied consistently in 2012 and 2013.
USE OF ESTIMATESWhen applying the accounting principles disclosed below for the purpose of preparing the Group’s consolidated financial statements, the Management makes assumptions and estimates that may have an
impact on figures recorded in the income statement, on the valuation of assets and liabilities in the balance sheet, and on information disclosed in the notes to the consolidated financial statements.
In order to make these assumptions and estimates, the Management uses information available at the date of preparation of the consolidated financial statements and can exercise its judgment. By nature, valuations based on estimates include risks and uncertainties relating to their occurrence in the future. Consequently, actual future results may differ from these estimates and have a significant impact on the financial statements.
The use of estimates mainly concerns the following valuations:
n fair value in the balance sheet of financial instruments not quoted in an active market which are classified as Financial assets and liabilities at fair value through profit or loss, Hedging derivatives or available-for-sale financial assets (described in paragraph 2 and Note 3) and fair value of unlisted instruments for which this information must be disclosed in the notes to the financial statements;
n the amount of impairment of financial assets (Loans and receivables, Available-for-sale financial assets, Held-to-maturity financial assets), Lease financing and similar agreements, Tangible or intangible fixed assets and Goodwill (described in paragraph 2 and Notes 4, 17 and 23);
n provisions recognised under liabilities, including Provisions for employee benefits or Underwriting reserves of insurance companies (described in paragraph 2 and Notes 22, 23, 25 and 34);
n the amount of Deferred tax assets recognised in the balance sheet (described in paragraph 2 and Note 14);
n initial value of goodwill determined for each business combination (described in paragraph 1 and Notes 2 and 17);
n in the event of the loss of control of a consolidated subsidiary, the fair value that is used to remeasure the portion retained by the Group in this entity, where applicable (described in paragraph 1).
1. CONSOLIDATION PRINCIPLESThe consolidated financial statements of Societe Generale include the financial statements of the parent company and of the main French and foreign companies as well as foreign branches that make up the Group. Since the financial statements of foreign subsidiaries and branches are prepared in accordance with accepted accounting principles in their respective countries, any necessary restatements and adjustments are made prior to consolidation so that they comply with the accounting principles used by the Societe Generale Group.
CONSOLIDATION METHODSThe consolidated financial statements are built up from the financial statements of the entities that are included in the consolidation scope. Companies with a fiscal year ending more than three months before or after that of Societe Generale prepare pro-forma statements for a twelve-month period ended December 31. All significant balances, profits and transactions between Group companies are eliminated.
276 I 2014 REGISTRATION DOCUMENT I SOCIETE GENERALE GROUP
6 I FINANCIAL INFORMATION I NOTES TO THE CONSOLIDATED FINANCIAL STATEMENTS I NOTE 1
When determining voting rights for the purpose of establishing the Group’s degree of control over a company and the appropriate consolidation methods, potential voting rights are taken into account where they can be freely exercised or converted at the time the assessment is made. Potential voting rights are instruments such as call options on ordinary shares outstanding on the market or rights to convert bonds into new ordinary shares.
The results of newly acquired subsidiaries are included in the consolidated financial statements from the date the acquisition became effective and results of subsidiaries disposed of during the fiscal year are included up to the date where the Group relinquished control.
The following consolidation methods are used:
n Full consolidationThis method is applied to companies over which Societe Generale exercises control. Control over a subsidiary is defined as the power to govern the financial and operating policies of said subsidiary so as to obtain benefits from its activities. It is exercised:
n either by directly or indirectly holding the majority of voting rights in the subsidiary;
n or by holding the power to appoint or remove the majority of the members of the subsidiary’s governing, management or supervisory bodies, or to command the majority of the voting rights at meetings of these bodies;
n or by holding the power to exert a controlling influence over the subsidiary by virtue of an agreement or provisions in the company’s charter or by-laws.
n Proportionate consolidationCompanies over which the Group exercises joint control are consolidated using the proportionate method.
Joint control exists when control over a subsidiary run jointly by a limited number of partners or shareholders is shared in such a way that the financial and operating policies of said subsidiary are determined by mutual agreement.
A contractual agreement must require the consent of all controlling partners or shareholders as regards the economic activity of said subsidiary and any strategic decisions.
n Equity methodCompanies over which the Group exercises significant influence are accounted for under the equity method. Significant influence is the power to influence the financial and operating policies of a subsidiary without exercising control over said subsidiary. In particular, significant influence can result from Societe Generale being represented on the Board of Directors or supervisory board, from its involvement in strategic decisions, from the existence of significant intercompany transactions, from the exchange of management staff, or from the company’s technical dependency on Societe Generale. The Group is assumed to exercise significant influence over the financial and operating policies of a subsidiary when it directly or indirectly holds at least 20% of the voting rights in this subsidiary.
SPECIFIC TREATMENT OF SPECIAL PURPOSE VEHICLES (SPV)Independent legal entities set up specifically to manage a transaction or group of similar transactions (“special purpose vehicles” or SPVs) are consolidated whenever they are substantially controlled by the Group, even in cases where the Group holds none of the capital in the entities.
Control of a special purpose vehicle is generally considered to exist if any one of the following criteria applies:
n the SPV’s activities are being conducted exclusively on behalf of the Group so that the Group obtains benefits from the SPV’s operation;
n the Group has the decision-making powers to obtain the majority of the benefits from the SPV’s operation, whether or not this control has been delegated through an “autopilot” mechanism;
n the Group has the ability to obtain the majority of the benefits of the SPV;
n the Group retains the majority of the risks of the SPV.
In consolidating SPVs considered to be substantially controlled by the Group, the shares of said entities not held by the Group are recognised as Debt in the balance sheet.
TRANSLATION OF FOREIGN ENTITY FINANCIAL STATEMENTSThe balance sheet items of consolidated companies reporting in foreign currencies are translated at the official exchange rates prevailing at the closing date. Income statement items of these companies are translated at the average month-end exchange rates. Gains and losses arising from the translation of capital, reserves, retained earnings and income are included in shareholders’ equity under Unrealised or deferred gains and losses – Translation differences. Gains and losses arising from the translation of the capital contribution of foreign branches of Group banks are also included in changes in consolidated shareholders’ equity under the same heading.
In accordance with the option allowed under IFRS 1, the Group allocated all differences arising on translation of foreign entity financial statements at January 1, 2004 to consolidated reserves. As a result, if any of these entities are sold, the proceeds from the sale will only include write-backs of those translation differences arising since January 1, 2004.
TREATMENT OF ACQUISITIONS AND GOODWILLThe Group uses the acquisition method to recognise its business combinations. The acquisition cost is calculated as the total fair value, at the date of acquisition, of all assets given, liabilities incurred or assumed and equity instruments issued in exchange for the control of the acquired entity. The costs directly linked to business combinations are recognised in the income statement for the period.
Any contingent consideration is included in the acquisition cost at its fair value on the acquisition date, even if its occurrence is only potential. It is recognised under equity or debt in the balance sheet depending on the settlement alternatives; any subsequent adjustments are recorded under income for financial liabilities in accordance with IAS 39 and within the scope of the appropriate standards for other debts. For equity instruments, these subsequent adjustments are not recognised.
At the acquisition date, all assets, liabilities, off-balance sheet items and contingent liabilities of the acquired entities that are identifiable under the provisions of IFRS 3 “Business Combinations” are measured individually at their fair value regardless of their purpose. The analyses and professional appraisals required for this initial valuation must be carried out within 12 months as from the acquisition date, as must any corrections to the value based on new information.
SOCIETE GENERALE GROUP I 2014 REGISTRATION DOCUMENT I 277
NOTE 1 I NOTES TO THE CONSOLIDATED FINANCIAL STATEMENTS I FINANCIAL INFORMATION I 6
Any excess of the price paid over the assessed fair value of the proportion of net assets acquired is recorded on the asset side of the consolidated balance sheet under Goodwill. Any deficit is immediately recognised in the income statement. Non-controlling interests are valued according to their share of the fair value of the identifiable assets and liabilities of the acquired entity. However, for each business combination, the Group may also choose to measure non-controlling interests initially at their fair value, in which case a fraction of goodwill is allocated. At the acquisition date, each item of goodwill is allocated to one or more cash-generating units expected to derive benefits from the acquisition. When the Group reorganises its reporting structure in a way that changes the composition of one or more cash-generating units, goodwill previously allocated to modified units shall be reallocated to the units affected (new or existing). This reallocation is generally performed using a relative approach based on the normative capital requirements of each cash-generating unit affected.
On the date of acquisition of an entity, any stake in this entity already held by the Group is remeasured at fair value through profit or loss. In the case of a step acquisition, goodwill is therefore determined by referring to the fair value on the acquisition date.
In the event of an increase in Group stakes in entities over which it already exercises control: the difference between the price paid for the additional stake and the assessed fair value of the proportion of net assets acquired at this date is recorded under the Group’s Consolidated reserves; also, in the event of a reduction in the Group’s stake in an entity over which it keeps control, the difference between the selling price and the carrying amount of the share of interests sold is accounted for under Retained earnings, Group share. The cost relative to these transactions is recognised directly in equity.
At the date when the Group loses control of a consolidated subsidiary, any investment retained in the former subsidiary is then remeasured at fair value through profit or loss, at the same time as the capital gain or loss is recorded under Net income/expense from other assets in the consolidated income statement. The gain or loss on disposal includes a share of goodwill previously allocated to the cash-generating units to which the subsidiary belongs. This share is determined using a relative approach based on the normative capital allocated to the subsidiary that is disposed and to the portion of cash-generating unit that is retained.
Goodwill is reviewed regularly by the Group and tested for impairment whenever there is any indication that its value may have diminished, and at least once a year. Any impairment of goodwill is calculated based on the recoverable value of the relevant cash-generating unit(s).
If the recoverable amount of the cash-generating unit(s) is less than its(their) carrying amount, an irreversible impairment is recorded in the consolidated income statement for the period under Impairment losses on goodwill.
Goodwill for companies that are accounted for under the equity method is recorded under Investments in subsidiaries and affiliates accounted for by the equity method in the consolidated balance sheet. These investments are tested for impairment if there is an objective evidence of impairment. If the recoverable amount of the
investment is lower than its carrying amount, an impairment loss is recorded under Net income from companies accounted by the equity method. Realised capital gains and losses on sale of these companies that are accounted for under the equity method are recognised under Net income/expense from other assets.
COMMITMENTS TO BUY OUT MINORITY SHAREHOLDERS IN FULLY CONSOLIDATED SUBSIDIARIESThe Group has awarded minority shareholders in some fully consolidated Group subsidiaries commitments to buy out their stakes. For the Group, these buyout commitments are put option sales. The exercise price for these options can be based on a formula agreed upon at the time of the acquisition of the shares of the subsidiary that takes into account its future performance or can be set as the fair value of these shares at the exercise date of the options.
The commitments are recorded as follows:
n in accordance with IAS 32, the Group recorded a financial liability for the put options granted to minority shareholders of the subsidiaries over which it exercises control. This liability was initially recognised at the present value of the estimated exercise price of the put options under Other liabilities;
n the obligation to recognise a liability even though the put options have not been exercised means that, in order to be consistent, the Group must use the same accounting treatment as that applied to transactions in non-controlling interests. As a result, the counterpart of this liability is a write-down in value of non-controlling interests underlying the options, with any balance deducted from the Group’s Consolidated reserves;
n subsequent variations in this liability linked to changes in the estimated exercise price of the options and the carrying value of non-controlling interests are recorded in full in the Group’s Consolidated reserves;
n if the buy-out takes place, the liability is settled by the cash payment linked to the acquisition of non-controlling interests in the subsidiary in question. However if, when the commitment reaches its term, the buy-out has not occurred, the liability is written off against Non-controlling interests and the Group’s Consolidated reserves for their respective portions;
n as long as the options have not been exercised, the results linked to non-controlling interests with a put option are recorded under Non-controlling interests on the Group’s consolidated income statement.
These accounting principles may be revised over the coming years in line with any amendments proposed by the IFRS Interpretations Committee (formerly IFRIC) or the IASB.
SEGMENT REPORTINGThe Group is managed on a matrix basis that takes into account of its different business lines and the geographical breakdown of its activities. Segment information is therefore presented under both criteria.
278 I 2014 REGISTRATION DOCUMENT I SOCIETE GENERALE GROUP
6 I FINANCIAL INFORMATION I NOTES TO THE CONSOLIDATED FINANCIAL STATEMENTS I NOTE 1
The Group includes in the results of each division all operating income and expenses directly related to its activity. Income for each division, except for the Corporate Centre, also includes the yield on capital allocated to it, based on the estimated rate of return on Group capital. In return, the yield on the division’s book capital is reallocated to the Corporate Centre. Transactions between divisions are carried out under the same terms and conditions as those applying to non-Group customers.
The Group’s core businesses are managed through three strategic pillars:
n French Retail Banking, which includes the domestic networks Societe Generale, Crédit du Nord and Boursorama;
n International Retail Banking & Financial Services, which consists of:
– International Retail Banking including consumer finance activities,
– Corporate Financial Services and Insurance (operational vehicle leasing and fleet management, equipment finance and insurance activities).
n Global Banking and Investor Solutions which comprises:
– Corporate and Investment Banking via the “Global Markets” and “Financing & Advisory” business lines,
– Private Banking and Asset Management,
– Investor Services (Securities Services and Brokerage).
These strategic pillars are supplemented by the Corporate Centre which acts as the Group’s central funding department. As such, it recognises the cost of carry of equity investments in subsidiaries and related dividend payments, as well as income and expenses stemming from the Group’s Asset and Liability Management (ALM) and income from the Group’s management of its assets (management of its industrial and bank equity portfolio and of its real estate assets). Income and expenses that do not relate directly to the activity of the core businesses are also allocated to the Corporate Centre.
Segment income is presented taking into account internal transactions in the Group, while segment assets and liabilities are presented after their elimination. The tax rate levied on each business line is based on the standard tax rate applicable in each country where the division makes profits. Any difference with respect to the Group’s tax rate is allocated to the Corporate Centre. For the purpose of segment reporting by geographical region, segment profit or loss and assets and liabilities are presented based on the location of the booking entities.
2. ACCOUNTING POLICIES AND VALUATION METHODS
TRANSACTIONS DENOMINATED IN FOREIGN CURRENCIESAt the balance sheet date, monetary assets and liabilities denominated in foreign currencies are translated into the entity’s functional currency at the prevailing spot exchange rate. Realised or unrealised foreign exchange losses or gains are recognised in the income statement.
Forward foreign exchange transactions are recognised at fair value based on the forward exchange rate for the remaining maturity. Spot foreign exchange positions are valued using the official spot rates prevailing at the end of the period. Unrealised gains and losses are recognised in the income statement.
Non-monetary financial assets denominated in foreign currencies, including shares and other variable income securities that are not part of the trading portfolio, are converted into the entity’s functional currency at the exchange rate prevailing at the end of the period. Currency differences arising on these financial assets are recorded to shareholders’ equity and are only recorded in the income statement when sold or impaired or where the currency risk is fair value-hedged. In particular, non-monetary assets funded by a liability denominated in the same currency are converted at the spot rate prevailing at the end of the period while booking the impact of exchange rate fluctuations to income subject to a fair value hedge relationship existing between the two financial instruments.
DETERMINING THE FAIR VALUE OF FINANCIAL INSTRUMENTSFair value is the price that would be received to sell an asset or paid to transfer a liability in an orderly transaction between market participants at the measurement date. The valuation methods used by the Group to establish the fair value of financial instruments are detailed in Note 3.
FINANCIAL ASSETS AND LIABILITIESPurchases and sales of non-derivative financial assets at fair value through profit or loss, held-to-maturity financial assets and available-for-sale financial assets (see below) are recognised in the balance sheet at the delivery-settlement date while derivatives are recognised at the trade date. Changes in fair value between the trade and settlement dates are recorded in the income statement or to shareholders’ equity depending on the accounting category of the relevant financial assets. Loans and receivables are recorded in the balance sheet on the date they are paid or at the maturity date for invoiced services.
When initially recognised, financial assets and liabilities are measured at fair value including transaction costs (except for financial instruments recognised at fair value through profit or loss) and classified under one of the four categories detailed below.
If the initial fair value is based on observable market data, any difference between the fair value and the transaction price, i.e. the sales margin, is immediately recognised in the income statement. However, if valuation parameters are not observable or if the valuation models are not recognised by the market, the initial fair value of the financial instrument is deemed to be the transaction price and the sales margin is then generally recognised in the income statement over the life of the instrument. For some instruments, due to their complexity, this margin is recognised at their maturity or in the event of early sale. Where substantial volumes of issued instruments are traded on a secondary market with quoted prices, the sales margin is recognised in the income statement in accordance with the method used to determine the instrument’s price. When valuation parameters become observable, any portion of the sales margin that has not yet been recorded is recognised in the income statement at that time.
SOCIETE GENERALE GROUP I 2014 REGISTRATION DOCUMENT I 279
NOTE 1 I NOTES TO THE CONSOLIDATED FINANCIAL STATEMENTS I FINANCIAL INFORMATION I 6
n Loans and receivablesLoans and receivables include non-derivative financial assets with fixed or determinable payments that are not quoted in an active market, held for trading purposes or held for sale from the time they are originated or acquired. Loans and receivables are recognised in the balance sheet under Due from banks or Customer loans depending on the type of counterparty. Thereafter, they are valued at amortised cost using the effective interest rate method and impairment may be recorded if appropriate.
n Financial assets and liabilities at fair value through profit or lossThese are financial assets and liabilities held for trading purposes. They are recorded at fair value at the balance sheet date and recognised in the balance sheet under Financial assets or liabilities at fair value through profit or loss. Changes in their fair value are recorded in the income statement as Net gains and losses on financial instruments at fair value through profit or loss.
This category also includes non-derivative financial assets and liabilities designated by the Group upon initial recognition to be carried at fair value through profit or loss in accordance with the option available under IAS 39. The Group’s aim in using the fair value option is:
n firstly, to eliminate or significantly reduce discrepancies in the accounting treatment of certain financial assets and liabilities.
The Group thus recognises at fair value through profit or loss some structured bonds issued by Societe Generale Corporate and Investment Banking. These issues are purely commercial and the associated risks are hedged on the market using financial instruments managed in trading portfolios. The use of the fair value option enables the Group to ensure consistency between the accounting treatment of these issued bonds and that of the derivatives hedging the associated market risks, which have to be carried at fair value.
The Group also recognises at fair value through profit or loss the financial assets held to guarantee unit-linked policies of its life insurance subsidiaries to ensure their accounting treatment matches that of the corresponding insurance liabilities. Under IFRS 4, insurance liabilities must be recognised according to local accounting principles. The revaluations of underwriting reserves on unit-linked policies, which are directly linked to revaluations of the financial assets underlying their policies, are therefore recognised in the income statement. The fair value option thus allows the Group to record changes in the fair value of the financial assets through profit or loss so that they match fluctuations in value of the insurance liabilities associated with these unit-linked policies.
n secondly, so that the Group can recognise certain compound financial instruments at fair value, thereby avoiding the need to separate embedded derivatives that would otherwise have to be recognised separately. This approach is notably used for valuation of the convertible bonds held by the Group.
n Held-to-maturity financial assetsThese are non-derivative financial assets with fixed or determinable payments and a fixed maturity, that are quoted in an active market and which the Group has the intention and ability to hold to maturity. They are measured after acquisition at their amortised cost and may be subject to impairment as appropriate. The amortised cost includes premiums and discounts as well as transaction costs. These assets are recognised in the balance sheet under Held-to-maturity financial assets.
n Available-for-sale financial assetsThese are non-derivative financial assets held for an indeterminate period which the Group may sell at any time. By default, these are any assets that do not fall into one of the above three categories. These financial assets are recognised in the balance sheet under Available-for-sale financial assets and measured at their fair value at the balance sheet date. Interest accrued or paid on fixed-income securities is recognised in the income statement using the effective interest rate method under Interest and similar income – Transactions in financial instruments. Changes in fair value other than income are recorded in shareholders’ equity under Unrealised or deferred capital gains and losses. The Group only records the changes in fair value in the income statement when assets are sold or impaired, in which case they are reported as Net gains and losses on available-for-sale financial assets. Impairments regarding equity securities recognised as Available-for-sale financial assets are irreversible. Dividend income earned on these securities is recorded in the income statement under Dividend income.
SECURITIES LENDING AND BORROWINGSecurities involved in a repurchase agreement or securities lending transaction are held in their original position on the asset side of the Group’s balance sheet. For repurchase agreements, the obligation to return the amounts deposited is recorded under Liabilities on the liabilities side of the balance sheet, with the exception of transactions initiated under trading activities, which are recorded under Financial liabilities at fair value through profit or loss.
Securities involved in a reverse repurchase agreement or securities borrowing transaction are not recorded in the Group’s balance sheet. However, in the event the borrowed securities are subsequently sold, a debt representing the return of these securities to their lender is recorded on the liabilities side of the Group’s balance sheet, under Financial liabilities at fair value through profit or loss. For securities received under a reverse repurchase agreement, the right to recover the amounts delivered by the Group is recorded under Loans and receivables on the asset side of the balance sheet, with the exception of transactions initiated under trading activities, which are recorded under Financial assets at fair value through profit or loss.
Securities lending and securities borrowing transactions that are fully matched by cash are assimilated to repurchase and reverse repurchase agreements and are recorded and recognised as such in the balance sheet.
RECLASSIFICATION OF FINANCIAL ASSETSAfter their initial recognition, financial assets may not be later reclassified as Financial assets at fair value through profit or loss.
A non-derivative financial asset, initially recognised as an asset held for trading purposes under Financial assets at fair value through profit or loss, may be reclassified out of its category when it fulfils the following conditions:
280 I 2014 REGISTRATION DOCUMENT I SOCIETE GENERALE GROUP
6 I FINANCIAL INFORMATION I NOTES TO THE CONSOLIDATED FINANCIAL STATEMENTS I NOTE 1
n if a financial asset with fixed or determinable payments, initially held for trading purposes, can no longer, after acquisition, be quoted in an active market and the Group has the intention and ability to hold it for the foreseeable future or until maturity, then this financial asset may be reclassified in the Loans and receivables category, provided that the eligibility criteria for this category are met;
n if rare circumstances generate a change of the holding purpose of non-derivative debt or equity financial assets held for trading, then these assets may be reclassified in Available-for-sale financial assets or in Held-to-maturity financial assets, provided in the latter case that the eligibility criteria for this category are met.
In any case, financial derivatives and financial assets measured using the fair value option shall not be reclassified out of Financial assets at fair value through profit or loss.
A financial asset initially recognised under Available-for-sale financial assets may be reclassified in Held-to-maturity financial assets, provided that the eligibility criteria for this category are met. Furthermore, if a financial asset with fixed or determinable payments initially recognised under Available-for-sale financial assets can subsequently no longer be quoted in an active market and if the Group has the intention and ability to hold it for the foreseeable future or until maturity, then this financial asset may be reclassified in Loans and receivables provided that the eligibility criteria for this category are met.
These reclassified financial assets are transferred to their new category at their fair value at the date of reclassification and are subsequently measured according to the rules that apply to the new category. The amortised cost of financial assets reclassified out of Financial assets at fair value through profit or loss or Available-for-sale financial assets to Loans and receivables and the amortised cost of financial assets reclassified out of Financial assets at fair value through profit or loss to Available-for-sale financial assets are determined on the basis of estimated future cash flows measured at the date of reclassification. The estimated future cash flows must be reviewed at each closing date. In the event of an increase in estimated future cash flows, as a result of an increase in their recoverability, the effective interest rate is adjusted prospectively. However, if there is objective evidence that the financial asset has been impaired as a result of an event occurring after reclassification and that loss event has a negative impact on the estimated future cash flows of the financial asset, the impairment of this financial asset is recognised under Cost of risk in the income statement.
DEBTSGroup borrowings that are not classified as financial liabilities recognised through profit or loss are initially recognised at cost, measured as the fair value of the amount borrowed net of transaction fees. These liabilities are valued at period-end and at amortised cost using the effective interest rate method, and are recognised in the balance sheet under Due to banks, Customer deposits or Debt securities issued.
n Amounts due to banks and Customer depositsAmounts due to banks and customer deposits are classified according to their initial duration and type: demand (demand deposits and current accounts) and time deposits and borrowings in the case of banks; regulated savings accounts and other deposits in the case of customers. They also include securities sold to banks and customers under repurchase agreements.
Interest accrued on these accounts at the effective interest rate is recorded as Related payables and as an expense in the income statement.
n Debt securities issuedThese liabilities are classified by type of security: loan notes, interbank market certificates, negotiable debt instruments, bonds and other debt securities excluding subordinated notes, which are classified under Subordinated debt.
Interest accrued on these debt instruments, determined using the effective interest rate, are recorded as Related payables and as an expense in the income statement. Bond issuance and redemption premiums are amortised at the effective interest rate over the life of the related borrowings. The resulting charge is recognised under Interest expense in the income statement.
SUBORDINATED DEBTThis item includes all dated or undated borrowings, whether or not in the form of debt securities, which in the event of the liquidation of the borrowing company may only be redeemed after all other creditors have been paid. Interest accrued and payable in respect of long-term subordinated debt, if any, is recorded as Related payables and as an expense in the income statement.
DERECOGNITION OF FINANCIAL ASSETS AND LIABILITIESThe Group derecognises all or part of a financial asset (or group of similar assets) when the contractual rights to the cash flows on the asset expire or when the Group has transferred the contractual rights to receive the cash flows and substantially all of the risks and rewards linked to the ownership of the asset.
Where the Group has transferred the cash flows of a financial asset but has neither transferred nor retained substantially all the risks and rewards of its ownership and has effectively not retained control of the financial asset, the Group derecognises it and, where necessary, recognises a separate asset or liability to cover any rights and obligations created or retained as a result of the asset’s transfer. If the Group has retained control of the asset, it continues to recognise it in the balance sheet to the extent of its continuing involvement in that asset.
When a financial asset is derecognised in its entirety, a gain or loss on disposal is recorded in the income statement for an amount equal to the difference between the carrying value of the asset and the payment received for it, adjusted where necessary for any unrealised profit or loss previously recognised directly in equity.
The Group only derecognises all or part of a financial liability when it is extinguished, i.e. when the obligation specified in the contract is discharged, cancelled or expired.
SOCIETE GENERALE GROUP I 2014 REGISTRATION DOCUMENT I 281
NOTE 1 I NOTES TO THE CONSOLIDATED FINANCIAL STATEMENTS I FINANCIAL INFORMATION I 6
FINANCIAL DERIVATIVES AND HEDGE ACCOUNTINGAll financial derivatives are recognised at fair value in the balance sheet as financial assets or financial liabilities. Changes in the fair value of financial derivatives, except those designated as cash flow hedges (see below), are recognised in the income statement for the period.
Financial derivatives are divided into two categories:
n Trading financial derivativesDerivative instruments are considered to be trading financial derivatives by default, unless they are designated as hedging instruments for accounting purposes. They are recorded in the balance sheet under Financial assets or liabilities at fair value through profit or loss. Changes in fair value are recorded in the income statement under Net gains and losses on financial instruments at fair value through profit or loss.
Changes in the fair value of financial derivatives involving counterparties which subsequently went into default are recorded under Net gains and losses on financial instruments at fair value through profit or loss until the termination date of these instruments. At this termination date, receivables and debts on these counterparties are recognised at fair value in the balance sheet. Any further impairment on these receivables is recognised under Cost of risk in the income statement.
n Derivative hedging instrumentsTo designate an instrument as a derivative hedging instrument, the Group must document the hedging relationship at the inception of the hedge. This documentation specifies the asset, liability, or future transaction hedged, the risk to be hedged, the type of financial derivative used and the valuation method applied to measure its effectiveness. The derivative designated as a hedging instrument must be highly effective in offsetting the change in fair value or cash flows arising from the hedged risk, both when the hedge is first set up and throughout its life. Derivative hedging instruments are recognised in the balance sheet under Hedging derivatives.
Depending on the risk hedged, the Group designates the derivative as a fair value hedge, cash flow hedge, or currency risk hedge for a net foreign investment.
Fair value hedgeIn a fair value hedge, the carrying value of the hedged item in the balance sheet is adjusted for gains and losses attributable to the hedged risk, which are reported in the income statement under Net gains and losses on financial instruments at fair value through profit or loss. To the extent that the hedge is highly effective, changes in the fair value of the hedged item are accurately reflected in the fair value of the derivative hedging instrument. As regards interest rate derivatives, accrued interest income or expenses are recorded in the income statement under Interest income and expense – Hedging derivatives at the same time as the interest income or expense related to the hedged item.
If it becomes apparent that the derivative has ceased to meet the effectiveness criteria for hedge accounting or if it is terminated or sold, hedge accounting is discontinued prospectively. Thereafter, the carrying amount of the hedged asset or liability ceases to be adjusted for changes in fair value and the cumulative adjustments previously recognised under hedge accounting are amortised over its remaining life. Hedge accounting is discontinued automatically if the hedged item is sold before maturity or redeemed early.
Cash flow hedgeIn a cash flow hedge (including hedges of highly probable forecast transactions), the effective portion of the changes in fair value of the hedging derivative instrument is recognised in a specific equity account, while the ineffective portion is recognised in the income statement under Net gains and losses on financial instruments at fair value through profit or loss.
Amounts directly recognised in equity under cash flow hedge accounting are reclassified in Interest income and expense in the income statement at the same time as the cash flows being hedged. Accrued interest income or expense on hedging derivatives is recorded in the income statement under Interest income and expense – Hedging derivatives at the same time as the interest income or expense related to the hedged item.
Whenever the hedging derivative ceases to meet the effectiveness criteria for hedge accounting or is terminated or sold, hedge accounting is discontinued prospectively. Amounts previously recognised directly in equity are reclassified under Interest income and expense in the income statement over the periods where the interest margin is affected by cash flows arising from the hedged item. If the hedged item is sold or redeemed earlier than expected or if the forecast transaction hedged ceases to be highly probable, unrealised gains and losses recognised in equity are immediately reclassified in the income statement.
Hedging of a net investment in a foreign operationAs with a cash flow hedge, the effective portion of the changes in the fair value of the hedging derivative designated for accounting purposes as a hedge of a net investment is recognised in equity under Unrealised or deferred gains and losses while the ineffective portion is recognised in the income statement.
Macro-fair value hedgeIn this type of hedge, interest rate derivatives are used to globally hedge structural interest rate risks usually arising from Retail Banking activities. When accounting for these transactions, the Group applies the IAS 39 “carve-out” standard as adopted by the European Union, which facilitates:
n the application of fair value hedge accounting to macro-hedges used for asset-liability management, including customer demand deposits in the fixed-rate positions being hedged;
282 I 2014 REGISTRATION DOCUMENT I SOCIETE GENERALE GROUP
6 I FINANCIAL INFORMATION I NOTES TO THE CONSOLIDATED FINANCIAL STATEMENTS I NOTE 1
n the performance of effectiveness tests required by IAS 39 as adopted by the European Union.
The accounting treatment of financial derivatives designated as macro-fair value hedge is similar to that for other fair value hedging instruments. Changes in fair value of the portfolio of macro-hedged instruments are reported on a separate line in the balance sheet under Revaluation differences on portfolios hedged against interest rate risk through profit or loss.
Embedded derivativesAn embedded derivative is a component of a hybrid instrument. If this hybrid instrument is not measured at fair value through profit or loss, the Group separates the embedded derivative from its host contract if, at the inception of the transaction, the economic characteristics and risks of the derivative are not closely related to the economic characteristics and risk profile of the host contract and it would separately meet the definition of a derivative. Once separated, the derivative is recognised at its fair value in the balance sheet under Financial assets or liabilities at fair value through profit or loss and accounted for as above. The host contract is classified and measured according to its accounting category.
IMPAIRMENT OF FINANCIAL ASSETS
n Financial assets measured at amortised costAt each balance sheet date, the Group assesses whether there is objective evidence that any financial asset or group of financial assets has been impaired as a result of one or more events occurring since they were initially recognised (a “loss event”) and whether that loss event (or events) has (have) an impact on the estimated future cash flows of the financial asset or group of financial assets that can be reliably estimated.
The Group first assesses whether objective evidence of impairment exists individually for financial assets that are individually significant, and individually or collectively for financial assets that are not individually significant. Notwithstanding the existence of a guarantee, the criteria used to assess objective evidence of credit risk include the existence of unpaid instalments overdue by over three months (over six months for real estate loans and over nine months for loans to local authorities) or independently of the existence of any unpaid amount, the existence of objective evidence of credit risk counterparty or when the counterparty is subject to judicial proceedings.
If there is objective evidence that loans or other receivables, or financial assets classified as Held-to-maturity financial assets, are impaired, an impairment is recognised for the difference between the carrying amount and the present value of estimated future recoverable cash flows, taking into account any guarantees, this discount is calculated using the financial assets’ original effective interest rate. The depreciation is deducted from the carrying value of the impaired financial asset. Allocations to and reversals of impairments are recorded under Cost of risk. The impaired loans or receivables are remunerated for accounting purposes by the reversal over time of the discounting to present value, which is recorded under Interest and similar income in the income statement.
Where there is no objective evidence that an impairment loss has been incurred on a financial instrument considered individually, be it significant or not, the Group includes that financial asset in a group of financial assets having similar characteristics in terms of credit risk and tests the whole group for impairment.
In a homogenous portfolio, as soon as a credit risk is incurred on a group of financial instruments, impairment is recognised without waiting for the risk to individually affect one or more receivables. Homogeneous portfolios thus impaired can include:
n receivables on counterparties which have encountered financial difficulties since these receivables were initially recognised, without any objective evidence of impairment having yet been identified at the individual level (sensitive receivables) or;
n receivables on counterparties linked to economic sectors considered as being in crisis further to the occurrence of loss events or;
n receivables on geographical sectors or countries on which a deterioration of credit risk has been assessed.
The amount of impairment on a group of homogeneous assets is notably determined on the basis of historical default or loss data for assets with credit risk characteristics similar to those in the portfolio, or using hypothetical extreme loss scenarios or, if necessary, ad-hoc studies. These factors are then adjusted to reflect any relevant current economic conditions. Allocations to and reversals of such impairment are recorded under Cost of risk.
n Available-for-sale financial assetsAn available-for-sale financial asset is impaired if there is objective evidence of impairment as a result of one or more events that occurred after the initial recognition of this asset.
For listed equity instruments, a significant or prolonged decline in their price below their acquisition cost constitutes objective evidence of impairment. For this purpose, the Group considers as impaired listed shares showing an unrealised loss greater than 50% of their acquisition price on the balance sheet date, as well as listed shares for which the quoted prices have been below their acquisition price on every trading day for at least the last 24 months before the balance sheet date. Further factors, such as the financial situation of the issuer or its development outlook, can lead the Group to consider that the cost of its investment may not be recovered even if the above-mentioned criteria are not met. An impairment loss is then recorded through profit or loss equal to the difference between the last quoted price of the security on the balance sheet date and its acquisition price.
For unlisted equity instruments, the criteria used to assess the evidence of impairment are identical to those mentioned above; the value of these instruments at the balance sheet date is determined using the valuation methods described in Note 3.
The criteria for the impairment of debt instruments are similar to those for the impairment of financial assets measured at amortised cost.
When a decline in the fair value of an available-for-sale financial asset has been recognised directly in shareholders’ equity under Unrealised or deferred gains and losses and subsequent objective evidence of
SOCIETE GENERALE GROUP I 2014 REGISTRATION DOCUMENT I 283
NOTE 1 I NOTES TO THE CONSOLIDATED FINANCIAL STATEMENTS I FINANCIAL INFORMATION I 6
impairment emerges, the Group recognises the total accumulated unrealised loss previously recorded in shareholders’ equity in the income statement under Cost of risk for debt instruments and under Net gains and losses on available-for-sale financial assets for equity securities.
This cumulative loss is measured as the difference between the acquisition cost (net of any repayments of principal and amortisation) and the present fair value, less any impairment of the financial asset that has already been recorded through profit or loss.
Impairment losses recognised through profit or loss on an equity instrument classified as available-for-sale are only reversed through profit or loss when the instrument is sold. Once a shareholders’ equity instrument has been recognised as impaired, any further loss of value is recorded as an additional impairment loss. For debt instruments, however, an impairment loss is reversed through profit or loss if they subsequently recover in value.
LEASE FINANCING AND SIMILAR AGREEMENTSLeases are classified as finance leases if they substantially transfer all the risks and rewards incident to ownership of the leased asset to the lessee. Otherwise they are classified as operating leases.
Lease finance receivables are recognised in the balance sheet under Lease financing and similar agreements and represent the Group’s net investment in the lease, calculated as the present value of the minimum payments to be received from the lessee discounted at the interest rate implicit in the lease, plus any unguaranteed residual value.
Interest included in the lease payments is recorded under Interest and similar income in the income statement such that the lease generates a constant periodic rate of return on the lessor’s net investment. If there has been a reduction in the estimated unguaranteed residual value used to calculate the lessor’s gross investment in the finance lease, the present value of this reduction is recognised as a loss under Expenses from other activities in the income statement and as a reduction of lease finance receivables on the asset side of the balance sheet.
Operating fixed assets held under operating lease activities are presented in the balance sheet under Tangible and intangible fixed assets. In the case of buildings, they are recorded as Investment property under the same heading. Lease payments are recognised in the income statement on a straight-line basis over the life of the lease under Income from other activities. Income invoiced for maintenance services provided in connection with leasing activities are recognised under Income from other activities and their accounting treatment aims to show over the life of the lease a constant margin on these products in relation to the expense incurred.
TANGIBLE AND INTANGIBLE FIXED ASSETSOperating and investment fixed assets are carried at their purchase price on the asset side of the balance sheet. Borrowing expenses incurred to fund a lengthy construction period for the fixed assets are included in the acquisition cost, along with all other directly attributable expenses. Investment subsidies received are deducted from the cost of the relevant assets.
Software developed internally is recorded on the asset side of the balance sheet in the amount of the direct cost of development. This includes external expenditures on hardware and services and personnel expenses which can be directly attributed to the production of the asset and its preparation for use.
As soon as they are fit for use, fixed assets are depreciated over their useful life. Any residual value of the asset is deducted from its depreciable amount. If there is a subsequent decrease or increase in this initial residual value, the depreciable amount of the asset is adjusted, leading to a prospective modification of the depreciation schedule.
Amortisations are recorded in the income statement under Amortisation, depreciation and impairment of tangible and intangible fixed assets.
When one or more components of a fixed asset are used for different purposes or to generate economic benefits over a different time period from the asset considered as a whole, these components are depreciated over their own useful life. The Group has applied this approach to its operating and investment properties, breaking down its assets into at least the following components and using their corresponding depreciation periods:
Infrastructure
Major structures 50 years
Doors and windows, roofing 20 years
Façades 30 years
Technical installations
Elevators
10 to 30 years
Electrical installations
Electricity generators
Air conditioning, extractors
Technical wiring
Security and surveillance installations
Plumbing
Fire safety equipmentFixtures and fittings Finishings, surroundings 10 years
Depreciation periods for fixed assets other than buildings depend on their useful life, which is usually estimated within the following ranges:
Plant and equipment 5 years
Transport 4 years
Furniture 10 to 20 years
Office equipment 5 to 10 years
IT equipment 3 to 5 years
Software, developed or acquired 3 to 5 years
Concessions, patents, licenses, etc. 5 to 20 years
Fixed assets are tested for impairment whenever there is any indication that their value may have diminished and, for intangible assets with an indefinite useful life, at least once a year. Evidence of a loss in value is assessed at every balance sheet date. Impairment tests are carried out on assets grouped by cash-generating unit. Where a loss is established, an impairment loss is recorded in the
284 I 2014 REGISTRATION DOCUMENT I SOCIETE GENERALE GROUP
6 I FINANCIAL INFORMATION I NOTES TO THE CONSOLIDATED FINANCIAL STATEMENTS I NOTE 1
income statement under Amortisation, depreciation and impairment of tangible and intangible fixed assets. It may be reversed when the factors that prompted impairment have changed or no longer exist. This impairment loss will reduce the depreciable amount of the asset and thus affect its future depreciation schedule.
Realised capital gains and losses on operating fixed assets are recognised under Net income from other assets, while profits or losses on investment real estate are recognised under Income from other activities.
NON-CURRENT ASSETS HELD FOR SALE AND DISCONTINUED OPERATIONSA non-current asset or group of assets and liabilities is deemed to be “held for sale” if its carrying value will primarily be recovered via a sale and not through its continuing use. For applying this classification, the asset or a group of assets and liabilities must then be immediately available-for-sale in its present condition and it must be highly probable that the sale will occur within twelve months.
For this to be the case, the Group must be committed to a plan to sell the asset (or disposal group of assets and liabilities) and have begun actively searching for a buyer. Furthermore, the asset or group of assets and liabilities must be marketed at a price that is reasonable in relation to its current fair value.
Assets and liabilities falling under this category are reclassified as Non-current assets held for sale and Non-current liabilities held for sale, with no netting.
Any negative differences between the fair value less selling costs of non-current assets and groups of assets held for sale and their net carrying value is recognised as impairment in profit or loss. Moreover, Non-current assets held for sale are no longer depreciated.
A discontinued operation is a component of an entity that either has been disposed of, or is classified as held for sale, and:
n represents a separate major line of business or geographical area of operations;
n is part of a single co-ordinated plan to dispose of a separate major line of business or geographical area of operations or;
n is a subsidiary acquired exclusively with a view to resale.
Discontinued operations are recognised as a single item in the income statement for the period, at their net income after taxes for the period up to the date of sale, combined with any net gains and losses after taxes on their disposal or on the fair value less selling costs of the assets and liabilities making up the discontinued operations. Similarly, cash flows generated by discontinued operations are recorded as a separate item in the cash flow statement for the period.
PROVISIONSProvisions, other than those for credit risk or employee benefits, represent liabilities whose timing or amount cannot be precisely determined. Provisions may be recorded where, by virtue of a commitment to a third-party, the Group will probably or certainly incur an outflow of resources to this third-party without receiving at least the equivalent value in exchange.
The expected outflows are then discounted to present value to determine the amount of the provision, where this discounting has a significant impact. Allocations to and reversals of provisions are recorded through profit or loss under the items corresponding to the future expense.
The provisions are presented in the Note 23. Information on the nature and the amount of the risks is not disclosed when the Group estimates that such disclosure could seriously prejudice its position in a dispute with other parties on the object of the provision.
COMMITMENTS UNDER “CONTRATS ÉPARGNE-LOGEMENT” (MORTGAGE SAVINGS AGREEMENTS)Comptes d’épargne-logement (CEL or mortgage savings accounts) and plans d’épargne-logement (PEL or mortgage savings plans) are special savings schemes for individual customers which are governed by Law 65-554 of July 10, 1965. These products combine an initial deposits phase in the form of an interest-earning savings account, followed by a lending phase where the deposits are used to provide mortgage loans. Under the current regulation, this last phase is subject to the prior existence of the savings phase and is therefore inseparable from it. The savings deposits collected and loans granted are measured at amortised cost.
These instruments create two types of commitments for the Group: the obligation to remunerate customer savings for an indeterminate future period at an interest rate established at the inception of the mortgage savings agreement, and the obligation to subsequently lend to the customer at an interest rate also established at the inception of the savings agreement.
If it is clear that commitments under the PEL/CEL agreements will have negative consequences for the Group, a provision is recorded on the liabilities side of the balance sheet. Any changes in these provisions are recognised as Net banking income under net interest income. These provisions only relate to commitments arising from PEL/CEL that are outstanding at the date of calculation.
Provisions are calculated for each generation of mortgage savings plans (PEL), with no netting between different PEL generations, and for all mortgage saving accounts (CEL) making up a single generation.
During the deposits phase, the underlying commitment used to determine the amount to be provisioned is calculated as the difference between the average expected amount of deposits and the minimum expected amount. These two amounts are determined statistically on the basis of the historical observations of past customer behaviour.
During the lending phase, the underlying commitment to be provisioned includes loans already granted but not yet drawn at the date of calculation, and future loans that are considered statistically probable on the basis of deposits that are currently recognised in the balance sheet at the date of calculation and on the basis of historical observations of past customer behaviour.
A provision is recognised if the discounted value of expected future earnings for a given generation of PEL/CEL is negative. Earnings are estimated on the basis of interest rates available to individual customers for equivalent savings and loan products, with a similar estimated life and date of inception.
LOAN COMMITMENTS
The Group initially recognises at fair value loan commitments that are not considered as financial derivatives. Thereafter, these commitments are provisioned as necessary in accordance with the accounting principles for Provisions.
SOCIETE GENERALE GROUP I 2014 REGISTRATION DOCUMENT I 285
NOTE 1 I NOTES TO THE CONSOLIDATED FINANCIAL STATEMENTS I FINANCIAL INFORMATION I 6
FINANCIAL GUARANTEES GIVENWhen considered as non-derivative financial instruments, financial guarantees issued by the Group are initially recognised in the balance sheet at fair value. Thereafter, they are measured at the higher of the amount of the obligation and the amount initially recognised less, when appropriate, the cumulative amortisation of a guarantee commission. Where there is objective evidence of a loss of value, a provision for financial guarantees given is recognised among liabilities in the balance sheet.
DISTINCTION BETWEEN LIABILITIES AND SHAREHOLDERS’ EQUITYFinancial instruments issued by the Group are recognised in whole or in part to debt or to equity depending on whether or not they contractually oblige the issuer to remunerate the holders of the security in cash.
n Perpetual subordinated notes (TSDI)Given their characteristics, perpetual subordinated notes (TSDI) issued by the Group and that do not include any discretionary features governing the payment of interest, as well as shares issued by a Group subsidiary in order to fund its property leasing activities, are classified as debt instruments.
These perpetual subordinated notes (TSDI) are then classified under Subordinated debt.
However, perpetual subordinated notes (TSDI) issued by the Group and that include some discretionary features governing the payment of interest are classified as equity.
These notes issued by Societe Generale are recorded under Other equity instruments.
n Preferred sharesDue to the discretionary nature of the decision to pay dividends to shareholders, preferred shares issued by subsidiaries of the Group are classified as equity.
Preferred shares issued by Group subsidiaries are recognised under Non-controlling interests. Remuneration paid to preferred shareholders is recorded under Non-controlling interests in the income statement.
n Deeply subordinated notesGiven the discretionary nature of the decision to pay interest in order to remunerate the deeply subordinated notes issued by the Group, these notes have been classified as equity.
These notes issued by Societe Generale are recognised under Other equity instruments.
NON-CONTROLLING INTERESTSNon-controlling interests refer to equity holdings in fully consolidated subsidiaries that are neither directly nor indirectly attributable to the Group. They include equity instruments issued by these subsidiaries and not held by the Group.
TREASURY SHARESSociete Generale shares held by the Group are deducted from consolidated equity irrespective of the purpose for which they are held. Income on these shares is eliminated from the consolidated income statement.
Financial derivatives having Societe Generale shares as their underlying instrument or shares in subsidiaries over which the Group exercises sole control and whose liquidation entails the payment of a fixed amount in cash (or another financial asset) against a fixed number of Societe Generale shares (other than derivatives) are initially recognised as equity. Premiums paid or received on financial derivatives classified as equity instruments are recognised directly in equity. Changes in the fair value of the derivatives are not recorded.
Other financial derivatives having Societe Generale shares as their underlying instrument are recorded in the balance sheet at fair value in the same manner as derivatives with other underlying instruments.
INTEREST INCOME AND EXPENSEInterest income and expense are recognised in the income statement under Interest and similar income for all financial instruments valued at amortised cost using the effective interest rate method.
The effective interest rate is taken to be the rate used to discount future cash inflows and outflows over the expected life of the instrument in order to establish the book value of the financial asset or liability. The calculation of this rate considers the future cash flows based on the contractual provisions of the financial instrument without taking account of possible future loan losses and also includes commissions paid or received between the parties where these may be assimilated to interest, transaction costs and all types of premiums and discounts.
When a financial asset or group of similar financial assets has been impaired following an impairment of value, subsequent interest income is recorded on the basis of the effective interest rate used to discount the future cash flows when measuring the loss of value.
Moreover, except for those related to employee benefits, provisions recognised as balance sheet liabilities generate interest expenses that are calculated using the same interest rate as is used to discount the expected outflow of resources.
NET FEES FOR SERVICESThe Group recognises fee income and expense for services provided and received in different ways depending on the type of service.
Fees for ongoing services, such as some payment services, custody fees, or web-service subscriptions are recognised as income over the life of the service. Fees for one-off services, such as fund activity, finder’s fees received, arbitrage fees, or penalties following payment incidents are recognised as income when the service is provided.
In syndication deals, the effective interest rate for the share of the issuance retained on the Group’s balance sheet is comparable to that applied to the other members of the syndicate including, when needed, a share of the underwriting fees and participation fees; the balance of these fees is recorded in the income statement at the end of the syndication period. Arrangement fees are recorded as income when the placement is legally complete.
286 I 2014 REGISTRATION DOCUMENT I SOCIETE GENERALE GROUP
6 I FINANCIAL INFORMATION I NOTES TO THE CONSOLIDATED FINANCIAL STATEMENTS I NOTE 1
PERSONNEL EXPENSESPersonnel expenses include all expenses related to personnel, including the cost of the legal employee profit-sharing and incentive plans for the year as well as the cost of the various Group pension and retirement schemes and expenses related to payments based on Societe Generale shares.
EMPLOYEE BENEFITSGroup companies, in France and abroad, may award their employees:
n post-employment benefits, such as pension plans or retirement benefits;
n long-term benefits such as deferred variable remuneration, long service awards or the Compte Épargne Temps (CET) flexible working provisions;
n termination benefits.
n Post-employment benefitsPension plans may be defined contribution or defined benefit plans.
Defined contribution plans limit the Group’s liability to the subscriptions paid into the plan but do not commit the Group to a specific level of future benefits. Contributions paid are recorded as an expense for the year in question.
Defined benefit plans commit the Group, either formally or constructively, to pay a certain amount or level of future benefits and therefore bear the associated medium or long-term risk.
Provisions are recognised on the liabilities side of the balance sheet under Provisions, to cover the whole of these retirement obligations. These provisions are assessed regularly by independent actuaries using the projected unit credit method. This valuation technique incorporates assumptions about demographics, early retirement, salary rises and discount and inflation rates.
When these plans are financed from external funds classified as plan assets, the fair value of these funds is subtracted from the provision to cover the obligations.
Differences arising from changes in calculation assumptions (early retirements, discount rates, etc.) or differences between actuarial assumptions and real performance are recognised as actuarial gains and losses.
Actuarial gains and losses, as well as the return on plan assets excluding amounts expensed as net interest on the net defined benefit liability (asset) and any change in the effect of the asset ceiling are components used to re-measure the net defined benefit liability (or asset). They are immediately and fully recognised in Unrealised or deferred gains and losses and they are subsequently never reclassified into income.
In the Group consolidated financial statements, these items that will not be subsequently reclassified into income are displayed separately in the Statement of net income and unrealised or deferred gains and losses, but they are transferred immediately to retained earnings in the Statement of changes in shareholders’ equity so that they are presented directly under Retained earnings in shareholders’ equity in the Consolidated balance sheet.
Where a new or amended plan comes into force, the past service cost is immediately recognised in profit or loss.
An annual charge is recorded under Personnel expenses for defined benefit plans, consisting of:
n the additional entitlements vested by each employee (current service cost);
n past service cost resulting from a plan amendment or a curtailment;
n the financial expense resulting from the discount rate and the interest income on plan assets (net interest on the net defined benefit liability or asset);
n the settlement of plans.
n Long-term benefitsThese are benefits paid to employees more than 12 months after the end of the period in which they provided the related services. Long-term benefits are measured in the same way as post-employment benefits, except for the treatment of actuarial gains and losses, which are recognised immediately as income.
PAYMENTS BASED ON SOCIETE GENERALE SHARES OR SHARES ISSUED BY A CONSOLIDATED ENTITYShare-based payments include:
n payments in equity instruments;
n cash payments whose amount depends on the performance of equity instruments.
Share-based payments systematically give rise to a personnel expense recognised as Personnel expenses under the terms set out below.
n Global Employee Share Ownership PlanEvery year the Group carries out a capital increase reserved for current and former employees as part of the Global Employee Share Ownership Plan. New shares are offered at a discount with an obligatory five-year holding period. The resultant benefit to the employees is recognised by the Group as an expense for the year under Personnel expenses – Employee profit-sharing and incentives. This benefit is measured as the difference between the fair value of each security acquired and the acquisition price paid by the employee, multiplied by the number of shares purchased. The fair value of the acquired securities is measured taking account of the associated legal obligatory holding period using market parameters (notably the borrowing rate) applicable to market participants who benefit from these non-transferable shares to estimate the free disposal ability.
n Other share-based paymentsThe Group can award some of its employees stock purchase or subscription options, free shares or rights to a future cash payment based on the increase in Societe Generale share price (SAR).
The options are measured at their fair value when the employees are first notified, without waiting for the conditions that trigger the award to be met, or for the beneficiaries to exercise their options.
SOCIETE GENERALE GROUP I 2014 REGISTRATION DOCUMENT I 287
NOTE 1 I NOTES TO THE CONSOLIDATED FINANCIAL STATEMENTS I FINANCIAL INFORMATION I 6
Group stock-option plans are measured using a binomial formula when the Group has adequate statistics to take into account the behaviour of the option beneficiaries. When such data are not available, the Black & Scholes model or Monte Carlo model is used. Valuations are performed by independent actuaries.
For equity-settled share-based payments (free shares, stock purchase or subscription options), the fair value of these instruments, measured at the vesting date, is spread over the vesting period and recorded under Issuing premium and capital reserves under shareholders’ equity. At each accounting date, the number of these instruments is revised in order to take into account performance and service conditions and adjust the overall cost of the plan as originally determined. Expenses recognised under Personnel expenses from the start of the plan are then adjusted accordingly.
For cash-settled share-based payments (stock-options granted by unlisted companies or compensation indexed on Societe Generale shares), the fair value of the amounts payable is recorded under Personnel expenses as an expense over the vesting period against a corresponding liabilities entry recognised in the balance sheet under Other liabilities – Expenses payable on employee benefits. This payables item is then remeasured at fair value against income until settled. For hedging derivatives, the effective portion of the change in their fair value is recorded in profit or loss.
COST OF RISKCost of risk includes allocations, net of reversals, to provisions and to impairments for credit risk, the amount of the loan considered uncollectible and the amount of recoveries on loans written off, as well as allocations and reversals of provisions for other risks.
INCOME TAX
n Current taxesCurrent tax is based on the taxable profits of each consolidated taxable entity and determined in accordance with the rules established by the local taxation authorities, upon which income taxes are payable.
Tax credits arising in respect of interest from loans and income from securities are recorded in the relevant interest account as they are applied in settlement of income taxes for the year. The related tax charge is included under Income tax in the consolidated income statement.
n Deferred taxesDeferred taxes are recognised whenever the Group identifies a temporary difference between the book value and tax value of balance sheet assets and liabilities that will affect future tax payments. Deferred tax assets and liabilities are measured in each consolidated taxable entity and in accordance with the rules established by the local taxation authorities, upon which their income taxes are payable. This amount is based on the tax rate enacted or substantively enacted which is expected to apply when the asset is realised or the liability settled. These deferred taxes are adjusted in the event of changes to tax rates. This amount is not discounted to present
value. Deferred tax assets can result from deductible temporary differences or from tax loss carry forwards. These deferred tax assets are recorded only if it is probable that the entity concerned is likely to be able to apply them within a set time. These temporary differences or tax loss carry forwards can also be used against future taxable profit. Tax loss carry forwards are subject to an annual review taking into account the tax system applicable to the relevant entities and a realistic projection of their tax income or expense, based on their business development outlook: any previously unrecognised deferred tax assets are recorded in the balance sheet to the extent it has become probable that future taxable profit will allow the deferred tax asset to be recovered; however, the carrying value of deferred tax assets already recognised in the balance sheet is reduced where a risk of total or partial non-recovery occurs.
Current and deferred taxes are recognised in the consolidated income statement under Income tax. But the deferred taxes related to gains and losses recorded under Unrealised or deferred gains and losses are also recognised under the same heading in shareholders’ equity.
INSURANCE ACTIVITIES
n Financial assets and liabilitiesThe financial assets and liabilities of the Group’s insurance companies are recognised and measured according to the rules governing financial instruments explained above.
n Underwriting reserves of insurance companiesUnderwriting reserves correspond to the commitments of insurance companies with respect to policyholders and the beneficiaries of policies.
In accordance with IFRS 4 on insurance contracts, life and non-life underwriting reserves continue to be measured under the same local regulations.
Life insurance underwriting reserves mainly comprise actuarial reserves, which correspond to the difference between the current value of commitments falling to the insurer and those falling to the policyholder, and reserves for claims incurred but not settled. The risks covered are principally death, invalidity and incapacity for work.
Underwriting reserves for unit-linked policies with discretionary profit-sharing or any other significant feature are measured at the balance sheet date on the basis of the current value of the assets underlying these policies.
Non-life insurance underwriting reserves comprise reserves for unearned premiums (share of premium income relating to subsequent financial years) and for outstanding claims. The risks covered are principally risks linked to home, car and accident insurance guarantees.
Under the principles defined in IFRS 4, and in compliance with local regulations applicable with respect thereto, life insurance policies with discretionary profit-sharing features are subject to “mirror accounting”, whereby any changes in the value of financial assets liable to affect policyholders are recorded in Deferred profit-sharing.
288 I 2014 REGISTRATION DOCUMENT I SOCIETE GENERALE GROUP
6 I FINANCIAL INFORMATION I NOTES TO THE CONSOLIDATED FINANCIAL STATEMENTS I NOTE 1
This reserve is calculated to reflect the potential rights of policyholders to unrealised gains on financial instruments measured at fair value or their potential share of unrealised losses.
To demonstrate the recoverability of the deferred profit-sharing asset in the event of an unrealised net loss, two approaches are used to show that the liquidity requirements caused by an unfavourable economic environment would not require assets to be sold in the event of unrealised losses:
n the first consists in simulating deterministic (“standardised” or extreme) stress scenarios. This is used to show that in these scenarios no significant losses would be realised on the assets existing at the balance sheet date for the scenarios tested,
n the aim of the second approach is to ensure that in the long or medium term, the sale of assets to meet liquidity needs would not generate any significant losses. The approach is verified for projections based on extreme scenarios,
n a liability adequacy test is also carried out semi-annually using a stochastic model based on parameter assumptions consistent with those used for the MCEV (Market Consistent Embedded Value). This test takes into account all of the future cash flows from policies, including management charges, fees and policy options and guarantees.
3. PRESENTATION OF FINANCIAL STATEMENTS
ANC RECOMMENDED FORMAT FOR BANKS’ SUMMARY FINANCIAL STATEMENTSAs the IFRS accounting framework does not specify a standard model, the format used for the financial statements is consistent with the format proposed by the French Accounting Standards Board, the ANC, under Recommendation 20013-04 of November 7, 2013.
RULE ON OFFSETTING FINANCIAL ASSETS AND FINANCIAL LIABILITIES
A financial asset and liability are offset and a net balance presented in the balance sheet when the Group is entitled to do so by law and intends either to settle the net amount or to realise the asset and to settle the liability at the same time.
TRANSFER OF UNREALISED OR DEFERRED GAINS AND LOSSESUnrealised or deferred gains and losses recognised directly in equity during the period and which will not be reclassified subsequently into income are displayed separately in the Statement of net income and unrealised or deferred gains and losses.
At the end of the period they are transferred immediately to Retained Earnings in the Consolidated balance sheet and in the Statement of changes in shareholders’ equity.
CASH AND CASH EQUIVALENTSIn the cash flow statement, Cash and cash equivalents include cash accounts, demand deposits, loans and borrowings due to and from central banks and other credit institutions.
EARNINGS PER SHAREEarnings per share are measured by dividing the net income attributable to ordinary shareholders by the weighted average number of shares outstanding over the period, excluding treasury shares. The net profit attributable to ordinary shareholders takes account of dividend rights of preferred shareholders such as holders of preferred shares, subordinated securities or deeply subordinated securities classified in equity. Diluted earnings per share take into account the potential dilution of shareholders’ interests in the event dilutive instruments (stock options or free share plans) are converted into ordinary shares. This dilutive effect is determined using the share buyback method.
4. ACCOUNTING STANDARDS AND INTERPRETATIONS TO BE APPLIED BY THE GROUP IN THE FUTURENot all of the accounting standards published by the IASB had been adopted by the European Union at December 31, 2013. These accounting standards and interpretations are required to be applied from annual periods beginning on January 1, 2014 at the earliest or on the date of their adoption by the European Union. They were therefore not applied by the Group as of December 31, 2013.
ACCOUNTING STANDARDS, AMENDMENTS OR INTERPRETATIONS ADOPTED BY THE EUROPEAN UNION
Accounting standards or InterpretationsAdoption dates by the
European Union
Effective dates: annual periods beginning on
or afterAmendments to IAS 32 “Presentation - Offsetting Financial Assets and Financial Liabilities” December 13, 2012 January 1, 2014
IFRS 10 “Consolidated Financial Statements” December 11, 2012 January 1, 2014
IFRS 11 “Joint Arrangements” December 11, 2012 January 1, 2014
IFRS 12 “Disclosure of Interests in Other Entities” December 11, 2012 January 1, 2014
Amendments to IAS 27 “Separate Financial Statements” December 11, 2012 January 1, 2014
Amendments to IAS 28 “Investments in Associates and Joint Ventures” December 11, 2012 January 1, 2014
Transition guidance (Amendments to IFRS 10, 11 and 12) April 4, 2013 January 1, 2014
Investment entities (Amendments to IFRS 10, 12 and IAS 27) November 20, 2013 January 1, 2014
Amendments to IAS 36 “Recoverable Amount Disclosures for Non-Financial Assets” December 19, 2013 January 1, 2014
Amendments to IAS 39 “Novation of Derivatives and Continuation of Hedge Accounting” December 19, 2013 January 1, 2014
SOCIETE GENERALE GROUP I 2014 REGISTRATION DOCUMENT I 289
NOTE 1 I NOTES TO THE CONSOLIDATED FINANCIAL STATEMENTS I FINANCIAL INFORMATION I 6
n Amendments to IAS 32 “Presentation - Offsetting Financial Assets and Financial Liabilities”These amendments clarify existing application issues relating to offsetting rules: rights of set-off must be legally enforceable in all circumstances, and the Group must intend to either settle on a net basis or to realise the financial asset and settle the financial liability simultaneously. The Group is currently analysing the potential impact of these amendments on its consolidated financial statements.
n IFRS 10 “Consolidated Financial Statements”This new standard modifies the definition of control in a way that will imply a more judgemental approach to assess the control over an entity. The new definition of control includes all of the following elements: power over the investee, rights or exposure to variable returns of the investee and ability to use the power over the investee to affect the amount of the investor’s returns. The Group is currently analysing the potential impact of this new standard on its consolidated financial statements. Following this new definition of control, two securitisation vehicles (Barton and Antalis – See Note 29) structured on behalf of third parties will be consolidated from January 1, 2014.
n IFRS 11 “Joint Arrangements”This standard distinguishes between two forms of joint arrangement (joint operation and joint venture) by assessing the rights and obligations conferred upon the parties and removes the option of applying the proportionate consolidation method. Joint ventures must now be consolidated by applying the equity method. Newedge Group (brokerage and derivatives) is the main joint venture currently consolidated by the Group using the proportionate method (see Note 46). The application of the equity method for the consolidation of Newedge Group from January 1, 2014 will reduce by approximately EUR 20 billion the total balance sheet amount of the Group.
n IFRS 12 “Disclosure of Interests in Other Entities”This standard includes all the disclosures that are required to be presented in the notes for all subsidiaries, joint arrangements, associates as well as for consolidated and unconsolidated structured entities. Accordingly, the Group will enhance its disclosures in the notes to the financial statements for annual periods beginning on or after January 1, 2014.
n Amendments to IAS 27 “Separate Financial Statements”The objective of these amendments is to set standards to be applied in accounting for investments in subsidiaries, joint ventures and associates when an entity elects to present separate financial statements.
n Amendments to IAS 28 “Investments in Associates and Joint Ventures”Further to amendments to IFRS 10 and IFRS 11, IAS 28 has been amended to prescribe the accounting treatment of investments in associates and joint ventures.
n Transition guidance (Amendments to IFRS 10, IFRS 11 and IFRS 12)The amendments to IFRS 10, IFRS 11 and IFRS 12 concerning transition guidance limit the requirement to provide adjusted comparative information to only the preceding comparative period and eliminate the requirement to present comparative information for unconsolidated structured entities for periods before IFRS 12 is first applied.
n Investment entities (Amendments to IFRS 10, IFRS 12 and IAS 27)These amendments provide an exception to the consolidation requirements in IFRS 10 and require investment entities to measure particular subsidiaries at fair value through profit or loss. It also set out disclosure requirements for investment entities.
n Amendments to IAS 36 “Recoverable Amount Disclosures for Non-Financial Assets”These amendments limit to impaired assets the obligation to disclose information about the recoverable amount and the basis on which the cash-generating unit’s fair value has been determined (less costs of disposal) and including goodwill or intangible assets with indefinite useful lives.
n Amendments to IAS 39 “Novation of Derivatives and Continuation of Hedge Accounting”These amendments allow hedging relationships to be maintained in situations where counterparties of an hedging instrument are obliged as a consequence of regulations or laws (for example European Market and Infrastructure Regulation-EMIR in European Union) to arise a novation. As a consequence, counterparties of certain hedging instruments should agree to replace their original counterparty of the hedging transaction by a central counterparty without modifying the contractual terms of the instruments.
AMENDMENTS OR INTERPRETATIONS NOT YET ADOPTED BY THE EUROPEAN UNION AT DECEMBER 31, 2013
Accounting standards or InterpretationsPublication dates
by IASB
Effective dates:annual periods
beginning on or after
IFRS 9 “Financial Instruments” (Phase 1: Classification and Measurement)
November 12, 2009October 28, 2010
December 16, 2011and November 19, 2013 Undetermined
IFRIC Interpretation 21 “Levies” May 20, 2013 January 1, 2014IFRS 9 “Financial Instruments” (Phase 3: Hedge accounting) and amendments to IFRS 9, IFRS 7 and IAS 39 November 19, 2013 Undetermined
Amendments to IAS 19 “Defined Benefit Plans: Employee Contributions” November 21, 2013 July 1, 2014
Improvements to IFRSs (2010-2012 and 2011-2013) - December 2013 December 12, 2013 July 1, 2014
290 I 2014 REGISTRATION DOCUMENT I SOCIETE GENERALE GROUP
6 I FINANCIAL INFORMATION I NOTES TO THE CONSOLIDATED FINANCIAL STATEMENTS I NOTE 1
n IFRS 9 “Financial Instruments” (Phase 1: Classification and Measurement)This standard aims to replace IAS 39. IFRS 9 – Phase 1 determines new requirements for classifying and measuring financial assets and financial liabilities. This standard will be completed by credit risk impairment methodology for financial assets (IFRS 9 – Phase 2 which is currently being finalised by IASB) and hedge accounting treatment (IFRS 9 – Phase 3 See below).
Financial assets are required to be classified into three categories (amortised cost, fair value through profit or loss and fair value through other comprehensive income) depending on the entity’s business model for managing its financial instruments and the contractual cash flow characteristics of the instrument.
All debt instruments (loans, receivables and bonds) will be measured at amortised cost only if the objective of the entity (business model) is to collect the contractual cash flows and if these cash flows consist solely of payments of principal and interest. All other debt instruments will be measured at fair value through profit or loss.
All equity instruments will be measured at fair value through profit or loss except in case of irrevocable election made at initial recognition for measurement at fair value through other comprehensive income (provided these financial assets are not held for trading purposes and not measured at fair value through profit or loss) without subsequent reclassification into income.
Embedded derivatives will no longer be recognised separately when their host contracts are financial assets and the hybrid instrument in its entirety will then be measured at fair value through profit or loss.
Requirements for the classification and measurement of financial liabilities contained in IAS 39 have been incorporated into IFRS 9 without any modifications, except for financial liabilities designated at fair value through profit or loss (using the fair value option). The amount of change in the liability’s fair value attributable to changes in credit risk is recognised in other comprehensive income without subsequent reclassification into income.
Provisions related to derecognition of financial assets and financial liabilities have been carried forward unchanged from IAS 39 to IFRS 9.
The current IFRS 9 – Phase 1 is subject to amendments relative to classification and measurement of financial assets for which IASB has issued for public comment an exposure-draft “Classification and Measurement: Limited Amendments to IFRS 9” on November 28, 2012. The final content of the standard are currently being finalised by IASB and may vary the existing version described above.
n IFRIC Interpretation 21 “Levies”This interpretation of IAS 37 “Provisions, Contingent Liabilities and Contingent Assets” clarifies the accounting for a liability to pay a levy. For an entity the obligating event that gives rise to a liability to pay a levy is the activity that triggers the payment of the levy, as identified by the legislation. The liability to pay a levy is recognised progressively if the obligating event occurs over a period of time. Furthermore, if an obligation to pay a levy is triggered when a minimum threshold is reached the corresponding liability is recognised when that minimum activity threshold is reached.
n IFRS 9 “Financial Instruments” (Phase 3: Hedge accounting) and amendments to IFRS 9, IFRS 7 and IAS 39This new standard will align hedge accounting more closely with risk management activities undertaken by companies when hedging their financial and non-financial risk exposures.
For this purpose, the standard extends the scope of non-derivative financial instruments that could be considered as hedging instruments. Similarly, the scope of items that could be considered as hedged items is increased to include components of non-financial items. The standard also amends the approach for assessing hedge effectiveness. In addition, additional disclosures are required to explain both the effect that hedge accounting has had on the financial statements and the entity’s risk management strategy.
IFRS 9 did not address the accounting treatment for macro hedging as part of the general hedge accounting model. The IASB has launched a separate project for macro hedge accounting.
n Amendments to IAS 19 “Defined Benefit Plans: Employee Contributions”These amendments apply to contributions from employees to defined benefit plans. The objective of the amendments is to simplify the accounting for contributions that are independent of the number of years of employee service.
n Improvements to IFRSs (2010-2012 and 2011-2013) - December 2013As part of the annual Improvements to International Financial Reporting Standards, the IASB has published amendments to some accounting standards.
SOCIETE GENERALE GROUP I 2014 REGISTRATION DOCUMENT I 291
NOTES 2-3 I NOTES TO THE CONSOLIDATED FINANCIAL STATEMENTS I FINANCIAL INFORMATION I 6
Note 2
CHANGES IN CONSOLIDATION SCOPEAs at December 31, 2013, the Group’s consolidation scope included 766 companies:
n 620 fully consolidated companies;
n 79 proportionately consolidated companies;
n 67 companies accounted for by the equity method.
The consolidation scope includes entities under Group’s exclusive control, joint control or significant influence that are not negligible compared to the Group’s consolidated financial statements, notably regarding Group consolidated total assets and gross operating income.
The main changes to the consolidation scope at December 31, 2013, compared with the scope applicable at the closing date of December 31, 2012, are as follows:
n the Group completed the sale of its stake in TCW Group Inc., i.e. 89.56%, to Carlyle Group and to the TCW Management;
n the Group’s equity interest in Banque Tarneaud increased from 97.57 to 100% due to the purchase by le Crédit du Nord of shares held by minority shareholders;
n the Group completed the sale of its stake in National Societe Generale Bank, i.e. 77.17%, to Qatar National Bank;
n the Group’s stake in SG Banque au Liban decreased from 19% to 16.8% due to a capital increase not subscribed by the Group.
n the Group completed the sale of its stake in Societe Generale Private Banking (Japan) Ltd., i.e. 100%.
n the Group’s stake in Rosbank increased by 10% to 92.4% due to the purchase of shares held by minority shareholders. As a consequence, the interest rates in LLC Rusfinance, LLC Rusfinance Bank and Commercial Bank Deltacrédit increased to 92.4%, and the interest rates in SG Strakhovanie LLC and Societe Generale Strakhovanie zizhni LLC increased from 96.66% to 98.56%.
The gain before tax from disposals of consolidated investments amounted to EUR 583 million and was recorded in Net income/expense from other assets in the income statement.
In accordance with IFRS 5 “Non-current assets held for sale and discontinued operations”, the main items classified in Non-current assets and liabilities held for sale are assets and liabilities relating consumer finance in Hungary and Turkey.
Note 3
FAIR VALUE OF FINANCIAL INSTRUMENTSThis section specifies the valuation methods used by the Group to establish the fair value of the financial instruments presented in the following notes:
Notes Description
Note 6Financial assets and liabilities at fair value through profit or loss
Note 7 Hedging derivatives
Note 8 Available-for-sale financial assets
Note 9 Due from banks
Note 10 Customer loans
Note 11 Reclassification of financial assets
Note 12 Lease financing and similar agreements
Note 13 Held-to-maturity financial assets
Note 18 Due to banks
Note 19 Customer deposits
Note 20 Debt securities issued
Note 26 Subordinated debt
1. DEFINITION OF FAIR VALUE AND FAIR VALUE HIERARCHYFair value is the price that would be received to sell an asset or paid to transfer a liability in an orderly transaction between market participants at the measurement date.
FAIR VALUE HIERARCHY:For information purposes, in the notes to the consolidated financial statements, the fair value of the financial instruments are classified using a fair value hierarchy that reflects the significance of the inputs used, according to the following levels:
n Level 1 (L1): instruments valued on the basis of quoted prices (unadjusted) in active markets for identical assets or liabilities.
Level 1 instruments carried at fair value on the balance sheet include in particular shares listed in an active market, government or corporate bonds priced directly by external brokers/dealers, derivatives traded on organised markets (futures, options), and units of funds (including UCITS) whose net asset value is available on the balance sheet date.
A financial instrument is regarded as quoted in an active market if quoted prices are readily and regularly available from an exchange, dealer, broker, industry group, pricing service or regulatory agency, and they reflect actual and regular market transactions on an arm’s length basis.
Determining whether a market is inactive requires the use of indicators such as a sharp decline in trading volume and the level of activity in the market, a sharp disparity in prices over time and between the various above mentioned market participants, or the fact that the latest transactions conducted on an arm’s length basis did not take place recently enough.
292 I 2014 REGISTRATION DOCUMENT I SOCIETE GENERALE GROUP
6 I FINANCIAL INFORMATION I NOTES TO THE CONSOLIDATED FINANCIAL STATEMENTS I NOTE 3
Where a financial instrument is traded in several markets to which the Group has immediate access, its fair value is represented by the market price at which volumes and activity levels are highest for the instrument in question.
Transactions resulting from involuntary liquidations or distressed sales are usually not taken into account to determine the market price.
n Level 2 (L2): instruments valued using inputs other than quoted prices included in Level 1 that are observable for the asset or liability, either directly (i.e. as prices) or indirectly (i.e. derived from prices).
Instruments quoted in an insufficiently liquid market and those traded over-the-counter belong to this level. Prices published by an external source derived from the valuation of similar instruments are considered as data derived from prices.
Level 2 instruments include in particular securities carried at fair value on the balance sheet that are not directly quoted (e.g. corporate bonds, mortgage-backed securities, units of funds), and firm derivatives and options traded over-the-counter: interest rate swaps, caps, floors, swaptions, equity options, index options, foreign exchange options, commodity options and credit derivatives. The maturities of these instruments are linked to ranges of terms commonly traded in the market, and the instruments themselves can be simple or offer a more complex remuneration profile (e.g. barrier options, products with multiple underlying instruments), with said complexity remaining limited however. The valuation techniques used in this category are based on common methods shared by the main market participants.
This category also includes the fair value of loans and receivables at amortised cost granted to counterparties whose credit risk is quoted via CDS.
n Level 3 (L3): instruments valued using inputs that are not based on observable market data (referred to as unobservable inputs). Those carried at fair value on the balance sheet are predominantly instruments for which the sales margin is not immediately recognized in profit or loss.
Accordingly, Level 3 financial instruments include derivatives with longer maturities than those usually traded and/or with specifically-tailored return profiles. Similarly, debt measured at fair value is classified as Level 3 where the valuation of the associated embedded derivatives is also based on unobservable methods.
The main L3 complex derivatives are:
– equity derivatives: options with long maturities and/or incorporating bespoke remuneration mechanisms. These instruments are sensitive to market inputs (volatility, dividend rates, correlations, etc.). In the absence of market depth and of an objective approach made possible by regularly observed prices, their valuation is based on proprietary methods (e.g. extrapolation from observable data, historical analysis). Hybrid equity instruments (i.e. having at least one non-equity underlying instrument) are also classified as L3 due to the generally unobservable correlation between the different underlyings,
– interest rate derivatives: exotic options, products sensitive to correlation between different interest rates, different exchange rates, between interest rates and exchange rates or, for quanto products for example (in which the instrument is settled in a currency different from the one of the underlying); they are liable to be classified as L3 because the valuation parameters are unobservable due to the liquidity of the correlated pair and the residual maturity of the transactions (e.g. exchange rate correlations are deemed unobservable for the USD/JPY),
– credit derivatives: L3 credit derivatives mainly include baskets of instruments exposed to time to default correlation (“N to default” products in which the buyer of the hedge is compensated as of the Nth default, which are exposed to the credit quality of the issuers comprising the basket and to their correlation, or CDO Bespoke products, which are Collateralised Debt Obligations created specifically for a group of investors and structured according to their needs), as well as products subject to credit spread volatility,
– commodity derivatives: this category includes products involving unobservable volatility or correlation inputs (e.g. options on commodity swaps, baskets of underlyings).
2. FINANCIAL INSTRUMENTS CARRIED AT FAIR VALUE ON THE BALANCE SHEET
2.1 VALUATION METHODSFor financial instruments recognised at fair value on the balance sheet, fair value is determined primarily on the basis of the prices quoted in an active market. These prices can be adjusted if none are available on the balance sheet date or if the clearing value does not reflect transaction prices.
However, due notably to the varied characteristics of financial instruments traded over-the-counter on the financial markets, a large number of financial products traded by the Group does not have quoted prices in the markets.
For these products, fair value is determined using models based on valuation techniques commonly used by market participants to measure financial instruments, such as discounted future cash flows for swaps or the Black & Scholes formula for certain options, and using valuation parameters that reflect current market conditions as at the balance sheet date. These valuation models are validated independently by the experts from the Market Risk Department of the Group’s Risk Division.
Furthermore, the parameters used in the valuation models, whether derived from observable market data or not, are checked by the Finance Division of GBIS (Global Banking and Investor Solutions), in accordance with the methodologies defined by the Market Risk Department.
SOCIETE GENERALE GROUP I 2014 REGISTRATION DOCUMENT I 293
NOTE 3 I NOTES TO THE CONSOLIDATED FINANCIAL STATEMENTS I FINANCIAL INFORMATION I 6
If necessary, these valuations are supplemented by additional reserves (such as bid-ask spreads and liquidity) determined reasonably and appropriately after an analysis of available information.
Derivatives in particular are subject to a Credit Valuation Adjustment (CVA) or Debt Valuation Adjustment (DVA). The Group includes all third parties with the exception of certain clearing houses in this adjustment, which also reflects the netting agreements existing for each counterparty. CVA is determined on the basis of the Group entity’s positive expected exposure to the counterparty, to the counterparty’s probability of default (conditional to the entity not defaulting) and by the loss given default. The DVA is determined symmetrically based on the negative expected exposure. These calculations are carried out over the life of the potential exposure, with a focus on the use of relevant and observable market data.
Similarly, an adjustment to take into account the costs or profits linked to the financing of these transaction (FVA, “Funding Value Adjustment”) is performed on certain derivatives not covered by netting agreements.
Observable data must be: independent of the bank (non-bank data), available, publically distributed, based on a narrow consensus and backed up by transaction prices.
For example, consensus data provided by external counterparties are considered observable if the underlying market is liquid and if the prices provided are confirmed by actual transactions. For high maturities, these consensus data are not observable. This is the case for the implied volatility used for the valuation of equity options with maturities of more than five years. However, when the residual maturity of the instrument falls below five years, its fair value becomes sensitive to observable parameters.
In the event of unusual tensions on the markets, leading to a lack of the usual reference data used for the valuation of a financial instrument, the Risk Division may implement a new model in accordance with pertinent available data, similar to methods used by other market players.
n Shares and other variable-income securitiesFor listed shares, fair value is taken to be the quoted price on the balance sheet date. For unlisted shares, fair value is determined depending on the type of financial instrument and according to one of the following methods:
n valuation based on a recent transaction involving the issuing company (third party buying into the issuing company’s capital, appraisal by professional valuation agent, etc.);
n valuation based on a recent transaction in the same sector as the issuing company (income multiple, asset multiple, etc.);
n proportion of net asset value held.
For unlisted securities in which the Group has significant holdings, valuations based on the above methods are supplemented by a discounted future cash flow valuation based on business plans or on valuation multiples of similar companies.
n Debt (fixed-income) instruments held in portfolio, issues of structured securities measured at fair value and financial derivativesThe fair value of these financial instruments is determined based on the quoted price on the balance sheet date or prices provided by brokers on the same date, when available. For unlisted financial instruments, fair value is determined using valuation techniques. Concerning liabilities measured at fair value, the on-balance sheet amounts include changes in the Group’s issuer credit risk.
n Other debtsFor listed financial instruments, fair value is taken as their closing quoted price on the balance sheet date. For unlisted financial instruments, fair value is determined by discounting future cash flows to present value at market rates (including counterparty risks, non-performance and liquidity risks).
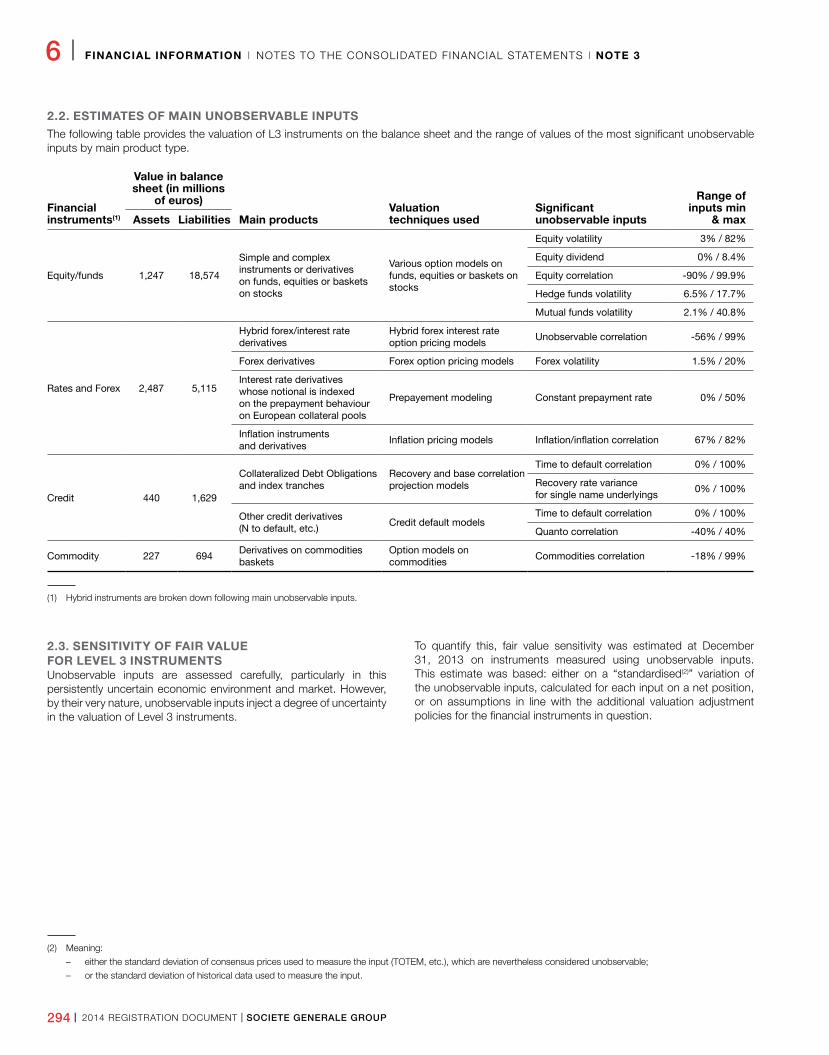
294 I 2014 REGISTRATION DOCUMENT I SOCIETE GENERALE GROUP
6 I FINANCIAL INFORMATION I NOTES TO THE CONSOLIDATED FINANCIAL STATEMENTS I NOTE 3
2.2. ESTIMATES OF MAIN UNOBSERVABLE INPUTSThe following table provides the valuation of L3 instruments on the balance sheet and the range of values of the most significant unobservable inputs by main product type.
Financial instruments(1)
Value in balance sheet (in millions
of euros)
Main productsValuation techniques used
Significant unobservable inputs
Range of inputs min
& maxAssets Liabilities
Equity/funds 1,247 18,574
Simple and complex instruments or derivatives on funds, equities or baskets on stocks
Various option models on funds, equities or baskets on stocks
Equity volatility 3% / 82%
Equity dividend 0% / 8�4%
Equity correlation -90% / 99�9%
Hedge funds volatility 6�5% / 17�7%
Mutual funds volatility 2�1% / 40�8%
Rates and Forex 2,487 5,115
Hybrid forex/interest rate derivatives
Hybrid forex interest rate option pricing models
Unobservable correlation -56% / 99%
Forex derivatives Forex option pricing models Forex volatility 1�5% / 20%
Interest rate derivatives whose notional is indexed on the prepayment behaviour on European collateral pools
Prepayement modeling Constant prepayment rate 0% / 50%
Inflation instruments and derivatives
Inflation pricing models Inflation/inflation correlation 67% / 82%
Credit 440 1,629
Collateralized Debt Obligations and index tranches
Recovery and base correlation projection models
Time to default correlation 0% / 100%
Recovery rate variance for single name underlyings
0% / 100%
Other credit derivatives (N to default, etc�)
Credit default modelsTime to default correlation 0% / 100%
Quanto correlation -40% / 40%
Commodity 227 694Derivatives on commodities baskets
Option models on commodities
Commodities correlation -18% / 99%
(1) Hybrid instruments are broken down following main unobservable inputs.
2.3. SENSITIVITY OF FAIR VALUE FOR LEVEL 3 INSTRUMENTSUnobservable inputs are assessed carefully, particularly in this persistently uncertain economic environment and market. However, by their very nature, unobservable inputs inject a degree of uncertainty in the valuation of Level 3 instruments.
To quantify this, fair value sensitivity was estimated at December 31, 2013 on instruments measured using unobservable inputs. This estimate was based: either on a “standardised(2)” variation of the unobservable inputs, calculated for each input on a net position, or on assumptions in line with the additional valuation adjustment policies for the financial instruments in question.
(2) Meaning:
– either the standard deviation of consensus prices used to measure the input (TOTEM, etc.), which are nevertheless considered unobservable;
– or the standard deviation of historical data used to measure the input.
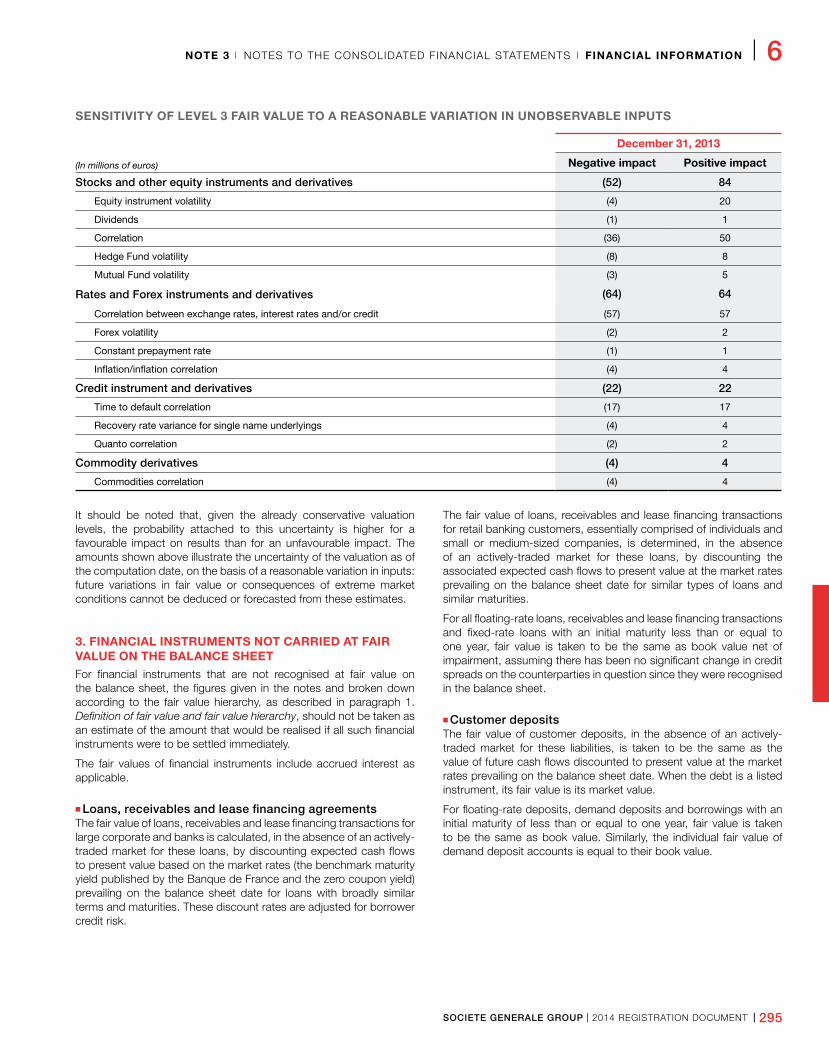
SOCIETE GENERALE GROUP I 2014 REGISTRATION DOCUMENT I 295
NOTE 3 I NOTES TO THE CONSOLIDATED FINANCIAL STATEMENTS I FINANCIAL INFORMATION I 6
SENSITIVITY OF LEVEL 3 FAIR VALUE TO A REASONABLE VARIATION IN UNOBSERVABLE INPUTS
(In millions of euros)
December 31, 2013
Negative impact Positive impact
Stocks and other equity instruments and derivatives (52) 84
Equity instrument volatility (4) 20
Dividends (1) 1
Correlation (36) 50
Hedge Fund volatility (8) 8
Mutual Fund volatility (3) 5
Rates and Forex instruments and derivatives (64) 64
Correlation between exchange rates, interest rates and/or credit (57) 57
Forex volatility (2) 2
Constant prepayment rate (1) 1
Inflation/inflation correlation (4) 4
Credit instrument and derivatives (22) 22
Time to default correlation (17) 17
Recovery rate variance for single name underlyings (4) 4
Quanto correlation (2) 2
Commodity derivatives (4) 4
Commodities correlation (4) 4
It should be noted that, given the already conservative valuation levels, the probability attached to this uncertainty is higher for a favourable impact on results than for an unfavourable impact. The amounts shown above illustrate the uncertainty of the valuation as of the computation date, on the basis of a reasonable variation in inputs: future variations in fair value or consequences of extreme market conditions cannot be deduced or forecasted from these estimates.
3. FINANCIAL INSTRUMENTS NOT CARRIED AT FAIR VALUE ON THE BALANCE SHEETFor financial instruments that are not recognised at fair value on the balance sheet, the figures given in the notes and broken down according to the fair value hierarchy, as described in paragraph 1. Definition of fair value and fair value hierarchy, should not be taken as an estimate of the amount that would be realised if all such financial instruments were to be settled immediately.
The fair values of financial instruments include accrued interest as applicable.
n Loans, receivables and lease financing agreementsThe fair value of loans, receivables and lease financing transactions for large corporate and banks is calculated, in the absence of an actively- traded market for these loans, by discounting expected cash flows to present value based on the market rates (the benchmark maturity yield published by the Banque de France and the zero coupon yield) prevailing on the balance sheet date for loans with broadly similar terms and maturities. These discount rates are adjusted for borrower credit risk.
The fair value of loans, receivables and lease financing transactions for retail banking customers, essentially comprised of individuals and small or medium-sized companies, is determined, in the absence of an actively-traded market for these loans, by discounting the associated expected cash flows to present value at the market rates prevailing on the balance sheet date for similar types of loans and similar maturities.
For all floating-rate loans, receivables and lease financing transactions and fixed-rate loans with an initial maturity less than or equal to one year, fair value is taken to be the same as book value net of impairment, assuming there has been no significant change in credit spreads on the counterparties in question since they were recognised in the balance sheet.
n Customer depositsThe fair value of customer deposits, in the absence of an actively-traded market for these liabilities, is taken to be the same as the value of future cash flows discounted to present value at the market rates prevailing on the balance sheet date. When the debt is a listed instrument, its fair value is its market value.
For floating-rate deposits, demand deposits and borrowings with an initial maturity of less than or equal to one year, fair value is taken to be the same as book value. Similarly, the individual fair value of demand deposit accounts is equal to their book value.
296 I 2014 REGISTRATION DOCUMENT I SOCIETE GENERALE GROUP
6 I FINANCIAL INFORMATION I NOTES TO THE CONSOLIDATED FINANCIAL STATEMENTS I NOTE 4
Note 4
RISK MANAGEMENT LINKED TO FINANCIAL INSTRUMENTSThis note describes the main risks linked to financial instruments and how they are managed by the Group.
n Types of risksThe Group is exposed to the risks inherent in its core businesses. Given the diversity and changes in the Group’s activities, its risk management focuses on the following main categories of risks, any of which could adversely affect its performance:
n credit and counterparty risk (including country risk): risk of losses arising from the inability of the Group’s customers, issuers or other counterparties to meet their financial commitments. Credit risk includes the counterparty risk linked to market transactions (replacement risk), as well as securitisation activities. Country risk arises when an exposure can be negatively affected by changing political, economic, social and financial conditions in the country of operation. Credit risk may be by concentration risk, which arises from a large exposure to a given risk, to one or more counterparties, or to one or more homogeneous groups of counterparties. Limits are set for some countries, geographical regions, sectors, products or types of customers with a view to minimising the most significant risks. In addition, major concentration risks are analysed periodically for the entire Group;
n market risk: risk of a decline in the value of financial instruments arising from changes in market parameters, the volatility of these parameters and correlations between them. These parameters include but are not limited to exchange rates, interest rates, and the price of securities (equities, bonds), commodities, derivatives and other assets, including real estate assets. Positions and risks are subject to daily controls and compared to predefined limits that, for major positions, are validated by the Board of Directors on the advice of the Audit, Internal Control and Risk Committee (CACIR) in accordance with the risk appetite defined by the Board of Directors;
n structural interest and exchange rate risk: risk of loss or write-downs in the Group’s assets arising from variations in interest or exchange rates. Structural interest and exchange rate risk arises from commercial activities and from transactions entered into by the Corporate Centre. The Group’s general objective is to minimise structural interest rate and exchange rate risks as much as possible within its consolidated entities. Wherever possible, commercial transactions are therefore hedged against interest rate and exchange rate risks. Any residual structural interest rate risk exposure is subject to sensitivity limits set for each entity and for the overall Group as validated by the Finance Policy Committee. As for exchange rates, the Group’s policy is to immunise its solvency ratio against fluctuations in the major currencies in which it operates;
n liquidity risk: risk of the Group not being able to meet its cash or collateral requirements as they arise and at a reasonable cost. Given that liquidity is a scarce resource, the Group’s objective is to finance
its activities at the best possible rates under normal conditions whilst maintaining adequate buffers to cover outflows in periods of stress. The scope of the Group’s short and long-term financing plan, which supplements customer deposits, is conservative with reduced concentration in the short term while ensuring diversification in terms of products and regions. Targets are validated by the Board of Directors in accordance with Risk Appetite.
1. ORGANISATION, PROCEDURES AND METHODS
1.1. RISK MANAGEMENT STRATEGYImplementing a robust and effective risk management structure is a critical undertaking for the Societe Generale Group, in all businesses, markets and regions in which the bank operates, as well as are maintaining a balance between strong risk culture and promoting innovation. Specifically, the main objectives of the Group’s risk management strategy are:
n to contribute to the development of the Group’s various businesses by optimising its overall risk-adjusted profitability in accordance with its risk appetite;
n to guarantee the Group’s sustainability as a going concern by implementing an effective risk analysis, measurement and monitoring system;
n to make risk management a differentiating factor and a competitive strength acknowledged by all.
This can take the form of:
n clear principles for governing, managing and organising risks;
n determining and formally defining the Group’s risk appetite;
n effective risk management tools;
n a risk culture that is cultivated and established at each level of the Group.
These points are the focus of a series of initiatives established under of the ERM (Enterprise Risk Management) programme, which aims to improve the consistency and effectiveness of the Group’s risk management system by fully integrating risk prevention and control in the day-to-day management of the bank’s businesses.
1.2. GOVERNANCE, CONTROL AND ORGANISATION OF RISK MANAGEMENTGovernance of the Group’s risk management is based on:
n extensive managerial involvement in the risk management process and promotion of risk culture, throughout the entire organisational structure, from the Board of Directors to operational staff;
n clearly defined internal rules and procedures;
n continuous supervision by an independent body to monitor risks and to enforce rules and procedures.
SOCIETE GENERALE GROUP I 2014 REGISTRATION DOCUMENT I 297
NOTE 4 I NOTES TO THE CONSOLIDATED FINANCIAL STATEMENTS I FINANCIAL INFORMATION I 6
The Group’s risk management is organised around two key principles:
n risk assessment departments should be independent from the business divisions;
n the risk management approach and risk monitoring should be consistent throughout the Group.
Compliance with these principles forms part of the consolidation plans for subsidiaries acquired by the Group.
Group risk management is governed by two main bodies: the Board of Directors, via the Audit, Internal Control and Risk Committee, and the Risk Committee. The Group’s Corporate Divisions, such as the Risk Division and Finance Division, which are independent from the business divisions, are dedicated to permanent risk management and control under the authority of the General Management.
n Board of DirectorsThe Board of Directors defines the Group’s strategy, and oversees its implementation, while assuming and controlling risks. In particular, the Board of Directors ensures the adequacy of the Group’s risk management infrastructure, monitors changes in the portfolio and particularly in the cost of risk, and approves the market risk limits. Presentations on the main aspects of, and significant changes of the Group’s risk management strategy are made to the Board of Directors by the General Management at least once a year (more often if circumstances require it), as part of the exercise to determine the Group’s risk appetite.
n Audit, Internal Control and Risk CommitteeThe Board of Directors’, the Audit, Internal Control and Risk Committee plays a crucial role in the assessing the quality of the Group’s internal control. More specifically, it is responsible for examining the consistency of the internal risk monitoring framework with the procedures, laws and regulations in force. Special presentations are made by the General Management to the Committee, which reviews the procedures for controlling certain market risks as well as structural interest rate risks, and is consulted about the setting of risk limits. It also issues an opinion on the Group’s overall provisioning policy and on large specific provisions. Finally, the Group’s risk map and risk appetite indicators are presented to the Committee annually, and every year it examines the Annual Report on Internal Control, which is submitted to the Board of Directors and the French Prudential Supervisory and Resolution Authority (ACPR).
n Risk Committee and Large Exposures CommitteeChaired by the General Management, the Group Risk Committee (CORISQ) is made up of members of the Group Executive Committee (COMEX), managers from the Risk Division and, where necessary, representatives from the different Divisions concerned by items on its agenda. It meets at least once a month in order to discuss the Group’s core risk strategy.
CORISQ is globally responsible, upon the advice of the Risk Division (RISQ), for all of the main decisions pertaining to the different types of risk affecting the Group (credit risk, country risk, market and operational risks).
The Large Exposures Committee is an ad hoc committee which is chaired by the General Management and made up of the operational and RISQ managers in charge of analysing and overseeing the Group’s main individual exposures.
n Risk DivisionThe main responsibility of the Risk Division is to contribute to the development of the activities and the profitability of the Societe Generale Group by working under the aegis of the General Management and in connection with the Finance department and the pillars to define the Group’s risk Appetite (deployed within the Group’s various businesses), and to establish a risk management and monitoring system. In exercising its duties, the Risk Division reconciles independence from and close cooperation with the business divisions, which are responsible first and foremost for the transactions they initiate.
Accordingly, the Risk Division is responsible for:
n carrying out hierarchical and functional supervision of the Group’s Risk structure;
n alongside the Finance Division, setting the Group’s risk appetite which is then submitted to the executive body and to the Boards of Directors for approval;
n identifying the risks incurred by the Group;
n implementing a governance and monitoring system for these risks across all business lines, and regularly reporting on the nature and extent of these risks to the General Management, the Board of Directors and the supervisory authorities;
n helping to define the Group’s risk policies, taking into account the aims of the pillars and the corresponding risk issues;
n defining and validating risk analysis, assessment, approval and monitoring methods and procedures;
n validating the transactions and limits proposed by the business line managers;
n defining the “risk” information system, and ensuring its suitability for the needs of the businesses and its consistency with the Group’s information system.
n New Product CommitteeEach division submits all new products, businesses or activities to the New Product Committee. This committee, which is jointly managed by the Risk Division and the business divisions, aims to ensure that, prior to the launch of a new product, business or activity:
n all associated risks are fully identified, understood and correctly addressed;
n compliance is assessed with respect to the laws and regulations in force, codes of good professional conduct and risks to the image and reputation of the Group;
n all the support functions have been consulted and have no, or no longer have, any reservations regarding the new product, business or activity in question.
This process is underpinned by a very broad definition of a new product, which ranges from the creation of a new product, to the adaptation of an existing product to a new environment or the transfer of activities involving new team or new systems.
298 I 2014 REGISTRATION DOCUMENT I SOCIETE GENERALE GROUP
6 I FINANCIAL INFORMATION I NOTES TO THE CONSOLIDATED FINANCIAL STATEMENTS I NOTE 4
n Finance DivisionThe Finance Division, Financial Management and Capital Department manages the Group’s capital requirements and capital structure. In accordance with regulatory principles that advocate the separation of oversight and control functions, two different entities manage and monitor structural risks:
n the Balance Sheet and Global Treasury Management Department oversees structural risks, and also supervises and coordinates all Group treasury functions (external Group financing, internal entity financing, centralised collateral management). Moreover, it manages the Financial Centre and executes financial transactions;
n the ALM Risk Control Department is responsible for supervising structural risk for the entire Group. In particular, it validates structural risk models and monitors compliance with limits and management practices by division, business line and entity. This Department is functionally supervised by the Risk Division.
The Finance Division is also responsible for assessing and managing the other major types of risk, including strategic risks, business risks, etc.
The Finance Policy Committee is chaired by the General Management and validates the system used to analyse and measure structural risks as well as the exposure limits for each Group entity. It also serves an advisory role for the business divisions and entities.
Societe Generale’s risk measurement and assessment processes are an integral part of the bank’s ICAAP (Internal Capital Adequacy Assessment Process(1)). Alongside capital management, ICAAP is aimed at providing guidance to both CORISQ and the Finance Committee in defining the Group’s overall risk Appetite and setting risk limits.
The Finance Division’s new Strategic and Financial Steering Department has been in charge of overseeing scarce resources and performance since January 1, 2013.
2. CREDIT RISK
2.1. RISK MANAGEMENT - GENERAL PRINCIPLES n 2.1.1. Credit policy
Societe Generale’s credit policy is based on the principle that approval of any credit risk undertaking must be based on sound knowledge of the customer and the customer’s business, an understanding of the purpose and structure of the transaction and the sources of repayment of the debt. Credit decisions must also ensure that the structure of the transaction will minimise the risk of loss in the event the counterparty defaults. Furthermore, the credit approval process takes into consideration the overall commitment of the group to which the customer belongs. Risk approval forms part of the Group’s risk management strategy in line with its risk Appetite.
n 2.1.2. Approval processThe risk approval process is based on four core principles:
n all transactions involving credit risk (debtor risk, settlement/ delivery risk, issuer risk and replacement risk) must be pre-authorised;
n responsibility for analysing and approving transactions lies respectively with the dedicated primary customer relationship unit and risk unit, which examine all authorisation requests relating to a specific customer or customer group, to ensure a consistent approach to risk management;
n the primary customer relationship unit and the risk unit must be independent from one another;
n credit decisions are systematically based on internal risk ratings (obligor rating), as provided by the primary customer relationship unit and approved by the Risk Division.
The Risk Division submits recommendations to CORISQ on the limits it deems appropriate for certain countries, geographic regions, sectors, products or types of customers, in order to reduce risks with strong correlations. The allocation of limits is subject to final approval by the Group’s General Management and is based on a process that involves the Business Divisions exposed to risk and the Risk Division.
Finally, the supervision exercised by CORISQ is supplemented by the Large Exposures Committee which focuses on reviewing large individual exposures.
n 2.1.3. Credit and counterparty risk monitoringSociete Generale places great emphasis on carefully monitoring its credit and counterparty risk exposure in order to minimise its losses in case of default. Furthermore, counterparty limits are assigned to all counterparties (banks, other financial institutions, corporate and public institutions).
Any significant weakening in the bank’s counterparties also prompts urgent internal rating reviews. A specific supervision and approval process is implemented for the most sensitive counterparties or the most complex financial instruments.
2.2. RISK MEASUREMENT AND INTERNAL RATINGSThe Group’s rating system relies on a quantitative analysis of the credit risks based on models that estimate the internal Basel parameters. In this regard, these models are used to calculate the Group’s regulatory capital requirements. They also comply with the Group’s risk management objectives and operational activities. As such, they are used as a tool to structure, price and approve transactions and help to determine the limits for approval decisions assigned to the operational teams and the Risk function.
Internal models, used to estimate PD (Probability of Default) and LGD (Loss Given Default), cover the vast majority of the Group’s credit portfolios. Most were IRBA-validated (Internal Ratings Based Advanced approach) in 2007 and have since undergone regular performance assessments.
(1) ICAAP: Internal Capital Adequacy Assessment Process, corresponds to the Pillar II process required under the Basel Accord that enables the Group to ensure capital adequacy to support all business risks.
SOCIETE GENERALE GROUP I 2014 REGISTRATION DOCUMENT I 299
NOTE 4 I NOTES TO THE CONSOLIDATED FINANCIAL STATEMENTS I FINANCIAL INFORMATION I 6
The Group’s rating system makes a key distinction between customers:
n for retail customers, the Basel parameters are automatically assigned, in line with the Basel guidelines;
n for corporate, bank and sovereign customers, the rating system is based on two main pillars: a counterparty rating system, supported by models, and a system that automatically assigns LGD and CCF (Credit Conversion Factor) parameters according to the characteristics of the transactions.
In both cases a set of procedures defines the rules governing the rating process (scope, choice of the rating model, frequency of rating review, rating approval procedure, etc.), and for the supervision, back-testing and validation of models. Among other things, these procedures facilitate human judgement, which provides a critical view of the results and is an essential complement to the models for these portfolios.
All Group risk models are developed and validated on the basis of the longest available internal historical data, which must be representative (both in terms of the portfolios in question and the effects of the economic environment during the period considered) and conservative. As a result, the Group’s risk estimates are not excessively sensitive to changes in the economic environment, while being able to detect any deterioration of risks. The PD modelling for large corporates has also been calibrated against long-term default statistics obtained from an external rating agency.
2.3. MANAGEMENT OF THE CREDIT PORTFOLIO AND OF COUNTERPARTY RISKThe Group uses credit risk mitigation techniques both for market and commercial banking activities. These techniques provide partial or full protection against the risk of debtor insolvency.
n Use of credit derivatives to manage corporate concentration riskThe Group uses credit derivatives in the management of its Corporate credit portfolio, primarily to reduce individual, sector and geographic concentration and to implement a proactive risk and capital management approach. Individual protection is essentially purchased under the over-concentration management policy. For example, the ten most hedged names account for 98% of the total amount of individual protection purchased.
Total outstanding purchases of protection through Corporate credit derivatives were stable at EUR 1.4 billion at end-December 2013 (EUR 1.9 billion at end-December 2012). In 2013, the spreads on Credit Default Swaps (CDS) from European investment-grade issues (Itraxx index) narrowed, reducing the portfolio’s sensitivity to tightening spreads. Consequently, the credit derivatives transactions implemented in prior years to limit the earnings volatility generated by this CDS portfolio (these positions are marked-to-market) have not needed to be renewed.
Almost all protection was purchased from bank counterparties with ratings of BBB+ or above, the average being A/A-. Concentration with any particular counterparty is also carefully monitored.
All credit derivatives regardless of their purpose are recognised at fair value through profit or loss and cannot be recorded as hedging instruments. Accordingly, they are recognised as trading derivatives at their notional and fair value.
n Guarantees and collateralThe Group uses credit risk mitigation techniques both for market and commercial banking activities. These techniques provide partial or full protection against the risk of debtor insolvency.
There are two main techniques:
n personal guarantees are commitments made by a third party to replace the primary debtor in the event of the latter’s default. Guarantees encompass the protection commitments and mechanisms provided by banks and similar credit institutions, specialised institutions such as mortgage guarantors (e.g Crédit Logement in France), monoline or multiline insurers, export credit agencies, etc. By extension, credit insurance and credit derivatives (purchase of protection) also belong to this category;
n collateral can consist of physical assets in the form of property, commodities or precious metals, as well as financial instruments such as cash, high-quality investments and securities and also insurance policies.
The Group proactively manages its risks by diversifying guarantees: physical collateral, personal guarantees and others (including CDS). In order to reduce its risk taking, the Group leads an active management of the guaranties and collateral by diversifying them: physical collateral, personal guaranties and other including CDS.
During the credit approval process, an assessment of the value of guarantees and collateral, their legal enforceability and the guarantor’s ability to meet its obligations is undertaken. This process also ensures that the collateral or guarantee successfully meets the criteria set forth in the Capital Requirements Directive (CRD).
Guarantor ratings are reviewed internally at least once a year and collateral is subject to revaluation at least once a year.
The Risk Department is responsible for validating the operating procedures established by the business divisions for the regular valuation of guarantees and collateral, either automatically or based on an expert opinion, both during the approval phase for a new loan or upon the annual renewal of the credit application.
n Mitigation of counterparty risk linked to market transactionsSociete Generale uses different techniques to reduce this risk. With regard to trading counterparties, it seeks to implement master agreements with a termination-clearing clause wherever it can. In the event of default, they allow netting of all due and payable amounts. The agreements usually call for the revaluation of required collateral at regular time intervals (often on a daily basis) and for the payment of the corresponding margin calls. Collateral is largely composed of cash and high-quality liquid assets such as government bonds with a good rating. Other tradable assets are also accepted, provided that the appropriate haircuts are made to reflect the lower quality and/or liquidity of the asset.
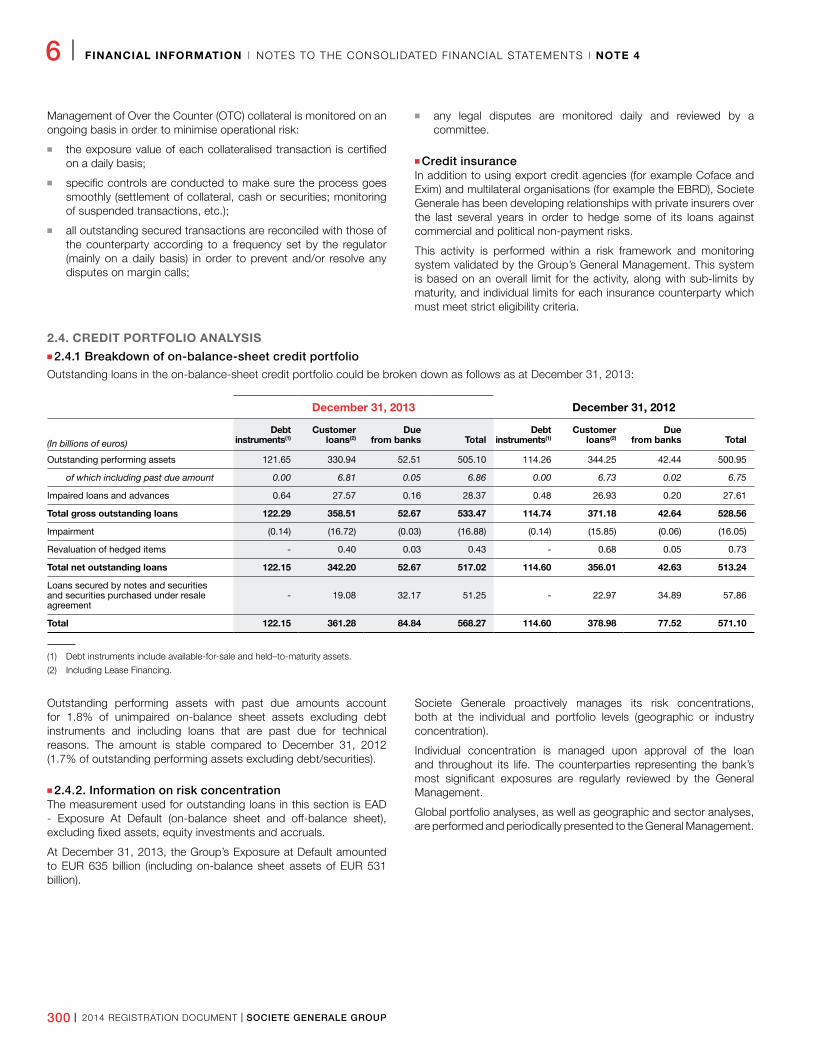
300 I 2014 REGISTRATION DOCUMENT I SOCIETE GENERALE GROUP
6 I FINANCIAL INFORMATION I NOTES TO THE CONSOLIDATED FINANCIAL STATEMENTS I NOTE 4
Management of Over the Counter (OTC) collateral is monitored on an ongoing basis in order to minimise operational risk:
n the exposure value of each collateralised transaction is certified on a daily basis;
n specific controls are conducted to make sure the process goes smoothly (settlement of collateral, cash or securities; monitoring of suspended transactions, etc.);
n all outstanding secured transactions are reconciled with those of the counterparty according to a frequency set by the regulator (mainly on a daily basis) in order to prevent and/or resolve any disputes on margin calls;
n any legal disputes are monitored daily and reviewed by a committee.
n Credit insuranceIn addition to using export credit agencies (for example Coface and Exim) and multilateral organisations (for example the EBRD), Societe Generale has been developing relationships with private insurers over the last several years in order to hedge some of its loans against commercial and political non-payment risks.
This activity is performed within a risk framework and monitoring system validated by the Group’s General Management. This system is based on an overall limit for the activity, along with sub-limits by maturity, and individual limits for each insurance counterparty which must meet strict eligibility criteria.
2.4. CREDIT PORTFOLIO ANALYSIS n 2.4.1 Breakdown of on-balance-sheet credit portfolio
Outstanding loans in the on-balance-sheet credit portfolio could be broken down as follows as at December 31, 2013:
December 31, 2013 December 31, 2012
(In billions of euros)Debt
instruments(1)Customer
loans(2)Due
from banks TotalDebt
instruments(1)Customer
loans(2)Due
from banks Total
Outstanding performing assets 121�65 330�94 52�51 505�10 114�26 344�25 42�44 500�95
of which including past due amount 0.00 6.81 0.05 6.86 0.00 6.73 0.02 6.75
Impaired loans and advances 0�64 27�57 0�16 28�37 0�48 26�93 0�20 27�61
Total gross outstanding loans 122.29 358.51 52.67 533.47 114.74 371.18 42.64 528.56
Impairment (0�14) (16�72) (0�03) (16�88) (0�14) (15�85) (0�06) (16�05)
Revaluation of hedged items - 0�40 0�03 0�43 - 0�68 0�05 0�73
Total net outstanding loans 122.15 342.20 52.67 517.02 114.60 356.01 42.63 513.24
Loans secured by notes and securities and securities purchased under resale agreement
- 19�08 32�17 51�25 - 22�97 34�89 57�86
Total 122.15 361.28 84.84 568.27 114.60 378.98 77.52 571.10
(1) Debt instruments include available-for-sale and held–to-maturity assets.
(2) Including Lease Financing.
Outstanding performing assets with past due amounts account for 1.8% of unimpaired on-balance sheet assets excluding debt instruments and including loans that are past due for technical reasons. The amount is stable compared to December 31, 2012 (1.7% of outstanding performing assets excluding debt/securities).
n 2.4.2. Information on risk concentrationThe measurement used for outstanding loans in this section is EAD - Exposure At Default (on-balance sheet and off-balance sheet), excluding fixed assets, equity investments and accruals.
At December 31, 2013, the Group’s Exposure at Default amounted to EUR 635 billion (including on-balance sheet assets of EUR 531 billion).
Societe Generale proactively manages its risk concentrations, both at the individual and portfolio levels (geographic or industry concentration).
Individual concentration is managed upon approval of the loan and throughout its life. The counterparties representing the bank’s most significant exposures are regularly reviewed by the General Management.
Global portfolio analyses, as well as geographic and sector analyses, are performed and periodically presented to the General Management.
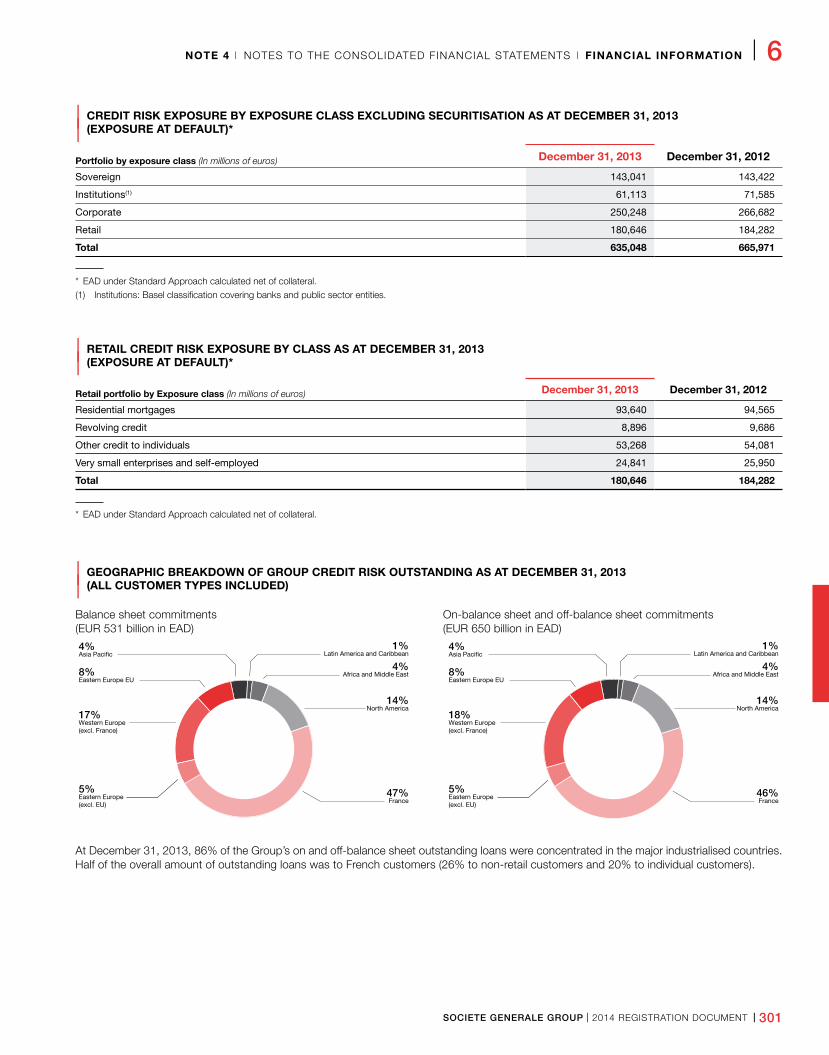
SOCIETE GENERALE GROUP I 2014 REGISTRATION DOCUMENT I 301
NOTE 4 I NOTES TO THE CONSOLIDATED FINANCIAL STATEMENTS I FINANCIAL INFORMATION I 6
| CREDIT RISK EXPOSURE BY EXPOSURE CLASS EXCLUDING SECURITISATION AS AT DECEMBER 31, 2013
| (EXPOSURE AT DEFAULT)*
Portfolio by exposure class (In millions of euros) December 31, 2013 December 31, 2012
Sovereign 143,041 143,422
Institutions(1) 61,113 71,585
Corporate 250,248 266,682
Retail 180,646 184,282
Total 635,048 665,971
* EAD under Standard Approach calculated net of collateral.
(1) Institutions: Basel classification covering banks and public sector entities.
| RETAIL CREDIT RISK EXPOSURE BY CLASS AS AT DECEMBER 31, 2013
| (EXPOSURE AT DEFAULT)*
Retail portfolio by Exposure class (In millions of euros) December 31, 2013 December 31, 2012
Residential mortgages 93,640 94,565
Revolving credit 8,896 9,686
Other credit to individuals 53,268 54,081
Very small enterprises and self-employed 24,841 25,950
Total 180,646 184,282
* EAD under Standard Approach calculated net of collateral.
| GEOGRAPHIC BREAKDOWN OF GROUP CREDIT RISK OUTSTANDING AS AT DECEMBER 31, 2013
| (ALL CUSTOMER TYPES INCLUDED)
Balance sheet commitments (EUR 531 billion in EAD)
North America
France
Western Europe (excl. France)
Eastern Europe (excl. EU)
5%
Eastern Europe EU8%
1%
14%
Asia Pacific4%
47%
17%
Latin America and Caribbean
4%Africa and Middle East
North America
France
Western Europe (excl. France)
Eastern Europe (excl. EU)
5%
Eastern Europe EU8%
1%
14%
Asia Pacific4%
46%
18%
Latin America and Caribbean
4%Africa and Middle East
On-balance sheet and off-balance sheet commitments (EUR 650 billion in EAD)
North America
France
Western Europe (excl. France)
Eastern Europe (excl. EU)
5%
Eastern Europe EU8%
1%
14%
Asia Pacific4%
47%
17%
Latin America and Caribbean
4%Africa and Middle East
North America
France
Western Europe (excl. France)
Eastern Europe (excl. EU)
5%
Eastern Europe EU8%
1%
14%
Asia Pacific4%
46%
18%
Latin America and Caribbean
4%Africa and Middle East
At December 31, 2013, 86% of the Group’s on and off-balance sheet outstanding loans were concentrated in the major industrialised countries. Half of the overall amount of outstanding loans was to French customers (26% to non-retail customers and 20% to individual customers).
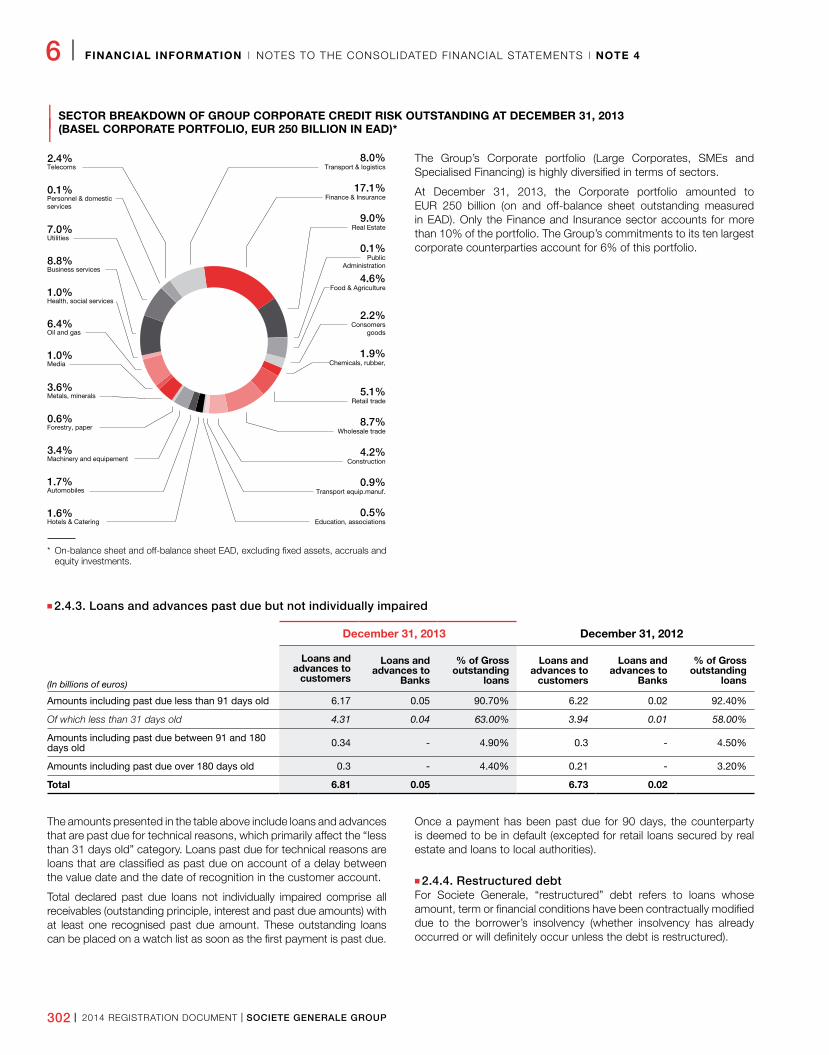
302 I 2014 REGISTRATION DOCUMENT I SOCIETE GENERALE GROUP
6 I FINANCIAL INFORMATION I NOTES TO THE CONSOLIDATED FINANCIAL STATEMENTS I NOTE 4
| SECTOR BREAKDOWN OF GROUP CORPORATE CREDIT RISK OUTSTANDING AT DECEMBER 31, 2013
| (BASEL CORPORATE PORTFOLIO, EUR 250 BILLION IN EAD)*
Telecoms
Personnel & domestic services
Utilities
Business services
Health, social services
Oil and gas
Media
Metals, minerals
Forestry, paper
Machinery and equipement
Automobiles
Hotels & Catering
Finance & Insurance
Transport & logistics
Real Estate
PublicAdministration
Food & Agriculture
Consomersgoods
Chemicals, rubber,
Retail trade
Wholesale trade
Construction
Education, associations
Transport equip.manuf.
2.4%
0.1%
7.0%
8.8%
1.0%
6.4%
1.0%
3.6%
0.6%
3.4%
1.7%
1.6%
17.1%
8.0%
9.0%
0.1%
4.6%
2.2%
1.9%
5.1%
8.7%
4.2%
0.5%
0.9%
* On-balance sheet and off-balance sheet EAD, excluding fixed assets, accruals and equity investments.
The Group’s Corporate portfolio (Large Corporates, SMEs and Specialised Financing) is highly diversified in terms of sectors.
At December 31, 2013, the Corporate portfolio amounted to EUR 250 billion (on and off-balance sheet outstanding measured in EAD). Only the Finance and Insurance sector accounts for more than 10% of the portfolio. The Group’s commitments to its ten largest corporate counterparties account for 6% of this portfolio.
n 2.4.3. Loans and advances past due but not individually impaired
(In billions of euros)
December 31, 2013 December 31, 2012
Loans and advances to
customers
Loans and advances to
Banks
% of Gross outstanding
loans
Loans and advances to
customers
Loans and advances to
Banks
% of Gross outstanding
loans
Amounts including past due less than 91 days old 6�17 0�05 90�70% 6�22 0�02 92�40%
Of which less than 31 days old 4.31 0.04 63.00% 3.94 0.01 58.00%
Amounts including past due between 91 and 180 days old 0�34 - 4�90% 0�3 - 4�50%
Amounts including past due over 180 days old 0�3 - 4�40% 0�21 - 3�20%
Total 6.81 0.05 6.73 0.02
The amounts presented in the table above include loans and advances that are past due for technical reasons, which primarily affect the “less than 31 days old” category. Loans past due for technical reasons are loans that are classified as past due on account of a delay between the value date and the date of recognition in the customer account.
Total declared past due loans not individually impaired comprise all receivables (outstanding principle, interest and past due amounts) with at least one recognised past due amount. These outstanding loans can be placed on a watch list as soon as the first payment is past due.
Once a payment has been past due for 90 days, the counterparty is deemed to be in default (excepted for retail loans secured by real estate and loans to local authorities).
n 2.4.4. Restructured debtFor Societe Generale, “restructured” debt refers to loans whose amount, term or financial conditions have been contractually modified due to the borrower’s insolvency (whether insolvency has already occurred or will definitely occur unless the debt is restructured).
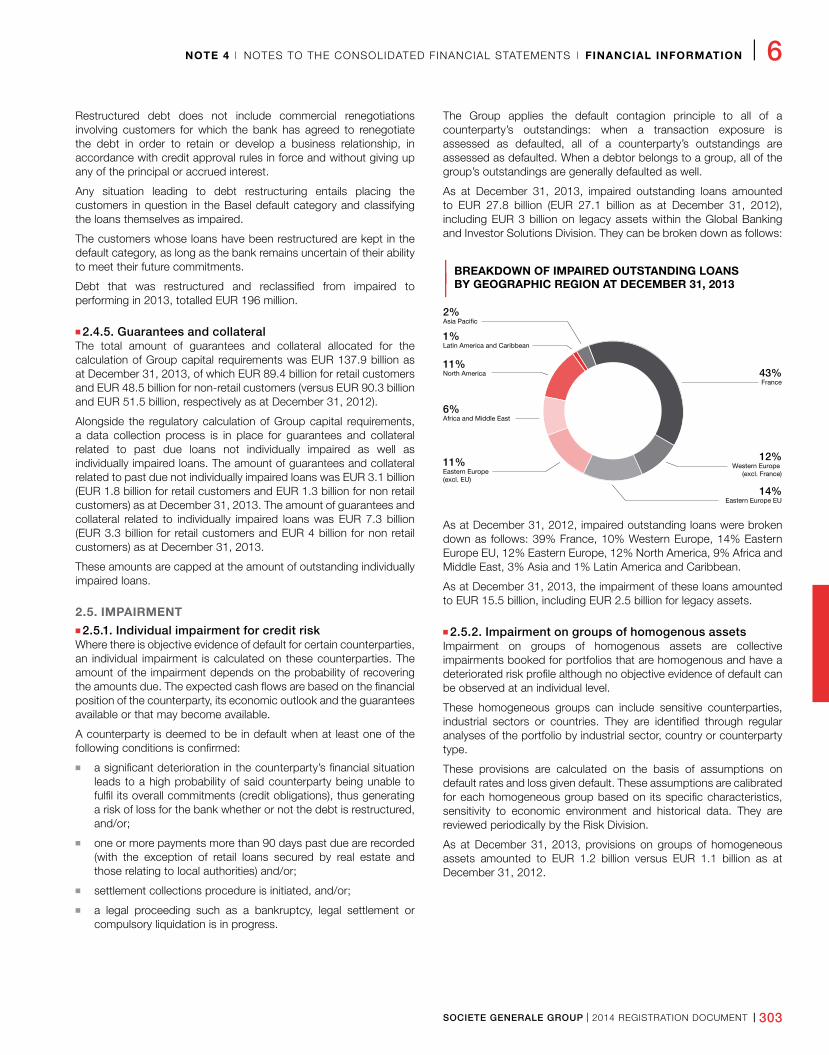
SOCIETE GENERALE GROUP I 2014 REGISTRATION DOCUMENT I 303
NOTE 4 I NOTES TO THE CONSOLIDATED FINANCIAL STATEMENTS I FINANCIAL INFORMATION I 6
Restructured debt does not include commercial renegotiations involving customers for which the bank has agreed to renegotiate the debt in order to retain or develop a business relationship, in accordance with credit approval rules in force and without giving up any of the principal or accrued interest.
Any situation leading to debt restructuring entails placing the customers in question in the Basel default category and classifying the loans themselves as impaired.
The customers whose loans have been restructured are kept in the default category, as long as the bank remains uncertain of their ability to meet their future commitments.
Debt that was restructured and reclassified from impaired to performing in 2013, totalled EUR 196 million.
n 2.4.5. Guarantees and collateralThe total amount of guarantees and collateral allocated for the calculation of Group capital requirements was EUR 137.9 billion as at December 31, 2013, of which EUR 89.4 billion for retail customers and EUR 48.5 billion for non-retail customers (versus EUR 90.3 billion and EUR 51.5 billion, respectively as at December 31, 2012).
Alongside the regulatory calculation of Group capital requirements, a data collection process is in place for guarantees and collateral related to past due loans not individually impaired as well as individually impaired loans. The amount of guarantees and collateral related to past due not individually impaired loans was EUR 3.1 billion (EUR 1.8 billion for retail customers and EUR 1.3 billion for non retail customers) as at December 31, 2013. The amount of guarantees and collateral related to individually impaired loans was EUR 7.3 billion (EUR 3.3 billion for retail customers and EUR 4 billion for non retail customers) as at December 31, 2013.
These amounts are capped at the amount of outstanding individually impaired loans.
2.5. IMPAIRMENT n 2.5.1. Individual impairment for credit risk
Where there is objective evidence of default for certain counterparties, an individual impairment is calculated on these counterparties. The amount of the impairment depends on the probability of recovering the amounts due. The expected cash flows are based on the financial position of the counterparty, its economic outlook and the guarantees available or that may become available.
A counterparty is deemed to be in default when at least one of the following conditions is confirmed:
n a significant deterioration in the counterparty’s financial situation leads to a high probability of said counterparty being unable to fulfil its overall commitments (credit obligations), thus generating a risk of loss for the bank whether or not the debt is restructured, and/or;
n one or more payments more than 90 days past due are recorded (with the exception of retail loans secured by real estate and those relating to local authorities) and/or;
n settlement collections procedure is initiated, and/or;
n a legal proceeding such as a bankruptcy, legal settlement or compulsory liquidation is in progress.
The Group applies the default contagion principle to all of a counterparty’s outstandings: when a transaction exposure is assessed as defaulted, all of a counterparty’s outstandings are assessed as defaulted. When a debtor belongs to a group, all of the group’s outstandings are generally defaulted as well.
As at December 31, 2013, impaired outstanding loans amounted to EUR 27.8 billion (EUR 27.1 billion as at December 31, 2012), including EUR 3 billion on legacy assets within the Global Banking and Investor Solutions Division. They can be broken down as follows:
| BREAKDOWN OF IMPAIRED OUTSTANDING LOANS
| BY GEOGRAPHIC REGION AT DECEMBER 31, 2013
Eastern Europe(excl. EU)
Western Europe (excl. France)
Asia Pacific
Latin America and Caribbean
Africa and Middle East
France
Eastern Europe EU
North America
12%11%
2%
1%
43%
6%
14%
11%
As at December 31, 2012, impaired outstanding loans were broken down as follows: 39% France, 10% Western Europe, 14% Eastern Europe EU, 12% Eastern Europe, 12% North America, 9% Africa and Middle East, 3% Asia and 1% Latin America and Caribbean.
As at December 31, 2013, the impairment of these loans amounted to EUR 15.5 billion, including EUR 2.5 billion for legacy assets.
n 2.5.2. Impairment on groups of homogenous assetsImpairment on groups of homogenous assets are collective impairments booked for portfolios that are homogenous and have a deteriorated risk profile although no objective evidence of default can be observed at an individual level.
These homogeneous groups can include sensitive counterparties, industrial sectors or countries. They are identified through regular analyses of the portfolio by industrial sector, country or counterparty type.
These provisions are calculated on the basis of assumptions on default rates and loss given default. These assumptions are calibrated for each homogeneous group based on its specific characteristics, sensitivity to economic environment and historical data. They are reviewed periodically by the Risk Division.
As at December 31, 2013, provisions on groups of homogeneous assets amounted to EUR 1.2 billion versus EUR 1.1 billion as at December 31, 2012.
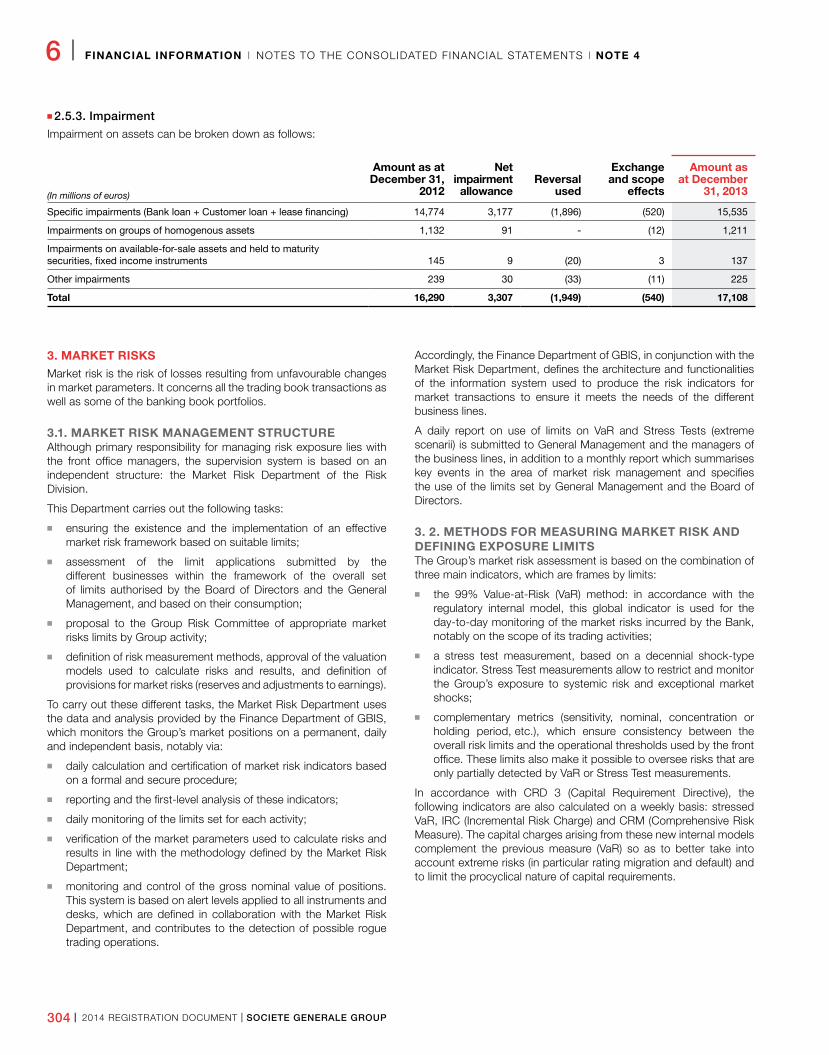
304 I 2014 REGISTRATION DOCUMENT I SOCIETE GENERALE GROUP
6 I FINANCIAL INFORMATION I NOTES TO THE CONSOLIDATED FINANCIAL STATEMENTS I NOTE 4
n 2.5.3. Impairment
Impairment on assets can be broken down as follows:
(In millions of euros)
Amount as at December 31,
2012
Net impairment
allowanceReversal
used
Exchange and scope
effects
Amount as at December
31, 2013
Specific impairments (Bank loan + Customer loan + lease financing) 14,774 3,177 (1,896) (520) 15,535
Impairments on groups of homogenous assets 1,132 91 - (12) 1,211
Impairments on available-for-sale assets and held to maturity securities, fixed income instruments 145 9 (20) 3 137
Other impairments 239 30 (33) (11) 225
Total 16,290 3,307 (1,949) (540) 17,108
3. MARKET RISKSMarket risk is the risk of losses resulting from unfavourable changes in market parameters. It concerns all the trading book transactions as well as some of the banking book portfolios.
3.1. MARKET RISK MANAGEMENT STRUCTUREAlthough primary responsibility for managing risk exposure lies with the front office managers, the supervision system is based on an independent structure: the Market Risk Department of the Risk Division.
This Department carries out the following tasks:
n ensuring the existence and the implementation of an effective market risk framework based on suitable limits;
n assessment of the limit applications submitted by the different businesses within the framework of the overall set of limits authorised by the Board of Directors and the General Management, and based on their consumption;
n proposal to the Group Risk Committee of appropriate market risks limits by Group activity;
n definition of risk measurement methods, approval of the valuation models used to calculate risks and results, and definition of provisions for market risks (reserves and adjustments to earnings).
To carry out these different tasks, the Market Risk Department uses the data and analysis provided by the Finance Department of GBIS, which monitors the Group’s market positions on a permanent, daily and independent basis, notably via:
n daily calculation and certification of market risk indicators based on a formal and secure procedure;
n reporting and the first-level analysis of these indicators;
n daily monitoring of the limits set for each activity;
n verification of the market parameters used to calculate risks and results in line with the methodology defined by the Market Risk Department;
n monitoring and control of the gross nominal value of positions. This system is based on alert levels applied to all instruments and desks, which are defined in collaboration with the Market Risk Department, and contributes to the detection of possible rogue trading operations.
Accordingly, the Finance Department of GBIS, in conjunction with the Market Risk Department, defines the architecture and functionalities of the information system used to produce the risk indicators for market transactions to ensure it meets the needs of the different business lines.
A daily report on use of limits on VaR and Stress Tests (extreme scenarii) is submitted to General Management and the managers of the business lines, in addition to a monthly report which summarises key events in the area of market risk management and specifies the use of the limits set by General Management and the Board of Directors.
3. 2. METHODS FOR MEASURING MARKET RISK AND DEFINING EXPOSURE LIMITSThe Group’s market risk assessment is based on the combination of three main indicators, which are frames by limits:
n the 99% Value-at-Risk (VaR) method: in accordance with the regulatory internal model, this global indicator is used for the day-to-day monitoring of the market risks incurred by the Bank, notably on the scope of its trading activities;
n a stress test measurement, based on a decennial shock-type indicator. Stress Test measurements allow to restrict and monitor the Group’s exposure to systemic risk and exceptional market shocks;
n complementary metrics (sensitivity, nominal, concentration or holding period, etc.), which ensure consistency between the overall risk limits and the operational thresholds used by the front office. These limits also make it possible to oversee risks that are only partially detected by VaR or Stress Test measurements.
In accordance with CRD 3 (Capital Requirement Directive), the following indicators are also calculated on a weekly basis: stressed VaR, IRC (Incremental Risk Charge) and CRM (Comprehensive Risk Measure). The capital charges arising from these new internal models complement the previous measure (VaR) so as to better take into account extreme risks (in particular rating migration and default) and to limit the procyclical nature of capital requirements.
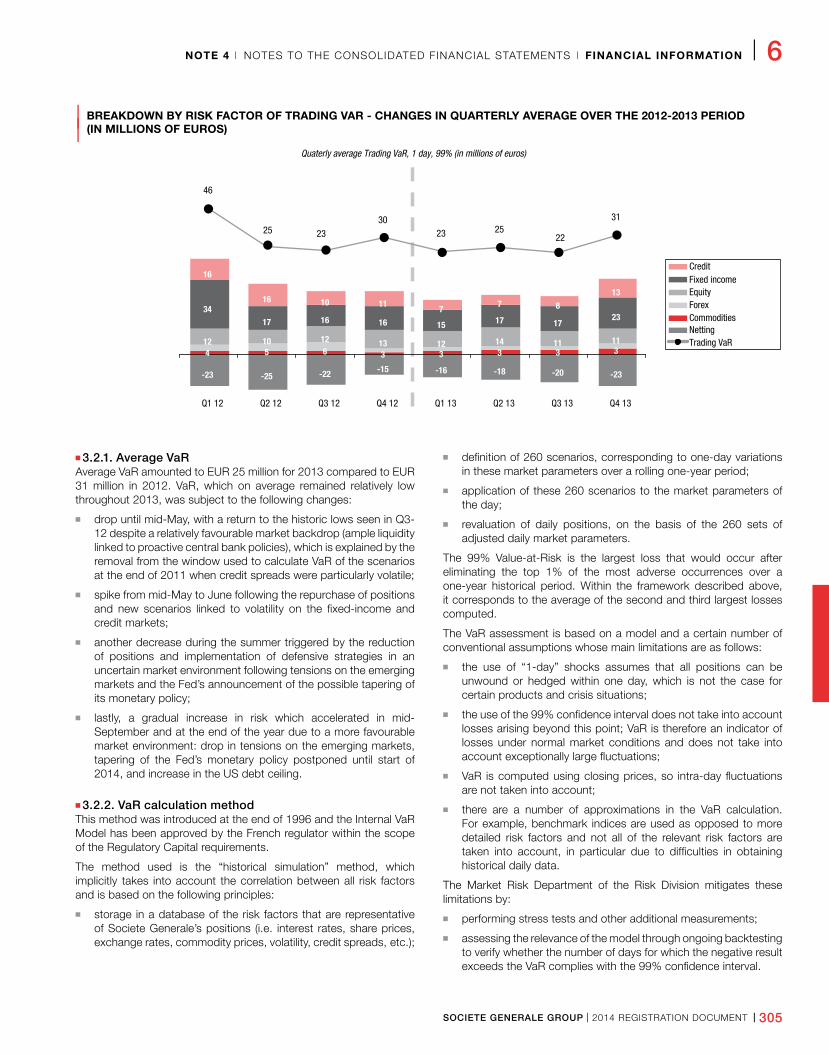
SOCIETE GENERALE GROUP I 2014 REGISTRATION DOCUMENT I 305
NOTE 4 I NOTES TO THE CONSOLIDATED FINANCIAL STATEMENTS I FINANCIAL INFORMATION I 6
| BREAKDOWN BY RISK FACTOR OF TRADING VAR - CHANGES IN QUARTERLY AVERAGE OVER THE 2012-2013 PERIOD
| (IN MILLIONS OF EUROS)
-23 -25 -22 -15 -16 -18 -20 -23
4 5 6 3 3 3 3 3 12 10 12 13 12 14 11 11
34 17 16 16 15 17 17
23
16
16 10 11 7
7 8
13
46
25 23 30
23 25 22
31
Q1 12 Q2 12 Q3 12 Q4 12 Q1 13 Q2 13 Q3 13 Q4 13
Quaterly average Trading VaR, 1 day, 99% (in millions of euros)
Fixed incomeCredit
EquityForexCommodities
Trading VaRNetting
n 3.2.1. Average VaRAverage VaR amounted to EUR 25 million for 2013 compared to EUR 31 million in 2012. VaR, which on average remained relatively low throughout 2013, was subject to the following changes:
n drop until mid-May, with a return to the historic lows seen in Q3-12 despite a relatively favourable market backdrop (ample liquidity linked to proactive central bank policies), which is explained by the removal from the window used to calculate VaR of the scenarios at the end of 2011 when credit spreads were particularly volatile;
n spike from mid-May to June following the repurchase of positions and new scenarios linked to volatility on the fixed-income and credit markets;
n another decrease during the summer triggered by the reduction of positions and implementation of defensive strategies in an uncertain market environment following tensions on the emerging markets and the Fed’s announcement of the possible tapering of its monetary policy;
n lastly, a gradual increase in risk which accelerated in mid-September and at the end of the year due to a more favourable market environment: drop in tensions on the emerging markets, tapering of the Fed’s monetary policy postponed until start of 2014, and increase in the US debt ceiling.
n 3.2.2. VaR calculation methodThis method was introduced at the end of 1996 and the Internal VaR Model has been approved by the French regulator within the scope of the Regulatory Capital requirements.
The method used is the “historical simulation” method, which implicitly takes into account the correlation between all risk factors and is based on the following principles:
n storage in a database of the risk factors that are representative of Societe Generale’s positions (i.e. interest rates, share prices, exchange rates, commodity prices, volatility, credit spreads, etc.);
n definition of 260 scenarios, corresponding to one-day variations in these market parameters over a rolling one-year period;
n application of these 260 scenarios to the market parameters of the day;
n revaluation of daily positions, on the basis of the 260 sets of adjusted daily market parameters.
The 99% Value-at-Risk is the largest loss that would occur after eliminating the top 1% of the most adverse occurrences over a one-year historical period. Within the framework described above, it corresponds to the average of the second and third largest losses computed.
The VaR assessment is based on a model and a certain number of conventional assumptions whose main limitations are as follows:
n the use of “1-day” shocks assumes that all positions can be unwound or hedged within one day, which is not the case for certain products and crisis situations;
n the use of the 99% confidence interval does not take into account losses arising beyond this point; VaR is therefore an indicator of losses under normal market conditions and does not take into account exceptionally large fluctuations;
n VaR is computed using closing prices, so intra-day fluctuations are not taken into account;
n there are a number of approximations in the VaR calculation. For example, benchmark indices are used as opposed to more detailed risk factors and not all of the relevant risk factors are taken into account, in particular due to difficulties in obtaining historical daily data.
The Market Risk Department of the Risk Division mitigates these limitations by:
n performing stress tests and other additional measurements;
n assessing the relevance of the model through ongoing backtesting to verify whether the number of days for which the negative result exceeds the VaR complies with the 99% confidence interval.
306 I 2014 REGISTRATION DOCUMENT I SOCIETE GENERALE GROUP
6 I FINANCIAL INFORMATION I NOTES TO THE CONSOLIDATED FINANCIAL STATEMENTS I NOTE 4
Daily profit and loss used for backtesting includes, in particular, changes in value of the portfolio held at the end of the day before (book value), the impact of new transactions or transactions, changed during the day (including their sales margins), refinancing costs, the various related commissions (brokerage fees, custody fees, etc.), as well as provisions and parameters adjustments made for market risk. Some components (for example, some adjustements for market risk) calculated at various frequencies are allocated on a daily basis.
In 2013, the VaR model has been continuously improved. In particular, the shocks applied to sovereign bonds are now based on historic yield curve spreads (Z-spread), instead of shocks observed on CDS. This treatment allows capturing the basis between bond and CDS.
Today, the market risks for almost all of Corporate and Investment Banking’s activities including those related to the most complex products, as well as the main market activities of Retail Banking and Private Banking outside France, are monitored using the VaR method. The few activities not covered by the VaR method, either for technical reasons or because the stakes are too low, are monitored using stress tests and give rise to capital requirements using the standard method or through alternative in-house methods.
n 3.2.3. Stressed VaR (SVaR)Societe Generale has been authorised by the French Prudential Supervisory Authority (Autorité de Contrôle Prudentiel et de Résolution) to complement its internal models with the new CRD3 measurements, in particular Stressed VaR, for the same scope as VaR.
The calculation method used is the same as under the VaR approach. This consists in carrying out a historical simulation with 1-day shocks and a 99% confidence interval. Contrary to VaR, which uses 260 scenarios for one-day fluctuations over a rolling one-year period. Stressed VaR uses a fixed one-year historical window corresponding to a period of significant financial tension.
The historical window, which is determined using a method approved by the regulator, captures significant shocks on all risk factors (risks related to equity, interest rates, foreign exchange rates and commodities). It is subject to an annual review.
n 3.2.4. Stress Test assessmentAlongside the internal VaR model, Societe Generale monitors its exposure using stress test simulations to take into account exceptional market occurrences.
A stress test estimates the loss resulting from an extreme change in market parameters over a period corresponding to the time required to unwind or hedge the positions affected (5 to 20 days for most trading positions).
This stress test risk assessment is applied to all of the Bank’s market activities. It is based on a set of historical and theoretical scenarios that include the "Societe Generale Hypothetical Financial Crisis Scenario" (or “Generalised” scenario) based on the events observed in 2008. These scenarios apply shocks to all substantial risk factors including exotic parameters. Together with the VaR model, this stress test risk assessment methodology is one of the main pillars of the risk management system. The underlying principles are as follows:
n risks are calculated every day for each of the Bank’s market activities (all products together), using each of the historical and hypothetical scenarios;
n stress test limits are established for the Group’s activity as a whole and then for the Bank’s various business lines. They frame the most adverse result arising from the set of historical and hypothetical scenarios;
n the various stress test scenarios are revised and improved by the Risk Division on a regular basis, in conjunction with the Group’s teams of economists and specialists. In 2013 this stress test assessment was based on a set of 34 scenarios, 26 that are historical scenarios and 8 that are hypothetical scenarii).
n 3.2.5. Historical Stress TestsThis method consists of an analysis of the major economic crises that have affected the financial markets since 1995 (a period since which the financial markets have become global and subject to increased regulatory requirements): the changes in the prices of financial assets (equities, interest rates, exchange rates, credit spreads, etc.) during each of these crises have been analysed in order to define scenarios for potential variations in these risk factors which, when applied to the bank’s trading positions, could generate significant losses.
Using this methodology, Societe Generale has defined 26 historical scenarios.
n 3.2.6. Hypothetical Stress TestsThe hypothetical scenarios are defined with the Bank’s economists and are designed to simulate possible sequences of events that could lead to a major crisis in the financial markets (e.g. a major terrorist attack, political instability in the main oil-producing countries, etc.). The Bank’s aim is to select extreme but nonetheless plausible events which would have major repercussions on all the international markets. Societe Generale has adopted 8 hypothetical scenarii.
4. STRUCTURAL INTEREST RATE AND EXCHANGE RATE RISKSStructural exposure to interest rate and exchange rate risks encompasses exposures resulting from commercial activities and their hedging and the proprietary transactions of all of the Group’s consolidated entities.
The interest rate and exchange rate risks linked to trading activities are excluded from the structural risk measurement scope as they belong to the category of market risks. The structural and market exposures constitute the total interest rate and exchange rate exposure of the Group.
The general objective is to reduce structural interest rate and exchange rate risks as much as possible within the consolidated entities. Wherever possible, commercial transactions are hedged against interest rate and exchange rate risks, either through micro-hedging (individual hedging of each commercial transaction) or macro-hedging techniques (hedging of portfolios of similar commercial transactions within a treasury department). Interest rate and exchange rate risks linked to proprietary transactions must also be hedged as far as possible excepted for some foreign exchange positions kept to immunise the Tier 1 ratio against foreign exchange rate fluctuation.
SOCIETE GENERALE GROUP I 2014 REGISTRATION DOCUMENT I 307
NOTE 4 I NOTES TO THE CONSOLIDATED FINANCIAL STATEMENTS I FINANCIAL INFORMATION I 6
4.1. ORGANISATION OF THE MANAGEMENT OF STRUCTURAL INTEREST RATE AND EXCHANGE RATE RISKSThe principles and standards for managing these risks are defined at the Group level. The entities are first and foremost responsible for managing these risks. The ALM (Asset and Liability Management) Risks Control Departments of the Group Business divisions conducts second-level controls over the entities’ structural risk management.
n The Group Finance Committee, a General Management body:
n validates and reviews the appropriateness the structural risk monitoring, management and supervision processes;
n reviews changes in the Group’s structural risks through consolidated reporting by the Finance Division;
n examines and validates the measures proposed by the Group Finance Division.
n The Balance Sheet and Global Treasury Management Department, which is part of the Finance Division, is responsible for:
n defining the structural interest rate, exchange rate and liquidity risk policies for the Group and in particular evaluating and planning the Group’s funding;
n defining the steering indicators and overall stress test scenarios for the different types of structural risks and setting the main limits for the business divisions and the entities;
n analysing the Group’s structural risk exposure and defining hedging strategies;
n monitoring the regulatory environment concerning structural risks.
n The ALM Risk Control Department, which is part of the Finance Division is responsible for:
n defining the ALM principles for the Group and monitoring the regulatory environment concerning ALM;
n defining the normative framework of the structural risk metrics;
n validating the models used by the Group entities with regard to structural risks;
n inventorying, consolidating and reporting on Group structural risks;
n performing controls of structural risk limits.
The ALM Risk Control Department reports to the Chief Financial Officer of the Group and is functionally supervised by the Chief Risk Officer, to whom it reports its activities and who validates its working plan jointly with the Chief Financial Officer. The ALM Risk Control Department is integrated in the Group Risk function in compliance with regulation CRBF 97-02.
n Entities are responsible for structural risk managementIn this respect, entities apply the standards defined at the Group level, develop their models, measure their risk exposure and implement the required hedges.
Each entity has its own structural risk manager, who reports to the entity’s Finance Department and is responsible for conducting first
level controls and for reporting the entity’s structural risk exposure to the Group Finance Division via a shared IT system.
Retail banking entities both in France and abroad generally have an ad-hoc ALM (Asset Liability Management) Committee responsible for validating the models used, managing their exposures to interest rate and exchange rate risks and implementing the hedging programmes in compliance with the principles set out by the Group and the limits validated by the Finance Committee.
4.2. STRUCTURAL INTEREST RATE RISKStructural interest rate risk is measured within the scope of structural activities (transactions with customers, the associated hedging transactions and proprietary transactions).
Structural interest rate risk arises mainly from the residual gaps (surplus or deficit) in each entity’s fixed-rate forecast positions.
n 4.2.1. Objective of the GroupThe Group’s main aim is to reduce each Group entity’s exposure to structural interest rate risk as much as possible.
To this end, any residual structural interest rate risk exposure must comply with the sensitivity limits set for each entity and for the overall Group as validated by the Finance Committee. Sensitivity is defined as the variation in the net present value of future (maturities of up to 20 years) residual fixed-rate positions (surplus or deficit) for a 1% parallel increase in the yield curve (i.e. this sensitivity does not relate to the sensitivity of the annual net interest margin). The limit set at Group level is EUR 1 billion, representing an amount equal to 2.1% of its regulatory capital.
n 4.2.2. Measurement and monitoring of structural interest rate risksIn order to quantify its exposure to structural interest rate risks, the Group assesses the interest rate gaps generated by all fixed-rate positions at future maturities. These positions come from transactions bearing fixed interest rates and from their maturities.
Assets and liabilities are analysed independently, without any a priori matching. The maturities of outstanding assets and liabilities are determined on the basis of the contractual terms of transactions, models based on customers’ historic behaviour patterns (particularly for regulated savings accounts, early loan repayments, etc.), as well as conventional assumptions relating to certain balance sheet items (principally shareholders’ equity and sight deposits).
Once the Group has identified its fixed-rate positions (surplus or deficit), it calculates the sensitivity (as defined above) to interest rate variations. This sensitivity is defined as the variation of the net present value of the fixed-rate positions for a 1% instantaneous parallel increase in the yield curve.
In addition to this analysis, the Group also analyses the sensitivity to different yield curve configurations of the fixed-rate position (steepening and flattening of the yield curve). The measurement of the net interest income sensitivity is also used by the Group to quantify the structural interest rate risk of significant entities.
Throughout 2013, the Group’s overall sensitivity to interest rate risk remained below 1.5% of Group regulatory capital and within the EUR 1 billion limit.
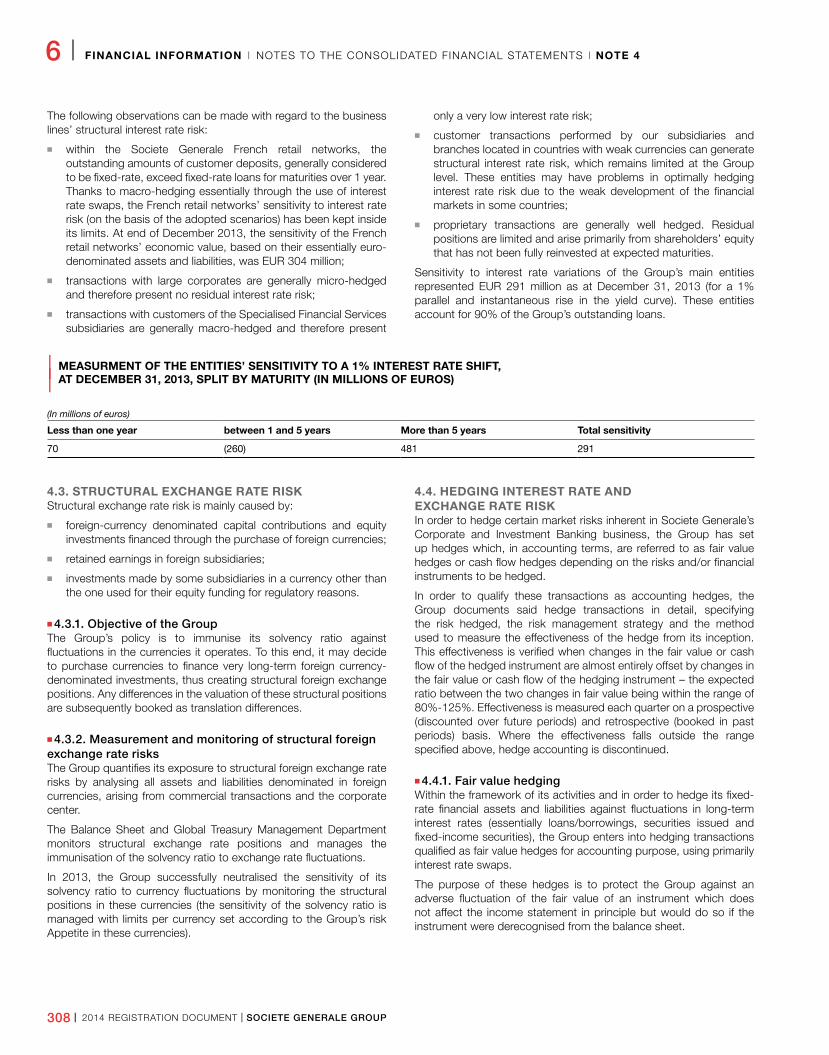
308 I 2014 REGISTRATION DOCUMENT I SOCIETE GENERALE GROUP
6 I FINANCIAL INFORMATION I NOTES TO THE CONSOLIDATED FINANCIAL STATEMENTS I NOTE 4
The following observations can be made with regard to the business lines’ structural interest rate risk:
n within the Societe Generale French retail networks, the outstanding amounts of customer deposits, generally considered to be fixed-rate, exceed fixed-rate loans for maturities over 1 year. Thanks to macro-hedging essentially through the use of interest rate swaps, the French retail networks’ sensitivity to interest rate risk (on the basis of the adopted scenarios) has been kept inside its limits. At end of December 2013, the sensitivity of the French retail networks’ economic value, based on their essentially euro-denominated assets and liabilities, was EUR 304 million;
n transactions with large corporates are generally micro-hedged and therefore present no residual interest rate risk;
n transactions with customers of the Specialised Financial Services subsidiaries are generally macro-hedged and therefore present
only a very low interest rate risk;
n customer transactions performed by our subsidiaries and branches located in countries with weak currencies can generate structural interest rate risk, which remains limited at the Group level. These entities may have problems in optimally hedging interest rate risk due to the weak development of the financial markets in some countries;
n proprietary transactions are generally well hedged. Residual positions are limited and arise primarily from shareholders’ equity that has not been fully reinvested at expected maturities.
Sensitivity to interest rate variations of the Group’s main entities represented EUR 291 million as at December 31, 2013 (for a 1% parallel and instantaneous rise in the yield curve). These entities account for 90% of the Group’s outstanding loans.
| MEASURMENT OF THE ENTITIES’ SENSITIVITY TO A 1% INTEREST RATE SHIFT,
| AT DECEMBER 31, 2013, SPLIT BY MATURITY (IN MILLIONS OF EUROS)
(In millions of euros)
Less than one year between 1 and 5 years More than 5 years Total sensitivity
70 (260) 481 291
4.3. STRUCTURAL EXCHANGE RATE RISKStructural exchange rate risk is mainly caused by:
n foreign-currency denominated capital contributions and equity investments financed through the purchase of foreign currencies;
n retained earnings in foreign subsidiaries;
n investments made by some subsidiaries in a currency other than the one used for their equity funding for regulatory reasons.
n 4.3.1. Objective of the GroupThe Group’s policy is to immunise its solvency ratio against fluctuations in the currencies it operates. To this end, it may decide to purchase currencies to finance very long-term foreign currency-denominated investments, thus creating structural foreign exchange positions. Any differences in the valuation of these structural positions are subsequently booked as translation differences.
n 4.3.2. Measurement and monitoring of structural foreign exchange rate risksThe Group quantifies its exposure to structural foreign exchange rate risks by analysing all assets and liabilities denominated in foreign currencies, arising from commercial transactions and the corporate center.
The Balance Sheet and Global Treasury Management Department monitors structural exchange rate positions and manages the immunisation of the solvency ratio to exchange rate fluctuations.
In 2013, the Group successfully neutralised the sensitivity of its solvency ratio to currency fluctuations by monitoring the structural positions in these currencies (the sensitivity of the solvency ratio is managed with limits per currency set according to the Group’s risk Appetite in these currencies).
4.4. HEDGING INTEREST RATE AND EXCHANGE RATE RISKIn order to hedge certain market risks inherent in Societe Generale’s Corporate and Investment Banking business, the Group has set up hedges which, in accounting terms, are referred to as fair value hedges or cash flow hedges depending on the risks and/or financial instruments to be hedged.
In order to qualify these transactions as accounting hedges, the Group documents said hedge transactions in detail, specifying the risk hedged, the risk management strategy and the method used to measure the effectiveness of the hedge from its inception. This effectiveness is verified when changes in the fair value or cash flow of the hedged instrument are almost entirely offset by changes in the fair value or cash flow of the hedging instrument – the expected ratio between the two changes in fair value being within the range of 80%-125%. Effectiveness is measured each quarter on a prospective (discounted over future periods) and retrospective (booked in past periods) basis. Where the effectiveness falls outside the range specified above, hedge accounting is discontinued.
n 4.4.1. Fair value hedgingWithin the framework of its activities and in order to hedge its fixed-rate financial assets and liabilities against fluctuations in long-term interest rates (essentially loans/borrowings, securities issued and fixed-income securities), the Group enters into hedging transactions qualified as fair value hedges for accounting purpose, using primarily interest rate swaps.
The purpose of these hedges is to protect the Group against an adverse fluctuation of the fair value of an instrument which does not affect the income statement in principle but would do so if the instrument were derecognised from the balance sheet.
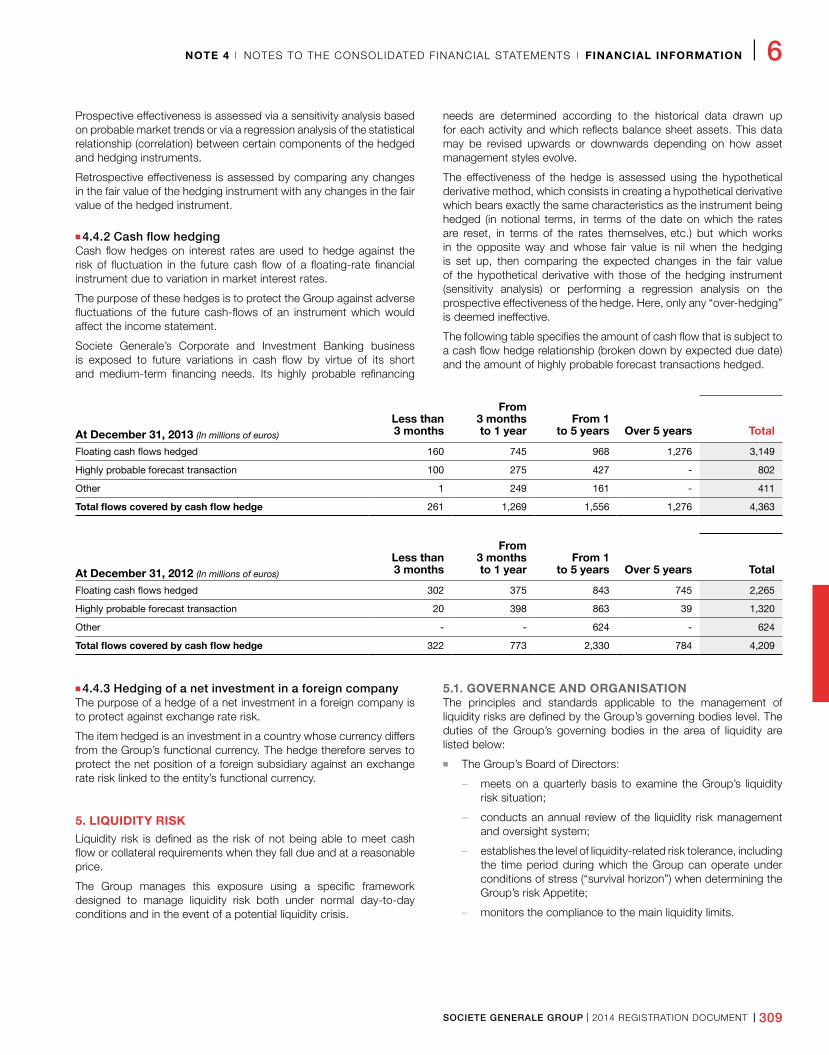
SOCIETE GENERALE GROUP I 2014 REGISTRATION DOCUMENT I 309
NOTE 4 I NOTES TO THE CONSOLIDATED FINANCIAL STATEMENTS I FINANCIAL INFORMATION I 6
Prospective effectiveness is assessed via a sensitivity analysis based on probable market trends or via a regression analysis of the statistical relationship (correlation) between certain components of the hedged and hedging instruments.
Retrospective effectiveness is assessed by comparing any changes in the fair value of the hedging instrument with any changes in the fair value of the hedged instrument.
n 4.4.2 Cash flow hedgingCash flow hedges on interest rates are used to hedge against the risk of fluctuation in the future cash flow of a floating-rate financial instrument due to variation in market interest rates.
The purpose of these hedges is to protect the Group against adverse fluctuations of the future cash-flows of an instrument which would affect the income statement.
Societe Generale’s Corporate and Investment Banking business is exposed to future variations in cash flow by virtue of its short and medium-term financing needs. Its highly probable refinancing
needs are determined according to the historical data drawn up for each activity and which reflects balance sheet assets. This data may be revised upwards or downwards depending on how asset management styles evolve.
The effectiveness of the hedge is assessed using the hypothetical derivative method, which consists in creating a hypothetical derivative which bears exactly the same characteristics as the instrument being hedged (in notional terms, in terms of the date on which the rates are reset, in terms of the rates themselves, etc.) but which works in the opposite way and whose fair value is nil when the hedging is set up, then comparing the expected changes in the fair value of the hypothetical derivative with those of the hedging instrument (sensitivity analysis) or performing a regression analysis on the prospective effectiveness of the hedge. Here, only any “over-hedging” is deemed ineffective.
The following table specifies the amount of cash flow that is subject to a cash flow hedge relationship (broken down by expected due date) and the amount of highly probable forecast transactions hedged.
At December 31, 2013 (In millions of euros)
Less than 3 months
From 3 months to 1 year
From 1 to 5 years Over 5 years Total
Floating cash flows hedged 160 745 968 1,276 3,149
Highly probable forecast transaction 100 275 427 - 802
Other 1 249 161 - 411
Total flows covered by cash flow hedge 261 1,269 1,556 1,276 4,363
At December 31, 2012 (In millions of euros)
Less than 3 months
From 3 months to 1 year
From 1 to 5 years Over 5 years Total
Floating cash flows hedged 302 375 843 745 2,265
Highly probable forecast transaction 20 398 863 39 1,320
Other - - 624 - 624
Total flows covered by cash flow hedge 322 773 2,330 784 4,209
n 4.4.3 Hedging of a net investment in a foreign companyThe purpose of a hedge of a net investment in a foreign company is to protect against exchange rate risk.
The item hedged is an investment in a country whose currency differs from the Group’s functional currency. The hedge therefore serves to protect the net position of a foreign subsidiary against an exchange rate risk linked to the entity’s functional currency.
5. LIQUIDITY RISKLiquidity risk is defined as the risk of not being able to meet cash flow or collateral requirements when they fall due and at a reasonable price.
The Group manages this exposure using a specific framework designed to manage liquidity risk both under normal day-to-day conditions and in the event of a potential liquidity crisis.
5.1. GOVERNANCE AND ORGANISATIONThe principles and standards applicable to the management of liquidity risks are defined by the Group’s governing bodies level. The duties of the Group’s governing bodies in the area of liquidity are listed below:
n The Group’s Board of Directors:
– meets on a quarterly basis to examine the Group’s liquidity risk situation;
– conducts an annual review of the liquidity risk management and oversight system;
– establishes the level of liquidity-related risk tolerance, including the time period during which the Group can operate under conditions of stress (“survival horizon”) when determining the Group’s risk Appetite;
– monitors the compliance to the main liquidity limits.
310 I 2014 REGISTRATION DOCUMENT I SOCIETE GENERALE GROUP
6 I FINANCIAL INFORMATION I NOTES TO THE CONSOLIDATED FINANCIAL STATEMENTS I NOTE 4
n The General Management:
– presents a framework of Group-wide liquidity risk tolerance levels to the Board of Directors for validation in line with the Group’s risk Appetite;
– sets liquidity limits for each business division and major Group entity;
– monitors the compliance to liquidity limits for the Group and for each business division;
– validates remedial action plans in the event that liquidity limits are exceeded at the Group or business division level.
n The Finance Committee:
– meets at least quarterly under the chairmanship of the Chairman and Chief Executive Officer or a Deputy Chief Executive Officer with the representatives from the different corporate divisions and business divisions;
– prepares the decisions of the General Management in the areas of general policy, liquidity risk tolerance and liquidity limits;
– ensures the adequacy of the risk management and control system;
– examines and validates the measures advocated by the Departments;
– monitors developments in the liquidity situation within the Group’s scope of management.
The business divisions and major Group entities manage liquidity under the direct supervision of the Group Finance Division. The other operating entities are responsible for managing their own liquidity and for complying with applicable regulatory constraints, under the supervision of the core business to which they report. The entities submit reports on their structural liquidity risk to the Group via a shared IT system.
The Group Finance Division provides liquidity risk management, oversight and monitoring via three distinct entities in compliance with the principles advocating a separation of risk steering, execution and control functions.
n The Financial and Strategic Steering Department, responsible for:
– establishing the Group’s liquidity framework in compliance with its strategic objectives, regulatory requirements and market expectations;
– ensuring that liquidity oversight is in line with the Group’s other objectives in the areas of profitability and scarce resources;
– establishing targets and limits for the businesses and monitoring their compliance;
– monitoring the regulatory environment and developing oversight standards for the core businesses.
n The Balance Sheet and Global Treasury Management Department, responsible for:
– the operational implementation of the Group’s financing through long-term issuances;
– supervising and coordinating the Group’s Treasury functions;
– performing a market monitoring and providing its operational expertise when establishing targets in the area of liquidity steering;
– managing the collateral used in refinancing operations (Central Banks, covered bonds, securitisation);
– managing the Group’s central funding department (management of liquidity and regulatory capital within the Group).
n The Structural Risk Monitoring and Control Department, responsible for:
– supervising and managing the structural risks (interest rates, foreign exchange rates, liquidity) to which the Group is exposed;
– in particular, verifiying models and monitoring compliance with limit restrictions and management practices by the divisions, business lines and entities of the Group;
– reporting hierarchically to the Chief Financial Officer and reporting functionally to the Group Chief Risk Officer.
In addition, several Risk Division departments contribute, together with the Finance Division, to the operational supervision of liquidity risk. Their actions are coordinated by the Cross-Business Risk Monitoring Department shared by the Group Chief Risk Officer. Specifically, they relate to:
n the independent review of capital market models;
n the validation of all the Group’s liquidity models within the framework of centralised governance;
n the examination of requests for risk limits relating to liquidity risk metrics and the monitoring of any limit breaches.
5.2. LIQUIDITY RISK MANAGEMENTThe Group’s primary objective is to ensure the funding of its activities in the most cost-effective way by managing liquidity risk by adhering to regulatory limits. The liquidity oversight system is aimed at providing a balance sheet framework with an asset and liability target structure that is consistent with the risk appetite defined by the Board of Directors.
n The target asset structure should allow the businesses to develop their activities in a way that is liquidity-efficient and compatible with the target liability structure. This development must comply with the liquidity gaps defined on the Group level (under static and stress scenarios) as well as regulatory requirements.
n The target liability structure is based on the ability of the businesses to collect financial resources from customers and the ability of the Group to sustainably raise financial resources on the markets, in accordance with its risk appetite.
This oversight system requires measuring and determining the limits of the businesses’ liquidity gaps under reference and stress scenarios, their need for funding raised from the Group, the Group’s fundraising on the market, the eligible assets and the businesses’ contribution to regulatory ratios.
n The businesses must observe zero or low static liquidity gaps within the operating limits of their activities through a back-to-back with the Group’s central treasury, which can, if needed, run a transformation/antitransformation position, and manage it within the framework of the established risk limits.
SOCIETE GENERALE GROUP I 2014 REGISTRATION DOCUMENT I 311
NOTE 4 I NOTES TO THE CONSOLIDATED FINANCIAL STATEMENTS I FINANCIAL INFORMATION I 6
n Internal liquidity stress tests, established on the basis of the systemic, specific and combined scenarios, are controlled at the Group level. They are used to ensure compliance with the survival horizon established by the Board of Directors and to calibrate liquidity reserves. They are accompanied by a Contingency Funding Plan that foresees measures to be taken in the event of a liquidity crisis.
The Group’s liquidity reserve contain cash and assets that can be used to meet treasury outflows under a stress scenario. The reserve assets are available, i.e. not used as a guarantee or as collateral on any transaction. They are included in the reserves after application of a haircut to reflect their expected valuation under stress. The Group’s liquidity reserve contain assets that can be freely transferred within the Group or used to meet liquidity outflows at the level of subsidiaries in the event of a crisis.
n The composition of the liquidity reserves is reviewed regularly by a special committee comprising together the Finance Division, the Risk Division and the Management of the GBIS business division, and is adjusted by delegation of the Finance Committee.
n The funding needs of businesses (short-term and long-term) are determined on the basis of the franchises’ development targets and in line with the Group’s fundraising targets and capabilities.
n A plan for long term funding, which complements the resources raised by the business divisions, is aimed at ensuring the repayments of upcoming maturities and finance the growth of the businesses. It takes into account the Group’s investment capabilities and aims to optimise the cost of fundraising while complying with limits in terms of market concentration. Diversification in terms of issuers and investor pools is also examined and managed.
Regarding the assets given as collateral in respect of collateralised financing, with respect to market financing, the Group closely monitors the proportion of collateralised financing and the associated overcollateralisation ratio. The objective is to optimise the use of collateral available within the Group, comply with existing obligations and reduce the overall refinancing cost.
n The Group’s short-term resources are aimed at financing the short-term needs of the businesses over periods appropriate to their management and in line with market concentration limits. As outlined above, the amount of short-terme resources is based on the asset liquidity reserve according to the established stress survival horizon as well as the Group’s LCR target (see below).
n The Group’s oversight takes into account compliance with the target regulatory ratios. The contributions of the businesses to these ratios is closely monitored.
The “Liquidity Coverage Ratio” (LCR), the ratio defined by the Basel Committee is aimed at ensuring that banks have a sufficient safety buffer consisting of liquid or cash assets to withstand severe stress for a duration of one month, involving a combination of a market crisis and a specific crisis. The minimum ratio will be set at January 1, 2015 with a gradual increase of 10% per year, reaching 100% on January 1, 2018. At December 31, 2013, the Group’s LCR was above 100%.
The oversight of the Group also includes the adherence to the standard ACPR liquidity ratio (defined by current French regulations) which remained systematically above the minimum requirement of 100% in 2013.
Finally, liquidity is framed in terms of cost via the Group’s internal transfer pricing scheme. Funding allocated to the businesses is invoiced at rates that must reflect the average liquidity cost for the Group. This system is aimed at optimising the use of external financing sources by the businesses and is used to oversee funding balances on the balance sheet.
Societe Generale performed a review of its liquidity risks and has determined that it is able to meet its future maturities.
6. CAPITAL MANAGEMENT AND COMPLIANCE WITH REGULATORY RATIOS
6.1. QUALITATIVE INFORMATION
n Description of the approach to capital managementGroup policy on the use of shareholders’ equity meets the following three priorities: for a given market capitalisation target, 1) to ensure internal growth, 2) to manage and optimise the Group’s portfolio and 3) to maintain a clear and consistent policy with respect to its shareholders (principally on matters of dividend pay-outs).
To this end, Societe Generale Group establishes a capital target based on a combination of factors specific to the Group (target rating, business mix, Group risk profile and strategy) and external factors (competitors’ level of shareholders’ equity, market expectations, minimum capitalisation expected by the supervisory authorities). The size of the capital is also determined in order to cover extreme losses calculated through global stress tests taking into account the whole risk profile of the Group and allowing the measurement of its resilience to macroeconomic crisis scenarios.
Financial planning is used to maintain this objective, which consists in simulating the balance of resources in relation to capital requirements and capital transactions. Capital management is monitored through data collected within the framework of the Group budget and strategic plan, which are periodically updated
n Compliance with ratiosThe solvency ratio (Basel 2.5 solvency ratio) complies with the calculation methods established by the French Prudential Supervisory Authority. This ratio is based on the Group’s consolidated banking activities, thus eliminating the contributions of the insurance entities.
Prudential capital is comprised of the following: Tier 1 capital, upper Tier 2 capital and lower Tier 2 capital are calculated in accordance with Regulation No. 90-02 relating to capital. Supplementary capital (Tier 2) is taken into account only within the limit of 100% of Tier 1 capital. Furthermore, additional Tier 2 capital may not exceed the limit of 50% of Tier 1 capital. Hybrid equity instruments (both innovative and non-innovative) are limited to 35% of the consolidated bank’s Tier 1 capital, innovative hybrid equity instruments being subject to stringent conditions and limited to a maximum of 15% of this Tier 1 capital.
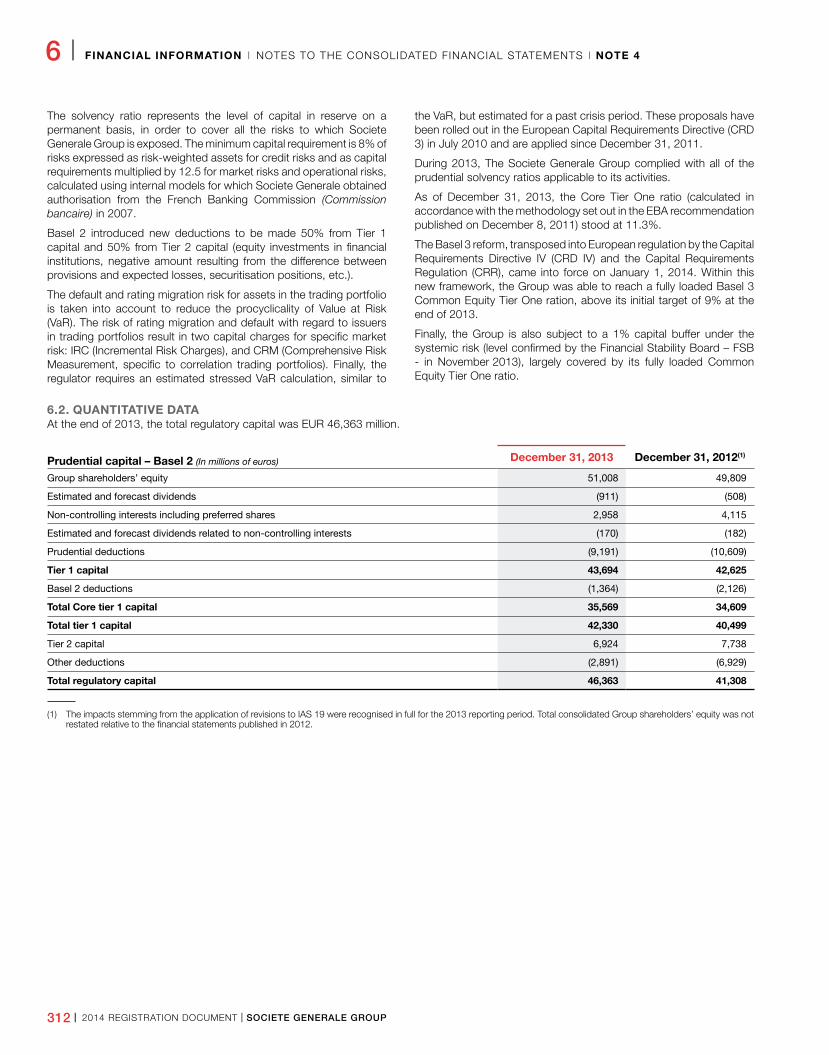
312 I 2014 REGISTRATION DOCUMENT I SOCIETE GENERALE GROUP
6 I FINANCIAL INFORMATION I NOTES TO THE CONSOLIDATED FINANCIAL STATEMENTS I NOTE 4
The solvency ratio represents the level of capital in reserve on a permanent basis, in order to cover all the risks to which Societe Generale Group is exposed. The minimum capital requirement is 8% of risks expressed as risk-weighted assets for credit risks and as capital requirements multiplied by 12.5 for market risks and operational risks, calculated using internal models for which Societe Generale obtained authorisation from the French Banking Commission (Commission bancaire) in 2007.
Basel 2 introduced new deductions to be made 50% from Tier 1 capital and 50% from Tier 2 capital (equity investments in financial institutions, negative amount resulting from the difference between provisions and expected losses, securitisation positions, etc.).
The default and rating migration risk for assets in the trading portfolio is taken into account to reduce the procyclicality of Value at Risk (VaR). The risk of rating migration and default with regard to issuers in trading portfolios result in two capital charges for specific market risk: IRC (Incremental Risk Charges), and CRM (Comprehensive Risk Measurement, specific to correlation trading portfolios). Finally, the regulator requires an estimated stressed VaR calculation, similar to
the VaR, but estimated for a past crisis period. These proposals have been rolled out in the European Capital Requirements Directive (CRD 3) in July 2010 and are applied since December 31, 2011.
During 2013, The Societe Generale Group complied with all of the prudential solvency ratios applicable to its activities.
As of December 31, 2013, the Core Tier One ratio (calculated in accordance with the methodology set out in the EBA recommendation published on December 8, 2011) stood at 11.3%.
The Basel 3 reform, transposed into European regulation by the Capital Requirements Directive IV (CRD IV) and the Capital Requirements Regulation (CRR), came into force on January 1, 2014. Within this new framework, the Group was able to reach a fully loaded Basel 3 Common Equity Tier One ration, above its initial target of 9% at the end of 2013.
Finally, the Group is also subject to a 1% capital buffer under the systemic risk (level confirmed by the Financial Stability Board – FSB - in November 2013), largely covered by its fully loaded Common Equity Tier One ratio.
6.2. QUANTITATIVE DATAAt the end of 2013, the total regulatory capital was EUR 46,363 million.
Prudential capital – Basel 2 (In millions of euros) December 31, 2013 December 31, 2012(1)
Group shareholders’ equity 51,008 49,809
Estimated and forecast dividends (911) (508)
Non-controlling interests including preferred shares 2,958 4,115
Estimated and forecast dividends related to non-controlling interests (170) (182)
Prudential deductions (9,191) (10,609)
Tier 1 capital 43,694 42,625
Basel 2 deductions (1,364) (2,126)
Total Core tier 1 capital 35,569 34,609
Total tier 1 capital 42,330 40,499
Tier 2 capital 6,924 7,738
Other deductions (2,891) (6,929)
Total regulatory capital 46,363 41,308
(1) The impacts stemming from the application of revisions to IAS 19 were recognised in full for the 2013 reporting period. Total consolidated Group shareholders’ equity was not restated relative to the financial statements published in 2012.
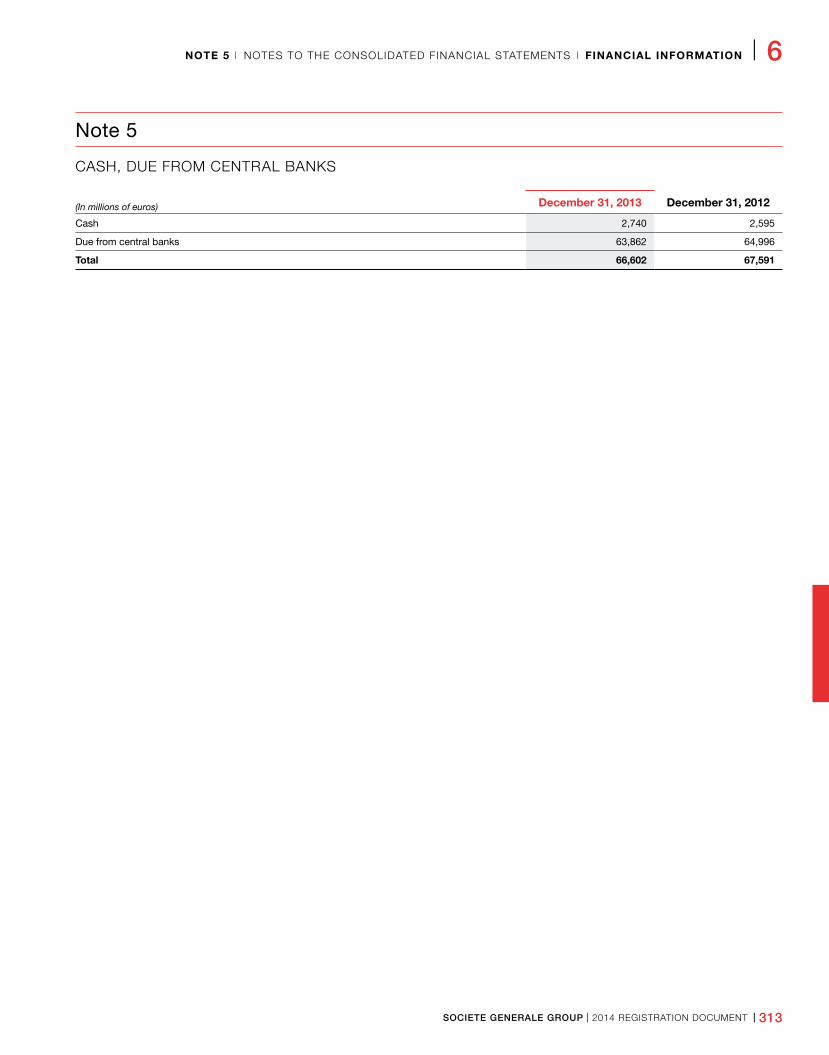
SOCIETE GENERALE GROUP I 2014 REGISTRATION DOCUMENT I 313
NOTE 5 I NOTES TO THE CONSOLIDATED FINANCIAL STATEMENTS I FINANCIAL INFORMATION I 6
Note 5
CASH, DUE FROM CENTRAL BANKS
(In millions of euros) December 31, 2013 December 31, 2012
Cash 2,740 2,595
Due from central banks 63,862 64,996
Total 66,602 67,591
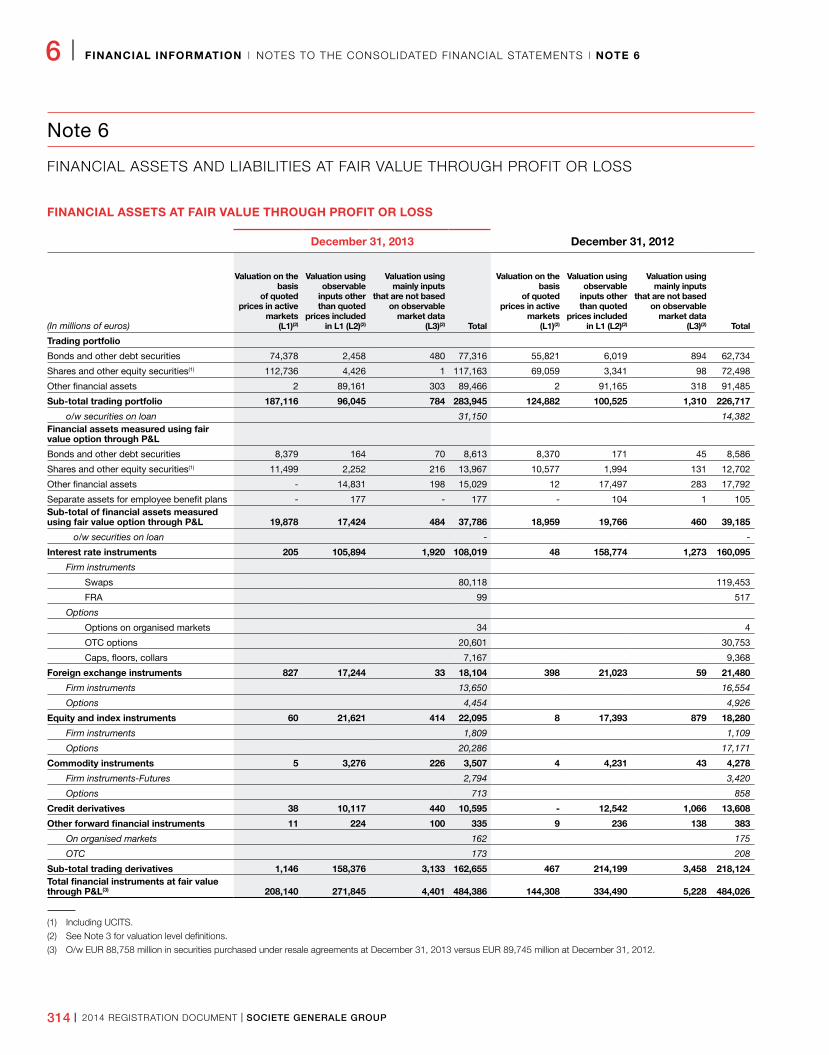
314 I 2014 REGISTRATION DOCUMENT I SOCIETE GENERALE GROUP
6 I FINANCIAL INFORMATION I NOTES TO THE CONSOLIDATED FINANCIAL STATEMENTS I NOTE 6
Note 6
FINANCIAL ASSETS AND LIABILITIES AT FAIR VALUE THROUGH PROFIT OR LOSS
FINANCIAL ASSETS AT FAIR VALUE THROUGH PROFIT OR LOSS
December 31, 2013 December 31, 2012
(In millions of euros)
Valuation on the basis
of quotedprices in active
markets(L1)(2)
Valuation using observable
inputs other than quoted
prices included in L1 (L2)(2)
Valuation usingmainly inputs
that are not based on observable
market data(L3)(2) Total
Valuation on the basis
of quotedprices in active
markets(L1)(2)
Valuation using observable
inputs other than quoted
prices included in L1 (L2)(2)
Valuation usingmainly inputs
that are not based on observable
market data(L3)(2) Total
Trading portfolio
Bonds and other debt securities 74,378 2,458 480 77,316 55,821 6,019 894 62,734
Shares and other equity securities(1) 112,736 4,426 1 117,163 69,059 3,341 98 72,498
Other financial assets 2 89,161 303 89,466 2 91,165 318 91,485
Sub-total trading portfolio 187,116 96,045 784 283,945 124,882 100,525 1,310 226,717
o/w securities on loan 31,150 14,382Financial assets measured using fair value option through P&L
Bonds and other debt securities 8,379 164 70 8,613 8,370 171 45 8,586
Shares and other equity securities(1) 11,499 2,252 216 13,967 10,577 1,994 131 12,702
Other financial assets - 14,831 198 15,029 12 17,497 283 17,792
Separate assets for employee benefit plans - 177 - 177 - 104 1 105Sub-total of financial assets measured using fair value option through P&L 19,878 17,424 484 37,786 18,959 19,766 460 39,185
o/w securities on loan - -
Interest rate instruments 205 105,894 1,920 108,019 48 158,774 1,273 160,095
Firm instruments
Swaps 80,118 119,453
FRA 99 517
Options
Options on organised markets 34 4
OTC options 20,601 30,753
Caps, floors, collars 7,167 9,368
Foreign exchange instruments 827 17,244 33 18,104 398 21,023 59 21,480
Firm instruments 13,650 16,554
Options 4,454 4,926
Equity and index instruments 60 21,621 414 22,095 8 17,393 879 18,280
Firm instruments 1,809 1,109
Options 20,286 17,171
Commodity instruments 5 3,276 226 3,507 4 4,231 43 4,278
Firm instruments-Futures 2,794 3,420
Options 713 858
Credit derivatives 38 10,117 440 10,595 - 12,542 1,066 13,608
Other forward financial instruments 11 224 100 335 9 236 138 383
On organised markets 162 175
OTC 173 208
Sub-total trading derivatives 1,146 158,376 3,133 162,655 467 214,199 3,458 218,124Total financial instruments at fair value through P&L(3) 208,140 271,845 4,401 484,386 144,308 334,490 5,228 484,026
(1) Including UCITS.
(2) See Note 3 for valuation level definitions.
(3) O/w EUR 88,758 million in securities purchased under resale agreements at December 31, 2013 versus EUR 89,745 million at December 31, 2012.
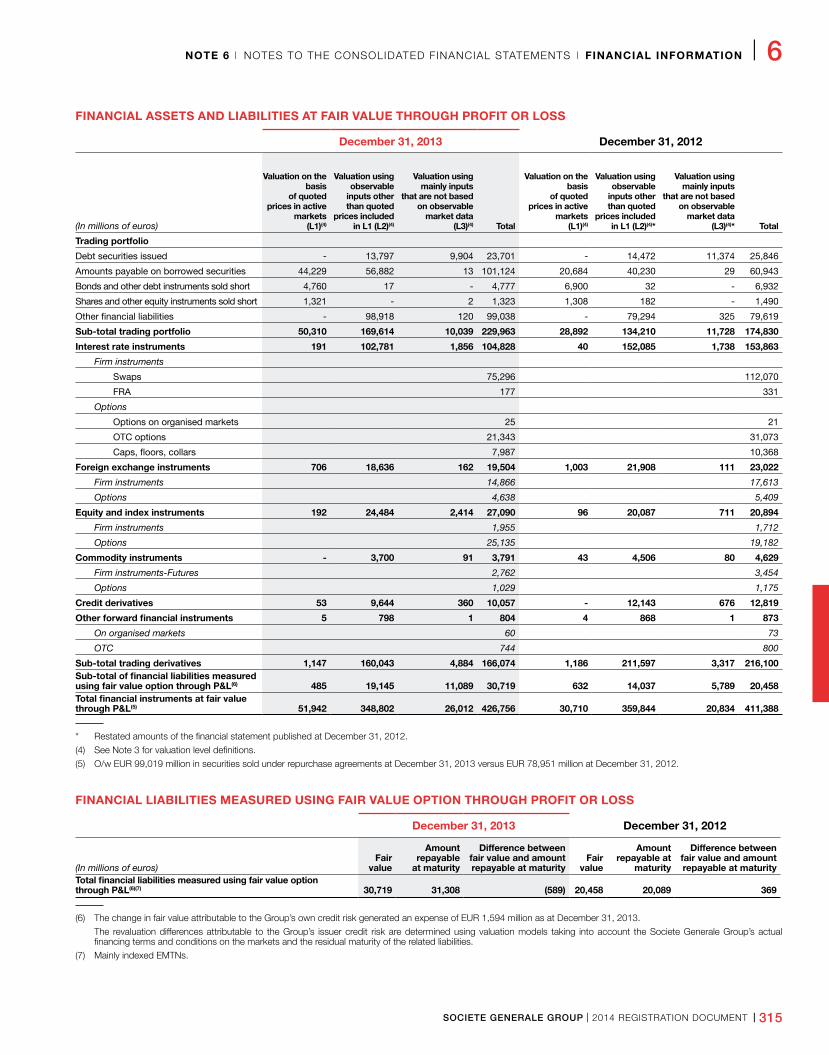
SOCIETE GENERALE GROUP I 2014 REGISTRATION DOCUMENT I 315
NOTE 6 I NOTES TO THE CONSOLIDATED FINANCIAL STATEMENTS I FINANCIAL INFORMATION I 6
FINANCIAL ASSETS AND LIABILITIES AT FAIR VALUE THROUGH PROFIT OR LOSS
December 31, 2013 December 31, 2012
(In millions of euros)
Valuation on the basis
of quotedprices in active
markets(L1)(4)
Valuation using observable
inputs other than quoted
prices included in L1 (L2)(4)
Valuation usingmainly inputs
that are not based on observable
market data(L3)(4) Total
Valuation on the basis
of quotedprices in active
markets(L1)(4)
Valuation using observable
inputs other than quoted
prices included in L1 (L2)(4)*
Valuation usingmainly inputs
that are not based on observable
market data(L3)(4)* Total
Trading portfolio
Debt securities issued - 13,797 9,904 23,701 - 14,472 11,374 25,846
Amounts payable on borrowed securities 44,229 56,882 13 101,124 20,684 40,230 29 60,943
Bonds and other debt instruments sold short 4,760 17 - 4,777 6,900 32 - 6,932
Shares and other equity instruments sold short 1,321 - 2 1,323 1,308 182 - 1,490
Other financial liabilities - 98,918 120 99,038 - 79,294 325 79,619
Sub-total trading portfolio 50,310 169,614 10,039 229,963 28,892 134,210 11,728 174,830
Interest rate instruments 191 102,781 1,856 104,828 40 152,085 1,738 153,863
Firm instruments
Swaps 75,296 112,070
FRA 177 331
Options
Options on organised markets 25 21
OTC options 21,343 31,073
Caps, floors, collars 7,987 10,368
Foreign exchange instruments 706 18,636 162 19,504 1,003 21,908 111 23,022
Firm instruments 14,866 17,613
Options 4,638 5,409
Equity and index instruments 192 24,484 2,414 27,090 96 20,087 711 20,894
Firm instruments 1,955 1,712
Options 25,135 19,182
Commodity instruments - 3,700 91 3,791 43 4,506 80 4,629
Firm instruments-Futures 2,762 3,454
Options 1,029 1,175
Credit derivatives 53 9,644 360 10,057 - 12,143 676 12,819
Other forward financial instruments 5 798 1 804 4 868 1 873
On organised markets 60 73
OTC 744 800
Sub-total trading derivatives 1,147 160,043 4,884 166,074 1,186 211,597 3,317 216,100 Sub-total of financial liabilities measured using fair value option through P&L(6) 485 19,145 11,089 30,719 632 14,037 5,789 20,458 Total financial instruments at fair value through P&L(5) 51,942 348,802 26,012 426,756 30,710 359,844 20,834 411,388
* Restated amounts of the financial statement published at December 31, 2012.
(4) See Note 3 for valuation level definitions.
(5) O/w EUR 99,019 million in securities sold under repurchase agreements at December 31, 2013 versus EUR 78,951 million at December 31, 2012.
FINANCIAL LIABILITIES MEASURED USING FAIR VALUE OPTION THROUGH PROFIT OR LOSS
December 31, 2013 December 31, 2012
(In millions of euros)Fair
value
Amount repayable
at maturity
Difference between fair value and amount repayable at maturity
Fair value
Amount repayable at
maturity
Difference between fair value and amount repayable at maturity
Total financial liabilities measured using fair value option through P&L(6)(7) 30,719 31,308 (589) 20,458 20,089 369
(6) The change in fair value attributable to the Group’s own credit risk generated an expense of EUR 1,594 million as at December 31, 2013.
The revaluation differences attributable to the Group’s issuer credit risk are determined using valuation models taking into account the Societe Generale Group’s actual financing terms and conditions on the markets and the residual maturity of the related liabilities.
(7) Mainly indexed EMTNs.
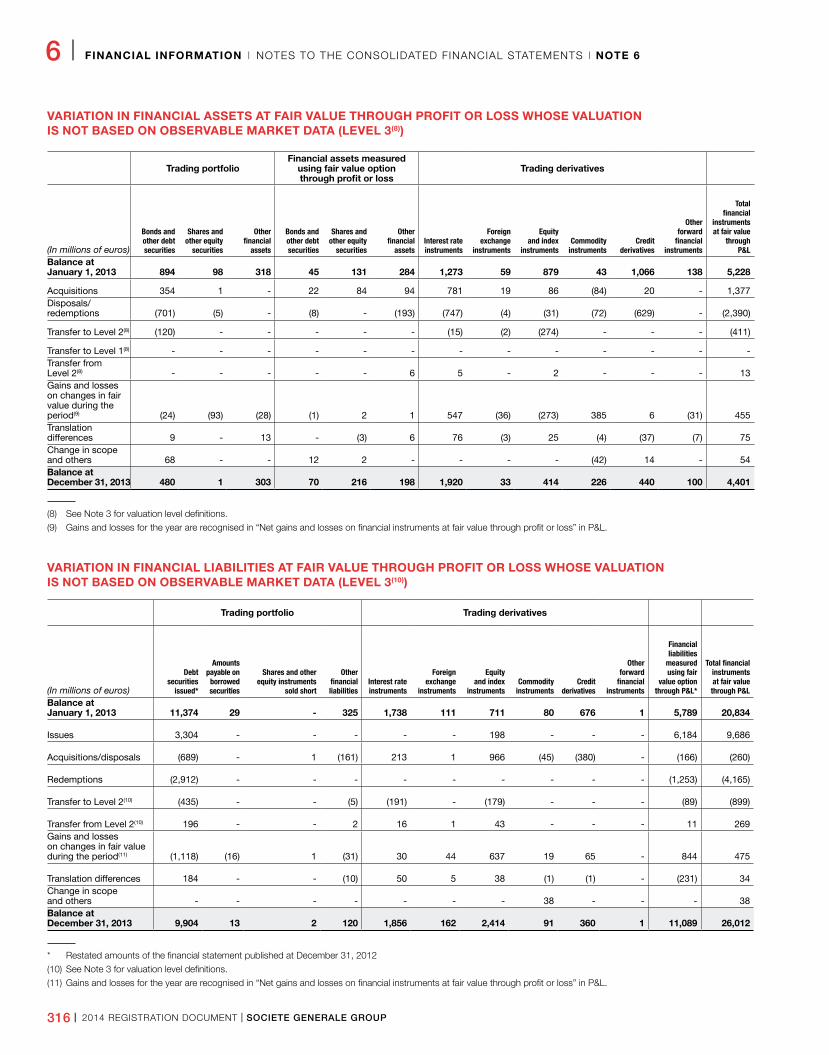
316 I 2014 REGISTRATION DOCUMENT I SOCIETE GENERALE GROUP
6 I FINANCIAL INFORMATION I NOTES TO THE CONSOLIDATED FINANCIAL STATEMENTS I NOTE 6
VARIATION IN FINANCIAL ASSETS AT FAIR VALUE THROUGH PROFIT OR LOSS WHOSE VALUATION IS NOT BASED ON OBSERVABLE MARKET DATA (LEVEL 3(8))
Trading portfolioFinancial assets measured
using fair value option through profit or loss
Trading derivatives
(In millions of euros)
Bonds and other debt securities
Shares and other equity
securities
Other financial
assets
Bonds and other debt securities
Shares and other equity
securities
Other financial
assetsInterest rate instruments
Foreign exchange
instruments
Equity and index
instrumentsCommodity
instrumentsCredit
derivatives
Other forward
financial instruments
Total financial
instruments at fair value
through P&L
Balance at January 1, 2013 894 98 318 45 131 284 1,273 59 879 43 1,066 138 5,228
Acquisitions 354 1 - 22 84 94 781 19 86 (84) 20 - 1,377Disposals/redemptions (701) (5) - (8) - (193) (747) (4) (31) (72) (629) - (2,390)
Transfer to Level 2(8) (120) - - - - - (15) (2) (274) - - - (411)
Transfer to Level 1(8) - - - - - - - - - - - - -Transfer from Level 2(8) - - - - - 6 5 - 2 - - - 13Gains and losses on changes in fair value during the period(9) (24) (93) (28) (1) 2 1 547 (36) (273) 385 6 (31) 455 Translation differences 9 - 13 - (3) 6 76 (3) 25 (4) (37) (7) 75Change in scope and others 68 - - 12 2 - - - - (42) 14 - 54Balance at December 31, 2013 480 1 303 70 216 198 1,920 33 414 226 440 100 4,401
(8) See Note 3 for valuation level definitions.
(9) Gains and losses for the year are recognised in “Net gains and losses on financial instruments at fair value through profit or loss” in P&L.
VARIATION IN FINANCIAL LIABILITIES AT FAIR VALUE THROUGH PROFIT OR LOSS WHOSE VALUATION IS NOT BASED ON OBSERVABLE MARKET DATA (LEVEL 3(10))
Trading portfolio Trading derivatives
(In millions of euros)
Debt securities
issued*
Amounts payable on
borrowed securities
Shares and other equity instruments
sold short
Other financial liabilities
Interest rate instruments
Foreign exchange
instruments
Equity and index
instrumentsCommodity
instrumentsCredit
derivatives
Other forward
financial instruments
Financial liabilities
measured using fair
value option through P&L*
Total financial instruments at fair value through P&L
Balance at January 1, 2013 11,374 29 - 325 1,738 111 711 80 676 1 5,789 20,834
Issues 3,304 - - - - - 198 - - - 6,184 9,686
Acquisitions/disposals (689) - 1 (161) 213 1 966 (45) (380) - (166) (260)
Redemptions (2,912) - - - - - - - - - (1,253) (4,165)
Transfer to Level 2(10) (435) - - (5) (191) - (179) - - - (89) (899)
Transfer from Level 2(10) 196 - - 2 16 1 43 - - - 11 269Gains and losses on changes in fair value during the period(11) (1,118) (16) 1 (31) 30 44 637 19 65 - 844 475
Translation differences 184 - - (10) 50 5 38 (1) (1) - (231) 34Change in scope and others - - - - - - - 38 - - - 38Balance at December 31, 2013 9,904 13 2 120 1,856 162 2,414 91 360 1 11,089 26,012
* Restated amounts of the financial statement published at December 31, 2012
(10) See Note 3 for valuation level definitions.
(11) Gains and losses for the year are recognised in “Net gains and losses on financial instruments at fair value through profit or loss” in P&L.
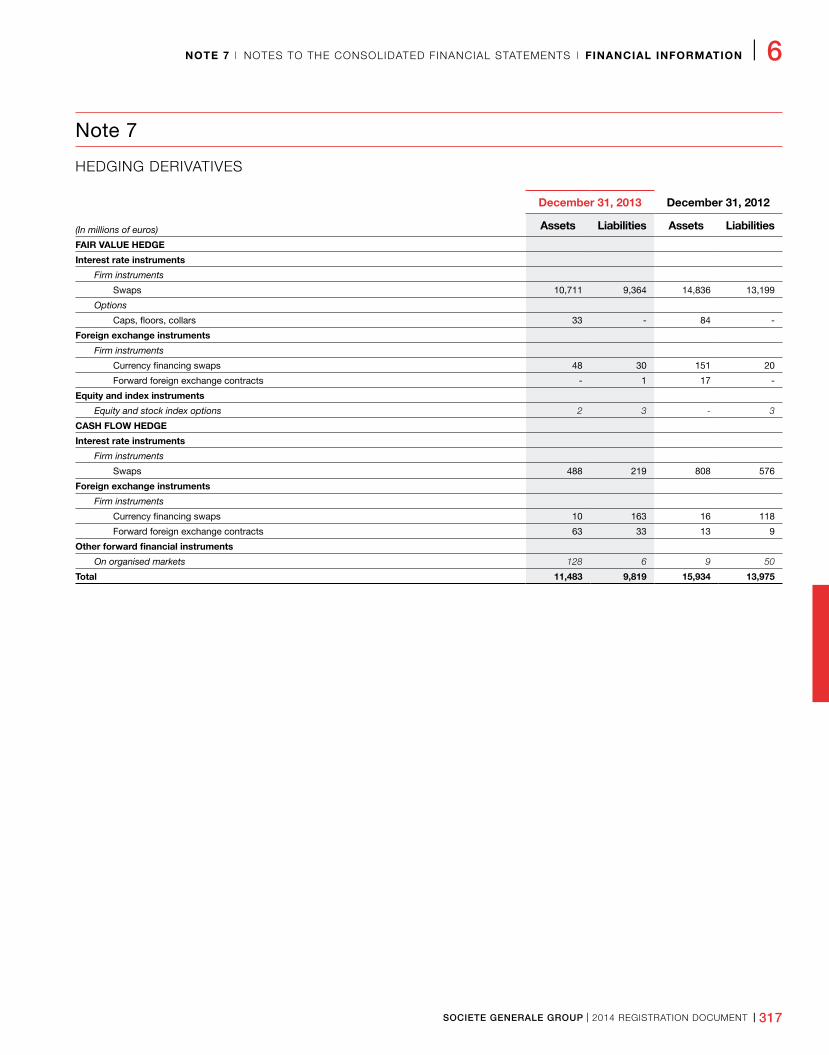
SOCIETE GENERALE GROUP I 2014 REGISTRATION DOCUMENT I 317
NOTE 7 I NOTES TO THE CONSOLIDATED FINANCIAL STATEMENTS I FINANCIAL INFORMATION I 6
Note 7
HEDGING DERIVATIVES
December 31, 2013 December 31, 2012
(In millions of euros) Assets Liabilities Assets Liabilities
FAIR VALUE HEDGE
Interest rate instruments
Firm instruments
Swaps 10,711 9,364 14,836 13,199
Options
Caps, floors, collars 33 - 84 -
Foreign exchange instruments
Firm instruments
Currency financing swaps 48 30 151 20
Forward foreign exchange contracts - 1 17 -
Equity and index instruments
Equity and stock index options 2 3 - 3
CASH FLOW HEDGE
Interest rate instruments
Firm instruments
Swaps 488 219 808 576
Foreign exchange instruments
Firm instruments
Currency financing swaps 10 163 16 118
Forward foreign exchange contracts 63 33 13 9
Other forward financial instruments
On organised markets 128 6 9 50
Total 11,483 9,819 15,934 13,975
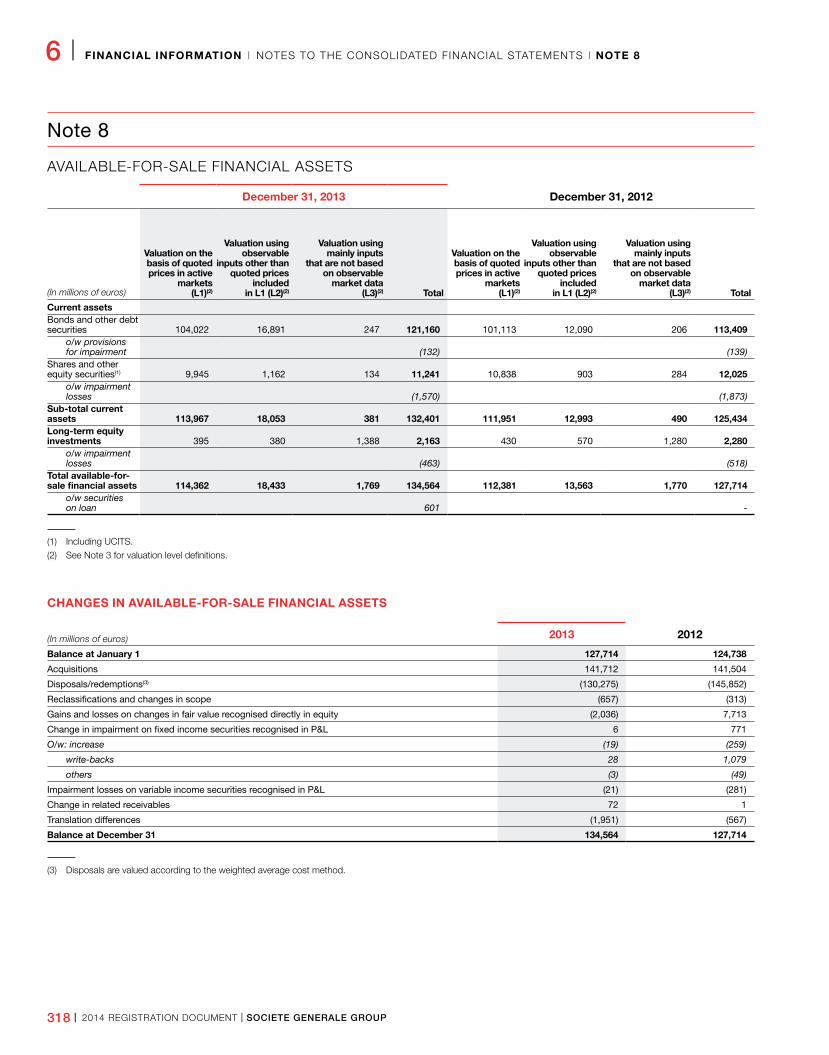
318 I 2014 REGISTRATION DOCUMENT I SOCIETE GENERALE GROUP
6 I FINANCIAL INFORMATION I NOTES TO THE CONSOLIDATED FINANCIAL STATEMENTS I NOTE 8
Note 8
AVAILABLE-FOR-SALE FINANCIAL ASSETS
December 31, 2013 December 31, 2012
(In millions of euros)
Valuation on the basis of quotedprices in active
markets(L1)(2)
Valuation using observable
inputs other than quoted prices
included in L1 (L2)(2)
Valuation usingmainly inputs
that are not based on observable
market data(L3)(2) Total
Valuation on the basis of quotedprices in active
markets(L1)(2)
Valuation using observable
inputs other than quoted prices
included in L1 (L2)(2)
Valuation usingmainly inputs
that are not based on observable
market data(L3)(2) Total
Current assetsBonds and other debt securities 104,022 16,891 247 121,160 101,113 12,090 206 113,409
o/w provisions for impairment (132) (139)
Shares and other equity securities(1) 9,945 1,162 134 11,241 10,838 903 284 12,025
o/w impairment losses (1,570) (1,873)
Sub-total current assets 113,967 18,053 381 132,401 111,951 12,993 490 125,434Long-term equity investments 395 380 1,388 2,163 430 570 1,280 2,280
o/w impairment losses (463) (518)
Total available-for-sale financial assets 114,362 18,433 1,769 134,564 112,381 13,563 1,770 127,714
o/w securities on loan 601 -
(1) Including UCITS.
(2) See Note 3 for valuation level definitions.
CHANGES IN AVAILABLE-FOR-SALE FINANCIAL ASSETS
(In millions of euros) 2013 2012
Balance at January 1 127,714 124,738
Acquisitions 141,712 141,504
Disposals/redemptions(3) (130,275) (145,852)
Reclassifications and changes in scope (657) (313)
Gains and losses on changes in fair value recognised directly in equity (2,036) 7,713
Change in impairment on fixed income securities recognised in P&L 6 771
O/w: increase (19) (259)
write-backs 28 1,079
others (3) (49)
Impairment losses on variable income securities recognised in P&L (21) (281)
Change in related receivables 72 1
Translation differences (1,951) (567)
Balance at December 31 134,564 127,714
(3) Disposals are valued according to the weighted average cost method.
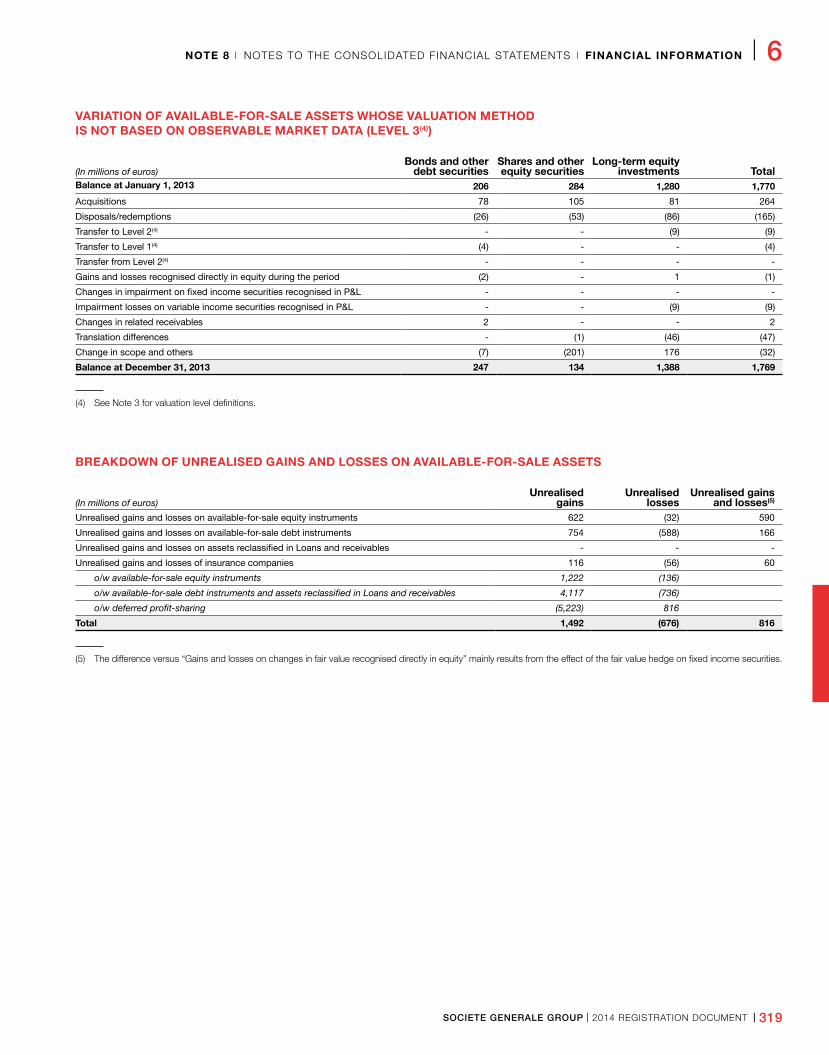
SOCIETE GENERALE GROUP I 2014 REGISTRATION DOCUMENT I 319
NOTE 8 I NOTES TO THE CONSOLIDATED FINANCIAL STATEMENTS I FINANCIAL INFORMATION I 6
VARIATION OF AVAILABLE-FOR-SALE ASSETS WHOSE VALUATION METHOD IS NOT BASED ON OBSERVABLE MARKET DATA (LEVEL 3(4))
(In millions of euros)Bonds and other
debt securitiesShares and other equity securities
Long-term equity investments Total
Balance at January 1, 2013 206 284 1,280 1,770
Acquisitions 78 105 81 264
Disposals/redemptions (26) (53) (86) (165)
Transfer to Level 2(4) - - (9) (9)
Transfer to Level 1(4) (4) - - (4)
Transfer from Level 2(4) - - - -
Gains and losses recognised directly in equity during the period (2) - 1 (1)
Changes in impairment on fixed income securities recognised in P&L - - - -
Impairment losses on variable income securities recognised in P&L - - (9) (9)
Changes in related receivables 2 - - 2
Translation differences - (1) (46) (47)
Change in scope and others (7) (201) 176 (32)
Balance at December 31, 2013 247 134 1,388 1,769
(4) See Note 3 for valuation level definitions.
BREAKDOWN OF UNREALISED GAINS AND LOSSES ON AVAILABLE-FOR-SALE ASSETS
(In millions of euros)Unrealised
gainsUnrealised
lossesUnrealised gains
and losses(5)
Unrealised gains and losses on available-for-sale equity instruments 622 (32) 590
Unrealised gains and losses on available-for-sale debt instruments 754 (588) 166
Unrealised gains and losses on assets reclassified in Loans and receivables - - -
Unrealised gains and losses of insurance companies 116 (56) 60
o/w available-for-sale equity instruments 1,222 (136)
o/w available-for-sale debt instruments and assets reclassified in Loans and receivables 4,117 (736)
o/w deferred profit-sharing (5,223) 816
Total 1,492 (676) 816
(5) The difference versus “Gains and losses on changes in fair value recognised directly in equity” mainly results from the effect of the fair value hedge on fixed income securities.
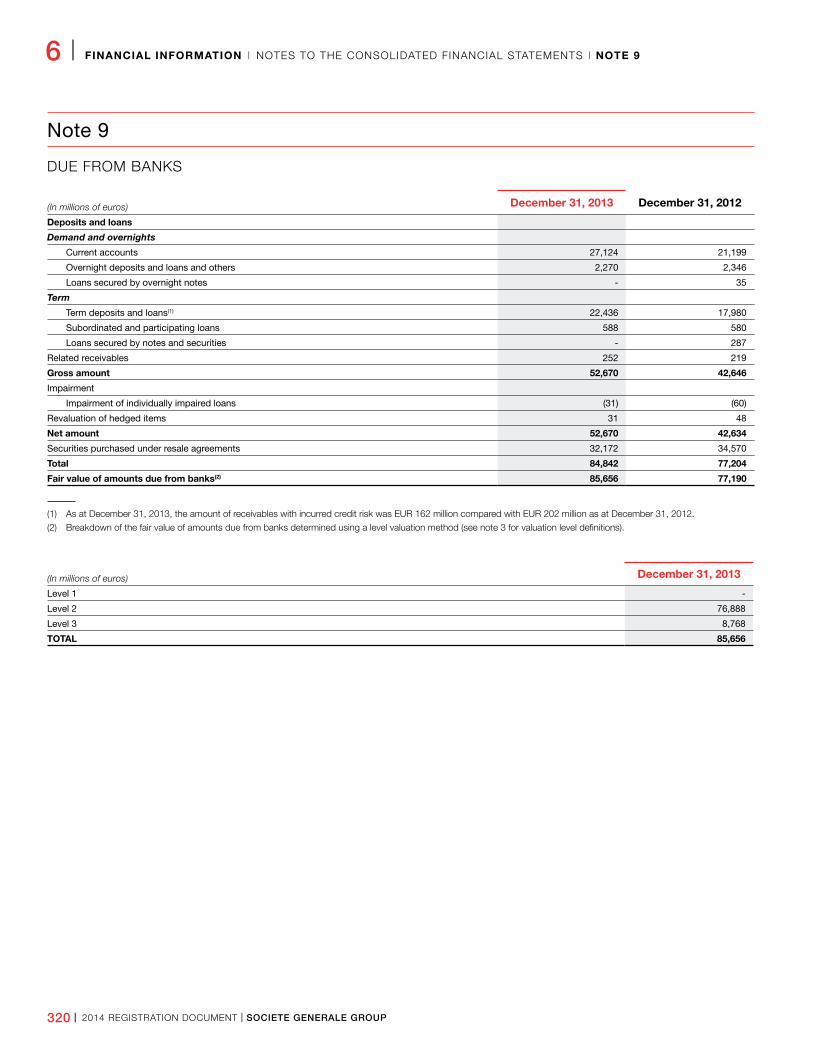
320 I 2014 REGISTRATION DOCUMENT I SOCIETE GENERALE GROUP
6 I FINANCIAL INFORMATION I NOTES TO THE CONSOLIDATED FINANCIAL STATEMENTS I NOTE 9
Note 9
DUE FROM BANKS
(In millions of euros) December 31, 2013 December 31, 2012
Deposits and loans
Demand and overnights
Current accounts 27,124 21,199
Overnight deposits and loans and others 2,270 2,346
Loans secured by overnight notes - 35
Term
Term deposits and loans(1) 22,436 17,980
Subordinated and participating loans 588 580
Loans secured by notes and securities - 287
Related receivables 252 219
Gross amount 52,670 42,646
Impairment
Impairment of individually impaired loans (31) (60)
Revaluation of hedged items 31 48
Net amount 52,670 42,634
Securities purchased under resale agreements 32,172 34,570
Total 84,842 77,204
Fair value of amounts due from banks(2) 85,656 77,190
(1) As at December 31, 2013, the amount of receivables with incurred credit risk was EUR 162 million compared with EUR 202 million as at December 31, 2012.
(2) Breakdown of the fair value of amounts due from banks determined using a level valuation method (see note 3 for valuation level definitions).
(In millions of euros) December 31, 2013
Level 1 -
Level 2 76,888
Level 3 8,768
TOTAL 85,656
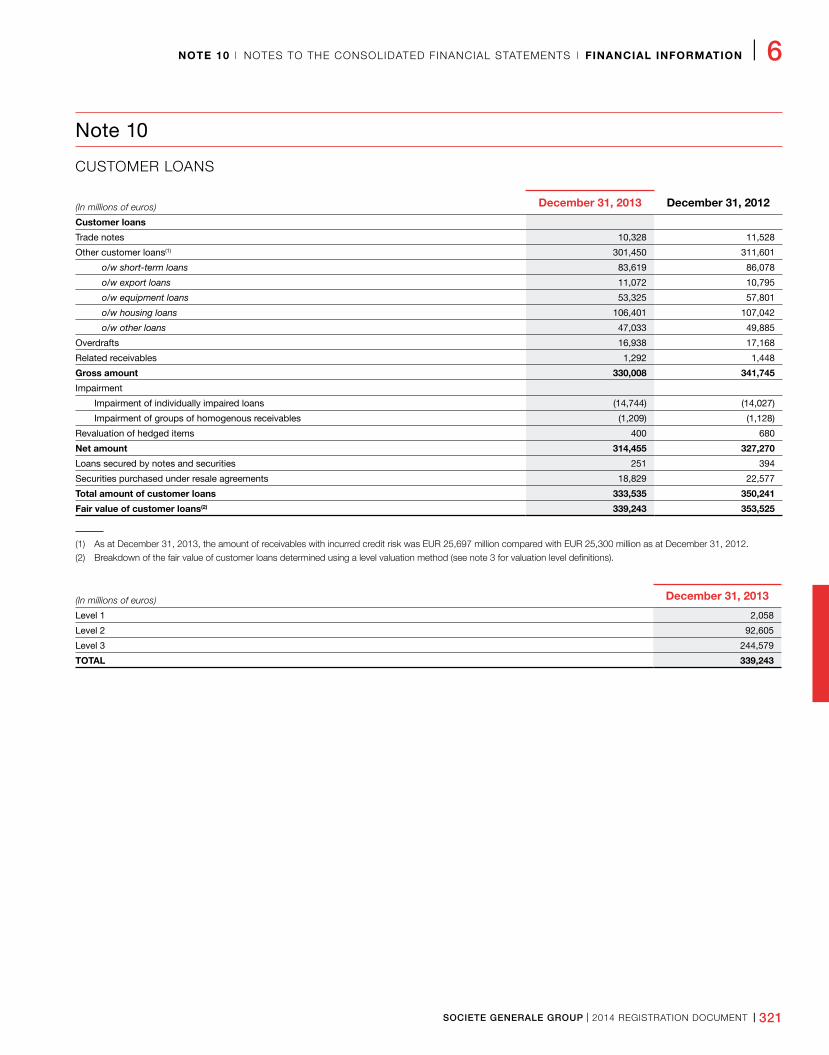
SOCIETE GENERALE GROUP I 2014 REGISTRATION DOCUMENT I 321
NOTE 10 I NOTES TO THE CONSOLIDATED FINANCIAL STATEMENTS I FINANCIAL INFORMATION I 6
Note 10
CUSTOMER LOANS
(In millions of euros) December 31, 2013 December 31, 2012
Customer loans
Trade notes 10,328 11,528
Other customer loans(1) 301,450 311,601
o/w short-term loans 83,619 86,078
o/w export loans 11,072 10,795
o/w equipment loans 53,325 57,801
o/w housing loans 106,401 107,042
o/w other loans 47,033 49,885
Overdrafts 16,938 17,168
Related receivables 1,292 1,448
Gross amount 330,008 341,745
Impairment
Impairment of individually impaired loans (14,744) (14,027)
Impairment of groups of homogenous receivables (1,209) (1,128)
Revaluation of hedged items 400 680
Net amount 314,455 327,270
Loans secured by notes and securities 251 394
Securities purchased under resale agreements 18,829 22,577
Total amount of customer loans 333,535 350,241
Fair value of customer loans(2) 339,243 353,525
(1) As at December 31, 2013, the amount of receivables with incurred credit risk was EUR 25,697 million compared with EUR 25,300 million as at December 31, 2012.
(2) Breakdown of the fair value of customer loans determined using a level valuation method (see note 3 for valuation level definitions).
(In millions of euros) December 31, 2013
Level 1 2,058
Level 2 92,605
Level 3 244,579
TOTAL 339,243
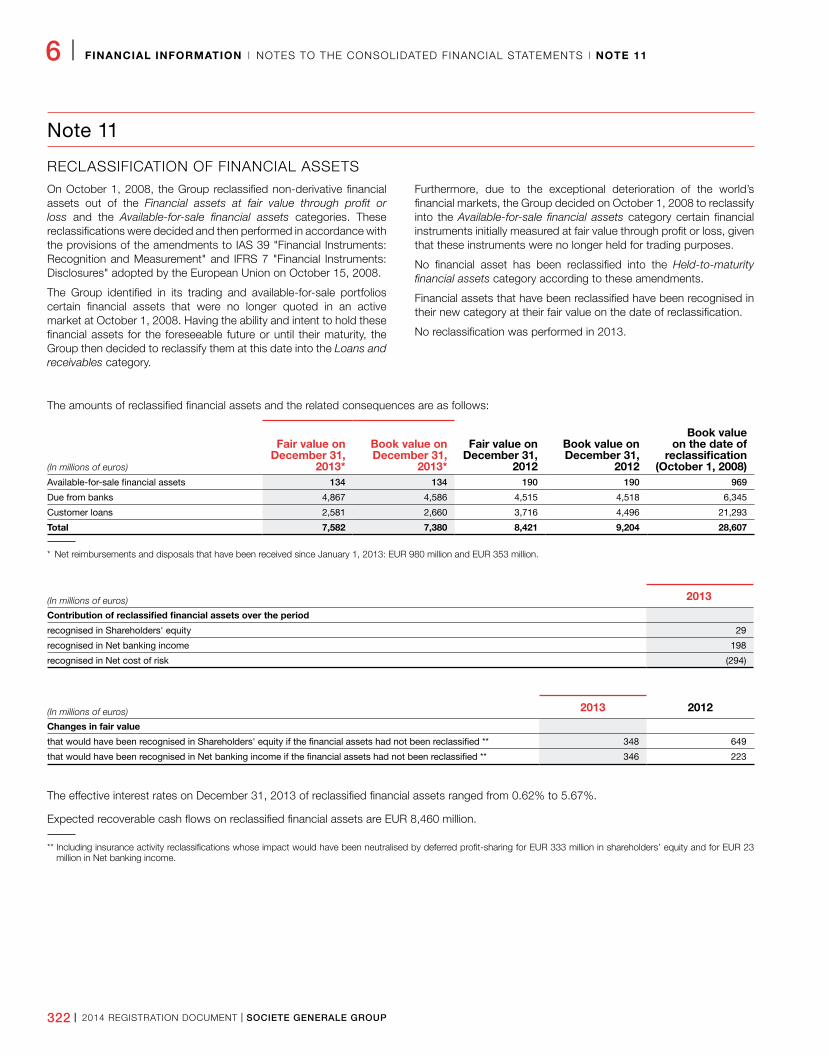
322 I 2014 REGISTRATION DOCUMENT I SOCIETE GENERALE GROUP
6 I FINANCIAL INFORMATION I NOTES TO THE CONSOLIDATED FINANCIAL STATEMENTS I NOTE 11
Note 11
RECLASSIFICATION OF FINANCIAL ASSETSOn October 1, 2008, the Group reclassified non-derivative financial assets out of the Financial assets at fair value through profit or loss and the Available-for-sale financial assets categories. These reclassifications were decided and then performed in accordance with the provisions of the amendments to IAS 39 "Financial Instruments: Recognition and Measurement" and IFRS 7 "Financial Instruments: Disclosures" adopted by the European Union on October 15, 2008.
The Group identified in its trading and available-for-sale portfolios certain financial assets that were no longer quoted in an active market at October 1, 2008. Having the ability and intent to hold these financial assets for the foreseeable future or until their maturity, the Group then decided to reclassify them at this date into the Loans and receivables category.
Furthermore, due to the exceptional deterioration of the world’s financial markets, the Group decided on October 1, 2008 to reclassify into the Available-for-sale financial assets category certain financial instruments initially measured at fair value through profit or loss, given that these instruments were no longer held for trading purposes.
No financial asset has been reclassified into the Held-to-maturity financial assets category according to these amendments.
Financial assets that have been reclassified have been recognised in their new category at their fair value on the date of reclassification.
No reclassification was performed in 2013.
The amounts of reclassified financial assets and the related consequences are as follows:
(In millions of euros)
Fair value onDecember 31,
2013*
Book value on December 31,
2013*
Fair value onDecember 31,
2012
Book value onDecember 31,
2012
Book value on the date of
reclassification (October 1, 2008)
Available-for-sale financial assets 134 134 190 190 969
Due from banks 4,867 4,586 4,515 4,518 6,345
Customer loans 2,581 2,660 3,716 4,496 21,293
Total 7,582 7,380 8,421 9,204 28,607
* Net reimbursements and disposals that have been received since January 1, 2013: EUR 980 million and EUR 353 million.
(In millions of euros) 2013
Contribution of reclassified financial assets over the period
recognised in Shareholders' equity 29
recognised in Net banking income 198
recognised in Net cost of risk (294)
(In millions of euros) 2013 2012
Changes in fair value
that would have been recognised in Shareholders' equity if the financial assets had not been reclassified ** 348 649
that would have been recognised in Net banking income if the financial assets had not been reclassified ** 346 223
The effective interest rates on December 31, 2013 of reclassified financial assets ranged from 0.62% to 5.67%.
Expected recoverable cash flows on reclassified financial assets are EUR 8,460 million.
** Including insurance activity reclassifications whose impact would have been neutralised by deferred profit-sharing for EUR 333 million in shareholders’ equity and for EUR 23 million in Net banking income.
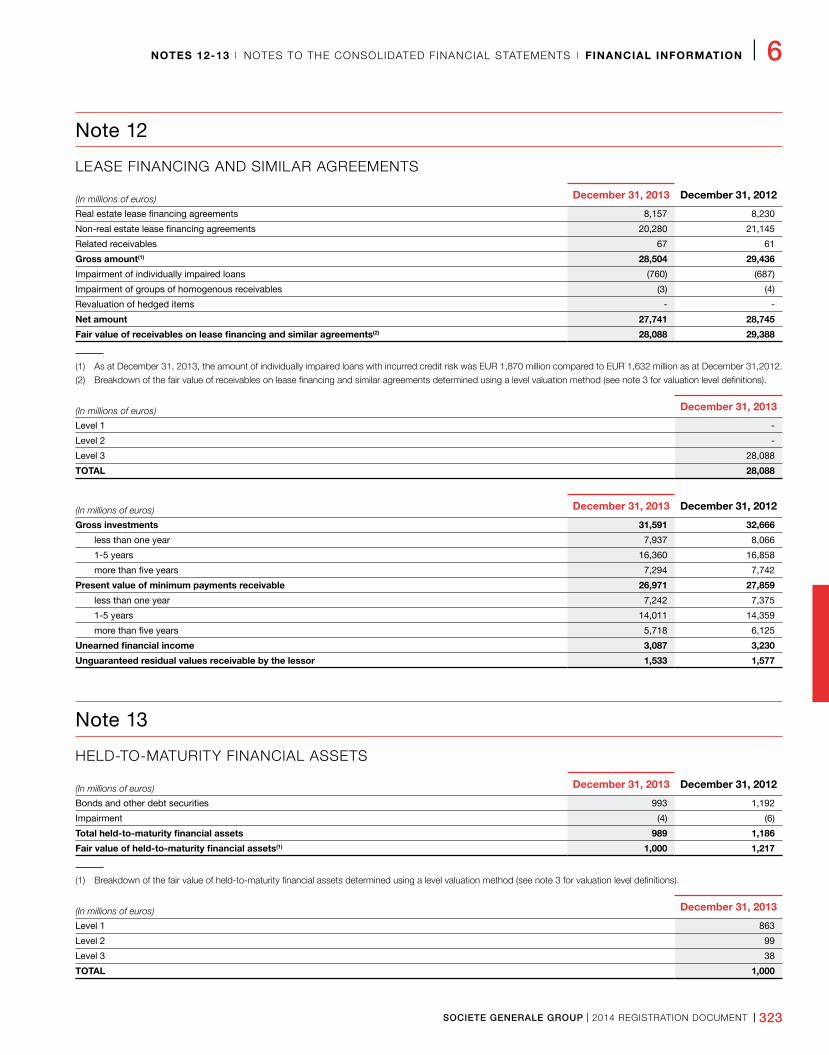
SOCIETE GENERALE GROUP I 2014 REGISTRATION DOCUMENT I 323
NOTES 12-13 I NOTES TO THE CONSOLIDATED FINANCIAL STATEMENTS I FINANCIAL INFORMATION I 6
Note 12
LEASE FINANCING AND SIMILAR AGREEMENTS
(In millions of euros) December 31, 2013 December 31, 2012
Real estate lease financing agreements 8,157 8,230
Non-real estate lease financing agreements 20,280 21,145
Related receivables 67 61
Gross amount(1) 28,504 29,436
Impairment of individually impaired loans (760) (687)
Impairment of groups of homogenous receivables (3) (4)
Revaluation of hedged items - -
Net amount 27,741 28,745
Fair value of receivables on lease financing and similar agreements(2) 28,088 29,388
(1) As at December 31, 2013, the amount of individually impaired loans with incurred credit risk was EUR 1,870 million compared to EUR 1,632 million as at December 31,2012.
(2) Breakdown of the fair value of receivables on lease financing and similar agreements determined using a level valuation method (see note 3 for valuation level definitions).
(In millions of euros) December 31, 2013
Level 1 -
Level 2 -
Level 3 28,088
TOTAL 28,088
(In millions of euros) December 31, 2013 December 31, 2012
Gross investments 31,591 32,666
less than one year 7,937 8,066
1-5 years 16,360 16,858
more than five years 7,294 7,742
Present value of minimum payments receivable 26,971 27,859
less than one year 7,242 7,375
1-5 years 14,011 14,359
more than five years 5,718 6,125
Unearned financial income 3,087 3,230
Unguaranteed residual values receivable by the lessor 1,533 1,577
Note 13
HELD-TO-MATURITY FINANCIAL ASSETS
(In millions of euros) December 31, 2013 December 31, 2012
Bonds and other debt securities 993 1,192
Impairment (4) (6)
Total held-to-maturity financial assets 989 1,186
Fair value of held-to-maturity financial assets(1) 1,000 1,217
(1) Breakdown of the fair value of held-to-maturity financial assets determined using a level valuation method (see note 3 for valuation level definitions).
(In millions of euros) December 31, 2013
Level 1 863
Level 2 99
Level 3 38
TOTAL 1,000
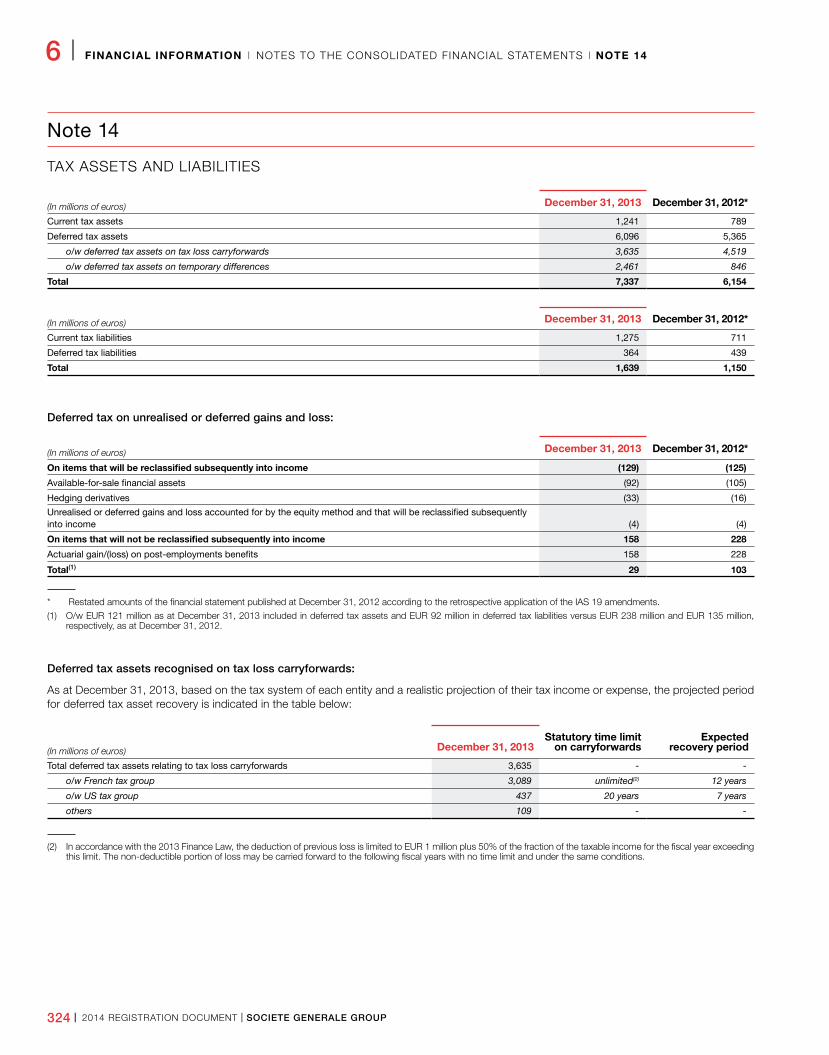
324 I 2014 REGISTRATION DOCUMENT I SOCIETE GENERALE GROUP
6 I FINANCIAL INFORMATION I NOTES TO THE CONSOLIDATED FINANCIAL STATEMENTS I NOTE 14
Note 14
TAX ASSETS AND LIABILITIES
(In millions of euros) December 31, 2013 December 31, 2012*
Current tax assets 1,241 789
Deferred tax assets 6,096 5,365
o/w deferred tax assets on tax loss carryforwards 3,635 4,519
o/w deferred tax assets on temporary differences 2,461 846
Total 7,337 6,154
(In millions of euros) December 31, 2013 December 31, 2012*
Current tax liabilities 1,275 711
Deferred tax liabilities 364 439
Total 1,639 1,150
Deferred tax on unrealised or deferred gains and loss:
(In millions of euros) December 31, 2013 December 31, 2012*
On items that will be reclassified subsequently into income (129) (125)
Available-for-sale financial assets (92) (105)
Hedging derivatives (33) (16)
Unrealised or deferred gains and loss accounted for by the equity method and that will be reclassified subsequently into income (4) (4)
On items that will not be reclassified subsequently into income 158 228
Actuarial gain/(loss) on post-employments benefits 158 228
Total(1) 29 103
* Restated amounts of the financial statement published at December 31, 2012 according to the retrospective application of the IAS 19 amendments.
(1) O/w EUR 121 million as at December 31, 2013 included in deferred tax assets and EUR 92 million in deferred tax liabilities versus EUR 238 million and EUR 135 million, respectively, as at December 31, 2012.
Deferred tax assets recognised on tax loss carryforwards:
As at December 31, 2013, based on the tax system of each entity and a realistic projection of their tax income or expense, the projected period for deferred tax asset recovery is indicated in the table below:
(In millions of euros) December 31, 2013Statutory time limit
on carryforwardsExpected
recovery period
Total deferred tax assets relating to tax loss carryforwards 3,635 - -
o/w French tax group 3,089 unlimited(2) 12 years
o/w US tax group 437 20 years 7 years
others 109 - -
(2) In accordance with the 2013 Finance Law, the deduction of previous loss is limited to EUR 1 million plus 50% of the fraction of the taxable income for the fiscal year exceeding this limit. The non-deductible portion of loss may be carried forward to the following fiscal years with no time limit and under the same conditions.
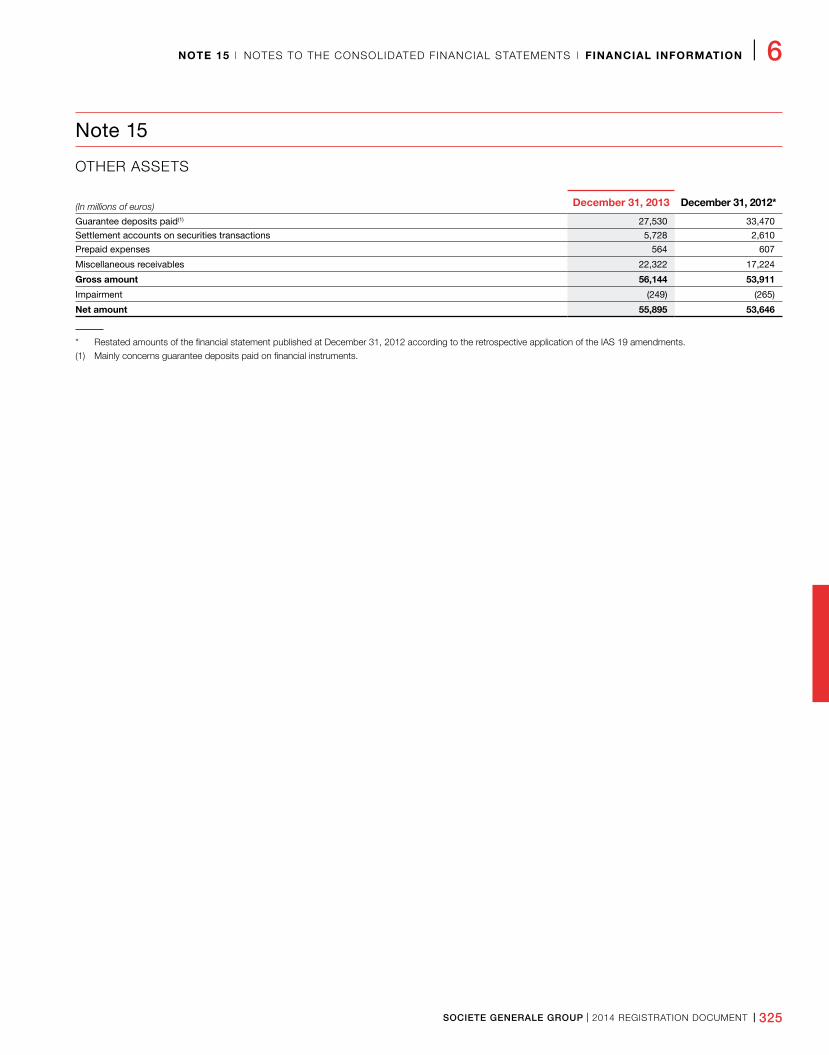
SOCIETE GENERALE GROUP I 2014 REGISTRATION DOCUMENT I 325
NOTE 15 I NOTES TO THE CONSOLIDATED FINANCIAL STATEMENTS I FINANCIAL INFORMATION I 6
Note 15
OTHER ASSETS
(In millions of euros) December 31, 2013 December 31, 2012*
Guarantee deposits paid(1) 27,530 33,470
Settlement accounts on securities transactions 5,728 2,610
Prepaid expenses 564 607
Miscellaneous receivables 22,322 17,224
Gross amount 56,144 53,911
Impairment (249) (265)
Net amount 55,895 53,646
* Restated amounts of the financial statement published at December 31, 2012 according to the retrospective application of the IAS 19 amendments.
(1) Mainly concerns guarantee deposits paid on financial instruments.
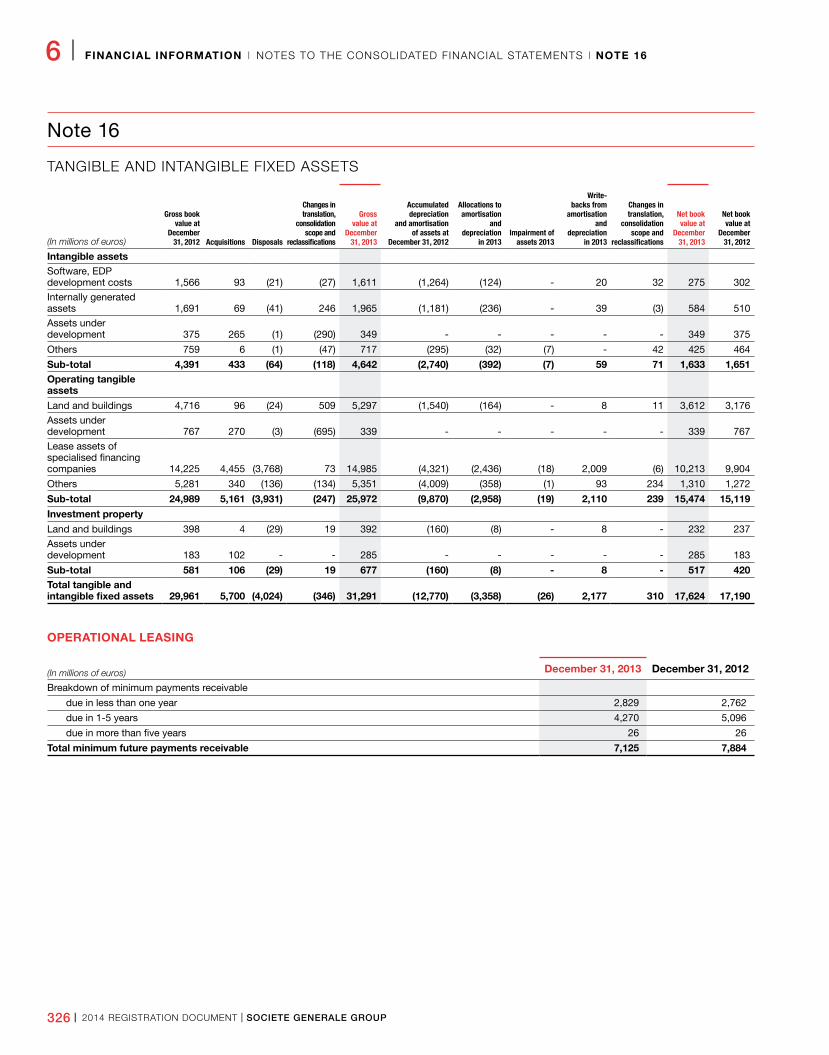
326 I 2014 REGISTRATION DOCUMENT I SOCIETE GENERALE GROUP
6 I FINANCIAL INFORMATION I NOTES TO THE CONSOLIDATED FINANCIAL STATEMENTS I NOTE 16
Note 16
TANGIBLE AND INTANGIBLE FIXED ASSETS
(In millions of euros)
Gross book value at
December 31, 2012 Acquisitions Disposals
Changes in translation,
consolidation scope and
reclassifications
Gross value at
December 31, 2013
Accumulated depreciation
and amortisation of assets at
December 31, 2012
Allocations to amortisation
and depreciation
in 2013Impairment of
assets 2013
Write-backs from
amortisation and
depreciation in 2013
Changes in translation,
consolidation scope and
reclassifications
Net book value at
December 31, 2013
Net book value at
December 31, 2012
Intangible assetsSoftware, EDP development costs 1,566 93 (21) (27) 1,611 (1,264) (124) - 20 32 275 302Internally generated assets 1,691 69 (41) 246 1,965 (1,181) (236) - 39 (3) 584 510Assets under development 375 265 (1) (290) 349 - - - - - 349 375
Others 759 6 (1) (47) 717 (295) (32) (7) - 42 425 464
Sub-total 4,391 433 (64) (118) 4,642 (2,740) (392) (7) 59 71 1,633 1,651Operating tangible assets
Land and buildings 4,716 96 (24) 509 5,297 (1,540) (164) - 8 11 3,612 3,176Assets under development 767 270 (3) (695) 339 - - - - - 339 767Lease assets of specialised financing companies 14,225 4,455 (3,768) 73 14,985 (4,321) (2,436) (18) 2,009 (6) 10,213 9,904
Others 5,281 340 (136) (134) 5,351 (4,009) (358) (1) 93 234 1,310 1,272
Sub-total 24,989 5,161 (3,931) (247) 25,972 (9,870) (2,958) (19) 2,110 239 15,474 15,119
Investment property
Land and buildings 398 4 (29) 19 392 (160) (8) - 8 - 232 237Assets under development 183 102 - - 285 - - - - - 285 183
Sub-total 581 106 (29) 19 677 (160) (8) - 8 - 517 420Total tangible and intangible fixed assets 29,961 5,700 (4,024) (346) 31,291 (12,770) (3,358) (26) 2,177 310 17,624 17,190
OPERATIONAL LEASING
(In millions of euros) December 31, 2013 December 31, 2012
Breakdown of minimum payments receivable
due in less than one year 2,829 2,762
due in 1-5 years 4,270 5,096
due in more than five years 26 26
Total minimum future payments receivable 7,125 7,884
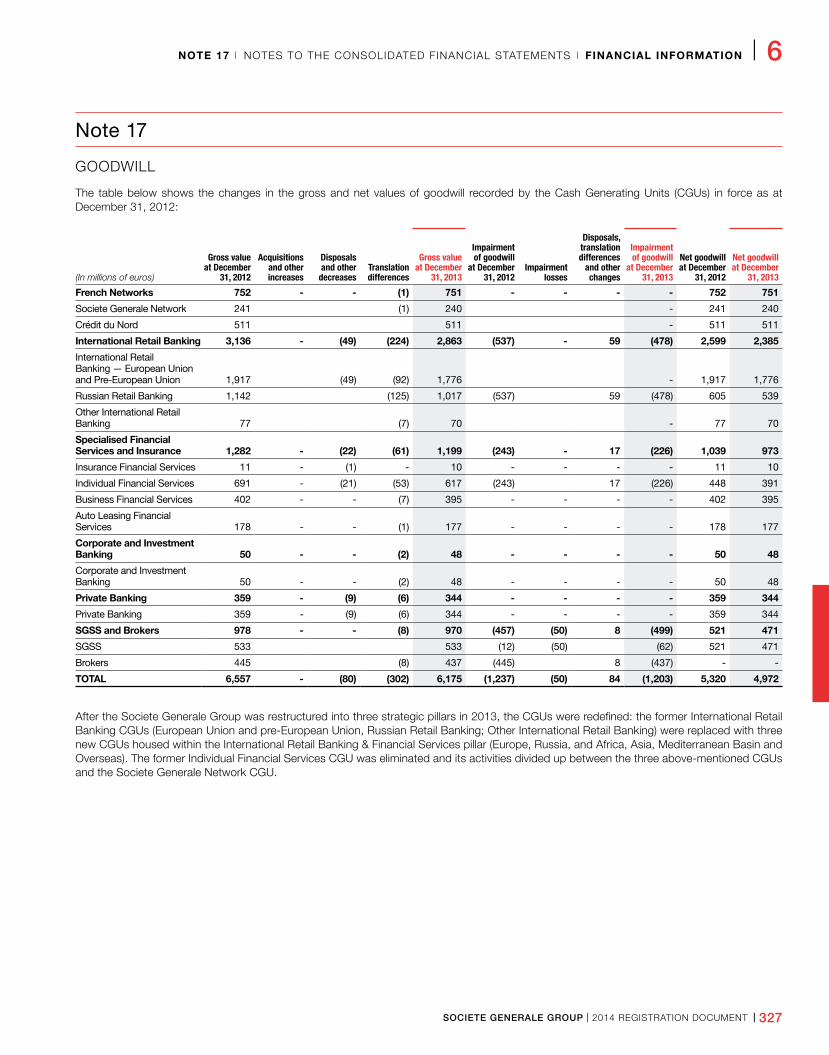
SOCIETE GENERALE GROUP I 2014 REGISTRATION DOCUMENT I 327
NOTE 17 I NOTES TO THE CONSOLIDATED FINANCIAL STATEMENTS I FINANCIAL INFORMATION I 6
Note 17
GOODWILL
The table below shows the changes in the gross and net values of goodwill recorded by the Cash Generating Units (CGUs) in force as at December 31, 2012:
(In millions of euros)
Gross value at December
31, 2012
Acquisitions and other increases
Disposals and other
decreasesTranslation differences
Gross value at December
31, 2013
Impairment of goodwill
at December 31, 2012
Impairment losses
Disposals, translation differences
and other changes
Impairment of goodwill
at December 31, 2013
Net goodwill at December
31, 2012
Net goodwill at December
31, 2013
French Networks 752 - - (1) 751 - - - - 752 751
Societe Generale Network 241 (1) 240 - 241 240
Crédit du Nord 511 511 - 511 511
International Retail Banking 3,136 - (49) (224) 2,863 (537) - 59 (478) 2,599 2,385
International Retail Banking — European Union and Pre-European Union 1,917 (49) (92) 1,776 - 1,917 1,776
Russian Retail Banking 1,142 (125) 1,017 (537) 59 (478) 605 539
Other International Retail Banking 77 (7) 70 - 77 70
Specialised Financial Services and Insurance 1,282 - (22) (61) 1,199 (243) - 17 (226) 1,039 973
Insurance Financial Services 11 - (1) - 10 - - - - 11 10
Individual Financial Services 691 - (21) (53) 617 (243) 17 (226) 448 391
Business Financial Services 402 - - (7) 395 - - - - 402 395
Auto Leasing Financial Services 178 - - (1) 177 - - - - 178 177
Corporate and Investment Banking 50 - - (2) 48 - - - - 50 48
Corporate and Investment Banking 50 - - (2) 48 - - - - 50 48
Private Banking 359 - (9) (6) 344 - - - - 359 344
Private Banking 359 - (9) (6) 344 - - - - 359 344
SGSS and Brokers 978 - - (8) 970 (457) (50) 8 (499) 521 471
SGSS 533 533 (12) (50) (62) 521 471
Brokers 445 (8) 437 (445) 8 (437) - -
TOTAL 6,557 - (80) (302) 6,175 (1,237) (50) 84 (1,203) 5,320 4,972
After the Societe Generale Group was restructured into three strategic pillars in 2013, the CGUs were redefined: the former International Retail Banking CGUs (European Union and pre-European Union, Russian Retail Banking; Other International Retail Banking) were replaced with three new CGUs housed within the International Retail Banking & Financial Services pillar (Europe, Russia, and Africa, Asia, Mediterranean Basin and Overseas). The former Individual Financial Services CGU was eliminated and its activities divided up between the three above-mentioned CGUs and the Societe Generale Network CGU.
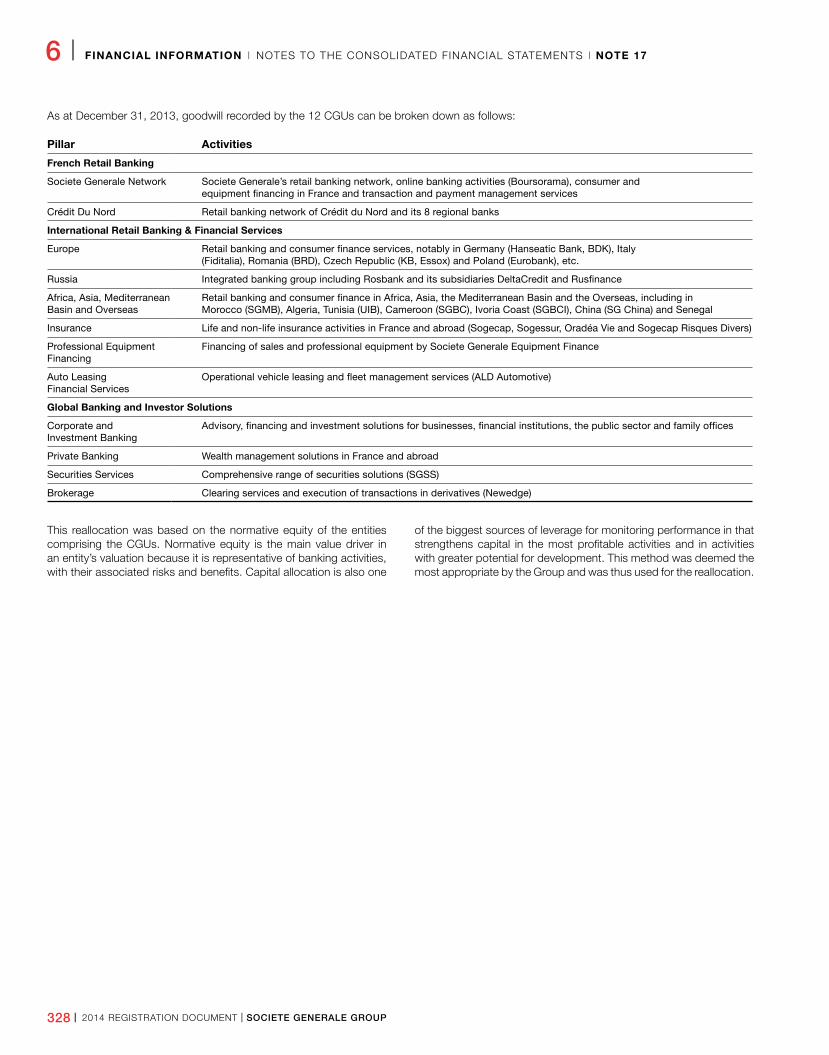
328 I 2014 REGISTRATION DOCUMENT I SOCIETE GENERALE GROUP
6 I FINANCIAL INFORMATION I NOTES TO THE CONSOLIDATED FINANCIAL STATEMENTS I NOTE 17
As at December 31, 2013, goodwill recorded by the 12 CGUs can be broken down as follows:
Pillar Activities
French Retail Banking
Societe Generale Network Societe Generale’s retail banking network, online banking activities (Boursorama), consumer and equipment financing in France and transaction and payment management services
Crédit Du Nord Retail banking network of Crédit du Nord and its 8 regional banks
International Retail Banking & Financial Services
Europe Retail banking and consumer finance services, notably in Germany (Hanseatic Bank, BDK), Italy (Fiditalia), Romania (BRD), Czech Republic (KB, Essox) and Poland (Eurobank), etc.
Russia Integrated banking group including Rosbank and its subsidiaries DeltaCredit and Rusfinance
Africa, Asia, Mediterranean Basin and Overseas
Retail banking and consumer finance in Africa, Asia, the Mediterranean Basin and the Overseas, including in Morocco (SGMB), Algeria, Tunisia (UIB), Cameroon (SGBC), Ivoria Coast (SGBCI), China (SG China) and Senegal
Insurance Life and non-life insurance activities in France and abroad (Sogecap, Sogessur, Oradéa Vie and Sogecap Risques Divers)
Professional Equipment Financing
Financing of sales and professional equipment by Societe Generale Equipment Finance
Auto Leasing Financial Services
Operational vehicle leasing and fleet management services (ALD Automotive)
Global Banking and Investor Solutions
Corporate and Investment Banking
Advisory, financing and investment solutions for businesses, financial institutions, the public sector and family offices
Private Banking Wealth management solutions in France and abroad
Securities Services Comprehensive range of securities solutions (SGSS)
Brokerage Clearing services and execution of transactions in derivatives (Newedge)
This reallocation was based on the normative equity of the entities comprising the CGUs. Normative equity is the main value driver in an entity’s valuation because it is representative of banking activities, with their associated risks and benefits. Capital allocation is also one
of the biggest sources of leverage for monitoring performance in that strengthens capital in the most profitable activities and in activities with greater potential for development. This method was deemed the most appropriate by the Group and was thus used for the reallocation.
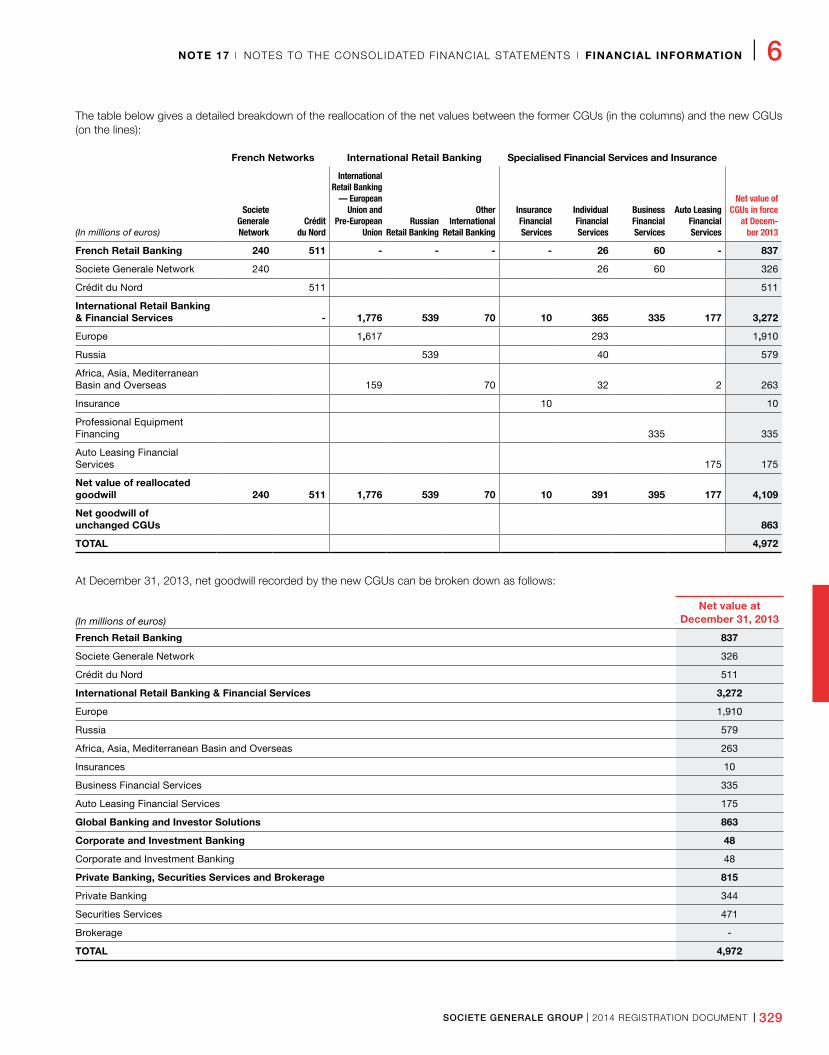
SOCIETE GENERALE GROUP I 2014 REGISTRATION DOCUMENT I 329
NOTE 17 I NOTES TO THE CONSOLIDATED FINANCIAL STATEMENTS I FINANCIAL INFORMATION I 6
The table below gives a detailed breakdown of the reallocation of the net values between the former CGUs (in the columns) and the new CGUs (on the lines):
French Networks International Retail Banking Specialised Financial Services and Insurance
(In millions of euros)
Societe Generale Network
Crédit du Nord
International Retail Banking
— European Union and
Pre-European Union
Russian Retail Banking
Other International
Retail Banking
Insurance Financial Services
Individual Financial Services
Business Financial Services
Auto Leasing Financial Services
Net value of CGUs in force
at Decem-ber 2013
French Retail Banking 240 511 - - - - 26 60 - 837
Societe Generale Network 240 26 60 326
Crédit du Nord 511 511
International Retail Banking & Financial Services - 1,776 539 70 10 365 335 177 3,272
Europe 1,617 293 1,910
Russia 539 40 579
Africa, Asia, Mediterranean Basin and Overseas 159 70 32 2 263
Insurance 10 10
Professional Equipment Financing 335 335
Auto Leasing Financial Services 175 175
Net value of reallocated goodwill 240 511 1,776 539 70 10 391 395 177 4,109
Net goodwill of unchanged CGUs 863
TOTAL 4,972
At December 31, 2013, net goodwill recorded by the new CGUs can be broken down as follows:
(In millions of euros)
Net value at December 31, 2013
French Retail Banking 837
Societe Generale Network 326
Crédit du Nord 511
International Retail Banking & Financial Services 3,272
Europe 1,910
Russia 579
Africa, Asia, Mediterranean Basin and Overseas 263
Insurances 10
Business Financial Services 335
Auto Leasing Financial Services 175
Global Banking and Investor Solutions 863
Corporate and Investment Banking 48
Corporate and Investment Banking 48
Private Banking, Securities Services and Brokerage 815
Private Banking 344
Securities Services 471
Brokerage -
TOTAL 4,972
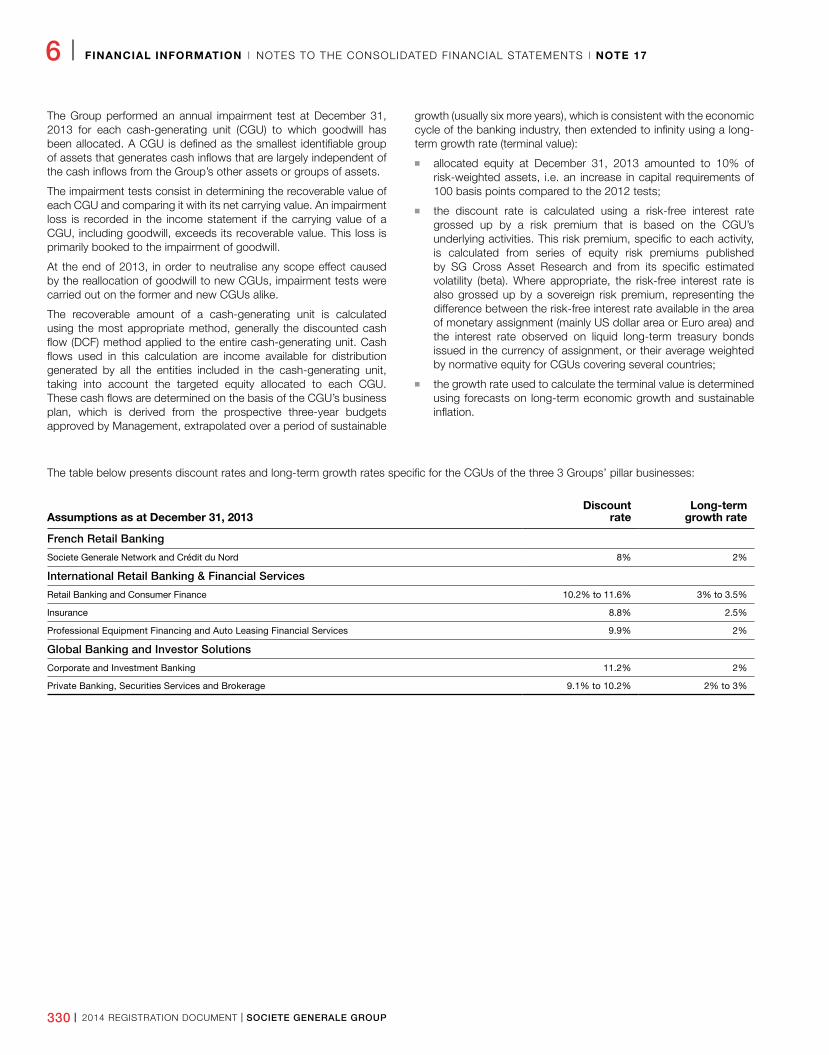
330 I 2014 REGISTRATION DOCUMENT I SOCIETE GENERALE GROUP
6 I FINANCIAL INFORMATION I NOTES TO THE CONSOLIDATED FINANCIAL STATEMENTS I NOTE 17
The Group performed an annual impairment test at December 31, 2013 for each cash-generating unit (CGU) to which goodwill has been allocated. A CGU is defined as the smallest identifiable group of assets that generates cash inflows that are largely independent of the cash inflows from the Group’s other assets or groups of assets.
The impairment tests consist in determining the recoverable value of each CGU and comparing it with its net carrying value. An impairment loss is recorded in the income statement if the carrying value of a CGU, including goodwill, exceeds its recoverable value. This loss is primarily booked to the impairment of goodwill.
At the end of 2013, in order to neutralise any scope effect caused by the reallocation of goodwill to new CGUs, impairment tests were carried out on the former and new CGUs alike.
The recoverable amount of a cash-generating unit is calculated using the most appropriate method, generally the discounted cash flow (DCF) method applied to the entire cash-generating unit. Cash flows used in this calculation are income available for distribution generated by all the entities included in the cash-generating unit, taking into account the targeted equity allocated to each CGU. These cash flows are determined on the basis of the CGU’s business plan, which is derived from the prospective three-year budgets approved by Management, extrapolated over a period of sustainable
growth (usually six more years), which is consistent with the economic cycle of the banking industry, then extended to infinity using a long-term growth rate (terminal value):
n allocated equity at December 31, 2013 amounted to 10% of risk-weighted assets, i.e. an increase in capital requirements of 100 basis points compared to the 2012 tests;
n the discount rate is calculated using a risk-free interest rate grossed up by a risk premium that is based on the CGU’s underlying activities. This risk premium, specific to each activity, is calculated from series of equity risk premiums published by SG Cross Asset Research and from its specific estimated volatility (beta). Where appropriate, the risk-free interest rate is also grossed up by a sovereign risk premium, representing the difference between the risk-free interest rate available in the area of monetary assignment (mainly US dollar area or Euro area) and the interest rate observed on liquid long-term treasury bonds issued in the currency of assignment, or their average weighted by normative equity for CGUs covering several countries;
n the growth rate used to calculate the terminal value is determined using forecasts on long-term economic growth and sustainable inflation.
The table below presents discount rates and long-term growth rates specific for the CGUs of the three 3 Groups’ pillar businesses:
Assumptions as at December 31, 2013Discount
rateLong-term
growth rate
French Retail Banking
Societe Generale Network and Crédit du Nord 8% 2%
International Retail Banking & Financial Services
Retail Banking and Consumer Finance 10�2% to 11�6% 3% to 3�5%
Insurance 8�8% 2�5%
Professional Equipment Financing and Auto Leasing Financial Services 9�9% 2%
Global Banking and Investor Solutions
Corporate and Investment Banking 11�2% 2%
Private Banking, Securities Services and Brokerage 9�1% to 10�2% 2% to 3%
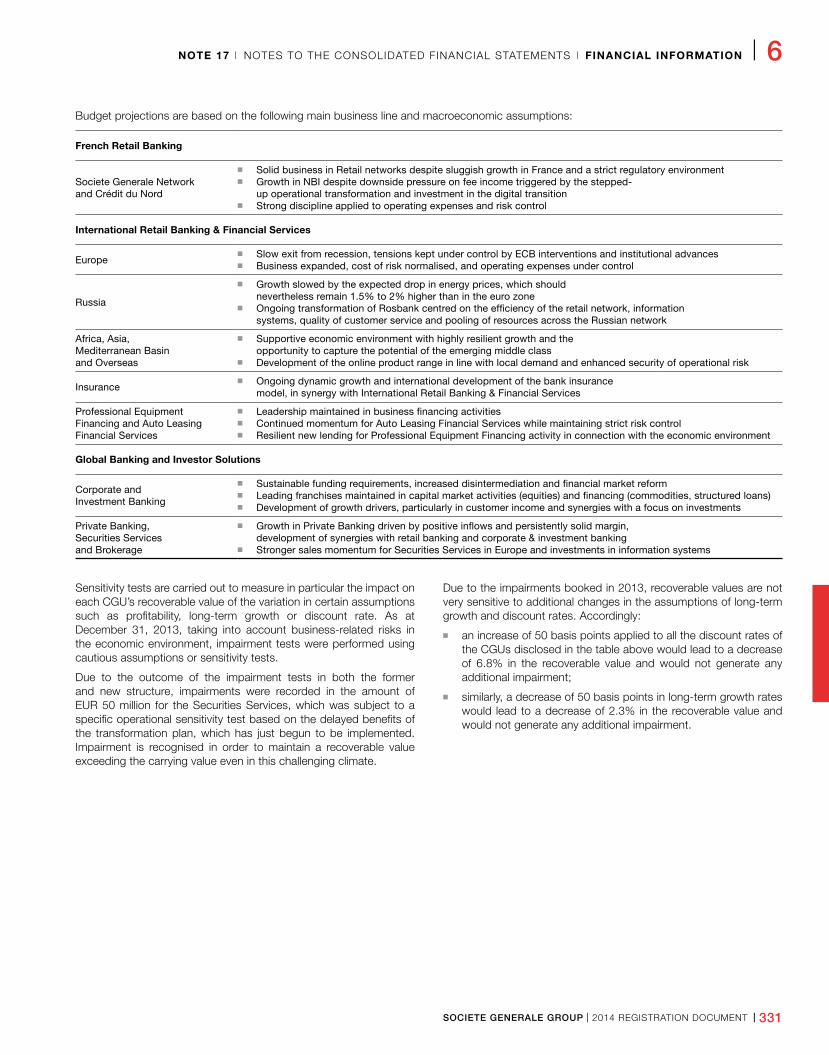
SOCIETE GENERALE GROUP I 2014 REGISTRATION DOCUMENT I 331
NOTE 17 I NOTES TO THE CONSOLIDATED FINANCIAL STATEMENTS I FINANCIAL INFORMATION I 6
Budget projections are based on the following main business line and macroeconomic assumptions:
French Retail Banking
Societe Generale Network and Crédit du Nord
n Solid business in Retail networks despite sluggish growth in France and a strict regulatory environment n Growth in NBI despite downside pressure on fee income triggered by the stepped-
up operational transformation and investment in the digital transition n Strong discipline applied to operating expenses and risk control
International Retail Banking & Financial Services
Europe n Slow exit from recession, tensions kept under control by ECB interventions and institutional advances n Business expanded, cost of risk normalised, and operating expenses under control
Russia
n Growth slowed by the expected drop in energy prices, which should nevertheless remain 1�5% to 2% higher than in the euro zone
n Ongoing transformation of Rosbank centred on the efficiency of the retail network, information systems, quality of customer service and pooling of resources across the Russian network
Africa, Asia, Mediterranean Basin and Overseas
n Supportive economic environment with highly resilient growth and the opportunity to capture the potential of the emerging middle class
n Development of the online product range in line with local demand and enhanced security of operational risk
Insurance n Ongoing dynamic growth and international development of the bank insurance
model, in synergy with International Retail Banking & Financial Services
Professional Equipment Financing and Auto Leasing Financial Services
n Leadership maintained in business financing activities n Continued momentum for Auto Leasing Financial Services while maintaining strict risk control n Resilient new lending for Professional Equipment Financing activity in connection with the economic environment
Global Banking and Investor Solutions
Corporate and Investment Banking
n Sustainable funding requirements, increased disintermediation and financial market reform n Leading franchises maintained in capital market activities (equities) and financing (commodities, structured loans) n Development of growth drivers, particularly in customer income and synergies with a focus on investments
Private Banking, Securities Services and Brokerage
n Growth in Private Banking driven by positive inflows and persistently solid margin, development of synergies with retail banking and corporate & investment banking
n Stronger sales momentum for Securities Services in Europe and investments in information systems
Sensitivity tests are carried out to measure in particular the impact on each CGU’s recoverable value of the variation in certain assumptions such as profitability, long-term growth or discount rate. As at December 31, 2013, taking into account business-related risks in the economic environment, impairment tests were performed using cautious assumptions or sensitivity tests.
Due to the outcome of the impairment tests in both the former and new structure, impairments were recorded in the amount of EUR 50 million for the Securities Services, which was subject to a specific operational sensitivity test based on the delayed benefits of the transformation plan, which has just begun to be implemented. Impairment is recognised in order to maintain a recoverable value exceeding the carrying value even in this challenging climate.
Due to the impairments booked in 2013, recoverable values are not very sensitive to additional changes in the assumptions of long-term growth and discount rates. Accordingly:
n an increase of 50 basis points applied to all the discount rates of the CGUs disclosed in the table above would lead to a decrease of 6.8% in the recoverable value and would not generate any additional impairment;
n similarly, a decrease of 50 basis points in long-term growth rates would lead to a decrease of 2.3% in the recoverable value and would not generate any additional impairment.
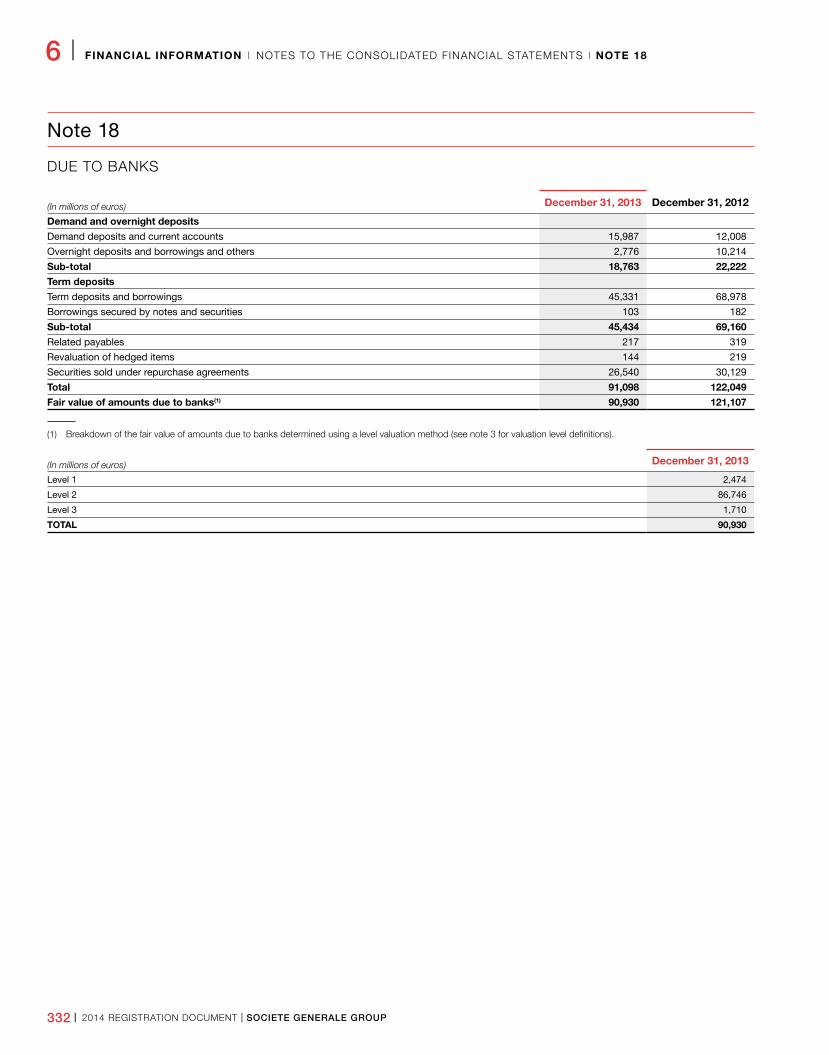
332 I 2014 REGISTRATION DOCUMENT I SOCIETE GENERALE GROUP
6 I FINANCIAL INFORMATION I NOTES TO THE CONSOLIDATED FINANCIAL STATEMENTS I NOTE 18
Note 18
DUE TO BANKS
(In millions of euros) December 31, 2013 December 31, 2012
Demand and overnight deposits
Demand deposits and current accounts 15,987 12,008
Overnight deposits and borrowings and others 2,776 10,214
Sub-total 18,763 22,222
Term deposits
Term deposits and borrowings 45,331 68,978
Borrowings secured by notes and securities 103 182
Sub-total 45,434 69,160
Related payables 217 319
Revaluation of hedged items 144 219
Securities sold under repurchase agreements 26,540 30,129
Total 91,098 122,049
Fair value of amounts due to banks(1) 90,930 121,107
(1) Breakdown of the fair value of amounts due to banks determined using a level valuation method (see note 3 for valuation level definitions).
(In millions of euros) December 31, 2013
Level 1 2,474
Level 2 86,746
Level 3 1,710
TOTAL 90,930
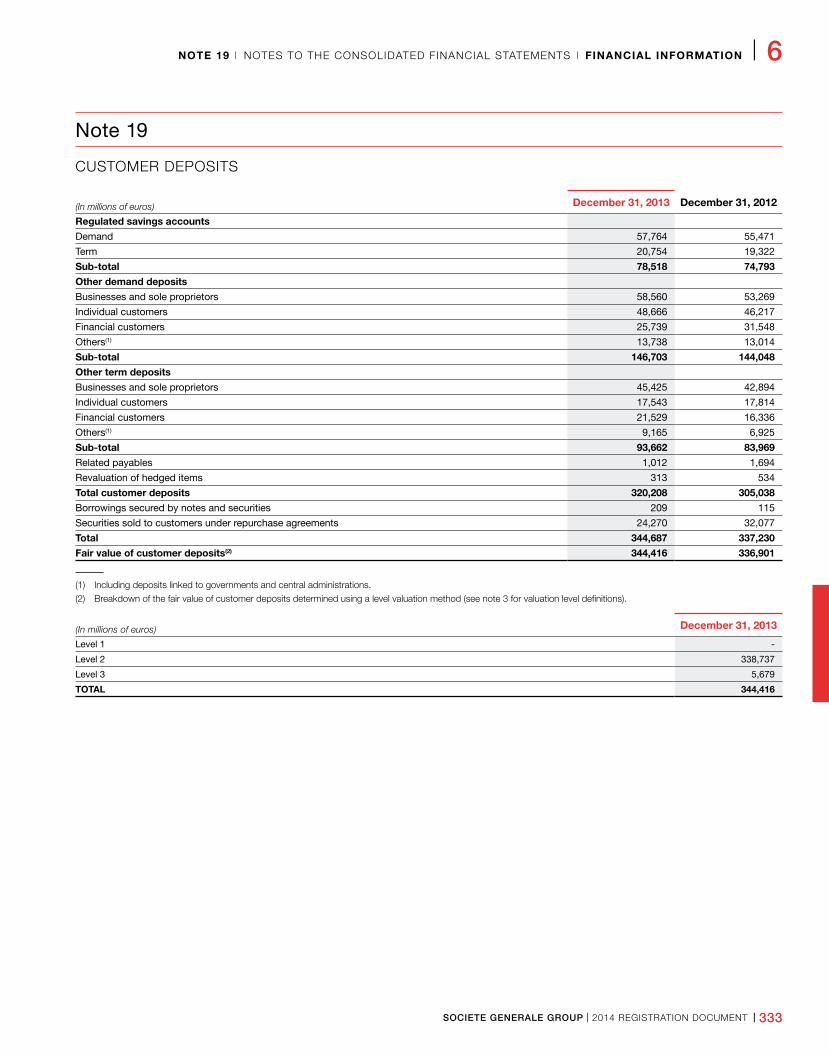
SOCIETE GENERALE GROUP I 2014 REGISTRATION DOCUMENT I 333
NOTE 19 I NOTES TO THE CONSOLIDATED FINANCIAL STATEMENTS I FINANCIAL INFORMATION I 6
Note 19
CUSTOMER DEPOSITS
(In millions of euros) December 31, 2013 December 31, 2012
Regulated savings accounts
Demand 57,764 55,471
Term 20,754 19,322
Sub-total 78,518 74,793
Other demand deposits
Businesses and sole proprietors 58,560 53,269
Individual customers 48,666 46,217
Financial customers 25,739 31,548
Others(1) 13,738 13,014
Sub-total 146,703 144,048
Other term deposits
Businesses and sole proprietors 45,425 42,894
Individual customers 17,543 17,814
Financial customers 21,529 16,336
Others(1) 9,165 6,925
Sub-total 93,662 83,969
Related payables 1,012 1,694
Revaluation of hedged items 313 534
Total customer deposits 320,208 305,038
Borrowings secured by notes and securities 209 115
Securities sold to customers under repurchase agreements 24,270 32,077
Total 344,687 337,230
Fair value of customer deposits(2) 344,416 336,901
(1) Including deposits linked to governments and central administrations.
(2) Breakdown of the fair value of customer deposits determined using a level valuation method (see note 3 for valuation level definitions).
(In millions of euros) December 31, 2013
Level 1 -
Level 2 338,737
Level 3 5,679
TOTAL 344,416
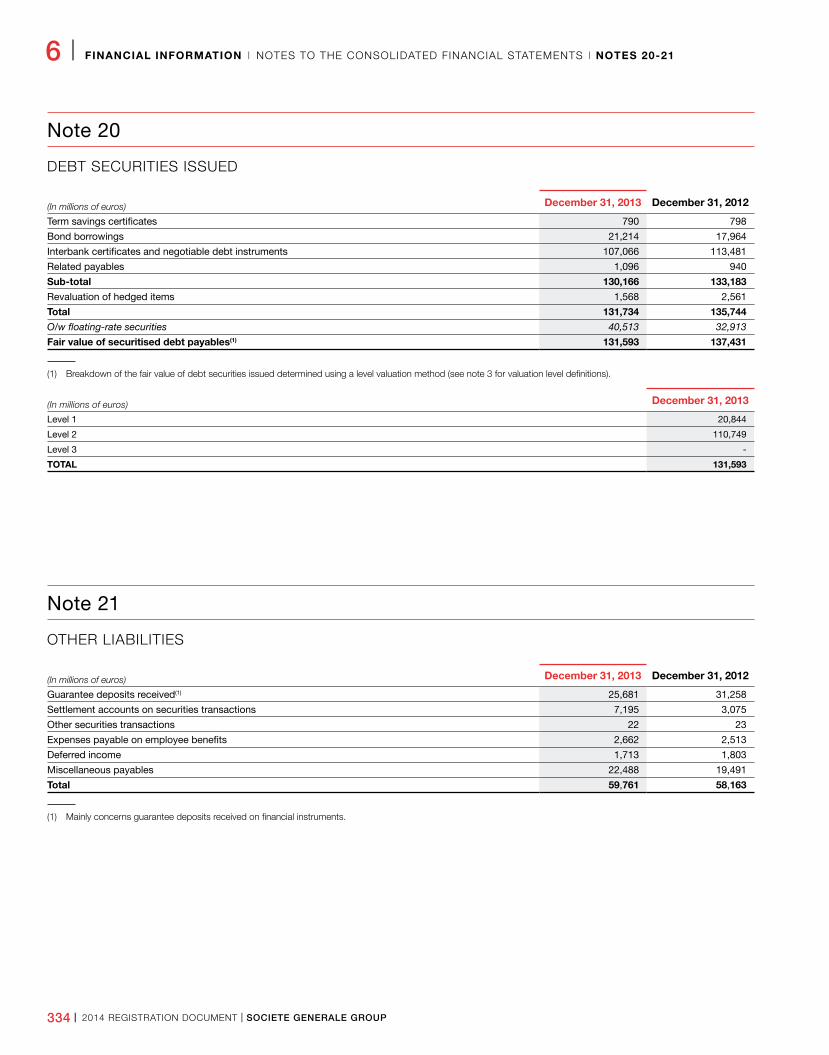
334 I 2014 REGISTRATION DOCUMENT I SOCIETE GENERALE GROUP
6 I FINANCIAL INFORMATION I NOTES TO THE CONSOLIDATED FINANCIAL STATEMENTS I NOTES 20-21
Note 21
OTHER LIABILITIES
(In millions of euros) December 31, 2013 December 31, 2012
Guarantee deposits received(1) 25,681 31,258
Settlement accounts on securities transactions 7,195 3,075
Other securities transactions 22 23
Expenses payable on employee benefits 2,662 2,513
Deferred income 1,713 1,803
Miscellaneous payables 22,488 19,491
Total 59,761 58,163
(1) Mainly concerns guarantee deposits received on financial instruments.
Note 20
DEBT SECURITIES ISSUED
(In millions of euros) December 31, 2013 December 31, 2012
Term savings certificates 790 798
Bond borrowings 21,214 17,964
Interbank certificates and negotiable debt instruments 107,066 113,481
Related payables 1,096 940
Sub-total 130,166 133,183
Revaluation of hedged items 1,568 2,561
Total 131,734 135,744
O/w floating-rate securities 40,513 32,913
Fair value of securitised debt payables(1) 131,593 137,431
(1) Breakdown of the fair value of debt securities issued determined using a level valuation method (see note 3 for valuation level definitions).
(In millions of euros) December 31, 2013
Level 1 20,844
Level 2 110,749
Level 3 -
TOTAL 131,593
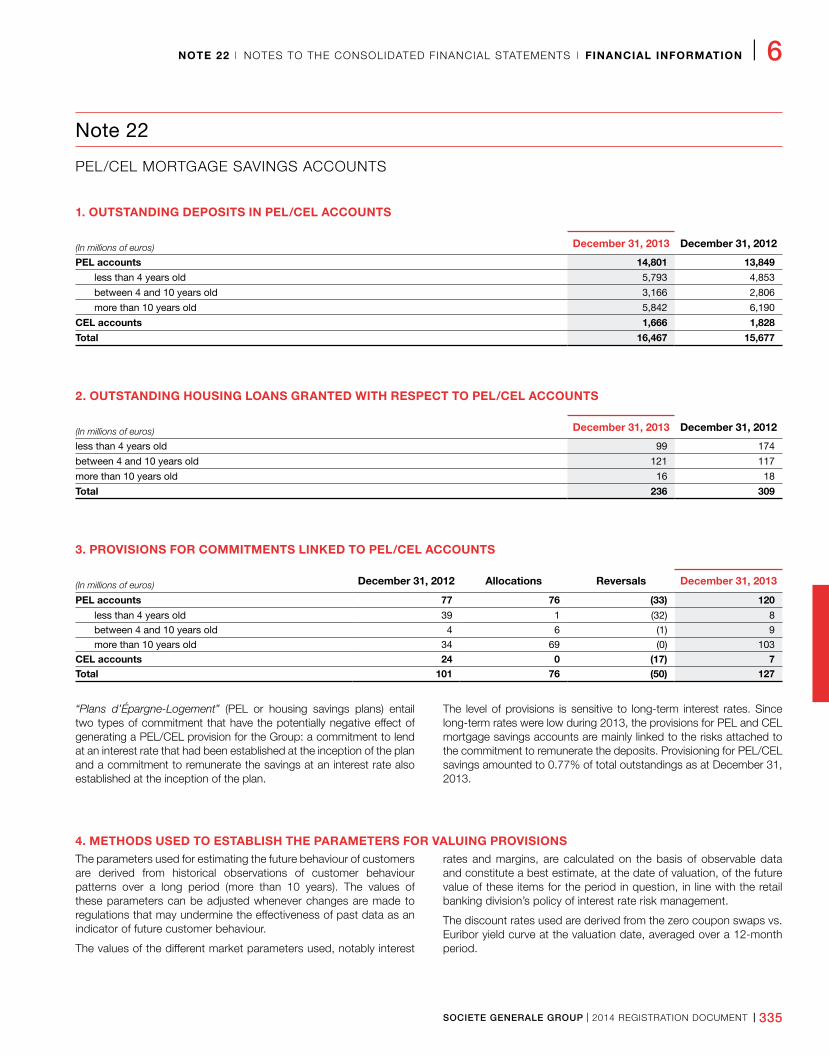
SOCIETE GENERALE GROUP I 2014 REGISTRATION DOCUMENT I 335
NOTE 22 I NOTES TO THE CONSOLIDATED FINANCIAL STATEMENTS I FINANCIAL INFORMATION I 6
Note 22
PEL/CEL MORTGAGE SAVINGS ACCOUNTS
1. OUTSTANDING DEPOSITS IN PEL/CEL ACCOUNTS
(In millions of euros) December 31, 2013 December 31, 2012
PEL accounts 14,801 13,849
less than 4 years old 5,793 4,853
between 4 and 10 years old 3,166 2,806
more than 10 years old 5,842 6,190
CEL accounts 1,666 1,828
Total 16,467 15,677
2. OUTSTANDING HOUSING LOANS GRANTED WITH RESPECT TO PEL/CEL ACCOUNTS
(In millions of euros) December 31, 2013 December 31, 2012
less than 4 years old 99 174
between 4 and 10 years old 121 117
more than 10 years old 16 18
Total 236 309
3. PROVISIONS FOR COMMITMENTS LINKED TO PEL/CEL ACCOUNTS
(In millions of euros) December 31, 2012 Allocations Reversals December 31, 2013
PEL accounts 77 76 (33) 120
less than 4 years old 39 1 (32) 8between 4 and 10 years old 4 6 (1) 9more than 10 years old 34 69 (0) 103
CEL accounts 24 0 (17) 7Total 101 76 (50) 127
“Plans d’Épargne-Logement” (PEL or housing savings plans) entail two types of commitment that have the potentially negative effect of generating a PEL/CEL provision for the Group: a commitment to lend at an interest rate that had been established at the inception of the plan and a commitment to remunerate the savings at an interest rate also established at the inception of the plan.
The level of provisions is sensitive to long-term interest rates. Since long-term rates were low during 2013, the provisions for PEL and CEL mortgage savings accounts are mainly linked to the risks attached to the commitment to remunerate the deposits. Provisioning for PEL/CEL savings amounted to 0.77% of total outstandings as at December 31, 2013.
4. METHODS USED TO ESTABLISH THE PARAMETERS FOR VALUING PROVISIONSThe parameters used for estimating the future behaviour of customers are derived from historical observations of customer behaviour patterns over a long period (more than 10 years). The values of these parameters can be adjusted whenever changes are made to regulations that may undermine the effectiveness of past data as an indicator of future customer behaviour.
The values of the different market parameters used, notably interest
rates and margins, are calculated on the basis of observable data and constitute a best estimate, at the date of valuation, of the future value of these items for the period in question, in line with the retail banking division’s policy of interest rate risk management.
The discount rates used are derived from the zero coupon swaps vs. Euribor yield curve at the valuation date, averaged over a 12-month period.
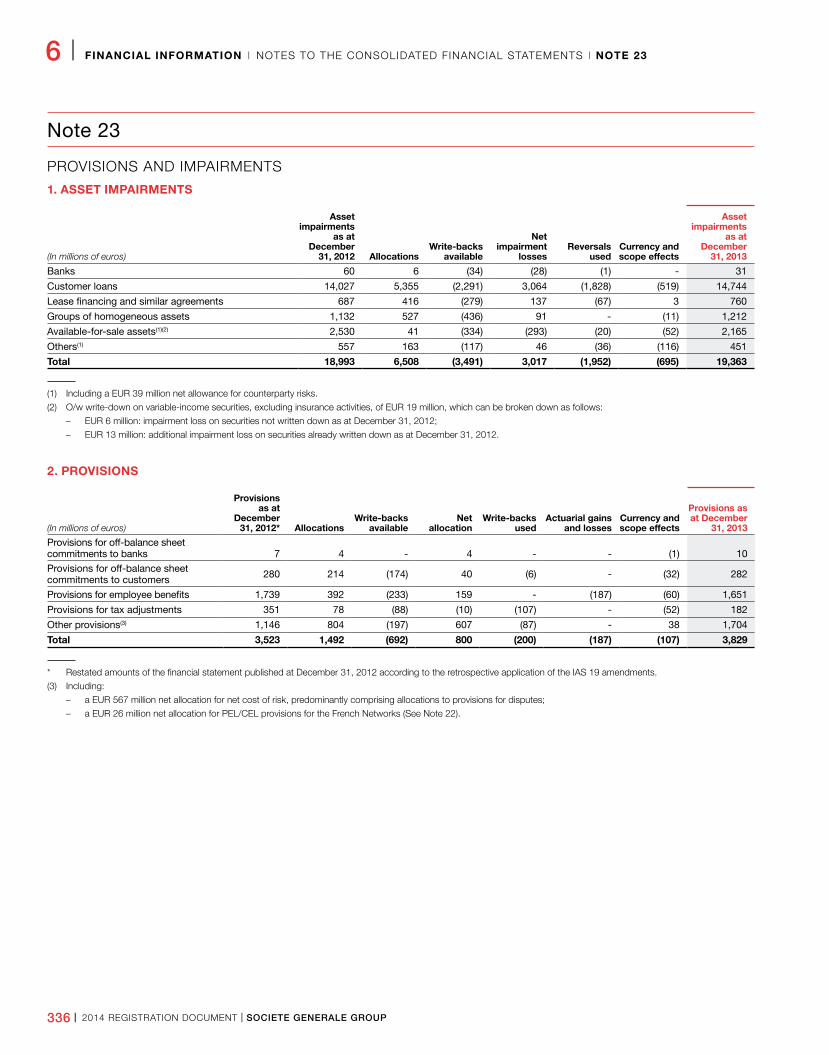
336 I 2014 REGISTRATION DOCUMENT I SOCIETE GENERALE GROUP
6 I FINANCIAL INFORMATION I NOTES TO THE CONSOLIDATED FINANCIAL STATEMENTS I NOTE 23
Note 23
PROVISIONS AND IMPAIRMENTS
1. ASSET IMPAIRMENTS
(In millions of euros)
Asset impairments
as at December
31, 2012 AllocationsWrite-backs
available
Net impairment
lossesReversals
usedCurrency and scope effects
Asset impairments
as at December
31, 2013
Banks 60 6 (34) (28) (1) - 31
Customer loans 14,027 5,355 (2,291) 3,064 (1,828) (519) 14,744
Lease financing and similar agreements 687 416 (279) 137 (67) 3 760
Groups of homogeneous assets 1,132 527 (436) 91 - (11) 1,212
Available-for-sale assets(1)(2) 2,530 41 (334) (293) (20) (52) 2,165
Others(1) 557 163 (117) 46 (36) (116) 451
Total 18,993 6,508 (3,491) 3,017 (1,952) (695) 19,363
(1) Including a EUR 39 million net allowance for counterparty risks.
(2) O/w write-down on variable-income securities, excluding insurance activities, of EUR 19 million, which can be broken down as follows:
– EUR 6 million: impairment loss on securities not written down as at December 31, 2012;
– EUR 13 million: additional impairment loss on securities already written down as at December 31, 2012.
2. PROVISIONS
(In millions of euros)
Provisions as at
December 31, 2012* Allocations
Write-backs available
Net allocation
Write-backs used
Actuarial gains and losses
Currency and scope effects
Provisions as at December
31, 2013
Provisions for off-balance sheet commitments to banks 7 4 - 4 - - (1) 10Provisions for off-balance sheet commitments to customers 280 214 (174) 40 (6) - (32) 282
Provisions for employee benefits 1,739 392 (233) 159 - (187) (60) 1,651
Provisions for tax adjustments 351 78 (88) (10) (107) - (52) 182
Other provisions(3) 1,146 804 (197) 607 (87) - 38 1,704
Total 3,523 1,492 (692) 800 (200) (187) (107) 3,829
* Restated amounts of the financial statement published at December 31, 2012 according to the retrospective application of the IAS 19 amendments.
(3) Including:
– a EUR 567 million net allocation for net cost of risk, predominantly comprising allocations to provisions for disputes;
– a EUR 26 million net allocation for PEL/CEL provisions for the French Networks (See Note 22).
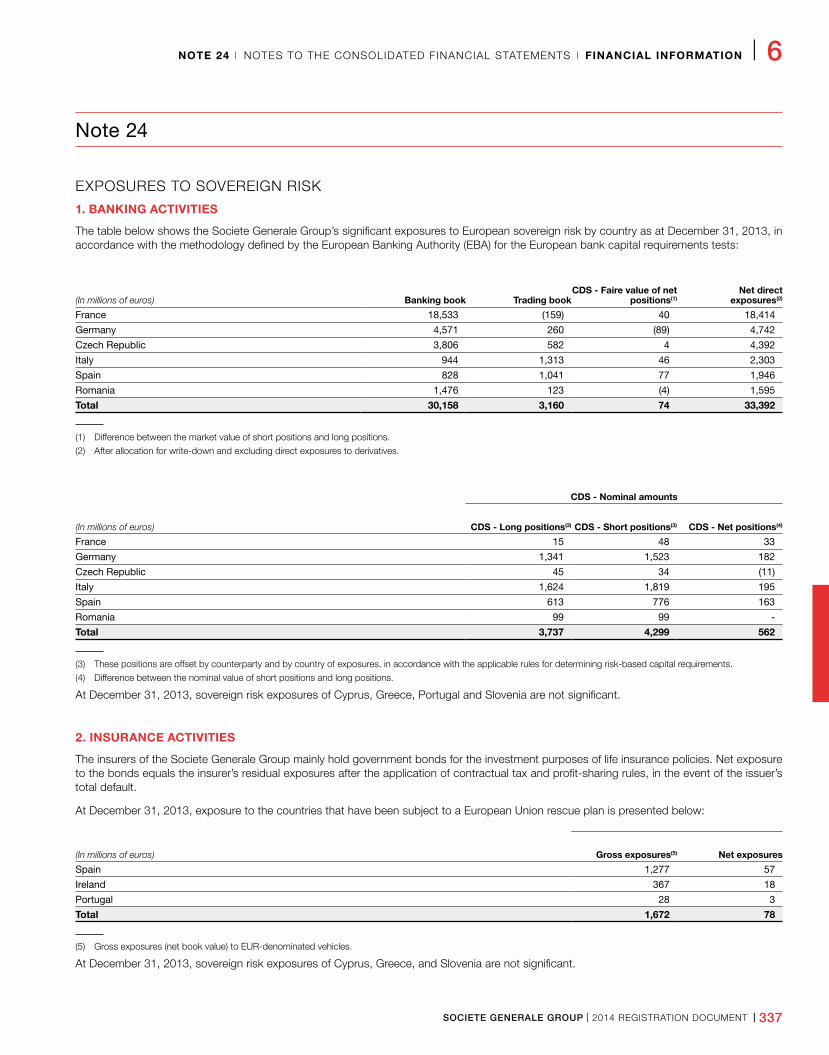
SOCIETE GENERALE GROUP I 2014 REGISTRATION DOCUMENT I 337
NOTE 24 I NOTES TO THE CONSOLIDATED FINANCIAL STATEMENTS I FINANCIAL INFORMATION I 6
Note 24
EXPOSURES TO SOVEREIGN RISK
1. BANKING ACTIVITIES
The table below shows the Societe Generale Group’s significant exposures to European sovereign risk by country as at December 31, 2013, in accordance with the methodology defined by the European Banking Authority (EBA) for the European bank capital requirements tests:
(In millions of euros) Banking book Trading bookCDS - Faire value of net
positions(1)Net direct
exposures(2)
France 18,533 (159) 40 18,414
Germany 4,571 260 (89) 4,742
Czech Republic 3,806 582 4 4,392
Italy 944 1,313 46 2,303
Spain 828 1,041 77 1,946
Romania 1,476 123 (4) 1,595
Total 30,158 3,160 74 33,392
(1) Difference between the market value of short positions and long positions.
(2) After allocation for write-down and excluding direct exposures to derivatives.
CDS - Nominal amounts
(In millions of euros) CDS - Long positions(3) CDS - Short positions(3) CDS - Net positions(4)
France 15 48 33
Germany 1,341 1,523 182
Czech Republic 45 34 (11)
Italy 1,624 1,819 195
Spain 613 776 163
Romania 99 99 -
Total 3,737 4,299 562
(3) These positions are offset by counterparty and by country of exposures, in accordance with the applicable rules for determining risk-based capital requirements.
(4) Difference between the nominal value of short positions and long positions.
At December 31, 2013, sovereign risk exposures of Cyprus, Greece, Portugal and Slovenia are not significant.
2. INSURANCE ACTIVITIES
The insurers of the Societe Generale Group mainly hold government bonds for the investment purposes of life insurance policies. Net exposure to the bonds equals the insurer’s residual exposures after the application of contractual tax and profit-sharing rules, in the event of the issuer’s total default.
At December 31, 2013, exposure to the countries that have been subject to a European Union rescue plan is presented below:
(In millions of euros) Gross exposures(5) Net exposures
Spain 1,277 57
Ireland 367 18
Portugal 28 3
Total 1,672 78
(5) Gross exposures (net book value) to EUR-denominated vehicles.
At December 31, 2013, sovereign risk exposures of Cyprus, Greece, and Slovenia are not significant.
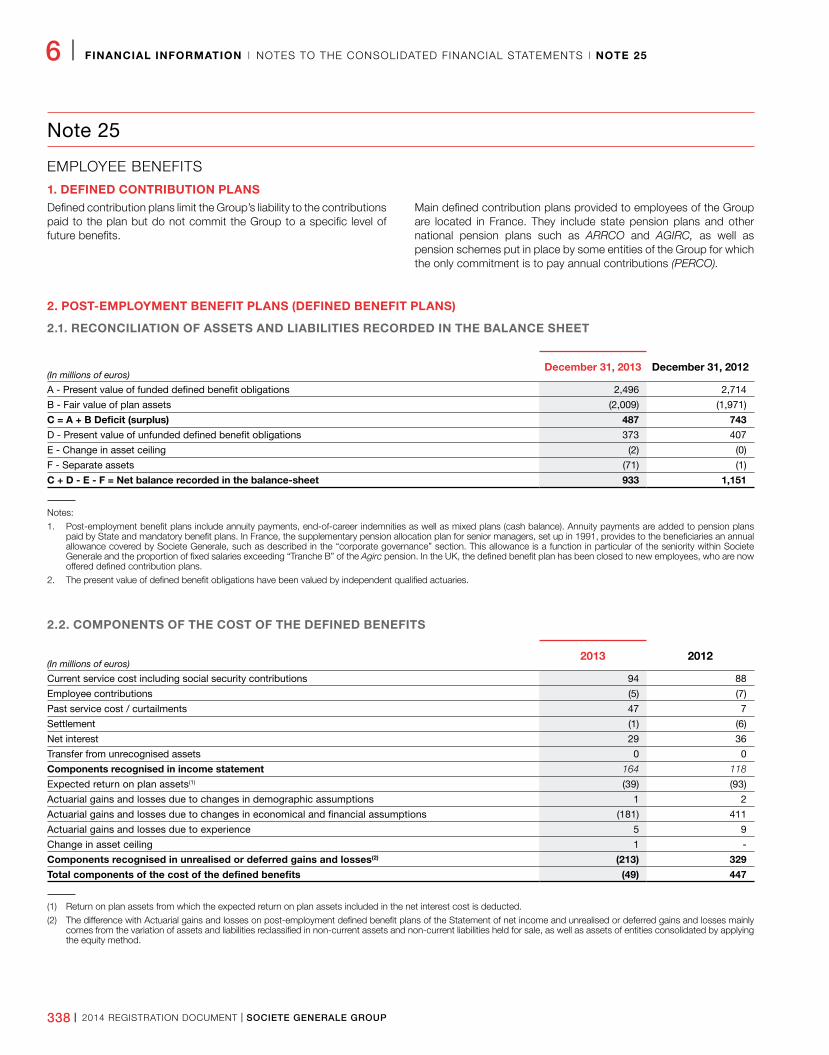
338 I 2014 REGISTRATION DOCUMENT I SOCIETE GENERALE GROUP
6 I FINANCIAL INFORMATION I NOTES TO THE CONSOLIDATED FINANCIAL STATEMENTS I NOTE 25
Note 25
EMPLOYEE BENEFITS
1. DEFINED CONTRIBUTION PLANSDefined contribution plans limit the Group’s liability to the contributions paid to the plan but do not commit the Group to a specific level of future benefits.
Main defined contribution plans provided to employees of the Group are located in France. They include state pension plans and other national pension plans such as ARRCO and AGIRC, as well as pension schemes put in place by some entities of the Group for which the only commitment is to pay annual contributions (PERCO).
2. POST-EMPLOYMENT BENEFIT PLANS (DEFINED BENEFIT PLANS)
2.1. RECONCILIATION OF ASSETS AND LIABILITIES RECORDED IN THE BALANCE SHEET
(In millions of euros)December 31, 2013 December 31, 2012
A - Present value of funded defined benefit obligations 2,496 2,714
B - Fair value of plan assets (2,009) (1,971)
C = A + B Deficit (surplus) 487 743
D - Present value of unfunded defined benefit obligations 373 407
E - Change in asset ceiling (2) (0)
F - Separate assets (71) (1)
C + D - E - F = Net balance recorded in the balance-sheet 933 1,151
Notes:
1. Post-employment benefit plans include annuity payments, end-of-career indemnities as well as mixed plans (cash balance). Annuity payments are added to pension plans paid by State and mandatory benefit plans. In France, the supplementary pension allocation plan for senior managers, set up in 1991, provides to the beneficiaries an annual allowance covered by Societe Generale, such as described in the “corporate governance” section. This allowance is a function in particular of the seniority within Societe Generale and the proportion of fixed salaries exceeding “Tranche B” of the Agirc pension. In the UK, the defined benefit plan has been closed to new employees, who are now offered defined contribution plans.
2. The present value of defined benefit obligations have been valued by independent qualified actuaries.
2.2. COMPONENTS OF THE COST OF THE DEFINED BENEFITS
(In millions of euros)2013 2012
Current service cost including social security contributions 94 88
Employee contributions (5) (7)
Past service cost / curtailments 47 7
Settlement (1) (6)
Net interest 29 36
Transfer from unrecognised assets 0 0
Components recognised in income statement 164 118
Expected return on plan assets(1) (39) (93)
Actuarial gains and losses due to changes in demographic assumptions 1 2
Actuarial gains and losses due to changes in economical and financial assumptions (181) 411
Actuarial gains and losses due to experience 5 9
Change in asset ceiling 1 -
Components recognised in unrealised or deferred gains and losses(2) (213) 329
Total components of the cost of the defined benefits (49) 447
(1) Return on plan assets from which the expected return on plan assets included in the net interest cost is deducted.
(2) The difference with Actuarial gains and losses on post-employment defined benefit plans of the Statement of net income and unrealised or deferred gains and losses mainly comes from the variation of assets and liabilities reclassified in non-current assets and non-current liabilities held for sale, as well as assets of entities consolidated by applying the equity method.
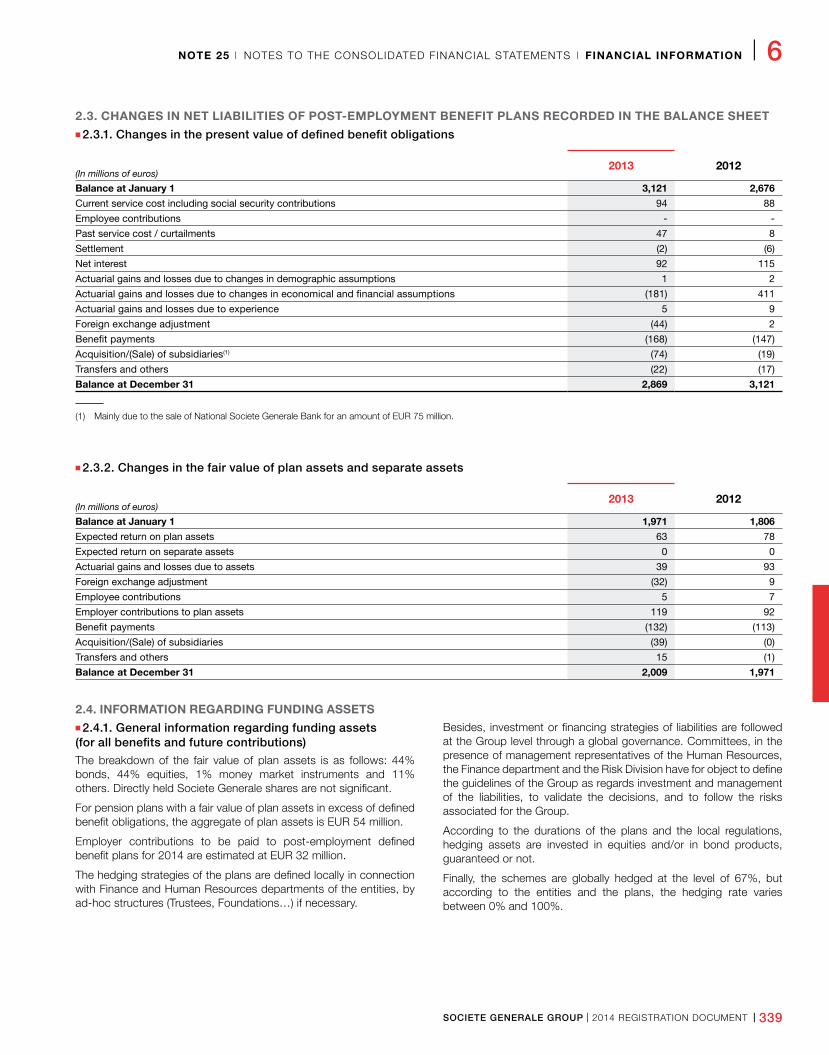
SOCIETE GENERALE GROUP I 2014 REGISTRATION DOCUMENT I 339
NOTE 25 I NOTES TO THE CONSOLIDATED FINANCIAL STATEMENTS I FINANCIAL INFORMATION I 6
2.3. CHANGES IN NET LIABILITIES OF POST-EMPLOYMENT BENEFIT PLANS RECORDED IN THE BALANCE SHEET n 2.3.1. Changes in the present value of defined benefit obligations
(In millions of euros)2013 2012
Balance at January 1 3,121 2,676
Current service cost including social security contributions 94 88
Employee contributions - -
Past service cost / curtailments 47 8
Settlement (2) (6)
Net interest 92 115
Actuarial gains and losses due to changes in demographic assumptions 1 2
Actuarial gains and losses due to changes in economical and financial assumptions (181) 411
Actuarial gains and losses due to experience 5 9
Foreign exchange adjustment (44) 2
Benefit payments (168) (147)
Acquisition/(Sale) of subsidiaries(1) (74) (19)
Transfers and others (22) (17)
Balance at December 31 2,869 3,121
(1) Mainly due to the sale of National Societe Generale Bank for an amount of EUR 75 million.
n 2.3.2. Changes in the fair value of plan assets and separate assets
(In millions of euros)2013 2012
Balance at January 1 1,971 1,806
Expected return on plan assets 63 78
Expected return on separate assets 0 0
Actuarial gains and losses due to assets 39 93
Foreign exchange adjustment (32) 9
Employee contributions 5 7
Employer contributions to plan assets 119 92
Benefit payments (132) (113)
Acquisition/(Sale) of subsidiaries (39) (0)
Transfers and others 15 (1)
Balance at December 31 2,009 1,971
2.4. INFORMATION REGARDING FUNDING ASSETS n 2.4.1. General information regarding funding assets
(for all benefits and future contributions)
The breakdown of the fair value of plan assets is as follows: 44% bonds, 44% equities, 1% money market instruments and 11% others. Directly held Societe Generale shares are not significant.
For pension plans with a fair value of plan assets in excess of defined benefit obligations, the aggregate of plan assets is EUR 54 million.
Employer contributions to be paid to post-employment defined benefit plans for 2014 are estimated at EUR 32 million.
The hedging strategies of the plans are defined locally in connection with Finance and Human Resources departments of the entities, by ad-hoc structures (Trustees, Foundations…) if necessary.
Besides, investment or financing strategies of liabilities are followed at the Group level through a global governance. Committees, in the presence of management representatives of the Human Resources, the Finance department and the Risk Division have for object to define the guidelines of the Group as regards investment and management of the liabilities, to validate the decisions, and to follow the risks associated for the Group.
According to the durations of the plans and the local regulations, hedging assets are invested in equities and/or in bond products, guaranteed or not.
Finally, the schemes are globally hedged at the level of 67%, but according to the entities and the plans, the hedging rate varies between 0% and 100%.
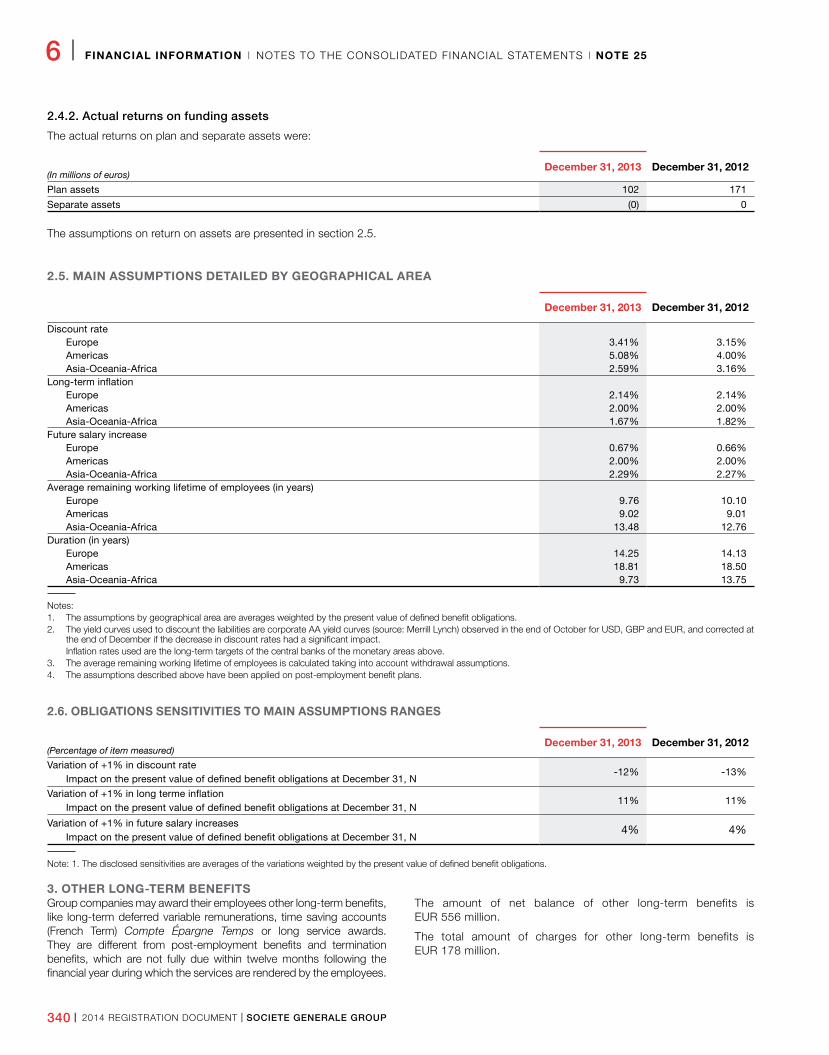
340 I 2014 REGISTRATION DOCUMENT I SOCIETE GENERALE GROUP
6 I FINANCIAL INFORMATION I NOTES TO THE CONSOLIDATED FINANCIAL STATEMENTS I NOTE 25
2.4.2. Actual returns on funding assets
The actual returns on plan and separate assets were:
(In millions of euros)December 31, 2013 December 31, 2012
Plan assets 102 171
Separate assets (0) 0
The assumptions on return on assets are presented in section 2.5.
2.5. MAIN ASSUMPTIONS DETAILED BY GEOGRAPHICAL AREA
December 31, 2013 December 31, 2012
Discount rateEurope 3�41% 3�15%Americas 5�08% 4�00%Asia-Oceania-Africa 2�59% 3�16%
Long-term inflationEurope 2�14% 2�14%Americas 2�00% 2�00%Asia-Oceania-Africa 1�67% 1�82%
Future salary increaseEurope 0�67% 0�66%Americas 2�00% 2�00%Asia-Oceania-Africa 2�29% 2�27%
Average remaining working lifetime of employees (in years)Europe 9�76 10�10Americas 9�02 9�01Asia-Oceania-Africa 13�48 12�76
Duration (in years)Europe 14�25 14�13Americas 18�81 18�50Asia-Oceania-Africa 9�73 13�75
Notes:1. The assumptions by geographical area are averages weighted by the present value of defined benefit obligations.2. The yield curves used to discount the liabilities are corporate AA yield curves (source: Merrill Lynch) observed in the end of October for USD, GBP and EUR, and corrected at
the end of December if the decrease in discount rates had a significant impact. Inflation rates used are the long-term targets of the central banks of the monetary areas above.3. The average remaining working lifetime of employees is calculated taking into account withdrawal assumptions.4. The assumptions described above have been applied on post-employment benefit plans.
2.6. OBLIGATIONS SENSITIVITIES TO MAIN ASSUMPTIONS RANGES
(Percentage of item measured)December 31, 2013 December 31, 2012
Variation of +1% in discount rateImpact on the present value of defined benefit obligations at December 31, N
-12% -13%
Variation of +1% in long terme inflationImpact on the present value of defined benefit obligations at December 31, N
11% 11%
Variation of +1% in future salary increasesImpact on the present value of defined benefit obligations at December 31, N
4% 4%
Note: 1. The disclosed sensitivities are averages of the variations weighted by the present value of defined benefit obligations.
3. OTHER LONG-TERM BENEFITSGroup companies may award their employees other long-term benefits, like long-term deferred variable remunerations, time saving accounts (French Term) Compte Épargne Temps or long service awards. They are different from post-employment benefits and termination benefits, which are not fully due within twelve months following the financial year during which the services are rendered by the employees.
The amount of net balance of other long-term benefits is EUR 556 million.
The total amount of charges for other long-term benefits is EUR 178 million.
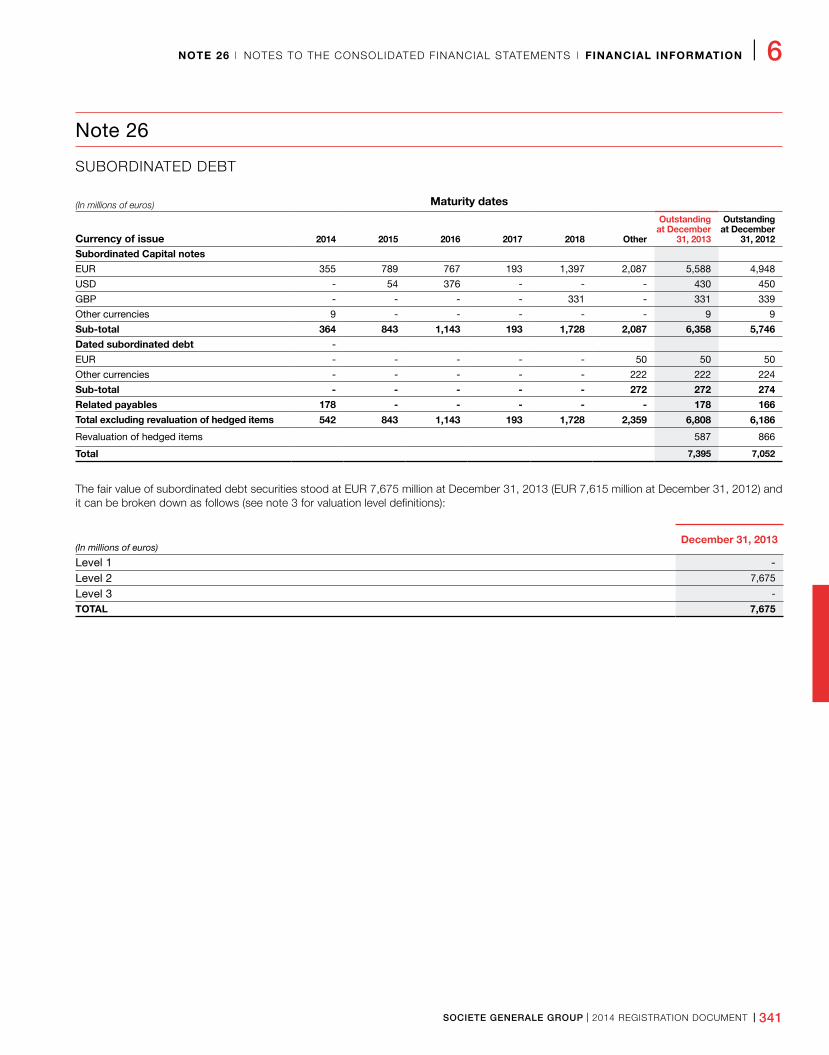
SOCIETE GENERALE GROUP I 2014 REGISTRATION DOCUMENT I 341
NOTE 26 I NOTES TO THE CONSOLIDATED FINANCIAL STATEMENTS I FINANCIAL INFORMATION I 6
Note 26
SUBORDINATED DEBT
(In millions of euros) Maturity dates
Currency of issue 2014 2015 2016 2017 2018 Other
Outstanding at December
31, 2013
Outstanding at December
31, 2012
Subordinated Capital notes
EUR 355 789 767 193 1,397 2,087 5,588 4,948
USD - 54 376 - - - 430 450
GBP - - - - 331 - 331 339
Other currencies 9 - - - - - 9 9
Sub-total 364 843 1,143 193 1,728 2,087 6,358 5,746
Dated subordinated debt -
EUR - - - - - 50 50 50
Other currencies - - - - - 222 222 224
Sub-total - - - - - 272 272 274
Related payables 178 - - - - - 178 166
Total excluding revaluation of hedged items 542 843 1,143 193 1,728 2,359 6,808 6,186
Revaluation of hedged items 587 866
Total 7,395 7,052
The fair value of subordinated debt securities stood at EUR 7,675 million at December 31, 2013 (EUR 7,615 million at December 31, 2012) and it can be broken down as follows (see note 3 for valuation level definitions):
(In millions of euros)December 31, 2013
Level 1 -Level 2 7,675
Level 3 -
TOTAL 7,675
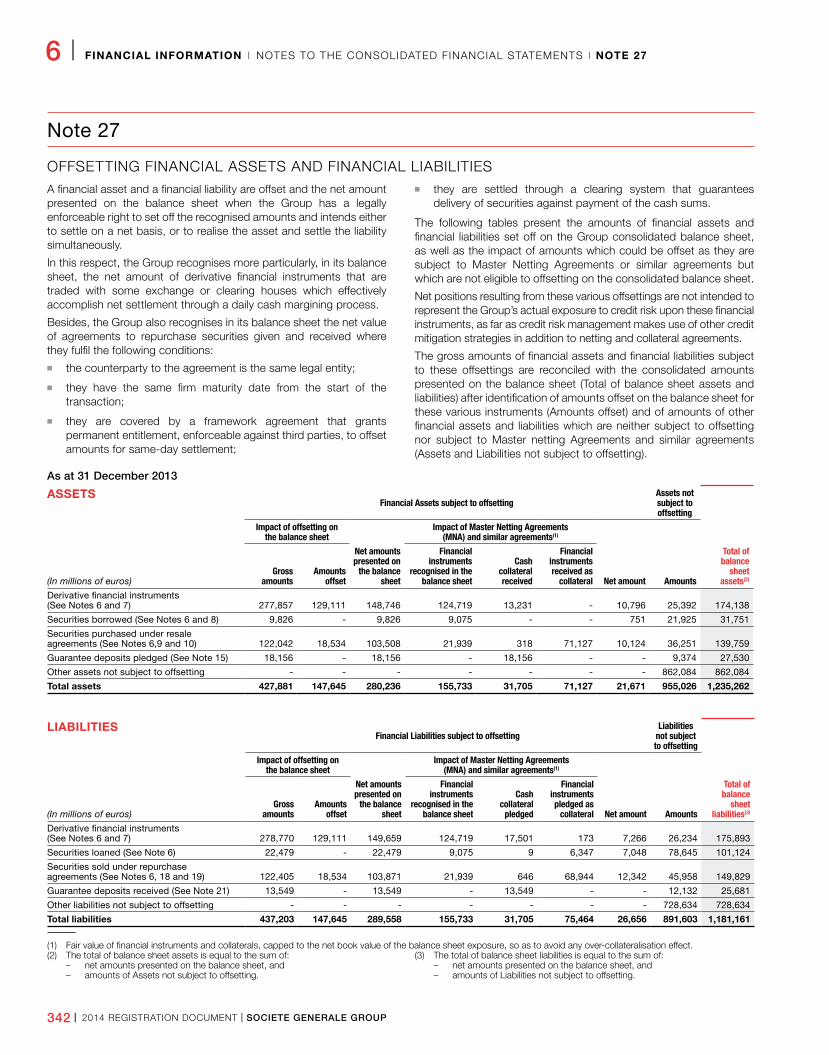
342 I 2014 REGISTRATION DOCUMENT I SOCIETE GENERALE GROUP
6 I FINANCIAL INFORMATION I NOTES TO THE CONSOLIDATED FINANCIAL STATEMENTS I NOTE 27
Note 27
OFFSETTING FINANCIAL ASSETS AND FINANCIAL LIABILITIESA financial asset and a financial liability are offset and the net amount presented on the balance sheet when the Group has a legally enforceable right to set off the recognised amounts and intends either to settle on a net basis, or to realise the asset and settle the liability simultaneously.
In this respect, the Group recognises more particularly, in its balance sheet, the net amount of derivative financial instruments that are traded with some exchange or clearing houses which effectively accomplish net settlement through a daily cash margining process.
Besides, the Group also recognises in its balance sheet the net value of agreements to repurchase securities given and received where they fulfil the following conditions:
n the counterparty to the agreement is the same legal entity;
n they have the same firm maturity date from the start of the transaction;
n they are covered by a framework agreement that grants permanent entitlement, enforceable against third parties, to offset amounts for same-day settlement;
n they are settled through a clearing system that guarantees delivery of securities against payment of the cash sums.
The following tables present the amounts of financial assets and financial liabilities set off on the Group consolidated balance sheet, as well as the impact of amounts which could be offset as they are subject to Master Netting Agreements or similar agreements but which are not eligible to offsetting on the consolidated balance sheet.
Net positions resulting from these various offsettings are not intended to represent the Group’s actual exposure to credit risk upon these financial instruments, as far as credit risk management makes use of other credit mitigation strategies in addition to netting and collateral agreements.
The gross amounts of financial assets and financial liabilities subject to these offsettings are reconciled with the consolidated amounts presented on the balance sheet (Total of balance sheet assets and liabilities) after identification of amounts offset on the balance sheet for these various instruments (Amounts offset) and of amounts of other financial assets and liabilities which are neither subject to offsetting nor subject to Master netting Agreements and similar agreements (Assets and Liabilities not subject to offsetting).
As at 31 December 2013
ASSETSFinancial Assets subject to offsetting
Assets not subject to offsetting
Total of balance
sheet assets(2)
Impact of offsetting on the balance sheet
Net amounts presented on
the balance sheet
Impact of Master Netting Agreements (MNA) and similar agreements(1)
Net amount Amounts(In millions of euros)Gross
amountsAmounts
offset
Financial instruments
recognised in the balance sheet
Cash collateral received
Financial instruments received as
collateral
Derivative financial instruments (See Notes 6 and 7) 277,857 129,111 148,746 124,719 13,231 - 10,796 25,392 174,138
Securities borrowed (See Notes 6 and 8) 9,826 - 9,826 9,075 - - 751 21,925 31,751
Securities purchased under resale agreements (See Notes 6,9 and 10) 122,042 18,534 103,508 21,939 318 71,127 10,124 36,251 139,759
Guarantee deposits pledged (See Note 15) 18,156 - 18,156 - 18,156 - - 9,374 27,530
Other assets not subject to offsetting - - - - - - - 862,084 862,084
Total assets 427,881 147,645 280,236 155,733 31,705 71,127 21,671 955,026 1,235,262
LIABILITIESFinancial Liabilities subject to offsetting
Liabilities not subject to offsetting
Total of balance
sheet liabilities(3)
Impact of offsetting on the balance sheet
Net amounts presented on
the balance sheet
Impact of Master Netting Agreements (MNA) and similar agreements(1)
Net amount Amounts(In millions of euros)Gross
amountsAmounts
offset
Financial instruments
recognised in the balance sheet
Cash collateral
pledged
Financial instruments pledged as
collateral
Derivative financial instruments (See Notes 6 and 7) 278,770 129,111 149,659 124,719 17,501 173 7,266 26,234 175,893
Securities loaned (See Note 6) 22,479 - 22,479 9,075 9 6,347 7,048 78,645 101,124
Securities sold under repurchase agreements (See Notes 6, 18 and 19) 122,405 18,534 103,871 21,939 646 68,944 12,342 45,958 149,829
Guarantee deposits received (See Note 21) 13,549 - 13,549 - 13,549 - - 12,132 25,681
Other liabilities not subject to offsetting - - - - - - - 728,634 728,634
Total liabilities 437,203 147,645 289,558 155,733 31,705 75,464 26,656 891,603 1,181,161
(1) Fair value of financial instruments and collaterals, capped to the net book value of the balance sheet exposure, so as to avoid any over-collateralisation effect.(2) The total of balance sheet assets is equal to the sum of:
– net amounts presented on the balance sheet, and – amounts of Assets not subject to offsetting.
(3) The total of balance sheet liabilities is equal to the sum of: – net amounts presented on the balance sheet, and – amounts of Liabilities not subject to offsetting.
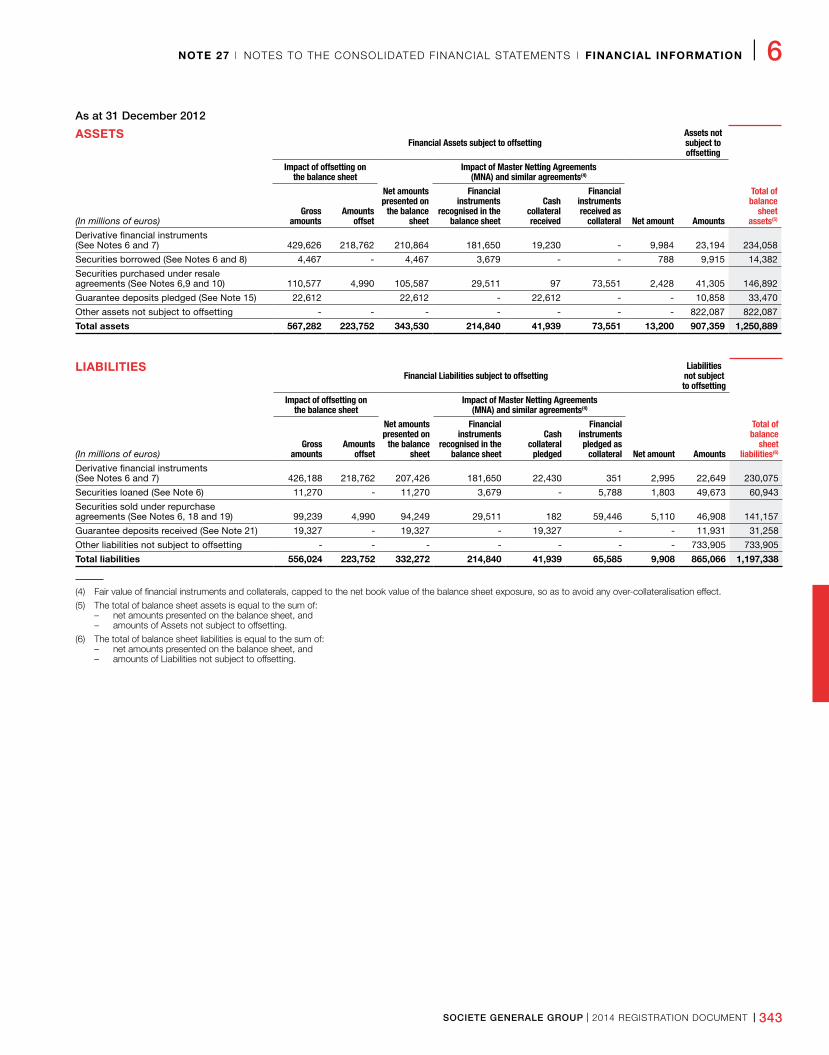
SOCIETE GENERALE GROUP I 2014 REGISTRATION DOCUMENT I 343
NOTE 27 I NOTES TO THE CONSOLIDATED FINANCIAL STATEMENTS I FINANCIAL INFORMATION I 6
As at 31 December 2012
ASSETSFinancial Assets subject to offsetting
Assets not subject to offsetting
Total of balance
sheet assets(5)
Impact of offsetting on the balance sheet
Net amounts presented on
the balance sheet
Impact of Master Netting Agreements (MNA) and similar agreements(4)
Net amount Amounts(In millions of euros)Gross
amountsAmounts
offset
Financial instruments
recognised in the balance sheet
Cash collateral received
Financial instruments received as
collateral
Derivative financial instruments (See Notes 6 and 7) 429,626 218,762 210,864 181,650 19,230 - 9,984 23,194 234,058
Securities borrowed (See Notes 6 and 8) 4,467 - 4,467 3,679 - - 788 9,915 14,382
Securities purchased under resale agreements (See Notes 6,9 and 10) 110,577 4,990 105,587 29,511 97 73,551 2,428 41,305 146,892
Guarantee deposits pledged (See Note 15) 22,612 22,612 - 22,612 - - 10,858 33,470
Other assets not subject to offsetting - - - - - - - 822,087 822,087
Total assets 567,282 223,752 343,530 214,840 41,939 73,551 13,200 907,359 1,250,889
LIABILITIESFinancial Liabilities subject to offsetting
Liabilities not subject to offsetting
Total of balance
sheet liabilities(6)
Impact of offsetting on the balance sheet
Net amounts presented on
the balance sheet
Impact of Master Netting Agreements (MNA) and similar agreements(4)
Net amount Amounts(In millions of euros)Gross
amountsAmounts
offset
Financial instruments
recognised in the balance sheet
Cash collateral
pledged
Financial instruments pledged as
collateral
Derivative financial instruments (See Notes 6 and 7) 426,188 218,762 207,426 181,650 22,430 351 2,995 22,649 230,075
Securities loaned (See Note 6) 11,270 - 11,270 3,679 - 5,788 1,803 49,673 60,943
Securities sold under repurchase agreements (See Notes 6, 18 and 19) 99,239 4,990 94,249 29,511 182 59,446 5,110 46,908 141,157
Guarantee deposits received (See Note 21) 19,327 - 19,327 - 19,327 - - 11,931 31,258
Other liabilities not subject to offsetting - - - - - - - 733,905 733,905
Total liabilities 556,024 223,752 332,272 214,840 41,939 65,585 9,908 865,066 1,197,338
(4) Fair value of financial instruments and collaterals, capped to the net book value of the balance sheet exposure, so as to avoid any over-collateralisation effect.
(5) The total of balance sheet assets is equal to the sum of: – net amounts presented on the balance sheet, and – amounts of Assets not subject to offsetting.
(6) The total of balance sheet liabilities is equal to the sum of: – net amounts presented on the balance sheet, and – amounts of Liabilities not subject to offsetting.
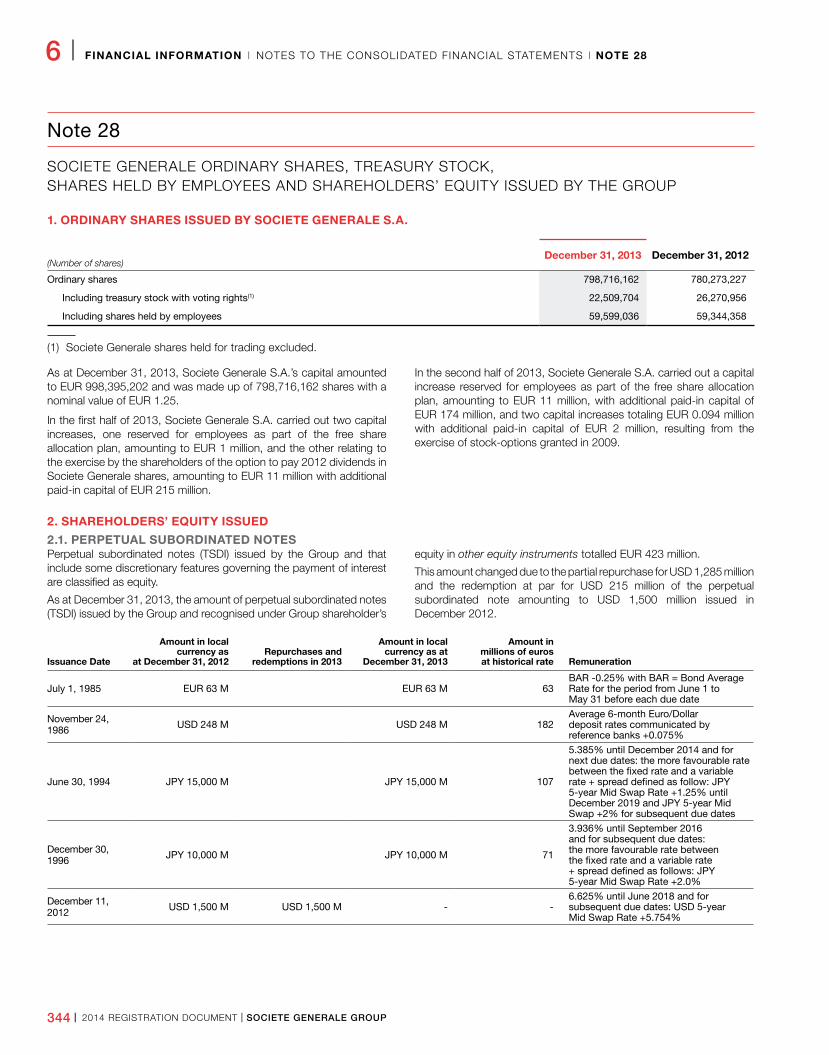
344 I 2014 REGISTRATION DOCUMENT I SOCIETE GENERALE GROUP
6 I FINANCIAL INFORMATION I NOTES TO THE CONSOLIDATED FINANCIAL STATEMENTS I NOTE 28
Note 28
SOCIETE GENERALE ORDINARY SHARES, TREASURY STOCK, SHARES HELD BY EMPLOYEES AND SHAREHOLDERS’ EQUITY ISSUED BY THE GROUP
1. ORDINARY SHARES ISSUED BY SOCIETE GENERALE S.A.
(Number of shares)December 31, 2013 December 31, 2012
Ordinary shares 798,716,162 780,273,227
Including treasury stock with voting rights(1) 22,509,704 26,270,956
Including shares held by employees 59,599,036 59,344,358
(1) Societe Generale shares held for trading excluded.
As at December 31, 2013, Societe Generale S.A.’s capital amounted to EUR 998,395,202 and was made up of 798,716,162 shares with a nominal value of EUR 1.25.
In the first half of 2013, Societe Generale S.A. carried out two capital increases, one reserved for employees as part of the free share allocation plan, amounting to EUR 1 million, and the other relating to the exercise by the shareholders of the option to pay 2012 dividends in Societe Generale shares, amounting to EUR 11 million with additional paid-in capital of EUR 215 million.
In the second half of 2013, Societe Generale S.A. carried out a capital increase reserved for employees as part of the free share allocation plan, amounting to EUR 11 million, with additional paid-in capital of EUR 174 million, and two capital increases totaling EUR 0.094 million with additional paid-in capital of EUR 2 million, resulting from the exercise of stock-options granted in 2009.
2. SHAREHOLDERS’ EQUITY ISSUED
2.1. PERPETUAL SUBORDINATED NOTESPerpetual subordinated notes (TSDI) issued by the Group and that include some discretionary features governing the payment of interest are classified as equity.
As at December 31, 2013, the amount of perpetual subordinated notes (TSDI) issued by the Group and recognised under Group shareholder’s
equity in other equity instruments totalled EUR 423 million.
This amount changed due to the partial repurchase for USD 1,285 million and the redemption at par for USD 215 million of the perpetual subordinated note amounting to USD 1,500 million issued in December 2012.
Issuance Date
Amount in local currency as
at December 31, 2012Repurchases and
redemptions in 2013
Amount in local currency as at
December 31, 2013
Amount in millions of euros at historical rate Remuneration
July 1, 1985 EUR 63 M EUR 63 M 63BAR -0.25% with BAR = Bond Average Rate for the period from June 1 to May 31 before each due date
November 24, 1986 USD 248 M USD 248 M 182
Average 6-month Euro/Dollar deposit rates communicated by reference banks +0.075%
June 30, 1994 JPY 15,000 M JPY 15,000 M 107
5�385% until December 2014 and for next due dates: the more favourable rate between the fixed rate and a variable rate + spread defined as follow: JPY 5-year Mid Swap Rate +1.25% until December 2019 and JPY 5-year Mid Swap +2% for subsequent due dates
December 30, 1996 JPY 10,000 M JPY 10,000 M 71
3.936% until September 2016 and for subsequent due dates: the more favourable rate between the fixed rate and a variable rate + spread defined as follows: JPY 5-year Mid Swap Rate +2.0%
December 11, 2012 USD 1,500 M USD 1,500 M - -
6�625% until June 2018 and for subsequent due dates: USD 5-year Mid Swap Rate +5.754%
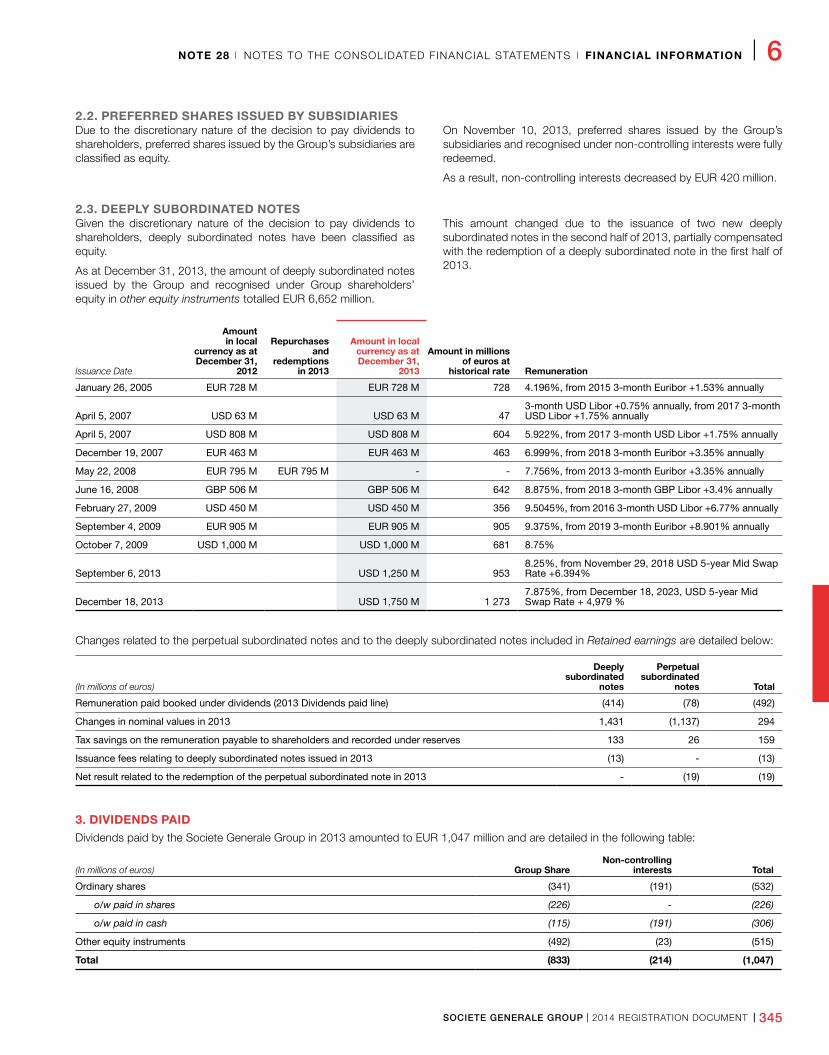
SOCIETE GENERALE GROUP I 2014 REGISTRATION DOCUMENT I 345
NOTE 28 I NOTES TO THE CONSOLIDATED FINANCIAL STATEMENTS I FINANCIAL INFORMATION I 6
2.2. PREFERRED SHARES ISSUED BY SUBSIDIARIESDue to the discretionary nature of the decision to pay dividends to shareholders, preferred shares issued by the Group’s subsidiaries are classified as equity.
On November 10, 2013, preferred shares issued by the Group’s subsidiaries and recognised under non-controlling interests were fully redeemed.
As a result, non-controlling interests decreased by EUR 420 million.
2.3. DEEPLY SUBORDINATED NOTESGiven the discretionary nature of the decision to pay dividends to shareholders, deeply subordinated notes have been classified as equity.
As at December 31, 2013, the amount of deeply subordinated notes issued by the Group and recognised under Group shareholders’ equity in other equity instruments totalled EUR 6,652 million.
This amount changed due to the issuance of two new deeply subordinated notes in the second half of 2013, partially compensated with the redemption of a deeply subordinated note in the first half of 2013.
Issuance Date
Amount in local
currency as at December 31,
2012
Repurchases and
redemptions in 2013
Amount in local currency as at December 31,
2013
Amount in millions of euros at
historical rate Remuneration
January 26, 2005 EUR 728 M EUR 728 M 728 4.196%, from 2015 3-month Euribor +1.53% annually
April 5, 2007 USD 63 M USD 63 M 473-month USD Libor +0.75% annually, from 2017 3-month USD Libor +1.75% annually
April 5, 2007 USD 808 M USD 808 M 604 5.922%, from 2017 3-month USD Libor +1.75% annually
December 19, 2007 EUR 463 M EUR 463 M 463 6.999%, from 2018 3-month Euribor +3.35% annually
May 22, 2008 EUR 795 M EUR 795 M - - 7.756%, from 2013 3-month Euribor +3.35% annually
June 16, 2008 GBP 506 M GBP 506 M 642 8.875%, from 2018 3-month GBP Libor +3.4% annually
February 27, 2009 USD 450 M USD 450 M 356 9.5045%, from 2016 3-month USD Libor +6.77% annually
September 4, 2009 EUR 905 M EUR 905 M 905 9.375%, from 2019 3-month Euribor +8.901% annually
October 7, 2009 USD 1,000 M USD 1,000 M 681 8�75%
September 6, 2013 USD 1,250 M 9538.25%, from November 29, 2018 USD 5-year Mid Swap Rate +6.394%
December 18, 2013 USD 1,750 M 1 2737.875%, from December 18, 2023, USD 5-year Mid Swap Rate + 4,979 %
Changes related to the perpetual subordinated notes and to the deeply subordinated notes included in Retained earnings are detailed below:
(In millions of euros)
Deeply subordinated
notes
Perpetual subordinated
notes Total
Remuneration paid booked under dividends (2013 Dividends paid line) (414) (78) (492)
Changes in nominal values in 2013 1,431 (1,137) 294
Tax savings on the remuneration payable to shareholders and recorded under reserves 133 26 159
Issuance fees relating to deeply subordinated notes issued in 2013 (13) - (13)
Net result related to the redemption of the perpetual subordinated note in 2013 - (19) (19)
3. DIVIDENDS PAIDDividends paid by the Societe Generale Group in 2013 amounted to EUR 1,047 million and are detailed in the following table:
(In millions of euros) Group ShareNon-controlling
interests Total
Ordinary shares (341) (191) (532)
o/w paid in shares (226) - (226)
o/w paid in cash (115) (191) (306)
Other equity instruments (492) (23) (515)
Total (833) (214) (1,047)
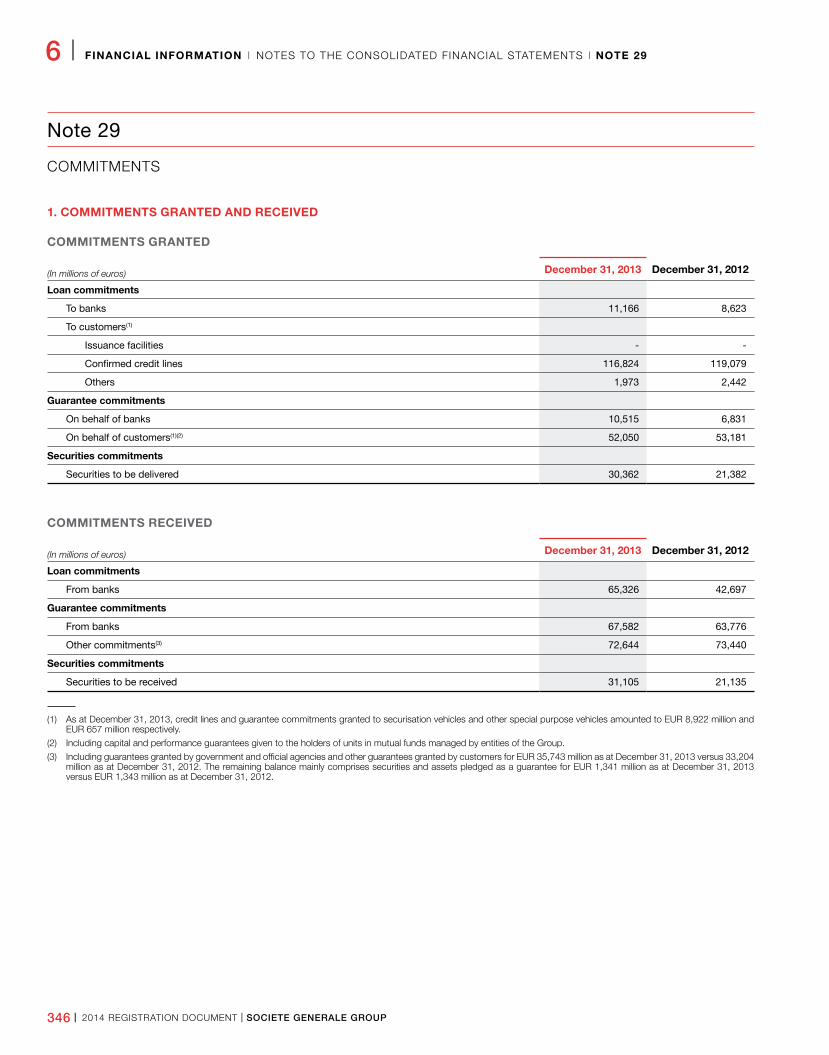
346 I 2014 REGISTRATION DOCUMENT I SOCIETE GENERALE GROUP
6 I FINANCIAL INFORMATION I NOTES TO THE CONSOLIDATED FINANCIAL STATEMENTS I NOTE 29
Note 29
COMMITMENTS
1. COMMITMENTS GRANTED AND RECEIVED
COMMITMENTS GRANTED
(In millions of euros) December 31, 2013 December 31, 2012
Loan commitments
To banks 11,166 8,623
To customers(1)
Issuance facilities - -
Confirmed credit lines 116,824 119,079
Others 1,973 2,442
Guarantee commitments
On behalf of banks 10,515 6,831
On behalf of customers(1)(2) 52,050 53,181
Securities commitments
Securities to be delivered 30,362 21,382
COMMITMENTS RECEIVED
(In millions of euros) December 31, 2013 December 31, 2012
Loan commitments
From banks 65,326 42,697
Guarantee commitments
From banks 67,582 63,776
Other commitments(3) 72,644 73,440
Securities commitments
Securities to be received 31,105 21,135
(1) As at December 31, 2013, credit lines and guarantee commitments granted to securisation vehicles and other special purpose vehicles amounted to EUR 8,922 million and EUR 657 million respectively.
(2) Including capital and performance guarantees given to the holders of units in mutual funds managed by entities of the Group.
(3) Including guarantees granted by government and official agencies and other guarantees granted by customers for EUR 35,743 million as at December 31, 2013 versus 33,204 million as at December 31, 2012. The remaining balance mainly comprises securities and assets pledged as a guarantee for EUR 1,341 million as at December 31, 2013 versus EUR 1,343 million as at December 31, 2012.
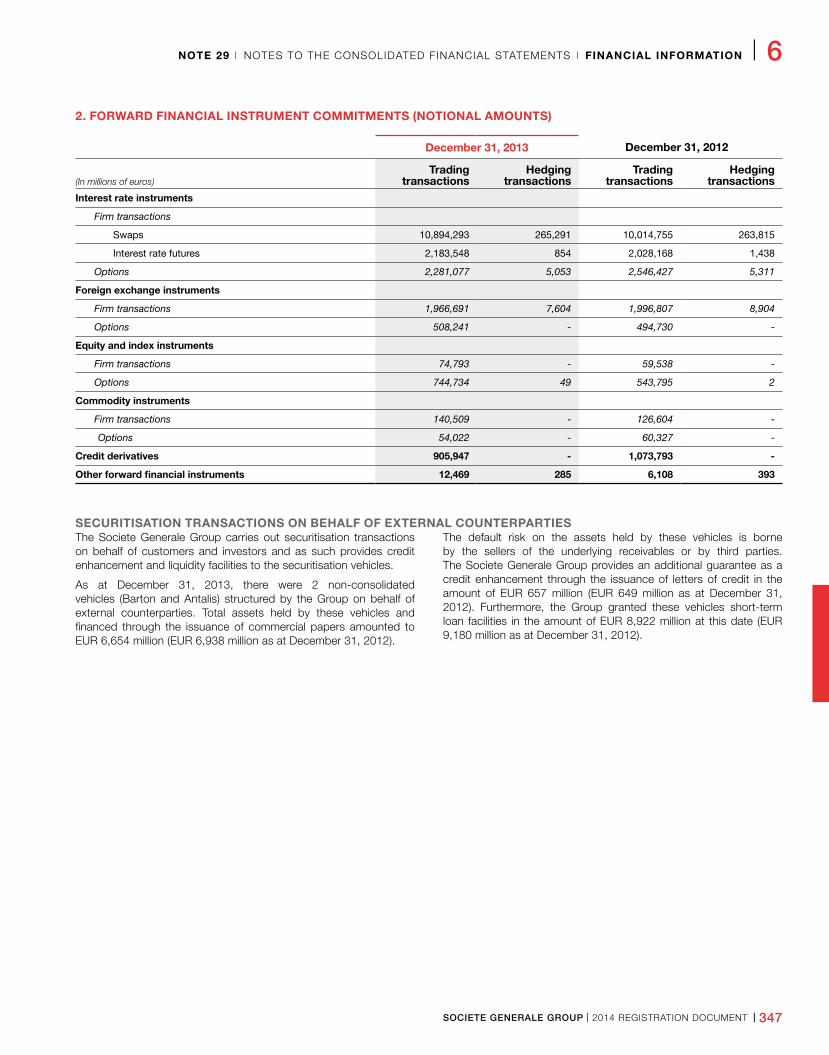
SOCIETE GENERALE GROUP I 2014 REGISTRATION DOCUMENT I 347
NOTE 29 I NOTES TO THE CONSOLIDATED FINANCIAL STATEMENTS I FINANCIAL INFORMATION I 6
2. FORWARD FINANCIAL INSTRUMENT COMMITMENTS (NOTIONAL AMOUNTS)
December 31, 2013 December 31, 2012
(In millions of euros)Trading
transactionsHedging
transactionsTrading
transactionsHedging
transactionsInterest rate instruments
Firm transactions
Swaps 10,894,293 265,291 10,014,755 263,815
Interest rate futures 2,183,548 854 2,028,168 1,438
Options 2,281,077 5,053 2,546,427 5,311
Foreign exchange instruments
Firm transactions 1,966,691 7,604 1,996,807 8,904
Options 508,241 - 494,730 -
Equity and index instruments
Firm transactions 74,793 - 59,538 -
Options 744,734 49 543,795 2
Commodity instruments
Firm transactions 140,509 - 126,604 -
Options 54,022 - 60,327 -
Credit derivatives 905,947 - 1,073,793 -
Other forward financial instruments 12,469 285 6,108 393
SECURITISATION TRANSACTIONS ON BEHALF OF EXTERNAL COUNTERPARTIESThe Societe Generale Group carries out securitisation transactions on behalf of customers and investors and as such provides credit enhancement and liquidity facilities to the securitisation vehicles.
As at December 31, 2013, there were 2 non-consolidated vehicles (Barton and Antalis) structured by the Group on behalf of external counterparties. Total assets held by these vehicles and financed through the issuance of commercial papers amounted to EUR 6,654 million (EUR 6,938 million as at December 31, 2012).
The default risk on the assets held by these vehicles is borne by the sellers of the underlying receivables or by third parties. The Societe Generale Group provides an additional guarantee as a credit enhancement through the issuance of letters of credit in the amount of EUR 657 million (EUR 649 million as at December 31, 2012). Furthermore, the Group granted these vehicles short-term loan facilities in the amount of EUR 8,922 million at this date (EUR 9,180 million as at December 31, 2012).
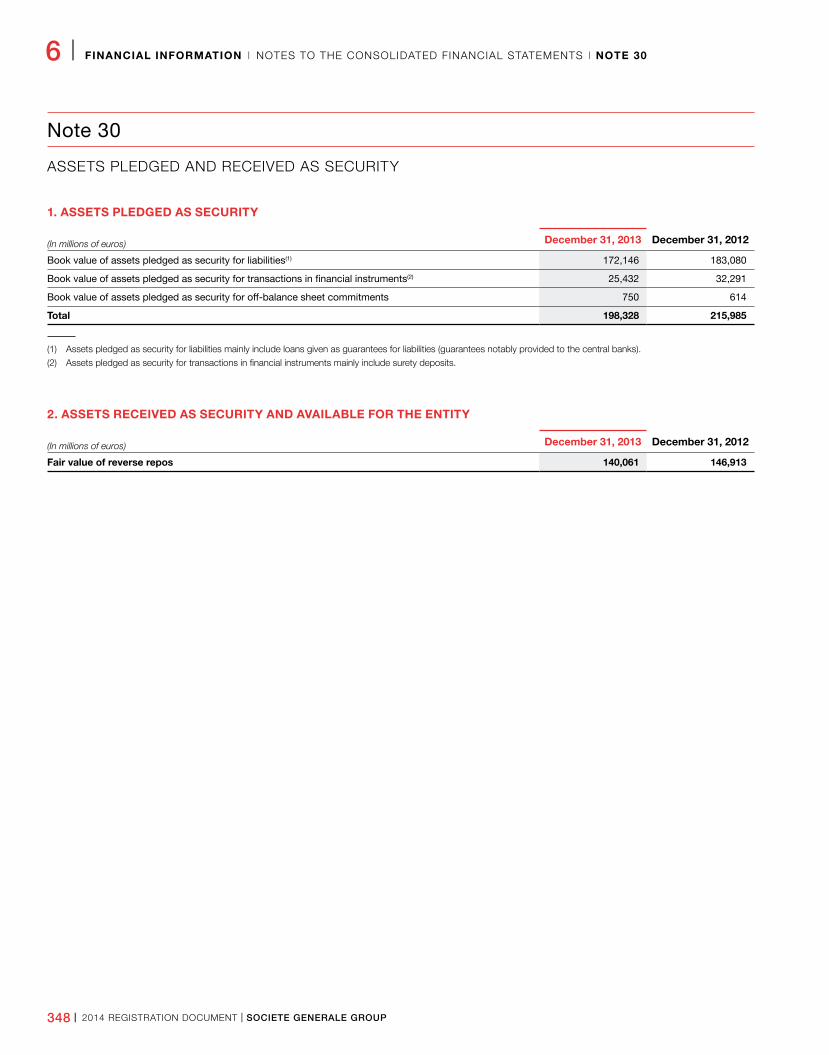
348 I 2014 REGISTRATION DOCUMENT I SOCIETE GENERALE GROUP
6 I FINANCIAL INFORMATION I NOTES TO THE CONSOLIDATED FINANCIAL STATEMENTS I NOTE 30
Note 30
ASSETS PLEDGED AND RECEIVED AS SECURITY
1. ASSETS PLEDGED AS SECURITY
(In millions of euros) December 31, 2013 December 31, 2012
Book value of assets pledged as security for liabilities(1) 172,146 183,080
Book value of assets pledged as security for transactions in financial instruments(2) 25,432 32,291
Book value of assets pledged as security for off-balance sheet commitments 750 614
Total 198,328 215,985
(1) Assets pledged as security for liabilities mainly include loans given as guarantees for liabilities (guarantees notably provided to the central banks).
(2) Assets pledged as security for transactions in financial instruments mainly include surety deposits.
2. ASSETS RECEIVED AS SECURITY AND AVAILABLE FOR THE ENTITY
(In millions of euros) December 31, 2013 December 31, 2012
Fair value of reverse repos 140,061 146,913
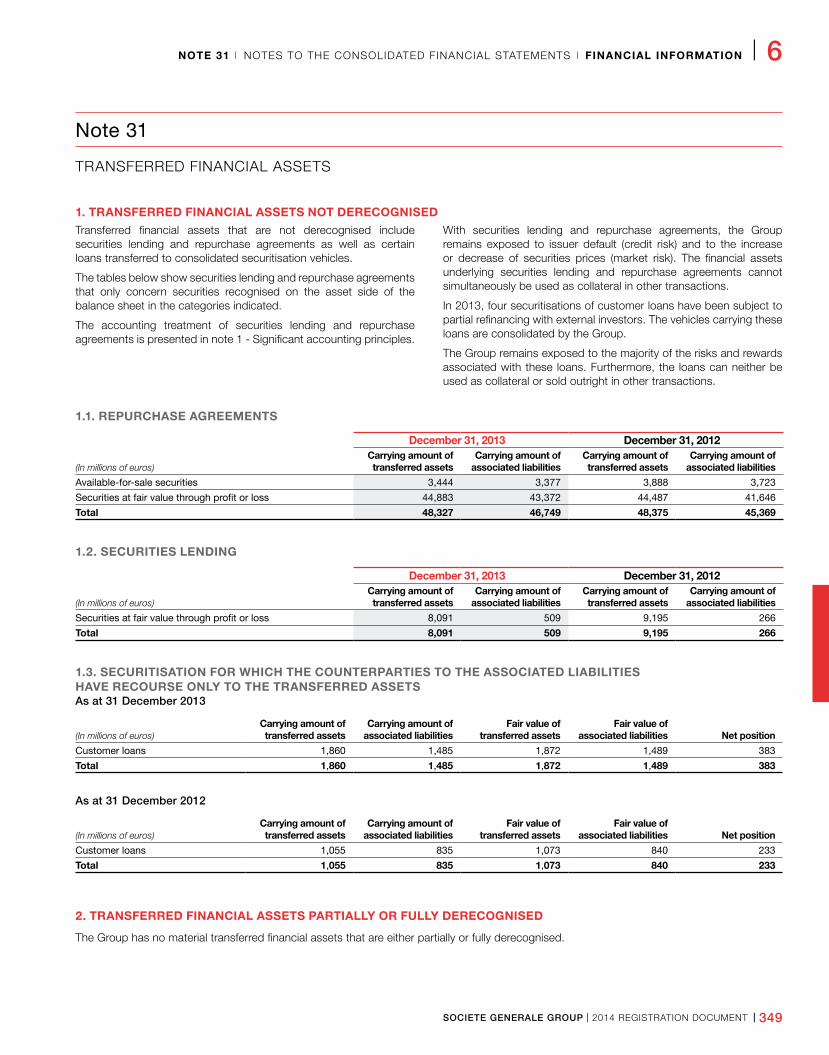
SOCIETE GENERALE GROUP I 2014 REGISTRATION DOCUMENT I 349
NOTE 31 I NOTES TO THE CONSOLIDATED FINANCIAL STATEMENTS I FINANCIAL INFORMATION I 6
Note 31
TRANSFERRED FINANCIAL ASSETS
1. TRANSFERRED FINANCIAL ASSETS NOT DERECOGNISEDTransferred financial assets that are not derecognised include securities lending and repurchase agreements as well as certain loans transferred to consolidated securitisation vehicles.
The tables below show securities lending and repurchase agreements that only concern securities recognised on the asset side of the balance sheet in the categories indicated.
The accounting treatment of securities lending and repurchase agreements is presented in note 1 - Significant accounting principles.
With securities lending and repurchase agreements, the Group remains exposed to issuer default (credit risk) and to the increase or decrease of securities prices (market risk). The financial assets underlying securities lending and repurchase agreements cannot simultaneously be used as collateral in other transactions.
In 2013, four securitisations of customer loans have been subject to partial refinancing with external investors. The vehicles carrying these loans are consolidated by the Group.
The Group remains exposed to the majority of the risks and rewards associated with these loans. Furthermore, the loans can neither be used as collateral or sold outright in other transactions.
1.1. REPURCHASE AGREEMENTS
(In millions of euros)
December 31, 2013 December 31, 2012Carrying amount of transferred assets
Carrying amount of associated liabilities
Carrying amount of transferred assets
Carrying amount of associated liabilities
Available-for-sale securities 3,444 3,377 3,888 3,723
Securities at fair value through profit or loss 44,883 43,372 44,487 41,646
Total 48,327 46,749 48,375 45,369
1.2. SECURITIES LENDING
(In millions of euros)
December 31, 2013 December 31, 2012Carrying amount of transferred assets
Carrying amount of associated liabilities
Carrying amount of transferred assets
Carrying amount of associated liabilities
Securities at fair value through profit or loss 8,091 509 9,195 266
Total 8,091 509 9,195 266
1.3. SECURITISATION FOR WHICH THE COUNTERPARTIES TO THE ASSOCIATED LIABILITIES HAVE RECOURSE ONLY TO THE TRANSFERRED ASSETSAs at 31 December 2013
(In millions of euros)Carrying amount of transferred assets
Carrying amount of associated liabilities
Fair value of transferred assets
Fair value of associated liabilities Net position
Customer loans 1,860 1,485 1,872 1,489 383
Total 1,860 1,485 1,872 1,489 383
As at 31 December 2012
(In millions of euros)Carrying amount of transferred assets
Carrying amount of associated liabilities
Fair value of transferred assets
Fair value of associated liabilities Net position
Customer loans 1,055 835 1,073 840 233
Total 1,055 835 1,073 840 233
2. TRANSFERRED FINANCIAL ASSETS PARTIALLY OR FULLY DERECOGNISED
The Group has no material transferred financial assets that are either partially or fully derecognised.
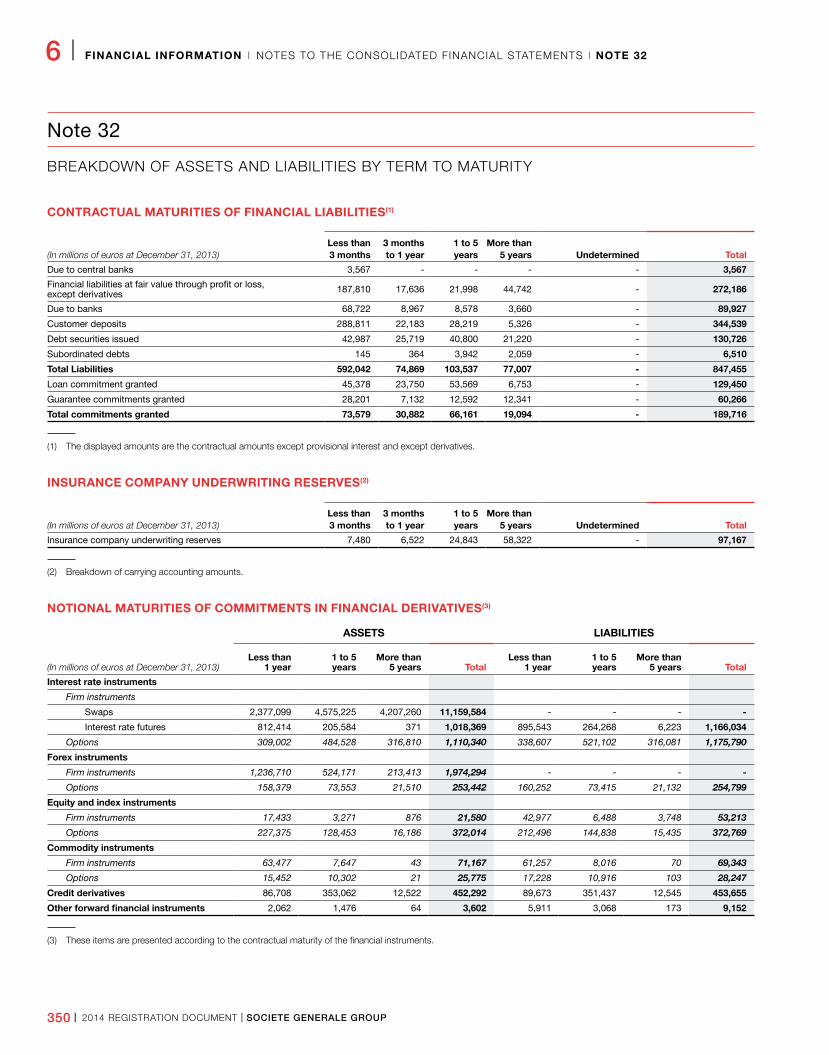
350 I 2014 REGISTRATION DOCUMENT I SOCIETE GENERALE GROUP
6 I FINANCIAL INFORMATION I NOTES TO THE CONSOLIDATED FINANCIAL STATEMENTS I NOTE 32
Note 32
BREAKDOWN OF ASSETS AND LIABILITIES BY TERM TO MATURITY
CONTRACTUAL MATURITIES OF FINANCIAL LIABILITIES(1)
(In millions of euros at December 31, 2013)Less than 3 months
3 months to 1 year
1 to 5 years
More than 5 years Undetermined Total
Due to central banks 3,567 - - - - 3,567
Financial liabilities at fair value through profit or loss, except derivatives 187,810 17,636 21,998 44,742 - 272,186
Due to banks 68,722 8,967 8,578 3,660 - 89,927
Customer deposits 288,811 22,183 28,219 5,326 - 344,539
Debt securities issued 42,987 25,719 40,800 21,220 - 130,726
Subordinated debts 145 364 3,942 2,059 - 6,510
Total Liabilities 592,042 74,869 103,537 77,007 - 847,455
Loan commitment granted 45,378 23,750 53,569 6,753 - 129,450
Guarantee commitments granted 28,201 7,132 12,592 12,341 - 60,266
Total commitments granted 73,579 30,882 66,161 19,094 - 189,716
(1) The displayed amounts are the contractual amounts except provisional interest and except derivatives.
INSURANCE COMPANY UNDERWRITING RESERVES(2)
(In millions of euros at December 31, 2013)Less than 3 months
3 months to 1 year
1 to 5 years
More than 5 years Undetermined Total
Insurance company underwriting reserves 7,480 6,522 24,843 58,322 - 97,167
(2) Breakdown of carrying accounting amounts.
NOTIONAL MATURITIES OF COMMITMENTS IN FINANCIAL DERIVATIVES(3)
ASSETS LIABILITIES
(In millions of euros at December 31, 2013)Less than
1 year1 to 5 years
More than 5 years Total
Less than 1 year
1 to 5 years
More than 5 years Total
Interest rate instruments
Firm instruments
Swaps 2,377,099 4,575,225 4,207,260 11,159,584 - - - -
Interest rate futures 812,414 205,584 371 1,018,369 895,543 264,268 6,223 1,166,034
Options 309,002 484,528 316,810 1,110,340 338,607 521,102 316,081 1,175,790
Forex instruments
Firm instruments 1,236,710 524,171 213,413 1,974,294 - - - -
Options 158,379 73,553 21,510 253,442 160,252 73,415 21,132 254,799
Equity and index instruments
Firm instruments 17,433 3,271 876 21,580 42,977 6,488 3,748 53,213
Options 227,375 128,453 16,186 372,014 212,496 144,838 15,435 372,769
Commodity instruments
Firm instruments 63,477 7,647 43 71,167 61,257 8,016 70 69,343
Options 15,452 10,302 21 25,775 17,228 10,916 103 28,247
Credit derivatives 86,708 353,062 12,522 452,292 89,673 351,437 12,545 453,655
Other forward financial instruments 2,062 1,476 64 3,602 5,911 3,068 173 9,152
(3) These items are presented according to the contractual maturity of the financial instruments.
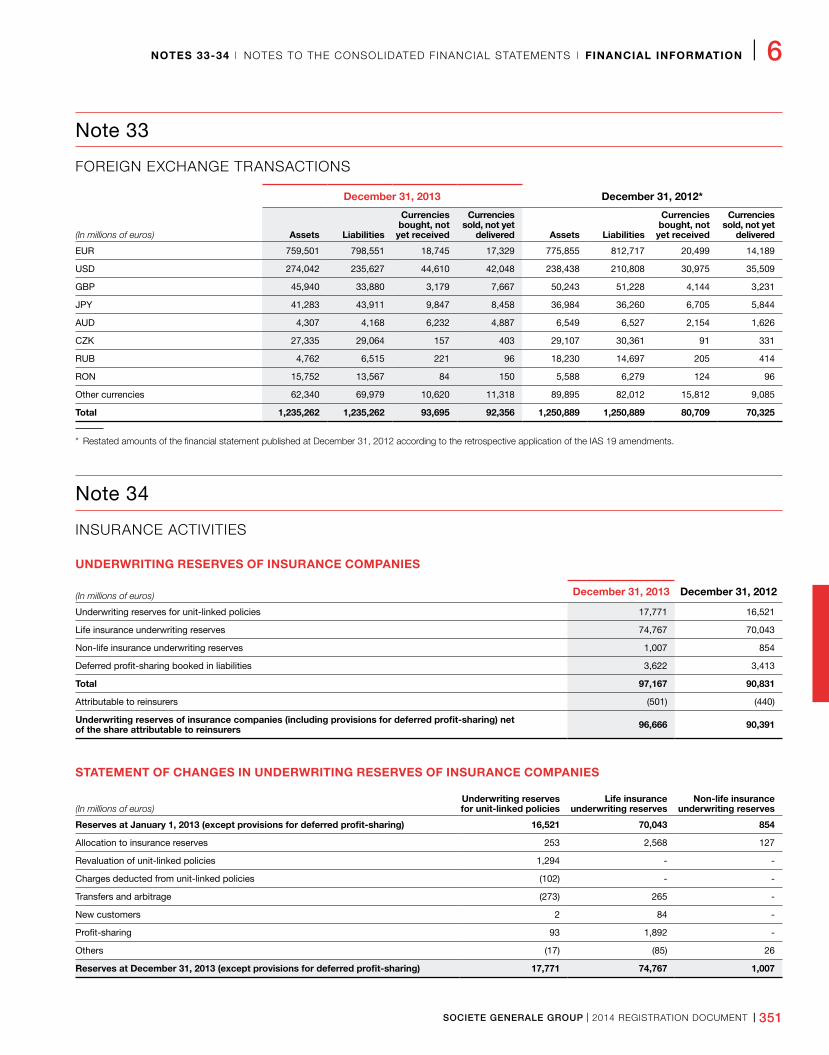
SOCIETE GENERALE GROUP I 2014 REGISTRATION DOCUMENT I 351
NOTES 33-34 I NOTES TO THE CONSOLIDATED FINANCIAL STATEMENTS I FINANCIAL INFORMATION I 6
Note 33
FOREIGN EXCHANGE TRANSACTIONS
December 31, 2013 December 31, 2012*
(In millions of euros) Assets Liabilities
Currencies bought, not
yet received
Currencies sold, not yet
delivered Assets Liabilities
Currencies bought, not
yet received
Currencies sold, not yet
delivered
EUR 759,501 798,551 18,745 17,329 775,855 812,717 20,499 14,189
USD 274,042 235,627 44,610 42,048 238,438 210,808 30,975 35,509
GBP 45,940 33,880 3,179 7,667 50,243 51,228 4,144 3,231
JPY 41,283 43,911 9,847 8,458 36,984 36,260 6,705 5,844
AUD 4,307 4,168 6,232 4,887 6,549 6,527 2,154 1,626
CZK 27,335 29,064 157 403 29,107 30,361 91 331
RUB 4,762 6,515 221 96 18,230 14,697 205 414
RON 15,752 13,567 84 150 5,588 6,279 124 96
Other currencies 62,340 69,979 10,620 11,318 89,895 82,012 15,812 9,085
Total 1,235,262 1,235,262 93,695 92,356 1,250,889 1,250,889 80,709 70,325
* Restated amounts of the financial statement published at December 31, 2012 according to the retrospective application of the IAS 19 amendments.
Note 34
INSURANCE ACTIVITIES
UNDERWRITING RESERVES OF INSURANCE COMPANIES
(In millions of euros) December 31, 2013 December 31, 2012
Underwriting reserves for unit-linked policies 17,771 16,521
Life insurance underwriting reserves 74,767 70,043
Non-life insurance underwriting reserves 1,007 854
Deferred profit-sharing booked in liabilities 3,622 3,413
Total 97,167 90,831
Attributable to reinsurers (501) (440)
Underwriting reserves of insurance companies (including provisions for deferred profit-sharing) net of the share attributable to reinsurers 96,666 90,391
STATEMENT OF CHANGES IN UNDERWRITING RESERVES OF INSURANCE COMPANIES
(In millions of euros)Underwriting reserves for unit-linked policies
Life insurance underwriting reserves
Non-life insurance underwriting reserves
Reserves at January 1, 2013 (except provisions for deferred profit-sharing) 16,521 70,043 854
Allocation to insurance reserves 253 2,568 127
Revaluation of unit-linked policies 1,294 - -
Charges deducted from unit-linked policies (102) - -
Transfers and arbitrage (273) 265 -
New customers 2 84 -
Profit-sharing 93 1,892 -
Others (17) (85) 26
Reserves at December 31, 2013 (except provisions for deferred profit-sharing) 17,771 74,767 1,007
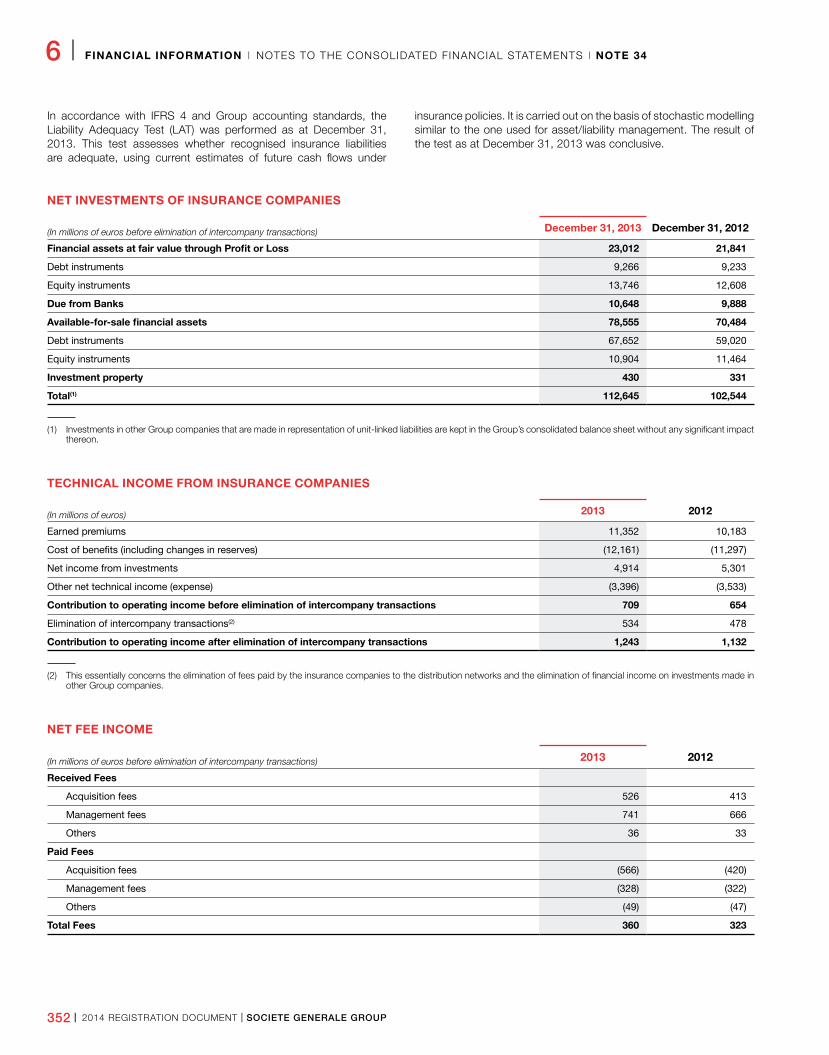
352 I 2014 REGISTRATION DOCUMENT I SOCIETE GENERALE GROUP
6 I FINANCIAL INFORMATION I NOTES TO THE CONSOLIDATED FINANCIAL STATEMENTS I NOTE 34
In accordance with IFRS 4 and Group accounting standards, the Liability Adequacy Test (LAT) was performed as at December 31, 2013. This test assesses whether recognised insurance liabilities are adequate, using current estimates of future cash flows under
insurance policies. It is carried out on the basis of stochastic modelling similar to the one used for asset/liability management. The result of the test as at December 31, 2013 was conclusive.
NET INVESTMENTS OF INSURANCE COMPANIES
(In millions of euros before elimination of intercompany transactions) December 31, 2013 December 31, 2012
Financial assets at fair value through Profit or Loss 23,012 21,841
Debt instruments 9,266 9,233
Equity instruments 13,746 12,608
Due from Banks 10,648 9,888
Available-for-sale financial assets 78,555 70,484
Debt instruments 67,652 59,020
Equity instruments 10,904 11,464
Investment property 430 331
Total(1) 112,645 102,544
(1) Investments in other Group companies that are made in representation of unit-linked liabilities are kept in the Group’s consolidated balance sheet without any significant impact thereon.
TECHNICAL INCOME FROM INSURANCE COMPANIES
(In millions of euros) 2013 2012
Earned premiums 11,352 10,183
Cost of benefits (including changes in reserves) (12,161) (11,297)
Net income from investments 4,914 5,301
Other net technical income (expense) (3,396) (3,533)
Contribution to operating income before elimination of intercompany transactions 709 654
Elimination of intercompany transactions(2) 534 478
Contribution to operating income after elimination of intercompany transactions 1,243 1,132
(2) This essentially concerns the elimination of fees paid by the insurance companies to the distribution networks and the elimination of financial income on investments made in other Group companies.
NET FEE INCOME
(In millions of euros before elimination of intercompany transactions) 2013 2012
Received Fees
Acquisition fees 526 413
Management fees 741 666
Others 36 33
Paid Fees
Acquisition fees (566) (420)
Management fees (328) (322)
Others (49) (47)
Total Fees 360 323
SOCIETE GENERALE GROUP I 2014 REGISTRATION DOCUMENT I 353
NOTE 34 I NOTES TO THE CONSOLIDATED FINANCIAL STATEMENTS I FINANCIAL INFORMATION I 6
MANAGEMENT OF INSURANCE RISKSThere are two main types of insurance risks:
n technical risks, mainly pricing risks and risks of discrepancies in total fluctuations in claim experience: in non-life insurance and individual personal protection alike, profits are exposed to risks of deterioration in claim rate observed compared to claim rate anticipated at the time the price schedule is established. Discrepancies can be linked to multiple complex factors such as changes in the behaviour of the policyholders (lapses), changes in the macroeconomic environment, pandemics, natural disasters, mortality, morbidity, longevity, etc,
n risks linked to the financial markets and ALM: in life insurance, insurers are exposed to the instabilities of the financial markets (changes in interest rates and stock market fluctuations) which can be made worse by the behaviour of policyholders.
Managing these risks is key to the insurance business line’s activity. It is carried out by qualified and experienced teams, with major bespoke IT resources. Risks undergo regular monitoring and are reported to the General Management of both the entities concerned and the business lines.
In the area of pricing risks and risks of discrepancies in total loss experience, a number of guidelines are applied:
n heightened security for the risk acceptance process, with the aim of guaranteeing that the price schedule matches the policyholder’s risk profile from the very beginning. Proper application of these procedures is verified via Quality Audits and multi-annual Internal Audits. These processes have been ISO-certified;
n monitoring of claim/premium ratios on a regular basis, based on statistics developed per year of occurrence. This analysis (expansion of the portfolio, level of provisions for reported claims and for incurred but not reported claims) allows pricing adjustments to be made, where applicable, for the subsequent financial years;
n implementation of a reinsurance plan to protect the Group from major/serial claims.
Management of risks linked to the financial markets is just as much an integral part of the investment strategy as the aim of long-term performance. The optimisation of these two factors is highly influenced by the asset/liability balance. Liability commitments (guarantees offered to customers, maturity of policies), as well as the amounts booked under the major items on the balance sheet (shareholders’ equity, income, provisions, reserves, etc.) are analysed by the Finance and Risk Department of the insurance business line. Societe Generale’s overall asset and liability management policy is validated by the Group’s General Management at the ALM Committee meetings held every six months.
Risk management and analysis are based on the following key principles:
n asset/liability risk management:
– monitoring of long-term cash flows: the term of a liability is matched against the term of an asset, and cash flow peaks are strictly controlled in order to minimise liquidity risks,
– close monitoring of the redemption flows and stress scenarios simulations,
– close monitoring of the equity markets and stress scenarios simulations,
– hedging of exchange rate risks (in the event of rise or drop in the markets) using financial instruments.
n financial risk management via the establishment of limits:
– counterparty limits (e.g. limits according to the issuer’s country of domiciliation, distinction between sovereign issuers and private issuers),
– rating limits by issuer,
– limits per type of asset (e.g. equities, private equity).
All of these strategies are assessed by simulating various scenarios of financial market behaviour and insured party behaviour using stress tests and stochastic modelling.
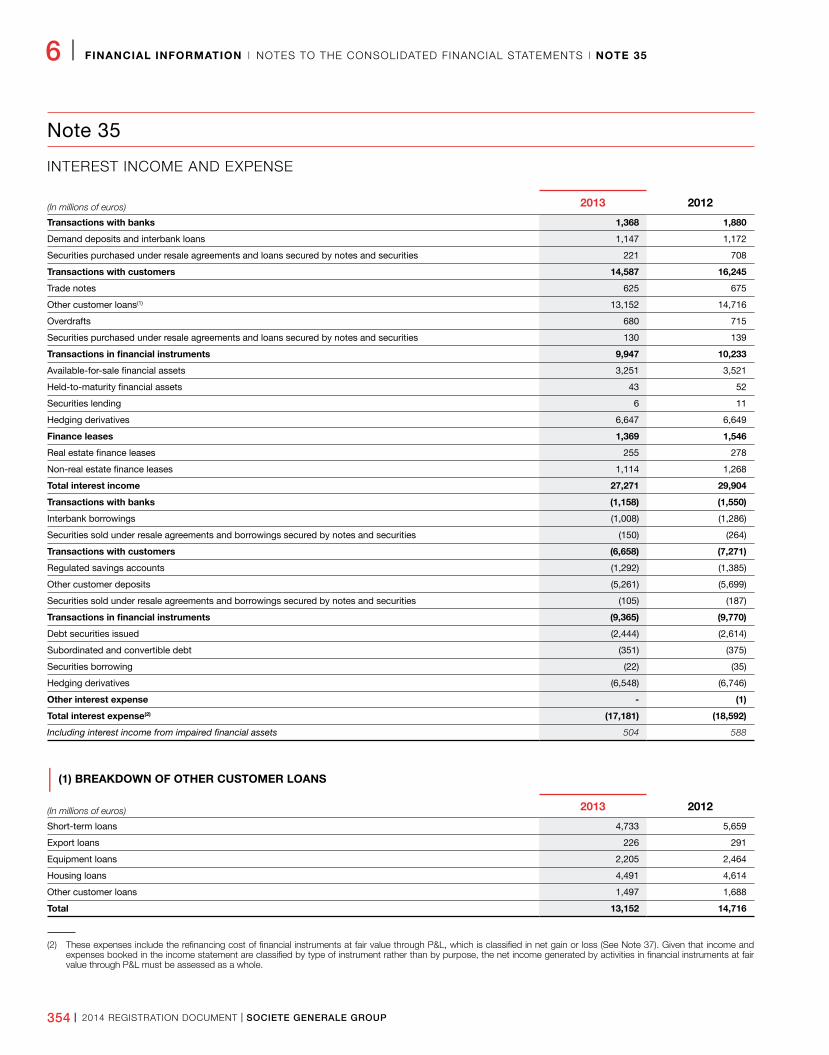
354 I 2014 REGISTRATION DOCUMENT I SOCIETE GENERALE GROUP
6 I FINANCIAL INFORMATION I NOTES TO THE CONSOLIDATED FINANCIAL STATEMENTS I NOTE 35
Note 35
INTEREST INCOME AND EXPENSE
(In millions of euros) 2013 2012
Transactions with banks 1,368 1,880
Demand deposits and interbank loans 1,147 1,172
Securities purchased under resale agreements and loans secured by notes and securities 221 708
Transactions with customers 14,587 16,245
Trade notes 625 675
Other customer loans(1) 13,152 14,716
Overdrafts 680 715
Securities purchased under resale agreements and loans secured by notes and securities 130 139
Transactions in financial instruments 9,947 10,233
Available-for-sale financial assets 3,251 3,521
Held-to-maturity financial assets 43 52
Securities lending 6 11
Hedging derivatives 6,647 6,649
Finance leases 1,369 1,546
Real estate finance leases 255 278
Non-real estate finance leases 1,114 1,268
Total interest income 27,271 29,904
Transactions with banks (1,158) (1,550)
Interbank borrowings (1,008) (1,286)
Securities sold under resale agreements and borrowings secured by notes and securities (150) (264)
Transactions with customers (6,658) (7,271)
Regulated savings accounts (1,292) (1,385)
Other customer deposits (5,261) (5,699)
Securities sold under resale agreements and borrowings secured by notes and securities (105) (187)
Transactions in financial instruments (9,365) (9,770)
Debt securities issued (2,444) (2,614)
Subordinated and convertible debt (351) (375)
Securities borrowing (22) (35)
Hedging derivatives (6,548) (6,746)
Other interest expense - (1)
Total interest expense(2) (17,181) (18,592)
Including interest income from impaired financial assets 504 588
| (1) BREAKDOWN OF OTHER CUSTOMER LOANS
(In millions of euros) 2013 2012
Short-term loans 4,733 5,659
Export loans 226 291
Equipment loans 2,205 2,464
Housing loans 4,491 4,614
Other customer loans 1,497 1,688
Total 13,152 14,716
(2) These expenses include the refinancing cost of financial instruments at fair value through P&L, which is classified in net gain or loss (See Note 37). Given that income and expenses booked in the income statement are classified by type of instrument rather than by purpose, the net income generated by activities in financial instruments at fair value through P&L must be assessed as a whole.
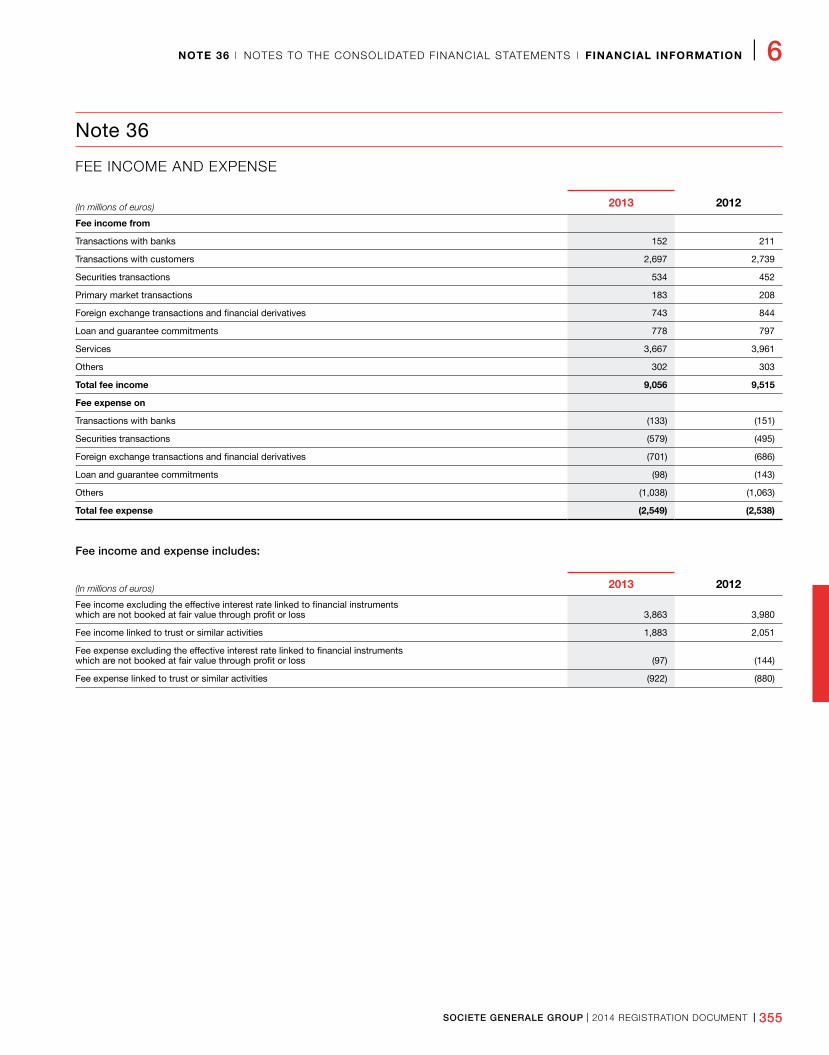
SOCIETE GENERALE GROUP I 2014 REGISTRATION DOCUMENT I 355
NOTE 36 I NOTES TO THE CONSOLIDATED FINANCIAL STATEMENTS I FINANCIAL INFORMATION I 6
Note 36
FEE INCOME AND EXPENSE
(In millions of euros) 2013 2012
Fee income from
Transactions with banks 152 211
Transactions with customers 2,697 2,739
Securities transactions 534 452
Primary market transactions 183 208
Foreign exchange transactions and financial derivatives 743 844
Loan and guarantee commitments 778 797
Services 3,667 3,961
Others 302 303
Total fee income 9,056 9,515
Fee expense on
Transactions with banks (133) (151)
Securities transactions (579) (495)
Foreign exchange transactions and financial derivatives (701) (686)
Loan and guarantee commitments (98) (143)
Others (1,038) (1,063)
Total fee expense (2,549) (2,538)
Fee income and expense includes:
(In millions of euros) 2013 2012
Fee income excluding the effective interest rate linked to financial instruments which are not booked at fair value through profit or loss 3,863 3,980
Fee income linked to trust or similar activities 1,883 2,051
Fee expense excluding the effective interest rate linked to financial instruments which are not booked at fair value through profit or loss (97) (144)
Fee expense linked to trust or similar activities (922) (880)
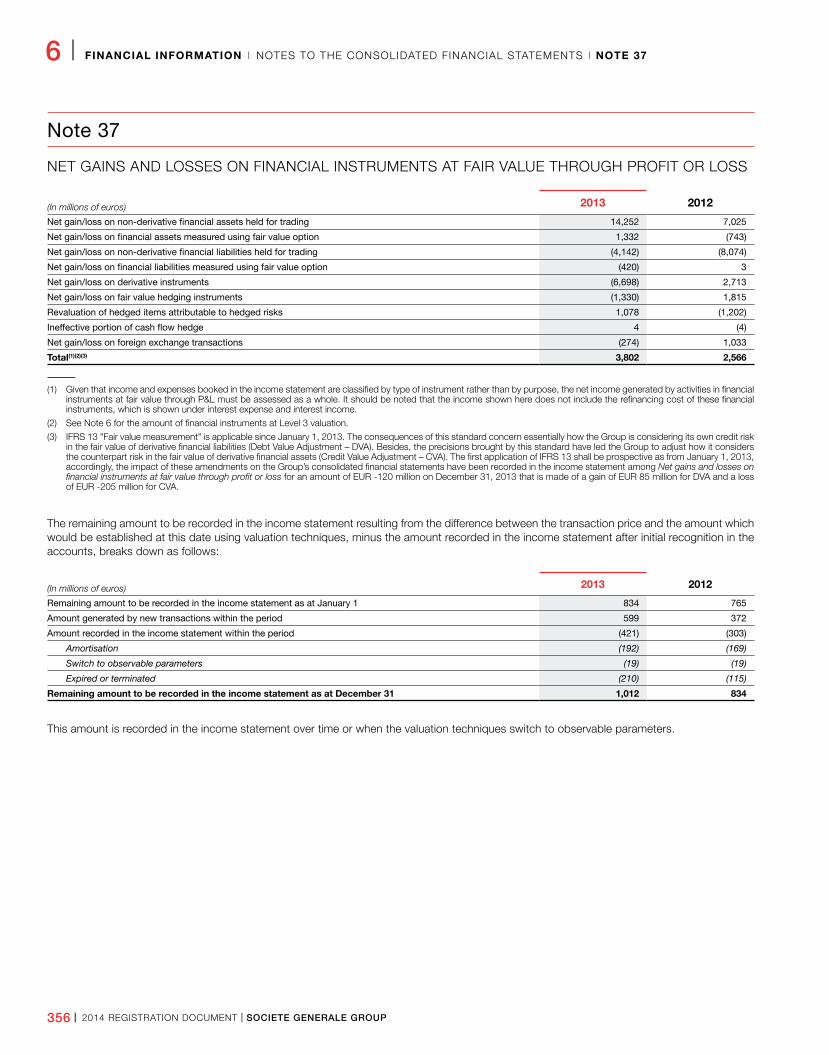
356 I 2014 REGISTRATION DOCUMENT I SOCIETE GENERALE GROUP
6 I FINANCIAL INFORMATION I NOTES TO THE CONSOLIDATED FINANCIAL STATEMENTS I NOTE 37
Note 37
NET GAINS AND LOSSES ON FINANCIAL INSTRUMENTS AT FAIR VALUE THROUGH PROFIT OR LOSS
(In millions of euros) 2013 2012
Net gain/loss on non-derivative financial assets held for trading 14,252 7,025
Net gain/loss on financial assets measured using fair value option 1,332 (743)
Net gain/loss on non-derivative financial liabilities held for trading (4,142) (8,074)
Net gain/loss on financial liabilities measured using fair value option (420) 3
Net gain/loss on derivative instruments (6,698) 2,713
Net gain/loss on fair value hedging instruments (1,330) 1,815
Revaluation of hedged items attributable to hedged risks 1,078 (1,202)
Ineffective portion of cash flow hedge 4 (4)
Net gain/loss on foreign exchange transactions (274) 1,033
Total(1)(2)(3) 3,802 2,566
(1) Given that income and expenses booked in the income statement are classified by type of instrument rather than by purpose, the net income generated by activities in financial instruments at fair value through P&L must be assessed as a whole. It should be noted that the income shown here does not include the refinancing cost of these financial instruments, which is shown under interest expense and interest income.
(2) See Note 6 for the amount of financial instruments at Level 3 valuation.
(3) IFRS 13 "Fair value measurement" is applicable since January 1, 2013. The consequences of this standard concern essentially how the Group is considering its own credit risk in the fair value of derivative financial liabilities (Debt Value Adjustment – DVA). Besides, the precisions brought by this standard have led the Group to adjust how it considers the counterpart risk in the fair value of derivative financial assets (Credit Value Adjustment – CVA). The first application of IFRS 13 shall be prospective as from January 1, 2013, accordingly, the impact of these amendments on the Group’s consolidated financial statements have been recorded in the income statement among Net gains and losses on financial instruments at fair value through profit or loss for an amount of EUR -120 million on December 31, 2013 that is made of a gain of EUR 85 million for DVA and a loss of EUR -205 million for CVA.
The remaining amount to be recorded in the income statement resulting from the difference between the transaction price and the amount which would be established at this date using valuation techniques, minus the amount recorded in the income statement after initial recognition in the accounts, breaks down as follows:
(In millions of euros) 2013 2012
Remaining amount to be recorded in the income statement as at January 1 834 765
Amount generated by new transactions within the period 599 372
Amount recorded in the income statement within the period (421) (303)
Amortisation (192) (169)
Switch to observable parameters (19) (19)
Expired or terminated (210) (115)
Remaining amount to be recorded in the income statement as at December 31 1,012 834
This amount is recorded in the income statement over time or when the valuation techniques switch to observable parameters.
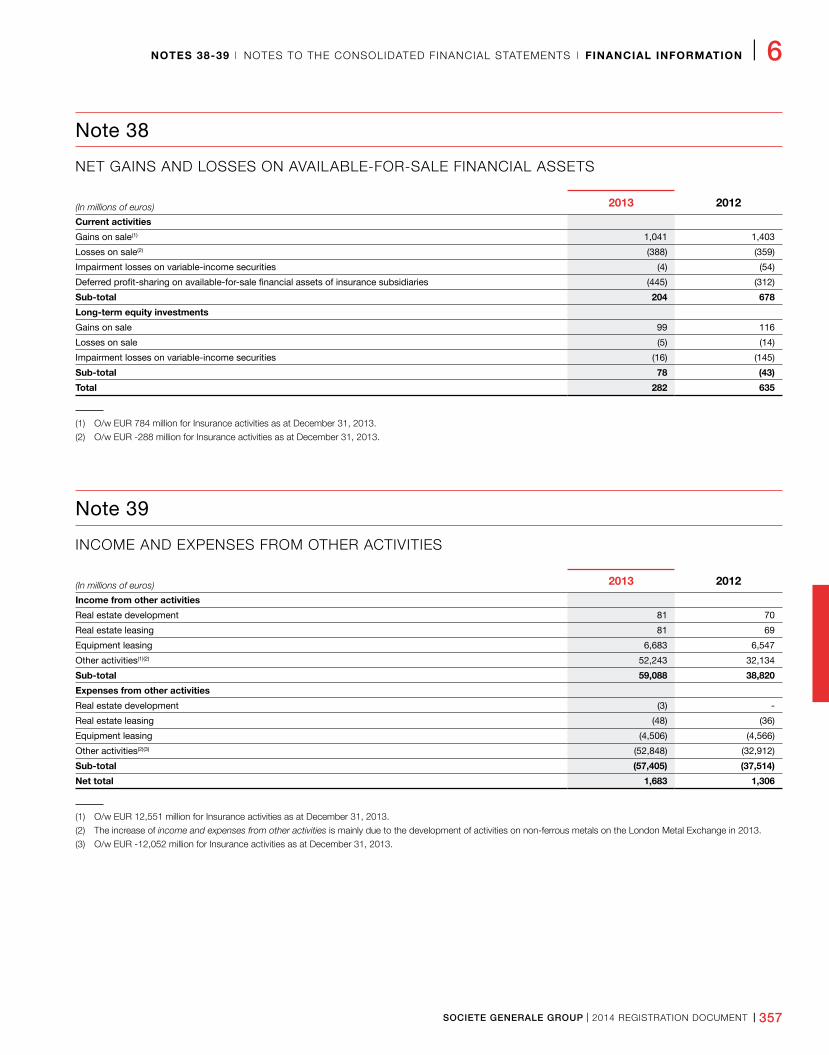
SOCIETE GENERALE GROUP I 2014 REGISTRATION DOCUMENT I 357
NOTES 38-39 I NOTES TO THE CONSOLIDATED FINANCIAL STATEMENTS I FINANCIAL INFORMATION I 6
Note 38
NET GAINS AND LOSSES ON AVAILABLE-FOR-SALE FINANCIAL ASSETS
(In millions of euros) 2013 2012
Current activities
Gains on sale(1) 1,041 1,403
Losses on sale(2) (388) (359)
Impairment losses on variable-income securities (4) (54)
Deferred profit-sharing on available-for-sale financial assets of insurance subsidiaries (445) (312)
Sub-total 204 678
Long-term equity investments
Gains on sale 99 116
Losses on sale (5) (14)
Impairment losses on variable-income securities (16) (145)
Sub-total 78 (43)
Total 282 635
(1) O/w EUR 784 million for Insurance activities as at December 31, 2013.
(2) O/w EUR -288 million for Insurance activities as at December 31, 2013.
Note 39
INCOME AND EXPENSES FROM OTHER ACTIVITIES
(In millions of euros) 2013 2012
Income from other activities
Real estate development 81 70
Real estate leasing 81 69
Equipment leasing 6,683 6,547
Other activities(1)(2) 52,243 32,134
Sub-total 59,088 38,820
Expenses from other activities
Real estate development (3) -
Real estate leasing (48) (36)
Equipment leasing (4,506) (4,566)
Other activities(2)(3) (52,848) (32,912)
Sub-total (57,405) (37,514)
Net total 1,683 1,306
(1) O/w EUR 12,551 million for Insurance activities as at December 31, 2013.
(2) The increase of income and expenses from other activities is mainly due to the development of activities on non-ferrous metals on the London Metal Exchange in 2013.
(3) O/w EUR -12,052 million for Insurance activities as at December 31, 2013.
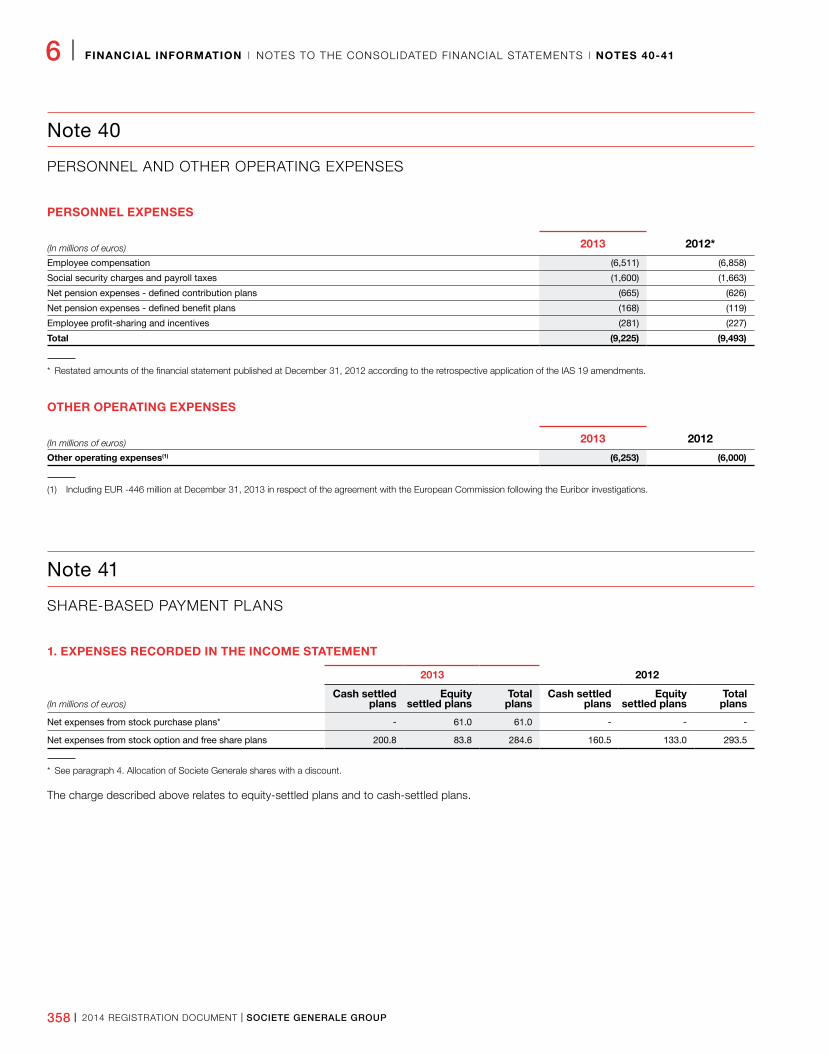
358 I 2014 REGISTRATION DOCUMENT I SOCIETE GENERALE GROUP
6 I FINANCIAL INFORMATION I NOTES TO THE CONSOLIDATED FINANCIAL STATEMENTS I NOTES 40-41
Note 40
PERSONNEL AND OTHER OPERATING EXPENSES
PERSONNEL EXPENSES
(In millions of euros) 2013 2012*
Employee compensation (6,511) (6,858)
Social security charges and payroll taxes (1,600) (1,663)
Net pension expenses - defined contribution plans (665) (626)
Net pension expenses - defined benefit plans (168) (119)
Employee profit-sharing and incentives (281) (227)
Total (9,225) (9,493)
* Restated amounts of the financial statement published at December 31, 2012 according to the retrospective application of the IAS 19 amendments.
OTHER OPERATING EXPENSES
(In millions of euros) 2013 2012
Other operating expenses(1) (6,253) (6,000)
(1) Including EUR -446 million at December 31, 2013 in respect of the agreement with the European Commission following the Euribor investigations.
Note 41
SHARE-BASED PAYMENT PLANS
1. EXPENSES RECORDED IN THE INCOME STATEMENT
2013 2012
(In millions of euros)Cash settled
plansEquity
settled plansTotal plans
Cash settled plans
Equity settled plans
Total plans
Net expenses from stock purchase plans* - 61�0 61�0 - - -
Net expenses from stock option and free share plans 200�8 83�8 284�6 160�5 133�0 293�5
* See paragraph 4. Allocation of Societe Generale shares with a discount.
The charge described above relates to equity-settled plans and to cash-settled plans.
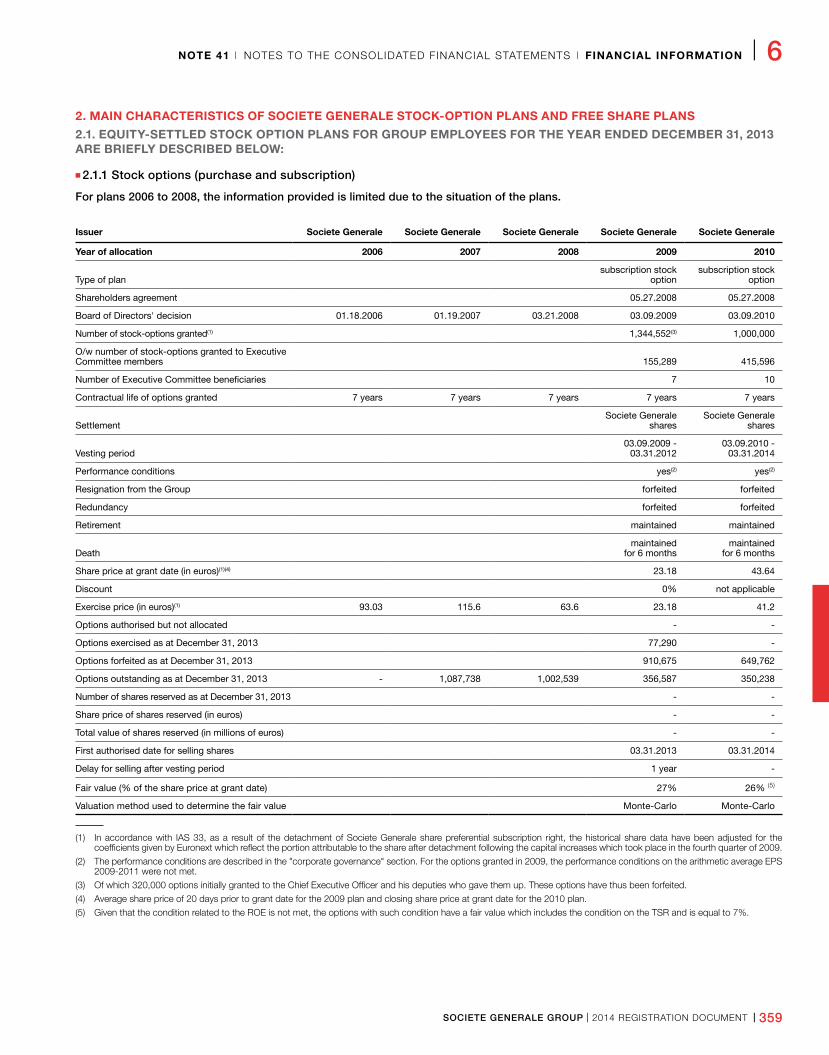
SOCIETE GENERALE GROUP I 2014 REGISTRATION DOCUMENT I 359
NOTE 41 I NOTES TO THE CONSOLIDATED FINANCIAL STATEMENTS I FINANCIAL INFORMATION I 6
2. MAIN CHARACTERISTICS OF SOCIETE GENERALE STOCK-OPTION PLANS AND FREE SHARE PLANS
2.1. EQUITY-SETTLED STOCK OPTION PLANS FOR GROUP EMPLOYEES FOR THE YEAR ENDED DECEMBER 31, 2013 ARE BRIEFLY DESCRIBED BELOW:
n 2.1.1 Stock options (purchase and subscription)
For plans 2006 to 2008, the information provided is limited due to the situation of the plans.
Issuer Societe Generale Societe Generale Societe Generale Societe Generale Societe Generale
Year of allocation 2006 2007 2008 2009 2010
Type of plansubscription stock
optionsubscription stock
option
Shareholders agreement 05�27�2008 05�27�2008
Board of Directors' decision 01�18�2006 01�19�2007 03�21�2008 03�09�2009 03�09�2010
Number of stock-options granted(1) 1,344,552(3) 1,000,000
O/w number of stock-options granted to Executive Committee members 155,289 415,596
Number of Executive Committee beneficiaries 7 10
Contractual life of options granted 7 years 7 years 7 years 7 years 7 years
SettlementSociete Generale
sharesSociete Generale
shares
Vesting period03�09�2009 -
03�31�201203�09�2010 -
03�31�2014
Performance conditions yes(2) yes(2)
Resignation from the Group forfeited forfeited
Redundancy forfeited forfeited
Retirement maintained maintained
Deathmaintained
for 6 monthsmaintained
for 6 months
Share price at grant date (in euros)(1)(4) 23�18 43�64
Discount 0% not applicable
Exercise price (in euros)(1) 93�03 115�6 63�6 23�18 41�2
Options authorised but not allocated - -
Options exercised as at December 31, 2013 77,290 -
Options forfeited as at December 31, 2013 910,675 649,762
Options outstanding as at December 31, 2013 - 1,087,738 1,002,539 356,587 350,238
Number of shares reserved as at December 31, 2013 - -
Share price of shares reserved (in euros) - -
Total value of shares reserved (in millions of euros) - -
First authorised date for selling shares 03�31�2013 03�31�2014
Delay for selling after vesting period 1 year -
Fair value (% of the share price at grant date) 27% 26% (5)
Valuation method used to determine the fair value Monte-Carlo Monte-Carlo
(1) In accordance with IAS 33, as a result of the detachment of Societe Generale share preferential subscription right, the historical share data have been adjusted for the coefficients given by Euronext which reflect the portion attributable to the share after detachment following the capital increases which took place in the fourth quarter of 2009.
(2) The performance conditions are described in the "corporate governance" section. For the options granted in 2009, the performance conditions on the arithmetic average EPS 2009-2011 were not met.
(3) Of which 320,000 options initially granted to the Chief Executive Officer and his deputies who gave them up. These options have thus been forfeited.
(4) Average share price of 20 days prior to grant date for the 2009 plan and closing share price at grant date for the 2010 plan.
(5) Given that the condition related to the ROE is not met, the options with such condition have a fair value which includes the condition on the TSR and is equal to 7%.
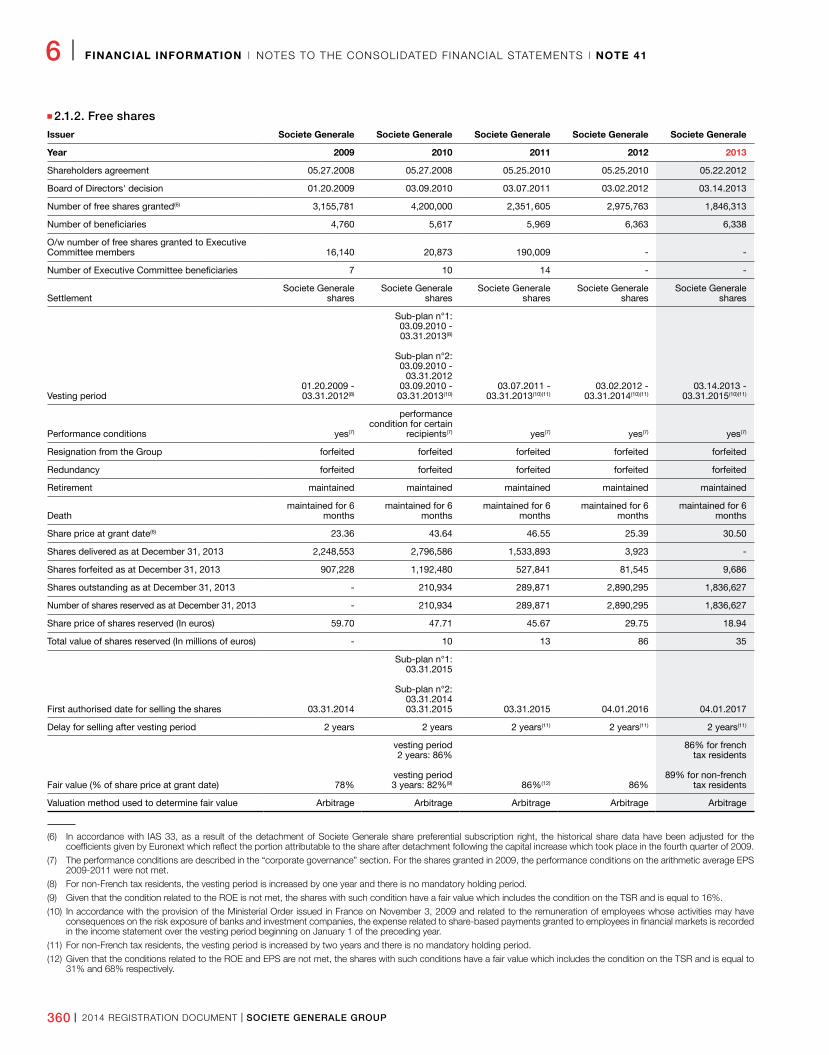
360 I 2014 REGISTRATION DOCUMENT I SOCIETE GENERALE GROUP
6 I FINANCIAL INFORMATION I NOTES TO THE CONSOLIDATED FINANCIAL STATEMENTS I NOTE 41
n 2.1.2. Free sharesIssuer Societe Generale Societe Generale Societe Generale Societe Generale Societe Generale
Year 2009 2010 2011 2012 2013
Shareholders agreement 05�27�2008 05�27�2008 05�25�2010 05�25�2010 05�22�2012
Board of Directors' decision 01�20�2009 03�09�2010 03�07�2011 03�02�2012 03�14�2013
Number of free shares granted(6) 3,155,781 4,200,000 2,351, 605 2,975,763 1,846,313
Number of beneficiaries 4,760 5,617 5,969 6,363 6,338
O/w number of free shares granted to Executive Committee members 16,140 20,873 190,009 - -
Number of Executive Committee beneficiaries 7 10 14 - -
SettlementSociete Generale
sharesSociete Generale
sharesSociete Generale
sharesSociete Generale
sharesSociete Generale
shares
Vesting period01�20�2009 - 03�31�2012(8)
Sub-plan n°1: 03�09�2010 - 03�31�2013(8)
Sub-plan n°2: 03�09�2010 -
03�31�2012 03�09�2010 -
03�31�2013(10)03�07�2011 -
03�31�2013(10)(11)03�02�2012 -
03�31�2014(10)(11)03�14�2013 -
03�31�2015(10)(11)
Performance conditions yes(7)
performance condition for certain
recipients(7) yes(7) yes(7) yes(7)
Resignation from the Group forfeited forfeited forfeited forfeited forfeited
Redundancy forfeited forfeited forfeited forfeited forfeited
Retirement maintained maintained maintained maintained maintained
Deathmaintained for 6
monthsmaintained for 6
monthsmaintained for 6
monthsmaintained for 6
monthsmaintained for 6
months
Share price at grant date(6) 23�36 43�64 46�55 25�39 30�50
Shares delivered as at December 31, 2013 2,248,553 2,796,586 1,533,893 3,923 -
Shares forfeited as at December 31, 2013 907,228 1,192,480 527,841 81,545 9,686
Shares outstanding as at December 31, 2013 - 210,934 289,871 2,890,295 1,836,627
Number of shares reserved as at December 31, 2013 - 210,934 289,871 2,890,295 1,836,627
Share price of shares reserved (In euros) 59�70 47�71 45�67 29�75 18�94
Total value of shares reserved (In millions of euros) - 10 13 86 35
First authorised date for selling the shares 03�31�2014
Sub-plan n°1: 03�31�2015
Sub-plan n°2:
03�31�2014 03�31�2015 03�31�2015 04�01�2016 04�01�2017
Delay for selling after vesting period 2 years 2 years 2 years(11) 2 years(11) 2 years(11)
Fair value (% of share price at grant date) 78%
vesting period 2 years: 86%
vesting period 3 years: 82%(9) 86%(12) 86%
86% for french tax residents
89% for non-french
tax residents
Valuation method used to determine fair value Arbitrage Arbitrage Arbitrage Arbitrage Arbitrage
(6) In accordance with IAS 33, as a result of the detachment of Societe Generale share preferential subscription right, the historical share data have been adjusted for the coefficients given by Euronext which reflect the portion attributable to the share after detachment following the capital increase which took place in the fourth quarter of 2009.
(7) The performance conditions are described in the “corporate governance” section. For the shares granted in 2009, the performance conditions on the arithmetic average EPS 2009-2011 were not met.
(8) For non-French tax residents, the vesting period is increased by one year and there is no mandatory holding period.
(9) Given that the condition related to the ROE is not met, the shares with such condition have a fair value which includes the condition on the TSR and is equal to 16%.
(10) In accordance with the provision of the Ministerial Order issued in France on November 3, 2009 and related to the remuneration of employees whose activities may have consequences on the risk exposure of banks and investment companies, the expense related to share-based payments granted to employees in financial markets is recorded in the income statement over the vesting period beginning on January 1 of the preceding year.
(11) For non-French tax residents, the vesting period is increased by two years and there is no mandatory holding period.
(12) Given that the conditions related to the ROE and EPS are not met, the shares with such conditions have a fair value which includes the condition on the TSR and is equal to 31% and 68% respectively.
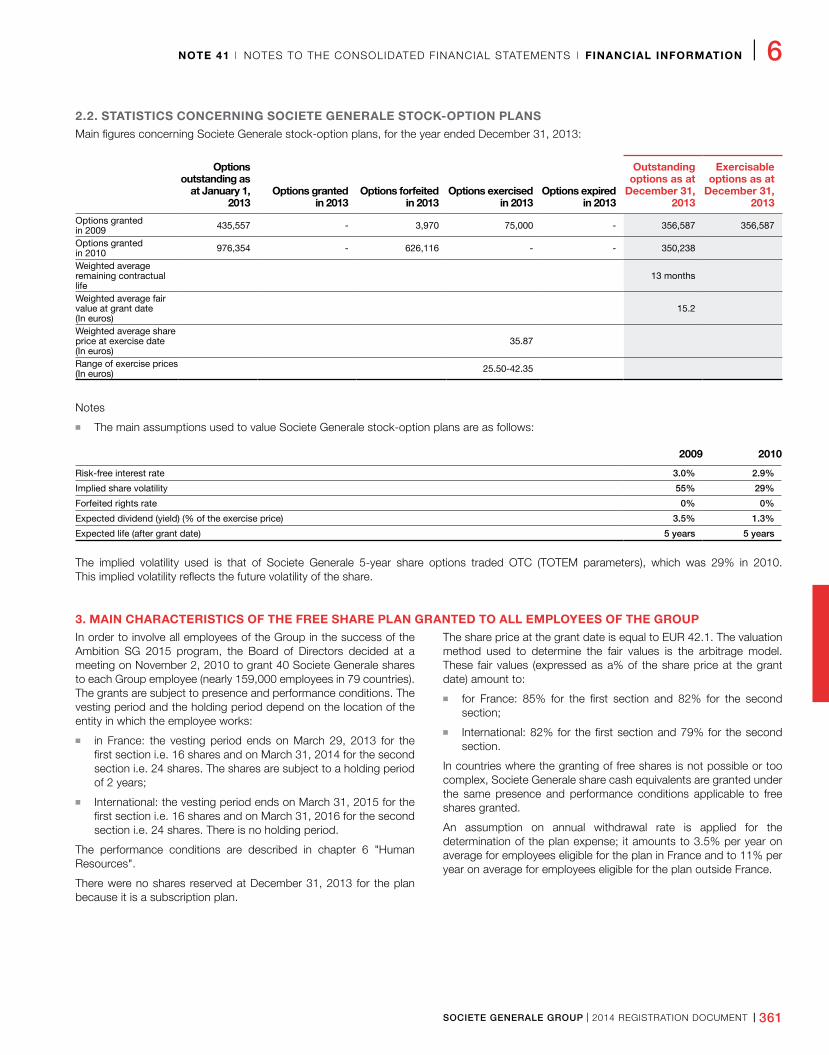
SOCIETE GENERALE GROUP I 2014 REGISTRATION DOCUMENT I 361
NOTE 41 I NOTES TO THE CONSOLIDATED FINANCIAL STATEMENTS I FINANCIAL INFORMATION I 6
2.2. STATISTICS CONCERNING SOCIETE GENERALE STOCK-OPTION PLANSMain figures concerning Societe Generale stock-option plans, for the year ended December 31, 2013:
Options outstanding as
at January 1, 2013
Options granted in 2013
Options forfeited in 2013
Options exercised in 2013
Options expired in 2013
Outstanding options as at
December 31, 2013
Exercisable options as at
December 31, 2013
Options granted in 2009 435,557 - 3,970 75,000 - 356,587 356,587
Options granted in 2010 976,354 - 626,116 - - 350,238
Weighted average remaining contractual life
13 months
Weighted average fair value at grant date (In euros)
15�2
Weighted average share price at exercise date (In euros)
35�87
Range of exercise prices (In euros) 25�50-42�35
Notes
n The main assumptions used to value Societe Generale stock-option plans are as follows:
2009 2010
Risk-free interest rate 3.0% 2.9%
Implied share volatility 55% 29%
Forfeited rights rate 0% 0%
Expected dividend (yield) (% of the exercise price) 3.5% 1.3%
Expected life (after grant date) 5 years 5 years
The implied volatility used is that of Societe Generale 5-year share options traded OTC (TOTEM parameters), which was 29% in 2010. This implied volatility reflects the future volatility of the share.
3. MAIN CHARACTERISTICS OF THE FREE SHARE PLAN GRANTED TO ALL EMPLOYEES OF THE GROUPIn order to involve all employees of the Group in the success of the Ambition SG 2015 program, the Board of Directors decided at a meeting on November 2, 2010 to grant 40 Societe Generale shares to each Group employee (nearly 159,000 employees in 79 countries). The grants are subject to presence and performance conditions. The vesting period and the holding period depend on the location of the entity in which the employee works:
n in France: the vesting period ends on March 29, 2013 for the first section i.e. 16 shares and on March 31, 2014 for the second section i.e. 24 shares. The shares are subject to a holding period of 2 years;
n International: the vesting period ends on March 31, 2015 for the first section i.e. 16 shares and on March 31, 2016 for the second section i.e. 24 shares. There is no holding period.
The performance conditions are described in chapter 6 "Human Resources".
There were no shares reserved at December 31, 2013 for the plan because it is a subscription plan.
The share price at the grant date is equal to EUR 42.1. The valuation method used to determine the fair values is the arbitrage model. These fair values (expressed as a% of the share price at the grant date) amount to:
n for France: 85% for the first section and 82% for the second section;
n International: 82% for the first section and 79% for the second section.
In countries where the granting of free shares is not possible or too complex, Societe Generale share cash equivalents are granted under the same presence and performance conditions applicable to free shares granted.
An assumption on annual withdrawal rate is applied for the determination of the plan expense; it amounts to 3.5% per year on average for employees eligible for the plan in France and to 11% per year on average for employees eligible for the plan outside France.
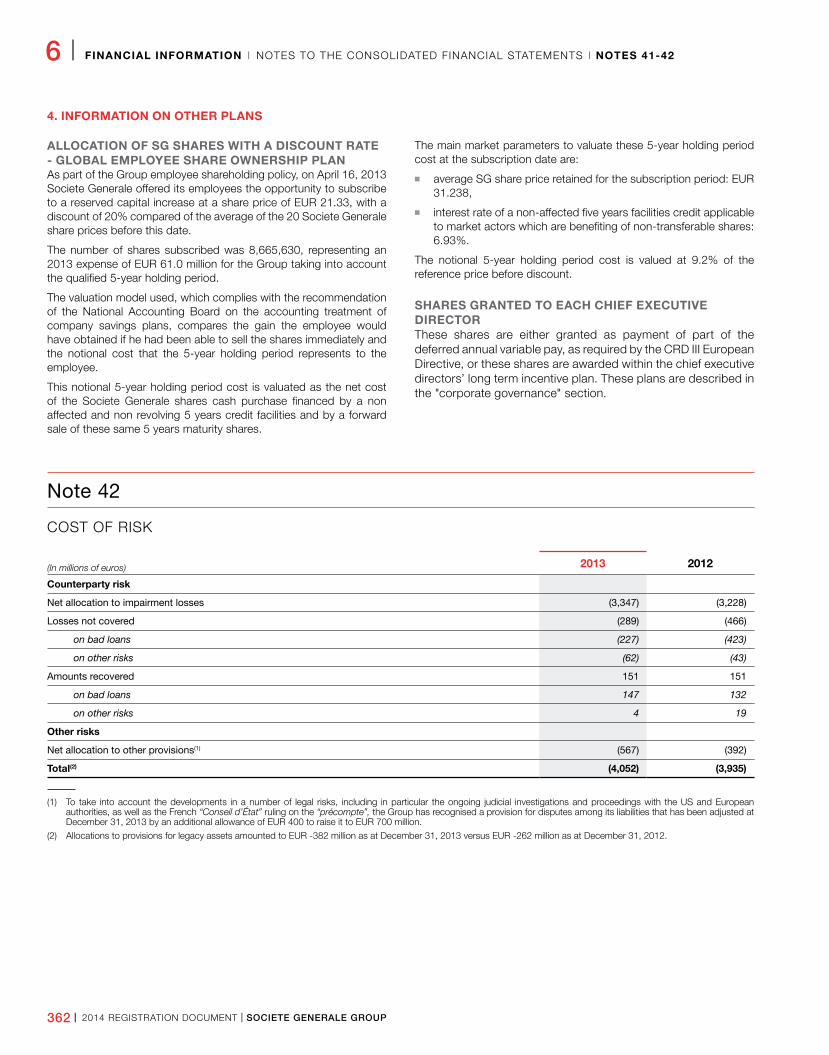
362 I 2014 REGISTRATION DOCUMENT I SOCIETE GENERALE GROUP
6 I FINANCIAL INFORMATION I NOTES TO THE CONSOLIDATED FINANCIAL STATEMENTS I NOTES 41-42
4. INFORMATION ON OTHER PLANS
ALLOCATION OF SG SHARES WITH A DISCOUNT RATE - GLOBAL EMPLOYEE SHARE OWNERSHIP PLANAs part of the Group employee shareholding policy, on April 16, 2013 Societe Generale offered its employees the opportunity to subscribe to a reserved capital increase at a share price of EUR 21.33, with a discount of 20% compared of the average of the 20 Societe Generale share prices before this date.
The number of shares subscribed was 8,665,630, representing an 2013 expense of EUR 61.0 million for the Group taking into account the qualified 5-year holding period.
The valuation model used, which complies with the recommendation of the National Accounting Board on the accounting treatment of company savings plans, compares the gain the employee would have obtained if he had been able to sell the shares immediately and the notional cost that the 5-year holding period represents to the employee.
This notional 5-year holding period cost is valuated as the net cost of the Societe Generale shares cash purchase financed by a non affected and non revolving 5 years credit facilities and by a forward sale of these same 5 years maturity shares.
The main market parameters to valuate these 5-year holding period cost at the subscription date are:
n average SG share price retained for the subscription period: EUR 31.238,
n interest rate of a non-affected five years facilities credit applicable to market actors which are benefiting of non-transferable shares: 6.93%.
The notional 5-year holding period cost is valued at 9.2% of the reference price before discount.
SHARES GRANTED TO EACH CHIEF EXECUTIVE DIRECTORThese shares are either granted as payment of part of the deferred annual variable pay, as required by the CRD III European Directive, or these shares are awarded within the chief executive directors’ long term incentive plan. These plans are described in the "corporate governance" section.
Note 42
COST OF RISK
(In millions of euros) 2013 2012
Counterparty risk
Net allocation to impairment losses (3,347) (3,228)
Losses not covered (289) (466)
on bad loans (227) (423)
on other risks (62) (43)
Amounts recovered 151 151
on bad loans 147 132
on other risks 4 19
Other risks
Net allocation to other provisions(1) (567) (392)
Total(2) (4,052) (3,935)
(1) To take into account the developments in a number of legal risks, including in particular the ongoing judicial investigations and proceedings with the US and European authorities, as well as the French “Conseil d’État” ruling on the “précompte”, the Group has recognised a provision for disputes among its liabilities that has been adjusted at December 31, 2013 by an additional allowance of EUR 400 to raise it to EUR 700 million.
(2) Allocations to provisions for legacy assets amounted to EUR -382 million as at December 31, 2013 versus EUR -262 million as at December 31, 2012.
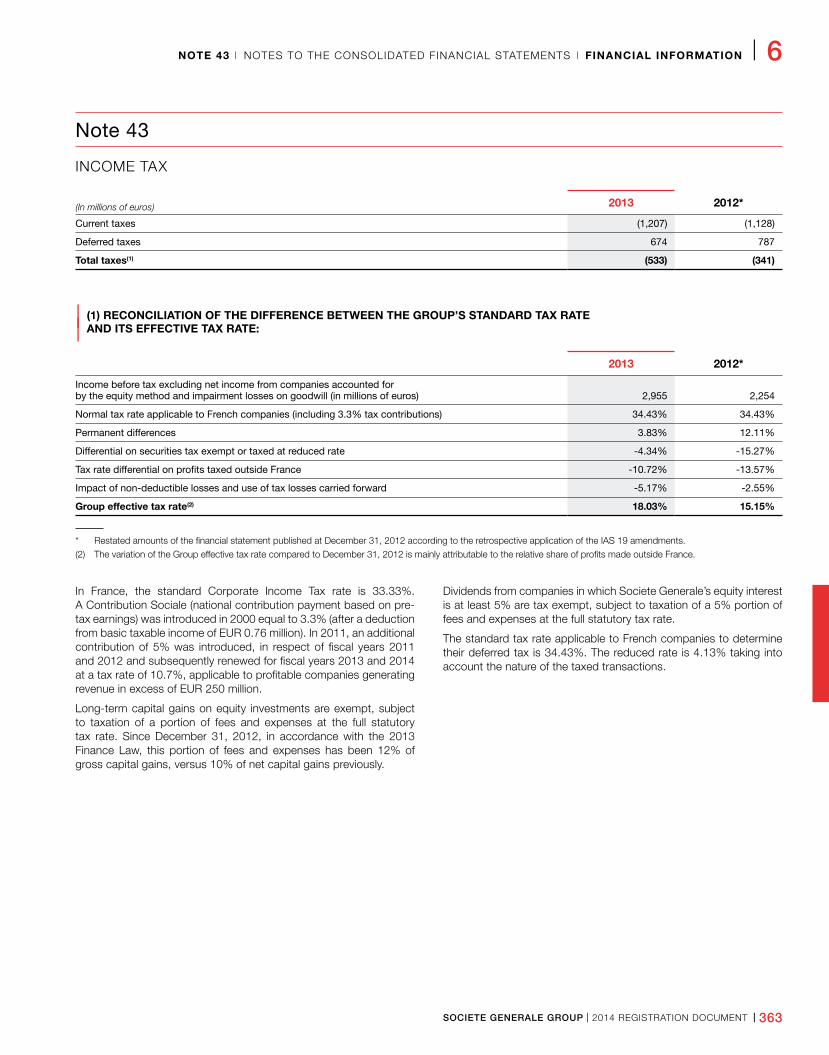
SOCIETE GENERALE GROUP I 2014 REGISTRATION DOCUMENT I 363
NOTE 43 I NOTES TO THE CONSOLIDATED FINANCIAL STATEMENTS I FINANCIAL INFORMATION I 6
Note 43
INCOME TAX
(In millions of euros) 2013 2012*
Current taxes (1,207) (1,128)
Deferred taxes 674 787
Total taxes(1) (533) (341)
| (1) RECONCILIATION OF THE DIFFERENCE BETWEEN THE GROUP’S STANDARD TAX RATE
| AND ITS EFFECTIVE TAX RATE:
2013 2012*
Income before tax excluding net income from companies accounted for by the equity method and impairment losses on goodwill (in millions of euros) 2,955 2,254
Normal tax rate applicable to French companies (including 3.3% tax contributions) 34�43% 34�43%
Permanent differences 3�83% 12�11%
Differential on securities tax exempt or taxed at reduced rate -4�34% -15�27%
Tax rate differential on profits taxed outside France -10�72% -13�57%
Impact of non-deductible losses and use of tax losses carried forward -5�17% -2�55%
Group effective tax rate(2) 18.03% 15.15%
* Restated amounts of the financial statement published at December 31, 2012 according to the retrospective application of the IAS 19 amendments.
(2) The variation of the Group effective tax rate compared to December 31, 2012 is mainly attributable to the relative share of profits made outside France.
In France, the standard Corporate Income Tax rate is 33.33%. A Contribution Sociale (national contribution payment based on pre-tax earnings) was introduced in 2000 equal to 3.3% (after a deduction from basic taxable income of EUR 0.76 million). In 2011, an additional contribution of 5% was introduced, in respect of fiscal years 2011 and 2012 and subsequently renewed for fiscal years 2013 and 2014 at a tax rate of 10.7%, applicable to profitable companies generating revenue in excess of EUR 250 million.
Long-term capital gains on equity investments are exempt, subject to taxation of a portion of fees and expenses at the full statutory tax rate. Since December 31, 2012, in accordance with the 2013 Finance Law, this portion of fees and expenses has been 12% of gross capital gains, versus 10% of net capital gains previously.
Dividends from companies in which Societe Generale’s equity interest is at least 5% are tax exempt, subject to taxation of a 5% portion of fees and expenses at the full statutory tax rate.
The standard tax rate applicable to French companies to determine their deferred tax is 34.43%. The reduced rate is 4.13% taking into account the nature of the taxed transactions.
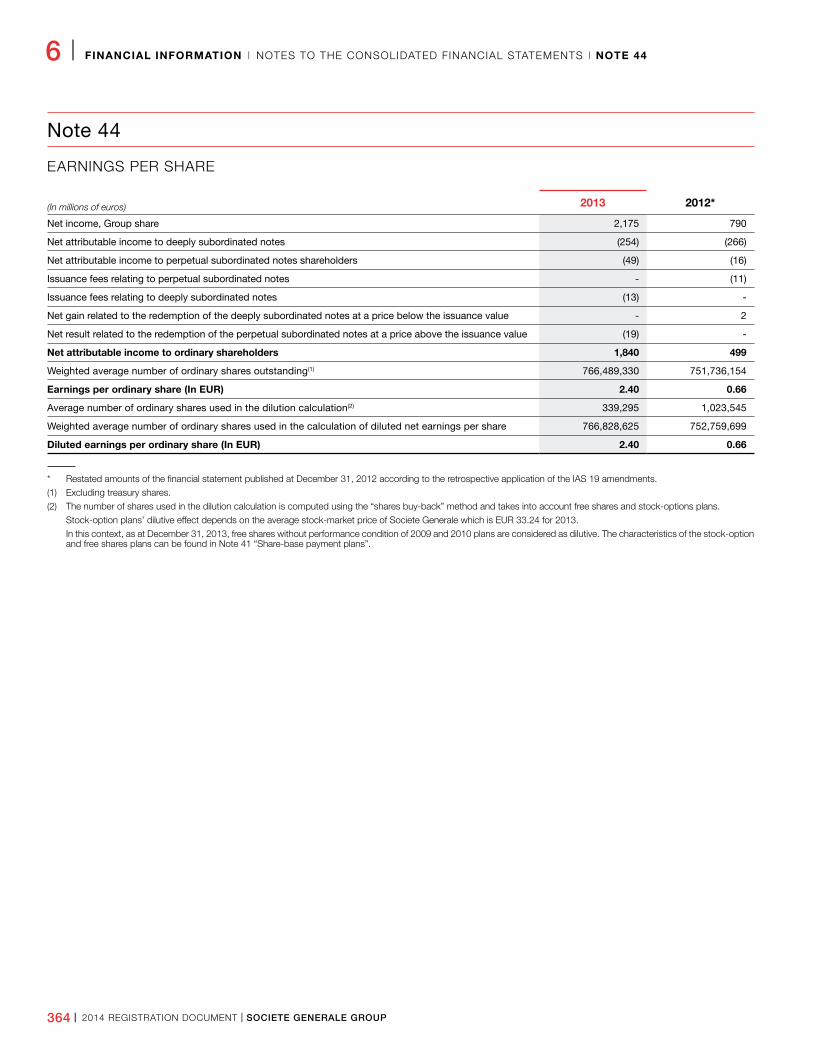
364 I 2014 REGISTRATION DOCUMENT I SOCIETE GENERALE GROUP
6 I FINANCIAL INFORMATION I NOTES TO THE CONSOLIDATED FINANCIAL STATEMENTS I NOTE 44
Note 44
EARNINGS PER SHARE
(In millions of euros) 2013 2012*
Net income, Group share 2,175 790
Net attributable income to deeply subordinated notes (254) (266)
Net attributable income to perpetual subordinated notes shareholders (49) (16)
Issuance fees relating to perpetual subordinated notes - (11)
Issuance fees relating to deeply subordinated notes (13) -
Net gain related to the redemption of the deeply subordinated notes at a price below the issuance value - 2
Net result related to the redemption of the perpetual subordinated notes at a price above the issuance value (19) -
Net attributable income to ordinary shareholders 1,840 499
Weighted average number of ordinary shares outstanding(1) 766,489,330 751,736,154
Earnings per ordinary share (In EUR) 2.40 0.66
Average number of ordinary shares used in the dilution calculation(2) 339,295 1,023,545
Weighted average number of ordinary shares used in the calculation of diluted net earnings per share 766,828,625 752,759,699
Diluted earnings per ordinary share (In EUR) 2.40 0.66
* Restated amounts of the financial statement published at December 31, 2012 according to the retrospective application of the IAS 19 amendments.
(1) Excluding treasury shares.
(2) The number of shares used in the dilution calculation is computed using the “shares buy-back” method and takes into account free shares and stock-options plans.
Stock-option plans’ dilutive effect depends on the average stock-market price of Societe Generale which is EUR 33.24 for 2013.
In this context, as at December 31, 2013, free shares without performance condition of 2009 and 2010 plans are considered as dilutive. The characteristics of the stock-option and free shares plans can be found in Note 41 “Share-base payment plans”.
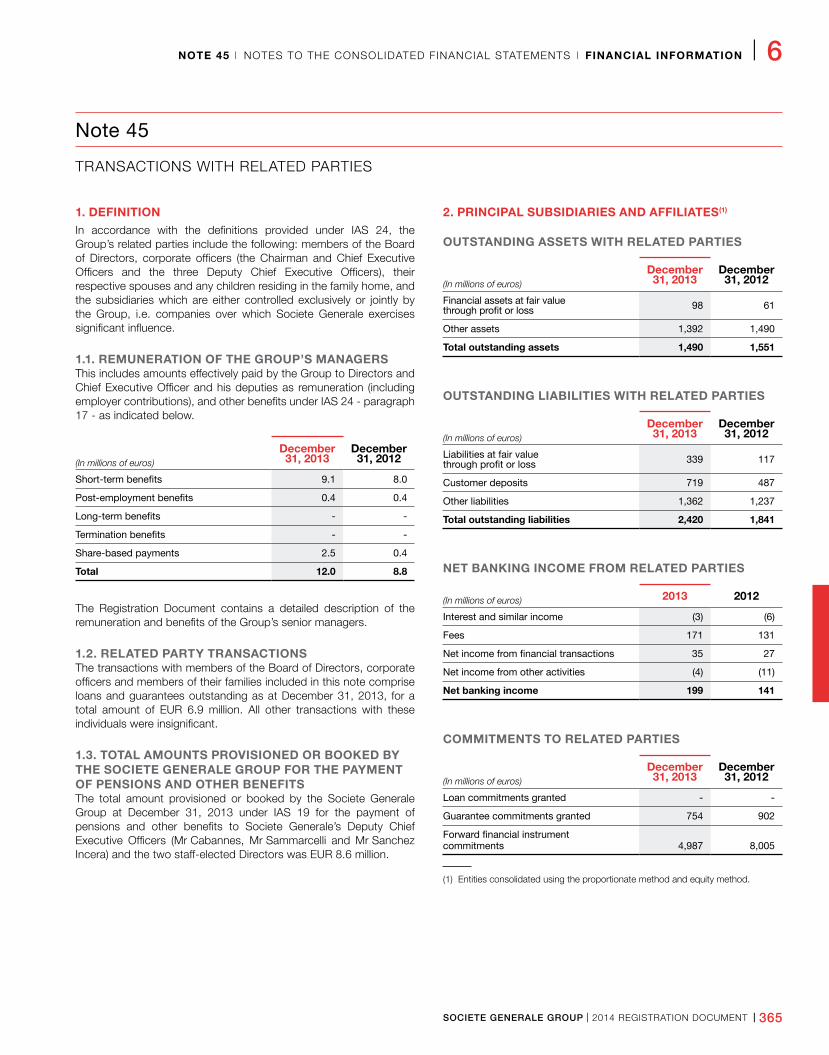
SOCIETE GENERALE GROUP I 2014 REGISTRATION DOCUMENT I 365
NOTE 45 I NOTES TO THE CONSOLIDATED FINANCIAL STATEMENTS I FINANCIAL INFORMATION I 6
Note 45
TRANSACTIONS WITH RELATED PARTIES
1. DEFINITIONIn accordance with the definitions provided under IAS 24, the Group’s related parties include the following: members of the Board of Directors, corporate officers (the Chairman and Chief Executive Officers and the three Deputy Chief Executive Officers), their respective spouses and any children residing in the family home, and the subsidiaries which are either controlled exclusively or jointly by the Group, i.e. companies over which Societe Generale exercises significant influence.
1.1. REMUNERATION OF THE GROUP’S MANAGERS This includes amounts effectively paid by the Group to Directors and Chief Executive Officer and his deputies as remuneration (including employer contributions), and other benefits under IAS 24 - paragraph 17 - as indicated below.
(In millions of euros)
December 31, 2013
December 31, 2012
Short-term benefits 9�1 8�0
Post-employment benefits 0�4 0�4
Long-term benefits - -
Termination benefits - -
Share-based payments 2�5 0�4
Total 12.0 8.8
The Registration Document contains a detailed description of the remuneration and benefits of the Group’s senior managers.
1.2. RELATED PARTY TRANSACTIONS The transactions with members of the Board of Directors, corporate officers and members of their families included in this note comprise loans and guarantees outstanding as at December 31, 2013, for a total amount of EUR 6.9 million. All other transactions with these individuals were insignificant.
1.3. TOTAL AMOUNTS PROVISIONED OR BOOKED BY THE SOCIETE GENERALE GROUP FOR THE PAYMENT OF PENSIONS AND OTHER BENEFITSThe total amount provisioned or booked by the Societe Generale Group at December 31, 2013 under IAS 19 for the payment of pensions and other benefits to Societe Generale’s Deputy Chief Executive Officers (Mr Cabannes, Mr Sammarcelli and Mr Sanchez Incera) and the two staff-elected Directors was EUR 8.6 million.
2. PRINCIPAL SUBSIDIARIES AND AFFILIATES(1)
OUTSTANDING ASSETS WITH RELATED PARTIES
(In millions of euros)
December 31, 2013
December 31, 2012
Financial assets at fair value through profit or loss 98 61
Other assets 1,392 1,490
Total outstanding assets 1,490 1,551
OUTSTANDING LIABILITIES WITH RELATED PARTIES
(In millions of euros)
December 31, 2013
December 31, 2012
Liabilities at fair value through profit or loss 339 117
Customer deposits 719 487
Other liabilities 1,362 1,237
Total outstanding liabilities 2,420 1,841
NET BANKING INCOME FROM RELATED PARTIES
(In millions of euros) 2013 2012
Interest and similar income (3) (6)
Fees 171 131
Net income from financial transactions 35 27
Net income from other activities (4) (11)
Net banking income 199 141
COMMITMENTS TO RELATED PARTIES
(In millions of euros)
December 31, 2013
December 31, 2012
Loan commitments granted - -
Guarantee commitments granted 754 902
Forward financial instrument commitments 4,987 8,005
(1) Entities consolidated using the proportionate method and equity method.
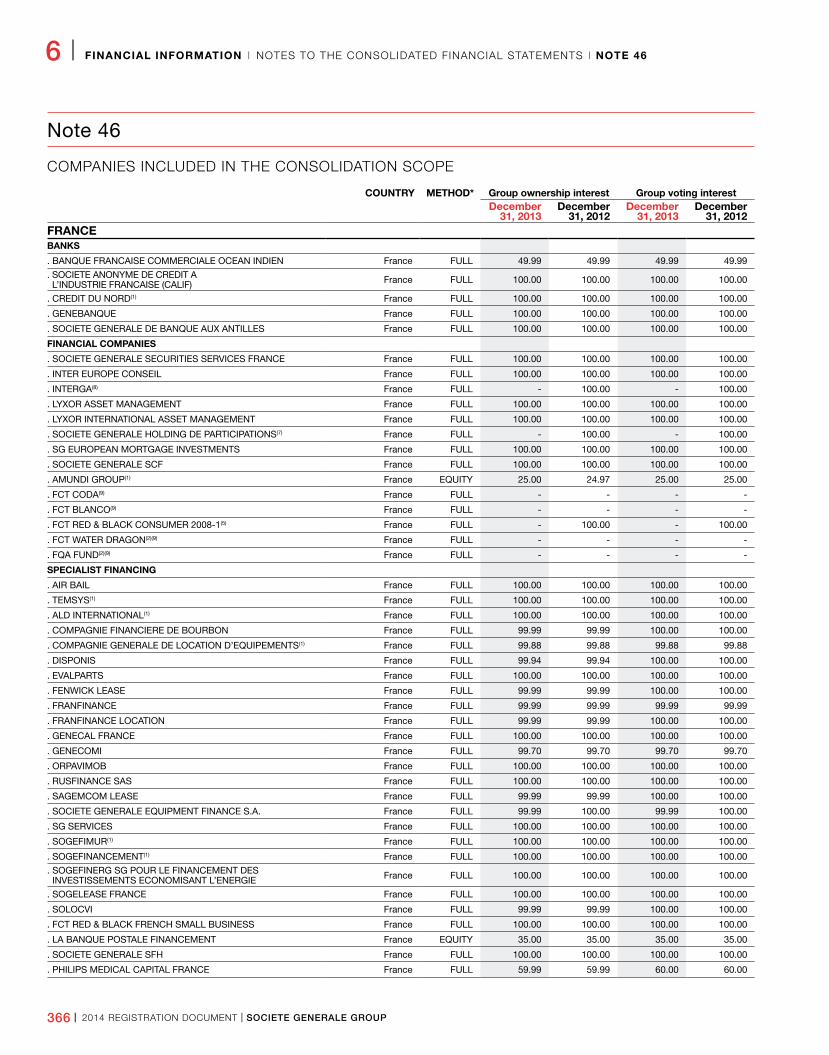
366 I 2014 REGISTRATION DOCUMENT I SOCIETE GENERALE GROUP
6 I FINANCIAL INFORMATION I NOTES TO THE CONSOLIDATED FINANCIAL STATEMENTS I NOTE 46
Note 46
COMPANIES INCLUDED IN THE CONSOLIDATION SCOPE
COUNTRY METHOD* Group ownership interest Group voting interestDecember
31, 2013December
31, 2012December
31, 2013December
31, 2012FRANCEBANKS
. BANQUE FRANCAISE COMMERCIALE OCEAN INDIEN France FULL 49�99 49�99 49�99 49�99
. SOCIETE ANONYME DE CREDIT A L’INDUSTRIE FRANCAISE (CALIF) France FULL 100�00 100�00 100�00 100�00
� CREDIT DU NORD(1) France FULL 100�00 100�00 100�00 100�00
� GENEBANQUE France FULL 100�00 100�00 100�00 100�00
� SOCIETE GENERALE DE BANQUE AUX ANTILLES France FULL 100�00 100�00 100�00 100�00
FINANCIAL COMPANIES
. SOCIETE GENERALE SECURITIES SERVICES FRANCE France FULL 100�00 100�00 100�00 100�00
� INTER EUROPE CONSEIL France FULL 100�00 100�00 100�00 100�00
� INTERGA(8) France FULL - 100�00 - 100�00
. LYXOR ASSET MANAGEMENT France FULL 100�00 100�00 100�00 100�00
. LYXOR INTERNATIONAL ASSET MANAGEMENT France FULL 100�00 100�00 100�00 100�00
� SOCIETE GENERALE HOLDING DE PARTICIPATIONS(7) France FULL - 100�00 - 100�00
. SG EUROPEAN MORTGAGE INVESTMENTS France FULL 100�00 100�00 100�00 100�00
� SOCIETE GENERALE SCF France FULL 100�00 100�00 100�00 100�00
. AMUNDI GROUP(1) France EQUITY 25�00 24�97 25�00 25�00
� FCT CODA(9) France FULL - - - -
� FCT BLANCO(9) France FULL - - - -
. FCT RED & BLACK CONSUMER 2008-1(5) France FULL - 100�00 - 100�00
� FCT WATER DRAGON(2)(9) France FULL - - - -
� FQA FUND(2)(9) France FULL - - - -
SPECIALIST FINANCING
� AIR BAIL France FULL 100�00 100�00 100�00 100�00
. TEMSYS(1) France FULL 100�00 100�00 100�00 100�00
� ALD INTERNATIONAL(1) France FULL 100�00 100�00 100�00 100�00
. COMPAGNIE FINANCIERE DE BOURBON France FULL 99�99 99�99 100�00 100�00
. COMPAGNIE GENERALE DE LOCATION D’EQUIPEMENTS(1) France FULL 99�88 99�88 99�88 99�88
� DISPONIS France FULL 99�94 99�94 100�00 100�00
. EVALPARTS France FULL 100�00 100�00 100�00 100�00
. FENWICK LEASE France FULL 99�99 99�99 100�00 100�00
� FRANFINANCE France FULL 99�99 99�99 99�99 99�99
� FRANFINANCE LOCATION France FULL 99�99 99�99 100�00 100�00
� GENECAL FRANCE France FULL 100�00 100�00 100�00 100�00
. GENECOMI France FULL 99�70 99�70 99�70 99�70
. ORPAVIMOB France FULL 100�00 100�00 100�00 100�00
� RUSFINANCE SAS France FULL 100�00 100�00 100�00 100�00
. SAGEMCOM LEASE France FULL 99�99 99�99 100�00 100�00
. SOCIETE GENERALE EQUIPMENT FINANCE S.A. France FULL 99�99 100�00 99�99 100�00
. SG SERVICES France FULL 100�00 100�00 100�00 100�00
. SOGEFIMUR(1) France FULL 100�00 100�00 100�00 100�00
. SOGEFINANCEMENT(1) France FULL 100�00 100�00 100�00 100�00
. SOGEFINERG SG POUR LE FINANCEMENT DES INVESTISSEMENTS ECONOMISANT L’ENERGIE France FULL 100�00 100�00 100�00 100�00
� SOGELEASE FRANCE France FULL 100�00 100�00 100�00 100�00
. SOLOCVI France FULL 99�99 99�99 100�00 100�00
. FCT RED & BLACK FRENCH SMALL BUSINESS France FULL 100�00 100�00 100�00 100�00
. LA BANQUE POSTALE FINANCEMENT France EQUITY 35�00 35�00 35�00 35�00
� SOCIETE GENERALE SFH France FULL 100�00 100�00 100�00 100�00
. PHILIPS MEDICAL CAPITAL FRANCE France FULL 59�99 59�99 60�00 60�00
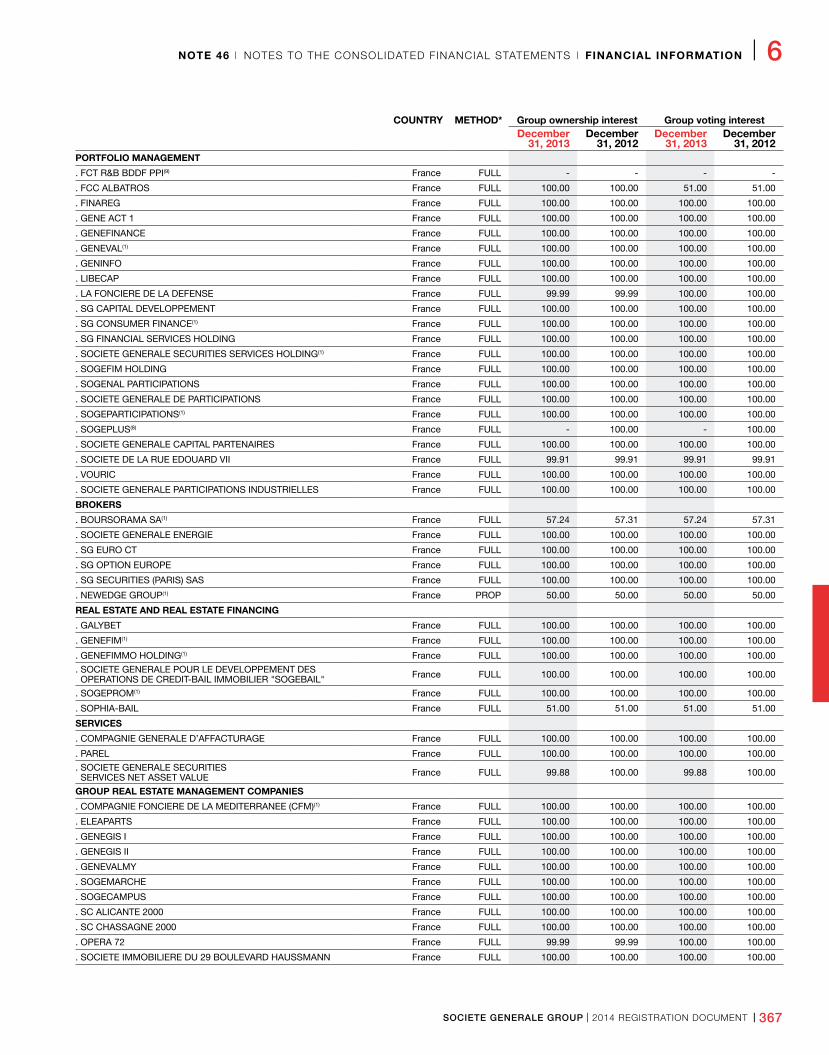
SOCIETE GENERALE GROUP I 2014 REGISTRATION DOCUMENT I 367
NOTE 46 I NOTES TO THE CONSOLIDATED FINANCIAL STATEMENTS I FINANCIAL INFORMATION I 6
COUNTRY METHOD* Group ownership interest Group voting interestDecember
31, 2013December
31, 2012December
31, 2013December
31, 2012PORTFOLIO MANAGEMENT
. FCT R&B BDDF PPI(9) France FULL - - - -
� FCC ALBATROS France FULL 100�00 100�00 51�00 51�00
� FINAREG France FULL 100�00 100�00 100�00 100�00
� GENE ACT 1 France FULL 100�00 100�00 100�00 100�00
� GENEFINANCE France FULL 100�00 100�00 100�00 100�00
. GENEVAL(1) France FULL 100�00 100�00 100�00 100�00
� GENINFO France FULL 100�00 100�00 100�00 100�00
� LIBECAP France FULL 100�00 100�00 100�00 100�00
� LA FONCIERE DE LA DEFENSE France FULL 99�99 99�99 100�00 100�00
. SG CAPITAL DEVELOPPEMENT France FULL 100�00 100�00 100�00 100�00
. SG CONSUMER FINANCE(1) France FULL 100�00 100�00 100�00 100�00
. SG FINANCIAL SERVICES HOLDING France FULL 100�00 100�00 100�00 100�00
. SOCIETE GENERALE SECURITIES SERVICES HOLDING(1) France FULL 100�00 100�00 100�00 100�00
. SOGEFIM HOLDING France FULL 100�00 100�00 100�00 100�00
� SOGENAL PARTICIPATIONS France FULL 100�00 100�00 100�00 100�00
� SOCIETE GENERALE DE PARTICIPATIONS France FULL 100�00 100�00 100�00 100�00
� SOGEPARTICIPATIONS(1) France FULL 100�00 100�00 100�00 100�00
� SOGEPLUS(8) France FULL - 100�00 - 100�00
� SOCIETE GENERALE CAPITAL PARTENAIRES France FULL 100�00 100�00 100�00 100�00
. SOCIETE DE LA RUE EDOUARD VII France FULL 99�91 99�91 99�91 99�91
. VOURIC France FULL 100�00 100�00 100�00 100�00
� SOCIETE GENERALE PARTICIPATIONS INDUSTRIELLES France FULL 100�00 100�00 100�00 100�00
BROKERS
. BOURSORAMA SA(1) France FULL 57�24 57�31 57�24 57�31
� SOCIETE GENERALE ENERGIE France FULL 100�00 100�00 100�00 100�00
� SG EURO CT France FULL 100�00 100�00 100�00 100�00
� SG OPTION EUROPE France FULL 100�00 100�00 100�00 100�00
� SG SECURITIES (PARIS) SAS France FULL 100�00 100�00 100�00 100�00
� NEWEDGE GROUP(1) France PROP 50�00 50�00 50�00 50�00
REAL ESTATE AND REAL ESTATE FINANCING
� GALYBET France FULL 100�00 100�00 100�00 100�00
. GENEFIM(1) France FULL 100�00 100�00 100�00 100�00
. GENEFIMMO HOLDING(1) France FULL 100�00 100�00 100�00 100�00
. SOCIETE GENERALE POUR LE DEVELOPPEMENT DES OPERATIONS DE CREDIT-BAIL IMMOBILIER "SOGEBAIL" France FULL 100�00 100�00 100�00 100�00
. SOGEPROM(1) France FULL 100�00 100�00 100�00 100�00
� SOPHIA-BAIL France FULL 51�00 51�00 51�00 51�00
SERVICES
. COMPAGNIE GENERALE D’AFFACTURAGE France FULL 100�00 100�00 100�00 100�00
� PAREL France FULL 100�00 100�00 100�00 100�00
� SOCIETE GENERALE SECURITIES SERVICES NET ASSET VALUE France FULL 99�88 100�00 99�88 100�00
GROUP REAL ESTATE MANAGEMENT COMPANIES
. COMPAGNIE FONCIERE DE LA MEDITERRANEE (CFM)(1) France FULL 100�00 100�00 100�00 100�00
� ELEAPARTS France FULL 100�00 100�00 100�00 100�00
� GENEGIS I France FULL 100�00 100�00 100�00 100�00
� GENEGIS II France FULL 100�00 100�00 100�00 100�00
. GENEVALMY France FULL 100�00 100�00 100�00 100�00
. SOGEMARCHE France FULL 100�00 100�00 100�00 100�00
. SOGECAMPUS France FULL 100�00 100�00 100�00 100�00
� SC ALICANTE 2000 France FULL 100�00 100�00 100�00 100�00
� SC CHASSAGNE 2000 France FULL 100�00 100�00 100�00 100�00
� OPERA 72 France FULL 99�99 99�99 100�00 100�00
. SOCIETE IMMOBILIERE DU 29 BOULEVARD HAUSSMANN France FULL 100�00 100�00 100�00 100�00
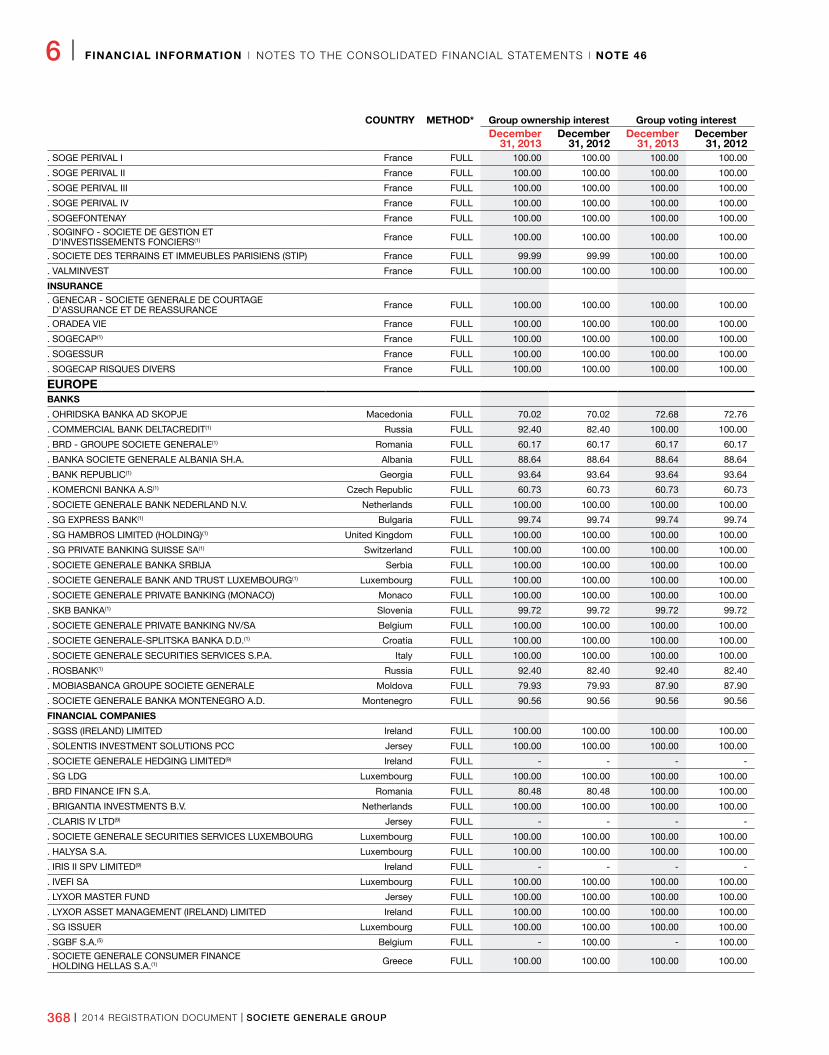
368 I 2014 REGISTRATION DOCUMENT I SOCIETE GENERALE GROUP
6 I FINANCIAL INFORMATION I NOTES TO THE CONSOLIDATED FINANCIAL STATEMENTS I NOTE 46
COUNTRY METHOD* Group ownership interest Group voting interestDecember
31, 2013December
31, 2012December
31, 2013December
31, 2012. SOGE PERIVAL I France FULL 100�00 100�00 100�00 100�00
. SOGE PERIVAL II France FULL 100�00 100�00 100�00 100�00
. SOGE PERIVAL III France FULL 100�00 100�00 100�00 100�00
. SOGE PERIVAL IV France FULL 100�00 100�00 100�00 100�00
� SOGEFONTENAY France FULL 100�00 100�00 100�00 100�00
� SOGINFO - SOCIETE DE GESTION ET D’INVESTISSEMENTS FONCIERS(1) France FULL 100�00 100�00 100�00 100�00
. SOCIETE DES TERRAINS ET IMMEUBLES PARISIENS (STIP) France FULL 99�99 99�99 100�00 100�00
. VALMINVEST France FULL 100�00 100�00 100�00 100�00
INSURANCE� GENECAR - SOCIETE GENERALE DE COURTAGE D’ASSURANCE ET DE REASSURANCE France FULL 100�00 100�00 100�00 100�00
. ORADEA VIE France FULL 100�00 100�00 100�00 100�00
� SOGECAP(1) France FULL 100�00 100�00 100�00 100�00
� SOGESSUR France FULL 100�00 100�00 100�00 100�00
. SOGECAP RISQUES DIVERS France FULL 100�00 100�00 100�00 100�00
EUROPE BANKS
. OHRIDSKA BANKA AD SKOPJE Macedonia FULL 70�02 70�02 72�68 72�76
. COMMERCIAL BANK DELTACREDIT(1) Russia FULL 92�40 82�40 100�00 100�00
� BRD - GROUPE SOCIETE GENERALE(1) Romania FULL 60�17 60�17 60�17 60�17
. BANKA SOCIETE GENERALE ALBANIA SH.A. Albania FULL 88�64 88�64 88�64 88�64
. BANK REPUBLIC(1) Georgia FULL 93�64 93�64 93�64 93�64
. KOMERCNI BANKA A.S(1) Czech Republic FULL 60�73 60�73 60�73 60�73
. SOCIETE GENERALE BANK NEDERLAND N.V. Netherlands FULL 100�00 100�00 100�00 100�00
. SG EXPRESS BANK(1) Bulgaria FULL 99�74 99�74 99�74 99�74
. SG HAMBROS LIMITED (HOLDING)(1) United Kingdom FULL 100�00 100�00 100�00 100�00
. SG PRIVATE BANKING SUISSE SA(1) Switzerland FULL 100�00 100�00 100�00 100�00
. SOCIETE GENERALE BANKA SRBIJA Serbia FULL 100�00 100�00 100�00 100�00
. SOCIETE GENERALE BANK AND TRUST LUXEMBOURG(1) Luxembourg FULL 100�00 100�00 100�00 100�00
. SOCIETE GENERALE PRIVATE BANKING (MONACO) Monaco FULL 100�00 100�00 100�00 100�00
. SKB BANKA(1) Slovenia FULL 99�72 99�72 99�72 99�72
. SOCIETE GENERALE PRIVATE BANKING NV/SA Belgium FULL 100�00 100�00 100�00 100�00
. SOCIETE GENERALE-SPLITSKA BANKA D.D.(1) Croatia FULL 100�00 100�00 100�00 100�00
. SOCIETE GENERALE SECURITIES SERVICES S.P.A. Italy FULL 100�00 100�00 100�00 100�00
. ROSBANK(1) Russia FULL 92�40 82�40 92�40 82�40
. MOBIASBANCA GROUPE SOCIETE GENERALE Moldova FULL 79�93 79�93 87�90 87�90
. SOCIETE GENERALE BANKA MONTENEGRO A.D. Montenegro FULL 90�56 90�56 90�56 90�56
FINANCIAL COMPANIES
. SGSS (IRELAND) LIMITED Ireland FULL 100�00 100�00 100�00 100�00
. SOLENTIS INVESTMENT SOLUTIONS PCC Jersey FULL 100�00 100�00 100�00 100�00
. SOCIETE GENERALE HEDGING LIMITED(9) Ireland FULL - - - -
� SG LDG Luxembourg FULL 100�00 100�00 100�00 100�00
� BRD FINANCE IFN S�A� Romania FULL 80�48 80�48 100�00 100�00
. BRIGANTIA INVESTMENTS B.V. Netherlands FULL 100�00 100�00 100�00 100�00
. CLARIS IV LTD(9) Jersey FULL - - - -
. SOCIETE GENERALE SECURITIES SERVICES LUXEMBOURG Luxembourg FULL 100�00 100�00 100�00 100�00
� HALYSA S�A� Luxembourg FULL 100�00 100�00 100�00 100�00
. IRIS II SPV LIMITED(9) Ireland FULL - - - -
. IVEFI SA Luxembourg FULL 100�00 100�00 100�00 100�00
. LYXOR MASTER FUND Jersey FULL 100�00 100�00 100�00 100�00
. LYXOR ASSET MANAGEMENT (IRELAND) LIMITED Ireland FULL 100�00 100�00 100�00 100�00
� SG ISSUER Luxembourg FULL 100�00 100�00 100�00 100�00
� SGBF S�A�(5) Belgium FULL - 100�00 - 100�00
. SOCIETE GENERALE CONSUMER FINANCE HOLDING HELLAS S�A�(1) Greece FULL 100�00 100�00 100�00 100�00
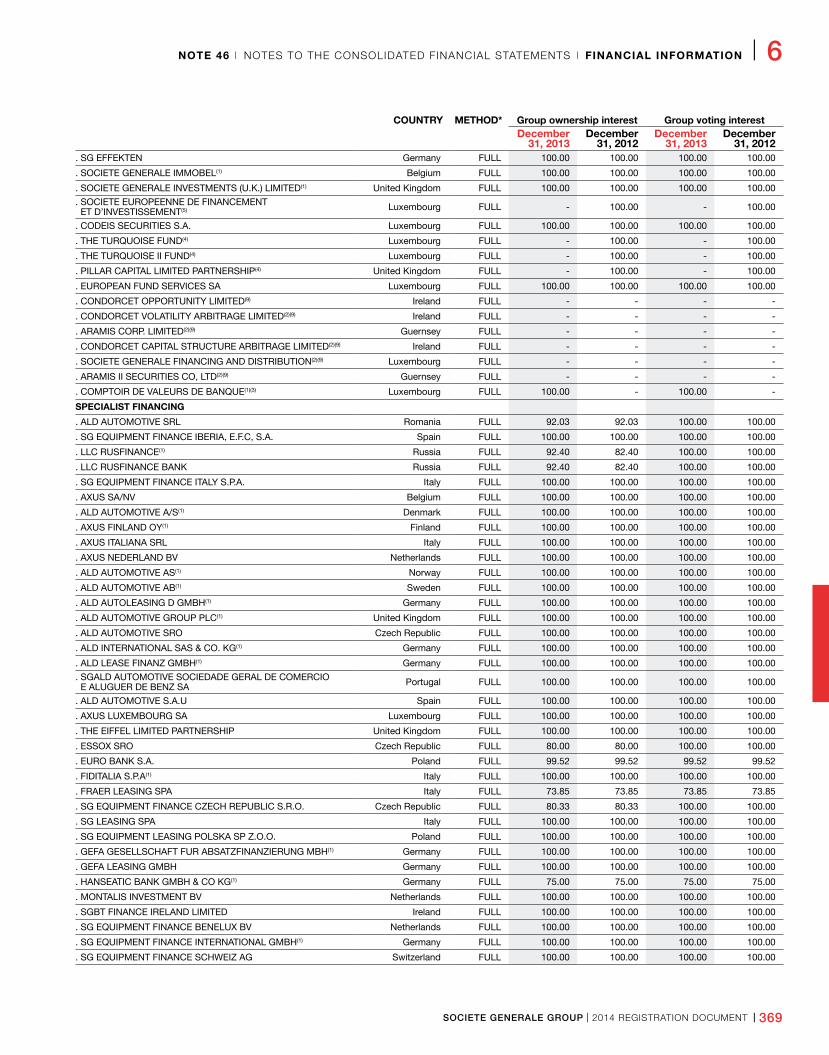
SOCIETE GENERALE GROUP I 2014 REGISTRATION DOCUMENT I 369
NOTE 46 I NOTES TO THE CONSOLIDATED FINANCIAL STATEMENTS I FINANCIAL INFORMATION I 6
COUNTRY METHOD* Group ownership interest Group voting interestDecember
31, 2013December
31, 2012December
31, 2013December
31, 2012. SG EFFEKTEN Germany FULL 100�00 100�00 100�00 100�00
. SOCIETE GENERALE IMMOBEL(1) Belgium FULL 100�00 100�00 100�00 100�00
. SOCIETE GENERALE INVESTMENTS (U.K.) LIMITED(1) United Kingdom FULL 100�00 100�00 100�00 100�00
. SOCIETE EUROPEENNE DE FINANCEMENT ET D’INVESTISSEMENT(5) Luxembourg FULL - 100�00 - 100�00
� CODEIS SECURITIES S�A� Luxembourg FULL 100�00 100�00 100�00 100�00
� THE TURQUOISE FUND(4) Luxembourg FULL - 100�00 - 100�00
� THE TURQUOISE II FUND(4) Luxembourg FULL - 100�00 - 100�00
. PILLAR CAPITAL LIMITED PARTNERSHIP(4) United Kingdom FULL - 100�00 - 100�00
. EUROPEAN FUND SERVICES SA Luxembourg FULL 100�00 100�00 100�00 100�00
. CONDORCET OPPORTUNITY LIMITED(9) Ireland FULL - - - -
. CONDORCET VOLATILITY ARBITRAGE LIMITED(2)(9) Ireland FULL - - - -
. ARAMIS CORP. LIMITED(2)(9) Guernsey FULL - - - -
. CONDORCET CAPITAL STRUCTURE ARBITRAGE LIMITED(2)(9) Ireland FULL - - - -
� SOCIETE GENERALE FINANCING AND DISTRIBUTION(2)(9) Luxembourg FULL - - - -
. ARAMIS II SECURITIES CO, LTD(2)(9) Guernsey FULL - - - -
. COMPTOIR DE VALEURS DE BANQUE(1)(3) Luxembourg FULL 100�00 - 100�00 -
SPECIALIST FINANCING
. ALD AUTOMOTIVE SRL Romania FULL 92�03 92�03 100�00 100�00
. SG EQUIPMENT FINANCE IBERIA, E.F.C, S.A. Spain FULL 100�00 100�00 100�00 100�00
� LLC RUSFINANCE(1) Russia FULL 92�40 82�40 100�00 100�00
. LLC RUSFINANCE BANK Russia FULL 92�40 82�40 100�00 100�00
. SG EQUIPMENT FINANCE ITALY S.P.A. Italy FULL 100�00 100�00 100�00 100�00
. AXUS SA/NV Belgium FULL 100�00 100�00 100�00 100�00
. ALD AUTOMOTIVE A/S(1) Denmark FULL 100�00 100�00 100�00 100�00
� AXUS FINLAND OY(1) Finland FULL 100�00 100�00 100�00 100�00
� AXUS ITALIANA SRL Italy FULL 100�00 100�00 100�00 100�00
. AXUS NEDERLAND BV Netherlands FULL 100�00 100�00 100�00 100�00
. ALD AUTOMOTIVE AS(1) Norway FULL 100�00 100�00 100�00 100�00
. ALD AUTOMOTIVE AB(1) Sweden FULL 100�00 100�00 100�00 100�00
. ALD AUTOLEASING D GMBH(1) Germany FULL 100�00 100�00 100�00 100�00
. ALD AUTOMOTIVE GROUP PLC(1) United Kingdom FULL 100�00 100�00 100�00 100�00
. ALD AUTOMOTIVE SRO Czech Republic FULL 100�00 100�00 100�00 100�00
. ALD INTERNATIONAL SAS & CO. KG(1) Germany FULL 100�00 100�00 100�00 100�00
. ALD LEASE FINANZ GMBH(1) Germany FULL 100�00 100�00 100�00 100�00
. SGALD AUTOMOTIVE SOCIEDADE GERAL DE COMERCIO E ALUGUER DE BENZ SA Portugal FULL 100�00 100�00 100�00 100�00
. ALD AUTOMOTIVE S.A.U Spain FULL 100�00 100�00 100�00 100�00
. AXUS LUXEMBOURG SA Luxembourg FULL 100�00 100�00 100�00 100�00
. THE EIFFEL LIMITED PARTNERSHIP United Kingdom FULL 100�00 100�00 100�00 100�00
� ESSOX SRO Czech Republic FULL 80�00 80�00 100�00 100�00
. EURO BANK S.A. Poland FULL 99�52 99�52 99�52 99�52
� FIDITALIA S�P�A(1) Italy FULL 100�00 100�00 100�00 100�00
� FRAER LEASING SPA Italy FULL 73�85 73�85 73�85 73�85
. SG EQUIPMENT FINANCE CZECH REPUBLIC S.R.O. Czech Republic FULL 80�33 80�33 100�00 100�00
� SG LEASING SPA Italy FULL 100�00 100�00 100�00 100�00
. SG EQUIPMENT LEASING POLSKA SP Z.O.O. Poland FULL 100�00 100�00 100�00 100�00
. GEFA GESELLSCHAFT FUR ABSATZFINANZIERUNG MBH(1) Germany FULL 100�00 100�00 100�00 100�00
. GEFA LEASING GMBH Germany FULL 100�00 100�00 100�00 100�00
. HANSEATIC BANK GMBH & CO KG(1) Germany FULL 75�00 75�00 75�00 75�00
. MONTALIS INVESTMENT BV Netherlands FULL 100�00 100�00 100�00 100�00
. SGBT FINANCE IRELAND LIMITED Ireland FULL 100�00 100�00 100�00 100�00
. SG EQUIPMENT FINANCE BENELUX BV Netherlands FULL 100�00 100�00 100�00 100�00
. SG EQUIPMENT FINANCE INTERNATIONAL GMBH(1) Germany FULL 100�00 100�00 100�00 100�00
. SG EQUIPMENT FINANCE SCHWEIZ AG Switzerland FULL 100�00 100�00 100�00 100�00
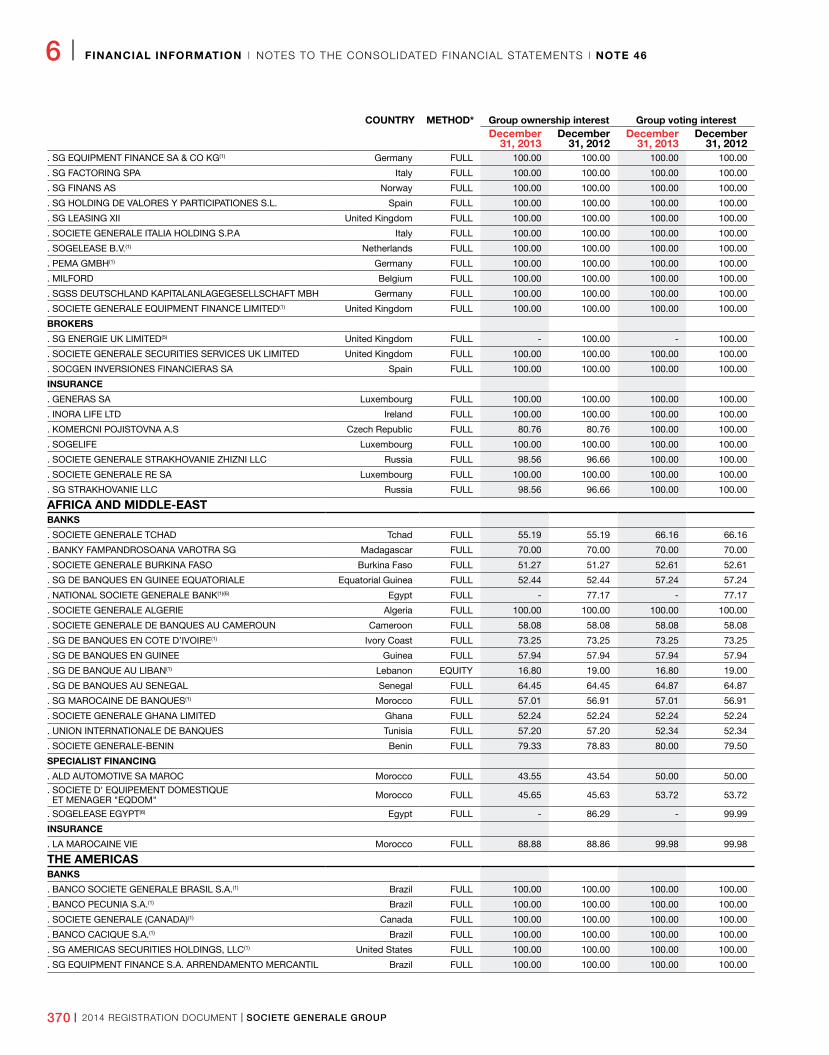
370 I 2014 REGISTRATION DOCUMENT I SOCIETE GENERALE GROUP
6 I FINANCIAL INFORMATION I NOTES TO THE CONSOLIDATED FINANCIAL STATEMENTS I NOTE 46
COUNTRY METHOD* Group ownership interest Group voting interestDecember
31, 2013December
31, 2012December
31, 2013December
31, 2012. SG EQUIPMENT FINANCE SA & CO KG(1) Germany FULL 100�00 100�00 100�00 100�00
� SG FACTORING SPA Italy FULL 100�00 100�00 100�00 100�00
� SG FINANS AS Norway FULL 100�00 100�00 100�00 100�00
. SG HOLDING DE VALORES Y PARTICIPATIONES S.L. Spain FULL 100�00 100�00 100�00 100�00
� SG LEASING XII United Kingdom FULL 100�00 100�00 100�00 100�00
� SOCIETE GENERALE ITALIA HOLDING S�P�A Italy FULL 100�00 100�00 100�00 100�00
. SOGELEASE B.V.(1) Netherlands FULL 100�00 100�00 100�00 100�00
. PEMA GMBH(1) Germany FULL 100�00 100�00 100�00 100�00
. MILFORD Belgium FULL 100�00 100�00 100�00 100�00
. SGSS DEUTSCHLAND KAPITALANLAGEGESELLSCHAFT MBH Germany FULL 100�00 100�00 100�00 100�00
. SOCIETE GENERALE EQUIPMENT FINANCE LIMITED(1) United Kingdom FULL 100�00 100�00 100�00 100�00
BROKERS
. SG ENERGIE UK LIMITED(5) United Kingdom FULL - 100�00 - 100�00
. SOCIETE GENERALE SECURITIES SERVICES UK LIMITED United Kingdom FULL 100�00 100�00 100�00 100�00
. SOCGEN INVERSIONES FINANCIERAS SA Spain FULL 100�00 100�00 100�00 100�00
INSURANCE
� GENERAS SA Luxembourg FULL 100�00 100�00 100�00 100�00
� INORA LIFE LTD Ireland FULL 100�00 100�00 100�00 100�00
. KOMERCNI POJISTOVNA A.S Czech Republic FULL 80�76 80�76 100�00 100�00
� SOGELIFE Luxembourg FULL 100�00 100�00 100�00 100�00
. SOCIETE GENERALE STRAKHOVANIE ZHIZNI LLC Russia FULL 98�56 96�66 100�00 100�00
� SOCIETE GENERALE RE SA Luxembourg FULL 100�00 100�00 100�00 100�00
. SG STRAKHOVANIE LLC Russia FULL 98�56 96�66 100�00 100�00
AFRICA AND MIDDLE-EAST BANKS
� SOCIETE GENERALE TCHAD Tchad FULL 55�19 55�19 66�16 66�16
. BANKY FAMPANDROSOANA VAROTRA SG Madagascar FULL 70�00 70�00 70�00 70�00
. SOCIETE GENERALE BURKINA FASO Burkina Faso FULL 51�27 51�27 52�61 52�61
� SG DE BANQUES EN GUINEE EQUATORIALE Equatorial Guinea FULL 52�44 52�44 57�24 57�24
. NATIONAL SOCIETE GENERALE BANK(1)(6) Egypt FULL - 77�17 - 77�17
� SOCIETE GENERALE ALGERIE Algeria FULL 100�00 100�00 100�00 100�00
. SOCIETE GENERALE DE BANQUES AU CAMEROUN Cameroon FULL 58�08 58�08 58�08 58�08
. SG DE BANQUES EN COTE D’IVOIRE(1) Ivory Coast FULL 73�25 73�25 73�25 73�25
� SG DE BANQUES EN GUINEE Guinea FULL 57�94 57�94 57�94 57�94
� SG DE BANQUE AU LIBAN(1) Lebanon EQUITY 16�80 19�00 16�80 19�00
� SG DE BANQUES AU SENEGAL Senegal FULL 64�45 64�45 64�87 64�87
. SG MAROCAINE DE BANQUES(1) Morocco FULL 57�01 56�91 57�01 56�91
. SOCIETE GENERALE GHANA LIMITED Ghana FULL 52�24 52�24 52�24 52�24
� UNION INTERNATIONALE DE BANQUES Tunisia FULL 57�20 57�20 52�34 52�34
� SOCIETE GENERALE-BENIN Benin FULL 79�33 78�83 80�00 79�50
SPECIALIST FINANCING
. ALD AUTOMOTIVE SA MAROC Morocco FULL 43�55 43�54 50�00 50�00
. SOCIETE D' EQUIPEMENT DOMESTIQUE ET MENAGER "EQDOM" Morocco FULL 45�65 45�63 53�72 53�72
� SOGELEASE EGYPT(6) Egypt FULL - 86�29 - 99�99
INSURANCE
. LA MAROCAINE VIE Morocco FULL 88�88 88�86 99�98 99�98
THE AMERICAS BANKS
� BANCO SOCIETE GENERALE BRASIL S�A�(1) Brazil FULL 100�00 100�00 100�00 100�00
� BANCO PECUNIA S�A�(1) Brazil FULL 100�00 100�00 100�00 100�00
� SOCIETE GENERALE (CANADA)(1) Canada FULL 100�00 100�00 100�00 100�00
� BANCO CACIQUE S�A�(1) Brazil FULL 100�00 100�00 100�00 100�00
. SG AMERICAS SECURITIES HOLDINGS, LLC(1) United States FULL 100�00 100�00 100�00 100�00
. SG EQUIPMENT FINANCE S.A. ARRENDAMENTO MERCANTIL Brazil FULL 100�00 100�00 100�00 100�00
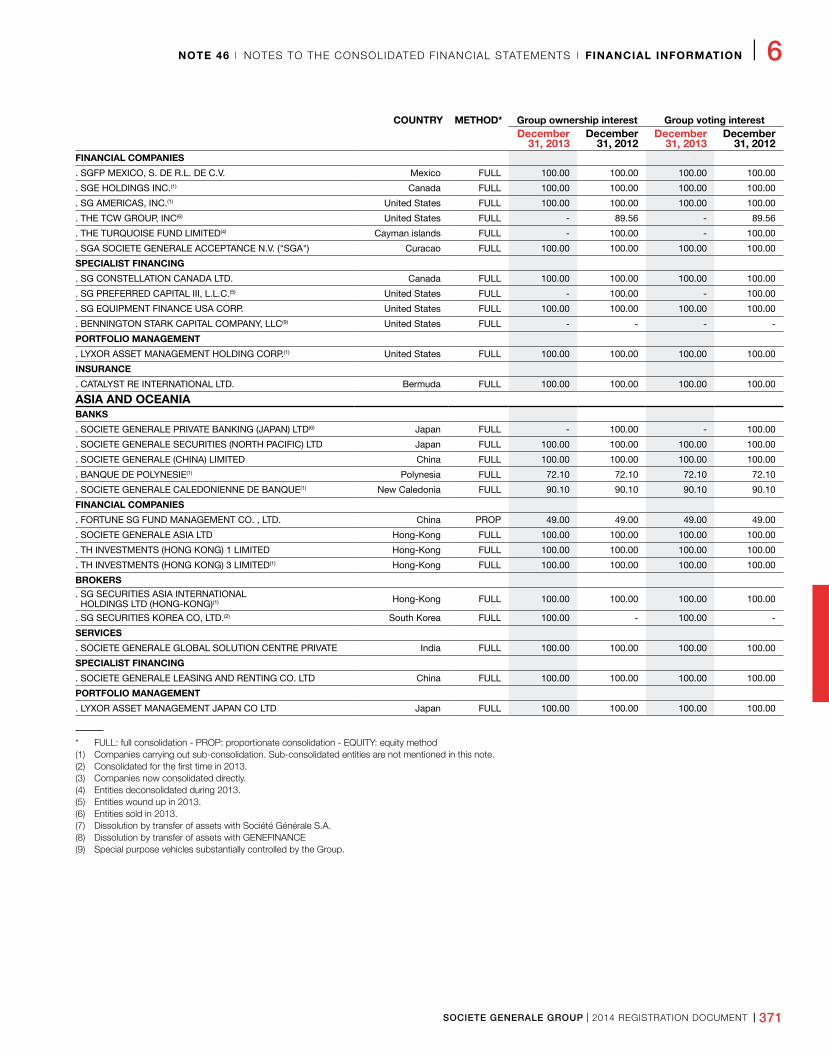
SOCIETE GENERALE GROUP I 2014 REGISTRATION DOCUMENT I 371
NOTE 46 I NOTES TO THE CONSOLIDATED FINANCIAL STATEMENTS I FINANCIAL INFORMATION I 6
COUNTRY METHOD* Group ownership interest Group voting interestDecember
31, 2013December
31, 2012December
31, 2013December
31, 2012FINANCIAL COMPANIES
. SGFP MEXICO, S. DE R.L. DE C.V. Mexico FULL 100�00 100�00 100�00 100�00
� SGE HOLDINGS INC�(1) Canada FULL 100�00 100�00 100�00 100�00
. SG AMERICAS, INC.(1) United States FULL 100�00 100�00 100�00 100�00
� THE TCW GROUP, INC(6) United States FULL - 89�56 - 89�56
. THE TURQUOISE FUND LIMITED(4) Cayman islands FULL - 100�00 - 100�00
. SGA SOCIETE GENERALE ACCEPTANCE N.V. ("SGA") Curacao FULL 100�00 100�00 100�00 100�00
SPECIALIST FINANCING
� SG CONSTELLATION CANADA LTD� Canada FULL 100�00 100�00 100�00 100�00
� SG PREFERRED CAPITAL III, L�L�C�(5) United States FULL - 100�00 - 100�00
. SG EQUIPMENT FINANCE USA CORP. United States FULL 100�00 100�00 100�00 100�00
. BENNINGTON STARK CAPITAL COMPANY, LLC(9) United States FULL - - - -
PORTFOLIO MANAGEMENT
. LYXOR ASSET MANAGEMENT HOLDING CORP.(1) United States FULL 100�00 100�00 100�00 100�00
INSURANCE
� CATALYST RE INTERNATIONAL LTD� Bermuda FULL 100�00 100�00 100�00 100�00
ASIA AND OCEANIA BANKS
. SOCIETE GENERALE PRIVATE BANKING (JAPAN) LTD(6) Japan FULL - 100�00 - 100�00
� SOCIETE GENERALE SECURITIES (NORTH PACIFIC) LTD Japan FULL 100�00 100�00 100�00 100�00
. SOCIETE GENERALE (CHINA) LIMITED China FULL 100�00 100�00 100�00 100�00
� BANQUE DE POLYNESIE(1) Polynesia FULL 72�10 72�10 72�10 72�10
� SOCIETE GENERALE CALEDONIENNE DE BANQUE(1) New Caledonia FULL 90�10 90�10 90�10 90�10
FINANCIAL COMPANIES
. FORTUNE SG FUND MANAGEMENT CO. , LTD. China PROP 49�00 49�00 49�00 49�00
� SOCIETE GENERALE ASIA LTD Hong-Kong FULL 100�00 100�00 100�00 100�00
. TH INVESTMENTS (HONG KONG) 1 LIMITED Hong-Kong FULL 100�00 100�00 100�00 100�00
. TH INVESTMENTS (HONG KONG) 3 LIMITED(1) Hong-Kong FULL 100�00 100�00 100�00 100�00
BROKERS� SG SECURITIES ASIA INTERNATIONAL HOLDINGS LTD (HONG-KONG)(1) Hong-Kong FULL 100�00 100�00 100�00 100�00
. SG SECURITIES KOREA CO, LTD.(2) South Korea FULL 100�00 - 100�00 -
SERVICES
. SOCIETE GENERALE GLOBAL SOLUTION CENTRE PRIVATE India FULL 100�00 100�00 100�00 100�00
SPECIALIST FINANCING
� SOCIETE GENERALE LEASING AND RENTING CO� LTD China FULL 100�00 100�00 100�00 100�00
PORTFOLIO MANAGEMENT
. LYXOR ASSET MANAGEMENT JAPAN CO LTD Japan FULL 100�00 100�00 100�00 100�00
* FULL: full consolidation - PROP: proportionate consolidation - EQUITY: equity method(1) Companies carrying out sub-consolidation. Sub-consolidated entities are not mentioned in this note.(2) Consolidated for the first time in 2013.(3) Companies now consolidated directly.(4) Entities deconsolidated during 2013.(5) Entities wound up in 2013.(6) Entities sold in 2013.(7) Dissolution by transfer of assets with Société Générale S.A.(8) Dissolution by transfer of assets with GENEFINANCE(9) Special purpose vehicles substantially controlled by the Group.
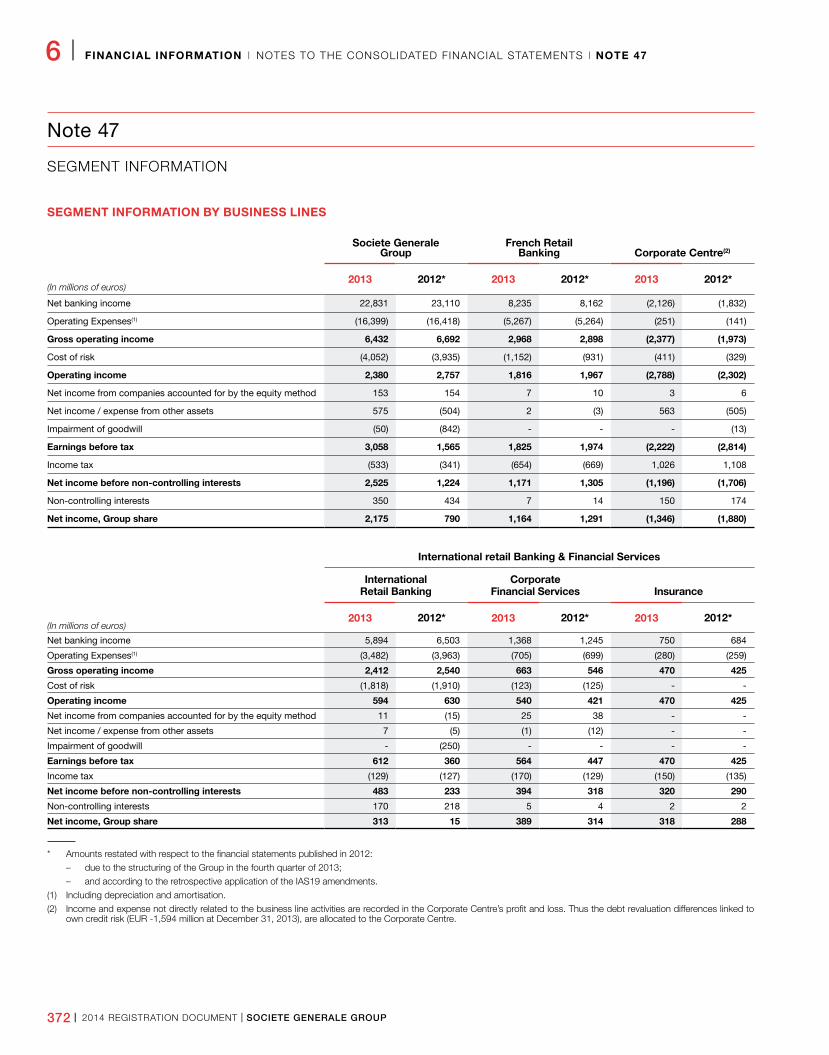
372 I 2014 REGISTRATION DOCUMENT I SOCIETE GENERALE GROUP
6 I FINANCIAL INFORMATION I NOTES TO THE CONSOLIDATED FINANCIAL STATEMENTS I NOTE 47
Note 47
SEGMENT INFORMATION
SEGMENT INFORMATION BY BUSINESS LINES
Societe Generale Group
French Retail Banking Corporate Centre(2)
(In millions of euros)2013 2012* 2013 2012* 2013 2012*
Net banking income 22,831 23,110 8,235 8,162 (2,126) (1,832)
Operating Expenses(1) (16,399) (16,418) (5,267) (5,264) (251) (141)
Gross operating income 6,432 6,692 2,968 2,898 (2,377) (1,973)
Cost of risk (4,052) (3,935) (1,152) (931) (411) (329)
Operating income 2,380 2,757 1,816 1,967 (2,788) (2,302)
Net income from companies accounted for by the equity method 153 154 7 10 3 6
Net income / expense from other assets 575 (504) 2 (3) 563 (505)
Impairment of goodwill (50) (842) - - - (13)
Earnings before tax 3,058 1,565 1,825 1,974 (2,222) (2,814)
Income tax (533) (341) (654) (669) 1,026 1,108
Net income before non-controlling interests 2,525 1,224 1,171 1,305 (1,196) (1,706)
Non-controlling interests 350 434 7 14 150 174
Net income, Group share 2,175 790 1,164 1,291 (1,346) (1,880)
International retail Banking & Financial Services
International Retail Banking
Corporate Financial Services Insurance
(In millions of euros)2013 2012* 2013 2012* 2013 2012*
Net banking income 5,894 6,503 1,368 1,245 750 684
Operating Expenses(1) (3,482) (3,963) (705) (699) (280) (259)
Gross operating income 2,412 2,540 663 546 470 425
Cost of risk (1,818) (1,910) (123) (125) - -
Operating income 594 630 540 421 470 425
Net income from companies accounted for by the equity method 11 (15) 25 38 - -
Net income / expense from other assets 7 (5) (1) (12) - -
Impairment of goodwill - (250) - - - -
Earnings before tax 612 360 564 447 470 425
Income tax (129) (127) (170) (129) (150) (135)
Net income before non-controlling interests 483 233 394 318 320 290
Non-controlling interests 170 218 5 4 2 2
Net income, Group share 313 15 389 314 318 288
* Amounts restated with respect to the financial statements published in 2012:
– due to the structuring of the Group in the fourth quarter of 2013;
– and according to the retrospective application of the IAS19 amendments.
(1) Including depreciation and amortisation.
(2) Income and expense not directly related to the business line activities are recorded in the Corporate Centre’s profit and loss. Thus the debt revaluation differences linked to own credit risk (EUR -1,594 million at December 31, 2013), are allocated to the Corporate Centre.
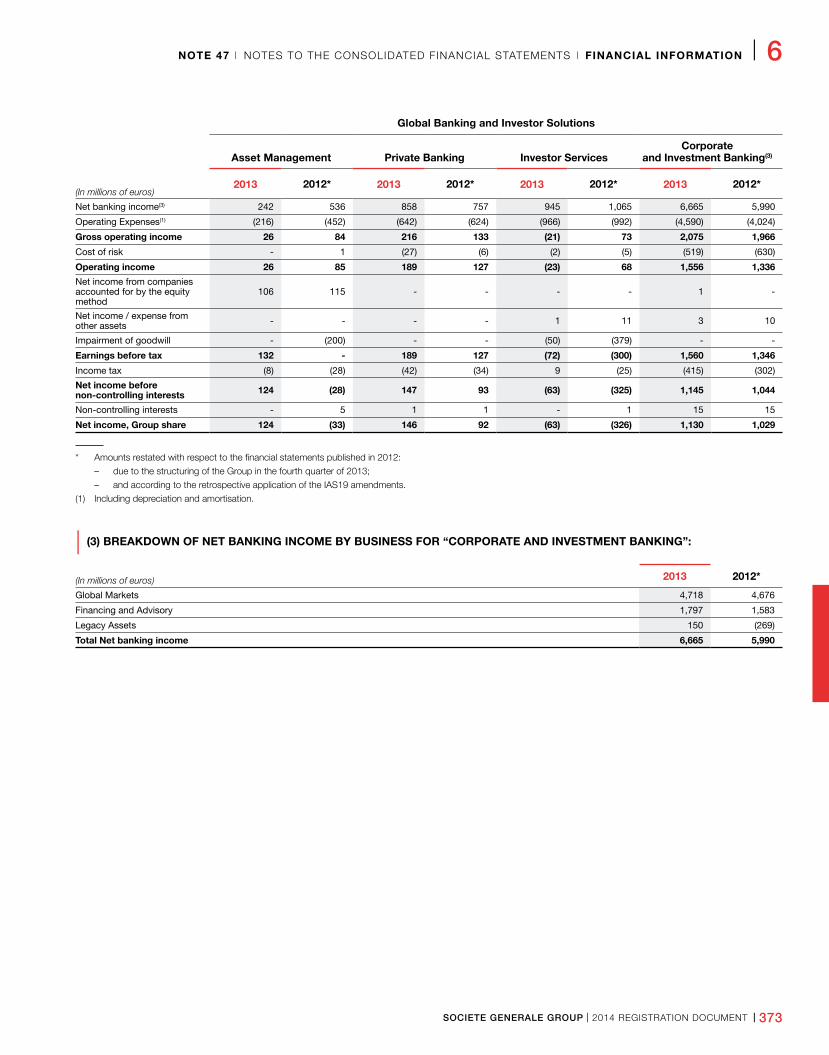
SOCIETE GENERALE GROUP I 2014 REGISTRATION DOCUMENT I 373
NOTE 47 I NOTES TO THE CONSOLIDATED FINANCIAL STATEMENTS I FINANCIAL INFORMATION I 6
Global Banking and Investor Solutions
Asset Management Private Banking Investor ServicesCorporate
and Investment Banking(3)
(In millions of euros)2013 2012* 2013 2012* 2013 2012* 2013 2012*
Net banking income(3) 242 536 858 757 945 1,065 6,665 5,990
Operating Expenses(1) (216) (452) (642) (624) (966) (992) (4,590) (4,024)
Gross operating income 26 84 216 133 (21) 73 2,075 1,966
Cost of risk - 1 (27) (6) (2) (5) (519) (630)
Operating income 26 85 189 127 (23) 68 1,556 1,336
Net income from companies accounted for by the equity method
106 115 - - - - 1 -
Net income / expense from other assets - - - - 1 11 3 10
Impairment of goodwill - (200) - - (50) (379) - -
Earnings before tax 132 - 189 127 (72) (300) 1,560 1,346
Income tax (8) (28) (42) (34) 9 (25) (415) (302)
Net income before non-controlling interests 124 (28) 147 93 (63) (325) 1,145 1,044
Non-controlling interests - 5 1 1 - 1 15 15
Net income, Group share 124 (33) 146 92 (63) (326) 1,130 1,029
* Amounts restated with respect to the financial statements published in 2012:
– due to the structuring of the Group in the fourth quarter of 2013;
– and according to the retrospective application of the IAS19 amendments.
(1) Including depreciation and amortisation.
| (3) BREAKDOWN OF NET BANKING INCOME BY BUSINESS FOR “CORPORATE AND INVESTMENT BANKING”:
(In millions of euros) 2013 2012*
Global Markets 4,718 4,676
Financing and Advisory 1,797 1,583
Legacy Assets 150 (269)
Total Net banking income 6,665 5,990
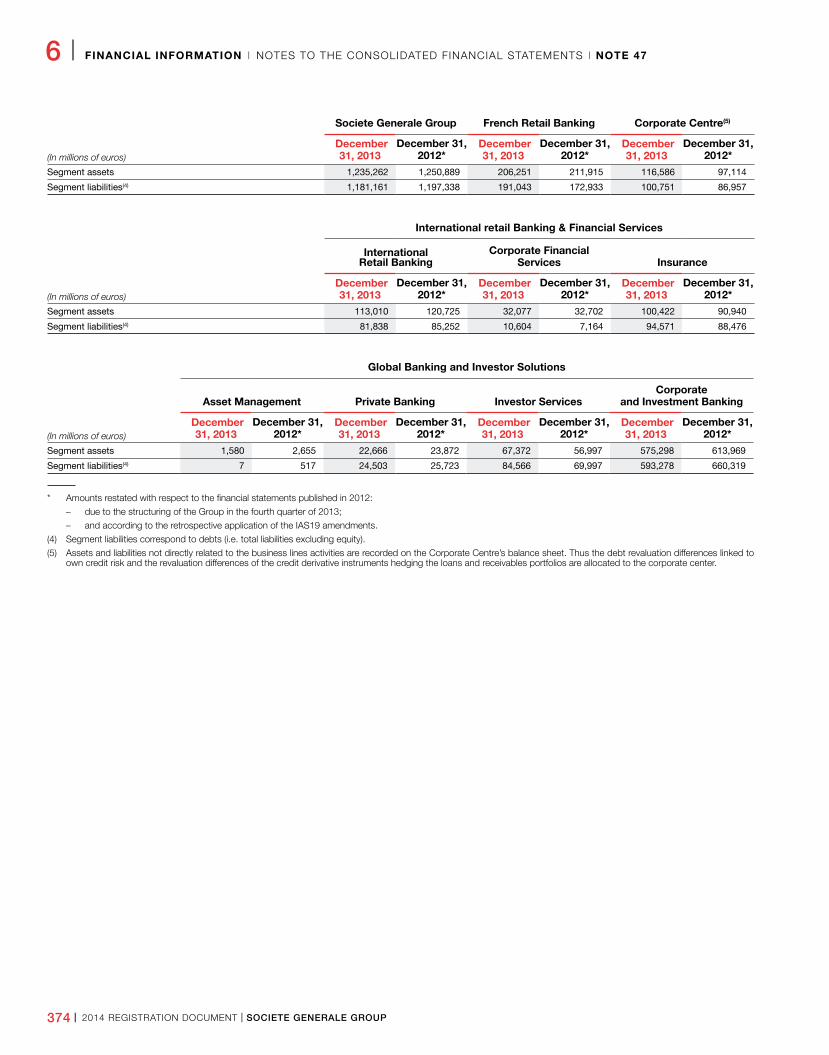
374 I 2014 REGISTRATION DOCUMENT I SOCIETE GENERALE GROUP
6 I FINANCIAL INFORMATION I NOTES TO THE CONSOLIDATED FINANCIAL STATEMENTS I NOTE 47
Societe Generale Group French Retail Banking Corporate Centre(5)
(In millions of euros) December
31, 2013 December 31,
2012* December
31, 2013 December 31,
2012* December
31, 2013 December 31,
2012*
Segment assets 1,235,262 1,250,889 206,251 211,915 116,586 97,114
Segment liabilities(4) 1,181,161 1,197,338 191,043 172,933 100,751 86,957
International retail Banking & Financial Services
International Retail Banking
Corporate Financial Services Insurance
(In millions of euros) December
31, 2013 December 31,
2012* December
31, 2013 December 31,
2012* December
31, 2013 December 31,
2012*
Segment assets 113,010 120,725 32,077 32,702 100,422 90,940
Segment liabilities(4) 81,838 85,252 10,604 7,164 94,571 88,476
Global Banking and Investor Solutions
Asset Management Private Banking Investor ServicesCorporate
and Investment Banking
(In millions of euros) December
31, 2013 December 31,
2012* December
31, 2013 December 31,
2012* December
31, 2013 December 31,
2012* December
31, 2013 December 31,
2012*
Segment assets 1,580 2,655 22,666 23,872 67,372 56,997 575,298 613,969
Segment liabilities(4) 7 517 24,503 25,723 84,566 69,997 593,278 660,319
* Amounts restated with respect to the financial statements published in 2012:
– due to the structuring of the Group in the fourth quarter of 2013;
– and according to the retrospective application of the IAS19 amendments.
(4) Segment liabilities correspond to debts (i.e. total liabilities excluding equity).
(5) Assets and liabilities not directly related to the business lines activities are recorded on the Corporate Centre’s balance sheet. Thus the debt revaluation differences linked to own credit risk and the revaluation differences of the credit derivative instruments hedging the loans and receivables portfolios are allocated to the corporate center.
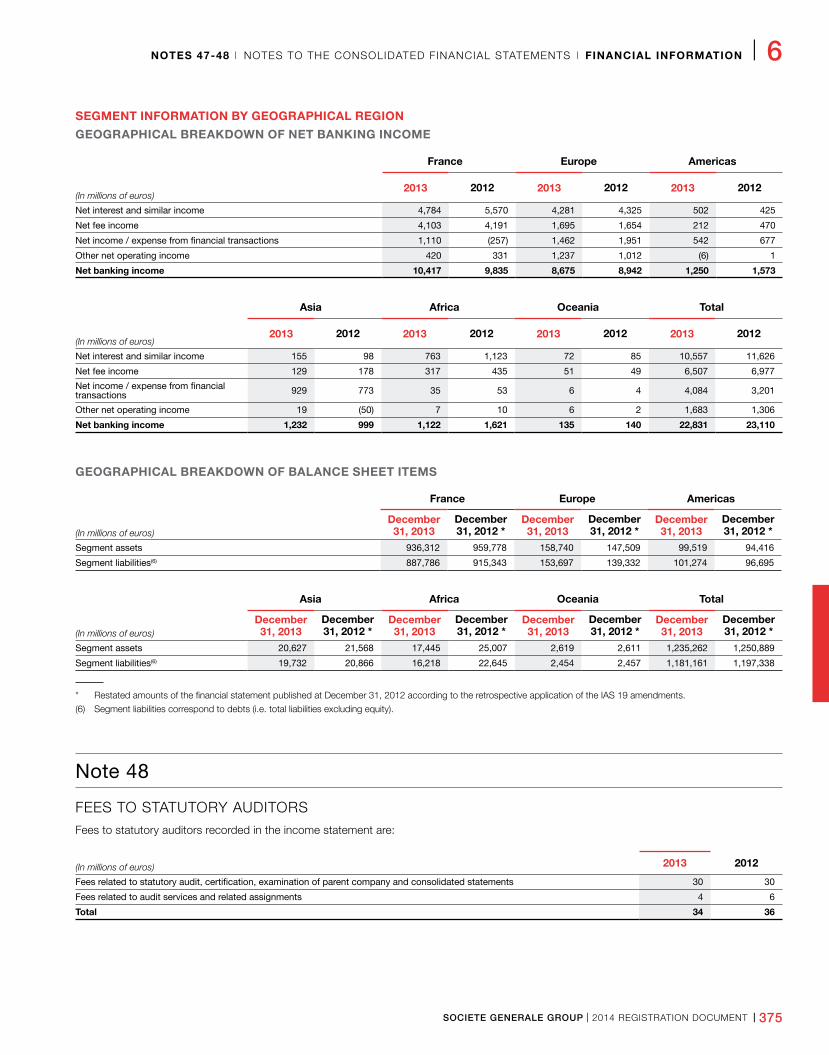
SOCIETE GENERALE GROUP I 2014 REGISTRATION DOCUMENT I 375
NOTES 47-48 I NOTES TO THE CONSOLIDATED FINANCIAL STATEMENTS I FINANCIAL INFORMATION I 6
Note 48
FEES TO STATUTORY AUDITORSFees to statutory auditors recorded in the income statement are:
(In millions of euros) 2013 2012
Fees related to statutory audit, certification, examination of parent company and consolidated statements 30 30
Fees related to audit services and related assignments 4 6
Total 34 36
SEGMENT INFORMATION BY GEOGRAPHICAL REGION
GEOGRAPHICAL BREAKDOWN OF NET BANKING INCOME
France Europe Americas
(In millions of euros)2013 2012 2013 2012 2013 2012
Net interest and similar income 4,784 5,570 4,281 4,325 502 425
Net fee income 4,103 4,191 1,695 1,654 212 470
Net income / expense from financial transactions 1,110 (257) 1,462 1,951 542 677
Other net operating income 420 331 1,237 1,012 (6) 1
Net banking income 10,417 9,835 8,675 8,942 1,250 1,573
Asia Africa Oceania Total
(In millions of euros)2013 2012 2013 2012 2013 2012 2013 2012
Net interest and similar income 155 98 763 1,123 72 85 10,557 11,626
Net fee income 129 178 317 435 51 49 6,507 6,977
Net income / expense from financial transactions 929 773 35 53 6 4 4,084 3,201
Other net operating income 19 (50) 7 10 6 2 1,683 1,306
Net banking income 1,232 999 1,122 1,621 135 140 22,831 23,110
GEOGRAPHICAL BREAKDOWN OF BALANCE SHEET ITEMS
France Europe Americas
(In millions of euros)December 31, 2013
December 31, 2012 *
December 31, 2013
December 31, 2012 *
December 31, 2013
December 31, 2012 *
Segment assets 936,312 959,778 158,740 147,509 99,519 94,416
Segment liabilities(6) 887,786 915,343 153,697 139,332 101,274 96,695
Asia Africa Oceania Total
(In millions of euros)December 31, 2013
December 31, 2012 *
December 31, 2013
December 31, 2012 *
December 31, 2013
December 31, 2012 *
December 31, 2013
December 31, 2012 *
Segment assets 20,627 21,568 17,445 25,007 2,619 2,611 1,235,262 1,250,889
Segment liabilities(6) 19,732 20,866 16,218 22,645 2,454 2,457 1,181,161 1,197,338
* Restated amounts of the financial statement published at December 31, 2012 according to the retrospective application of the IAS 19 amendments.
(6) Segment liabilities correspond to debts (i.e. total liabilities excluding equity).
376 I 2014 REGISTRATION DOCUMENT I SOCIETE GENERALE GROUP
6 I FINANCIAL INFORMATION I STATUTORY AUDITOR’S REPORT ON THE CONSOLIDATED FINANCIAL STATEMENTS
3. STAT U TO RY AU D I TO R ’ S R E P O RT O N T H E C O N SO L I DAT E D F I N A N C I A L STAT E M E N TS
This is a free translation into English of the statutory auditors’ report on the consolidated financial statements issued in French and it is provided solely for the convenience of English-speaking users.
The statutory auditors’ report includes information specifically required by French law in such reports, whether modified or not. This information is presented below the audit opinion on the consolidated financial statements and includes an explanatory paragraph discussing the auditors’ assessments of certain significant accounting and auditing matters. These assessments were considered for the purpose of issuing an audit opinion on the consolidated financial statements taken as a whole and not to provide separate assurance on individual account balances, transactions or disclosures.
This report also includes information relating to the specific verification of information given in the group’s management report.
This report should be read in conjunction with and construed in accordance with French law and professional auditing standards applicable in France.
DELOITTE & ASSOCIES
185, avenue Charles de Gaulle 92524 Neuilly-sur-Seine Cedex S.A. au capital de € 1.723.040
Commissaire aux Comptes Membre de la compagnie régionale de Versailles
ERNST & YOUNG et Autres
1/2, place des Saisons 92400 Courbevoie - Paris-La Défense 1
S.A.S. à capital variable
Commissaire aux Comptes Membre de la compagnie régionale de Versailles
SOCIETE GENERALE - YEAR ENDED DECEMBER 31, 2013To the Shareholders,
In compliance with the assignment entrusted to us by your annual general meeting, we hereby report to you, for the year ended December 31, 2013, on:
n the audit of the accompanying consolidated financial statements of Societe Generale;
n the justification of our assessments;
n the specific verification required by law.
These consolidated financial statements have been approved by the board of directors. Our role is to express an opinion on these consolidated financial statements based on our audit.
I. OPINION ON THE CONSOLIDATED FINANCIAL STATEMENTSWe conducted our audit in accordance with professional standards applicable in France; those standards require that we plan and perform the audit to obtain reasonable assurance about whether the consolidated financial statements are free of material misstatement. An audit involves performing procedures, using sampling techniques or other methods of selection, to obtain audit evidence about the amounts and disclosures in the consolidated financial statements. An audit also includes evaluating the appropriateness of accounting policies used and the reasonableness of accounting estimates made,
as well as the overall presentation of the consolidated financial statements. We believe that the audit evidence we have obtained is sufficient and appropriate to provide a basis for our audit opinion.
In our opinion, the consolidated financial statements give a true and fair view of the assets and liabilities and of the financial position of the group as at December 31, 2013 and of the results of its operations for the year then ended in accordance with International Financial Reporting Standards as adopted by the European Union.
Without qualifying our opinion, we draw your attention to note 1 “Significant accounting principles - Introduction” which sets out the consequences of the initial application of the amendments to IAS 19 “Employee Benefits” and of IFRS 13 “Fair value measurement”.
II. JUSTIFICATION OF OUR ASSESSMENTSIn accordance with the requirements of article L. 823-9 of the French commercial code (Code de commerce) relating to the justification of our assessments, we bring to your attention the following matters:
n For the purpose of preparing the consolidated financial statements, your company records depreciation to cover the credit risks inherent to its activities and performs significant accounting estimates, as described in note 1 to the consolidated financial statements, related in particular to the valuation of goodwill and the assessment of the deferred tax assets, to the valuation of provisions other than those for credit risk as well as the assessment of provisions for employee benefits. We have reviewed and tested the processes implemented by management, the underlying assumptions and the valuation parameters, and we
SOCIETE GENERALE GROUP I 2014 REGISTRATION DOCUMENT I 377
STATUTORY AUDITOR’S REPORT ON THE CONSOLIDATED FINANCIAL STATEMENTS I FINANCIAL INFORMATION I 6
have assessed whether these accounting estimates are based on documented procedures consistent with the accounting policies disclosed in note 1 to the consolidated financial statements.
n As detailed in note 3 to the consolidated financial statements, your company uses internal models to measure financial instruments that are not listed on active markets. Our procedures consisted in reviewing the control procedures for the models used, assessing the underlying data and assumptions as well as their observability, and verifying that the risks generally expected from the markets were taken into account in the valuations.
n As stated in notes 3 and 6 to the consolidated financial statements, your company assessed the impact of changes in its own credit risk with respect to the valuation of certain financial liabilities measured at fair value through profit or loss. We have verified the appropriateness of the data used for this purpose.
These assessments were made as part of our audit of the consolidated financial statements taken as a whole, and therefore contributed to the opinion we formed which is expressed in the first part of this report.
III. SPECIFIC VERIFICATIONAs required by law we have also verified in accordance with professional standards applicable in France the information presented in the group’s management report.
We have no matters to report as to its fair presentation and its consistency with the consolidated financial statements.
Neuilly-sur-Seine and Paris-La Défense, March 4, 2014 The statutory auditors
French original signed by
DELOITTE & ASSOCIES Jean-Marc Mickeler
ERNST & YOUNG et Autres Isabelle Santenac

378 I 2014 REGISTRATION DOCUMENT I SOCIETE GENERALE GROUP
SOCIETE GENERALE GROUP I 2014 REGISTRATION DOCUMENT I 379
SOCIETE GENERALE MANAGEMENT REPORT I FINANCIAL INFORMATION I 6
Contents of Societe Generale management report4. SOCIETE GENERALE MANAGEMENT REPORT
Analysis of balance sheet of Societe Generale �������������������������������������������������������������������������������������������������������������������������������������������������������������������������������������������������380Summary income statement of Societe Generale ���������������������������������������������������������������������������������������������������������������������������������������������������������������������������������������������381Supplier payables payment schedule ���������������������������������������������������������������������������������������������������������������������������������������������������������������������������������������������������������������382Five-year financial summary of Societe Generale ���������������������������������������������������������������������������������������������������������������������������������������������������������������������������������������������383Main changes in the investment portfolio in 2013 ��������������������������������������������������������������������������������������������������������������������������������������������������������������������������������������������383Information required pursuant to article L� 511-4-2 of the French Monetary and Financial Code related to Societe Generale SA �����������������������������������������������������������������384
5. PARENT COMPANY FINANCIAL STATEMENTS
Parent company balance sheet �������������������������������������������������������������������������������������������������������������������������������������������������������������������������������������������������������������������������385Income statement ����������������������������������������������������������������������������������������������������������������������������������������������������������������������������������������������������������������������������������������������387
6. NOTES TO THE PARENT COMPANY FINANCIAL STATEMENTS
Note 1 Significant accounting principles ������������������������������������������������������������������������������������������������������������������������������������������������������������������������������������������������������388Note 2 Due from banks ���������������������������������������������������������������������������������������������������������������������������������������������������������������������������������������������������������������������������������395Note 3 Customer loans ���������������������������������������������������������������������������������������������������������������������������������������������������������������������������������������������������������������������������������396Note 4 Treasury notes, bonds and other debt securities, shares and other equity securities ���������������������������������������������������������������������������������������������������������������������397 Additional information on securities �������������������������������������������������������������������������������������������������������������������������������������������������������������������������������������������������397 Portfolios transfers ����������������������������������������������������������������������������������������������������������������������������������������������������������������������������������������������������������������������������398Note 5 Affiliates and other long term securities �������������������������������������������������������������������������������������������������������������������������������������������������������������������������������������������399Note 6 Investments in subsidiaries ���������������������������������������������������������������������������������������������������������������������������������������������������������������������������������������������������������������399Note 7 Tangible and intangible fixed assets �������������������������������������������������������������������������������������������������������������������������������������������������������������������������������������������������400Note 8 Treasury stock �����������������������������������������������������������������������������������������������������������������������������������������������������������������������������������������������������������������������������������400Note 9 Accruals, other accounts receivable and other assets ���������������������������������������������������������������������������������������������������������������������������������������������������������������������401Note 10 due to banks �������������������������������������������������������������������������������������������������������������������������������������������������������������������������������������������������������������������������������������401Note 11 customer deposits ����������������������������������������������������������������������������������������������������������������������������������������������������������������������������������������������������������������������������402Note 12 Debt Securities Issued ����������������������������������������������������������������������������������������������������������������������������������������������������������������������������������������������������������������������402Note 13 Accruals, other accounts payable and other liabilities ���������������������������������������������������������������������������������������������������������������������������������������������������������������������403Note 14 Provisions and depreciations ������������������������������������������������������������������������������������������������������������������������������������������������������������������������������������������������������������404Note 15 Mortgage savings agreements (PEL/CEL) ����������������������������������������������������������������������������������������������������������������������������������������������������������������������������������������405Note 16 Subordinated debt ����������������������������������������������������������������������������������������������������������������������������������������������������������������������������������������������������������������������������406Note 17 Changes in shareholders’ equity ������������������������������������������������������������������������������������������������������������������������������������������������������������������������������������������������������408Note 18 Commitments �����������������������������������������������������������������������������������������������������������������������������������������������������������������������������������������������������������������������������������409Note 19 Forward financial instruments commitments ������������������������������������������������������������������������������������������������������������������������������������������������������������������������������������410 Fair-value of the transactions qualified as hedging ��������������������������������������������������������������������������������������������������������������������������������������������������������������������������410Note 20 Interests incomes and expenses ������������������������������������������������������������������������������������������������������������������������������������������������������������������������������������������������������411Note 21 Dividend income �������������������������������������������������������������������������������������������������������������������������������������������������������������������������������������������������������������������������������412Note 22 Net fee income ����������������������������������������������������������������������������������������������������������������������������������������������������������������������������������������������������������������������������������412Note 23 Net income from financial transactions ��������������������������������������������������������������������������������������������������������������������������������������������������������������������������������������������413Note 24 Personnel expenses ��������������������������������������������������������������������������������������������������������������������������������������������������������������������������������������������������������������������������413Note 25 Employee benefits ����������������������������������������������������������������������������������������������������������������������������������������������������������������������������������������������������������������������������414Note 26 Subscription or purchase stock-option plans and free share plans �������������������������������������������������������������������������������������������������������������������������������������������������419Note 27 Cost of risk ����������������������������������������������������������������������������������������������������������������������������������������������������������������������������������������������������������������������������������������420Note 28 Net income from long-term investments ������������������������������������������������������������������������������������������������������������������������������������������������������������������������������������������420Note 29 Income tax ����������������������������������������������������������������������������������������������������������������������������������������������������������������������������������������������������������������������������������������421Note 30 Breakdown of assets and liabilities by term to maturity �������������������������������������������������������������������������������������������������������������������������������������������������������������������421Note 31 Transactions in foreign currencies ����������������������������������������������������������������������������������������������������������������������������������������������������������������������������������������������������421Note 32 Geographical breakdown of net banking income �����������������������������������������������������������������������������������������������������������������������������������������������������������������������������422Note 33 Operations in uncooperative states or territories �����������������������������������������������������������������������������������������������������������������������������������������������������������������������������423Note 34 Table of subsidiaries and affiliates ����������������������������������������������������������������������������������������������������������������������������������������������������������������������������������������������������424
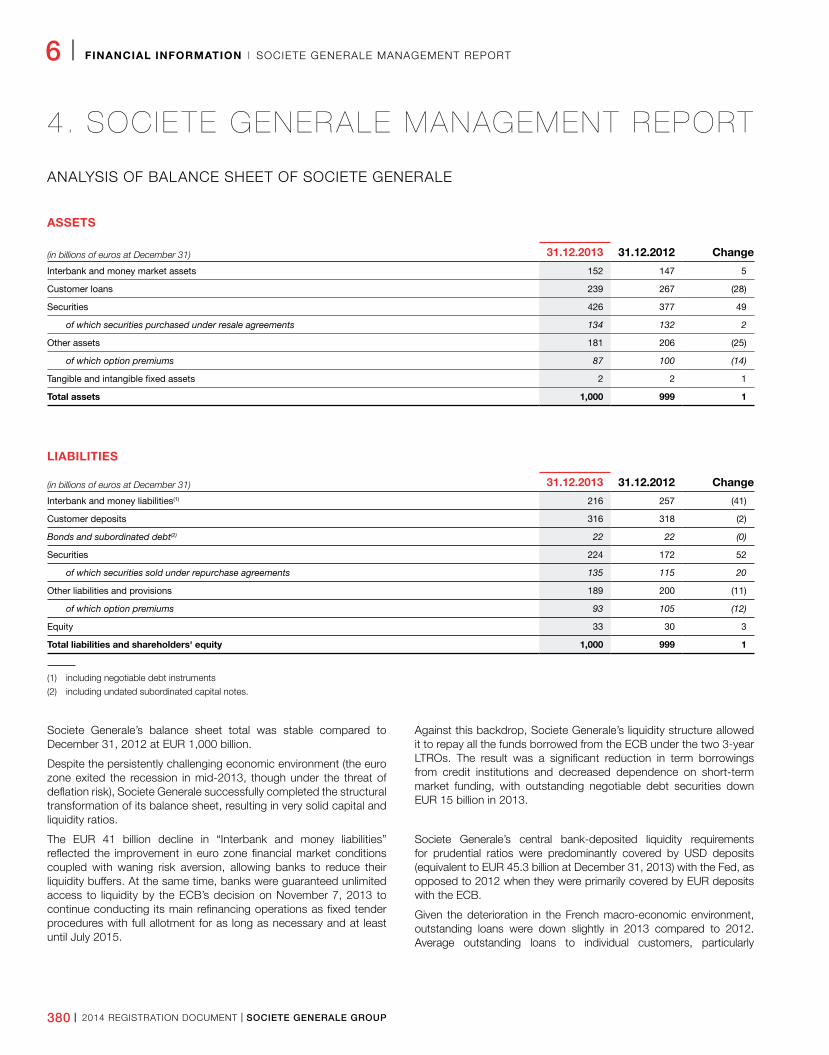
380 I 2014 REGISTRATION DOCUMENT I SOCIETE GENERALE GROUP
6 I FINANCIAL INFORMATION I SOCIETE GENERALE MANAGEMENT REPORT
4. SOCIE TE GENERALE MANAGEMENT REPORT
ANALYSIS OF BALANCE SHEET OF SOCIETE GENERALE
ASSETS
(in billions of euros at December 31) 31.12.2013 31.12.2012 Change
Interbank and money market assets 152 147 5
Customer loans 239 267 (28)
Securities 426 377 49
of which securities purchased under resale agreements 134 132 2
Other assets 181 206 (25)
of which option premiums 87 100 (14)
Tangible and intangible fixed assets 2 2 1
Total assets 1,000 999 1
LIABILITIES
(in billions of euros at December 31) 31.12.2013 31.12.2012 Change
Interbank and money liabilities(1) 216 257 (41)
Customer deposits 316 318 (2)
Bonds and subordinated debt(2) 22 22 (0)
Securities 224 172 52
of which securities sold under repurchase agreements 135 115 20
Other liabilities and provisions 189 200 (11)
of which option premiums 93 105 (12)
Equity 33 30 3
Total liabilities and shareholders' equity 1,000 999 1
(1) including negotiable debt instruments
(2) including undated subordinated capital notes.
Societe Generale’s balance sheet total was stable compared to December 31, 2012 at EUR 1,000 billion.
Despite the persistently challenging economic environment (the euro zone exited the recession in mid-2013, though under the threat of deflation risk), Societe Generale successfully completed the structural transformation of its balance sheet, resulting in very solid capital and liquidity ratios.
The EUR 41 billion decline in “Interbank and money liabilities” reflected the improvement in euro zone financial market conditions coupled with waning risk aversion, allowing banks to reduce their liquidity buffers. At the same time, banks were guaranteed unlimited access to liquidity by the ECB’s decision on November 7, 2013 to continue conducting its main refinancing operations as fixed tender procedures with full allotment for as long as necessary and at least until July 2015.
Against this backdrop, Societe Generale’s liquidity structure allowed it to repay all the funds borrowed from the ECB under the two 3-year LTROs. The result was a significant reduction in term borrowings from credit institutions and decreased dependence on short-term market funding, with outstanding negotiable debt securities down EUR 15 billion in 2013.
Societe Generale’s central bank-deposited liquidity requirements for prudential ratios were predominantly covered by USD deposits (equivalent to EUR 45.3 billion at December 31, 2013) with the Fed, as opposed to 2012 when they were primarily covered by EUR deposits with the ECB.
Given the deterioration in the French macro-economic environment, outstanding loans were down slightly in 2013 compared to 2012. Average outstanding loans to individual customers, particularly
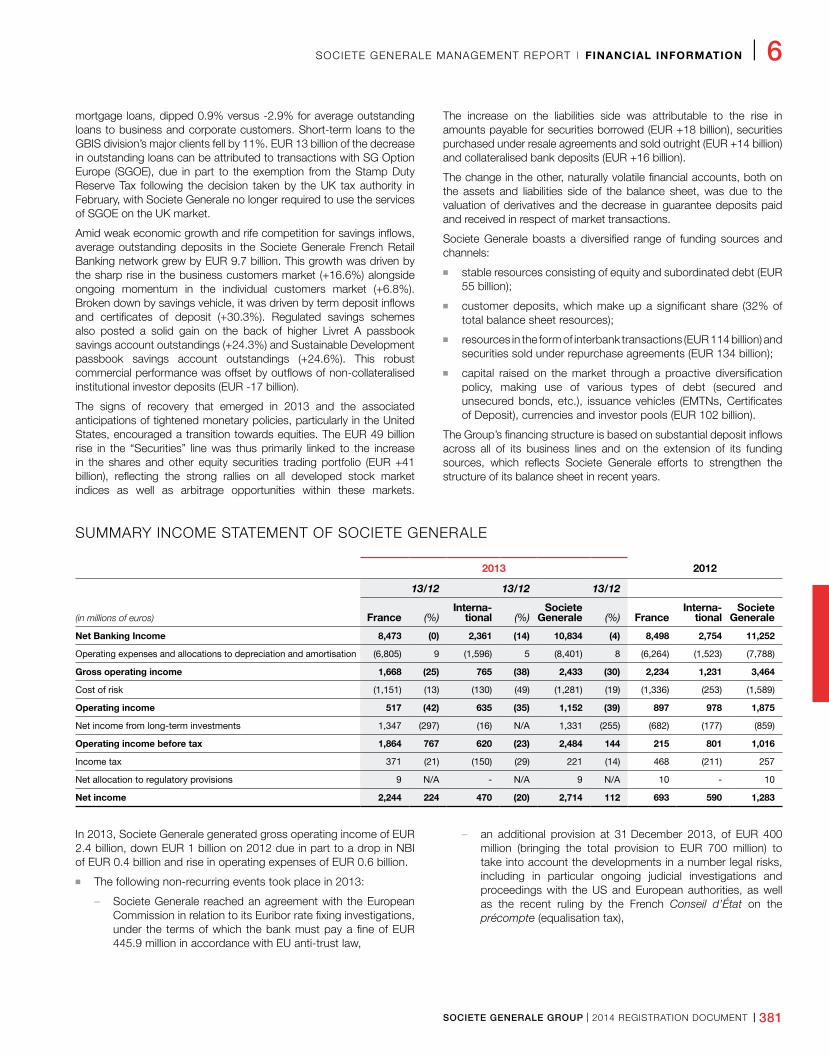
SOCIETE GENERALE GROUP I 2014 REGISTRATION DOCUMENT I 381
SOCIETE GENERALE MANAGEMENT REPORT I FINANCIAL INFORMATION I 6
mortgage loans, dipped 0.9% versus -2.9% for average outstanding loans to business and corporate customers. Short-term loans to the GBIS division’s major clients fell by 11%. EUR 13 billion of the decrease in outstanding loans can be attributed to transactions with SG Option Europe (SGOE), due in part to the exemption from the Stamp Duty Reserve Tax following the decision taken by the UK tax authority in February, with Societe Generale no longer required to use the services of SGOE on the UK market.
Amid weak economic growth and rife competition for savings inflows, average outstanding deposits in the Societe Generale French Retail Banking network grew by EUR 9.7 billion. This growth was driven by the sharp rise in the business customers market (+16.6%) alongside ongoing momentum in the individual customers market (+6.8%). Broken down by savings vehicle, it was driven by term deposit inflows and certificates of deposit (+30.3%). Regulated savings schemes also posted a solid gain on the back of higher Livret A passbook savings account outstandings (+24.3%) and Sustainable Development passbook savings account outstandings (+24.6%). This robust commercial performance was offset by outflows of non-collateralised institutional investor deposits (EUR -17 billion).
The signs of recovery that emerged in 2013 and the associated anticipations of tightened monetary policies, particularly in the United States, encouraged a transition towards equities. The EUR 49 billion rise in the “Securities” line was thus primarily linked to the increase in the shares and other equity securities trading portfolio (EUR +41 billion), reflecting the strong rallies on all developed stock market indices as well as arbitrage opportunities within these markets.
The increase on the liabilities side was attributable to the rise in amounts payable for securities borrowed (EUR +18 billion), securities purchased under resale agreements and sold outright (EUR +14 billion) and collateralised bank deposits (EUR +16 billion).
The change in the other, naturally volatile financial accounts, both on the assets and liabilities side of the balance sheet, was due to the valuation of derivatives and the decrease in guarantee deposits paid and received in respect of market transactions.
Societe Generale boasts a diversified range of funding sources and channels:
n stable resources consisting of equity and subordinated debt (EUR 55 billion);
n customer deposits, which make up a significant share (32% of total balance sheet resources);
n resources in the form of interbank transactions (EUR 114 billion) and securities sold under repurchase agreements (EUR 134 billion);
n capital raised on the market through a proactive diversification policy, making use of various types of debt (secured and unsecured bonds, etc.), issuance vehicles (EMTNs, Certificates of Deposit), currencies and investor pools (EUR 102 billion).
The Group’s financing structure is based on substantial deposit inflows across all of its business lines and on the extension of its funding sources, which reflects Societe Generale efforts to strengthen the structure of its balance sheet in recent years.
SUMMARY INCOME STATEMENT OF SOCIETE GENERALE
2013 2012
13/12 13/12 13/12
(in millions of euros) France (%)Interna
tional (%)Societe
Generale (%) FranceInterna
tionalSociete
Generale
Net Banking Income 8,473 (0) 2,361 (14) 10,834 (4) 8,498 2,754 11,252
Operating expenses and allocations to depreciation and amortisation (6,805) 9 (1,596) 5 (8,401) 8 (6,264) (1,523) (7,788)
Gross operating income 1,668 (25) 765 (38) 2,433 (30) 2,234 1,231 3,464
Cost of risk (1,151) (13) (130) (49) (1,281) (19) (1,336) (253) (1,589)
Operating income 517 (42) 635 (35) 1,152 (39) 897 978 1,875
Net income from long-term investments 1,347 (297) (16) N/A 1,331 (255) (682) (177) (859)
Operating income before tax 1,864 767 620 (23) 2,484 144 215 801 1,016
Income tax 371 (21) (150) (29) 221 (14) 468 (211) 257
Net allocation to regulatory provisions 9 N/A - N/A 9 N/A 10 - 10
Net income 2,244 224 470 (20) 2,714 112 693 590 1,283
In 2013, Societe Generale generated gross operating income of EUR 2.4 billion, down EUR 1 billion on 2012 due in part to a drop in NBI of EUR 0.4 billion and rise in operating expenses of EUR 0.6 billion.
n The following non-recurring events took place in 2013:
– Societe Generale reached an agreement with the European Commission in relation to its Euribor rate fixing investigations, under the terms of which the bank must pay a fine of EUR 445.9 million in accordance with EU anti-trust law,
– an additional provision at 31 December 2013, of EUR 400 million (bringing the total provision to EUR 700 million) to take into account the developments in a number legal risks, including in particular ongoing judicial investigations and proceedings with the US and European authorities, as well as the recent ruling by the French Conseil d’État on the précompte (equalisation tax),
382 I 2014 REGISTRATION DOCUMENT I SOCIETE GENERALE GROUP
6 I FINANCIAL INFORMATION I SOCIETE GENERALE MANAGEMENT REPORT
– Societe Generale sold its equity interest in its Egyptian subsidiary National Societe Generale Bank (NSGB) to Qatar National Bank Group (QNB Group).
n Net banking income dipped slightly to EUR 10.8 billion in 2013 versus EUR +11.3 billion in 2012.
– despite a trying macro-economic environment, the Societe Generale French Retail Banking network delivered a solid commercial performance, attesting to the robustness of its franchise. Even in such a time of weak economic growth, the Societe Generale French Retail Banking network remained fully committed to its customers and continued to actively support the economy by helping business and individual customers alike to finance their projects. The Societe Generale French Retail Banking Network posted resilient revenues in 2013. The interest margin improved (excluding the PEL/CEL effect) on 2012, with the increase in outstanding deposits and slight bump in the margin on loans offsetting the drop in deposit reinvestment rates,
– in Corporate and Investment Banking, capital market activities generated higher revenues, as the fixed income markets returned to normal in the wake of a very supportive 2012,
marked by accommodative monetary policies. The Fixed Income, Currencies and Commodities activities delivered resilient revenues in light of last year’s strong comparison base driven by highly favourable market conditions in 2012.
n Restated for the agreement with the European Commission in relation to the Euribor investigations, in the amount of EUR 445.9 million, operating expenses rose by a moderate 2.1% year-on-year.
n Amounting to EUR 1.3 billion at December 31, 2013, net cost of risk included in particular an additional collective provision for litigation risk EUR 400 million (versus EUR 300 million in 2012). This provision stood at EUR 700 million at end-2013, corresponding to the level of risk identified at that date.
n The combination of all these items brought operating income down by EUR 723 million.
n Gains on fixed assets were materially impacted by the disposal of Societe Generale’s entire stake in NSGB, i.e. 77.17%, to Qatar National Bank Group, which generated a capital gain of EUR 1.3 billion.
n Net income after tax came out at EUR 2.7 billion at December 31, 2013 versus EUR 1.3 billion at December 31, 2012.
SUPPLIER PAYABLES PAYMENT SCHEDULE
December 31, 2013 December 31, 2012
Payables not yet due
Payables due Total
Payables not yet due
Payables due Total
1 to 30 days
31 to 60 days
More than 60
days1 to 30 days
31 to 60 days
More than 60
days
(In millions of euros)
Supplier payables 71�4 50�5 8�5 25�1 155�5 61�8 46�4 0�5 41�3 150�0
The maturity dates correspond to the conditions calculated to 60 days invoices dates.
The processing of Societe Generale France’s supplier invoices is largely centralised. The department responsible for this processing books and settles invoices passed or payment by all of Societe Generale France’s corporate and business divisions. The branches of the French network, however, have dedicated teams to process and pay their own invoices.
In accordance with the Group’s internal control procedures, invoices are only paid after they have been validated by the departments that signed for the services. The average time for the payment of invoices after validation is between 3 and 7 days.
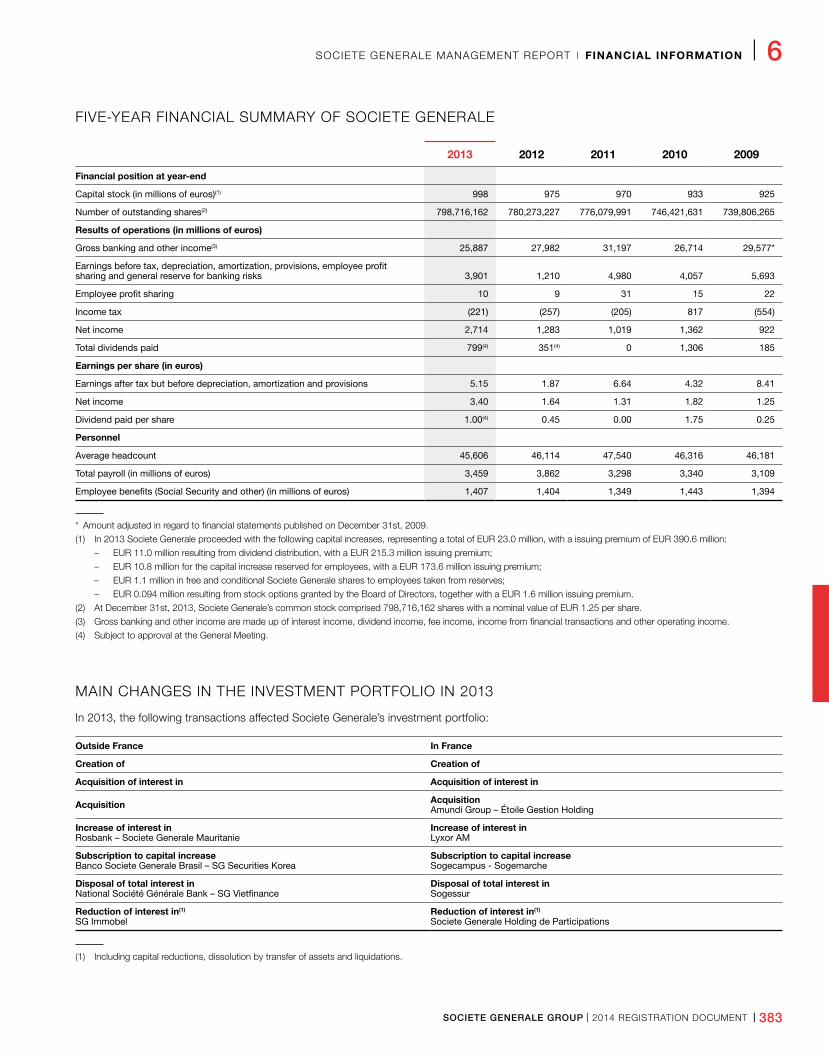
SOCIETE GENERALE GROUP I 2014 REGISTRATION DOCUMENT I 383
SOCIETE GENERALE MANAGEMENT REPORT I FINANCIAL INFORMATION I 6
FIVE-YEAR FINANCIAL SUMMARY OF SOCIETE GENERALE
2013 2012 2011 2010 2009
Financial position at yearend
Capital stock (in millions of euros)(1) 998 975 970 933 925
Number of outstanding shares(2) 798,716,162 780,273,227 776,079,991 746,421,631 739,806,265
Results of operations (in millions of euros)
Gross banking and other income(3) 25,887 27,982 31,197 26,714 29,577*
Earnings before tax, depreciation, amortization, provisions, employee profit sharing and general reserve for banking risks 3,901 1,210 4,980 4,057 5,693
Employee profit sharing 10 9 31 15 22
Income tax (221) (257) (205) 817 (554)
Net income 2,714 1,283 1,019 1,362 922
Total dividends paid 799(4) 351(4) 0 1,306 185
Earnings per share (in euros)
Earnings after tax but before depreciation, amortization and provisions 5�15 1�87 6�64 4�32 8�41
Net income 3�40 1�64 1�31 1�82 1�25
Dividend paid per share 1�00(4) 0�45 0�00 1�75 0�25
Personnel
Average headcount 45,606 46,114 47,540 46,316 46,181
Total payroll (in millions of euros) 3,459 3,862 3,298 3,340 3,109
Employee benefits (Social Security and other) (in millions of euros) 1,407 1,404 1,349 1,443 1,394
* Amount adjusted in regard to financial statements published on December 31st, 2009.
(1) In 2013 Societe Generale proceeded with the following capital increases, representing a total of EUR 23.0 million, with a issuing premium of EUR 390.6 million:
– EUR 11.0 million resulting from dividend distribution, with a EUR 215.3 million issuing premium;
– EUR 10.8 million for the capital increase reserved for employees, with a EUR 173.6 million issuing premium;
– EUR 1.1 million in free and conditional Societe Generale shares to employees taken from reserves;
– EUR 0.094 million resulting from stock options granted by the Board of Directors, together with a EUR 1.6 million issuing premium.
(2) At December 31st, 2013, Societe Generale’s common stock comprised 798,716,162 shares with a nominal value of EUR 1.25 per share.
(3) Gross banking and other income are made up of interest income, dividend income, fee income, income from financial transactions and other operating income.
(4) Subject to approval at the General Meeting.
MAIN CHANGES IN THE INVESTMENT PORTFOLIO IN 2013
In 2013, the following transactions affected Societe Generale’s investment portfolio:
Outside France In France
Creation of Creation of
Acquisition of interest in Acquisition of interest in
Acquisition AcquisitionAmundi Group – Étoile Gestion Holding
Increase of interest inRosbank – Societe Generale Mauritanie
Increase of interest inLyxor AM
Subscription to capital increase Banco Societe Generale Brasil – SG Securities Korea
Subscription to capital increase Sogecampus - Sogemarche
Disposal of total interest inNational Société Générale Bank – SG Vietfinance
Disposal of total interest inSogessur
Reduction of interest in(1)
SG ImmobelReduction of interest in(1)
Societe Generale Holding de Participations
(1) Including capital reductions, dissolution by transfer of assets and liquidations.
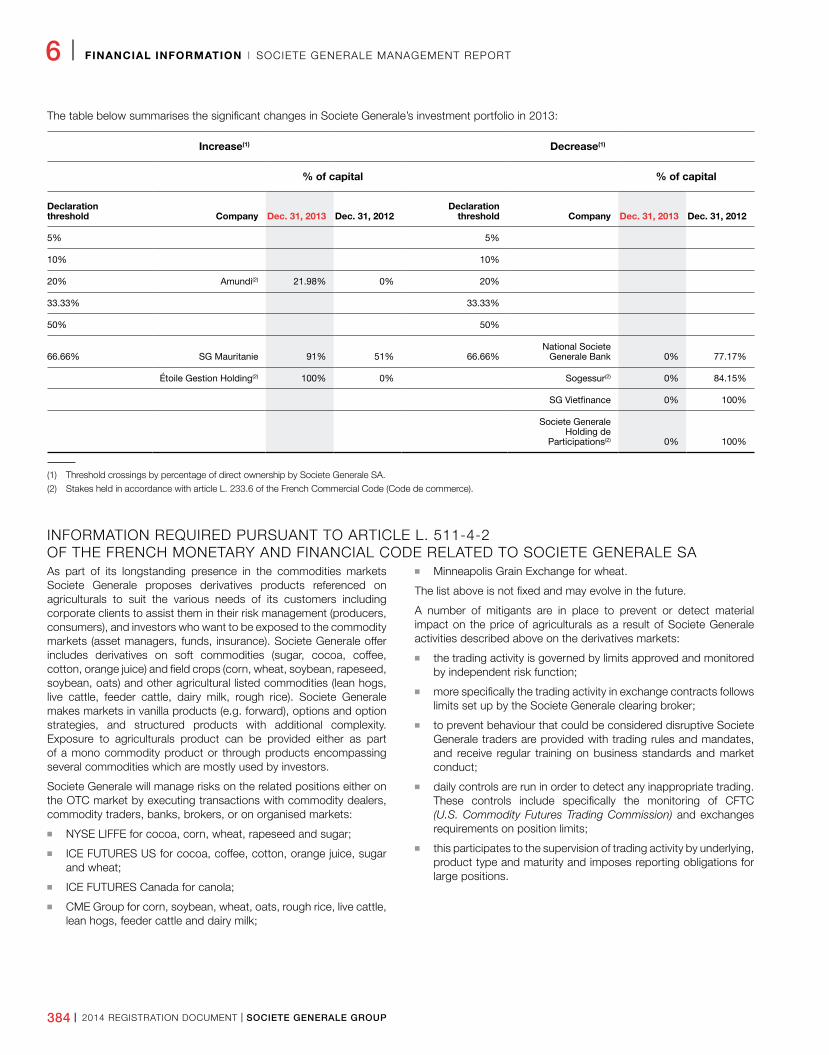
384 I 2014 REGISTRATION DOCUMENT I SOCIETE GENERALE GROUP
6 I FINANCIAL INFORMATION I SOCIETE GENERALE MANAGEMENT REPORT
The table below summarises the significant changes in Societe Generale’s investment portfolio in 2013:
Increase(1) Decrease(1)
% of capital % of capital
Declaration threshold Company Dec. 31, 2013 Dec. 31, 2012
Declaration threshold Company Dec. 31, 2013 Dec. 31, 2012
5% 5%
10% 10%
20% Amundi(2) 21�98% 0% 20%
33�33% 33�33%
50% 50%
66�66% SG Mauritanie 91% 51% 66�66%National Societe
Generale Bank 0% 77�17%
Étoile Gestion Holding(2) 100% 0% Sogessur(2) 0% 84�15%
SG Vietfinance 0% 100%
Societe Generale Holding de
Participations(2) 0% 100%
(1) Threshold crossings by percentage of direct ownership by Societe Generale SA.
(2) Stakes held in accordance with article L. 233.6 of the French Commercial Code (Code de commerce).
INFORMATION REQUIRED PURSUANT TO ARTICLE L. 511-4-2 OF THE FRENCH MONETARY AND FINANCIAL CODE RELATED TO SOCIETE GENERALE SAAs part of its longstanding presence in the commodities markets Societe Generale proposes derivatives products referenced on agriculturals to suit the various needs of its customers including corporate clients to assist them in their risk management (producers, consumers), and investors who want to be exposed to the commodity markets (asset managers, funds, insurance). Societe Generale offer includes derivatives on soft commodities (sugar, cocoa, coffee, cotton, orange juice) and field crops (corn, wheat, soybean, rapeseed, soybean, oats) and other agricultural listed commodities (lean hogs, live cattle, feeder cattle, dairy milk, rough rice). Societe Generale makes markets in vanilla products (e.g. forward), options and option strategies, and structured products with additional complexity. Exposure to agriculturals product can be provided either as part of a mono commodity product or through products encompassing several commodities which are mostly used by investors.
Societe Generale will manage risks on the related positions either on the OTC market by executing transactions with commodity dealers, commodity traders, banks, brokers, or on organised markets:
n NYSE LIFFE for cocoa, corn, wheat, rapeseed and sugar;
n ICE FUTURES US for cocoa, coffee, cotton, orange juice, sugar and wheat;
n ICE FUTURES Canada for canola;
n CME Group for corn, soybean, wheat, oats, rough rice, live cattle, lean hogs, feeder cattle and dairy milk;
n Minneapolis Grain Exchange for wheat.
The list above is not fixed and may evolve in the future.
A number of mitigants are in place to prevent or detect material impact on the price of agriculturals as a result of Societe Generale activities described above on the derivatives markets:
n the trading activity is governed by limits approved and monitored by independent risk function;
n more specifically the trading activity in exchange contracts follows limits set up by the Societe Generale clearing broker;
n to prevent behaviour that could be considered disruptive Societe Generale traders are provided with trading rules and mandates, and receive regular training on business standards and market conduct;
n daily controls are run in order to detect any inappropriate trading. These controls include specifically the monitoring of CFTC (U.S. Commodity Futures Trading Commission) and exchanges requirements on position limits;
n this participates to the supervision of trading activity by underlying, product type and maturity and imposes reporting obligations for large positions.
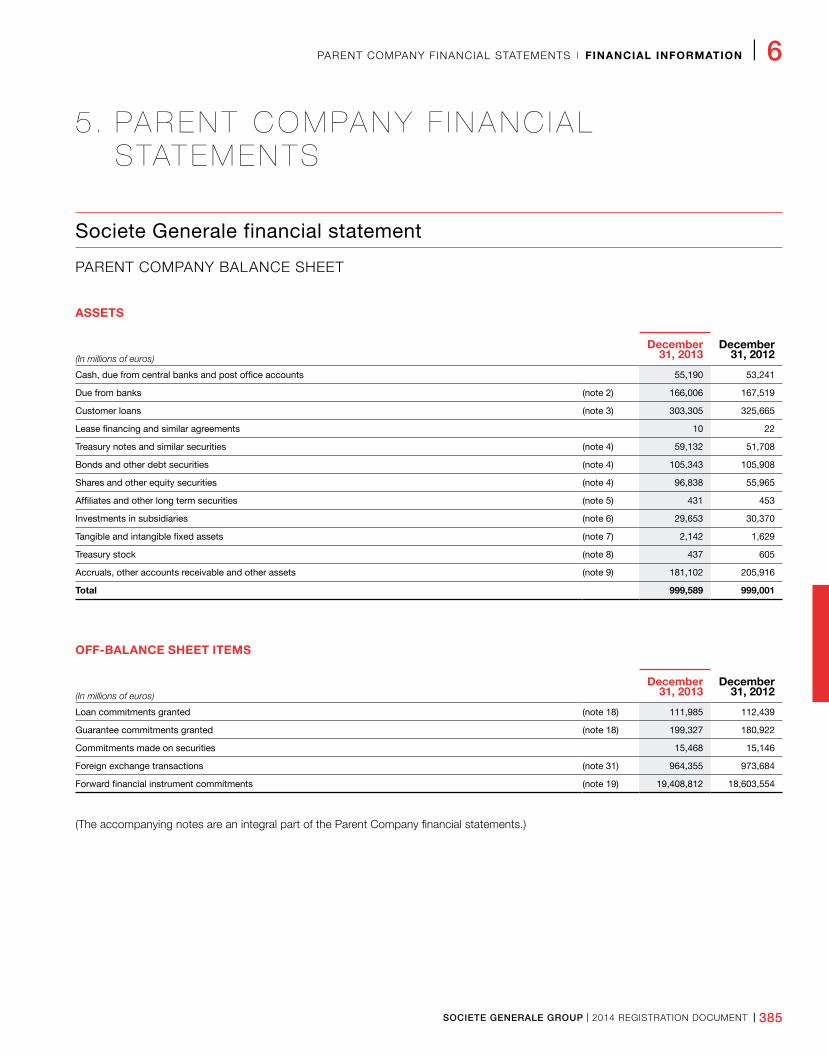
SOCIETE GENERALE GROUP I 2014 REGISTRATION DOCUMENT I 385
PARENT COMPANY FINANCIAL STATEMENTS I FINANCIAL INFORMATION I 6
5. PA R E N T C O M PA N Y F I N A N C I A L STAT E M E N TS
Societe Generale financial statement
PARENT COMPANY BALANCE SHEET
ASSETS
(In millions of euros)
December 31, 2013
December 31, 2012
Cash, due from central banks and post office accounts 55,190 53,241
Due from banks (note 2) 166,006 167,519
Customer loans (note 3) 303,305 325,665
Lease financing and similar agreements 10 22
Treasury notes and similar securities (note 4) 59,132 51,708
Bonds and other debt securities (note 4) 105,343 105,908
Shares and other equity securities (note 4) 96,838 55,965
Affiliates and other long term securities (note 5) 431 453
Investments in subsidiaries (note 6) 29,653 30,370
Tangible and intangible fixed assets (note 7) 2,142 1,629
Treasury stock (note 8) 437 605
Accruals, other accounts receivable and other assets (note 9) 181,102 205,916
Total 999,589 999,001
OFFBALANCE SHEET ITEMS
(In millions of euros)
December 31, 2013
December 31, 2012
Loan commitments granted (note 18) 111,985 112,439
Guarantee commitments granted (note 18) 199,327 180,922
Commitments made on securities 15,468 15,146
Foreign exchange transactions (note 31) 964,355 973,684
Forward financial instrument commitments (note 19) 19,408,812 18,603,554
(The accompanying notes are an integral part of the Parent Company financial statements.)
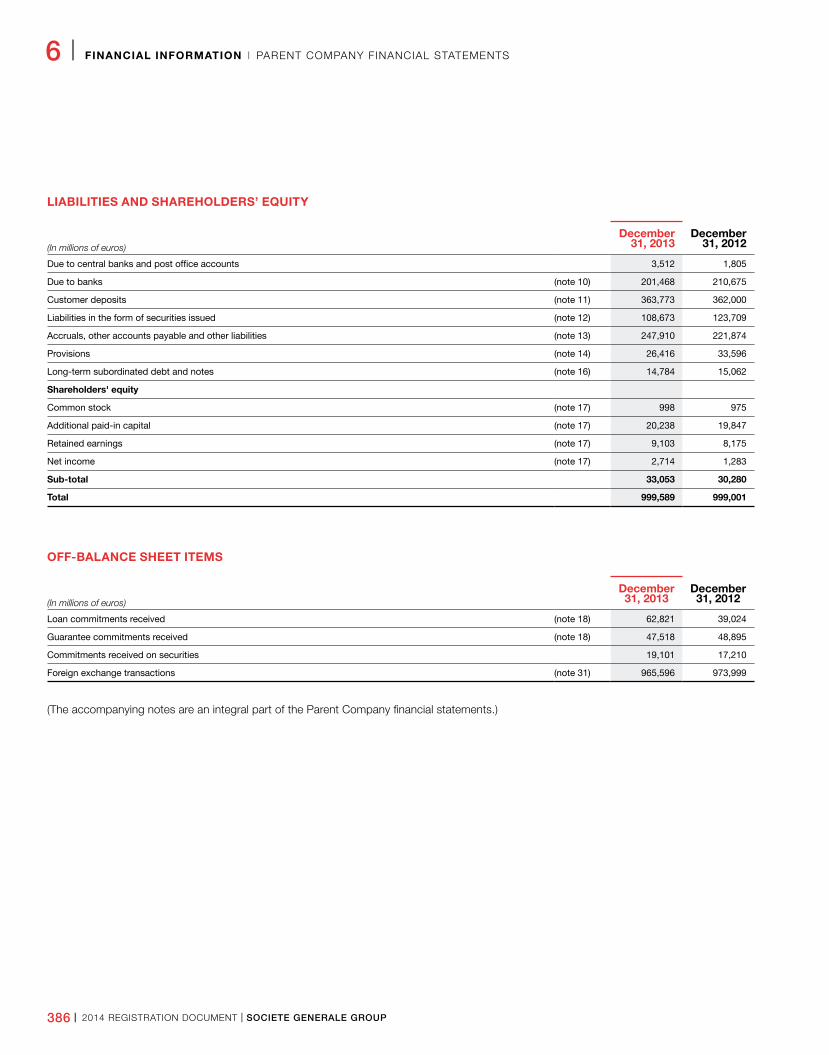
386 I 2014 REGISTRATION DOCUMENT I SOCIETE GENERALE GROUP
6 I FINANCIAL INFORMATION I PARENT COMPANY FINANCIAL STATEMENTS
LIABILITIES AND SHAREHOLDERS’ EQUITY
(In millions of euros)
December 31, 2013
December 31, 2012
Due to central banks and post office accounts 3,512 1,805
Due to banks (note 10) 201,468 210,675
Customer deposits (note 11) 363,773 362,000
Liabilities in the form of securities issued (note 12) 108,673 123,709
Accruals, other accounts payable and other liabilities (note 13) 247,910 221,874
Provisions (note 14) 26,416 33,596
Long-term subordinated debt and notes (note 16) 14,784 15,062
Shareholders' equity
Common stock (note 17) 998 975
Additional paid-in capital (note 17) 20,238 19,847
Retained earnings (note 17) 9,103 8,175
Net income (note 17) 2,714 1,283
Subtotal 33,053 30,280
Total 999,589 999,001
OFFBALANCE SHEET ITEMS
(In millions of euros)
December 31, 2013
December 31, 2012
Loan commitments received (note 18) 62,821 39,024
Guarantee commitments received (note 18) 47,518 48,895
Commitments received on securities 19,101 17,210
Foreign exchange transactions (note 31) 965,596 973,999
(The accompanying notes are an integral part of the Parent Company financial statements.)
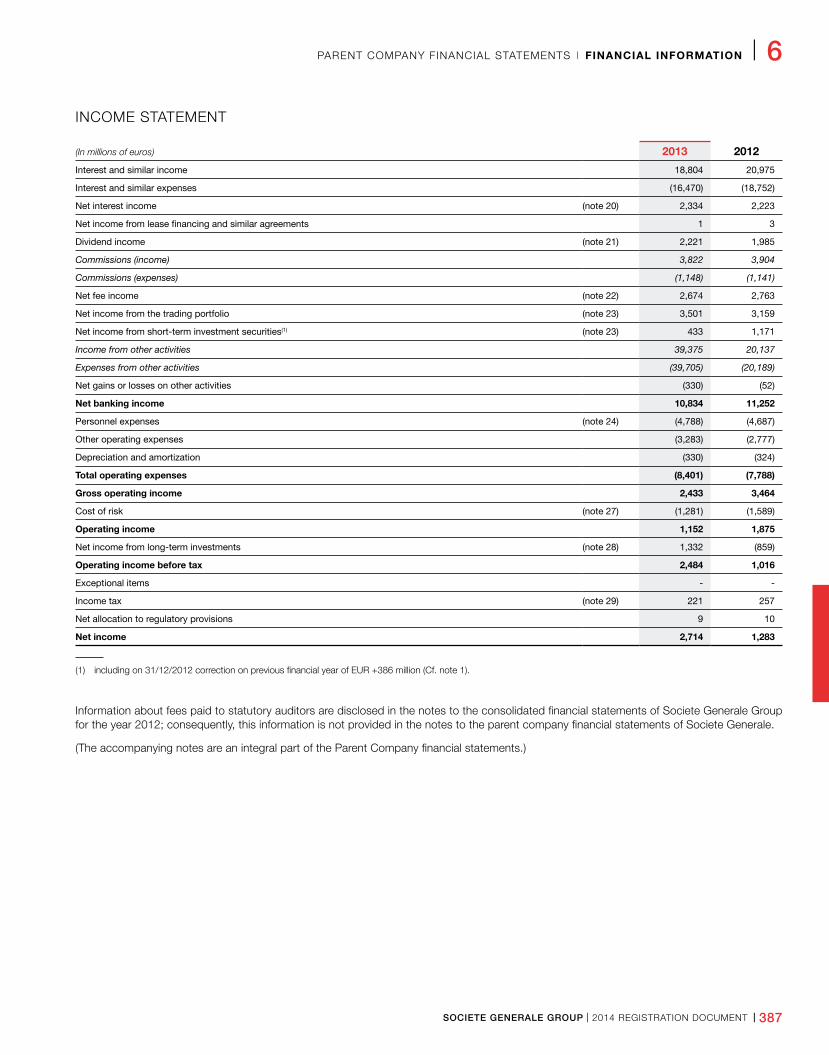
SOCIETE GENERALE GROUP I 2014 REGISTRATION DOCUMENT I 387
PARENT COMPANY FINANCIAL STATEMENTS I FINANCIAL INFORMATION I 6
INCOME STATEMENT
(In millions of euros) 2013 2012
Interest and similar income 18,804 20,975
Interest and similar expenses (16,470) (18,752)
Net interest income (note 20) 2,334 2,223
Net income from lease financing and similar agreements 1 3
Dividend income (note 21) 2,221 1,985
Commissions (income) 3,822 3,904
Commissions (expenses) (1,148) (1,141)
Net fee income (note 22) 2,674 2,763
Net income from the trading portfolio (note 23) 3,501 3,159
Net income from short-term investment securities(1) (note 23) 433 1,171
Income from other activities 39,375 20,137
Expenses from other activities (39,705) (20,189)
Net gains or losses on other activities (330) (52)
Net banking income 10,834 11,252
Personnel expenses (note 24) (4,788) (4,687)
Other operating expenses (3,283) (2,777)
Depreciation and amortization (330) (324)
Total operating expenses (8,401) (7,788)
Gross operating income 2,433 3,464
Cost of risk (note 27) (1,281) (1,589)
Operating income 1,152 1,875
Net income from long-term investments (note 28) 1,332 (859)
Operating income before tax 2,484 1,016
Exceptional items - -
Income tax (note 29) 221 257
Net allocation to regulatory provisions 9 10
Net income 2,714 1,283
(1) including on 31/12/2012 correction on previous financial year of EUR +386 million (Cf. note 1).
Information about fees paid to statutory auditors are disclosed in the notes to the consolidated financial statements of Societe Generale Group for the year 2012; consequently, this information is not provided in the notes to the parent company financial statements of Societe Generale.
(The accompanying notes are an integral part of the Parent Company financial statements.)
388 I 2014 REGISTRATION DOCUMENT I SOCIETE GENERALE GROUP
6 I FINANCIAL INFORMATION I NOTES TO THE PARENT COMPANY FINANCIAL STATEMENTS I NOTE 1
6. N OT ES TO T H E PA R EN T C O M PA N Y F I N A N C I A L STAT EM EN TS
Note 1
SIGNIFICANT ACCOUNTING PRINCIPLESThe parent company financial statements for Societe Generale were drawn up in accordance with the provisions of regulation 91-01 of the French Banking Regulation Committee (CRB) applicable to credit establishments, and with the accounting principles generally accepted in the French banking industry. As the financial statements of foreign branches were prepared using accounting principles generally accepted in their respective countries, they were subsequently adjusted to comply with the accounting principles applicable in France. The presentation of the financial statements complies with regulation 2000-03 of the French Accounting Regulation Committee (CRC) on parent company financial statements for enterprises governed by the French Banking and Financial Regulation Committee (CRBF), amended by CRC regulation 2005-04 dated November 3, 2005.
ACCOUNT COMPARABILITYIn 2011, a line of securities, recorded in short-term investment securities, was fully impaired by mistake. Consequently, net income for 2011 was reduced by EUR 386 million. In early 2012, this line of securities was sold and the impairment reversed, thus increasing net income for 2012 by EUR 386 million.
ACCOUNTING POLICIES AND VALUATION METHODSIn accordance with the accounting principles applicable to French banks, the majority of transactions are recorded using valuation methods that take into account the purpose for which they were made.
In financial intermediation transactions, assets and liabilities are generally carried at historical cost and depreciation are recognised where counterparty risk arises. Revenues and expenses arising from these transactions are recorded over the life of the transaction in accordance with the time period concept. Transactions on forward financial instruments carried out for hedging purposes or to manage the bank’s overall interest rate risk are accounted for using the same principles.
Trading transactions are generally marked to market at year-end, except for loans, borrowings and short-term investment securities which are recorded at nominal value (see below). When financial instruments are not quoted in an active market, the market value used is reduced for reasons of prudence. Moreover, a reserve is recorded to cover valuations established on the basis of in-house models (Reserve Policy), which is determined according to the complexity of the model used and the life of the financial instrument.
TRANSLATION OF FOREIGN CURRENCY FINANCIAL STATEMENTS The on-and off-balance sheet items of branches reporting in foreign currencies are translated at the official exchange rate prevailing at year-end. Income statement items of these branches are translated at the average month-end exchange rates. Gains and losses arising from the translation of reserves, retained earnings and net income are included in shareholders’ equity under Translation differences. Gains and losses arising from the translation of the capital contribution of foreign branches are also included in changes in shareholders’ equity under the same heading.
Gains and losses arising from the translation of the capital contribution of foreign branches are included under Other accounts payable or Other accounts receivable.
In accordance with CNC Recommendation 98-01, translation differences relating to branches in the euro zone are retained in shareholders’ equity and are only recognised in the income statement when these entities are sold.
AMOUNTS DUE FROM BANKS, CUSTOMER LOANS, GUARANTEES AND ENDORSEMENTS Amounts due from banks and customer loans are classified according to their initial duration and type: demand deposits (current accounts and overnight transactions) and term deposits in the case of banks, and commercial loans, overdrafts and other loans to customers. They also include securities purchased from banks and customers under resale agreements, and loans secured by notes and securities.
Only amounts due and customer loans which meet the following criteria are offset on the balance sheet: those with the same counterparty, maturity, currency and accounting entity, and those for which an agreement exists with the counterparty allowing the company to combine the accounts and exercise the right of offset.
Interest accrued on these receivables is recorded as Related receivables and recognised in the income statement.
Fees received and incremental transaction costs related to the granting of a loan are comparable to interests and spread over the effective life of the loan.
Guarantees and endorsements recorded off-balance sheet represent transactions which have not yet given rise to cash movements, such as irrevocable commitments for the undrawn portion of facilities made available to banks and customers or guarantees given on their behalf.
Under CRC regulation 2002-03, if a commitment carries an incurred credit risk which makes it probable that Societe Generale will not recover all or part of the amounts due under the counterparty’s commitment in accordance with the original terms of the contract, despite the existence of a guarantee, the corresponding outstanding loan is classified as a doubtful loan. Moreover, any loan will be classified as doubtful if one or more repayments are more than three
SOCIETE GENERALE GROUP I 2014 REGISTRATION DOCUMENT I 389
NOTE 1 I NOTES TO THE PARENT COMPANY FINANCIAL STATEMENTS I FINANCIAL INFORMATION I 6
months overdue (six months for mortgage loans and nine months for loans to local authorities), or, regardless of whether any payments have been missed, if it can be assumed that there is an identified risk, or if legal proceedings have been started.
If a loan to a given borrower is classified as doubtful, all outstanding loans or commitments to that borrower are reclassified as doubtful, regardless of whether or not they are backed by a guarantee.
Depreciation for unrealised losses and for doubtful loans is recorded in the amount of the probable loss. Depreciation for unrealised losses is equal to the difference between the carrying amount of the asset and the present value of estimated future recoverable cash flows, taking into account any guarantees, discounted at the financial assets’ original effective interest rate. Furthermore, this depreciation may not be less than the full amount of the accrued interest on the doubtful loan. Depreciation, reversals of depreciation, losses on bad debts and recovery of impaired debts are recognised under Cost of risk, along with write-backs of depreciation linked to the passage of time.
In a homogenous portfolio, as soon as a credit risk is incurred on a group of financial instruments, a depreciation is recognised without waiting for the risk to individually affect one or more receivables. The amount of depreciation is notably determined on the basis of historical data on default rates and incurred losses on assets with credit risk characteristics that are similar to those in the portfolio, adjusted to reflect any relevant current economic conditions and, where necessary, the opinion of an expert. Changes in depreciation calculated as such are recognised under Cost of risk.
Doubtful loans can be reclassified as performing loans when the credit risk has been definitively eliminated and regular repayments have resumed according to the original terms of the contract. Similarly, doubtful loans which have been restructured can be reclassified as performing loans. When a loan is restructured, a discount is applied to any differences between the cash flows expected to be received under the initial terms of the contract and the present value of the future flows of capital and interest expected to be received under the new terms, discounted at the original effective interest rate.
The amount deducted is recognised under Cost of risk. If the restructured loan is subsequently reclassified as a performing loan, it is reincorporated into net interest income over the remaining term of the loan.
When a borrower’s solvency is such that after the loan has been classified as doubtful for a reasonable period, it is not foreseeable that it will be reclassified as a performing loan, the loan is identified as a non-performing loan. A loan is classified as non-performing once the bank asks for an early termination, when the contract is terminated and in any case one year after it was classified as doubtful, except where the original terms of the contract have been respected or where the loan is covered by guarantees which ensure its recovery. Loans which have been restructured and for which the borrower has not respected the new conditions are also classified as non-performing.
SECURITIES PORTFOLIO Securities are classified according to:
n their type: public notes (Treasury notes and similar securities), bonds and other debt securities (negotiable debt instruments, interbank securities), shares and other equity securities;
n the purpose for which they were acquired: trading, short-term and long-term investment, shares intended for portfolio activity, investments in non-consolidated subsidiaries and affiliates, and other long-term equity investments.
Purchases and sales of securities are recorded in the balance sheet at the date of settlement-delivery.
According to CRB amended regulation n° 90-01 relative to the accounting treatment of securities transactions and modified by CRC regulation 2008-17, the classification and valuation rules applied for each portfolio category are as follows:
n Trading securitiesTrading securities are securities acquired or incurred principally for the purpose of selling or repurchasing them in the near-term, or held for the purpose of market-making activities. These securities are traded in active markets, and the available market price reflects frequent buying and selling under normal conditions of competition. Trading securities also include securities linked to a sale commitment in the context of an arbitrage operation done on an organised or assimilated market and securities purchased or sold in the specialised management of a trading portfolio containing forward financial instruments, securities or other financial instruments that are managed together and for which there is evidence of a recent pattern of short-term profit-taking.
Trading securities are recognised in the balance sheet at cost, excluding acquisition expenses.
They are marked to market at the end of the financial period.
Net unrealised gains or losses, together with net gains or losses on disposals, are recognised in the income statement under Net income from financial transactions. Coupon payments received on fixed-income securities in the trading portfolio are recorded in the income statement under Net interest income from bonds and other debt securities.
Trading securities that are no longer held for the purpose of selling them in the near-term, or no longer held for the purpose of market-making activities, or held in the specialised management of a trading portfolio for which there is no longer evidence of a recent pattern of short-term profit-taking, may be reclassified into the Short-term investment securities category or into the Long-term investment securities category if:
n exceptional market situations generate a change of holding strategy; or
n if after their acquisition debt securities become no longer negotiable in an active market and Societe Generale has the intention and the ability to hold them for the foreseeable future or until maturity.
390 I 2014 REGISTRATION DOCUMENT I SOCIETE GENERALE GROUP
6 I FINANCIAL INFORMATION I NOTES TO THE PARENT COMPANY FINANCIAL STATEMENTS I NOTE 1
Securities which are then reclassified are recorded in their new category at their fair market value on the date of reclassification.
n Short-term investment securities Short-term investment securities are all those that are not classified as trading securities, long-term investment securities, or investments in consolidated subsidiaries and affiliates.
Shares and other equity securities
Equity securities are carried on the balance sheet at cost excluding acquisition expenses, or at contribution value. At year-end, cost is compared to realisable value. For listed securities, realisable value is defined as the most recent market price. Unrealised capital gains are not recognised in the accounts but a depreciation of portfolio securities is recorded to cover unrealised capital losses, without the said depreciation being offset against any unrealised capital gains. Income from these securities is recorded in Dividend income.
Bonds and other debt securities
These securities are carried at cost excluding acquisition expenses and, in the case of bonds, excluding interest accrued and not yet due at the date of purchase. The positive or negative difference between cost and redemption value is amortised to income over the life of the relevant securities and using the actuarial method. Accrued interest on bonds and other short-term investment securities is recorded as Related receivables and under Net interest income from bonds and other debt securities in the income statement.
At year-end, cost is compared to realisable value or, in the case of listed securities, to their most recent market price. Unrealised capital gains are not recognised in the accounts but a depreciation of portfolio securities is recorded to cover unrealised capital losses, after consideration of any gains made on any related hedging transactions.
Allocations to and reversals of depreciation for losses on short-term investment securities together with gains and losses on sales of these securities are recorded under Net income from financial transactions in the income statement.
Short-term investment securities may be reclassified into the Long-term investment securities category provided that:
n exceptional market situations generate a change of holding strategy; or
n if after their acquisition debt securities become no longer negotiable in an active market and Societe Generale has the intention and the ability to hold them for the foreseeable future or until maturity.
n Long-term investment securities Long-term investment securities are acquired debt securities or reclassified short-term investment securities which Societe Generale intends to hold until maturity, where it has the financial capacity to do so and is not subject to any legal or other form of constraint that might call into question its intention to do so. Long-term investment securities also include trading and short-term investment securities which have been reclassified by Societe Generale following the particular conditions described here before (facing exceptional market situations or when debt securities are no longer negotiable in an active market).
These instruments may be designated as hedged items in hedging transactions using forward financial instruments used to hedge the interest rate risk on identifiable items or groups of similar items.
Long-term investments are recorded according to the same principles as short-term investment securities, except that no depreciation is made for unrealised losses, unless there is a strong probability that the securities will be sold in the short term, or unless there is a risk that the issuer will be unable to redeem them.
Allocations to and reversals of depreciation for losses on long-term investment securities, together with gains and losses on sales of these securities, are recorded in the income statement under Net income from long-term investments.
n Investments in consolidated subsidiaries and affiliates, and other long-term equity investments This category of securities covers shares held in consolidated subsidiaries and affiliates, when it is deemed useful to Societe Generale’s business to hold the said shares in the long term. This notably covers investments that meet the following criteria:
n shares in companies that share Directors or senior managers with Societe Generale and where influence can be exercised over the company in which the shares are held;
n shares in companies that belong to the same group controlled by individuals or legal entities, where the said persons or entities exercise control over the group and ensure that decisions are taken in unison;
n shares representing more than 10% of the voting rights in the capital issued by a bank or a company whose business is directly linked to that of Societe Generale.
This category also includes Other long-term equity investments. These are equity investments made by Societe Generale with the aim of developing special professional relations with a company over the long term but without exercising any influence on its management due to the low proportion of attached voting rights.
Investments in consolidated subsidiaries and affiliates, and other long-term equity investments are recorded at their purchase price net of acquisition costs. Dividend income earned on these securities is recognised in the income statement under Dividend income.
At year-end, investments in consolidated subsidiaries and affiliates are valued at their value in use, namely the price the company would accept to pay to obtain the said securities if it had to acquire them in view of its investment objective. This value is estimated on the basis of various criteria, such as shareholders’ equity, profitability, and the average share price over the last three months. Unrealised capital gains are not recognised in the accounts but a depreciation on portfolio securities is recorded to cover unrealised capital losses. Allocations to and reversals of depreciation as well as any capital gains or losses realised on the disposal of these securities, including any profit or loss generated when tendering these securities to public share exchange offers, are recognised under Net income from long-term investments.
SOCIETE GENERALE GROUP I 2014 REGISTRATION DOCUMENT I 391
NOTE 1 I NOTES TO THE PARENT COMPANY FINANCIAL STATEMENTS I FINANCIAL INFORMATION I 6
TANGIBLE AND INTANGIBLE FIXED ASSETS Premises, equipment and other fixed assets are carried at their purchase price on the assets side of the balance sheet. Borrowing expenses incurred to fund a lengthy construction period for fixed assets are included in the acquisition cost, along with other directly attributable expenses. Investment subsidies received are deducted from the cost of the relevant assets.
Software developed internally is recorded on the asset side of the balance sheet in the amount of the direct cost of development, which includes external expenditure on hardware and services and personnel expenses which can be attributed directly to its production and preparation for use.
As soon as they are fit for use, fixed assets are depreciated over their useful life. Any residual value of the asset is deducted from its depreciable amount.
Where one or several components of a fixed asset are used for different purposes or to generate economic benefits over a different time period from the asset considered as a whole, these components are depreciated over their own useful life, through the income statement under Depreciation and amortisation. Societe Generale has applied this approach to its operating property, breaking down its assets into the following minimum components with their corresponding depreciation periods:
Infrastructure
Major structures 50 years
Doors and windows, roofing 20 years
Façades 30 years
Technical installations
Elevators
10-30 years
Electrical installations
Electricity generators
Air conditioning, extractors
Technical wiring
Security and surveillance installations
Plumbing
Fire safety equipment
Fixtures and fittings Finishings, surroundings 10 years
Depreciation periods for fixed assets other than buildings depend on their useful life, usually estimated in the following ranges:
Plant and equipment 5 years
Transport 4 years
Furniture 10-20 years
Office equipment 5-10 years
IT equipment 3-5 years
Software, developed or acquired 3-5 years
Concessions, patents, licenses, etc� 5-20 years
AMOUNTS DUE TO BANKS, CUSTOMER DEPOSITS Amounts due to banks and customer deposits are classified according to their initial duration and type: demand (demand deposits and current accounts) and time deposits and borrowings in the case of banks, and regulated savings accounts and other deposits in the case of customers. They also include securities sold to banks and customers under repurchase agreements.
Interest accrued on these deposits is recorded as Related payables and as an expense in the income statement.
SECURITISED DEBT PAYABLES These liabilities are classified by type of security: loan notes, interbank market certificates, negotiable debt instruments, bonds and other debt securities, but exclude subordinated notes which are classified under Subordinated debt.
Interest accrued is recorded as Related payables and as an expense in the income statement. Bond issuance and redemption premiums are amortised using the straight-line or actuarial method over the life of the related borrowings. The resulting expense is recorded in the income statement under Net income from bonds and other debt securities.
Bond issuance costs accrued over the period are recorded as expenses for the period, under Net income from bonds and other debt securities in the income statement.
SUBORDINATED DEBT This item includes all dated or undated borrowings, whether or not in the form of securitised debt, which in the event of the liquidation of the borrowing company may only be redeemed after all other creditors have been paid.
Interest accrued and payable in respect of long-term subordinated debt, if any, is recorded as Related payables and as an expense in the income statement.
PROVISIONS Provisions include:
n provisions for country risks considered as a reserve, which are calculated on a lump-sum basis based on estimates by Societe Generale of its risks on the related countries and on debtors located in these countries at the balance sheet date, using criteria such as estimates of the country’s economic, financial and socio-political situation, or the discount rate on the secondary market;
n provisions for commitments;
n provisions for contingencies and disputes.
A description of contingencies and disputes is provided in the Risk Management report.
Provisions for contingencies and disputes are defined as liabilities with no precisely defined amount or due date. They are only recorded if the company has an obligation to a third party that will probably or necessarily lead to a transfer of funds to the third party, without compensation for at least an equivalent amount being expected from this third party.
392 I 2014 REGISTRATION DOCUMENT I SOCIETE GENERALE GROUP
6 I FINANCIAL INFORMATION I NOTES TO THE PARENT COMPANY FINANCIAL STATEMENTS I NOTE 1
The provisions are presented in the note 14. Information on the nature and the amount of the risks is not disclosed when the Group estimates that such disclosure could prejudice seriously its position in a dispute with other parties on the subject matter of the provision.
Net allocations to provisions are classified by type of risk in the corresponding accounts in the income statement.
CRB regulation 99-06 defines the funds necessary for the deposit guarantee fund. These resources comprise certificates of association acquired by each entity, together with annual subscription fees. CRB regulation 99-08 sets the total amount of these subscription fees which were payable over the period 1999 through 2002 in order to endow the fund. Half of said fees were paid in the form of guarantee deposits. Certificates of association and guarantee deposits are recorded in the balance sheet under Other sundry debtors. A provision was recognised at the end of 1999 under Exceptional items for all subscription fees to be paid by Societe Generale over the 2000-2002 period for the initial endowment of the guarantee fund. Subsequent fees were recorded under Other operating expenses.
In case of share purchase options and free shares plans granted to employees, a provision must be recorded for the loss that the entity will incur when it will deliver treasury shares to the employees.
This provision is recorded under Personnel expenses for an amount equal to the difference:
n between the quoted price of the treasury shares at the balance sheet closing date and the exercise price (zero in the case of free shares) if the entity has not already purchased its treasury shares in order to give them to the employees;
n between the acquisition price of treasury shares held and the exercise price (zero in case of free shares) if the entity has already purchased its treasury shares in order to deliver them to the employees.
If vesting conditions such as service or performance conditions must to be satisfied for the employees to become entitled to receive shares, the allowance expense on provision shall be accounted for the services as they are rendered by the employees during the vesting period.
In the case of share subscription plans, no expense shall be recorded concerning treasury shares that have to be issued.
COMMITMENTS UNDER CONTRATS ÉPARGNE-LOGEMENT (MORTGAGE SAVINGS AGREEMENTS) Comptes d’épargne-logement (CEL or mortgage savings accounts) and plans d’épargne-logement (PEL or mortgage savings plans) are special savings schemes for individual customers which are governed by Law 65-554 of July 10, 1965. These products combine an initial deposits phase in the form of an interest-earning savings account, followed by a lending phase where the deposits are used to provide mortgage loans. Under the current regulation, this last phase is subject to the prior existence of the savings phase and is therefore inseparable from it. The savings deposits collected and loans granted are recognised at amortised cost.
These instruments create two types of commitments for Societe Generale: the obligation to remunerate customer savings for an indeterminate future period at an interest rate established at the inception of the mortgage savings agreement, and the obligation to subsequently lend to the customer at an interest rate also established at the inception of the savings agreement.
If it is clear that commitments under the PEL/CEL agreements will have negative consequences for the company, a provision is recorded in the liabilities side of the balance sheet. Any changes in these provisions are recognised as net banking income under Net interest income. These provisions only relate to commitments arising from PEL/CEL that are outstanding at the date of calculation.
Provisions are calculated for each generation of mortgage savings plans (PEL), with no netting between different PEL generations, and for all mortgage saving accounts (CEL) which constitute a single generation.
During the deposits phase, the underlying commitment used to determine the amount to be provisioned is calculated as the difference between the average expected amount of deposits and the minimum expected amount. These two amounts are determined statistically on the basis of the historical observed past behaviour of customers.
During the lending phase, the underlying commitment to be provisioned includes loans already granted but not yet drawn at the date of calculation, and future loans that are considered statistically probable on the basis of the amount of balance sheet deposits at the date of calculation and the historical observed past behaviour of customers.
A provision is recorded if the discounted value of expected future earnings for a given generation of PEL/CEL is negative. Earnings are estimated on the basis of interest rates available to individual customers for equivalent savings and loan products (with a similar estimated life and date of inception).
TREASURY SHARES In accordance with Recommendation No. 2000-05 of the French National Accounting Standards Board relating to the recognition in the accounts of treasury shares held by companies governed by the French Banking and Financial Regulation Committee, Societe Generale shares acquired for allocation to employees are recorded as “Short-term investment securities” (Treasury) shares on the assets side of the balance sheet.
Societe Generale shares held with a view to underpinning the share price or as part of arbitrage transactions on the CAC 40 index are recorded under “Trading securities”.
TRANSACTIONS DENOMINATED IN FOREIGN CURRENCIES Gains and losses arising from ordinary activities in foreign currencies are recognised in the income statement. In accordance with CRB regulation 89-01, outright forward foreign exchange transactions and those used to hedge other forward foreign exchange transactions are valued on the basis of the forward foreign exchange rate of the relevant currency for the remaining maturity. Spot and other forward foreign exchange positions are revalued on a monthly basis using official month-end spot rates. Unrealised gains and losses are recognised in the income statement. Premiums and discounts resulting from hedged forward foreign exchange transactions, as defined by article 9 of the above-mentioned regulation, are amortised to income on a straight-line basis over the remaining term to maturity of these transactions.
SOCIETE GENERALE GROUP I 2014 REGISTRATION DOCUMENT I 393
NOTE 1 I NOTES TO THE PARENT COMPANY FINANCIAL STATEMENTS I FINANCIAL INFORMATION I 6
FORWARD FINANCIAL INSTRUMENTS Forward financial instruments relating to interest rates, foreign exchange or equities are used for trading and hedging purposes and are accounted for in compliance with CRB amended regulations 88-02 and 90-15 and directive 94-04 of the French Banking Commission (Commission bancaire). Nominal commitments on forward financial instruments are recorded as a separate off-balance sheet item. This amount represents the volume of outstanding transactions and does not represent the potential gain or loss associated with the market or counterparty risk on these transactions. Credit derivatives purchased to hedge credit risks on financial assets which are not valued at market value are classified and treated as guarantee commitments received.
The accounting treatment of income or expenses on these forward financial instruments depends on the purpose for which the transaction was concluded, as follows:
n Hedging transactions Income and expenses on forward financial instruments used as a hedge and assigned from the beginning to an identifiable item or group of similar items, are recognised in the income statement in the same manner as revenues and expenses on the hedged items. Income and expenses on interest rate instruments are recorded as net interest income in the same interest income or expense account as the items hedged. Income and expenses on other instruments such as equity instruments, stock market indexes or currencies are recognised as Net income from financial transactions, under Net income from forward financial instruments.
Income and expenses on forward financial instruments used to hedge or manage an overall interest rate risk are recognised in the income statement over the life of the instrument under Net income from financial transactions, in the caption Net income from forward financial instruments.
n Trading transactions Trading transactions include instruments traded on organised or similar markets and other instruments, such as credit derivatives and composite option products, which are included in the trading portfolio although they are traded over the-counter on less liquid markets, together with debt securities with a forward financial instrument component for which this classification in the accounts most appropriately reflects the results and associated risks. These transactions are measured at their market value at the balance sheet date. When financial instruments are not quoted in an active market, this value is generally determined on the basis of in-house models. Where necessary, these valuations are adjusted for reasons of prudence by applying a discount (Reserve Policy). This discount is determined on the basis of the instruments concerned and the associated risks, and takes into account:
n a conservative valuation of all the instruments, regardless of the liquidity of the corresponding market;
n a reserve calculated according to the size of the position and intended to cover the risk that Societe Generale will be unable to liquidate the investment in one go due to the size of the holding;
n an adjustment for the reduced liquidity of instruments and modeling risks in the case of complex products as well as transactions on less liquid markets (less liquid since they have been developed recently or are more specialised).
Furthermore, for over-the-counter transactions on forward interest rate instruments, the market value takes into account counterparty risks and the discounted value of future management costs.
The corresponding gains or losses are directly recognised as income for the period, regardless of whether they are realised or unrealised. They are recognised in the income statement as Net income from financial transactions.
Gains or losses corresponding to contracts concluded within the scope of cash management activities managed by the trading room, in order to benefit from any interest rate fluctuations, are recorded when liquidated or over the life of the contract, depending on the type of instrument. Unrealised losses are provisioned at year-end and the corresponding amount is recorded under Net income from financial transactions.
NET FEES FOR SERVICES Societe Generale recognises fee income and expense for services provided and received in different ways depending on the type of service.
Fees for ongoing services, such as some payment services, custody fees, or web-service subscriptions are recorded as income over the lifetime of the service. Fees for one-off services, such as fund activity, finder’s fees received, arbitrage fees, or penalties following payment incidents are recognised in income when the service is provided.
In syndication deals, the effective interest rate for the share of the issue retained on the Societe Generale’s balance sheet is comparable to that applying to the other members of the syndicate including, when needed, a share of the underwriting fees and participation fees; the balance of these fees is recorded in the income statement at the end of the syndication period. Arrangement fees are recorded in income when the placement is legally complete.
PERSONNEL EXPENSES The Personnel expenses account includes all expenses related to personnel, notably the cost of the legal employee profit-sharing, income of CICE (tax Credit for Competiveness and Employment) and incentive plans for the year, as well as the cost of internal restructuring operations.
EMPLOYEE BENEFITS Societe Generale in France, and its branches in foreign countries, may award their employees:
n post-employment benefits, such as pension plans or retirement bonuses;
n long-term benefits such as deferred variable remuneration, long service awards or the Compte Épargne Temps (CET) flexible working provisions;
n termination benefits.
n Post-employment benefits Pension plans may be defined contribution or defined benefit plans.
394 I 2014 REGISTRATION DOCUMENT I SOCIETE GENERALE GROUP
6 I FINANCIAL INFORMATION I NOTES TO THE PARENT COMPANY FINANCIAL STATEMENTS I NOTE 1
Defined contribution plans limit Societe Generale’s liability to the subscriptions paid into the plan but do not commit the company to a specific level of future benefits. Contributions paid are recorded as an expense for the year in question.
Defined benefit plans commit Societe Generale, either formally or constructively, to pay a certain amount or level of future benefits and therefore bear the medium-or long-term risk.
Provisions are recognised on the liabilities side of the balance sheet under Provisions, to cover the whole of these retirement obligations. This is assessed regularly by independent actuaries using the projected unit credit method.
This valuation technique incorporates assumptions about demographics, early retirement, salary rises and discount and inflation rates.
When these plans are financed from external funds classed as plan assets, the fair value of these funds is subtracted from the provision to cover the obligations.
Differences arising from changes in calculation assumptions (early retirements, discount rates, etc.) or differences between actuarial assumptions and real performance (return on plan assets) are recognised as actuarial gains or losses. They are amortised in the income statement according to the “corridor” method: i.e. over the expected average remaining working lives of the employees participating in the plan, as soon as they exceed the greater of:
n 10% of the present value of the defined benefit obligation;
n 10% of the fair value of the assets at the end of the previous financial year.
Where a new or amended plan comes into force the cost of past services is spread over the remaining period until vesting.
An annual charge is recorded under Personnel expenses for defined benefit plans, consisting of:
n the additional entitlements vested by each employee (current service cost);
n the financial expense resulting from the discount rate;
n the expected return on plan assets (gross return);
n the amortisation of actuarial gains and losses and past service cost;
n the settlement or curtailment of plans.
n Long-term benefits These are benefits paid to employees more than 12 months after the end of the period in which they provided the related services. Long-term benefits are measured in the same way as post-employment benefits, except for the treatment of actuarial gains and losses and past service costs, which are recorded immediately in income.
COST OF RISK Cost of risk includes allocations, net of reversals, to provisions and to impairments for credit risk, the amount of the loan considered uncollectable and the amount of recoveries on loans written off, as well as allocations and reversals of provisions for other risks.
NET INCOME FROM LONGTERM INVESTMENTS This item covers capital gains or losses realised on disposals, as well as the net allocation to depreciation for investments in consolidated subsidiaries and affiliates, long-term investment securities and offices and other premises. Income from real-estate holdings excluding offices is recorded under net banking income.
INCOME TAX
n Current taxes In the 1989 financial year, Societe Generale opted to apply a tax consolidation regime. At December 31, 2013, 300 subsidiaries had signed a tax consolidation agreement with the company, under which they are required to record in their accounts the tax expense they would have paid if they had not been consolidated with Societe Generale for tax purposes.
In France, the normal corporate income tax rate is 33.33%. As from January 1, 2007, long-term capital gains on equity investments are exempted but taxed a share of expenses of 12% of gross gains on sales in case of long term net gain of sale, used to be an effective rate of 4.13%.
Additionally, a Contribution sociale (national contribution payment based on pre-tax earnings) was introduced in 2000 equal to 3.3% (based on corporate income tax after a deduction of EUR 0.76 million from basic taxable income).
Another exceptional contribution equal to 10.7% was introduced in 2011 and based on corporate income tax for 2013 and 2014.
Dividends from companies in which Societe Generale’s interest is at least 5% are tax exempt up to 95%.
n Deferred tax Societe Generale has opted to apply the option allowing it to recognise deferred taxes in its parent company accounts.
Deferred taxes are recorded when there is a timing difference between the book value and tax value of balance sheet assets and liabilities that will affect future tax payments. Deferred tax assets and liabilities are measured based on the tax rate enacted or substantively enacted which is expected to apply when the asset is realised or the liability settled. The impact of changes to tax rates is recorded in the income statement under Deferred taxes. Net deferred tax assets are not recorded unless it is probable that the subsidiary that owns the assets is likely to be able to apply them within a set timeframe.
In 2012 and thereafter, the normal tax rate applicable to French companies to determine their deferred tax is 34.43%.
Deferred taxes are determined separately for each taxable entity and are not discounted to present value when the corresponding effect is not significant or when a precise timetable has not been drawn up.
EXCEPTIONAL ITEMS This caption includes income earned and expenses incurred by Societe Generale that are considered to be exceptional in view of either the amount or the manner in which they were generated. In most cases, said income or expenses are the result of events that fall outside Societe Generale’s activity.
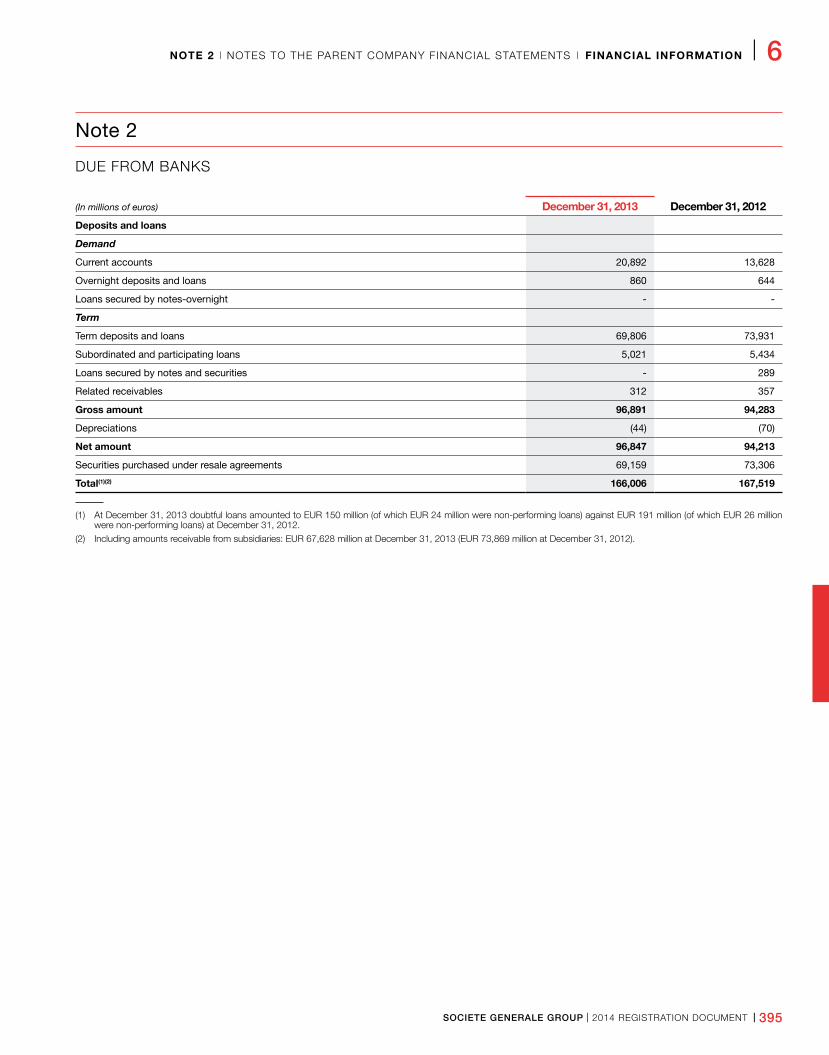
SOCIETE GENERALE GROUP I 2014 REGISTRATION DOCUMENT I 395
NOTE 2 I NOTES TO THE PARENT COMPANY FINANCIAL STATEMENTS I FINANCIAL INFORMATION I 6
Note 2
DUE FROM BANKS
(In millions of euros) December 31, 2013 December 31, 2012
Deposits and loans
Demand
Current accounts 20,892 13,628
Overnight deposits and loans 860 644
Loans secured by notes-overnight - -
Term
Term deposits and loans 69,806 73,931
Subordinated and participating loans 5,021 5,434
Loans secured by notes and securities - 289
Related receivables 312 357
Gross amount 96,891 94,283
Depreciations (44) (70)
Net amount 96,847 94,213
Securities purchased under resale agreements 69,159 73,306
Total(1)(2) 166,006 167,519
(1) At December 31, 2013 doubtful loans amounted to EUR 150 million (of which EUR 24 million were non-performing loans) against EUR 191 million (of which EUR 26 million were non-performing loans) at December 31, 2012.
(2) Including amounts receivable from subsidiaries: EUR 67,628 million at December 31, 2013 (EUR 73,869 million at December 31, 2012).
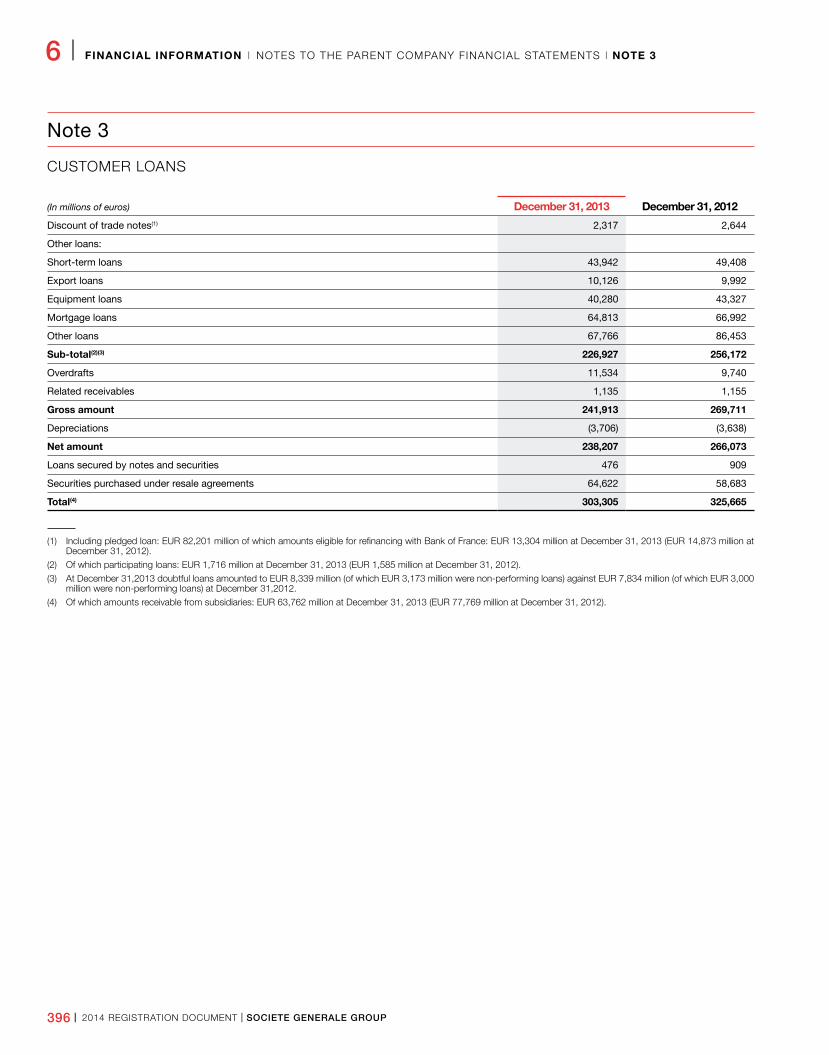
396 I 2014 REGISTRATION DOCUMENT I SOCIETE GENERALE GROUP
6 I FINANCIAL INFORMATION I NOTES TO THE PARENT COMPANY FINANCIAL STATEMENTS I NOTE 3
Note 3
CUSTOMER LOANS
(In millions of euros) December 31, 2013 December 31, 2012
Discount of trade notes(1) 2,317 2,644
Other loans:
Short-term loans 43,942 49,408
Export loans 10,126 9,992
Equipment loans 40,280 43,327
Mortgage loans 64,813 66,992
Other loans 67,766 86,453
Subtotal(2)(3) 226,927 256,172
Overdrafts 11,534 9,740
Related receivables 1,135 1,155
Gross amount 241,913 269,711
Depreciations (3,706) (3,638)
Net amount 238,207 266,073
Loans secured by notes and securities 476 909
Securities purchased under resale agreements 64,622 58,683
Total(4) 303,305 325,665
(1) Including pledged loan: EUR 82,201 million of which amounts eligible for refinancing with Bank of France: EUR 13,304 million at December 31, 2013 (EUR 14,873 million at December 31, 2012).
(2) Of which participating loans: EUR 1,716 million at December 31, 2013 (EUR 1,585 million at December 31, 2012).
(3) At December 31,2013 doubtful loans amounted to EUR 8,339 million (of which EUR 3,173 million were non-performing loans) against EUR 7,834 million (of which EUR 3,000 million were non-performing loans) at December 31,2012.
(4) Of which amounts receivable from subsidiaries: EUR 63,762 million at December 31, 2013 (EUR 77,769 million at December 31, 2012).
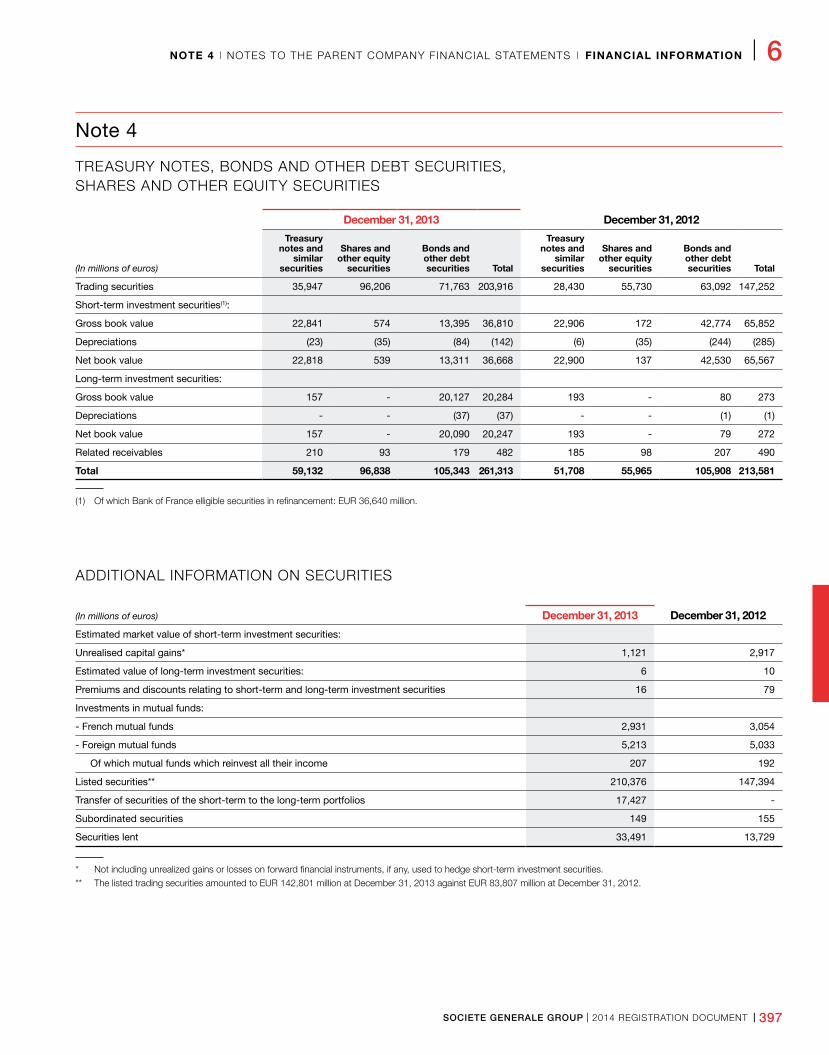
SOCIETE GENERALE GROUP I 2014 REGISTRATION DOCUMENT I 397
NOTE 4 I NOTES TO THE PARENT COMPANY FINANCIAL STATEMENTS I FINANCIAL INFORMATION I 6
Note 4
TREASURY NOTES, BONDS AND OTHER DEBT SECURITIES, SHARES AND OTHER EQUITY SECURITIES
December 31, 2013 December 31, 2012
(In millions of euros)
Treasury notes and
similar securities
Shares and other equity
securities
Bonds and other debt securities Total
Treasury notes and
similar securities
Shares and other equity
securities
Bonds and other debt securities Total
Trading securities 35,947 96,206 71,763 203,916 28,430 55,730 63,092 147,252
Short-term investment securities(1):
Gross book value 22,841 574 13,395 36,810 22,906 172 42,774 65,852
Depreciations (23) (35) (84) (142) (6) (35) (244) (285)
Net book value 22,818 539 13,311 36,668 22,900 137 42,530 65,567
Long-term investment securities:
Gross book value 157 - 20,127 20,284 193 - 80 273
Depreciations - - (37) (37) - - (1) (1)
Net book value 157 - 20,090 20,247 193 - 79 272
Related receivables 210 93 179 482 185 98 207 490
Total 59,132 96,838 105,343 261,313 51,708 55,965 105,908 213,581
(1) Of which Bank of France elligible securities in refinancement: EUR 36,640 million.
ADDITIONAL INFORMATION ON SECURITIES
(In millions of euros) December 31, 2013 December 31, 2012
Estimated market value of short-term investment securities:
Unrealised capital gains* 1,121 2,917
Estimated value of long-term investment securities: 6 10
Premiums and discounts relating to short-term and long-term investment securities 16 79
Investments in mutual funds:
- French mutual funds 2,931 3,054
- Foreign mutual funds 5,213 5,033
Of which mutual funds which reinvest all their income 207 192
Listed securities** 210,376 147,394
Transfer of securities of the short-term to the long-term portfolios 17,427 -
Subordinated securities 149 155
Securities lent 33,491 13,729
* Not including unrealized gains or losses on forward financial instruments, if any, used to hedge short-term investment securities.
** The listed trading securities amounted to EUR 142,801 million at December 31, 2013 against EUR 83,807 million at December 31, 2012.
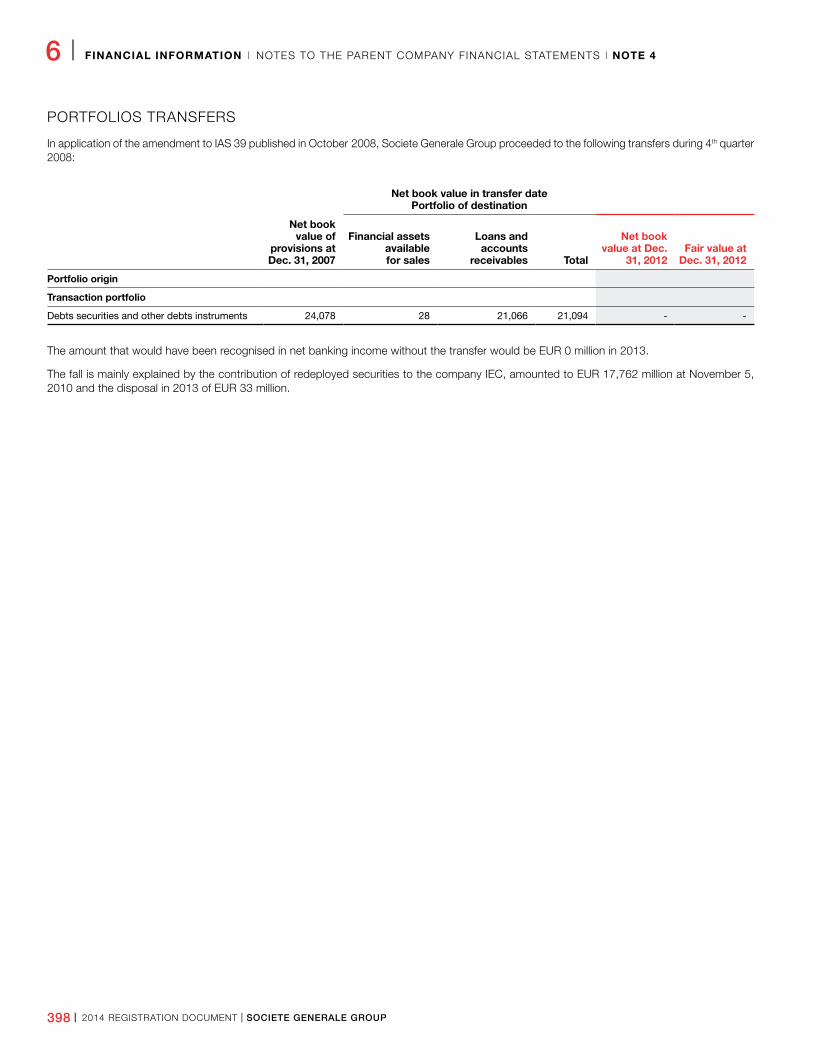
398 I 2014 REGISTRATION DOCUMENT I SOCIETE GENERALE GROUP
6 I FINANCIAL INFORMATION I NOTES TO THE PARENT COMPANY FINANCIAL STATEMENTS I NOTE 4
PORTFOLIOS TRANSFERS
In application of the amendment to IAS 39 published in October 2008, Societe Generale Group proceeded to the following transfers during 4th quarter 2008:
Net book value in transfer date Portfolio of destination
Net book value of
provisions at Dec. 31, 2007
Financial assets available for sales
Loans and accounts
receivables Total
Net book value at Dec.
31, 2012Fair value at
Dec. 31, 2012
Portfolio origin
Transaction portfolio
Debts securities and other debts instruments 24,078 28 21,066 21,094 - -
The amount that would have been recognised in net banking income without the transfer would be EUR 0 million in 2013.
The fall is mainly explained by the contribution of redeployed securities to the company IEC, amounted to EUR 17,762 million at November 5, 2010 and the disposal in 2013 of EUR 33 million.
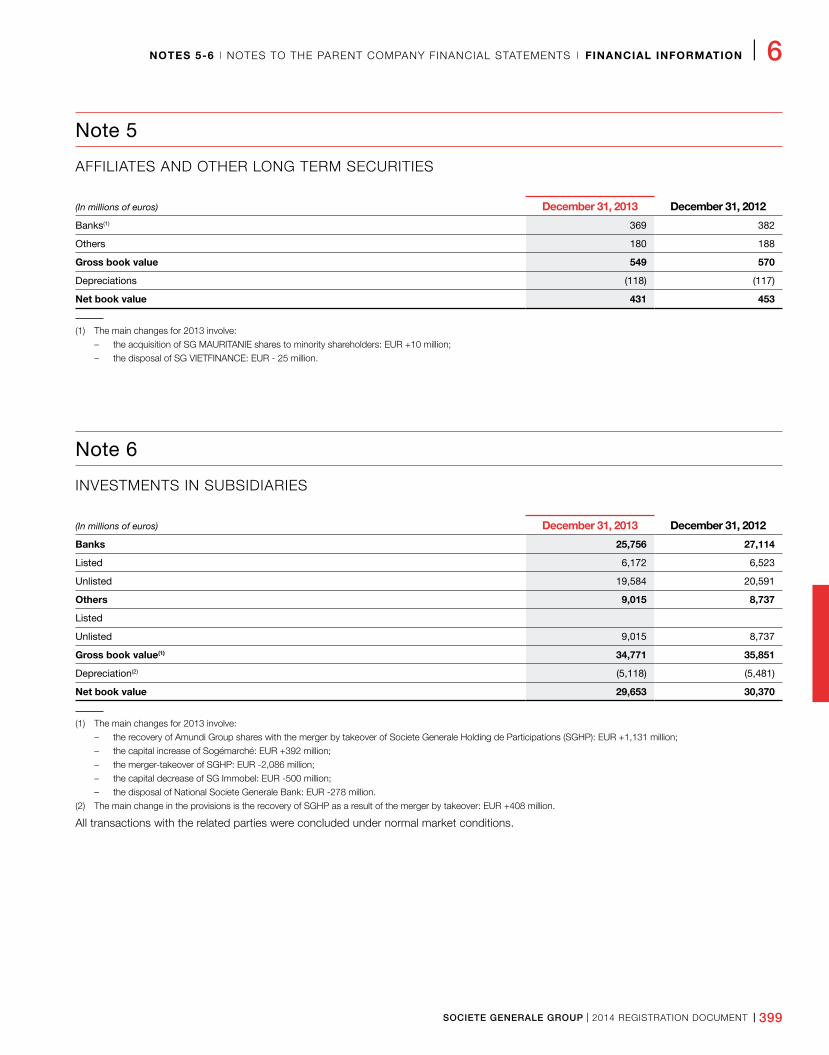
SOCIETE GENERALE GROUP I 2014 REGISTRATION DOCUMENT I 399
NOTES 56 I NOTES TO THE PARENT COMPANY FINANCIAL STATEMENTS I FINANCIAL INFORMATION I 6
Note 5
AFFILIATES AND OTHER LONG TERM SECURITIES
(In millions of euros) December 31, 2013 December 31, 2012
Banks(1) 369 382
Others 180 188
Gross book value 549 570
Depreciations (118) (117)
Net book value 431 453
(1) The main changes for 2013 involve:
– the acquisition of SG MAURITANIE shares to minority shareholders: EUR +10 million;
– the disposal of SG VIETFINANCE: EUR - 25 million.
Note 6
INVESTMENTS IN SUBSIDIARIES
(In millions of euros) December 31, 2013 December 31, 2012
Banks 25,756 27,114
Listed 6,172 6,523
Unlisted 19,584 20,591
Others 9,015 8,737
Listed
Unlisted 9,015 8,737
Gross book value(1) 34,771 35,851
Depreciation(2) (5,118) (5,481)
Net book value 29,653 30,370
(1) The main changes for 2013 involve:
– the recovery of Amundi Group shares with the merger by takeover of Societe Generale Holding de Participations (SGHP): EUR +1,131 million;
– the capital increase of Sogémarché: EUR +392 million;
– the merger-takeover of SGHP: EUR -2,086 million;
– the capital decrease of SG Immobel: EUR -500 million;
– the disposal of National Societe Generale Bank: EUR -278 million.
(2) The main change in the provisions is the recovery of SGHP as a result of the merger by takeover: EUR +408 million.
All transactions with the related parties were concluded under normal market conditions.
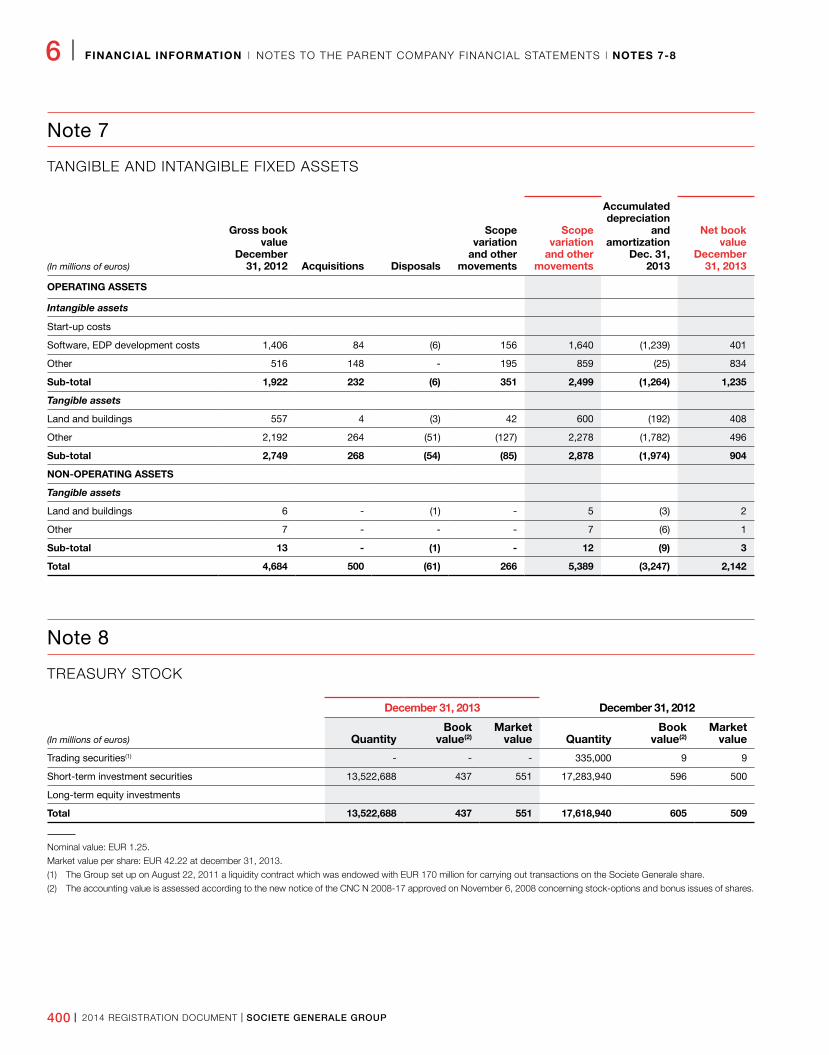
400 I 2014 REGISTRATION DOCUMENT I SOCIETE GENERALE GROUP
6 I FINANCIAL INFORMATION I NOTES TO THE PARENT COMPANY FINANCIAL STATEMENTS I NOTES 78
Note 7
TANGIBLE AND INTANGIBLE FIXED ASSETS
(In millions of euros)
Gross book value
December 31, 2012 Acquisitions Disposals
Scope variation
and other movements
Scope variation
and other movements
Accumulated depreciation
and amortization
Dec. 31, 2013
Net book value
December 31, 2013
OPERATING ASSETS
Intangible assets
Start-up costs
Software, EDP development costs 1,406 84 (6) 156 1,640 (1,239) 401
Other 516 148 - 195 859 (25) 834
Subtotal 1,922 232 (6) 351 2,499 (1,264) 1,235
Tangible assets
Land and buildings 557 4 (3) 42 600 (192) 408
Other 2,192 264 (51) (127) 2,278 (1,782) 496
Subtotal 2,749 268 (54) (85) 2,878 (1,974) 904
NONOPERATING ASSETS
Tangible assets
Land and buildings 6 - (1) - 5 (3) 2
Other 7 - - - 7 (6) 1
Subtotal 13 (1) 12 (9) 3
Total 4,684 500 (61) 266 5,389 (3,247) 2,142
Note 8
TREASURY STOCK
December 31, 2013 December 31, 2012
(In millions of euros) QuantityBook
value(2)Market
value QuantityBook
value(2)Market
value
Trading securities(1) - - - 335,000 9 9
Short-term investment securities 13,522,688 437 551 17,283,940 596 500
Long-term equity investments
Total 13,522,688 437 551 17,618,940 605 509
Nominal value: EUR 1.25.
Market value per share: EUR 42.22 at december 31, 2013.
(1) The Group set up on August 22, 2011 a liquidity contract which was endowed with EUR 170 million for carrying out transactions on the Societe Generale share.
(2) The accounting value is assessed according to the new notice of the CNC N 2008-17 approved on November 6, 2008 concerning stock-options and bonus issues of shares.
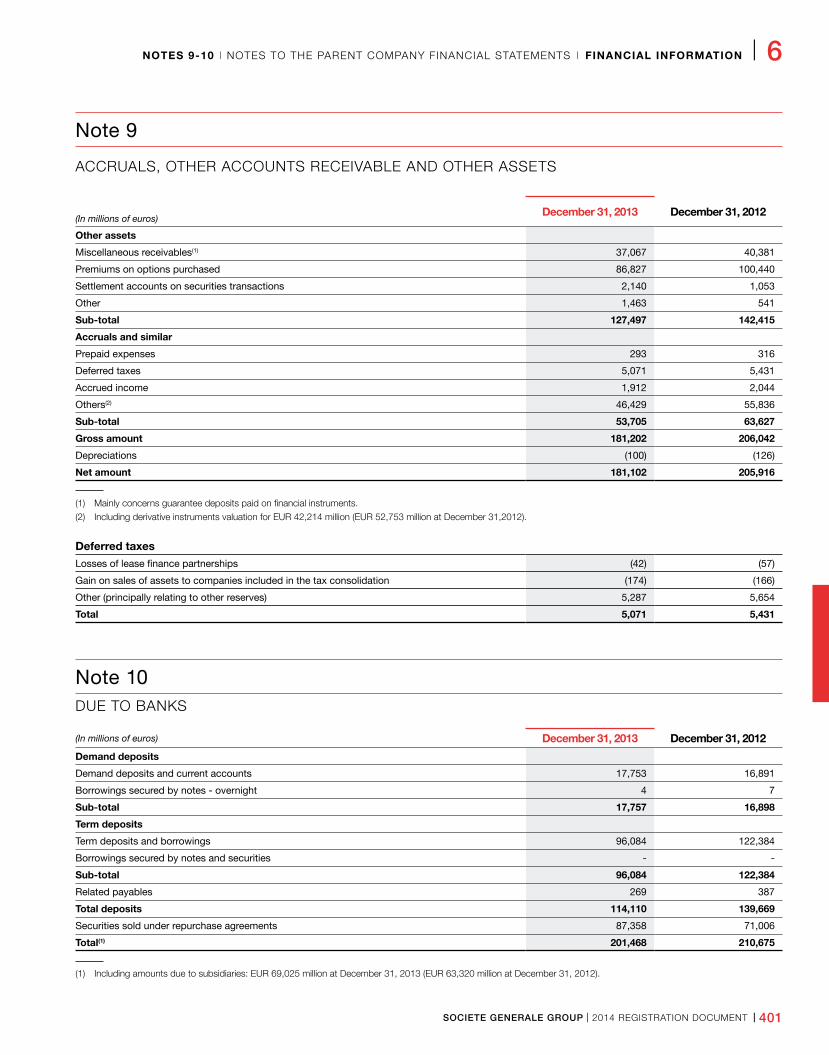
SOCIETE GENERALE GROUP I 2014 REGISTRATION DOCUMENT I 401
NOTES 910 I NOTES TO THE PARENT COMPANY FINANCIAL STATEMENTS I FINANCIAL INFORMATION I 6
Note 9
ACCRUALS, OTHER ACCOUNTS RECEIVABLE AND OTHER ASSETS
(In millions of euros)December 31, 2013 December 31, 2012
Other assets
Miscellaneous receivables(1) 37,067 40,381
Premiums on options purchased 86,827 100,440
Settlement accounts on securities transactions 2,140 1,053
Other 1,463 541
Subtotal 127,497 142,415
Accruals and similar
Prepaid expenses 293 316
Deferred taxes 5,071 5,431
Accrued income 1,912 2,044
Others(2) 46,429 55,836
Subtotal 53,705 63,627
Gross amount 181,202 206,042
Depreciations (100) (126)
Net amount 181,102 205,916
(1) Mainly concerns guarantee deposits paid on financial instruments.
(2) Including derivative instruments valuation for EUR 42,214 million (EUR 52,753 million at December 31,2012).
Deferred taxes Losses of lease finance partnerships (42) (57)
Gain on sales of assets to companies included in the tax consolidation (174) (166)
Other (principally relating to other reserves) 5,287 5,654
Total 5,071 5,431
Note 10DUE TO BANKS
(In millions of euros) December 31, 2013 December 31, 2012
Demand deposits
Demand deposits and current accounts 17,753 16,891
Borrowings secured by notes - overnight 4 7
Subtotal 17,757 16,898
Term deposits
Term deposits and borrowings 96,084 122,384
Borrowings secured by notes and securities - -
Subtotal 96,084 122,384
Related payables 269 387
Total deposits 114,110 139,669
Securities sold under repurchase agreements 87,358 71,006
Total(1) 201,468 210,675
(1) Including amounts due to subsidiaries: EUR 69,025 million at December 31, 2013 (EUR 63,320 million at December 31, 2012).
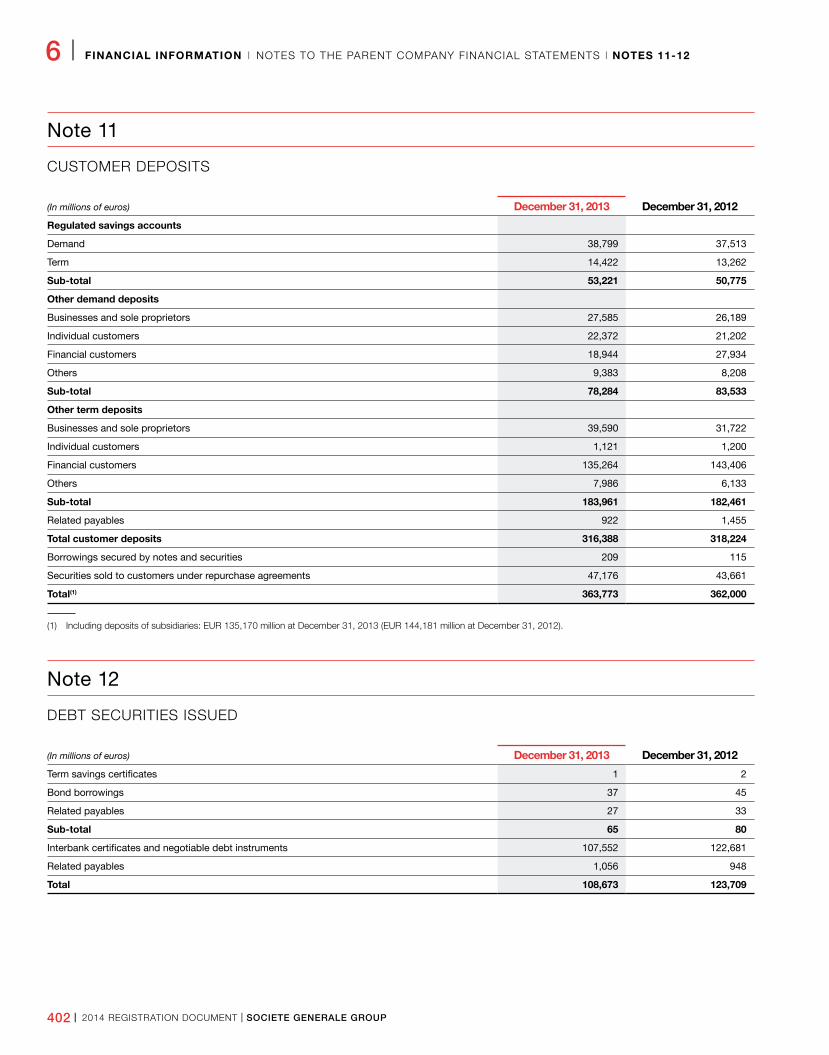
402 I 2014 REGISTRATION DOCUMENT I SOCIETE GENERALE GROUP
6 I FINANCIAL INFORMATION I NOTES TO THE PARENT COMPANY FINANCIAL STATEMENTS I NOTES 1112
Note 11
CUSTOMER DEPOSITS
(In millions of euros) December 31, 2013 December 31, 2012
Regulated savings accounts
Demand 38,799 37,513
Term 14,422 13,262
Subtotal 53,221 50,775
Other demand deposits
Businesses and sole proprietors 27,585 26,189
Individual customers 22,372 21,202
Financial customers 18,944 27,934
Others 9,383 8,208
Subtotal 78,284 83,533
Other term deposits
Businesses and sole proprietors 39,590 31,722
Individual customers 1,121 1,200
Financial customers 135,264 143,406
Others 7,986 6,133
Subtotal 183,961 182,461
Related payables 922 1,455
Total customer deposits 316,388 318,224
Borrowings secured by notes and securities 209 115
Securities sold to customers under repurchase agreements 47,176 43,661
Total(1) 363,773 362,000
(1) Including deposits of subsidiaries: EUR 135,170 million at December 31, 2013 (EUR 144,181 million at December 31, 2012).
Note 12
DEBT SECURITIES ISSUED
(In millions of euros) December 31, 2013 December 31, 2012
Term savings certificates 1 2
Bond borrowings 37 45
Related payables 27 33
Subtotal 65 80
Interbank certificates and negotiable debt instruments 107,552 122,681
Related payables 1,056 948
Total 108,673 123,709
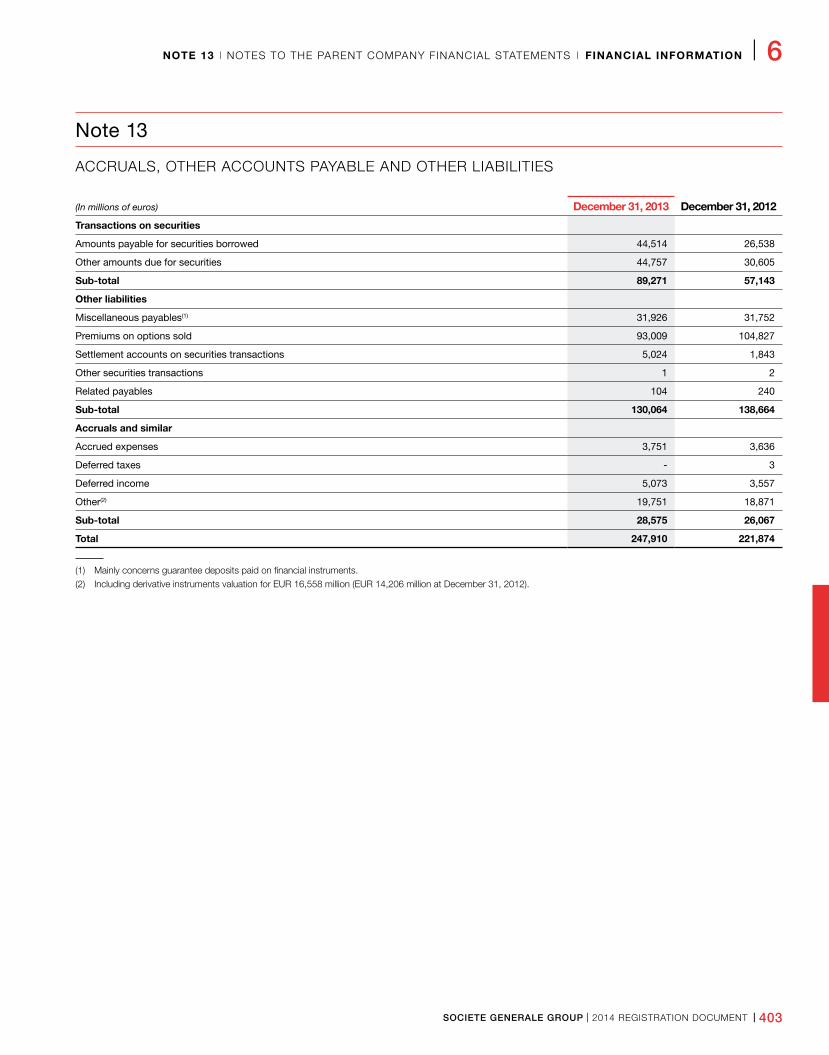
SOCIETE GENERALE GROUP I 2014 REGISTRATION DOCUMENT I 403
NOTE 13 I NOTES TO THE PARENT COMPANY FINANCIAL STATEMENTS I FINANCIAL INFORMATION I 6
Note 13
ACCRUALS, OTHER ACCOUNTS PAYABLE AND OTHER LIABILITIES
(In millions of euros) December 31, 2013 December 31, 2012
Transactions on securities
Amounts payable for securities borrowed 44,514 26,538
Other amounts due for securities 44,757 30,605
Subtotal 89,271 57,143
Other liabilities
Miscellaneous payables(1) 31,926 31,752
Premiums on options sold 93,009 104,827
Settlement accounts on securities transactions 5,024 1,843
Other securities transactions 1 2
Related payables 104 240
Subtotal 130,064 138,664
Accruals and similar
Accrued expenses 3,751 3,636
Deferred taxes - 3
Deferred income 5,073 3,557
Other(2) 19,751 18,871
Subtotal 28,575 26,067
Total 247,910 221,874
(1) Mainly concerns guarantee deposits paid on financial instruments.
(2) Including derivative instruments valuation for EUR 16,558 million (EUR 14,206 million at December 31, 2012).
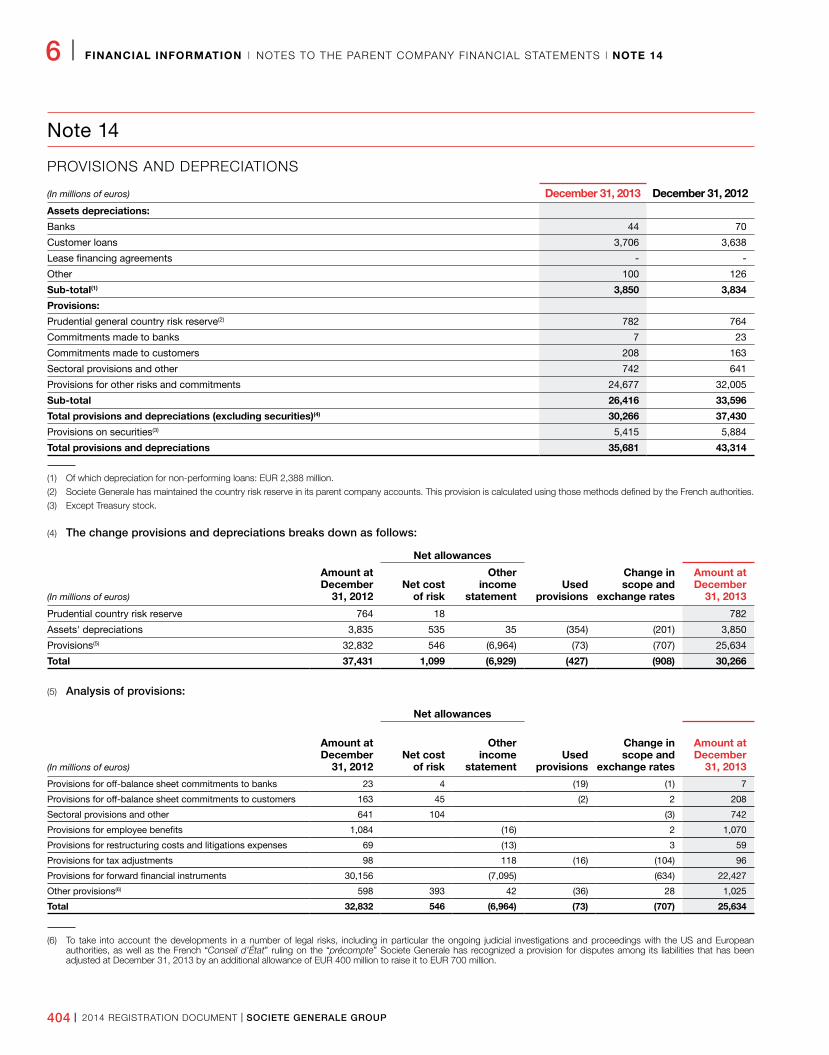
404 I 2014 REGISTRATION DOCUMENT I SOCIETE GENERALE GROUP
6 I FINANCIAL INFORMATION I NOTES TO THE PARENT COMPANY FINANCIAL STATEMENTS I NOTE 14
Note 14
PROVISIONS AND DEPRECIATIONS
(In millions of euros) December 31, 2013 December 31, 2012
Assets depreciations:
Banks 44 70
Customer loans 3,706 3,638
Lease financing agreements - -
Other 100 126
Subtotal(1) 3,850 3,834
Provisions:
Prudential general country risk reserve(2) 782 764
Commitments made to banks 7 23
Commitments made to customers 208 163
Sectoral provisions and other 742 641
Provisions for other risks and commitments 24,677 32,005
Subtotal 26,416 33,596
Total provisions and depreciations (excluding securities)(4) 30,266 37,430
Provisions on securities(3) 5,415 5,884
Total provisions and depreciations 35,681 43,314
(1) Of which depreciation for non-performing loans: EUR 2,388 million.
(2) Societe Generale has maintained the country risk reserve in its parent company accounts. This provision is calculated using those methods defined by the French authorities.
(3) Except Treasury stock.
(4) The change provisions and depreciations breaks down as follows:
Net allowances
(In millions of euros)
Amount at December
31, 2012Net cost
of risk
Other income
statementUsed
provisions
Change in scope and
exchange rates
Amount at December
31, 2013
Prudential country risk reserve 764 18 782
Assets' depreciations 3,835 535 35 (354) (201) 3,850
Provisions(5) 32,832 546 (6,964) (73) (707) 25,634
Total 37,431 1,099 (6,929) (427) (908) 30,266
(5) Analysis of provisions:
Net allowances
(In millions of euros)
Amount at December
31, 2012Net cost
of risk
Other income
statementUsed
provisions
Change in scope and
exchange rates
Amount at December
31, 2013
Provisions for off-balance sheet commitments to banks 23 4 (19) (1) 7
Provisions for off-balance sheet commitments to customers 163 45 (2) 2 208
Sectoral provisions and other 641 104 (3) 742
Provisions for employee benefits 1,084 (16) 2 1,070
Provisions for restructuring costs and litigations expenses 69 (13) 3 59
Provisions for tax adjustments 98 118 (16) (104) 96
Provisions for forward financial instruments 30,156 (7,095) (634) 22,427
Other provisions(6) 598 393 42 (36) 28 1,025
Total 32,832 546 (6,964) (73) (707) 25,634
(6) To take into account the developments in a number of legal risks, including in particular the ongoing judicial investigations and proceedings with the US and European authorities, as well as the French “Conseil d’État” ruling on the “précompte” Societe Generale has recognized a provision for disputes among its liabilities that has been adjusted at December 31, 2013 by an additional allowance of EUR 400 million to raise it to EUR 700 million.
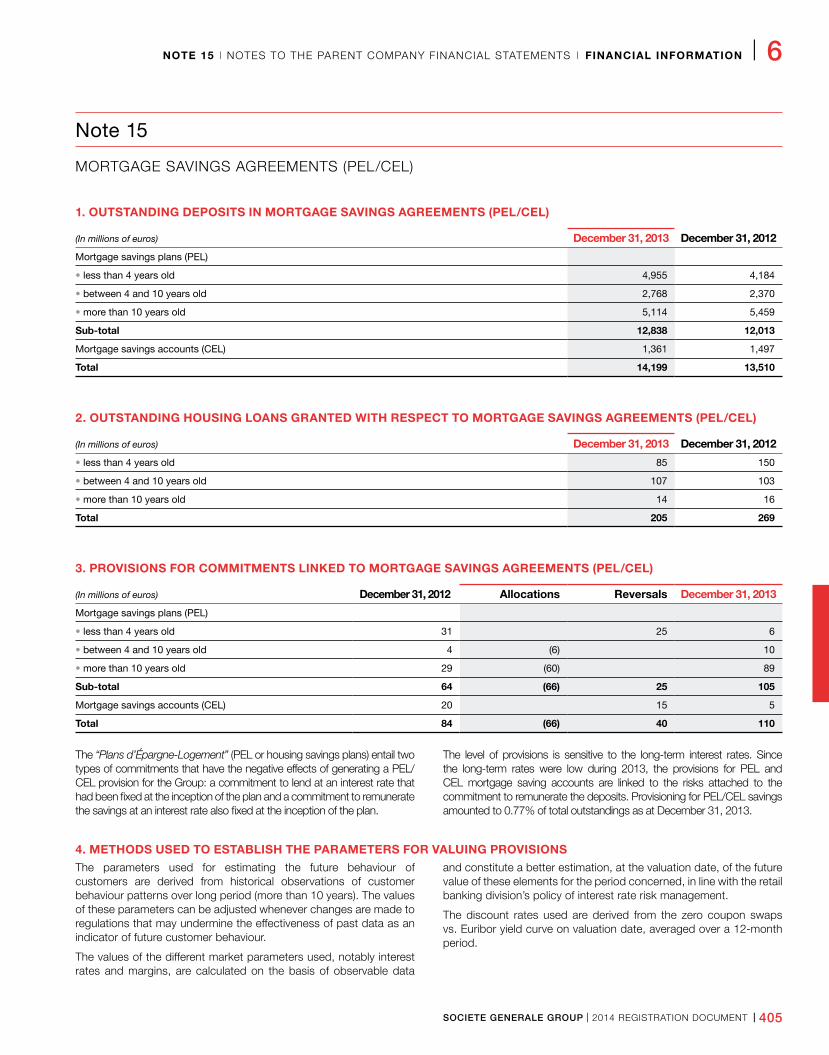
SOCIETE GENERALE GROUP I 2014 REGISTRATION DOCUMENT I 405
NOTE 15 I NOTES TO THE PARENT COMPANY FINANCIAL STATEMENTS I FINANCIAL INFORMATION I 6
Note 15
MORTGAGE SAVINGS AGREEMENTS (PEL/CEL)
1. OUTSTANDING DEPOSITS IN MORTGAGE SAVINGS AGREEMENTS (PEL/CEL)
(In millions of euros) December 31, 2013 December 31, 2012
Mortgage savings plans (PEL)
• less than 4 years old 4,955 4,184
• between 4 and 10 years old 2,768 2,370
• more than 10 years old 5,114 5,459
Subtotal 12,838 12,013
Mortgage savings accounts (CEL) 1,361 1,497
Total 14,199 13,510
2. OUTSTANDING HOUSING LOANS GRANTED WITH RESPECT TO MORTGAGE SAVINGS AGREEMENTS (PEL/CEL)
(In millions of euros) December 31, 2013 December 31, 2012
• less than 4 years old 85 150
• between 4 and 10 years old 107 103
• more than 10 years old 14 16
Total 205 269
3. PROVISIONS FOR COMMITMENTS LINKED TO MORTGAGE SAVINGS AGREEMENTS (PEL/CEL)
(In millions of euros) December 31, 2012 Allocations Reversals December 31, 2013
Mortgage savings plans (PEL)
• less than 4 years old 31 25 6
• between 4 and 10 years old 4 (6) 10
• more than 10 years old 29 (60) 89
Subtotal 64 (66) 25 105
Mortgage savings accounts (CEL) 20 15 5
Total 84 (66) 40 110
The “Plans d’Épargne-Logement” (PEL or housing savings plans) entail two types of commitments that have the negative effects of generating a PEL/CEL provision for the Group: a commitment to lend at an interest rate that had been fixed at the inception of the plan and a commitment to remunerate the savings at an interest rate also fixed at the inception of the plan.
The level of provisions is sensitive to the long-term interest rates. Since the long-term rates were low during 2013, the provisions for PEL and CEL mortgage saving accounts are linked to the risks attached to the commitment to remunerate the deposits. Provisioning for PEL/CEL savings amounted to 0.77% of total outstandings as at December 31, 2013.
4. METHODS USED TO ESTABLISH THE PARAMETERS FOR VALUING PROVISIONSThe parameters used for estimating the future behaviour of customers are derived from historical observations of customer behaviour patterns over long period (more than 10 years). The values of these parameters can be adjusted whenever changes are made to regulations that may undermine the effectiveness of past data as an indicator of future customer behaviour.
The values of the different market parameters used, notably interest rates and margins, are calculated on the basis of observable data
and constitute a better estimation, at the valuation date, of the future value of these elements for the period concerned, in line with the retail banking division’s policy of interest rate risk management.
The discount rates used are derived from the zero coupon swaps vs. Euribor yield curve on valuation date, averaged over a 12-month period.
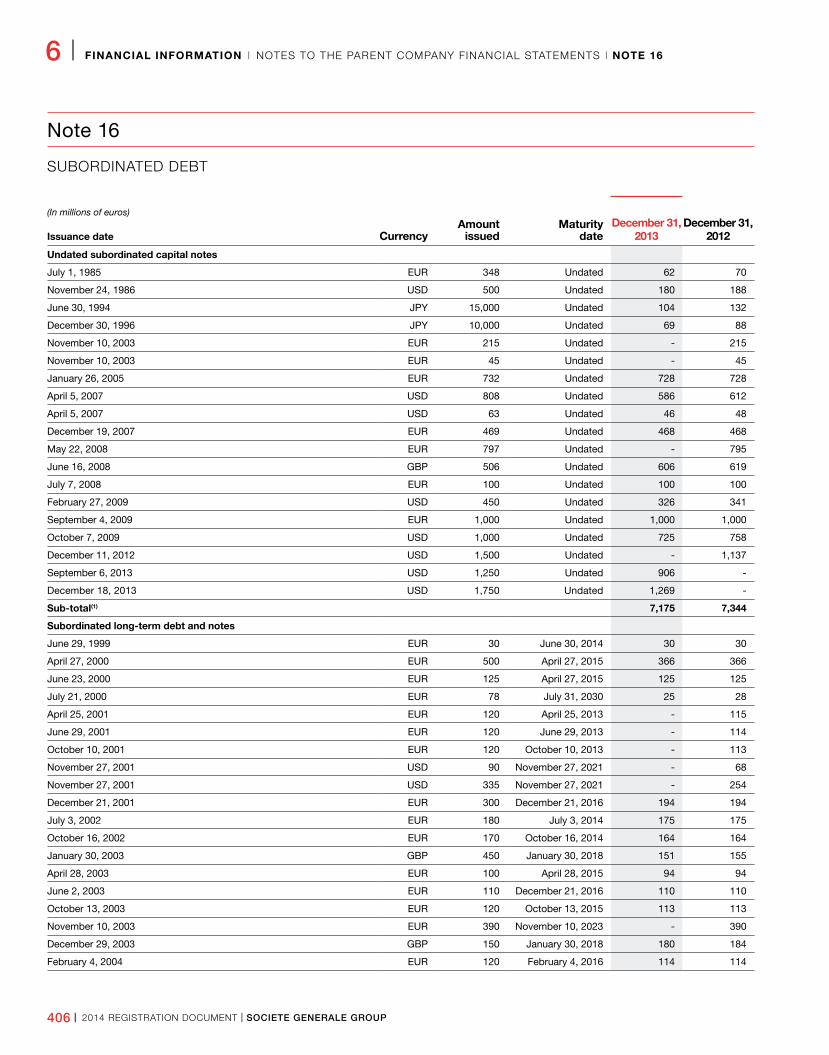
406 I 2014 REGISTRATION DOCUMENT I SOCIETE GENERALE GROUP
6 I FINANCIAL INFORMATION I NOTES TO THE PARENT COMPANY FINANCIAL STATEMENTS I NOTE 16
Note 16
SUBORDINATED DEBT
(In millions of euros)
CurrencyAmount
issuedMaturity
dateDecember 31,
2013December 31,
2012Issuance date
Undated subordinated capital notes
July 1, 1985 EUR 348 Undated 62 70
November 24, 1986 USD 500 Undated 180 188
June 30, 1994 JPY 15,000 Undated 104 132
December 30, 1996 JPY 10,000 Undated 69 88
November 10, 2003 EUR 215 Undated - 215
November 10, 2003 EUR 45 Undated - 45
January 26, 2005 EUR 732 Undated 728 728
April 5, 2007 USD 808 Undated 586 612
April 5, 2007 USD 63 Undated 46 48
December 19, 2007 EUR 469 Undated 468 468
May 22, 2008 EUR 797 Undated - 795
June 16, 2008 GBP 506 Undated 606 619
July 7, 2008 EUR 100 Undated 100 100
February 27, 2009 USD 450 Undated 326 341
September 4, 2009 EUR 1,000 Undated 1,000 1,000
October 7, 2009 USD 1,000 Undated 725 758
December 11, 2012 USD 1,500 Undated - 1,137
September 6, 2013 USD 1,250 Undated 906 -
December 18, 2013 USD 1,750 Undated 1,269 -
Subtotal(1) 7,175 7,344
Subordinated longterm debt and notes
June 29, 1999 EUR 30 June 30, 2014 30 30
April 27, 2000 EUR 500 April 27, 2015 366 366
June 23, 2000 EUR 125 April 27, 2015 125 125
July 21, 2000 EUR 78 July 31, 2030 25 28
April 25, 2001 EUR 120 April 25, 2013 - 115
June 29, 2001 EUR 120 June 29, 2013 - 114
October 10, 2001 EUR 120 October 10, 2013 - 113
November 27, 2001 USD 90 November 27, 2021 - 68
November 27, 2001 USD 335 November 27, 2021 - 254
December 21, 2001 EUR 300 December 21, 2016 194 194
July 3, 2002 EUR 180 July 3, 2014 175 175
October 16, 2002 EUR 170 October 16, 2014 164 164
January 30, 2003 GBP 450 January 30, 2018 151 155
April 28, 2003 EUR 100 April 28, 2015 94 94
June 2, 2003 EUR 110 December 21, 2016 110 110
October 13, 2003 EUR 120 October 13, 2015 113 113
November 10, 2003 EUR 390 November 10, 2023 - 390
December 29, 2003 GBP 150 January 30, 2018 180 184
February 4, 2004 EUR 120 February 4, 2016 114 114
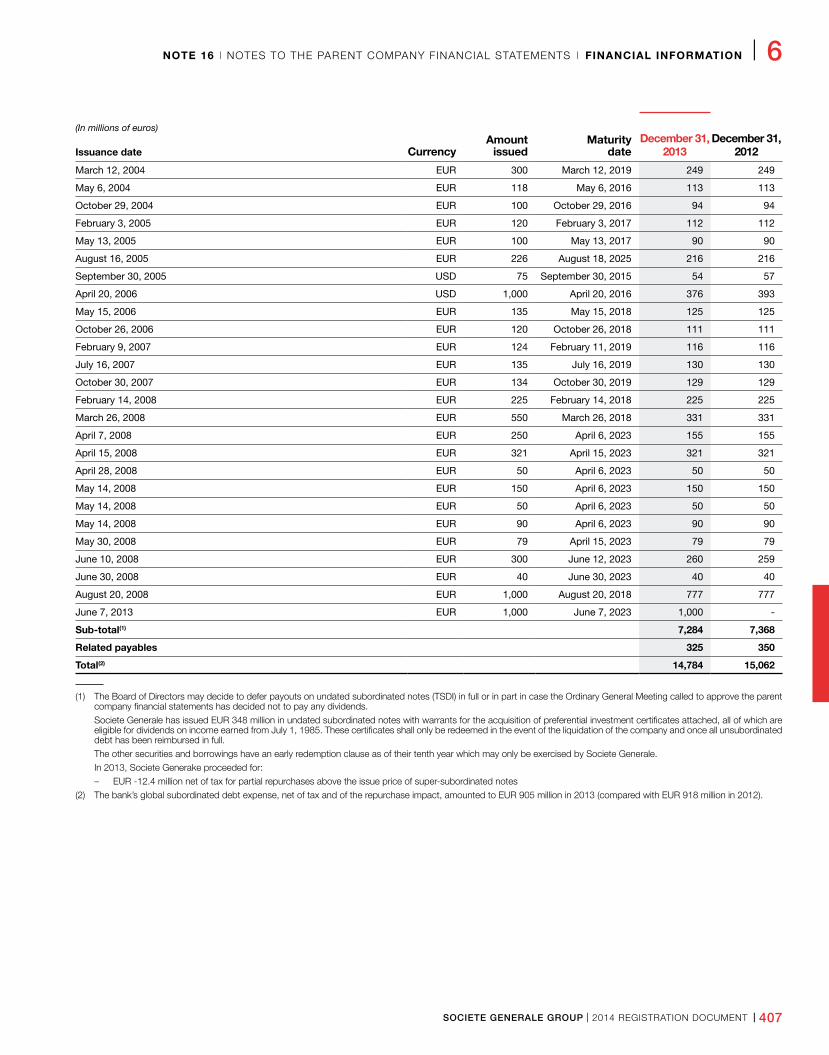
SOCIETE GENERALE GROUP I 2014 REGISTRATION DOCUMENT I 407
NOTE 16 I NOTES TO THE PARENT COMPANY FINANCIAL STATEMENTS I FINANCIAL INFORMATION I 6
(In millions of euros)
CurrencyAmount
issuedMaturity
dateDecember 31,
2013December 31,
2012Issuance date
March 12, 2004 EUR 300 March 12, 2019 249 249
May 6, 2004 EUR 118 May 6, 2016 113 113
October 29, 2004 EUR 100 October 29, 2016 94 94
February 3, 2005 EUR 120 February 3, 2017 112 112
May 13, 2005 EUR 100 May 13, 2017 90 90
August 16, 2005 EUR 226 August 18, 2025 216 216
September 30, 2005 USD 75 September 30, 2015 54 57
April 20, 2006 USD 1,000 April 20, 2016 376 393
May 15, 2006 EUR 135 May 15, 2018 125 125
October 26, 2006 EUR 120 October 26, 2018 111 111
February 9, 2007 EUR 124 February 11, 2019 116 116
July 16, 2007 EUR 135 July 16, 2019 130 130
October 30, 2007 EUR 134 October 30, 2019 129 129
February 14, 2008 EUR 225 February 14, 2018 225 225
March 26, 2008 EUR 550 March 26, 2018 331 331
April 7, 2008 EUR 250 April 6, 2023 155 155
April 15, 2008 EUR 321 April 15, 2023 321 321
April 28, 2008 EUR 50 April 6, 2023 50 50
May 14, 2008 EUR 150 April 6, 2023 150 150
May 14, 2008 EUR 50 April 6, 2023 50 50
May 14, 2008 EUR 90 April 6, 2023 90 90
May 30, 2008 EUR 79 April 15, 2023 79 79
June 10, 2008 EUR 300 June 12, 2023 260 259
June 30, 2008 EUR 40 June 30, 2023 40 40
August 20, 2008 EUR 1,000 August 20, 2018 777 777
June 7, 2013 EUR 1,000 June 7, 2023 1,000 -
Subtotal(1) 7,284 7,368
Related payables 325 350
Total(2) 14,784 15,062
(1) The Board of Directors may decide to defer payouts on undated subordinated notes (TSDI) in full or in part in case the Ordinary General Meeting called to approve the parent company financial statements has decided not to pay any dividends.
Societe Generale has issued EUR 348 million in undated subordinated notes with warrants for the acquisition of preferential investment certificates attached, all of which are eligible for dividends on income earned from July 1, 1985. These certificates shall only be redeemed in the event of the liquidation of the company and once all unsubordinated debt has been reimbursed in full.
The other securities and borrowings have an early redemption clause as of their tenth year which may only be exercised by Societe Generale.
In 2013, Societe Generake proceeded for:
– EUR -12.4 million net of tax for partial repurchases above the issue price of super-subordinated notes
(2) The bank’s global subordinated debt expense, net of tax and of the repurchase impact, amounted to EUR 905 million in 2013 (compared with EUR 918 million in 2012).
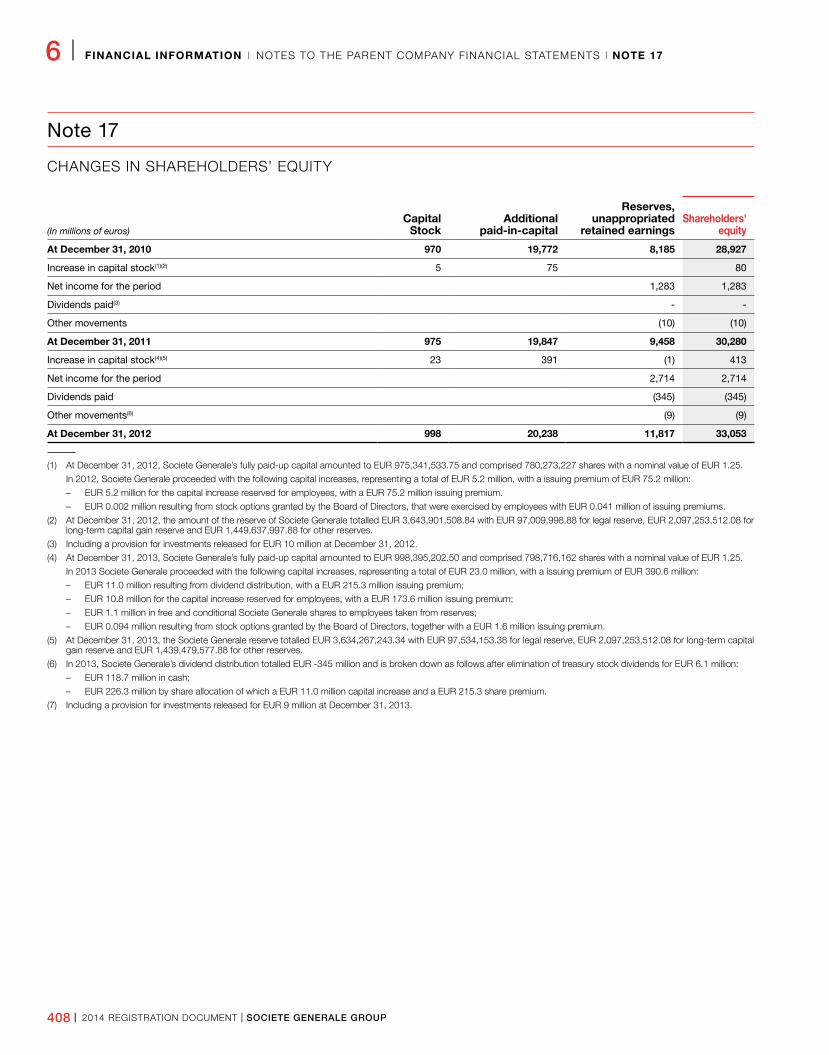
408 I 2014 REGISTRATION DOCUMENT I SOCIETE GENERALE GROUP
6 I FINANCIAL INFORMATION I NOTES TO THE PARENT COMPANY FINANCIAL STATEMENTS I NOTE 17
Note 17
CHANGES IN SHAREHOLDERS’ EQUITY
(In millions of euros)Capital
StockAdditional
paidincapital
Reserves, unappropriated
retained earningsShareholders'
equity
At December 31, 2010 970 19,772 8,185 28,927
Increase in capital stock(1)(2) 5 75 80
Net income for the period 1,283 1,283
Dividends paid(3) - -
Other movements (10) (10)
At December 31, 2011 975 19,847 9,458 30,280
Increase in capital stock(4)(5) 23 391 (1) 413
Net income for the period 2,714 2,714
Dividends paid (345) (345)
Other movements(6) (9) (9)
At December 31, 2012 998 20,238 11,817 33,053
(1) At December 31, 2012, Societe Generale’s fully paid-up capital amounted to EUR 975,341,533.75 and comprised 780,273,227 shares with a nominal value of EUR 1.25.
In 2012, Societe Generale proceeded with the following capital increases, representing a total of EUR 5.2 million, with a issuing premium of EUR 75.2 million:
– EUR 5.2 million for the capital increase reserved for employees, with a EUR 75.2 million issuing premium.
– EUR 0.002 million resulting from stock options granted by the Board of Directors, that were exercised by employees with EUR 0.041 million of issuing premiums.
(2) At December 31, 2012, the amount of the reserve of Societe Generale totalled EUR 3,643,901,508.84 with EUR 97,009,998.88 for legal reserve, EUR 2,097,253,512.08 for long-term capital gain reserve and EUR 1,449,637,997.88 for other reserves.
(3) Including a provision for investments released for EUR 10 million at December 31, 2012.
(4) At December 31, 2013, Societe Generale’s fully paid-up capital amounted to EUR 998,395,202.50 and comprised 798,716,162 shares with a nominal value of EUR 1.25.
In 2013 Societe Generale proceeded with the following capital increases, representing a total of EUR 23.0 million, with a issuing premium of EUR 390.6 million:
– EUR 11.0 million resulting from dividend distribution, with a EUR 215.3 million issuing premium;
– EUR 10.8 million for the capital increase reserved for employees, with a EUR 173.6 million issuing premium;
– EUR 1.1 million in free and conditional Societe Generale shares to employees taken from reserves;
– EUR 0.094 million resulting from stock options granted by the Board of Directors, together with a EUR 1.6 million issuing premium.
(5) At December 31, 2013, the Societe Generale reserve totalled EUR 3,634,267,243.34 with EUR 97,534,153.38 for legal reserve, EUR 2,097,253,512.08 for long-term capital gain reserve and EUR 1,439,479,577.88 for other reserves.
(6) In 2013, Societe Generale’s dividend distribution totalled EUR -345 million and is broken down as follows after elimination of treasury stock dividends for EUR 6.1 million:
– EUR 118.7 million in cash;
– EUR 226.3 million by share allocation of which a EUR 11.0 million capital increase and a EUR 215.3 share premium.
(7) Including a provision for investments released for EUR 9 million at December 31, 2013.
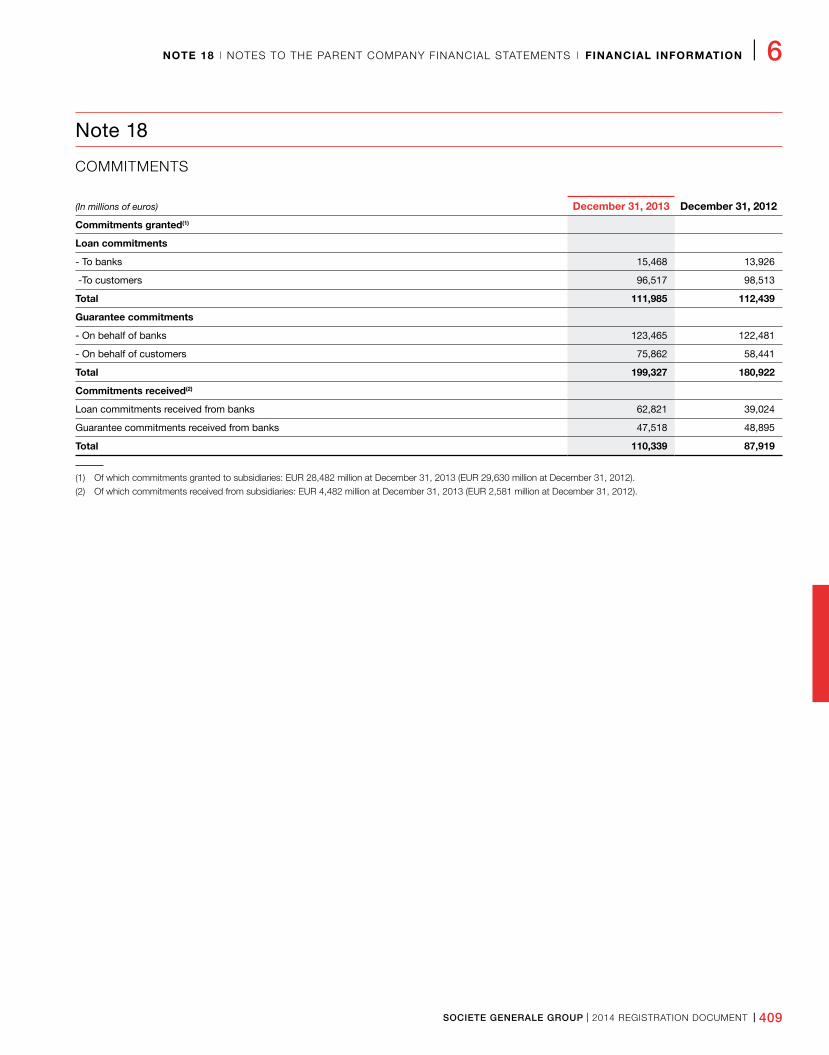
SOCIETE GENERALE GROUP I 2014 REGISTRATION DOCUMENT I 409
NOTE 18 I NOTES TO THE PARENT COMPANY FINANCIAL STATEMENTS I FINANCIAL INFORMATION I 6
Note 18
COMMITMENTS
(In millions of euros) December 31, 2013 December 31, 2012
Commitments granted(1)
Loan commitments
- To banks 15,468 13,926
-To customers 96,517 98,513
Total 111,985 112,439
Guarantee commitments
- On behalf of banks 123,465 122,481
- On behalf of customers 75,862 58,441
Total 199,327 180,922
Commitments received(2)
Loan commitments received from banks 62,821 39,024
Guarantee commitments received from banks 47,518 48,895
Total 110,339 87,919
(1) Of which commitments granted to subsidiaries: EUR 28,482 million at December 31, 2013 (EUR 29,630 million at December 31, 2012).
(2) Of which commitments received from subsidiaries: EUR 4,482 million at December 31, 2013 (EUR 2,581 million at December 31, 2012).
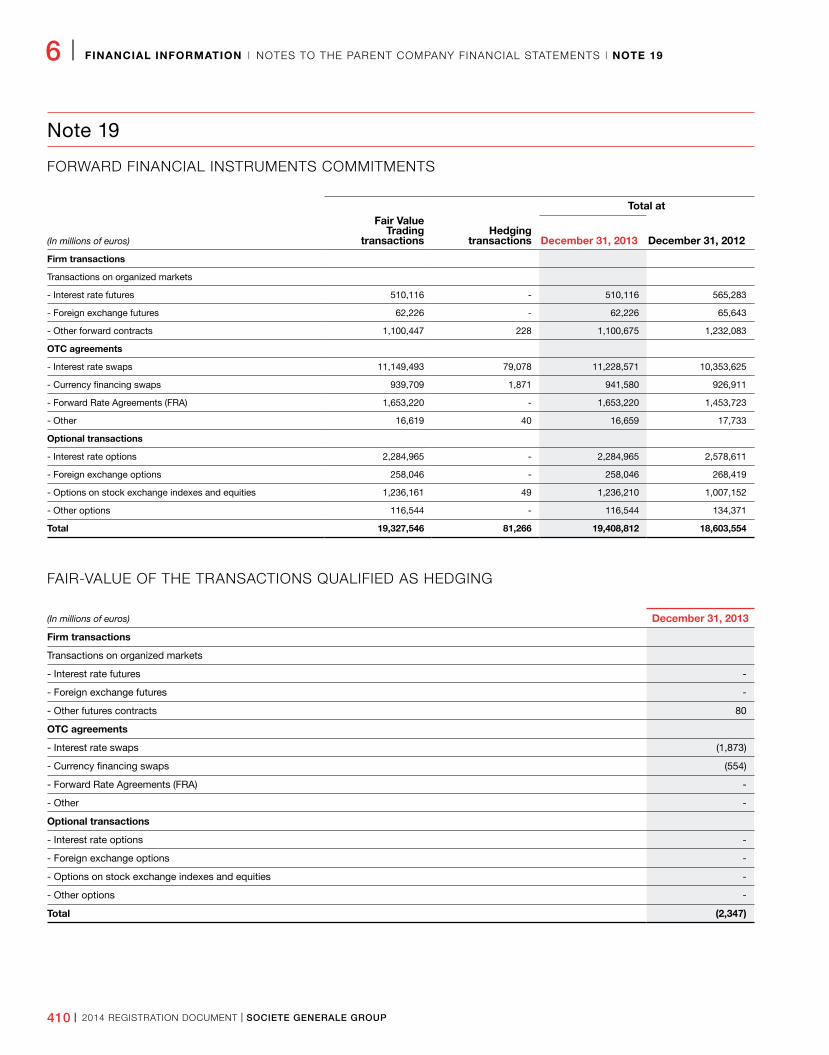
410 I 2014 REGISTRATION DOCUMENT I SOCIETE GENERALE GROUP
6 I FINANCIAL INFORMATION I NOTES TO THE PARENT COMPANY FINANCIAL STATEMENTS I NOTE 19
Note 19
FORWARD FINANCIAL INSTRUMENTS COMMITMENTS
(In millions of euros)
Fair ValueTrading
transactionsHedging
transactions
Total at
December 31, 2013 December 31, 2012
Firm transactions
Transactions on organized markets
- Interest rate futures 510,116 - 510,116 565,283
- Foreign exchange futures 62,226 - 62,226 65,643
- Other forward contracts 1,100,447 228 1,100,675 1,232,083
OTC agreements
- Interest rate swaps 11,149,493 79,078 11,228,571 10,353,625
- Currency financing swaps 939,709 1,871 941,580 926,911
- Forward Rate Agreements (FRA) 1,653,220 - 1,653,220 1,453,723
- Other 16,619 40 16,659 17,733
Optional transactions
- Interest rate options 2,284,965 - 2,284,965 2,578,611
- Foreign exchange options 258,046 - 258,046 268,419
- Options on stock exchange indexes and equities 1,236,161 49 1,236,210 1,007,152
- Other options 116,544 - 116,544 134,371
Total 19,327,546 81,266 19,408,812 18,603,554
FAIR-VALUE OF THE TRANSACTIONS QUALIFIED AS HEDGING
(In millions of euros) December 31, 2013
Firm transactions
Transactions on organized markets
- Interest rate futures -
- Foreign exchange futures -
- Other futures contracts 80
OTC agreements
- Interest rate swaps (1,873)
- Currency financing swaps (554)
- Forward Rate Agreements (FRA) -
- Other -
Optional transactions
- Interest rate options -
- Foreign exchange options -
- Options on stock exchange indexes and equities -
- Other options -
Total (2,347)
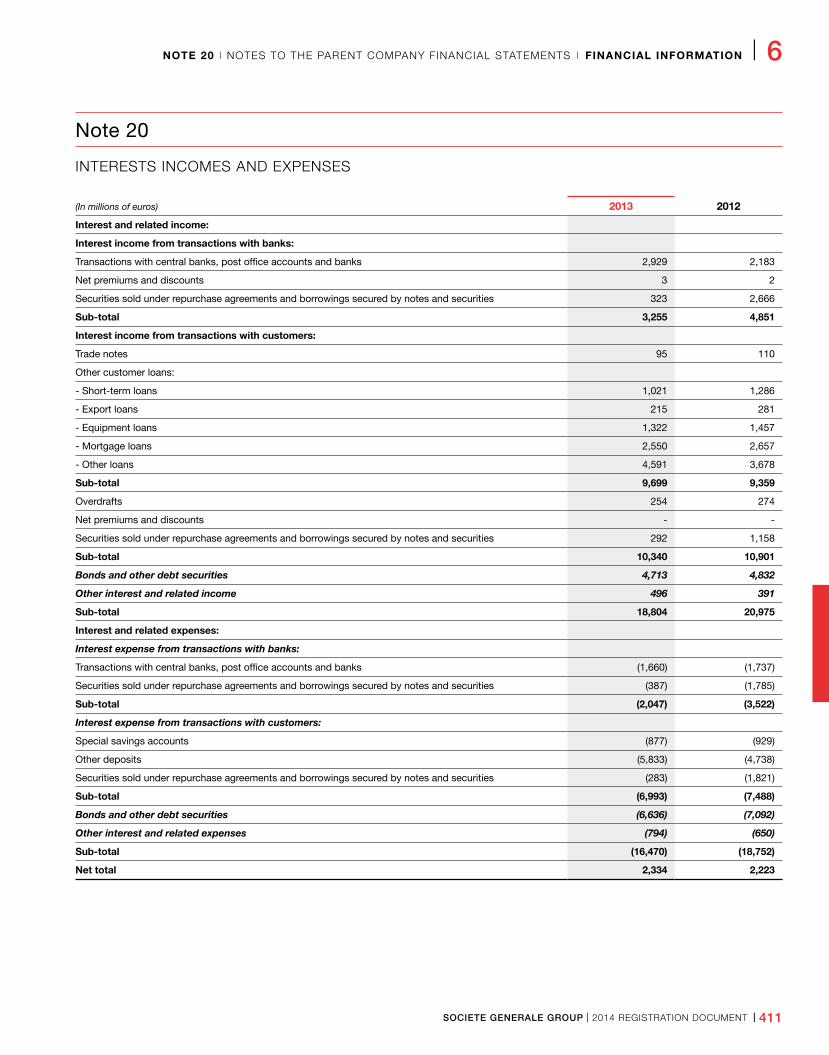
SOCIETE GENERALE GROUP I 2014 REGISTRATION DOCUMENT I 411
NOTE 20 I NOTES TO THE PARENT COMPANY FINANCIAL STATEMENTS I FINANCIAL INFORMATION I 6
Note 20
INTERESTS INCOMES AND EXPENSES
(In millions of euros) 2013 2012
Interest and related income:
Interest income from transactions with banks:
Transactions with central banks, post office accounts and banks 2,929 2,183
Net premiums and discounts 3 2
Securities sold under repurchase agreements and borrowings secured by notes and securities 323 2,666
Subtotal 3,255 4,851
Interest income from transactions with customers:
Trade notes 95 110
Other customer loans:
- Short-term loans 1,021 1,286
- Export loans 215 281
- Equipment loans 1,322 1,457
- Mortgage loans 2,550 2,657
- Other loans 4,591 3,678
Subtotal 9,699 9,359
Overdrafts 254 274
Net premiums and discounts - -
Securities sold under repurchase agreements and borrowings secured by notes and securities 292 1,158
Subtotal 10,340 10,901
Bonds and other debt securities 4,713 4,832
Other interest and related income 496 391
Subtotal 18,804 20,975
Interest and related expenses:
Interest expense from transactions with banks:
Transactions with central banks, post office accounts and banks (1,660) (1,737)
Securities sold under repurchase agreements and borrowings secured by notes and securities (387) (1,785)
Subtotal (2,047) (3,522)
Interest expense from transactions with customers:
Special savings accounts (877) (929)
Other deposits (5,833) (4,738)
Securities sold under repurchase agreements and borrowings secured by notes and securities (283) (1,821)
Subtotal (6,993) (7,488)
Bonds and other debt securities (6,636) (7,092)
Other interest and related expenses (794) (650)
Subtotal (16,470) (18,752)
Net total 2,334 2,223
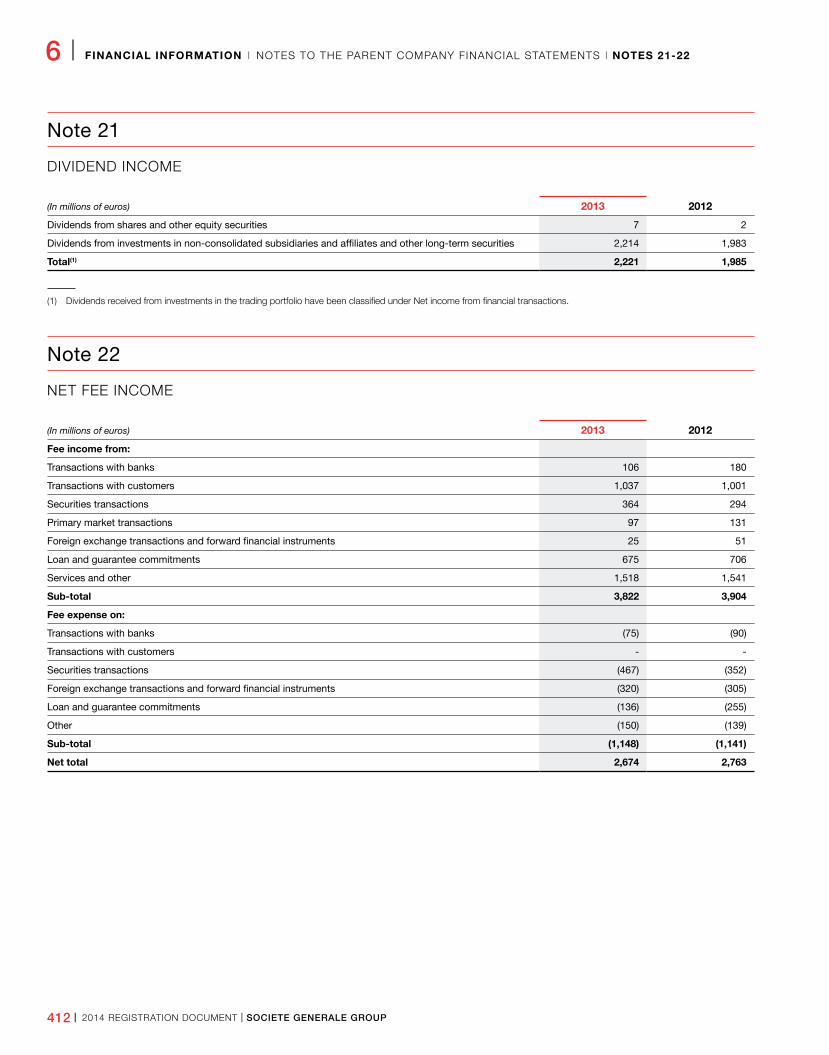
412 I 2014 REGISTRATION DOCUMENT I SOCIETE GENERALE GROUP
6 I FINANCIAL INFORMATION I NOTES TO THE PARENT COMPANY FINANCIAL STATEMENTS I NOTES 2122
Note 21
DIVIDEND INCOME
(In millions of euros) 2013 2012
Dividends from shares and other equity securities 7 2
Dividends from investments in non-consolidated subsidiaries and affiliates and other long-term securities 2,214 1,983
Total(1) 2,221 1,985
(1) Dividends received from investments in the trading portfolio have been classified under Net income from financial transactions.
Note 22
NET FEE INCOME
(In millions of euros) 2013 2012
Fee income from:
Transactions with banks 106 180
Transactions with customers 1,037 1,001
Securities transactions 364 294
Primary market transactions 97 131
Foreign exchange transactions and forward financial instruments 25 51
Loan and guarantee commitments 675 706
Services and other 1,518 1,541
Subtotal 3,822 3,904
Fee expense on:
Transactions with banks (75) (90)
Transactions with customers - -
Securities transactions (467) (352)
Foreign exchange transactions and forward financial instruments (320) (305)
Loan and guarantee commitments (136) (255)
Other (150) (139)
Subtotal (1,148) (1,141)
Net total 2,674 2,763
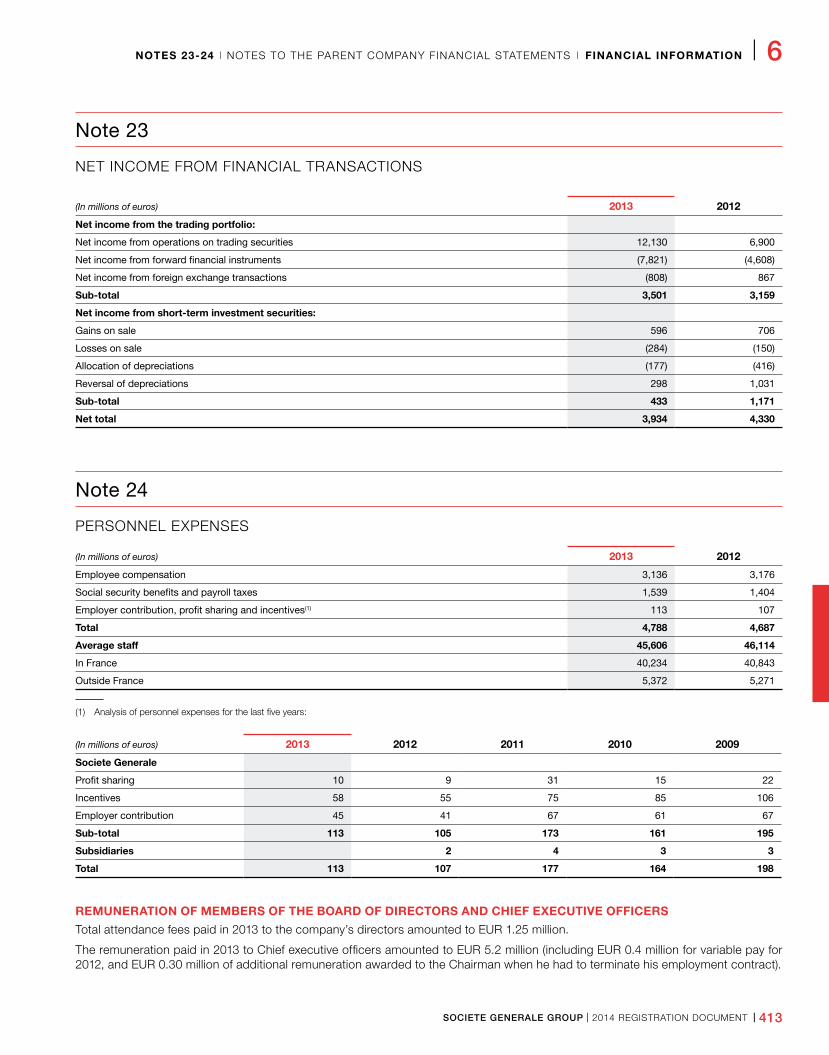
SOCIETE GENERALE GROUP I 2014 REGISTRATION DOCUMENT I 413
NOTES 2324 I NOTES TO THE PARENT COMPANY FINANCIAL STATEMENTS I FINANCIAL INFORMATION I 6
Note 23
NET INCOME FROM FINANCIAL TRANSACTIONS
(In millions of euros) 2013 2012
Net income from the trading portfolio:
Net income from operations on trading securities 12,130 6,900
Net income from forward financial instruments (7,821) (4,608)
Net income from foreign exchange transactions (808) 867
Subtotal 3,501 3,159
Net income from shortterm investment securities:
Gains on sale 596 706
Losses on sale (284) (150)
Allocation of depreciations (177) (416)
Reversal of depreciations 298 1,031
Subtotal 433 1,171
Net total 3,934 4,330
Note 24
PERSONNEL EXPENSES
(In millions of euros) 2013 2012
Employee compensation 3,136 3,176
Social security benefits and payroll taxes 1,539 1,404
Employer contribution, profit sharing and incentives(1) 113 107
Total 4,788 4,687
Average staff 45,606 46,114
In France 40,234 40,843
Outside France 5,372 5,271
(1) Analysis of personnel expenses for the last five years:
(In millions of euros) 2013 2012 2011 2010 2009
Societe Generale
Profit sharing 10 9 31 15 22
Incentives 58 55 75 85 106
Employer contribution 45 41 67 61 67
Subtotal 113 105 173 161 195
Subsidiaries 2 4 3 3
Total 113 107 177 164 198
REMUNERATION OF MEMBERS OF THE BOARD OF DIRECTORS AND CHIEF EXECUTIVE OFFICERS
Total attendance fees paid in 2013 to the company’s directors amounted to EUR 1.25 million.
The remuneration paid in 2013 to Chief executive officers amounted to EUR 5.2 million (including EUR 0.4 million for variable pay for 2012, and EUR 0.30 million of additional remuneration awarded to the Chairman when he had to terminate his employment contract).
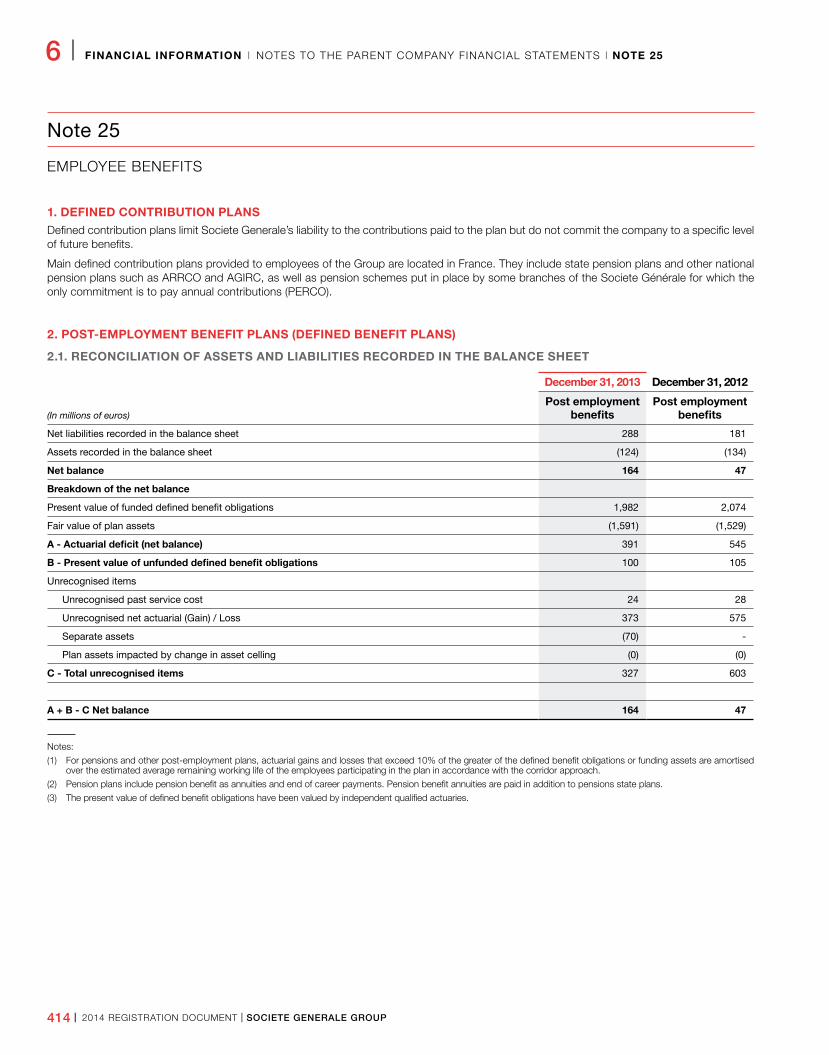
414 I 2014 REGISTRATION DOCUMENT I SOCIETE GENERALE GROUP
6 I FINANCIAL INFORMATION I NOTES TO THE PARENT COMPANY FINANCIAL STATEMENTS I NOTE 25
Note 25
EMPLOYEE BENEFITS
1. DEFINED CONTRIBUTION PLANSDefined contribution plans limit Societe Generale’s liability to the contributions paid to the plan but do not commit the company to a specific level of future benefits.
Main defined contribution plans provided to employees of the Group are located in France. They include state pension plans and other national pension plans such as ARRCO and AGIRC, as well as pension schemes put in place by some branches of the Societe Générale for which the only commitment is to pay annual contributions (PERCO).
2. POSTEMPLOYMENT BENEFIT PLANS (DEFINED BENEFIT PLANS)
2.1. RECONCILIATION OF ASSETS AND LIABILITIES RECORDED IN THE BALANCE SHEET
December 31, 2013 December 31, 2012
(In millions of euros)Post employment
benefitsPost employment
benefits
Net liabilities recorded in the balance sheet 288 181
Assets recorded in the balance sheet (124) (134)
Net balance 164 47
Breakdown of the net balance
Present value of funded defined benefit obligations 1,982 2,074
Fair value of plan assets (1,591) (1,529)
A - Actuarial deficit (net balance) 391 545
B - Present value of unfunded defined benefit obligations 100 105
Unrecognised items
Unrecognised past service cost 24 28
Unrecognised net actuarial (Gain) / Loss 373 575
Separate assets (70) -
Plan assets impacted by change in asset celling (0) (0)
C Total unrecognised items 327 603
A + B C Net balance 164 47
Notes:
(1) For pensions and other post-employment plans, actuarial gains and losses that exceed 10% of the greater of the defined benefit obligations or funding assets are amortised over the estimated average remaining working life of the employees participating in the plan in accordance with the corridor approach.
(2) Pension plans include pension benefit as annuities and end of career payments. Pension benefit annuities are paid in addition to pensions state plans.
(3) The present value of defined benefit obligations have been valued by independent qualified actuaries.
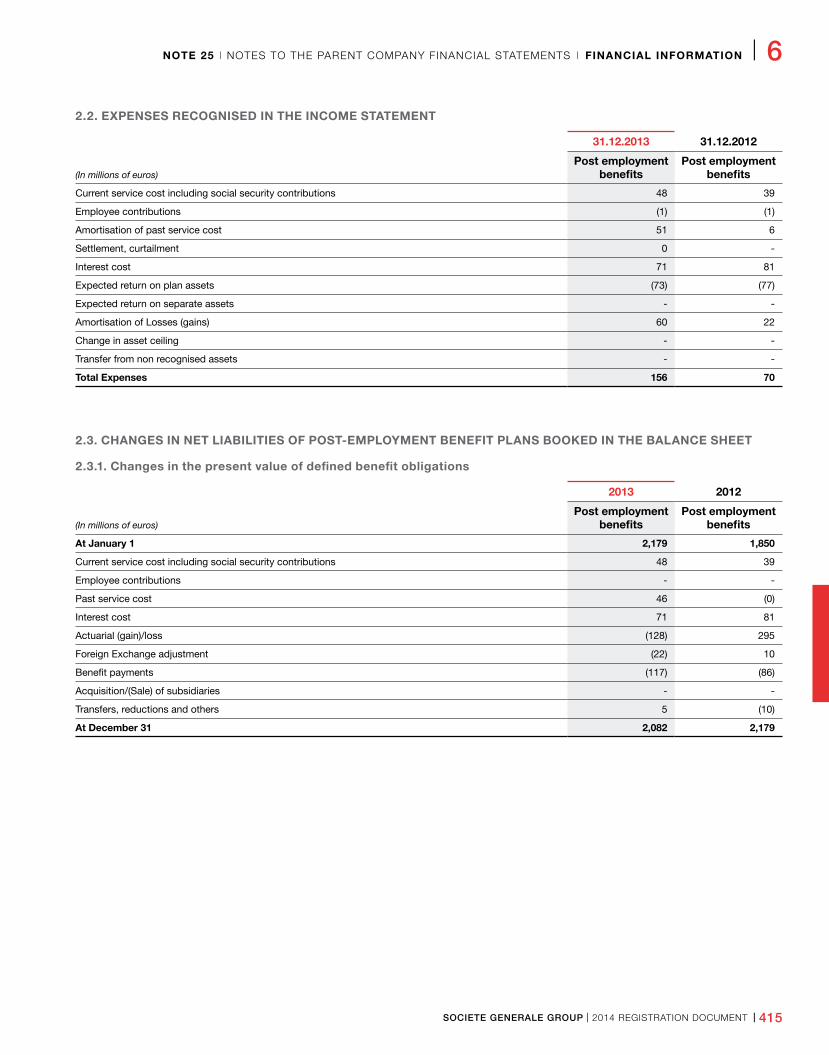
SOCIETE GENERALE GROUP I 2014 REGISTRATION DOCUMENT I 415
NOTE 25 I NOTES TO THE PARENT COMPANY FINANCIAL STATEMENTS I FINANCIAL INFORMATION I 6
2.2. EXPENSES RECOGNISED IN THE INCOME STATEMENT
31.12.2013 31.12.2012
(In millions of euros)Post employment
benefitsPost employment
benefits
Current service cost including social security contributions 48 39
Employee contributions (1) (1)
Amortisation of past service cost 51 6
Settlement, curtailment 0 -
Interest cost 71 81
Expected return on plan assets (73) (77)
Expected return on separate assets - -
Amortisation of Losses (gains) 60 22
Change in asset ceiling - -
Transfer from non recognised assets - -
Total Expenses 156 70
2.3. CHANGES IN NET LIABILITIES OF POSTEMPLOYMENT BENEFIT PLANS BOOKED IN THE BALANCE SHEET
2.3.1. Changes in the present value of defined benefit obligations
2013 2012
(In millions of euros)Post employment
benefitsPost employment
benefits
At January 1 2,179 1,850
Current service cost including social security contributions 48 39
Employee contributions - -
Past service cost 46 (0)
Interest cost 71 81
Actuarial (gain)/loss (128) 295
Foreign Exchange adjustment (22) 10
Benefit payments (117) (86)
Acquisition/(Sale) of subsidiaries - -
Transfers, reductions and others 5 (10)
At December 31 2,082 2,179
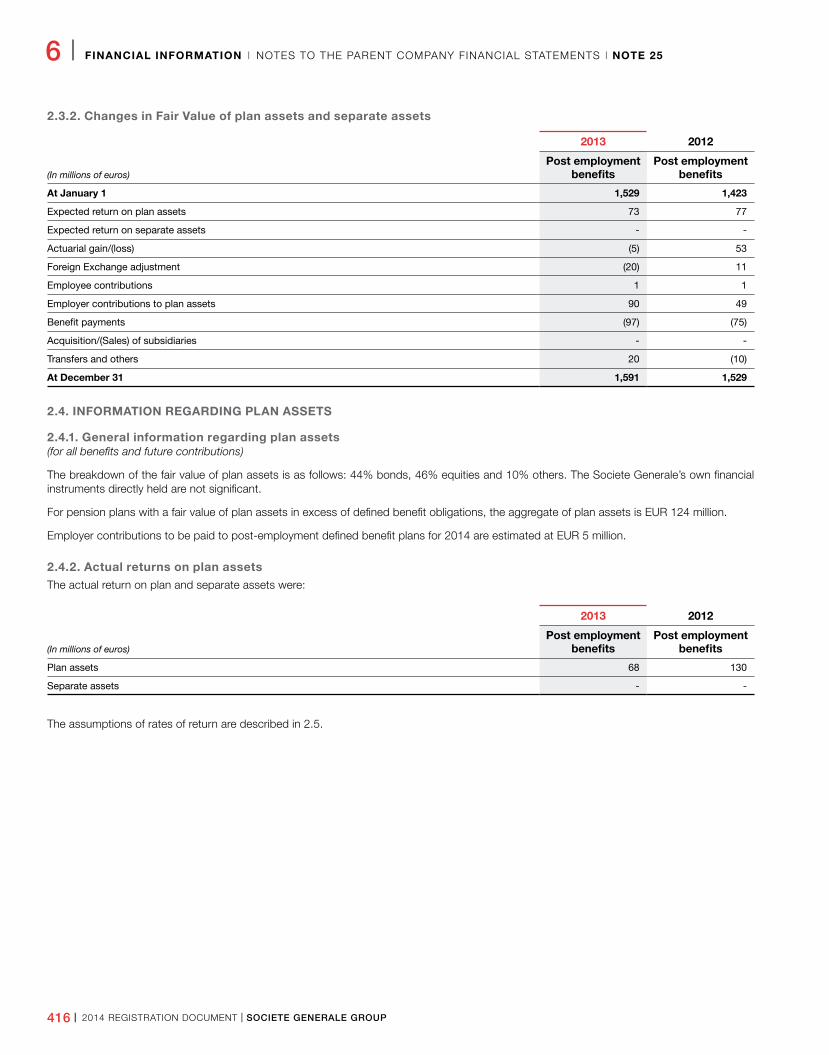
416 I 2014 REGISTRATION DOCUMENT I SOCIETE GENERALE GROUP
6 I FINANCIAL INFORMATION I NOTES TO THE PARENT COMPANY FINANCIAL STATEMENTS I NOTE 25
2.3.2. Changes in Fair Value of plan assets and separate assets
2013 2012
(In millions of euros)Post employment
benefitsPost employment
benefits
At January 1 1,529 1,423
Expected return on plan assets 73 77
Expected return on separate assets - -
Actuarial gain/(loss) (5) 53
Foreign Exchange adjustment (20) 11
Employee contributions 1 1
Employer contributions to plan assets 90 49
Benefit payments (97) (75)
Acquisition/(Sales) of subsidiaries - -
Transfers and others 20 (10)
At December 31 1,591 1,529
2.4. INFORMATION REGARDING PLAN ASSETS
2.4.1. General information regarding plan assets(for all benefits and future contributions)
The breakdown of the fair value of plan assets is as follows: 44% bonds, 46% equities and 10% others. The Societe Generale’s own financial instruments directly held are not significant.
For pension plans with a fair value of plan assets in excess of defined benefit obligations, the aggregate of plan assets is EUR 124 million.
Employer contributions to be paid to post-employment defined benefit plans for 2014 are estimated at EUR 5 million.
2.4.2. Actual returns on plan assetsThe actual return on plan and separate assets were:
2013 2012
(In millions of euros)Post employment
benefitsPost employment
benefits
Plan assets 68 130
Separate assets - -
The assumptions of rates of return are described in 2.5.
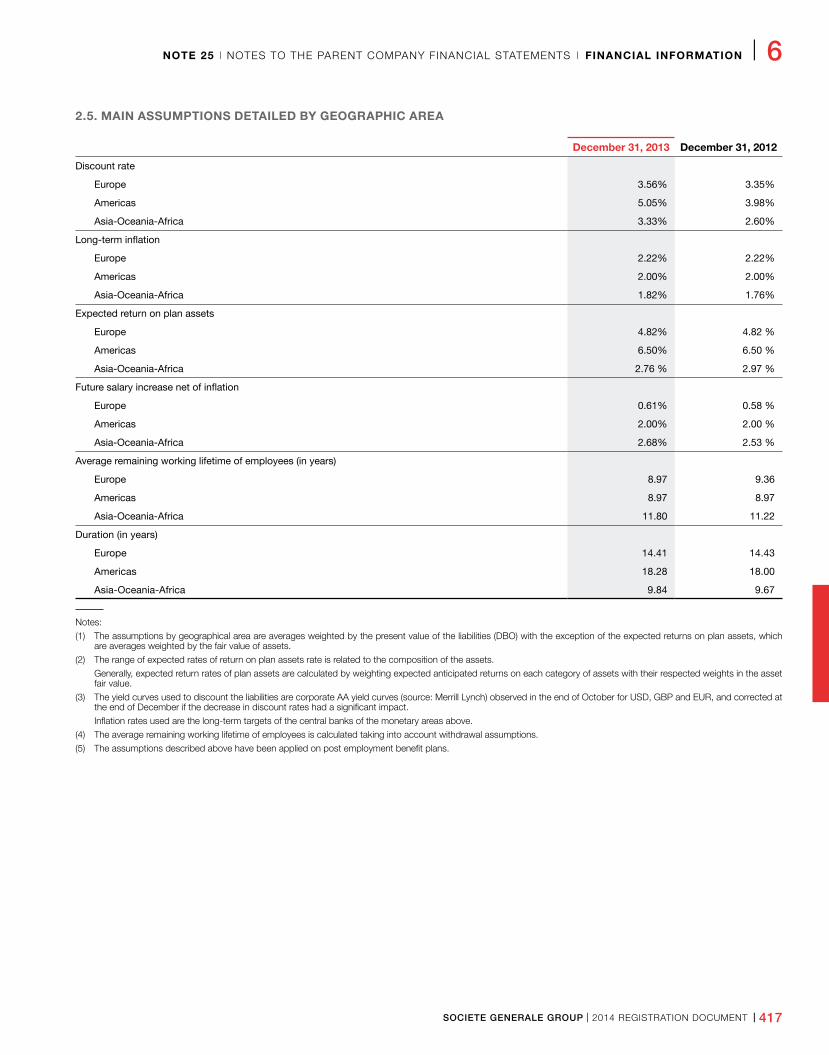
SOCIETE GENERALE GROUP I 2014 REGISTRATION DOCUMENT I 417
NOTE 25 I NOTES TO THE PARENT COMPANY FINANCIAL STATEMENTS I FINANCIAL INFORMATION I 6
2.5. MAIN ASSUMPTIONS DETAILED BY GEOGRAPHIC AREA
December 31, 2013 December 31, 2012
Discount rate
Europe 3�56% 3�35%
Americas 5�05% 3�98%
Asia-Oceania-Africa 3�33% 2�60%
Long-term inflation
Europe 2�22% 2�22%
Americas 2�00% 2�00%
Asia-Oceania-Africa 1�82% 1�76%
Expected return on plan assets
Europe 4�82% 4�82 %
Americas 6�50% 6�50 %
Asia-Oceania-Africa 2�76 % 2�97 %
Future salary increase net of inflation
Europe 0�61% 0�58 %
Americas 2�00% 2�00 %
Asia-Oceania-Africa 2�68% 2�53 %
Average remaining working lifetime of employees (in years)
Europe 8�97 9�36
Americas 8�97 8�97
Asia-Oceania-Africa 11�80 11�22
Duration (in years)
Europe 14�41 14�43
Americas 18�28 18�00
Asia-Oceania-Africa 9�84 9�67
Notes:
(1) The assumptions by geographical area are averages weighted by the present value of the liabilities (DBO) with the exception of the expected returns on plan assets, which are averages weighted by the fair value of assets.
(2) The range of expected rates of return on plan assets rate is related to the composition of the assets.
Generally, expected return rates of plan assets are calculated by weighting expected anticipated returns on each category of assets with their respected weights in the asset fair value.
(3) The yield curves used to discount the liabilities are corporate AA yield curves (source: Merrill Lynch) observed in the end of October for USD, GBP and EUR, and corrected at the end of December if the decrease in discount rates had a significant impact.
Inflation rates used are the long-term targets of the central banks of the monetary areas above.
(4) The average remaining working lifetime of employees is calculated taking into account withdrawal assumptions.
(5) The assumptions described above have been applied on post employment benefit plans.
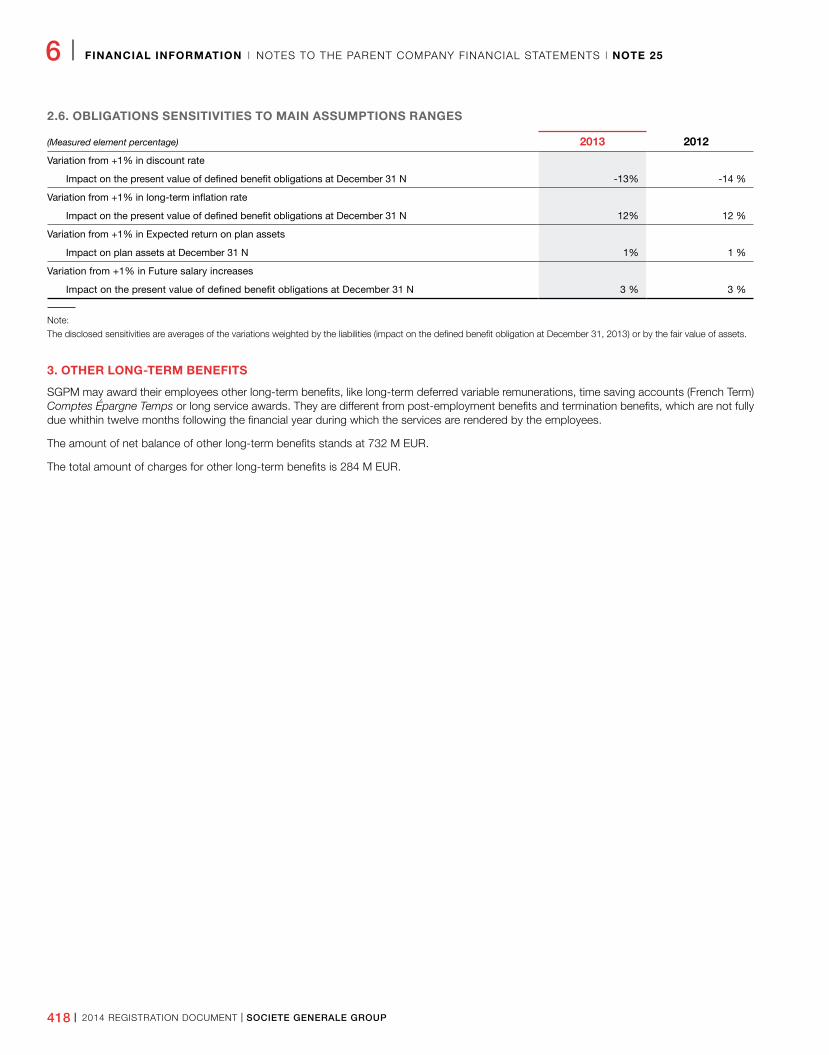
418 I 2014 REGISTRATION DOCUMENT I SOCIETE GENERALE GROUP
6 I FINANCIAL INFORMATION I NOTES TO THE PARENT COMPANY FINANCIAL STATEMENTS I NOTE 25
2.6. OBLIGATIONS SENSITIVITIES TO MAIN ASSUMPTIONS RANGES
(Measured element percentage) 2013 2012
Variation from +1% in discount rate
Impact on the present value of defined benefit obligations at December 31 N -13% -14 %
Variation from +1% in long-term inflation rate
Impact on the present value of defined benefit obligations at December 31 N 12% 12 %
Variation from +1% in Expected return on plan assets
Impact on plan assets at December 31 N 1% 1 %
Variation from +1% in Future salary increases
Impact on the present value of defined benefit obligations at December 31 N 3 % 3 %
Note:
The disclosed sensitivities are averages of the variations weighted by the liabilities (impact on the defined benefit obligation at December 31, 2013) or by the fair value of assets.
3. OTHER LONGTERM BENEFITS
SGPM may award their employees other long-term benefits, like long-term deferred variable remunerations, time saving accounts (French Term) Comptes Épargne Temps or long service awards. They are different from post-employment benefits and termination benefits, which are not fully due whithin twelve months following the financial year during which the services are rendered by the employees.
The amount of net balance of other long-term benefits stands at 732 M EUR.
The total amount of charges for other long-term benefits is 284 M EUR.
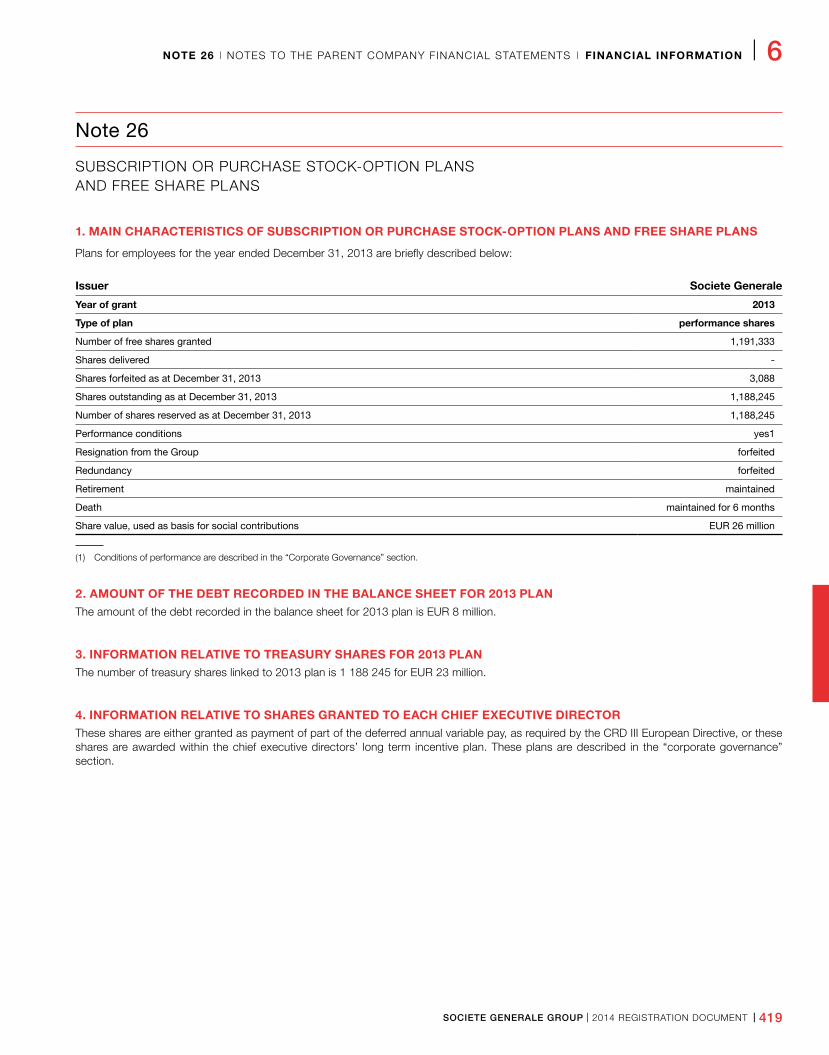
SOCIETE GENERALE GROUP I 2014 REGISTRATION DOCUMENT I 419
NOTE 26 I NOTES TO THE PARENT COMPANY FINANCIAL STATEMENTS I FINANCIAL INFORMATION I 6
Note 26
SUBSCRIPTION OR PURCHASE STOCK-OPTION PLANS AND FREE SHARE PLANS
1. MAIN CHARACTERISTICS OF SUBSCRIPTION OR PURCHASE STOCKOPTION PLANS AND FREE SHARE PLANS
Plans for employees for the year ended December 31, 2013 are briefly described below:
Issuer Societe Generale
Year of grant 2013
Type of plan performance shares
Number of free shares granted 1,191,333
Shares delivered -
Shares forfeited as at December 31, 2013 3,088
Shares outstanding as at December 31, 2013 1,188,245
Number of shares reserved as at December 31, 2013 1,188,245
Performance conditions yes1
Resignation from the Group forfeited
Redundancy forfeited
Retirement maintained
Death maintained for 6 months
Share value, used as basis for social contributions EUR 26 million
(1) Conditions of performance are described in the “Corporate Governance” section.
2. AMOUNT OF THE DEBT RECORDED IN THE BALANCE SHEET FOR 2013 PLANThe amount of the debt recorded in the balance sheet for 2013 plan is EUR 8 million.
3. INFORMATION RELATIVE TO TREASURY SHARES FOR 2013 PLANThe number of treasury shares linked to 2013 plan is 1 188 245 for EUR 23 million.
4. INFORMATION RELATIVE TO SHARES GRANTED TO EACH CHIEF EXECUTIVE DIRECTORThese shares are either granted as payment of part of the deferred annual variable pay, as required by the CRD III European Directive, or these shares are awarded within the chief executive directors’ long term incentive plan. These plans are described in the “corporate governance” section.
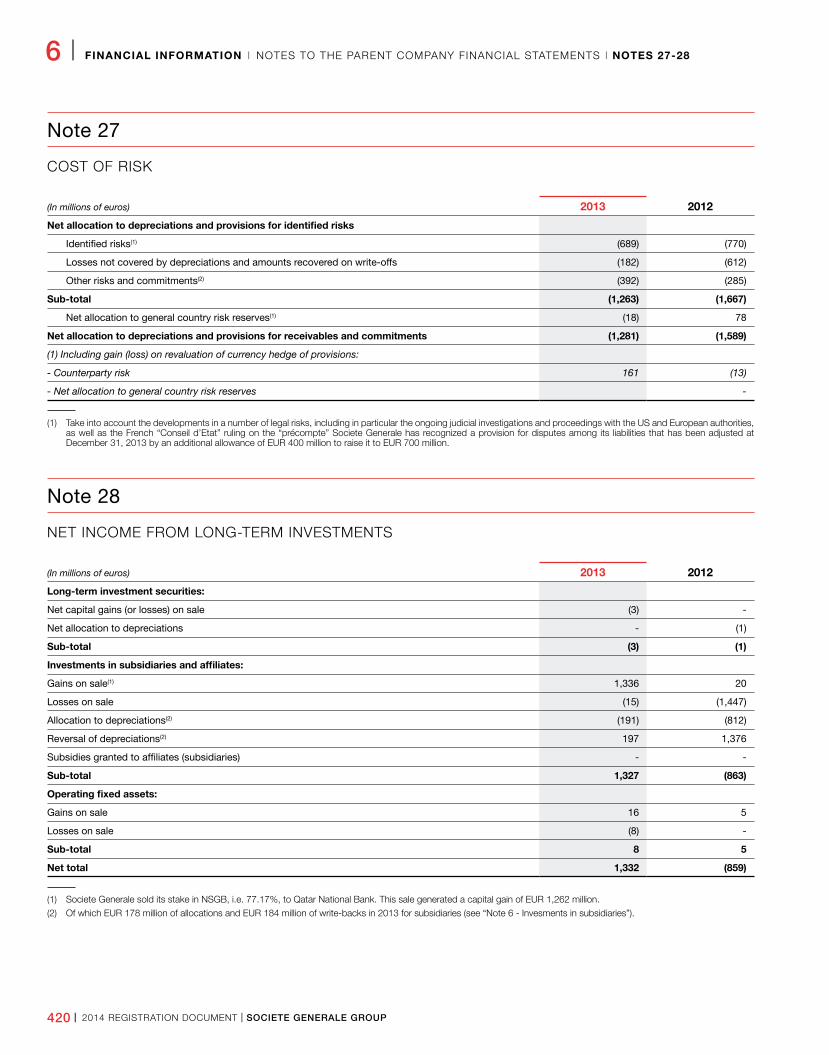
420 I 2014 REGISTRATION DOCUMENT I SOCIETE GENERALE GROUP
6 I FINANCIAL INFORMATION I NOTES TO THE PARENT COMPANY FINANCIAL STATEMENTS I NOTES 2728
Note 27
COST OF RISK
(In millions of euros) 2013 2012
Net allocation to depreciations and provisions for identified risks
Identified risks(1) (689) (770)
Losses not covered by depreciations and amounts recovered on write-offs (182) (612)
Other risks and commitments(2) (392) (285)
Subtotal (1,263) (1,667)
Net allocation to general country risk reserves(1) (18) 78
Net allocation to depreciations and provisions for receivables and commitments (1,281) (1,589)
(1) Including gain (loss) on revaluation of currency hedge of provisions:
- Counterparty risk 161 (13)
- Net allocation to general country risk reserves -
(1) Take into account the developments in a number of legal risks, including in particular the ongoing judicial investigations and proceedings with the US and European authorities, as well as the French “Conseil d’Etat” ruling on the “précompte” Societe Generale has recognized a provision for disputes among its liabilities that has been adjusted at December 31, 2013 by an additional allowance of EUR 400 million to raise it to EUR 700 million.
Note 28
NET INCOME FROM LONG-TERM INVESTMENTS
(In millions of euros) 2013 2012
Longterm investment securities:
Net capital gains (or losses) on sale (3) -
Net allocation to depreciations - (1)
Subtotal (3) (1)
Investments in subsidiaries and affiliates:
Gains on sale(1) 1,336 20
Losses on sale (15) (1,447)
Allocation to depreciations(2) (191) (812)
Reversal of depreciations(2) 197 1,376
Subsidies granted to affiliates (subsidiaries) - -
Subtotal 1,327 (863)
Operating fixed assets:
Gains on sale 16 5
Losses on sale (8) -
Subtotal 8 5
Net total 1,332 (859)
(1) Societe Generale sold its stake in NSGB, i.e. 77.17%, to Qatar National Bank. This sale generated a capital gain of EUR 1,262 million.
(2) Of which EUR 178 million of allocations and EUR 184 million of write-backs in 2013 for subsidiaries (see “Note 6 - Invesments in subsidiaries”).
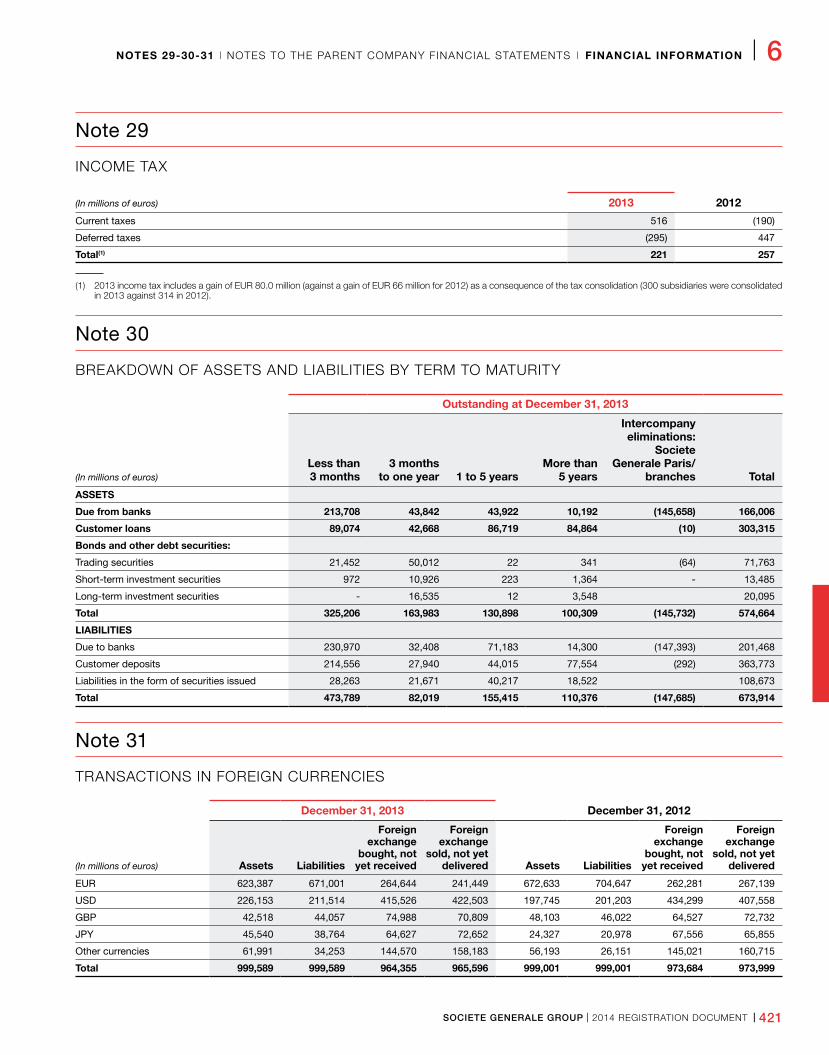
SOCIETE GENERALE GROUP I 2014 REGISTRATION DOCUMENT I 421
NOTES 293031 I NOTES TO THE PARENT COMPANY FINANCIAL STATEMENTS I FINANCIAL INFORMATION I 6
Note 29
INCOME TAX
(In millions of euros) 2013 2012
Current taxes 516 (190)
Deferred taxes (295) 447
Total(1) 221 257
(1) 2013 income tax includes a gain of EUR 80.0 million (against a gain of EUR 66 million for 2012) as a consequence of the tax consolidation (300 subsidiaries were consolidated in 2013 against 314 in 2012).
Note 30
BREAKDOWN OF ASSETS AND LIABILITIES BY TERM TO MATURITY
Outstanding at December 31, 2013
(In millions of euros)Less than 3 months
3 months to one year 1 to 5 years
More than 5 years
Intercompanyeliminations:
Societe Generale Paris/
branches Total
ASSETS
Due from banks 213,708 43,842 43,922 10,192 (145,658) 166,006
Customer loans 89,074 42,668 86,719 84,864 (10) 303,315
Bonds and other debt securities:
Trading securities 21,452 50,012 22 341 (64) 71,763
Short-term investment securities 972 10,926 223 1,364 - 13,485
Long-term investment securities - 16,535 12 3,548 20,095
Total 325,206 163,983 130,898 100,309 (145,732) 574,664
LIABILITIES
Due to banks 230,970 32,408 71,183 14,300 (147,393) 201,468
Customer deposits 214,556 27,940 44,015 77,554 (292) 363,773
Liabilities in the form of securities issued 28,263 21,671 40,217 18,522 108,673
Total 473,789 82,019 155,415 110,376 (147,685) 673,914
Note 31
TRANSACTIONS IN FOREIGN CURRENCIES
December 31, 2013 December 31, 2012
(In millions of euros) Assets Liabilities
Foreign exchange
bought, not yet received
Foreign exchange
sold, not yet delivered Assets Liabilities
Foreign exchange
bought, not yet received
Foreign exchange
sold, not yet delivered
EUR 623,387 671,001 264,644 241,449 672,633 704,647 262,281 267,139
USD 226,153 211,514 415,526 422,503 197,745 201,203 434,299 407,558
GBP 42,518 44,057 74,988 70,809 48,103 46,022 64,527 72,732
JPY 45,540 38,764 64,627 72,652 24,327 20,978 67,556 65,855
Other currencies 61,991 34,253 144,570 158,183 56,193 26,151 145,021 160,715
Total 999,589 999,589 964,355 965,596 999,001 999,001 973,684 973,999
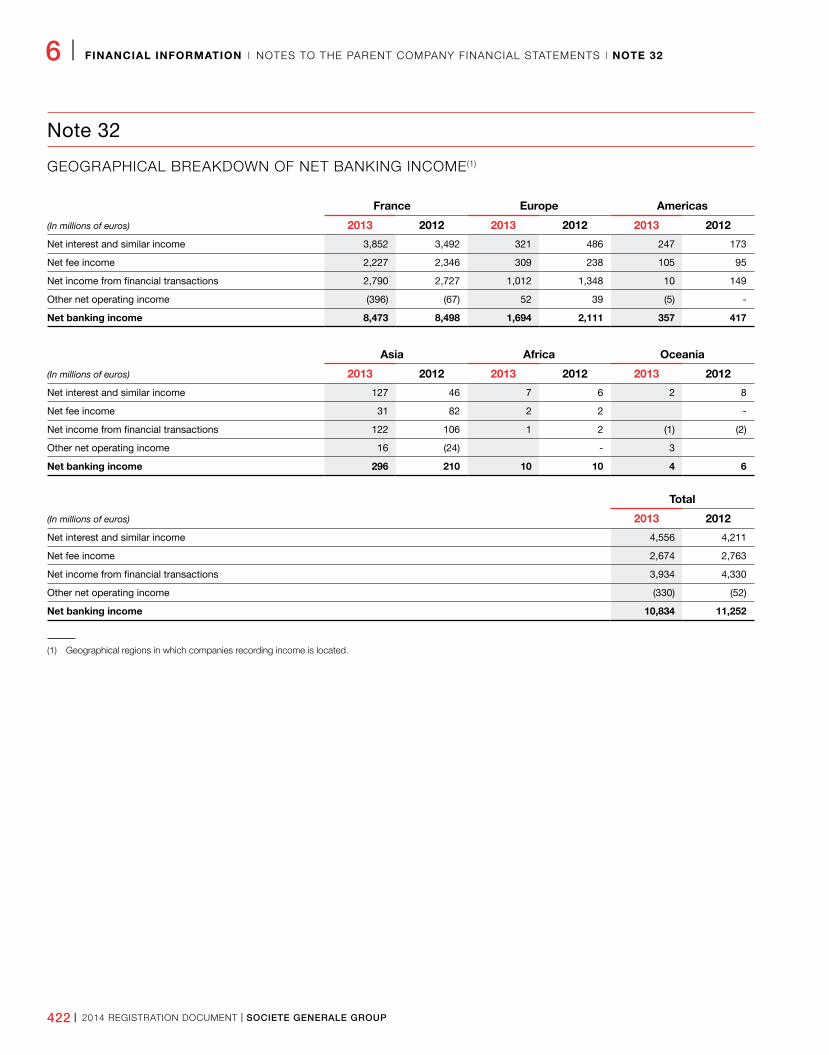
422 I 2014 REGISTRATION DOCUMENT I SOCIETE GENERALE GROUP
6 I FINANCIAL INFORMATION I NOTES TO THE PARENT COMPANY FINANCIAL STATEMENTS I NOTE 32
Note 32
GEOGRAPHICAL BREAKDOWN OF NET BANKING INCOME(1)
France Europe Americas
(In millions of euros) 2013 2012 2013 2012 2013 2012
Net interest and similar income 3,852 3,492 321 486 247 173
Net fee income 2,227 2,346 309 238 105 95
Net income from financial transactions 2,790 2,727 1,012 1,348 10 149
Other net operating income (396) (67) 52 39 (5) -
Net banking income 8,473 8,498 1,694 2,111 357 417
Asia Africa Oceania
(In millions of euros) 2013 2012 2013 2012 2013 2012
Net interest and similar income 127 46 7 6 2 8
Net fee income 31 82 2 2 -
Net income from financial transactions 122 106 1 2 (1) (2)
Other net operating income 16 (24) - 3
Net banking income 296 210 10 10 4 6
Total
(In millions of euros) 2013 2012
Net interest and similar income 4,556 4,211
Net fee income 2,674 2,763
Net income from financial transactions 3,934 4,330
Other net operating income (330) (52)
Net banking income 10,834 11,252
(1) Geographical regions in which companies recording income is located.
SOCIETE GENERALE GROUP I 2014 REGISTRATION DOCUMENT I 423
NOTE 33 I NOTES TO THE PARENT COMPANY FINANCIAL STATEMENTS I FINANCIAL INFORMATION I 6
Note 33
OPERATIONS IN UNCOOPERATIVE STATES OR TERRITORIES
Since 2003, Societe Generale defined strict internal rules to prevent the development of operations in countries qualified as uncooperative tax havens by the OECD. Any operation, or development of activities as part of existing operations, may only be authorised by decision of the General Management after approval by the Group Corporate Secretary and the Risk Division.
Since 2010, Societe Generale decided to close and therefore took the necessary steps to close, all the Group’s operations in Countries and Territories deemed non-cooperative by France, the list of which was updated by the Ministerial act of January 17, 2014 (published in January 19, 2014).
In 2013, Societe Generale no longer directly or indirectly held any operation in the states and territories in question. Societe Generale holds an unused license to operate in Brunei.
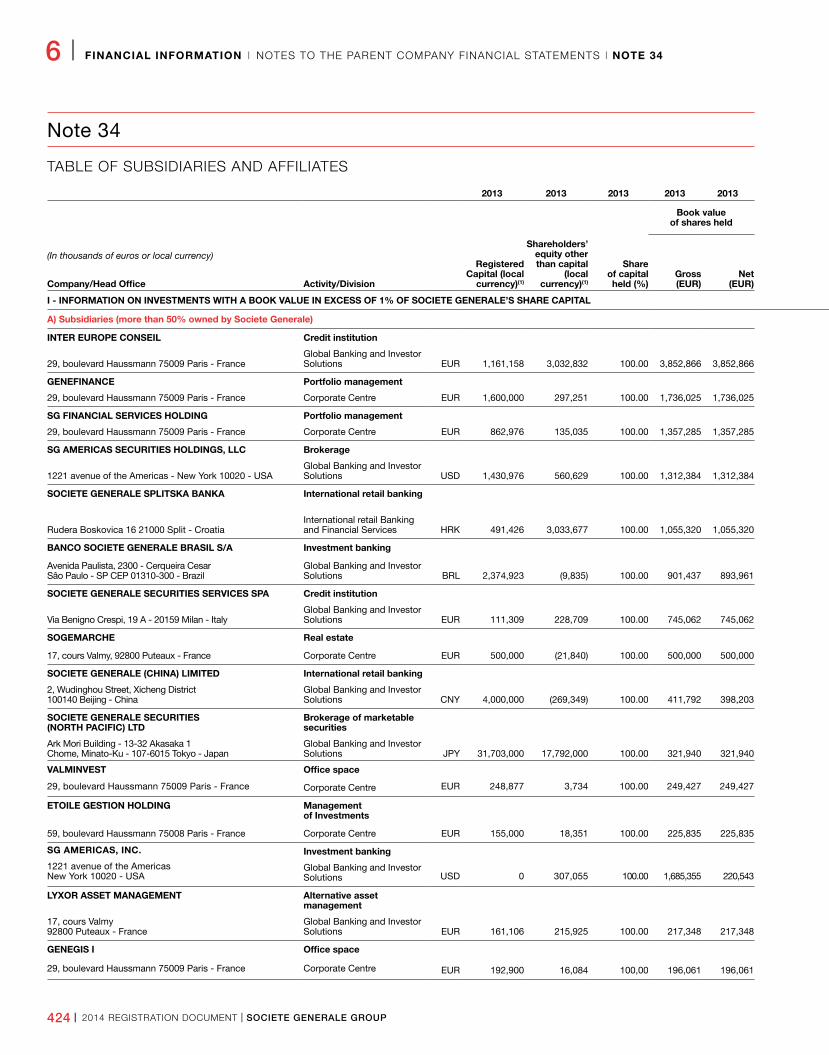
424 I 2014 REGISTRATION DOCUMENT I SOCIETE GENERALE GROUP
6 I FINANCIAL INFORMATION I NOTES TO THE PARENT COMPANY FINANCIAL STATEMENTS I NOTE 34
Note 34
TABLE OF SUBSIDIARIES AND AFFILIATES
2013 2013 2013 2013 2013 2013 2013 2013 2013 2013 2013
Book value of shares held
(In thousands of euros or local currency)
Activity/Division
Registered Capital (local
currency)(1)
Shareholders’ equity other than capital
(local currency)(1)
Share of capital held (%)
Gross (EUR)
Net (EUR)
Unreimbursed loans and advances made by the Company (in EUR)
Guarantees given by the Company (in EUR)
Revenue excluding tax for the last financial year (local currency)
(1) (2) (3)
Net income (loss) for the last financial
year (local currency)(1)(3)
Dividends received by the Company during the
year (in EUR)Remarks
Revaluation differencesCompany/Head Office
I INFORMATION ON INVESTMENTS WITH A BOOK VALUE IN EXCESS OF 1% OF SOCIETE GENERALE’S SHARE CAPITAL
A) Subsidiaries (more than 50% owned by Societe Generale)
INTER EUROPE CONSEIL Credit institution
29, boulevard Haussmann 75009 Paris - FranceGlobal Banking and Investor Solutions EUR 1,161,158 3,032,832 100�00 3,852,866 3,852,866 14,565,794 0 5,144,999 34,428 0
GENEFINANCE Portfolio management
29, boulevard Haussmann 75009 Paris - France Corporate Centre EUR 1,600,000 297,251 100�00 1,736,025 1,736,025 2,194,260 0 879,957 744,095 187,000
SG FINANCIAL SERVICES HOLDING Portfolio management
29, boulevard Haussmann 75009 Paris - France Corporate Centre EUR 862,976 135,035 100�00 1,357,285 1,357,285 2,057,120 0 264,150 74,715 201,794
SG AMERICAS SECURITIES HOLDINGS, LLC Brokerage
1221 avenue of the Americas - New York 10020 - USAGlobal Banking and Investor Solutions USD 1,430,976 560,629 100�00 1,312,384 1,312,384 464,071 0 792,297 135,180 0 1 EUR = 1�3791 USD
SOCIETE GENERALE SPLITSKA BANKA International retail banking
Rudera Boskovica 16 21000 Split - CroatiaInternational retail Banking and Financial Services HRK 491,426 3,033,677 100�00 1,055,320 1,055,320 57,022 260,000 1,046,795 92,514 26,676 1 EUR = 7�6265 HRK
BANCO SOCIETE GENERALE BRASIL S/A Investment banking
Avenida Paulista, 2300 - Cerqueira Cesar Sâo Paulo - SP CEP 01310-300 - Brazil
Global Banking and Investor Solutions BRL 2,374,923 (9,835) 100�00 901,437 893,961 0 0 113,275 9,078 0 1 EUR = 3�2576 BRL
SOCIETE GENERALE SECURITIES SERVICES SPA Credit institution
Via Benigno Crespi, 19 A - 20159 Milan - ItalyGlobal Banking and Investor Solutions EUR 111,309 228,709 100�00 745,062 745,062 0 0 160,292 21,677 40,043
SOGEMARCHE Real estate
17, cours Valmy, 92800 Puteaux - France Corporate Centre EUR 500,000 (21,840) 100�00 500,000 500,000 95,000 34,580 14,078 (21,840) 0
SOCIETE GENERALE (CHINA) LIMITED International retail banking
2, Wudinghou Street, Xicheng District 100140 Beijing - China
Global Banking and Investor Solutions CNY 4,000,000 (269,349) 100�00 411,792 398,203 0 179,685 369,041 (137,250) 0 1 EUR = 8�3491 CNY
SOCIETE GENERALE SECURITIES (NORTH PACIFIC) LTD
Brokerage of marketable securities
Ark Mori Building - 13-32 Akasaka 1 Chome, Minato-Ku - 107-6015 Tokyo - Japan
Global Banking and Investor Solutions JPY 31,703,000 17,792,000 100�00 321,940 321,940 34,549 101 31,176,000 13,751,000 76,429 1 EUR = 144�72 JPY
VALMINVEST Office space
29, boulevard Haussmann 75009 Paris - France Corporate Centre EUR 248,877 3,734 100�00 249,427 249,427 36,100 0 9,850 4,149 0
ETOILE GESTION HOLDING Management of Investments
59, boulevard Haussmann 75008 Paris - France Corporate Centre EUR 155,000 18,351 100�00 225,835 225,835 0 0 8,076 5,311 0
SG AMERICAS, INC. Investment banking capital = 1 USD
1221 avenue of the Americas New York 10020 - USA
Global Banking and Investor Solutions USD 0 307,055 100�00 1,685,355 220,543 0 0 40,527 (12,090) 0 1 EUR = 1�3791 USD
LYXOR ASSET MANAGEMENT Alternative asset management
17, cours Valmy 92800 Puteaux - France
Global Banking and Investor Solutions EUR 161,106 215,925 100�00 217,348 217,348 0 0 100,649 (8,638) 31,277
GENEGIS I Office space
29, boulevard Haussmann 75009 Paris - France Corporate Centre EUR 192,900 16,084 100,00 196,061 196,061 7,344 0 235,214 (5,956) 0
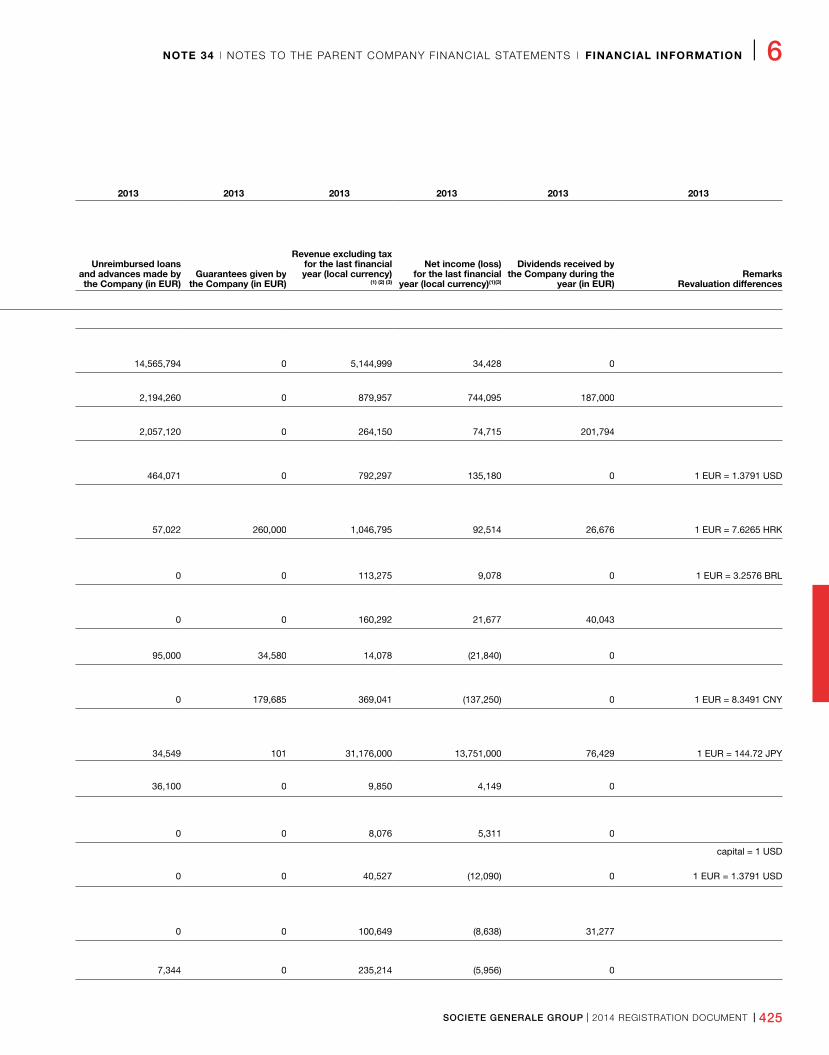
SOCIETE GENERALE GROUP I 2014 REGISTRATION DOCUMENT I 425
NOTE 34 I NOTES TO THE PARENT COMPANY FINANCIAL STATEMENTS I FINANCIAL INFORMATION I 6
TABLE OF SUBSIDIARIES AND AFFILIATES
2013 2013 2013 2013 2013 2013 2013 2013 2013 2013 2013
Book value of shares held
(In thousands of euros or local currency)
Activity/Division
Registered Capital (local
currency)(1)
Shareholders’ equity other than capital
(local currency)(1)
Share of capital held (%)
Gross (EUR)
Net (EUR)
Unreimbursed loans and advances made by the Company (in EUR)
Guarantees given by the Company (in EUR)
Revenue excluding tax for the last financial year (local currency)
(1) (2) (3)
Net income (loss) for the last financial
year (local currency)(1)(3)
Dividends received by the Company during the
year (in EUR)Remarks
Revaluation differencesCompany/Head Office
I INFORMATION ON INVESTMENTS WITH A BOOK VALUE IN EXCESS OF 1% OF SOCIETE GENERALE’S SHARE CAPITAL
A) Subsidiaries (more than 50% owned by Societe Generale)
INTER EUROPE CONSEIL Credit institution
29, boulevard Haussmann 75009 Paris - FranceGlobal Banking and Investor Solutions EUR 1,161,158 3,032,832 100�00 3,852,866 3,852,866 14,565,794 0 5,144,999 34,428 0
GENEFINANCE Portfolio management
29, boulevard Haussmann 75009 Paris - France Corporate Centre EUR 1,600,000 297,251 100�00 1,736,025 1,736,025 2,194,260 0 879,957 744,095 187,000
SG FINANCIAL SERVICES HOLDING Portfolio management
29, boulevard Haussmann 75009 Paris - France Corporate Centre EUR 862,976 135,035 100�00 1,357,285 1,357,285 2,057,120 0 264,150 74,715 201,794
SG AMERICAS SECURITIES HOLDINGS, LLC Brokerage
1221 avenue of the Americas - New York 10020 - USAGlobal Banking and Investor Solutions USD 1,430,976 560,629 100�00 1,312,384 1,312,384 464,071 0 792,297 135,180 0 1 EUR = 1�3791 USD
SOCIETE GENERALE SPLITSKA BANKA International retail banking
Rudera Boskovica 16 21000 Split - CroatiaInternational retail Banking and Financial Services HRK 491,426 3,033,677 100�00 1,055,320 1,055,320 57,022 260,000 1,046,795 92,514 26,676 1 EUR = 7�6265 HRK
BANCO SOCIETE GENERALE BRASIL S/A Investment banking
Avenida Paulista, 2300 - Cerqueira Cesar Sâo Paulo - SP CEP 01310-300 - Brazil
Global Banking and Investor Solutions BRL 2,374,923 (9,835) 100�00 901,437 893,961 0 0 113,275 9,078 0 1 EUR = 3�2576 BRL
SOCIETE GENERALE SECURITIES SERVICES SPA Credit institution
Via Benigno Crespi, 19 A - 20159 Milan - ItalyGlobal Banking and Investor Solutions EUR 111,309 228,709 100�00 745,062 745,062 0 0 160,292 21,677 40,043
SOGEMARCHE Real estate
17, cours Valmy, 92800 Puteaux - France Corporate Centre EUR 500,000 (21,840) 100�00 500,000 500,000 95,000 34,580 14,078 (21,840) 0
SOCIETE GENERALE (CHINA) LIMITED International retail banking
2, Wudinghou Street, Xicheng District 100140 Beijing - China
Global Banking and Investor Solutions CNY 4,000,000 (269,349) 100�00 411,792 398,203 0 179,685 369,041 (137,250) 0 1 EUR = 8�3491 CNY
SOCIETE GENERALE SECURITIES (NORTH PACIFIC) LTD
Brokerage of marketable securities
Ark Mori Building - 13-32 Akasaka 1 Chome, Minato-Ku - 107-6015 Tokyo - Japan
Global Banking and Investor Solutions JPY 31,703,000 17,792,000 100�00 321,940 321,940 34,549 101 31,176,000 13,751,000 76,429 1 EUR = 144�72 JPY
VALMINVEST Office space
29, boulevard Haussmann 75009 Paris - France Corporate Centre EUR 248,877 3,734 100�00 249,427 249,427 36,100 0 9,850 4,149 0
ETOILE GESTION HOLDING Management of Investments
59, boulevard Haussmann 75008 Paris - France Corporate Centre EUR 155,000 18,351 100�00 225,835 225,835 0 0 8,076 5,311 0
SG AMERICAS, INC. Investment banking capital = 1 USD
1221 avenue of the Americas New York 10020 - USA
Global Banking and Investor Solutions USD 0 307,055 100�00 1,685,355 220,543 0 0 40,527 (12,090) 0 1 EUR = 1�3791 USD
LYXOR ASSET MANAGEMENT Alternative asset management
17, cours Valmy 92800 Puteaux - France
Global Banking and Investor Solutions EUR 161,106 215,925 100�00 217,348 217,348 0 0 100,649 (8,638) 31,277
GENEGIS I Office space
29, boulevard Haussmann 75009 Paris - France Corporate Centre EUR 192,900 16,084 100,00 196,061 196,061 7,344 0 235,214 (5,956) 0
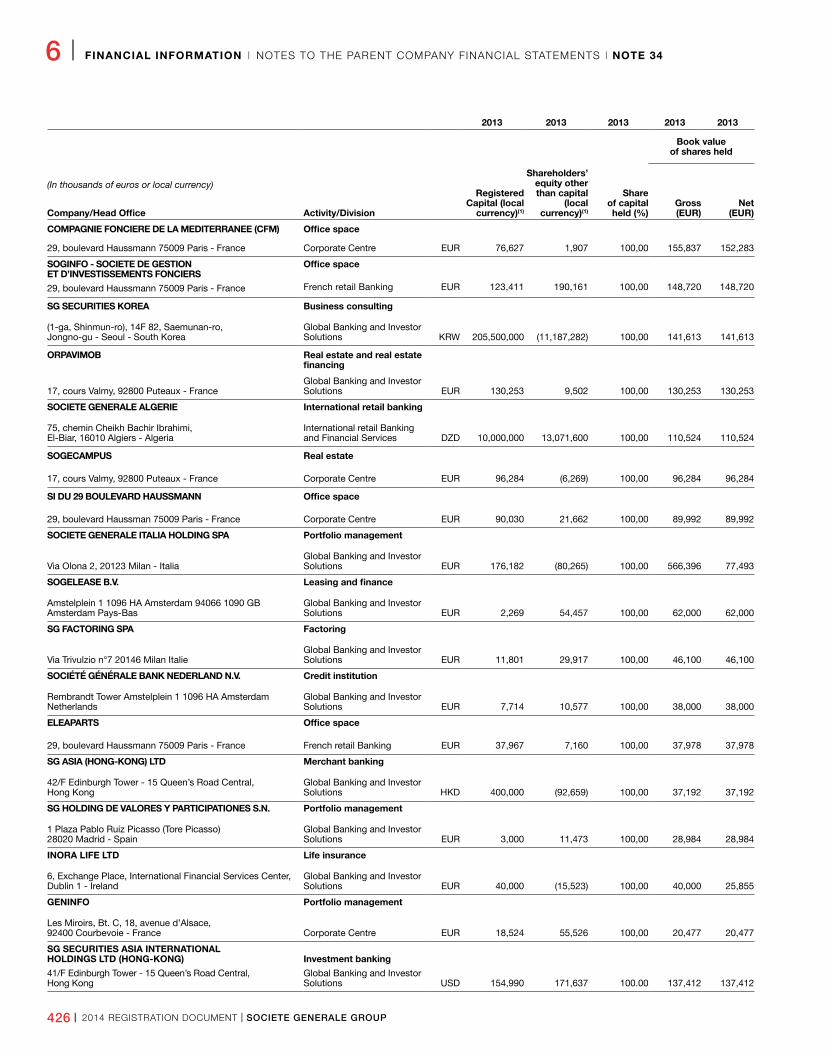
426 I 2014 REGISTRATION DOCUMENT I SOCIETE GENERALE GROUP
6 I FINANCIAL INFORMATION I NOTES TO THE PARENT COMPANY FINANCIAL STATEMENTS I NOTE 34
2013 2013 2013 2013 2013 2013 2013 2013 2013 2013 2013
Book value of shares held
(In thousands of euros or local currency)
Activity/Division
Registered Capital (local
currency)(1)
Shareholders’ equity other than capital
(local currency)(1)
Share of capital held (%)
Gross (EUR)
Net (EUR)
Unreimbursed loans and advances made by the Company (in EUR)
Guarantees given by the Company (in EUR)
Revenue excluding tax for the last financial year (local currency)
(1) (2) (3)
Net income (loss) for the last financial
year (local currency)(1)(3)
Dividends received by the Company during the
year (in EUR)Remarks
Revaluation differencesCompany/Head Office
COMPAGNIE FONCIERE DE LA MEDITERRANEE (CFM) Office space
29, boulevard Haussmann 75009 Paris - France Corporate Centre EUR 76,627 1,907 100,00 155,837 152,283 35,434 0 602 655 1,121
SOGINFO SOCIETE DE GESTION ET D’INVESTISSEMENTS FONCIERS
Office space
29, boulevard Haussmann 75009 Paris - France French retail Banking EUR 123,411 190,161 100,00 148,720 148,720 0 2,000 31,895 6,718 23,375
SG SECURITIES KOREA Business consulting
(1-ga, Shinmun-ro), 14F 82, Saemunan-ro, Jongno-gu - Seoul - South Korea
Global Banking and Investor Solutions KRW 205,500,000 (11,187,282) 100,00 141,613 141,613 0 0 16,520,928 (6,639,666) 0 1 EUR = 1450,93 KRW
ORPAVIMOB Real estate and real estate financing
17, cours Valmy, 92800 Puteaux - FranceGlobal Banking and Investor Solutions EUR 130,253 9,502 100,00 130,253 130,253 0 0 17,149 2,698 0
SOCIETE GENERALE ALGERIE International retail banking
75, chemin Cheikh Bachir Ibrahimi, El-Biar, 16010 Algiers - Algeria
International retail Banking and Financial Services DZD 10,000,000 13,071,600 100,00 110,524 110,524 0 51,099 14,447,492 3,419,833 28,201 1 EUR = 107,63475 DZD
SOGECAMPUS Real estate
17, cours Valmy, 92800 Puteaux - France Corporate Centre EUR 96,284 (6,269) 100,00 96,284 96,284 90,000 0 0 (163) 0
SI DU 29 BOULEVARD HAUSSMANN Office space
29, boulevard Haussman 75009 Paris - France Corporate Centre EUR 90,030 21,662 100,00 89,992 89,992 0 0 7,571 3,224 2,701
SOCIETE GENERALE ITALIA HOLDING SPA Portfolio management
Via Olona 2, 20123 Milan - ItaliaGlobal Banking and Investor Solutions EUR 176,182 (80,265) 100,00 566,396 77,493 0 0 (12,317) (17,588) 0
SOGELEASE B.V. Leasing and finance
Amstelplein 1 1096 HA Amsterdam 94066 1090 GB Amsterdam Pays-Bas
Global Banking and Investor Solutions EUR 2,269 54,457 100,00 62,000 62,000 0 0 317 (172) 0
SG FACTORING SPA Factoring
Via Trivulzio n°7 20146 Milan ItalieGlobal Banking and Investor Solutions EUR 11,801 29,917 100,00 46,100 46,100 0 240,000 12,048 4,021 4,243
SOCIÉTÉ GÉNÉRALE BANK NEDERLAND N.V. Credit institution
Rembrandt Tower Amstelplein 1 1096 HA Amsterdam Netherlands
Global Banking and Investor Solutions EUR 7,714 10,577 100,00 38,000 38,000 0 0 14,733 10,406 0
ELEAPARTS Office space
29, boulevard Haussmann 75009 Paris - France French retail Banking EUR 37,967 7,160 100,00 37,978 37,978 0 0 2,839 888 841
SG ASIA (HONGKONG) LTD Merchant banking
42/F Edinburgh Tower - 15 Queen’s Road Central, Hong Kong
Global Banking and Investor Solutions HKD 400,000 (92,659) 100,00 37,192 37,192 0 0 109,502 40,930 0 1 EUR = 10,6933 HKD
SG HOLDING DE VALORES Y PARTICIPATIONES S.N. Portfolio management
1 Plaza Pablo Ruiz Picasso (Tore Picasso) 28020 Madrid - Spain
Global Banking and Investor Solutions EUR 3,000 11,473 100,00 28,984 28,984 18,909 0 787 22,577 0
INORA LIFE LTD Life insurance
6, Exchange Place, International Financial Services Center, Dublin 1 - Ireland
Global Banking and Investor Solutions EUR 40,000 (15,523) 100,00 40,000 25,855 0 8,721 2,029 (1,671) 0
GENINFO Portfolio management
Les Miroirs, Bt� C, 18, avenue d’Alsace, 92400 Courbevoie - France Corporate Centre EUR 18,524 55,526 100,00 20,477 20,477 0 0 12,899 11,741 0
SG SECURITIES ASIA INTERNATIONAL HOLDINGS LTD (HONGKONG) Investment banking
41/F Edinburgh Tower - 15 Queen’s Road Central, Hong Kong
Global Banking and Investor Solutions USD 154,990 171,637 100�00 137,412 137,412 50,758 0 784,920 458,607 290,274 1 EUR = 1�3791 USD
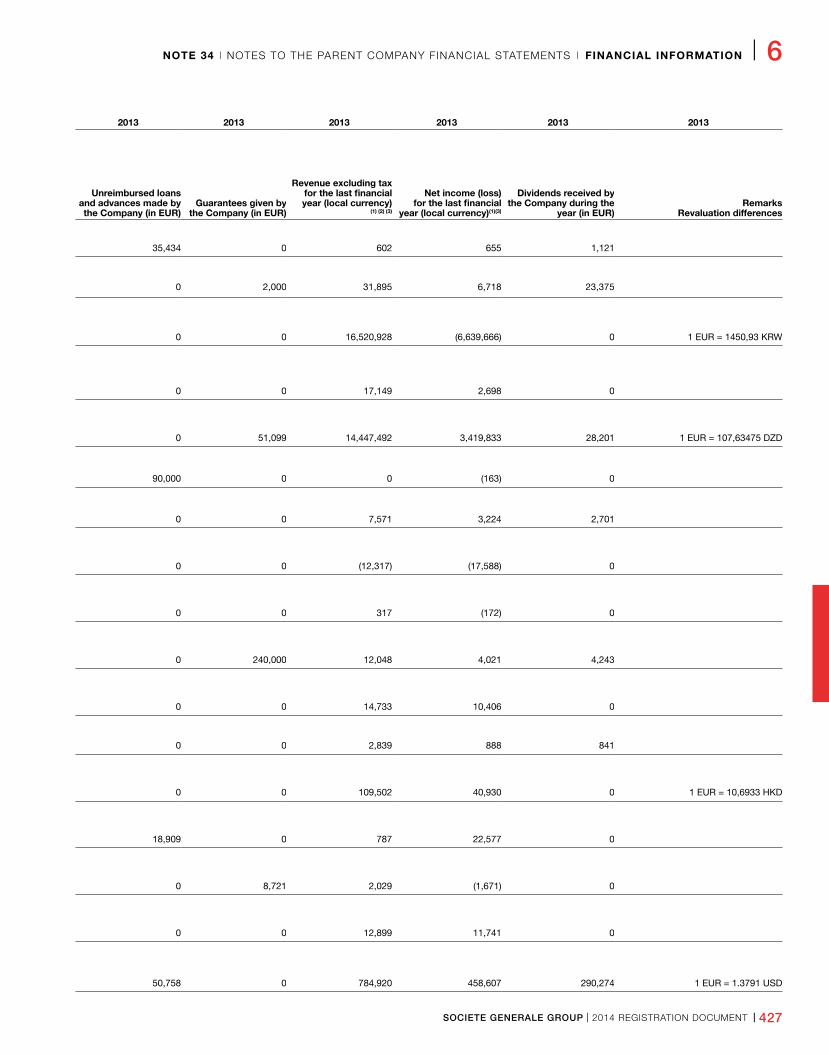
SOCIETE GENERALE GROUP I 2014 REGISTRATION DOCUMENT I 427
NOTE 34 I NOTES TO THE PARENT COMPANY FINANCIAL STATEMENTS I FINANCIAL INFORMATION I 6
2013 2013 2013 2013 2013 2013 2013 2013 2013 2013 2013
Book value of shares held
(In thousands of euros or local currency)
Activity/Division
Registered Capital (local
currency)(1)
Shareholders’ equity other than capital
(local currency)(1)
Share of capital held (%)
Gross (EUR)
Net (EUR)
Unreimbursed loans and advances made by the Company (in EUR)
Guarantees given by the Company (in EUR)
Revenue excluding tax for the last financial year (local currency)
(1) (2) (3)
Net income (loss) for the last financial
year (local currency)(1)(3)
Dividends received by the Company during the
year (in EUR)Remarks
Revaluation differencesCompany/Head Office
COMPAGNIE FONCIERE DE LA MEDITERRANEE (CFM) Office space
29, boulevard Haussmann 75009 Paris - France Corporate Centre EUR 76,627 1,907 100,00 155,837 152,283 35,434 0 602 655 1,121
SOGINFO SOCIETE DE GESTION ET D’INVESTISSEMENTS FONCIERS
Office space
29, boulevard Haussmann 75009 Paris - France French retail Banking EUR 123,411 190,161 100,00 148,720 148,720 0 2,000 31,895 6,718 23,375
SG SECURITIES KOREA Business consulting
(1-ga, Shinmun-ro), 14F 82, Saemunan-ro, Jongno-gu - Seoul - South Korea
Global Banking and Investor Solutions KRW 205,500,000 (11,187,282) 100,00 141,613 141,613 0 0 16,520,928 (6,639,666) 0 1 EUR = 1450,93 KRW
ORPAVIMOB Real estate and real estate financing
17, cours Valmy, 92800 Puteaux - FranceGlobal Banking and Investor Solutions EUR 130,253 9,502 100,00 130,253 130,253 0 0 17,149 2,698 0
SOCIETE GENERALE ALGERIE International retail banking
75, chemin Cheikh Bachir Ibrahimi, El-Biar, 16010 Algiers - Algeria
International retail Banking and Financial Services DZD 10,000,000 13,071,600 100,00 110,524 110,524 0 51,099 14,447,492 3,419,833 28,201 1 EUR = 107,63475 DZD
SOGECAMPUS Real estate
17, cours Valmy, 92800 Puteaux - France Corporate Centre EUR 96,284 (6,269) 100,00 96,284 96,284 90,000 0 0 (163) 0
SI DU 29 BOULEVARD HAUSSMANN Office space
29, boulevard Haussman 75009 Paris - France Corporate Centre EUR 90,030 21,662 100,00 89,992 89,992 0 0 7,571 3,224 2,701
SOCIETE GENERALE ITALIA HOLDING SPA Portfolio management
Via Olona 2, 20123 Milan - ItaliaGlobal Banking and Investor Solutions EUR 176,182 (80,265) 100,00 566,396 77,493 0 0 (12,317) (17,588) 0
SOGELEASE B.V. Leasing and finance
Amstelplein 1 1096 HA Amsterdam 94066 1090 GB Amsterdam Pays-Bas
Global Banking and Investor Solutions EUR 2,269 54,457 100,00 62,000 62,000 0 0 317 (172) 0
SG FACTORING SPA Factoring
Via Trivulzio n°7 20146 Milan ItalieGlobal Banking and Investor Solutions EUR 11,801 29,917 100,00 46,100 46,100 0 240,000 12,048 4,021 4,243
SOCIÉTÉ GÉNÉRALE BANK NEDERLAND N.V. Credit institution
Rembrandt Tower Amstelplein 1 1096 HA Amsterdam Netherlands
Global Banking and Investor Solutions EUR 7,714 10,577 100,00 38,000 38,000 0 0 14,733 10,406 0
ELEAPARTS Office space
29, boulevard Haussmann 75009 Paris - France French retail Banking EUR 37,967 7,160 100,00 37,978 37,978 0 0 2,839 888 841
SG ASIA (HONGKONG) LTD Merchant banking
42/F Edinburgh Tower - 15 Queen’s Road Central, Hong Kong
Global Banking and Investor Solutions HKD 400,000 (92,659) 100,00 37,192 37,192 0 0 109,502 40,930 0 1 EUR = 10,6933 HKD
SG HOLDING DE VALORES Y PARTICIPATIONES S.N. Portfolio management
1 Plaza Pablo Ruiz Picasso (Tore Picasso) 28020 Madrid - Spain
Global Banking and Investor Solutions EUR 3,000 11,473 100,00 28,984 28,984 18,909 0 787 22,577 0
INORA LIFE LTD Life insurance
6, Exchange Place, International Financial Services Center, Dublin 1 - Ireland
Global Banking and Investor Solutions EUR 40,000 (15,523) 100,00 40,000 25,855 0 8,721 2,029 (1,671) 0
GENINFO Portfolio management
Les Miroirs, Bt� C, 18, avenue d’Alsace, 92400 Courbevoie - France Corporate Centre EUR 18,524 55,526 100,00 20,477 20,477 0 0 12,899 11,741 0
SG SECURITIES ASIA INTERNATIONAL HOLDINGS LTD (HONGKONG) Investment banking
41/F Edinburgh Tower - 15 Queen’s Road Central, Hong Kong
Global Banking and Investor Solutions USD 154,990 171,637 100�00 137,412 137,412 50,758 0 784,920 458,607 290,274 1 EUR = 1�3791 USD
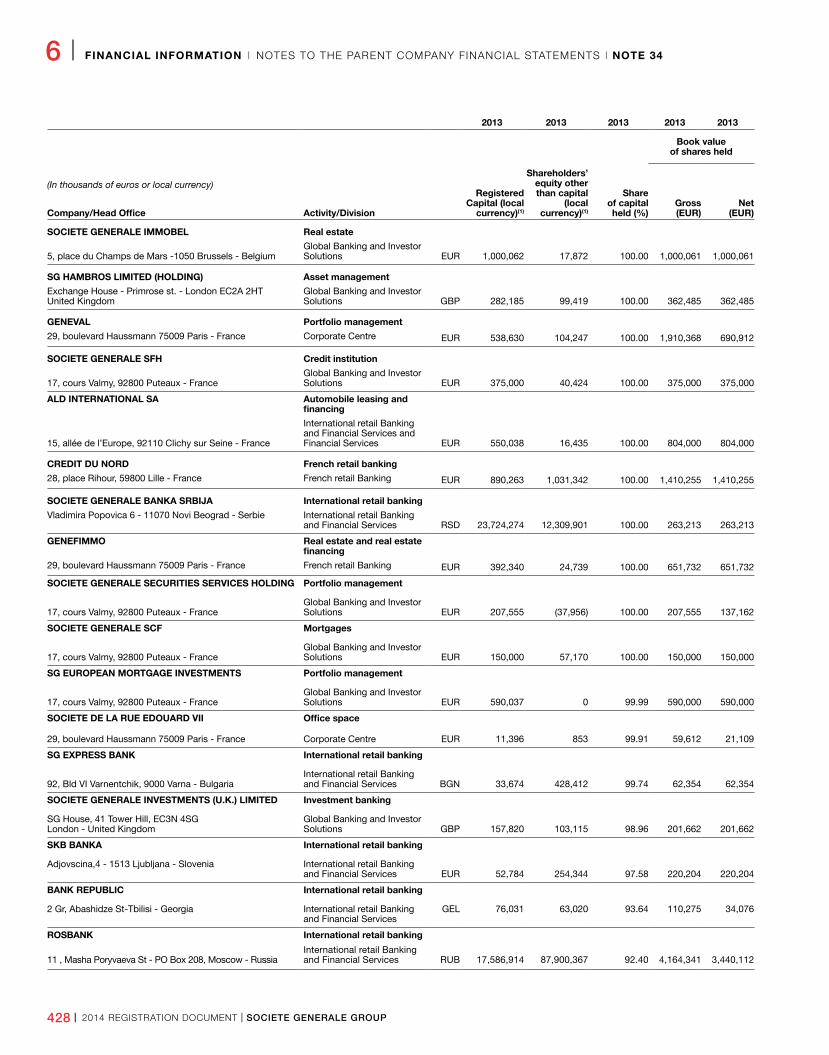
428 I 2014 REGISTRATION DOCUMENT I SOCIETE GENERALE GROUP
6 I FINANCIAL INFORMATION I NOTES TO THE PARENT COMPANY FINANCIAL STATEMENTS I NOTE 34
2013 2013 2013 2013 2013 2013 2013 2013 2013 2013 2013
Book value of shares held
(In thousands of euros or local currency)
Activity/Division
Registered Capital (local
currency)(1)
Shareholders’ equity other than capital
(local currency)(1)
Share of capital held (%)
Gross (EUR)
Net (EUR)
Unreimbursed loans and advances made by the Company (in EUR)
Guarantees given by the Company (in EUR)
Revenue excluding tax for the last financial year (local currency)
(1) (2) (3)
Net income (loss) for the last financial
year (local currency)(1)(3)
Dividends received by the Company during the
year (in EUR)Remarks
Revaluation differencesCompany/Head Office
SOCIETE GENERALE IMMOBEL Real estate
5, place du Champs de Mars -1050 Brussels - BelgiumGlobal Banking and Investor Solutions EUR 1,000,062 17,872 100�00 1,000,061 1,000,061 116,395 0 33,754 26,775 52,491
SG HAMBROS LIMITED (HOLDING) Asset management
Exchange House - Primrose st. - London EC2A 2HT United Kingdom
Global Banking and Investor Solutions GBP 282,185 99,419 100�00 362,485 362,485 35,997 0 101,866 22,128 58,948 1 EUR = 0�8337 GBP
GENEVAL Portfolio management
29, boulevard Haussmann 75009 Paris - France Corporate Centre EUR 538,630 104,247 100�00 1,910,368 690,912 0 0 7,308 46,330 0
SOCIETE GENERALE SFH Credit institution
17, cours Valmy, 92800 Puteaux - FranceGlobal Banking and Investor Solutions EUR 375,000 40,424 100�00 375,000 375,000 149,725 0 1,840,677 40,032 0
ALD INTERNATIONAL SA Automobile leasing and financing
15, allée de l’Europe, 92110 Clichy sur Seine - France
International retail Banking and Financial Services and Financial Services EUR 550,038 16,435 100�00 804,000 804,000 778,000 16 53,934 6,170 0
CREDIT DU NORD French retail banking
28, place Rihour, 59800 Lille - France French retail Banking EUR 890,263 1,031,342 100�00 1,410,255 1,410,255 1,065,052 200,448 1,324,633 619,823 222,566
SOCIETE GENERALE BANKA SRBIJA International retail banking
Vladimira Popovica 6 - 11070 Novi Beograd - Serbie International retail Banking and Financial Services RSD 23,724,274 12,309,901 100�00 263,213 263,213 281,487 352,693 10,402,242 (1,691,306) 0 1 EUR = 114�1666 RSD
GENEFIMMO Real estate and real estate financing
29, boulevard Haussmann 75009 Paris - France French retail Banking EUR 392,340 24,739 100�00 651,732 651,732 99,199 1,888 13,734 9,756 22,125
SOCIETE GENERALE SECURITIES SERVICES HOLDING Portfolio management
17, cours Valmy, 92800 Puteaux - FranceGlobal Banking and Investor Solutions EUR 207,555 (37,956) 100�00 207,555 137,162 0 0 0 (41,772) 0
SOCIETE GENERALE SCF Mortgages
17, cours Valmy, 92800 Puteaux - FranceGlobal Banking and Investor Solutions EUR 150,000 57,170 100�00 150,000 150,000 0 750,000 29,634 17,024 0
SG EUROPEAN MORTGAGE INVESTMENTS Portfolio management
17, cours Valmy, 92800 Puteaux - FranceGlobal Banking and Investor Solutions EUR 590,037 0 99�99 590,000 590,000 0 0 0 (32,389) 26,301
SOCIETE DE LA RUE EDOUARD VII Office space difference = 16 509
29, boulevard Haussmann 75009 Paris - France Corporate Centre EUR 11,396 853 99�91 59,612 21,109 0 0 58 12 35
SG EXPRESS BANK International retail banking
92, Bld VI Varnentchik, 9000 Varna - BulgariaInternational retail Banking and Financial Services BGN 33,674 428,412 99�74 62,354 62,354 119,237 173,307 164,582 26,703 0 1 EUR = 1�9558 BGN
SOCIETE GENERALE INVESTMENTS (U.K.) LIMITED Investment banking
SG House, 41 Tower Hill, EC3N 4SG London - United Kingdom
Global Banking and Investor Solutions GBP 157,820 103,115 98�96 201,662 201,662 1,009,669 277,909 33,654 53,276 76,491 1 EUR = 0�8337 GBP
SKB BANKA International retail banking
Adjovscina,4 - 1513 Ljubljana - Slovenia International retail Banking and Financial Services EUR 52,784 254,344 97�58 220,204 220,204 356,887 195,000 98,647 (34,003) 0
BANK REPUBLIC International retail banking
2 Gr, Abashidze St-Tbilisi - Georgia International retail Banking and Financial Services
GEL 76,031 63,020 93�64 110,275 34,076 9,514 114,374 88,607 28,092 0 1 EUR = 2�3914 GEL
ROSBANK International retail banking
11 , Masha Poryvaeva St - PO Box 208, Moscow - RussiaInternational retail Banking and Financial Services RUB 17,586,914 87,900,367 92�40 4,164,341 3,440,112 642,185 900,124 46,940,981 10,977,823 0 1 EUR = 45�3246 RUB
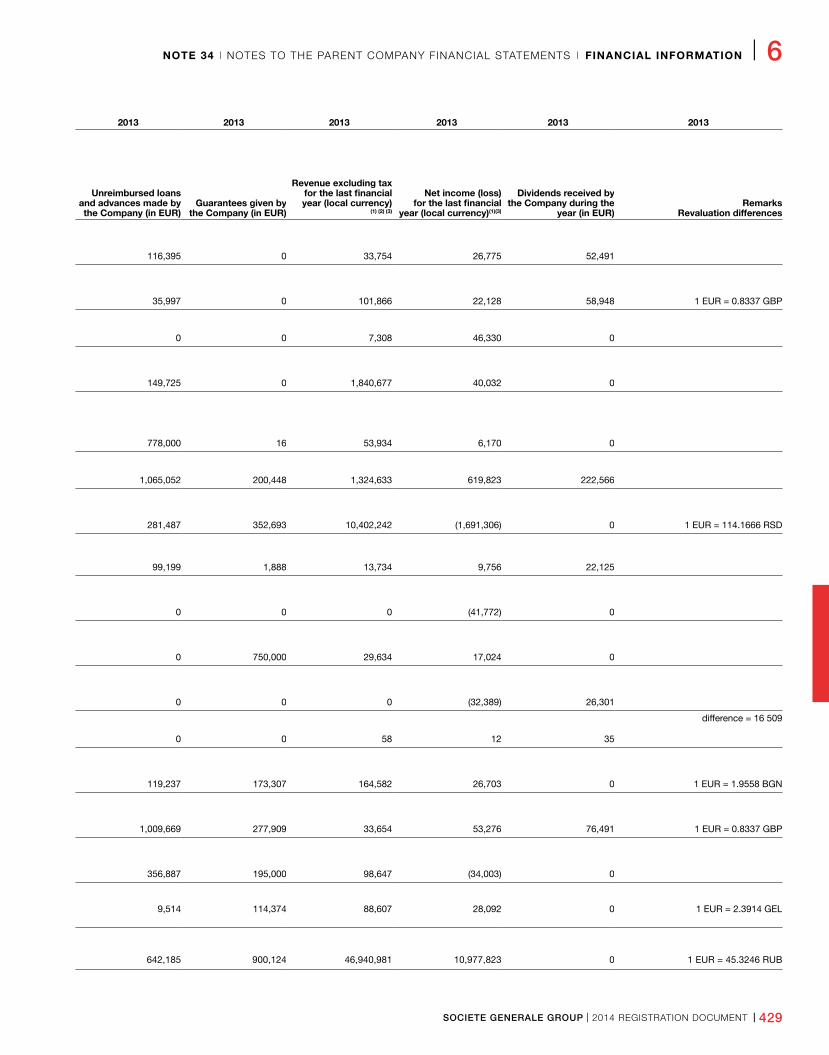
SOCIETE GENERALE GROUP I 2014 REGISTRATION DOCUMENT I 429
NOTE 34 I NOTES TO THE PARENT COMPANY FINANCIAL STATEMENTS I FINANCIAL INFORMATION I 6
2013 2013 2013 2013 2013 2013 2013 2013 2013 2013 2013
Book value of shares held
(In thousands of euros or local currency)
Activity/Division
Registered Capital (local
currency)(1)
Shareholders’ equity other than capital
(local currency)(1)
Share of capital held (%)
Gross (EUR)
Net (EUR)
Unreimbursed loans and advances made by the Company (in EUR)
Guarantees given by the Company (in EUR)
Revenue excluding tax for the last financial year (local currency)
(1) (2) (3)
Net income (loss) for the last financial
year (local currency)(1)(3)
Dividends received by the Company during the
year (in EUR)Remarks
Revaluation differencesCompany/Head Office
SOCIETE GENERALE IMMOBEL Real estate
5, place du Champs de Mars -1050 Brussels - BelgiumGlobal Banking and Investor Solutions EUR 1,000,062 17,872 100�00 1,000,061 1,000,061 116,395 0 33,754 26,775 52,491
SG HAMBROS LIMITED (HOLDING) Asset management
Exchange House - Primrose st. - London EC2A 2HT United Kingdom
Global Banking and Investor Solutions GBP 282,185 99,419 100�00 362,485 362,485 35,997 0 101,866 22,128 58,948 1 EUR = 0�8337 GBP
GENEVAL Portfolio management
29, boulevard Haussmann 75009 Paris - France Corporate Centre EUR 538,630 104,247 100�00 1,910,368 690,912 0 0 7,308 46,330 0
SOCIETE GENERALE SFH Credit institution
17, cours Valmy, 92800 Puteaux - FranceGlobal Banking and Investor Solutions EUR 375,000 40,424 100�00 375,000 375,000 149,725 0 1,840,677 40,032 0
ALD INTERNATIONAL SA Automobile leasing and financing
15, allée de l’Europe, 92110 Clichy sur Seine - France
International retail Banking and Financial Services and Financial Services EUR 550,038 16,435 100�00 804,000 804,000 778,000 16 53,934 6,170 0
CREDIT DU NORD French retail banking
28, place Rihour, 59800 Lille - France French retail Banking EUR 890,263 1,031,342 100�00 1,410,255 1,410,255 1,065,052 200,448 1,324,633 619,823 222,566
SOCIETE GENERALE BANKA SRBIJA International retail banking
Vladimira Popovica 6 - 11070 Novi Beograd - Serbie International retail Banking and Financial Services RSD 23,724,274 12,309,901 100�00 263,213 263,213 281,487 352,693 10,402,242 (1,691,306) 0 1 EUR = 114�1666 RSD
GENEFIMMO Real estate and real estate financing
29, boulevard Haussmann 75009 Paris - France French retail Banking EUR 392,340 24,739 100�00 651,732 651,732 99,199 1,888 13,734 9,756 22,125
SOCIETE GENERALE SECURITIES SERVICES HOLDING Portfolio management
17, cours Valmy, 92800 Puteaux - FranceGlobal Banking and Investor Solutions EUR 207,555 (37,956) 100�00 207,555 137,162 0 0 0 (41,772) 0
SOCIETE GENERALE SCF Mortgages
17, cours Valmy, 92800 Puteaux - FranceGlobal Banking and Investor Solutions EUR 150,000 57,170 100�00 150,000 150,000 0 750,000 29,634 17,024 0
SG EUROPEAN MORTGAGE INVESTMENTS Portfolio management
17, cours Valmy, 92800 Puteaux - FranceGlobal Banking and Investor Solutions EUR 590,037 0 99�99 590,000 590,000 0 0 0 (32,389) 26,301
SOCIETE DE LA RUE EDOUARD VII Office space difference = 16 509
29, boulevard Haussmann 75009 Paris - France Corporate Centre EUR 11,396 853 99�91 59,612 21,109 0 0 58 12 35
SG EXPRESS BANK International retail banking
92, Bld VI Varnentchik, 9000 Varna - BulgariaInternational retail Banking and Financial Services BGN 33,674 428,412 99�74 62,354 62,354 119,237 173,307 164,582 26,703 0 1 EUR = 1�9558 BGN
SOCIETE GENERALE INVESTMENTS (U.K.) LIMITED Investment banking
SG House, 41 Tower Hill, EC3N 4SG London - United Kingdom
Global Banking and Investor Solutions GBP 157,820 103,115 98�96 201,662 201,662 1,009,669 277,909 33,654 53,276 76,491 1 EUR = 0�8337 GBP
SKB BANKA International retail banking
Adjovscina,4 - 1513 Ljubljana - Slovenia International retail Banking and Financial Services EUR 52,784 254,344 97�58 220,204 220,204 356,887 195,000 98,647 (34,003) 0
BANK REPUBLIC International retail banking
2 Gr, Abashidze St-Tbilisi - Georgia International retail Banking and Financial Services
GEL 76,031 63,020 93�64 110,275 34,076 9,514 114,374 88,607 28,092 0 1 EUR = 2�3914 GEL
ROSBANK International retail banking
11 , Masha Poryvaeva St - PO Box 208, Moscow - RussiaInternational retail Banking and Financial Services RUB 17,586,914 87,900,367 92�40 4,164,341 3,440,112 642,185 900,124 46,940,981 10,977,823 0 1 EUR = 45�3246 RUB
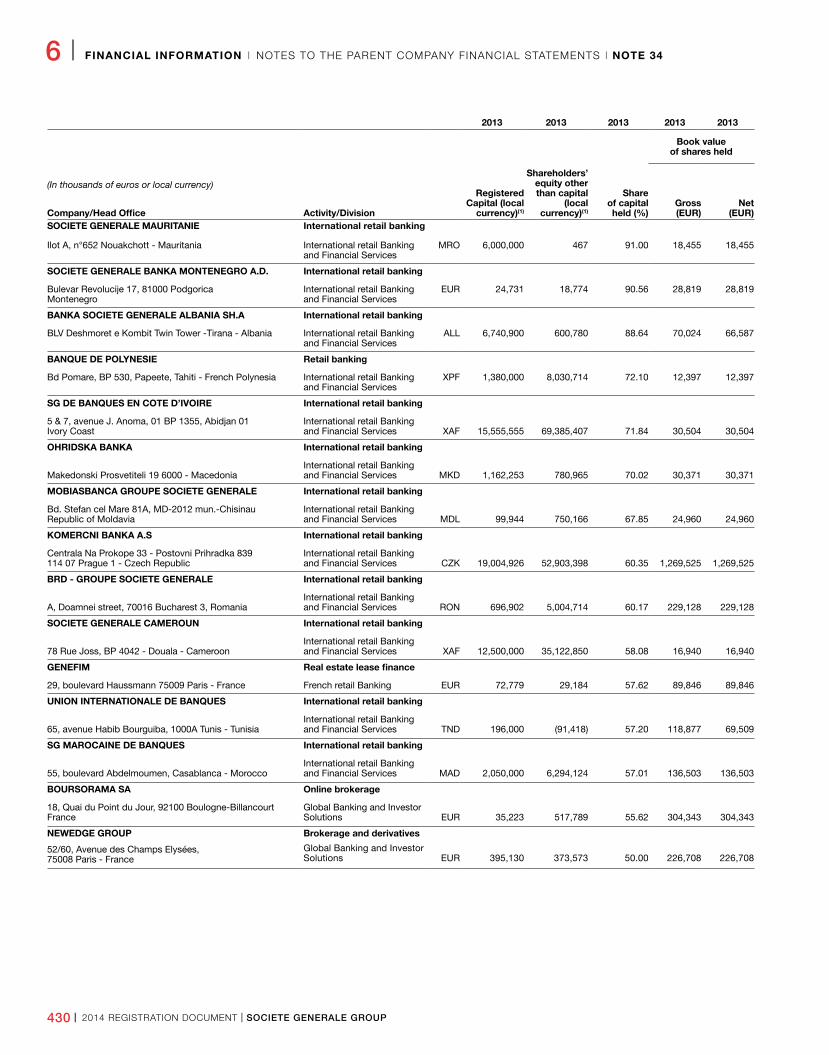
430 I 2014 REGISTRATION DOCUMENT I SOCIETE GENERALE GROUP
6 I FINANCIAL INFORMATION I NOTES TO THE PARENT COMPANY FINANCIAL STATEMENTS I NOTE 34
2013 2013 2013 2013 2013 2013 2013 2013 2013 2013 2013
Book value of shares held
(In thousands of euros or local currency)
Activity/Division
Registered Capital (local
currency)(1)
Shareholders’ equity other than capital
(local currency)(1)
Share of capital held (%)
Gross (EUR)
Net (EUR)
Unreimbursed loans and advances made by the Company (in EUR)
Guarantees given by the Company (in EUR)
Revenue excluding tax for the last financial year (local currency)
(1) (2) (3)
Net income (loss) for the last financial
year (local currency)(1)(3)
Dividends received by the Company during the
year (in EUR)Remarks
Revaluation differencesCompany/Head OfficeSOCIETE GENERALE MAURITANIE International retail banking
Ilot A, n°652 Nouakchott - Mauritania International retail Banking and Financial Services
MRO 6,000,000 467 91�00 18,455 18,455 0 0 5,680,000 1,355,000 396 1 EUR = 402�7592 MRO
SOCIETE GENERALE BANKA MONTENEGRO A.D. International retail banking
Bulevar Revolucije 17, 81000 PodgoricaMontenegro
International retail Banking and Financial Services
EUR 24,731 18,774 90�56 28,819 28,819 23,000 78,460 20,417 5,324 0
BANKA SOCIETE GENERALE ALBANIA SH.A International retail banking
BLV Deshmoret e Kombit Twin Tower -Tirana - Albania International retail Banking and Financial Services
ALL 6,740,900 600,780 88�64 70,024 66,587 19,579 50,161 2,794,503 691,928 0 1 EUR = 140�25 ALL
BANQUE DE POLYNESIE Retail banking
Bd Pomare, BP 530, Papeete, Tahiti - French Polynesia International retail Banking and Financial Services
XPF 1,380,000 8,030,714 72�10 12,397 12,397 53,399 166,756 6,653,233 (50,907) 2,268 1 EUR = 119�33174 XPF
SG DE BANQUES EN COTE D’IVOIRE International retail banking difference = 5 166
5 & 7, avenue J� Anoma, 01 BP 1355, Abidjan 01 Ivory Coast
International retail Banking and Financial Services XAF 15,555,555 69,385,407 71�84 30,504 30,504 0 0 61,767,871 12,378,683 19,572 1 EUR = 655�957 XAF
OHRIDSKA BANKA International retail banking
Makedonski Prosvetiteli 19 6000 - MacedoniaInternational retail Banking and Financial Services MKD 1,162,253 780,965 70�02 30,371 30,371 39,000 148,407 1,154,327 218,291 0 1 EUR = 61�44935 MKD
MOBIASBANCA GROUPE SOCIETE GENERALE International retail banking
Bd� Stefan cel Mare 81A, MD-2012 mun�-Chisinau Republic of Moldavia
International retail Banking and Financial Services MDL 99,944 750,166 67�85 24,960 24,960 0 60,000 349,479 67,774 660 1 EUR = 18�00575 MDL
KOMERCNI BANKA A.S International retail banking
Centrala Na Prokope 33 - Postovni Prihradka 839 114 07 Prague 1 - Czech Republic
International retail Banking and Financial Services CZK 19,004,926 52,903,398 60�35 1,269,525 1,269,525 628,138 55,000 29,117,795 12,367,139 203,183 1 EUR = 27�427 CZK
BRD GROUPE SOCIETE GENERALE International retail banking
A, Doamnei street, 70016 Bucharest 3, RomaniaInternational retail Banking and Financial Services RON 696,902 5,004,714 60�17 229,128 229,128 1,030,577 229,840 2,762,759 123,392 0 1 EUR = 4�471 RON
SOCIETE GENERALE CAMEROUN International retail banking difference = 1 675
78 Rue Joss, BP 4042 - Douala - CameroonInternational retail Banking and Financial Services XAF 12,500,000 35,122,850 58�08 16,940 16,940 0 27,441 46,101,273 8,051,169 5,428 1 EUR = 655�957 XAF
GENEFIM Real estate lease finance
29, boulevard Haussmann 75009 Paris - France French retail Banking EUR 72,779 29,184 57�62 89,846 89,846 2,092,022 0 43,115 19,056 5,924
UNION INTERNATIONALE DE BANQUES International retail banking
65, avenue Habib Bourguiba, 1000A Tunis - TunisiaInternational retail Banking and Financial Services TND 196,000 (91,418) 57�20 118,877 69,509 44,611 53,700 194,388 (24,800) 0 1 EUR = 2�2663 TND
SG MAROCAINE DE BANQUES International retail banking difference = 1 142
55, boulevard Abdelmoumen, Casablanca - MoroccoInternational retail Banking and Financial Services MAD 2,050,000 6,294,124 57�01 136,503 136,503 16,525 409,184 4,049,173 586,270 12,373 1 EUR = 11�2452 MAD
BOURSORAMA SA Online brokerage
18, Quai du Point du Jour, 92100 Boulogne-Billancourt France
Global Banking and Investor Solutions EUR 35,223 517,789 55�62 304,343 304,343 334,466 460,000 175,134 (31,846) 0
NEWEDGE GROUP Brokerage and derivatives
52/60, Avenue des Champs Elysées, 75008 Paris - France
Global Banking and Investor Solutions EUR 395,130 373,573 50�00 226,708 226,708 782,000 1,375,000 116,173 38,384 0
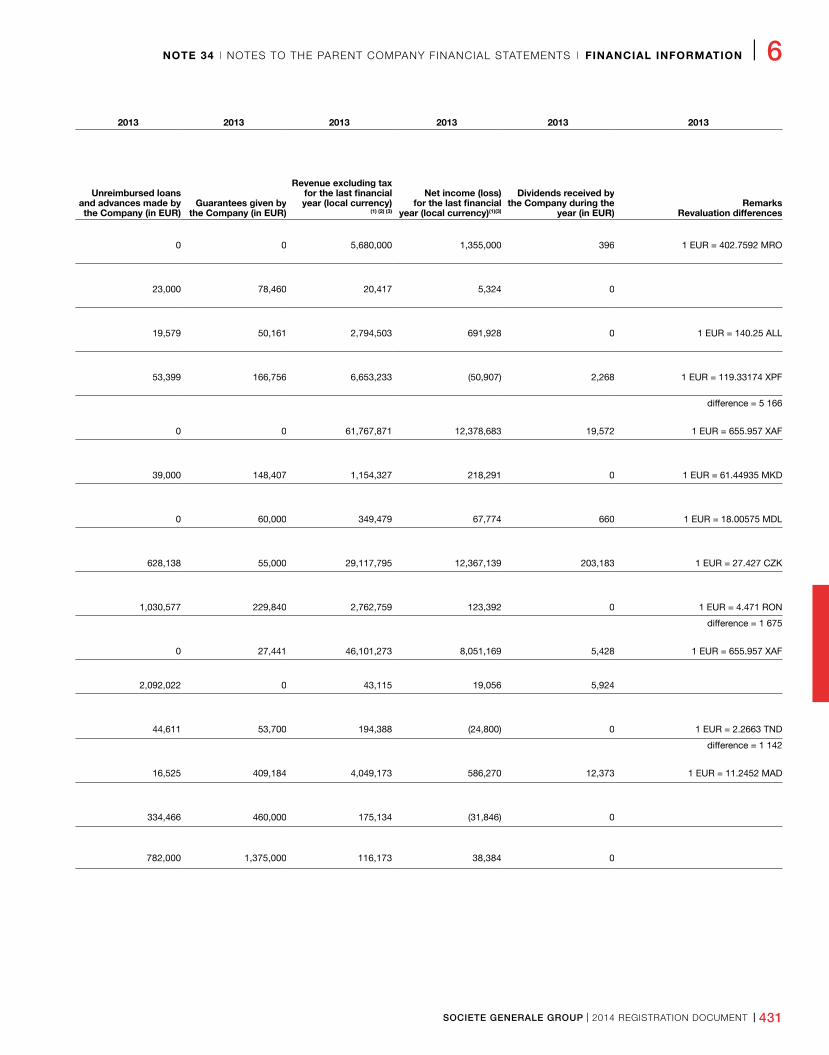
SOCIETE GENERALE GROUP I 2014 REGISTRATION DOCUMENT I 431
NOTE 34 I NOTES TO THE PARENT COMPANY FINANCIAL STATEMENTS I FINANCIAL INFORMATION I 6
2013 2013 2013 2013 2013 2013 2013 2013 2013 2013 2013
Book value of shares held
(In thousands of euros or local currency)
Activity/Division
Registered Capital (local
currency)(1)
Shareholders’ equity other than capital
(local currency)(1)
Share of capital held (%)
Gross (EUR)
Net (EUR)
Unreimbursed loans and advances made by the Company (in EUR)
Guarantees given by the Company (in EUR)
Revenue excluding tax for the last financial year (local currency)
(1) (2) (3)
Net income (loss) for the last financial
year (local currency)(1)(3)
Dividends received by the Company during the
year (in EUR)Remarks
Revaluation differencesCompany/Head OfficeSOCIETE GENERALE MAURITANIE International retail banking
Ilot A, n°652 Nouakchott - Mauritania International retail Banking and Financial Services
MRO 6,000,000 467 91�00 18,455 18,455 0 0 5,680,000 1,355,000 396 1 EUR = 402�7592 MRO
SOCIETE GENERALE BANKA MONTENEGRO A.D. International retail banking
Bulevar Revolucije 17, 81000 PodgoricaMontenegro
International retail Banking and Financial Services
EUR 24,731 18,774 90�56 28,819 28,819 23,000 78,460 20,417 5,324 0
BANKA SOCIETE GENERALE ALBANIA SH.A International retail banking
BLV Deshmoret e Kombit Twin Tower -Tirana - Albania International retail Banking and Financial Services
ALL 6,740,900 600,780 88�64 70,024 66,587 19,579 50,161 2,794,503 691,928 0 1 EUR = 140�25 ALL
BANQUE DE POLYNESIE Retail banking
Bd Pomare, BP 530, Papeete, Tahiti - French Polynesia International retail Banking and Financial Services
XPF 1,380,000 8,030,714 72�10 12,397 12,397 53,399 166,756 6,653,233 (50,907) 2,268 1 EUR = 119�33174 XPF
SG DE BANQUES EN COTE D’IVOIRE International retail banking difference = 5 166
5 & 7, avenue J� Anoma, 01 BP 1355, Abidjan 01 Ivory Coast
International retail Banking and Financial Services XAF 15,555,555 69,385,407 71�84 30,504 30,504 0 0 61,767,871 12,378,683 19,572 1 EUR = 655�957 XAF
OHRIDSKA BANKA International retail banking
Makedonski Prosvetiteli 19 6000 - MacedoniaInternational retail Banking and Financial Services MKD 1,162,253 780,965 70�02 30,371 30,371 39,000 148,407 1,154,327 218,291 0 1 EUR = 61�44935 MKD
MOBIASBANCA GROUPE SOCIETE GENERALE International retail banking
Bd� Stefan cel Mare 81A, MD-2012 mun�-Chisinau Republic of Moldavia
International retail Banking and Financial Services MDL 99,944 750,166 67�85 24,960 24,960 0 60,000 349,479 67,774 660 1 EUR = 18�00575 MDL
KOMERCNI BANKA A.S International retail banking
Centrala Na Prokope 33 - Postovni Prihradka 839 114 07 Prague 1 - Czech Republic
International retail Banking and Financial Services CZK 19,004,926 52,903,398 60�35 1,269,525 1,269,525 628,138 55,000 29,117,795 12,367,139 203,183 1 EUR = 27�427 CZK
BRD GROUPE SOCIETE GENERALE International retail banking
A, Doamnei street, 70016 Bucharest 3, RomaniaInternational retail Banking and Financial Services RON 696,902 5,004,714 60�17 229,128 229,128 1,030,577 229,840 2,762,759 123,392 0 1 EUR = 4�471 RON
SOCIETE GENERALE CAMEROUN International retail banking difference = 1 675
78 Rue Joss, BP 4042 - Douala - CameroonInternational retail Banking and Financial Services XAF 12,500,000 35,122,850 58�08 16,940 16,940 0 27,441 46,101,273 8,051,169 5,428 1 EUR = 655�957 XAF
GENEFIM Real estate lease finance
29, boulevard Haussmann 75009 Paris - France French retail Banking EUR 72,779 29,184 57�62 89,846 89,846 2,092,022 0 43,115 19,056 5,924
UNION INTERNATIONALE DE BANQUES International retail banking
65, avenue Habib Bourguiba, 1000A Tunis - TunisiaInternational retail Banking and Financial Services TND 196,000 (91,418) 57�20 118,877 69,509 44,611 53,700 194,388 (24,800) 0 1 EUR = 2�2663 TND
SG MAROCAINE DE BANQUES International retail banking difference = 1 142
55, boulevard Abdelmoumen, Casablanca - MoroccoInternational retail Banking and Financial Services MAD 2,050,000 6,294,124 57�01 136,503 136,503 16,525 409,184 4,049,173 586,270 12,373 1 EUR = 11�2452 MAD
BOURSORAMA SA Online brokerage
18, Quai du Point du Jour, 92100 Boulogne-Billancourt France
Global Banking and Investor Solutions EUR 35,223 517,789 55�62 304,343 304,343 334,466 460,000 175,134 (31,846) 0
NEWEDGE GROUP Brokerage and derivatives
52/60, Avenue des Champs Elysées, 75008 Paris - France
Global Banking and Investor Solutions EUR 395,130 373,573 50�00 226,708 226,708 782,000 1,375,000 116,173 38,384 0
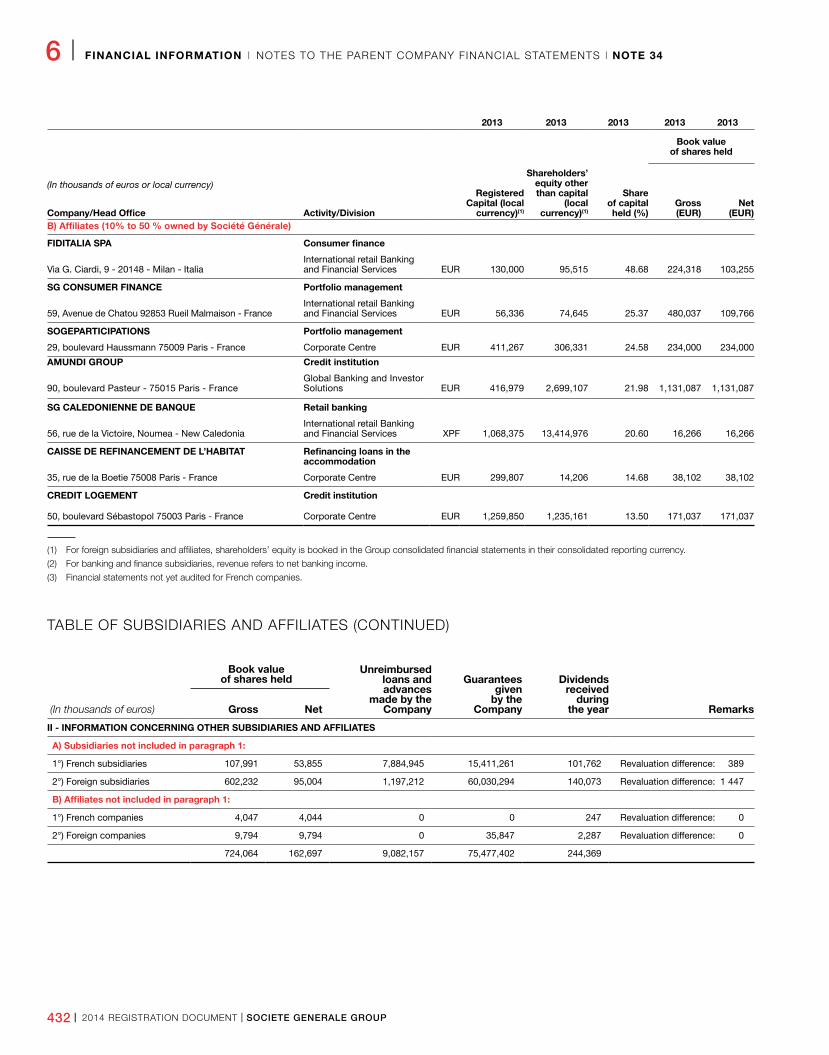
432 I 2014 REGISTRATION DOCUMENT I SOCIETE GENERALE GROUP
6 I FINANCIAL INFORMATION I NOTES TO THE PARENT COMPANY FINANCIAL STATEMENTS I NOTE 34
2013 2013 2013 2013 2013 2013 2013 2013 2013 2013 2013
Book value of shares held
(In thousands of euros or local currency)
Activity/Division
Registered Capital (local
currency)(1)
Shareholders’ equity other than capital
(local currency)(1)
Share of capital held (%)
Gross (EUR)
Net (EUR)
Unreimbursed loans and advances made by the Company (in EUR)
Guarantees given by the Company (in EUR)
Revenue excluding tax for the last financial year (local currency)
(1) (2) (3)
Net income (loss) for the last financial
year (local currency)(1)(3)
Dividends received by the Company during the
year (in EUR)Remarks
Revaluation differencesCompany/Head OfficeB) Affiliates (10% to 50 % owned by Société Générale)
FIDITALIA SPA Consumer finance
Via G� Ciardi, 9 - 20148 - Milan - ItaliaInternational retail Banking and Financial Services EUR 130,000 95,515 48�68 224,318 103,255 2,886,950 100 149,160 (43,943) 0
SG CONSUMER FINANCE Portfolio management
59, Avenue de Chatou 92853 Rueil Malmaison - FranceInternational retail Banking and Financial Services EUR 56,336 74,645 25�37 480,037 109,766 853,158 0 (1,585) 27,947 0
SOGEPARTICIPATIONS Portfolio management
29, boulevard Haussmann 75009 Paris - France Corporate Centre EUR 411,267 306,331 24�58 234,000 234,000 865,679 0 450,296 550,258 218,883
AMUNDI GROUP Credit institution
90, boulevard Pasteur - 75015 Paris - FranceGlobal Banking and Investor Solutions EUR 416,979 2,699,107 21�98 1,131,087 1,131,087 0 0 342,844 293,953 58,669
SG CALEDONIENNE DE BANQUE Retail banking
56, rue de la Victoire, Noumea - New CaledoniaInternational retail Banking and Financial Services XPF 1,068,375 13,414,976 20�60 16,266 16,266 32,708 49,326 9,084,253 2,791,306 4,190 1 EUR = 119�33174 XPF
CAISSE DE REFINANCEMENT DE L’HABITAT Refinancing loans in the accommodation
35, rue de la Boetie 75008 Paris - France Corporate Centre EUR 299,807 14,206 14�68 38,102 38,102 21,831 0 2,108,053 632 217
CREDIT LOGEMENT Credit institution
50, boulevard Sébastopol 75003 Paris - France Corporate Centre EUR 1,259,850 1,235,161 13�50 171,037 171,037 320,043 0 297,057 73,910 7,046
(1) For foreign subsidiaries and affiliates, shareholders’ equity is booked in the Group consolidated financial statements in their consolidated reporting currency.
(2) For banking and finance subsidiaries, revenue refers to net banking income.
(3) Financial statements not yet audited for French companies.
TABLE OF SUBSIDIARIES AND AFFILIATES (CONTINUED)
Book value of shares held
Unreimbursedloans and advances
made by theCompany
Guaranteesgiven
by theCompany
Dividendsreceived
duringthe year Remarks (In thousands of euros) Gross Net
II INFORMATION CONCERNING OTHER SUBSIDIARIES AND AFFILIATES
A) Subsidiaries not included in paragraph 1:
1°) French subsidiaries 107,991 53,855 7,884,945 15,411,261 101,762 Revaluation difference: 389
2°) Foreign subsidiaries 602,232 95,004 1,197,212 60,030,294 140,073 Revaluation difference: 1 447
B) Affiliates not included in paragraph 1:
1°) French companies 4,047 4,044 0 0 247 Revaluation difference: 0
2°) Foreign companies 9,794 9,794 0 35,847 2,287 Revaluation difference: 0
724,064 162,697 9,082,157 75,477,402 244,369
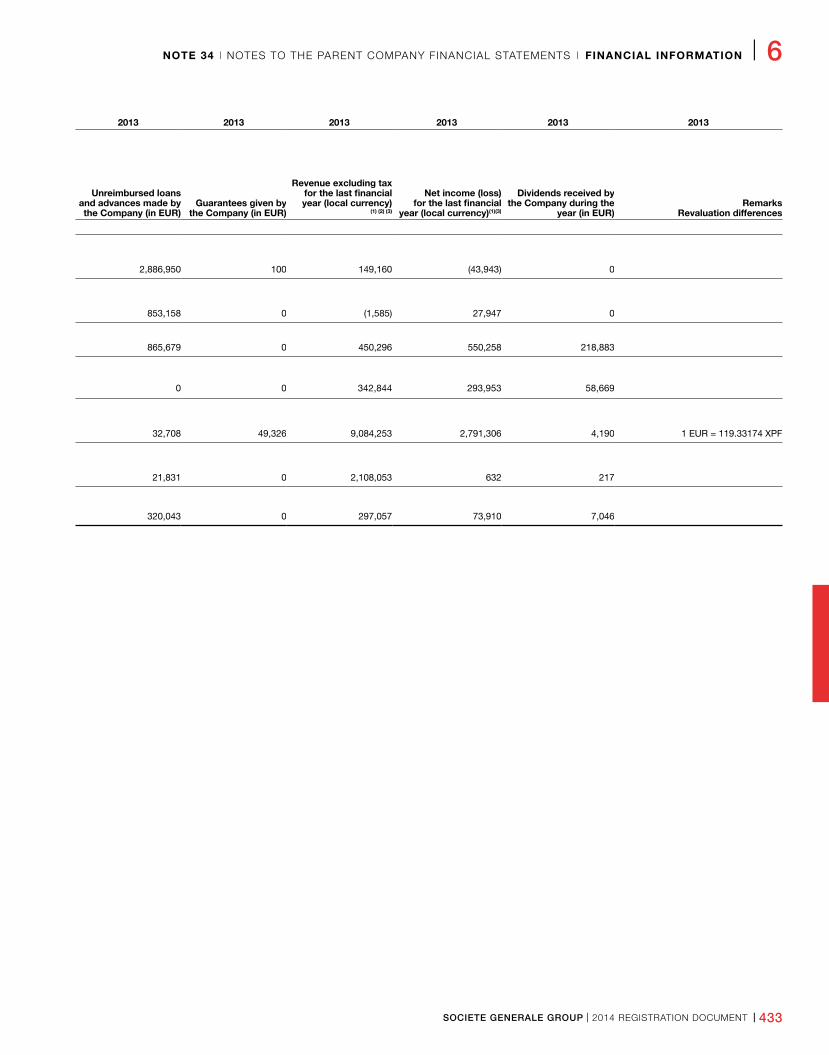
SOCIETE GENERALE GROUP I 2014 REGISTRATION DOCUMENT I 433
NOTE 34 I NOTES TO THE PARENT COMPANY FINANCIAL STATEMENTS I FINANCIAL INFORMATION I 6
2013 2013 2013 2013 2013 2013 2013 2013 2013 2013 2013
Book value of shares held
(In thousands of euros or local currency)
Activity/Division
Registered Capital (local
currency)(1)
Shareholders’ equity other than capital
(local currency)(1)
Share of capital held (%)
Gross (EUR)
Net (EUR)
Unreimbursed loans and advances made by the Company (in EUR)
Guarantees given by the Company (in EUR)
Revenue excluding tax for the last financial year (local currency)
(1) (2) (3)
Net income (loss) for the last financial
year (local currency)(1)(3)
Dividends received by the Company during the
year (in EUR)Remarks
Revaluation differencesCompany/Head OfficeB) Affiliates (10% to 50 % owned by Société Générale)
FIDITALIA SPA Consumer finance
Via G� Ciardi, 9 - 20148 - Milan - ItaliaInternational retail Banking and Financial Services EUR 130,000 95,515 48�68 224,318 103,255 2,886,950 100 149,160 (43,943) 0
SG CONSUMER FINANCE Portfolio management
59, Avenue de Chatou 92853 Rueil Malmaison - FranceInternational retail Banking and Financial Services EUR 56,336 74,645 25�37 480,037 109,766 853,158 0 (1,585) 27,947 0
SOGEPARTICIPATIONS Portfolio management
29, boulevard Haussmann 75009 Paris - France Corporate Centre EUR 411,267 306,331 24�58 234,000 234,000 865,679 0 450,296 550,258 218,883
AMUNDI GROUP Credit institution
90, boulevard Pasteur - 75015 Paris - FranceGlobal Banking and Investor Solutions EUR 416,979 2,699,107 21�98 1,131,087 1,131,087 0 0 342,844 293,953 58,669
SG CALEDONIENNE DE BANQUE Retail banking
56, rue de la Victoire, Noumea - New CaledoniaInternational retail Banking and Financial Services XPF 1,068,375 13,414,976 20�60 16,266 16,266 32,708 49,326 9,084,253 2,791,306 4,190 1 EUR = 119�33174 XPF
CAISSE DE REFINANCEMENT DE L’HABITAT Refinancing loans in the accommodation
35, rue de la Boetie 75008 Paris - France Corporate Centre EUR 299,807 14,206 14�68 38,102 38,102 21,831 0 2,108,053 632 217
CREDIT LOGEMENT Credit institution
50, boulevard Sébastopol 75003 Paris - France Corporate Centre EUR 1,259,850 1,235,161 13�50 171,037 171,037 320,043 0 297,057 73,910 7,046
434 I 2014 REGISTRATION DOCUMENT I SOCIETE GENERALE GROUP
6 I FINANCIAL INFORMATION I STATUTORY AUDITORS
7. STAT U TO RY AU D I TO R S ’ R E P O RT O N T H E F I N A N C I A L STAT E M E N TS
This is a free translation into English of the statutory auditors’ report on the financial statements issued in French and it is provided solely for the convenience of English-speaking users.
The statutory auditors’ report includes information specifically required by French law in such reports, whether modified or not. This information is presented below the audit opinion on the financial statements and includes explanatory paragraphs discussing the auditors’ assessments of certain significant accounting and auditing matters. These assessments were considered for the purpose of issuing an audit opinion on the financial statements taken as a whole and not to provide separate assurance on individual account balances, transactions or disclosures.
This report also includes information relating to the specific verification of information given in the management report and in the documents addressed to the shareholders.
This report should be read in conjunction with and construed in accordance with French law and professional auditing standards applicable in France.
DELOITTE & ASSOCIES
185, avenue Charles de Gaulle 92524 Neuilly-sur-Seine Cedex S.A. au capital de € 1.723.040
Commissaire aux Comptes Membre de la compagnie régionale de Versailles
ERNST & YOUNG et Autres
1/2, place des Saisons 92400 Courbevoie - Paris-La Défense 1
S.A.S. à capital variable
Commissaire aux Comptes Membre de la compagnie régionale de Versailles
SOCIETE GENERALE - YEAR ENDED DECEMBER 31, 2013To the Shareholders,
In compliance with the assignment entrusted to us by your annual general meeting, we hereby report to you, for the year ended December 31, 2013, on:
n the audit of the accompanying financial statements of Societe Generale;
n the justification of our assessments;
n the specific verifications and information required by law.
These financial statements have been approved by the board of directors. Our role is to express an opinion on these financial statements based on our audit.
I. OPINION ON THE FINANCIAL STATEMENTSWe conducted our audit in accordance with professional standards applicable in France; those standards require that we plan and perform the audit to obtain reasonable assurance about whether the financial statements are free of material misstatement. An audit involves performing procedures, using sampling techniques or other methods of selection, to obtain audit evidence about the amounts and disclosures in the financial statements. An audit also includes evaluating the appropriateness of accounting policies used and the reasonableness of accounting estimates made, as well as the overall
presentation of the financial statements. We believe that the audit evidence we have obtained is sufficient and appropriate to provide a basis for our audit opinion.
In our opinion, the financial statements give a true and fair view of the assets and liabilities and of the financial position of the Company as at 31 December 2013 and of the results of its operations for the year then ended in accordance with French accounting principles.
II. JUSTIFICATION OF OUR ASSESSMENTSIn accordance with the requirements of article L. 823-9 of the French commercial code (Code de commerce) relating to the justification of our assessments, we bring to your attention the following matters:
n For the purpose of preparing the financial statements, your company records depreciation and provisions to cover the credit risks inherent to its activities and performs significant accounting estimates, as described in note 1 to the financial statements, related in particular to the valuation of investments in subsidiaries and of its securities portfolio, to the assessment of the deferred tax assets, to the valuation of provisions other than those for credit risk as well as the assessment of provisions for employee benefits. We have reviewed and tested the processes implemented by management, the underlying assumptions and the valuation parameters, and we have assessed whether these accounting estimates are based on documented procedures consistent with the accounting policies disclosed in note 1 to the financial statements.
SOCIETE GENERALE GROUP I 2014 REGISTRATION DOCUMENT I 435
STATUTORY AUDITORS I FINANCIAL INFORMATION I 6
n As detailed in note 1 to the financial statements, your company uses internal models to measure financial instruments that are not listed on active markets. Our procedures consisted in reviewing the control procedures for the models used, assessing the underlying data and assumptions as well as their observability, and verifying that the risks generally expected from the markets were taken into account in the valuations.
These assessments were made as part of our audit of the financial statements taken as a whole, and therefore contributed to the opinion we formed which is expressed in the first part of this report.
III. SPECIFIC VERIFICATIONS AND INFORMATIONWe have also performed, in accordance with professional standards applicable in France, the specific verifications required by French law.
We have no matters to report as to the fair presentation and the consistency with the financial statements of the information given in
the management report of the board of directors and in the documents addressed to the shareholders with respect to the financial position and the financial statements.
Concerning the information given in accordance with the requirements of article L. 225-102-1 of the French Commercial Code (Code de commerce) relating to remunerations and benefits received by the directors and any other commitments made in their favour, we have verified its consistency with the financial statements, or with the underlying information used to prepare these financial statements and, where applicable, with the information obtained by your company from companies controlling your company or controlled by it. Based on this work, we attest the accuracy and fair presentation of this information.
In accordance with French law, we have verified that the required information concerning the purchase of investments and controlling interests and the identity of the shareholders and holders of the voting rights and mutual shareholders has been properly disclosed in the management report.
Neuilly-sur-Seine and Paris-La Défense, March 4, 2014 The statutory auditors
French original signed by
DELOITTE & ASSOCIES Jean-Marc Mickeler
ERNST & YOUNG et Autres Isabelle Santenac
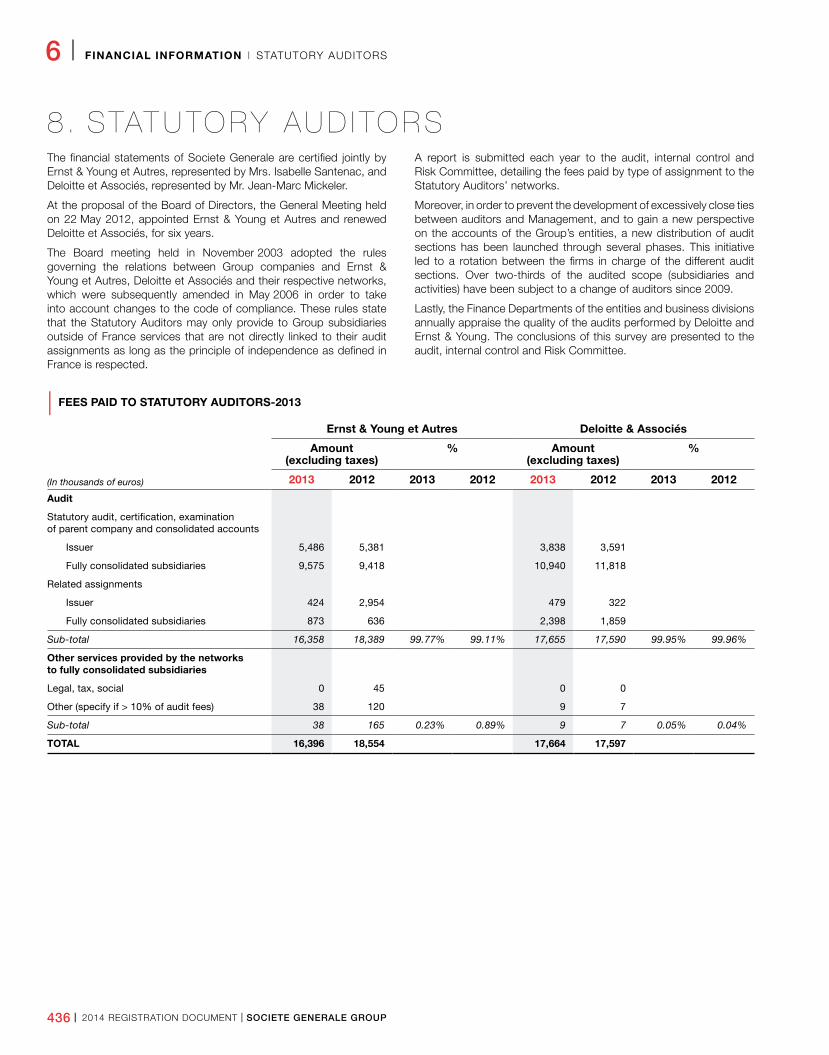
436 I 2014 REGISTRATION DOCUMENT I SOCIETE GENERALE GROUP
6 I FINANCIAL INFORMATION I STATUTORY AUDITORS
8. STAT U TO RY AU D I TO R SThe financial statements of Societe Generale are certified jointly by Ernst & Young et Autres, represented by Mrs. Isabelle Santenac, and Deloitte et Associés, represented by Mr. Jean-Marc Mickeler.
At the proposal of the Board of Directors, the General Meeting held on 22 May 2012, appointed Ernst & Young et Autres and renewed Deloitte et Associés, for six years.
The Board meeting held in November 2003 adopted the rules governing the relations between Group companies and Ernst & Young et Autres, Deloitte et Associés and their respective networks, which were subsequently amended in May 2006 in order to take into account changes to the code of compliance. These rules state that the Statutory Auditors may only provide to Group subsidiaries outside of France services that are not directly linked to their audit assignments as long as the principle of independence as defined in France is respected.
A report is submitted each year to the audit, internal control and Risk Committee, detailing the fees paid by type of assignment to the Statutory Auditors’ networks.
Moreover, in order to prevent the development of excessively close ties between auditors and Management, and to gain a new perspective on the accounts of the Group’s entities, a new distribution of audit sections has been launched through several phases. This initiative led to a rotation between the firms in charge of the different audit sections. Over two-thirds of the audited scope (subsidiaries and activities) have been subject to a change of auditors since 2009.
Lastly, the Finance Departments of the entities and business divisions annually appraise the quality of the audits performed by Deloitte and Ernst & Young. The conclusions of this survey are presented to the audit, internal control and Risk Committee.
| FEES PAID TO STATUTORY AUDITORS2013
(In thousands of euros)
Ernst & Young et Autres Deloitte & Associés
Amount(excluding taxes)
% Amount(excluding taxes)
%
2013 2012 2013 2012 2013 2012 2013 2012
Audit
Statutory audit, certification, examinationof parent company and consolidated accounts
Issuer 5,486 5,381 3,838 3,591
Fully consolidated subsidiaries 9,575 9,418 10,940 11,818
Related assignments
Issuer 424 2,954 479 322
Fully consolidated subsidiaries 873 636 2,398 1,859
Sub-total 16,358 18,389 99.77% 99.11% 17,655 17,590 99.95% 99.96%
Other services provided by the networksto fully consolidated subsidiaries
Legal, tax, social 0 45 0 0
Other (specify if > 10% of audit fees) 38 120 9 7
Sub-total 38 165 0.23% 0.89% 9 7 0.05% 0.04%
TOTAL 16,396 18,554 17,664 17,597
SOCIETE GENERALE GROUP I 2014 REGISTRATION DOCUMENT I 437
7S H A R E , S H A R E C A P I TA L
A N D L E G A L I N F O R M AT I O N
1. The Societe Generale share .................................438Stock market performance ��������������������� 438Stock exchange listing ����������������������� 438Stock market indices ������������������������ 438Total return for shareholders �������������������� 438Dividend history ��������������������������� 4392013 dividend ���������������������������� 440
2. Information on share capital ..................................442Changes in share capital ���������������������� 442Share capital ����������������������������� 443Share buybacks and treasury shares ���������������� 443Share buybacks ��������������������������� 443Shareholder agreements ���������������������� 445Information required by article L. 225-100-3 of the French commercial code ����������� 445List of outstanding delegations and their use in 2013 and early 2014 (up to 11 February 2014) �������� 446
3. Additional information .......................................................448General information ������������������������� 448
4. By-laws ..................................................................................................450Type of company – Name – Registered office – Purpose ���� 450Board of Directors �������������������������� 451Shareholders’ meeting ����������������������� 453Special meetings �������������������������� 453Statutory auditors �������������������������� 454Annual financial statements �������������������� 454Forum selection clause ����������������������� 454Dissolution ����������������������������� 454
5. Internal rules of the Board of Directors ..........................................455
6. Director’s Charter ..................................................................459
7. List of regulated information published in the last 12 months .....................461
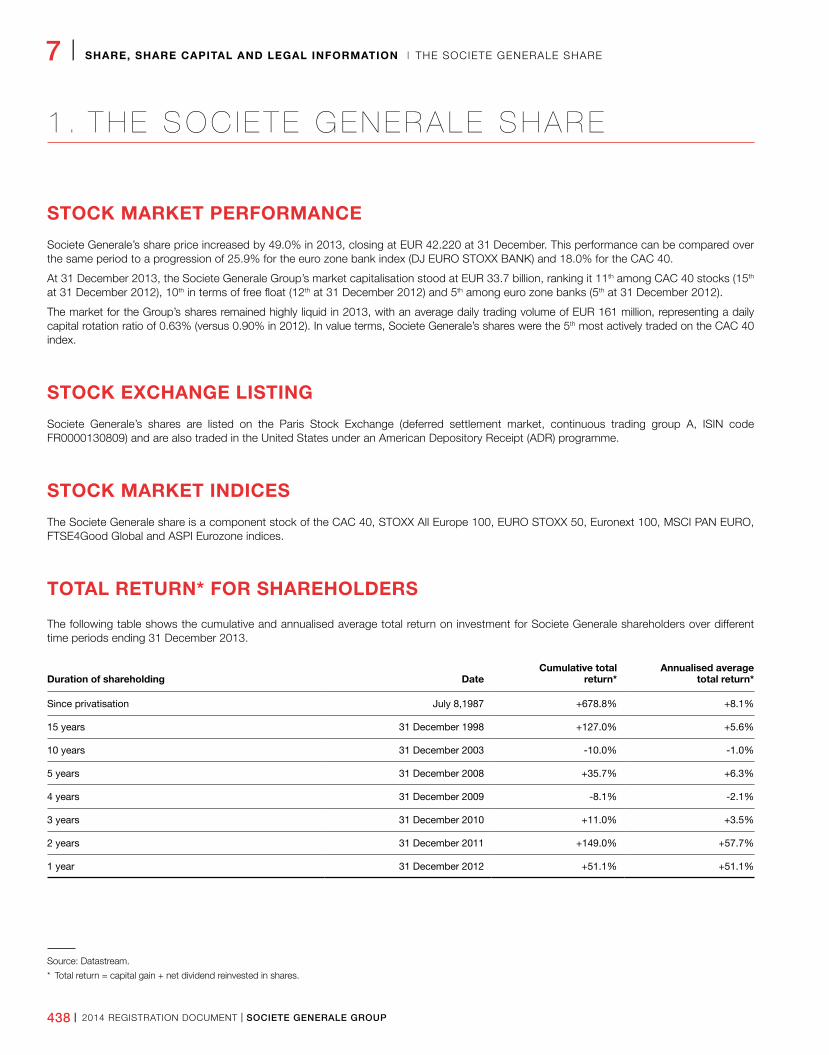
7 I SHARE, SHARE CAPITAL AND LEGAL INFORMATION I THE SOCIETE GENERALE SHARE
438 I 2014 REGISTRATION DOCUMENT I SOCIETE GENERALE GROUP
1 . T H E S O C I E T E G E N E R A L E S H A R E
STOCK MARKET PERFORMANCE
Societe Generale’s share price increased by 49.0% in 2013, closing at EUR 42.220 at 31 December. This performance can be compared over the same period to a progression of 25.9% for the euro zone bank index (DJ EURO STOXX BANK) and 18.0% for the CAC 40.
At 31 December 2013, the Societe Generale Group’s market capitalisation stood at EUR 33.7 billion, ranking it 11th among CAC 40 stocks (15th at 31 December 2012), 10th in terms of free float (12th at 31 December 2012) and 5th among euro zone banks (5th at 31 December 2012).
The market for the Group’s shares remained highly liquid in 2013, with an average daily trading volume of EUR 161 million, representing a daily capital rotation ratio of 0.63% (versus 0.90% in 2012). In value terms, Societe Generale’s shares were the 5th most actively traded on the CAC 40 index.
STOCK EXCHANGE LISTING
Societe Generale’s shares are listed on the Paris Stock Exchange (deferred settlement market, continuous trading group A, ISIN code FR0000130809) and are also traded in the United States under an American Depository Receipt (ADR) programme.
STOCK MARKET INDICES
The Societe Generale share is a component stock of the CAC 40, STOXX All Europe 100, EURO STOXX 50, Euronext 100, MSCI PAN EURO, FTSE4Good Global and ASPI Eurozone indices.
TOTAL RETURN* FOR SHAREHOLDERS
The following table shows the cumulative and annualised average total return on investment for Societe Generale shareholders over different time periods ending 31 December 2013.
Duration of shareholding DateCumulative total
return*Annualised average
total return*
Since privatisation July 8,1987 +678.8% +8.1%
15 years 31 December 1998 +127.0% +5.6%
10 years 31 December 2003 -10.0% -1.0%
5 years 31 December 2008 +35.7% +6.3%
4 years 31 December 2009 -8.1% -2.1%
3 years 31 December 2010 +11.0% +3.5%
2 years 31 December 2011 +149.0% +57.7%
1 year 31 December 2012 +51.1% +51.1%
Source: Datastream.
* Total return = capital gain + net dividend reinvested in shares.
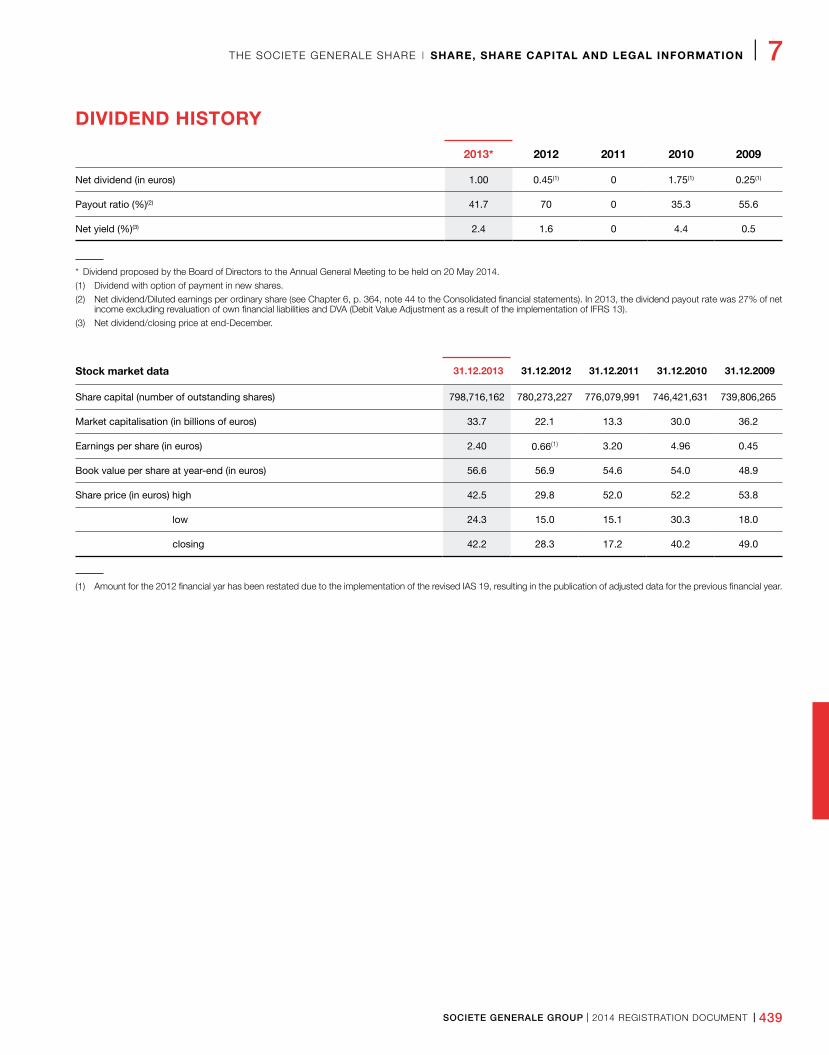
THE SOCIETE GENERALE SHARE I SHARE, SHARE CAPITAL AND LEGAL INFORMATION I 7
SOCIETE GENERALE GROUP I 2014 REGISTRATION DOCUMENT I 439
DIVIDEND HISTORY
2013* 2012 2011 2010 2009
Net dividend (in euros) 1.00 0.45(1) 0 1.75(1) 0.25(1)
Payout ratio (%)(2) 41.7 70 0 35.3 55.6
Net yield (%)(3) 2.4 1.6 0 4.4 0.5
* Dividend proposed by the Board of Directors to the Annual General Meeting to be held on 20 May 2014.
(1) Dividend with option of payment in new shares.
(2) Net dividend/Diluted earnings per ordinary share (see Chapter 6, p. 364, note 44 to the Consolidated financial statements). In 2013, the dividend payout rate was 27% of net income excluding revaluation of own financial liabilities and DVA (Debit Value Adjustment as a result of the implementation of IFRS 13).
(3) Net dividend/closing price at end-December.
Stock market data 31.12.2013 31.12.2012 31.12.2011 31.12.2010 31.12.2009
Share capital (number of outstanding shares) 798,716,162 780,273,227 776,079,991 746,421,631 739,806,265
Market capitalisation (in billions of euros) 33.7 22.1 13.3 30.0 36.2
Earnings per share (in euros) 2.40 0.66(1) 3.20 4.96 0.45
Book value per share at year-end (in euros) 56.6 56.9 54.6 54.0 48.9
Share price (in euros) high 42.5 29.8 52.0 52.2 53.8
low 24.3 15.0 15.1 30.3 18.0
closing 42.2 28.3 17.2 40.2 49.0
(1) Amount for the 2012 financial yar has been restated due to the implementation of the revised IAS 19, resulting in the publication of adjusted data for the previous financial year.
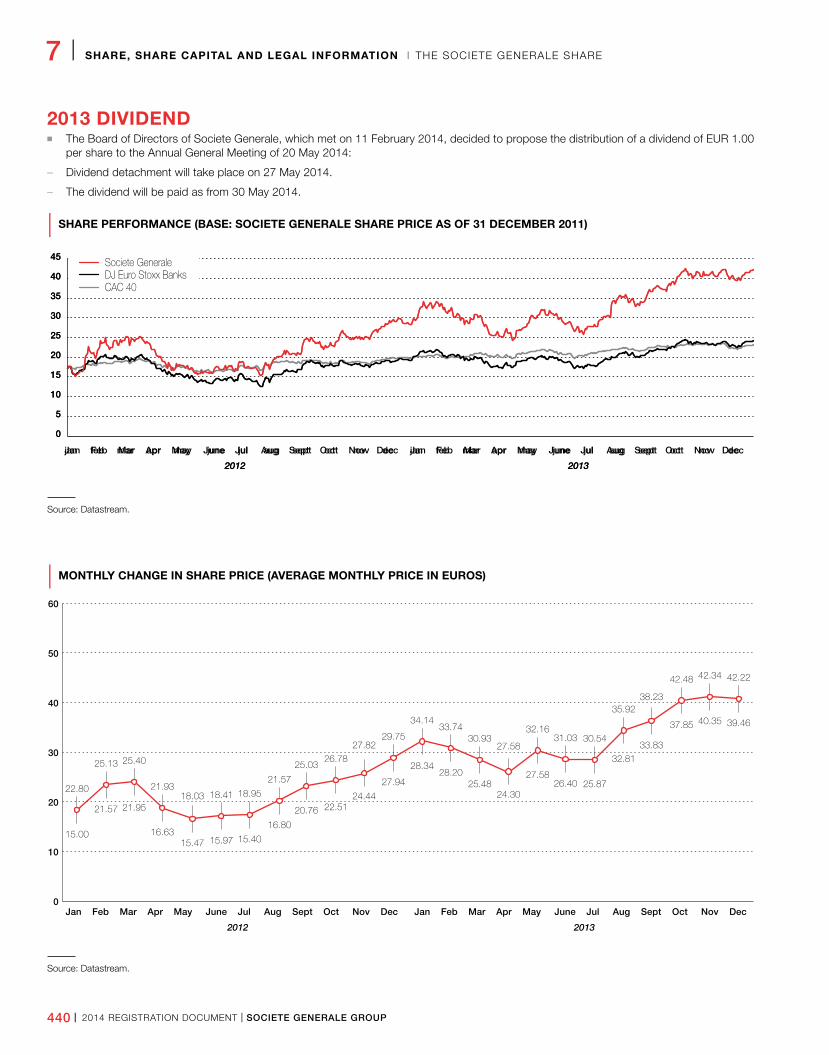
7 I SHARE, SHARE CAPITAL AND LEGAL INFORMATION I THE SOCIETE GENERALE SHARE
440 I 2014 REGISTRATION DOCUMENT I SOCIETE GENERALE GROUP
2013 DIVIDEND n The Board of Directors of Societe Generale, which met on 11 February 2014, decided to propose the distribution of a dividend of EUR 1.00
per share to the Annual General Meeting of 20 May 2014:
– Dividend detachment will take place on 27 May 2014.
– The dividend will be paid as from 30 May 2014.
| SHARE PERFORMANCE (BASE: SOCIETE GENERALE SHARE PRICE AS OF 31 DECEMBER 2011)
0
5
10
15
20
25
30
35
40
45
CAC 40DJ Euro Stoxx BanksSociete Generale
20132012
Jan Feb Mar Apr May June Jul Aug Sept Oct Nov Dec Jan Feb Mar Apr May June Jul Aug Sept Oct Nov Dec
0
10
20
30
40
50
60
22.80
15.00
25.13
21.57
25.40
21.95
21.93
16.63
18.41
15.97
18.95
15.40
21.57
16.80
25.03
20.76
26.78
22.51
27.82
24.44
29.75
27.94
34.14
28.34
33.74
28.20
30.93
25.48
27.58
24.30
32.16
27.58
31.03
26.40
30.54
25.87
35.92
32.81
38.23
33.83
42.48
37.85
42.22
39.46
42.34
40.35
18.03
15.47
20132012
Jan Feb Mar Apr May June Jul Aug Sept Oct Nov Dec Jan Feb Mar Apr May June Jul Aug Sept Oct Nov Dec
0
5
10
15
20
25
30
35
40
45
CAC 40DJ Euro Stoxx BanksSociete Generale
20132012
jan feb mar apr may june jul aug sept oct nov dec jan feb mar apr may june jul aug sept oct nov dec
0
10
20
30
40
50
60
22.80
15.00
25.13
21.57
25.40
21.95
21.93
16.63
18.41
15.97
18.95
15.40
21.57
16.80
25.03
20.76
26.78
22.51
27.82
24.44
29.75
27.94
34.14
28.34
33.74
28.20
30.93
25.48
27.58
24.30
32.16
27.58
31.03
26.40
30.54
25.87
35.92
32.81
38.23
33.83
42.48
37.85
42.22
39.46
42.34
40.35
18.03
15.47
20132012
jan feb mar apr may june jul aug sept oct nov dec jan feb mar apr may june jul aug sept oct nov dec
Source: Datastream.
| MONTHLY CHANGE IN SHARE PRICE (AVERAGE MONTHLY PRICE IN EUROS)
0
5
10
15
20
25
30
35
40
45
CAC 40DJ Euro Stoxx BanksSociete Generale
20132012
Jan Feb Mar Apr May June Jul Aug Sept Oct Nov Dec Jan Feb Mar Apr May June Jul Aug Sept Oct Nov Dec
0
10
20
30
40
50
60
22.80
15.00
25.13
21.57
25.40
21.95
21.93
16.63
18.41
15.97
18.95
15.40
21.57
16.80
25.03
20.76
26.78
22.51
27.82
24.44
29.75
27.94
34.14
28.34
33.74
28.20
30.93
25.48
27.58
24.30
32.16
27.58
31.03
26.40
30.54
25.87
35.92
32.81
38.23
33.83
42.48
37.85
42.22
39.46
42.34
40.35
18.03
15.47
20132012
Jan Feb Mar Apr May June Jul Aug Sept Oct Nov Dec Jan Feb Mar Apr May June Jul Aug Sept Oct Nov Dec
Source: Datastream.
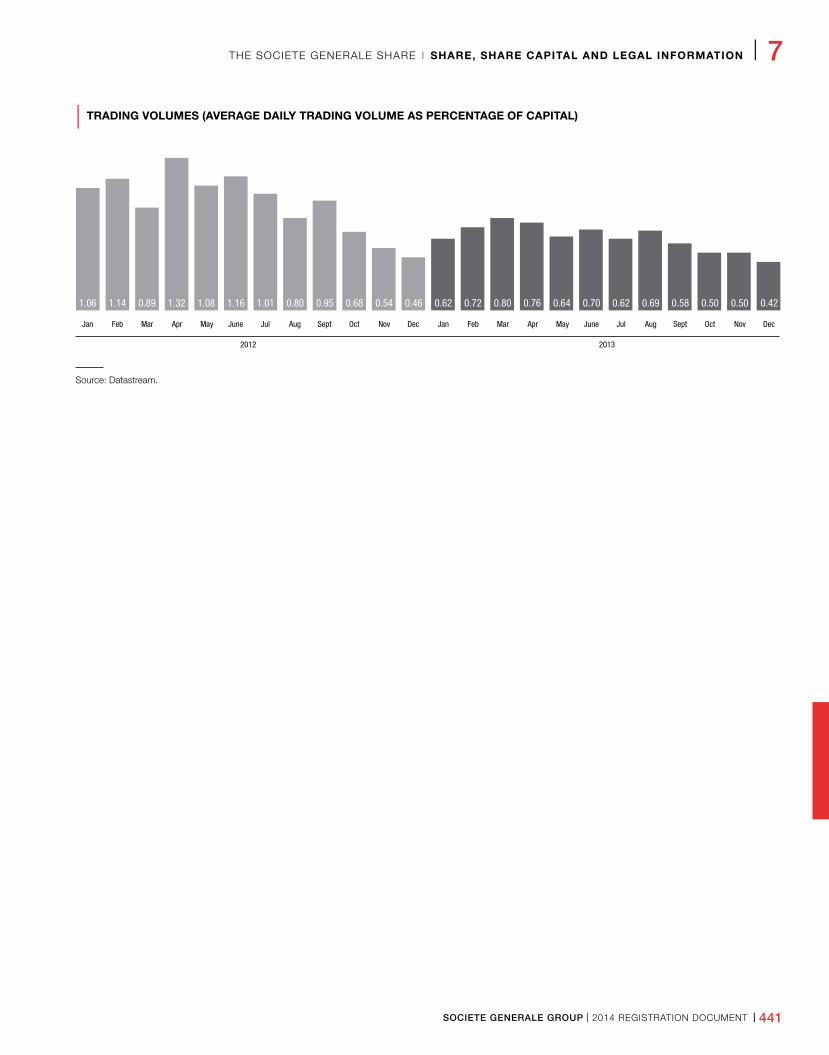
THE SOCIETE GENERALE SHARE I SHARE, SHARE CAPITAL AND LEGAL INFORMATION I 7
SOCIETE GENERALE GROUP I 2014 REGISTRATION DOCUMENT I 441
| TRADING VOLUMES (AVERAGE DAILY TRADING VOLUME AS PERCENTAGE OF CAPITAL)
1.06 1.14 0.89 1.32 1.08 1.16 1.01 0.80 0.95 0.68 0.54 0.46 0.62 0.72 0.80 0.76 0.64 0.70 0.62 0.69 0.58 0.50 0.50 0.42
Jan Feb Mar Apr May June Jul Aug Sept Oct Nov Dec Jan Feb Mar Apr May June Jul Aug Sept Oct Nov Dec
2012 2013
Source: Datastream.
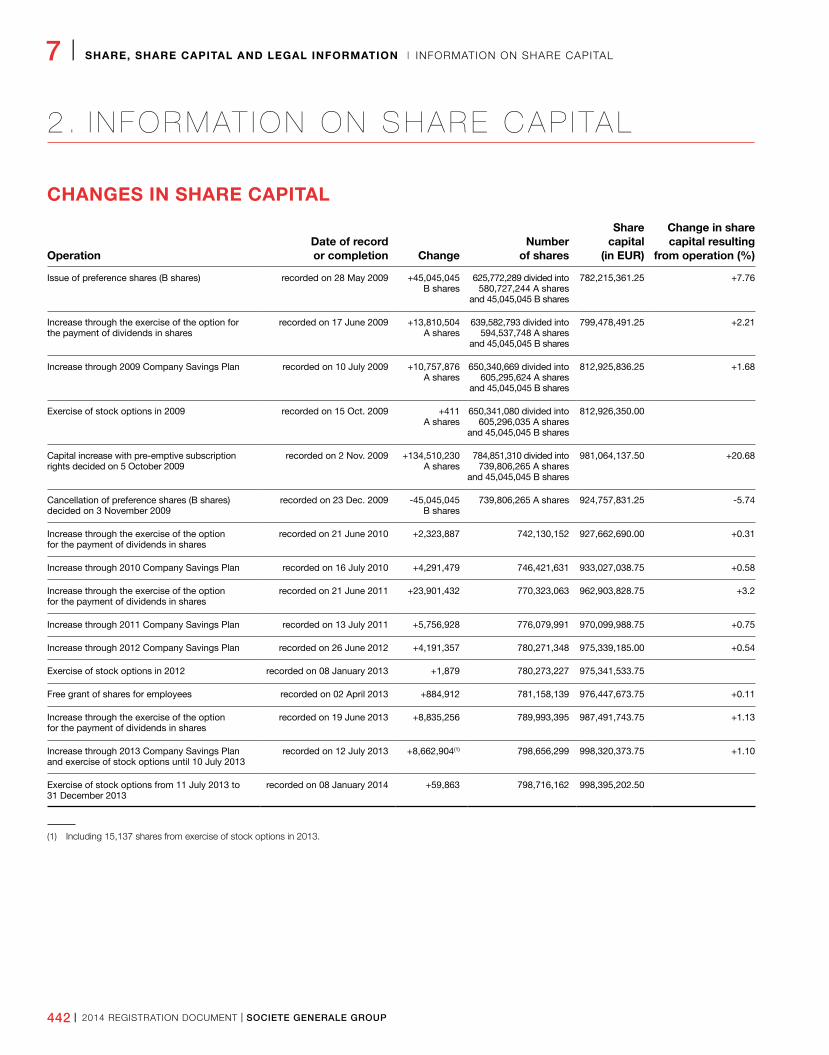
442 I 2014 REGISTRATION DOCUMENT I SOCIETE GENERALE GROUP
7 I SHARE, SHARE CAPITAL AND LEGAL INFORMATION I INFORMATION ON SHARE CAPITAL
2 . I N F O R M AT I O N O N S H A R E C A P I TA L
CHANGES IN SHARE CAPITAL
OperationDate of record or completion Change
Number of shares
Share capital
(in EUR)
Change in share capital resulting
from operation (%)
Issue of preference shares (B shares) recorded on 28 May 2009 +45,045,045 B shares
625,772,289 divided into 580,727,244 A shares
and 45,045,045 B shares
782,215,361.25 +7.76
Increase through the exercise of the option for the payment of dividends in shares
recorded on 17 June 2009 +13,810,504 A shares
639,582,793 divided into 594,537,748 A shares
and 45,045,045 B shares
799,478,491.25 +2.21
Increase through 2009 Company Savings Plan recorded on 10 July 2009 +10,757,876 A shares
650,340,669 divided into605,295,624 A shares
and 45,045,045 B shares
812,925,836.25 +1.68
Exercise of stock options in 2009 recorded on 15 Oct. 2009 +411 A shares
650,341,080 divided into 605,296,035 A shares
and 45,045,045 B shares
812,926,350.00
Capital increase with pre-emptive subscription rights decided on 5 October 2009
recorded on 2 Nov. 2009 +134,510,230 A shares
784,851,310 divided into 739,806,265 A shares
and 45,045,045 B shares
981,064,137.50 +20.68
Cancellation of preference shares (B shares) decided on 3 November 2009
recorded on 23 Dec. 2009 -45,045,045 B shares
739,806,265 A shares 924,757,831.25 -5.74
Increase through the exercise of the option for the payment of dividends in shares
recorded on 21 June 2010 +2,323,887 742,130,152 927,662,690.00 +0.31
Increase through 2010 Company Savings Plan recorded on 16 July 2010 +4,291,479 746,421,631 933,027,038.75 +0.58
Increase through the exercise of the option for the payment of dividends in shares
recorded on 21 June 2011 +23,901,432 770,323,063 962,903,828.75 +3.2
Increase through 2011 Company Savings Plan recorded on 13 July 2011 +5,756,928 776,079,991 970,099,988.75 +0.75
Increase through 2012 Company Savings Plan recorded on 26 June 2012 +4,191,357 780,271,348 975,339,185.00 +0.54
Exercise of stock options in 2012 recorded on 08 January 2013 +1,879 780,273,227 975,341,533.75
Free grant of shares for employees recorded on 02 April 2013 +884,912 781,158,139 976,447,673.75 +0.11
Increase through the exercise of the option for the payment of dividends in shares
recorded on 19 June 2013 +8,835,256 789,993,395 987,491,743.75 +1.13
Increase through 2013 Company Savings Plan and exercise of stock options until 10 July 2013
recorded on 12 July 2013 +8,662,904(1) 798,656,299 998,320,373.75 +1.10
Exercise of stock options from 11 July 2013 to 31 December 2013
recorded on 08 January 2014 +59,863 798,716,162 998,395,202.50
(1) Including 15,137 shares from exercise of stock options in 2013.
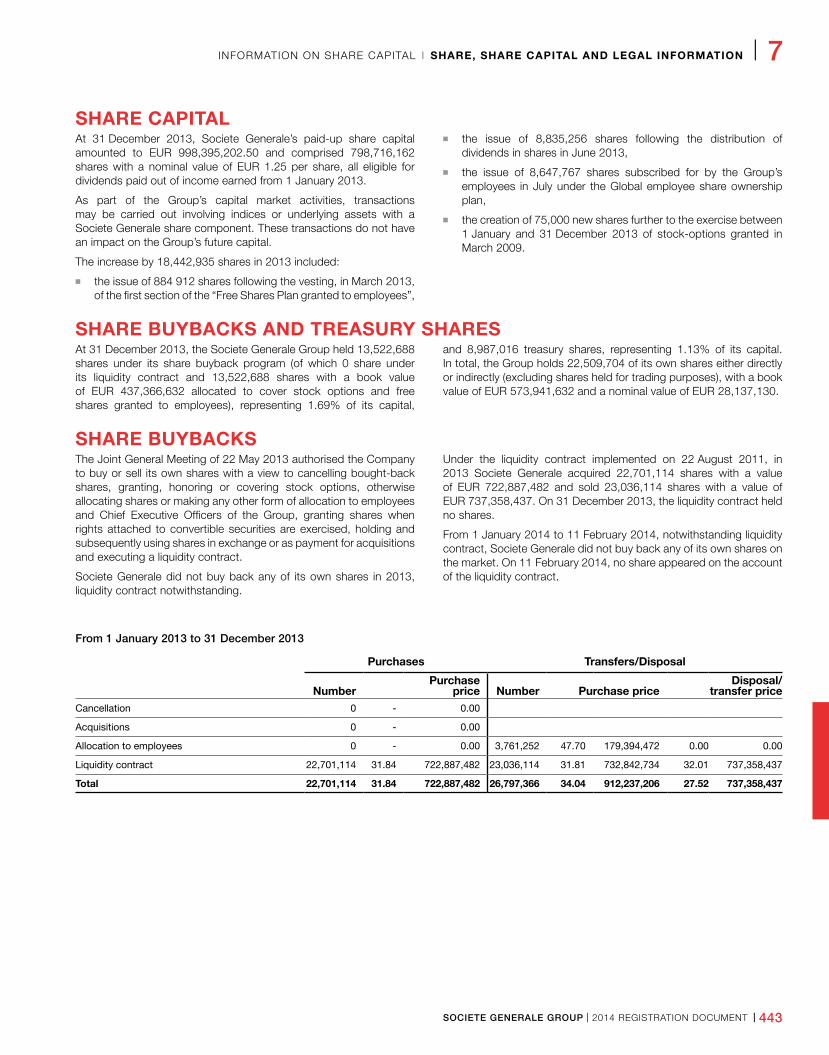
SOCIETE GENERALE GROUP I 2014 REGISTRATION DOCUMENT I 443
INFORMATION ON SHARE CAPITAL I SHARE, SHARE CAPITAL AND LEGAL INFORMATION I 7
SHARE CAPITALAt 31 December 2013, Societe Generale’s paid-up share capital amounted to EUR 998,395,202.50 and comprised 798,716,162 shares with a nominal value of EUR 1.25 per share, all eligible for dividends paid out of income earned from 1 January 2013.
As part of the Group’s capital market activities, transactions may be carried out involving indices or underlying assets with a Societe Generale share component. These transactions do not have an impact on the Group’s future capital.
The increase by 18,442,935 shares in 2013 included:
n the issue of 884 912 shares following the vesting, in March 2013, of the first section of the “Free Shares Plan granted to employees”,
n the issue of 8,835,256 shares following the distribution of dividends in shares in June 2013,
n the issue of 8,647,767 shares subscribed for by the Group’s employees in July under the Global employee share ownership plan,
n the creation of 75,000 new shares further to the exercise between 1 January and 31 December 2013 of stock-options granted in March 2009.
SHARE BUYBACKS AND TREASURY SHARESAt 31 December 2013, the Societe Generale Group held 13,522,688 shares under its share buyback program (of which 0 share under its liquidity contract and 13,522,688 shares with a book value of EUR 437,366,632 allocated to cover stock options and free shares granted to employees), representing 1.69% of its capital,
and 8,987,016 treasury shares, representing 1.13% of its capital. In total, the Group holds 22,509,704 of its own shares either directly or indirectly (excluding shares held for trading purposes), with a book value of EUR 573,941,632 and a nominal value of EUR 28,137,130.
SHARE BUYBACKSThe Joint General Meeting of 22 May 2013 authorised the Company to buy or sell its own shares with a view to cancelling bought-back shares, granting, honoring or covering stock options, otherwise allocating shares or making any other form of allocation to employees and Chief Executive Officers of the Group, granting shares when rights attached to convertible securities are exercised, holding and subsequently using shares in exchange or as payment for acquisitions and executing a liquidity contract.
Societe Generale did not buy back any of its own shares in 2013, liquidity contract notwithstanding.
Under the liquidity contract implemented on 22 August 2011, in 2013 Societe Generale acquired 22,701,114 shares with a value of EUR 722,887,482 and sold 23,036,114 shares with a value of EUR 737,358,437. On 31 December 2013, the liquidity contract held no shares.
From 1 January 2014 to 11 February 2014, notwithstanding liquidity contract, Societe Generale did not buy back any of its own shares on the market. On 11 February 2014, no share appeared on the account of the liquidity contract.
From 1 January 2013 to 31 December 2013
Purchases Transfers/Disposal
NumberPurchase
price Number Purchase priceDisposal/
transfer priceCancellation 0 - 0.00
Acquisitions 0 - 0.00
Allocation to employees 0 - 0.00 3,761,252 47.70 179,394,472 0.00 0.00
Liquidity contract 22,701,114 31.84 722,887,482 23,036,114 31.81 732,842,734 32.01 737,358,437
Total 22,701,114 31.84 722,887,482 26,797,366 34.04 912,237,206 27.52 737,358,437
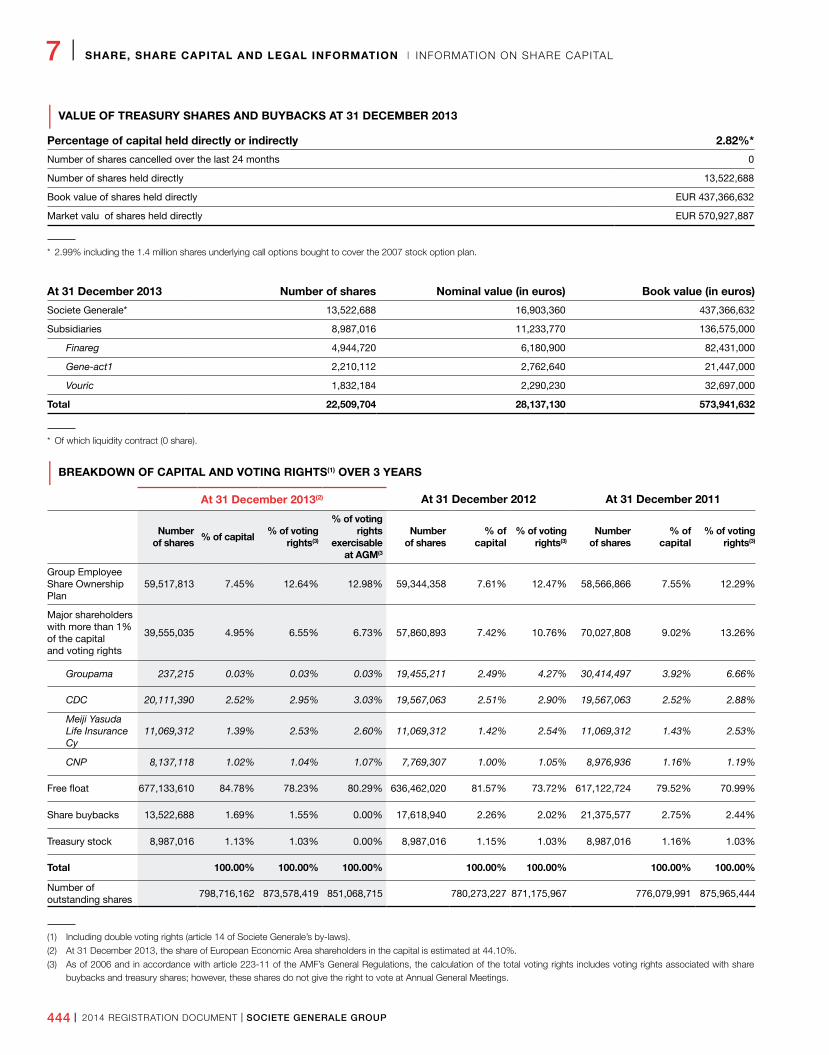
444 I 2014 REGISTRATION DOCUMENT I SOCIETE GENERALE GROUP
7 I SHARE, SHARE CAPITAL AND LEGAL INFORMATION I INFORMATION ON SHARE CAPITAL
| VALUE OF TREASURY SHARES AND BUYBACKS AT 31 DECEMBER 2013
Percentage of capital held directly or indirectly 2.82%*
Number of shares cancelled over the last 24 months 0
Number of shares held directly 13,522,688
Book value of shares held directly EUR 437,366,632
Market valu of shares held directly EUR 570,927,887
* 2.99% including the 1.4 million shares underlying call options bought to cover the 2007 stock option plan.
At 31 December 2013 Number of shares Nominal value (in euros) Book value (in euros)
Societe Generale* 13,522,688 16,903,360 437,366,632
Subsidiaries 8,987,016 11,233,770 136,575,000
Finareg 4,944,720 6,180,900 82,431,000
Gene-act1 2,210,112 2,762,640 21,447,000
Vouric 1,832,184 2,290,230 32,697,000
Total 22,509,704 28,137,130 573,941,632
* Of which liquidity contract (0 share).
| BREAKDOWN OF CAPITAL AND VOTING RIGHTS(1) OVER 3 YEARS
At 31 December 2013(2) At 31 December 2012 At 31 December 2011
Number of shares % of capital % of voting
rights(3)
% of voting rights
exercisable at AGM(3
Number of shares
% of capital
% of voting rights(3)
Number of shares
% of capital
% of voting rights(3)
Group Employee Share Ownership Plan
59,517,813 7.45% 12.64% 12.98% 59,344,358 7.61% 12.47% 58,566,866 7.55% 12.29%
Major shareholders with more than 1% of the capital and voting rights
39,555,035 4.95% 6.55% 6.73% 57,860,893 7.42% 10.76% 70,027,808 9.02% 13.26%
Groupama 237,215 0.03% 0.03% 0.03% 19,455,211 2.49% 4.27% 30,414,497 3.92% 6.66%
CDC 20,111,390 2.52% 2.95% 3.03% 19,567,063 2.51% 2.90% 19,567,063 2.52% 2.88%
Meiji Yasuda Life Insurance Cy
11,069,312 1.39% 2.53% 2.60% 11,069,312 1.42% 2.54% 11,069,312 1.43% 2.53%
CNP 8,137,118 1.02% 1.04% 1.07% 7,769,307 1.00% 1.05% 8,976,936 1.16% 1.19%
Free float 677,133,610 84.78% 78.23% 80.29% 636,462,020 81.57% 73.72% 617,122,724 79.52% 70.99%
Share buybacks 13,522,688 1.69% 1.55% 0.00% 17,618,940 2.26% 2.02% 21,375,577 2.75% 2.44%
Treasury stock 8,987,016 1.13% 1.03% 0.00% 8,987,016 1.15% 1.03% 8,987,016 1.16% 1.03%
Total 100.00% 100.00% 100.00% 100.00% 100.00% 100.00% 100.00%
Number of outstanding shares
798,716,162 873,578,419 851,068,715 780,273,227 871,175,967 776,079,991 875,965,444
(1) Including double voting rights (article 14 of Societe Generale’s by-laws).
(2) At 31 December 2013, the share of European Economic Area shareholders in the capital is estimated at 44.10%.
(3) As of 2006 and in accordance with article 223-11 of the AMF’s General Regulations, the calculation of the total voting rights includes voting rights associated with share buybacks and treasury shares; however, these shares do not give the right to vote at Annual General Meetings.
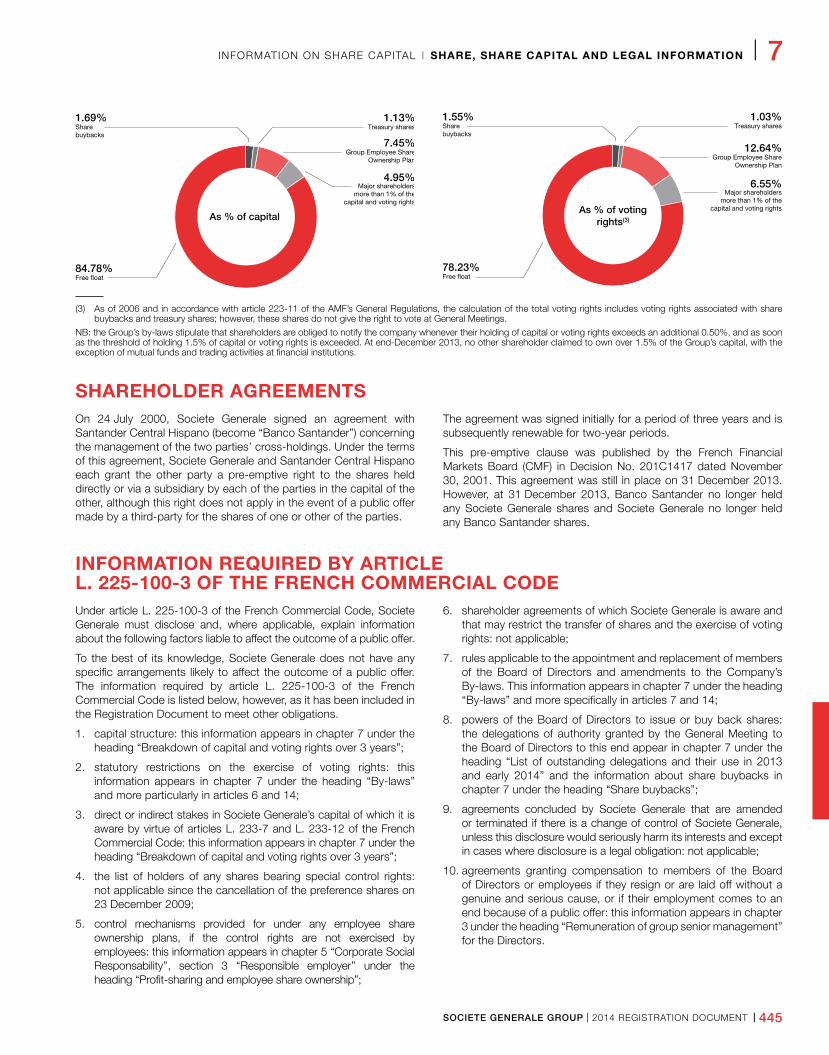
SOCIETE GENERALE GROUP I 2014 REGISTRATION DOCUMENT I 445
INFORMATION ON SHARE CAPITAL I SHARE, SHARE CAPITAL AND LEGAL INFORMATION I 7
4.95%
7.45%
84.78%
1.69% Sharebuybacks
1.13%
Group Employee ShareOwnership Plan
Major shareholdersmore than 1% of the
capital and voting rights
Free float
Treasury shares
As % of capital
6.55%
12.75%
78.12%
1.55% Sharebuybacks
1.03%
Group Employee ShareOwnership Plan
Major shareholdersmore than 1% of the
capital and voting rights
Free float
Treasury shares
As % of votingrights(3)
4.95%
7.45%
84.78%
1.69% Sharebuybacks
1.13%
Group Employee ShareOwnership Plan
Major shareholdersmore than 1% of the
capital and voting rights
Free float
Treasury shares
As % of capital
6.55%
12.64%
78.23%
1.55% Sharebuybacks
1.03%
Group Employee ShareOwnership Plan
Major shareholdersmore than 1% of the
capital and voting rights
Free float
Treasury shares
As % of votingrights(3)
(3) As of 2006 and in accordance with article 223-11 of the AMF’s General Regulations, the calculation of the total voting rights includes voting rights associated with share buybacks and treasury shares; however, these shares do not give the right to vote at General Meetings.
NB: the Group’s by-laws stipulate that shareholders are obliged to notify the company whenever their holding of capital or voting rights exceeds an additional 0.50%, and as soon as the threshold of holding 1.5% of capital or voting rights is exceeded. At end-December 2013, no other shareholder claimed to own over 1.5% of the Group’s capital, with the exception of mutual funds and trading activities at financial institutions.
SHAREHOLDER AGREEMENTSOn 24 July 2000, Societe Generale signed an agreement with Santander Central Hispano (become “Banco Santander”) concerning the management of the two parties’ cross-holdings. Under the terms of this agreement, Societe Generale and Santander Central Hispano each grant the other party a pre-emptive right to the shares held directly or via a subsidiary by each of the parties in the capital of the other, although this right does not apply in the event of a public offer made by a third-party for the shares of one or other of the parties.
The agreement was signed initially for a period of three years and is subsequently renewable for two-year periods.
This pre-emptive clause was published by the French Financial Markets Board (CMF) in Decision No. 201C1417 dated November 30, 2001. This agreement was still in place on 31 December 2013. However, at 31 December 2013, Banco Santander no longer held any Societe Generale shares and Societe Generale no longer held any Banco Santander shares.
INFORMATION REQUIRED BY ARTICLE L. 225-100-3 OF THE FRENCH COMMERCIAL CODEUnder article L. 225-100-3 of the French Commercial Code, Societe Generale must disclose and, where applicable, explain information about the following factors liable to affect the outcome of a public offer.
To the best of its knowledge, Societe Generale does not have any specific arrangements likely to affect the outcome of a public offer. The information required by article L. 225-100-3 of the French Commercial Code is listed below, however, as it has been included in the Registration Document to meet other obligations.
1. capital structure: this information appears in chapter 7 under the heading “Breakdown of capital and voting rights over 3 years”;
2. statutory restrictions on the exercise of voting rights: this information appears in chapter 7 under the heading “By-laws” and more particularly in articles 6 and 14;
3. direct or indirect stakes in Societe Generale’s capital of which it is aware by virtue of articles L. 233-7 and L. 233-12 of the French Commercial Code: this information appears in chapter 7 under the heading “Breakdown of capital and voting rights over 3 years”;
4. the list of holders of any shares bearing special control rights: not applicable since the cancellation of the preference shares on 23 December 2009;
5. control mechanisms provided for under any employee share ownership plans, if the control rights are not exercised by employees: this information appears in chapter 5 “Corporate Social Responsability’’, section 3 ‘‘Responsible employer’’ under the heading “Profit-sharing and employee share ownership”;
6. shareholder agreements of which Societe Generale is aware and that may restrict the transfer of shares and the exercise of voting rights: not applicable;
7. rules applicable to the appointment and replacement of members of the Board of Directors and amendments to the Company’s By-laws. This information appears in chapter 7 under the heading “By-laws” and more specifically in articles 7 and 14;
8. powers of the Board of Directors to issue or buy back shares: the delegations of authority granted by the General Meeting to the Board of Directors to this end appear in chapter 7 under the heading “List of outstanding delegations and their use in 2013 and early 2014” and the information about share buybacks in chapter 7 under the heading “Share buybacks”;
9. agreements concluded by Societe Generale that are amended or terminated if there is a change of control of Societe Generale, unless this disclosure would seriously harm its interests and except in cases where disclosure is a legal obligation: not applicable;
10. agreements granting compensation to members of the Board of Directors or employees if they resign or are laid off without a genuine and serious cause, or if their employment comes to an end because of a public offer: this information appears in chapter 3 under the heading “Remuneration of group senior management” for the Directors.
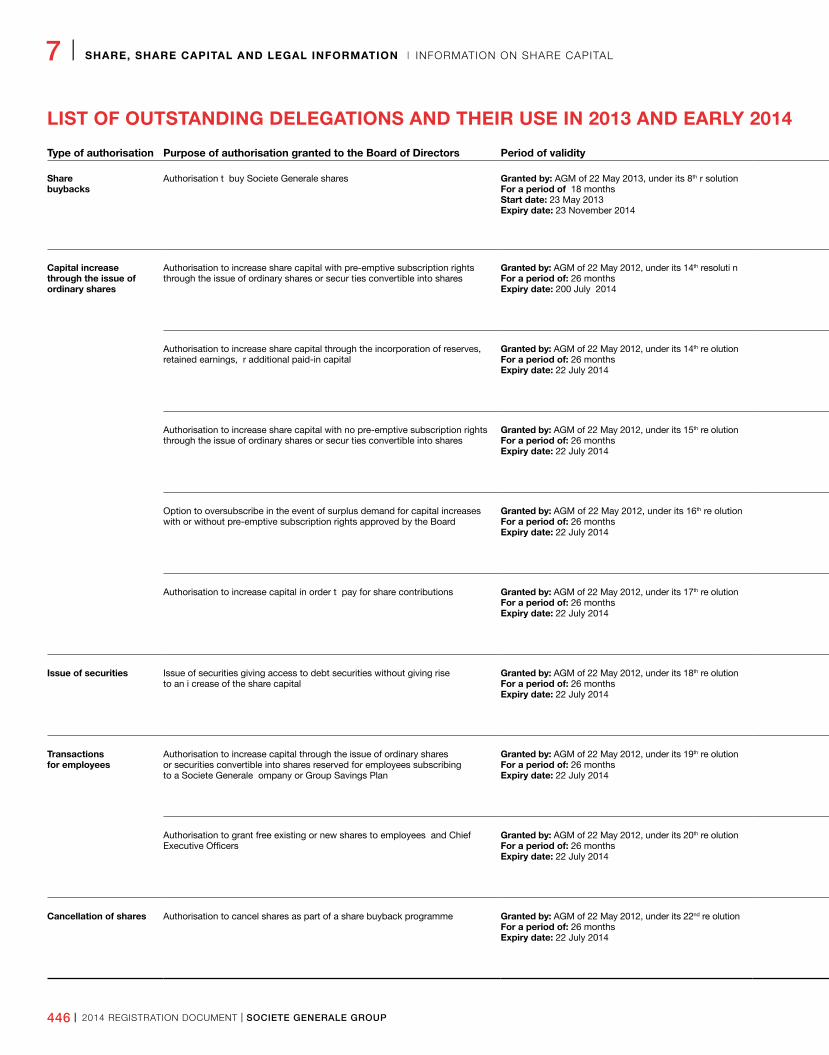
446 I 2014 REGISTRATION DOCUMENT I SOCIETE GENERALE GROUP
7 I SHARE, SHARE CAPITAL AND LEGAL INFORMATION I INFORMATION ON SHARE CAPITAL
LIST OF OUTSTANDING DELEGATIONS AND THEIR USE IN 2013 AND EARLY 2014 (UP TO 11 FEBRUARY 2014)
Type of authorisation Purpose of authorisation granted to the Board of Directors Period of validity Limit Use in 2013Use in 2014(up to February 11)
Sharebuybacks
Authorisation t buy Societe Generale shares Granted by: AGM of 22 May 2013, under its 8th r solutionFor a period of 18 monthsStart date: 23 May 2013Expiry date: 23 November 2014
5% of capital at the date of the pur hase Excluding the liquidity contract: none.On 31 December 2013, no share was recorded in the liquidity contract account (see details on p. 443 of the 2014 Registration Docu ent)
Excluding the liquidity Contract: none On 11 February 2014, no share was recorded in the liquidity contract account.
Capital increase through the issue of ordinary shares
Authorisation to increase share capital with pre-emptive subscription rights through the issue of ordinary shares or secur ties convertible into shares
Granted by: AGM of 22 May 2012, under its 14th resoluti nFor a period of: 26 monthsExpiry date: 200 July 2014
Nominal EUR 485 million for shares, i.e. 49.99% of capital on the date the authorisation was grantedNominal EUR 6 billion for securities convertible into shares Note: these limits are included in those set under res lutions 15 to 17 and 19 to 20 of the AGM of 22 May 2012
None None
Authorisation to increase share capital through the incorporation of reserves, retained earnings, r additional paid-in capital
Granted by: AGM of 22 May 2012, under its 14th re olutionFor a period of: 26 monthsExpiry date: 22 July 2014
Nominal EUR 550 million, i.e. 56.6% of capital on the date the authorisation was granted None None
Authorisation to increase share capital with no pre-emptive subscription rights through the issue of ordinary shares or secur ties convertible into shares
Granted by: AGM of 22 May 2012, under its 15th re olutionFor a period of: 26 monthsExpiry date: 22 July 2014
Nominal EUR 145 million for shares, i.e. 14.95% of capital on the date the authorisation was grantedNominal EUR 6 billion for securities convertible into sharesNote: these limits are included in those of resolution 14, and include hos set in resolutions 16 and 17 of the AGM of 22 May 2012
None None
Option to oversubscribe in the event of surplus demand for capital increases with or without pre-emptive subscription rights approved by the Board
Granted by: AGM of 22 May 2012, under its 16th re olutionFor a period of: 26 monthsExpiry date: 22 July 2014
15% of the initial issue Note: such operations are carried out at the same prices as the initial issue and within the same limits as thos se out in resolutions 14 and 15 of the AGM of 22 May 2012
None None
Authorisation to increase capital in order t pay for share contributions Granted by: AGM of 22 May 2012, under its 17th re olutionFor a period of: 26 monthsExpiry date: 22 July 2014
10% of capital Note: this limit is included in tho e s t under resolutions 14 and 15 of the AGM of 22 May 2012
None None
Issue of securities Issue of securities giving access to debt securities without giving rise to an i crease of the share capital
Granted by: AGM of 22 May 2012, under its 18th re olutionFor a period of: 26 monthsExpiry date: 22 July 2014
Nominal EUR 2 billion None None
Transactions for employees
Authorisation to increase capital through the issue of ordinary shares or securities convertible into shares reserved for employees subscribing to a Societe Generale ompany or Group Savings Plan
Granted by: AGM of 22 May 2012, under its 19th re olutionFor a period of: 26 monthsExpiry date: 22 July 2014
3% of capital on the date the authorisation was grantedNote: this limit is included in the limit set under resolution 14 of the AGM of 22 May 2012
8,647,767 shares allocated, i.e. 1,10% of capital on the date of allocation
Transaction of wich the principle was decided by the Board on 11 Feb. 2014
Authorisation to grant free existing or new shares to employees and Chief Executive Officers
Granted by: AGM of 22 May 2012, under its 20th re olutionFor a period of: 26 monthsExpiry date: 22 July 2014
2% of capital at the date on which the authorisation was granted. Note: this limit is included in the limit set under resolution 14 of the AGM of 22 May 20120.10% of capital for Chief Executive OfficersNote: this limit is included in th 2% limit set under resolution 20 of the AGM of 22 May 2012
1,900,000 shares allocated, i.e. 0.24% of capital on the date of allocation
None
Cancellation of shares Authorisation to cancel shares as part of a share buyback programme Granted by: AGM of 22 May 2012, under its 22nd re olutionFor a period of: 26 monthsExpiry date: 22 July 2014
5% of the total number of shares per 24-month period None None
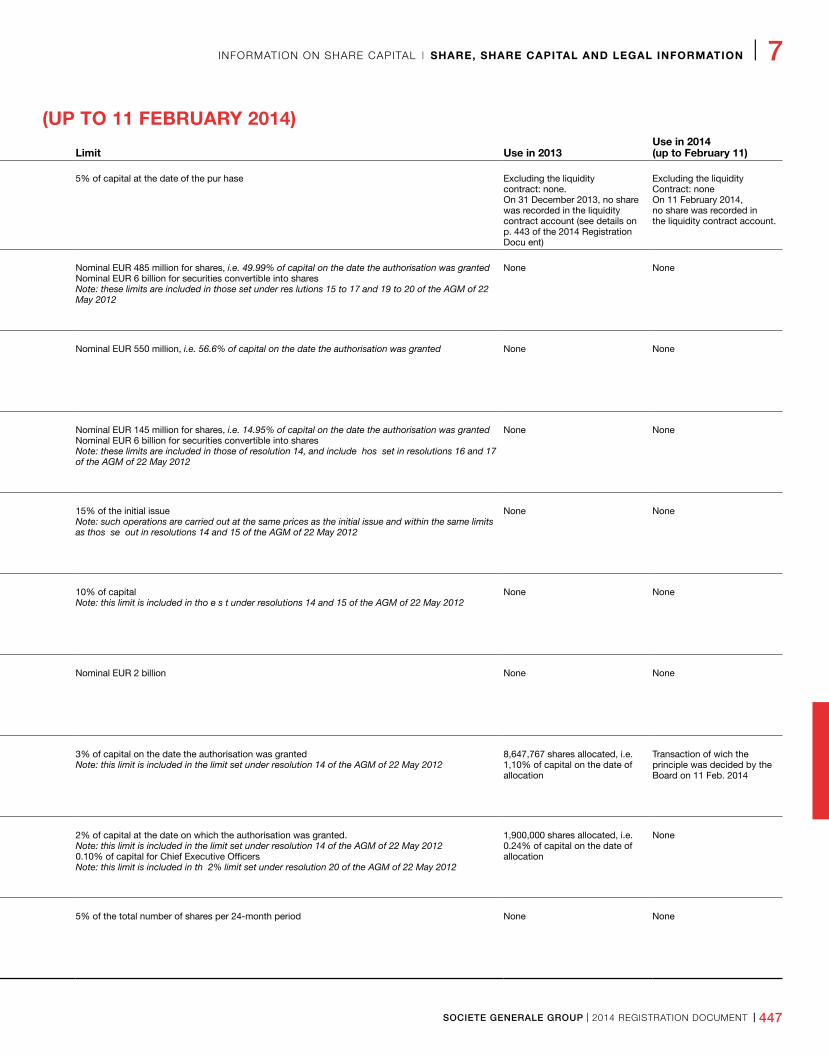
SOCIETE GENERALE GROUP I 2014 REGISTRATION DOCUMENT I 447
INFORMATION ON SHARE CAPITAL I SHARE, SHARE CAPITAL AND LEGAL INFORMATION I 7
LIST OF OUTSTANDING DELEGATIONS AND THEIR USE IN 2013 AND EARLY 2014 (UP TO 11 FEBRUARY 2014)
Type of authorisation Purpose of authorisation granted to the Board of Directors Period of validity Limit Use in 2013Use in 2014(up to February 11)
Sharebuybacks
Authorisation t buy Societe Generale shares Granted by: AGM of 22 May 2013, under its 8th r solutionFor a period of 18 monthsStart date: 23 May 2013Expiry date: 23 November 2014
5% of capital at the date of the pur hase Excluding the liquidity contract: none.On 31 December 2013, no share was recorded in the liquidity contract account (see details on p. 443 of the 2014 Registration Docu ent)
Excluding the liquidity Contract: none On 11 February 2014, no share was recorded in the liquidity contract account.
Capital increase through the issue of ordinary shares
Authorisation to increase share capital with pre-emptive subscription rights through the issue of ordinary shares or secur ties convertible into shares
Granted by: AGM of 22 May 2012, under its 14th resoluti nFor a period of: 26 monthsExpiry date: 200 July 2014
Nominal EUR 485 million for shares, i.e. 49.99% of capital on the date the authorisation was grantedNominal EUR 6 billion for securities convertible into shares Note: these limits are included in those set under res lutions 15 to 17 and 19 to 20 of the AGM of 22 May 2012
None None
Authorisation to increase share capital through the incorporation of reserves, retained earnings, r additional paid-in capital
Granted by: AGM of 22 May 2012, under its 14th re olutionFor a period of: 26 monthsExpiry date: 22 July 2014
Nominal EUR 550 million, i.e. 56.6% of capital on the date the authorisation was granted None None
Authorisation to increase share capital with no pre-emptive subscription rights through the issue of ordinary shares or secur ties convertible into shares
Granted by: AGM of 22 May 2012, under its 15th re olutionFor a period of: 26 monthsExpiry date: 22 July 2014
Nominal EUR 145 million for shares, i.e. 14.95% of capital on the date the authorisation was grantedNominal EUR 6 billion for securities convertible into sharesNote: these limits are included in those of resolution 14, and include hos set in resolutions 16 and 17 of the AGM of 22 May 2012
None None
Option to oversubscribe in the event of surplus demand for capital increases with or without pre-emptive subscription rights approved by the Board
Granted by: AGM of 22 May 2012, under its 16th re olutionFor a period of: 26 monthsExpiry date: 22 July 2014
15% of the initial issue Note: such operations are carried out at the same prices as the initial issue and within the same limits as thos se out in resolutions 14 and 15 of the AGM of 22 May 2012
None None
Authorisation to increase capital in order t pay for share contributions Granted by: AGM of 22 May 2012, under its 17th re olutionFor a period of: 26 monthsExpiry date: 22 July 2014
10% of capital Note: this limit is included in tho e s t under resolutions 14 and 15 of the AGM of 22 May 2012
None None
Issue of securities Issue of securities giving access to debt securities without giving rise to an i crease of the share capital
Granted by: AGM of 22 May 2012, under its 18th re olutionFor a period of: 26 monthsExpiry date: 22 July 2014
Nominal EUR 2 billion None None
Transactions for employees
Authorisation to increase capital through the issue of ordinary shares or securities convertible into shares reserved for employees subscribing to a Societe Generale ompany or Group Savings Plan
Granted by: AGM of 22 May 2012, under its 19th re olutionFor a period of: 26 monthsExpiry date: 22 July 2014
3% of capital on the date the authorisation was grantedNote: this limit is included in the limit set under resolution 14 of the AGM of 22 May 2012
8,647,767 shares allocated, i.e. 1,10% of capital on the date of allocation
Transaction of wich the principle was decided by the Board on 11 Feb. 2014
Authorisation to grant free existing or new shares to employees and Chief Executive Officers
Granted by: AGM of 22 May 2012, under its 20th re olutionFor a period of: 26 monthsExpiry date: 22 July 2014
2% of capital at the date on which the authorisation was granted. Note: this limit is included in the limit set under resolution 14 of the AGM of 22 May 20120.10% of capital for Chief Executive OfficersNote: this limit is included in th 2% limit set under resolution 20 of the AGM of 22 May 2012
1,900,000 shares allocated, i.e. 0.24% of capital on the date of allocation
None
Cancellation of shares Authorisation to cancel shares as part of a share buyback programme Granted by: AGM of 22 May 2012, under its 22nd re olutionFor a period of: 26 monthsExpiry date: 22 July 2014
5% of the total number of shares per 24-month period None None
448 I 2014 REGISTRATION DOCUMENT I SOCIETE GENERALE GROUP
7 I SHARE, SHARE CAPITAL AND LEGAL INFORMATION I ADDITIONAL INFORMATION
3 . A D D I T I O N A L I N F O R M AT I O N
GENERAL INFORMATION
NameSociete Generale
Registered office29, boulevard Haussmann, 75009 Paris
Administrative office17, Cours Valmy, 92972 Paris-La Défense
Postal address: Societe Generale, Tours Societe Generale, 75886 Paris cedex 18
Telephone number: +33 (0)1.42.14.20.00 Website: www.societegenerale.com
Legal formSociete Generale is a public limited company (société anonyme) established under French law and having the status of a bank.
Governing lawSubject to the legislative and regulatory provisions relating to credit institutions, notably the articles of the French Monetary and Financial Code (Code monétaire et financier) that apply to them, the Company is governed by the commercial laws of France, in particular articles L. 210-1 et seq. of the French commercial code, as well as its current By-laws.
Societe Generale is a credit institution authorised to act as a bank. As such, it can carry out all banking transactions. It can also carry out all investment-related services or allied services, as listed by articles L. 321-1 and L. 321-2 of the French Monetary and Financial code, except for operating a multilateral trading facility. In its capacity as an investment services provider, Societe Generale is subject to the regulations applicable to the same. It must notably comply with a number of prudential rules and is subject to the controls carried out by the French Prudential Supervision and Resolution Authority (Autorité de Contrôle Prudentiel et de Résolution). Its management and all employees are bound by rules governing professional secrecy, violation of which is punishable by law. Societe Generale also acts as an insurance broker.
Date of formation and durationSociete Generale was incorporated by deed approved by the Decree of 4 May 1864. The duration of Societe Generale will expire on 31 December 2047, unless the Company is wound up before that date or its duration extended.
Corporate purposeArticle 3 of the Company By-laws describes its corporate purpose. The purpose of Societe Generale is, under the conditions determined by the laws and regulations applicable to credit institutions, to carry out with individuals and corporate entities, in France and abroad:
n all banking transactions;
n all transactions related to banking operations, including in particular investment services or allied services as listed by articles L. 321-1 and L. 321-2 of the French Monetary and Financial code;
n all acquisitions of interests in other companies.
Societe Generale may also, on a regular basis, as defined in the conditions set by the French Banking and Financial Regulation Committee, engage in all transactions other than those mentioned above, including in particular insurance brokerage.
Generally, Societe Generale may carry out, on its own behalf, on behalf of a third-party or jointly, all financial, commercial, industrial, agricultural, personal property or real property transactions, directly or indirectly related to the above-mentioned activities or likely to facilitate the accomplishment of such activities.
Registration number552 120 222 RCS PARISISIN code (International Securities Identification Number): FR 0000130809NAF (trade sector) code: 6419Z
Company reports and documentsAll Societe Generale reports and documents, including in particular its By-laws, financial statements and the reports submitted to General Meetings by the Board of Directors and the Statutory Auditors, may be consulted at the Company’s administrative offices at Tours Societe Generale, 17, cours Valmy, 92972 Paris- La Défense cedex, France.
The current version of the By-laws has been registered with public notaries “Thibierge, Pône, Fremeaux, Palud, Sarrazin, Sagaut et Chaput” in Paris, France.
Fiscal yearThe fiscal year starts on 1 January and ends on 31 December.
Categories of shares and attached rightsUnder the terms of article 4 of the Company’s By-laws, the share capital is divided into 798,716,162 fully paid-up shares with a nominal value of EUR 1.25 per share.
SOCIETE GENERALE GROUP I 2014 REGISTRATION DOCUMENT I 449
ADDITIONAL INFORMATION I SHARE, SHARE CAPITAL AND LEGAL INFORMATION I 7
Double voting rightsIn accordance with article 14 of the Company’s By-laws, double voting rights, in relation to the share of capital stock they represent, are allocated to all those shares which are fully paid-up and which have been registered in the name of the same shareholder for at least two years as from 1 January 1993. Double voting rights are also allocated to new registered shares that may be allocated free of charge to a shareholder in respect of the shares with double voting rights already held by him, in the case of a capital increase by incorporation of reserves, earnings, or additional paid-in capital.
According to the law, these double voting rights are rendered null and void if the shares are converted into bearer form or if ownership of the shares is transferred. Nevertheless, transfers through inheritance, the liquidation of marital assets, or transfers to a spouse or direct relative, do not result in the loss of rights and do not affect the minimum two-year vesting period. The same applies, unless otherwise stated in the Company’s By-laws, following a merger or split-off relating to a shareholder company.
Limitation of voting rightsUnder the terms of article 14 of the Company’s By-laws, the number of votes at General Meetings to be used by one shareholder, either personally or by a proxy, may not exceed 15% of total voting rights at the date of the Meeting. This 15% limit does not apply to the Chairman or any other proxy with respect to the total number of voting rights they hold on a personal basis and in their capacity as proxy, provided each shareholder for which they act as proxy complies with the 15% rule. For the purposes of applying this 15% limit, shares held by a single shareholder include shares held indirectly or jointly in accordance with the conditions described in articles L. 233-7 et seq. of the French Commercial Code. This limit ceases to apply when a shareholder acquires – either directly or indirectly or jointly with another shareholder – more than 50.01% of the Company’s voting rights following a public offer.
Declaration of shareholdings exceeding statutory limitsIn accordance with article 6.2 of the Company’s By-laws, any shareholder acting on his own or jointly, who comes to hold directly or indirectly at least 1.5% of the capital or voting rights of the Company, must inform the latter within 15 days of the time at which he exceeds this threshold, and must also indicate in his declaration the number of shares he held in the share capital. Mutual fund management companies must provide this information based on the total number of shares held in the Company by the funds they manage. Beyond the initial 1.5%, shareholders are obliged to notify the Company, under the conditions set in article 6.2 of the Company’s By-laws, whenever their holding of capital or voting rights exceeds an additional 0.5%.
Failure to comply with this requirement will be penalised in accordance with legal provisions on this matter, at the request of one or more shareholders with at least a 5% holding in the Company’s capital or voting rights. The said request will be duly recorded in the minutes of the General Meeting.
Any shareholder acting on his own or jointly, is also required to inform the Company within 15 days if the percentage of his capital hold or voting rights falls below each of the thresholds described in article 6.2 of the Company’s By-laws.
Convening and rules for attending General Meetings of ShareholdersUnder the terms of article 14 of the Company’s By-laws, General Meetings are called and deliberate as provided for by the legal and regulatory provisions in force. They meet at the head office or in any other place in metropolitan France indicated in the Notice of Meeting. Such meetings are chaired by the Chairman of the Board or, in his absence, by a Director appointed for this purpose by the Chairman of the Board.
Regardless of the number of shares held, all shareholders whose shares are registered under the terms and at a date set forth by decree have the right, upon proof of their identity and status as a shareholder, to participate in the General Meetings. They may, as provided for by the legal and regulatory provisions in force, personally attend the General Meetings, vote remotely or appoint a proxy. The intermediary registered on behalf of shareholders may participate in the General Meetings, as provided for by the legal and regulatory provisions in force.
In order for the ballots to be counted, they must be received by the Company at least two days before the General Meeting is held, unless a shorter period is specified in the Notice of Meeting or required by the regulations in force.
Shareholders may participate in General Meetings by videoconference or any other means of telecommunication, when provided for in the Notice of Meeting and subject to the conditions defined therein.
The General Meeting may be publicly broadcast by means of electronic communication subject to the approval and under the terms set by the Board of Directors. Notice will be given in the preliminary Notice of Meeting and/or Notice to attend the Meeting.
In all General Meetings, the voting right attached to shares that include a usufructuary right, is exercised by the usufructuary.
Identification of holders of bearer sharesArticle 6.3 of the Company’s By-laws provides that Societe Generale can at any time, in accordance with current legislative and regulatory provisions, request that the organisation responsible for securities clearing provide information relating to the shares granting the right to vote in its General Meetings, either immediately or in the future, as well as information about the holders of these shares.
DocumentsSociete Generale’s By-laws are included in the present Registration Document. All reports, letters and other documents, historical financial data, assessments and declarations established by external experts at the request of the issuer and included in part or referred to in the present document, as well as all financial data on Societe Generale and its subsidiaries for each of the two fiscal periods preceding the publication of this document, can be consulted on the Societe Generale Group website or at its administrative office.
450 I 2014 REGISTRATION DOCUMENT I SOCIETE GENERALE GROUP
7 I SHARE, SHARE CAPITAL AND LEGAL INFORMATION I BY-LAWS
4 . B Y- L AW S (Updated on 8 January 2014)
TYPE OF COMPANY – NAME – REGISTERED OFFICE – PURPOSE Article 1 The Company, named Societe Generale, is a public limited company (société anonyme) incorporated by deed approved by the Decree of 4 May 1864, and is approved as a bank.
The duration of Societe Generale, previously fixed at 50 years with effect from 1 January 1899, was then extended by 99 years with effect from 1 January 1949.
Under the legislative and regulatory provisions relating to credit institutions, notably the articles of the French Monetary and Financial Code that apply to them, the Company is subject to the commercial laws, in particular articles L. 210-1 and following of the French Commercial Code, as well as by the current By-laws.
Article 2 Societe Generale’s registered office is at 29, boulevard Haussmann, Paris (9e).
In accordance with current legal and regulatory provisions it may be transferred to any other location.
Article 3 The purpose of Societe Generale is, under the conditions determined by the laws and regulations applicable to credit institutions, to carry out with individuals and corporate entities, in France or abroad:
n all banking transactions;
n all transactions related to banking operations, including in particular investment services or allied services as listed by articles L. 321-1 and L. 321-2 of the French Monetary and Financial Code;
n all acquisitions of interests in other companies.
Societe Generale may also, on a regular basis, as defined in the conditions set by the French Financial and Banking Regulation Committee, engage in all transactions other than those mentioned above, including in particular insurance brokerage.
Generally, Societe Generale may carry out, on its own behalf, on behalf of a third-party or jointly, all financial, commercial, industrial, agricultural, movable property or real property transactions, directly or indirectly related to the abovementioned activities or likely to facilitate the accomplishment of such activities.
CAPITAL – SHARES Article 4 4.1. SHARE CAPITAL
The share capital amounts to EUR 998,395,202.50. This is divided into 798,716,162 shares each having a nominal value of EUR 1.25 and fully paid up.
4.2. CAPITAL INCREASE AND REDUCTION
The capital may be increased or reduced on the decision of the competent General Meeting or Meetings.
Any capital reduction motivated by losses shall be shared between shareholders in proportion to their share of the capital.
Article 5 Unless otherwise provided by legal and regulatory provisions, all shares have the same rights.
All shares which make up or which will make up the share capital will be given equal rank as regards taxes. Consequently, all taxes which, for whatever reason, may become payable on certain shares following capital reimbursement, either during the life of the Company or during its liquidation, shall be divided between all the shares making up the capital on such reimbursement(s) so that, while allowing for the nominal and non-amortised value of the shares and for their respective rights, all present or future shares shall entitle their owners to the same effective advantages and to the right to receive the same net sum.
Whenever it is necessary to possess a certain number of shares in order to exercise a right, it is incumbent on shareholders who own fewer shares than the total number required to assemble the necessary number of shares.
Article 6
6.1. FORM AND TRANSFER OF SHARES
Shares may, in accordance with the holder’s wishes, be registered or bearer shares and shall be freely negotiable, unless otherwise stipulated by law.
6.2. STATUTORY THRESHOLDS
Any shareholder acting on his own or jointly, who comes to hold directly or indirectly at least 1.5% of the capital or voting rights, must inform the Company within fifteen days of the time at which he exceeds this threshold, and must also indicate in his declaration the number of shares he holds in the share capital. Mutual fund management companies must provide this information based on the total number of shares held in the Company by the funds they manage. Beyond the initial 1.5%, shareholders are obliged to notify the Company, under the aforementioned conditions, whenever their holding of capital or voting rights exceeds an additional 0.50%.
SOCIETE GENERALE GROUP I 2014 REGISTRATION DOCUMENT I 451
BY-LAWS I SHARE, SHARE CAPITAL AND LEGAL INFORMATION I 7
Failure to comply with this requirement will be penalised in accordance with legal provisions on this matter, at the request of one or more shareholders with at least a 5% holding in the Company’s capital or voting rights. The said request will be duly recorded in the minutes of the General Meeting.
Any shareholder acting on his own or jointly, is also required to inform the Company within fifteen days if the percentage of his capital or voting rights falls below each of the thresholds described in this article.
6.3. IDENTIFICATION OF SHAREHOLDERS
The Company can at any time, in accordance with current legal and regulatory provisions, request that the organisation responsible for securities clearing provide information relating to the shares granting the right to vote in its General Meetings, either immediately or in the future, as well as information about the holders of these shares.
6.4. SHAREHOLDERS’ RIGHTS
The rights of shareholders shall comply with applicable legal and regulatory provisions, subject to the specific provisions of the current By-laws.
BOARD OF DIRECTORSArticle 7
I – DIRECTORS The Company is administered by a Board of Directors made up of two categories of Directors:
1. DIRECTORS APPOINTED BY THE ORDINARY GENERAL MEETING OF SHAREHOLDERS
There are at least nine of these Directors, and thirteen at the most.
The term of office of Directors appointed by the Ordinary General Meeting shall expire four years after the approval of the current article. This provision does not apply to Directors in office at the time of this approval.
When, in application of current legislative and regulatory provisions, a Director is appointed to replace another, then his term of office shall not exceed the term of office remaining to be served by his predecessor.
Each Director must hold at least six hundred shares.
2. DIRECTORS ELECTED BY EMPLOYEES
The status and the methods of electing these Directors are laid down by Articles L. 225-27 to L. 225-34 of the French Commercial Code, as well as by these By-laws.
There are two such Directors, one to represent the executives and one to represent all other Company employees.
In any event, their number may not exceed one-third of the Directors appointed by the General Meeting.
Their term of office is three years.
Regardless of the appointment procedure, the duties of a Director cease at the end of the Ordinary General Meeting called to approve the financial statements of the previous fiscal year and held during the year in which his term of office expires.
Directors may be re-elected, as long as they meet the legal provisions, particularly with regard to age.
II – METHODS OF ELECTING DIRECTORS ELECTED BY EMPLOYEES For each seat to be filled, the voting procedure is that set forth by law.
The first Directors elected by employees will begin their term of office during the Board of Directors’ Meeting held after publication of the full results of the first elections.
Subsequent Directors shall take up office upon expiry of the outgoing Directors’ terms of office.
If, under any circumstances and for any reason whatsoever, there shall remain in office less than the statutory number of Directors before the normal end of the term of office of such Directors, vacant seats shall remain vacant until the end of the term of office and the Board shall continue to meet and take decisions validly until that date.
Elections shall be organised every three years so that a second vote may take place at the latest fifteen days before the normal end of the term of office of outgoing Directors.
For both the first and second ballot, the following deadlines should be adhered to:
n posting of the date of the election at least eight weeks before the polling date;
n posting of the lists of the electors at least six weeks before the polling date;
n registration of candidates at least five weeks before the polling date;
n posting of lists of candidates at least four weeks before the polling date;
n sending of documents required for postal voting at least three weeks before the polling date.
The candidatures or lists of candidates other than those entered by a representative trade union should be accompanied by a document including the names and signatures of the one hundred employees presenting the candidates.
Polling takes place the same day, at the work place, and during working hours. Nevertheless, the following may vote by post:
n employees not present on the day of polling;
n employees working abroad;
n employees of a department or office, or seconded to a subsidiary in France, not having a polling station, or who cannot vote in another office.
Each polling station consists of three elective members, the Chairman being the oldest one among them. The Chairman is responsible for seeing that voting operations proceed correctly.
Votes are counted in each polling station, and immediately after the closing of the polls; the report is drawn up as soon as the counting has been completed.
Results are immediately sent to the Head Office of Societe Generale, where a centralised results station will be set up with a view to drafting the summary report and announcing the results.
452 I 2014 REGISTRATION DOCUMENT I SOCIETE GENERALE GROUP
7 I SHARE, SHARE CAPITAL AND LEGAL INFORMATION I BY-LAWS
Methods of polling not specified by Articles L. 225-27 to L. 225-34 of the French Commercial Code or these By-laws are settled up by the General Management after consulting with the representative trade unions.
These methods may include electronic voting, whose organisation may deviate, where necessary, from the practical organisation and polling methods described herein.
III – NON-VOTING DIRECTORS On the proposal of the Chairman, the Board of Directors may appoint one or two Non-Voting Directors.
Non-Voting Directors are convened and attend Board of Directors’ meetings in a consultative capacity.
They are appointed for a period not exceeding four years and the Board can renew their terms of office or terminate them at any time.
They may be selected from among shareholders or non-shareholders, and receive an annual remuneration determined by the Board of Directors.
Article 8 The Board of Directors determines the Company’s strategy and ensures its implementation. Subject to the powers expressly attributed to the General Meeting and within the scope of the corporate purpose, it considers all matters that affect the Company’s operations and settles by its decisions matters that concern it.
It carries out all the controls and verifications it deems appropriate. The Chairman or Chief Executive Officer is required to furnish each director with any documents or information required to carry out their function.
Article 9 The Board of Directors elects a Chairman from among its natural person members, determines his remuneration and sets the duration of his term of office, which may not exceed that of his term of office as Director.
No member of 70 years of age or more shall be appointed Chairman. If the Chairman in office reaches the age of 70, his duties shall cease after the next Ordinary General Meeting called to approve the financial statements of the preceding fiscal year.
The Chairman organises and manages the work of the Board of Directors and reports on its activities to the General Meeting. He ensures that the Company’s bodies operate correctly and in particular ensures that the Directors are able to fulfil their functions.
Article 10 The Board of Directors meets as often as is required by the interests of the Company, upon convocation by the Chairman, either at the registered office or in any other place indicated in the Notice of Meeting. The Board examines the items placed on the agenda.
It shall also meet when at least one-third of Board members or the Chief Executive Officer submits a request for a meeting with a specific agenda to the Chairman.
If the Chairman is unable to attend, the Board of Directors can be convened either by at least one-third of its members, or by the Chief Executive Officer or a Deputy Chief Executive Officer, provided they are members of the Board.
Unless specifically provided for, Directors are called to meetings by letter or by any other means. In any event, the Board may always deliberate validly if all its members are present or represented.
Article 11 Board meetings are chaired by the Chairman of the Board of Directors or, in his absence, by a Director designated for this purpose at the beginning of the meeting.
Each Director may give his proxy to another Director, but a Director may act as proxy for only one other Director and a proxy can only be given for one specific meeting of the Board.
In all cases, deliberations of the Board are valid only if at least half the members are present.
The Chief Executive Officer attends meetings of the Board.
One or several delegates of the Central Works Council attend Board meetings, under the conditions laid down by the legislation in force.
At the request of the Chairman of the Board of Directors, members of the General Management, the Statutory Auditors or other persons outside the Company with specific expertise relating to the items on the agenda may attend all or part of a Board meeting.
Resolutions are adopted by a majority vote of the Directors present or represented. In the event of a tie, the Chairman holds a casting vote.
A member of the Management appointed by the Chairman serves as Secretary of the Board.
Minutes are prepared and copies or extracts certified and delivered in accordance with the law.
Article 12 Members of the Board may receive Director’s fees in the form of a global sum set by the General Meeting distributed by the Board among its members as it sees fit.
SOCIETE GENERALE GROUP I 2014 REGISTRATION DOCUMENT I 453
BY-LAWS I SHARE, SHARE CAPITAL AND LEGAL INFORMATION I 7
GENERAL MANAGEMENT Article 13 The General Management of the Company is the responsibility of either the Chairman of the Board of Directors, or any other individual appointed by the Board of Directors to act as Chief Executive Officer.
The Board of Directors may choose between the two general management structures, and its decision is only valid if:
n the agenda with respect to this choice is sent to members at least 15 days before the date of the Board Meeting;
n at least two-thirds of Directors are present or represented.
Shareholders and third-parties shall be informed of this decision in accordance with the regulations in force.
When the Chairman of the Board of Directors assumes responsibility for the general management of the Company, the following provisions relating to the Chief Executive Officer shall be applicable to him.
The Chief Executive Officer shall be granted exhaustive powers to act on behalf of the Company in all matters. He shall exercise these powers within the scope of the Company’s purpose and subject to those powers expressly assigned by law to meetings of shareholders and the Board of Directors. He shall represent the company vis-à-vis third-parties.
The Board of Directors sets the remuneration and the duration of the Chief Executive Officer’s term, which may not exceed that of the dissociation of the functions of Chairman and Chief Executive Officer nor, where applicable, that of his term as Director.
No person aged 70 or more may be appointed Chief Executive Officer. If the Chief Executive Officer in office reaches 70 years of age, his functions shall end at the end of the next Ordinary General Meeting called to approve the financial statements of the preceding fiscal year.
On recommendation by the Chief Executive Officer, the Board of Directors can appoint up to five persons to assist the Chief Executive Officer, who shall have the title of Deputy Chief Executive Officer.
In agreement with the Chief Executive Officer, the Board of Directors determines the extent and duration of the powers granted to the Deputy Chief Executive Officers. The Board of Directors sets their remuneration. With respect to third-parties, the Deputy Chief Executive Officers have the same powers as the Chief Executive Officer.
SHAREHOLDERS’ MEETING Article 14 General Meetings are comprised of all shareholders.
The General Meeting is called and deliberates as provided for by the legal and regulatory provisions in force.
It meets at the Company’s head office or in any other place in mainland France indicated in the Notice to attend the General Meeting.
Such meetings are chaired by the Chairman of the Board or, in his absence, by a Director appointed for this purpose by the Chairman of the Board.
Regardless of the number of shares held any shareholder whose shares are registered under the terms and at a date set forth by decree, has the right, upon proof of his identity and status as a shareholder, to participate in the General Meetings. He may, as provided for by the legal and regulatory provisions in force, personally attend the General Meetings, vote remotely or appoint a proxy.
The intermediary registered on behalf of shareholders may participate in the General Meetings, as provided for by the legal and regulatory provisions in force.
In order for the ballots to be counted, they must be received by the Company at least two days before the General Meeting is held, unless otherwise specified in the Notice of Meeting or required by the regulations in force.
Shareholders may participate in General Meetings by videoconference or any other means of telecommunication, when stipulated in the Notice of Meeting and subject to the conditions provided therein.
The General Meeting may be publicly broadcast by means of electronic communication subject to the approval and under the terms set by the Board of Directors. Notice will be given in the preliminary Notice of Meeting and/or Notice to attend the Meeting.
Double voting rights, in relation to the share of capital stock they represent, are allocated to all those shares which are fully paid up and which have been registered in the name of the same shareholder for at least two years as from 1 January 1993. Double voting rights are also allocated to new registered shares that may be allocated free of charge to a shareholder in respect of the shares with double voting rights already held by him, in the case of a capital increase by incorporation of reserves, earnings, or additional paid-in capital.
The number of votes at General Meetings to be used by one shareholder, either personally or by a proxy, may not exceed 15% of total voting rights at the date of the Meeting.
This 15% limit does not apply to the Chairman or any other proxy with respect to the total number of voting rights they hold on a personal basis and in their capacity as proxy, provided that each shareholder for which they act as proxy complies with the rule stipulated in the previous paragraph.
For the purposes of applying this limit, shares held by a single shareholder include shares held indirectly or jointly in accordance with the conditions described in Articles L. 233-7 and following of the French Commercial Code.
This limit ceases to apply when a shareholder acquires – either directly or indirectly or jointly with another shareholder – more than 50.01% of the Company’s voting rights following a public offering.
In all General Meetings, the voting right attached to shares that include a usufructuary right, is exercised by the usufructuary.
SPECIAL MEETINGS Article 15 When different categories of shares exist, the Special Meetings of the Shareholders of such categories of shares are convened and deliberate as provided by the applicable legislative and regulatory provisions and Article 14 herein.
454 I 2014 REGISTRATION DOCUMENT I SOCIETE GENERALE GROUP
7 I SHARE, SHARE CAPITAL AND LEGAL INFORMATION I BY-LAWS
STATUTORY AUDITORS Article 16 The Statutory Auditors are appointed and carry out their duties according to the applicable statutory and regulatory provisions.
ANNUAL FINANCIAL STATEMENTS Article 17 The financial year starts on 1 January and ends on 31 December.
The Board of Directors prepares the financial statements for the year under the conditions fixed by the applicable laws and regulations.
All other documents prescribed by the applicable laws and regulations are also drawn up.
Article 18 The results for the year are determined in accordance with the applicable legal and regulatory provisions.
At least 5% of the profits for the year, less any previous losses, must be set aside to form a reserve fund required by law until the said fund reaches 10% of the capital.
The net income available after this deduction, increased by any net income brought forward, constitutes the profits available for distribution, to be successively allocated to ordinary, extraordinary or special reserves or to be carried forward in those amounts which the General Meeting may deem useful, upon the recommendation of the Board of Directors.
The balance is then allocated to the Shareholders in proportion of their participation in the share capital.
The General Meeting may also resolve to distribute amounts from available reserves.
The General Meeting approving the annual financial statements may, with regard to all or part of the dividend or interim dividend, grant each shareholder the option of choosing between payment of the dividend or interim dividend in cash or in shares in accordance with the conditions fixed by the laws in force. Shareholders who exercise this option must do so for all of the dividends or interim dividends attached to their shares.
Except in cases of a reduction in capital, no distribution may be made to shareholders if the shareholders’ equity of the Company is or may subsequently become less than the amount capital plus the reserves that may not be distributed by law or under the Company’s By-laws.
FORUM SELECTION CLAUSE Article 19 Any dispute arising during the life of the Company or during its liquidation, between the Company and its shareholders or among the Shareholders themselves, related to Company matters, shall be brought solely before the courts with jurisdiction over the Company’s registered office.
DISSOLUTION Article 20 In the event that Societe Generale is wound up and unless otherwise provided for by Law, the General Meeting determines the method of liquidation, appoints the liquidators on the proposal of the Board of Directors and continues to exercise its assigned powers during the said liquidation until completion thereof.
The net assets remaining after repayment of the nominal value of the shares are distributed among the shareholders, in proportion to their share of the capital.
SOCIETE GENERALE GROUP I 2014 REGISTRATION DOCUMENT I 455
INTERNAL RULES OF THE BOARD OF DIRECTORS I SHARE, SHARE CAPITAL AND LEGAL INFORMATION I 7
5 . I N T E R N A L R U L E S O F T H E B O A R D O F D I R E C T O R S *
(Updated on 13 April 2012)
Preamble Societe Generale applies the April 2010 AFEP-MEDEF Corporate Governance Code for listed companies. The Board’s organisation and operating procedures are defined in these Internal Rules.
These Internal Rules are included in the Company’s Registration Document.
Article 1: Powers The Board shall deliberate on any issue that falls within the scope of the powers ascribed to it by law or by regulations.
Moreover, the Board:
a) approves the Group’s strategy and reviews it at least once a year;
b) approves all strategic investments and transactions, notably acquisitions or disposals, liable to have a material impact on the Group’s earnings, its balance sheet structure or its risk profile.
This prior approval process concerns:
– organic growth operations where these represent a unit amount in excess of EUR 250 million and have not already been approved within the framework of the annual budget or the strategic plan;
– acquisitions for a unit amount exceeding 3% of the Group’s consolidated shareholders’ equity or 1.50% of consolidated shareholders’ equity where acquisitions do not comply with the development priorities approved in the strategic plan;
– disposals for a unit amount exceeding 1.50% of the Group’s consolidated shareholders’ equity;
– partnerships involving a cash payment exceeding 1.50% of the Group’s consolidated shareholders’ equity;
– transactions that would result in a substantial deterioration of the Group’s risk profile.
If, for reasons of urgency, it is impossible to convene a meeting of the Board to deliberate on a transaction that falls within the aforementioned categories, the Chairman shall do his utmost to obtain the opinion of all the Directors before taking a decision. He shall keep the Vice-Chairman informed thereof.
The Chairman assesses the appropriateness of convening the Board to deliberate on a transaction that does not fall within the aforementioned categories on a case-by-case basis.
During each Board meeting, the Chairman shall report on the transactions concluded since the previous meeting, as well as on the main projects in progress that are liable to be concluded before the next Board meeting.
c) deliberates on modifications to the Group’s management structures prior to their implementation and is informed of the principal changes to its organisation;
d) notably ensures the adequacy of the Group’s risk management infrastructures, monitors the global risk exposure of its activities and approves the risk budgets for market and credit risk. At least once a year, it examines the main aspects of, and major changes to, the Group’s risk management strategy;
e) deliberates at least once a year on its operation and that of its Committees, and on the conclusions of their periodic evaluation;
f) sets the compensation of the Chief Executive Officers, particularly their basic fixed salaries, performance-linked pay and benefits in kind, as well as stock option or performance share allocations and post-employment benefits;
g) establishes the remuneration policy rules applicable within the Group, particularly those regarding employees whose activities have a significant impact on the Group’s risk profile, and ensures that the internal control systems effectively verify the rules’ compliance with the regulations and professional standards and are suitable for meeting risk management objectives;
h) deliberates once a year on the Company’s policy regarding professional and wage equality between male and female employees;
i) approves the “Corporate Governance” chapter of the Registration Document, which notably includes the Report of the Chairman on Corporate Governance and internal control and risk management procedures and the activity report of the Board, the Committees and the Vice-Chairman, the presentation of the Board of Directors and the General Management and the policy followed for the remuneration of Chief Executive Officers and employees, as well as stock option subscription or purchase plans and share award plans;
j) ensures the accuracy and sincerity of the parent company and consolidated financial statements and the quality of the information communicated to shareholders and the market.
Article 2: The Chairman and Vice-Chairman of the Board of Directorsa) The Chairman calls and chairs the Board of Directors’ meetings.
He sets the timetable and the agenda of Board meetings. He organises and manages the work of the Board of Directors and reports on its activities to the General Meeting. He chairs the General Meetings of Shareholders.
* This document does not form part of Societe Generale’s By-laws. It is not enforceable against third-parties. It may not be cited by third-parties or shareholders as evidence against Societe Generale.
456 I 2014 REGISTRATION DOCUMENT I SOCIETE GENERALE GROUP
7 I SHARE, SHARE CAPITAL AND LEGAL INFORMATION I INTERNAL RULES OF THE BOARD OF DIRECTORS
The Chairman ensures that the Company’s bodies, including the Board Committees, operate correctly and consistently with the best principles of corporate governance. He may request the opinion of the Committees on specific questions. He produces the report on the organisation of the Board’s work and on internal control and risk management procedures.
He ensures that the Directors are in a position to fulfill their duties and that they are provided with the appropriate information.
He speaks alone in the Board’s name, barring exceptional circumstances or specific assignments entrusted to another Director.
As the Chief Executive Officer, he proposes and implements the Company’s strategy, within the limits defined by French Law and in compliance with the Company’s corporate governance rules and the strategies determined by the Board of Directors.
b) The Board of Directors may appoint a Vice-Chairman to assist the Chairman in his tasks, particularly the organisation and correct operation of the Board and its Committees, and the supervision of corporate governance, internal control and risk management.
Consequently the Vice-Chairman chairs the Audit, Internal Control and Risk Committee and is a member of the Nomination and Corporate Governance and the Compensation Committees. He may question the members of the Group Executive Committee and the managers responsible for drawing up financial statements, internal control, risk management, compliance and internal audits, and more generally the Group’s management executives and Statutory Auditors. He is provided with the information and documents he deems necessary to accomplish his assignments.
At least once a year he holds a meeting with the Directors who are not employees of the Group, from which the Chairman and Chief Executive Officer is excluded, notably to evaluate the Chief Executive Officers.
In agreement with the Chairman and Chief Executive Officer, he may represent the Company during meetings with third-parties about corporate governance, internal control and risk management.
Article 3: MeetingsThe Board shall meet at least six times a year.
The Directors participating in the Board meeting via videoconferencing or any other means of telecommunications that allows their identification and active participation, shall be considered present for the calculation of the quorum and majority. To this end, the means chosen must transmit at least the voice of the participating members and comply with specifications that permit continuous and simultaneous transmission of the debates.
This provision is not valid where the Board has been convened to establish and approve the parent company and consolidated financial statements and the Management Report.
Notices to attend Board meetings issued by the Secretary of the Board or the Corporate Secretary may be sent by letter, fax or electronic mail, or by any other means, including verbally.
On the decision of the Chairman, the Deputy Chief Executive Officers or other Group management executives or, where relevant, people who are not members of the Board and are able to contribute usefully to discussions, may attend all or part of meetings of the Board of Directors.
Article 4: Information provided to the Board of DirectorsEach Director shall receive all the documents and information necessary for him to accomplish his mission.
Prior to the Board and Committee meetings, a file containing agenda items requiring special analysis and prior reflection, will be made available or posted online in a timely manner whenever confidentiality rules allow.
Moreover, between meetings, the Directors shall receive any relevant information, including any critical reviews, about significant events or transactions concerning the Company. In particular, they shall receive copies of press releases issued by the Company.
At least once a year, the Board is informed of and regularly discusses Group policy with respect to human resources, information systems and organisation.
Article 5: Training of DirectorsEach Director may benefit, either at the time of his appointment or during the term of his mandate, from any training that he deems necessary for the exercise of his duties.
This training shall be organised and proposed by the Company, which shall bear its cost.
Article 6: The Board’s CommitteesIn certain areas, the Board’s resolutions are prepared by specialised Committees composed of Directors appointed by the Board, who examine the issues within their competencies and submit their opinions and proposals to the Board.
These Committees shall act under the responsibility of the Board.
The Committees may, in the course of their respective duties, request the communication of any relevant information, hear reports from the Group’s Chief Executive Officers and senior managers and, after informing the Chairman, request that external technical studies be conducted, at the expense of the Company. The Committees shall subsequently report on the information obtained and the opinions collected.
There are three permanent Committees:
n the Audit, Internal Control and Risk Committee;
n the Compensation Committee;
n the Nomination and Corporate Governance Committee.
The Board may create one or more “ad hoc” Committees.
The Audit, Internal Control and Risk Committee shall be chaired by the Vice-Chairman or, in his absence, by a Chairman appointed by the Board of Directors based on a proposal made by the Nomination and Corporate Governance Committee.
The Compensation Committee and the Nomination and Corporate Governance Committee shall be chaired by a Chairman appointed by the Board of Directors based on a proposal made by the Nomination and Corporate Governance Committee.
The secretarial functions for each Committee shall be the responsibility of a person appointed by the Chairman of the Committee.
The Chairman of each Committee shall report to the Board on the Committee’s work. A written report of the Committee’s activities shall be regularly sent to the Board.
SOCIETE GENERALE GROUP I 2014 REGISTRATION DOCUMENT I 457
INTERNAL RULES OF THE BOARD OF DIRECTORS I SHARE, SHARE CAPITAL AND LEGAL INFORMATION I 7
Each Committee shall present the Board with its annual work program.
Article 7: The Compensation CommitteeThe Compensation Committee:
a) proposes to the Board, in accordance with the guidelines given by the AFEP-MEDEF Corporate Governance Code and with the professional standards, the policy governing the remuneration of the Chief Executive Officers and Directors, and particularly the determination criteria, structure and amount of this remuneration, including allowances and benefits in kind, personal protection insurance or pension benefits, as well as any compensation received from Group companies, and ensures that the policy is properly applied;
b) prepares the annual performance appraisal of the Chief Executive Officers;
c) submits a proposal to the Board of Directors for the performance share and stock option award policy and formulates an opinion on the list of beneficiaries;
d) prepares the decisions of the Board relating to the employee savings plan;
e) examines each year and gives the Board of Directors its opinion on the General Management’s proposals for the remuneration policy principles applicable within the Group, the policy for the compensation of employees referred to by regulation No. 97-02 on internal control, particularly employees whose activities have a significant impact on the Group’s risk profile, and makes sure with the General Management that the policy is being implemented. It also ensures that the General Management and Risk Management and Compliance do in fact cooperate in the definition and application of this policy, as required by professional standards, and that due consideration is given to the opinions of Risk Management and Compliance;
f) checks that the report made to it by the General Management complies with regulation No. 97-02 and is consistent with the applicable professional standards. It receives all the information necessary for it to complete its mission and particularly the annual report sent to the French Prudential Control Authority (Autorité de contrôle prudentiel) and compensation for individual amounts above a threshold that it determines. It shall call on the internal audit departments or outside experts where necessary. It reports to the Board on its activities. It may perform the same tasks for the Group companies monitored by the French Prudential Control Authority (Autorité de contrôle prudentiel) on a consolidated or sub-consolidated basis;
g) gives the Board of Directors its opinion on the section of the Registration Document dealing with these issues and produces an Annual Activity Report, submitted to the Board for its approval, which is then inserted in the Registration Document.
It is made up of at least three Directors, who may not be Chief Executive Officers of the Company, nor linked to the Company or one of its subsidiaries by an employment contract. At least two-thirds of its members shall be independent according to the definition given in the AFEP-MEDEF Corporate Governance Code and have the expertise to analyse the remuneration policies and practices according to all the relevant criteria, including the Group risk policy.
Article 8: The Nomination and Corporate Governance CommitteeThis Committee is assigned the task of submitting proposals to the Board for the nomination of Directors and for the appointment of successors to the Chief Executive Officers, especially where a position becomes vacant unexpectedly, after carrying out any necessary inquiries.
It provides the Board with proposals for appointments to the Board’s Committees.
It may propose the appointment of a Vice-Chairman.
The Committee carries out preparatory work for the examination by the Board of Directors of corporate governance issues. It is responsible for the evaluation of the Board of Directors’ performance, which is carried out each year.
It submits a proposal to the Board of Directors for the presentation of the Board of Directors to be included in the Registration Document and notably the list of independent Directors.
It gives the Board of Directors its opinion on the section of the Registration Document dealing with these issues and produces an Annual Activity Report, submitted to the Board for its approval, which is then inserted in the Registration Document.
The Nomination and Corporate Governance Committee is informed prior to the appointment of any member of the Group’s Executive Committee and any corporate department heads who do not sit on this Committee. It is informed of the list of replacements for these senior managers.
It is made up of at least three Directors, who may not be Chief Executive Officers of the Company, nor linked to the Company or one of its subsidiaries by an employment contract. At least two-thirds of its members shall be independent according to the definition given in the AFEP-MEDEF Corporate Governance Code and have the expertise to analyse the nomination, corporate governance policies and practices according to all the relevant criteria.
Article 9: The Audit, Internal Control and Risk CommitteeThis Committee’s mission is to monitor issues concerning the production and control of accounting and financial information, and to monitor the efficiency of the internal control and risk assessment, monitoring and management systems.
It is particularly in charge of:
– ensuring monitoring of the process for drawing up financial information, particularly examining the quality and reliability of the systems in place and making suggestions for their improvement, and verifying that corrective actions have been implemented if faults are found in the procedure;
– analysing the draft financial statements to be submitted to the Board in order, in particular, to verify the clarity of the information provided and to offer an assessment of the relevance and consistency of the accounting methods used to draw up parent company and consolidated financial statements;
– ensuring the independence of Statutory Auditors, in particular by reviewing the breakdown of the fees paid by the Group to them as well as to the network to which they may belong and through prior approval of all assignments that do not fall within the strict framework of a statutory audit of accounts, but which may
458 I 2014 REGISTRATION DOCUMENT I SOCIETE GENERALE GROUP
7 I SHARE, SHARE CAPITAL AND LEGAL INFORMATION I INTERNAL RULES OF THE BOARD OF DIRECTORS
be the consequence of, or a supplement to, the same, all other assignments being prohibited; implementing the procedure for selecting the Statutory Auditors and submitting an opinion to the Board of Directors concerning the appointment or renewal of such as well as their remuneration;
– examining the work program of the Statutory Auditors and more generally ensuring the supervision of account monitoring by the Statutory Auditors;
– offering an assessment of the quality of internal control, in particular the consistency of risk assessment, monitoring and management systems, and proposing additional actions where appropriate. To this end, the Committee is responsible primarily for:
– reviewing the Group’s internal audit program and the Annual Report on internal control drawn up in accordance with banking regulations, as well as formulating an opinion on the organisation and operation of the internal control departments,
– reviewing the follow-up letters sent by the French Banking Commission (Commission bancaire) and issuing an opinion on draft responses to these letters,
– examining the market risk and structural interest rate risk control procedures and being consulted about setting risk limits,
– formulating an opinion on the Group’s global provisioning policy, as well as on specific provisions relating to large sums,
– examining the annual risk assessment and control procedures report drawn up in accordance with the French banking regulations,
– reviewing the policy concerning risk management and off-balance sheet commitment monitoring, in particular in the light of memoranda drafted to this end by the Finance Division, the Risk Division and the Statutory Auditors.
Aside from the persons referred to in Article 6, the Committee may interview, under conditions it shall establish, the Statutory Auditors and the managers in charge of drawing up financial statements, internal control, risk management, compliance and internal audits. The Statutory Auditors shall be invited to the meetings of the Audit, Internal Control and Risk Committee unless the Committee decides otherwise.
It gives the Board of Directors its opinion on the section of the Registration Document dealing with these issues and produces an Annual Activity Report, submitted to the Board for its approval, which is then inserted in the Registration Document.
The Audit, Internal Control and Risk Committee shall consist of at least three Directors appointed by the Board of Directors, who have appropriate financial, accounting, auditing, internal control or risk management expertise. They may not be Chief Executive Officers of the Company, nor linked to the Company or one of its subsidiaries by an employment contract, nor members of the Compensation Committee, except for the Vice-Chairman. At least two-thirds of its members shall be independent according to the definition given in the AFEP-MEDEF Corporate Governance Code. At least one of the independent members must have specific accounting and financial expertise.
Article 10: Conflicts of interestAny Director faced with a conflict of interest, or even a potential conflict of interest, especially when it concerns his role within another company, should inform the Board and abstain from voting on the corresponding resolution.
The Chairman may also request that he does not participate in the deliberating process.
Article 11: Directors’ attendance feesThe global amount of the attendance fee is set at the General Meeting.
The Chairman and Chief Executive Officer does not receive any attendance fees.
The global amount of the attendance fee is divided into two parts: one fixed part equal to one-third of the global amount and one variable part equal to two-thirds.
The Vice-Chairman receives 35% of the fixed part of the annual attendance fee as a special attendance fee, calculated pro-rata to the duration of his mandate over the period.
After allocation of the Vice-Chairman’s share, the fixed part of the attendance fee allocated to the other Directors, calculated pro-rata to the duration of their mandate over the period, is split as follows:
– four shares for the Chairman of the Audit, Internal Control and Risk Committee;
– three shares for the members of the Audit, Internal Control and Risk Committee;
– two shares for the Chairman of the Nomination and Corporate Governance and Compensation Committees;
– one share for the other Directors.
The variable part of the attendance fee is shared between the Directors at the end of the year according to the number of Board meetings or working meetings of the Board and Committee meetings that they have attended. However, meetings of the Compensation Committee and the Nomination and Corporate Governance Committee held on the same day are taken into account as one unit for those who are members of both Committees.
The compensation paid to the Non-Voting Directors for their participation in Board meetings is equal to the attendance fee paid to Directors who are not members of a Committee, according to the terms defined above.
Article 12: Reimbursement of expensesDirectors’ and Non-Voting Directors’ travel, accommodation, meals and assignment-related expenses linked to Board or Committee meetings, the General Meeting of Shareholders or any other meetings associated with the duties of the Board or Committees, are paid for or reimbursed by Societe Generale, upon submission of receipts.
The Company pays for the Vice-Chairman’s office, secretariat and communication expenses in relation with his duties.
The Secretary of the Board of Directors receives and checks these receipts and ensures that the amounts due are paid for by the Company or reimbursed.
Article 13: ConfidentialityEach Director or Non-Voting Director should consider himself bound by professional secrecy with regard to confidential information received in his capacity as Director or Non-Voting Director, and with regard to the opinions expressed by each Board member.
SOCIETE GENERALE GROUP I 2014 REGISTRATION DOCUMENT I 459
DIRECTOR’S CHARTER I SHARE, SHARE CAPITAL AND LEGAL INFORMATION I 7
6 . D I R E C T O R ’ S C H A R T E R * (Updated on 19 April 2011)
Article 1: RepresentationThe Board of Directors represents all shareholders and acts in the best interests of the Company. Each Director represents all the Company’s shareholders, regardless of the manner in which he or she was appointed and should act in all circumstances in the best interests of the company.
Article 2: MissionEach Director undertakes to continuously improve his or her knowledge of the Company and its sector of activity. He or she assumes an obligation of vigilance and circumspection; he or she does not disclose to third parties confidential information which he or she receives, details of debates in which he or she participate or decisions taken until they are made public.
Each Director remains independent in his or her views, decisions and actions under all circumstances.
Each Director undertakes not to seek, nor to accept, any benefits liable to compromise said independence.
Article 3: Knowledge of rights and obligationsWhen a new Director or Non-Voting Director (censeur) is appointed, the Secretary of the Board of Directors provides him with a file containing the Company’s By-laws, the provisions enacted by the Board governing its functioning, and a presentation of the legal principles as regards the responsibilities of Directors. The Secretary of the Board of Directors organizes him or her an informative training course on the Group and its businesses, adapted to his or her specific needs.
Each Director or Non-Voting Director may consult with the Secretary of the Board of Directors, at any time, regarding the scope of these documents and his or her rights and obligations as a Director or Non-Voting Director.
Article 4: Shares held in a personal capacityEach Director, appointed by the General Meeting (in his or her own name or as a permanent representative of a legal entity) must hold at least 1,000 shares or the equivalent. Each Director within a six month time-frame must hold the 600 shares provided for by the by-laws and must increase his or her stake to 1,000 shares within the following six months. Directors in function on 19 April 2011 must hold 1,000 shares by 19 October 2011 at the latest.
Each Director shall refrain from hedging his or her shares.
Article 5: Insider trading rulesEach Director or Non-Voting Director must respect the provisions set out by the French monetary and financial code and the General Regulations of the French Financial Markets Authority (AMF) relating to the communication and the use of insider information, with regard to Societe Generale’s securities as well as the securities of companies on which he or she has insider information.
Directors and Non-Voting Directors shall abstain from carrying out any operations on Societe Generale shares or assimilated securities(1) during the 30 calendar days prior to the publication of Societe Generale’s quarterly, half-yearly and annual results as well as on the date of publication itself.
Directors and Non-Voting Directors shall abstain from carrying out speculative or leveraged transactions in the securities, and, to this end:
– shall conserve the acquired stocks for at least two months as of their date of purchase;
– shall abstain from using financial instruments likely to allow them to carry out speculative transactions. This specifically applies to transactions in derivative instruments.
The same rules apply for dealings in the shares of French or foreign listed companies that are controlled directly or indirectly by Societe Generale as defined in Article L. 233-3 of the French commercial code.
Directors and Non-Voting Directors shall bring any difficulty they may encounter in enforcing this provision to the attention of the Secretary of the Board of Directors.
Article 6: TransparencyThe Directors and Non-Voting Directors of Societe Generale must register all Societe Generale securities which they hold in compliance with article 4 above.
In accordance with Articles L. 621-18-2 of the French monetary and financial code and Articles 223-22 and 223-26 of the General Regulations of the French Financial Markets Authority (AMF) and in compliance with AMF directive No. 2006-05 of 3 February 2006 amended on 23 April 2008, Deputy Chief Executive Officers, Directors, Non-Voting Directors or anyone closely related to them must report all transactions involving the acquisition, disposal, subscription or exchange of Societe Generale shares or any other type of financial instruments linked to Societe Generale shares.
A copy of this declaration is sent to the Secretary of the Board of Directors. These declarations are kept on record by the Corporate Secretary.
* This document does not form part of Societe Generale’s By-laws. It is not enforceable against third-parties. It may not be cited by third-parties or shareholders as evidence against Societe Generale.
(1) Here the term shares is taken to mean, on the one hand, securities giving the buyer the right, however this right may be exercised, to buy or sell Societe Generale shares or to receive a sum calculated by referral to the current share price upon exercising this right; and on the other hand, assets composed primarily of Societe Generale shares or related securities (e.g. units in the E-Fund).
460 I 2014 REGISTRATION DOCUMENT I SOCIETE GENERALE GROUP
7 I SHARE, SHARE CAPITAL AND LEGAL INFORMATION I DIRECTOR’S CHARTER
Article 7: Conflicts of interest – Statement7.1 Each Director or Non-Voting Director shall inform the Board of any existing or potential conflict of interest to which he or she may be directly or indirectly exposed. He or she shall refrain from participating in any discussion and voting on such matters.
7.2 Each Director or Non-Voting Director also informs the Chairman of the Nominations Committee of his or her intention to accept a new mandate in a listed company not belonging to the group in which he or she is an Executive Officer. This is to allow the Board of Directors, on the Nominations Committee’s proposal, if necessary, to decide that such appointment is incompatible with the mandate of Director of Societe Generale.
7.3 Each Director or Non-Voting Director informs the Chairman of the Board of Directors of any conviction for involvement in fraud, of any criminal charges and/or public sanction, and about any ban from managing or administering pronounced against him or her, as well as of any bankruptcy, sequestration or liquidation proceeding in which he or she would have been associated.
7.4 Each Director or Non-Voting Director signs a sworn statement declaring whether or not he or she has been involved in the above mentioned cases in 7.1 and 7.3 hereabove. This sworn statement is required i) upon taking his or her role, ii) every year on the request of the Secretary of the Board of Directors at the time of the preparation of the Registration Document, iii) at any time on the request of the Secretary of the Board of Directors, and iv) within ten working days following any event rendering the previous statement partially or totally inaccurate.
Article 8: Regular attendanceEach Director or Non-Voting Director shall dedicate the time needed to fulfill his duties. He or she shall respect the principles laid down by the AFEP-MEDEF Corporate Governance Code and the French commercial code as regards multiple mandates.
In the event that a Director or Non-Voting Director accepts a new Directorship or changes his or her professional responsibilities, he or she shall inform the Board within 10 working days as from the acceptance of the new mandate or the change of professional responsibilities.
He or she makes a commitment to put his or her mandate at the Board’s disposal in case of significant change in his or her professional responsibilities and mandates.
He or she commits himself or herself to resign from his or her mandate if he or she is no longer capable of performing his or her office within the Board and Committees of which he or she is member.
The Annual Report shall indicate the rate of attendance of the Directors at Board meetings and Committee meetings.
Each Director shall strive to attend the General Meetings of Shareholders.
SOCIETE GENERALE GROUP I 2014 REGISTRATION DOCUMENT I 461
LIST OF REGULATED INFORMATION PUBLISHED IN THE LAST 12 MONTHS I SHARE, SHARE CAPITAL AND LEGAL INFORMATION I 7
7 . L I S T O F R E G U L AT E D I N F O R M AT I O N P U B L I S H E D I N T H E L A S T 1 2 M O N T H S *
PRESS RELEASES PUBLISHED UNDER REGULATED INFORMATION
n 6/2/2013 – Societe Generale announces the closing of the sale of TCW
n 13/2/2013 – New phase in the transformation: organisation changes and appointments
n 13/2/2013 – 2012 dividend payment procedures
n 28/3/2013 – Closing of the sale of the stake in National Societe Generale Bank (NSGB)
n 9/4/2013 – Pillar 3 Report
n 9/4/2013 – Updated Pillar 3 Report
n 30/4/2013 – 2012 Remuneration Policies and Practices Report
n 22/5/2013 – Annual General Meeting and Board of Directors
n 19/6/2013 – 65% of the 2012 dividend will be paid in new shares
n 12/7/2013 – New share capital
n 29/8/2013 – Successful subordinated hybrid Tier 1 issue
n 9/9/2013 – Update of Q2 13 financial information: publication of the Basel 3 leverage ratio
n 19/9/2013 – Communication of the Board of Directors
n 7/10/2013 – Societe Generale signs a framework agreement with VTB to strengthen its position in Rosbank
n 7/11/2013 – Societe Generale’s projected acquisition of Newedge to provide an integrated client offer from market activities to post-trade activities
n 16/12/2013 – EBA transparency exercise publication
REGISTRATION DOCUMENTS AND UPDATES – ANNUAL FINANCIAL REPORT
n 4/3/2013 – 2013 Registration Document
n 4/3/2013 – Annual Financial Report
n 13/5/2013 – Update of the 2013 Registration Document
n 13/7/2013 – First update of the 2013 Registration Document
n 2/8/2013 – Second update of the 2013 Registration Document
n 8/11/2013 – Third update of the 2013 Registration Document
HALF-YEARLY FINANCIAL REPORT n 2/8/2013 – Half-Yearly Financial Report
n QUARTERLY FINANCIAL INFORMATION
n 13/2/2013 – 4th quarter and 2012 results
n 7/5/2013 – Q1 13
n 1/8/2013 – Q2 13
n 7/11/2013 – Q3 13
n 12/2/2014 – 4th quarter and 2013 results
MONTHLY DECLARATIONS ON THE TOTAL NUMBER OF VOTING RIGHTS AND SHARES
n 12 declaration forms
DESCRIPTION OF THE BUYBACK PROGRAMMES AND LIQUIDITY CONTRACT OVERVIEWS
n 8/1/2013 – Declaration on the liquidity contract overview
n 16/5/2013 – Description of the share buyback programme
n 2/7/2013 – Declaration on the liquidity contract overview
n 9/1/2014 – Declaration on the liquidity contract overview
REPORTS ON CORPORATE GOVERNANCE AND INTERNAL CONTROL AND RISK MANAGEMENT PROCEDURES
n 4/3/2013 – Publication of the Report on corporate governance and internal control and risk management procedures
STATUTORY AUDITORS’ FEES n 4/5/2013 – Press Release
REGULATED INFORMATION RELEASES ON PROVISION OR CONSULTATION OF INFORMATION RELATIVE TO GENERAL SHAREHOLDERS’ MEETINGS
n 22/4/2013 – Provision or consultation of information relative to the Ordinary Shareholders’ Meeting of 22 May 2013
REGULATED INFORMATION RELEASES SETTING OUT THE ARRANGEMENTS FOR PROVISION OF PROSPECTUSES
n 16/4/2013 – Information document: capital increase reserved for employees
* More detailed information available on www.societegenerale.com in the “Regulated information” section under “Measuring our Performance”.

462 I 2014 REGISTRATION DOCUMENT I SOCIETE GENERALE GROUP
SOCIETE GENERALE GROUP I 2014 REGISTRATION DOCUMENT I 463
8P E R S O N R E S P O N S I B L E F O R
T H E R E G I S T R AT I O N D O C U M E N T
1. Person responsible for the Registration Document ....................................464
2. Statement of the person responsible for the Registration Document and the annual financial report.........................464
3. Person responsible for the audit of the financial statements ......................................465Statutory auditors �������������������������� 465Substitute statutory auditors �������������������� 465
8 I PERSON RESPONSIBLE FOR THE REGISTRATION DOCUMENT I STATEMENT OF THE PERSON RESPONSIBLE
FOR THE REGISTRATION DOCUMENT AND THE ANNUAL FINANCIAL REPORT
464 I 2014 REGISTRATION DOCUMENT I SOCIETE GENERALE GROUP
1 . P E R S O N R E S P O N S I B L E F O R T H E R E G I S T R AT I O N D O C U M E N T
Mr. Frédéric Oudéa
Chairman and Chief Executive Officer of Societe Generale.
2. STATEMENT OF THE PERSON RESPONSIBLE FOR THE REGISTRAT ION DOCUMENT AND THE ANNUAL F INANCIAL REPORT
I hereby declare, after taking all reasonable measures for this purpose and to the best of my knowledge, that the information contained in this Registration Document is in accordance with the facts and that it makes no omission likely to affect its meaning.
I certify, to the best of my knowledge, that the accounts have been prepared in accordance with applicable accounting standards and are a fair reflection of the assets, liabilities, financial position and profit or loss of the Company and all the undertakings included in the consolidation scope, and that the Management Report (the cross-reference table of the annual financial statement in Chapter 9 indicates the contents of said report) presents a fair view of the Company’s business, performance and financial position and that of all the undertakings included in the consolidation scope, as well as a description of the main risks and uncertainties to which they are exposed.
I have received a completion letter from the Statutory Auditors stating that they have audited the information contained in this Registration Document about the Company’s financial position and accounts and that they have read this document in its entirety.
The historical financial data presented in this Registration Document has been discussed in the Statutory Auditors’ reports found on pages 376 to 377 and 434 to 435 herein and those enclosed for reference for the financial years 2011 and 2012, found respectively on pages 363 to 364 and 426 to 427 of the 2012 Registration Document and on pages 385 to 386 and 446 to 447 of the 2013 Registration Document. The Statutory Auditors’ reports on the consolidated financial statements 2013 and on the 2012 parent company financial statements contain observations.
Paris, 4 March 2014
Chairman and Chief Executive Officer Frédéric Oudéa
SOCIETE GENERALE GROUP I 2014 REGISTRATION DOCUMENT I 465
PERSON RESPONSIBLE FOR THE AUDIT OF THE FINANCIAL STATEMENTS I PERSON RESPONSIBLE
FOR THE REGISTRATION DOCUMENT I 8
3 . P E R S O N R E S P O N S I B L E F O R T H E A U D I T O F T H E F I N A N C I A L S TAT E M E N T S
STATUTORY AUDITORSName: Société Ernst & Young et Autres
represented by Ms. Isabelle Santenac
Address: 1-2, place des Saisons 92400 Courbevoie – Paris-La Défense 1
Date of appointment: 22 May 2012
Term of office: six financial years
End of current term of office: at the close of the Ordinary General Meeting which will approve the financial statements for the year ended 31 December 2017.
Name: Société Deloitte et Associés represented by Mr. Jean-Marc Mickeler
Address: 185, avenue Charles-de-Gaulle 92524 Neuilly-sur-Seine cedex
Date of first appointment: 18 April 2003
Date of renewal: 22 May 2012
Term of office: six financial years
End of current term of office: at the close of the Ordinary General Meeting which will approve the financial statements for the year ended 31 December 2017.
SUBSTITUTE STATUTORY AUDITORSName: Société Picarle et Associés
Address: 1-2, place des Saisons 92400 Courbevoie – Paris-La Défense 1
Date of appointment: 22 May 2012
Term of office: six financial years
Name: Société BEAS
Address: 7-9 Villa Houssay 92200 Neuilly-sur-Seine
Date of appointment: 22 May 2012
Term of office: six financial years
Ernst & Young et Autres and Deloitte et Associés are registered as Statutory Auditors with the Compagnie régionale des Commissaires aux comptes de Versailles.

466 I 2014 REGISTRATION DOCUMENT I SOCIETE GENERALE GROUP

SOCIETE GENERALE GROUP I 2014 REGISTRATION DOCUMENT I 467
9C R O S S R E F E R E N C E
TA B L E S
Registration Document cross reference table ...................................................................468Annual financial report and management report cross reference table ...................................................................470Cross reference table of Pillar 3 report .....................................................................................471Cross reference table with the recommendations made by the enhanced disclosure task force ...................473CSR concordance table (Article 225 - Grenelle II) .........................................................475
9 I CROSS REFERENCE TABLES I REGISTRATION DOCUMENT CROSS REFERENCE TABLE
468 I 2014 REGISTRATION DOCUMENT I SOCIETE GENERALE GROUP
REGISTRATION DOCUMENT CROSS REFERENCE TABLE
Subject Page in the Registration Document
1. PERSONS RESPONSIBLE FOR THE REGISTRATION DOCUMENT 464
2. STATUTORY AUDITORS 436 ; 465
3. SELECTED FINANCIAL INFORMATION
3.1. Selected historical financial information on the issuer for each financial year key figures p. 5
3.2. Selected financial information for interim periods NA
4. RISK FACTORS 56 ; 107-120 ; 124-213
5. INFORMATION ABOUT THE ISSUER
5.1. History and development of the Company 4 ; 448
5.2. Investments 54
6. BUSINESS OVERVIEW 22
6.1. Principal activities 5 ; 46-48
6.2. Principal markets 5-22 ; 372-375
6.3. Exceptional factors NA
6.4. Dependence of the issuer on patents or licences, industrial, commercial or financial contracts or new manufacturing processes NA
6.5. The basis for statements made by the issuer regarding its competitive position Contents
7. ORGANISATIONAL STRUCTURE
7.1. Brief description of the Group 5 ; 22-23
7.2. List of significant subsidiaries 27-45 ; 366-371 ; 424-433
8. PROPERTY, PLANT AND EQUIPMENT
8.1. Material tangible fixed assets (existing or planned) 55 ; 326
8.2. Environmental issues that may affect the issuer’s utilisation of the tangible fixed assets 216-261
9. OPERATING AND FINANCIAL REVIEW
9.1. Financial condition 49-53
9.2. Operating results 24-45
10. CAPITAL RESOURCES
10.1. Information on the issuer’s capital resources 266-272
10.2. Sources and amounts of the issuer’s cash flow 273
10.3. Information on the issuer’s borrowing requirements and funding structure 51-53
10.4. Information regarding any restrictions for the use of capital resources that have materially affected, or could materially affect, the issuer’s operations 449
10.5. Information regarding the anticipated sources of funds needed to fulfil commitments referred to in items 5.2.3 and 8.1 52-53 ; 55
11. RESEARCH AND DEVELOPMENT, PATENTS AND LICENCES NA
12. TREND INFORMATION 57-58
13. PROFIT FORECASTS OR ESTIMATES NA
14. ADMINISTRATIVE, MANAGEMENT AND SUPERVISORY BODIES AND GENERAL MANAGEMENT
14.1. Board of Directors and General Management 60-81
14.2. Administrative bodies’ and General Management’s conflicts of interests 69
REGISTRATION DOCUMENT CROSS REFERENCE TABLE I CROSS REFERENCE TABLES I 9
SOCIETE GENERALE GROUP I 2014 REGISTRATION DOCUMENT I 469
Page No.
15. REMUNERATION AND BENEFITS
15.1. Amount of remuneration paid and benefits in kind 82-104
15.2. Total amounts set aside or accrued by the issuer to provide pension, retirement or similar benefits 365
16. BOARD PRACTICES
16.1. Date of expiration of the current term of office 61-66
16.2. Members of the administrative bodies’ service contracts with the issuer NA
16.3. Information about the issuer’s Audit Committee and Remuneration Committee 77-79
16.4. Statement as to whether or not the issuer complies with the corporate governance regime 71
17. EMPLOYEES
17.1. Number of employees 234-246
17.2. Shareholdings and stock options awarded to directors 61-66 ; 82-104
17.3. Arrangements for involving employees in the capital of the issuer 243
18. MAJOR SHAREHOLDERS
18.1. Shareholders owning more than 5% of capital or voting rights 444-445
18.2. Different voting rights held by the major shareholders 444-445 ; 449
18.3. Control of the issuer 444-445
18.4. Arrangements known to the issuer, the operation of which may at a subsequent date result in a change in control of the issuer NA
19. RELATED PARTY TRANSACTIONS 105-106 ; 365 ; 424-433
20. FINANCIAL INFORMATION CONCERNING THE ASSETS AND LIABILITIES, FINANCIAL POSITION AND PROFITS AND LOSSES OF THE ISSUER
20.1. Historical financial information 266-375 ; 380-433 ; 469
20.2. Pro forma financial information NA
20.3. Financial statements 266-375 ; 380-433
20.4. Auditing of historical annual financial information 121-122 ; 376-377 ; 434-435
20.5. Age of latest financial information 266 ; 380
20.6. Interim financial information NA
20.7. Dividend policy 438-441
20.8. Legal and arbitration proceedings 202-204
20.9. Significant changes in the issuer’s financial or trading position 56
21. ADDITIONAL INFORMATION
21.1. Share capital 442-449
21.2. Memorandum and by-laws 450-454
22. MATERIAL CONTRACTS 55
23. THIRD-PARTY INFORMATION AND STATEMENTS BY EXPERTS AND DECLARATIONS OF ANY INTEREST NA
24. DOCUMENTS ON DISPLAY 449
25. INFORMATION ON HOLDINGS 22-23 ; 366-371 ; 424-433
In accordance with the requirements of Article 28 of EC regulation No. 809/2004 dated 29 April 2004, the following elements are enclosed for reference purposes:
n the parent company and consolidated financial statements for the year ended 31 December 2012, the related Statutory Auditors’ report and the Group Management Report presented respectively on pages 387 to 445 and 270 to 384, pages 446 to 447 and 385 to 386 and pages 37 to 74 of the Registration Document D. 13-0101 submitted to the AMF on 4 March 2013;
n the parent company and consolidated financial statements for the year ended 31 December 2011, the related Statutory Auditors’ report and the Group Management Report presented respectively on pages 365 to 425, pages 246 to 362, pages 426 to 427 and 363 to 364 and pages 37 to 74 of the Registration Document D.12-0125 submitted to the AMF on 2 March 2012;
The chapters of the Registration Documents D. 13-0101 and D. 12-0125 not mentioned above do not apply to investors or are covered in another part of the present document.
9 I CROSS REFERENCE TABLES I ANNUAL FINANCIAL REPORT AND MANAGEMENT REPORT CROSS REFERENCE TABLE
470 I 2014 REGISTRATION DOCUMENT I SOCIETE GENERALE GROUP
ANNUAL FINANCIAL REPORT AND MANAGEMENT REPORT CROSS REFERENCE TABLE
In application of Article 222-3 of the AMF’s General Regulations, the annual financial report referred to in paragraph 1 of Article 451-1-2 of the French Monetary and Financial Code contains the information described in the following pages of the Registration Document:
Annual financial report Page No.
Statement of the person responsible for the Registration Document 464
Management report
Analysis of results, financial condition and parent company and consolidated Group risks and list of authorisations to increase the share capital (Article L. 225-100 and L. 225-100-2 of the French Commercial Code)
5-19 ; 24-45 ; 49-50 ; 57-58 ; 124-213 ; 234-236 ; 317 ; 446-447
Information required by Article L. 225-100-3 of the French Commercial Code relating to factors likely to affect the outcome of a public offer 445
Information about share buybacks (Article L. 225-211, paragraph 2, of the French Commercial Code) 443-444
Financial statements
Annual financial statements 380-433
Statutory Auditors’ report on the annual financial statements 434-435
Consolidated financial statements 266-375
Statutory Auditors’ report on the consolidated financial statements 376-377
CROSS REFERENCE TABLE OF PILLAR 3 REPORT I CROSS REFERENCE TABLES I 9
SOCIETE GENERALE GROUP I 2014 REGISTRATION DOCUMENT I 471
CROSS REFERENCE TABLE OF PILLAR 3 REPORT
CRD Disclosure Requirements Reference*
Scope of consolidation
(a) Name of the consolidating entity;(b) Differences between accounting and prudential accounting,
brief description of the entities that are:(i) fully consolidated;(ii) proportionally consolidated;(iii) deducted from capital; or(iv) neither consolidated nor deducted;
(c) Practical or legal impediments to the prompt transfer of capital or other commitments of the parent to its subsidiaries;
(d) The aggregate amount of the gap and the names of subsidiaries whose capital falls short of requirements; and
(e) Where applicable, the circumstances of making use of the provisions laid down in Articles 69 and 70.
(a) p. 448(b) Summary descriptions of subsidiaries: note 46 to the
financial statements; Scope changes: Chapter 4, table 1 to 3 (i) and (ii)
Chapter 4, section 3, table 1. (iii) deducted companies: insurance companies: chapter 4, section 3, table 6, companies consolidated using the equity method: chapter 4, section 3, table 1 (iv) Other subsidiaries excluded; chapter 4, section 3, table 3
(c) (d) (e) Information not published for confidentiality reasons.
Capital
(a) Summary information regarding the composition of capital.(b) Reconciliation of accounting and prudential capital.(c) The total amount of additional capital.(d) Deductions.(e) Total eligible capital.
All information contained in chapter 4, section 3 of this Registration Document, page 140.(a) Description and tables page 142 and following(b) Table 6(c) Tables 4 and 5(d) Tables 6 and 8(e) Tables 4, 5, 6 and details on Tier 2 issuance available in
note 16 to the parent company’s financial statements, page 406; note 28 page 344.
Securitisation
(a) Description of Group’s securitisation activity.(b) The nature of other risks including liquidity risk inherent in securitised assets.(c) Risks in terms of seniority of tranches held and the re-securitisation processes.(d) Roles of the establishment in the securitisation process.(e) Additional information related to (d).(f) Description of processes in place to monitor credit and market risk. (g) Portfolio hedging principles. (h) Approaches to calculating risk weighted exposure amounts.(i) Type of vehicles used for securitisation(j) Accounting methods(k) Use of rating agencies(l) Description of IAA models(m) Qualitative explanations(n) For both the banking book and the trading book, information by type of exposure:
(i) total securitisation outstandings (standard and synthetic securitisation) and securitisation for which the Group is the sponsor;(ii) positions held on the balance sheet and off balance sheet commitments(iii) positions held on outstandings awaiting securitisation(iv)securitised facilities subject to the early amortisation treatment(v) securitisations deducted from capital or risk-weighted at 1,250%;(vi) Summary of securitisation activity over past financial year;
(o) For both the banking trading activity:(i) total amount of securitisation held of acquired and related capital needs;(ii) Amount of re-securitisations and classification based on quality of counterparties.
(p) Information on outstandings in arrears(q) For the trading portfolio, total securitised exposures subject to capital requirements
for market risk, broken down by synthetic and standard securitisations by type of exposure.
All required information contained in chapter 4, section 5, p. 161 and following, barring exceptions below:
(f) (g) Credit and market risks monitored in accordance with Group rules and procedures (See chapter 4, sections 4 and 6, respectively p. 151 and 174)
(n) (iv) Not applicable.
* References refer to sections in this Registration Document. Except when stated otherwise, references to notes to the financial statements regarding the Group’s consolidated financial statements.
9 I CROSS REFERENCE TABLES I CROSS REFERENCE TABLE OF PILLAR 3 REPORT
472 I 2014 REGISTRATION DOCUMENT I SOCIETE GENERALE GROUP
Remuneration
The complete remuneration report will be published with the first update of the Registration Document. Information on the Remuneration Committee and general principles governing the link between risk and remuneration are described on pages 79 and 110.
Market risk
(a) For each portfolio covered:(i) the characteristics of the models used;(ii) for the capital charges in accordance with points 5a and 5l of Annex V to Directive 2006/49/EC, the methodologies used and the risks measured through the use of an internal model to determine liquidity horizons, the methodologies used to achieve a capital assessment that is consistent with the required soundness standard and the approach used in the valuation of the model;(iii) a description of stress testing;(iv) a description of the approaches used for back-testing and validating models.
(b) the review scope of the competent authority.(c) a description of the extent and methodologies for compliance with the
requirements set out in Part B of Annex VII to Directive 2006/49/EC.(d) the highest, the lowest and the mean of VaR at close of period, stressed VaR, IRC
and CRM.(e) Average liquidity horizon used under an internal model for each sub-portfolio
covered, in accordance with points 5a and 5l of Annex V to Directive 2006/49/EC.(f) Comparison between VAR and daily result.
All required information is contained in section 6 of Chapter 4 of this Registration Document, page 174 and following, except where mentioned to the contrary. The following information is not described in this chapter:- The breakdown by risk factor of capital charges using
internal models (the breakdown of VaR by risk factor before netting effect having nevertheless been prodide, p. 177);
- The descriptions by portfolio of methodologies used for i) internal models, ii) stress tests, and iii) backtesting, insofar as the general principles of these models, which applies to all asset classes and to sub-portfolios, are already covered in a general description.
IRB Approach
Detailed information regarding the IRB approach will be published in March, and included in the first update of the Registration Document. The information summarising the approach related to credit risk are included in Chapter 4 of this Registration Document.
Equity risk
(c) for credit institutions calculating the risk-weighted exposure amounts in accordance with Articles 84 to 89, 8% of weighted exposures for each of the exposure categories pursuant to Article 86. For exposures to retail customers, this requirement applies to each exposure category to which all correlations set out in Annex VII, part 1, points 10 to 13, correspond.For equity exposures, this requirement applies:
i) to each approach set out in Annex VII, part 1, points 17 to 26;ii) to exposures to listed equities, to private equity exposures belonging to a sufficiently-diversified portfolio, and to other exposures;iii) to exposures subject to a transitional prudential framework in terms of capital requirements; andiv) to exposures subject to a grandfather clause in terms of capital requirements;
d) minimum capital requirements calculated in accordance with Article 75, points b) and c); and
e) minimum requirements of capital calculated in accordance with Article 103 to 105, which were published separately.
Information available in Chapter 4 – Other risks – equity risks, p. 205.
CROSS REFERENCE TABLE WITH THE RECOMMENDATIONS MADE BY THE ENHANCED DISCLOSURE TASK FORCE I CROSS REFERENCE TABLES I 9
SOCIETE GENERALE GROUP I 2014 REGISTRATION DOCUMENT I 473
CROSS REFERENCE TABLE WITH THE RECOMMENDATIONS MADE BY THE ENHANCED DISCLOSURE TASK FORCE
Recommendation Details Page
Definition of main terms used Glossary of main terms used Definitions included in relevant chapter
477
Risks and Outlook Key figures Types of risks Risk factors Recent developments and outlook
124-125126127
6 ; 57
Regulatory changes and new benchmark ratios
Non fully-loaded Basel 3 capital ratio Additional capital requirements for SIFIs Leverage ratio LCR NSFR
149150
150; 6193-194193-194
Risk governance Group corporate governance principles (condensed chart) Chairman’s report on corporate governance Chairman’s report on internal control and risk management Risk management principles (condensed chart) Credit risk Market risk Operational risk
6071
107135151174181
Risk culture Organisation and governance of risk management structure The Enterprise Risk Management programme
135137
Key figures of business lines Group key figures Description of business lines Risk key figures
59
124-125
Stress test structure General description Credit stress tests Market risk stress tests
138152178
Capital requirements Capital requirements by type of risk 147
Reconciliation of accounting and prudential data
Reconciliation of accounting and prudential balance sheets Reconciliation of accounting and prudential capital
141145
Change in prudential capital Capital reconciliation chart Table
52146
Information on change in prudential capital Qualitative assessment, adding to detailed tables 149
Breakdown of weighted outstandings by core business
Graphic Additional information in the analyses by type of risk (credit, market, operational, etc.)
125
Table of RWA by calculation method Group’s RWA 147
Table of credit risks by Basel portfolio Information published in the first update of the 2014 Registration Document -
Analysis of changes in RWA and capital needs
Credit risk table (summary) Market risk table (summary) Market risk table (VAR by type of risk and change in capital requirements)
147-148147-148177; 180
Back testing Credit risk Market risk
156175
Liquidity buffer Qualitative and quantitative assessment Methodology
19344
Refinancing Collateralised financing (exc. repurchase agreements and securities lending/borrowing)
193
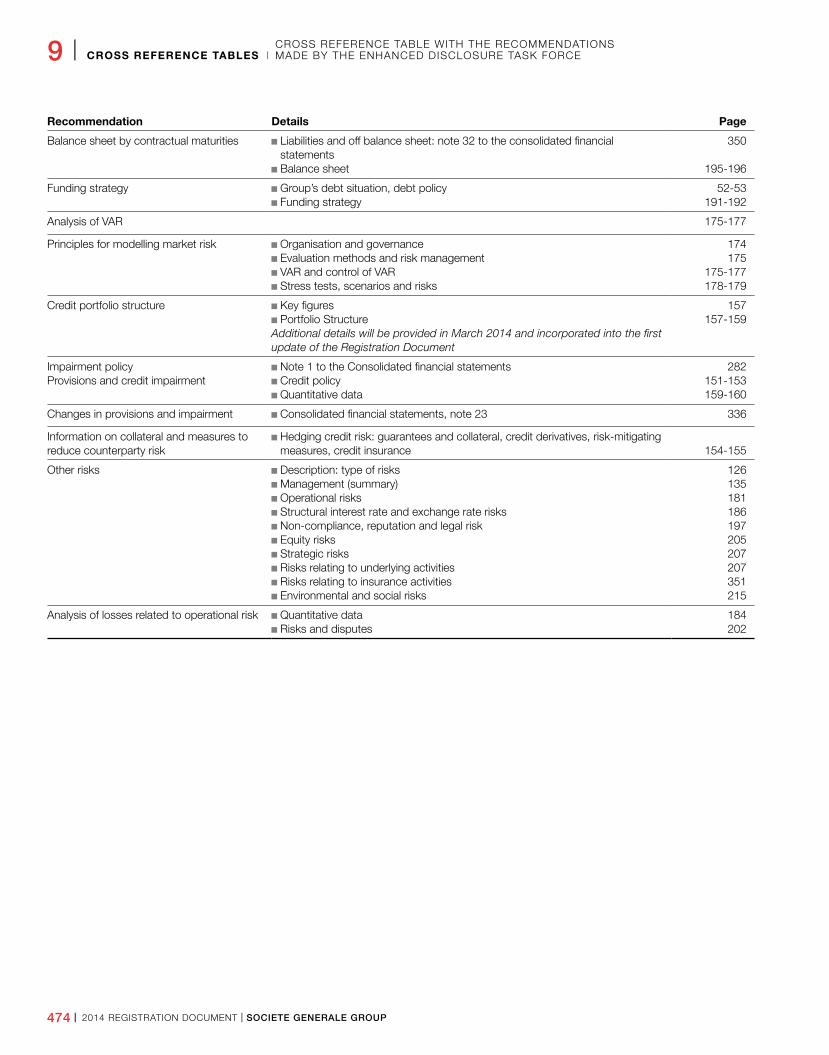
9 I CROSS REFERENCE TABLES ICROSS REFERENCE TABLE WITH THE RECOMMENDATIONS MADE BY THE ENHANCED DISCLOSURE TASK FORCE
474 I 2014 REGISTRATION DOCUMENT I SOCIETE GENERALE GROUP
Recommendation Details Page
Balance sheet by contractual maturities Liabilities and off balance sheet: note 32 to the consolidated financial statements
Balance sheet
350
195-196
Funding strategy Group’s debt situation, debt policy Funding strategy
52-53191-192
Analysis of VAR 175-177
Principles for modelling market risk Organisation and governance Evaluation methods and risk management VAR and control of VAR Stress tests, scenarios and risks
174175
175-177178-179
Credit portfolio structure Key figures Portfolio Structure
Additional details will be provided in March 2014 and incorporated into the first update of the Registration Document
157157-159
Impairment policyProvisions and credit impairment
Note 1 to the Consolidated financial statements Credit policy Quantitative data
282151-153159-160
Changes in provisions and impairment Consolidated financial statements, note 23 336
Information on collateral and measures to reduce counterparty risk
Hedging credit risk: guarantees and collateral, credit derivatives, risk-mitigating measures, credit insurance 154-155
Other risks Description: type of risks Management (summary) Operational risks Structural interest rate and exchange rate risks Non-compliance, reputation and legal risk Equity risks Strategic risks Risks relating to underlying activities Risks relating to insurance activities Environmental and social risks
126135181186197205207207351215
Analysis of losses related to operational risk Quantitative data Risks and disputes
184202
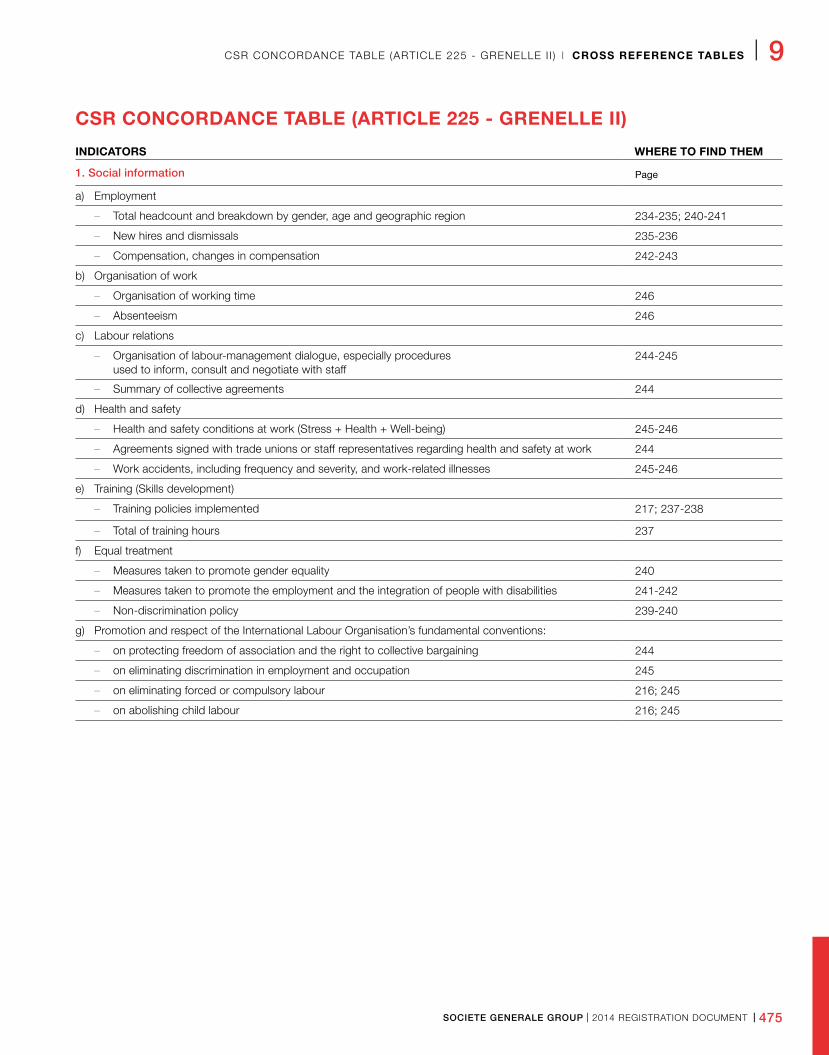
CSR CONCORDANCE TABLE (ARTICLE 225 - GRENELLE I I ) I CROSS REFERENCE TABLES I 9
SOCIETE GENERALE GROUP I 2014 REGISTRATION DOCUMENT I 475
CSR CONCORDANCE TABLE (ARTICLE 225 - GRENELLE II)
INDICATORS WHERE TO FIND THEM
1. Social information Page
a) Employment
– Total headcount and breakdown by gender, age and geographic region 234-235; 240-241
– New hires and dismissals 235-236
– Compensation, changes in compensation 242-243
b) Organisation of work
– Organisation of working time 246
– Absenteeism 246
c) Labour relations
– Organisation of labour-management dialogue, especially procedures used to inform, consult and negotiate with staff
244-245
– Summary of collective agreements 244
d) Health and safety
– Health and safety conditions at work (Stress + Health + Well-being) 245-246
– Agreements signed with trade unions or staff representatives regarding health and safety at work 244
– Work accidents, including frequency and severity, and work-related illnesses 245-246
e) Training (Skills development)
– Training policies implemented 217; 237-238
– Total of training hours 237
f) Equal treatment
– Measures taken to promote gender equality 240
– Measures taken to promote the employment and the integration of people with disabilities 241-242
– Non-discrimination policy 239-240
g) Promotion and respect of the International Labour Organisation’s fundamental conventions:
– on protecting freedom of association and the right to collective bargaining 244
– on eliminating discrimination in employment and occupation 245
– on eliminating forced or compulsory labour 216; 245
– on abolishing child labour 216; 245
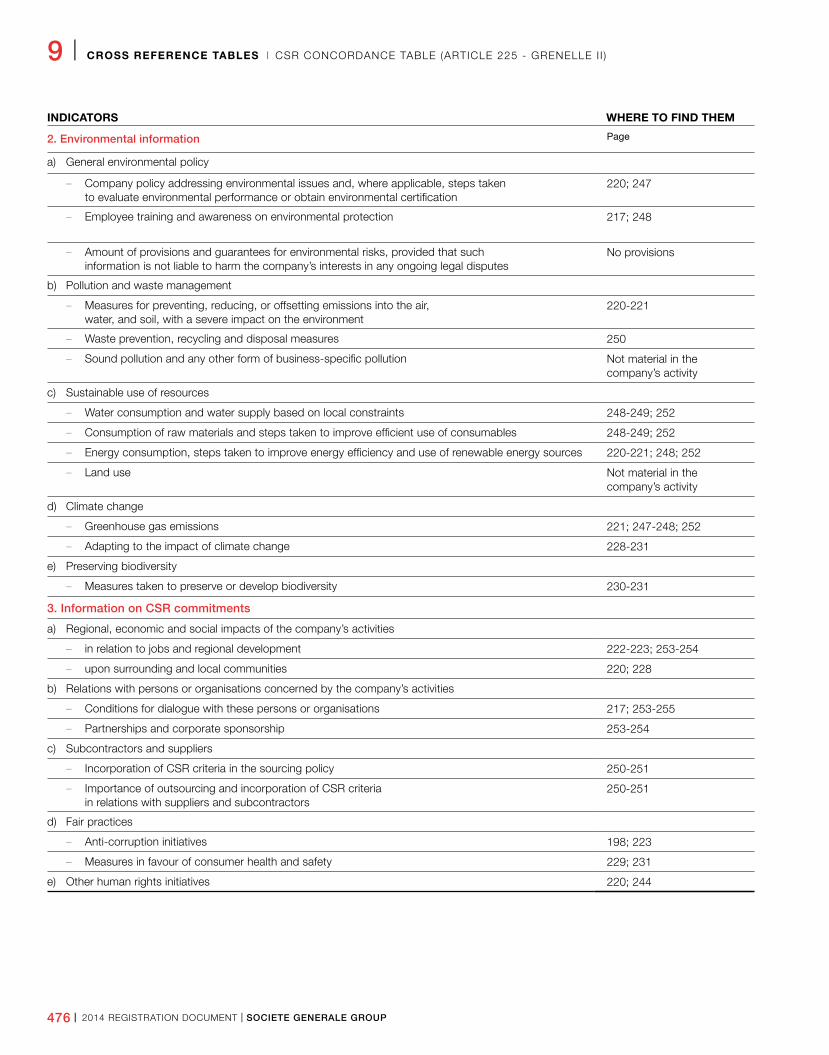
9 I CROSS REFERENCE TABLES I CSR CONCORDANCE TABLE (ARTICLE 225 - GRENELLE I I )
476 I 2014 REGISTRATION DOCUMENT I SOCIETE GENERALE GROUP
INDICATORS WHERE TO FIND THEM
2. Environmental information Page
a) General environmental policy
– Company policy addressing environmental issues and, where applicable, steps taken to evaluate environmental performance or obtain environmental certification
220; 247
– Employee training and awareness on environmental protection 217; 248
– Amount of provisions and guarantees for environmental risks, provided that such information is not liable to harm the company’s interests in any ongoing legal disputes
No provisions
b) Pollution and waste management
– Measures for preventing, reducing, or offsetting emissions into the air, water, and soil, with a severe impact on the environment
220-221
– Waste prevention, recycling and disposal measures 250
– Sound pollution and any other form of business-specific pollution Not material in the company’s activity
c) Sustainable use of resources
– Water consumption and water supply based on local constraints 248-249; 252
– Consumption of raw materials and steps taken to improve efficient use of consumables 248-249; 252
– Energy consumption, steps taken to improve energy efficiency and use of renewable energy sources 220-221; 248; 252
– Land use Not material in the company’s activity
d) Climate change
– Greenhouse gas emissions 221; 247-248; 252
– Adapting to the impact of climate change 228-231
e) Preserving biodiversity
– Measures taken to preserve or develop biodiversity 230-231
3. Information on CSR commitments
a) Regional, economic and social impacts of the company’s activities
– in relation to jobs and regional development 222-223; 253-254
– upon surrounding and local communities 220; 228
b) Relations with persons or organisations concerned by the company’s activities
– Conditions for dialogue with these persons or organisations 217; 253-255
– Partnerships and corporate sponsorship 253-254
c) Subcontractors and suppliers
– Incorporation of CSR criteria in the sourcing policy 250-251
– Importance of outsourcing and incorporation of CSR criteria in relations with suppliers and subcontractors
250-251
d) Fair practices
– Anti-corruption initiatives 198; 223
– Measures in favour of consumer health and safety 229; 231
e) Other human rights initiatives 220; 244
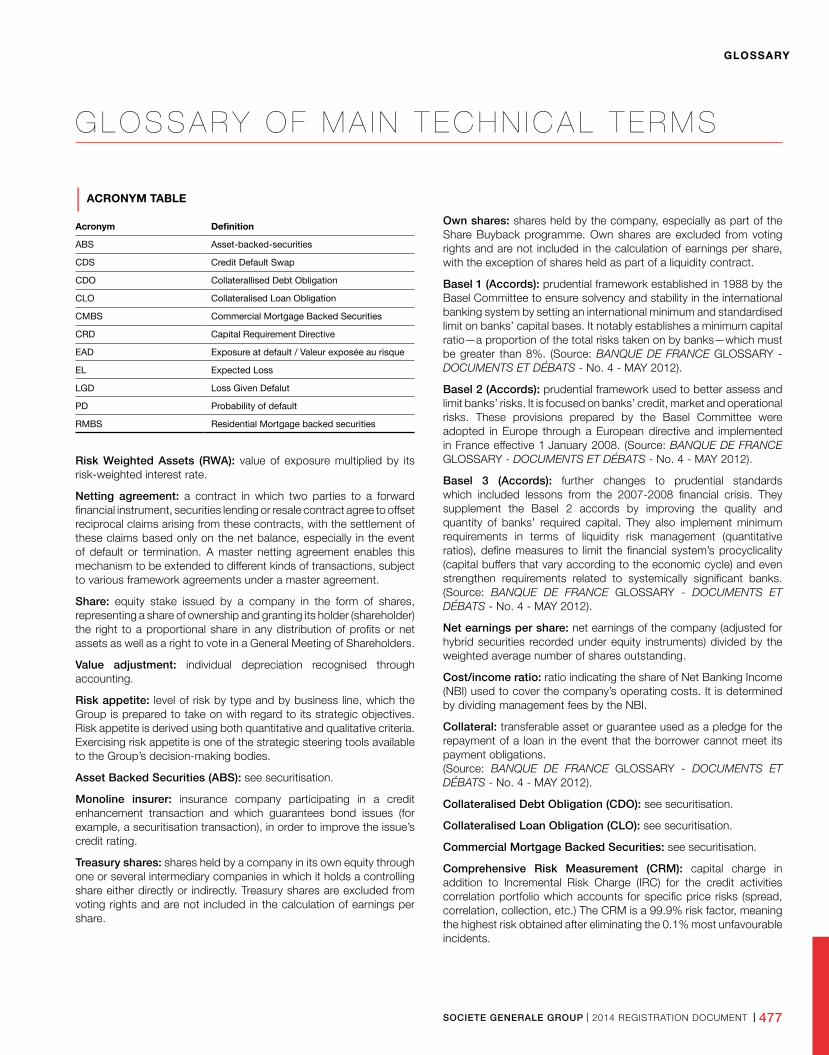
GLOSSARY
SOCIETE GENERALE GROUP I 2014 REGISTRATION DOCUMENT I 477
G L O S S A R Y O F M A I N T E C H N I C A L T E R M S
| ACRONYM TABLE
Acronym Definition
ABS Asset-backed-securities
CDS Credit Default Swap
CDO Collaterallised Debt Obligation
CLO Collateralised Loan Obligation
CMBS Commercial Mortgage Backed Securities
CRD Capital Requirement Directive
EAD Exposure at default / Valeur exposée au risque
EL Expected Loss
LGD Loss Given Defalut
PD Probability of default
RMBS Residential Mortgage backed securities
Risk Weighted Assets (RWA): value of exposure multiplied by its risk-weighted interest rate.
Netting agreement: a contract in which two parties to a forward financial instrument, securities lending or resale contract agree to offset reciprocal claims arising from these contracts, with the settlement of these claims based only on the net balance, especially in the event of default or termination. A master netting agreement enables this mechanism to be extended to different kinds of transactions, subject to various framework agreements under a master agreement.
Share: equity stake issued by a company in the form of shares, representing a share of ownership and granting its holder (shareholder) the right to a proportional share in any distribution of profits or net assets as well as a right to vote in a General Meeting of Shareholders.
Value adjustment: individual depreciation recognised through accounting.
Risk appetite: level of risk by type and by business line, which the Group is prepared to take on with regard to its strategic objectives. Risk appetite is derived using both quantitative and qualitative criteria. Exercising risk appetite is one of the strategic steering tools available to the Group’s decision-making bodies.
Asset Backed Securities (ABS): see securitisation.
Monoline insurer: insurance company participating in a credit enhancement transaction and which guarantees bond issues (for example, a securitisation transaction), in order to improve the issue’s credit rating.
Treasury shares: shares held by a company in its own equity through one or several intermediary companies in which it holds a controlling share either directly or indirectly. Treasury shares are excluded from voting rights and are not included in the calculation of earnings per share.
Own shares: shares held by the company, especially as part of the Share Buyback programme. Own shares are excluded from voting rights and are not included in the calculation of earnings per share, with the exception of shares held as part of a liquidity contract.
Basel 1 (Accords): prudential framework established in 1988 by the Basel Committee to ensure solvency and stability in the international banking system by setting an international minimum and standardised limit on banks’ capital bases. It notably establishes a minimum capital ratio—a proportion of the total risks taken on by banks—which must be greater than 8%. (Source: BANQUE DE FRANCE GLOSSARY - DOCUMENTS ET DÉBATS - No. 4 - MAY 2012).
Basel 2 (Accords): prudential framework used to better assess and limit banks’ risks. It is focused on banks’ credit, market and operational risks. These provisions prepared by the Basel Committee were adopted in Europe through a European directive and implemented in France effective 1 January 2008. (Source: BANQUE DE FRANCE GLOSSARY - DOCUMENTS ET DÉBATS - No. 4 - MAY 2012).
Basel 3 (Accords): further changes to prudential standards which included lessons from the 2007-2008 financial crisis. They supplement the Basel 2 accords by improving the quality and quantity of banks’ required capital. They also implement minimum requirements in terms of liquidity risk management (quantitative ratios), define measures to limit the financial system’s procyclicality (capital buffers that vary according to the economic cycle) and even strengthen requirements related to systemically significant banks. (Source: BANQUE DE FRANCE GLOSSARY - DOCUMENTS ET DÉBATS - No. 4 - MAY 2012).
Net earnings per share: net earnings of the company (adjusted for hybrid securities recorded under equity instruments) divided by the weighted average number of shares outstanding.
Cost/income ratio: ratio indicating the share of Net Banking Income (NBI) used to cover the company’s operating costs. It is determined by dividing management fees by the NBI.
Collateral: transferable asset or guarantee used as a pledge for the repayment of a loan in the event that the borrower cannot meet its payment obligations. (Source: BANQUE DE FRANCE GLOSSARY - DOCUMENTS ET DÉBATS - No. 4 - MAY 2012).
Collateralised Debt Obligation (CDO): see securitisation.
Collateralised Loan Obligation (CLO): see securitisation.
Commercial Mortgage Backed Securities: see securitisation.
Comprehensive Risk Measurement (CRM): capital charge in addition to Incremental Risk Charge (IRC) for the credit activities correlation portfolio which accounts for specific price risks (spread, correlation, collection, etc.) The CRM is a 99.9% risk factor, meaning the highest risk obtained after eliminating the 0.1% most unfavourable incidents.
GLOSSARY
478 I 2014 REGISTRATION DOCUMENT I SOCIETE GENERALE GROUP
Cost of risk in basis points: the cost of risk in basis points is calculated using the ratio of the net cost of commercial risk to loan outstandings at the start of the period.
Credit Default Swaps (CDS): insurance mechanism against credit risk in the form of a bilateral financial contract, in which the protection buyer periodically pays the seller in return for a guarantee to compensate the buyer for losses on reference assets (government, bank or corporate bond) if a credit event occurs (bankruptcy. default, moratorium, restructuring). (Source: BANQUE DE FRANCE GLOSSARY - DOCUMENTS ET DÉBATS - No. 4 - MAY 2012).
CRD3: European Directive in which the Basel Committee proposals were transposed in July 2010 and implemented beginning 31 December 2011. In July 2009, this committee published new proposals known as Basel 2.5 regarding market risk to better incorporate the risk of default or rating migration for assets in the trading book (tranched and untranched assets), and to reduce the procyclicality of Value at Risk (VaR).
CRD4: European Directive which will transpose the Basel 3 Accord proposals (see glossary definition).
Haircut: percentage by which the market value of securities is reduced to reflect their value in the context of stress (counterparty or market stress risk). The extent of the reduction reflects the perceived risk.
Impairment: recording of probable loss on an asset. (Source: BANQUE DE FRANCE GLOSSARY - DOCUMENTS ET DÉBATS - No. 4 - MAY 2012).
Derivative: a financial asset or financial contract, the value of which changes based on the value of an underlying asset, which may be financial (equities, bonds, currencies, etc.) or non-financial (commodities, agricultural commodities, etc.). Depending on the circumstances, this change may be accompanied by a leverage effect. Derivatives can take the form of securities (warrants, certificates, structured EMTNs, etc.) or in the form of contracts (forwards, options, swaps, etc.).
Credit derivative: a financial product for which the underlying asset is a receivable or a security representing a receivable (bond). The purpose of a credit derivative is to transfer credit risk without transferring the asset itself, for hedging purposes. One of the most common forms of credit derivatives is a Credit Default Swap (CDS, see definition).(Source: BANQUE DE FRANCE GLOSSARY - DOCUMENTS ET DÉBATS - No. 4 - MAY 2012).
Tier-1 capital: consolidated shareholder’s equity, less prudential deductions.
Tier-2 capital: supplementary capital consisting mainly of subordinated notes less prudential deductions.
Incremental Risk Charge (IRC): capital cost incurred due to rating migration risk and risk of issuers’ default within a one-year horizon for trading book debt instruments (bonds and CDS). The IRC is a 99.9% risk factor, meaning the highest risk obtained after eliminating the 0.1% most unfavourable incidents.
Internal Capital Adequacy Assessment Process (ICAAP): process outlined in Pillar 2 of the Basel Accord, by which the Group verifies its capital adequacy with regard to all risks incurred.
Investment grade: long-term rating provided by an external ratings agency, ranging from AAA/Aaa to BBB-/Baa3 for a counterparty or underlying issue. A rating of BB+/Ba1 or lower indicates a Non-Investment Grade instrument.
Fair value: the amount for which an asset could be exchanged or a liability settled, between informed and consenting parties under normal market conditions.
Liquidity: for a bank, the capacity to cover its short-term maturities. For an asset, this term indicates the potential to purchase or sell it quickly on the market, with a limited discount. (Source: BANQUE DE FRANCE GLOSSARY - DOCUMENTS ET DÉBATS - No. 4 - MAY 2012).
Mezzanine: form of financing between equity and debt. In terms of ranking, mezzanine debt is subordinate to senior debt, but it is still above equity.
Rating: assessment by a ratings agency (Moody’s, Fitch Ratings, Standard & Poor’s, etc.) of an issuer’s financial solvency risk (company, government or other public institution) or of a given transaction (bond loan, securitisation, covered bond). The rating has a direct impact on the cost of raising capital. (Source: BANQUE DE FRANCE GLOSSARY - DOCUMENTS ET DÉBATS - No. 4 - MAY 2012).
Bond: a bond is a fraction of a loan, issued in the form of a security, which is tradable and—in a given issue—grants rights to the issuer according to the issue’s nominal value (the issuer being a company, public sector entity or government).
Expected Loss (EL): losses that may occur given the quality of a transaction’s structuring and all measures taken to reduce risk, such as collateral.
Loss Given Default (LGD): ratio between the loss incurred from exposure to default by a counterparty and the amount of the exposure at the time of default.
Probability of Default (PD): likelihood that a counterparty of the bank will default within one year.
Total capital ratio: ratio between total (Tier-1 and Tier-2) capital and risk-weighted assets.
Core Tier-1 ratio: ratio between Core Tier-1 capital and risk-weighted assets.
Liquidity Coverage Ratio (LCR): this ratio is intended to promote short-term resilience of a bank’s liquidity risk profile. The LCR requires banks to hold risk-free assets that may be easily liquidated on markets in order to meet required payments for outflows net of inflows during a thirty-day crisis period without central bank support (source: December 2010 Basel document).
Leverage ratio: The leverage ratio intends to be a simple ratio that aims to limit the size of banks’ balance sheets. The leverage ratio compares the Tier One prudential capital with the accounting balance sheet/off balance sheet, after restatements of certain items (see page 150). The precise definition of this ratio could change slightly depending on new recommendations made by the Basel Committee (January 2014).
GLOSSARY
SOCIETE GENERALE GROUP I 2014 REGISTRATION DOCUMENT I 479
Net Stable Funding Ratio (NSFR): this ratio aims to promote resilience over a longer time horizon by creating additional incentives for banks to fund their activities with more stable sources of funding. This structural ratio has a time horizon of one year and has been developed to provide a sustainable maturity structure of assets and liabilities (source: December 2010 Basel document).
Tier-1 ratio: ratio between Tier-1 capital and risk-weighted assets.
Deleveraging: reduction in the level of banks’ debt leverage which can be achieved through various methods, notably by reducing the size of the balance sheet (sale of assets, slowdown in the distribution of new loans) and/or increasing capital (recapitalisation, retained earnings). This financial adjustment process often has negative impacts on the real economy, especially through a contraction of credit supply. (Source: BANQUE DE FRANCE GLOSSARY - DOCUMENTS ET DÉBATS - No. 4 - MAY 2012).
Residential mortgage backed securities (RMBS): see securitisation.
Resecuritisation: securitisation of an already securitised exposure where the risk associated with underlyings is divided into tranches and, therefore, at least one of the underlying exposures is a securitised exposure.
Return On Equity (ROE): ratio between the net income restated for interest on hybrid securities recorded under equity instruments and restated book equity (especially hybrid securities), which enables return on capital to be measured.
Insurance risk: beyond asset/liability risk management (interest-rate, valuation, counterparty and currency risk), these include underwriting risk, mortality risk and structural risk of life and non-life insurance activities, including pandemics, accidents and catastrophic events (such as earthquakes, hurricanes, industrial disasters, or acts of terrorism or war).
Credit and counterparty risk: risk of losses arising from the inability of the Group’s customers, issuers or other counterparties to meet their financial commitments. Credit risk also includes the counterparty risk linked to market transactions, as well as that stemming from securitisation activities.
Market risk: risk of impairment of financial instruments arising from changing market parameters, as well as their volatility and the correlations between them. In particular, these parameters are foreign exchange rates, interest rates, securities prices (equity and bonds), commodities prices and derivatives prices.
Operational risks (including accounting and environmental risks): risk of losses or sanctions, notably due to failures in procedures and internal systems, human error or external events, etc.
Structural interest rate and currency risk: risk of loss or of write-downs in the Group’s assets arising from variations in interest or exchange rates. Structural interest rate and exchange rate risks are incurred in commercial activities and proprietary transactions.
Transformation risk: appears as soon as assets are financed through resources with a different maturity. Due to their traditional activity of transforming resources with a short maturity into longer-term maturities, banks are naturally faced with transformation risk which itself leads to liquidity and interest-rate risk. Transformation occurs when assets have a longer maturity than liabilities; anti-transformation occurs when assets are financed through longer-maturity resources.
Systemically Important Financial Institution (SIFI): the Financial Stability Board (FSB) coordinates all of the measures to reduce moral hazard and risks to the global financial system posed by systematically important institutions Globally Systemically Important Financial Institutions (G-SIFI). These banks meet criteria defined in the Basel Committee rules included in the document titled «Global systemically important banks: Assessment methodology and the additional loss absorbency requirement» and published as a list in November 2011. This list is updated by the FSB each November (29 banks to date).
Market stress tests: to assess market risks, alongside the internal VaR and SVaR model, the Group monitors its exposure using market stress test simulations to take into account exceptional market occurrences, based on 26 historical scenarios and eight hypothetical scenarios.
Personal commitment: represented by a deposit, autonomous guarantee or letter of intent. Whoever makes themselves guarantor for an obligation binds themselves to the creditor to honour that obligation, if the debtor does not honour it themselves. An independent guarantee is an undertaking by which the guarantor binds themself, in consideration of a debt subscribed by a third party, to pay a sum either on first demand or subject to terms agreed upon. A letter of intent is an undertaking to do or not to do, the purpose of which is the support provided to a debtor in honouring their obligation
Collateral: guarantees consisting of assets including tangible and intangible property and securities, including commodities, precious metals, cash, financial instruments and insurance contracts.
Risk weight: percentage of weighting of exposures which are applied to a particular exposure in order to determine the related risk-weighted asset.
Securitisation: transaction that transfers a credit risk (loan outstandings) to an organisation that issues, for this purpose, tradable securities to which investors subscribe. This transaction may involve a transfer of outstandings (physical securitisation) or a transfer of risk only (credit derivatives). Securitisation transactions may, if applicable, enable securities subordination (tranches). The following products are considered securitisations:
ABS: Asset Backed Securities;
CDO: Collateralised Debt Obligation, a debt security backed by an asset portfolio (bank loans (residential) or corporate bonds). Interest and principal payment may be subordinated (tranche creation);
CLO: Collateralised Loan Obligation, a CDO backed by an asset portfolio of bank loans;
CMBS: Commercial Mortgage Backed Securities, a debt security backed by an asset portfolio of corporate real estate loans leading to a mortgage;
RMBS: Residential Mortgage Backed Securities, a debt security backed by an asset portfolio of residential mortgage loans.
Value at Risk (VaR): composite indicator used to monitor the Group’s daily market risk exposure, notably for its trading activities (99% VaR in accordance with the internal regulatory model). It corresponds to the greatest risk calculated after eliminating the top 1% of most unfavourable occurrences observed over a one-year period. Within the framework described above, it corresponds to the average of the second and third largest losses computed.
GLOSSARY
480 I 2014 REGISTRATION DOCUMENT I SOCIETE GENERALE GROUP
Credit Value at Risk (CVaR): the largest loss that would be incurred after eliminating the top 1% of the most adverse occurrences, used to set the risk limits for individual counterparties.
Stressed Value at Risk (SVaR): Identical to the VaR approach, the calculation method consists of a «historical simulation» with «one-day» shocks and a 99% confidence interval. Unlike the VaR, which uses 260 scenarios of daily variation year-on-year, the stressed VaR uses a fixed one-year window that corresponds to a historical period of significant financial tensions.
Exposure at default (EAD): Group exposure to default by a counterparty. The EAD includes both balance sheet and off-balance sheet exposures. Off-balance sheet exposures are converted to their balance sheet equivalent using internal or regulatory conversion factors (drawdown assumption).
This label recognizes the most transparent Registration Documents according to the criteria of the Annual Transparency Ranking.
WEBSITE: WWW.SOCIETEGENERALE.COM INVESTOR RELATIONS AND FINANCIAL INFORMATION
Tel: 33 (0) 1 42 14 47 72
PRESS RELATIONS
Tel: 33 (0) 1 42 14 67 02
COMMUNICATION DEPARTMENT
Postal address:
Tours Societe Generale
75886 – Paris Cedex 18
SOCIETE GENERALE
Registered office: 29, Bd Haussmann – 75009 Paris
Tel: 33 (0) 1 42 14 20 00
A French limited company founded in 1864
Share capital: EUR 998,395,202.50
552 120 222 RCS Paris
Design and production
Societe GeneraleSIOP/DSI/PLT/IMPSG Publishing Services
This document is printed in France on paper sourced from certified sustainable forests
Translation CPW Group

RE
F: (
A)
71
47
85
- S
tud
io S
oci
été
Gén
éral
e +
33
(0)1
42
14
27
05
- 0
3/1
4


