Embed Size (px)
Citation preview

Reducing defects in producing expendable mold with 3D printers in NCSU rapid prototyping lab
Team : Wolf Improve
Members:
VIGNESHWAR MANOKARAN
ASHWATH PARTHASARATHY

Agenda
• Project Charter
• SIPOCDefine
• KPI
• Run Chart
• MSAMeasure
• Brainstorming
• C&E diagram
• Screening Design
• ANOVA
Analyze
• Response surface analysis
• Confirmation RunImprove
• Modification of Standard Operating ProcedureControl
2
DEFINE PHASE
PROJECT CHARTER
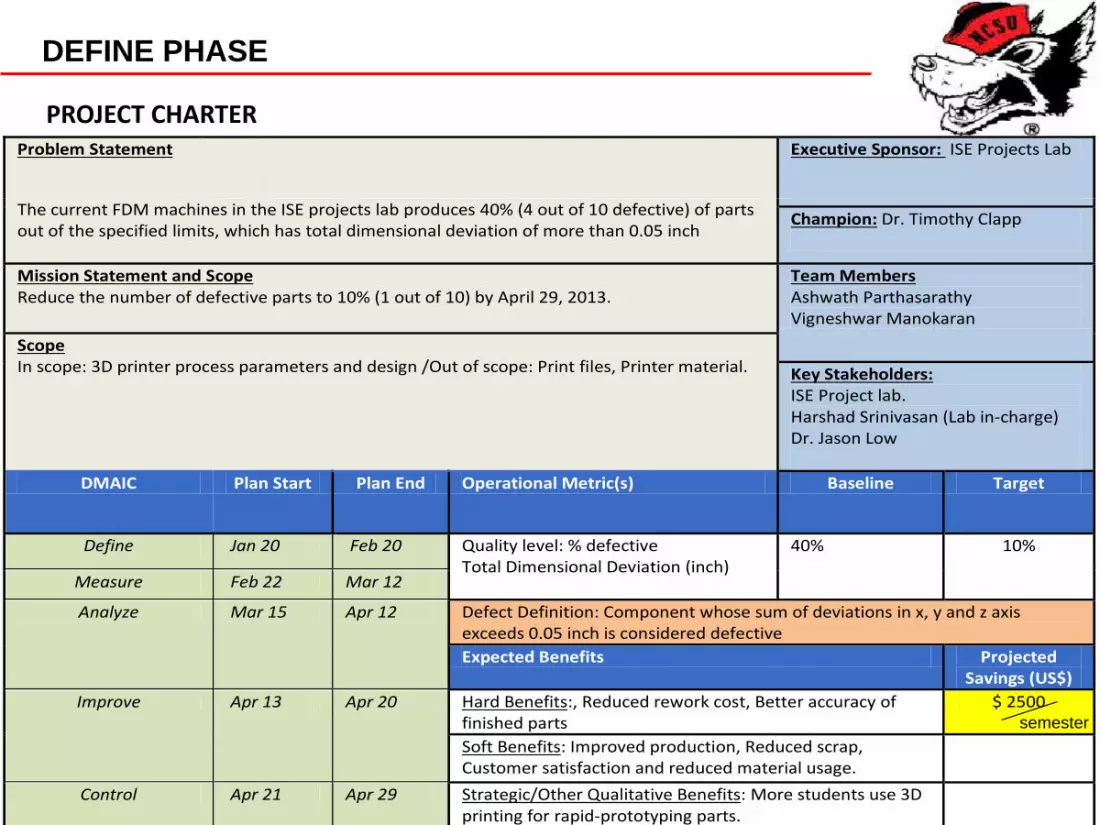
Problem Statement
Executive Sponsor: ISE Projects Lab
The current FDM machines in the ISE projects lab produces 40% (4 out of 10 defective) of parts out of the specified limits, which has total dimensional deviation of more than 0.05 inch
Champion: Dr. Timothy Clapp
Mission Statement and Scope Reduce the number of defective parts to 10% (1 out of 10) by April 29, 2013.
Team Members Ashwath Parthasarathy Vigneshwar Manokaran
Scope In scope: 3D printer process parameters and design /Out of scope: Print files, Printer material. Key Stakeholders:
ISE Project lab. Harshad Srinivasan (Lab in-charge) Dr. Jason Low
DMAIC Plan Start Plan End Operational Metric(s) Baseline Target
Define Jan 20 Feb 20 Quality level: % defective Total Dimensional Deviation (inch)
40% 10%
Measure Feb 22 Mar 12
Analyze Mar 15 Apr 12 Defect Definition: Component whose sum of deviations in x, y and z axis exceeds 0.05 inch is considered defective
Expected Benefits Projected Savings (US$)
Improve Apr 13 Apr 20 Hard Benefits:, Reduced rework cost, Better accuracy of finished parts
$ 2500
Soft Benefits: Improved production, Reduced scrap, Customer satisfaction and reduced material usage.
Control Apr 21 Apr 29 Strategic/Other Qualitative Benefits: More students use 3D printing for rapid-prototyping parts.
semester

DEFINE PHASE
PROCESS MAP - SIPOC
Project: 3D printing of wolf model
Team: Ashwath Parthasarathy, Vigneshwaran Manokaran
Date Revised: 2/20/2013
SUPPLIER INPUT PROCESS OUTPUT CUSTOMER
NC STATE Student CAD file of the model CAD file to STL STL File Slicing software
Computer Aided
Design DocumentSTL file STL File to Slicing Build File G Code, M code
G-code, M-code file
Code file, Part
material, support
material
Part material, support
material
Fused deposition
method prototypingNC State Student
MEASURE PHASE
KEY PERFORMANCE INDICATORS
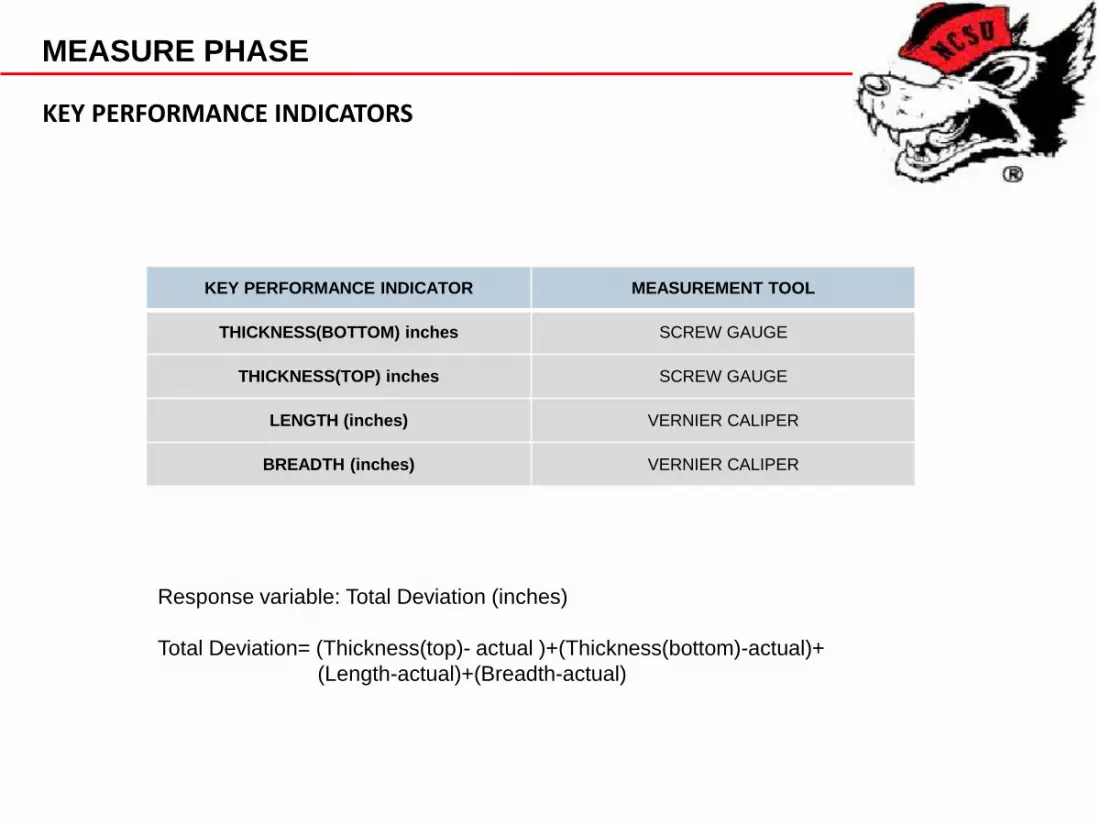
KEY PERFORMANCE INDICATOR MEASUREMENT TOOL
THICKNESS(BOTTOM) inches SCREW GAUGE
THICKNESS(TOP) inches SCREW GAUGE
LENGTH (inches) VERNIER CALIPER
BREADTH (inches) VERNIER CALIPER
Response variable: Total Deviation (inches)
Total Deviation= (Thickness(top)- actual )+(Thickness(bottom)-actual)+
(Length-actual)+(Breadth-actual)

MEASURE PHASE
RUN CHART- DEVIATION
Upper Specification Limit: 0.0525
Sample size: 6
Number of defects: 2
% defects : 33.33%

MEASURE PHASE
MEASUREMENT SYSTEM ANALYSIS
Component % contribution of Total
Gauge R&R 2.37
Repeatability 2.37
Part-to-Part 97.63
• Measuring Tool - Vernier caliper & Screw gauge• No. of operators - 1, hence error due to
reproducibility.• Type of parts - 2
Result:• The variation due to Gauge is less than
10%, hence the measurement system can be used without any modification.

ANALYZE PHASE
ROOT CAUSE ANALYSIS – RESULT OF BRAINSTORMING
Motor-High inertial
mass affecting tool
motion
Table- not horizontally
held by the point
contact
Material-exposed to
environmental which
affects its properties
Base-No vibration
separator between
base table and the
machine
ANALYZE PHASE
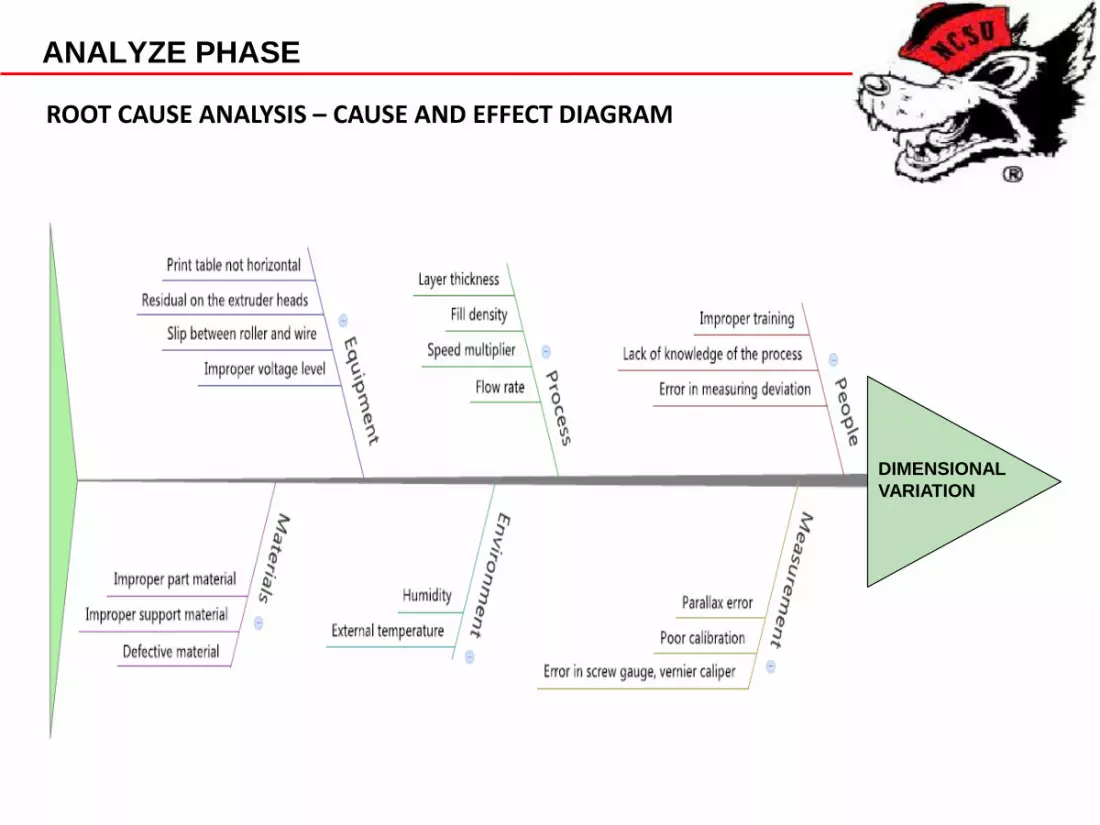
ROOT CAUSE ANALYSIS – CAUSE AND EFFECT DIAGRAM
DIMENSIONAL
VARIATION
ANALYZE PHASE
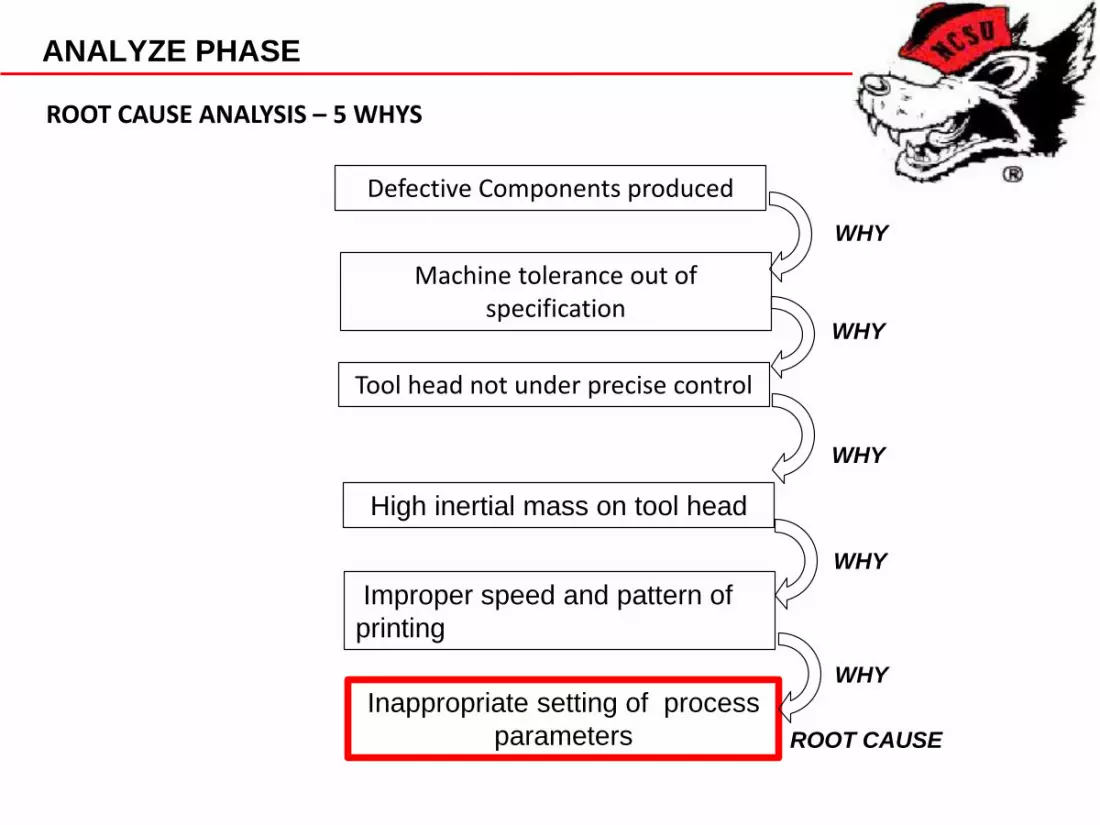
ROOT CAUSE ANALYSIS – 5 WHYS
Defective Components produced
Tool head not under precise control
High inertial mass on tool head
Improper speed and pattern of
printing
Inappropriate setting of process
parameters
Machine tolerance out of specification
ROOT CAUSE
WHY
WHY
WHY
WHY
WHY

ANALYZE PHASE
ROOT CAUSE ANALYSIS – PROCESS PARAMETERS
The process parameters that could affect the final dimension are
identified from the previous analysis as:
PARAMETERS TYPE LEVEL/RANGE
LAYER THICKNESS (inch) CATEGORICAL 0.125, 0.25, 0.5
SPEED MULTIPLIER CONTINUOUS 0.5x-1.3x
FLOW RATE (RPM) CONTINUOUS 6-60
FILL DENSITY (%) CONTINUOUS 10-90
A screening design was created to identify the parameters that have
a significant effect on the final dimensional accuracy. Dimensional
deviation is taken as the response variable.
ANALYZE PHASE
ROOT CAUSE ANALYSIS – SCREENING DESIGN
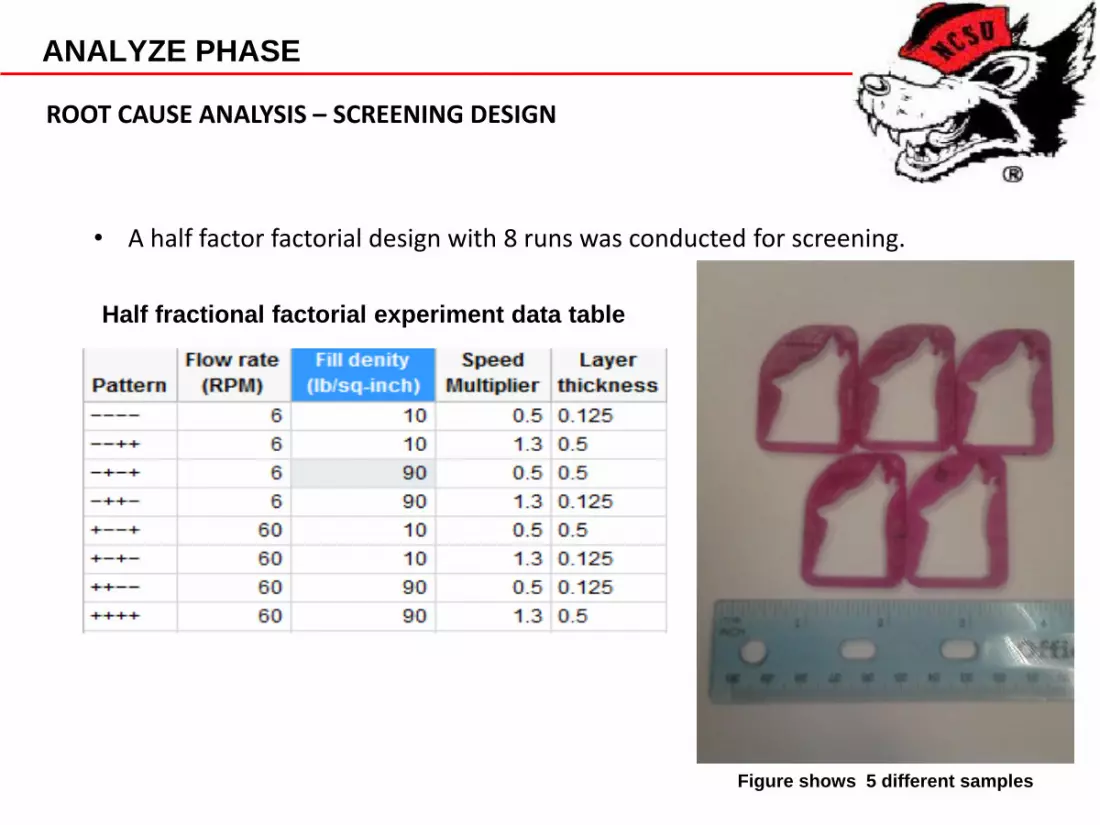
• A half factor factorial design with 8 runs was conducted for screening.
Half fractional factorial experiment data table
Figure shows 5 different samples
ANALYZE PHASE
ROOT CAUSE ANALYSIS – SCREENING DESIGN RESULTS
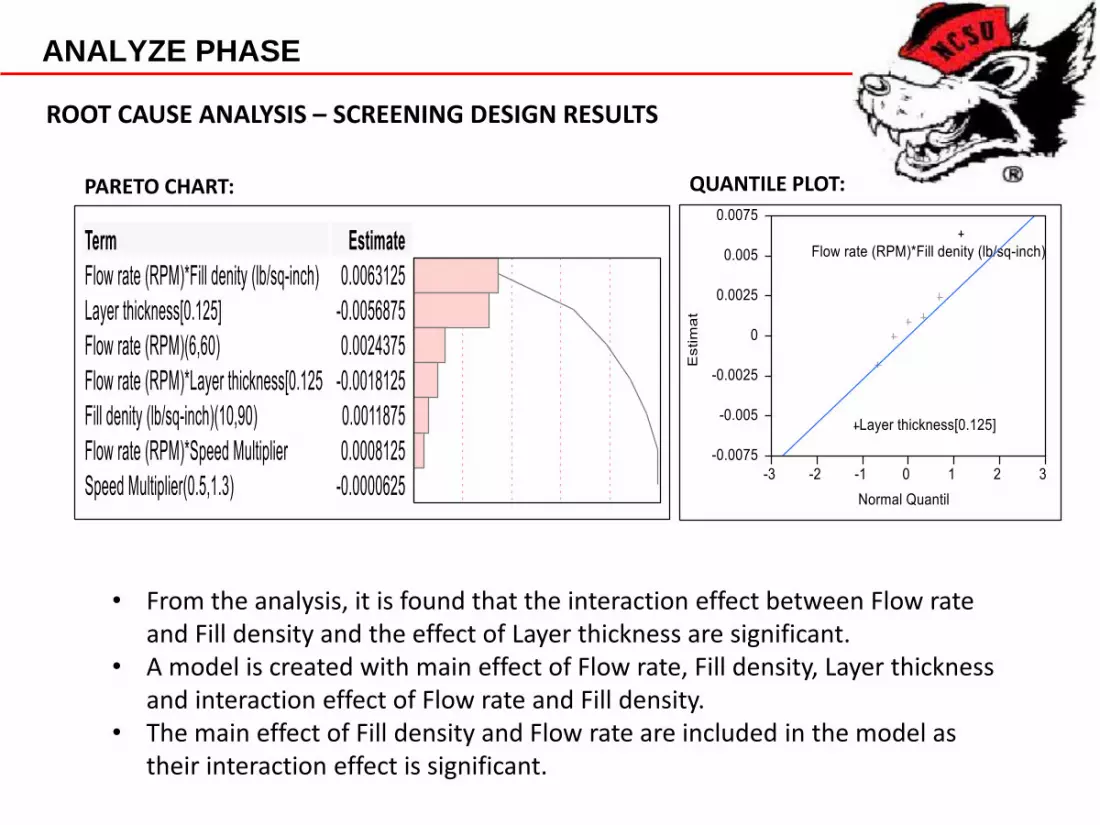
PARETO CHART:
• From the analysis, it is found that the interaction effect between Flow rate and Fill density and the effect of Layer thickness are significant.
• A model is created with main effect of Flow rate, Fill density, Layer thickness and interaction effect of Flow rate and Fill density.
• The main effect of Fill density and Flow rate are included in the model as their interaction effect is significant.
QUANTILE PLOT:

ANALYZE PHASE
ROOT CAUSE ANALYSIS – FINAL MODEL
• After removing the insignificant terms the following model was
obtained, it will be used as the model for further full factorial
analysis.
TOTAL DEVIATION = 0.0408125 - 0.005688(LAYER THICKNESS) + 0.0011875(FILL DENSITY) + 0.0024375(FLOW RATE) + 0.0063125(FILL DENSITY * FLOW RATE)

ANALYZE PHASE
ROOT CAUSE ANALYSIS – ANOVA TABLE
• R2 adjusted is 0.88, hence the model explains most of the
variations in the data.
• As the ANOVA table indicates, the model effect is significant.
Source DF Sum of Squares Mean Square F Ratio
Model 4 0.00063638 0.000159 15.1068
Error 3 0.00003159 0.000011 Prob > F
C. Total 7 0.00066797 0.0250*

IMPROVE PHASE
RESPONSE SURFACE ANALYSIS-CENTRAL COMPOSITE DESIGN
• A central composite design was constructed for layer
thickness of 0.125 mm (most commonly used layer thickness).
• A response surface was created and the optimal process
parameters were identified.
From the RSA it was found that the optimal values are
Fill Density = 10 %
Flow rate = 49.673 RPM

CONTROL PHASE
MODIFICATION OF THE STANDARD OPERATING PROCEDURE
• The SOP which is the lab manual given to all the users of the
lab has to be updated with the latest findings.
Excerpt from SOP before change
Area to be
updated

Q?18


