Embed Size (px)
Citation preview
1
Red wells or green wells and does it matter?
Examining household use of arsenic contaminated water in Bangladesh
A.K.E. Haque, Z.H. Khan, M. Nepal, and P. Shyamsundar1
October 18 2011
1. Introduction
Bangladesh currently faces a major health calamity because of arsenic contamination of
groundwater aquifers. Bangladesh has copious quantities of ground water, but the alluvial
aquifers of the Ganges delta are polluted by naturally occurring arsenic (Nickson et al. 1998).
Approximately 27 percent of shallow tube wells in Bangladesh are estimated to have arsenic
content that exceeds the government’s safety standards of 50 g/liter (Caldwell et al. 2006; BGS
and DPHE 2001).2 Some 46 percent of wells exceed the safety standards set by the World
Health Organization of 10 g/liter (BGS and DPHE 2001).3 For Bangladesh, this means that an
estimated 27 to 60 percent of its population is at risk from arsenic exposure (Smith, Lingas and
Rahman, 2000).
Historically, Bangladesh has been very successful in providing its population with access to safe
drinking water. Death due to cholera and diarrheal disease was effectively contained in the
seventies and eighties by replacing existing sources of drinking water with tube wells, a strategy
1United International University ([email protected]), Transparency International, Bangladesh
([email protected]) and SANDEE ([email protected] and [email protected]). 2 Based on a national sample of 3,534 tubewells. 3 Air and water quality international standards set by the World Health Organization can differ from
national standards. The World Health Organization’s arsenic standards apply in several developed countries but many developing countries have set their own standards for practical reasons.
2
that was vigorously pursued by the Government of Bangladesh, UNICEF and other donors.
Tube wells were bored to obtain clean water from thirty to hundred feet below the surface. This
water did not have to be boiled and was free of many bacterial contaminants. Shallow tube wells
were cheap, could be installed close to homes and women found them extremely convenient.
Notably, the expansion of tubewells occurred at a period when oral re-hydration treatment was
also widely distributed. While, there is evidence that oral re-hydration therapy, more so than the
availability of tube well water, was responsible for reduction in diarrheal mortality, tube wells
grew rapidly as a dominant water source (Caldwell et al. 2006). As of 1997, some 97 percent of
the rural population in Bangladesh obtained their drinking water from tube wells (Farouque and
Alam 2002). Since the discovery of arsenic in ground water in 1993, Bangladesh has struggled
once again with the problem of delivering safe water.
Arsenic poisoning, or arsenicosis, can cause numerous health problems ranging from skin lesions
to cancer and cardio-vascular diseases. We discuss some of these symptoms in detail later.
Exposure to high concentrations of arsenic can result in rapid onset of diseases, but this is not the
case in Bangladesh. Ingestion is mainly through low doses of arsenic in water, resulting in
symptoms appearing over a long period of time. Because the presence of arsenic in water is
impossible to detect through our normal senses and because health effects are not immediately
obvious, it can be difficult to convince households about the threats of arsenic.
Over the last decade, the Bangladesh government, donors and NGOs have made different
investments to provide arsenic free water and run health campaigns to inform people about the
risks of arsenic. The government’s main campaign to inform people about the presence of
3
arsenic in drinking water sources is through a binary color coding system. A green-colored tube-
well is safe for collecting drinking and cooking water while a red-colored one is not, i.e., the
arsenic content in red wells is higher than the government safety standards of 50 g/liter. NGOs
have also undertaken door-to-door awareness programs and information has been disseminated
through the media. Nonetheless, either due to limited alternative sources of water or for other
reasons, many households continue to use water from unsafe tubewells.
It is in this context, that this study examines arsenic exposure and people’s responses in two
Upazilas4 in Bangladesh. We seek to understand if providing information on arsenic
contamination contributes to reduced exposure. We are particularly interested in the efficacy of
different sources of information. We also identify the costs of using arsenic contaminated water.
The study attempts to answer three questions: a) how effective are different sources of
information in reducing household use of contaminated water? b) do households that are able to
reduce their exposure to red wells have specific characteristics, i.e. are they wealthy or have
larger families, allowing them to find alternatives? And c) what are the costs to households of
continuing to use red wells? We try to address these questions by examining the behavior of
households that drink water from red (unsafe) and green (safe) wells. We assess how the
probability of using red wells is affected by information and other household characteristics. We
also examine medical expenditures and sick days that occur as a result of arsenic related
symptoms. Investigating these issues will help us understand the impacts of government and
NGO activities and may contribute towards designing better public health strategies.
4Administratively, Bangladesh is divided into several tiers: Division, District, Upazila, Union and Ward.
The local government structure begins at the district level and the Upazila is the second tier of local government.
4
Information campaigns are a well tried strategy for regulating pollution and natural resource use
(Tietenberg and Wheeler 2001). There is a sizable literature on the viability of information, with
several studies examining the effect of labeling, news and media information, and government
disclosure of data, on firm, farmer, investor, and consumer behavior (Khanna et al. 1998;
Kathuria 2007; Lemos 2008 and Wang et al. 2004). Summarizing this literature, Tietenberg and
Wheeler (2001) conclude that information strategies can be effective in changing consumer and
firm behavior. However, how information is provided, how much is provided and what kinds of
complementary actions are taken, play a role.
An earlier paper by Madajewicz et al. (2007) offers a careful analysis of the impact of
information on health risks in Bangladesh. This study was a joint effort by a large number of
scientists and public health specialists in collaboration with professors from Columbia
University. Households were provided with information on the health consequences of drinking
arsenic contaminated water and the results of a health exam. The study scientists were also able
to run tests on 6,500 wells in one district and inform households about the contamination in their
wells. The same households were visited 6 to 12 months later to assess the effect of information.
Household response to the information campaign was quick and significant. Knowing that wells
have an unsafe level of arsenic raised the probability that a household switches to a new alternate
source of well within a year by 0.37. This switch was done despite a 15 fold (4.3 minutes per
round trip) increase in the time spent collecting water from alternate sources. An interesting and
very important finding from this study is that media communicated general information is as
effective (in terms of awareness generation) as expensive house-specific information. However,
5
media campaigns are less able to induce behavioral change and awareness does not necessarily
lead to action.
Another study of relevance to our work is Jalan et al. (2009) on the determinants of water
purification behavior among a country-wide sample of Indian respondents. Jalan et al. (2009)
treat schooling, media exposure and the presence of diarrhea as indicators of awareness of health
risks. They ask how these indicators influence households to purify water. Using a large
dataset, they find that each of these variables has a significant effect on home purification
activities, independent of household characteristics such as wealth. For example, the probability
of purification increases by 8 percent points if a female household member reads a newspaper at
least once a week. The probability that a household boils water for drinking increases by 5
percent if the household has experienced a previous health shock. The impact of education is also
significant. Overall, the effect of ‘information and awareness’ are comparable in magnitude to
wealth effects.
Our study is not based on multiple surveys and control and treatment groups as found in
Madajewicz et al. (2007) and is more along the lines of Jalan et al. (2009). It also builds on an
earlier study by Aziz et al. (2006) that examines the determinants of knowledge of arsenic
symptoms and household decisions to switch wells. Like these other studies, we are interested
in the role of education versus media versus government and NGO campaigns on water use
behavior. The Columbia University study also established the cost of switching wells using
information on time costs of collecting water from alternate sources. We attempt to estimate the
benefits of switching by looking at medical and time costs resulting from illness.
6
In the following sections, we first provide background information on the extent of arsenic
contamination in ground water in Bangladesh and health effects. We then discuss our study area
and the data used to examine the impact of different sources of information. Section 4 presents
the analyses on the role of information. In section 5, we assess the costs of illness associated
with arsenic contamination in Bangladesh. Our final section concludes and discusses next steps.
2. Background
Bangladesh is a very densely populated country with a population of over 140 million (BBS
2009). With a per capita GDP of USD 444 in 2005 (BER 2005), Bangladesh is also one of the
least developed countries in the world. Nevertheless, Bangladesh has made significant strides in
accelerating economic and human development. Providing access to clean water is a major
development goal of the government. Until the discovery of arsenic, 97 percent of households
were estimated to have access to clean water. Because of the presence of arsenic, this number is
now down to 74 percent (Khan 2007).
Out of 4.95 million tubewells screened in Bangladesh in 2002-03, 1.44 million or 29% were
estimated to be contaminated with arsenic above the safe standards of 50 g/liter.5 Since several
million tubewells are yet to be screened, the official estimate is that nationwide some 20 percent
of tubewells or one in five shallow tubewells is contaminated with arsenic above the 50 g/liter
5 These numbers are slightly higher than the estimates referred to earlier by BGS and DPHE (2001).
7
safety standard (DPHE website 2011, UNICEF, Bangladesh 2011).6 The state of affairs is dire in
some parts of Bangladesh. A 2009 situation analyses indicates that only 4 percent of 9 million
people who live in areas where over 80 percent of wells are contaminated, have arsenic free
water (UNICEF, Bangladesh 2011).
In terms of people affected, according to the Government of Bangladesh’s Department of Public
Health and Engineering (DPHE), there are some 38,380 arsenic-affected patients in Bangladesh.
This is a small number given Bangladesh’s current estimated population of over 140 million
(BBS 2009). However, this may be the tip of the iceberg since arsenicosis is a slow growing
disease. Screening done by the Bangladesh Arsenic Mitigation and Water Supply Programme, in
fact, demonstrates that the figure might be as high as 1.1 cases of arsenicosis per thousand
(World Bank 2002).
While the overall cases of illness is hard to estimate given lack of data on symptomatic patients,
some understanding of exposure is possible. A national sample survey, the Bangladesh
Household Survey 2004, found that some 7.9 percent of the sampled population drank from
wells that had arsenic over the safety standards of 50 g/liter (Khan et al. 2007). Using the same
safety standards, the Bangladesh Department of Health and Engineering estimates the exposed
population to be higher at 30-35 million Bangladeshis (conservatively about 20% of the
population) (DPHE website 2011). The government’s estimates are comparable to UNICEF’s
estimate of 20 million people who are exposed to high levels of arsenic contamination (UNICEF,
Bangladesh 2011). Thus, while there is clear information on the number of wells contaminated
6 http://www.dphe.gov.bd (accessed 8/30/2011) and http://www.unicef.org/bangladesh/Arsenic_Mitigation_in_Bangladesh.pdf (UNICEF media notes, accessed 8/30/2011).
8
with un-safe levels of arsenic, there is uncertainty regarding the exposed population and even
more uncertainty about the number of cases of illness.
The primary pathway to arsenicosis is prolonged exposure through drinking arsenic-
contaminated water,7 with symptoms taking five to twenty years to develop. Because of its slow
progress, the evolution of the disease is divided into several stages. In the primary stage, an
arsenicosis patient may develop several symptoms, sometimes simultaneously, such as
blackening of parts of the body (melanosis), thickening and roughness of the palms and soles
(keratosis), redness of the eye (conjunctivitis), inflammation of the respiratory tract and nausea
and vomiting (gastroenteritis). If a patient continues to be exposed to arsenic-contaminated
water and if adequate preventive measures are not adopted, the symptoms advance and become
more visible: white intermittent dots within blackened areas (called leukonelanosis or Rain Drop
Syndrome), nodular growth on the palms and soles (hyper-keratosis), swelling of the feet and
legs (non-pitting edema), and peripheral neuropathy as well as liver and kidney disorders. In the
tertiary stage, an arsenicosis patient’s physical condition deteriorates rapidly and the condition
becomes irreversible. Gangrene, cancer of the skin, lungs and urinary bladder, and kidney and
liver failure become manifest (Khan 2007).
Numerous studies in Bangladesh have documented the health consequences of arsenic
contamination. Chen and Ahsan (2004) estimate a doubling of lifetime mortality risk from liver,
bladder and lung cancer in Bangladesh, because of arsenic exposure through drinking water. A
cohort analyses between 1991 and 2000 of 115, 903 people in Matlab Upazila suggests that the
7 Absorption of arsenic through the skin is minimal. Thus hand-washing, bathing and laundry done with water containing arsenic does not pose human health risks.
9
death rate due to cancers, cardiovascular disease and infectious disease increases by a factor of
1.44, 1.16 and 1.30, respectively for patients exposed to contaminated water higher than the
Bangladesh safety standards (UNICEF, Bangladesh 2011). In other work, Smith et al. (1999)
show arsenic contamination may be mainly responsible for bladder and lung cancer relative to
other cancers.
Given the severity of the problem, several Government, NGO and international institutions are
engaged in providing technical and financial support for arsenic detection, research and
mitigation projects. However, alternatives to drinking water from tubewells are limited. Dug
wells that draw water from close to the surface are an option, but there is fear of microbial
contamination. The growth of shallow tubewells was historically a great achievement precisely
because it provided people with cheap bacteria-free water. Now, finding a new substitute poses
a huge water supply and economic challenge. Deep tubewells that obtain water from over 150
meters below the ground are a limited option because they are expensive, which explains why
there are currently relatively few private deep tubewells. There are also some household level
technologies available for arsenic control, but these are possibly less affordable.8
Since all wells in a particular location are not contaminated, well testing and switching is another
important strategy. Given the spatial variability of arsenic content in water, well switching could
be a viable in all but 29 Upazilas, where 80 percent of the wells are un-safe (van Geen et al.
2002). However, we note that people also like to use shallow tubewells because the water is
conveniently available for bathing and washing; it is only drinking water that poses health
8 There are several processes through which arsenic in water can be reduced to the ‘safe’ level. Some are
at the household level using small filtration units; others are at the community level. For details please refer to http://www.bdiusa.org/Publications/JBS/Volumes/Volume8/jbs8.2-3.pdf
10
hazards. It is in this context, that we try to understand the reasons why household continue to
drink from un-safe ‘red’ wells.
3. Data and Study Area
The data used in this paper is based on a 2005 survey of 5,563 individuals from 878 households
in two Upazilas (sub-districts) of Bangladesh (Khan 2007; Khan and Haque 2011). The data
was collected as part of a research project undertaken by one of the authors, Zakir H. Khan, and
was sponsored by SANDEE.
The study area, Upazilas Matlab and Laksham, are located in the southeastern part of
Bangladesh, which is the most arsenic prone region in the country. The two Upazilas are located
within fifty kilometers of each other. Matlab has had numerous health-related interventions
because of work by the International Centre for Diarrheal Diseases Research, Bangladesh, while
Laksham seems to have had more government interventions. The government has marked a
large number of tube wells (though not all) in this area as red (unsafe for drinking) or green
(safe). Data provided by DPHE at the time of the study indicated that only 30% of the wells in
our study sample fell within the green safety standards of 50 g/liter.
To identify households for our study, we developed a sampling frame based on a DPHE
database. The database contained information on wells, location of wells and households using
the wells. As described in Khan and Haque (2011), a two-step procedure was used to select
households. In the first stage, 900 tube wells were randomly chosen (450 from each Upazila)
11
from three Unions9 in Matlab and four Unions in Laksham. Since the same tubewell is shared by
several households, at the second stage, one household from each tube-well user group was
randomly selected from the DPHE database. The total number of households selected was 878.
The 2005 survey collected data on: a) household level socio-economic information; b) individual
health symptoms and demographic information; and c) work days lost, income loss, sick days,
and averting and mitigating activities both at household and individual levels. Avertive activities
refer to actions taken by households to avoid use of contaminated water. Mitigating activities
refer to doctor and hospital visits. Survey enumerators were trained to identify different variants
of arsenicosis based on symptoms narrated by respondents.
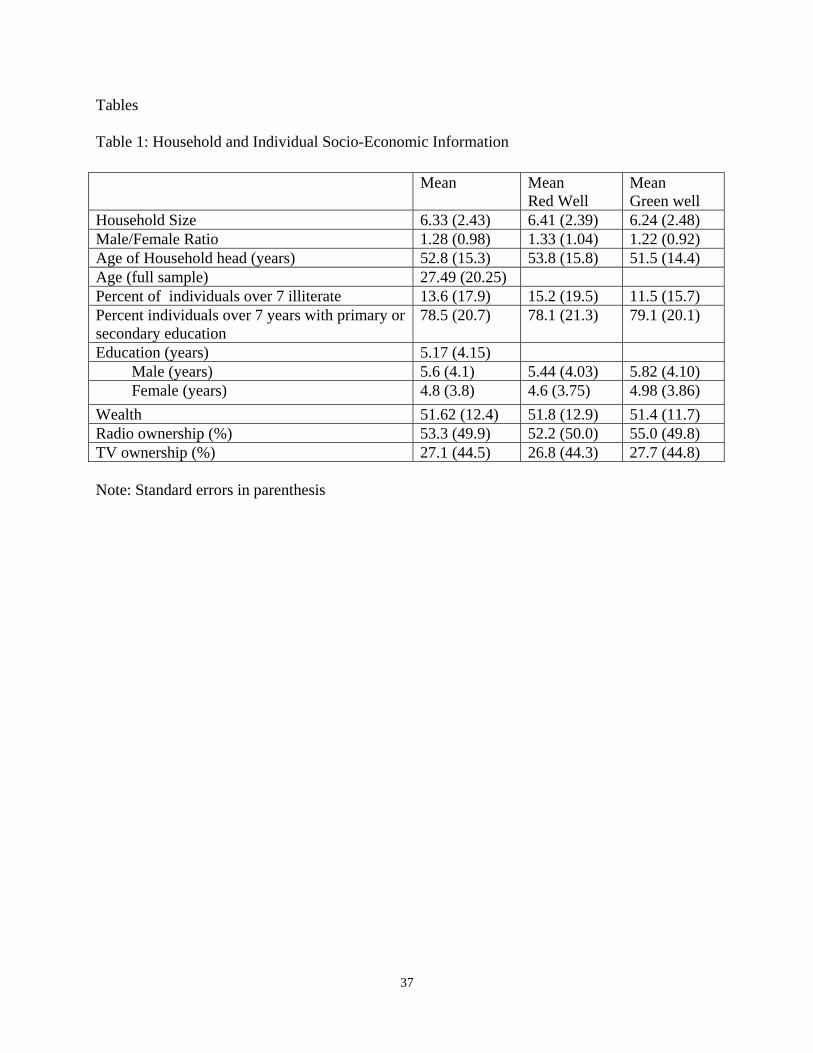
Table 1 provides a brief summary of statistics at the individual and household level. The average
household size in our study area is 6.3. If we examine the number of working members,
households have some 4.5 members over the age of 14. The average age of the individuals in the
sample is 28 years and the male to female ratio is 1.28, which is higher than the Bangladesh
average. Individuals in our sample have about five years of schooling on average. Women have
approximately 1 year less education than men. Some 14 percent individuals over 7 years of age
have no education; while 79 percent individuals have either primary or secondary education, and
about 7 percent individuals have more than secondary education.
To determine the wealth status of the household, we used a check list of 43 assets. Using this
list, each household was assigned a number on a wealth index that ranged from 0 to 100.10 The
9 Union is at the third tier of local government and is comprised of 10 wards. Each Union has a chair and
13 elected members (one from each ward plus 3 women members).
12
wealth distribution of the sampled households follows a tight bell shape curve (Khan 2007). In
terms of assets, ownership of radio and TV are important for understanding the role of
information. Table 1 indicates that some 53 percent of households owned a radio while 23
percent owned a television.
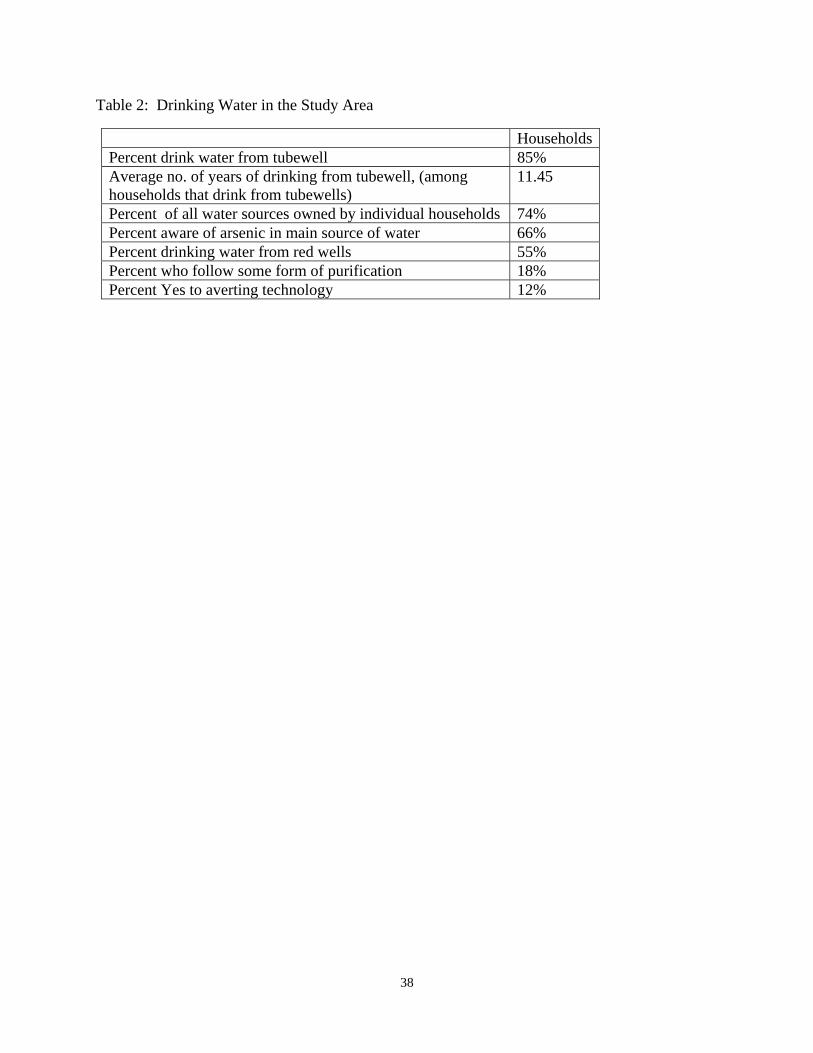
In order to understand how households were exposed to arsenic, we looked at sources of drinking
water. Table 2 indicates that eighty five percent of the households obtain their drinking water
from tube wells. On average, these households had been using the same source of tubewell
water for over 11 years. Less than 11 percent of households have access to deep tubewells (over
150 meters deep), which are generally arsenic free. Furthermore, over three quarters of all water
sources are privately owned. Thus, our understanding is that over the last twenty or more years,
households have drilled individual tubewells for themselves and use of public sources of water is
limited. Very few households use surface water or get water from taps at home, less than 0.5
percent people use filters and only 0.2 percent use water from arsenic removal plants. Most
importantly, Table 2 indicates that fifty five percent of households still drink water from red
tubewells. This shows the extent of vulnerability of the population to arsenicosis.
10 The wealth index is given by:
100
)min()max(
)min(43
1
jiji
jiij
i aa
aaWI
where, j refers that the holding of i number assets (a) and aij = 1 if the ith household has the jth asset, and 0 = otherwise i = 1,2,3, … m representing households, and j = 1,2,3, … n representing the assets available at the household. The minimum of aji means holding by jth household of the lowest number of i assets
13
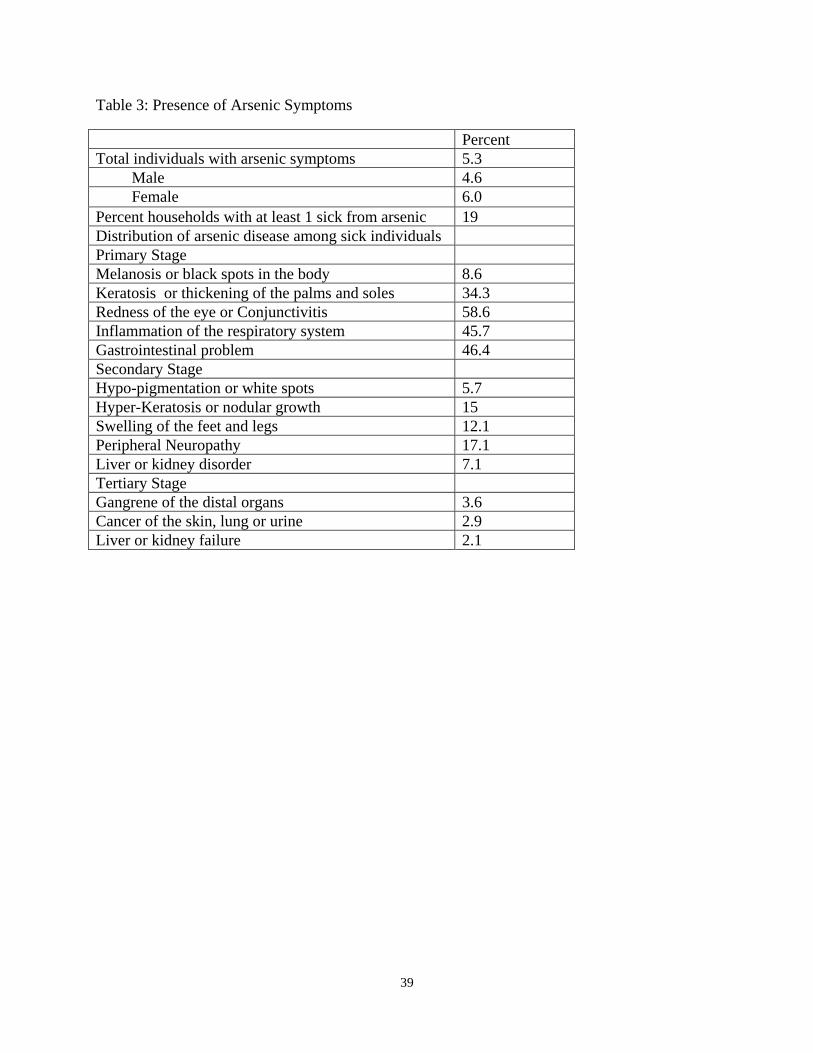
Table 3 shows that approximately 5 percent of the sampled population suffered from arsenicosis.
A slightly larger percentage of women (6 percent) versus men (4.6 percent) had symptoms.
Interestingly, Madajewicz et al. (2007) also found that some 6 percent of the sample population
in nearby Araihazar Upazila showed signs of arsenic impacts. In our sample, some 19 percent of
households in the sample had at least one person sick from arsenic exposure. If we divide our
sample into red well and green well users, we find that a small percentage of green well users are
also sick from arsenic. This may be because they were previously exposed and switched water
sources over time. If we look at only red well users, 9 percent of the sample females show signs
of arsenic contamination.
Most of the individuals who suffered from some form of arsenic exposure were in the early
stages of the disease (see Table 3). Some 34 percent of sick individuals exhibited signs of
kertosis or thickening of the palms and soles. Some 45-50 percent of sick individuals also
indicated that they had other symptoms of arsenic poisoning such as redness of the eye and
gastro-intestinal problems. Between 2-3 percent of the population exhibited advanced
conditions of arsenic poisoning. Given that this is a late acting disease that can take 20 odd years
to set in, the distribution of the disease is not surprising.
4. The role of information
In this study, we are interested in the role of information in reducing household exposure to
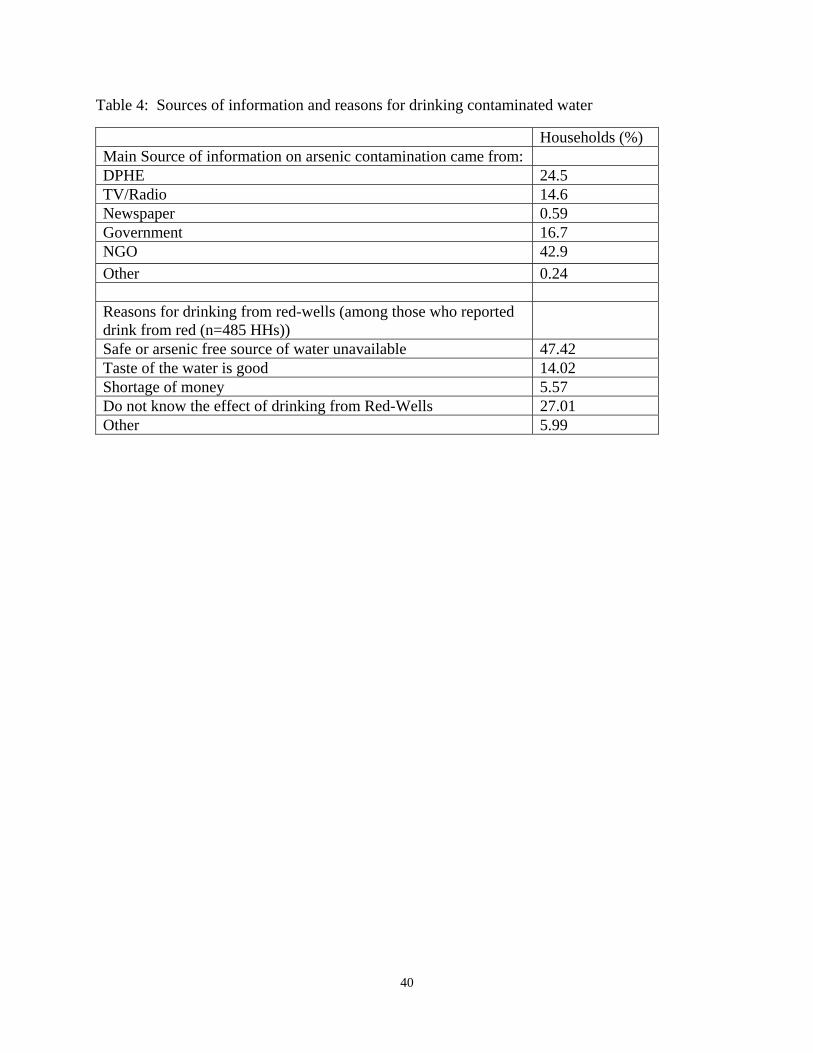
arsenic contaminated water. Some 66 percent of households in our sample indicated that they
were aware of the presence of arsenic in their wells. These numbers echo results from Aziz et al.
14
(2006) who found that some 70 percent of their sample of households in Matlab Upazila were
aware of the arsenic problem in their water. As Table 4 shows, the main sources of arsenic
related information amongst our study households are: NGOs (43 percent of households), DPHE
(25 percent) and other government sources, including health facilities (17 percent). Some 32
percent of households had attended awareness programs organized by NGOs. Not surprising,
since NGOs activities cover nearly 50 percent of the rural Bangladeshi population. Some 15
percent of households got their information from a TV or radio. It is possible that households
got information from multiple sources. Our survey, however, probed and obtained data on the
‘main’ source of information.
One of the questions we try to address in this paper is whether different sources of information
available through the government, NGOs or the media has an impact on household use of
arsenic contaminated water. As previously noted, many wells in this area are painted red or
green but households continue to use both kinds of wells. There are clearly various reasons why
households continue to use contaminated ‘red’ wells but the most important reason identified is
lack of alternate sources (see Table 4). However, as Table 1 shows there are no systematic
differences in terms of wealth or demographics between red well and green well users.
Indicators such as household size, age, male female ratio and wealth do not vary much across
people who imbibe from red wells versus green. Green well users are slightly more educated.
We think the main reasons for why some households may use red versus green may be two-fold:
a) geological, i.e., because of their location some households have better access to red wells; and
b) behavioral – because of information available some households may have switched to green
wells.
15
To examine this question of why some households use red wells versus green more carefully we
ask what factors affect the probability of a household using a ‘red’ well. In particular, we ask if
different sources of information in the form of TV or Radio, NGO awareness activities and
information by the Department of Public Health have influenced the use of red wells. We are
also interested in the role of education.
We use the following model to assess factors that influence household use of red versus green
wells:
1 2 2 1i i kY X Y u (1)
where Y1 is a binary variable (1 for drinking from red, 0 for drinking from other sources,
including green tubewells), X’s are a set of independent variables including information sources,
Y2 is the number of household members affected by arsenic in a household, and k is a Union
fixed effect.11 We estimate equation 1 to assess the impact of different sources of information on
the probability of drinking from red wells. We discuss below our empirical strategy for
addressing the endogeneity problem posed by the inclusion of Y2.
Drinking from red wells is expected to be affected by household characteristics such as wealth,
the relative number of females in the household, which reflects knowledge about water sources
and ability to carry water, and whether the well is owned privately. We hypothesize that wealth
increases access to alternate sources of water or purification technologies, and the percent of
11 Union is a lower level political unit in Bangladesh and includes groups of villages.
16
females in the household decreases the probability of drinking from red wells. Whether the well
is privately or publicly owned is an interesting variable. Our hypothesis is that if a household
owns the private well that it has access to, it may be reluctant to switch because of investments
already made. This hypothesis builds on results by Madajewicz et al. (2007), who find that well
switching is negatively related to well ownership. If the household doesn’t own the well,
switching may be more likely. Since we are not able to link household use with household
specific ownership rights, we are unable to hypothesize on the sign of the coefficient on private
well ownership.
The right hand side variables in the above model include three information related indicator
variables: a) whether the household obtained arsenic information from various government
sources (mainly from the health sector); b) whether the household obtained its information from
the electronic media such as TV or Radio, and c) whether the household obtained its arsenic
information from NGOs. In the empirical estimation of Y1 in equation (1), the coefficients of
these variables are ascertained relative to the default position of the households obtaining
information from DPHE. We do this because we partly want to assess whether the role of DPHE
is as important as other information campaigns. We are also interested in the effect of education
as this could be considered an indicator of awareness of health risks (Jalan et al. 2009).
Following Jalan et al. (2009), we hypothesize that households are less likely to use red wells if
they already have sick people in the household. As previously noted, some 19 percent of the
households have at least a member who is sick with arsenicosis. We hypothesize that health
shocks are likely to make the household more aware of sources and use of alternate water. We
17
also hypothesize that, given cultural biases, if there are more men than women in the household
that are sick with arsenicosis, this decreases the probability of drinking from red wells.
The inclusion of arsenic patients in the household as an ‘awareness’ indicator creates an
endogeneity problem with estimating equation (1). The presence of arsenic patients in the
household (Y2 in equation (2) below) is itself dependent on drinking water from red wells (Y1).
In order to remove this potential endogeneity in our model, we use a two-stage instrumental
variable approach. In the first stage, we estimate the number of arsenic affected people in a
household (Y2). Since the number of arsenic affected people is a discrete non-negative integer;
we use a negative binomial model to estimate equation (2). When the left-hand side variable is
a count of one kind or the other, it is appropriate to model this information assuming that the data
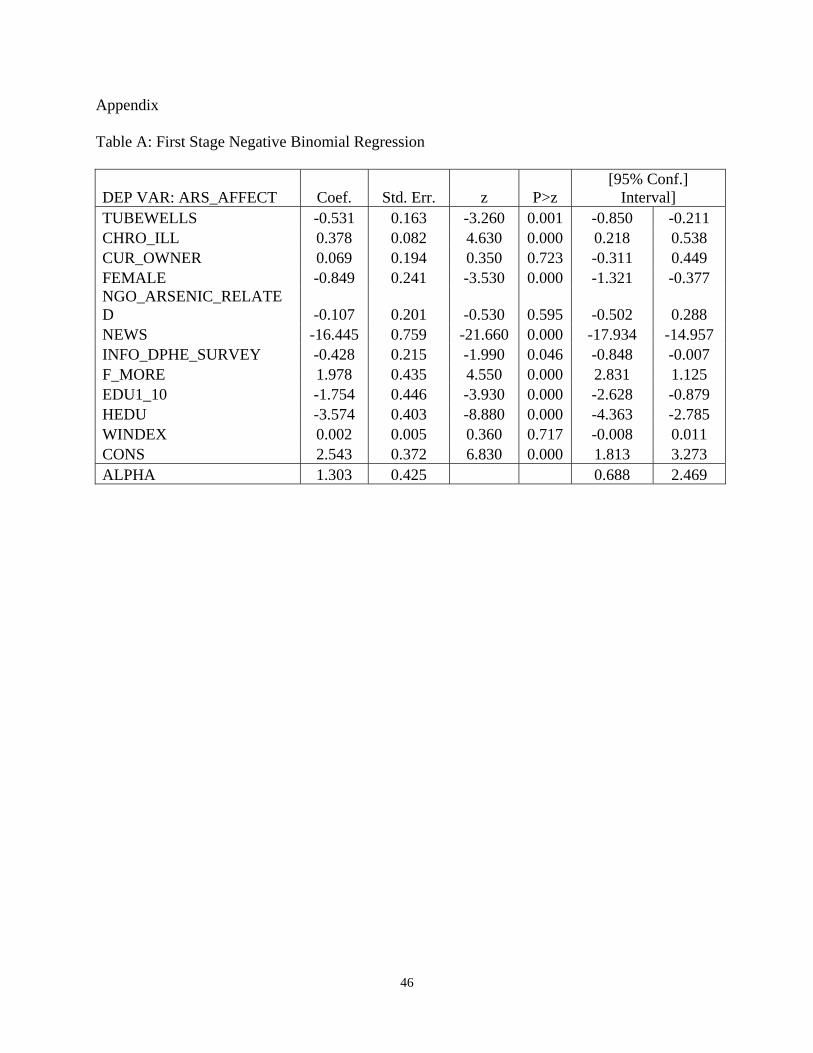
follows a Poisson or negative binomial distribution. The first stage results are presented in Table
A of the appendix, which shows that the coefficient alpha (the negative binomial variance
parameter) is significantly different from zero, indicating that the negative binomial is better
suited than the Poisson model. Thus, we use the negative binomial model for the first stage
estimation.
In the first stage regression, we use two instrumental variables (Zj), chronic illness and use of
tubewells, which are assumed to be correlated with the presence of sick people with arsenicosis,
but not correlated with drinking water from red tubewells. Both of these instruments are
indicator variables. Since the arsenic effect on the human body depends on the immunity levels
of individuals, we use chronic illness as an instrument. Since arsenicosis is linked to drinking of
water from shallow aquifer based tubewells, we use drinking from tubewells as another
18
instrument. We recognize that these variables are imperfect instruments, but we are constrained
by data limitations.
In order to verify the relevance of the instruments, we perform statistical tests. We first run the
first-stage regression and perform the joint significance test of the instruments. This joint
significance test indicates that coefficients of these two instruments are jointly significant,
indicating that they are correlated with the endogenous variable. This suggests that our
instruments are good enough to address the endogeneity issue.
Following the first stage estimation, in the second stage, we estimate a logit regression in which
the dependent variable (Y1) is a binary variable with Y1= 1 if the household drinks water from
tubewells marked as ‘red’ and 0 otherwise. In equation (3) 2̂Y is predicted from equation (2) as
given below:
2 2i i j j kY X Z u (2)
1 2 2 1ˆ
i i kY X Y u (3)
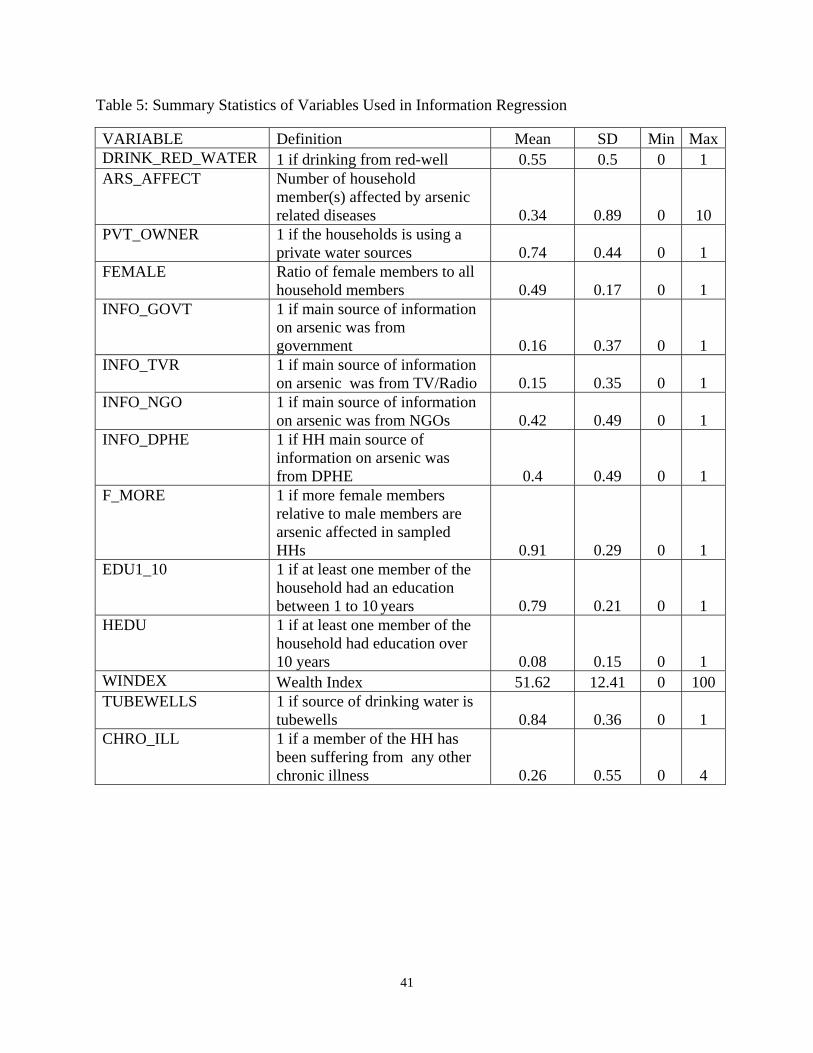
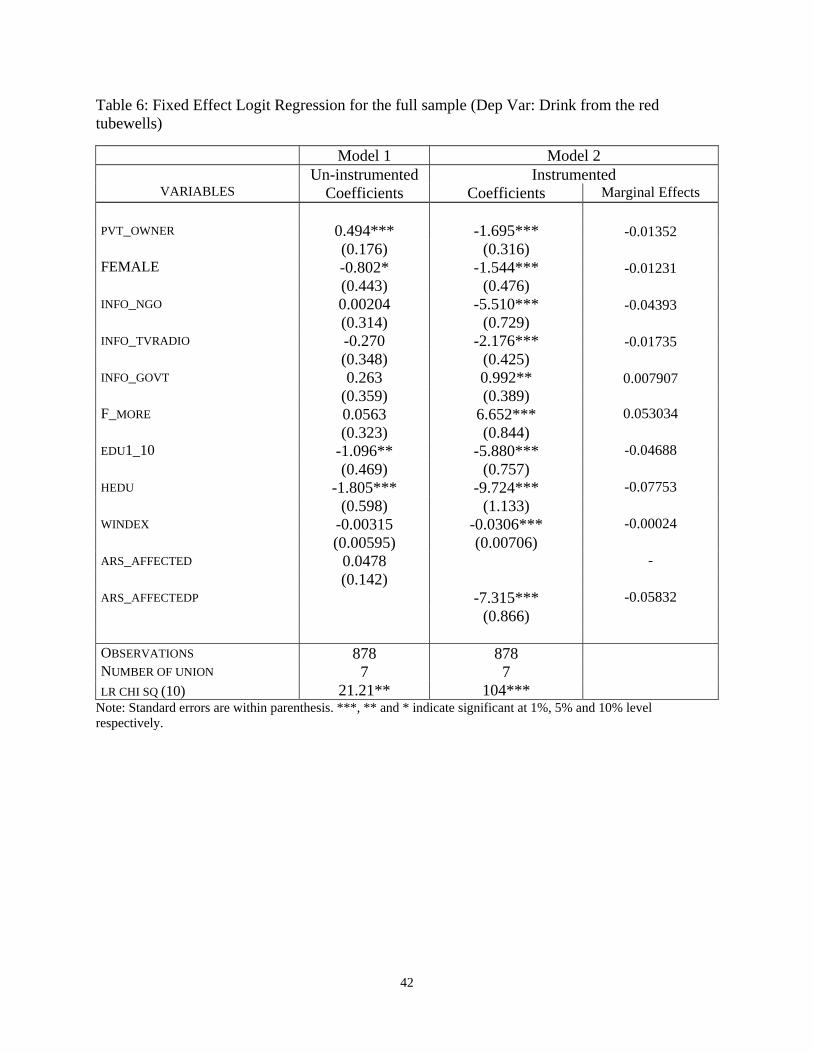
Table 5 presents the summary statistics of the variables used in the two-stage estimation. The
results are presented in Table 6. Column 1 of Table 6 represents the results from a basic logit
model without instrumenting for arsenic patients in the household. Column 2 presents the
coefficients of the logit equation after instrumenting the number of arsenic patients. These logit
equations are estimated after controlling for un-observed heterogeneity at the ‘Union (local
government)’ level. There are 25 Unions in Laksham and 22 in Matlab. While a number of
investment decisions, including those related to water and sanitation, are made at the Union
level, we do not have this information. Therefore, we use a Union fixed effect model to account
19
for heterogeneity among Unions. As results from alternative specifications are stable,12 we
restrict our discussion below to results from the two-stage model presented in column 2
(coefficients) and column 3 (marginal effects) of Table 6.
As Table 6 shows private ownership of wells has a negative impact on the probability of drinking
from a red well as does the percentage of women in the family.13 More women in the house may
reflect a higher capacity to carry safe drinking water from a distance. As expected, wealth,
which reflects access to alternate water sources and purification possibilities, reduces the
probability of drinking from red wells.
Two of the three information variables (TV/Radio and NGO information) reduce the probability
of a household using a red well relative to information obtained from DPHE. Information
coming from NGOs seems to be the most effective. The probability of drinking from red wells
decreases by 4.4 percent more when the information comes from NGOs relative to DPHE.
Information from the media is significantly more effective than DPHE information but not by a
huge degree. Information from other government agencies seems to be less effective than
information from DPHE, as indicated by the positive marginal effect of the variable
INFO_GOVT. Overall, our analyses suggests that information on arsenic in water provide by
non-government sources, including the electronic media, is, at least, if not more effective than
12 We also estimated an alternative model without wealth index as an explanatory variable, and results are
comparable in terms of sign and statistical significance. 13 It is possible for the variable ‘private ownership of tubewells’ to be highly correlated with the wealth
index. If these variables are highly correlated, we cannot use them together as explanatory variables. In our sample, the correlation coefficient between these two variables, however, is very low (less than 0.08). This is not surprising because while the well may be privately owned, not all households in our sample own the well from which they obtain water.
20
information provided by government sources. This is useful to know because government
provision of information may be more costly relative to other sources.
Education plays an important role in reducing exposure to arsenic. These results are on par with
Jalan et al. (2009) and Aziz et al. (2006), who find that education is significant in inducing
behavioral change that reduces health risks. Table 6 shows that the marginal effects of higher
education (7.8 percent) and studies up to 10th grade (4.7 percent) are both negative. As expected,
higher education has a bigger impact on reducing the probability of drinking from red wells.
Notably, Madajewicz et al. (2007) find that secondary and higher education increase the
probability of well-switching while primary education does not. In our analyses, higher
education has the biggest effect relative to all other variables that may induce households to
switch from red to green wells.
If the household has more male members affected from arsenic compared to females, then this
reduces the probability of using a red well. Thus, even though females may be the managers of
water in the household, the likelihood of switching to clean water is higher if more male
members are sick as a result of exposure. It may be the case that male members of the
households have more influence in deciding where to obtain drinking water.
The coefficient on the number of arsenic affected household members is positive in the basic
model but switches sign and is negative in the two-stage model. Thus, once we correct for
endogeneity, it is clear that the number of arsenic patients in the household sends a signal and
lowers the likelihood of using a red well. Interestingly, the marginal effect of a health shock on
21
the probability of sickness in our analyses (6%) is not that different from the results obtained by
Jalan et al. (2009), who find that a health shock increases the probability of households boiling
water for drinking purposes by 5%.
In general, however, our data and analysis suggest that providing information to households
about arsenic contamination in wells – even if this information is very specific – is not sufficient.
Fifty five percent of the wells used by the sample households were contaminated with arsenic at
higher than safe levels; yet households continue to use these wells. Education and information
campaigns do reduce use, but lack of access to alternate safe sources of water results in
households exposing themselves to arsenic poisoning continuously.
An interesting issue that emerged in reviewing our data was that the two Upazilas Laksham and
Matlab are quite different from each other. T-tests of mean differences were significant for a
number of variables such as higher education, households with members sick with arsenic
disease, information sources, water purification behavior and so on. This may be because they
are in two neighboring districts, but we note that Matlab also hosts a major field center for
diarrheal research in Bangladesh and has had significant NGO presence.
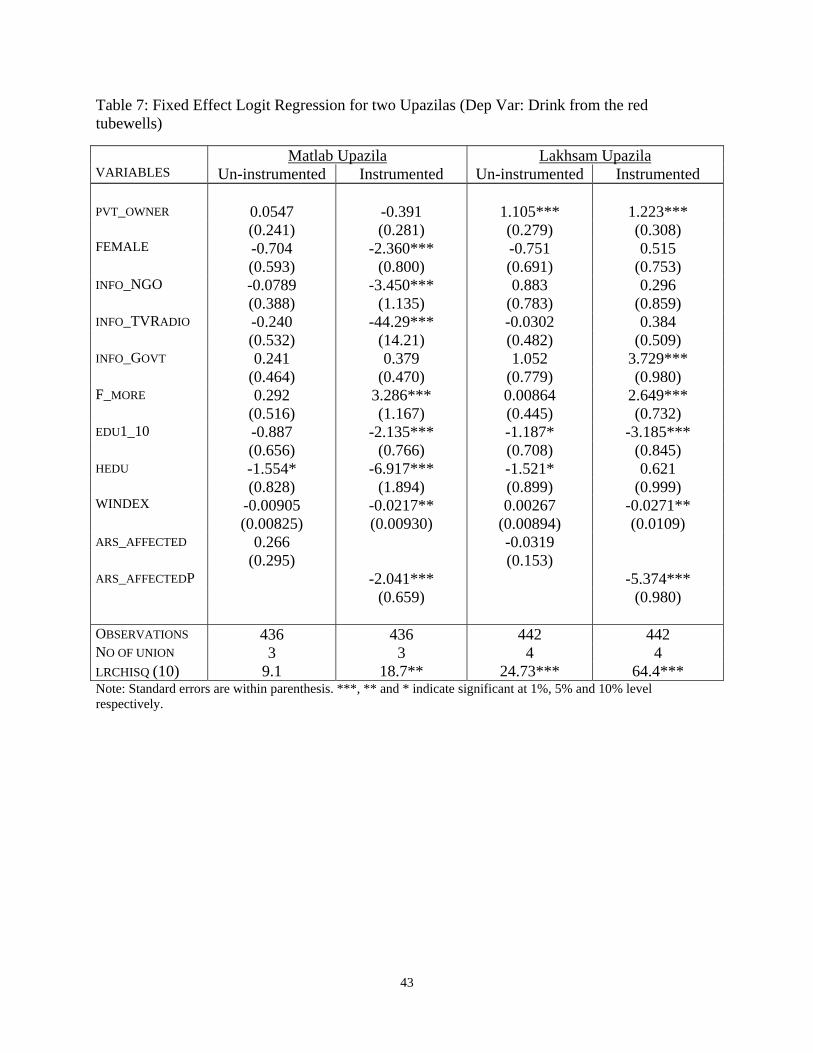
Because the underlying characteristics and access to information in Matlab and Laksham are
different, we also ran separate regressions on data from these two sub-districts. These results are
presented in Table 7. The results from Matlab (column 2) reinforce our overall understanding of
what affects the probability of drinking from red wells (obtained from Table 6). Thus, as Table 7
shows, in Matlab, wealth, percentage of females, arsenic patients in the household, and education
22
have a negative effect on drinking from red. The same information variables (TV/Radio and
NGO campaigns) have a significant impact. However, the results from Laksham are not as clear.
While wealth and education certainly reduce the use of arsenic contaminated water, the only
information variable that is significant is government information (from departments such as
health services), which is less effective (positive sign) than the information provided by DPHE.
This likely reflects the lack of NGO presence in Laksham and perhaps a stronger role by DPHE.
5. Cost of Illness
The next question we ask is what kind of a burden households bear as a result of exposure to
arsenic contamination. Are households willing to pay to make the switch to clean water and to
what extent are they already paying in the way of health costs and workdays lost? In order to
address this question, we follow a simple health production function model to estimate health
costs. Here, we build on earlier work by Dasgupta and Ray (1986, 1987) on the importance of
nutrition for employment and poverty reduction. Dasgupta and Ray (1986, 1987) discuss a
context where malnourished workers are less productive, earn less, and, therefore, simply unable
to become more productive. Such workers are caught in a poverty trap. Similarly, we assert
that sickness due to arsenic can reduce wage income available to households because of losses in
productivity and due to medical expenses. This may well contribute to leaving such households
trapped in poverty.
Following Freeman (1993), most health cost studies start with a utility maximizing individual,
whose utility function is defined as:
23
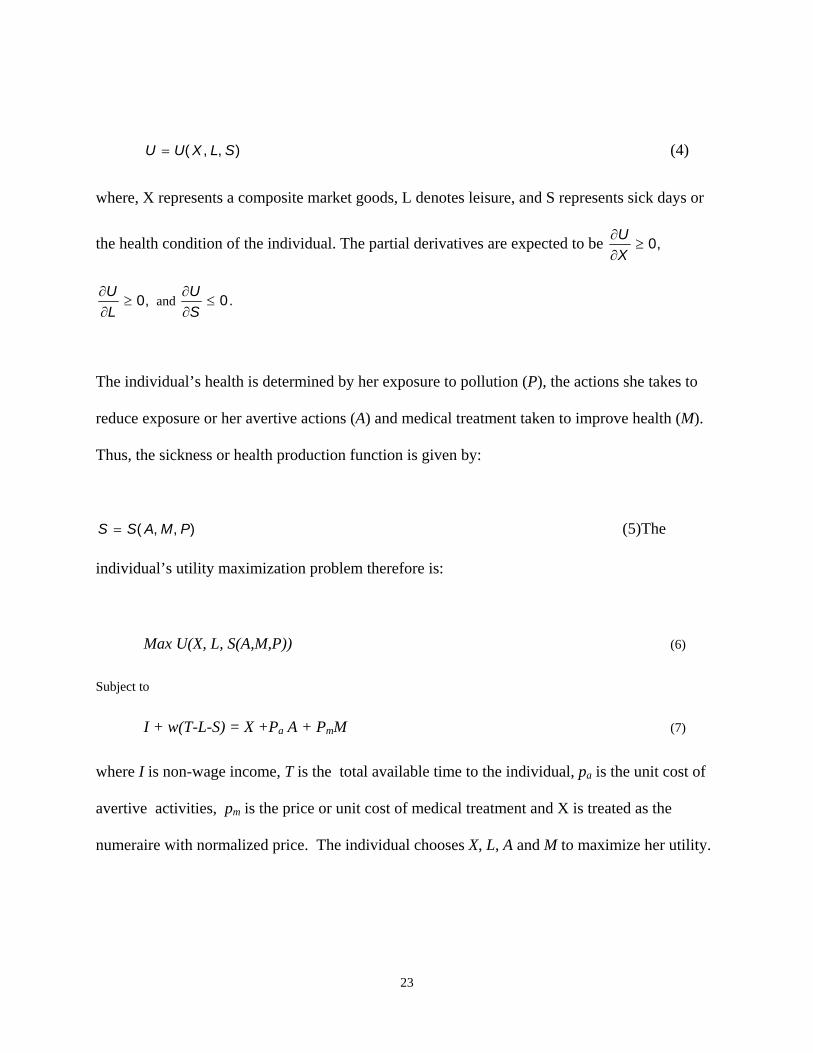
( , , )U U X L S (4)
where, X represents a composite market goods, L denotes leisure, and S represents sick days or
the health condition of the individual. The partial derivatives are expected to be 0,UX
0,UL
and 0.U
S
The individual’s health is determined by her exposure to pollution (P), the actions she takes to
reduce exposure or her avertive actions (A) and medical treatment taken to improve health (M).
Thus, the sickness or health production function is given by:
( , , )S S A M P (5)The
individual’s utility maximization problem therefore is:
Max U(X, L, S(A,M,P)) (6)
Subject to
I + w(T-L-S) = X +Pa A + PmM (7)
where I is non-wage income, T is the total available time to the individual, pa is the unit cost of
avertive activities, pm is the price or unit cost of medical treatment and X is treated as the
numeraire with normalized price. The individual chooses X, L, A and M to maximize her utility.
24
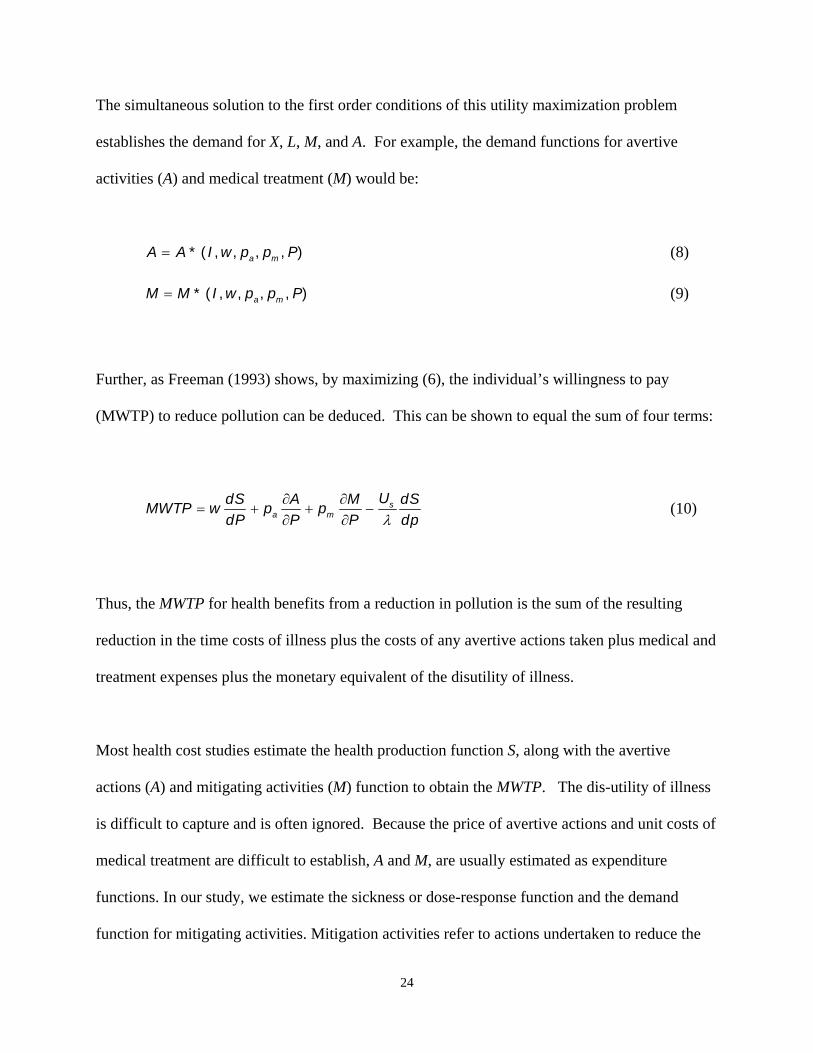
The simultaneous solution to the first order conditions of this utility maximization problem
establishes the demand for X, L, M, and A. For example, the demand functions for avertive
activities (A) and medical treatment (M) would be:
* ( , , , , )a mA A I w p p P (8)
* ( , , , , )a mM M I w p p P (9)
Further, as Freeman (1993) shows, by maximizing (6), the individual’s willingness to pay
(MWTP) to reduce pollution can be deduced. This can be shown to equal the sum of four terms:
sa m
UdS A M dSMWTP w p pdP P P dp
(10)
Thus, the MWTP for health benefits from a reduction in pollution is the sum of the resulting
reduction in the time costs of illness plus the costs of any avertive actions taken plus medical and
treatment expenses plus the monetary equivalent of the disutility of illness.
Most health cost studies estimate the health production function S, along with the avertive
actions (A) and mitigating activities (M) function to obtain the MWTP. The dis-utility of illness
is difficult to capture and is often ignored. Because the price of avertive actions and unit costs of
medical treatment are difficult to establish, A and M, are usually estimated as expenditure
functions. In our study, we estimate the sickness or dose-response function and the demand
function for mitigating activities. Mitigation activities refer to actions undertaken to reduce the
25
effects of arsenic related sickness and include medical expenses, fees paid to doctors or
pharmacists, and travel costs. We do not have data to estimate averting costs.
Survey data shows that arsenic affected patients have very few sick days, when they fully stop
working, and limited medical expenditures. Only 82 individuals, out of more than 3,260
individuals with some form of sickness, reported workdays lost due to sickness. In our sample of
5,563 individuals, only 88 reported medical expenditures related to arsenic, even though 296
suffered from arsenic-related diseases. Consequently, instead of using continuous data to
estimate the dose response and mitigating functions, we use binary variables. Sickness takes the
value of 1 if the individual reported arsenic-related sickness and 0 otherwise. Similarly,
mitigating activities take the value 1 if an individual has any medical expenditure and zero
otherwise. Using probit models, we estimate the probability of sickness and the probability of
incurring mitigating expenditure due to exposure to arsenic.
A vector of independent variables is hypothesized to affect sickness and mitigating expenditures.
These variables include: a) individual level information such as age measured in years, education
and the gender of the individual; and b) a binary variable indicating the presence of arsenic in
drinking water (which equals 1 if the tube well is labeled red or 0 if labeled green). Using a
probit model, we determine the marginal effect due to a change in the source of drinking water
(from red to green). The marginal effect measures the benefit of switching the source of water to
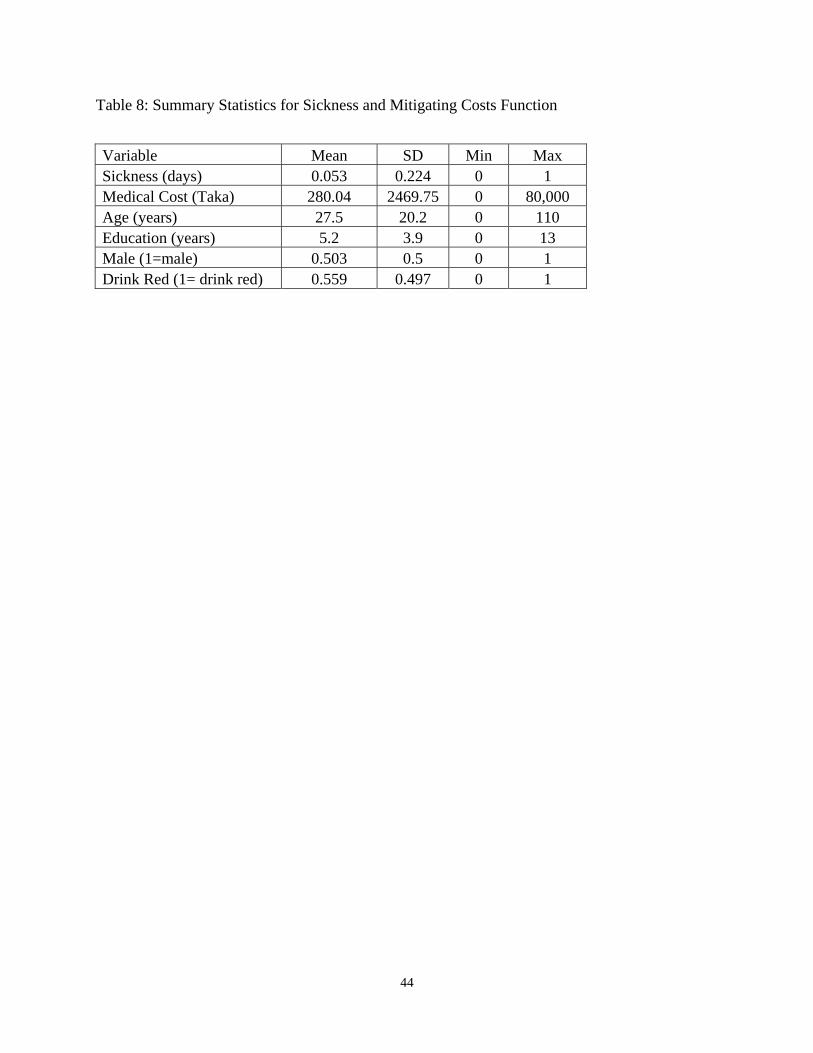
a safe mode. The summary statistics of the variables used in the estimation of the dose-response
26
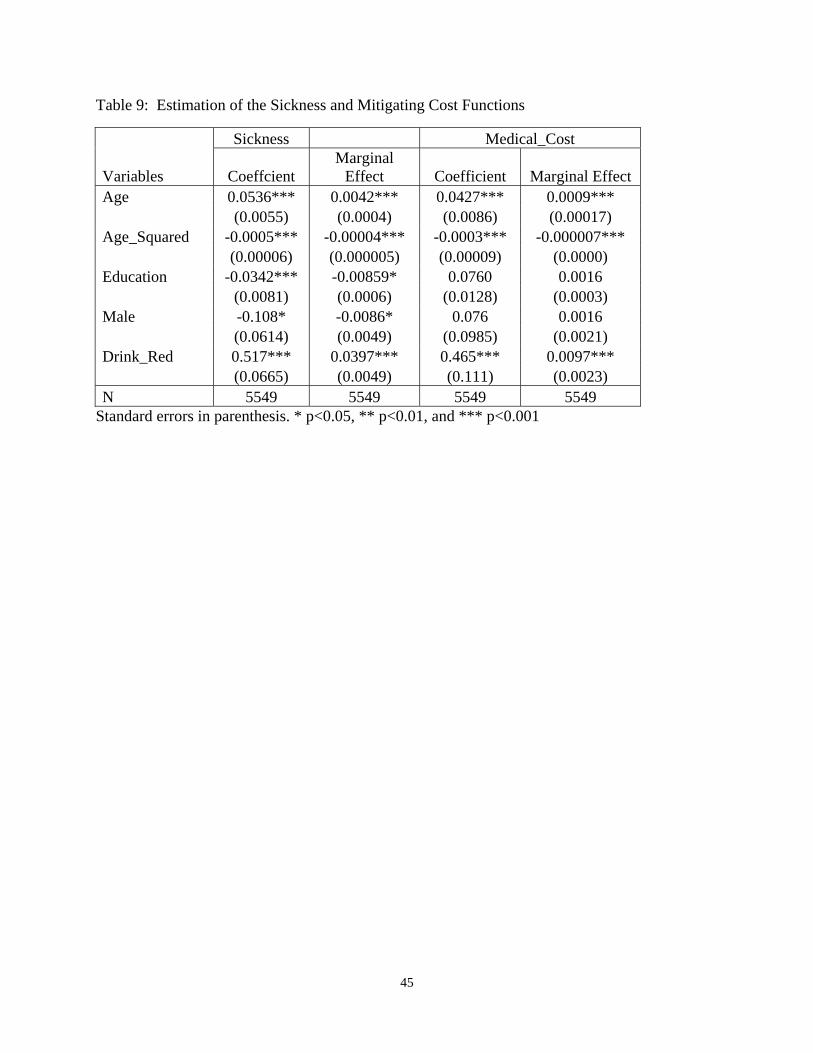
and mitigating activities regressions are presented in Table 8. The estimated probit equations
and the marginal effects are shown in Table 9.14
Column 2 of Table 9 shows that the probability of sickness is associated with changes in age, and
education. Since arsenic is a bio-accumulative element, the probability of arsenicosis increases
non-linearly with age at a decreasing rate. Years of schooling is negatively associated with the
probability of sickness. This reinforces our understanding that education is an indicator of health
awareness; it may also be picking up some wealth effects. Finally, the impact of switching from
red to green sources of water reduces the probability of sickness by 4 percent, by far the largest
gain in terms of reducing sickness.
Column 4 of Table 9 shows the marginal effects of the mitigating expenditures regression. The
probability of incurring health expenditures increases if the water source is red. Age, as in the
previous case, has a non-linear effect.
The next step is to estimate the willingness to pay of households for switching to cleaner water
sources. We estimate the marginal willingness to pay in the following manner:
)|()|( PMPMPSPWDLwMWTP ........................................................... (11)
= (A) + (B)
where P(S|P) is the marginal effect or change in the probability of sickness (related to arsenic
poisoning) for an individual due to changes in the level of arsenic poisoning, P is the change
from red to green well; w is average wage of the adult working population, WDL is the mean
14 We also estimated these two probit equations jointly and did not find any difference in the results.
27
workdays lost, M is the mean mitigating expenditure per individual when he/she is affected with
arsenic related diseases and P(M|P) is the changes in the probability of incurring mitigating
expenses due to changes in the level of exposure at the individual level. (A) measures the
marginal impact in terms of income loss due to changes in the level of exposure to arsenic and
(B)measures the marginal effect on mitigating expenditure due to changes in the exposure to
arsenic poisoning.
Based on equation (11), and the coefficients from Table 9, we calculate the mean cost of illness
for an individual from continuing to drink from red wells to be Taka 219 (USD 3) per year.
Thus, to avoid sickness to all household members, a household would, on average, have to pay
Taka 1,386 (USD 20) per household per year. However, if we consider that all household
members are currently not sick, the lower limit on this number (taking into account the
percentage currently sick or probability of sickness) is Taka 70 (USD 1) per year. These
numbers provide a range for annual household willingness to pay for switching from red to green
sources of water.
It is useful to compare our estimate of the benefits of switching with some other recent studies on
willingness-to-pay (WTP) for clean water in Bangladesh. An earlier study by Ahmad et al.,
(2002) estimates the WTP for safe water to be Taka 2,831 per household per year. They use
contingent valuation based on an understanding that households would have access to clean
water either through home connections or stand posts. Madagewicz et al. (2007) estimate the
lower bound for WTP based on an assessment of additional time taken by women to walk to
alternative water sources. The implied WTP from their study is 90 Taka per month or Taka
28
1,080 per household per year. It is interesting to note that the time costs to households who
switch wells in Madagewicz et al. (2007) is so much higher than the productivity and medical
costs accrued by the average household in our study. So at the household level, the benefits of
switching may be lower than the costs. This may partly explain why at least some households
continue to use red wells.
6. Conclusions
Our analysis of water use in Matlab and Laksham Upazilas in Bangladesh suggests that a
majority of households continue to drink from arsenic contaminated red wells. Fifty five percent
of our sample households indicated that they used red wells, despite the fact that many were
aware of arsenic contamination of their main source of water. We note that some 70 percent of
the wells in the two Upazilas contain water with arsenic levels higher than the Bangladesh
government’s safe standard of 50 g/liter.
There are many factors that constrain households from switching to safer water sources. In
nearby Araihazar Upazila, Madajewicz et al. (2007) report that an information campaign lead 60
percent of people who learned that their well was unsafe to switch to a safe well within a year.
In our study area, the red well/green well strategy is a way of providing households with similar
information. Yet, a large percentage of households continue to drink from red wells. It is
possible that many households switched to green wells when this information was originally
provided by DPHE, but limited access to clean water prevented the remaining population from
switching. Madajewicz et al. (2007) find that private well owners share their water mainly with
29
relatives. Thus, there may be both social and distance or opportunity costs related issues that
prevent well switching. These are topics that need to be further probed.
Higher education is the most important factor that reduces the probability of households drinking
from red wells (it is far more important than wealth, for example). There is also an important
role for information campaigns in reducing exposure to arsenic contaminated water. We find that
information from TV/Radio and NGO campaigns are more effective in reducing exposure to
arsenic relative to information provided by the official agency DPHE. These effects are
independent of other variables that may affect the household’s decision to drink from red wells.
Our overall conclusion is that non-government and private sector media sources of information
are at least, if not more, effective than government sources. This is useful to know because the
costs of delivering information through electronic media and NGO operations will differ from
costs associated with government strategies.
Some 5 percent of our sampled individuals showed symptoms of arsenicosis. Most patients
exhibited early stages of the disease. While this number seems small, the burden of arsenic
contamination is clearer at the household level since 19 percent of households have at least one
person sick from arsenic. Arsenic is a slow growing disease. Thus, with continual exposure, we
expect the number of sick individuals to continue to grow.
Households pay for their use of unsafe water by the sickness they experience. However,
monetary payments in terms of wages lost or medical costs borne are low. We estimated a lower
bound to the costs sick individuals bear as a result of arsenicosis and find that this is Taka 219
30
per year. Given that the per capita GDP in Bangladesh in 2005 was USD 444, the health costs of
arsenic exposure amount to about 1 percent of annual income (for sick individuals). This
percentage, however, is an under-estimate since income in rural districts is likely to be lower
than the Bangladeshi average and because we are only able to estimate the costs partially. The
stress, the difficult choices households face, the general malaise from using bad water, and the
costs of any avertive actions taken are not accounted for in our analyses.
Previous research (Khan 2007) suggests that there are technologies available to remove arsenic
that cost less than 1000 taka to buy and would cost about the same per year to maintain. These
seem to be too expensive relative to medical and productivity losses currently sustained by
households. UNICEF estimates that an investment of USD 200 million is required to provide
arsenic free water to the most exposed 20 million population (assuming 20 people share one
tubewell) (UNICEF Bangladesh 2011). This suggests an investment cost of USD 10 per person
or approximately USD 50 per household. Any such investment may be viable because it would
bring benefits that go beyond reductions in arsenicosis. Plus, as we previously noted, the costs
of continued exposure to arsenic will increase over time. However, like so many governments
in developing countries, the Government of Bangladesh is constrained by resources and ability in
terms of the public investments it can rapidly make.
Finally, we note that we are unable to say for sure what factors lead to the actual switch from red
wells to green wells. We do not have before and after information to answer this specific
question. We have also yet to ascertain the independent effect of different types of information
awareness campaigns. Further, our results hinge on the use of somewhat imperfect instruments.
31
Thus, there are several issues that require further analyses. Arsenic contamination is a serious
long-term issue in Bangladesh. This paper is mainly an effort to raise awareness about the issue
and identify areas for future economics research.
7. Acknowledgements
The data used in this paper was collected as part of a research project undertaken by Zakir H.
Khan and was sponsored by SANDEE. We are grateful to SANDEE’s sponsors for financial
support and for SANDEE’s advisors who helped with earlier stages of this work. We also thank
David Starrett and Scott Barrett for their comments, which helped improve the paper
substantially.
32
REFERENCES
Aziz, Sonia, Kevin J. Boyle and Mahfazur Rahman ( 2006). ‘Knowledge of Arsenic in Drinking-
water: Risks and Avoidance in Matlab, Bangladesh’. Jour of Health, Population and Nutrition,
24 (3): 327-335.
BGS AND DPHE (British Geological Survey and Department of Public Health and Engineering)
(2001). Arsenic contamination of groundwater in Bangladesh. D.G. Kinniburgh and P.L.
Smedley (eds), British Geological Survey Technical Report WC/00/19, Keyworth: British
Geological Survey.
BBS (Bangladesh Bureau of Statistics) (2009). 2008 Statistical Year Book of Bangladesh (28th
Edition). Planning Division, Ministry of Planning, Government of the People’s Republic of
Bangladesh (www.bbs.gov.bd accessed 31 August 2011).
Caldwell B. K., W.T. Smith, K. Lokuge, G. Ranmuthugala, K. Dear, A. H. Milton, M.R. Sim, J.
C. Ng, and S.N. Mitra (2006). ‘Access to drinking water and Arsenicosis in Bangladesh’. Jour of
Health, Population and Nutrition: 24/3: 336-345.
Chen Y. and Ahsan H. (2004). ‘Excess risk of internal cancers due to arsenic exposure from
drinking water in Bangladesh’. American Journal of Public Health, 94/5:741-744.
33
Dasgupta, P. and D. Ray (1986). ‘Inequality as a Determinant of Malnutrition and
Unemployment: Theory’. Economic Journal, 96/4: 1011-1034.
Dasgupta, P. and D. Ray (1987). ‘Inequality as a Determinant of Malnutrition and
Unemployment: Policy’. Economic Journal, 97/1: 177-188.
Farouque, H. S. M. and S. Alam (2002). State of arsenic contamination in Bangladesh.
Dialogue on Food Water and Environment: International Water Conference, Hanoi, Vietnam.
Freeman, A M. III, (1993).The Measurement of Environmental and Resource Values: Theory
and Methods, Washington, D. C: Resources for the Future.
Jalan, J. E., Somanathan and S. Chaudhuri. (2009). ‘Awareness and demand for environmental
quality. Survey evidence on drinking water in urban India’. Environment and Development
Economics, 14: 665-692.
Kathuria, V. (2007). ‘Informal regulation of pollution in a developing country: Evidence from
India’. Ecological Economics, 63/ 2-3: 403-417.
Khan, M.M. H., K. Aklimunnessa, M. Kabir and M.Mori. (2007). Determinants of drinking
arsenic-contaminated tubewell water in Bangladesh. Health Policy and Planning, 22/5:335-343.
34
Khan, Z. H. and A.K. E. Haque (2011). Red wells, green wells and the costs of arsenic
contamination in Bangladesh, in Murty, M.N, A.K.E. Haque and P. Shyamsundar (eds),
Environmental Valuation in South Asia, New Delhi: Cambridge University Press, 477.
Khan, Z. H. (2007). Managing the arsenic disaster in water supply: risk measurement, costs of
illness and policy choices in Bangladesh. SANDEE Working Paper No. 27. Kathmandu,
Nepal:SANDEE.
Khanna, M., W. Quimio, and D. Bojilova (1998). ‘Toxic Release Information: A Policy Tool for
Environmental Protection’. Journal of Environmental Economics and Management, 36 /3: 243-
266.
Lemos, M.C. (2008). ‘What Influences Innovation Adoption by Water Managers? Climate
Information Use in Brazil and the United States’. Journal of the American Water Resources
Association, 44/6:1388-1396.
Madajewicz, M., A. Pfaff, A. van Green, J. Graziano, I. Hussein, H. Momataj, R. Sylvi and H.
Ahsan. (2007).’Can Information alone change behavior? Response to arsenic contamination of
ground water in Bangladesh’. Jour of Dev Economics, 84: 731-754
Nickson, R, J. McArthur, W. Burgess, K.M. Ahmed, P. Ravenscroft and M. Rahmanñ (1998).
‘Arsenic Poisoning of Bangladesh Groundwater’. Nature, 395: 338.
35
Smith, A. H., E. O. Lingas and M. Rahman (2000), ‘Contamination of Drinking Water by
Arsenic in Bangladesh: A Public Health Emergency’. Bulletin of WHO, 78:1093-103.
Smith, A., M. L. Biggs, and L. Moore (1999), ‘Cancer Risks from Arsenic in Drinking Water:
Implications for Drinking Water Standards’, in W R Chappell, CO Abernathy and Rebecca L
Calderon (eds), Arsenic Exposure and Health Effects, Proceedings of the Third International
Conference on Arsenic Exposure and Health Effects, 1998, San Diego, California.
Tietenberg, T. and D. Wheeler. (2000). Empowering the Community. Information Strategies for
Pollution Control, in H. Folmer, H. L. Gabel, S. Gerking and A. Rose (eds), Frontiers of
Environmental Economics. UK: Edward Elgar Publishing, 85-120.
UNICEF, Bangladesh. (2011). Arsenic Mitigation in Bangladesh.
http://www.unicef.org/bangladesh/Arsenic_Mitigation_in_Bangladesh.pdf (accessed 30 August
2011)
van Geen, A., H. Ahsan, A.H. Horneman, R.K. Dhar, Y. Zheng, I. Hussain, K.M. Ahmed, A.
Gelman, M. Stute, H.J. Simpson, S.Wallace, C. Small, F. Parvez, V.Slavkovich, N.J. Lolocano,
M. Becker, Z. Cheng, H. Momotaj, M. Shahnewaz, A.A. Seddique, J.H. Graziano (2002).
‘Promotion of well-switching to mitigate the current arsenic crisis in Bangladesh’. Bulletin of the
World Health Organization, 80 /9:732–737.
36
Wang, H., J. Bi, D.Wheeler, J. Wang, D. Cao, G. Lu and Y. Wang, (2004). ‘Environmental
performance rating and disclosure: China's Green Watch program’. Journal of Environmental
Management, 71/2: 123-133.
37
Tables
Table 1: Household and Individual Socio-Economic Information
Note: Standard errors in parenthesis
Mean Mean Red Well
Mean Green well
Household Size 6.33 (2.43) 6.41 (2.39) 6.24 (2.48) Male/Female Ratio 1.28 (0.98) 1.33 (1.04) 1.22 (0.92) Age of Household head (years) 52.8 (15.3) 53.8 (15.8) 51.5 (14.4) Age (full sample) 27.49 (20.25) Percent of individuals over 7 illiterate 13.6 (17.9) 15.2 (19.5) 11.5 (15.7) Percent individuals over 7 years with primary or secondary education
78.5 (20.7) 78.1 (21.3) 79.1 (20.1)
Education (years) 5.17 (4.15) Male (years) 5.6 (4.1) 5.44 (4.03) 5.82 (4.10) Female (years) 4.8 (3.8) 4.6 (3.75) 4.98 (3.86)
Wealth 51.62 (12.4) 51.8 (12.9) 51.4 (11.7) Radio ownership (%) 53.3 (49.9) 52.2 (50.0) 55.0 (49.8) TV ownership (%) 27.1 (44.5) 26.8 (44.3) 27.7 (44.8)
38
Table 2: Drinking Water in the Study Area
Households Percent drink water from tubewell 85% Average no. of years of drinking from tubewell, (among households that drink from tubewells)
11.45
Percent of all water sources owned by individual households 74% Percent aware of arsenic in main source of water 66% Percent drinking water from red wells 55% Percent who follow some form of purification 18% Percent Yes to averting technology 12%
39
Table 3: Presence of Arsenic Symptoms
Percent Total individuals with arsenic symptoms 5.3 Male 4.6 Female 6.0 Percent households with at least 1 sick from arsenic 19 Distribution of arsenic disease among sick individuals Primary Stage Melanosis or black spots in the body 8.6 Keratosis or thickening of the palms and soles 34.3 Redness of the eye or Conjunctivitis 58.6 Inflammation of the respiratory system 45.7 Gastrointestinal problem 46.4 Secondary Stage Hypo-pigmentation or white spots 5.7 Hyper-Keratosis or nodular growth 15 Swelling of the feet and legs 12.1 Peripheral Neuropathy 17.1 Liver or kidney disorder 7.1 Tertiary Stage Gangrene of the distal organs 3.6 Cancer of the skin, lung or urine 2.9 Liver or kidney failure 2.1
40
Table 4: Sources of information and reasons for drinking contaminated water
Households (%) Main Source of information on arsenic contamination came from: DPHE 24.5 TV/Radio 14.6 Newspaper 0.59 Government 16.7 NGO 42.9
Other 0.24 Reasons for drinking from red-wells (among those who reported drink from red (n=485 HHs))
Safe or arsenic free source of water unavailable 47.42 Taste of the water is good 14.02 Shortage of money 5.57 Do not know the effect of drinking from Red-Wells 27.01 Other 5.99
41
Table 5: Summary Statistics of Variables Used in Information Regression
VARIABLE Definition Mean SD Min MaxDRINK_RED_WATER 1 if drinking from red-well 0.55 0.5 0 1 ARS_AFFECT Number of household
member(s) affected by arsenic related diseases 0.34 0.89 0 10
PVT_OWNER 1 if the households is using a private water sources 0.74 0.44 0 1
FEMALE Ratio of female members to all household members 0.49 0.17 0 1
INFO_GOVT 1 if main source of information on arsenic was from government 0.16 0.37 0 1
INFO_TVR 1 if main source of information on arsenic was from TV/Radio 0.15 0.35 0 1
INFO_NGO 1 if main source of information on arsenic was from NGOs 0.42 0.49 0 1
INFO_DPHE 1 if HH main source of information on arsenic was from DPHE 0.4 0.49 0 1
F_MORE 1 if more female members relative to male members are arsenic affected in sampled HHs 0.91 0.29 0 1
EDU1_10 1 if at least one member of the household had an education between 1 to 10 years 0.79 0.21 0 1
HEDU 1 if at least one member of the household had education over 10 years 0.08 0.15 0 1
WINDEX Wealth Index 51.62 12.41 0 100 TUBEWELLS 1 if source of drinking water is
tubewells 0.84 0.36 0 1 CHRO_ILL 1 if a member of the HH has
been suffering from any other chronic illness 0.26 0.55 0 4
42
Table 6: Fixed Effect Logit Regression for the full sample (Dep Var: Drink from the red tubewells)
Model 1 Model 2 Un-instrumented Instrumented
VARIABLES Coefficients Coefficients Marginal Effects PVT_OWNER 0.494*** -1.695*** -0.01352 (0.176) (0.316) FEMALE -0.802* -1.544*** -0.01231 (0.443) (0.476) INFO_NGO 0.00204 -5.510*** -0.04393 (0.314) (0.729) INFO_TVRADIO -0.270 -2.176*** -0.01735 (0.348) (0.425) INFO_GOVT 0.263 0.992** 0.007907 (0.359) (0.389) F_MORE 0.0563 6.652*** 0.053034 (0.323) (0.844) EDU1_10 -1.096** -5.880*** -0.04688 (0.469) (0.757) HEDU -1.805*** -9.724*** -0.07753 (0.598) (1.133) WINDEX -0.00315 -0.0306*** -0.00024 (0.00595) (0.00706) ARS_AFFECTED 0.0478 - (0.142) ARS_AFFECTEDP -7.315*** -0.05832 (0.866) OBSERVATIONS 878 878 NUMBER OF UNION 7 7 LR CHI SQ (10) 21.21** 104***
Note: Standard errors are within parenthesis. ***, ** and * indicate significant at 1%, 5% and 10% level respectively.
43
Table 7: Fixed Effect Logit Regression for two Upazilas (Dep Var: Drink from the red tubewells)
Matlab Upazila Lakhsam Upazila VARIABLES Un-instrumented Instrumented Un-instrumented Instrumented PVT_OWNER 0.0547 -0.391 1.105*** 1.223*** (0.241) (0.281) (0.279) (0.308) FEMALE -0.704 -2.360*** -0.751 0.515 (0.593) (0.800) (0.691) (0.753) INFO_NGO -0.0789 -3.450*** 0.883 0.296 (0.388) (1.135) (0.783) (0.859) INFO_TVRADIO -0.240 -44.29*** -0.0302 0.384 (0.532) (14.21) (0.482) (0.509) INFO_GOVT 0.241 0.379 1.052 3.729*** (0.464) (0.470) (0.779) (0.980) F_MORE 0.292 3.286*** 0.00864 2.649*** (0.516) (1.167) (0.445) (0.732) EDU1_10 -0.887 -2.135*** -1.187* -3.185*** (0.656) (0.766) (0.708) (0.845) HEDU -1.554* -6.917*** -1.521* 0.621 (0.828) (1.894) (0.899) (0.999) WINDEX -0.00905 -0.0217** 0.00267 -0.0271** (0.00825) (0.00930) (0.00894) (0.0109) ARS_AFFECTED 0.266 -0.0319 (0.295) (0.153) ARS_AFFECTEDP -2.041*** -5.374*** (0.659) (0.980) OBSERVATIONS 436 436 442 442 NO OF UNION 3 3 4 4 LRCHISQ (10) 9.1 18.7** 24.73*** 64.4*** Note: Standard errors are within parenthesis. ***, ** and * indicate significant at 1%, 5% and 10% level respectively.
44
Table 8: Summary Statistics for Sickness and Mitigating Costs Function
Variable Mean SD Min Max Sickness (days) 0.053 0.224 0 1 Medical Cost (Taka) 280.04 2469.75 0 80,000 Age (years) 27.5 20.2 0 110 Education (years) 5.2 3.9 0 13 Male (1=male) 0.503 0.5 0 1 Drink Red (1= drink red) 0.559 0.497 0 1
45
Table 9: Estimation of the Sickness and Mitigating Cost Functions
Sickness Medical_Cost
Variables Coeffcient Marginal
Effect Coefficient Marginal Effect Age 0.0536*** 0.0042*** 0.0427*** 0.0009***
(0.0055) (0.0004) (0.0086) (0.00017) Age_Squared -0.0005*** -0.00004*** -0.0003*** -0.000007***
(0.00006) (0.000005) (0.00009) (0.0000) Education -0.0342*** -0.00859* 0.0760 0.0016
(0.0081) (0.0006) (0.0128) (0.0003) Male -0.108* -0.0086* 0.076 0.0016
(0.0614) (0.0049) (0.0985) (0.0021) Drink_Red 0.517*** 0.0397*** 0.465*** 0.0097***
(0.0665) (0.0049) (0.111) (0.0023) N 5549 5549 5549 5549
Standard errors in parenthesis. * p<0.05, ** p<0.01, and *** p<0.001
46
Appendix Table A: First Stage Negative Binomial Regression
DEP VAR: ARS_AFFECT Coef. Std. Err. z P>z [95% Conf.]
Interval] TUBEWELLS -0.531 0.163 -3.260 0.001 -0.850 -0.211 CHRO_ILL 0.378 0.082 4.630 0.000 0.218 0.538 CUR_OWNER 0.069 0.194 0.350 0.723 -0.311 0.449 FEMALE -0.849 0.241 -3.530 0.000 -1.321 -0.377 NGO_ARSENIC_RELATED -0.107 0.201 -0.530 0.595 -0.502 0.288 NEWS -16.445 0.759 -21.660 0.000 -17.934 -14.957 INFO_DPHE_SURVEY -0.428 0.215 -1.990 0.046 -0.848 -0.007 F_MORE 1.978 0.435 4.550 0.000 2.831 1.125 EDU1_10 -1.754 0.446 -3.930 0.000 -2.628 -0.879 HEDU -3.574 0.403 -8.880 0.000 -4.363 -2.785 WINDEX 0.002 0.005 0.360 0.717 -0.008 0.011 CONS 2.543 0.372 6.830 0.000 1.813 3.273 ALPHA 1.303 0.425 0.688 2.469

47


