Embed Size (px)
Citation preview

University of South FloridaScholar Commons
Graduate Theses and Dissertations Graduate School
January 2013
Parent Pathways: Recognition and Responses toDevelopmental Delays in Young ChildrenJennifer MarshallUniversity of South Florida, [email protected]
Follow this and additional works at: http://scholarcommons.usf.edu/etd
Part of the Public Health Commons, and the Special Education and Teaching Commons
This Dissertation is brought to you for free and open access by the Graduate School at Scholar Commons. It has been accepted for inclusion inGraduate Theses and Dissertations by an authorized administrator of Scholar Commons. For more information, please [email protected].
Scholar Commons CitationMarshall, Jennifer, "Parent Pathways: Recognition and Responses to Developmental Delays in Young Children" (2013). GraduateTheses and Dissertations.http://scholarcommons.usf.edu/etd/4534
Parent Pathways: Recognition and Responses to Developmental Delays in Young
Children: A Mixed-Methods Exploratory Study
by
Jennifer Tess Marshall
A dissertation submitted in partial fulfillment
of the requirements for the degree of
Doctor of Philosophy
Department of Community and Family Health
College of Public Health
University of South Florida
Major Professor: Russell S. Kirby, Ph.D.
Martha Coulter, Dr.P.H.
Donna J. Petersen, Sc.D.
Linda M. Raffaele Mendez, Ph.D.
Peter A. Gorski, M.D.
Date of Approval:
May 30, 2013
Keywords: Developmental Disabilities, Developmental Screening, Early Childhood
Copyright © 2013, Jennifer Tess Marshall

Dedication
To Kirin Karver for teaching me the most about child development, the joys and worries of
parenting, the importance and impact of parents and community on children’s future.
To Marc Karver for his clarity, strength, and commitment to excellence. His loyalty, generosity,
partnership, and support throughout my career, graduate school, and raising our family have
made it all possible.
To Don Marshall for passing on his compassion for others, concern for social justice, and for his
ever-present love and support.
To Janeen Strole for modeling a passion for learning, love, and overcoming fear and doubt; for
her lifelong quest to understand and find meaning in the human condition; and for her faith and
pride in my accomplishments.

Acknowledgments
Major Professor and Advisor: Russell Kirby
Research team: Katerina Kozyr, Luis Enrique Diaz, Natalia Vega, Allie Prendergast, Jean Paul
Tanner
Community Partners: Hillsborough County Head Start & Early Head Start, Early Childhood
Council of Hillsborough County, Tampa Metro YMCA, Champions for Children, Layla’s House,
St. Joseph’s Advocacy Center

i
Table of Contents
List of Tables ...................................................................................................................................v
List of Figures ................................................................................................................................ vi
Abstract ......................................................................................................................................... vii
Section 1. Introduction and Statement of the Problem ....................................................................1
Developmental Delay – Definitions, Prevalence, and Leading Issues ................................2
Early Intervention Systems and Challenges ........................................................................6
Factors Related to Parental Recognition and Help-Seeking ..............................................11
Awareness and Recognition ...................................................................................12
Policy, Community, & Organizational Level Factors ...............................12 Family, Parent, and Child Level Factors ...................................................13
Concern and Help-Seeking ....................................................................................16
Policy, Community, & Organizational Level Factors ...............................16
Family, Parent, and Child Level Factors ...................................................18
Section 2. Study Overview ............................................................................................................22
Research Considerations ....................................................................................................22
Health Belief Model ...............................................................................................23
Social Support ........................................................................................................29
Methods Considerations.....................................................................................................33
Section 3. Factors Associated with Early Recognition & Intervention for Developmental
Delays: Findings from the 2007 National Survey of Children’s Health ..................................40
Abstract ..............................................................................................................................40
Introduction ........................................................................................................................41
Purpose ...............................................................................................................................44
Methods..............................................................................................................................45
Analysis..................................................................................................................46
Results ................................................................................................................................47
Concern ..................................................................................................................48
Public Intervention Services (IEP/IFSP) ...............................................................50
Private Therapy ......................................................................................................51
Discussion ..........................................................................................................................53
Conclusion .........................................................................................................................60
Section 4. Parent Pathways: Recognition and Responses to Developmental Concerns in Young
Children....................................................................................................................................83

ii
Abstract ..............................................................................................................................83
Introduction ........................................................................................................................84
Purpose ...............................................................................................................................87
Methods..............................................................................................................................88
Sampling and Recruitment .....................................................................................88
Procedures ..............................................................................................................89
Analysis..................................................................................................................91
Results ................................................................................................................................92
Participant Demographics ......................................................................................93
Knowledge of Child Development ........................................................................94
Recognition of Developmental Delays ..................................................................95
Parent Appraisal of Developmental Differences ...................................................96
Social Support: Appraisal Support.........................................................................97
Help-Seeking..........................................................................................................99
Cultural Expectations and Decisions ...................................................................102
Benefits & Barriers ..............................................................................................104
Informational Support ..........................................................................................108
Stigma ..................................................................................................................109
Instrumental Support ............................................................................................112
Self-Efficacy ........................................................................................................113
Emotional Support ...............................................................................................115
Pediatrician ..........................................................................................................116
Community Agencies and Referral Coordination ................................................120
Discussion ........................................................................................................................121
Strengths and Limitations ....................................................................................126
Conclusion .......................................................................................................................128
Section 5. Research Synthesis: Discussion and Conclusions ......................................................139
Discussion ........................................................................................................................139
Recognition of Developmental Delays ................................................................140
Child Factors ............................................................................................141 Parent & Family Factors 152
Parent & Family Factors ..........................................................................142
Community & System Factors .................................................................147
Response to Developmental Concerns.................................................................148 Child Factors 169
Child Factors ............................................................................................149 Child Factors 141 Parent & Family Factors 152
Parent & Family Factors ..........................................................................150
Community & System Factors .................................................................153
Research Methodology: Strengths & Limitations................................................156
Compatibility of Findings with the Proposed Theoretical
Framework ...............................................................................................156
Mixed Methods Approach .......................................................................157
Phase 1: Quantitative Analysis ................................................................158
Phase 2: Qualitative Analysis ..................................................................161
Conclusion .......................................................................................................................166
Future Study .........................................................................................................169
Implications for Public Health .............................................................................170

iii
References ....................................................................................................................................173
Appendices ...................................................................................................................................228
Appendix A: Literature Review .......................................................................................229
Introduction ..........................................................................................................229
Individual Level Measures of Child Development ..............................................234
Child Scales .............................................................................................234
Parent and Caregiver Scales.....................................................................235
Developmental Screening ........................................................................236
Early Intervention ................................................................................................245
Underenrollment ......................................................................................247
The Role of Parents ..............................................................................................249
Awareness and Recognition .....................................................................250
Concern ....................................................................................................255
Help-seeking ............................................................................................256
Existing Research.................................................................................................259
Relevant Theories ................................................................................................260
Social Determinants, Health Disparities and the Lifecourse Model ........261
Other Theoretical Approaches .................................................................271
Proposed Theoretical Framework ........................................................................274
Health Belief Model .................................................................................274
Social Support ..........................................................................................280
Research Considerations ......................................................................................282
Reliability .................................................................................................284
Validity ....................................................................................................286
Generalizability ........................................................................................288
Recommendations ....................................................................................288
Appendix B: Children under Age Five with Developmental Concerns and Delays
-Status Estimates from the Literature ........................................................................291
Appendix C: Measures of Child Development, Parenting, & Program
Implementation ...........................................................................................................292
Appendix D: National Surveys Related to Early Childhood Health, Development,
Well-Being ..................................................................................................................294
Appendix E: Relevant PRAMS-2 Variables ....................................................................295
Appendix F: Relevant NS-CSHCN Variables .................................................................296
Appendix G: NSCH Scoring Criteria: Developmental Concern and Risk for
Developmental Delay.................................................................................................297
Appendix H: Relevant NSCH Variables..........................................................................298
Appendix I: Recruitment Flyer ........................................................................................301
Appendix J: Recruitment Agencies .................................................................................303
Appendix K: Telephone Screening Form for Focus Group Participants .........................304
Appendix L: Focus Group Guide .....................................................................................306
Appendix M: Demographic Questionnaire ......................................................................311
Appendix N: IRB Approval and Consent Form ..............................................................315
Appendix O: Knowledge of Infant Development Scales (KIDI) .....................................324
Appendix P: Parent Evaluation of Developmental Status (PEDS) ..................................333

iv
Appendix Q: Definitions ..................................................................................................334
Appendix R: Pathways to Assessment Services: Research Support for Theoretical
Framework .................................................................................................................336
Appendix S: Pathways to Assessment Services: Theoretical Framework and
Potential Data Sources ...............................................................................................337
Appendix T: Summary of significant variables across three outcomes: concern,
IEP/IFSP, and therapy- phases 1 and 2 ......................................................................338

v
List of Tables
Table 1.1 Number and type of concern and service enrollment among parents of children
Ages 0-5 ...................................................................................................................................63
Table 1.2 Rates of reported concern and public intervention services by state among
Children ages 0-5and 0-2 .........................................................................................................64
Table 1.3 Frequencies and percents between parent concern groups for children ages birth
to 5 years for child, parent, family and community characteristics .........................................66
Table 1.4 Frequencies and percents between IEP/IFSP enrollment groups for children ages
birth to 5 years for child, parent, family and community characteristics ...............................69
Table 1.5 Frequencies and percents between therapy enrollment groups for children ages
birth to 5 years for child, parent, family and community characteristics ................................72
Table 1.6 Adjusted odds ratios (OR) for parent concern by selected child, parent, family,
and community characteristics .................................................................................................75
Table 1.7 Adjusted odds ratios (OR) for help-seeking (IEP) by selected child, parent,
family, and community characteristics ....................................................................................77
Table 1.8 Adjusted odds ratios (OR) for help-seeking (therapy) by selected child, parent,
family, and community characteristics ....................................................................................80
Table 1.9 Summary of significant variables across three outcomes: concern, IEP/IFSP, and
therapy......................................................................................................................................82
Table 2.1 Community-based Sampling Strategy .........................................................................132
Table 2.2: a priori and emergent codes and variables of interest by data source ........................133
Table 2.3: Participant characteristics as reported on the Demographic Questionnaire ...............134
Table 2.4: Correlation Coefficients for Parent Knowledge of Child Development among
Socio-Demographic Groups...................................................................................................136

vi
List of Figures
Figure 1.1 Risk and services status among parents reporting concern for children ages 0-5 ........62
Figure 2.1 Theoretical model of parent recognition and response to developmental delays .......137
Figure 2.2 Map of participants’ home zip code ...........................................................................138

vii
Abstract
The importance of early recognition and intervention for developmental delays is
increasingly acknowledged, yet high rates of under-enrollment and 1-3 year delays in entry to the
public early intervention system continue. Much research has examined developmental screening
in health and child care settings, but less well understood is what prompts parents to identify
problems and seek help for their children. This mixed methods study rooted in the Health Belief
Model and Social Support Theory examined child, parent, family, and community level factors
related to parent recognition (awareness and concern) and response (help-seeking and enrollment
in services), including formal and informal sources of appraisal, informational, instrumental, and
emotional support.
Phase 1 examined responses from 27,566 parents of children ages 0-5 using the 2007
NSCH to quantify the type and number of parent concerns regarding their child’s development in
eight developmental domains, rates of enrollment in public intervention or private therapy, and
factors associated with increased or decreased likelihood of concern or services enrollment.
Regression analyses indicated that the likelihood of parent developmental concern and
enrollment in public or private services differed by: child age, sex, health status, and type of
developmental delay; parent and family characteristics (e.g. maternal race/primary language,
reading to the child, etc.); pediatrician inquiry about concerns; insurance type; and child care
type. Maternal age, education, marital status, and family structure and income were controlled
for in all three models, but did not consistently contribute to likelihood of concern or services
across outcomes.

viii
Phase 2 of the study utilized purposive, convenience, quota sampling via community agencies to
invite 6 Spanish and 17 English speaking parents of high and low socioeconomic status to share
their experiences in recognizing and responding to developmental concerns in their children
(ages 2 weeks-4 ½ years) via 18 interviews and 2 focus groups. Participants also completed
demographic, developmental status (PEDS), and knowledge of infant/child development (KIDI)
questionnaires. About half of participants reported behavior (54%), social (50%), or speech
concerns (54%); over a third had academic (38%), receptive language (42%), or self-help
concerns (33%); and roughly 15% reported fine motor (17%) or gross motor (13%) concerns.
Parents described in detail observations that first sparked developmental concerns, their decision-
making processes in help-seeking and timelines for services; types and sources of social support;
and facilitators and barriers related to recognition and help-seeking. The average score on the
infant questionnaire was 50% correct and 65% on the prekindergarten questionnaire (range 32-
91%).
The results of this study describe child (sex, age, health status, type of delay), parent (age,
education, race, ethnicity, home language, perception of susceptibility and severity of child
delay), family (siblings, income, reading to the child, relative child care, social support), and
community (pediatric practices, source of medical care, insurance, community support and
referral coordination)factors related to early identification of developmental delays and access to
public early intervention and private therapy services. Findings can be used to inform and
improve community education, developmental screening, and Child Find outreach efforts. This
study also contributes to our understanding of how parents interface with early intervention
systems and both formal and informal parenting supports in the community, and identifies
triggers for parental recognition and help-seeking for developmental delays and preferred entry

ix
points and pathways to assessment services. Recommendations include additional research on
the causes, risk factors, co-morbidities, onset, and stability of diagnosis for developmental
delays; continued development and universal implementation of valid and reliable screening and
assessment tools, particularly for infants and toddlers; education campaigns to increase provider,
parent, and public knowledge about developmental expectations, the importance of early
intervention, and intervention options; further expansion of free, culturally appropriate programs
to support child development for children with and without developmental delays and to
strengthen formal and informal social supports for parents; improved referral coordination and
timelines; and ongoing evaluation research to further demonstrate the efficacy of a variety of
intervention service delivery models.

1
Section 1. Introduction and Statement of the Problem
Because developmental disabilities are fairly common and affect the life course trajectory
of individuals and their families, public health and education systems strive for early
identification and intervention in order to optimize development and achievement in school,
work, and community life. Developmental screening efforts and public and private intervention
programs have been implemented across the country with mixed results. One constant is the role
of parents and other primary caregivers in recognizing and responding to early signs of
developmental disabilities, including delayed milestones or other physical, cognitive,
communication or behavior challenges.
This mixed methods cross-sectional study seeks to better understand the child, family,
and community-level factors that contribute to parents’ recognition of developmental delays and
help-seeking for assessment services in their young children. Phase 1 (Manuscript 1) will
identify important population characteristics and relevant factors associated with recognition and
responses at the national level using the 2007 National Survey of Children’s Health. Phase 2
(Manuscript 2) will explore the decision making processes and influences on parent concern and
help-seeking for developmental delays elicited through focus groups, and will assess parent
knowledge of development, and the type and number of concerns using standardized measures.
This study will contribute to the literature the previously unexplored parents’ perspectives on
first awareness of developmental differences, development of concern, and help-seeking
decisions related to developmental disabilities in their young children. Findings will inform

2
future screening and early intervention outreach efforts, including social marketing campaigns
aimed at improving early recognition and access to services.
Developmental Delay – Definitions, Prevalence, and Leading Issues
A developmental delay is any non-attainment of expected milestones for a child’s age in
the area of speech/language, physical, cognitive, self-help, or social/emotional development.
Delayed milestones, such as not walking or talking at the expected age, or developmental
differences in socialization, play, emotion regulation, or self-care activities such as toileting,
feeding compared to same age peers or siblings may trigger concerns in an adult (Navas,
Verdugo, Arias, & Gómez, 2012). A developmental disability means a severe, chronic disability
of an individual 5 years of age or older attributable to a mental or physical impairment (or
combination of mental and physical impairments) that manifests before the individual attains age
22, is likely to continue indefinitely and results in substantial functional limitations in three or
more of the following areas of major life activity: self-care; receptive and expressive language;
learning; mobility; self-direction; capacity for independent living; and economic self-sufficiency
(U. S. DHHS, 2000). The United Nations Children’s Fund (UNICEF) defines developmental
disability in children as “limitations in mental and/or physical function relative to age-specific
norms that become apparent prenatally, perinatally or during infancy, childhood, or
adolescence.” (UNICEF, 2008, p 3). For children under age 5, eligibility categories under Part C
of the Individuals with Disabilities Education Act (I.D.E.A.) include: mental retardation, hearing
impairments, speech or language impairments, visual impairments, emotional disturbance,
orthopedic impairments, other health impairments, specific learning disabilities, deaf-blindness,
multiple disabilities, autism, traumatic brain injury and developmental delay (Shackelford,
2006). Current prevalence of developmental delays and disabilities is often estimated from

3
national parent surveys, because there is not a comprehensive nationwide registry; children may
be enrolled in multiple intervention programs, and under-enrollment in intervention is high
(Boyle, et al., 2011; Buysse, Bernier, & McWilliam, 2002; Rosenberg, Zhang, & Robinson,
2008; US OSEP, 2011). The current estimated prevalence of any kind of delay, including
social/emotional challenges is up to 17% or 1 in 6 of all children under age 5 ( Boyle, et al.,
2011; Rosenberg, Zhang, & Robinson, 2008), or 10% of children under age 3 (Sices, 2007; U. S.
Office of Special Education Programs, 2003). Some international estimates quote 7-10%,
depending on the age group and conditions included.
There are numerous challenges in early recognition, diagnosis, and evaluation of
developmental disabilities, as well as in identifying the etiology, funding and ensuring access to
intervention, and measuring outcomes (Shevell, 2008). Screening is defined by the Centers for
Disease Control and Prevention (CDC) (2005), as “A brief assessment designed to identify
children who should receive more intensive diagnosis or assessment”. Evaluation is the process
of gathering information for the purpose of making decisions: including diagnosis; determination
of eligibility for a program; assessment for program planning purposes; monitoring of progress
throughout an intervention; and assessment for accountability (McLean, Wolery, and Bailey
(2004, p.13). Developmental evaluation is a time and labor-intensive process that requires skilled
investigation including medical and psychosocial history, physical examination,
neurodevelopmental assessment, and sometimes laboratory tests (Shevell, 2008). Assessment
tools are used to evaluate child health and illness, attainment or delay of developmental
milestones, academic abilities or challenges, and social emotional function or dysfunction
(Clifford & Crawford, 2009).

4
For children under age 3, Part C establishes a diagnosis of developmental delay through a
multidisciplinary diagnostic evaluation including standardized test scores (by percent or standard
deviations below the mean) in one or more developmental areas of development, informed
clinical opinion or the decision of the evaluation team, or an established condition or at-risk
status resulting in the likelihood of developmental delay in the absence of intervention.
Measurement of developmental delay relies upon consistent definitions, valid and reliable tools,
and multiple measures over time. However, persistent developmental delays tend to be reliably
identifiable with specificity and sensitivity at young ages based on a number of screening tools
such as those presented in Appendix C (Kleinman, et al., 2007; Nygren, et al., 2012; US DHHS,
ACF 2005; Yang, Lung, Johg, Hsu, & Chen, 2010, p. 895).
As Glascoe (2005) puts it, high quality developmental screening takes into account that
“children’s development is malleable, and manifests with age”. Considerable dialogue continues
in the literature as information about recommended screening tools is learned and tools are
created or revised (Glascoe, Page, & Frankenberg, 2002; Glascoe, 2005). Developmental
screening occurs in pediatric, child care/education, and community settings. Much of the
research on early identification of developmental delays has focused on developmental screening
by professionals, such as primary pediatric health care providers (AAP, 2001, 2006; Allen,
Berry, Brewster, Chalasani, & Mack, 2010; Bethel, Reuland, Schor, Abrahms, & Halfon, 2011;
Daniel, Prue, Taylor, Thomas, & Scales, 2009; Glascoe, 1997, 2005; Halfon, et al., 2004;
Halfon, Regalado, & Sareen, 2004; Hix-Small, 2007; Johnson, 2000; Mendez & Hess (2003);
Pinto-Martin et al., 2005; Rydz, et al., 2006; Sand et al., 2005; Schonwald, Huntington, Chan,
Risko, & Bridgemohan, 2009; Seligman & Darling, 2007; Sices, 2003, 2007; National Center on
Birth Defects and Developmental Disabilities, 2005), early childhood caregivers or teachers
5
(Allen, 2007; Bowman, 2001 Halfon, 2004;Halfon, Russ, & Regalado, 2004; Pinto-Martin, et al.,
2005; Powell, 2008), or comprehensive community based programs (Bergman, 2004; Halfon,
Russ, & Regalado, 2004; McLean, Wolery, & Bailey, 2004). Across settings, parent-professional
agreement maximizes the likelihood of help-seeking and use of services (Allen, Berry, Brewster,
Chalasani, & Mack, 2010; Glaun, Cole, & Reddihough, 1999; Ho, Miller, & Armstrong, 1994).
While individual level measures may assist physicians, clinicians, teachers, and parents in
assessing and monitoring health and development (Appendix C), measures are increasingly used
in aggregate form for program, system, or policy decision-making at the organizational,
community, state, national and international levels. International surveys, such as the Multiple
Indicator Cluster Surveys (MICS) developed by UNICEF (2008), measure the status of women
and children across participating countries through administration of a household questionnaire,
women’s questionnaire, and children under 5 years of age questionnaire (2008). The child
questionnaire covers areas such as child characteristics, anthropometry, birth registration, early
learning, nutrition, and health, and also includes optional modules for child development and for
source and cost of treatment supplies (UNICEF, 2008).
A Healthy People 2020 objective is to “Increase the proportion of children who are ready
for school in all five domains of healthy development: physical development, social-emotional
development, approaches to learning, language, and cognitive development.” Seven national data
sources have been considered for tracking progress on this objective (U. S. DHHS, 2011). At the
State and National levels, many large scale surveys (Appendix D) offer access to an
unprecedented scope of large, diverse, and publically available population-level data for
researching incidence and prevalence; individual, family, and community experiences;
disparities; and practices. For example, several national surveys explore topics related to the care
6
of children with special needs. The National Survey of Children’s Health (NSCH) examines the
physical and mental health status, health care quality and access, and the family, neighborhood
and social context for over 90,000 children, including 26,192 children ages 0-5 nationwide (U. S.
DHHS, 2007a). The National Survey for Children with Special Health Care Needs (Appendix F)
interviews over 40,000 families nationwide regarding their child’s medical care needs and
access, family-professional partnership, developmental screening, and transition services (U. S.
DHHS, 2007b). The National Longitudinal Survey of Youth measures non-resident father
involvement (Shandra, Hogan, & Spearin, 2008), the Statistics Canada National Longitudinal
Survey of Children and Youth and the National Health Interview Survey, Disability Supplement
examine the emotional, financial and health impacts on family members (Burton, Lethbridge, &
Phipps, 2008; Rogers & Hogan, 2003); and the National Longitudinal Transition Study of
Special Education Students asks about key transition experiences (Wells, Sandefur & Hogan
(2003). The Pregnancy Risk Assessment Monitoring System – 2 year follow-up survey
(PRAMS-2) has the advantage of comparing measures from two time periods, shortly after birth
and a re-interview at age two for approximately 1,880 families in Oregon (Rosenberg, et al.,
2011, Appendix E).
Early Intervention Systems and Challenges
Early intervention is typically conceptualized as the process of providing services,
education and support to young children who have been diagnosed with a developmental
disability (an established condition, a physical or mental condition (with a high probability of
resulting in a developmental delay), an existing delay, or a child who is at-risk of developing a
delay that may affect their development or impede their education) in order to lessen the effects
of the disability or delay (Wrightslaw, n.d.). According to the Individuals with Disabilities

7
Education Act (IDEA) (U. S. Department of Education, n.d.), early intervention is defined as
developmental services that are provided under public supervision, at no cost, and to the
maximum extent appropriate, are provided in natural environments (including the home, and
community settings in which children without disabilities participate). The services must be
designed to meet the developmental needs of an infant or toddler with a disability, as identified
by the individualized family service plan team in any 1 or more of five developmental areas,
including: physical, cognitive, communication, social/emotional, and adaptive development.
These services may include early identification, screening, and assessment services;
family training, counseling, and home visits; service coordination; special instruction;
psychological services; speech-language pathology, audiology, sign language and cued language
services; occupational and physical therapy; medical services only for diagnostic or evaluation
purposes; health services necessary to enable the infant or toddler to benefit from the other early
intervention services; social work services; vision services; assistive technology devices and
services; and transportation and related costs that are necessary to enable an infant or toddler and
the infant's or toddler's family to receive these services. IDEA intervention services must be
provided by qualified personnel, including special educators; speech-language pathologists and
audiologists; occupational therapists; physical therapists; psychologists; social workers; nurses;
registered dietitians; family therapists; vision specialists, including ophthalmologists and
optometrists; orientation and mobility specialists; and pediatricians and other physicians (U.S.
Department of Education, n.d.).
Dunst proposed a “Third Generation Model” of early intervention that is broader and
more family-centered than traditional services approaches (2000, p. 95). In addition to the
intervention model described above, Dunst’s model includes other services and supports in three

8
dimensions: child learning opportunities, parenting supports, and family/community supports
and resources. The model asserts that intervention can: incorporate both formal and informal
family and community supports and resources to support parenting and childrearing activities;
include child, parent, and family priorities and preferences; and strengthen existing capabilities
and promote child, parent, and family competence. In addition to the three dimensions of the
model, their overlapping intersections define additional elements of effective practices. For
example, the intersection of children’s learning opportunities and family/community supports
defines the activity settings serving as the sources and contexts of natural learning opportunities
as part of family and community life as described in IDEA. Another important intersection is that
of parenting and family/community support, which defines the kinds of interactions parents have
with personal social support network members influencing parenting attitudes and behaviors.
The importance of early intervention is increasingly recognized; it can support
development during important windows of opportunity, correct maladaptive patterns of
development early, and improve school readiness (Pinto-Martin et al., 2005; Ramey & Ramey,
2004). A recent examination of data from Part C and Part B early intervention programs found
greater than expected growth for 68-81% of participants in self-help, knowledge and skills, and
social development (Early Childhood Outcomes Center, 2012). Yet studies have found high rates
of under-enrollment and 1-3 year delays in entry to the U. S. public early intervention system
(Buysse, Bernier, & McWilliam, 2002; Pinto-Martin et al., 2005; Ramey & Ramey, 2004;Sices,
2007; U.S. OSEP, 2011). Public early intervention (assessment, coordination, and services) for
children birth to age three is provided nationwide by Part C, a component of IDEA that
guarantees a free and appropriate public education for children with disabilities. Early
intervention is intended to support families and caregivers in developing the competence and

9
confidence to help their children learn and develop in their ‘natural environment’, such as the
home or child care setting. Early Steps is Florida's early intervention system administered by The
Florida Department of Health that serves infants and toddlers (birth to 36 months) with
significant delays or a condition likely to result in a developmental delay. Locally, the Bay Area
Early Steps Program is administered by the University of South Florida Department of Pediatrics
and Infants and Young Children of West Central Florida (IYC). In 2009, this program served
3,642 children in Hillsborough County (FICCIT, 2009). This equates to less than one percent
(.07%) of the 52,131 children under age three residing in the County (based on births 2007-
2009). Nationwide, public early intervention/Part C programs serve about 2.8% (ranging from
1.48-6.96) of children ages 0-3, though the estimated prevalence of developmental delays in this
age group is about 10% (Sices, 2007; U. S. Office of Special Education Programs, 2003).
Enrollment in early intervention increases by age. In 2010, 12% of Part C participants
were ages birth to 12 months, 31% were 1-year olds, and 57% were 2-year olds. Florida’s Part C
program served 2.06% (13,158) of children (U.S. OSEP, 2011). In one study, the mean age of
entry in one state’s Part C early intervention system was 17 months for most participants
(Buysse, Bernier, & McWilliam, 2002) and Sices (2007) found that the average age of diagnosis
was 11 months for Cerebral Palsy, 27 months for global delay, and 32 months for language
delay. Hebbeler and colleagues’ report from the National Early Intervention Longitudinal Study
(2007) found similar ages for entry. In a five state study examining Part C services among
underserved population, state programs reported challenges such as budget shortfalls and
personnel layoffs; difficulties in approaching close-knit ethnic communities; difficulties in the
recruitment of related services personnel trained in multilingual, multicultural issues to work in
rural areas; difficulties in building relationships with physicians; meeting the needs of highly

10
mobile children and families, including undocumented immigrant families; and drawing from
multiple, incompatible databases to conduct data analysis related to children’s race/ethnicity and
other important characteristics (Pierce & Müller, 2005). However, some families may elect to
receive private or alternative intervention services and may not be captured in the public
intervention flags or datasets. For example, in the National Survey of Children’s Health, of 2,129
parents of children birth to age 5 with concerns, 71% reported no IFSP/IEP for their child
(Figure 1.1).
Connecting parents to assessment services early is critical – early intervention makes a
big difference for many children, and helps to ameliorate developmental challenges before they
enter school (Pinto-Martin et al., 2005). Once a delay is recognized, it can take parents years to
find the appropriate help. In the US, the lag time between parents first awareness of
developmental concern and access to assessment services averages between 1–3 years (Batshaw,
2002; Sices, 2007). Unfortunately, most of these children do not receive the developmental
supports and services during critical windows of development; fewer than 30% of children are
identified prior to age five. Children enter Child Find (the Part B component of IDEA serving
ages 3-21) at age 3 or 4. However, Part B it is usually administered by the LEA (local education
agency) which offers limited services during the summer, so there is little time to receive
assessment or intervention before kindergarten. The result is that 70-80% of children with
developmental delays are not diagnosed until they enter kindergarten; as a result, they begin
school not ready to learn.
In California, a four-tiered system for developmental services began with continual and
flexible community-wide surveillance and support, leading to pediatric secondary screening and
surveillance, then provided mid-level developmental assessment, treatment, and coordination co-

11
located with existing programs and early education settings, and finally offered more formalized
systems of evaluation to determine eligibility for services through IDEA. This model utilized a
place-based approach at the neighborhood level and sector-based training and development
specific to the service sector (Halfon, Russ, & Regalado, 2004). Ready Schools, National Report
Card, and State of the Child initiatives also attempt to measure and monitor children’s health,
and well-being in the context of their families and communities by tracking population level
indicators through available datasets. Over the past 10 years, these efforts have increasingly
shifted beyond survival to include child well-being, from a negative orientation to include
positive outcomes, examining children’s rights, children’s perspectives, and policy relevance
(Ben-Arieh, 2011).
Factors Related to Parental Recognition and Help-Seeking
Across populations within the United States and internationally, parents and primary
caregivers are key to identifying or corroborating concerns, and to ensuring that the child
receives needed services (Glanz, Rimer, & Viswanath, 2008; Glascoe, 1997, 2000; Sivberg,
2003). However, parents may be unsure of how to best recognize and respond when these
concerns arise in their children. Seligman and Darling characterize help-seeking for parents of
children with hearing impairment as an “extended diagnostic journey, which contributes to
ambiguity, stress, anxiety, and family conflict” (2007, p. 205). Much of the developmental
disabilities research has focused on family coping and adaptation post-diagnosis (Feldman, et al.,
2007; Hodapp, 2007; O’Brien, 2001; Twoy, 2007). The help-seeking literature has primarily
focused on adults and adolescents (Broadhurst, 2003; Keller & McDade, 2000), though a body of
research has been established in the area of parental help-seeking for child mental health
concerns (Keller & McDade, 2000; Lau & Takeuchi, 2001; Raviv, et al. 2003a, 2003b) and

12
parental recognition and help-seeking for early signs of autism (Novak & Zubritsky, 2000;
Twyman, Maxim, Leet, & Ultmann, 2009; Twoy, 2006). The decision-making literature uses
theory to look at preventive care decisions, such as immunizations (Benin, Wisler-Sher, Colson,
Shapiro, & Homboe, 2006; Kennedy, Basket, & Sheedy, 2011; Meszaros, et al., 1996; Poss,
2001; Smailbegovic, Laing, & Bedford, 2003), sunscreen use (Benjes, et al., 2004), prenatal
screening (Sagi, Shiloh, & Cohen, 1992) and difficult child treatment decisions (Mahant,
Jovcevska, & Cohen, 2011). These findings may be utilized to develop a framework for setting a
research agenda to better understand the processes of recognition (awareness and concern), and
response (help-seeking and enrollment in services) for developmental delays. A literature review
(Appendix A, Appendix R) has identified over 30 factors at all levels of the socioecological
model (policy, community/organizational, family, child) associated with early recognition and
response to developmental concerns.
Awareness and Recognition
Policy, Community, & Organizational Level Factors
Community-level theories, such as Community Organizing (Minkler, Wallerstein, &
Wilson, 2008) or Coalition Theory (Bartholomew, et al., 2011, Butterfoss & Kegler, 2009;
Feighery & Rogers, 1990), can inform intervention efforts to addressing system-level barriers to
early recognition, concern, and help-seeking. Most research on recognition of delays has focused
on the role of professionals in conducting screening and responding to parental concerns.
Organizational capacity will drive local outreach and recruitment efforts. Parents have access to
child development and parenting information through a variety of media outlets, including the
internet, television, radio, and magazines. The media has the potential to reach a wide range of
families (Sanders & Prinz, 2008).

13
Family, Parent, and Child Level Factors
Knowledge of normal child development and knowledge of developmental milestones
can lead to recognition of developmental problems. Major milestones can trigger awareness,
such as motor delay between 6-18 months of age, and language and behavior for children 18
months and older (Batshaw, 2002; Blanchard, Gurka, & Blackman, 2003; De Giacomo &
Fombonne, 1998; Twyman, et al., 2008). In 2006, 91% of children entering early intervention
after age two were eligible due to delayed developmental milestones versus a preexisting
condition or at-risk status (Scarborough, Hebbeler, & Spiker, 2006). Glascoe (1997b) found that
parents were able to identify developmental problems based on language, motor, global, medical,
and academic concerns in children over age four. Glascoe (2005) asserts that young children at-
risk generally demonstrate mild delays by age two. It has been demonstrated in numerous studies
that parents can be accurate identifiers of developmental delays in their children when they have
developmental concerns, regardless of education, income, or parenting experience. Identification,
however, may be contingent upon parents’ knowledge of milestones; specificity is high
(developmental concerns are usually warranted) (Glascoe, 1997a, 2000), but sensitivity is low
when it comes to detecting developmental concerns, particularly for cognition problems, global
delay, and behavioral versus language or motor problems (Chia-Ying Chung, et al., 2011). In the
case of autism spectrum disorders, symptoms can often be recognized by parents within the first
2 years (Dewrang & Sandberg, 2010; Kleinman, et al., 2007).
One of the main objectives of the CDC’s Learn the Signs, Act Early campaign was to
increase awareness of developmental milestones and early warning signs of developmental
problems (Patel, 2007). Of 267 respondents, 76% pre-campaign and 82.9% post-campaign
parents stated that they look for milestones their child should be reaching in terms of how he /she
14
plays, acts, speaks and learns. However, the sample was largely White, married, and 70% had
attended or graduated college. Still only 40%-50% of these high SES respondents felt a child
with autism should get help before age two, only half felt they should get a second opinion if the
doctor suggested to wait and see if the child outgrew a developmental problem, and just 59%
knew which behaviors most suggested a developmental delay (Porter Novelli, n.d.). Similar
knowledge scores (median score of 19 out of 40) on the Caregiver Knowledge of Child
Development Inventory (KIDI) were found in a survey of 1200 mothers of children ages birth to
three in Turkey (Ertem, et al., 2007; MacPhee, 1981).
The KIDI was developed by MacPhee (1981) using a variety of sources including
textbooks, infant care and public health publications, developmental tests, and pediatricians’
reports about questions they frequently receive from parents. The statements included in the
KIDI focus on infants’ physical, social, linguistic, perceptual and cognitive development, and
include principles related to early experience, social influences, atypical development and
individual differences. Some example statements include: (1) infants understand only words they
can say; (2) you must stay in the bathroom when your child is in the tub; (3) the way a child is
brought up has little effect on how smart he (she) will be; (4) a good way to teach your child not
to bite is to bite back; and (5) infants of 12 months can remember toys they have watched being
hidden. In scoring, the number of questions answered and accuracy are taken into account to
produce a total score. A higher score indicates more knowledge of developmental processes and
infant norms as based on predetermined correct responses. Huang and colleagues (2005) found
that of 378 mothers (a sample that was higher income, education, married and White than the
general population) who completed interviews at 2-4 months of age and observations at 16-18
months, 56% correctly estimated their children’s development using the KIDI. Mothers who

15
were White or Hispanic, older, married, more experienced, had higher education, and less
depressive symptoms were more likely to correctly estimate their children’s development
(Huang, et al., 2004).
In the 2003 National Survey of Children’s Health, 20% of parents of children 18 months
to 5 years of age expressed concerns about their children’s development (Blanchard, Gurka, &
Blackman, 2008). A multistate study of 451 first-time, low-income, adolescent mothers
compared parent “worry” regarding child’s development and a prenatal interview using the KIDI
with actual rates of delays in their children at ages 12 and 24 months (MacPhee, 1981; Smith,
Akai, Kleman, & Kletner, 2010). The average knowledge of development on the 14 item scale
was 40 (range 33-70) and a significant relationship was found between parent knowledge of
infant development and warranted worries (accounted for about 8% of the variance). The authors
noted the high rate of delays and low knowledge and detection in this high risk sample; 23% of
the children at 12 months of age and 30% at 24 months met Part C intervention eligibility
guidelines for developmental delays, yet only 2% (at 12 months) and 9% (at 24 months) had
been identified by medical professionals as having a concern (Smith, et al., 2010). The KIDI was
also used by Rowe (2008) to assess parental knowledge of child development. Parents were
asked to indicate whether they agree/disagree with 39 statements about child development and
19 statements on the age that children reach certain developmental milestones. The measure
includes statements regarding child development during infancy and toddlerhood which were
selected to address principles of infant development, effective rearing techniques and health and
safety issues. Parents varied widely in total KIDI scores from 48.3 to 93.1, with a mean score of
79.33, slightly lower than previous means found with samples of middle-class mothers, and
higher than samples of Head Start mothers (Rowe, 2008), as might be expected for a sample

16
diverse in SES. KIDI scores were correlated with family income (r=0.43, p<0.01) and education
(r=0.56, p<0.001).
Parents are more apt to recognize moderate to severe developmental delay and genetic
disorders with visible signs than milder delays or language disorders (Ho, et al., 1994; Meszaros,
et al., 1996). The presence of a chronic health condition could sensitize or obstruct parents’ or
practitioners’ to considering the possibility of comorbid developmental delays. In a study
comparing rates of emotional, developmental and behavioral (EDB) problems among children
with chronic health conditions using NS-CSHCN and NSCH data, prevalence rates of EBD for
children with chronic health conditions were higher overall (15%), and specifically for attention
deficit disorder/attention-deficit/hyperactivity disorder (18%) (Blackman, Gurka, Gurka, &
Oliver, 2011). However, ‘diagnostic overshadowing’ can also occur; in which one diagnosis can
mask the presence of other conditions (Dykens, 2007).
Concern and Help-Seeking
Policy, Community, & Organizational Level Factors
A number of theoretical perspectives are useful and relevant in explaining the multi-level
factors that support or hinder parents’ pursuit of developmental services once a concern arises.
Participation in early intervention depends first on early recognition and response to
developmental red flags by parents and caregivers, and then the support of providers in affirming
parents’ concerns and connecting parents to assessment services. At the policy level, research
has examined gaps in enrollment and state level differences in funding, eligibility criteria, and
patterns in enrollment and under-enrollment (U.S. OSEP, 2011. Some studies have explored
factors at the organizational and systems levels that serve as facilitators and barriers, as well as
the potential moderating factors (e.g. primary language, income, etc.) affecting parent’s

17
opportunities to access those services (Batshaw, 2002; Coulter, Wallace, & Laude, 1993; Halfon,
Russ, & Regalado, 2004). For example, in Florida the under-availability of programs and
enrollment slots, general lack of awareness, under identification, cost, distance and lack of
transportation, lack of interagency linkages, and sub-threshold level of developmental delay
(ineligibility), were barriers to enrollment in early intervention program (Coulter, Wallace, &
Laude, 1993). Early recognition and response to developmental concerns remains an essential
component of our child health and education systems. The prevalence of developmental
disabilities remains relatively high, critical periods of development are now recognized, and
school success hinges on early learning opportunities. Early childhood programs (such as Head
Start/Early Head Start, and subsidized child care programs) and quality improvement systems
(such as NAEYC and NAFCC accreditation programs) require developmental screening (Allen,
2007; Bowman, 2001; Clifford & Crawford, 2009; Early Learning Coalition, 2007; Halfon,
2004; Hess & Marshall, 2009; Maxwell & Clifford, 2004; NAEYC, 2006; U.S. DHHS, 2009).
The presence of a primary physician and that physician’s practices influence both
recognition and response to developmental delays. For example, parent perception may be that
the delay is simply a temporary natural variation in developmental milestone attainment or in
temperament, and a physician can conduct a standardized screening to assess the child’s
development and reinforce concern and help-seeking. The family-centered care movement has
recognized that the incorporation of the principals of dignity and respect; family perspectives and
choices; information sharing; participation in decision making; and collaboration all greatly
enhance client satisfaction and follow-through, particularly among underserved populations
(Gance-Cleveland, 2006; Institute for Patient- and Family-Centered Care, 2011). In a review of
24 studies, family-centered care was associated with improved outcomes for children with a

18
variety of special health care needs, including improved efficient use of services, health status,
satisfaction, access to care, communication, systems of care, family functioning, and family
impact/cost (Kuhlthau, et al., 2011). More than one third of parents with concerns did not discuss
them with health care providers. Additionally, 60% of the children found to have disabilities had
parents who identified a primary health provider for the child. A t-test revealed that parents with
providers had far more concerns of any type, and children with regular health care providers
(whether parents discussed concerns or not) were almost 11 times more likely to be enrolled in
services. In this study, when parents did discuss concerns, they appeared to be more motivated
by concerns about expressive language or perceptions that children had health problems than by
concerns about children’s overall developmental status (Glascoe, 1997).While some have not
found income or insurance status to impact receipt of services (Rosenberg , Zhang, and
Robinson, 2008), others have found that it does impact receipt of developmental screening
(Pinto-Martin 2005, Pelletier & Abrams, 2002). The Assuring Better Child Health and
Development (ABCD) initiative, a collaborative effort between Medicaid agencies in four states,
dramatically raised screening rates among low-income children in one state from 15% to 75%
simply by changing Medicaid financing and reimbursement strategies (Pinto-Martin 2005,
Pelletier & Abrams, 2002). Many lessons have been learned from across the country as different
states and programs have used different models and strategies to improve the experiences of
families accessing public insurance. Additionally, parents rely on formal parenting support,
education, and early intervention systems to provide high quality, family-centered services.
Family, Parent, and Child Level Factors
Community level programs help agencies coordinate and improve services and raise
awareness, but parents remain central in directing access and engagement in services. Both

19
Family Systems Theory and the Family Life Course Perspective identify family-level variables
which include structures or processes impacting parent response to developmental delay (White
& Klein, 2008). For example, family structure (number, gender, and roles of household members
and relationship networks), interaction (subsystems, boundaries, cohesion, communication, and
adaptability), and functions (economic, daily care, recreation, socialization, self-identity,
affection, educational/vocational, and spiritual) impact both the family system and family life
when a child has a disability (Seligman & Darling, 2007; Turnbull, Turnbull, & Wehmeyer,
2010; Zimmerman, 2005). Twoy (2006) utilized the Resiliency Model of Family Stress,
Adjustment, and Adaptation and the construct family resources to determine correlations
between coping scores and family demographics impacting the timeline from parents’ suspicion
of Autism to professional diagnosis. Child demographics also influence assessment and
diagnosis (Boyle, et al., 2011; Zimmerman, 2005). Zimmerman’s (2005) model of help-seeking
for child mental health problems included: level of symptoms, SES (education, race and income),
insurance status, traumatic events, genetic background, and demographic characteristics (family
structure, birth order, gender of child).
Reviews of help-seeking literature have identified perception of the delay as a problem
(i.e. concern) as an important step between recognition of an issue and help-seeking (Broadhurst
2003; Sayal, 2006). In Bussing and colleague’s sample of 389 children, two-thirds of the parents
did not see a need for professional treatment for children who met ADHD criteria (2003).
Problem perception has been operationalized across studies to include parent concern, burden,
and estimate of greater problems than other children (Sayal, 2006). In Smith and colleagues’
sample, 8% of the 23% of children determined eligible for Part C at 12 months had elicited
worry about their development from the mother (2010). Dietz and colleagues found that among

20
18 children ages 14-15 months who tested positive for Autism using a population screener
(31,724 children), 14% of parents waited 6 months before seeking evaluation, and 18% did not
seek any further evaluation. This delay in follow up was higher for parents of children who were
younger, had higher cognitive skill, and fewer symptoms (Dietz, Swinkels, van Daalen, Van
Engeland, & Buitelaar, 2007). Broadhurst asserts that problem definition is socially constructed,
that parents’ help-seeking experiences have likely been misrepresented due to studies requiring
“a priori attribution of meaning by the individual concerned or symptoms that should be
recognized as problematic,” and cautions that sampling can be biased if soliciting only the views
of “service users” (2003, p. 343). There can be wide variance in family experiences within
communities based on culture (ethnicity, language), socio-economic status, and relation to the
surrounding sociopolitical climate (Toran, Squires, & Lawrence, 2011; Hewitt, & Maloney,
2010). Once a developmental concern arises, many factors effect parents’ help-seeking responses
including personal qualities (self-efficacy, knowledge, skills, energy, and persistence), peer and
family influences and norms, and expectations that their actions will be fruitful (Toran, Squires,
& Lawrence, 2011; Turnbull & Turnbull, 2001, Worcester, 2008). Parent self-efficacy, outcome
expectancies, empowerment, engagement and social norms all play a role (Herman, 2007,
Turnbull & Turnbull, 2001). Past experiences of interactions with primary care or other formal
supports (treatment by the agency and feeling respected by the provider) strongly affect help-
seeking and service use decision-making, as do trust, family and cultural norms, stigma, and self-
care practices (Benin, Wisler-Sher, Colson, Shapiro, & Homboe, 2006; Broadhurst, 2003;
Bussing, et al., 2003, 2005; Fröjd, Marttunen, Pelkonen, von der Pahlen & Kaltiala-Heino, 2007;
Gance-Cleveland, 2006; Keller & McDade, 2000; Kerkorian, McKay, & Bannon, 2006;
Mandell, Novak & Zubritsky, 2005; Sayal, 2005). Factors related to interactions with formal

21
systems of care vary by race and ethnicity, including African American and American Indian
parents (Bussing, et al., 2003, 2005; Keller and McDade, 2000; Kerkorian, McKay, & Bannon,
2006; Oswald, Bodurtha, Willis, Gilles, Chroston, Ogston, & Tlusty, 2011). Rosenberg, Zhang,
and Robinson (2008) found that at 24 months, only 10% of children with delays received
services. While poverty and insurance status did not significantly predict receipt of intervention
services, Black children were less likely to receive services than children from other ethnic and
racial groups. Perceptions of shame and stigma are related to family, cultural, and societal norms,
and can affect comfort with self-disclosure and intention to seek help for concerns related to
behavioral, psychological, or parenting concerns, particularly from formal services (Broadhurst,
2003; Edelstein-Dolev & Selberstein, 2003; Hinson & Swanson, 1993; Keller & McDade, 2000;
Lau & Takeuchi, 2001; Raviv, et al. 2003a, 2003b).
Barriers, such as low education or socioeconomic status, lack of social support, mental
health problems, lack of transportation, high cost, and distance to travel, also impact pursuit of
services (Coulter, Wallace, & Laude, 1993; Halfon, Russ, & Regalado, 2004). Additional
barriers may include lack of insurance (Pinto-Martin et al., 2005) and issues with cultural
competency and language barriers (Pinto-Martin et al., 2005; Toran, Squires, & Lawrence, 2011;
Turnbull & Turnbull, 2001). The research suggests that maternal knowledge of child
development (and education and parenting experience), the number and type of concerns, the
child’s age, and identification of a primary physician for the child appear to be the most
predictive factors in early recognition. Cultural (Race/ethnicity) factors, and family-,
organization- or system-level barriers appear to strongly influence parental response to concerns,
or “help-seeking”.

22
Section 2: Study Overview
Research Considerations
A number of individual, family, and community level factors have been identified in
relation to help-seeking, but awareness is less researched outside of Glascoe’s work in the
context of the pediatric setting, and small studies looking at specific high-risk groups (Smith,
Akai, Kleman, & Kletner, 2010) or focused specifically on Autism (Dewrang & Sandberg, 2010;
Kleinman, et al., 2007). Additionally, a coherent explanation of parents’ decision making
process for help-seeking is missing from the literature. Additionally, few studies examine
parents’ help-seeking decisions and experiences, with the exception of pursuit of mental health
services for older children (Keller & McDade, 2000; Lau & Takeuchi, 2001; Raviv, et al. 2003a,
2003b) or children specifically with autism (Novak & Zubritsky, 2000; Twyman, Maxim, Leet,
& Ultmann, 2009; Twoy, 2006 ). Clearly, research on early brain development and its impact
across the lifespan has highlighted the importance of early intervention (Lu & Halfon, 2003;
Marshall, 2011; Shonkoff & Phillips, 2000; Twardosz & Lutzker, 2010). Additional important
research has explored the experiences of parents who have children with disabilities and their
critical roles in early recognition, help-seeking, and caregiving (Broadhurst, 2003; Seligman &
Darling, 2007; Turnbull, Turnbull, & Wehmeyer, 2010).
Much research has explored health care provider practices (Hix-Small, 2007; Ploof &
Hamel, 2002; Radecki, et al., 2011; Sand et al., 2005; Sices, 2003, 2007) related to
developmental screening, and Glascoe (1997a,b, 2004, 2005, 2008) has thoroughly examined the
23
intersection between parents and health care providers in developmental screening. There has
been increased focus on developmental screening in child care and early education programs as
well (Allen, 2007; Bowman, 2001 Halfon, 2004; Halfon, Russ, & Regalado, 2004; Pinto-Martin,
et al., 2005; Powell, 2008). Others have guided community-based screening efforts (Bethel,
Reuland, Schor, Abrahms, & Halfon, 2011; Daniel, Prue, Taylor, Thomas, & Scales, 2009;
Halfon, Russ, & Regalado, 2004), and national-level population based screening strategies
(Bethel, et al., 2008; CDC, 2006, 2007; Newacheck, Kim, Blumberg, & Rising, 2008; Postert,
2009; Shandra, Hogan, & Spearin, 2008). All of this research has created a patchwork of theories
and approaches to early recognition and response to developmental delays. The literature
continues to reveal gaps in systems of surveillance and services, particularly among underserved
populations. Additional research is needed to identify critical processes, networks, and
connection and entry points that are socially and culturally relevant to families in identifying and
responding to developmental delays in young children.
Health Belief Model
In light of the complex factors influencing families who may seek developmental services
for their children, no one theory is able to cover all of them; a multi-theory model for recognition
and help-seeking can incorporate key constructs found in the literature. Skinner and Weisner
(2007) called for a “sociocultural” approach towards studying the experiences of families of
children with intellectual disabilities. Understanding theory-based environmental and behavioral
determinants of health behaviors informs health education programs (to increase knowledge,
change attitudes, influence habit) which may be delivered to priority populations community-
wide through a social marketing approach (Kotler & Lee, 2008). The Health Belief Model
(Champion & Skinner, 2008) describes parent experiences influenced by internal and external

24
factors, and Social Support Theory explains the influence of interpersonal relationships, within
and beyond the family, on pathways to assessment services (see Appendix A, Appendix R). The
Health Belief Model (HBM) is a value-expectancy theory rooted in behavioral and psychological
principals, with a long history beginning in the 1950’s with a study of decisions to receive X-ray
examinations for tuberculosis. Conceptualized by Rosenstock in 1966, and furthered by Becker
and colleagues in the 1970’s and 1980’s, the original model included the four constructs of
susceptibility, severity, barriers, and benefits (Champion & Skinner, 2008; Poss, 2001; Rimer &
Glanz, 2005). Later, a cost-benefit analysis of barriers and benefits was articulated, as was
perceived threat (comprised of severity and susceptibility assessment) (Champion & Skinner,
2008). Additionally, socio-demographic variables (as moderators), and cues to action, self-
efficacy, perceived behavioral control, and health motivation have been mentioned as potential
additions to the model (Champion & Skinner, 2008; Poss, 2001). HBM predicts the likelihood
that the individual will take a recommended health action (prevention or treatment) based on
their value assessment of the behavior. HBM has been used to explain various health-seeking
behaviors (Favor et al, 1999; Tucker, 1995) particularly in the area of treatment compliance or
screening for health issues such as cancer and tuberculosis screening (Poss, 2011; Tanner-Smith
& Brown, 2010), child vaccination (Meszaros, et al., 1996; Smailbegovic, Laing, & Bedford,
2003), and prenatal screening (Sagi, Shiloh, & Cohen, 1992).
Perceived threat, akin to concern, is comprised of perceptions of susceptibility and
severity and is predictive of help-seeking behaviors for many types of problems (Benjes, et al.,
2004; Bussing, et al., 2003; Hinson & Swanson, 2001; Lau & Takeuchi, 2001; Mandell, Novak,
& Zubritsky, 2005; Sayal, 2005). Consistent with Broadhurst’s “problem appraisal” (2003, p.
343), perceived severity (how serious the condition is and how damaging its consequences may

25
be) also affects parental perception of a developmental concern as a problem (Bussing, et al.,
2003; Sayal, 2005) and a pediatrician’s or parent’s likelihood of addressing a delay proactively
(AAP, 2001, 2006; Batshaw, 2002; Shapiro, 2004). Mothers have recognized but drastically
underestimated the severity of delays (particularly in the areas of cognitive and motor
development as opposed to speech and language development), or perceived the delay as
temporary, which was consistent with earlier studies of parent perceptions that their children
would ‘outgrow’ the delays (Patel, 2007). Research suggests that the type of concern and number
of concerns predict help-seeking (Glascoe, 1997; Zimmerman, 2005). Using data from over 900
families collected over several studies, Glascoe developed an algorithm for pediatric follow up to
families’ developmental concerns based on the number and significance of the concern (2000).
Her research revealed that sensitivity for detecting disabilities ranged from 74-79% across age
levels, and specificity for absence of concerns for children without disabilities ranged from 70-
80%. Among all parents, 11% had two or more concerns (corresponding to 20 times the risk of
developmental delay; 53% of children met evaluation criteria for special education (ESE) and
16% scored substantially below average. Additionally, 23% of parents had one significant
developmental concern (8 times risk, 29% met ESE eligibility), and 20% had concerns about
behavior (which was not predictive of developmental disability). Finally, 43% of parents did not
have concerns about their child’s development (there was only 5% chance of disabilities among
this group) and 3% of parents did not have concerns but had communication difficulties due to
non-English primary language, parent communication or mental health problem, or non-primary
caregiver (among this group children had a four-fold risk of developmental disability and 20%
met ESE criteria). A parent’s perceived susceptibility (assessment of how likely it is that the
child will have developmental problems) may be low if the pregnancy and birth were uneventful,

26
there is no family history of developmental problems, and if parents are unaware of expected
developmental milestones or red flags associated with specific developmental disorders
(Maldonado, 2004; Zimmerman, 2005).
The perceived benefits of seeking assessment must outweigh potential barriers, and may
further motivate parents to take action. In fact, the ABCD Program has made raising parental
expectations a key program component (Pelletier & Abrams, 2003). Outcome expectations may
also contribute to parents’ perceptions of the benefit of seeking formal help (Herman, 2007,
Turnbull & Turnbull, 2001). Barriers (factors that discourage or inhibit help-seeking) are also a
recurring theme in the services access literature, because they play such a strong role in
determining motivation, action, and ultimately receipt of services. Intervention providers have
reported encountering family barriers such as education, low SES, low family support, mental
health problems, lack of transportation, high cost, and distance to travel (Coulter, Wallace, &
Laude, 1993; Halfon, Russ, & Regalado, 2004). Additional barriers cited in the literature include
lack of insurance, poor communication among parents and providers, and issues with cultural
and linguistic competency (Pelletier & Abrams, 2003; Pinto-Martin et al., 2005; Turnbull &
Turnbull, 2001). In Hillsborough County, a lack of care coordination amongst medical, school,
and community providers resulted in a lengthy wait time for assessment, diagnosis, and
treatment, contributing to parents’ many difficulties: obtaining proper diagnosis, accurate
medical information, and guidance for further assessment; finding services covered by insurance;
and planning smooth transitions from Part C to Part B services (Mendez & Hess, 2003).
Self-efficacy refers to the parent’s confidence in his or her ability to pursue and access
services in spite of potential barriers, and can be influenced by parents’ previous negative
experiences with accessing services for themselves or their children (Bussing, et al., 2003, 2005;

27
Gance-Cleveland, 2006; Kerkorian, McKay, & Bannon, 2006). Most parents have had limited
experience with disabilities, and therefore may not have the knowledge and skills to seek
specialized services for further assessment. Often the parent has experienced only stereotypes
and stigma regarding developmental disabilities (Broadhurst, 2003; Edelstein-Dolev &
Selberstein, 2003; Hinson & Swanson, 1993; Keller & McDade, 2000; Lau & Takeuchi, 2001;
Raviv, et al. 2003a, 2003b; Seligman & Darling, 2007).
HBM proposes that there may be cues (temporal prompts in the form of events,
interactions, or tangibles, such as a brochure) that drive the parent to take action. Cues to action
may include information provided or sought, reminders by powerful others, persuasive
communications, and personal experiences (Champion & Skinner, 2008). Social marketing
campaigns, such as the CDC’s Learn the Signs, Act Early campaign, may embed cues to action
into their approach (Patel, 2007). Additionally, reports through the media may raise parental
awareness (Sanders & Prinz, 2008). Although not well-researched, cues may offer some
important information about what provides the final ‘push’ for parents to seek services, after
what is often a delay period of several months following concern. Finally, HBM acknowledges
that a number of modifying factors affect the above-mentioned components, including
demographic variables (such as age, gender, ethnicity, or occupation) or socio-psychological
variables (SES, family structure). However, findings related to modifying factors have been
mixed. Modifiers such as income, insurance status, military status, and interactions with the
health system have been found to be potentially relevant (Mandell, Novak, & Zubritsky, 2005;
Pinto-Martin et al., 2005; Shapiro & Derrington, 2004). For example, Mandell, Novak, and
Zubritsky (2005) observed that near-poor children received an autism diagnosis on average 0.9
years later than those more than 100% above the Federal Poverty Level (FPL) and those below

28
FPL, likely due to increased access through private or public insurance and other programs.
Additionally, children living in rural areas and those with multiple pediatricians were diagnosed
later, suggesting lack of a medical home, or perhaps a search for a pediatrician responsive to
developmental concerns. In another study, Glascoe examined parent concerns about their child’s
development elicited in pediatric settings (1997). Of the 408 parents, 220 had developmental
concerns. Predictor variables that were examined included race, parents’ levels of education,
employment, marital status, numbers of children in the home, children’s developmental status,
age, participation in school programs, whether mother versus fathers/other primary caretakers
responded, and parents’ perceptions of children’s health status. Only two predictors were
significant: parents’ perceptions of children’s health status (aOR = 3.8; 95% CI=1.6–9.1) and
the presence or absence of developmental disabilities (aOR = 2.1; 95% CI=1.0–4.2). Some
studies have not found SES to be predictive of timely recognition, assessment and services,
though others have. In a national survey of 2,068 parents of children 4-35 months of age, Halfon
and colleagues (2004) did not find an association between rates of assessment and SES. In Twoy
(2006), the sample was of higher SES, well informed, and college-level educated, yet 66% still
faced over a 6 month delay in obtaining services. All of these authors called for further
investigation to better understand the mixed and unexpected results; there is a need to further
explore the individual, family, and systemic modifying factors affecting pathways to services.
The Health Belief Model has a long, robust history and breadth of research. Its
parsimonious, common-sense constructs are easy to understand, apply, and test (Champion &
Skinner, 2008; Poss, 2001). The model’s simplicity is its strength as well as a limitation; the
theoretical components are broadly defined, and they have not been uniformly operationalized
and tested (Champion & Skinner, 2008). The theory does not suggest a process, or specific order
29
in which the variables come into play. As a cognitively based model, it is difficult to measure the
complex relationships between perceived severity and susceptibility in assessing overall
perceived risk. While widely used, cues to action can be fleeting, are retrospective, and have
rarely been measured systematically as ‘cues’ (Champion & Skinner, 2008; Poss, 2001). Finally,
HBM does not explicitly measure normative, social, or cultural factors beyond “modifying
factors”, nor have modifying factors been consistently measured across studies (Poss, 2001;
Tanner-Smith & Brown, 2010). These modifying factors are a limitation in this theory, best
addressed through a system level approach. While HBM provides a framework for illustrating
parents’ individual processes, Social Support Theory contributes to understanding interpersonal
relationships affecting parents’ decision-making and action.
Social Support
Social support is a key interpersonal construct throughout the journey from awareness to
assessment. Social support has been described as a factor in parents’ coping and adjustment with
caring for children diagnosed with disabilities (Batshaw, 2002, Twoy, 2007), and as a
contributing factor in overcoming barriers to help-seeking (Gulliver, Griffiths, & Christensen,
2010). Types of social support include emotional, instrumental, informational, and appraisal
support; each can have contrasting positive or negative influences (Gottlieb & Bergen, 2010;
Heaney & Israel, 2008). A family member or friend may provide emotional support (comfort,
empathy) to a parent with concerns about his or her child, but may not be able to provide
information support (such as knowledge about where to go for help) or appraisal support
(verification/corroboration of the parent’s perceptions of a potential developmental concern).
Family members and friends may play a role in identification and perceived need for help,

30
affecting help-seeking among depressed adolescents (Fröjd, Marttunen, Pelkonen, von der
Pahlen & Kaltiala-Heino, 2007).
While Poss (2001) combined HBM with social norms (from the Theory of Reasoned
Action) to explain culturally influenced decision-making, social support also has a component
addressing interpersonal influences with a subtle but important difference: it focuses on the point
of decision-making through appraisal supports rather than normative beliefs about the behavior
itself. The appraisal support that individuals give will help the parent in decision-making about
whether the delay is of concern and warrants help. While parents will often go to their
pediatrician for guidance when concerns arise, they will turn to others for support if the
pediatrician doesn’t follow through (AAP, 2001; Sayal, 2005). Supportive social networks (the
web of relationships associated with an individual) provide a protective role for child and family
well-being, linkage to family support services, and help-seeking decision making. Some studies
found that parents preferred seeking help first from within their informal social networks and
suggested that for some, their help-seeking choices were outside of family norms (Broadhurst,
2003; Bussing, et al., 2005; Gamoran, Turley, Turner, & Fish, 2011). Several studies found that
friends were perceived as most helpful over family for a variety of concerns (Keller & McDade,
2000; Raviv, Raviv, Edelstein-Dolev & Selberstein, 2000; Rose, Campbell, and Kub, 2000).
Twoy (2006) found in his study of parents with children with autism that 93% sought advice and
information from others who face similar problems, 80% from community agencies, and just
56% of families relied on their physicians. Among low income parents surveyed regarding help-
seeking for parenting, the most frequently selected sources of help were family, books and
videos, telephone helplines and friends; least likely sources of help were child protective
services, school personnel, clergy, and social service/counseling agencies (Keller & McDade,

31
2000). The relationship between social support and health behaviors and outcomes has strong
empirical support (Gottlieb & Bergen, 2010; Heaney & Israel, 2008). The various types and
sources of social support can be quantitatively and qualitatively measured utilizing empirically
developed tools among various populations (Gottlieb & Bergen, 2010).
A methodological complication is that the type and quality of support may have positive,
neutral or negative effects. As stated by Heaney and Israel for health behavior intervention, we
must decide “who should provide what to whom (and when)?” (2008, p. 207). Measures must be
sensitive to cultural variations (Gottlieb & Bergen, 2010). Another challenge in using social
support theory in public health is that it explains one influence on health behavior among many
within an ecological framework, therefore it is best utilized with additional theories in
understanding health behaviors (Heaney & Israel, 2008). This project will critically examine the
role that social support plays in contributing to or deterring both recognition and help-seeking
decisions for developmental delays.
In summary, the theoretical model Pathways to Assessment Services (Figure 2.1)
proposes that the level of threat (perceived severity of and susceptibility to child’s developmental
delays) contributes to parental perception of the delay as a problem, and subsequent motivation
to seek assessment services. When the perceived benefits to pursuing services outweigh the
barriers, a confident (self-efficacious) parent will take action. Modifiers and cues to action also
play a role in the model. Informational, instrumental, emotional and appraisal support may
reduce barriers to problem perception, appraisal, and help-seeking.
Measurement of this model will include the variables of recognition awareness, concern,
help-seeking, and enrollment as services as well as the theory-based variables described in the
model. Recognition of developmental delays is dependent upon knowledge of warning signs, or

32
to some degree of typical developmental milestones and can be measured using a scale such as
the KIDI (Ertem, et al., 2007; Huang, et al., 2005; Smith, Akai, Kleman, & Kletner, 2010).
Research questions may ask, “What variables (from HBM and Social Support) best predict
parent recognition, concern and help-seeking for developmental delays in their young children?”,
or conversely, “What set of variables (selected from HBM and Social Support) best characterize
parents who are aware, concerned, and seek help for developmental delays in their young
children?” Other questions may ask about the meaning, levels, or process of developing
awareness, concern, and help-seeking among parents with children who have developmental
delays. Research questions should address each specific variable (e.g. perceived severity,
susceptibility, barriers and benefits, and self-efficacy, and subtypes, sources, quality, and timing
of support, etc.) and its relative contribution to recognition and help-seeking. A mixed methods
approach will help to better understand the relationships between predictive variables to the
outcomes of awareness, concern, help-seeking, and enrollment in services. Quantitative measures
of many of these variables are available in the research literature (Blanchard, Gurka, &
Blackman, 2008), and some, such as help-seeking or social support, can be better understood via
qualitative methods. Other potential modifying factors, such as parent education, income,
experience, and insurance status are also measurable and widely collected at the national level
through surveys.
Far less researched are the relationships between these variables, and the relative
contributions of each one to the likelihood that a parent will detect, develop concern, and then
seek help for a developmental delay. This study will contribute to our current understanding of
how parents may interface with early intervention Child Find systems as well as informal

33
supports in the community, identifying key triggers for parental awareness and help-seeking for
developmental delays and preferred entry points and pathways to assessment services.
Methods Considerations
Public Health seeks to promote physical and mental health and to prevent disease, injury
and disability. There is a plethora of data on early childhood measures (including vital statistics,
administrative datasets, and examples of individual measures found in Appendix C,) of health
and disease that exists largely in silos with little coordination. For example, national surveys
(Appendix D) are administered by different federal offices. Holistic, population-wide, and
longitudinal measurement will improve the use of data for research synthesis to improve public
health. Holistic measurement includes comprehensive scales and datasets as well as the use of
well-researched indicators and proxies. Anderson and colleagues (2003) conceptualize early
childhood education as part of a coordinated system including child care, nutrition, housing,
transportation, employment, and health care. Determining a common set of outcomes in this
complex scenario is challenging. Besides methods and design issues, lack of standard measures,
and variability in program design and implementation, there are, “the complex interactions of
biology, individual and family characteristics, and the social and physical environments” that
play a strong role in each child’s developmental trajectory (Anderson, et al., 2003; Roberts,
Bellinger & McCormick, 2007). A broad population-level view of the problems of
underdetection and underenrollment for developmental delays leads to an understanding of gaps
in policy development and implementation at the national or state levels. At the community
level, population-wide research can identify specific groups who may be falling through the
cracks, as well as the consequences of changes in policy or practice. Throughout US history,

34
important policies have been developed in response to research identifying critical health issues
and disparities (see http://www.mchb.hrsa.gov/timeline/text-only.html).
National surveys, epidemiological investigations, can examine the experiences of large
sectors of the population. In addition to the big picture, more focused research on individual
experiences can answer complex and important questions about processes and systems for which
data are either unavailable in existing datasets, or difficult to quantify in a survey format
(nuanced). Program planning models and social marketing approaches identify individual
behaviors related to health problems, and the determinants of those behaviors. Mixed Methods
are used for these approaches, looking at existing data and also becoming intimately familiar
with the individual/interpersonal, socioeconomic, cultural characteristics of the population(s) that
may not be found in existing datasets. Potential datasets (surveys, program and service use data)
cannot inform researchers about the process that led to the child’s participation in the service or
program, nor about the children that have not participated.
A broad view approach can examine data from a large number of parents from diverse
backgrounds regarding what factors were associated with early recognition, concern and help-
seeking. National surveys are a large, accessible, and reliable data source for this type of
analysis. Questionnaires may also be developed, however the same limitations may apply and
much of the formative research has not been done. The strengths are generalizability and validity
by asking standardized questions across populations; the limitation is that questions may be
interpreted in different ways, respondents are limited by answer choices presented and processes
cannot be easily described through a cross sectional dataset. There are several national
population surveys that have the potential to reach parents who have concerns about their young
children’s development and may be in various stages of seeking assessment or intervention

35
services. The Pregnancy Risk Assessment Monitoring System – 2 year follow up survey
(PRAMS-2) would be a useful dataset for examining factors predictive of developmental
conditions and potentially for early recognition of developmental delays. The primary drawback
to using this survey is it’s sample size and characteristics; the total sample size is approximately
1,880, therefore the number of children with developmental disabilities will likely be ~10%, or
under 200. Additionally, the majority of respondents are White, educated, and insured
(Rosenberg, et al., 2011).
Two national surveys utilize the State and Local Area Integrated Telephone Survey
(SLAITS) approach developed by the National Center for Health Statistics. The National Survey
of Children with Special Health Care Needs (2009/2010) (Appendix E) has the most current data
available on the status of 59,941 children with a variety of special health care needs (CSHCN)
and 311,676 children who do not. The survey has data on 112,633 children ages 0-5 nationwide,
and 2,428 in Florida. This survey defines CSHCN as using more than average medical, mental
health, education, or therapy services; having emotional or behavioral concerns requiring
counseling; having limitations that interfere with the ability to play or to go on outings; or if the
doctor has ever told the parent there is a problem in behavior, development, or health; lasting for
12 months or longer. The survey also asks about access to services, such as: the place a parent
usually goes for advice on illness or health; public services (early intervention or special
education) or alternative services; and a plethora of questions related to health services access
and utilization. Within this large nationally representative sample, 10,775 (9%) children ages
birth to five were identified with special health care needs, and 2,152 (1.8%) had emotional,
behavioral, or developmental issues. Functional limitations were found in 3% (n= 13,041), 2.4%
(n= 8,943) received above routine level services. While the survey is thorough in describing

36
child health status and function and services, it does not provide information on family
functioning, social support, or child care participation as does the National Survey of Children’s
Health (2007) (Appendix H), described in Section 2.
Another approach to understanding those factors influencing early recognition, concern
and help-seeking is a qualitative approach. Initial pilot research in rural and urban settings in
Malaysia retrospectively explored early awareness, concern, and help-seeking for developmental
delays among racially, ethnically, and linguistically diverse parents of children with diagnosed
disabilities living in urban and rural settings, as well as the general attitudes and perspectives on
this topic among community members. Participants shared through interviews and focus groups,
what their process was for first recognizing and responding to developmental differences in their
young children. Qualitative methods provide an opportunity to further explore the attitudes,
beliefs, experiences, and influences related to lack of concern or response to formal services. The
strength is that participants can speak in their own words, can clarify meaning and give relative
weights to different influences, can share context and background, discuss feelings and thought
processes, resulting in deeper understanding of complex experiences over time. Potential
limitations include lack of generalizability, recall bias, lack of full disclosure due to social
desirability bias, and potential selection bias. Qualitative methods offer the ability to document
the depth and complexity of each parent’s experience, including the influences of unique
individual and interpersonal factors and the larger context of the family’s prior experiences and
current circumstances. Qualitative methods are especially useful for underrepresented groups by
increasing understanding of cultural and other influences and context-specific challenges from
each parent’s unique perspective through a detailed account in their own words. Based on
national and local estimates (US Census, 2010b; Mendez & Hess, 2003), there are likely

37
thousands of infants and young children in Hillsborough County who have developmental
concerns, yet have not received the developmental supports and services they need during critical
windows of development.
A mixed methods approach will be utilized for this study due to the breadth, depth, and
complex nature of the proposed research questions (Weathers, et al., 2011; Tashakkori &
Teddlie, 1998). Utilizing mixed methods (both qualitative and quantitative) allows for
triangulation of data, which is important when looking at a complex and potentially stigmatizing
issue. For example, underreporting may occur, and is hard to verify when only one measure is
utilized. Blumberg & Cynamon (2001) found 13-20% underreporting of Medicaid enrollment in
three statewide surveys compared to actual Medicaid enrollment records. They attribute
underreporting to possible stigma associated with enrollment in public insurance, genuine lack of
certainty about current enrollment status due to lapses in coverage, or recordkeeping errors.
This study seeks to better understand the child, family, and community-level factors that
contribute to parents’ recognition of developmental delays and subsequent help-seeking for
developmental services for their young children. Phase 1 (Manuscript 1) will identify important
population characteristics and relevant factors associated with recognition (concern) and
responses (enrollment in services) at the national level. The process of power analysis can help to
determine the required number of participants within each stratum required in order to
reasonably detect effects. The process of a priori power estimation entails selecting a desired
effect size (based on realistic estimates found in similar studies in the literature, generally 0.50-
0.80), and alpha level (generally accepted <.05), as well as the number of groups (strata)
measured. A rule of thumb is that 20 subjects per group is the minimum required (Stevens, 2007,
2009). Therefore, while analysis will also examine Florida-specific rates, it is unlikely that there

38
will be sufficient number of responses (and therefore adequate power) to compare within-group
differences on all of the variables. Additionally, minimizing within-group variability within the
sampling strategy, paying careful attention to covariates, and selecting independent variables
likely to have strong linkages to dependent variables will improve power (Stevens, 2009). Phase
2 (Manuscript 2) will explore the decision making processes and influences on parent
recognition (awareness, concern) and help-seeking for developmental delays. Specifically, the
following research questions and its corresponding objectives are proposed:
1) What individual, interpersonal, and community-level factors (identified in the Pathways
to Assessment model, and drawn from HBM and Social Support theory) are associated
with parents who are more likely to recognize developmental delays in their young children
(ages 0-3)?
Objective 1a: To quantify and describe the type and number of concerns parents have
regarding their child’s development.
Objective 1b: To identify and explore factors that most contribute to parent
recognition of developmental delays.
Objective 1c: To assess participants’ knowledge of child development
2) Once a delay is recognized, what process do parents go through in judging whether the
delay is a concern that warrants help-seeking?
Objective 2a: To describe the factors (including social support and the HBM
constructs of perceived threat (severity/susceptibility) and experiences that parents
report most contribute to their judgment of a developmental delay as a “concern”.
3) What individual, interpersonal, and community-level factors (identified in the Pathways
to Assessment model, and drawn from HBM and Social Support theory) are associated
39
with parents who are more likely to seek help (public and private) for developmental
concerns?
Objective 3a: To describe the decision-making process parents go through in seeking
assessment services or other help for their child’s development.
Objective 3b: To examine and explore the role of social support in impacting HBM
constructs of Perceived Threat (severity, susceptibility), Self-Efficacy and
Benefits/Barriers to help-seeking.
Objective 3c: To identify the factors associated with use of public early intervention
services, private intervention services, and no services.
Objective 3d: To explore factors influencing the decision a parent makes regarding
type of help they will seek, if any.
It is hypothesized that while parents may have similar experiences in recognizing
developmental delays in their young children, there will likely be differing attitudes and
experiences related to conceptualizing developmental differences as “concerns” and to help-
seeking choices and decisions based on family and community context.

40
Section 3. Factors Associated with Early Recognition & Intervention for Developmental
Delays: Findings from the 2007 National Survey of Children’s Health
Abstract
The importance of early recognition and intervention for developmental delays is
increasingly acknowledged, yet high rates of under-enrollment and 1-3 year delays in entry to the
public early intervention system continue. This cross-sectional exploratory study examined
responses from 27,566 parents of children ages 0-5 using the 2007 National Survey of Children’s
Health (NSCH) to quantify the type and number of parent concerns regarding their child’s
development, rates of enrollment in public intervention or private therapy, and to identify child,
parent, family, and community level factors related to parent recognition (concern) and help-
seeking (IEP/IFSP or therapy) for developmental delays using SAS 9.3 PROC SURVEY
commands to calculate descriptive and inferential statistics while accounting for categorical
classification variables and sampling. Rates of parent concern in eight developmental domains
and of enrollment in public and private services across age groups and by state are reported.
Regression analyses indicate that the likelihood of parent developmental concern and
enrollment in public or private services differ by: child age, sex, health status, and type of
developmental delay; parent and family characteristics (such as number of siblings, marital
status, primary language); pediatrician inquiry about concerns, insurance type, and child care
type. Maternal age, race/ethnicity, and education, family income, and number of adults in the
household were controlled for in all three models, but did not consistently contribute to increased
41
likelihood across all three outcomes. The results of this study describe multilevel factors related
to early identification of developmental delays and access to public early intervention and private
therapy services to inform and improve community education, developmental screening, and
Child Find outreach efforts.
Introduction
Because there is no comprehensive registry of children with developmental delays or
disabilities, as there are for specific birth defects, estimating the prevalence and status of young
children with developmental delays is a challenge. Adding to this challenge is that this
population spans all stages of recognition, help-seeking, and service use. Developmental delays
in young children may go unrecognized by their parents, child care providers, and/or
pediatricians (Chia-Ying Chung, et al., 2011; Glascoe, 2000; Smith, Akai, Kleman, & Kletner,
2010). Still others may have elicited parent concerns, the majority of which have a sound basis
(Glascoe, 1997a), and parents may be searching for services for months to years (Seligman and
Darling, 2007; Sices, 2007). The estimated prevalence of children under age 5 with
developmental delays is about 15-17% (Aron & Loprest, 2012; Boyle, et al., 2011; Rosenberg,
Zhang, & Robinson, 2008), rising up to 23% in high risk samples (Halfon, Houtrow, Larson &
Newacheck, 2012). The percentage of parents of young children with concerns ranges from 9-
23% depending on how the question is framed (Glascoe, 2000; Smith, et al., 2010).
Development of population-wide screening, assessment, and referral registries is in the
early stages (Roux, Herrera, Wold, Dunkle, Glascoe, & Shattuck, 2012). Thus prevalence of
children with delays is usually estimated from national surveys, clinical samples, or from
intervention programs, which will miss the population of children who have concerned parents,
yet have not enrolled in intervention services (Smith, Akai, Kleman, & Kletner, 2010; Patel,

42
2007). The importance of early intervention is increasingly recognized, as it can support
development during important windows of opportunity, correct maladaptive patterns of
development early, and improve school readiness (Pinto-Martin et al., 2005; Ramey & Ramey,
2004). Yet studies have found high rates of under-enrollment and one to three year delays in
entry to the U. S. public early intervention system (Buysse, Bernier, & McWilliam, 2002; Pinto-
Martin et al., 2005; Ramey & Ramey, 2004;Sices, 2007; U.S. OSEP, 2011).
Among those who have successfully enrolled in intervention services, parents may have
selected public intervention, private therapy services, or a combination of the two. Although the
estimated prevalence of developmental delays in this age group is about 10% (Sices, 2007; U. S.
Office of Special Education Programs, 2003), public early intervention/Part C programs in the
U.S. were reported to serve about 2.8% of children ages birth to three (ranging from 1.48-6.96).
A study conducted by Marshall and Hess (2009) found that medical, early childhood, and social
service providers referred children who failed developmental screening as often or more often to
private providers than to public Part C/Part B programs. Finally, there may be parents who are
aware of developmental delays in their children, but are not seeking services due to some
additional factor, such as the belief that the child will grow out of it (Shevell, 2008) or perceived
practical or cultural barriers to accessing formal services (Halfon, Russ, & Regalado, 2004;
Pinto-Martin et al., 2005; Toran, Squires, & Lawrence, 2011).
Income may also play a role in access to developmental screening and to public or
private intervention services. Low income families may receive developmental screening
services via Medicaid’s mandated Early and Periodic Screening, Diagnosis, and Treatment
(EPSDT) schedule, and may also receive referrals to public intervention programs through other
social service programs focused on “at risk” populations. Furthermore, low income families may

43
have children enrolled in subsidized child care or Head Start; both programs implement
developmental screening and referral procedures. Conversely, higher income families may have
access to high-quality pediatric care and child care programs, and may have insurance that
covers private therapy. Thus, children from higher income families may receive consistent
primary care through a medical home, increasing opportunities for developmental screening and
consultation as well as referral to specialists, including therapy. Children enrolled in high quality
child care settings may receive care from more highly educated teachers, and may also be
enrolled in National Association for the Education of Young Children (NAEYC) or National
Association for Family Child Care (NAFCC) accredited centers or homes which also mandate
developmental screening. Thus it is important to examine access for those families with incomes
hovering just above the Medicaid eligibility level.
To apply the Health Belief Model (HBM) (Champion & Skinner, 2008; Poss, 2001;
Rimer & Glanz, 2005) to this problem, it can be proposed that the level of threat (perceived
severity of and susceptibility to child’s developmental delays) contributes to parental perception
of the delay as a problem, and increases motivation to seek assessment services. When the
perceived benefits to pursuing services outweigh the barriers, a confident (self-efficacious)
parent will take action. Modifiers (demographic or other background characteristics) and cues to
action (triggering events or items prompting the person to act) also play a role in the Health
Belief Model. Additionally, subtypes of Social Support (informational, instrumental, emotional
and appraisal support) may increase problem perception, appraisal, and reduce barriers to help-
seeking.
The socioecological model has been increasingly used in public health because of its
utility in identifying the multilevel influences on child and adult health (Bronfenbrenner, 1979,
44
in Gauvain & Cole, 2004; White & Klein, 2008). The processes described through HBM and
Social Support theories are influenced by factors within the individual, interpersonal,
community, and system levels or domains. To identify leverage points for improvement in
recognition and access to services, processes within and across each of these levels must be
examined and accounted for.
Purpose
This cross-sectional exploratory study examined factors within the child, parent, family,
and community domains in relation to recognition (operationalized as parent concern) and help-
seeking (operationalized as receiving services from public programs funded through the
Individuals with Disabilities Education Act (IDEA) and/or from private providers) for
developmental delays in children ages birth to five, using multivariable analysis of data from the
2007 National Survey of Children’s Health. Research questions include:
1) What individual, interpersonal, and community-level factors contribute to parent
recognition of developmental delays in their young children?
Objective 1: To quantify the type and number of concerns parents have regarding
their child’s development.
Objective 2: To identify the factors associated with parent recognition of
developmental delays.
2) What are the individual, interpersonal, and community-level factors that most
contribute to parents’ help-seeking for developmental concerns?
Objective 1: To quantify the type of early intervention services received (public,
private, both, or none) by selected child, family, and community level structure and
characteristics.

45
Objective 2: To identify the factors associated with use of public early intervention
services, private intervention services, and no services.
Methods
This study examined data from a nationally representative sample of racially, ethnically,
and geographically diverse parents of 27,566 children ages birth to five participating in the
National Survey of Children’s Health (NSCH), which collects parent-reported information on the
physical and mental health status, health care quality and access, and the family, neighborhood
and social context (U. S. DHHS, 2007). The NSCH questions related to developmental concerns
are adapted from the Parents’ Evaluation of Developmental Status (PEDS) (Glascoe, 2000,
Appendix G). In addition to a question asking about whether the parent has “any” concern about
the child’s learning, development, or behavior in general, there are additional prompts asking
about whether the parent has a lot, a little, or no specific concern about how the child: talks and
makes speech sounds; understands what parent says; uses his/her hands and fingers to do things;
uses his/her arms and legs; behaves; gets along with others; is learning to do things for
him/herself; and is learning preschool or school skills.
The survey also collects data on many aspects of child and family health and
functioning, access and utilization of medical and community services, and family structure and
demographics. Several variables are available individually and also in composite scales for
parent concern, developmental problems, at-risk status, health insurance coverage, primary
pediatric care/medical home, child care, developmental screening, and social support.
Comparison groups in this study include NSCH parents who have developmental concerns
versus those who do not, and parents with children enrolled in public or private intervention
programs versus those without. The variables within child, parent, family, and community

46
domains that were examined for this study are listed in Appendix H. This study was reviewed by
the University of South Florida Internal Review Board in 2011 and did not meet the definition of
human subjects research, as the dataset is publicly available and de-identified.
Analysis
All variables related to child and family characteristics (child sex, age, health status, and
maternal age, education, income, marital status), parental involvement (read to child or take on
outing), access to services (medical home, insurance coverage, utilization of specialty care,
number of doctor visits, developmental screening, sources of medical care), child care utilization
and type, and family structure (number of adults and siblings in the household) were examined
for construct validity. Those variables best representing constructs in the theoretical model were
selected for further analysis (Figure 2.1). Excluded variables included those that were redundant,
less precise, and highly correlated with the outcome variables.
Quantitative analysis was conducted using SAS 9.3 (www.sas.com) using PROC
SURVEY syntax, which accounts for the complex survey sampling utilized in the NSCH
(Blumberg, et al., 2012). Data were examined for missing values and outliers; those with higher
levels of missingness (maternal education 5.19%, age 5.04%, self-help concern 14.44%, and
academic concern 28.58%) were formatted to include a “Missing” stratum in the analysis. A
composite ‘Concern” variable was constructed from the general and specific concern questions, a
composite “RaceLanguage” variable combined race/ethnicity and home language to account for
interactions, and “Maternal Age” and “Number of Days Read to Child” were grouped into
meaningful categories. The characteristics of subgroups of parents with and without
developmental concerns were examined using PROC SURVEYFREQ to generate frequencies
and distributions, and chi-square tests assessed significant differences between groups on
47
specific variables at the p<.05 level. Decisions regarding removal or addition of variables at this
step were made based on statistical significance, specificity, and redundancy in the theoretical
model.
PROC SURVEYLOGISTIC was used to estimate linear logistic regression models using
maximum likelihood estimation, incorporating the sample design into the analysis. Adjusted
odds ratios and corresponding 95% confidence intervals were calculated; statistical tests were
two-tailed, using alpha<.05 to determine significance. The first series of univariate regression
analyses examined the outcome “concern” and the second series of regressions examined “public
services” (IEP/IFSP) and “private services” (therapy). Regression models were also tested for
interactions among covariates; variables which interacted with more predictive variables were
removed from the model and more specific variables were used (i.e. CSHCN variable replaced
with Health Status variable). As race/ethnicity and language interacted significantly, a composite
variable was created to better show associations with the outcomes for each combination of
factors.
Results
The distribution of respondents by developmental concern and enrollment in public and
private intervention services by selected child, parent, family, and community characteristics are
presented in Figure 1.1 and in Tables 1.1-1.5. Rates of concern and enrollment in public early
intervention varied by state (Table 1.2). Bivariate analysis (Rao Scott Chi Square, p<.05)
identified several significant differences between groups. There were significant differences
between concern and no concern groups in child age, sex, health status, age position (relative to
siblings), and frequency read to by an adult. There were also significant differences by maternal
education, age, race/ethnicity, primary language, marital status, family income, and number of

48
adults in the household (Table 1.3). Interestingly there was not a significant difference between
concern and no concern groups in the rates of “Provider Asked about Concerns”, though groups
did differ significantly in insurance type, usual source of medical care, and child care type.
In terms of receiving or not receiving public and private developmental services, groups
significantly differed on child age, sex, health status, and by number and type of concerns, but
not by age position relative to siblings (Tables 1.4-1.5). These groups did not differ significantly
by maternal or family characteristics (education, race/ethnicity, income, marital status, or
number of adults in the household) except for differences between groups in maternal age (for
therapy versus no therapy groups) and the number of days an adult spends reading to the child
(for both groups). Parents in both of services groups (for IEP/IFSP and for Therapy) differed
significantly from parents reporting no services in whether the provider asked about concerns,
insurance type, and child care type.
Univiariate logistic regression identified several characteristics in child, parent, family,
and community domains significantly associated with increased or decreased odds of concern
and services enrollment (Tables 1.6-1.8) among NSCH parents of children ages birth to five.
Multivariable logistic regression models with all covariates included were used to estimate
adjusted odds ratios and 95% confidence intervals for parent concern (Table 1.6), enrollment in
public intervention/special education (IEP/IFSP), or and for enrollment in private therapy
(Tables 7-8). Significantly associated variables for the three outcomes (concern, IEP/IFSP, and
therapy) are summarized in Table 9 and described below.
Concern
Likelihood of developmental concern was greater among parents of children who were
older (aOR ranged from 2.62, 95% CI [2.03, 3.08] at age 1 to 4.75, 95% CI [3.67,6.15] at age

49
5), male (aOR 1.40, 95% [CI 1.23, 1.59]), and had poorer reported health (compared to
“Excellent”: aOR ranged from 1.81, 95% CI [1.56, 2.10] for “Very good” to 7.70, 95% CI [3.17,
18.74] for “Poor” health), and among parents who were Hispanic or Non-White race and from a
Non-English speaking home (aOR 1.59, 95% CI [1.20, 2.12] for Hispanic to 3.63, 95% CI [1.02,
12.98] for Multiracial), who read to the child moderately (1-3 days per week compared to not at
all, aOR 1.49, 95% CI [1.06, 2.10]), and received relative child care for their children (compared
to none, aOR 1.31, 95% CI [1.07,1.60]).
Those children from families with “Missing” values for maternal education had increased
odds (aOR 2.18, 95% CI [1.17, 4.08]) for developmental concern. Increased number of older
siblings was associated with a 20-40% decreased likelihood of parent-reported developmental
concerns. Parents who reported having a usual source of medical care (aOR 0.56, 95% CI [0.40,
0.78]), were less likely to report concerns, but those whose health care provider asked about
concerns (aOR 1.19, 95% CI [1.05, 1.36]) had increased likelihood of concerns.
Child factors were predominant in recognition of developmental concerns. Likelihood of
parent concern increased up to 4.75 times with child age from infancy to age 5. The child’s
health status was the greatest predictor of concern; a decline in health was associated with
increased odds of concern, and children with poorest reported health were 7.70 times more likely
to have parent-reported developmental concerns. Family income, marital status, maternal age,
and education were controlled for in the model but did not show an association with increased
odds of reporting developmental concern. Multivariable analysis among only parents reporting
concerns (n=10,057) and among only parents of children under age 3 (n=12,646) produced
similar results as the full birth to age five model.

50
Public Intervention Services (IEP/IFSP)
The odds of having a child with an IEP/IFSP were greater among parents of male
children (aOR 1.67, 95% CI [1.17, 2.38]) with relatively poorer reported health (“Very Good”
aOR 1.61, 95% CI [1.07, 2.41]or “Good” aOR 2.10, 95% CI 1.26, 3.51compared to
“Excellent”); who read to the child more (1-3 days aOR 3.89, 95% CI [1.44, 10.52], 4-7 days
aOR 4.60, 95% CI [1.76, 12.00]); had “Any” concern about learning, development or behavior
(aOR 4.18, 95% CI [2.88, 5.97]) or specific concerns with speech (aOR 4.63, 95% CI [3.00,
7.15]), receptive language (aOR 1.97, 95% CI [1.12, 3.46]), self-help (aOR 4.63 ), or fine motor
(aOR 2.34, 95% CI [1.44, 3.80]) skills; and had a health care provider who asked about concerns
(aOR 2.09, 95% CI [1.45, 3.00]).
Additionally, families at 100-199% FPL were more likely (aOR 1.91, 95% CI [1.08,
3.40]) to report IEP/IFSP compared to those below poverty level. Parents who had private (aOR
0.44, 95% CI [ 0.25, 0.78]) or no insurance (aOR 0.33, 95% CI [0.17, 0.65]) compared to
Medicaid were less likely to have IEP/IFSP. Furthermore, English-speaking (home language)
parents of Black children were half as likely (aOR 0.50, 95% CI [0.30, 0.81]) as English-
speaking parents of White children to have a child with an IEP/IFSP. The odds of IEP/IFSP
enrollment were even less for Non-English speakers who were Hispanic (aOR 0.14, 95% CI
[0.05, 0.41]) or reported “Other” race (aOR 0.07, 95% CI [0.02, 0.26]), although non-English
speaking minorities were 1.59 to 3.63 times more likely to express concern about development in
the univariate models.
No significant association was found with gross motor, academic, social or behavior
concerns or child care type. Child or maternal age, maternal education, marital status, or the
number of adults in the home or siblings did not contribute increased or decreased likelihood but

51
were controlled for in the model. Multivariable analysis among only parents reporting concerns
(n=10,057) produced similar results with one exception; there was a two to three-fold increased
likelihood of IEP/IFSP enrollment for children of older mothers (ages 31-40 OR 2.90 95% CI
[1.04, 8.10], age >40 OR 3.38, 95% CI [1.00-11.38] ) among those parents with concerns, but
not in the overall NSCH sample. Multivariable analysis conducted among only parents of
children under age 3 (n=11,283) also produced similar results as the full birth to age five model
with a couple of exceptions. Male children under age 3 did not have increased odds of IFSP, nor
were there increased odds of IFSP among children with speech/language concern (this question
is not asked for parents of children under 18 months of age). Among parents of children ages 0-
3, a mother with less than high school education did have greater odds of the child having an
IFSP (aOR 2.88, 95% CI [1.08, 7.67] ), and children living in a household with neither parent
(kinship or foster care) had nine times the likelihood of an IFSP (aOR 9.24, 95% CI [1.35,
63.09]).
Private Therapy
Parents of children who were male (aOR 2.44, 95% CI [1.66, 3.60]) and had poorer
reported health (for children in poorest health, aOR 53.31, 95% CI [12.42, 228.91]); who read to
the child most often (4-7 times per week, aOR 4.21, 95% CI [1.44, 12.36]), and had a provider
ask about concerns (aOR 2.17, 95% CI [1.35, 3.49]) were more likely to have children receiving
private therapy. The likelihood of the child receiving private therapy increased with income
above 200%FPL (aOR 2.46, 95% CI [1.31, 4.61] for 200-399%FPL and 2.22, 95% CI [1.05,
4.71] for >400%FPL) and maternal age (increasing with age up to aOR 11.08, 95% CI [2.75,
44.72] for mothers > 40). There were also higher odds of therapy received for children of
mothers without a high school diploma (aOR 1.93, 95% CI [1.01, 3.70]).

52
Those families with private insurance (aOR 0.55, 95% CI [0.32, 3.49]) or no insurance
(aOR 0.25, 95% CI [0.11, 0.58]) were much less likely to enroll children in private therapy
compared to those with public insurance. English-speaking parents of children with Black (aOR
0.53, 95% CI [0.29, 0.94]) or Multiple (aOR 0.29, 95% CI [0.12, 0.74]) race were also much
less likely to report accessing private therapy services, as were non-English speaking parents of
Hispanic (aOR 0.17, 95% CI [0.17, 0.40]) or “Other” race/ethnicity (aOR 0.07, 95% CI [0.02,
0.33]), although these groups had higher odds of developmental concern. Finally, report of
“Any” concern about learning, development or behavior (aOR 6.22, 95% CI [4.15, 9.34]), or
specific concerns about speech (aOR 3.38, 95% CI [2.21, 5.17]), self-help (aOR 2.36, 95% CI,
[1.31, 4.25]) and gross motor skills (aOR 3.10, 95% CI [2.21, 5.17]), were associated with
increased odds of accessing therapy. No significant association was found with other types of
concerns. Child age, marital status, number of adults in the household or siblings, child care type,
or usual source of medical care did not contribute increased or decreased likelihood of therapy
enrollment but were controlled for in the model.
Multivariable analysis among only parents reporting concerns (n=9,225) produced similar
results. Multivariable analysis was also conducted among only parents of children under age 3
(n=11,327) and produced similar results as the full birth to age five model, except that male
children under age 3 did not have increased odds of receiving therapy, and behavioral concerns
were associated with a significantly reduced likelihood of receiving therapy (aOR 0.28, 95% CI
[0.13, 0.61]) among single parents. Also, among parents of children under age 3, single parents
did not have significantly increased odds of child enrollment in therapy, nor did those who read
to the child more.

53
Discussion
The results of this study point to a number of child, parent, family, and community
characteristics associated with increased or decreased likelihood of early recognition and receipt
of services for developmental delays among young children. It appears that child factors have the
greatest influence on parent concern, and that family and community level factors also strongly
impact access to services. It makes sense that child factors play such a strong role in recognition;
increased child age and poorer child health were associated with the greatest odds of parent
reporting concern. Delays that are identified in the early years often co-occur with health issues
or birth defects, and with specific milestones expected for children at ages one and two (such as
walking and talking), and the increased focus on academic and social skills during pre-
kindergarten years accounts for the increase in concern by child age. The age trend is also
partially driven by the fact that the most common concerns. Behavioral and speech/language
issues are more visible after age two, and that developmental questions are not asked of children
under age 4 months, and some are not asked of children under 10 or 18 months (see Table 2).
Maenner and Colleagues (2013) found that the median age of autism identification was
considerably lowered (from 8.2 to 3.8 years) depending on the number and types of concerns.
The higher likelihood of developmental problems among boys is documented in the
literature; boys tend to exhibit more externalizing behaviors (Alink, et al., 2006; Auyeung,
Wheelwright, Allison, Atkinson, Nelum, & Baron-Cohen, 2009; Knickmeyer & Baron-Cohen,
2006) and may develop some specific skills later than girls (Boyle, et al., 2011, Chen, 2010;
Else-Quest, Hyde, Goldsmith, & Van Hulle, 2006; Spelke, 2005), and even controlling for
behavioral problems, boys tend to have higher use of medication, care, and special therapies, and
be identified with more limitations and educational or behavioral problems (Leiter & Rieker,

54
2012). The reason for this difference is unknown but there appear to be social and biological
factors contributing (e.g. differences in exposure to lead, hormonal and chromosomal
differences, and brain development, etc.) (Leiter & Rieker, 2012).
The complex personal and social context in which parenting occurs is partially illustrated
in findings at the parent or community level. Parent factors related to concern included missing
maternal education, and Non-English speaking, non-White race/ethnicity. The missingness of
maternal demographic factors (education) may relate to some shared characteristic of families
reporting missing data for maternal factors. In the bivariate analysis, there was also an increased
likelihood of concern among children living with no parents. Perhaps there is a subgroup of
children living with a foster parent or other relative due to neglect or abuse, which are known to
be at higher risk of developmental delays (Barnett, Miller-Perrin, and Perrin, 2005; Herman,
2007; Stahmer, Sutton, Fox, & Leslie, 2010). Non-English speaking, non-White parents showed
higher odds of concern in univariate and multivariable models when other demographics were
controlled for.
There was also an increased concern among English-speaking Black parents. There is
endless speculation as to the disparities in child health and development by race and ethnicity
(Rushton & Jensen, 2005); this can certainly be related to additional higher developmental risks
associated with comparatively poorer birth outcomes among Black mothers (Curry, Pfeiffer,
Slopen, & McVeigh, 2012; Feinberg, Silverstein, Donahue, & Bliss, 2011) and also the
differences in speech development among children who are second language learners (Hoff,
Core, Place, Rumiche, & Parra, 2012; Hambly, Wren, McLeod, & Roulstone, 2013; Paradis,
2010). Sociodemographic factors associated with decreased likelihood enrollment in public early
intervention (IFSP), including Black race, lower income, no parents in the household, and male

55
children were also found in an examination of early intervention enrollment from the National
Early Intervention Longitudinal Study (Hebbeler, et al., 2007) and the racial disparity in early
intervention was also found in the Early Childhood Longitudinal Study (Rosenberg, Zhang, &
Robinson, 2008).
Parents who read to their child moderately reported higher odds of concern than those
who didn’t read, yet those who read to the child most often did not have significantly higher
odds. As levels of parent involvement and cognitive stimulation at home are associated with
increased or decreased risk of developmental delays (Walker, et al., 2011; Shonkoff & Phillips,
2000) it is possible that the mixed effects of these levels of parent involvement do not clearly
show effects due to the cross-sectional design of the study; parents who read to the child provide
more cognitive stimulation and thus lower risk of delay, and those who are reading to the child
moderately may be working to ameliorate a developmental concerns or may be more likely to
notice an existing problem.There were decreased odds of concern among children with older
siblings, and likelihood decreased as the number of siblings increased. The reason for this
relationship is unknown, and further research is needed to determine how parenting siblings
contributes to risk, recognition, and concern for developmental delays.
The lower odds of having a usual source of care among parents with concerns is
consistent with other aspects of health care utilization in this group; compared to parents without
concerns, parents in the NSCH reporting developmental concerns also report that they access
medical care for their child more often from the ER or a clinic than a personal doctor’s office,
have public rather than private insurance, and have a higher number of doctor visits and children
with poorer health. The variable is defined in NSCH quite broadly, as having a usual place of
care categorized as a doctor's office, hospital outpatient department, clinic or health center,

56
school, friend or relative, some other place, or a telephone advice line. The child is considered
not to have a usual source of care if the place of care is a hospital emergency room, is located
outside the U.S., or the child does not go to one place most often. What really drives parent
recognition of delays may be related to the provider practices rather than the provider setting. It
is possible that a provider who asks about concerns can point out problems or elicit parent
worries, thus the provider screening practices will lead to increased recognition and help-
seeking. What prompts providers to ask about concerns may be the child factors (age/milestones,
severity of delay, health status) or the parent report of an issue that prompted the doctor to ask.
Thus, child factors and parental/interpersonal factors may hold as the main drivers of
recognition. Due to the cross-sectional nature of this study, the temporal relationship among
these factors cannot be determined.
When it comes to accessing services, in addition to child factors (sex, health status),
system level factors come into play. The level and type of concern may drive increased odds of
IEP/IFSP based on program eligibility. Because PROCSURVEY accounts for weights and
distributions in the survey sampling by state, the State variable cannot be included in the
regression model. However, as can be seen in Table 1.3, rates of enrollment in public
intervention for children ages 0-5 range widely, as do eligibility criteria, funding, and service
delivery models. As shown in the study, specific types of concern (speech, language and fine
motor) were associated with enrollment in public intervention/special education, perhaps
reflecting the priorities and resources available in public schools. Other types of concerns
(speech, self-help, and gross motor skills) may be more likely to be referred to private therapy
agencies by physicians concerned with health-related concerns, such as feeding issues or motor
impairment. Children with more subtle delays at a young age (cognitive or social/behavioral

57
challenges) may be less likely to be referred or to qualify for services. Poorer health status may
lead to greater involvement (continuity of care) with medical providers, including discussing
concerns and establishing referrals (Miller, Condin, McKellin, & Shaw, 2009).
Additionally, enrollment in services requires parent action. As seen in Tables 6-8, racial
and ethnic minority parents, although more likely to have concerns, are less likely to access
services. This disparity has been found in other local and national studies (Hebbeler, et al., 2007;
Johnson, 2011) and could relate to issues with cultural competency and language barriers (Pinto-
Martin et al., 2005; Rosenberg, Zhang, and Robinson, 2008; Toran, Squires, & Lawrence, 2011;
Turnbull & Turnbull, 2001). Also, parent who read to their children more were more likely to
enroll them in public or private services, reflecting perhaps higher investment in child
development. Mothers who were older and had higher income were more likely to access
therapy. Perhaps these combined factors relate to self-efficacy, access to information, or other
resources. Based on the dataset, one can only speculate. However it is certainly important to note
that parent characteristics appear to be important in some way to the process of successfully
enrolling children in developmental services.
Additional barriers to accessing services cited in the literature include lack of insurance
(Pinto-Martin et al., 2005) and cost (Coulter, Wallace, & Laude, 1993; Halfon, Russ, &
Regalado, 2004). This barrier was also demonstrated in this study. However, the relationship
between income and insurance and access to services is not necessarily linear. Those who
accessed therapy had increased income; those who enrolled in public intervention had income
that was above Medicaid eligibility but below 200% FPL. Public insurance versus private or no
insurance was related to increased likelihood of services, reflecting specific funding barriers to

58
accessing therapy through private insurance or private pay (Boyd, Odom, Humphreys, & Sam,
2010).
Due to the cross-sectional nature of surveys, we cannot ascertain which correlations are
causal factors for developmental delay in children versus predictive of parental recognition, nor
can we identify children who have developmental delays, but have not activated parent concern
nor received services. The analysis is also limited to those factors asked within the NSCH
protocol. The measure of parent concern is of particular interest. For example, when asked in
general about “Any concern about the child’s learning, behavior, or development”, only 9%
answered in the affirmative, yet 38% of parents report a concern when asked additionally about
specific speech, language, motor, behavior, social, self-help, or academic skills. This indicates
that parents may perceive or express concerns or services differently from how they are framed
in the survey. While the presence of a developmental delay is not confirmed by a standardized
screening tool, there has been some research suggesting that to some extent, parent concern is a
reliable indicator of a delay (Glascoe, 1997b). There are no precise measures of parenting self-
efficacy, knowledge of child development, or other parent qualities that may positively impact
recognition or help-seeking for developmental delays. Parent education may also play a role
although the relationship is less clear in this sample. Davis-Kean (2005) found that among White
and African American parents education and income were related to child achievement indirectly
through the parent’s beliefs and behaviors (such as reading to the child, ostensibly because the
reading reflects higher educational expectations and warmth parent-child interactions), regardless
of income level.
The measures that were used in this study included parenting experience (siblings),
maternal education, and number of days read to the child (which showed significant associations

59
across all three outcomes); thus a better measure of this important construct would be helpful.
Furthermore, the race variable is derived from a question asking about the selected child’s race,
not the race or ethnicity of the parent, and the primary language question refers to language
spoken in the household. Thus, measure of parent race/ethnicity and primary language is
imprecise and does not capture actual maternal demographics. Additionally, there were few
measures to specifically capture social support; only marital status, number of adults in the
household, relative child care, and neighborhood level trust and support are measured in the
NSCH. The role of friends and family members in this process is an important one, and not
captured in this dataset (Broadhurst, 2003; Bussing, et al., 2005; Gamoran, Turley, Turner, &
Fish, 2011; Keller & McDade, 2000; Twoy, 2006). There was not a direct measure of “help-
seeking” in the NSCH, so enrollment in services was used as the outcome indicator of help-
seeking. Unfortunately, the percentage of parents who have successfully enrolled in services is
less than 5%; so again we only have information on those who have purposefully and
successfully accessed services. However, the distinction between those who access public versus
private services is enlightening in that it points out potential facilitators and barriers to service
options for a variety of children and families.
The strength of this study is its diverse sample of parents of children from infancy
throughout early childhood, and the inclusion of several covariates at multiple socioecological
levels in the analysis. The focus of this study is factors which may be associated with parent
recognition of developmental delays and with help-seeking, therefore casting a ‘wide net’ of
parent concern rather than only confirmed cases will yield the most enlightening results, from
parents who may or may not have accessed services.Valuable information from this study can
guide efforts to parents to improve early recognition of developmental delays and also increase

60
the timeliness of early intervention for children in need of those services. For example, we can
use child data as a barometer for where targeted screening and outreach does and should occur to
improve early identification and enrollment in services. We can easily identify system level
barriers, such as enrollment categories, cost and insurance coverage, and racial and ethnic
disparities, and work towards addressing them. Finally, we must strongly consider parent factors
influencing the process – there was some evidence in the study that parent factors play an
important role.
Conclusion
This study provided important insights into factors which may be related to recognition
of developmental delays and also differences in access to public and private services. Certainly it
is important to identify children at risk particularly at the earliest ages, and among those with
significant health concerns. The study demonstrates as well that delays and concerns span all
ages, income levels, race/ethnicity and family structures. While the examination of help-seeking
was limited to those enrolled in services, the study does show how many parents have concerns
and what potential access gaps may exist. Future study needs to identify the role of others in the
parent’s environment in facilitating recognition and access to services. The NSCH did identify
the role of relative caregivers in increased recognition and the crucial role of health care
providers in eliciting parent concerns and providing referrals to services. Child care providers
may offer developmental screening and referral, however not consistently enough to show as a
significant influence on the process in this study. In accessing public and private intervention,
policy makers must recognize the differences in access for specific types of concerns, and
particularly the large gap in support for behavioral concerns which are among the most common
concerns. Insurance and financial gaps remain barriers to accessing service options (public

61
versus private), as do cultural differences, particularly among families whose home language is
not English.
Parents must know where to go. The role of additional factors – access to information,
and family culture, dynamics, and involvement could be better measured. Further examination of
the timing and process requires longitudinal studies which could best be captured by population
wide studies and through registries/databases of screening, referral, services, and child outcomes.
The results of this study can contribute to the body of information to help inform and improve
community education, developmental screening, and Child Find outreach efforts to enhance
early identification and intervention for developmental delays.

62
Figure 1.1: Risk and services status among parents reporting concern for children ages 0-5.
61% 12%
14%
8% 1% 2% 2%
No Concerns
Low Risk
Moderate Risk
High Risk
Therapy Only
Both Therapy & IEP
IEP Only

63
Table 1.1: Number and type of concern and service enrollment among parents of children ages
0-5
Number of
Concerns N % (Std Error)
0
One or more
1
2
3
4
5
6
7
8
Missing
17509
10057
4070
2045
1113
714
490
473
412
518
222
61.72(.75)
38.27(n/a)
14.20(.53)
7.84(.42)
4.29(.31)
2.50(.20)
2.28(.27)
2.08(.23)
1.92(.22)
2.08(.21)
1.08(.20)
Concern Type A lot A little Total Missing A lot A little Total Missing
None
Behavior
Speech
Social
Rec Language
Academic
Self-Help
Fine Motor
Gross Motor
“Any
concerns”
25422
1342
1421
1118
1384
999
1024
1029
988
2129
-
3747
3547
3091
1556
1882
1588
991
833
-
25422
5089
4968
4209
2930
2881
2612
2020
1821
2129
15
1403
1407
1418
1427
7877
3980
1401
1399
15
90.92(.50)
6.34(.42)
5.96(.40)
5.09(.35)
6.00(.36)
0.45(.34)
4.92(.36)
4.42(.29)
4.66(.37)
9.08(.50)
-
13.59(.50)
13.88(.55)
11.53(.48)
5.86(.36)
6.83(.37)
5.96(.37)
4.53(.40)
3.28(.27)
-
90.92
18.46
18.02
15.27
10.67
10.45
9.48
7.33
6.61
9.08
2.00(30)
4.97(.30)
5.16(.33)
5.12(.32)
28.10(.68)
14.18(.54)
4.95(.29)
4.93(.29)
Services Full Sample (N=27,566) Parents reporting concern (N=10,057)
N % (Std Error) N % (Std Error)
IFSP/IEP only
Therapy only
Both Services
No Services
603
231
548
26059
2.19(.20)
0.84(.10)
1.69(.15)
95.28(.27)
1008
719
511
8775
9.05(.60)
6.25(.46)
4.19(.39)
88.99(.65)

64
Table 1.2: Rates of reported concern and public intervention services by state among children
ages 0-5and 0-2 State Concern IFSP/EIP
Birth to Age 5 (27,566)
Mean 35.88%, Range
26.53-45.55%
Birth to Age 5 (27,441)
F=1.65 (df=50), p=.00
Mean 1.96%, Range
0.22%-9.16%
Birth to Age 3 (13,600)
F=1.11 (df=50) p=.28
Mean 0.04%, Range
0%-.23%
n % n % n %
Alabama 182 36.11 11 1.50(73) 2 0.01(.01)
Alaska 204 36.43 30 0.41(.10) 9 0.01(.01)
Arizona 196 34.69 15 1.71(.61) 3 0.05(.03)
Arkansas 189 37.80 28 1.82(.45) 9 0.02(.02)
California 208 38.52 16 9.16(3.28) 4 0.14(.11)
Colorado 166 31.26 17 1.40(.50) 7 0.04(.02)
Connecticut 189 33.93 25 1.36(.32 8 0.03(.01)
Delaware 188 36.29 23 .035(.10) 5 0.00(.00)
District of Columbia 231 36.38 16 0.14(.04) 8 0.00(.00)
Florida 207 39.96 14 2.41(1.12) 6 0.09(.06)
Georgia 199 34.08 17 2.99(1.09) 6 0.09(.06)
Hawaii 204 37.71 26 0.57(.14) 10 0.02(01)
Idaho 186 35.29 22 0.45(.13) 5 0.01(.01)
Illinois 219 37.50 20 3.28(.89) 7 0.09(.04)
Indiana 193 36.69 24 2.69(.78) 5 0.04(.02)
Iowa 170 32.08 16 0.63(.23) 5 0.01(.00)
Kansas 171 33.40 24 0.97(.27) 8 0.02(.01)
Kentucky 203 39.42 19 1.34(.34) 5 0.02(.01)
Louisiana 222 40.22 22 2.67(.84) 6 0.09(.05)
Maine 170 33.66 24 0.38(.10) 2 0.00(.00)
Maryland 187 37.18 25 2.31(.68) 7 0.04(.02)
Massachusetts 178 34.30 36 3.85(.86) 13 0.13(.05)
Michigan 181 34.67 23 4.45(1.18) 6 0.11(.05)
Minnesota 147 26.53 28 1.86(.44) 8 0.03(.01)
Mississippi 240 41.38 13 0.47(.15) 4 0.01(.01)
Missouri 190 34.23 21 1.73(.53) 1 0.01(.01)
Montana 171 33.33 18 0.26(.08) 4 0.00(.02)
Nebraska 176 33.33 18 0.47(.15) 6 0.01(.01)
Nevada 2514 40.81 16 0.86(.28) 4 0.02(.01)
New Hampshire 137 30.31 25 0.61(.16) 5 0.02(.01)
New Jersey 219 38.69 27 3.18(.85) 5 0.05(.03)
New Mexico 172 34.06 24 0.83(.27) 6 0.02(.01)
New York 215 39.67 30 7.58(1.81) 5 .07(.04)
North Carolina 194 37.24 18 3.64(1.35) 6 0.14(.09)
North Dakota 155 30.69 23 0.22(.05) 10 0.01(.00)
Ohio 177 35.40 22 4.19(1.20) 11 0.12(.05)
Oklahoma 227 39.96 24 1.21(.32) 9 0.02(.01)
Oregon 184 34.72 23 0.89(.29) 1 0.00(.00)
Pennsylvania 205 38.46 36 5.41(1.28) 16 0.16(.06)
Rhode Island 168 35.67 34 0.44(.11) 8 0.01(.01)
South Carolina 218 37.46 26 1.92(.59) 12 0.05(.03)
South Dakota 181 35.91 22 0.46(.12) 8 0.01(.01)

65
Table 1.2 (Cont.)
Tennessee 212 39.48 17 1.98(.66) 3 0.04(.03)
Texas 271 45.55 15 5.75(2.68) 6 0.23(.15)
Utah 211 34.99 14 1.07(.34) 3 0.03(.02)
Vermont 151 31.20 20 0.27(.07) 9 0.04(.03)
Virginia 190 34.80 23 2.33(.60) 3 0.01(.00)
Washington 205 37.27 20 1.00(.31) 7 0.04(.02)
West Virginia 161 31.51 29 0.84(.20) 8 0.02(.01)
Wisconsin 176 34.58 29 3.33(.82) 6 0.03(.02)
Wyoming 188 35.01 43 0.38(.09) 13 0.01(.00)

66
Table 1.3: Frequencies and percents between parent concern groups for children ages birth to 5
years for child, parent, family and community characteristics.
Total
Concern
N=10,057 (38.27%)
No Concern
N=17,509 (61.73%)
N % (Std Err) % (Std Err) % (Std Err) Rao Scott X
2
Child Domain
Child Age
<1
Age 1
Age 2
Age 3
Age 4
Age 5
4769
17.00(.58)
796
7.93(.82)
3973
22.63(.78)
F=38.15
(df=5)
p=< .0001
4853 17.52(.57) 1612 16.07(.90) 3241 18.42(.74)
3978 15.17(.54) 1521 14.82(.81) 2457 15.39(.72)
4694 16.30(.56) 2019 18.61(.92) 2675 14.87(.71)
4714 16.50(.56) 2127 19.92(.93) 2587 14.38(.69)
4558 17.51(.59) 1982 22.65(1.16) 2576 14.32(.60)
Child Sex
Male
Female
14243
13304
51.11(.76)
48.89(.76)
5676
4376
21.53(.63)
16.76(.59)
8567
8928
29.90(.68)
32.48(.72)
F=27.60
(df=1)
p=<.0001
Child Health
Excellent
Very good
Good
Fair
Poor
19071
5630
2339
450
69
65.26(.75)
21.39(.62)
10.97(.56)
2.15(.29)
0.23(.04)
5801
2593
1304
300
56
54.15(1.27)
26.40(1.13)
15.62(1.02)
4.36(.72)
0.48(.09)
13270
3037
1035
150
13
72.78(.87)
18.28(.71)
8.08(.64)
0.78(.11)
0.08(.03)
F=61.48
(df=4)
p=<.0001
Parent Domain
Maternal
Education < High School
HS Graduate
> HS
Missing
2260
4521
19400
1385
12.26(.59)
22.27(.68)
60.28(.77)
5.19(.34)
1052
1804
6544
657
14.97(1.04)
24.35(1.17)
54.20(1.28)
6.48(.68)
1208
2717
12856
728
10.57(.70)
20.98(.81)
64.05(.95)
4.39(.34)
F=13.26
(df=3)
p=<.0001
Maternal Age
≤20
21-30
31-40
>40
Missing
719
9957
12766
2650
1474
2.97(.25)
38.73(.76)
44.29(.75)
8.97(.43)
5.04(.32)
234
3574
4478
1100
671
2.92(.48)
38.58(1.26)
42.38(1.21)
10.14(.80)
5.96(.65)
485
6383
8288
1550
803
2.98(.28)
38.82(.95)
45.48(.94)
8.24(.50)
4.47(.34)
F=2.60
(df=4)
p=.0340
Race/ Ethnicity
English Home
Lang. White
Black
Hispanic
Multiracial
Other
17379
2362
2159
1521
991
53.24(.76)
12.26(.45)
9.43(.53)
5.25(.39)
2.97(.24)
5693
1057
827
580
418
46.19(1.22)
13.86(.78)
9.14(.87)
4.76(.40)
3.03(.36)
11686
1305
1332
941
573
57.61(.98)
11.27(.55)
9.61(.67)
5.55(.57)
2.93(.04)
F=m-*
Race/ Ethnicity
Non-English
Home Lang. White
Black
Hispanic
Multiracial
Other
204
59
1995
29
390
0.87(.14)
0.26(.10)
13.25(.69)
0.09(.04)
2.28(.31)
72
27
999
14
194
1.09(.32)
0.26(.07)
17.87(1.24)
0.18(.10)
3.55(.68)
132
32
996
15
196
0.73(.10)
0.26(.15)
10.40(.80)
0.04(.01)
1.50(.29)

67
Table 1.3 (Cont.)
Home
Language
English
Non-English
24790
2752
83.08(.72)
16.92(.74)
8698
1349
76.74(1.32)
23.26(1.32)
13092
1403
87.01(.83)
12.99(.82)
F=9.15
(df=1)
p=.0025
Race/ Ethnicity
White
Black
Hispanic
Multiracial
Other
17588
2423
4166
1553
1381
54.14(.77)
12.52(.46)
22.72(.77)
5.35(.39)
5.25(.39)
5765
1085
1832
596
612
47.28(1.24)
14.13(.78)
27.05(1.34)
4.95(.42)
6.58(.75)
11823
1338
2334
957
769
58.39(.99)
11.53(.57)
20.04(.94)
5.60(.57)
4.43(.42)
F=13.22
(df=4)
p=<.0001
Family Domain
Age Position
Only Child
Oldest Child
Second Oldest
Third Oldest
Fourth Oldest
11281
3640
8524
2991
1130
24.65(.55)
14.02(.49)
34.13(.72)
19.87(.73)
7.33(.47)
3985
1456
3041
985
368
24.93(.91)
16.10(.88)
34.36(1.19)
18.12(1.18)
6.50(.71)
7204
2148
5421
1980
756
24.49(.68)
12.73(.58)
33.99(.89)
20.95(.92)
7.8(.62)
F=3.40
(df=4)
p=.0087
Household
Income
≤100% FPL
100%-199%
200%-399%
≥ 400% FPL
3933
4948
8926
9759
21.01(.68)
22.03(.66)
29.04(.65)
27.88(.65)
1814
1995
3193
3055
24.11(1.10)
24.57(1.19)
27.77(1.05)
23.55(1.01)
2119
2953
5733
6704
19.12(.87)
20.47(.77)
29.83(.82)
30.58(.85)
F=12.64
(df=3)
p=<.0001
Parent Inv.
days read to
child/wk.
0 days
1-3 days
4-7 days
1516
5117
20789
7.57(.46)
22.94(.68)
69.50(.74)
522
2139
7331
6.84(.70)
28.16(1.25)65
.00(1.29)
994
2978
13458
8.01(.60)
19.72(.76)
72.27(.88)
F=17.35
(df=2)
p=<.0001
No. of Adults
in Household 1
2
>3
1762
21116
4596
7.67(.36)
73.27(.72)
18.05(.68)
807
7345
1858
9.23(.66)
70.17(1.21)
20.69(1.14)
955
13771
2738
6.72(.42)
75.25(.88)
18.04(.84)
F=7.56
(df=2)
p=<.0005
Marital Status
Married
Cohabiting
Neither
No parents
20847
2448
3544
540
72.12(.70)
11.72(.59)
14.35(.49)
1.80(.17)
7081
1039
1592
273
67.98(1.19)
13.31(1.00)
16.70(.87)
2.01(.22)
13766
1409
1952
267
74.69(.86)
10.75(.71)
12.89(.59)
1.67(.23)
F=8.00
(df=3)
p=<.0001
Community Domain
Provider ask
about concerns Yes
No
13518
12944
46.03(.75)
49.90(.76)
4940
4753
45.02(1.24)
50.91(1.25)
8578
8191
49.65(.94)
49.27(.95)
F=.60
(df=2)
p=.55
Insurance
Type
Public
Private
None
7211
18291
1769
34.73(.77)
57.37(.78)
7.90(.46)
3212
5999
711
41.05(1.29)
50.98(1.27)
7.97(.68)
3999
12292
1058
30.82(.94)
61.33(.98)
7.86(.61)
F=21.92
(df=2)
p=<.0001
Table 1.3 (Cont.)

68
Usual Source
of Medical
Care
Yes
No
26237
1287
93.59
6.41
9400
634
90.80(.90)
9.20(.90)
16837
653
95.32(.43)
4.68(.43)
F=26.35
(df=1)
P=<.0001
Child Care
Neither type
Non-relatives
Relatives
Both Types
11418
9503
3793
2847
45.84(.76)
29.10(.64)
14.69(.56)
10.37(.48)
3884
3556
1372
1244
42.32(1.25)
30.35(1.09)
15.50(1.01)
11.83(.78)
7534
5947
2421
1603
48.03(.96)28.
33(.80)
14.19(.66)
9.46(.61)
F=4.97
(df=3)
p=.0019
Note: m- denotes that statistics cannot be calculated as one cell contains n=0

69
Table 1.4: Frequencies and percents between IEP/IFSP enrollment groups for children ages birth
to 5 years for child, parent, family and community characteristics.
Total
IEP
N=1151 (3.88%)
No IEP
N= 29290 (96.12%)
N % (Std Err) % (Std Err) % (Std
Err)
Rao Scott X2
F(df), p< .05
Child Domain
Child Age
<1
Age 1
Age 2
Age 3
Age 4
Age 5
4739
4832
3959
4679
4691
4541
16.99(.58)
17.52(.58)
15.18(.54)
16.32(.56)
16.48(.56)
17.50(.59)
65
113
158
220
288
307
6.22(1.64)
11.58(2.29)
12.02(1.76)
15.69(2.33)
24.05(2.43)
30.45(3.23)
4674
4719
3801
4459
4403
4234
17.43(.60)
17.76(.59)
15.31(.56)
16.34(.47)
16.18(.57)
16.97(.60)
F=11.10 (df=5)
p=<.0001
Child Sex
Male
Female
14167
13256
51.06(.76)
48.94(.76)
751
399
65.29(3.21)
34.71(3.21)
13416
12857
48.83(.76)
47.48(.76)
F=18.25 (df=1)
p=<.0001
Child Health
Excellent
Very good
Good
Fair
Poor
19011
5597
2312
447
68
65.33(.75)
21.37(.62)
10.92(.56)
2.15(.29)
0.23(.04)
472
337
225
95
22
38.46(3.19)
31.36(3.24)
19.56(2.23)
9.16(1.49)
1.46(.47)
18539
5260
2087
352
46
66.41(.77)
20.96(.63)
10.57(.58)
1.87(.30)
0.18(.04)
F=37.09 (df=4)
p=<.0001
Number of
Concerns
0
1
2
3
4
5
6
7
8
9
17464
4049
2035
1106
704
483
466
407
509
218
61.82(.75)
14.21(.53)
7.84(.42)
4.30(.31)
2.47(.19)
2.26(.27)
2.05(.23)
1.92(.22)
2.06(.21)
1.08(.20)
143
176
117
93
104
91
106
88
114
119
10.94(2.15)
16.05(2.58)
7.73(1.12)
8.75(1.89)
7.91(1.20)
9.59(2.25)
10.78(2.44)
7.40(1.36)
11.27(1.78)
9.88(1.89)
17321
3873
1918
1013
600
392
360
319
395
99
63.88(.76)
14.13(.54)
7.84(.44)
4.12(.31)
2.26(.19)
1.97(.27)
1.70(.21)
1.69(.22)
1.69(.21
0.69(.19)
F=61.52 (df=9)
p=<.0001
Concern Type NONE
Behavior
Speech
Social
Recept. Lang.
Academic
Self-Help
Fine Motor
Gross Motor
“Any Concerns”
25323
4168
2899
4168
2899
2850
2581
1988
1796
2105
90.96
17.15
19.73
16.56
11.77
11.3
10.82
8.89
7.90
9.04
556
481
835
490
544
503
496
417
335
594
48.63
52.31
71.85
45.76
51.11
43.5
45.26
40.35
30.22
51.37
24767
3678
2355
3678
2355
2347
2085
1571
1461
1511
92.67
18.54
17.93
15.37
10.18
10.00
9.43
7.63
7.00
7.32
F=433.55 (df=1)
F=84.95 (df=3)
F=230.05(df=3)
F=73.19 (df=3)
F=155.53 (df=3)
F=259.24 (df=3)
F=118.14 (df=3)
F=118.71 (df=3)
F=89.77 (df=3)
F=433.55 (df=1)
All: p=<.0001

70
Table 1.4 (Cont.)
Parent Domain
Maternal
Education < High School
HS Graduate
> HS
Missing
2228
4488
19354
1371
12.21(.59)
22.25(.68)
60.37(.78)
5.17(.34)
73
209
779
90
11.12(2.44)
22.82(2.76)
59.43(3.23)
6.64(1.37)
2155
4279
18575
1281
12.25(.60)
22.23(.70)
60.41(.80)
5.11(.35)
F=.43 (df=3)
p=.73
Maternal Age
≤20
21-30
31-40
>40
Missing
708
9900
12732
2641
1460
2.95(.25)
38.69(.76)
44.35(.75)
8.98(.44)
0.05(6.12)
17
343
506
193
92
2.74(1.83)
35.24(3.16)
41.03(3.12)
14.87(2.30)
6.12(1.16)
691
9557
12226
2448
1368
2.96(.25)
38.83(.78)
44.48(.77)
8.75(.44)
4.98(.35)
F=2.08
(df=4) p=.08
Race/ Ethnicity
English Home
Lang.
White
Black
Hispanic
Multiracial
Other
17333
2346
2144
1514
29
385
53.29(.76)
12.25(.45)
9.42(.53)
5.24(.39)
2.97(.24)
746
98
101
80
54
58.30(3.29)
13.38(2.05)
10.45(2.39)
6.59(1.63)
3.02(.62)
16587
2248
2043
1434
926
53.09(.78)
12.20(.46)
9.38(.54)
5.19(.40)
2.97(.25) F=m-
Race/ Ethnicity
Non-English
Home Lang. White
Black
Hispanic
Multiracial
Other
203
59
1977
980
596
0.87(.14)
0.26(.10)
13.24(.69)
0.09(.04)
2.28(.32)
8
0
35
0
9
0.59(.42)
-
6.60(2.16)
-
0.77(.34)
195
59
1942
29
376
0.88(.14)
0.27(.10)
13.51(.71)
0.10(.04)
2.34(0.33)
Home Lang.
English
Non-English
24691
2726
83.09(.72)
16.91(.74)
1098
52
92.12(2.18)7
.87(2.18)
23593
2674
82.73(.75)
17.27(.75)
F=9.15 (df=1)
p=.0025
Race/ Ethnicity
White
Black
Hispanic
Multiracial
Other
4133
17541
2407
1546
1365
22.70(.77)
54.19(.77)
12.52(.46)
5.35(.39)
5.25(.39)
137
754
98
80
63
17.35(3.01)
58.88(3.29)
13.38(2.05)
6.59(1.63)
3.80(.71)
3996
16787
2309
1466
1302
22.91(.80)
54.00(.79)
12.48(.47)
5.30(.40)
5.31(.41)
F=1.56 (df=4)
p=.18
Family Domain
Age Position
Only Child
Oldest Child
Second Oldest
Third Oldest
Fourth Oldest
11223
3630
8489
29754
1124
24.62(.55)
14.05(.49)
34.13(.72)
19.87(.73)
7.33(.47)
408
191
364
142
46
20.77(2.34)
19.94(2.84)
34.32(3.05)
18.27(2.63)
6.70(1.54)
10815
3439
8125
2833
1078
24.78(.57)
13.81(.50)
34.12(.73)
19.94(.75)
7.35(.48)
F=1.99 (df=4)
p=.09
Household
Income
≤100% FPL
100%-199%
200%-399%
≥ 400% FPL
3892
4916
8892
9741
21.00(.68)
22.00(.67)
29.07(.65)
27.95(.67)
195
252
385
319
19.56(2.24)
28.68(3.00)
29.77(2.84)
22.00(3.02)
3697
4664
8507
9422
21.05(.73)
21.72(.68)
29.04(.66)
28.19(.67)
F=2.76
(df=3) p=.04
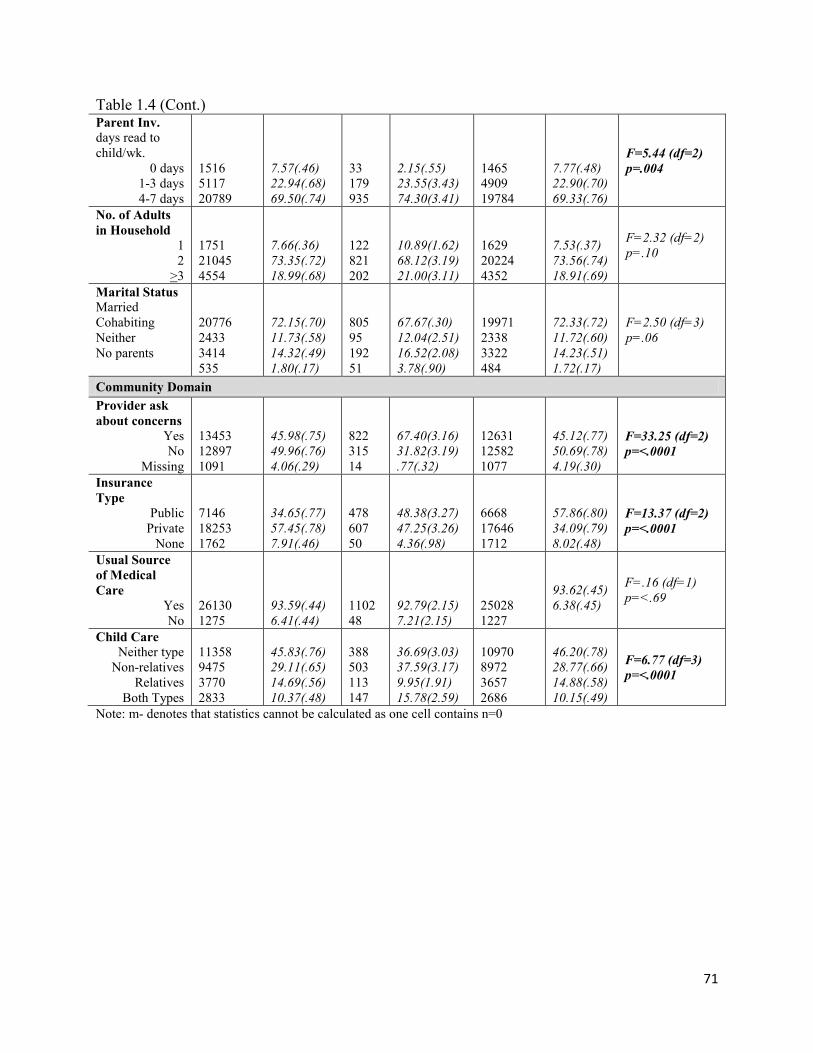
71
Table 1.4 (Cont.) Parent Inv.
days read to
child/wk.
0 days
1-3 days
4-7 days
1516
5117
20789
7.57(.46)
22.94(.68)
69.50(.74)
33
179
935
2.15(.55)
23.55(3.43)
74.30(3.41)
1465
4909
19784
7.77(.48)
22.90(.70)
69.33(.76)
F=5.44 (df=2)
p=.004
No. of Adults
in Household 1
2
>3
1751
21045
4554
7.66(.36)
73.35(.72)
18.99(.68)
122
821
202
10.89(1.62)
68.12(3.19)
21.00(3.11)
1629
20224
4352
7.53(.37)
73.56(.74)
18.91(.69)
F=2.32 (df=2)
p=.10
Marital Status
Married
Cohabiting
Neither
No parents
20776
2433
3414
535
72.15(.70)
11.73(.58)
14.32(.49)
1.80(.17)
805
95
192
51
67.67(.30)
12.04(2.51)
16.52(2.08)
3.78(.90)
19971
2338
3322
484
72.33(.72)
11.72(.60)
14.23(.51)
1.72(.17)
F=2.50 (df=3)
p=.06
Community Domain
Provider ask
about concerns Yes
No
Missing
13453
12897
1091
45.98(.75)
49.96(.76)
4.06(.29)
822
315
14
67.40(3.16)
31.82(3.19)
.77(.32)
12631
12582
1077
45.12(.77)
50.69(.78)
4.19(.30)
F=33.25 (df=2)
p=<.0001
Insurance
Type
Public
Private
None
7146
18253
1762
34.65(.77)
57.45(.78)
7.91(.46)
478
607
50
48.38(3.27)
47.25(3.26)
4.36(.98)
6668
17646
1712
57.86(.80)
34.09(.79)
8.02(.48)
F=13.37 (df=2)
p=<.0001
Usual Source
of Medical
Care
Yes
No
26130
1275
93.59(.44)
6.41(.44)
1102
48
92.79(2.15)
7.21(2.15)
25028
1227
93.62(.45)
6.38(.45)
F=.16 (df=1)
p=<.69
Child Care
Neither type
Non-relatives
Relatives
Both Types
11358
9475
3770
2833
45.83(.76)
29.11(.65)
14.69(.56)
10.37(.48)
388
503
113
147
36.69(3.03)
37.59(3.17)
9.95(1.91)
15.78(2.59)
10970
8972
3657
2686
46.20(.78)
28.77(.66)
14.88(.58)
10.15(.49)
F=6.77 (df=3)
p=<.0001
Note: m- denotes that statistics cannot be calculated as one cell contains n=0

72
Table 1.5: Frequencies and percents between therapy enrollment groups for children ages birth to
5 years for child, parent, family and community characteristics.
Total
Therapy
N=794 (2.57%)
No Therapy
N=26772 (97.43%)
N % (Std Err) % (Std Err) % (Std Err) Rao Scott X
2
F(df), p< .05
Child Domain
Child Age
<1
Age 1
Age 2
Age 3
Age 4
Age 5
4769
4853
3978
4694
4714
4558
17.00(.58)
17.52(.57)
15.17(.54)
16.30(.56)
16.50(.56)
17.51(.59)
56
98
112
163
186
179
6.34(1.49)
13.99(2.32)
12.85(0.16)
18.03(3.26)
23.74(2.69)
25.06(3.07)
4713
4755
3866
4531
4528
4379
17.29(.59)
17.61(.59)
15.23(.55)
16.25(.57)
16.31(.57)
17.31(.60)
F=165.87 (df=1)
p=<.0001
Child Sex
Male
Female
14243
13304
51.12(.76)
48.89(.76)
529
265
67.89(3.16)
32.11(3.16)
13714
13039
50.67(75)4
9.33(.76)
F=24.72 (df=1)
p=<.0001
Child Health
Excellent
Very good
Good
Fair
Poor
19071
5630
2339
450
69
65.26(.75)
21.39(.62)
10.97(.56)
2.15(.29)
0.23(.04)
201
241
219
103
30
21.59(2.97)
31.32(3.47)
27.71(2.94)
15.84(2.35)
3.54(.89)
18870
5389
2120
347
39
66.42(.76)
21.12(.63)
10.52.57)
1.79(.29)
0.15(.04)
F=96.60 (df=4)
p=<.0001
No. of
Concerns
0
1
2
3
4
5
6
7
8
9
17509
4070
2045
1113
714
490
473
412
518
222
61.73(.75)
14.20(.53)
7.84(.42)
4.29(.31)
2.50(.19)
2.28(.27)
2.08(.23)
1.92(.22)
2.08(.21)
1.08(.20)
75
72
72
54
68
74
82
80
97
120
7.02(1.28)
6.91(1.31)
8.4(1.46)
7.87(1.89)
8.07(1.48)
11.88(3.23)
10.35(1.92)
9.41(1.92)
13.09(2.21)
16.98(2.96)
17434
3998
1973
1059
646
516
391
332
421
102
63.17(.76)
14.39(.54)
7.83(.43)
4.20(.31)
2.36(.19)
2.03(.26)
1.86(.23)
1.72(.22)
1.79(.21)
0.66(.19)
F=96.52 (df=9)
p=<.0001
Concern Type NONE
Behavior
Speech
Social
Receptive Lang.
Academic
Self-Help
Fine Motor
Gross Motor
“Any Concerns”
25422
5089
4968
4209
2940
2881
2612
2020
1721
10057
90.92
19.93
6.36
10.88
11.86
11.38
10.88
8.95
7.94
9.08
284
389
592
4209
442
399
441
371
336
509
34.49
52.45
75.81
58.26
60.25
51.14
58.26
51.54
48.98
65.51
25138
4640
4376
3820
2498
2482
2171
1649
1485
1620
92.41
15.68
18.36
15.68
10.58
10.33
6.63
7.82
6.86
7.59
F=706.42 (df=1)
F=126.54 (df=3)
F=126.54(df=3)
F=293.54 (df=3)
F=87.02 (df=3)
F=180.60 (df=3)
F=110.55 (df=3)
F=171.85 (df=3)
F=165.61 (df=3)
F=190.32 (df=3)
F=706.42 (df=1)
All: p=<.0001

73
Table 1.5 (Cont.) Parent Domain
Mat. Education < High School
HS Graduate
> HS
Missing
2260
4521
19400
1385
12.26(.59)
22.27(.68)
60.28(.77)
5.19(.34)
62
155
522
794
12.63(2.36)
21.26(2.62)
59.81(3.35)
6.30(1.50)
2198
4366
18878
1330
12.25(.60)
22.30(.69)
60.29(.79)
5.16(.34)
F=.05 (df=2)
p=.95
Maternal Age
≤20
21-30
31-40
>40
Missing
719
9957
127662
650
1474
2.97(.25)
38.73(.76)
44.29(.75)
8.97(.43)
5.04(.32)
8
245
342
142
57
.84(.39)
33.92(3.10)
44.28(3.60)
15.23(2.19)
5.73(1.33)
711
9712
12424
2508
1417
3.02(.26)
38.86(.77)
44.30(.76)
8.80(.44)
5.03(.33)
F=4.71 (df=4)
p=.0008
Race/ Ethnicity
English Home
Lang. White
Black
Hispanic
Multiracial
Other
7379
2362
2159
1521
991
53.24(.76)
12.26(.45)
9.43(.53)
5.25(.39)
2.97(.24)
501
61
76
52
40
57.82(3.57)
14.02(2.71)
11.52(2.83)
3.24(.70)
3.45(.74)
16878
2301
2083
1469
951
53.12(.78)
12.21(.46)
9.38(.54)
5.30(.40)
2.96(.25) F=m-
Race/ Ethnicity
Non-English
Home Lang. White
Black
Hispanic
Multiracial
Other
204
59
1995
29
390
0.87(.14)
0.26(.10)
13.25(.69)
0.09(.04)
2.28(.31)
7
0
37
1
6
0.88(.63)
-
8.35(1.98)
0.10(.10)
0.64(.31)
197
59
1958
28
384
0.87(.14)
0.27(.10)
13.37(.70)
0.09(.04)
2.33(.32)
Home
Language
English
Non-English
24790
2752
83.07(.72)
16.92(.74)
741
53
90.24(2.03)
9.76(2.03)
24049
2699
82.89(.74)
17.11(.74) F=7.72 (df=1)
p=.0055
Race/ Ethnicity
White
Black
Hispanic
Multiracial
Other
4166
17588
2423
1553
1381
22.72(.77)
54.14(.77)
12.53(.46)
5.35(.39)
5.25(.39)
113
508
61
53
46
19.87(3.21)
58.69(3.56)
14.02(2.71)
3.34(.71)
4.09(.81)
4053
17080
2362
1500
1335
22.80(.79)
54.03(.78)
12.49(.47)
5.41(.40)
5.28(.40)
F=1.22 (df=4)
p=.30
Family Domain
Age Position
Only Child
Oldest Child
Second Oldest
Third Oldest
Fourth Oldest
11281
3640
8524
2991
1130
24.66(.55)
14.02(.49)
34.13(.71)
19.87(.73)
7.33(.47)
320
129
241
75
29
25.60(2.62)
17.99(2.87)
32.88(3.03)
17.01(3.46)
6.52(1.83)
10961
3511
8283
2916
1101
24.63(.56)
13.91(.50)
34.16(.73)
19.94(.74)
7.35(.48)
F=.77 (df=4)
p=.54
Household
Income
≤100% FPL
100%-199%
200%-399%
≥ 400% FPL
3933
4948
8926
9759
27.03(.68)
22.04(.66)
29.04(.65)
27.89(.65)
141
164
267
222
20.83(2.56
21.86)2.71)
32.86(.313)
24.45(3.58)
3792
4784
8659
9537
21.04(.69)
22.04(.68)
28.94(.66)
27.98.66)
F=.63 (df=3)
p=.59

74
Table 1.5 (Cont.) Parent Inv.
days read to
child/wk.
0 days
1-3 days
4-7 days
1516
5117
20789
7.57(.46)
22.94(.68)
69.50(.74)
32
116
641
3.21(.83)
16.49(2.54)
80.30(2.64)
1484
5001
20148
7.68(.47)
23.11(.69)
69.21(.76)
F=8.60 (df=2)
p=.0002
No. of Adults
in Household 1
2
>3
1762
21116
4596
7.68(.65)
73.27(.72)
19.05(.68)
85
553
151
9.64(1.88)
70.00(3.07)
20.37(2.67)
1677
20563
4445
7.63(.37)
73.37(.73)
19.02(.69)
F=86 (df=2)
p=.42
Marital Status
Married
Cohabiting
Neither
No parents
20847
2448
3544
540
72.12(.70)
11.72(.58)
14.35(.49)
1.80(.17)
547
66
142
28
67.61(3.23)
12.46(2.34)
17.34(2.55)
2.30(.86)
20300
2382
3402
512
72.24(.71)
11.71(.59)
14.27(.50)
1.78(.17)
F=1.02 (df=3)
p=.38
Community Domain
Provider ask
about concerns Yes
No
13518
12944
46.03(.75)
49.90(.76)
593
196
71.56(3.42)
27.74(3.42)
12925
12748
45.35(.77)
50.48(.77)
F=32.48 (df=2)
p=<.0001
Insurance
Type
Public
Private
None
7211
18291
1769
34.73(.77)
57.37(.78)
7.89(.46)
362
398
20
46.93(3.47)
50.14(3.52)
2.93(.97)
6849
17893
1749
34.41(.78)
57.56(.79)
8.03(.47)
=10.01 (df=2)
p=<.0001
Usual Source
of Medical
Care
Yes
No
26237
1287
93.59(.44)
6.41(.44)
760
33
95.58(1.21)
4.42(1.21)
25477
1254
93.54(.45)
6.46(.45)
F=1.87 (df=1)
p=.17
Child Care
Neither type
Non-relatives
Relatives
Both Types
11418
9503
3793
2847
45.84(.76)
29.10(.65)
14.69(.56)
10.37(.48)
277
336
77
104
37.84(3.25)
39.36(3.55)
8.56(1.68)
14.24(2.54)
11141
9167
3716
2743
46.05(.78)
28.83(.65)
14.85(.58)
10.27(.49)
F=6.55 (df=3)
p=.0002
Note: m- denotes that statistics cannot be calculated as one cell contains n=0

75
Table 1.6: Adjusted odds ratios (OR) for parent concern by selected child, parent, family, and
community characteristics. Univariate Model
OR (95% CI)
Multivariable Model
OR (95% CI) N=25,552
Child Domain
Child Age
<1
Age 1
Age 2
Age 3
Age 4
Age 5
Ref
2.44
2.61
3.55
3.78
4.32
Ref
1.83,3.24
1.96,3.48
2.68,4.71
2.85,5.01
3.25,5.74
Ref
2.62
2.87
4.18
4.13
4.75
Ref
2.03,3.38
2.22,3.72
3.20,5.46
3.14,5.44
3.67,6.15
Child Sex
Male
Female
1.41
Ref
1.24,1.61 Ref
1.40
Ref
1.23,1.59 Ref
Child Health
Excellent
Very good
Good
Fair
Poor
Ref
2.05
2.68
8.13
8.07
Ref
1.75,2.39
2.10,3.41
5.13,12.89
3.09,21.07
Ref
1.81
2.11
5.88
7.70
Ref
1.56,2.10
1.62,2.76
3.86,8.96
3.17,18.74
Parent Domain
Maternal Education < High School
HS Graduate
> HS
Missing
1.26
Ref
0.72
1.39
0.97,1.63
Ref
0.62,.85
0.97,2.01
1.03
Ref
0.93
2.18
0.78,1.38
Ref
0.78,1.12
1.17,4.08
Maternal Age
≤20
21-30
31-40
>40
Missing
Ref
0.99
0.91
1.15
1.34
Ref
0.66,1.49
0.61,1.36
0.74,1.79
0.81,2.22
Ref
0.86
0.94
1.13
0.57
Ref
0.52,1.41
0.56,1.55
0.29,1.10
0.66,1.94
Race/ Ethnicity by
Language Spoken in
the Home
English White
Black
Hispanic
Multiracial
Other
Ref
1.58
1.23
1.06
1.18
Ref
1.32, 1.90
0.93, 1.61
0.79, 1.43
0.83, 1.67
Ref
1.20
1.02
1.07
1.19
Ref
0.98,1.47
0.78,1.33
0.81,1.42
0.85,1.65
Non-English White
Black
Hispanic
Multiracial
Other
1.93
3.08
2.18
5.39
3.01
0.96, 3.88
1.25, 7.58
1.67, 2.84
1.25, 23.27
1.78, 5.08
1.83
2.87
1.59
3.63
3.22
0.84,3.98
1.59,6.36
1.20,2.12
1.02,12.98
1.89,5.80
‘
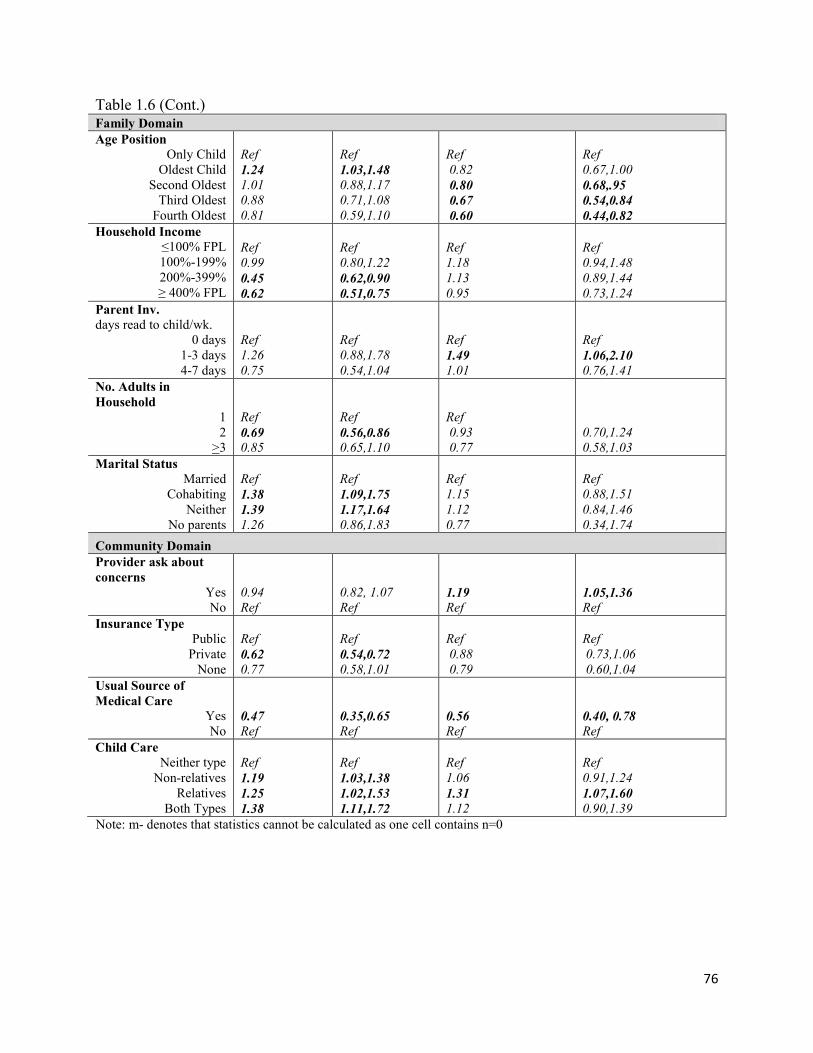
76
Table 1.6 (Cont.) Family Domain
Age Position
Only Child
Oldest Child
Second Oldest
Third Oldest
Fourth Oldest
Ref
1.24
1.01
0.88
0.81
Ref
1.03,1.48
0.88,1.17
0.71,1.08
0.59,1.10
Ref
0.82
0.80
0.67
0.60
Ref
0.67,1.00
0.68,.95
0.54,0.84
0.44,0.82
Household Income
≤100% FPL
100%-199%
200%-399%
≥ 400% FPL
Ref
0.99
0.45
0.62
Ref
0.80,1.22
0.62,0.90
0.51,0.75
Ref
1.18
1.13
0.95
Ref
0.94,1.48
0.89,1.44
0.73,1.24
Parent Inv.
days read to child/wk.
0 days
1-3 days
4-7 days
Ref
1.26
0.75
Ref
0.88,1.78
0.54,1.04
Ref
1.49
1.01
Ref
1.06,2.10
0.76,1.41
No. Adults in
Household 1
2
>3
Ref
0.69
0.85
Ref
0.56,0.86
0.65,1.10
Ref
0.93
0.77
0.70,1.24
0.58,1.03
Marital Status
Married
Cohabiting
Neither
No parents
Ref
1.38
1.39
1.26
Ref
1.09,1.75
1.17,1.64
0.86,1.83
Ref
1.15
1.12
0.77
Ref
0.88,1.51
0.84,1.46
0.34,1.74
Community Domain
Provider ask about
concerns Yes
No
0.94
Ref
0.82, 1.07
Ref 1.19
Ref 1.05,1.36 Ref
Insurance Type
Public
Private
None
Ref
0.62
0.77
Ref
0.54,0.72
0.58,1.01
Ref
0.88
0.79
Ref
0.73,1.06
0.60,1.04
Usual Source of
Medical Care
Yes
No 0.47 Ref
0.35,0.65
Ref 0.56
Ref
0.40, 0.78
Ref
Child Care
Neither type
Non-relatives
Relatives
Both Types
Ref
1.19
1.25
1.38
Ref
1.03,1.38
1.02,1.53
1.11,1.72
Ref
1.06
1.31
1.12
Ref
0.91,1.24
1.07,1.60 0.90,1.39
Note: m- denotes that statistics cannot be calculated as one cell contains n=0

77
Table 1.7: Adjusted odds ratios (OR) for help-seeking (IEP) by selected child, parent, family,
and community characteristics. Univariate Model
OR (95% CI)
Multivariable Model
OR (95% CI) N=24,116
Child Domain
Child Age
<1
Age 1
Age 2
Age 3
Age 4
Age 5
Ref
1.75
2.11
2.56
4.08
5.05
Ref
0.84,3.60
1.11,4.03
1.32,4.96
2.22,7.50
2.69,9.47
Ref
0.54
0.79
0.78
1.32
1.49
Ref
0.12,2.46
0.17,3.76
0.16,3.72
0.29,6.07
0.31,7.10
Child Sex
Male
Female
1.83
Ref 1.36,2.46
Ref
1.67
Ref
1.17,2.38
Ref
Child Health
Excellent
Very good
Good
Fair
Poor
Ref
2.73
3.51
8.92
13.67
Ref
1.92,3.89
2.46,4.99
5.31,14.99
5.99,31.21
Ref
1.61
2.10
1.82
2.96
Ref
1.07,2.41
1.26,3.51
0.88,3.75
0.62,14.15
Concern Type
None
Behavior
Speech
Social
Receptive Lang.
Academic
missing
Self-Help
missing
Fine Motor
Gross Motor
“Any concerns”
Ref
4.57
12.13
4.44
9.20
6.61
0.91
7.22
0.42
8.27
5.53
12.34
Ref
3.46,6.02
8.86,16.62
3.36,5.86
6.92,12.23
4.91,8.89
0.57,1.44
5.38,9.69
0.24,0.74
6.12,11.17
4.07,7.52
9.12,16.73
Ref
0.87
4.63
0.80
1.97
0.97
1.36
1.63
0.32
2.34
0.73
4.18
Ref
0.60,1.26
3.00,7.15 0.51,1.25
1.12,3.46 0.61,1.55
0.66,2.80
1.03,2.59 0.07,1.46
1.44,3.80 0.43,1.24
2.88,5.97
Parent Domain
Maternal Education < High School
HS Graduate
> HS
Missing
0.87
Ref
0.97
1.55
0.48,1.56
Ref
0.69,1.35
0.91,2.65
0.83
Ref
1.04
1.15
0.53,2.04
Ref
0.74,1.80
0.28,2.50
Maternal Age
≤20
21-30
31-40
>40
Missing
Ref
0.94
0.96
1.74
1.60
Ref
0.24,3.72
0.25,3.78
0.43,7.06
0.39,0.62
Ref
0.56
0.56
0.71
0.41
Ref
0.09,3.73
0.09,3.70
0.10,5.14
0.06,3.10

78
Table 1.7 (Cont.)
Race/ Ethnicity
English Home Lang. White
Black
Hispanic
Multiracial
Other
Ref
1.05
1.09
1.18
0.93
Ref
0.72,1.52
0.64,1.85
0.67,2.06
0.58,1.49
Ref
0.50
0.63
0.95
0.74
Ref
0.30,0.81
0.33,1.20
0.47,1.90
0.43,1.27
Race/ Ethnicity
Non-English Home Lang. White
Black
Hispanic
Multiracial
Other
0.67
m-
0.47
m-
0.21
0.16,2.87
m-
0.23,0.96
m-
0.08,0.59
0.48
m-
0.14
m-
0.07
0.17,1.36
m-
0.05,0.41
m-
0.02,0.26
Family Domain
Age Position
Only Child
Oldest Child
Second Oldest
Third Oldest
Fourth Oldest
Ref
1.78
1.22
1.07
1.16
Ref
1.17,2.71
0.87,1.72
0.70,1.64
0.67,2.03
Ref
1.53
1.21
1.30
1.34
Ref
0.98,2.39
0.73,2.01
0.77,2.21
0.73,2.47
Household Income
≤100% FPL
100%-199%
200%-399%
≥ 400% FPL
Ref
1.44
1.10
.83
Ref
0.99,2.09
0.78,1.56
0.55,1.28
Ref
1.91
1.73
1.50
Ref
1.08,3.40 0.94,3.16
0.70,3.25
Parent Inv. days read to
child/wk.
0 days
1-3 days
4-7 days
Ref
3.88
3.75
Ref
1.90,7.91
2.00,7.03
Ref
3.89
4.60
Ref
1.44,10.52
1.76,12.00
No. of Adults in
Household 1
2
>3
Ref
0.64
0.81
Ref
0.44,0.92
0.50,1.32
Ref
0.81
1.45
0.38,1.75
0.73,2.88
Marital Status
Married
Cohabiting
Neither
No parents
Ref
1.10
1.25
2.68
Ref
0.67,1.82
0.91,1.73
1.55,4.62
Ref
0.96
0.88
2.82
0.48,1.91
0.44,1.74
0.55,14.36
Community Domain
Provider ask about
concerns Yes
No
2.41
Ref 1.77,3.27
Ref 2.09
Ref 1.45,3.00
Ref
Insurance Type
Public
Private
None
Ref
0.57
0.39
Ref
0.43,0.75
0.23,0.65
Ref
0.44
0.33
Ref
0.25,0.78
0.17,0.65

79
Table 1.7 (Cont.)
Usual Source of Medical
Care
Yes
No
0.75
Ref
0.39,1.46
Ref
0.56
Ref
0.25,1.26
Ref
Child Care
Neither type
Non-relatives
Relatives
Both Types
Ref
1.64
0.87
1.99
Ref
1.21,2.23
0.55,1.38
1.29,3.09
Ref
1.16
0.64
1.19
Ref
0.83,1.62
0.37,1.12
0.73,1.92
Note: m- denotes that statistics cannot be calculated as one cell contains n=0

80
Table 1.8: Adjusted odds ratios (OR) for help-seeking (therapy) by selected child, parent, family,
and community characteristics. Univariate Model
OR (95% CI)
Multivariable Model
OR (95% CI) N=24,202
Child Domain
Child Age
<1
Age 1
Age 2
Age 3
Age 4
Age 5
Ref
2.24
2.27
2.93
3.72
4.12
Ref
1.20,4.19
1.21,4.26
1.49,5.75
2.121,6.57
2.30,7.41
Ref
0.60
1.02
1.33
1.54
1.40
Ref
0.16,2.62
0.24,4.81
0.32,6.51
0.36,7.04
0.31,5.86
Child Sex
Male
Female
2.09
Ref
1.54,2.84
Ref
2.44
Ref
1.66,3.60
Ref
Child Health
Excellent
Very good
Good
Fair
Poor
Ref
4.96
9.12
30.32
82.83
Ref
3.18,7.72
5.92,14.04
17.11,53.71
37.38,183.56
Ref
3.72
8.53
15.82
53.31
Ref
2.38,5.82
5.27,13.83
7.74,32.32
12.42,228.91
Concern Type
None
Behavior
Speech
Social
Receptive Lang.
Academic
missing
Self-Help
missing
Fine Motor
Gross Motor
“Any concerns”
Ref
6.30
15.02
5.64
12.69
9.75
1.45
11.84
0.45
12.46
12.29
22.30
Ref
4.71,8.42
11.05,20.41
4.19,7.58
9.44,17.05
6.89,13.80
0.93,2.24
8.57,16.38
0.22,0.93
9.08,17.10
8.91,16.97
16.26,30.58
Ref
0.95
3.38
0.60
1.47
0.92
1.93
2.36
0.31
1.44
3.10
6.22
Ref
0.59,1.53
2.21,5.17 0.32,1.11
0.75,2.88
0.49,1.72
0.96,3.89
1.31,4.25 0.07,1.41
0.80,2.61
1.78,5.41
4.15,9.34
Parent Domain
Maternal Education < High School
HS Graduate
> HS
Missing
1.07
Ref
1.03
1.04
0.65,1.77
Ref
0.73,1.44
0.54,1.99
1.93
Ref
1.26
0.26
1.01,3.70 Ref
0.89,2.35
0.02,2.84
Maternal Age
≤20
21-30
31-40
>40
Missing
Ref
2.94
3.44
5.87
3.66
Ref
1.14,7.58
1.32,8.94
2.21,15.58
1.26,10.67
Ref
7.00
9.77
11.08
6.52
Ref
2.04,24.05
2.75, 34.76
2.75, 44.72
0.55, 77.60
Race/ Ethnicity
English Home Lang. White
Black
Hispanic
Multiracial
Other
Ref
1.08
1.21
0.56
1.05
Ref
0.67,1.74
0.68,2.17
0.11,8.97
0.63,1.73
Ref
0.53
0.89
0.29
0.95
Ref
0.29,0.94
0.46,1.70
0.12,0.74
0.52,1.74
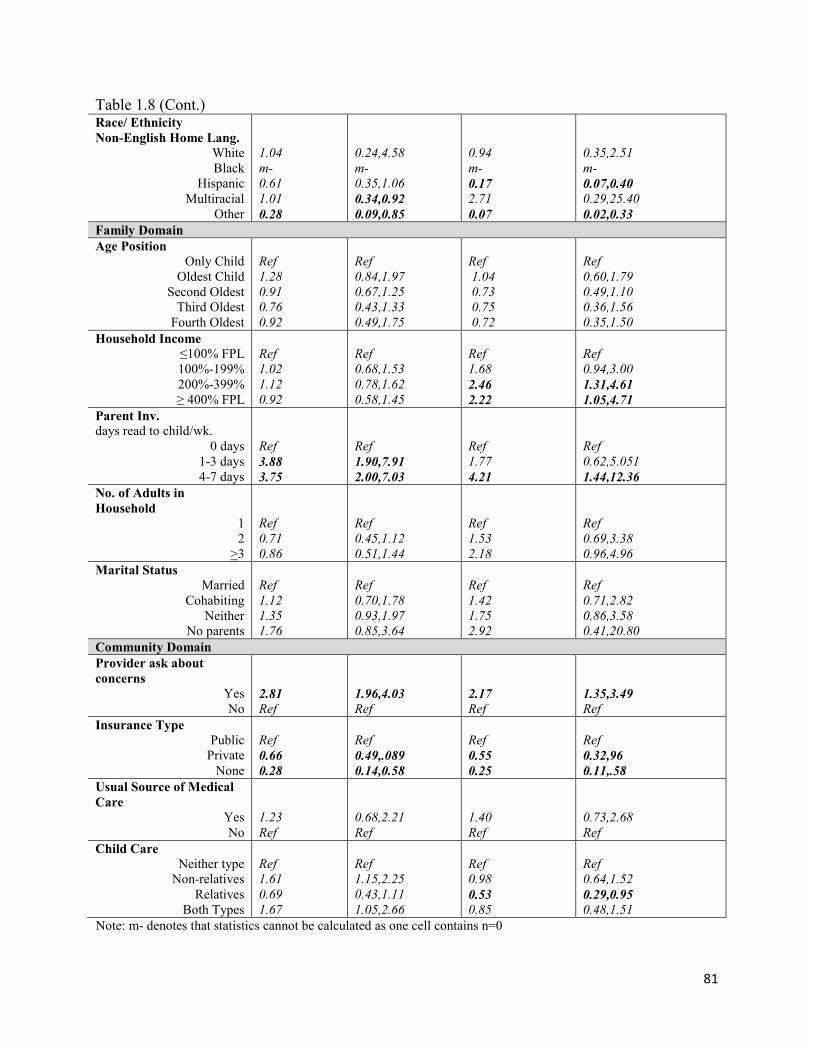
81
Table 1.8 (Cont.)
Race/ Ethnicity
Non-English Home Lang. White
Black
Hispanic
Multiracial
Other
1.04
m-
0.61
1.01
0.28
0.24,4.58
m-
0.35,1.06
0.34,0.92
0.09,0.85
0.94
m-
0.17
2.71
0.07
0.35,2.51
m-
0.07,0.40
0.29,25.40
0.02,0.33
Family Domain
Age Position
Only Child
Oldest Child
Second Oldest
Third Oldest
Fourth Oldest
Ref
1.28
0.91
0.76
0.92
Ref
0.84,1.97
0.67,1.25
0.43,1.33
0.49,1.75
Ref
1.04
0.73
0.75
0.72
Ref
0.60,1.79
0.49,1.10
0.36,1.56
0.35,1.50
Household Income
≤100% FPL
100%-199%
200%-399%
≥ 400% FPL
Ref
1.02
1.12
0.92
Ref
0.68,1.53
0.78,1.62
0.58,1.45
Ref
1.68
2.46
2.22
Ref
0.94,3.00
1.31,4.61
1.05,4.71
Parent Inv.
days read to child/wk.
0 days
1-3 days
4-7 days
Ref
3.88
3.75
Ref
1.90,7.91
2.00,7.03
Ref
1.77
4.21
Ref
0.62,5.051
1.44,12.36
No. of Adults in
Household 1
2
>3
Ref
0.71
0.86
Ref
0.45,1.12
0.51,1.44
Ref
1.53
2.18
Ref
0.69,3.38
0.96,4.96
Marital Status
Married
Cohabiting
Neither
No parents
Ref
1.12
1.35
1.76
Ref
0.70,1.78
0.93,1.97
0.85,3.64
Ref
1.42
1.75
2.92
Ref
0.71,2.82
0.86,3.58
0.41,20.80
Community Domain
Provider ask about
concerns Yes
No
2.81
Ref 1.96,4.03
Ref 2.17
Ref 1.35,3.49
Ref
Insurance Type
Public
Private
None
Ref
0.66
0.28
Ref
0.49,.089
0.14,0.58
Ref
0.55
0.25
Ref
0.32,96
0.11,.58
Usual Source of Medical
Care
Yes
No
1.23
Ref
0.68,2.21
Ref
1.40
Ref
0.73,2.68
Ref
Child Care
Neither type
Non-relatives
Relatives
Both Types
Ref
1.61
0.69
1.67
Ref
1.15,2.25
0.43,1.11
1.05,2.66
Ref
0.98
0.53
0.85
Ref
0.64,1.52
0.29,0.95 0.48,1.51
Note: m- denotes that statistics cannot be calculated as one cell contains n=0

82
Table 1.9: Summary of significant variables across three outcomes: concern, IEP/IFSP, and
therapy Concern IEP/IFSP Therapy
Child older (aOR 2.62-4.75)
Child male(aOR 1.40) Child male(aOR 1.67) Child male(aOR 2.44)
Increasingly poorer child health(aOR 1.81-7.70)
Relatively poorer child health (aOR 1.61-2.10)
Increasingly poorer child health(aOR 3.72-53.31)
[Not included in model]
General, speech, language, self-help, fine motor concern
(aOR 4.18, 4.63, 1.97, 1.63, 2.34)
General, speech, self-help, gross motor concern
(aOR 6.22, 3.38, 2.36, 3.10)
Maternal education Missing (aOR 2.18)
Maternal education < HS (aOR 1.93)
Older mother (aOR 7.00-11.08)
Black race & English home language – LESS
(aOR 0.50)
Black race or Multiracial & English home language – LESS
(aOR 0.53, 0.29)
Non-English Home Language & Hispanic or Non-White race –
MORE (aOR 1.59-3.63)
Non-English home language & Hispanic or Other race - LESS (aOR 0.14, 0.07)
Non-English home language & Hispanic or Other
race – LESS (aOR 0.17, 0.07)
Older siblings –LESS (aOR 0.60-0.80 )
Income 100-199%FPL (aOR 1.91)
Increased income over 200%FPL (aOR 2.46-2.22)
Read to 1-3 days vs. none (aOR 1.49)
Read to more vs. none (aOR 3.89-4.60)
Read to most vs. none (aOR 5.32)
Provider ask about concerns (aOR 1.19)
Provider ask about concerns (aOR 2.09)
Provider ask about concerns (aOR 2.17)
Private or no insurance – LESS(aOR 0.44, 0.33)
Private or no insurance – LESS(aOR 0.55, 0.25)
Usual source of health care – LESS (aOR 0.56)
Relative child care vs. none- MORE (aOR 1.31)
Relative child care vs. none - LESS (aOR 0.53)
Note: Number of adults in the household and marital status was also controlled for in all models

83
Section 4. Parent Pathways: Recognition and Responses to Developmental Concerns in
Young Children
Abstract
Although research has examined developmental screening in health and child care
settings, factors prompting parents to identify problems and seek help for their children are
equally important. Child, family, interpersonal and system-level factors impact recognition and
pursuit of services, and existing research has resulted in an incomplete picture of these influences
and processes. This qualitative study rooted in the Health Belief Model and Social Support
Theory sought to better understand the multi-level influences and factors associated with
recognition (awareness and concern) and response (help-seeking and enrollment in services) for
developmental concerns, and to describe the process parents go through in judging whether the
delay is a concern that warrants help-seeking, and if so, when and where to seek services.
To answer these questions, the study utilized purposive, convenience, quota sampling via
community agencies to invite 6 Spanish and 17 English speaking parents to share their
experiences in recognizing and responding to developmental concerns in their young children
(ages 2 weeks-4½ years) in 18 interviews and 2 focus groups. Participants also completed
demographic, developmental status (PEDS), and knowledge of infant/child development (KIDI)
questionnaires. Discussions were translated, transcribed, and analyzed using both a priori and
emergent codes to identify constructs and themes. About half of participants reported behavior
(54%), social (50%), or speech concerns (54%); over a third had academic (38%), receptive

84
language (42%), or self-help concerns (33%); and roughly 15% reported fine motor (17%) or
gross motor (13%) concerns.
Parents described in detail the observations that first generated developmental concern,
their decision-making processes in assessing whether and when to seek help, types of and
sources of social support, and facilitators and barriers related to the process. While parent
knowledge of child development was low (the average score on the infant questionnaire was
50% correct and 65% on the pre-kindergarten questionnaire (range 32-91%), parent’s level of
concern was consistent with referral for services. Suspicions of developmental delay or problems
appeared to be highly accurate; 66% of the children had been referred for services, 20% were in
process or the parent chose not to pursue services. The 3 children (12%) not recommended for
services also had lower levels of parent concern.
Experiences and paths to services varied greatly, illustrating the lack of consistency in
service systems, referrals, and outreach efforts. Efforts to increase awareness of developmental
issues and services in the public, among parents, and among providers would greatly facilitate
parents’ appraisal process when encountering developmental concerns. Enhancing and
strengthening formal and informal social supports for parents of young children will also help
parents overcome barriers to access and improve the timeline from awareness of a developmental
problem to enrollment in intervention services.
Introduction
Developmental concerns among parents of young children are relatively common and can
be a good indicator of a developmental problem (Glascoe, 1997a). A national study found that
20% of parents of children 18 months to 5 years of age expressed concerns about their child’s
development (Blanchard, Gurka, & Blackman, 2006), while Glascoe (1997) reported that 23% of

85
parents had one significant developmental concern (29% met ESE eligibility), and 20% had
concerns about behavior. While tracking rates of concern and delays is important, to improve
systems of screening and referral a deeper understanding of the process of recognizing and
responding to developmental delays from the parent perspective is critical.
What signals developmental concern? What do parents notice and how do they make
sense of the developmental differences they see? Research has explored health care provider
practices related to developmental screening (Hix-Small, 2007; Ploof & Hamel, 2002; Radecki,
et al., 2011; Sand et al., 2005; Sices, 2003, 2007), and Glascoe has thoroughly examined the
intersection between parents and health care providers in developmental screening
(Glascoe,1997a,b, 2004, 2005, 2008). Numerous studies have examined developmental
screening in child care and early education programs (Allen, 2007; Bowman, 2001; Pinto-
Martin, et al., 2005; Powell, 2008); and others have guided community-based screening efforts
(Bethel, Reuland, Schor, Abrahms, & Halfon, 2011; Daniel, Prue, Taylor, Thomas, & Scales,
2009; Halfon, Russ, & Regalado, 2004) or national-level population-based strategies (Bethel, et
al., 2008; CDC, 2006, 2007; Newacheck, Kim, Blumberg, & Rising, 2008; Postert, 2009;
Shandra, Hogan, & Spearin, 2008). However, family-focused research is limited.
This study attempts to identify what prompts parents to seek help and which formal and
informal sources of social support assist them in decision-making and help-seeking. For
example, parents have described seeking help for children with hearing impairment as an
“extended diagnostic journey, which contributes to ambiguity, stress, anxiety, and family
conflict” (Seligman & Darling, 2007, p. 205). Family, organizational, and system level barriers
such as low education or socioeconomic status, lack of social support, mental health problems,
lack of transportation, high cost and distance to travel lack of insurance, and issues with cultural

86
competency and language barriers all impact pursuit of services (Coulter, Wallace, & Laude,
1993; Halfon, Russ, & Regalado, 2004; Pinto-Martin et al., 2005).
Additional barriers may be social or cultural, related to past experiences, social norms, or
stigma around developmental disabilities or utilization of formal services (Benin, et al., 2006;
Broadhurst, 2003; Bussing, et al., 2003, 2005; Fröjd, et al., 2007; Gance-Cleveland, 2006; Keller
& McDade, 2000; Kerkorian, McKay, & Bannon, 2006; Mandell, Novak & Zubritsky, 2005;
Sayal, 2005). So, what keeps parents going when they encounter barriers to help-seeking? Social
support has been identified as a facilitator to overcoming barriers to help-seeking (Gulliver,
Griffiths, & Christensen, 2010). Additional qualities such as self-efficacy (Champion & Skinner,
2008; Rimer & Glanz, 2005), outcome expectancies, empowerment, engagement and social
norms may all play a role (Herman, 2007, Turnbull & Turnbull, 2001). In sum, the literature thus
far has resulted in diverse theories and approaches to early recognition and intervention for
developmental delays that have yet to be synthesized and fully described, particularly from the
parent perspective.
A number of the factors related to concern and help-seeking can be found within the
constructs of the Health Belief Model (HBM) (Champion & Skinner, 2008; Poss, 2001; Rimer &
Glanz, 2005). In the context of recognition and response to developmental delays, this model
proposes that the level of threat (perceived severity of and susceptibility to child’s developmental
delays) contributes to parental perception of the delay as a problem (concern) and subsequent
motivation to seek developmental services. When the perceived benefits to pursuing services
outweigh the barriers, a confident (self-efficacious) parent will take action. Modifiers and cues to
action also play a role in the model. Additionally, interpersonal factors appear to influence health
behavior and decision making. The four subtypes of social support (informational, instrumental,

87
emotional and appraisal support) may reduce barriers to problem perception, appraisal, and help-
seeking. Recognition of developmental delays may also depend upon knowledge of warning
signs, or to some degree of typical developmental milestones and can be measured using a scale
such as the Knowledge of Child Development Inventory (KIDI) (Ertem, et al., 2007; Huang, et
al., 2005; Smith, et al, 2010). A conceptual model of these theories in relation to recognition and
responses to developmental delays can be found in Figure 2.1.
While current studies continues to reveal gaps in systems of surveillance and services,
particularly among underserved populations, additional research is needed to identify critical
processes, networks, and connection and entry points that are socially and culturally relevant to
families in identifying and responding to developmental delays in young children.
Purpose
This exploratory study utilized a qualitative approach to better understand the
experiences of parents of children ages birth to age five with developmental delays related to the
process of establishing developmental concern and help-seeking. Three specific research
questions were addressed.
1) What individual, interpersonal, and community-level factors contribute to parent
recognition of developmental delays in their young children?
Objective 1a: To explore factors that parents report most contribute to awareness of
developmental delays.
Objective 1b: To assess participants’ knowledge of child development
Objective 1c: To describe concerns parents have regarding their child’s development.
2) Once a delay is recognized, what process do parents go through in judging whether the
delay is a concern that warrants help-seeking?
88
Objective 2a: To describe the factors (including social support and the HBM
constructs of perceived threat (severity/susceptibility) and experiences that parents
report most contribute to their judgment of a developmental delay as a “concern”.
3) What are the factors that most contribute to parents’ help-seeking for developmental
concerns?
Objective 3a: To explore factors influencing the decision a parent makes regarding
type of help they will seek, if any.
Objective 3b: To examine the role of social support in impacting HBM constructs of
Perceived Threat (severity, susceptibility), Self-Efficacy, and Benefits/Barriers to
help-seeking.
Objective 3c: To describe the decision-making process parents go through in seeking
assessment services or other help for their child’s development.
Methods
Sampling and Recruitment
This qualitative study utilized purposive, convenience, quota sampling via community
agencies to invite English and Spanish speaking parents of high and low socioeconomic status to
share their experiences in recognizing and responding to developmental concerns in their young
children. The aim of this study’s sampling approach was to recruit participants who were the best
informants on the topic to provide their perspectives during the help-seeking process rather than
retrospectively. Thus, participants were not recruited directly from agencies already serving
children diagnosed with developmental delays or disabilities.
In order to learn about the experiences of parents in one county system, it was important
to hear the perspectives of parents who represent the major demographic groups of the region.

89
Hillsborough County, Florida is a large and diverse county, with 1,229,226 residents, including
79,899 children under age 5 in 2010. Among adults, 78% of Hillsborough County residents were
White, 16% Black, 3% Asian, and 3% Other, and 23% of residents were Hispanic, with Spanish
being the most common language spoken among the 25% of the population who do not speak
English as a primary language. Additionally, 15% of residents in Hillsborough County are
foreign-born; in 2010, 28% of births were to mothers born outside of the United States.
In Hillsborough County, 85% of adults are high school graduates, and 14% live below
the poverty level. Therefore the sampling frame was designed to include English and Spanish-
speaking parents, and those with varying levels of income and education. The sample population
for this study included all English or Spanish speaking parents or primary caregivers who have a
child under age five and have experienced a concern about their child’s development. Primary
caregivers who did not speak English or Spanish, were under the age of 18, or resided outside of
Hillsborough County were excluded.
Quota sampling is helpful when the perspectives of groups with specific characteristics
are sought. Hard to reach populations may be recruited through snowball sampling in which
participants recruit others through social networks (Wolfe, 2007). Thus, a community based
sampling strategy was used to ensure diverse perspectives and improve rates of participation.
Partnerships were developed with community agencies (Table 1). Orientation presentations were
held for agency administrators and staff outlining the purpose of the study, safeguards in relation
to IRB protocol, and researcher and agency responsibilities.
Procedures
Research staff translated all documents (flyers, consent forms, questionnaire packets) into
Spanish, then back-translated to English to ensure meaning had not been altered. Recruitment

90
flyers (Appendix A) were distributed and posted by partner agencies (Appendix C). Interested
parents were instructed to call the Principal Investigator (PI) who verified eligibility via a
screening form (Appendix D) and recorded preferred meeting location, day, and time, and
whether the parent would like a private interview or to join a focus group. Focus groups and
interviews took place in private rooms out of hearing range of non-participants in accessible and
child-friendly community locations (e.g. libraries, family support and resource centers, etc.) at
convenient times and locales for participants. Two interviews were held at participant homes.
All research assistants had previous research experience and were trained by the PI in data
collection procedures, interviewing, analysis, and human research protections. All focus groups
were conducted by one facilitator, and one note-taker. Spanish groups and interviews were
moderated by a Spanish speaking moderator and note taker. A focus group/interview guide was
utilized to ensure that the discussion covered key research questions and probes for theoretical
constructs (Table 1). Refreshments were served at the focus groups and participants received a
$10 gift card, a small gift for their child (book, toy), and local resource information (brochures,
flyers, guides) to thank them for their participation.
Prior to each group or interview, participants completed a demographic questionnaire
created by the PI (Appendix E), which collected information on parent characteristics, family
structure, access to transportation, primary language, services enrollment and screening, and
residential zip code. Participants also completed Parents’ Evaluation of Developmental Status
(PEDS) (Glascoe, 2000), and Knowledge of Infant Development (KIDI) questionnaires
(MacPhee, 1981). The PEDS is a brief, evidence-based 10 item questionnaire asking parents
about general and specific concerns regarding their children’s development. It is published in
both English and Spanish. The KIDI is a 75-item instrument offered in Infant and Preschool

91
versions measuring parents’ factual knowledge of parental practices, child developmental
processes, and infant norms of behavior. Psychometric testing for the English KIDI with parents
resulted in internal consistency reliability (Cronbach’s alpha) of 0.82, Guttman split-half
coefficients of 0.85, and test-retest reliability (2-week interval) correlation coefficients of 0.92
for the total score, and 0.91 for accuracy (MacPhee, 1981). For this study, both English and
Spanish versions were utilized; because the Spanish version has not been validated, it was
reviewed and corrected by three fluent Spanish speakers from South America, Mexico, and
Puerto Rico. One question on the KIDI had inconsistent wording across versions and was
removed from all scoring and analysis.
Participants were advised not to share names during the focus groups, and personal
identifying information was not collected. Although signed consent was waived by the IRB, a
consent form was read to participants, a copy was provided to them, and verbal agreement to
participate was obtained prior to the focus group or interview.
Analysis
All focus groups and interviews were audio-recorded and transcribed verbatim, and
Spanish focus group and interviews were transcribed directly into English; all transcriptions were
reviewed by at least two research team members for accuracy. Transcripts were analyzed using
both a priori (theory driven) and emergent (data driven) codes to identify key constructs and
themes using a hybrid or “recursive” approach (Fereday & Muir-Cochrane, 2006; Gilgan, 2011;
LeCompte & Shensul, 1999, p. 15). Three waves of code development occurred. First, the PI
took reflective notes following each group or interview to identify important themes from the
initial theoretical framework and also unique factors in each case. Second, all transcripts were
printed and read through; the PI noted key points in each one, particularly emerging

92
themes/constructs (Table 2). This first read-through identified 12 emergent codes; as a new code
was identified, the earlier transcripts were reviewed a second time for those codes. The code
system was then updated, and each transcript was systematically coded using MAXQDA 11
software (http://www.maxqda.com/). Seven transcripts (35%) were coded by a second research
team member to assess reliability and discrepancies were examined and reviewed to ensure that
the codes were distinct, clearly defined, and accurate. All transcript segments were then sorted
by code category for the third wave of thematic analysis using constant comparison method to
identify the main themes in the study (LeCompte & Shensul, 1999). Additionally, co-occurrence
rates of codes were established and examined. Finally, negative and contrasting cases were
scrutinized, and cross-comparison of coded transcripts by income, age, language, and KIDI score
was conducted to verify that themes rang true across participants.
Participant demographics, PEDS questionnaire responses, KIDI scores, and parent-
reported level of child development knowledge and referral for services from interview
transcripts were entered into a participant spreadsheet that was uploaded to SAS 9.3
(http://www.sas.com/). Quantitative descriptive statistics and correlation coefficients were
generated to describe and compare KIDI scores based on parent characteristics collected from
the demographic questionnaire (Table 2.4).
Results
A total of 18 interviews and 2 focus groups were conducted with 6 Spanish- and 17
English-speaking caregivers of 24 children ages 2 weeks to 4½ years of age. Just over half of the
children were boys (58%). Parents described in detail observations that first prompted
developmental concerns, their decision-making processes in assessing whether and when to seek

93
help, the types of and sources of social support influencing their decisions, and facilitators and
barriers related to accessing services.
Participant Demographics
Participants were referred to the study through seven agencies, resided in 14 zip codes
throughout the county (Figure 2.2), and represented a diverse range of demographics (Table 2.3).
Compared to the overall county population, this sample was racially representative (82% White,
13% Black, and 4% Asian), but a higher percentage of participants in this study were Hispanic
(61%), non-English speaking or spoke English as a second language (42%), and had lower
income (44% under 25,000 annual household income). Additionally a higher percentage of the
participants were older (58% age 35 or older), married (74%), and had higher education levels
(85% high school diploma, 63% college degree). Half of the participants (52%) had 2 or more
other children, 22% had one other child, and 17% were first-time parents.
About half of participants reported behavior (54%), social (50%), or speech concerns
(54%); over a third had academic (38%), receptive language (42%), or self-help concerns (33%);
and roughly 15% reported fine motor (17%) or gross motor (13%) concerns. A number of
discrepancies between written and reported concerns occurred. Interestingly, 3 participants
responded “No” to "Any concern" on the PEDS questionnaire, yet described their concerns in the
interview. One mother who had an infant with multiple congenital conditions, including physical
and heart defects and a feeding tube, reported "a little" concern on the questionnaire. According
to the PEDS scoring criteria, scores of participants’ 24 children indicated that 8 should be
referred, 11 vigilantly monitored, and 5 counseled, then referred for parent training or behavioral
intervention as needed.

94
Half of the participants’ children were not enrolled in any services, and just 8 (30%) of
24 had enrolled in public intervention and/or private therapy; but 16 (67%) of parents reported
that their child had been screened by someone (via questionnaire or verbal inquiry) and 16 (67%)
reported that their child had been referred to a program. There was not a significant correlation
between screening and referral (Pearson Correlation Coefficient -0.31, p=0.14); only about a
third of those who were referred had been screened, and they had received screening from a
number of sources.
Knowledge of Child Development
Participants reported varying levels of knowledge of child development. Some had
professional experience in the field of child development, others had prior parenting experience
or took care of younger siblings, and several lamented that they really didn’t know what to
expect in terms of child development. For example, one mother asked the interviewer, “I was
just wondering what…I mean I don’t know if there’s like a certain age, but what age should your
child be talking? What is…I mean I know they say like you know, words, but when should they be
having conversations and talking clear and is there an age?” In particular, those who had
children with behavioral concerns, and first-time parents were unsure about what was considered
age-appropriate development, “When is it extreme? When do you think it’s extreme?”
Most parents attributed their knowledge of child development to previous parenting
experience, “I have three kids and I knew that by age 4 all my kids spoke the same, in the same
manner babyish, all my kids spoke the same way so there wasn’t any concern in the moment that
they start Pre-K within maybe a month or so they came on but my son never happened, I never
saw the jump from 3 to 4 where I never saw that because it were no talking.” The two parents
with highest knowledge scores had work experience in a child-related field. Of 23 KIDI

95
questionnaires, 21 could be scored and analyzed (two respondents filled in the questionnaire
incorrectly -one chose the same answer selection for every question and the other entered two
responses for each question). Knowledge of child development as measured on the KIDI
questionnaire was low (mean=61, range 32-91%); the average percent correct on the infant
questionnaire was 50% (n=7) and on the pre-k questionnaire was 65% (n=14). The KIDI score
was significantly correlated with family income and maternal race/ethnicity, but not with parent
age or parenting experience (number of other children) (Table 2.4). Parents also reported that
they participate in community programs (playgroups, library), peruse the internet, and refer to
books to learn about child development.
Recognition of Developmental Delays
Eight parents could recall a specific trigger noticing a problem. Three parents were
alerted to the problem by a professional and the others remembered being triggered by a sudden
change in their child or a difference in behavior or development compared to siblings or peers or
across settings, “…his two cousins that live out of town, and when they come in…she was like
eight and she was like ‘I don’t understand what he’s saying.’ You know, it’s like ‘Oh my God!’
So they kind of like, you know? ...and then other children notice, you know, that they don’t
understand him.” Some parents described behaviors that were notably unusual or extreme,
“When he started to walk I looked at him like a normal child, but he starting doing circles until
dizzy, but when time passed by I thought this is not normal that he did so many circles and he
grabbed a toy and would not let the toy…and circles circles circles… he kept the toy all
day…When he started his one year old…when he learn to walk, he preferred to walk, walk, walk
than play in the playground”. There was some evidence that a developmental milestone can
serve as a cue – particularly compared to siblings,

96
“Well, I just kind of figured by like 2 ½, 3, he would be speaking. ‘cause I remember my
daughter we used to do flashcard stuff with her and... He’s not even speaking and we can’t teach
him anything and have him expect to respond if he doesn’t know how to respond. “
Parent Appraisal of Developmental Differences
Parents seemed to go through a period of deciding whether the developmental difference
or delay was of concern warranting help-seeking. Parents waited for a period of time to establish
if the problem would improve on its own, “I was thinking that…I was, had…everything in my
head, you know, maybe it’s cause he’s, you know, he’s young. Maybe it’s because he’s a boy.
Maybe it’s because the pacifier. I couldn’t think of, that I was thinking of the ears, I couldn’t
think of really because I didn’t have a speech problem when I was little. His father didn’t. And
only person in my family was…is my cousin and I don’t know how that can…and you know.”
Parents also attempted to understand the cause of the developmental or behavioral difference by
observing the child compared to other children (peers, older or younger siblings, or cousins) or
observing across settings (playgroups, preschool, home, park), “…and then when I go like to,
you know, the Family Resource Center I would see other kids, comparing to her to see how they
behave and how much they were talking. You know how they relate people like talking to other
people and she was not there. I mean she would try to talk to you but it you just couldn’t
understand what the heck she was saying.”
The parents also went through a process of assessing the behavior in relation to other
developmental characteristics and especially the temperament of the child. In some cases, parents
guessed that the problem was situational; perhaps related to the environment or parenting issues,
“I feel like sometime he’s not active though. Like active like when I compare with other kids, uh,
not that much active. He just want to watch cartoons, that’s it. He has lots of toys and he doesn’t

97
want to play with toys. Because I always behind him and going to compare with other kids
because) my friend has the same age, but when I see that child is very active and that he’s very
lazy to speak, just want to point and just that only a little bit play, not interest that much.”
As part of the appraisal process, parents assessed child factors such as age, previous health
problems, and the type of delay to determine the extent of concern. In particular, parents who
had children with more physical concerns (feeding, bowed legs, vision) prioritized those
concerns over other developmental concerns.
Poor health appeared to increase sensitization to other types of concerns, “She was
always been my concern because she’s the sickest one I think of all the three.” “He also had
torticollis, so we were at therapy every week. So we went to therapy and they said he could be a
little behind due to that... So, I don’t know…but he’d say ‘mama, dada, baba, be-be’ well that
was his binky. But he wouldn’t form any other sentences and when I knew the big difference,
when he was nine months old, my baby prior was able to talk like ‘I food. I need food.’ Like he
would communicate better and this one would just point ‘mmm, mmm, mmm!’ and he wouldn’t
speak. And then I was like ‘something is wrong’.”
Social Support: Appraisal Support
Parents also rely on others to give them feedback regarding whether the delay is of
concern. The main sources of appraisal support were spouse or partner, the parent’s mother or
other relatives, and friends or other parents. Formal sources included pediatricians, teachers, and
developmental specialists. The vast majority of participants reported that their husband was not
concerned, or was neutral and deferred to the mother for appraising whether the delay was a
problem. Report of conferring with grandparents or other relatives was frequent, but their
helpfulness was mixed. Older siblings noticed differences as well. Most mothers reported that

98
their husbands were less worried about the concerns, “Right my husband, he’s well…I think he’s
way more likely to be like ‘oh that’s normal, he’s four. That’s normal, he’s three’ or whatever,
you know just more laid back about it,” and less anxious to pursue services, “Because my
husband didn’t interest that much. He said ‘ok don’t worry he will speak one day’. But, um, I
think he’s very low in like compared with others he’s behind. He said uh,’ no don’t worry one
day he has to speak so don’t go into hurry right now’, like that.”
Friends/other parents seemed to be the most consistent source of appraisal support to
validate a parent’s concern, “Yeah …my mother and my father, and my aunt…we were
wondering like, you know, how come, you know, he…cause I do have a cousin, which is my
aunt’s son, that had…but it was, he had ear problems. So I’m thinking maybe…I took him to a
doctor, maybe it’s his ears, I don’t know. I thought maybe…there’s nothing wrong with his ears,
he could hear. / Did you mention to the doctor at all about the speech or did the doctor…/
Yeah, I did, and I…you know they said that I should look into the speech. And then luckily they
had, you know, helped me out here with it./ So during that time when he was two and three, was
there anything else…anyone else that you talked with? / Yeah, the…his preschool teacher, the
daycare teacher, she was saying, you know, and then I…see I thought maybe too because, I know
it had something to do with too the Spanglish thing going on. Because she had, you know,
students that just only spoke Spanish, so she was speaking Spanish and English, she was talking
English-Spanish, reading English – Spanish, which is great but I think it might’ve confused him
a little bit,.” and a few of the parents preferred to rely on their developmental specialist/social
worker, home visitor, or life coach to provide ongoing assessment and feedback, “I would say
only [social worker] is the one who was always like the screens you know. So that’s basically
what I have. / Has there been anyone who has told you, you know don’t worry about it, maybe
99
it’s not a problem? Or would you say everyone has agreed? /My husband, in the beginning he
used to say that. He started to notice as she got older he started to notice that it wasn’t a normal
thing. And then my mother in law, she was always concerned. And my mother, you see she lives
in my country so she’s like. She was like you know, you were like that. You didn’t talk until you
were like 4.”
Teachers were also often mentioned as validators of parent concerns about development
and behavior. Pediatricians almost always deferred to the parent or encouraged the parent to
‘give it time’ or hold off until a future check-up.
Help-Seeking
Only 8 of the 23 participants had enrolled their children in public intervention or therapy
services at the time of interview, and 16 of the 23 had been referred to a program. There was
some ambivalence about developmental services among some parents. Three parents did not
intend to pursue developmental services in spite of concern, and another parent was only a little
concerned but was eager to access services as ‘prevention’. The Health Belief Model appears to
be an appropriate frame for what parents are describing in terms of decision-making around
seeking services.
During the interview, parents were not asked about perceived threat (perceived severity
and susceptibility), yet these concepts were implicit throughout the discussions. Perceived
susceptibility was often expressed when parents mentioned the child’s poor health, “He was
always like a very quiet baby, very easy, I mean even as an infant we were always like ‘oh he’s
so calm, and relaxed, and quiet’. And it was really nice ‘til then I thought, wait maybe something
is wrong. Why is he still so quiet? He never babbled or made any noises.” or developmental
history or family history, “I compared her with her actions um, with my little cousin ‘cause I

100
have a cousin. He’s about 11 now, but he has ADHD and the same you know, ways that he has,
she has.” In particular, an older sibling, cousin or parent with ADHD or mental health issues
caused two parents to take behavioral concerns seriously, “I don’t know what the diseases called,
but I know that there are mental issues in my husband´s family, and that… you know… I know
that no person is perfect and there is always a mental issue regardless of what it is but I just
wanted to make sure that he is not gonna exhibit to the point where need to be in a hospital or
something… to feel better so I just wanted to make sure that whenever it is he is able to
function…”
Also, a number of participants had other family members with speech delays, so they
continued to watch the speech development of their younger children for similar problems, “I’m
thinking, you know, if, ‘cause that was one of my cousins! ‘Cause he had, he had bad ear, he had
to get tubes in his ears, so did my mother when she was little. So I’m thinking, Oh my God!
Maybe that’s what he needs!” Another parent shared, “Well yeah, his pediatrician ‘cause I have
a nephew that had slight ear infections but not enough to bother him. Um, he never developed
any fevers so it was never detected. So he always had this fluid buildup in his ear so when he
heard voices he didn’t hear properly. So he didn’t speak properly… he kind of spoke how my son
speaks. And I was afraid the same thing was going to happen so every time I went in I made sure
he checked his ears and he was good, he can hear./ So you were doing that all along, ever since
he was little? Would you say? / Yes. / You’ve been looking for that. /‘Cause he’s in college now
and he still has a speech impediment. He’s already been though speech therapy but they didn’t
start until he was 4 ‘cause they didn’t know. So I know to look for this in advance. I wanted to
know if that’s why he isn’t speaking well”

101
Other parents referred to the child as having a history of health or developmental
problems, so they were vigilant about other issues and also more closely linked to specialists,
“Well, when he was one, a few months after he born, the doctor noticed that he had a small
head. And believe it or not, my husband, when he was born, he had a small head and they
wanted to do surgery on him, and there was like a fifty-fifty chance that he was gonna be
retarded or he was going to die… Now you know he’s 6’4”, his head, his brain is normal. He’s a
normal gentleman so.../ So when your middle child was born and you noticed that, you were
paying attention right away to make sure/ Yeah! I was like, to myself I was like, you know ‘boy,
I wonder did it just like shrivel down like in the gene’ but the thing about with my six-year-
old…he comprehend. … It’s just, he kinda get frustrated because his speech is almost like a child
that stutters. Sometimes if they can’t get their word out there, sometimes they, you know, hit
theyself or they get upset, they get frustrated. It’s not because…nothing up here, they can
function right! I had concern when the doctor kept doing brain scans.”
Perceived severity was related to the parents’ expression of how extreme or concerning
the problem was to them (how many months delayed the child is, how extreme the behavior was,
or whether the problem was perceived as medical in nature), “She started sticking her finger in
her own mouth to throw up and she threw up in my husband’s face. Like he couldn’t believe she
did that. She just cried and he just, he was standing his ground, he was trying to stand his
ground. This was recently.” Another parent described the culmination of behavioral concerns
that prompted help-seeking, “She wants to climb on everything so we tell her “No” and
we’re…as we’re holding her down, throws a fit and gets…and we got scared this week when she
hit the dog.” The parents’ distress or the extent of others’ concern (urging from specialists or
notes home from the teacher) impacted perceived severity, “They started writing county forms

102
putting the blame all on my child on the county forms…I got the form with all complaints about
my child…how bad my child was but nothing on what they did to help my child… it was all bad,
bad, bad.”
Cues to action included a flyer or an incident or complaint, “…on the flyer. I think it had
this behavioral, uh where they would screen behavioral ‘cause as far as you know the…you
know I don’t really know all of them. The, you know skills that they need; motor skills, things like
that. Yeah, she’s fine in that. It’s behavioral…Yes, ma’am at my daughter’s VPK they had the
program advertised.” Another parent explained, “I’m from Miami, my parents live still in Miami,
they saw a news article.”
Parents were asked about their sense of urgency or ideal timeline for accessing services.
Most reported that they wanted to address the problem before it gets too big or resolve it before
kindergarten or preschool, “And my only fear…let’s fix the issue now so when he goes to
kindergarten, we don’t get thrown out and have issues with the school system. There’s one
problem child the first day, the first year, that’s always gets labeled as the problem child, and I
don’t want that.”and as one parent succinctly put it, “In my case a lady friend of mine tells me
‘small children, small problems.’” Several parents lamented that the timeline was moving too
slowly, “I was so… I was about to cry. She told me she was going to go to school. It was like oh
my God, what I am going to do with this girl if she’s like that. You know I was scared. Scared,
once she was going to go to VPK, she was not going to be at the level that she was supposed to
be at with her peers. You know.”
Cultural Expectations and Decisions
Family culture also impacts normative expectations around child development and the
timing and options for early intervention. Parents may differ in what types of developmental

103
issues warrant intervention and also on what age they feel intervention should begin. There were
a number of discussions about cross-cultural differences in behavioral expectations for girls
versus boys:
“Family dynamics. We don’t have any special needs on either side of the family. So like
there’s nobody there that sign or even understands special needs in the family. I know for us to
actually learn sign would be a huge deal… She has the severe to profound hearing loss so she
hears at like a lawnmower level. So we knew even with hearing aids, she wouldn’t gain the
speech. So we knew the cochlear implant is what was gonna give her the speech. You know like
automatically we started doing the research and it’s like okay, so that was the best thing for
her… I mean with our family and our family dynamics that was worked best for our family, was
teaching her listening and spoken language.”
“My husband’s from India so he says, he’s from a particular caste that their nature is to
be violent, they were warriors, you know in India they still have the caste system. But their
history, so the women used to fight in wars, just by nature they’re very strong and dominant. He
says ‘I wonder if that has something to do with it?’ I said ‘I don’t, I don’t know.’” We talk about
it ‘cause you know, we wonder. It’s just that, he doesn’t think it’s, it doesn’t make him proud that
she’s…has a tendency to be that strong because in women, over there although they were
required to be, you know fight and be hardworking, you still had to be modest and reserved and
proper. So when we take her to India, I mean she’s gonna freak them out because she’s so
independent and this is, you know, she’s going to tell them no. And that’s another thing, she
always says no. No and no and no. Everything is no. But if we tell her no, she throws a fit. And
my mom said I was very strong in my personality when I was a baby and um, but I don’t know. I
don’t know if it’s genetic, I don’t know if it’s nature versus nurture, what are we doing, or if it’s

104
our…I just don’t know….So well, she’s half American. Go to America, she has a voice! ….And
she’s smart and she’s strong and that will really serve her well when she grows up…Oh maybe
she’ll be able to pick her husband… Maybe she, maybe that’s…’cause that was one of the things
about, you know his family, they do that. They do the arranged marriages and he picked his
sister’s husband and the other sister’s husband and I’m like ‘I don’t know if that’s gonna quite
work for this one.’ This one may not even wanna get married!”
“I have South Tampa moms and I have my North Tampa moms; different playgroups that
I hang out with because I’m like right in the middle of all of them. So the South Tampa moms,
you can see that they’re more like my daughter, that they’re like, the kids are, not that they’re
overly spoiled but we tend to ignore stuff more. Like there’s one mom she’s like ‘oh I just need a
you know, I’ll just take a wine, glass of wine and let her do whatever the hell she wants.’ I’m like
‘well I don’t drink so how does that help me?’ Your advice is not helping me, I just drink coffee
and eat chocolate. So we have a group… we all try to compare notes cause we have like a
little…I wish they were like little support groups that were not, that were not just focused on…
that were on focused on behavior. ‘Cause half of the problem is behavior and parents knowing
how to act.”
Benefits & Barriers
The process of connecting to help included weighing the benefits of getting help versus
barriers. Benefits of receiving services (early intervention, ready for school) were indicated in
the comments above related to the importance of early intervention, “The faster you try to treat
him, the faster he will get out of there, the smaller we start ... when we start working with them
from smaller, the faster they will be able to improve their language, their motor level, this is
going to be a lot better if we start from small when we detect that problem, “as well as comments

105
from parents who had received services for their child or a sibling in the past and had seen the
progress, “In Early Steps [the older sister] received therapy for a full year. She, thank God, has
equaled by the program and she is out of the danger zone, her communication is very well- she is
even.”
Barriers included family transitions (moving in or out of the county, state, and country);
the mother’s own health issues; lack of information about services or other service options;
cost/insurance coverage; long waits and poor response from agencies; and practical challenges
related to time, transportation, and competing needs of other children in the family.
Informational and instrumental social supports played a role in helping parents overcome barriers
to accessing services. One parent had a newborn baby, “Well right now right now the hardest
thing I think is that I have a C-section, so it’s been a real hard thing to assist my baby, assist the
other ones with my C-section because all the other ones that I have they are been normal
deliveries; so in a week I am up and now with this one it’s been like hard at that point because
‘mama I need this’ even though they are old now they still need a lot of stuff.” and another was
battling cancer, “And I’m going through health issues so, today I get my…the full MRI to see if
you know it spread or if it’s gone away. I’ve been going through therapy, so my bones are
hurting because of the infusion and everything and I was blessed that my hair, nothing has you
know gone. So I’m exhausted more. So I think that because, and I just want to share that because
I think it’s fair for the research part of it, that when you’re not as alert sometimes, you do let
tend to let things go.” These contextual factors are important, as they can affect many aspects of
parenting, including developmental monitoring and help-seeking.
Several parents attributed the time lag from concern to services to the agency’s poor
response and wait lists, “No, she said they were all free… she said it could take up to six months

106
to get the appointment. I said ‘Ma’am, I don’t mind to pay for it’. Like, it needs to be an option
that we can pay for it. Like, obviously that’s my son. So that’s one of the issues is the
wait…waiting.” and parents were willing to find alternative services, even at higher cost, to meet
their children’s needs in a more timely manner, “Waiting is a long time. I mean ok, so, there’s a
six month waiting list. So, he’ll be out of there, going into kindergarten, and not seen one person
about behavior. Hopefully that doesn’t happen. She says they’re opening up more appointments
for Saturdays, but we will see. And if it gets too bad, then I will find a behavior specialist myself
that is under my insurance, and pay for it.”
The time delay was especially frustrating for Spanish speaking families, “In my case the
language, because of the fact that they speak Spanish then they have to get a therapists that
speak Spanish and people who make the assessment in Spanish, and there are very few people,
so the waiting list is very long ... very long… including public schools ... my eldest son is right
now in a kindergarten program, since last year is being assessed, but we don’t have a
psychologist that speaks Spanish , then the fact that they speak Spanish, they believe that they do
not understand English, and then they are referred to a specialist who is Hispanic or speaks
Spanish. Even in the evaluation that they did to the older, he had a higher percentage in English
than in Spanish, but no, they wanted to find a Hispanic psychologist, then many times these
people believe that because the first language at home is Hispanic… Spanish, then someone
cannot have access to the other services provided in English only. That’s for me was a major
obstacle, the long wait. Mom #3: yeah, well I agree with [her] regarding the language, this also
up for us in order to communicate to the persons handling or coordinating ... the development of
the stages that we must be passed in order to entry is long and tedious because of the language
for someone that is not a master of English at 100%.”

107
Cost and insurance coverage was cited both as a barrier and as not a barrier; however, a
lack of information about where to go or how to access other service options was frequently
discussed. If a parent did access a program and didn’t qualify, it seemed as though an alternative
service or program was not offered:
“…like we had an appointment for today, but my insurance won’t even cover the assessment. So
all I was going to do today was an assessment to see a therapist who’s trained in prompt just to
see if she thought we needed prompt and then my insurance won’t cover it; its $650. And I, that’s
cost prohibitive. I cannot go there and pay $650 for an hour consultation, so we canceled it. We
rescheduled, I was like let’s reschedule and but like this is one of those appointments that I made
3 months ago.”
“And I haven’t even dealt into KidCare. There was a period of time when he transitioned
into this job that I thought we were going to lose SSI, so I started checking into it and I put in the
application. Well, they can’t do anything with my application that’ll come up denied because we
have Medicaid right now. So like ok, is there gonna be a lag in service when I do this? Whenever
we go that next step? So, yeah, it’s very confusing system. Yeah with kid you… I haven’t, I’m
trying to find out about the Medicaid right now and that’s where my head is just completely
wrapped around. And I seem to remember, depending on which type of Medicaid you have also
affects, right? I’ve had to, from the start we had straight Medicaid and then we had Medipass
and then once the SSI got approved, it’s Medicaid through SSI. So it’s a completely, you know
you have to tell the people when they’re looking at the screens it’s…Medicaid through SSI,
because yeah it is completely different.”

108
Informational Support
Parents had strong preferences about whom they go to for information; some preferred
formal service providers and others preferred informal sources. Family members were helpful for
some parents, but not consistently so “Well like my sister is incredibly helpful even though she
has, you know, her own developmental stuff with her daughter, she’s just knowledgeable. But, we
were talking the other day about like parents. Like my mom is very sweet but she like, it’s funny
cause it’s like you would think she didn’t… wasn’t a parent or something. Like I’ll ask my mom
stuff and she’s like ‘I just don’t know honey’ or ‘I don’t remember’ or like, almost like it was just
so easy and it was just… Like when I had post-partum [depression], my mom was like ‘I just
don’t know hun, I just loved you from the minute you were born’”. I’m like ‘yeah I love my child,
I have post-partum depression’ you know like…not, she’s not much of a problem solver, so... an
empathizer, I guess. I mean she tries but it’s like, it’s kind of like ‘I don’t know’…so that’s not
really helpful for me.” One couple argued about who would be the most appropriate social
support during the interview, “Father: your mom?/ Mother: but she is not here /Father: but, that
is your emotional support, like you call her ‘mom I have this problem with my daughter, what
can I do with her? When you had (name) what did you tell her to make her to behave good’/
Mother: but normally I don’t talk with my mom about that…/Father: that is the problem, because
you should ask to the moms and ask them ‘what can I do?’ /Mother: not really.” Sources of
informational support may vary and may change over time as a parent continues on the
diagnostic journey towards assessment and services, “So I did get their help; there were no, like
navigational help. You know, like ‘oh you should call this person or oh you should…’ That was
all me except, you know what, as I talk to people you know if they knew somebody; would say,
like you know my friend told me to talk to [therapist]. You know it was like a lot of times. I have

109
another friend who… recommended another lady who recommended her co-worker and we met
with her. So there were friends that were, by this summer, who were saying, oh this is who you
should talk to...So yeah it was like hearing it from one person to take it to the next, to take it to
the next… It’s like this connecting, it’s this spider web of connecting people to who’s who;
opening your mouth, saying what you need, how you need it, and then even if you get a no, to
keep going another route.”
To some extent, parent decision-making about whether to access services, and especially
whether to reach out to others for appraisal or informational support is impacted by their cultural
beliefs. Stigma is a strong barrier to help-seeking. Several participants cited the internet as one of
their main sources of information, others preferred to talk with professionals over family or
friends.
Stigma
Parents explained that it was worrisome to consider that their child may have a
developmental problem, “It’s, I think for me it’s frustrating because the, since I work in mental
health, I want to…a, I want to diagnose him because I want to make sense of what he’s doing, I
want to fit him in a category. And then on the same, you know at the same time, I’m so scared
that’s he’s gonna have a mental health diagnosis. I’m like I don’t want him, you know, be like all
those kids that I see because I see that parents have so much trouble with kids that have you
know ADHD and Oppositional Defiant Disorder… and it’s when it’s your own child, you know
it’s different when it’s your own. It’s scary. Is he normal? Is he not normal? What’s wrong with
my child? Am I doing something wrong? I should have all these resources, I teach them to other
people.”

110
Some parents also reported discomfort in talking about developmental concerns with
others:
“I just watch and compare, that’s it, because I’m not going to compare. I don’t like to talk about
my child like that; I don’t like to tell like he’s behind like that.”
“Father: we know other parents / Do you talked with them about concerns? Are they helpful or
not really?/Father: not really, not about… concern about the kids just… sometimes we see them
in the supermarket we talk about for a few minutes about the child…/ …sometimes friends are
helpful and sometimes people don’t like to talk about that with other parents /Father: That’s
right. She doesn’t like to talk about the personal things sometimes.”
“I think, also having some kind of like a mom support group, you know for maybe moms
that don’t have other friends with kids their age or something. Making that readily available can
be a...probably help tremendously with the mothers. Just having some kind of mom support
group or something and advertising for it…I think it’d be helpful…moms a lot that don’t
necessarily want to reach out or say…you know because if you tell other people, sometimes
they’ll think you’re a bad parent or you know, afraid they’re gonna judge you. So if there’s a
support group so they know that other moms are struggling with similar things they’re
struggling with, it might help them to come out more and speak more about it.”
When asked directly about whether their race, ethnicity, or primary language affected
their experiences, parents replied that it was other factors that influenced their process more
strongly, “And ok do you think your ethnicity, or your culture, or anything else has impacted
the services that you received or your experience with the services? Do you think people would
refer you differently based on that? / I don’t think so. I got the help I wanted. I mean maybe I
had to insist more but, you know... I didn’t think the school district… like I have a complaint

111
about the lady from the USF because she was kind of not too much about messages and
returning calls.” Several parents had accessed services through a number of providers and could
describe differences in the quality of care they received, as is evident in this discussion among
several parents, “Mom #1: Even in the evaluation that they did to [older brother], he had a
higher percentage in English than in Spanish, but no they wanted to find a Hispanic
psychologist. Then many times these people believe that because the first language at home is
Hispanic… Spanish, then someone cannot have access to the other services provided in English
only. That for me was a major obstacle, the long wait./ Mom #3: yeah, well I agree with [her]
regarding the language, this also up to us in order to communicate to the persons handling or
coordinating ... the development of the stages that we pass in order to enter is long and tedious
because of the language for someone that is not a master of English at 100% ./ You agreed on
an ethnic issue, race, language, do you believe that this has been a factor in accessing services
and on the other hand ... there is some other factor that affected in addition to race, origin,
language?/Mom #1: No ... in fact it hasn’t been a total obstacle, what happens is that there is a
long waiting list, then a child ... But aside from that, each mother our child as perfect, because
we hardly say oh yes, my son is failing, until someone lets us know, then stay in a trance to
realize that our son is failing in something, and then there is the long wait to access services with
a therapist Hispanic or Spanish-speaking so child will feel a lot more comfortable. So this is a
delaying. / Then the waiting time for accessing services due to language is an obstacle? /Mom
#2: Yes, of course./ Do you think this is a cultural thing, because you speak Spanish ... why the
lack of information?/Mom #1: Because of the lack of publicity I think. Because of the lack of
publicity because I don’t think that only Hispanics, but a lot of people that I know American or
Hispanic that I've had talk to about the ASQ, because it is something that if you do not access to

112
these programs you do not know./Mom #4: Neither did I until … /Mom #2: neither do I …/Mom
#1: it is not being published ... the lack of information, I would also think that they have to guide,
talk a little more to the parents.”
For other parents, practical barriers like the time it takes to find services, especially with
caring for other children, and lack of transportation were the greatest barriers for them, “It’s
really hard, because sometimes I am tired… as I said when I talk to transportation when they
told me ‘we can't go for you because you are close to a bus stop and your kid doesn’t have a
disability’ and then I say where I live to get to the bus stop is like half a mile, and then I said,
who assures me that when I leave my home something is not going to happen or starts raining
and I get wet and my child get wet… I carry him in the stroller and I cannot go, then I said who
assures me that something is not going to happen to me? The things are very bad in the street,
people walk where they want to, you don’t know who is walking… or raining or I don’t know…
and then I get wet! And he says ‘it’s better to get wet; you can take an umbrella and get struck by
lightning.’”
Instrumental Support
Many parents reported that they had no one else to help them on a daily basis, even
though the majority of participants were married, “So like you said you first started to wonder
at 9 months and then now he’s a little over 2 and you’re just starting to see the progress. So
even with all of your efforts it has taken over a year? / Yes, and that’s a lot, I meant that’s a lot.
There were times when I felt like it was a job. Like my job was to get services for my son, you
know? Like it felt, it was like a hole; it sucked up all of my time and energy.” Explained one
parent, “Basically it’s me and my husband he's like always busy…But yeah it’s me go to all these
things- her speech and all that.” Others relied more on extended family for instrumental support,
113
“It’s more challenging because I’m a single mom and I work, so it’s kind of hard for me to, I
have to try to do these appointments and other stuff and have a day off. So, that’s what’s more
challenging. / So is there anyone that helps you with the practical aspects? /My sister. Like
tomorrow, they did an ear exam here, and because he doesn’t talk, so they did work out, they
sent me to a special place and I couldn’t get the time off so my sister’s going to take him.”
Parents described the stress and worry that they were experiencing throughout the process of
recognizing and responding to developmental concerns. They also describe doing extensive
research in understanding the problem and finding assistance. Their success may be dependent
on their own resources, self-efficacy, the informational and instrumental supports described
above, and ongoing emotional support. Additionally, the community level response impacts the
parent’s ability to access services – community agencies, specialists, and pediatricians can
support the parent directly and also by coordinating referrals.
Self-Efficacy
Self-efficacy, though not discussed explicitly in the interviews, was clearly evident in the
participants’ stories, “So now I am waiting for articulation because I want make sure he gets all
the help that he can get as early as possible and we are also working privately, you know I am
working… I just got the number to a psychologist so I am probably taking him to a psychologist
for a few sessions to see if that, you know, helps because I want him to be the best that he can be.
They never said anything but I got the form on a Tuesday on Wednesday I had all the help lined
up, because I am resourceful…that what parents do… I should say parents with knowledge and
background too…it is not everybody, not everybody the same way that I do so… you know I am, I
am immediate help, you know? They tell me wait for the speech therapy, you know, and the
speech therapy were are running on a six months waiting list…but I am not sitting down and

114
saying, you know I’m gonna wait six months; my child is getting help right now for speech. And
that’s my personality, you know, it’s like what he needs it’s what he will get.”
Parents described their personal qualities -- dedication, commitment, and persistence –
and their values, that enabled them to continue to seek answers and services to address their
concerns, “But you’ve been pretty persistent…/ Oh yeah, yeah. I will be and I will keep going. If
not, then guess what, I get another job and I pay for someone to do what I need them to do –you
know to figure out if anything’s wrong. And like honestly if the lady calls me and tells me it’s
gonna be a six month waiting list…ok, can you tell me who you would refer me to once we got
accepted? She’s gonna tell me the names and I will get…and start calling behavior specialist, I
will call the psychologist or whoever I need to and go get the money to pay for it, you know.
Which I know sometimes behavior specialists can obviously be a lot of money.”
Self-efficacy seemed to grow over time as parents continued to seek resources and
supports on behalf of their child, “So that led me into it even a little bit more and find out, you
know, different areas of services that I could find out…anything and everything. That any type of
help that I could look at, any type of provider that would be pertinent to this whole situation…
Just digging…. Just digging through the websites, getting out there, knowing your providers,
knowing where…Just kind of filtering where all these pieces go together. And it, like I said in
[town], I already knew where a lot of the pieces were ‘cause I already worked with a lot of
providers, I already did a lot of community events. And then here it is like ‘ok who goes to who,
and who’s what, and who does the help?’”
This was particularly true for the majority of parents who had no prior direct experience
with services systems, “So have you dealt with issues like this before [mom says no] so you
have just learned to navigate on your own?/What choice do I have? What choice do I

115
have?...You know I just had to learn to take it one day at a time, because if you think about it you
got so overwhelmed you get paralyzed so I have to…. do what you can.” Another parent
described her transformation over time in pursuing assessment and intervention services for her
son, “I think … like I said I sort of hit this point… that I am not confrontational at all. I’m a
pleaser, but I got to a point where, I was like, ‘this is my kid and nobody else is doing anything
so I’m going to’… You know I was like a squeaky wheel. I would call people, and keep calling
and calling and calling. / So because of your job skills and because you know what it takes.
/yeah and just keep calling and calling and calling. And I don’t think that’s everybody but I think
that happens a lot of times.”
Emotional Support
Most participants relied primarily on their significant other for emotional support, “You
know whereas if I was working full time and you know… and heaven forbid I wasn’t. I didn’t
have my husband. I mean he was, there were many night I would like, you know. I’m not even
really emotional but there was a lot of crying…there was a lot of lost sleep, lots of tears. So I
can’t imagine having to do that by myself.” and some found this support in their parents, “My
mother, my mother and I talked every day and my mother knows my kids, she knows them to the
level of knowledge and the fact that you know she is my mother and she knows that my kids are
brilliant she knows, you know that, she is able to bring me back into reality and say you know
this is not for you to worry about because your kids are smart and I am like… you start to putting
two and two together… and the lady of [agency] was very nice, you know we talk quite a bit for
1 ½ to 2 hours a night, you know the nights that she called me, and then… I´m sure she has other
kids she has to deal with.”

116
Others relied on their social worker, home visitor, or another professional, “… it has been
a person up in the hospital…she came and talked to me and also she offers me some…some
advice and everything. She said if I needed somebody to talk to or just you know feeling all
emotional, because hormones sometimes you´re very happy and sometimes you are very sad and
all that, and she told me that I can call her if I needed something. / So is your husband still at
your house with you? /He is not here, he is in Mexico… he is very concerned… so I talked to
him every day, because of the baby, and you know, we try to be in communication because of
what’s going on with the baby. He has been there for about 6 months so, yeah I try to be in touch
with him, and I talk about the baby with him because it’s something that we need to do
together…”
Pediatrician
The role of pediatricians is critical in supporting or hindering early recognition and
access to services. All participants in the study had a regular doctor for their child. Parents
described their relationship with the pediatrician and their perception of quality of care in great
detail, and several had switched doctors at least once. The following discussion among a group
of Spanish speaking parents highlights the need for, and lack of, family-centered care:
“Do you rely on your pediatricians, for example? /Mom #1: no. /Mom #2: no. /Mom #1:
I do not think they provide that kind of confidence. The pediatrician at the medical appointment
is limited to 5 minutes only, and then he gets you out faster /Mom #2: exactly 5 minutes and it is
already done. /Mom #3: they are shielded.... They are like a shield, I mean the doctor is a person
that ... I don’t know, sometimes he is limited only to read, to ask questions that are in the
software and answer only what is there, and sometimes there is a lack of interaction that’s what
I've heard of other people ... however, I have been really lucky and blessed for the pediatrician

117
that I got for the children, for example, has interacted with us a little longer, but I know from
many people and I had the opportunity that it was like that, I felt helpless that way with the
pediatrician did not fit much, I did not count on .../Mom #4: In my case is not like that… well it
could be the relationship that I have with the pediatrician because we are friends outside the
physician office ... we are friends and when I was worried about my son or my daughter, she is
very nice, the pediatrician/ Mom #2: in my case, is like... I too have felt that pediatricians here,
are very like a robot; just simply say very general things and this is it. They are like… that does
not motivate to you to want to ask, does not inspire confidence./Mom #1: exactly./ Mom #2: I do
not know if it's because ... well in my case the baby does not have insurance, he didn’t born here,
the baby… but in my country we did had insurance and the doctor… well I stayed talking to one
hour and he resolve me all doubts that I had, but not here ... it’s not like that /Mom #4: here is
like in and out ... you go for the reason you went, and that’s it! In my case, because I had to deal
with my child’s specialist after the operation ... but with my pediatrician it wasn’t like that, the
pediatrician of the girls I had more to express any concerns when they were more little, when…
/Mom #2: and especially when you're a first time mom, you have many questions /Mom #4: in my
case ... she is the third. But there are always little things that one worry, when they are babies
and I could talk everything or ask what I wanted and she was always willing to… so I say that in
my case, until now about I my doctor I cannot complain, because she has always been very kind
to me, she has always helped me in what I ask ... she is very, very good people, but I know about
a lot that are not.”
Well-child visits provide brief windows of opportunity to address concerns and conduct
developmental screening, So anyway, when she was one year old I took her again and I told him
you know she doesn’t stop drooling. I mean it’s really… And then he asked me again how many
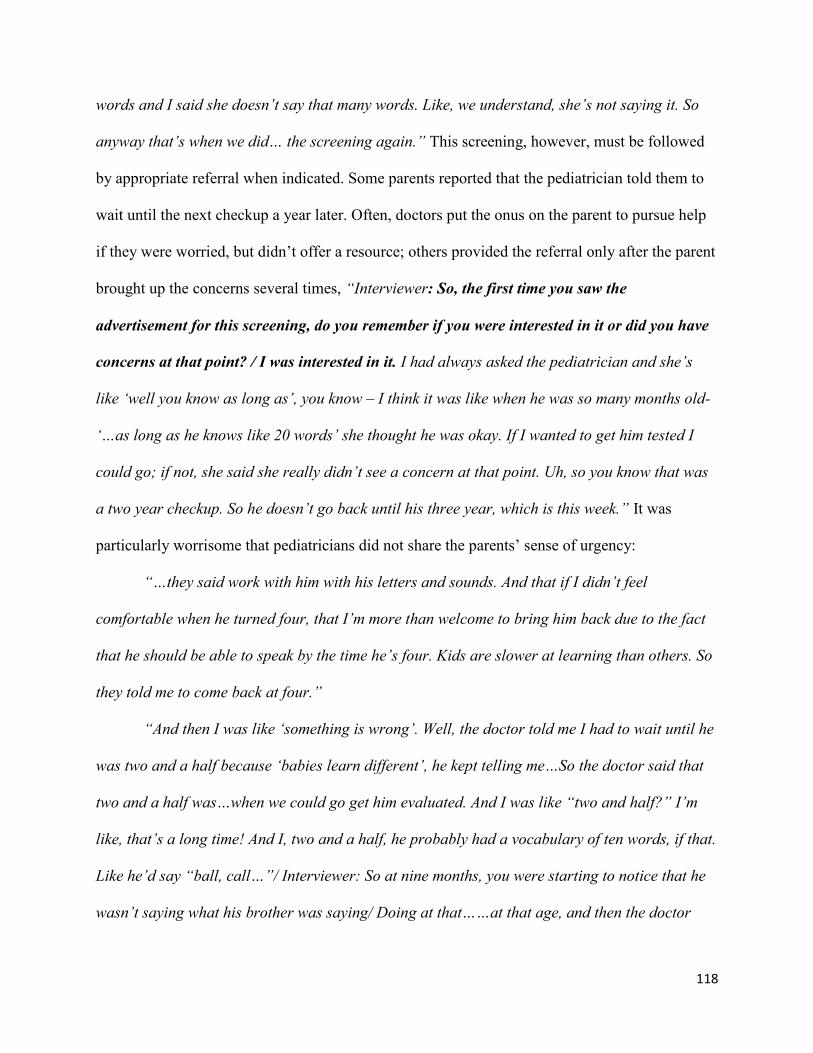
118
words and I said she doesn’t say that many words. Like, we understand, she’s not saying it. So
anyway that’s when we did… the screening again.” This screening, however, must be followed
by appropriate referral when indicated. Some parents reported that the pediatrician told them to
wait until the next checkup a year later. Often, doctors put the onus on the parent to pursue help
if they were worried, but didn’t offer a resource; others provided the referral only after the parent
brought up the concerns several times, “Interviewer: So, the first time you saw the
advertisement for this screening, do you remember if you were interested in it or did you have
concerns at that point? / I was interested in it. I had always asked the pediatrician and she’s
like ‘well you know as long as’, you know – I think it was like when he was so many months old-
‘…as long as he knows like 20 words’ she thought he was okay. If I wanted to get him tested I
could go; if not, she said she really didn’t see a concern at that point. Uh, so you know that was
a two year checkup. So he doesn’t go back until his three year, which is this week.” It was
particularly worrisome that pediatricians did not share the parents’ sense of urgency:
“…they said work with him with his letters and sounds. And that if I didn’t feel
comfortable when he turned four, that I’m more than welcome to bring him back due to the fact
that he should be able to speak by the time he’s four. Kids are slower at learning than others. So
they told me to come back at four.”
“And then I was like ‘something is wrong’. Well, the doctor told me I had to wait until he
was two and a half because ‘babies learn different’, he kept telling me…So the doctor said that
two and a half was…when we could go get him evaluated. And I was like “two and half?” I’m
like, that’s a long time! And I, two and a half, he probably had a vocabulary of ten words, if that.
Like he’d say “ball, call…”/ Interviewer: So at nine months, you were starting to notice that he
wasn’t saying what his brother was saying/ Doing at that……at that age, and then the doctor

119
said wait until he’s two and a half and check that… well he said check at two and then we got to
a point where he was two and a half… I’m like ‘oh his shots are coming up, we’ll just talk to him
about it’. And when I did, he’s like ‘everybody develops differently. You guys can take him to
Early Steps’, told me about Early Steps, and see if they qualify him for speech therapy, and we
can go from there, but I don’t see a concern’. So he said check back at two… and then you get
that Early Steps at two and a half… Cause I, we kept pushing the issue that something is not
right…. Cause I wouldn’t stop asking about speech over there.”
“We were at the pediatrician last week for his yearly evaluation and we told him we were
going, and he says ‘if you have concerns, I would suggest you go’. And I’m like ‘what is your
opinion on his behavior’ and he’s like ‘I only see him thirty minutes, once a year, unless he’s
sick. I don’t know his behavior at home’. But [child] refused to do all the tests at the doctor’s
office, like his eye test, his drawing. The doctor will say ‘can you draw a line?’ you know, to see
his development, he refused, and they just wrote it off as ‘oh, he’s having a bad day, it’s ok’.”
On the other hand, parents must be willing to discuss developmental concerns with the
pediatrician; for many parents the pediatrician was the first go-to person for questions, but others
were reluctant to bring up concerns with the pediatrician. Two parents felt much more
comfortable talking with the pediatrician about medical concerns than developmental ones,
“…the pediatrician has been someone you could go to also? / Yeah, I’d say if I wanted to be
more aggressive to…if I thought it was severe enough of an issue I probably would bring it up to
her, but…/ Ok. And in terms of um, getting the services, your pediatrician could get help if you
were concerned? Does the pediatrician know where to refer you to? /M: mm-hmm. / So that
would be the place you would go if you needed to?/Yeah, we also um, with the insurance

120
company we have… there’s a company that we call where there’s nurses on hand and if we like
don’t know what to do or where to go, they’ll refer us somewhere.”
Community Agencies and Referral Coordination
A previous health issue sensitizes the parent to other types of concerns, and it also opens
the door for professionals. Some parents reported that a specialist identified the developmental
problem as they were addressing another issue, or recommended another specialist when the
parent had questions. Additionally, local family support agencies have tendrils out into the
community. The Family Support and Resource Centers were hubs of information and support for
two parents who were new to the area. Home visitors, Head Start social workers, and
developmental specialists also provided appraisal, informational and emotional support for some
parents. Networks of providers facilitated referrals for several participants. Breaks in the system
were also revealed in participants’ stories. This scenario emerged several times, thus “Referral
Coordination” was added as a code and ultimately as a theme in the analysis:
“…we were doing Parents as Teachers program, and she had been visiting since he was
born…and so we were doing the Ages and Stages Questionnaire. I am, hands down Parents as
Teachers; I think are why we are where we are. I think if I hadn’t had the ASQ to show…you
know, like I had the proof, I had the worry but then I had the proof in a developmental screen to
be able to say, you know…..and if she hadn’t been bringing that then we wouldn’t have been
doing it, and if we wouldn’t have been doing it then we wouldn’t have had that to be going to the
pediatrician. Because I, from what I heard that’s pretty rare that at one year if I would have
voiced concerns they probably would have said wait a little bit longer and so I think having
that... That’s why I love that we’re doing that at work.”

121
“And she [pediatrician] was, you know, she thought everything we were doing was great.
She was glad that we were going to see a developmental pediatrician and she also wanted me to
see a pediatric neurologist. (So she recommended one and we ended up seeing him. After we saw
[neurologist] and he concurred her diagnosis but he didn’t want to do an MRI or anything like
that at that point ... and she recommended that I talk to a friend of hers who is a pediatrician, but
he works with kids, like older kids with developmental issues so he does more… I think like ADD
or ADHD or stuff like that. Um, so I talked to him, and then he works with [developmental
pediatrician], and he said you should see [developmental pediatrician],and he was like ‘she’s
been around forever, she’s wonderful.’, so yeah that was another one of those three ways down
the line. It works.”
Discussion
It was hypothesized that parents recognize developmental differences, then go through a
process of decision-making concerning when to pursue assessment or intervention services. This
was able to better describe that process, and to identify the influences at the individual,
interpersonal, and community levels that impact the parental recognition and decision-making
about developmental services. In particular, the constructs of perceived threat, benefits, barriers,
and cues to action from the Health Belief Model and sources of four types of Social Support
(appraisal, emotional, instrumental, and informational) were examined.
Some parent factors (e.g. experience, knowledge, education, age, etc.) are reported in the
literature to impact parent recognition and responses to delays; in this study parents completed a
demographic questionnaire and were asked directly about their knowledge of child development.
Additionally, participants described their processes of recognition and decision-making related to
responses. Parents reported that their ability to monitor development and detect delays comes

122
primarily from past parenting experience, or from their own research through the internet or
participation in community programs, and for a few parents, professional experience.
The impact of knowledge of child development on recognition of developmental delays
has yet to be established in the literature. In this study, measured knowledge of development was
considerably lower than other studies that found mean scores of 79% for college students, 79%
for mothers of diverse SES, 87% for middle class mothers and 84% for middle class fathers, and
70% for low income mothers (MacPhee, 1981). However, parents may have general knowledge
rather than specific items that can be measured on a scale, or they may be able to identify
particular red flags even in light of low overall knowledge. Numerous studies have shown that
parents can be accurate identifiers of developmental delays in their children when they have
developmental concerns, regardless of education, income, or parenting experience. Identification,
however, may be contingent upon parents’ knowledge of milestones; specificity is high
(developmental concerns are usually warranted) (Glascoe, 1997a), but sensitivity is low when it
comes to detecting developmental concerns, particularly for cognition problems, global delay,
and behavioral versus language or motor problems (Chia-Ying Chung, et al., 2011). In this study
we found that parents clearly went through a sophisticated process of observing their children
over time and across settings, and compared to peers or to siblings when they were of the same
age.
Additionally, parents considered the child’s temperament, health status, and environment
as part of the appraisal process. Often there was a triggering event for noticing delays (an
expected developmental milestone, a dramatic change in behavior, or a discrepancy among
skills). In some cases, another person pointed out the developmental or behavioral concern to the
parent. In assessing whether the delay is a concern warranting formal intervention, parents

123
evaluated the severity of the problem based on the type and amount of delay, and cultural
expectations related to the child’s age and gender. To some extent, susceptibility plays a role;
parents report delays in conjunction with other or past health problems and also based on family
history of a condition.
This appraisal process rarely occurred in a vacuum. Participants often consulted with
their spouse or partner first, and also discussed concerns with family and friends. Additionally,
parents consulted with their child’s pediatrician or other professionals (teachers, home visitors,
developmental specialists). Unfortunately, responses from these various sources were
inconsistent. It appears that parents had to consult with a number of individuals to find validation
for their concerns, and it may be an uphill battle if the spouse or pediatrician doesn’t agree.
The reported rates of screening and referral by pediatricians is consistent with what has
been found in the research; roughly half of pediatricians don’t conduct developmental screening,
and approximately 75% don’t use standardized assessments (Bethel, et al., 2011; Halfon,
Regalado, & Sareen, 2004; Pinto-Martin et al., 2005; Sand et al., 2005). About half of
participants in this study reported that their pediatrician or mobile clinic developmental specialist
conducted some type of screening (verbal or using a questionnaire). The reduced likelihood of
receiving developmental screening or elicitation of concerns among parents who are Black or
Hispanic, particularly non-English speaking, and of lower income (Guerrero, Rodriguez, &
Flores, 2011) was also reflected among participants. Many of the parents relied on their
pediatrician for guidance when developmental concerns arose, yet most did not receive screening
or referral, and many were postponed for months until the next well child visit. Some parents
were reluctant to discuss developmental issues with their pediatrician; two parents brought up
medical concerns but not developmental ones. Those who did were as often as not told to wait

124
until the next check-up to see how the child was doing, which has also been cited in past studies
(Daniel, et al., 2009; Mendez & Hess, 2003; Seligman & Darling, 2007).
Those parents who did connect with service referrals described a network of providers;
some pediatricians conducted regular screening and referred families to private therapy, public
intervention, or to other specialists. The descriptions of the process were aligned with
recommendations for screening and referral described in Bethell and colleagues’ analysis of
national trends (Bethell, Reuland, Schor, Abrahms, & Halfon, 2011). In addition to resistance
from formal and informal others (e.g. pediatricians, spouses, or other family members, etc.), the
lack of information on where to go for help was a critical barrier to accessing services. In
particular, parents who were anxious to get help for their child but were put on waitlists for
public intervention sought alternative services, many of which were not covered by insurance.
Thus, parents reported ‘digging and digging’ for information.
While parents were able to identify other individuals who supported them along the way,
their individual decision-making processes and efforts are central in this story. Mothers were
almost always the primary person responsible for their child’s development, though one
grandfather participated in the interview and indicated that he and the child’s grandmother had
taken the primary parenting role. Parents’ own evaluation of susceptibility (the likelihood that
this was a problem that would persist) and the severity of the concern, feedback from others, and
their normative developmental and behavioral expectations (developmental domain, child’s age
and gender) impacted their desired timeline for services. Many parents were hoping to ‘fix’
problems while they felt the child was young enough to be manageable; and others were hoping
to resolve issues before school entry. The timelines from first concern to service referrals
spanned months to years; parents reported a high level of commitment, and pre-existing or
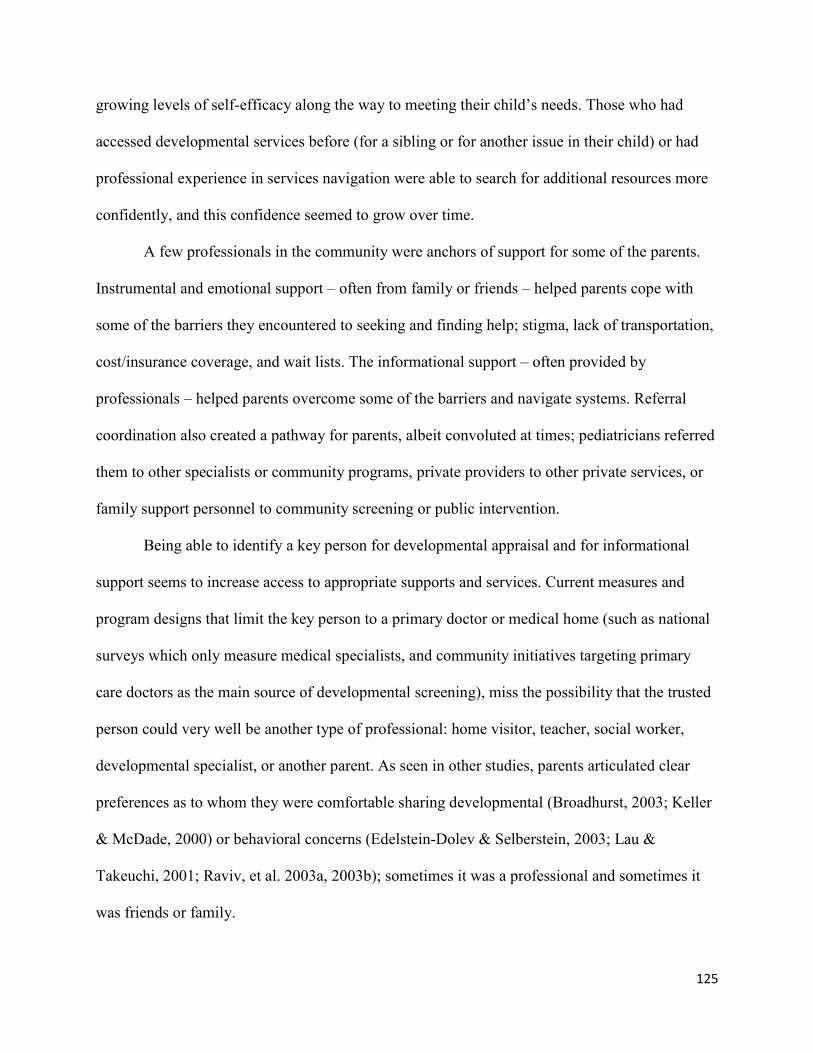
125
growing levels of self-efficacy along the way to meeting their child’s needs. Those who had
accessed developmental services before (for a sibling or for another issue in their child) or had
professional experience in services navigation were able to search for additional resources more
confidently, and this confidence seemed to grow over time.
A few professionals in the community were anchors of support for some of the parents.
Instrumental and emotional support – often from family or friends – helped parents cope with
some of the barriers they encountered to seeking and finding help; stigma, lack of transportation,
cost/insurance coverage, and wait lists. The informational support – often provided by
professionals – helped parents overcome some of the barriers and navigate systems. Referral
coordination also created a pathway for parents, albeit convoluted at times; pediatricians referred
them to other specialists or community programs, private providers to other private services, or
family support personnel to community screening or public intervention.
Being able to identify a key person for developmental appraisal and for informational
support seems to increase access to appropriate supports and services. Current measures and
program designs that limit the key person to a primary doctor or medical home (such as national
surveys which only measure medical specialists, and community initiatives targeting primary
care doctors as the main source of developmental screening), miss the possibility that the trusted
person could very well be another type of professional: home visitor, teacher, social worker,
developmental specialist, or another parent. As seen in other studies, parents articulated clear
preferences as to whom they were comfortable sharing developmental (Broadhurst, 2003; Keller
& McDade, 2000) or behavioral concerns (Edelstein-Dolev & Selberstein, 2003; Lau &
Takeuchi, 2001; Raviv, et al. 2003a, 2003b); sometimes it was a professional and sometimes it
was friends or family.

126
Strengths and Limitations
Purposive, convenience sampling, while not generalizable, is a viable approach to
recruiting participants from specific subgroups within the population who are willing to share
their perspectives and experiences. The goal of this study was to obtain the perspectives of
parents who were in the process of help-seeking therefore the high percentage of parents who
were not in services provided enlightening information on the decision-making process
prospectively. The diverse sample of parents (by race/ethnicity, primary language, income,
education, and geography) also offered a variety of perspectives not always elicited in other
studies.
Additionally, the community-based settings, option of individual interviews, and
presence of diverse and bilingual materials, community partner recruiters, and research team
members helped to raise the comfort level of participants in discussing sensitive topics, such as
stigma and cultural differences. While the heterogeneity of the sample is a strength, it is also a
limitation in that it challenges theoretical saturation. Interviews continued to be conducted until
no new information was being heard from parents in terms of their perceived influences on
recognition and help-seeking. The diversity among participants by demographics and by where
they were in the timeline from recognition to response was further diversified in the age, health
status, and developmental issues among the children. For example, one child had short-term
delays as a result of having been emotionally abused by a child care provider and the mother
noticed the abuse because of changes in speech and behavior. Two children had been identified
with congenital conditions at birth. Other children had previous health issues but not previously
identified developmental delay (e.g. premature birth, microcephaly, asthma, enlarged adenoids,
etc.). However all of these parents described the process of observing developmental issues and
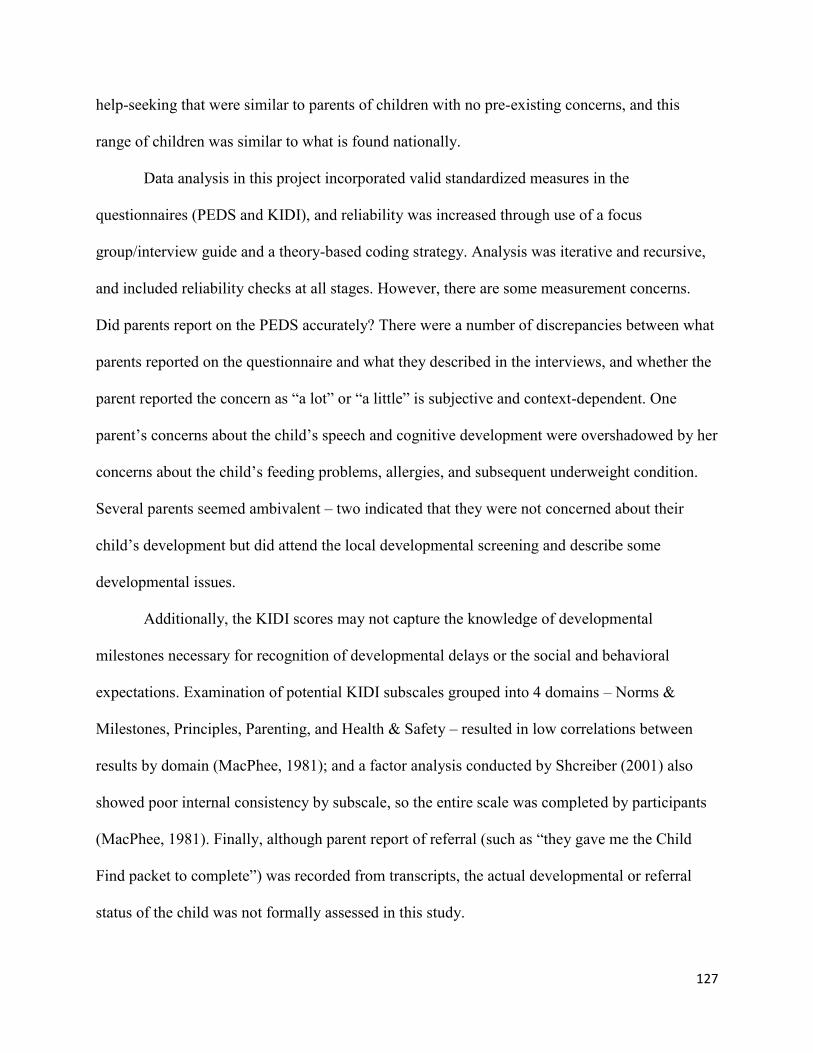
127
help-seeking that were similar to parents of children with no pre-existing concerns, and this
range of children was similar to what is found nationally.
Data analysis in this project incorporated valid standardized measures in the
questionnaires (PEDS and KIDI), and reliability was increased through use of a focus
group/interview guide and a theory-based coding strategy. Analysis was iterative and recursive,
and included reliability checks at all stages. However, there are some measurement concerns.
Did parents report on the PEDS accurately? There were a number of discrepancies between what
parents reported on the questionnaire and what they described in the interviews, and whether the
parent reported the concern as “a lot” or “a little” is subjective and context-dependent. One
parent’s concerns about the child’s speech and cognitive development were overshadowed by her
concerns about the child’s feeding problems, allergies, and subsequent underweight condition.
Several parents seemed ambivalent – two indicated that they were not concerned about their
child’s development but did attend the local developmental screening and describe some
developmental issues.
Additionally, the KIDI scores may not capture the knowledge of developmental
milestones necessary for recognition of developmental delays or the social and behavioral
expectations. Examination of potential KIDI subscales grouped into 4 domains – Norms &
Milestones, Principles, Parenting, and Health & Safety – resulted in low correlations between
results by domain (MacPhee, 1981); and a factor analysis conducted by Shcreiber (2001) also
showed poor internal consistency by subscale, so the entire scale was completed by participants
(MacPhee, 1981). Finally, although parent report of referral (such as “they gave me the Child
Find packet to complete”) was recorded from transcripts, the actual developmental or referral
status of the child was not formally assessed in this study.

128
There was very little overlap among 962 coded segments, suggesting that the codes were
distinct; an analysis of frequency of overlap in coded segments identified constructs and
subtypes of social support which co-occurred in participant narratives. For example parents often
utilized particular people for different combinations of social support: instrumental and
emotional support; appraisal and informational support; and for emotional and informational
support. It makes sense that partners or family members may help with practical and emotional
needs, but another person may be the source of developmental appraisal and information.
Additionally, among some parents, there was a reliance on professionals for ongoing
emotional, instrumental, and appraisal support. Additionally, there is considerable overlap in
parent-reported referral to services with perceived severity, and also with referral coordination.
Finally, discussions describing barriers coincided with descriptions of instrumental and
informational support, self-efficacy, and with care coordination. Statements related to cultural
differences or stigma also co-occurred in discussions about barriers. While every effort was
made to ensure that participants felt comfortable talking about their issues and concerns, and the
role that their race, ethnicity, and other individual characteristics as well as close personal
relationships played in impacting their experiences, it is possible that some participants were less
forthcoming about personal issues and challenges and withheld important information.
Conclusion
This study contributes to our understanding of how parents interface with early
intervention systems and both formal and informal parenting supports in the community. The
study also identifies triggers for parental recognition and help-seeking for developmental delays
and preferred entry points and pathways to assessment services. There is a need for better
measures of parent knowledge of child development that specifically focus on major and more

129
subtle milestones at shorter and earlier intervals. We continue to lack standardized measures of
parenting confidence, knowledge of early childhood development, and self-efficacy. More
research should examine what parents and providers believe is an appropriate age to begin early
intervention for specific types of developmental delays or behavioral concerns. Decision-making
about developmental expectations and early intervention services is impacted to some extent by
their cultural beliefs. There does not appear to be a clear understanding of developmental
expectations and red flags among children under age three for parents or providers, thus
problems persist until just before kindergarten. These studies can inform education efforts –
culturally relevant parent and professional education on early childhood development,
particularly social/emotional development and behavioral training. This information can also
contribute to health education efforts, such as expanding CDC’s Learn the Signs, Act Early
(Patel, 2007) to identify a variety of developmental issues.
More research is also needed on informal sources of information and support and social
networks for parents of young children. Families hear about services through word of mouth, and
providers also operate through social networks. It is important to recognize this and include
relationship-building in planning and funding for community-wide efforts and social marketing
campaigns. We cannot ignore the important role that fathers, friends, and extended family
members play in helping parents assess concerns and navigate often circuitous systems. Better
measures of sources and type of social support in our national and local surveys and social
network mapping would be helpful components in parenting and services access research. When
asked directly whether their race, ethnicity, or primary language affected their experiences,
parents replied that it was other factors that influenced their process more strongly. This does not
necessarily mean that people don’t experience disparities in quality of care based on their race,

130
ethnicity or primarily language, but rather that studies examining racial and ethnic disparities in
services access and utilization should carefully account for socioeconomic factors in their
analysis.
The process of identifying and appraising developmental concerns, then navigating
service systems to access screening, assessment, referral and services takes time even under the
best of circumstances, and early intervention is crucial for addressing many developmental
problems during critical periods in early childhood. In this study, identification of at least one
key support person facilitated the process; community programs must continue to build case
management into their designs. Those case managers must be developmental specialists who can
form trusting, stable, and long-term relationships with parents, because intervention systems
have a number of built-in transition gaps that parents fall into. Early intervention programs that
end at age three stop enrolling children at age 2½ and Child Find programs for 3-5 year olds may
not assess children after age 4, instead waiting until the child enters kindergarten. Glascoe (2005)
asserts that young children at-risk generally demonstrate mild delays by age two, and more
significant conditions such as autism and can also be identified in the first two to three years of
age (Chawarska, Paul, Klin, Hannigen, Dichtel, & Volkmar, 2006; Twyman, Maxim, Leet, &
Ultmann, 2009).
However, ages three and four are the most common ages for identifying developmental
concerns among prekindergarten children, and also the ages parents become most motivated to
get help for their children, thus the systems must be streamlined to account for the flood of
referrals at that age. We have research on some barriers to accessing care, including disparities
by race/ethnicity, income, insurance status (Batshaw, 2002; Coulter, Wallace, & Laude, 1993;
Halfon, Russ, & Regalado, 2004), but there is little on the relative impact of different barriers.

131
For example, one parent found that transportation was a barrier that superseded language,
income, time or any other factor. Qualitative research can more clearly define the specific
economic, social, and cultural barriers that could ultimately be used in larger scale studies to
create structural equation models to more accurately map these pathways from recognition to
services.
This study has shown that close examination of the appraisal and decision-making
processes related to recognizing and responding to developmental concerns can reveal
individual, interpersonal, and system-level facilitators and barriers to accessing early
identification and intervention for developmental disabilities in young children. Understanding
these influences is the first step in addressing them to better support parents and their children.

132
Table 2.1: Community-based sampling strategy
Community Based Sampling Strategy: 4 English, 2 Spanish
High SES Mixed SES Low SES
Bright Horizons – USF Campus (2), North Tampa (2)
Early Childhood Council Developmental Screening Program – South Tampa, Ruskin
Head Start/Early Head Start BOCC – Countywide, RCMA Migrant Program
USF Preschool For Creative Learning
Family Support And Resource Center – North Tampa, Ruskin
Safety Land Day Care
YMCA– Countywide Baby Bungalow Healthy Start
Parents As Teachers WIC
Hillsborough County Public Library- Saunders/Ybor, New Tampa, Temple Terrace, Brandon, North Tampa, Town ‘N Country
South Shore Community Resource Center
St. Joseph’s Advocacy Center/Mobile Clinic
Layla’s House
Initial Demographic Stratification – Hillsborough County Population
SES: Maternal Education (< HS 15%, > HS) Income (Low 14%, Mod/High )
Child Age: “Baby & Toddler Talk” (Ages Birth through Two) “Pre-K Parent Talk” (Ages 3 through 4)
Minimum Number of Focus Groups
Child age 0-2 Child age 3-4
Low SES 2 2
High SES 2 2
Spanish Speaking 2 2
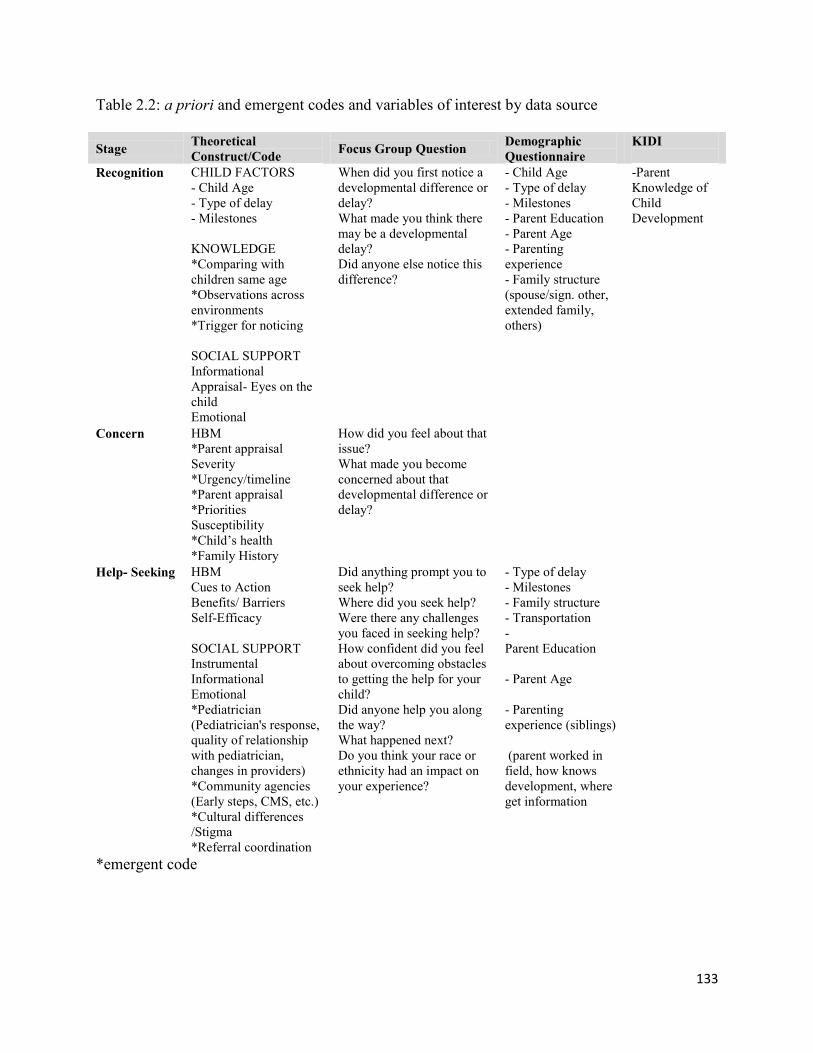
133
Table 2.2: a priori and emergent codes and variables of interest by data source
Stage Theoretical
Construct/Code Focus Group Question
Demographic
Questionnaire
KIDI
Recognition CHILD FACTORS
- Child Age
- Type of delay
- Milestones
KNOWLEDGE
*Comparing with
children same age
*Observations across
environments
*Trigger for noticing
SOCIAL SUPPORT
Informational
Appraisal- Eyes on the
child
Emotional
When did you first notice a
developmental difference or
delay?
What made you think there
may be a developmental
delay?
Did anyone else notice this
difference?
- Child Age
- Type of delay
- Milestones
- Parent Education
- Parent Age
- Parenting
experience
- Family structure
(spouse/sign. other,
extended family,
others)
-Parent
Knowledge of
Child
Development
Concern HBM
*Parent appraisal
Severity
*Urgency/timeline
*Parent appraisal
*Priorities
Susceptibility
*Child’s health
*Family History
How did you feel about that
issue?
What made you become
concerned about that
developmental difference or
delay?
Help- Seeking HBM
Cues to Action
Benefits/ Barriers
Self-Efficacy
SOCIAL SUPPORT
Instrumental
Informational
Emotional
*Pediatrician
(Pediatrician's response,
quality of relationship
with pediatrician,
changes in providers)
*Community agencies
(Early steps, CMS, etc.)
*Cultural differences
/Stigma
*Referral coordination
Did anything prompt you to
seek help?
Where did you seek help?
Were there any challenges
you faced in seeking help?
How confident did you feel
about overcoming obstacles
to getting the help for your
child?
Did anyone help you along
the way?
What happened next?
Do you think your race or
ethnicity had an impact on
your experience?
- Type of delay
- Milestones
- Family structure
- Transportation
-
Parent Education
- Parent Age
- Parenting
experience (siblings)
(parent worked in
field, how knows
development, where
get information
*emergent code

134
Table 2.3: Participant characteristics as reported on the Demographic Questionnaire Demographic Variable Number Percent
Child Characteristics N=24*
Child Age <1 1 2 3 4
2 4 4 6 8
8 17 17 25 33
Child Sex Male Female
14 10
58 42
Type of Concern “Any Concern” Behavior Speech Social Receptive Language Academic Self-Help Fine Motor Gross Motor
21 14 13 12 10 9 8 4 3
88 58 54 50 42 38 33 17 13
Number of Concerns 1 2 3 or more
5 6 12
22 26 50
Developmental Screening/ By whom “Any screening” Pediatrician Developmental Specialist Teacher Early Intervention Agency Staff
16 (4 verbal only) 4 8 4 2
67 17 33 17 8
Parent reported referral Referred by screener Have not sought referral Not referred/recommended
16 5 3
67 21 13
Services enrollment (select all that apply) Enrolled in any Services Public Early Intervention Children’s Medical Services (CMS) Private Therapy Early Learning Program/Daycare
12 5 1 4 6
50 21 4 17 25
Parent/Family Characteristics N=23
Participant Referral Agency Community Screening Central Community Screening South County Community Agency (FSRC Layla’s House, Parents as Teachers) Mobile Clinic Head Start West
4 5 8 3 3
17 22 33 13 13
Table 2.3 (Cont.)

135
Parent Race/Ethnicity White Black Asian
19 3 1
82 13 4
Parent Ethnicity Non-Hispanic Hispanic
9 14
39 61
English Proficiency Well Some Not at all
14 6 4
58 26 17
Annual Family Income Less than $15,000 $15,001- 25,000 $25,001- 50,000 $50,000-75,000 More than 75,00 Not reported
5 5 5 3 4 1
22 22 22 13 17 4
Parent Education Less than High School High School Graduate Some College College Degree Graduate Degree
1 6 2 11 3
4 26 9 49 13
Parent Age 20-29 30-34 35 or older
4 5 14
17 22 58
Parenting experience No other child 1 other child >1 other child
5 6 12
22 26 52
Marital Status Married Residing with significant other Single Separated/ Divorced
17 2 3 1
74 9 13 4
Other adult who Assists no other adult spouse/partner family member friend/other
1 17 5 0
4 74 22 0
*One parent reported on two of her children with separate concerns. .

136
Table 2.4: Correlation coefficients for parent knowledge of child development among socio-
demographic groups KIDI
%
Correct
N=21
Reported
Knowledge
PCC= 0.497
p=0.026
SCC=0.426
p=0.061
Parent
Education
PCC=0.517
p=0.016
SCC=0.519
p=0.0159
Annual
Family
Income
PCC=0.633
p=0.002
SCC=0.643
p=0.004
Race/
Ethnicity
X2 F=15.80,
do 6, p=0.015
Number of
Other
Children
PCC=
-0.236
p=0.304
SCC=0.239
p=0.297
Parent Age
PCC= 0.189
p=0.412
SCC=0.194
p=0.399
91 High College degr. >$75K White 1 30
84 High College degr. $25,001-50K Hispanic 0 35
74 Moderate College degr. >$75K White 3 35
74 Moderate College degr. $50,000-75K White 3 20
74 Moderate Graduate degr. $50,000-75K White 1 35
72 Low College degr. $25,001-50K Hispanic 1 35
70 High Graduate degr. >$75K White 2 35
67 Moderate HS Diploma $15,001-25K Hispanic 3 30
65 Moderate College degr. $50,000-75K Black 0 35
63 Moderate College degr. >$75K Hispanic 2 35
63 Moderate HS Diploma <$15K Hispanic 2 35
63 High HS Diploma $25,001-50K Hispanic 1 35
53 Low College degr. <$15K Hispanic 0 25
51 Moderate College degr. $15,001-25K Hispanic 2 35
51 High dev.
Low beh.
Graduate degr. Not reported Hispanic 1 35
49 Moderate HS Diploma $25,001-50K Black 5 30
47 Moderate Some College $15,001-25K Black 2 20
47 Moderate College degr. $25,001-50K Hispanic 3 35
47 Moderate HS Diploma $15,001-25K Hispanic 4 30
33 Moderate < High School $15,001-25K Hispanic 3 35
32 Low HS Diploma <$15K Asian 0 25
Drop Moderate College degr. <$15K Hispanic 1 35
Drop Low Some College <$15K Hispanic 0 30
PCC= Pearson Correlation Coefficient
SCC= Spearman Correlation Coefficient

137
Figure 2.1: Theoretical model of parent recognition and response to developmental delays
Appraisal (corroboration of parent concern) Informational (milestones, resources) Emotional (comfort, reassurance) Instrumental (transportation, financial) Response
Help-Seeking,
Enrollment in Services
Cues to Action
Perceived Self-Efficacy in ability to locate and access developmental assessment services
Perceived Benefits of seeking help
Perceived Barriers to seeking help
Perceived Threat susceptibility and severity of the developmental delay.
Modifying Factors
Recognition
Awareness, Concern
Ch
ild
Par
en
t
Fam
ily
Co
mm
un
ity

138
Figure 2.2: Map of participants’ home zip code

139
Section 5. Research Synthesis: Discussion and Conclusions
Discussion
This dissertation explored the individual, interpersonal, and community-level factors
(identified in the Pathways to Assessment model, and drawn from HBM and Social Support
theory) associated with parents’ recognition and responses to developmental and behavioral
concerns in their young children. In addition to quantifying the number and types of concerns
parents have, factors contributing to recognition of a delay, and parent judgment of a
developmental delay as a “concern”, this study examined the role of social support in impacting
HBM constructs of perceived threat (severity, susceptibility), self-efficacy and benefits/barriers
to help-seeking. The quantitative analysis of the NSCH was able to determine the factors
associated with use of public early intervention services, private intervention services, and no
services, while qualitative methods in Phase 2 examined parents’ decision-making processes
regarding the timing and type of help they would seek, if any.
It is hypothesized that while parents may have similar triggers for recognizing
developmental delays in their young children (such as developmental milestones), there would
likely be differing attitudes and experiences related to conceptualizing developmental differences
as “concerns” (i.e. differing developmental expectations by child age or sex) and related to help-
seeking choices and decisions based on family and community context (i.e. individual and
cultural differences in attitudes towards discussing concerns with others and approaches to early
intervention). In particular, the constructs of perceived threat, benefits, barriers, and cues to

140
action from Health Belief Model and sources of four types of Social Support (appraisal,
emotional, instrumental, and informational) were examined.
The results of this study point to a number of factors associated with increased or
decreased likelihood of early recognition and receipt of services for developmental delays. It
appears that child factors have the greatest influence on early recognition, and that parents
conduct some level of developmental monitoring, often with feedback from family, friends, and
professionals. In addition to child factors, factors in the parent, family, and community domains
also strongly impact access to services. Some parent characteristics associated with increased
likelihood of recognition and response – such as knowledge of typical child development and
self-efficacy – are critically important, yet the least measureable and understood. Each of these
multilevel factors as examined in this mixed-methods study is discussed in detail below.
Recognition of Developmental Delays
The high prevalence of parent concerns across developmental domains reported by
parents in the National Survey of Children’s Health (NSCH) and in the qualitative phase of this
study highlighted the breadth and depth of the issue; early identification and connection to
developmental services for young children with delays is an important problem for many young
children and their families. Nationally, the prevalence of developmental delays is estimated at
17% (Boyle, et al., 2011; Rosenberg, Zhang, & Robinson, 2008), and as examined in this study
38% of parents reported to the 2007 NSCH one or more concerns about their child’s
development, with specific types of concerns emerging at different ages. While not all parent-
reported concerns may lead to diagnosis of developmental delay, these concerns should be taken
seriously as they are usually fairly accurate indicators of some type of developmental problem
(Chia-Ying Chung, et al., 2011; Glascoe, 1997b, 2000).

141
Child Factors
Child factors associated with recognition included the type of delay, increased child’s
age, poorer health, and male sex. It was not surprising that child factors (i.e. health status and
age) impacted recognition; delays that are identified in the early years often co-occur with health
issues or birth defects, and age-specific milestones such as walking or talking for toddlers, or
early academic skills for preschoolers account for the increase in concerns as the children aged
from infancy to 5 years. In this study, compared to infants under age one, likelihood of
recognizing a developmental concern was two-fold for toddlers (aOR 2.62, 95% CI [2.03, 3.38]
at age 1, aOR 2.87, 95% CI [2.22, 3.72] age 2) and more than four times higher for preschoolers
(aOR 4.18, 95% CI [3.20, 5.44] age 3, aOR 4.13, 95% CI [3.14, 5.44] age 4, aOR 4.75, 95% CI
[3.67, 6.15] age 5) than for infants under age one (Table 1.6). Although speech and behavioral
issues are commonly responded to at ages 3 or 4, the signs of these problems appear much
earlier, and recognition of social concerns in toddlers can be early markers for autism at young
ages (Chawarska, Paul, Klin, Hannigen, Dichtel, & Volkmar, 2006; Twyman, Maxim, Leet, &
Ultmann, 2009).
The NSCH was limited in that it asked about specific concerns only through the PEDS
and did not ask about specific types of concerns for children younger than 18 months (Appendix
H), however interviews with parents (Section 4. Manuscript 2) revealed that parents remembered
health and developmental concerns from the child’s infancy, for example that the child had
always been sickly or unusually quiet. Developmental, behavioral, and medical concerns may be
delineated in research and in service systems, but for parents they are much more interrelated.
The NSCH analysis showed that in addition to recognition increasing with age, poor child health
was highly associated with 2 to 7 times increased likelihood of parent developmental concern.
142
This is certainly in part due to conditions that have both health and developmental effects. For
example, birth defects impact about one in 33 births (Parker, et al., 2010); one in 12 children is
born preterm and/or low birth weight (Boulet, Schieve, & Boyle, 2009; Boyle, et al., 2011); and
food or environmental allergies in up to one in five children can exacerbate illness and contribute
to feeding problems (Gupta, et al. 2011; Sharief, Jariwala, Kumar, Muntner & Melamed, 2011).
De Giacomo & Fombonne (1998) also found that a medical problem and delay in a milestone
was associated with lower age of recognition of concern among children with autism. In addition
to the higher prevalence of children with developmental problems among children in poor health,
parents may be more sensitized to their child’s developmental progress and behavioral patterns
when their infant has been in a state of heightened vulnerability and stress. Additionally, parents
of children with special health care needs may access health care professionals more often who
can alert them to additional developmental issues.
The higher likelihood of developmental problems among boys is well documented in the
literature; boys tend to exhibit more externalizing behaviors (Alink, et al., 2006; Auyeung,
Wheelwright, Allison, Atkinson, Nelum, & Baron-Cohen, 2009; Knickmeyer & Baron-Cohen,
2006), develop some specific skills later than girls (Boyle, et al., 2011, Chen, 2010; Else-Quest,
Hyde, Goldsmith, & Van Hulle, 2006; Spelke, 2005), and may have different cumulative
exposures contributing to developmental, medical, and behavioral problems (Leiter & Rieker,
2012).
Parent & Family Factors
In Phase 1 (NSCH analysis) maternal age, education, and parenting experience did not
appear to increase the odds of recognizing developmental concerns, a finding consistent with
other studies (De Giacomo & Fombonne, 1998; Glascoe, 1997b; Twyman, Maxim, Leet, &

143
Ultmann, 2009). Phase 2 examined more proximal factors (knowledge of child development,
social influences) and processes (appraisal) related to parent recognition.
The impact of knowledge of child development on recognition of developmental delays
has yet to be clearly established in the literature. In Phase 2, parents completed a questionnaire
and were asked directly about their knowledge of child development. Parents did not
demonstrate a strong base of specific knowledge of child development, milestones, behavioral
expectations, or red flags as measured by the KIDI. Instead, parents reported that their
knowledge of child development comes primarily from past parenting experience, or from their
own research through the internet or participation in community programs, and for a few parents,
professional experience. It appears that parents use major milestones, observational comparisons
with peers, siblings, and feedback from others to determine if the child is on target. Parents in
Phase 2 described a sophisticated process of observing their children over time and across
settings, and compared to peers or to siblings when they were of the same age.
Additionally, parents considered the child’s temperament, health status, and environment
as part of the appraisal process. Many parents reported a triggering event for noticing delays (an
expected developmental milestone, a dramatic change in behavior, or a discrepancy among
skills). In some cases, another person pointed out the developmental or behavioral concern to the
parent. In assessing whether the delay is a concern warranting formal intervention, parents
evaluated the severity of the problem based on the type and amount of delay and cultural
expectations related to the child’s age and gender. To some extent, susceptibility plays a role;
parents report delays in conjunction with other or past health problems and also based on family
history of a condition. This period of observation and appraisal takes valuable time, and concerns
could be addressed quickly and clearly with the aid of a valid, standardized screening tool.

144
In Phase 2, parents who had higher family income and education, and were White, non-
Hispanic race/ethnicity had higher scores on the KIDI (Table 2.4); though it is notable that
knowledge was fairly low across the board, which is similar to other findings (Ertem, et al, 2007;
Huang, et al., 2004). Davis-Kean (2005) found that among White and African American parents
education and income were related to child achievement indirectly through the parent’s beliefs
and behaviors (such as warmth in parent-child interactions and reading to the child, ostensibly
because the reading reflects higher educational expectations), regardless of income level. While
studies have linked knowledge of child development to parenting style and sensitivity (Gaziano,
2012; Huang, et al., 2004), this has not extended specifically to recognition of developmental
delays.
Lower levels of parenting knowledge have been found among parents who are
‘authoritarian” or “unengaged” in their parenting style (Gaziano, 2012). In some studies,
parenting style is impacted by socioeconomic status (SES), and in turn affects child development
due to perinatal conditions, prenatal care, and family resources to provide cognitive stimulation;
differences in SES manifest in child development as early as infancy (Hackman & Farah, 2009;
Turkheimer, Haley, Waldron, D’Onofrio, & Gottesman, 2003). Gaziano proposes that low SES
parents face greater barriers to parenting in the way that they would wish (p. 19), while higher
SES offers greater resources. Parents who read to their children moderately reported higher odds
of concern than those who didn’t read, yet those who read to the child most often did not have
significantly higher odds. As levels of parent involvement and cognitive stimulation at home are
associated with increased or decreased risk of developmental delays (Walker, et al., 2011;
Shonkoff & Phillips, 2000) it is possible that the mixed effects of these levels of parent
involvement do not clearly show effects due to the cross-sectional design of the study; parents

145
who are reading to the child moderately may be working to ameliorate a developmental concern,
or may be more likely to notice an existing problem, reflecting Glascoe’s description of the
“highly observant” parents who are sensitive to subtle differences in their child’s development
(1997b, p. 525).
In contrast with De Giacomo & Fombonne (1998), in the NSCH phase of this study,
children with older siblings were up to 40% less likely to have a parent report developmental
concerns, and likelihood decreased as the number of siblings increased. The reason for this
relationship is unknown, and further research is needed to determine how parenting siblings
contributes to risk, recognition, and concern for developmental delays. Parents may be less likely
to worry about developmental differences if they have older children, particularly if the older
children had some early delays that resolved on their own; perhaps similar to the ‘wait and see’
approach often taken by doctors when concerns are discussed (AAP, 2001; Porter Novelli, n.d.;
Sayal, 2005). However, this speculation is in contrast to what was found in Phase 2; parents
reported that they relied heavily on comparisons with siblings to recognize delays, and were also
more sensitive to developmental problems if another family member had also experienced issues.
In Glascoe’s study (1997b), 58% of children with disabilities in the sample had parents who did
not recognize the concern (sensitivity was low). Parents who did not recognize a concern did not
differ in health, education, income, family size, or prior special education; but these parents were
more likely to not speak English (Glascoe, 1997b).
The complex personal and social context in which parenting occurs is partially illustrated
in findings at the parent or community level. Additional parent factors related to concern
included missing maternal education, and Non-English speaking, non-White race/ethnicity. It
may be that missing maternal education may relate to a higher risk subgroup of children living

146
with no parents who also had higher risk in the bivariate model. Children may not be living with
either of their parents due to abuse, neglect, or other disrupting or traumatic circumstances,
which have been shown to impact brain development and biological stress systems resulting in
increased need for early intervention, as seen by Bramlett and Blumberg in the 2003 NSCH
(Barnett, Miller-Perrin, and Perrin, 2005; Bramlet and Blumberg, 2007; Herman, 2007; Stahmer,
Sutton, Fox, & Leslie, 2010).
The increased likelihood of developmental concerns in parents of children in households
where a language other than English is spoken was expected, as patterns of language acquisition
are different for English language learners (ELL) (Hambly, Wren, McLeod, & Roulstone, 2013;
Hoff, Core, Place, Rumiche, & Parra, 2012; Hambly, Wren, McLeod, & Roulstone, 2013;
Paradis, 2010). Much work remains in distinguishing language and learning problems from
typical patterns of acquisition among children who are ELL. Wagner, Francis, and Morris
explained that “Identification of English language learners with learning disabilities is hampered
by a lack of theory and empirical norms that describe the normal course of language and literacy
development for English language learners and the individual, school, and social factors that
relate to that development.” (2005, p.13). Increased concern was also found among English-
speaking Black parents. Although disparities in child health and development by race and
ethnicity are yet to be well understood (Rushton & Jensen, 2005); the higher rates of concern
may reflect higher developmental risks associated with comparatively poorer birth outcomes or
other risk factors among Black mothers (Curry, Pfeiffer, Slopen, & McVeigh, 2012; Feinberg,
Silverstein, Donahue, & Bliss, 2011).
In Phase 2 parents also discussed their developmental monitoring and concern appraisal
process. This appraisal process rarely occurred in a vacuum. Participants in Phase 2 discussed

147
how they often consulted with their spouse or partner first; and also discussed concerns with
family and friends. Yet, in the NSCH multivariable analysis, parent marital status and the
number of adults in the home did not significantly contribute to increased or decreased odds of
recognizing developmental concerns; however utilization of relative child care resulted in
increased likelihood of recognizing concerns. It is important to remember that in the national
survey, marital status, adults in the home, and child care source are crude measures for
interpersonal resources. As reflected in Phase 2, parents discussed a wide range of people who
they went to for developmental information, including extended family members, close friends,
and trusted professionals. Perhaps it is access to these informational resources through social
networks or other programs which assist parents in identifying red flags.
Community & System Factors
The lower odds of having a usual source of care among parents with concerns is
consistent with other aspects of health care utilization in this group; compared to parents without
concerns, parents in the NSCH reporting developmental concerns also report that they access
medical care for their children more often from the ER or Clinic than a personal doctor’s office,
have public rather than private insurance, and have a higher number of doctor visits and children
with poorer health. What really drives parent recognition of delays may be related to the provider
practices rather than the provider setting; it is not just presence of usual source of care, it is the
interactions and sometimes complex care management that must occur between parents and
pediatricians (AAP, 2006). In the NSCH, parents whose pediatrician asked about concerns also
had a much higher likelihood of recognition and help-seeking. While some providers may screen
every child in their practice, what drives providers to ask about concerns may also be related to
child factors (age/milestones, severity of delay, health status) or the parent concern. Due to the

148
cross-sectional nature of the quantitative analysis, the temporal relationship among these factors
cannot be determined. What both Phases 1 and 2 of this study show is that pediatricians continue
to be critical players in this scenario, as the first person many parents go to for developmental or
behavioral concerns.
Additionally, parents consulted with other professionals about their concerns (teachers,
home visitors, developmental specialists), as has been seen in other studies (De Giacomo &
Fombonne, 1998). The use of screening tools was reported by some parents as extremely helpful
in monitoring their child’s development and validating concerns. Unfortunately, response from
personal and professional supports was inconsistent. It appears that parents had to consult with
multiple individuals to find validation for their concerns, and it may have been an uphill battle if
the spouse or pediatrician did not agree. Sayal’s review of studies examining physician
recognition of mental health disorders in children ages 2-16 found that although parents of
children with mental health problems were in contact with their child’s pediatrician, they did not
always bring up these concerns, and even fewer were referred (2006). Predictors of recognition
of mental problems included gender, older child age, practitioner familiarity with the child, and
continuity of care.
Response to Developmental Concerns
Response to developmental concerns was based on child factors, parent appraisal of those
factors, and help-seeking was influenced by interpersonal supports, interactions, and resources.
Access to services was constrained by barriers including lack of information, cost/insurance, and
stigma/cultural preferences, and was facilitated by parental self-efficacy and formal and informal
social supports.

149
Child Factors
Poor child health status, male sex, and type of concern were predictors of enrollment in
public or private services among parents in the NSCH (Phase 1), and were described in Phase 2
as well. There did not appear to be increased likelihood of IFSP/IEP or therapy based on child
age in multivariable models, though present in the bivariate analysis. This is likely because other
factors, such as the child’s health and types of concerns play a much stronger role in impacting
accessing services than age. For example, children in poorer health are more likely to be
accessing some type of specialty care or more frequent pediatric care, may have parents with
more experience accessing care for concerns, and thus their parents have more opportunities to
learn of resources and receive referrals for then. Additionally, as described above, males are
more likely to have developmental concerns, enroll in therapy, and/ or have an IFSP/IEP. In
Sayal’s study (2006), predictors of service use for child mental health problems included teacher
concern, male gender, age, and income. In Phase 2 of the study, parents described preexisting or
family conditions sensitizing them to possible developmental problems (susceptibility) and also
an assessment of the extent and persistence of the delay in comparison to other children and
across time and settings (susceptibility).
This study found speech, language, self-help and fine motor concerns among children
were associated with higher likelihood of IEP/IFSP, and speech, self-help, or gross motor
concern were associated with higher likelihood of enrollment in private therapy. Children with
speech or language delay had the highest odds of IEP/IFSP (aOR 4.18, 95% CI [2.88, 5.97],
4.63, 95% CI [3.00, 7.15], respectively) and the highest odds of therapy enrollment (speech
concern, aOR 6.22, 95% CI [4.15, 9.34]). The patterns of referral and enrollment in services
could be based on parent or provider perceptions of the appropriate type and timing of different

150
intervention approaches, or could be driven by what services are more commonly available and
prioritized by intervention program eligibility guidelines. Earls, Andrews and Hay (2009) also
found that most children were referred for public intervention for speech and language delays,
followed by gross motor and social concerns, and that the likelihood of referral was higher when
there were parent concerns and delays in multiple domains. In another study, physicians were
more likely to refer for communication delay or gross motor delay than for other types of delays
(Hix-Small 2007). In fact, of 1,428 children at 12 and 24 month check-ups, 7.5% of children
were referred for developmental concerns; 1.8% of children were referred based only on clinical
judgment by physicians (child passed screen), another 4.3% were referred only for failed screen
(not physician recommended), and just1.4% of children were referred based on physician and
screening agreement. Referrals increased with child age (Hix-Small, 2007). Therefore, child
characteristics (age and type of delay) combined with parent and provider perceptions can impact
referral decisions.
Parent & Family Factors
The processes of concern appraisal and decision-making related to help-seeking included
balancing the perceived severity of and susceptibility to developmental problem with the benefits
and barriers to accessing developmental services. There may also be a triggering event or a cue
to action. The NSCH analysis identified that in addition to child factors, some maternal and
family characteristics (non-White race/ethnicity, non-English household language) contributed to
decreased likelihood and maternal education, income, and reading to the child increased
likelihood of accessing therapy and/or public intervention (IFSP/EIP). In Phase 2, mothers were
almost always the primary person responsible for monitoring their child’s development and
managing their care. Parents’ normative developmental and behavioral expectations, their

151
evaluation of susceptibility (the likelihood that this was a problem that would persist), and the
severity of the concern was combined with feedback from others to determine their desired
timeline for services. Finlayson found that expectations for school readiness were highly
correlated with parents’ education and that access to strategies and resources to support
development were correlated with income (Finlayson, 2004). These findings reflect the parent’s
perspective, the parent, as described by Broadhurst is “an active agent, negotiating pathways to a
range of formal or informal sources of help” (Broadhurst, 2003, p. 342).
In the NSCH (Phase 1), parents who read to their children more had a higher likelihood
of enrolling their children in public or private services (reflecting perhaps higher investment in
child development) and mothers who were older and had higher income were more likely to
access therapy. In particular, parents who were anxious to get help for their child but were put on
waitlists for public intervention sought alternative services, many of which were not covered by
insurance. Many parents were hoping to ‘fix’ problems while they felt their child was young
enough to be manageable; and others were hoping to resolve issues before school entry. The
timeline from first concern to service referral spanned months to years, and parents reported a
high level of commitment and pre-existing or growing levels of self-efficacy along the way to
meeting their child’s needs. Those who had accessed developmental services before (for a sibling
or for another issue in their child) or had professional experience in services navigation were
able to search for additional resources more confidently, and this confidence seemed to grow
over time.
In Phase 1of this study, racial/ethnic minority parents and those who speak a language
other than English at home, although more likely to have concerns, were less likely to access
services (Tables 1.6-1.8). This could relate to issues with cultural competency and language

152
barriers (Pinto-Martin et al., 2005; Rosenberg, Zhang, & Robinson, 2008; Toran, Squires, &
Lawrence, 2011; Turnbull & Turnbull, 2001). In an examination of early intervention enrollment
from the National Early Intervention Longitudinal Study, sociodemographic factors (SES)
impacted enrollment in public early intervention (IFSP), including Black race, lower income, no
parents in the household, and being male (Hebbeler, et al., 2007).
In Phase 2 parents reported extensive searching for services, as was described by parents
in another local study of parents of young children with challenging behaviors (Worcester,
2008). However, parents also described cultural values held by themselves, their spouses, or
other family members that impacted decisions around service type, timing, and disclosure about
developmental concerns. Parents don’t always recognize a need for services, and differences in
perceptions of developmental or social/behavioral problems may vary based on race, ethnicity, or
the gender of the child (Sayal, 2006; Zimmerman, 2005). Research on the social validity of
interventions has identified differences among parents’ and professionals’ perceptions of the
value and appropriateness of intervention services or programs (Callahan, Henson, & Cowan,
2008; Golly, Stiller, & Walker, 2013; McClean, Snyder, Smith, & Sandall, 2002). Parent-
professional consensus does speed the timeline from concern to services (Johnson, 2011), but
parents and professionals may not agree on diagnosis or recommendations for
intervention/management (Ho, Miller, & Armstrong, 1994). In Ho, Miller, and Armstrong’s
study only two-thirds of parents left the diagnostic evaluation with the same impression as the
professional.
From another perspective, the reduced likelihood of receiving developmental screening
or elicitation of concerns among parents who are Black (Hebbeler, et al., 2007; Rosenberg,
Zhang, & Robinson, 2008 ) or are non-White and non-English speaking, and of lower income
153
(Guerrero, Rodriguez, & Flores, 2011) was also reflected among participants. Families who
spoke a language other than English were naturally less likely to access therapy or IEP; few
programs and systems are well equipped to assist families consistently in languages other than
English. Additionally Black or Multi-racial parents (who spoke English) were still half to two-
thirds less likely to access services, perhaps related to differences in utilization of formal services
influenced by past negative experiences with primary care, early intervention, or other providers
(Bailey, Hebbeler, Spiker, Scarborough, Mallik, & Nelson, 2005; Bussing, et al., 2003, 2005;
Keller and McDade, 2000; Kerkorian, McKay, & Bannon, 2006; Oswald, Bodurtha, Willis,
Gilles, Chroston, Ogston, & Tlusty, 2011; Rosenberg, Zhang, and Robinson, 2008).
Community & System Factors
When parents in Phase 2 were asked about the role their race, ethnicity, or primary
language played in impacting the services-seeking decisions or process, some explained that
services in Spanish took much longer to access, and most clarified that other barriers (including
lack of transportation, lack of information, and financial barriers) superseded possible cultural
barriers. Additional barriers to accessing services cited in the literature include lack of insurance
(Pinto-Martin et al., 2005) and cost (Coulter, Wallace, & Laude, 1993; Halfon, Russ, &
Regalado, 2004). Those who accessed therapy had increased income; those who enrolled in
public intervention had income that was above Medicaid eligibility but below 200% FPL. Public
insurance (versus private or no insurance) increased the likelihood of both IFSP/IEP and private
therapy services, reflecting specific funding barriers to accessing therapy through private
insurance or private pay (Boyd, Odom, Humphreys, & Sam, 2010).
Those parents who did connect with service referrals described a network of providers;
some pediatricians conducted regular screening and referred families to private therapy, public

154
intervention, or to other specialists. A few professionals in the community were anchors of
support for some of the parents. Instrumental and emotional support – often from family or
friends– helped parents cope with some of the barriers they encountered to seeking and finding
help; stigma, lack of transportation, cost/insurance coverage, and wait lists. The informational
support, often provided by professionals, helped parents overcome some of the barriers and
navigate systems. A web of professional and personal social supports can facilitate coping and
help with accessing and coordinating services (Twoy, 2007). Benin and colleagues found that
parents relied on trusted others for information and to help with decision making about infant
vaccines; their decisions were strongly influenced by “promoters” and “inhibiters” (Benin,
Wisler-Sher, Colson, Shapiro, & Homboe, 2006).
Being able to identify a key person for developmental appraisal and for informational
support seems to increase access to appropriate supports and services. Current measures and
program designs that limit designation of this key person to a primary doctor or medical home
may miss the possibility that the trusted person is another type of professional (e.g. home visitor,
teacher, social worker, developmental specialist, etc.) or another parent. As seen in other studies,
parents articulated clear preferences as to whom they were comfortable sharing developmental
(Broadhurst, 2003; Keller & McDade, 2000) or behavioral concerns (Edelstein-Dolev &
Selberstein, 2003; Lau & Takeuchi, 2001; Raviv, et al. 2003a, 2003b); sometimes it was a
professional and sometimes it was friends or family.
The reported rates of screening and referral by pediatricians is consistent with what has
been found in the research; roughly half of pediatricians don’t conduct developmental screening,
and approximately 75% don’t uses standardized assessments (Bethel, et al., 2011; Halfon,
Regalado, & Sareen, 2004; Pinto-Martin et al., 2005; Sand et al., 2005). About half of

155
respondents in the NSCH (Phase 1) and half of participants in Phase 2 of this study reported that
their pediatrician or mobile clinic developmental specialist conducted some type of screening
(verbal or using a questionnaire). While community efforts can improve rates of developmental
screening among pediatric providers, many still did not consistently refer children who fail
screens to services (Earls, Andrews, & Hay, 2009; King, et al., 2010; Schonwald, et al., 2009).
Many of the parents really relied on their pediatrician for guidance, yet did not receive it. Some
parents were reluctant to discuss developmental issues with their pediatrician as well; two
parents had brought up medical concerns but not developmental ones. Those who did were as
often as not told to wait until the next check-up to see how the child was doing, which has also
been cited in past studies (Daniel, et al., 2009; Mendez & Hess, 2003; Seligman & Darling,
2007).
Referral coordination also created a pathway for parents, albeit convoluted at times;
pediatricians referred parents to other specialists or community programs, private providers
referred to other private services, and family support personnel referred to community screening
or public intervention (Miller, Condin, McKellin, & Shaw, 2009). The descriptions of this
process of connecting to help through provider networks are aligned with other local reports
(Worcester, 2008) and with recommendations for screening and referral described in Bethell and
colleagues’ analysis of national trends (Bethell, Reuland, Schor, Abrahms, & Halfon, 2011). For
example, a workgroup examining child screening for the Florida Cabinet of Children and Youth
(Ghazvini, 2009) identified gaps in screening and referral, and recommended creating a system
of standardized screening across Florida, including expanding SHOTS registry (online database
of immunization and other health records), promoting EPSDT and insurance reimbursements for
screening, expanding access to mental health screening, increasing training for providers and

156
screening vulnerable children (such as those in the child welfare system), improving capacity of
public early intervention, and identifying services for those children who do not qualify for
public intervention.
Research Methodology: Strengths & Limitations
Compatibility of Findings with the Proposed Theoretical Framework
The results of this study illustrated the usefulness of the proposed theoretical framework
“Pathways to Assessment Services” (Figure 2.1), which incorporates constructs from the
Socioecological Model, the Health Belief Model, and Social Support Theory to describe
recognition and help-seeking for developmental delays. The processes of concern appraisal and
decision-making related to help-seeking described by parents in this study were typified
weighing perceived threat with benefits and barriers. Triggering events and cues to action were
clearly remembered by parents in Phase 2. Additionally, modifiers (SES, race/ethnicity, primary
language) were examined in Phase 1 and explored more in depth in Phase 2. Both formal and
informal sources of informational, instrumental, emotional and appraisal support contributed to
recognition of developmental problems and both positively and negatively influenced the process
of appraisal, and help-seeking. Recognition of developmental delays was dependent upon the
parents’ developmental monitoring process, although knowledge of child development was not
fully captured using the KIDI (Ertem, et al., 2007; Gaziano, 2012; Huang, et al., 2005; MacPhee,
1981; Smith, Akai, Kleman, & Kletner, 2010). Additionally, pursuit of information and services
was highly reliant on parental self-efficacy; though it was not directly measured in the NSCH
(Phase 1), self-efficacy was clearly described in Phase 2. Ultimately, examining parents’
experiences by using apt and measureable theoretical models can provide valuable insight into
the factors and processes influencing recognition, concern, and decision-making related to
157
developmental delays, and can be used to create more valid and reliable measures that can be
used on a larger scale. Well-established theoretical models that have created an evidence base in
their use for addressing other public health problems can potentially be applied to improving
identification and intervention efforts to support children with special needs and their families
more effectively.
Mixed Methods Approach
A mixed methods approach was used for this study due to the breadth, depth, and
complex nature of the proposed research questions (Weathers, et al., 2011; Tashakkori &
Teddlie, 1998). Utilizing mixed methods (both qualitative and quantitative) allowed for
triangulation of data and offered a more comprehensive view of multilevel factors associated
with early parent recognition and help-seeking, in the context of their socio-economic and social
circumstances, family structure and lifestyle, and interactions with medical and early childhood
systems. For example, weak associations between marital status, child care, and medical
home/usual source of care found in Phase 1 were explained more clearly in Phase 2. Contrary to
what may be assumed, just because a parent is married or has a usual source of child care or
medical care for the child doesn’t guarantee that the parent has access to social supports,
developmental screening, or referral for developmental concerns. The strong associations
between child age and health, primary language, provider elicitation of parental concerns with
increased odds of recognition and services enrollment found in Phase 1 was strongly reinforced
in Phase 2.
The two approaches (quantitative and qualitative) were highly complementary, and
allowed for a more comprehensive picture to be conceptualized in terms of parental recognition
and response to a variety of developmental and behavioral concerns during the critical period of

158
early childhood. Phase 1 allowed examination of various factors among a large and diverse
sample of parents from the 2007 National Survey of Children’s Health (NSCH), and Phase 2
identified important influences, processes, beliefs, and preferences that were not captured in
existing datasets (Appendix S). Quantitative measures of many of these variables are available in
the research literature (Blanchard, Gurka, & Blackman, 2008), and are also measured in some
national surveys (Appendix R). Some of the variables, such as perceptions of severity or specific
sources and types of social support, can be better understood via qualitative methods. Other
potential modifying factors, such as parent education, income, experience, and insurance status
are also measureable and widely collected at the national level through surveys; far less
researched are the relationships between these variables, and the relative contributions of each
one to the likelihood that a parent will detect, develop concern, and then seek help for a
developmental delay.
Phase 1: Quantitative Analysis
The quantitative approach in Phase 1 using the NSCH provided an overview of the
problems of underdetection and underenrollment for developmental delays which can illustrate
gaps in policy development and implementation at the national or state level. The wide range of
variables available in the dataset also allowed for examination of factors associated with early
recognition, concern and help-seeking for parents from diverse backgrounds, to identify specific
groups who may be falling through the cracks. The strengths of this approach are generalizability
and validity by asking standardized questions across populations; the limitation is that questions
may be interpreted in different ways and cannot be verified by other means (Blumberg &
Cynamon, 2001), respondents are limited by answer choices presented, and processes cannot be
easily described through a cross-sectional dataset.

159
While the data were derived from parent report and could not be verified with other
sources, results could be compared to findings from other large surveys and datasets to establish
some reliability. Furthermore, while the presence of a developmental delay was not confirmed by
a formal evaluation, the use of the valid and reliable PEDS screening tool within the survey
increased validity, and there is research suggesting that to some extent, parent concern is a
reliable indicator of a delay (Glascoe, 1997b). Unfortunately we cannot identify children within
the dataset who may have developmental delays, but have not elicited parent concern.
The analysis was also limited to those variables available within the NSCH protocol. The
questions examining parents’ developmental concerns was answered inconsistently; only 9% of
parents answered affirmatively for “Any concern about the child’s learning, behavior”, yet 38%
of parents reported a specific concern about specific speech, language, motor, behavior, social,
self-help, or academic development. Scoring criteria for risk of developmental delay is based on
Glascoe’s assertion that for specific ages there are age‐specific parental concerns that are
“predictive” of a child’s risk for delays (2000). The more concerns a parent has related to the
specific predictive items, the more at risk the child is for delays. Children whose parents’ report
concerns related to 2 or more predictive items, are identified as at “high risk”. Children whose
parents’ have concerns related to one item that is predictive of a delay are identified as at
“moderate risk”. Children whose parents have concerns, but those concerns are not predictive of
delays are identified at “low risk”. Lastly, children whose parents report no concerns regarding
any of the eight items asked are identified as “no risk” (Data Resource Center, 2011). In
Glascoe’s study, about 80% of participants reported concerns regarding the child’s behavior,
social, or speech development, followed by 60% with academic, receptive language, or self-help
concerns, and 20-30% with fine or gross motor concerns. This is consistent with the reports of

160
parents in the NSCH. Because parents perceive and express concern differently, the widest
possible measure was used in this study: any level of general or specific concern expressed by
parents (Section 3, Manuscript 1, Table 1).
Secondly, there are no precise measures of parenting self-efficacy, knowledge of child
development, or other parental factors that may positively impact recognition or help-seeking for
developmental delays at the parent level. The NSCH does measure parenting experience
(siblings), maternal education, and number of days read to the child (which showed significant
associations across all three outcomes). Additionally the race variable is derived from a question
asking about the child’s race, not the race or ethnicity of the parent, and the primary language
question refers to language spoken in the household. Thus, measure of parent race/ethnicity and
primary language is imprecise and does not capture actual maternal demographics.Third, there
was not a comprehensive examination of social support, nor were the subtypes of social support
distinguished; marital status, number of adults in the household, relative child care, and
neighborhood level trust and support are measured in the NSCH. As found in the literature, the
role of friends and family members in this process is an important one, and not captured in this
dataset (Broadhurst, 2003; Bussing, et al., 2005; Gamoran, Turley, Turner, & Fish, 2011; Keller
& McDade, 2000; Sayal, 2005; Twoy, 2006). Finally, there was not a direct measure of “help-
seeking” in the NSCH, so enrollment in services was used as the outcome indicator of help-
seeking. Unfortunately, the percentage of parents who have successfully enrolled in services is
less than 5%; so again we only have information on those who have purposefully and
successfully accessed services. However, the distinction between the most common intervention
approaches – enrollment in public intervention (IFSP/IEP) versus private therapy – is
enlightening in that it points out potential facilitators and barriers to service options for a variety

161
of children and families. Phase 2 of the study was able to examine all of these variables more
closely.
Due to the cross-sectional nature of the analysis and the multifactorial origins of
developmental delays, only broad associations could be examined; it is impossible to disentangle
risk factors for developmental delay in children versus those factors predictive of parental
recognition. Most questions in the NSCH are not asked specifically in the context of
developmental concerns and services. Again, triangulation of findings from Phase 2 and from
other studies documented in the literature can help in interpretation of the results.
The strength of the NSCH analysis is its diverse sample of over 27,000 parents of
children ages birth to five years, and the inclusion of several covariates at multiple
socioecological levels in the analysis. This analysis is much more generalizable than a clinical
sample in that it casts a ‘wide net’ of parent concern rather than only confirmed cases or only
parents who accessed services.
The results of this study can guide efforts to improve early recognition of developmental
concerns and also increase the timeliness of early intervention for children in need of those
services by addressing well-known barriers, such as non-English primary language, insurance
coverage, and the continued need for screening and referral in well-child care. We can use child
data as a barometer for where targeted screening and outreach does and should occur, and
consider the parent factors identified as influencing the process.
Phase 2: Qualitative Analysis
In addition to the big picture presented in Phase 1, more focused research on individual
experiences can answer complex and nuanced questions about processes and systems for which

162
data are either unavailable in existing datasets, or difficult to quantify in a survey format. The
strength of this approach is that participants can speak in their own words, clarify meaning and
give relative weights to different influences, share context and background, and discuss feelings
and thought processes, resulting in a deeper understanding of complex experiences over time.
Qualitative methods offer the ability to document the depth and complexity of each parent’s
experience, including the influences of unique individual and interpersonal factors and the larger
context of the family’s prior experiences and current circumstances. Potential limitations include
recall bias, lack of full disclosure due to social desirability bias, potential selection bias, and lack
of generalizability.
Qualitative methods are especially useful for underrepresented groups by increasing
understanding of cultural and other influences and context-specific challenges from each parent’s
unique perspective through a detailed account in their own words. Purposive, convenience
sampling, while not generalizable, is a viable approach to recruiting participants from specific
subgroups within the population who are willing to share their perspectives and experiences.
Based on national and local estimates (US Census, 2010b; Mendez & Hess, 2003), there are
likely thousands of infants and young children in Hillsborough County who have developmental
concerns, yet have not received the developmental supports and services they need during critical
windows of development. The goal of this study was to obtain the perspectives of parents who
were in the process of help-seeking; therefore the high percentage of parents who were not in
services provided enlightening information on the decision-making process prospectively. The
diverse sample of parents (by race/ethnicity, primary language, income, education, and
geography) also offered a variety of perspectives not always elicited in other studies.
Recruitment of this diverse and hard to reach sample was made possible by the strong social

163
networks, structures and mechanisms for community dialogue, value systems, and the learning
culture among community partners in Hillsborough County, including local coalitions and
convening groups organized around funding streams (such as The Children’s Board or United
Way), specific populations (e.g. Hispanic Services Council, etc.), and health issues (e.g.
ReachUP for pregnant women or the Children’s Committee addressing child welfare) with a long
history of collaboration among stakeholders.
While the heterogeneity of the sample was a strength, it is also a limitation in that it
challenges theoretical saturation. Interviews continued to be conducted until no new information
was being heard from parents in terms of their perceived influences on recognition and help-
seeking. The diversity among parent participants by demographics and by where they were in the
timeline of recognition and response was further diversified in the age, health status, and
developmental issues among the children. However all of these parents described the process of
observing developmental issues and help-seeking that were similar to parents of children with no
pre-existing concerns and this range of children is similar to what is found in other studies.
However, participants who were willing to be interviewed may differ from those who would not
participate in the study, and participants were largely recruited from agencies and may be more
reflective of parents who are willing to access formal services. To reduce selection bias,
participants were recruited from a wide range of community agencies and not recruited from
specific early intervention programs.
Analysis was iterative and recursive, and included reliability checks at all stages. There
was very little overlap among 962 coded segments, suggesting that the codes were distinct.
Additionally, this project incorporated valid standardized measures in the form of questionnaires
(PEDS and KIDI), and increased reliability through the use of a focus group/interview guide and

164
a theory-based coding strategy. It was not possible to verify participants’ responses (e.g. reported
income, program enrollment, child developmental status, etc.), but triangulation of data was used
wherever possible and the community-based settings, option of individual interviews, and
bilingual materials, community partner recruiters, and research team members helped to raise the
comfort level of participants in discussing sensitive topics, such as stigma and cultural
differences. While every effort was made to ensure that participants felt comfortable talking
about their issues and concerns, and the role that their race, ethnicity, and other individual
characteristics as well as close personal relationships played in impacting their experiences, it is
possible that some participants were less forthcoming about personal issues and challenges and
withheld important information. The interview guide was piloted in rural and urban settings in
Malaysia – this pilot study was helpful in preparing a guide and approach that could examine
perceptions of developmental delays and intervention options among a widely diverse population
of Iban, Malay, and Chinese parents of children with diagnosed disabilities as well as the general
attitudes and perspectives on this topic among community members. While the population in
Malaysia is different than those locally, the approach was useful in that it gave the primary
investigator experience in presenting issues and questions in as culturally unbiased manner as
possible, and in conducting multilingual research.
Second, each participant completed a packet including a demographic questionnaire, the
PEDS questionnaire, and the KIDI. All of these items were translated into Spanish and reviewed
by native Spanish speakers from Mexico, Puerto Rico, Columbia, and Panama. The demographic
questionnaire has been used in several other studies by the primary investigator, and thus has
been piloted in English and Spanish versions. Of concern is the number of inconsistencies in how
parents completed the PEDS questionnaire (as was found in the NSCH, Phase 1); there were

165
discrepancies between what parents reported on the questionnaire versus what they described in
the interviews. This observation underscores the important issue of individual perspective:
whether the parent reported the concern as “a lot” or “a little” is subjective and context-
dependent. Additionally, the KIDI may not capture the specific types of knowledge of
development necessary for recognition of developmental delays or social and behavioral
expectations. Reported knowledge and measured knowledge of child development has not been
rigorously examined in the context of accurate recognition of developmental concerns, partly
because there is not a measure specifically designed for this purpose. Although parents’
anecdotally-reported levels of knowledge of development were significantly correlated with
KIDI scores (Table 2.4), their descriptions of the developmental monitoring process, experience,
and skills did not correspond well with the measure. Perhaps recognition of developmental
differences and delays relies on a more global sense of what developmental steps or milestones
should be accomplished for a given age – while we know parents are generally correct when they
do see a developmental problem, their accuracy regarding specific expectations or the type of
delay is relatively low. More research in this area is needed to identify what key triggers for
noticing concerns would be best understood and most utilized by parents of all backgrounds.
Finally, although parent report of referral was recorded from transcripts, the actual
developmental or referral status of the child was not formally assessed in this study; thus some of
the children in this study may not have confirmed developmental or behavioral problems that
would warrant intervention services. However, the PEDS has been established as a valid and
reliable screening tool, and PEDS scores of participants (24 children) indicated that 8 children
should be referred, 11 vigilantly monitored, and 5 should be counseled, then referred for parent
training or behavioral intervention as needed. The interviews did not delve deeper than a general
166
discussion regarding motivations for obtaining screening or for enrollment in services, and these
motivations may represent important attitudes and beliefs about developmental expectations,
monitoring, and services (Finlayson, 2004). For example, two participants expressed that they
were very concerned but reluctant to access services, and another parent was only a little
concerned but was eager to access services as ‘prevention’. This ambivalence about the
connection of concerns to services requires further study.
Conclusion
The study demonstrates that delays and concerns span all ages, income levels,
race/ethnicity and family structures. Certainly it is important to identify children at risk,
particularly at the earliest ages, and among those with significant health concerns. There does not
appear to be a clear understanding of child development and indicators of developmental and
behavioral problems among parents or providers, particularly for children under age three and for
social/behavioral concerns. Early intervention programs that end at age three stop enrolling
children at age 2½ and Child Find programs for 3-5 year olds may not assess children after age 4,
instead waiting until the child enters kindergarten. Glascoe (2005) asserts that young children at-
risk generally demonstrate mild delays by age two, and ages three and four are the most common
ages for identifying developmental problems among prekindergarten children, and also the ages
parents become most motivated to get help for their children, thus the systems must be
streamlined to account for the flood of referrals at that age while simultaneously working to
improve earlier identification and referral. Future studies can more closely examine parent and
provider perceptions which will inform efforts to critically evaluate, improve, and expand
culturally relevant parent and professional education efforts to increase timely recognition and
response to a variety of developmental issues.
167
This study illuminated factors related to recognition of developmental delays and also
differences in access to public and private services. While the NCSH examination of help-
seeking was limited to those enrolled in services, the study showed the large scale of parents’
concerns and pointed to potential gaps in access to care. In accessing public and private
intervention, policy makers must recognize the differences in access for specific types of
concerns, and particularly the large gap in support for behavioral concerns which are among the
most common concerns. Insurance and financial gaps remain barriers to accessing service
options (public versus private), as do cultural differences, particularly among families whose
home language is not English. When asked directly about whether their race, ethnicity, or
primary language affected their experiences, parents replied that it was other factors that
influenced their process more strongly. This does not necessarily mean that people don’t
experience disparities in quality of care based on their race, ethnicity or primary language,
simply that studies examining racial and ethnic disparities in services access and utilization
carefully account for socioeconomic factors in their analysis. The NSCH did identify the role of
relative caregivers in increased recognition and the crucial role of health care providers in
eliciting parent concerns and providing referrals to services. Child care providers may offer
developmental screening and referral, however not consistently enough to demonstrate a
significant influence on the process in this study. Phase 2 uniquely contributed to our current
understanding of how parents interface with early intervention systems with the influence of both
formal and informal parenting supports in the community. There was also a range of other
opportunities for informational and appraisal support – namely informal sources (spouse,
extended family, and friends) and trusted professionals (developmental specialists through
community centers, playgroups, mobile clinics, preschools, and home visiting programs).

168
In combination, Phases 1 and 2 of this study also identified triggers for parental
recognition and help-seeking for developmental delays and preferred entry points and pathways
to assessment services. The process of identifying and appraising developmental delays, then
navigating service systems to access screening, assessment, referral and services is one that takes
time. In this study, identification of at least one key support person facilitated the process. We
cannot ignore the important role that fathers, friends, and extended family members play in
helping parents assess concerns and navigate often circuitous systems. Continued research is
needed on informal sources of information and support and social networks for parents of young
children. Because families hear about services through word of mouth, and providers also
operate through social networks, it is important to recognize this and include relationship-
building in planning and funding for community-wide efforts and social marketing campaigns.
Anderson and colleagues (2003) conceptualize early childhood education as part of a coordinated
system including child care, nutrition, housing, transportation, employment, and health care.
Community programs must continue to build case management into their designs; those case
managers must be developmental specialists who can form trusting, stable, and long-term
relationships with parents across intervention systems and transitions. Better measures of sources
and type of social support in our national and local surveys and social network mapping would
be helpful components in parenting and services access research.
We have research on some barriers to accessing care, including disparities by
race/ethnicity, income, and insurance status (Batshaw, 2002; Coulter, Wallace, & Laude, 1993;
Halfon, Russ, & Regalado, 2004), but there is little on the relative impact of different barriers.
For example, one parent found that transportation was a barrier that superseded language,
income, time or any other factor. Qualitative research can more clearly define the economic,

169
social, and cultural barriers that could ultimately be used in larger scale studies to create
structural equation models to map these pathways more accurately.
Future Study
This study will contribute to our current understanding of how parents may interface with
early intervention child find systems as well as informal supports in the community, identifying
key triggers for parental awareness and help-seeking for developmental delays and preferred
entry points and pathways to assessment services. There is a need for better measures of parent
knowledge of child development that specifically focus on major and more subtle milestones at
shorter and earlier intervals. To some extent, decision-making about developmental expectations
and accessing services is impacted by their cultural beliefs and the parent’s own background
(Finlayson, 2004). Additionally, we have few standardized measures of parenting confidence,
knowledge of early childhood development, and self-efficacy. Specifically, more research is
needed to examine what parents and providers believe is an appropriate age to begin early
intervention for specific types of developmental delays or behavioral concerns. Future study to
identify the role of others in the parent’s environment more broadly (formal and informal) and at
a larger scale can greatly facilitate recognition and access to services. The role of additional
factors – access to information, and family culture, dynamics, and involvement could also be
better measured. National surveys continue to improve in this area, though more could still be
done. Further examination of the timing and process of recognition and responses to delays
requires longitudinal approaches which could best be captured by population wide studies and
through registries/databases of screening, referral, services, and child outcomes. The results of
this study provide can contribute to the body of information to help inform and improve
170
community education, developmental screening, and Child Find outreach efforts to enhance
early identification and intervention for developmental delays.
Implications for Public Health
1) There is an ongoing need to research the causes, risk factors, co-morbidities, onset, and
stability of diagnosis for different types of developmental delays through longitudinal
research (Hebbeler, et al, 2007). Development of better screening and assessment tools,
particularly for infants and toddlers, and implementation of universal screening would
greatly assist families in moving quickly from recognition to response. Efforts to increase
early and regular screening using standardized tools in pediatric offices, early childhood
programs, and community settings should be applauded and expanded. The focus on
identifying autism as early as 18 months (De Giacomo & Fombonne, 1998),
recommendations put forth by Bright Futures (Sices, 2007), and other projects have
raised awareness of this issue and work towards increasing and improving screening in
pediatric offices (AAP, 2006; Allen, Berry, Brewster, Chalasani, & Mack, 2010; King, et
al., 2010).
2) Education about developmental expectations, the importance of early intervention, and
intervention options needs to be provided to the public, including fathers, and also to
professionals. Further research would improve our understanding of knowledge of child
development, developmental monitoring, and appraisal of concerns from the public,
parent, and practitioner perspectives would uncover attitudes, beliefs, social norms, and
potential biases inhibiting help-seeking and referral for children with developmental
problems (Ertem, et al., 2007). More precise, valid and reliable measures of parent
knowledge of child development (Gaziano, 2012; Hamilton & Orme, 1990) would help to
171
inform and improve social marketing campaigns such as Learn the Signs, Act Early
(Patel, 2007; Porter Novelli, n.d.) and other health education efforts disseminated via
popular entertainment and news media (newspaper, television, and film), parenting
magazines, and on websites to trigger, validate, and reinforce parent concerns, and to
assist families in accessing developmental screening and assessment services.
3) While vulnerable populations can be targeted for recognition and referral (e.g. parents
whose primary language is not English, lowest income families, teen parents, children in
foster care, etc.) the most ideal approach will be population wide, because programs
targeting parents from a deficit perspective based on specific risk characteristics can
contribute to stigma and rejection of those services. Instead, population-wide programs
open to all parents are more likely to be utilized, and research has shown that parents
with more resources also encounter significant challenges to accessing services and
supports. Additionally, as illustrated in Phase 2 of this study, some parents prefer to
observe their children across settings and to discuss concerns with trusted individuals;
community assets that provide space and time for those connections (such as Family
Support and Resource Centers or local libraries) are critically important. Others may find
it stigmatizing or culturally inappropriate to discuss certain types of concerns; having
information and parent-completed screening tools, such as the ASQ, available online and
throughout the community (in pediatric offices, child care settings, and public spaces)are
important ways to support parents.
4) Screening needs to lead to referral, and referral is driven by parent and provider
perceptions of social norms about children’s development, program capacity and social
validity of different types of interventions. We must increase the comfort level of parents

172
and providers in discussing developmental screening results and intervention options and
knowledge of local resources that meet families’ needs (Sices, 2007). Enhancing and
strengthening existing social networks and developing new linkages will increase all
types of social support for parents and will improve coordination among service
providers (Heaney & Israel, 2008; Miller, Condin, McKellin, & Shaw, 2009).
5) However, we need to continue to demonstrate the efficacy of different service delivery
models – to conduct social validation studies, barriers and highlight benefits, to increase
capacity, and reduce stigma. Comprehensive longitudinal studies can examine
participants, services, and outcomes (Hebbeler, et al., 2007). Community wide programs
such as ABCD or Help Me Grow can be expanded and evaluated (Sices, 2007), and
studies of local systems (Marshall & Mendez, n.d.; Johnson, 2007; Worcester, 2008).
6) Timing is critically important. Researchers must continue to examine the timeline from
recognition to services on a large scale; to identify where the roadblocks are, and to
determine ideal windows of opportunity such as well-child visits, transitions to preschool
and kindergarten entry.
173
References
Abidin, R. R., PAR Staff, Ona, N. (1995). Parenting Stress Index (3rd
Ed.) [PSI] Mental
Measurements Yearbook: 13, AN: 13121472.
Alink, L. R. A., Mesman, J., van Zeijl, J., Stolk, M. N., Juffer, F., Koot, H. M., Bakerman-
Kranenburg, M. J., & van IJzendoorn, M. H. (2006) The early childhood aggression
curve: development of physical aggression in 10- to 50-month-old children. Child
Development, 77(4), 954-966.
Allen, S. F. (2007). Assessing the development of young children in child care: A survey
of formal assessment practices in one state. Early Childhood Education Journal,
34(6).
Allen, S. G., Berry, A. D., Brewster, J. A., Chalasani, R., & Mack, P. K. (2010). Enhancing
developmentally oriented primary care: and Illinois initiative to increase developmental
screening in medical homes. Pediatrics, 126; S160-S164. DOI: 10.1542/peds.2010-
1466K
Alexander, G. R. & Kotelchuck, M. (2001). Assessing the role and effectiveness of prenatal care:
history, challenges, and directions for future research. Public Health Reports, 116(4),
306–316.
American Academy of Pediatrics (AAP) Committee on Children with Disabilities
(2001).Developmental surveillance and screening of infants and young children.
Pediatrics, 108(1) 192-195.
174
American Academy of Pediatrics (AAP) Council on Children with Disabilities Section on
Developmental Behavioral Pediatrics, Bright Futures Steering Committee and Medical
Home initiatives for Children With Special Needs Project Advisory Committee. (2006).
Identifying infants and young children with developmental disorder in the medical home:
An algorithm for developmental surveillance and screening. Pediatrics, 118(1).
American Academy of Pediatrics (AAP) (2008) Recommendations for Preventative Pediatric
Health Care. Retrieved from
http://brightfutures.aap.org/pdfs/AAP%20Bright%20Futures%20Periodicity%20Sched%
20101107.pdf
American Psychological Association (APA): Task Force on Early Mental Health Intervention
(2003). Addressing Missed Opportunities for Early Childhood Mental Health
Intervention: Current Knowledge and Policy Implications. Retrieved from
http://www.apa.org/pi/cyf/emhireport.pdf
American Psychological Association (APA): Working Group on Children’s Mental Health
(2001). Developing Psychology’s National Agenda for Children’s Mental Health: APA’s
Response to the Surgeon General’s Action Agenda for Children’s Mental Health.
Retrieved from http://www.apa.org/pi/cyf/dpnacmh.pdf
Anderson L. M., Shinn, C., Fulilove M. T., Scrimshaw, S. C., Fielding, J. E., Normand J.,
Carande-Kulis, V. G., and the Task Force on Community Preventive Services.(2003).
The effectiveness of early childhood development programs: A systematic review.
American Journal of Preventive Medicine, 24, 32-46.
Annie E. Casey Foundation (2011). Kids Count Data Center. Retrieved from
http://datacenter.kidscount.org/

175
Aron, L. & Loprest, P. (2012). Disability and the education system. The Future of Children,
22(1). 97-122.
Auyeung, B., Wheelwright, S., Allison, C., Atkinson, M., Nelum, S., & Baron-Cohen, S. (2009).
The Children’s Empathy Quotient and Systemizing Quotient: Sex differences in typical
development and in autism spectrum conditions. J Autism Dev Disord 39,1509–1521.
doi:10.1007/s10803-009-0772-x
Axelrod, R., & Tesfatsion, L. (2005). A Guide for Newcomers to Agent-Based Modeling in the
Social Sciences. Paper provided by Iowa State University, Department of Economics in
its series Staff General Research Papers with number 12515. Retrieved from
http://ideas.repec.org/p/isu/genres/12515.html.
Azjen, I. (1985). From intentions to action: A theory of planned behavior. In Kuh., J. &
Beckman, J. (Eds.), Action Control: From Cognitions to Behaviors, (p. 11-39). New
York: Springer.
Azjen, I. (1991). The theory of planned behavior. Organizational Behavior and Human Decision
Processes, 50; 179-211.
Bachrach, A., Isakson, E., Seith, D., & Brellochs, C. (2011). Pediatric Medical Homes:Laying
the Foundation of a Promising Model of Care. National Center for Children in Poverty.
Retrieved from http://www.nccp.org/publications/pdf/text_1041.pdf
Balcazar, F. E., Garcia-Iriarte, E., & Suarez-Balcazar, Y. (2009). Participatory action research
with Colombian immigrants. Hispanic Journal of Behavioral Sciences, 31(1), 112-127,
Bailey, D. B., Hebbeler, K., Spiker, D., Scarborough, A., Mallik, S., & Nelson, L. (2005). Thirty-
six-month outcomes for families of children who have disabilities and participated in
early intervention. Pediatrics,116(6),1346-1352. doi:10.1542/peds.2004-1239

176
Barnett, O., Miller-Perrin, C. L., & Perrin, R. D. (2005). Family Violence across the Lifespan
(2nd Ed.) Thousand Oaks, CA. Sage Publications.
Barnett, W. S., & Masse, L.N. (2002) Funding issues for early childhood care and education
programs. In Cryer (Ed.). Early Childhood Education and Care in the USA, (2002).
Baltimore: Paul H. Brookes Publishing Co.
Bartholomew, L. K., Parcel, G. S., Kok, Gottlieb, N. H., & Fenandez, M. E. (2011). Planning
Health Promotion Programs, (3rd Edition). San Francisco: Jossey-Bass
Batshaw, M. L. (2002). Children with Disabilities (5th ed.). Washington, D.C.: Paul H. Brookes
Publishing.
Beck, A., Steer, R. A., Brown, G. K. (1996). Beck Depression Inventory-II. [BDI-II] Mental
Measurements Yearbook,14 (AN: 14122148).
Ben-Arieh, A. (2011). How do we measure and monitor the “state of our children”? Revisiting
the topic in honor of Sheila B. Kamerman. Children and Youth Services Review. Doi:
10.1016/j.childyouth.2011.10.008
Ben-Shlomo, Y. & Kuh, D. (2002). Editorial: A life course approach to chronic diseases
epidemiology: conceptual models, empirical challenges and interdisciplinary perspectives
International Journal of Epidemiology, 31, 285-293. doi:10.1093/ije/31.2.285
Ben-Shlomo Y, Kuh, D. (2007). A life course approach to chronic diseases epidemiology:
conceptual models, empirical challenges and interdisciplinary perspectives. International
Journal of Epidemiology 2007;36(3):481-483.
Benin, A. L., Wisler-Scher, D. J., Colson, E., Shapiro, E. D., & Holmboe, E. S. (2006).
Qualitative analysis of mothers’ decision-making about vaccines for infants: the
importance of trust. Pediatrics, 117(5); 1532-1541.

177
Benjes, L. S., Brooks, D. R., Zhang, Z., Livstone, L., Sayers, L., Powers, C., Miller, D. R.,
Heeren, T. & Geller, A. C. (2004). Changing patterns of sun protection between the first
and second summers for very young children. Archives of Dermatoloty, 140, 925-930.
Berge, J. M., Mendenhall, T. J., & Doherty, W. J. (2009). Using community-based participatory
research (CBPR) to target health disparities in families. Family Relations, 58(4), 475-
488.
Bergman, D. (2004). Screening for behavioral developmental problems: issues, obstacles, and
opportunities for change. Pediatrics, 99, 830-837.
Bernstein, J., Gracyk, A. Lawrence, D., Bernstein, E., & Strunin, L. (2011). Determinants of
drinking trajectories among minority youth and young adults: the interaction of risk and
resilience. Youth & Society, XX(X). doi: 10.1177/0044118X10382033
Bess, G., Allen, J., & Deters, P. B. (2004). The evaluation life cycle: A retrospective assessment
of stages and phases of the Circles of Care Initiative. American Indian and Alaska Native
Mental Health Research: The Journal of the National Center, 11(2), 30-41.
Bethell, C. D., Read, D., Blumberg, S. J. & Newacheck, P. W. (2008). What is the prevalence
of children with special health care needs? Toward an understanding of variations in
findings and methods across three national surveys. Maternal and Child Health Journal,
12; 1-14.
Bethell, C., Reuland, C., Schor, E., Abrams, M., & Halfon, N. (2011). Rates of parent-centered
developmental screening: disparities and links to service access. Pediatrics, 128(1); 146-
155.
Black, K. & Lobo, M. (2008). A conceptual review of family resilience factors. Journal of
Family Nursing, 1433-55. Doi: 10.1177/107840707312237

178
Blackman, J. A., Gurka, M. J., Gurka, K. K., & Oliver, M. N. (2011). Emotional, developmental
and behavioural co-morbidities of children with chronic health conditions. Journal of
Pediatric Child Health, 47(10):742-7. doi: 10.1111/j.1440-1754.2011.02044.x
Blanchard, L. T., Gurka, M. J., Blackman, J. A. Emotional, developmental, and behavioral health
of American children and their families: a report from the 2003 National Survey of
Children’s Health. Pediatrics, 117(6); e1202-e1212. doi: 10.1542/peds.2005-2606
Blumberg, S. J. & Cynamon, M. L. (2001). Misreporting Medicaid Enrollment: Results of Three
Studies Linking Telephone Surveys to State Administrative Records. In Seventh
Conference on Health Survey Research Methods. Centers for Disease Control and
Prevention, National Center for Health Statistics. DHHS Publication No. (PHS) 01-1013
Retrieved from http://198.246.124.20/nchs/data/slaits/conf07.pdf#page=180
Blumberg, S. J., Foster, E. B., Frasier, A. M., Satorius, J., Skalland, B. J., Nysse-Carris, K. L.,
Morrison, H. M., Chowdhury, S. R., O'Connor, K. S. (2012). Design and operation of the
National Survey of Children's Health. Vital Health Stat 1. Jun;(55):1-149. U.S.
Department of Health & Human Services, Centers for Disease Control and Prevention,
National Center for Health Statistics, Hyattsville, Maryland 20782, USA. Boschee, M.
A., & Jacobs, G. (1997). Childcare in the United States: Yesterday and today. National
Network for Child Care. Retrieved from www.nncc.org
Boulet, S. L., Schieve, L.A., & Boyle, C. A. (2009). Birth weight and health and developmental
outcomes in US children, 1997–2005. Maternal & Child Health Journal, 15(7):836-44.
doi: 10.1007/s10995-009-0538-2

179
Bowman, B.T. (2001). Comments on Teacher Education: Childcare Briefing: Professional
education for teachers of young children. Retrieved from
http://www.apa.org/ppo/issues/sbowman_kidbrief01.html
Boyd, B. A., Odom, S. L., Humphreys, B. P., Sam, A. M. (2010). Infants and toddlers with
autism spectrum disorder: early identification and early intervention. Journal of Early
Intervention, 32(2), 75-98.
Boyle, C. A., Boulet, S., Schieve, L. A., Cohen, R. A., Blumberg, S. J., Yeargin-Allsopp, M.,
Visser, S., & Kogan, M. (2011). Trends in the prevalence of developmental disabilities in
US children, 1997-2008. Pediatrics,127(6);1034-1042. doi: 10.1542/peds.2010-2989
Bramlett, M. D. & Blumberg, S. J. (2007). Family structure and children's physical and mental
health. Health Affairs, 26(2), 549-558. doi:10.1377/hlthaff.26.2.549Health Aff March
2007 vol. 26no. 2 549-558 8
Broadhurst, K. (2003). Engaging parents and carers with family support services: What can be
learned from research on help-seeking? Child and Family Social Work, 8, 341-350.
Brown, I. & Schormans, A. F. (2003). Maltreatment and life stressors in single mothers who
have children with developmental delay. Journal on Developmental disabilities, 10(1);
61-66.
Brown, I. & Schormans, A. F. (2002). Brief Report: parent composition and risk of physical
harm for children with developmental delays reported for maltreatment. Journal on
Developmental disabilities, 9(1); 61-66.
Bronfenbrenner, U. (2004). Ecological models of human development. In Gauvain, M. & Cole,
M., Readings on the Development of Children, 4th Edition (ISBN-10: 0716709619). New
York, Cole Publishers.

180
Bronfenbrenner, U. (1979). The Ecology of Human Development: Experiments by Nature and
Design. Cambridge, MA: Harvard University Press. (ISBN 0-674-22457-4)
Brydon-Miller, M. & Maguire, P. (2009). Participatory action research: Contributions to the
development of practitioner inquiry in education. Educational Action Research, 17(1),
79-93.
Burton, P., Lethbridge, L., & Phipps, S. (2008). Mothering children with disabilities and chronic
conditions: Long-term implications for self-reported health. Canadian Public Policy,
XXXIV (3):359-378.
Buschmann, A., Jooss , B., Rupp, A., Dockter, S., Blaschtikowitz, H., Heggen, I., & Pietz, J.
(2008). Children with developmental language delay at 24 months of age: results of a
diagnostic work-up. Developmental Medicine & Child Neurology, 50(3), 223–229. doi:
10.1111/j.1469-8749.2008.02034.x
Bussing, R., Koro-Ljungberg, M. E., Gary, F., Mason, D., & Garvan, C. W. (2005). Exploring
help-seeking for ADHD symptoms: a mixed-methods approach. Harvard Review of
Psychiatry, 13(2); 85-101. DOI: 10.1080/10673220590956465.
Bussing, R., Zima, B. T., Faye, A. G., & Garvan, C. W. (2003). Barriers to detection, help-
seeking, and service use for children with ADHD symptoms. The Journal of Behavioral
Health Services & Research, 30,(2),176-189.
Butterfoss, F. D., Kegler, M. C., & Francisco, V. T. (2008). Mobilizing organizations for health
promotion: Theories of organizational change. In K. Glanz, B. K. Rimer, & K. Viswanth
(Eds.), Health Behavior and Health Education: Theory Research, and Practice (4th
Ed.,
pp. 335-362). San Francisco: Jossey-Bass.
181
Butterfoss, F. D. & Kegler, M. C. (2009). The Community Coalition Theory. In R. J.
DiClemente, R. A. Crosby, & M. C. Kegler (Eds.) Emerging Theories in Health
Promotion Practice and Research (pp. 237-276). San Francisco. Jossey-Bass.
Buysse, V., Bernier, K., & McWilliam, R. A. (2002) A statewide profile of early intervention
services using the Part C data system. Journal of Early Intervention, 25(1), 15-26.
Callahan, K., Henson, R. K., & Cowan, A. K. (2008). Social validation of evidence-based
practices in autism by parents, teachers, and administrators. Journal of Autism and
Developmental Disorders, 38, 678–692. doi:10.1007/s10803-007-0434-9
Carneiro, P. Meghir, C., & Parey, M. (2007). Maternal education, home environments and the
development of children and adolescents. The Institute for Fiscal Studies. WP 15/07.
Retrieved from http://eprints.ucl.ac.uk/14874/1/14874.pdf
Casey, P., Goolsby, S., Berkowitz, C., Frank, D., Cook, J., Cutts, D., Black, M. M., Zaldivar, N.,
Levenson, S., Heeren, T., & Meyers, A. (2004) Pediatrics,113, 298-304. doi:
10.1542/peds.113.2.298
Centers for Disease Control and Prevention (CDC). (n.d.a). Learn the Signs. Act Early.
Retrieved from http://www.cdc.gov/ncbddd/actearly/about.html.
Centers for Disease Control and Prevention (CDC). (n.d.b). The 10 Essential Public Health
Functions. Retrieved from http://www.cdc.gov/nphpsp/essentialservices.html
Centers for Disease Control and Prevention (CDC). (2006) Mental health in the United States:
parental report of diagnosed autism in children aged 4-17 years--United States, 2003-
2004. MMWR Morb Mortal Wkly Rep, May 5,55(17):481-6.
182
Centers for Disease Control and Prevention (CDC) (2010). Vaccines & Immunizations Statistics
and Surveillance: 2010 Table Data. Retrieved from http://www.cdc.gov/vaccines/stats-
surv/nis/data/tables_2010.htm#age
Centers for Disease Control and Prevention (CDC) (2011). The National Survey of Children with
Special Health Care needs. Retrieved from http://www.cdc.gov/nchs/slaits/cshcn.htm#09-
10
Champion, V. L. & Skinner, C. S. (2008). The Health Belief Model. In K. Glanz, B. K. Rimer,
& K. Viswanath (Eds.), Health behavior and health education: Theory Research, and
Practice (4th
Ed.) (pp. 45-62). San Francisco: Jossey-Bass.
Charlemaigne, C. V., & Gauthier, A. H. (2009). The social determinants of child health:
variations across health outcomes – a population-based cross-sectional analysis. BMC
Pediatrics, 9(53):1-12. Doi:10.1.1186/147-2431/9/53.
Chawarska, K., Paul, R., Klin, A., Hannigen, S., Dichtel, L. E., & Volkmar, F. (2006). Parental
recognition of developmental problems in toddlers with autism spectrum disorders. J
Autism Dev Disord.,37(1), 62-72.
Child and Adolescent Health Measurement Initiative. (2007) National Survey of Children’s
Health. Retrieved from http://childhealthdata.org/browse/survey/results?q=234
Chen, J. J. (2010). Gender differences in externalising problems among preschool children:
implications for early childhood educators. Early Child Development and Care, 180(4),
463–474. doi:10.1080/03004430802041011
Children’s Defense Fund. (2011) State of America’s Children. Retrieved from
http://www.childrensdefense.org/child-research-data-publications/state-of-americas-children-
2011/pdfs/poverty.pdf

183
Chung, C., Liu, W.,Chang, C., Chen, C., Tang, S. F., & Wong, A. M. (2011). The relationship
between parental concerns and final diagnosis in children with developmental delay.
Journal of Child Neurology,26: 413. doi: 10.1177/0883073810381922
Cieza, A., Brockow, T., Ewert, T., Amman, E., Kollerits, B., Chatterji, S., Üstün, B., & Stucki,
G. (2002). Linking health-status measurements to the International Classification of
Functioning, Disability and Health. Journal of Rehabilitative Medicine, 34; 205-210.
Clifford, R. M., & Crawford, G. M. (2009). Beginning School: U. S. Policies in International
Perspective. New York, Teachers College Press.
Collins, J. W., Wambach, J., David, R.J., & Rankin, K. M. (2008). Women's lifelong exposure to
neighborhood poverty and low birth weight: a population-based study. Maternal & Child
Health Journal, 13(3):326-33.
Committee on Assuring the Health of the Public in the 21st Century. Future of the Public’s
Health in the 21st Century. Washington DC: Institute of Medicine, 2003.
Conway, T. & Hutson, R. Q. (2007). Parental incarceration: how to avoid a “death sentence” for
families. Journal of Poverty Law and Policy, 41(3-4); 212-221
Costello, E. J., Egger, H., & Angold, A. (2005). 10 year research update review: the
epidemiology of child and adolescent psychiatric disorders: I. Methods and public health burden.
Journal of the American Academy of Child and Adolescent Psychiatry, 44(10), 972-986.
Costello, E. J., Messer, S. C., Bird, H. R., Cohen, P., & Reinherz, H. Z. (1998). The prevalence
of serious emotional disturbance: a re-analysis of community studies. Journal of Child
and Family Studies, 7(4), 411-432. DOI: 10.1023/A:1022901909205
Coulter, M. L., Wallace, T., Laude, M. (1993). Early intervention services in selected Florida
counties: The provider perspective. Children’s Health Care, 22(2), 125-141.

184
Council on Children With Disabilities, Section on Developmental Behavioral Pediatrics, Bright
Futures Steering Committee and Medical Home Initiatives for Children with Special
Needs Project Advisory Committee (2006). Policy statement: identifying infants and
young children with developmental disorders in the medical home: an algorithm for
developmental surveillance and screening. Pediatrics: 118(1): 405-420
doi:10.1542/peds.2006-1231
Council on School Health (2008). Role of the school nurse in providing school health services.
Pediatrics, 121, 1052-1056.
Cousins, J. B., & Earl, L. M. (1992). The case for participatory evaluation. Educational
Evaluation and Policy Analysis, 14(4), 397-418.
Crosby, R. A., Kegler, M. C., & DiClemente (2009). Theory in health promotion practice and
research. In R. J. DiClemente, R. A. Crosby, & M. C. Kegler (Eds.) Emerging Theories
in Health Promotion Practice and Research (pp. 3-18). San Francisco. Jossey-Bass.
Cummings, M. E., Keller, P. S., Davies, P. T. (2005). Towards a family process model of
maternal and paternal depressive symptoms: Exploring multiple relations with child and
family functioning. Journal of Child Psychology and Psychiatry, 46(5):479-489.
Curry, A. E., Pfeiffer, M. R., Slopen, M. E., & McVeigh, K. H. (2012). Rates of early
intervention referral and significant developmental delay, by birthweight and gestational
age. Matern Child Health J.,16(5),989-96. doi: 10.1007/s10995-011-0820-y.
Damboise, M. C. & Hughes, M. (2010). Nurturing Families Network: 2010 Annual Evaluation
Report. Retrieved from: http://www.ct.gov/ctf/lib/ctf/2010_NFN_report_final.pdf
Data Resource Center (2011). PEDS© scoring algorithms used in the NSCH. Retrieved from
http://www.childhealthdata.org/docs/nsch-docs/peds_scoring_4website-pdf.pdf

185
Danis M, Kotwani N, Garrett J, Kotwani, N., Garrett, J., Rivera, I., Davies-Cole, J., & Carter-
Nolan, P.(2010) Priorities of low-income urban residents for Interventions to address the
socio-economic determinants of health. Journal of Health Care for the Poor and
Underserved, 21(4):1318-1339.
Davis-Kean, P. E. (2005). the influence of parent education and family income on child
achievement: the indirect role of parental expectations and thehome environment.
Journal of Family Psychology, 19(2), 294-304. doi: 10.1037/0893-3200.19.2.294
Day, S. M. (2011). Do we know what the prevalence of cerebral palsy is? Developmental
Medicine & Child Neurology, doi:10.111/j.469-8749.2011.04072.x
De Marco, M. D., & de Marco, A. C. (2007). Welcome to the neighborhood: Does where you
live affect the use of nutrition, health, and welfare programs? Journal of Sociology &
Social Welfare, XXXVI(1); 141-166.
Delia, M. A., O’Brien, R. W., Aden-Kiernan, M. (2003) Relationship of Family and Parental
Characteristics to Children’s Cognitive and Social Development in Head Start. Paper
presented at the Society for Research in Child Development Biennial Conference.
Retrieved from
http://www.acf.hhs.gov/programs/opre/hs/faces/pres_papers/relation_program/prog_title.
html.
Daniel, K. L., Prue, C., Taylor, M. K., Thomas, J., & Scales, M. (2009). ‘Learn the signs. Act
early’” A campaign to help every child reach his or her full potential. Public Health, 13,
e11-6. doi:10.1016/j.puhe.2009.06.002.
De Giacomo, A. & Fombonne, E. (1998). Parental recognition of developmental abnormalities In
autism. European Child and Adolescent Psychiatry,7, 131-136.

186
Dewrang, P. & Sandberg, A. D.(2010) Parental retrospective assessment of development and
behavior in Asperger syndrome during the first 2 years of life. Research in Autism
Spectrum Disorders, 4(3), 461–473.
DiClemente, R. J., Crosby, R. A., Kegler, M. C. (2009). Emerging Theories in Health Promotion
Practice and Research. San Francisco. Jossey-Bass.
Dietz, C., Swinkels, S. H., van Daalen, E., van Engeland, H., Buitelaar, J. K. (2007). Parental
compliance after screening social development in toddlers. Archives of Pediatric &
Adolescent Medicine, 161(4), 363-8.
Dorfman, S. L. (2000). Preventative Interventions under Managed Care: Mental Health and
Substance Abuse Services. DHHS Pub (SMA) 00-3437.
Drotar, D. Stancin, T., & Dworkin, P. (2008). Pediatric developmental screening: understanding
and selecting screening instruments. The Commonwealth Fund. Retrieved from
http://www.commonwealthfund.org/Publications/Fund Manuals/2008/Feb/Pediatric-
Developmental-Screening--Understanding-and-Selecting-Screening-Instruments.aspx
Drummond, M. (2011) Presentation: Life Course Perspective: A Community Approach,
American Public Health Association Annual Meeting, Martha May Eliot Forum: Life
Course Perspective: Moving from Theory to Practice. October 31, 2011. Washington DC.
Dunst, C. J. (2000). Revisiting "Rethinking Early Intervention" Topics in Early Childhood
Special Education, 20, 95-104. doi: 10.1177/027112140002000205
Durlak, J. A. & DuPre, E. P. (2008). Implementation matters: A review of research on the
influence of implementation on program outcomes and the factors affecting
implementation. American Journal of Community Psychology, 41I, 327-350. Doi:
10.1007/s10464-008-9165-0

187
Dykens, E. M. (2007). Psychiatric and behavioral disorders in persons with Down syndrome.
Mental Retardation and Developmental Disabilities Research Reviews, 13, 272-278.
doi:10.1002/mrdd.20159
Earls, F, & Carlson, M. (2001). The social ecology of child health and well-being. Annual
Review in Public Health, 2,:143-66.
Earls, M. F., & Hay, S. S. (2004). Setting the stage for success: implementation of
developmental and behavioral screening and surveillance in primary care practice- The
North Carolina Assuring Better Child Health and Development (ABCD) Project.
Pediatrics, 118, 183-188.
Early Childhood Outcomes Center. (2012). Outcomes for children served through IDEA’s early
childhood programs: 2010–11. Retrieved from
http://projects.fpg.unc.edu/~eco/assets/pdfs/OutcomesforChildren-FFY2010.pdf
Early Learning Coalition of Hillsborough County. (2007). School Readiness Information
Session. Retrieved from
http://www.elchc.org/WOYC/SR%20Transition%20Presentation.pdf
Eisenhower, A. S., Baker, B. L., & Blacher, J. (2009). Children’s delayed development and
behavior problems: impact on mothers’ perceived physical health across early childhood.
Social Science & Medicine, 68, 89-99.
Eiser, C. & Morse, R. (2001). Can parents rate their child’s health-related quality of life? Results
of a systematic review. Quality of Life Research, 10, 347-357.
Else-Quest, N. M., Hyde, J. S., Goldsmith, H. H., & Van Hulle, C. A. (2006). Gender
Differences in Temperament: A Meta-Analysis. Psychological Bulletin, 132(1), 33–72.
doi: 10.1037/0033-2909.132.1.33

188
Elwood, S. (2009). Integrating participatory action research and GIS education: Negotiating
methodologies, politics and technology. Journal of Geography and Higher Education,
33(1), 51-65.
Engle, P. L., Castle, S., & Menon, P. (1996). Child development: vulnerability and resilience.
Social Science & Medicine, 42(5);621-635.
Engle, P. L., Fernald, H. H., Behrman, J. O’Gara, C. Yousafzai, A., Cabral de Mello, M.,
Hidrobo, M., Ulkuer, N. Ertem, I., Iltus, S., & the Global Child Development Steering
Group. (2011). Strategies for reducing inequalities and improving developmental
outcomes. Lancet, 378;1339-1353.
Ertem, I. O., Atay, G., Dogan, D. G., Bayhan, A., Bingoler, B. E. , Gok, C. G., Ozbas, S.,
Haznedaroglu, D., & Isikli, S. (2007). Mothers’ knowledge of young child development
in a developing country. Child: Care, Health and Development, 33(6), 728-737.
Feighery, E., & Rogers, T. (1990) Building and maintaining effective coalitions. Health
Promotion Resource Center: How-to Guides on Community Health Promotion. Retrieved
from http://immunizepa.org/images/uploads/building_effective_coalitions.pdf
Federal Interagency Forum on Child and Family Statistics (2011) America's Children: Key
National Indicators of Well-Being, 2009. Retrieved from
http://www.childstats.gov/pdf/ac2009/ac_09.pdf
Federal Interagency Forum on Child and Family Statistics (2011) America's Children: Key
National Indicators of Well-Being, 2011. Retrieved from
http://www.childstats.gov/americaschildren/glance.asp

189
Feinberg, E., Silverstein, M., Donahue, S., & Bliss, R. (2011).The impact of race on participation
in Part C early intervention services. Dev Behav Pediatr, 32(4),284-291. doi:
10.1097/DBP.0b013e3182142fbd
Feldman, M., McDonald, L., Serbian, L., Stack, D., Sacco, M. L., & Yu, C. T. (2007). Predictors
of depressive symptoms in primary caregivers of young children with or at risk for
developmental delay. Journal of Intellectual Disability Research, 51(8): 606-619.
Fenichel, E. (2002). Relationships at risk: The policy environment as a context for infant
development. Infants & Young Children, 15(2), 49-56.
Fereday, J. & Muir-Cochrane, E. (2006). Demonstrating rigor using thematic analysis: a hybrid
approach of inductive and deductive coding and theme development. International
Journal of Qualitative Methods,5(1), 80-92.
Fine, A. (2011). Integrating high quality academic programs and supportive health, social and
community services. Center for the Study of Social Policy. Retrieved from
http://www.cssp.org/publications/documents/neighborhood-investment/integrating-high-
quality-academic-programs-and-supportive-health-social-and-community-services
Fine, A., Kotelchuck, M., Adess, N., Pies, C. (2009). Policy Brief: A new agenda for MCH
policy and programs: integrating a life course perspective. Family, Maternal and Child
Health Programs, Contra Costa Health Services. Martinez CA Retrieved from
www.cchealth.org/groups/lifecourse.
Finer, L. B. & Zolna, M. R. (2011). Unintended pregnancy in the United States: incidence and
disparities, 2006. Contraception, 84, 478-485. doi:10.1016/j.contraception.2011.07.013

190
Finlayson, N. N. (2004). Predicting Low Income Children's Kindergarten Readiness: An
Investigation of Parents’ Perceptions of Their Children's Development and Connections
to the Educational System. Doctoral Dissertation. Retrieved from
http://etd.fcla.edu/SF/SFE0000524/Final.pdf
First 5 California Children and Families Commission & Maryland Early Childhood Public
Engagement Campaign (2006). School Readiness: Children’s Readiness for School AND
Schools’ Readiness for Children. Retrieved from
http://www.countdownmd.org/pdfs/SectionAll051903b.pdf
Fishbein, M. (2009). An integrative model for behavioral prediction and its application to health
promotion. In R. J. DiClemente, R. A. Crosby, & M. C. Kegler (Eds.) Emerging Theories
in Health Promotion Practice and Research (pp. 245-234). San Francisco. Jossey-Bass.
Flores-Kastanis, E. (2009). Change at big school and little school: Institutionalization and
contestation in participatory action research. Educational Action Research, 17(3), 391-
405
Florida Covering Kids and Families (n.d.) Who we are. Retrieved from
http://health.usf.edu/nocms/publichealth/chiles/fckaf/index.htm
Florida Department of Children and Families (2011). ACCESS Florida Food, Medical
Assistance and Cash. General Information about Medicaid. Retrieved from
http://www.dcf.state.fl.us/programs/access/medicaid.shtml#nc
Florida Department of Health (2011). Hillsborough County Health Department 2010/2011
Community Health Profile, Retrieved from
http://www.hillscountyhealth.org/community/pdf/HCHD_2010-
2011_Community_Health_Profile_Report.pdf
191
Florida CHARTS (2010), County & State Profiles, 2008-2010 Pregnancy and Young Child
Profile. Retrieved from:
http://www.floridacharts.com/charts/MICProfile.aspx?county=29&profileyear=2010
Florida KidCare (2011). Eligibility and Cost. Retrieved from
http://www.floridakidcare.org/eligibility.html
Friedman, R. M. (2001) A Conceptual Framework for Developing and Implementing Effective
Policy in Children’s Mental Health. Online publication, Research and Training Center
for Children’s Mental Health Department of Child and Family Studies Louis de la Parte
Florida Mental Health Institute, University of South Florida. Retrieved from
http://endmentalhealthdisparities.net/documents/Conceptual_Framework.pdf
Friedman, M. (2001) Results-Based Accountability (RBA)for Communities and Programs that
want to get From Talk to Action, Fiscal Policy Studies Institute, Santa Fe,New Mexico.
Freeman, B., Iron Cloud-Two Dogs, E., Novins, D. K., & LeMaster, P. (2004). Contextual issues
for strategic planning and evaluation of systems of care for American Indian and Alaska
Native communities: An introduction to Circles of Care. American Indian and Alaska
Native Mental Health Research, 11(2), 13-41.
Fröjd, S. Marttunen, M., Pelkonene, M., von der Pahlen, B. Kaltiala-Heino, R. (2007). Adult and
peer involvement in help-seeking for depression in adolescent population. Social
Psychiatry and Psychiatric Epidemiology, 42; 945-952.
Fujishiro, K (2009), Is perceived racial privilege associated with health? Findings from the
Behavioral Risk Factor Surveillance System. Social Science & Medicine, 68(5), 840-844.
doi:10.1016/j.socscimed.2008.12.007

192
Gamoran, A., Lopez Turley, R. N., Turner, A., & Fish, R. (2011). Differences between Hispanic
and non-Hispanic families in social capital and child development: first-year findings
from an experimental study. Research in Social Stratification and Mobility, in press.
doi:10.1016/j.rssm.2011.08.001
Gance-Cleveland, B. (2006). Family-centered care: Decreasing health disparities. Journal for
Specialists in Pediatric Nursing, 11(1), 72-76. DOI: 10.1111/j.1744-6155.2006.00046.x
Garcia-Iriarte, E., Kramer, J. C., Kramer, J. M., & Hammel, J. (2008). “Who did what?” A
participatory action research project to increase group capacity for advocacy. Journal of
Applied Research in Intellectual Disabilities, 22, 10-22.
Gaziano, C. (2012). Antecedents of Knowledge Gaps: Parenting Knowledge and Early
Childhood Cognitive Development-Review and Call for Research. The Open
Communication Journal, 6, 17-28.
Ghazvini, A. (2009). Child screening for developmental, health and environmental information.
Tallahassee, FL: The Policy Group for Florida’s Families and Children.
Gilgan, J. F. (2011). Coding in deductive qualitative analysis. Current Issues in Qualitative
Research, 2( 1), Retrieved from http://www.scribd.com/doc/47331325/Coding-in-
Deductive-Qualitative-Analysis
Glanz, K., Rimer, B. K., & Viswanath, K. (2008). Health Behavior and Health Education:
Theory, Research, and Practice (4th ed.). San Francisco: Jossey-Bass. Glascoe, F. P.
(1997a) The importance of discussing parents’ concerns about development. Ambulatory
Child Health, 2, 349–356.
Glascoe, F. P. (1997b). Parents’ concerns about children’s development: prescreening technique
or screening test? Pediatrics, 99, 522-528 DOI: 10.154/peds.99.4.522

193
Glascoe, F. P. (2000). Evidence-based approach to developmental and behavioral surveillance
using parents’ concerns. Developmental and behavioral Surveillance, 26(2); 138-149.
Glascoe, F. P. (2005). Screening for developmental and behavioral problems. Mental
Retardation and Developmental Disabilities Research Reviews, 11, 173-179.
Glascoe, F., Page, F., Frankenberg, W.K. (2002). Two views of developmental testing. Letter to
the editor. Pediatrics,109, 6.
Glascoe, F.P., Foster, E.M., Wolraich, M.L. (1997). An economic analysis of developmental
detection methods. Pediatrics, 99,830-837.
Glascoe F. P., & Robertshaw, N. S. (2008). PEDS: Developmental Milestones. (PEDS:DM): A
tool for Surveillance and Screening, Professionals' Manual. Nolensville, TN:
PEDSTest.com,LLC. (www.pedstest.com)
Glasgow, R. E., & Linnan, L. A. (2008) Evaluation of theory-based interventions. In K. Glanz,
B. K. Rimer, & K. Viswanath (Eds.), Health behavior and health education: Theory
Research, and Practice (4th
Ed., pp. 487-505). San Francisco: Jossey-Bass.
Glass, T. A., & McAtee, M. J. (2006). Behavioral science at the crossroads in public health:
extending horizons, envisioning the future. Social Science & Medicine, 62,1650-1671
doi: 10.1016/j.sociscimed.2005.05.044
Glaun, D. E., Cole, K. E., & Reddinhough, D. S. (1999). Mother-professional agreement about
developmental delay in preschool children. Journal of Applied Research in Intellectual
Disabilities, 12(1), 69-76. DOI: 10.1111/j.1468-3148.1999.tb00051.x
Golly, A. M., Stiller, B., & Walker, H. M. (1998). First step to success : replication and social
validation of an early intervention. Journal of Emotional and Behavioral Disorders, 6,
243. doi: 10.1177/106342669800600406

194
Gottlieb, B. H., & Bergen, A. E. (2010). Social support concepts and measures. Journal of
Psychosomatic Research, 69, 511–520.
Granner, M. L., & Sharpe, P. A. (2004). Evaluating community coalition characteristics and
functioning: a summary of measurement tools. Health Education Research, 19(5); 514-
532.
Grbich, C. (1999). Qualitative research in health: An introduction. London: Sage.
Green, L. W. & Mercer, S. L. (2001). Can public health researchers and agencies reconcile the
push from funding bodies and the pull from communities? American Journal of Public
Health, 91(12), 1926-1943.
Green, J. (2000). The role of theory in evidence-based health promotion practice. Health
Education Research, 15 (2); 125-129. doi: 10.1093/her/15.2.125
Greenson, J., Donaldson, A., Varley, J., Dawson, G., Rogers, S., Munson, J., Smith, M., &
Winter, J. (2010). Randomized, controlled trial of an intervention for toddlers with
autism: The Early Start Denver Model. Pediatrics, 125(e17): doi: 10.1542/peds.2009-
0958.
Grella, C. E. & Greenwell, L. (2006). Correlates of parental status and attitudes toward parenting
among substance-abusing women offenders. The Prison Journal,86(1),89-113.
Groves, R. M., Presser, S., & Dipko, S. (2004). The role of topic interest in survey participation
decisions. Public Opinion Quarterly, 68, 2–31. doi: 10.1542/peds.2011-0030
Guerrero, A. D., Rodriguez, M. A., & Flores, G. (2011). Disparities in Provider Elicitation of
Parents' Developmental Concerns for US Children. Pediatrics, 128(5), 901-909.doi:
10.1542/peds.2011-0030
195
Gulliver, A., Griffiths, K. M., & Christensen, H. (2010). Perceived barriers and facilitators to
mental health help-seeking in young people: a systematic review. BMC Psychiatry,
10(113), 1-9. 10:113 doi:10.1186/1471-244X-10-113
Gupta, R. S., Springston, E. E., Warrier, M. R., Smith, B., Kumar, R., Pongracic, J.& Holl, J. A.
(2011). The prevalence, severity, and distribution of childhood food allergy in the United
States. Pediatrics, 128(1), p. e9 -e17. doi: 10.1542/peds.2011-0204
Halfon, N., Regalado, M., Sateen, H., Inkelas, M., Peck Reuland, C.H., Glascoe, F.P., & Olson,
L. M. (2004). Supplement Article: Assessing development in the pediatric office.
Pediatrics: 113(6): 1926-1933.
Halfon, N., Russ, M. B., & Regalado, M. D. (2004). Building a model system of developmental
services in Orange County. UCLS Center for Healthier Children, Families, and
Communities. Retrieved from
http://www.healthychild.ucla.edu/PUBLICATIONS/Documents/FinalOC.pdf
Halfon, N. (2009). Life course health development: a new approach for addressing upstream
determinants of health and spending. Expert Voices. National Institute for Health Care
Management (NIHCM) Foundation. Retrieved from
http://www.nihcm.org/pdf/ExpertVoices_Halfon_FINAL.pdf
Halfon, N., Houtrow, A., Larson. L. & Newacheck, P. W. ( 2012). The changing landscape of
disability in childhood. The Future of Children, 22(1).13-42.
Halfon N., Russ, S., Regalado, M. (2004), Building a Model System of Developmental Services
in Orange County. UCLA Center for Healthier Children, Families and Communities.
Retrieved from
http://www.healthychild.ucla.edu/PUBLICATIONS/Documents/FinalOC.pdf

196
Halfon, N., Regalado, M., Sareen, H., Inkelas, M., Peck Reuland, C. H., Glascoe, F. P., & Olson,
L. M. (2004). Supplement Article: Assessing development in the pediatric office.
Pediatrics, 2004;113:1926-1933.
Hambly, H., Wren, Y., McLeod, S., & Roulstone, S. (2013). The influence of bilingualism on
speech production: A systematic review. Int J Lang Commun Disord, 48(1), 1–24.
Hamilton, M. A. & Orme, J. G. (1990). Examining the construct validity of three parenting
knowledge measures using LISREL. Social Service Review, 64(1), 121-143.
Hart, S. N. & Glaser, D. (2011). Psychological maltreatment- maltreatment of the mind: a
catalyst for advancing child protection toward proactive primary prevention and
promotion of personal well-being. Child Abuse & Neglect, 35(10), 758-766.
doi:10.1016/jchiabu.2011.06.002.
Hawaii State Department of Health [DOH] (2005). A family view of children’s health in
Hawai‘i: children with and without special health care needs, 2003. Children with Special
Health Needs Branch, Family Health Services Division. Retrieved from:
http://hawaii.gov/health/family-child-health/cshcn/pdf/childhealthsurvey2003.pdf
Hawkins, D., Brown, E. C., Oesterle, S., Arthur, M. W., Abbott, R. D., & Catalano, R. F. (2008).
Early effects of communities that care on targeted risks and initiation of delinquent
behavior and substance use. Journal of Adolescent Health, 43(1),15-22.
doi:10.1016/j.jadohealth.2008.01.022
Heaney, C. A. & Israel, B. A. (2008). Social networks and social support. In K. Glanz, B. K.
Rimer, & K. Viswantth (Eds.), Health behavior and health education: Theory, Research,
and Practice (4th
Ed., pp. 335-362). San Francisco: Jossey-Bass.

197
Hebbeler, K., Spiker, D., Bailey, D. B., Scarborough, A., Mallik, S., Simeonsson, R., Singer, M.,
& Nelson, L. (2007). Thirty-six-month outcomes for families of children who have
disabilities and participated in early intervention. SSRI International, 333 Ravenswood
Avenue, Menlo Park, CA 94025.
Herd, P, Goesling, B, House, JS. (2007). Socioeconomic position and health: The differential
effects of education versus income on the onset versus progression of health problems.
Journal of Health and Social Behavior, 48(3): 223-38.
Herman, B. (2007) CAPTA and early childhood intervention: policy and the role of parents.
National Association of Social Workers, CCC Code 1532-8759/07.
Herron, M. (2011).Deaths: Leading Causes for 2007, National Vital Statistics Report, 59(8).
Retrieved from http://www.cdc.gov/nchs/data/nvsr/nvsr59/nvsr59_08.pdf
Hess, J. & Marshall, J. (2009). Developmental Screening in Hillsborough County: A Resource
Mapping Project. Retrieved from
http://www.ecctampabay.org/info/index.php?option=com_docman&task=cat_view&gid=
26&Itemid=46
Hill, T. D., Ross, C. E., Angel, R. J. (2005). Neighborhood disorder, psychophysiological
distress, and health. Journal of Health and Social Behavior, 46(2), 170-186. doi:
10.1177/002214650504600204
Hillsborough County Head Start and Early Head Start Program Information Report for the 2005-
2006 Program Year. In Press. Agency Website available at:
http://www.hillsboroughcounty.org/headstart.
Hillsborough County- Official County Government Online Resource. Retrieved from
http://www.hillsboroughcounty.org/about/

198
Hillsborough County Head Start and Early Head Start (n.d.) Retrieved from
http://www.hillsboroughcounty.org/headstart/about/facts.cfm
Himmelman, K. (2011). Cerebral palsy, patterns and patchwork. Developmental Medicine &
Child Neurology, doi:10.111/j.469-8749.2011.04072.x
Hinson, J. A. & Swanson, J. L. (1993). Willingness to seek help as a function of self-disclosure
and problem severity. Journal of Counseling & Development, March/April, 71 265-470.
Hix-Small, H. (2007). Developmental screening in practice: Using parent report within pediatric
practice to detect infant and toddler developmental delays. Dissertation Abstracts
International: Section A. Humanities and Social Sciences, 68(4-A), 3318.
Ho, H. H., Miller, A., & Armstrong, R. W. (1994) Parent-professional agreement on diagnosis
and recommendations for children with developmental disorders. Children’s Health
Care, 23 (2); 137-148.
Hochberg, Z., Feil, R. Constancia, M., Fagam M., Junien, C., Caral, J. –C., Bioeau, P., Le Bouc,
Y., Deal, C. L., Lillycrop, K., Scharfmann, R., Sheppard, A., Skinner, M., Szyf, M.,
Waterland, R. A., Waxman, D. J., Whitelaw, E., Ong, K., & Albetsson-Wikland, K.
(2011). Child health, developmental plasticity, and epigenetic programming. Endocrine
Reviews, 32(2), 0000-0000. Doi: 10.1210/er.2099-0039.
Hodapp, R. M. (2007). Families of persons with Down Syndrome: new perspectives, findings,
and research needs. Mental Retardation and Developmental Disabilities Research
Review, 13(3):279-87.
Hoff, E., Core, C., Place, S., Rumiche, R., & Parra, M. (2012). Dual language exposure and early
bilingual development. Journal of Child Language, 39, 1-27.
doi:10.1017/S0305000910000759

199
Hummer, R. A., Hack, K. A., & Raley, R. K. (2004). Retrospective reports of pregnancy
wantedness and child well-being in the United States. Journal of Family Issues,
25(3):404-428.
Hutchison, E. D. (2007). Dimensions of Human Behavior. Chapter 1: A life course perspective.
Sage Publications. Thousand Oaks, CA. Retrieved from http://www.corwin.com/upm-
data/16295_Chapter_1.pdf
Hogan, M. Lopez, A, Lozano, R., Murray, C. J. L., Naghavi, M., & Rajaratnam, J. K. (2010).
Building Momentum: Global Progress Toward Reducing Maternal and Child Mortality.
University of Washington, Institute for Health Metrics and Evaluation. Retrieved from
http://www.healthmetricsandevaluation.org/publications/policy-report/building-
momentum-global-progress-toward-reducing-maternal-and-child-mor
Huang, K., Caughy, M. O., Genevro, J. L., & Miller, T. L. (2005). Maternal knowledge of child
development and quality of parenting among White, African-American and Hispanic
mothers. Applied Developmental Psychology, 26, 149-170.
Institute for Patient- and Family-Centered Care (2011) Advancing the Practice of patient- and
Family-Centered Care in Primary Care and Other Ambulatory Settings. Retrieved from
http://www.ipfcc.org/pdf/GettingStarted-AmbulatoryCare.pdf.
Jaudes, P. K. & Mackey-Bilaver, L. (2008). Do chronic conditions increase young children’s risk
of being maltreated? Child Abuse & Neglect, 32, 671-681.
Johnson, B. (2000). Family-centered care: four decades of progress. Family Systems and Health,
18; 137-156.

200
Johnson, J. F. (2011). An Evaluation of the Early Steps Referral Process in Hillsborough County
to Detect Delays on Access to Early Intervention Services. Graduate School Theses and
Dissertations. Retrieved from
http://scholarcommons.usf.edu/cgi/viewcontent.cgi?article=4366&context=etd
Joshi, P. & Bogen, K. (2007). Nonstandard schedules and young children’s behavioral outcomes
among working low-income families. Journal of Marriage and Family, 69; 139-156.
Kahn, R. S., Zuckerman, B., Bauchner, H., Homer, C. J., & Wise, P. H. (2002). Women’s health
after pregnancy and child outcomes at age 3 years: a prospective cohort study. American
Journal of Public Health, 92(8); 1312-1317.
Kaminski, J. W., Valle, L. A., Filene, J. H., & Boyle, C. L. (2008). A meta-analytic review of
components associated with parent training program effectiveness. Journal of Abnormal
Child Psychology, 36, 567-589. doi: 10.1007/s108000002-007-9201-9
Katz, G. & Lazcano-Ponce, E. (2008). Intellectual disability: definition, etiological factors,
classification, diagnosis, treatment and prognosis. Salud Pública de México, 50(2), s132-
s141.
Keller, J. & McDade, K. (2000). Attitudes of low-income parents toward seeking help with
parenting: implications for practice. Child Welfare, LXXIX(3); 285-312.
Kennedy, A., Basket, M., & Sheedy, K. (2011). Vaccine attitudes, concerns, and information
sources reported by parents of young children: results from the 2009 HealthStyles
Survey. Pediatrics, 127, S92-S99. doi: 10.1542/peds.2010/1722N
201
Kerkorian, D., McKay, M., Bannon, W. M. (2006). Seeking help a second time:
parents’/caregivers’ characterizations of previous experiences with mental health services
for their children a perceptions of barriers to future use. American Journal of
Orthopsychiatry, 76(2); 161-166.
King, T. M., Tandon, S. D., Macias, M. M., Healy, J. A., Duncan, P. M., Swigonski, N. L.,
Skipper, S. M., & Lipkin, P. H. (2010). Implementing developmental screening and
referrals: Lessons learned from a national project. Pediatrics, 125, 350-360; originally
published online January 25, 2010; doi: 10.1542/peds.2009-0388
Kleinman, J. M., Ventola, P. E., Pandey, J., Verbalis, A. D., Barton, M., Hodgson, S., Green, J.,
Dumont-Mathieu, T., Robins, D. L., & Fein, D. (2007). Diagnostic Stability in Very
Young Children with Autism Spectrum Disorders. Journal of Autism and Developmental
Disorders, 38(4), 606-615. doi:10.1007/s10803-007-0427-8
Knickmeyer, R. C. & Baron-Cohen, S. (2006). Topical review: fetal testosterone and sex
differences in typical social development and in autism. J Child Neurol, 21, 825. doi:
10.1177/08830738060210101601
Knitzer, J., & Gilliam, W. S. (2008). Giving infants and toddlers and head start: getting policies
in sync with knowledge. Infants & Young Children, 21(1): 18-29.
Kotler, P. & Lee, N. R. (2008). Social Marketing: Influencing Behaviors for Good, 3rd
Ed.
Thousand Oaks, CA: Sage Publications.
Krauss, M. W., Seltzer, M.M., & Jacobson, H. T. (2004). Adults with autism living at home or in
non-family settings: positive and negative aspects of residential status. Journal of
Intellectual Disability Research, 49(2): 111-124.

202
Krieger, N. (2007). Why epidemiologists can’t afford to ignore poverty. Epidemiology, 18(6),
658-663.
Krieger, N. (2011). Epidemiology and People’s Health. New York, Oxford University Press.
Krieger, N., Williams, D. R., & Moss, N. E. (1997). Measuring social class in us public health
research: concepts, methodologies, and guidelines. Annual Review of Public Health, 18,:
341-378. DOI: 10.1146/annurev.publhealth.18.1.341
Kuhlthau , K. A. Bloom, S., Van Cleave, J., Knapp, A. A., Romm, D, Klatka, K., Homer, C. J.,
Newacheck, P. W., & Perrin, J. M.(2011). Evidence for family-centered care for children
with special health care needs: a systematic review. Academic Pediatrics, 11(2):136-43.
La Paro, K. M., Pianta, R. C., & Stuhlman, M. (2004). The classroom assessment scoring
system: findings from the prekindergarten year. The Elementary School Journal, 104(5);
Lau, A. & Takeuchi, D. (2001). Cultural factors in help-seeking for child behavior problems:
value orientation, affective responding, and severity appraisals among Chinese-
American parents. Journal of Community Psychology, 29(6); 675-692.
LeCompte, M. D. & Schensul, J. J. (1999). Designing and Conducting Ethnographic Research.
Lanham, MD: AltaMira Press.
Leiter V. & Rieker P. P. (2012). Mind the gap: gender differences in child special health care
needs. Maternal & Child Health Journal,16(5),1072-80. doi: 10.1007/s10995-011-0834-
5.
Lieberman, A. F. & Osofsky, J. D. (2009). Poverty, trauma, and infant mental health. Zero to
Three, November, 54-58.

203
Lowe, J. I. (2010). A new way to talk about the social determinants of health. Vulnerable
populations portfolio. Robert Wood Johnson Foundation. Retrieved from
http://www.rwjf.org/vulnerablepopulations/product.jsp?id=66428
Lu, M., Kotlechuck, M. Pies, C., Parthatsarthy, P. (2007) Presentation: A life-course approach to
MCH epidemiology. Presented ant Maternal and Child Health Epidemiology Conference,
Atlanta, GA. December 12, 2007. Retrieved from
http://www.citymatch.org/lifecoursetoolbox/theory_and_research.php
Lu, M. C., & Halfon, M. (2003). Racial and ethnic disparities in birth outcomes: a life-course
perspective. Maternal and Child Health Journal, 7(1) 13-30, DOI:
10.1023/A:1022537516969
Lynch, J. W., Law, C., Brinkman, S., & Chittleborough. (2010). Inequalities in child healthy
development: some challenges for effective implementation. Social Science & Medicine.
doi: 10.1016/j.socscimed.2010.07.008
Lynch, V., Phong, S., Kenney, G., & Macri, J. (2010). Uninsured Children: Who Are They and
Where Do They Live? New National and State Estimates from the 2008 American
Community Survey. The Urban Institute. Retrieved from
http://health.usf.edu/NR/rdonlyres/5F99141C-9DF9-4717-8A88-
48A3426E8488/0/UninsuredChildrenWhotheyareandWhere.pdf
MacPhee, D., (1981). Knowledge of Infant Development Inventory. Unpublished manuscript,
University of North Carolina. Retrieved from
http://www.acf.hhs.gov/programs/opre/ehs/perf_measures/reports/resources_measuring/r
es_meas_phir.html

204
Macy, M.W., & Willer, R. (2002). From factors to actors: computational sociology and agent-
based modeling. Annual Review of Sociology, 28, 43-166.
MacPhee, D. Manual: Knowledge of Infant Development Inventory (1981). Unpublished
manuscript, University of North Carolina,.
Maenner, M. J., Schieve, L. A, Rice, C. E., Cunniff, C., Giarelli, E., Kirby, R. S., Lee, L.C.,
Nicholas, J. S., Wingate, M. S., & Durkin, M. S. (2013) Frequency and Pattern of
Documented Diagnostic Features and the Age of Autism Identification. Journal of the
American Academy of Child & Adolescent Psychiatry, 52(4),401-413.e8
Mahant, S., Jovcevska, V., & Cohen, E. (2011). Decision-making around gastrostomy-feeding in
children with neurologic disabilities. Pediatrics, 127, e1471-1481. doi:
10.1542/peds.2010-3007
Maldonado, E. R. (2008). Early symptom recognition among Latino parents of children with
autism spectrum disorders: An ethnographic study. Dissertation Abstracts International:
Section B. Sciences and Engineering, 69(9-B), 832.
Mandell, D. S., Novak, M. M., & Zubritsky, C. D. (2005). Factors associated with age of
diagnosis among children with autism spectrum disorders. Pediatrics,116: 1480-1486.
doi:10.1542/peds.2005-0185.
Manuel, J. I., Martinson, M. L., Bledsoe-Mansori, S. E., & Bellamy, J. L., The influence of stress
and social support on depressive symptoms in mothers with young children, Social
Science & Medicine (2012), doi: 10.1016/j.socscimed.2012.07.034.
Marshall, J. & Mendez, L.R. (unpublished manuscript). Evaluation of a community-based
developmental screening program: do families get the services their children need?

205
Marshall, J. & Ng, J. (2011) Environmental effects of phthalate exposure on development during
gestation, infancy, and early childhood: United States and Canada. Umwelt und
Gesundheit Online, 4, 73-82.
Marshall, J. (2011) Infant neurosensory development: considerations for infant child care. Early
Childhood Education Journal,39, 175-181. doi: 10.1007/s10643-011-0460-2
Mashburn, A. J., Pianta, R. C., Hamre, B. K., Downer, J. T., Barbarin, O. A., Bryant, D.,
Burchinal, M., Early, D. M., & Howes, C. (2008). Measures of classroom quality in
prekindergarten and children’s development of academic, language, and social skills.
Child Development, 79(3.), 732-749.
Mason, C. A., Chapman, D. A., & Scott, K. G. (1999). The identification of early risk factors for
severe emotional disturbances and emotional handicaps: an epidemiological approach.
American Journal of Community Psychology, 27(3), 357-381. doi:
10.1023/A:1022281910190
Masten, A. S. & Wright, M. O. (1998).Cumulative Risk and protection models of child
maltreatment. Journal of Aggression, Maltreatment & Trauma, 2(1); 7-30.
Maxwell, K. L., & Clifford, R. M.(2004). School readiness assessment. Young Children,
January. Retrieved from http://journal.naeyc.org/btj/200401/maxwell.asp
McClean, M. E., Snyder, P., Smith, B. J., & Sandall, S. R. (2002). The DEC Recommended
Practices in Early Intervention/Early Childhood Special Education: social validation.
Journal of Early Intervention, 25, 120. doi: 10.1177/105381510202500209
McKenzie, K. & Megson, P. (2011). Screening for intellectual disability in children: a review of
the literature. Journal of Applied Research in Intellectual Disabilities. Doi:
10.111/j.1468-3148.2011.00650.x

206
McLean, M, Wolery, M. & Bailey, D. B. (2004). Assessing infants and preschoolers with special
needs (3rd Ed.) Upper Saddle River, NJ: Pearson Education, Inc.
Meisels, S. J., Atkins-Burnett, S., & Nicholsen, J. (1996). Assessment of social competence,
adaptive behaviors, and approaches to learning with young children. National Center for
Education Statistics, Working Paper Series, No. 96-18. Retrieved from
http://nces.ed.gov/pubs96/9618.pdf
Mendelsohn, M. & Rozek, F. (1983). Denying disability: the case of deafness. Family Systems
Medicine, 1(2): 37-47.
Mendez, L. R. & Hess, J. (2003). An Analysis of Community-Based Services and Supports for
Children & Young Adults with Special Needs in Hillsborough County. Retrieved from
http://www.childrensboard.org/providers/analysis_reports.aspx
Meszaros, J. R., Asch, D. A., Baron, J., Hershey, J. C., Kunreuther, H., & Schwartz-Buzaglo, J.
(1996). Cognitive processes and the decisions of some parents to forego pertussis
vaccination for their children. Journal of Clinical Epidemiology, 49(6), 697-703.
Miller, A. R., Condin, C. J., McKellin, W. H., & Shaw, N. (2009). Continuity of care for children
with complex chronic health conditions: parents' perspectives. BMC Health Services
Research, 9,242. Electronic publication. doi:10.1186/1472-6963-9-242.
Minkler, M., Wallerstein, N. & Wilson, N. (2008). Improving health through community
organization and community building. In K. Glanz, B. K. Rimer, & K. Viswanath (Eds.),
Health behavior and health education: Theory Research, and Practice (4th
Ed.) (pp. 287-
309). San Francisco: Jossey-Bass.

207
Montaňo, D. E. & Kaspryzk, D. (2008). Theory of Reasoned Action, Theory of Planned
Behavior, and the Integrated Behavior Model. In Glanz, K., Rimer, B. K., & Viswanath,
K. (2008). Health Behavior and Health Education: Theory, Research, and Practice (4th
ed.)(pp. 67-92). San Francisco: Jossey-Bass.
Moore, K. A. & Redd, Z. (2002). Children in Poverty: Trends, Consequences, and Policy
Options. Pub# 2002-54. Retrieved from www.Childtrends.org
Pierce, L. & Müller, E. (2005). Part C underserved populations: State outreach efforts. Retrieved
from http://www.projectforum.org/docs/
National Association for the Education of Young Children (NAEYC) (2006). Early Childhood
Program Standards and Accreditation Criteria. Retrieved from
http://www.naeyc.org/academy/standards/standard4/standard4C.asp
National Health Service (NHS) Scotland (1999). The Stages of Change model and its use in
health promotion: a critical review. Retrieved from
http://www.healthscotland.com/documents/351.aspx
National Women’s Law Center (2008). A platform for progress: Building a better future for
women and their families. Retrieved from http://www.nwlc.org/resource/platform-
progress-building-better-future-women-and-their-families-introduction
Navas, P., Verdugo, M. A., Arias, B., Gómez, L. E. (2012). Development of an instrument for
diagnosing significant limitations in adaptive behavior in early childhood. Research in
Developmental Disabilities, 33, 1551–1559.
Nepomnyaschy, L. (2009). Socioeconomic gradients in infant health across race and ethnicity
Maternal and Child Health Journal, 13(6), 720-731. doi: 10.1007/s10995-009-0490-1

208
Newacheck, P. W., Kim, S. E., Blumberg, S. J., & Rising, J. P. (2008). Who is at risk for special
health care needs: findings from the National Survey of Children's Health. Pediatrics,
122(2), 347-59.
Nygren, G., Sandberg, E., Gillstedt, F., Ekeroth, G., Arvidsson, T., & Gillberg, C. (2012). A new
screening program for autism in a general population of Swedish toddlers. Research in
Developmental Disabilities, 33(Jul-Aug 4), 1200–1210.
http://dx.doi.org/10.1016/j.ridd.2012.02.018
O’Brien, M. E. (2001). Living in a house of cards: family experiences with long-term childhood
technology dependence. Journal of Pediatric Nursing, 16(1): 13-22.
Oberg, C. N., & Aga, A. (2010). Childhood poverty and the social safety net. Current Problems
in Pediatric and Adolescent Health Care 40(10):237-262.
Oswald, D. P., Bodurtha, J. N., Willis, J. H., Gilles, D. L., Christon, L.M., Ogston, P. L., &
Tlusty, S. M. (2011). Disparities in the clinical encounter: Virginia’s African American
Children with Special Health Care Needs. International Scholarly Research Network,
2011. doi: 10.5402/2011/273938
Oosterling, I. J., Wensing, M., Swinkels, S. H., van der Gaag, R. J., Visser, J. C., Woudenberg,
T., Minderaa, R., Steenhuis, M., & Buitelaar, J. K. (2010), Advancing early detection of
autism spectrum disorder by applying an integrated two-stage screening approach.
Journal of Child Psychology and Psychiatry, 51(3), 250–258. doi:10.1111/j.1469-
7610.2009.02150.x
Orton, J., Spittle, A., Doyle, L., Anderson, P., & Boyd, R. (2009). Do early intervention
programmes improve cognitive and motor outcomes for preterm infants after discharge?
A systematic review. Developmental Medicine & Child Neurology, 51, 851-859.
209
Palloni, A. M., & Milesi, C. (2005). Economic achievement, inequalities and health
disparities: The intervening role of early health status. Research on Social stratification
and Mobility, 24, 21-40. doi: 10.1016/j.rssm.2005.02.001
Paradis, J. (2010). The interface between bilingual development and specific language
Impairment. Applied Psycholinguistics, 31(2), 227-252.
doi:http://dx.doi.org/10.1017/S0142716409990373 Parker, S. E., Mai, C. T., Canfield, M.
A., Rickard, R., Wang,Y., Meyer, R. E., Anderson, P., Mason, C. A., Collins, J.
S., Kirby, R. S. & Correa, A.; National Birth Defects Prevention Network.
(2010).Updated national birth prevalence estimates for selected birth defects in the
United States, 2004-2006. Birth Defects Research Part A: Clinical and Molecular
Teratology,88(12),1008-16. doi: 10.1002/bdra.20735. Epub 2010 Sep 28.
Patel, K. P. (2007). The Impact of the “Learn the Signs. Act Early.” Public Health Awareness
Campaign on Early Intervention Behavior. Public Health Theses. Paper 3. Retrieved from
http://digitalarchive.gsu.edu/iph_theses/3
Peck Reuland, C., & Bethell, C. (2005). National Academy for State Health Policy Technical
Report: Key Measurement Issues in Screening, Referral, and Follow-Up Care for Young
Children’s Social and Emotional Development. Retrieved from
http://www.commonwealthfund.org/innovations/innovations_show.htm?doc_id=273198
Pedhazur, E. J. (1997). Multiple Regression in Behavioral Research: Explanation and Prediction
(3rd
Ed.). United States: Thomson Learning.

210
Pelletier, H. & Abrams, M. (2002). The North Carolina ABCD Project: A new approach for
providing developmental services in primary care practice. National Academy for State
Health Policy. Retrieved from http://www.nashp.org/publication/north-carolina-abcd-
project-new-approach-providing-developmental-services-primary-care
Pelletier, H., Abrams, M. (2003). ABCD: Lessons from a Four-State Consortium. National
Academy for State Health Policy. Retrieved from
http://www.nashp.org/Files/CW9_ABCD_Lessons_Learned.pdf
Pies, C., Parthasarathy, P., Kotelchuck, M., & Lu, M. (2009). Making a paradigm shift in
maternal and child health: A report on the national MCH life course meeting. Family,
Maternal and Child Health Programs, Contra Costa Health Services. Retrieved from
www. Cchealth.org/groups./lifecourse
Pinto-Martin, J. A., Dunkle, M., Earls, M., Fliedner, D., & Landes, C. (2005). Developmental
stages of developmental screening: steps to implementation of a successful program.
American Journal of Public Health. 95: 1928-1932.
Pittman, L. D., & Boswell, M. K. (2007). The role of grandmothers in the lives of preschoolers
growing up in urban poverty. Applied Developmental Science, 11(1); 20-42.
Ploof, D. & Hamel, S. C. (2002). Developmental screening is an important part of well care:
How can we really make it happen? Basic principles for practice change in the real
world. American Academy of Pediatrics’ Section on Developmental and Behavioral
Pediatrics’ Newsletter. Retrieved from
https://www.firstsigns.org/downloads/05_Basic_Principles_for_Practice_Change_in_the_
Real_World..pdf

211
Porter Novelli (n.d.). Promote early screening for children at risk for developmental
disabilities. Retrieved from http://www.porternovelli.com/portfolio/centers-for-disease-
control-and-prevention.
Posavac, E. J. & Carey, R. G. (2007). Program Evaluation: Methods and Case Studies,7th Ed..
Upper Saddle River, New Jersey: Pearson Prentice Hall.
Poss, J. (2001). Developing a new model for cross-cultural research: synthesizing the health
belief model and the theory of reasoned action. Advances in Nursing Science, 23(4), 1-15.
Postert, C., Averbeck-Holocher, M., Beyer, T., Müller, J., & Furniss, T. (2009). Five systems of
psychiatric classification for preschool children: do differences in validity, usefulness and
reliability make for competitive or complimentary constellations? Child Psychiatry &
Human Development, 40, 25-41. Doi: 10.1007/s10578-008-0113-x
Powell, D. R. (2008). Who’s watching the babies? Improving the quality of family, friend, and
neighbor care. Washington, DC: Zero to Three.
Prochaska J. and Velicer W. (1997) The Transtheoretical Model of Health Behaviour Change
American Journal of Health Promotion, 12 (1); 38-48.
Prochaska, J. O. & Norcross, J. C. (2001) Stages of change. Psychotherapy, 4; 443-448.
Prochaska, J. O., Redding, C. A., & Evers, K. E. (2008). The Transtheoretical Model and stages
of change. In K. Glanz, B. K. Rimer, & K. Viswanath (Eds.), Health behavior and health
education: Theory Research, and Practice (4th
Ed., pp. 97-117). San Francisco: Jossey-
Bass.
Radecki, L., Sand-Loud, N., O’Connor, K. G., Sharp, S., & Olson, L. M. (2011). Trends in the
use of standardized tools for developmental screening in early childhood: 2002-2009.
Pediatrics, 128(1), 14-19.

212
Ramey, C. T. & Ramey, S. L. (2004). Early learning and school readiness: can early intervention
make a difference? Merrill-Palmer Quarterly, 50(4), 471-491.
doi:10.1353/mpq.2004.0034.
Raviv, A., Raviv, A., Edelstein-Dolev, Y., & Selberstein, O. (2003a). The gap between a mother
seeking psychological help for her child and for a friend’s child. International Journal of
Behavioral Development, 27(4); 329-337. DOI: 10.1080/01650250244000353
Raviv, A. Raviv, A. Propper, A., & Schachter Fink, A. (2003b). Mothers; attitudes toward
seeking help for their children from school and private psychologists. Professional
Psychology Research and Practice, 34(1); 95-101.
Reichman, N., Teitler, J., Hamilton, E. 2009. Effects of neighborhood racial composition on
birthweight. Health and Place, 15, 784-791.
Rimer, B. K., & Glanz, K. (2005). Theory at a Glance: A Guide for Health Promotion Practice.
DHHS NIH Pub 05-3896.
Riou, E. M., Ghosh, S., Francoeur, E., Shevell, M. I. (2009). Global developmental delay and its
relationship to cognitive skills. Developmental Medicine & Child Neurology, 51(8), 600–
606. doi: 10.1111/j.1469-8749.2008.03197.x
Roberts, G., Anderson, P. J., Doyle, L. W. & the Victorian Infant Collaborative Study Group
(2010). The stability of the diagnosis of developmental disability between ages 2 and 8 in
a geographic cohort of very preterm children born in 1997. Archives of Disability in
Children, 10(95),786-790. doi:10.1136/adc.2009.160283
Roberts, G., Bellinger D., & McCormick, M.C. (2007). A cumulative risk factor model for early
identification of academic difficulties in premature and low birth weight infants.
Maternal & Child Health Journal, 11,161-172.

213
Rose, L. E., Campbell, J., Kub, J. (2000). The role of social support and family relationships in
women’s responses to battering. Health Care for Women International, 21; 27-39.
Rosenberg, K. D., Sandoval, A. P., Ahluwalia, I. B., Kroelinger, C. D., Barradas, D. T., &
Cunningham, T. J. (2011) Characteristics associated with seasonal influenza vaccination
of preschool children - Oregon, 2006—2008. Morbidity and Mortality Weekly Report,
60(29), 981-984.
Rosenberg, S. A. & Smith, E. G. (2010). Rates of part c eligibility for young children
investigated by child welfare. Topics in Early childhood Special Education, 28(2), 68-74.
Rosenberg, S.A., Zhang, D., & Robinson, C. C. (2008). Prevalence of developmental delays and
participation in early intervention for young children. Pediatrics, 121;e1503-w1509. doi:
10.1542/peds.2007-1680
Rogers, E. S. & Erbs, V. (1994). Participatory action research: Implications for research and
evaluation in psychiatric rehabilitation. Psychosocial Rehabilitation, 18(2), 3-12.
Rogers, M. & Hogan, D. P. (2003). Family life with children with disabilities: The key role of
rehabilitation. Journal of Marriage and Family, 65(Nov): 818-833.
Rosenstock IM (1966). Why people use health services. Milbank Memorial Fund Quarterly
44(3); 94–127 Retrieved from http://www.jstor.org/journals/00263745.html
Ross, N., Wolfson, M., Dunn, J., & Lynch, J. (2000). Relation between income inequality and
mortality in Canada and in the United States: cross sectional assessment using census
data and vital statistics. British Medical Journal, 320(7239), 898–902.
Roux, A. M.,Herrera, P., Wold, C. M., Dunkle, M. C., Glascoe, F. P., Shattuck,P. T. (2012).
Developmental and autism screening through 2-1-1: reaching underserved families.
American Journal of Preventive Medicine,43(6S5), S457–S463.

214
Rushton, J. P. & Jensen, A. R. (2005). Thirty years of research on race differences in cognitive
ability. Psychology, Public Policy, and Law, 11(2), 235–294. doi:10.1037/1076-
8971.11.2.235
Rowe, M. (2008). Parental knowledge of child development. Journal of Child Language, 35,
185–205. doi:10.1017/S0305000907008343
Rutter, M. (2006). Implications of resilience concepts for scientific understanding. Annals New
York Academy of Sciences, 1094,1-12
Rydz, D., Shevell, M., Majnemer, A., and Oskoui, M. (2005). Developmental Screening.
Journal of Child Neurology, 20(1), 4-21.
Rydz, D., Srour, M., Oskoui, M., Marget, N., Shiller, M., Birnbaum, R., Majnemer, A., Shevell,
M.I. (2006). Screening for developmental delay in the setting of a community pediatric
clinic: a prospective assessment of parent-report questionnaires. Pediatrics, 118,1178-
1186.
Sagi, M., Shiloh, S., & Cohen, T. (1992). Application of the Health Belief Model in a study on
Parents’ Intentions to Utilize Prenatal Diagnosis of Cleft Lip and/or Palate. American
Journal of Medical Genetics, 44, 326-333.
Salganicoff, A. & Wyn, R. (1999). Access to care for low-income women: the impact of
Medicaid. Journal of Health Care for the Poor and Underserved, 10(4), 453-467.
Sand, N., Silverstein, M., Glascoe, F. P., Gupta, V. B., Tonniges, T. P., & O’Connor, K. G.
(2005). Pediatrician’s reported practices regarding developmental screening: do
guidelines work? Do they help? Pediatrics, 116,174-179.

215
Sanders, M. R. & Prinz, R. J. (2008). Using the mass media as a population level strategy to
strengthen parenting skills. Journal of Clinical Child & Adolescent Psychology, 37(3),
609–621. doi: 10.1080/15374410802148103
Sanjakdar, F. (2009). Participatory action research: Creating spaces for beginningconversations
in sexual health education for young Australian Muslims. Educational Action Research,
17(2), 259-275.
Sawhill, I. (2006). Policy Brief: Opportunity in America: The role of education. The Future of
Children, Fall. Retrieved from
http://www.brookingstsinghua.cn/~/media/Files/rc/papers/2006/fall_childrenfamilies_sa
whill/20060913foc.pdf
Sayal, K. (2006). Annotation: pathways to care for children with mental health problems.
Journal of Child Psychology and Psychiatry, 47(7); 649-659.
Scarborough, A. A., Hebbeler, K. M., & Spiker, D. (2006). Eligibility characteristics of infants
and toddlers entering early intervention services in the United States. Journal of Policy
and Practice in Intellectual Disabilities, 3(1), Mar, 57-64.
Scarborough, A. A., Lloyd, E. C., & Barth, R. P. (2009). Maltreated infants and
toddlers:predictors of developmental delay. Journal of Developmental and Behavioral
Pediatrics, 30(6), 489-498.
Schmidt, L. J., Garratt, A. M., & Fitzpatrick, R. (2002). Child/parent-assessed population health
outcome measures: a structured review. Child: Care, Health & Development, 28(3), 227-
237.
Shackelford, J. (2006), State and jurisdictional eligibility definitions for infants and toddlers with
disabilities under IDEA. NECTAC Notes, Issue 21.

216
Sharief, S., Jariwala, S., Kumar, J., Muntner, P., & Melamed, M. L. (2011). Vitamin D levels and
food and environmental allergies in the United States: Results from the National Health
and Nutrition Examination Survey 2005-2006. Journal of Allergy and Clinical
Immunology, 127(5), 1195–1202.
Shonkoff, J. P., & Phillips, D. (2000). From Neurons to Neighborhoods: The Science of Early
Childhood Development. Washington, D. C.: National Academy Press
Schonwald, A., Huntington, N., Chan, E., Risko, W., & Bridgemohan, C. (2009). Routine
developmental screening implemented in urban primary care settings: more evidence of
feasibility and effectiveness. Pediatrics, 123, 660-668
Schormans, A. F. & Brown, I. (2002). An investigation into the characteristics of the
maltreatment of children with developmental delays and the alleged perpetrators of this
maltreatment. Journal on Developmental Disabilities, 9(1), 1-20.
Schulman, K. & Blank, H. (2011). State Child Care Assistance Policies 2011: Reduced Support
for Families in Challenging Times. National Women’s Law Center. Retrieved from
http://www.nwlc.org/resource/state-child-care-assistance-policies-2011-reduced-support-
families-challenging-times
Schulz, A.J., Parker, E.A., Israel, B.A., Fisher, T. (2001). Social context, stressors and disparities
in women's health. Journal of the American Medical Women's Association, 56, 143-149.
Seith, D. & Kalof, C. (2011). Who are America’s poor children? Examining health disparities by
race and ethnicity. National Center for Children in Poverty. Retrieved from
http://www.nccp.org/publications/pdf/text_1032.pdf
Seligman, M., & Darling, R. B. (2007). Ordinary Families, Special Children: A Systems
Approach to Childhood Disability (3rd Ed.). New York: Guilford Press.

217
Shandra, C. L., Hogan, D.P., & Spearin, C. E. (2008). Parenting a child with a disability: An
examination of resident and non-resident fathers. Journal of Population Research, 25(3):
357-377.
Shapiro, B. J. & Derrington, T. M. (2004). Equity and disparity in access to services: An
outcomes-based evaluation of early intervention child find in Hawai’i. Topics in Early
Childhood Special Education 24(4), 199-212.
Sherrman, J. (2003). Promises made…promises kept. a policy analysis of public services
available to Florida residents with developmental disabilities. Report by The University
of Miami School of Medicine, Mailman Center for Child Development for the Florida
Developmental Disabilities Council (FDDC) Retrieved from
http://www.fddc.org/publications
Shevell, M., Majnemer, A., Platt, R. W., Webster, R., & Birnbaum, r. (2005) Developmental and
functional outcomes at school age of preschool children with global developmental
delay. Journal of Child Neurology, 20(8),648-53.
Shevell, M. (2008). Global developmental delay and mental retardation or intellectual disability:
conceptualization, evaluation, and etiology. Developmental Disabilities, Part I, 55(5),
1071–1084.
Shevell, M. (2010) Present conceptualization of early childhood neurodevelopmental disabilities.
Journal of Child Neurology, 25(1), 120-126. doi:10.117/0883073809336122
Sices, L. (2007). Developmental screening in primary care: The effectiveness of current practice
and recommendations for improvement. Commonwealth Fund, Publication no. 1082.
Sices, L. S., Stancin, T. Kirchners, H. L., & Bauchner, H. (2009). PEDS and ASQ developmental
screening tests may not identify the same children. Pediatrics, 124(4.).

218
Sices, L., Feundtner, C., McLaughlin, J., Drotar, D., & Williams, M. (2003). How do primary
care physicians identify young children with developmental delays? A national survey.
Journal of Developmental and Behavioral Pediatrics, 24(6), Dec, 409-417.
Siega-Riz, A. M., Kranz, S. Blanchette, D., Haines, P. S., Guilkey, D. K., & Popkin, B. M.
(2004). The effect of participation in the WIC program on preschoolers’ diets. Journal of
Pediatrics, 144,229-34.
Skinner, D. & Weisner, T. S. (2007). Sociocultural studies of families of children with
intellectual disabilities. Mental Retardation and Developmental Disabilities Research
Reviews, 13 302-312.
Smailbegovic, M. S., Laing, G. J., & Bedford, H. (2003). Why do parents decide against
immunization? The effect of health beliefs and health professionals. Child: Care, Health
& Development, 29(4), 303-311.
Smith, L. E., Akai, C. E., Klerman, L. V., & Keltner, B. R. (2010). What mothers don’t know
and doctors don’t say: detecting early developmental delays. Infant Mental Health
Journal, 31(4), 455-466. Doi: 10.1002/imhj.20266
Snell, P., Miguel, N., & East, J. (2009). Changing directions: Participatory action research as a
parent involvement strategy. Educational Action Research, 17(2), 239-258.
Solari, C. D. & Mare, R. D. (2011). Housing crowding effects on chidren’s wellbeing. Social
Science Research, doi: 10.1016/j.ssresearch.2011.09.012
Spelke, E. S. (2005). Sex differences in intrinsic aptitude for mathematicsand science? a critical
review. American Psychologist ,60( 9), 950–958. doi: 10.1037/0003-066X.60.9.95
219
Spittle, A. J., Doyle, L. W., & Boyd, R. N. (2008). A systematic review of the clinimetric
properties of neuromotor assessments for preterm infants during the first year of life.
Developmental Medicine & Child Neurology, 50, 254-266.
Stahmer, A. C., Sutton, D. T., Fox, L., & Leslie, L. K. (2008). State Part C agency practices and
the Child Abuse Prevention and Treatment Act (CAPTA). Topics in Early Childhood
Special Education, 283, 99-108.
Starfield, B. and Shi, L. (2004). The medical home, access to care, and insurance: a review of
evidence. Pediatrics, 113,1493-1498.
Stevens, J. P. (2007). Intermediate Statistics: A Modern Approach (3rd
Ed.). New York:
Routledge.
Stevens, J. P. (2009). Applied Multivariate Statistics for the Social Sciences (5th
Ed.). New York:
Routledge.
Suchman, A.L. (2002). An introduction to complex responsive process: theory and Implications
for organizational change initiatives. University of Hertfordshire. Relationship Centered
Health Care. Retrieved from
http://www.plexusinstitute.org/resource/collection/5FD4ACEF-7B50-4388-A93E-
109B0988049F/Intro_to_CRP_Suchman_ACFB945.PDF
Susser, M., & Susser, E. (1996). Choosing a future for epidemiology: II. From Black box to
Chinese boxes and eco-epidemiology. American Journal of Public Health, 86, 674-677.
Tanner-Smith, E. E. & Brown, T. N. (2010). Evaluating the Health Belief Model: A critical
review of studies predicting mammographic and pap screening. Social Theory & Health,
8, 95–125. doi:10.1057/sth.2009.23

220
Tashakkori, A., & Teddlie, C. (1998). Mixed Methodology: Combining Qualitative and
Quantiataive Approaches. Applied Social Research Methods Series, Volume 46. Sage
Publications, Thousand Oaks.
Taylor, P., Cohn, D., Livingston, G., Wang, W., & Dockterman, D. (2010). The new
demography of American motherhood. Pew Research Center. Retrieved from
http://pewsocialtrends.org
Thompson, L. Kemp, J., Wilson, P., Pritchett, R., Minnis, H., Toms-Whittle, L., Puckering, C.,
Law, J., & Gillberg, C. (2009). What have birth cohort studies asked about genetic, pre-
and perinatal exposures and child and adolescent onset mental health outcomes? A
systematic review. European Child & Adolescent Psychiatry, ISSN 1018-882. Retrieved
from http://eprints.gla.ac.uk/6636
Toran, H., Squires, J., & Lawrence, K. (2011). Infant mental health in Malaysia. Infant Mental
Health Journal, 32(2), 263-275.
Tough, S. C., Siever, J. E., Benzies, K., Leew, S., & Johnston, D. W. (2010). Maternal well-
being and its association to the risk of developmental problems in children at school
entry. BMC Pediatrics, 10(19), online publication. Doi: 10.1186/1471-2431/10/19/prepub
Twardosz, S. & Lutzker, J. R. (2010). Child maltreatment and the developing brain: A review of
neuroscience perspectives. Aggression and Violent Behavior, 15, 59-68.
Twyman, K. A., Maxim, R. A., Leet, T. L., & Ultmann, M. H. (2009). Parents’ developmental
concerns and age variance at diagnosis of children with autism spectrum disorder.
Research in Autism Spectrum Disorders, 3, 489-495.
Turnbull, A. P. & Turnbull, H. R. III (2001). Families, Professionals, and Exceptionality:
Collaborating for Empowerment. (4th Ed.). Upper Saddle River, NJ: Prentice-Hall, Inc.
221
Turnbull, A., Turnbull, R., & Wehmeyer, M. L. (2010). Exceptional Lives: Special Education in
Today’s Schools (6th Ed.). Columbus, Ohio: Merrill.
Twoy, R., Connolly, P. M., & Novak, J. M. (2007). Coping strategies used by parentschildren
with autism. Journal of the American Academy of Nurse Practitioners, 19, 251-260
United Nations Children’s Fund (UNICEF), Division of Policy and Practice (2008). Monitoring
Child Disability in Developing Countries: Results from the Multiple Indicator Cluster
Surveys. ISBN: 978-92-806-4407-4.
University of North Carolina, FPC Child Development Institute. (n.d.) About Environmental
Rating Scales. Retrieved from http://ers.fpg.unc.edu/about-environment-rating-scales
Upton, P., Lawford, J., & Eiser, C. (2008). Parent-child agreement across child health-related
quality of life instruments: a review of the literature. Quality of Life Research, 17, 895-
913. doi: 10.1007/s11136-008-9350-5
U. S. Census Bureau Quick Facts: Hillsborough County, Florida. Retrieved from
http://quickfacts.census.gov/qfd/states/12/12057.html
U. S. Census Bureau (2005). American Community Survey. Retrieved from
http://www.census.gov/acs/www/Products/Profiles/Single/2003/ACS/Narrative/050/NP0
5000US12057.htm
U. S. Census Bureau (2009). National Characteristics: Vintage 2009 Tables
Median Age and Age by Sex. Annual Estimates of the Resident Population by Sex and Five-
Year Age Groups for the United States: April 1, 2000 to July 1, 2009 (NC-EST2009-01)
http://www.census.gov/popest/data/national/asrh/2009/index.html

222
U.S. Census Bureau (2010). POV01. Age and Sex of All People, Family Members and Unrelated
Individuals Iterated by Income-to-Poverty Ratio and Race. Current Population Survey
CPS 2011 Annual Social and Economic Supplement Retrieved from
http://www.census.gov/hhes/www/cpstables/032011/pov/new01_100.htm
U.S. Census Bureau (2012). Americans With Disabilities: 2010. Current Population Reports,
Household Economic Studies. Retrieved from
http://www.census.gov/prod/2012pubs/p70-131.pdf
U. S. Congress (2009). Public Law111-3: Children’s Health Insurance Program Reauthorization
Act of 2009. Retrieved from http://www.gpo.gov/fdsys/pkg/PLAW-
111publ3/html/PLAW-111publ3.htm
U. S. Department of Health and Human Services (US DHHS) Administration for Children and
Families (n.d.).Resources for Measuring Services & Outcomes in Head Start Programs
Serving Infants & Toddlers. Retrieved from
http://www.acf.hhs.gov/programs/opre/ehs/perf_measures/reports/resources_measuring/r
es_meas_phi.html
U. S. Department of Health and Human Services (US DHHS) (1999) Mental Health: A Report of
the Surgeon General—Executive Summary. Rockville, MD: U. S.
U. S. U. S. Department of Health and Human Services, Substance Abuse and Mental Health
Services Administration, Center for Mental Health Services, National Institutes of
Health, National Institute of- Mental Health. Retrieved from
http://www.surgeongeneral.gov/topics/cmh/childreport.htm

223
U. S. Department of Health and Human Services (US DHHS) Administration for Children and
Families (ACF). (2009). Building partnerships for children and families. Child Care
Bulletin,35;1-15 Retrieved from: http://nccic.acf.hhs.gov/files/resources/issue35.pdf
U. S. Department of Health and Human Services (US DHHS) Administration for Children and
Families (ACF): Office of Head Start. (2007) Federal Performance Standards. Retrieved
from http://eclkc.ohs.acf.hhs.gov/hslc/
U. S. Department of Health and Human Services (US DHHS), Administration for Children and
Families (ACF). (2005). Head Start Impact Study: First Year Findings. Washington DC.
U. S. Department of Education, Office of Special Education and Rehabilitative Services. Twenty-
Five Years of Progress in Educating Children with Disabilities through IDEA. Retrieved
from: ttp://www2.ed.gov/policy/speced/leg/idea/history.html
U. S. Department of Health and Human Services (US DHHS) (2011). Healthy People 2020:
Early and Middle Childhood Objective. Retrieved from:
http://www.healthypeople.gov/2020/topicsobjectives2020/objectiveslist.aspx?topicid=10
U. S. Department of Health and Human Services (US DHHS). (n.d.). Progress Toward Healthy
eople 2010 Targets: MidCourse Review. Retrieved from
http://www.healthypeople.gov/2010/data/midcourse/
U. S. Department of Health and Human Services, Administration for Children and Families.
(2010). The National Head Start Impact Study Final Report. Retrieved from
http://www.acf.hhs.gov/programs/opre/hs/impact_study/reports/impact_study/hs_impact_
study_final.pdf

224
U. S. Department of Health and Human Services, Health Resources and Services Administration,
Maternal and Child Health Bureau. (U.S. DHHS) (2007a). The National Survey of
Children’s Health. Rockville, Maryland.
U. S. Department of Health and Human Services, Health Resources and Services Administration,
Maternal and Child Health Bureau. (U.S. DHHS) (2007b). The National Survey of
Children with Special Health Care Needs Chartbook 2005-2006. Rockville, Maryland.
U. S. Department of Health and Human Services (DHHS), Administration on Developmental
Disabilities (2000). Developmental Disabilities Assistance and Bill of Rights Act of
2000. PUBLIC LAW 106–402—OCT. 30, 2000 114 STAT. 1677. Retrieved from
http://www.acf.hhs.gov/progr2\ams/add/ddact/DDACT2.html
U. S. Department of Health and Human Services, National Child Care Information and Technical
Assistance Center. (2009) Child Care Bulletin, 3,1-15.
U. S. Library of Congress (2000) Public Law 106-310. Retrieved from
http://www.gpo.gov/fdsys/pkg/PLAW-106publ310/pdf/PLAW-106publ310.pdf
U. S. Office of Special Education (OSEP) (2007) Individuals with Disabilities Act (IDEA) Data
Accountability Center: Home Page. Retrieved from
https://www.ideadata.org/PopulationData.asp
U. S. Office of Special Education (OSEP) (2011) Data Accountability Center. Table 8-3:
Number of at-risk infants and toddlers ages birth through 2 receiving early intervention
services under IDEA, Part C, by age and state: Fall 2010. Retrieved from
https://www.ideadata.org/arc_toc12.asp#partcCC
Venetsanou, F, & Kambas, A. (2010). Environmental factors affecting preschoolers’ motor
development. Early Childhood Education Journal, 37, 319-327.

225
Victorino, C. C., & Gauthier, A. H. (2009). The social determinants of child health: variations
across health outcomes- a population-based cross-sectional analysis. BMC Pediatrics,
9(53), 1-12. doi: 10.1186/1471-2431-9-53
Wagner, R. K., Francis, D. J., Morris, R. D. (2005). Identifying English Language Learners with
Learning Disabilities: Key Challenges and Possible Approaches. Learning Disabilities
Research & Practice, 20(1), 6–15 C, The Division for Learning Disabilities of the
Council for Exceptional Children.
Wagner, J., Jenkins, B., & Smith, B. (2006) Nurses’ utilization of parent questionnaires for
developmental screening. Pediatric Nursing, 32(5), 409-412.
Walker, S. P., Wachs, T. D., Gardner, J. M., Lozoff, B., Wasserman, G. A., Pollitt, E., Carter, J.
A., & the International Child Development Steering Group. (2007). Child development in
developing countries 2. Child development: risk factors for adverse outcomes in
developing countries. The Lancet, 369, 145-157.
Walker, S. P., Wachs, T. D., Grantham-McGregor, S., Black, M. M., Nelson, C. A., Huffman, S.
L., Baker-Henningham, H., Change, S. M., Hamadani, J. D., Lozoff, B., Gardner, J. M.
M., Powell, C. A., Rahman, A., & Richter, L. (2011). Inequality in early childhood: risk
and protective factors for early child development. The Lancet, 378, 1325-1338.
Weathers, B. Barg, F. K., Bowman, M. Briggs, V., Delmoor, E., Kumanyika, S., Johnson, J. C.,
Purnell, J., Rogers, R., & Halbert, C., H. (2011). Using a mixed-methods approach to
identify health concerns in an African American community. American Journal of Public
Health, 101(11), 2087-2092.
Wells, Sandefur & Hogan (2003). What happens after the high school years among young
persons with disabilities? Social Forces, 8(2):803-832.

226
White, J. M., & Klein, D. M. Family Theories (3rd Ed.). (2008). Thousand Oaks, CA: Sage
Publications, Inc.
Williams, J. G., Higgins, J. P. T., & Brayne, C. E. G. (2011). Systematic review of prevalence
studies of autism spectrum disorders. Archives of Disease in Childhood, 91(8), 8-15. doi:
10.1136/adc.2004.062083
Wise, P. H. (2003). Framework as Metaphor: The Promise and Peril of MCH Life-Course
Perspectives. Maternal and Child Health Journal,7(3), 151-156, doi:
0.1023/A:1025180203483
Worcester, J. A., Nesman, T. M., Raffaele Mendez, L. M., & Keller, H. R. (2008). Giving voice
to parents of young children with challenging behavior. Exceptional Children, 74(4),
509-525. Retrieved from http://cec.metapress.com/content/n0qv8r6w35p47117/
World Health Organization. (2007). The International Classification of Functioning, Disability
and Health- Children and Youth Version: ICF_CY. Geneva: WHO; 2007. Retrieved from
ttp://www.who.int/mediacentre/news/releases/2007/pr59/en/index.html
Wrightslaw (n.d.). Early Intervention (Part C of IDEA): What is Early Intervention? Retrieved
from http://www.wrightslaw.com/info/ei.index.htm
Yang, P., Lung, F., Jong, Y., Hsu, H., Chen, C. (2010). Stability and change of cognitive
attributes in children with uneven/delayed cognitive development from preschool through
childhood. Research in Developmental Disabilities, 31(4), 895–902.
Zlotnick, C. & Soman, L. A. (2004). The impact of insurance lapse among low-income children.
Journal of Urban Health: Bulletin of the New York Academy of Medicine, 81(4), 433-
441..doi:10.1093/jurban/jth141

227
Ziv, Y., Alva, S., Zill, N. (2010). Understanding Head Start children’s problem behaviors in the
context of arrest or incarceration of household members. Early Childhood Research
Quarterly, 25; 396-408.
Zullig, K. J., Matthews, M. R., Gilman, R., Valois, R. F., & Huebner, E. S. (2010). Generic
quality of life measures for children and adolescents. In Preedy V.R., & Watson R.W.,
Handbook of Disease Burdens and Quality of Life Measures. Heidelberg, Germany:
Springer Publishing Company.

228
Appendices

229
Appendix A: Literature Review
Introduction
The United Nations Children’s Fund (UNICEF) defines developmental disability in
children as “limitations in mental and/or physical function relative to age-specific norms that
become apparent prenatally, perinatally or during infancy, childhood, or adolescence.”
(UNICEF, 2008, p 3). Developmental delay is a general term used to describe a child’s non-
attainment of a developmental milestone at the expected age in a single or multiple
developmental areas (cognitive, vision, hearing, motor, neurologic, speech, language, or
behavior). According to the Developmental Disabilities Act (U. S. DHHS, 2000), a
developmental disability means a severe, chronic disability of an individual 5 years of age or
older attributable to a mental or physical impairment (or combination of mental and physical
impairments) that manifests before the individual attains age 22, is likely to continue
indefinitely; and results in substantial functional limitations in three or more of the following
areas of major life activity: self-care; receptive and expressive language; learning; mobility; self-
direction; capacity for independent living; and economic self-sufficiency.
Public special education is provided to children under age 3 through Part C and for
children ages 3-21 through Part B of the Individuals with Disabilities Education Act (I.D.E.A.)
(Aron & Loprest, 2012; Shackelford, 2006). For children under age 5, eligibility categories under
Part C include: mental retardation, hearing impairments, speech or language impairments, visual
impairments, emotional disturbance, orthopedic impairments, other health impairments, specific
learning disabilities, deaf-blindness, multiple disabilities, autism, traumatic brain injury,
developmental delay (Shackelford, 2006). Under Part C, participating states and jurisdictions
provide services to children who are experiencing developmental delays, and those who have a
230
diagnosed mental or physical condition that has a high probability of resulting in developmental
delay, such as chromosomal abnormalities; genetic or congenital disorders; sensory impairments;
inborn errors of metabolism; disorders reflecting disturbance of the development of the nervous
system; congenital infections; severe attachment disorders; and disorders secondary to exposure
to toxic substances, including fetal alcohol syndrome.
Developmental delay is determined through a multidisciplinary diagnostic evaluation
determining a level of delay (25% delay or 2 standard deviations below the mean in one or more
developmental areas, or 20% delay or 1.5 standard deviations in two or more areas) in one or
more of the following areas: cognitive development, physical development, including vision and
hearing, communication development, social or emotional development, or adaptive
development. Other determinants include informed clinical opinion or the decision of the
evaluation team. Several states also elect to serve children who are at risk of experiencing a
substantial developmental delay if early intervention services are not provided (Shackelford,
2006). This risk may be biomedical (e.g. low birth weight, intraventricular hemorrhage at birth,
chronic lung disease, failure to thrive, etc.) or environmental (e.g. parental substance abuse,
family social disorganization, poverty, homelessness, parental developmental disability, parental
age, parental educational attainment, child abuse or neglect, etc.).
There are numerous challenges in early recognition, diagnosis, and evaluation of
developmental disabilities, as well as identifying the etiology, funding and ensuring access to
intervention, and measuring outcomes (Shevell, 2008). Developmental delays can be caused by
birth defects (which occur in approximately 1 in every 33 births in the US), metabolic
conditions, intrauterine infections, perinatal complications (such as premature birth or birth
trauma), or environmental deprivation or insults (toxic exposures, brain trauma, abuse or neglect,

231
nutritional deficiencies, accidents, or chronic or acute illness) but most often the cause is
unknown. Global developmental delays often persist, that is children don’t tend to ‘grow out of’
global developmental delays (Roberts, Anderson, Doyle, & the Victorian Infant Collaborative
Study Group, 2012; Shevell, Majnemer, Platt, Webster, & Birnbaum, 2005). Hebbeler and
colleagues (2007) found that 68% of children receiving early intervention had disabilities by
kindergarten; 58% were enrolled in special education, 10% had a disability but were not
enrolled, and 32% did not have a disability. Shevell (2008) points out that while the term global
developmental delay implies that the child may ‘catch up’ over time and is not interchangeable
with mental retardation or intellectual disability, many studies have demonstrated the persistence
of global delays over time. However, developmental delays within and across domains have
varied etiology (often indiscernible) and prognosis.
Current prevalence estimates of developmental delay in children under age five range
from 13-17% (Aron & Loprest, 2012; Boyle, et al., 2011; Rosenberg, Zhang, & Robinson, 2008).
Several national surveys asking parents about disabilities (functional limitations) in several
developmental domains report prevalence ranging over the past decade from 4.3-8.8% (Halfon,
Houtrow, Larson & Newacheck, 2012). Determining the prevalence of developmental delays in
young children is extremely difficult for two important reasons: one is that population level
measurement is problematic – using Part C or Part B data only captures those children enrolled
in the program, deducing by risk factors is imprecise, and via parent report only captures those
who have recognized a concern or who have been told by another. For example, Boyle and
colleagues (2011) used data on children ages 3 to 17 from 1997 to 2008 from the National Health
Interview Surveys (ongoing nationally representative samples of US households) to estimate
prevalence of the following conditions: attention deficit hyperactivity disorder; intellectual

232
disability; cerebral palsy; autism; seizures; stuttering or stammering; moderate to profound
hearing loss; blindness; learning disorders; and/or other developmental delays. Rosenberg,
Zhang, and Robinson (2008) used data from the Early Childhood Longitudinal Study, Birth
Cohort examining reports from parents of children at 9 and 24 months of age to generate national
estimates of developmental delays significant enough to qualify for Part C early intervention
services. The results showed that 13% of children in the sample had developmental delays that
would make them eligible for Part C early intervention.
This still leaves a portion of children yet unrecognized, and of those who are – a lack of
data on them. While individual level measures may assist physicians, clinicians, teachers, and
parents in assessing and monitoring health and development, measures are increasingly used in
aggregate form for program, system, or policy decision-making at the organizational,
community, state, national and international levels. The most widely used and consistent
measure of infant health is infant mortality and morbidity used throughout the world through
vital statistics. At the international scale, the Millennium Development Goals (Hogan, et al.,
2010) include reduction in maternal, infant and child mortality, by tracking vital statistics in 189
nations. Across nations, tracking systems vary, and within countries, changes to classification,
reporting, and tracking systems (such as the U. S. ICD-10 classification system and birth and
death certificate changes) add challenges to measuring trends and comparing across populations
(Halfon, Houtrow, Larson & Newacheck, 2012; Hogan et al, 2010). International Classification
of Functioning, Disability and Health for Children and Youth is a scale designed by the World
Health Organization to promote a consistent terminology and measurement of child health and
development worldwide (Cieza, et al., 2002). International surveys, such as the Multiple
Indicator Cluster Surveys (MICS) developed by UNICEF (2008), measure the status of women

233
and children across participating countries through administration of a household questionnaire,
women’s questionnaire, and children under 5 years of age questionnaire (2008). The child
questionnaire covers areas such as child characteristics, anthropometry, birth registration, early
learning, nutrition, and health, and also includes optional modules for child development and for
source and cost of treatment supplies (UNICEF, 2008).
Secondly, measurement of developmental delay relies upon consistent definitions, valid
and reliable tools, and multiple measures over time. However, persistent developmental delays
tend to be reliably identifiable with specificity and sensitivity at young ages based on a number
of screening tools. In Sweden, a population-level screening for autism among 3,999 children at
age 2 ½ using the MCHAT and clinically trained nurses yielded a ‘‘definitive’’ suspicion of
autism spectrum disorder (ASD) in 64 children. Of 54 of those children who received clinical
assessment, 48 received a confirmed diagnosis of ASD, 3 had severe language disorder, and
three were classified as having typical development, resulting in a positive predictive value of
90% (Nygren, Sandberg, Gillstedt, Ekeroth, Arvidsson, & Gillberg, 2012). Kleinman and
colleagues (2007) also found that autism diagnosis among 2 year olds in the Northeastern US
remained stable in 85% of children in the sample by age 42-48 months, and among children
initially diagnosed with PDD-NOS, 47% retained the diagnosis. Another study in Taiwan found
that while IQ scores for the majority of a clinical sample of children initially diagnosed with
mental retardation, autism, or developmental language disorder were correlated with IQ scores
six years later, a substantial minority of children changed IQ ranges drastically from preschool
through early childhood (Yang, Lung, Johg, Hsu, & Chen, 2010, p. 895).

234
Individual Level Measures of Child Development
Screening is defined by the Centers for Disease Control and Prevention (2005), as “A
brief assessment designed to identify children who should receive more intensive diagnosis or
assessment”. Evaluation is the process of gathering information for the purpose of making
decisions, including diagnosis; determination of eligibility for a program; assessment for
program planning purposes; monitoring of progress throughout an intervention; and assessment
for accountability (McLean, Wolery, and Bailey (2004, p.13). Developmental evaluation is a
time and labor-intensive process that requires skilled investigation including medical and
psychosocial history, physical examination, neurodevelopmental assessment, and sometimes
laboratory tests (Shevell, 2008). Assessment tools are used to evaluate child health and illness,
attainment or delay of developmental milestones, academic abilities or challenges, and social
emotional function or dysfunction (Clifford & Crawford, 2009).
Child Scales
Individual measures of child health, development and well-being are constantly being
developed and refined for use routine care and to measure intervention outcomes (Appendix C).
Measures of fetal growth, gestation, birth weight have implications for child and adult health;
Hochberg and colleagues (2011) stress the importance of measuring not just weight and height,
but growth rates throughout pregnancy in order to determine the differences between intrauterine
growth restriction and small for gestational age to assess risk. Assessment tools are also used to
evaluate progress in a cognitive, motor, language, social, and adaptive domains for children who
are receiving educational or intervention services. Recently embraced paradigms such as the
socio-ecological (Glanz, Rimer, & Viswanath, 2008) and lifecourse (Lu & Halfon, 2003) models
have led to a greater appreciation for the multiple influences on child health and development

235
over time. For example, outcomes data show that early intervention has a positive impact on
children’s development, behavior and school performance (Sices, 2007). Additionally, brain
development research has led to improved understanding of the interconnections between the
domains of child development, and the sensory, emotional/limbic, and self-regulatory systems
(Marshall, 2011; Twardosz & Lutzker, 2010). As a result, indicators of broader concepts, such as
the “approaches to learning” are now broadly used (Meisels, Atkins-Burnett, & Nicholsen,
1996). Posavac and Carey caution that social indicators are akin to physical symptoms of a
malady; they can tell us that problems exist and where they are most pressing, but not the
fundamental causes or what to do about them (2007, p. 118).
Parent and Caregiver Scales
Because children grow and develop in symphony with their relationships with primary
caregivers, measures of parenting and family climate are often utilized to assess risk or strengths
(Marshall, 2011). In fact over 40 developmental assessment tools for young children and 26
scales of parenting behavior and home conditions for young children are fully described by U.S.
DHHS Administration for Children and Families (ACF) (n.d.). Traditionally, parenting scales
have been developed to identify and measure dysfunction rather than function, and focus on the
parent or the child rather than interactions between the two or among other family members.
Clinical psychology offers insight into measurement of individual and behavioral factors
negatively affecting parental and child mental health, developing helpful tools such as the Brief
Symptom Inventory, Beck Depression Inventory, or the Parenting Stress Index (a scale
measuring parent, child, and situational or demographic life factors) which can assist the parent
and the professional in getting a clear picture of how the parent and child relationship is
functioning under stress (Abidin, PAR Staff, & Ona, 1995; Beck, Steer, & Brown, 1996).

236
Howard, Dryden, and Johnson (1999) warned of problems related to measuring social assets,
particularly if the measures do not have a research base, are outside of social context, or assume
that “one size fits all’ by imparting a value system that assumes that individual, family, school
and community definitions of risk or assets are the same for everyone. In one study, factors
associated with positive parenting attitudes included higher self-efficacy, decision-making
ability, social conformity; negative correlates included parental depression, lower education and
non-White ethnicity (Grella & Greenwell, 2006).
Caregivers in child care settings play an important role in supporting the health and
development of infants and young children. Thus, measures of teacher-child interactions are
often built into comprehensive classroom assessment tools (Marshall, 2011; Mashburn, et al.,
2008). A number of quality improvement systems ensure that children are cared for in a safe,
nurturing physical and social environment, including state or local-level quality rating
improvement systems, accreditation programs for center-based care or family child care homes,
and program standards, such as Head Start and subsidized child care programs. Commonly used
assessment tools include the Infant Toddler, Early Childhood, and Family Child Care
Environmental Rating Scales (University of North Carolina, n.d.) or the Classroom Assessment
Scoring System (CLASS) (La Paro, Pianta, & Stuhlman, 2004). Efforts have been made
throughout the country to better integrate these standards and measures (U.S. DHHS, 2009).
Developmental Screening
Much of the research on early identification of developmental delays has focused on
developmental screening by professionals, such as primary pediatric health care providers (AAP,
2001, 2006; Allen, Berry, Brewster, Chalasani, & Mack, 2010; Bethel, Reuland, Schor,
Abrahms, & Halfon., 2011; Daniel, Prue, Taylor, Thomas, & Scales, 2009; Glascoe, 1997, 2005;

237
Halfon, et al., 2004; Halfon, Regalado, & Sareen, 2004; Hix-Small, 2007; Johnson, 2000;
Mendez & Hess (2003); Pinto-Martin et al., 2005; Rydz, et al., 2006; Sand et al., 2005;
Schonwald, Huntington, Chan, Risko, & Bridgemohan, 2009; Seligman & Darling, 2007; Sices,
2003, 2007; National Center on Birth Defects and Developmental Disabilities, 2005), early
childhood caregivers or teachers (Allen, 2007; Bowman, 2001 Halfon, 2004;Halfon, Russ, &
Regalado, 2004; Pinto-Martin, et al., 2005; Powell, 2008), or comprehensive community based
programs (Bergman, 2004; Halfon, Russ, & Regalado, 2004; McLean, Wolery, & Bailey, 2004).
Across settings, parent-professional agreement maximizes the likelihood of help-seeking and use
of services (Allen, Berry, Brewster, Chalasani, & Mack, 2010; Glaun, Cole, & Reddihough,
1999; Ho, Miller, & Armstrong, 1994).
As Glascoe (2005) asserts, high quality developmental screening takes into account that
children’s development is malleable, and manifests with age. Considerable dialogue continues in
the literature as information about recommended screening tools is learned and tools are created
or revised (Glascoe, Page, & Frankenberg, 2002). Commonly used tools, such as the Denver II or
self-developed questionnaires have not stood up to tests of rigor, though many valid and reliable
standardized tests such as the PEDS, ASQ/ASQ-SE ECBI/SESBI, MCHAT, BIT-SEA, and IDI
are widely available easy to administer (Glascoe, 2005). Additionally, research touts the
advantages and accuracy of using parent-report screening tools (AAP, 2001; Bergman, 2004;
Glascoe, 1997; Hix-Small, 2007; Pinto-Martin et al.; 2005; Radecki, et al., 2011; Rydz, et al.,
2006; Schonwald, et al., 2009; Sices, 2003, 2007, 2009). The importance of early identification
of social and emotional problems was highlighted by the Surgeon General’s National Action
Agenda for Children’s Mental Health (U. S. DHHS, 1999) and the American Psychological
Association’s (APA) Workgroup on Children’s Mental Health (APA, 2001, 2003). APA

238
advocated for more research on the etiology of mental health problems, exploring barriers to
reliable diagnosis, and educating professionals from a variety of disciplines, particularly in early
childhood settings. It is important to recognize the prevalence of all types of emotional and
behavioral disorders (EBD), including those that have internal and external manifestations, and
refer for proper treatment and supports due to the long-term impact of EBD throughout the
lifespan (Mason, Chapman, & Scott, 1999).
Without early recognition and treatment, children may experience decline in
psychological, school and social functioning. Students with depression are at risk of suicide, the
third leading cause of death among adolescents (Herron, 2011; Turnbull, Turnbull, & Wehmeyer,
2010) and those with oppositional defiant disorder or conduct disorder face increased risk of
involvement in the juvenile justice system and school drop-out. Severe emotional disturbances
encompass anxiety disorders, mood disorders, oppositional defiant disorders, conduct disorders,
and schizophrenia, each having several subtypes and a variety of manifestations (Turnbull,
Turnbull, and Wehmeyer, 2010). Developmental assessment tools for young children (Appendix
C) often include a social-emotional component. Additional measures of social-emotional skills
and problems include; Personal Maturity Scale, Child Behavior Checklist for Preschool-Aged
Children, Behavior Problems Index, Aggressive Behavior Scale, Hyperactive Behavior Scale,
and the Withdrawn behavior Scale (Ziv, Alva, Zill, 2011). Additionally, classification systems,
such as the International Classification of Diseases (ICD) Version10 and the APA’s Diagnostic
and Statistical Manual of Mental Disorders (DSM) version III-R and DSM 0-3 for young
children are commonly used to define, describe, and classify social-emotional problems in
children (Postert, 2009).

239
Developmental screening occurs in pediatric, child care/education, and community
settings. Health care settings are naturally convenient venues for health assessment; screening for
chronic and infectious diseases, growth, vision, dental, and hearing problems, and environmental
exposures. Use of standardized tools and checklists among healthcare providers is recommended,
though reportedly inconsistent. The American Academy of Pediatrics (2008) offers a list of
health screening tools. Health assessment presents an opportunity for providers to listen to parent
concerns and to provide anticipatory guidance regarding common age appropriate health issues,
milestones, and risks. Well-child care is an important source of health care for children,
including monitoring of health and development, identification and treatment of health concerns,
and preventive care activities such as provision of immunizations and anticipatory guidance.
Ideally, well-child care is administered in a medical home, which can be described as a usual
source of care provided by a personal physician or nurse and receiving needed referrals for
specialty care, health care coordination, and family-centered care (AAP, 2006; Bachrach, et al.,
2011; Starfield & Shi, 2004).
Because children’s development is a continual process, the primary care setting (medical
home) is an ideal one for regular, repeated screening, which can take place in conjunction with
EPSDT recommended immunizations. Nurses and other medical clinic staff play an important
role in developmental screening by assuring that it is incorporated into the pediatric practice
(Wagner, Jenkins, & Smith, 2006). Several sources have developed guidelines for effective and
family-centered developmental screening in pediatric settings (Allen, Berry, Brewster,
Chalasani, & Mack, 2010; American Academy of Pediatrics, 2006; Daniel, et al., 2009; Glascoe,
2005; Glaun, Cole, & Reddihough, 1999; Ho, Miller, & Armstrong, 1994; Johnson, 2000; Proof
& Hamel, 2002; The National Center on Birth Defects and Developmental Disabilities, 2005).
240
However, roughly half of pediatricians don’t conduct developmental screening, approximately
75% don’t uses standardized assessments (Bethel, et al., 2011; Halfon, Regalado, & Sareen,
2004; Pinto-Martin et al., 2005; Sand et al., 2005), and those who identify a concern often under-
respond by adopting a “wait-and-see” approach rather than referring for further assessment
(Daniel, et al., 2009; Mendez & Hess, 2003; Seligman & Darling, 2007).
Currently, the percent of children who receive standardized developmental screening in
primary care varies by state, ranging from 10%-47% (Bethel, et al., 2011). One national survey
revealed that 57% of children 10-35 months of age ever received a developmental assessment,
and 42% of their parents recalled ever being told by their child’s provider that an assessment was
being done (Halfon, 2004). Another limitation of relying on health care providers to conduct
screening is that up to 30% of some population groups are without health insurance and 10% are
without a usual source of medical care (Seith & Kalof, 2007). Uninsured children are three times
more likely to have an unmet health need, and low income (Seith & Kalof, 2011). Among
persons without a specific source of ongoing care (medical home), the rate for the
Hispanic/Latino population was more than twice the White non-Hispanic rate (Seith & Kalof,
2011).
Uninsurance, underinsurance, and coverage lapses restrict access to needed preventive,
screening, or tertiary treatment for chronic or infectious diseases, particularly for children with
special health care needs. Unmet routine health care needs can lead to increased emergency room
visits, longer hospital stays, and medication use (Bachrach, et al., 2011; Salganicoff & Wyn,
1999; Starfield & Shi, 2004; Zlotnick & Soman, 2004). Policy responses such as eliminating the
5 year waiting period for immigrant/non-citizen children to enroll, extending subsides for health
care coverage up to 400% FPL, and allowing for full-family coverage can reduce uninsurance
241
rates. On the other hand, screening rates may be higher among low-income, minority families
who do access regular pediatric care. Consistent with Bethell and Colleagues’ findings
nationwide (2011), Shevell (2008) found that although the overall rate of developmental
screening in Florida was 17.1%, the prevalence of screening was highest for children younger
than 12 months (26.7%), black children (24.4%), and children covered by public health
insurance (23.6%), compared to children ages 36 months to 71 months (17.4%), White non-
Hispanic children (18.6%), and children with no insurance (or with coverage gaps in the previous
year (14.8%) 16.5%).The odds that a child aged 1 to 5 years had an early intervention plan or
IFSP were 2.41 times greater if they received a DS-PC from their doctor or other health care
provider, even after adjusting for the child’s age, gender, race/ethnicity, primary household
language, household income, type of health insurance, and developmental risk and special-needs
status.
Another setting for developmental screening is child care. Early childhood education and
child care providers have the benefit of child development expertise and experience and repeated
observations over time, to better recognize subtle differences between normal variations in
children’s learning and early signs of developmental delay (Bowman, 2001). Relationships with
family members can facilitate elicitation of input regarding developmental skills, concerns, and
referral options, though teachers may not be equipped to provide concerned parent appropriate
referrals to assessment services. (Allen, 2007; Bowman, 2001; Halfon, 2004; Hess & Marshall,
2009). Large scale initiatives through early childhood coalitions, school readiness, accreditation,
and child care programs enhance capacity, rigor, and consistency in child care screening
practices (Allen, 2007; Clifford & Crawford, 2009; Early Learning Coalition, 2007; Maxwell &
Clifford, 2004). However, only 40-45% of infants and toddlers of employed mothers are in

242
formal child care; and 25-35% are cared for by grandparents or other relatives (Annie E. Casey
Foundation, 2011; Powell, 2008).
Other sources of developmental screening include Child Find outreach efforts (McLean,
Wolery, & Bailey, 2004) and community-based programs, such as Healthy Start, Parents as
Teachers, and WIC offices (Pinto-Martin, et al., 2005). Quality developmental screening
includes use of valid and reliable tools; periodic, repeated screening intervals, and multiple
sources of information. Intervention programs utilize varying thresholds to determine a diagnosis
of developmental delay, using standardized assessment tools to measure performance in several
domains and establishing eligibility for developmental services based on standard deviations
from normed scores (McLean, Wolery, & Bailey, 2004). Efforts are underway to improve the
rates and coordination of population-wide measurement of child health, development and well-
being. Concludes Bethel and colleagues (2011, abstract), “There is a significant gap between the
developmental screening that is recommended and what is reported nationally. When children
are not screened consistently, opportunities for early identification, intervention, and treatment
may be delayed.” In the United States, community programs, such as the Assuring Better Child
Development (ABCD) and First 5 Programs (Bergman, 2004; Halfon, Russ, & Regalado, 2004;
Sices,2007) are moving beyond demographic census data to more sophisticated indicators of
academic, social, or economic risk or well-being, either to seek or maintain funding or to guide
or monitor interventions.
A Healthy People 2020 objective under consideration is to “Increase the proportion of
children who are ready for school in all five domains of healthy development: physical
development, social-emotional development, approaches to learning, language, and cognitive
development.” Seven National data sources have been considered for tracking progress on this
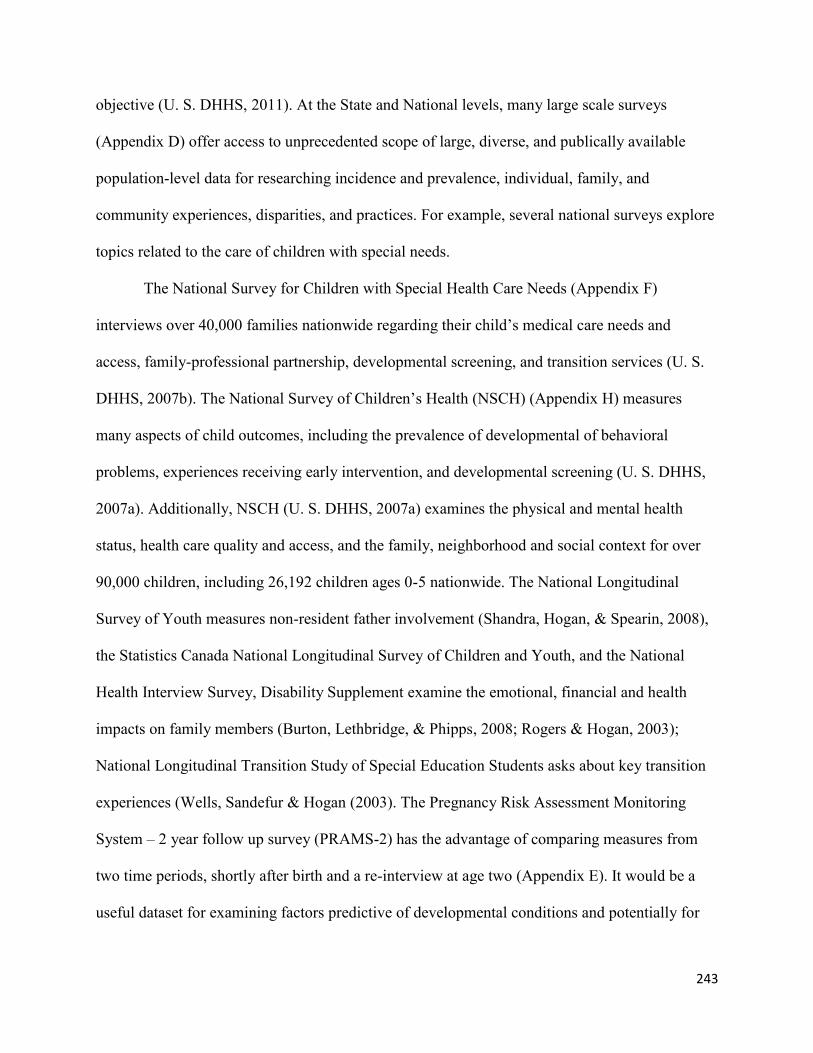
243
objective (U. S. DHHS, 2011). At the State and National levels, many large scale surveys
(Appendix D) offer access to unprecedented scope of large, diverse, and publically available
population-level data for researching incidence and prevalence, individual, family, and
community experiences, disparities, and practices. For example, several national surveys explore
topics related to the care of children with special needs.
The National Survey for Children with Special Health Care Needs (Appendix F)
interviews over 40,000 families nationwide regarding their child’s medical care needs and
access, family-professional partnership, developmental screening, and transition services (U. S.
DHHS, 2007b). The National Survey of Children’s Health (NSCH) (Appendix H) measures
many aspects of child outcomes, including the prevalence of developmental of behavioral
problems, experiences receiving early intervention, and developmental screening (U. S. DHHS,
2007a). Additionally, NSCH (U. S. DHHS, 2007a) examines the physical and mental health
status, health care quality and access, and the family, neighborhood and social context for over
90,000 children, including 26,192 children ages 0-5 nationwide. The National Longitudinal
Survey of Youth measures non-resident father involvement (Shandra, Hogan, & Spearin, 2008),
the Statistics Canada National Longitudinal Survey of Children and Youth, and the National
Health Interview Survey, Disability Supplement examine the emotional, financial and health
impacts on family members (Burton, Lethbridge, & Phipps, 2008; Rogers & Hogan, 2003);
National Longitudinal Transition Study of Special Education Students asks about key transition
experiences (Wells, Sandefur & Hogan (2003). The Pregnancy Risk Assessment Monitoring
System – 2 year follow up survey (PRAMS-2) has the advantage of comparing measures from
two time periods, shortly after birth and a re-interview at age two (Appendix E). It would be a
useful dataset for examining factors predictive of developmental conditions and potentially for

244
early recognition of developmental delays. The primary drawback to using this survey is it’s
sample size and characteristics; the total sample size is approximately 1,880, therefore the
number of children with developmental disabilities will likely be ~10%, or under 200.
Additionally, the majority of respondents are White, educated, and insured (Rosenberg, et al.,
2011).
Community-wide collaboration to provide developmental screening is an ideal way to
provide a family-friendly path from identification to services regardless of the point of entry, and
to reduce duplication of services and wasted resources. As recommended by Peck Reuland and
Bethell (2005), measurement must be accessible and specific; standardized data collection
among participating agencies within the evaluation, should include a denominator and a
numerator, a clearly specified scoring methodology and mechanisms for reporting and
interpreting results. Additionally, child-level measurement may allow for tracking of services
across systems in order to further ascertain treatment or service outcomes. For example, In
California, a four-tiered system for developmental services began with continual and flexible
community-wide surveillance and support, leading to pediatric secondary screening and
surveillance, then provided mid-level developmental assessment, treatment, and coordination co-
located with existing programs and early education settings, and finally offered more formalized
systems of evaluation to determine eligibility for services through IDEA. This model utilized a
place-based approach at the neighborhood level and sector-based training and development
specific to the service sector (Halfon, Russ, & Regalado, 2004). Ready Schools, National Report
Card, and State of the Child initiatives also attempt to measure and monitor children’s health,
and well-being in the context of their families and communities by tracking population level
indicators through available datasets. Over the past 10 years, these efforts have increasingly

245
shifted beyond survival to include child well-being, from a negative orientation to include
positive outcomes, examining children’s rights, children’s perspectives, and policy relevance
(Ben-Arieh, 2011).
Early Intervention
The importance of early intervention is increasingly recognized, as it can support
development during important windows of opportunity, correct maladaptive patterns of
development early, and improve school readiness (Pinto-Martin et al., 2005; Ramey & Ramey,
2004). Research measuring the positive impact of early intervention has been hampered by many
methodological challenges. These challenges include heterogeneous samples at the program or
child level, lack of valid tools for very young children or consistency in measurement or
implementation across programs, and the other influences on children’s development
(confounders). For example, Walker and Colleagues (2007) reviewed the evidence linking four
key factors associated to developmental delays among 200 million children under age 5 in
developing countries, including stunting, inadequate cognitive stimulation, iodine deficiency,
and iron deficiency anemia. Outcome measures are intended to show children’s progress across
time (Appendix C), but assessment of outcomes among very young children is problematic
because child development is non-linear, sensitive to environmental and social influences, and
multidimensional. Periodic and repeated assessment across settings and using multiple measures
and sources of information is recommended (Clifford & Crawford, 2009; McLean, Wolery, &
Bailey, 2004). Additionally, there are few valid and reliable developmental assessment measures,
particularly for infants, adding challenge to outcomes measurement for non-typically developing
children (Anderson, et al., 2003; Ben-Shlomo & Kuh, 2007; Orton, Doyle, & Anderson, 2009).
In a community based randomized control trial (RCT), Ramey & Ramey (2004) were able to

246
demonstrate the significant positive effects of a high quality early childhood program on the
cognitive development of high risk infants over 5 years. Walker and Colleagues (2007) provide
numerous examples of how cumulative negative effects of biological and social risk factors in
early life impact later development – and the positive impact of early intervention as documented
through RCT’s in multiple countries. One RCT of an intervention for infants and toddlers with
Autism who received intervention found that those receiving intervention achieved twice the
standard score improvement (1 Standard Deviation, 15 points) than the control group, and
retained age-level adaptive scores over the 2-year span (Greenson, et al., 2009).
Public early intervention (assessment, coordination, and services) for children birth to age
three is provided nationwide by Part C, a component of the Individuals with Disabilities
Education Act (IDEA) that guarantees a free and appropriate public education for children with
disabilities. Early intervention is intended to support families and caregivers in developing the
competence and confidence to help their children learn and develop in their ‘natural
environment’, such as the home or child care setting. Early Steps is Florida's early intervention
system administered by The Florida Department of Health that serves infants and toddlers (birth
to 36 months) with significant delays or a condition likely to result in a developmental delay.
Locally, the Bay Area Early Steps Program is administered by the University of South Florida
Department of Pediatrics and Infants and Young Children of West Central Florida (IYC). In
2009, this program served 3,642 children in Hillsborough County (FICCIT, 2009). This equates
to less than 1 percent (.07%) of the 52,131 children under age three (based on births 2007-2009).
In 2010, the Bay Area Early Steps program (Hillsborough and Polk Counties) received 2,633
referrals, and averages 75-80% eligible per month. Early Steps services are provided by
contracted local offices that coordinate with community agencies and providers. These services

247
may include: identification, multidisciplinary evaluations, service coordination, individualized
family support planning, intervention services, therapies and supports, and hearing and vision
services. Most services are delivered within the everyday routines, activities, and places of the
child and family (as mandated by I.D.E.A) and are designed to be based on the concerns,
priorities and resources identified by the child’s family within the Individualized Family Support
Plan team. Early Steps utilizes available resources and is the payer of last resort.
Underenrollment
Although early intervention has been shown to be effective (Pinto-Martin et al., 2005),
less than 30% of children are identified with developmental delays prior to age five (Glascoe,
2005, Appendix B). System-level factors can facilitate or inhibit recognition or access to
services. There is typically a lag between the parent’s first recognition of a concern and
connection to developmental assessment services, lasting on average one to three years for most
developmental conditions, including hearing impairment, autism, and Fragile X syndrome
(Batshaw, 2002; Sices, 2007). For children birth to three, participation in early intervention
averages only 2% of the estimated 10% prevalence of developmental problems in this age range
(Sices, 2007; U. S. Office of Special Education Programs, 2003). Of 20,921,289 children ages 0-
5 in 2007 (US Census, 2009), approximately 5% were enrolled in public early intervention
programs (Part C and Part B) (US OSEP, 2007). Nationwide, public early intervention/Part C
programs serve about 2.8% (ranging from 1.48-6.96) of children ages 0-3, though the estimated
prevalence of developmental delays in this age group is about 10% (Sices, 2007; U. S. Office of
Special Education Programs, 2003).
Enrollment in early intervention increases by age. In 2010, 12% of Part C participants
were ages birth to 12 months, 31% were 1-year olds, and 57% were 2-year olds. Florida’s Part C

248
program served 2.06% (13,158) children (U.S. OSEP, 2011). In one study, the mean age of entry
in one state’s Part C early intervention system was 17 months for most participants (Buysse,
Bernier, & McWilliam, 2002) and Sices (2007) found that the average age of diagnosis was 11
months for Cerebral Palsy, 27 months for global delay, and 32 months for language delay.
Hebbeler and colleagues’ report from the National Early Intervention Longitudinal Study (2007)
found similar ages for entry. In a 5-state study examining Part C services among underserved
population, state programs reported challenges such as budget shortfalls and personnel layoffs;
difficulties in approaching close-knit ethnic communities; difficulties in the recruitment of
related services personnel trained in multilingual, multicultural issues to work in rural areas;
difficulties in building relationships with physicians;, meeting the needs of highly mobile
children and families, including undocumented immigrant families; and drawing from multiple,
incompatible databases to conduct data analysis related to children’s race/ethnicity and other
important characteristics (Pierce & Müller, 2005).
Children enter Child Find (the Part B component of IDEA serving ages 3-21) at age 3 or
4. However, Part B it is usually administered by the LEA (local education agency) which offers
limited services during the summer, so there is little time to receive assessment or intervention
before kindergarten. Across conditions and domains, children are demonstrating developmental
delays and are eligible for free services, but do not receive these services in a timely manner.
Although parents may access therapy, medical, or intervention services through private
providers, these services are expensive and may not be covered by public or private health
insurance. In the 2007 National Survey of Children’s Health, of 2,129 parents of children birth to
age 5 reporting concerns, 71% had no IFSP/IEP for their child. Connecting parents to assessment

249
services early is critical – early intervention makes a big difference for many children, and helps
to ameliorate developmental challenges before they enter school (Pinto-Martin et al., 2005).
Additionally, parents choose instead to enroll the child into a preschool or other type of
community program in order to enhance his or her skills. These private or community programs
may not refer the family to the free public Part C or Part B programs that provide intervention
and special education services. A study conducted by Hess and Marshall (2009) found that
medical, early childhood, and social service providers referred children with developmental
delays identified through screening to private providers as often as to public Part C/Part B
programs. Another local study (Marshall & Mendez, unpublished manuscript) examined parents’
experiences after participating in a community based developmental screening program. Overall
70% of children were connected to recommended services, yet only 54% of connected parents
reported that the service met their needs, and 62% were satisfied with services received. The
study identified many organizational and community-level barriers to accessing services, as well
as communication disconnects with parents about screening results.
The Role of Parents
Parents are the key to identifying or corroborating concerns and to ensuring that the child
receives needed services and supports to reach their optimum potential, however parents may be
unsure of how to best recognize and respond when an unexpected developmental concern in their
child arises. Developmental delays are often subtle or present incrementally over time. Research
has generally been focused on the role of professionals rather than parents in identifying
developmental problems. However, it has been reported in numerous studies that parents can be
accurate identifiers of developmental delays in their children (Glascoe, 1997; Herman, 2007;
Maldonado, 2008; Rydz et al., 2006). Seligman & Darling (2007) describe the process parents of

250
children with hearing impairment may endure as an “extended diagnostic journey, which
contributes to ambiguity, stress, anxiety, and family conflict”. Participation in early intervention
depends first on early recognition and response to developmental red flags by parents and
caregivers, and then the support of providers in affirming parents’ concerns and connecting
parents to assessment services. Parent perception may be that the delay is simply a temporary
natural variation in developmental milestone attainment or in temperament.
Much of the developmental disabilities research has focused on family coping and
adaptation post-diagnosis (Feldman, et al., 2007; Hodapp, 2007; O’Brien, 2001; Twoy, 2007).
The help-seeking literature has primarily focused on adults and adolescents (Broadhurst, 2003;
Keller & McDade, 2000), though a body of research has been established in the area of parental
help-seeking for child mental health concerns (Keller & McDade, 2000; Lau & Takeuchi, 2001;
Raviv, et al. 2003a, 2003b) and parental recognition and help-seeking for early signs of autism
(Novak & Zubritsky, 2000; Twyman, Maxim, Leet, & Ultmann, 2009; Twoy, 2006). The
decision-making literature, uses theory to look at preventive care decisions, such as
immunizations (Benin, Wisler-Sher, Colson, Shapiro, & Homboe, 2006; Kennedy, Basket, &
Sheedy, 2011; Meszaros, et al., 1996; Poss, 2001; Smailbegovic, Laing, & Bedford, 2003),
sunscreen use (Benjes, et al., 2004), prenatal screening (Sagi, Shiloh, & Cohen, 1992) and
difficult child treatment decisions (Mahant, Jovcevska, & Cohen, 2011). These findings may be
utilized to develop a framework for setting a research agenda to better understand the processes
of recognition, concern, and help-seeking for developmental delays.
Awareness and Recognition
Awareness of normal child development and knowledge of developmental milestones can
lead to recognition of developmental delays. Glascoe (2005) asserts that young children at-risk

251
generally demonstrate mild delays by age two. It has been demonstrated in numerous studies that
parents can be accurate identifiers of developmental delays in their children, regardless of
education, income, or parenting experience. Identification, however, may be contingent upon
parents’ knowledge of milestones; specificity is high (developmental concern is usually
warranted) (Glascoe, 1997b), but sensitivity is low when it comes to detecting developmental
problems, particularly for cognition problems, global delay, and behavioral versus language or
motor problems (Chia-Ying Chung, et al., 2011). In the case of autism spectrum disorders,
symptoms can be often recognized by parents within the first 2 years (Dewrang & Sandberg,
2010; Kleinman, et al., 2007).
One of the main objectives of the CDC’s Learn the Signs, Act Early campaign was to
increase awareness of developmental milestones and early warning signs of developmental
problems (Patel, 2007). Of 267 parent respondents, 76% pre-campaign and 82.9% post-campaign
stated that they look for milestones their child should be reaching in terms of how he /she plays
acts, speaks and learns. However, the sample was largely White, married, and 70% had attended
or graduated college. Still only 40%-50% of these high SES respondents felt a child with autism
should get help before age two, only half felt they should get a second opinion if the doctor
suggested to wait and see if the child outgrew a developmental problem, and just 59% knew
which behaviors most suggested a developmental delay (Porter Novelli, n.d.). Similar knowledge
scores (median score of 19 out of 40) on the Caregiver Knowledge of Child Development
Inventory (KIDI) were found in a survey of 1200 mothers of children ages birth to three in
Turkey (Ertem, et al., 2007; MacPhee, 1981). The KIDI was developed by MacPhee (1981)
using a variety of sources including textbooks, infant care and public health publications,
developmental tests, and pediatricians’ reports about questions they frequently receive from

252
parents. The scale is written at a 7th
grade reading level, and statements included in the KIDI
focus on infants’ physical, social, linguistic, perceptual and cognitive development, and include
principles related to early experience, social influences, atypical development and individual
differences. Some example statements include: (1) infants understand only words they can say;
(2) you must stay in the bathroom when your child is in the tub; (3) the way a child is brought up
has little effect on how smart he (she) will be; (4) a good way to teach your child not to bite is to
bite back; and (5) infants of 12 months can remember toys they have watched being hidden. In
scoring, the number of questions answered and accuracy are taken into account to produce a total
score. A higher score indicates more knowledge of developmental processes and infant norms as
based on predetermined correct responses.
The KIDI was initially standardized using three groups: a diverse sample of 256 mothers
from a local hospital; 99 pediatricians and 53 child psychologists; and 320 undergraduate
students in North Carolina. Eight additional studies reported internal consistency of 0.80-.86
across several populations, including mothers of different ages, parenting experience, and
socioeconomic status (SES) levels and fathers (see MacPhee, 1981). The was also compared
with several other parenting scales, including HIGH/SCOPE, Concepts of Development
Questionnaire (CODQ), Knowledge of Child Development Inventory (KCDI), and the Parent
Opinion Questionnaire (POQ) (MacPhee, 1981). One challenge is that few measures of
knowledge or child development exist, and all of these scales measure different dimensions of
parenting. The convergent validity of KIDI with HIGH/SCOPE and CODQ scales was low
r=.26-.51. In studies comparing KIDI with the KCDI and POQ, confirmatory factor analysis
showed acceptable correlation with KIDI scores for the POQ (r=.64) even though is more
focused on attitudes and pracices as a screening tool for child maltreatment. KIDI correlation

253
was best with the KCDI (r=.86) which is the most similar tool in design and administration.
Examination of potential subscales grouped into 4 domains ( Norms & Milestones, Principles,
Parenting, and Health & Safety) resulted in low correlations between results by domain
(MacPhee, 1981); and a factor analysis conducted by Shcreiber (2001) also showed poor internal
consistency by subscale. Therefore, the KIDI is recommended to be used in its entirety.
Huang and colleagues (2005) found that of 378 mothers (a sample that was higher
income, education, married and White than the general population) who completed interviews at
2-4 months of age and observations at 16-18 months, 56% correctly estimated their child’s
development using the KIDI. Mothers who were White or Hispanic, older, married, more
experienced, had higher education, and less depressive symptoms were more likely to correctly
estimate their child’s development (Huang, et al., 2004). In the National Survey of Children’s
Health, 20% of parents of children 18 months to 5 years of age expressed concerns about their
child’s development (Blanchard, Gurka, & Blackman, 2008). A multistate study of 451 first-
time, low-income, adolescent mothers compared parent “worry” regarding child’s development
and a prenatal interview using the KIDI with actual rates of delays in their children at ages 12
and 24 months (MacPhee, 1981; Smith, Akai, Kleman, & Kletner, 2010). The average
knowledge of development on the 14 item scale was 40 (range 33-70) and a significant
relationship was found between parent knowledge of infant development and warranted worries
(accounted for about 8% of the variance). The authors noted the high rate of delays and low
knowledge and detection in this high risk sample; 23% of the children at 12 months of age and
30% at 24 months met Part C intervention eligibility guidelines for developmental delays, yet
only 2% (at 12 months) and 9% (at 24 months) had been expressed by medical professionals as
having a concern (Smith, Akai, Kleman, & Kletner, 2010).

254
The KIDI was also used by Rowe (2008) to assess parental knowledge of child
development. Parents were asked to indicate whether they agree/disagree with 39 statements
about child development and 19 statements on the age that children reach certain developmental
milestones. The measure includes statements regarding child development during infancy and
toddlerhood which were selected to address principles of infant development, effective rearing
techniques and health and safety issues. Parents varied widely in total KIDI scores from 48.3 to
93.1, with a mean score of 79.33, slightly lower than previous means found with samples of
middle-class mothers, and higher than samples of Head Start mothers (Rowe, 2008), as might be
expected for a sample diverse in SES. KIDI scores were correlated with family income (r=0.43,
p<0.01) and education (r=0.56, p<0.001).
Major milestones can trigger awareness, such as motor delay between 6-18 months of
age, and language and behavior for children 18 months and older (Batshaw, 2002; Blanchard,
Gurka, & Blackman, 2003; De Giacomo & Fombonne, 1998; Twyman, Maxim, Leet, &
Ultmann, 2009). In 2006, 91% of children entering early intervention after age two found that
91% were eligible due to delayed developmental milestones versus a preexisting condition or at-
risk status (Scarborough, Hebbeler, & Spiker, 2006). Glascoe (1997b) found that parents were
able to identify developmental problems based on language, motor, global, medical, and
academic concerns in children over age four. Parents are more apt to recognize moderate to
severe developmental delay, and genetic disorders with visible signs than milder delays or
language disorders (Ho, et al., 1994; Meszaros, et al., 1996). The presence of a chronic health
condition could sensitize or obstruct parents’ or practitioners’ to considering the possibility of
comorbid developmental delays. In a study comparing rates of emotional, developmental and
behavioral (EDB) problems among children with chronic health conditions using NS-CSHCN

255
and NSCH data, prevalence rates of EBD for children with chronic health conditions were higher
overall (15%), and specifically for attention deficit disorder/attention-deficit/hyperactivity
disorder (18%) (Blackman, Gurka, Gurka, & Oliver, 2011). However, ‘diagnostic
overshadowing’ can also occur; in which one diagnosis can mask the presence of other
conditions (Dykens, 2007).
Concern
Reviews of help-seeking literature have identified “perception of the delay as a problem”
as an important step between recognition of an issue and help-seeking (Broadhurst 2003; Sayal,
2006). In Bussing and colleague’s sample of 389 children, two-thirds of the parents did not see a
need for professional treatment for children who met ADHD criteria (2003). Problem perception
has been operationalized across studies to include parent concern, burden, and estimate of greater
problems than other children (Sayal, 2006). In Smith and colleagues’ sample, 8% of the 23% of
children determined eligible for Part C at 12 months had elicited worry about their development
from the mother (2010). Dietz and colleagues found that among 18 children ages 14-15 months
who tested positive for Autism using a population screener (31,724 children), 14% of parents
waited 6 months before seeking evaluation, and 18% did not seek any further evaluation. This
delay in follow up was higher for parents of children who were younger, had higher cognitive
skill, and fewer symptoms (Dietz, Swinkels, van Daalen, Van Engeland, & Buitelaar, 2007).
Broadhurst asserts that problem definition is socially constructed, that parents’ help-seeking
experiences have likely been misrepresented due to studies requiring “a priori attribution of
meaning by the individual concerned or symptoms that should be recognized as problematic,”
and cautions that sampling can be biased if soliciting only the views of “service users” (2003, p.
343).
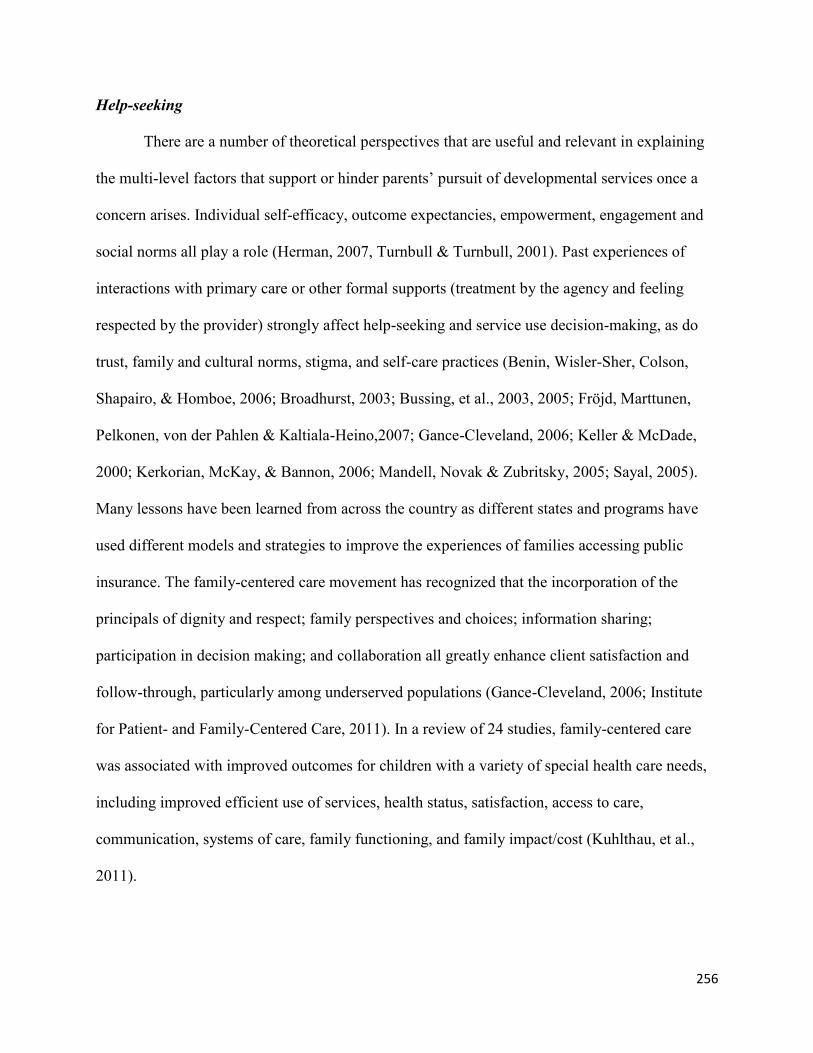
256
Help-seeking
There are a number of theoretical perspectives that are useful and relevant in explaining
the multi-level factors that support or hinder parents’ pursuit of developmental services once a
concern arises. Individual self-efficacy, outcome expectancies, empowerment, engagement and
social norms all play a role (Herman, 2007, Turnbull & Turnbull, 2001). Past experiences of
interactions with primary care or other formal supports (treatment by the agency and feeling
respected by the provider) strongly affect help-seeking and service use decision-making, as do
trust, family and cultural norms, stigma, and self-care practices (Benin, Wisler-Sher, Colson,
Shapairo, & Homboe, 2006; Broadhurst, 2003; Bussing, et al., 2003, 2005; Fröjd, Marttunen,
Pelkonen, von der Pahlen & Kaltiala-Heino,2007; Gance-Cleveland, 2006; Keller & McDade,
2000; Kerkorian, McKay, & Bannon, 2006; Mandell, Novak & Zubritsky, 2005; Sayal, 2005).
Many lessons have been learned from across the country as different states and programs have
used different models and strategies to improve the experiences of families accessing public
insurance. The family-centered care movement has recognized that the incorporation of the
principals of dignity and respect; family perspectives and choices; information sharing;
participation in decision making; and collaboration all greatly enhance client satisfaction and
follow-through, particularly among underserved populations (Gance-Cleveland, 2006; Institute
for Patient- and Family-Centered Care, 2011). In a review of 24 studies, family-centered care
was associated with improved outcomes for children with a variety of special health care needs,
including improved efficient use of services, health status, satisfaction, access to care,
communication, systems of care, family functioning, and family impact/cost (Kuhlthau, et al.,
2011).

257
Factors related to interactions with formal systems of care vary by race and ethnicity,
including African American and American Indian parents (Bailey, Hebbeler, Spiker,
Scarborough, Mallik, & Nelson, 2005; Bussing, et al., 2003, 2005; Keller and McDade, 2000;
Kerkorian, McKay, & Bannon, 2006; Oswald, Bodurtha, Willis, Gilles, Chroston, Ogston, &
Tlusty, 2011). Rosenberg , Zhang, and Robinson (2008) found that at 24 months, only 10% of
children with delays received services. While poverty and insurance status did not significantly
predict receipt of intervention services, black children were less likely to receive services than
children from other ethnic and racial groups. Perceptions of shame and stigma are related to
family, cultural, and societal norms, and can affect comfort with self-disclosure and intention to
seek help for a concerns related to behavioral, psychological, or parenting concerns, particularly
from formal services (Broadhurst, 2003; Edelstein-Dolev & Selberstein, 2003; Hinson &
Swanson, 1993; Keller & McDade, 2000; Lau & Takeuchi, 2001; Raviv, et al. 2003a, 2003b).
Both Family Systems Theory and the Family Life Course Perspective identify family-
level variables which include structures or processes impacting parent response to developmental
delay (White & Klein, 208). For example, family structure (number, gender, and roles of
household members and relationship networks), interaction (subsystems, boundaries, cohesion,
communication, and adaptability), and functions (economic, daily care, recreation, socialization,
self-identity, affection, educational/vocational, and spiritual) impact the family system and
family life when a child has a disability (Seligman & Darling, 2007; Turnbull, Turnbull, &
Wehmeyer, 2010; Zimmerman, 2005). Seligman and Darling characterize help-seeking for
parents of children with hearing impairment as an “extended diagnostic journey, which
contributes to ambiguity, stress, anxiety, and family conflict” (2007, p. 205). Twoy (2006)
utilized the Resiliency Model of Family Stress, Adjustment, and Adaptation and “family

258
resources” to determine correlations between coping scores and family demographics impacting
the timeline from parents’ suspicion of Autism to professional diagnosis. Child demographics
also influence assessment and diagnosis (Boyle, et al., 2011; Zimmerman, 2005). Zimmerman’s
(2005) model of help-seeking for child mental health problems included: level of symptoms, SES
(education, race and income), insurance status, traumatic events, genetic background, and
demographic characteristics (family structure, birth order, gender of child).
Some studies have explored factors at the organizational and systems levels that serve as
facilitators and barriers, as well as the potential moderating factors (e.g. primary language,
income, etc.) affecting parent’s opportunities to access those services (Batshaw, 2002; Coulter,
Wallace, & Laude, 1993; Halfon, Russ, & Regalado, 2004). For example, in Florida the under-
availability of programs and enrollment slots, general lack of awareness, under identification,
cost, distance and lack of transportation, lack of interagency linkages, and sub-threshold level of
developmental delay (ineligibility), were barriers to enrollment in early intervention program
(Coulter, Wallace, & Laude, 1993). The Assuring Better Child Health and Development (ABCD)
initiative, a collaborative effort between Medicaid agencies in four states, dramatically raised
screening rates among low-income children in one state from 15% to 75% simply by changing
Medicaid financing and reimbursement strategies (Pinto-Martin 2005, Pelletier & Abrams,
2002). Community-level theories, such as Community Organizing (Minkler, Wallerstein, &
Wilson, 2008) or Coalition Theory (Bartholomew, et al., 2011, Butterfoss & Kegler, 2009;
Feighery & Rogers, 1990), can inform intervention efforts to addressing system-level barriers to
early recognition, concern, and help-seeking. Parents rely on formal parenting support,
education, and early intervention systems to provide high quality, family-centered services.
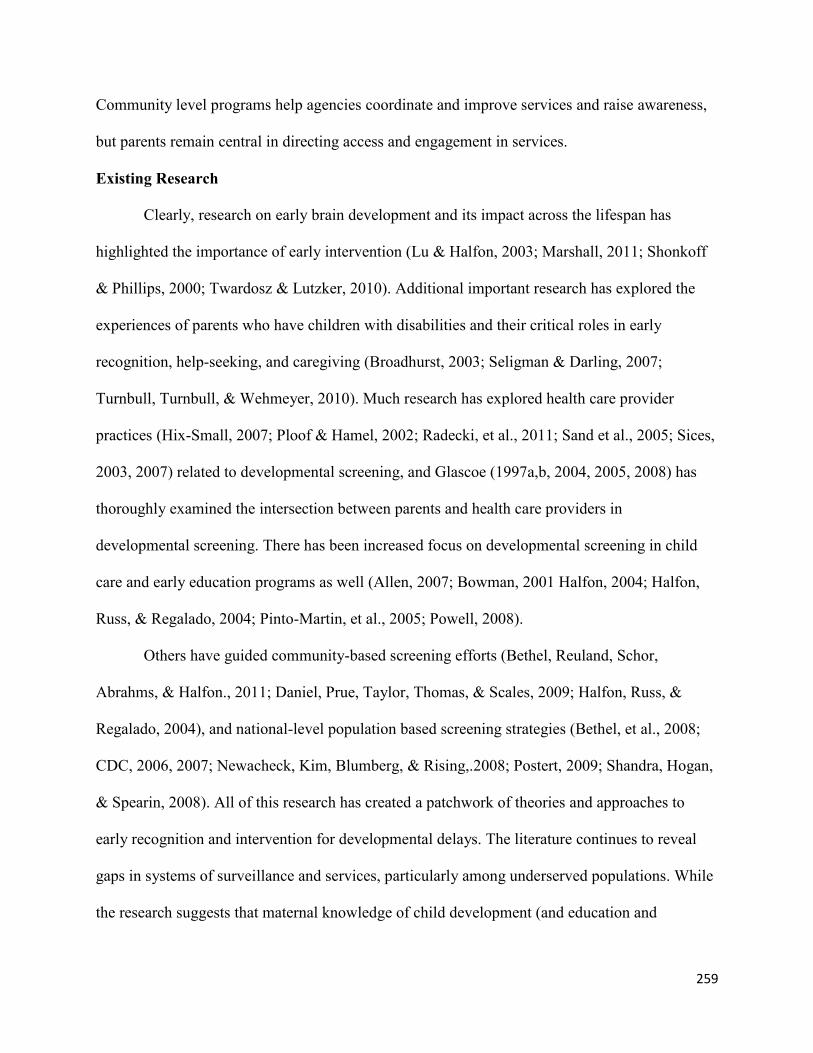
259
Community level programs help agencies coordinate and improve services and raise awareness,
but parents remain central in directing access and engagement in services.
Existing Research
Clearly, research on early brain development and its impact across the lifespan has
highlighted the importance of early intervention (Lu & Halfon, 2003; Marshall, 2011; Shonkoff
& Phillips, 2000; Twardosz & Lutzker, 2010). Additional important research has explored the
experiences of parents who have children with disabilities and their critical roles in early
recognition, help-seeking, and caregiving (Broadhurst, 2003; Seligman & Darling, 2007;
Turnbull, Turnbull, & Wehmeyer, 2010). Much research has explored health care provider
practices (Hix-Small, 2007; Ploof & Hamel, 2002; Radecki, et al., 2011; Sand et al., 2005; Sices,
2003, 2007) related to developmental screening, and Glascoe (1997a,b, 2004, 2005, 2008) has
thoroughly examined the intersection between parents and health care providers in
developmental screening. There has been increased focus on developmental screening in child
care and early education programs as well (Allen, 2007; Bowman, 2001 Halfon, 2004; Halfon,
Russ, & Regalado, 2004; Pinto-Martin, et al., 2005; Powell, 2008).
Others have guided community-based screening efforts (Bethel, Reuland, Schor,
Abrahms, & Halfon., 2011; Daniel, Prue, Taylor, Thomas, & Scales, 2009; Halfon, Russ, &
Regalado, 2004), and national-level population based screening strategies (Bethel, et al., 2008;
CDC, 2006, 2007; Newacheck, Kim, Blumberg, & Rising,.2008; Postert, 2009; Shandra, Hogan,
& Spearin, 2008). All of this research has created a patchwork of theories and approaches to
early recognition and intervention for developmental delays. The literature continues to reveal
gaps in systems of surveillance and services, particularly among underserved populations. While
the research suggests that maternal knowledge of child development (and education and

260
parenting experience), the number and type of concerns, the child’s age, and identification of a
primary physician for the child appear to be the most predictive factors in early recognition.
Cultural (Race/ethnicity) factors, and family-, organization- or system-level barriers appear to
strongly influence parental response to concerns, or “help-seeking”. Additional research is
needed to identify critical processes, networks, and connection and entry points that are socially
and culturally relevant to families in identifying and responding to developmental delays in
young children.
Relevant Theories
A theory is an organized set of concepts, definitions, and propositions related to one
another in a way that explains a specific event, situation, or behavior. Theories can be
empirically tested to determine their ability to accurately and thoroughly explain or predict
behavior or situations and can be applied to a variety of areas, including exploratory research,
social marketing, intervention planning, or program evaluation. Theories may operate at
individual/intrapersonal, interpersonal, organizational, community, or policy levels (Rimer &
Glanz, 2005). Concepts are ideas that relate to one another to form the basic components of the
theory, and may be adapted or further developed into constructs which are specific to that theory.
Variables are operationalized constructs. Many studies have cited variables found to be relevant
to identification or help-seeking for developmental delay, but they are rarely nested within an
explicitly described theory. Theoretical models or frameworks draw from more than one theory,
and help to explain or understand a specific situation, though guidelines for this process are not
well developed (Green, 2000). The socio-ecological model (Glanz, Rimer, & Viswanath, 2008)
pulls from individual, interpersonal, organizational, and community level theories to better
understand or address an issue or problem. A less developed or tested model is described as a

261
conceptual or theoretical framework, such as the Empowerment Framework that combines intra-
personal and interpersonal factors (self-efficacy, knowledge, skills, energy, persistence, outcome
and expectations) influencing both parents’ and professionals’ motivation and opportunities for
collaboration (Turnbull & Turnbull, 2001, p 235). Pathways to Assessment (Appendix R,
Appendix S) is a theoretical framework describing factors influencing parental recognition,
concern, and help-seeking for child developmental delays and possible data sources. Theoretical
research in the areas of decision-making, recognition and help-seeking has been conducted in
many areas within psychology, medicine, and public health. Current paradigms in public health
have implications for prevention, recognition of populations at risk, and for the importance of
intervention.
Social Determinants, Health Disparities and the Lifecourse Model
The lifecourse framework has received considerable attention in public health due to its
common sense, elegance and explanatory power in understanding the interconnections,
complexities of health outcomes, particularly in explaining and addressing health disparities
(Fine & Kotelchuck, 2010; Lu & Halfon, 2003). The components of this framework – ecology
and multilevel influences, cumulative pathways and trajectories, and timing – are not new.
Firstly, ecological theory, bioecological, and biomedical models have been used to explain the
multilevel influences on health. The Bioecological Framework combines concepts from
Darwin’s theories of natural selection, human development, and adaptation with
Bronfenbrenner’s socio-ecological model, which recognizes of influence at the microsystem,
mesosystem, exosystem, macrosystem and chronosystem levels. Influences in these systems
could be the individual’s family, community, sociopolitical, and historical influences
(Bronfenbrenner, 1979, in Gauvain & Cole, 2004; White & Klein, 2008). Therefore,

262
bioecological theories account for the structures and processes affecting individuals, including
their adaptive ranges; maturation and ontogenic development; symbiotic relationships and
mutual dependence on others and the larger ecosystem. Constraints and resources in this system
depend on the natural life cycle and spatially organized interactions from the individual to
population levels (White & Klein, 2008). Our increased awareness of the social determinants of
health has led to theory development accounts for these levels of influence in a way that is
applicable across disciplines to address problems such as disparities in birth outcomes, school
performance, and adult health outcomes.
Secondly, the cumulative pathways component within the lifecourse framework echoes
previous risk and protective, resiliency, and diathesis-stress models to predict lifecourse
trajectories (Howard, Dryden, & Johnson, 1999; Masten & Wright, 1998; Rutter, 2006;
Victorino & Gauthier, 2009). Understanding of cumulative pathways has also been deepened by
research on fetal and developmental programming and epigenetics (Hochberg, et al, 2011;
Thompson, et al, 2009) that allude to the myriad contributions of stressors and supports over
time that promote or reduce health – a trajectory that begins in-utero, continues throughout the
life course, and to subsequent generations. Risk appears to accumulate over the life course; as
independent contributions of childhood and adulthood socioeconomic circumstances influence
adult health. Biological exposures (such as teratogens) or other factors (such as nutrition) during
gestation, infancy, and childhood are part of long-term biological chains of risk (Ben-Shlomo &
Kuh, 2007; Marshall & Ng, 2010; Rutter, 2006). Social chains of risk (e.g. physical hazards and
behaviors, stressful conditions, etc.) may begin with a socially compromised start to life, then
operate throughout the life course via education and other experiences, ultimately leading to
adult SES circumstances (Ben-Shlomo & Kuh, 2002). While infancy and toddlerhood can be a

263
time of celebration and opportunity, for some is a time of threat and vulnerability to risks. The
leading causes of infant mortality (in rank order) in the U.S. include congenital malformations;
disorders related to short gestation and low birth weight; SIDS; affects from maternal
complications of pregnancy; and unintentional injuries (Herron, 2011).
In contrast, the leading causes of death among children ages 1 to 4 (in rank order)
included accidents (unintentional injuries); congenital malformations, deformations and
chromosomal abnormalities; assault; malignant neoplasms; and diseases of the heart (Herron,
2011). A fetal environment that has stress, deprivation or trauma can affect brain architecture and
developmental trajectory, and a life course orientation can help guide interventions to address the
sources of problems at key points in time such as the 3rd
and “4th
trimester” (Lieberman &
Osofsky, 2009; Marshall, 2011). Longitudinal cohort studies have demonstrated the persistence
of sequelae from deprivation or abuse, dependent on the duration and timing during windows of
developmental plasticity, affecting brain development and biological stress systems, thereby
impacting all areas of development (Barnett, Miller-Perrin, & Perrin, 2005; Rutter, 2006;
Twardosz & Lutzker, 2010). However protective factors also exist, such as the mediating effect
of rehabilitation services (Rogers and Hogan, 2003) or a family’s renorming process as they
adjust and redefine beliefs, values, and priorities at each stage of the family life course (Krauss,
Seltzer, & Jacobson, 2004; O’Brien, 2001; Rogers & Hogan, 2003; Seligman & Darling, 2007).
The Child Abuse Prevention and Treatment Act (CAPTA), which streamlines access to
early intervention (Part C) services for abused or neglected children, is underutilized (Herman,
2007; Stahmer, Sutton, Fox, & Leslie, 2010). In one state, an estimated 17% of eligible
maltreated infants and toddlers were enrolled in Part C, and nationwide only 20-50% of children
with developmental or social-emotional concerns are identified until they enter kindergarten or

264
elementary school (Sices, 2007, Glascoe, 2005), beyond the time when early intervention may
have addressed maladaptive developmental patterns, facilitated the critical ‘windows of
opportunity’ for age-specific milestones, or identified and treated underlying health problems.
The third component of the lifecourse framework is timing. Risk and protective
influences have complex and varied impacts (dependent on timing, duration and intensity
exposures) throughout the lifespan and sometimes across generations, with heterogeneous affects
among individuals, which challenges measurement of specific events on developmental
trajectories. Windows of risk or opportunity occur throughout the lifespan, particularly during
fetal and newborn periods which are characterized by adaptive plasticity in response to
environmental and social conditions (Hochberg 2011; Marshall, 2011). Exposure to risk is not
simply cumulative, linear, nor always detrimental; in some cases, controlled exposure to a
biologic or social “risk”, such as pathogens or stress, contribute to resilience by strengthening
immune function or coping, respectively (Rutter, 2006). In a commentary, Wise (2003)
cautioned that a deterministic and literal view of the ‘life course trajectory’ can be problematic
for both policy and research efforts; development and lifelong influences are much more
complex and dynamic than a linear trajectory.
The lifecourse for children begins at conception and throughout prenatal development.
First trimester prenatal care, which focuses on maternal infectious and chronic disease
management, health behaviors, dental health, nutrition, and more recently the impact of
environmental stress on the mother, dominated the policy agenda for 20 years (Alexander &
Kotelchuck, 2001; U. S. DHHS, n.d.; http://www.mchb.hrsa.gov/timeline/text-only.html). More
recently, an awareness of the impact of interconception health on birth outcomes and fetal
development has affected policy and practice, in part due to the recognition that nearly half of all

265
pregnancies are unplanned; by the time the mother realizes she if pregnant much fetal
development may have already occurred (Finer & Zolna, 2011). Prenatal conditions do not only
affect birth outcomes; recent research has suggested that “fetal programming” (the ability of the
fetus to “forecast” living conditions based on uterine conditions and subsequently modify its
metabolism, physiology, and growth trajectory) affects adult health, sometimes decades later
(Hochberg, et al., 2011). Examples of fetal programming are associations between fetal under-
nutrition and low birth weight with adult coronary heart disease (Barker, 2007) and suboptimal
fetal environments with adult cancers and with chronic bronchitis (Ben Shlomo & Kuh, 2007).
Of all U. S. births in 2007, 12.7% of babies born were born preterm and 8.2% were low birth
weight, with higher prevalence among particular groups (Federal Interagency Forum on Child
and Family Statistics [FIFCFS], 2009). Low birth weight and prematurity are associated with
SES in Black and White mothers, but also are much higher for Black mothers regardless of SES
(Nepomnyaschy, 2009).
Some have found that neighborhood factors, such as poverty or racial gentrification
affect infant mortality, birth weight, and gestational age, particularly for African Americans
(Collins, Wambach, David, & Rankin, 2009; De Marco & De Marco, 2007; Reichman, Teitler &
Hamilton, 2009). Environmental factors that have the potential to impact maternal and fetal
health, via teratogenic, social, psychological, and physiological stressors or supports (Marshall,
2011). Disparities in birth outcomes can be explained in terms of risk, but also possibilities for
change, though the optimal leverage points for intervention are still not well understood, to guide
policy throughout and beyond pregnancy to promote a supportive prenatal environment.
Increasing health disparities across the lifespan among specific and growing social,
economic, and ethnic groups across the lifespan have led to increased use of the lifecourse model

266
to guide policy, research, and programs. Disparities are a primary focus in current U.S. health
policy, and research continues to disentangle the combined and separate risks of minority race or
ethnicity with socioeconomic status (U.S. DHHS, 2011). Seith and Kalof (2011) examined the
intersection between income and race/ethnicity in impacting many aspects of child health, citing
the wide variation among low income groups by race and ethnicity in problems such as food
insecurity, second hand smoke exposure, asthma, lead poisoning, child obesity, lack of health
insurance, and health care underutilization, overall health and birth weight. The authors suggest
that a closer look at culturally relevant issues associated with each health problem may lead to
more effective policy responses. Some socio-demographic variables have been used to
characterize “vulnerable populations” that have been considered at-risk due to societal
conditions, including: immigrants and refugees, youth or the elderly, minority race or ethnicity,
gender, education level, employment, and exposure to intimate or neighborhood violence
(Charlemaigne & Gauthier, 2009; De Marco & De Marco, 2007; Lowe, 2010).
There are over 10 million young children who are considered “at risk” due to having
parents with limited education, parenting style differences, parental mental health problems,
single parent status, more than three children in the home, stressful events, and low occupational
status (Glascoe, 2005; Peck Reuland & Bethell, 2005). Children “at risk” are 1.5-3 times more
likely to die in childhood, 2 times more likely to have a serious physical or mental disability, 2
times more likely to repeat a grade, 3-4 times more likely to be expelled, 1/3 less likely to attend
college, 1/2 as likely to graduate from college (Turnbull and Turnbull, 2001). The causes of these
determinants are found in the arenas of economics, institutionalized racism, and public policy.
Children comprise nearly ¼ of the U. S. population; one in five (21.5% in 2009) is living in
poverty and 11.5% live in extreme poverty (½ the FPL) (Annie E. Casey Foundation, 2011;
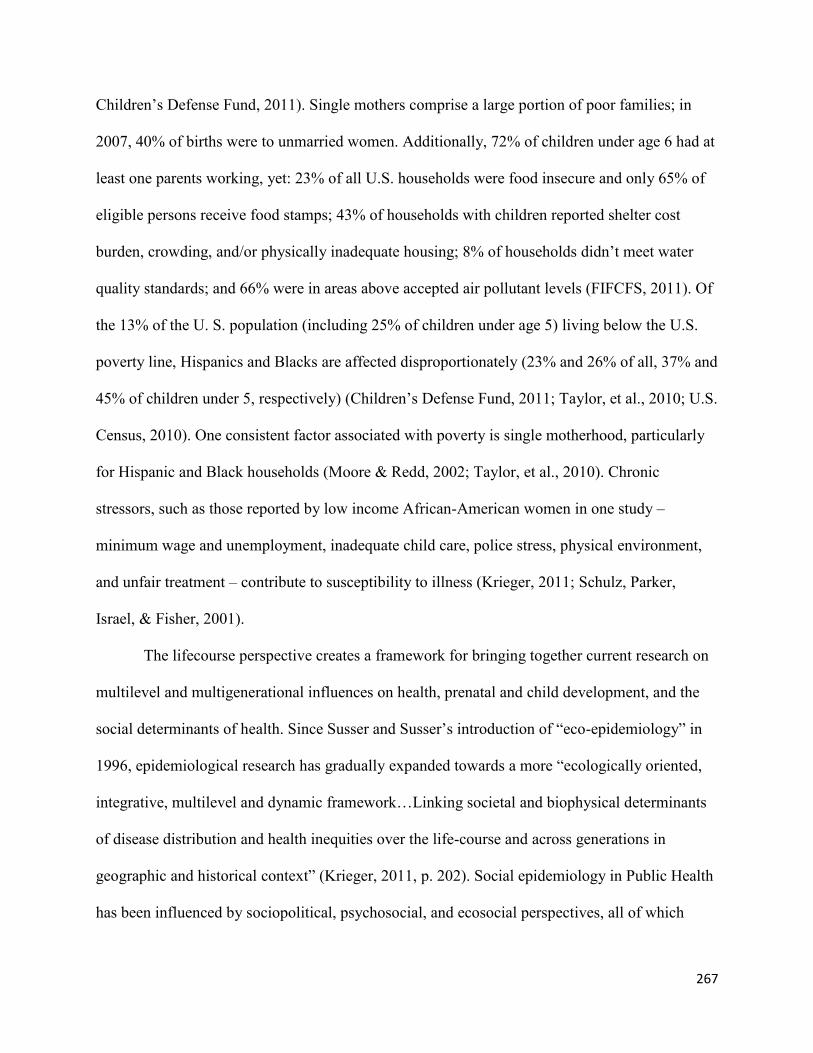
267
Children’s Defense Fund, 2011). Single mothers comprise a large portion of poor families; in
2007, 40% of births were to unmarried women. Additionally, 72% of children under age 6 had at
least one parents working, yet: 23% of all U.S. households were food insecure and only 65% of
eligible persons receive food stamps; 43% of households with children reported shelter cost
burden, crowding, and/or physically inadequate housing; 8% of households didn’t meet water
quality standards; and 66% were in areas above accepted air pollutant levels (FIFCFS, 2011). Of
the 13% of the U. S. population (including 25% of children under age 5) living below the U.S.
poverty line, Hispanics and Blacks are affected disproportionately (23% and 26% of all, 37% and
45% of children under 5, respectively) (Children’s Defense Fund, 2011; Taylor, et al., 2010; U.S.
Census, 2010). One consistent factor associated with poverty is single motherhood, particularly
for Hispanic and Black households (Moore & Redd, 2002; Taylor, et al., 2010). Chronic
stressors, such as those reported by low income African-American women in one study –
minimum wage and unemployment, inadequate child care, police stress, physical environment,
and unfair treatment – contribute to susceptibility to illness (Krieger, 2011; Schulz, Parker,
Israel, & Fisher, 2001).
The lifecourse perspective creates a framework for bringing together current research on
multilevel and multigenerational influences on health, prenatal and child development, and the
social determinants of health. Since Susser and Susser’s introduction of “eco-epidemiology” in
1996, epidemiological research has gradually expanded towards a more “ecologically oriented,
integrative, multilevel and dynamic framework…Linking societal and biophysical determinants
of disease distribution and health inequities over the life-course and across generations in
geographic and historical context” (Krieger, 2011, p. 202). Social epidemiology in Public Health
has been influenced by sociopolitical, psychosocial, and ecosocial perspectives, all of which
268
examine the contributions to social factors on individual health (Krieger, 2011). As expressed by
Williams, “Historic & contemporary expressions of institutional discrimination have led to
“racial’ differences in the quality of education, income returns for a given level of education,
wealth associated with a given level of income, the purchasing power of income, the stability of
employment, and the health risks associated with occupational status.“ (1997, p. 112).
Interpersonal and structural racism and environmental segregation contribute to disparities in
exposure to risks such as pollution and crime, and in access to health promotion resources, such
as healthy foods, parks, and services. In fact, racism may detrimentally affect health both for the
privileged and those who are discriminated against (Krieger, 2011; Fujishiro, 2009). Therefore, it
is important to not only ensure that Public Health research is conducted on racially and ethnically
representative populations, but also that race and income are considered in research design when
examining health issues.
Internationally, Walker and Colleagues (2007) estimated the prevalence of a number of
risk factors for child development in developing countries as examined in published studies.
They found inadequate cognitive stimulation (65-90%), growth retardation from chronic under
nutrition (31%), iodine deficiency (35%), iron deficiency anemia (23-33%), malaria (300-660
million episodes), maternal depression (17%), violence (27-38%), low birth weight and
intrauterine growth restriction (11%), and metals exposure (lead, 40%, and arsenic – 30 million
people in southeast Asia). One study examining data from the National Survey of Children’s
Health identified several potential risk factors associated with an increased or decreased risk of
developing a special health care need; these factors related to predisposing characteristics,
genetic endowment, physical environment, social environment, and health-influencing behavior.
Health care system characteristics did not appear to have a significant effect. The specific

269
variables identified occurred at child level, family level, and neighborhood level (Newacheck,
Kim, Blumberg, & Rising, 2008). Charlemaigne & Gauthier (2009) found that parental mental
health, number of children, and family structure mediated the association between household
income and child asthma, migraine/severe headaches, and ear infections. Another study noted
that the association between pregnancy unwantedness and poor child outcomes generally
decreased when controlling for social risk factors (Hummer, Hack, & Raley, 2004). Robert
(1998) asserted that individual and family influences often supersede the association between
community level factors and health, and Hussey and Hennel (2010) remind us that income
deprivation alone is not an adequate measure of social risk; other aspects of community (social
capital, employment opportunity, green space, less crowded housing) impacted the long term
health of low-income populations differentially in two cities.
Specific exposures act across the life span, in combination with socially patterned
exposures acting at different stages of life, contributing to disease risk. Therefore, studies which
have data concerning only one period of the life course are inadequate for further advancing our
understanding of both disease etiology and the production of socioeconomic (SES) differentials
in health (Ben Shlomo & Kuh, 2007). Kahn and colleagues (2002) used multiple direct and
parent self-report measures to look at the persistence, comorbidity and association of maternal
and environmental factors post-pregnancy with child outcomes at age three. Measures included:
a longitudinal follow up survey for child outcomes (measuring physical health status,
hospitalizations, asthma, language, and behavior); women’s health (physical health,
hospitalizations, doctor visits, and smoking); sociodemographic factors (income/poverty line
ratio, mother’s age, education, marital status, race/ethnicity); and covariates (birth weight, child’s
age at first survey, birth defects, history of hospital transfer at birth or first month, and re-

270
hospitalization). The strength of this study is its prospective longitudinal design. Limitations
were that measures were taken only 18 months apart, excluded paternal health, employment,
other relationships and other potentially important factors, and may have been affected by
response bias, invalid tools, or sampling bias. The study did show persistent and comorbid health
conditions for women after pregnancy, and graded associations between poor maternal health
and smoking and depressive symptoms with children’s physical health, delayed language, and
behavior problems (Kahn, et al, 2002). Sawhill suggests that inheritance of genetic attributes and
values/behaviors from family accounts for half of the similarity in incomes across generations
(Sawhill, 2006).
Emerging theory must recognize that while no single factor can account for health,
poverty and racial inequality are prevalent and strongly contribute to increased risk for poor
health outcomes, and there is mounting evidence that income disparities affect everyone.
Research using the lifecourse framework must take into account the heterogeneity, non-linearity,
complexity, and instability in individual and group experiences across the life course. Because
there is tremendous heterogeneity in individual experiences, and family structure, culture, and
ideology, life course stages and trajectories naturally vary (Seligman & Darling, 2007; Turnbull
& Turnbull, 2001). Families experience non-typical patterns in some stages (such as marriage,
childbearing, retirement) by choice, or sometimes not by choice. For example, the experiences of
homosexuals, foster parents, immigrants may not follow a ‘typical’ trajectory of stages due to
prohibitive policies. Third, a multitude of events can impact individuals differentially in
innumerable and complex ways. While the framework recognizes ecological influences, it does
not contain a mechanism for systematically accounting for multilevel influences that may impact
social determinants on the life course, such our nation’s social, economic and policy climate, or

271
events such as war or natural disasters. A paradigmatic shift from individual health to population
health may spark more sophisticated research methods, health monitoring, and subsequently
policy. Further development and training is needed in research methods (spatial analysis and
social network analysis), statistical strategies (multilevel/hierarchical and structural equation
modeling, and predictive analytics/simulation), longitudinal data collection (more sensitive
spatial, income, quality of life variables, indicators) and linkage (vital statistics, registries,
agency databases (Axelrod, & Tesfatsion, 2005; Macy & Willer, 2002; Pedhazur, 1999; Stevens,
2009; Zullig, et al., 2010).
Furthermore, we must develop sufficient definitions, uniformity and inclusion of
variables at the individual (“SES”, education, income, race), family (structure, genetics, process),
community (actual & perceived racism, safety, cohesion, built environment) and national (policy
changes and impacts, leading indicators of health, well-being, morbidity, and mortality) levels.
Public health is compatible with lifecourse model because it is inherently political (based in
social justice, linked with government), grounded in the sciences: social, behavioral,
epidemiological, psychological, and health; focused on prevention, and embraces
multidisciplinary collaboration. Research funding can be restructured from traditional
disciplinary or problem sector silos to address complex problems collaboratively. Complex
problems are also ever-changing, due to demographic, political and social trends within society.
Therefore, public health is ever-expanding, reanalyzing the problem, looking at new problems,
and adapting new strategies.
Other Theoretical Approaches
Stage models have been used since the 1970’s to explain help-seeking processes for
preventive health services (Benin, Wisler-Sher, Colson, Shapiro, & Homboe, 2006; National

272
Health Service (NHS) Scotland, 1999). Broadhurst (2003) characterized help-seeking as a series
of stages including problem definition, decision to seek help, and actively seeking help. Widely
accepted and utilized stages of change include precontemplation, contemplation, preparation,
action, and maintenance. (Prochaska & Norcross, 2001). The Transtheoretical Model (TTM)
combines these stages 15 corresponding processes that move the individual from one stage to
another in adopting a health behavior. The CDC and others utilized TTM’s Stages of Change to
develop an awareness campaign, based on formative research findings that many parents were in
the pre-contemplation stage for seeking developmental services (Daniel,et al., 2009). Stages of
change are also used to guide research and intervention in many areas, including mental health,
substance abuse, mammography and genetic breast cancer screening, chronic pain management,
healthy diet, and sun protection (Benjes, et al., 2004; National Health Service of Scotland [NHS],
1999, Prochaska & Norcross, 2001; Prochaska, Redding, & Evers, 2008).
The strength of this model is its research base, optimism, and simplicity, which make it
attractive to a wide range of users across many areas of intervention and health promotion
(NHS,1999; Prochaska, Redding, & Evers, 2008). TTM also captures the process of behavior
change over time, and provides guidance regarding populations who are not in a stage of
readiness for traditional “action-oriented” behavior change programs (Prochaska, Redding, &
Evers, 2008, p. 102). The model also has a number of limitations, particularly for use in better
understanding the process of parental recognition, concern and help-seeking. There are
methodological limitations in valid measurement of self-reported stages of change, the
tautological nature of the model (that behavioral processes and outcomes are reciprocally
determined), and questions whether change may occur through discrete linear stages versus a
continuum (NHS Scotland, 1999; Prochaska, Redding, & Evers, 2008). Practical limitations

273
include the tendency of programs and researchers to focus on the stages over the processes of
change, challenges in validating the stages of the model across individuals and settings,
limitations of the model in explaining complex behaviors, and the assignation of ‘positive and
negative behaviors (NHS, 1999). The model is predictive of adoption and maintenance of a
specific behavior rather than a decision-making tipping point. Therefore, the model may be more
appropriate for developmental surveillance or adherence to an intervention program than for
initial help-seeking. Additionally, the assumptive target behavior is help-seeking, which may be
problematic if parental definitions of help-seeking vary or policy or environmental barriers exist,
resulting in a focus on “those who have ‘change potential’ to the exclusion of other ‘less ready’
groups, [or] clients who may wish to opt out of any change process are held within it.” (NHS,
1999).
The Theory of Reasoned Action (TRA) was developed by Fishbein in 1967 to describe
the influences of attitudes (towards the behavior and evaluation of behavioral outcomes), social
norms (normative beliefs and motivation to comply), and intentions on behavior (In Montaňo &
Kaspryzk, 2008; Poss, 2001). The Theory of Planned Behavior (TPB) added the construct of
perceived behavioral control to the TRA model (Azjen, 1985, 1991; Connor & Armitage, 1998;
Fishbein, 2009). To some extent attitudes or beliefs are present in many individual level theories;
the strengths of TPB is its inclusion of social norms, and behavioral beliefs, control, and
intentions. The theory can be applied to a variety of health behaviors, and can measure these
constructs for specific individuals and populations, making it useful for health promotion
planning (Conner & Armitage,1998; Montaňo & Kaspryzk, 2008). Components of TPB were
used in the planning of the CDC’s Learn the Signs. Act Early campaign to develop survey
questions such as “How important of a problem is autism? What do you believe can cause

274
autism? Who can best see the early signs of autism?” (Patel, 2007). One challenge with the
theory is identifying and measuring beliefs. The theory is missing critical constructs related of
decision-making relative to child development concerns such as emotions or other “irrational”
determinants, or concern, and past behaviors. It is possible to miss specific beliefs associated
with intention, and aspects such as belief salience and affective beliefs are not measured (Conner
& Armitage, 1998; Montaňo & Kaspryzk, 2008; Poss, 2001). TPB measures intention to engage
in a behavior rather than action, and perceptions of behavioral control, rather than actual barriers
(Conner & Armitage, 1998; Fishbein, 2009; White & Klein, 2008)
Proposed Theoretical Framework
In light of the complex factors influencing families who may seek developmental services
for their children, no one theory is able to cover all of them; a multi-theory model for recognition
and help-seeking can incorporate key constructs found in the literature. Skinner and Weisner
(2007) called for a “sociocultural” approach towards studying the experiences of families of
children with intellectual disabilities. Understanding theory-based environmental and behavioral
determinants of health behaviors informs health education programs (to increase knowledge,
change attitudes, influence habit) which may be delivered to priority populations community-
wide through a social marketing approach (Kotler & Lee, 2008). The Health Belief Model
(Champion & Skinner, 2008) describes parent experiences influenced by internal and external
factors, and Social Support Theory explains the influence of interpersonal relationships, within
and beyond the family, on pathways to assessment services (Appendix R, Appendix S).
Health Belief Model
The Health Belief Model (HBM) is a value-expectancy theory rooted in behavioral and
psychological principals, with a long history beginning in the 1950’s with a study of decisions to

275
receive X-ray examinations for tuberculosis. Conceptualized by Rosenstock in 1966, and
furthered by Becker and colleagues in the 1970’s and 1980’s, the original model included the
four constructs of susceptibility, severity, barriers, and benefits (Champion & Skinner, 2008;
Poss, 2001; Rimer & Glanz, 2005). Later, a cost-benefit analysis of barriers and benefits was
articulated, as was perceived threat (comprised of severity and susceptibility assessment)
(Champion & Skinner, 2008) Additionally, socio-demographic variables (as moderators), and
cues to action, self-efficacy, perceived behavioral control, and health motivation have been
mentioned as potential additions to the model (Champion & Skinner, 2008; Poss, 2001). HBM
predicts the likelihood that the individual will take a recommended health action (prevention or
treatment) based on their value assessment of the behavior.
HBM has been used to explain various health-seeking behaviors (Favor et al, 1999;
Tucker, 1995) particularly in the area of treatment compliance or screening for health issues such
as cancer and tuberculosis screening (Poss, 2011; Tanner-Smith & Brown, 2010), child
vaccination (Meszaros, et al., 1996; Smailbegovic, Laing, & Bedford, 2003), and prenatal
screening (Sagi, Shiloh, & Cohen, 1992). Perceived threat is comprised of perceptions of
susceptibility and severity and is predictive of help-seeking behaviors for many types of
concerns (Benjes, et al., 2004; Bussing, et al., 2003; Hinson & Swanson, 2001; Lau & Takeuchi,
2001; Mandell, Novak, & Zubritsky, 2005; Sayal, 2005). Consistent with Broadhurst’s “problem
appraisal” (2003, p. 343), perceived severity (how serious the condition is and how damaging its
consequences may be) also affects parental perception of a developmental concern as a problem
(Bussing, et al., 2003; Sayal, 2005) and a pediatrician’s or parent’s likelihood of addressing a
delay proactively (AAP, 2001; Batshaw, 2002; Shapiro, 2004). Mothers have recognized but
drastically underestimated the severity of delays (particularly in the areas of cognitive and motor

276
development as opposed to speech and language development), or perceived the delay as
temporary, which was consistent with earlier studies of parent perceptions that their children
would ‘outgrow’ the delays (Patel, 2007). Using data from over 900 families collected over
several studies, Glascoe developed an algorithm for pediatric follow up to families’
developmental concerns based on the number and significance of the concern (2000). Her
research revealed that sensitivity for detecting disabilities ranged from 74-79% across age levels,
and specificity for absence of concerns for children without disabilities ranged from 70-80%.
Among all parents, 11% had two or more concerns (corresponding to 20 times the risk of
developmental delay; 53% of children met evaluation criteria for special education (ESE) and
16% scored substantially below average. Additionally, 23% of parents had one significant
developmental concern (8 times risk, 29% met ESE eligibility), and 20% had concerns about
behavior (which was not predictive of developmental disability). Finally, 43% of parents did not
have concerns about their child’s development (there was only 5% chance of disabilities among
this group) and 3% of parents did not have concerns but had communication difficulties due to
non-English primary language, parent communication or mental health problem, or non-primary
caregiver (among this group children had a 4 time risk of developmental disability and 20% met
ESE criteria).
A parent’s perceived susceptibility (assessment of how likely it is that the child will have
developmental problems) may be low if the pregnancy and birth were uneventful, there is no
family history of developmental problems, and if parents are unaware of expected developmental
milestones or red flags associated with specific developmental disorders (Maldonado, 2004). The
perceived benefits of seeking assessment may further motivate parents to take action. In fact, the
ABCD Program has made raising parental expectations a key program component (Pelletier &

277
Abrams, 2003). Barriers (factors that discourage or inhibit help-seeking) are also a recurring
theme in the services access literature, because they play such a strong role in determining
motivation and successful action. Intervention providers have reported encountering family
barriers such as education, low SES, low family support, mental health problems, lack of
transportation, high cost, and distance to travel (Coulter, Wallace, & Laude, 1993; Halfon, Russ,
& Regalado, 2004). Additional barriers cited in the literature include lack of insurance, poor
communication among parents and providers, and issues with cultural and linguistic competency
(Pelletier & Abrams, 2003; Pinto-Martin et al., 2005; Turnbull & Turnbull, 2001).
In Hillsborough County, a lack of care coordination amongst medical, school, and
community providers resulted in a lengthy wait time for assessment, diagnosis, and treatment,
contributing to parents’ many difficulties: obtaining proper diagnosis, accurate medical
information, and guidance for further assessment; finding services covered by insurance; and
planning smooth transitions from Part C to Part B services (Mendez & Hess, 2003). Self-efficacy
refers to the parent’s confidence in his or her ability to pursue and access services in spite of
potential barriers, and can be influenced by parents’ previous negative experiences with
accessing services for themselves or their children (Bussing, et al., 2003, 2005; Gance-
Cleveland, 2006; Kerkorian, McKay, & Bannon, 2006). Most parents have had limited
experience with disabilities, and therefore may not have the knowledge and skills to seek
specialized services for further assessment. Often the parent has experienced only stereotypes
and stigma regarding developmental disabilities (Seligman & Darling, 2007). HBM also
proposes that there may be cues (temporal prompts in the form of events, interactions, or
tangibles, such as a brochure) that are that drive the parent to take action. Cues to action may
include information provided or sought, reminders by powerful others, persuasive

278
communications, and personal experiences (Champion & Skinner, 2008). Although not well-
researched cues may offer some important information about what provides the final ‘push’ for
parents to seek services, after what is often a delay period of several months following concern.
Finally, HBM acknowledges that a number of modifying factors affect the above-mentioned
components, including demographic variables (such as age, gender, ethnicity, or occupation) or
socio-psychological variables (SES, family structure). However, findings related to modifying
factors have been mixed. Modifiers such as income, insurance status, military status, and
interactions with the health system have been found to be potentially relevant (Mandell, Novak,
& Zubritsky,2005; Pinto-Martin et al., 2005; Shapiro & Derrington, 2004. For example, Mandell,
Novak, and Zubritsky (2005) observed that near-poor children received an autism diagnosis on
average 0.9 years later than those more than 100% above the Federal Poverty Level (FPL) and
those below FPL, likely due to increased access through private or public insurance and other
programs.
Additionally, children living in rural areas and those with multiple pediatricians were
diagnosed later, suggesting lack of a medical home, or perhaps a search for a responsive
pediatrician to developmental concerns. In another study, Glascoe examined parent concerns
about their child’s development elicited in pediatric settings (1997). Of the 408 parents, 220 had
developmental concerns. Predictor variables that were examined included race, parents’ levels of
education, employment, marital status, numbers of children in the home, children’s
developmental status, age, participation in school programs, whether mother versus fathers/other
primary caretakers responded, and parents’ perceptions of children’s health status. Only two
predictors were significant: parents’ perceptions of children’s health status (aOR = 3.8; 95%
CI=1.6–9.1) and the presence or absence of developmental disabilities (aOR = 2.1; 95%

279
CI=1.0–4.2). More than one third of parents with concerns did not discuss them with health care
providers. Additionally, 60% of the children found to have disabilities had parents who identified
a primary health provider for the child. A t-test revealed that parents with providers had far more
concerns of any type, and children with regular health care providers (whether parents discussed
concerns or not) were almost 11 times more likely to be enrolled in services. In this study, when
parents did discuss concerns, they appeared to be more motivated by concerns about expressive
language or perceptions that children had health problems than by concerns about children’s
overall developmental status (Glascoe, 1997).
Some studies have not found SES to be predictive of timely assessment and services. In a
national survey of 2,068 parents of children 4-35 months of age, Halfon and colleagues (2004)
did not find an association between rates of assessment and SES. In Twoy (2006), the sample
was of higher SES, well informed, and college-level educated, yet 66% still faced over a 6 month
delay in obtaining services. All of these authors called for further investigation to better
understand the mixed and unexpected results; there is a need to further explore the individual,
family, and systemic modifying factors affecting pathways to services. The Health Belief Model
has a long, robust history and breadth of research. Its parsimonious, common-sense constructs
are easy to understand, apply, and test (Champion & Skinner, 2008; Poss, 2001). The model’s
simplicity is a strength as well as a limitation; the theoretical components are broadly defined,
and they have not been uniformly operationalized and tested (Champion & Skinner, 2008). The
theory does not suggest a process, or specific order in which the variables come into play. As a
cognitively based model, it is difficult to measure the complex relationships between perceived
severity and susceptibility in assessing overall perceived risk. While widely used, cues to action
can be fleeting, are retrospective, and have rarely been measured systematically as ‘cues’

280
(Champion & Skinner, 2008; Poss, 2001). Finally, HBM does not explicitly measure normative,
social, or cultural factors beyond “modifying factors”, nor have modifying factors been
consistently measured across studies (Poss, 2001; Tanner-Smith & Brown, 2010). These
modifying factors are a limitation in this theory, best addressed through a system level theory.
While HBM provides a framework for illustrating parents’ individual processes, Social Support
Theory contributes to understanding interpersonal relationships affecting parents’ decision-
making and action.
Social Support
Social support is a key interpersonal construct throughout the journey from awareness to
assessment. Social support has been described as a factor in parents’ coping and adjustment with
caring for children diagnosed with disabilities (Batshaw, 2002), and as a contributing factor in
overcoming barriers to help-seeking (Gulliver, Griffiths, & Christensen, 2010). Types of social
support include emotional, instrumental, informational, and appraisal support; each can have
contrasting positive or negative influences (Gottlieb & Bergen, 2010; Heaney & Israel, 2008). A
family member or friend may provide emotional support (comfort, empathy) to a parent with
concerns about his or her child, but may not be able to provide information support (for example,
knowledge about where to go for help) or appraisal support (verification/corroboration of the
parent’s perceptions of a potential developmental problems). Family members and friends may
play a role in identification and perceived need for help, affecting help-seeking among depressed
adolescents (Fröjd, Marttunen, Pelkonen, von der Pahlen & Kaltiala-Heino, 2007). While Poss
(2001) combined HBM with social norms (TRA) to explain culturally influenced decision-
making, social support also has a component addressing interpersonal influences with a subtle
but important difference; it focuses on the point of decision-making through appraisal supports
281
rather than normative beliefs about the behavior itself. The appraisal support that individuals
give will help the parent in decision-making about whether the delay is of concern and warrants
help. While parents will often go to their pediatrician for guidance when concerns arise, they will
turn to others for support if the pediatrician doesn’t follow through (AAP, 2001; Sayal, 2005).
Supportive social networks (the web of relationships associated with an individual)
provide a protective role for child and family well-being, linkage to family support services, and
help-seeking decision making. Some studies found that parents preferred seeking help first from
within their informal social networks and suggested that for some, their help-seeking choices
were outside of family norms (Broadhurst, 2003; Bussing, et al., 2005; Gamoran, Turley, Turner,
& Fish, 2011). Several studies found that friends were perceived as most helpful over family for
a variety of concerns (Keller & McDade, 2000; Raviv, Raviv, Edelstein-Dolev & Selberstein,
2000; Rose, Campbell, and Kub, 2000). Twoy (2006) found in his study of parents with children
with autism that 93% sought advice and information from others who face similar problems,
80% from community agencies, and just 56% of families relied on their physician. Among low
income parents surveyed regarding help-seeking for parenting, the most frequently selected
sources of help were family, books and videos, telephone helplines and friends; least likely
sources of help were child protective services, school personnel, clergy, and social
service/counseling agencies (Keller & McDade, 2000). The relationship between social support
and health behaviors and outcomes has strong empirical support (Gottlieb & Bergen, 2010;
Heaney & Israel, 2008). The various types and sources of social support can be quantitatively
and qualitatively measured utilizing empirically developed tools among various populations
(Gottlieb & Bergen, 2010). A methodological complication is that the type and quality of support
may have positive, neutral or negative effects. As stated by Heaney and Israel for health behavior

282
intervention, we must decide “who should provide what to whom (and when)?” (2008, p. 207).
Measures must be sensitive to cultural variations (Gottlieb & Bergen, 2010). Another challenge
in using social support theory in public health is that it explains one influence on health behavior
among many within an ecological framework, therefore it is best utilized with additional theories
in understanding health behaviors (Heaney & Israel, 2008).
Research Considerations
Public Health seeks to promote physical and mental health and to prevent disease, injury
and disability. There is a plethora of data on early childhood measures (individual measures, vital
statistics, and administrative datasets) of health and disease that exists largely in silos with little
coordination. For example, National surveys are administered by different federal offices.
Holistic, population-wide, and longitudinal measurement will improve the use of data for
research synthesis to improve public health. Holistic measurement includes comprehensive
scales and datasets as well as the use of well-researched indicators and proxies. Anderson and
colleagues (2003) conceptualize early childhood education as part of a coordinated system
including child care, nutrition, housing, transportation, employment, and health care.
Determining a common set of outcomes in this complex scenario is challenging. Besides
methods and design issues, lack of standard measures, and variability in program design and
implementation, there are, “the complex interactions of biology, individual and family
characteristics, and the social and physical environments” that play a strong role in each child’s
developmental trajectory (Anderson, et al., 2003; Roberts, Bellinger & McCormick, 2007). A
broad population-level view of the problems of underdetection and underenrollment for
developmental delays leads to an understanding of gaps in policy development and
implementation at the national or state levels (see Appendix B). At the community level,

283
population-wide research can identify specific groups who may be falling through the cracks, as
well as the consequences of changes in policy or practice. National surveys, epidemiological
investigations, can examine the experiences of large sectors of the population. In addition to the
big picture, more focused research on individual experiences can answer complex and important
questions about processes and systems for which data are either unavailable in existing datasets,
or difficult to quantify in a survey format (nuanced). Program planning models and social
marketing approaches identify individual behaviors related to health problems, and the
determinants of those behaviors. Mixed Methods are used for these approaches, looking at
existing data and also becoming intimately familiar with the individual/interpersonal,
socioeconomic, cultural characteristics of the population(s) that may not be found in existing
datasets. Potential datasets (surveys, program and service use data) cannot inform researchers
about the process that led to the child’s participation in the service or program, nor about the
children that have not participated.
Nationally, there are a number of efforts to collaborate for more holistic outcomes
measurement and ultimately program coordination and improvement. The Children’s Health Act,
Public Law 106-310 (U. S. Congress, 2010) calls for collaboration between the NICHD and
CDC, the Environmental Protection Agency, and the National Institute for Environmental Health
to explore potential correlations between social-behavioral and biomedical issues in children
through longitudinal studies. The Early Childhood Longitudinal Study (ECLS) U.S. Department
of Education, National Center for Health Statistics, n.d.) includes three longitudinal studies that
examine child development, school readiness, and early school experiences, and the National
Federal Interagency Forum on Child and Family Statistics supports coordination and
collaboration using child and family data amongst twelve U. S. Department Agencies. Perhaps

284
these efforts will result contributions to our current understanding of long-term outcomes and
impacts. “The responsibility for child and family services that influence early health and
development is divided across multiple health, education, and social service sectors and
programs, a more coordinated approach is necessary if early childhood services are to be
delivered in an effective, efficient, and accessible manner.” (Halfon, 2004, p. 26). Key Although
program and data heterogeneity limit the ease of meta-analysis or systematic review, one can
argue for diversity in analytical scope and approaches, as long as coordination exists. Each level
of analysis (from the individual to state or nationwide aggregate studies) each contributes a
meaningful perspective. Research designs (cohort, case-control, cross-sectional, and randomized
control trials) each have strengths and limitations. Furthermore, both child and family measures
are necessary in measuring long-term child outcomes. The lifecourse approach to disease and
health is a leading paradigm, driving further development of appropriate research methods and
presenting new challenges (Fine & Kotelchuck, 2010).
Reliability
Assessment tools should be reliable; administered at multiple points in time and across
assessors with similar results. However, child development is dynamic, some conditions may be
unstable or sporadic, and young children are sensitive to the environment. Therefore, screening
and assessment results can vary greatly across settings. The best strategy to increase reliability is
that child assessment takes place periodically, and systematically, using standardized tools and
incorporating parent input, because the parent has had the opportunity to observe the child
repeatedly over time and across settings. Another challenge to reliability is that National surveys
and the U.S. Census, classification systems, and vital statistics measures may change their
questions, affecting the ability to reliably compare datasets across years (Bethel, et al., 2008;

285
Postert, 2009; Shandra, Hogan, & Spearin, 2008). Any single data source has limitations, so
inter-measure reliability is important as well. For example, one study found that across 20
participating countries in 2005-2008, 14-35% of children screened positive for a disability
(UNICEF, 2008). Limitations cited in the report include missing data on children in institutional
care (which varies by country), differences across countries in nutritional status, environmental
risk factors, disease, accidents and political conflicts, and the availability of health services (all
of which are difficult to measure and quantify systematically) and increases in disability that
correlated with decreased infant mortality (UNICEF, 2008).
Sherman (2003) recognizes a number of limitations in determining prevalence of
developmental disabilities, including reliance on service use data for estimates. In the U.S.,
Bethel, and Colleagues (2008) compared reported prevalence rates of children with special
health care needs among three national surveys and found rates ranging from 12-17%. Estimated
prevalence of developmental delay the birth-5 year population is 5-10% of (Rydz, et al, 2005),
the CDC estimates 17% of all children have some type of developmental or behavioral disability
(Boyle, et al., 2011), and other prevalence rates range from 8-22% based on the ages observed
(Glascoe, 2005). The CDC (2006) compared prevalence rates and other data related to autism in,
the National Health Interview Survey (NHIS) and the National Survey of Children's Health
(NSCH). The consistency in estimates between the two surveys suggests high reliability for
parental report of autism (prevalence of 3.4 and 6.7 per 1,000 children, respectively) and parent
reported child symptoms and needs.

286
Validity
Valid measures and measurement practices will accurately and thoroughly reflect the
selected constructs (and not others) in a way that will clearly differentiate individual responses,
is predictive, and intuitively makes sense. These requirements reflect construct, content,
discriminant, criterion, predictive and face validity in measurement. To maximize validity and
minimize erroneous inferences or conclusions, tools should be carefully researched, pilot-tested,
normed across populations, and compared to existing tests (Schmidt, Garratt, & Fitzpatrick,
2002). False conclusions may be the result of Type I error (false positive due to random
statistical error or faulty evaluation design or measurement) or Type II error (an undetected
positive result) (Posavac & Carey, 2007). Quantitative methods allow for more efficient
gathering of data from a larger number of families. These methods can provide a broad view of
parent perspectives from a diverse population. However, large quantitative studies may miss
important details and contextual factors, as well as causal mechanisms for relationships between
variables. Surveys are an efficient and effective way to gather information from a large number
of parents and to cross-reference responses with demographic and diagnostic data. Surveys have
been utilized in many studies looking at health care experiences (Salganicoff & Wyn, 1999) as
has secondary data analysis through review of database and medical records (Zlotnick & Soman,
2004). Furthermore, some variables may require multilevel modeling as children may be enrolled
in one of 4 different systems, or may be receiving services in specific organizations (Pedhazur,
1997). If those second-level relationships are not accounted for, results may be spurious. In
evaluation, it can be easy to miss positive effects due to lack of sufficient data, instruments that
are not sensitive, large samples and highly reliable measures (Posavac & Carey, 2007). For
quantitative projects, sampling is ideally random and may include a comparison or control group

287
to maximize validity and reduce potential bias. For quantitative analysis, data must be checked
for outliers, errors and missing values, use a data dictionary that explicitly operationalizes each
item, and analyzed based on its form and limitations within the assumptions of the statistical test.
The benefit of quantitative questionnaires is that people are often more comfortable filling out a
questionnaire than discussing a sensitive topic in person. However, many surveys or
questionnaires rely on parent or teacher report versus actual observation of the child, and
caregiver attitudes and beliefs versus observed caregiving behaviors, contributing bias through
question misinterpretation, social desirability, or recall bias. Questionnaires also often use
categorical Likert scales which reduce precision and reliability. The questionnaire must be
written in simple, understandable language, in a language that the respondent is proficient in, and
a trained facilitator should be available to assist with answering questions. Validity (construct,
content, criterion, and concurrent) is difficult to achieve when surveys and population level
measures rely on proxies and do not share use consistent definitions and measures. For example
one program used marital status, unemployed partner, inadequate income or “no information”,
unstable housing, no phone, history of abortions (including sought or attempted), and other
measures to screen first time mothers for “at-risk status” (Damboise, & Hughes, 2010). In
another study parental arrest or incarceration was an indicator of household risk factors affecting
child behavior, but the measure did not specify the nature of the crime, length of incarceration, or
number of arrests (Ziv, Alva, & Zill, 2010). Positive or neutral measures also rely on proxies; for
parent involvement, the NSCH asks “how many minutes do you read to your child each week?”
and another study measured parent involvement via the presence of spanking or not-spanking
and teacher report (attended open house and class events, volunteered in classroom, initiated
contact with the teacher). These proxies can be narrowly focused and have great potential for
288
bias (Howard, Dryden, & Johnson, 1999). Finally, predictive validity is a constant challenge in
child measurement due to the complexity of factors influencing child health and development.
No single measure or group of measures has been identified to satisfactorily predict desired child
outcomes, though some variables (gestational age, early reading experiences, and 3rd
grade
reading level) appear to correlate highly with outcomes such as school success.
Generalizability
Selection bias is an important issue in survey and health services utilization data because
non-responders/participants differ from responders/participants, and regardless of sample size,
biased results are the consequence, particularly when response rates are low (Groves, Presser, &
Dipko, 2004; Stevens, 2009). Comparing by ethnic group or race is problematic due to
variability within these groups and other issues such as multilevel influences (state,
organizational), income, or education (Gamoran, et al., 2011). Researchers have suggested
sampling from populations of only low income families to look at the differences between
subgroups in terms of outcomes, and purposively soliciting the perspectives of non service-users
(Broadhurst, 2003). Data from too few respondents may not have sufficient power to detect
effects and may not be generalizable, while a large number may increase power to detect
statistical significance, though meaningful effect sizes should be calculated through follow up
tests. Random assignment is the gold standard for reducing selection bias but is not always
possible, though participants can be randomly assigned by a unit (such as a school) or strata, or
can be matched to a comparison group (Gamoran, et al., 2011).
Recommendations
An increased demand for longitudinal data, driven by research paradigms and outcomes-
focused policy has resulted in further development of data collection and collaboration, research
289
design and analytic methods. Challenges in measuring child health holistically over the long-
term include heterogeneity in programs, inconsistent standards and measures, potential
confounders, and data constraints. Multiple time series cohort studies look key periods, such as
birth, early childhood, school entry, and beyond. To improve consistency in health measurement,
the AAP Bright Futures Program (http://brightfutures.aap.org) provides age-specific health,
development, and mental health screening tools for infants, children, and adolescent care.
Funding for IDEA, Head Start, and child care subsidies is increasingly fragmented, insufficient,
and dependent on outcomes evidence (Barnett & Masse, 2002; Boschee & Jacobs, 1997; U. S.
DHHS, ACF 2007). The FACES study offers researchers opportunities to analyze longitudinal
data from a large national sample of children who are or were enrolled in Head Start, to identify
parent or household variables in relation to children’s outcomes over time (Ziv, Alva, & Zill,
2010).
These studies could be strengthened by including comparison groups such as families on
the Head Start waitlists or in similar programs such as school readiness. The National Head Start
Impact Study measures developmental and family outcomes for approximately 5,000 children
participating in 84 nationally representative Head Start programs (U. S. DHHS, 2010). The study
also attempts to identify specific models and program implementation factors that correspond to
the best outcomes. Each of these diverse approaches is effective in capturing outcomes. Finally,
the Office of Special Education’s Data Accountability Center (U. S. OSEP, 2007) supports the
analysis of high-quality IDEA data by enhancing state capacity to meet data requirements, and
also offers technical assistance and financing to support state-level research and demonstration
projects (OSEP) such as linkages of Part C data with public school Part B and educational data.
Until we can collect, synthesize, analyze and report data in a way that reflects this approach, our

290
outcomes measures will be insufficient and our questions about best practices will remain
unanswered.

291
Appendix B: Children under Age Five with Developmental Concerns and Delays- Status
Estimates from the Literature
With delays– 15% Total (Rosenberg, Zhang, & Robinson, 2008 ECLS birth-3 - 13%; Boyle
2011 NHIS 17%; Smith, et al., 2010, high risk sample ages 0-3- 23%; Halfon, Houtrow, Larson
& Newacheck, 2012 – 5-8% birth to age 18 national surveys)
Concerned parents – 10%- estimate (Glascoe, 2000- 23%, Smith, et al. 8% of 23%,
http://www.childhealthdata.org, NSCH -9%)
concerned parent, public intervention (Glascoe, 2005 of children w/delays, 4.5%
“recognized”, 10.5%” unrecognized”, Marshall - estimate from Census/OSEP, 5%)
concerned parent, alternative services (Hess & Marshall, 2009)- estimate
concerned parent, seeking services (no data available) - estimate
concerned parent, no services (Smith, et al., 2010- 13% of 23% ; Patel, 2007)
with delays, unrecognized (Glascoe, 2000- 3%; Smith, et al., 9% of 30% = 2.7%)
at-risk for delays – poverty, low birth weight, CSHCN, birth defects
no delays (Rosenberg, Zhang, & Robinson, 2008 ECLS birth-3 - 13%; Boyle 2011 NHIS
17%; Smith, et al., 2010, high risk sample ages 0-3- 23%)
4% 3% 3%
2%
3%
85%
concerned parent, public intervention
concerned parent, alternative services
concerned parent, seeking services
concerned parent, no services
with delays, unrecognized
no delays
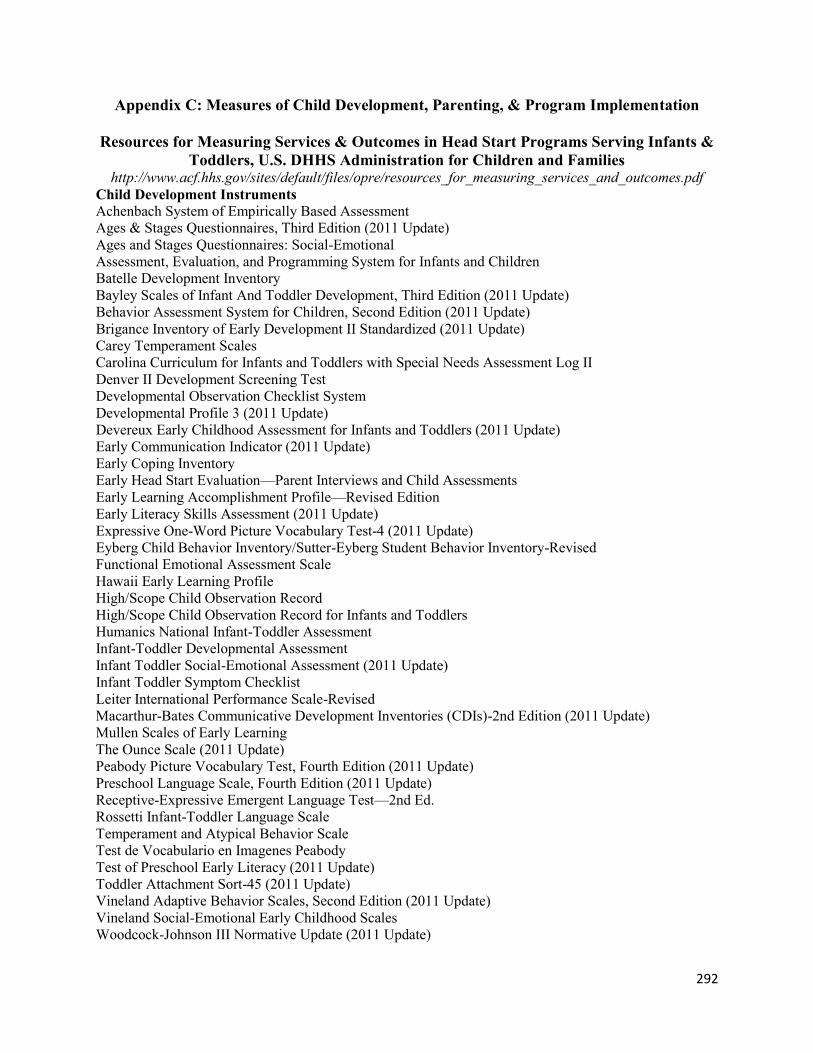
292
Appendix C: Measures of Child Development, Parenting, & Program Implementation
Resources for Measuring Services & Outcomes in Head Start Programs Serving Infants &
Toddlers, U.S. DHHS Administration for Children and Families http://www.acf.hhs.gov/sites/default/files/opre/resources_for_measuring_services_and_outcomes.pdf
Child Development Instruments
Achenbach System of Empirically Based Assessment
Ages & Stages Questionnaires, Third Edition (2011 Update)
Ages and Stages Questionnaires: Social-Emotional
Assessment, Evaluation, and Programming System for Infants and Children
Batelle Development Inventory
Bayley Scales of Infant And Toddler Development, Third Edition (2011 Update)
Behavior Assessment System for Children, Second Edition (2011 Update)
Brigance Inventory of Early Development II Standardized (2011 Update)
Carey Temperament Scales
Carolina Curriculum for Infants and Toddlers with Special Needs Assessment Log II
Denver II Development Screening Test
Developmental Observation Checklist System
Developmental Profile 3 (2011 Update)
Devereux Early Childhood Assessment for Infants and Toddlers (2011 Update)
Early Communication Indicator (2011 Update)
Early Coping Inventory
Early Head Start Evaluation—Parent Interviews and Child Assessments
Early Learning Accomplishment Profile—Revised Edition
Early Literacy Skills Assessment (2011 Update)
Expressive One-Word Picture Vocabulary Test-4 (2011 Update)
Eyberg Child Behavior Inventory/Sutter-Eyberg Student Behavior Inventory-Revised
Functional Emotional Assessment Scale
Hawaii Early Learning Profile
High/Scope Child Observation Record
High/Scope Child Observation Record for Infants and Toddlers
Humanics National Infant-Toddler Assessment
Infant-Toddler Developmental Assessment
Infant Toddler Social-Emotional Assessment (2011 Update)
Infant Toddler Symptom Checklist
Leiter International Performance Scale-Revised
Macarthur-Bates Communicative Development Inventories (CDIs)-2nd Edition (2011 Update)
Mullen Scales of Early Learning
The Ounce Scale (2011 Update)
Peabody Picture Vocabulary Test, Fourth Edition (2011 Update)
Preschool Language Scale, Fourth Edition (2011 Update)
Receptive-Expressive Emergent Language Test—2nd Ed.
Rossetti Infant-Toddler Language Scale
Temperament and Atypical Behavior Scale
Test de Vocabulario en Imagenes Peabody
Test of Preschool Early Literacy (2011 Update)
Toddler Attachment Sort-45 (2011 Update)
Vineland Adaptive Behavior Scales, Second Edition (2011 Update)
Vineland Social-Emotional Early Childhood Scales
Woodcock-Johnson III Normative Update (2011 Update)

293
Appendix C (Cont.) Parenting, the Home Environment, and Parent Well-Being Instruments
Adult-Adolescent Parenting Inventory-2
Beck Anxiety Inventory
Beck Depression Inventory-Second Edition
Center for Epidemiologic Studies Depression Scale
Child Abuse Potential Inventory
Composite International Diagnostic Interview
Conflict Tactics Scales, Parent-Child Version
Confusion, Hubbub, and Order Scale
Early Head Start National Evaluation Questionnaires
Edinburgh Postnatal Depression Scale
Family Environment Scale
Family Map of the Parenting Environment of Infants and Toddlers and in Early Childhood (2011 Update)
Family Needs Scale
Family Resource Scale
Family Support Scale
Home Observation for Measurement of the Environment (2011 Update)
Infant-Toddler and Family Instrument
Kempe Family Stress Inventory
Knowledge of Infant Development Inventory
Nursing Child Assessment Teaching Scales
Parental Modernity Scale (2011 Update)
Parenting Alliance Measure (2011 Update)
Parenting Interactions with Children: Checklist of Observations Linked to Outcomes (2011 Update)
Parenting Stress Index
Support Functions Scale
Program Implementation and Quality Instruments
Arnett Caregiver Interaction Scale
Classroom Assessment Scoring System Toddler and Pre-K (2011 Update)
Early Childhood Environment Rating Scale-Revised
Early Head Start Evaluation—Parent Services Interviews
Family Child Care Environment Rating Scale-Revised Edition (2011 Update)
Family Day Care Rating Scale
Head Start Family Information System
Home Visit Rating Scales and Home Visit Rating Scales-Adapted (2011 Update)
Infant/Toddler Environment Rating Scale Revised Edition (2011 Update)
National Association for the Education of Young Children Accreditation Criteria
Parent-Caregiver Relationship Scale (2011 Update)
Program Implementation Checklist and Rating Scales (2011 Update)
Program Review Instrument for Systems Monitoring

294
Appendix D: National Surveys Related to Early Childhood Health,
Development, Well-Being
American Community Survey American Housing Survey U. S. Census Current population Survey Federal Interagency Forum on Child & Family Statistics http://www.childstats.gov/americaschildren/ Updated annually since 1997 Data from 22 federal & private agencies, 40 indicators: Family & Social Environments- vital stats, child care, families /living arrangements (census), Economic Circumstances, Health Care- utilization (AHRQ), Physical Environment. & Safety- WISQARS High School Transcript Studies – National Center for Education Statistics Medical Expenditures Panel Survey (MEPS) Monitoring the Future National Assessment of Educational Progress National Center for Health Statistics http://www.cdc.gov/nchs/ (data from birth & death records, medical records, interview surveys, & through direct physical exams and laboratory testing). National Center for Educational Outcomes http://www.coled.umn.edu/nceo National Center for Secondary Education & Transition http://ici.umn.edu/ncset National Child Abuse & Neglect Data System National Crime Victimization Survey National Early Intervention Longitudinal Study http://www.sri.com/neils National Education Longitudinal Study National Health & Nutrition Examination Survey National Health Interview Survey, - Disability Supplement National Hospital Ambulatory Medical Care Survey National Household Education Survey National Immunization Survey National Institute for Child Health & Development Early Care and Research Network. National Longitudinal Survey of Youth. National Longitudinal Transition Study of Special Education Students http://www.sri.com neils National Survey of America’s Families National Survey of Children With Special Health Care Needs National Survey of Children’s Health National Survey on Drug Use & Health National Survey of Early Childhood Health National Vital Statistics System Pre-elementary Education Longitudinal Study http://www.sri.com /peels Safe Drinking Water Information System Special Education Elementary Longitudinal Study http://www.seels.net Statistics Canada National Longitudinal Survey of Children & Youth Study of State & Local Implementation & Impact of the Individuals with Disabilities Education Act http://www.abt.sliidea.org Survey of Income & Program Participation Welfare, Children, & Families: A Three-City Study Youth Risk Behavior Surveillance System
Compiled by Jennifer Marshall

295
Appendix E: Relevant PRAMS-2 Variables
PRAMS 2
79. Please circle Y (Yes) or N (No) for each of the following. Does your two-year-old have . . . ? a. A diagnosis of a chronic condition such as: No Yes (1) Asthma N Y (2) Autism N Y (3) Cleft palate N Y (4) Down syndrome N Y (5) Cerebral palsy N Y (6) Other chronic condition N Y Please tell us:_____________________________ b. An ongoing need (lasting six months or more) for: (1) Specialty health care N Y (2) Behavioral health or mental health services N Y (3) Physical therapy N Y (4) Occupational therapy N Y (5) Speech services N Y c. An ongoing need (lasting six months or more) for: (1) Medication N Y (2) Home health services N Y (3) Special diet N Y (4) Use of assistive devices N Y (5) Durable medical equipment N Y 80. Please circle Y (Yes) or N (No) for each of the following. Does your two-year-old…..? No Yes b. Need more time at doctor’s visits than usual for children his/her age N Y c. Need more frequent office visits than usual for children his/her age N Y d. Need or use more medical or mental health services than usual for children his/her age N Y e. Currently need or use medicine (other than vitamins) prescribed by a doctor N Y f. Seem limited or prevented in any way in his or her ability to do the things most two-year-olds can do N Y g. Experience any kind of emotional, developmental or behavioral problem for which he/she needs treatment or counseling N Y
13 81. Early Intervention Services is a State program that offers free services to children age 3 and under who have developmental problems or delays. Has your two-year-old ever….? No Yes a. Been referred for Early Intervention Service N Y b. Been screened or tested for Early Intervention services N Y c. Been found eligible (qualified) for Early Intervention services N Y d. Received Early Intervention services N Y If your two-year-old has never been referred for Early Intervention, please go to Question 83. 82. Below are reasons why children who were referred for Early Intervention may not receive services. For each item, circle Y (Yes) if it was a reason for your two-year-old or circle N (No) if it was not. No Yes a. I don’t think my child needs Early Intervention services N Y b. My child is getting private services instead N Y c. I don’t know how to get my child tested N Y d. The testing process is too confusing and complicated N Y e. My child was tested but not found eligible N Y f. My child was tested and is eligible. We have been waiting ____ months for services N Y g. There are no openings right now N Y h. I can’t get time off to take my child N Y i. I don’t have childcare for my other kids and can’t take them with us N Y j. I don’t have transportation N Y k. We moved N Y l. Other → Please tell us: N Y 13 81. Early Intervention Services is a State program that offers free services to children age 3 and under who have developmental problems or delays. Has your two-year-old ever….? No Yes

296
Appendix F: Relevant NS-CSHCN Variables
National Survey of Children with Special Health Care Needs (2009/2010) Defined Group CSHCN (lasting 12 mos. or longer)
Need or use more services: medical, mental health, education, therapy? Emotional/Behavioral concern needs counseling? Limited in any way? Interferes w/ability to play? Interferes w/ability to go on outings? Dr. ever told problem? Type: behavior (adhd, depression, anxiety, conduct) Development (autism, dev delay, int disability, mr, cp?), r/o health only or birth defects Compared to other children [his/her] age, would you say he/she experiences a little difficulty, a lot of difficulty or no difficulty with each of the following: Taking care of [himself/herself], for example, doing things like eating, dressing and bathing? (C3Q27) Coordination or moving around (C3Q28) Using [his/her] hands (C3Q29) Learning, understanding, or paying attention? (C3Q30) Speaking, communicating, or being understood? (C3Q31) With feeling anxious or depressed? (C3Q32) With behavior problems, such as acting-out, fighting, bullying, or arguing? (C3Q33) Making and keeping friends? (C3Q34) You reported that [CHILD’S NAME] does not experience any difficulty in any of the areas just mentioned. In your opinion, would you say this is because [CHILD’S NAME]’s health problems are being treated and are under control? ( C3Q35 – asked only for children with no difficulties reported in questions C3Q21 through C3Q34) Why is it that [CHILD’S NAME]’s health problems do not currently cause [him/her] difficulty? ( C3Q35A - asked only for respondents who reported that child’s health problems are NOT being treated and are under control (C3Q35=NO)) For the following list of conditions, has a doctor or other health care provider ever told you that [CHILD'S NAME] had the condition, even if [he/she] does not have the condition now? If yes, does [CHILD'S NAME] currently have the condition? Is that condition mild, moderate, or severe? *The following list is applicable for ages 2-17 years only Attention Deficit Disorder or Attention Deficit Hyperactive Disorder (ADD or ADHD) (K2Q31A,K2Q31B,K2Q31C) Depression (K2Q32A,K2Q32B,K2Q32C) Anxiety Problems (K2Q33A,K2Q33B,K2Q33C) Behavioral or Conduct Problems (K2Q34A,K2Q34B,K2Q34C) Autism, Asperger’s Disorder, pervasive developmental disorder, or other autism spectrum disorder (K2Q34A,K2Q35B,K2Q35C,Age of Diagnosis: K2Q35D) Developmental Delay (K2Q36A,K2Q36B,K2Q36C) Intellectual Disability or Mental Retardation (K2Q37A,K2Q37B,K2Q37C) Place usually go for advice on illness or health Public service #16-17 EI/spEd Private? #18 ‘alternative’ No services Section 5Q1 any services?

297
Appendix G: NSCH Scoring Criteria: Developmental Concern and Risk for
Developmental Delay
Child’s Age: 4 mos. ‐‐ 17mos
Child’s Age: 18mos to 2 yrs.
Child’s Age: 3 to 4yrs Child’s Age: 5 yrs.
PREDICTIVE CONCERNS: Expressive language (K6Q02) Socio‐emotional (K6Q07) Non‐PREDICTIVE CONCERNS: Global concerns (K6Q01) Receptive lang (K6Q03) Fine motor (K6Q04) Gross motor (K6Q05) Behavior (K6Q06) IF 10‐18mos: Self‐help (K6Q08)
PREDICTIVE CONCERNS: Expressive language (K6Q02) Receptive language (K6Q03) Non‐PREDICTIVE CONCERNS: Global concerns (K6Q01) Fine motor (K6Q04) Gross motor (K6Q05) Behavior (K6Q06) Self‐help (K6Q08) Socio‐emotional (K6Q07) Preschool/schl skills (K6Q09)
PREDICTIVE CONCERNS: Expressive language (K6Q02) Receptive language (K6Q03) Gross motor (K6Q05) Non‐PREDICTIVE CONCERNS: Global concerns (K6Q01) Fine motor (K6Q04) Behavior (K6Q06) Self‐help (K6Q08) Socio‐emotional (K6Q07) Preschool/school skills (K6Q09)
PREDICTIVE CONCERNS: Expressive language (K6Q02) Receptive l language (K6Q03) Gross motor (K6Q05) Fine motor (K6Q04) Preschool/school skills (K6Q09) Non‐PREDICTIVE CONCERNS: Global concerns (K6Q01) Behavior (K6Q06) Self‐help (K6Q08) Socio‐emotional (K6Q07)
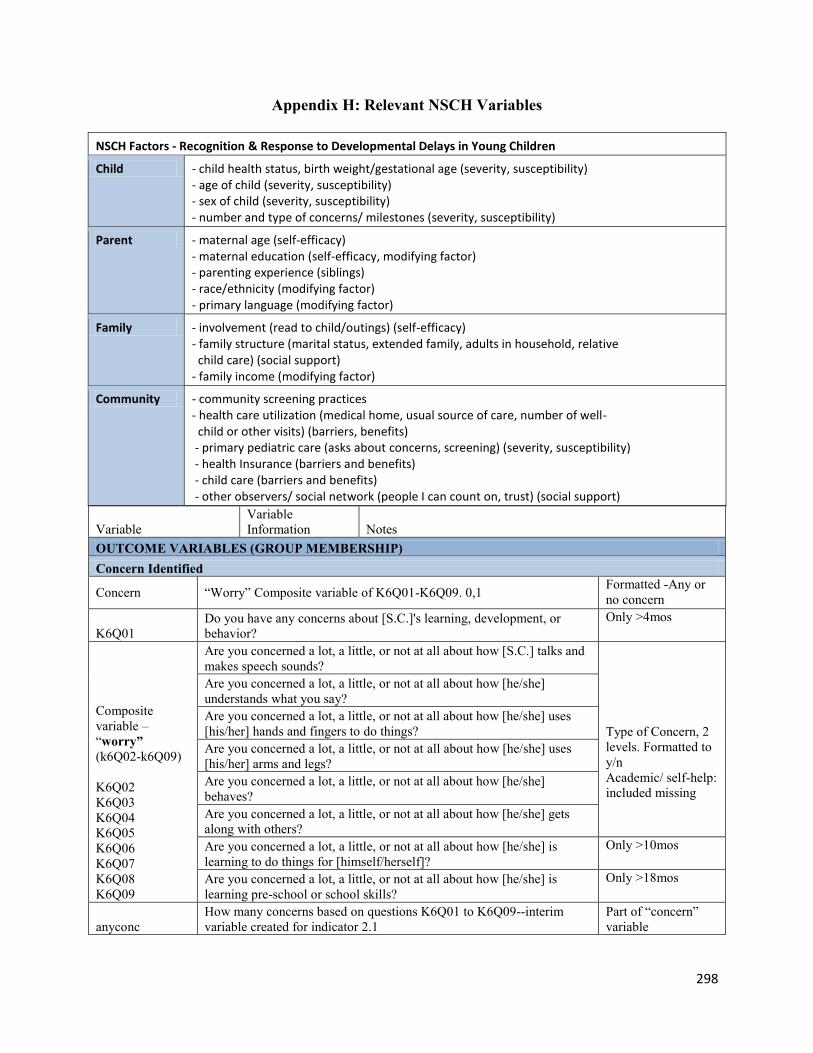
298
Appendix H: Relevant NSCH Variables
NSCH Factors - Recognition & Response to Developmental Delays in Young Children
Child - child health status, birth weight/gestational age (severity, susceptibility) - age of child (severity, susceptibility) - sex of child (severity, susceptibility) - number and type of concerns/ milestones (severity, susceptibility)
Parent - maternal age (self-efficacy) - maternal education (self-efficacy, modifying factor) - parenting experience (siblings) - race/ethnicity (modifying factor) - primary language (modifying factor)
Family - involvement (read to child/outings) (self-efficacy) - family structure (marital status, extended family, adults in household, relative child care) (social support) - family income (modifying factor)
Community - community screening practices - health care utilization (medical home, usual source of care, number of well- child or other visits) (barriers, benefits) - primary pediatric care (asks about concerns, screening) (severity, susceptibility) - health Insurance (barriers and benefits) - child care (barriers and benefits) - other observers/ social network (people I can count on, trust) (social support)
Variable
Variable
Information Notes
OUTCOME VARIABLES (GROUP MEMBERSHIP)
Concern Identified
Concern “Worry” Composite variable of K6Q01-K6Q09. 0,1 Formatted -Any or
no concern
K6Q01
Do you have any concerns about [S.C.]'s learning, development, or
behavior?
Only >4mos
Composite
variable –
“worry”
(k6Q02-k6Q09)
K6Q02
K6Q03
K6Q04
K6Q05
K6Q06
K6Q07
K6Q08
K6Q09
Are you concerned a lot, a little, or not at all about how [S.C.] talks and
makes speech sounds?
Type of Concern, 2
levels. Formatted to
y/n
Academic/ self-help:
included missing
Are you concerned a lot, a little, or not at all about how [he/she]
understands what you say?
Are you concerned a lot, a little, or not at all about how [he/she] uses
[his/her] hands and fingers to do things?
Are you concerned a lot, a little, or not at all about how [he/she] uses
[his/her] arms and legs?
Are you concerned a lot, a little, or not at all about how [he/she]
behaves?
Are you concerned a lot, a little, or not at all about how [he/she] gets
along with others?
Are you concerned a lot, a little, or not at all about how [he/she] is
learning to do things for [himself/herself]?
Only >10mos
Are you concerned a lot, a little, or not at all about how [he/she] is
learning pre-school or school skills?
Only >18mos
anyconc
How many concerns based on questions K6Q01 to K6Q09--interim
variable created for indicator 2.1
Part of “concern”
variable

299
Appendix H (Cont.)
Assessment Received
K6Q15
Does [S.C.] have any developmental problems for which [he/she] has a
written intervention plan called an [Individualized Family Services
Plan or an IFSP / Individualized Education Program or IEP]?
therapy Qualified on use of special therapies?
PREDICTOR VARIABLES (CHARACTERISTICS)
Child Domain
AGEYR_CHILD1 S.C.'s AGE IN YEARS
< 12 months= 0
K2Q01
In general, how would you describe [S.C.]'s health? excellent, very
good, good, fair, or poor?
SEX Male, Female
CSHCN2
Child with Special Health Care Need--based on questions K2Q10-
K2Q23 Includes therapy
mhealth_07
Qualified on ongoing emotional, developmental or behavioral
conditions? CSHCN screener questions
Selected therapy &
k6q15
needspecial_07 Needed to see specialist during past 12 months
Correlation with
therapy and health
Parent Domain
EDUC_MOM3 What is the highest grade or year of school [you have / [S.C.]'s
[MOTHER TYPE] has] completed?
Included missing
Mage Mother’s age Reformat-ted
Included missing
Race5_074*
[S.C.] White, Black, Hispanic, Multiracial, Other Non-White, Black,
or Hispanic
=“Other”
(suppressed)
Created composite
racelang variable to
remove interactions
planguage Derived from K1Q03 and indicates whether the primary language
spoken in the household was not English.
Family Domain
AGEPOS45
Birth position relative to other children in home
K6Q60
During the past week, how many days did you or other family
members read to [S.C.]?
Reformatted to 0, 1-
3, 4-7
K6Q64
During the past week, how many days did you or any family member
take [S.C.] on any kind of outing, such as to the park, library, zoo,
shopping, church, restaurants, or family gatherings?
Chose k6q60, more
precise variable
TOTADULT36 Total number of adults in the home - Top Coded at 3+
MARCOH_PAR7
Marital/Cohab Status of Parent(s) in the Home
POVERTY_LEV
ELR8 Relative to FPL
K10Q32_r People I can count on Community level
K10Q34_r Adults I can trust Community level

300
Appendix H (Cont.)
Community Domain
K6Q10
[During the past 12 months, did [S.C.]'s doctors or other health care
providers ask if you have concern about learning, development, behavior?
instype_07 Type of insurance coverage--public, private or no insurance currently
usual
Usual Sources for Sick and Well Care sub-component of MEDICAL HOME
composite measure
ind6_16b_07
Sources of childcare for 10 or more hours per week, set to binary variable-
none, relative, center-based, both
K4Q20R
How many times did [S.C.] see a doctor, nurse, or other health care provider
for preventive medical care such as a physical exam or well-child checkup?
Correlated to health
and age
mh_comp
ChIldren receiving coordinated, ongoing, comprehensive care within a
medical home
Iincludes therapy/
specialty care
K6Q12
Did a doctor or other health care provider have you fill out a questionnaire
about specific concerns or observations you may have about [S.C.]'s
development, communication, or social behaviors?
High number of
missing responses
unins_07 Current health insurance coverage--currently insured or not currently insured Used “instype_07”
ind6_16a_07 Does child receive some form of non-parental care for at least 10 hours/wk? Used ind6_16b_07
1AGEYR_CHILD—The child’s age in years was recorded when the child was first identified as the sampled child
(which may have been prior to the date when the actual interview was completed). Valid values for age are 0
through 17, where “0” means younger than one year. 2CSHCN—This variable is based on the CSHCN Screener (K2Q10, K2Q11, K2Q12, K2Q13, K2Q14, K2Q15,
K2Q16, K2Q17, K2Q18, K2Q19, K2Q20, K2Q21, K2Q22, and K2Q23) and indicates whether or not the child has
special health care needs. 3EDUC_MOMR, EDUC_DADR, and EDUC_RESR—These variables reflecting the highest level of education
completed by the mother, father, and respondent, respectively, were derived from data collected in variables
K11Q20 through K11Q22. 4RACER, RACEAIAN, RACEASIA, and RACE_HI—These race classification variables were derived from data
collected in variables K11Q02X01 through K11Q02X08. *Parent’s race is derived from selected child [S.C.]’s
reported race RACE5_07. 5AGEPOS4—This variable represents the age of the sampled child, relative to the ages of the other children 17
years of age or younger living in the household. Because it is not known if the sampled child was related to the other
children living in the household, or if the child has siblings who do not live in the household, or if the child has
siblings older than 17 years of age, this variable should not be interpreted as birth order. 6TOTADULT3—The total number of adults in the household was derived by subtracting the total number of
children in the household (S_UNDR18) from the total number of persons in the household (K9Q00). As noted
previously, this variable was top coded at 3 or more adults to protect confidentiality. 7MARCOH_PAR—This variable indicates the marital/cohabitation status of the child’s parent or parents who live
in the household and is based on variables K9Q17A, K9Q17B, K9Q17B_3, K9Q17C, K9Q17_3 and K9Q17D.
Parents living with the child were coded as either married, cohabiting, or neither married nor cohabiting. An
additional category reflects that no parents lived in the household. 8POVERTY_LEVELR—This indicator was created using total household members (K9Q00) and the household
income value. If data for either of these two components were missing, refused, or had a “don’t know” response, this
measure was assigned a missing value code. The household income value was the actual dollar amount reported by
respondents who reported an exact household income (K11Q51). However, when respondents did not supply a
specific dollar amount for household income, it was necessary to go through a series of questions asking respondents
whether the household income was below, exactly at, or above threshold amounts (K11Q52 through K11Q59A). If
respondents did not complete the income cascade, either because they refused or did not know the answer to one of
the cascade questions, this measure was assigned a missing value code. Once an income-to-household-size measure
was computed, it was compared with DHHS Federal Poverty Guidelines. More detail about the development of this
poverty indicator is available in Appendix VII. Missing values for this poverty indicator were multiply imputed.
Details about the development of the imputed values are included in Appendix XII.
(Blumberg, et al., 2012)
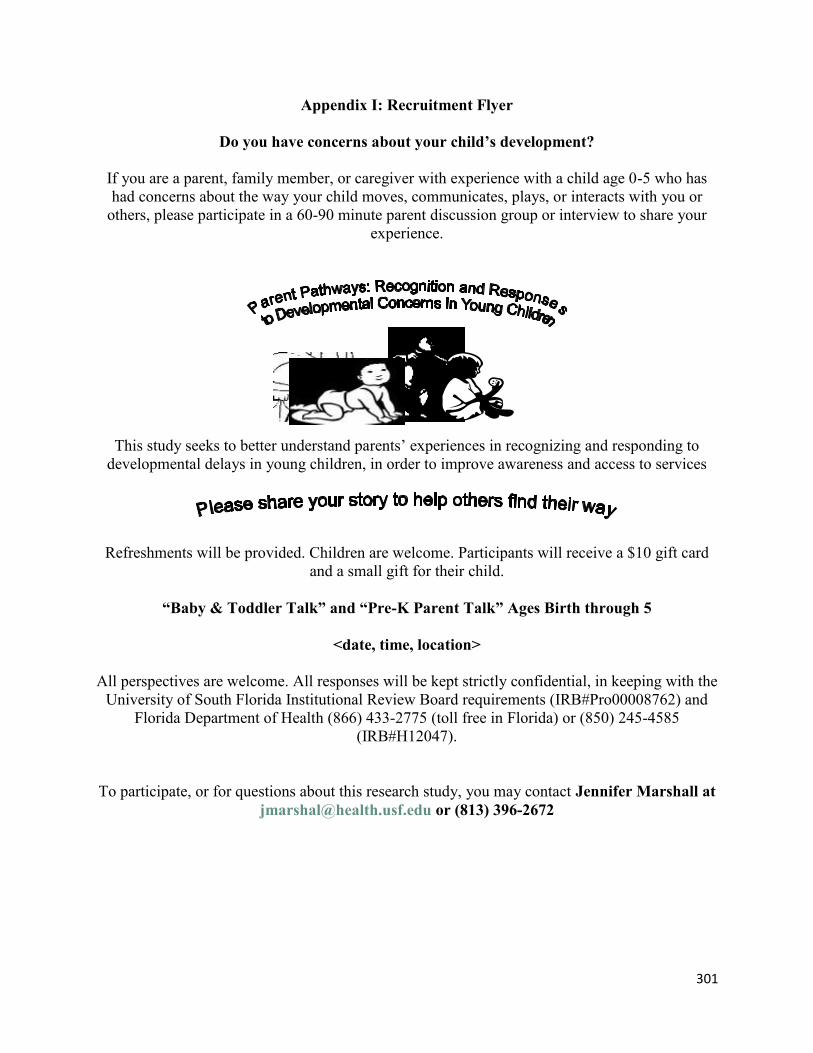
301
Appendix I: Recruitment Flyer
Do you have concerns about your child’s development?
If you are a parent, family member, or caregiver with experience with a child age 0-5 who has
had concerns about the way your child moves, communicates, plays, or interacts with you or
others, please participate in a 60-90 minute parent discussion group or interview to share your
experience.
This study seeks to better understand parents’ experiences in recognizing and responding to
developmental delays in young children, in order to improve awareness and access to services
Refreshments will be provided. Children are welcome. Participants will receive a $10 gift card
and a small gift for their child.
“Baby & Toddler Talk” and “Pre-K Parent Talk” Ages Birth through 5
<date, time, location>
All perspectives are welcome. All responses will be kept strictly confidential, in keeping with the
University of South Florida Institutional Review Board requirements (IRB#Pro00008762) and
Florida Department of Health (866) 433-2775 (toll free in Florida) or (850) 245-4585
(IRB#H12047).
To participate, or for questions about this research study, you may contact Jennifer Marshall at
[email protected] or (813) 396-2672

302
Appendix I (Cont.)
¿Le preocupa el desarrollo de su hijo/a?
Si usted es un padre, familiar o cuidador con experiencia con un niño de 0-5 que ha tenido su
preocupación por la forma en que su niño se mueve, se comunica, juega o interactúa con usted u
otras personas, por favor, participar en un minuto 60-90 matriz del grupo o uno entrevista de
discusión para compartir su experiencia
Este estudio busca comprender mejor las experiencias de los padres para reconocer y
responder a los retrasos en el desarrollo de los niños pequeños, a fin de mejorar el
conocimiento y el acceso a los servicios
Refrescos disponibles refrigerios. Los niños son bienvenidos. Los participantes recibirán una
tarjeta de regalo de $10 y un pequeño regalo para su hijo/a.
"Hablar bebés y niños pequeños" y "Hablar para padres de Pre-K" desde el nacimiento
hasta edad 5
<date, time, location>
Todos los puntos de vista son bienvenidos. Todas las respuestas serán estrictamente
confidenciales, de acuerdo con la Universidad del Sur de Florida Requisitos Institucionales Junta
(IRB #Pro00008762) y Florida Department of Health IRB (866) 433-2775 (toll free in Florida)
or (850) 245-4585 (IRB#H12047)
.
Para participar, o si tiene preguntas sobre este estudio de investigación, póngase en contacto con
Jennifer Marshall at [email protected] or (813) 396-2672

303
Appendix J: Recruitment Agencies
Recruitment Agencies
Bright Horizons – USF campus (2), North Tampa (2)
USF Preschool for Creative Learning
Early Childhood Council Developmental Screening Program
YMCA – New Tampa
Head Start/Early Head Start BOCC – Countywide
RCMA Head Start/Early Head Start
South Shore community resource center
Safety Land day care
Hillsborough County Public Library -New Tampa,Temple Terrace, Brandon, North Tampa,
Town ‘n country, Saunders (central Tampa)
Layla’s House
WIC
Healthy Start
Champions for Children
St. Joseph’s Advocacy Center
Family Support and Resource Center – North Tampa, Ruskin

304
Appendix K: Telephone Screening Form for Focus Group Participants
Thank you for your interest in participating in a focus group to share your experiences in
recognizing or responding to developmental concerns. It is anticipated that our discussion will
take approximately 60 minutes. Refreshments will be available, and you are welcome to bring
your child to play in a safe and comfortable environment. I will be contacting you with date and
time for the group discussion in _month__. You will receive a $10 gift card and a small gift for
your child for your participation, and refreshments available at the group meeting.
Date Primary caregiver?
Telephone Number
Age of Child? under age 5
Developmental concern?
What part of town is most convenient for you?
Best day/ time available for a 1 hour focus group or interview
Referred from:

305
Appendix K (Cont.)
Gracias por su interés en participar en un grupo de discusión para compartir sus experiencias en el reconocimiento o la respuesta a los problemas de desarrollo. Se prevé que la discusión se llevará aproximadamente 60 minutos. Los refrescos estarán disponibles, y pueden traer a su hijo/a a jugar en un ambiente seguro y cómodo. Voy a estar en contacto con usted con la fecha y hora para la discusión de grupo en _Mes_. Usted recibirá una un pequeño regalo para su hijo/a por su participación y refrescos disponibles en la reunión del grupo. Date Fecha
Primary caregiver? Over 18? Nombre Cuidador principal? Más del 18?
Telephone Number Número de Teléfono
Age of Child? Under age 5 Edad del Niño? Menores de 5 años
Developmental concern? la preocupación del desarrollo?
What part of town is most convenient for you? Qué parte de la ciudad es más conveniente para usted?
Best day/ time available for a 1-2 hour focus group El mejor día / tiempo disponible para un grupo de enfoque 1 hora o uno entrevista
Referred from: Procedente de:

306
Appendix L: Focus Group Guide
Good morning and welcome! My name is Jennifer Marshall. I am here from the University of South Florida to talk with parents about their experiences related to noticing and responding to developmental concerns in young children. I thank each of you who agreed to join our group today to share your thoughts, ideas and experiences as parents, or caregivers of young children who have had developmental concerns. The results of this series of focus groups will be compiled into a report that describes parents’ experiences in noticing and seeking help for developmental concerns to better understand and improve access to appropriate supports and services. This topic can elicit strong feelings and opinions, as well as a range of experiences and views. Therefore I ask that you listen respectfully and recognize that there are no right or wrong answers today, simply a sharing of ideas in a safe, comfortable environment. So please feel free to respond and build on the ideas of others and to talk with one another. My role as moderator will be to guide our group through a series of questions. Nicholas will be translating. Also, I am tape recording our discussion in order to ensure that I’ve heard each person and the translation correctly; this recording will be kept confidential and no names will be shared. You participation is completely voluntary, and you choose what you want to share; we ask that what is discussed here is kept confidential. You can step out if you need to use the restroom, attend to your child, take a phone call, get a drink… just join back as soon as you can. While you can leave at any time, we will try to end by __time___ as I realize you have other things to do today. So, let’s get started! QUESTIONS Introduction: tell us _____________________ Sometimes a child may show signs that he or she is developing differently than other children of the same age. He or she may be slow to talk or to walk, may behave, play, or interact differently. Some children have difficulty eating, sleeping, moving around, or being soothed.Today we are going to talk about developmental differences in young children (ages birth through 2 OR ages 3 through 4, before they enter school)
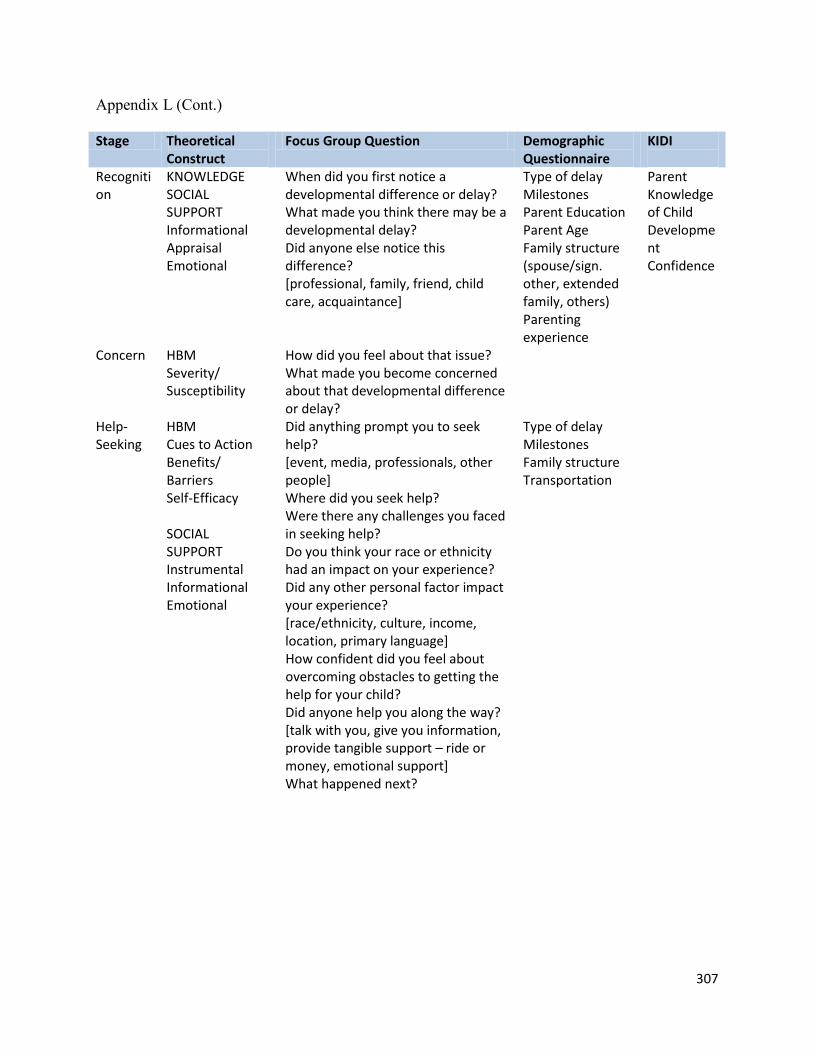
307
Appendix L (Cont.) Stage Theoretical
Construct Focus Group Question Demographic
Questionnaire KIDI
Recognition
KNOWLEDGE SOCIAL SUPPORT Informational Appraisal Emotional
When did you first notice a developmental difference or delay? What made you think there may be a developmental delay? Did anyone else notice this difference? [professional, family, friend, child care, acquaintance]
Type of delay Milestones Parent Education Parent Age Family structure (spouse/sign. other, extended family, others) Parenting experience
Parent Knowledge of Child Development Confidence
Concern HBM Severity/ Susceptibility
How did you feel about that issue? What made you become concerned about that developmental difference or delay?
Help- Seeking
HBM Cues to Action Benefits/ Barriers Self-Efficacy SOCIAL SUPPORT Instrumental Informational Emotional
Did anything prompt you to seek help? [event, media, professionals, other people] Where did you seek help? Were there any challenges you faced in seeking help? Do you think your race or ethnicity had an impact on your experience? Did any other personal factor impact your experience? [race/ethnicity, culture, income, location, primary language] How confident did you feel about overcoming obstacles to getting the help for your child? Did anyone help you along the way? [talk with you, give you information, provide tangible support – ride or money, emotional support] What happened next?
Type of delay Milestones Family structure Transportation

308
Appendix L (Cont.) Buenos días y bienvenidos! Mi nombre es Jennifer Marshall. Yo estoy aquí en la Universidad del Sur de Florida para hablar con los padres acerca de sus experiencias relacionadas con el darse cuenta y responder a los problemas de desarrollo en los niños pequeños. Doy las gracias a cada uno de ustedes que accedió a unirse a nuestro grupo hoy para compartir tus pensamientos, ideas y experiencias como padres o cuidadores de niños pequeños que han tenido problemas de desarrollo. Los resultados de esta serie de grupos focales se compilarán en un informe que describe las experiencias de los padres en darse cuenta y buscar ayuda para problemas de desarrollo para comprender mejor y mejorar el acceso a apoyos y servicios apropiados. Este tema puede provocar fuertes sentimientos y opiniones, así como una amplia gama de experiencias y opiniones. Por lo tanto les pido que escuchen con respeto y reconocer que no hay respuestas correctas o incorrectas hoy, simplemente un intercambio de ideas en un ambiente seguro y cómodo. Así que por favor no dude en responder y construir sobre las ideas de los demás y hablar unos con otros. Mi función como moderador será la de guiar a nuestro grupo a través de una serie de preguntas. Nicolás se traduce. Además, soy cinta de grabación de nuestra discusión con el fin de asegurar que he oído de cada persona y la traducción correcta, esta grabación se mantendrá confidencial y no será compartido con los nombres. Es la participación es completamente voluntaria, y usted decide lo que quieres compartir, le pedimos que lo que se discute aquí es confidencial. Usted puede salir si necesita ir al baño, atender a su hijo/a, atender una llamada telefónica, conseguir una bebida ... simplemente se unen a la mayor brevedad posible. Mientras que usted puede salir en cualquier momento, vamos a tratar de terminar time___ __ como me doy cuenta de que tiene otras cosas que hacer hoy. Por lo tanto, vamos a empezar! PREGUNTAS Introducción: nos dicen _____________________ A veces un niño puede mostrar signos de que él o ella se está desarrollando de manera diferente que los demás niños de su misma edad. Él o ella puede ser lento para hablar o caminar, pueden actuar, jugar o interactuar de forma diferente. Algunos niños tienen dificultad para comer, dormir, moverse, o que se calmó. Hoy vamos a hablar de las diferencias de desarrollo en los niños pequeños (edades de nacimiento hasta los 2 o edades de 3 a 4, antes de entrar a la escuela)

309
Appendix L (Cont.)
Stage Theoretical
Construct Focus Group Question Demographic
Questionnaire KIDI
Recognition
KNOWLEDGE SOCIAL SUPPORT Informational Appraisal Emotional
• ¿Cuándo notó por primera vez una diferencia en el desarrollo o retraso? • ¿Qué te hizo pensar que puede haber un retraso en el desarrollo? • ¿Alguien más cuenta de esta diferencia? [profesional, familiar, amigo, cuidado de niños, el conocimiento] • ¿Cómo te sientes acerca de esta cuestión? • ¿Qué hizo que usted se convierte en preocupación por que la diferencia en el desarrollo o retraso? • ¿Hubo algo que le pide que busque ayuda? • [de eventos, medios de comunicación, profesionales, de los demás] • ¿Dónde buscar ayuda? • ¿Hubo retos a los que se enfrentan en busca de ayuda? • ¿Cree que su raza u origen étnico tuvo un impacto en su experiencia? ¿Tuvo algún impacto otro factor personal de su experiencia? • [la raza / etnia, la cultura, el ingreso, ubicación, idioma primario] • ¿Qué tan seguro te sientes acerca de la superación de los obstáculos para conseguir la ayuda para su hijo/a? • ¿Alguien le ayuda en el camino? • [hablar con usted, le dará información, proporcionar apoyo tangible - paseo o dinero, apoyo emocional] • ¿Qué pasó después?
Type of delay Milestones Parent Education Parent Age Family structure (spouse/sign. other, extended family, others) Parenting experience
Parent Knowledge of Child Dev. Confidence
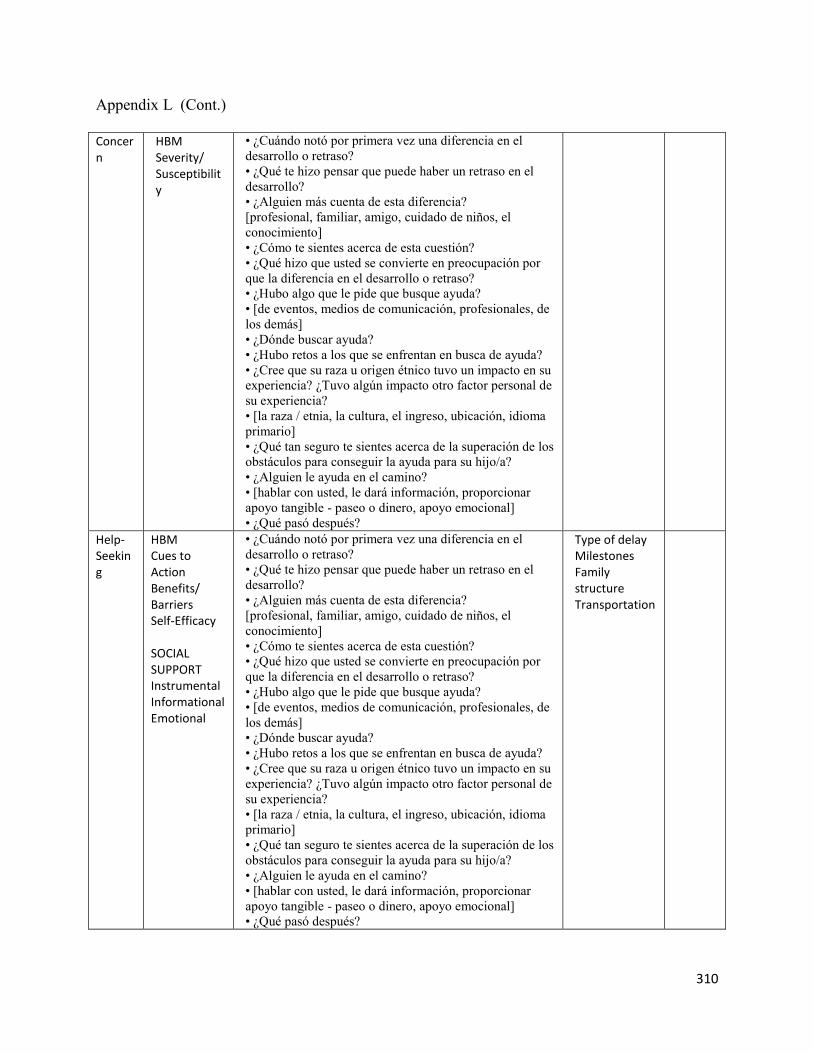
310
Appendix L (Cont.)
Concern
HBM Severity/ Susceptibility
• ¿Cuándo notó por primera vez una diferencia en el
desarrollo o retraso?
• ¿Qué te hizo pensar que puede haber un retraso en el
desarrollo?
• ¿Alguien más cuenta de esta diferencia?
[profesional, familiar, amigo, cuidado de niños, el
conocimiento]
• ¿Cómo te sientes acerca de esta cuestión?
• ¿Qué hizo que usted se convierte en preocupación por
que la diferencia en el desarrollo o retraso?
• ¿Hubo algo que le pide que busque ayuda?
• [de eventos, medios de comunicación, profesionales, de
los demás]
• ¿Dónde buscar ayuda?
• ¿Hubo retos a los que se enfrentan en busca de ayuda?
• ¿Cree que su raza u origen étnico tuvo un impacto en su
experiencia? ¿Tuvo algún impacto otro factor personal de
su experiencia?
• [la raza / etnia, la cultura, el ingreso, ubicación, idioma
primario]
• ¿Qué tan seguro te sientes acerca de la superación de los
obstáculos para conseguir la ayuda para su hijo/a?
• ¿Alguien le ayuda en el camino?
• [hablar con usted, le dará información, proporcionar
apoyo tangible - paseo o dinero, apoyo emocional]
• ¿Qué pasó después?
Help- Seeking
HBM Cues to Action Benefits/ Barriers Self-Efficacy SOCIAL SUPPORT Instrumental Informational Emotional
• ¿Cuándo notó por primera vez una diferencia en el
desarrollo o retraso?
• ¿Qué te hizo pensar que puede haber un retraso en el
desarrollo?
• ¿Alguien más cuenta de esta diferencia?
[profesional, familiar, amigo, cuidado de niños, el
conocimiento]
• ¿Cómo te sientes acerca de esta cuestión?
• ¿Qué hizo que usted se convierte en preocupación por
que la diferencia en el desarrollo o retraso?
• ¿Hubo algo que le pide que busque ayuda?
• [de eventos, medios de comunicación, profesionales, de
los demás]
• ¿Dónde buscar ayuda?
• ¿Hubo retos a los que se enfrentan en busca de ayuda?
• ¿Cree que su raza u origen étnico tuvo un impacto en su
experiencia? ¿Tuvo algún impacto otro factor personal de
su experiencia?
• [la raza / etnia, la cultura, el ingreso, ubicación, idioma
primario]
• ¿Qué tan seguro te sientes acerca de la superación de los
obstáculos para conseguir la ayuda para su hijo/a?
• ¿Alguien le ayuda en el camino?
• [hablar con usted, le dará información, proporcionar
apoyo tangible - paseo o dinero, apoyo emocional]
• ¿Qué pasó después?
Type of delay Milestones Family structure Transportation

311
Appendix M: Demographic Questionnaire Please complete this brief demographic questionnaire. This information will help us to ensure that we receive a variety of perspectives. Thank you! 1. What is your home zip code? __________
2. Do you have reliable transportation? Yes No 3. What is your age?
Under 20 20-24 25-29 30-34 35 or older 4. What is your total annual net (after taxes) household income, including all earners in your
household?
Less than 15,000
15,001- 25,000
25,001- 50,000
50,000-75,000
Over 75,000
Prefer not to answer 5. What is your race/ethnicity (please check all that apply)?
White
Black
Asian
Asian Pacific Island/Alaska Native
Hispanic
Other _________ 6. How well do you speak English?
Very Well Some Little 7. What is the highest level of education you have completed?
Less than High School
High School Graduate
Some College
College Degree (Associate/Bachelors)
Graduate College Degree (Masters/Doctorate) 8. How many children live in your household? Please list how many in each age group:
Under 1 Ages 2-5 Ages 5-10 Ages 11-18
Over 18
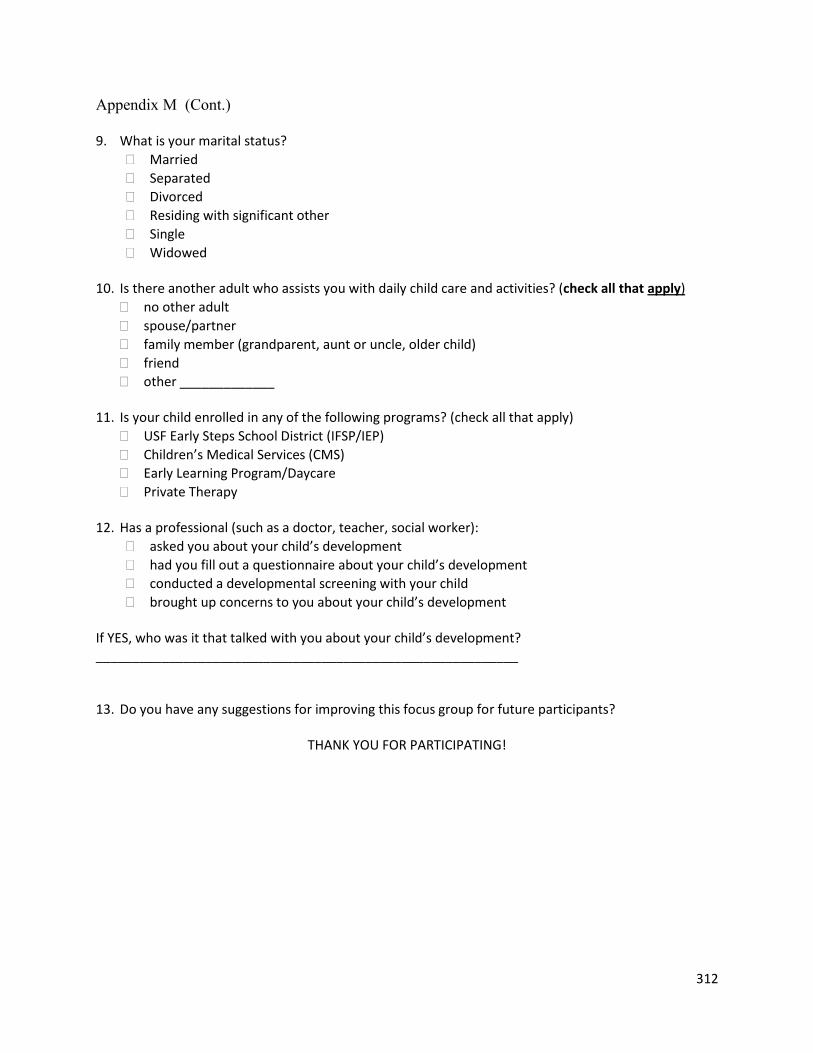
312
Appendix M (Cont.) 9. What is your marital status?
Married
Separated
Divorced
Residing with significant other
Single
Widowed 10. Is there another adult who assists you with daily child care and activities? (check all that apply)
no other adult
spouse/partner
family member (grandparent, aunt or uncle, older child)
friend
other _____________ 11. Is your child enrolled in any of the following programs? (check all that apply)
USF Early Steps School District (IFSP/IEP)
Children’s Medical Services (CMS)
Early Learning Program/Daycare
Private Therapy 12. Has a professional (such as a doctor, teacher, social worker):
asked you about your child’s development
had you fill out a questionnaire about your child’s development
conducted a developmental screening with your child
brought up concerns to you about your child’s development If YES, who was it that talked with you about your child’s development? __________________________________________________________ 13. Do you have any suggestions for improving this focus group for future participants?
THANK YOU FOR PARTICIPATING!

313
Appendix M (Cont.) Por favor conteste este breve cuestionario demográfico. Su información nos ayudará a asegurar que tenemos una amplia variedad de perspectivas. Gracias! 1. ¿En qué código postal vive? __________
2. ¿Tiene transporte confiable? Sí No 3. ¿Cuál es su edad?
Menor de 20 20-24 25-29 30-34 35 o mayor 4. ¿Cuál es el ingreso anual total de su hogar (después de pagar impuestos)? Incluya los ingresos de
todas las personas que viven en su hogar.
Menos de $15,000
$15,001- 25,000
$25,001- 50,000
Más de $50,000
prefiero no responder 5. ¿A qué grupo étnico/raza pertenece? (Indique todos los que apliquen)
Blanco
Negro
Asiático
Nativo de las Islas del Pacifico Sur / Nativo de Alaska
Hispano
Otro_________ 6. ¿Qué tan bien habla inglés?
Bien Algo Poco 7. ¿Cuál es el más alto nivel de educación que han terminado?
Menos de Alta Escuela
Graduado de la Escuela Secundaria
Algunos cursos universitarios
Graduado título universitario (Asociados o Bachillerato)
Postgrado título universitario (Master / Doctorado) 8. ¿Cuántos niños viven en su hogar? Por favor indique cuantos por edad:
Menores de 1 año
De 2-5 años
De 5-10 años
De 11-18 años
Mayores de 18 años

314
Appendix M (Cont.) 9. ¿Cuál es su estado civil?
Casado
Separado
Divorciado
Residen con el otro significativo
Soltero
Viudo 10. ¿Hay algún otro adulto que le ayude en el cuidado y actividades diarias del niño?
a. Nadie más b. Esposo/pareja c. Familiar (Abuelos, tíos, hermano mayor) d. Amigo e. Otro _____________
11. ¿Esta su hijo/a inscrito en alguno de los siguientes programas? (marque lo que corresponda)
USF Early Steps/School District (IFSP/IEP)
Children’s Medical Services (CMS)
Early Learning Program/Daycare (escuela prescolar)
Private Therapy (therapia) 13. ¿Tuvo un profesional (como un médico, maestro, trabajador social):
le preguntó sobre el desarrollo de su hijo/a
solicitado que usted rellenaran un cuestionario sobre el desarrollo de su hijo/a
completado una evaluación del desarrollo con su hijo/a
criado preocupaciones con usted sobre el desarrollo de su hijo/a En caso afirmativo, quien le habló sobre el desarrollo de su hijo/a? ______________________________________________________
14 ¿Tiene algunos comentarios para mejorar el grupo focal para futuros participantes? GRACIAS PARA SU PARTICIPACION!

315
Appendix N: IRB Approval and Consent Form

316
Appendix N (Cont.)
Parent Pathways: Recognition and Responses to Developmental Concerns in Young Children Informed Consent to Participate in Research Information to Consider Before Taking Part in this Research Study IRB Study # __ We are asking you to take part in a research study that is called “Parent Pathways: Recognition and Responses to Developmental Concerns in Young Children.” Research studies include only people who choose to take part. This document is called an informed consent form. Please read this information carefully and take your time making your decision. Ask the researcher or study staff to discuss this consent form with you, please ask him/her to explain any words or information you do not clearly understand. We encourage you to talk with your family and friends before you decide to take part in this research study. The nature of the study, risks, inconveniences, discomforts, and other important information about the study are listed below. The person who is in charge of this research study is Jennifer Marshall. This person is called the Principal Investigator. However, other research staff may be involved and can act on behalf of the

317
Appendix N (Cont.) person in charge. Jennifer Marshall is being guided in this research by Dr. Russell Kirby at the USF College of Public Health. Purpose of the study You have been asked to participate in this study as a family members, community members, parents, or caregivers of young children who have had developmental concerns. The purpose of this study is to better understand the factors that influence parents’ recognition and responses to developmental delays. Should you take part in this study? Before you decide:
Read this form and find out what the study is about.
You may have questions this form does not answer. You do not have to guess at things you don’t understand. If you have questions ask the person in charge of the study or study staff as you go along. Ask them to explain things in a way you can understand.
Take your time to think about it. This form tells you about this research study. This form explains:
Why this study is being done.
What will happen during this study and what you will need to do.
Whether there is any chance of benefits from being in this study.
The risks involved in this study.
How the information collected about you during this study will be used and with whom it may be shared.
Why is this research being done? The purpose of the study is to better understand the community, family, and child-level factors that contribute to parents’ recognition and responses to developmental delays in their children. The results of this series of focus groups will be utilized for the primary investigator’s doctoral dissertation research; compiled into a report that describes the perspectives of parents across settings and cultures regarding recognition, concern and help-seeking for developmental delays that can be used to help health and education systems to improve parental awareness and access to timely diagnosis and intervention services and programs. Why are you being asked to take part? You are being asked to participate in a focus group as a parent or caregiver of a child (ages 0-5) to reflect on your experience with recognizing and responding to developmental concerns. What will happen during this study? If you take part in this study, you will be asked to participate in a 1-2 hour focus group conducted by one facilitator and one note-taker with approximately 10 other parents. Participants will be asked to share experiences in recognizing and responding to developmental concerns in their children.

318
Appendix N (Cont.) Total Number of Participants Up to 200 total individuals will take part in this study. Each focus group will consist of approximately 10 individuals sharing their perspectives. Alternatives You do not have to participate in this research study. You have the alternative to choose not to participate in this research study. If you would like to participate, you may simply respond to the invitation. If you decide not to participate, no record of your non-participation will be kept. There will be no consequences for nonparticipation or withdrawal at any time during the study. Benefits The potential benefits to you are the opportunity to share your perspective and experience, and to be part of a project that can contribute to improvements in systems of services and support for families who have children with developmental concerns. Risks or Discomfort This research is considered to be minimal risk. That means that the risks associated with this study are the same as what you face every day. There are no known additional risks to those who take part in this study. Compensation You will receive a $10 gift card and a small gift for your child for taking part in this study. Your Rights Your participation in the project is completely voluntary and confidential. You may refuse to sign this form. If you do not sign this form will not affect your relationship with the University of South Florida or elsewhere. Confidentiality of Information Used in the Study: Who will disclose (share), receive, and/or use your information? Only the research team, including the Principal Investigator and research staff, will be able to see information about individual participants. All privacy and research records will be kept confidential by the research team; only authorized research personnel will inspect the records from this project. The results of the focus group may be presented. However, the data will be aggregated or de-identified; individual responses will be combined with data from other people and will not include names or any other information that would personally identify survey respondents. Privacy and Confidentiality We will keep your study records private and confidential. Certain people may need to see your study records. By law, anyone who looks at your records must keep them completely confidential. The only people who will be allowed to see these records are:
The research team, including the Principal Investigator, study coordinator, and all other research staff.
Certain government and university people who need to know more about the study. For example, individuals who provide oversight on this study may need to look at your records. This
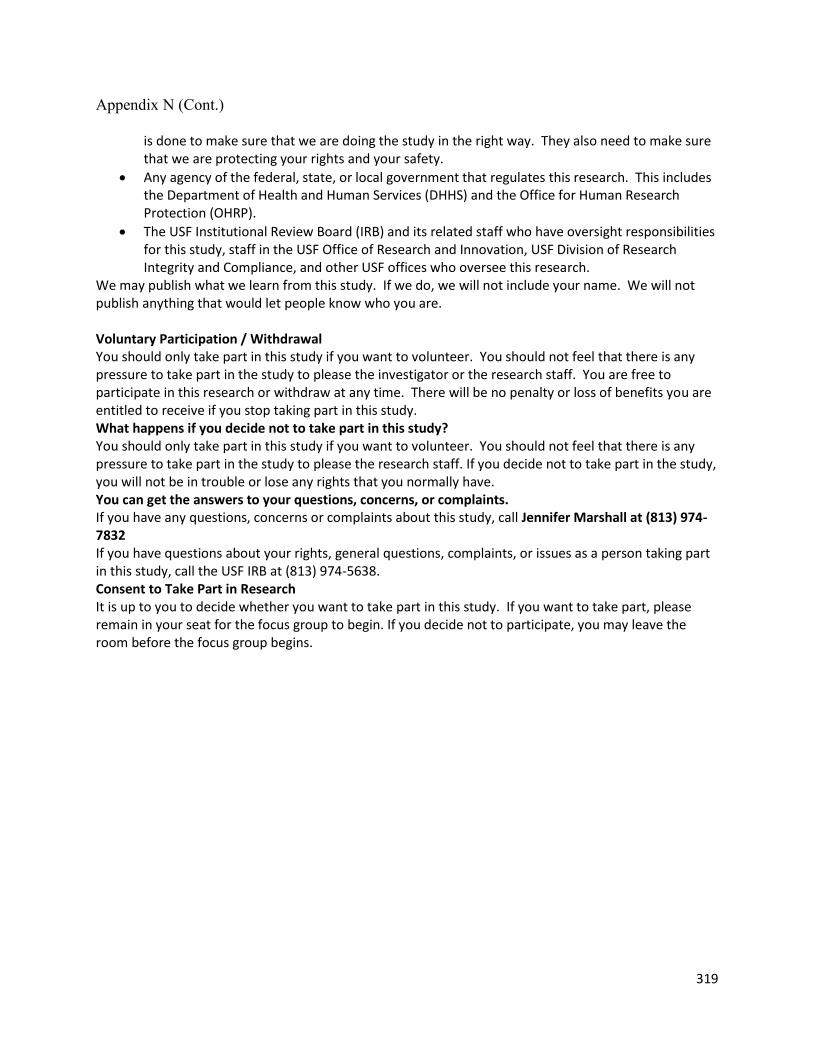
319
Appendix N (Cont.)
is done to make sure that we are doing the study in the right way. They also need to make sure that we are protecting your rights and your safety.
Any agency of the federal, state, or local government that regulates this research. This includes the Department of Health and Human Services (DHHS) and the Office for Human Research Protection (OHRP).
The USF Institutional Review Board (IRB) and its related staff who have oversight responsibilities for this study, staff in the USF Office of Research and Innovation, USF Division of Research Integrity and Compliance, and other USF offices who oversee this research.
We may publish what we learn from this study. If we do, we will not include your name. We will not publish anything that would let people know who you are. Voluntary Participation / Withdrawal You should only take part in this study if you want to volunteer. You should not feel that there is any pressure to take part in the study to please the investigator or the research staff. You are free to participate in this research or withdraw at any time. There will be no penalty or loss of benefits you are entitled to receive if you stop taking part in this study. What happens if you decide not to take part in this study? You should only take part in this study if you want to volunteer. You should not feel that there is any pressure to take part in the study to please the research staff. If you decide not to take part in the study, you will not be in trouble or lose any rights that you normally have. You can get the answers to your questions, concerns, or complaints. If you have any questions, concerns or complaints about this study, call Jennifer Marshall at (813) 974-7832 If you have questions about your rights, general questions, complaints, or issues as a person taking part in this study, call the USF IRB at (813) 974-5638. Consent to Take Part in Research It is up to you to decide whether you want to take part in this study. If you want to take part, please remain in your seat for the focus group to begin. If you decide not to participate, you may leave the room before the focus group begins.

320
Appendix N (Cont.)
Rutas para los padres: Reconocimiento y respuestas a los problemas de desarrollo en los niños pequeños Consentimiento Informado para participar en la Investigación. Información para Considerar Antes de Tomar Parte en este Estudio de Investigación. Numero de estudio del IRB # __________________ Solicitamos su participación en este estudio titulado “Rutas para los padres: Reconocimiento y respuestas a los problemas de desarrollo en los niños pequeños.” Los estudios de investigación incluyen solamente a personas que eligen tomar parte. Este documento se llama un consentimiento informado. Por favor lea está información cuidadosamente y tome su tiempo para decidirse. Pregúntele al investigador o personal de investigación que discuta este consentimiento con usted, por favor, pídale que le explique cualquier palabra o información que usted no entienda claramente. Lo exhortamos a que hable con su familia y sus amistades antes de que decida tomar parte en este estudio de investigación. La naturaleza del estudio, los riesgos, inconveniencias, incomodidades, y otra información importante acerca del estudio están detalladas a continuación. La persona encargada de este estudio de investigación es Jennifer Marshall. Esta persona es la Investigadora Principal. No obstante, otro personal de investigación puede estar envuelto y puede actuar en nombre de la persona encargada. El Dr. Russell Kirby dirige a Jennifer Marshall en esta investigación en el Colegio de Salud Pública de USF. Propósito del Estudio El propósito del estudio es para entender mejor los factores que influyen en el reconocimiento de los padres y las respuestas a retrasos en el desarrollo. ¿Debería usted tomar parte en este estudio? Antes de decidir:
Lea este formulario y entérese de que se trata este estudio.
Usted puede que tenga preguntas que este formulario no responde. Usted no tiene que adivinar cosas que no entienda. Si usted tiene preguntas, pregúntele a la persona encargada del estudio o al personal del estudio a medida que avance el mismo. Pídale que explique de una manera que usted pueda entender.
Tómese su tiempo para pensarlo. Este formulario le dice de qué se trata este estudio de investigación. Este formulario explica:
Porque se está haciendo el estudio.
Que ocurrirá durante este estudio y lo que usted tendrá que hacer.
Si existe alguna oportunidad de recibir beneficios o remuneración al participar en este estudio.
Los riesgos involucrados en este estudio.
Cómo se utilizará la información recopilada sobre usted durante este estudio y con quién podrá ser compartida.
¿Por qué se está haciendo este investigación?

321
Appendix N (Cont.) El propósito del estudio es entender mejor los factores de la comunidad, la familia, y el niño que contribuyen al reconocimiento de los padres y las respuestas a retrasos en el desarrollo de sus hijos. Los resultados de esta serie de grupos de enfoque se utilizará para la investigación, el investigador principal de la tesis doctoral, compilados en un informe que describe las perspectivas de los padres a través de lugares y culturas respecto al reconocimiento, la preocupación y la búsqueda de ayuda-por retrasos en el desarrollo que se pueden utilizar para ayudar a los sistemas de salud y educación para mejorar la concienciación de los padres y el acceso al diagnóstico oportuno y los servicios y programas de intervención. ¿Por qué se le pide que participe? Usted está siendo invitado a participar en un grupo de discusión como un padre o cuidador principal de un niño (0-5 años) para reflexionar sobre su experiencia con ¿Qué ocurrirá durante este estudio? Si usted toma parte en este estudio, se le pedirá que participe en un grupo de enfoque de 60-90 minutos conducido por un facilitador y un encargado de tomar notas con hasta otros 10 cuidadores. Se les pedirá a los participantes para compartir experiencias en reconocer y responder a los problemas de desarrollo en sus hijos. Número total de participantes Aproximadamente un total de 200 individuos participarán en este estudio. Cada grupo consistirá de aproximadamente 10 individuos que compartirán sus perceptivas. Alternativas Usted no tiene que participar en este estudio de investigación. Usted tiene la alternativa de elegir no participar en este estudio de investigación. Si le gustaría participar, simplemente responda a la invitación. Si usted decide no participar, ningún registro de no-participación será mantenido. No habrá consecuencias por no participar o retirarse en cualquier momento durante el estudio. Beneficios Los beneficios potenciales para usted son la oportunidad de compartir sus perspectivas y experiencia, y tomar parte en un proyecto que contribuirá a mejorar el sistema de servicios y apoyo para las otras familias que tienen hijos con problemas con el desarollo. Riesgos o Incomodidades Esta investigación está considerada ser de riesgo mínimo. Esto significa que los riesgos asociados con este estudio son los mismos que los que usted enfrenta cada día. No se conocen riesgos adicionales para los que toman parte en este estudio. Compensación Usted recibirá una tarjeta de regalo de $ 10 y un pequeño regalo para su hijo por participar en este estudio. Sus Derechos Su participación en el proyecto es completamente voluntaria y confidencial. Usted puede negarse a firmar este formulario. Si usted no firma este formulario, no afectara su relación con la Universidad de Sur de la Florida o con cualquier otra parte.

322
Appendix N (Cont.) Confidencialidad de información usada en el Estudio: ¿Quién divulgará (compartirá), recibirá, y/o usara su información? Solo el equipo de investigación, incluyendo el Investigador Primario y su personal será capaz de ver información acerca de participantes individuales. Todos los archivos de privacidad e investigación serán mantenidos de manera confidencial por el equipo de investigación; solo personal de investigación autorizado inspeccionará los archivos de este proyecto. Los resultados del grupo de enfoque podrán ser presentados. No obstante, los datos serán agregados o sin identificación; respuestas individuales serán combinadas con datos de otras personas y no incluirán nombres o ninguna otra información que pueda identificar personalmente a los que respondieron a la encuesta. Privacidad y Confidencialidad Nosotros mantendremos sus archivos de investigación privados y confidenciales. Puede que algunas personas necesiten ver sus archivos de investigación. Por ley, cualquiera que vea sus archivos deberá mantenerlos completamente confidenciales. Las únicas personas a quienes se les permitirá ver estos archivos son:
El equipo de investigación, incluyendo la Investigadora Principal, el coordinador del estudio, las enfermeras del estudio, y otro personal de investigación.
Ciertas personas del gobierno y de la universidad que necesiten saber más acerca del estudio. Por ejemplo, individuos que proveen supervisión al estudio puede que necesiten ver sus archivos. Esto es para asegurarse de que estamos realizando el estudio de la manera correcta. Ellos también necesitan asegurarse de que estamos protegiendo sus derechos y su seguridad.
Cualquier agencia federal, estatal o gobierno local que regula esta investigación. Estos inluyen, La Administración de Alimentos y Medicamentos ( Food and Drug Administration, FDA), El Departamento de Salud de la Florida, y el Departamento de Salud y Servicios Humanos ((Department of Health and Human Services, DHHS) y la Oficina de Protección de Investigación de seres humanos (Office for Human Research Protection, OHRP).
La Junta de Revisión Institucional de USF (USF Institutional Review Board) y su personal relacionado que han supervisado las responsabilidades de este estudio, personal en la Oficia de Investigación e Innovación de USF, la División de Investigación e Integridad y Cumplimiento, y otras oficinas de USF que supervisan esta investigación.
Puede que publiquemos lo que hemos aprendido de este estudio. Si lo hacemos, no incluiremos su nombre. No publicaremos información alguna que pueda dejarle saber a otros quien es usted. Participación Voluntaria/Retiro Usted solo debe tomar parte en este estudio si usted desea ser voluntario. Usted no debe sentir que se le está presionando a tomar parte en el estudio para complacer al investigador o al personal de investigación. Usted puede participar libremente en esta investigación o retirarse en cualquier momento. No habrá penalidad o pérdida de beneficios que usted recibe si deja de participar en este estudio. ¿Que sucede si usted decide no tomar parte en este estudio? Usted solo debe tomar parte en este estudio si usted desea ser voluntario. No debe sentir que se le está presionando a tomar parte en el estudio para complacer al personal de investigación.

323
Appendix N (Cont.) Puede conseguir respuestas a sus preguntas, preocupaciones, o quejas. Si tiene cualquier pregunta, preocupación o queja sobre este estudio, comuníquese con Jennifer Marshall al (813) 974-7832. Si tiene preguntas sobre sus derechos, preguntas en general, quejas o problemas como participante en este estudio, llama a USF IRB al (813) 974-5638. Consentimiento para participar en la investigación Depende de usted decidir si desea participar en este estudio. Si usted desea participar, por favor permanezca en su puesto para el grupo objetivo para empezar. Si usted decide no participar, puede dejar la habitación antes de que el grupo de enfoque comienza.

324
Appendix O: Knowledge of Infant Development Scales, English and Spanish (Infant and
Preschool Versions

325
Appendix O (Cont.)

326
Appendix O (Cont.)

327
Appendix O (Cont.)

328
Appendix O (Cont.)

329
Appendix O (Cont.)

330
Appendix O (Cont.)

331
Appendix O (Cont.)

332
Appendix O (Cont.)

333
Appendix P: Parent Evaluation of Developmental Status (PEDS)

334
Appendix Q: Definitions
Developmental Delay
Delay: any non-attainment of expected milestones
Disability: persistent limitation identified early in life impacting major life activities. Prevalence ranges
from 12%-17%. “Limitations in mental and/or physical function relative to age-specific norms that
become apparent prenatally, perinatally or during infancy, childhood, or adolescence.” (UNICEF, 2008,
p. 3)
Developmental Screening & Evaluation
Usually delays are recognized through Developmental Screening and developmental disabilities are
diagnosed through Assessment/Evaluation:
Screening: “A brief assessment designed to identify children who should receive more intensive
diagnosis or assessment” (CDC, 2005)
Evaluation: Evaluation is the process of gathering information for the purpose of making decisions:
diagnosis; determination of eligibility for a program; assessment for program planning purposes;
monitoring of progress throughout an intervention; and assessment for accountability (McLean, Wolery,
& Bailey, 2004, p.13). Developmental evaluation is a time and labor-intensive process that requires
skilled investigation including medical and psychosocial history, physical examination,
neurodevelopmental assessment, and sometimes laboratory tests (Shevell, 2008).
*For children under age 3, Part C establishes a diagnosis of developmental delay through a
multidisciplinary diagnostic evaluation including standardized test scores (by percent or standard
deviations below the mean) in one or more developmental areas of development, informed clinical
opinion or the decision of the evaluation team, or an established condition or at-risk status resulting in
the likelihood of developmental delay in the absence of intervention. Measurement of developmental
delay relies upon consistent definitions, valid and reliable tools, and multiple measures over time.
However, persistent developmental delays tend to be reliably identifiable with specificity and sensitivity
at young ages based on a number of screening tools (Kleinman, et al., 2007; Nygren, et al., 2012; US
DHHS, ACF 2005; Yang, Lung, Johg, Hsu, & Chen, 2010, p. 895).
Early Intervention
Public: Individuals with Disabilities Education Act (IDEA),: guarantees a free and appropriate public education for children with disabilities under public supervision, at no cost, in natural environments, as determined by the EIP/IFSP team. Services may include early identification, screening, and assessment services; family training, counseling, and home visits; service coordination; special instruction; psychological services; speech-language pathology, audiology, sign language and cued language services; occupational and physical therapy; medical services only for diagnostic or evaluation purposes; health services; social work services; vision services; assistive technology devices and services; and

335
Appendix Q (Cont.) transportation and related costs and are provided by qualified personnel (special educators; speech-
language pathologists and audiologists; occupational therapists; physical therapists; psychologists; social
workers; nurses; registered dietitians; family therapists; vision specialists, including ophthalmologists
and optometrists; orientation and mobility specialists; and pediatricians and other physicians
Private: private providers or agencies through self-pay, insurance, or other funding streams
General Definitions
Parent: The primary caregiver(s) of a child may be categorized according to their biological, social or
legal relationship.
Recognition & response to developmental delays – recognition is awareness of the developmental
difference or delay and concern, response includes help-seeking (very broadly defined) and enrollment
in early intervention services.
Recognition: Parent awareness of a developmental delay or developmental difference in their child,
compared to a child’s same age peers. This recognition is often measured as “concern” though a
percentage of parents may recognize a developmental delay but not judge it as a concern.
Help-Seeking: Contacting a professional provider/agency for screening, assessment, or services.
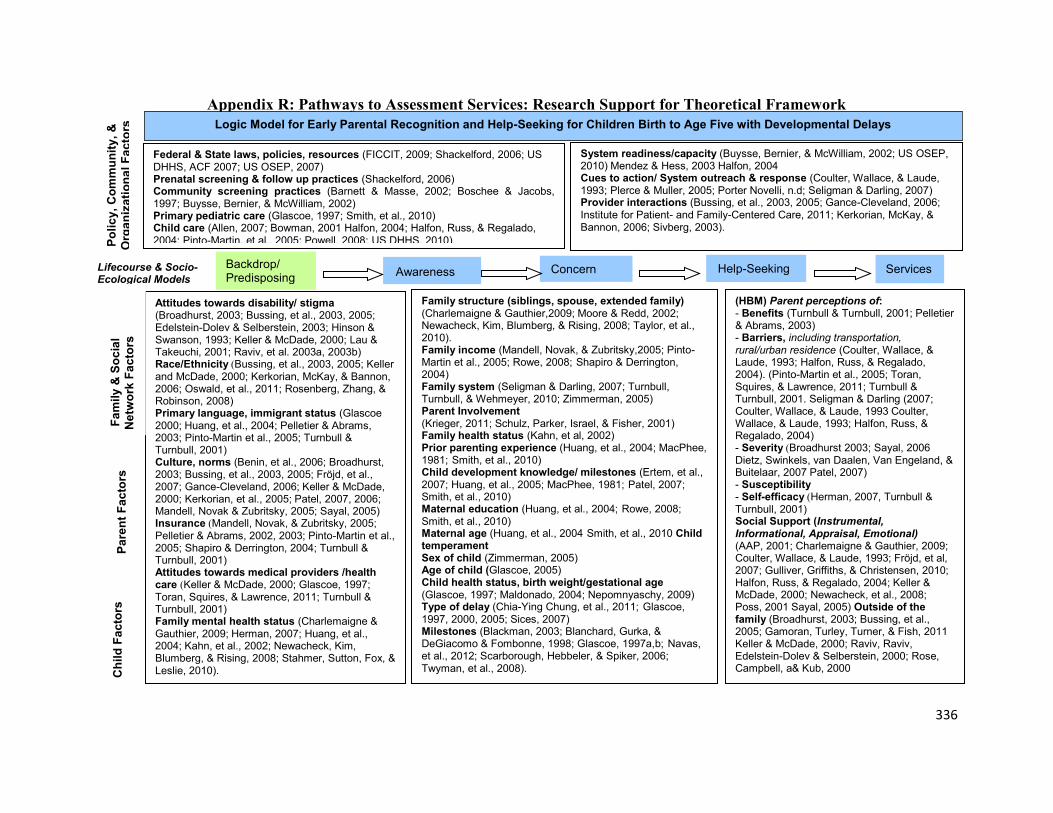
336
Appendix R: Pathways to Assessment Services: Research Support for Theoretical Framework
stigma Attitudes towards disability/ (Broadhurst, 2003; Bussing, et al., 2003, 2005; Edelstein-Dolev & Selberstein, 2003; Hinson & Swanson, 1993; Keller & McDade, 2000; Lau & Takeuchi, 2001; Raviv, et al. 2003a, 2003b)
(Race/Ethnicity Bussing, et al., 2003, 2005; Keller and McDade, 2000; Kerkorian, McKay, & Bannon, 2006; Oswald, et al., 2011; Rosenberg, Zhang, & Robinson, 2008)
(Glascoe Primary language, immigrant status 2000; Huang, et al., 2004; Pelletier & Abrams, 2003; Pinto-Martin et al., 2005; Turnbull & Turnbull, 2001)
(Benin, et al., 2006; Broadhurst, Culture, norms2003; Bussing, et al., 2003, 2005; Fröjd, et al., 2007; Gance-Cleveland, 2006; Keller & McDade, 2000; Kerkorian, et al., 2005; Patel, 2007, 2006; Mandell, Novak & Zubritsky, 2005; Sayal, 2005)
(Insurance Mandell, Novak, & Zubritsky, 2005; Pelletier & Abrams, 2002, 2003; Pinto-Martin et al., 2005; Shapiro & Derrington, 2004; Turnbull & Turnbull, 2001) Attitudes towards medical providers /health
(care Keller & McDade, 2000; Glascoe, 1997; Toran, Squires, & Lawrence, 2011; Turnbull & Turnbull, 2001) Family mental health status Charlemaigne & (Gauthier, 2009; Herman, 2007; Huang, et al., 2004; Kahn, et al., 2002; Newacheck, Kim, Blumberg, & Rising, 2008; Stahmer, Sutton, Fox, & Leslie, 2010).
Help-Seeking
Logic Model for Early Parental Recognition and Help-Seeking for Children Birth to Age Five with Developmental Delays
Services Concern
Ch
ild
Fa
cto
rs
Fa
mily
& S
oc
ial
Netw
ork
Fa
cto
rs
System readiness/capacity (Buysse, Bernier, & McWilliam, 2002; US OSEP, 2010) Mendez & Hess, 2003 Halfon, 2004 Cues to action/ System outreach & response (Coulter, Wallace, & Laude, 1993; Plerce & Muller, 2005; Porter Novelli, n.d; Seligman & Darling, 2007) Provider interactions (Bussing, et al., 2003, 2005; Gance-Cleveland, 2006; Institute for Patient- and Family-Centered Care, 2011; Kerkorian, McKay, & Bannon, 2006; Sivberg, 2003).
Awareness Backdrop/ Predisposing
(HBM) Parent perceptions of: - Benefits (Turnbull & Turnbull, 2001; Pelletier & Abrams, 2003) - Barriers, including transportation, rural/urban residence (Coulter, Wallace, & Laude, 1993; Halfon, Russ, & Regalado, 2004). (Pinto-Martin et al., 2005; Toran, Squires, & Lawrence, 2011; Turnbull & Turnbull, 2001. Seligman & Darling (2007; Coulter, Wallace, & Laude, 1993 Coulter, Wallace, & Laude, 1993; Halfon, Russ, & Regalado, 2004) - Severity (Broadhurst 2003; Sayal, 2006
Dietz, Swinkels, van Daalen, Van Engeland, & Buitelaar, 2007 Patel, 2007) - Susceptibility - Self-efficacy (Herman, 2007, Turnbull & Turnbull, 2001) Social Support (Instrumental, Informational, Appraisal, Emotional) (AAP, 2001; Charlemaigne & Gauthier, 2009; Coulter, Wallace, & Laude, 1993; Fröjd, et al, 2007; Gulliver, Griffiths, & Christensen, 2010; Halfon, Russ, & Regalado, 2004; Keller & McDade, 2000; Newacheck, et al., 2008; Poss, 2001 Sayal, 2005) Outside of the family (Broadhurst, 2003; Bussing, et al., 2005; Gamoran, Turley, Turner, & Fish, 2011
Keller & McDade, 2000; Raviv, Raviv, Edelstein-Dolev & Selberstein, 2000; Rose, Campbell, a& Kub, 2000
Family structure (siblings, spouse, extended family) (Charlemaigne & Gauthier,2009; Moore & Redd, 2002; Newacheck, Kim, Blumberg, & Rising, 2008; Taylor, et al., 2010). Family income (Mandell, Novak, & Zubritsky,2005; Pinto-Martin et al., 2005; Rowe, 2008; Shapiro & Derrington, 2004) Family system (Seligman & Darling, 2007; Turnbull, Turnbull, & Wehmeyer, 2010; Zimmerman, 2005) Parent Involvement (Krieger, 2011; Schulz, Parker, Israel, & Fisher, 2001) Family health status (Kahn, et al, 2002) Prior parenting experience (Huang, et al., 2004; MacPhee, 1981; Smith, et al., 2010) Child development knowledge/ milestones (Ertem, et al., 2007; Huang, et al., 2005; MacPhee, 1981; Patel, 2007; Smith, et al., 2010)
(Huang, et al., 2004; Rowe, 2008; Maternal educationSmith, et al., 2010)
(Huang, et al., 2004 Smith, et al., 2010 Child Maternal agetemperament Sex of child (Zimmerman, 2005) Age of child (Glascoe, 2005) Child health status, birth weight/gestational age (Glascoe, 1997; Nepomnyaschy, 2009) Maldonado, 2004; Type of delay (Chia-Ying Chung, et al., 2011; Glascoe, 1997, 2000, 2005; Sices, 2007) Milestones (Blackman, 2003; Blanchard, Gurka, & DeGiacomo & Fombonne, 1998; Glascoe, 1997a,b; Navas, et al., 2012; Scarborough, Hebbeler, & Spiker, 2006; Twyman, et al., 2008).
Federal & State laws, policies, resources (FICCIT, 2009; Shackelford, 2006; US DHHS, ACF 2007; US OSEP, 2007) Prenatal screening & follow up practices (Shackelford, 2006) Community screening practices (Barnett & Masse, 2002; Boschee & Jacobs, 1997; Buysse, Bernier, & McWilliam, 2002) Primary pediatric care (Glascoe, 1997; Smith, et al., 2010) Child care (Allen, 2007; Bowman, 2001 Halfon, 2004; Halfon, Russ, & Regalado, 2004; Pinto-Martin, et al., 2005; Powell, 2008; US DHHS, 2010) P
oli
cy
, C
om
mu
nit
y,
&
Org
an
iza
tio
na
l F
ac
tors
P
are
nt
Fa
cto
rs
Lifecourse & Socio- Ecological Models

337
Appendix S: Pathways to Assessment Services: Theoretical Framework and Potential Data Sources
Awareness
Logic Model for Early Parental Recognition and Help-Seeking for Children Birth to Age Five with Developmental Delays
Key: MPH- MPH Special project Marshall 2007, Hess & Marshall, 2009; NSCH – National Study of Children’s Health; PRAMS- Pregnancy risk
monitoring system, 2 year follow up survey; KIDI – Knowledge of Infant Development Inventory; CSHCN – National Study of Children with Special
Health Care Needs
Help-Seeking Concern
Child
Fa
cto
rs
Fa
mily
& S
ocia
l
Netw
ork
Fa
cto
rs
- System readiness/ capacity / culture MPH PRAMS- 2 #79-82 - System outreach efforts - Provider interactions CSHCN - Cues to action CSHCN?
Backdrop/ Predisposing
(HBM) Parent perceptions of:
- Benefits – health seeking practices - Barriers – including previous treatment/ trust of health care providers - Severity - Susceptibility - Self-efficacy (Social Support) PRAMS-2 NSCH - Instrumental - Informational - Appraisal - Emotional QUALITATIVE- FOCUS GROUPS, INTERVIEWS
-Family history - Family structure PRAMS-2 NSCH CSHCN - Maternal Age PRAMS- 2 NSCH CSHCN - Maternal Education PRAMS-2 NSCH CSHCN - Perinatal history, -Child birth weight/gestational age PRAMS-2 - Genetic background - Family health status PRAMS-2 CSHCN - Family mental health status PRAMS-2 CSHCN - Attitudes towards disability - Attitudes towards medical providers PRAMS-2 - Health care utilization CSHCN - Race/Ethnicity NSCH PRAMS-2 CSHCN -Culture, primary language, immigrant status PRAMS-2 CSHCN
- Child temperament - Child health status, birth weight/gestational age PRAMS-2 NSCH CSHCN - Age of child NSCH PRAMS-2 CSHCN - Sex of child NSCH PRAMS-2 CSHCN - Type of delay PRAMS-2 CSHCN - Milestones NSCH
- Other observers/ social network NSCH CSHCN - Maternal Education NSCH CSHCN - Involvement (read/outings w/child) NSCH - Family structure (siblings, spouse, extended family) PRAMS-2 NSCH CSHCN - Family system - Competing family needs - Child development knowledge- (milestones, red flags) KIDI - Know others w/special needs
- Community screening practices PRAMS-2 #69 MPH NSCH CSHCN - Primary pediatric care PRAMS-2 MPH NSCH CSHCN - Health Insurance PRAMS-2 #62-65 MPH NSCH CSHCN - Child care PRAMS-2 # 84-85 MPH NSCH
-hospital/birth center policy & practice PRAMS-2? -Prenatal screening & follow up practices PRAMS-2?
Federal & State laws, policies, resources Local resources MPH Socio-Economic Situation PRAMS-2 #1-6, 39-40 NSCH CSHCN
Services
Po
licy,
Com
mu
nity,
&
Org
an
iza
tion
al F
acto
rs
Pa
ren
t F
acto
rs
Lifecourse & Socio-Ecological Models
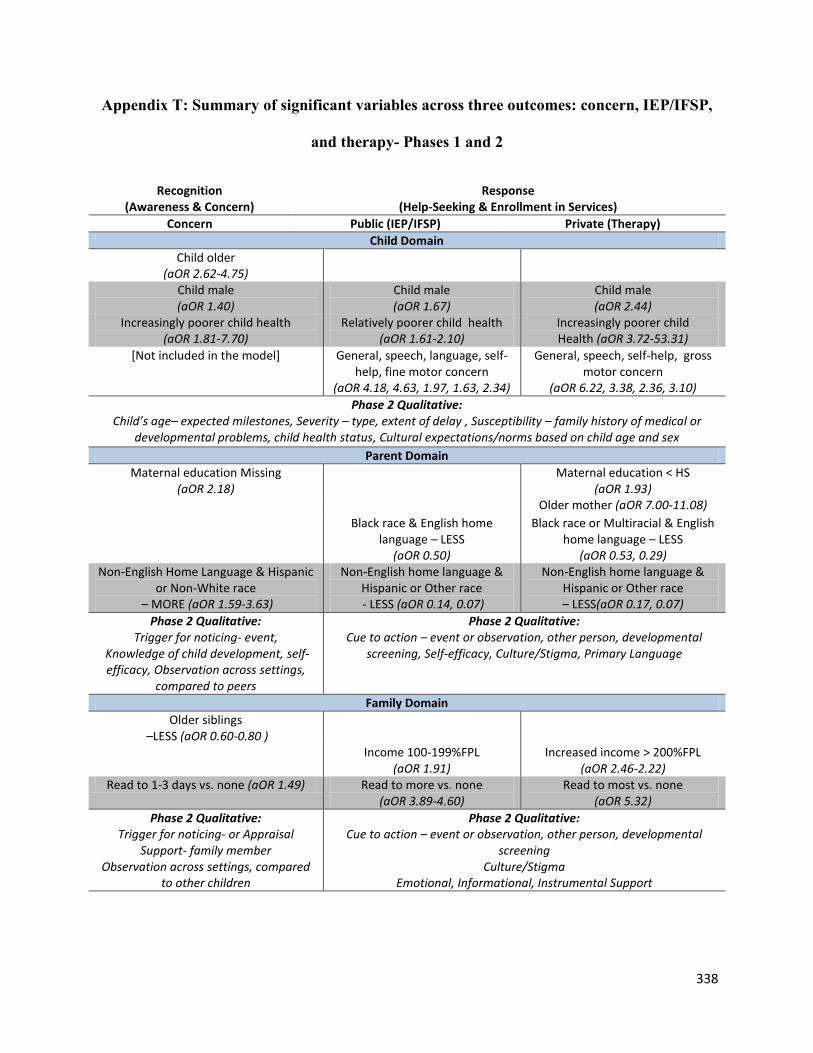
338
Appendix T: Summary of significant variables across three outcomes: concern, IEP/IFSP,
and therapy- Phases 1 and 2
Recognition (Awareness & Concern)
Response (Help-Seeking & Enrollment in Services)
Concern Public (IEP/IFSP) Private (Therapy)
Child Domain
Child older (aOR 2.62-4.75)
Child male (aOR 1.40)
Child male (aOR 1.67)
Child male (aOR 2.44)
Increasingly poorer child health (aOR 1.81-7.70)
Relatively poorer child health (aOR 1.61-2.10)
Increasingly poorer child Health (aOR 3.72-53.31)
[Not included in the model] General, speech, language, self-help, fine motor concern
(aOR 4.18, 4.63, 1.97, 1.63, 2.34)
General, speech, self-help, gross motor concern
(aOR 6.22, 3.38, 2.36, 3.10)
Phase 2 Qualitative: Child’s age– expected milestones, Severity – type, extent of delay , Susceptibility – family history of medical or
developmental problems, child health status, Cultural expectations/norms based on child age and sex
Parent Domain
Maternal education Missing (aOR 2.18)
Maternal education < HS (aOR 1.93)
Older mother (aOR 7.00-11.08)
Black race & English home language – LESS
(aOR 0.50)
Black race or Multiracial & English home language – LESS
(aOR 0.53, 0.29) Non-English Home Language & Hispanic
or Non-White race – MORE (aOR 1.59-3.63)
Non-English home language & Hispanic or Other race - LESS (aOR 0.14, 0.07)
Non-English home language & Hispanic or Other race – LESS(aOR 0.17, 0.07)
Phase 2 Qualitative: Trigger for noticing- event,
Knowledge of child development, self-efficacy, Observation across settings,
compared to peers
Phase 2 Qualitative: Cue to action – event or observation, other person, developmental
screening, Self-efficacy, Culture/Stigma, Primary Language
Family Domain
Older siblings –LESS (aOR 0.60-0.80 )
Income 100-199%FPL (aOR 1.91)
Increased income > 200%FPL (aOR 2.46-2.22)
Read to 1-3 days vs. none (aOR 1.49) Read to more vs. none (aOR 3.89-4.60)
Read to most vs. none (aOR 5.32)
Phase 2 Qualitative: Trigger for noticing- or Appraisal
Support- family member Observation across settings, compared
to other children
Phase 2 Qualitative: Cue to action – event or observation, other person, developmental
screening Culture/Stigma
Emotional, Informational, Instrumental Support

339
Appendix T (Cont.)
Community Domain
Provider ask about concerns (aOR 1.19)
Provider ask about concerns (aOR 2.09)
Provider ask about concerns (aOR 2.17)
Private or no insurance – LESS (aOR 0.44, 0.33)
Private or no insurance – LESS (aOR 0.55, 0.25)
Usual source of health care – LESS (aOR 0.53)
Relative child care vs. none - MORE (aOR 1.28)
Relative child care vs. none - LESS (aOR 0.53)
Phase 2 Qualitative: Developmental Screening, Appraisal
Support- teacher, pediatrician, community program or provider
Phase 2 Qualitative: Informational support – pediatrician, community agencies/providers,
referralcoordination, Insurance, income
Note: Number of adults in the household and marital status was also controlled for in all models


