Embed Size (px)
Citation preview

REAPPORTIONMENT AND PARTISAN COMPETITION: When Does Reapportionment Matter?.
Gary W. Copeland and Jean G. McDonald
This research considers the effects of reapportionment on partisan competition. More pre- cisely, this study develops a set of specifications under which we might expect varying effects of reapportionment on electoral patterns. By considering the history of political competition in the state, the geographic distribution of partisans, the history and methods of previous apportionments, and the political nature of the reapportionment, a set of spe- cific hypotheses regarding the effects can be deduced. The theory is tested by application of it to the state of Oklahoma. Utilizing an interrupted time-series analysis of election results, we conclude that the 1964 reapportionment in Oklahoma had immediate elec- toral consequences. The 1971 reapportionment had virtually no effect. These findings are consistent with the expectations based on the theory developed in the paper.
When the U. S. Supreme Court handed down its far-reaching reappor- tionment decisions, beginning with Baker v. Carr (1962) and running through Reynolds v. Sims (1964), political observers anticipated substantial changes in American state legislative politics. No one knew with any degree of certi- tude what would be the ramifications of correcting the substantial mal- apportionment found in the majority of the states, but speculation centered around the possibilities of more liberal policy making (e. g., Pulsipher and Weatherby, 1968), increasing the political power of urban and suburban areas (e.g,, McKay, 1965, pp. 55-58), increasing electoral competition (e.g., Jewell, 1966), and shifting the partisan balance in state legislatures (e.g., Hamilton, 1967). The direct effects, of course, would be confined to the electoral arena, but even in that realm subsequent research left doubts regarding the influ- ence of reapportionment. In order to help clarify that muddled picture, this paper will focus on the electoral consequences of reapportionment by focus- ing on state legislative races in the state of Oklahoma.
Gary W. Copeland, University of Oklahoma, Carl Albert Center, 680 Parrington Oval, Nor- man, OK 78019. Jean G. McDonald, National Governors' Association.
Political Behavior © 1987 Agathon Press, Inc. Vol. 9, No. 2
160

REAPPORTtONMENT AND PARTISAN POLITICS 16t
ELECTORAL CONSEQUENCES OF REAPPORTIONMENT
Most observers of state legislative elections expected that reapportionment would lead to greater competition for legislative seats. Jewell (1966), for example, argued that the proportion of one-party districts would decline after district lines were redrawn. While this effect will vary according to specific circumstances, competition will increase because "more legislators will come from districts [primarily, urban and suburban] where two-party competition is likely to be high" (p. 81). In states where metropolitan areas were under- represented, the view was that reapportionment would increase the level of competition because urban areas tended to reflect a more even partisan split than most rural areas and because districts in urban areas were likely to be contested, factors which combine to produce more marginal outcomes.
The partisan split of the legislature was also expected to be influenced. Since in most of the nation, urban areas tended to be much more Demo- cratic than the overrepresented rural areas, the partisan balance of the leg- islatures after reapportionment was likely to tip toward Democrats. In states where the Democratic party was urban-based, the shift was expected to be profound. Still, Jewell and others noted that by the mid-1960s the urban population shift had become a suburban shift, which could stem the onslaught of Democrats on state capitols.
The consequences of reapportionment were also expected to vary depend- ing on the districting method used prior to the switch to single-member dis- tricts. At the time of the Baker v. Carr decision, about one-third of all state senators were selected in countywide multimember or at-large elections (David and Eisenberg, 1962). On the House side, about one-third represented multimember districts, one-third single member districts, and almost one- third represented multimember districts that were smaller than the county.
The use of multimember districts affected partisan fortunes substantially (e.g., Jewell and Patterson, 1977; Hamilton, 1967, pp. 821-840; and Jewell, 1969, pp. 18-14). The election of any candidates from the minority party was virtually impossible in one-party areas such as the South. Even in com- petitive settings, the election of any representative from the minority party was unusual. More commonly, there were complete swings from one party to the other from election to election (Jewell, 1966, p. 84).
The specific consequences of reapportionment in any given state also depended upon the precise natm'e of politics in that state. The most impor- tant distinction was the historical nature of partisan competition in the state. In the South, the Republican Party was expected to benefit from the imple- mentation of one person, one vote mandates. Republicans were gaining some electoral strength throughout in the region, but that strength was largely centered in urban and, to a lesser extent, suburban areas, Republican presi- dential candidates were running strong in southern metropolitan areas, and
t62 COPELAND AND McDONALD
Republicans began contesting most congressional races in urban areas (Jewell, 1967, p. 106). Fairer districting for southern state legislative races, then, was expected to be a boon to Republicans.
Reapportionment in the south, then, was expected to have a positive impact on the Republican Party in two different ways. First, the increase in the number of representatives of urban and suburban districts, where Repub- lican strength was found, made likely an increased number of Republican representatives. Second, Republicans should also benefit from the transition from the multimember districts to single member districts in urban areas. A third, indirect, advantage that Republicans could accrue from the reappor- tionment process was greater motivation and capacity to improve their organizational capacity and to become a viable alternative.
Of course, none of this was certain. Baker, for example, countered some of the above arguments with the reminder that since the majority party wotfld be responsible, in most cases, for reapportionment, they could easily gerry- mander to the benefit of their own party (1968, pp. 88-89). The literature of that era, then, left the issue of the partisan impact of reapportionment something of an open question. Since then, surprisingly little research has been done on the subject.
The first study to broach the topic of the partisan impact of reapportion- ment in state legislatures utilized data from congressional elections due, in part, to the paucity of data readily available for state legislative elections. Robert Erickson (1971) examined the partisan division in 88 northern state legislative chambers from 1952 to 1968. His basic conclusion was that Dem- ocrats fared slightly better after reapportionment than they had before (a net gain of 2.9% of the seats). More substantial differences were found in the East, where the urban-based Democratic party benefitted significantly, and in states that were previously seriously malapportioned.
Utilizing state legislative elections data, Uslaner and Weber (1977) com- pared the distribution of seats after the pre-reapportionment election of 1962 with the outcome of the 1967-68 elections for nearly every state in the nation. They concluded that reapportionment had varying effects on the translation of votes into seats in the legislature. They also offer evidence that some of the concerns expressed regarding the potential to gerrymander during reap- portionment may have been well-founded. Where reapportionment was con- trolled by the courts, the effects were more likely to satisfy the ideals of reformers.
Another substantial analysis of state legislative races examined the parti- san effect of reapportionment in six states (including one southern state, Ten- nessee) from 1959 to 1978 (O'Rourke, 1980). That study found some evidence that the party previously disadvantaged by malapportionment rebounded after the new lines were drawn, but that evidence was mixed, at best. In the case of Tennessee, though, Republicans clearly benefitted from
REAPPORTIONMENT AND PARTISAN POLITICS 163
the reapportionment, particularly in urban areas, where it was accompa- nied by a switch from multimember districts to single member districts.
The primary conclusion to be drawn from the literature available on the effects of reapportionment can be summarized using the conclusion to the Uslaner and Weber paper: "Reapportionment in the 1960s had a very mixed impact upon the relationship between votes cast for a party's legislative can- didates and the number of seats won in the legislature by those candidates" (p. 37). Still, this group of research leaves us with a set of hypotheses regard- ing the conditions under which reapportionment will have certain types of effects. The general hypothesis is, of course, that the party which suffered from malapportionment will benefit from reapportionment. Of more inter- est to this study is the set of suhhypotheses which follows the conclusions of previous research. First, if the party which is discriminated against is urban based, it will benefit most in those urban areas. Further, if there is a simul- taneous switch from multimember districts to single member districts, the impact on the minority party will be even greater. Finally, the impact of reap- portionment should be more evident when it is developed in a primarily nonpolitical manner.
Each of these hypotheses will be tested using data from the state of Okla- homa. That state clearly had a minority party which suffered under gross malapportionment. The minority Republicans, however, were experiencing increasing electoral strength in statewide elections. Their greatest source of strength was found in urban Oklahoma City (Oklahoma County) and Tulsa (Tulsa County). And, Tulsa used multimember districts while Oklahoma City utilized single member districts. Finally, the reapportionment in the early 1960s was essentially a nonpolitical reapportionment while the 1971 reap- portionment was much more evidently political. These hypotheses, then, will be tested below after a discussion of the political setting in Oklahoma.
THE OKLAHOMA POLITICAL SETTING
Apportionment
The history of apportionment and reapportionment in Oklahoma is typi- cal of most states. The state's constitution called for decennial redistricting, but no serious changes were made between 1921 and the court-ordered action of 1964 (Singleton, 1981; McKay, 1965; Bingham, 1972; Mauer, 1964; Dixon, 1968). By the 1960s, then, the state was seriously malapportioned: 29% of the population could elect a majority in either house; and on the Schubert-Press index of skewness and kurtosis, where 100 is the value for a perfectly apportioned legislature, Oklahoma scored 9.5, 47th in the nation (Schubert and Press, 1964, p. 325).
Following decades of protests by urban residents, the courts finally de-

164 COPELAND AND McDONALD
clared Oklahoma's apportionment statutes unconstitutional and no longer in effect immediately following Baker v. Cart. Redistricting, though, did not come easily. After much legislative and legal maneuvering, the court finally took command by ordering a plan that combined work done by the Bureau of Government Research at the University of Oklahoma and a statistician who was an active member of the League of Women Voters. Both plans were politically neutral; thus, after politics had played out, the I964 reapportion- ment was finalized without regard to political considerations.
The legislature learned its lesson from the 1964 experience and was deter- mined not to let the court do its redistricting in 1971. Still, while the 1971 reapportionment conformed to the letter of the law, it was overtly political. The House developed a plan to protect incumbents, although the Democratic leadership also used the opportunity to punish a few maverick Democrats who had opposed the incumbent Speaker. The Senate leadership in a parti- san manner protected Democratic incumbents, especially those from the urban areas. Overall, the role of politics in developing the 1971 plans is typ- ical of most redistrictings, but a sharp contrast to 1964 in Oklahoma.
The Shifting Partisan Balance in Oklahoma
At statehood, Oklahoma had the potential to become a two-party state. There was substantial Republican strength in the northern tier of counties that bordered Kansas. Those counties consisted primarily of wheat farmers, most of whom had migrated to Oklahoma from the north. Democrats, who had migrated primarily from the south, were found in eastern and southern Oklahoma. The strength of the Republican Party, however, was sapped by the New Deal. In a very short period of time, Oklahoma became a clear example of a one-party dominant state.
If we examine the pattern of partisan competition, beginning prior to the New Deal realignment, we find that Republicans contested the vast major- ity of elections, won considerable votes, and captured elective offices both locally and statewide. In the 1930s and 1940s, though, Democrats completely dominated voting in Oklahoma. Republicans contested fewer and fewer elec- tions, captured few votes, and won few elections. But, Republican strength began to reappear in the 1950s and 1960s. Republican resurgence was evident, first, in presidential elections. (Eisenhower carried the state in 1952 and 1956.) Republican strength soon began to show in races for statewide offices. Republicans won consecutive gubernatorial and senatorial races in the 1960s. But, in state legislative elections, Democratic strength reached its apogee in the 1950s. Election statistics fail to reveal substantial Republi- can gains in the 1950s and into the 1960s (McDonald, 1982). Republican vote totals continued to be unimpressive due to both the small number of Republican candidates and the frequent poor showing of those who did run.
REAPPORTIONMENT AND PARTISAN POLfflCS 165
Republicans hoped that reapportionment in 1964 would change the pic- ture of state legislative races. They surged in effort by offering candidates in numbers not seen since the teens and twenties. The analysis presented below will determine whether the expectations of political scientists and the hopes of Republicans in Oklahoma bore fruit in the two decades that followed that reapportionment.
RESEARCH DESIGN
A number of research designs might be used to test these hypotheses on the effects of reapportionment. For a variety of reasons, including the avail- ability and the reliability of the data, they will be tested by a longitudinal analysis of elections in the State of Oklahoma. Narrowing the focus to a sin- gle state permits expansion of the time series, but the disadvantage of that design is normally a lack of variation in some key factors. In this case, though, Oklahoma has variance in all the concepts identified as mediating the effects of reapportionment. The choice of this particular state, then, permits us to test all the hypotheses.
The hypotheses explicated above can, therefore, be more precisely applied to the Oklahoma case. The first hypothesis, as applied to Oklahoma, is that the Republican Party should have fared better after the 1964 reapportion- ment than they had previously. Republicans should have fared substantially. better immediately after reapportionment due to fairer boundary lines, a larger number of urban districts, and the elimination of multimember dis- tricts. The reapportionment of 1971 is expected to have had little effect because there was minimal malapportionment in 1971 and due to the politi- cal nature of that redistricting. The second and third hypotheses suggest that the effects of reapportionment should be substantially more significant in the state's urban counties than in the remainder of the state. And, since Tulsa had been apportioned in multimember districts, the effects of reapportion- ment should be greater in Tulsa County than in Oklahoma County.
In order to test these hypotheses, we will analyze all legislative races after the New Deal realignment (beginning in 1984) until i980. The level of par- tisan competition will be gauged in several ways. We will look at both the vote split between the parties and also the seat split. We will also consider the percentage of the races where there was no Republican candidate. Each of these dependent variables will be analyzed utilizing standard ordinary least squares interrupted time-series analysis. Specifically, we will utilize one count variable to detect any secular trends across the time period under consideration, Then we employ a variable to denote the interruption effect of the 1964 realignment (coded 0 prior to 1964 and 1 thereafter) and a sec- ond count variable beginning in 1964. The first of this set of variables will detect the immediate effect of the reapportionment, and the second will
166 COPELAND AND McDONALD
de t ec t any long- te rm t r e n d tha t resul ts f rom tha t r e a p p o r t i o n m e n t . We also use a second set of two t ime va r iab les beg inn ing in 1972 for tha t second r e a p p o r t i o n m e n t . 1
ANALYSIS
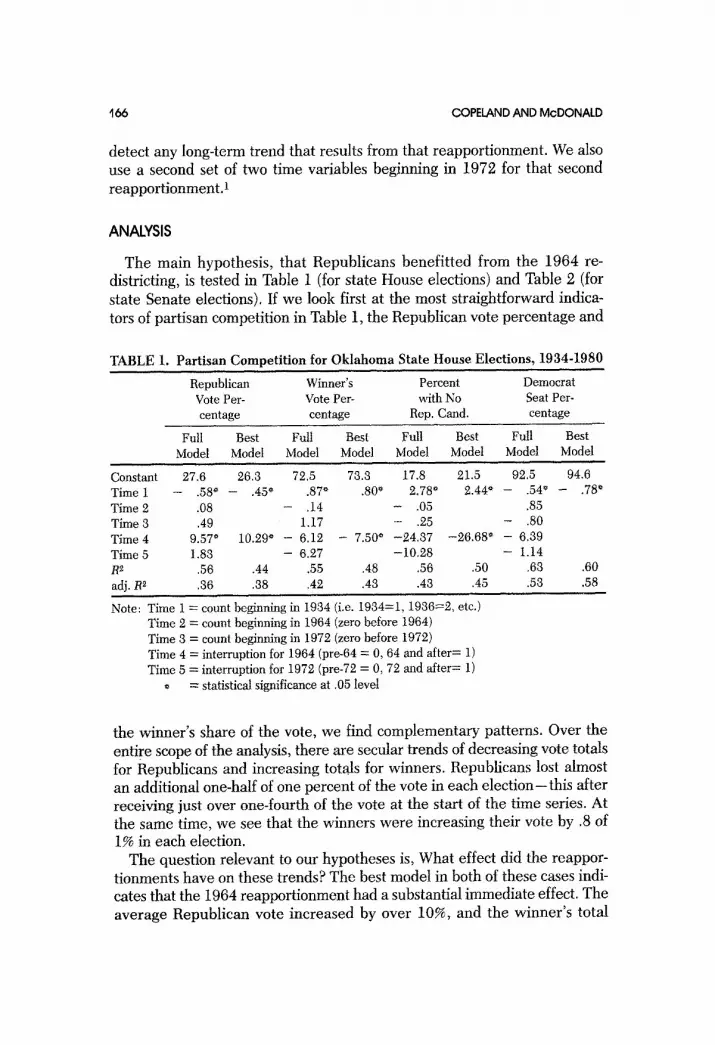
T h e m a i n hypo thes i s , t ha t R e p u b l i c a n s b e n e f i t t e d f rom the 1964 re- dis t r ic t ing, is t e s t ed in Table 1 (for s ta te House elect ions) and Table 2 (for s ta te Sena te elect ions) , If w e look f irst a t the most s t r a igh t fo rward indica- tors of pa r t i s an compe t i t i on in Table 1, t he Re pub l i c a n vote p e r c e n t a g e a n d
TABLE 1. Partisan Competit ion for Oklahoma State House Elections, 1934-1980
Republican Winner's Percent Democrat Vote Per- Vote Per- with No Seat Per- centage centage Rep. Cand. centage
Full Best Full Best Full Best Full Best Model Model Model Model Model Model Model Model
Constant 27.6 26.3 72.5 78.3 17.8 21.5 92.5 94.6 Time 1 -- ,58 ~ -- ,45* .87* .80* 2.78 ~ 2.44* - .54 ~ - .78* Time 2 .08 - .14 - .05 .85 Time3 .49 1.17 - .25 - .80 Time 4 9.57 ~ 10.29" - 6.12 - 7.50 ~ -24.37 -26.68* - 6.39 Time 5 1.83 - 6.27 -10.28 - 1.14 R e .56 .44 .55 ,48 .56 .50 .63 .60 adj. R 2 .36 .38 .42 .43 .43 .45 .53 .58
Note: Time 1 = count beginning in 1934 (i.e. 1934=1, 1936=2, etc.) Time 2 = count beginning in 1964 (zero before 1964) Time 3 = count beginning in 1972 (zero before 1972) Time 4 = interruption for 1964 (pre-64 --- 0, 64 and after= 1) Time 5 = interruption for 1972 (pre-72 = 0, 72 and after= 1)
= statistical significance at .05 level
the w inne r ' s share of the vote , w e f ind c o m p l e m e n t a r y pa t t e rns . Ove r the en t i re scope of the analysis , t he re a re secular t r ends of dec reas ing vote totals for Repub l i cans and increas ing totals for winners . Repub l i cans lost a lmost an add i t iona l one-ha l f of one pe r cen t of the vote in each e l e c t i o n - this a f te r r ece iv ing jus t over one- four th of t he vote at t he s ta r t of the t ime ser ies . At the s a m e t ime , w e see tha t t he w inne r s w e r e inc reas ing the i r vote by .8 of 1% in each elect ion.
T h e ques t ion r e l e v a n t to our hypo theses is, W h a t ef fec t d id the r e a p p o r - t i onmen t s have on these t r ends? The bes t m o d e l in bo th of these cases indi- cates tha t the 1964 r e a p p o r t i o n m e n t had a subs tant ia l i m m e d i a t e effect. The a v e r a g e R e p u b l i c a n vo te i n c r e a s e d by ove r 10%, a n d the w i n n e r ' s t o t a l

REAPPORTIONMENT AND PARTISAN POLITICS t67
dropped by 7.5% due to the 1964 reapport ionment. Other than the immedi- ate effect, though, that reappor t ionment had no further effect, nor did the 1971 reappor t ionment influence part isan competition. In fact, since the t ime variable (Time 1), which picks up the secular trend, remains opera- tive, the Republican vote continued to erode at the .45% pace even after reapport ionment.
The remainder of the table suggests reasons for this outcome. At the start of the t ime series, Republicans failed to offer candidates in about 20% of the districts. Over the t ime series, though, the percentage of races uncontested by Republicans increased by almost 2.5 an election. In 1964, though, the number of Republicans contesting races jumped by almost 27%. The num- ber of contested seats corresponds quite well with the earlier conclusion that the Republican vote jumped substantially, But, examining the distribution of seats in the state House, we find that there was no significant change in
TABLE 2. Partisan Competition for Oklahoma State Senate Elections, 1934-1980
Republican Winner's Percent Democrat Vote Per- Vote Per- with No Seat Per- centage centage Rep. Cand. centage
Full Best Full Best Full Best Full Best Model Model Mode l Model Model Model Model Model
Constant 2 7 . 5 8 2 7 . 7 2 7 2 . 9 0 7 3 . 4 0 1 4 . 6 8 19 .59 98 .18 100.37 Time 1 - .73 ~ - .74 ~ .87 ~ .82 ~ 3.15 ~ 2.70 ~ - .65 ~ - .88 ~ Time2 - .73 - .14 1.22 .02 Time 3 2.55 1.84 * - .28 - 5.82 .37 Time4 12.42" 10.72 ~ - 7.92 - 8.80 ~ -81.80 -29.60 '~ - 3.19 Time 5 1.10 .40 .75 - 2 . 5 2
R 2 .45 .44 .87 .86 .47 .40 .61 .59 adj. R 2 .29 .86 .19 .30 .82 .84 .50 .57
N o t e : Terms defined in Table i.
the percentage of the seats held by Democrats. In other words, Republicans ran more candidates, and hence received more votes and narrowed winning margins, but did n o t win more seats.
Senate races, shown in Table 2, exhibit almost the identical pat terns as that found in the House, although the models have slightly less overall explan- atory power. Again, we see a pat tern where Republicans were in a general state of decline over most of the time period, but a t tempted to take advan- tage of the 1964 reapport ionment. They offered more candidates, received more votes, but failed to win more seats. The only substantial difference here from the House is that there has been a reversal in the trend for the

168 COPELAND AND McDONALD
percentage of Republican votes garnered since 1972. Taking the net differ- ence be tween the first t ime trend and the most recent trend variable (Time 3), we see an increase of almost 1% in the Republican vote from election to election. This may be evidence that the long-term Republican rebuilding effort is beginning to have visible consequences.~
We can consider our hypotheses regarding the effects of reappor t ionment in Republican urban areas by examining Tables 8-6. The first observation is that most models do not explain partisan competition as well as in the state- wide analysis, although some do quite well. In Oklahoma County House
TABLE 3. Partisan Competition for Oklahoma County State House Elections, 1934-1980
Republican Winner's Percent Democrat Vote Per- Vote Per- with No Seat Per- centage centage Rep. Cand, centage
Full Best Full Best Full Best Full Best Model Model Model Model Mode l Model Mode l Model
Constant 2 4 . 2 0 2 3 . 6 7 74.95 - 1.94 3.44 110.78 107.45 Time 1 .g4 .42 ~ - .25 1.74 1.15 ~ - 1.gS ~ - 1.02 ~ Time 2 - .44 2.62 .66 1.27 Timeg - .91 - .03 2.00 .18 Time 4 4.9S - 3.66 -15.34 --19.27 ~ --15.169 Time 5 1.74 -- 7.8I --11.77 1.93 R 2 .16 .13 .10 .18 .15 .80 .77 adj. R 2 - .07 .09 - .16 - .05 .ii .74 .75
Note: Terms defined in Table 1. Empty column indicates no model was at all successfid,
races, the Republicans began the t ime series with about one-fourth of the vote, which is similar to the statewide finding. But, while the Republican share of the vote decreased statewide, it increased over t ime in Oklahoma County (while offering a smaller pe rcen tage of candidates). In fact, the Republicans were making small but consistent inroads into the percentage of seats held by Democrats.
Reapport ionment also had the opposite effect in Oklahoma County from the remainder of the state. Republicans did not offer more candidates (in percentage terms), did not receive more votes, did not cut winning margins, but did win a substantially greater portion number of the seats (about 15%). And, the trend of winning more seats that was evident prior to reapportion- ment has continued since.
In the Senate the pat tern for Oklahoma County was somewhat different from the House. Republicans did not continually increase their vote totals in Senate races as they did in House races, but they also experienced a sub-
REAPPORTIONMENT AND PARTISAN POLITICS 169
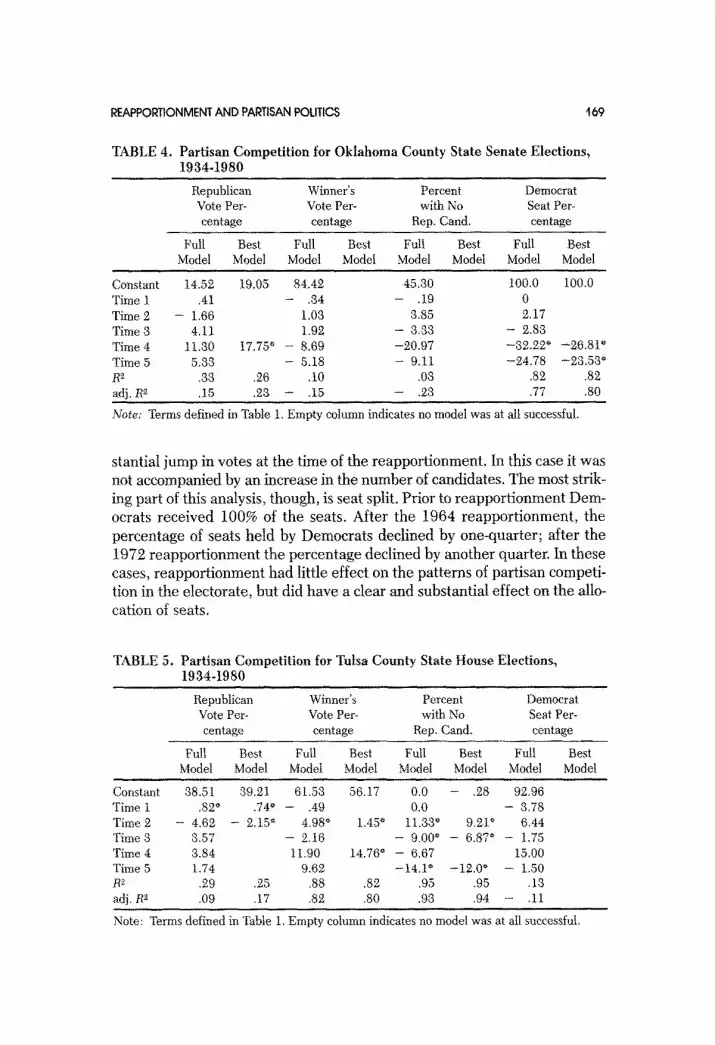
TABLE 4. Pa r t i s an C o m p e t i t i o n for O k l a h o m a C o u n t y S ta te S e n a t e Elec t ions , 1984-1980
Republican Winner's Percent Democrat Vote Per- Vote Per- with No Seat Per- centage centage Rep. Can& centage
Full Best Full Best Full Best Full Best Model Model Model Model Model Model Model Model
Constant Time I Tirae 2 Time 3 Time 4 Time 5 R2 adj, B 2
14.52 19.05 84.42 45.30 100.0 100.0 ,41 - .34 - .19 O
- 1,66 1.08 3.85 2.17 4,11 1,92 - 3,33 - 2.88
11.80 17.75 ~ - 8.69 -20 .97 - 3 2 . 2 2 ~ -26 .81" 5,38 - 5.18 - 9.11 -24 .78 -23.53*
.38 .26 .1O .08 .82 .82
.15 .23 - .15 - .23 .77 .80
Note: Terms defined in Table 1. Empty column indicates no model was at all successful.
s t a n t i a l j u m p i n v o t e s a t t h e t i m e of t h e r e a p p o r t i o n m e n t . In t h i s c a s e i t w a s
n o t a c c o m p a n i e d b y a n i n c r e a s e in t h e n u m b e r of c a n d i d a t e s . T h e m o s t s t r ik-
i ng p a r t of t h i s a n a l y s i s , t h o u g h , is s e a t spl i t . P r i o r to r e a p p o r t i o n m e n t D e m -
o c r a t s r e c e i v e d 1 0 0 % of t h e s e a t s . A f t e r t h e 1 9 6 4 r e a p p o r t i o n m e n t , t h e
p e r c e n t a g e of s e a t s h e l d b y D e m o c r a t s d e c l i n e d b y o n e - q u a r t e r ; a f t e r t h e
1 9 7 2 r e a p p o r t i o n m e n t t h e p e r c e n t a g e d e c l i n e d b y a n o t h e r q u a r t e r . In t h e s e
ca ses , r e a p p o r t i o n m e n t h a d l i t t l e e f f e c t o n t h e p a t t e r n s of p a r t i s a n c o m p e t i -
t i o n in t h e e l e c t o r a t e , b u t d i d h a v e a c l e a r a n d s u b s t a n t i a l e f f e c t o n t h e a l to- c a t i o n of sea t s .
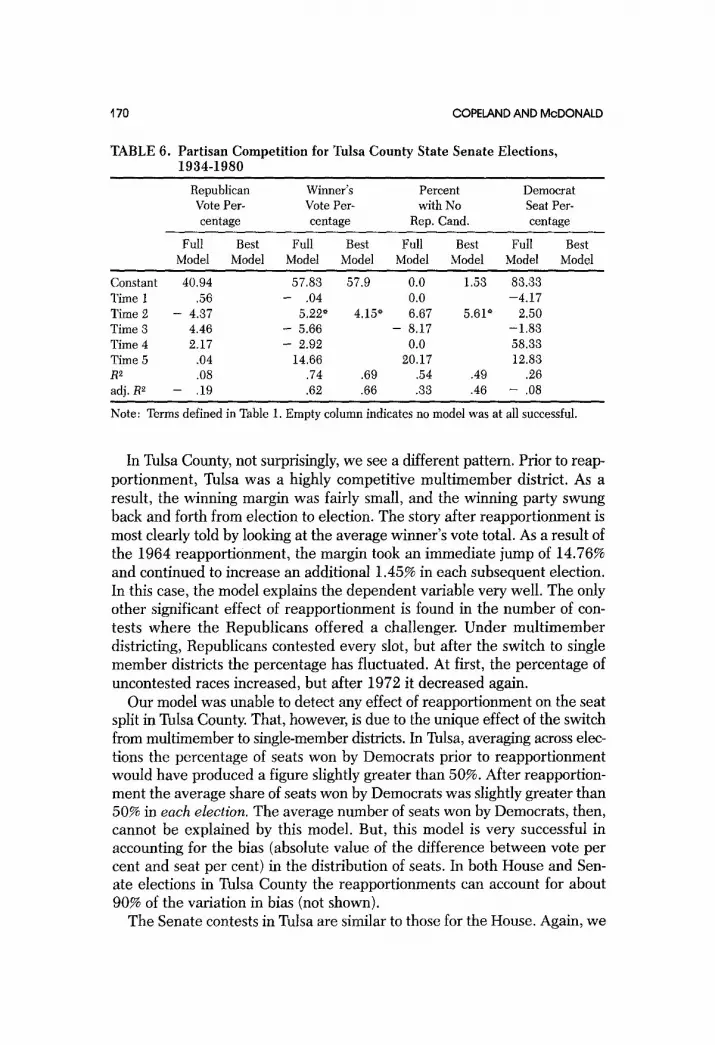
TABLE 5. P a r t i s a n C om pe t i t i on for Tulsa Coun ty Sta te House Elect ions , 1934-1980
Republican Winner's Percent Democrat Vote Per- Vote Per- with No Seat Per- centage centage Rep. Can& centage
Full Best Full Best Full Best Full Best Model Model Model Model Model Model Model Model
Constant 38.51 39.2I 61.53 56.17 0.0 - .28 92.96 Time 1 .82" .74* - .49 0.0 - 8.78 Time 2 - 4,62 - 2.15" 4.98* 1.45" 11.33" 9,21 ~ 6.44 Time3 8.57 -- 2.16 -- 9.00 ~ -- 6.87 ~ - 1.75 Time 4 S.84 11.90 14.76 ~ -- 6.67 15.00 Time 5 1.74 9.62 -14 .1" -12 .0" - 1.50 R z .29 .25 .88 .82 .95 .95 .13 adj. B 2 .09 .17 .82 .80 .98 .94 - .11
Note: Terms defined in Table 1. Empty column indicates no model was at all successful.
170 COPELAND AND McDONALD
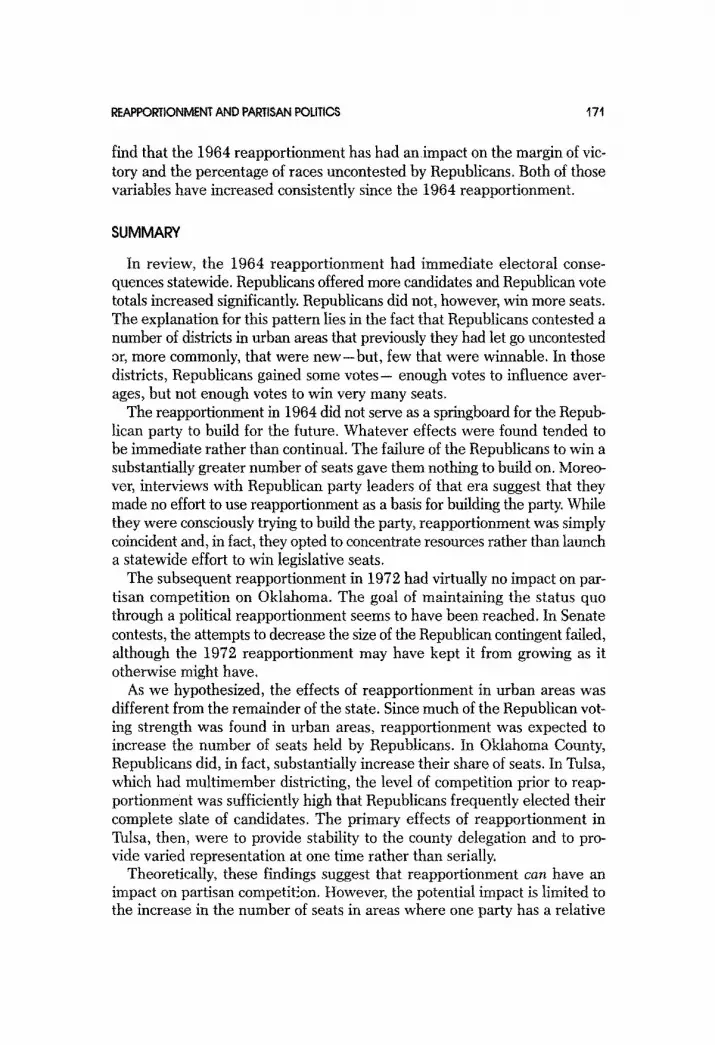
TABLE 6. Pa r t i s an C o m p e t i t i o n for Tulsa C o u n t y Sta te Sena te Elec t ions , 1934-1980
Republican Winner's Percent Democrat Vote Per- Vote Per- with No Seat Per- centage centage Rep. Cand. centage
Full Best Full Best Full Best Full Best Model Model Model Model Model Model Model Model
Constant 40.94 57.88 57.9 0.0 1.53 83.33 Time 1 .56 - .04 0.0 - 4 . 1 7 Time 2 - 4.37 5.22* 4.15 ~ 6.67 5.61" 2.50 Time 5 4.46 - 5.66 - 8.17 -1 .83 Time 4 2.17 - 2.92 0.0 58.33 Time 5 .04 14.66 20.17 12.83 R 2 .08 .74 .69 .54 .49 .26 adj. B 2 - .19 .62 .66 .8S .46 - .08
Note: Terms defined in Table 1. Empty column indicates no model was at all successful.
In Tulsa County, not surprisingly, we see a different pattern. Prior to reap- portionment, Tulsa was a highly competitive multimember district. As a result, the winning margin was fairly small, and the winning party swung back and forth from election to election. The story after reapportionment is most clearly told by looking at the average winner's vote total. As a result of the 1964 reapportionment, the margin took an immediate jump of 14.76% and continued to increase an additional 1.45% in each subsequent election. In this case, the model explains the dependent variable very well. The only other significant effect of reapportionment is found in the number of con- tests where the Republicans offered a challenger. Under multimember districting, Republicans contested every slot, but after the switch to single member districts the percentage has fluctuated. At first, the percentage of uncontested races increased, but after 1972 it decreased again.
Our model was unable to detect any effect of reapportionment on the seat split in Tulsa County. That, however, is due to the unique effect of the switch from multimember to single-member districts. In Tulsa, averaging across elec- tions the percentage of seats won by Democrats prior to reapportionment would have produced a figure slightly greater than 50%. After reapportion- ment the average share of seats won by Democrats was slightly greater than 50% in each election. The average number of seats won by Democrats, then, cannot be explained by this model. But, this model is very successful in accounting for the bias (absolute value of the difference between vote per cent and seat per cent) in the distribution of seats. In both House and Sen- ate elections in Tulsa County the reapportionments can account for about 90% of the variation in bias (not shown).
The Senate contests in Tulsa are similar to those for the House. Again, we
REAPPOK:q'IONMENT AND PARTISAN POLITICS t7t
find that the 1964 reapportionment has had animpact on the margin of vic- tory and the percentage of races uncontested by Republicans. Both of those variables have increased consistently since the 1964 reapportionment.
SUMMARY
In review, the 1964 reapportionment had immediate electoral conse- quences statewide. Republicans offered more candidates and Republican vote totals increased significantly. Republicans did not, however, win more seats. The explanation for this pattern lies in the fact that Republicans contested a number of districts in urban areas that previously they had let go uncontested or, more commonly, that were n e w - b u t , few that were winnable. In those districts, Republicans gained some vo tes - enough votes to influence aver- ages, but not enough votes to win very many seats.
The reapportionment in 1964 did not serve as a springboard for the Repub- lican party to build for the future. Whatever effects were found tended to be immediate rather than continual. The failure of the Republicans to win a substantially greater number of seats gave them nothing to build on. Moreo- ver, interviews with Republican party leaders of that era suggest that they made no effort to use reapportionment as a basis for building the party. While they were consciously trying to build the party, reapportionment was simply coincident and, in fact, they opted to concentrate resources rather than launch a statewide effort to win legislative seats.
The subsequent reapportionment in 1972 had virtually no impact on par- tisan competition on Oklahoma. The goal of maintaining the status quo through a political reapportionment seems to have been reached. In Senate contests, the attempts to decrease the size of the Republican contingent failed, although the 1972 reapportionment may have kept it from growing as it otherwise might have.
As we hypothesized, the effects of reapportionment in urban areas was different from the remainder of the state. Since much of the Republican vot- ing strength was found in urban areas, reapportionment was expected to increase the number of seats held by Republicans. In Oklahoma County, Republicans did, in fact, substantially increase their share of seats. In Tulsa, which had multimember districting, the level of competition prior to reap- portionment was sufficiently high that Republicans frequently elected their complete slate of candidates. The primary effects of reapportionment in Tulsa, then, were to provide stability to the county delegation and to pro- vide varied representation at one time rather than serially.
Theoretically, these findings suggest that reapportionment c a n have an impact on partisan competition. However, the potential impact is limited to the increase in the number of seats in areas where one party has a relative
172 COPELAND AND McDONALD
strength. Further, a number of circumstances can moderate even that lim- ited effect. The party, for one, must opt to aggressively contest those seats. Second, the politics of the reapportionment may be such that the lines are drawn to counter the potential effect. The effects of redistricting cannot be understood without considering whether the lines were gerrymandered. Finally, to understand the effects of reapportionment, the apportionment method (i.e., single- or mult imember districts) must be examined.
The sum of these conclusions suggests that, while generalizing about the effects of reapportionment is difficult, it is possible to specify the effects with a fairly small number of variables: the history of partisan competition in the state, the geographic distribution of partisans, the previous apportionment method, and the political nature of the reapportioning process. Moreover, it seems that for reapportionments subsequent to the early 1960s, the politi- cal nature of the process should dominate the effects of the reapportionment.
NOTES
1. The interrupted time-series methodology is new to the study of the effects of reapportion- ment, but we feel that it offers some advantages. Primarily, it provides a degree of control that is lacking in most cross-sectional analyses and permits simultaneous consideration of the secular trend toward the Republicans. Moreover, this methodology has been successfully employed in other areas (e.g. Lewis-Beck and Alford, 1980; Lewis-Beck, 1986; Meier, 1980).
2. Because of the nature of this analysis, we calculated the Durbin-Watson statistic to test for positive serial correlation. In no case did we find serial correlation. For all but four of the equations used, we were able to conclude that there was no autocorrelation-and three of the four inconclusive cases were very close to the upper limit. No corrective action was taken in any of the cases.
REFERENCES
Baker, Gordon E. (1968). One person, one vote. In Robert A. Gotdwin (ed.), Repre- sentation and Misrepresentation, pp. 71-90. New York: Rand McNatly.
Bingham, Richard D. (1972) Reapportionment of the Oklahoma House of Repre- sentatives: Politics and Process. Norman, OK: Bureau of Government Research, University of Oklahoma.
David, Paul T., and Eisenberg, Ralph (1962). State Legislative Districting. Chicago: Public Administration Service.
Dixon, Robert G., Jr. (1968). Democratic Representation: Reapportionment in Law and PoEtics. New York: Oxford University Press.
Erickson, Robert S. (197 l). The partisan impact of state legislative reapportionment. Midwest Journal of Political Science 15: 57-71.
Hamilton, Howard (1967). Legislative constituencies: single-member districts, multi- member districts, and floterial districts. Western Political Quarterly 20: 321-840.
Jewell, Malcolm E. (1966). The political setting. In Alexander Heard (ed.), State Legislatures in American Politics. Englewood Cliffs, NJ: Prentice-Hall.
Jewell, Malcolm E. (1967). Legislati~e Bepresentation in the Contemporary South. Durham, NC" Duke University Press.
REAPPORTIONMENT AND PARTISAN POLITICS ~t73
Jewell, Malcolm E. (1969). Metropolitan Representation: State Legislative Districting in Urban Counties. National Municipal League.
Jewell, Malcolm E., and Patterson, Samuel C. (1977). The Legislative Process in the United States, third ed. New York: Random House.
Lewis-Beck, Michael S. (1986). Interrupted time series. In William D. Berry and Michael S. Lewis-Beck (eds.), New 1bols for Social Scientists, pp. 209-240. Beverly Hills, CA: Sage.
Lewis-Beck, Michael S., and Alford, John R. (1980). Can government regulate safety? The coal mine example. American Political Science Review 74: 745-756.
Mauer, George J. (1964). Political equality and legislative apportionment in Okla- homa. Unpublished Ph.D. dissertation, University" of Oklahoma.
McDonald, Jean G. (1982). State Legislative Competition in a Changing Party System: The Case of Oklahoma. Norman: Bureau of Government Research, University of Oklahoma.
McKay, Robert B. (t965). Reapportionment: The Law and Politics of Equal Repre- sentation. New York: Twentieth Century Fund.
Meier, Kenneth J. (1980). Executive reorganization of government: impact on employ- ment and expenditures, American Journal of Political Science 24: 396-412.
O'Rourke, Timothy (1980). The Impact of Reapportionment. New Brunswick, NJ: Transaction Books.
Pulsipher, Allan G., and Weatherby, James L. (1968). Malapportionment, party com- petition, and the functional distribution of governmental expenditures, American Political Science Review 62: 1207-I219.
Schubert, Glendon, and Press, Charles (1964). Measuring malapportionment. Ameri- can Political Science Review 58: 302-327.
Singleton, J. Allen (1981). Oklahoma. In Leroy C. Hardy, Alan Heslop, and Stuart Anderson (eds.), Reapportionment Politics: The History of Redistricting in 50 States, pp. 266-270. Beverly Hills, CA: Sage Publications.
Uslaner, Eric M., and Weber, Ronald E. (1977). Reapportionment, gerrymandering, and change in the partisan balance of power in the American states. Paper delivered at the annual meeting of the American Political Science Association.


![[2011] Political Competition](https://img.dokumen.tips/doc/110x75/6336f66a1c5ab7fce2057d03/2011-political-competition.jpg)


