Embed Size (px)
Citation preview

Political Science
Political Science Publications
University of Iowa 11-1991
A Reference Group Theory of Partisan
Coalitions
Arthur H. Miller Christopher Wlezien
Anne Hildreth
Copyright 1991 Southern Political Science Association. Used by permission.http://journals.cambridge.org/action/displayJournal?jid=JOP
This paper is posted at Iowa Research Online.
http://ir.uiowa.edu/polisci pubs/54
A Reference Group Theory of Partisan Coalitions
Arthur H. Miller University of Iowa
Christopher Wlezien University of Houston
Anne Hildreth University of New York at Albany
Group cleavages and coalitions have long been an important aspect of how politicians view everyday American politics. Moreover, there is growing evidence which suggests that during recent years groups as actors in the political arena, and perceived group differences, have become increasingly visible to the public and more important in determining the political behavior of the average citizen. Most importantly, the types of group voters themselves associate with and the extent to which these groups are connected with the parties or particular candidates has important implications for structuring voters' political decisions.
Analyses of correlations between thermometer ratings of various social groups and political parties indicate the public does indeed link parties and groups in their political thinking. Certain clusters of groups are generally associated with each party, thereby suggesting perceptions of party coalitions. Empirical evidence from a multivariate analysis for both 1972 and 1984 suggests that how people feel about social groups associated with the parties not only structures their partisan orientation but strongly influences candidate evaluations and voting behavior.
INTRODUCTION
In the 1984 presidential campaign the Democratic party was successfully branded by Ronald Reagan as the party of "special interests." This charge was rather surprising, for historically, at least during the previous three decades, the Democrats had been perceived as a broad coalition of working-class Americans. But, particular events of the 1984 campaign, such as the early union endorsement of Walter Mondale, Jesse Jackson's campaign for the Democratic party's nomination, and the pressure politics surrounding the selection of Geraldine Ferraro as the vice presidential candidate, all made the Democrats vulnerable to being labeled as the party of special interests.
It would be a mistake, however, to conclude from those events of the 1984 campaign that the labeling of the Democrats as the party of special interests was merely another Reagan rhetorical device, or an ephemeral aspect of an
THE JOURNAL OF POLITICS, Vol. 53, No.4, November 1991 © 1991 by the University of Texas Press
A Reference Group Theory of Partisan Coalitions 1135
effective advertising campaign. On the contrary, the immediate and relatively widespread acceptance of this label for the Democrats suggests that the criticism had touched upon a basic shift in the public's cognitions of the Democratic party. Moreover, later events suggest that the practical political concerns associated with this change went well beyond the 1984 election contest. As the 1988 presidential campaign got under way, Paul Kirk, the chairman of the National Democratic Party, and most of the candidates for the Democratic party's nomination, continued to voice concerns about the party's image and the role of particular groups in the candidate selection process (David Shribman, "Jackson Reaches out to Despairing Iowa Farmers to Broaden Appeal beyond Core of Black Support," Wall Street Journal 19 May 1987; E. J. Dionne, "Survey Finds Democrats Still Prefer Hart," 5 August 1987, New York Times).
Group cleavages and coalitions have long been an important aspect of how politicians view everyday American politics. The increased visibility of various groups in the political arena arises partly from shifts in how politics are conducted. For example, Walker (1983) has documented a dramatic rise in public interest groups during recent years. Likewise, changes in election laws regulating campaign financing have not only contributed to the explosion in the number of organized interest groups, but they have made PAC's a household word (Sabato 1985; Scholzman and Tierney 1986). In addition, political scientists writing about the party system, and political institutions more generally, point to the current threat of fragmentation and ungovernability arising from the rapid growth of single-issue groups (see for example, Crotty 1984; Berry 1984; Orren 1982; and Rapoport et al. 1986). Given this increased visibility of group politics, the fact that Republicans were able to brand the Democrats as the party of "special interests" in 1984 appears more understandable and less ephemeral.
However, this rhetoric would not be successful at the mass level if group associations did not mean something very particular to individuals. Social groups are recognized actors in the political arena. Previous research reveals that along with candidates, issues, and political parties, groups are one of the major foci people use in organizing their general political cognitions (Lau 1986; Hamill, Lodge, and Blake 1985). There is also growing evidence that evaluations and cognitions involving social groups influence a variety of political attitudes including political ideology and policy preferences (Brady and Sniderman 1985; Sears et al. 1980), evaluations of government economic performance (Conover 1987) and beliefs about the distribution of power and equity in America (Sears et al. 1986; Dennis 1987). Much less attention, however, has been given to the role of social groups in structuring partisan evaluations and cognitions, the central focus of this article.
The analysis proceeds by first examining the extent to which the public has perceived a connection between groups and parties over the years. Next,
1136 Arthur H. Miller, Christopher Wlezien, and Anne Hildreth
we explore the shifts occurring during the past decade in the set of groups that the public associates with each of the parties. A multivariate analysis is then employed to compare group affect as an explanation of partisan evaluations and candidate choice with other competing hypotheses found in the literature on party change and voting behavior. Subsequently we argue that the changing group structure of partisan evaluations has contributed to fragmentation of the Democratic party and increased support for the Republican party among people who are not identified with any of the groups in the Democratic coalition. The empirical evidence derives from the University of Michigan, American National Election Studies for the presidential contests of 1972-1984.
SOCIAL GROUPS AND PARTY EVALUATIONS
A. The Prevalence of Group Thinking
Previous research has consistently demonstrated that how the public evaluates political parties reflects, at least in part, beliefs about the types of social groups each was felt to support (Campbell et al. 1960, chap. 2; Wattenberg and Miller 1981). In the 1950s, as well as during the 1970s and 1980s, group-related comments have accounted for roughly one-third of all the statements people made when reporting on what they liked and disliked about the two parties. Group-related comments were somewhat more prevalent in evaluations of the Democratic party than they were in assessments of the Republican party, even among Republican respondents. l
In general, the substantive content of the comments suggests that the Democratic party has consistently been thought of as best representing common people, the working class, labor unions, blacks, and small business owners. The Republican party, on the other hand, has traditionally been associated with big business interests, the rich, and upper class. Regardless of the voter's party identification, these popular group-related images produced a net pro-Democratic orientation among the electorate. Group references were most prevalent among comments indicating positive assessments of the Democratic party and negative evaluations of the Republican party,
1 The prevalence of group references varies by which party was being evaluated, as well as across partisan subgroups. Democrats, moreso than Republicans or Independents, referred to groups when discussing their evaluations of the parties. In particular Democrats were far more likely to make group references when speaking of what they disliked about the Republican party. Perhaps because the Democratic party is comprised of a broader coalition of diverse groups, Democrats are more aware of groups and are more likely to think about politics in group terms. Furthermore, earlier research reveals that some of the minority groups in the Democratic coalition, such as blacks, have a higher proportion of individuals who identify very strongly with their social group than do people in the subgroups comprising the Republican party (Gurin et al. 1980).

A Reference Group Theory of Partisan Coalitions 1137
even among Republican identifiers. Clearly the group-related evaluations of the Republican party did not prevent these individuals from identifying with the Republican party. Party evaluations and party identification, obviously, are not synonymous, nor is party identification merely a reflection of general group perceptions.
Yet in order to test a theory that postulates an association between attitudes toward social groups and party evaluations, each of these concepts must be measured separately. The likes/dislikes questions do not provide for independent operationalization of party and group evaluations. An alternative approach to determining the structure of group-related party evaluations is to employ the NES thermometer measures to operationalize both party evaluations and attitudes toward social groups. Such an approach is parsimonious, conceptually pleasing, and feasible. The NES studies have asked respondents over the years to rate numerous social groups, as well as the two parties on the 0-100 thermometer scale. That the thermometer measures global evaluations of the parties is not only obvious on the surface but has been established by previous research (Wiesberg and Rusk 1970; Rabinowitz 1972). Similarly, ratings of social groups using the thermometer have been used in earlier research both as a component of group consciousness (Miller et al. 1981) and as a cognitive heuristic that helped people "figure out the issue positions of strategic groups" (Brady and Sniderman 1985, 1062).
These group-based politics spring from the fact that power struggles between competing groups in society are salient. Over time citizens forget about the specific details of these group interactions, but they develop a general sense of those groups they share common concerns with and those that are less similar to their own political orientation. Theoretically, if people like certain groups and they perceive those groups as aligned with a particular party, they should evaluate the party more positively. Similarly, if they dislike the group, it should have a negative impact on their judgment of the party. The critical aspects of the theory are: Which groups are perceived to be associated with what party? To what extent are these groups positively or negatively assessed? Do these perceived party-group connections and ratings of groups change over time? If so, what is the consequence for support of the political parties?
B. What Groups with Which Party?
The social groups that are associated with each party are not constant across time. In fact, between 1972 and 1984 a telling redefinition of the group basis for party support occurred. 2 As of 1972 the particular social
2 A straightforward extension of the analysis reported here to the 1988 NES is not possible, because certain group thermometers were excluded or changed in phrasing. A comparable analysis using 1988 data gathered by the Iowa Social Science Institute, however, reveals a factor
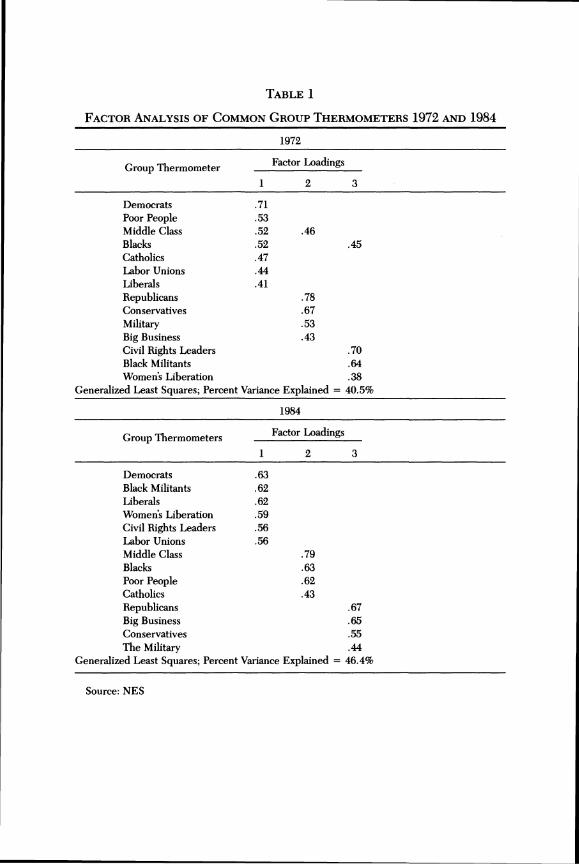
TABLE 1
FACTOR ANALYSIS OF COMMON GROUP THERMOMETERS 1972 AND 1984
Group Thermometer
Democrats Poor People Middle Class Blacks Catholics Labor Unions Liberals Republicans Conservatives Military Big Business Civil Rights Leaders
1
.71
.53
.52
.52
.47
.44
.41
1972
Factor Loadings
2 3
.46 .45
.78
.67
.53
.43 .70
Black Militants .64 Women·s Liberation .38
Generalized Least Squares; Percent Variance Explained = 40.5%
1984
Group Thermometers Factor Loadings
1 2 3
Democrats .63 Black Militants .62 Liberals .62 Women"s Liberation .59 Civil Rights Leaders .56 Labor Unions .56 Middle Class .79 Blacks .63 Poor People .62 Catholics .43 Republicans .67 Big Business .65 Conservatives .55 The Military .44
Generalized Least Squares; Percent Variance Explained = 46.4%
Source: NES
A Reference Group Theory of Partisan Coalitions 1139
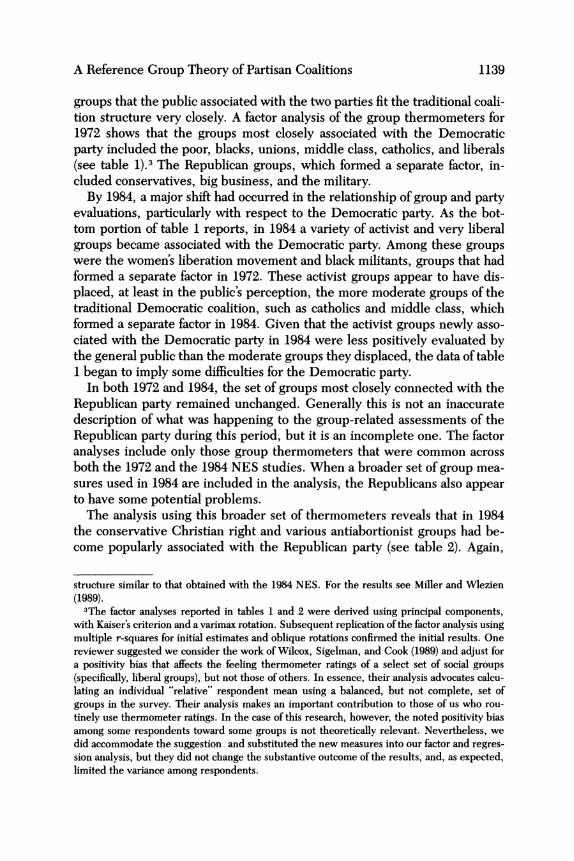
groups that the public associated with the two parties fit the traditional coalition structure very closely. A factor analysis of the group thermometers for 1972 shows that the groups most closely associated with the Democratic party included the poor, blacks, unions, middle class, catholics, and liberals (see table 1).3 The Republican groups, which formed a separate factor, included conservatives, big business, and the military.
By 1984, a major shift had occurred in the relationship of group and party evaluations, particularly with respect to the Democratic party. As the bottom portion of table 1 reports, in 1984 a variety of activist and very liberal groups became associated with the Democratic party. Among these groups were the women's liberation movement and black militants, groups that had formed a separate factor in 1972. These activist groups appear to have displaced, at least in the public's perception, the more moderate groups of the traditional Democratic coalition, such as catholics and middle class, which formed a separate factor in 1984. Given that the activist groups newly associated with the Democratic party in 1984 were less positively evaluated by the general public than the moderate groups they displaced, the data of table 1 began to imply some difficulties for the Democratic party.
In both 1972 and 1984, the set of groups most closely connected with the Republican party remained unchanged. Generally this is not an inaccurate description of what was happening to the group-related assessments of the Republican party during this period, but it is an incomplete one. The factor analyses include only those group thermometers that were common across both the 1972 and the 1984 NES studies. When a broader set of group measures used in 1984 are included in the analysis, the Republicans also appear to have some potential problems.
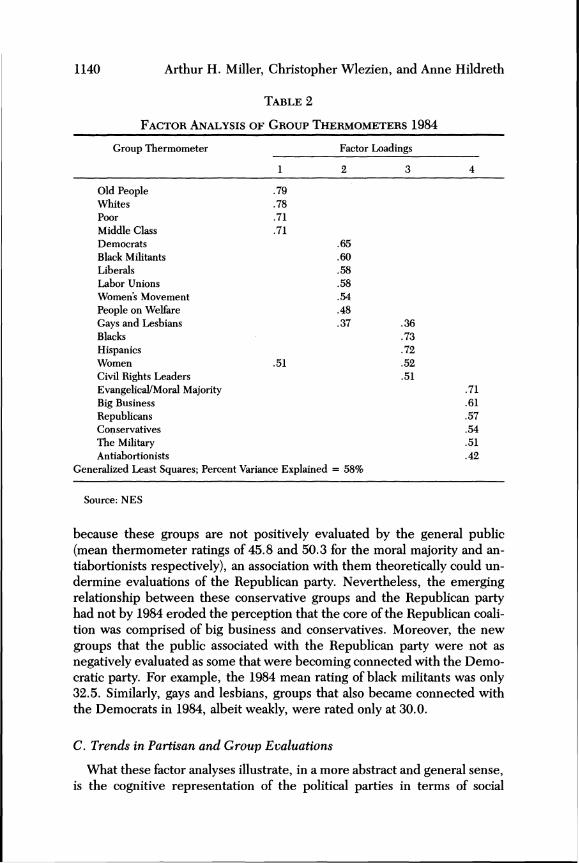
The analysis using this broader set of thermometers reveals that in 1984 the conservative Christian right and various antiabortionist groups had become popularly associated with the Republican party (see table 2). Again,
structure similar to that obtained with the 1984 NES. For the results see Miller and Wlezien (1989).
3The factor analyses reported in tables 1 and 2 were derived using principal components, with Kaiser's criterion and a varimax rotation. Subsequent replication of the factor analysis using multiple r-squares for initial estimates and oblique rotations confirmed the initial results. One reviewer suggested we consider the work of Wilcox, Sigelman, and Cook (1989) and adjust for a positivity bias that affects the feeling thermometer ratings of a select set of social groups (specifically, liberal groups), but not those of others. In essence, their analysis advocates calculating an individual "relative" respondent mean using a balanced, but not complete, set of groups in the survey. Their analysis makes an important contribution to those of us who routinely use thermometer ratings. In the case of this research, however, the noted positivity bias among some respondents toward some groups is not theoretically relevant. Nevertheless, we did accommodate the suggestion. and substituted the new measures into our factor and regression analysis, but they did not change the substantive outcome of the results, and, as expected, limited the variance among respondents.
1140 Arthur H. Miller, Christopher Wlezien, and Anne Hildreth
TABLE 2
FACTOR ANALYSIS OF GROUP THERMOMETERS 1984
Group Thermometer Factor Loadings
1 2 3 4
Old People .79 Whites .78 Poor .71 Middle Class .71 Democrats .65 Black Militants .60 Liberals .58 Labor Unions .58 Women's Movement .54 People on Welfare .48 Gays and Lesbians .37 .36 Blacks .73 Hispanics .72 Women .51 .52 Civil Rights Leaders .51 Evangelical/Moral Majority .71 Big Business .61 Republicans .57 COl,lservatives .54 The Military .51 Antiabortionists .42
Generalized Least Squares; Percent Variance Explained = 58%
Source: NES
because these groups are not positively evaluated by the general public (mean thermometer ratings of 45.8 and 50.3 for the moral majority and antiabortionists respectively), an association with them theoretically could undermine evaluations of the Republican party. Nevertheless, the emerging relationship between these conservative groups and the Republican party had not by 1984 eroded the perception that the core of the Republican coalition was comprised of big business and conservatives. Moreover, the new groups that the public associated with the Republican party were not as negatively evaluated as some that were becoming connected with the Democratic party. For example, the 1984 mean rating of black militants was only 32.5. Similarly, gays and lesbians, groups that also became connected with the Democrats in 1984, albeit weakly, were rated only at 30.0.
C. Trends in Partisan and Group Evaluations
What these factor analyses illustrate, in a more abstract and general sense, is the cognitive representation of the political parties in terms of social
A Reference Group Theory of Partisan Coalitions
FIGURE 1
PARTY EVALUATION BY PARTY IDENTIFICATION
Standardized Mean Thermometer Ratings
1141
25l Republicans Ra!ing Republican Party
W --------__ -- -- Democrats Rating Democratic Party :: .... -=.=.~ .. -=.-:::.~ .. ~.::-:-.. =-.~.:::. ............................... . 5
Indepe\ldents Rating Republican Party
Ot _______ --------~~~ I- Independents Rating Democratic Party _ .. _---------------. -5 r---·----··=--:.:.:.··.::::--~ ... ~.·
-10 ---------------. Democrats Rating Republican Party
-15 -.-.-.- -.
_ 20 .... ' ________________ R_ep=-u_;_li~_-;_~_R_a_·iing Democratic Party
1972 1976 1980 1984 1986
Source: NES
groups. The factors reflect the overall associations that people perceive between various social groups and the political parties. In other words, the analysis conveys a sense of which groups the public believes are best represented by the respective parties. Shifts in these perceptions could theoretically influence evaluations of the political parties. The image of a party could improve through new associations with popular social groups or deteriorate through connections with unpopular groups. Similarly, partisan evaluations might suffer if public affect toward a group that was part of the traditional coalition declined.
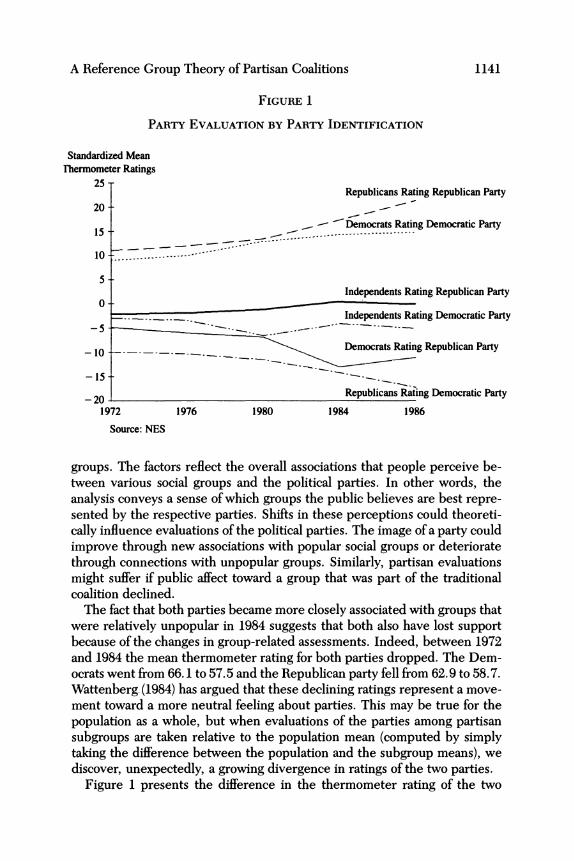
The fact that both parties became more closely associated with groups that were relatively unpopular in 1984 suggests that both also have lost support because of the changes in group-related assessments. Indeed, between 1972 and 1984 the mean thermometer rating for both parties dropped. The Democrats went from 66.1 to 57.5 and the Republican party fell from 62.9 to 58.7. Wattenberg (1984) has argued that these declining ratings represent a movement toward a more neutral feeling about parties. This may be true for the population as a whole, but when evaluations of the parties among partisan subgroups are taken relative to the population mean (computed by simply taking the difference between the population and the subgroup means), we discover, unexpectedly, a growing divergence in ratings of the two parties.
Figure 1 presents the difference in the thermometer rating of the two

1142 Arthur H. Miller, Christopher Wlezien, and Anne Hildreth
parties among partisan subgroups. What is evident from the data of figure 1 is growing polarization in evaluations of the parties. Democrats and Republicans alike have come to evaluate their own party more positively, while at the same time becoming increasingly negative toward the opposite party. In short there appears to be a growing sense of "us" versus "them" displayed in the data for partisan identifiers. Ratings of the two parties also have diverged among Independents. They became somewhat more positive toward the Republican party and more negative toward Democrats between 1972 and 1986.
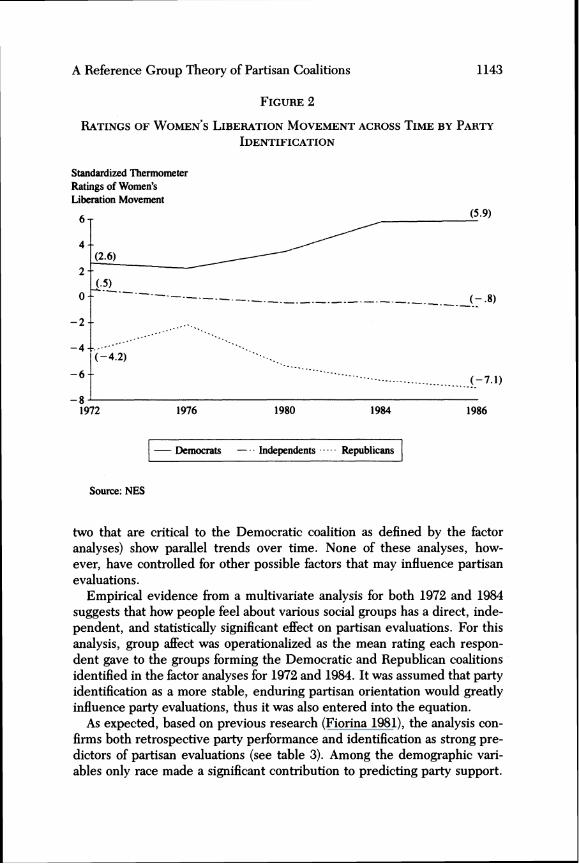
It is noteworthy that affective ratings of certain social groups also showed increasing divergence among partisans during the 1972-1986 period. For example, evaluative ratings of both labor unions and the women's movement, key elements in the current Democratic coalition, diverge sharply among Democrats and Republicans. Ratings of the women's movement have risen for all partisan subgroups; between 1972 and 1984 the mean thermometer rating for the women's movement rose from 48.1 to 63.4 among Democrats, and 41.3 to 51.2 among Republicans. Relative to the population trend, however, Democrats became positive at a much faster rate than did Republicans (see figure 2). The net result of these different rates of change was an increased gap in ;the assessments of the women's movement among Democrats and Republicans. Perhaps the most telling trend, however, is the drift toward a relatively more negative rating of the women's movement that occurred among Independents. Such a trend would not promote an advantage for the Democratic party among Independents who may take on a partisan identification in the future.
The trend in affect toward labor unions was slightly different. Here the divergence in attitudes reHected both differential rates of change and a slight decline in absolute ratings as well. Among Republicans the mean thermometer rating for unions dropped slightly (49.6 to 46.4), whereas among Democrats it remained virtually unchanged between 1972 and 1984 (61.3 to 62.0). The net result of these various trends, however, was to produce relative assessments of these groups that were increasingly divergent among Democrats and Republicans, and relatively more pro-Republican among Independents.
D. A Multivariate Analysis o/Group Influence on Party Evaluations and Candidate Choice
Thus far we have established that the public does indeed link parties and groups in their political thinking. Furthermore, we know that certain clusters of groups are generally associated with each particular party, thereby suggesting that the public perceives the parties in terms of group coalitions. Also, affective ratings of both parties and certain social groups (in this case
A Reference Group Theory of Partisan Coalitions 1143
FIGURE 2
RATINGS OF WOMEN'S LIBERATION MOVEMENT ACROSS TIME BY PARTY
IDENTIFICATION
Standardized Thermometer Ratings of Women's Liberation Movement
6
4 (2.6)
2 (.5)
___ -----..:....(5.9)
o ~-.---'-'-'--- ( ~ --.-------.---.-.---.-------.----~.
-2
-4 ( -4.2)
-6 ,J-7.1)
-8~----------------------------------------------1972 1976 1980 1984 1986
\- Democrats _ .. Independents ... _. Republicans I Source: NES
two that are critical to the Democratic coalition as defined by the factor analyses) show parallel trends over time. None of these analyses, however, have controlled for other possible factors that may influence partisan evaluations.
Empirical evidence from a multivariate analysis for both 1972 and 1984 suggests that how people feel about various social groups has a direct, independent, and statistically significant effect on partisan evaluations. For this analysis, group affect was operationalized as the mean rating each respondent gave to the groups forming the Democratic and Republican coalitions identified in the factor analyses for 1972 and 1984. It was assumed that party identification as a more stable, enduring partisan orientation would greatly influence party evaluations, thus it was also entered into the equation.
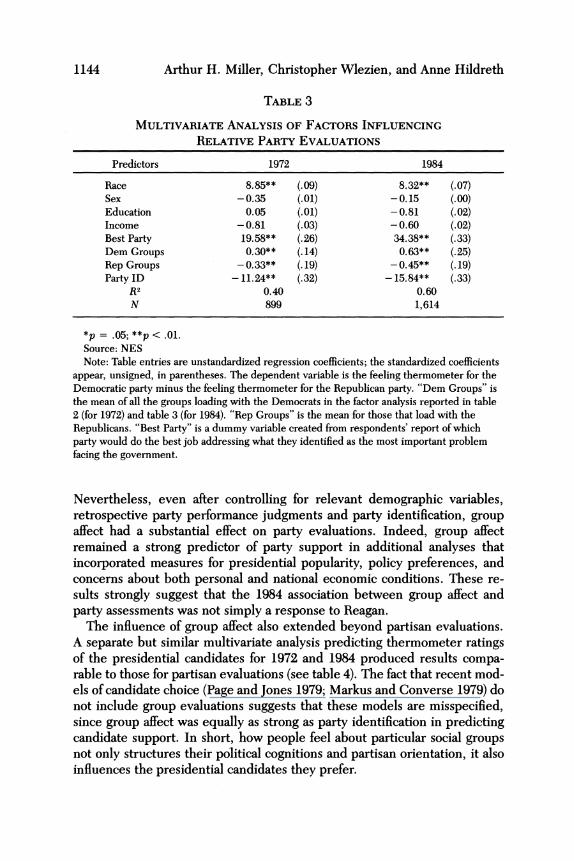
As expected, based on previous research (Fiorina 1981), the analysis confirms both retrospective party performance and identification as strong predictors of partisan evaluations (see table 3). Among the demographic variables only race made a significant contribution to predicting party support.
1144 Arthur H. Miller, Christopher Wlezien, and Anne Hildreth
TABLE 3
MULTIVARIATE ANALYSIS OF FACTORS INFLUENCING
RELATIVE PARTY EVALUATIONS
Predictors 1972 1984
Race 8.85** (.09) 8.32** Sex -0.35 (.01) -0.15 Education 0.05 (.01) -0.81 Income -0.81 (.03) -0.60 Best Party 19.58** (.26) 34.38** Oem Groups 0.30** (.14) 0.63** Rep Groups -0.33** (.19) -0.45** PartyID -11.24** (.32) -15.84**
R2 0.40 0.60 N 899 1,614
*p = .05; **p < .01. Source: NES
(.07) (.00) (.02) (.02) (.33) (.25) (.19) (.33)
Note: Table entries are unstandardized regression coefficients; the standardized coefficients appear, unsigned, in parentheses. The dependent variable is the feeling thermometer for the Democratic party minus the feeling thermometer for the Republican party. "Oem Groups" is the mean of all the groups loading with the Democrats in the factor analysis reported in table 2 (for 1972) and table 3 (for 1984). "Rep Groups" is the mean for those that load with the Republicans. "Best Party" is a dummy variable created from respondents' report of which party would do the best job addressing what they identified as the most important problem facing the government.
Nevertheless, even after controlling for relevant demographic variables, retrospective party performance judgments and party identification, group affect had a substantial effect on party evaluations. Indeed, group affect remained a strong predictor of party support in additional analyses that incorporated measures for presidential popularity, policy preferences, and concerns about both personal and national economic conditions. These results strongly suggest that the 1984 association between group affect and party assessments was not simply a response to Reagan.
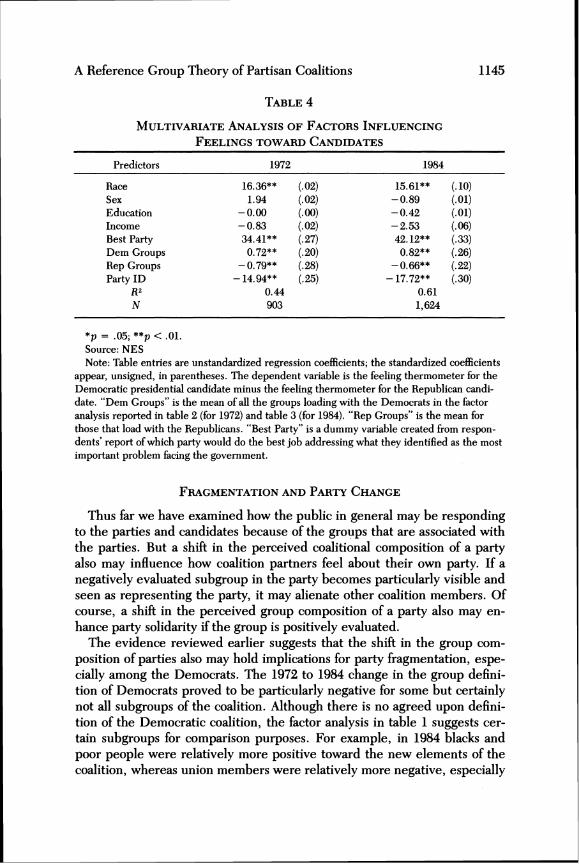
The influence of group affect also extended beyond partisan evaluations. A separate but similar multivariate analysis predicting thermometer ratings of the presidential candidates for 1972 and 1984 produced results comparable to those for partisan evaluations (see table 4). The fact that recent models of candidate choice (Page and Jones 1979; Markus and Converse 1979) do not include group evaluations suggests that these models are misspecified, since group affect was equally as strong as party identification in predicting candidate support. In short, how people feel about particular social groups not only structures their political cognitions and partisan orientation, it also influences the presidential candidates they prefer.
A Reference Group Theory of Partisan Coalitions
TABLE 4
MULTIVARIATE ANALYSIS OF FACTORS INFLUENCING
FEELINGS TOWARD CANDIDATES
Predictors
Race Sex Education Income Best Party Oem Groups Rep Groups Party ID
R2 N
*p = .05; **p < .01. Source: NES
1972 1984
16.36** (.02) 15.61** 1.94 (.02) -0.89
-0.00 (.00) -0.42 -0.83 (.02) -2.53 34.41** (.27) 42.12** 0.72** (.20) 0.82**
-0.79** (.28) -0.66** -14.94** (.25) -17.72**
0.44 0.61 903 1,624
1145
(.10) (.01) (.01) (.06) (.33) (.26) (.22) (.30)
Note: Table entries are unstandardized regression coefficients; the standardized coefficients appear, unsigned, in parentheses. The dependent variable is the feeling thermometer for the Democratic presidential candidate minus the feeling thermometer for the Republican candidate. "Oem Groups" is the mean of all the groups loading with the Democrats in the factor analysis reported in table 2 (for 1972) and table 3 (for 1984). "Rep Groups" is the mean for those that load with the Republicans. "Best Party" is a dummy variable created from respondents' report of which party would do the best job addressing what they identified as the most important problem facing the government.
FRAGMENTATION AND PARTY CHANGE
Thus far we have examined how the public in general may be responding to the parties and candidates because of the groups that are associated with the parties. But a shift in the perceived coalitional composition of a party also may influence how coalition partners feel about their own party. If a negatively evaluated subgroup in the party becomes particularly visible and seen as representing the party, it may alienate other coalition members. Of course, a shift in the perceived group composition of a party also may enhance party solidarity if the group is positively evaluated.
The evidence reviewed earlier suggests that the shift in the group composition of parties also may hold implications for party fragmentation, especially among the Democrats. The 1972 to 1984 change in the group definition of Democrats proved to be particularly negative for some but certainly not all subgroups of the coalition. Although there is no agreed upon definition of the Democratic coalition, the factor analysis in table 1 suggests certain subgroups for comparison purposes. For example, in 1984 blacks and poor people were relatively more positive toward the new elements of the coalition, whereas union members were relatively more negative, especially
1146 Arthur H. Miller, Christopher Wlezien, and Anne Hildreth
TABLE 5
MEAN RATING OF GROUPS ASSOCIATED WITH DEMOCRATIC AND
REpUBLICAN PARTIES BY COALITION SUBPOPULATIONS 1972 AND 1984
1972 1984
Democratic Republican Democratic Republican Groups Groups Groups Groups
Total 65.1 62.2 47.5 57.3 Democrats 67.7 59.5 52.5 54.3 Independents 64.1 61.5 48.0 57.4 Republican 61.9 66.1 41.7 60.9 Union Household 66.3 61.2 49.1 54.6 Non-Union 64.6 62.5 47.1 58.1 Male 63.3 60.7 44.9 55.9 Female 66.4 63.2 49.5 58.5 White 63.9 62.8 46.1 56.9 Black 76.3 57.5 59.7 54.4 Low Income 67.4 63.7 51.7 55.5 Medium Income 65.1 61.4 46.9 56.4 High Income 62.7 61.3 44.9 59.4 Protestant 64.6 63.6 45.9 58.9 Catholic 67.1 61.3 50.3 58.4 Jew 65.1 SO. 1 SO. 8 44.6 Southern White Males 62.7 66.4 43.2 60.1
Source: NES Note: Democratic and Republican groups means are computed for the particular thermome
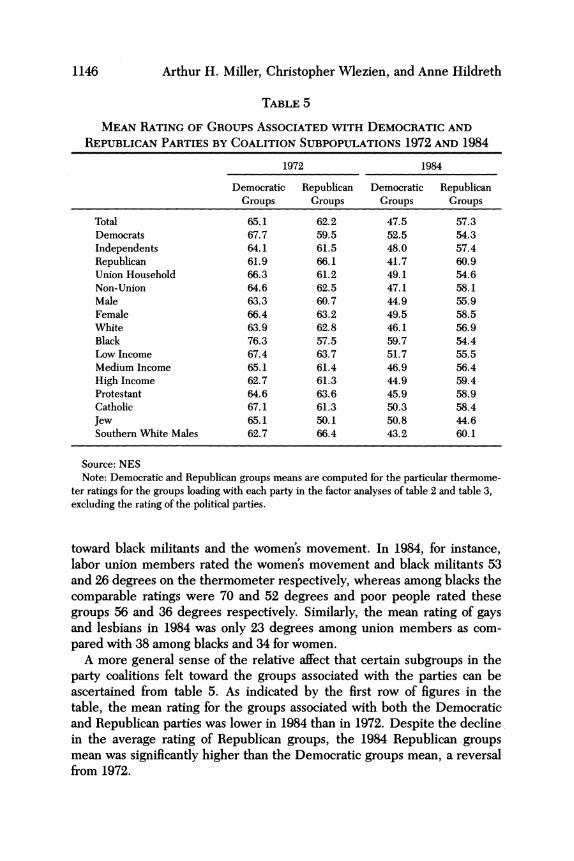
ter ratings for the groups loading with each party in the factor analyses of table 2 and table 3, excluding the rating of the political parties.
toward black militants and the women's movement. In 1984, for instance, labor union members rated the women's movement and black militants 53 and 26 degrees on the thermometer respectively, whereas among blacks the comparable ratings were 70 and 52 degrees and poor people rated these groups 56 and 36 degrees respectively. Similarly, the mean rating of gays and lesbians in 1984 was only 23 degrees among union members as compared with 38 among blacks and 34 for women.
A more general sense of the relative affect that certain subgroups in the party coalitions felt toward the groups associated with the parties can be ascertained from table 5. As indicated by the first row of figures in the table, the mean rating for the groups associated with both the Democratic and Republican parties was lower in 1984 than in 1972. Despite the decline. in the average rating of Republican groups, the 1984 Republican groups mean was significantly higher than the Democratic groups mean, a reversal from 1972.
A Reference Group Theory of Partisan Coalitions 1147
In both years identifiers of each party rated the groups associated with their own party higher than identifiers of the opposite party (for example, in 1984 Democrats rated Democratic groups at 52.5 whereas Republicans gave them a rating of 41. 7). Nevertheless, in 1984 Democrats, as well as Independents, rated the Democratic groups lower on the average than they rated the Republican groups. Again, this was a reversal of the relative ratings found in 1972.
A similar pattern of relative group ratings also was found for a number of the subpopulations traditionally associated with the New Deal coalition. For example, in 1984 union household members, lower income people, Catholics and especially southern white males rated the Democratic groups significantly lower than the Republican groups in 1984. Of the subpopulations listed in table 5 only blacks and Jews rated the Democratic groups relatively higher than the Republican groups. These results suggest problems for the Democratic party. The relatively lower group evaluations in 1984, when combined with the regressions in table 3 and table 4, suggest that the declining identification with the Democratic party since the early seventies, and its internal fragmentation, as well as the string of Republican presidential victories since then are partially a reflection of how the public feels toward the social groups popularly associated with each of the parties.
CONCLUSION
Social groups provide important cues that influence both how citizens think about politics and the electoral choices they make. How people feel about the groups the public associates with political parties structures their evaluations of the parties and influences which presidential candidates they prefer. The groups associated with the political parties, particularly the Democratic party, changed substantially between 1972 and 1984. In addition to the groups that the public traditionally has connected with the Democratic coalition, such as labor unions and blacks, certain activist groups became closely associated with the Democrats in the public's mind during that period. Because the activist groups were evaluated more negatively than the traditional groups of the Democratic coalition, the popular appeal of the party suffered, particularly among Republicans and Independents.
The negative assessment of the new Democratic subgroups may be the result of a reaction against the interest those groups represent. The increased visibility of the newer partners in the Democratic coalition-gays and lesbians, militant blacks, and feminists-was due in part to pressure group activity aimed at influencing policy for the benefit of their members. Prior to this mobilization they had been quiet partners in the broad coalition of groups that formed the Democratic party. The actions of these groups pose a dilemma for the Democratic party. How can they mobilize On behalf
1148 Arthur H. Miller, Christopher Wlezien, and Anne Hildreth
of their own group interests and yet be kept within the Democratic coalition? Moreover, how can that process of group mobilization occur without harming the broader coalition?
Manuscript submitted 11 January 1989 Final manuscript received 1 February 1991
REFERENCES
Berry, Jeffrey M. 1984. The Interest Group Society. Boston: Little, Brown. Billig, M., and Henry Tajfel. 1973. "Social Categorization and Similarity in Intergroup Behav
ior." European Journal of Social Psychology 3: 27 -52. Brady, Henry E., and Paul M. Sniderman. 1985. "Attitude Attribution: A Group Basis for
Political Reasoning." American Political Science Review 79: 1061-78. Campbell, Angus, Phillip E. Converse, Warren E. Miller, and Donald E. Stokes. 1960. The
American Voter. New York: Wiley. Conover, Pamela Johnston. 1987. "Gender Identification and Basic Political Orientation." Paper
presented at the annual meeting of the American Political Science Association, Chicago. Crotty, William. 1984. American Parties in Decline. 2d ed. Boston: Little, Brown. Dennis, Jack. 1987. "Groups and Political Behavior: Legitimation, Deprivation, and Competing
Values." Political Behavior 9: 323-72. Dionne, E. J., Jr. 1987. "Survey Finds Democrats Still Prefer Hart." New York Times, 5
August. Fiorina, Morris. 1981. Restrospective Voting in American National Elections. New Haven: Yale
Univerisity Press. Fiske, Susan T., and Shelley E. Taylor. 1984. Social Cognition. New York: Random House. Gurin, Patricia, Arthur H. Miller, and Gerald Gurin. 1980. "Stratum Identification and Con
sciousness." Social Psychology Quarterly 43:38-47. Hamill, Ruth, Milton Lodge, and F. Blake. 1985. "The Breadth, Depth and Utility of Political
Schemas." Paper presented at the annual meeting of the Midwest Political Science Association, Chicago.
Kiecolt, K. Jill. 1987. "Group Consciousness and the Attribution of Blame for National Economic Problems." American Politics Quarterly 15:203-22.
Lau, Richard R. 1983. "A Preliminary Report on Social Identification, Reference Groups, and Political Behavior: The Importance of Social, Political and Psychological Contexts." Paper presented at the annual metting of the American Political Science Association, Chicago.
Lau, Richard, and David O. Sears. 1986. Political Cognition: The 19th Annual Carnegie Symposium on Cognition. Hillsdale, NJ: Lawrence Erlbaum.
Markus, Gregory, and Philip Converse. 1979. " A Dynamic Simultaneous Equation Model of Electoral Choice." American Political Science Review 73: 1055-70.
Miller, Arthur H., Patricia Gurin, Gerald Gurin, and Oksana Malanchuk. 1981. "Group Consciousness and Political Participation." American Journal of Political Science 25: 494-511.
Miller, Arthur H., Anne Hildreth, and Grace Simmons. 1988. "The Political Implications of Gender Group Consciousness." In The Political Interest of Gender, eds. Kathleen B. Jones and Anna G. Jonasdottir. London: Sage.
Miller, Arthur H., and Christopher Wlezien. 1989. "The Social Group Dynamics of Partisan Evaluations." Paper presented at the annual meeting of the American Political Science Association, Atlanta.
Orren, Gary. 1982. "The Changing Styles of American Party Politics." In The Future of American Political Parties, ed. Joel L. Fleishman. Englewood Cliffs, NJ: Prentice-Hall.

A Reference Group Theory of Partisan Coalitions 1149
Page, Benjamin, and Calvin Jones. 1979. "Reciprocal Effects, Policy Preferences, Party Loyalties and the Vote." American Political Science Review 73: 1071-90.
Petrocik, John R., and Frederick T. Steeper. 1987. "The Political Landscape in 1988." Public Opinion September/October.
Rabinowitz, George. 1972. "An Introduction to Nonmetric Multidimensional Scaling." American Journal of Political Science 19:343-90.
Rapoport, Ronald B., Alan I. Abramowitz, and Walter J. Stone. 1986. "Groups and the Democratic Party: The 1984 Presidential Caucuses." Paper presented at the annual meeting of the American Political Science Association, Washington, DC.
Sabato, Larry. 1985. Pac Power. New York: Norton. Schlozman, Kay Lehman, and John T. Tierney. 1986. Organized Interests and American De
nwcracy. New York: Harper & Row. Sears, David 0., Richard R. Lau, Tom R. Tyler, and H.M. Allen, Jr. 1980. "SelfIdentification
versus Symbolic Politics in Policy Attitudes and Presidential Voting." American Political Science Review 74:670-84.
Sears, David 0., Leonie L. Huddy, and Lynitta Shaffer. 1986. "A Schematic Variant of Symbolic Political Theory, as Applied to Racial and Gender Equality." In Political Cognition: The 19th Annual Carnegie Symposium on Cognition, eds. Richard R. Lau and David O. Sears. Hillsdale, NJ: Lawrence Erlbaum.
Sears, David O. 1986. "Symbolic Racism." In Towards the Elimination of Racism, eds. Phyllis Katz and Dalmas Taylor. New York: Plenum.
Shribman, David. 1987. "Jackson Reaches out to Despairing Iowa Farmers to Broaden Appeal beyond Core of Black Support." Wall Street Journal, 19 May.
Tajfel, Henri. 1972. "Some Developments in European Social Psychology." European Journal of Social Psychology 2:307-22.
Tajfel, Henri. 1978. 'The Structure of Our Views about Society." In Introduction to Social Psychology, eds. Henri Tajfel and C. Fraser. Harmoundsworth: Penguin Press.
Tajfel, Henri. 1981. Human Groups and Social Categories. Cambridge University Press. Walker, Jack. 1983. "The Origins and Maintenance ofInterest Groups in America." American
Political Science Review 77: 390-406. Wattenberg, Martin. 1984. The Decline of American Political Parties, 1950-1980. Cambridge,
MA: Harvard University Press. Wattenberg, Martin, and Arthur H. Miller. 1981. "Decay in Regional Party Coalitions." In
Party Coalitions in the 1980's, ed. S.M. Lipset. San Francisco: Institute for Contemporary Studies.
Wiesberg, Herbert F., and Jerrold G. Rusk. 1970. Dimensions of Candidate Evaluation. American Political Science Review 64: 1167 -85.
Wilcox, Clyde, Lee Sigelman, and Elizabeth Cook. 1989. "Some Like It Hot: Individual Differences in Responses to Group Feeling Thermometers." Public Opinion Quarterly 53:246-57.
Arthur H. Miller is institute director, Iowa Social Science Institute, University of Iowa, Iowa City IA 52242.
Anne Hildreth is assistant professor of political science, State University of New York at Albany, Albany, NY 12222.
Christopher Wlezien is assistant professor of political science, University of Houston, Houston, TX 77204-3474.


