Embed Size (px)
Citation preview
MPRAMunich Personal RePEc Archive
Re-examining Purchasing Power Parityfor East-Asian Currencies: 1976-2002
Barumshah, Ahmad Zubaidi, Chan, Tze-Haw and Fountas,
Stilianos
Universiti Putra Malaysia
2004
Online at http://mpra.ub.uni-muenchen.de/2025/
MPRA Paper No. 2025, posted 07. November 2007 / 02:10
Re-examining Purchasing Power Parity for
East-Asian Currencies: 1976-2002
Ahmad Zubaidi BaharumshahDepartment of Economics
Faculty of Economics and ManagementUniversiti Putra Malaysia
MALAYSIA
Chan Tze HawMedical Education and Research Unit
International Medical UniversityMALAYSIA
Stilianos Fountas*Department of EconomicsUniversity of Macedonia
156 Egnatia St.Thessaloniki 540 06
GREECE
*Corresponding author: Tel: +30-2310-891774, fax: +30-2310-891292, E-mail:[email protected]

1
Re-examining Purchasing Power Parity for East-Asian Currencies:
1976-2002
Abstract
We investigate the behavior of real exchange rates of six East-Asia countries in relation totheir two major trading partners – the US and Japan. These countries, Singapore excepted,were affected by the financial crisis of the fall 1997. Using monthly frequency data from1976 to 2002 and the ARDL cointegration procedure we test for the long-run PPP hypothesis.We find no evidence for the weak form of PPP in the pre-crisis period but strong evidence inthe post-crisis period. For the post-crisis period, we also find very small persistence of PPPdeviations as indicated by very small half-lives (less than 7 months) and narrow confidenceintervals with an upper bound of 1 year or less in most countries. Our findings reveal that theEast Asian countries are returning to some form of PPP-oriented rule as a basis for theirexchange rate policies.
JEL Classification: C12; C23; F31; F40
Keywords: Purchasing power parity, Asian financial crisis, bounds test, half-lives,confidence intervals

2
Re-examining Purchasing Power Parity for East-Asian Currencies:1976-2002
1. Introduction
The consensus in the profession is that the theorem of purchasing power parity (PPP)
does not hold continuously, and perhaps does not hold even over long periods. The validity of
long-run PPP can be tested on the basis of unit root tests in the real exchange rate. If the unit
root null hypothesis is rejected in favor of the alternative, then there is long-run real exchange
rate mean reversion, supporting PPP. Research on PPP during the recent float using
Augmented-Dickey-Fuller (ADF) tests on univariate real exchange rate time series for
industrial countries has rarely rejected the unit root null. It has become clear that such tests
possess low power against local alternatives. Hence, the results from earlier studies say more
about the low power of the conventional unit root tests than about PPP (Froot and Rogoff,
1995; Papell, 2002). Moreover, the consensus in the empirical literature summarised in
Rogoff (1996) and Taylor and Taylor (2004) is that the half-life of a real exchange rate shock
is about 3 to 5 years implying slow rate of adjustment to the parity condition despite the
observed high short-term real exchange rate volatility. This is the so-called PPP puzzle
(Rogoff, 1996).
In response to the low power of the standard unit root tests with long half-lives,
research in this area in an attempt to resolve the puzzle and produce smaller half-lives has
progressed in three directions. First, univariate techniques have been applied to long-horizon
real exchange rates spanning one to two centuries (e.g., Diebold et al., 1991; Lothian and
Taylor, 1996: Mollick, 1999, Taylor, 2002)1. Second, tests for unit roots in panels have been
used to test for PPP in the post-1973 period. Panel unit root tests have not produced strong
evidence for PPP for the US dollar-based real exchange rates (Wu, 1996, Papell, 1997,
O’Connell, 1998) as they imply quite long half-lives. Third, the use of median-unbiased
estimation (e.g., Murray and Papell, 2002) has produced evidence contradicting the earlier
findings on the half-lives summarised in Rogoff (1996). Moreover, extending the median-
unbiased estimation to the more powerful unit root test of Elliott et al. (1996) has led to
1 Mollick (1999) utilized the standard unit root test to examine the behavior of the real exchange rate in Brazilover the period 1855 through 1990 (136 years). Contrary to the mean reversion behavior of the real exchangerates reported in Lothian and Taylor (1996) for the industrialized countries, the evidence based on the Braziliandata is mixed.

3
tighter confidence intervals that give ammunition to the advocates of the PPP puzzle (Lopez
et al., 2003). The first two approaches have shortcomings. The long-horizon studies
combine periods of fixed and floating exchange rate regimes, and hence their results are
influenced by the change in the exchange rate regime2. Panel studies use tests that show size
distortion due to the lack of consideration of cross-sectional dependence in real exchange
rates (O’Connell, 1998). Accounting for both cross-sectional dependence and serial
correlation, O’Connell (1998) finds no evidence supporting PPP, a finding that cannot be
explained by the low test power3.
The purpose of this paper is to test for long-run PPP using more recent data that
include the Asian financial crisis. We intend to investigate whether the sharp fall in the
currencies of these countries following the financial crisis has had a significant impact on the
long-run PPP relationship. To ensure robust results, we employ both the US dollar and the
Japanese yen as the base currency. In doing so, we utilize the Pesaran and Shin (1995) and
Pesaran et al. (2001) methodology to test for the long-run PPP relationship for the following
six Asian countries: Malaysia, Thailand, Indonesia, Singapore, South Korea, and the
Philippines (Asia-6)4. Monthly data over the 1976-2002 are used and the sample period
includes the economic turmoil that engulfed many of the Asian countries.
This paper contributes to the literature on PPP in several ways. First, we adopt an
alternative estimating and testing approach for cointegration due to Pesaran and Shin (1995).
This approach has a number of advantages discussed below. Second, we measure the half-
lives of deviations from PPP using an approach based on more powerful unit root tests and
can produce tighter confidence intervals for half-lives. Third, we construct confidence
intervals on the basis of the estimated half-lives. Fourth, in contrast to previous literature, we
examine data for the major Asian countries using a longer span that covers the 1976-2002
2 The argument here is that real exchange rates tend to be more volatile under floating than under fixed rates,and hence the econometric implications of mixing data from the two exchange rate regimes are unclear (Mussa,1986).3 Several recent papers have provided evidence of non-linear mean reversion of real exchange rates during thepost-Bretton Woods period (Dumas, 1992; Taylor and Peel, 2000). These studies find that the speed ofconvergence to PPP increases with the distance of real exchange rates from their means.
4 Asian-6 is increasingly becoming a key player in the global market, with high export and import levelsrecorded. All six countries are member of the Asian Pacific Economic Corporation (APEC). The same sixeconomies, except South Korea, also belong to ASEAN trading bloc.
4
period5. Fifth, to overcome the well-known problem of possible structural breaks associated
with the recent financial crisis, the data was truncated into two sub-periods. These are, first,
the January 1976 to June 1997 period that coincides with the era of financial deregulation and
the fast growing phase of the East-Asian countries; and second, the July 1997 to September
2002 period that incorporates the post-crisis years along with the major structural and
financial reforms undertaken by the crisis-affected East-Asia countries. The first sub period
of January 1976-June 1997 has been the focus of interest in earlier studies (for example,
Azali et al., 2000). The financial crisis has cast serious doubts on the existence of a long-run
relationship between exchange rates and relative prices in the studied countries. We speculate
that the crisis, as well as the economic reforms introduced during the financial crisis, has
facilitated nominal exchange rate adjustment towards their long-run equilibrium. Our results
seem to confirm this hypothesis.
The empirical literature on PPP studies for emerging countries is quite rich: McNown
and Wallace (1989), Bahmani-Oskooee (1993), Baharumshah and Ariff (1997), Mollick
(1999), Chinn (2000), Azali et al. (2001), Liew et al. (2004), Choudhry (2005) to name a few.
However, despite the use of numerous econometric techniques and data sets covering a
sample period of less than 25 years, there has been little evidence in support of the PPP
hypothesis. For instance, Bahami-Oskooee (1993) overwhelmingly rejects real exchange rate
stationarity for most of the emerging economies (including Malaysia, Indonesia and
Thailand)6 implying that real exchange rate changes in these countries are persistent.
Meanwhile, to address the issue of low power of standard unit root tests, Mollick (1999) uses
data spanning over 138 years, from 1855 through 1990 bur was still unable to find evidence
for the mean reversion behavior of the Brazilian real exchange rate. On the contrary, Azali et
al., (2001) using panel data of six Asia countries report evidence of mean reversion
supporting long-run PPP only for the yen-based exchange rates. Further evidence by Chinn
(2000), for instance, also found favorable evidence of PPP for Hong Kong, Indonesia, Korea,
Malaysia, Singapore, Thailand, Taiwan and the Philippines. The evidence reported in this
paper, however, is rather specific to the numeraire (dollar, yen or multilateral) or the choice
of deflator utilized in the time series study (producer or consumer price index). In a sample of
5 The beginning of general floating is in 1973 (quarter 2) but most researchers have found that the initial periodof floating 1973-1976 is problematic as it was characterized by excessive exchange rate volatility. To avoid thisproblem we begin the sample period in January 1976.
6 The real effective exchange rate is stationary for South Korea based on both the ADF and Phillips-Perron testwhile the real effective exchange rates in Singapore and the Philippines are stationary based only on thePhillips-Perron test.
5
ten Latin American countries from the 1940s and 1950s to 1989, Liu (1992) found evidence
of PPP based on the Johansen technique. More recently, Liew et al. (2004) using a nonlinear
unit root test find considerable evidence for real exchange rate stationarity for Asian
exchange rates. In short, the answer to whether the theorem of PPP holds for the emerging
economies data is still an open question.
Meanwhile, authors like Ogawa and Kawasaki (2003) and Choudhry (2005) utilize
the generalized PPP (G-PPP) theory developed by Enders and Hurn (1994) to explain the
non-mean reverting behavior of real exchange rates in East Asian countries. Briefly, the G-
PPP hypothesizes that real exchange rates will share common trends if fundamental variables
are sufficiently interrelated (see Ender and Hurn, 1994). Both papers look at the same set of
currencies examined in the present paper. Ogawa and Kawasaki (2003) investigate the G-PPP
between the East Asian countries using data during the pre-crisis period while Choudhry
(2005) extends the analysis to include the post-crisis period. Interestingly, Choudhry finds
evidence of G-PPP between the real rates of the five currencies over the post-crisis period
regardless of the base currencies—the US dollar, the yen and the Thai baht. Choudhry
concludes that the findings suggest an increased link between the economic and exchange
rate policies in the region following the Asian financial crisis.
The remainder of this paper is organized as follows. In section 2 we introduce the
econometric methodology adopted in the study. Section 3 describes the data set and reports
our empirical results. A final section concludes the paper.
2. Theoretical Foundations
According to the strong form of PPP, the nominal exchange rate is proportional to the
relative price so that the real exchange rate remains constant overtime. Researchers have
taken two approaches in testing for long-run PPP. The first approach is to examine whether
the real exchange rate is itself stationary. The second approach is to test for cointegration
between the nominal exchange rate and the national price levels by estimating the following
regression:
tttt pps εββα +++= *210 (1)
where ts is the logarithm of the nominal exchange rate measured as the domestic price of one
unit of foreign currency, and tp and *tp are the logarithms of the domestic and foreign price
level, respectively, with t = 1, 2 ,…, T. In the cointegration literature, the strong form of PPP

6
is said to hold in the long run if the following conditions hold. First, the time series of ts , tp
and *tp are individually non-stationary but integrated of order one, or I(1). Second, there
exists a linear combination of these variables which is integrated of order zero, or I(0). Third,
this linear combination satisfies the restrictions 0α =0, 1β =1, 2β = -1 on the cointegrating
vector parameters7.
Bounds Test
Pesaran et al. (2001) have proposed the Bounds Test (henceforth BT) procedure for the
investigation of a long-run equilibrium among a number of time-series variables. The most
important advantage of the BT procedure is that it is applicable irrespective of whether the
model’s regressors are purely I(0), purely I(1) or cointegrated. Another important advantage
of the BT procedure is that estimation is possible even when the explanatory variables are
endogenous8.
The present study proceeds in two stages. First, we test for the existence of a long-run
relationship in levels among the variables in question by using the BT procedure. Once the
long-run relationship has been verified, we proceed to the second stage in which we estimate
the parameters of the long-run relationship and the associated short-run dynamic error
correction models (ECM) by applying the Autoregressive Distributed Lag (ARDL) approach
as proposed in Pesaran and Shin (1995). For a comprehensive description of the procedure,
the reader may refer to Pesaran et al. (2001).
According to the Pesaran et al. (2001) methodology, in order to perform the BT the
following ARDL error correction version of the PPP model (with maximum lag = 6) is
estimated:
tttti
itii
itii
itit ppspdpcsbas µδδδ ++++Δ+Δ+Δ+=Δ −−−=
−=
−=
− ∑∑∑ 131211
6
1
6
1
6
10 ** (2)
where *,, ppst are as defined above. The null hypothesis of the non-existence of a long-run
relationship is
7 Patel (1990) argues that since different countries use different weights in constructing price indices, the unityconstraint on the price indices may not be satisfied even if PPP holds.
8 Pesaran and Shin (1995) demonstrate that valid asymptotic inferences on short- and long-run parameters canbe made under least squares estimates of an ARDL model, provided the order of the ARDL model isappropriately augmented to allow for contemporaneous correlation between the stochastic components of the
7
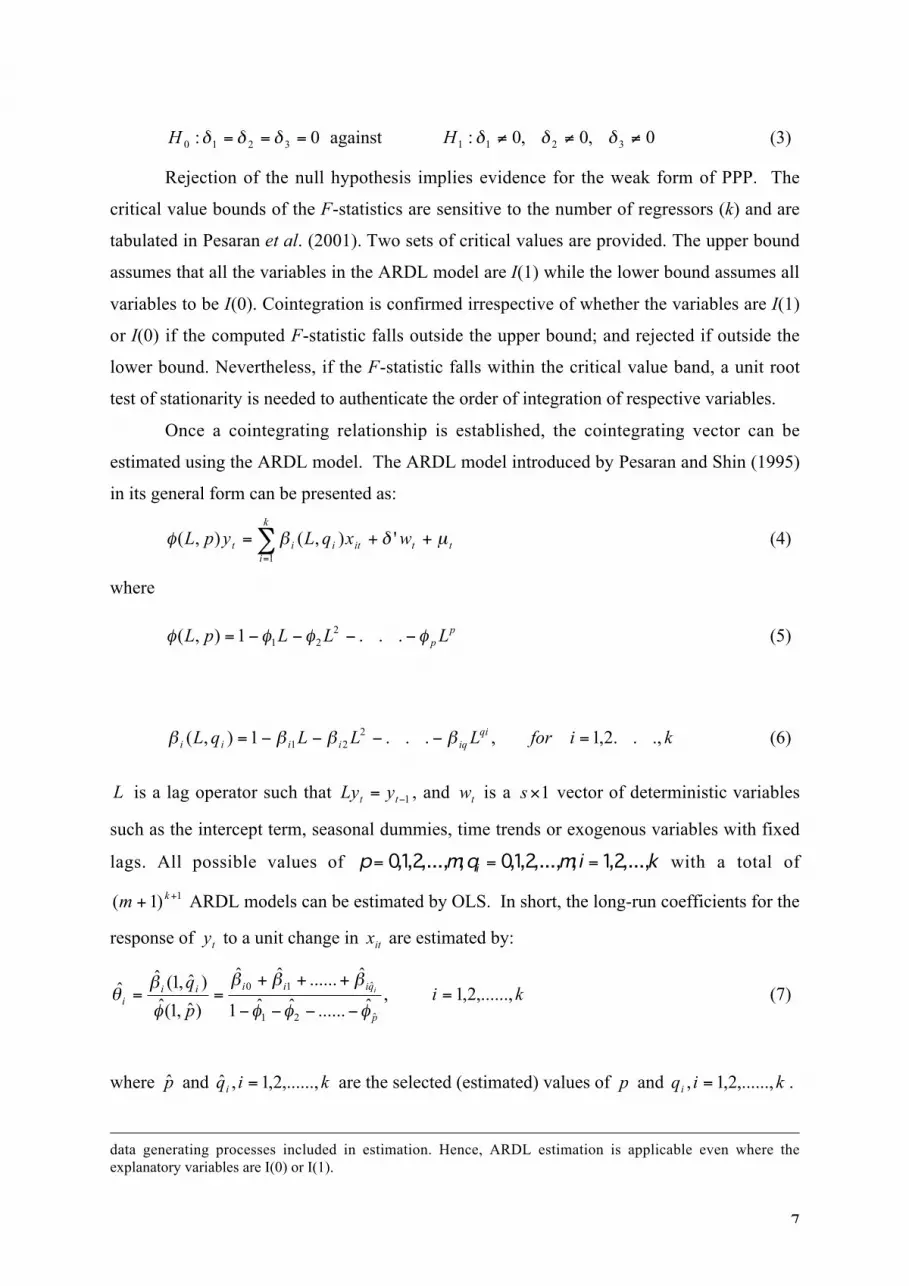
0: 3210 === δδδH against 0,0,0: 3211 ≠≠≠ δδδH (3)
Rejection of the null hypothesis implies evidence for the weak form of PPP. The
critical value bounds of the F-statistics are sensitive to the number of regressors (k) and are
tabulated in Pesaran et al. (2001). Two sets of critical values are provided. The upper bound
assumes that all the variables in the ARDL model are I(1) while the lower bound assumes all
variables to be I(0). Cointegration is confirmed irrespective of whether the variables are I(1)
or I(0) if the computed F-statistic falls outside the upper bound; and rejected if outside the
lower bound. Nevertheless, if the F-statistic falls within the critical value band, a unit root
test of stationarity is needed to authenticate the order of integration of respective variables.
Once a cointegrating relationship is established, the cointegrating vector can be
estimated using the ARDL model. The ARDL model introduced by Pesaran and Shin (1995)
in its general form can be presented as:
∑=
++=k
ittitiit wxqLypL
1
'),(),( µδβφ (4)
where
pp LLLpL φφφφ −−−−= ...1),( 2
21 (5)
kiforLLLqL qiiqiiii .,..2,1,...1),( 2
21 =−−−−= ββββ (6)
L is a lag operator such that 1−= tt yLy , and tw is a 1×s vector of deterministic variables
such as the intercept term, seasonal dummies, time trends or exogenous variables with fixed
lags. All possible values of kimqmp i ,...,2,1;,...,2,1,0;,...,2,1,0 === with a total of
1)1( ++ km ARDL models can be estimated by OLS. In short, the long-run coefficients for the
response of ty to a unit change in itx are estimated by:
kip
q
p
qiiiiii
i ,......,2,1,ˆ......ˆˆ1
ˆ......ˆˆ
)ˆ,1(ˆ)ˆ,1(ˆˆ
ˆ21
ˆ10 =−−−−
+++==
φφφ
βββ
φ
βθ (7)
where p̂ and kiqi ,......,2,1,ˆ = are the selected (estimated) values of p and kiqi ,......,2,1, = .
data generating processes included in estimation. Hence, ARDL estimation is applicable even where theexplanatory variables are I(0) or I(1).
8
3. Data and Empirical Results
(i) Data
Monthly data on nominal exchange rates and the consumer price index (CPI) were
extracted from International Monetary Fund’s International Financial Statistics (IFS)
database. Our sample includes data for six East-Asia countries, namely, South Korea,
Thailand, Indonesia, Malaysia, Singapore and the Philippines (Asia-6). We use US dollar
and yen exchange rates as the US and Japan represent the two most important trading
partners of Asia-6. In addition, several authors have documented the importance of structural
breaks in influencing the PPP outcome. The sampling period is therefore truncated into two
sub-periods. These are (i) January 1976 - June 1997, i.e., the period prior to the Asian
financial crisis that coincides with the fast growing phase of the Asian economies; and (ii)
July 1997 – September 2002 which constitutes a period of macroeconomic instability and
sharp fall in the currencies of the countries affected by the Asian financial crisis. The post-
Asian financial crisis - a time when many countries had to abandon pegging their exchange
rate - provides a good episode for the examination of PPP.
(ii) Empirical results
We follow the Pesaran and Shin (1995) two-step procedure. We select the order of
the lags in the ARDL model on the basis of Akaike (AIC) or Schwartz (SIC) information
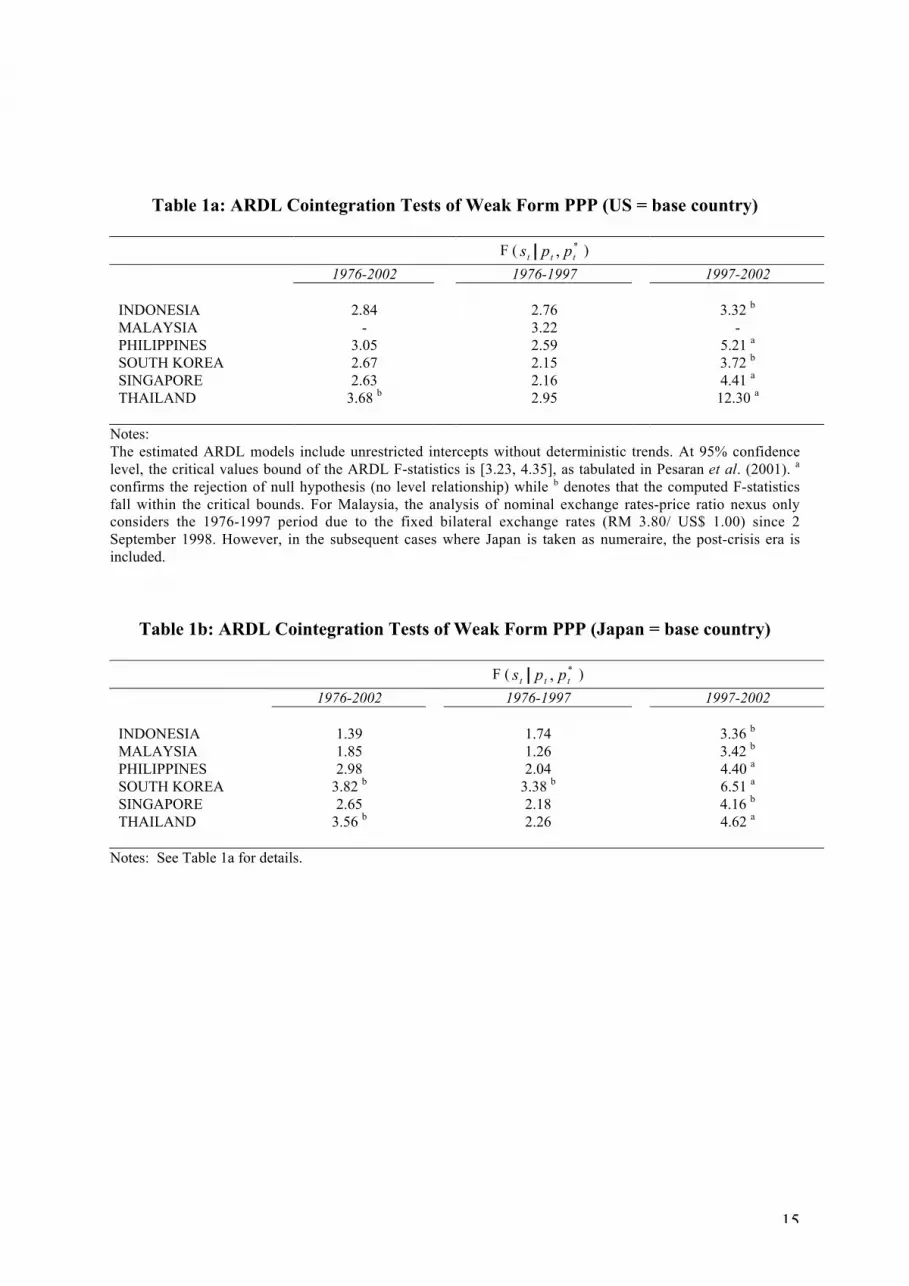
criteria. Tables 1a and 1b report the F-statistics of the bounds test for cointegration using the
US and Japan as base country, respectively. According to the results reported in Table 1a, in
the pre-crisis period the calculated F-statistic is lower than the critical value reported in
Pesaran et al. (2001) in all countries. Hence, we cannot reject the null hypothesis that there is
no long-run relationship between price levels and exchange rates. The same conclusion
applies for all countries, except Thailand, for the full sample period. However, in sharp
contrast to these results, according to Table 1a, the reported F-statistic exceeds the upper
critical value in 3 of the 6 countries in the 1997-2002 period implying a unique and stable
long-run equilibrium. This evidence supports the weak form of long-run PPP in these
countries. In the case of Indonesia and South Korea, the F-statistic falls within the critical
values bound implying that further investigation is needed. We take up this point below.

9
Table 1b reports the respective results for the yen exchange rates. Again, we observe
more evidence for PPP in the post-1997 period in comparison with the pre-1997 period. In 3
of the 6 countries, we find that the F-statistic exceeds the upper bound critical value rejecting
the null of no long-run PPP. It is obvious that the currency crisis has affected the long-run
PPP relationship in all the Asian countries. This finding is in line with the evidence reported
in a number of studies that show that PPP holds when structural breaks are taken into account
(for major Asian countries, see Aggarwal et al., 2000).
Having found evidence for the weak form of PPP on the basis of the bounds test,
Tables 2a and 2b report the estimated long-run coefficients based on the ARDL models for
the cases where cointegration applies, as well as, asymptotic standard errors. Notice that
most of the coefficients in the long-run PPP equation are signed correctly (β1>0; β2<0) but
they are not statistically significant at conventional significance levels (mostly for dollar
exchange rates).
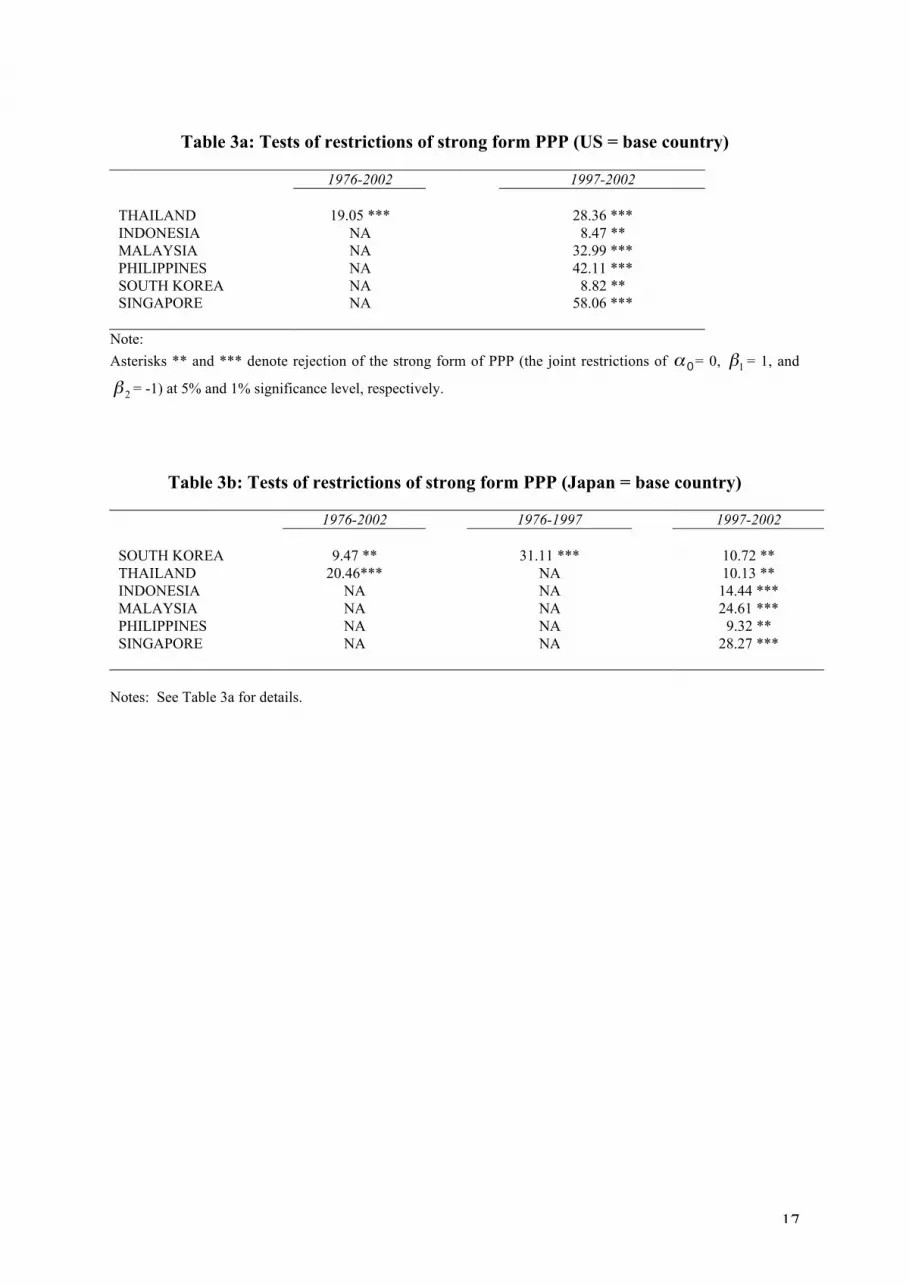
To examine whether the strong form of PPP holds, we test for the restrictions on the
cointegrating parameters implied by PPP referred to in the previous section. Tables 3a and
3b indicate that these restrictions can be rejected at conventional significance levels in all
countries and sample periods, under either choice of a reference country. This is not
surprising, as Patel (1990), among others, has argued that deviations from strong PPP can
arise for several reasons such as differences in the weights used to construct price indices.
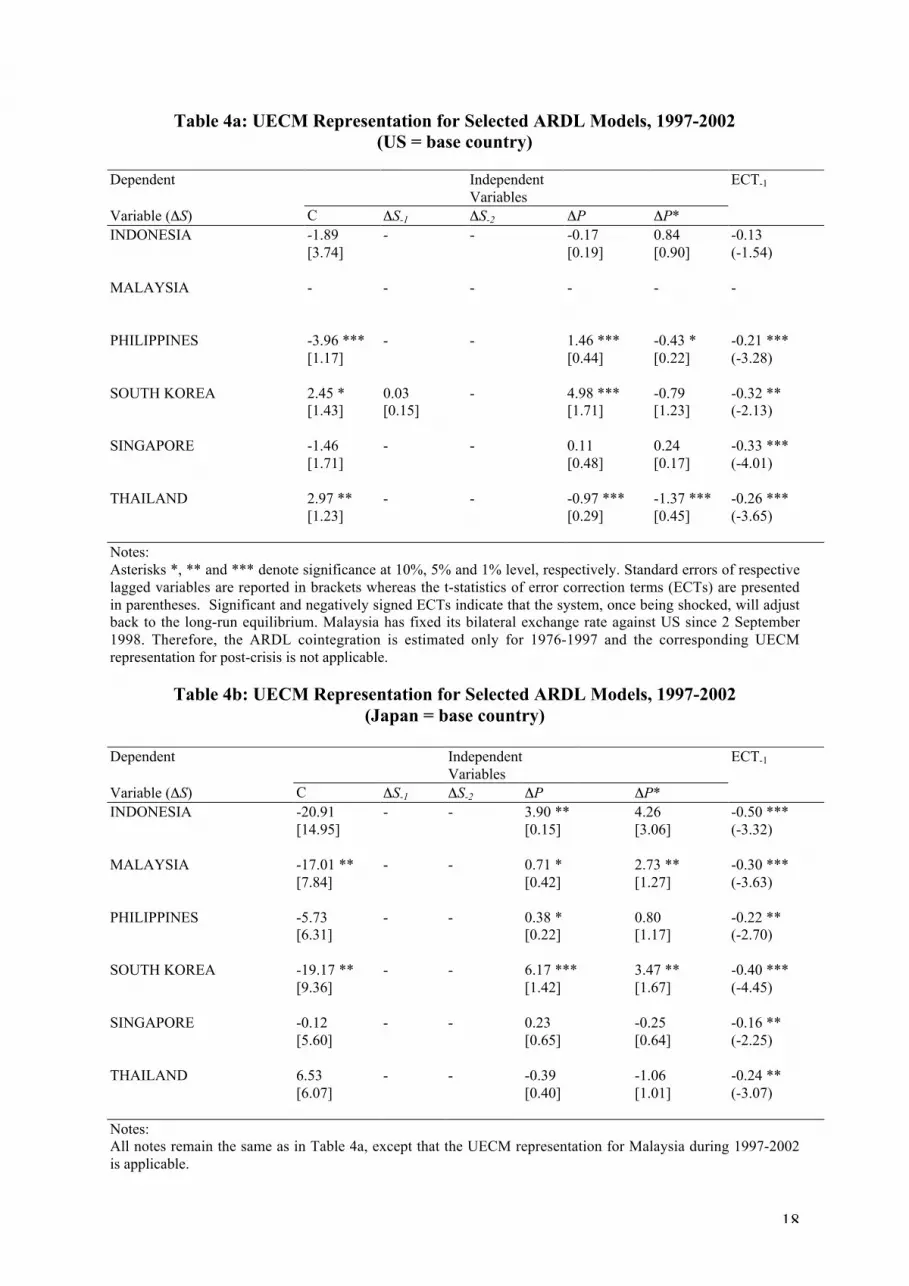
Given the evidence for cointegration in several countries, as reported in Tables 1a and
1b, we estimated the Unrestricted Error-Correction Models (UECM). The results for the
1997-2002 period are reported in Tables 4a and 4b. This approach allows us to obtain
evidence for cointegration even in cases where there was an ambiguity on the basis of the
ARDL cointegration test, most notably for the post-crisis period. In fact, Kremers et al.
(1992) argue that the finding of a negative and significant lagged Error-Correction Term
(ECT) provides a relatively more efficient way to establish cointegration. On the basis of this
approach, the results of Table 4a show strong support for weak PPP in all cases except
Indonesia for the dollar exchange rates. For the yen exchange rates, the evidence for
cointegration is even stronger as it applies to all six countries (see Table 4b).
Half-lives
10
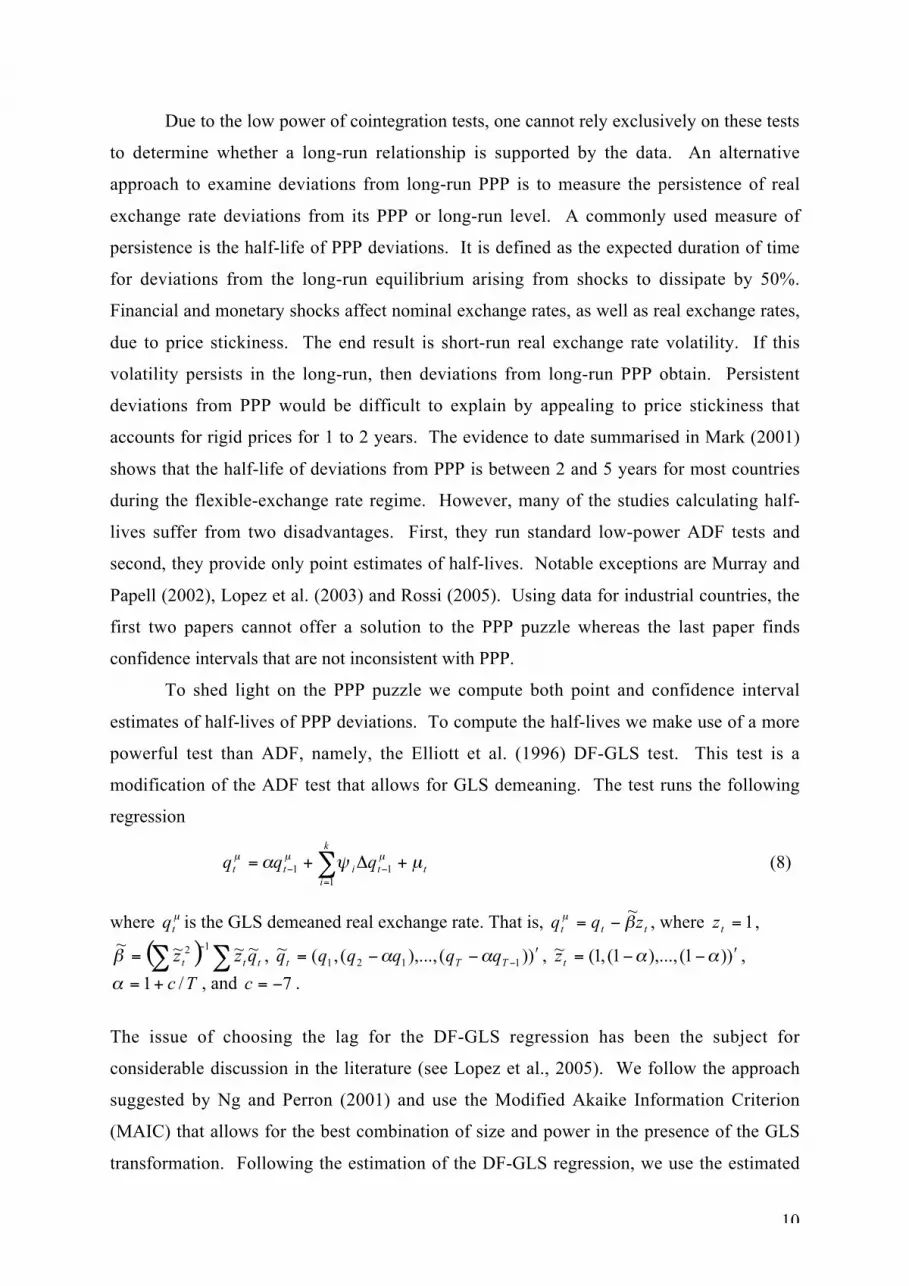
Due to the low power of cointegration tests, one cannot rely exclusively on these tests
to determine whether a long-run relationship is supported by the data. An alternative
approach to examine deviations from long-run PPP is to measure the persistence of real
exchange rate deviations from its PPP or long-run level. A commonly used measure of
persistence is the half-life of PPP deviations. It is defined as the expected duration of time
for deviations from the long-run equilibrium arising from shocks to dissipate by 50%.
Financial and monetary shocks affect nominal exchange rates, as well as real exchange rates,
due to price stickiness. The end result is short-run real exchange rate volatility. If this
volatility persists in the long-run, then deviations from long-run PPP obtain. Persistent
deviations from PPP would be difficult to explain by appealing to price stickiness that
accounts for rigid prices for 1 to 2 years. The evidence to date summarised in Mark (2001)
shows that the half-life of deviations from PPP is between 2 and 5 years for most countries
during the flexible-exchange rate regime. However, many of the studies calculating half-
lives suffer from two disadvantages. First, they run standard low-power ADF tests and
second, they provide only point estimates of half-lives. Notable exceptions are Murray and
Papell (2002), Lopez et al. (2003) and Rossi (2005). Using data for industrial countries, the
first two papers cannot offer a solution to the PPP puzzle whereas the last paper finds
confidence intervals that are not inconsistent with PPP.
To shed light on the PPP puzzle we compute both point and confidence interval
estimates of half-lives of PPP deviations. To compute the half-lives we make use of a more
powerful test than ADF, namely, the Elliott et al. (1996) DF-GLS test. This test is a
modification of the ADF test that allows for GLS demeaning. The test runs the following
regression
tt
k
iitt qqq µψα µµµ +Δ+= −
=− ∑ 1
11 (8)
where µtq is the GLS demeaned real exchange rate. That is, ttt zqq βµ ~
−= , where 1=tz ,
( ) ttt qzz ~~~~ 12 ∑∑−
=β , ))(),...,(,(~1121 ′−−= −TTt qqqqqq αα , ))1(),...,1(,1(~ ′−−= ααtz ,
Tc /1+=α , and 7−=c .
The issue of choosing the lag for the DF-GLS regression has been the subject for
considerable discussion in the literature (see Lopez et al., 2005). We follow the approach
suggested by Ng and Perron (2001) and use the Modified Akaike Information Criterion
(MAIC) that allows for the best combination of size and power in the presence of the GLS
transformation. Following the estimation of the DF-GLS regression, we use the estimated
11
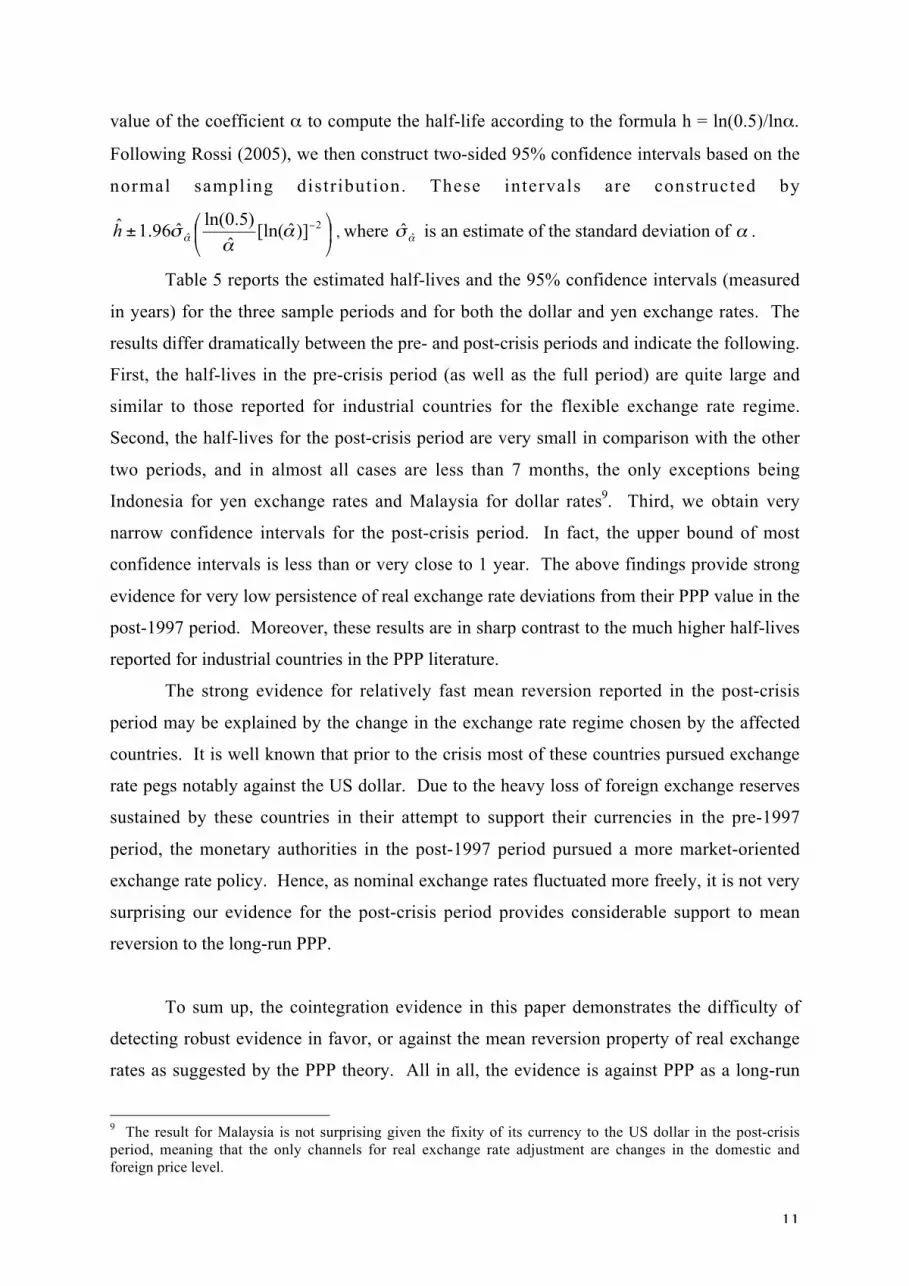
value of the coefficient α to compute the half-life according to the formula h = ln(0.5)/lnα.
Following Rossi (2005), we then construct two-sided 95% confidence intervals based on the
normal sampling distribution. These intervals are constructed by
± −2ˆ )]ˆ[ln(
ˆ)5.0ln(
ˆ96.1ˆ αα
σαh , where ασ ˆˆ is an estimate of the standard deviation of α .
Table 5 reports the estimated half-lives and the 95% confidence intervals (measured
in years) for the three sample periods and for both the dollar and yen exchange rates. The
results differ dramatically between the pre- and post-crisis periods and indicate the following.
First, the half-lives in the pre-crisis period (as well as the full period) are quite large and
similar to those reported for industrial countries for the flexible exchange rate regime.
Second, the half-lives for the post-crisis period are very small in comparison with the other
two periods, and in almost all cases are less than 7 months, the only exceptions being
Indonesia for yen exchange rates and Malaysia for dollar rates9. Third, we obtain very
narrow confidence intervals for the post-crisis period. In fact, the upper bound of most
confidence intervals is less than or very close to 1 year. The above findings provide strong
evidence for very low persistence of real exchange rate deviations from their PPP value in the
post-1997 period. Moreover, these results are in sharp contrast to the much higher half-lives
reported for industrial countries in the PPP literature.
The strong evidence for relatively fast mean reversion reported in the post-crisis
period may be explained by the change in the exchange rate regime chosen by the affected
countries. It is well known that prior to the crisis most of these countries pursued exchange
rate pegs notably against the US dollar. Due to the heavy loss of foreign exchange reserves
sustained by these countries in their attempt to support their currencies in the pre-1997
period, the monetary authorities in the post-1997 period pursued a more market-oriented
exchange rate policy. Hence, as nominal exchange rates fluctuated more freely, it is not very
surprising our evidence for the post-crisis period provides considerable support to mean
reversion to the long-run PPP.
To sum up, the cointegration evidence in this paper demonstrates the difficulty of
detecting robust evidence in favor, or against the mean reversion property of real exchange
rates as suggested by the PPP theory. All in all, the evidence is against PPP as a long-run
9 The result for Malaysia is not surprising given the fixity of its currency to the US dollar in the post-crisisperiod, meaning that the only channels for real exchange rate adjustment are changes in the domestic andforeign price level.
12
relationship during the pre-crisis period. On the other hand, we find sufficient evidence to
support PPP as a long-run relationship for many East-Asian countries over the post-crisis
period. A different picture emerged when we combined the two sub-periods. Our studies
suggest that PPP may be a valid representation of the long-run equilibrium relation among the
bilateral exchange rate, domestic and foreign prices but it is important to note here that the
results are time specific. The time specificity of the results is also supported by our half-life
evidence. Considerably smaller half-lives and much narrower confidence intervals are
obtained for the post-crisis period. These half-life results provide more information than the
cointegration hypothesis testing concerning the relevance of PPP. This is so because they
indicate very large degrees of mean reversion for all countries, even in cases where, on the
basis of cointegration tests, there is evidence for the weak form of PPP or no evidence at all.
4. Conclusions and Policy Implications
Long-run PPP is a fundamental assumption of modern theories of exchange rates and
open-economy macroeconomic models. A plethora of theoretical and empirical models of
exchange rate behavior has been built around PPP. As PPP represents a yardstick for
measuring over- or undervaluation of a currency, it is of crucial importance to policy makers
concerned by sizable short-run deviations from PPP in recent years. In this article, we
examine the PPP hypothesis for the Asia-6 currencies using the ARDL procedure advocated
by Pesaran and Shin (1995) and Pesaran et al. (2001). We also measure the persistence of
PPP deviations by calculating point estimates and confidence intervals of half-lives. Splitting
our sample in two sub-periods (pre- and post-crisis) we obtain some important results. First,
we find no evidence of a cointegrating relationship between the nominal exchange rate and
domestic and foreign prices for the first sub-period ending prior to the Asian financial crisis.
Moreover, using a longer sample encompassing the post-crisis period (full sample) does not
strengthen the evidence in favor of PPP. Second, and in contrast to the first result, we find
strong evidence for the weak form of PPP for the more recent sub-period 1997-2002,
suggesting the evidence for PPP is stronger following the financial crisis. These findings
imply that the cointegration relationship is time dependent. The changing nature of the
cointegrating relationship between the two sub-periods highlights the sensitivity of the results
to the change in the regime that is identified with the financial crisis. Third, for the post-
crisis period, we find very small persistence of PPP deviations as indicated by very small
half-lives (less than 7 months) and narrow confidence intervals with an upper bound of 1 year
13
or less in most countries. The conclusions for the second sub-sample should be taken
cautiously since the length of this period is too short to warrant the reliability of the results
obtained. However, we note that this finding appears to concur with that reported in
Choudhry (2005). Despite this limitation, we believe our results provide some evidence on
how the ASEAN countries reacted in the post-crisis years.
The above results carry important implications for policymaking. They suggest that
the exchange rates of the East-Asian countries satisfy the weak PPP relationship in the post-
crisis era. This finding suggests that the East-Asian countries are returning to some form of
PPP-oriented rule as a basis for their exchange rate policies in order to maintain international
competitiveness and to stabilize domestic income (Dornbusch, 1982; Gross, 1986). An
examination of the data, as well as, our recent research findings on the current account
balances of the severely crisis-affected countries indicates that the current account swung
from a large deficit to surplus after the currencies of these countries took a sharp fall. Indeed,
the study by Baharumshah et al. (2003) shows that after the crisis all the crisis-affected East
Asia countries maintained current accounts that are sustainable. The sensitivity of the
cointegration results to the regime that was noted above carries the policy implication that the
exchange rates of the East Asia countries were possibly misaligned, i.e., overvalued, during
the pre-crisis period. Intervention that seeks to reduce the variability of real exchange rates to
protect the tradable sector cannot be justified during the pre-crisis period. Meanwhile, the
mean-reverting behavior of these currencies over the post-crisis period suggests that
departures from the equilibrium (or PPP) rates are temporary and that the exchange rate will
eventually be corrected and therefore, indicates that intervention in the foreign exchange
market has some justification.
Finally, Frenkel (1976, 1980) has argued that exchange rates do in fact appear to be
related to economic fundamentals (e.g., monetary model), particularly in the presence of large
movements in the underlying fundamentals such as hyperinflation. As exchange rates become
increasingly misaligned with economic fundamentals, as demonstrated by the currency crisis
in the region, one might expect that the pressure both from the market and the policy makers
to return to the neighborhood of fundamental equilibrium would become increasingly
stronger. In fact, the half-life between the two sample periods decreased sharply, indicating
that the pace of adjustment is more rapid in the post-crisis era. Emerging theoretical models,
which suggest that exchange rate deviation may be governed by nonlinear factors, support
this reasoning (e.g. Dumas, 1992). Of course, these issues are interesting and worthy of
further research. This is in the authors’ research agenda.
14
Acknowledgements:
The first author would like to thank MOSTE for funding this project [Project no: 05-020-0532-EA001]. Earlier versions of this paper were presented at a seminar at the Faculty ofEconomics & Management of University Putra Malaysia and the Asia Pacific Economics andBusiness Conference (Penang, 2004). We are grateful to the participants for their commentsand suggestions on the earlier drafts of this paper. The usual disclaimer applies.
15
Table 1a: ARDL Cointegration Tests of Weak Form PPP (US = base country)
F ( *, ttt pps )
1976-2002 1976-1997 1997-2002
INDONESIA 2.84 2.76 3.32 b
MALAYSIA - 3.22 -PHILIPPINES 3.05 2.59 5.21 a
SOUTH KOREA 2.67 2.15 3.72 b
SINGAPORE 2.63 2.16 4.41 a
THAILAND 3.68 b 2.95 12.30 a
Notes:The estimated ARDL models include unrestricted intercepts without deterministic trends. At 95% confidencelevel, the critical values bound of the ARDL F-statistics is [3.23, 4.35], as tabulated in Pesaran et al. (2001). a
confirms the rejection of null hypothesis (no level relationship) while b denotes that the computed F-statisticsfall within the critical bounds. For Malaysia, the analysis of nominal exchange rates-price ratio nexus onlyconsiders the 1976-1997 period due to the fixed bilateral exchange rates (RM 3.80/ US$ 1.00) since 2September 1998. However, in the subsequent cases where Japan is taken as numeraire, the post-crisis era isincluded.
Table 1b: ARDL Cointegration Tests of Weak Form PPP (Japan = base country)
F ( *, ttt pps )
1976-2002 1976-1997 1997-2002
INDONESIA 1.39 1.74 3.36 b
MALAYSIA 1.85 1.26 3.42 b
PHILIPPINES 2.98 2.04 4.40 a
SOUTH KOREA 3.82 b 3.38 b 6.51 a
SINGAPORE 2.65 2.18 4.16 b
THAILAND 3.56 b 2.26 4.62 a
Notes: See Table 1a for details.

16
Table 2a: ARDL Estimated Long Run Coefficients (US = base country)
Lags Constant p *p1976-2002
THAILAND (2,0,0) 2.23 [0.60] *** 2.39 [0.81] *** -2.12 [0.91] **
1997-2002
INDONESIA (1,1,1) 0.20 [0.12] * -0.01 [0.00] * -0.01 [0.03]MALAYSIA - - - -PHILIPPINES (1,0,0) -19.29 [7.13] *** 7.09 [3.01] ** -2.09 [1.49]SOUTH KOREA (2,1,0) 7.77 [2.97] ** 2.31 [2.78] -2.49 [2.94]SINGAPORE (1,0,0) -4.32 [5.36] 0.32 [1.47] -0.71 [0.39] *THAILAND (1,0,0) 11.27 [6.71] * 3.69 [1.52] ** -5.19 [2.54] **
Notes:Asterisks *, ** and *** denote significance at 10%, 5% and 1% level, respectively. Asymptotic standard errorsare reported in brackets. The selection of optimal lags is based on the Schwartz’s Bayesian InformationCriterion.
Table 2b: ARDL Estimated Long Run Coefficients (Japan = base country)
Lags Constant p *p1976-2002
SOUTH KOREA (1,0,1) 18.02 [2.15] *** 0.67 [0.23] *** -4.49 [0.69] ***THAILAND (1,0,0) -0.78 [0.87] 0.78 [0.34] ** -0.78 [0.16] ***
1976-1997
SOUTH KOREA (1,0,1) 20.22 [3.11] *** 0.96 [0.37] *** -5.25 [1.03] ***
1997-2002
INDONESIA (1,1,0) -41.7 [23.41] * 1.23 [0.25] *** -8.50 [4.87] *MALAYSIA (1,0,0) -57.24 [20.08] *** 2.38 [1.04] ** -9.19 [3.48] **PHILIPPINES (1,0,0) 27.60 [30.33] 1.66 [0.69] ** -4.43 [1.96] **SOUTH KOREA (1,1,0) 10.25 [3.98] ** -0.42 [0.16] ** -1.69 [0.72] **SINGAPORE (1,0,0) -0.42 [0.51] 0.24 [0.07] *** -0.21 [0.06] ***THAILAND (1,0,0) -13.48 [13.33] 0.53 [0.15] *** -2.16 [0.39] ***
Notes: See Table 2a for details.
17
Table 3a: Tests of restrictions of strong form PPP (US = base country)
1976-2002 1997-2002
THAILAND 19.05 *** 28.36 ***INDONESIA NA 8.47 **MALAYSIA NA 32.99 ***PHILIPPINES NA 42.11 ***SOUTH KOREA NA 8.82 **SINGAPORE NA 58.06 ***
Note:
Asterisks ** and *** denote rejection of the strong form of PPP (the joint restrictions of 0α = 0, 1β = 1, and
2β = -1) at 5% and 1% significance level, respectively.
Table 3b: Tests of restrictions of strong form PPP (Japan = base country)
1976-2002 1976-1997 1997-2002
SOUTH KOREA 9.47 ** 31.11 *** 10.72 **THAILAND 20.46*** NA 10.13 **INDONESIA NA NA 14.44 ***MALAYSIA NA NA 24.61 ***PHILIPPINES NA NA 9.32 **SINGAPORE NA NA 28.27 ***
Notes: See Table 3a for details.
18
Table 4a: UECM Representation for Selected ARDL Models, 1997-2002(US = base country)
Dependent IndependentVariables
ECT-1
Variable (ΔS) C ΔS-1 ΔS-2 ΔP ΔP*INDONESIA -1.89
[3.74]- - -0.17
[0.19]0.84[0.90]
-0.13(-1.54)
MALAYSIA - - - - - -
PHILIPPINES -3.96 ***[1.17]
- - 1.46 ***[0.44]
-0.43 *[0.22]
-0.21 ***(-3.28)
SOUTH KOREA 2.45 *[1.43]
0.03[0.15]
- 4.98 ***[1.71]
-0.79[1.23]
-0.32 **(-2.13)
SINGAPORE -1.46[1.71]
- - 0.11[0.48]
0.24[0.17]
-0.33 ***(-4.01)
THAILAND 2.97 **[1.23]
- - -0.97 ***[0.29]
-1.37 ***[0.45]
-0.26 ***(-3.65)
Notes:Asterisks *, ** and *** denote significance at 10%, 5% and 1% level, respectively. Standard errors of respectivelagged variables are reported in brackets whereas the t-statistics of error correction terms (ECTs) are presentedin parentheses. Significant and negatively signed ECTs indicate that the system, once being shocked, will adjustback to the long-run equilibrium. Malaysia has fixed its bilateral exchange rate against US since 2 September1998. Therefore, the ARDL cointegration is estimated only for 1976-1997 and the corresponding UECMrepresentation for post-crisis is not applicable.
Table 4b: UECM Representation for Selected ARDL Models, 1997-2002(Japan = base country)
Dependent IndependentVariables
ECT-1
Variable (ΔS) C ΔS-1 ΔS-2 ΔP ΔP*INDONESIA -20.91
[14.95]- - 3.90 **
[0.15]4.26[3.06]
-0.50 ***(-3.32)
MALAYSIA -17.01 **[7.84]
- - 0.71 *[0.42]
2.73 **[1.27]
-0.30 ***(-3.63)
PHILIPPINES -5.73[6.31]
- - 0.38 *[0.22]
0.80[1.17]
-0.22 **(-2.70)
SOUTH KOREA -19.17 **[9.36]
- - 6.17 ***[1.42]
3.47 **[1.67]
-0.40 ***(-4.45)
SINGAPORE -0.12[5.60]
- - 0.23[0.65]
-0.25[0.64]
-0.16 **(-2.25)
THAILAND 6.53[6.07]
- - -0.39[0.40]
-1.06[1.01]
-0.24 **(-3.07)
Notes:All notes remain the same as in Table 4a, except that the UECM representation for Malaysia during 1997-2002is applicable.

19
Table 5: Half-lives and Confidence Intervals based on
Standard Asymptotics and the DF-GLS test
ASIA6-US ASIA6-JAPk φ HL(A) 95% CI k φ HL(A) 95%CI
1976-2002INDONESIA 6 -0.0248 2.30 [0.37, 4.23] 14 -0.0197 2.91 [0.84, 4.98]MALAYSIA 4 -0.0168 3.41 [0.09, 6.73] 2 -0.0152 3.78 [1.08, 6.47]PHILIPPINES 6 -0.0175 3.28 [0.00, 6.70] 6 -0.0175 3.28 [0.60, 5.95]SINGAPORE 6 -0.0168 3.42 [0.80, 6.04] 8 -0.0134 4.29 [0.26, 8.33]SOUTH KOREA 1 -0.0224 2.55 [0.29, 4.82] 11 -0.0208 2.75 [0.00, 5.52]THAILAND 2 -0.0155 3.70 [0.00, 7.96] 5 -0.0223 2.56 [0.06, 5.06]Median 3.35 3.10
1976-1997INDONESIA 2 -0.0196 2.92 [0.83, 5.02] 2 -0.0096 6.01 [0.59, 11.44]MALAYSIA 1 -0.0141 4.06 [0.00, 8.22] 1 -0.0114 5.02 [0.23, 9.82]PHILIPPINES 15 -0.0147 3.91 [0.00, 9.27] 15 -0.0170 3.37 [0.50, 6.25]SINGAPORE 4 -0.0144 3.97 [0.08, 7.86] 2 -0.0117 4.92 [0.45, 9.39]SOUTH KOREA 4 -0.0155 3.71 [0.00, 7.99] 4 -0.0200 2.86 [0.79, 4.94]THAILAND 10 -0.0132 4.34 [0.00, 9.51] 1 -0.0116 4.97 [1.29, 8.65]Median 3.94 4.95
1997-2002INDONESIA 1 -0.1446 0.37 [0.06, 0.68] 1 -0.0685 0.81 [0.27, 1.36]MALAYSIA 1 -0.0928 0.59 [0.00, 1.19] 1 -0.0961 0.57 [0.01, 1.13]PHILIPPINES 1 -0.1110 0.49 [0.03,0.95] 1 -0.1006 0.55 [0.01, 1.08]SINGAPORE 1 -0.1729 0.30 [0.06, 0.55] 4 -0.1239 0.44 [0.29, 0.59]SOUTH KOREA 1 -0.1556 0.34 [0.07, 0.62] 1 -0.1556 0.34 [0.07, 0.62]THAILAND 1 -0.1579 0.34 [0.08, 0.59] 1 -0.1711 0.31 [0.07, 0.55]Median 0.36 0.50
Notes:HL(A) is the half-life measured in years. The half-life estimation is based on the DF-GLS unit root testproposed by Elliott et al. (1996). The optimal lags are selected using the Modified Akaike Information Criterion(MAIC) suggested by Ng and Perron (2001). To compute the half-life, the estimated coefficient of the laggedregressor (α) as defined in the DF-GLS equation is used in h = ln0.5/ ln α where φ = (α-1). The two-sided 95%confidence intervals (CI) measured in years are based on the normal sampling distribution and constructed
according to
± −2ˆ )]ˆ[ln(
ˆ)5.0ln(
ˆ96.1ˆ αα
σαh , where ασ ˆˆ is an estimate of the standard deviation of α .
Though Malaysia has fixed the bilateral exchange rates to US at RM 3.80/ US$ 1.00 since 2 September 1998,the half-life estimation is possible as real exchange rate adjustment may take place via changes in domestic andforeign prices.
20
References
Aggarwal, R., A. Montana and M. Ponz (2000) Evidence of Long-Run Purchasing PowerParity: Analysis of Real Asian Exchange Rates in terms of the Japanese Yen, Japanand the World Economy, 351-361.
Azali, M., M.S. Habibullah and A.Z. Baharumshah (2001) Does PPP hold between Asian andThe Japanese Economies? Evidence Using Panel Unit Root and Panel Cointegration,Japan and the World Economy, 13, 35-50.
Baharumshah, A.Z. and M. Ariff (1997) Purchasing Power Parity in South East AsianCountries: A Cointegration Approach, Asian Economic Journal, 11, 141-154.
Baharumshah, A.Z., E. Lau, and S. Fountas (2003) On the sustainability of current accountdeficits: evidence from four ASEAN countries, Journal of Asian Economics, 14, 465-487.
Bahmani-Oskooee, M., (1993) Purchasing Power Parity Based on Effective Exchange Rateand Cointegration; 25 LDCs Experience with its Absolute Formulation, WorldDevelopment, 21, 1023-31.
Chinn, M.D. (2000) Before the Fall: Were East Asian Currencies Overvalued? EmergingMarkets Review, 1, 101-126.
Choudhry, T. (2005) Asian Currency Crisis and the Generalized PPP: Evidence from the FarEast, Asian Economic Journal, 19(2), 137-157.
Diebold, F.X., S. Husted and M. Rush (1991) Real Exchange Rates Under the GoldStandards, Journal of Political Economy, 99, 1252-1271.
Dornbusch, R. (1982) PPP Exchange Rates Rules and macroeconomic stability, Journal ofPolitical Economy, 90, 158-65.
Dumas, B. (1992) Dynamic Equilibrium and the Real Exchange Rates in a SpatiallySeparated World, Review of Financial Studies, 5, 153-180.
Elliott, G., T. Rothenberg, and J.H. Stock (1996) Efficient Tests for an Autoregressive UnitRoot, Econometrica, 64, 813-836.
Enders, W. and S. Hurn (1994) Common Trends and Generalized Purchasing Power Parity,Mathematics and Computers in Simulations, 43, 437-43.
Frenkel, J.A. (1976) A monetary approach to the exchange rate: Doctrinal Aspects andEmpirical evidence, Scandinavian Journal of Economics, 78, 200-224.
Frenkel, J.A. (1980) Purchasing Power Parity: Doctrinal Aspects and Empirical evidencefrom the 1920s, Journal of International Economics, 8, 169-191.
Froot, K.A. and K. Rogoff, (1995) Perspective on PPP and Long-run Real Exchange Rates.In: Grossman, G., Rogoff, K. (Eds.), Handbook of International Economics, Vol. 3.Elsevier Press, Amsterdam, pp. 1648-1684.
21
Gross, D. (1986). Wage Indexation and the Real Exchange Rate in Small Open Economies,International Monetary Fund Staff Papers, 33, 117-38.
Kremers, J. J., N. R. Ericsson, and J. J. Dolado (1992). The power of cointegration tests,Oxford Bulletin of Economics and Statistics, 54, 325-347.
Liew, V. K., A.Z. Baharumshah, T. T. Chong (2004) Are Asian real exchange ratesstationary?, Economics Letters, 83, 313-316.
Liu, P., (1992) Purchasing Power Parity in Latin America: A Cointegration Analysis,Weltwirtschaftliches Archiv, 128, 662-80.
Lopez, C., C. J. Murray and D.H. Papell (2003) State of the Art Unit Root Tests and the PPPPuzzle, Working Paper, Department of Economics, University of Houston.
Lopez, C., C. J. Murray and D.H. Papell (2005) State of the Art Unit Root Tests andPurchasing Power Parity, Journal of Money, Credit and Banking, 37, 361-370.
Lothian, J.R. and M.P Taylor (1996) Real Exchange rate Behaviour: The Recent Float fromthe Perspective of the Past Two Centuries, Journal of Political Economy, 104, 488-509.
McNown, R. and M. Wallace, (1989) National Price Level, Purchasing Power Parity, andCointegration: A test of Four High Inflation Economies, Journal of InternationalMoney and Finance, 8, 533-45.
Mark, N. (2001) International Macroeconomics and Finance: Theory and empirical methods,Blackwell Publishers.
Mollick, A.V., (1999) The Real Exchange Rate in Brazil: Mean Reversion or Random Walkin the Long run? International Review of Economics and Finance, 8, 115-126.
Murray, C.J., and D.H. Papell (2002) The Purchasing Power Parity Persistence Paradigm,Journal of International Economics, 56, 1-19.
Mussa, M., (1986) Nominal Exchange Rate Regimes and the Behavior of Real ExchangeRates: Evidence and Applications, Carnegie Rochester Series on Public Policy, 25,117-213.
Ng, S. and P. Perron (2001) Lag Length Selection and the Construction of Unit Root Testswith Good Size and Power, Econometrica, 69, 1519-1554.
O’Connell, P., (1998) The Overvaluation of Purchasing Power Parity, Journal ofInternational Economics, 44, 1-19.
Ogawa, E. and K. Kawasaki (2003) Possibility of Creating a Common Currency Basket forEast Asia, Discussion Paper No.5 JBIC Institute, Tokyo, Japan.
22
Papell, D.H. (1997) Searching for Stationarity: Purchasing Power Parity under the CurrentFloat, Journal of International Economics, 43, 313-332.
Papell, D.H. (2002) The Great Appreciation, The Great Depreciation, and The PurchasingPower Parity, Journal of International Economics, 57, 51-82.
Patel, J. (1990) Purchasing Power Parity as a Long run Relation, Journal of AppliedEconometrics, 5, 367-379.
Pesaran, M.H., and Y. Shin, (1995) An Autoregressive Distributed Lag Modelling Approachto Cointegration Analysis, DAE Working Paper no 9514, Department of AppliedEconomics, University of Cambridge.
Pesaran, M.H., Y. Shin and R.J. Smith (2001) Bounds Testing Approach to the Analysis ofLevel Relationships, Journal of Applied Econometrics, 16, 289-326.
Rogoff, K. (1996) The Purchasing Power Parity Puzzle, Journal of Economic Literature, 34,647-668.
Rossi, B. (2005) Confidence Intervals for Half-Life Deviations from Purchasing PowerParity, Journal of Business and Economics Statistics, 23, 432-442.
Taylor, A. M. (2002). A century of Purchasing Power Parity, Review of Economics andStatistics, 84, 139-150.
Taylor, A. M. and M. P. Taylor, 2004. The Purchasing Power Parity debate, Journal ofEconomic Perspectives, 18, 135-158.
Taylor, M. P. and D. A. Peel (2000). Nonlinear adjustment, long-run equilibrium andexchange rate fundamentals, Journal of International Money and Finance, 19, 33-53.
Wu, Y., (1996). Are Real Exchange Rates Nonstationary? Evidence form a Panel-data Test,Journal of Money, Credit and Banking, 28, 54-63.


