Embed Size (px)
Citation preview

ORIGINAL PAPER
Rapid Profiling of Animal-Derived Fatty Acids Using FastGC 3 GC Coupled to Time-of-Flight Mass Spectrometry
Sung-Tong Chin Æ Yaakob Bin Che Man ÆChin Ping Tan Æ Dzulkifly Mat Hashim
Received: 13 February 2009 / Revised: 19 May 2009 / Accepted: 12 June 2009 / Published online: 30 June 2009
� AOCS 2009
Abstract Rapid profiling of fatty acid methyl esters
(FAME) from five different animal sources was examined
in this study using fast comprehensive two-dimensional gas
chromatography coupled to time-of-flight mass spectrom-
etry (fast GC 9 GC–TOFMS). The result showed that
GC 9 GC analysis combining two different microbore
columns (SLB-5 ms, 10 m 9 0.10 mm 9 0.10 lm and
DBWax, 0.5 m 9 0.10 mm 9 0.10 lm) allowed three-
fold faster analysis times than those observed for conven-
tional GC 9 GC analysis. The modulation ratio (MR) of
the system was defined at the value of 2.38 by optimizing
the modulation period and offset temperature for precise
mass spectral identification and highest effluent resolution
in the analysis. In accordance with the normalized FAME
level obtained from various animal fats, namely lard (LA),
chicken fat (CF), beef tallow (BF), mutton tallow (MF) and
cod liver oil (CLO), a clear discrimination of LA from the
other species by principal components analysis (PCA) was
observed. This was attributed to several FAME constitu-
ents involving methyl 6,9,12,15-heneicosatetraenoate
(C21:4n-6), methyl 11,14-eicosadienoate (C20:2n-6),
trans-9,12-methyl octadecadienoate (C18:2n-6t), trans-9-
methyl octadecenoate (C18:1n-9t) and methyl hexadecan-
oate (C16:0).
Keywords GC 9 GC � TOFMS � Fast GC � FAME �PCA � Animal fats � Lard
Introduction
For dietary and therapeutic reasons, the role of fatty acids
as the major building blocks of food lipids has drawn
increasing concern over aspects of their composition and
functionality. Analysis of fatty acids commonly involves
derivatization of fatty acids (FA) to methyl esters through a
saponification process prior to individual analyte separa-
tion with gas chromatography [1, 2]. In conjunction with
several detection methods, various stationary phases of
different polarities have been used in order to verify the
fatty acid methyl esters (FAME) composition from various
foods [3, 4]. More importantly, such FAME profiles are an
efficient method for discriminating lipids from a specific
source. This is crucial for the growing health-conscious-
ness of consumers, as well as religious commitments of
some ethnic groups. For instance, usage of glycerides that
were derived from, or consist of, lard is absolutely pro-
hibited in the production of Kosher and Halal food, as
dictated in Biblical Hebrew and Quranic guidance [5].
Nevertheless, the determination of the FAME profile,
especially in animal glycerides, remains a great challenge,
mainly because of their complex structural attributes that
are rarely fully resolved in chromatography.
The GC 9 GC technique was introduced in the last
decade to comprehensively unravel all the individual rele-
vant components, which are barely resolved in the conven-
tional single dimensional GC [6–9]. Recent advancement in
S.-T. Chin � Y. B. Che Man (&) � D. M. Hashim
Halal Products Research Institute,
Putra Infoport, Universiti Putra Malaysia,
43400 UPM Serdang, Selangor, Malaysia
e-mail: [email protected]
S.-T. Chin
e-mail: [email protected]
C. P. Tan
Department of Food Technology,
Faculty of Food Science and Technology,
Universiti Putra Malaysia,
43400 UPM Serdang, Selangor, Malaysia
123
J Am Oil Chem Soc (2009) 86:949–958
DOI 10.1007/s11746-009-1427-y

GC 9 GC has offered significant improvements in the
aspects of resolution, capacity and sensitivity of the chro-
matography analysis for extremely complex samples. This
technique has been successfully applied in diverse fields,
namely petrochemicals, fragrances, flavor and environ-
mental analysis [8–11]. Unlike the heart-cut multidimen-
sional GC technique, GC 9 GC incorporates serial coupling
of two columns with orthogonal retention behavior that
allows all sample portions emerging from the first dimen-
sional column to enter the second and be analyzed sequen-
tially without losing any solute data. Moreover, the increase
in sensitivity is due to the incremental increase of response
height based on the refocusing of a zone of a peak eluting
from the first chromatographic column prior to the modu-
lating interface and its release to the fast second column as
narrow modulated peaks. In fact, reliability of the acquired
GC 9 GC data demands adequate peak modulation, which
is mainly depicted by the modulated peak pattern as well as
the modulation ratio [9–13]. Marriott and co-workers [12,
13] have stated that a minimum MR value of 1.5 is required to
ensure data precision during a semi-quantitative analysis.
The modulated peak pattern (peak shape and magnitude) is
governed by the release efficiency of each cryo-trapped
solute particle remobilizing to the second column, which
involves the offset heating operation, in the case where a
thermal modulator is used. Specifically, a few GC 9 GC
studies have been conducted on the FAME derived from
marine oil using a column 30-m in length as the primary
dimension; disclosing that substantial separation of FAME
corresponded to their grouping on an equal-double-bond-
number basic along the contour plot [11, 14]. However, the
long analysis time for a conventional GC 9 GC analysis
makes it an unfavorable technique, due to the increasing
demands for high-throughput and fast-turnaround analytical
approaches made by industry and laboratories today. In
working to develop a fast GC technique, a microbore cap-
illary column was evaluated recently for creating a rapid
FAME profiling analysis in a one-dimensional GC applica-
tion. Minor losses of resolution and peak capacity were
reported as the main drawbacks [15]. Such a microbore
column was also employed in chiral GC 9 GC work that
showed a two-fold decrease in overall analysis time, while
still providing the desired resolution of the majority enan-
tiomer compounds [16]. Thus, it is desired that an analyte’s
separation on the secondary column be performed rapidly,
within a millisecond period. An adequate data acquisition
rate and modulation condition is crucial in the development
of a fast GC 9 GC method.
Multivariate analysis is a mathematical procedure for
resolving sets of data into orthogonal components whose
linear combinations approximate the original data to any
desired degree of accuracy. Principal component analysis
(PCA) is one of the most commonly applied techniques in
multivariate data analysis. PCA is an unsupervised cluster-
ing method that does not require any knowledge of the data
set, which reduces the dimensionality of data, detects the
number of components, and visualizes the outliers [17]. This
statistical analysis has been applied widely to understand the
relationships expressed in terms of similarity or dissimilarity
among groups of multivariate data that are acquired from
different instrumental analysis, such as GC, NMR, FTIR, and
so on [18–20]. Attempting to establish a complete FAME
profile with enhanced speed, the present work evaluated the
FAME composition derived from animal fats, including cod
liver oil, lard, beef tallow, mutton tallow and chicken fat
using fast GC 9 GC analysis. The data obtained was further
characterized using multivariate statistical analysis.
Methodology
Materials
Different batches of subcutaneous tissues from four animal
species, namely pigs, cows, sheep and poultry, as well as
cod liver oil were collected from the local market in
Selangor, Malaysia. Animal fat specimens were then
extracted from the tissues using the microwave procedure
described in a previous work [21]. FAME standards were
purchased from Sigma–Aldrich Chemicals (Deisenhofen,
Germany) and diluted to the range of 50–150 mg L-1.
Chromatography-grade methanol and hexane were pur-
chased from Fisher Scientific (UK), while sodium
hydroxide pellets was purchased from Merck Chemicals
(Darmstadt, Germany).
Derivatization of FAME Compounds
The conversion of extracted fat to FAME was performed
according to our previous report [22]. A 50-mg fat sample
was dissolved in 800 lL of hexane prior to the addition of
200 lL of 1N methanolic sodium solution. The mixture
underwent both hydrolysis and derivatization reactions
under 1 min of vortex mixing. The resulting FAME extract
was collected from the upper hexane layer and then
transferred into a 2-mL vial for GC 9 GC analysis.
GC 9 GC Analysis
An Agilent 6,890N GC 9 GC that was connected serially
with a Leco dual-stage thermal modulator was coupled to a
Leco Pegasus 4D time-of-flight mass spectrometer (MI,
USA) for FAME profiling analysis. The sample was
injected into the GC injector at 250 �C. Helium gas with
99.9999% purity was used as the carrier gas, while con-
figurations for conventional and fast GC 9 GC analysis
950 J Am Oil Chem Soc (2009) 86:949–958
123

were performed as stated in Table 1. The transfer line that
connected the GC and TOF-MS was maintained at 240 �C.
The TOF-MS generated 70 eV electron impacts at 220 �C
with 1,500 V of detector gain voltage, and a mass scan
ranging from 35 to 450 lg. Data points were collected
using 100 and 150 spectra per second acquisition rates for
conventional and fast GC 9 GC, respectively, prior to the
integration of a deconvoluted apexing peak using the
ChromaTOF software, version 3.34. The data was screened
with a threshold of 100 for the signal-to-noise ratio prior to
identification of FAME compounds from the specimens by
matching their mass spectral data with FAME standards,
NIST library version 2.0d as well as published data [23].
The normalized percentage of FAME was obtained and
then evaluated using Minitab statistical software, version
14. Analysis of variance (ANOVA) without intercept and
principal component analysis (PCA) with correlation
matrix were conducted. At least three replicates were
conducted for the entire experiment on each sample type.
Results and Discussion
Configuration of Fast GC 9 GC Settings
According to the revised GC 9 GC development model
[24], aspects of resolution, sensitivity and structure have to
be compromised when speed of analysis is being empha-
sized. While use of the microbore GC column allows suffi-
cient resolution under rapid-oven-ramping operation, the
amount of the sample being introduced in the fast GC
analysis (0.1 lL) was considerably less than that in the
conventional GC analysis (1 lL) in order to reduce column
overloading error. Complete separation of all 37 FAME
compounds was obtained by fast GC 9 GC and a good
distribution of these compounds was illustrated along the
contour plots (Fig. 1) under these orthogonal systems. A
three-fold shorter analysis time was possible, as compared to
that needed for the conventional GC 9 GC approach [25].
During the set up of GC 9 GC, the modulation con-
figuration is crucial for improving the resolution, sensi-
tivity and peak structure. Evaluation of the C-18 cluster
separation (Fig. 2) showed that the modulation period (PM)
was restricted below 2 s in order to acquire precise peak
measurement, while the shorter second column with 0.5 m
length was compromised. This revealed that a minimum
value for the modulation ratio, MR around 2.38, was
required for the fast GC 9 GC analysis. Such a value was
relatively higher than the recommended 1.5 MR value for
the conventional GC 9 GC analysis stated previously [12].
Table 1 Parameters of GC 9 GC operation
Configuration Parameter 1 (conventional GC 9 GC) Parameter 2 (fast GC 9 GC))
Primary column DB5 ms; 30 m 9 0.25 mm i.d. 9 0.25 lm dfa SLB5 ms; 10 m 9 0.10 mm
i.d. 9 0.10 lm dfb
Secondary column DBwax; 1 m 9 0.10 mm i.d. 9 0.10 lm dfc DBwax; 0.5 m 9 0.10 mm
i.d. 9 0.10 lm df
Injection mode 1.0 lL; split ratio 100:1 0.1 lL; split ratio 100:1
Primary oven ramping Initial 40 �C hold for 3 min, ramp to 160 �C at
15 �C min-1, ramp to 250 �C at 2 �C min-1, hold
5 min
Initial 40 �C hold 1 min, ramp to 160 �C
at 70 �C min-1, ramp to 250 �C at
8 �C min-1, hold 3 min
Secondary oven ramping 45 �C hold for 3 min, ramp to 165 �C at
15 �C min-1, ramp to 255 �C at 2 �C min-1, hold
5 min
45 �C hold for 1 min, ramp to 165 �C at
70 �C min-1 ramp to 255 �C at
8 �C min-1, hold 3 min
Modulation 4 s frequency, 1 s hot pulse 2 s frequency, 0.5 s hot pulse
a 5% Phenyldimethylsiloxane stationary phase (J&W, US)b 5% Phenyldimethylsiloxane stationary phase (Supelco, US)c Polyethylene glycol stationary phase (J&W, US)
Fig. 1 Separation of 37 FAME compounds in contour plot acquired
by fast GC 9 GC method
J Am Oil Chem Soc (2009) 86:949–958 951
123
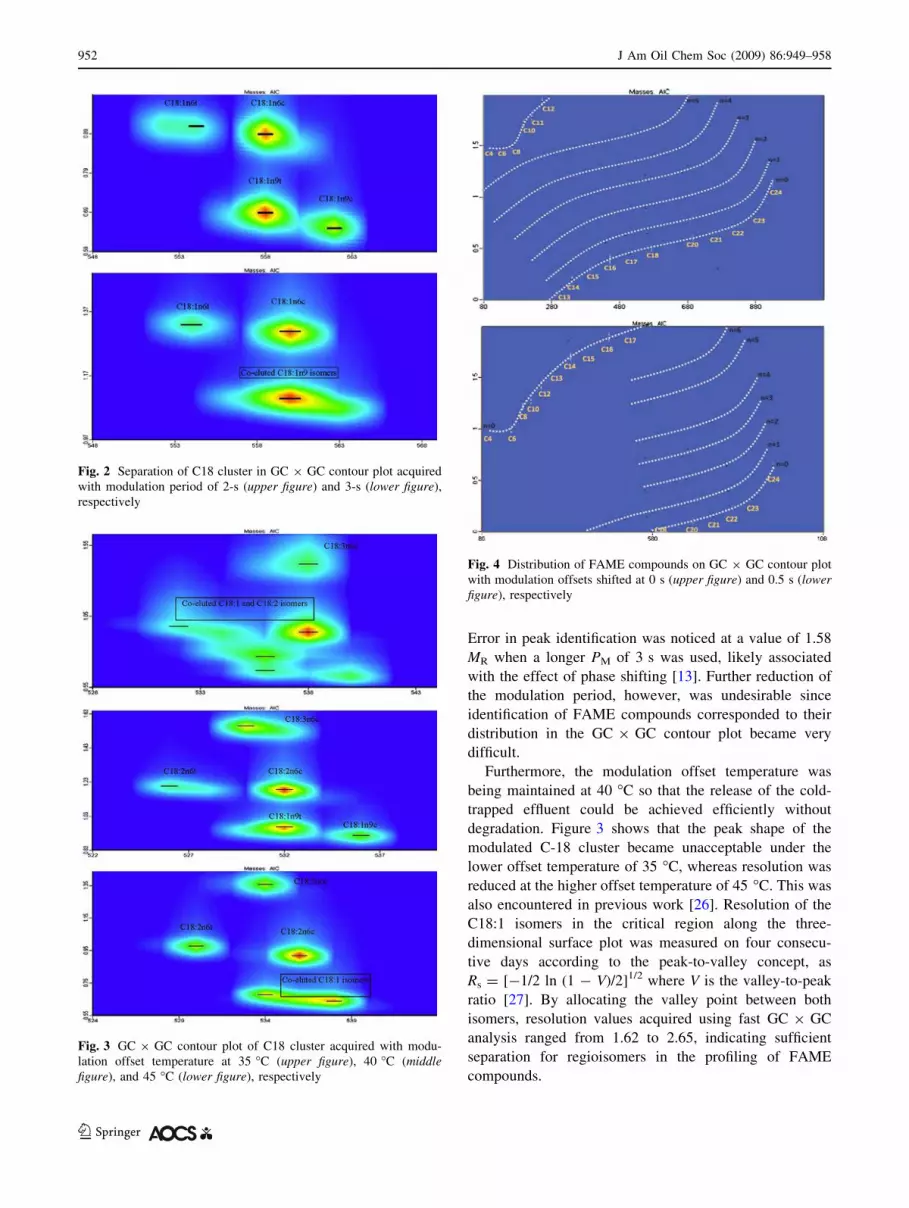
Error in peak identification was noticed at a value of 1.58
MR when a longer PM of 3 s was used, likely associated
with the effect of phase shifting [13]. Further reduction of
the modulation period, however, was undesirable since
identification of FAME compounds corresponded to their
distribution in the GC 9 GC contour plot became very
difficult.
Furthermore, the modulation offset temperature was
being maintained at 40 �C so that the release of the cold-
trapped effluent could be achieved efficiently without
degradation. Figure 3 shows that the peak shape of the
modulated C-18 cluster became unacceptable under the
lower offset temperature of 35 �C, whereas resolution was
reduced at the higher offset temperature of 45 �C. This was
also encountered in previous work [26]. Resolution of the
C18:1 isomers in the critical region along the three-
dimensional surface plot was measured on four consecu-
tive days according to the peak-to-valley concept, as
Rs = [-1/2 ln (1 - V)/2]1/2 where V is the valley-to-peak
ratio [27]. By allocating the valley point between both
isomers, resolution values acquired using fast GC 9 GC
analysis ranged from 1.62 to 2.65, indicating sufficient
separation for regioisomers in the profiling of FAME
compounds.
Fig. 2 Separation of C18 cluster in GC 9 GC contour plot acquired
with modulation period of 2-s (upper figure) and 3-s (lower figure),
respectively
Fig. 3 GC 9 GC contour plot of C18 cluster acquired with modu-
lation offset temperature at 35 �C (upper figure), 40 �C (middlefigure), and 45 �C (lower figure), respectively
Fig. 4 Distribution of FAME compounds on GC 9 GC contour plot
with modulation offsets shifted at 0 s (upper figure) and 0.5 s (lowerfigure), respectively
952 J Am Oil Chem Soc (2009) 86:949–958
123

Ta
ble
2F
AM
Ep
rofi
les
der
ived
fro
md
iffe
ren
tsp
ecie
su
sin
gfa
stG
C9
GC
–T
OF
MS
FA
ME
com
po
un
dE
mp
iric
form
ula
No
rmal
ized
per
cen
tag
e
Lar
dC
hic
ken
fat
Bee
fta
llo
wM
utt
on
tall
ow
Co
dli
ver
oil
Met
hy
lh
exan
oat
eC
6:0
nd
nd
trac
en
dn
d
Met
hy
lo
ctan
oat
eC
8:0
0.0
2±
0.0
1a
0.0
1±
0.0
1a
0.0
1±
0.0
1a
0.0
3±
0.0
2a
0.8
7±
0.2
8b
Met
hy
ld
ecen
oat
eC
10
:1n
dn
dn
dtr
ace
nd
Met
hy
ld
ecan
oat
eC
10
:00
.14
±0
.01
a0
.03
±0
.02
a0
.10
±0
.04
a0
.28
±0
.12
b0
.48
±0
.13
c
Met
hy
lu
nd
ecan
oat
eC
11
:0tr
ace
nd
nd
trac
etr
ace
Met
hy
ld
od
ecan
oat
eC
12
:00
.13
±0
.05
a0
.66
±0
.66
a0
.98
±1
.04
a0
.27
±0
.18
a0
.09
±0
.07
a
Met
hy
l1
0-m
eth
yld
od
ecan
oat
eC
13
:0ai
nd
nd
nd
trac
en
d
Met
hy
ltr
idec
ano
ate
C1
3:0
nd
trac
etr
ace
0.0
6±
0.0
6n
d
Met
hy
l1
2-m
eth
ylt
rid
ecan
oat
eC
14
:0ai
nd
nd
0.1
1±
0.0
4b
0.1
8±
0.0
6b
0.0
2±
0.0
3a
Met
hy
l1
1-t
etra
dec
eno
ate
C1
4:1
trac
e0
.14
±0
.06
a1
.71
±1
.34
b0
.04
±0
.03
a0
.08
±0
.02
a
Met
hy
lte
trad
ecan
oat
eC
14
:01
.61
±0
.35
a1
.31
±0
.17
a8
.40
±5
.10
b4
.58
±0
.26
ab
6.5
5±
0.9
7ab
Met
hy
l4
,8,1
2-t
rim
eth
ylt
rid
ecan
oat
e4
,8,1
2m
-C1
5:0
nd
nd
nd
0.1
8±
0.1
7a
0.2
1±
0.0
2a
Met
hy
l1
3-m
eth
ylt
etra
dec
ano
ate
c15
:0i
nd
nd
0.2
4±
0.2
0a
0.5
3±
0.0
8b
0.2
4±
0.0
4a
Met
hy
l1
2-m
eth
ylt
etra
dec
ano
ate
c15
:0ai
nd
nd
0.3
9±
0.1
3a
0.6
6±
0.2
2a
0.0
3±
0.0
3b
Met
hy
lp
enta
dec
eno
ate
c15
:1n
dn
dtr
ace
trac
en
d
Met
hy
lp
enta
dec
ano
ate
C1
5:0
0.0
7±
0.0
2a
0.1
0±
0.0
5a
0.6
7±
0.2
3bc
1.1
7±
0.2
0c
0.3
9±
0.1
0ab
Met
hy
l1
4-m
eth
ylp
enta
dec
ano
ate
C1
6:0
in
dn
d0
.26
±0
.09
a0
.36
±0
.07
a0
.08
±0
.02
b
Met
hy
l7
,10
-hex
adec
adie
no
ate
C1
6:2
n-6
nd
0.0
6±
0.0
7a
nd
nd
0.0
1±
0.0
2a
Met
hy
l7
,10
,13
-hex
adec
atri
eno
ate
C1
6:3
n-3
nd
nd
nd
nd
0.0
8±
0.0
4
Met
hy
ltr
ans-
7-h
exad
ecen
oat
eC
16
:1n
-9t
1.5
2±
0.2
4a
4.8
1±
1.1
1b
3.8
7±
1.9
7ab
1.0
6±
0.6
5a
8.5
3±
0.3
4c
Met
hy
l9
,12
-hex
adec
adie
no
ate
C1
6:2
n-4
nd
nd
nd
nd
0.3
0±
0.2
7
Met
hy
lci
s-7
-hex
adec
eno
ate
C1
6:1
n-9
cn
dn
d0
.21
±0
.27
a0
.58
±0
.48
a0
.21
±0
.02
a
Met
hy
lh
exad
ecan
oat
eC
16
:02
2.5
9±
3.4
8a
25
.62
±8
.96
a2
8.4
8±
10
.30
a1
4.5
5±
4.4
2a
18
.45
±2
.03
a
Met
hy
l2
-met
hy
lhex
adec
ano
ate
2m
-C1
6:0
nd
nd
nd
0.0
3±
0.0
2n
d
Met
hy
lcy
clo
pen
tan
eun
dec
ano
ate
Cy
clo
pen
ta-C
11
:0n
dn
dn
d0
.05
±0
.03
nd
Met
hy
l7
-met
hy
lhex
adec
e-6
-no
ate
7m
-16
:1n
dn
dn
dn
d0
.44
±0
.10
Met
hy
l2
,6,1
0,1
4-t
etra
met
hy
lpen
tad
ecan
oat
e2
,6,1
0,1
4m
-C1
5:0
nd
nd
nd
0.0
8±
0.0
5a
0.0
9±
0.0
2a
Met
hy
l1
5-m
eth
ylh
exad
ecan
oat
eC
17
:0i
nd
nd
0.3
7±
0.1
7a
0.6
8±
0.1
0b
0.1
5±
0.0
3a
Met
hy
l1
4-m
eth
ylh
exad
ecan
oat
eC
17
:0ai
0.0
1±
0.0
1a
trac
e0
.71
±0
.29
b1
.01
±0
.13
b0
.08
±0
.01
a
Met
hy
lh
epta
dec
eno
ate
C1
7:1
0.2
2±
0.0
6ab
0.0
3±
0.0
2a
0.6
5±
0.3
4b
0.3
2±
0.2
8ab
0.2
6±
0.0
7ab
Met
hy
lh
epta
dec
ano
ate
C1
7:0
0.4
7±
0.0
9a
0.1
2±
0.0
1a
1.2
7±
0.5
2b
2.1
5±
0.0
9c
0.1
4±
0.0
5a
Met
hy
l1
6-m
eth
ylh
epta
dec
ano
ate
C1
8:0
in
dn
d0
.14
±0
.08
b0
.16
±0
.03
b0
.04
±0
.02
a
Met
hy
l3
,7,1
1,1
5-t
etra
met
hy
lhex
adec
ano
ate
3,7
,11
,15
m-C
16
:0n
dn
d0
.03
±0
.05
a0
.16
±0
.03
b0
.17
±0
.05
b
J Am Oil Chem Soc (2009) 86:949–958 953
123

Ta
ble
2co
nti
nu
ed
FA
ME
com
po
un
dE
mp
iric
form
ula
No
rmal
ized
per
cen
tag
e
Lar
dC
hic
ken
fat
Bee
fta
llo
wM
utt
on
tall
ow
Co
dli
ver
oil
Met
hy
lci
s-9
,12
,15
-oct
adec
atri
eno
ate
C1
8:3
n-3
cn
d0
.03
±0
.01
nd
nd
trac
e
Met
hy
l6
,9,1
2,1
5-o
ctad
ecat
etra
eno
ate
C1
8:4
n-3
nd
nd
nd
nd
1.9
1±
0.4
1
Met
hy
ltr
ans-
9,1
2-o
ctad
ecad
ien
oat
eC
18
:2n
-6t
19
.18
±2
.41
a2
0.5
9±
9.3
8a
0.8
8±
0.5
3b
1.0
9±
0.0
8b
2.7
1±
1.9
9b
Met
hy
l6
,9,1
2-o
ctad
ecat
rien
oat
eC
18
:3n
-6c
1.2
3±
0.6
8ab
1.1
6±
0.6
4ab
0.3
2±
0.5
5a
2.2
6±
1.0
6b
0.7
8±
0.4
2ab
Met
hy
ltr
ans-
9-o
ctad
ecen
oat
eC
18
:1n
-9t
35
.42
±2
.41
a3
7.2
9±
4.1
2a
25
.52
±4
.94
b3
2.6
3±
5.0
1ab
23
.19
±0
.06
b
Met
hy
lci
s-9
-Oct
adec
eno
ate
C1
8:1
n-9
c0
.02
±0
.02
atr
ace
1.8
2±
2.5
0a
9.9
5±
4.4
6b0
.22
±0
.02
a
Met
hy
lci
s-9
,12
-oct
adec
eno
ate
C1
8:2
n-6
cn
dn
dtr
ace
1.0
1±
0.2
9b
0.0
9±
0.0
4a
Met
hy
l1
1-o
ctad
ecen
oat
eC
18
:1n
-7n
dn
dtr
ace
trac
en
d
Met
hy
lo
ctad
ecan
oat
eC
18
:01
5.3
1±
5.5
9bc
7.6
0±
1.2
8ab
21
.47
±6
.56
c2
0.2
0±
6.3
1c
2.3
1±
0.0
6a
Met
hy
l7
,8-o
ctad
ecad
ien
oat
eC
18
:2n
-10
nd
nd
0.4
6±
0.3
2tr
ace
nd
Met
hy
ln
on
adec
atri
eno
ate
C1
9:3
n-3
nd
nd
nd
0.8
0±
0.5
5n
d
Met
hy
ln
on
adec
atri
eno
ate
C1
9:3
n-6
nd
nd
nd
0.0
8±
0.0
3n
d
Met
hy
l1
7-m
eth
ylo
ctad
ecan
oat
eC
19
:0i
nd
nd
nd
trac
en
d
Met
hy
l1
6-m
eth
ylo
ctad
ecan
oat
eC
19
:0ai
nd
nd
nd
trac
en
d
Met
hy
l1
0-N
on
adec
eno
ate
C1
9:1
0.0
3±
0.0
3a
nd
0.0
9±
0.0
8ab
0.1
4±
0.0
6b
trac
e
Met
hy
ln
on
adec
ano
ate
C1
9:0
0.0
2±
0.0
0a
trac
e0
.08
±0
.04
a0
.13
±0
.12
an
d
Met
hy
l5
,8,1
1,1
4-e
ico
sate
trae
no
ate
C2
0:4
n-6
0.1
5±
0.0
5ab
0.0
7±
0.0
6a
nd
nd
0.2
1±
0.0
8b
Met
hy
l5
,8,1
1,1
4-e
ico
sap
enta
eno
ate
C2
0:5
n-3
nd
nd
nd
nd
7.0
1±
0.9
4
Met
hy
l1
1,1
4,1
7-e
ico
satr
ien
oat
eC
20
:3n
-30
.05
±0
.02
a0
.03
±0
.02
an
dtr
ace
trac
e
Met
hy
l8
,11
,14
,17
-eic
osa
tetr
aen
oat
eC
20
:4n
-3n
d0
.04
±0
.03
an
dn
d0
.40
±0
.03
b
Met
hy
l1
1,1
4-e
ico
sad
ien
oat
eC
20
:2n
-60
.62
±0
.10
an
dn
dtr
ace
0.1
3±
0.0
6b
Met
hy
l1
1-e
ico
sen
oat
eC
20
:1n
-90
.70
±0
.21
a0
.21
±0
.05
a0
.17
±0
.17
a0
.14
±0
.21
a9
.52
±2
.00
b
Met
hy
l8
,11
,14
-eic
osa
trie
no
ate
C2
0:3
n-6
0.0
7±
0.0
3a
nd
nd
trac
e0
.03
±0
.03
a
Met
hy
lei
cosa
no
ate
C2
0:0
0.1
8±
0.0
5a
0.0
5±
0.0
1a
0.1
6±
0.1
3a
0.5
1±
0.6
3a
0.0
5±
0.0
2a
Met
hy
l6
,9,1
2,1
5,1
8-h
enei
cosa
pen
taen
oat
eC
21
:5n
-3n
dtr
ace
nd
nd
0.0
8±
0.0
9
Met
hy
lh
enei
cosa
no
ate
C2
1:0
trac
en
dn
dtr
ace
nd
Met
hy
l4
,7,1
0,1
3,1
6,1
9-d
oco
sah
exae
no
ate
C2
2:6
n-3
nd
trac
en
dtr
ace
5.5
2±
2.4
9
Met
hy
l6
,9,1
2,1
5-h
enei
cosa
tetr
aen
oat
eC
21
:4n
-60
.05
±0
.04
nd
nd
nd
nd
Met
hy
l7
,10
,13
,16
,19
-do
cosa
pen
taen
oat
eC
22
:5n
-3n
dn
dn
dn
d0
.68
±0
.06
Met
hy
lci
s-1
3,1
6-d
oco
sad
ien
oat
eC
22
:2n
-6tr
ace
nd
nd
trac
en
d
Met
hy
l1
3-d
oco
sen
oat
eC
22
:1n
-9tr
ace
nd
trac
etr
ace
6.8
7±
1.4
3
Met
hy
ld
oco
san
oat
eC
22
:0tr
ace
nd
trac
e0
.30
±0
.50
trac
e
954 J Am Oil Chem Soc (2009) 86:949–958
123

Profiling of FAME Derived from Various
Animal Species
FAME components with different carbon-chain lengths and
levels of unsaturated bonds were clustered orderly on the
GC 9 GC contour plot by shifting the modulation offsets
accordingly. Figure 4 illustrates the distribution of FAME
compounds on the GC 9 GC contour plot with modulation
offsets shifted at 0 and 0.5 s (n is the number of unsaturated
bonds). This observation has greatly assisted in the rec-
ognition of the FAME compounds and eliminated the
wrap-around effect. In general, the FAME fraction derived
from the tested species was unraveled into a total of 68
compounds ranging from 6 to 24 carbon-chain lengths
(Table 2). C16:0, C18:0 and C18:1n-9t compounds were
found to be abundant in all the tested species, while levels
of a few other components were noticeably high in specific
species: C18:2n-6t in both lard and chicken fat; C14:0 in
beef tallow; C18:1n-9c in mutton tallow; and C20:1n-9,
C20:5n-3, C22:6n-3 and C22:1n-9 in cod liver oil.
The majority of individual FAME content was statisti-
cally varied (p \ 0.05) among the tested species (Table 2).
In a few previous studies, branch-chained fatty acids
(BCFA) occurred as the characteristic FAs of various
animals and bacteria [28, 29]. Our result also depicted that
MU contained significantly higher amounts of C14:0ai,
C15:0i, C15:0ai, C16:0i, C17:0i, C17:0ai and C18:0i.
Levels of 4,8,12 m-C15:0, 2 m-C16:0, 2,6,10,14 m-
C15:0.C18:1n-9c and C18:2n-3c components in MF were
also markedly higher among the tested species (p \ 0.05).
Apart from the BCFAs of C14:0ai, C15:0ai, C16:0i,
C17:0ai and C18:0i, high levels of C14:1, C14:0, C17:1
and C17:0 were observed in the BF.
trans-Positional unsaturated FAs were proposed previ-
ously as a characteristic of ruminants and animals with
ruminant-like digestive systems [30]. In contradiction to
this, CLO was characterized with significantly greater
levels of several monounsaturated and long-chain polyun-
saturated fatty acids (PUFA), including C16:1n-9t, C20:1n-
9t, C20:5n-3, C22:1 and C22:6n-3. Besides containing
lower level of BCFA and PUFA, both CF and LA also
possessed distinctly greater amounts of C18:2n-9t, as
compared to MF, BF and CLO samples. Nevertheless, the
content of C16:1n-9t and C18:3n-3c in CF was signifi-
cantly (p \ 0.05) higher than LA, which consisted of ele-
vated amounts of C20:2n-6 and C21:4n-6 compounds. The
C21:4n-6 component was previously detected in the rat’s
liver [31] but has not been reported in lard fat to date.
The presence of some minor FAME components such as
C18:1n-5, C16:1n-7 and C21:1n-7, which have been
reported previously in LA [32] was not observed in this
work. This was likely due to the small injection volume as
well as the rapid derivatization reaction during sampleTa
ble
2co
nti
nu
ed
FA
ME
com
po
un
dE
mp
iric
form
ula
No
rmal
ized
per
cen
tag
e
Lar
dC
hic
ken
fat
Bee
fta
llo
wM
utt
on
tall
ow
Co
dli
ver
oil
Met
hy
ltr
ico
san
oat
eC
23
:0tr
ace
nd
nd
trac
etr
ace
Met
hy
l1
5-t
etra
cose
no
ate
C2
4:1
nd
nd
nd
nd
0.3
4±
0.1
5
Met
hy
lte
trac
osa
no
ate
C2
4:0
nd
nd
nd
0.0
2±
0.0
2tr
ace
nd
no
td
etec
ted
;tr
ace
aver
age
con
ten
tb
elo
w0
.00
5%
Mea
nv
alu
esin
the
sam
ero
ww
ith
dif
fere
nt
sup
ersc
rip
tsar
esi
gn
ifica
ntl
y(p
\0
.05
)d
iffe
ren
t
J Am Oil Chem Soc (2009) 86:949–958 955
123
preparation. A saponification step could be utilized as an
alternative for better recovery of unsaturated FAMEs as
stated by Jua0reza [33]. Nevertheless, such derivatization
methods have produced poorly reproducible results since
the long and tedious preparation procedure has to be
compromised. Different column combinations and a lower
detection threshold could be utilized for complete profiling
of FAME at trace levels, as demonstrated by de Koning
et al. [34], who clearly distinguished the cis- and trans-
regioisomers between C18:1n-9 and C18:1n-15 using a
column combination of CP-WAX and VF-23 ms.
PCA Classification of FAME Species
Classification of the normalized data was evaluated using
PCA. An accumulative eigenvalue of about 90% was
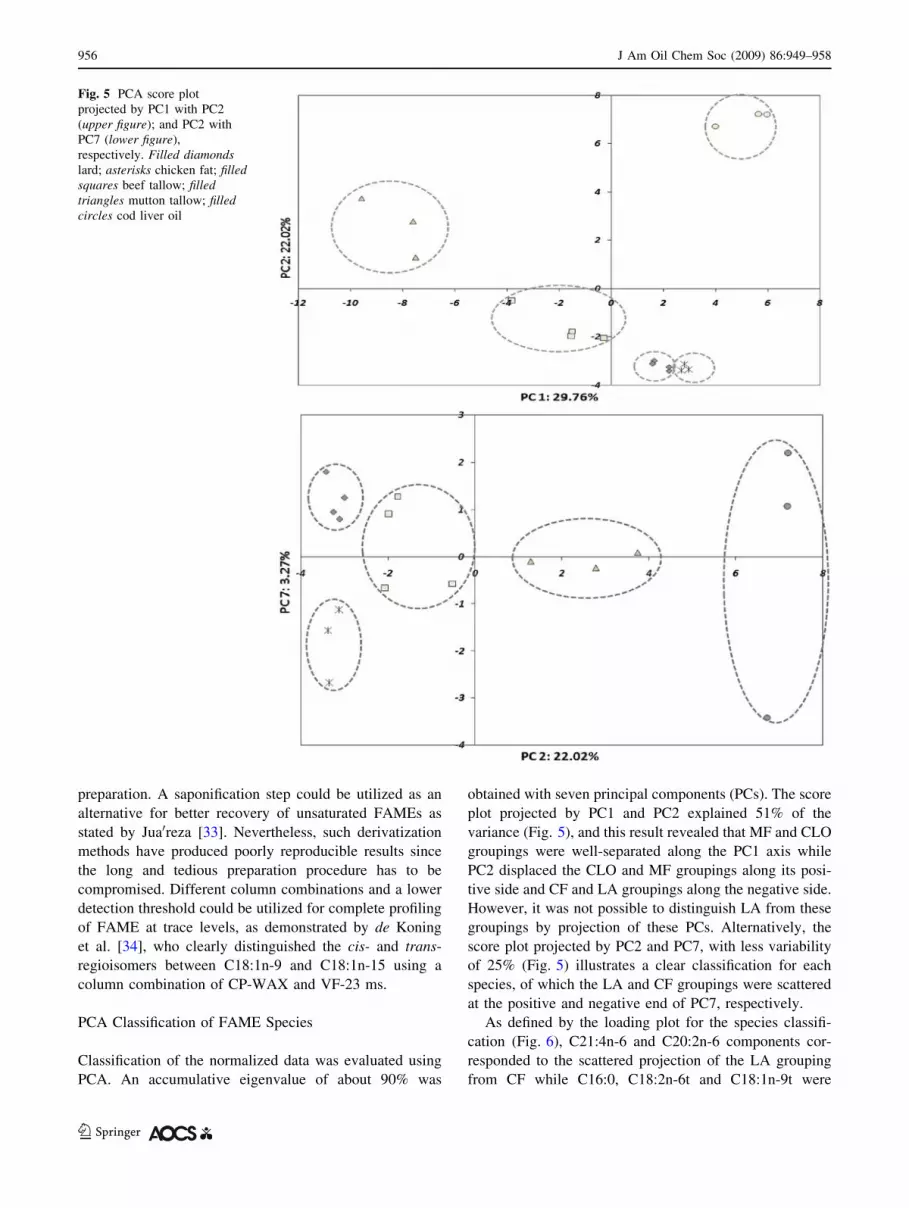
obtained with seven principal components (PCs). The score
plot projected by PC1 and PC2 explained 51% of the
variance (Fig. 5), and this result revealed that MF and CLO
groupings were well-separated along the PC1 axis while
PC2 displaced the CLO and MF groupings along its posi-
tive side and CF and LA groupings along the negative side.
However, it was not possible to distinguish LA from these
groupings by projection of these PCs. Alternatively, the
score plot projected by PC2 and PC7, with less variability
of 25% (Fig. 5) illustrates a clear classification for each
species, of which the LA and CF groupings were scattered
at the positive and negative end of PC7, respectively.
As defined by the loading plot for the species classifi-
cation (Fig. 6), C21:4n-6 and C20:2n-6 components cor-
responded to the scattered projection of the LA grouping
from CF while C16:0, C18:2n-6t and C18:1n-9t were
Fig. 5 PCA score plot
projected by PC1 with PC2
(upper figure); and PC2 with
PC7 (lower figure),
respectively. Filled diamondslard; asterisks chicken fat; filledsquares beef tallow; filledtriangles mutton tallow; filledcircles cod liver oil
956 J Am Oil Chem Soc (2009) 86:949–958
123

attributed to the separation of LA from CLO, MF, and BF
groupings. Despite the variation in FAME composition of
the samples due to various factors including age, cuts and
animal diets, the classification of different animal fats was
performed using rapid analysis by the fast GC 9 GC
approach with simple methylation and a high detection
threshold. The detection of LA as an adulterant has gained
considerable importance in many parts of the world. Pre-
vious techniques for LA detection were predominately
based on the determination of saturated FA, specifically
C16:0 at the sn-2 position of the triacylglycerols [22]. In
this study, additional variables that involved C21:4n-3,
C20:2n-6, C18:2n-6t and C18:1n-9t were used to distin-
guish LA from other fat samples. The use of C16:0 alone
will not achieve the same result.
Conclusion
Although information is widely available on the FAME
composition of different lipids, data comparison is difficult
to perform, mainly due to the use of varied experimental
designs and analytical methods. Rapid analysis of FAME
using a fast GC 9 GC approach involving the coupling of
two microbore GC columns was demonstrated in this
study. The desired resolution was obtained by manipulating
the modulation program under orthogonal column
configurations. In addition, classification of various animal
fats derived from five different animal species was suc-
cessfully achieved using this approach. The fast GC 9 GC
approach is definitely advantageous for the comprehensive
determination of animal fat composition with exceptional
speed and precision. Further studies are needed for the
characterization of regioisomers and enantiomers of acyl-
glycerol molecules from various sources, using the fast
GC 9 GC approach to facilitate food authenticity studies.
A discriminant study of LA adulteration in other edible oils
utilizing the preceding unsaturated FAs should be investi-
gated and validated further.
Acknowledgment The authors thank the Ministry of Science,
Technology and Innovation Malaysia for providing Prof Dr. Yaakob
bin Che Man the research grant (ScienceFund 05-01-04-SF0285) to
conduct this study.
References
1. AOAC Official Method 969.33 (2000) AOAC official methods of
analysis, chapter 41. AOAC, Arlington, pp 20–41
2. Duchateau GSMJE, van Oosten HJ, Vasconcellos MA (1996)
Analysis of cis- and trans-fatty acid isomers in hydrogenated
and refined vegetable oils by capillary gas–liquid chromatogra-
phy. J Am Oil Chem Soc 73(3):275–282
3. Hartig C (2008) Rapid identification of fatty acid methyl esters
using a multidimensional gas chromatography–mass spectrome-
try database. J Chromatogr A 1177:159–169
Fig. 6 PCA loading plot
of PC2 versus PC7
J Am Oil Chem Soc (2009) 86:949–958 957
123

4. Thurnhofer S, Vetter W (2005) A gas chromatography/electron
ionization-mass spectrometry-selected ion monitoring method for
determining the fatty acid pattern in food after formation of fatty
acid methyl esters. J Agric Food Chem 53:8896–8903
5. Eliasi JR, Dwyer JT (2002) Kosher and Halal: religious obser-
vances affecting dietary intakes. J Am Diet Assoc 102:911–913
6. Philips JB, Beens J (1999) Comprehensive two-dimensional gas
chromatography: a hyphenated method with strong coupling
between the two dimensions. J Chromatogr A 856:331–347
7. Ong RCY, Marriott PJ (2002) A review of basic concepts in
comprehensive two-dimensional gas chromatography. J Chro-
matogr Sci 40:276–291
8. Pierce KM, Hoggard J, Mohler C, Synovec RE (2008) Recent
advancement in comprehensive two-dimensional separations with
chemometrics. J Chromatogr A 1184:341–352
9. Schoenmakers P, Marriott P, Beens J (2003) Nomenclature and
conventions in comprehensive multidimensional chromatogra-
phy. LC GC Europe 16:1–4
10. Adahchour M, Beens J, Brinkman UATh (2008) Recent devel-
opments in the application of comprehensive two-dimensional
gas chromatography. J Chromatogr A 1186:67–108
11. Mondello L, Casilli A, Tranchida PQ, Dugo P, Dugo G (2003)
Detailed analysis and group-type separation of natural fats and
oils using comprehensive two-dimensional gas chromatography.
J Chromatogr A 1019:187–196
12. Khummueng W, Harynuk J, Marriott PJ (2006) Modulation ratio
in comprehensive two-dimensional gas chromatography. Anal
Chem 78(13):4578–4587
13. Harynuk J, Kwong AH, Marriott PJ (2008) Modulation-induced
error in comprehensive two-dimensional gas chromatographic
separations. J Chromatogr A 1200:17–27
14. Western RJ, Lau SSG, Marriott PJ, Nichols PD (2002) Positional
and geometric isomer separation of FAME by comprehensive
2-D GC. Lipids 37:715–724
15. Mondello L, Casilli A, Tranchida PQ, Costa R, Chiofalo B, Dugo
P, Dugo G (2004) Evaluation of fast gas chromatography and gas
chromatography–mass spectrometry in the analysis of lipids.
J Chromatogr A 1035:237–247
16. Jungle M, Bieri S, Huegel H, Marriott PJ (2007) Fast compre-
hensive two-dimensional gas chromatography with cryogenic
modulation. Anal Chem 79:4454–4484
17. Martens M, Martens H (2001) Multivariate analysis of quality: an
introduction. Wiley, Chichester
18. Cho H, Choi HK, Kim YS (2006) Difference in the volatile
composition of pine-mushrooms (Tricholoma matsutake Sing.)
according to their grades. J Agric Food Chem 54(13):4820–4825
19. Mannina L, Dugo G, Salvo F, Cicero L, Ansanelli G, Calcagni C,
Segre A (2003) Study of the cultivar-composition relationship in
sicilian olive oils by GC, NMR, and statistical methods. J Agric
Food Chem 51(1):120–127
20. Duarte IF, Barros A, Almeida C, Spraul M, Gil AM (2004)
Multivariate analysis of NMR and FTIR data as a potential tool
for the quality control of beer. J Agric Food Chem 52(5):1031–
1038
21. De Pedro E, Casillas M, Miranda CM (1997) Microwave oven
application in the extraction of fat from the subcutaneous tissue
of Iberian pig ham. Meat Sci 45:45–51
22. Marrikar JMN, Ghazali HM, Che Man YB, Peiris TSG, Lai OM
(2005) Use of gas liquid chromatography in combination with
pancreatic lipolysis and multivariate data analysis techniques for
identification of lard contamination in some vegetable oils. Food
Chem 90:23–30
23. The lipid library (accessed July 2008) Mass spectrometry of fatty
acid derivatives. http://www.lipidlibrary.co.uk/ms/arch_me/index.
htm
24. Harynuk J, Marriott PJ (2006) Fast GC 9 GC with short primary
columns. Anal Chem 78:2028–2034
25. Application notes for separation science by instrument from Leco
(accessed September 2008) Determination of fatty acid methyl
esters by GC 9 GC–TOFMS. http://www.leco.com/resources/
application_note_subs/pdf/separation_science/-277.pdf
26. Banerjee K, Patil SH, Dasgupta S, Oulkar DP, Patil SB, Savant R,
Adsule PG (2008) Optimization of separation and detection
conditions for the multiresidue analysis of pesticides in grapes by
comprehensive two-dimensional gas chromatography–time-of-
flight mass spectrometry. J Chromatogr A 1190:350–357
27. Peters S, Vivo-Truyols G, Marriott PJ, Schoenmakers PJ (2007)
Development of a resolution metric for comprehensive two-
dimensional chromatography. J Chromaotgr A 1146:232–241
28. Thurnhofer S, Hottinger G, Vetter W (2007) Enantioselective
determination of anteiso fatty acids in food samples. Anal Chem
79:4696–4701
29. Kaneda T (1967) Fatty acids in the genus Bacillus. I. Iso- and
anteiso-fatty acids as characteristic constituents of lipids in 10
species. J Bacteriol 93:894–903
30. Hui YH (1996) Animal fats in Bailey’s industrial oil and fat
products, vol 1, 5th edn. Wiley, New York, pp 1–18
31. Schlenk H, Gerson T, Sand DM (1969) Conversion of non-bio-
logical polyunsaturated fatty acids in rat liver. Biochim Biophys
Acta 176:740–747
32. Bragagnolo N, Rodriguez-Amaya DB (2002) Simultaneous
determination of total lipid, cholesterol and fatty acids in meat
and backfat of suckling and adult pigs. Food Chem 79:255–260
33. Jua0reza M, Polvillo O, Conto‘ B, Ficcob M, Ballico S, Failla S
(2008) Comparison of four extraction/methylation analytical
methods to measure fatty acid composition by gas chromatog-
raphy in meat. J Chromatogr A 1990:327–332
34. De Koning SD, Janssen H, Brinkman UA (2006) Characterization
of triacylglycerols from edible oils and fats using single and
multidimensional techniques. LC GC Europe 19(11):590–602
958 J Am Oil Chem Soc (2009) 86:949–958
123


