Embed Size (px)
Citation preview

RAPID HAZARD AND RISK ASSESSMENT
POST-FLOOD RETURN ANALYSIS
UNESCO on behalf of OCHA and UNCT, NEPAL Funded by UNDP
Supported by ICON/ADAPT Nepal
TABLE OF CONTENT
TABLE OF CONTENT....................................................................................................... II
LIST OF TABLES..............................................................................................................IV
LIST OF FIGURES.............................................................................................................V
1 INTRODUCTION .................................................................................................. 1
1.1 BACKGROUND .......................................................................................................... 1 1.2 OBJECTIVES/SCOPE OF THE STUDY................................................................................ 2 1.3 METHODOLOGY AND ORGANIZATION OF THE REPORT ..................................................... 3 1.4 LIMITATION.............................................................................................................. 6 1.5 ASSESSMENT TEAM.................................................................................................... 6
2 RIVER KOSHI AND THE BREACH ....................................................................... 8
2.1 INTRODUCTION ......................................................................................................... 8 2.2 RIVER SYSTEM........................................................................................................... 9
2.2.1 Sunkoshi Basin..................................................................................................... 10 2.2.2 Arun River Basin.................................................................................................. 11 2.2.3 Tamur River Basin................................................................................................ 12
2.3 KOSHI AREA TOPOGRAPHY....................................................................................... 12 2.4 THE KOSHI PROJECT ................................................................................................ 14 2.5 CHARACTERISTICS OF THE RIVER KOSHI CHANNELS WITH RESPECT TO GEOMORPHIC
CONTEXT GENERAL ......................................................................................................... 18 2.6 RIVER CHANNEL CHARACTERISTICS........................................................................... 19
2.6.1 River Channel Geometry and Processes..................................................................... 20 2.6.2 Response of Koshi River in Altered Conditions ........................................................... 23 2.6.3 Historical Records................................................................................................. 26 2.6.4 Sediment Load...................................................................................................... 26 2.6.5 Bed and Flood Profile Slopes.................................................................................... 27
2.7 SPUR FAILURE ......................................................................................................... 30 2.8 HYDROLOGICAL ASPECTS.......................................................................................... 36 2.9 ASSESSMENT OF THE EVENT OF THE EMBANKMENT BREACH FLOOD ON 18TH AUGUST 2008. 40
3 OBSERVATIONS FROM THE FIELD VISIT......................................................... 44
3.1 AREA AND PEOPLE AFFECTED .................................................................................... 44 3.2 PROPERTIES LOST ..................................................................................................... 45 3.3 BREACH REPAIR...................................................................................................... 52 3.4 CONDITIONS OF THE SPURS AND MAINTENANCE.......................................................... 52 3.5 REHABILITATION WORKS IN PROGRESS ....................................................................... 54 3.6 ASSESSMENT OF BREACH FLOOD RISK......................................................................... 54 3.7 EXPOSURES TO POTENTIAL RISK................................................................................. 57 3.8 LOCAL CAPACITY TO COPE WITH FLOOD RISK ............................................................... 63 3.9 FLOOD RISK MANAGEMENT...................................................................................... 65
3.9.1 The August 2008 breach flood ................................................................................. 65 3.10 PREPAREDNESS ....................................................................................................... 74 3.11 FLOOD FIGHTING AND PREPAREDNESS ( FF&P)............................................................ 75
4 CONCLUSIONS AND KEY ISSUES..................................................................... 77
4.1 INTRODUCTION ....................................................................................................... 77 4.2 TECHNICAL ISSUES:.................................................................................................. 77
Rapid Hazard and Risk Assessment Final Report: 20 March 2009 Koshi River Embankment Breach
iii
4.3 INSTITUTIONAL ISSUES:............................................................................................. 79 4.4 SOCIAL ISSUES ......................................................................................................... 79 4.5 PREPAREDNESS ISSUES: ............................................................................................. 80
5 RECOMMENDATION FOR RISK REDUCTION.................................................. 82
5.1 IMPROVING PREPAREDNESS ....................................................................................... 82 5.2 PREPARATION OF FLOOD STANDING ORDER ................................................................ 83
5.2.1 Nepal-India History of Flood Forecasting Cooperation ................................................. 84 5.2.2 Review of the existing hydrological and meteorological network ..................................... 88 5.2.3 Strategy to prepare a Flood Standing Order............................................................... 90
5.3 ASSESSMENT OF EARLY WARNING SYSTEM (EWS) AND STRATEGY FOR CREATING EWS ..... 91 5.4 MAINTENANCE OF SPURS.......................................................................................... 95 5.5 COMPREHENSIVE STUDY TO REDESIGN THE SPURS ......................................................... 96 5.6 DAM BREAK ANALYSIS.............................................................................................. 97 5.7 GENERATING ‘WHAT-IF SCENARIOS’ ........................................................................... 98 5.8 MONITORING MECHANISM........................................................................................ 98 5.9 MANPOWER TRAINING:............................................................................................ 99 5.10 CONSTRUCTION OF RETIRED EMBANKMENT................................................................. 99 5.11 LONG TERM ISSUES – CLIMATE CHANGE......................................................................100 5.12 RECOMMENDED ACTIVITIES AND RESPONSIBILITIES ......................................................101 5.13 MEDIUM TERM PLAN ..............................................................................................102
6 REFERENCES......................................................................................................103
Rapid Hazard and Risk Assessment Final Report: 20 March 2009 Koshi River Embankment Breach
iv
LIST OF TABLES
Table 2.1: Aggradation/Degradation of the River Koshi (GFCC & CBIP, 1986)..........26
Table 2.2: Hydraulic Parameters of the Koshi River (GFCC & CBIP, 1986).................29 Table 2.3: Flood frequency analysis at Chatara ............................................................38
Table 3.1: Number of households and population figures for the affected VDCs.......44
Table 3.2: Number of deaths and injuries .....................................................................45 Table 3.3: Loss of /damage to private properties.........................................................46
Table 3.4: Extent of damage to cultivated land............................................................46
Table 3.5: Number of livestock lost...............................................................................47 Table 3.6: Loss of crops in quintal.................................................................................48
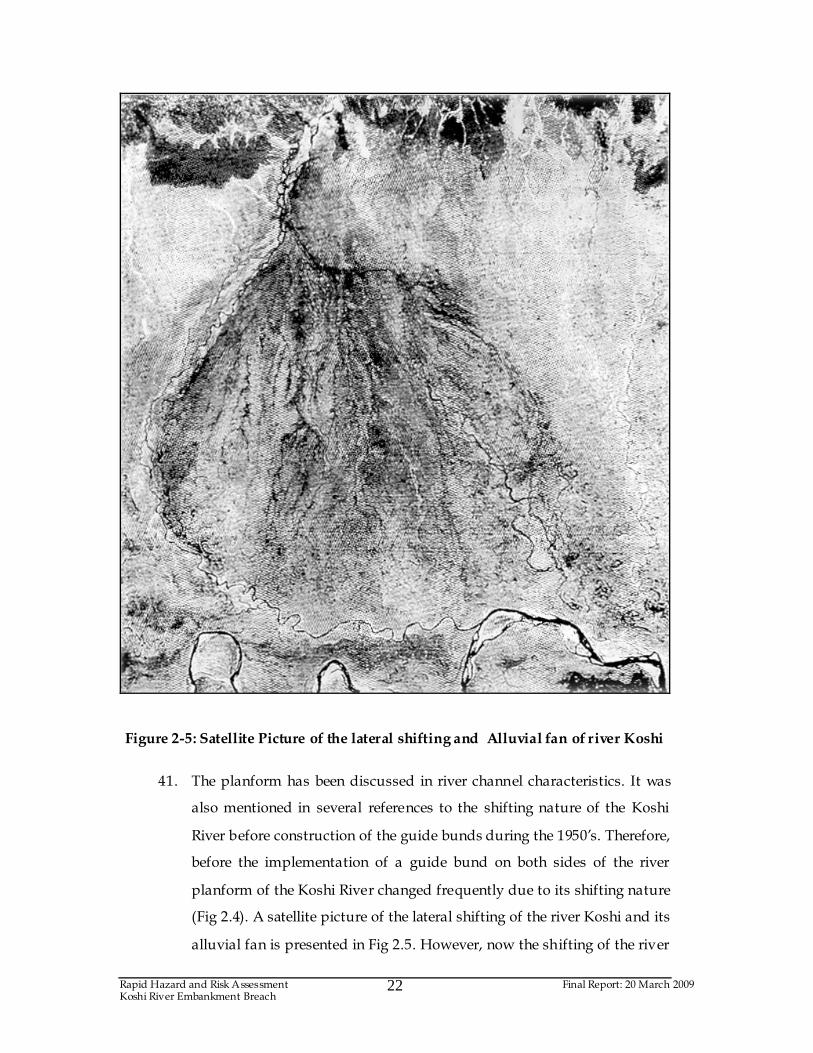
Table 3.7: Loss of fruits in quintal.................................................................................48
Table 3.8: Losses of vegetables in quintal.....................................................................49 Table 3.9: Loss of household goods in number.............................................................50
Table 3.10: Estimated monetary loss...............................................................................50
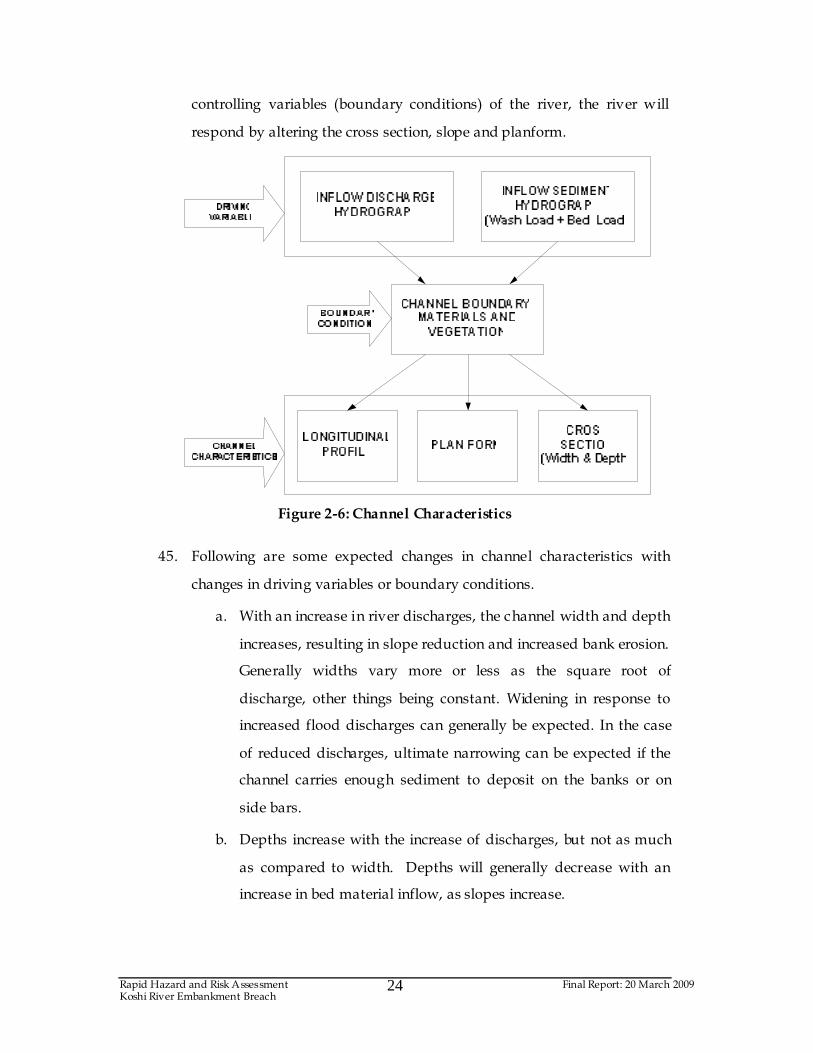
Table 3.11: Loss/damage of roads and trails..................................................................51 Table 3.12: Damage toinfrastructure..............................................................................51
Table 3.13: Number of days when the flow of goods and services were closed ............52
Table 3.14: Elements exposed to the potential risk of breach flood in Koshi.................59 Table 3.15: Area under different levels of risk and population......................................60
Table 3.16: Area under different levels of risk by land types.........................................61
Table 3.17: Number and percentage of houses located with different levels of flood risk.................................................................................................................61
Table 3.18: No. and percentage of livestock owned by households with different
levels of flood risk.........................................................................................62 Table 3.19: Major crops with level of risk.......................................................................62
Table 3.20: Number and percentage of public buildings, industries and structures
by the level of flood risk ..............................................................................63 Table 3.21: Number and percentage of items of infrastructure by level of flood risk....63
Table 3.22: Number of households by major occupation...............................................64
Table 3.23: Number of households by size of landholding............................................64 Table 3.24: Number of households by annual income category.....................................65
Table 3.25: Number of households by level of food sufficiency from own
production.....................................................................................................65 Table 3.26: Number of households and population in vacated camps located on the
western bank of Koshi River. ........................................................................67
Table 3.27: Number of camps by size of population ......................................................68 Table 3.28: Number of people by sex and other status...................................................68
Table 3.29: Number of families by ownership of land ...................................................69
Table 3.30: Number of household and population living in the camps by the place of origin.........................................................................................................69
Table 3.31: Number of camps with/without service facilities .......................................70
Table 3.32: One month’s expenditure on different items in the camps..........................70 Table 3.33: Number of camps reporting sufficiency in the distribution of goods and
services ..........................................................................................................71
Table 3.34: International/National Agencies Involved in Relief by Sector....................72 Table 3.35: Number of people willing/not willing to return home ...............................73
Rapid Hazard and Risk Assessment Final Report: 20 March 2009 Koshi River Embankment Breach
v
LIST OF FIGURES
Figure 1-1: Assessment Framework............................................................................4
Figure 1-2: Framework for Analysis ...........................................................................5 Figure 2-1: Koshi River Basin......................................................................................9
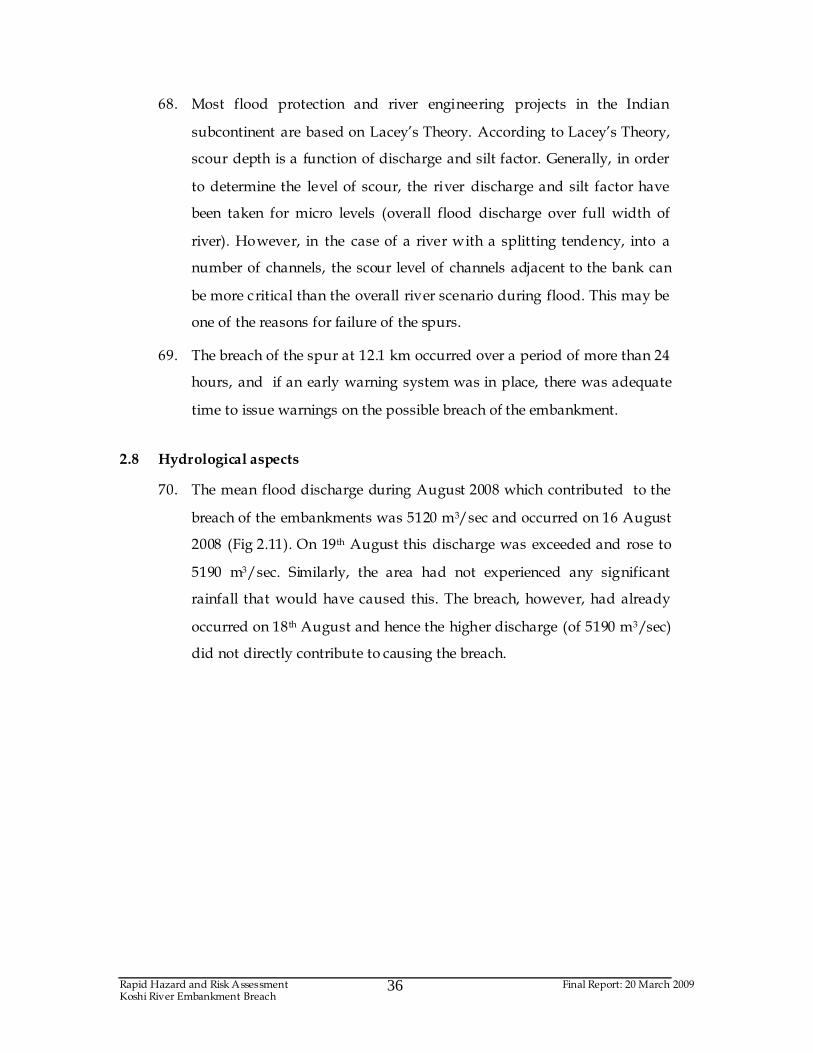
Figure 2-2: Koshi Topography..................................................................................14
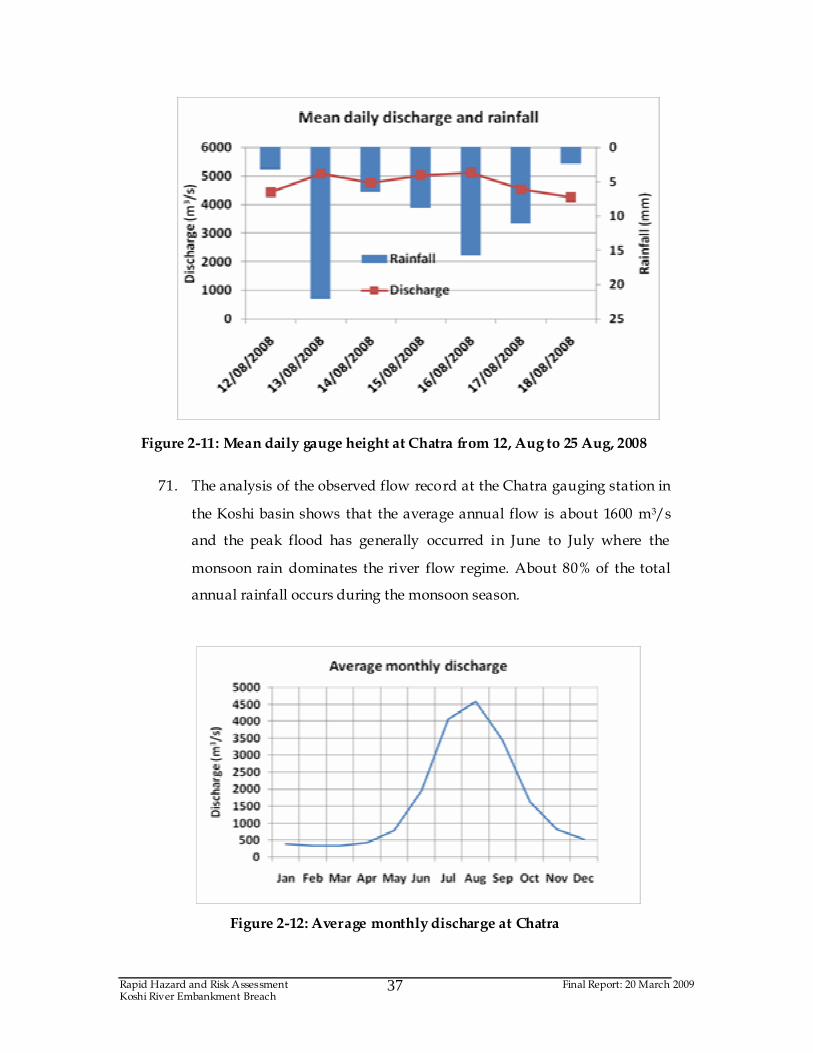
Figure 2-3: Major River Control Structure................................................................17 Figure 2-4: Historical Shifting of Koshi River...........................................................21
Figure 2-5: Satellite Picture of the lateral shifting and Alluvial fan of river Koshi .22
Figure 2-6: Channel Characteristics ..........................................................................24 Figure 2-7 Relationship between river discharge and sediment load at Koshi
Barrage at Hanuman Nagar (Garde et al., 1990) ....................................28
Figure 2-8: Schematic representation of the breach location with respect to the spurs at chainage 12.1 kmand 12.9km (Not to scale).............................33
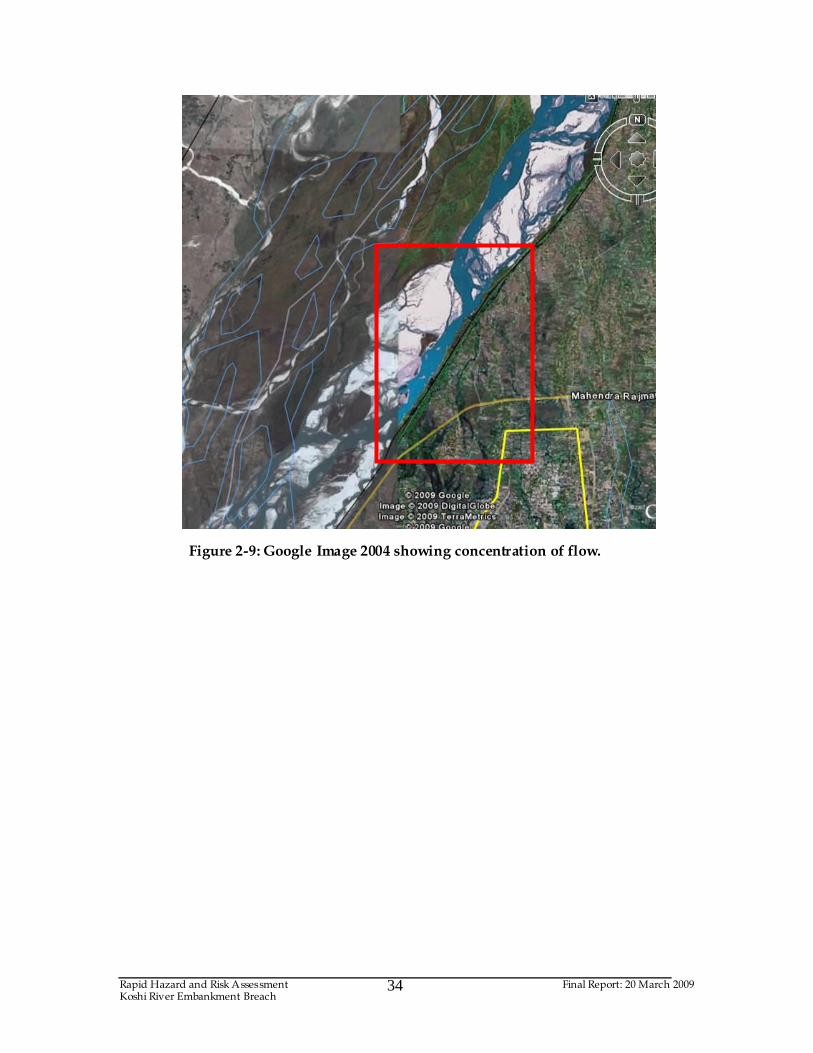
Figure 2-9: Google Image 2004 showing concentration of flow. ..............................34
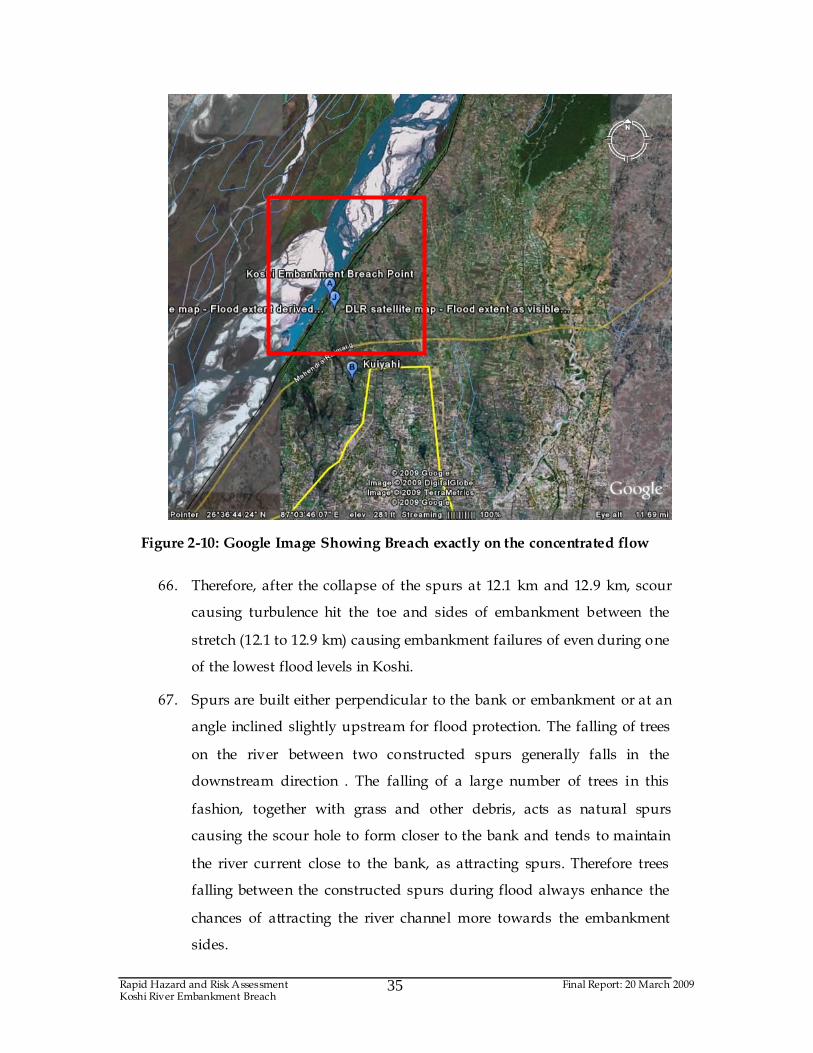
Figure 2-10: Google Image Showing Breach exactly on the concentrated flow.........35 Figure 2-11: Mean daily gauge height at Chatara from 12, Aug to 25 Aug, 2008 ......37
Figure 2-12: Average monthly discharge at Chatara..................................................37
Figure 2-13: Maximum instantaneous flood discharge in Koshi at Chatara..............39 Figure 2-14: Mean daily discharge at Chatara and mean daily rainfall for 12 Aug to
18 Aug, 2008............................................................................................39
Figure 3-1: Potential Breach Points and Flow Paths.................................................55 Figure 3-2: Google Earth Image showing concentration of flow upstream of the
breach (1=Current Breach, 2= Prakashpur, 3= Rajabas and
4=Pulthegaunda).....................................................................................56 Figure 3-3: Area under risk and major ethnic groups ..............................................58
Figure 3-4: Risk classification of the Koshi Basin below Chatra until the Barrage...60
Figure 3-5: Shelter Camps in the Area......................................................................67 Figure 3-6: Area Covered by Sand and Water..........................................................73
Figure 5-1: Conceptual Approach to Koshi Flood Preparedness .............................83
Figure 5-2: Line Diagram of Hydrometric Station on Koshi and its Tributeries in India ........................................................................................................86
Figure 5-3: Hydrometric and Precipitation Station in Koshi Basin..........................87
Rapid Hazard and Risk Assessment Final Report: 20 March 2009 Koshi River Embankment Breach
1
1 INTRODUCTION
1.1 Background
1. Flooding is a common phenomenon in the Himalayan Rivers. Every year
floods affect thousands of people in the Himalayan region. Every year the
monsoon floods of immense magnitude from the Himalayan Rivers cause
huge loss in terms of damage and disruption to economic livelihoods,
businesses, infrastructure, services and public health. Long term data on
natural disasters suggests that floods are by far the most common cause
of natural disasters in this region. This has both an immediate effect such
as loss of life by drowning as well as a long term effect such as the spread
of disease. Fifty five percent of all people whose lives have been affected
by natural disasters are the victims of flooding. Between 1980 and 2008,
every year an average of 10 million people suffered flood damage, a
statistic which makes floods the most devastating of all natural disasters.
2. Flooding is already one of the most widespread of hydrometeorological
hazards, and international panels such as IPCC and ISDR have predicted
that it is very likely that flood hazard will continue to increase in many
areas of the world, including the Himalayan region, (McCarthy et al.,
2001). Both the number and magnitude of flood risks are increasing. This
increase is partly due to an uncertainty in the way that natural
phenomena are understood and interpreted, and partly due to the
increasing vulnerability of people living in the flood plain or in an area
with high exposure to a flood event.
3. The Koshi flood that occurred on the 18th of August had a devastating
impact. The disaster occurred due to the breach of eastern embankment
of the Koshi barrage at Kushaha of Sunsari district. The flood entered into
the settlements damaging national highways, power transmission lines,
communication cables, schools, health posts, village roads and private
and public buildings. After the initial rescue and relocation works
carried out by the administration, security forces and NGOs, the
Rapid Hazard and Risk Assessment Final Report: 20 March 2009 Koshi River Embankment Breach
2
immediate remedial measures for flood control are being carried out to
restore the pre-flood situation in the affected district. The objective of
ongoing repair and construction works is not only to repair and retrofit
the damage caused, but also to create a situation such that it is safe for the
internally displaced people (IDP) to return to their homes and farms.
1.2 Objectives/scope of the study
4. Although the Koshi River is now flowing back within the guided
embankment, there are several activities that need to be undertaken to
ensure that such disasters do not happen again. There was an immediate
need to undertake a risk and vulnerability assessment to ascertain :
a. Risk for and vulnerability of the IDPs in returning back to their
place of origin vis-à-vis the quality and pace of repair and
construction work along the embankment, especially the breach
area;
b. Adequacy of flood preparedness and early warning;
c. Likelihood of return of the flood in the area.
5. The broader objective of this assignment was to carry out a rapid
assessment of the ongoing remedial measures undertaken for the Koshi
Floods in terms of hydraulic and structural effectiveness. More
specifically, the objectives of the assignment were::
a. To make a qualitative and quantitative assessment of the
immediate vulnerability of the flood affected people of Koshi,
especially a risk and vulnerability analysis of the quality and pace
of ongoing repair works vis-à-vis the flood displaced community
in a participatory manner;
b. To assess the adequacy of flood preparation and the early warning
mechanism in the flood prone region;
Rapid Hazard and Risk Assessment Final Report: 20 March 2009 Koshi River Embankment Breach
3
c. To assess the likelihood of the scenario of the return of floods of
similar magnitude and the potential for disaster.
d. To develop a risk management plan to deal with possible flooding
that will facilitate coordination between agencies, including the
UN system agencies
e. To prepare a medium term action plan and an implementation
plan.
1.3 Methodology and Organization of the report
6. This report was prepared on the basis of a rapid assessment of the
disaster stricken area. The team, comprised of senior government officials
from Nepal, consultants from both India and Nepal and led by a UN
official, visited the breach site and undertook a detailed investigation on
the cause of the breach and analyzed the existence of pre-breach hazard
and vulnerability in the area. The work was undertaken at the request of
UNCT, Nepal.
7. This report is an outcome of 8 days (4 -11 Feb 2009) of extensive fieldwork
by experts, 30 days of hydrological data collection and assessment both in
Kathmandu and in the field (21 January – 18 February, 2009) and 30 days
( 30 January – 1 March, 2009) of socioeconomic data collection. While the
fieldwork of the experts mainly involved high-level interactions and
measurements, the latter two involved all three methods of data
collection – review of literature, survey at Village Development
Committee (VDC) level and observation. Published and unpublished
documents, information sheets and maps from relevant institutions were
collected and reviewed. All the affected VDCs and those located along the
Koshi river bank and its adjoining areas and all the shelter camps and
institutions located in local areas were surveyed with the help of
structured check lists. The current situation of the river channel
morphology, spurs and embankment were observed.
Rapid Hazard and Risk Assessment Final Report: 20 March 2009 Koshi River Embankment Breach
4
8. For vulnerability assessment, a total of 17 VDCs were surveyed. Among
them 12 VDCs1 were affected by the flood and the remaining 5 VDCs are
adjoining VDCs. Information at VDC level was generated through group
discussion. Social mapping was another important aspect in the collection
of field information. The group was requested to identify different levels
of flood hazard-prone areas within their VDCs, based on their
experience/perception and to delineate such areas in the toposheet on the
scale of 1:25000. The participants in the group discussion included VDC
secretary, ex-chairman, ex-ward chairman, leaders of different political
parties, social workers, businessmen etc. The size of the group in most
cases ranged from 10-12.
9. Similarly a total of 26 shelter camps were surveyed. Group discussion
was organized in each camp. The participants in the group discussion
included members of the shelter camp management main and sub-
committees, the camp supervisor, the health worker and internally
displaced people living in the respective camps.
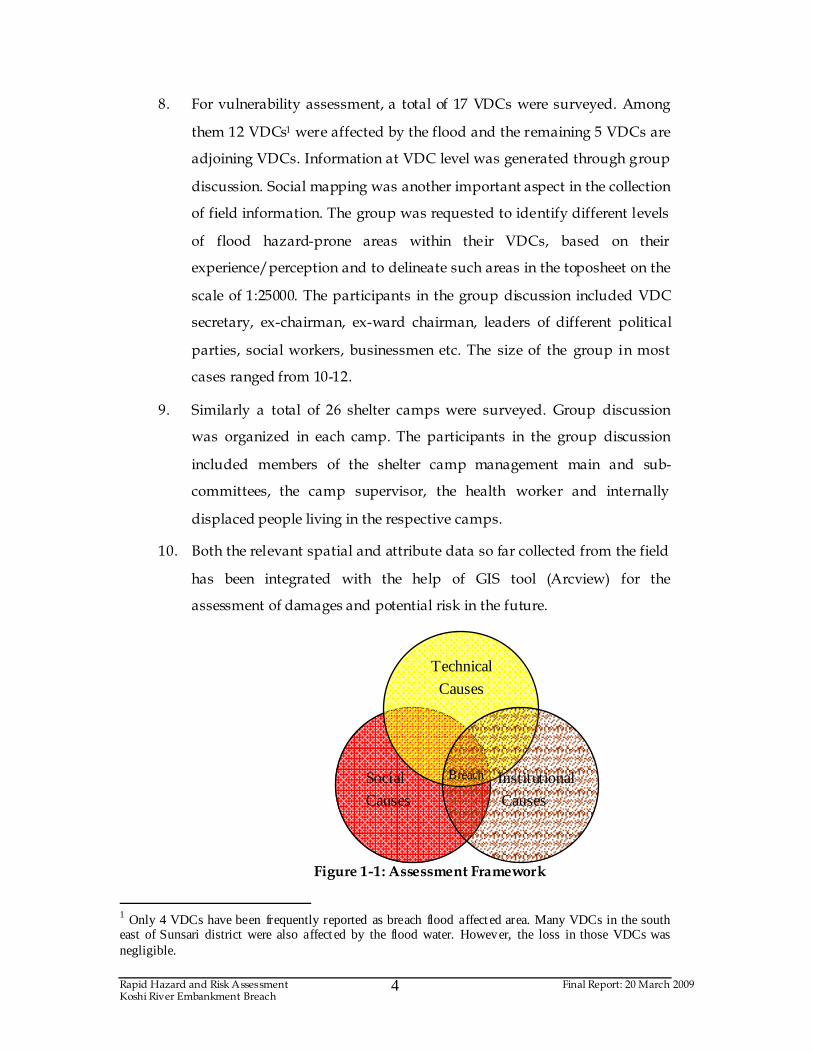
10. Both the relevant spatial and attribute data so far collected from the field
has been integrated with the help of GIS tool (Arcview) for the
assessment of damages and potential risk in the future.
Figure 1-1: Assessment Framework
1 Only 4 VDCs have been frequently reported as breach flood affected area. Many VDCs in the south east of Sunsari district were also affected by the flood water. However, the loss in those VDCs was negligible.
Social
Causes
Technical
Causes
Institutional
Causes
Breach
Rapid Hazard and Risk Assessment Final Report: 20 March 2009 Koshi River Embankment Breach
5
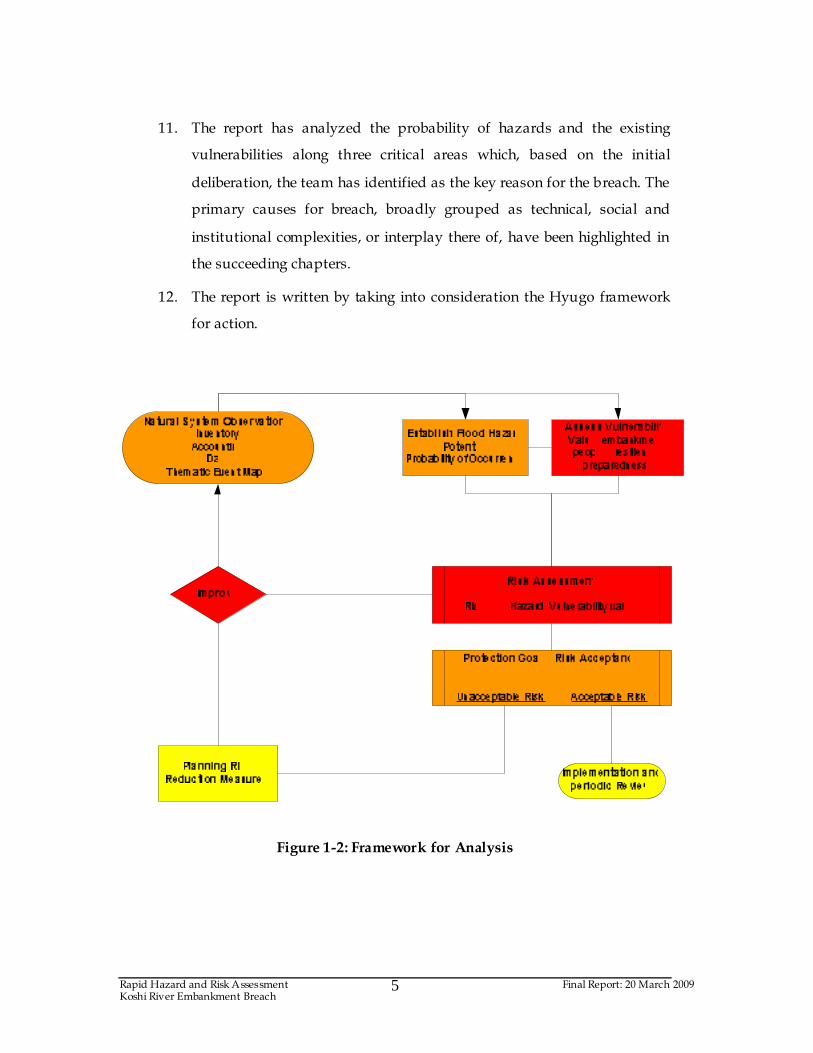
11. The report has analyzed the probability of hazards and the existing
vulnerabilities along three critical areas which, based on the initial
deliberation, the team has identified as the key reason for the breach. The
primary causes for breach, broadly grouped as technical, social and
institutional complexities, or interplay there of, have been highlighted in
the succeeding chapters.
12. The report is written by taking into consideration the Hyugo framework
for action.
Figure 1-2: Framework for Analysis
Rapid Hazard and Risk Assessment Final Report: 20 March 2009 Koshi River Embankment Breach
6
1.4 Limitation
13. This is a preliminary assessment at the pre-feasibility level. This is limited
only to Nepal and only for the eastern bank of the Koshi River, although a
cursory visit and observation was also made of the Western
Embankment. The level of field information generated for this study is at
VDC level, through group discussion. Likewise, the identification of the
potential breaching site was done based on the discussion with the key
informants and visual observation without making detailed investigation
of the properties of the materials used and the sheer strength of the
construction.
14. It must be noted that this report has been prepared to facilitate
humanitarian assistance and is not an attempt to question any bilateral
understanding which exists between India and Nepal. The content of this
report is not the view of UN agencies, but solely that of those who were
involved in the rapid assessment and how have they interpreted the
situation on the ground. Therefore the content of this report should in
no way be used as a bilateral negotiation tool.
1.5 Assessment Team
15. The Assessment Team involved senior government officials from Nepal,
Experts from Both India and Nepal.
a. Dr. L.P. Devkota, Hon. Member NPC
b. Mr. M. Dangol, Joint Secretary, MOWR
c. Mr. M. Gurung, DG, DWIDP
d. Mr. Adarsha Pokhrel, Former DG, DHM
e. Mr. R. Khadka, Regional Director, DWIDP
f. Prof. Prakash Adhikari, Department of Geology, TU
g. Prof. P.P. Mujumdar, Indian Institute of Science, Bangalore,
India
h. Prof. U.C. Kothyari, IIT, Roorkee, India
Rapid Hazard and Risk Assessment Final Report: 20 March 2009 Koshi River Embankment Breach
7
i. Mr. D.B.Yadav, Officer In-charge Regional office of DHM, Dharan
j. Prof. Narendra Khanal, Department of Geography, TU.
k. Dr. Sanjeev Shah, Structural Engineer, ICON
l. Mr. Srijan Aryal, Hydrologist, ICON
m. Dr. K.N.Dulal, Hydrologist, Nepal
n. Dr. B.R. Neupane, UNESCO
Rapid Hazard and Risk Assessment Final Report: 20 March 2009 Koshi River Embankment Breach
8
2 RIVER KOSHI AND THE BREACH
2.1 Introduction
16. The event proved beyond the reasonable doubt that the burden of loss, of
course, is greatest in poor communities, where previous studies have
shown that thirteen times more people die from flood events compared to
their rich counterparts. Economic losses also tend to be larger as a
proportion of the total economy of poorer communities tends to be
uninsured. The current flood has also proved that a natural disaster
knows no boundaries, economic background or ethnicity and is unbiased
in its assault. Koshi disaster impacted on two countries, affected millions
and perhaps pushed back the pace of development in the impacted area
by several decades, by hitting hard on local economies, health, quality of
life, education, politics and perhaps stability of the area.
17. This corroborates the common wisdom on flood management that there
is a dire need to share information on existing flood preparedness and
adopt practices that are best for the area. Enhanced preparedness is
obviously better than cure after the flood has impacted on the area.
Understanding the fact that floods can still return, there is a need to
undertake unilaterally, bilaterally or multilaterally the design and
establishment of an integrated system of flood management and
forecasting.
18. Complacency on the part of the authorities regarding existing strategies
and actions on monitoring, opted modalities for repair and maintenance,
confidence over the existing system of mutual cooperation, reliance on
available facilities for flood fighting and lack of emergency preparedness
all have played a distinct role in the breach that caused massive damage
and destruction and led to about 55 deaths thus far. Having said this, one
of the biggest contributors to the disaster is the very limited knowledge of
the Koshi River itself, which remains one of the least understood and
least studied rivers in Nepal. The information available about this river is
Rapid Hazard and Risk Assessment Final Report: 20 March 2009 Koshi River Embankment Breach
9
insufficient in terms of what is normally required to better understand a
river.
2.2 River System
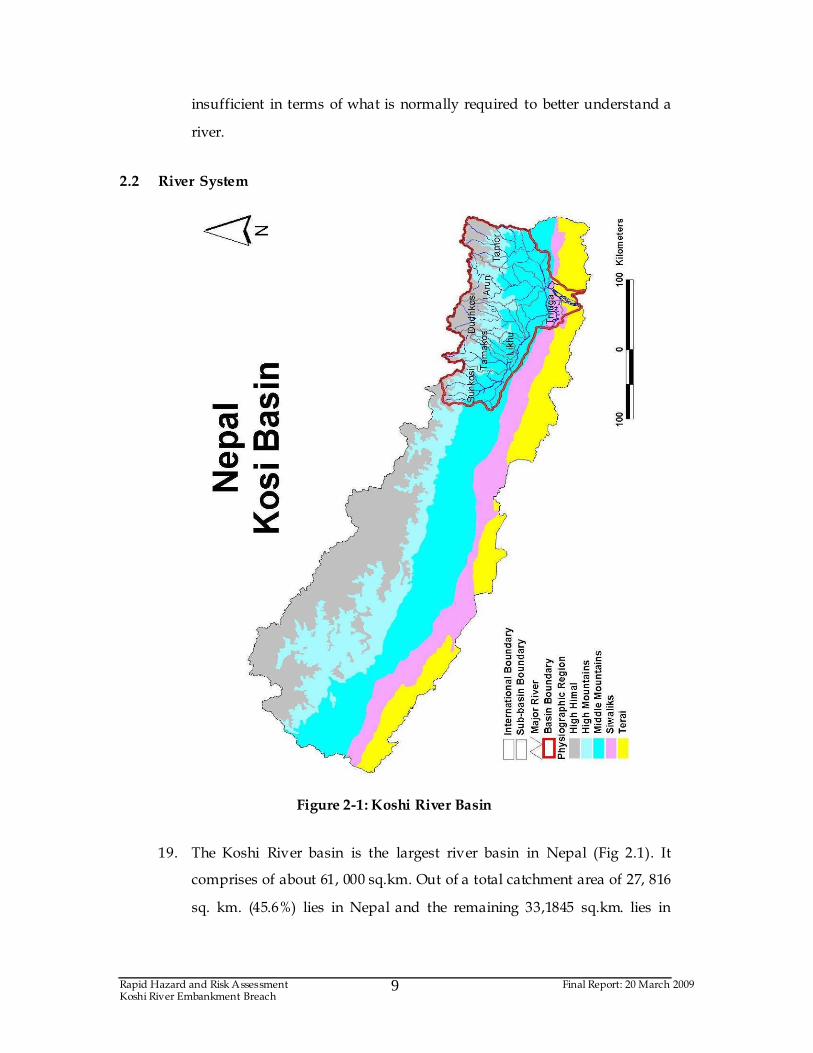
Figure 2-1: Koshi River Basin
19. The Koshi River basin is the largest river basin in Nepal (Fig 2.1). It
comprises of about 61, 000 sq.km. Out of a total catchment area of 27, 816
sq. km. (45.6%) lies in Nepal and the remaining 33,1845 sq.km. lies in
Rapid Hazard and Risk Assessment Final Report: 20 March 2009 Koshi River Embankment Breach
10
Tibet. In addition to the Koshi River basin, the other two major basins are
in Nepal namely; the Karnali and Gandaki River basins.
20. The River Koshi also commonly known as Sapta Koshi comprises of
seven rivers namely (From west to east); Indrawati, Sunkoshi, Tama
Koshi, Likhu, Dudh Koshi, Arun and Tamor. Out of these three major
rivers or tributaries originate in Tibet; namely; the Sun Koshi, Tama
Koshi and Arun. Broadly, the basin of Koshi can be divided into three
major river sub-basins; the Sunkoshi, Arun and Tamor. The Sunkoshi
River comprises of the Indarwati, Sunkhoshi, Tama Koshi, Likhu and
Dudh Koshi rivers.
2.2.1 Sunkoshi Basin
21. The catchment area of the Sunkoshi basin is about 19,000 Km2. The
Sunkoshi River originates in the mountain range east of Barhabise called
Kalinchowk, and flows in a westerly direction with steep river gradients
of 1:10 to meet the Bhotekoshi at Barhabise. The Bhotekoshi, originates
from a glacier on the south slope of Mt. Xixabangma Feng, in the
southern part of the Himalayan range in the Tibetan plateau. The
catchment area at the confluence point is about 2,375 km2 of which about
2000 km2 lies in Tibet. The average gradient in the upper reach is 1:8,
while in the lower reach it is about 1:31.
22. The Sunkoshi flows in a south-east direction up to Dolalghat, the
confluence point of the Sunkoshi with the Indrawati River, with an
average gradient of 1:130. The Indrawati River, one of the main
tributaries of the Sunkoshi River, originates in the Himalayan range and
flows in a south, south-east direction to meet with the River Sunkoshi at
Dolalghat. The average gradient of this river is about 1:34 in the upper
reach and 1:194 in the lower reach. The total catchment area of the
Indrawati at the confluence with the Sunkoshi River is about 1,175 km2.
The Sunkoshi River, after the confluence with Indrawati River, flows in a
south-east direction up to Tribeni with an average gradient of 1:450.
Rapid Hazard and Risk Assessment Final Report: 20 March 2009 Koshi River Embankment Breach
11
23. The Tamakoshi River, which originates in the southern part of the Tibetan
Plateau of China, flows in a southerly direction through the Rolwalin
Himalayan range and enters Nepal. Within Nepal, the river flows in a
southern direction through the mountainous and hilly areas with an
average gradient of 1:20 in the upper reach and 1:110 in the lower reach to
meet with Sunkoshi River at Khurkot. The Tamakoshi River has total
drainage area of 4,190 km2 at Khurkot. About 40 km downstream of
Khurkot, the Sunkoshi River joins with the Likhu Khola.
24. The Likhu Khola originates in the mountain areas and flows towards the
south to meet the Sunkoshi River. The average gradient of Likhu Khola is
about 1:54. Its drainage area at the confluence point with the Sunkoshi is
1,070 Km2. The Sunkoshi River after the confluence with Likhu Khola,
meets with the Dudhkoshi about 25 km downstream.
25. The Dudhkoshi originates in the Khumbu and Nojumpa Glaciers located
on the southern slopes of the Mahalangur Himalaya range and flows
directly from north to south resulting in a rapid river gradient. The
average gradient is about 1:30 in the upper reach and 1:250 in the lower
reach. The total drainage area of the river (at the confluence with the
Sunkoshi River) is about 4,140 km2.
26. The Sunkoshi River flows in a south-eastern direction to meet the Arun
and Tamur Rivers to form the Saptakoshi at Tribeni. The total length of
the river is 330 km. The gradient of the Sunkoshi River is approximately
1:210 through out the entire length of its course in Nepal.
2.2.2 Arun River Basin
27. The Arun River originates from a glacier on the northern slope of Mt.
Xixabangma Feng (El.8012m), part of the Himalyan range in the southern
part of the Tibetan highland. The river is called Pengqu within Tibet. It
flows eastward almost parallel to the Himalyan range in upper reaches
for a distance of about 280 km and then makes a sharp turn to the
southwest at the junction with its tributary, the Yenuzangbu River (in
Rapid Hazard and Risk Assessment Final Report: 20 March 2009 Koshi River Embankment Breach
12
Tibet), forming a big bend. The Arun then flows southward crossing the
Himalyan range into Nepal. It continues to flow south and joins the
Saptakoshi (Koshi) River at Tribeni. The total length of the river is about
510 km and the total drainage area is about 36,000 km2, out of which
25,310 km2 lies in Tibet. In Tibet it has a gradient of 1:130 and 1:630 in
upper and lower reach, respectively. When it enters in Nepal it has a
steep slope in the range of 1:30 to 1:50 in upper reach. In the middle reach
of Nepal it has a slope of 1: 96 and in lower reaches it has a slope of 1:300
to 1: 400.
2.2.3 Tamur River Basin
28. The river has its source in the High Himalayas. Near its source the
Tamur is called Medalung Khola. Before becoming the Tamur River it is
joined by a large khola called Yangma Khola. The north boundary of the
Tamur catchment lies in high Himalayas and delineates the border
between Nepal and Tibet. Similarly the eastern boundary lies in the High
Himalayas and delineates the border between Nepal and India.
Kanchanjanga (at an elevation of 8586m) the world’s third highest peak
lies in this basin. In addition, there are 13 other major peaks in the basin,
ranging from 5938 m (Ganbul on northern border of Nepal with Tibet) to
7902 m (Kambachen inside Nepal).
2.3 Koshi Area Topography
29. The altitude of the basin ranges from only 65 m near the Nepal-India
border in the south to 8848 m in the north within a short distance of
about 150 km. The channel gradient in the north is high, as a result the
tributaries are powerful in terms of erosion and transportation. When the
river debouches from the mountain areas near Chatra its gradient is
decreased and the channel pattern becomes braided. In the south near the
border and the barrage area, the relief of the channel bed is only 0.5 - 0.6
Rapid Hazard and Risk Assessment Final Report: 20 March 2009 Koshi River Embankment Breach
13
m/km. There are marked differences in the discharge between winter
and summer. The minimum recorded discharge is 280m3/s whereas the
average flood discharge during the monsoon period is about 11400 m3/s.
The long term average discharge in August is 4729 m3/s. The recorded
peak discharge was 25878 m3/s in 1968 (Dixit, 2009). Six events of
extraordinary flood in the Koshi River have been reported by local
people. These were in 1954, 1962, 1969, 1979, 1988 and 1996. One
extraordinary flood event usually occurs every 7-10 years. The river is
heavily loaded with sediments. It brings about 120 million cubic meters of
sediment every year of which about 90% is transported during monsoon
period. The major sources of sediment in the mountain areas are
landslide, debris flow, rockfall, avalanche, glacial lake outburst, active
down cutting of the river bed and bank erosion etc.. Due to such a high
sediment load, the river channel in the Terai, south from Chatra, is very
dynamic. This river has shifted about 115 km from the east to the west in
the last 220 years (Gole and Chitale, 1996 cited in Dixit, 2009). This
shifting of the Koshi River in the west is in the reverse topographic
gradient associated with the shifting of channel bars, due to excessive
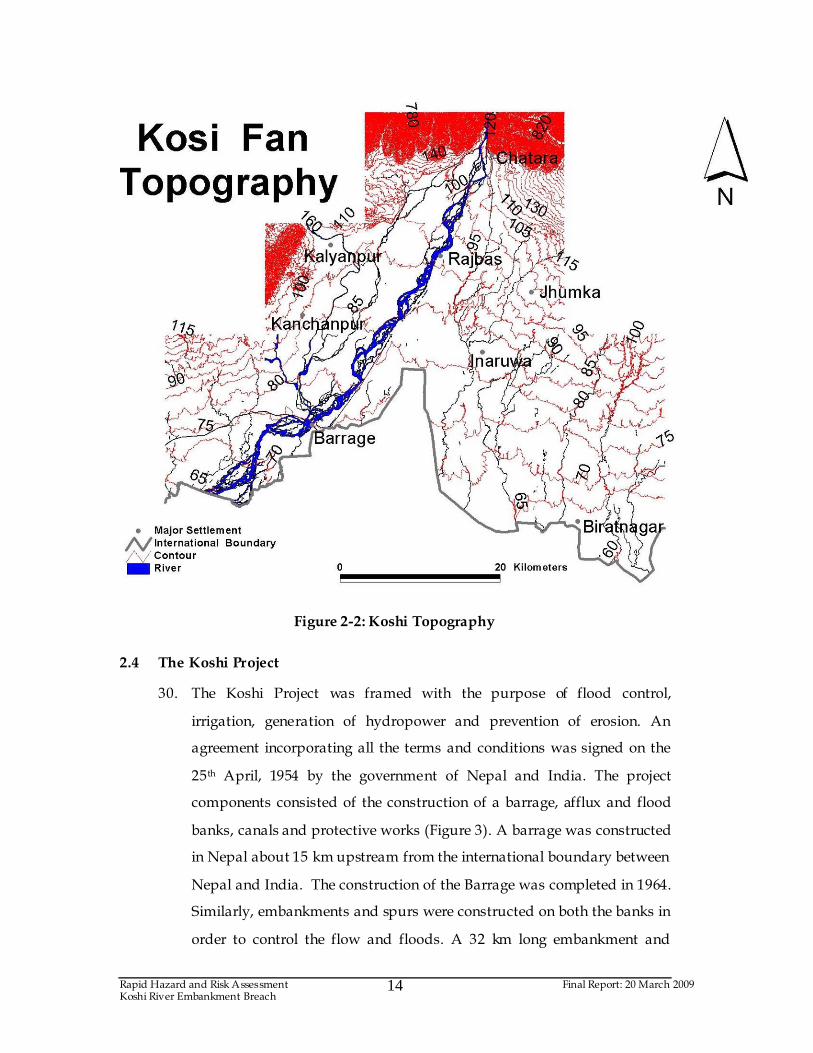
sediment concentration in the river. The topography of the Piedmont
area has been tilted from north-west to south-east as shown by the
contours (Figure 2). There is therefore the possibility of the river
shifting eastwards by avulsion, a fact which was realized long ago
(Chorely, 1984).
Rapid Hazard and Risk Assessment Final Report: 20 March 2009 Koshi River Embankment Breach
14
Figure 2-2: Koshi Topography
2.4 The Koshi Project
30. The Koshi Project was framed with the purpose of flood control,
irrigation, generation of hydropower and prevention of erosion. An
agreement incorporating all the terms and conditions was signed on the
25th April, 1954 by the government of Nepal and India. The project
components consisted of the construction of a barrage, afflux and flood
banks, canals and protective works (Figure 3). A barrage was constructed
in Nepal about 15 km upstream from the international boundary between
Nepal and India. The construction of the Barrage was completed in 1964.
Similarly, embankments and spurs were constructed on both the banks in
order to control the flow and floods. A 32 km long embankment and
Rapid Hazard and Risk Assessment Final Report: 20 March 2009 Koshi River Embankment Breach
15
spurs on the west bank and a 29 km long embankment with 46 spurs
were constructed by the project. The major work for the construction of
embankment and spurs was completed in 1959 some years ago when the
construction of the barrage was completed. A railway line was
constructed along the embankment between the barrage and
Chatra/Ghopa for the purpose of transporting construction materials
such as stone. After the completion of the construction work of the major
structures its operation was stopped and almost all the materials used in
the construction of railway line have been stolen.
31. The original agreement of 1954 between Nepal and India was
amended in 1966 (GoN, 1975). Some of the provisions of the amended
agreement of 1966 are as follows.
a. Any construction work for the project within Nepal is carried out
in consultation with the Government of Nepal.
b. Investigations and surveys for the general maintenance and
operation of the project are carried out by the Union
(Government of India) after due intimation to the Government
of Nepal.
c. All the data, specimens, reports and other results of surveys and
investigations carried out by the Union are made available to the
Government of Nepal freely and without delay. Similarly,
relevant data, maps, specimens, reports and other results and
surveys and investigations carried out by the Government of
Nepal are made available to the Union.
d. The Government of Nepal permits necessary access for the
execution of construction works including occupation of necessary
land.
e. No customs duty or duty of any kind, during construction and
subsequent maintenance, on any article and materials required
Rapid Hazard and Risk Assessment Final Report: 20 March 2009 Koshi River Embankment Breach
16
for the purpose and project and work connected therewith, are
not to be charged for by the government of Nepal.
f. Compensation for lands required for the execution of various
works, submerged lands, houses and other immovable
property and loss of land revenue is paid by the Union.
Compensation, in every case is tendered by the Union through
the Government of Nepal to the owners of the land for all
accidents that may have occurred .
g. Assessment of the compensation and the manner of payment is
determined jointly by mutual agreement.
h. Preference is given to Nepali labor, personnel and contractors for
the construction work where available. .
i. The establishment of a joint Indo-Nepal Koshi Project
Commission for the discussion of problems of common interest in
connection with the project and for purposes of co-ordination and
co-operation between the two governments. Until the joint
commission is formed, provision is also made for a temporary
coordination committee for the Koshi Project, in order to solve
the problems associated with land acquisition, the rehabilitation of
displaced people and maintenance of law and order.
j. As per the agreement, the Government of Nepal has established
Liaison and Land Acquisition Offices in Biratnagar with 25 staff.
These salaries of these staff are paid by the Koshi project. The
Liaison Office facilitates the import of construction materials
whereas the Land Acquisition Office keeps land records for
compensation.
32. The Koshi Project agreement between Nepal and India indicates that
the role of the Government of Nepal is limited to facilitation of the
project with very limited role in major decision making processes for
investigation of the embankment and river control structures and their
Rapid Hazard and Risk Assessment Final Report: 20 March 2009 Koshi River Embankment Breach
17
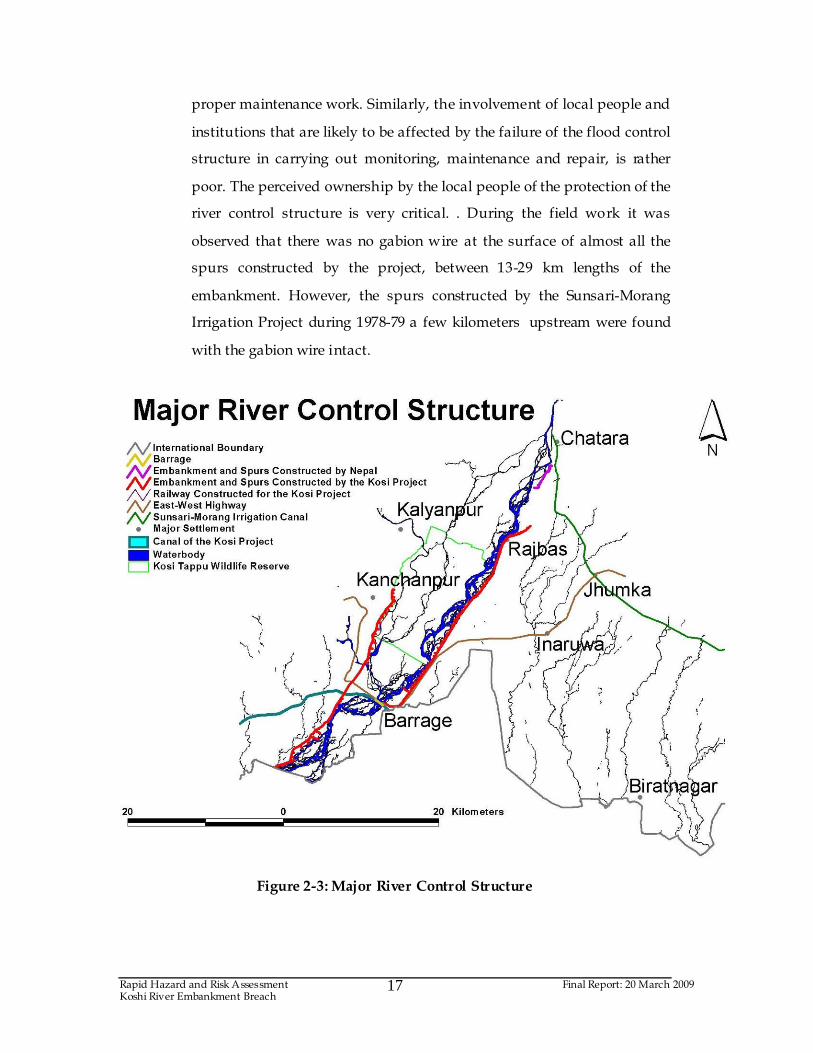
proper maintenance work. Similarly, the involvement of local people and
institutions that are likely to be affected by the failure of the flood control
structure in carrying out monitoring, maintenance and repair, is rather
poor. The perceived ownership by the local people of the protection of the
river control structure is very critical. . During the field work it was
observed that there was no gabion wire at the surface of almost all the
spurs constructed by the project, between 13-29 km lengths of the
embankment. However, the spurs constructed by the Sunsari-Morang
Irrigation Project during 1978-79 a few kilometers upstream were found
with the gabion wire intact.
Figure 2-3: Major River Control Structure
Rapid Hazard and Risk Assessment Final Report: 20 March 2009 Koshi River Embankment Breach
18
33. Another major project in the Piedmont area is the Sunsari-Morang
Irrigation Project. It was originally implemented as a Chatra Canal Project
under grant aid from the Government of India in 1964. The main canal
has a length of 53 km with a net total command area of 73,000 hectares
(Figure 2.3). The intake site is located near Chatra. During 1978-86, the
Koshi river control works were carried out and the embankment and
spurs were constructed.
34. The Koshi Tappu Wildlife Reserve between 6-25 km upstream from
the Barrage with an area of 175 sq. km, was established in 1976. It
was also recognized as Ramsar site in 1987.
2.5 Characteristics of the River Koshi Channels with respect to Geomorphic Context General
35. In general terms, the drainage basin of the Koshi River can be divided
into three main zones: an upper erosional zone of sediment production, a
middle zone of sediment transport with simultaneous erosion and
deposition, and a lower zone of sediment deposition. Flooding is more
common in the lower zones where the river overflows frequently onto
adjacent agricultural and other areas on both banks.
36. In the case of the Koshi River, the longitudinal profile of the stream
system tends to flatten through time by degradation in the upper reaches
and aggradation in the lower reaches. As in most of the natural river
systems this process is also slow enough to be of little engineering
concern; but in the case of the Koshi River the process is remarkable. It
has been observed that after the intervention on the Koshi River during
1950, profile flattening has been proceeding at very noticeable rates. The
flattening of the longitudinal profile was found to proceed rather
dramatically, especially in the lower zones after the construction of an
afflux bund for the Koshi Barrage and an embankment for flood
protection.
Rapid Hazard and Risk Assessment Final Report: 20 March 2009 Koshi River Embankment Breach
19
37. After assessments of the basin and channel system geomorphology
including historical maps, aerial photographs, satellite images,
hydrological records, geological and soils reports, ground reconnaissance,
and consultation with local residents and specialists, it was observed that
during the design and implementation of the Koshi Project during the
1950’s, more attention had been given to hydraulic design studies
whereas insufficient attention had been given to stability and
sedimentation aspects. In other words, stability was addressed to a great
extent but insufficient attention was given to long-term effects and
responses within and beyond the project area.
2.6 River Channel Characteristics
38. The lower zone of the Koshi River (from the foot hills of Nepal to the
downstream section ) comprises of an alluvial fans channel where the
river emerges from a mountain valley onto relatively flat land. In this
zone, the depositional tendency of the river channel is found to be
prominent. Depositional features are usually characterized by quantities
of coarse to fine alluvial materials. Similarly, unstable multiple channels
subject to frequent shifts or “avulsions” is a common phenomenon in the
lower zone of the river. It was also observed that the main channel is
often “perched” on the highest ground a number of times. It was
observed with the help of historical aerial photographs and through
interaction with senior local people, that deposition of sediment is highly
noticeable during the historical flood events in the alluvial fan and the
stream is eroding into earlier deposits dramatically. In general, the main
features of the river in the area of concern are (i.e. lower zone) the
formation of multiple channels and coarse deposits which are dynamic in
nature. The results of this phenomenon further deteriorate the stability
problems of the channel by sudden shifts in channel direction, erratic
deposition and degradation in the channel.

Rapid Hazard and Risk Assessment Final Report: 20 March 2009 Koshi River Embankment Breach
20
39. Embankments and other structure stability problems on this type of
alluvial fan include avulsion of the river at a point upstream of the
barrage structure or along river training works, thereby bypassing the
structures and infilling of the designed conveyance channel with coarse
to fine sediment deposits. Although, it was observed that flood control
works have been provided sufficiently far upstream of the barrage and
afflux bond stretches, however consideration for trapping or removal of
the sediment upstream of the flood control zone has been found lacking.
2.6.1 River Channel Geometry and Processes
40. In general, channel geometry has four main components: planform, cross
section, slope (gradient), and bed topography. The term “channel
processes” generally refers to natural changes in planform, cross-sectional
boundaries, longitudinal profiles, and bed topography.
Rapid Hazard and Risk Assessment Final Report: 20 March 2009 Koshi River Embankment Breach
21
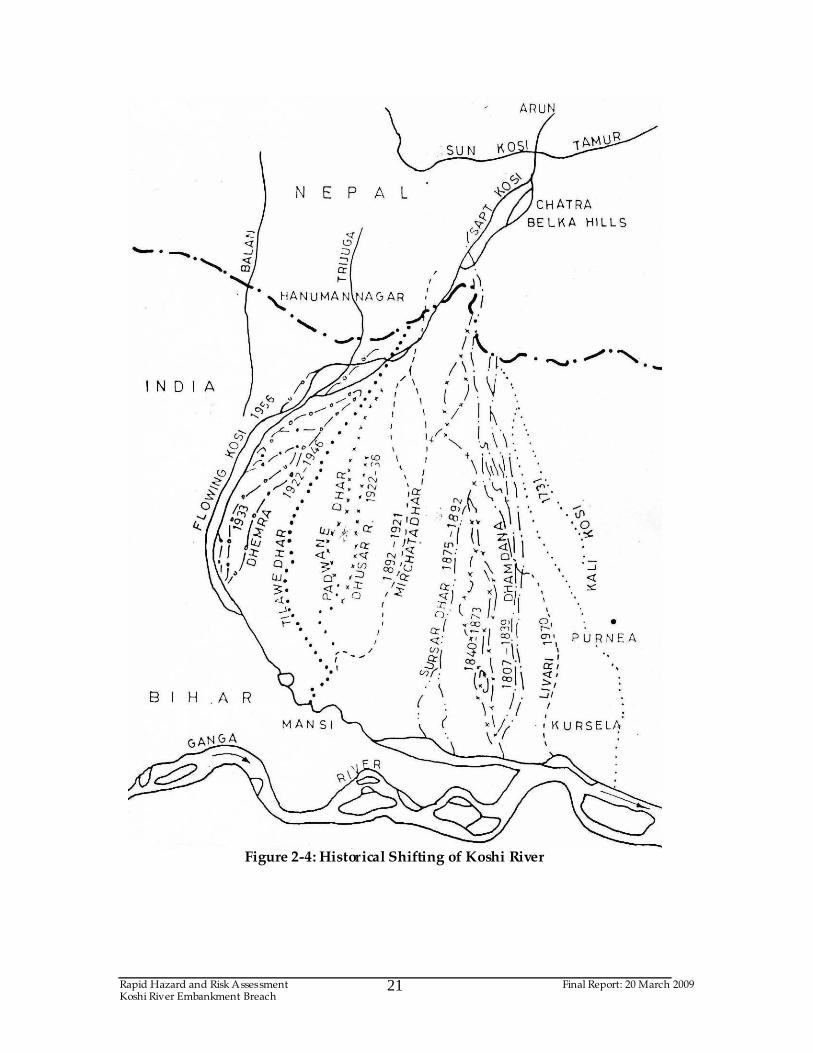
Figure 2-4: Historical Shifting of Koshi River
Rapid Hazard and Risk Assessment Final Report: 20 March 2009 Koshi River Embankment Breach
22
Figure 2-5: Satellite Picture of the lateral shifting and Alluvial fan of river Koshi
41. The planform has been discussed in river channel characteristics. It was
also mentioned in several references to the shifting nature of the Koshi
River before construction of the guide bunds during the 1950’s. Therefore,
before the implementation of a guide bund on both sides of the river
planform of the Koshi River changed frequently due to its shifting nature
(Fig 2.4). A satellite picture of the lateral shifting of the river Koshi and its
alluvial fan is presented in Fig 2.5. However, now the shifting of the river
Rapid Hazard and Risk Assessment Final Report: 20 March 2009 Koshi River Embankment Breach
23
has been restricted within the bund. Relationships between planform and
other aspects of geometry and processes of Koshi River are difficult to
systematize. In order to establish some relationship of planform and other
aspects of geometry and processes, the river has to be vigorously
monitored and assessed on a regular basis for the long term.
42. In general the cross section of a natural channel depends on basin runoff,
sediment input, and boundary soils and vegetation. Although under
natural conditions the average cross section usually does not change
much over a period of years, in the case of the Koshi River it was
observed that cross sections on the lower zone have been altering
frequently and temporarily during medium to severe floods.
43. Further, in the Koshi River channel the process of cross-section
enlargement by erosion is prominent on one bank and has been observed
by most people. This is mainly because the loss of banks and adjacent
properties are much more of a social issue than the shrinkage on the
opposite bank. Shrinkage of the cross section varies considerably. The
phenomenon of shrinkage of the cross section in the Koshi River is
mainly due to significant differences in the rate of deposition and the rate
of sedimentation during medium to severe floods.
2.6.2 Response of Koshi River in Altered Conditions
44. Instability and sedimentation have two aspects with respect to
construction of the barrage and afflux bund in the Koshi River: the impact
of existing processes on the project, and the impact of project changes on
the stream system both within and beyond the project length. In the case
of the Koshi River, it has been observed that the first aspect has been
taken greater care of than the second aspect. It should be noted that, the
flooding of adjacent banks and the breaching of the embankment of the
Koshi River were due to non-consideration of second aspect. The figure
below illustrates concepts for long term formation and the response of the
Koshi River. It is clearly illustrated that with the alterations in the
Rapid Hazard and Risk Assessment Final Report: 20 March 2009 Koshi River Embankment Breach
24
controlling variables (boundary conditions) of the river, the river will
respond by altering the cross section, slope and planform.
Figure 2-6: Channel Characteristics
45. Following are some expected changes in channel characteristics with
changes in driving variables or boundary conditions.
a. With an increase in river discharges, the channel width and depth
increases, resulting in slope reduction and increased bank erosion.
Generally widths vary more or less as the square root of
discharge, other things being constant. Widening in response to
increased flood discharges can generally be expected. In the case
of reduced discharges, ultimate narrowing can be expected if the
channel carries enough sediment to deposit on the banks or on
side bars.
b. Depths increase with the increase of discharges, but not as much
as compared to width. Depths will generally decrease with an
increase in bed material inflow, as slopes increase.
Rapid Hazard and Risk Assessment Final Report: 20 March 2009 Koshi River Embankment Breach
25
c. Similarly if bed-sediment load increases, the depth is reduced
with a remarkable increase in the bed slope, resulting changes in
planform, especially by increasing bars and channel splitting. This
may increase channel erosion.
46. The most widely known geomorphic relationship embodying slope and
the equilibrium concept is known as Lane’s (1955) Principle and can be
expressed in the form:
QS ~ QS D50
where
Q = discharge, ft3/sec
S = slope, ft/ft
Qs = bed material discharge, tons/day
D50 = median sediment size, ft
47. The periodic devastating floods on the Koshi River can be attributed to
the raising of the bed of its embanked channel by sediment brought down
from upper catchment, followed by the raising of the banks, whereby the
river is forced to flow above the level of the plains. When the river was
first embanked during the 1950’s, a considerable space was left between
the embankments and its banks on each side, so that sufficient space has
been provided to allow deviations in the channel and in consideration of
two main aspects; that a large area would be available for the depositing
of sediment and that a good width of channel would be available for
flood discharge. However it has been observed that the channel keeps on
shifting to the either side of the riparian land left within the
embankments and exposed to every flood. The boundary of the inner
embankments were formed close to the river, thereby greatly confining
the flood-waters, and consequently raising the flood-level and the river-
bed and therefore exposing these embankments to undermining by
merely a moderate change in position of the river channel.
Rapid Hazard and Risk Assessment Final Report: 20 March 2009 Koshi River Embankment Breach
26
2.6.3 Historical Records
48. Most of the left bank tributaries of the River Ganga originate in the
Himalayas and carry an enormous amount of silt. The problem of bank
erosion in these rivers is very common. The Koshi Rver shifted east-
wards over a distance of 112 kms in a period of about 225 years. In 1963,
the Koshi Project was constructed with a barrage at Hanuman Nagar and
with embankments along both the river banks. Earlier a disastrous breach
of the eastern embankment had occurred in 1984. An excessive silt load
and the consequent aggradation of the river bed are believed to be the
main cause of the braiding plan form of river and also that of the shifting
tendency of its numerous channels.
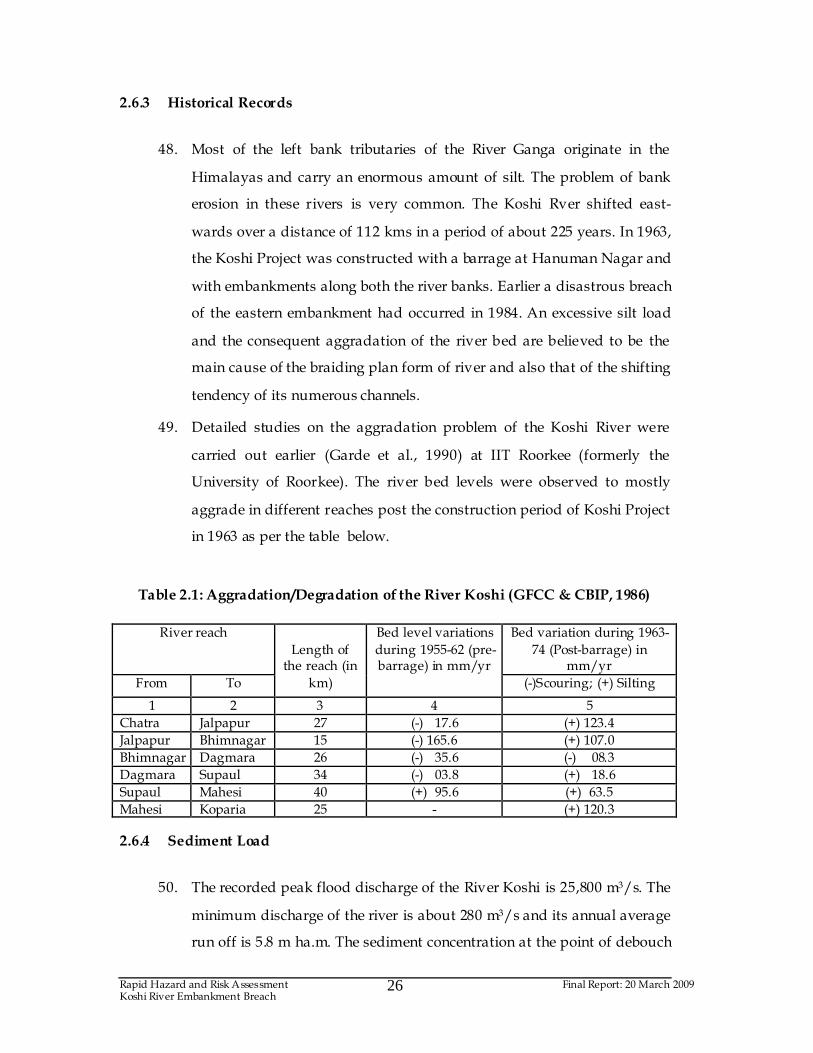
49. Detailed studies on the aggradation problem of the Koshi River were
carried out earlier (Garde et al., 1990) at IIT Roorkee (formerly the
University of Roorkee). The river bed levels were observed to mostly
aggrade in different reaches post the construction period of Koshi Project
in 1963 as per the table below.
Table 2.1: Aggradation/Degradation of the River Koshi (GFCC & CBIP, 1986)
River reach Bed variation during 1963-
74 (Post-barrage) in mm/yr
From To
Length of the reach (in
km)
Bed level variations
during 1955-62 (pre-barrage) in mm/yr
(-)Scouring; (+) Silting
1 2 3 4 5
Chatra Jalpapur 27 (-) 17.6 (+) 123.4
Jalpapur Bhimnagar 15 (-) 165.6 (+) 107.0
Bhimnagar Dagmara 26 (-) 35.6 (-) 08.3
Dagmara Supaul 34 (-) 03.8 (+) 18.6
Supaul Mahesi 40 (+) 95.6 (+) 63.5
Mahesi Koparia 25 - (+) 120.3
2.6.4 Sediment Load
50. The recorded peak flood discharge of the River Koshi is 25,800 m3/s. The
minimum discharge of the river is about 280 m3/s and its annual average
run off is 5.8 m ha.m. The sediment concentration at the point of debouch
Rapid Hazard and Risk Assessment Final Report: 20 March 2009 Koshi River Embankment Breach
27
from the gorge is about 0.2 percent by volume. The river carries little
coarse sediment; about 0.02 percent of the total load. The percentage of
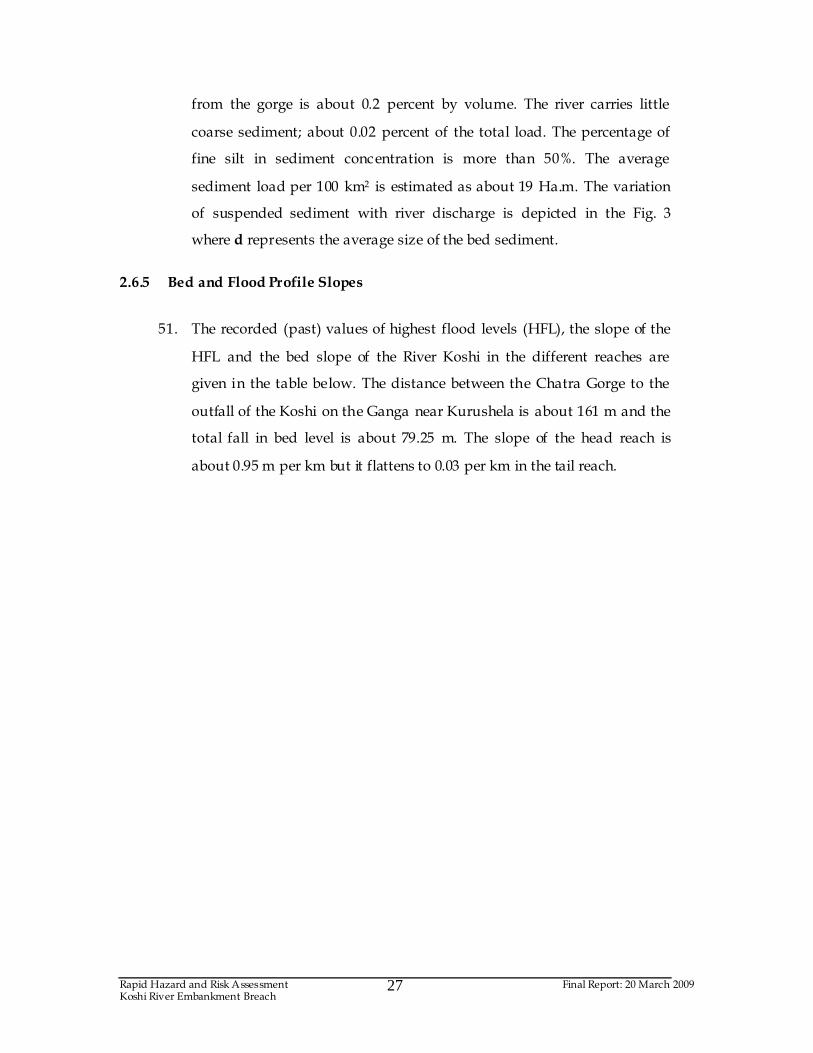
fine silt in sediment concentration is more than 50%. The average
sediment load per 100 km2 is estimated as about 19 Ha.m. The variation
of suspended sediment with river discharge is depicted in the Fig. 3
where d represents the average size of the bed sediment.
2.6.5 Bed and Flood Profile Slopes
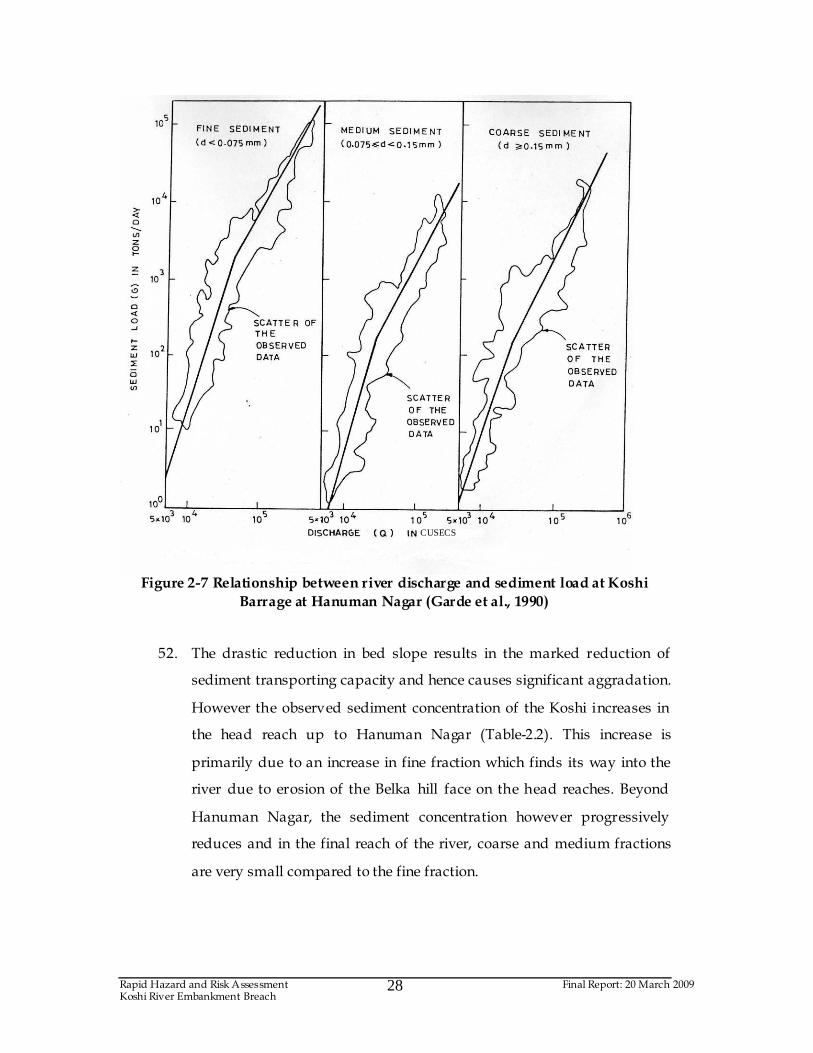
51. The recorded (past) values of highest flood levels (HFL), the slope of the
HFL and the bed slope of the River Koshi in the different reaches are
given in the table below. The distance between the Chatra Gorge to the
outfall of the Koshi on the Ganga near Kurushela is about 161 m and the
total fall in bed level is about 79.25 m. The slope of the head reach is
about 0.95 m per km but it flattens to 0.03 per km in the tail reach.
Rapid Hazard and Risk Assessment Final Report: 20 March 2009 Koshi River Embankment Breach
28
Figure 2-7 Relationship between river discharge and sediment load at Koshi
Barrage at Hanuman Nagar (Garde et al., 1990)
52. The drastic reduction in bed slope results in the marked reduction of
sediment transporting capacity and hence causes significant aggradation.
However the observed sediment concentration of the Koshi increases in
the head reach up to Hanuman Nagar (Table-2.2). This increase is
primarily due to an increase in fine fraction which finds its way into the
river due to erosion of the Belka hill face on the head reaches. Beyond
Hanuman Nagar, the sediment concentration however progressively
reduces and in the final reach of the river, coarse and medium fractions
are very small compared to the fine fraction.
CUSECS
Rapid Hazard and Risk Assessment Final Report: 20 March 2009 Koshi River Embankment Breach
29
Table 2.2: Hydraulic Parameters of the Koshi River (GFCC & CBIP, 1986)
Sr. No.
Station (starting upstream)
Distance (in km)
Suspended sediment load
in terms and percent of corresponding
values at Barakshetra
HFL (in m)
HFL slope (in
m per km)
Bed level (in m)
Bed
slopes (in m per km)
1. Chatra 0 109 110.18 - 102.16 -
2. Galpharia 17.71 111 - 0.95 - 0.89
3. Raniganj 41.86 - 70.74 - 65.08 -
4. Hanuman Nagar
51.52 141.5 - 0.50 - 0.42
5. Bhaptiahi 74.06 - 56.98 0.21 51.79 0.19
6. Saupaul 114.31 - 48.38 - 44.27 -
7. Karahara 123.97 96.5 - 0.12 - 0.23
8. Dhamra Ghat
210.91 - 36.25 - 19.58 -
9. Basua 238.28 27.5 - 0.32 - 0.023
10. Nagchia 296.24 - 33.35 0.074 17.19 0.057
11. Kursela 318.78 24 31.70 - 11.12 -
53. Because of a typical river morphology and huge sediment deposition, the
Koshi is characterized by a large number of small, local islands due to
braiding. This causes the flow to be constricted in narrow channels with
increased velocities. Further, the braids themselves change in shape, size
and location depending on the flow and sediment characteristics which
therefore adds complexity to flood protection measures for the river
system.
54. With these complexities there has to be a paradigm shift in management
of the Koshi River floods from ‘river control’ to ‘river management’
which emphasizes an integrated approach and addresses the cause rather
than the effect (Brierley and Fryirs, 2005). The river management strategy
must include modern approaches such as satellite-based monitoring and
system dynamic approaches integrated into user-friendly decision
support systems.
Rapid Hazard and Risk Assessment Final Report: 20 March 2009 Koshi River Embankment Breach
30
2.7 Spur Failure
55. The Koshi River is one of the typical Himalayan rivers possessing some of
its own specific evolutionary history besides the common characteristics
that it shares with the others. Generally, a combination of embankments
with spurs is provided in flood protection measures. Spurs at regular
intervals are provided to protect flood embankments. Spurs generally
minimize scouring on the embankment by moving the scour-causing
turbulence away from the embankment. Therefore, spurs are necessary to
protect the bank and the embankment from which they are projected and
deflect the current away from the bank.
56. In general, there are three reasons for embankment breach:
a. Overtopping-high flood, silt deposition
b. Piping- seepage and leakage due to rat holes, inappropriate
material and insufficient compaction
c. Scouring-flow concentration, high flood
57. To tame the Koshi River, different river training works have been
followed. The most commonly used structures to protect the bank erosion
and flood controls in the Koshi River are the construction of marginal
embankments and spurs. There are numerous spurs regularly arranged
from Chatra to the Koshi Barrage on the eastern (and western) side of the
Koshi River. Marginal embankments are constructed parallel to the bank
line, which shed regular spurs transversely into the river. The marginal
embankments near the Koshi Barrage acts as guided banks as well. The
spurs constructed more than 40 years ago are still functioning. The older
spurs are constructed ofearthen material; while the recently built spurs in
the upper reaches of the fan are of masonry bounded by woven wire nets.
Most of the spurs are at right angles to the riverbanks, but a few become
oblique due to the later action of river.
58. The marginal embankment along the eastern side of the Koshi River from
the Koshi Barrage to Chatra was focused on for the present study. The
Rapid Hazard and Risk Assessment Final Report: 20 March 2009 Koshi River Embankment Breach
31
embankment has a dual purpose , one for protecting the eastern area
from flooding and the other is serving as an embankment service/village
road. The embankment was constructed about 50 years ago, while the
embankment around west of Prakashpur and the Chakraghatti area are
newer. The older one was constructed using earthen material and the
latter was constructed using stone masonry with soil covering. The
embankment is about 2 to 3 m in height from the general surface i.e. the
bottom of the embankment, (which was more than 5 m above the water
surface of the river during the field inspection), and 5 m in width at the
top and 7 to 8 m at the bottom. The action of the embankment upstream
of the Koshi Barrage becomes evident by noting the elevation difference
of the ground on the riverside and the outer side of the embankments.
The elevation in some areas reaches up to 2 m or more. The elevation
differences become more just downstream of the spurs radiating into the
riverward side from embankment.
59. The spurs along the banks of the Koshi River are built to obtain certain
objectives, such as:
a. To train the river along the desired courses by attracting, or deflecting the flow in the desired direction.
b. To reduce the concentration of flow at a particular point of attack.
c. To create the slack zone for silting up the area.
d. To protect the bank by keeping the flow away from it.
60. In general, the spurs on the eastern bank of the Koshi River worked
satisfactorily to protect the area until the event of 18th August 2008.
61. The spur has two types of sedimentary processes, erosional and
depositional processes on either side, i.e., upstream and downstream
sides. The upstream side of the spur represents the site of erosion, and the
downstream side is the site of siltation, i.e., site of deposition. By
maintaining the good spacing between spurs, the worst effects of erosion
on the upstream side can be mitigated. The consequence of improper
spacing of the spurs has occurred at some locations. An example of one of
Rapid Hazard and Risk Assessment Final Report: 20 March 2009 Koshi River Embankment Breach
32
the worst cases of this occurred near the Salbandi village, Sunsari
district..
62. The breaching of the embankment on August 18 2008 took place due to
the failure of the upstream and the down stream spurs at the breach
point. The successive failure of a downstream spur (12.1 km from the
Barrage) and then an upstream spur (12.9 Km) allowed the stream
channel to shift from its previous location to the adjacent embankment.
The failure was due to the effect of scouring rather than to the magnitude
of the flood. The magnitude of the flood on that particular day had been
assessed with the help of gauging data at Chatra, which concluded that
the flood level was even less than 5 year return period flood in Koshi
River.
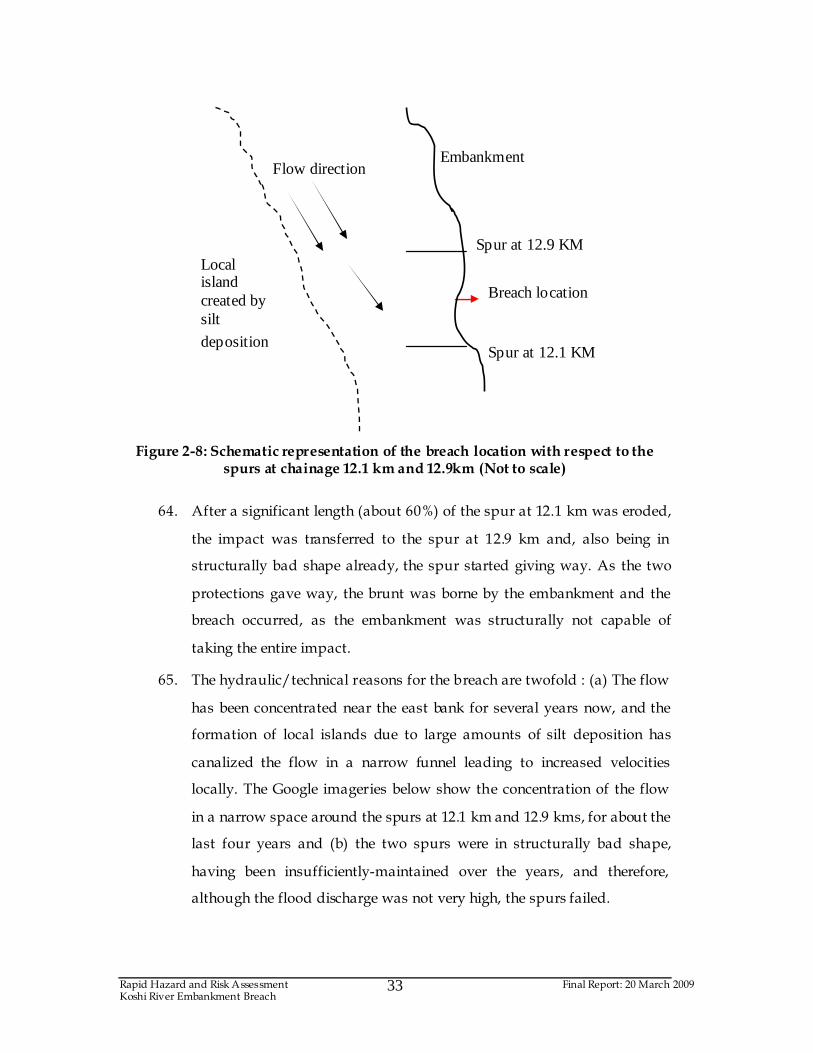
63. Figure 2.8 below shows a schematic of the breach portion with respect to
the spurs at chainage 12.1 km and 12.9 km. The spur at chainage 12.1 km,
which had eroded considerably over the last few years and was not
restored to its original length, was hit first. The nose portion of the spur –
which is the most critical structural part of a spur – failed because of the
high velocity of flow. Once the nose portion was eroded, the spur did not
have the structural strength and protection to resist further damage and a
rapid failure of the spur ensued.
Rapid Hazard and Risk Assessment Final Report: 20 March 2009 Koshi River Embankment Breach
33
Figure 2-8: Schematic representation of the breach location with respect to the spurs at chainage 12.1 km and 12.9km (Not to scale)
64. After a significant length (about 60%) of the spur at 12.1 km was eroded,
the impact was transferred to the spur at 12.9 km and, also being in
structurally bad shape already, the spur started giving way. As the two
protections gave way, the brunt was borne by the embankment and the
breach occurred, as the embankment was structurally not capable of
taking the entire impact.
65. The hydraulic/technical reasons for the breach are twofold : (a) The flow
has been concentrated near the east bank for several years now, and the
formation of local islands due to large amounts of silt deposition has
canalized the flow in a narrow funnel leading to increased velocities
locally. The Google imageries below show the concentration of the flow
in a narrow space around the spurs at 12.1 km and 12.9 kms, for about the
last four years and (b) the two spurs were in structurally bad shape,
having been insufficiently-maintained over the years, and therefore,
although the flood discharge was not very high, the spurs failed.
Flow direction
Spur at 12.1 KM
Spur at 12.9 KM
Breach location
Local island created by silt
deposition
Embankment
Rapid Hazard and Risk Assessment Final Report: 20 March 2009 Koshi River Embankment Breach
34
Figure 2-9: Google Image 2004 showing concentration of flow.
Rapid Hazard and Risk Assessment Final Report: 20 March 2009 Koshi River Embankment Breach
35
Figure 2-10: Google Image Showing Breach exactly on the concentrated flow
66. Therefore, after the collapse of the spurs at 12.1 km and 12.9 km, scour
causing turbulence hit the toe and sides of embankment between the
stretch (12.1 to 12.9 km) causing embankment failures of even during one
of the lowest flood levels in Koshi.
67. Spurs are built either perpendicular to the bank or embankment or at an
angle inclined slightly upstream for flood protection. The falling of trees
on the river between two constructed spurs generally falls in the
downstream direction . The falling of a large number of trees in this
fashion, together with grass and other debris, acts as natural spurs
causing the scour hole to form closer to the bank and tends to maintain
the river current close to the bank, as attracting spurs. Therefore trees
falling between the constructed spurs during flood always enhance the
chances of attracting the river channel more towards the embankment
sides.
Rapid Hazard and Risk Assessment Final Report: 20 March 2009 Koshi River Embankment Breach
36
68. Most flood protection and river engineering projects in the Indian
subcontinent are based on Lacey’s Theory. According to Lacey’s Theory,
scour depth is a function of discharge and silt factor. Generally, in order
to determine the level of scour, the river discharge and silt factor have
been taken for micro levels (overall flood discharge over full width of
river). However, in the case of a river with a splitting tendency, into a
number of channels, the scour level of channels adjacent to the bank can
be more critical than the overall river scenario during flood. This may be
one of the reasons for failure of the spurs.
69. The breach of the spur at 12.1 km occurred over a period of more than 24
hours, and if an early warning system was in place, there was adequate
time to issue warnings on the possible breach of the embankment.
2.8 Hydrological aspects
70. The mean flood discharge during August 2008 which contributed to the
breach of the embankments was 5120 m3/sec and occurred on 16 August
2008 (Fig 2.11). On 19th August this discharge was exceeded and rose to
5190 m3/sec. Similarly, the area had not experienced any significant
rainfall that would have caused this. The breach, however, had already
occurred on 18th August and hence the higher discharge (of 5190 m3/sec)
did not directly contribute to causing the breach.
Rapid Hazard and Risk Assessment Final Report: 20 March 2009 Koshi River Embankment Breach
37
Figure 2-11: Mean daily gauge height at Chatra from 12, Aug to 25 Aug, 2008
71. The analysis of the observed flow record at the Chatra gauging station in
the Koshi basin shows that the average annual flow is about 1600 m3/s
and the peak flood has generally occurred in June to July where the
monsoon rain dominates the river flow regime. About 80% of the total
annual rainfall occurs during the monsoon season.
Figure 2-12: Average monthly discharge at Chatra
Rapid Hazard and Risk Assessment Final Report: 20 March 2009 Koshi River Embankment Breach
38
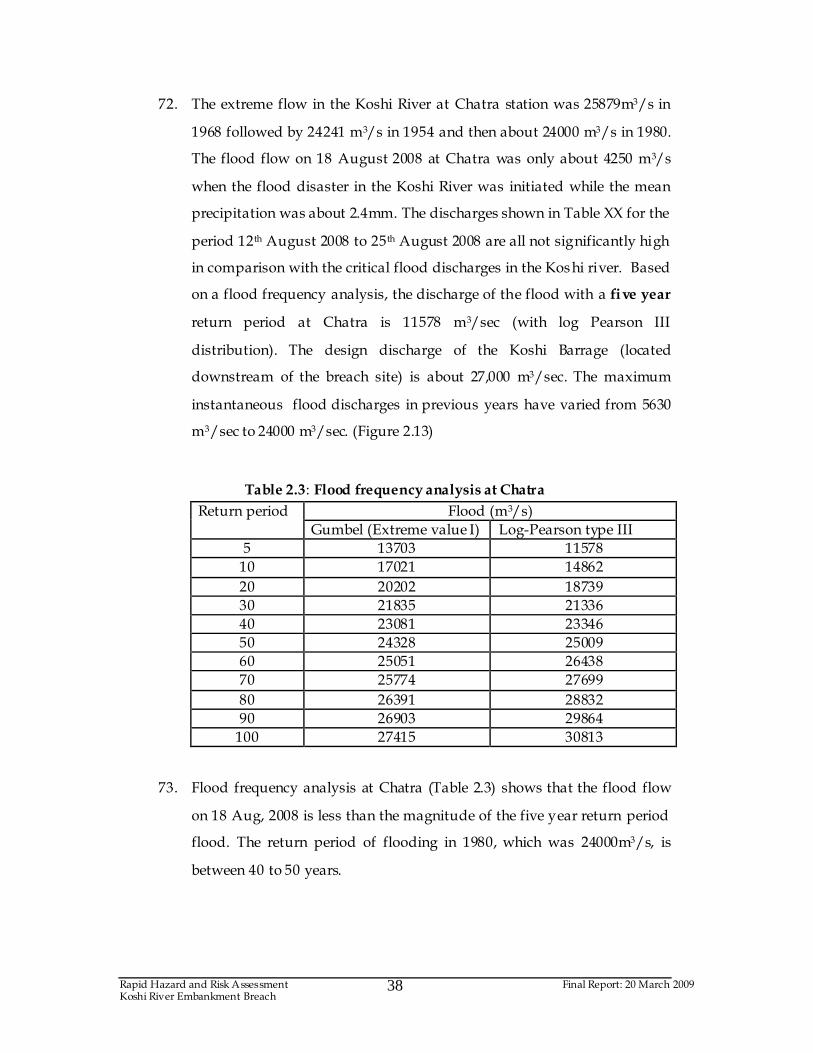
72. The extreme flow in the Koshi River at Chatra station was 25879m3/s in
1968 followed by 24241 m3/s in 1954 and then about 24000 m3/s in 1980.
The flood flow on 18 August 2008 at Chatra was only about 4250 m3/s
when the flood disaster in the Koshi River was initiated while the mean
precipitation was about 2.4mm. The discharges shown in Table XX for the
period 12th August 2008 to 25th August 2008 are all not significantly high
in comparison with the critical flood discharges in the Koshi river. Based
on a flood frequency analysis, the discharge of the flood with a five year
return period at Chatra is 11578 m3/sec (with log Pearson III
distribution). The design discharge of the Koshi Barrage (located
downstream of the breach site) is about 27,000 m3/sec. The maximum
instantaneous flood discharges in previous years have varied from 5630
m3/sec to 24000 m3/sec. (Figure 2.13)
Table 2.3: Flood frequency analysis at Chatra
Flood (m3/s) Return period
Gumbel (Extreme value I) Log-Pearson type III
5 13703 11578
10 17021 14862
20 20202 18739
30 21835 21336
40 23081 23346
50 24328 25009
60 25051 26438
70 25774 27699
80 26391 28832
90 26903 29864
100 27415 30813
73. Flood frequency analysis at Chatra (Table 2.3) shows that the flood flow
on 18 Aug, 2008 is less than the magnitude of the five year return period
flood. The return period of flooding in 1980, which was 24000m3/s, is
between 40 to 50 years.
Rapid Hazard and Risk Assessment Final Report: 20 March 2009 Koshi River Embankment Breach
39
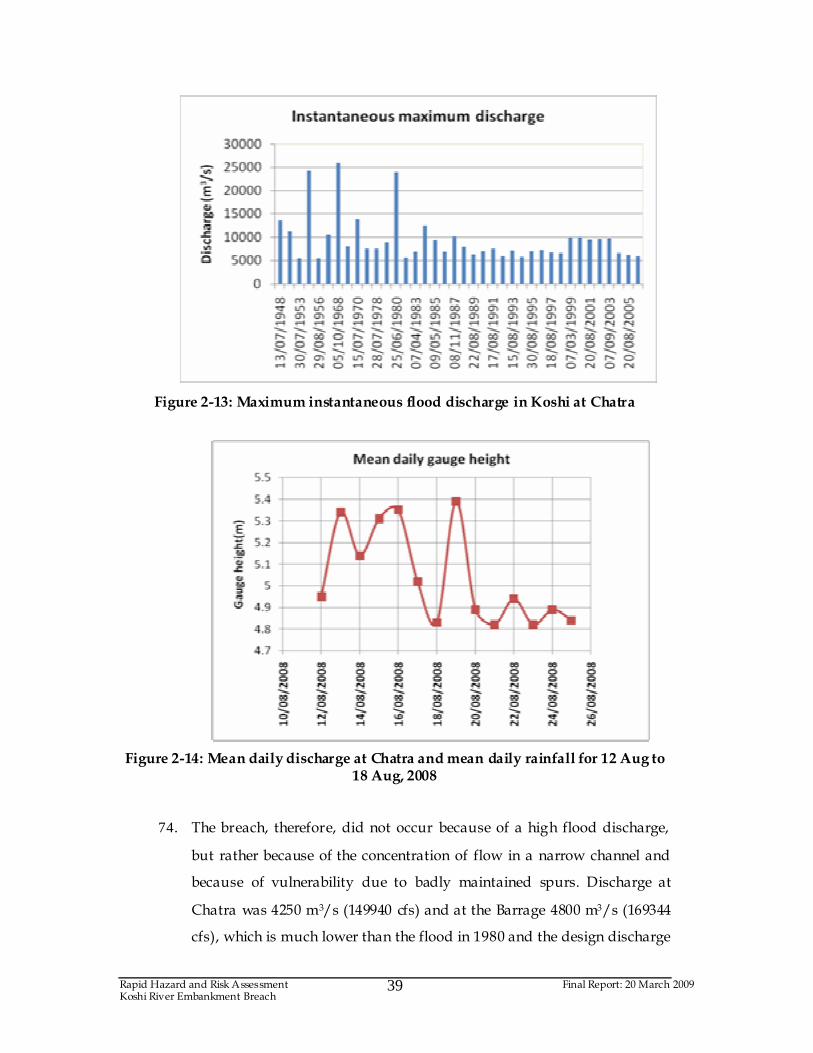
Figure 2-13: Maximum instantaneous flood discharge in Koshi at Chatra
Figure 2-14: Mean daily discharge at Chatra and mean daily rainfall for 12 Aug to
18 Aug, 2008
74. The breach, therefore, did not occur because of a high flood discharge,
but rather because of the concentration of flow in a narrow channel and
because of vulnerability due to badly maintained spurs. Discharge at
Chatra was 4250 m3/s (149940 cfs) and at the Barrage 4800 m3/s (169344
cfs), which is much lower than the flood in 1980 and the design discharge
Rapid Hazard and Risk Assessment Final Report: 20 March 2009 Koshi River Embankment Breach
40
of the Barrage, whereas the average daily rainfall on 18 August was 2.4
mm only. The 10 year return period flood is 12,831 m3/s. From these
facts, it can be concluded that the breach was not due to hydrological and
meteorological extremes. The embankment was breached due to
scouring. The reasons for scouring may be the following:
a. Concentration of flow towards left bank at the breached site for
the last few years.
b. Rise in river bed level due to sediment deposition.
c. Drainage congestion due to opening of only 34 gates out of 56
gates on August 18, that contributed to the scouring of spurs.
d. Lack of proper inspection, observations and regular maintenance
of the spur and a prompt engineering response recognizing the
criticality of the problem.
2.9 Assessment of the Event of the Embankment Breach Flood on 18th August 2008
75. As noted the Koshi River cut two spurs and an embankment in the east
and consequently its flow diverted to further south east on 18th August
2008, when the discharge was far below the long term average high
flow. Complete breaching of the embankment occurred at 12:55 PM.
Since, the danger of breaching was realized since the early morning and
local people were informed about the potentially dangerous areas, they
had decided to evacuate before the breach. The speed of the breach was
not so high at the beginning. It took about one and half hours for the
flood to reach the highway.
76. The breaching of the embankment was neither due to the overtopping of
water over the embankment nor was it due to a seepage of water. It was
due to the change in the flow direction to the embankment on the one
hand and the weak shearing properties within the embankment on the
other. It was also partly due to slackness in regular monitoring,
maintenance and repair of the spurs and embankment.
Rapid Hazard and Risk Assessment Final Report: 20 March 2009 Koshi River Embankment Breach
41
77. The need for the maintenance and repair of the spurs and embankment
was realized one month back before the breaching occurred. The office of
the Koshi Tappu Wildlife Reserve was requested for permission to clear
trees and bushes along the embankment and to permit entry of
construction materials without any obstruction through the office of the
Chief District Officer. However no permission was granted until the day
of the breaching.
78. There was also a one week bandh (strike) called by Terai Madhes
Loktantrik Party between 12-16 August. It was reported that the
continuous cutting back of the spur-12.10 by the river was noticed on 15th
August but the flood fighting work was hindered due to the
combination of different events - evacuation of the area by the army
for gun firing on the same day, bargaining for wages by the local
laborers, the theft of gabion wire from the project site, attempts to set fire
to the Koshi Project officials’ vehicles, delays from the customs office in
granting permission for the import of construction materials and
desertion of Koshi Project staff from the potential breach site for security
reasons at midnight on the 17th of August. They returned to the breach
site only on the 22 August, i.e., four days after the breach when security
was ensured for their return.
79. In many places, the spur length has been reduced by 20-80 m due to
cutting by the river. However, no attempt has been made to bring them to
their original design length. After this flood disaster, the project has
considered repairing many spurs but it has only considered extending it
by 10 m.
80. Reportedly, a test model is being conducted at the Pune Research Lab and
the results of the test will be used as a basis to redesign the spurs and
their lengths. It will be a very welcome move to reduce underlying risk
on the area.
81. Before 1988 when an earthquake of 6.6 on the Richter scale occurred, with
its epicenter in the Udaypur district, the larger portion of water flowing
Rapid Hazard and Risk Assessment Final Report: 20 March 2009 Koshi River Embankment Breach
42
was on the western side of the embankment. After this event the flow had
diverted to the eastern part, damaging most of the spurs along the eastern
embankment.
82. As per the agreement and general practices of the project, the inspection
is carried out during the lean season of the river. Reportedly, the
maintenance and repair works take place during the lean season,
however, the focus is also kept on flood fighting (normally between 15th
June and 15th October). During this period, most of the spurs and the
embankment are covered with bushes and shrubs. As a result access to
the spur, embankment and reaches of the river becomes poor. It also
hampers the identification of potentially hazardous sites where breaching
could occur and in the carrying out of maintenance and repair works.
83. As discussed earlier, shifting of the river channel and diversion of flow by
avulsion are common geo-hydrological processes even in a natural
braided channel in the Terai. For example, the Sundari – one of the
tributaries of Koshi completely changed its channel and flow direction
during and after the floods of 1973 (Khanal, 1993). Seven events of flood
disaster due to breaching of the embankment have been reported from
Bihar and Nepal between 1963 and 1991. Among them, two events – one
in 1963 at Dalwa and another in 1991 in Joginiya on the west bank, a few
km downstream from the Koshi Barrage have been reported (Mishra,
2006 cited in Dixit, 2009). Flood disasters due to breaching of the
embankments have also been reported from other areas of Nepal. Many
people were swept away and a huge amount of property was damaged
due to the embankment breach flood in the Tinau River near Butwal in
1981 and the Rapti River in the Makawanpur and Chitwan districts in
1993 (Khanal, 1996).
84. The threat of breaching of the embankment after cutting of the spur toe
was noticed 17 km from Prakashpur in 1993. However, the breach and
the subsequent disaster were averted through active flood-fighting with
the active participation of the local people. It is very difficult to say if the
Rapid Hazard and Risk Assessment Final Report: 20 March 2009 Koshi River Embankment Breach
43
breach of 2008 could have been averted if similar measures had been
taken. However an attitude of complacency about flood recurrence is
quite noticeable.
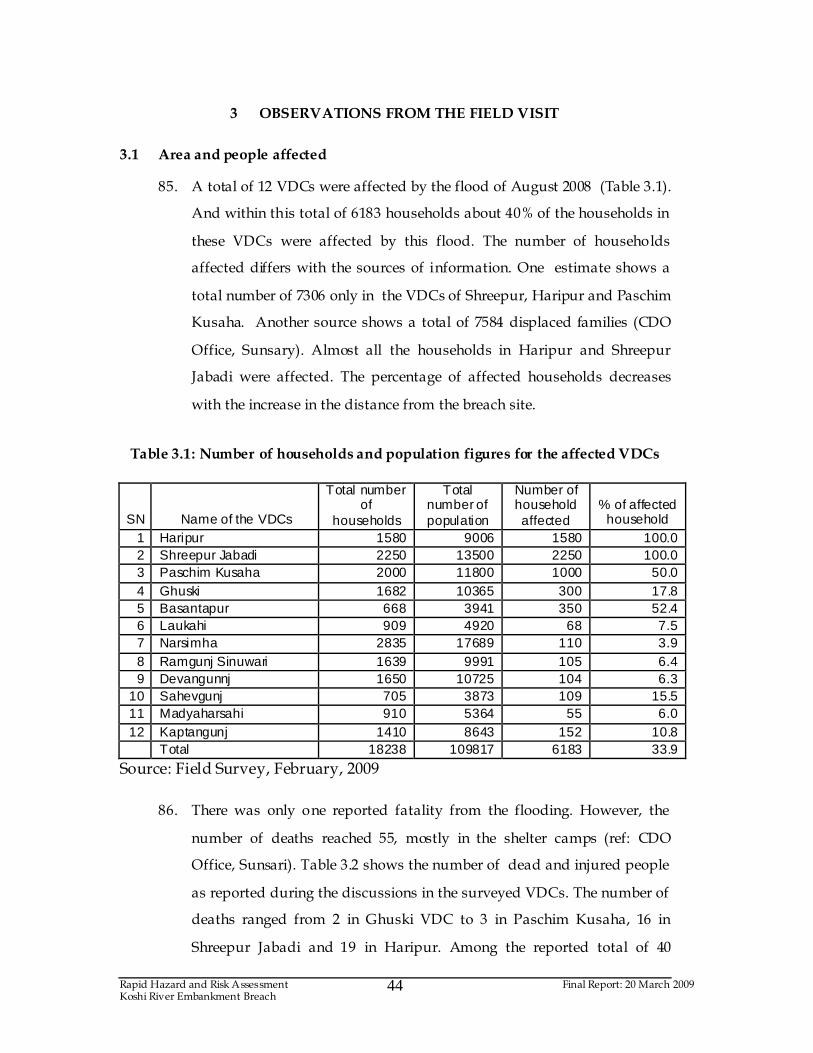
Rapid Hazard and Risk Assessment Final Report: 20 March 2009 Koshi River Embankment Breach
44
3 OBSERVATIONS FROM THE FIELD VISIT
3.1 Area and people affected
85. A total of 12 VDCs were affected by the flood of August 2008 (Table 3.1).
And within this total of 6183 households about 40% of the households in
these VDCs were affected by this flood. The number of households
affected differs with the sources of information. One estimate shows a
total number of 7306 only in the VDCs of Shreepur, Haripur and Paschim
Kusaha. Another source shows a total of 7584 displaced families (CDO
Office, Sunsary). Almost all the households in Haripur and Shreepur
Jabadi were affected. The percentage of affected households decreases
with the increase in the distance from the breach site.
Table 3.1: Number of households and population figures for the affected VDCs
SN Name of the VDCs
Total number of
households
Total number of population
Number of household affected
% of affected household
1 Haripur 1580 9006 1580 100.0 2 Shreepur Jabadi 2250 13500 2250 100.0 3 Paschim Kusaha 2000 11800 1000 50.0 4 Ghuski 1682 10365 300 17.8 5 Basantapur 668 3941 350 52.4 6 Laukahi 909 4920 68 7.5 7 Narsimha 2835 17689 110 3.9 8 Ramgunj Sinuwari 1639 9991 105 6.4 9 Devangunnj 1650 10725 104 6.3
10 Sahevgunj 705 3873 109 15.5 11 Madyaharsahi 910 5364 55 6.0 12 Kaptangunj 1410 8643 152 10.8 Total 18238 109817 6183 33.9
Source: Field Survey, February, 2009
86. There was only one reported fatality from the flooding. However, the
number of deaths reached 55, mostly in the shelter camps (ref: CDO
Office, Sunsari). Table 3.2 shows the number of dead and injured people
as reported during the discussions in the surveyed VDCs. The number of
deaths ranged from 2 in Ghuski VDC to 3 in Paschim Kusaha, 16 in
Shreepur Jabadi and 19 in Haripur. Among the reported total of 40
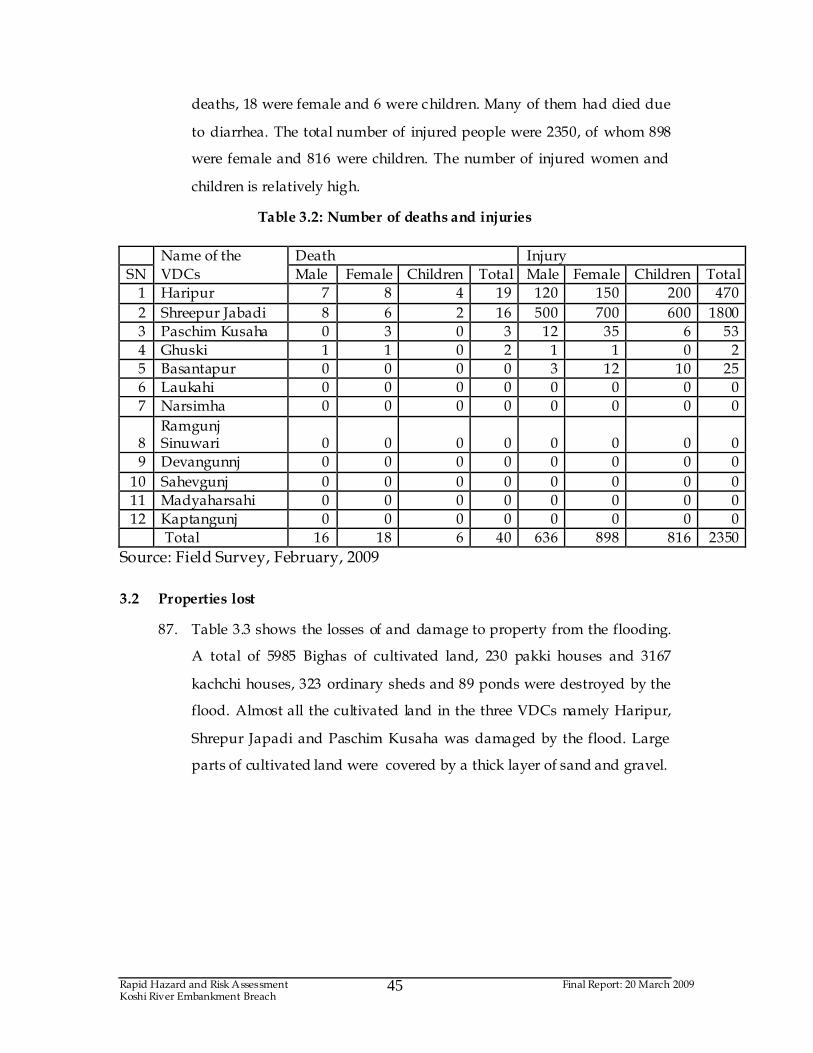
Rapid Hazard and Risk Assessment Final Report: 20 March 2009 Koshi River Embankment Breach
45
deaths, 18 were female and 6 were children. Many of them had died due
to diarrhea. The total number of injured people were 2350, of whom 898
were female and 816 were children. The number of injured women and
children is relatively high.
Table 3.2: Number of deaths and injuries
Death Injury
SN
Name of the
VDCs Male Female Children Total Male Female Children Total
1 Haripur 7 8 4 19 120 150 200 470
2 Shreepur Jabadi 8 6 2 16 500 700 600 1800
3 Paschim Kusaha 0 3 0 3 12 35 6 53
4 Ghuski 1 1 0 2 1 1 0 2
5 Basantapur 0 0 0 0 3 12 10 25
6 Laukahi 0 0 0 0 0 0 0 0
7 Narsimha 0 0 0 0 0 0 0 0
8 Ramgunj Sinuwari 0 0 0 0 0 0 0 0
9 Devangunnj 0 0 0 0 0 0 0 0
10 Sahevgunj 0 0 0 0 0 0 0 0
11 Madyaharsahi 0 0 0 0 0 0 0 0
12 Kaptangunj 0 0 0 0 0 0 0 0
Total 16 18 6 40 636 898 816 2350
Source: Field Survey, February, 2009
3.2 Properties lost
87. Table 3.3 shows the losses of and damage to property from the flooding.
A total of 5985 Bighas of cultivated land, 230 pakki houses and 3167
kachchi houses, 323 ordinary sheds and 89 ponds were destroyed by the
flood. Almost all the cultivated land in the three VDCs namely Haripur,
Shrepur Japadi and Paschim Kusaha was damaged by the flood. Large
parts of cultivated land were covered by a thick layer of sand and gravel.
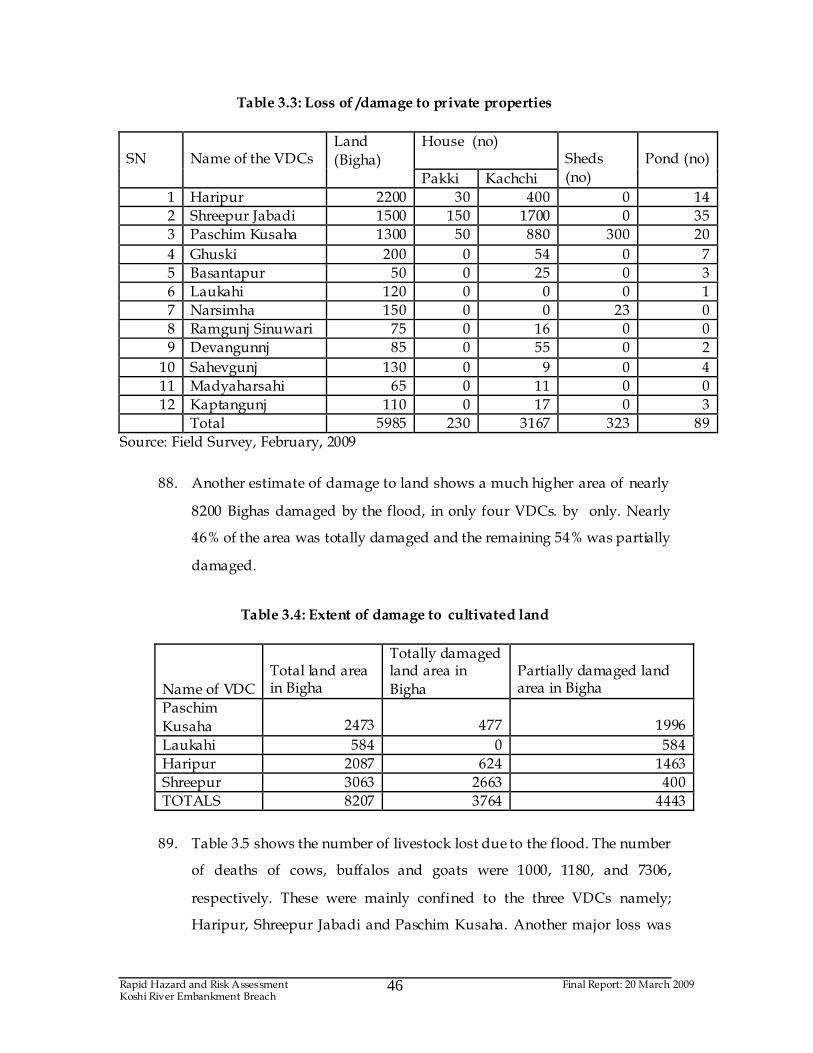
Rapid Hazard and Risk Assessment Final Report: 20 March 2009 Koshi River Embankment Breach
46
Table 3.3: Loss of /damage to private properties
House (no)
SN
Name of the VDCs
Land
(Bigha) Pakki Kachchi
Sheds
(no)
Pond (no)
1 Haripur 2200 30 400 0 14
2 Shreepur Jabadi 1500 150 1700 0 35
3 Paschim Kusaha 1300 50 880 300 20
4 Ghuski 200 0 54 0 7
5 Basantapur 50 0 25 0 3
6 Laukahi 120 0 0 0 1
7 Narsimha 150 0 0 23 0
8 Ramgunj Sinuwari 75 0 16 0 0
9 Devangunnj 85 0 55 0 2
10 Sahevgunj 130 0 9 0 4
11 Madyaharsahi 65 0 11 0 0
12 Kaptangunj 110 0 17 0 3
Total 5985 230 3167 323 89
Source: Field Survey, February, 2009
88. Another estimate of damage to land shows a much higher area of nearly
8200 Bighas damaged by the flood, in only four VDCs. by only. Nearly
46% of the area was totally damaged and the remaining 54% was partially
damaged.
Table 3.4: Extent of damage to cultivated land
Name of VDC
Total land area in Bigha
Totally damaged land area in
Bigha
Partially damaged land area in Bigha
Paschim
Kusaha 2473 477 1996
Laukahi 584 0 584
Haripur 2087 624 1463
Shreepur 3063 2663 400
TOTALS 8207 3764 4443
89. Table 3.5 shows the number of livestock lost due to the flood. The number
of deaths of cows, buffalos and goats were 1000, 1180, and 7306,
respectively. These were mainly confined to the three VDCs namely;
Haripur, Shreepur Jabadi and Paschim Kusaha. Another major loss was
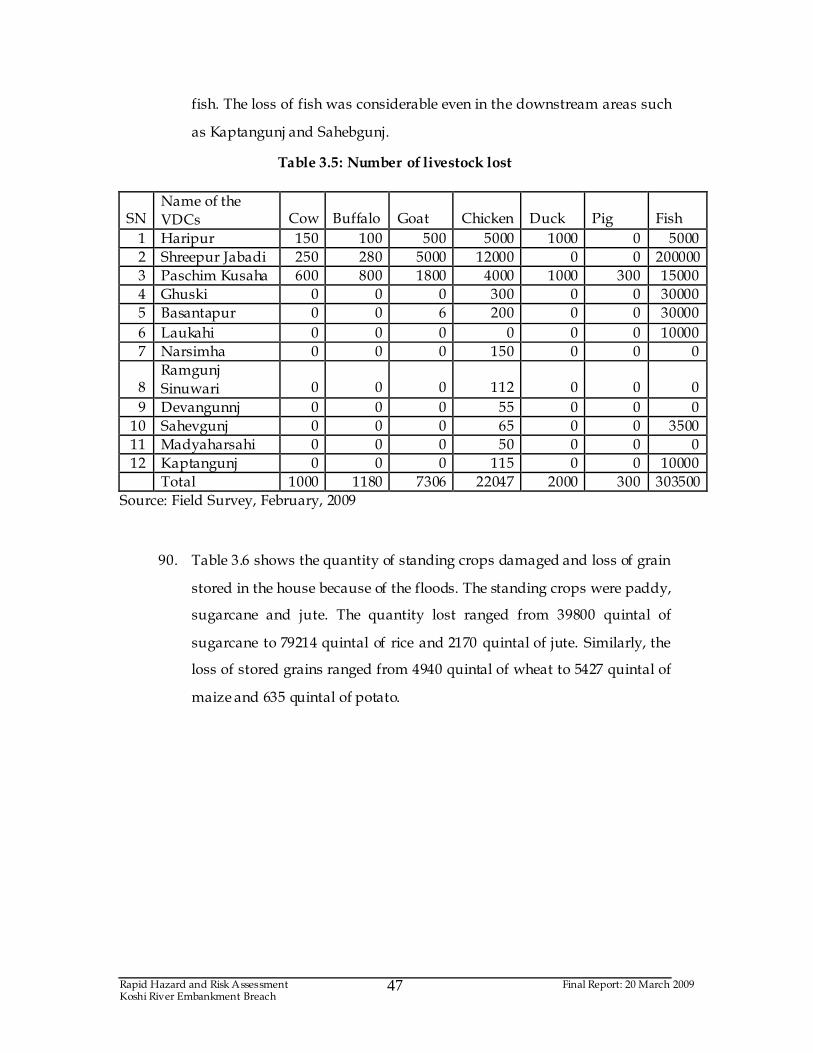
Rapid Hazard and Risk Assessment Final Report: 20 March 2009 Koshi River Embankment Breach
47
fish. The loss of fish was considerable even in the downstream areas such
as Kaptangunj and Sahebgunj.
Table 3.5: Number of livestock lost
SN Name of the
VDCs Cow Buffalo Goat Chicken Duck Pig Fish
1 Haripur 150 100 500 5000 1000 0 5000
2 Shreepur Jabadi 250 280 5000 12000 0 0 200000
3 Paschim Kusaha 600 800 1800 4000 1000 300 15000
4 Ghuski 0 0 0 300 0 0 30000
5 Basantapur 0 0 6 200 0 0 30000
6 Laukahi 0 0 0 0 0 0 10000
7 Narsimha 0 0 0 150 0 0 0
8 Ramgunj
Sinuwari 0 0 0 112 0 0 0
9 Devangunnj 0 0 0 55 0 0 0
10 Sahevgunj 0 0 0 65 0 0 3500
11 Madyaharsahi 0 0 0 50 0 0 0
12 Kaptangunj 0 0 0 115 0 0 10000
Total 1000 1180 7306 22047 2000 300 303500
Source: Field Survey, February, 2009
90. Table 3.6 shows the quantity of standing crops damaged and loss of grain
stored in the house because of the floods. The standing crops were paddy,
sugarcane and jute. The quantity lost ranged from 39800 quintal of
sugarcane to 79214 quintal of rice and 2170 quintal of jute. Similarly, the
loss of stored grains ranged from 4940 quintal of wheat to 5427 quintal of
maize and 635 quintal of potato.
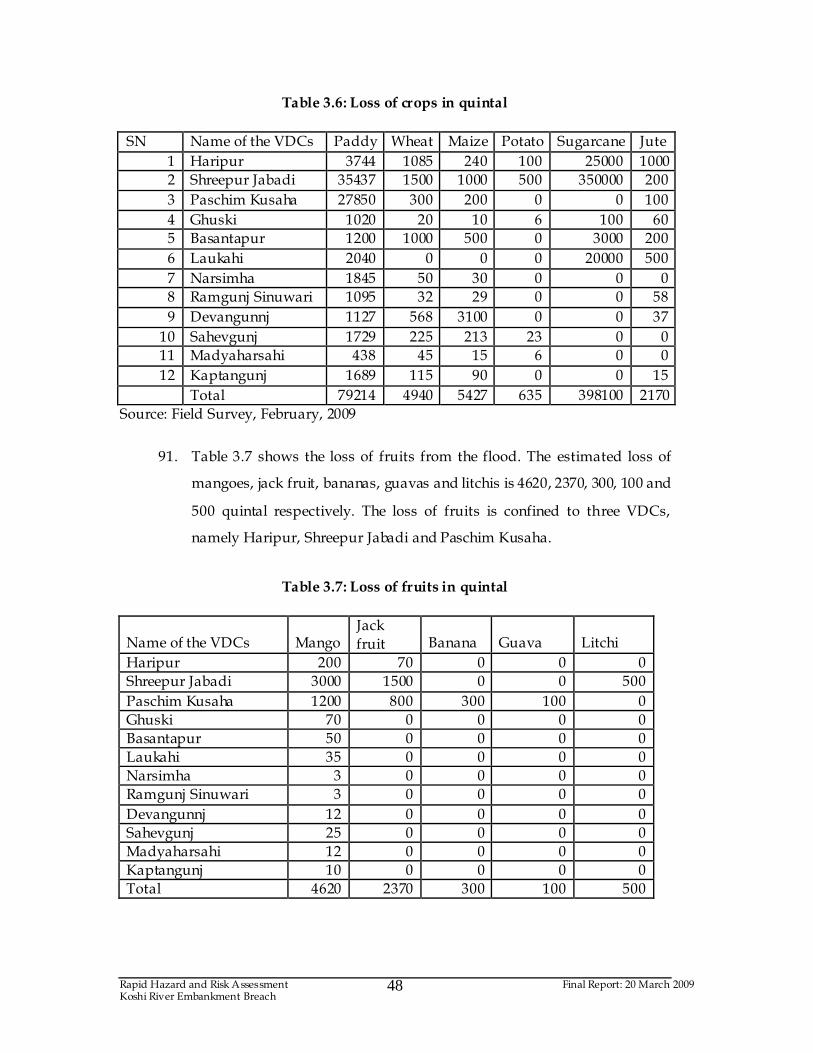
Rapid Hazard and Risk Assessment Final Report: 20 March 2009 Koshi River Embankment Breach
48
Table 3.6: Loss of crops in quintal
SN Name of the VDCs Paddy Wheat Maize Potato Sugarcane Jute
1 Haripur 3744 1085 240 100 25000 1000
2 Shreepur Jabadi 35437 1500 1000 500 350000 200
3 Paschim Kusaha 27850 300 200 0 0 100
4 Ghuski 1020 20 10 6 100 60
5 Basantapur 1200 1000 500 0 3000 200
6 Laukahi 2040 0 0 0 20000 500
7 Narsimha 1845 50 30 0 0 0
8 Ramgunj Sinuwari 1095 32 29 0 0 58
9 Devangunnj 1127 568 3100 0 0 37
10 Sahevgunj 1729 225 213 23 0 0
11 Madyaharsahi 438 45 15 6 0 0
12 Kaptangunj 1689 115 90 0 0 15
Total 79214 4940 5427 635 398100 2170
Source: Field Survey, February, 2009
91. Table 3.7 shows the loss of fruits from the flood. The estimated loss of
mangoes, jack fruit, bananas, guavas and litchis is 4620, 2370, 300, 100 and
500 quintal respectively. The loss of fruits is confined to three VDCs,
namely Haripur, Shreepur Jabadi and Paschim Kusaha.
Table 3.7: Loss of fruits in quintal
Name of the VDCs Mango Jack
fruit Banana Guava Litchi
Haripur 200 70 0 0 0
Shreepur Jabadi 3000 1500 0 0 500
Paschim Kusaha 1200 800 300 100 0
Ghuski 70 0 0 0 0
Basantapur 50 0 0 0 0
Laukahi 35 0 0 0 0
Narsimha 3 0 0 0 0
Ramgunj Sinuwari 3 0 0 0 0
Devangunnj 12 0 0 0 0
Sahevgunj 25 0 0 0 0
Madyaharsahi 12 0 0 0 0
Kaptangunj 10 0 0 0 0
Total 4620 2370 300 100 500
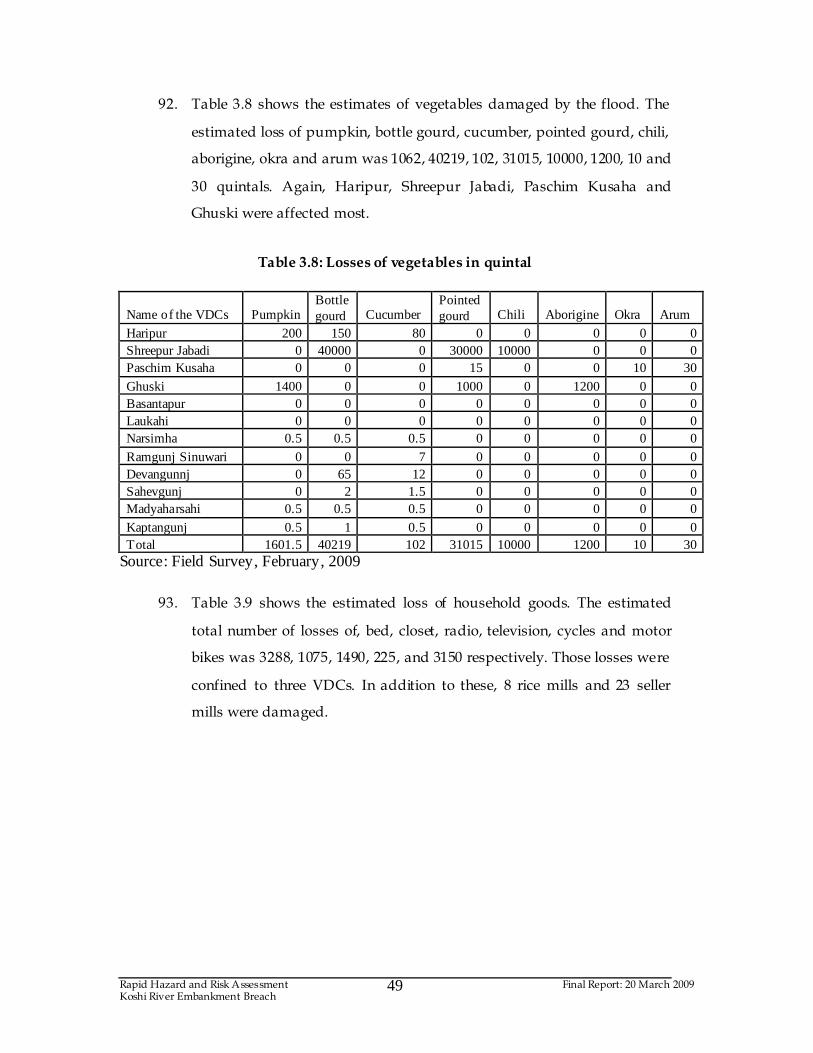
Rapid Hazard and Risk Assessment Final Report: 20 March 2009 Koshi River Embankment Breach
49
92. Table 3.8 shows the estimates of vegetables damaged by the flood. The
estimated loss of pumpkin, bottle gourd, cucumber, pointed gourd, chili,
aborigine, okra and arum was 1062, 40219, 102, 31015, 10000, 1200, 10 and
30 quintals. Again, Haripur, Shreepur Jabadi, Paschim Kusaha and
Ghuski were affected most.
Table 3.8: Losses of vegetables in quintal
Name of the VDCs Pumpkin Bottle gourd Cucumber
Pointed gourd Chili Aborigine Okra Arum
Haripur 200 150 80 0 0 0 0 0 Shreepur Jabadi 0 40000 0 30000 10000 0 0 0 Paschim Kusaha 0 0 0 15 0 0 10 30
Ghuski 1400 0 0 1000 0 1200 0 0 Basantapur 0 0 0 0 0 0 0 0 Laukahi 0 0 0 0 0 0 0 0 Narsimha 0.5 0.5 0.5 0 0 0 0 0
Ramgunj Sinuwari 0 0 7 0 0 0 0 0 Devangunnj 0 65 12 0 0 0 0 0 Sahevgunj 0 2 1.5 0 0 0 0 0 Madyaharsahi 0.5 0.5 0.5 0 0 0 0 0
Kaptangunj 0.5 1 0.5 0 0 0 0 0 Total 1601.5 40219 102 31015 10000 1200 10 30
Source: Field Survey, February, 2009
93. Table 3.9 shows the estimated loss of household goods. The estimated
total number of losses of, bed, closet, radio, television, cycles and motor
bikes was 3288, 1075, 1490, 225, and 3150 respectively. Those losses were
confined to three VDCs. In addition to these, 8 rice mills and 23 seller
mills were damaged.
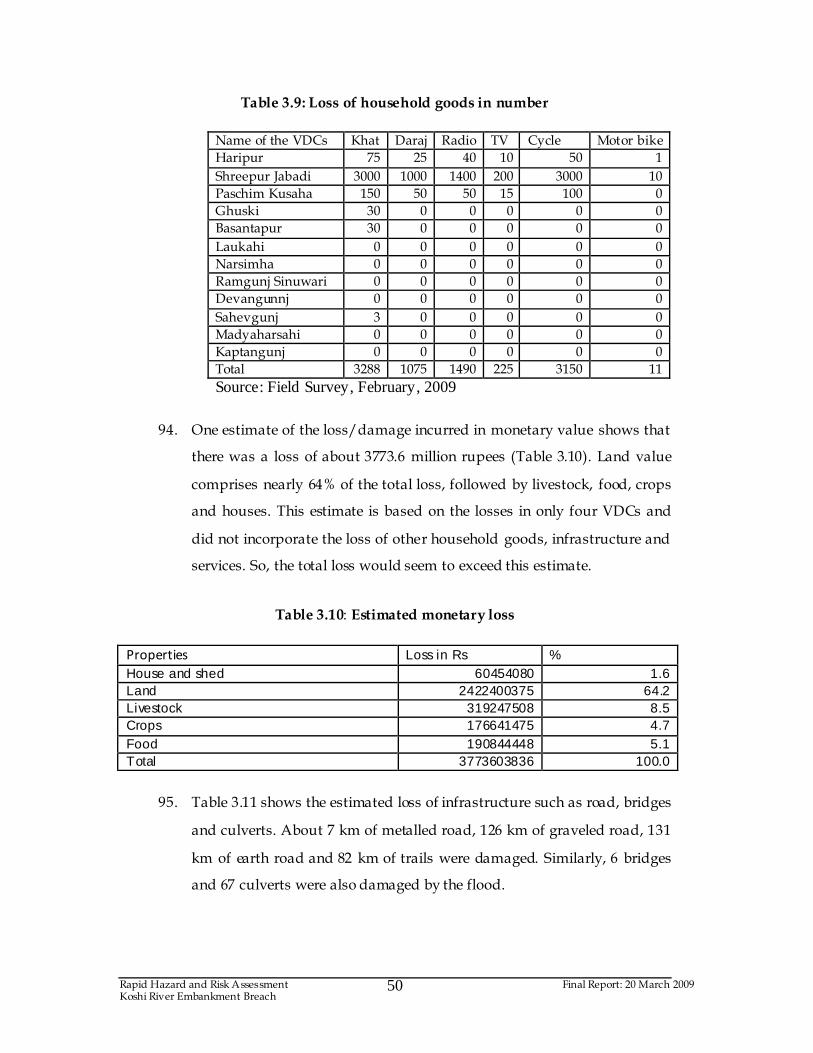
Rapid Hazard and Risk Assessment Final Report: 20 March 2009 Koshi River Embankment Breach
50
Table 3.9: Loss of household goods in number
Name of the VDCs Khat Daraj Radio TV Cycle Motor bike
Haripur 75 25 40 10 50 1
Shreepur Jabadi 3000 1000 1400 200 3000 10
Paschim Kusaha 150 50 50 15 100 0
Ghuski 30 0 0 0 0 0
Basantapur 30 0 0 0 0 0
Laukahi 0 0 0 0 0 0
Narsimha 0 0 0 0 0 0
Ramgunj Sinuwari 0 0 0 0 0 0
Devangunnj 0 0 0 0 0 0
Sahevgunj 3 0 0 0 0 0
Madyaharsahi 0 0 0 0 0 0
Kaptangunj 0 0 0 0 0 0
Total 3288 1075 1490 225 3150 11
Source: Field Survey, February, 2009
94. One estimate of the loss/damage incurred in monetary value shows that
there was a loss of about 3773.6 million rupees (Table 3.10). Land value
comprises nearly 64% of the total loss, followed by livestock, food, crops
and houses. This estimate is based on the losses in only four VDCs and
did not incorporate the loss of other household goods, infrastructure and
services. So, the total loss would seem to exceed this estimate.
Table 3.10: Estimated monetary loss
Properties Loss in Rs % House and shed 60454080 1.6 Land 2422400375 64.2 Livestock 319247508 8.5 Crops 176641475 4.7 Food 190844448 5.1 Total 3773603836 100.0
95. Table 3.11 shows the estimated loss of infrastructure such as road, bridges
and culverts. About 7 km of metalled road, 126 km of graveled road, 131
km of earth road and 82 km of trails were damaged. Similarly, 6 bridges
and 67 culverts were also damaged by the flood.
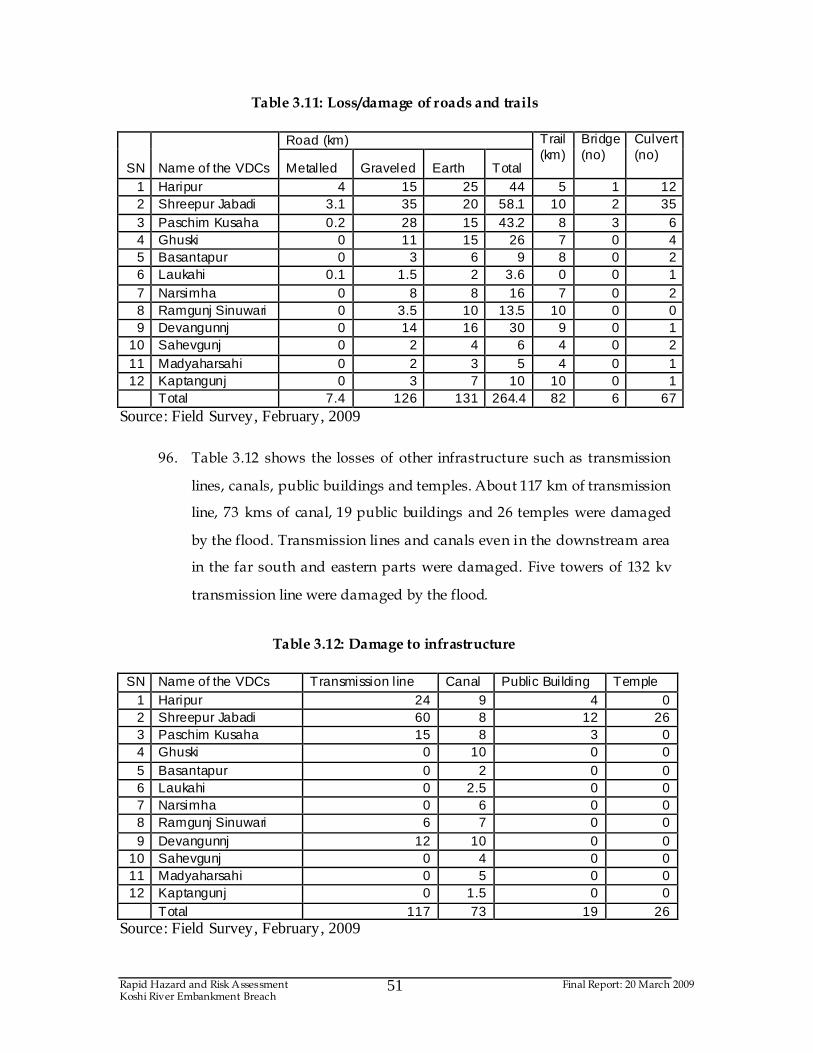
Rapid Hazard and Risk Assessment Final Report: 20 March 2009 Koshi River Embankment Breach
51
Table 3.11: Loss/damage of roads and trails
Road (km)
SN
Name of the VDCs Metalled Graveled Earth Total
Trail (km)
Bridge (no)
Culvert (no)
1 Haripur 4 15 25 44 5 1 12 2 Shreepur Jabadi 3.1 35 20 58.1 10 2 35 3 Paschim Kusaha 0.2 28 15 43.2 8 3 6 4 Ghuski 0 11 15 26 7 0 4 5 Basantapur 0 3 6 9 8 0 2 6 Laukahi 0.1 1.5 2 3.6 0 0 1 7 Narsimha 0 8 8 16 7 0 2 8 Ramgunj Sinuwari 0 3.5 10 13.5 10 0 0 9 Devangunnj 0 14 16 30 9 0 1
10 Sahevgunj 0 2 4 6 4 0 2 11 Madyaharsahi 0 2 3 5 4 0 1 12 Kaptangunj 0 3 7 10 10 0 1 Total 7.4 126 131 264.4 82 6 67
Source: Field Survey, February, 2009
96. Table 3.12 shows the losses of other infrastructure such as transmission
lines, canals, public buildings and temples. About 117 km of transmission
line, 73 kms of canal, 19 public buildings and 26 temples were damaged
by the flood. Transmission lines and canals even in the downstream area
in the far south and eastern parts were damaged. Five towers of 132 kv
transmission line were damaged by the flood.
Table 3.12: Damage to infrastructure
SN Name of the VDCs Transmission line Canal Public Building Temple
1 Haripur 24 9 4 0 2 Shreepur Jabadi 60 8 12 26 3 Paschim Kusaha 15 8 3 0 4 Ghuski 0 10 0 0 5 Basantapur 0 2 0 0 6 Laukahi 0 2.5 0 0 7 Narsimha 0 6 0 0 8 Ramgunj Sinuwari 6 7 0 0 9 Devangunnj 12 10 0 0
10 Sahevgunj 0 4 0 0 11 Madyaharsahi 0 5 0 0 12 Kaptangunj 0 1.5 0 0 Total 117 73 19 26
Source: Field Survey, February, 2009
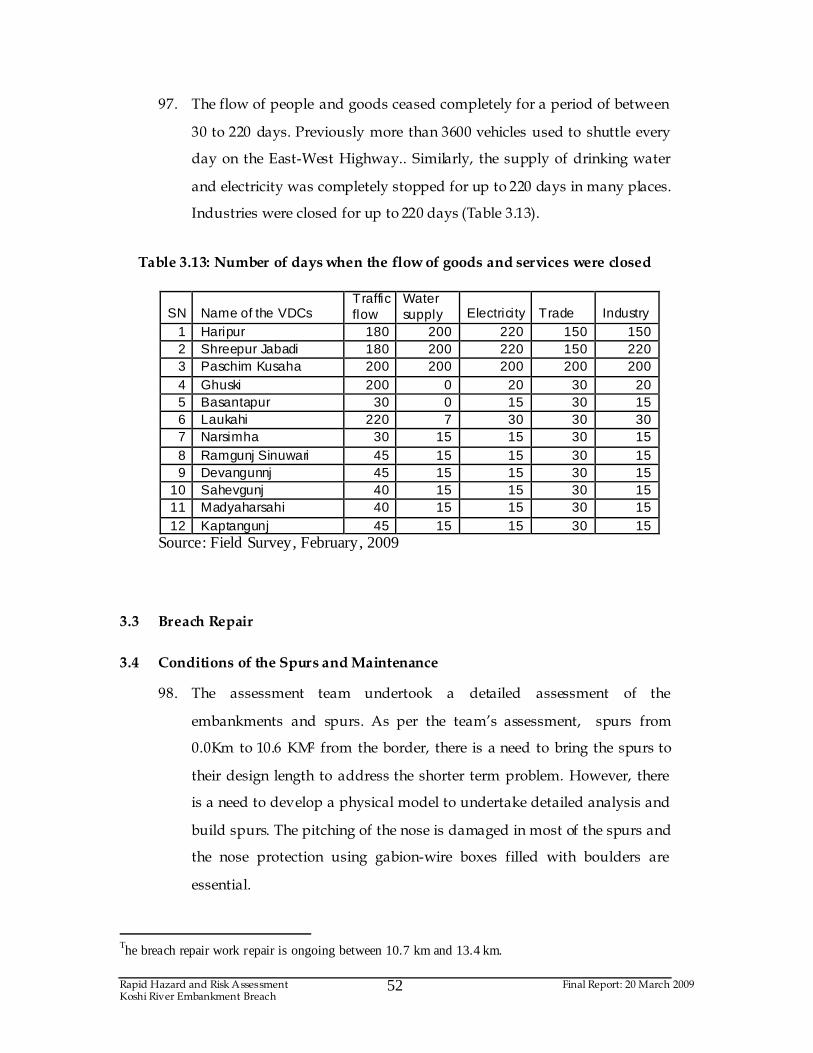
Rapid Hazard and Risk Assessment Final Report: 20 March 2009 Koshi River Embankment Breach
52
97. The flow of people and goods ceased completely for a period of between
30 to 220 days. Previously more than 3600 vehicles used to shuttle every
day on the East-West Highway.. Similarly, the supply of drinking water
and electricity was completely stopped for up to 220 days in many places.
Industries were closed for up to 220 days (Table 3.13).
Table 3.13: Number of days when the flow of goods and services were closed
SN Name of the VDCs Traffic flow
Water supply Electricity Trade Industry
1 Haripur 180 200 220 150 150 2 Shreepur Jabadi 180 200 220 150 220 3 Paschim Kusaha 200 200 200 200 200 4 Ghuski 200 0 20 30 20 5 Basantapur 30 0 15 30 15 6 Laukahi 220 7 30 30 30 7 Narsimha 30 15 15 30 15 8 Ramgunj Sinuwari 45 15 15 30 15 9 Devangunnj 45 15 15 30 15
10 Sahevgunj 40 15 15 30 15 11 Madyaharsahi 40 15 15 30 15 12 Kaptangunj 45 15 15 30 15
Source: Field Survey, February, 2009
3.3 Breach Repair
3.4 Conditions of the Spurs and Maintenance
98. The assessment team undertook a detailed assessment of the
embankments and spurs. As per the team’s assessment, spurs from
0.0Km to 10.6 KM2 from the border, there is a need to bring the spurs to
their design length to address the shorter term problem. However, there
is a need to develop a physical model to undertake detailed analysis and
build spurs. The pitching of the nose is damaged in most of the spurs and
the nose protection using gabion-wire boxes filled with boulders are
essential.
The breach repair work repair is ongoing between 10.7 km and 13.4 km.
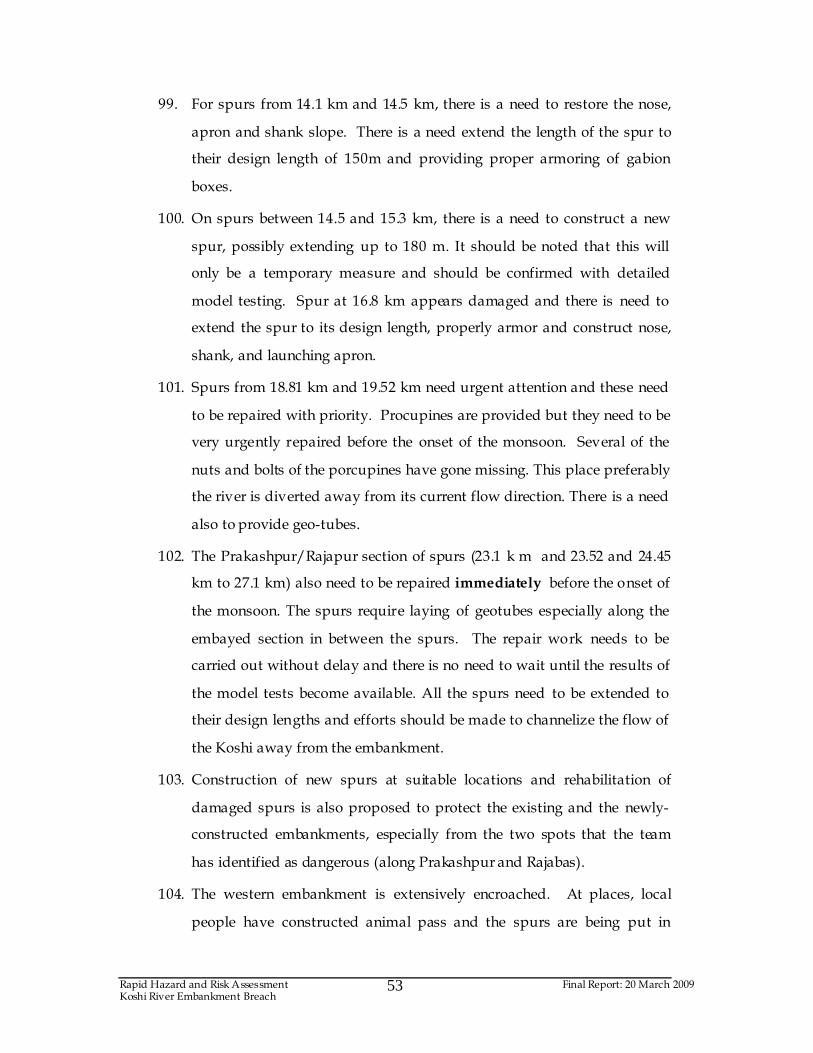
Rapid Hazard and Risk Assessment Final Report: 20 March 2009 Koshi River Embankment Breach
53
99. For spurs from 14.1 km and 14.5 km, there is a need to restore the nose,
apron and shank slope. There is a need extend the length of the spur to
their design length of 150m and providing proper armoring of gabion
boxes.
100. On spurs between 14.5 and 15.3 km, there is a need to construct a new
spur, possibly extending up to 180 m. It should be noted that this will
only be a temporary measure and should be confirmed with detailed
model testing. Spur at 16.8 km appears damaged and there is need to
extend the spur to its design length, properly armor and construct nose,
shank, and launching apron.
101. Spurs from 18.81 km and 19.52 km need urgent attention and these need
to be repaired with priority. Procupines are provided but they need to be
very urgently repaired before the onset of the monsoon. Several of the
nuts and bolts of the porcupines have gone missing. This place preferably
the river is diverted away from its current flow direction. There is a need
also to provide geo-tubes.
102. The Prakashpur/Rajapur section of spurs (23.1 k m and 23.52 and 24.45
km to 27.1 km) also need to be repaired immediately before the onset of
the monsoon. The spurs require laying of geotubes especially along the
embayed section in between the spurs. The repair work needs to be
carried out without delay and there is no need to wait until the results of
the model tests become available. All the spurs need to be extended to
their design lengths and efforts should be made to channelize the flow of
the Koshi away from the embankment.
103. Construction of new spurs at suitable locations and rehabilitation of
damaged spurs is also proposed to protect the existing and the newly-
constructed embankments, especially from the two spots that the team
has identified as dangerous (along Prakashpur and Rajabas).
104. The western embankment is extensively encroached. At places, local
people have constructed animal pass and the spurs are being put in
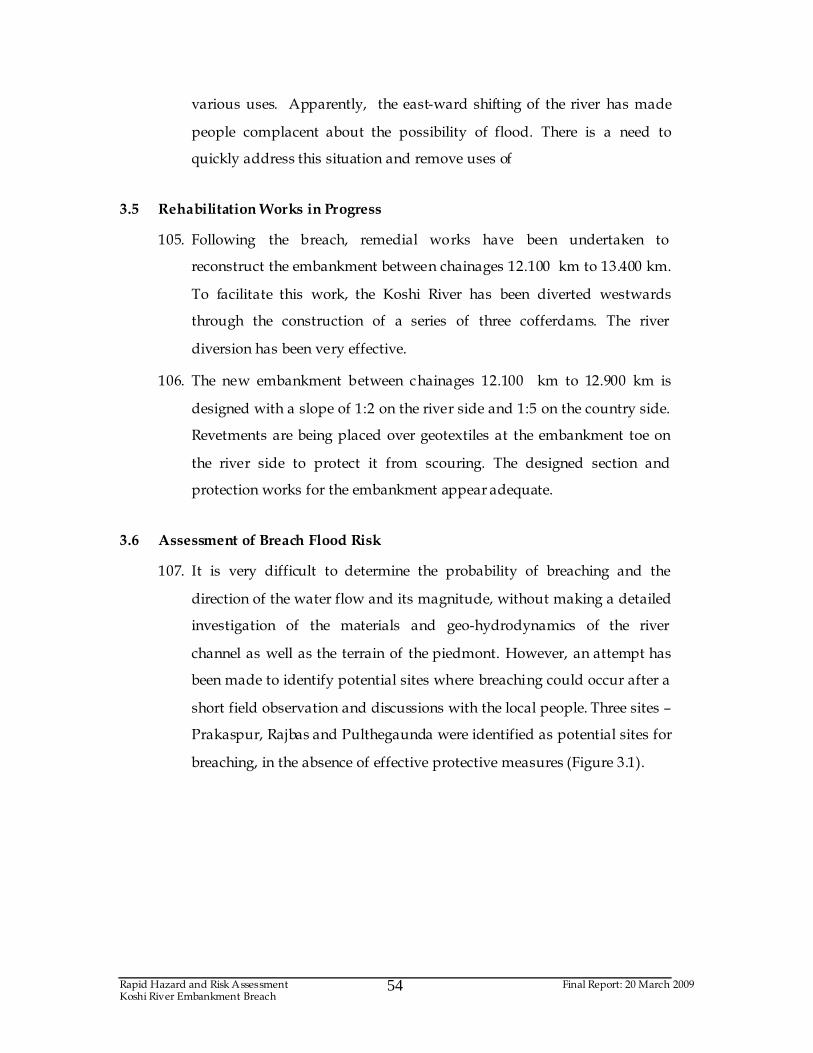
Rapid Hazard and Risk Assessment Final Report: 20 March 2009 Koshi River Embankment Breach
54
various uses. Apparently, the east-ward shifting of the river has made
people complacent about the possibility of flood. There is a need to
quickly address this situation and remove uses of
3.5 Rehabilitation Works in Progress
105. Following the breach, remedial works have been undertaken to
reconstruct the embankment between chainages 12.100 km to 13.400 km.
To facilitate this work, the Koshi River has been diverted westwards
through the construction of a series of three cofferdams. The river
diversion has been very effective.
106. The new embankment between chainages 12.100 km to 12.900 km is
designed with a slope of 1:2 on the river side and 1:5 on the country side.
Revetments are being placed over geotextiles at the embankment toe on
the river side to protect it from scouring. The designed section and
protection works for the embankment appear adequate.
3.6 Assessment of Breach Flood Risk
107. It is very difficult to determine the probability of breaching and the
direction of the water flow and its magnitude, without making a detailed
investigation of the materials and geo-hydrodynamics of the river
channel as well as the terrain of the piedmont. However, an attempt has
been made to identify potential sites where breaching could occur after a
short field observation and discussions with the local people. Three sites –
Prakaspur, Rajbas and Pulthegaunda were identified as potential sites for
breaching, in the absence of effective protective measures (Figure 3.1).
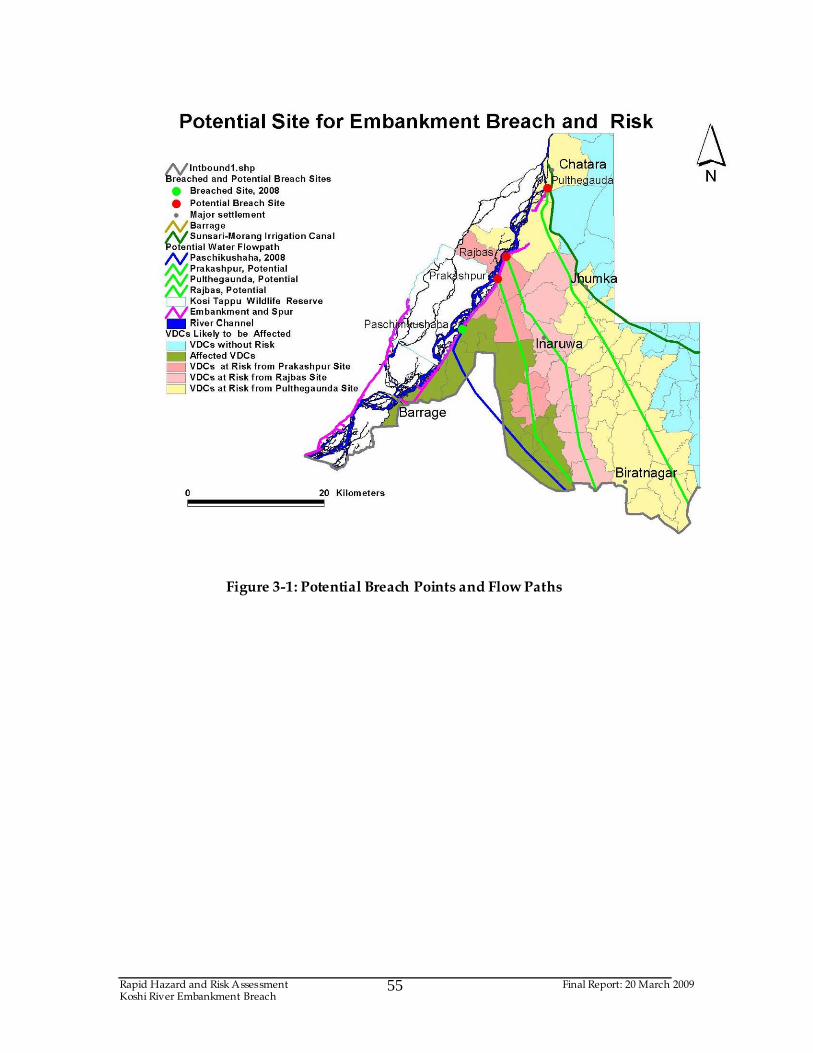
Rapid Hazard and Risk Assessment Final Report: 20 March 2009 Koshi River Embankment Breach
55
Figure 3-1: Potential Breach Points and Flow Paths
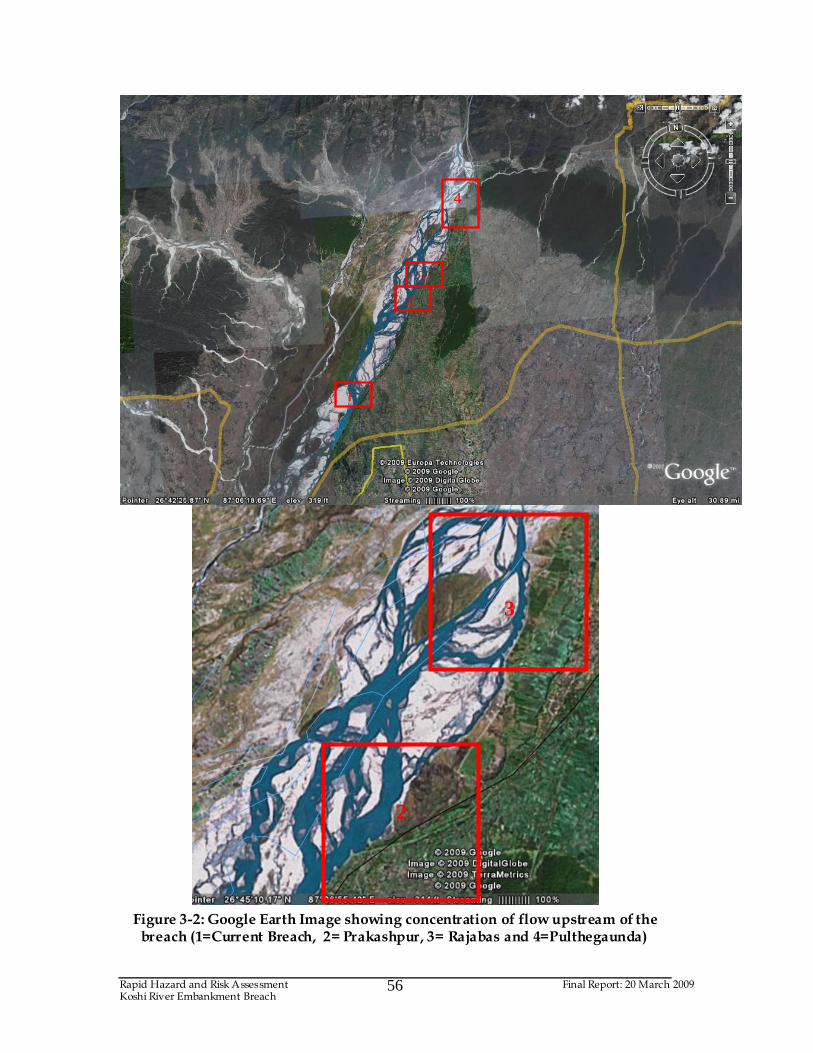
Rapid Hazard and Risk Assessment Final Report: 20 March 2009 Koshi River Embankment Breach
56
Figure 3-2: Google Earth Image showing concentration of flow upstream of the breach (1=Current Breach, 2= Prakashpur, 3= Rajabas and 4=Pulthegaunda)
2
3
1
2
3
4
Rapid Hazard and Risk Assessment Final Report: 20 March 2009 Koshi River Embankment Breach
57
108. The flow path was determined based on the gradient of the terrain as
indicated by the contours. Another consideration in determining the flow
path, particularly from Pulthegaunda, was the old channel of the Koshi
River. The old channel of the Koshi River has been traced to about 35 km
east from the Barrage (Gole and Chitale, 1996 cited in Dixit, 2009). It is in
this context that the flow is likely to follow the old channel.
109. As can be seen in Figure 3.2 above, similar concentrations of river are
clearly visible on the embankment.
3.7 Exposures to Potential Risk
110. Identification and quantification of the elements exposed have been based
on two sources of information – topo sheet maps and field surveys at
VDC level. The analysis is made at VDC level. The breach floods of 2008
affected 12 VDCs with a total population of 98,680 according to the
Population Census of 2005. The number of VDCs likely to be affected
from the Prakashpur site are 20 (12+8), which also includes VDCs located
in the downstream area with a population of 163,846. Likewise, the
number of VDCs likely to be affected due to the breach at Rajbas is 29
with a total population of 259,646. Inaruwa, the district headquarters of
Sunsari District is likely to be affected. The number of VDCs likely to be
affected due to breaching at Pulthegauda is 54 with a total population of
652,811. Biratnagar is likely to be affected in this scenario (Table 3.1 and
Figure 3.14). The cultivated land likely to be affected ranges from 360 sq.
km from the potential Prakashpur breach to 436 sq. km from Rajbas and
826 sq. km from Pulthegaunda. The total area likely to be affected ranges
from about 44.6 sq km of forest, 14.5 sq. km of plantation area, 25.2 sq. km
of grassland and 2.5 sq. km of built up areas. About 677 km of road,
including 61 km of highway is likely to be affected. There are more than
100 ethnic groups living in this area. The major ethnic groups in
population are Muslim, Tharu, Bahun, Chhetri, Yadav, Koiri, Mushahar,
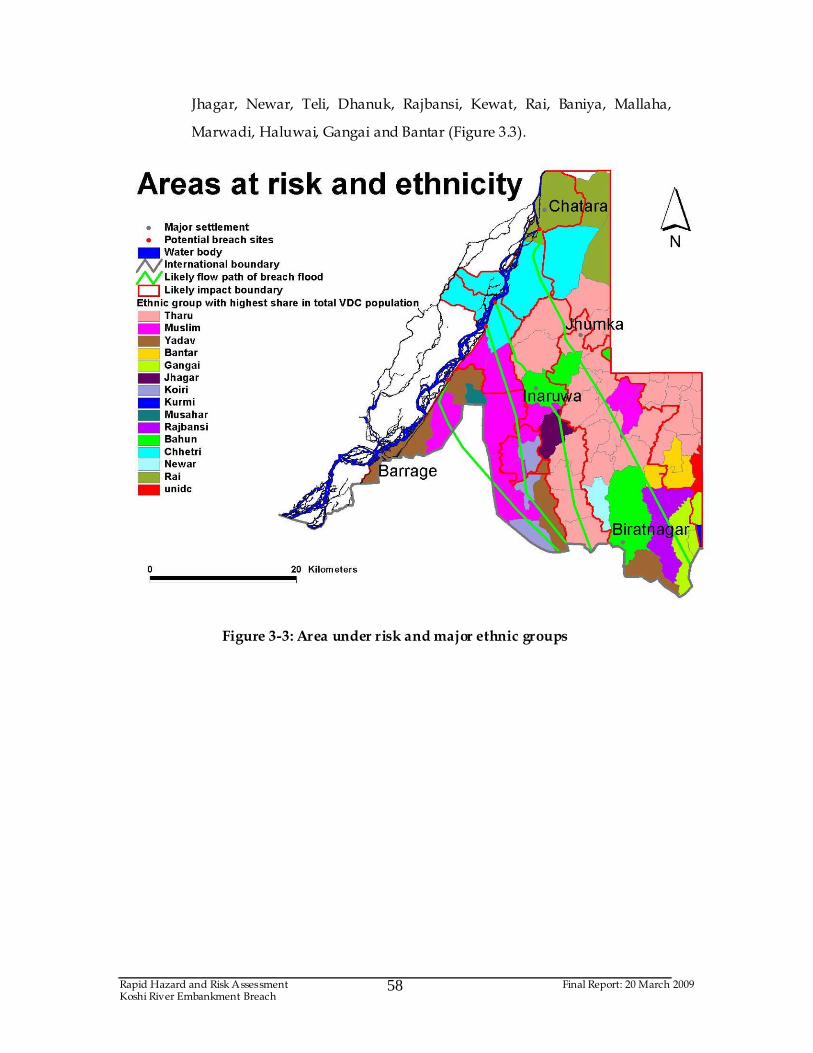
Rapid Hazard and Risk Assessment Final Report: 20 March 2009 Koshi River Embankment Breach
58
Jhagar, Newar, Teli, Dhanuk, Rajbansi, Kewat, Rai, Baniya, Mallaha,
Marwadi, Haluwai, Gangai and Bantar (Figure 3.3).
Figure 3-3: Area under risk and major ethnic groups
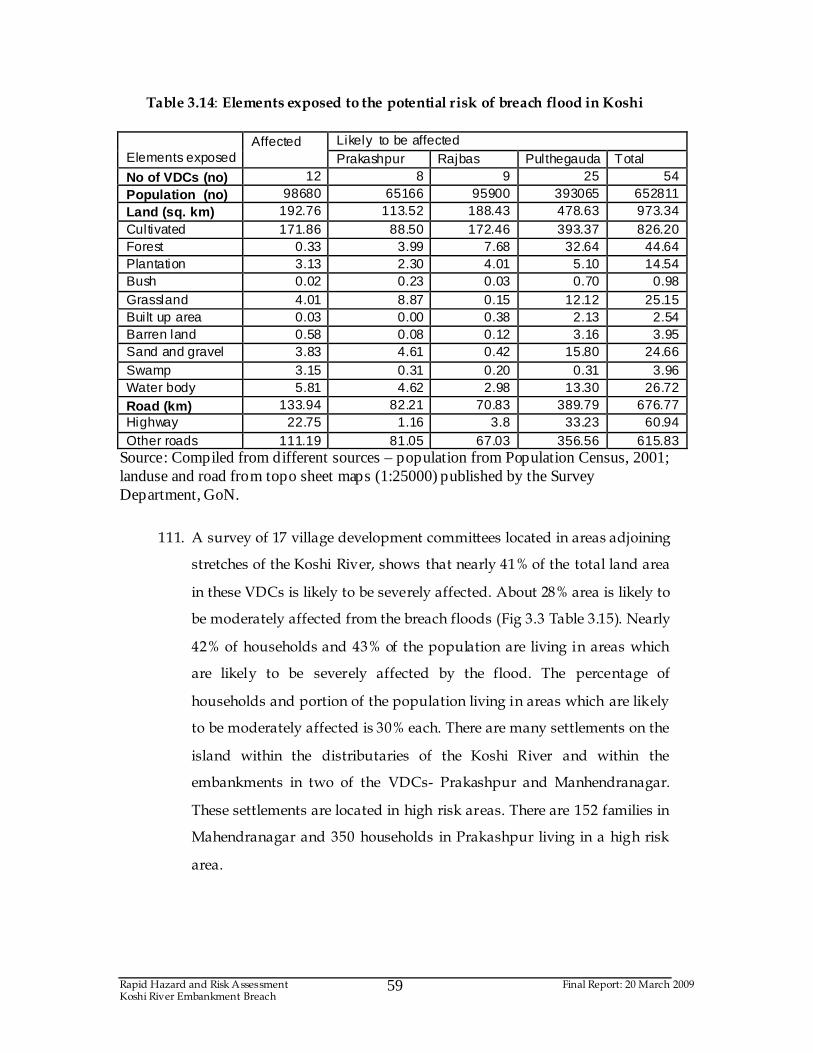
Rapid Hazard and Risk Assessment Final Report: 20 March 2009 Koshi River Embankment Breach
59
Table 3.14: Elements exposed to the potential risk of breach flood in Koshi
Likely to be affected
Elements exposed Affected Prakashpur Rajbas Pulthegauda Total
No of VDCs (no) 12 8 9 25 54 Population (no) 98680 65166 95900 393065 652811 Land (sq. km) 192.76 113.52 188.43 478.63 973.34 Cultivated 171.86 88.50 172.46 393.37 826.20 Forest 0.33 3.99 7.68 32.64 44.64 Plantation 3.13 2.30 4.01 5.10 14.54 Bush 0.02 0.23 0.03 0.70 0.98 Grassland 4.01 8.87 0.15 12.12 25.15 Built up area 0.03 0.00 0.38 2.13 2.54 Barren land 0.58 0.08 0.12 3.16 3.95 Sand and gravel 3.83 4.61 0.42 15.80 24.66 Swamp 3.15 0.31 0.20 0.31 3.96 Water body 5.81 4.62 2.98 13.30 26.72 Road (km) 133.94 82.21 70.83 389.79 676.77 Highway 22.75 1.16 3.8 33.23 60.94 Other roads 111.19 81.05 67.03 356.56 615.83
Source: Compiled from different sources – population from Population Census, 2001; landuse and road from topo sheet maps (1:25000) published by the Survey Department, GoN.
111. A survey of 17 village development committees located in areas adjoining
stretches of the Koshi River, shows that nearly 41% of the total land area
in these VDCs is likely to be severely affected. About 28% area is likely to
be moderately affected from the breach floods (Fig 3.3 Table 3.15). Nearly
42% of households and 43% of the population are living in areas which
are likely to be severely affected by the flood. The percentage of
households and portion of the population living in areas which are likely
to be moderately affected is 30% each. There are many settlements on the
island within the distributaries of the Koshi River and within the
embankments in two of the VDCs- Prakashpur and Manhendranagar.
These settlements are located in high risk areas. There are 152 families in
Mahendranagar and 350 households in Prakashpur living in a high risk
area.
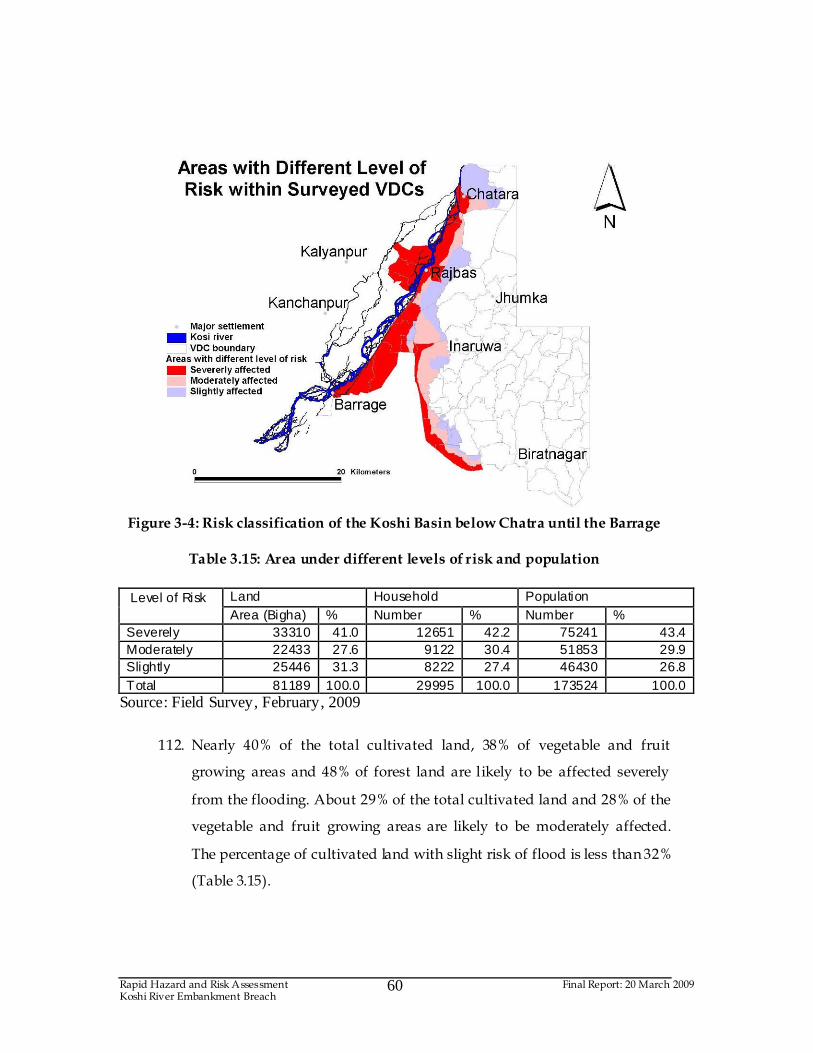
Rapid Hazard and Risk Assessment Final Report: 20 March 2009 Koshi River Embankment Breach
60
Figure 3-4: Risk classification of the Koshi Basin below Chatra until the Barrage
Table 3.15: Area under different levels of risk and population
Land Household Population Level of Risk
Area (Bigha) % Number % Number % Severely 33310 41.0 12651 42.2 75241 43.4 Moderately 22433 27.6 9122 30.4 51853 29.9 Slightly 25446 31.3 8222 27.4 46430 26.8 Total 81189 100.0 29995 100.0 173524 100.0
Source: Field Survey, February, 2009
112. Nearly 40% of the total cultivated land, 38% of vegetable and fruit
growing areas and 48% of forest land are likely to be affected severely
from the flooding. About 29% of the total cultivated land and 28% of the
vegetable and fruit growing areas are likely to be moderately affected.
The percentage of cultivated land with slight risk of flood is less than 32%
(Table 3.15).
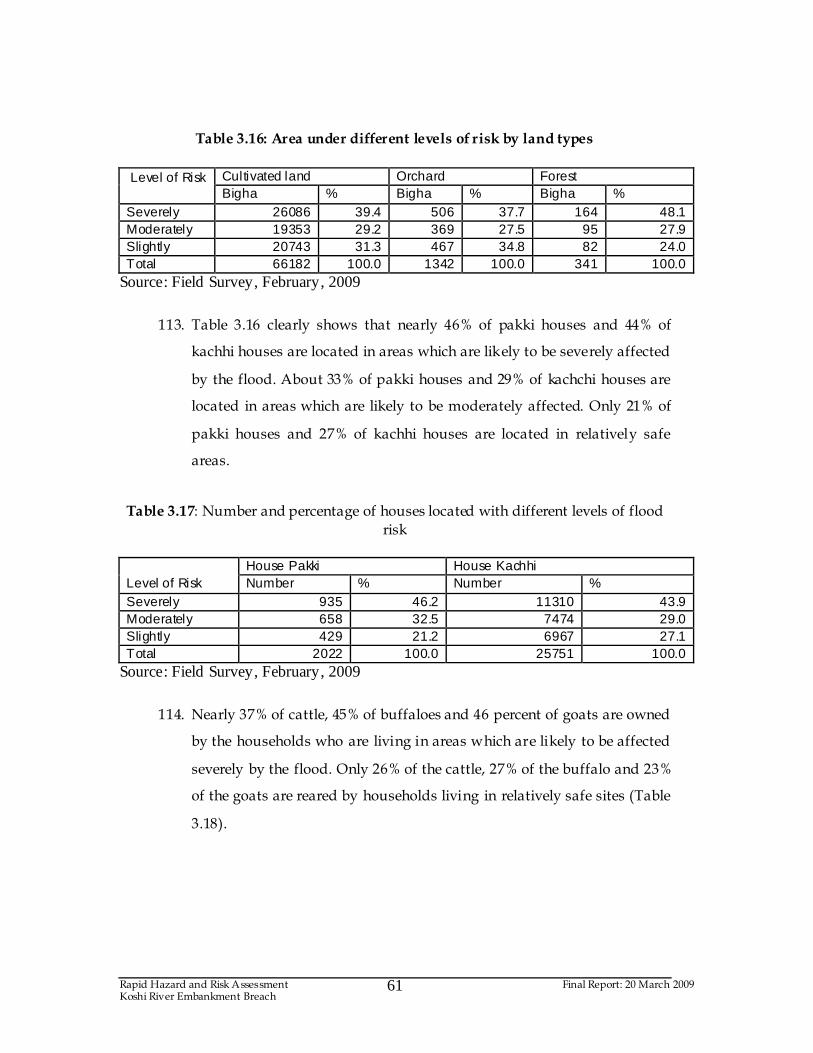
Rapid Hazard and Risk Assessment Final Report: 20 March 2009 Koshi River Embankment Breach
61
Table 3.16: Area under different levels of risk by land types
Cultivated land Orchard Forest Level of Risk
Bigha % Bigha % Bigha % Severely 26086 39.4 506 37.7 164 48.1 Moderately 19353 29.2 369 27.5 95 27.9 Slightly 20743 31.3 467 34.8 82 24.0 Total 66182 100.0 1342 100.0 341 100.0
Source: Field Survey, February, 2009
113. Table 3.16 clearly shows that nearly 46% of pakki houses and 44% of
kachhi houses are located in areas which are likely to be severely affected
by the flood. About 33% of pakki houses and 29% of kachchi houses are
located in areas which are likely to be moderately affected. Only 21% of
pakki houses and 27% of kachhi houses are located in relatively safe
areas.
Table 3.17: Number and percentage of houses located with different levels of flood
risk
House Pakki House Kachhi Level of Risk Number % Number % Severely 935 46.2 11310 43.9 Moderately 658 32.5 7474 29.0 Slightly 429 21.2 6967 27.1 Total 2022 100.0 25751 100.0
Source: Field Survey, February, 2009
114. Nearly 37% of cattle, 45% of buffaloes and 46 percent of goats are owned
by the households who are living in areas which are likely to be affected
severely by the flood. Only 26% of the cattle, 27% of the buffalo and 23%
of the goats are reared by households living in relatively safe sites (Table
3.18).
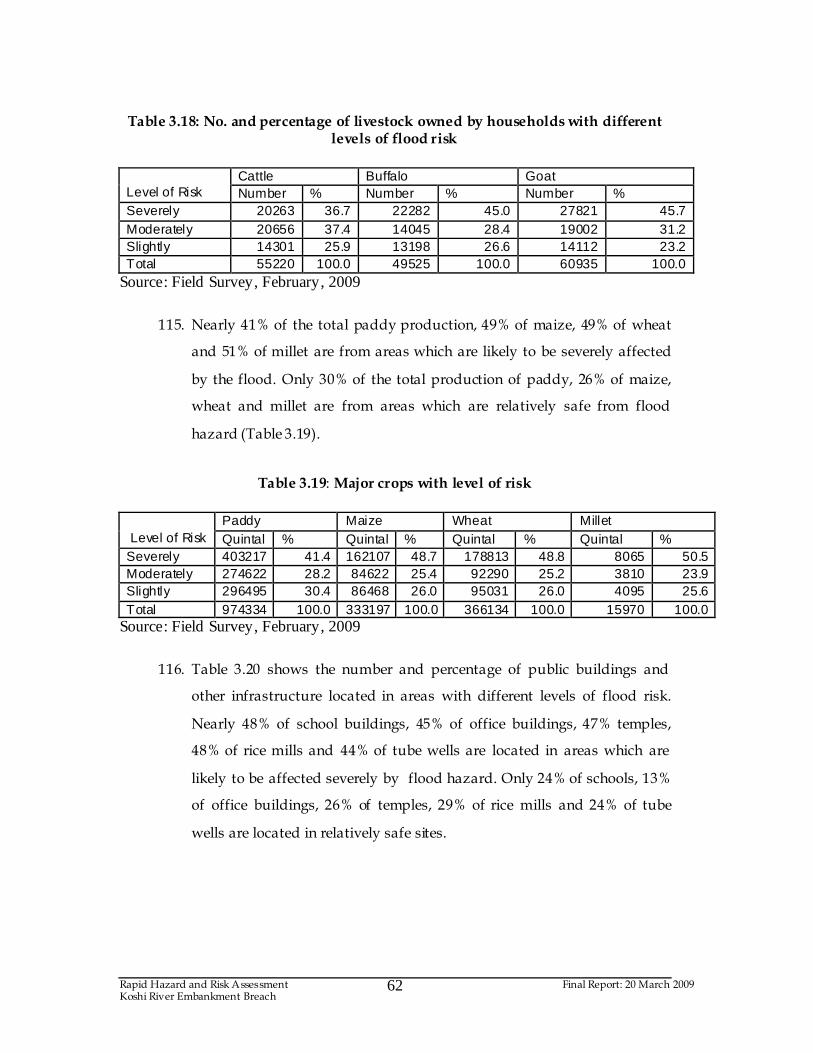
Rapid Hazard and Risk Assessment Final Report: 20 March 2009 Koshi River Embankment Breach
62
Table 3.18: No. and percentage of livestock owned by households with different
levels of flood risk
Cattle Buffalo Goat Level of Risk Number % Number % Number % Severely 20263 36.7 22282 45.0 27821 45.7 Moderately 20656 37.4 14045 28.4 19002 31.2 Slightly 14301 25.9 13198 26.6 14112 23.2 Total 55220 100.0 49525 100.0 60935 100.0
Source: Field Survey, February, 2009
115. Nearly 41% of the total paddy production, 49% of maize, 49% of wheat
and 51% of millet are from areas which are likely to be severely affected
by the flood. Only 30% of the total production of paddy, 26% of maize,
wheat and millet are from areas which are relatively safe from flood
hazard (Table 3.19).
Table 3.19: Major crops with level of risk
Paddy Maize Wheat Millet
Level of Risk Quintal % Quintal % Quintal % Quintal % Severely 403217 41.4 162107 48.7 178813 48.8 8065 50.5 Moderately 274622 28.2 84622 25.4 92290 25.2 3810 23.9 Slightly 296495 30.4 86468 26.0 95031 26.0 4095 25.6 Total 974334 100.0 333197 100.0 366134 100.0 15970 100.0
Source: Field Survey, February, 2009
116. Table 3.20 shows the number and percentage of public buildings and
other infrastructure located in areas with different levels of flood risk.
Nearly 48% of school buildings, 45% of office buildings, 47% temples,
48% of rice mills and 44% of tube wells are located in areas which are
likely to be affected severely by flood hazard. Only 24% of schools, 13%
of office buildings, 26% of temples, 29% of rice mills and 24% of tube
wells are located in relatively safe sites.
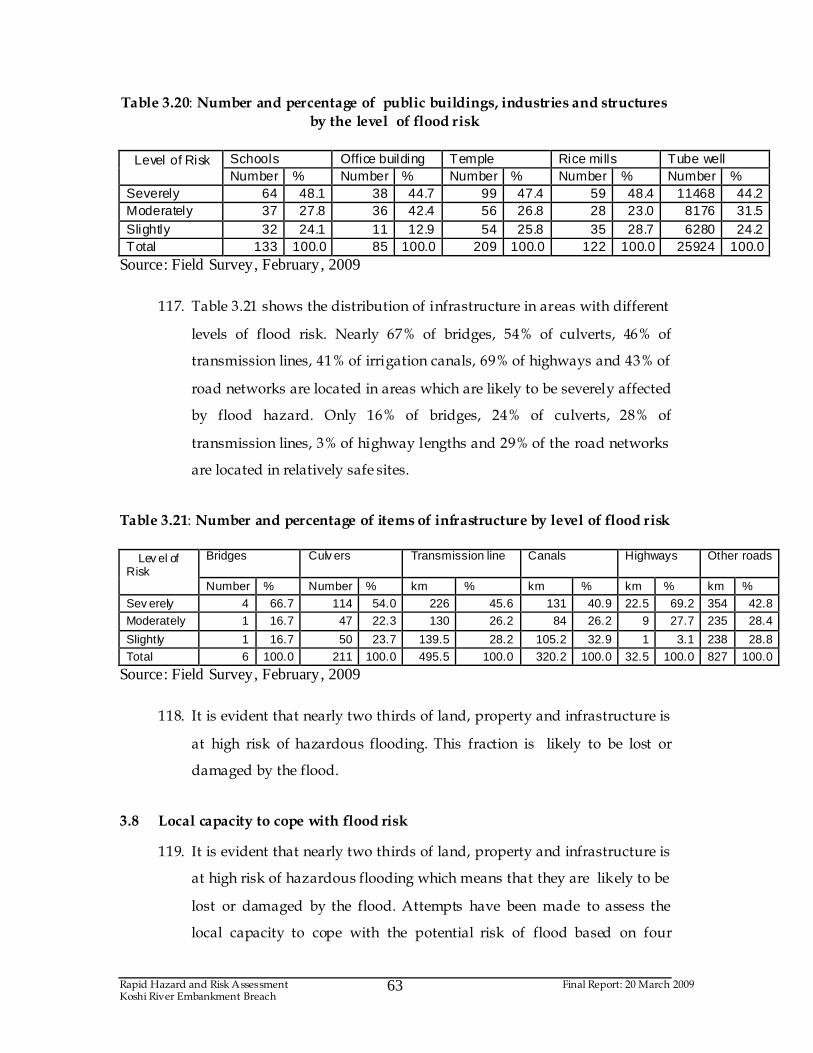
Rapid Hazard and Risk Assessment Final Report: 20 March 2009 Koshi River Embankment Breach
63
Table 3.20: Number and percentage of public buildings, industries and structures
by the level of flood risk
Schools Office building Temple Rice mills Tube well Level of Risk
Number % Number % Number % Number % Number % Severely 64 48.1 38 44.7 99 47.4 59 48.4 11468 44.2 Moderately 37 27.8 36 42.4 56 26.8 28 23.0 8176 31.5 Slightly 32 24.1 11 12.9 54 25.8 35 28.7 6280 24.2 Total 133 100.0 85 100.0 209 100.0 122 100.0 25924 100.0
Source: Field Survey, February, 2009
117. Table 3.21 shows the distribution of infrastructure in areas with different
levels of flood risk. Nearly 67% of bridges, 54% of culverts, 46% of
transmission lines, 41% of irrigation canals, 69% of highways and 43% of
road networks are located in areas which are likely to be severely affected
by flood hazard. Only 16% of bridges, 24% of culverts, 28% of
transmission lines, 3% of highway lengths and 29% of the road networks
are located in relatively safe sites.
Table 3.21: Number and percentage of items of infrastructure by level of flood risk
Bridges
Culv ers
Transmission line
Canals
Highways
Other roads
Lev el of Risk Number % Number % km % km % km % km % Sev erely 4 66.7 114 54.0 226 45.6 131 40.9 22.5 69.2 354 42.8 Moderately 1 16.7 47 22.3 130 26.2 84 26.2 9 27.7 235 28.4
Slightly 1 16.7 50 23.7 139.5 28.2 105.2 32.9 1 3.1 238 28.8 Total 6 100.0 211 100.0 495.5 100.0 320.2 100.0 32.5 100.0 827 100.0
Source: Field Survey, February, 2009
118. It is evident that nearly two thirds of land, property and infrastructure is
at high risk of hazardous flooding. This fraction is likely to be lost or
damaged by the flood.
3.8 Local capacity to cope with flood risk
119. It is evident that nearly two thirds of land, property and infrastructure is
at high risk of hazardous flooding which means that they are likely to be
lost or damaged by the flood. Attempts have been made to assess the
local capacity to cope with the potential risk of flood based on four
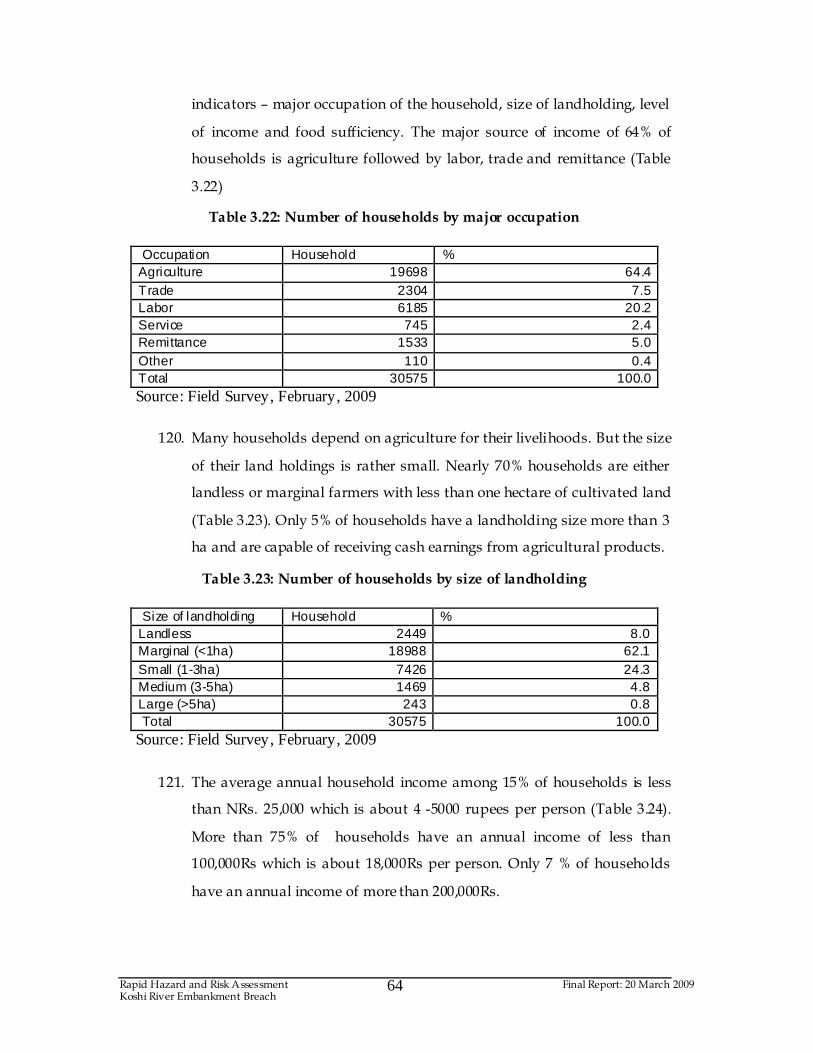
Rapid Hazard and Risk Assessment Final Report: 20 March 2009 Koshi River Embankment Breach
64
indicators – major occupation of the household, size of landholding, level
of income and food sufficiency. The major source of income of 64% of
households is agriculture followed by labor, trade and remittance (Table
3.22)
Table 3.22: Number of households by major occupation
Occupation Household % Agriculture 19698 64.4 Trade 2304 7.5 Labor 6185 20.2 Service 745 2.4 Remittance 1533 5.0 Other 110 0.4 Total 30575 100.0
Source: Field Survey, February, 2009
120. Many households depend on agriculture for their livelihoods. But the size
of their land holdings is rather small. Nearly 70% households are either
landless or marginal farmers with less than one hectare of cultivated land
(Table 3.23). Only 5% of households have a landholding size more than 3
ha and are capable of receiving cash earnings from agricultural products.
Table 3.23: Number of households by size of landholding
Size of landholding Household % Landless 2449 8.0 Marginal (<1ha) 18988 62.1 Small (1-3ha) 7426 24.3 Medium (3-5ha) 1469 4.8 Large (>5ha) 243 0.8 Total 30575 100.0
Source: Field Survey, February, 2009
121. The average annual household income among 15% of households is less
than NRs. 25,000 which is about 4 -5000 rupees per person (Table 3.24).
More than 75% of households have an annual income of less than
100,000Rs which is about 18,000Rs per person. Only 7 % of households
have an annual income of more than 200,000Rs.
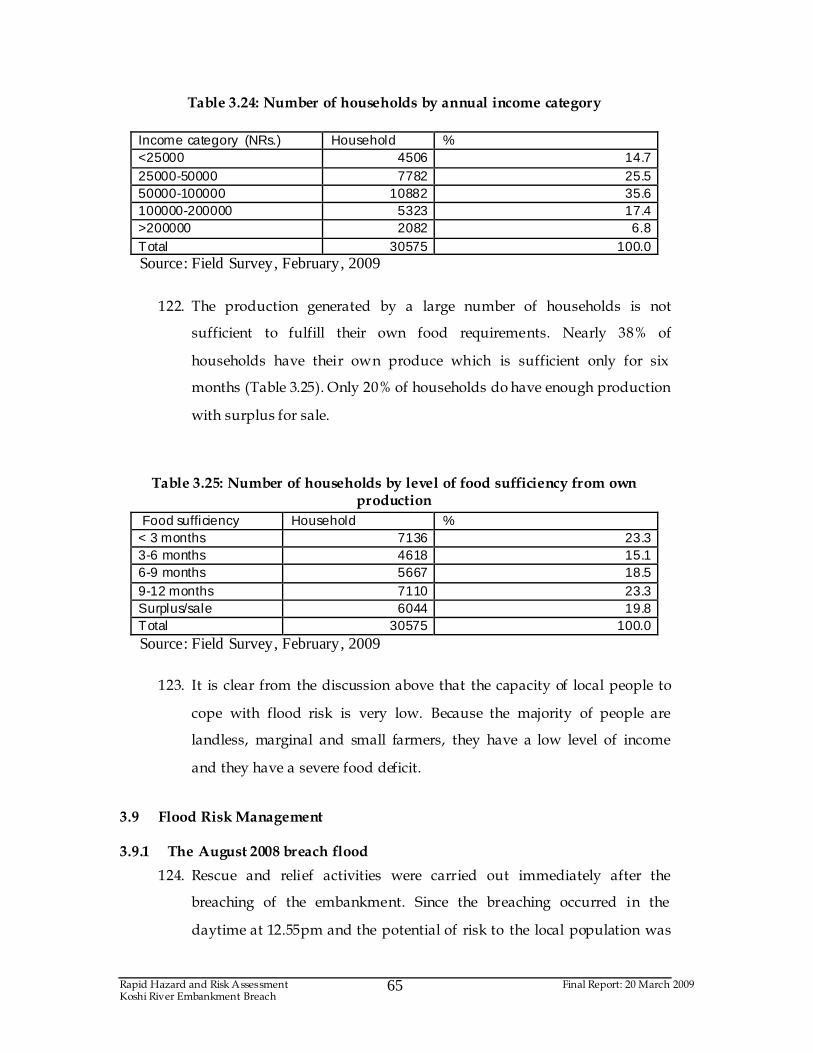
Rapid Hazard and Risk Assessment Final Report: 20 March 2009 Koshi River Embankment Breach
65
Table 3.24: Number of households by annual income category
Income category (NRs.) Household % <25000 4506 14.7 25000-50000 7782 25.5 50000-100000 10882 35.6 100000-200000 5323 17.4 >200000 2082 6.8 Total 30575 100.0
Source: Field Survey, February, 2009
122. The production generated by a large number of households is not
sufficient to fulfill their own food requirements. Nearly 38% of
households have their own produce which is sufficient only for six
months (Table 3.25). Only 20% of households do have enough production
with surplus for sale.
Table 3.25: Number of households by level of food sufficiency from own production
Food sufficiency Household % < 3 months 7136 23.3 3-6 months 4618 15.1 6-9 months 5667 18.5 9-12 months 7110 23.3 Surplus/sale 6044 19.8 Total 30575 100.0
Source: Field Survey, February, 2009
123. It is clear from the discussion above that the capacity of local people to
cope with flood risk is very low. Because the majority of people are
landless, marginal and small farmers, they have a low level of income
and they have a severe food deficit.
3.9 Flood Risk Management
3.9.1 The August 2008 breach flood
124. Rescue and relief activities were carried out immediately after the
breaching of the embankment. Since the breaching occurred in the
daytime at 12.55pm and the potential of risk to the local population was
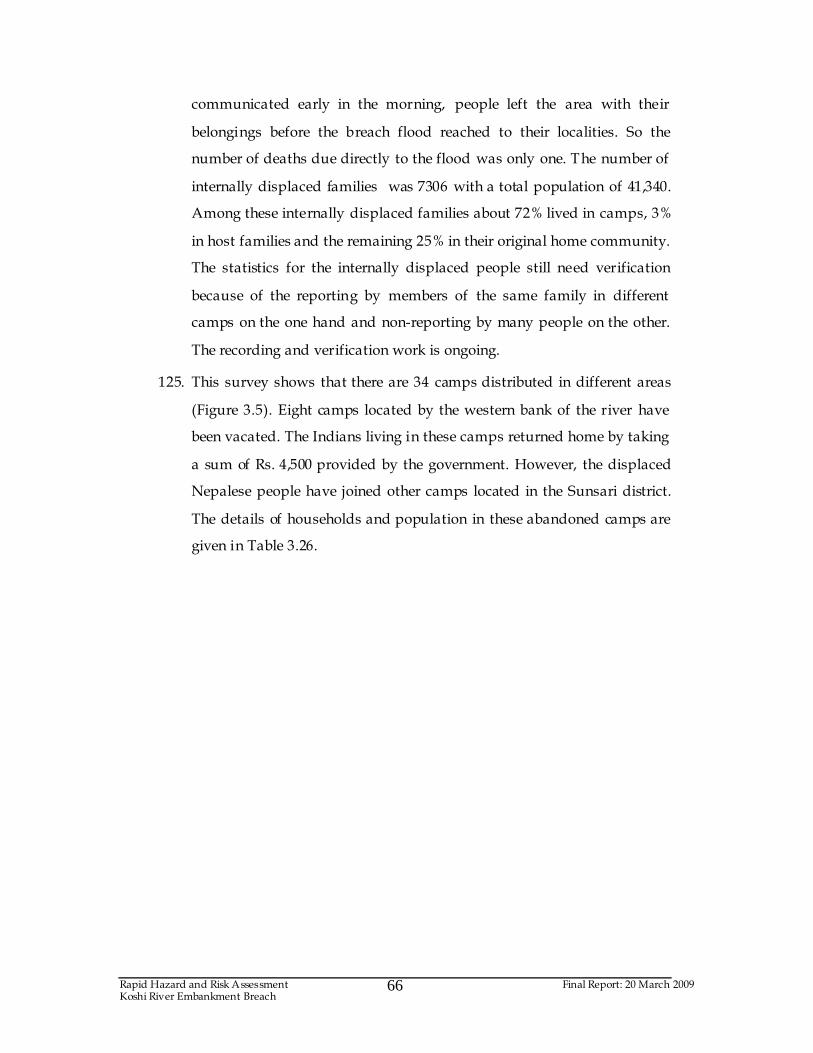
Rapid Hazard and Risk Assessment Final Report: 20 March 2009 Koshi River Embankment Breach
66
communicated early in the morning, people left the area with their
belongings before the breach flood reached to their localities. So the
number of deaths due directly to the flood was only one. The number of
internally displaced families was 7306 with a total population of 41,340.
Among these internally displaced families about 72% lived in camps, 3%
in host families and the remaining 25% in their original home community.
The statistics for the internally displaced people still need verification
because of the reporting by members of the same family in different
camps on the one hand and non-reporting by many people on the other.
The recording and verification work is ongoing.
125. This survey shows that there are 34 camps distributed in different areas
(Figure 3.5). Eight camps located by the western bank of the river have
been vacated. The Indians living in these camps returned home by taking
a sum of Rs. 4,500 provided by the government. However, the displaced
Nepalese people have joined other camps located in the Sunsari district.
The details of households and population in these abandoned camps are
given in Table 3.26.
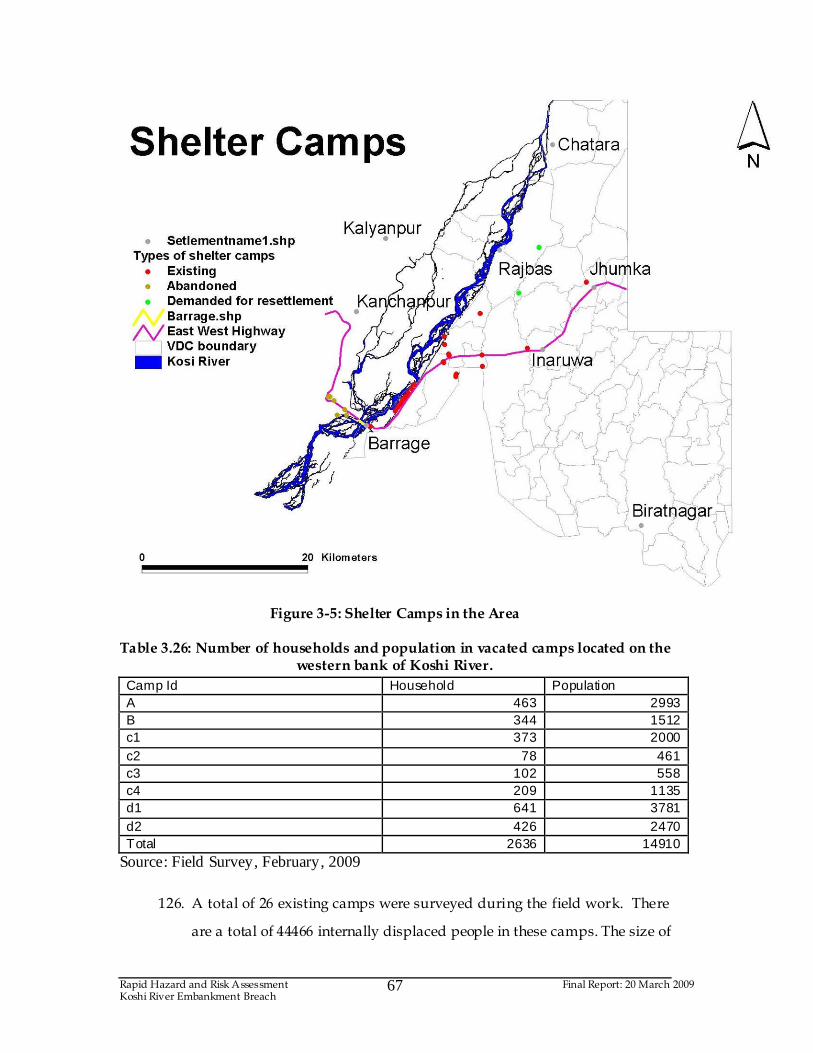
Rapid Hazard and Risk Assessment Final Report: 20 March 2009 Koshi River Embankment Breach
67
Figure 3-5: Shelter Camps in the Area
Table 3.26: Number of households and population in vacated camps located on the western bank of Koshi River.
Camp Id Household Population A 463 2993 B 344 1512 c1 373 2000 c2 78 461 c3 102 558 c4 209 1135 d1 641 3781 d2 426 2470 Total 2636 14910
Source: Field Survey, February, 2009
126. A total of 26 existing camps were surveyed during the field work. There
are a total of 44466 internally displaced people in these camps. The size of
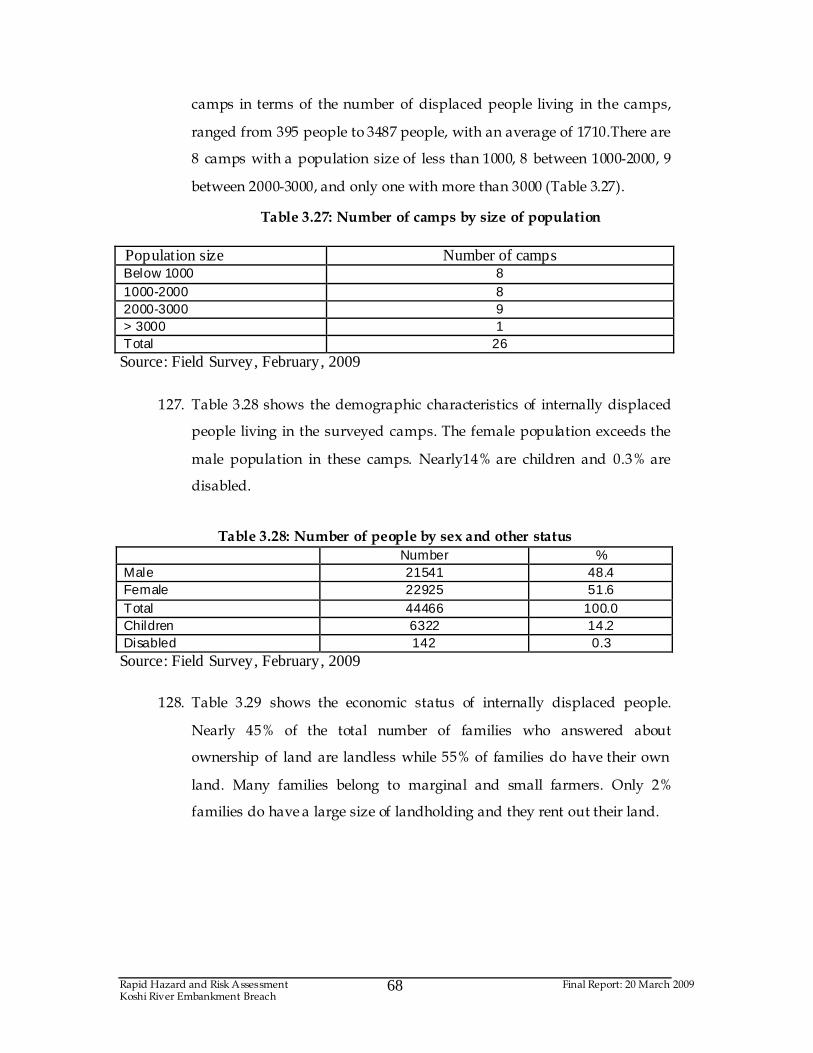
Rapid Hazard and Risk Assessment Final Report: 20 March 2009 Koshi River Embankment Breach
68
camps in terms of the number of displaced people living in the camps,
ranged from 395 people to 3487 people, with an average of 1710.There are
8 camps with a population size of less than 1000, 8 between 1000-2000, 9
between 2000-3000, and only one with more than 3000 (Table 3.27).
Table 3.27: Number of camps by size of population
Population size Number of camps Below 1000 8 1000-2000 8 2000-3000 9 > 3000 1 Total 26 Source: Field Survey, February, 2009
127. Table 3.28 shows the demographic characteristics of internally displaced
people living in the surveyed camps. The female population exceeds the
male population in these camps. Nearly14% are children and 0.3% are
disabled.
Table 3.28: Number of people by sex and other status
Number % Male 21541 48.4 Female 22925 51.6 Total 44466 100.0 Children 6322 14.2 Disabled 142 0.3 Source: Field Survey, February, 2009
128. Table 3.29 shows the economic status of internally displaced people.
Nearly 45% of the total number of families who answered about
ownership of land are landless while 55% of families do have their own
land. Many families belong to marginal and small farmers. Only 2%
families do have a large size of landholding and they rent out their land.
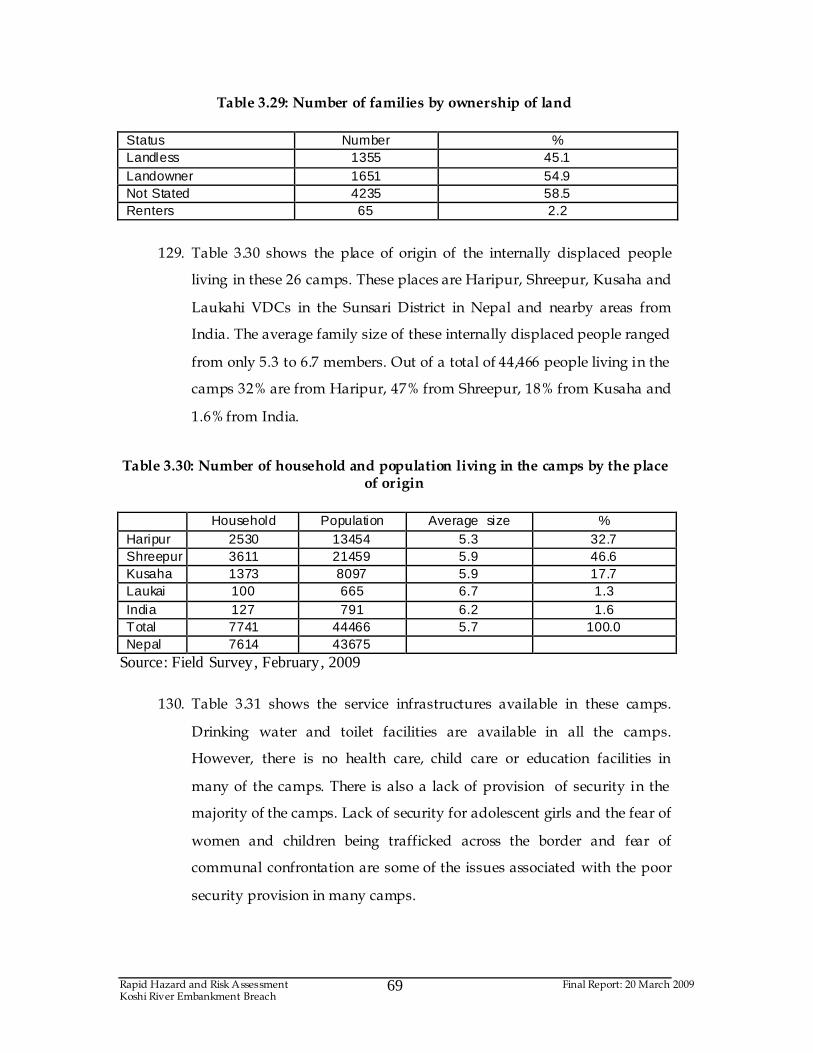
Rapid Hazard and Risk Assessment Final Report: 20 March 2009 Koshi River Embankment Breach
69
Table 3.29: Number of families by ownership of land
Status Number % Landless 1355 45.1 Landowner 1651 54.9 Not Stated 4235 58.5 Renters 65 2.2
129. Table 3.30 shows the place of origin of the internally displaced people
living in these 26 camps. These places are Haripur, Shreepur, Kusaha and
Laukahi VDCs in the Sunsari District in Nepal and nearby areas from
India. The average family size of these internally displaced people ranged
from only 5.3 to 6.7 members. Out of a total of 44,466 people living in the
camps 32% are from Haripur, 47% from Shreepur, 18% from Kusaha and
1.6% from India.
Table 3.30: Number of household and population living in the camps by the place
of origin
Household Population Average size % Haripur 2530 13454 5.3 32.7 Shreepur 3611 21459 5.9 46.6 Kusaha 1373 8097 5.9 17.7 Laukai 100 665 6.7 1.3 India 127 791 6.2 1.6 Total 7741 44466 5.7 100.0 Nepal 7614 43675
Source: Field Survey, February, 2009
130. Table 3.31 shows the service infrastructures available in these camps.
Drinking water and toilet facilities are available in all the camps.
However, there is no health care, child care or education facilities in
many of the camps. There is also a lack of provision of security in the
majority of the camps. Lack of security for adolescent girls and the fear of
women and children being trafficked across the border and fear of
communal confrontation are some of the issues associated with the poor
security provision in many camps.
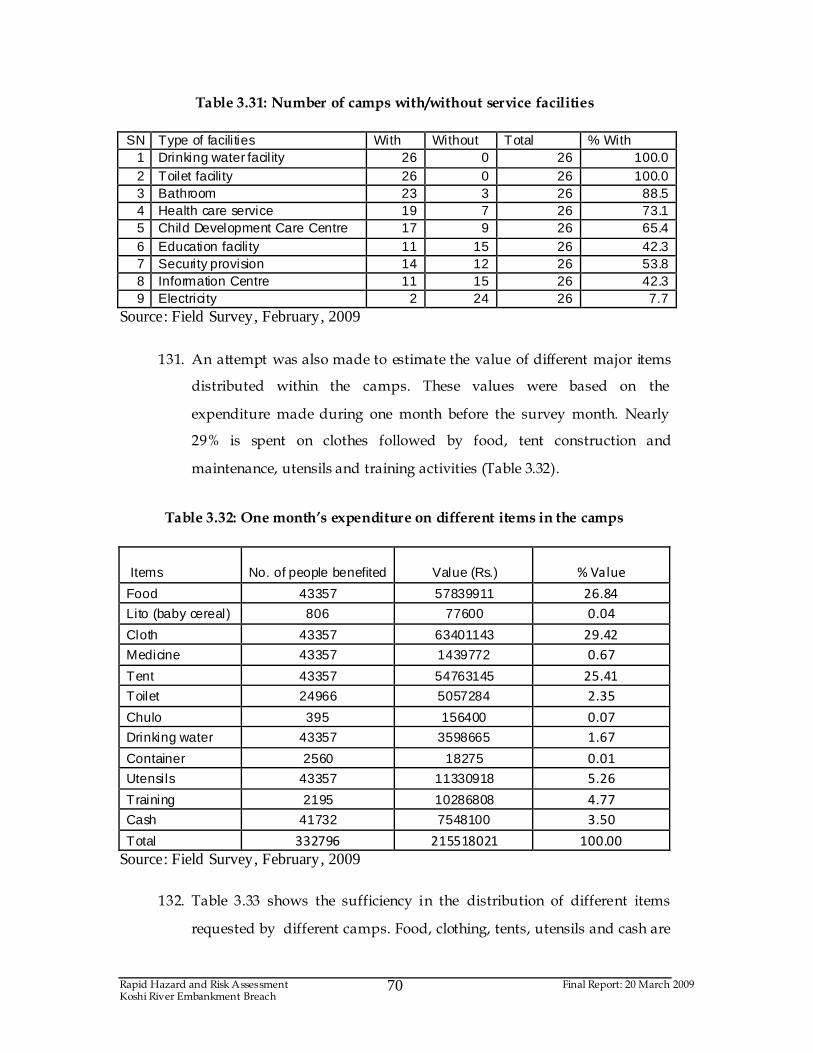
Rapid Hazard and Risk Assessment Final Report: 20 March 2009 Koshi River Embankment Breach
70
Table 3.31: Number of camps with/without service facilities
SN Type of facilities With Without Total % With
1 Drinking water facil ity 26 0 26 100.0 2 Toilet facility 26 0 26 100.0 3 Bathroom 23 3 26 88.5 4 Health care service 19 7 26 73.1 5 Child Development Care Centre 17 9 26 65.4 6 Education facility 11 15 26 42.3 7 Security provision 14 12 26 53.8 8 Information Centre 11 15 26 42.3 9 Electricity 2 24 26 7.7
Source: Field Survey, February, 2009
131. An attempt was also made to estimate the value of different major items
distributed within the camps. These values were based on the
expenditure made during one month before the survey month. Nearly
29% is spent on clothes followed by food, tent construction and
maintenance, utensils and training activities (Table 3.32).
Table 3.32: One month’s expenditure on different items in the camps
Items No. of people benefited Value (Rs.) % Value
Food 43357 57839911 26.84
Lito (baby cereal) 806 77600 0.04
Cloth 43357 63401143 29.42
Medicine 43357 1439772 0.67
Tent 43357 54763145 25.41
Toilet 24966 5057284 2.35
Chulo 395 156400 0.07
Drinking water 43357 3598665 1.67
Container 2560 18275 0.01
Utensils 43357 11330918 5.26
Training 2195 10286808 4.77
Cash 41732 7548100 3.50
Total 332796 215518021 100.00
Source: Field Survey, February, 2009
132. Table 3.33 shows the sufficiency in the distribution of different items
requested by different camps. Food, clothing, tents, utensils and cash are
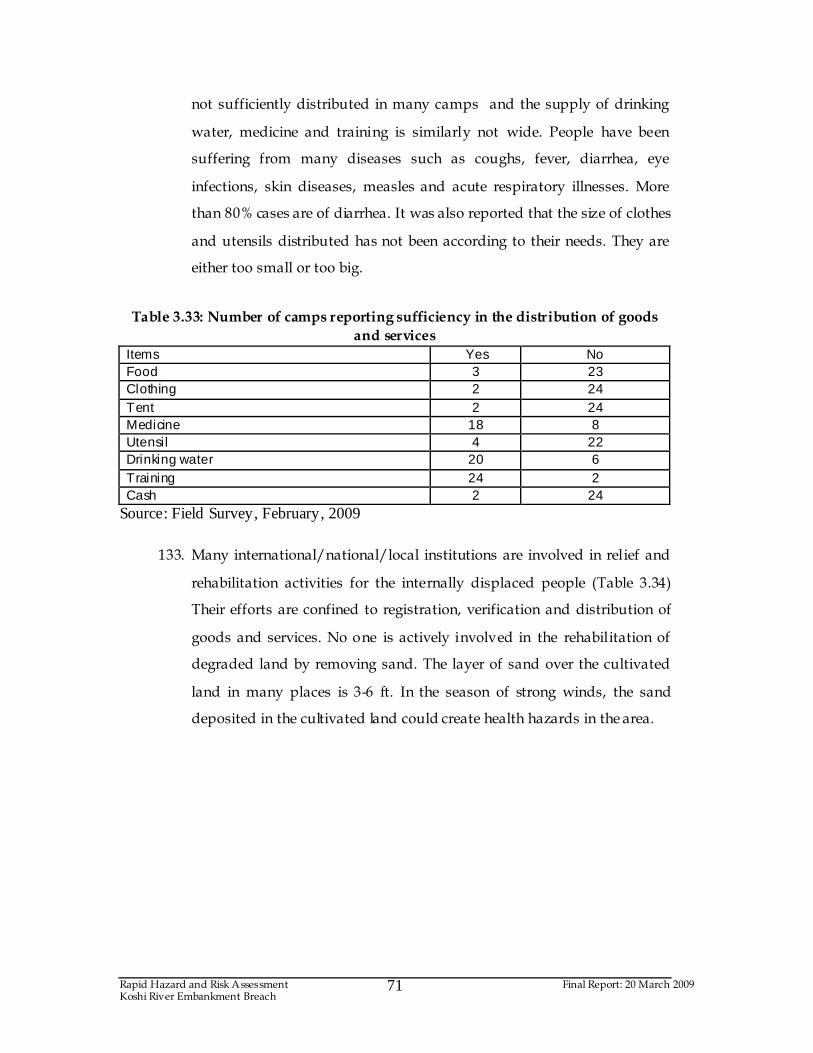
Rapid Hazard and Risk Assessment Final Report: 20 March 2009 Koshi River Embankment Breach
71
not sufficiently distributed in many camps and the supply of drinking
water, medicine and training is similarly not wide. People have been
suffering from many diseases such as coughs, fever, diarrhea, eye
infections, skin diseases, measles and acute respiratory illnesses. More
than 80% cases are of diarrhea. It was also reported that the size of clothes
and utensils distributed has not been according to their needs. They are
either too small or too big.
Table 3.33: Number of camps reporting sufficiency in the distribution of goods
and services
Items Yes No Food 3 23 Clothing 2 24 Tent 2 24 Medicine 18 8 Utensil 4 22 Drinking water 20 6 Training 24 2 Cash 2 24
Source: Field Survey, February, 2009
133. Many international/national/local institutions are involved in relief and
rehabilitation activities for the internally displaced people (Table 3.34)
Their efforts are confined to registration, verification and distribution of
goods and services. No one is actively involved in the rehabilitation of
degraded land by removing sand. The layer of sand over the cultivated
land in many places is 3-6 ft. In the season of strong winds, the sand
deposited in the cultivated land could create health hazards in the area.
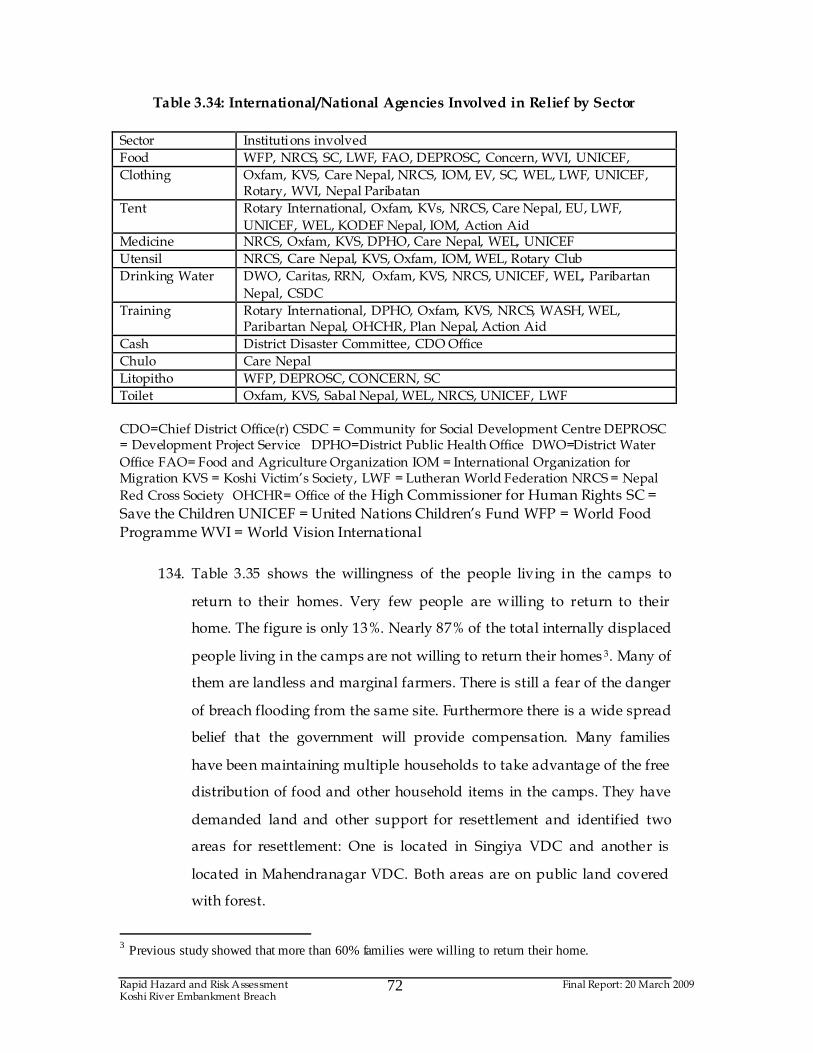
Rapid Hazard and Risk Assessment Final Report: 20 March 2009 Koshi River Embankment Breach
72
Table 3.34: International/National Agencies Involved in Relief by Sector
Sector Institutions involved
Food WFP, NRCS, SC, LWF, FAO, DEPROSC, Concern, WVI, UNICEF,
Clothing Oxfam, KVS, Care Nepal, NRCS, IOM, EV, SC, WEL, LWF, UNICEF, Rotary, WVI, Nepal Paribatan
Tent Rotary International, Oxfam, KVs, NRCS, Care Nepal, EU, LWF,
UNICEF, WEL, KODEF Nepal, IOM, Action Aid Medicine NRCS, Oxfam, KVS, DPHO, Care Nepal, WEL, UNICEF
Utensil NRCS, Care Nepal, KVS, Oxfam, IOM, WEL, Rotary Club
Drinking Water DWO, Caritas, RRN, Oxfam, KVS, NRCS, UNICEF, WEL, Paribartan
Nepal, CSDC
Training Rotary International, DPHO, Oxfam, KVS, NRCS, WASH, WEL, Paribartan Nepal, OHCHR, Plan Nepal, Action Aid
Cash District Disaster Committee, CDO Office
Chulo Care Nepal
Litopitho WFP, DEPROSC, CONCERN, SC
Toilet Oxfam, KVS, Sabal Nepal, WEL, NRCS, UNICEF, LWF
CDO=Chief District Office(r) CSDC = Community for Social Development Centre DEPROSC = Development Project Service DPHO=District Public Health Office DWO=District Water
Office FAO= Food and Agriculture Organization IOM = International Organization for Migration KVS = Koshi Victim’s Society, LWF = Lutheran World Federation NRCS = Nepal
Red Cross Society OHCHR= Office of the High Commissioner for Human Rights SC =
Save the Children UNICEF = United Nations Children’s Fund WFP = World Food
Programme WVI = World Vision International
134. Table 3.35 shows the willingness of the people living in the camps to
return to their homes. Very few people are willing to return to their
home. The figure is only 13%. Nearly 87% of the total internally displaced
people living in the camps are not willing to return their homes 3. Many of
them are landless and marginal farmers. There is still a fear of the danger
of breach flooding from the same site. Furthermore there is a wide spread
belief that the government will provide compensation. Many families
have been maintaining multiple households to take advantage of the free
distribution of food and other household items in the camps. They have
demanded land and other support for resettlement and identified two
areas for resettlement: One is located in Singiya VDC and another is
located in Mahendranagar VDC. Both areas are on public land covered
with forest.
3 Previous study showed that more than 60% families were willing to return their home.
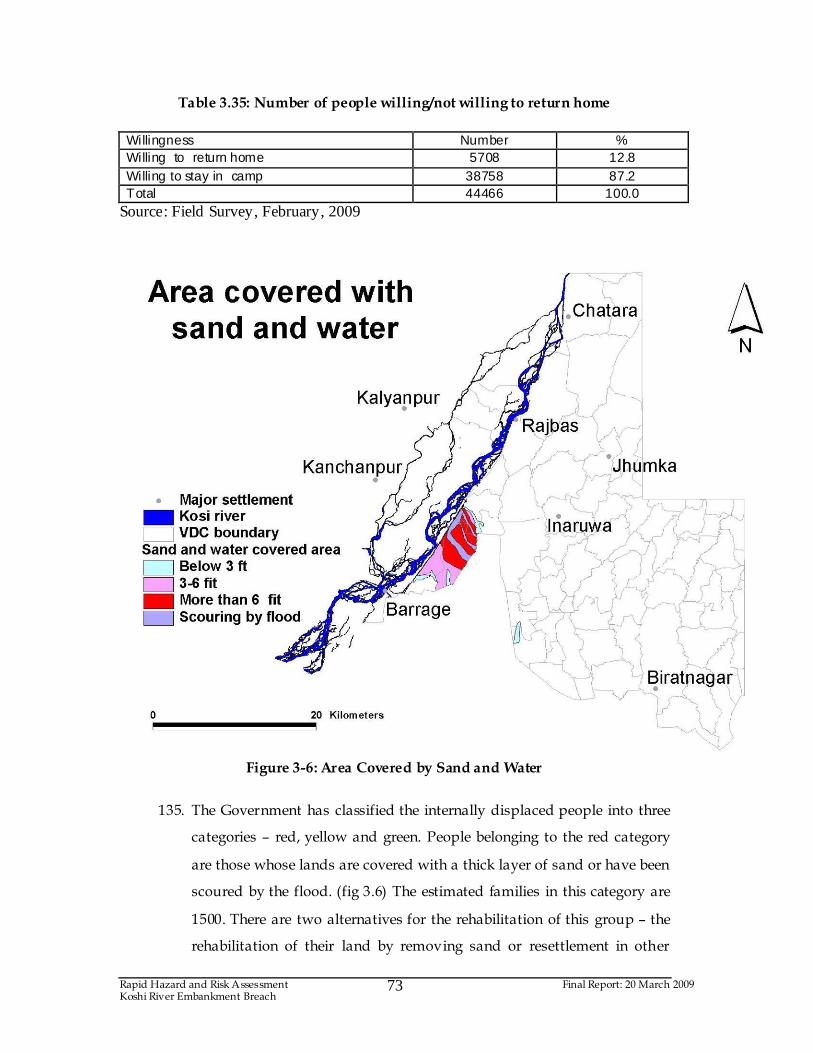
Rapid Hazard and Risk Assessment Final Report: 20 March 2009 Koshi River Embankment Breach
73
Table 3.35: Number of people willing/not willing to return home
Willingness Number % Willing to return home 5708 12.8 Willing to stay in camp 38758 87.2 Total 44466 100.0
Source: Field Survey, February, 2009
Figure 3-6: Area Covered by Sand and Water
135. The Government has classified the internally displaced people into three
categories – red, yellow and green. People belonging to the red category
are those whose lands are covered with a thick layer of sand or have been
scoured by the flood. (fig 3.6) The estimated families in this category are
1500. There are two alternatives for the rehabilitation of this group – the
rehabilitation of their land by removing sand or resettlement in other

Rapid Hazard and Risk Assessment Final Report: 20 March 2009 Koshi River Embankment Breach
74
areas. No collective or institutional effort has been made in connection
with the rehabilitation of damaged land till now. There was an
opportunity to rehabilitate the sand deposited area if proper care had
been made for cultivation when there was enough moisture in the soil, by
providing seeds, fertilizer and technology for the landowners.
136. The government has issued a package of Rs. 50,000 per family to return
internally displaced people in the yellow and green category to their
homes. However, the demands of internally displaced people including
the leaders of many political parties were higher than this. They
demanded land for resettlement. The Jhumka Agricultural Farm is
another alternative for the resettlement of the internally displaced people.
However, the size of land available is too small to accommodate all the
displaced people. This issue has been politicized and the large
landholders who belong to different political parties have asked others
not to leave the camps hoping that they could receive compensation for
all their land from the government through their collective voice.
3.10 Preparedness
137. Most of the activities have been focused on rescue and relief activities.
Only a few activities have been carried out for rehabilitation and
preparedness. The provision of NRs. 50,000 package for Nepalese
displaced families and NRs 4,500 for Indians has been made to encourage
people to return home. The capacities of many internally displaced
people has been improved through different types of training. However
no effort has yet been made for the rehabilitation of damaged land and
resettlement or other alternatives for those who are unwilling to return
home.
138. It has been planned for the maintenance of all those spurs which are
shortened due to toe cutting by the river. It was reported that the
proposed plan i.e. the addition in length by 100m in the existing spur in
many places is not enough to reduce the risk of beach.
Rapid Hazard and Risk Assessment Final Report: 20 March 2009 Koshi River Embankment Breach
75
139. Improvement in the road network- 23 km of the Jhumka-Chatra road, 12
km Dharan-Chatra road, Kanchanpur-Fattepur road and the Inaruwa-
Jalpapur-Dewangunj road and the provision of a ferry with a maximum
capacity of transporting 20 tons at a time, are some of the major activities
performed for flood preparedness. Keeping in view the magnitude of the
vehicular flow (1800 one way traffic per day), the provision of a ferry is
not enough. There is a need to construct a permanent bridge for better
preparedness.
140. Local people including political parties at a local level are not well aware
of the need of for preparedness activities. They often care for fulfilling
immediate needs. During the discussion, it was reported that the
investment in improvement in roads is a waste of resources. They
demanded that investing that resource for the rehabilitation of displaced
people should be a priority rather than spending on road improvement.
It is in this context that efforts should be made to make local people
aware of the importance of flood preparedness activities and the
development of a preparedness plan by involving them, in order to
reduce and manage the risk of flood hazard in the future.
3.11 Flood Fighting and Preparedness ( FF&P)
141. The assessment revealed that there is no organization responsible for
flood fighting and preparedness. There is no preparedness plan in place.
Notwithstanding, there is a mechanism that exists to undertake relief
measures after a disaster has already occurred. A large gap exists in terms
of organization, especially when it comes to coordination. The
Government of Nepal (GoN) has mandated the Department of Water
Induced Disaster Prevention (DWIDP) under the Ministry of Water
Resources (MoWR) to deal with water induced disasters. In the Koshi
case according to the Nepal-India agreement, the Government of India
(GoI) is responsible for all infrastructural works including repair and
maintenance from Chatra to the Indian Border. This makes DWIDP’s role
Rapid Hazard and Risk Assessment Final Report: 20 March 2009 Koshi River Embankment Breach
76
almost none existent in the area from the Chatra confluence to the
Barrage. The GoN has mandated the Department of Hydrology and
Meteorology (DHM) for hydrological and meteorological data collection,
including early warning and flood forecasting on a nation-wide basis, but
the DHM has very limited instrumentation in the Koshi river basin.
Needless to say the establishment of an Early Warning System (EWS) is
one of the prime requirements for flood fighting and a preparedness plan
to save lives and properties on n both the Nepali and Indian side. The
assessment clearly demanded that a fully- fledged EWS is established on
a priority basis as a non-structural measure in the Koshi Basin.
Rapid Hazard and Risk Assessment Final Report: 20 March 2009 Koshi River Embankment Breach
77
4 CONCLUSIONS AND KEY ISSUES
4.1 Introduction
142. As requested by UNCT in Nepal, UNESCO fielded a team of government
officers from Nepal and experts from both India and Nepal. The Team
was assigned to undertake a Rapid Hazard Risk Assessment. The Team
has just completed their field work. The following conclusions can be
drawn from the team’s findings:
143. The river has been diverted within the course of the designed
embankment. A very dry winter in Nepal has helped the breach repair.
144. The construction work is going on satisfactorily and the observation by
the team’s structural engineer has been very positive on the quality and
pace of construction. The efficiency of the Indian engineers in
spearheading the task deserves appreciation.
145. Having said the above, if analysis is made of the pre-breach conditions of
2008, there are several conditions that still exist that indicate the existence
of risk. The following paragraphs briefly evaluate these threats:
4.2 Technical Issues:
146. All the spurs along the embankment require major repair work. The
rebatement along the sides of the spurs are almost non-existent. Also
most of the noses and the aprons of the spurs are eroded. As the Team’s
analysis has established that the breach of 2008 had principally occurred
due to the spur failure, followed by the embankment failure, there is a
need to consider restoring spurs to their original design lengths.
147. The team identified that all spurs have been shortened on average by 20-
70 meters and they need to be restored to their design length and their
noses and launching aprons need to be repaired. The repair work falls
short of what is considered adequate.
Rapid Hazard and Risk Assessment Final Report: 20 March 2009 Koshi River Embankment Breach
78
148. The condition of the spurs and the way they stand is not sufficiently
strong to withstand floods of a higher magnitude. As per the Team’s
observation the 2008 flood was only about 80 percent of the average high
flow in Koshi. It was not one of the critical historical hydrological events
which caused breaches.
149. The Teams have identified three places upstream of the current breach
requiring immediate attention, as the constricted flow of about 75% of the
total flow is flowing only 70 meters away from the embankment. These
spots in Rajabas, Prakashpur and Pulthegaunda need immediate
attention as a breach in either of these spots could cause massive
destruction in the area compared to the 2008 breach.
150. The geomorphology of the river is poorly understood and as the world’s
second largest silt carrying river, the role of silt in bank erosion needs
further study.
151. The basin is also prone to danger due to GLOF-related events. Although
the problem will not be so much about water but about the silt that the
GOLF can potentially bring down to the alluvial fan. This can
dramatically decrease the cross-section of the river, ultimately leading to
possible over-topping of the embankment.
152. The river is still flowing along the eastern embankment in a narrow
channel highly prone to erosion. The Google image of 2004 clearly shows
the concentration of flow, which still exists.
153. The trees in between the spurs inside the embankment in the Koshi wild
life reserve can act as attracting spurs upon their natural felling due to
smaller floods.
154. The western embankment is in relatively worse shape and if the river
course changes its course towards the western bank, a bigger catastrophe
could occur.
155. The use of latest technology and mathematical modeling is lacking (or
reportedly on-going), which could alternatively justify constructing
Rapid Hazard and Risk Assessment Final Report: 20 March 2009 Koshi River Embankment Breach
79
frequent shorter length spurs. The shorter length flood could facilitate
maintenance and flood fighting measures quickly as practiced in the
Sunsari Morang command area development.
4.3 Institutional Issues:
156. The maintenance of the embankment is guided by a bilateral treaty and in
this treaty it is highly desirable that the role of Nepal should be
enhanced. Reportedly, this has lead to deliberate delays and/or
obstruction of work.
157. Several forms of communication failures, similar to those that existed
before the 2008 breach, still exist amongst the various agencies involved
in flood risk reduction.
158. Transparency in monitoring of the embankment and spurs still has room
for improvement. Information on regular periodic maintenance and
repairs needs to be properly archived. At least on the Nepal side, no
such archive exits.
159. The role of the authority that oversees wildlife reserve of Koshi may be
looked at again and revisited. Reportedly, the monitoring of spurs was
hampered due to indifferent behavior and neglect. This also has a bearing
on clearing of trees on the river-side of the embankment.
160. There appears to exist a focus on flood fighting and not so much focus on
the repair and maintenance of the spurs. Obviously, the “wait and watch”
approach is taking prevalence over prompt repairs and maintenance.
4.4 Social Issues
161. There is a need to look again at the broader picture of the basin and the
application of non-structural approaches, such as erosion control at the
source of the river upstream are essential.
162. The 2008 breach displaced nearly 7000 families in which majority are
landless and poor farmers. Their vulnerability to flood hazard is rather
high, thus their exposure to risk is also very high.
Rapid Hazard and Risk Assessment Final Report: 20 March 2009 Koshi River Embankment Breach
80
163. People's participation in the embankment repair and maintenance needs
to be improved by involving local people in the embankment repair,
maintenance and monitoring works.
164. The ownership of the embankment is the key and local people appear not
to own the embankment and spurs.
165. The team was informed of several problems regarding labor, which
existed just prior to breach. The team interviewed a few labor suppliers
and can conclude that such problems are still likely to occur.
166. The area suffers from Bandhs and strikes almost an every alternate day.
Such strikes can hamper repairs and maintenance and especially the flood
fighting effort, as it did in 2008.
4.5 Preparedness Issues:
167. The team observed that the basin does not have proper data collection,
information sharing and archiving arrangements. There is a need for
improvement vis-à-vis the application of new technology, real time data
collection, information archiving and processing.
168. There is a need to prepare hazard and risk maps and assessments which
can pay particular attention to the potential sites of embankment
breaching.
169. Since the coping capacity of local people is low, their capacity for risk
management needs to be enhanced through capacity development
interventions.
170. There is a need to develop a thorough calibrated model, either in
HECRAS or in MIKE Flood and the generation of finer resolution DEM,
and their application etc.
171. Despite the fact that the area is highly susceptible to flooding, the team
found no early warning system or flood warning system in the area.
Rapid Hazard and Risk Assessment Final Report: 20 March 2009 Koshi River Embankment Breach
81
172. There is a need to prepare “what-if” scenarios for the river. In this way
the flood issue scenarios can be best tackled and flood risk reduction
modality properly established.
Rapid Hazard and Risk Assessment Final Report: 20 March 2009 Koshi River Embankment Breach
82
5 RECOMMENDATION FOR RISK REDUCTION
5.1 Improving preparedness
173. The embankment failure in the Koshi basin has provided sufficient reason to
justify the application of all forms of risk reduction strategies. There is a need
to avoid risk; develop people’s ability to live with risk; reduce risk; and
develop risk transfer mechanisms and schemes wherever possible.
174. The team used the UN/ISDR strategy to analyse the preparedness of the
Koshi region. No programme to reduce physical, social, economic and
environmental vulnerability through the enhancement of national and local
capabilities prevails in the area at all. People were observed occupying flood
plains as their permanent home for short-term economic motivations and
because of an over-reliance on the structural efforts put in place. From the
governments’ side inconsistencies remain in terms of the attention to short-
term emergency relief measures and very little long-term thinking or
investment in disaster preparedness, including that for institutional capacity-
building. As noted people’s involvement and role in disaster risk reduction
strategies is not apparent. Similarly, the broader context of disaster
mitigation at the basin scale exists only in concept and currently no solid
transboundary and basin-wide initiative exists for Koshi. This includes any
development of a participatory process on creating awareness, processing
and dissemination and for the development of empirical knowledge of risk.
175. The breach has provided a basis on which to conclude that there is a need to
undertake strategic risk preparedness in the area as a national priority with a
strong organizational and policy basis for implementation. For this, there is a
need to better identify, assess and monitor disaster risks and enhance early
warning. Suggested priorities for action could include: completing, updating
and disseminating risk maps. There is a need to increase the use of
knowledge, innovation and education to build a culture of safety and
resilience. Suggested priorities for action may include: providing readily
understood information on flood risks and protection options; capitalizing
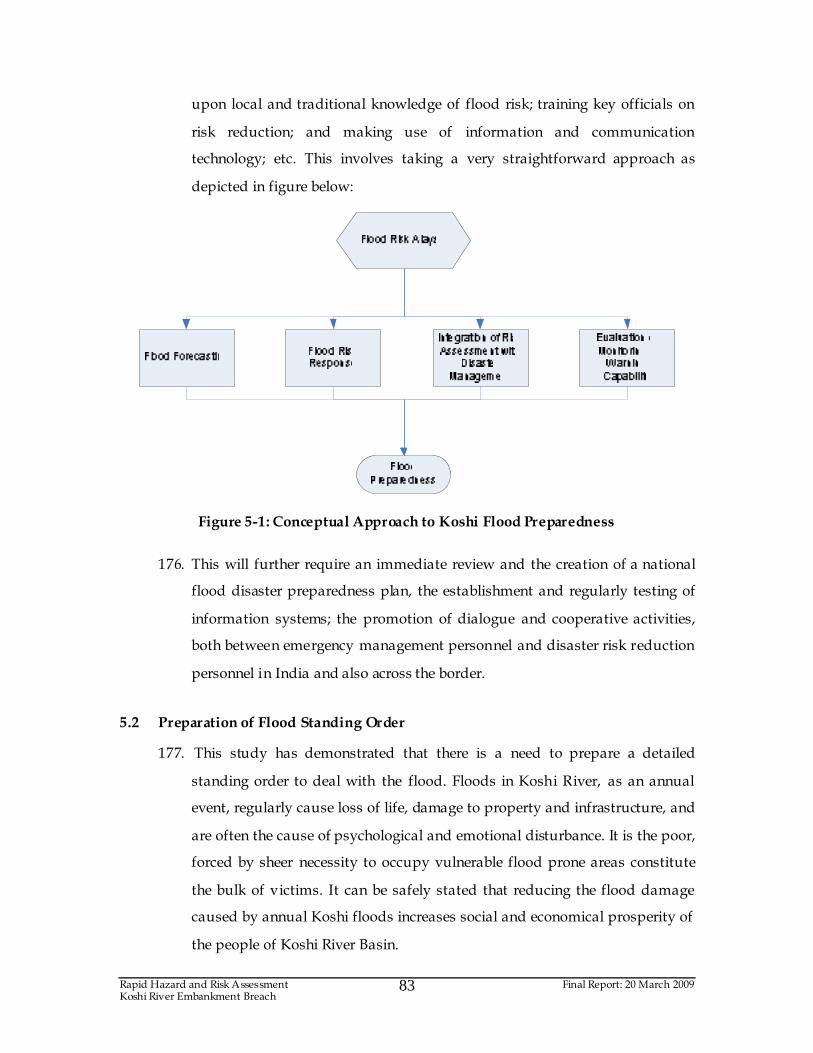
Rapid Hazard and Risk Assessment Final Report: 20 March 2009 Koshi River Embankment Breach
83
upon local and traditional knowledge of flood risk; training key officials on
risk reduction; and making use of information and communication
technology; etc. This involves taking a very straightforward approach as
depicted in figure below:
Figure 5-1: Conceptual Approach to Koshi Flood Preparedness
176. This will further require an immediate review and the creation of a national
flood disaster preparedness plan, the establishment and regularly testing of
information systems; the promotion of dialogue and cooperative activities,
both between emergency management personnel and disaster risk reduction
personnel in India and also across the border.
5.2 Preparation of Flood Standing Order
177. This study has demonstrated that there is a need to prepare a detailed
standing order to deal with the flood. Floods in Koshi River, as an annual
event, regularly cause loss of life, damage to property and infrastructure, and
are often the cause of psychological and emotional disturbance. It is the poor,
forced by sheer necessity to occupy vulnerable flood prone areas constitute
the bulk of victims. It can be safely stated that reducing the flood damage
caused by annual Koshi floods increases social and economical prosperity of
the people of Koshi River Basin.
Rapid Hazard and Risk Assessment Final Report: 20 March 2009 Koshi River Embankment Breach
84
178. Floods can neither be eliminated nor totally controlled and so efforts are to
be directed towards reducing flood vulnerability and mitigating the flood
impact through improved flood managements. After the emergence of Koshi
in the plain area the Koshi embankment has been the main protective device
against flooding for the last few decades however, the sustainability and
efficacy of massive embankment construction as a permanent flood defense,
especially where Koshi carries such a tremendous amount of sediment load is
a subject of serious debate and the debate has been aggravated more with the
2008 Koshi breach.
179. A non-structural approach to flood management lies in flood forecasting and
early warning system. Because of frequently recurring flood events people
have learned to live with these conditions and are inclined to stay with their
homes and protect their belongings. With an advance early warning system,
a significant reduction in losses can be obtained by taking protective and
preventive measures. A timely warning provides time for the disaster
services to best deploy their services.
180. The objective of establishing such a system would be to protect the
agricultural land and human settlements from flooding along the entire
Koshi basin with specific focus on the foothills and the low-lying areas on the
either side of the embankment. The value of flood forecasting increases as
the lead-time increases and hence effective and timely information
dissemination to those responsible for disaster management and then directly
to the people affected, would be likely to achieve a successful result.
5.2.1 Nepal-India History of Flood Forecasting Cooperation
181. It was agreed at the secretary level meeting between Nepal and India held in
Kathmandu on December 22, 1987 that Nepal and India would expedite the
implementation of facilities to be provided for an efficient flood forecasting
system on the major tributaries of the Ganga that flow from Nepal into India.
It was also agreed that Nepal would implement and maintain the system in
its territory and would accept the necessary equipment from India to
Rapid Hazard and Risk Assessment Final Report: 20 March 2009 Koshi River Embankment Breach
85
implement the system expeditiously. In pursuance of this meeting, a high
level Indian delegation of technical officers, headed by the Member for (River
Management), the Central Water Commission, New Delhi, held further
discussions with the officers of the Government of Nepal in March 1988 and
identified 20 hydro-meteorological and 25 meteorological sites. A list of
additional equipment required to make these 45 stations fully operational
was also identified.
182. In May 1988 a subsequent secretary level meeting decided to form an expert
team to install a real-time data transmission system to India from selected
rain gauge and hydrological stations in Nepal. It was also agreed that on a
reciprocal basis, India would provide Nepal with hydrological data of rivers
entering India from Nepal, at two points downstream of the border. ,. It was
envisaged that the real time transmission of rainfall and hydrological data
from Nepal would help in increasing the lead time of the flood forecast
resulting in enhanced preparation time for evacuation and other preparatory
measures. This transmission of data is still continuing but the efficiency,
effectiveness and the benefits derived from this system are to be carefully
analyzed. The system as it is now carries almost no weight in terms of adding
any substantial improvement to the flood forecasting system of both
countries.
183. Moreover with the recent development in communication systems, wireless
data transmission is almost obsolete. There are several modern technologies
available which are automatic and robust and are highly reliable, based on
satellite technology and remote sensing systems. Therefore future action
should be directed to establishing a full-fledged flood forecasting system for
the Koshi Basin. It would consist of optimizing the hydrological and
meteorological observation network, ensuring sustainable operation of the
system and the establishment of early warning systems equipped with
modern technology capable of disseminating reliable flood information.
184. The Nepal-India Committee on Flood Forecasting prepared a draft Flood
Forecasting Network for the 7 major river basins of Nepal in July 2002. The
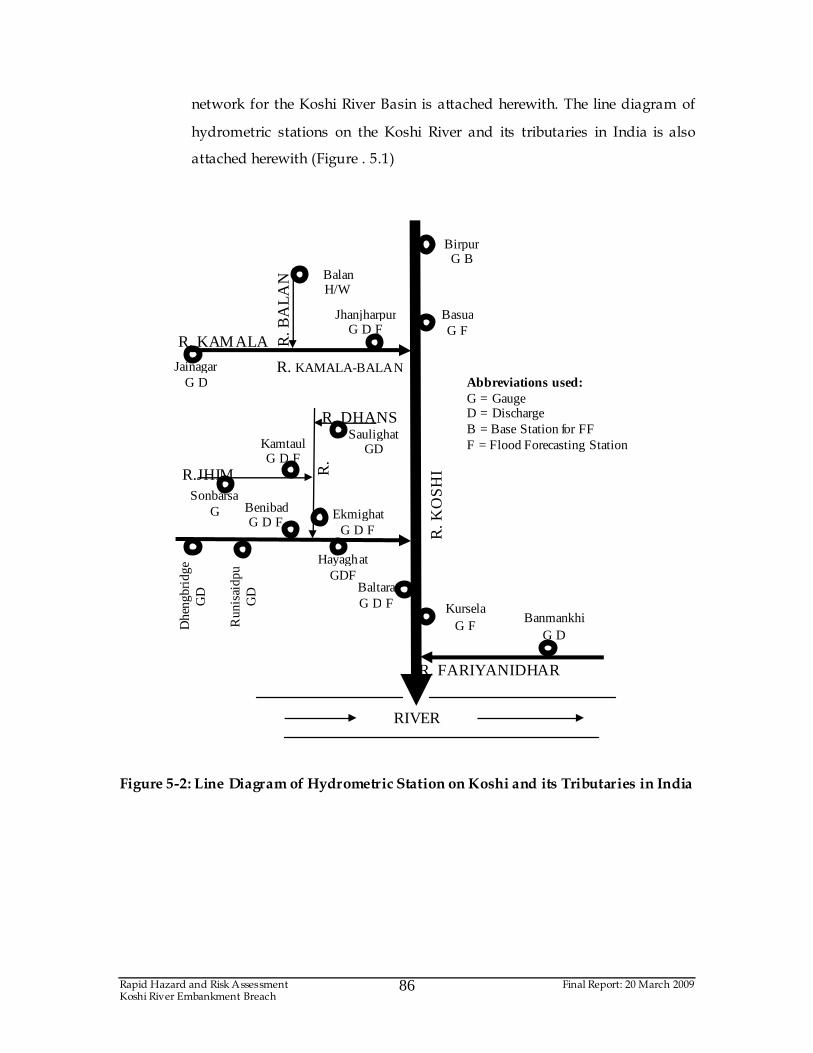
Rapid Hazard and Risk Assessment Final Report: 20 March 2009 Koshi River Embankment Breach
86
network for the Koshi River Basin is attached herewith. The line diagram of
hydrometric stations on the Koshi River and its tributaries in India is also
attached herewith (Figure . 5.1)
Figure 5-2: Line Diagram of Hydrometric Station on Koshi and its Tributaries in India
Sonbarsa G
R. DHANS
Kamtaul G D F
Balan H/W
Jainagar G D
Basua G F
Birpur G B
Banmankhi G D
R. FARIYANIDHAR
Kursela G F
Saulighat GD
Dhe
ngbr
idge
G
D Baltara
G D F
Jhanjharpur G D F
R.JHIM
R. KAMALA-BALAN
R. KAMALA R. B
ALA
N
R.
AD
HW
AR
A
R. K
OS
HI
Ekmighat G D F
Hayaghat GDF
Run
isai
dpu
GD
Benibad G D F
RIVER GANGA
Abbreviations used: G = Gauge D = Discharge B = Base Station for FF F = Flood Forecasting Station
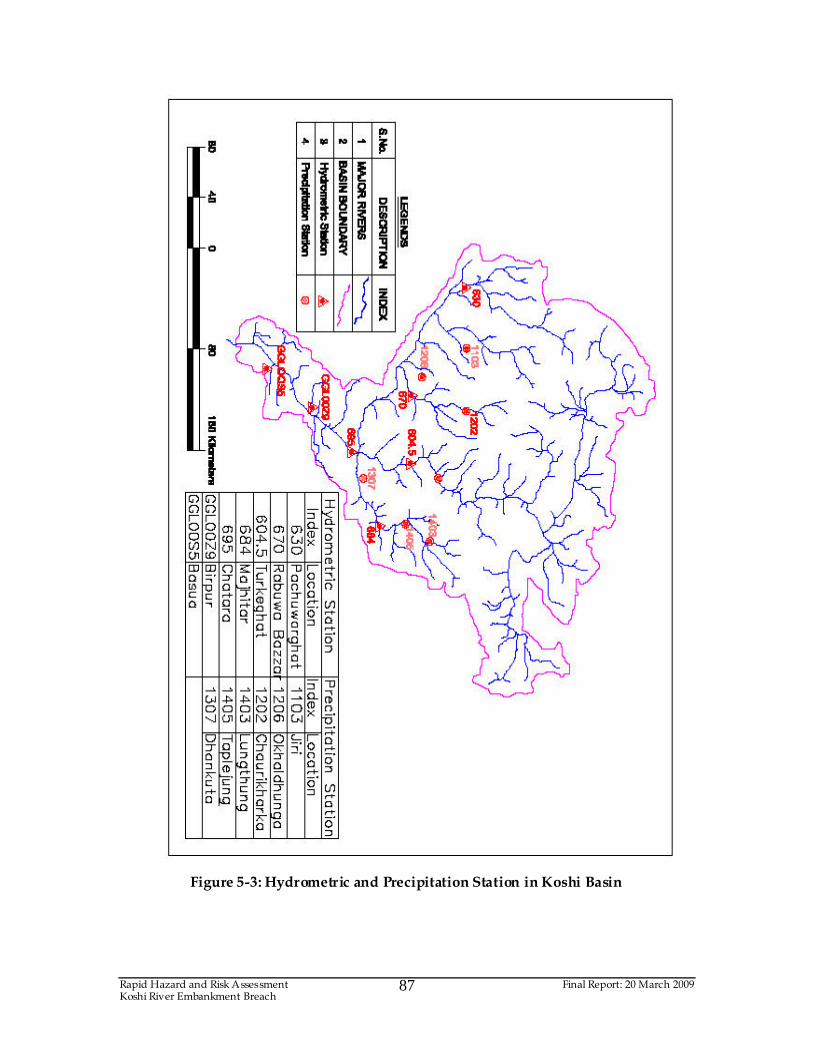
Rapid Hazard and Risk Assessment Final Report: 20 March 2009 Koshi River Embankment Breach
87
Figure 5-3: Hydrometric and Precipitation Station in Koshi Basin
Rapid Hazard and Risk Assessment Final Report: 20 March 2009 Koshi River Embankment Breach
88
185. The draft observation station network prepared by the above committee
needs to be reviewed and optimized in the present context. The Department
of Hydrology and Meteorology is to be made responsible for establishing a
fully operational flood forecasting and early warning System. A wide
dissemination of information must be ensured and a Flood Disaster
Preparedness Plan (DPP) is to be put in place. The DPP is to be coordinated
by the Ministry of Home Affairs (MoHA) and the members should include
the DHM, DWIDP, other relevant central government agencies, local
government, local people, and NGO’s and INGO’s related with disasters. The
Early Warning System (EWS) is to be constructed in such a way that all the
people that come under the flood influence would be informed of the
potential danger in a timely manner. Warning Sirens are to be installed in a 1
km by 1 km grid and evacuation plans are to be prepared before the
monsoon. Large shelters are to be constructed for settling the evacuated
people. These shelters will be on the available highland and could be used by
a school or for some other fruitful purpose during the no-flood period.
5.2.2 Review of the existing hydrological and meteorological network
186. The DHM maintains 33 river gauging stations within the basin. Out of these
all 33 have a manual staff gauge, 23 have the facilities to make discharge
measurements from the cable-way and 14 stations have Automatic Water-
Level Recorder (AWLR) in which only 6 are functional. The water level is
observed only two times a day in all 33 stations. There are 19 climatological
and 55 rain gauge stations. The climatological station includes the
observation of temperature, relative humidity, vapor pressure and
precipitation. The rain gauge stations have a manual rain gauge which is
observed once in 24 hours at 08:45 Nepal time. Biratnagar Airport only has a
continuous rainfall recording device.
187. After analysis of the network and the facilities available presently for flood
forecasting purposes, the following points are observed and recommended:
Rapid Hazard and Risk Assessment Final Report: 20 March 2009 Koshi River Embankment Breach
89
a. The existing network is not designed for flood forecasting purposes.
This network has to be tailored in the light of flood forecasting
requirements. The present network has only 6 functional AWLRs of
which only the Sapta Koshi Chatra station is the most important. Data
from the other 5 stations will contribute very little in the Koshi flood
forecasting task.
b. The same problem exists with rain gauge stations in the basin. Many
rain gauge stations are in the district headquarters and in the Terai
area. Being a mountainous catchment and having very little lead-time,
the network is to be modified and the rain gauge stations are to be
improved by installing automatic rain gauge recorders for real time
data transmission.
c. Data collection, analysis and the transmission system are to be
modernized
d. A Flood Forecasting Centre (FFC) has to be established at Chatra to
facilitate a data hub, an analysis wing and flood forecasting and an
early warning release.
e. Real time data transmission from the river gauges and rain-gauge
stations is to be fully automated using satellite links or other remote
sensing devices so that the FFC could retrieve the data at any time.
f. Himalayan glaciers have become very active resulting in the
formation and expansion of glacial lakes. The UNEP and ICIMOD
study of 2002 shows that 26 glacial lakes of the Nepalese Himalayas
are potentially dangerous and can create Glacial Lake Outburst Flood
(GLOF). GLOF of smaller magnitude during the dry season may not
influence the Koshi plain area much but, if it is combined with the
monsoon rain-fed flood it may cause heavy casualties. Therefore the
FFC is to be strongly linked with the GLOF monitoring system.
g. The FFC at Chatra would disseminate flood information and issue
warnings. It would also be responsible for raising public awareness.
Rapid Hazard and Risk Assessment Final Report: 20 March 2009 Koshi River Embankment Breach
90
h. Additionally, a flood hazard map is to be prepared to identify the risk
area in relation to the flood level. It will help in ascertaining flood
affected areas and information dissemination to the people.
5.2.3 Strategy to prepare a Flood Standing Order
188. Preparation of status reports for appropriate stretches from the Chatra confluence
and identification of the desired level of preparedness associated with each of the
stretch. Ideally, there should at least be an ultra sonic technique-based sensor,
a staff gauge or radar installed to determine flow. The Joint Koshi High Level
Committee could request the Department of Hydrology and Meteorology
and Department of Water Induced Disaster Preparedness to carry out the
feasibility and install such a system.
189. Re-evaluate and re-design of hydrometric system in the basin: There is a need to
reevaluate the sufficiency of the stations that DHM maintains and their
effectiveness in relaying the relevant information to processing hubs. There is
a need to establish more number gauging stations on the stretch from the
confluence at Chatra to the Barrage. Local people may be trained and
instructed to provide the reading or any visual observation by phone to the
authority.
190. Establishing basic protocol for information collection, processing and dissemination:
For this a standard guidebook can be prepared. According to the water level
at Chatra and in the AWLR, established in the 42 KM stretch, the flood and
its intensity may be defined as: Minor Flood Level; Major Flood Level;
Dangerous Flood Level and Critical Flood Level.
191. Flood forecasting: The DHM should collect hydrological and meteorological
data from all river gauging stations and rainfall stations in the basin. The
usual method can be adopted to provide the daily stage heights and rainfall
data to the monitoring centre in Chatra (or in any other of the other station
before the barrage) at the end of each month. However, when floods are
expected during the monsoons, field personnel can be asked to submit the
hourly data to the monitoring centre via telephone and radio transceivers. If a
Rapid Hazard and Risk Assessment Final Report: 20 March 2009 Koshi River Embankment Breach
91
flood of a very high magnitude is expected, field personnel can be instructed
to provide stage heights and rainfall figures hourly. Based on these, runoff
figures can be calculated using rating curves and the MIKE 21 or MIKE
FLOOD package, and the areas that would be inundated can be made known
to the public through radio and television. Simultaneously hourly stage
heights can be plotted and using previous experiences, a rough idea of the
intensity of the flood could be arrived at.
192. Flood warning: When the water level reaches minor flood level at Chatra or
on other established stations with the continuous rainfall in the upper
catchment, a minor flood warning can be given. At this time the flood
monitoring centre can issue warnings to the public via television, radio, the
district office and the police stations, using loudspeakers. This information
can simultaneously be shared with people in India. The level and seriousness
of the warning may be increased as the water level height increases.
193. List of accountability: An office for the flood committee can be instituted at the
Regional DWIDP office in Biratnagar with a mandate to share information
with their Indian counterparts. For mitigation of floods in the Koshi, the
currently established RRU may be used. This may receive instructions on an
‘as and when needed’ basis, or when notification of a flood of major or
dangerous level is received, from the JHLC.
5.3 Assessment of Early Warning System (EWS) and Strategy for creating EWS
194. The Department of Hydrology and Meteorology (DHM), the principal
collector and disseminator of hydro-meteorological data of Nepal, has
established several hydrological and meteorological stations in Koshi River
basin (see section 5.2 for details).
195. The team assessed and categorically states that frequency of discharge
measurement for developing rating curve is very low. Not least to note the
reliability of rating curve is questionable. That means discharge data
Rapid Hazard and Risk Assessment Final Report: 20 March 2009 Koshi River Embankment Breach
92
computed from rating curve and all assessments made thereof are
questionable.
196. The team found that high frequency discharge and rainfall data, e.g. hourly
data are not available. Daily data is collected and is available to purchase it.
Numerical weather forecast for the basin is not available. Similarly no
telemetry system is installed to transmit data in real time.
197. As noted earlier, Koshi Basin receives bulk of its waters from the Chinese
side. There is no hydrometeorological data exchange agreement between
China and Nepal on the basin. This situation is complicated by sparse
raingauge network, no data on rainfall intensity, as well as prevailing poor
understanding of space and time variability of rainfall. Thus, full
hydrological regime can not be represented due to limited number of stream
gauging stations. Similarly, there is no systematic snow measurement except
in two stations. The available length of record is generally short and only a
few variables are being measured.
198. Similarly, continuous records of sediment load data are not available. There
is no high resolution DEM that can be accessed and there are no properly
surveyed cross-sections. Although DHM has a unit named ‘Flood Forecasting
project’, forecasting has not been started yet due to lack of real time data
transmission system, forecasting model and dissemination system. Neither
there are any solid efforts in place that can change the system hitherto in
place anytime soon. There are very few trained hydrologists to produce
reliable forecasts.
199. Given the recurrence, importance and huge implications of the Koshi River
flooding, it is imperative that an early warning system be developed for the
river, spanning over the entire river basin across Nepal and India.
200. The early warning system must use stage data from a Real-Time Data
Acquisition System (RTDAS) with electronic sensors to measure river stages.
Rapid Hazard and Risk Assessment Final Report: 20 March 2009 Koshi River Embankment Breach
93
201. A few, automatic rain gauges must be installed in the catchment area.
Locations for these must be decided based on hydrologic features of the
catchment.
202. Simple and computationally fast flood forecasting models must be developed
specifically with the real time data likely to be available. For example, use of
Artificial Neural Networks (ANNs), that use the rainfall in the catchment
area and river stage at several locations in the river on a real time basis may
be developed to issue flood forecasts.
203. Separate ‘soft’ warnings may also be issued based on the structural
conditions of the embankments and the spurs, even in the absence of a
critically high flood forecast.
204. Administratively, a single window should be created for real-time data
acquisition (both hydro-meteorological and structural), executing the
forecasting models and issuing warnings.
205. Currently improving data collection is the only way forward as it will be key
to establish the EWS and thus better the flood preparedness in the
downstream stretches.
a. There is a need to develop a concept and reach understanding on data
collection protocol between China and India.
b. There is a need to prepare a finer resolution (preferably 5-10 m
resolution) DEM of Koshi River. Most analyses appears to have been
done based on the high resolution freely available DEM (SRTM 90m
DEM). Higher resolution DEM will be needed to get more accurate
drainage network, slope, drainage length and cross-sectional
parameters, and to produce quality inundation map. There is a need
to explore the possibility of generating high resolution DEM from
available contour map.
c. As regards hydro-meteorological data, the responsible agency, DHM,
is desired improve existing hydro-meteorological network density.
Rapid Hazard and Risk Assessment Final Report: 20 March 2009 Koshi River Embankment Breach
94
d. Efforts should be made to automate hydrological and meteorological
data recording and collection system and collection of continuous
data with short intervals. This may be coupled with real-time
communication system to transmit data from field to dedicated
forecast offices.
e. Rather than depending on traditional methods of discharge
measurement, which is quite tedious and less accurate for large rivers,
the possibility of modern methods should be explored. For Example,
the measurement of discharge may be done using ultrasonic system
(acoustic signal) and the measurement of discharge from space may
be enhanced by coupling data collection with satellite-based sensors
that can measure hydraulic variables, such as water-surface width,
water-surface elevation and slope, and the surface velocity of rivers.
Similarly for water level data, measurement of water level may be
initiated using radar sensor (microwaves).
f. Much also is needed to improve the data transfer situation. Although
communication system has really taken a leap forward in the recent
years, existing system still rely on wireless system. Use of internet,
CDMA, satellite or other wireless communication system can really
enhance the data dissemination.
g. Recently, there have been many breakthroughs on the application of
satellite-based rainfall for ungauged or poorly gauged basin and the
same technology may be introduced to develop near real time flood
forecasting system until a more ground-truthing based approach is
established in Koshi. A quick assessment to determine the feasibility
of using satellite-based rainfall data is therefore very timely.
h. There is a need to establish a basin-wide hydro-meteorological
database and management system or at least develop a barebone
structure that can be collectively worked on by the countries that
share the basin or are prone to flooding.
Rapid Hazard and Risk Assessment Final Report: 20 March 2009 Koshi River Embankment Breach
95
206. The team also suggests that there is a need to simultaneously improve the
flood forecasting modeling capability on the part of the authorities. These
may be process-based hydrological and hydraulic models (routing models);
hydrodynamic model, or soft-computing models.
207. The team suggests application of BTOPMC (Block wise use of Top model
with Muskingum-Cunge routing), which is distributed hydrological model
developed at the University of Yamanashi, Japan. Given the model is based
on freely available DEM and data on soil, land use, and NDVI and CRU
climate data (for computing evapotranspiration). The model offers grid by
grid computation of flow and also spatial distribution of variables. It is noted
however that the model has several calibration difficulties and may take a
very high computation time for large basins.
208. Similarly, there may be a staged approach for which universities or research
institutions may be contracted. Utilization of lumped conceptual
hydrological models like NAM, TANK, UBC, HBV etc. by dividing up the
basin into a number of small sub-basins. This will be easy to implement and
also be rapidly computation time. However, this can also render difficulties
in calibration and may not provide reliable result outside the range of
calibration.
5.4 Maintenance of Spurs
209. The existing spurs along the river bank are long and spaced at considerable
distances. As the spacing of spurs is a function of the spur length, the existing
arrangement of long spurs at large distances is theoretically correct. Longer
spurs also keep the river flow substantially away from the embankments.
However, the drawback of this arrangement is that damage to any one of the
spurs washes out the still water pool and erodes the bank line over the entire
distance between that particular spur and the next downstream spur. Thus,
the river flow is allowed approach the embankment over a considerably long
stretch, resulting in the possibility of toe cutting of embankments and
Rapid Hazard and Risk Assessment Final Report: 20 March 2009 Koshi River Embankment Breach
96
possible their breaching. This effect is particularly severe immediately
upstream of the next downstream spur. This phenomenon also stresses the
downstream spur and can result in a chain reaction whereby
210. In view of the above, it is prudent to build a series of shorter spurs at regular
intervals. Though it draws the river flow closer to the bank line, this
arrangement minimizes the exposed length of the embankment in case of
failure of any one particular spur in the series of spurs. Even in this case, all
the problems referred to above may still come into play within the affected
span; however, the affected span is localized and is, therefore, not likely to
affect most of the downstream spurs. The localization of the problem also
eases repair and rehabilitation works. Needless to say, the repair and
maintenance of shorter spurs is also easier than that for longer spurs.
211. During the inspection, it was noticed that protection at the spur noses were
damaged or completely washed away. As they are most vulnerable to
damage during floods, the spur noses should be provided with adequate
protection through boulder pitching or placement of gabions or
interconnected pre-cast concrete blocks.
212. It appears that the spurs and embankments have not been regularly
maintained over the past few years. Therefore, regular inspection and
maintenance of the spurs and embankments, particularly before the onset of
monsoon, must be made mandatory.
5.5 Comprehensive study to redesign the spurs
213. While it is necessary to treat the Koshi river flooding with an integrated
approach, addressing river morphology, hydrology, engineering and socio-
economic aspects simultaneously, the designs of the structural measures
already in place, (viz., the embankments, the barrage and the spurs) must be
revisited and checked for their adequacy in view of the complexities of the
problem and the huge implications of structural failures.
Rapid Hazard and Risk Assessment Final Report: 20 March 2009 Koshi River Embankment Breach
97
214. The spurs were designed as part of the Koshi project in the late fifties/early
sixties. The locations, the length and the structural aspects of the nose and the
apron of the spurs should be studied with sophisticated mathematical
models using the latest methodologies that consider the hydrodynamics and
geomorphology of the river. The end results of such studies should be aimed
at providing renewed designs of the spurs – in terms of their location,
geometry and structural design.
215. The option of providing a larger number of correctly located spurs which are
shorter i.e. smaller in size, both on the east and west banks, must be explored
in these studies. The shorter spurs may be easier to maintain and are likely to
be less prone to puncturing.
5.6 Dam break analysis
216. Comprehensive dam break analysis with good quality data from both the
Nepal and Indian sides, should be carried out. The aim of such analysis
should be to assess implications of flooding if a breach occurred again. The
analysis should be carried out with different flood discharges and resulting
vulnerability maps must be put in place. Typical data required for such an
analysis are the flood hydrographs, the channel geometry and hydraulic
characteristics, complete mapping of the floodplains, including contour
maps, land use patterns and socio-economic data on the settlements in the
floodplains. Sophisticated models are now available for carrying out such
analyses and must be made use of.
217. The dam break analyses should be carried out with simulated breaches at
several potential locations on the embankment and also at locations where
river diversion works are in place (e.g., around chainage 23.1 km to 26.9 and
at Pulthedunga
Rapid Hazard and Risk Assessment Final Report: 20 March 2009 Koshi River Embankment Breach
98
5.7 Generating ‘what-if scenarios’
218. With the dam break analysis and/or otherwise, a number of critical flooding
scenarios should be worked out for the river.
219. A well calibrated hydrodynamic model that also considers sediment
deposition and river morphology (e.g., the MIKE21 or the HEC-RAS) may be
used along with a specialist dam break model to generate the scenarios. The
services of academic and research institutes well versed with such modeling
must be used for generating the scenarios.
220. A typical non-exhaustive list of the possible scenarios to be generated is:
a. Similar embankment breach occurring in immediate future, with
varying discharges;
b. Higher floods and larger breaches; number of breaches occurring
simultaneously at several locations.
c. Overtopping floods – the embankment does not breach but gets
overtopped, both on eastern and western banks.
d. Flooding on the western side – embankment breach on the western
slide Deposition of heavy sediments due to GLOF
e. Simultaneous embankment failure on eastern and western banks
f. Lake formation due to landslides
g. Cloud burst events, resulting in instantaneous high discharges.
5.8 Monitoring mechanism
221. A strict monitoring mechanism must be put in place immediately to help in
issuing early warnings.
222. As an important component of monitoring, extensive instrumentation must
be put in place to detect scouring at the spurs and at potential locations along
the two embankments.
Rapid Hazard and Risk Assessment Final Report: 20 March 2009 Koshi River Embankment Breach
99
223. A real-time data acquisition system (RTDAS) may be implemented to
monitor a critical rise in water levels at several locations in the river. Such
systems typically involve electronic sensors and will be useful in issuing
early warnings.
224. Routine general monitoring and periodic maintenance of spurs and
embankments must be put in place.
225. Additionally, comprehensive stretch-wise monitoring that includes
examining the structural condition of the embankment and the spurs must be
taken up periodically.
5.9 Manpower Training:
226. Trained professional manpower is required for flood fighting. Personnel
working in EWS need extensive in-house and a practical training (which may
be in India for a period of about a month during the flood season) where
there is a functional EWS followed with refresher courses. Local people are to
be trained in flood fighting and attend periodic awareness-raising program.
5.10 Construction of Retired Embankment
227. The authorities should hasten the existing repair work and also consider
constructing additional works, remembering that in spite of proper
maintenance, the possibility of a breach in the eastern embankment during
high floods in future years, cannot be ignored. An appropriate measure for
this purpose appears to be to provide a retired embankment. The location,
profile and alignment of the proposed retired embankment shall have to be
decided based on detailed hydraulic and hydrological investigations. The
third phase would consist of long term planning and would be considering
the continued aggradations within embankments rendering the further
raising of the embankments, even after long period.
Rapid Hazard and Risk Assessment Final Report: 20 March 2009 Koshi River Embankment Breach
100
228. The provision of an additional retired flood embankment is considered as an
appropriate provision so that if the existing embankment is breached again,
the retired embankment would come into play and provide protection
against flooding. This retired embankment can better be compartmentalized
by providing cross embankments at intervals so that if and when a breach
occurs in the existing embankment, flood water would fill the specific
compartment opposite the breach and form a pond. The result of this will
stop further development of the breach and closing the breach will become
easier, faster and much less expensive.
229. Such a retired embankment will obviously involve high cost but it will be
justified considering the colossal damage and cost incurred in flood fighting
and flood relief work entailed last year after the breach in the existing
embankment. Details investigations of the feasibility of this proposal should
be commenced at the earliest opportunity. This shall require detailed
hydraulic and hydrological investigations, involving both mathematical and
physical modeling, which can be commenced immediately.
5.11 Long term issues – climate change
230. Climate change is likely to have an adverse impact on the intensity,
magnitude and frequency of floods, particularly in the snow fed Himalayan
Rivers. A systematic study should be taken up to work out the intensity-
duration-frequency (IDF) relationship for the Koshi river basin in the face of
climate change. These relationships must be used to check the adequacy of
the structural designs and to formulate the non-structural responses (such as
issuing early warnings).
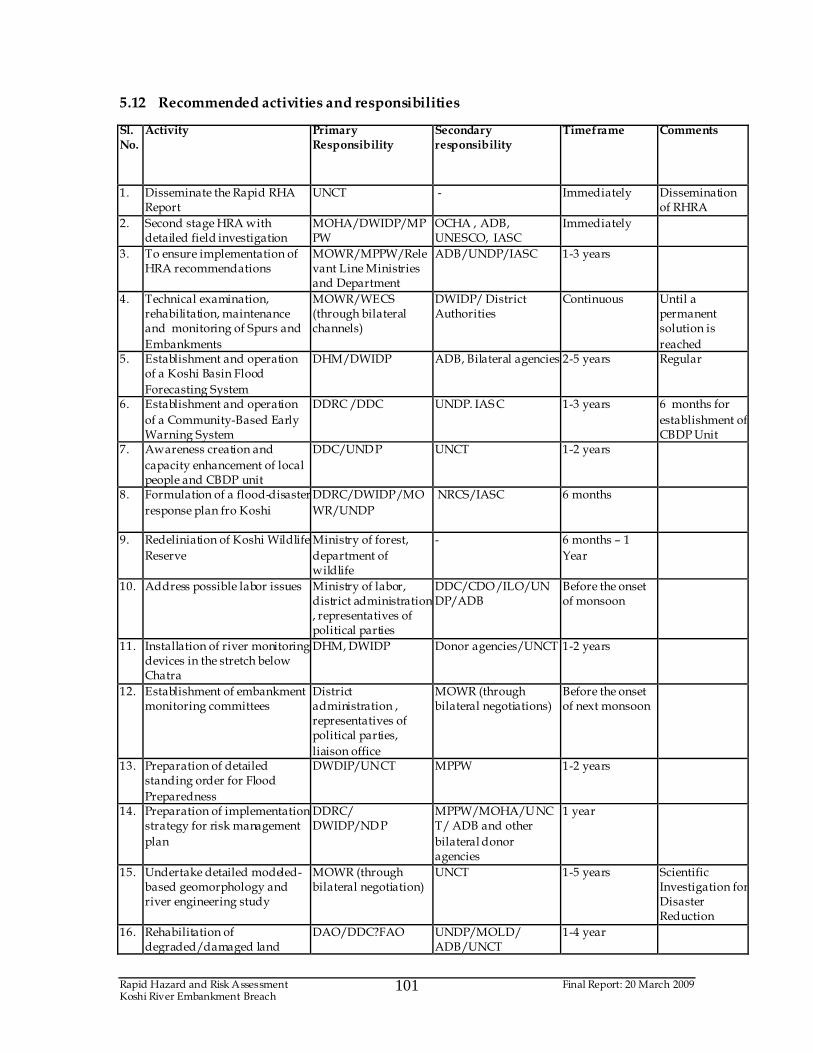
Rapid Hazard and Risk Assessment Final Report: 20 March 2009 Koshi River Embankment Breach
101
5.12 Recommended activities and responsibilities
Sl. No.
Activity Primary Responsibility
Secondary responsibility
Timeframe
Comments
1. Disseminate the Rapid RHA Report
UNCT - Immediately Dissemination of RHRA
2. Second stage HRA with detailed field investigation
MOHA/DWIDP/MPPW
OCHA , ADB, UNESCO, IASC
Immediately
3. To ensure implementation of HRA recommendations
MOWR/MPPW/Relevant Line Ministries and Department
ADB/UNDP/IASC 1-3 years
4. Technical examination, rehabilitation, maintenance and monitoring of Spurs and
Embankments
MOWR/WECS (through bilateral channels)
DWIDP/ District Authorities
Continuous Until a permanent solution is
reached 5. Establishment and operation
of a Koshi Basin Flood
Forecasting System
DHM/DWIDP ADB, Bilateral agencies 2-5 years Regular
6. Establishment and operation
of a Community-Based Early Warning System
DDRC /DDC UNDP. IASC 1-3 years 6 months for
establishment of CBDP Unit
7. Awareness creation and
capacity enhancement of local people and CBDP unit
DDC/UNDP UNCT 1-2 years
8. Formulation of a flood-disaster
response plan fro Koshi
DDRC/DWIDP/MO
WR/UNDP
NRCS/IASC 6 months
9. Redeliniation of Koshi Wildlife
Reserve
Ministry of forest,
department of wildlife
- 6 months – 1
Year
10. Address possible labor issues Ministry of labor, district administration , representatives of political parties
DDC/CDO/ILO/UNDP/ADB
Before the onset of monsoon
11. Installation of river monitoring devices in the stretch below Chatra
DHM, DWIDP Donor agencies/UNCT 1-2 years
12. Establishment of embankment monitoring committees
District administration , representatives of political parties,
liaison office
MOWR (through bilateral negotiations)
Before the onset of next monsoon
13. Preparation of detailed standing order for Flood
Preparedness
DWDIP/UNCT MPPW 1-2 years
14. Preparation of implementation strategy for risk management
plan
DDRC/ DWIDP/NDP
MPPW/MOHA/UNCT/ ADB and other
bilateral donor agencies
1 year
15. Undertake detailed modeled- based geomorphology and river engineering study
MOWR (through bilateral negotiation)
UNCT 1-5 years Scientific Investigation for Disaster Reduction
16. Rehabilitation of degraded/damaged land
DAO/DDC?FAO UNDP/MOLD/ ADB/UNCT
1-4 year
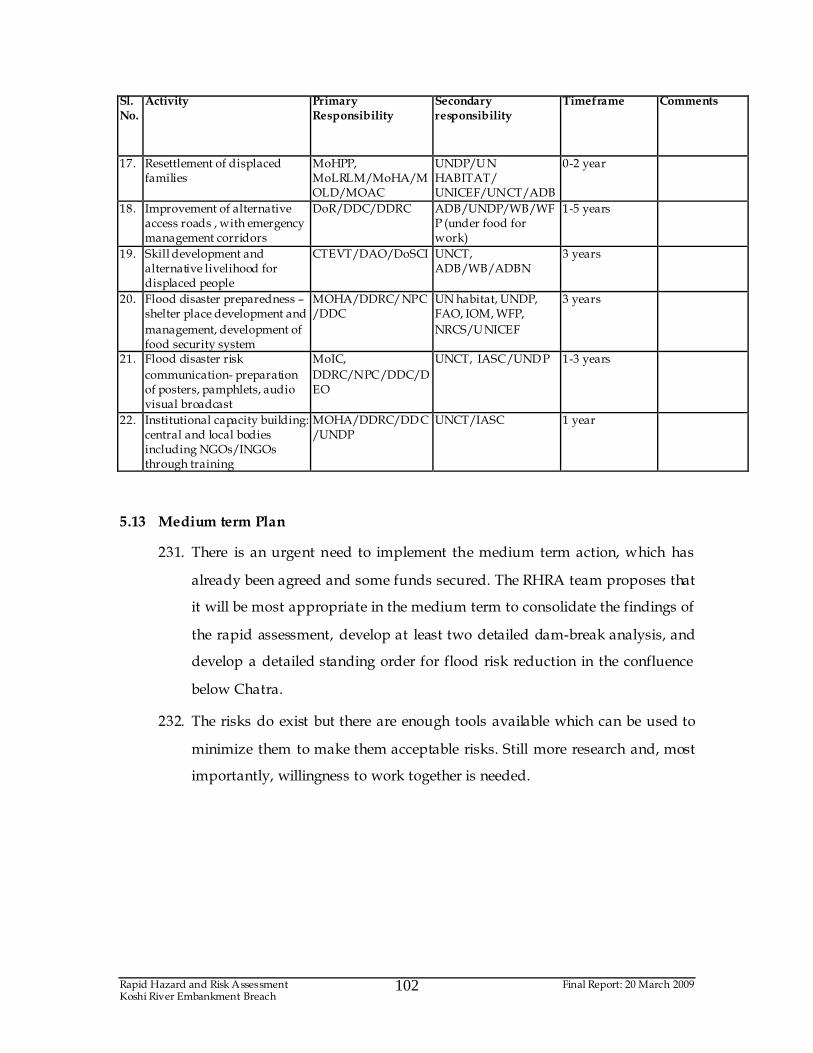
Rapid Hazard and Risk Assessment Final Report: 20 March 2009 Koshi River Embankment Breach
102
Sl. No.
Activity Primary Responsibility
Secondary responsibility
Timeframe
Comments
17. Resettlement of displaced families
MoHPP, MoLRLM/MoHA/MOLD/MOAC
UNDP/UN HABITAT/ UNICEF/UNCT/ADB
0-2 year
18. Improvement of alternative access roads , with emergency management corridors
DoR/DDC/DDRC ADB/UNDP/WB/WFP (under food for work)
1-5 years
19. Skill development and alternative livelihood for displaced people
CTEVT/DAO/DoSCI UNCT, ADB/WB/ADBN
3 years
20. Flood disaster preparedness – shelter place development and
management, development of food security system
MOHA/DDRC/NPC/DDC
UN habitat, UNDP, FAO, IOM, WFP,
NRCS/UNICEF
3 years
21. Flood disaster risk
communication- preparation of posters, pamphlets, audio visual broadcast
MoIC,
DDRC/NPC/DDC/DEO
UNCT, IASC/UNDP 1-3 years
22. Institutional capacity building: central and local bodies including NGOs/INGOs through training
MOHA/DDRC/DDC/UNDP
UNCT/IASC 1 year
5.13 Medium term Plan
231. There is an urgent need to implement the medium term action, which has
already been agreed and some funds secured. The RHRA team proposes that
it will be most appropriate in the medium term to consolidate the findings of
the rapid assessment, develop at least two detailed dam-break analysis, and
develop a detailed standing order for flood risk reduction in the confluence
below Chatra.
232. The risks do exist but there are enough tools available which can be used to
minimize them to make them acceptable risks. Still more research and, most
importantly, willingness to work together is needed.
Rapid Hazard and Risk Assessment Final Report: 20 March 2009 Koshi River Embankment Breach
103
6 REFERENCES
Affeltranger, B., 2002, User-based design of efficient flood warnings, Mekong River
Commission Meeting, Phnom Penh, Cambodia, February-March 2002
Brierley G.J. and Fryirs, K. (2005). River futures. An integrative scientific approach to river
repair. Island Press.
Brouwer, Van Ek, Boeters and Bouma, 2001, Living with floods: an integrated assessment of land use changes and floodplain restoration as alternative flood
protection measures in the Netherlands, CSERGE Working Paper ECM 01-06;
available at http://www.uea.ac.uk/env/cserge/pub/wp/ecm/ecm_2001_06.pdf
Chorley, R. J.; Schumm, S.A. and Sugden, D. E. 1984. Geomorphology. London and
New York: Methuen.
Dixit, A. 2009. Embankment Breach in Nepal: Need for Paradigm Shift in Responding to Floods. Economic Political Weekly. Feb 7. pp. 70-78. India
Frijters and Leentvaar, 2001, Participatory planning for flood management in the
Netherlands; for more information visit http://www.unescap.org/esd/water/disaster/2001/netherlands.doc
Garde, R.J., Ranga Raju, K.G., Pande, P.K., Asawa, G.L. Kothyari, U.C. and Srivastava, R.
(1990). Mathematical modelling of the morphological changes in the River Koshi. Dept. of Civil, Egineering, Univ. of Roorkee, 92 pp.
GFCC and CBIP, (1986). Proc. Seminar on Morphology of Ganga River, N. Delho, pp146.
Gole, C. V. and Chitale, S. V. 1966. Inland Delta Building Activities of the Koshi River. Journal Hydraulic Division, ASCE. March. Pp. 111-126
GoN. 1975. Revised Agreement Between the Government of Nepal (then His Majesty’s
Government of Nepal) and the Government of India on the Koshi Project. The Ministry of Water Resources (then Ministry of Water and Power), GoN,
Kathmandu.
Insisiengmay, T., 2003, In Conclusions of EWC-II, 16-18 October 2003, Bonn, Germany
ISDR, 2004a, Living with risk - A global review of disaster reduction initiatives, Second
Edition, Geneva: UN-ISDR
ISDR, 2004b, Second World Conference on Disaster Reduction, January 2005, Kobe, Japan, First Announcement Flyer, 20 February 2004, Geneva: UN-ISDR
Khanal, N. R. 1996. Assessment of Natural Hazards in Nepal. A Report Submitted to
Research Division, Tribhuvan University, Kirtipur, Kathmandu.
Khanal, N.R.1993. Watershed Condition, Processes of Change and Its Implication and
Management Plans for the Churia and Terai Region of Nepal: A Case Study of
Mahuli Khola Watershed in Saptari District. Unpublished Report Submitted to Nepal-German Churia Forest Development Project. Kathmandu.
Knutsson, P., Ostwald, M., 2004, Quantitative description of how to make a living - The
SLA approach, 7th ECARDC Conference, 8-10 September 2004, Greenwich University, U.K.
Rapid Hazard and Risk Assessment Final Report: 20 March 2009 Koshi River Embankment Breach
104
Mishra, D.K. 2006. Dui Patan Ke Bich: Koshi Nadi ki Kahani Loka Bigyan. Santhan Dehra
Dun.
Reineck,H.-E. and Singh, I.B.1980. Depositional Sedimentary Environments with
Reference to Terigenous Clastics (second revised and updated edition). Berlin,
Heidelberg and New York: Springer-Verlag.
UN/GA, 2004, World Conference on Disaster Reduction, Draft Programme Outcome
Document, A/CONF.206/PC(II)/4, 13 August 2004, 13 p.
Viljoen, M.F., du Plessis, L.A., Booysen, H.J., 2001, Extending flood damage assessment methodology to include sociological and environmental dimensions, in Water SA,
Vol.27, No.4, October 2001, 517-521


