Embed Size (px)
Citation preview
Raman Optical Activity of Proteins, Carbohydratesand Glycoproteins
FUJIANG ZHU,1 NEIL W. ISAACS,1 LUTZ HECHT,1
GEORGE E. TRANTER,2 and LAURENCE D. BARRON1*1WestCHEM, Department of Chemistry, University of Glasgow, Glasgow, United Kingdom
2Biological Chemistry, Division of Biomedical Sciences, Imperial College, London, United Kingdom
ABSTRACT On account of its sensitivity to chirality, Raman optical activity (ROA),which may be measured as a small difference in the intensity of vibrational Ramanscattering from chiral molecules in right- and left-circularly polarized incident light, or asthe intensity of a small circularly polarized component in the scattered light, is a pow-erful probe of the structure of biomolecules. Protein ROA spectra provide informationon secondary and tertiary structures of polypeptide backbones, backbone hydration andside-chain conformations, and on structural elements present in unfolded states.Carbohydrate ROA spectra provide information on the central features of carbohydratestereochemistry, especially that of the glycosidic link. Glycoprotein ROA spectra pro-vide information on both the polypeptide and carbohydrate components. This articledescribes the ROA technique and presents and discusses the ROA spectra of a selectionof proteins, carbohydrates, and a glycoprotein. The many structure-sensitive bands inprotein ROA spectra are favorable for applying pattern recognition techniques, illus-trated here using nonlinear mapping, to determine structural relationships betweendifferent proteins. A 2005 Wiley-Liss, Inc. Chirality 18:103–115, 2006.
KEY WORDS: Raman optical activity; vibrational optical activity; proteins; carbohy-drates; glycoproteins; pattern recognition; structural genomics
The determination of protein structure and function re-mains at the forefront of biomolecular science in the post-genomic era. Although X-ray crystallography is the tech-nique of choice in this enterprise, supplemented by mul-tidimensional NMR for smaller structures in aqueoussolution, the majority of proteins specified by a genomeare currently inaccessible to these techniques.1,2 Accord-ing to recent statistics collated from structural genomicscenters worldwide (www.mcsg.anl.gov), of f50,000 pro-teins cloned, to date only f2,000 have yielded X-ray orNMR structures. A major impediment to the application ofX-ray crystallography is the lack of suitable crystals. Thiscan be due to a number of factors, the most fundamentalbeing that the protein lacks a compact tertiary fold in itsnative state.3,4 The structural analysis of glycoproteins,which play many fundamental roles in biochemistry andare of great interest to the pharmaceutical and biotechnol-ogy industries as drug targets, mediators in drug action,and therapeutics, is especially difficult. In the few caseswhere X-ray crystal or solution NMR structures of intactor partially deglycosylated glycoprotein structures havebeen obtained, most of the oligosaccharide structure ispoorly defined, in part due to conformational heterogene-ity, with only the first few residues attached to the proteinadopting fixed conformations about their respective glyco-sidic links.5 – 7
There is an urgent need for techniques that can providestructural information for the enormous number of
proteins and glycoproteins that are inaccessible to X-rayand NMR methods. Even for those proteins that do crys-tallize, it would be valuable to have techniques that providefold information, albeit not at atomic resolution, becausesuch data could, among other things, expedite the crys-tallization and structure solution process. It would beespecially valuable to have a technique capable of deter-mining the structures of the peptide and carbohydratecomponents of intact glycoproteins in aqueous solutionand how they modulate each other’s stability and behavior.
Techniques such as vibrational spectroscopy measuredvia infrared8 and Raman9,10 methods; electronic circulardichroism measured in the ultraviolet (UVCD)11 and ex-tended into the vacuum ultraviolet (VUVCD) using syn-chrotron radiation;12 and vibrational circular dichroism(VCD)13 have all been promoted as aids to the analysis ofprotein structure and behavior. Here we focus on the tech-nique of Raman optical activity (ROA) which, like VCD,
Presented at the 10th International Conference on Circular Dichroism,2005, Destin, FloridaContract grant sponsor: BBSRC.*Correspondence to: Laurence D. Barron, Department of Chemistry,University of Glasgow, Glasgow G12 8QQ, U.K. E-mail: [email protected] for publication 31 August 2005; Accepted 24 October 2005
A 2005 Wiley-Liss, Inc.
CHIRALITY 18:103–115 (2006)
DOI: 10.1002/chir.20225Published online in Wiley InterScience (www.interscience.wiley.com).
combines the extra sensitivity to three-dimensional struc-ture of chiroptical methods such as UVCD with the ad-vantages of vibrational spectroscopy and so reports onchirality associated with all the 3N�6 fundamental molec-ular vibrational transitions, where N is the number of atomsin the molecule.
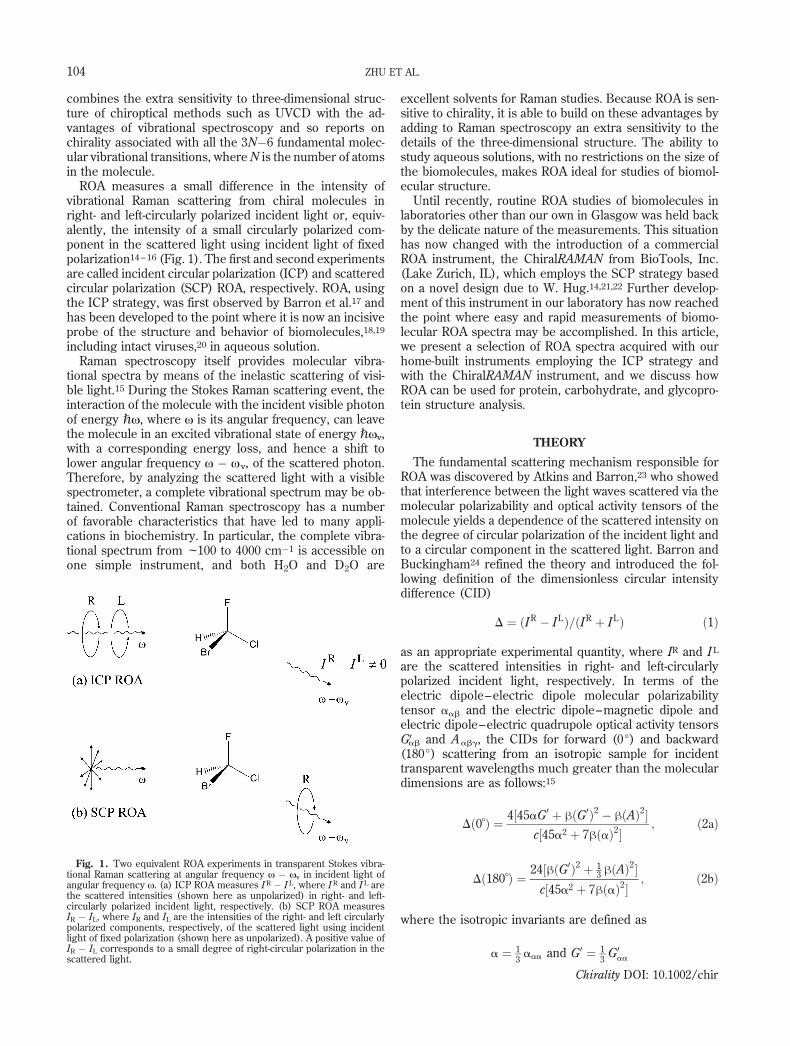
ROA measures a small difference in the intensity ofvibrational Raman scattering from chiral molecules inright- and left-circularly polarized incident light or, equiv-alently, the intensity of a small circularly polarized com-ponent in the scattered light using incident light of fixedpolarization14 – 16 (Fig. 1). The first and second experimentsare called incident circular polarization (ICP) and scatteredcircular polarization (SCP) ROA, respectively. ROA, usingthe ICP strategy, was first observed by Barron et al.17 andhas been developed to the point where it is now an incisiveprobe of the structure and behavior of biomolecules,18,19
including intact viruses,20 in aqueous solution.Raman spectroscopy itself provides molecular vibra-
tional spectra by means of the inelastic scattering of visi-ble light.15 During the Stokes Raman scattering event, theinteraction of the molecule with the incident visible photonof energy ,N, where N is its angular frequency, can leavethe molecule in an excited vibrational state of energy ,Nv,with a corresponding energy loss, and hence a shift tolower angular frequency N � Nv, of the scattered photon.Therefore, by analyzing the scattered light with a visiblespectrometer, a complete vibrational spectrum may be ob-tained. Conventional Raman spectroscopy has a numberof favorable characteristics that have led to many appli-cations in biochemistry. In particular, the complete vibra-tional spectrum from f100 to 4000 cm�1 is accessible onone simple instrument, and both H2O and D2O are
excellent solvents for Raman studies. Because ROA is sen-sitive to chirality, it is able to build on these advantages byadding to Raman spectroscopy an extra sensitivity to thedetails of the three-dimensional structure. The ability tostudy aqueous solutions, with no restrictions on the size ofthe biomolecules, makes ROA ideal for studies of biomol-ecular structure.
Until recently, routine ROA studies of biomolecules inlaboratories other than our own in Glasgow was held backby the delicate nature of the measurements. This situationhas now changed with the introduction of a commercialROA instrument, the ChiralRAMAN from BioTools, Inc.(Lake Zurich, IL), which employs the SCP strategy basedon a novel design due to W. Hug.14,21,22 Further develop-ment of this instrument in our laboratory has now reachedthe point where easy and rapid measurements of biomo-lecular ROA spectra may be accomplished. In this article,we present a selection of ROA spectra acquired with ourhome-built instruments employing the ICP strategy andwith the ChiralRAMAN instrument, and we discuss howROA can be used for protein, carbohydrate, and glycopro-tein structure analysis.
THEORY
The fundamental scattering mechanism responsible forROA was discovered by Atkins and Barron,23 who showedthat interference between the light waves scattered via themolecular polarizability and optical activity tensors of themolecule yields a dependence of the scattered intensity onthe degree of circular polarization of the incident light andto a circular component in the scattered light. Barron andBuckingham24 refined the theory and introduced the fol-lowing definition of the dimensionless circular intensitydifference (CID)
D ¼ ðIR � ILÞ=ðIR þ ILÞ ð1Þ
as an appropriate experimental quantity, where IR and IL
are the scattered intensities in right- and left-circularlypolarized incident light, respectively. In terms of theelectric dipole–electric dipole molecular polarizabilitytensor aab and the electric dipole–magnetic dipole andelectric dipole–electric quadrupole optical activity tensorsGVab and Aabg, the CIDs for forward (0j) and backward(180j) scattering from an isotropic sample for incidenttransparent wavelengths much greater than the moleculardimensions are as follows:15
Dð0 Þ ¼ 4½45aG0 þ hðG0Þ2 � hðAÞ2�c½45a2 þ 7hðaÞ2�
; ð2aÞ
Dð180 Þ ¼24½hðG0Þ2 þ 1
3 hðAÞ2�
c½45a2 þ 7hðaÞ2�; ð2bÞ
where the isotropic invariants are defined as
Fig. 1. Two equivalent ROA experiments in transparent Stokes vibra-tional Raman scattering at angular frequency N � Nv in incident light ofangular frequency N. (a) ICP ROA measures I R � I L, where I R and I L arethe scattered intensities (shown here as unpolarized) in right- and left-circularly polarized incident light, respectively. (b) SCP ROA measuresIR � IL, where IR and IL are the intensities of the right- and left circularlypolarized components, respectively, of the scattered light using incidentlight of fixed polarization (shown here as unpolarized). A positive value ofIR � IL corresponds to a small degree of right-circular polarization in thescattered light.
j
j
a ¼ 13aaa and G0 ¼ 1
3G0
aa
104 ZHU ET AL.
Chirality DOI: 10.1002/chir
and the anisotropic invariants as
hðaÞ2 ¼ 12ð3aahaah � aaaahhÞ;
hðG0Þ2 ¼ 12ð3aahG0
ah � aaaG0hhÞ;
and
hðAÞ2 ¼ 1
2Naah"agyAgyh:
We are using a Cartesian tensor notation in which a re-peated Greek suffix denotes summation over the threecomponents, and qabg is the third-rank unit antisymmet-ric tensor.
For the case of a molecule composed entirely of ide-alized axially symmetric bonds, for which b(GV)2 = b(A)2
and aGV = 0, a simple bond polarizability theory shows thatROA is generated exclusively by anisotropic scattering,and the CID expressions reduce to15
Dð0 Þ ¼ 0; ð3aÞ
Dð180 Þ ¼ 32hðG0Þ2
c½45a2 þ 7hðaÞ2�: ð3bÞ
Unlike conventional Raman scattering intensities, whichare the same in the forward and backward directions, ROAintensity is therefore maximized in backscattering andzero in forward scattering. These considerations lead tothe important conclusion that backscattering boosts theROA signal relative to the background Raman intensityand is consequently the best experimental strategy formost ROA studies of biomolecules in aqueous solution.25,26
It has already been mentioned that, in addition to thecircular intensity difference, ROA is also manifest as asmall, circularly polarized component in the scatteredbeam using incident light of fixed polarization (includingunpolarized). Within the far-from-resonance approxima-tion, measurement of this circular component (SCP ROA)as (IR � IL)/(IR + IL), where IR and IL denote the intensitiesof the right- and left-circularly polarized components, re-spectively, of the scattered light, provides equivalent infor-mation to the CID measurement (ICP ROA).15
All of these results apply specifically to Rayleigh(elastic) scattering. For Raman (inelastic) scattering, thesame basic CID expressions apply but with the molecularproperty tensors replaced by corresponding vibrationalRaman transition tensors between the initial and final vi-brational states nv and mv. Thus aab etc. are replaced byhmvjaab(Q)jnvi etc., where aab(Q) etc. are effective polar-izability and optical activity operators that depend para-metrically on the normal vibrational coordinates Q sothat, within the Placzek polarizability theory of theRaman effect,15 the ROA intensity depends on such pro-ducts as (Baab/BQ)0(BGVab/BQ)0 and (Baab/BQ)0qagd(BAgdb/BQ)0. Although ab initio calculations of ROAspectra, which are usually based on the Placzek approx-imation, are becoming increasingly successful for smaller
chiral molecules27,28 (including mono- and disaccharides)and may readily be performed with a recent version of theGaussian 03 software package, they are hopelessly inade-quate for ROA calculations on structures as large and com-plex as proteins.
Enhanced Sensitivity of ROA to ChiralBiomolecular Structure
The normal vibrational modes of biopolymers can behighly complex, with contributions from local vibrationalcoordinates within both the backbone and the amino acidside chains. ROA is able to cut through the complexity ofthe corresponding vibrational spectra since the largestsignals are often associated with vibrational coordinatesthat sample the most rigid and chiral parts of the structure.These are usually within the backbone and often give riseto ROA band patterns characteristic of the backbone con-formation. Polypeptides in the standard conformationsdefined by characteristic Ramachandran f,c angles foundin secondary, loop, and turn structures within proteins areparticularly favorable in this respect because signals fromthe peptide backbone usually dominate the ROA spec-trum. In contrast, the parent conventional Raman spec-trum of a protein is dominated by bands arising from theamino acid side chains which often obscure the peptidebackbone bands.
MATERIALS AND METHODSInstrumentation
Because most ROA intensity is maximized in back-scattering, the backscattering geometry has proven to beessential for the routine measurement of ROA spectra ofbiomolecules in aqueous solution. Backscattering ROAspectra may be acquired using both the ICP and SCP mea-surement strategies, although the designs of the corre-sponding instruments are completely different.
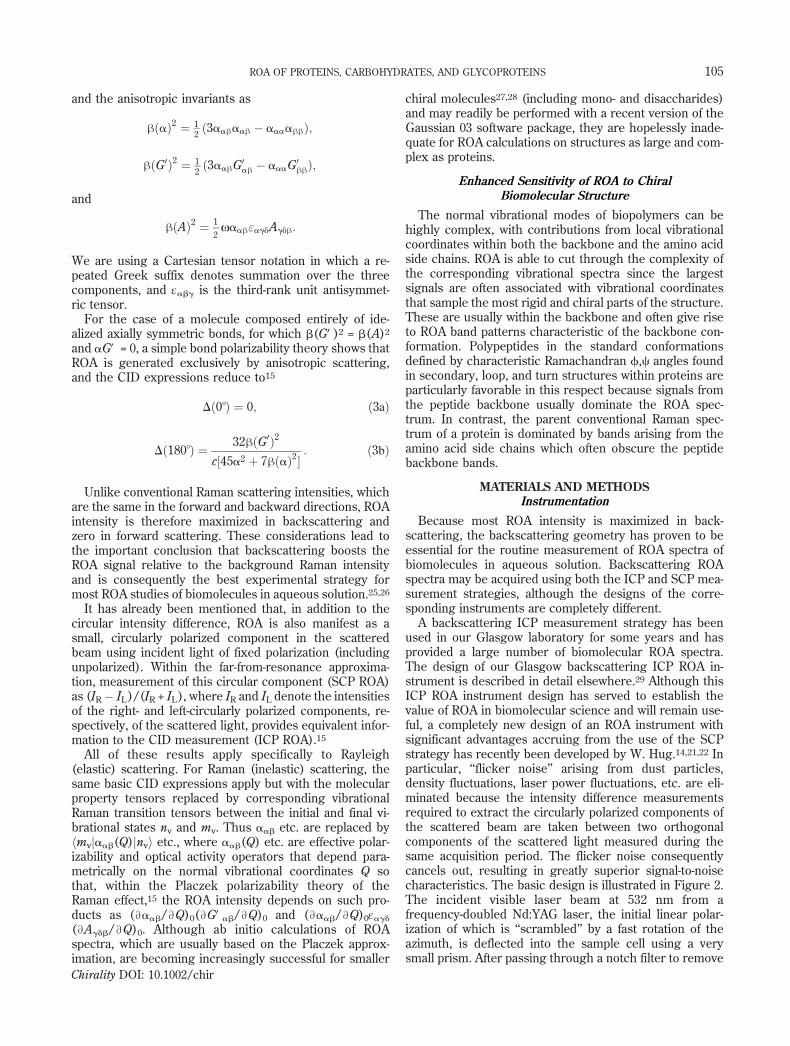
A backscattering ICP measurement strategy has beenused in our Glasgow laboratory for some years and hasprovided a large number of biomolecular ROA spectra.The design of our Glasgow backscattering ICP ROA in-strument is described in detail elsewhere.29 Although thisICP ROA instrument design has served to establish thevalue of ROA in biomolecular science and will remain use-ful, a completely new design of an ROA instrument withsignificant advantages accruing from the use of the SCPstrategy has recently been developed by W. Hug.14,21,22 Inparticular, ‘‘flicker noise’’ arising from dust particles,density fluctuations, laser power fluctuations, etc. are eli-minated because the intensity difference measurementsrequired to extract the circularly polarized components ofthe scattered beam are taken between two orthogonalcomponents of the scattered light measured during thesame acquisition period. The flicker noise consequentlycancels out, resulting in greatly superior signal-to-noisecharacteristics. The basic design is illustrated in Figure 2.The incident visible laser beam at 532 nm from afrequency-doubled Nd:YAG laser, the initial linear polar-ization of which is ‘‘scrambled’’ by a fast rotation of theazimuth, is deflected into the sample cell using a verysmall prism. After passing through a notch filter to remove
j
j
105ROA OF PROTEINS, CARBOHYDRATES, AND GLYCOPROTEINS
Chirality DOI: 10.1002/chir
the intense Rayleigh line, the cone of backscattered light iscollimated onto a liquid crystal retarder set to convertright- and left-circular polarization states into linear polar-ization states with azimuths perpendicular and parallel,respectively, to the plane of the instrument. A beam-splitting cube then diverts the perpendicular component at90o to the propagation direction of the parallel component,which passes through undiverted. In this way, the right-and left-circularly polarized components of the backscat-tered light are separated and collected into the ends of twofiber optics. Each fiber optic converts the cross sectionfrom circular at the input end to a linear configuration atthe output end that matches the entrance slit of the fastimaging spectrograph (Kaiser Holospec, Kaiser OpticalSystems, Inc., Ann Arbor, MI) containing a highly efficientsingle volume-holographic transmission grating, therebyenabling separate Raman spectra for the right- and left-circularly polarized components of the scattered light to bedispersed simultaneously one above the other on the chipof a back-thinned CCD detector. Subtraction then providesthe required ICP ROA spectrum corresponding to tinycircularly polarized components in the Raman bands (foran achiral sample the intensities of the right-and left-circularly polarized components of the scattered lightwould be identical). Small differences in the two detectionchannels are compensated by interconverting their func-tion through the switching of the liquid crystal retarderfrom the �l/4 to the +l/4 state.
A commercial instrument based on this new designthat also incorporates a sophisticated artefact suppres-sion protocol, based on a ‘‘virtual enantiomers’’ approachwhich greatly facilitates the routine acquisition of reli-able ROA spectra,22 has recently become available (theChiralRAMAN from BioTools, Inc.). This instrument pro-
vides high-quality protein ROA spectra in f2–5 h, whichis around five times faster than our home-built ICPROA instruments, using a sample volume of f30 ml andf500 mW of focused laser power at the sample. Further-more, the ChiralRAMAN instrument extends protein ROAdata acquisition routinely to the low-wavenumber regionfrom f250 to 600 cm�1.
Materials and Experimental Procedures
With the exception of bovine b-casein, which wassupplied by Dr. C. Holt at the Hannah Research Insti-tute (Ayr, U.K.), all the protein and carbohydrate sam-ples were purchased from Sigma-Aldrich Company Ltd.(Dorset, England).
The carbohydrate Raman and ROA spectra were re-corded using the Glasgow backscattering ICP instru-ment. They are displayed in analog-to-digital counterunits as a function of the Stokes wavenumber shift withrespect to the exciting laser wave number, and are pre-sented as circular intensity sums (IR + IL) and differences(IR � IL), respectively. The protein Raman and ROA spec-tra were recorded using the ChiralRAMAN backscatter-ing SCP instrument, and they are presented as circularpolarization intensity sums (IR + IL) and differences (IR �IL), respectively.
The protein, carbohydrate, and glycoprotein solutionswere studied at concentrations of f50–100 mg/ml in wateror aqueous buffers at ambient temperature (f20jC). Thesolutions were filtered through 0.22-mm Millipore filtersinto quartz microfluorescence cells, which were centri-fuged prior to mounting in the ROA instrument. Visiblefluorescence from traces of impurities, which can givelarge backgrounds in Raman spectra, was quenched byleaving the samples to equilibrate in the laser beam beforeacquiring ROA data.
ROA OF PROTEINSROA Spectra Characteristic of the Basic Protein
Structural Classes
Rather than dwelling on ROA bands characteristic ofsecondary structure elements and how the correspondingpercentages may be extracted, as is commonly done formost other spectroscopic methods, we shall go immedi-ately to the ROA spectra of proteins belonging to the dif-ferent basic structural types within the SCOP classificationof protein structures (http://scop.mrc-lmb.cam.ac.uk/scop/data/scop.b.html) to illustrate how these may oftenbe recognized immediately. Figure 3 displays the backscat-tered SCP ROA spectra of human serum albumin (SCOPclass, all a; fold, serum-albumin-like), human immunoglob-ulin G (all b; immunoglobulin-like), bovine ribonucleaseA (a +b; RNase A-like), subtilisin Carlsberg (a/b; subtilisin-like) and the natively unfolded protein bovine b-casein, allmeasured in aqueous solution.30 MOLSCRIPT diagrams31
of the first four are also displayed for convenience. It isimmediately apparent that all five ROA spectra are quitedistinct, much more so than the parent Raman spectraalso shown. Small wavenumber discrepancies betweensome band peaks and those in earlier published proteinROA spectra are due to slight differences in the calibration
Fig. 2. Optical design of the scattered circular polarization (SCP)BioTools ChiralRAMAN backscattering ROA instrument. The lenses arerepresented by double-headed arrows. (Adapted from ref. 21.)
106 ZHU ET AL.
Chirality DOI: 10.1002/chir
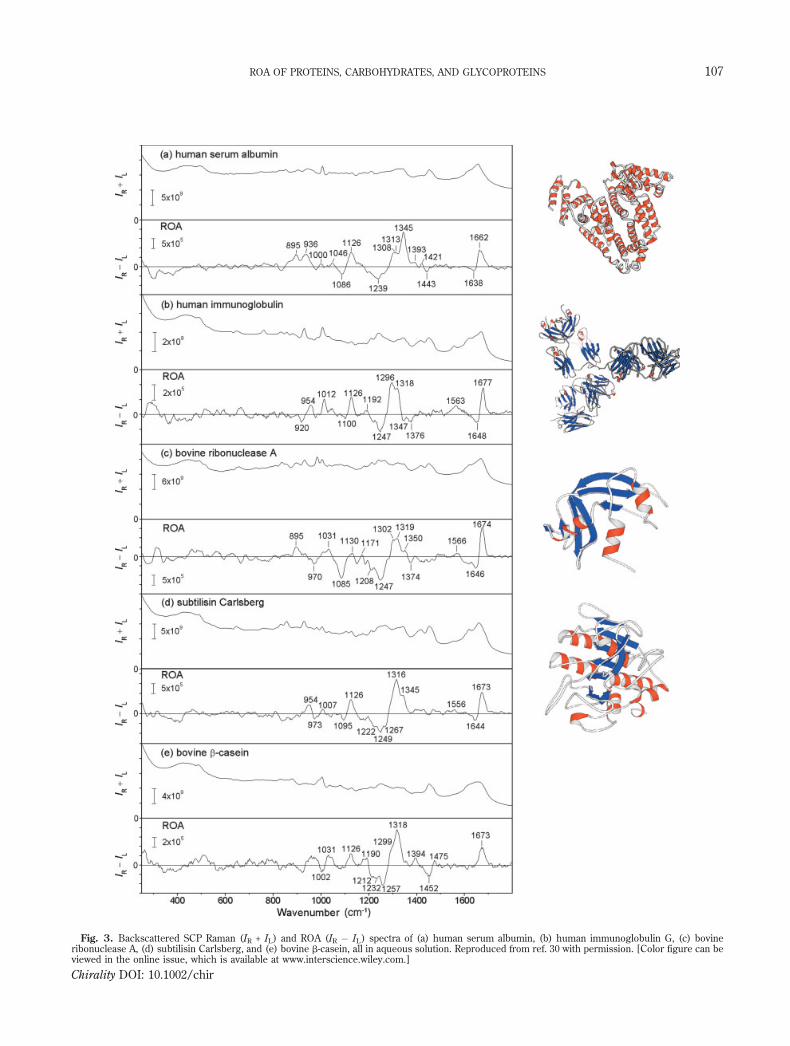
Fig. 3. Backscattered SCP Raman (IR + IL) and ROA (IR � IL) spectra of (a) human serum albumin, (b) human immunoglobulin G, (c) bovineribonuclease A, (d) subtilisin Carlsberg, and (e) bovine b-casein, all in aqueous solution. Reproduced from ref. 30 with permission. [Color figure can beviewed in the online issue, which is available at www.interscience.wiley.com.]
107ROA OF PROTEINS, CARBOHYDRATES, AND GLYCOPROTEINS
Chirality DOI: 10.1002/chir
of the new SCP ChiralRAMAN instrument and our earlierICP instruments and also to uncertainties in the precisepeak positions of some ROA bands.
As explained above, protein ROA spectra are oftendominated by bands originating in the peptide backbonewhich directly reflect the solution conformation. Vibra-tions of the backbone in polypeptides and proteins areusually associated with three main regions of the Ramanspectrum.9,32 These are the backbone skeletal stretchregion f870–1150 cm�1 originating in mainly Ca–C, Ca–Cb and C–N stretch coordinates; the amide III regionf1230–1310 cm�1 often assigned mostly to the in-phasecombination of the in-plane N–H deformation with the C–Nstretch; and the amide I region f1630–1700 cm�1 whicharises mostly from the C=O stretch. However, it is nowrecognized that the amide III region involves much moremixing between the N–H and Ca–H deformations thanpreviously thought and should be extended to at least1340 cm�1.33,34 This extended amide III region is partic-ularly important for ROA studies because the couplingbetween N–H and Ca–H deformations is very sensitive togeometry and generates a rich and informative ROA bandstructure. Although side-chain vibrations generate manycharacteristic Raman bands,9,32 these are usually lessprominent in ROA spectra due to some conformationalfreedom which can suppress the ROA intensities; however,a few side-chain vibrations, especially those associatedwith tryptophan and phenylalanine, do give rise to usefulROA signals.
The ROA band pattern for human serum albumin is verysimilar to that for poly(L-lysine) in a model a-helical con-formation,18,19,35 reflecting the large amount of extendeda-helix contained within its fold (69.2% a-helix and 0.0%b-strand in PDB structure 1ao6). The ROA band patternfor human immunoglobulin G has similarities with thatfor poly(L-lysine) in a model b-sheet conformation,36 whichaccords with the large amount of antiparallel b-sheetwithin each of its 12 b-sandwich fold domains based on theGreek key motif (43.0% b-strand and 3.0% a-helix in PDBstructure 1hzh). However, there are some important dif-ferences of detail which reflect the fact that the b-sheet inthe model polypeptide structure is more flat and uniformthan that found in typical proteins as well as being fullyhydrated. The ROA spectra of bovine ribonuclease A andsubtilisin Carlsberg contain bands characteristic of botha-helix and b-sheet: the former contains 17.7% a-helix and34.7% b-strand according to PDB structure 1rph; and thelatter contains 29.6% a-helix and 17.2% b-strand within itsRossmann fold according to PDB structure 1sca. The ROAspectrum of bovine b-casein, the natively unfolded char-acter of which is well characterized,37,38 looks very similarto that of disordered poly(L-lysine), which is now thoughtto be made up largely of poly(L-proline) II (PPII) sequencesrather than ‘‘random coil.’’39 This is reinforced by theclose similarity with the ROA spectrum of the water solublealanine-rich peptide AcOO(Ala)7OONH2
40 shown defini-tively by NMR and UVCD to comprise largely of PPII.41
There are of course a number of bands that may beassigned unequivocally to secondary structure.35,36 Exam-ples include a couplet in the amide I region, negative on the
low wavenumber side and positive on the high, shown byboth a-helix and b-sheet, but shifted by f10 cm�1 to higherwavenumber in the latter. Clear examples may be seen inthe ROA spectra of human serum albumin (negative andpositive components at f1638 and 1662 cm�1, respectively)and human immunoglobulin G (negative and positivecomponents at f1648 and 1677 cm�1) in Figure 3. Like-wise the positive extended amide III bands at f1345 cm�1
in human serum albumin and subtilisin Carlsberg orig-inate in a-helix; and the negative bands at f1247 cm�1 inhuman immunoglobulin G, bovine ribonuclease A, andsubtilisin Carlsberg originate in the b-structure.
One advantage ROA has over other spectroscopies forprotein structure analysis is that resolved signatures ofloops and turns appear in addition to those of secondarystructure, which is why ROA band patterns often providemotif or even fold information. Examples are the positiveband at f1296 cm�1 and the two negative bands at f1347and 1376 cm�1 in the ROA spectrum of human immuno-globulin G that are characteristic of b-turns.36 Similarbands are absent from the ROA spectrum of the a/b pro-tein subtilisin Carlsberg because the ends of the parallelb-strands within its Rossman fold are connected byextended a-helix sequences rather than by b-turns; where-as a clear negative band at f1374 cm�1 assigned to b-turnsis present in the ROA spectrum of the a + b protein bovineribonuclease A in which the b-sheet is antiparallel. Thislast observation suggests a simple method for distinguish-ing between a/b and a + b proteins. However, it is notinfallible for distinguishing between parallel and antipar-allel b-sheet in all-b proteins: for example, in the b-helixfold, parallel strands are connected by b-turns; and indeedlarge turn signatures are present in the ROA spectrum ofthe b-helix protein P.69 pertactin.36
Hydrated a-Helix and b-Sheet
ROA is unique among spectroscopic methods in havingthe ability to distinguish between hydrated and unhydrateda-helix. A strong sharp positive ROA band at f1340 cm�1
in a-helical proteins such as human serum albumin hasbeen assigned to a hydrated form of a-helix, and a positiveband at f1300 cm�1 to unhydrated a-helix.35 Guided bystudies of water molecules in high-resolution protein X-raycrystal structures, it has been suggested that the positivef1300 and 1340 cm�1 ROA bands assigned to unhydratedand hydrated a-helix may correspond, respectively, to thecanonical form of a-helix and to a more open variant inwhich the C=Oi group, already engaged in intrachain helixhydrogen bonding to NHi+4, forms a hydrogen bond withan external water molecule.35 This external type of back-bone hydration is present on the hydrophilic side of am-phipathic a-helix, which has a distinct hydrophobic sideprotected from water and a distinct exposed hydrophilicside, and leads to helix bending due to slightly differentRamachandran f,c angles on the two sides.42
The ability of ROA to distinguish hydrated from un-hydrated a-helix is valuable in studies relating structure tobehavior. For example, hydrated a-helix has a greatlyenhanced susceptibility to unfolding,43 which ROA studieshave suggested may be primarily to PPII structure rather
108 ZHU ET AL.
Chirality DOI: 10.1002/chir
than the random coil, and which may have implications foramyloid fibril formation in certain situations.44
Although yet to be explored in detail, there are hintsthat ROA may similarly be able to discriminate betweenhydrated and unhydrated b-sheet via negative bands atf1220 and 1240 cm�1, respectively. For example, b-sheetpoly(L-lysine) in aqueous solution, which is expected to befully hydrated, shows a strong negative ROA band atf1218 cm�1 but no negative band at f1240 cm�1.36
Low-Wavenumber ROA
Thanks to the ChiralRAMAN instrument, we have beenable to acquire protein ROA spectral data in the rangef250–600 cm�1 for the first time. This covers the regionwhere modes such as helix breathing, torsions, and skel-etal deformations occur.32 We have so far observed onlyweak ROA signals in the S–S stretch region f500–550 cm�1 from disulfide bridges. Much remains to be ex-plored through this newly opened low-wavenumber ROAwindow on protein structure.
Side Chains
Bands from side chains are usually not very prominent inthe ROA spectra of polypeptides and proteins. There are,however, several distinct regions where side-chain vibra-tions appear to be largely responsible for the observed ROAfeatures. In particular, ROA bands in the range f1400–1480 cm�1 originate in CH2 and CH3 side-chain deforma-tions and also in tryptophan vibrations; ROA bands in therange f1545–1560 cm�1 originate in tryptophan vibra-tions; and some ROA bands in the range f1600–1630 cm�1
originate in vibrations of aromatic side chains, especiallytyrosine.18 Also the ring breathing mode of the aromaticring in phenylalanine, which generates a strong band inthe conventional Raman spectrum at f1000 cm�1,32 anda strong ROA band in small chiral molecules such as1-phenylethanol,16,45 may be associated with ROA bandsobserved in this region in some proteins.
The absolute stereochemistry of the tryptophan con-formation, in terms of the sign and magnitude of the tor-sion angle x2,1 around the bond connecting the indole ringto the Cb atom, may be obtained from the f1545–1560 cm�1 tryptophan ROA band, assigned to a W3-typevibration of the indole ring.46 This was discovered fromobservations of W3 tryptophan ROA bands with similarmagnitudes but opposite signs in two different filamentousbacterial viruses with coat protein subunits containing asingle tryptophan, which suggested that the tryptophansadopt quasi-enantiomeric conformations in the two vi-ruses. Because the magnitude of the angle x2,1 may bededuced from the W3 Raman band wavenumbers,9 it ispossible to obtain both the sign and magnitude of this anglefrom the ROA spectrum, something usually only obtain-able from high-resolution X-ray protein crystal structures.The W3 ROA band may also be used as a probe of con-formational heterogeneity among a set of tryptophans indisordered regions within a protein structure since can-cellation from ROA contributions with opposite signs willresult in a loss of ROA intensity, as observed, for example,in a molten globule state of human lysozyme.44 Tryptophan
ROA is similar in this respect to the near UVCD bands fromaromatic side chains, which disappear when tertiary struc-ture is lost on partial denaturation.11 These two techniquesprovide complementary perspectives because ROA probesthe intrinsic skeletal chirality of the tryptophan side chainwhereas UVCD probes the chirality in the general environ-ment of the chromophore.
Polyproline (II) Helix and Unfolded Proteins
Although originally defined for the conformation adoptedby polymers of L-proline, the PPII helix can be supported byamino acid sequences other than those based on L-prolineand has been recognized as a common structural motifwithin the longer loops in the X-ray crystal structures ofmany proteins.47 It consists of a left-handed helix with 3-foldrotational symmetry (n=� 3) in which the f,c angles of theconstituent residues are restricted to values around �78j,+146j, corresponding to a region of the Ramachandran sur-face adjacent to the b-region. The extended nature of thePPII helix precludes intrachain hydrogen bonds, the struc-ture being stabilized instead by main chain hydrogenbonding with water molecules and side chains.48 PPII cur-rently attracts much interest as a major conformationalelement of disordered polypeptides and unfolded proteinsin aqueous solution.39,49 It can be distinguished from ran-dom coil in polypeptides using UVCD, VCD, IR, and Raman,but these techniques have difficulty in identifying it whenother conformational elements are present, as in proteins.However, it is readily identified even in proteins usingROA,19 which has proved valuable for studying PPII inunfolded and partially folded proteins50 and its possible rolein amyloid fibril formation in certain protein misfoldingdiseases.38,44,51 The ROA spectrum of the natively unfoldedprotein b-casein, displayed in Figure 3, is characteristic ofa PPII-rich structure,38 the main features being the strongpositive extended amide III ROA band at f1318 cm�1
together with the weaker positive amide I ROA band atf1673 cm�1.
ROA OF CARBOHYDRATES
Carbohydrates in aqueous solution are highly favor-able samples for ROA studies, giving rich and informativeband structure over a wide range of the vibrational spec-trum. Their complex and highly coupled normal modesgenerate strong ROA bands which produce patterns cha-racteristic of the various types of structural units (sugarrings and glycosidic links) that are usually much easier tointerpret than the parent Raman band patterns.
The ROA of a large range of monosaccharides, in-cluding aldose, pentose and ketose sugars, have been sur-veyed52 – 54 and provide a database of spectral assignmentsfor the key stereochemical features. In particular, it hasbeen demonstrated that the ROA spectra contain infor-mation on the ring conformation, the relative disposition ofOH groups around the ring, the absolute configuration andaxial or equatorial orientation of groups attached to theanomeric carbon and the exocyclic CH2OH conformation.
In structural glycobiology, much importance is placed onthe conformation of the C–O–C glycosidic link, formedupon condensation of two monosaccharide units, as it is the
109ROA OF PROTEINS, CARBOHYDRATES, AND GLYCOPROTEINS
Chirality DOI: 10.1002/chir
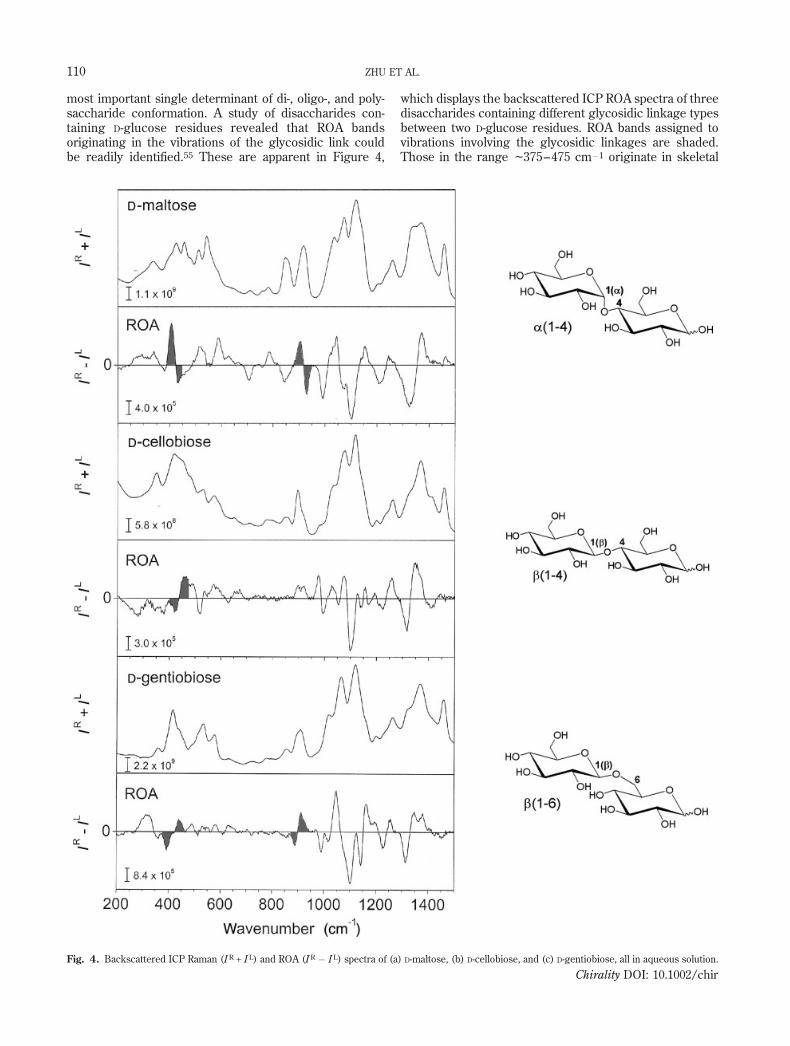
most important single determinant of di-, oligo-, and poly-saccharide conformation. A study of disaccharides con-taining D-glucose residues revealed that ROA bandsoriginating in the vibrations of the glycosidic link couldbe readily identified.55 These are apparent in Figure 4,
which displays the backscattered ICP ROA spectra of threedisaccharides containing different glycosidic linkage typesbetween two D-glucose residues. ROA bands assigned tovibrations involving the glycosidic linkages are shaded.Those in the range f375–475 cm�1 originate in skeletal
Fig. 4. Backscattered ICP Raman (I R + I L) and ROA (I R � I L) spectra of (a) D-maltose, (b) D-cellobiose, and (c) D-gentiobiose, all in aqueous solution.
110 ZHU ET AL.
Chirality DOI: 10.1002/chir
deformations and torsions and are characteristic of thea(1–4), b(1–4), and b(1–6) linkage types and conforma-tions in D-maltose, D-cellobiose, and D-gentiobiose, respec-tively, in aqueous solution. Those in the range f850–950 cm�1 are associated with bending and stretching co-ordinates of the glycosidic link and are especially sensitiveto different types of link since the couplets are of oppositesign in D-maltose and D-gentiobiose, with D-cellobioseshowing little ROA here.
The sensitivity of ROA to glycosidic linkage conforma-tion in large structures was demonstrated by a study of thepolysaccharides laminarin and pullulan.56 Laminarin iscomposed mainly of D-glucose units joined throughb(1–3) links and is known to form triple helical structuresin aqueous solution. Comparison of the ROA spectrum oflaminarin with that of its constituent disaccharide D-lami-naribiose reveals striking differences. Most notably, largechanges in the region f1050–1150 cm�1, especially a signchange in a sharp strong couplet centered at f1120 cm�1,were observed and ascribed to changes in the glycosidiclink conformation on adopting an ordered helical con-formation. In contrast, it was found that the unorderedpolysaccharide pullulan exhibits an ROA spectrum thatappears to be a sum of contributions from the constituentrepeating units.
The cyclodextrins are particularly interesting samplesfor ROA studies. These are cyclic oligosaccharides con-taining six, seven, or eight D-glucose residues joinedthrough a(1–4) links and are labeled with the prefix a, b,or g, respectively. They are stabilized by a ring of intra-molecular hydrogen bonds and have the shape of a hollowtruncated cone with a hydrophobic center, which is re-sponsible for their renowned ability to form inclusioncomplexes with a wide variety of guest molecules. Cyclo-dextrins exhibit an enormous (D-value f30 times larger)glycosidic ROA couplet centered at f918 cm�1 as com-pared with that observed in the corresponding a(1–4)-linked disaccharide D-maltose.55 ROA was used to studythe dynamics of the b-cyclodextrin system by monitoringchanges in the glycosidic couplet brought about by changesin environmental factors such as solvent and temperatureand by the formation of host–guest inclusion complexes.57
The fact that the glycosidic ROA couplets in the cyclo-dextrins occur at exactly the same wavenumber as in D-maltose suggests that the huge ROA intensity originates insome type of electronic, rather than vibrational, effect.
ROA OF GLYCOPROTEINS
Intact glycoproteins provide good ROA spectra withclear bands originating in both the polypeptide andcarbohydrate components,18,58 from which informationabout the structure of both components may be deduced.58
As an example, we focus on a1-acid glycoprotein (AGP),a much-studied physiologically important glycoproteinwhose exact biological function remains obscure.59 Todate, no X-ray crystal structure has been reported, butspectroscopic studies together with homology modeling ofthe polypeptide component have provided some insightinto its structure.60 The polypeptide is a single chainformed from 183 amino acids with two disulfide bridges.
The carbohydrate content represents 45% of the molecularweight and contains five highly sialylated oligosaccharidechains linked via N-glycosidic bonds to asparagineresidues. The polypeptide is thought to adopt a lipocalin-type fold based on an eight-stranded antiparallel b-sheetin the form of a barrel with strands linked by b-hairpinsplus a long loop.60
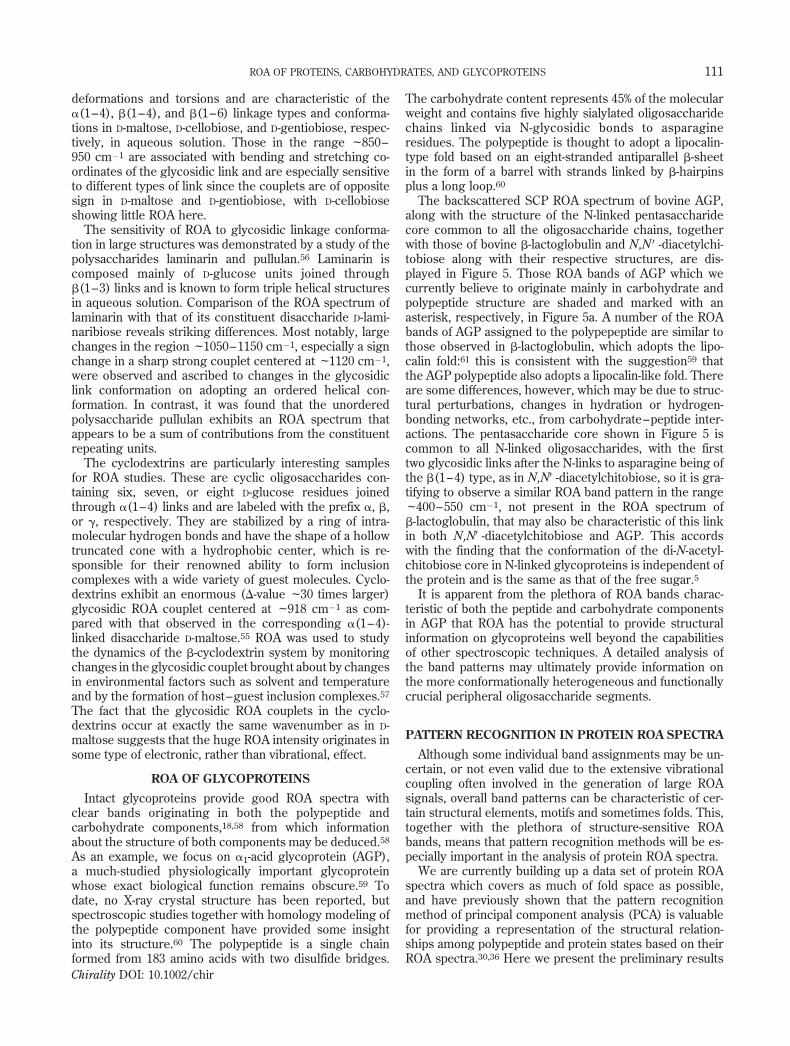
The backscattered SCP ROA spectrum of bovine AGP,along with the structure of the N-linked pentasaccharidecore common to all the oligosaccharide chains, togetherwith those of bovine b-lactoglobulin and N,NV-diacetylchi-tobiose along with their respective structures, are dis-played in Figure 5. Those ROA bands of AGP which wecurrently believe to originate mainly in carbohydrate andpolypeptide structure are shaded and marked with anasterisk, respectively, in Figure 5a. A number of the ROAbands of AGP assigned to the polypepeptide are similar tothose observed in b-lactoglobulin, which adopts the lipo-calin fold:61 this is consistent with the suggestion59 thatthe AGP polypeptide also adopts a lipocalin-like fold. Thereare some differences, however, which may be due to struc-tural perturbations, changes in hydration or hydrogen-bonding networks, etc., from carbohydrate–peptide inter-actions. The pentasaccharide core shown in Figure 5 iscommon to all N-linked oligosaccharides, with the firsttwo glycosidic links after the N-links to asparagine being ofthe b(1–4) type, as in N,NV-diacetylchitobiose, so it is gra-tifying to observe a similar ROA band pattern in the rangef400–550 cm�1, not present in the ROA spectrum ofb-lactoglobulin, that may also be characteristic of this linkin both N,NV-diacetylchitobiose and AGP. This accordswith the finding that the conformation of the di-N-acetyl-chitobiose core in N-linked glycoproteins is independent ofthe protein and is the same as that of the free sugar.5
It is apparent from the plethora of ROA bands charac-teristic of both the peptide and carbohydrate componentsin AGP that ROA has the potential to provide structuralinformation on glycoproteins well beyond the capabilitiesof other spectroscopic techniques. A detailed analysis ofthe band patterns may ultimately provide information onthe more conformationally heterogeneous and functionallycrucial peripheral oligosaccharide segments.
PATTERN RECOGNITION IN PROTEIN ROA SPECTRA
Although some individual band assignments may be un-certain, or not even valid due to the extensive vibrationalcoupling often involved in the generation of large ROAsignals, overall band patterns can be characteristic of cer-tain structural elements, motifs and sometimes folds. This,together with the plethora of structure-sensitive ROAbands, means that pattern recognition methods will be es-pecially important in the analysis of protein ROA spectra.
We are currently building up a data set of protein ROAspectra which covers as much of fold space as possible,and have previously shown that the pattern recognitionmethod of principal component analysis (PCA) is valuablefor providing a representation of the structural relation-ships among polypeptide and protein states based on theirROA spectra.30,36 Here we present the preliminary results
111ROA OF PROTEINS, CARBOHYDRATES, AND GLYCOPROTEINS
Chirality DOI: 10.1002/chir
from the application of another pattern recognition tech-nique, namely, nonlinear mapping (NLM);62 specificallymonotone nonmetric multidimensional scaling (MS)63
using standardized spectra (i.e., each spectrum shiftedand rescaled to have zero mean and unit standard devia-tion to put them all on an equal footing). In such patternrecognition techniques, each digitized spectrum can beconsidered as a vector from the origin to a point in a mul-tidimensional space, with the axes representing thedigitized wavenumbers. The differences between spectracan therefore be represented by the distances betweentheir corresponding points in this multidimensional space.NLM/MS methods seek to create a lower dimensionalspace (two dimensions here) where the points can beplotted so as to best preserve all their distances from eachother and thereby provide a more easily comprehendedrepresentation. Thus points close to each other in the two-dimensional plot represent similar spectra and, corre-spondingly, those points distant from each other representdissimilar spectra. Various weighting schemes can beemployed, leading to emphasis on whether small or largedistances are best reproduced or, as here, whether themonotonic order of distances is preserved.62 As the meth-ods focus on inter-point distances, within such plots thechoice of the two axes is arbitrary and the distribution ofpoints can be arbitrarily rotated or translated in unisonwithin the plane. The advantage of such techniques over,say, PCA is that they aim to best represent the relation-
ships between all spectra rather than just describe thegross overall variance; thus characterization of spectral orstructural similarities is optimized. Moreover, by consid-ering specific wavenumber regions, different features ofthe protein structure and composition can be probed.
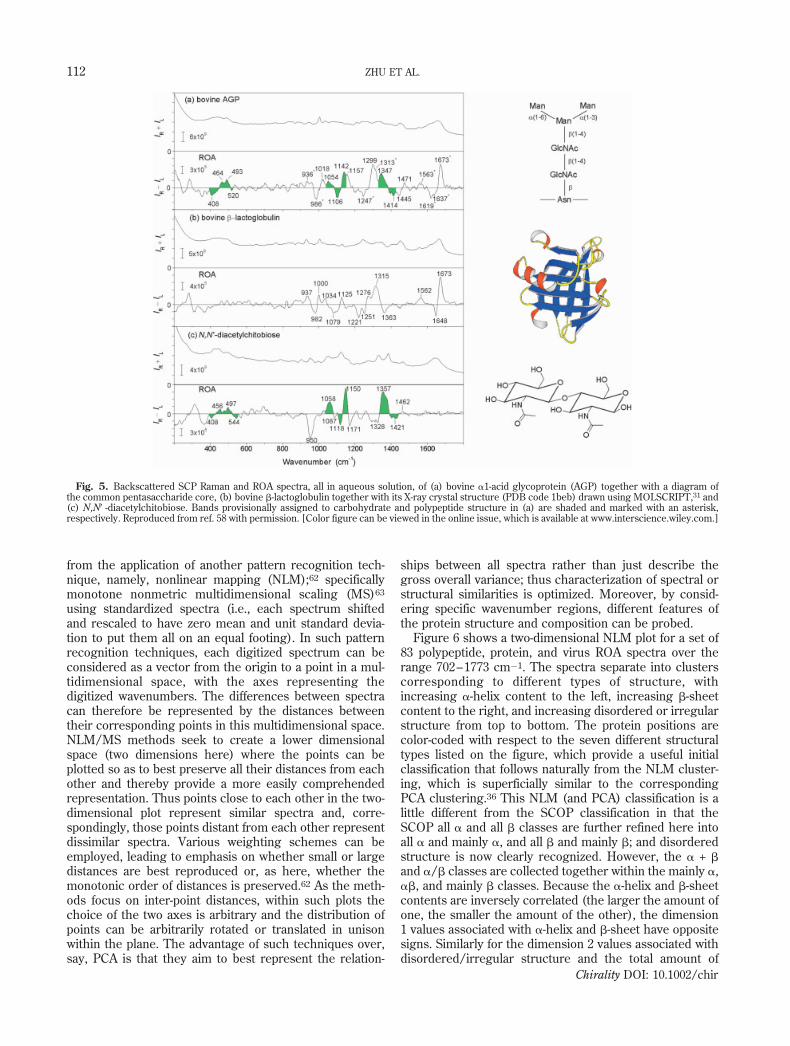
Figure 6 shows a two-dimensional NLM plot for a set of83 polypeptide, protein, and virus ROA spectra over therange 702–1773 cm�1. The spectra separate into clusterscorresponding to different types of structure, withincreasing a-helix content to the left, increasing b-sheetcontent to the right, and increasing disordered or irregularstructure from top to bottom. The protein positions arecolor-coded with respect to the seven different structuraltypes listed on the figure, which provide a useful initialclassification that follows naturally from the NLM cluster-ing, which is superficially similar to the correspondingPCA clustering.36 This NLM (and PCA) classification is alittle different from the SCOP classification in that theSCOP all a and all b classes are further refined here intoall a and mainly a, and all b and mainly b; and disorderedstructure is now clearly recognized. However, the a + b
and a/b classes are collected together within the mainly a,ab, and mainly b classes. Because the a-helix and b-sheetcontents are inversely correlated (the larger the amount ofone, the smaller the amount of the other), the dimension1 values associated with a-helix and b-sheet have oppositesigns. Similarly for the dimension 2 values associated withdisordered/irregular structure and the total amount of
Fig. 5. Backscattered SCP Raman and ROA spectra, all in aqueous solution, of (a) bovine a1-acid glycoprotein (AGP) together with a diagram ofthe common pentasaccharide core, (b) bovine b-lactoglobulin together with its X-ray crystal structure (PDB code 1beb) drawn using MOLSCRIPT,31 and(c) N,NV-diacetylchitobiose. Bands provisionally assigned to carbohydrate and polypeptide structure in (a) are shaded and marked with an asterisk,respectively. Reproduced from ref. 58 with permission. [Color figure can be viewed in the online issue, which is available at www.interscience.wiley.com.]
112 ZHU ET AL.
Chirality DOI: 10.1002/chir
a-helix and b-sheet (the larger the amount of secondarystructure, helix or sheet or both, the smaller the amount ofdisordered/irregular structure).
The positions of poly(L-lysine) in model conforma-tions,36 together with those of the five proteins whoseROA spectra are displayed in Figure 3, are indicated. Asexpected, poly(L-lysine) in a-helical, b-sheet, and disor-dered states lie in the upper left, upper right, and lowercenter, respectively, of the plot. Human serum albumin lieswithin the all-a region, and human immunoglobulin G,within the all-b region. Bovine ribonuclease A and subtilisinCarlsberg both lie within the ab region, but the latter islying lower due to the significant amount of disordered orirregular structure it contains in its many long loops; thisis consistent with the structural differences between thecorresponding a + b and a/b classes. As mentioned earlier,discrimination is often provided by bands characteristic ofb-turns, which are present in a + b structures but not in a/bstructures. The natively unfolded protein bovine b-caseinlies in the lower central region, a little higher than dis-ordered poly(L-lysine), but both being well above the modelPPII structure AcOO(Ala)7OONH2. Hence NLM providesconsistent and informative relationships between differentproteins that correspond to the distinct structural typesspecified in Figure 6.
As well as applying NLM to the entire ROA spectralrange as in Figure 6, it can be advantageous to apply NLMto a set of restricted ranges. For example, for the rangef1200–1400 cm�1 we have found the clustering with re-spect to basic protein structural types to be even tighterthan in Figure 6 because the extended amide III vibrationswhich dominate this range are especially sensitive to thepeptide backbone conformation. And by focusing on therange of a particular side-chain vibration, such as f1545–1560 cm�1 for the tryptophan W3 mode, it may be possibleto correlate side-chain conformations.
ACKNOWLEDGMENTS
We thank BBSRC for a research grant, Dr. I. H. McCollfor recording the ROA spectra of the three disaccharidesshown in Figure 4, and Dr. C. Holt for the sample of bo-vine b-casein.
LITERATURE CITED
1. Pusey ML, Liu ZJ, Tempel W, Praissman J, Lin D, Wang BC, GaviraJA, Ng JD. Life in the fast lane for protein crystallization and X-raycrystallography. Prog Biophys Mol Biol 2005;88:359 – 386.
2. Sue SC, Chang CF, Huang YT, Chou CY, Huang TH. Challenges inNMR-based structural genomics. Physica A 2005;350:12 – 27.
Fig. 6. Two-dimensional NLM plot for a set of 83 polypeptide, protein, and virus ROA spectra. The examples discussed in this article are labeled asfollows: a-helical (1a), b-sheet (1b), and disordered (1c) poly(L-lysine); human serum albumin (2); human immunoglobulin G (3); bovine ribonuclease A(4); subtilisin Carlsberg (5); bovine b-casein (6); AcOO(Ala)7OONH2 (7). More complete definitions of the structural types are as follows: all-a, >f60%a-helix with little or no other secondary structure; mainly a, >f35% a-helix and a small amount of b-sheet (f5 – 15%); ab, similar significant amountsof a-helix and b-sheet; mainly b, >f35% b-sheet and a small amount of a-helix (f5 – 15%); all b, >f45% b-sheet with little or no other secondary struc-ture; mainly disordered/irregular, little secondary structure; all disordered/irregular, no secondary structure.
113ROA OF PROTEINS, CARBOHYDRATES, AND GLYCOPROTEINS
Chirality DOI: 10.1002/chir
3. Uversky VN. Natively unfolded proteins: a point where biology waitsfor physics. Protein Sci 2002;11:739 – 756.
4. Dyson HJ, Wright PE. Intrinsically unstructured proteins and theirfunctions. Nat Rev 2005;6:197 – 208.
5. Dwek RA. Toward understanding the function of sugars. Chem Rev1996;96:683 – 720.
6. Lapthorn AJ, Harris DC, Littlejohn A, Lustbader JW, Canfield RE,Machin KJ, Morgan FJ, Isaacs NW. Crystal structure of humanchorionic gonadotropin. Nature 1994;369:455 – 461.
7. Wormald MR, Petrescu AJ, Pao Y-L, Glithero A, Elliot T, Dwek RA.Conformational studies of oligosaccharides and glycopeptides: com-plementarity of NMR, X-ray crystallography, and molecular modelling.Chem Rev 2002;102:371 – 386.
8. Barth A, Zscherp C. What vibrations tell us about proteins. Q RevBiophys 2002;35:369 – 430.
9. Miura T, Thomas Jr GJ. Raman spectroscopy of proteins and theirassemblies. In: Biswas BB, Roy S, editors. Subcellular biochemistry.Vol 24. Proteins: structure, function and engineering. New York:Plenum Press; 1995. p 55 – 99.
10. Tuma R. Raman spectroscopy of proteins: from peptides to largeassemblies. J Raman Spectrosc 2005;36:307 – 319.
11. Fasman GD (editor). Circular dichroism and the conformational anal-ysis of biomolecules. New York: Plenum Press; 1996.
12. Wallace BA, Wien F, Miles AJ, Lees JG, Hoffmann SV, Evans P,Wistow GJ, Slingsby C. Biomedical applications of synchrotron ra-diation circular dichroism spectroscopy: identification of mutant pro-teins associated with disease and development of a reference databasefor fold motifs. Faraday Discuss 2004;126:237 – 243.
13. Keiderling TA. Peptide and protein conformational studies withvibrational circular dichroism and related spectroscopies. In: BerovaN, Nakanishi K, Woody RW, editors. Circular dichroism. Principlesand applications. New York: Wiley-VCH; 2000. p 621 – 666.
14. Hug W. Raman optical activity. In: Chalmers JM, Griffiths PR, editors.Handbook of vibrational spectroscopy, Vol. 1. Chichester, U.K.: JohnWiley & Sons; 2002. p 745 – 758.
15. Barron LD. Molecular light scattering and optical activity, 2nd edition.Cambridge, England: Cambridge University Press; 2004.
16. Barron LD, Hecht L, Blanch EW, McColl IH. Raman optical activitycomes of age. Mol Phys 2004;102:731 – 744.
17. Barron LD, Bogaard MP, Buckingham AD. Raman scattering ofcircularly polarized light by optically active molecules. J Am Chem Soc1973;95:603 – 605.
18. Barron LD, Hecht L, Blanch EW, Bell AF. Solution structure anddynamics of biomolecules from Raman optical activity. Prog BiophysMol Biol 2000;73:1 – 49.
19. Barron LD, Zhu F, Hecht L, Barron LD. Structure and behavior ofproteins from Raman optical activity. In: Uversky VN, Permyakov EA,editors. Protein structures: methods in protein structure and stability.New York: Nova Science Publishers; 2006.
20. Blanch EW, Hecht L, Syme CD, Volpetti V, Lomonossoff GP, NielsenK, Barron LD. Molecular structures of viruses from Raman opticalactivity. J Gen Virol 2002;83:2593 – 2600.
21. Hug W, Hangartner G. A novel high-throughput Raman spectrometerfor polarization difference measurements. J Raman Spectrosc 1999;30:841 – 852.
22. Hug W. Virtual enantiomers as the solution of optical activity’s deter-ministic offset problem. Appl Spectrosc 2003;57:1 – 13.
23. Atkins PW, Barron LD. Rayleigh scattering of polarized photons bymolecules. Mol Phys 1969;16:453 – 466.
24. Barron LD, Buckingham AD. Rayleigh and Raman scattering fromoptically active molecules. Mol Phys 1971;20:1111 – 1119.
25. Hecht L, Barron LD, Hug W. Vibrational Raman optical activity inbackscattering. Chem Phys Lett 1989:158;341 – 344.
26. Hecht L, Barron LD. An analysis of modulation experiments forRaman optical activity. Appl Spectrosc 1990:44;483 – 491.
27. Polavarapu PL. Ab initio vibrational Raman and Raman optical activityspectra. J Phys Chem 1990;94:8106 – 8112.
28. Zuber G, Hug W. Rarified basis sets for the calculation of opticaltensors. 1. The importance of gradients on hydrogen atoms for theRaman scattering tensor. J Phys Chem A 2004;108:2108 – 2118.
29. Hecht L, Barron LD, Blanch EW, Bell AF, Day LA. Raman opticalactivity instrument for studies of biopolymer structure and dynamics.J Raman Spectrosc 1999;30:815 – 825.
30. Zhu F, Isaacs NW, Hecht L, Barron LD. Raman optical activity: a toolfor protein structure analysis. Structure 2005;13:1409 – 1419.
31. Kraulis PJ. MOLSCRIPT: a program to produce both detailed and sche-matic plots of protein structures. J Appl Crystallogr 1991;24:946 –950.
32. Tu AT. Peptide backbone conformation and microenvironment ofprotein side chains. Adv Spectrosc 1986;13:47 – 112.
33. Diem M. Modern vibrational spectroscopy. New York: John Wiley &Sons; 1993.
34. Schweitzer-Stenner R, Eker F, Huang Q, Griebenow K, Mroz PA,Kozlowski PM. Structure analysis of dipeptides in water by exploringand utilizing the structural sensitivity of amide III by polarized visibleRaman, FTIR-spectroscopy and DFT based normal coordinate anal-ysis. J Phys Chem B 2002;106:4294 – 4304.
35. McColl IH, Blanch EW, Hecht L, Barron LD. A study of a-helixhydration in polypeptides, proteins and viruses using vibrationalRaman optical activity. J Am Chem Soc 2004;126:8181 – 8188.
36. McColl IH, Blanch EW, Gill AC, Rhie AGO, Ritchie MA, Hecht L,Nielsen K, Barron LD. A new perspective on b-sheet structures usingvibrational Raman optical activity: from poly(L-lysine) to the prionprotein. J Am Chem Soc 2003;125:10019 – 10026.
37. Holt C, Sawyer L. Caseins as rheomorphic proteins: interpretation ofprimary and secondary structures of the aS1-, b- and k-caseins. JChem Soc Faraday Trans 1993;89:2683 – 2692.
38. Syme CD, Blanch EW, Holt C, Jakes R, Goedert M, Hecht L, BarronLD. A Raman optical activity study of rheomorphism in caseins,synucleins and tau protein: implications for fibrillogenic propensity.Eur J Biochem 2002;269:148 – 156.
39. Shi Z, Woody RW, Kallenbach N. Is polyproline II a major backboneconformation in unfolded proteins? Adv Protein Chem 2002;62:163–240.
40. McColl IH, Blanch EW, Hecht L, Kallenbach NR, Barron LD.Vibrational Raman optical activity characterization of poly(L-proline)II helix in alanine oligopeptides. J Am Chem Soc 2004;126:5076 – 5077.
41. Shi Z, Olson CA, Rose GD, Baldwin RL, Kallenbach NR. Polyproline IIstructure in a sequence of seven alanine residues. Proc Natl Acad SciUSA 2002;99:9190 – 9195.
42. Blundell T, Barlow D, Borkakoti N, Thornton J. Solvent-induceddistortions and the curvature of a-helices. Nature 1983;306:281 – 283.
43. Sundaralingham M, Sekharudu YC. Water inserted a-helical segmentsimplicate reverse turns as folding intermediates. Science 1989;244:1333 – 1337.
44. Blanch EW, Morozova-Roche LA, Cochran DAE, Doig AJ, Hecht L,Barron LD. Is polyproline II helix the killer conformation? A Ramanoptical activity study of the amyloidogenic prefibrillar intermediate ofhuman lysozyme. J Mol Biol 2000;301:553 – 563.
45. Macleod NA, Butz P, Simons JP, Grant GH, Baker CM, Tranter GE.Structure, electronic circular dichroism and Raman optical activity inthe gas phase and in solution: a computational and experimental in-vestigation. Phys Chem Chem Phys 2005;7:1432 – 1440.
46. Blanch EW, Hecht L, Day LA, Pederson DM, Barron LD. Tryptophanabsolute stereochemistry in viral coat proteins from Raman opticalactivity. J Am Chem Soc 2001;123:4863 – 4864.
47. Adzhubei AA, Sternberg MJE. Left-handed polyproline II helicescommonly occur in globular proteins. J Mol Biol 1993;229:472 – 493.
48. Creamer TP, Campbell MN. Determinants of the polyproline II helixfrom modelling studies. Adv Protein Chem 2002;62:263 – 282.
49. Bochicchio B, Tamburro AM. Polyproline II structure in proteins:identification by chiroptical spectroscopies, stability, and functions.Chirality 2002;14:782 – 792.
50. Barron LD, Blanch EW, Hecht L. Unfolded proteins studied by Ramanoptical activity. Adv Protein Chem 2002;62:51 – 90.
51. Blanch EW, Gill AC, Rhie AGO, Hope J, Hecht L, Nielsen K, BarronLD. Raman optical activity demonstrates poly(L-proline) II helix in the
114 ZHU ET AL.
Chirality DOI: 10.1002/chir
N-terminal region of the ovine prion protein: implications for functionand misfunction. J Mol Biol 2004;343:467 – 476.
52. Wen ZQ, Barron LD, Hecht L. Vibrational Raman optical activity ofmonosaccharides. J Am Chem Soc 1993;115:285 – 292.
53. Bell AF, Barron LD, Hecht L. Vibrational Raman optical activity studyof D-glucose. Carbohydr Res 1994;257:11 – 24.
54. Bell AF, Hecht L, Barron LD. Vibrational Raman optical activity ofketose monosaccharides. Spectrochim Acta A 1995;51:1367 – 1378.
55. Bell AF, Hecht L, Barron LD. Disaccharide solution stereochemistryfrom vibrational Raman optical activity. J Am Chem Soc 1994;116:5155 – 5161.
56. Bell AF, Hecht L, Barron LD. Polysaccharide vibrational Raman opticalactivity: laminarin and pullulan. J Raman Spectrosc 1995;26:1071 – 1074.
57. Bell AF, Hecht L, Barron LD. New evidence for conformational flexi-bility in cyclodextrins from vibrational Raman optical activity. ChemEur J 1997;3:1292 – 1298.
58. Zhu F, Isaacs NW, Hecht L, Barron LD. Polypeptide and carbohydratestructure of an intact glycoprotein from Raman optical activity. J AmChem Soc 2005;127:6142 – 6143.
59. Fournier T, Medjoubi-N N, Porquet D. Alpha-1-acid glycoprotein. Bio-chem Biophys Acta 2000;1482:157 – 171.
60. Kopecky Jr V , Ettrich R, Hofbauerova K, Baumrauk V. Structure ofhuman a1-acid glycoprotein and its high-affinity binding site. BiochemBiophys Res Commun 2003;300:41 – 46.
61. Brownlow S, Cabral JHM, Cooper R, Flower DR, Yewdall SJ,Polikarpov I, North ACT, Sawyer L. Bovine b-lactoglobulin at 1.8 Aresolution—still an enigmatic lipocalin. Structure 1997;5:481 – 495.
62. Krzanowski WJ. Principles of multivariate analysis, a user’s perspec-tive. Oxford Statistical Science Series 3. Oxford, England: OxfordUniversity Press, Oxford Science Publications; 1998.
63. STATISTICA (data analysis software system), version 6 (www.statsoft.com). Tulsa, OK: StatSoft, Inc.; 2004.
115ROA OF PROTEINS, CARBOHYDRATES, AND GLYCOPROTEINS
Chirality DOI: 10.1002/chir


