Embed Size (px)
Citation preview
Chapter 31Radioisotopic Measurements (137Cs and 210Pb)to Assess Erosion and Sedimentation Processes:Case Study in Austria
L. Mabit, A. Klik, and A. Toloza
Abstract Twelve to seventeen percentage of the European soil is threatened bywater erosion and around 13% of Austrian territory is affected. Only scarce informa-tion based on conventional assessment and measurements are available on erosionand sedimentation rates in Austria. The magnitude of sedimentation processes wasevaluated in a small agricultural Austrian watershed using both nuclear techniques(137Cs and 210Pb) and conventional non-isotopic measurements in runoff erosionplots during the 1994–2006 periods. Using the erosion data provided by the plots(29.4 t ha–1 year–1 for the conventional tilled plot, 4.2 t ha–1 year–1 for the plotreceiving conservation tillage and 2.7 t ha–1 year–1 for the plot receiving directseeding treatment) and the 137Cs soil profiles content and the conversion modelmass balance 2 (MBM 2), a sedimentation rate of 13.2 t–1 ha–1 year–1 (value deter-mined down slope of the runoff plot under direct seeding treatment) to 50.5 t–1 ha–1
year–1 (value determined in the lowest sedimentation area of the watershed underconventional tillage) was estimated. Under the experimental condition the conserva-tion tillage and direct seeding system were effective in reducing the sedimentationmagnitude by 65%. However, due to a high variability of the initial fallout inventoryand a high γ-spectrometry measurement error, information provided by the 210Pbmethod was not usable in the study area. The combined use of conventional erosionmeasurements and nuclear techniques appears to be a promising and complementaryapproach to evaluate sedimentation processes.
Keywords Water erosion · 137Cs · 210Pb · Runoff erosion plots · Sedimentationrates · Erosion rates
L. Mabit (B)Soil Science Unit, FAO/IAEA Agriculture & Biotechnology Laboratory, IAEA LaboratoriesSeibersdorf, Vienna A-1400, Austriae-mail: [email protected]
401P. Zdruli et al. (eds.), Land Degradation and Desertification: Assessment, Mitigationand Remediation, DOI 10.1007/978-90-481-8657-0_31,C© Springer Science+Business Media B.V. 2010
402 L. Mabit et al.
31.1 Introduction
Degradation phenomena, such as erosion, desertification and salinization affect 65%of the soil in both developed and developing countries. In Europe, soil erosion bywind and water is the major threat to the resource soil and represents the mainmechanisms of landscapes degradation. Indeed, around 115 × 106 ha of agriculturalused land – around 12% of the total area of Europe – are highly affected by erosionprocesses (CEC, 2006).
On-site soil erosion affect farmers particularly through soil losses, removal, andreduction of soil quality; such processes are associated with fertility, productivityand yield decline. Sediment and associated potential pollutant can reach water-courses and contribute to the eutrophication of water resources, increase or createsiltation problems and other major off-site impacts like mudslide and flow whichcan damage human infrastructure and habitation (Boardman and Poesen, 2006).
Influenced by the effects of climate change and global warming, water erosionrisk is expected to increase in the EU by the year 2050 in about 80% of the agricul-tural areas, and this pressure will mainly take place in the areas where soil erosion iscurrently severe and Austria is part of this area (EEA, 1999, 2002). For the conserva-tion, improvement and sustainable use of natural resources for food and agriculturethere is a clear need of an integrated land and water management that should startfirstly with an accurate spacio-temporal assessment of erosion and sedimentationmagnitudes.
The Global Assessment of Human Induced Soil Degradation (GLASOD) sur-vey carried out during the 1980s by the United Nations Environment Programme(UNEP) and the International Soil Reference and Information Centre (ISRIC) estab-lished that the severity of human induced degradation has been classified as severefor 37% of the Austrian territory (FAO, 2005). In 1999, about 4.4 × 10⁴ ha agri-cultural land was classified highly erodible (Strauss and Klaghofer, 2006). Usinglong-term, remotely sensed Normalized Difference Vegetation Index (NDVI) andrainfall data Bai et al. (2008) evaluated that land degradation represents 28,291 km2
equivalents to 34% of the Austrian territory.However, no data on historical quantitative soil loss rates are available in Austria.
Long-term annual rainfall (1961–1990) varies between 430 and 2,250 mm with anoverall mean of 1,170 mm. This corresponds to theoretical R factors of 38–180 Nh–1 (Strauss et al., 1995). However, intensive agricultural land use to which theUniversal Soil Loss Equation (USLE) calculations are limited, is not accurate withannual rainfall above 1,500 mm.
Qualitative evidence of historical soil erosion exists in various forms. Especiallyin the wine-growing area situated in the eastern part of Austria the formation oflarge gullies on loess soils shows the impact of soil erosion processes. Results fromfield experiments mainly focussing on effects of different soil management practicescan be used as indicator of the erosion severity. Klik (2003) investigated the effectsof different tillage practices on runoff and soil loss at three sites in Lower Austria.Over 9 years he measured average soil loss rates of 5–39 t ha–1 year–1 for con-ventional plots with 2–6 t ha–1 year–1 for conservation tilled plots and 0.5–4 t ha–1
year–1 for no-till plots. Two-year experiments by Pollhammer (1997) at two sites in
31 Radioisotopic Measurements to Assess Erosion and Sedimentation in Austria 403
Styria delivered soil loss rates of 8–72 t ha–1 year–1 for ploughed plots and 1–46 tha–1 year–1 for chiselled plots. Soil erosion is mainly affected by extreme events.Strauss and Klaghofer (2004) mapped linear soil features within a 2.89 km2 largeexperimental watershed after a 5-day period of heavy rain (115 mm) and recordedtotal amounts of soil transport by rilling of more than 730 t but only 17 t leavingthe watershed. Soil erosion took place only in few fields with the highest soil lossrecorded at almost 300 t ha–1.
Traditional monitoring and modelling techniques (e.g. erosion pins, erosion mod-elling, e.g RUSLE, WEPP; sediment yields and reservoir silting measurements,runoff plots monitoring data under natural or artificial rainfall, sediment traps) forsoil erosion/sedimentation require many parameters and of course years of measure-ments to integrate climatic inter-annual variability (Mabit et al., 2002a, b). Artificialradionuclide such as 137Cs (T1/2 = 30 years), geogenic radioisotope such as 210Pb(T1/2 = 22 years) and also more recently cosmogenic radioisotope such as 7Be (T1/2= 53 days) have been used worldwide to assess medium and short term soil erosionand deposition processes (Mabit et al., 2008a; Ritchie and Ritchie, 2008).
Soil redistribution is commonly based on a comparison of the fallout radionu-clides “FRNs” (137Cs, 210Pb and 7Be) areal activity density in the landscape witha “stable” landscape position known as the “reference site”, where neither erosionnor deposition has occurred (Mabit et al., 2008a). The erosion or sedimentationrates can be estimated using conversion models, which mathematically define therelationship between the increase or decrease in the FRNs inventory relative to thereference inventory (Walling et al., 2002). One of the main advantages of the use ofthe FRNs is that time-consuming, costly maintenance and installations required bynon-isotopic and conventional methods can be avoided (Mabit et al., 2007, 2008b).
Innovative methodological approaches and protocols for the use of FRNs toobtain spatio-temporal patterns and magnitude of soil erosion/sedimentation weretested, compared and reported since the 1990s in many European countries such asGermany (Schimmack et al., 2002), France (Mabit et al., 1998), Spain (Navas andWalling, 1992), Italy (Porto et al., 2003), UK (Walling and Quine, 1991), Poland(Froehlich and Walling, 1992), Slovakia (Fulajtar, 2000), Slovenia (Mabit et al.,2009b). Such data from FRN test as soil tracer were not available in Austria untilthe present case study. The aim of the investigation in Mistelbach, a small Austrianagricultural watershed, was to measure soil redistribution rates using runoff plotsand radioisotopics approaches (137Cs and 210Pb) and to assess the relative efficiencyof soil conservation measures on soil losses.
31.2 Materials and Methods
31.2.1 Study Area, Soil Sampling and Laboratory Analyses
A field experiment was implemented from 1994 to 2006 in Mistelbach, a small agri-cultural watershed of 18 ha located 60 km north of Vienna, Austria, to investigatesoil conservation impacts of three different tillage practices. Cereals growing on
404 L. Mabit et al.
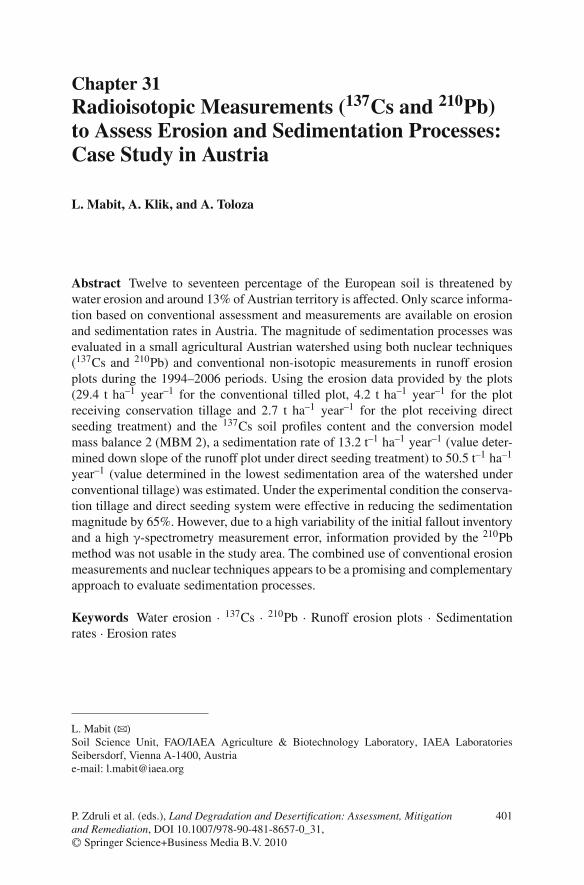
silty-loam gentle slopes dominate the landscape. The treatments included a conven-tional tilled plot (CVT), a conservation tillage plot (CST) with cover crops duringwinter and a plot under direct seeding (DS) with cover crops during winter. Eachtillage practices tests were carried out on three 45 m2 runoff plots with 14% slopeto measure surface runoff and erosion processes (Fig. 31.1).
Runoff and associated sediment were collected from 1994 to 2006 using an auto-mated erosion wheel (Klik et al., 2004). Shifting from conventional tillage to directseeding the yearly soil loss was reduced significantly by a factor of 10. Indeed, overthe 13 years of investigation, the annual average soil loss was 29.4 t ha–1 for theconventional tilled plot, 4.2 t ha–1 for the conservation tillage plot and 2.7 t ha–1 forthe direct seeding treatment (Mabit et al., 2008c).
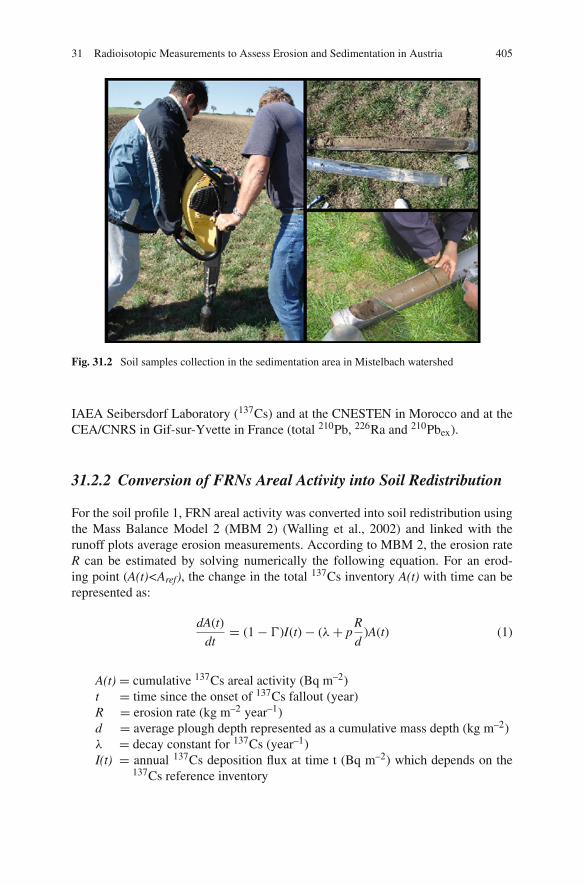
To establish the 137Cs reference value 76 soil samples were collected along amulti-grid design (Mabit et al., 2008d) in an undisturbed small forest within theMistelbach watershed (Soil newsletter). Eleven samples were randomly selected foranalyses of total 210Pb, 226Ra and 210Pbex. In the sedimentation area of the water-shed (Fig. 31.1), two 0–100 cm composite samples of three cores were collectedwith an automatic soil column cylinder auger (Fig. 31.2). One soil profile was col-lected down slope of the field containing the runoff plots (Profile 1) and the otherone was collected in the talweg runoff convergence located 15 m from the previoussoil profile (Profile 2)
After pre-treatment (sieving at 2 mm after oven-drying for 48 h at 70◦C) thegamma measurement of the soil samples, according to the recommendation pro-vided by Shakhashiro and Mabit (2009) were completed by γ-spectrometry at the
Fig. 31.1 Location of the study area (Adapted from Mabit et al., 2009a)
31 Radioisotopic Measurements to Assess Erosion and Sedimentation in Austria 405
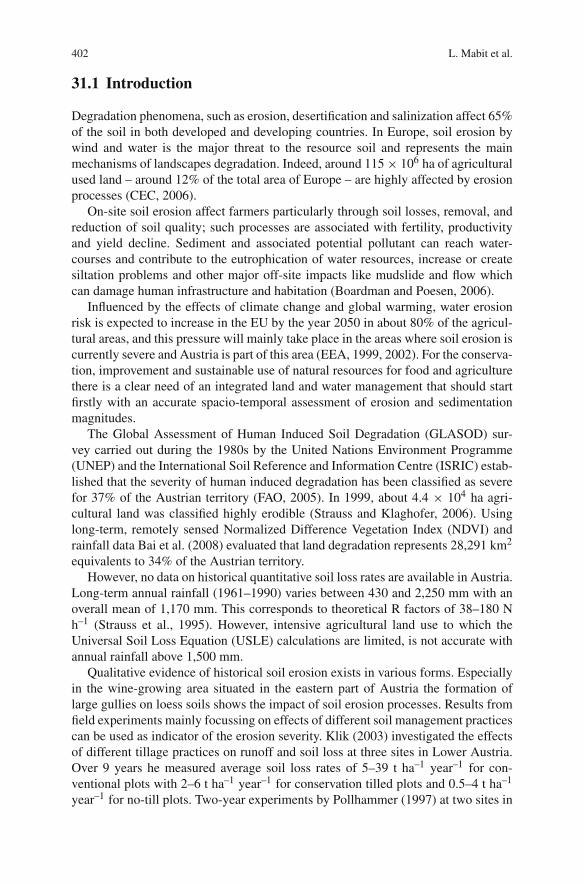
Fig. 31.2 Soil samples collection in the sedimentation area in Mistelbach watershed
IAEA Seibersdorf Laboratory (137Cs) and at the CNESTEN in Morocco and at theCEA/CNRS in Gif-sur-Yvette in France (total 210Pb, 226Ra and 210Pbex).
31.2.2 Conversion of FRNs Areal Activity into Soil Redistribution
For the soil profile 1, FRN areal activity was converted into soil redistribution usingthe Mass Balance Model 2 (MBM 2) (Walling et al., 2002) and linked with therunoff plots average erosion measurements. According to MBM 2, the erosion rateR can be estimated by solving numerically the following equation. For an erod-ing point (A(t)<Aref), the change in the total 137Cs inventory A(t) with time can berepresented as:
dA(t)
dt= (1 − �)I(t) − (λ + p
R
d)A(t) (1)
A(t) = cumulative 137Cs areal activity (Bq m–2)t = time since the onset of 137Cs fallout (year)R = erosion rate (kg m–2 year–1)d = average plough depth represented as a cumulative mass depth (kg m–2)λ = decay constant for 137Cs (year–1)I(t) = annual 137Cs deposition flux at time t (Bq m–2) which depends on the
137Cs reference inventory
406 L. Mabit et al.
P = particle size correction factorΓ = proportion of the freshly deposited 137Cs fallout removed by erosion
before being mixed into the plough layer by cultivation.
For a depositional site (A(t)>Aref), the sediment deposition rate R’ can beestimated using the following equation:
R’ = A(t) − Areft∫
t0Cd(t′)e−λ(t−t′)dt′
(2)
Cd (t’) is the 137Cs concentration of deposited sediment assumed to be the weightedmean of the 137Cs concentrations of the sediment mobilized originating from theentire eroded area represented by Ce (t’) from the upslope contributing area S (m2).Cd (t’) can be calculated as following, where R is the erosion rate in the erodingzone and P’ is the particle correction size:
Cd = 1∫s
RdS
∫
s
P′Ce(t′)RdS (3)
Depth redistribution activity of FRNs from both soil profiles (1 and 2) was also usedto evaluate the sedimentation magnitudes. The following formula (Allison et al.,1998; Walling and He, 1999) was used:
R’ = Db − Dpl
Ts(4)
Ts : time since the beginning of significant fallout and the collection of thesediment core (year)
Db : plough depth (kg m–2)Dpl: plough depth based on the 137Cs depth profile distribution (kg m–2)R’ : sedimentation rate (kg m–2 year–1)
31.3 Results and Discussion
31.3.1 FRNs (137Cs and 210Pb) Baseline Level in the ReferenceSite and Test of the 210Pb Methodology
Following an exponential decrease activity with depth, 90% of the 137Cs is con-centrated in the first 15 cm soil layer of the forest area. The 137Cs areal activity ofthe seventy-six forested samples was 1,954 Bq m–2 with a coefficient of variationof 20%. This reliable value <2kBqm–2 (n = 76) demonstrates clearly a negligibleimpact of Chernobyl. It could therefore be concluded that the Chernobyl fallouts
31 Radioisotopic Measurements to Assess Erosion and Sedimentation in Austria 407
in the study area were small enough not to significantly influence the relationshipbetween soil and 137Cs losses.
Measurement error of total 210Pb and 226Ra is acceptable however and the biasconcerning the value of 210Pbex can be as high as the measured values itself. Basedon the laboratory γ-measurements there is no significant difference between the total210Pb and 226Ra. Indeed, in most cases, the activity of total 210Pb and 226Ra fromthe reference site as well as from the two soil profiles collected in the sedimentationarea are similar (Tables 31.1 and 31.2). The value of 210Pbex can sometimes evenbe negative due to the measurement uncertainty and the overlapping activity of total210Pb and 226Ra. In that case the value of 210Pbex was reported as zero (Tables 31.1and 31.2).
In summary, it was not possible to validate the 210Pb method in the Mistelbachwatershed, due to a very low level of ‘unsupported’ 210Pb coupled with a highvariability of the initial fallout inventory and a high measurement uncertainty(Tables 31.1 and 31.2). As mentioned by Mabit et al. (2009a) similar limitationlike 210Pbex poorly enriched precipitations have been reported in several countries.With regard to gamma spectrometry and detection of total 210Pb, a series of rec-ommendations were also provided by the IAEA Seibersdorf Laboratory to improveanalytical performance, in particular analytical quality assurance system to assessthe accuracy and precision of the measurements (Shakhashiro and Mabit, 2009).
31.3.2 Assessment of Soil Deposition Rates Using 137Cs Data
Based on the different soil layers areal activity, soil profile 1 (presence of 137Cs till40 cm) and profile 2 (presence of 137Cs till 50 cm) revealed a radio-caesium activ-ity typical of sedimentation processes significantly higher than the reference site of
Table 31.1 Results and error measurements of total 210Pb, 226Ra and 210Pbex from the referencesite (n = 11)
210Pb-total (Bq kg–1) 226Ra (Bq kg–1) 210Pbex (Bq kg–1)
40.14 (6.76) † 35.36 (2.96) † 4.78 (7.38†; 154‡)34.69 (6.08) † 33.38 (2.42) † 1.31 (6.54†; 499‡)34.45 (5.18) † 35.63 (3.18) † 0 (n.a†; n.a‡)35.52 (6.22) † 34.30 (3.18) † 1.22 (6.98†; 572‡)42.60 (6.84) † 35.42 (3.36) † 7.18 (7.62†; 106‡)42.25 (6.60) † 33.10 (2.90) † 9.15 (7.22†; 79‡)39.69 (1.89) † 36.68 (0.41) † 3.01 (1.93†; 64‡)40.06 (1.91) † 39.50 (0.41) † 0.56 (1.95†; 348‡)43.00 (1.68) † 40.45 (0.37) † 2.55 (1.72†; 67‡)34.02 (1.85) † 35.84 (0.40) † 0 (n.a†; n.a‡)30.53 (1.91) † 39.10 (0.44) † 0 (n.a†; n.a‡)
n.a = non applicable; (†) measurement error in Bq kg–1 at 2σ; (‡)measurement error in % at 2σ.
408 L. Mabit et al.
Table 31.2 Results and error measurements of total 210Pb, 226Ra and 210Pbex in the sedimentationarea
Soil samples 210Pbtot (Bq kg–1) 226Ra (Bq kg–1) 210Pbex (Bq kg–1)
P1 (0–5 cm) 44.16 (6.62) † 35.92 (3.08) † 8.24 (7.3†; 88‡)P1 (5–10 cm) 41.45 (5.84) † 38.71 (3.00) † 2.74 (6.58†; 240‡)P1 (10–15 cm) 36.79 (4.96) † 36.54 (3.14) † 0.25 (5.86†; 2344‡)P1 (15–20 cm) 39.04 (5.70) † 36.99 (3.10) † 2.05 (6.5†; 317‡)P1 (20–25 cm) 37.42 (4.88) † 37.03 (2.70) † 0.39 (5.56†; 1425‡)P1 (25–30 cm) 37.41 (6.08) † 35.74 (2.96) † 1.66 (6.78†; 408‡)P1 (30–35 cm) 32.19 (5.46) † 32.65 (2.88) † 0 (n.a†; n.a‡)P1 (35–40 cm) 40.14 (6.62) † 36.83 (2.96) † 3.31 (7.24†; 218‡)P1 (40–45 cm) 40.02 (5.54) † 37.58 (3.18) † 2.45 (6.4†; 261‡)P1 (45–50 cm) 37.91 (6.42) † 34.14 (3.12) † 3.77 (7.14†; 189‡)P1 (50–55 cm) 40.53 (6.30) † 37.17 (3.30) † 3.36 (7.1†; 211‡)P1 (55–60 cm) 40.24 (6.04) † 35.99 (3.02) † 4.25 (6.74†; 158‡)P1 (60–65 cm) 35.31 (4.58) † 35.32 (2.46) † 0 (n.a†; n.a‡)P1 (65–70 cm) 45.27 (6.72) † 37.76 (3.08) † 7.51 (7.38†; 98‡)P1 (70–75 cm) 37.17 (5.34) † 36.88 (2.78) † 0.29 (6.02†; 2075‡)P1 (75–80 cm) 37.74 (5.08) † 36.10 (2.96) † 1.64 (5.88†; 358‡)P1 (80–85 cm) 40.38 (5.84) † 36.02 (2.96) † 4.36 (6.54†; 150‡)P1 (85–90 cm) 37.98 (4.90) † 36.60 (2.74) † 1.38 (5.6†; 405‡)P1 (90–95 cm) 35.63 (5.84) † 36.92 (2.94) † 0 (n.a†; n.a‡)P2 (0–10 cm) 40.25 (1.94) † 43.81 (0.44) † 0 (n.a†; n.a‡)P2 (10–20 cm) 42.06 (1.66) † 38.37 (0.29) † 3.69 (1.69†; 46‡)P2 (20–30 cm) 39.36 (2.18) † 38.03 (0.38) † 1.33 (2.21†; 166‡)P2 (30–40 cm) 41.49 (2.12) † 39.15 (0.37) † 2.34 (2.15†; 92‡)P2 (40–50 cm) 38.00 (2.19) † 38.86 (0.39) † 0 (n.a†; n.a‡)P2 (50–60 cm) 40.14 (2.05) † 40.43 (0.37) † 0 (n.a†; n.a‡)P2 (60–70 cm) 38.59 (2.09) † 38.94 (0.37) † 0 (n.a†; n.a‡)P2 (70–80 cm) 41.64 (1.33) † 38.02 (0.23) † 3.62 (1.35†; 37‡)P2 (80–90 cm) 39.38 (1.78) † 34.90 (0.30) † 4.48 (1.81†; 40‡)P2 (90–100 cm) 37.56 (1.98) † 35.84 (0.33) † 1.72 (2.01†; 117‡)
n.a = non applicable; (†) measurement error in Bq kg–1 at 2σ; (‡) measurement error in % at2σ.
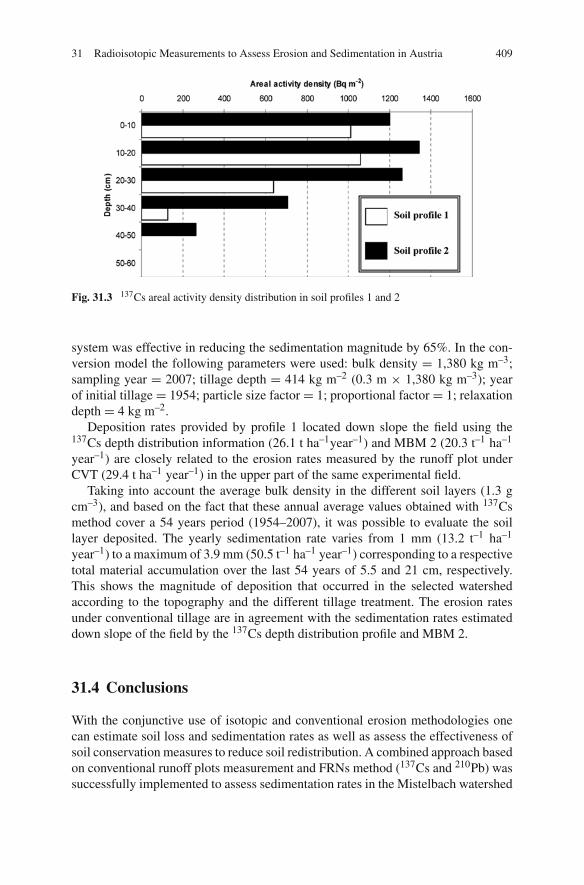
respectively 2,836 and 4,776 Bq m–2 (Fig. 31.3). Using the information provided bythe 137Cs depth distribution, the sedimentation rate of profiles 1 and 2 was respec-tively estimated at 26.1 and at 50.5 t ha–1year–1. These results are in agreement withthe landscape position of the selected profiles.
The information collected from profile 1 was compiled with the erosion plotsresults. As the sedimentation source of the deposited material is the eroded soils ofthe contiguous field containing the runoff plots located upstream, the MBM 2 wasused to assess the sedimentation rates of the different treatments using the 137Csactivity data derived from the runoff plots (685 Bq m–2 for CVT; 1,680 Bq m–2 forCST and 1,775 Bq m–2 for DS) and the 137Cs information of the soil profile 1.
Profile 1 revealed a yearly sedimentation rate of 20.3, 13.5 and 13.2 t–1 ha–1
respectively for CVT, CST and DS. Comparing to the CVT, the DS conservation
31 Radioisotopic Measurements to Assess Erosion and Sedimentation in Austria 409
Fig. 31.3 137Cs areal activity density distribution in soil profiles 1 and 2
system was effective in reducing the sedimentation magnitude by 65%. In the con-version model the following parameters were used: bulk density = 1,380 kg m–3;sampling year = 2007; tillage depth = 414 kg m–2 (0.3 m × 1,380 kg m–3); yearof initial tillage = 1954; particle size factor = 1; proportional factor = 1; relaxationdepth = 4 kg m–2.
Deposition rates provided by profile 1 located down slope the field using the137Cs depth distribution information (26.1 t ha–1year–1) and MBM 2 (20.3 t–1 ha–1
year–1) are closely related to the erosion rates measured by the runoff plot underCVT (29.4 t ha–1 year–1) in the upper part of the same experimental field.
Taking into account the average bulk density in the different soil layers (1.3 gcm–3), and based on the fact that these annual average values obtained with 137Csmethod cover a 54 years period (1954–2007), it was possible to evaluate the soillayer deposited. The yearly sedimentation rate varies from 1 mm (13.2 t–1 ha–1
year–1) to a maximum of 3.9 mm (50.5 t–1 ha–1 year–1) corresponding to a respectivetotal material accumulation over the last 54 years of 5.5 and 21 cm, respectively.This shows the magnitude of deposition that occurred in the selected watershedaccording to the topography and the different tillage treatment. The erosion ratesunder conventional tillage are in agreement with the sedimentation rates estimateddown slope of the field by the 137Cs depth distribution profile and MBM 2.
31.4 Conclusions
With the conjunctive use of isotopic and conventional erosion methodologies onecan estimate soil loss and sedimentation rates as well as assess the effectiveness ofsoil conservation measures to reduce soil redistribution. A combined approach basedon conventional runoff plots measurement and FRNs method (137Cs and 210Pb) wassuccessfully implemented to assess sedimentation rates in the Mistelbach watershed
410 L. Mabit et al.
in Austria. While the 137Cs appeared to be a mature isotopic technique the 210Pbwas not applicable in the area under investigation due to very low concentrations of210Pbex associated to a high uncertainty in the measurements.
There is always scope for further refinement of the FRN methodologies that pre-viously had mostly focussed on soil degradation and redistribution at the hill slope,plot and field scale. New up-scale development to the watershed scale in a widerange of agricultural landscapes using interpolation tools and also considering sed-iment sources and budget, transfer residence and storage are needed to shift fromuse of these isotopic tracers (especially 137Cs) as a research tool to a standardizeddecision support tool in the following years to protect natural resources quality inboth developed and developing countries.
Acknowledgements This study was conducted in support of the FAO/IAEA Co-ordinatedResearch Project “Assess the effectiveness of soil conservation measures for sustainable watershedmanagement using fallout radionuclides” (D1.50.08). The authors would like to thank Dr. GudniHardarson, Head of the Soil Science Unit and the Dr. Felipe Zapata (Soil and Water Management& Crop Nutrition Section) for suggestions to improve the manuscript.
References
Allison, M.A., Kuehl, S.A., Martin, T.C. and Hassan, A. (1998). Importance of flood-plain sed-imentation for river sediment budgets and terrigenous input to the oceans: insights from theBrahmaputra-Jamuna River. Geology 26(2):175–178.
Bai, Z.G., Dent, D.L., Olsson, L. and Schaepman, M.E. (2008). Proxy global assessment of landdegradation. Soil Use and Management 24:223–234.
Boardman J., Poesen J. (eds.) (2006). Soil Erosion in Europe. Wiley, Chichester.Commission of the European Communities (CEC). (2006). Thematic Strategy for Soil Protection.
Communication from the Commission to the Council, the European Parliament, the EuropeanEconomic and Social Committee, and the Committees of the Region – COM (2006)231 final;Brussels 22.9.2006. 12 pp.
EEA – European Environmental Agency. (1999). Environment in the European Union at the turnof the century. Environmental Issue series, No. 2. Copenhagen: 448 pp.
EEA – European Environmental Agency. (2002). Down to earth: Soil degradation and sustainabledevelopment in Europe. A challenge for the 21st century. Environmental Issue series, No. 16.Copenhagen: 32 pp.
Food and Agriculture Organization of the United Nations. (2005). FAO/AGL. GLASOD.National Soil Degradation Maps. Soil Degradation Map of Austria. http://www.fao.org/landandwater/agll/glasod/glasodmaps.jsp?country=AUT&search=Display+map+%21
Froehlich, W. and Walling, D.E. (1992). The use of radionuclides in investigations of erosion andsediment delivery in the Polish Flysh Carpathians. IAHS publication 209:61–76.
Fulajtar, E. (2000). Assessment of soil erosion through the use of 137Cs at Jaslovske Bohunice,Western Slovakia. Acta Geologica Hispanica 35(3–4):291–300.
Klik, A. (2003). Einfluss unterschiedlicher Bodenbearbeitung auf Oberflaechenabfluss,Bodenabtrag sowie auf Naehrstoff- und Pestizidaustraege. Oesterr. Wasserwirtschaft 55(5–6):89–96.
Klik, A., Sokol, W. and Steindl, F. (2004). Automated erosion wheel: A new measuring device forfield erosion plots. Journal of Soil and Water Conservation 59(3):116–121.
Mabit, L., Benmansour, M. and Walling, D.E. (2008a). Comparative advantages and limitations ofFallout radionuclides (137Cs, 210Pb and 7Be) to assess soil erosion and sedimentation. Journalof Environmental Radioactivity 99(12):1799–1807.
31 Radioisotopic Measurements to Assess Erosion and Sedimentation in Austria 411
Mabit, L., Bernard, C. and Laverdière, M.R. (2002a). Quantification of soil redistribution and sedi-ment budget in a Canadian watershed from fallout caesium-137 (137Cs) data. Canadian Journalof Soil Science 82(4):423–431.
Mabit, L., Bernard, C. and Laverdière, M.R. (2007). Assessment of erosion in the Boyer Riverwatershed (Canada) using a GIS oriented sampling strategy and 137Cs measurements. Catena71(2):242–249.
Mabit, L., Bernard, C., Laverdière, M.R. and Wicherek, S. (1998). Spatialisation et cartographiedes risques érosifs à l’échelle d’un bassin versant agricole par un radio-isotope (137Cs). Étudeet Gestion des sols 5(3):171–180.
Mabit, L., Bernard, C., Makhlouf, M. and Laverdière, M.R. (2008b). Spatial variability of ero-sion and soil organic matter content estimated from 137Cs measurements and geostatistics.Geoderma 145(3–4):245–251.
Mabit, L., Klik, A., Benmansour, M., Toloza, A., Geisler, A. and Gerstmann, U.C. (2008c).Assessment of erosion and sedimentation rates using 137Cs, 210Pbex and conventional erosionmeasurements within an Austrian watershed (Mistelbach). In: Laboratory Activities-Research,IAEA-Soils Newsletter 31(1):18–20.
Mabit, L., Klik, A., Benmansour, M., Toloza, A., Geisler, A. and Gerstmann, U.C. (2009a).Assessment of erosion and deposition rates within an Austrian agricultural watershed bycombining 137Cs, 210Pbex and conventional measurements. Geoderma 150(3–4):231–239.
Mabit, L., Klik, A., Toloza, A., Geisler, A. and Gerstmann, U.C. (2008d). Evaluation of the initialfallout of 137Cs and characterisation of a reference site in the Mistelbach watershed (Austria).In: Laboratory Activities-Research, IAEA-Soils Newsletter 30(2):20.
Mabit, L., Laverdière, M.R. and Bernard, C. (2002b). L’érosion hydrique: méthodes et études decas dans le nord de la France. Cahiers Agricultures 11(3):195–206.
Mabit, L., Zupanc, V., Martin, P. and Toloza, A. (2009b). Preliminary investigation using nucleartechniques to assess soil erosion in Slovenia. In: Laboratory Activities-Research, IAEA-SoilsNewsletter 31(2):23–25.
Navas, A. and Walling, D.E. (1992). Using caesium-137 to assess sediment movement on slopesin a semiarid upland environment in Spain. IAHS publication 209:129–138.
Pollhammer, J. (1997). Die Auswirkung ausgewaehlter ackerbaulicher, pflanzenbaulicher undlandtechnischer Maßnahmen auf den Bodenabtrag durch Wasser. Master Thesis. Universityof Natural Resources and Applied Life Sciences, Vienna.
Porto, P., Walling, D.E., Ferro, V. and Di Stefano, C. (2003). Validating erosion rate estimates pro-vided by caesium-137 measurements for two small forested catchments in Calabria, SouthernItaly. Land Degradation and Development 14:389–408.
Ritchie, J.C. and Ritchie, C.A. (2008). Bibliography of publications of Cs137 studies related toerosion and sediment deposition. http://www.ars.usda.gov/Main/docs.htm?docid=15237 .
Schimmack, W., Auerswald, K. and Bunzl, K. (2002). Estimation of soil erosion and deposi-tion rates at an agricultural site in Bavaria, Germany, as derived from fallout radiocesium andplutonium as tracers. Naturwissenschaften 89(1):43–46.
Shakhashiro, A. and Mabit, L. (2009). Results of an IAEA inter-comparison exercise toassess 137Cs and total 210Pb analytical performance in soil. Applied Radiation and Isotopes67(1):139–146.
Strauss, P., Auerswald, K., Blum, W.E.H. and Klaghofer, E. (1995). Erosivitaet von Nieders-chlaegen. Ein Vergleich Oesterreich–Bayern. Zeitschrift fuer Kulturtechnik und Landen-twicklung 36:304–309.
Strauss, P. and Klaghofer, E. (2004). Scale considerations fort he estimation of processes andeffects of soil erosion in Austria. In: Francaviglia R. (ed.), Agricultural Impacts on Soil Erosionand Biodiversity: Developing Indicators for Policy Analysis. March 2003. Proceedings OECDExpert Meeting. Proceedings from an OECD Expert Meeting, Rome, pp. 229–238.
Strauss, P. and Klaghofer, E. (2006). Status of Soil Erosion in Austria. Chap. 1.17. In: BoardmanJ., Poesen J. (eds.), Soil Erosion in Europe. Wiley, Chichester, pp. 205–212.

412 L. Mabit et al.
Walling, D.E. and He, Q. (1999). Improved models for estimating soil erosion rates from cesium-137 measurements. Journal of Environmental Quality 28:611–622.
Walling, D.E., He, Q. and Appleby, P.G. (2002). Conversion models for use in soil-erosion,soil-redistribution and sedimentation investigations. In: Zapata F. (ed.), Handbook for theAssessment of Soil Erosion and Sedimentation Using Environmental Radionuclides. Chap.7.Kluwer Dordrecht, The Netherlands, pp. 111–164.
Walling, D.E. and Quine, T.A. (1991). Recent rates of soil loss from areas of arable cultivation inthe UK. IAHS publication 203:123–131.


