Embed Size (px)
Citation preview
Chemical Geology, 63 (1987) 181-196 181 Elsevier Science Publishers B.V., Amsterdam - - Printed in The Netherlands
NATURAL (21°pb, 7Be) AND FALLOUT (137Cs, 239'24°pu, 9°Sr) RADIONUCLIDES AS GEOCHEMICAL TRACERS OF SEDIMENTATION IN GREIFENSEE, SWITZERLAND
G.J. W A N .1, P .H. S A N T S C H 1 . 2 , M. S T U R M , K. F A R R E N K O T H E N , A. L U E C K , E. W E R T H and Ch. S C H U L E R
Swiss Federal Institute of Water Research and Water Pollution Control, EA WAG, CH-8600 Dftbendorf (Switzerland)
(Received February 20, 1986; revised and accepted November 12, 1986)
Abstract
Wan, G.J., Santschi, P.H., Sturm, M., Farrenkothen, K., Lueck, A., Werth, E. and Schuler, Ch., 1987. Natural (21°Pb, 7Be) and fallout ( 1:~7Cs, 2'~9'24°pu, 9°Sr) radionuclides as geochemical tracers of sedimentation in Greifensee, Swit- zerland. Chem. Geol., 63: 181-196.
The average sedimentation rate of Greifensee has been evaluated by using varve counting and 21°pb and fallout radionuclide dating from 4 different sites in the lake, to amount to 0.14_+ 0.02 g cm 2 yr. 1. The geochronology of Greifensee agrees with previous dating attempts based on varve counting of sediments from the deepest part of the lake {Emerson and Widmer, 1978). A simple erosion model for substances derived predominantly from the drainage basin can explain the inventories of the natural and fallout radionuclides in the lake sediments.
1. In troduct ion
Prev ious geochemical s tudies of sed imen t s f rom Gre i fensee came to widely d i f fe ren t esti- ma tes of the r ecen t s e d i m e n t a t i o n rate: values ranging f rom 0.3 to 0.8 cm yr. ' have been repor ted for the same site ( G~iggeler et al., 1976; E m e r s o n and Widmer , 1978; Tschopp , 1979; Weber , 1979). Whi le some of the de t e rmina - t ions might be correc t , o the r s might have fai led to cons ider s ed imen t i nhomogene i t i e s or migh t s imply be wrong. We set out to r e d e t e r m i n e the average s e d im e n ta t i on ra te of the lake and to
*1present address: Institute of Geochemistry, Academica Sinica, Guiyang, Suizhou Province, The People's Republic of China. *~Author to whom correspondence should be addressed.
compare the 2'°Pb techn ique (Koide et al., 1973) wi th m a r k e r t echn iques based on the 1963 hori- zon of the fal lout rad ionucl ides '37Cs, 239'24°pu,
and 9°Sr (with half- l ifes of 30, 2.4" 104/6.6 • 103 and 28 yr., respect ively) and varve ch rono logy in one sed imen t core. T h r e e o the r cores were da ted us ing the fa l lout t r ace r 13VCs and varve chronology. T h e p resence of adequa te levels of VBe (half-l ife 53.3 days) in the core tops insured for possible s ed imen t loss dur ing cor ing opera t ions .
T h e 21°pb da t ing t echn ique is one of the mos t c o m m o n l y used da t ing t echn iques of r ecen t lacus t r ine s e d i m e n t a r y deposits . M a n y h u m a n impac t and po l lu t ion s tudies rely on it to cal- cula te r ecen t increases of an th ropogen ic fluxes. T h e c o m m o n as sumpt ions of the 2 '°Pb tech- n ique are: (1) s teady'-s tate condi t ions exis t in
0009-2541/87/$03.50 © 1987 Elsevier Science Publishers B.V.
182
the sedimentary deposit with respect to the 21°pb flux and radioactive decay (half-life of 22.4 yr.); (2) sediments can be considered as a closed system with respect to the sediment and 21°pb fluxes; (3) the 2~°Pb has a short removal resi- dence time in comparison with the residence time of the lake water, which means, that most of the 2~°pb reaching the lake will be trans- ferred efficiently to the sediments; (4) no post- depositional mobility of 21°pb occurs in the sediments; and (5) the excess 21°pb (21°Pbxs) can be calculated from the total 21°pb and the 226Ra activity in the sediments, i.e. as the dif- ference between the activities of the two nuclides. Corrections for possible loss of 222Rn, the volatile daughter nuclide of 226Ra, can be applied according to Imboden and Stiller (1982). Often, it is assumed that the 226Ra activity is constant throughout the core, and therefore, that its activity can be determined from the constant 21°pb activity at depth, where ~l°Pb and 226Ra can be assumed to be in radio- active equilibrium.
The two most commonly used models to cal- culate sedimentation rates and ages are: (1) the constant rate of supply (CRS) model [also called the constant flux (CF) model ] ; and ( 2 ) the constant initial concentration (CIC) model [also called the constant activity (CA) model (Robbins and Edgington, 1975; Appleby and Oldfield, 1978; Robbins, 1978)]. The first one applies in cases of efficient transfers of el°pb from the atmosphere to the sediments with a constant or variable sedimentation rate, and the second model should be used in cases of a con- stant activity at the sediment-water interface, often produced by the other major source of 2~°pb, the eroded soil particles from the drain- age basin.
In most instances, it has been found that the 2~°Pb dating technique gives reliable sediment accumulation rates (e.g., Robbins and Edging- ton, 1975; reviews in Appleby and Oldfield, 1978; Robbins, 1978), which agree with those deter- mined by other methods. There are, however, also documented cases of disagreement between
different dating methods (e.g., Dominik et al., 1981; Bloesch and Evans, 1982; Davis et al., 1984; McCall et al., 1984 ). In most instances of disagreement between the 21°Pb and the bomb fallout tracer method, the authors of such stud- ies proposed that:
(1) surface sediment was lost during coring operations,
(2) recent erosion rates in the drainage basin have drastically increased in the past two de- cades, causing an apparent underestimate of the sedimentation rate by the 21°Pb technique, or
( 3 ) the bomb fallout tracers show a broad or displaced maximum due to diagenetic mobility, causing an overestimate of the recent sedimen- tation rate.
Loss of surface sediments has to be negligi- ble, if VBe inventories in surface sediments are comparable to those expected from atmo- spheric and particle deposition. Recent increases in erosion rates should be a function of deforestation rates and changes in agricul- tural practices. Postdepositional mobility of radionuclides can be caused either by the migration of the particles carrying the nuclide (e.g., by bioturbating benthic macrofauna) or by desorption and/or dissolution processes and subsequent diffusion in the pore waters.
The analysis of natural and fallout radio- nuclides in a number of sediment cores from this lake allowed: (1) comparison of the inven- tories and sedimentation rates derived from the different radionuclides; and (2) investigation of the sediment and radionuclide source and accu- mulation pattern through space and time.
2. M ethods
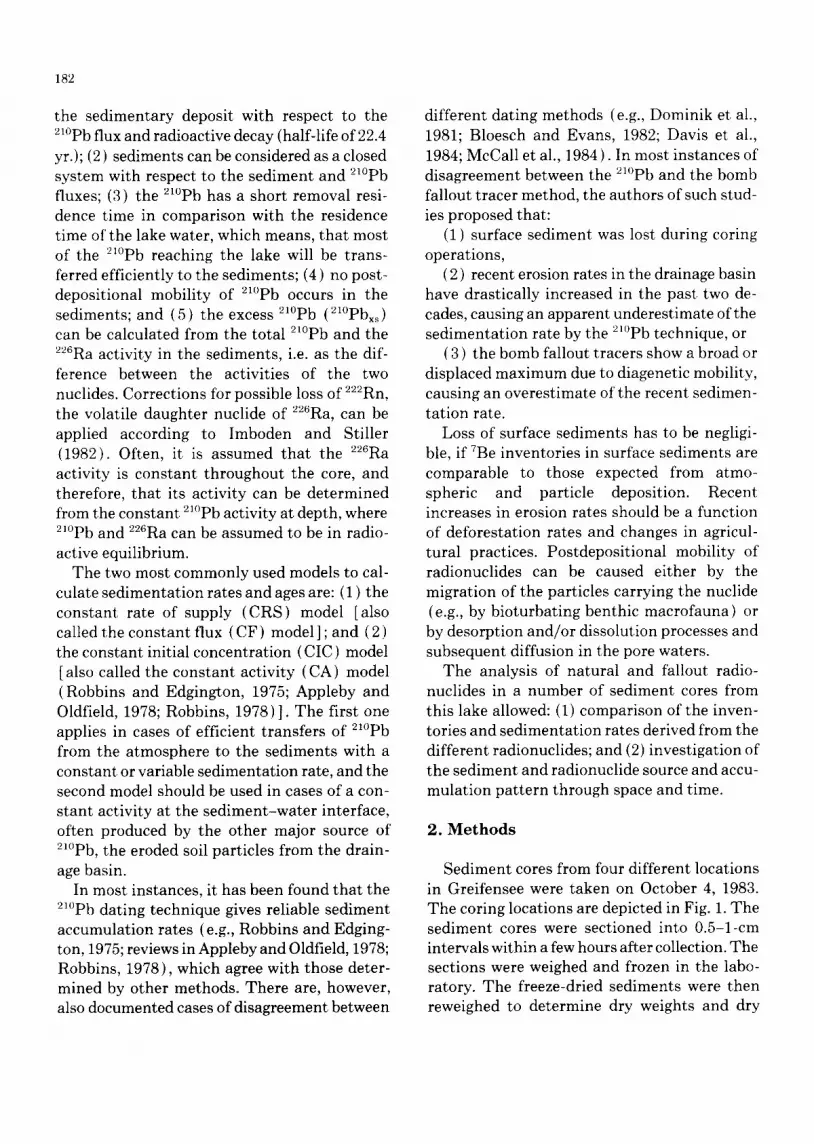
Sediment cores from four different locations in Greifensee were taken on October 4, 1983. The coring locations are depicted in Fig. 1. The sediment cores were sectioned into 0.5-1-cm intervals within a few hours after collection. The sections were weighed and frozen in the labo- ratory. The freeze-dried sediments were then reweighed to determine dry weights and dry

~ h a Ltorf
NNW SEE Orn lOre 20m 30m 40rn
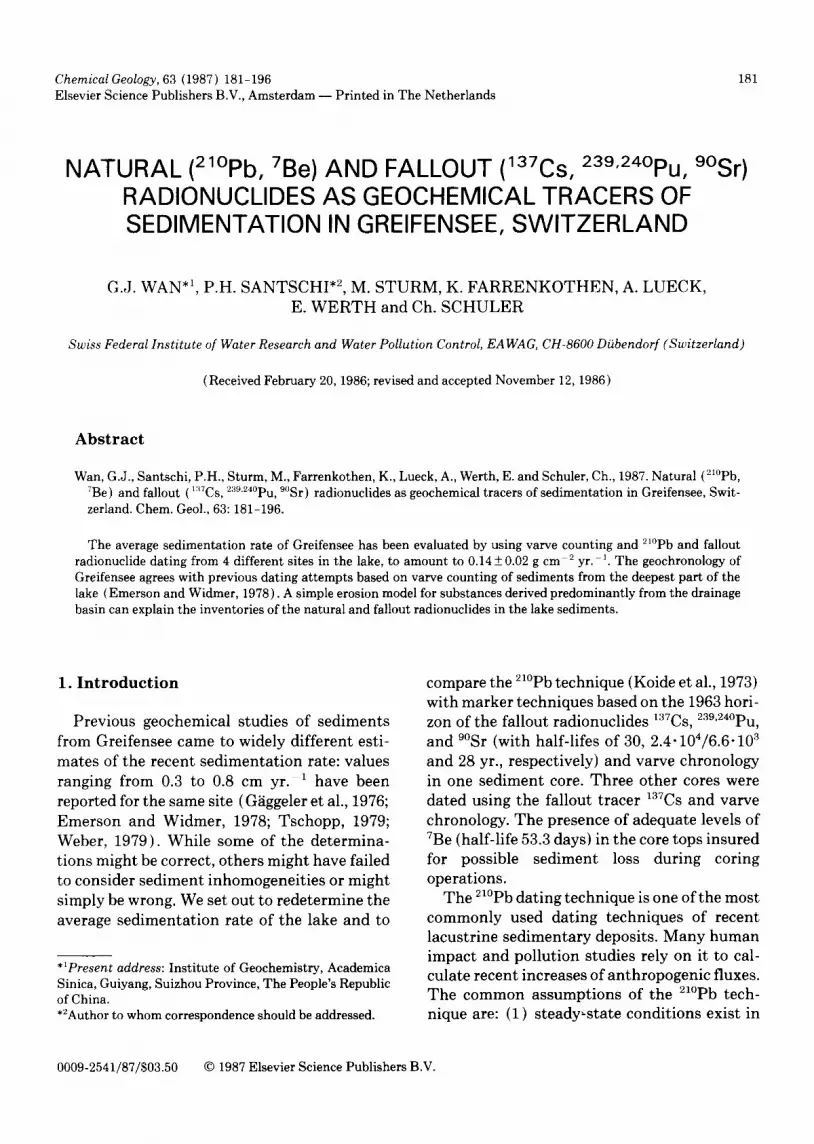
Fig. 1. The hydrography of Greifensee (M~irki, 1944). Greifensee has a volume of 1.6" 105 m ~, surface area of 8.5" 10 ~ m ~, a mean depth of 19 m, maximum depth of 32 m, a res- idence time of the water of 1.5 yr., a drainage basin of 163 km 2, with a population density of 430 inhabitants km ~.
density. The whole sections were gamma counted using a H-P ® Ge well detector for the surface samples and a Ge(Li) detector for all other samples, both coupled to a multichannel analyzer. ~37Cs and VBe standards, supplied by New England Nuclear, Dreieich, F.R.G., and Laboratoire de M~tdorologie des Rayonne- ments Ionisants, Gif-sur-Yvette, France, respectively, were used to calibrate both detec- tors for the appropriate geometries. Aliquots of the sediments were taken for the analysis of 21°pb and 239'24°pu (Santschi et al., 1980) and ofg°Sr (Goldin et al., 1958).
For the Pu and Sr analysis, 20-25 g of dry sediment were used. The samples were leached with hot 8 N H N Q and 30% H2Oz, after spik- ing with 24epu yield tracer ( supplied by the U.S. Department of Energy, EML Laboratories, New York; intercalibration results are reported in Volchok and Feiner, 1979) and Sr carrier. The supernatant Pu was converted to Pu (IV) by the addition of NaNO2. Sr and Pu were separated by anion exchange (Bio-Rad ® AG1-X4, 100-200 mesh, chloride form ) in 8 N H N Q . Pu was eluted with concentrated HC1 and NH4I, evaporated, and electrodeposited. Pu was then measured by alpha spectroscopy using Ortec ® surface barrier detectors, coupled to a multi- channel analyzer.
The 9°Sr was coprecipitated with SrCQ, pu- rifled and separated from grown-in 9oy. Both fractions were beta-counted on a gas-flow pro-
183
portional counter. 9°Sr standards from Amer- sham Corp. were used to calibrate the analytical methods, which had been further verified in international intercalibration tests.
For el°pb analysis, 2-3 g of dry sediment were taken. The sediment was leached with hot 8 N HNO3 and 30% H202, after spiking with 2°Spo tracer. The 2°Spo yield tracer was supplied by Amersham Corp. and intercalibrated with 21°Pb standards from EML Laboratories of New York (U.S. Department of Energy), and with 2°SPo from other laboratories. 21°p0 in the leach solu- tion was then coprecipitated with Fe(OH).~ using NH4OH, redissolved in HC1 and auto- plated onto Ag discs in 1.5 N HC1, in the pres- ence of small amounts of ascorbic acid to mask Fe (III) in solution.
Absolute activities for alpha-emitting iso- topes were obtained by comparing the respec- tive peaks to those of the yield tracers, after correcting for appropriate backgrounds and radioactive decay.
226Ra activities were calculated from the layer of constant 21°pb activities below 20-cm depth in core GR 83-11, and were measured directly in some other cores by the 222Rn method (Mathieu, 1977). Several 100 ml of pore water from Greifensee was gained by squeezing or centrifuging sections of sediment cores under a N2 atmosphere. Analysis of 2~°pb and 21°po was carried out as described above.
3. Results and discussion
The results of the varve chronology and of the radionuclide analysis are presented in Tables I-IV. The presence of VBe in all cores insured against possible core-top loss. Com- plete core recovery was also assured by the presence of bacterial mats (Beggiatoa sp.) at the top of the cores. The bacterial species Beg- giatoa sp. is known to form a delicate layer, highly susceptible to physical mixing, at the sediment-water interface of the anoxic hypo- limnion of eutrophic lakes. Another proof for
184
preservation of the uppermost sediment layer is evidenced by the varve chronology (see fol- lowing section). The results will be discussed in terms of varve chronology, radionuclide chronology, implications for the retention capacity of the lake for atmospheric inputs, the influence of erosional inputs of radionuclides, the diagenetic mobility of radionuclides in the sediments, and the evaluation of an average sediment accumulation rate of the lake.
3.1. Varve chronology
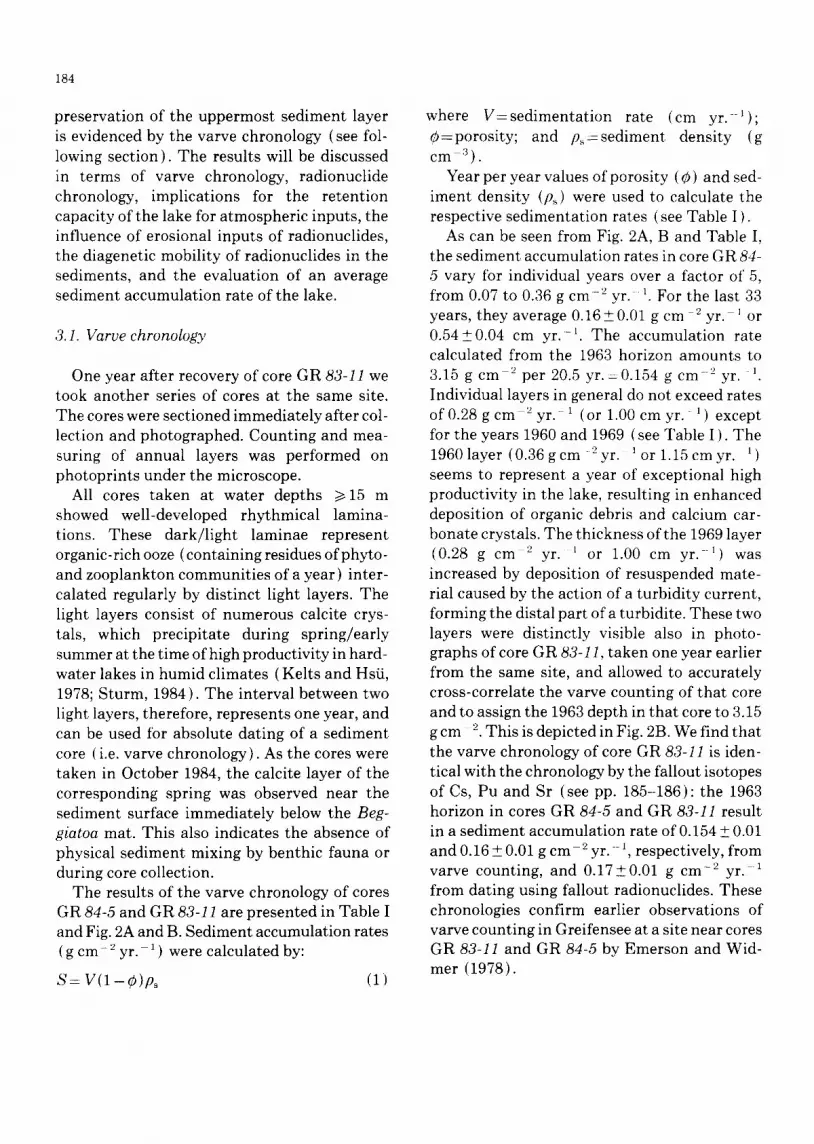
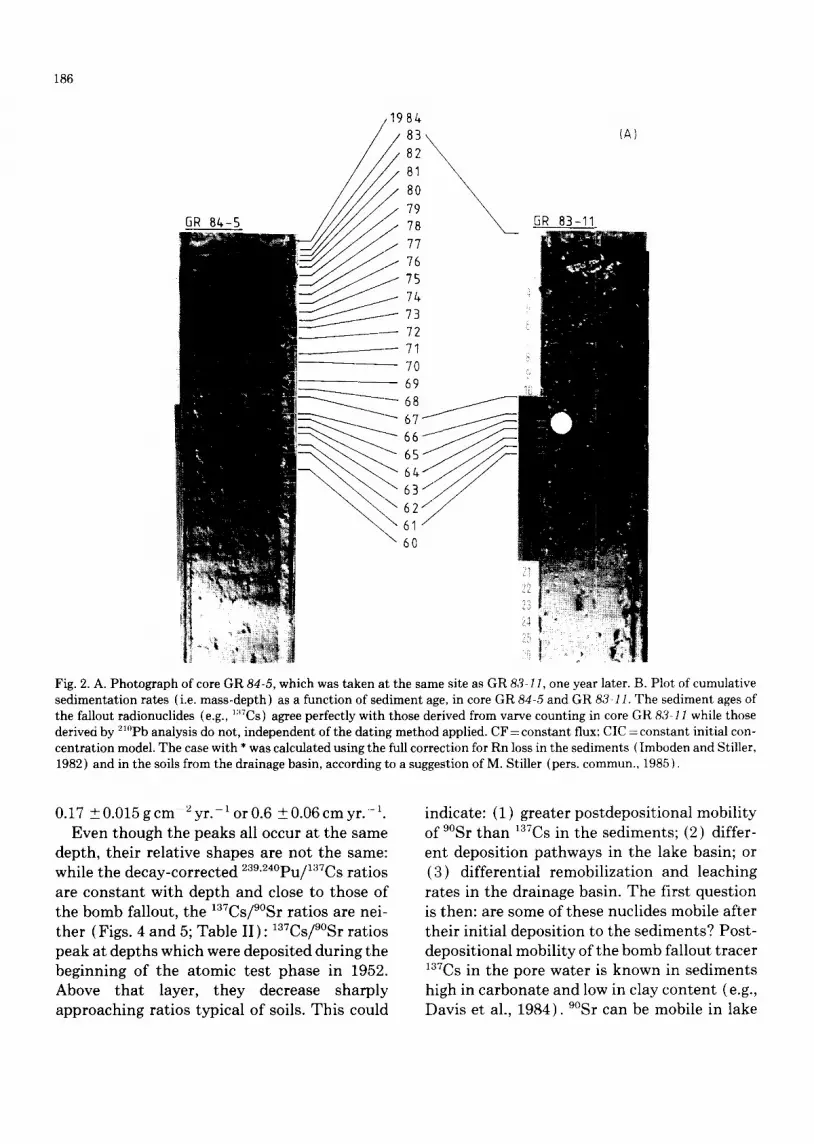
One year after recovery of core GR 83-11 we took another series of cores at the same site. The cores were sectioned immediately after col- lection and photographed. Counting and mea- suring of annual layers was performed on photoprints under the microscope.
All cores taken at water depths >/15 m showed well-developed rhythmical lamina- tions. These dark/l ight laminae represent organic-rich ooze (containing residues ofphyto- and zooplankton communities of a year) inter- calated regularly by distinct light layers. The light layers consist of numerous calcite crys- tals, which precipitate during spring/early summer at the time of high productivity in hard- water lakes in humid climates (Kelts and Hsii, 1978; Sturm, 1984). The interval between two light layers, therefore, represents one year, and can be used for absolute dating of a sediment core (i.e. varve chronology). As the cores were taken in October 1984, the calcite layer of the corresponding spring was observed near the sediment surface immediately below the Beg- giatoa mat. This also indicates the absence of physical sediment mixing by benthic fauna or during core collection.
The results of the varve chronology of cores GR 84-5 and GR 83-11 are presented in Table I and Fig. 2A and B. Sediment accumulation rates (g cm- 2 yr. ~ ) were calculated by:
S = V(1-O)ps (1)
where V= sedimentation rate (cm yr. ~); 0=poros i ty ; and p~=sediment density (g cm 3).
Year per year values of porosity (0) and sed- iment density (p~) were used to calculate the respective sedimentation rates (see Table I ).
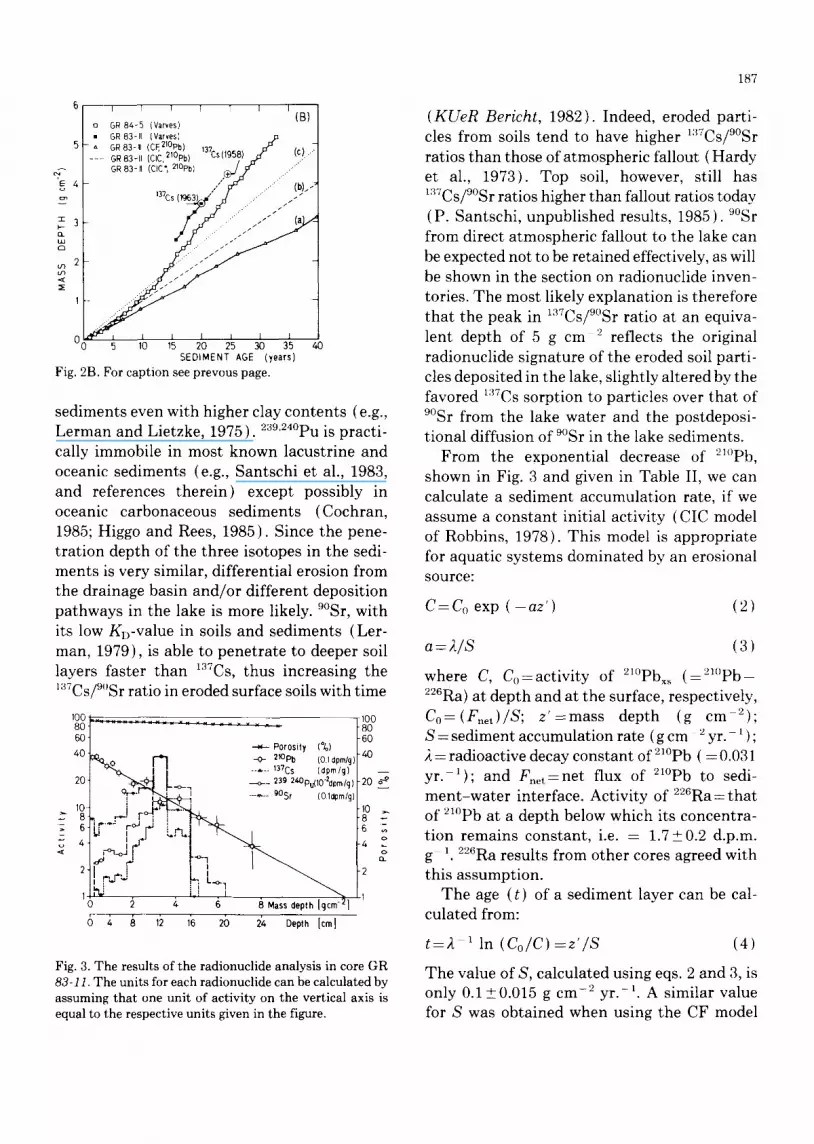
As can be seen from Fig. 2A, B and Table I, the sediment accumulation rates in core GR 84- 5 vary for individual years over a factor of 5, from 0.07 to 0.36 g c m - 2 yr. 1. For the last 33 years, they average 0.16_+0.01 g cm e yr. ~ or 0.54_+0.04 cm yr. -1. The accumulation rate calculated from the 1963 horizon amounts to 3.15 g cm 2 per 20.5 yr.=0.154 g cm 2 yr. 1 Individual layers in general do not exceed rates of 0.28 g cm 2 yr.- 1 ( or 1.00 cm yr. ~ ) except for the years 1960 and 1969 (see Table I ). The 19601ayer(0 .36gcm 2yr. ~ o r l . 1 5 c m y r . 1) seems to represent a year of exceptional high productivity in the lake, resulting in enhanced deposition of organic debris and calcium car- bonate crystals. The thickness of the 1969 layer (0.28 g cm '~ yr. 1 or 1.00 cm yr. 1) was increased by deposition of resuspended mate- rial caused by the action of a turbidity current, forming the distal part of a turbidite. These two layers were distinctly visible also in photo- graphs of core GR 83-11, taken one year earlier from the same site, and allowed to accurately cross-correlate the varve counting of tha t core and to assign the 1963 depth in tha t core to 3.15 g cm 2. This is depicted in Fig. 2B. We find that the varve chronology of core GR 83-11 is iden- tical with the chronology by the fallout isotopes of Cs, Pu and Sr (see pp. 185-186): the 1963 horizon in cores GR 84-5 and GR 83-11 result in a sediment accumulation rate of 0.154 _+ 0.01 and 0.16 + 0.01 g cm 2 yr.-- ~, respectively, from varve counting, and 0.17_+0.01 g cm --2 yr. from dating using fallout radionuclides. These chronologies confirm earlier observations of varve counting in Greifensee at a site near cores GR 83-11 and GR 84-5 by Emerson and Wid- mer (1978).
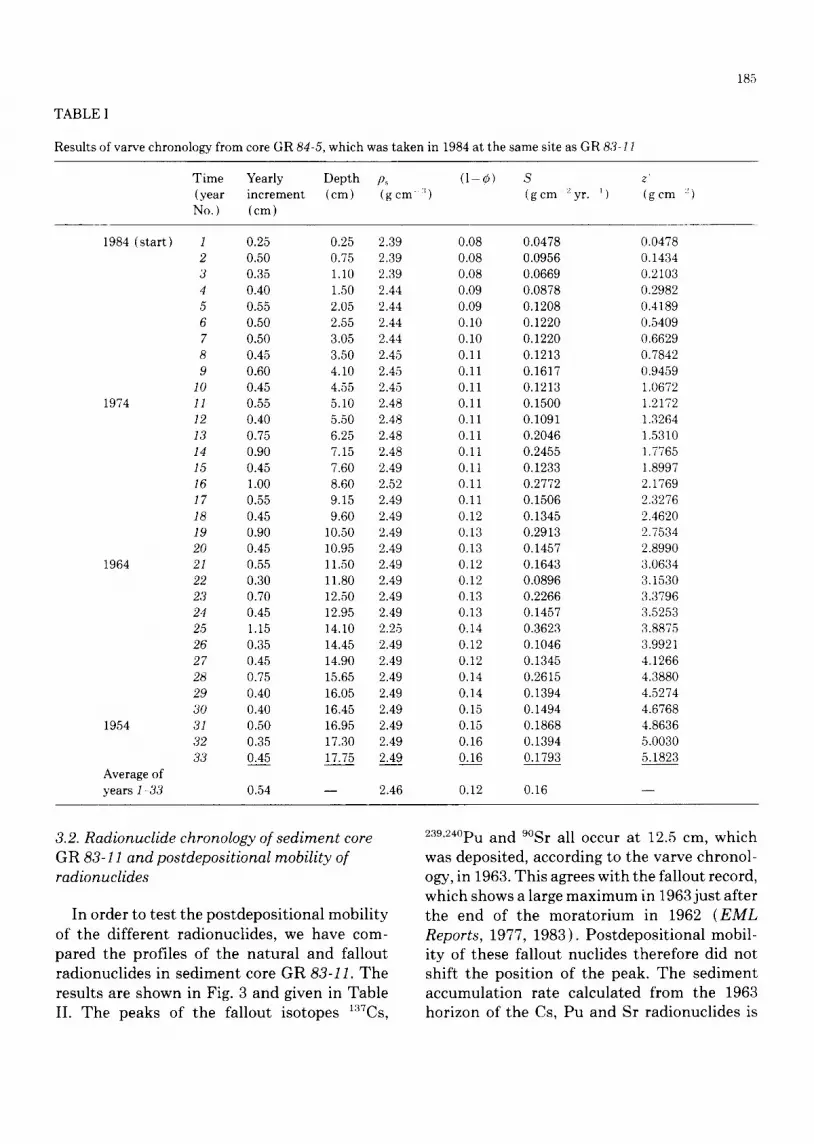
TABLE I
Results of varve chronology from core GR 84-5, which was taken in 1984 at the same site as GR 83-11
185
Time (year No.)
Yearly increment (cm)
Depth p~ (1 - ¢) S z' (cm) ( g c m :~) ( g c m ~yr. l) ( g c m ~)
1984 (start) 1 0.25 2 0.50 3 0.35 4 0.40 5 0.55 6 0.50 7 0.50 8 0.45 9 0.60
10 0.45 1974 11 0.55
12 0.40 13 0.75 14 0.90 15 0.45 16 1.00 17 0.55 18 0.45 19 0.90 20 0.45
1964 21 0.55 22 0.30 23 0.70 24 0.45 25 1.15 26 0.35 27 0.45 28 0.75 29 0.40 30 0.40
1954 31 0.50 32 0.35 33 0.45
Average of years 1-33 0.54
0.25 2.39 0.08 0.0478 0.0478 0.75 2.39 0.08 0.0956 0.1434 1.10 2.39 0.08 0.0669 0.2103 1.50 2.44 0.09 0.0878 0.2982 2.05 2.44 0.09 0.1208 0.4189 2.55 2.44 0.10 0.1220 0.5409 3.05 2.44 0.10 0.1220 0.6629 3.50 2.45 0.11 0.1213 0.7842 4.10 2.45 0.11 0.1617 0.9459 4.55 2.45 0.11 0.1213 1.0672 5.10 2.48 0.11 0.1500 1.2172 5.50 2.48 0.11 0.1091 1.3264 6.25 2.48 0.11 0.2046 1.5310 7.15 2.48 0.11 0.2455 1.7765 7.60 2.49 0.11 0.1233 1.8997 8.60 2.52 0.11 0.2772 2.1769 9.15 2.49 0.11 0.1506 2.3276 9.60 2.49 0.12 0.1345 2.4620
10.50 2.49 0.13 0.2913 2.7534 10.95 2.49 0.13 0.1457 2.8990 11.50 2.49 0.12 0.1643 3.0634 11.80 2.49 0.12 0.0896 3.1530 12.50 2.49 0.13 0.2266 3.3796 12.95 2.49 0.13 0.1457 3.5253 14.10 2.25 0.14 0.3623 3.8875 14.45 2.49 0.12 0.1046 3.9921 14.90 2.49 0.12 0.1345 4.1266 15.65 2.49 0.14 0.2615 4.3880 16.05 2.49 0.14 0.1394 4.5274 16.45 2.49 0.15 0.1494 4.6768 16.95 2.49 0.15 0.1868 4.8636 17.30 2.49 0.16 0.1394 5.0030 17.75 2.49 0.16 0.1793 5.1823
2.46 0.12 0.16
3.2. Radionuclide chronology of sediment core GR 83-11 and postdepositional mobility of radionuclides
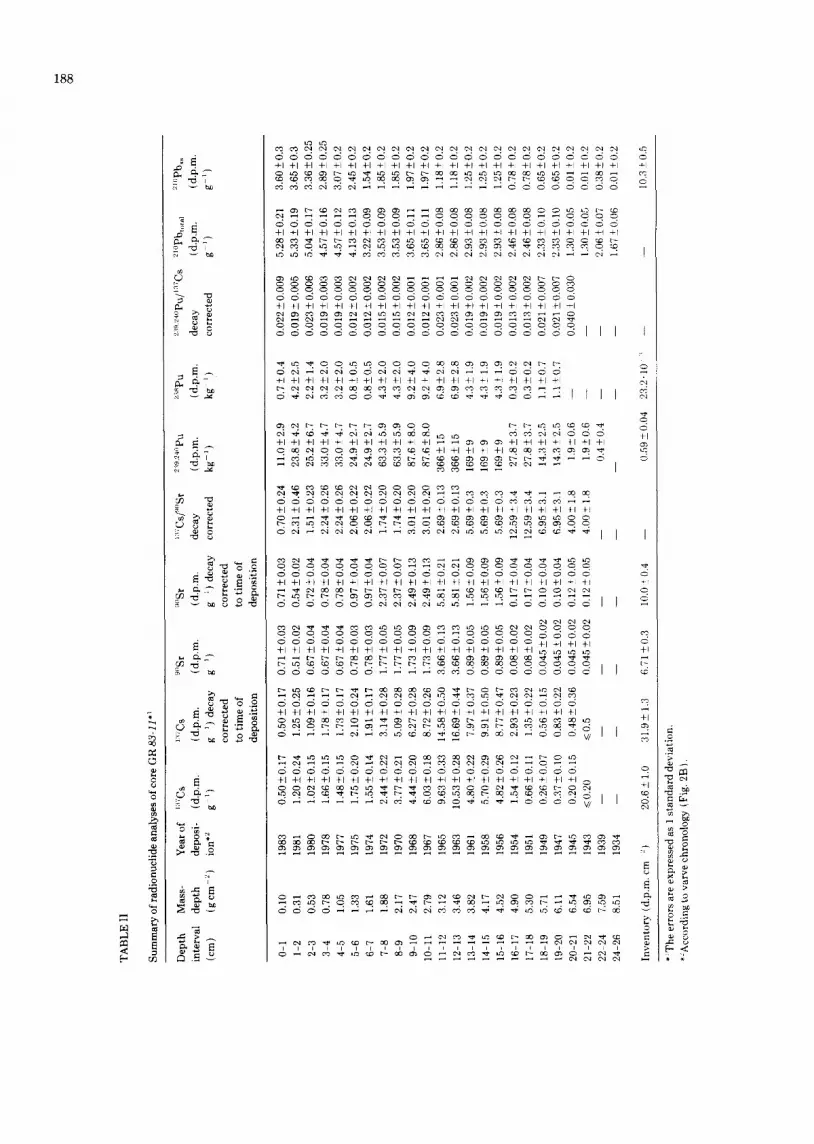
In order to test the postdepositional mobility of the different radionuclides, we have com- pared the profiles of the natural and fallout radionuclides in sediment core GR 83-11. The results are shown in Fig. 3 and given in Table II. The peaks of the fallout isotopes 137Cs,
~39'24°pu and 9°Sr all occur at 12.5 cm, which was deposited, according to the varve chronol- ogy, in 1963. This agrees with the fallout record, which shows a large maximum in 1963 just after the end of the moratorium in 1962 (EML Reports, 1977, 1983). Postdeposit ional mobil- ity of these fallout nuclides therefore did not shift the position of the peak. The sediment accumulation rate calculated from the 1963 horizon of the Cs, Pu and Sr radionuclides is
186
Ie84 83 82 81
80
79 78 5R 83-11
(A)
Fig. 2. A. Photograph of core GR 84-5, which was taken at the same site as GR 83-I1, one year later. B. Plot of cumulative sedimentation rates (i.e. mass-depth) as a function of sediment age, in core GR 84-5 and GR 83-11. The sediment ages of the fallout radionuclides (e.g., 1:~7Cs) agree perfectly with those derived from varve counting in core GR 83 11 while those derived by 21°pb analysis do not, independent of the dating method applied. CF = constant flux; CIC = constant initial con- centration model. The case with * was calculated using the full correction for Rn loss in the sediments ( Imboden and Stiller, 1982) and in the soils from the drainage basin, according to a suggestion of M. Stiller (pers. commun., 1985).
0.17 + 0 . 0 1 5 g c m 2 y r . - l o r 0 . 6 + 0 . 0 6 c m y r . -1. E v e n t h o u g h the p e a k s all occur a t the s a m e
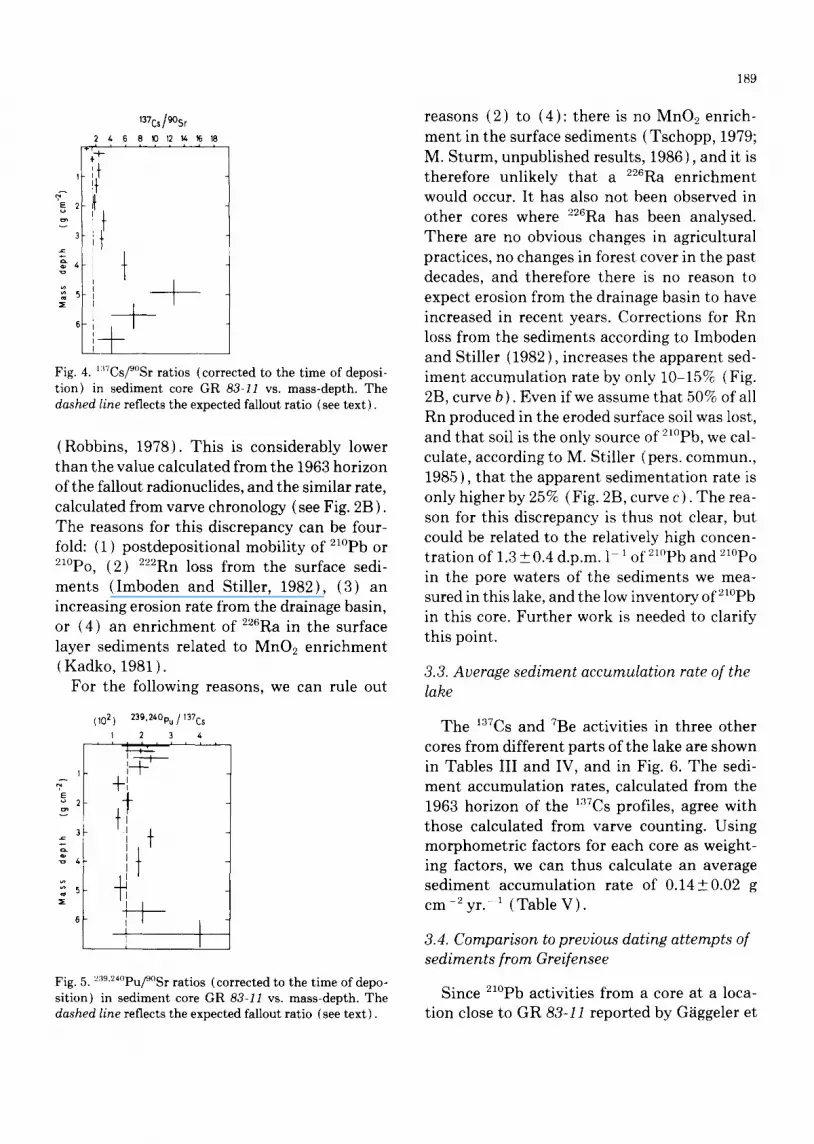
depth , t he i r re la t ive s hapes are no t the same: while the d e c a y - c o r r e c t e d 239'24°Pu/137Cs ra t ios are c o n s t a n t wi th d e p t h a n d close to those of the b o m b fal lout , the '37Csff°Sr ra t ios are nei- t he r (Figs. 4 a n d 5; Tab l e I I ) : l~TCsff°Sr ra t ios p e a k a t dep th s which were depos i t ed du r ing the beg inn ing of the a t o m i c t e s t p h a s e in 1952. Above t h a t layer, t h e y decrease s h a r p l y a p p r o a c h i n g ra t ios typ ica l o f soils. T h i s could
indicate : (1) g rea te r pos tdepos i t i ona l mobi l i ty of 9°Sr t h a n '37Cs in the sed iments ; (2) differ-
en t depos i t ion p a t h w a y s in the lake basin; or (3) d i f fe ren t ia l r emob i l i za t ion a n d leaching r a t e s in the d ra inage basin . T h e f i rs t ques t ion is then : are some of these nucl ides mobi le a f t e r the i r in i t ia l depos i t ion to the s e d i m e n t s ? Pos t - depos i t iona l mob i l i t y of the b o m b fa l lout t r a ce r '37Cs in the pore w a t e r is k n o w n in s e d i m e n t s
high in c a r b o n a t e a n d low in clay c o n t e n t (e.g., Dav i s et al., 1984) . 9°St can be mobi le in lake
6 - - I I i I 1 I I
o GR 84-5 (Var~,es) (B) • GR 83-11 (Varves) P I
5 - ~. GR83-11 (CF,210pb) 137~ . . . . . . p , d (C) ffl - - - GR 83-11 (CIC, 210pb) t.slluD,~) ~:f . , " /
GR83-n (CIC', 210pb) , ~ ' / f ........... /
~ 3 -
0 w I I 0 5 10 15 20 25 30 35 40
SEDIMENT AGE (years) Fig. 2B. For c a p t i o n see p r evous page.
sediments even with higher clay contents (e.g., Lerman and Lietzke, 1975). 239'24°pu is practi- cally immobile in most known lacustrine and oceanic sediments (e.g., Santschi et al., 1983, and references therein) except possibly in oceanic carbonaceous sediments (Cochran, 1985; Higgo and Rees, 1985). Since the pene- tration depth of the three isotopes in the sedi- ments is very similar, differential erosion from the drainage basin and/or different deposition pathways in the lake is more likely. 9°Sr, with its low KD-value in soils and sediments (Ler- man, 1979), is able to penetrate to deeper soil layers faster than ~'~TCs, thus increasing the 137Csff'Sr ratio in eroded surface soils with time
100 ~ =. . . . . . . . . . . . . .
j - - , . - Porosity (%) 40 ~ = ^ ~ -¢- 210pb (O.IdpmA
I °%. i I . . . . . lSTCs {dpm/g) 20t '_~, . . .~ L-o- . _ . ~ _ _ 2 S g 240pu(lO"dpm/g )
J - 2 g 1} 16 2b 2X Oeplh Icm]
- 100 -80 -60 -40
-20 ~'~
o
o Q.
-2
Fig. 3. T h e resu l t s o f t h e r ad ionuc l ide ana l y s i s in core G R 83-1 I. T h e u n i t s for e ach rad ionuc l ide can be ca lcu la ted by a s s u m i n g t h a t one u n i t of ac t iv i ty on t h e ver t ica l axis is equal to t he respec t ive u n i t s g iven in t he figure.
187
(KUeR Bericht, 1982). Indeed, eroded parti- cles from soils tend to have higher ]:~TCsff°Sr ratios than those of atmospheric fallout ( Hardy et al., 1973). Top soil, however, still has l:~TCsff°Sr ratios higher than fallout ratios today (P. Santschi, unpublished results, 1985). 9°St from direct atmospheric fallout to the lake can be expected not to be retained effectively, as will be shown in the section on radionuclide inven- tories. The most likely explanation is therefore that the peak in l'~TCsff°Sr ratio at an equiva- lent depth of 5 g cm 2 reflects the original radionuclide signature of the eroded soil parti- cles deposited in the lake, slightly altered by the favored ]:37Cs sorption to particles over that of 9°Sr from the lake water and the postdeposi- tional diffusion of 9°Sr in the lake sediments.
From the exponential decrease of' 21°Pb, shown in Fig. 3 and given in Table II, we can calculate a sediment accumulation rate, if we assume a constant initial activity (CIC model of Robbins, 1978). This model is appropriate for aquatic systems dominated by an erosional source:
C=Co exp (-az') (2
a=2/S (3
where C, Co=activity of 21°Pbxs ( = 2 ~ ° p b - 22GRa) at depth and at the surface, respectively, Co=(Fnet)/S; z ' = m a s s depth (g cm 2); S = sediment accumulation rate (gcm ~ yr. ~ ) ; 2 = radioactive decay constant of 21°Pb ( = 0.031 yr. 1); and Fnet=net flux of 'n°Pb to sedi- men t -wa te r interface. Activity of 226Ra=-that of 2~°Pb at a depth below which its concentra- tion remains constant, i.e. = 1.7-+0.2 d.p.m. g 1.2,~6Ra results from other cores agreed with this assumption.
The age (t) of a sediment layer can be cal- culated from:
t = 2 1 in (Co~C)=z'/S (4)
The value of S, calculated using eqs. 2 and 3, is only 0.1_+0.015 g cm -2 yr. -1. A similar value for S was obtained when using the CF model
188
,--]
[..
"'8 i
=
m.L--"
~ me
. ~ o ~ ~'~ ~'~
o i
+ 1 + 1 + 1 + 1 + 1 + 1 + 1 + 1 + 1 + 1 + 1 + 1 + 1 + 1 + 1 + 1 + 1 + 1 + 1 + [ + 1 + 1 + 1 + 1 ~1
+I +I +i +I +I +I +I +I +i +I +I +I +I +I +I +I +I +i +i +I +i +I +! +I
+ I + I + I + I + I + I + I + I + I + I + I + I + I + P + I + I + I + I + I H + I
d d d d d d d d d d ~ d d d d d d d & d d I I
+ l + l + l + l + l + l ~ l + r + l + l + l + l + l + l + i + l + l + l + l + l
+ 1 + 1 + 1 + 1 + 1 + 1 + 1 + 1 + 1 + 1 + 1 ~ ~ + 1 + 1 + 1 ÷ 1 + 1 + 1 + 1 ~ ~ ~ + 1 + 1 ÷ 1 + 1 + 1 ~ ~
+ l +~ +1 +~ + l +~ +~ +~ +~ +~ +~ +r +1 + l + l +~ + l +~ +~ + l + l +~
I
&
+1 +1 + l +1 +1 +1 +1 + l +1 +1 +1 +1 + [ +1 +1 +1 +1 +1 +1 +1 +1 +1
+ + , ~ ~ + + , ~ ° ° + ' + + , ~ +
+ l + l + l + l + l + l + l + l + l + l + l + l + l + l + l + l + l + l + ( + l + l
d d ~ d d d d d d d d d d d d d d d d ~ d + l + l + l + l + t + l + l + l + l + l + l + l + l + t + l + l + l + l + l + l + l ~
d . . . . . . N ~ d d 4 ~ £ d d d ~ ~
+!
+1
,5
b
137Cs/9'05r
2 4. 6 8 10 12 14 16 18
I '1t
Fig. 4. l:~TCs/~°Sr ratios (corrected to the time of deposi- tion) in sediment core GR 83-11 vs. mass-depth. The dashed line reflects the expected fallout ratio (see text).
(Robbins, 1978). This is considerably lower than the value calculated from the 1963 horizon of the fallout radionuclides, and the similar rate, calculated from varve chronology (see Fig. 2B ). The reasons for this discrepancy can be four- fold: (1) postdepositional mobility of 21°pb or 21°Po, (2) 22aRn loss from the surface sedi- ments ( Imboden and Stiller, 1982), (3) an increasing erosion rate from the drainage basin, or (4) an enrichment of 226Ra in the surface layer sediments related to MnO2 enrichment (Kadko, 1981 ).
For the following reasons, we can rule out
7
E ~ 2 v
3 £
(102 ) 23g,240p u / 137Cs
t 2 3 i I I , i i
i ! ,__~' +I
, +
't % [ I
Fig. 5. ~:~9'24°puff°Sr ratios (corrected to the time of depo- sition) in sediment core GR 83-11 vs. mass-depth. The dashed line reflects the expected fallout ratio (see text).
189
reasons (2) to (4): there is no MnO2 enrich- ment in the surface sediments (Tschopp, 1979; M. Sturm, unpublished results, 1986), and it is therefore unlikely that a 226Ra enrichment would occur. It has also not been observed in other cores where 226Ra has been analysed. There are no obvious changes in agricultural practices, no changes in forest cover in the past decades, and therefore there is no reason to expect erosion from the drainage basin to have increased in recent years. Corrections for Rn loss from the sediments according to Imboden and Stiller (1982), increases the apparent sed- iment accumulation rate by only 10-15% (Fig. 2B, curve b). Even if we assume that 50% of all Rn produced in the eroded surface soil was lost, and that soil is the only source of 2~°Pb, we cal- culate, according to M. Stiller (pers. commun., 1985), that the apparent sedimentat ion rate is only higher by 25% (Fig. 2B, curve c). The rea- son for this discrepancy is thus not clear, but could be related to the relatively high concen- tration of 1.3 + 0.4 d.p.m, l- 1 of 21°Pb and ~l°Po in the pore waters of the sediments we mea- sured in this lake, and the low inventory of 2~°Pb in this core. Further work is needed to clarify this point.
3.3. Average sediment accumulation rate of the lake
The 137Cs and 7Be activities in three other cores from different parts of the lake are shown in Tables III and IV, and in Fig. 6. The sedi- ment accumulation rates, calculated from the 1963 horizon of the 13VCs profiles, agree with those calculated from varve counting. Using morphometric factors for each core as weight- ing factors, we can thus calculate an average sediment accumulation rate of 0.14+0.02 g c m - 2 yr. - 1 ( Table V ).
3.4. Comparison to previous dating attempts of sediments from Greifensee
Since 21°pb activities from a core at a loca- tion close to GR 83-1I reported by G~iggeler et
190
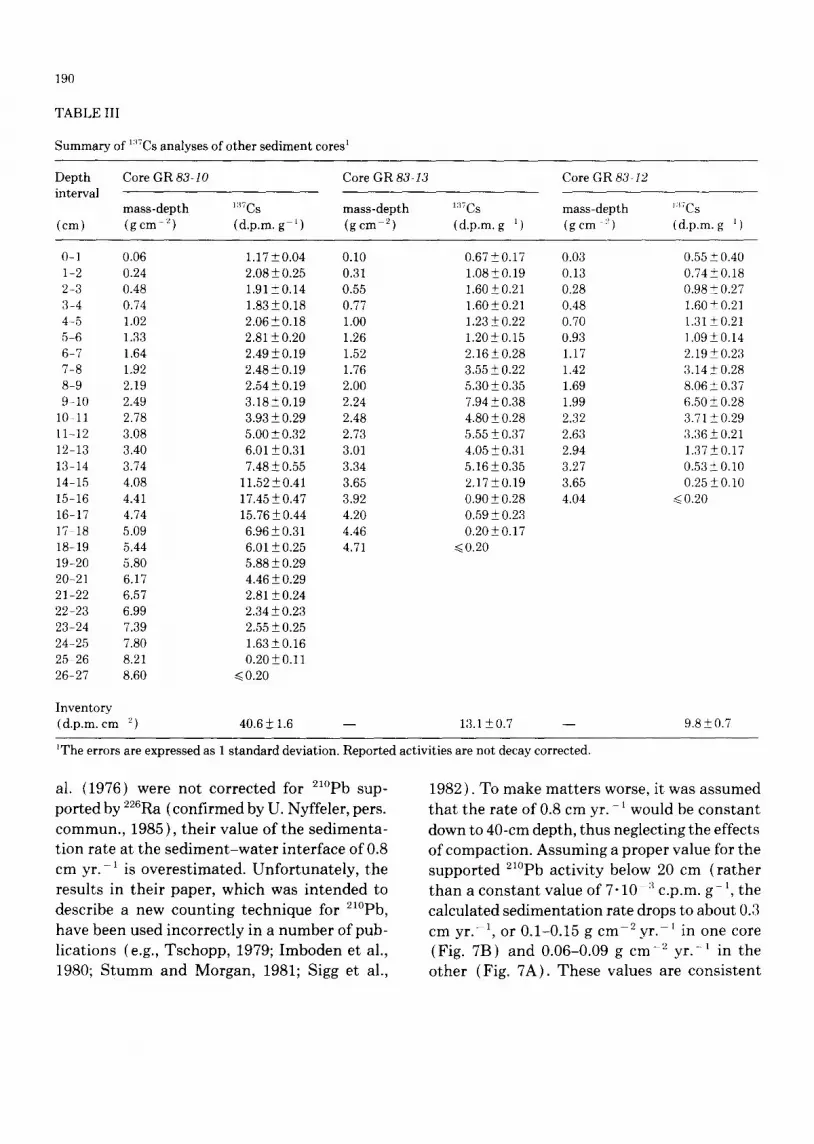
TABLE III
Summary of 137Cs analyses of o ther sediment cores 1
Depth Core GR 83-10 Core GR 83-13 interval
mass-depth l:~VCs mass-depth 137Cs (cm) ( g c m ~) (d .p .m.g 1) ( g c m 2) (d .p .m.g 1)
Core GR 83-12
mass-depth ( g c m ~)
I:I;Cs ( d.p.m, g ')
0-1 0.06 1.17_+0.04 0.10 0.67__+0.17 1-2 0.24 2.08_+0.25 0.31 1.08-+0.19 2-3 0.48 1.91_+0.14 0.55 1.60__+0.21 3-4 0.74 1.83_+0.18 0.77 1.60-+0.21 4-5 1.02 2.06 _+ 0.18 1.00 1.23 -+ 0.22 5-6 1.33 2.81-+0.20 1.26 1.20_+0.15 6-7 1.64 2.49__+0.19 1.52 2 .16±0.28 7-8 1.92 2.48 _+ O. 19 1.76 3.55 _+ 0.22 8-9 2.19 2.54_+0.19 2.00 5.30_+0.35 9-10 2.49 3.18_+0.19 2.24 7.94_+0.38
10-11 2.78 3.93_+0.29 2.48 4.80-+0.28 11-12 3.08 5.00_+0.32 2.73 5.55_+0.37 12 13 3.40 6.01-+0.31 3.01 4.05_+0.31 13-14 3.74 7.48_+0.55 3.34 5.16_+0.35 14-15 4.08 11.52_+0.41 3.65 2.17-+0.19 15-16 4.41 17.45-+0.47 3.92 0.90_+0.28 16-17 4.74 15.76_+0.44 4.20 0.59_+0.23 17 18 5.09 6.96_+0.31 4.46 0.20-+0.17 18-19 5.44 6.01_+0.25 4.71 ~<0.20 19-20 5.80 5.88 -+ 0.29 20-21 6.17 4.46_+0.29 21-22 6.57 2.81 _+ 0.24 22-23 6.99 2.34_+0.23 23-24 7.39 2.55 _+ 0.25 24-25 7.80 1.63 -+ 0.16 25 26 8.21 0.20_+0.11 26-27 8.60 ~<0.20
0.03 0.13 0.28 O.48 0.70 0.93 1.17 1.42 1.69 1.99 2.32 2.63 2.94 3.27 3.65 4.04
0.55 _+ 0.40 0.74_+0.18 0.98 _+ 0.27 1.60+0.21 1.31 + 0.21 1.09 + 0.14 2.19_+0.23 3.14_+0.28 8.06 ± 0.37 6.50 _+ 0.28 3.71 -+ 0.29 3.36±0.21 1.37-+0.17 0.53_+0.10 0.25_+0.10
~<0.20
Inventory (d.p.m. cm 2) 40.6± 1.6 - - 13.1 ±0.7 9.8-+0.7
~The errors are expressed as 1 s tandard deviation. Reported activit ies are not decay corrected.
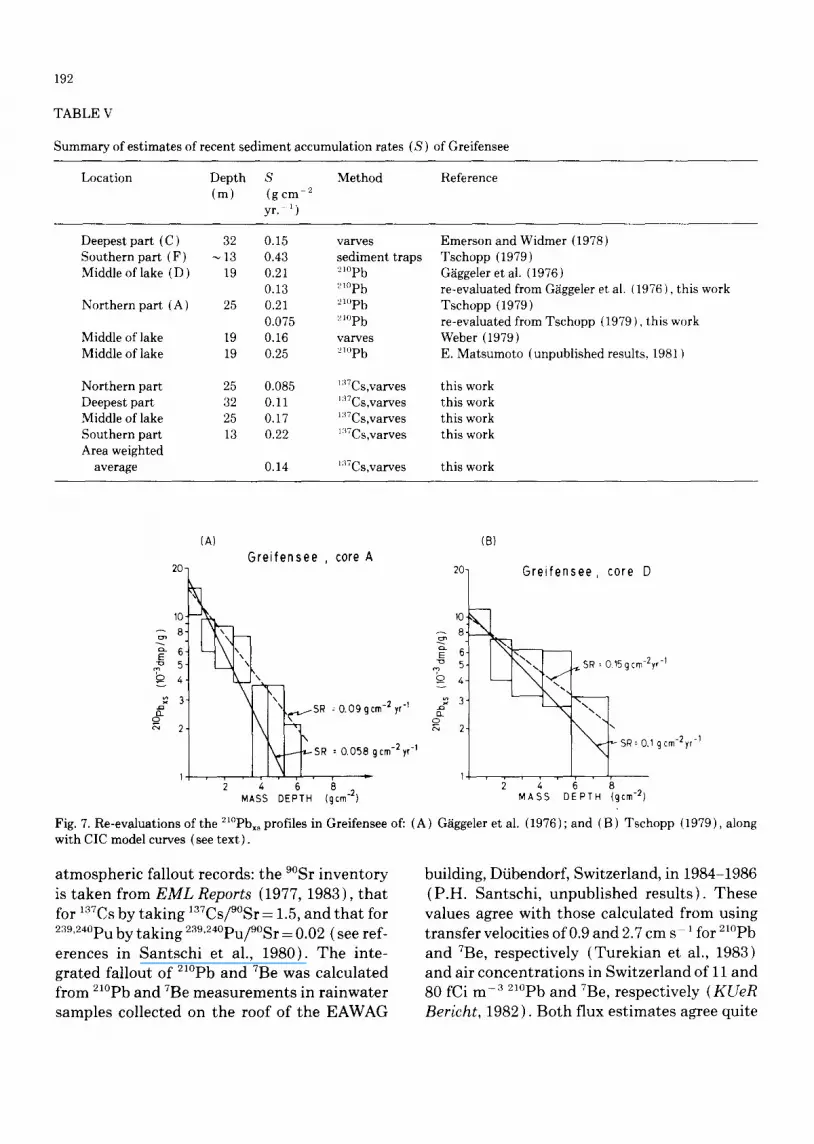
al. (1976) were not corrected for 21°pb sup- ported by e26Ra (confirmed by U. Nyffeler, pers. commun., 1985), their value of the sedimenta- tion rate at the sediment-water interface of 0.8 cm yr. 1 is overestimated. Unfortunately, the results in their paper, which was intended to describe a new counting technique for 2~°pb, have been used incorrectly in a number of pub- lications (e.g., Tschopp, 1979; Imboden et al., 1980; Stumm and Morgan, 1981; Sigg et al.,
1982). To make m a t t e r s worse, it was a s sumed t h a t the ra te of 0.8 cm y r . - 1 would be c o n s t a n t
down to 40-cm depth, thus neglect ing the effects of compac t ion . Assuming a p rope r value for the suppor t ed el°pb ac t iv i ty below 20 cm ( r a t h e r
t h a n a co n s t an t value of 7-10 :~ c.p.m, g - 1, the
calculated sed imenta t ion rate drops to about 0.3 cm yr. -1, or 0.1-0.15 g cm 2yr. ~ in one core (Fig. 7B) and 0.06-0.09 g cm -2 yr. -~ in the o the r (Fig. 7A) . Th ese values are cons i s t en t
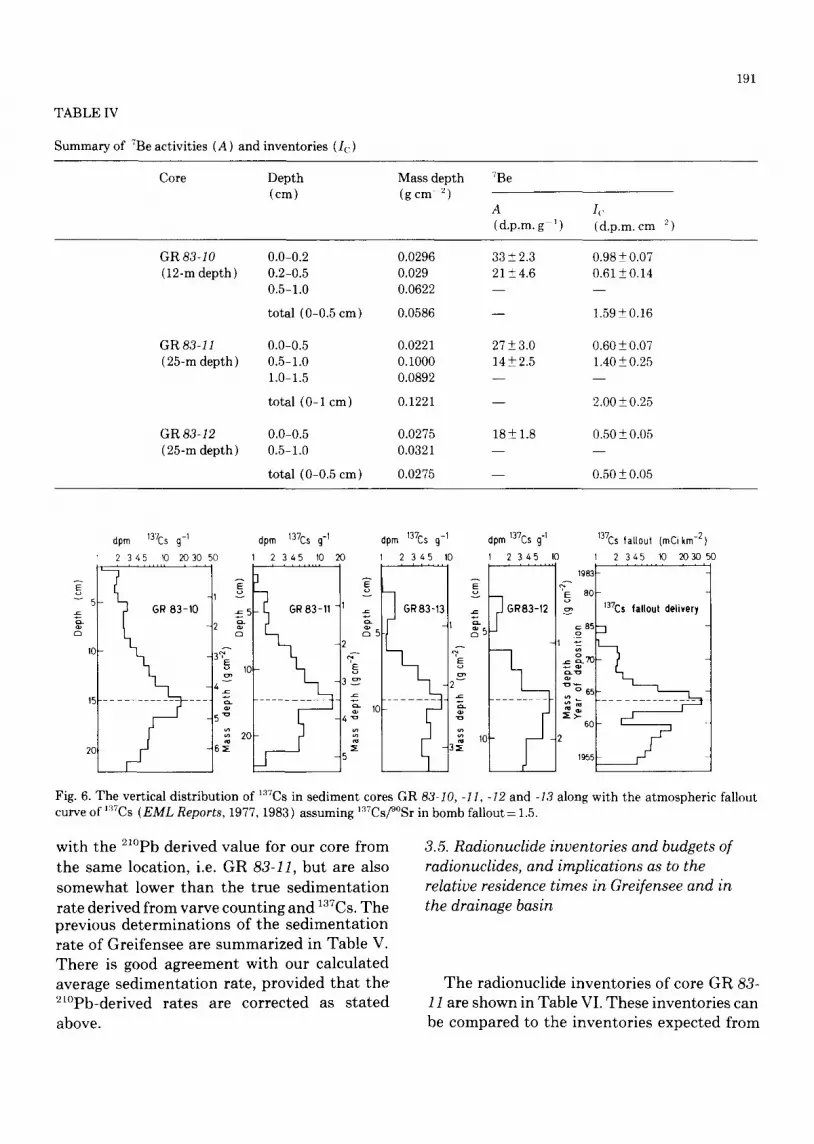
TABLE IV
Summary of 7Be activities (A) and inventories (Ic)
191
Core Depth (cm)
Mass depth (gcm -2)
7Be
A (d.p.m. g 1)
I£ ,
(d.p.m. cm 2)
GR83-10 (12-m depth)
GR 83-11 ( 25-m depth)
GR 83-12 ( 25-m depth )
0.0-0.2 0.2-0.5 0.5-1.0
total (0-0.5 cm)
0.0-0.5 0.5-1.0 1.0-1.5
total (0-1 cm)
0.0-0.5 0.5-1.0
total (0-0.5 cm)
0.0296 0.029 0.0622
0.0586
0.0221 0.1000 0.0892
0.1221
0.0275 0.0321
0.0275
33±2.3 21±4.6
27±3.0 14±2.5
18±1.8
0.98 ± 0.07 0.61 ± 0.14
1.59+0.16
0.60 + 0.07 1.40 + 0.25
2.00 + 0.25
0.50 + 0.05
0.50 + 0.05
v
~= 10
c~
15 . . . . . . . . . . . . . . .
2O
dpm 137Cs cJ -I
2 345 10 2O 30 50
~ = 5
~ 2o
dpm 13?Cs g-I 2 3 4 5 10 20
-½7 I , ~ 1(
dpm 137Cs 9 -1
2 345 10
.x:
dpm 137Cs cJ -1
2 3 4 5
GR83-12
137Cs fallout (mCi km -2)
2O305O I0 1 2 345 10
19831 - I ~ 8ot-
l '37c, fallout delivery , ~ 85p
Fig. 6. The vertical distribution of 1'~7Cs in sediment cores GR 83 10, -11, -I2 and -13 along with the atmospheric fallout curve of 1:~7Cs (EML Reports, 1977, 1983) assuming 137Csff°Sr in bomb fallout= 1.5.
with the 21°Pb derived value for our core from the same location, i.e. GR 83-11, but are also somewhat lower than the true sedimentation rate derived from varve counting and 137Cs. The previous determinations of the sedimentat ion rate of Greifensee are summarized in Table V. There is good agreement with our calculated average sedimentat ion rate, provided tha t the 21°pb-derived rates are corrected as stated above.
3.5. Radionuclide inventories and budgets of radionuclides, and implications as to the relative residence times in Greifensee and in the drainage basin
The radionuclide inventories of core GR 83- 11 are shown in Table VI. These inventories can be compared to the inventories expected from
192
TABLE V
Summary of estimates of recent sediment accumulation rates (S) of Greifensee
Location Depth S Method Reference (m) (gcm 2
yr. ~)
Deepest part (C) 32 0.15 varves Southern part (F) ~ 13 0.43 sediment traps Middle of lake (D) 19 0.21 2'°Pb
0.13 ~1°Pb Northern part (A) 25 0.21 "~°Pb
0.075 :~l°Pb Middle of lake 19 0.16 varves Middle of lake 19 0.25 '-n°Pb
Northern part 25 0.085 ~:~?Cs,varves Deepest part 32 0.11 ~TCs,varves Middle of lake 25 0.17 ~:*7Cs,varves Southern part 13 0.22 ~:*TCs,varves Area weighted
average 0.14 ~:~TCs,varves
Emerson and Widmer (1978) Tschopp (1979) G/iggeler et al. (1976) re-evaluated from G~iggeler et al. (1976), this work Tschopp (1979) re-evaluated from Tschopp (1979), this work Weber (1979) E. Matsumoto (unpublished results, 1981)
this work this work this work this work
this work
20-
10-
8-
5- 4-
3-
o 2-
(A) G r e i f e n s e e , core A
\
\ ~ SR ; o.Oggcm -2 yr -1
I ' k ~ S R :O.058gcm-2yr-'
2 4 6 8 2 MASS DEPTH (gcm-)
20 ̧
(B)
G r e i f e n s e e , core D
5 4.
g3 o
2 ¸
2 4 M A S S
..~ SR : 0 15gcm-2yr -I
~%" %
8 DEPTH (gem -2)
g cm-2yr -1
Fig. 7. Re-evaluations of the 21°Pbx~ profiles in Greifensee of: (A) G~iggeler et al. (1976); and (B) Tschopp (1979), along with CIC model curves (see text).
atmospheric fallout records: the 9°Sr inventory is taken from EML Reports (1977, 1983), that for ]3?Cs by taking 137Csff°Sr = 1.5, and that for 239'24°pu by taking 239'24°pu/9°Sr = 0.02 ( see ref-
erences in Santschi et al., 1980). The inte- grated fallout of 2]°pb and ?Be was calculated from 21°pb and VBe measurements in rainwater samples collected on the roof of the EAWAG
building, Dtibendorf, Switzerland, in 1984-1986 (P.H. Santschi, unpublished results). These values agree with those calculated from using transfer velocities of 0.9 and 2.7 cm s i for 21°pb and ?Be, respectively (Turekian et al., 1983) and air concentrations in Switzerland of 11 and 80 fCi m -3 2]°pb and 7Be, respectively (KUeR Bericht, 1982). Both flux estimates agree quite
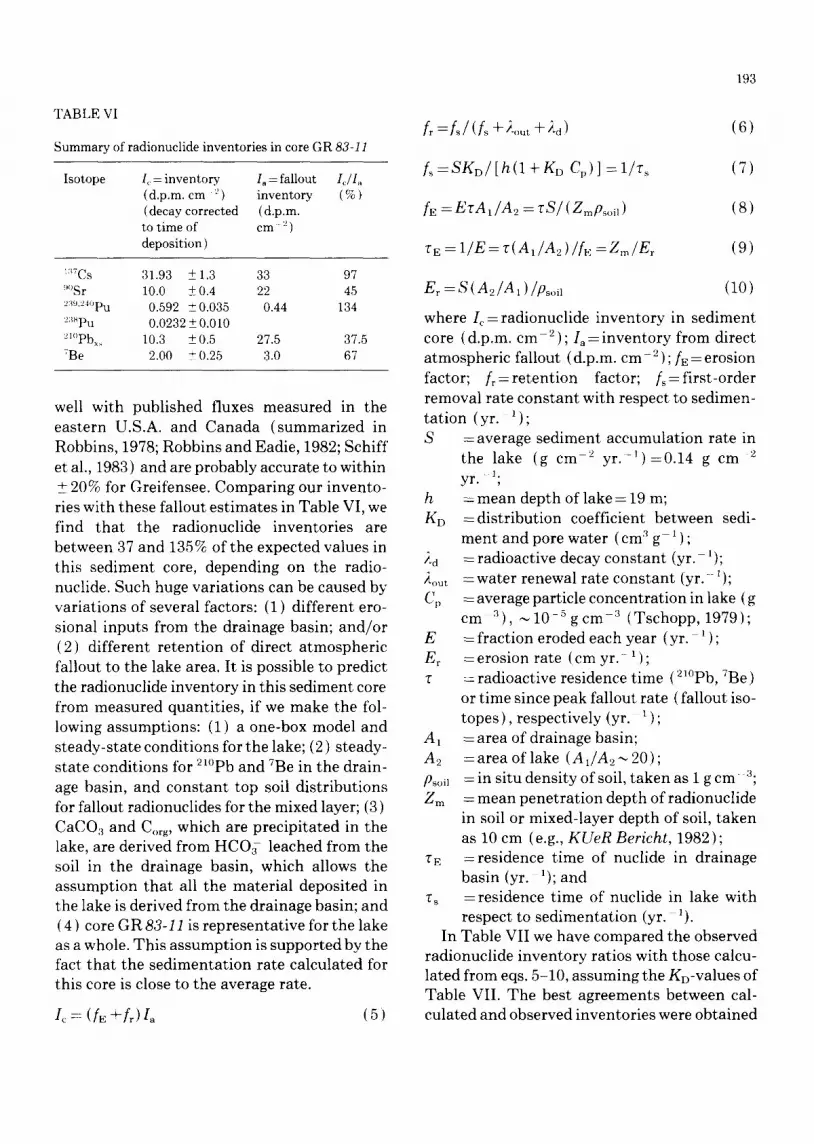
TABLE VI
Summary of radionuclide inventor ies in core GR 83-I1
Isotope Ic = inventory I, = fallout I~/I~, (d.p.m. cm ~) inventory (%) ( decay corrected ( d.p.m. to t ime of cm ~) deposi t ion)
1:~7Cs 31.93 +_ 1.3 33 97 ~°Sr 10.0 +_ 0.4 22 45 2:~'q'24°Pu 0.592 +_ 0.035 0.44 134 ~:~SPu 0.0232 + 0.010 ~l')pb,~ 10.3 _+ 0.5 27.5 37.5 TBe 2.00 _+ 0.25 3.0 67
well with published fluxes measured in the eastern U.S.A. and Canada (summarized in Robbins, 1978; Robbins and Eadie, 1982; Schiff et al., 1983 ) and are probably accurate to within + 20% for Greifensee. Comparing our invento- ries with these fallout est imates in Table VI, we find that the radionuclide inventories are between 37 and 135% of the expected values in this sediment core, depending on the radio- nuclide. Such huge variations can be caused by variations of several factors: (1) different ero- sional inputs from the drainage basin; and/or (2) different retention of direct atmospheric fallout to the lake area. It is possible to predict the radionuclide inventory in this sediment core from measured quantities, if we make the fol- lowing assumptions: (1) a one-box model and steady-state conditions for the lake; (2) steady- state conditions for 2~°Pb and VBe in the drain- age basin, and constant top soil distributions for fallout radionuclides for the mixed layer; (3) CaCOs and Corg, which are precipitated in the lake, are derived from HCO3 leached from the soil in the drainage basin, which allows the assumption that all the material deposited in the lake is derived from the drainage basin; and (4) core GR 83-11 is representative for the lake as a whole. This assumption is supported by the fact that the sedimentat ion rate calculated for this core is close to the average rate.
I¢ = (/E +fr)Ia (5)
193
L=L/ (L + £.~ + 2~) (6)
L=SKD/[h(I+KD Cp)] ~ - l / r s (7)
fE =ETAI /A2 = r S / ( Zmfl~oil) (8)
rE = 1/E = r{A1/A2) ~rE = Zm/Er (9)
Er =S(A2/A1)/Ps,,il (10)
where I¢ = radionuclide inventory in sediment core (d.p.m. cm 2) ; Ia = inventory from direct atmospheric fallout (d.p.m. cm- 2 ) ;/n = erosion factor; /r = retention factor; fs=f i rs t -order removal rate constant with respect to sedimen- tation (yr. ~); S = average sediment accumulation rate in
the lake (g cm 2 y r . - l ) = 0 . 1 4 g cm z 1. yr. ,
h = mean depth of lake = 19 m; K D =dis t r ibut ion coefficient between sedi-
ment and pore water (cm 3 g ~) ; 2d = radioactive decay constant (yr. 1); ),out = w a t e r renewal rate constant (yr. 1); Cp = average particle concentration in lake (g
cm 3), ~ 1 0 - ~ g cm -3 (Tschopp, 1979); E = fraction eroded each year (yr. 1); Er = erosion rate (cm yr. - 1 ) ; r =radioact ive residence time (21°pb, VBe)
or time since peak fallout rate ( fallout iso- topes) , respectively (yr. 1 ) ;
A1 = area of drainage basin; A2 =a rea of lake (A1/A2-~20); Psoi~ = in situ density of soil, taken as 1 g cm 3; Zm = mean penetrat ion depth ofradionuclide
in soil or mixed-layer depth of soil, taken as 10 cm (e.g., KUeR Bericht, 1982 ) ;
rE =res idence time of nuclide in drainage basin (yr. 1); and
rs --residence time of nuclide in lake with respect to sedimentation (yr. 1).
In Table VII we have compared the observed radionuclide inventory ratios with those calcu- lated from eqs. 5-10, assuming the KD-values of Table VII. The best agreements between cal- culated and observed inventories were obtained
194
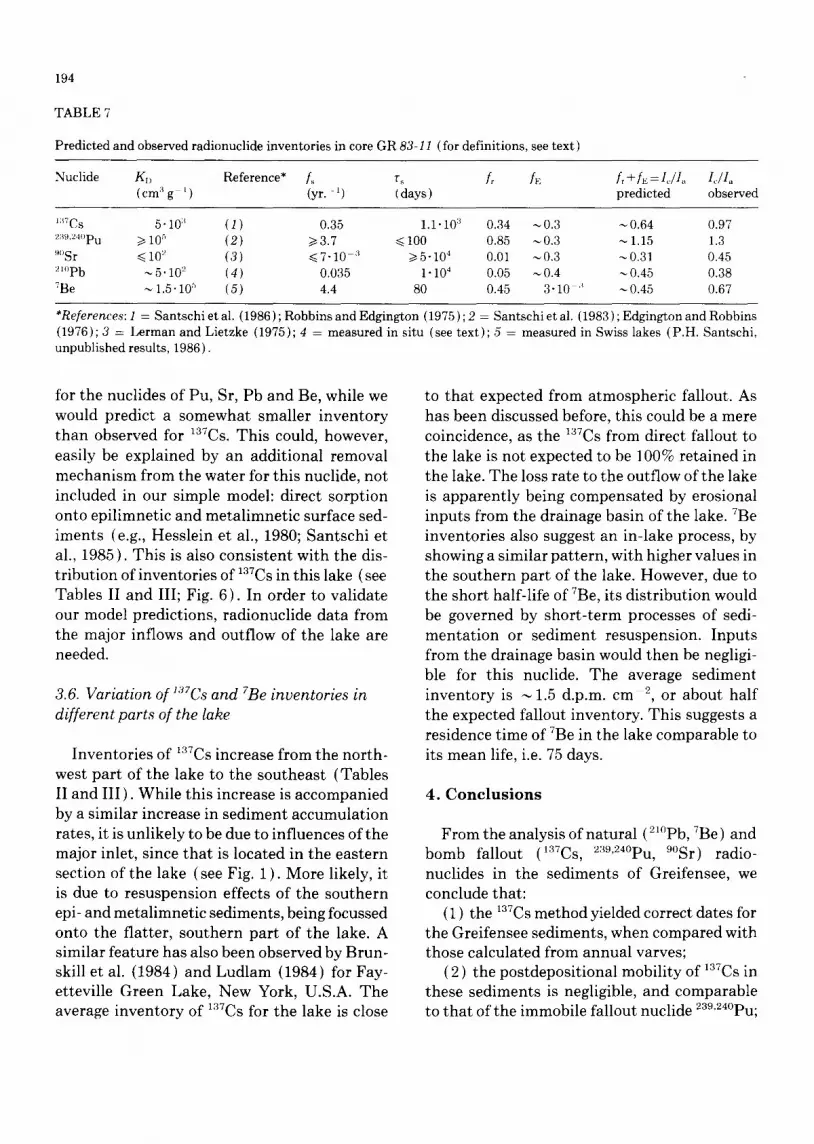
TABLE 7
Predicted and observed radionuclide inventories in core GR 83-11 (for definitions, see text)
Nuclide KD Reference* f~ r~ L fE /r+fE =I,,/I~ L/I~ (cm:~g l) (yr. 1) (days) predicted observed
l:~TCs 5-10 :~ ( 1 ) 0.35 1.1-103 0.34 ~ 0.3 ~ 0.64 0.97 239'24°pu ~ 10 '~ (2) i> 3.7 < 100 0.85 ~0.3 ~ 1.15 1.3 ~°Sr ~<10 ~ (3) ~<7"10 :~ >~5"104 0.01 ~0.3 ~0.31 0.45 21,pb ~ 5" 102 (4) 0.035 1" 104 0.05 ~ 0.4 ~ 0.45 0.38 7Be ~ 1.5"10 ~ (5) 4.4 80 0.45 3"10 ~ ~0.45 0.67
*References: 1 = Santschi et al. (1986 ) ; Robbins and Edgington (1975) ; 2 = Santschi et al. ( 1983 ) ; Edgington and Robbins (1976); 3 = Lerman and Lietzke (1975); 4 = measured in situ (see text); 5 = measured in Swiss lakes (P.H. Santschi, unpublished results, 1986).
for the nuclides of Pu, Sr, Pb and Be, while we would predict a somewhat smaller inventory than observed for 137Cs. This could, however, easily be explained by an additional removal mechanism from the water for this nuclide, not included in our simple model: direct sorption onto epilimnetic and metalimnetic surface sed- iments {e.g., Hesslein et al., 1980; Santschi et al., 1985 ). This is also consistent with the dis- tribution of inventories of 137Cs in this lake (see Tables II and III; Fig. 6). In order to validate our model predictions, radionuclide data from the major inflows and outflow of the lake are needed.
3.6. Variation of 137Cs and 7Be inventories in different parts of the lake
Inventories of 137Cs increase from the north- west part of the lake to the southeast (Tables II and III) . While this increase is accompanied by a similar increase in sediment accumulation rates, it is unlikely to be due to influences of the major inlet, since tha t is located in the eastern section of the lake (see Fig. 1 ). More likely, it is due to resuspension effects of the southern epi- and metalimnetic sediments, being focussed onto the flatter, southern part of the lake. A similar feature has also been observed by Brun- skill et al. (1984) and Ludlam (1984) for Fay- etteville Green Lake, New York, U.S.A. The average inventory of 137Cs for the lake is close
to tha t expected from atmospheric fallout. As has been discussed before, this could be a mere coincidence, as the 137Cs from direct fallout to the lake is not expected to be 100% retained in the lake. The loss rate to the outflow of the lake is apparently being compensated by erosional inputs from the drainage basin of the lake. 7Be inventories also suggest an in-lake process, by showing a similar pattern, with higher values in the southern part of the lake. However, due to the short half-life of 7Be, its distribution would be governed by short-term processes of sedi- mentat ion or sediment resuspension. Inputs from the drainage basin would then be negligi- ble for this nuclide. The average sediment inventory is ~ 1.5 d.p.m, cm 2, or about half the expected fallout inventory. This suggests a residence time of 7Be in the lake comparable to its mean life, i.e. 75 days.
4. C o n c l u s i o n s
From the analysis of natural (21°pb, 7Be ) and bomb fallout (137Cs, 239'24°pu, 9°Sr) radio-
nuclides in the sediments of Greifensee, we conclude that:
(1) the 137Cs method yielded correct dates for the Greifensee sediments, when compared with those calculated from annual varves;
(2) the postdepositional mobility of 137Cs in these sediments is negligible, and comparable to tha t of the immobile fallout nuclide 239'24°pu;
(3) the 21°Pb method yielded sedimentation rates which were ~25-40% lower, possibly related to postdepositional mobility of this nuclide;
(4) 137Csff°Sr ratios in core GR 83-11 indi- cated the original ratios of particles deposited in the lake, possibly altered for 1arCs by the higher sorption rates and for 9°Sr by the higher leaching rates in soil and diffusion rates in sediments;
(5) the average sediment accumulation rate of the lake is 0.14+0.02 gcm -2 yr. 1;
(6) the inputs of the particle-reactive Pu nuclides from all sources amount to ~ 135% of the direct atmospheric fallout to Greifensee, suggesting that up to 35% of the atmospheric input of particle-reactive atmospheric pollu- tants could be derived from the drainage basin;
( 7 ) the inventories of all radionuclides in the sediments can be correctly predicted by assum- ing a simple one-box model for the lake, and an erosional source for the sediments deposited in the lake;
(8) the pattern of ~37Cs deposition indicates some sediment resuspension and focussing in the southern part of the lake; and
(9) the average inventory of 7Be in the sed- iments of this lake would indicate,a residence time of 7Be in the water (with respect to sedi- mentat ion only) of 75 days.
Acknowledgements
The first author acknowledges the hospital- ity of EAWAG.
References
Appleby, P.G. and Oldfield, F., 1978. The calculation of 2~°Pb dates assuming a constant rate of supply of unsup- ported ~°Pb to the sediment. Catena, 5: 1-8.
Bloesch, J. and Evans, R.D., 1982. Lead-210 dating of sed- iments compared with accumulation rates estimated by natural markers and measured with sediment traps. Hydrobiologia, 92: 578-586.
Brunskill, G.J., Ludlam, S.D. and Peng, T.-H., 1984. Fay- etteville Green Lake, N.Y., U.S.A. VIII. Mass balance
195
for ~:~TCs in water, varved and non-varved sediment. Chem. Geol., 44: 101-117.
Cochran, J.K., 1985. Particle mixing rates in sediments of the eastern equatorial Pacific: Evidence from '-'l°Pb, 2:~9'24°pu and 1arCs distributions at MANOP sits. Geo- chim. Cosmochim. Acta, 49: 1195-1210.
Davis, R.B., Hess, C.T., Norton, S.A., Hanson, D.W., Hoogland, K.D. and Anderson, D.S., 1984. l:tVCs and ~°Pb dating of sediments from soft-water lakes in New- England (U.S.A.) and Scandinavia, a failure of ':~7Cs dating. Chem. Geol., 44: 151-185.
Dominik, J., Mangini, A. and Miiller, G., 1981. Determi- nation of recent deposition rates in Lake Constance with radioisotopic methods. Sedimentology, 28: 653-677.
Edgington, O.N. and Robbins, J.A., 1976. Patterns of depo- sition of natural and fallout radionuclides in the sedi- ments of Lake Michigan and their relation to limnological processes. In: J.O. Nriagu (Editor), Envi- ronmental Biogeochemistry, Vol. 2. Ann Arbor Science Publishers, Ann Arbor, Mich., pp. 705-729.
Emerson, S. and Widmer, G., 1978. Early diagenesis in anaerobic lake sediments, II. Thermodynamic and kinetic factors controlling the formation of iron phos- phate. Geochim. Cosmochim. Acta, 42: 1307-1316.
EML (Environmental Measurements Laboratory) Reports, 1977. Final tabulation of monthly 9°Sr fallout data: 1954-1976. Environ. Meas. Lab., New York, N.Y. HASL-329, UC-11. Also R.J. Larson, 1983. Worldwide deposition of "~°Sr through 1981. Environ. Meas. Lab., New York, N.Y.
G~iggeler, H., von Gunten, H.R. and Nyffeler, U., 1976. Determination of 2~°Pb in lake sediments and in air samples by direct gamma-ray measurement. Earth Planet. Sci. Lett., 33: 119-121.
Goldin, A.S., Velten, R.J. and Frishkorn, W., 1958. Deter- mination of radioactive strontium. Am. Chem. Soc. Meet., Chicago, Ill. (abstract).
Hardy, Jr., E.P., Krey, P.W. and Volchock, H.L., 1973. Global inventory and distribution of fallout Plutonium. Nature (London), 241 (5390): 444-445.
Hesslein, R.H., Broecker, W.S. and Schindler, D.W., 1980. Fates of metal radiotracers added to a whole lake: sedi- ment-water interactions. Can. J. Fish. Aquatic Sci., 37: 378-386.
Higgo, J.J.W. and Rees, L.V.C., 1986. Adsorption of acti- nides by marine sediments: Effect of the sediment/sea- water ratio on the measured distribution ratio. Environ. Sci. Technol. 20: 483-490. Radionuclide sorption by marine sediments. U.K. Dep. Environ., Rep. RW 83- 481/231.
Imboden, D.M. and Stiller, M., 1982. The influence of radon diffusion on the e~°Pb distribution in sediments. J. Geo- phys. Res., 87: 557-565.
Imboden, D.M., Tschopp, J. and Stumm, W., 1980. Die Rekonstruktion frtiherer Stofffrachten in einem See mittels Sedimentuntersuchungen. Schweiz. Z. Hydrol., 42(1): 1-14.
196
Kadko, D., 1981. A detailed study of Uranium series nuclides for several sedimentary regimes of the Pacific. Ph.D. Thesis, Columbia University, New York, N.Y., 312 pp.
Kelts, K. and Hsti, K.J., 1978. Freshwater Carbonate Sedi- mentation. In: A. Lerman (Editor), Lakes: Chemistry, Geology, Physics. Springer, Berlin, pp. 295-324.
Koide, M., Bruland, K.W. and Goldberg, E.D., 1973. ~SThff:~2Th and ~l°Pb geochronologies in marine and lake sediments. Geochim. Cosmochim. Acta, 37: 1171-1187.
KUeR (Kommission zur Uberwachung der Radioaktivit~t) Bericht, 1982.25 Jahre Radioaktivit~tstiberwachung in der Schweiz. Phys. Inst. Univ. of Freiburg, Freiburg.
Lerman, A., 1979. Geochemical Processes. Water and Sed- iment Environment. Wiley, New York, N.Y., 481 pp.
Lerman, A. and Lietzke, T.A., 1975. Uptake and migration of tracers in lake sediments. Limnol. Oceanogr., 20 (4): 497-510.
Ludlam, S.D., 1984. Fayetteville Green Lake, N.Y., U.S.A. VII. Varve chronology and sediment focussing. Chem. Geol., 44: 85-100.
M~irki, E., 1944. Chemische, physikalische und bakterio- logische Untersuchungen am Greifensee. Ber. Schweiz. Bot. Ges., 54: 75-140.
Mathieu, G.G., 1977.22eRn and e2~Ra technique of analysis. Progr. Rep. E.R.D.A. (Energy Res. Dev. Adm.), Contr. Ey 76-S-02-2185.
McCall, P.I., Robbins, J.A. and Matisoff, G., 1984. ~:*TCs and el°Pb transport and geochronologies in urbanized reservoirs with rapidly increasing sedimentation rates. Chem. Geol., 44: 33-66.
Robbins, J.A., 1978. Geochemical and geophysical appli- cations of radioactive lead. In: J.O. Nriagu (Editor), The Biogeochemistry of Radioactive Lead in the Envi- ronment. Elsevier, Amsterdam, pp. 285-393.
Robbins, J.A. and Eadie, B.J., 1982. Be-7: a tracer of sea- sonal particle transport processed in Lake Michigan. EOS (Trans. Am. Geophys. Union), 63(45): 957 (abstract).
Robbins, J.A. and Edgington, D.N., 1975. Determination of recent sedimentation rates in Lake Michigan using
2~°Pb and ~37Cs. Geochim. Cosmochim. Acta, 39: 285-304.
Santschi, P.H., Li, Y.H., Bell, J., Trier, R.M. and Kawta- luk, K., 1980. Pu in coastal marine environments. Earth Planet. Sci. Lett., 51: 248-265.
Santschi, P.H., Li, Y.H., Adler, D.M., Amdurer, M., Bell, J. and Nyffeler, U.P., 1983. The relative mobility of nat- ural (Th, Pb and Po) and fallout (Pu, Am, Cs) radio- nuclides in the coastal marine environment: results from model ecosystems (MERL) and Narragansett Bay. Geochim. Cosmochim. Acta, 47: 201-210.
Santschi, P.H., Nyffeler, U.P., Anderson, R.F., Schiff, S.L., O'Hara, P,, 1986. Response of radioactive trace metals to acid-base titrations in controlled experimental eco- systems: Evaluation of transport parameters for appli- cation to whole-lake radiotracer experiments. Can. J. Fish. Aquatic Sci., 43: 60-77.
Schiff, S.L., Beaty, K.G. and Anderson, R.F., 1983.7Be mass balance of two small Precambrian shield lakes. EOS (Trans. Am. Geophys. Union), 64 (52): 1030 (abstract).
Sigg, L., Sturm, M. and Stumm, W., 1982. Metal transfer mechanisms in lakes. Thalassia Jugosl., 18(1-4): 293.
Stumm, W. and Morgan, J.J., 1981. Aquatic Chemistry. Wiley, New York, N.Y., 2nd ed., 780 pp.
Sturm, M., 1984. Suspended particles in lakes. EAWAG (Swiss Inst. Water. Resour. Water Pollut. Control.) - News 16/17: 3-6.
Tschopp, J., 1979. Die Verunreinigung der Seen mit Schwermetallen - - Modelle Ftir die Regulierung der Metallkonzentrationen. Ph.D, Thesis, ETH (Eidge- nSssische Technische Hochschule), Ziirich (un- published).
Turekian, K.K., Benninger, L.K. and Dion, E.P., 1983.7Be and 2~°Pb total deposition fluxes at New Haven, Conn. and at Bermuda. J. Geophys. Res., 88 (C9):5411-5415.
Volchok, H.L. and Feiner, M., 1979. A radioanalytical lab- oratory intercomparison exercise. U.S. Dep. Energy. Environ. Meas. Lab., New York, N.Y., EML-366.
Weber, H.P., 1979. Sedimentology and geochemistry of Greifensee, Switzerland. Ph.D. Thesis. ETH (Eidge- nSssische Technische Hochschule), Ztirich (un- published).


