Embed Size (px)
Citation preview
1
Vol.:(0123456789)
Scientific Reports | (2022) 12:4927 | https://doi.org/10.1038/s41598-022-08860-3
www.nature.com/scientificreports
Quinoline based thiosemicarbazones as colorimetric chemosensors for fluoride and cyanide ions and DFT studiesRabia Basri1, Nadeem Ahmed1, Muhammad Khalid2, Muhammad Usman Khan3, Muhammad Abdullah4, Asad Syed5, Abdallah M. Elgorban5, Salim S. Al‑Rejaie6, Ataualpa Albert Carmo Braga7 & Zahid Shafiq1*
High toxicity and extensive accessibility of fluoride and cyanide ions in diverse environmental media encouraged attention for scheming well‑organized probes for their detection. Keeping in mind we have designed and synthesized thiosemicarbazone‑based chemosensors RB‑1, RB‑2 and RB‑3 for the detection of fluoride and cyanide ions. The structural elucidation of the synthesized chemosensors is done by employing different analytical techniques including nuclear magnetic resonance and electronic absorption specrtoscopies. Admirable detection limit, binding constant and fast response time (2 s) to F− and CN− ions enlarged the applications of these chemosensors. Additional confirmation of the sensing ability of these chemosensors is derived from DFT and TDDFT calculations with M06/6‑311G(d,p) method by performing FMO, UV–Vis, QTAIM and global reactivity parameters elucidation. Overall results point out that investigated chemosensors are suitable candidates for sensing the F− ions. These chemosensors were successfully applied to detect F− ions in a commercial toothpaste sample.
In supramolecular chemistry, selective and sensitive detection of anions have attracted a great attention due to their biomedical, environmental and chemical applications1–5. Among the numerous anions CN− and F− are immensely harmful to environment and human health6. The fluoride is the smallest and most electronegative ion that promotes healthy bone growth and avoids dental cavities due to which it is considered as a micronutrient7. The F− ions are commonly present in toothpaste, pharmaceutical agents and drinking water due to their signifi-cant role in avoiding dental caries and treatment of osteoporosis8. The F− ions are also used for the separation of radioactive and non-radioactive substances in nuclear industry9. Apart from its biological activity, the F− ions are also used as potential catalysts in synthesis and is identified as a strong Lewis’s base10. In addition, the F− ions have also various industrial application mainly in steel and aluminum industries11. The rate of absorption of the F− ions are fast as compared to excretion12. The World Health Organization (WHO) has set the extreme limit of F− ions (1.5 mg L−1) for human health13. The high intake of the F− ions cause fluorosis which is supplemented with set of diseases such as tooth mottling, metabolic disturbances and neurotoxicity14. In molecular and cell biol-ogy, a greater concentration of NaF also affects the cell signaling processes and thus causes apoptosis15. Besides this, it was also expected that the F− ions with higher concentration cause mitochondrial disorder and promote mitochondrial oxidative stress16. Similarly, the CN− ions are widely known as toxic and extremely effective species to human health. Though, the CN− ions are extensively used in industrial developments, such as artificial plastic and gum industry, production of pharmaceutical, gold-silver mining, metallurgy and X-ray film recovery17,18. In nature, various food and plants also contain CN− ions17. In chemical industry, the CN− salt (1.5 million ton/year) are also involved in synthesis of nitriles, nylon, and acrylic polymer19. Even at low concentrations, the
OPEN
1Institute of Chemical Sciences, Bahauddin Zakariya University, Multan 60800, Pakistan. 2Department of Chemistry, Khwaja Fareed University of Engineering & Information Technology, Rahim Yar Khan 64200, Pakistan. 3Department of Chemistry, University of Okara, Okara 56300, Pakistan. 4Department of Chemistry, Colorado State University, Fort Collins, CO 80523, USA. 5Department of Botany and Microbiology, College of Science, King Saud University, P.O. 2455, Riyadh 11451, Saudi Arabia. 6Department of Pharmacology and Toxicology, College of Pharmacy, King Saud University, P.O. Box 55760, Riyadh 11451, Saudi Arabia. 7Departamento de Química Fundamental, Instituto de Química, Universidade de São Paulo, Av. Prof. Lineu Prestes, 748, São Paulo 05508-000, Brazil. *email: [email protected]
2
Vol:.(1234567890)
Scientific Reports | (2022) 12:4927 | https://doi.org/10.1038/s41598-022-08860-3
www.nature.com/scientificreports/
CN− ions are extremely toxic20. The CN− ions are quickly absorbed through digestive, respiratory and cutaneous paths as a hypertonic anion21,22. The increased concentration of CN− ions blocks the electron transport chain and inhibits cellular respiration. The maximum concentration of the CN− ions in drinking water is 1.9 µM as defined by WHO18. Therefore, the detection of these ions is important23. Recently, some colorimetric are reported for the selective and sensitive detection of F− and CN− ions24–29. The colorimetric method (naked-eye detection) is typically based on N–H proton transfer from donor unit to anions. The example of proton donors include urea and pyrrole derivatives30–34.
Quinoline and its derivatives have been utilized for designing probes for various ions because of their high chelating ability and unique photophysical properties35–41. Herein, we have reported three quinoline derivative-based chemosensors RB-1, RB-2 and RB-3 for the detection of F− and CN− ions. These chemosensors were syn-thesis in a single step by condensation of quinoline aldehyde with substituted thiosemicarbazides. The synthesized chemosensors were thourghly characterized by NMR (1H and 13C) and electronic absorption (UV–Vis and FTIR) spectroscopies. The remarkable color changes of the chemosensors with the addition of both fluoride as well as cyanide ions were observed. The Computational calculations were executed for confirmation of experimental findings using FMO, UV–Vis, QTAIM and global reactivity parameters (GRPs) elucidation.
ExperimentMethods and material. The chemicals purchased from Sigma Aldrich were used without further purifica-tions. All of the reactions took place in an oven-dried round bottom flask. Thin layer chromatography (TLC) was used to track the reaction progress on a 0.25 mm thick silica plate, and the chromatograms were visualized using staining agents or UV illumination (254 nm). The tetra butyl ammonium salts of fluoride, iodide, chloride, perchlorate, bromide, acetate, bisulfate, thiocyanate and bisulfate were used for the preparation of solutions. The 1HNMR spectra were collected on a Bruker spectrometer. The UV–visible measurement were carried on Shimadzu UV-1800 spectrophotometer using 1 cm path length quartz cuvette. The stock solution of various ions were prepared in acetonitrile and DMSO.
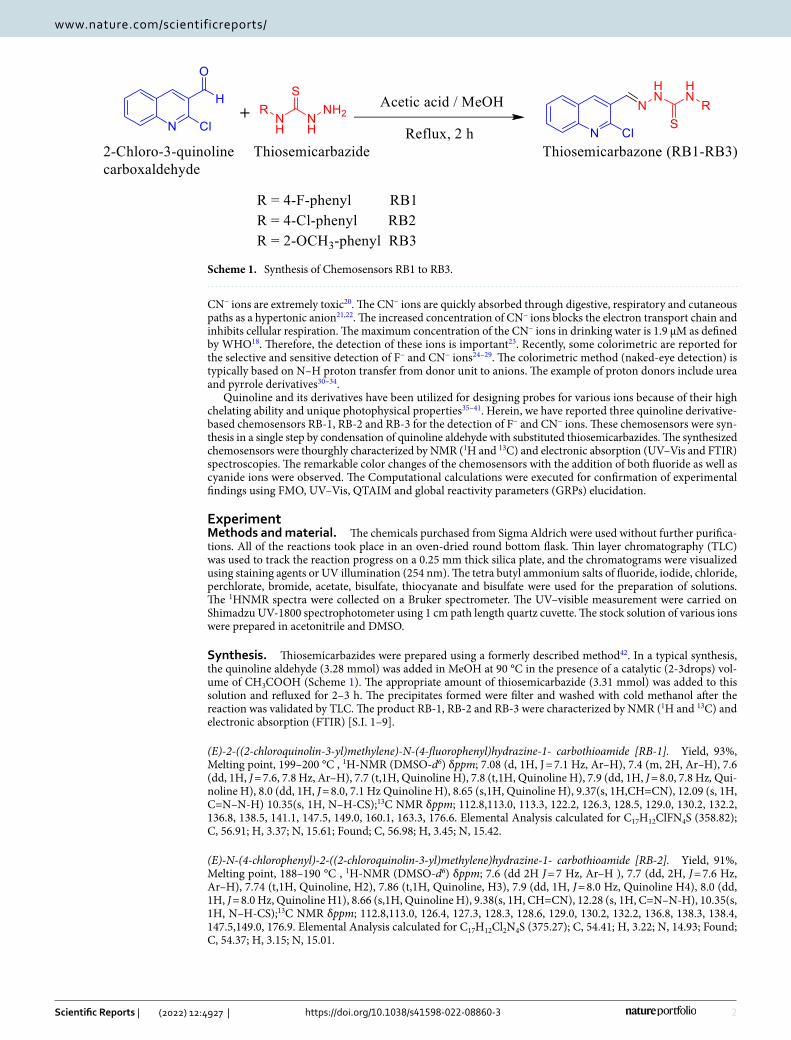
Synthesis. Thiosemicarbazides were prepared using a formerly described method42. In a typical synthesis, the quinoline aldehyde (3.28 mmol) was added in MeOH at 90 °C in the presence of a catalytic (2-3drops) vol-ume of CH3COOH (Scheme 1). The appropriate amount of thiosemicarbazide (3.31 mmol) was added to this solution and refluxed for 2–3 h. The precipitates formed were filter and washed with cold methanol after the reaction was validated by TLC. The product RB-1, RB-2 and RB-3 were characterized by NMR (1H and 13C) and electronic absorption (FTIR) [S.I. 1–9].
(E)‑2‑((2‑chloroquinolin‑3‑yl)methylene)‑N‑(4‑fluorophenyl)hydrazine‑1‑ carbothioamide [RB‑1]. Yield, 93%, Melting point, 199–200 °C , 1H-NMR (DMSO-d6) δppm; 7.08 (d, 1H, J = 7.1 Hz, Ar–H), 7.4 (m, 2H, Ar–H), 7.6 (dd, 1H, J = 7.6, 7.8 Hz, Ar–H), 7.7 (t,1H, Quinoline H), 7.8 (t,1H, Quinoline H), 7.9 (dd, 1H, J = 8.0, 7.8 Hz, Qui-noline H), 8.0 (dd, 1H, J = 8.0, 7.1 Hz Quinoline H), 8.65 (s,1H, Quinoline H), 9.37(s, 1H,CH=CN), 12.09 (s, 1H, C=N–N-H) 10.35(s, 1H, N–H-CS);13C NMR δppm; 112.8,113.0, 113.3, 122.2, 126.3, 128.5, 129.0, 130.2, 132.2, 136.8, 138.5, 141.1, 147.5, 149.0, 160.1, 163.3, 176.6. Elemental Analysis calculated for C17H12ClFN4S (358.82); C, 56.91; H, 3.37; N, 15.61; Found; C, 56.98; H, 3.45; N, 15.42.
(E)‑N‑(4‑chlorophenyl)‑2‑((2‑chloroquinolin‑3‑yl)methylene)hydrazine‑1‑ carbothioamide [RB‑2]. Yield, 91%, Melting point, 188–190 °C , 1H-NMR (DMSO-d6) δppm; 7.6 (dd 2H J = 7 Hz, Ar–H ), 7.7 (dd, 2H, J = 7.6 Hz, Ar–H), 7.74 (t,1H, Quinoline, H2), 7.86 (t,1H, Quinoline, H3), 7.9 (dd, 1H, J = 8.0 Hz, Quinoline H4), 8.0 (dd, 1H, J = 8.0 Hz, Quinoline H1), 8.66 (s,1H, Quinoline H), 9.38(s, 1H, CH=CN), 12.28 (s, 1H, C=N–N-H), 10.35(s, 1H, N–H-CS);13C NMR δppm; 112.8,113.0, 126.4, 127.3, 128.3, 128.6, 129.0, 130.2, 132.2, 136.8, 138.3, 138.4, 147.5,149.0, 176.9. Elemental Analysis calculated for C17H12Cl2N4S (375.27); C, 54.41; H, 3.22; N, 14.93; Found; C, 54.37; H, 3.15; N, 15.01.
Scheme 1. Synthesis of Chemosensors RB1 to RB3.
3
Vol.:(0123456789)
Scientific Reports | (2022) 12:4927 | https://doi.org/10.1038/s41598-022-08860-3
www.nature.com/scientificreports/
(E)‑2‑((2‑chloroquinolin‑3‑yl)methylene)‑N‑(2‑methoxyphenyl)hydrazine‑1‑ carbothioamide [RB‑3]. Yield of the compound 92%, Melting point, 203–205 °C, 1H-NMR (DMSO-d6) δppm; 3.79 (s 3H Ar-CH3), 7.2 (d 1H J = 7.1 Hz, Ar–H), 7.2 (m, 2H, Ar–H), 7.72 (t,1H, Quinoline H2), 7.8 (t, 1H, Quinoline, H3), 7.9 (dd, 1H, J = 8.0 Hz, Quinoline H4), 8.07(dd, 1H, J = 8.0 Hz, Quinoline H1), 8.65 (s, 1H, Quinoline H), 9.41(s, 1H,CH=CN), 12.02 (s, 1H, C=N–N-H), 10.2(s, 1H, N–H-CS);13C NMR δppm; 40.5,40.3,39.9 55.69, 111.6, 112.2, 118.7, 126.4, 127.2, 129.4, 136.8,140.4, 147.5,149.0,159.5,163.11,176.51. Elemental Analysis calculated for C18H15ClN4OS (380.86); C, 58.30; H, 4.08; N, 15.11; Found; C, 58.37; H, 4.15; N, 15.03.
Computational procedure. The sensing behaviors of RB-1, RB-2 and RB-3 chemosensors towards flu-oride ions recognition were investigated theoretically using DFT and TDDFT calculations. Gauss View 5.043 generated input files of RB-1, RB-2 and RB-3 chemosensors were subjected to Gaussian 09 W44 program pack-age. To find appropriate functional for performing the entire computational analysis of current draft, geometry optimization analysis was initially carried out at various levels of DFT like B3LYP45, CAM-B3LYP46, LC-BLYP47, M0648, M06-2X49 and 6-311G(d,p) basis set combinations. The completion of optimization analysis and pres-ence of optimized geometries at lower energy minima is confirmed through frequency analysis using same above-mentioned combinations of functionals. The stability of the optimized geometries was confirmed due to the absence of imaginary frequency. Singlet states in RB-1, RB-2 and RB-3 chemosensors were calculated by performing TDDFT computations in acetonitrile solvent using CPCM model at B3LYP/6-311G(d,p), CAM-B3LYP/6-311G(d,p), LC-BLYP/6-311G(d,p), M06/6-311G(d,p), and M06-2X/6-311G(d,p) functionals. The TDDFT computed absorption maxima (λmax) values at M06/6-311G(d,p) level of theory were found in good agreement with experimental λmax values of RB-1, RB-2 and RB-3. Therefore, M06/6-311G(d,p) level is selected for further quantum chemical calculations of RB-1, RB-2 and RB-3. Geometry optimization followed by the frequency analysis of RB-1, RB-2 and RB-3 with F− ions is executed at M06/6-311G(d,p) level of theory. Frontier molecular orbital (FMO), and QTAIM analysis were performed using same selected functional.
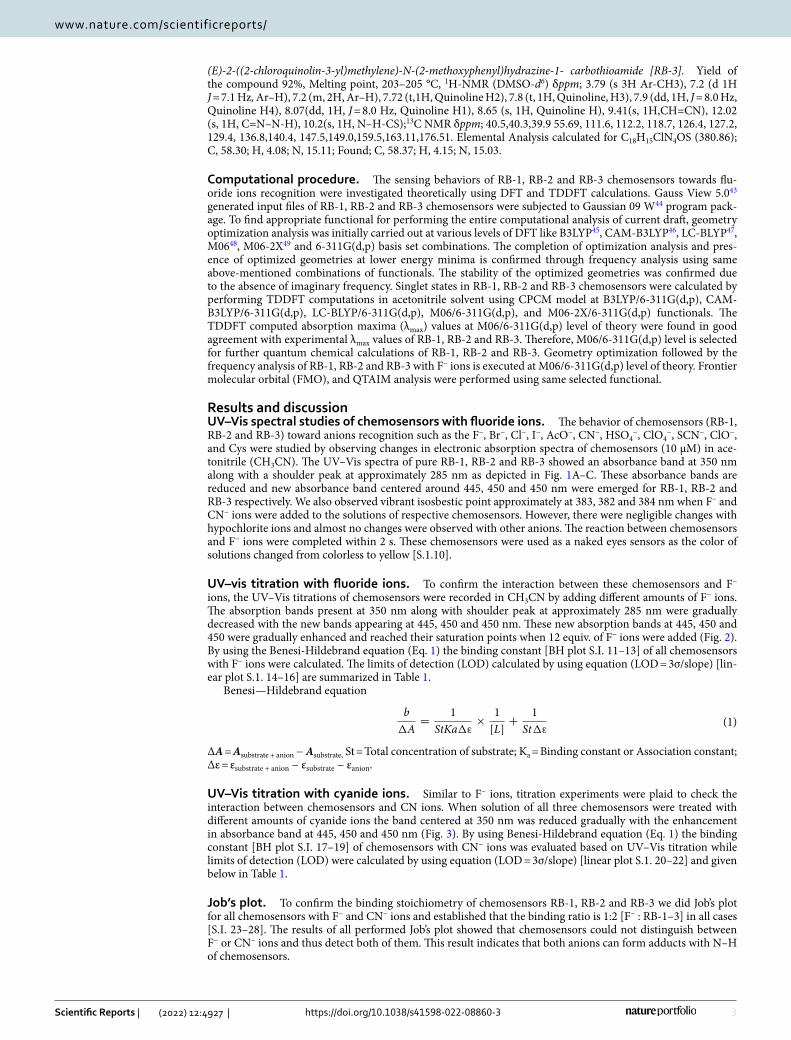
Results and discussionUV–Vis spectral studies of chemosensors with fluoride ions. The behavior of chemosensors (RB-1, RB-2 and RB-3) toward anions recognition such as the F−, Br−, Cl−, I−, AcO−, CN−, HSO4
−, ClO4−, SCN−, ClO−,
and Cys were studied by observing changes in electronic absorption spectra of chemosensors (10 μM) in ace-tonitrile (CH3CN). The UV–Vis spectra of pure RB-1, RB-2 and RB-3 showed an absorbance band at 350 nm along with a shoulder peak at approximately 285 nm as depicted in Fig. 1A–C. These absorbance bands are reduced and new absorbance band centered around 445, 450 and 450 nm were emerged for RB-1, RB-2 and RB-3 respectively. We also observed vibrant isosbestic point approximately at 383, 382 and 384 nm when F− and CN− ions were added to the solutions of respective chemosensors. However, there were negligible changes with hypochlorite ions and almost no changes were observed with other anions. The reaction between chemosensors and F− ions were completed within 2 s. These chemosensors were used as a naked eyes sensors as the color of solutions changed from colorless to yellow [S.1.10].
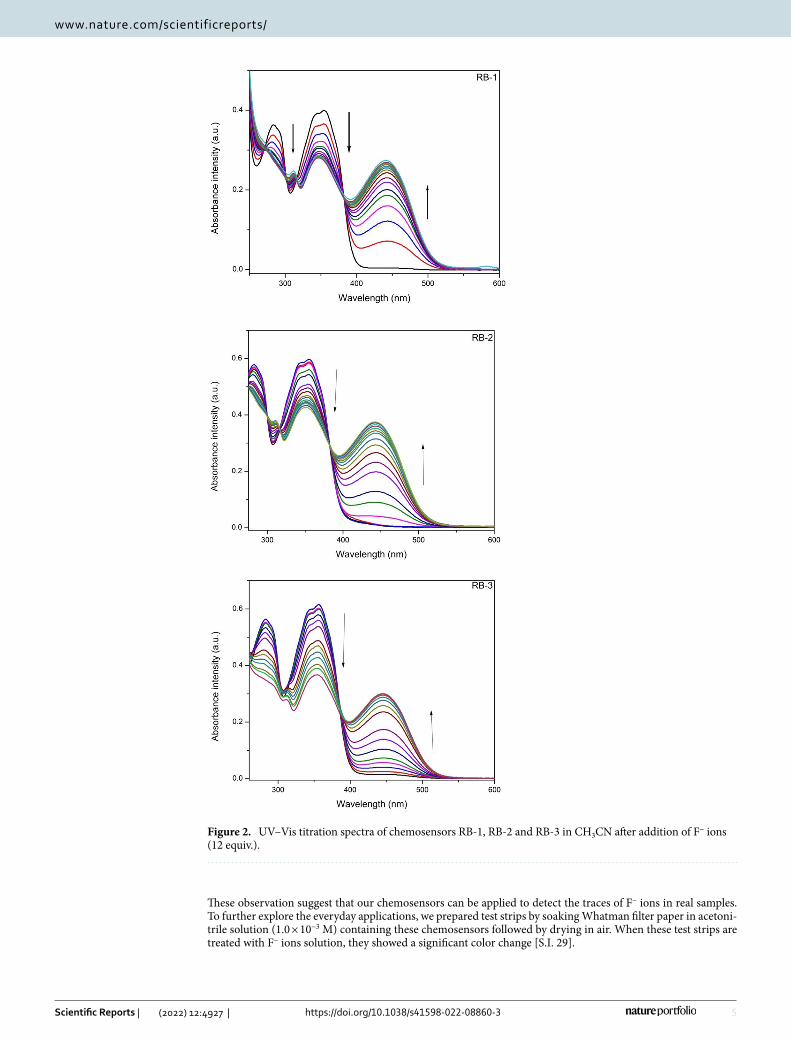
UV–vis titration with fluoride ions. To confirm the interaction between these chemosensors and F− ions, the UV–Vis titrations of chemosensors were recorded in CH3CN by adding different amounts of F− ions. The absorption bands present at 350 nm along with shoulder peak at approximately 285 nm were gradually decreased with the new bands appearing at 445, 450 and 450 nm. These new absorption bands at 445, 450 and 450 were gradually enhanced and reached their saturation points when 12 equiv. of F− ions were added (Fig. 2). By using the Benesi-Hildebrand equation (Eq. 1) the binding constant [BH plot S.I. 11–13] of all chemosensors with F− ions were calculated. The limits of detection (LOD) calculated by using equation (LOD = 3σ/slope) [lin-ear plot S.1. 14–16] are summarized in Table 1.
Benesi—Hildebrand equation
ΔA = Asubstrate + anion − Asubstrate, St = Total concentration of substrate; Ka = Binding constant or Association constant; Δε = εsubstrate + anion − εsubstrate − εanion.
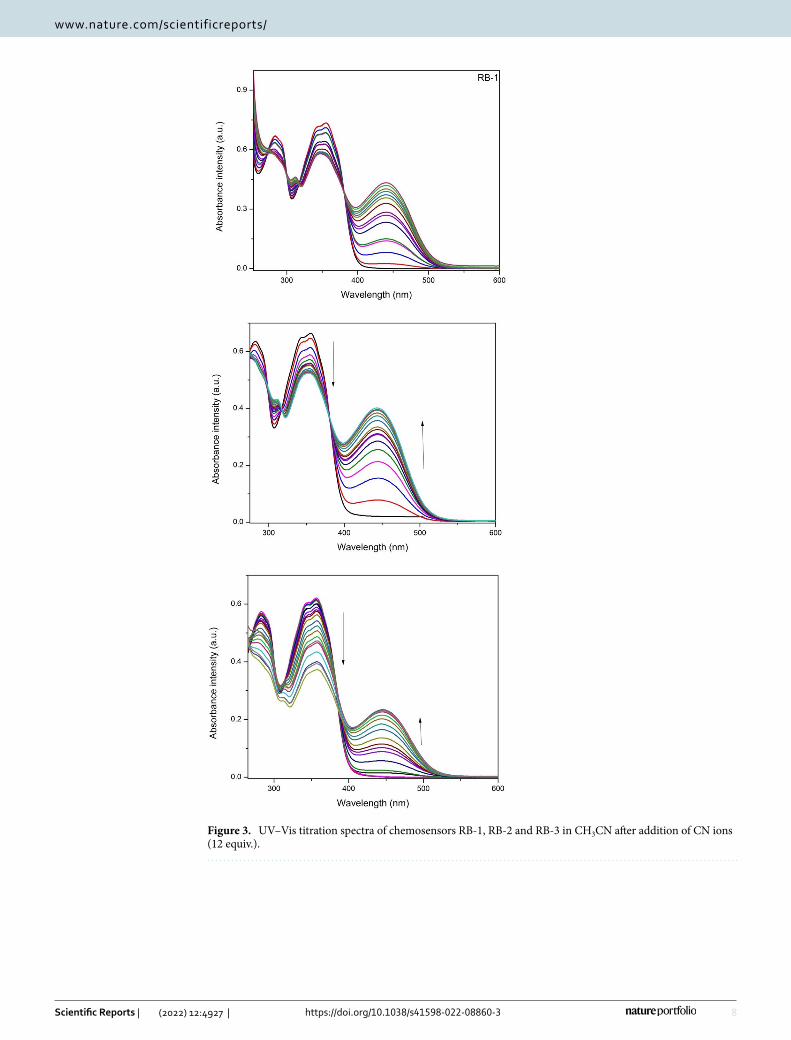
UV–Vis titration with cyanide ions. Similar to F− ions, titration experiments were plaid to check the interaction between chemosensors and CN ions. When solution of all three chemosensors were treated with different amounts of cyanide ions the band centered at 350 nm was reduced gradually with the enhancement in absorbance band at 445, 450 and 450 nm (Fig. 3). By using Benesi-Hildebrand equation (Eq. 1) the binding constant [BH plot S.I. 17–19] of chemosensors with CN− ions was evaluated based on UV–Vis titration while limits of detection (LOD) were calculated by using equation (LOD = 3σ/slope) [linear plot S.1. 20–22] and given below in Table 1.
Job’s plot. To confirm the binding stoichiometry of chemosensors RB-1, RB-2 and RB-3 we did Job’s plot for all chemosensors with F− and CN− ions and established that the binding ratio is 1:2 [F− : RB-1–3] in all cases [S.I. 23–28]. The results of all performed Job’s plot showed that chemosensors could not distinguish between F− or CN− ions and thus detect both of them. This result indicates that both anions can form adducts with N–H of chemosensors.
(1)b
�A=
1
StKa�ε
×1
[L]+
1
St�ε
4
Vol:.(1234567890)
Scientific Reports | (2022) 12:4927 | https://doi.org/10.1038/s41598-022-08860-3
www.nature.com/scientificreports/
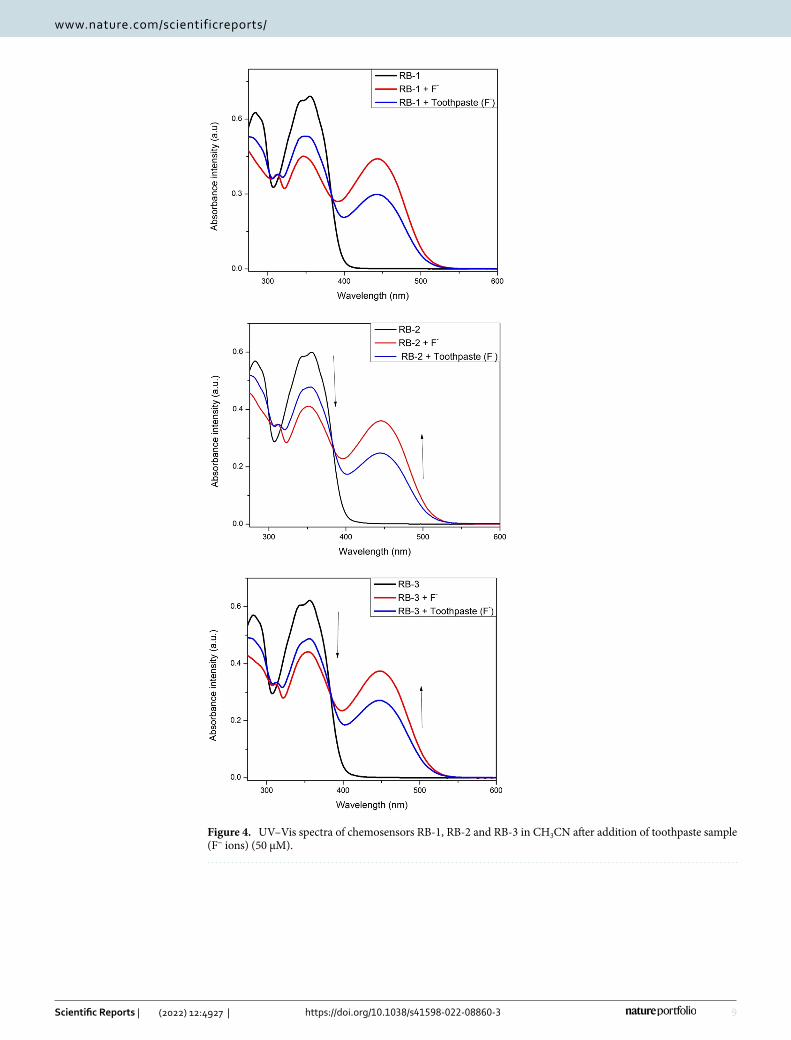
Real‑life applications. To check the response of these chemosensors to F− ions in real sample, we used commercially available tooth -paste as a source of F− ions. The toothpaste sample for analysis was prepared by dissolving 50 mg of commercially available tooth-paste (Sensodyne) in 3 mL CH3CN with sonication followed by centrifugation and filtration. When the filtrate of toothpaste sample (50 µM) was added to chemosensors solutions (10 µM) the bands at 385 were reduced with the emergence of new bands at 445, 450 and 450 nm for RB-1, RB-2 and RB-3 respectively (Fig. 4). The color of solutions was also changed from colorless to yellowish.
Figure 1. (A–C) UV–vis spectra of chemosensors RB-1, RB-2 and RB-3 in CH3CN after addition of anions (10 µM).
5
Vol.:(0123456789)
Scientific Reports | (2022) 12:4927 | https://doi.org/10.1038/s41598-022-08860-3
www.nature.com/scientificreports/
These observation suggest that our chemosensors can be applied to detect the traces of F− ions in real samples. To further explore the everyday applications, we prepared test strips by soaking Whatman filter paper in acetoni-trile solution (1.0 × 10⁻³ M) containing these chemosensors followed by drying in air. When these test strips are treated with F− ions solution, they showed a significant color change [S.I. 29].
Figure 2. UV–Vis titration spectra of chemosensors RB-1, RB-2 and RB-3 in CH3CN after addition of F− ions (12 equiv.).
6
Vol:.(1234567890)
Scientific Reports | (2022) 12:4927 | https://doi.org/10.1038/s41598-022-08860-3
www.nature.com/scientificreports/
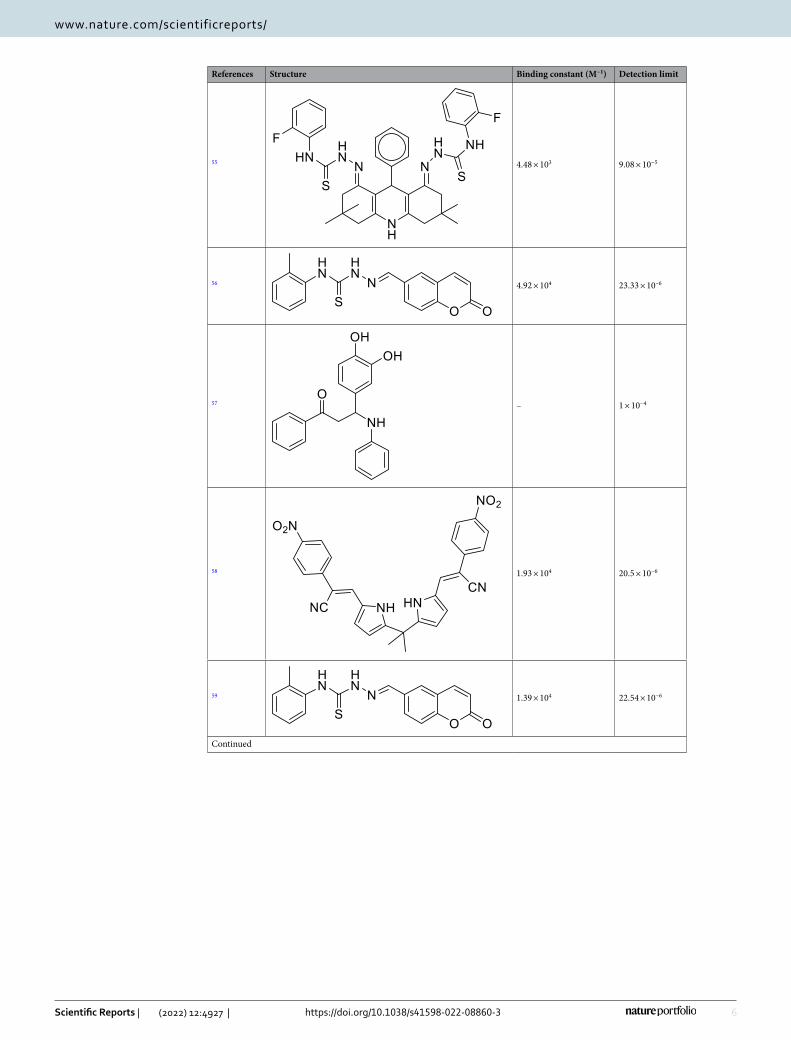
References Structure Binding constant (M−1) Detection limit
55 4.48 × 10³ 9.08 × 10⁻⁵
56 4.92 × 10⁴ 23.33 × 10⁻⁶
57 – 1 × 10⁻⁴
58 1.93 × 10⁴ 20.5 × 10⁻⁶
59 1.39 × 10⁴ 22.54 × 10⁻⁶
Continued
7
Vol.:(0123456789)
Scientific Reports | (2022) 12:4927 | https://doi.org/10.1038/s41598-022-08860-3
www.nature.com/scientificreports/
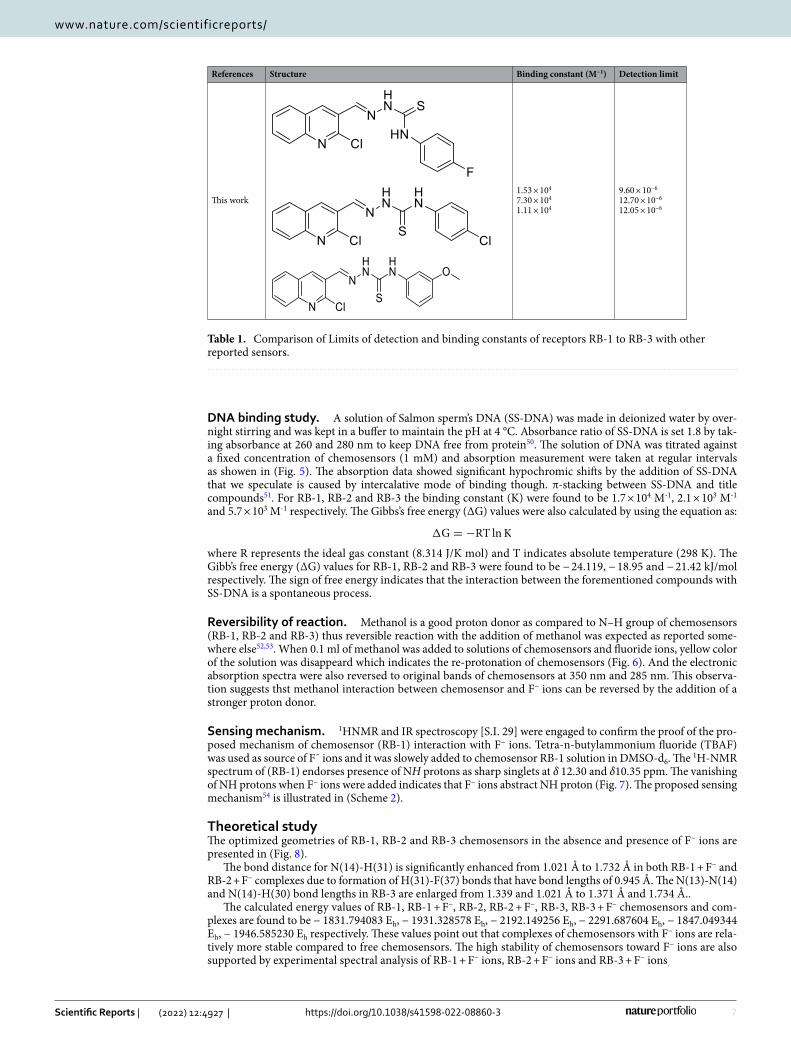
Table 1. Comparison of Limits of detection and binding constants of receptors RB-1 to RB-3 with other reported sensors.
References Structure Binding constant (M−1) Detection limit
This work1.53 × 104
7.30 × 10⁴
1.11 × 10⁴
9.60 × 10⁻⁶
12.70 × 10⁻⁶
12.05 × 10⁻⁶
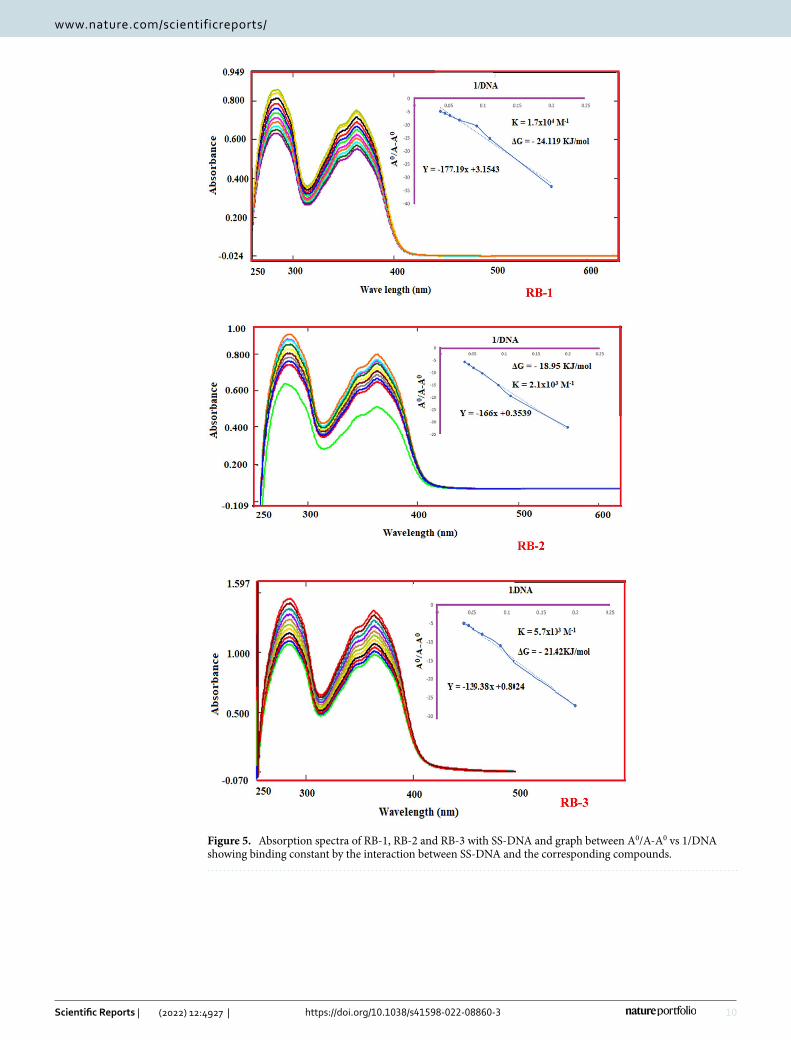
DNA binding study. A solution of Salmon sperm’s DNA (SS-DNA) was made in deionized water by over-night stirring and was kept in a buffer to maintain the pH at 4 °C. Absorbance ratio of SS-DNA is set 1.8 by tak-ing absorbance at 260 and 280 nm to keep DNA free from protein50. The solution of DNA was titrated against a fixed concentration of chemosensors (1 mM) and absorption measurement were taken at regular intervals as showen in (Fig. 5). The absorption data showed significant hypochromic shifts by the addition of SS-DNA that we speculate is caused by intercalative mode of binding though. π-stacking between SS-DNA and title compounds51. For RB-1, RB-2 and RB-3 the binding constant (K) were found to be 1.7 × 10⁴ M-1, 2.1 × 10³ M-1 and 5.7 × 10³ M-1 respectively. The Gibbs’s free energy (ΔG) values were also calculated by using the equation as:
where R represents the ideal gas constant (8.314 J/K mol) and T indicates absolute temperature (298 K). The Gibb’s free energy (ΔG) values for RB-1, RB-2 and RB-3 were found to be − 24.119, − 18.95 and − 21.42 kJ/mol respectively. The sign of free energy indicates that the interaction between the forementioned compounds with SS-DNA is a spontaneous process.
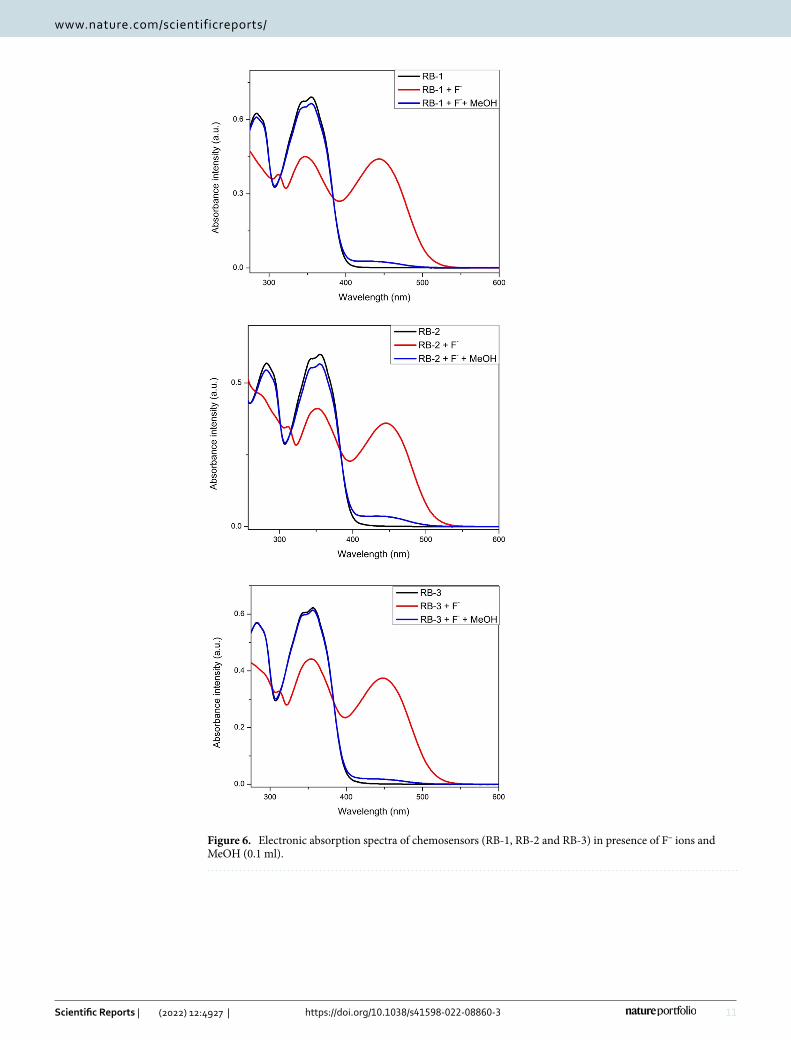
Reversibility of reaction. Methanol is a good proton donor as compared to N–H group of chemosensors (RB-1, RB-2 and RB-3) thus reversible reaction with the addition of methanol was expected as reported some-where else52,53. When 0.1 ml of methanol was added to solutions of chemosensors and fluoride ions, yellow color of the solution was disappeard which indicates the re-protonation of chemosensors (Fig. 6). And the electronic absorption spectra were also reversed to original bands of chemosensors at 350 nm and 285 nm. This observa-tion suggests thst methanol interaction between chemosensor and F− ions can be reversed by the addition of a stronger proton donor.
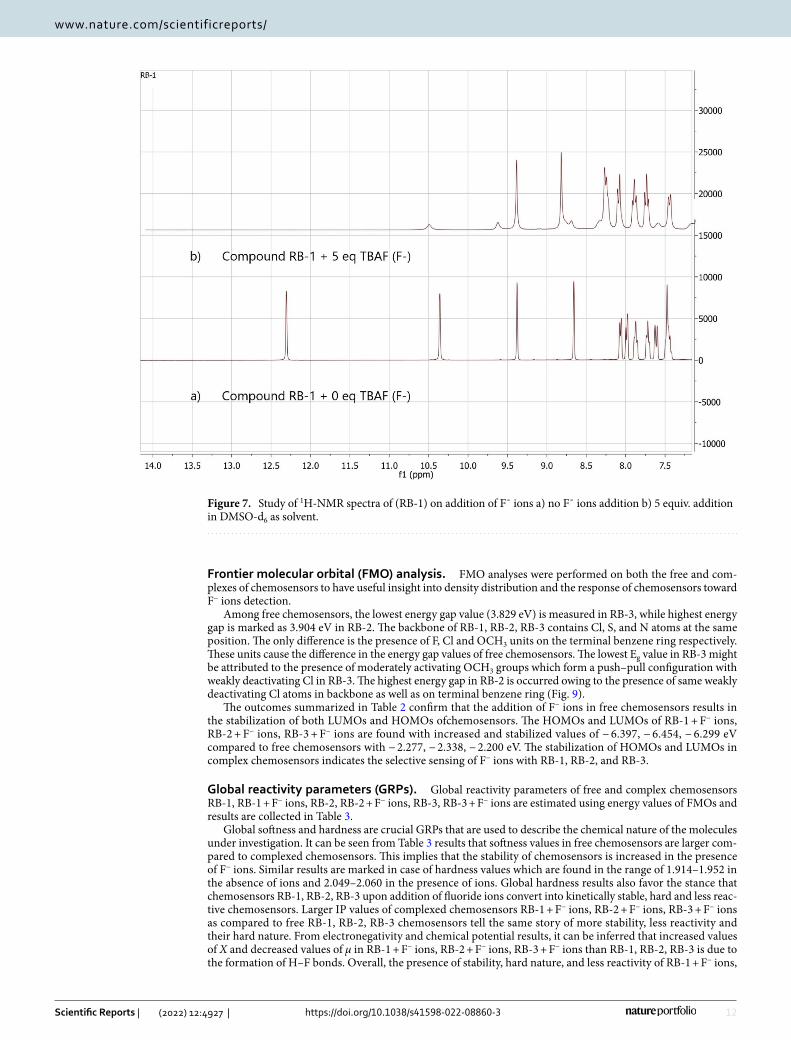
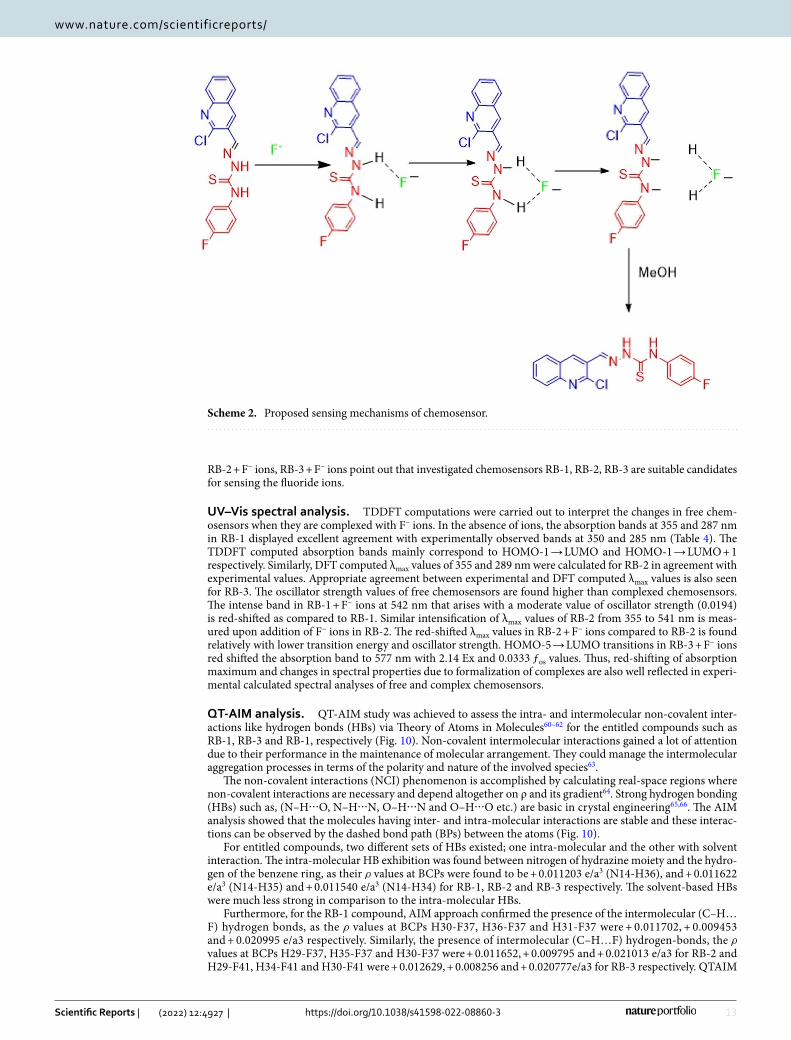
Sensing mechanism. 1HNMR and IR spectroscopy [S.I. 29] were engaged to confirm the proof of the pro-posed mechanism of chemosensor (RB-1) interaction with F− ions. Tetra-n-butylammonium fluoride (TBAF) was used as source of Fˉ ions and it was slowely added to chemosensor RB-1 solution in DMSO-d6. The 1H-NMR spectrum of (RB-1) endorses presence of NH protons as sharp singlets at δ 12.30 and δ10.35 ppm. The vanishing of NH protons when F− ions were added indicates that F− ions abstract NH proton (Fig. 7). The proposed sensing mechanism54 is illustrated in (Scheme 2).
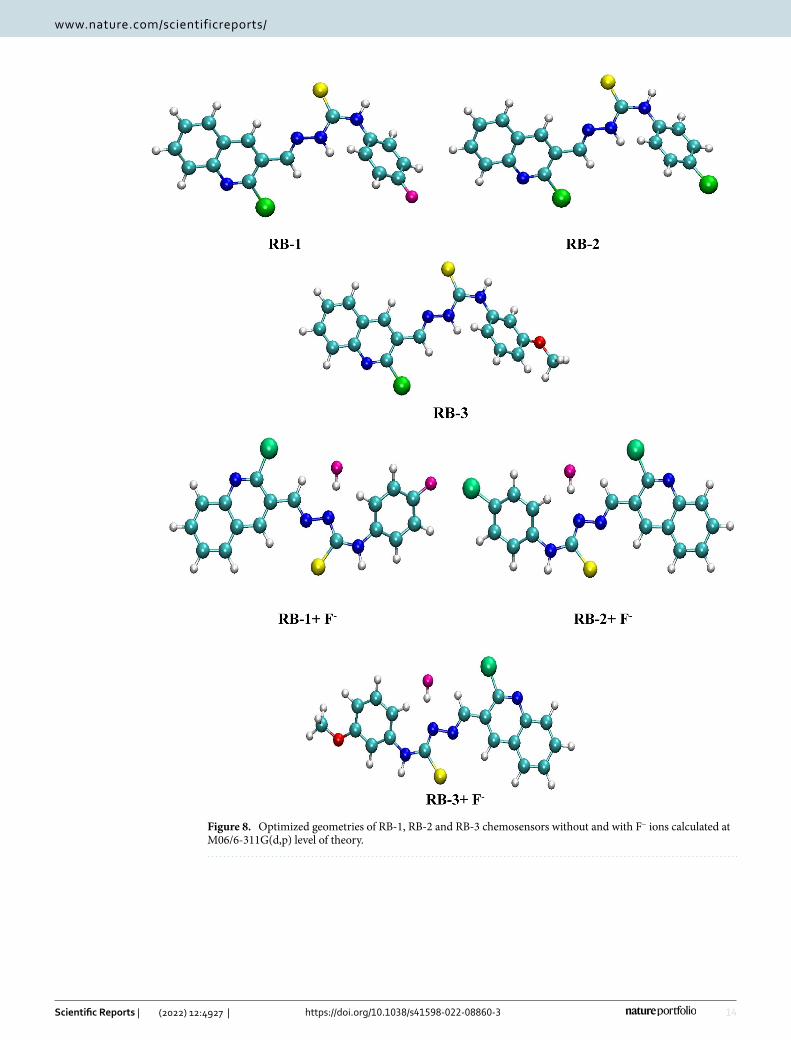
Theoretical studyThe optimized geometries of RB-1, RB-2 and RB-3 chemosensors in the absence and presence of F− ions are presented in (Fig. 8).
The bond distance for N(14)-H(31) is significantly enhanced from 1.021 Å to 1.732 Å in both RB-1 + F− and RB-2 + F− complexes due to formation of H(31)-F(37) bonds that have bond lengths of 0.945 Å. The N(13)-N(14) and N(14)-H(30) bond lengths in RB-3 are enlarged from 1.339 and 1.021 Å to 1.371 Å and 1.734 Å..
The calculated energy values of RB-1, RB-1 + F−, RB-2, RB-2 + F−, RB-3, RB-3 + F− chemosensors and com-plexes are found to be − 1831.794083 Eh, − 1931.328578 Eh, − 2192.149256 Eh, − 2291.687604 Eh, − 1847.049344 Eh, − 1946.585230 Eh respectively. These values point out that complexes of chemosensors with F− ions are rela-tively more stable compared to free chemosensors. The high stability of chemosensors toward F− ions are also supported by experimental spectral analysis of RB-1 + F− ions, RB-2 + F− ions and RB-3 + F− ions.
�G = −RT lnK
8
Vol:.(1234567890)
Scientific Reports | (2022) 12:4927 | https://doi.org/10.1038/s41598-022-08860-3
www.nature.com/scientificreports/
Figure 3. UV–Vis titration spectra of chemosensors RB-1, RB-2 and RB-3 in CH3CN after addition of CN ions (12 equiv.).
9
Vol.:(0123456789)
Scientific Reports | (2022) 12:4927 | https://doi.org/10.1038/s41598-022-08860-3
www.nature.com/scientificreports/
Figure 4. UV–Vis spectra of chemosensors RB-1, RB-2 and RB-3 in CH3CN after addition of toothpaste sample (F− ions) (50 µM).
10
Vol:.(1234567890)
Scientific Reports | (2022) 12:4927 | https://doi.org/10.1038/s41598-022-08860-3
www.nature.com/scientificreports/
Figure 5. Absorption spectra of RB-1, RB-2 and RB-3 with SS-DNA and graph between A0/A-A0 vs 1/DNA showing binding constant by the interaction between SS-DNA and the corresponding compounds.
11
Vol.:(0123456789)
Scientific Reports | (2022) 12:4927 | https://doi.org/10.1038/s41598-022-08860-3
www.nature.com/scientificreports/
Figure 6. Electronic absorption spectra of chemosensors (RB-1, RB-2 and RB-3) in presence of F− ions and MeOH (0.1 ml).
12
Vol:.(1234567890)
Scientific Reports | (2022) 12:4927 | https://doi.org/10.1038/s41598-022-08860-3
www.nature.com/scientificreports/
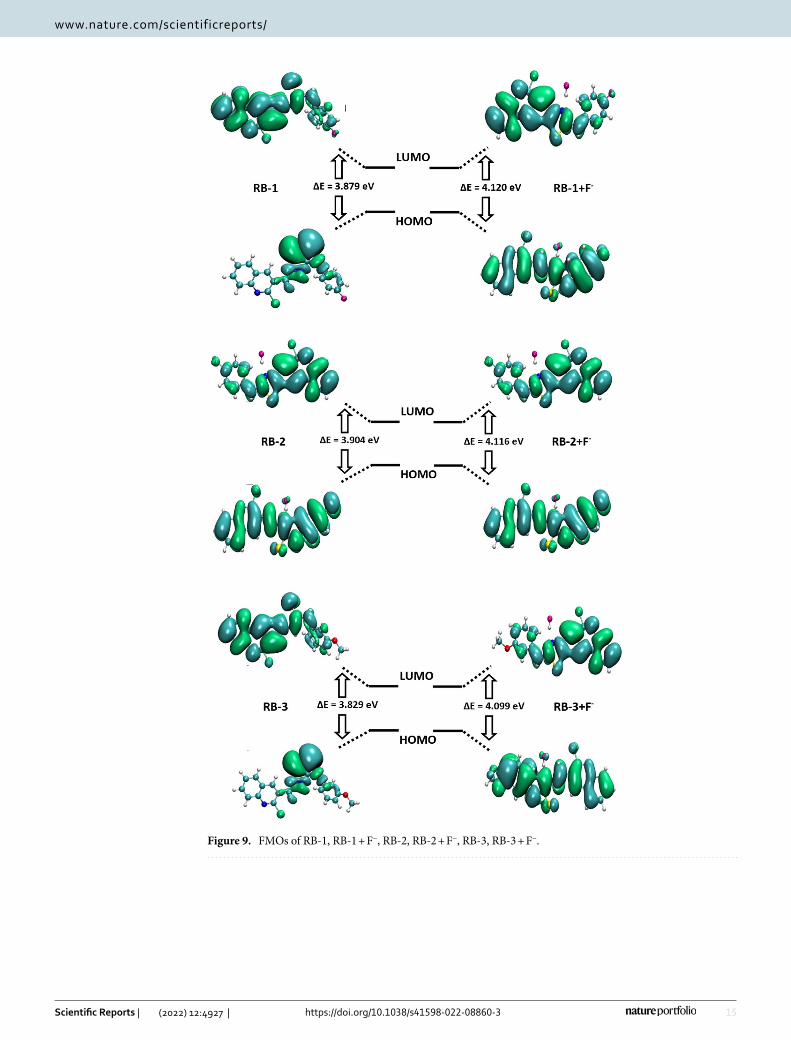
Frontier molecular orbital (FMO) analysis. FMO analyses were performed on both the free and com-plexes of chemosensors to have useful insight into density distribution and the response of chemosensors toward F− ions detection.
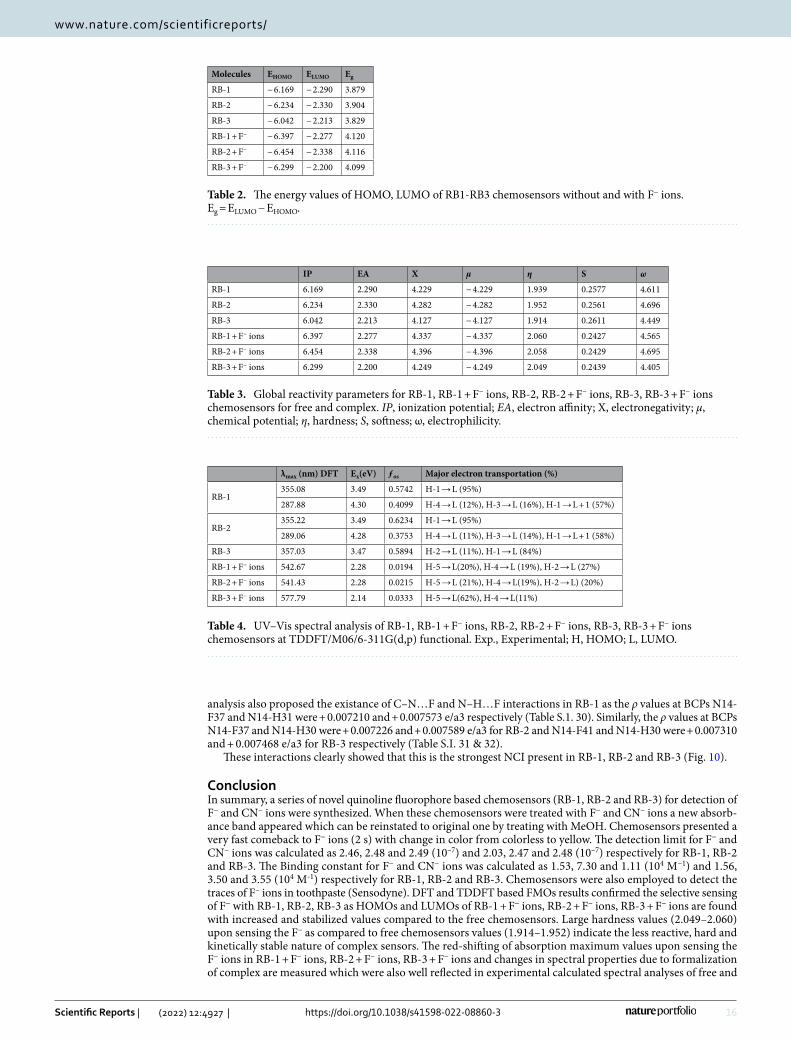
Among free chemosensors, the lowest energy gap value (3.829 eV) is measured in RB-3, while highest energy gap is marked as 3.904 eV in RB-2. The backbone of RB-1, RB-2, RB-3 contains Cl, S, and N atoms at the same position. The only difference is the presence of F, Cl and OCH3 units on the terminal benzene ring respectively. These units cause the difference in the energy gap values of free chemosensors. The lowest Eg value in RB-3 might be attributed to the presence of moderately activating OCH3 groups which form a push–pull configuration with weakly deactivating Cl in RB-3. The highest energy gap in RB-2 is occurred owing to the presence of same weakly deactivating Cl atoms in backbone as well as on terminal benzene ring (Fig. 9).
The outcomes summarized in Table 2 confirm that the addition of F− ions in free chemosensors results in the stabilization of both LUMOs and HOMOs ofchemosensors. The HOMOs and LUMOs of RB-1 + F− ions, RB-2 + F− ions, RB-3 + F− ions are found with increased and stabilized values of − 6.397, − 6.454, − 6.299 eV compared to free chemosensors with − 2.277, − 2.338, − 2.200 eV. The stabilization of HOMOs and LUMOs in complex chemosensors indicates the selective sensing of F− ions with RB-1, RB-2, and RB-3.
Global reactivity parameters (GRPs). Global reactivity parameters of free and complex chemosensors RB-1, RB-1 + F− ions, RB-2, RB-2 + F− ions, RB-3, RB-3 + F− ions are estimated using energy values of FMOs and results are collected in Table 3.
Global softness and hardness are crucial GRPs that are used to describe the chemical nature of the molecules under investigation. It can be seen from Table 3 results that softness values in free chemosensors are larger com-pared to complexed chemosensors. This implies that the stability of chemosensors is increased in the presence of F− ions. Similar results are marked in case of hardness values which are found in the range of 1.914–1.952 in the absence of ions and 2.049–2.060 in the presence of ions. Global hardness results also favor the stance that chemosensors RB-1, RB-2, RB-3 upon addition of fluoride ions convert into kinetically stable, hard and less reac-tive chemosensors. Larger IP values of complexed chemosensors RB-1 + F− ions, RB-2 + F− ions, RB-3 + F− ions as compared to free RB-1, RB-2, RB-3 chemosensors tell the same story of more stability, less reactivity and their hard nature. From electronegativity and chemical potential results, it can be inferred that increased values of X and decreased values of μ in RB-1 + F− ions, RB-2 + F− ions, RB-3 + F− ions than RB-1, RB-2, RB-3 is due to the formation of H–F bonds. Overall, the presence of stability, hard nature, and less reactivity of RB-1 + F− ions,
Figure 7. Study of 1H-NMR spectra of (RB-1) on addition of Fˉ ions a) no Fˉ ions addition b) 5 equiv. addition in DMSO-d6 as solvent.
13
Vol.:(0123456789)
Scientific Reports | (2022) 12:4927 | https://doi.org/10.1038/s41598-022-08860-3
www.nature.com/scientificreports/
RB-2 + F− ions, RB-3 + F− ions point out that investigated chemosensors RB-1, RB-2, RB-3 are suitable candidates for sensing the fluoride ions.
UV–Vis spectral analysis. TDDFT computations were carried out to interpret the changes in free chem-osensors when they are complexed with F− ions. In the absence of ions, the absorption bands at 355 and 287 nm in RB-1 displayed excellent agreement with experimentally observed bands at 350 and 285 nm (Table 4). The TDDFT computed absorption bands mainly correspond to HOMO-1 → LUMO and HOMO-1 → LUMO + 1 respectively. Similarly, DFT computed λmax values of 355 and 289 nm were calculated for RB-2 in agreement with experimental values. Appropriate agreement between experimental and DFT computed λmax values is also seen for RB-3. The oscillator strength values of free chemosensors are found higher than complexed chemosensors. The intense band in RB-1 + F− ions at 542 nm that arises with a moderate value of oscillator strength (0.0194) is red-shifted as compared to RB-1. Similar intensification of λmax values of RB-2 from 355 to 541 nm is meas-ured upon addition of F− ions in RB-2. The red-shifted λmax values in RB-2 + F− ions compared to RB-2 is found relatively with lower transition energy and oscillator strength. HOMO-5 → LUMO transitions in RB-3 + F− ions red shifted the absorption band to 577 nm with 2.14 Ex and 0.0333 ƒos values. Thus, red-shifting of absorption maximum and changes in spectral properties due to formalization of complexes are also well reflected in experi-mental calculated spectral analyses of free and complex chemosensors.
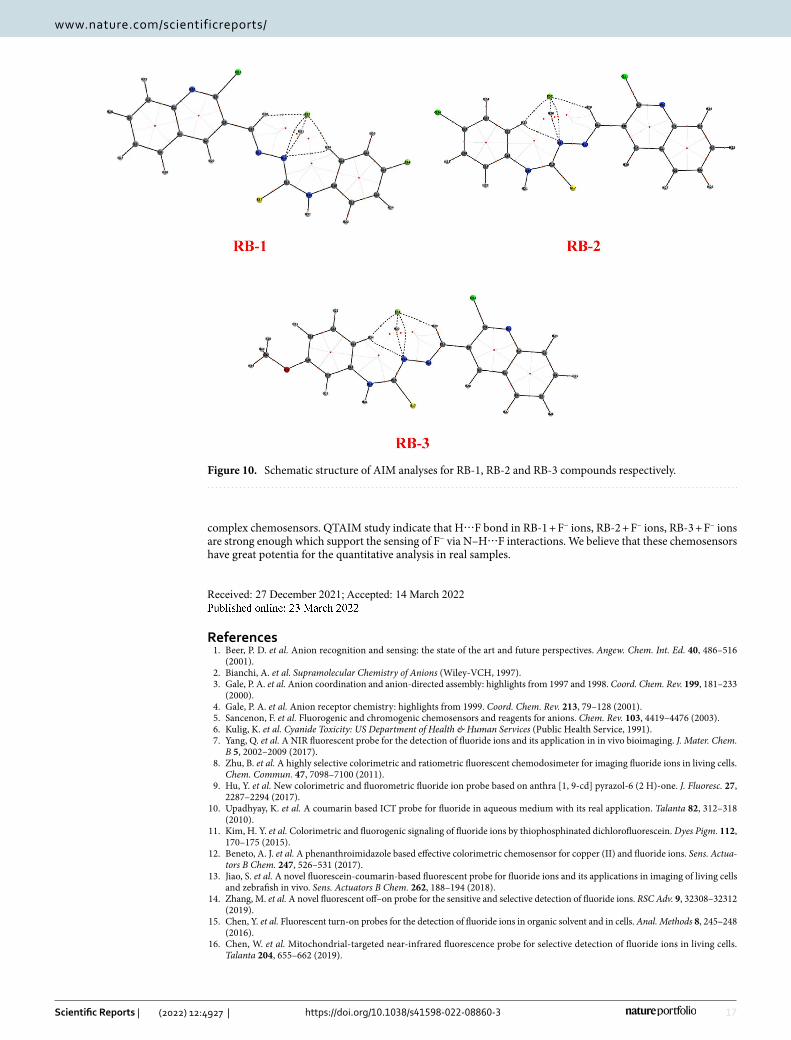
QT‑AIM analysis. QT-AIM study was achieved to assess the intra- and intermolecular non-covalent inter-actions like hydrogen bonds (HBs) via Theory of Atoms in Molecules60–62 for the entitled compounds such as RB-1, RB-3 and RB-1, respectively (Fig. 10). Non-covalent intermolecular interactions gained a lot of attention due to their performance in the maintenance of molecular arrangement. They could manage the intermolecular aggregation processes in terms of the polarity and nature of the involved species63.
The non-covalent interactions (NCI) phenomenon is accomplished by calculating real-space regions where non-covalent interactions are necessary and depend altogether on ρ and its gradient64. Strong hydrogen bonding (HBs) such as, (N–H⋯O, N–H⋯N, O–H⋯N and O–H⋯O etc.) are basic in crystal engineering65,66. The AIM analysis showed that the molecules having inter- and intra-molecular interactions are stable and these interac-tions can be observed by the dashed bond path (BPs) between the atoms (Fig. 10).
For entitled compounds, two different sets of HBs existed; one intra-molecular and the other with solvent interaction. The intra-molecular HB exhibition was found between nitrogen of hydrazine moiety and the hydro-gen of the benzene ring, as their ρ values at BCPs were found to be + 0.011203 e/a3 (N14-H36), and + 0.011622 e/a3 (N14-H35) and + 0.011540 e/a3 (N14-H34) for RB-1, RB-2 and RB-3 respectively. The solvent-based HBs were much less strong in comparison to the intra-molecular HBs.
Furthermore, for the RB-1 compound, AIM approach confirmed the presence of the intermolecular (C–H…F) hydrogen bonds, as the ρ values at BCPs H30-F37, H36-F37 and H31-F37 were + 0.011702, + 0.009453 and + 0.020995 e/a3 respectively. Similarly, the presence of intermolecular (C–H…F) hydrogen-bonds, the ρ values at BCPs H29-F37, H35-F37 and H30-F37 were + 0.011652, + 0.009795 and + 0.021013 e/a3 for RB-2 and H29-F41, H34-F41 and H30-F41 were + 0.012629, + 0.008256 and + 0.020777e/a3 for RB-3 respectively. QTAIM
Scheme 2. Proposed sensing mechanisms of chemosensor.
14
Vol:.(1234567890)
Scientific Reports | (2022) 12:4927 | https://doi.org/10.1038/s41598-022-08860-3
www.nature.com/scientificreports/
Figure 8. Optimized geometries of RB-1, RB-2 and RB-3 chemosensors without and with F− ions calculated at M06/6-311G(d,p) level of theory.
15
Vol.:(0123456789)
Scientific Reports | (2022) 12:4927 | https://doi.org/10.1038/s41598-022-08860-3
www.nature.com/scientificreports/
Figure 9. FMOs of RB-1, RB-1 + F−, RB-2, RB-2 + F−, RB-3, RB-3 + F−.
16
Vol:.(1234567890)
Scientific Reports | (2022) 12:4927 | https://doi.org/10.1038/s41598-022-08860-3
www.nature.com/scientificreports/
analysis also proposed the existance of C–N…F and N–H…F interactions in RB-1 as the ρ values at BCPs N14-F37 and N14-H31 were + 0.007210 and + 0.007573 e/a3 respectively (Table S.1. 30). Similarly, the ρ values at BCPs N14-F37 and N14-H30 were + 0.007226 and + 0.007589 e/a3 for RB-2 and N14-F41 and N14-H30 were + 0.007310 and + 0.007468 e/a3 for RB-3 respectively (Table S.I. 31 & 32).
These interactions clearly showed that this is the strongest NCI present in RB-1, RB-2 and RB-3 (Fig. 10).
ConclusionIn summary, a series of novel quinoline fluorophore based chemosensors (RB-1, RB-2 and RB-3) for detection of F− and CN− ions were synthesized. When these chemosensors were treated with F− and CN− ions a new absorb-ance band appeared which can be reinstated to original one by treating with MeOH. Chemosensors presented a very fast comeback to F− ions (2 s) with change in color from colorless to yellow. The detection limit for F− and CN− ions was calculated as 2.46, 2.48 and 2.49 (10–7) and 2.03, 2.47 and 2.48 (10–7) respectively for RB-1, RB-2 and RB-3. The Binding constant for F− and CN− ions was calculated as 1.53, 7.30 and 1.11 (104 M−1) and 1.56, 3.50 and 3.55 (104 M-1) respectively for RB-1, RB-2 and RB-3. Chemosensors were also employed to detect the traces of F− ions in toothpaste (Sensodyne). DFT and TDDFT based FMOs results confirmed the selective sensing of F− with RB-1, RB-2, RB-3 as HOMOs and LUMOs of RB-1 + F− ions, RB-2 + F− ions, RB-3 + F− ions are found with increased and stabilized values compared to the free chemosensors. Large hardness values (2.049–2.060) upon sensing the F− as compared to free chemosensors values (1.914–1.952) indicate the less reactive, hard and kinetically stable nature of complex sensors. The red-shifting of absorption maximum values upon sensing the F− ions in RB-1 + F− ions, RB-2 + F− ions, RB-3 + F− ions and changes in spectral properties due to formalization of complex are measured which were also well reflected in experimental calculated spectral analyses of free and
Table 2. The energy values of HOMO, LUMO of RB1-RB3 chemosensors without and with F− ions. Eg = ELUMO − EHOMO.
Molecules EHOMO ELUMO Eg
RB-1 − 6.169 − 2.290 3.879
RB-2 − 6.234 − 2.330 3.904
RB-3 − 6.042 − 2.213 3.829
RB-1 + F− − 6.397 − 2.277 4.120
RB-2 + F− − 6.454 − 2.338 4.116
RB-3 + F− − 6.299 − 2.200 4.099
Table 3. Global reactivity parameters for RB-1, RB-1 + F− ions, RB-2, RB-2 + F− ions, RB-3, RB-3 + F− ions chemosensors for free and complex. IP, ionization potential; EA, electron affinity; X, electronegativity; μ, chemical potential; η, hardness; S, softness; ω, electrophilicity.
IP EA X μ η S ω
RB-1 6.169 2.290 4.229 − 4.229 1.939 0.2577 4.611
RB-2 6.234 2.330 4.282 − 4.282 1.952 0.2561 4.696
RB-3 6.042 2.213 4.127 − 4.127 1.914 0.2611 4.449
RB-1 + F− ions 6.397 2.277 4.337 − 4.337 2.060 0.2427 4.565
RB-2 + F− ions 6.454 2.338 4.396 − 4.396 2.058 0.2429 4.695
RB-3 + F− ions 6.299 2.200 4.249 − 4.249 2.049 0.2439 4.405
Table 4. UV–Vis spectral analysis of RB-1, RB-1 + F− ions, RB-2, RB-2 + F− ions, RB-3, RB-3 + F− ions chemosensors at TDDFT/M06/6-311G(d,p) functional. Exp., Experimental; H, HOMO; L, LUMO.
λmax (nm) DFT Ex(eV) ƒos Major electron transportation (%)
RB-1355.08 3.49 0.5742 H-1 → L (95%)
287.88 4.30 0.4099 H-4 → L (12%), H-3 → L (16%), H-1 → L + 1 (57%)
RB-2355.22 3.49 0.6234 H-1 → L (95%)
289.06 4.28 0.3753 H-4 → L (11%), H-3 → L (14%), H-1 → L + 1 (58%)
RB-3 357.03 3.47 0.5894 H-2 → L (11%), H-1 → L (84%)
RB-1 + F− ions 542.67 2.28 0.0194 H-5 → L(20%), H-4 → L (19%), H-2 → L (27%)
RB-2 + F− ions 541.43 2.28 0.0215 H-5 → L (21%), H-4 → L(19%), H-2 → L) (20%)
RB-3 + F− ions 577.79 2.14 0.0333 H-5 → L(62%), H-4 → L(11%)
17
Vol.:(0123456789)
Scientific Reports | (2022) 12:4927 | https://doi.org/10.1038/s41598-022-08860-3
www.nature.com/scientificreports/
complex chemosensors. QTAIM study indicate that H⋅⋅⋅F bond in RB-1 + F− ions, RB-2 + F− ions, RB-3 + F− ions are strong enough which support the sensing of F− via N–H⋅⋅⋅F interactions. We believe that these chemosensors have great potentia for the quantitative analysis in real samples.
Received: 27 December 2021; Accepted: 14 March 2022
References 1. Beer, P. D. et al. Anion recognition and sensing: the state of the art and future perspectives. Angew. Chem. Int. Ed. 40, 486–516
(2001). 2. Bianchi, A. et al. Supramolecular Chemistry of Anions (Wiley-VCH, 1997). 3. Gale, P. A. et al. Anion coordination and anion-directed assembly: highlights from 1997 and 1998. Coord. Chem. Rev. 199, 181–233
(2000). 4. Gale, P. A. et al. Anion receptor chemistry: highlights from 1999. Coord. Chem. Rev. 213, 79–128 (2001). 5. Sancenon, F. et al. Fluorogenic and chromogenic chemosensors and reagents for anions. Chem. Rev. 103, 4419–4476 (2003). 6. Kulig, K. et al. Cyanide Toxicity: US Department of Health & Human Services (Public Health Service, 1991). 7. Yang, Q. et al. A NIR fluorescent probe for the detection of fluoride ions and its application in in vivo bioimaging. J. Mater. Chem.
B 5, 2002–2009 (2017). 8. Zhu, B. et al. A highly selective colorimetric and ratiometric fluorescent chemodosimeter for imaging fluoride ions in living cells.
Chem. Commun. 47, 7098–7100 (2011). 9. Hu, Y. et al. New colorimetric and fluorometric fluoride ion probe based on anthra [1, 9-cd] pyrazol-6 (2 H)-one. J. Fluoresc. 27,
2287–2294 (2017). 10. Upadhyay, K. et al. A coumarin based ICT probe for fluoride in aqueous medium with its real application. Talanta 82, 312–318
(2010). 11. Kim, H. Y. et al. Colorimetric and fluorogenic signaling of fluoride ions by thiophosphinated dichlorofluorescein. Dyes Pigm. 112,
170–175 (2015). 12. Beneto, A. J. et al. A phenanthroimidazole based effective colorimetric chemosensor for copper (II) and fluoride ions. Sens. Actua‑
tors B Chem. 247, 526–531 (2017). 13. Jiao, S. et al. A novel fluorescein-coumarin-based fluorescent probe for fluoride ions and its applications in imaging of living cells
and zebrafish in vivo. Sens. Actuators B Chem. 262, 188–194 (2018). 14. Zhang, M. et al. A novel fluorescent off–on probe for the sensitive and selective detection of fluoride ions. RSC Adv. 9, 32308–32312
(2019). 15. Chen, Y. et al. Fluorescent turn-on probes for the detection of fluoride ions in organic solvent and in cells. Anal. Methods 8, 245–248
(2016). 16. Chen, W. et al. Mitochondrial-targeted near-infrared fluorescence probe for selective detection of fluoride ions in living cells.
Talanta 204, 655–662 (2019).
Figure 10. Schematic structure of AIM analyses for RB-1, RB-2 and RB-3 compounds respectively.
18
Vol:.(1234567890)
Scientific Reports | (2022) 12:4927 | https://doi.org/10.1038/s41598-022-08860-3
www.nature.com/scientificreports/
17. Guo, Z. et al. A colorimetric and fluorometric oligothiophene-indenedione-based sensor for rapid and highly sensitive detection of cyanide in real samples and bioimaging in living cells. Dyes Pigm. 163, 667–674 (2019).
18. Pan, H. et al. A dual-function colorimetric probe based on Carbazole-Cyanine dyad for highly sensitive recognition of cyanide and hypochlorous acid in aqueous media. Talanta 202, 329–335 (2019).
19. Chen, Z. et al. A colorimetric and fluorometric dual-modal chemosensor for cyanide in water. Sens. Actuators B Chem. 168, 14–19 (2012).
20. Guo, Z. et al. A highly selective and sensitive dual-mode sensor for colorimetric and turn-on fluorescent detection of cyanide in water, agro-products and living cells. Anal. Chim. Acta 1065, 113–123 (2019).
21. Chen, J. et al. Sensing mechanism for a fluorescent off–on chemosensor for cyanide anion. J. Lumin. 179, 203–210 (2016). 22. Kwon, S. K. et al. Sensing cyanide ion via fluorescent change and its application to the microfluidic system. Tetrahedron Lett. 49,
4102–4105 (2008). 23. Aydin, D. et al. Sensing of aluminum and cyanide ions utilizing a novel bis-phenol a based fluorogenic probe: Applications in test
stripts. Microchem. J. 159, 105477 (2020). 24. Bhaskar, R., Vijayakumar, V., Srinivasadesikan, V., Lee, S.-L. & Sarveswari, S. Rationally designed imidazole derivative as colori-
metric and fluorometric sensor for selective, qualitative and quantitative cyanide ion detection in real time samples. Spectrochimica Acta Part A Mol. Biomol. Spectroscopy 234, 118212 (2020).
25. Erdemir, S. & Malkondu, S. On-site and low-cost detection of cyanide by simple colorimetric and fluorogenic sensors: smartphone and test strip applications. Talanta 207, 120278 (2020).
26. Uahengo, V. et al. A colorimetric probe for the real-time naked eye detection of cyanide and hydroxide ions in tap water: Experi-mental and theoretical studies. Analyst 144, 6422–6431 (2019).
27. Hatterjee, C., Sethi, S., Mukherjee, V., Sahu, P. K. & Behera, N. Triazole derived azo-azomethine dye as a new colorimetric anion chemosensor. Spectrochim. Acta Part A Mol. Biomol. Spectrosc. 226, 117566 (2020).
28. Singh, A., Gowda, R. G. & Trivedi, D. R. Substituent effect on colorimetric detection of biologically and environmentally relevant anions: Insight in real-life applications. Spectrochim. Acta Part A Mol. Biomol. Spectrosc. 219, 517–529 (2019).
29. Zhang, L., Zhang, F., Ding, L. & Gao, J. Reusable colorimetric and fluorescent chemosensors based on 1, 8-naphthalimide deriva-tives for fluoride ion detection. Spectrochim. Acta Part A Mol. Biomol. Spectrosc. 237, 118 (2020).
30. Cho, E. J. et al. Visible colorimetric fluoride ion sensors. Org. Lett. 7, 2607–2609 (2005). 31. Kang, S. O. et al. Amide-based ligands for anion coordination. Angew. Chem. Int. Ed. 45, 7882–7894 (2006). 32. Mizuno, T. et al. Phenanthroline complexes bearing fused dipyrrolylquinoxaline anion recognition sites: efficient fluoride anion
receptors. J. Am. Chem. Soc. 124, 1134–1135 (2002). 33. Okudan, A. et al. ‘Naked-eye’detection of fluoride and acetate anions by using simple and efficient urea and thiourea based colori-
metric sensors. J. Mol. Struct. 1048, 392–398 (2013). 34. Vázquez, M. et al. A colorimetric approach to anion sensing: a selective chemosensor of fluoride ions, in which color is generated
by anion-enhanced π delocalization. Angew. Chem. Int. Ed. 43, 1962–1965 (2004). 35. Erdemir, S. et al. Fluorogenic recognition of Zn2+, Al3+ and F-ions by a new multi-analyte chemosensor based bisphenol A-qui-
noline. J. Fluoresc. 25, 719–727 (2015). 36. Fu, H. et al. A quinoline-based selective ‘turn on’chemosensor for zinc (II) via quad-core complex, and its application in live cell
imaging. Tetrahedron 75, 130710 (2019). 37. Jia, C. et al. A colorimetric and ratiometric fluorescent chemosensor for fluoride based on proton transfer. J. Fluoresc. 20, 291–297
(2010). 38. Kim, A. et al. Developing a new chemosensor targeting zinc ion based on two types of quinoline platform. Spectrochim. Acta Part
A Mol. Biomol. Spectrosc. 241, 118 (2020). 39. Wang, Y. et al. A novel AIE chemosensor based on quinoline functionalized Pillar arene for highly selective and sensitive sequential
detection of toxic Hg2+ and CN−. Dyes Pigm. 164, 279–286 (2019). 40. Maity, D. et al. Modulation of fluorescence sensing properties of quinoline-based chemosensor for Zn2+: Application in cell imag-
ing studies. J. Lumin. 210, 508–518 (2019). 41. Mal, K. et al. Synthesis of quinoline functionalized fluorescent chemosensor for Cu (II), DFT studies and its application in imaging
in living HEK 293 cells. J. Photochem. Photobiol. A Chem. 389, 112 (2020). 42. Kontogiorgis, C. A. et al. Synthesis and antiinflammatory activity of coumarin derivatives. J. Med. Chem. 48, 6400–6408 (2005). 43. Dennington, R.D. et al., GaussView 5.0. 8, Gaussian Inc, (2008). 44. Frisch, M.J. et al. Gaussian, Inc., Wallingford (2009). 45. Civalleri, B. et al. B3LYP augmented with an empirical dispersion term (B3LYP-D*) as applied to molecular crystals. CrystEngComm
10, 405–410 (2008). 46. Yanai, T. et al. A new hybrid exchange–correlation functional using the Coulomb-attenuating method (CAM-B3LYP). Chem. Phys.
Lett. 393, 51–57 (2004). 47. Iikura, H. et al. A long-range correction scheme for generalized-gradient-approximation exchange functionals. J. Chem. Phys. 115,
3540–3544 (2001). 48. Walker, M. et al. Performance of M06, M06–2X, and M06-HF density functionals for conformationally flexible anionic clusters:
M06 functionals perform better than B3LYP for a model system with dispersion and ionic hydrogen-bonding interactions. J. Phys. Chem. A 117, 12590–12600 (2013).
49. Zhao, Y. et al. The M06 suite of density functionals for main group thermochemistry, thermochemical kinetics, noncovalent interactions, excited states, and transition elements: two new functionals and systematic testing of four M06-class functionals and 12 other functionals. Theor. Chem. Acc. 120, 215–241 (2008).
50. Zhai, L. et al. The antileishmanial activity of novel oxygenated chalcones and their mechanism of action. J. Antimicrob. Chemother. 43(6), 793–803 (1999).
51. Rasool, F. et al. Experimental and Theoretical investigations on (E)-3-(4-ethoxyphenyl)-1-(2-(trifluoromethyl) phenyl) prop-2-en-1-one and (E)-3-(naphthalen-2-yl)-1-(2-(trifluoromethyl) phenyl) prop-2-en-1-one: DNA binding, Urease inhibition and Promising NLO response. J. Mol. Struct. 1253, 132194 (2021).
52. Arooj, M. et al. Coumarin based thiosemicarbazones as effective chemosensors for fluoride ion detection. Spectrochim. Acta Part A Mol. Biomol. Spectrosc. 17, 120011 (2021).
53. Islam, M. et al. Receptor-spacer-fluorophore based coumarin-thiosemicarbazones as anion chemosensors with “turn on” response: spectroscopic and computational (DFT) studies. ChemistrySelect 3, 7633–7642 (2018).
54. Basheer, S. M., Willis, A. C. & Sreekanth, A. Spectroscopic and TD-DFT studies on the dual mode fluorescent chemosensors based on pyrene thiosemicarbazones, and its application as molecular-scale logic devices. J. Lumin. 183, 266–280 (2017).
55. Isaac, I. O. et al. Novel acridine-based thiosemicarbazones as ‘turn-on’chemosensors for selective recognition of fluoride anion: a spectroscopic and theoretical study. R. Soc. Open Sci. 5, 180646 (2018).
56. Naseem, S., Tariq, S., Islam, M., Ahmad, N., & Shafiq, Z. Synthesis of coumarin derived thiosemicarbazones as colorimetric and fluorescent ‘turn on’ chemosensors for fluoride ions. Available at SSRN 3944472.
57. Nagaraaj, P. & Vijayakumar, V. Mannich base based (β-amino carbonyl compound) receptor for efficient and selective sensing of fluoride ions. J. Fluoresc. 29, 993–999 (2019).

19
Vol.:(0123456789)
Scientific Reports | (2022) 12:4927 | https://doi.org/10.1038/s41598-022-08860-3
www.nature.com/scientificreports/
58. Zhou, Y. & Bao, X. Synthesis, recognition and sensing properties of dipyrrolylmethane-based anion receptors. Spectrochim. Acta Part A Mol. Biomol. Spectrosc. 210, 1–8 (2019).
59. Arooj, M. et al. Coumarin based thiosemicarbazones as effective chemosensors for fluoride ion detection. Spectrochim. Acta Part A Mol. Biomol. Spectrosc. 261, 120 (2021).
60. Raghavendra, V. et al. Bader’s theory of atoms in molecules (AIM) and its applications to chemical bonding. J. Chem. Sci. 128, 1527–1536 (2016).
61. Bader, R. F. et al. Atoms in molecules. Acc. Chem. Res. 18, 9–15 (1985). 62. Bader, R. et al. Quantum theory of atoms in molecules-dalton revisited. Adv. Quantum Chem. 14, 63–124 (1981). 63. Wojtulewski, S. et al. N-oxide as a proton accepting group in multicomponent crystals: X-ray and theoretical studies on new
p-nitropyridine-N-oxide co-crystals. Cryst. Growth Des. 15, 5802–5815 (2015). 64. Johnson, E. R. Revealing non-covalent interactions in solids: NCI plots revisited. Phys. Chem. Chem. Phys. 14, 12165–12172 (2012). 65. Desiraju, G. R. et al. Crystal engineering: A brief overview. J. Chem. Sci. 122, 667–675 (2010). 66. Paredes, J. H. et al. Molecular structure, hydrogen-bonding patterns and topological analysis (QTAIM and NCI) of 5-methoxy-
2-nitroaniline and 5-methoxy-2-nitroaniline with 2-amino-5-nitropyridine (1: 1) co-crystal. J. Mol. Struct. 1119, 505–516 (2016).
AcknowledgementsThe authors extend their appreciation to the Researchers supporting Project number (RSP-2021/120), King Saud University, Riyadh, Saudi Arabia. Z. S is thankful to Higher Education Commission (HEC), Islamabad, Pakistan through Project No. 6975/NRPU/R&D.
Author contributionsZ.S., M.K. and M.A. designed the idea and wrote / revised the manuscript. R.B and N.A carried out synthesis of probes and their characterization. A.S., A.E. M and S.S. Al-R. preformed DNA studies and prepared figures. M.U.K and A.A.C.B. performed computational studies.
Competing interests The authors declare no competing interests.
Additional informationSupplementary Information The online version contains supplementary material available at https:// doi. org/ 10. 1038/ s41598- 022- 08860-3.
Correspondence and requests for materials should be addressed to Z.S.
Reprints and permissions information is available at www.nature.com/reprints.
Publisher’s note Springer Nature remains neutral with regard to jurisdictional claims in published maps and institutional affiliations.
Open Access This article is licensed under a Creative Commons Attribution 4.0 International License, which permits use, sharing, adaptation, distribution and reproduction in any medium or
format, as long as you give appropriate credit to the original author(s) and the source, provide a link to the Creative Commons licence, and indicate if changes were made. The images or other third party material in this article are included in the article’s Creative Commons licence, unless indicated otherwise in a credit line to the material. If material is not included in the article’s Creative Commons licence and your intended use is not permitted by statutory regulation or exceeds the permitted use, you will need to obtain permission directly from the copyright holder. To view a copy of this licence, visit http:// creat iveco mmons. org/ licen ses/ by/4. 0/.
© The Author(s) 2022


![Synthesis, cytotoxic evaluation, and DNA binding of novel thiazolo[5,4-b]quinoline derivatives](https://img.dokumen.tips/doc/110x75/635dae77095e4caf2205d875/synthesis-cytotoxic-evaluation-and-dna-binding-of-novel-thiazolo54-bquinoline.jpg)


![7-Chloro-4-[( E )- N ′-(4-fluorobenzylidene)hydrazinyl]quinoline monohydrate](https://img.dokumen.tips/doc/110x75/6344856cdf19c083b107a13e/7-chloro-4-e-n-4-fluorobenzylidenehydrazinylquinoline-monohydrate.jpg)


