Embed Size (px)
Citation preview
Citation: Salih, A.E.; Elsherif, M.;
Alam, F.; Chiesa, M.; Butt, H. Rapid
Colorimetric pH-Responsive Gold
Nanocomposite Hydrogels for
Sensing Applications. Nanomaterials
2022, 12, 1486. https://doi.org/
10.3390/nano12091486
Academic Editors: Deepak Kukkar
and Ki-Hyun Kim
Received: 28 March 2022
Accepted: 22 April 2022
Published: 27 April 2022
Publisher’s Note: MDPI stays neutral
with regard to jurisdictional claims in
published maps and institutional affil-
iations.
Copyright: © 2022 by the authors.
Licensee MDPI, Basel, Switzerland.
This article is an open access article
distributed under the terms and
conditions of the Creative Commons
Attribution (CC BY) license (https://
creativecommons.org/licenses/by/
4.0/).
nanomaterials
Article
Rapid Colorimetric pH-Responsive Gold NanocompositeHydrogels for Sensing ApplicationsAhmed E. Salih 1,* , Mohamed Elsherif 1, Fahad Alam 1 , Matteo Chiesa 1,2 and Haider Butt 1,*
1 Department of Mechanical Engineering, Khalifa University, Abu Dhabi P.O. Box 127788,United Arab Emirates; [email protected] (M.E.); [email protected] (F.A.);[email protected] (M.C.)
2 Department of Physics and Technology, UiT The Arctic University of Norway, 9010 Tromsø, Norway* Correspondence: [email protected] (A.E.S.); [email protected] (H.B.)
Abstract: Surface functionalization of metallic nanoparticles (NPs) with external groups can beengineered to fabricate sensors that are responsive to various stimuli like temperature, pH, andnumerous ions. Herein, we report the synthesis of gold nanoparticles (GNPs) functionalized with3-mercaptopropionic acid (GNPs-MPA) and the doping of these nanoparticles into hydrogel materialsusing the breathing-in/breathing-out (BI-BO) method. MPA has a carboxyl group that becomesprotonated and, thus, ionized at a pH below its pKa (4.32); hence, the GNPs-MPA solutions andgels were mostly pH-responsive in the range of 3–5. Optical properties were assessed throughultraviolet-visible (UV-Vis) spectroscopy, namely: transmission and absorption, and the parametersused to quantify the pH changes were the full width at half maximum (FWHM) and position ofsurface plasmon resonance (SPR). The solutions and gels gradually changed their colors from red toindigo with pH decrementation from 5 to 3, respectively. Furthermore, the solutions’ and doped gels’highest FWHM sensitivities towards pH variations were 20 nm and 55 nm, respectively, while theSPR’s position sensitivities were 18 nm and 10 nm, respectively. Also, transmission and scanningelectron microscopy showed synchronized dispersion and aggregation of NPs with pH change inboth solution and gel forms. The gel exhibited excellent repeatability and reversibility properties,and its response time was instantaneous, which makes its deployment as a colorimetric pH-triggeredsensor practical. To the best of our knowledge, this is the first study that has incorporated GNPs intohydrogels utilizing the BI-BO method and demonstrated the pH-dependent optical and colorimetricproperties of the developed nanocomposites.
Keywords: nanocomposites; Biosensors; pH sensors; colorimetric sensing; optical sensors
1. Introduction
Owing to their interesting optical, electronic, and chemical properties, gold nanoparti-cles (GNPs) have been used extensively in biomedical and chemical related industries [1–6].In a myriad of applications, GNPS undergo surface functionalization, which either enhancesthe intrinsic properties of these nanoparticles (NPs) or introduces new ones [7–10]. Some ofthe commonly used functional groups for gold nanoparticles include thiols, carboxylates,and amines. Surface functionalization with such groups allows gold nanoparticles to exhibitphysiochemical properties that are responsive to external stimuli, such as pH, temperature,and ions, making them attractive for biosensing and other biological applications [11,12].
Recently, pH-triggered colorimetric changes of functionalized gold colloidal NPs werestudied and utilized in numerous applications [13–19]. For example, Nam et al. functional-ized GNPs with an amide group and used their pH-responsive behavior in photothermalcancer therapy [11]. Thiols have widely been used as pH-triggered molecules and attachedto GNPs. For instance, Ansar et al. fabricated MUA-functionalized gold nanoparticlesand applied their pH-triggered aggregation and re-dispersion properties in catalysis [7].
Nanomaterials 2022, 12, 1486. https://doi.org/10.3390/nano12091486 https://www.mdpi.com/journal/nanomaterials
Nanomaterials 2022, 12, 1486 2 of 14
Authors showed that the GNPs aggregated at pH 4.1 due to MUA protonation, resultingin reduced surface charge. Yet at pH 8.7, MUA ionization occurred and phase transferinto an immiscible organic phase was induced. Further, optimum MUA surface coverage,which ensures adequate colloidal stability and catalytic activity was reported at 90%. Thesignificance of the developed catalyst was apparent in its ability to show excellent recoveryand reusability at different pH regimes. Fan et al. [7] developed responsive nanovesicles byself-assembly of GNPs with mercaptobenzonic acid (4-MBA) and oleylamine (OL) [20]. Self-assembled nanovesicles dissociated into monodisperse NPs at alkaline conditions (pH 11.7),yet those NPs reassembled into nanovesicles when placed in an acidic solution (pH 4.8).Similar to previous studies, this reversible behavior was due to the deprotonation andprotonation of 4-MBA. Reversible changes of the NPs were confirmed through capturedtransmission electron microscopy (TEM) images and measured surface plasmon resonance(SPR) position of the assembled and disassembled nanovesicles. Authors also tested theadequacy of the developed pH-responsive gold nanovesicles for drug release applicationsby loading the NPs with Rhodamine B (RhB), which has a fluorescence emission at around575 nm, and monitoring the release of RhB as the pH was varied. Results showed that thefluorescence intensity increased gradually with pH incrementation until all RhB moleculeswere released entirely, upon which the fluorescence intensity became stagnant. Thus, thesepH-responsive gold nanovesicles are good candidates for biosensing and controlled drugrelease. Moreover, Shiraishi et al. [20] grafted 3-mercaptopropionic acid (MPA) into goldnanoparticles (GNPs-MPA) and studied their optical-colorimetric response at different pHvalues [21].The developed GNPs-MPA exhibited a reversible colorimetric change betweenred and purple in basic and acidic conditions, respectively. The authors attributed theresulting change in color to the degree of NPs’ dispersion, which they confirmed throughTEM micrographs of the GNP at different pHs. Although the pKa of MPA is 4.34, authorsdid not report the pH at which their developed gold nanoparticles became precipitatedand heavily aggregated [21].
The aforementioned studies examined extensively multiple pH-responsive molecules,added them to GNPs, and utilized them for different applications. However, the opticaland colorimetric behavior of pH-responsive GNPs integrated into hydrogels has yet tobe thoroughly explored. Hydrogels have been utilized to fabricate smart sensing opticalfibers, contact lenses, and skin patches [22–28]. More recently, gold and silver nanoparticleswere introduced in contact lenses as color filtering devices for color blind patients [29,30].The latter highlights few of the contemporary research done in which nanoparticles wereintegrated with hydrogels for biomedical applications. Hence, successful incorporationof colorimetric pH-responsive GNPs into hydrogel materials could pave the way for thedevelopment of a wide range of nano-sensing devices.
In this study, pH-responsive GNPs-MPA were synthesized and incorporated intohydrogels via the breathing-in/breathing-out (BI-BO) method, which has been previouslyutilized to integrate NPs into hydrogel materials [31–34]. Optical properties of the de-veloped GNPs-MPA solutions were characterized through ultraviolet-visible (UV-Vis)spectroscopy at different pH values. The morphology of the colloidal nanoparticles atdistinct pHs was examined through the TEM. After using the BI-BO method, the devel-oped nanocomposites were characterized for their optical and morphological propertiesat different pHs. The colorimetric red, green, and blue (RGB) data from each hydrogelwas analyzed as the pH was altered. The optical properties used to quantify the sensor’sresponse were the SPR position and full width at half maximum (FWHM). The repeatability,reversibility, sensitivity, and response time capabilities of the developed nanocompositesensor were also reported and analyzed.
2. Materials and Methods2.1. Materials
Chloroauric acid (HAuCl4, 99.99% trace metals basis), 3-mercaptopropionic acid(MPA, ≥99.0%), trisodium citrate dihydrate (Na3C6H5O7·2H2O, ≥99.0%), sodium hydrox-
Nanomaterials 2022, 12, 1486 3 of 14
ide (NaOH, ≥98.0%), acetone (C3H6O, ≥99.5%), and hydrochloric acid (HCl, 37%) werepurchased from Sigma Aldrich (St. Louis, MO, USA) and used as is without further purifi-cation. Acuvue Oasys 1-Day with HydraLuxe contact lenses were obtained from Acuvue,Johnson & Johnson®, New Brunswick, NJ, USA.
2.2. Preparation and Fabrication of Gold Nanoparticles Protected by MPA
Colloidal GNPs-MPA were synthesized utilizing the well-known Turkevich citrate-reduction method [35,36]. 17 mg of HAuCl4 were dissolved in 100 mL of deionized water(DI) and heated to boiling point. Prior to that, 0.1 M sodium 3-mercaptopropionate (MPA-Na) was prepared by mixing 175 µL of MPA with 80 mg of NaOH in 20 mL of DI water.200 µL of the latter was added to 3.87 mL of 1% trisodium citrate dihydrate. When theprecursor solution reached boiling, the aforementioned mixture was added and stirred for3 min, upon which the color turned red. Then, the mixture was left to stir for 30 min atroom temperature and was subsequently stored at 4 ◦C.
2.3. Breathing of GNPs-MPA into Hydrogel Matrix
Colloidal GNPs-MPA were incorporated into the hydrogels utilizing the BI-BOmethod [31–33]. Contact lenses were used as hydrogel materials and were purchasedfrom Johnson & Johnson®. The hydrogels were placed in 5 mL of acetone for 2 min, afterwhich the gels became shrunken. Then, they were kept in 5 mL of the synthesized GNPs-MPA colloid for 5 min; gels were swollen at this stage. Subsequently, when the gels wereplaced again in acetone, the NPs remained inside their network while water was expelled.This process was repeated to show the effect of the number of cycles on the gel’s opticalproperties. Gels were washed with DI water to remove unadsorbed NPs. The fabricationscheme is demonstrated in Figure 1a.
2.4. Preparations and Testing of GNPs-MPA Solutions and GELs at Different pHs
GNPs-MPA colloids at distinct pHs were prepared by adding 1 mL of the colloidto 1 mL of DI water, which was adjusted using 0.1 M HCl/NaOH to reach the desiredpH. Although the pH of the prepared colloids ranged from strongly acidic to basic (2 to8 respectively), most of these solutions were designed around the pKa of MPA (4.34).Moreover, two GNPs-MPA gels with different concentrations (number of BI-BO cycles)were tested in five different pH solutions. The pH of the solutions was measured usingAtlas Scientific’s Lab Grade pH Probe.
2.5. Characterization of pH-Responsive GNPs-MPA Solutions and Gels
Optical and morphological characterizations were primarily done to assess the pHresponsive behavior of the developed GNPs-MPA solutions and doped gels. The transmis-sion and absorption spectra of the GNPs-MPA solutions were obtained using USB 4000+spectrophotometer (Ocean Optics, Douglas Avenue, Dunedin, FL, USA) with operationrange of 200–1100 nm. 1 mL of each solution was deposited into a cuvette, and the trans-mission and absorption spectra were recorded using OceanView software. Tecnai TEM200 kV was used to image the NPs’ morphology at different pHs. A copper mesh grid fromAgar Scientific was dipped in 1 mL of the GNPs-MPA solution for 1 min and was thendried in vacuum oven. Size and distribution histograms of the micrographs were done andanalyzed using 1.50d ImageJ software.
Furthermore, the transmission and absorption spectra of the doped nanocompositegels were recorded after 3, 6, 9, 12, and 15 BI-BO cycles. Leakage of the nanoparticlesfrom the gels was assessed over a one-month period and is provided in the supplementarymaterials. Also, optical spectra of two doped gels that have varying NPs’ concentrationwere measured upon immersing them in five different pH solutions. Then, the colorimetricresponse (RGB values) of the gels was processed through ImageJ.
Scanning electron microscopy (SEM) images of the doped gel’s cross-section weredone to examine the morphology of the NPs inside the gel; FEI Nova NanoSEM 650, which
Nanomaterials 2022, 12, 1486 4 of 14
has an electron beam resolution of 0.8 nm, was used in this study. Initially, the gel wasequally sheared, and one part was placed in a basic solution while the other was placed inan acidic solution. Both gels were dried in vacuum oven and coated with 8 nm layer ofGold/Palladium to avoid the charge-up effect.
Nanomaterials 2022, 12, x FOR PEER REVIEW 4 of 15
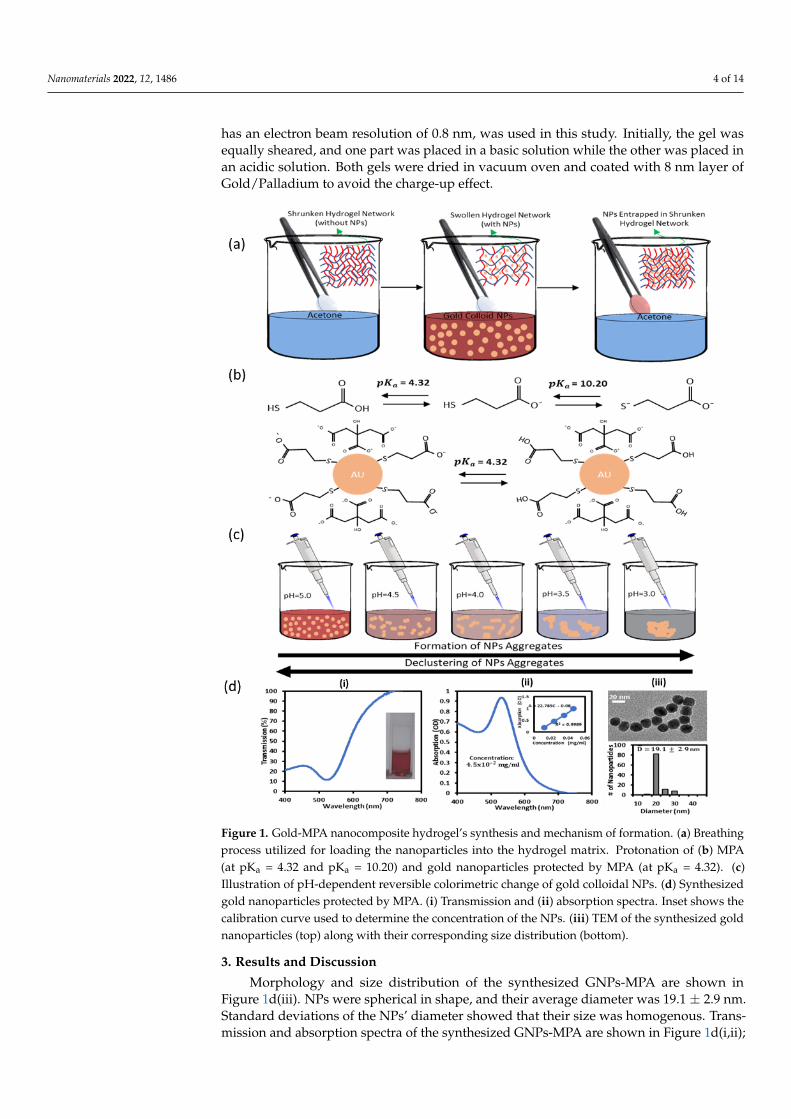
Figure 1. Gold-MPA nanocomposite hydrogel’s synthesis and mechanism of formation. (a) Breath-
ing process utilized for loading the nanoparticles into the hydrogel matrix. Protonation of (b) MPA
(at pKa = 4.32 and pKa = 10.20) and gold nanoparticles protected by MPA (at pKa = 4.32). (c) Illustra-
tion of pH-dependent reversible colorimetric change of gold colloidal NPs. (d) Synthesized gold
nanoparticles protected by MPA. (i) Transmission and (ii) absorption spectra. Inset shows the cali-
bration curve used to determine the concentration of the NPs. (iii) TEM of the synthesized gold
nanoparticles (top) along with their corresponding size distribution (bottom).
Furthermore, the transmission and absorption spectra of the doped nanocomposite
gels were recorded after 3, 6, 9, 12, and 15 BI-BO cycles. Leakage of the nanoparticles from
the gels was assessed over a one-month period and is provided in the supplementary ma-
terials. Also, optical spectra of two doped gels that have varying NPs’ concentration were
measured upon immersing them in five different pH solutions. Then, the colorimetric re-
sponse (RGB values) of the gels was processed through ImageJ.
Scanning electron microscopy (SEM) images of the doped gel’s cross-section were
done to examine the morphology of the NPs inside the gel; FEI Nova NanoSEM 650, which
has an electron beam resolution of 0.8 nm, was used in this study. Initially, the gel was
equally sheared, and one part was placed in a basic solution while the other was placed
Figure 1. Gold-MPA nanocomposite hydrogel’s synthesis and mechanism of formation. (a) Breathingprocess utilized for loading the nanoparticles into the hydrogel matrix. Protonation of (b) MPA(at pKa = 4.32 and pKa = 10.20) and gold nanoparticles protected by MPA (at pKa = 4.32). (c)Illustration of pH-dependent reversible colorimetric change of gold colloidal NPs. (d) Synthesizedgold nanoparticles protected by MPA. (i) Transmission and (ii) absorption spectra. Inset shows thecalibration curve used to determine the concentration of the NPs. (iii) TEM of the synthesized goldnanoparticles (top) along with their corresponding size distribution (bottom).
3. Results and Discussion
Morphology and size distribution of the synthesized GNPs-MPA are shown inFigure 1d(iii). NPs were spherical in shape, and their average diameter was 19.1 ± 2.9 nm.Standard deviations of the NPs’ diameter showed that their size was homogenous. Trans-mission and absorption spectra of the synthesized GNPs-MPA are shown in Figure 1d(i,ii);
Nanomaterials 2022, 12, 1486 5 of 14
the SPR occurred at 522 while the FWHM was 56 nm. The narrow bandwidth confirms theassertions made from the TEM images regarding the NPs’ homogenous size distribution.
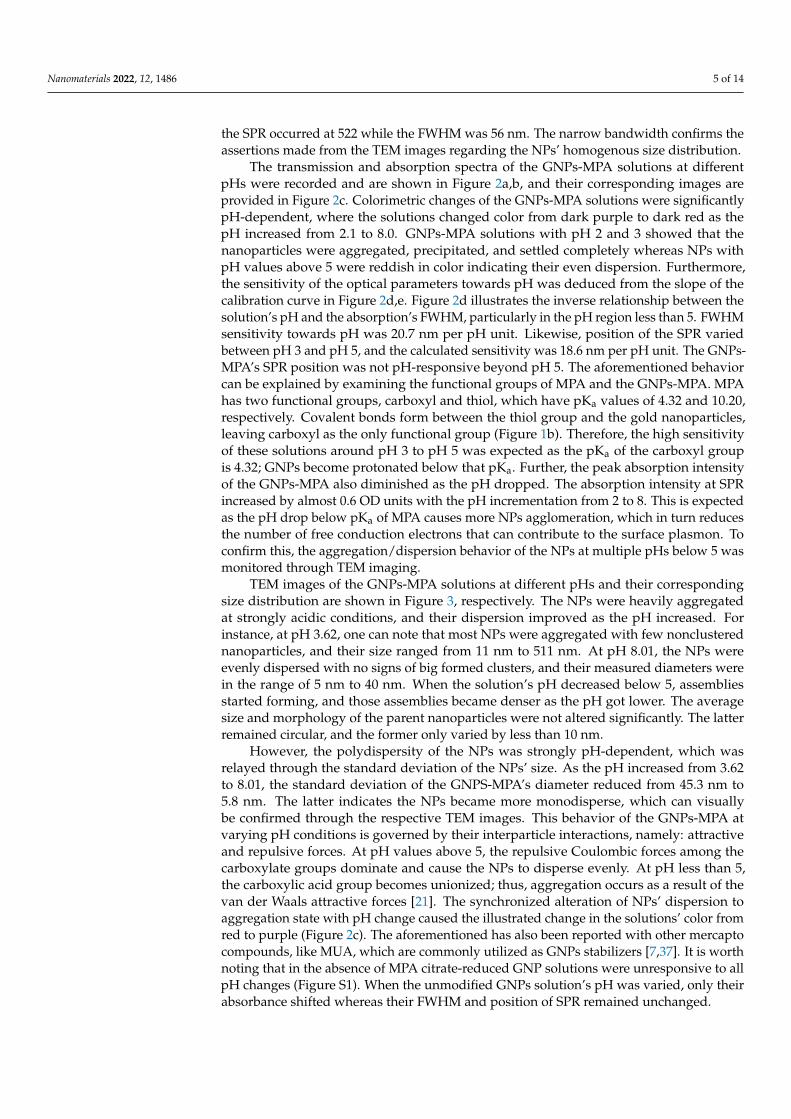
The transmission and absorption spectra of the GNPs-MPA solutions at differentpHs were recorded and are shown in Figure 2a,b, and their corresponding images areprovided in Figure 2c. Colorimetric changes of the GNPs-MPA solutions were significantlypH-dependent, where the solutions changed color from dark purple to dark red as thepH increased from 2.1 to 8.0. GNPs-MPA solutions with pH 2 and 3 showed that thenanoparticles were aggregated, precipitated, and settled completely whereas NPs withpH values above 5 were reddish in color indicating their even dispersion. Furthermore,the sensitivity of the optical parameters towards pH was deduced from the slope of thecalibration curve in Figure 2d,e. Figure 2d illustrates the inverse relationship between thesolution’s pH and the absorption’s FWHM, particularly in the pH region less than 5. FWHMsensitivity towards pH was 20.7 nm per pH unit. Likewise, position of the SPR variedbetween pH 3 and pH 5, and the calculated sensitivity was 18.6 nm per pH unit. The GNPs-MPA’s SPR position was not pH-responsive beyond pH 5. The aforementioned behaviorcan be explained by examining the functional groups of MPA and the GNPs-MPA. MPAhas two functional groups, carboxyl and thiol, which have pKa values of 4.32 and 10.20,respectively. Covalent bonds form between the thiol group and the gold nanoparticles,leaving carboxyl as the only functional group (Figure 1b). Therefore, the high sensitivityof these solutions around pH 3 to pH 5 was expected as the pKa of the carboxyl groupis 4.32; GNPs become protonated below that pKa. Further, the peak absorption intensityof the GNPs-MPA also diminished as the pH dropped. The absorption intensity at SPRincreased by almost 0.6 OD units with the pH incrementation from 2 to 8. This is expectedas the pH drop below pKa of MPA causes more NPs agglomeration, which in turn reducesthe number of free conduction electrons that can contribute to the surface plasmon. Toconfirm this, the aggregation/dispersion behavior of the NPs at multiple pHs below 5 wasmonitored through TEM imaging.
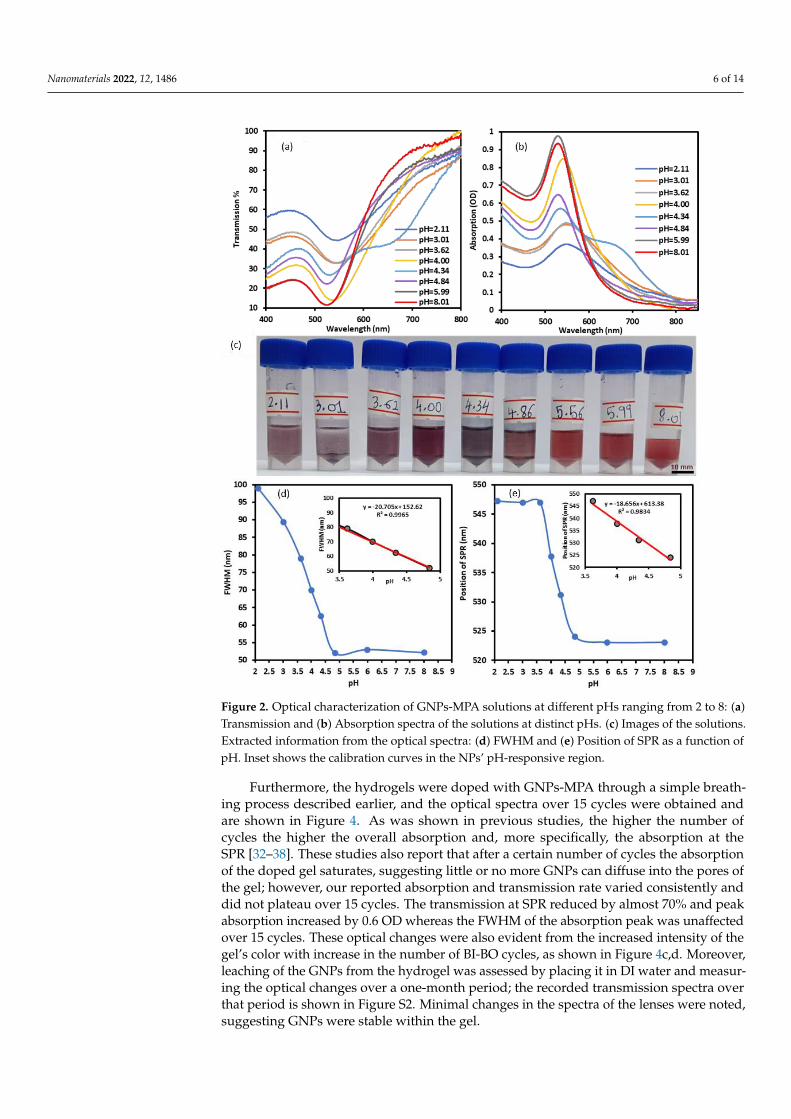
TEM images of the GNPs-MPA solutions at different pHs and their correspondingsize distribution are shown in Figure 3, respectively. The NPs were heavily aggregatedat strongly acidic conditions, and their dispersion improved as the pH increased. Forinstance, at pH 3.62, one can note that most NPs were aggregated with few nonclusterednanoparticles, and their size ranged from 11 nm to 511 nm. At pH 8.01, the NPs wereevenly dispersed with no signs of big formed clusters, and their measured diameters werein the range of 5 nm to 40 nm. When the solution’s pH decreased below 5, assembliesstarted forming, and those assemblies became denser as the pH got lower. The averagesize and morphology of the parent nanoparticles were not altered significantly. The latterremained circular, and the former only varied by less than 10 nm.
However, the polydispersity of the NPs was strongly pH-dependent, which wasrelayed through the standard deviation of the NPs’ size. As the pH increased from 3.62to 8.01, the standard deviation of the GNPS-MPA’s diameter reduced from 45.3 nm to5.8 nm. The latter indicates the NPs became more monodisperse, which can visuallybe confirmed through the respective TEM images. This behavior of the GNPs-MPA atvarying pH conditions is governed by their interparticle interactions, namely: attractiveand repulsive forces. At pH values above 5, the repulsive Coulombic forces among thecarboxylate groups dominate and cause the NPs to disperse evenly. At pH less than 5,the carboxylic acid group becomes unionized; thus, aggregation occurs as a result of thevan der Waals attractive forces [21]. The synchronized alteration of NPs’ dispersion toaggregation state with pH change caused the illustrated change in the solutions’ color fromred to purple (Figure 2c). The aforementioned has also been reported with other mercaptocompounds, like MUA, which are commonly utilized as GNPs stabilizers [7,37]. It is worthnoting that in the absence of MPA citrate-reduced GNP solutions were unresponsive to allpH changes (Figure S1). When the unmodified GNPs solution’s pH was varied, only theirabsorbance shifted whereas their FWHM and position of SPR remained unchanged.
Nanomaterials 2022, 12, 1486 6 of 14Nanomaterials 2022, 12, x FOR PEER REVIEW 6 of 15
Figure 2. Optical characterization of GNPs-MPA solutions at different pHs ranging from 2 to 8: (a)
Transmission and (b) Absorption spectra of the solutions at distinct pHs. (c) Images of the solutions.
Extracted information from the optical spectra: (d) FWHM and (e) Position of SPR as a function of
pH. Inset shows the calibration curves in the NPs’ pH-responsive region.
However, the polydispersity of the NPs was strongly pH-dependent, which was re-
layed through the standard deviation of the NPs’ size. As the pH increased from 3.62 to
8.01, the standard deviation of the GNPS-MPA’s diameter reduced from 45.3 nm to 5.8
nm. The latter indicates the NPs became more monodisperse, which can visually be con-
firmed through the respective TEM images. This behavior of the GNPs-MPA at varying
pH conditions is governed by their interparticle interactions, namely: attractive and re-
pulsive forces. At pH values above 5, the repulsive Coulombic forces among the carbox-
ylate groups dominate and cause the NPs to disperse evenly. At pH less than 5, the car-
boxylic acid group becomes unionized; thus, aggregation occurs as a result of the van der
Waals attractive forces [21]. The synchronized alteration of NPs’ dispersion to aggregation
state with pH change caused the illustrated change in the solutions’ color from red to
Figure 2. Optical characterization of GNPs-MPA solutions at different pHs ranging from 2 to 8: (a)Transmission and (b) Absorption spectra of the solutions at distinct pHs. (c) Images of the solutions.Extracted information from the optical spectra: (d) FWHM and (e) Position of SPR as a function ofpH. Inset shows the calibration curves in the NPs’ pH-responsive region.
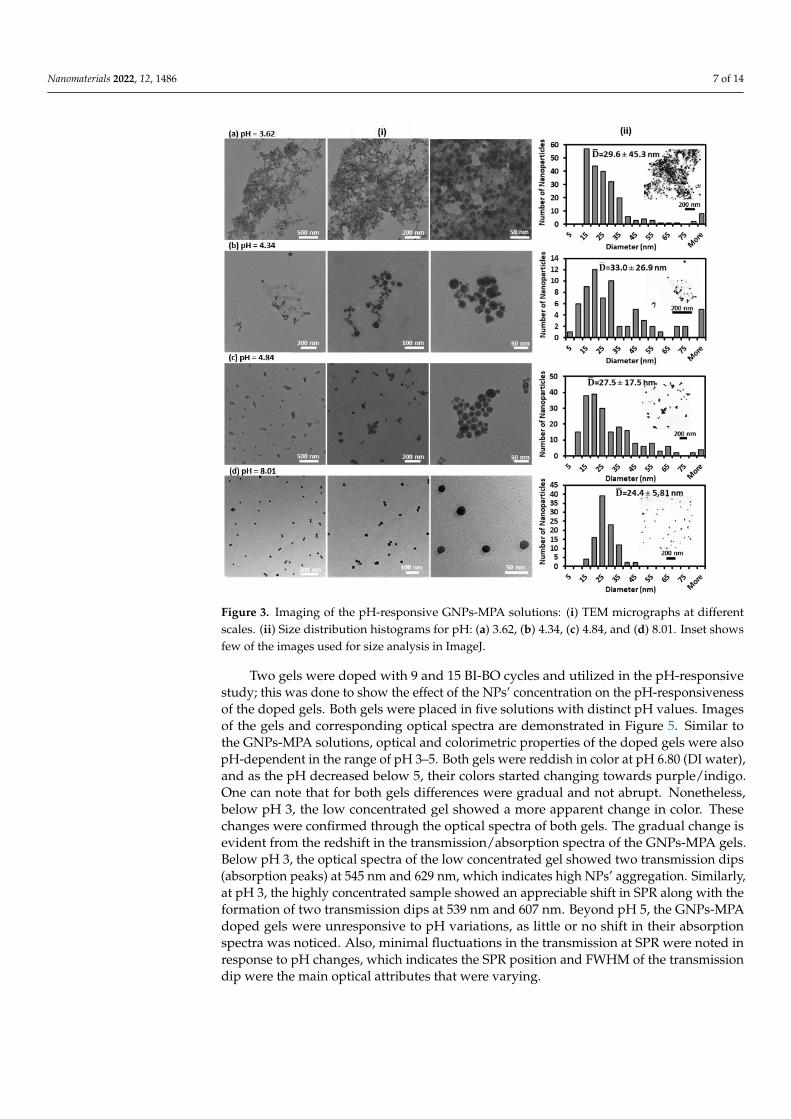
Furthermore, the hydrogels were doped with GNPs-MPA through a simple breath-ing process described earlier, and the optical spectra over 15 cycles were obtained andare shown in Figure 4. As was shown in previous studies, the higher the number ofcycles the higher the overall absorption and, more specifically, the absorption at theSPR [32–38]. These studies also report that after a certain number of cycles the absorptionof the doped gel saturates, suggesting little or no more GNPs can diffuse into the pores ofthe gel; however, our reported absorption and transmission rate varied consistently anddid not plateau over 15 cycles. The transmission at SPR reduced by almost 70% and peakabsorption increased by 0.6 OD whereas the FWHM of the absorption peak was unaffectedover 15 cycles. These optical changes were also evident from the increased intensity of thegel’s color with increase in the number of BI-BO cycles, as shown in Figure 4c,d. Moreover,leaching of the GNPs from the hydrogel was assessed by placing it in DI water and measur-ing the optical changes over a one-month period; the recorded transmission spectra overthat period is shown in Figure S2. Minimal changes in the spectra of the lenses were noted,suggesting GNPs were stable within the gel.
Nanomaterials 2022, 12, 1486 7 of 14
Nanomaterials 2022, 12, x FOR PEER REVIEW 7 of 15
purple (Figure 2c). The aforementioned has also been reported with other mercapto com-
pounds, like MUA, which are commonly utilized as GNPs stabilizers [7,37]. It is worth
noting that in the absence of MPA citrate-reduced GNP solutions were unresponsive to
all pH changes (Figure S1). When the unmodified GNPs solution’s pH was varied, only
their absorbance shifted whereas their FWHM and position of SPR remained unchanged.
Figure 3. Imaging of the pH-responsive GNPs-MPA solutions: (i) TEM micrographs at different
scales. (ii) Size distribution histograms for pH: (a) 3.62, (b) 4.34, (c) 4.84, and (d) 8.01. Inset shows
few of the images used for size analysis in ImageJ.
Furthermore, the hydrogels were doped with GNPs-MPA through a simple breath-
ing process described earlier, and the optical spectra over 15 cycles were obtained and are
shown in Figure 4. As was shown in previous studies, the higher the number of cycles the
higher the overall absorption and, more specifically, the absorption at the SPR [32–38].
These studies also report that after a certain number of cycles the absorption of the doped
gel saturates, suggesting little or no more GNPs can diffuse into the pores of the gel; how-
ever, our reported absorption and transmission rate varied consistently and did not plat-
eau over 15 cycles. The transmission at SPR reduced by almost 70% and peak absorption
increased by 0.6 OD whereas the FWHM of the absorption peak was unaffected over 15
cycles. These optical changes were also evident from the increased intensity of the gel’s
color with increase in the number of BI-BO cycles, as shown in Figure 4c,d. Moreover,
leaching of the GNPs from the hydrogel was assessed by placing it in DI water and meas-
uring the optical changes over a one-month period; the recorded transmission spectra
Figure 3. Imaging of the pH-responsive GNPs-MPA solutions: (i) TEM micrographs at differentscales. (ii) Size distribution histograms for pH: (a) 3.62, (b) 4.34, (c) 4.84, and (d) 8.01. Inset showsfew of the images used for size analysis in ImageJ.
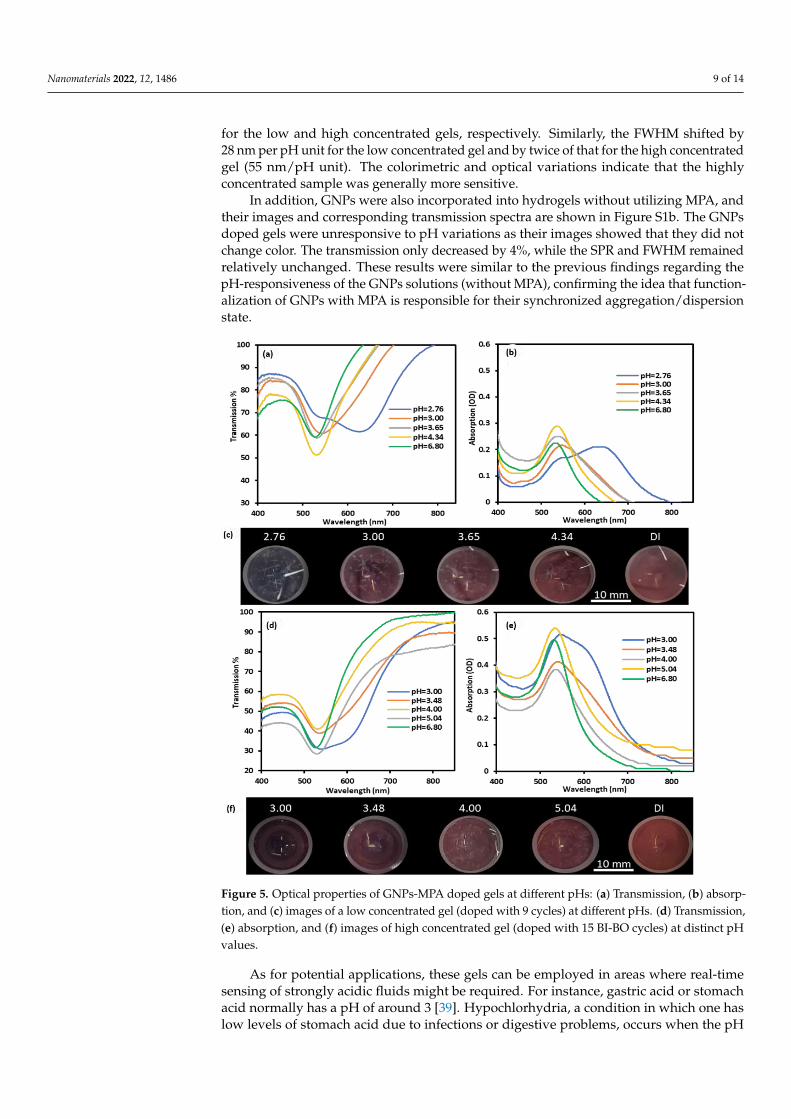
Two gels were doped with 9 and 15 BI-BO cycles and utilized in the pH-responsivestudy; this was done to show the effect of the NPs’ concentration on the pH-responsivenessof the doped gels. Both gels were placed in five solutions with distinct pH values. Imagesof the gels and corresponding optical spectra are demonstrated in Figure 5. Similar tothe GNPs-MPA solutions, optical and colorimetric properties of the doped gels were alsopH-dependent in the range of pH 3–5. Both gels were reddish in color at pH 6.80 (DI water),and as the pH decreased below 5, their colors started changing towards purple/indigo.One can note that for both gels differences were gradual and not abrupt. Nonetheless,below pH 3, the low concentrated gel showed a more apparent change in color. Thesechanges were confirmed through the optical spectra of both gels. The gradual change isevident from the redshift in the transmission/absorption spectra of the GNPs-MPA gels.Below pH 3, the optical spectra of the low concentrated gel showed two transmission dips(absorption peaks) at 545 nm and 629 nm, which indicates high NPs’ aggregation. Similarly,at pH 3, the highly concentrated sample showed an appreciable shift in SPR along with theformation of two transmission dips at 539 nm and 607 nm. Beyond pH 5, the GNPs-MPAdoped gels were unresponsive to pH variations, as little or no shift in their absorptionspectra was noticed. Also, minimal fluctuations in the transmission at SPR were noted inresponse to pH changes, which indicates the SPR position and FWHM of the transmissiondip were the main optical attributes that were varying.
Nanomaterials 2022, 12, 1486 8 of 14
Nanomaterials 2022, 12, x FOR PEER REVIEW 8 of 15
over that period is shown in Figure S2. Minimal changes in the spectra of the lenses were
noted, suggesting GNPs were stable within the gel.
Figure 4. Utilization of BI-BO method to incorporate GNPs-MPA into hydrogels and their corre-
sponding optical properties. (a) Transmission and (b) absorption spectra of the gels. Variation of the
(c) transmission percentage, absorption at the surface plasmon, and (d) FWHM of the GNPs-MPA
gels as a function of the number of BI-BO cycles. Images of the gel at each cycle are shown in the x-
axis.
Two gels were doped with 9 and 15 BI-BO cycles and utilized in the pH-responsive
study; this was done to show the effect of the NPs’ concentration on the pH-responsive-
ness of the doped gels. Both gels were placed in five solutions with distinct pH values.
Images of the gels and corresponding optical spectra are demonstrated in Figure 5. Similar
to the GNPs-MPA solutions, optical and colorimetric properties of the doped gels were
also pH-dependent in the range of pH 3–5. Both gels were reddish in color at pH 6.80 (DI
water), and as the pH decreased below 5, their colors started changing towards purple/in-
digo. One can note that for both gels differences were gradual and not abrupt. Nonethe-
less, below pH 3, the low concentrated gel showed a more apparent change in color. These
changes were confirmed through the optical spectra of both gels. The gradual change is
evident from the redshift in the transmission/absorption spectra of the GNPs-MPA gels.
Below pH 3, the optical spectra of the low concentrated gel showed two transmission dips
(absorption peaks) at 545 nm and 629 nm, which indicates high NPs’ aggregation. Simi-
larly, at pH 3, the highly concentrated sample showed an appreciable shift in SPR along
with the formation of two transmission dips at 539 nm and 607 nm. Beyond pH 5, the
GNPs-MPA doped gels were unresponsive to pH variations, as little or no shift in their
absorption spectra was noticed. Also, minimal fluctuations in the transmission at SPR
were noted in response to pH changes, which indicates the SPR position and FWHM of
the transmission dip were the main optical attributes that were varying.
Figure 4. Utilization of BI-BO method to incorporate GNPs-MPA into hydrogels and their corre-sponding optical properties. (a) Transmission and (b) absorption spectra of the gels. Variation of the(c) transmission percentage, absorption at the surface plasmon, and (d) FWHM of the GNPs-MPAgels as a function of the number of BI-BO cycles. Images of the gel at each cycle are shown in thex-axis.
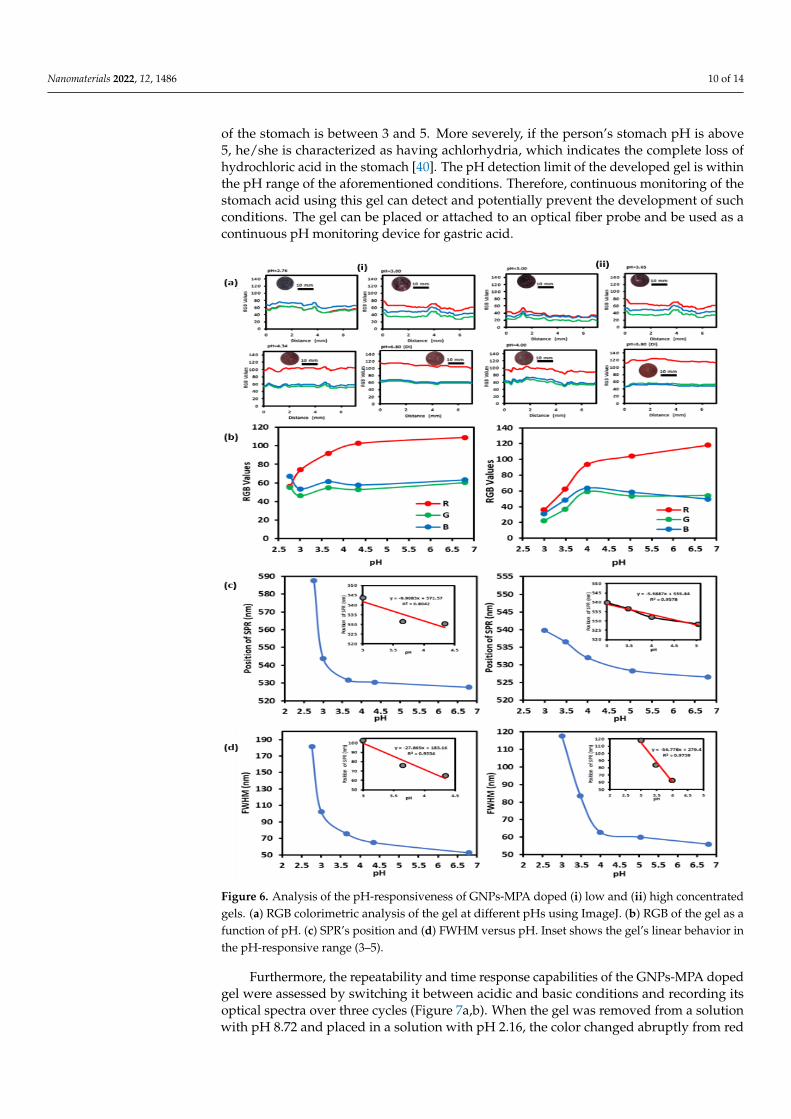
Further, colorimetric analysis was done on 7 mm of each gel at different pH valuesusing the “RGB Profiler” tool in ImageJ, and the RGB data were extracted and are plottedin Figure 6a. Also, the effect of the pH variation on the average RGB values for each gelis shown in Figure 6b. Firstly, the homogeneity of the gel’s color was apparent as majorfluctuations in the RGB data plot were negligible. The blue and green curves were overallat a constant value and remained relatively unchanged as the pH was varied. Red curveswere generally higher than the blue and green curves except for the low concentrated gel atpH 2.76 for which blue was the highest. This was expected as the gel was violet in color atthat pH. Moreover, the general trend was clear: as the pH increased, the red curve shiftedupwards indicating the reddish shift in the gel’s color. Hence, the plot of the red curve canbe used to relay the real-time value of the pH. Indeed, the red curve of each gel showed arelatively linear behavior as the pH was varied between 3 and 5. The relative change of thered value with pH was 21 units/pH and 39 units/pH for the low and high concentratedgels, respectively.
On the other hand, the position of SPR and FWHM of the doped gels’ transmissionspectra were inversely proportional to pH; Figure 6c,d shows the pH-responsive behaviorof these optical attributes for both gels. SPR’s position and FWHM of both gels showed thehighest variations between pH 3 and 5, yet one of the noticeable discrepancies was evidentat pH 2.76, at which the low concentrated gel’s SPR occurred at 587 nm. However, this wasreported as an average of the position of the two transmission dips which were at 545 nmand 629 nm and formed as a result of the excessive aggregation. This can be thought ofas a saturation limit for the sensor. Hence, the sensor has two saturation limits: (1) BelowpH 3, excessive NPs’ aggregation occurs, and color change becomes undistinguishable.(2) Beyond pH 5, MPA becomes deprotonated, and NPs’ color remains unchanged (reddish).As for the sensitivity, the position of SPR varied by almost 10 nm and 6 nm per pH unit
Nanomaterials 2022, 12, 1486 9 of 14
for the low and high concentrated gels, respectively. Similarly, the FWHM shifted by28 nm per pH unit for the low concentrated gel and by twice of that for the high concentratedgel (55 nm/pH unit). The colorimetric and optical variations indicate that the highlyconcentrated sample was generally more sensitive.
In addition, GNPs were also incorporated into hydrogels without utilizing MPA, andtheir images and corresponding transmission spectra are shown in Figure S1b. The GNPsdoped gels were unresponsive to pH variations as their images showed that they did notchange color. The transmission only decreased by 4%, while the SPR and FWHM remainedrelatively unchanged. These results were similar to the previous findings regarding thepH-responsiveness of the GNPs solutions (without MPA), confirming the idea that function-alization of GNPs with MPA is responsible for their synchronized aggregation/dispersionstate.
Nanomaterials 2022, 12, x FOR PEER REVIEW 9 of 15
Figure 5. Optical properties of GNPs-MPA doped gels at different pHs: (a) Transmission, (b) ab-
sorption, and (c) images of a low concentrated gel (doped with 9 cycles) at different pHs. (d) Trans-
mission, (e) absorption, and (f) images of high concentrated gel (doped with 15 BI-BO cycles) at
distinct pH values.
Further, colorimetric analysis was done on 7 mm of each gel at different pH values
using the “RGB Profiler” tool in ImageJ, and the RGB data were extracted and are plotted
in Figure 6a. Also, the effect of the pH variation on the average RGB values for each gel is
shown in Figure 6b. Firstly, the homogeneity of the gel’s color was apparent as major
fluctuations in the RGB data plot were negligible. The blue and green curves were overall
at a constant value and remained relatively unchanged as the pH was varied. Red curves
were generally higher than the blue and green curves except for the low concentrated gel
at pH 2.76 for which blue was the highest. This was expected as the gel was violet in color
at that pH. Moreover, the general trend was clear: as the pH increased, the red curve
shifted upwards indicating the reddish shift in the gel’s color. Hence, the plot of the red
curve can be used to relay the real-time value of the pH. Indeed, the red curve of each gel
showed a relatively linear behavior as the pH was varied between 3 and 5. The relative
change of the red value with pH was 21 units/pH and 39 units/pH for the low and high
concentrated gels, respectively.
Figure 5. Optical properties of GNPs-MPA doped gels at different pHs: (a) Transmission, (b) absorp-tion, and (c) images of a low concentrated gel (doped with 9 cycles) at different pHs. (d) Transmission,(e) absorption, and (f) images of high concentrated gel (doped with 15 BI-BO cycles) at distinct pHvalues.
As for potential applications, these gels can be employed in areas where real-timesensing of strongly acidic fluids might be required. For instance, gastric acid or stomachacid normally has a pH of around 3 [39]. Hypochlorhydria, a condition in which one haslow levels of stomach acid due to infections or digestive problems, occurs when the pH
Nanomaterials 2022, 12, 1486 10 of 14
of the stomach is between 3 and 5. More severely, if the person’s stomach pH is above5, he/she is characterized as having achlorhydria, which indicates the complete loss ofhydrochloric acid in the stomach [40]. The pH detection limit of the developed gel is withinthe pH range of the aforementioned conditions. Therefore, continuous monitoring of thestomach acid using this gel can detect and potentially prevent the development of suchconditions. The gel can be placed or attached to an optical fiber probe and be used as acontinuous pH monitoring device for gastric acid.
Nanomaterials 2022, 12, x FOR PEER REVIEW 10 of 15
Figure 6. Analysis of the pH-responsiveness of GNPs-MPA doped (i) low and (ii) high concentrated
gels. (a) RGB colorimetric analysis of the gel at different pHs using ImageJ. (b) RGB of the gel as a
function of pH. (c) SPR’s position and (d) FWHM versus pH. Inset shows the gel’s linear behavior
in the pH-responsive range (3–5).
On the other hand, the position of SPR and FWHM of the doped gels’ transmission
spectra were inversely proportional to pH; Figure 6c,d shows the pH-responsive behavior
of these optical attributes for both gels. SPR’s position and FWHM of both gels showed
the highest variations between pH 3 and 5, yet one of the noticeable discrepancies was
evident at pH 2.76, at which the low concentrated gel’s SPR occurred at 587 nm. However,
this was reported as an average of the position of the two transmission dips which were
at 545 nm and 629 nm and formed as a result of the excessive aggregation. This can be
thought of as a saturation limit for the sensor. Hence, the sensor has two saturation limits:
(1) Below pH 3, excessive NPs’ aggregation occurs, and color change becomes undistin-
guishable. (2) Beyond pH 5, MPA becomes deprotonated, and NPs’ color remains un-
changed (reddish). As for the sensitivity, the position of SPR varied by almost 10 nm and
6 nm per pH unit for the low and high concentrated gels, respectively. Similarly, the
Figure 6. Analysis of the pH-responsiveness of GNPs-MPA doped (i) low and (ii) high concentratedgels. (a) RGB colorimetric analysis of the gel at different pHs using ImageJ. (b) RGB of the gel as afunction of pH. (c) SPR’s position and (d) FWHM versus pH. Inset shows the gel’s linear behavior inthe pH-responsive range (3–5).
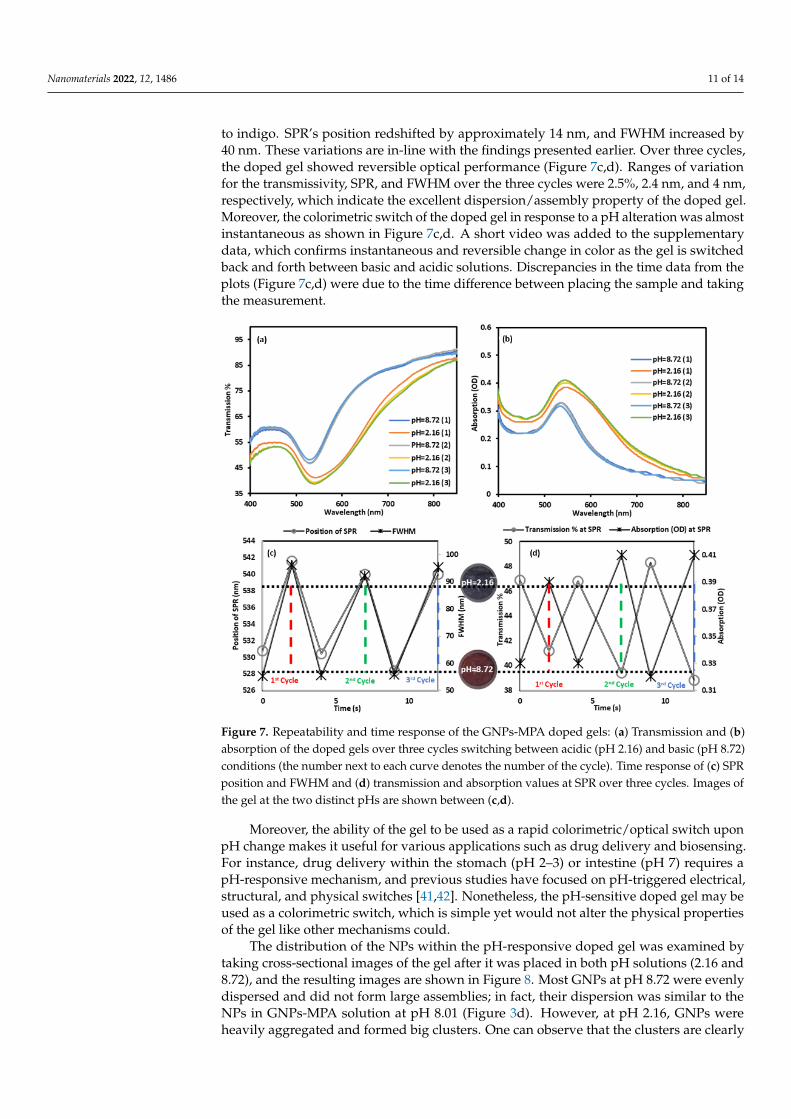
Furthermore, the repeatability and time response capabilities of the GNPs-MPA dopedgel were assessed by switching it between acidic and basic conditions and recording itsoptical spectra over three cycles (Figure 7a,b). When the gel was removed from a solutionwith pH 8.72 and placed in a solution with pH 2.16, the color changed abruptly from red
Nanomaterials 2022, 12, 1486 11 of 14
to indigo. SPR’s position redshifted by approximately 14 nm, and FWHM increased by40 nm. These variations are in-line with the findings presented earlier. Over three cycles,the doped gel showed reversible optical performance (Figure 7c,d). Ranges of variationfor the transmissivity, SPR, and FWHM over the three cycles were 2.5%, 2.4 nm, and 4 nm,respectively, which indicate the excellent dispersion/assembly property of the doped gel.Moreover, the colorimetric switch of the doped gel in response to a pH alteration was almostinstantaneous as shown in Figure 7c,d. A short video was added to the supplementarydata, which confirms instantaneous and reversible change in color as the gel is switchedback and forth between basic and acidic solutions. Discrepancies in the time data from theplots (Figure 7c,d) were due to the time difference between placing the sample and takingthe measurement.
Nanomaterials 2022, 12, x FOR PEER REVIEW 12 of 15
Figure 7. Repeatability and time response of the GNPs-MPA doped gels: (a) Transmission and (b)
absorption of the doped gels over three cycles switching between acidic (pH 2.16) and basic (pH
8.72) conditions (the number next to each curve denotes the number of the cycle). Time response of
(c) SPR position and FWHM and (d) transmission and absorption values at SPR over three cycles.
Images of the gel at the two distinct pHs are shown between (c,d).
The distribution of the NPs within the pH-responsive doped gel was examined by
taking cross-sectional images of the gel after it was placed in both pH solutions (2.16 and
8.72), and the resulting images are shown in Figure 8. Most GNPs at pH 8.72 were evenly
dispersed and did not form large assemblies; in fact, their dispersion was similar to the
NPs in GNPs-MPA solution at pH 8.01 (Figure 3d). However, at pH 2.16, GNPs were
heavily aggregated and formed big clusters. One can observe that the clusters are clearly
comprised of numerous NPs. The latter confirms the synchronized dispersion and assem-
bly of GNPs within the gel upon the quick pH variation. These findings were similar to
the ones deduced from the TEM images of the GNPs-MPA solutions.
Figure 7. Repeatability and time response of the GNPs-MPA doped gels: (a) Transmission and (b)absorption of the doped gels over three cycles switching between acidic (pH 2.16) and basic (pH 8.72)conditions (the number next to each curve denotes the number of the cycle). Time response of (c) SPRposition and FWHM and (d) transmission and absorption values at SPR over three cycles. Images ofthe gel at the two distinct pHs are shown between (c,d).
Moreover, the ability of the gel to be used as a rapid colorimetric/optical switch uponpH change makes it useful for various applications such as drug delivery and biosensing.For instance, drug delivery within the stomach (pH 2–3) or intestine (pH 7) requires apH-responsive mechanism, and previous studies have focused on pH-triggered electrical,structural, and physical switches [41,42]. Nonetheless, the pH-sensitive doped gel may beused as a colorimetric switch, which is simple yet would not alter the physical propertiesof the gel like other mechanisms could.
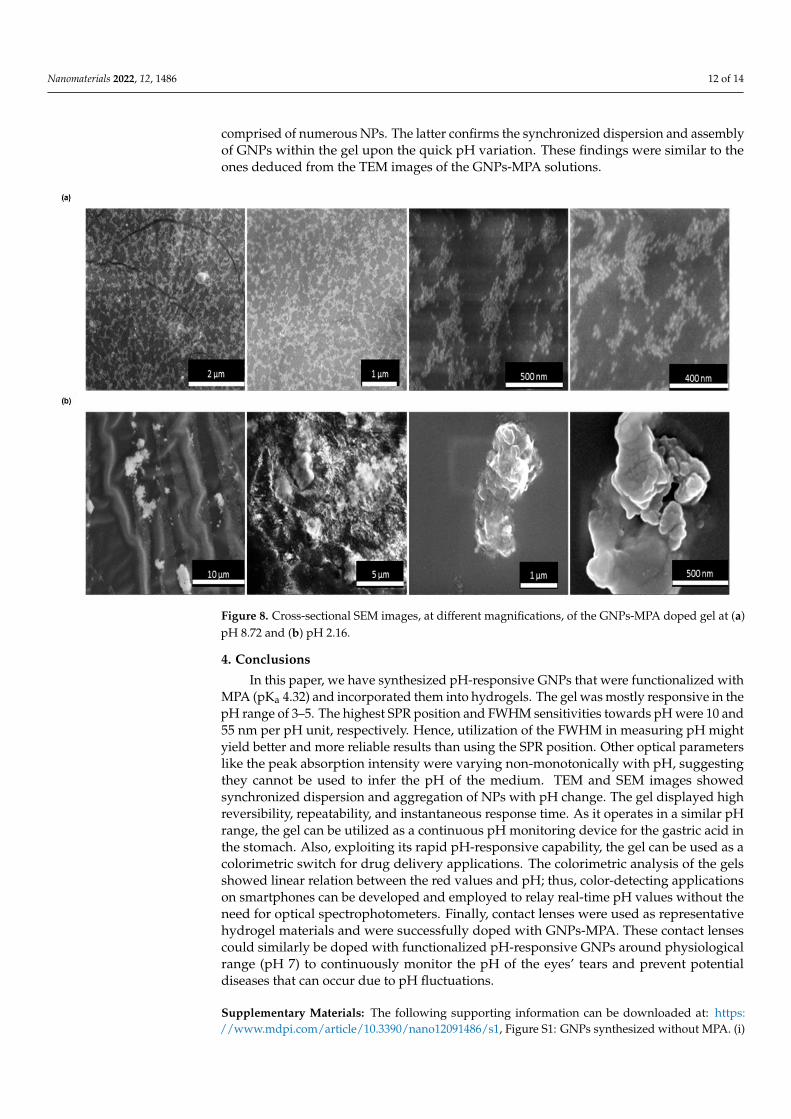
The distribution of the NPs within the pH-responsive doped gel was examined bytaking cross-sectional images of the gel after it was placed in both pH solutions (2.16 and8.72), and the resulting images are shown in Figure 8. Most GNPs at pH 8.72 were evenlydispersed and did not form large assemblies; in fact, their dispersion was similar to theNPs in GNPs-MPA solution at pH 8.01 (Figure 3d). However, at pH 2.16, GNPs wereheavily aggregated and formed big clusters. One can observe that the clusters are clearly
Nanomaterials 2022, 12, 1486 12 of 14
comprised of numerous NPs. The latter confirms the synchronized dispersion and assemblyof GNPs within the gel upon the quick pH variation. These findings were similar to theones deduced from the TEM images of the GNPs-MPA solutions.
Nanomaterials 2022, 12, x FOR PEER REVIEW 13 of 15
Figure 8. Cross-sectional SEM images, at different magnifications, of the GNPs-MPA doped gel at
(a) pH 8.72 and (b) pH 2.16.
4. Conclusion
In this paper, we have synthesized pH-responsive GNPs that were functionalized
with MPA (pKa 4.32) and incorporated them into hydrogels. The gel was mostly respon-
sive in the pH range of 3–5. The highest SPR position and FWHM sensitivities towards
pH were 10 and 55 nm per pH unit, respectively. Hence, utilization of the FWHM in meas-
uring pH might yield better and more reliable results than using the SPR position. Other
optical parameters like the peak absorption intensity were varying non-monotonically
with pH, suggesting they cannot be used to infer the pH of the medium. TEM and SEM
images showed synchronized dispersion and aggregation of NPs with pH change. The gel
displayed high reversibility, repeatability, and instantaneous response time. As it operates
in a similar pH range, the gel can be utilized as a continuous pH monitoring device for
the gastric acid in the stomach. Also, exploiting its rapid pH-responsive capability, the gel
can be used as a colorimetric switch for drug delivery applications. The colorimetric anal-
ysis of the gels showed linear relation between the red values and pH; thus, color-detect-
ing applications on smartphones can be developed and employed to relay real-time pH
values without the need for optical spectrophotometers. Finally, contact lenses were used
as representative hydrogel materials and were successfully doped with GNPs-MPA.
These contact lenses could similarly be doped with functionalized pH-responsive GNPs
around physiological range (pH 7) to continuously monitor the pH of the eyes’ tears and
prevent potential diseases that can occur due to pH fluctuations.
Supplementary Materials: The following supporting information can be downloaded at:
www.mdpi.com/xxx/s1, Figure S1: GNPs synthesized without MPA. (i) Images and (ii) absorption
and transmission spectra of (a) the solutions and (b) lenses at different pH values.; Figure S2: Trans-
mission test for the MPA-GNPs gel over a one-month period to assess NPs’ leakage.; Figure S3: EDS
analysis for the MPA-GNPs gels at pH (a) 2.16 and (b) 8.72.; Figure S4: FTIR analysis of the MPA-
Figure 8. Cross-sectional SEM images, at different magnifications, of the GNPs-MPA doped gel at (a)pH 8.72 and (b) pH 2.16.
4. Conclusions
In this paper, we have synthesized pH-responsive GNPs that were functionalized withMPA (pKa 4.32) and incorporated them into hydrogels. The gel was mostly responsive in thepH range of 3–5. The highest SPR position and FWHM sensitivities towards pH were 10 and55 nm per pH unit, respectively. Hence, utilization of the FWHM in measuring pH mightyield better and more reliable results than using the SPR position. Other optical parameterslike the peak absorption intensity were varying non-monotonically with pH, suggestingthey cannot be used to infer the pH of the medium. TEM and SEM images showedsynchronized dispersion and aggregation of NPs with pH change. The gel displayed highreversibility, repeatability, and instantaneous response time. As it operates in a similar pHrange, the gel can be utilized as a continuous pH monitoring device for the gastric acid inthe stomach. Also, exploiting its rapid pH-responsive capability, the gel can be used as acolorimetric switch for drug delivery applications. The colorimetric analysis of the gelsshowed linear relation between the red values and pH; thus, color-detecting applicationson smartphones can be developed and employed to relay real-time pH values without theneed for optical spectrophotometers. Finally, contact lenses were used as representativehydrogel materials and were successfully doped with GNPs-MPA. These contact lensescould similarly be doped with functionalized pH-responsive GNPs around physiologicalrange (pH 7) to continuously monitor the pH of the eyes’ tears and prevent potentialdiseases that can occur due to pH fluctuations.
Supplementary Materials: The following supporting information can be downloaded at: https://www.mdpi.com/article/10.3390/nano12091486/s1, Figure S1: GNPs synthesized without MPA. (i)
Nanomaterials 2022, 12, 1486 13 of 14
Images and (ii) absorption and transmission spectra of (a) the solutions and (b) lenses at different pHvalues.; Figure S2: Transmission test for the MPA-GNPs gel over a one-month period to assess NPs’leakage.; Figure S3: EDS analysis for the MPA-GNPs gels at pH (a) 2.16 and (b) 8.72.; Figure S4: FTIRanalysis of the MPA-GNPs solution.; Video S1: Visual representation of the rapid colorimetric changeof the gel as it is switched between pH 2.16 and pH 8.72.
Author Contributions: Conceptualization, A.E.S. and H.B.; methodology, A.E.S.; validation, M.E.and F.A.; resources, H.B.; data curation, A.E.S.; writing—original draft preparation, A.E.S.; writing—review and editing, F.A. and M.C.; visualization, A.E.S.; supervision, M.C. and H.B.; project adminis-tration, H.B.; funding acquisition, H.B. All authors have read and agreed to the published version ofthe manuscript.
Funding: This research was funded by Khalifa University-KAIST Joint Research Center (project code:8474000220-KKJRC-2019-Health1) and Sandooq Al Watan LLC jointly with Aldar Properties (SWARDProgram-Award Ref. SWARD-F19-008).
Informed Consent Statement: Not applicable.
Data Availability Statement: The data presented in this study are available on request from thecorresponding author.
Conflicts of Interest: The authors declare no conflict of interest.
References1. Amendola, V.; Pilot, R.; Frasconi, M.; Maragò, O.M.; Iatì, M.A. Surface plasmon resonance in gold nanoparticles: A review. J. Phys.
Condens. Matter Inst. Phys. J. 2017, 29, 203002. [CrossRef] [PubMed]2. Sun, C.; Lee, J.S.H.; Zhang, M. Magnetic nanoparticles in MR imaging and drug delivery. Adv. Drug Deliv. Rev. 2008, 60, 1252–1265.
[CrossRef] [PubMed]3. Sardar, R.; Funston, A.M.; Mulvaney, P.; Murray, R.W. Gold Nanoparticles: Past, Present, and Future. Langmuir ACS J. Surf.
Colloids 2009, 25, 13840–13851. [CrossRef]4. Yougbare, S.; Chang, T.-K.; Tan, S.-H.; Kuo, J.-C.; Hsu, P.-H.; Su, C.-Y.; Kuo, T.-R. Antimicrobial Gold Nanoclusters: Recent
Developments and Future Perspectives. Int. J. Mol. Sci. 2019, 20, 2924. [CrossRef] [PubMed]5. Zahra, Q.U.A.; Luo, Z.; Ali, R.; Khan, M.I.; Li, F.; Qiu, B. Advances in gold nanoparticles-based colorimetric aptasensors for the
detection of antibiotics: An overview of the past decade. Nanomaterials 2021, 11, 840. [CrossRef] [PubMed]6. Nejati, K.; Dadashpour, M.; Gharibi, T.; Mellatyar, H.; Akbarzadeh, A. Biomedical applications of functionalized gold nanoparti-
cles: A review. J. Clust. Sci. 2021, 33, 1–16. [CrossRef]7. Ansar, S.M.; Chakraborty, S.; Kitchens, C.L. pH-Responsive Mercaptoundecanoic Acid Functionalized Gold Nanoparticles and
Applications in Catalysis. Nanomaterials 2018, 8, 339. [CrossRef]8. Ansar, S.M.; Fellows, B.; Mispireta, P.; Mefford, O.T.; Kitchens, C.L. pH Triggered Recovery and Reuse of Thiolated Poly(acrylic
acid) Functionalized Gold Nanoparticles with Applications in Colloidal Catalysis. Langmuir ACS J. Surf. Colloids 2017, 33,7642–7648. [CrossRef]
9. Rostek, A.; Mahl, D.; Epple, M. Chemical composition of surface-functionalized gold nanoparticles. J. Nanopart. Res. 2011, 13,4809–4814. [CrossRef]
10. Nicol, J.R.; Dixon, D.; Coulter, J.A. Gold nanoparticle surface functionalization: A necessary requirement in the development ofnovel nanotherapeutics. Nanomedicine 2015, 10, 1315–1326. [CrossRef]
11. Nam, J.; Won, N.; Jin, H.; Chung, H.; Kim, S. pH-Induced Aggregation of Gold Nanoparticles for Photothermal Cancer Therapy. J.Am. Chem. Soc. 2009, 131, 13639–13645. [CrossRef] [PubMed]
12. Zeng, S.; Yong, K.-T.; Roy, I.; Dinh, X.-Q.; Yu, X.; Luan, F. A review on functionalized gold nanoparticles for biosensing applications.Plasmonics 2011, 6, 491–506. [CrossRef]
13. Bachelet, M. Design of pH-responsive gold nanoparticles in oncology. Mater. Sci. Technol. 2016, 32, 794–804. [CrossRef]14. Kim, J.-H.; Lee, T.R. Thermo-and pH-responsive hydrogel-coated gold nanoparticles. Chem. Mater. 2004, 16, 3647–3651. [CrossRef]15. Laaksonen, T.; Ahonen, P.; Johans, C.; Kontturi, K. Stability and Electrostatics of Mercaptoundecanoic Acid-Capped Gold
Nanoparticles with Varying Counterion Size. ChemPhysChem 2006, 7, 2143–2149. [CrossRef] [PubMed]16. Park, S.; Lee, W.J.; Park, S.; Choi, D.; Kim, S.; Park, N. Reversibly pH-responsive gold nanoparticles and their applications for
photothermal cancer therapy. Sci. Rep. 2019, 9, 20180. [CrossRef]17. Pillai, P.P.; Huda, S.; Kowalczyk, B.; Grzybowski, B.A. Controlled pH Stability and Adjustable Cellular Uptake of Mixed-Charge
Nanoparticles. J. Am. Chem. Soc. 2013, 135, 6392–6395. [CrossRef]18. Su, C.-H.; Wu, P.-L.; Yeh, C.-S. pH Dependence of Interparticle Coupling for Gold Nanoparticle Assemblies Formation: Electro-
static Attraction and Hydrogen Bonding. Bull. Chem. Soc. Jpn. 2004, 77, 189–193. [CrossRef]
Nanomaterials 2022, 12, 1486 14 of 14
19. Taladriz-Blanco, P.; Buurma, N.J.; Rodríguez-Lorenzo, L.; Pérez-Juste, J.; Liz-Marzán, L.M.; Hervés, P. Reversible assembly ofmetal nanoparticles induced by penicillamine. Dynamic formation of SERS hot spots. J. Mater. Chem. 2011, 21, 16880–16887.[CrossRef]
20. Fan, C.; Bian, T.; Shang, L.; Shi, R.; Wu, L.-Z.; Tung, C.-H.; Zhang, T. pH-Responsive reversible self-assembly of gold nanoparticlesinto nanovesicles. Nanoscale 2016, 8, 3923–3925. [CrossRef]
21. Shiraishi, Y.; Arakawa, D.; Toshima, N. pH-dependent color change of colloidal dispersions of gold nanoclusters: Effect ofstabilizer. Eur. Phys. J. E Soft Matter 2002, 8, 377–383. [CrossRef] [PubMed]
22. Dennyson Savariraj, A.; Salih, A.; Alam, F.; Elsherif, M.; AlQattan, B.; Khan, A.A.; Yetisen, A.K.; Butt, H. Ophthalmic Sensors andDrug Delivery. ACS Sens. 2021, 6, 2046–2076. [CrossRef] [PubMed]
23. Elsherif, M.; Alam, F.; Salih, A.E.; AlQattan, B.; Yetisen, A.K.; Butt, H. Wearable Bifocal Contact Lens for Continual GlucoseMonitoring Integrated with Smartphone Readers. Small 2021, 17, 2102876. [CrossRef]
24. Elsherif, M.; Hassan, M.U.; Yetisen, A.K.; Butt, H. Wearable Contact Lens Biosensors for Continuous Glucose Monitoring UsingSmartphones. ACS Nano 2018, 12, 5452–5462. [CrossRef]
25. Elsherif, M.; Hassan, M.U.; Yetisen, A.K.; Butt, H. Glucose Sensing with Phenylboronic Acid Functionalized Hydrogel-BasedOptical Diffusers. ACS Nano 2018, 12, 2283–2291. [CrossRef] [PubMed]
26. Alam, F.; Salih, A.E.; Elsherif, M.; Yetisen, A.K.; Butt, H. 3D printed contact lenses for the management of color blindness. Addit.Manuf. 2021, 49, 102464. [CrossRef]
27. Elsherif, M.; Salih, A.E.; Yetisen, A.K.; Butt, H. Contact Lenses for Color Vision Deficiency. Adv. Mater. Technol. 2021, 6, 2000797.[CrossRef]
28. Salih, A.E.; Elsherif, M.; Ali, M.; Vahdati, N.; Yetisen, A.K.; Butt, H. Ophthalmic Wearable Devices for Color Blindness Management.Adv. Mater. Technol. 2020, 5, 1901134. [CrossRef]
29. Salih, A.E.; Elsherif, M.; Alam, F.; Yetisen, A.K.; Butt, H. Gold Nanocomposite Contact Lenses for Color Blindness Management.ACS Nano 2021, 15, 4870–4880. [CrossRef]
30. Salih, A.E.; Shanti, A.; Elsherif, M.; Alam, F.; Lee, S.; Polychronopoulou, K.; Almaskari, F.; Al Safar, H.; Yetisen, A.K.; Butt, H.Silver Nanoparticle-Loaded Contact Lenses for Blue-Yellow Color Vision Deficiency. Phys. Status Solidi (A) 2022, 219, 2100294.[CrossRef]
31. Sheeney-Haj-Ichia, L.; Sharabi, G.; Willner, I. Control of the Electronic Properties of Thermosensitive Poly(N-isopropylacrylamide)and Au-Nano-particle/Poly(N-isopropylacrylamide) Composite Hydrogels upon Phase Transition. Adv. Funct. Mater. 2002, 12,27–32. [CrossRef]
32. Thomas, V.; Yallapu, M.M.; Sreedhar, B.; Bajpai, S. Breathing-in/breathing-out approach to preparing nanosilver-loaded hydrogels:Highly efficient antibacterial nanocomposites. J. Appl. Polym. Sci. 2009, 111, 934–944. [CrossRef]
33. Guo, Y.G.; Hu, J.-S.; Liang, H.-P.; Wan, L.-J.; Bai, C.-L. Highly Dispersed Metal Nanoparticles in Porous Anodic Alumina FilmsPrepared by a Breathing Process of Polyacrylamide Hydrogel. Chem. Mater. 2003, 15, 4332–4336. [CrossRef]
34. Salih, A.E.; Elsherif, M.; Alam, F.; Alqattan, B.; Yetisen, A.K.; Butt, H. Syntheses of Gold and Silver Nanocomposite Contact Lensesvia Chemical Volumetric Modulation of Hydrogels. ACS Biomater. Sci. Eng. 2022, in press.
35. Kimling, J.; Maier, M.; Okenve, B.; Kotaidis, V.; Ballot, H.; Plech, A. Turkevich method for gold nanoparticle synthesis revisited. J.Phys. Chem. B 2006, 110, 15700–15707. [CrossRef] [PubMed]
36. Yonezawa, T.; Kunitake, T. Practical preparation of anionic mercapto ligand-stabilized gold nanoparticles and their immobilization.Colloids Surf. A Physicochem. Eng. Asp. 1999, 149, 193–199. [CrossRef]
37. Simard, J.; Briggs, C.; Boal, A.K.; Rotello, V.M. Formation and pH-controlled assembly of amphiphilic gold nanoparticles. Chem.Commun. 2000, 1943–1944. [CrossRef]
38. Pardo-Yissar, V.; Gabai, R.; Shipway, A.N.; Bourenko, T.; Willner, I. Gold Nanoparticle/Hydrogel Composites with Solvent-Switchable Electronic Properties. Adv. Mater. 2001, 13, 1320–1323. [CrossRef]
39. Dent, J. Roles of gastric acid and pH in the pathogenesis of gastro-oesophageal reflux disease. Scand. J. Gastroenterol. Suppl. 1994,201, 55–61. [CrossRef]
40. Christiansen, P.M. The Incidence of Achlorhydria and Hypochlorhydria in Healthy Subjects and Patients with GastrointestinalDiseases. Scand. J. Gastroenterol. 1968, 3, 497–508. [CrossRef]
41. Negrini, R.; Mezzenga, R. pH-Responsive Lyotropic Liquid Crystals for Controlled Drug Delivery. Langmuir ACS J. Surf. Colloids2011, 27, 5296–5303. [CrossRef]
42. Jiang, H.; Yu, W.; Oscai, M.; Ziaie, B. A Smart Capsule with a Hydrogel-Based pH-Triggered Release Switch for GI-TractSite-Specific Drug Delivery. IEEE Trans. Biomed. Eng. 2018, 65, 2808–2813. [CrossRef] [PubMed]


