Embed Size (px)
Citation preview

tracer activity occasionally results in false-positive findingsfor the diagnosis ofright coronary arterydisease. Recently,Esquerre et al. (1) demonstrated that compared to 20―flsupine SPECT, tomographic images acquired in the proneposition have significantly higher 201'flcounts in the inferior wall, thus largely negating the problem of inferior wallattenuation. Furthermore, by visual interpretation, 201'flSPECT acquired in the prone position has been shown toimprove the overall specificity for detection of patientswith coronary artery disease as well as right coronary arterydisease specificity (2). The purpose of this work is todevelop 201'flprone SPECT quantitative normal limits, toevaluate the diagnostic efficacy of 201T1SPECT acquiredin the prone position and to compare the frequency ofpatient motion during SPECT acquisition.
SUBJECTS AND METhODS
Entry CriteriaThe study employedprospectivemale patients who had 2o―fl
prone SPECT performed on the cut-out table. These were consecutive patients who either had cardiac catheterization performed within 3 mo of 20―fltesting or who had a low (<5%)likelihood ofcoronary artery disease based on age, sex, symptomsand results ofstress electrocardiography(3-5). Patients with priorcoronary bypass surgery or balloon angioplasty, and those whoachieved <85% ofmaxirnal predicted heart rate without ischernicexerciseend-point (chest pain or ST-segmentdepression)wereexcluded.
We have not includeda femalepopulation sincewe feel,thatdue to the presence of breast tissue, prone imaging is not assuitable for the female population, from the point ofview of bothpatient comfort and the potential accentuation of artifactualbreast attenuation defects.
PatientPopulationDiagnostic efficacy ofprone SPECT was assessed in 111 males
witha meanageof59 ±12yr.Ofthe 36 patientswhohad cardiaccatheterization, 30 had coronary artery disease (defined as @50%stenosis in@ 1 major coronary vessels), and 6 had normal coronary arteriograrns. The data ofone patient with normal coronaryarteriogram could not be retrieved from the computer tape forquantitative analysis, but the images were included for visualanalysis. Twelve of the 36 patients had historically documented
Prone201flmyocardialperfusionSPECThasbeenshowntoimproveleft ventricularinferiorwall countscomparedto supine imaging, thus minimizingdiaphragmaticattenuation.ProneSPECT quantitativenormallimitswere developedandprospectivelyappliedto 36 patIentswho had coronaryangiography.The proneimagingtableusedhada cut-outundercardiac area which increased the average myocardial countsby 10.7% comparedto prone SPECT throughthe standardtable. Overall specificity and sensitivity were 80% and 93%,respectively. For the right, left circumflex and left anteriordescendingcoronary arteries, the specificitleswere 94%,71%, and 94%; and sensitivitieswere 88%, 89% and 78%,respectively.The normalcyrate in 55 normal patients was89%. IncIdenceand the seventy of patient motion in 200prone SPECT studies were compared to 200 supine SPECTstudies. Mild and severe motion occurred in 12% and 4% ofthe supine studies and in only 3.5% and none of the pronestudies, respectively.When compared to supine SPECT,proneSPECThadhigher(p < 0.01)regionalcounts/pixelinthe inferiorwallandseptum,but requiredan averageincreaseof2.9 ±1.0cmincameratochestwalldistanceandresultedin a reductionof total myocardialcounts.ProneSPECTprovidesan alternativeapproach for patients who cannottoleratesupineimaging.It shouldbe consideredwheninferiorwall detectson supIneimagingpose a diagnosticdilemmaand when motion on supine imaging necessitates repeatacquisition.
1992;33:1509—1515
raditionally, image acquisition of 201Tlsingle-photonemission computerized tomography (SPECT) has beenperformed with the patient in the supine position. Supinetomographic images however, frequently demonstrate relative reduction of 2OVflactivity in the left ventricularinferior wall, presumably due to increased attenuation ofphotons from that region. Such attenuation of myocardial
Received Dec. 3, 1991 ; revision accepted Mar. 10. 1992.For reprints contact: Daniel S. Berman, MD. Cedars-Sinai Medical Center,
8700BeverlyBlvd.,LosAngeles,CA90048.
Prone @°1TISPECT •Kiatet al 1509
QuantitativeStress-RedistributionThaffium-201SPECT Using Prone Imaging:MethodologicDevelopment and ValidationHosen Kiat, Kenneth F. Van Train, John D. Friedman, Guido Germano, Gerard Silagan, Fan Ping Wang,Jamshid Maddahi, Florence Prigent, and Daniel S. Berman
Departments ofMedicine (Division ofCardiology) and Nuclear Medicine, Cedars-Sinai Medical Center, University ofCal@forniaSchool ofMedicine, Los Angeles,California

TABLEIComparisonofDemographics,Clinical,ExercisePhysiology
and @°‘TlData BetweenPatientsUndergoingProneandSupine Stress Redistribution @°‘11SPECTProne
SupinepTotalpatients
100100Male85% 62%0.0002Age
62.4±9.7 63.9±11.7nsWeight(lbs) 173.5±30.5 167.6±36.2nsFemale
breastBrasize 36 ±2.1 37.1 ±3.0nsCupsizeof@ C 64% 47%nsEX
duration 7.7 ±2.9 6.5 ±3.00.008PeakEXheartrate143±22.4 138.5±22.8nsPeak
EXBP 184.1±25.9 180.6±33.2nsEXangina11% 15%nsIschemic
EXECG 40% 31%nsAbnOrmal201'fl 55% 68%nsEX
= exercise and BP = systolic blood pressure.
prior myocardial infarction. There were a total of 75 patientswith a low likelihoodof coronary artery disease.The data fromthe first twentywereused to developquantitative prone SPEC'Fnormal limits@
To assess the potential difference of camera-to-chest wall distance as a result of imagingposition, camera-to-chestwall distance for both prone and supine SPECTwas measured in fourpatients (weight: 55—86kg).
In addition, the frequencyof patient motion wasevaluatedin200 stressand redistribution 2o―flSPECT studies from 100consecutivepatientsundergoingprone 2o'fl study and wascompared to another 100 consecutive patients undergoing supine2OI-@ SPECT. The demographics, symptoms, exercise physiology
and the results of 201'fltesting between the supine and pronestudygroupswerecomparedin Table 1.
ExercIseand ImagingProtocolSymptom-linked treadmill was performed using the standard
Bruce protocol, and 3—4mCi of 2o―flwere injected at peakexercise. All patients were imaged using a rotating gamma camera(Siemens Orbiter). Prone SPECT employed a prototype imagingtable with a cut-out under the cardiac area developed by SiemensGammasonics, Inc. (Fig. 1). The table is of standard width (17inches)and has a regionof 12x 16in. under the cardiacarea inthe left mid-chest in which the structureofthe table was removedand covered only by fabric.The table is supportedby a steel barwrapping around the right side, precluding 360°imaging. TheSPECTacquisitionand processingprotocolswereas previouslydescribedfor 20―flSPE@ (6,7). Specifically,for SPECTacquisition by both prone and supine imaging, the patient was centeredin the field ofview and the 180°circular imaging arc was selected
for each patient so as to minimize the camera to chest walldistance.
Developmentof QuantitativePolarMap andNormal Limits
The method for 20Tl SPED' quantitative analysis, includinggeneration of polar map and normal limits, was based on thepreviouslyoptimizedand validatedCedars-SinaiMedicalCenter201T1SPECTquantitativeanalysisfor supineimaging(6,7). In
FIGURE1 Thespeciallydesignedproneimagingtabledamonstratinga cut-outunderthecardiacarea.
short, maximum counts circumferential profiles were generatedfromthe short-and verticallong-axistomogramsand normalizedto 100. All count profiles were then mapped onto a two-dimensional polar map representing the entire left ventricular myocardium. As with our supine 2o―flquantitative SPECT approach,normal limits were derived from the lowest observed values of allproffles from the 20 normal patients. The quantitative stressperfusion polar map was divided into three coronary territories.For eachterritoryin patientswithno prior myocardialinfarction,abnormality was defined according to our previous work withsupine 201T1SPECT (6,7) as a defect ofl2% for the left anteriordescending (LAD) or left circumflex (LCX) coronary arteries,respectively,or 8%forthe rightcoronaryartery(RCA)territory.For patients with prior myocardial infarction, the thresholds forabnormality in the individual vascular territories were modifiedbased on previous work from our group, which considers thecontiguity of a stress defect not in the vascular territory of aninfarcted zone with the defects within the infarcted vascularterritory(8). Thethresholdsforabnormalityfordefectsnot withinan infarcted zone but contiguouswith a defect in the infarctedzone were set as 12%for the LAD, 20% for the RCA and 40%for the LCX territories. For perfusion defects not contiguous withdefectsin the zone of prior myocardialinfarction, the standardcriteria were employed.
A studywas consideredabnormalif 1 vascularterritorieswas called abnormal.
Assessmentof Myocardial @°‘TICountStatisticsandCamera-to-Chest Wall Distance
For comparison of myocardial counts between supine andprone imaging, 24 patients with a low likelihood of coronaryartery disease underwent SPECT acquisition in both supine andprone position. For the first 14 patients in this study (Group 1),prone imagingwasfollowedimmediatelyby supineimaging.Forthe last 10 patients (Group 2), the imaging sequence was reversedwith supine SPECT preceding prone SPECT. For each stresspolar map, the counts in each of the five myocardial regions(anterior, septal, inferior, lateral walls and apex), previously defined for the polar map generation (6,7), were summed anddivided by the number of pixels in the region to give the meancounts/pixel for each region. The total myocardial counts fromall low likelihood patients (Groups 1 and 2) were measured bydrawing a region of interest encompassing the entire myocardialtomograms.
The minimaldistancebetweenthe centerofthe cameradetector and a marked point on the mid-chest offour patients undergoing supine and prone SPECT was measured over 10 projections15°apart, from the 45°RAO to the left lateral positions.
1510 The Journalof Nudear Medicine•Vol. 33 •No. 8 •August1992

Group1. (n = 14)
Myocardialregion Supine Prone p SupineGroup
2(n= 10)Total (n=24)PronepSupinePronepAnterior
88±3 87±3 0.287±386±40.788±387±30.1Septum82 ±5 88 ±6 0.05 78 ±586 ±30.00281 ±687 ±40.0001Inferior76 ±5 84 ±5 0.01 72 ±684 ±40.000175 ±784 ±40.001Lateral90 ±3 90 ±3 0.9 90 ±393 ±20.0290 ±391 ±30.2Apex92±3 94±5 0.191±392±30.492±393±30.1Group
1: SupineimageswereacquiredimmediatelyafterproneSPECT.Group2: ProneimagingwasperformedaftersupineSPECT.
were used to compare the attenuation effects produced by thetwo tables.
Tomographic images of the phantom study were processed
and are displayed in the same manner as that used for clinicalstudies(9,10). The imageswere inspectedby three experts(HK,DSB,KVT) for presenceof imagingartifacts.
Statistical AnalysisNormalcy rate was defined as the number of patients with a
low likelihood of disease with normal scintigraphic patterns divided by the total number of patients with a low likelihood ofdisease. The terms sensitivity and specificity were applied only tothe catheterized patients. The mean differences for continuousvariables were compared using the Student t-test. All continuousmeasures were summarized as the mean ±sd. McNemar's testwas used to assess the significance of the differences betweensensitivities and specificities. Probability (p) values [email protected] significant. Comparisons of proportions were madeusing a chi-square statistic or, when appropriate, using Fisher'sexact test. All computations were made using the SAS or BMDPstatistical software (15,16).
RESULTS
Myocardial Counts and Camera-to-Chest WallDistance
Table 2 demonstrates the mean myocardial count distribution for supine and prone imaging (using the modifiedtable). Results from both Group 1 (prone followed bysupine SPECT) and Group 2 (supine followed by proneSPECT) showed significantly higher counts in the inferiorwall and septum by prone SPECT. Furthermore, for eachimaging mode, both groups exhibited similar regionalmyocardial counts distribution.
Comparison ofthe total myocardial counts ofthe prone(with the modified table) and supine images from the lowlikelihood patients demonstrated reduced counts activityby prone SPECT (1 .45 x 106 ±2.9 x i0@versus 1.54 x10⁶ ±4.02 x iO@,p = 0.02). The measurement of cameradetector-to-chest wall distance demonstrated that whencompared to supine acquisition prone SPECT necessitatedincreased camera to chest wall distance for all imagingangles over the 180°arc, by an average of 2.9 ±1.0 cm.
Visual InterpretationImagedisplaymethodsforvisualinterpretationand the criteria
for perfusion defect abnormality and reversibility were as preyously described (9,10). For each study, the tomograms weredivided into 20 segments, and each segment was scored by ablinded expert using a four-point system. The assignment ofcoronary territories to the 20 myocardial SPECT segments wasbased on our previous work on SPECT angiographic correlations(11,12).
Assessmentof PatientMotionDuringSPECTAcquisition
Fordetection ofpatient motion(13,14), immediately followingeach tomographic acquisition, the raw projection data in a cineformat were reviewed by a technologist blinded to the patients'clinical and exercise data. The cine images are then scored forpatient motion using a three-point scoring system (0 = no motion,1 = mild motion, 2 = severe motion). This quality controlprocedurewasroutinelyperformedfor all SPECTstudies.
CardiacCatheterizationCoronary angiography and biplane left ventriculography were
performed within 60 days of the scintigraphic study. No patienthad a coronary event or significant worsening of cardiac symptoms in the interval between the 20―flstudy and coronary angiography. The angiographic data were interpreted by two experienced observers who were unaware of the 2o―flscintigraphicresults. In patients with prior myocardial infarction, arteries toterritories with infarction were defined on the basis oflocation ofQ-waveson ECG and/or nonreversible201'fldefects.
CardiacPhantomStudiesCardiac phantom studies that simulated patient imaging con
ditions were used to determine the count attenuation caused byprone imaging performed using a standard table (without a cutout) versus the modified (cut-out) table. The phantom used wasa modificationofa commerciallyavailablephantom (Data Spectrum) consisting of an elliptical bath and cardiac, lung and spineinserts. The cardiac insert contained a uniform concentration of2 @Ci/mlof20Tl in the“myocardium―(withoutdefects)andthe“myocardium―-to-backgroundratio was 2:1. Prone SPECT acquisition was performed using the standard table, and was followed immediately by a second acquisition using the modifiedtable. The average counts from a region of interest over the“myocardium―in multiple, matched raw data projection frames
TABLE 2ComparativeRegionalMyocardialCountsStatisticsBetweenSupineand Prone201TISPECT
Prone @°1TISPECT •Kiatet al 1511
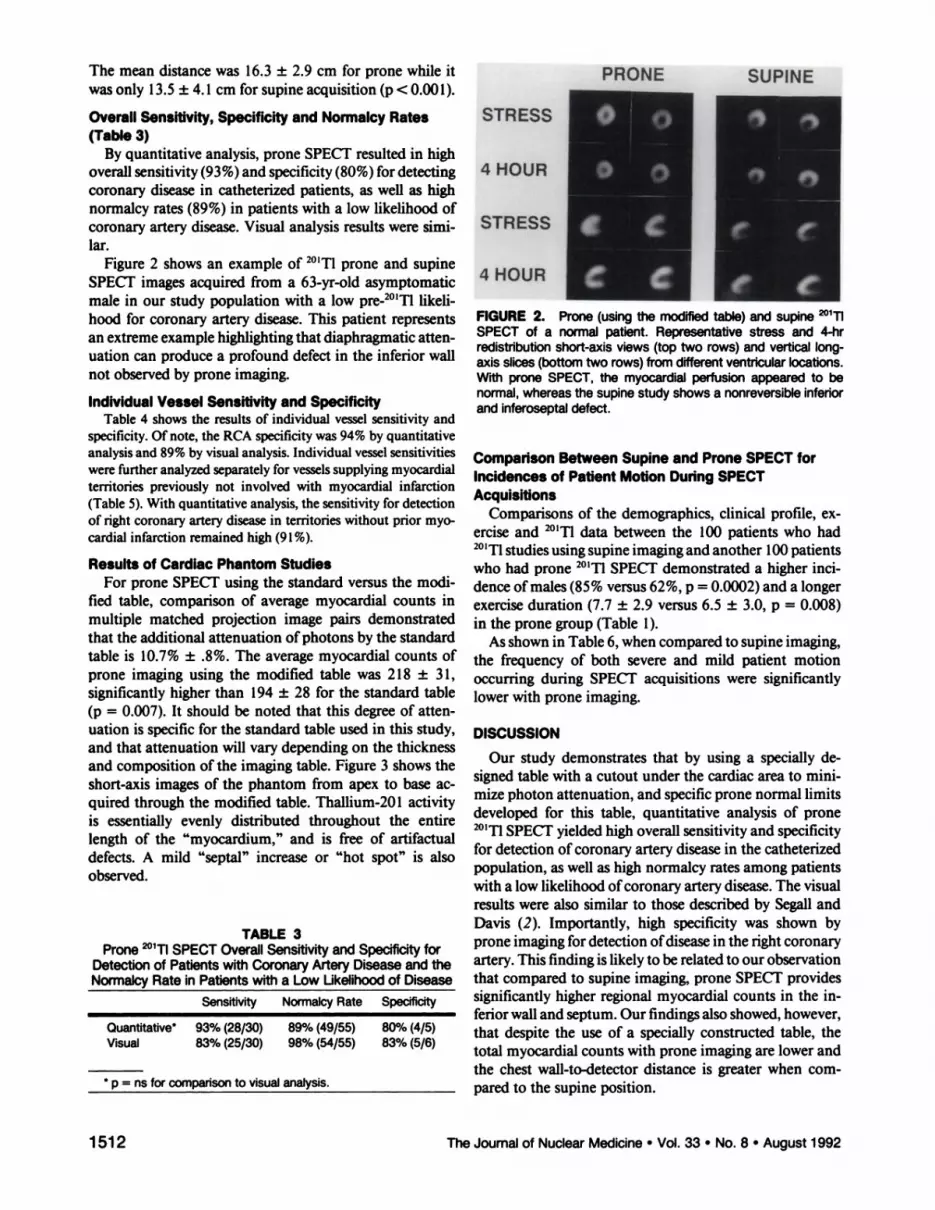
TABLE3Prone20111SPECT OverallSensitivityand SpeCificityfor
Detectionof Patientswith CoronaryArteryDiseaseandtheNormalcy Rate in Patients with a Low Ukelihood ofDiseaseSensitivity
NormalcyRateSpecificityQuantitative*
93%(28/30) 89%(49/55) 80%(4/5)Visual 83%(25/30) 98%(54/55) 83%(5/6)*
p = ns for comparison to visual analysis.
The mean distance was 16.3 ±2.9 cm for prone while itwas only 13.5 ±4. 1cm for supine acquisition (p < 0.001).
Overall Sensitivity, Specificity and Normalcy Rates(Table3)
By quantitative analysis, prone SPECT resulted in highoverall sensitivity (93%) and specificity (80%) for detectingcoronary disease in catheterized patients, as well as highnormalcy rates (89%) in patients with a low likelihood ofcoronary arterydisease. Visual analysis results were similar.
Figure 2 shows an example of 201Tlprone and supineSPECT images acquired from a 63-yr-old asymptomaticmale in our study population with a low pre-2011 likelihood for coronary artery disease. This patient representsan extreme example highlightingthat diaphragmaticattenuation can produce a profound defect in the inferior wallnot observed by prone imaging.
IndividualVessel Sensitivityand SpecificityTable 4 showsthe results of individual vesselsensitivityand
specificity. Of note, the RCA specificity was 94% by quantitative
analysis and 89% by visual analysis. Individual vessel sensitivitieswerefurtheranalyzedseparatelyfor vesselssupplyingmyocardialterritories previously not involved with myocardial infarction(Table 5). With quantitative analysis, the sensitivity for detectionof right coronaryartery diseasein territorieswithout prior myocardial infarction remained high (9 1%).
Results of Cardiac Phantom StudiesFor prone SPECT using the standard versus the modi
fled table, comparison of average myocardial counts inmultiple matched projection image pairs demonstratedthat the additional attenuation ofphotons by the standardtable is 10.7% ±.8%. The average myocardial counts ofprone imaging using the modified table was 218 ±31,significantly higher than 194 ±28 for the standard table(p = 0.007). It should be noted that this degree of attenuation is specific for the standard table used in this study,and that attenuation will vary depending on the thicknessand composition of the imaging table. Figure 3 shows theshort-axis images of the phantom from apex to base acquired through the modified table. Thallium-201 activityis essentially evenly distributed throughout the entirelength of the “myocardium,―and is free of artifactualdefects. A mild “septal―increase or “hotspot―is alsoobserved.
FIGURE2. Prone(usingthemodifiedtable)andsupine@°i1SPECT of a normalpatient. Representativestress and 4-hrredistributionshort-axis views (top two rows) and vertical longaxis slices(bottomtwo rows) from differentventricularlocations.With proneSPECT,the myocardialperfusionappearedto benormal,whereasthe supinestudy shows a nonreversibleinferiorandinferoseptaldefect.
ComparisonBetweenSupineand ProneSPECTforIncidencesof PatientMotionDuringSPECTAcquisitions
Comparisons of the demographics, clinical profile, exercise and 2O1i@data between the 100 patients who had201'flstudies using supine imaging and another 100 patientswho had prone 2O1@@SPECT demonstrated a higher mcidence ofmales (85% versus 62%, p = 0.0002) and a longerexercise duration (7.7 ±2.9 versus 6.5 ±3.0, p = 0.008)in the prone group (Table 1).
As shown in Table 6, when compared to supine imaging,the frequency of both severe and mild patient motionoccurring during SPECT acquisitions were significantlylower with prone imaging.
DISCUSSION
Our study demonstrates that by using a specially designed table with a cutout under the cardiac area to minimize photon attenuation, and specific prone normal limitsdeveloped for this table, quantitative analysis of prone201'flSPECT yielded high overall sensitivity and specificityfor detection of coronary artery disease in the catheterizedpopulation, as well as high normalcy rates among patientswith a low likelihood ofcoronary artery disease. The visualresults were also similar to those described by Segall andDavis (2). Importantly, high specificity was shown byprone imaging for detection ofdisease in the right coronaryartery. This finding is likely to be related to our observationthat compared to supine imaging, prone SPECT providessignificantly higher regional myocardial counts in the inferior wall and septum. Our findings also showed, however,that despite the use of a specially constructed table, thetotal myocardial counts with prone imaging are lower andthe chest wall-to-detector distance is greater when compared to the supine position.
1512 The Journal of Nuclear Medicine •Vol. 33 •No. 8 •August1992

Sensitivity Specificity
Total RCA LAD LCX Total RCA LAD LCX
TABLE5Prone201@flSPECT lndMdual Vessel SensitivityinPatientswith
no PriorMyocardialInfarctionTotal
RCA LADLCX
TABLE4IndividualVesselSensitivityand Specificityfor Prone @°@TlSPECT
Quantitative* @5%(45/53) 88%(15/17) 78%(14/18) 89%(16/18) 87%(45/52) 94%(17/18) 94%(16/17) 71%(12/17)Visual 74%(39/53) 76%(13/17) 67%(12/18) 78%(12/18) 91%(50/55) 89%(17/19) 100%(18/18) 83%(15/18)
* p = ns for all comparisons to visual analysis.
VisualVersusQuantitativeApproachThe results of quantitative prone SPECT were compa
rable to the resultsof visual analysis. This finding has alsobeen reported for supine 201@flSPECT in a large patientpopulation by DePasquale et al. (1 7). Quantitative approaches are still important in circumventing the problemsof intra- and interobservervariability, which helps in thetraining of inexperienced readers and assists observers byproviding an objective “secondopinion.―Additionally,quantitative 201'flSPECT has been previously shown tohave a high degree of reproducibility(18), provides accurate assessment of myocardial perfusion defect size (19,20) and shows a good correlation with the degree ofcoronary stenoses (21,22). Quantitative approaches maythus be clinically useful for the serial objective assessmentof treatment efficacy.
Incidenceand Degree of Severityof PatientMotionDuringSPECTAcquisition
Prone imaging appears to reduce the frequency anddegree of patient motion, a potential cause of artifactualperfusion defects (13,14). With prone imaging, motion isprobably reduced by having the anterior part of the chest,which contains the heart, immobilized against the table.Our results showed that severe motion occurred in 4% ofsupine 2o―flSPECT studies, but in none by prone imaging.Furthermore, while a mild degree of patient motion wasdetected in 12% ofthe supine studies, it was noted in only3.5% ofthe prone studies. In our experience, females withlarge breasts or patients with marked obesity generallyprefer supine imaging.
PotentialPitfallsof ProneSPECTIn comparison to supine imaging, prone SPECTresulted
in slightly lower total myocardial counts, most likely dueto the observed increase in camera-to-chest wall distance.
Since increased camera to chest wall distance also reducesimage resolution, this represents a major shortcoming ofprone imaging. Figure 4 demonstrates a case example ofprone imaging with a standard table in which the imagequality is clearly inferior to that of the images acquired inthe supine position. A narrow table (width: 11—13in.)would be desirable to minimize camera-to-chest wall distance.
From our experience, a small, mild and nonreversibleanterior/anteroseptal defect is occasionally observed withprone imaging, especially when the imaging is performedwith a standard table (Fig. 5). This phenomenon is thoughtto represent attenuation by a rib or the sternum. Aspreviously shown by Segall and Davis (2) with a cardiacmagnetic resonance imaging case example in the proneposition, the heart “flops―forward and comes to lie closerto the anterior chest wall. When closer to the heart, a bonystructure such as a rib or the sternum would attenuate agreater proportion of the emitted photons. Our cardiacphantom prone SPECT demonstrated no artifactual defects (Fig. 3). This finding corroborates the hypothesis (butdoes not prove) that the small and discrete nonreversibleanterior/anteroseptal wall defect observed in clinical proneSPED' may be caused by an anatomical structurebetweenthe heart and the camera. When imaging is performed onthe modified table with a cut-out, the occasionally seenprone artifact is often small, easily recognized and usuallydoes not pose a diagnostic dilemma, as reflected by thehigh normalcy rates and high LAD specificities for both
FIGURE3. ProneSPECTimagesofa cardiacphantomfromapex(segment1)to base(segment8)demonstratingeventracer distribution. Note the presence of small septal hot spot.
Quantitative79%(26/33) 91%(10/11) 64%(7/11) 82%(9/11)Visual 90%(23/33) 73%(8/11) 64%(7/11) 73%(8/11)
-@-*[email protected] @°1TISPECT •Kiatet al 1513
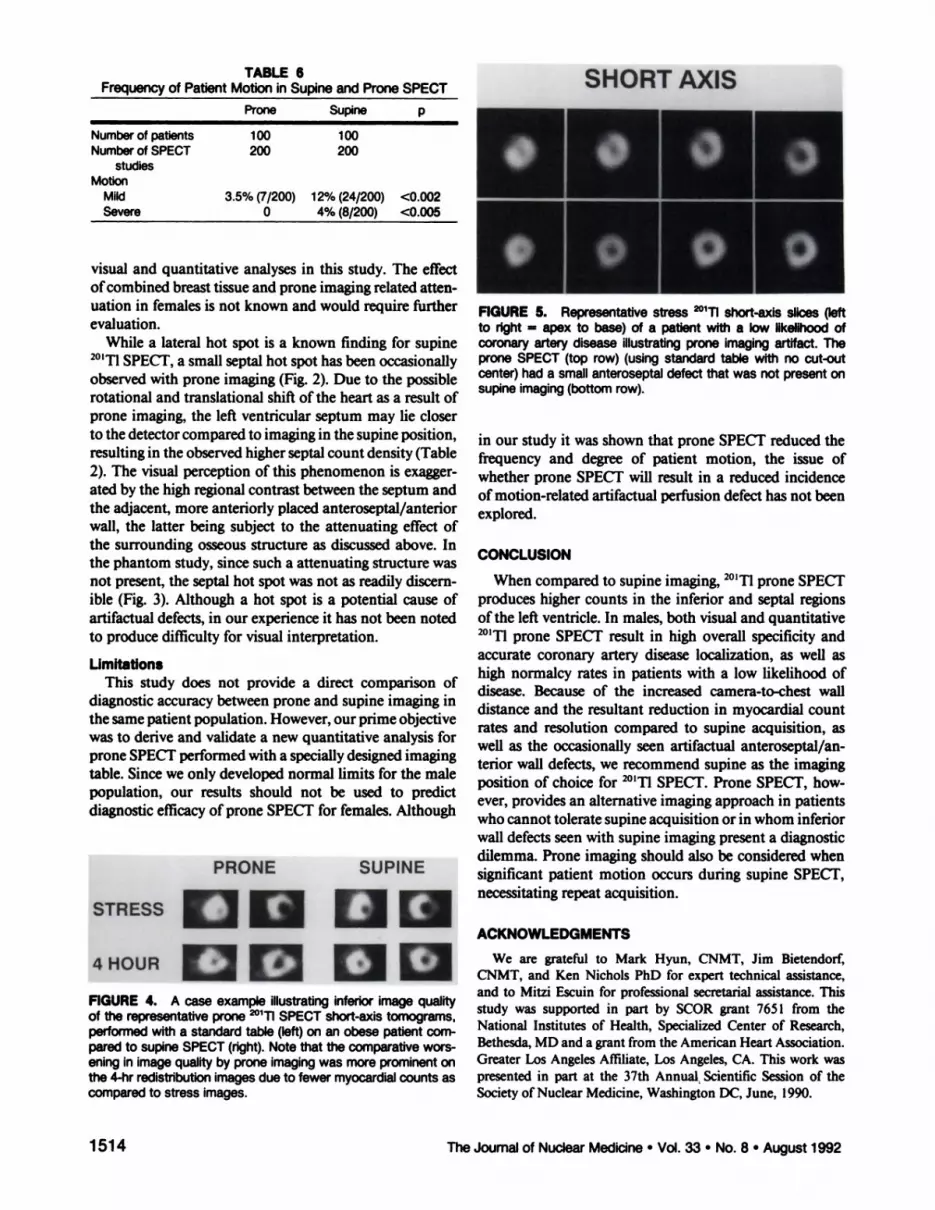
TABLE6Frequencyof Patient Motion in Supine andProneSPECTProneSupinepNumberofpatients100100Number
ofSPECT200200studiesMotionMild3.5%
(7/200)12%(24/200)<0.002Severe04%(8/200)<0.005
•000visual and quantitative analyses in this study. The effectofcombined breast tissue and prone imaging related attenuation in females is not known and would require furtherevaluation.
While a lateral hot spot is a known finding for supine201'flSPE@ a small septal hot spot has been occasionallyobserved with prone imaging (Fig. 2). Due to the possiblerotational and translational shift of the heart as a result ofprone imaging, the left ventricular septum may lie closerto the detectorcompared to imaging in the supine position,resulting in the observed higher septal count density (Table2). The visual perception of this phenomenonis exaggerated by the high regionalcontrast between the septum andthe adjacent, more anteriorlyplaced anteroseptal/anteriorwall, the latter being subject to the attenuating effect ofthe surrounding osseous structure as discussed above. Inthe phantom study, since such a attenuating structurewasnot present, the septal hot spot was not as readily discernible (Fig. 3). Although a hot spot is a potential cause ofartifactual defects, in our experience it has not been notedto produce difficulty for visual interpretation.
LimitationsThis study does not provide a direct comparison of
diagnostic accuracy between prone and supine imaging inthe same patient population. However, our prime objectivewas to derive and validate a new quantitative analysis forprone SPECTperformedwith a specially designed imagingtable. Since we only developed normal limits for the malepopulation, our results should not be used to predictdiagnostic efficacy of prone SPECT for females. Although
FIGURE4. A caseexampleillustratinginferiorimagequalityof the representative prone @°i1SPECT short-axis tomograms,performed with a standard table (left) on an obese patient cornpared to supine SPECT (right). Note that the comparative worsening in image quality by prone imaging was more prominent onthe4-hrredistributionimagesdueto fewermyocardialcountsascomparedto stress images.
FIGURE 5. Representativestress @°i1@ slicesQeftto right = apex to base) of a patient with a low likelihood ofcoronary artery disease illustrating prone imaging artifact. Theprone SPECT (top row) (using standard table with no cut-outcenter) had a small anteroseptal defect that was not present onsupineimaging(bottom row).
in our study it was shown that prone SPECT reduced thefrequency and degree of patient motion, the issue ofwhether prone SPECT will result in a reduced incidenceofmotion-related artifactual perfusion defect has not beenexplored.
CONCLUSION
When compared to supine imaging, 201Tlprone SPECTproduces higher counts in the inferior and septal regionsofthe left ventricle. In males, both visual and quantitative20)'flprone SPECT result in high overall specificity andaccurate coronary artery disease localization, as well ashigh normalcy rates in patients with a low likelihood ofdisease. Because of the increased camera-to-chest walldistance and the resultant reduction in myocardial countrates and resolution compared to supine acquisition, aswell as the occasionally seen artifactual anteroseptal/anterior wall defects, we recommend supine as the imagingposition of choice for 201'flSPECT. Prone SPECT, however, provides an alternative imaging approach in patientswho cannot toleratesupine acquisition or in whom inferiorwall defects seen with supine imaging present a diagnosticdilemma. Prone imaging should also be considered whensignificant patient motion occurs during supine SPECT,necessitating repeat acquisition.
We are grateful to Mark Hyun, CNMT, Jim Bietendorf,CNMT, and Ken Nichols PhD for expert technical assistance,and to Mitzi Escuin for professionalsecretarialassistance.Thisstudy was supported in part by SCOR grant 7651 from theNational Institutes of Health, Specialized Center of Research,Bethesda,MD and a grant fromthe AmericanHeart Association.Greater Los AngelesAffiliate,Los Angeles,CA. This work waspresented in part at the 37th Annual.ScientificSession of theSocietyof NuclearMedicine,WashingtonDC, June, 1990.
PRONE SUPINE
1514 TheJournalof NuclearMedicine•Vol.33 •No.8 •August1992
STRESS@@@ACKNOWLEDGMENTS
4HOUR@ clii

raphy. Am Heart J l986;l I 1:578—586.12. Kiat H, Maddahi J, Roy L, Friedman JD, Berman DS. Comparison of Ic
99m methoxy isobutyl isonitrile with 11-201 imaging by planarand SPECTtechnique for assessment of coronary artery disease. Am Heart I 1989;117:1—11.
13. Friedman 3, Van Train K, Maddahi J, et al. “Upwardcreep―ofthe heart.A frequent source of false-positive reversible defects on 11-201 stressredistribution SPEC!'. I Nuc/ Med 1989;30:1718—l722.
14.FriedmanJ, BermanDS,VanTrain K, etal. Patientmotionin thallium201myocardialSPECTimagingAn easilyidentifiedfrequentsourceofartifactualdefect.C/inNuc/Med 1988;135:321—324.
15. SAS Institute INC. SAS user's guide: Statistics. Version 5 edition. Cary,NC, 1985.
16. Dixon wi, @i.BMDP statistica/ sofiware—1985printing. Berkrley: University ofCalifornia Press; 1985.
17. DePasquale EE, Nody AC, DePuey EG, et al. Quantitative rotationalthallium-201 tomography for identifying and localizing coronary arterydisease.Circulation1988;77:316—327.
18. Prigent F, Berman D, BellulD, et al. Reproducibility ofquantitative indicesof follow-up SPECT one year in stable diagnostic patients [Abstractj. JNuc/Med l989;30:729.
19. Prigent F, Maddahi J, Garcia EV, Satoh Y, Van Train K, Berman DS.Quantification of myocardial infarct size by thallium-201 single photonemission computerized tomography: experimental validation in the dog.Circulation1986;74:852—861.
20. Piigent F, Maddahi J, Garcia EV, Resser K, Lew AS, Berman DS. Comparative methods for quantifying myocardial infarct size by thalhium-201SPECT. J Nuc/Med 1987;28:325—333.
21. PapanicolaouM, VanTrain KF, Kiat H, EiglerN, FriedmanJ, BermanD. Quantitative severity of myocardial stressthalhium-20l SPECT defectsin relation to quantitative coronary angiography. Circulation l990;82:111—321.
22. Hadjimiltiades 5, Watson R, Hakki A-H, Hen J, Iskandrian AS. Relationbetween myocardial thallium-201 kinetics during exercise and quantitativecoronary angiography in patients with one vessel coronary artery disease.JAm CoilCardio/1989;l3:1301—l308.
Prone @°1TlSPECT •Kiatet al 1515
REFERENCES
1. Esquerre J-P, Coca FJ, Martinez SJ, Guiraud RF. Prone decubitus: asolution to inferior wall attenuation in thallium-201 myocardial tomography. JNuclMed l989;30:398—40l.
2. SegallGM, DavisMi. ProneversussupinethalliummyocardialSPECT:amethod to decrease artifactual inferior defects. I Nuci Med l989;30:548—555.
3. DiamondGA, ForresteriS. Analysisofprobabilityas an aid in the clinicaldiagnosis ofcoronary arterydisease. NEngIJMed 1979;300:l350—1358.
4. DiamondGA, ForresterJS,HirschM, et al. Applicationof conditionalprobability analysis to the clinical diagnosis of coronary artery disease. JC/inInvest1980;65:1210—l221.
5. RozanskiA, DiamondGA, ForresteriS, Ctal.Alternativereferentstandarcis for cardiac normality. Implications for diagnostic testing. Ann InternMed l984;l0l:164—l7l.
6. Maddahi i, Van Train K, Prigent F, et al. Quantitative single photonemission computerized thallium-20l tomography for evaluation of coronary artery disease: optimization and prospective validation of a newtechnique.JAm CoilCardio/l989;l4:1689—1699.
7. Van Train K, Maddahi J, Berman DS, et at. Quantitative analysis oftomographic stress thallium-201 myocardial scintigrams: A multicentertrial.JNuc/Med 1990;3l:l168—1179.
8. ChouraquiP,MaddahiJ,OstrzegaE,etal.Quantitativeexercisethallium201 rotational tomography for evaluation ofpatients with prior myocardialinfarction. Am J Cardio/ 1990;66:151—157.
9. Kiat H, Berman DS, Maddahi J, et al. Late reversibilityof tomographicmyocardial thallium-201 defects: an accurate myocardial viability. I AmCoilCardio/ 1988;l2:955—963.
10. Yang LD, Berman DS, Kiat H, et a!. The frequency oflate reversibility inSPEC1' thallium-201 stress redistribution studies. JAm CoilCardio/ 1990;15:334—340.
11. PrigentF, MaddahiJ, Garcia E, et al. Non-invasivequantificationof theextent ofjeopardized myocardium in patients with single-vessel disease bystress thallium-201 single photon emission computerized rotational tomog