Embed Size (px)
Citation preview

ORIGINAL ARTICLE
Quantitative Poincare plot analysis of heart rate variability:effect of endurance training
Accepted: 20 June 2003 / Published online: 4 September 2003� Springer-Verlag 2003
Abstract The aim of the study was to evaluate theeffectiveness of the Poincare plot analysis of heart ratevariability (HRV) in observing endurance training-induced changes. Four 10-min manoeuvres were per-formed (supine lying, standing, steady state exercisingand subsequent recovery) by eight control subjectsbefore and after a short-term endurance training andby eight subjects trained for at least 3 years. HRV wasassessed by traditional time- and frequency-domainindexes, in parallel with the Poincare plot analysis. In thelatter each R-R interval is plotted as a function of theprevious one, and the standard deviations of the instan-taneous and long-term R-R interval variability are cal-culated. In our subjects, the Poincare scatter gramsbecame gradually narrower from supine to exercising,with progressive parasympathetic withdrawal. Short- andlong-term endurance training led to higher aerobic power(p<0.05) and ventilatory threshold shifted towardshigher power output (p<0.05). All HRV evaluationmethods showed that HRV values were higher aftertraining both during supine lying and standing (p<0.05).The Poincare scatter gramswerewider in the trained state.Standard deviations of the Poincare plot were sig-nificantly correlatedwith themain parameters of the time-and frequency-domain analyses, especially concerning theparasympathetic indicators. These results suggested thatPoincare plot parameters as well as the ‘‘width’’ of the
scatter gram could be considered as surrogates of time-and frequency-domain analysis to assess training-inducedchanges in HRV.
Keywords Autonomic cardiovascular control Æ Heartrate variability Æ Poincare plot Æ Spectral analysis
Introduction
Heart rate variability (HRV) reflects the continuousoscillation of the R-R intervals around its mean value,providing non-invasive assessment of both the para-sympathetic and sympathetic control of heart rate in real-life conditions (Task Force 1996). In the field of sporttesting, HRV analysis has been used to evaluate modifi-cations of autonomic cardiovascular functions duringexercise or after a training period. Whilst evaluation ofHRV at rest is now fairly established, its assessmentduring exercise is still incompletely understood, mainlybecause studies reporting HRV analysis duringexercise produced inconsistent results (Kamath et al.1991; Yamamoto et al. 1991; Casadei et al. 1995; Tulppoet al. 1996). Also, fitness level could alter HRV (Tulppoet al. 1998), and sufficiently long and intense endurancetraining could increase HRV (Dixon et al. 1992; Janssenet al. 1993; Macor et al. 1996; Melanson and Freedson2001) even if controversial results have been observed(Loimaala et al. 2000).
The inconsistency of past results regarding exerciseand endurance training on HRV could be explain bythe fact that different methods and protocols havebeen used at rest and during exercise. Informationabout HRV has been commonly obtained by usinglinear methods such as power spectral analysis (TaskForce 1996). In recent years, the use of non-lineardynamic methods has become widely applied to thequantitative analysis in many temporal physiologi-cal signals including the R-R intervals time series(Skinner et al. 1992). A number of studies dealing withHRV have shown that R-R intervals fluctuate in a
Eur J Appl Physiol (2004) 91: 79–87DOI 10.1007/s00421-003-0917-0
Laurent Mourot Æ Malika Bouhaddi Æ Stephane Perrey
Jean-Denis Rouillon Æ Jacques Regnard
L. Mourot (&) Æ M. Bouhaddi Æ J. RegnardLaboratoire de Physiologie Medecine,Faculte de Medecine et de Pharmacie,Place St Jacques, 25030 Besancon cedex, FranceE-mail: [email protected].: +33-3-81665654Fax: +33-3-81665614
L. Mourot Æ J.-D. RouillonLaboratoire des Sciences du Sport,Place St Jacques, 25030 Besancon cedex, France
S. PerreyUPRES-EA 2991, Faculte des Sciences du Sport,34090 Montpellier, France

very complex and apparently erratic manner exhibitingpatterns suggestive of non-linear processes (Braun et al.1998). It has been also proposed that, because of thesenon-linear components, the R-R interval time seriessignal cannot be properly assessed using linear tech-niques such as spectral analysis (Braun et al. 1998). Inthe search for improved methods for decoding hiddeninformation in the R-R interval dynamics, parametersarising from non-linear methods have therefore beenidentified. A Poincare plot of HRV, which consists ofplotting each R-R interval as a function of the previousinterval, is such a non-linear method that allows calcu-lation of changes in heart dynamics with trends. Inaddition of a visual measure of parasympathetic ner-vous system activity (Woo et al. 1994; Kamen et al.1996), this method permits immediate recognition ofectopic beats or artefacts which may otherwise gounobserved (Myers et al. 1992). Tulppo and colleagues(Tulppo et al. 1996) have demonstrated that this methodcan provide useful information of heart rate (HR)dynamics during exercise that are not easily detected byconventional linear measures of HRV. In the last study,the correlation coefficients between non-linear and lin-ear measures of HRV became weaker during the courseof exercise than at rest. The results could then be ex-plained by the statistical problems in quantifying HRVby frequency domain methods, because the R-R intervaltime series is non-stationary during exercise. The samegroups successfully used the quantitative Poincaremethod to assess age and fitness effects of vagal mod-ulation of HR during exercise (Tulppo et al. 1998). Todate, this method has however not been used withtraining state.
Therefore, the aim of the present study was toshow the effectiveness of the Poincare plot method toassess the endurance-training-induced changes in HRV.For this purpose, HRV analysis by traditional time-and frequency- domain and by Poincare plot wasperformed during four steady-state manoeuvres (i.e.supine rest, standing, sub-maximal constant exerciseand its subsequent recovery) in control subjects beforeand after short-term endurance training and in subjectswho have trained for at least 3 years.
Methods
Subjects
Eight male endurance-trained cyclists (T), enrolled in a licensedamateur team for at least 3 years, were compared to eight malecontrol subjects who were investigated twice, before (C) and after(CT) short-term endurance training on a cycle ergometer. Thegroup’s characteristics are presented in Table 1. Their medicalhistory and a medical examination were used to discard subjectswith cardiovascular, pulmonary, or metabolic diseases. The sub-jects were normotensive and none was taking any medication. Thestudy protocol complies with the Helsinki declaration for humanexperimentation and was approved by the office of the researchethics at the University of Franche Comte. Possible risks andbenefits were explained and written informed consent was obtainedfrom each subject prior to all testing.
Study protocol
The subjects came to the laboratory between 4:00 and7:00 pm. They were instructed to fast for at least 3 h beforetesting. They were also asked to refrain from ingesting bever-ages containing caffeine and alcohol and not to exercise duringthe 24 h preceding the test sessions (Furlan et al. 1993). Theorder of the tests was the same for all subjects. At least 3 daysafter an initial incremental exercise performed on a mechanicallybraked cycle ergometer (Monark 818E, Stockholm, Sweden),they remained in a supine position in a quiet, dimly lighted room(the ambient temperature was kept at 22�C to 24� C) beforestarting baseline measurements in a supine position for 10 min.At the end of supine rest measurement, systolic (SAP) and dia-stolic (DAP) arterial blood pressure measurements were per-formed with a standard mercury sphygmomanometer and astethoscope. Then, they remained in an upright position for15 min. Subsequently, each subject performed sub-maximalexercise for 10 min at 50% of peak power output ( _WW p) on acycle ergometer. At the cessation of exercise, the subjectremained seated and quiet on the cycle ergometer for 10 min.Electrocardiographic (ECG) data were obtained during the fourmanoeuvres while the subjects spontaneously adapted their tidalvolume and breathing frequency (fr). fr was recorded thanks to arespiratory amplifier consisting of a chest belt that measures thechanges in thoracic circumference while breathing (Biopac Sys-tem, Santa Barbara, Calif., USA). In the present study, fr wasalways >10 cycles/min (0.16 Hz). No significant difference wasobserved between C, CT and T subjects. Despite reported con-troversial results, no effects of fr and tidal volume on HRVassessment were found in the present study (Brown et al. 1993;Cooke et al. 1998).
Measurement of peak values and ventilatory threshold
During the incremental test, gas exchange data were collected ona breath-by-breath basis using an automated system (CPX,Medical Graphics, St. Paul, Mich., USA) to estimate the fol-lowing variables: _VV O2 (ml.min)1.kg)1), minute ventilation ( _VV E,l.min)1), carbon dioxide production ( _VV CO2, ml.min)1.kg)1),respiratory exchange ratio (RER), ventilatory equivalents foroxygen ( _VV E/ _VV O2) and carbon dioxide ( _VV E/ _VV CO2). Before eachtest, the oxygen analyzer system was calibrated according to themanufacturer’s instructions while the pneumotachograph wascalibrated using a 3-l syringe. After a 3-min resting period whileseated on the bike, the test started with a 3-min unloaded exercisebout, then the load was increased by 30 W every 3 min untilexhaustion (Gimenez et al. 1982). The highest load which couldbe maintained with a constant pedal rate of 60 rpm for 2 minwas taken as _WW p. Peak values of oxygen uptake ( _VV O2p), HR(HRp) and RER (RERp) were determined at _WW p. All subjectswere verbally encouraged and gave a maximum effort. The ven-tilatory threshold (VT) was assessed from the relation betweentime of exercise and selected ventilatory parameters (RER, _VV E,_VV E/ _VV O2 and _VV E/ _VV CO2 ratios) (Wasserman 1986) by three blinded
Table 1 Characteristics of the subjects. (C Control subjects beforeshort-term endurance training, CT control subjects after short-termendurance training, T subjects who have trained for at least 3 years,DAP diastolic arterial blood pressure, SAP systolic arterial bloodpressure)
Parameter C CT T
Age (years) 22.8 (3.2) 22.8 (3.2) 17.8 (1.8)Height (cm) 165.0 (6.1) 165.0 (6.1) 168.1 (7.9)Weight (kg) 59.9 (6.1) 59.5 (5.5) 60.2 (7.5)SAP (mmHg) 117.0 (8.8) 115.0 (10.3) 123.8 (6.3)DAP (mmHg) 67.0 (7.1) 61.8 (6.7) 66.3 (6.2)
80

experts. The mean of the two closest values (out of three) wastaken as VT. The power output corresponding to the ventilatorythreshold level ( _WW VT) was also registered.
Endurance training program
Training included three sessions per week for 6 weeks on a Monarkcycle ergometer according to the SWEET protocol (Gimenez et al.1982). Briefly, a session comprises nine consecutive periods of5 min including 4-min of ‘‘base’’ power output followed by 1 minof ‘‘peak’’ power output initially performed at the _WW VT and _WW P
levels, respectively. During the training sessions, _WW P and _WW VT werereadjusted in steps of 30 W when the HR recorded at the end of thesession was at least 10 beats.min)1 lower than the highest HR ofthe previous sessions.
HR measurement and analysis
The ECG signal was sampled at 500 Hz using an analogue todigital converter with 16-bit resolution and data acquisition soft-ware (BSL pro v.3.6.5.). R-R intervals were instantaneouslydetermined by software (BSL pro v.3.6.5., BIOPAC System, SantaBarbara, Calif., USA). The program calculated the R-R intervalsas the difference between successive R-wave peaks. All the R-Rintervals were edited initially by visual inspection to exclude all theundesirable beats (i.e. to ensure that each analysis for the segmentwas free of movement artefact and/or sharp transient in the signaldue to premature beats) which counted for <1% in every subjects.
Frequency- and time time-domain analyses
Frequency- and time-domain analyses were performed on a timeseries of five consecutive minutes manually selected over the 10- or15-min recordings. At least 256 cycles were used for each analysis.During exercise, steady state was considered when HR varied lessthan 5 beats.min)1 over the 5-min period. Three time domainmeasures were used as measures of total variation in HR during therespiratory cycle: the standard deviation of the R-R intervals (SD),the root mean square of successive differences of successive R-Rintervals (rMSSD), and the proportion of the number of intervaldifferences of successive R-R intervals greater than 50 ms (pNN50).Frequency analysis was performed with the coarse graining spectralanalysis (CGSA) method (Yamamoto and Hughson 1991) toquantify the total harmonic power of HRV (TP) and the powerof spectral components in the low (LF: 0.04–0.15 Hz) andhigh frequencies (HF: 0.15–0.50 Hz). The very low frequencies(0–0.04 Hz) were not addressed in the present study. HF power isalmost entirely mediated by the parasympathetic activity to thesinus node directly associated with respiratory activity (Pomeranzet al. 1985), whereas LF power reflects the mixed modulation ofparasympathetic and sympathetic activities (Bernardi et al. 1994).Parasympathetic and sympathetic nervous system activity were alsoevaluated by HF/TP and LF/TP ratios (PNS and SNS, respectivelyYamamoto et al. 1991; Nakamura et al. 1993; Task Force 1996).Changes in the ratio LF/HF were taken as an indication of changesin sympathetic activity (Yamamoto and Hughson 1991), althoughthis ratio may also be an index of sympathovagal balance (Paganiet al. 1986).
Quantitative beat-to-beat analysis of HRV
The Poincare Plot is a diagram (scatter gram) in which each R-Rinterval is plotted as a function of the previous one. This plot hasalso been shown to be useful in providing qualitative (visual)information about the degree of complexity in the R-R intervalin heart failure patients (Woo et al. 1994). A quantitative analysisof the Poincare plot was performed on the R-R interval timeseries and the following parameters were calculated from each
individual scatter gram, as described by Tulppo et al. (1996):standard deviation of the instantaneous beat-to-beat variabilityof the data (SD1), and standard deviation of the continuouslong-term R-R intervals (SD2). SD1 and SD2 are reported inabsolute values and in normalized units (SD1n and SD2n,respectively), obtained by dividing the absolute value by theaverage R-R interval and then by multiplying by 1000.
Statistical methods
Standard statistical methods were used for the calculation of mean(SD). The normality of the data distribution was verified by theKolmogorov-Smirnov test. Since the data distribution for allmeasures was markedly skewed, the logarithm was used in order todeskew the distribution. The new data distribution were subse-quently used for statistical analysis (Bigger et al. 1992). Differencein the HRV indexes between the four manoeuvres and between Cand CT conditions was tested for significance using a one-wayANOVA for repeated measures followed by a Tukey honest test.The difference between T and C or CT was tested using the un-paired t-test. By using the pooled data set of the four manoeuvresfor the three groups of subjects, the linear correlation coefficientsamong all the parameters were also determined. Statistical signifi-cance was accepted at p<0.05.
Results
Figure 1 shows the Poincare plot measured during thefour manoeuvres, for one control subject before (C) andafter (CT) 6 weeks of training, and one T subject.Visually, the pattern of Poincare plot was larger duringthe supine rest state (Fig. 1A), narrower during standing(Fig. 1B), reduced considerably during sub-maximalexercise (Fig. 1C), and returned to the standing positionappearance during recovery (Fig. 1D), though withsmaller dispersion. Also, the widening of the shapeof the scatter gram after endurance training can beobserved in Fig. 1. Thus, the extreme difference invariability between all conditions is apparent.
Effect of endurance training on aerobic capacity
After 6 weeks of endurance training, a significantincrease in _VV O2p, _VV O2VT, _WW p and _WW VT were observed inC, but T still had the highest values among the threegroups (Table 2). Consequently, power output duringsub-maximal exercise was higher in T than in CT andin C [146 (24) W, 89 (17) W and 67 (11) W, respec-tively, p<0.05], associated with a HR of 142.2(15.3) beats.min)1, 113.1 (9.6) beats.min)1 and 125.8(11.4) beats.min)1, respectively.
Effect of endurance training on HRV
Compared to pre-training (Tables 3, 4 and 5), C hadhigher values of R-R intervals during the fourmanoeuvres (p<0.05 during supine and recoveryconditions). This was accompanied with higher values
81

of SD and TP during supine, standing and exercise,and with higher (p<0.05) values of rMSSD, pNN50,HF, SD1, SD2, and SD1n only when supine andstanding. For C, SD2n was higher (p<0.05) in post-than in pre-training during standing, whereas LF andSNS were higher (p<0.05) during exercise in the post-training state.
In T compared to C subjects (Tables 3, 4 and 5), R-R intervals, SD, rMSSD, pNN50, TP, SD1, SD2,SD1n and SD2n were all significantly higher during
supine and standing. During exercise, R-R intervals,rMSSD, SD1 were lower (p<0.05) in T subjects.SNS was higher (p<0.05) in T than in C duringstanding and exercise. Finally, SD, TP, LF, SD2 andSD2n were higher (p<0.05) in T than in C duringrecovery.
During supine, rMSSD, pNN50, SD1 and SD1n werehigher (p<0.05) in T compared to CT (Tables 3, 4 and5). During exercise, when compared to CT, T have lower(p<0.05) R-R intervals, SD, rMSSD, HF, PNS, SD1,SD2, and SD1n values. Also, LF/HF was significantlyhigher in T. Significantly higher LF and SNS valueswere observed in T than in CT.
Effect of manoeuvres (supine, standing, steady-stateexercise and subsequent recovery) on HRV
In the three groups, R-R intervals decreased signifi-cantly during standing compared to supine and muchmore during exercise with values close to those duringstanding in the recovery period. The same trend wasobserved for SD, rMSSD, TP, HF, SD1, SD2 andalso for PNS. LF/HF increased with standing, andmuch more with exercise before to remain elevatedduring the recovery from exercise. It is of note thatT group exhibited the clearer response regardless themanoeuvres.
Fig. 1A–D Poincare plotsduring supine (A), standing (B),steady-state exercise (C) and thesubsequent recovery (D) for acontrol subject before (C) andafter (CT) short-termendurance training and in atrained subject (T). Thenarrowing induced by increasedsympathetic and withdrawnparasympathetic activitiescould be observed as well as theincreased scatter due toenhancement ofparasympathetic activity aftertraining during supine andstanding
Table 2 Effects of endurance training on oxygen uptake ( _VV O2,ml.min)1.kg)1), heart rate (HR, beats.min)1), power output( _WW , watt), and respiratory exchange ratio (RER) at the ventilatorythreshold (VT) and peak (p) levels. Other abbreviations as in legendto Table 1
C CT T
_VV O2VT 28.6 (4.7) 34.0 (3.6)*£ 47.3 (7.3)*HRVT 161.4 (13.8) 174.7 (14.8) 163.0 (11.3)_WW VT 123.8 (29.7) 165.0 (22.7)*£ 211.9 (52.6)*RERVT 0.97 (0.07) 0.97 (0.04) 1.02 (0.05)*_VV O2p 38.9 (5.3) 43.5 (4.1)*£ 61.5 (9.7)*HRp 184.0 (6.7) 191.1 (7.7) 192.0 (11.3)_WW p 153.8 (29.7) 195.0 (22.7)*£ 296.3 (58.3)*RERp 1.05 (0.08) 1.06 (0.04)£ 1.17 (0.07)*
*Significantly different from C;£significantly different from T; p<0.05
82
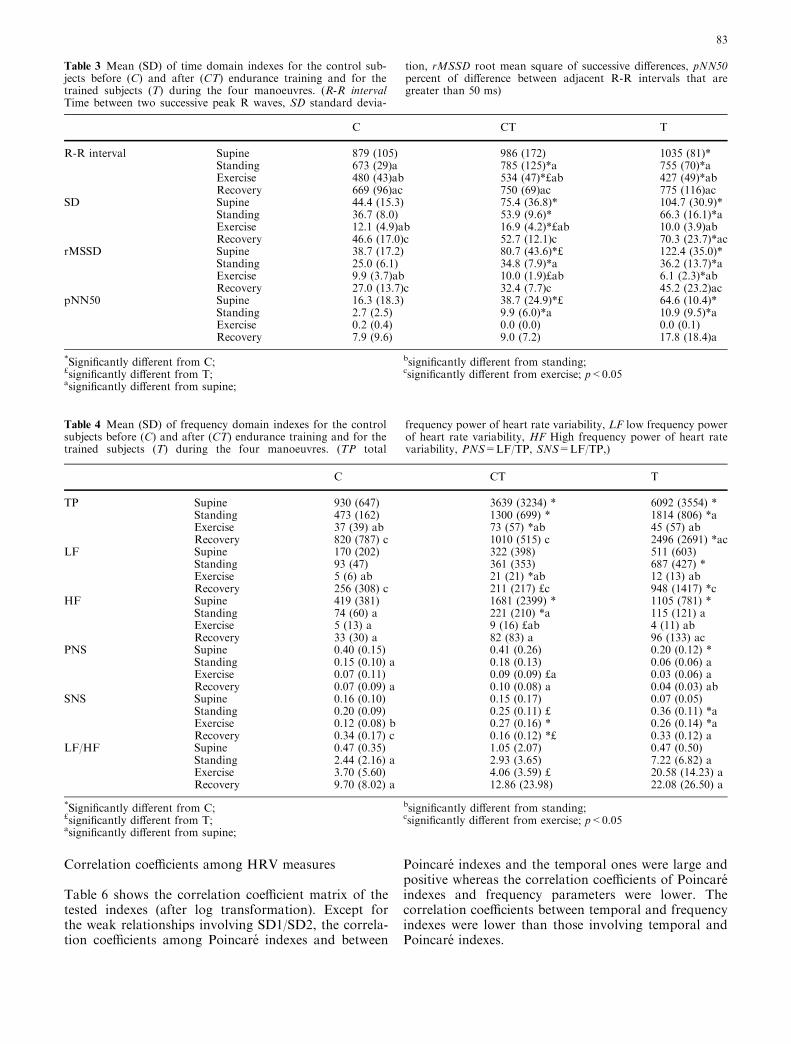
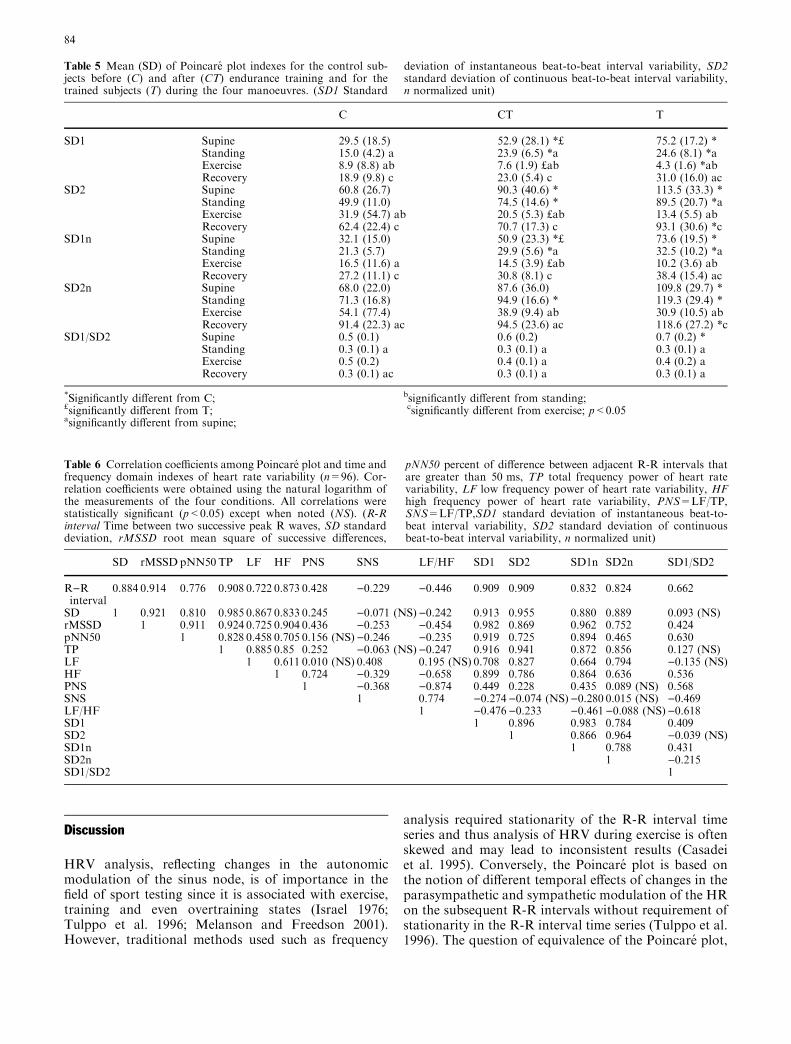
Correlation coefficients among HRV measures
Table 6 shows the correlation coefficient matrix of thetested indexes (after log transformation). Except forthe weak relationships involving SD1/SD2, the correla-tion coefficients among Poincare indexes and between
Poincare indexes and the temporal ones were large andpositive whereas the correlation coefficients of Poincareindexes and frequency parameters were lower. Thecorrelation coefficients between temporal and frequencyindexes were lower than those involving temporal andPoincare indexes.
Table 3 Mean (SD) of time domain indexes for the control sub-jects before (C) and after (CT) endurance training and for thetrained subjects (T) during the four manoeuvres. (R-R intervalTime between two successive peak R waves, SD standard devia-
tion, rMSSD root mean square of successive differences, pNN50percent of difference between adjacent R-R intervals that aregreater than 50 ms)
Table 4 Mean (SD) of frequency domain indexes for the controlsubjects before (C) and after (CT) endurance training and for thetrained subjects (T) during the four manoeuvres. (TP total
frequency power of heart rate variability, LF low frequency powerof heart rate variability, HF High frequency power of heart ratevariability, PNS=LF/TP, SNS=LF/TP,)
C CT T
TP Supine 930 (647) 3639 (3234) * 6092 (3554) *Standing 473 (162) 1300 (699) * 1814 (806) *aExercise 37 (39) ab 73 (57) *ab 45 (57) abRecovery 820 (787) c 1010 (515) c 2496 (2691) *ac
LF Supine 170 (202) 322 (398) 511 (603)Standing 93 (47) 361 (353) 687 (427) *Exercise 5 (6) ab 21 (21) *ab 12 (13) abRecovery 256 (308) c 211 (217) £c 948 (1417) *c
HF Supine 419 (381) 1681 (2399) * 1105 (781) *Standing 74 (60) a 221 (210) *a 115 (121) aExercise 5 (13) a 9 (16) £ab 4 (11) abRecovery 33 (30) a 82 (83) a 96 (133) ac
PNS Supine 0.40 (0.15) 0.41 (0.26) 0.20 (0.12) *Standing 0.15 (0.10) a 0.18 (0.13) 0.06 (0.06) aExercise 0.07 (0.11) 0.09 (0.09) £a 0.03 (0.06) aRecovery 0.07 (0.09) a 0.10 (0.08) a 0.04 (0.03) ab
SNS Supine 0.16 (0.10) 0.15 (0.17) 0.07 (0.05)Standing 0.20 (0.09) 0.25 (0.11) £ 0.36 (0.11) *aExercise 0.12 (0.08) b 0.27 (0.16) * 0.26 (0.14) *aRecovery 0.34 (0.17) c 0.16 (0.12) *£ 0.33 (0.12) a
LF/HF Supine 0.47 (0.35) 1.05 (2.07) 0.47 (0.50)Standing 2.44 (2.16) a 2.93 (3.65) 7.22 (6.82) aExercise 3.70 (5.60) 4.06 (3.59) £ 20.58 (14.23) aRecovery 9.70 (8.02) a 12.86 (23.98) 22.08 (26.50) a
*Significantly different from C;£significantly different from T;asignificantly different from supine;
bsignificantly different from standing;csignificantly different from exercise; p<0.05
C CT T
R-R interval Supine 879 (105) 986 (172) 1035 (81)*Standing 673 (29)a 785 (125)*a 755 (70)*aExercise 480 (43)ab 534 (47)*£ab 427 (49)*abRecovery 669 (96)ac 750 (69)ac 775 (116)ac
SD Supine 44.4 (15.3) 75.4 (36.8)* 104.7 (30.9)*Standing 36.7 (8.0) 53.9 (9.6)* 66.3 (16.1)*aExercise 12.1 (4.9)ab 16.9 (4.2)*£ab 10.0 (3.9)abRecovery 46.6 (17.0)c 52.7 (12.1)c 70.3 (23.7)*ac
rMSSD Supine 38.7 (17.2) 80.7 (43.6)*£ 122.4 (35.0)*Standing 25.0 (6.1) 34.8 (7.9)*a 36.2 (13.7)*aExercise 9.9 (3.7)ab 10.0 (1.9)£ab 6.1 (2.3)*abRecovery 27.0 (13.7)c 32.4 (7.7)c 45.2 (23.2)ac
pNN50 Supine 16.3 (18.3) 38.7 (24.9)*£ 64.6 (10.4)*Standing 2.7 (2.5) 9.9 (6.0)*a 10.9 (9.5)*aExercise 0.2 (0.4) 0.0 (0.0) 0.0 (0.1)Recovery 7.9 (9.6) 9.0 (7.2) 17.8 (18.4)a
*Significantly different from C;£significantly different from T;asignificantly different from supine;
bsignificantly different from standing;csignificantly different from exercise; p<0.05
83
Discussion
HRV analysis, reflecting changes in the autonomicmodulation of the sinus node, is of importance in thefield of sport testing since it is associated with exercise,training and even overtraining states (Israel 1976;Tulppo et al. 1996; Melanson and Freedson 2001).However, traditional methods used such as frequency
analysis required stationarity of the R-R interval timeseries and thus analysis of HRV during exercise is oftenskewed and may lead to inconsistent results (Casadeiet al. 1995). Conversely, the Poincare plot is based onthe notion of different temporal effects of changes in theparasympathetic and sympathetic modulation of the HRon the subsequent R-R intervals without requirement ofstationarity in the R-R interval time series (Tulppo et al.1996). The question of equivalence of the Poincare plot,
Table 5 Mean (SD) of Poincare plot indexes for the control sub-jects before (C) and after (CT) endurance training and for thetrained subjects (T) during the four manoeuvres. (SD1 Standard
deviation of instantaneous beat-to-beat interval variability, SD2standard deviation of continuous beat-to-beat interval variability,n normalized unit)
C CT T
SD1 Supine 29.5 (18.5) 52.9 (28.1) *£ 75.2 (17.2) *Standing 15.0 (4.2) a 23.9 (6.5) *a 24.6 (8.1) *aExercise 8.9 (8.8) ab 7.6 (1.9) £ab 4.3 (1.6) *abRecovery 18.9 (9.8) c 23.0 (5.4) c 31.0 (16.0) ac
SD2 Supine 60.8 (26.7) 90.3 (40.6) * 113.5 (33.3) *Standing 49.9 (11.0) 74.5 (14.6) * 89.5 (20.7) *aExercise 31.9 (54.7) ab 20.5 (5.3) £ab 13.4 (5.5) abRecovery 62.4 (22.4) c 70.7 (17.3) c 93.1 (30.6) *c
SD1n Supine 32.1 (15.0) 50.9 (23.3) *£ 73.6 (19.5) *Standing 21.3 (5.7) 29.9 (5.6) *a 32.5 (10.2) *aExercise 16.5 (11.6) a 14.5 (3.9) £ab 10.2 (3.6) abRecovery 27.2 (11.1) c 30.8 (8.1) c 38.4 (15.4) ac
SD2n Supine 68.0 (22.0) 87.6 (36.0) 109.8 (29.7) *Standing 71.3 (16.8) 94.9 (16.6) * 119.3 (29.4) *Exercise 54.1 (77.4) 38.9 (9.4) ab 30.9 (10.5) abRecovery 91.4 (22.3) ac 94.5 (23.6) ac 118.6 (27.2) *c
SD1/SD2 Supine 0.5 (0.1) 0.6 (0.2) 0.7 (0.2) *Standing 0.3 (0.1) a 0.3 (0.1) a 0.3 (0.1) aExercise 0.5 (0.2) 0.4 (0.1) a 0.4 (0.2) aRecovery 0.3 (0.1) ac 0.3 (0.1) a 0.3 (0.1) a
*Significantly different from C;£significantly different from T;asignificantly different from supine;
bsignificantly different from standing;csignificantly different from exercise; p<0.05
Table 6 Correlation coefficients among Poincare plot and time andfrequency domain indexes of heart rate variability (n=96). Cor-relation coefficients were obtained using the natural logarithm ofthe measurements of the four conditions. All correlations werestatistically significant (p<0.05) except when noted (NS). (R-Rinterval Time between two successive peak R waves, SD standarddeviation, rMSSD root mean square of successive differences,
pNN50 percent of difference between adjacent R-R intervals thatare greater than 50 ms, TP total frequency power of heart ratevariability, LF low frequency power of heart rate variability, HFhigh frequency power of heart rate variability, PNS=LF/TP,SNS=LF/TP,SD1 standard deviation of instantaneous beat-to-beat interval variability, SD2 standard deviation of continuousbeat-to-beat interval variability, n normalized unit)
SD rMSSD pNN50 TP LF HF PNS SNS LF/HF SD1 SD2 SD1n SD2n SD1/SD2
R)Rinterval
0.884 0.914 0.776 0.908 0.722 0.873 0.428 )0.229 )0.446 0.909 0.909 0.832 0.824 0.662
SD 1 0.921 0.810 0.985 0.867 0.833 0.245 )0.071 (NS))0.242 0.913 0.955 0.880 0.889 0.093 (NS)rMSSD 1 0.911 0.924 0.725 0.904 0.436 )0.253 )0.454 0.982 0.869 0.962 0.752 0.424pNN50 1 0.828 0.458 0.705 0.156 (NS) )0.246 )0.235 0.919 0.725 0.894 0.465 0.630TP 1 0.885 0.85 0.252 )0.063 (NS))0.247 0.916 0.941 0.872 0.856 0.127 (NS)LF 1 0.611 0.010 (NS) 0.408 0.195 (NS) 0.708 0.827 0.664 0.794 )0.135 (NS)HF 1 0.724 )0.329 )0.658 0.899 0.786 0.864 0.636 0.536PNS 1 )0.368 )0.874 0.449 0.228 0.435 0.089 (NS) 0.568SNS 1 0.774 )0.274)0.074 (NS))0.280 0.015 (NS) )0.469LF/HF 1 )0.476)0.233 )0.461)0.088 (NS))0.618SD1 1 0.896 0.983 0.784 0.409SD2 1 0.866 0.964 )0.039 (NS)SD1n 1 0.788 0.431SD2n 1 )0.215SD1/SD2 1
84

temporal and frequency measurements of HRV wasassessed in the present study by comparing thesesmethods under stabilized resting and exercising condi-tions before and after training.
Before discussing the results of the present study, wewould like to specify the meaning of the Poincare plotparameters. Because vagal effects on the sinus node areknown to develop faster than sympathetically mediatedeffects, the instantaneous beat-to-beat variability of theR-R interval time series (SD1 and SD1n) is mediated byvagal efferent activity. Incremental doses of atropineresult in a linear progressive reduction in SD1 (Tulppoet al. 1996). Thus, SD1 and SD1n are parameters ofparasympathetic control of the sinus node. Also, SD2and SD2n decrease during atropine administration, butdecrease again during exercise after complete parasym-pathetic blockade, suggesting that sympathetic activa-tion results in a progressive reduction in the long-termoscillation in HR (Tulppo et al. 1996). Moreover,moxonidine (a centrally acting anti-sympathetic drug)has also been shown to reduce SD2 (De Vito et al. 2002)suggesting that SD2 is influenced by both parasympa-thetic and sympathetic tone. Finally, SD1/SD2 ratioincreased during exercise after complete parasympa-thetic blockade but only from 60% of _VV O2max (Tulppoet al. 1996) and could be used therefore as an indicatorof sympathetic activity.
In the present study, four steady-state manoeuvreswere used to induce marked acute changes in the auto-nomic nervous activity, regardless of training status.SD1, SD1n, rMSSD, pNN50, HF and PNS (all indexesof parasympathetic activity; T 1996) decreased withupright posture, and further decreased during exercise,indicating the progressive withdrawal of parasympa-thetic activity (Pomeranz et al. 1985; Bahjaoui-Bouhaddiet al. 2000). SD2, SD2n, and LF increased duringstanding and decreased during exercise compared to thesupine rest condition, confirming that these indexes areinfluenced by both parasympathetic and sympatheticmodulations and thus they are not specific indexes. SNSwas higher during standing than during supine, but,instead of increasing again during exercise, it remainedat the same level in CT and decreased in C and T sub-jects. Thus, SNS could not be used as a good indicatorof sympathetic activity in the present study. Whenstanding, the SD1/SD2 ratio decreased significantlyinstead of increasing as sympathetic activation did. Thisdecrease was due to the important reduction of SD1compared to SD2, which highlights the parasympatheticwithdrawal that occurred during standing. In the presentstudy, LF/HF increased during standing and exercise(Yamamoto and Hughson 1991) but the statistical levelcould not be reached because of the important inter-subject variability and thus could not be considered as arobust frequency parameter for autonomic cardiovas-cular activity evaluation (Carrasco et al. 2001). Based onthe present results, parasympathetic withdrawal dur-ing specific manoeuvres could be well observed withtemporal and frequency domain indexes, as well as
with Poincare parameters, as already reported (Kamenet al. 1996). However, the progressive involvement ofsympathetic activity could not be precisely evaluatedwith any parameters. This could be related to the factthat, from rest to the intensity corresponding to theventilatory threshold, increased HR occurs mainlythanks to parasympathetic withdrawal whereas anyfurther increase is mainly due to sympathetic activation(Yamamoto et al. 1991).
The main result of the present study is that togetherwith changes in HRV due to acute manoeuvres(Carrasco et al. 2001) or disease (Woo et al. 1994), thePoincare plot could discriminate altered HRV due toshort- and/or long-term endurance training. Indeed,increased HRV values, particularly indexes of para-sympathetic activity, have been observed in highlytrained subjects compared to their healthy sedentarycounterparts (Dixon et al. 1992; Janssen et al. 1993;Macor et al. 1996). This increase can be achieved in onlyseveral weeks of training (Melanson and Freedson 2001).Janssen et al. (1993) have found that there is a parasym-pathetic predominance in athletes in the supine, but not inthe standing, position. In the present study, time domain(SD, rMSSD, pNN50) and frequency domain (TP, HF)indexes of parasympathetic activity were increased duringboth supine and standing, and the same results wereobserved with Poincare plot parameters (i.e. SD1 andSD1n). During exercise, a lower R-R intervals wasobserved in T, together with a pronounced decreased inlinear and non-linear parasympathetic indicators (e.g.rMSSD and SD1) and an increase in sympathetic indi-cators (SNS) compared to C pre- and post-training.Tperformed comparable relative power output during thesub-maximal exercise (50% _WW p), but the absolute valueswere twice as large in T than in C and 1.5 times as large asin CT and could therefore explain this trend. Thus, in T,the training effects disappeared during exercise (Macoret al. 1996) but it is of note that higher R-R intervals, SD,and TP values were observed in CT after 6 weeks oftraining despite the higher power output. All the trendsdescribed above were observed not only with the time andfrequency domain indexes, but also with Poincare plotparameters, especially SD1 and SD1n. Thus, the Poincareplot seems to be a tool powerful enough to assess theparasympathetic changes induced by short- and/or long-term training (Tulppo et al. 1998).
Moreover, an association between sympatheticactivity and the shape of the Poincare plot has beenestablished, where the narrower the pattern observed,the larger the sympathetic activity (Woo et al. 1994;Carrasco et al. 2001). The visual pattern found in thepresent study agrees with that association (Fig. 1). In thesupine position, when the parasympathetic activity waspredominant, the Poincare scatter gram had an ellipticform. In the standing position and exercise, as theparasympathetic activity decreases and sympatheticactivity increases, the Poincare scatter gram becomesnarrower. During recovery, the pattern is narrow, with areduced area induced by the persistence of sympathetic
85

activity (Perini et al. 1990). Conversely, the Poincarescatter gram becomes more scattered when the vagalactivity increased, as observed after endurance training(Dixon et al. 1992; Janssen et al. 1993; Macor et al. 1996;Melanson and Freedson 2001). Because the Poincarescatter gram gives visually distinguishable patterns foreach manoeuvre and is able to differentiate trainingstatus, it may be considered as a useful tool to describethe autonomic activity effect over the R-R intervaldynamics.
Correlation coefficients between temporal domainand Poincare plot indexes were higher than those be-tween temporal and frequency domain parameters orbetween frequency domain and Poincare plot indexes.The same results have been observed and discussedelsewhere (Carrasco et al. 2001). There is no evidencethat justifies a claim for a better performance of Poin-care plot parameters over temporal and frequency in-dexes. However, the Poincare plot parameters areinterchangeable HRV measures, especially in assessingparasympathetic tone to the sinus node (Kamen et al.1996; Tulppo et al. 1996).
Poincare plot analysis may provide additional prog-nostic information and insight into autonomic altera-tions (Woo et al. 1994). Indeed, low levels of HRV arerelated to an increased risk of sudden cardiac death inpatients with cardiovascular diseases (Tsuji et al. 1994)and in asymptomatic individuals (Molgaard et al. 1991).On the other hand, increasing HRV through regularexercise or endurance training could have a beneficialeffect since it has been demonstrated that the risk ofarrhythmic episodes and sudden cardiac death was de-creased after exercise training, parallel with an increasein HRV and a shift in autonomic balance towards anincreased parasympathetic activity (Hull et al. 1994), asobserved in the present study.
In the present study, frequency and temporal domainand Poincare plot analyses of the R-R interval werecompared in assessing training-induced autonomicchanges to the sinus node during four short-term steady-state measurements. The shape and the index of thePoincare plot correctly distinguished the parasympa-thetic changes induced by the four manoeuvres as well asby the endurance training. Thus, because Poincare plotparameters are easy to compute and because the Poincareplot is a quantitative visual tool, it could be applied tothe analysis of R-R interval data gathered over relativeshort time periods in the field of sports training.
Acknowledgements We thank the subjects for their reliable andcheerful contribution. This work was funded by the granting of theEA 479 by the Ministere de l’Education Nationale, de la Rechercheet de la Technologie.
References
Bahjaoui-Bouhaddi M, Cappelle S, Henriet MT, Dumoulin G,Wolf JP, Regnard J (2000) Graded vascular autonomic controlversus discontinuous cardiac control during gradual upright tilt.J Auton Nerv Syst 79:149–155
Bernardi L, Leuzzi S, Radaelli A, Passino C, Johnston JA, SleightP (1994) Low-frequency spontaneous fluctuations of R-Rinterval and blood pressure in conscious humans: a barore-ceptor or central phenomenon? Clin Sci (Lond) 87:649–654
Bigger JT Jr., Fleiss JL, Steinman RC, Rolnitzky LM, Kleiger RE,Rottman JN (1992) Correlations among time and frequencydomain measures of heart period variability two weeks afteracute myocardial infarction. Am J Cardiol 69:891–898
Braun C, Kowallik P, Freking A, Hadeler D, Kniffki KD, Mees-mann M (1998) Demonstration of nonlinear components inheart rate variability of healthy persons. Am J Physiol275:H1577–H1584
Brown TE, Beightol LA, Koh J, Eckberg DL (1993) Importantinfluence of respiration on human R-R interval power spectra islargely ignored. J Appl Physiol 75:2310–2317
Carrasco S, Gaitan MJ, Gonzalez R, Yanez O (2001) Correlationamong Poincare plot indexes and time and frequency domainmeasures of heart rate variability. JMedEngTechnol 25:240–248
Casadei B, Cochrane S, Johnston J, Conway J, Sleight P (1995)Pitfalls in the interpretation of spectral analysis of the heart ratevariability during exercise in humans. Acta Physiol Scand153:125–131
Cooke WH, Cox JF, Diedrich AM, Taylor JA, Beightol LA, AmesJEt, Hoag JB, Seidel H, Eckberg DL (1998) Controlledbreathing protocols probe human autonomic cardiovascularrhythms. Am J Physiol 274:H709–H718
De Vito G, Galloway SD, Nimmo MA, Maas P, McMurray JJ(2002) Effects of central sympathetic inhibition on heart ratevariability during steady-state exercise in healthy humans. ClinPhysiol Funct Imaging 22:32–38
Dixon EM, Kamath MV, McCartney N, Fallen EL (1992) Neuralregulation of heart rate variability in endurance athletes andsedentary controls. Cardiovasc Res 26:713–719
Furlan R, Piazza S, Dell’Orto S, Gentile E, Cerutti S, PaganiM, Malliani A (1993) Early and late effects of exercise andathletic training on neural mechanisms controlling heart rate.Cardiovasc Res 27:482–488
Gimenez M, Servera E, Salinas W (1982) Square-wave enduranceexercise test (SWEET) for training and assessment in trainedand untrained subjects. I. Description and cardiorespiratoryresponses. Eur J Appl Physiol 49:359–368
Hull SS Jr., Vanoli E, Adamson PB, Verrier RL, Foreman RD,Schwartz PJ (1994) Exercise training confers anticipatory pro-tection from sudden death during acute myocardial ischemia.Circulation 89:548–552
Israel S (1976) The problems of overtraining in a medical andsports physiological point of view (Zur Problematik des Uber-trainings aus internistischer und leistungsphysiologischer Sicht).Med Sport 16:1–12
Janssen MJ, de Bie J, Swenne CA, Oudhof J (1993) Supine andstanding sympathovagal balance in athletes and controls. EurJ Appl Physiol 67:164–167
Kamath MV, Fallen EL, McKelvie R (1991) Effects of steady stateexercise on the power spectrum of heart rate variability. MedSci Sports Exerc 23:428–434
Kamen PW, Krum H, Tonkin AM (1996) Poincare plot of heartrate variability allows quantitative display of parasympatheticnervous activity in humans. Clin Sci (Lond) 91:201–208
Loimaala A, Huikuri H, Oja P, Pasanen M, Vuori I (2000) Con-trolled 5-mo aerobic training improves heart rate but not heartrate variability or baroreflex sensitivity. J Appl Physiol89:1825–1829
Macor F, Fagard R, Amery A (1996) Power spectral analysis ofRR interval and blood pressure short-term variability at restand during dynamic exercise: comparison between cyclists andcontrols. Int J Sports Med 17:175–181
Melanson EL, Freedson PS (2001) The effect of endurance trainingon resting heart rate variability in sedentary adult males. Eur JAppl Physiol 85:442–449
Molgaard H, Sorensen KE, Bjerregaard P (1991) Attenuated 24-hheart rate variability in apparently healthy subjects, subsequentlysuffering sudden cardiac death. Clin Auton Res 1:233–237
86

Myers G, Workman M, Birkett C, Ferguson D, Kienzle M (1992)Problems in measuring heart rate variability of patients withcongestive heart failure. J Electrocardiol 25:214–219
Nakamura Y, Yamamoto Y, Muraoka I (1993) Autonomic controlof heart rate during physical exercise and fractal dimension ofheart rate variability. J Appl Physiol 74:875–881
Pagani M, Lombardi F, Guzzetti S, Rimoldi O, Furlan R, PizzinelliP, Sandrone G, Malfatto G, Dell’Orto S, Piccaluga E et al(1986) Power spectral analysis of heart rate and arterial pressurevariabilities as a marker of sympatho-vagal interaction in manand conscious dog. Circ Res 59:178–193
Perini R, Orizio C, Baselli G, Cerutti S, Veicsteinas A (1990) Theinfluence of exercise intensity on the power spectrum of heartrate variability. Eur J Appl Physiol 61:143–148
Pomeranz B, MacAulay RJB, Caudill MA, Kutz I, Adam D,Gordon D, Kilborn KM, Barger AC, Shannon DC, Cohen RJ,Benson H (1985) Assessment of autonomic function in humansby heart rate spectral analysis. Am J Physiol 248:H151–H153
Skinner JE, Molnar M, Vybiral T, Mitra M (1992) Application ofchaos theory to biology and medicine. Integr Physiol Behav Sci27:39–53
Task Force of the European Society of Cardiology and the NorthAmerican Society of Pacing and Electrophysiology (1996)Heart rate variability: standards of measurement, physiologicalinterpretation and clinical use. Circulation 93:1043–1065
Tsuji H, Venditti FJ Jr., Manders ES, Evans JC, Larson MG,Feldman CL, Levy D (1994) Reduced heart rate variability andmortality risk in an elderly cohort. The Framingham HeartStudy. Circulation 90:878–883
Tulppo MP, Makikallio TH, Takala TE, Seppanen T, Huikuri HV(1996) Quantitative beat-to-beat analysis of heart rate dynamicsduring exercise. Am J Physiol 271:H244–H252
Tulppo MP, Makikallio TH, Seppanen T, Laukkanen RT, HuikuriHV (1998) Vagal modulation of heart rate during exercise:effects of age and physical fitness. Am J Physiol 274:H424–H429
Wasserman K (1986) The anaerobic threshold: definition, physio-logical significance and identification. Adv Cardiol 35:1–23
Woo MA, Stevenson WG, Moser DK, Middlekauff HR (1994)Complex heart rate variability and serum norepinephrine levelsin patients with advanced heart failure. J Am Coll Cardiol23:565–569
Yamamoto Y, Hughson RL (1991) Coarse-graining spectral anal-ysis: new method for studying heart rate variability. J ApplPhysiol 71:1143–1150
Yamamoto Y, Hughson RL, Peterson JC (1991) Autonomic con-trol of heart rate during exercise studied by heart rate variabilityspectral analysis. J Appl Physiol 71:1136–1142
87


![Foster 2008 Legume Sm Plot[1]](https://img.dokumen.tips/doc/110x75/6321245b80403fa2920c9a0b/foster-2008-legume-sm-plot1.jpg)


