Embed Size (px)
Citation preview
Quantitative Measurement of Quality AttributePreferences Using Conjoint Analysis
KwangChun Lee, Ho-Jin Choi, Dan Hyung Lee, and Sungwon Kang
Information and Communications University119 Munjiro, Yuseong-Gu, Daejeon, Korea
{statkclee, hjchoi, danlee, kangsw} @icu.ac.kr
Abstract. Conjoint analysis has received considerable attention as atechnique for measuring customer preferences through utility tradeoffsamong products and services. This paper shows how the method canbe applied to the area of software architecture to analyze architecturaltradeoffs among quality attributes. By eliciting customers utilities throughconjoint analysis, software engineers can identify and focus on the usefulquality attributes, which will increase the chance of delivering satisfac-tory software products to the customers. This paper proposes a quan-titative method of measuring quality attribute preferences using con-joint analysis and demonstrates its efficacy by applying it to the ProjectManagement Center (PMCenter) project. The proposed method is com-plementary to the Architecture Trade-off Analysis Method (ATAM) inthat ATAM relies on customer’s feedback to elicit important qualityattributes, whereas this method can be used to actually measure theutilities of quality attributes in a quantitative manner. Furthermore, ourmethod provides a new framework for choosing architecture styles anddesign patterns based on customers’ preferences of quality attributes.
1 Introduction
Software architecture has become an important area of research and practicewithin software engineering over the past 15 years [15]. Software architectureis critical for designing high-utility software products because it is an artifactthat specifies early design decisions that would greatly affect subsequent de-velopment. Before enormous organizational resources have been committed, itwould be extremely desirable to have an adequate method to determine whetherquality goals can be achieved by the architecture [14]. The ATAM method devel-oped by the Software Engineering Institute aims to assess the consequences ofarchitectural decisions by using quality attributes-based scenarios [15]. However,the ATAM method lets architectural decision go into the heart of architectureconstruction without giving quantitative measurement of customer’s utility. Webelieve that by being able to measure the degrees of utilities to the customerwe can design higher quality architectures and ultimately provide higher qualityproducts to the customer.
2
The aim of this paper is to propose a quantitative measurement method ofquality attribute preferences using conjoint analysis, and to explore its poten-tial impact on the development of software architecture. Measuring customers’utility quantitatively is aligned with the development of high-utility softwarearchitecture. The remainder of the paper is structured in six parts. After thisintroduction, Section 2 is devoted to the explanation of the concept of softwarearchitecture and the ATAM method. Quality attributes play an important rolein evaluating software architecture, but when combined with conjoint analysis,they can deliver more useful information. In Section 3 we explore conjoint analy-sis, followed by a study of the literature and the conjoint analysis process. InSection 4 the conjoint analysis in ATAM has been shown. It provides a newmechanism for quantitative utility measurement of quality attributes in ATAM.In Section 5 the results of PMCenter project are presented. Finally, Section 6 isthe conclusion.
2 Software Architecture and ATAM
Users naturally focus on specifying their functional, or behavioral, requirements,but there is more to successful software development than just delivering theright functionality. They are known as software quality attributes, or qualityfactors, and are parts of the system’s nonfunctional requirements [12]. Thesefunctional and non-functional requirements are inputs to following software de-velopment life-cycle. Recently many researchers and practitioners have realizedthe importance of software architecture before moving toward detailed designphase. When systems are constructed from many components, the organizationof the overall system-the software architecture- presents design issues to softwareengineers [4].
The Architecture Tradeoff Analysis Method (ATAM) developed by the Soft-ware Engineering Institute (SEI) at CMU is a method for evaluating architecture-level designs that considers multiple quality attributes such as modifiability,performance, reliability and security in gaining insight as to whether the fullyfleshed-out incarnation of the architecture will meet its requirements [9]. TheATAM aims to identify architectural elements affecting quality attributes suchthat it helps to discover software architecture with high utility to customers. Inparticular, quality attributes facilitate communications among stakeholders.
Even though the ATAM has opened a new formal communication channelto deliver satisfactory software architecture to customers, it still assumes thatcustomers are intelligent enough to provide sufficient and reliable informationto software architects. In addition to it, measurement process and methods forcustomers utility have not been clearly documented. Therefore, the ATAM aimsto deliver high utility software architecture to customers, but it still lacks ofmeasuring customers utility in a quantitative manner. Choosing appropriate ar-chitectures from the recent activity in cataloging architecture styles or designpatterns which provides a broad palette of quality attributes and quantitative
3
measurement of quality attribute preferences under the ATAM framework in-creases the possibility of delivering high utility software to customers.
3 Conjoint Analysis
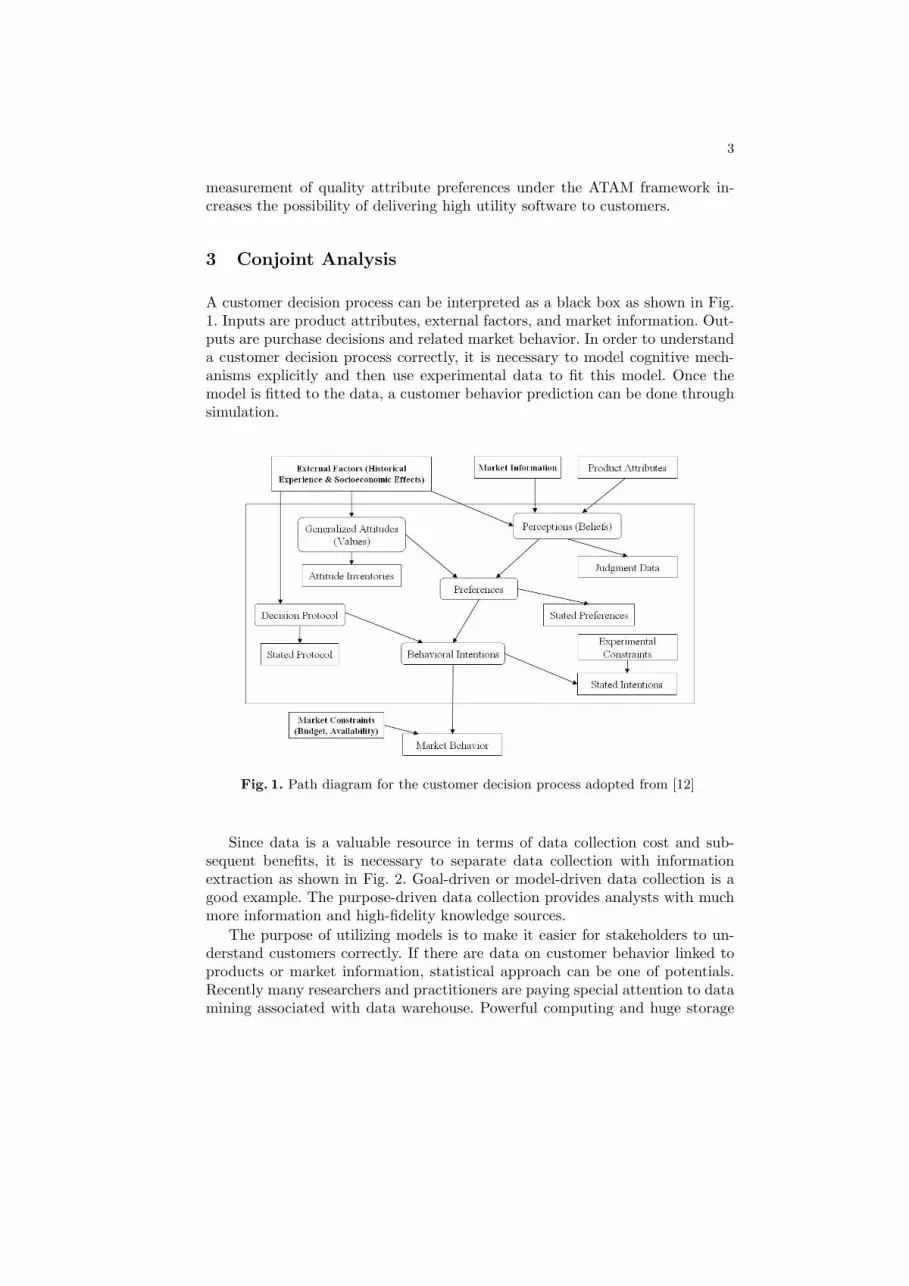
A customer decision process can be interpreted as a black box as shown in Fig.1. Inputs are product attributes, external factors, and market information. Out-puts are purchase decisions and related market behavior. In order to understanda customer decision process correctly, it is necessary to model cognitive mech-anisms explicitly and then use experimental data to fit this model. Once themodel is fitted to the data, a customer behavior prediction can be done throughsimulation.
Fig. 1. Path diagram for the customer decision process adopted from [12]
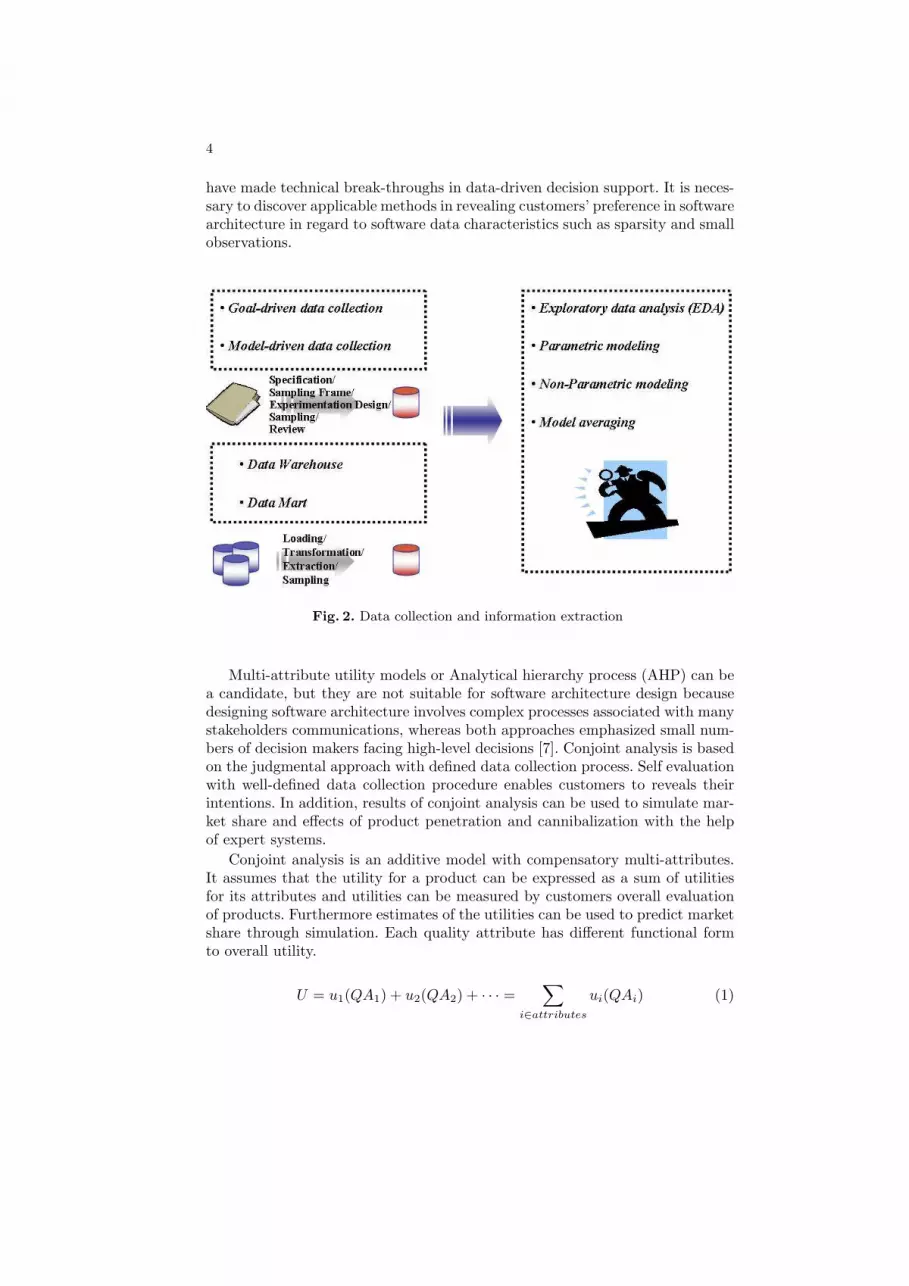
Since data is a valuable resource in terms of data collection cost and sub-sequent benefits, it is necessary to separate data collection with informationextraction as shown in Fig. 2. Goal-driven or model-driven data collection is agood example. The purpose-driven data collection provides analysts with muchmore information and high-fidelity knowledge sources.
The purpose of utilizing models is to make it easier for stakeholders to un-derstand customers correctly. If there are data on customer behavior linked toproducts or market information, statistical approach can be one of potentials.Recently many researchers and practitioners are paying special attention to datamining associated with data warehouse. Powerful computing and huge storage
4
have made technical break-throughs in data-driven decision support. It is neces-sary to discover applicable methods in revealing customers’ preference in softwarearchitecture in regard to software data characteristics such as sparsity and smallobservations.
Fig. 2. Data collection and information extraction
Multi-attribute utility models or Analytical hierarchy process (AHP) can bea candidate, but they are not suitable for software architecture design becausedesigning software architecture involves complex processes associated with manystakeholders communications, whereas both approaches emphasized small num-bers of decision makers facing high-level decisions [7]. Conjoint analysis is basedon the judgmental approach with defined data collection process. Self evaluationwith well-defined data collection procedure enables customers to reveals theirintentions. In addition, results of conjoint analysis can be used to simulate mar-ket share and effects of product penetration and cannibalization with the helpof expert systems.
Conjoint analysis is an additive model with compensatory multi-attributes.It assumes that the utility for a product can be expressed as a sum of utilitiesfor its attributes and utilities can be measured by customers overall evaluationof products. Furthermore estimates of the utilities can be used to predict marketshare through simulation. Each quality attribute has different functional formto overall utility.
U = u1(QA1) + u2(QA2) + · · · =∑
i∈attributes
ui(QAi) (1)
5
The conjoint analysis can provide a complementary approach in measuringcustomers’ utility in a quantitative manner. The conjoint analysis can measurecustomers’ utility quantitatively and objectively through well-defined process.In addition to it, it is not necessary for customers to understand the ATAM orsoftware system itself. Since the conjoint analysis delivers suitable design sets,the only thing that customers should do is to specify their preferences throughranking or comparisons, and then the defined conjoint analysis process will re-veal the hidden customers’ preferences. Benefits from understanding customers’preferences will lead to the development of high-quality software architectureand the smooth transition for the later part of software development life-cycle.
4 Conjoint Analysis in ATAM
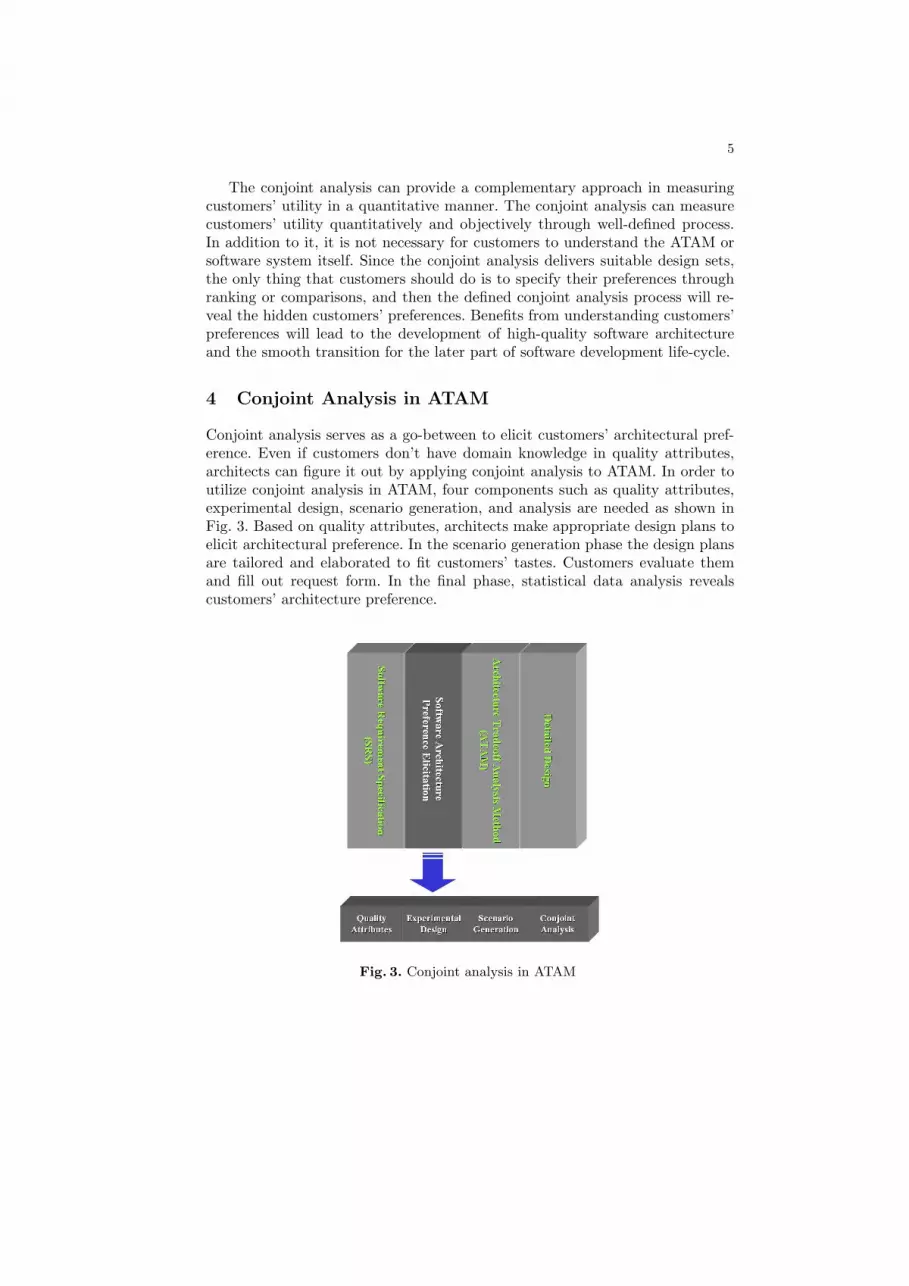
Conjoint analysis serves as a go-between to elicit customers’ architectural pref-erence. Even if customers don’t have domain knowledge in quality attributes,architects can figure it out by applying conjoint analysis to ATAM. In order toutilize conjoint analysis in ATAM, four components such as quality attributes,experimental design, scenario generation, and analysis are needed as shown inFig. 3. Based on quality attributes, architects make appropriate design plans toelicit architectural preference. In the scenario generation phase the design plansare tailored and elaborated to fit customers’ tastes. Customers evaluate themand fill out request form. In the final phase, statistical data analysis revealscustomers’ architecture preference.
Fig. 3. Conjoint analysis in ATAM
6
4.1 Process of Conjoint Analysis
Conjoint analysis is one of many techniques for handling situations in which adecision maker has to deal with options that simultaneously vary across two ormore attributes [7]. The seminal paper by Luce and Tukey [11] and the experi-mental design papers by Addelman [1] and Plackett and Burman [13] providedkey theoretical underpinnings and motivation for developing conjoint analysis.
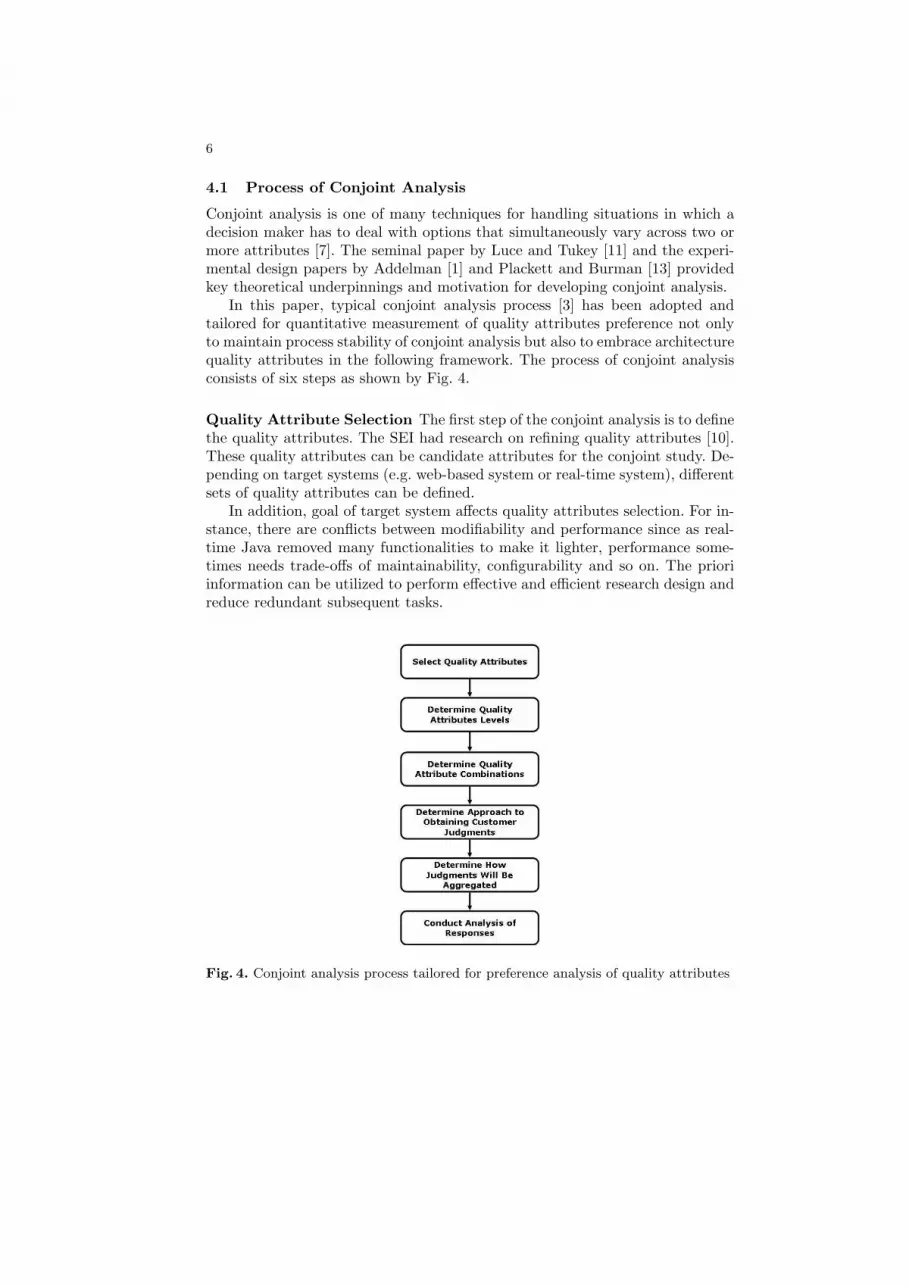
In this paper, typical conjoint analysis process [3] has been adopted andtailored for quantitative measurement of quality attributes preference not onlyto maintain process stability of conjoint analysis but also to embrace architecturequality attributes in the following framework. The process of conjoint analysisconsists of six steps as shown by Fig. 4.
Quality Attribute Selection The first step of the conjoint analysis is to definethe quality attributes. The SEI had research on refining quality attributes [10].These quality attributes can be candidate attributes for the conjoint study. De-pending on target systems (e.g. web-based system or real-time system), differentsets of quality attributes can be defined.
In addition, goal of target system affects quality attributes selection. For in-stance, there are conflicts between modifiability and performance since as real-time Java removed many functionalities to make it lighter, performance some-times needs trade-offs of maintainability, configurability and so on. The prioriinformation can be utilized to perform effective and efficient research design andreduce redundant subsequent tasks.
Fig. 4. Conjoint analysis process tailored for preference analysis of quality attributes
7
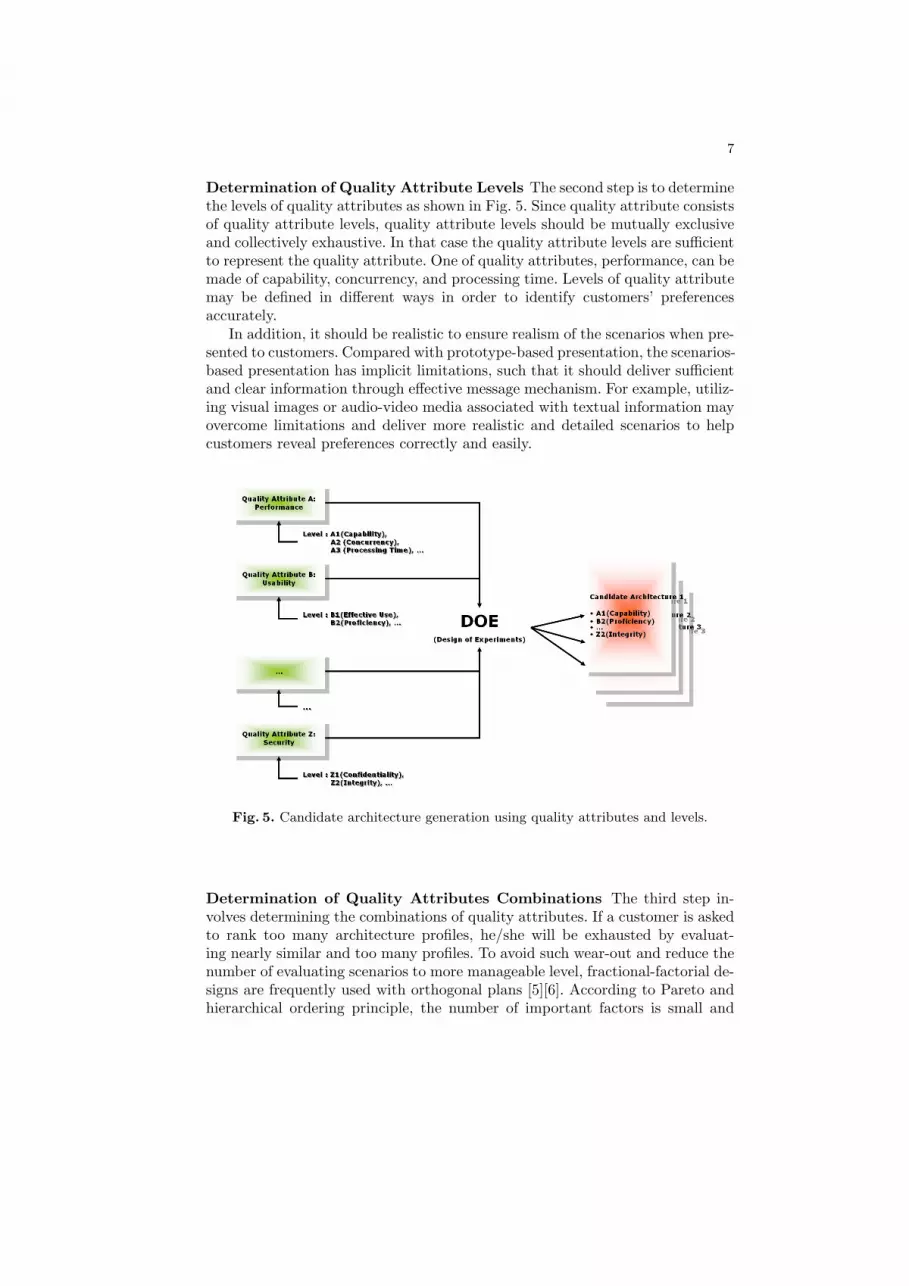
Determination of Quality Attribute Levels The second step is to determinethe levels of quality attributes as shown in Fig. 5. Since quality attribute consistsof quality attribute levels, quality attribute levels should be mutually exclusiveand collectively exhaustive. In that case the quality attribute levels are sufficientto represent the quality attribute. One of quality attributes, performance, can bemade of capability, concurrency, and processing time. Levels of quality attributemay be defined in different ways in order to identify customers’ preferencesaccurately.
In addition, it should be realistic to ensure realism of the scenarios when pre-sented to customers. Compared with prototype-based presentation, the scenarios-based presentation has implicit limitations, such that it should deliver sufficientand clear information through effective message mechanism. For example, utiliz-ing visual images or audio-video media associated with textual information mayovercome limitations and deliver more realistic and detailed scenarios to helpcustomers reveal preferences correctly and easily.
Fig. 5. Candidate architecture generation using quality attributes and levels.
Determination of Quality Attributes Combinations The third step in-volves determining the combinations of quality attributes. If a customer is askedto rank too many architecture profiles, he/she will be exhausted by evaluat-ing nearly similar and too many profiles. To avoid such wear-out and reduce thenumber of evaluating scenarios to more manageable level, fractional-factorial de-signs are frequently used with orthogonal plans [5][6]. According to Pareto andhierarchical ordering principle, the number of important factors is small and

8
lower order factors are more likely to be important than higher order factors.Therefore, this approach is useful and relatively straightforward in that moreoften than not, quality attribute combinations are determined with fractional-factorial and orthogonal plans.
Orthogonality is a strong assumption and sometimes unrealistic since twoor three quality attributes are correlated and they become critical for softwarequality. Therefore, other design schemes to detect these patters are necessary. Ifpriori information is not available, designs to investigate which quality attributesare significant are used in order to screen out potential factors out of trivial manyfactors. Once significant factors are discovered, fractional designs are used to in-vestigate interaction patterns among quality attributes. The two-stage designstrategy is desirable for relaxing orthogonal assumption and identifying interac-tions.
Determination of Approach to Obtaining Customer Judgments Thefourth step is to determine approach to obtaining customers judgments. Thereare various ways to obtain customers judgment such as rating, ranking, etc. Oneof popular presentation methods is to show profile cards or paragraph descrip-tions to customers. Pictorial materials or actual prototypes are frequently usedto enhance realism in representing product characteristics. Once these stimuli arerepresented, customers are asked to obtain ranking and rating scales judgmentfor each of stimuli.
Profiles do not contain all the attributes, such that fractional-factorial de-signs are typically used. Attributes are divided carefully, such that profiles con-tain partial and different attributes. Besides, paired comparisons are common incomputer-assisted methods [6]. In computer-aided cases, customers are asked toreveal their preference by selecting only one out of two candidates and repeatthis process in a similar manner.
Determining How Judgments Will Be Aggregated The fifth step involvesdetermining how judgments will be aggregated. If there are multiple respondents,it is necessary to determine how those judgments are collected and represented.When dealing with different customers, data pooling of similar respondents’conjoint full-profile responses through clustering algorithms can increase theaccuracy of estimation and avoid biases.
If software engineers aim to develop high-quality software products focusedon multiple customers, influence of customers and interaction with developersshould be dealt with in a formal framework. Bayesian approach can provide aconsistent framework to figure out this situation. However, it will be skipped inthis research because there is only one stakeholder.
Conducting Analysis of Responses The last step is to conduct analysisof responses. Usually analysis of responses has been fixed in the earliest con-joint analysis. Three analysis methods are popular: regression-based methods,
9
random-utility models, and hierarchical Bayesian estimation. In our method theordinary-least-square (OLS) regression was selected because the preference judg-ment is an approximate interval scale and the partworths are represented asdummy variables [8].
Statistical models should be validated through hold-out samples and residualanalysis. In design phase, samples are divided into two parts: modeling andvalidation samples. Since the residual analysis contains important and omittedinformation, it provides a clue for improving models.
5 Case Study
In this section, we apply our method to an industry software developmentproject1. The client of the project wants to have a software project managementsystem named PMCenter (Project Management System), which supports overallmanagement activities. The PMCenter consists of project planning, monitoring,controlling, and measure&analysis.
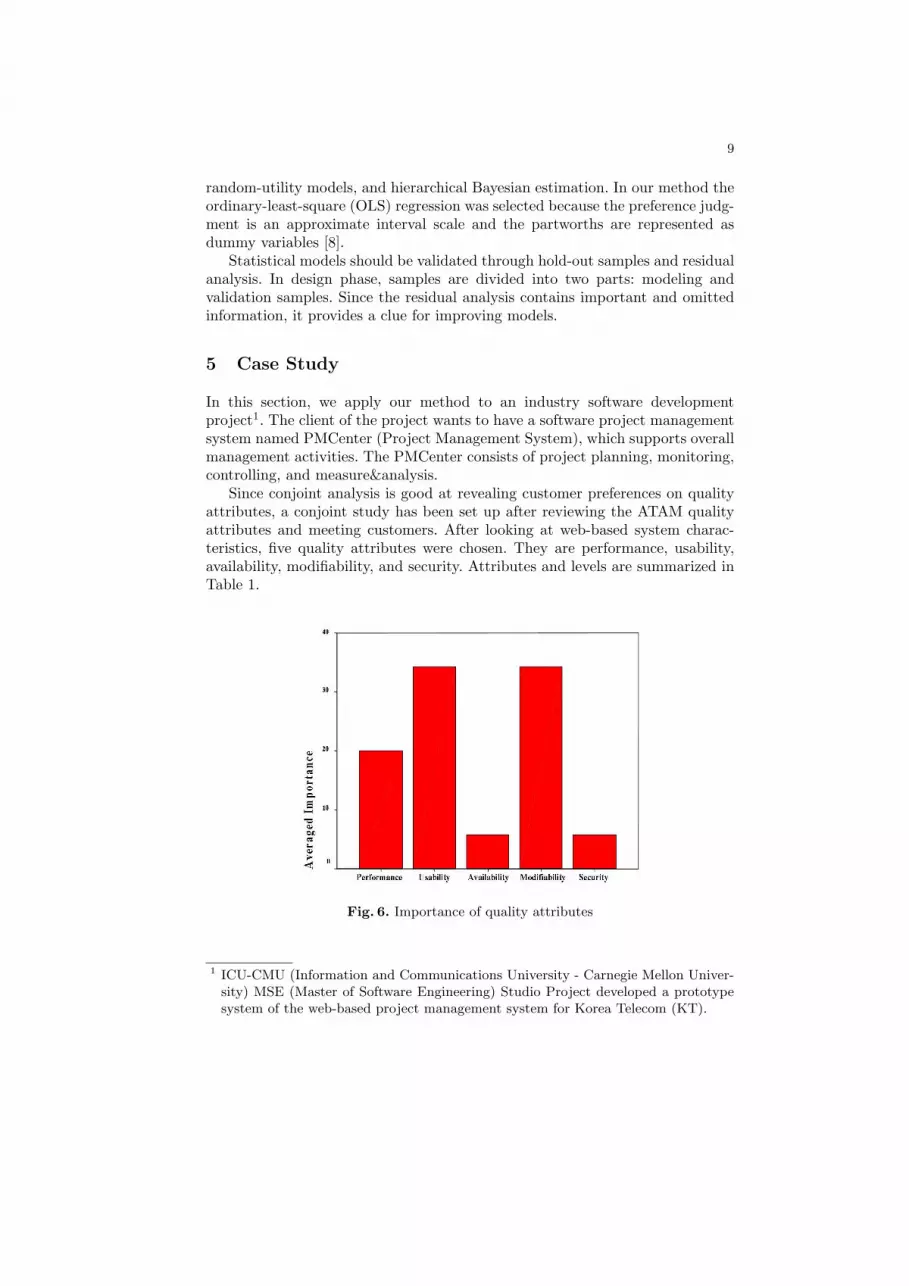
Since conjoint analysis is good at revealing customer preferences on qualityattributes, a conjoint study has been set up after reviewing the ATAM qualityattributes and meeting customers. After looking at web-based system charac-teristics, five quality attributes were chosen. They are performance, usability,availability, modifiability, and security. Attributes and levels are summarized inTable 1.
Fig. 6. Importance of quality attributes
1 ICU-CMU (Information and Communications University - Carnegie Mellon Univer-sity) MSE (Master of Software Engineering) Studio Project developed a prototypesystem of the web-based project management system for Korea Telecom (KT).
10
Table 1. Attributes and levels in the PMCenter.
Atributes Levels
Performance Capability, Concurrency, Processing TimeUsability Efficient Use, Proficiency/TestingAvailability Fault Tolerance, High AvailabilityModifiability Cost of Change, Prevention of Ripple EffectSecurity Confidentiality, Integrity
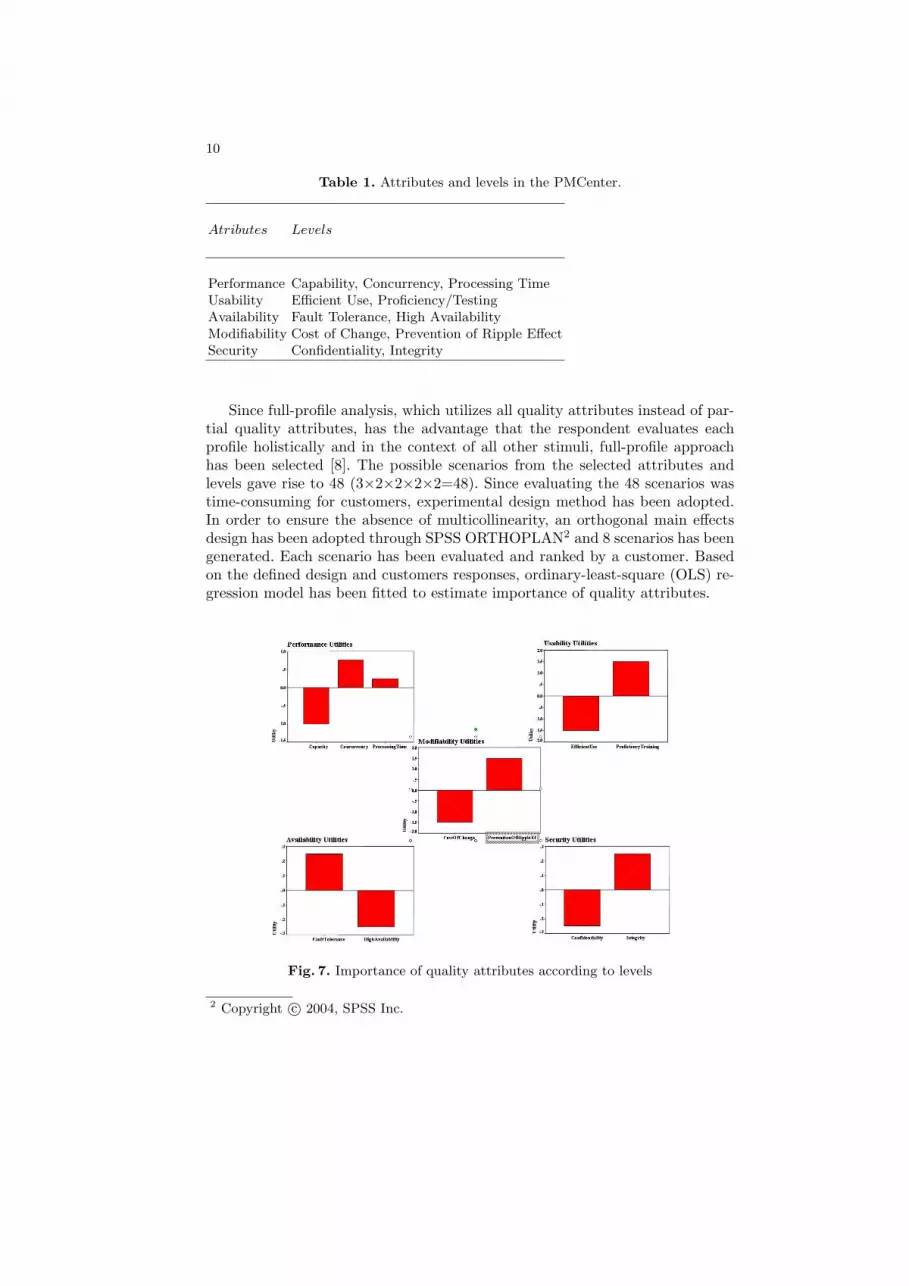
Since full-profile analysis, which utilizes all quality attributes instead of par-tial quality attributes, has the advantage that the respondent evaluates eachprofile holistically and in the context of all other stimuli, full-profile approachhas been selected [8]. The possible scenarios from the selected attributes andlevels gave rise to 48 (3×2×2×2×2=48). Since evaluating the 48 scenarios wastime-consuming for customers, experimental design method has been adopted.In order to ensure the absence of multicollinearity, an orthogonal main effectsdesign has been adopted through SPSS ORTHOPLAN2 and 8 scenarios has beengenerated. Each scenario has been evaluated and ranked by a customer. Basedon the defined design and customers responses, ordinary-least-square (OLS) re-gression model has been fitted to estimate importance of quality attributes.
Fig. 7. Importance of quality attributes according to levels
2 Copyright c© 2004, SPSS Inc.
11
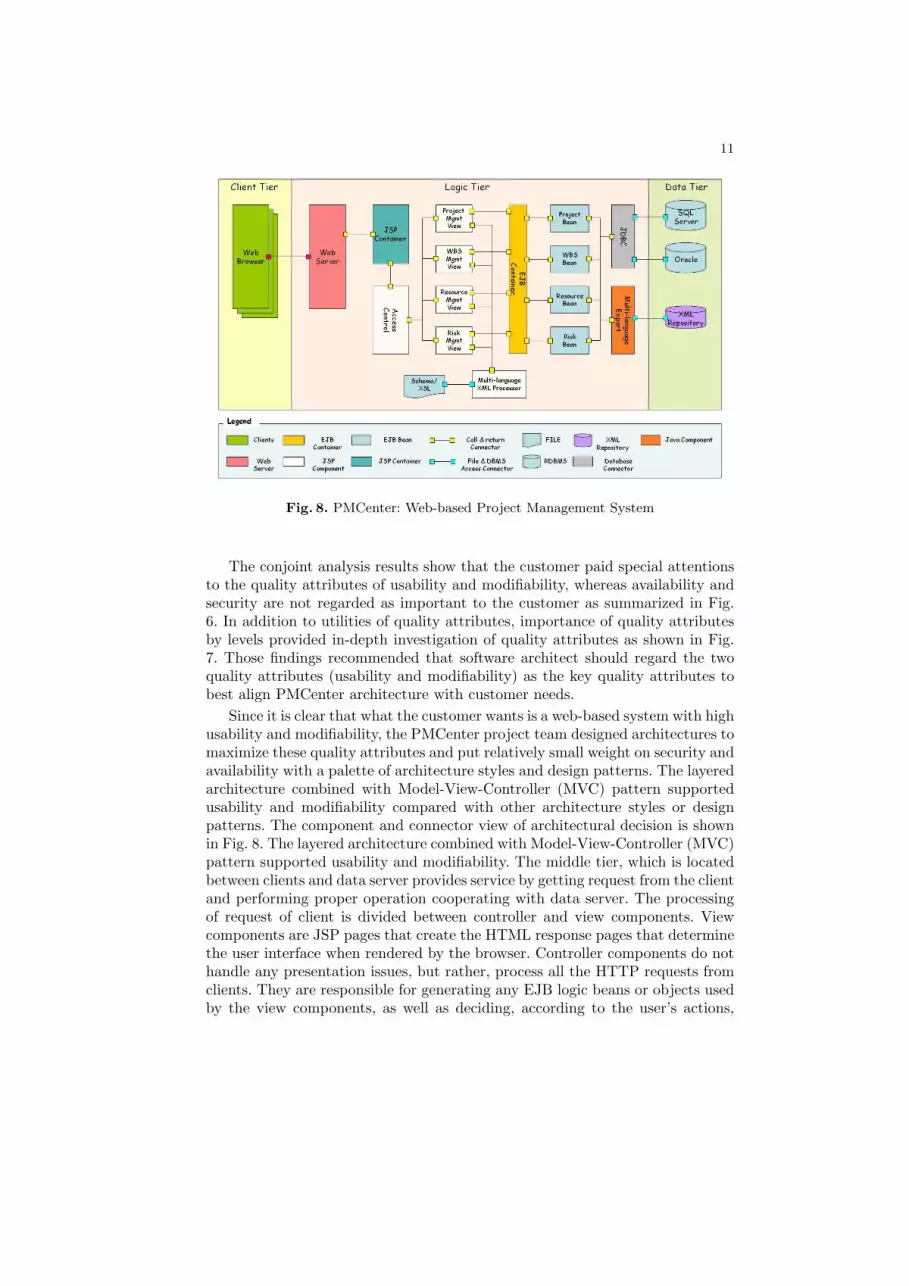
Fig. 8. PMCenter: Web-based Project Management System
The conjoint analysis results show that the customer paid special attentionsto the quality attributes of usability and modifiability, whereas availability andsecurity are not regarded as important to the customer as summarized in Fig.6. In addition to utilities of quality attributes, importance of quality attributesby levels provided in-depth investigation of quality attributes as shown in Fig.7. Those findings recommended that software architect should regard the twoquality attributes (usability and modifiability) as the key quality attributes tobest align PMCenter architecture with customer needs.
Since it is clear that what the customer wants is a web-based system with highusability and modifiability, the PMCenter project team designed architectures tomaximize these quality attributes and put relatively small weight on security andavailability with a palette of architecture styles and design patterns. The layeredarchitecture combined with Model-View-Controller (MVC) pattern supportedusability and modifiability compared with other architecture styles or designpatterns. The component and connector view of architectural decision is shownin Fig. 8. The layered architecture combined with Model-View-Controller (MVC)pattern supported usability and modifiability. The middle tier, which is locatedbetween clients and data server provides service by getting request from the clientand performing proper operation cooperating with data server. The processingof request of client is divided between controller and view components. Viewcomponents are JSP pages that create the HTML response pages that determinethe user interface when rendered by the browser. Controller components do nothandle any presentation issues, but rather, process all the HTTP requests fromclients. They are responsible for generating any EJB logic beans or objects usedby the view components, as well as deciding, according to the user’s actions,
12
which view component to forward the request to. Controller components havebeen implemented as Servlet. Model components represent enterprise data andthe business rules that govern access to and updates of this data. In addition, thequantitative results of conjoint analysis promoted an architectural design of highutility to the customer and facilitated communications among team memberswhen making important design decisions.
6 Conclusion
The conjoint analysis has been used in revealing customers preferences amongthe quality attributes for choosing appropriate architecture styles or design pat-terns and constructing software architecture in the web-based project manage-ment system. After conducting the ATAM process, we constructed a utility treewith stakeholders including the customer. Important quality attributes from theutility tree are in accordance with the result of conjoint analysis, viz. usabil-ity and modifiability. In addition, conjoint analysis identified interesting points.From the customer viewpoints software architect should pay special attentionto prevention of ripple effects because the customer put more weights on robustsoftware architecture, rather than concerns on rework.
When adopting in commercial off-the-shelf (COTS) based software systemdevelopment, it is more likely to be successful. The COTS products are dealingwith mass market such that it is necessary to understand customers’ preference.The traditional interview method can deliver biased investigation results by se-lecting inappropriate samples and limited communication channels. Variants ofconjoint analysis can overcome these weak points and facilitate successful COTSproduct development.
Since conjoint analysis is relatively new in HCI and software engineering,this method has been applied in custom-built software systems. The result hasshown a positive impact on quality attribute preference measurement. Conjointanalysis can be one method that enables us to develop more competitive softwareproducts by measuring customers’ preferences, facilitating smooth transitions,and developing high-utility products.
7 References
References
1. Addlelman, S.: Orthogonal main-effect plans for asymmetrical factorial experiments.Technometrics, Vol. 4 (1962) pp.21-46
2. Armstrong, S.: Principles of Forecasting, Kluwer Publishing (2001)3. Churchill, G. and Lacobucci, D.: Marketing research: methodological foundations,
8/e, South-Western College Pub. (2002)4. Garlan, D. and Shaw, M.: An introduction to software architecture, CMU/SEI-94-
TR-21, ESC-TR-94-21. (1994)5. Green, P. E. and Srinivasan, V.: Conjoint analysis in consumer research: issues and
outlook, Journal of Consumer Research, Vol.5 (1978) pp.103-23.

13
6. Green, P. E. and Srinivasan, V.: Conjoint analysis in marketing: new developmentwith implications for research and practice, Journal of Consumer Research, Vol.5(1990) pp.103-23.
7. Green, P. E., Krieger, A. M., and Wind, Y.: Thirty Years of Conjoint Analysis:Reflections and Prospects, Interfaces, 31:3, Part 2 of 2 (2001) pp. S56-S73.
8. Hauser, J. R. and Rao, V.: Conjoint analysis, related modeling, and applications,Advances in Marketing Research: Progress and Prospects, Jerry Wind, Ed. (2003)
9. Kazman, R., Klein, M., and Barbacci, M.: The architecture tradeoff analysis method,4th Int’l Conference on Engineering of Complex Computer Systems (ICECCS98),(1998)
10. Kazman, R., Klein, M., and Clements, P.: ATAM: method for architecture eval-uation Technical Report CMU/SEI-2000-TR-004, Software Engineering Institute,Carnegie Mellon University (2000)
11. Luce, R. D. and Tukey, J.: Simultaneous conjoint measurement: a new type offundamental measurement, Journal of Mathematical Psychology (1964) pp. 1-27.
12. McFadden, D.: The choice theory approach to market research, Marketing ScienceVol 5, No 4. (1986)
13. Plackett, R. L. and Burman, J. P.: The design of optimum multifactorial experi-ments, Biometrika, Vol. 33 (1946) pp. 305-325
14. Shaw, M. and Garlan, D.: Software architecture: perspectives on an emerging dis-cipline, Prentice Hall, (1996)
15. Smith, D. and Merson, P.: Using architecture evaluation to prepare a large webbased system for evolution, Proceedings of the 5th IEEE Int’l Workshop on WebSite Evolution, (2003)
16. Wiegers, K. E.: Software requirements, 2/e”, Microsoft Press, (2003)17. Wittink, D. R. and Cattin, P.: Commercial use of conjoint analysis: an update”,
Journal of Marketing, 53 (1989) pp. 91-96.18. Wittink, D. R., Vriens, M, and Burhenne, W.: Commercial use of conjoint analysis
in Europe: results and reflections”, International Journal of Research in Marketing,Vol. 11, (1994) pp. 41-52.


