Embed Size (px)
Citation preview
Quantifying Greenhouse Gas Fluxes in Agriculture and Forestry: Methods for Entity-Scale Inventory
Office of the Chief Economist Climate Change Program Office Technical Bulletin 1939 July 2014
United States Department of Agriculture

i
QuantifyingGreenhouseGasFluxesinAgricultureandForestry:MethodsforEntity‐ScaleInventoryMarlenEve,DianaPape,MarkFlugge,RachelSteele,DerinaMan,MarybethRiley‐GilbertandSarahBiggar,Editors.
USDATechnicalBulletin1939July2014Publishedby:U.S.DepartmentofAgricultureOfficeoftheChiefEconomistWashington,DC20250
ii
TheU.S.DepartmentofAgriculture(USDA)prohibitsdiscriminationagainstitscustomers,employees,andapplicantsforemploymentonthebasesofrace,color,nationalorigin,age,disability,sex,genderidentity,religion,reprisal,andwhereapplicable,politicalbeliefs,maritalstatus,familialorparentalstatus,sexualorientation,orallorpartofanindividual’sincomeisderivedfromanypublicassistanceprogram,orprotectedgeneticinformationinemploymentorinanyprogramoractivityconductedorfundedbytheDepartment.(Notallprohibitedbaseswillapplytoallprogramsand/oremploymentactivities.)
ToFileanEmploymentComplaint
IfyouwishtofileaCivilRightsprogramcomplaintofdiscrimination,completetheUSDAProgramDiscriminationComplaintForm,foundonlineathttp://www.ascr.usda.gov/complaint_filing_cust.html,oratanyUSDAoffice,orcall(866)632‐9992torequesttheform.Youmayalsowritealettercontainingalloftheinformationrequestedintheform.SendyourcompletedcomplaintformorlettertousbymailatU.S.DepartmentofAgriculture,Director,OfficeofAdjudication,1400IndependenceAvenue,S.W.,Washington,D.C.20250‐9410,byfax(202)690‐[email protected].
PersonswithDisabilities
Individualswhoaredeaf,hardofhearing,orhavespeechdisabilitiesandyouwishtofileeitheranEEOorprogramcomplaintpleasecontactUSDAthroughtheFederalRelayServiceat(800)877‐8339or(800)845‐6136(inSpanish).
Personswithdisabilities,whowishtofileaprogramcomplaint,pleaseseeinformationaboveonhowtocontactusbymaildirectlyorbyemail.Ifyourequirealternatemeansofcommunicationforprograminformation(e.g.,Braille,largeprint,audiotape,etc.)pleasecontactUSDA’sTARGETCenterat(202)720‐2600(voiceandTDD).
FormoreinformationontheQuantifyingGreenhouseGasFluxesinAgricultureandForestry:MethodsforEntity‐ScaleInventoryproject,visithttp://usda.gov/oce/climate_change/estimation.htm,orcontacttheUSDAClimateChangeProgramOfficebyemailattechguide@oce.usda.gov,fax202‐401‐1176,orphone202‐401‐0979.
iii
HowtoObtainCopies:YoumayelectronicallydownloadthisdocumentfromtheU.S.DepartmentofAgriculture’swebsiteat:http://www.usda.gov/oce/climate_change/estimation.htmSuggestedCitation
ReportCitation
Eve,M.,D.Pape,M.Flugge,R.Steele,D.Man,M.Riley‐Gilbert,andS.Biggar,(Eds),2014.QuantifyingGreenhouseGasFluxesinAgricultureandForestry:MethodsforEntity‐ScaleInventory.TechnicalBulletinNumber1939.OfficeoftheChiefEconomist,U.S.DepartmentofAgriculture,Washington,DC.606pages.July2014.
ChapterCitations
Eve,M.,M.Flugge,D.Pape,2014.Chapter1:Introduction.InQuantifyingGreenhouseGasFluxesinAgricultureandForestry:MethodsforEntity‐ScaleInventory.TechnicalBulletinNumber1939.OfficeoftheChiefEconomist,U.S.DepartmentofAgriculture,Washington,DC.606pages.July2014.Eve,M.,D.Pape,M.Flugge,R.Steele,D.Man,M.Riley‐Gilbert,andS.Biggar,Eds.
Eve,M.,M.Flugge,D.Pape,2014.Chapter2:ConsiderationsWhenEstimatingAgricultureandForestryGHGEmissionsandRemovals.InQuantifyingGreenhouseGasFluxesinAgricultureandForestry:MethodsforEntity‐ScaleInventory.TechnicalBulletinNumber1939,OfficeoftheChiefEconomist,U.S.DepartmentofAgriculture,Washington,DC.606pages.July2014.Eve,M.,D.Pape,M.Flugge,R.Steele,D.Man,M.Riley‐Gilbert,andS.Biggar,Eds.
Ogle,S.M.,P.R.Adler,F.J.Breidt,S.DelGrosso,J.Derner,A.Franzluebbers,M.Liebig,B.Linquist,G.P.Robertson,M.Schoeneberger,J.Six,C.vanKessel,R.Venterea,T.West,2014.Chapter3:QuantifyingGreenhouseGasSourcesandSinksinCroplandandGrazingLandSystems.InQuantifyingGreenhouseGasFluxesinAgricultureandForestry:MethodsforEntity‐ScaleInventory.TechnicalBulletinNumber1939,OfficeoftheChiefEconomist,U.S.DepartmentofAgriculture,Washington,DC.606pages.July2014.Eve,M.,D.Pape,M.Flugge,R.Steele,D.Man,M.Riley‐Gilbert,andS.Biggar,Eds.
Ogle,S.M.,P.Hunt,C.Trettin,2014.Chapter4:QuantifyingGreenhouseGasSourcesandSinksinManagedWetlandSystems.InQuantifyingGreenhouseGasFluxesinAgricultureandForestry:MethodsforEntity‐ScaleInventory.TechnicalBulletinNumber1939,OfficeoftheChiefEconomist,U.S.DepartmentofAgriculture,Washington,DC.606pages.July2014.Eve,M.,D.Pape,M.Flugge,R.Steele,D.Man,M.Riley‐Gilbert,andS.Biggar,Eds.
Powers,W.,B.Auvermann,N.A.Cole,C.Gooch,R.Grant,J.Hatfield,P.Hunt,K.Johnson,A.Leytem,W.Liao,J.M.Powell,2014.Chapter5:QuantifyingGreenhouseGasSourcesandSinksinAnimalProductionSystems.InQuantifyingGreenhouseGasFluxesinAgricultureandForestry:MethodsforEntity‐ScaleInventory.TechnicalBulletinNumber1939,OfficeoftheChiefEconomist,U.S.DepartmentofAgriculture,Washington,DC.606pages.July2014.Eve,M.,D.Pape,M.Flugge,R.Steele,D.Man,M.Riley‐Gilbert,andS.Biggar,Eds.
iv
Hoover,C.,R.Birdsey,B.Goines,P.Lahm,GreggMarland,D.Nowak,S.Prisley,E.Reinhardt,K.Skog,D.Skole,J.Smith,C.Trettin,C.Woodall,2014.Chapter6:QuantifyingGreenhouseGasSourcesandSinksinManagedForestSystems.InQuantifyingGreenhouseGasFluxesinAgricultureandForestry:MethodsforEntity‐ScaleInventory.TechnicalBulletinNumber1939,OfficeoftheChiefEconomist,U.S.DepartmentofAgriculture,Washington,DC.606pages.July2014.Eve,M.,D.Pape,M.Flugge,R.Steele,D.Man,M.Riley‐Gilbert,andS.Biggar,Eds.
Ogle,S.M.,2014.Chapter7:QuantifyingGreenhouseGasSourcesandSinksfromLandUseChange.InQuantifyingGreenhouseGasFluxesinAgricultureandForestry:MethodsforEntity‐ScaleInventory.TechnicalBulletinNumber1939,OfficeoftheChiefEconomist,U.S.DepartmentofAgriculture,Washington,DC.606pages.July2014.Eve,M.,D.Pape,M.Flugge,R.Steele,D.Man,M.Riley‐Gilbert,andS.Biggar,Eds.
Breidt,F.J.,Ogle,S.M.,Powers,W.,Hover,C.,2014.Chapter8:UncertaintyAssessmentforQuantifyingGreenhouseGasSourcesandSinks.InQuantifyingGreenhouseGasFluxesinAgricultureandForestry:MethodsforEntity‐ScaleInventory.TechnicalBulletinNumber1939,OfficeoftheChiefEconomist,U.S.DepartmentofAgriculture,Washington,DC.606pages.July2014.Eve,M.,D.Pape,M.Flugge,R.Steele,D.Man,M.Riley‐Gilbert,andS.Biggar,Eds.
Acknowledgements:TheDepartmentofAgriculturewouldliketoacknowledgethemanycontributorstothisreport,includingcontractors,universityresearchersandFederalGovernmentemployees.MarlenD.Eve,Ph.D.,EnvironmentalScientistintheClimateChangeProgramOffice,servedastheProjectManagerforthisreport.Heprovidedguidanceontheprocessfordevelopingthereport,insightsonthelevelofdetailprovidedforthemethods,andeditorialreviewofthedocument.WilliamHohenstein,DirectorfortheClimateChangeProgramOffice,providedoveralldirectionontheguidingprinciplesfordevelopingthemethodsandassociatedreport.Specifically,wewouldliketoacknowledgetheteamatICFInternationalthatplayedakeyroleincoordinatingtheworkandleadingthedevelopmentofeachchapterincludedinthereport.ThecoreteamatICFInternationalincludes:SarahBiggar,ICFInternationalMarkFlugge,ICFInternationalDerinaMan,ICFInternationalDianaPape,ICFInternationalMarybethRiley‐Gilbert,ICFInternationalRachelSteele,ICFInternational
Additionally,wewouldliketoacknowledgethetremendouseffortputintothereportbyourworkinggroupsandexpertauthorsforeachchapterofthereport,aswellasourothercontributors,subjectmatterexpertsandscientificreviewers.USDArecognizestheirsignificantinvestmentoftimeandexpertiseandappreciatesthecontributionofeachmember.
v
WorkingGroups:
Croplands/GrazingLands:StephenM.Ogle,ColoradoStateUniversity(LeadAuthor)PaulR.Adler,USDAAgriculturalResearchServiceJayBreidt,ColoradoStateUniversityStephenDelGrosso,USDAAgriculturalResearchServiceJustinDerner,USDAAgriculturalResearchServiceAlanFranzluebbers,USDAAgriculturalResearchServiceMarkLiebig,USDAAgriculturalResearchServiceBruceLinquist,UniversityofCalifornia,DavisPhilRobertson,MichiganStateUniversityMicheleSchoeneberger,USDAForestServiceJohanSix,UniversityofCalifornia,Davis;SwissFederalInstituteofTechnology,ETH‐ZurichChrisvanKessel,UniversityofCalifornia,DavisRodVenterea,USDAAgriculturalResearchServiceTristramWest,PacificNorthwestNationalLaboratory
Wetlands:StephenM.Ogle,ColoradoStateUniversity(LeadAuthor)PatrickHunt,USDAAgriculturalResearchServiceCarlTrettin,USDAForestService
AnimalAgriculture:WendyPowers,MichiganStateUniversity(LeadAuthor)BrentAuvermann,TexasA&MUniversityN.AndyCole,USDAAgriculturalResearchServiceCurtGooch,CornellUniversityRichGrant,PurdueUniversityJerryHatfield,USDAAgriculturalResearchServicePatrickHunt,USDAAgriculturalResearchServiceKristenJohnson,WashingtonStateUniversityAprilLeytem,USDAAgriculturalResearchServiceWeiLiao,MichiganStateUniversityJ.MarkPowell,USDAAgriculturalResearchService
Forestry:CoeliHoover,USDAForestService(LeadAuthor)RichardBirdsey,USDAForestService(Co‐LeadAuthor)BruceGoines,USDAForestServicePeterLahm,USDAForestServiceGreggMarland,AppalachianStateUniversityDavidNowak,USDAForestServiceStephenPrisley,VirginiaPolytechnicInstituteandStateUniversity
vi
ElizabethReinhardt,USDAForestServiceKenSkog,USDAForestServiceDavidSkole,MichiganStateUniversityJamesSmith,USDAForestServiceCarlTrettin,USDAForestServiceChristopherWoodall,USDAForestService
AdditionalContributors
MarkEaster,ColoradoStateUniversityRobertGleason,U.S.GeologicalSurveyJ.BooneKauffman,OregonStateUniversityErnieMarx,ColoradoStateUniversityKeithPaustian,ColoradoStateUniversityTomWirth,U.S.EnvironmentalProtectionAgencyAndre‐DenisWright,UniversityofVermont
AgroupofexpertswereconvenedinFebruary2012toreviewthesoilN2Omethodsinthecroplands/grazinglandssectionoftheReport.
SoilN2OWorkshopOrganizationCommittee:StephenM.Ogle,ColoradoStateUniversity(Co‐Chair)PhilRobertson,MichiganStateUniversity(Co‐Chair)SteveDelGrosso,USDAAgriculturalResearchServiceJohanSix,UniversityofCalifornia,Davis;SwissFederalInstituteofTechnology,ETH‐ZurichRodVenterea,USDAAgriculturalResearchService
SoilN2OWorkshopParticipants:MartinBurger,UniversityofCalifornia,DavisRaymondDesjardins,AgricultureandAgri‐FoodCanadaRonGehl,NorthCarolinaStateUniversityPeterGrace,QueenslandUniversityofTechnologyPeterGroffman,CaryInstituteofEcosystemStudiesArdellHalvorson,USDAAgriculturalResearchServiceWilliamHorwath,UniversityofCalifornia,DavisCesarIzaurralde,JointGlobalChangeResearchInstitute;UniversityofMarylandChangshengLi,UniversityofNewHampshireNevilleMillar,MichiganStateUniversityKeithPaustian,ColoradoStateUniversityPhilippeRochette,AgricultureandAgri‐FoodCanadaWilliamSalas,AppliedGeosolutionsCliffSnyder,InternationalPlantNutritionInstitute
ExpertReviewers
USDAwouldliketoacknowledgethefollowingexpertreviewers,whoreviewedallorpartsofthedocumentduringtheMarch2013ExpertReview:
vii
BobAbt,NorthCarolinaStateUniversityLeonHartwellAllen,USDAAgriculturalResearchServiceBenBond‐Lamberty,JointGlobalChangeResearchInstituteSandraBrown,WinrockInternationalDavidClay,SouthDakotaStateUniversityStevenDeGryze,TerraGlobalCapitalPeteEpanchin,AAASFellow,U.S.EnvironmentalProtectionAgencyErinFitzgerald,InnovationCenterforU.S.DairyRonGehl,NorthCarolinaStateUniversityAmrithGunasekara,CaliforniaDepartmentofAgricultureNoelGurwick,SmithsonianEnvironmentalResearchCenterLindaHeath,USDAForestServiceWilliamHorwath,UniversityofCalifornia,DavisCesarIzaurralde,JointGlobalChangeResearchInstitute;UniversityofMarylandJenniferJenkins,U.S.EnvironmentalProtectionAgencyKurtJohnsen,USDAForestServiceErmiasKebreab,UniversityofCalifornia,DavisWilliamLazarus,UniversityofMinnesotaDeanneMeyer,UniversityofCalifornia,DavisTimParkin,USDAAgriculturalResearchServiceCharlesRice,KansasStateUniversityNeilSampson,TheSampsonGroupKaramatSistani,USDAAgriculturalResearchServiceCliffSnyder,InternationalPlantNutritionInstituteBrentSohngen,OhioStateUniversityMarthaStevenson,WorldWildlifeFundRichardTodd,USDAAgriculturalResearchServiceMicheleWander,UniversityofIllinoisTomWirth,U.S.EnvironmentalProtectionAgency
Photocreditsforcoverandeachchapter: ExecutiveSummary:Stripsandshelterbelts:USDANRCS;NRCSMT00001.tif
http://photogallery.nrcs.usda.gov/netpub/server.np?find&catalog=catalog&template=detail.np&field=itemid&op=matches&value=4851&site=PhotoGallery
Chapter1:Planting:USDANRCS;JeffVanuga;NRCSVA02001.tifhttp://photogallery.nrcs.usda.gov/netpub/server.np?find&catalog=catalog&template=detail.np&field=itemid&op=matches&value=6529&site=PhotoGallery
Chapter3:Farmstead:USDANRCS;TimMcCabe;NRCSMD81005.tifhttp://photogallery.nrcs.usda.gov/netpub/server.np?find&catalog=catalog&template=detail.np&field=itemid&op=matches&value=4511&site=PhotoGallery
Chapter4:Wetland;USDANRCS;LynnBetts; NRCSIA99470.tifhttp://photogallery.nrcs.usda.gov/netpub/server.np?find&catalog=catalog&template=detail.np&field=itemid&op=matches&value=3629&site=PhotoGallery
Chapter5:Hogs:USDANRCS;LynnBetts;NRCSIA99210.tifhttp://photogallery.nrcs.usda.gov/netpub/server.np?find&catalog=catalog&template=detail.np&field=itemid&op=matches&value=3115&site=PhotoGallery

viii
Chapter6: Forest:USDANRCS;NRCSNM02093http://photogallery.nrcs.usda.gov/netpub/server.np?find&catalog=catalog&template=detail.np&field=itemid&op=matches&value=5971&site=PhotoGallery
Chapter7:ForestHWP:USDANRCS;JeffVanuga;NRCSNM02093http://photogallery.nrcs.usda.gov/netpub/server.np?find&catalog=catalog&template=detail.np&field=itemid&op=matches&value=5471&site=PhotoGallery
Chapter8: Compost:USDANRCS;NRCSCA06008.tifhttp://photogallery.nrcs.usda.gov/netpub/server.np?find&catalog=catalog&template=detail.np&field=itemid&op=matches&value=961&site=PhotoGallery
ix
TableofContents
ExecutiveSummary
1 Introduction...............................................................................................................................................1‐31.1 OverviewoftheReport...............................................................................................................................1‐41.2 ReportObjectives..........................................................................................................................................1‐51.3 ProcessfortheDevelopmentoftheMethods....................................................................................1‐61.4 ContentsoftheReport................................................................................................................................1‐91.5 UsesandLimitationsoftheReport......................................................................................................1‐10Chapter1References.............................................................................................................................................1‐14
2 ConsiderationsWhenEstimatingAgricultureandForestryGHGEmissionsandRemovals .........................................................................................................................................................................2‐3
2.1 Scope...................................................................................................................................................................2‐32.1.1 DefinitionofEntity........................................................................................................................2‐32.1.2 DefinitionofSystemBoundaries.............................................................................................2‐4
2.2 ReviewofRelevantCurrentToolsandMethods............................................................................2‐122.3 SelectionofMostAppropriateMethodandMitigationPracticestoInclude......................2‐132.4 OverviewofSectors....................................................................................................................................2‐14
2.4.1 CroplandsandGrazingLands.................................................................................................2‐162.4.2 Wetlands..........................................................................................................................................2‐172.4.3 AnimalProduction.......................................................................................................................2‐192.4.4 Forestry............................................................................................................................................2‐21
2.5 Land‐UseChange.........................................................................................................................................2‐222.6 Uncertainty....................................................................................................................................................2‐23Chapter2References.............................................................................................................................................2‐24
3 QuantifyingGreenhouseGasSourcesandSinksinCroplandandGrazingLandSystems..... .........................................................................................................................................................................3‐4
3.1 Overview...........................................................................................................................................................3‐53.1.1 OverviewofManagementPracticesandResultingGHGEmissions.........................3‐63.1.2 SystemBoundariesandTemporalScale............................................................................3‐103.1.3 SummaryofSelectedMethods/ModelsSourcesofData.............................................3‐103.1.4 OrganizationofChapter/Roadmap......................................................................................3‐11
3.2 CroplandManagement..............................................................................................................................3‐123.2.1 ManagementInfluencingGHGEmissionsinUplandSystems...................................3‐123.2.2 ManagementInfluencingGHGEmissionsinFloodedCroppingSystems.............3‐253.2.3 Land‐UseChangetoCropland................................................................................................3‐28
3.3 GrazingLandManagement......................................................................................................................3‐293.3.1 ManagementActivityInfluencingGHGEmissions.........................................................3‐303.3.2 Land‐UseChangetoGrazingLands......................................................................................3‐36
3.4 Agroforestry..................................................................................................................................................3‐37
x
3.4.1 CarbonStocks................................................................................................................................3‐393.4.2 NitrousOxide.................................................................................................................................3‐413.4.3 Methane...........................................................................................................................................3‐413.4.4 ManagementInteractions.........................................................................................................3‐42
3.5 EstimationMethods...................................................................................................................................3‐423.5.1 BiomassCarbonStockChanges.............................................................................................3‐433.5.2 LitterCarbonStockChanges...................................................................................................3‐493.5.3 SoilCarbonStockChanges.......................................................................................................3‐493.5.4 SoilNitrousOxide........................................................................................................................3‐583.5.5 MethaneUptakebySoils...........................................................................................................3‐743.5.6 MethaneandNitrousOxidefromFloodedRiceCultivation.......................................3‐773.5.7 CO2fromLiming...........................................................................................................................3‐833.5.8 Non‐CO2EmissionsfromBiomassBurning......................................................................3‐863.5.9 CO2fromUreaFertilizerApplications.................................................................................3‐90
3.6 SummaryofResearchGapsforCropandGrazingLandManagement..................................3‐92Appendix3‐A:SoilN2OModelingFrameworkSpecifications...............................................................3‐97
3‐A.1DescriptionofProcess‐BasedModels.....................................................................3‐993‐A.2EmpiricalScalarsforBaseEmissionRates.........................................................3‐1063‐A.3Practice‐BasedScalingFactors................................................................................3‐108
Appendix3‐B:GuidanceforCropsNotIncludedintheDAYCENTModel....................................3‐113Chapter3References..........................................................................................................................................3‐116
4 QuantifyingGreenhouseGasSourcesandSinksinManagedWetlandSystems................4‐34.1 Overview...........................................................................................................................................................4‐3
4.1.1 OverviewofManagementPracticesandResultingGHGEmissions.........................4‐44.1.2 SystemBoundariesandTemporalScale..............................................................................4‐74.1.3 SummaryofSelectedMethods/ModelsandSourcesofData......................................4‐74.1.4 OrganizationofChapter/Roadmap........................................................................................4‐8
4.2 ManagementandRestorationofWetlands........................................................................................4‐84.2.1 DescriptionofWetlandManagementPractices................................................................4‐84.2.2 Land‐UseChangetoWetlands................................................................................................4‐13
4.3 EstimationMethods...................................................................................................................................4‐144.3.1 BiomassCarboninWetlands..................................................................................................4‐144.3.2 SoilC,N2O,andCH4inWetlands............................................................................................4‐17
4.4 ResearchGapsforWetlandManagement.........................................................................................4‐21Chapter4References.............................................................................................................................................4‐23
5 QuantifyingGreenhouseGasSourcesandSinksinAnimalProductionSystems..............5‐55.1 Overview...........................................................................................................................................................5‐5
5.1.1 OverviewofManagementPracticesandResultingGHGEmissions.........................5‐55.1.2 SystemBoundariesandTemporalScale............................................................................5‐125.1.3 SummaryofSelectedMethods/Models/SourcesofData............................................5‐12
xi
5.1.4 OrganizationofChapter/Roadmap......................................................................................5‐145.2 AnimalProductionSystems....................................................................................................................5‐18
5.2.1 DairyProductionSystems........................................................................................................5‐185.2.2 BeefProductionSystems..........................................................................................................5‐225.2.3 SheepProductionSystems.......................................................................................................5‐255.2.4 SwineProductionSystems.......................................................................................................5‐255.2.5 PoultryProductionSystems....................................................................................................5‐28
5.3 EmissionsfromEntericFermentationandHousing.....................................................................5‐305.3.1 EntericFermentationandHousingEmissionsfromDairyProductionSystems........ .............................................................................................................................................................5‐315.3.2 EntericFermentationandHousingEmissionsfromBeefProductionSystems.5‐445.3.3 EntericFermentationandHousingEmissionsfromSheep........................................5‐525.3.4 EntericFermentationandHousingEmissionsfromSwineProductionSystems....... .............................................................................................................................................................5‐535.3.5 HousingEmissionsfromPoultryProductionSystems.................................................5‐605.3.6 EntericFermentationandHousingEmissionsfromOtherAnimals.......................5‐645.3.7 FactorsAffectingEntericFermentationEmissions.......................................................5‐665.3.8 LimitationsandUncertaintyinEntericFermentationandHousingEmissions
Estimates.........................................................................................................................................5‐735.4 ManureManagement.................................................................................................................................5‐75
5.4.1 TemporaryStackandLong‐TermStockpile.....................................................................5‐775.4.2 Source:U.S.EPA(2011).Composting...................................................................................5‐815.4.3 AerobicLagoon.............................................................................................................................5‐855.4.4 AnaerobicLagoon,RunoffHoldingPond,StorageTanks............................................5‐865.4.5 AnaerobicDigesterwithBiogasUtilization......................................................................5‐915.4.6 CombinedAerobicTreatmentSystems..............................................................................5‐935.4.7 Sand‐ManureSeparation..........................................................................................................5‐945.4.8 NutrientRemoval.........................................................................................................................5‐945.4.9 Solid–LiquidSeparation............................................................................................................5‐955.4.10 ConstructedWetland..................................................................................................................5‐975.4.11 Thermo‐ChemicalConversion................................................................................................5‐985.4.12 LimitationsandUncertaintyinManureManagementEmissionsEstimates......5‐99
5.5 ResearchGaps............................................................................................................................................5‐1055.5.1 EntericFermentation..............................................................................................................5‐1055.5.2 ManureManagement...............................................................................................................5‐106
Appendix5‐A:EntericCH4fromFeedlotCattle–MethaneConversionFactor(Ym)..............5‐109Appendix5‐B:FeedstuffsCompositionTable...........................................................................................5‐113Appendix5‐C:EstimationMethodsforAmmoniaEmissionsfromManureManagement
Systems......................................................................................................................................5‐1235‐C.1 MethodforEstimatingAmmoniaEmissionsUsingEquationsfromIntegrated
FarmSystemModel................................................................................................................5‐1235‐C.1.1RationaleforSelectedMethod...............................................................................5‐1235‐C.1.2ActivityData..................................................................................................................5‐123
xii
5‐C.1.3AncillaryData...............................................................................................................5‐1245‐C.2 MethodforAmmoniaEmissionsfromTemporaryStack,Long‐TermStockpile,
AnaerobicLagoons/RunoffHoldingPonds/StorageTanks,andAerobicLagoons........................................................................................................................................................5‐124
5‐C.3 MethodforEstimatingAmmoniaEmissionsfromCompostingUsingIPCCTier2Equations....................................................................................................................................5‐128
5‐C.3.1RationaleforSelectedMethod...............................................................................5‐1285‐C.3.2ActivityData..................................................................................................................5‐1295‐C.3.3AncillaryData...............................................................................................................5‐129
5‐C.4 MethodforAmmoniaEmissionsfromComposting..................................................5‐1295‐C.5 UncertaintyinAmmoniaEmissionsEstimates...........................................................5‐129
Appendix5‐D:ManureManagementSystemsShapeFactors( )...................................................5‐131Appendix5‐E:ModelReview:ReviewofEntericFermentationModels.......................................5‐134Chapter5References..........................................................................................................................................5‐139
6 QuantifyingGreenhouseGasSourcesandSinksinManagedForestSystems....................6‐46.1 Overview.........................................................................................................................................................6‐5
6.1.1 OverviewofManagementPracticesandResultingGHGEmissions.........................6‐66.1.2 SystemBoundariesandTemporalScale..............................................................................6‐96.1.3 SummaryofSelectedMethods/Models..............................................................................6‐106.1.4 SourcesofData..............................................................................................................................6‐116.1.5 OrganizationofChapter/Roadmap......................................................................................6‐12
6.2 ForestCarbonAccounting......................................................................................................................6‐156.2.1 DescriptionofForestCarbonAccounting..........................................................................6‐156.2.2 DataCollectionforForestCarbonAccounting.................................................................6‐236.2.3 EstimationMethods....................................................................................................................6‐256.2.4 Limitations,Uncertainty,andResearchGaps...................................................................6‐28
6.3 Establishing,Re‐establishing,andClearingForests....................................................................6‐296.3.1 Description.....................................................................................................................................6‐296.3.2 ActivityDataCollection.............................................................................................................6‐336.3.3 EstimationMethods....................................................................................................................6‐346.3.4 SpecificProtocolforComputation........................................................................................6‐376.3.5 ActualGHGRemovalsandEmissionsbySourcesandSinksfromForestClearing... .............................................................................................................................................................6‐436.3.6 LimitationsandUncertainty....................................................................................................6‐44
6.4 ForestManagement..................................................................................................................................6‐456.4.1 Description.....................................................................................................................................6‐456.4.2 ActivityData...................................................................................................................................6‐536.4.3 ManagementIntensityCategories........................................................................................6‐576.4.4 EstimationMethods....................................................................................................................6‐646.4.5 LimitationsandUncertainty....................................................................................................6‐66
6.5 HarvestedWoodProducts.....................................................................................................................6‐666.5.1 GeneralAccountingIssues.......................................................................................................6‐66
xiii
6.5.2 EstimationMethods....................................................................................................................6‐686.5.3 ActivityDataCollection.............................................................................................................6‐696.5.4 Limitations,Uncertainty,andResearchGaps...................................................................6‐70
6.6 UrbanForests..............................................................................................................................................6‐716.6.1 Description.....................................................................................................................................6‐716.6.2 ActivityDataCollection.............................................................................................................6‐736.6.3 EstimationMethods....................................................................................................................6‐746.6.4 LimitationsandUncertainty....................................................................................................6‐80
6.7 NaturalDisturbance–WildfireandPrescribedFire...................................................................6‐826.7.1 Description.....................................................................................................................................6‐826.7.2 ActivityDataCollection.............................................................................................................6‐826.7.3 EstimationMethods....................................................................................................................6‐826.7.4 LimitationsandUncertainty....................................................................................................6‐87
Appendix6‐A:HarvestedWoodProductsLookupTables.....................................................................6‐88Chapter6References..........................................................................................................................................6‐107
7 QuantifyingGreenhouseGasSourcesandSinksfromLand‐UseChange.............................7‐37.1 Overview...........................................................................................................................................................7‐37.2 DefinitionsofLandUse...............................................................................................................................7‐47.3 Caveats...............................................................................................................................................................7‐67.4 EstimatingGHGFluxfromLand‐UseChange.....................................................................................7‐6
7.4.1 CarbonPoolsinLiveBiomass,DeadBiomass,andSoilOrganicCarbon................7‐87.4.2 ChangesinSoilCarbon................................................................................................................7‐87.4.3 ChangesinotherGHGemissions...........................................................................................7‐13
Chapter7References.............................................................................................................................................7‐14
8 UncertaintyAssessmentforQuantifyingGreenhouseGasSourcesandSinks...................8‐3 ComponentsandInputstoanEntity‐ScaleMonteCarloUncertaintyAssessment............8‐48.1.1 ParameterUncertainty................................................................................................................8‐58.1.2 SamplingMethodUncertainty..................................................................................................8‐68.1.3 LargeDatasetUncertainty..........................................................................................................8‐98.1.4 ModelUncertainty.......................................................................................................................8‐16
ResearchGaps...............................................................................................................................................8‐20Appendix8‐A:ExampleOutputFilefromFVSSamplingUncertaintyBootstrappingApplicationFVSBoot(asprovidedinGreggandHummel,2002)................................................................................8‐21Appendix8‐B:UncertaintyTables....................................................................................................................8‐22Chapter8References.............................................................................................................................................8‐55

xiv
Thispageisintentionallyleftblank.
QUANTIFYINGGREENHOUSEGASFLUXESINAGRICULTURE ANDFORESTRY:METHODSFORENTITY‐SCALE INVENTORY
Eve,M.,D.Pape,M.Flugge,R.Steele,D.Man,M.Riley‐Gilbert,andS.Biggar,(Eds),2014.QuantifyingGreenhouseGasFluxesinAgricultureandForestry:MethodsforEntity‐ScaleInventory.TechnicalBulletinNumber1939.OfficeoftheChiefEconomist,U.S.DepartmentofAgriculture,Washington,DC.606pages.July2014.
ExecutiveSummary
BackgroundProvisionsofSection2709oftheFood,Conservation,andEnergyActof2008directtheU.S.DepartmentofAgriculture(USDA)topreparetechnicalguidelinesandscience‐basedmethodstomeasureenvironmentalservicebenefitsfromconservationandlandmanagementactivities,initiallyfocusedoncarbon.Themethodscontainedinthisdocumentaddressgreenhousegas(GHG)emissionsandremovalsfromagriculturalandforestryactivities.
Throughthedevelopmentofthisreport,USDAhaspreparedtwoprimaryproducts:
1. AcomprehensivereviewoftechniquescurrentlyinuseforestimatingGHGemissionsandremovalsfromagriculturalandforestryactivities;and
2. Atechnicalreportoutliningthepreferredscience‐basedapproachandspecificmethodsforestimatingGHGemissionsatthefarmorforestscale(i.e.,thisdocument).
PurposeoftheReportTheobjectiveforthisreportistocreateastandardsetofGHGestimationmethodsforusebyUSDA,landowners,andotherstakeholderstoassisttheminevaluatingtheGHGimpactsoftheirmanagementdecisions.ThemethodspresentedinthereportaddressGHGemissionsandcarbonsequestrationfortheentireentityoroperationandalsoprovidetheopportunitytoassessindividualpracticesormanagementdecisions.Therefore,easeofuseiscritical.
Aco‐objectiveistodemonstratecapacitywithinUSDA,establishingastandardized,consensussetofmethodsthatbecomethescientificbasisforentity‐scaleestimationoftheGHGimpactsoflandownermanagementdecisions.Therefore,scientificrigorandtransparencyarealsocritical.
UsesoftheReportandMethods:
EstimatingincreasesanddecreasesinGHGemissionsandcarbonsequestrationresultingfromcurrentandfutureconservationprogramsandpractices;
ProvidingmethodssuitableforGHGinventoryeffortsattheentity,farm,orforestscale,withpossibleimplicationsforregionalandnationalscaleassessmentsaswell;and
EstimatingincreasesanddecreasesinGHGemissionsandcarbonsequestrationassociatedwithchangesinlandmanagement.
Executive Summary
ES-2
Becausethereportisintendedasameansofevaluatingmanagementpracticesacrossthefullscopeofthefarm,ranch,andforestmanagementsystem,themethodsinthereportneedtobeascomprehensiveaspossible.Researchanddatagapsexistthatresultinsomemanagementpracticesnotbeingaccountedfororarereflectedinhigherlevelsofestimateuncertainty.Completenessisimportant,though,andthereportattemptstoidentifythemostsignificantresearchgapsanddataneeds.
ThisreportwillbeusedwithinUSDAandbyfarmers,ranchers,andforestlandowners,andwillbemadepubliclyavailable.Thesemethodsaredesignedto:
1. Provideascientificbasisformethodsthatcanbeusedbylandownersandmanagers,USDA,andotherstakeholderstoestimatechangesinGHGemissionsandremovalsatthelocalentityscale;
2. CreateastandardsetofGHGquantificationguidelinesandmethodsforusebystakeholders;
3. Quantifyallsignificantemissionsandremovalsassociatedwithspecificsourcecategories;
4. Quantifyemissionsfromland‐usechangeandcarbonsequestrationfromlandmanagementpracticesandtechnologies;and
5. Supportthedevelopmentofentity‐,farm‐,orforest‐scaleGHGinventoriesthatwillfacilitatetheparticipationoflandownersinpublicandprivateenvironmentalmarketregistriesandreportingsystems.
ThereportalsoservesasinputintothedevelopmentofaUSDAGHGEstimationTool.ThereportandthemethodsarenotintendedasanadditiontoorreplacementofanycurrentFederalGHGreportingsystemsorrequirements.
ProcessfortheDevelopmentoftheReportThisreportwasdevelopedbythreeauthorteams(i.e.,workinggroups)underthedirectionofoneleadauthorforeachteam(plusoneco‐leadauthorfortheforestrychapter).TheleadauthorswerechosenbasedontheirexperiencewithGHGinventoriesandaccountingmethodologiesandtheirprofessionalresearchexperience.Withinputfromeachleadauthor,USDAchose8to12workinggroupmembersperteamtowritethereport.TheseworkinggroupmemberseachhaddifferentbackgroundsthatfitwiththeanticipatedcontentofthedocumentandalsohadexperiencewithGHGaccountingand/orfieldresearchthatwasuniqueandaddressedoneormoreofthenichemethodsthatwereessentialforensuringthecomprehensivenessofthemethodsforeachsector.Theauthorteamswereprovidedwithapreliminaryoutlineoftheirchaptersandwithtwobackgroundreportsdevelopedaspartoftheproject.Onebackgroundreportwasananalysisofthescientificliteraturerelatedtoratesofcarbonsequestrationoremissionsreductionresultingfromvariousmanagementpracticesandtechnologies(Denefetal.,2011).Theotherreportwasacompilationofalloftheavailabletools,protocols,andmodels,withbasicinformationoneachone(Denefetal.,2012).
Themethodsweredevelopedaccordingtoseveralcriteriainordertomaximizetheirusefulness.Inparticular,themethodsmust:
1. Standontheirown,independentofanyotheraccountingsystem,yetmaintainconsistencywithotheraccountingsystemstothemaximumextentpossible;
2. Bescalableforuseatentity‐scalesitesacrosstheUnitedStates,withapplicabilityatcountyand/orStatelevelsaswell;
3. FacilitateusebyUSDAinassessingtheperformanceofconservationprograms;
Executive Summary
ES-3
4. ProvideabroadframeworktoassessmanagementpracticestoevaluatetheGHGaspectofproductionsustainability;
5. Maintainmaximumapplicabilityforuseinenvironmentalmarkets,includingpossiblefutureFederal,State,orlocalGHGoffsetsinitiatives;
6. BescientificallyvettedthroughUSDA,U.S.Governmentandacademicexpertreview,andpubliccomment;
7. Providereliable,real,andverifiableestimatesofonsiteGHGemissions,carbonstorage,andcarbonsequestration(themethodswillbedesignedsothatovertimetheycanbeappliedtoquantifyonsiteGHGreductionsandincreasesincarbonstorageduetoconservationandlandmanagementactivities);and
8. Provideabasisforconsistencyinestimationandtransparencyinreporting.
Developmentofthereporthasbeeniterativeasvariousdraftsofthedocumenthavebeenputthroughseveralreviewstages,includingaUSDAintra‐agencytechnicalreview,aFederalinteragencytechnicalreview,ascientificexpertreview,andapubliccommentperiod.
OverviewofRecommendedGHGEstimationMethodsintheReportThissectionprovidesanoverviewofthecurrentestimationmethodsorapproachesanentitycouldusetoestimateGHGemissionsandsinksonhisorherproperty.Thisoverviewisfollowedbyasummaryofeachsector’sproposedmethodologiesforentityGHGestimations.
Thereareseveralapproachesthatafarmer,rancher,orforestlandownercanusetoestimateGHGemissionsatanentityscale,andeachapproachgivesvaryingaccuracyandprecision.Themostaccuratewayofestimatingemissionsisthroughdirectmeasurement,whichoftenrequiresexpensiveequipmentortechniquesthatarenotfeasibleforasinglelandownerormanager.Ontheotherhand,lookuptablesandestimationequationsaloneoftendonotadequatelyrepresentlocalvariabilityorlocalconditions.Thisreportattemptstodelineatemethodsthatbalanceuser‐friendliness,datarequirements,andscientificrigorinawaythatistransparentandjustified.
Thefollowingapproacheswereconsideredfortheseguidelines:
Basicestimationequations(cf.,IPCC[IntergovernmentalPanelonClimateChange]Tier1)—involvecombinationsofactivitydata1withparametersanddefaultemissionfactors.2Anydefaultparametersordefaultemissionfactors(e.g.,lookuptables)areprovidedinthetext,orifsubstantialinlength,inanaccompanyingcompendiumofdata.
Models(cf.,IPCCTier3)—usecombinationsofactivitydatawithparametersanddefaultemissionfactors.Theinputsforthesemodelscanbeancillarydata3(e.g.,temperature,precipitation,elevation,andsoilnutrientlevelsthatmaybepulledfromanunderlyingsource),biologicalvariables(e.g.,plantdiversity)orsite‐specificdata(e.g.,numberofacres,
1Activitydataisdefinedasdataonthemagnitudeofhumanactivityresultinginemissionsorremovalstakingplaceduringagivenperiodoftime(IPCC,1997).2Emissionfactorisdefinedasacoefficientthatquantifiestheemissionsorremovalsofagasperunitofactivity.Emissionfactorsareoftenbasedonasampleofmeasurementdata,averagedtodeveloparepresentativerateofemissionforagivenactivitylevelunderagivensetofoperatingconditions(IPCC,2006).3Ancillarydataisdefinedasadditionaldatanecessarytosupporttheselectionofactivitydataandemissionfactorsfortheestimationandcharacterizationofemissions.Dataonsoil,croporanimaltypes,treespecies,operatingconditions,andgeographicallocationareexamplesofancillarydata.
Executive Summary
ES-4
numberofanimals).Theaccuracyofthemodelsisdependentontherobustnessofthemodelandtheaccuracyoftheinputs.
Fieldmeasurements—actualmeasurementsthatafarmerorlandownerwouldneedtotaketomoreaccuratelyestimatethepropertiesofthesoil,forest,orfarmortoestimateactualemissions.Measuringactualemissionsonthelandrequiresspecialequipmentthatmonitorstheflowofgasesfromthesourceintotheatmosphere.Thisequipmentisnotreadilyavailabletomostentities,sofieldmeasurementsaremoreoftenincorporatedintoothermethodsdescribedinthissectiontocreateahybridapproach.Afieldmeasurementsuchasasamplemeantreediametercouldbeincorporatedintoothermodelsorequationstogiveamoreaccurateinput.
Inference(cf.,IPCCTier2)—usesState,regional,ornationalemissions/sequestrationfactorsthatapproximateemissions/sequestrationperunitoftheinput.Theinputdataisthenmultipliedbythisfactortodeterminethetotalonsiteemissions.Thisfactorcanhavevaryingdegreesofaccuracyandoftendoesnotcapturethemitigationpracticesonthefarmortheuniquesoilconditions,climate,livestockdiet,livestockgenetics,oranyfarm‐specificcharacteristics,althoughtheycanbedevelopedwithspecificsoiltypes,livestockcategories,orclimacticregions.
Hybridestimationapproach(cf.,IPCCTier2orIPPCTier3)—anapproachthatusesacombinationoftheapproachesdescribedabove.Theapproachoftenusesfieldmeasurementsormodelstogenerateinputsusedforaninference‐basedapproachtoimprovetheaccuracyoftheestimate.
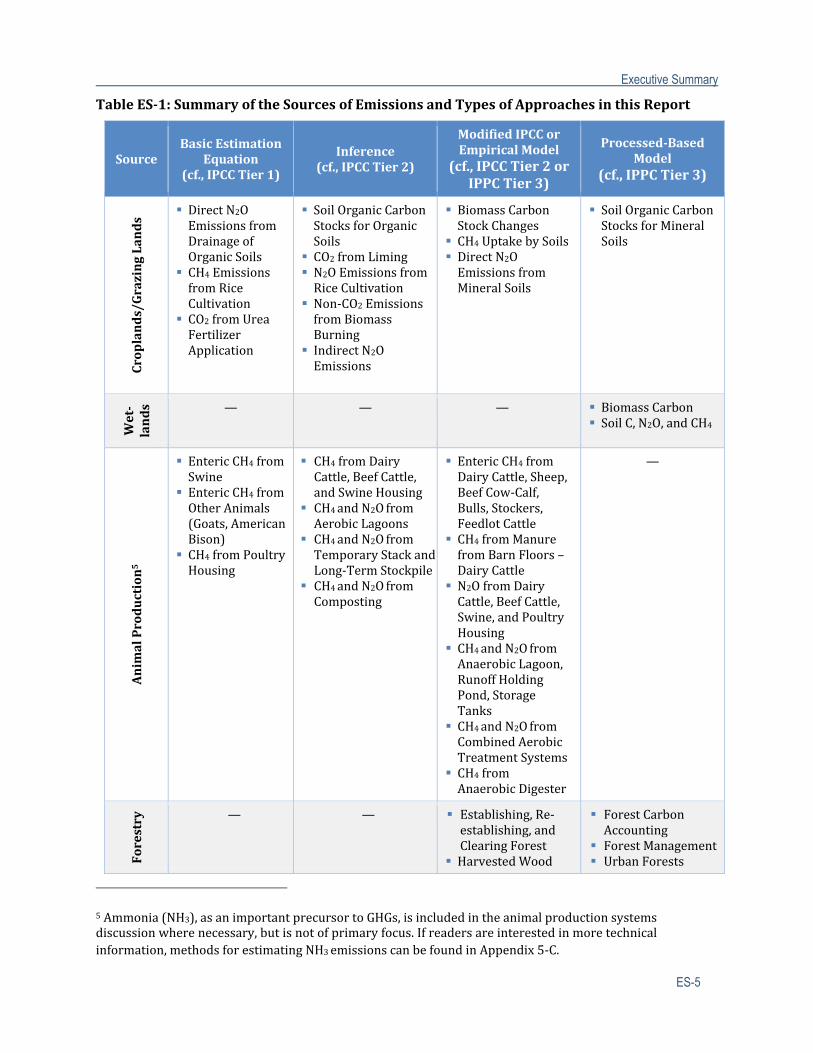
Thetypesofapproachesthattheauthorsrecommendedinthisreportincludebasicestimationequationswithdefaultemissionfactors(cf.,IPCCTier1);geography‐,crop‐,livestock‐,technology‐,orpractice‐specificemissionfactors(cf.,IPCCTier2);andmodifiedIPCC/empiricaland/orprocess‐basedmodeling(cf.,IPCCTier2orIPCCTier3).4TableES‐1categorizesthesourcesofemissionswiththetypesofapproachesthatarerecommendedinthisreport.
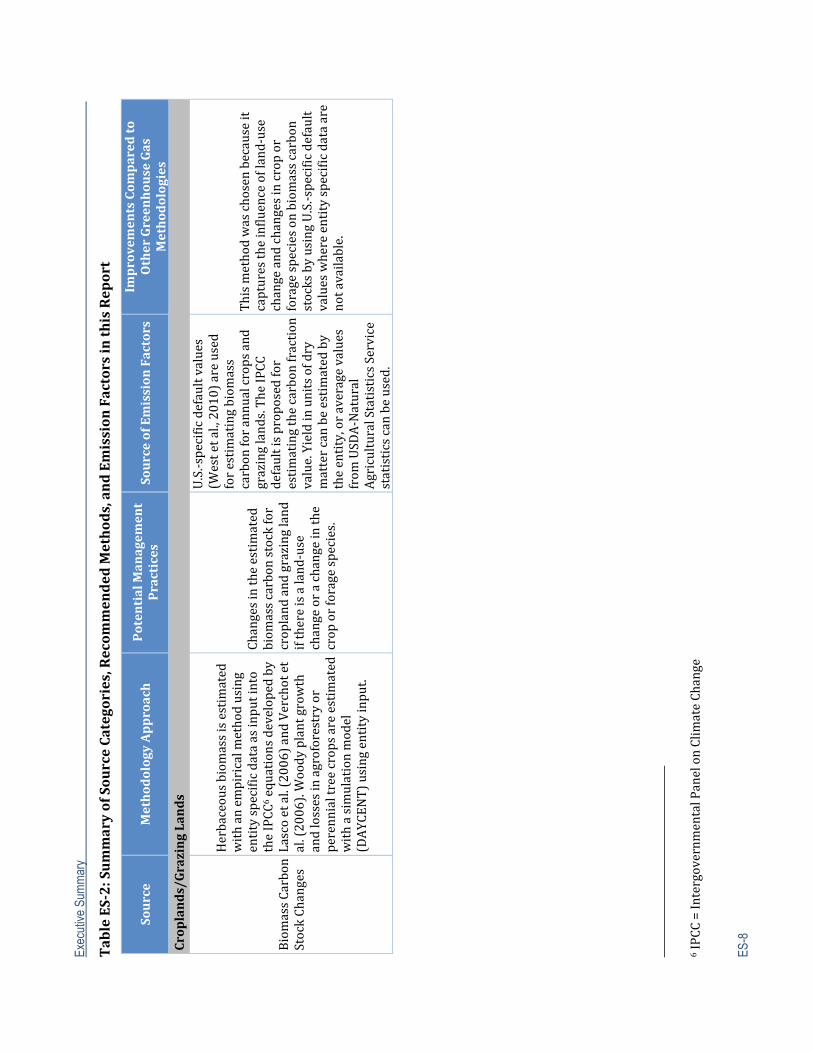
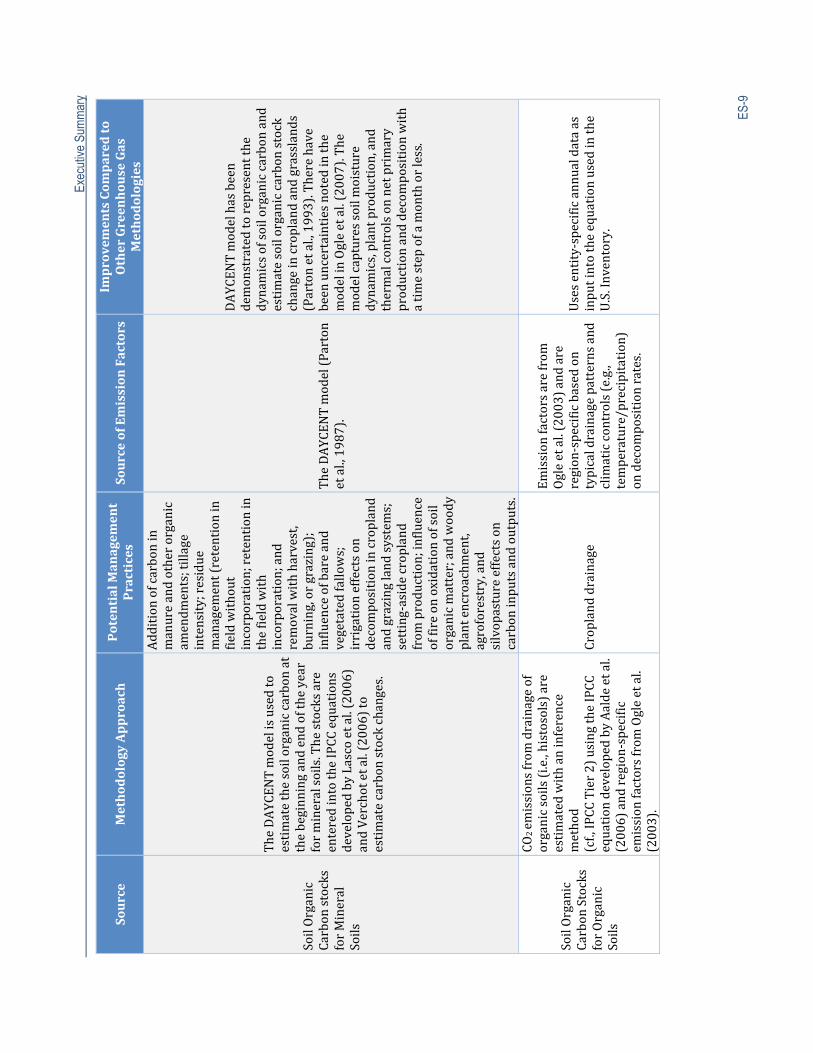
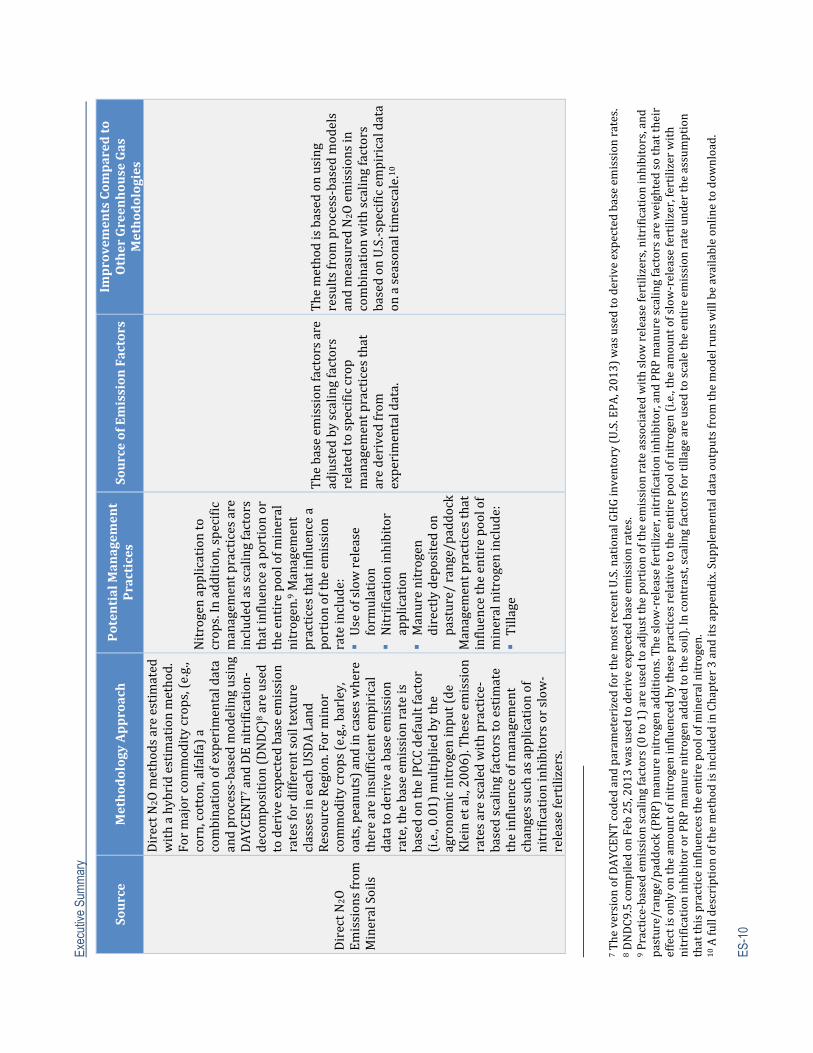
TableES‐2summarizesthesourcesofagriculturalandforestryGHGemissionsandremovalsdiscussedinthisreport,therecommendedmethodforestimatingemissionsandremovalsforeachsourcecategory,andthereference(s)usedforthedevelopmentofthemethod.
4Atierrepresentsalevelofmethodologicalcomplexity.Usuallythreetiersareprovided.Tier1isthebasicmethod,Tier2intermediate,andTier3mostdemandingintermsofcomplexityanddatarequirements.Tiers2and3aresometimesreferredtoashighertiermethodsandaregenerallyconsideredtobemoreaccurate(IPCC,2006).
Executive Summary
ES-5
TableES‐1:SummaryoftheSourcesofEmissionsandTypesofApproachesinthisReport
SourceBasicEstimation
Equation(cf.,IPCCTier1)
Inference(cf.,IPCCTier2)
ModifiedIPCCorEmpiricalModel
(cf.,IPCCTier2orIPPCTier3)
Processed‐BasedModel
(cf.,IPPCTier3)
Croplands/GrazingLands
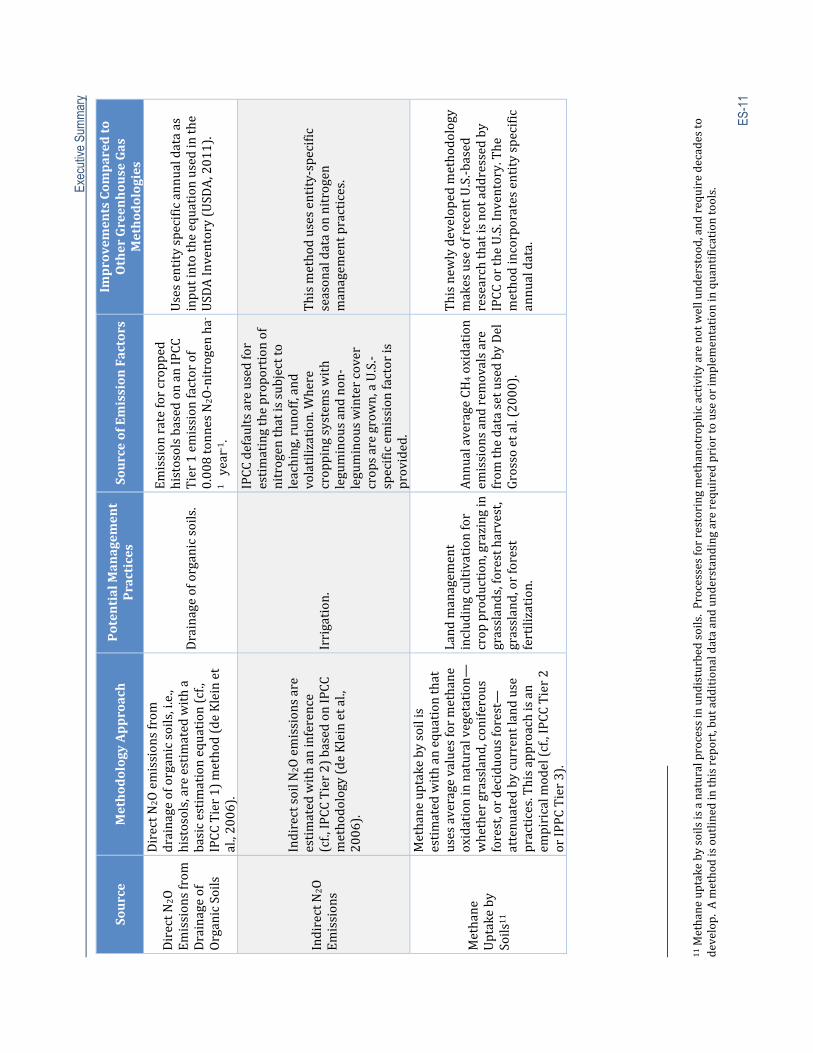
DirectN2OEmissionsfromDrainageofOrganicSoils
CH4EmissionsfromRiceCultivation
CO2fromUreaFertilizerApplication
SoilOrganicCarbonStocksforOrganicSoils
CO2fromLiming N2OEmissionsfromRiceCultivation
Non‐CO2EmissionsfromBiomassBurning
IndirectN2OEmissions
BiomassCarbonStockChanges
CH4UptakebySoils DirectN2OEmissionsfromMineralSoils
SoilOrganicCarbonStocksforMineralSoils
Wet‐
lands — — — BiomassCarbon
SoilC,N2O,andCH4
AnimalProduction5
EntericCH4fromSwine
EntericCH4fromOtherAnimals(Goats,AmericanBison)
CH4fromPoultryHousing
CH4 fromDairyCattle,BeefCattle,andSwineHousing
CH4andN2OfromAerobicLagoons
CH4andN2OfromTemporaryStackandLong‐TermStockpile
CH4andN2OfromComposting
Enteric CH4 fromDairyCattle,Sheep,BeefCow‐Calf,Bulls,Stockers,FeedlotCattle
CH4fromManurefromBarnFloors–DairyCattle
N2OfromDairyCattle,BeefCattle,Swine,andPoultryHousing
CH4andN2OfromAnaerobicLagoon,RunoffHoldingPond,StorageTanks
CH4andN2OfromCombinedAerobicTreatmentSystems
CH4fromAnaerobicDigester
—
Forestry — — Establishing,Re‐
establishing,andClearingForest
HarvestedWood
ForestCarbonAccounting
ForestManagement UrbanForests
5Ammonia(NH3),asanimportantprecursortoGHGs,isincludedintheanimalproductionsystemsdiscussionwherenecessary,butisnotofprimaryfocus.Ifreadersareinterestedinmoretechnicalinformation,methodsforestimatingNH3emissionscanbefoundinAppendix5‐C.
Executive Summary
ES-6
SourceBasicEstimation
Equation(cf.,IPCCTier1)
Inference(cf.,IPCCTier2)
ModifiedIPCCorEmpiricalModel
(cf.,IPCCTier2orIPPCTier3)
Processed‐BasedModel
(cf.,IPPCTier3)
Products NaturalDisturbance—WildfireandPrescribedFire
Land‐useChange AnnualChangein
CarbonStocksinDeadWoodandLitterDuetoLandConversion
ChangeinSoilOrganicCarbonStocksforMineralSoils
— — —
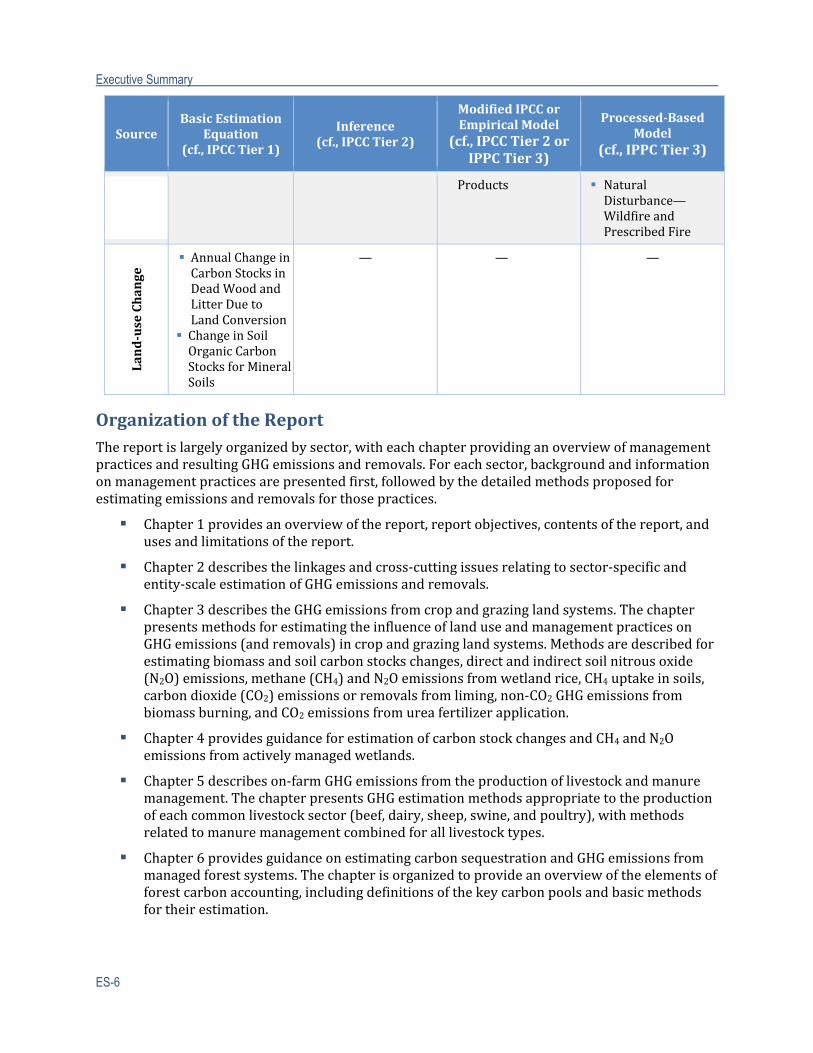
OrganizationoftheReportThereportislargelyorganizedbysector,witheachchapterprovidinganoverviewofmanagementpracticesandresultingGHGemissionsandremovals.Foreachsector,backgroundandinformationonmanagementpracticesarepresentedfirst,followedbythedetailedmethodsproposedforestimatingemissionsandremovalsforthosepractices.
Chapter1providesanoverviewofthereport,reportobjectives,contentsofthereport,andusesandlimitationsofthereport.
Chapter2describesthelinkagesandcross‐cuttingissuesrelatingtosector‐specificandentity‐scaleestimationofGHGemissionsandremovals.
Chapter3describestheGHGemissionsfromcropandgrazinglandsystems.ThechapterpresentsmethodsforestimatingtheinfluenceoflanduseandmanagementpracticesonGHGemissions(andremovals)incropandgrazinglandsystems.Methodsaredescribedforestimatingbiomassandsoilcarbonstockschanges,directandindirectsoilnitrousoxide(N2O)emissions,methane(CH4)andN2Oemissionsfromwetlandrice,CH4uptakeinsoils,carbondioxide(CO2)emissionsorremovalsfromliming,non‐CO2GHGemissionsfrombiomassburning,andCO2emissionsfromureafertilizerapplication.
Chapter4providesguidanceforestimationofcarbonstockchangesandCH4andN2Oemissionsfromactivelymanagedwetlands.
Chapter5describeson‐farmGHGemissionsfromtheproductionoflivestockandmanuremanagement.ThechapterpresentsGHGestimationmethodsappropriatetotheproductionofeachcommonlivestocksector(beef,dairy,sheep,swine,andpoultry),withmethodsrelatedtomanuremanagementcombinedforalllivestocktypes.
Chapter6providesguidanceonestimatingcarbonsequestrationandGHGemissionsfrommanagedforestsystems.Thechapterisorganizedtoprovideanoverviewoftheelementsofforestcarbonaccounting,includingdefinitionsofthekeycarbonpoolsandbasicmethodsfortheirestimation.
Executive Summary
ES-7
Chapter7providesguidanceonestimatingthenetGHGemissionsandremovalsresultingfromchangesbetweenlandtypes—i.e.,conversionsintoandoutofcropland,wetland,grazingland,orforestland—attheentityscale.
Chapter8presentstheapproachforaccountingfortheuncertaintyintheestimatednetemissionsbasedonthemethodspresentedinthisreport.AMonteCarloapproachwasselectedasthemethodforestimatingtheuncertaintyaroundtheoutputsfromthemethodologiesinthisreportasitiscurrentlythemostcomprehensive,soundmethodavailabletoassesstheuncertaintyattheentityscale.
SummaryIndevelopingthisreport,theauthorshavesoughttooutlinethemoststate‐of‐theartandsuitablescience‐basedapproachesandspecificmethodsforestimatingfarm‐orforest‐scaleGHGemissions(seeTableES‐2).Insomecases,theproposedmethodshavenotpreviouslybeenappliedinspecificallythewaythatisproposed.Forexample,theforestrysystemschapterdescribestheintegrationoftheForestVegetationSimulator(FVS)withinotherestimationtoolsforforestcarbonaccounting.ThisapplicationofFVS,whiletechnicallysound,willrequireadditionalefforttoimplement.Inothercases,theauthorshaveproposednewmethodsthatbuildonorenhancepreviouslyusedmethods.Forexample,anewhybridapproachisproposedforestimatingdirectsoilN2Oemissionsfrommineralsoilsoncroplandsandgrazinglands.Thehybridapproachusesmodelstoderiveexpectedemissionratesatthetypicalfertilizationrateforthemajorsoiltextures,weatherpatterns,andcroprotationsystemsineachUSDALandResourceRegionandusesameta‐analysisofempiricalstudiestodevelopemissionscalingfactorsforcroplandandgrazinglandsystems.Themethodalsoappliespractice‐basedscalingfactorsderivedfromameta‐analysisofthemostrecentdata.ThishybridapproachistheresultofaworkshopheldinFebruary2012thatconvenedexpertsonN2OemissionsfromcroplandsinordertodevelopestimationmethodsthatwereinclusiveandbestmettheobjectivesofUSDA.
Inadditiontoproposingscience‐basedmethods,theauthorsalsoacknowledgethatforcertainpracticesandtechnologies,adequatedatadonotcurrentlyexisttoaccuratelyestimateGHGemissionsand/orcarbonsequestration.Ineachsectorchapter,theauthorshaveincludedadiscussionofresearchgapsorpriorityareasforfuturedatacollectionthatareimportantinordertoimprovethecompletenessandaccuracyoftheestimationmethodsputforthinthisreport.EstimationofGHGemissionsfrommanagedwetlandsystemsisagoodexample.Whileamethodisputforwardthatreflectsthebestcurrentlyavailablescience,theauthorsstateinSection4.3thatthemethodsfortheselandsarenotaswelldevelopedasforothersectors.LaterinthatsamesectionthereistextdiscussingtheconsiderablelimitationstoestimatingGHGfluxesfromthesesystemsandthelargelevelsofuncertaintyaroundfluxestimates.InSection4.4,theauthorsoutlineasignificantlistofresearchanddataprioritiesthatwouldhelptorefineandstrengthentheestimationmethods.
Inthecontinualefforttoadvancethescienceandimprovetheunderstandingofthesecomplexanddynamicsystems,thisreportprovidesthefoundationforentity‐leveltoolstoquantifytheGHGbenefitsfromconservationandlandmanagementactivities.Thereportalsoidentifiesprioritiesforfutureeffortinordertobroadenthescopeofentity‐scaleGHGfluxestimationandreduceestimationuncertainties.
Exec
utiv
e Su
mm
ary
ES-8
TableES‐2:SummaryofSourceCategories,Recom
mendedMethods,andEmissionFactorsinthisReport
Source
MethodologyApproach
PotentialManagem
ent
Practices
SourceofEmissionFactors
ImprovementsCom
paredto
OtherGreenhouseGas
Methodologies
Croplands/GrazingLands
BiomassCarbon
StockChanges
Herbaceousbiom
assisestimated
withanempiricalm
ethodusing
entityspecificdataasinputinto
theIPCC
6 equationsdevelopedby
Lascoetal.(2006)andVerchotet
al.(2006).Woodyplantgrowth
andlossesinagroforestryor
perennialtreecropsareestimated
withasimulationmodel
(DAYCEN
T)usingentityinput.
Changesintheestimated
biom
asscarbonstockfor
croplandandgrazingland
ifthereisaland‐use
changeorachangeinthe
croporforagespecies.
U.S.‐specificdefaultvalues
(Westetal.,2010)areused
forestimatingbiom
ass
carbonforannualcropsand
grazinglands.TheIPCC
defaultisproposedfor
estimatingthecarbonfraction
value.Yieldinunitsofdry
mattercanbeestimatedby
theentity,oraveragevalues
from
USDA‐Natural
AgriculturalStatisticsService
statisticscanbeused.
Thismethodwaschosenbecauseit
capturestheinfluenceofland‐use
changeandchangesincropor
foragespeciesonbiom
asscarbon
stocksbyusingU.S.‐specificdefault
valueswhereentityspecificdataare
notavailable.
6 IPCC=Intergovernm
entalPanelonClimateChange
Exec
utiv
e Su
mm
ary
ES-9
Source
MethodologyApproach
PotentialManagem
ent
Practices
SourceofEmissionFactors
ImprovementsCom
paredto
OtherGreenhouseGas
Methodologies
SoilOrganic
Carbonstocks
forMineral
Soils
TheDAYCEN
Tmodelisusedto
estimatethesoilorganiccarbonat
thebeginningandendoftheyear
formineralsoils.Thestocksare
enteredintotheIPCCequations
developedbyLascoetal.(2006)
andVerchotetal.(2006)to
estimatecarbonstockchanges.
Additionofcarbonin
manureandotherorganic
amendm
ents;tillage
intensity;residue
managem
ent(retentionin
fieldwithout
incorporation;retentionin
thefieldwith
incorporation;and
removalwithharvest,
burning,orgrazing);
influenceofbareand
vegetatedfallows;
irrigationeffectson
decompositionincropland
andgrazinglandsystems;
setting‐asidecropland
from
production;influence
offireonoxidationofsoil
organicmatter;andwoody
plantencroachm
ent,
agroforestry,and
silvopastureeffectson
carboninputsandoutputs.
TheDAYCEN
Tmodel(Parton
etal.,1987).
DAYCEN
Tmodelhasbeen
demonstratedtorepresentthe
dynamicsofsoilorganiccarbonand
estimatesoilorganiccarbonstock
changeincroplandandgrasslands
(Partonetal.,1993).Therehave
beenuncertaintiesnotedinthe
modelinOgleetal.(2007).The
modelcapturessoilmoisture
dynamics,plantproduction,and
thermalcontrolsonnetprimary
productionanddecom
positionwith
atimestepofamonthorless.
SoilOrganic
CarbonStocks
forOrganic
Soils
CO2em
issionsfrom
drainageof
organicsoils(i.e.,histosols)are
estimatedwithaninference
method
(cf.,IPCCTier2)usingtheIPCC
equationdevelopedbyAaldeetal.
(2006)andregion‐specific
emissionfactorsfrom
Ogleetal.
(2003).
Croplanddrainage
Emissionfactorsarefrom
Ogleetal.(2003)andare
region‐specificbasedon
typicaldrainagepatternsand
climaticcontrols(e.g.,
temperature/precipitation)
ondecom
positionrates.
Usesentity‐specificannualdataas
inputintotheequationusedinthe
U.S.Inventory.
Exec
utiv
e Su
mm
ary
ES-1
0Source
MethodologyApproach
PotentialManagem
ent
Practices
SourceofEmissionFactors
ImprovementsCom
paredto
OtherGreenhouseGas
Methodologies
DirectN
2O
Emissionsfrom
MineralSoils
DirectN
2Omethodsareestimated
withahybridestimationmethod.
Formajorcom
moditycrops,(e.g.,
corn,cotton,alfalfa)a
combinationofexperimentaldata
andprocess‐basedmodelingusing
DAYCEN
T7andDEnitrification‐
decomposition(DNDC)
8 areused
toderiveexpectedbaseem
ission
ratesfordifferentsoiltexture
classesineachUSDALand
ResourceRegion.Forminor
commoditycrops(e.g.,barley,
oats,peanuts)andincaseswhere
thereareinsufficientempirical
datatoderiveabaseemission
rate,thebaseem
issionrateis
basedontheIPCCdefaultfactor
(i.e.,0.01)multipliedbythe
agronomicnitrogeninput(de
Kleinetal.,2006).Theseemission
ratesarescaledwithpractice‐
basedscalingfactorstoestimate
theinfluenceofm
anagem
ent
changessuchasapplicationof
nitrificationinhibitorsorslow
‐releasefertilizers.
Nitrogenapplicationto
crops.Inaddition,specific
managem
entpracticesare
includedasscalingfactors
thatinfluenceaportionor
theentirepoolofm
ineral
nitrogen.9 Managem
ent
practicesthatinfluencea
portionoftheem
ission
rateinclude:
Useofslowrelease
form
ulation
Nitrificationinhibitor
application
Manurenitrogen
directlydepositedon
pasture/range/paddock
Managem
entpracticesthat
influencetheentirepoolof
mineralnitrogeninclude:
Tillage
Thebaseem
issionfactorsare
adjustedbyscalingfactors
relatedtospecificcrop
managem
entpracticesthat
arederivedfrom
experimentaldata.
Themethodisbasedonusing
resultsfrom
process‐basedmodels
andmeasuredN2Oemissionsin
combinationwithscalingfactors
basedonU.S.‐specificempiricaldata
onaseasonaltimescale.10
7 TheversionofDAYCEN
Tcodedandparam
eterizedforthemostrecentU.S.nationalGHGinventory(U.S.EPA,2013)wasusedtoderiveexpectedbaseem
issionrates.
8 DNDC9.5com
piledonFeb25,2013wasusedtoderiveexpectedbaseem
issionrates.
9 Practice‐basedemissionscalingfactors(0to1)areusedtoadjusttheportionoftheemissionrateassociatedwithslow
releasefertilizers,nitrificationinhibitors,and
pasture/range/paddock(PRP)manurenitrogenadditions.Theslow‐releasefertilizer,nitrificationinhibitor,andPRPmanurescalingfactorsareweightedsothattheir
effectisonlyontheam
ountofnitrogeninfluencedbythesepracticesrelativetotheentirepoolofnitrogen(i.e.,theam
ountofslow‐releasefertilizer,fertilizerwith
nitrificationinhibitororPRPmanurenitrogenaddedtothesoil).Incontrast,scalingfactorsfortillageareusedtoscaletheentireemissionrateundertheassumption
thatthispracticeinfluencestheentirepoolofm
ineralnitrogen.
10AfulldescriptionofthemethodisincludedinChapter3anditsappendix.Supplem
entaldataoutputsfrom
themodelrunswillbeavailableonlinetodow
nload.
Exec
utiv
e Su
mm
ary
ES
-11
Source
MethodologyApproach
PotentialManagem
ent
Practices
SourceofEmissionFactors
ImprovementsCom
paredto
OtherGreenhouseGas
Methodologies
DirectN
2O
Emissionsfrom
Drainageof
OrganicSoils
DirectN
2Oemissionsfrom
drainageoforganicsoils,i.e.,
histosols,areestimatedwitha
basicestimationequation(cf.,
IPCCTier1)method(deKleinet
al.,2006).
Drainageoforganicsoils.
Emissionrateforcropped
histosolsbasedonanIPCC
Tier1em
issionfactorof
0.008tonnesN
2O‐nitrogenha
‐
1 year‐1 .
Usesentityspecificannualdataas
inputintotheequationusedinthe
USDAInventory(USDA,2011).
IndirectN
2O
Emissions
IndirectsoilN
2Oemissionsare
estimatedwithaninference
(cf.,IPCCTier2)basedonIPCC
methodology(deKleinetal.,
2006).
Irrigation.
IPCCdefaultsareusedfor
estimatingtheproportionof
nitrogenthatissubjectto
leaching,runoff,and
volatilization.Where
croppingsystemswith
leguminousandnon‐
leguminouswintercover
cropsaregrow
n,aU.S.‐
specificem
issionfactoris
provided.
Thismethodusesentity‐specific
seasonaldataonnitrogen
managem
entpractices.
Methane
Uptakeby
Soils
11
Methaneuptakebysoilis
estimatedwithanequationthat
usesaveragevaluesformethane
oxidationinnaturalvegetation—
whethergrassland,coniferous
forest,ordeciduousforest—
attenuatedbycurrentlanduse
practices.Thisapproachisan
empiricalm
odel(cf.,IPCCTier2
orIPPCTier3).
Landmanagem
ent
includingcultivationfor
cropproduction,grazingin
grasslands,forestharvest,
grassland,orforest
fertilization.
AnnualaverageCH4oxidation
emissionsandremovalsare
from
thedatasetusedbyDel
Grossoetal.(2000).
Thisnewlydevelopedmethodology
makesuseofrecentU.S.‐based
researchthatisnotaddressedby
IPCCortheU.S.Inventory.The
methodincorporatesentityspecific
annualdata.
11Methaneuptakebysoilsisanaturalprocessinundisturbedsoils.Processesforrestoringmethanotrophicactivityarenotwellunderstood,andrequiredecadesto
develop.Amethodisoutlinedinthisreport,butadditionaldataandunderstandingarerequiredpriortouseorimplem
entationinquantificationtools.
Exec
utiv
e Su
mm
ary
ES-1
2Source
MethodologyApproach
PotentialManagem
ent
Practices
SourceofEmissionFactors
ImprovementsCom
paredto
OtherGreenhouseGas
Methodologies
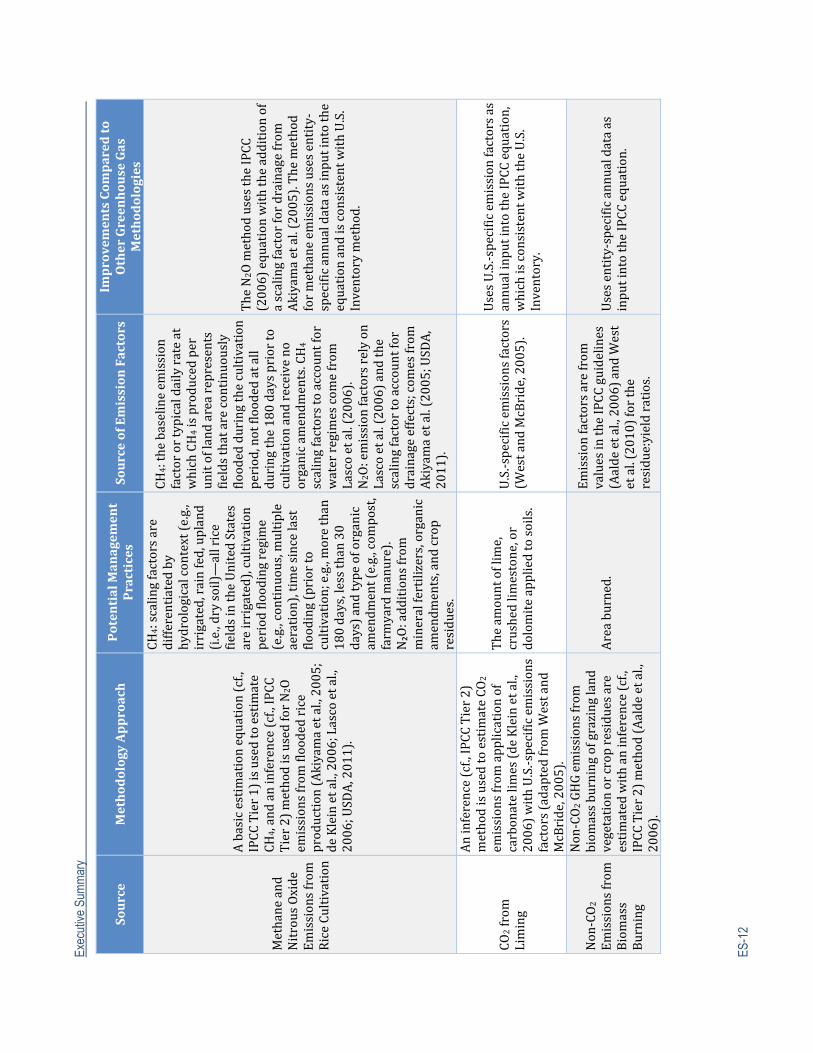
Methaneand
NitrousOxide
Emissionsfrom
RiceCultivation
Abasicestimationequation(cf.,
IPCCTier1)isusedtoestimate
CH4,andaninference(cf.,IPCC
Tier2)methodisusedforN2O
emissionsfrom
floodedrice
production(Akiyamaetal.,2005;
deKleinetal.,2006;Lascoetal.,
2006;USDA,2011).
CH4:scalingfactorsare
differentiatedby
hydrologicalcontext(e.g.,
irrigated,rainfed,upland
(i.e.,drysoil)—allrice
fieldsintheUnitedStates
areirrigated),cultivation
periodfloodingregime
(e.g.,continuous,m
ultiple
aeration),timesincelast
flooding(priorto
cultivation;e.g.,morethan
180days,lessthan30
days)andtypeoforganic
amendm
ent(e.g.,com
post,
farmyardmanure).
N₂O:additionsfrom
mineralfertilizers,organic
amendm
ents,andcrop
residues.
CH4:thebaselineem
ission
factorortypicaldailyrateat
whichCH4isproducedper
unitoflandarearepresents
fieldsthatarecontinuously
floodedduringthecultivation
period,notfloodedatall
duringthe180dayspriorto
cultivationandreceiveno
organicam
endm
ents.CH4
scalingfactorstoaccountfor
waterregimescom
efrom
Lascoetal.(2006).
N2O:emissionfactorsrelyon
Lascoetal.(2006)andthe
scalingfactortoaccountfor
drainageeffects;com
esfrom
Akiyamaetal.(2005;USDA,
2011).
TheN
2OmethodusestheIPCC
(2006)equationwiththeadditionof
ascalingfactorfordrainagefrom
Akiyamaetal.(2005).Themethod
formethaneemissionsusesentity‐
specificannualdataasinputintothe
equationandisconsistentw
ithU.S.
Inventorymethod.
CO2from
Liming
Aninference(cf.,IPCCTier2)
methodisusedtoestimateCO
2em
issionsfrom
applicationof
carbonatelim
es(deKleinetal.,
2006)withU.S.‐specificemissions
factors(adaptedfrom
Westand
McBride,2005).
Theamountoflime,
crushedlim
estone,or
dolomiteappliedtosoils.
U.S.‐specificemissionsfactors
(WestandMcBride,2005).
UsesU.S.‐specificemissionfactorsas
annualinputintotheIPCCequation,
whichisconsistentw
iththeU.S.
Inventory.
Non‐CO2
Emissionsfrom
Biomass
Burning
Non‐CO2GHGemissionsfrom
biom
assburningofgrazingland
vegetationorcropresiduesare
estimatedwithaninference(cf.,
IPCCTier2)method(Aaldeetal.,
2006).
Areaburned.
Emissionfactorsarefrom
valuesintheIPCCguidelines
(Aaldeetal.,2006)andWest
etal.(2010)forthe
residue:yieldratios.
Usesentity‐specificannualdataas
inputintotheIPCCequation.
Exec
utiv
e Su
mm
ary
ES-1
3
Source
MethodologyApproach
PotentialManagem
ent
Practices
SourceofEmissionFactors
ImprovementsCom
paredto
OtherGreenhouseGas
Methodologies
CO2fromUrea
Fertilizer
Application
CO2emissionsfrom
applicationof
ureaorurea‐basedfertilizersto
soilsareestimatedwithabasic
estimationequation(cf.,IPCCTier
1)method(deKleinetal.,2006).
Theamountofurea
fertilizerappliedtosoils.
Emissionfactorsarefrom
valuesintheIPCCguidelines
(deKleinetal.,2006).This
methodassumesthatthe
sourceofCO2usedto
manufactureureaisfossilfuel
CO2capturedduringNH3
manufacture.
Usesentity‐specificannualdataas
inputintotheIPCCequation,which
isusedfortheU.S.Inventory.
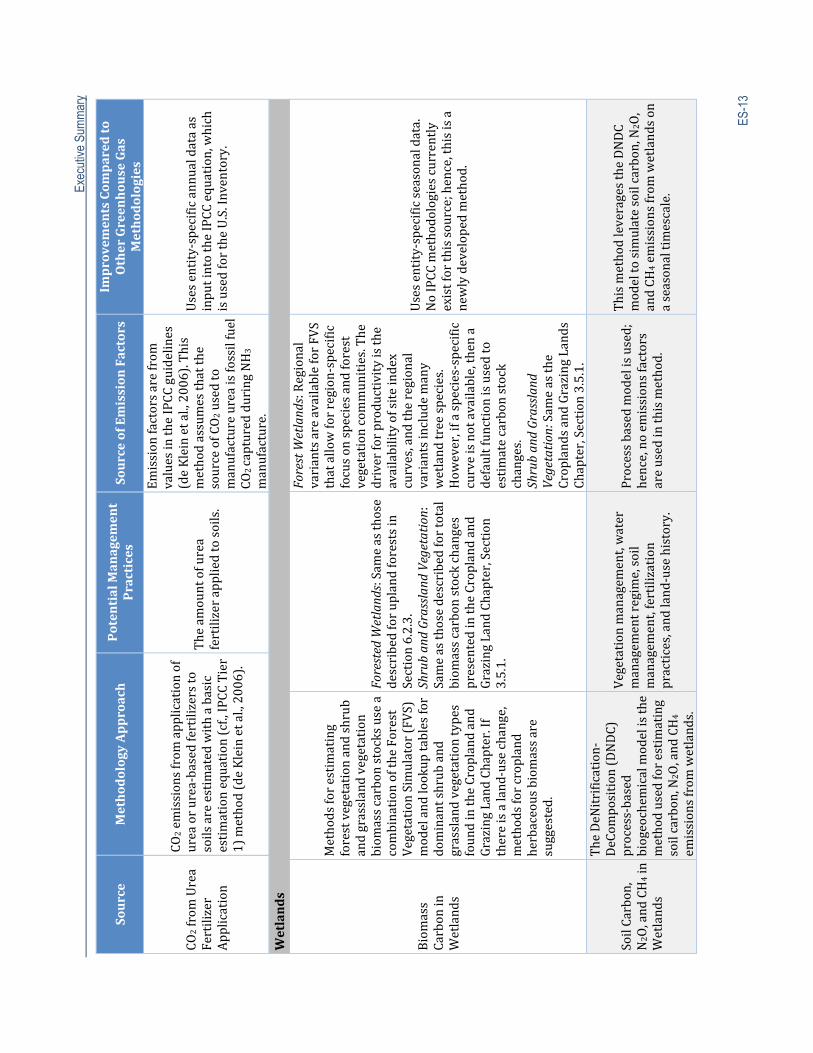
Wetlands
Biomass
Carbonin
Wetlands
Methodsforestimating
forestvegetationandshrub
andgrasslandvegetation
biom
asscarbonstocksusea
combinationoftheForest
VegetationSimulator(FVS)
modelandlookuptablesfor
dominantshruband
grasslandvegetationtypes
foundintheCroplandand
GrazingLandChapter.If
thereisaland‐usechange,
methodsforcropland
herbaceousbiomassare
suggested.
ForestedWetlands:Sam
easthose
describedforuplandforestsin
Section6.2.3.
ShrubandGrasslandVegetation:
Sameasthosedescribedfortotal
biom
asscarbonstockchanges
presentedintheCroplandand
GrazingLandChapter,Section
3.5.1.
ForestWetlands:Regional
variantsareavailableforFVS
thatallowforregion‐specific
focusonspeciesandforest
vegetationcom
munities.The
driverforproductivityisthe
availabilityofsiteindex
curves,andtheregional
variantsincludemany
wetlandtreespecies.
How
ever,ifaspecies‐specific
curveisnotavailable,thena
defaultfunctionisusedto
estimatecarbonstock
changes.
ShrubandGrassland
Vegetation:Sam
easthe
CroplandsandGrazingLands
Chapter,Section3.5.1.
Usesentity‐specificseasonaldata.
NoIPCCmethodologiescurrently
existforthissource;hence,thisisa
newlydevelopedmethod.
SoilCarbon,
N2O,andCH4in
Wetlands
TheDeNitrification‐
DeCom
position(DNDC)
process‐based
biogeochem
icalmodelisthe
methodusedforestimating
soilcarbon,N
2O,andCH4
emissionsfrom
wetlands.
Vegetationmanagem
ent,water
managem
entregime,soil
managem
ent,fertilization
practices,andland‐usehistory.
Processbasedmodelisused;
hence,noem
issionsfactors
areusedinthismethod.
ThismethodleveragestheDNDC
modeltosimulatesoilcarbon,N
2O,
andCH
4emissionsfrom
wetlandson
aseasonaltimescale.
Exec
utiv
e Su
mm
ary
ES-1
4Source
MethodologyApproach
PotentialManagem
ent
Practices
SourceofEmissionFactors
ImprovementsCom
paredto
OtherGreenhouseGas
Methodologies
AnimalProductionSystems
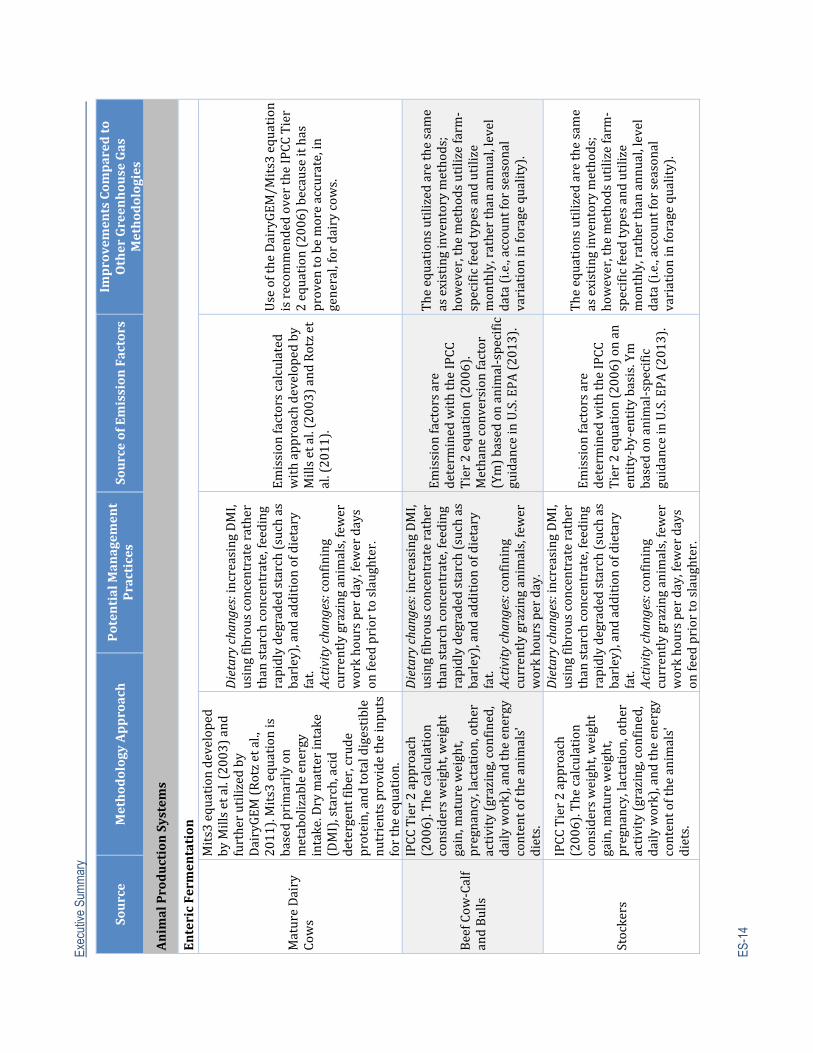
EntericFerm
entation
MatureDairy
Cows
Mits3equationdeveloped
byMillsetal.(2003)and
furtherutilizedby
DairyGEM
(Rotzetal.,
2011).Mits3equationis
basedprimarilyon
metabolizableenergy
intake.Drymatterintake
(DMI),starch,acid
detergentfiber,crude
protein,andtotaldigestible
nutrientsprovidetheinputs
fortheequation.
Dietarychanges:increasingDMI,
usingfibrousconcentraterather
thanstarchconcentrate,feeding
rapidlydegradedstarch(suchas
barley),andadditionofdietary
fat.
Activitychanges:confining
currentlygrazinganimals,fewer
workhoursperday,fewerdays
onfeedpriortoslaughter.
Emissionfactorscalculated
withapproachdevelopedby
Millsetal.(2003)andRotzet
al.(2011).
UseoftheDairyGEM
/Mits3equation
isrecom
mendedovertheIPCCTier
2equation(2006)becauseithas
proventobemoreaccurate,in
general,fordairycows.
BeefCow
‐Calf
andBulls
IPCCTier2approach
(2006).Thecalculation
considersweight,weight
gain,m
atureweight,
pregnancy,lactation,other
activity(grazing,confined,
dailywork),andtheenergy
contentoftheanimals'
diets.
Dietarychanges:increasingDMI,
usingfibrousconcentraterather
thanstarchconcentrate,feeding
rapidlydegradedstarch(suchas
barley),andadditionofdietary
fat.
Activitychanges:confining
currentlygrazinganimals,fewer
workhoursperday.
Emissionfactorsare
determinedwiththeIPCC
Tier2equation(2006).
Methaneconversionfactor
(Ym)basedonanimal‐specific
guidanceinU.S.EPA(2013).
Theequationsutilizedarethesame
asexistinginventorymethods;
however,themethodsutilizefarm‐
specificfeedtypesandutilize
monthly,ratherthanannual,level
data(i.e.,accountforseasonal
variationinforagequality).
Stockers
IPCCTier2approach
(2006).Thecalculation
considersweight,weight
gain,m
atureweight,
pregnancy,lactation,other
activity(grazing,confined,
dailywork),andtheenergy
contentoftheanimals'
diets.
Dietarychanges:increasingDMI,
usingfibrousconcentraterather
thanstarchconcentrate,feeding
rapidlydegradedstarch(suchas
barley),andadditionofdietary
fat.
Activitychanges:confining
currentlygrazinganimals,fewer
workhoursperday,fewerdays
onfeedpriortoslaughter.
Emissionfactorsare
determinedwiththeIPCC
Tier2equation(2006)onan
entity‐by‐entitybasis.Ym
basedonanimal‐specific
guidanceinU.S.EPA(2013).
Theequationsutilizedarethesame
asexistinginventorymethods;
however,themethodsutilizefarm‐
specificfeedtypesandutilize
monthly,ratherthanannual,level
data(i.e.,accountforseasonal
variationinforagequality).
Exec
utiv
e Su
mm
ary
ES
-15
Source
MethodologyApproach
PotentialManagem
ent
Practices
SourceofEmissionFactors
ImprovementsCom
paredto
OtherGreenhouseGas
Methodologies
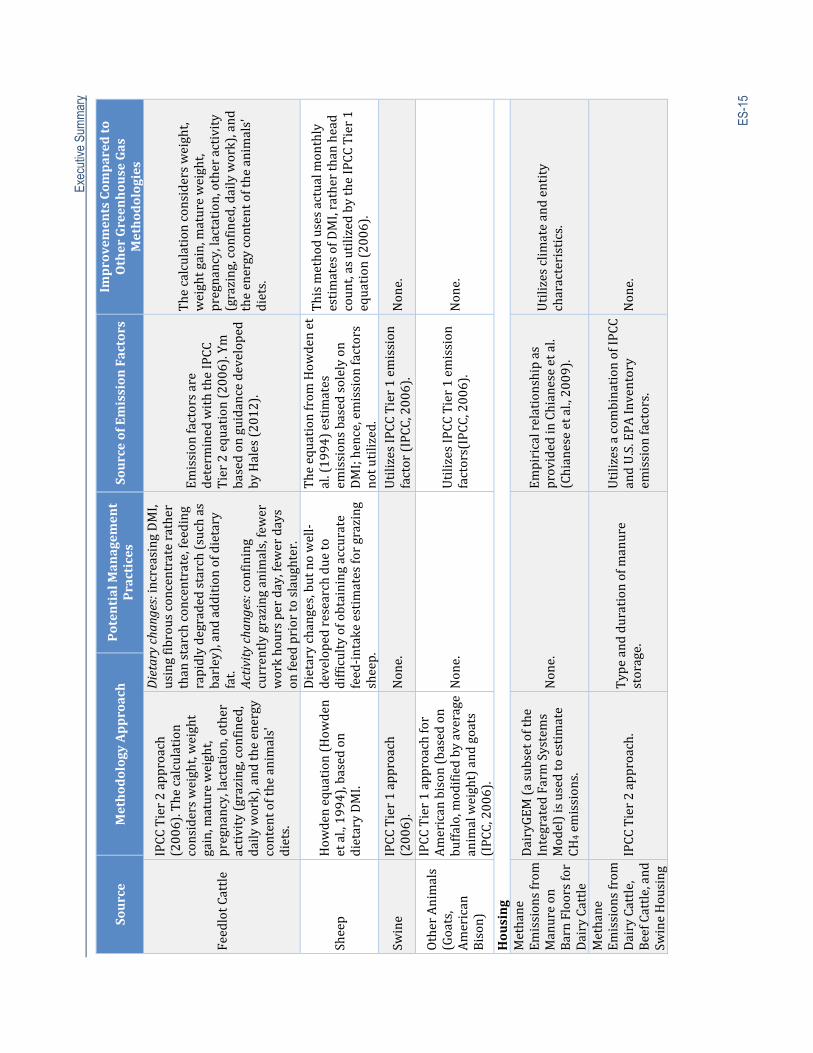
FeedlotCattle
IPCCTier2approach
(2006).Thecalculation
considersweight,weight
gain,m
atureweight,
pregnancy,lactation,other
activity(grazing,confined,
dailywork),andtheenergy
contentoftheanimals'
diets.
Dietarychanges:increasingDMI,
usingfibrousconcentraterather
thanstarchconcentrate,feeding
rapidlydegradedstarch(suchas
barley),andadditionofdietary
fat.
Activitychanges:confining
currentlygrazinganimals,fewer
workhoursperday,fewerdays
onfeedpriortoslaughter.
Emissionfactorsare
determinedwiththeIPCC
Tier2equation(2006).Ym
basedonguidancedeveloped
byHales(2012).
Thecalculationconsidersweight,
weightgain,matureweight,
pregnancy,lactation,otheractivity
(grazing,confined,dailywork),and
theenergycontentoftheanimals'
diets.
Sheep
How
denequation(How
den
etal.,1994),basedon
dietaryDMI.
Dietarychanges,butnowell‐
developedresearchdueto
difficultyofobtainingaccurate
feed‐intakeestimatesforgrazing
sheep.
Theequationfrom
How
denet
al.(1994)estimates
emissionsbasedsolelyon
DMI;hence,emissionfactors
notutilized.
Thismethodusesactualm
onthly
estimatesofDMI,ratherthanhead
count,asutilizedbytheIPCCTier1
equation(2006).
Swine
IPCCTier1approach
(2006).
None.
UtilizesIPCCTier1em
ission
factor(IPCC,2006).
None.
OtherAnimals
(Goats,
American
Bison)
IPCCTier1approachfor
Americanbison(basedon
buffalo,modifiedbyaverage
animalweight)andgoats
(IPCC,2006).
None.
UtilizesIPCCTier1em
ission
factors(IPCC,2006).
None.
Housing
Methane
Emissionsfrom
Manureon
BarnFloorsfor
DairyCattle
DairyGEM
(asubsetofthe
IntegratedFarmSystems
Model)isusedtoestimate
CH4emissions.
None.
Empiricalrelationshipas
providedinChianeseetal.
(Chianeseetal.,2009).
Utilizesclim
ateandentity
characteristics.
Methane
Emissionsfrom
DairyCattle,
BeefCattle,and
SwineHousing
IPCCTier2approach.
Typeanddurationofm
anure
storage.
Utilizesacom
binationofIPCC
andU.S.EPAInventory
emissionfactors.
None.
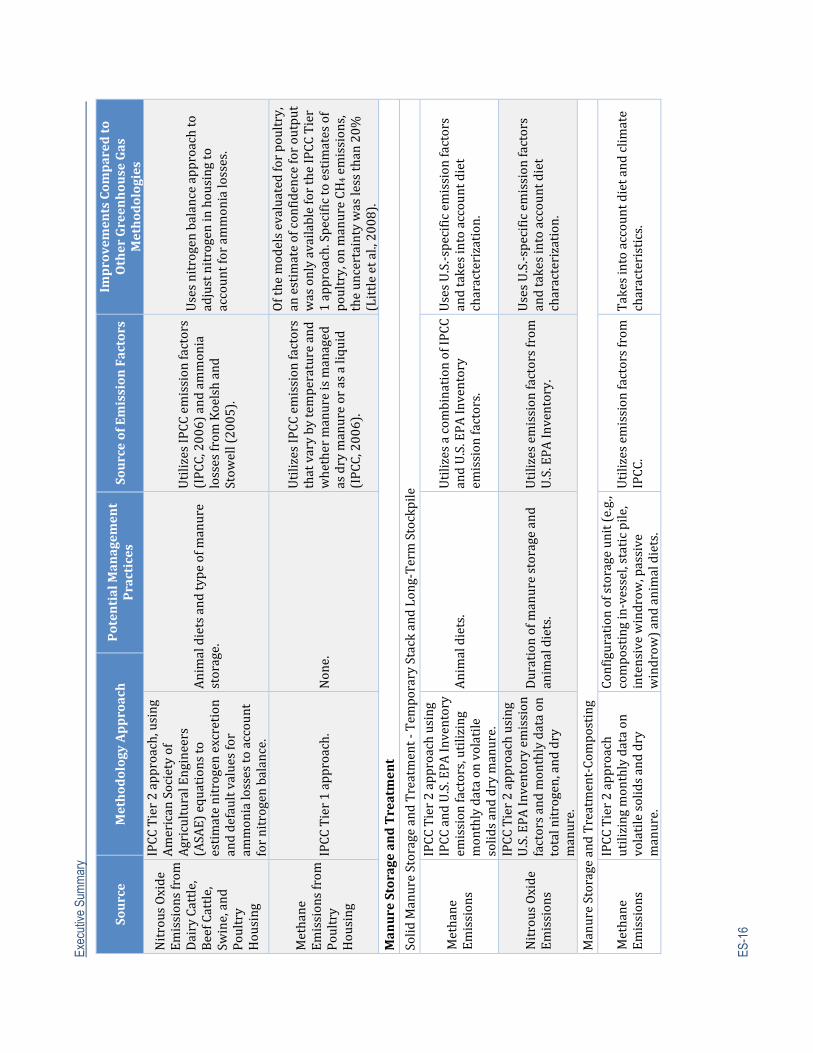
Exec
utiv
e Su
mm
ary
ES-1
6Source
MethodologyApproach
PotentialManagem
ent
Practices
SourceofEmissionFactors
ImprovementsCom
paredto
OtherGreenhouseGas
Methodologies
NitrousOxide
Emissionsfrom
DairyCattle,
BeefCattle,
Swine,and
Poultry
Housing
IPCCTier2approach,using
AmericanSocietyof
AgriculturalEngineers
(ASAE)equationsto
estimatenitrogenexcretion
anddefaultvaluesfor
ammonialossestoaccount
fornitrogenbalance.
Animaldietsandtypeofm
anure
storage.
UtilizesIPCCemissionfactors
(IPCC,2006)andammonia
lossesfrom
Koelshand
Stow
ell(2005).
Usesnitrogenbalanceapproachto
adjustnitrogeninhousingto
accountforammonialosses.
Methane
Emissionsfrom
Poultry
Housing
IPCCTier1approach.
None.
UtilizesIPCCemissionfactors
thatvarybytemperatureand
whethermanureismanaged
asdrymanureorasaliquid
(IPCC,2006).
Ofthemodelsevaluatedforpoultry,
anestimateofconfidenceforoutput
wasonlyavailablefortheIPCCTier
1approach.Specifictoestimatesof
poultry,onmanureCH
4emissions,
theuncertaintywaslessthan20%
(Littleetal.,2008).
ManureStorageandTreatment
SolidManureStorageandTreatment‐Tem
poraryStackandLong‐TermStockpile
Methane
Emissions
IPCCTier2approachusing
IPCCandU.S.EPAInventory
emissionfactors,utilizing
monthlydataonvolatile
solidsanddrymanure.
Animaldiets.
Utilizesacom
binationofIPCC
andU.S.EPAInventory
emissionfactors.
UsesU.S.‐specificemissionfactors
andtakesintoaccountdiet
characterization.
NitrousOxide
Emissions
IPCCTier2approachusing
U.S.EPAInventoryem
ission
factorsandmonthlydataon
totalnitrogen,anddry
manure.
Durationofmanurestorageand
animaldiets.
Utilizesemissionfactorsfrom
U.S.EPAInventory.
UsesU.S.‐specificemissionfactors
andtakesintoaccountdiet
characterization.
ManureStorageandTreatment‐Composting
Methane
Emissions
IPCCTier2approach
utilizingmonthlydataon
volatilesolidsanddry
manure.
Configurationofstorageunit(e.g.,
compostingin‐vessel,staticpile,
intensivewindrow
,passive
windrow
)andanimaldiets.
Utilizesemissionfactorsfrom
IPCC.
Takesintoaccountdietandclim
ate
characteristics.
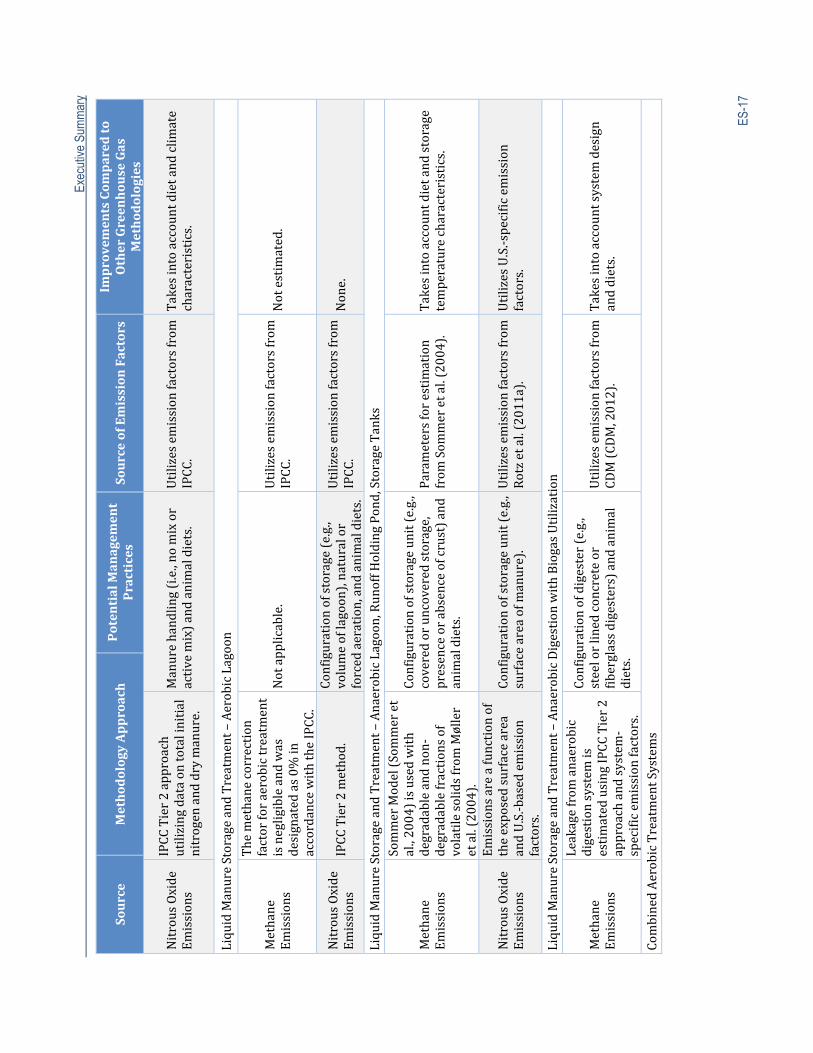
Exec
utiv
e Su
mm
ary
ES
-17
Source
MethodologyApproach
PotentialManagem
ent
Practices
SourceofEmissionFactors
ImprovementsCom
paredto
OtherGreenhouseGas
Methodologies
NitrousOxide
Emissions
IPCCTier2approach
utilizingdataontotalinitial
nitrogenanddrymanure.
Manurehandling(i.e.,nomixor
activemix)andanimaldiets.
Utilizesemissionfactorsfrom
IPCC.
Takesintoaccountdietandclim
ate
characteristics.
LiquidManureStorageandTreatment–AerobicLagoon
Methane
Emissions
Themethanecorrection
factorforaerobictreatment
isnegligibleandwas
designatedas0%
in
accordancewiththeIPCC.
Notapplicable.
Utilizesemissionfactorsfrom
IPCC.
Notestimated.
NitrousOxide
Emissions
IPCCTier2method.
Configurationofstorage(e.g.,
volumeoflagoon),naturalor
forcedaeration,andanimaldiets.
Utilizesemissionfactorsfrom
IPCC.
None.
LiquidManureStorageandTreatment–AnaerobicLagoon,RunoffHoldingPond,StorageTanks
Methane
Emissions
SommerModel(Sommeret
al.,2004)isusedwith
degradableandnon‐
degradablefractionsof
volatilesolidsfrom
Møller
etal.(2004).
Configurationofstorageunit(e.g.,
coveredoruncoveredstorage,
presenceorabsenceofcrust)and
animaldiets.
Parametersforestimation
from
Som
meretal.(2004).
Takesintoaccountdietandstorage
temperaturecharacteristics.
NitrousOxide
Emissions
Emissionsareafunctionof
theexposedsurfacearea
andU.S.‐basedemission
factors.
Configurationofstorageunit(e.g.,
surfaceareaofm
anure).
Utilizesemissionfactorsfrom
Rotzetal.(2011a).
UtilizesU.S.‐specificemission
factors.
LiquidManureStorageandTreatment–AnaerobicDigestionwithBiogasUtilization
Methane
Emissions
Leakagefrom
anaerobic
digestionsystem
is
estimatedusingIPCCTier2
approachandsystem‐
specificem
issionfactors.
Configurationofdigester(e.g.,
steelorlinedconcreteor
fiberglassdigesters)andanimal
diets.
Utilizesemissionfactorsfrom
CDM(CDM,2012).
Takesintoaccountsystemdesign
anddiets.
CombinedAerobicTreatmentSystems
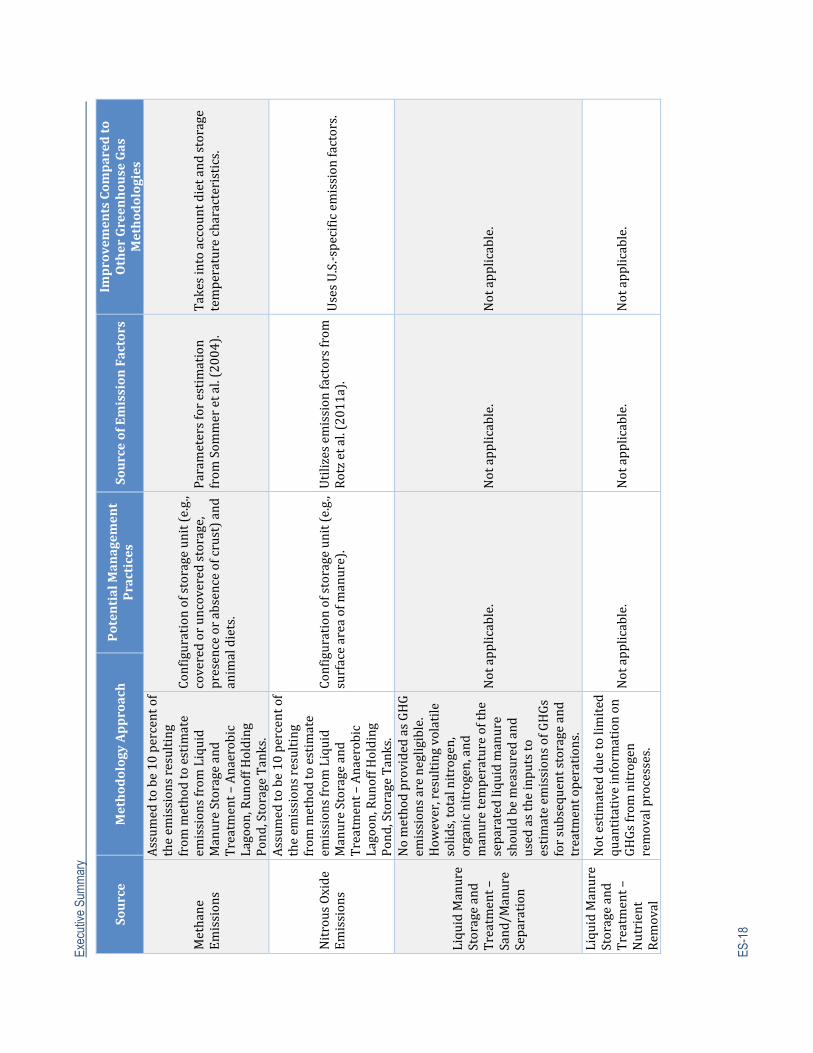
Exec
utiv
e Su
mm
ary
ES-1
8Source
MethodologyApproach
PotentialManagem
ent
Practices
SourceofEmissionFactors
ImprovementsCom
paredto
OtherGreenhouseGas
Methodologies
Methane
Emissions
Assum
edtobe10percentof
theem
issionsresulting
from
methodtoestimate
emissionsfrom
Liquid
ManureStorageand
Treatment–Anaerobic
Lagoon,RunoffHolding
Pond,StorageTanks.
Configurationofstorageunit(e.g.,
coveredoruncoveredstorage,
presenceorabsenceofcrust)and
animaldiets.
Parametersforestimation
from
Som
meretal.(2004).
Takesintoaccountdietandstorage
temperaturecharacteristics.
NitrousOxide
Emissions
Assum
edtobe10percentof
theem
issionsresulting
from
methodtoestimate
emissionsfrom
Liquid
ManureStorageand
Treatment–Anaerobic
Lagoon,RunoffHolding
Pond,StorageTanks.
Configurationofstorageunit(e.g.,
surfaceareaofm
anure).
Utilizesemissionfactorsfrom
Rotzetal.(2011a).
UsesU.S.‐specificemissionfactors.
LiquidManure
Storageand
Treatment–
Sand/M
anure
Separation
NomethodprovidedasGHG
emissionsarenegligible.
How
ever,resultingvolatile
solids,totalnitrogen,
organicnitrogen,and
manuretemperatureofthe
separatedliquidmanure
shouldbemeasuredand
usedastheinputsto
estimateem
issionsofGHGs
forsubsequentstorageand
treatmentoperations.
Notapplicable.
Notapplicable.
Notapplicable.
LiquidManure
Storageand
Treatment–
Nutrient
Rem
oval
Notestimatedduetolimited
quantitativeinformationon
GHGsfrom
nitrogen
removalprocesses.
Notapplicable.
Notapplicable.
Notapplicable.
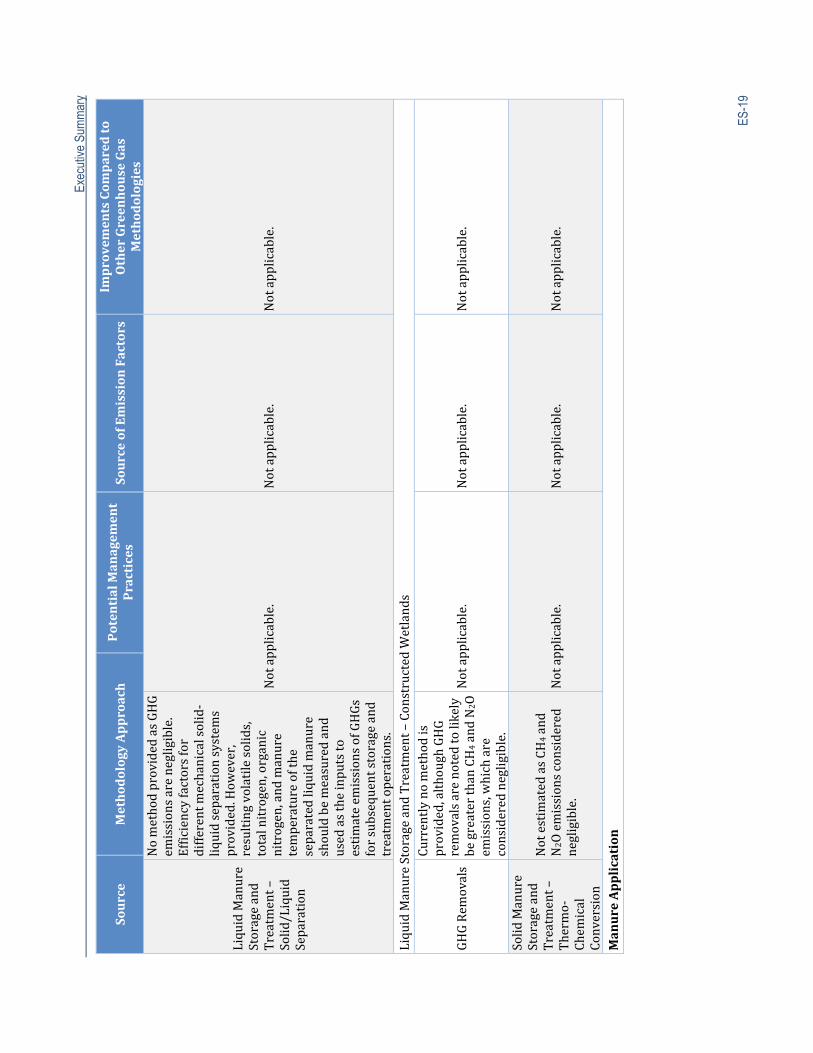
Exec
utiv
e Su
mm
ary
ES
-19
Source
MethodologyApproach
PotentialManagem
ent
Practices
SourceofEmissionFactors
ImprovementsCom
paredto
OtherGreenhouseGas
Methodologies
LiquidManure
Storageand
Treatment–
Solid/Liquid
Separation
NomethodprovidedasGHG
emissionsarenegligible.
Efficiencyfactorsfor
differentm
echanicalsolid‐
liquidseparationsystems
provided.How
ever,
resultingvolatilesolids,
totalnitrogen,organic
nitrogen,andmanure
temperatureofthe
separatedliquidmanure
shouldbemeasuredand
usedastheinputsto
estimateem
issionsofGHGs
forsubsequentstorageand
treatmentoperations.
Notapplicable.
Notapplicable.
Notapplicable.
LiquidManureStorageandTreatment–ConstructedWetlands
GHGRem
ovals
Currentlynomethodis
provided,althoughGHG
removalsarenotedtolikely
begreaterthanCH4andN
2O
emissions,whichare
considerednegligible.
Notapplicable.
Notapplicable.
Notapplicable.
SolidManure
Storageand
Treatment–
Thermo‐
Chem
ical
Conversion
NotestimatedasCH
4and
N2Oemissionsconsidered
negligible.
Notapplicable.
Notapplicable.
Notapplicable.
ManureApplication
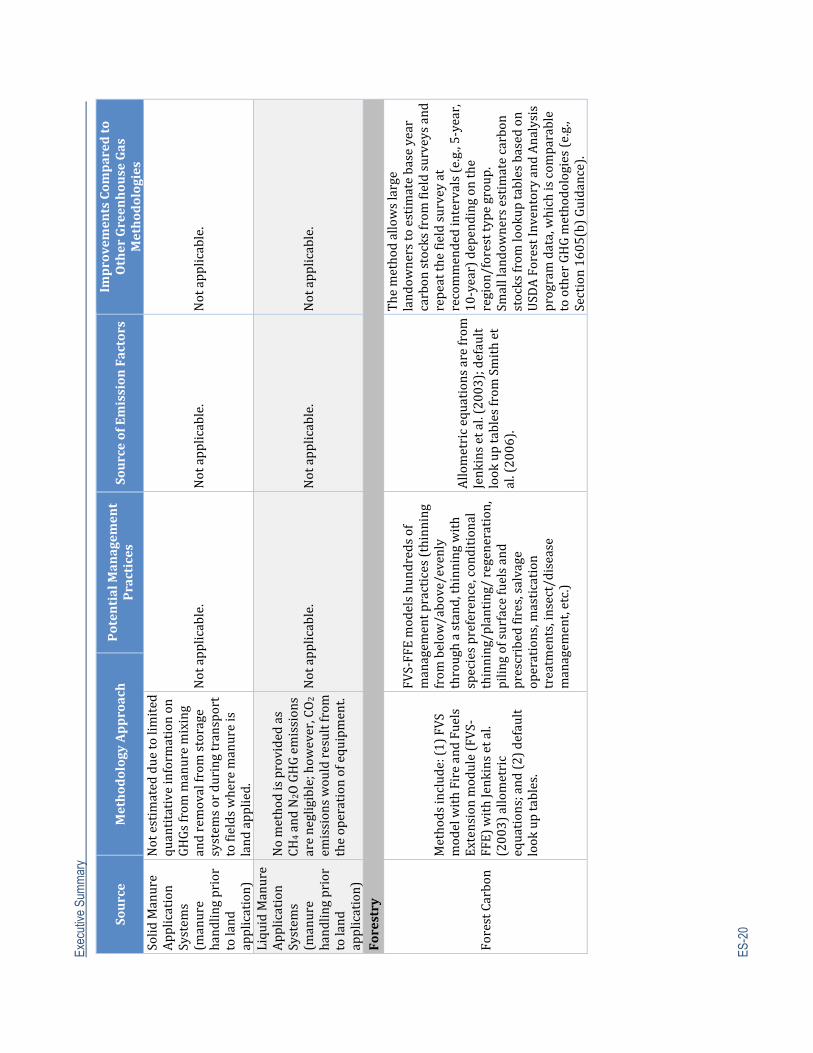
Exec
utiv
e Su
mm
ary
ES-2
0Source
MethodologyApproach
PotentialManagem
ent
Practices
SourceofEmissionFactors
ImprovementsCom
paredto
OtherGreenhouseGas
Methodologies
SolidManure
Application
System
s(manure
handlingprior
toland
application)
Notestimatedduetolimited
quantitativeinformationon
GHGsfrom
manuremixing
andremovalfrom
storage
system
sorduringtransport
tofieldswheremanureis
landapplied.
Notapplicable.
Notapplicable.
Notapplicable.
LiquidManure
Application
System
s(manure
handlingprior
toland
application)
Nomethodisprovidedas
CH4andN
2OGHGemissions
arenegligible;how
ever,CO2
emissionswouldresultfrom
theoperationofequipment.
Notapplicable.
Notapplicable.
Notapplicable.
Forestry
ForestCarbon
Methodsinclude:(1)FVS
modelwithFireandFuels
Extensionmodule(FVS‐
FFE)withJenkinsetal.
(2003)allometric
equations;and(2)default
lookuptables.
FVS‐FFEmodelshundredsof
managem
entpractices(thinning
from
below
/above/evenly
throughastand,thinningwith
speciespreference,conditional
thinning/planting/regeneration,
pilingofsurfacefuelsand
prescribedfires,salvage
operations,m
astication
treatments,insect/disease
managem
ent,etc.)
Allometricequationsarefrom
Jenkinsetal.(2003);default
lookuptablesfrom
Smithet
al.(2006).
Themethodallowslarge
landow
nerstoestimatebaseyear
carbonstocksfrom
fieldsurveysand
repeatthefieldsurveyat
recommendedintervals(e.g.,5‐year,
10‐year)dependingonthe
region/foresttypegroup.
Smalllandownersestimatecarbon
stocksfrom
lookuptablesbasedon
USDAForestInventoryandAnalysis
programdata,whichiscom
parable
tootherGHGmethodologies(e.g.,
Section1605(b)Guidance).
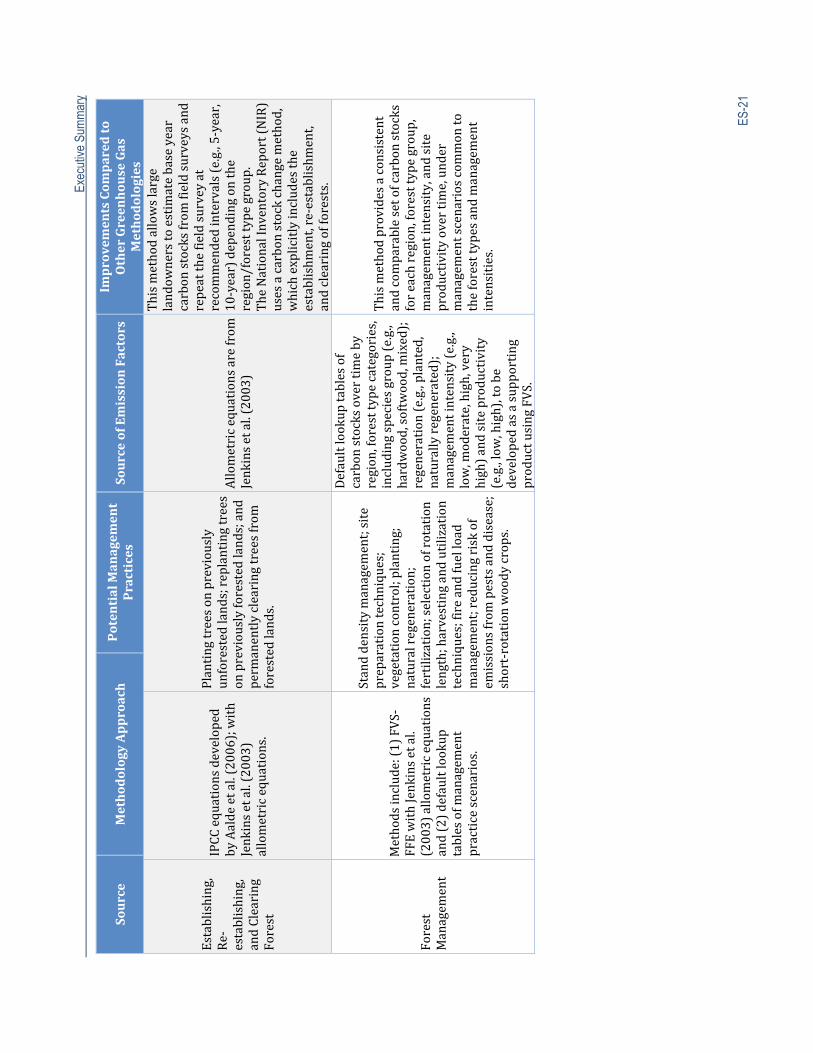
Exec
utiv
e Su
mm
ary
ES
-21
Source
MethodologyApproach
PotentialManagem
ent
Practices
SourceofEmissionFactors
ImprovementsCom
paredto
OtherGreenhouseGas
Methodologies
Establishing,
Re‐establishing,
andClearing
Forest
IPCCequationsdeveloped
byAaldeetal.(2006);w
ith
Jenkinsetal.(2003)
allometricequations.
Plantingtreesonpreviously
unforestedlands;replantingtrees
onpreviouslyforestedlands;and
permanentlyclearingtreesfrom
forestedlands.
Allometricequationsarefrom
Jenkinsetal.(2003)
Thismethodallowslarge
landow
nerstoestimatebaseyear
carbonstocksfrom
fieldsurveysand
repeatthefieldsurveyat
recommendedintervals(e.g.,5‐year,
10‐year)dependingonthe
region/foresttypegroup.
TheNationalInventoryReport(NIR)
usesacarbonstockchangemethod,
whichexplicitlyincludesthe
establishm
ent,re‐establishm
ent,
andclearingofforests.
Forest
Managem
ent
Methodsinclude:(1)FVS‐
FFEwithJenkinsetal.
(2003)allometricequations
and(2)defaultlookup
tablesofm
anagem
ent
practicescenarios.
Standdensitymanagem
ent;site
preparationtechniques;
vegetationcontrol;planting;
naturalregeneration;
fertilization;selectionofrotation
length;harvestingandutilization
techniques;fireandfuelload
managem
ent;reducingriskof
emissionsfrom
pestsanddisease;
short‐rotationwoodycrops.
Defaultlookuptablesof
carbonstocksovertimeby
region,foresttypecategories,
includingspeciesgroup(e.g.,
hardwood,softwood,mixed);
regeneration(e.g.,planted,
naturallyregenerated);
managem
entintensity(e.g.,
low,m
oderate,high,very
high)andsiteproductivity
(e.g.,low,high),tobe
developedasasupporting
productusingFVS.
Thismethodprovidesaconsistent
andcomparablesetofcarbonstocks
foreachregion,foresttypegroup,
managem
entintensity,andsite
productivityovertime,under
managem
entscenarioscom
monto
theforesttypesandmanagem
ent
intensities.
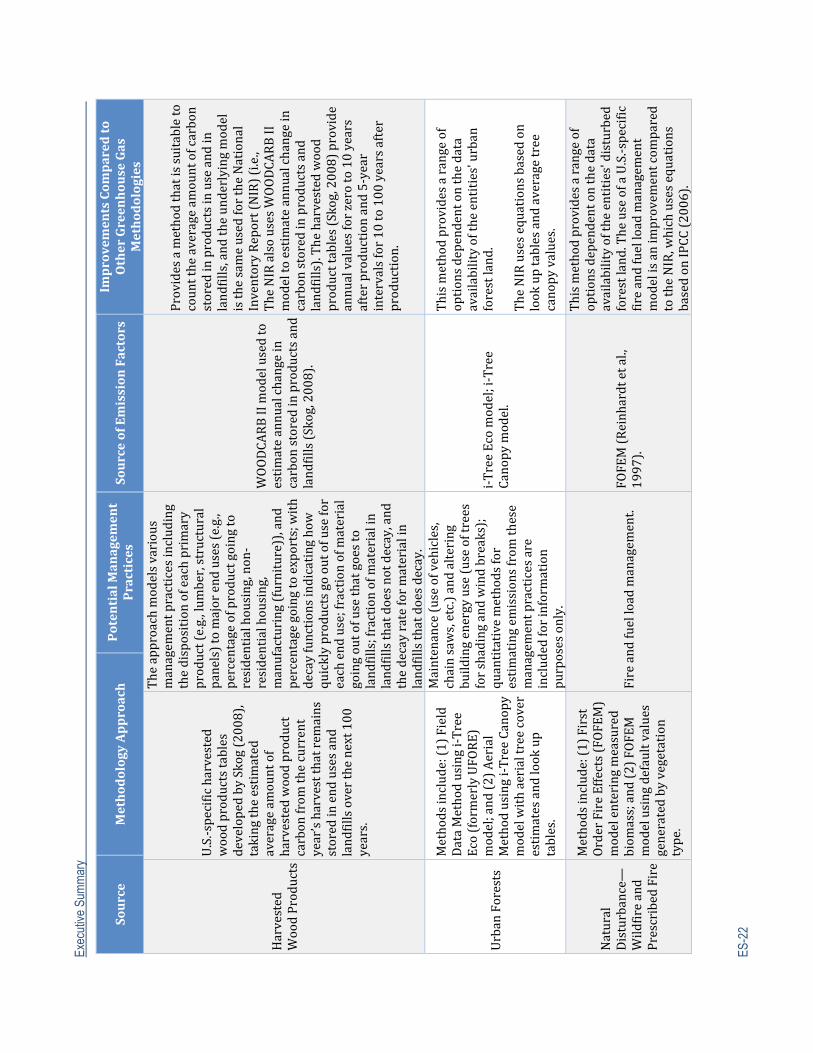
Exec
utiv
e Su
mm
ary
ES-2
2Source
MethodologyApproach
PotentialManagem
ent
Practices
SourceofEmissionFactors
ImprovementsCom
paredto
OtherGreenhouseGas
Methodologies
Harvested
WoodProductsU.S.‐specificharvested
woodproductstables
developedbySkog(2008),
takingtheestimated
averageam
ountof
harvestedwoodproduct
carbonfrom
thecurrent
year’sharvestthatrem
ains
storedinendusesand
landfillsoverthenext100
years.
Theapproachmodelsvarious
managem
entpracticesincluding
thedispositionofeachprimary
product(e.g.,lum
ber,structural
panels)tomajorenduses(e.g.,
percentageofproductgoingto
residentialhousing,non‐
residentialhousing,
manufacturing(furniture)),and
percentagegoingtoexports;w
ith
decayfunctionsindicatinghow
quicklyproductsgooutofusefor
eachenduse;fractionofmaterial
goingoutofusethatgoesto
landfills;fractionofmaterialin
landfillsthatdoesnotdecay,and
thedecayrateformaterialin
landfillsthatdoesdecay.
WOODCARBIImodelusedto
estimateannualchangein
carbonstoredinproductsand
landfills(Skog,2008).
Providesamethodthatissuitableto
counttheaverageamountofcarbon
storedinproductsinuseandin
landfills,andtheunderlyingmodel
isthesameusedfortheNational
InventoryReport(NIR)(i.e.,
TheNIRalsousesWOODCARBII
modeltoestimateannualchangein
carbonstoredinproductsand
landfills).Theharvestedwood
producttables(Skog,2008)provide
annualvaluesforzeroto10years
afterproductionand5‐year
intervalsfor10to100yearsafter
production.
UrbanForests
Methodsinclude:(1)Field
DataMethodusingi‐Tree
Eco(formerlyUFORE)
model;and(2)Aerial
Methodusingi‐TreeCanopy
modelwithaerialtreecover
estimatesandlookup
tables.
Maintenance(useofvehicles,
chainsaws,etc.)andaltering
buildingenergyuse(useoftrees
forshadingandwindbreaks);
quantitativemethodsfor
estimatingem
issionsfrom
these
managem
entpracticesare
includedforinformation
purposesonly.
i‐TreeEcomodel;i‐Tree
Canopymodel.
Thismethodprovidesarangeof
optionsdependentonthedata
availabilityoftheentities'urban
forestland.
TheNIRusesequationsbasedon
lookuptablesandaveragetree
canopyvalues.
Natural
Disturbance—
Wildfireand
PrescribedFire
Methodsinclude:(1)First
OrderFireEffects(FOFEM)
modelenteringmeasured
biom
ass;and(2)FOFEM
modelusingdefaultvalues
generatedbyvegetation
type.
Fireandfuelloadmanagem
ent.
FOFEM(Reinhardtetal.,
1997).
Thismethodprovidesarangeof
optionsdependentonthedata
availabilityoftheentities'disturbed
forestland.TheuseofaU.S.‐specific
fireandfuelloadmanagem
ent
modelisanimprovem
entcom
pared
totheNIR,whichusesequations
basedonIPCC(2006).
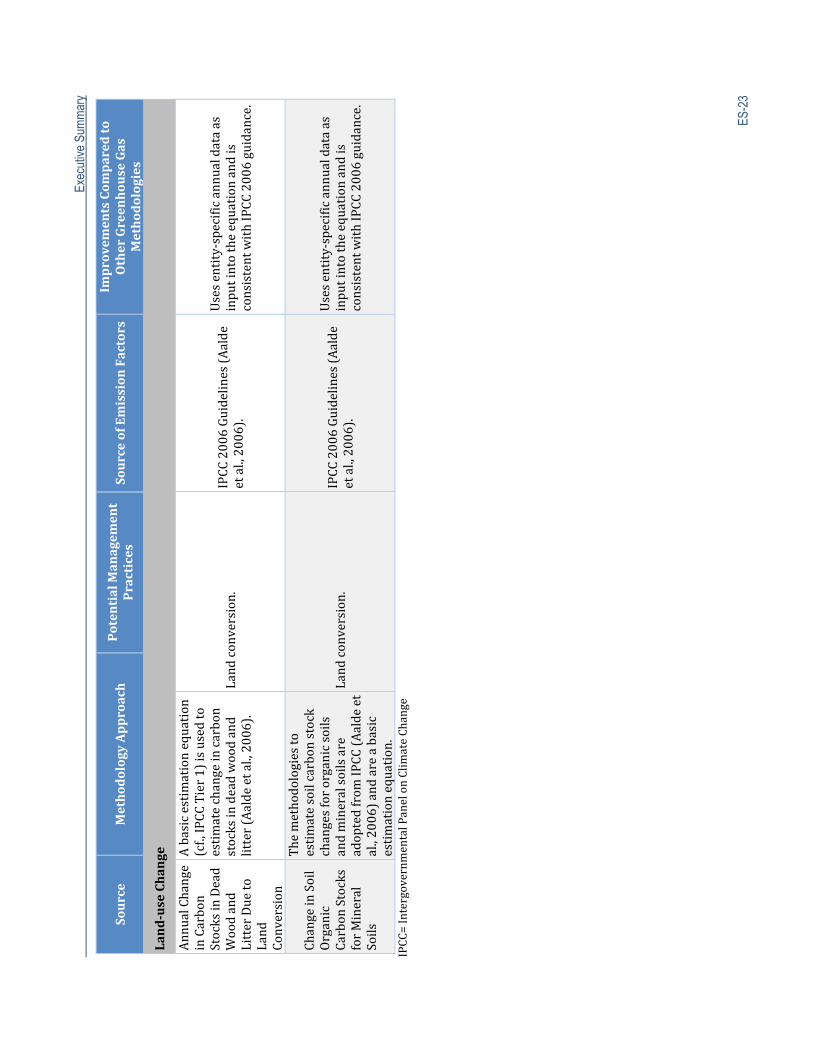
Exec
utiv
e Su
mm
ary
ES-2
3
Source
MethodologyApproach
PotentialManagem
ent
Practices
SourceofEmissionFactors
ImprovementsCom
paredto
OtherGreenhouseGas
Methodologies
Land‐useChange
AnnualChange
inCarbon
StocksinDead
Woodand
LitterDueto
Land
Conversion
Abasicestimationequation
(cf.,IPCCTier1)isusedto
estimatechangeincarbon
stocksindeadwoodand
litter(Aaldeetal.,2006).
Landconversion.
IPCC2006Guidelines(Aalde
etal.,2006).
Usesentity‐specificannualdataas
inputintotheequationandis
consistentwithIPCC2006guidance.
ChangeinSoil
Organic
CarbonStocks
forMineral
Soils
Themethodologiesto
estimatesoilcarbonstock
changesfororganicsoils
andmineralsoilsare
adoptedfrom
IPCC(Aaldeet
al.,2006)andareabasic
estimationequation.
Landconversion.
IPCC2006Guidelines(Aalde
etal.,2006).
Usesentity‐specificannualdataas
inputintotheequationandis
consistentwithIPCC2006guidance.
IPCC=Intergovernm
entalPanelonClimateChange
Executive Summary
ES-24
ReferencesAalde,H.,P.Gonzalez,M.Gytarski,T.Krug,etal.2006.Chapter2:Genericmethodologiesapplicable
tomultipleland‐usecategories.In2006IPCCGuidelinesforNationalGreenhouseGasInventories,S.Eggleston,L.Buendia,K.Miwa,T.NgaraandK.Tanabe(eds.).Japan:IGES.
Akiyama,H.,K.Yagi,andX.Yan.2005.DirectN2Oemissionsfromricepaddyfields:Summaryofavailabledata.GlobalBiogeochemicalCycles,19.
CDM.2012.Projectandleakageemissionsfromanaerobicdigesters.Ver.01.0.0:CleanDevelopmentMechanism,.
Chianese,D.S.,C.A.Rotz,andT.L.Richard.2009.Simulationofmethaneemissionsfromdairyfarmstoassessgreenhousegasreductionstrategies.Trans.ASABE,52:1313‐1323.
deKlein,C.,R.S.A.Novoa,S.Ogle,K.A.Smith,etal.2006.Chapter11:N2Oemissionsfrommanagedsoil,andCO2emissionsfromlimeandureaapplication.In2006IPCCguidelinesfornationalgreenhousegasinventories,Vol.4:Agriculture,forestryandotherlanduse,S.Eggleston,L.Buendia,K.Miwa,T.NgaraandK.Tanabe(eds.).Kanagawa,Japan:IGES.
DelGrosso,S.,W.Parton,A.Mosier,D.S.Ojima,etal.2000.GeneralCH4oxidationmodelandcomparisonsofCH4oxidationinnaturalandmanagedsystems.GlobalBiogeochemicalCycles,14:999‐1019.
Denef,K.,S.Archibeque,andK.Paustian.2011.GreenhouseGasEmissionsfromU.S.AgricultureandForestry:AReviewofEmissionSources,ControllingFactors,andMitigationPotential:InterimreporttoUSDAunderContract#GS‐23F‐8182H.http://www.usda.gov/oce/climate_change/techguide/Denef_et_al_2011_Review_of_reviews_v1.0.pdf.
Denef,K.,K.Paustian,S.Archibeque,S.Biggar,etal.2012.ReportofGreenhouseGasAccountingToolsforAgricultureandForestrySectors:InterimreporttoUSDAunderContract#GS‐23F‐8182H.http://www.usda.gov/oce/climate_change/techguide/Denef_et_al_2011_Review_of_reviews_v1.0.pdf.
Hales,K.E.,N.A.Cole,andJ.C.MacDonald.2012.Effectsofcornprocessingmethodanddietaryinclusionofwetdistillersgrainwithsolublesonenergymetabolismandentericmethaneemissionsoffinishingcattle.JournalofAnimalScience,90:3174‐3185.
Howden,S.M.,D.H.White,G.M.McKeon,J.C.Scanlan,etal.1994.Methodsforexploringmanagementoptionstoreducegreenhousegasemissionsfromtropicalgrazingsystems.ClimaticChange,27(1):49‐70.
IPCC.1997.Revised1996IPCCGuidelinesforNationalGreenhouseGasInventories,PreparedbytheNationalGreenhouseGasInventoriesProgramme.Bracknell,UK:IntergovernmentalPanelonClimateChange.http://www.ipcc‐nggip.iges.or.jp/public/gl/invs1.html.
IPCC.2006.2006IPCCGuidelinesforNationalGreenhouseGasInventories,PreparedbytheNationalGreenhouseGasInventoriesProgramme.EditedbyH.S.Eggleston,L.Buendia,K.Miwa,T.NgaraandK.Tanabe.Japan:IGES.http://www.ipcc‐nggip.iges.or.jp/public/2006gl/vol4.html.
Jenkins,J.C.,D.C.Chojnacky,L.S.Heath,andR.A.Birdsey.2003.National‐ScaleBiomassEstimatorsforUnitedStatesTreeSpecies.ForestScience,49(1):12‐35.
Lasco,R.D.,S.Ogle,J.Raison,L.Verchot,etal.2006.Chapter5:Cropland.In2006IPCCGuidelinesforNationalGreenhouseGasInventories,S.Eggleston,L.Buendia,K.Miwa,T.NgaraandK.Tanabe(eds.).Japan:IGES,IPCCNationalGreenhouseGasInventoriesProgram.
Little,S.,J.Linderman,K.MacLean,andH.Janzen.2008.HOLOS–atooltoestimateandreducegreenhousegasesfromfarms.Methodologyandalgorithmsforversions1.1x:Agricultureand
Executive Summary
ES-25
Agri‐FoodCanada.http://www4.agr.gc.ca/AAFC‐AAC/display‐afficher.do?id=1226606460726&lang=eng#s1.
Mills,J.A.N.,E.Kebreab,C.M.Yates,L.A.Crompton,etal.2003.Alternativeapproachestopredictingmethaneemissionsfromdairycows.JournalofAnimalScience,81(12):3141‐3150.
Møller,H.B.,S.G.Sommer,andB.K.Ahring.2004.Methaneproductivityofmanure,strawandsolidfractionsofmanure.BiomassandBioenergy,26(5):485‐495.
Ogle,S.M.,F.JayBreidt,M.D.Eve,andK.Paustian.2003.UncertaintyinestimatinglanduseandmanagementimpactsonsoilorganiccarbonstorageforUSagriculturallandsbetween1982and1997.GlobalChangeBiology,9(11):1521‐1542.
Ogle,S.M.,F.J.Breidt,M.Easter,S.Williams,etal.2007.Empiricallybaseduncertaintyassociatedwithmodelingcarbonsequestrationinsoils.EcologicalModelling,205:453‐463.
Parton,W.J.,D.S.Schimel,C.V.Cole,andD.S.Ojima.1987.AnalysisoffactorscontrollingsoilorganicmatterlevelsinGreatPlainsgrasslands.SoilScienceSocietyofAmericaJournal,51:1173‐1179.
Parton,W.J.,J.M.O.Scurlock,D.S.Ojima,T.G.Gilmanov,etal.1993.ObservationsandModelingofBiomassandSoilOrganicMatterDynamicsfortheGrasslandBiomeWorldwide.GlobalBiogeochemicalCycles,7(4):785‐809.
Reinhardt,E.D.,R.E.Keane,andJ.K.Brown.1997.FirstOrderFireEffectsModel:FOFEM4.0,User'sGuide.
Rotz,C.A.,M.S.Corson,D.S.Chianese,F.Montes,etal.2011.Integratedfarmsystemmodel:ReferenceManual.UniversityPark,PA:U.S.DepartmentofAgriculture,AgriculturalResearchService.http://ars.usda.gov/SP2UserFiles/Place/19020000/ifsmreference.pdf.
Skog,K.E.2008.SequestrationofcarboninharvestedwoodproductsfortheUnitedStates.ForestProductsJournal,58(6):56‐72.
Smith,J.E.,L.S.Heath,K.E.Skog,andR.A.Birdsey.2006.MethodsforcalculatingforestecosystemandharvestedcarbonwithstandardestimatesforforesttypesoftheUnitedStates.NewtownSquare,PA:USDepartmentofAgriculture,ForestService,NorthernResearchStation.
Sommer,S.G.,S.O.Petersen,andH.B.Møller.2004.Algorithmsforcalculatingmethaneandnitrousoxideemissionsfrommanuremanagement.NutrientCyclinginAgroecosystems,69:143‐154.
U.S.EPA.2013.InventoryofU.S.GreenhouseGasEmissionsandSinks:1990‐2011.Washington,DC:U.S.EnvironmentalProtectionAgency.http://epa.gov/climatechange/emissions/usinventoryreport.html.
USDA.2011.U.S.AgricultureandForestGreenhouseGasInventory:1990‐2008.Washington,DC:U.S.DepartmentofAgriculture.
Verchot,L.,T.Krug,R.D.Lasco,S.Ogle,etal.2006.Chapter5:Grassland.In2006IPCCGuidelinesforNationalGreenhouseGasInventories,S.Eggleston,L.Buendia,K.Miwa,T.NgaraandD.L.Tanaka(eds.).Japan:IGES.
West,T.O.,andA.C.McBride.2005.ThecontributionofagriculturallimetocarbondioxideemissionsintheUnitedStates:dissolution,transport,andnetemissions.Agriculture,Ecosystems&Environment,108(2):145‐154.
West,T.O.,C.C.Brandt,L.M.Baskaran,C.M.Hellwinckel,etal.2010.CroplandcarbonfluxesintheUnitedStates:increasinggeospatialresolutionofinventory‐basedcarbonaccounting.EcologicalApplications,20:1074‐1086.

Executive Summary
ES-26
Thispageisintentionallyleftblank.
Authors:
MarlenEve,U.S.DepartmentofAgriculture,OfficeoftheChiefEconomistMarkFlugge,ICFInternationalDianaPape,ICFInternational
Contents:
1 Introduction...............................................................................................................................................1‐31.1 OverviewoftheReport...............................................................................................................................1‐41.2 ReportObjectives..........................................................................................................................................1‐51.3 ProcessfortheDevelopmentoftheMethods....................................................................................1‐61.4 ContentsoftheReport................................................................................................................................1‐91.5 UsesandLimitationsoftheReport......................................................................................................1‐10Chapter1References.............................................................................................................................................1‐14
SuggestedChapterCitation:Eve,M.,M.Flugge,D.Pape,2014.Chapter1:Introduction.InQuantifyingGreenhouseGasFluxesinAgricultureandForestry:MethodsforEntity‐ScaleInventory.TechnicalBulletinNumber1939.OfficeoftheChiefEconomist,U.S.DepartmentofAgriculture,Washington,DC.606pages.July2014.Eve,M.,D.Pape,M.Flugge,R.Steele,D.Man,M.Riley‐Gilbert,andS.Biggar,Eds.
USDAisanequalopportunityproviderandemployer.
Chapter 1
Introduction
Chapter 1: Introduction
1-2
Acronyms,ChemicalFormulae,andUnits
C CarbonCH4 MethaneCO2 CarbondioxideCO2‐eq CarbondioxideequivalentsEO ExecutiveOrderEPA U.S.EnvironmentalProtectionAgencyGHG GreenhousegasISO InternationalOrganizationforStandardizationLCA LifecycleassessmentLCI LifecycleinventoryN2O NitrousOxideUSDA U.S.DepartmentofAgriculture
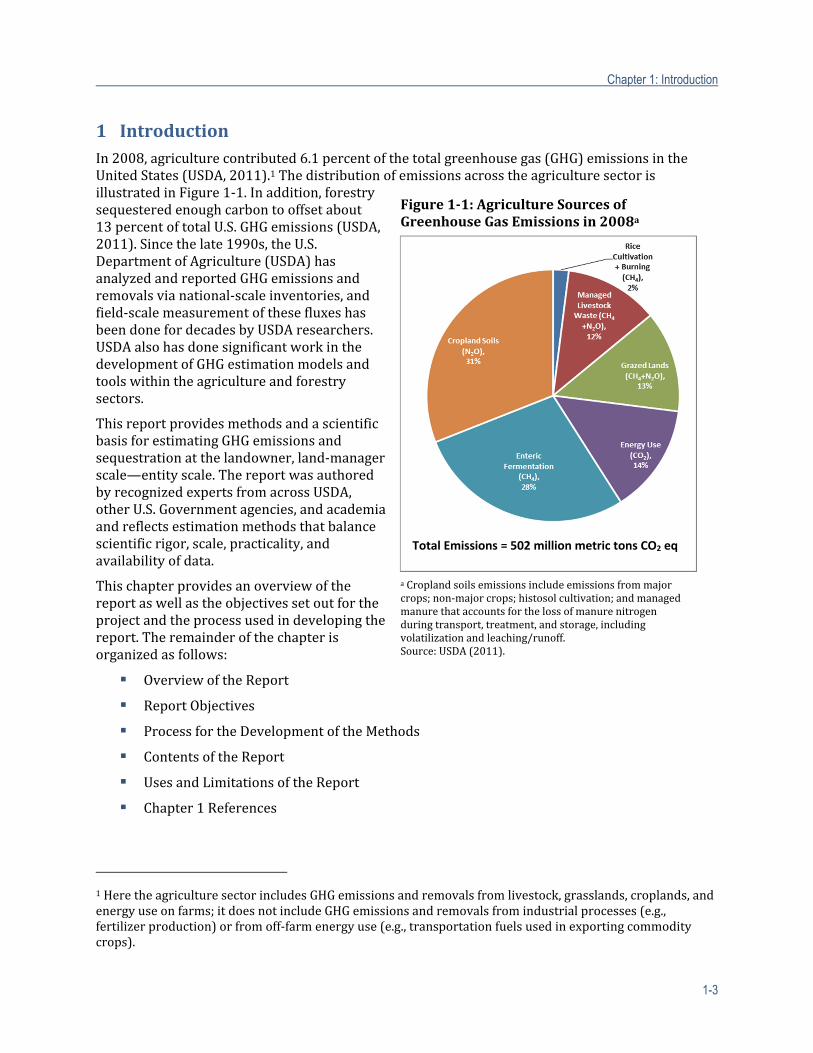
Chapter 1: Introduction
1-3
1 IntroductionIn2008,agriculturecontributed6.1percentofthetotalgreenhousegas(GHG)emissionsintheUnitedStates(USDA,2011).1ThedistributionofemissionsacrosstheagriculturesectorisillustratedinFigure1‐1.Inaddition,forestrysequesteredenoughcarbontooffsetabout13percentoftotalU.S.GHGemissions(USDA,2011).Sincethelate1990s,theU.S.DepartmentofAgriculture(USDA)hasanalyzedandreportedGHGemissionsandremovalsvianational‐scaleinventories,andfield‐scalemeasurementofthesefluxeshasbeendonefordecadesbyUSDAresearchers.USDAalsohasdonesignificantworkinthedevelopmentofGHGestimationmodelsandtoolswithintheagricultureandforestrysectors.
ThisreportprovidesmethodsandascientificbasisforestimatingGHGemissionsandsequestrationatthelandowner,land‐managerscale—entityscale.ThereportwasauthoredbyrecognizedexpertsfromacrossUSDA,otherU.S.Governmentagencies,andacademiaandreflectsestimationmethodsthatbalancescientificrigor,scale,practicality,andavailabilityofdata.
Thischapterprovidesanoverviewofthereportaswellastheobjectivessetoutfortheprojectandtheprocessusedindevelopingthereport.Theremainderofthechapterisorganizedasfollows:
OverviewoftheReport
ReportObjectives
ProcessfortheDevelopmentoftheMethods
ContentsoftheReport
UsesandLimitationsoftheReport
Chapter1References
1HeretheagriculturesectorincludesGHGemissionsandremovalsfromlivestock,grasslands,croplands,andenergyuseonfarms;itdoesnotincludeGHGemissionsandremovalsfromindustrialprocesses(e.g.,fertilizerproduction)orfromoff‐farmenergyuse(e.g.,transportationfuelsusedinexportingcommoditycrops).
a Croplandsoilsemissionsincludeemissionsfrommajorcrops;non‐majorcrops;histosolcultivation;andmanagedmanurethataccountsforthelossofmanurenitrogenduringtransport,treatment,andstorage,includingvolatilizationandleaching/runoff.Source:USDA(2011).
Figure1‐1:AgricultureSourcesofGreenhouseGasEmissionsin2008a
Total Emissions = 502 million metric tons CO2 eq
Chapter 1: Introduction
1-4
1.1 OverviewoftheReport
UnderprovisionofSection2709oftheFood,Conservation,andEnergyActof2008,USDAhasbeendirectedto“establishtechnicalguidelinesthatoutlinescience‐basedmethodstomeasuretheenvironmentalservicebenefitsfromconservationandlandmanagementactivitiesinordertofacilitatetheparticipationoffarmers,ranchers,andforestlandownersinemergingenvironmentalservicesmarkets.”ThelegislationfurtherstatesthattheinitialemphasisofthemethodsdevelopmentshouldfocusonGHGemissions.Agreementonthatsetofmethodsistheprimaryscopeandpurposeforthisreport.Thefindingsinthisreportprovidethefoundationforentity‐leveltoolstomeasuretheGHGbenefitsfromconservationandlandmanagementactivities.
ThisreportandtheestimationmethodsarenotintendedasanadditiontoorreplacementofanycurrentFederalorStateGHGreportingsystemsorrequirements.ThisreporthasbeenpreparedtooutlinemethodstocalculatedirectGHGemissionsandcarbonsequestrationfromagricultureandforestryprocessesandbuildsuponexistinginventoryeffortssuchasU.S.EnvironmentalProtectionAgency(EPA)andUSDA’snationalinventoriesandtheU.S.DepartmentofEnergy’sVoluntaryGreenhouseGasReportingProgramSection1605(b)Guidelines,withanaimofprovidingsimple,transparent,androbustinventoryandreportingmethods.
ThereportprovidestechnicalmethodsforestimatingandreportingGHGsfromsignificantagricultureandforestrysourcesandsinks.Thesemethodsaredesignedtoquantifysignificantemissionsandsinksassociatedwithspecificsourcecategoriesaswellasannualreductionsinthoseemissionsorfluxesincarbonstorageresultingfromland‐usechangeandlandmanagementpracticesandtechnologies.Therefore,thereportwillsupportthedevelopmentofentity‐,farm‐,orforest‐scaleGHGestimatesandinventories.
Becausethereportisintendedasameansofevaluatingmanagementpracticesacrossthefullscopeofthefarm,ranch,andforestmanagementsystem,themethodsinthereportneedtobeascomprehensiveaspossible.Researchanddatagapsexistthatresultinsomemanagementpracticesnotbeingaccountedfororarereflectedinhigherlevelsofestimateuncertainty.Completenessisimportant,though,andthereportattemptstoidentifythemostsignificantresearchgapsanddataneeds.
Themethodsweredevelopedaccordingtoseveralcriteriainordertomaximizetheirusefulness.Inparticular,themethodsmust:
1. Standontheirown,independentofanyotheraccountingsystem,yetmaintainconsistencywithotheraccountingsystemstothemaximumextentpossible;
2. Bescalableforuseatentity‐scalesitesacrosstheUnitedStates,withapplicabilityatcountyand/orStatelevelsaswell;
3. FacilitateusebyUSDAinassessingtheperformanceofconservationprograms;
4. ProvideabroadframeworktoassessmanagementpracticestoevaluatetheGHGaspectofproductionsustainability;
5. Maintainmaximumapplicabilityforuseinenvironmentalmarkets,includingpossiblefutureFederal,State,orlocalGHGoffsetsinitiatives;
6. BescientificallyvettedthroughUSDA,U.S.government,andacademicexpertreviewandpubliccomment;
7. Providereliable,real,andverifiableestimatesofon‐siteGHGemissions,carbonstorage,andcarbonsequestration(methodswillbedesignedsothatovertimetheycanbeappliedto
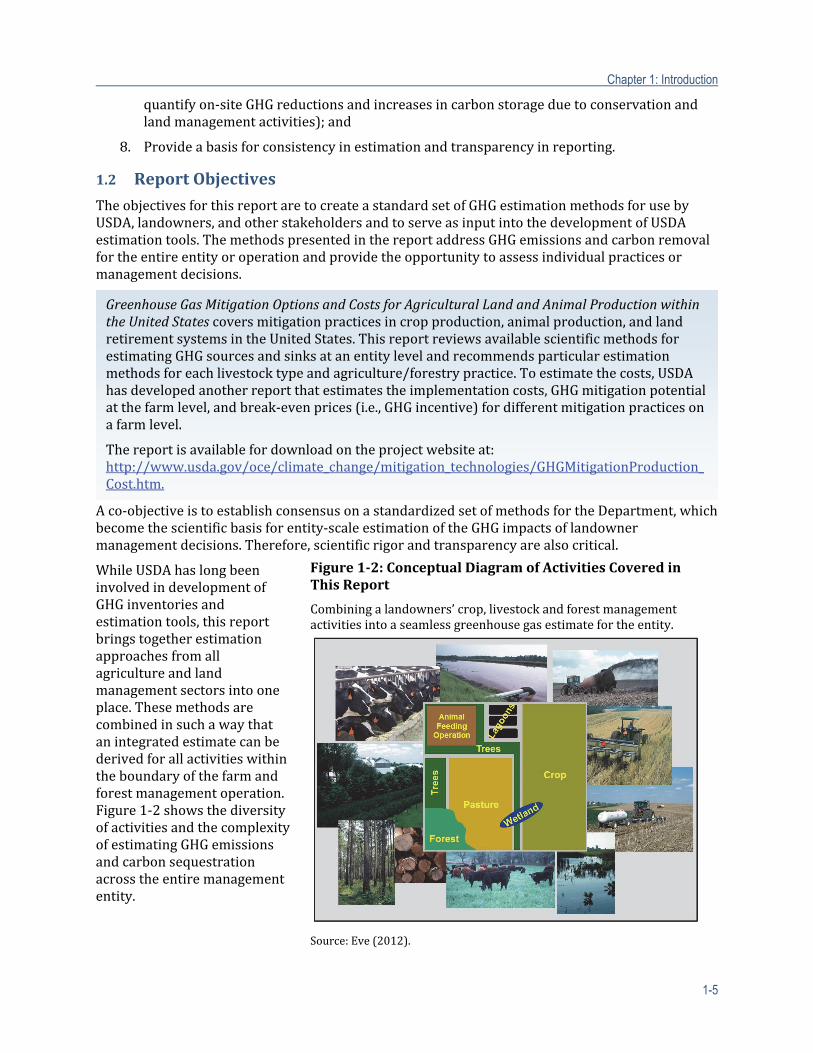
Chapter 1: Introduction
1-5
quantifyon‐siteGHGreductionsandincreasesincarbonstorageduetoconservationandlandmanagementactivities);and
8. Provideabasisforconsistencyinestimationandtransparencyinreporting.
1.2 ReportObjectives
TheobjectivesforthisreportaretocreateastandardsetofGHGestimationmethodsforusebyUSDA,landowners,andotherstakeholdersandtoserveasinputintothedevelopmentofUSDAestimationtools.ThemethodspresentedinthereportaddressGHGemissionsandcarbonremovalfortheentireentityoroperationandprovidetheopportunitytoassessindividualpracticesormanagementdecisions.
Aco‐objectiveistoestablishconsensusonastandardizedsetofmethodsfortheDepartment,whichbecomethescientificbasisforentity‐scaleestimationoftheGHGimpactsoflandownermanagementdecisions.Therefore,scientificrigorandtransparencyarealsocritical.
WhileUSDAhaslongbeeninvolvedindevelopmentofGHGinventoriesandestimationtools,thisreportbringstogetherestimationapproachesfromallagricultureandlandmanagementsectorsintooneplace.Thesemethodsarecombinedinsuchawaythatanintegratedestimatecanbederivedforallactivitieswithintheboundaryofthefarmandforestmanagementoperation.Figure1‐2showsthediversityofactivitiesandthecomplexityofestimatingGHGemissionsandcarbonsequestrationacrosstheentiremanagemententity.
Figure1‐2: ConceptualDiagramofActivitiesCoveredinThisReport
Combiningalandowners’ crop,livestockandforestmanagementactivitiesintoaseamlessgreenhousegasestimatefortheentity.
Source:Eve(2012).
GreenhouseGasMitigationOptionsandCostsforAgriculturalLandandAnimalProductionwithintheUnitedStatescoversmitigationpracticesincropproduction,animalproduction,andlandretirementsystemsintheUnitedStates.ThisreportreviewsavailablescientificmethodsforestimatingGHGsourcesandsinksatanentitylevelandrecommendsparticularestimationmethodsforeachlivestocktypeandagriculture/forestrypractice.Toestimatethecosts,USDAhasdevelopedanotherreportthatestimatestheimplementationcosts,GHGmitigationpotentialatthefarmlevel,andbreak‐evenprices(i.e.,GHGincentive)fordifferentmitigationpracticesonafarmlevel.
Thereportisavailablefordownloadontheprojectwebsiteat:http://www.usda.gov/oce/climate_change/mitigation_technologies/GHGMitigationProduction_Cost.htm.
Chapter 1: Introduction
1-6
1.3 ProcessfortheDevelopmentoftheMethods
Thisreportwasdevelopedbythreeauthorteams(i.e.,workinggroups)underthedirectionofoneleadauthorforeachteam(plusoneco‐leadauthorfortheforestrychapter).TheleadauthorswerechosenbasedontheirexperienceswithGHGinventoriesandaccountingmethodologiesandtheirprofessionalresearchexperiences.Withinputfromeachleadauthor,USDAchose10to13workinggroupmembersperteamtowritethereport.Theseworkinggroupmemberseachhaddifferentbackgroundsthatfitwiththeanticipatedcontentofthedocument.MembersalsohadexperiencewithGHGaccountingand/orfieldresearchthatwasuniqueandaddressedoneormoreofthenichemethodsthatwereessentialforensuringthecomprehensivenessofthemethodsforeachsector.Theauthorteamswereprovidedwithapreliminaryoutlineofachapterandtwobackgroundreportsdevelopedaspartoftheproject.Onebackgroundreportwasananalysisofthescientificliteraturerelatedtoratesofcarbonsequestrationoremissionsreductionresultingfromvariousmanagementpracticesandtechnologies(Denefetal.,2011);theotherwasacompilationofalloftheavailabletools,protocols,andmodelsandbasicinformationoneachone(Denefetal.,2012).Bothreportsareavailablefordownloadontheprojectwebsiteat:http://usda.gov/oce/climate_change/estimation.htm.
ThereareseveralgeneralwaystoestimateGHGemissionsandsequestrationatanentityscale,andeachapproachgivesvaryingaccuracyandprecision.Typically,themostaccuratewaytoestimateGHGfluxesisthroughdirectmeasurement,whichoftenrequiresexpensiveequipmentortechniquesthatarenotfeasibleforasinglelandownerormanager.2
Lookuptablesandestimationequationscanbemuchsimplertoimplementanduse,butwhenusedalonemaynotadequatelyrepresentlocalvariabilityorlocalconditions.Thisreportattemptstodelineatemethodsthatbalanceuserfriendliness,datarequirements,andscientificrigorinawaythatistransparentandjustified.
Figure1‐3illustratesthescopeoftheGHGemissionsourcesandremovalsandprocessesinmanagedecosystemsthatthesemethodsestimate.
Theauthorteamsconsideredthefollowinggeneralapproachesinderivingthemethodsforthisreport:
Basicestimationequations–Involvecombinationsofactivitydata3withparametersanddefaultemissionfactors.4Anydefaultparametersordefaultemissionfactors(e.g.,lookuptables)areprovidedinthetext,orifsubstantialinlength,inanaccompanying(orreferenced)compendiumofdata.
2Examplesincludeintermittentmeasurementofsoilorganiccarbonandbiomassreserves.EstimatesoffluxfordynamicprocessmeasureslikeN2Oemissionsneedtobebasedonmultiplemeasurestakenatreasonablefrequency.Directmeasurementmayworkforcomparativeanalysisbutmustbeextendedtoestimatetotalemissionsusingassumptionsormodelingmethod.3Activitydataisdefinedasdataonthemagnitudeofhumanactivityresultinginemissionsorremovalstakingplaceduringagivenperiodoftime(IPCC,1997).4Emissionfactorisdefinedasacoefficientthatquantifiestheemissionsorremovalsofagasperunitofactivity.Emissionfactorsareoftenbasedonasampleofmeasurementdata,averagedtodeveloparepresentativerateofemissionforagivenactivitylevelunderagivensetofoperatingconditions(IPCC,2006).
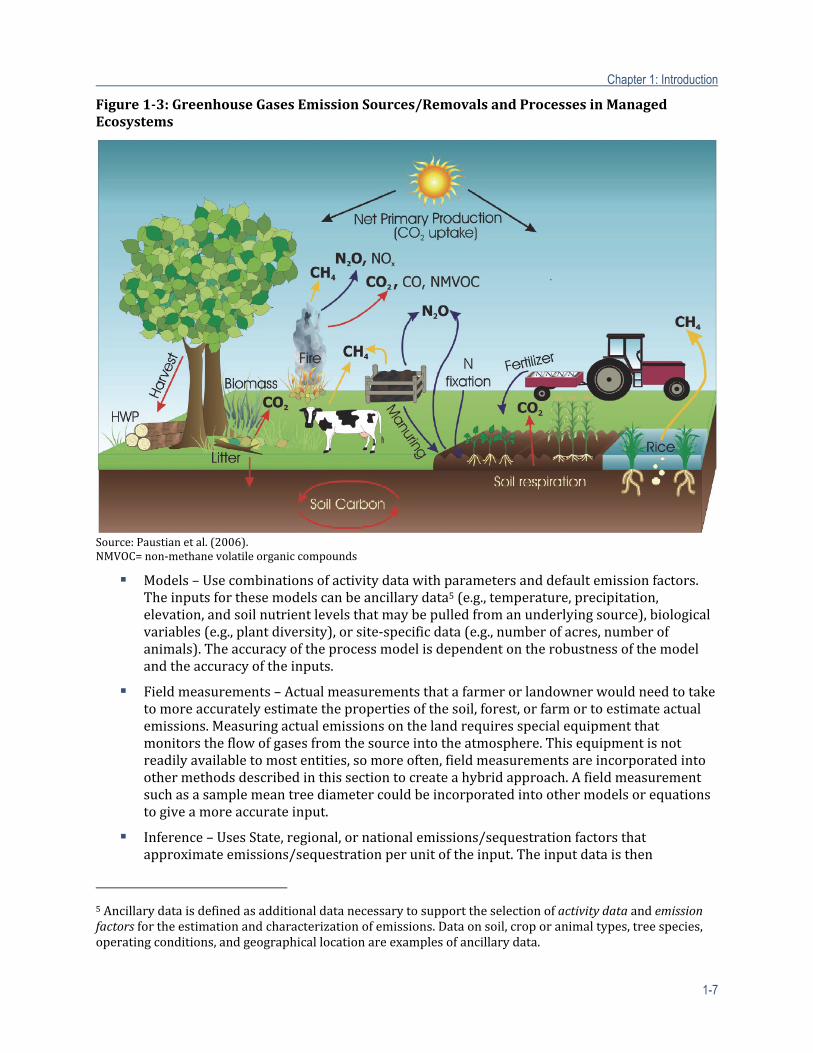
Chapter 1: Introduction
1-7
Figure1‐3:GreenhouseGasesEmissionSources/RemovalsandProcessesinManagedEcosystems
Source:Paustianetal.(2006).NMVOC=non‐methanevolatileorganiccompounds
Models–Usecombinationsofactivitydatawithparametersanddefaultemissionfactors.Theinputsforthesemodelscanbeancillarydata5(e.g.,temperature,precipitation,elevation,andsoilnutrientlevelsthatmaybepulledfromanunderlyingsource),biologicalvariables(e.g.,plantdiversity),orsite‐specificdata(e.g.,numberofacres,numberofanimals).Theaccuracyoftheprocessmodelisdependentontherobustnessofthemodelandtheaccuracyoftheinputs.
Fieldmeasurements–Actualmeasurementsthatafarmerorlandownerwouldneedtotaketomoreaccuratelyestimatethepropertiesofthesoil,forest,orfarmortoestimateactualemissions.Measuringactualemissionsonthelandrequiresspecialequipmentthatmonitorstheflowofgasesfromthesourceintotheatmosphere.Thisequipmentisnotreadilyavailabletomostentities,somoreoften,fieldmeasurementsareincorporatedintoothermethodsdescribedinthissectiontocreateahybridapproach.Afieldmeasurementsuchasasamplemeantreediametercouldbeincorporatedintoothermodelsorequationstogiveamoreaccurateinput.
Inference–UsesState,regional,ornationalemissions/sequestrationfactorsthatapproximateemissions/sequestrationperunitoftheinput.Theinputdataisthen
5Ancillarydataisdefinedasadditionaldatanecessarytosupporttheselectionofactivitydataandemissionfactorsfortheestimationandcharacterizationofemissions.Dataonsoil,croporanimaltypes,treespecies,operatingconditions,andgeographicallocationareexamplesofancillarydata.
Chapter 1: Introduction
1-8
multipliedbythisfactortodeterminethetotalonsiteemissions.Thisfactorcanhavevaryingdegreesofaccuracyandmaynotcapturethemitigationpracticesonthefarmortheuniquesoilconditions,climate,livestockdiet,livestockgenetics,oranyfarm‐specificcharacteristics,unlesstheyaredevelopedforspecificsoiltypes,livestockcategories,orclimacticregions,etc.
Hybridestimationapproach–Anapproachthatusesacombinationoftheapproachesdescribedabove.Theapproachoftenusesfieldmeasurementsormodelstogenerateinputsusedforaninference‐basedapproachtoimprovetheaccuracyoftheestimate.
Withthisbackground,andevaluatingtheseandotherdataandresources,eachauthorteamdevelopedthetextforitschapter.Developmentofthetexthasbeeniterativeasvariousdraftsofthedocumenthavebeenputthroughseveralreviewstages.Thereviewprocessforthereportofmethodsconsistsof:
USDATechnicalReview.USDAperformedanintra‐agencyreview.Theresultofthisreviewwasaseriesofcommentsandquestionsfortheleadauthorsandtheirworkinggroups.Thesecommentswerereceivedby,discussedwithin,andrespondedtobytheworkinggroupsandleadauthors.Forexample,onespecificoutcomeofthisreviewprocesswasanitrousoxide(N2O)CroppingPracticesWorkshopconsistingof20expertsinthefieldofN2Oemissionsfromcroplandsandgrazinglands.TheworkshopwasconvenedtoreviewthemethodsthatwereoriginallyproposedbytheworkinggroupandtodetermineiftherewasamorescientificallyrigorousmethodtoquantifyingN2Oemissionsfromagriculturalsoils.
Inter‐agencyTechnicalReview.TheMay2012versionofthereportwascirculatedforreviewbyaninter‐agencygroupofGHGemissionsandinventoryexperts.Thereviewersincludedover50membersfromnineagenciesincludingUSDA,U.S.DepartmentofEnergy,U.S.DepartmentoftheInterior,EPA,U.S.DepartmentofState,andseveraloftheWhiteHouseOffices.Theresultofthisreviewwasaseriesofcommentsandquestionsfortheleadauthorsandtheirworkinggroups.Thesecommentswerereceivedby,discussedwithin,andrespondedtobytheworkinggroupsandleadauthors.
ScientificExpertReview.Followingtheinter‐agencyreview,thenextversionofthereportwasreviewedbyateamofscientificexperts.Thereviewerswerechosenbasedonrecognizedexpertise,experienceinexpertreviews,availability,andwillingnesstoparticipate.Eachreviewerwasaskedtoreviewthosechaptersand/orsectionsofthereportrelatingtohisorherexpertise.Asubsetofthegroupofexpertreviewerswasaskedtoreviewthereportinitsentiretyandprovidecommentsspecificallyregardingissuesofconsistency,completeness,andaccuracy.Again,theleadauthorsandauthorteamsrespondedtoeachofthecommentsposedbytheexpertpanelandeditedthedocumentasappropriate.
PublicCommentPeriod.Oncealloftheexpertcommentswereaddressedandappropriateeditsweremade,thereportwasmadeavailableforpubliccomment.ThiscoincidedwithafinalreviewbyUSDAandotherFederalagencyGHGexperts.Commentsfromthisreviewwereassessed,andthereportwaseditedasnecessarypriortofinalpublicationofthereport.
Chapter 1: Introduction
1-9
1.4 ContentsoftheReport
Theremainderofthereportisorganizedbysector.Foreachsector,backgroundandinformationonmanagementpracticesarepresentedfirst,followedbythedetailedmethodsproposedforestimatingemissionsandsequestrationforthosepractices.Eachofthechaptersissummarizedasfollows:
Chapter2:ConsiderationsWhenEstimatingAgricultureandForestryGHGEmissionsandRemovals.Chapter2setsthecontextforthemethods,includinglinkagesandcross‐cuttingissuesthatspanthesectors.Thisincludes,forexample,definitionofentity,definitionofsystemboundaries,etc.
Chapter3:QuantifyingGreenhouseGasSourcesandSinksinCroplandandGrazingLandSystems.Chapter3describestheGHGemissionsfromcropandgrazinglandsystems.ThechapterpresentsmethodsforestimatingtheinfluenceoflanduseandmanagementpracticesonGHGemissions(andsinks)incropandgrazinglandsystems.Methodsaredescribedforestimatingbiomassandsoilcarbonstockschanges,directandindirectsoilN2Oemissions,methane(CH4)andN2Oemissionsfromwetlandrice,CH4uptakeinsoils,carbondioxide(CO2)emissionsorsinksfromliming,non‐CO2GHGemissionsfrombiomassburning,andCO2emissionsfromureafertilizerapplication.
Chapter4:QuantifyingGreenhouseGasSourcesandSinksinManagedWetlandSystems.Chapter4providesguidanceforestimationofcarbonstockchanges,CH4,andN2Oemissionsfromactivelymanagedwetlands.
Chapter5:QuantifyingGreenhouseGasSourcesandSinksinAnimalProductionSystems.Chapter5describeson‐farmGHGemissionsfromtheproductionoflivestockandmanuremanagement.ThechapterpresentsGHGestimationmethodsappropriatetotheproductionofeachcommonlivestocksector(i.e.,beef,dairy,sheep,swine,andpoultry),withmethodsrelatedtomanuremanagementcombinedforalllivestocktypes.
Chapter6:QuantifyingGreenhouseGasSourcesandSinksinManagedForestSystems.Chapter6providesguidanceonestimatingcarbonsequestrationandGHGemissionsfortheforestrysector.Thechapterisorganizedtoprovideanoverviewoftheelementsofforestcarbonaccounting,includingdefinitionsofthekeycarbonpoolsandbasicmethodsfortheirestimation.
HowtoUsetheReport
Inordertoaccomplishtheobjectivesnotedabove,thereportislaidoutbybroadland‐usesector(i.e.,croplandsandgrazinglands,wetlands,animalproduction,andforestry).Eachsectorchapterisfurtherdelineatedintotwomainparts:firstthecurrentscientificunderstandingandavailabledataforestimatingGHGfluxeswithinthesector;second,themethodsthatdemonstratethecurrentbestapproachtoestimatingGHGfluxes,balancingtheavailablescienceanddatawiththecriteriaandconsiderationsmentionedpreviously.Thereportisintendedtobeconsideredinitsentiretywithcontextualinformationprovidedinthefirstandsecondchaptersasbackgroundtothecontentpresentedinthefollowingchapters.Theauthorsrealizethatmanyusersmayfindspecificchaptersorsectionsespeciallyvaluableoruseful;therefore,summarizedcontextualinformationisalsoincludedatthebeginningofeachchapter.Thebeginningtothecroplandsandgrazinglands,wetlands,animalproduction,andforestrychaptersincludetablesthatsummarizethemethodsforeachsourceorremovalofGHGemissions.Thesubsequentsectionsinthereportareorganizedaccordingtothesourcesmentionedinthesummarytable.
Chapter 1: Introduction
1-10
Chapter7:QuantifyingGreenhouseGasSourcesandSinksfromLand‐UseChange.Chapter7providesguidanceonestimatingthenetGHGfluxresultingfromchangesbetweenlandtypes—i.e.,conversionsintoandoutofcropland,wetland,grazingland,orforestland—attheentityscale.
Chapter8:UncertaintyAssessmentforQuantifyingGreenhouseGasSourcesandSinks.Chapter8providesaframeworkforaMonteCarloassessmentofestimationuncertainty.
Thereportalsodescribesmethodsforuncertaintyassessmentforeachsourceaswellasfortheestimateintotal.Theauthorsrecognizethatforsomesources,currentdataarenotcompleteenoughtoallowforareliablestatisticalestimateofuncertainty.Insomecases,expertjudgmentwasusedtodelineateestimateduncertaintybounds.Inothercases,thereportsimplynotesthatmoredataarerequiredtoreliablyestimateuncertainty.Eachsectorchapterofthereportcontainsasectiononuncertaintyandlimitations.
Theauthorsacknowledgethatformanypracticesandtechnologies,adequatedatadonotcurrentlyexisttoaccuratelyestimateGHGemissionsand/orcarbonsequestration.Foreachsector,theauthorshaveincludedadiscussionofresearchgapsorpriorityareasforfuturedatacollectionthatareimportantinordertoimprovethecompletenessoraccuracyoftheestimationmethodsputforthinthisreport.
1.5 UsesandLimitationsoftheReport
Specificpotentialusesofthemethodsincludeaiding:
1. LandownersandotherstakeholdersinquantifyingincreasesanddecreasesinGHGemissionsandcarbonsequestrationassociatedwithchangesinlandmanagement;
2. USDAinunderstandingGHGandcarbonsequestrationincreasesanddecreasesresultingfromcurrentandfutureconservationprogramsandpractices;and
3. USDAandothersinevaluatingandimprovingnationalandregionalGHGinventoryefforts.
Thereportwillprovideadditionalcobenefits.Forexample,thereportmayprovideimprovedmethodsforvoluntaryGHGregistries,helptofacilitateregionalGHGmarkets,orinformexistingand/orfutureGHGreportingprograms(e.g.,sequestration/emissionsfromlanduseandagricultureunderExecutiveOrder[EO]13514).6
Thesemethodsaredesignedtoprovidethemostappropriate,single,accountingmethodforquantifyingGHGemissions/sequestrationforeachparticularsourcecategory(e.g.,CH4fromricecultivation)determinedfromtheactivitydata,publishedemissionfactors,andaccountingmethodsandtoolstypicallyavailablefortheentityscale.Thesemethodsarenotdesignedtoprovidearangeofemission/sequestrationaccountingoptions,orarangeofsimilaroptions,atvaryinglevelsofcomplexity(i.e.,tiers)foreachparticularsourcecategory.Thatsaid,theremaybespecificinstances(e.g.,forestcarbonstocks)wheredifferentindividualoptionsmightbespecifiedforentitieswithin
6ItshouldbenotedthatunderEO13514,agency‐levelreportingofemissionsandsequestrationasaresultoflandmanagementpracticesisnotrequiredatthistime.Inaddition,reportingofemissionsfromwildfiremanagement,prescribedburning,landuse,andland‐usechangesisnotrequired.AgencieschoosingtoreportactivitiesundertakentodateincalculatingsuchemissionswouldaddresstheminthequalitativeportionoftheirGHGinventory.EmissionsresultingfrommanuremanagementandentericfermentationwhentheanimalsareownedbytheFederalagencywouldbereportedvoluntarilyinscope1atthistime.IftheactivitiestakeplaceonFederalland,butareoperatedbyothers,theseemissionsmaybevoluntarilyreportedasscope3.
Chapter 1: Introduction
1-11
sourcecategorieswheretherearesignificantlydifferentoperationalscales(e.g.,commercialforestplantationsversussmallwoodlots).
ThisreportisdesignedtoprovideGHGaccountingmethodstodetermineactualGHGemissionsattheentityscale(i.e.,anemissionsinventory)and/ortoquantifytheemission(oremissionreductions)associatedwithanexistingorfuturemitigationpractice/technology.Atthetimeofthiswriting,theUnitedStatesdoesnothaveanationalpolicyguidingGHGemissionsreduction,monitoring,orcreditingintheagricultureandforestrysectors.PresentedaretherecommendedmethodsforquantifyingGHGemissionsandemissionreductions.Thereportisnotintendedasanaccountingframeworkforemissionreductioncreditingortrading—i.e.,themethodsdonotconstituteanoffsetprotocol.Asaresult,thisreportdoesnotprovidespecificguidanceoncriticalpolicyfeaturesofsuchoffsetprotocolsincludingadditionality,permanence,andleakage.Anynationalpolicywouldprovideprecisedefinitionsoftheseterms,andthenthemethodsdescribedinthisreportwouldbeadaptedtoconformtopolicystandardsandrequirements.
Asstatedabove,thisreportdoesnotaddresspolicyissuesrelatedtocreditingreductionssuchaspermanence,additionality,orleakage.Theintendedpurposeissimplytoprovideaquantitativeestimateofwhatisoccurringunderagivensetofpracticesandactivities,orwhatcouldbeexpectedtooccurgivenachangeinmanagement.Whilethereportisnotaddressingpolicyissues,itmayaddresspracticalconcernsaroundGHGestimation,suchastheriskofreversalifmanagementpracticesrevertbackintheforeseeablefuture.Forexample,alandmanagermustunderstandthatachangeinmanagementthatresultsinsoilcarbonsequestration,ifreversed,willleadtotheextrastoredcarbonlikelybeingrereleasedtotheatmosphere.Forthecontextofthisreport,wearemostconcernedwith“whattheatmospheresees”orwhatthelong‐termneteffectistoGHGlevelsintheatmosphere.
Thesourcecategoriescoveredinthereportarespecifictotheagricultureandforestrysectors(e.g.,croplands,grazinglands,managedwetlands,animalagriculture,andforestry).Thereportdoesnotapproachemissionsfromthesesourcesfromalife‐cycleperspective.Inotherwords,thereportdoesnotincludesourcecategoriesthatareassociatedwithmanagementactivitiesrelatedtocertainagricultureandforestryactivities(e.g.,transportation,fueluse,heatingfueluse),upstreamproduction(e.g.,animalfeedproduction,fertilizermanufacture),ordownstream(e.g.,wastewatertreatment,pulpandpapermanufacture,orlandfills).Asaresult,thereportdoesnotprovideGHGaccountingmethodsforsectorsincluding:energyandindustrialprocesses(e.g.,fertilizerproduction).
Thereportalsodoesnotincludeemissionsfromstationarysourcecombustion(e.g.,burningheatingoilornaturalgastoheatanimalhousing)ormobilesourcecombustion(e.g.,fueluseinvehicles)atthistime.However,wherethereareobviouschangesinthelevelofcombustionduetoachangeinpractices,thatchangeisqualitativelydiscussed.Forexample,ashiftfromconventionaltillagetonotillcanresultinalargereductioninfuelconsumptionbecauseoffewertripsacrossthefield.Theserelationshipsarenotedqualitativelyinthereport,butquantitativemethodsarenotproposed.MethodsforquantifyingemissionsfromstationaryormobilecombustionsareavailablefromotherFederalagencies.
Thescopeofthisreportisassessingtheimpactofspecificdecisionsmadebythefarmorforestmanagerwithintheconfinesofthefarmorforestgate.Alife‐cycleperspective,whilevaluable,isoutsidethescopeofthisreport.Alife‐cycleassessment(LCA)isausefultoolforquantificationofenvironmentalimpactsandbenefitsonabasisthatallowsforanalysisofenvironmentalburdenshiftingandtrade‐offsbetweendifferentoptions.LCAsincludetheenvironmentalimpactofmanagementdecisionsduringproductmanufacturingandprocessingofrawinputsto,aswellasproductsoutputfrom,thefarmorforestsystem,continuingthroughitsusebytheendconsumer.
Chapter 1: Introduction
1-12
ThemethodologiespresentedinthisreportdonotconstituteanLCA,butsupportseveralcomponentsofLCAs.Forexample,thisreportcoversemissions(e.g.,fromcroplands)thatcouldbeusedaspartofanattributionLCAforacommoditycropproduct,orusedaspartofaconsequentialLCAstudyingtheimpactsofagriculturalpolicydecisionsonGHGmitigationpotential.
ThetextboxbelowprovidesfurtherinformationonLCAsastheyrelatetoquantifyingGHGsourcesandsinksinagricultureandforestrysystems,includingbackgroundinformationonthepurposeofLCAs,theLCAprocess,theinterpretationofLCAresults,andcurrentLCAeffortsbyUSDAandotherorganizationsrelatedtoagricultureandforestry.
LifeCycleAssessment
AnLCAisatoolforaddressingtheenvironmentalaspects(e.g.,useofresources)andpotentialenvironmentalimpacts(e.g.,globalwarmingpotential)throughoutthelife‐cycleofaproductormaterial.Whenappliedtoagricultureandforestryproducts,thescopeofanLCAwouldlikelyincludeupstreamimpactsfromextractionandproductionofmaterialinputs(e.g.,fuels,fertilizers);theenvironmentalimpactsofmanagementdecisionsduringcrop,livestock,ortreegrowthonsite;andtheoutputsfromthefarmorforestsystem,includingthedownstreamimpactsfromuseanddisposalbytheendconsumer.TheaccountingboundaryofGHGemissionsourcesandsinksquantifiedinanLCAforanagriculturalorforestconsumerproductwouldextendbeyondtheaccountingboundaryofthemethodologiespresentedinthisreport.Forexample,anLCAforagrainproductwouldnotonlyincludeN2Oemissionsfromfertilizerapplication,butalsootherupstreaminputssuchasemissionsfromsyntheticfertilizerproduction,anddownstreamimpactssuchasemissionsfromgraintransportationandstorage,processing,use,anddisposal.
TheInternationalOrganizationforStandardization(ISO)hasestablishedseveralinternationalstandardsaddressingLCA,includingISO14040(ISO,2006a)describingtheprinciplesandframeworkforLCAs,ISO14044(ISO,2006b)addressingLCArequirementsandguidelines,andISO14048(ISO,2002)presentingastandardizedLCAdatadocumentationformat.aAsdefinedinISO14040(ISO,2006a),theLCAdevelopmentprocessincludesthefollowingprimarysteps:definingthegoalandscope;conductingalife‐cycleinventory(LCI)analysisbygatheringdataandquantifyingallrelevantinputsandoutputsoftheproductsystem,asdefinedinthescopeofthestudy;conductingalife‐cycleimpactassessmentthroughevaluationofthesignificanceoftheenvironmentalimpactsdefinedinthescopeofthestudyanddeterminedduringtheLCIprocess;andinterpretingtheresults(ISO,2002;2006a;2006b).USDAhasseveralinitiativesapplyingLCAstoagricultureandforestry.
USDA’sNationalAgriculturalLibraryhasdevelopedtheLCADigitalCommonsProject,adatabaseandtoolintendedtoprovideLCIdataforuseinLCAsoffood,biofuels,andotherbio‐products.Thedatabasecurrentlyincludesdataoninputs(e.g.,fertilizers)andoutputs(e.g.,airemissions,residues)perunitoffieldcropproductionfrom1996–2009forcorn,cotton,oats,peanuts,rice,soybeans,andwheat(durum,spring,andwinter)inStatescoveredbytheUSDAEconomicResearchServiceannualAgriculturalResourceManagementSurvey.Futurephasesofthisworkwillincludetheadditionofdatarepresentingirrigation,manuremanagement,farmequipmentoperation,cropstorage,transport,andproductionofmineralandorganicfertilizers,herbicides,insecticides,andfungicides.
(continued)
Chapter 1: Introduction
1-13
LifeCycleAssessment (continued)
USDAalsorecentlyworkedwiththeNationalCattlemen’sBeefAssociationandthechemicalcompanyBASFinthedevelopmentofaneco‐efficiencyassessmentfortheU.S.beefindustrybyquantifyinglife‐cycleinputsandoutputsforbeefproductionovertime.Theprocessinvolvedmeasuringthelife‐cycleenvironmentalimpactsandlife‐cyclecostsfordifferentbeefproductionprocessesatadefinedlevelofoutput.TheUSDAAgricultureResearchService’sIntegratedFarmSystemModelwasusedtoestimateenvironmentalimpacts(e.g.,airemissions,wateruse,abioticdepletionpotential,toxicity,etc.)basedondatafromtheUSDA’sRomaL.HruskaMeatAnimalResearchCenter(Battaglieseetal.,2013).
BeyondUSDA,otherLCAsandstudiesrelatedtoquantifyingenvironmentalimpactsfromagricultureandforestryproductshavebeenpublished.Belowisalistofrecentstudies,projects,orresourcesthatuseLCAsorcouldbeusedinthedevelopmentofLCAstoevaluateclimateimpactsfromagricultureandforestry.
TheInnovationCenterforU.S.Dairyanalyzedfluidmilk,cheese,anddairyprocessingandpackaging.ThesedatahaverecentlybeenmadepubliclyavailablethroughtheUSDA’sLCADigitalCommonsdatabase.b
TheInnovationCenterforU.S.DairydevelopedtheFarmSmarttoolthatcomparesenergyuse,GHGemissions,andwateruseagainstregionalandnationalaverages.Thetooltakesapproximately20minutestocompleteandwillhaveenhanceddecisionsupportfeaturesaddedin2014.c
TheNationalPorkBoardfundedastudyofporkproductsconductedbyresearchersattheUniversityofArkansas.d
TheUnitedKingdom’sCarbonTrustdevelopeda“carbonfootprinting”methodologythathasbeenusedbythegrocerychainTescotodeterminethelife‐cycleGHGimpactsofmanyoftheirproducts.e
TheUnitedKingdomFoodClimateResearchNetworkmaintainsacompendiumoffoodLCAs.f
KumarVenkatofCleanMetricsCorp.compared12organicandconventionalfarmingsystemsfromalife‐cycleGHGemissionsperspectiveusingagriculturalproductiondatafromtheUniversityofCalifornia‐Davis.g
FieldtoMarketpreparedareportpresentingenvironmentalandsocioeconomicindicatorsformeasuringoutcomesfromon‐farmagriculturalproductionintheUnitedStates.h
Acoalitionoffoodindustrycompanies,academicorganizations,andnon‐governmentalorganizationscreatedTheCoolFarmTool,aGHGcalculatordesignedtohelpfarmersreduceemissions.i
(continued)aSeehttp://www.iso.org/iso/iso_catalogue/catalogue_tc/catalogue_tc_browse.htm?commid=54854.bSeehttp://www.usdairy.com/sustainability/Greenhouse%20Gas%20Projects/Pages/ProcessingandPackagingLCA.aspxandhttp://www.lcacommons.gov/?q=node/16.cSeehttp://www.usdairy.com/FarmSmart/Pages/Home.aspx.dSeehttp://www.pork.org/filelibrary/NPB%20Scan%20Final%20‐%20May%202011.pdf.eSeehttp://www.carbontrust.com/our‐clients/t/tesco/.fSeehttp://www.fcrn.org.uk/research‐library/lca.gVenkat,K.2012.ComparisonofTwelveOrganicandConventionalFarmingSystems:ALifeCycleGreenhouseGasEmissionsPerspective.JournalofSustainableAgriculture36(6):620‐649.hSeehttp://www.fieldtomarket.org/report/national‐2/PNT_SummaryReport_A11.pdf.iSeehttp://www.coolfarmtool.org/Home.
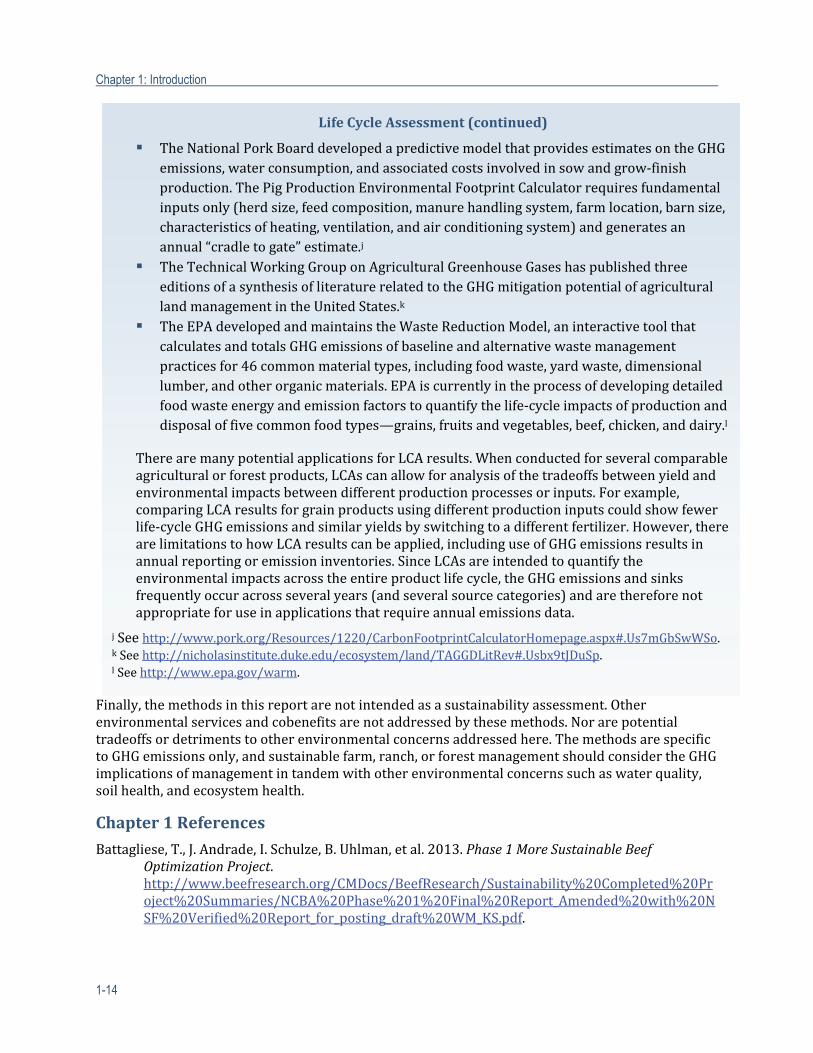
Chapter 1: Introduction
1-14
Finally,themethodsinthisreportarenotintendedasasustainabilityassessment.Otherenvironmentalservicesandcobenefitsarenotaddressedbythesemethods.Norarepotentialtradeoffsordetrimentstootherenvironmentalconcernsaddressedhere.ThemethodsarespecifictoGHGemissionsonly,andsustainablefarm,ranch,orforestmanagementshouldconsidertheGHGimplicationsofmanagementintandemwithotherenvironmentalconcernssuchaswaterquality,soilhealth,andecosystemhealth.
Chapter1References
Battagliese,T.,J.Andrade,I.Schulze,B.Uhlman,etal.2013.Phase1MoreSustainableBeefOptimizationProject.http://www.beefresearch.org/CMDocs/BeefResearch/Sustainability%20Completed%20Project%20Summaries/NCBA%20Phase%201%20Final%20Report_Amended%20with%20NSF%20Verified%20Report_for_posting_draft%20WM_KS.pdf.
LifeCycleAssessment (continued)
TheNationalPorkBoarddevelopedapredictivemodelthatprovidesestimatesontheGHGemissions,waterconsumption,andassociatedcostsinvolvedinsowandgrow‐finishproduction.ThePigProductionEnvironmentalFootprintCalculatorrequiresfundamentalinputsonly(herdsize,feedcomposition,manurehandlingsystem,farmlocation,barnsize,characteristicsofheating,ventilation,andairconditioningsystem)andgeneratesanannual“cradletogate”estimate.j
TheTechnicalWorkingGrouponAgriculturalGreenhouseGaseshaspublishedthreeeditionsofasynthesisofliteraturerelatedtotheGHGmitigationpotentialofagriculturallandmanagementintheUnitedStates.k
TheEPAdevelopedandmaintainstheWasteReductionModel,aninteractivetoolthatcalculatesandtotalsGHGemissionsofbaselineandalternativewastemanagementpracticesfor46commonmaterialtypes,includingfoodwaste,yardwaste,dimensionallumber,andotherorganicmaterials.EPAiscurrentlyintheprocessofdevelopingdetailedfoodwasteenergyandemissionfactorstoquantifythelife‐cycleimpactsofproductionanddisposaloffivecommonfoodtypes—grains,fruitsandvegetables,beef,chicken,anddairy.l
TherearemanypotentialapplicationsforLCAresults.Whenconductedforseveralcomparableagriculturalorforestproducts,LCAscanallowforanalysisofthetradeoffsbetweenyieldandenvironmentalimpactsbetweendifferentproductionprocessesorinputs.Forexample,comparingLCAresultsforgrainproductsusingdifferentproductioninputscouldshowfewerlife‐cycleGHGemissionsandsimilaryieldsbyswitchingtoadifferentfertilizer.However,therearelimitationstohowLCAresultscanbeapplied,includinguseofGHGemissionsresultsinannualreportingoremissioninventories.SinceLCAsareintendedtoquantifytheenvironmentalimpactsacrosstheentireproductlifecycle,theGHGemissionsandsinksfrequentlyoccuracrossseveralyears(andseveralsourcecategories)andarethereforenotappropriateforuseinapplicationsthatrequireannualemissionsdata.
jSeehttp://www.pork.org/Resources/1220/CarbonFootprintCalculatorHomepage.aspx#.Us7mGbSwWSo.kSeehttp://nicholasinstitute.duke.edu/ecosystem/land/TAGGDLitRev#.Usbx9tJDuSp.lSeehttp://www.epa.gov/warm.
Chapter 1: Introduction
1-15
Denef,K.,S.Archibeque,andK.Paustian.2011.GreenhouseGasEmissionsfromU.S.AgricultureandForestry:AReviewofEmissionSources,ControllingFactors,andMitigationPotential:InterimreporttoUSDAunderContract#GS‐23F‐8182H.http://www.usda.gov/oce/climate_change/techguide/Denef_et_al_2011_Review_of_reviews_v1.0.pdf.
Denef,K.,K.Paustian,S.Archibeque,S.Biggar,etal.2012.ReportofGreenhouseGasAccountingToolsforAgricultureandForestrySectors:InterimreporttoUSDAunderContract#GS‐23F‐8182H.http://www.usda.gov/oce/climate_change/techguide/Denef_et_al_2011_Review_of_reviews_v1.0.pdf.
Eve,M.2012.PresentationattheN2OCroppingPracticesWorkshop.February7‐9,2012,FortCollins,CO.
IPCC.1997.Revised1996IPCCGuidelinesforNationalGreenhouseGasInventories,PreparedbytheNationalGreenhouseGasInventoriesProgramme.Bracknell,UK:IntergovernmentalPanelonClimateChange.http://www.ipcc‐nggip.iges.or.jp/public/gl/invs1.html.
IPCC.2006.2006IPCCGuidelinesforNationalGreenhouseGasInventories,PreparedbytheNationalGreenhouseGasInventoriesProgramme.EditedbyH.S.Eggleston,L.Buendia,K.Miwa,T.NgaraandK.Tanabe.Japan:IGES.http://www.ipcc‐nggip.iges.or.jp/public/2006gl/vol4.html.
ISO.2002.ISO14048:Environmentalmanagement‐Lifecycleassessment‐Datadocumentationformat:InternationalOrganizationforStandardization.
ISO.2006a.ISO14040:Environmentalmanagement‐Lifecycleassessment‐Principlesandframework:InternationalOrganizationforStandardization.
ISO.2006b.ISO14044:Environmentalmanagement‐Lifecycleassessment‐Requirementsandguidelines:InternationalOrganizationforStandardization.
Paustian,K.,N.H.Ravindranath,A.Amstel,andM.Gytarsky.2006.Chapter1‐Introduction.In2006IPCCGuidelinesforNationalGreenhouseGasInventories,PreparedbytheNationalGreenhouseGasInventoriesProgramme,H.S.Eggleston,L.Buendia,K.Miwa,T.NgaraandK.Tanabe(eds.).Japan:IGES.
USDA.2011.U.S.AgricultureandForestGreenhouseGasInventory:1990‐2008.Washington,DC:U.S.DepartmentofAgriculture.

Chapter 1: Introduction
1-16
Thispageisintentionallyleftblank.
Authors:
MarlenEve,U.S.DepartmentofAgriculture,OfficeoftheChiefEconomistMarkFlugge,ICFInternationalDianaPape,ICFInternational
Contents:
2 ConsiderationsWhenEstimatingAgricultureandForestryGHGEmissionsandRemovals .........................................................................................................................................................................2‐3
2.1 Scope...................................................................................................................................................................2‐32.1.1 DefinitionofEntity..........................................................................................................2‐32.1.2 DefinitionofSystemBoundaries...............................................................................2‐4
2.2 ReviewofRelevantCurrentToolsandMethods............................................................................2‐122.3 SelectionofMostAppropriateMethodandMitigationPracticestoInclude......................2‐132.4 OverviewofSectors....................................................................................................................................2‐14
2.4.1 CroplandsandGrazingLands...................................................................................2‐162.4.2 Wetlands............................................................................................................................2‐172.4.3 AnimalProduction.........................................................................................................2‐192.4.4 Forestry..............................................................................................................................2‐21
2.5 Land‐UseChange.........................................................................................................................................2‐222.6 Uncertainty....................................................................................................................................................2‐23Chapter2References.............................................................................................................................................2‐24
SuggestedChapterCitation:Eve,M.,M.Flugge,D.Pape,2014.Chapter2:ConsiderationswhenEstimatingAgricultureandForestryGHGEmissionsandRemovals.InQuantifyingGreenhouseGasFluxesinAgricultureandForestry:MethodsforEntity‐ScaleInventory.TechnicalBulletinNumber1939.OfficeoftheChiefEconomist,U.S.DepartmentofAgriculture,Washington,DC.606pages.July2014.Eve,M.,D.Pape,M.Flugge,R.Steele,D.Man,M.Riley‐Gilbert,andS.Biggar,Editors.
USDAisanequalopportunityproviderandemployer.
Chapter 2Considerations When Estimating Agriculture and Forestry GHG Emissions and Removals
Chapter 2: Considerations When Estimating Agriculture and Forestry GHG Emissions and Removals
2-2
Acronyms,ChemicalFormulae,andUnits
CH4 MethaneCO CarbonmonoxideCO2 CarbondioxideCO2‐eq CarbondioxideequivalentsGHG GreenhousegasGWP Globalwarmingpotentialha HectaresHWP HarvestedwoodproductsIPCC IntergovernmentalPanelonClimateChangeN2O NitrousoxideNH3 AmmoniaNO NitricoxideNOx Mono‐nitrogenoxideNO2 NitriteNO3 NitratePDF ProbabilitydensityfunctionUSDA U.S.DepartmentofAgriculture
Chapter 2: Considerations When Estimating Agriculture and Forestry GHG Emissions and Removals
2-3
2 ConsiderationsWhenEstimatingAgricultureandForestryGHGEmissionsandRemovals
Thischapterdescribesthelinkagesandcross‐cuttingissuesrelatingtosector‐specificandentity‐scaleestimationofgreenhousegas(GHG)sourcesandsinks.Inparticular,thischapterdescribesthecommonelementsthatmustbeconsideredbothwithinanemissionssectororsourcecategoryaswellasacrosssectorsorsourcecategoriesinorderforanentitytoreportaccurateGHGinventoryestimates.
Chapter2isorganizedasfollows:
Scope
ReviewofRelevantCurrentToolsandMethods
SelectionofMostAppropriateMethodandMitigationPracticestoInclude
OverviewofSectors
− CroplandsandGrazingLands
− Wetlands
− AnimalProduction
− Forestry
− Uncertainty
2.1 Scope
InorderforanentitytoaccuratelyinventoryitsdirectGHGemissionsto(andremovalsfrom)theatmosphereandcompareemissionsandremovalsbetweenyears,practices,orentities,itisimportantthatestimationelements—e.g.,definitionsofentityandsystemboundaries—arecommontoallemissionsectorsandsourcecategories.Thesecommonelementsaredescribedinmoredetailinthesectionsthatfollowandinclude: DefinitionofEntity
DefinitionofSystemBoundaries:
− PhysicalBoundaries
− TemporalBoundaries
− ActivityBoundaries
− MaterialBoundaries
2.1.1 DefinitionofEntity
Thedefinitionofanentitywill,toalargedegree,determinethe(spatial)boundsoftheestimationmethodologies.Thiswillprimarilybedrivenbywhatdataalandownerchoosestoinput—i.e.,thedefinitionwillbeuser‐specificandprimarilydependontheuser’sdefinition.1However,itisanticipatedthatthescience‐basedmethodswillbesuitabletoquantifyGHGsourcesandsinksataprocessorpracticescale.Themethodsinthisreportprovideanintegratedassessmentofthenet
1Itshouldbenotedthatthedefinitionofanentityusedinthisreportisnotapolicyorregulatorydefinition,andisonlyprovidedtohelpthelandmanagerdeterminewhatpracticesshouldbeincludedintheestimation.
Chapter 2: Considerations When Estimating Agriculture and Forestry GHG Emissions and Removals
2-4
GHGemissionsforanentity,alllandsforwhichthelandownerhasmanagementresponsibility.TheyalsoprovidethebasisforanintegratedtooltobeusedbytheU.S.DepartmentofAgriculture(USDA)aswellasbyindividualfarmers,ranchers,forestowners,andotherstakeholderstoevaluatethenetGHGemissionsonparcelsoflandundertheirmanagement.Sowhiletheentitywouldbedefinedasalloftheactivitiesoccurringonalltractsoflandunderthemanagementcontrolofthelandowner,thereportdescribespractice‐levelmethodologiesthatcanbesummedcollectivelytoarriveatanestimatefortheentity.Thedefinitionofentityappliedhereisintentionallybroad,understandingthatanypolicy,registry,ormarketwillprovideitsownnarrowerdefinition.
2.1.2 DefinitionofSystemBoundaries
ThesystemboundariesshouldincludetheGHGemissionsandcarbonsequestrationoccurring(orestablished)onsiteforthesourcecategoryandmanagementpracticeinquestion.Forexample,thisreportdoesnotaddressindirectland‐usechangesoccurringoffsiteorbiogenicGHGfluxrelatedtosubsequentuseofagriculturalorforestryoutputs(e.g.,foodprocessing,pulpandpapermanufacture,biomasscombustion).However,certainoffsitecarbonstorageconsiderations(e.g.,flowofharvestedwoodintoharvestedwoodproducts[HWPs])havebeenconsideredinthereporttomaintainconsistencywithnationalinventoryefforts.
Fourtypesofsystemboundariesareimportantforconsideration:
PhysicalBoundaries
TemporalBoundaries
ActivityBoundaries
MaterialBoundaries
2.1.2.1 PhysicalBoundaries
Physicalboundaries(e.g.,spatial,sectoral)addresstheareaandthemanagementtobeconsideredinthereporting.Settingtheboundariesforwhichemissionsandsequestrationwillbeestimatedismoredifficultthanitfirstseems.Althoughtheremaybemultiplealternatives,clarityandconsistencyareimportant.Therearemanyfacetstoconsider.Onefactoriswhatconstitutesanentityorafarm/ranch/forestoperation;anotheriswhatoperationsareassociatedwiththatentity.Forexample,doestheuseoffertilizeronafarmincludetheprocessesofmanufacturinganddeliveringthatfertilizer?Anotherconsiderationishowtosubdividethatlargerentityintotherelevantsectorsaspresentedintheindividualchaptersinthisreport.Forexample,istheentityentirelygrazinglandorissomeofitinforestmanagement?Finally,theremaybequestionsofhowtoassociatemanagementpracticestothemostrelevantcategoriesforuseoftheaccountingguidelinesprovided,includinganyguidanceonsizelimits,whatconstitutesmanagement,andhowtoaddresschanginglanduses.Definitionsareanimportantpartofsettingboundariesandwillbeprovidedhereaswell.Examplesofmanagementpractices(e.g.,irrigation,tillage,orresiduemanagementforcroplands)areincludedwithinthevarioussectordescriptionsbelow(i.e.,croplandsandgrazinglands,wetlands,animalproduction,andforestry);whenconsideringwhatconstitutesamanagementpractice,anentityshouldnotethatinthecontextoftheseguidelines,amanagementpracticereferstochangesinthemanagementofagriculture,animal,orforestproductionthatimpactGHGemissionsandremovals.
TheobjectiveofthesemethodsistoprovideacompleteestimationofGHGemissionsandcarbonsequestrationwithintheboundariesofanentity.Thisisnotintendedasalifecycleanalysis,aswillbefurtherexplainedbelowinthediscussionofmaterialboundaries.Themethodsaredesignedtobeappliedatthelocalscale,butneedtobeflexibleenoughtobevalidforverylargeentities.The
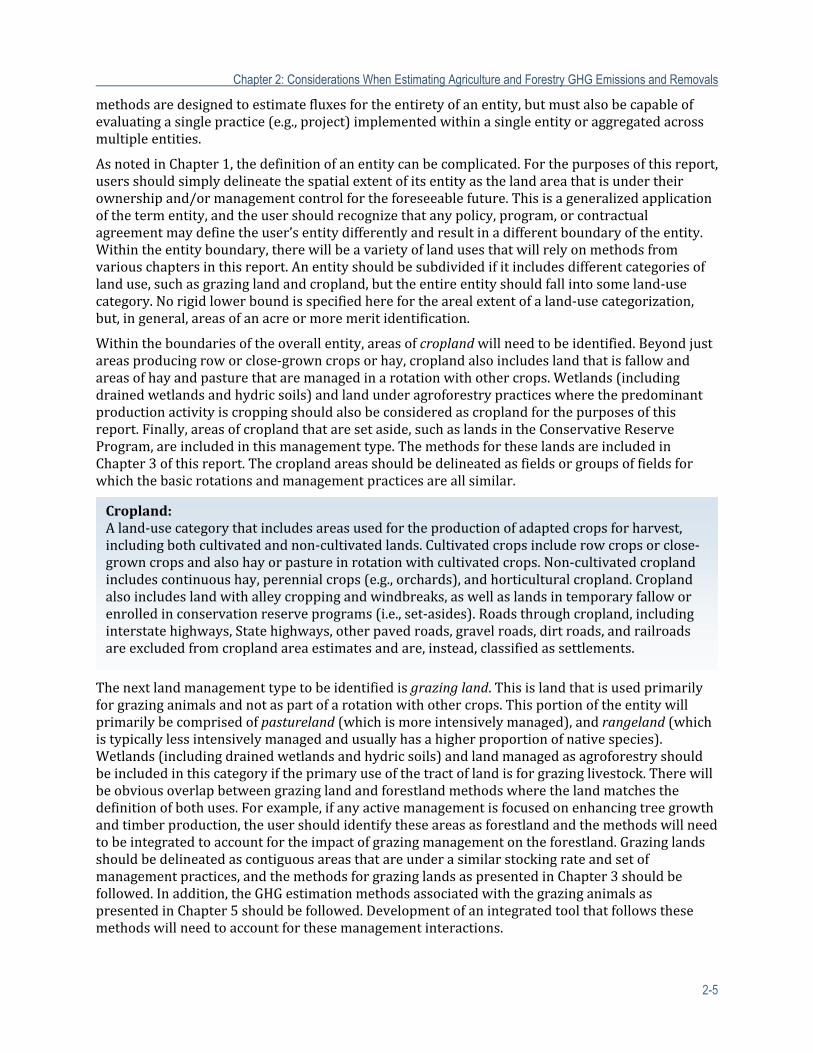
Chapter 2: Considerations When Estimating Agriculture and Forestry GHG Emissions and Removals
2-5
methodsaredesignedtoestimatefluxesfortheentiretyofanentity,butmustalsobecapableofevaluatingasinglepractice(e.g.,project)implementedwithinasingleentityoraggregatedacrossmultipleentities.
AsnotedinChapter1,thedefinitionofanentitycanbecomplicated.Forthepurposesofthisreport,usersshouldsimplydelineatethespatialextentofitsentityasthelandareathatisundertheirownershipand/ormanagementcontrolfortheforeseeablefuture.Thisisageneralizedapplicationofthetermentity,andtheusershouldrecognizethatanypolicy,program,orcontractualagreementmaydefinetheuser’sentitydifferentlyandresultinadifferentboundaryoftheentity.Withintheentityboundary,therewillbeavarietyoflandusesthatwillrelyonmethodsfromvariouschaptersinthisreport.Anentityshouldbesubdividedifitincludesdifferentcategoriesoflanduse,suchasgrazinglandandcropland,buttheentireentityshouldfallintosomeland‐usecategory.Norigidlowerboundisspecifiedhereforthearealextentofaland‐usecategorization,but,ingeneral,areasofanacreormoremeritidentification.
Withintheboundariesoftheoverallentity,areasofcroplandwillneedtobeidentified.Beyondjustareasproducingroworclose‐growncropsorhay,croplandalsoincludeslandthatisfallowandareasofhayandpasturethataremanagedinarotationwithothercrops.Wetlands(includingdrainedwetlandsandhydricsoils)andlandunderagroforestrypracticeswherethepredominantproductionactivityiscroppingshouldalsobeconsideredascroplandforthepurposesofthisreport.Finally,areasofcroplandthataresetaside,suchaslandsintheConservativeReserveProgram,areincludedinthismanagementtype.ThemethodsfortheselandsareincludedinChapter3ofthisreport.Thecroplandareasshouldbedelineatedasfieldsorgroupsoffieldsforwhichthebasicrotationsandmanagementpracticesareallsimilar.
Thenextlandmanagementtypetobeidentifiedisgrazingland.Thisislandthatisusedprimarilyforgrazinganimalsandnotaspartofarotationwithothercrops.Thisportionoftheentitywillprimarilybecomprisedofpastureland(whichismoreintensivelymanaged),andrangeland(whichistypicallylessintensivelymanagedandusuallyhasahigherproportionofnativespecies).Wetlands(includingdrainedwetlandsandhydricsoils)andlandmanagedasagroforestryshouldbeincludedinthiscategoryiftheprimaryuseofthetractoflandisforgrazinglivestock.Therewillbeobviousoverlapbetweengrazinglandandforestlandmethodswherethelandmatchesthedefinitionofbothuses.Forexample,ifanyactivemanagementisfocusedonenhancingtreegrowthandtimberproduction,theusershouldidentifytheseareasasforestlandandthemethodswillneedtobeintegratedtoaccountfortheimpactofgrazingmanagementontheforestland.Grazinglandsshouldbedelineatedascontiguousareasthatareunderasimilarstockingrateandsetofmanagementpractices,andthemethodsforgrazinglandsaspresentedinChapter3shouldbefollowed.Inaddition,theGHGestimationmethodsassociatedwiththegrazinganimalsaspresentedinChapter5shouldbefollowed.Developmentofanintegratedtoolthatfollowsthesemethodswillneedtoaccountforthesemanagementinteractions.
Cropland:Aland‐usecategorythatincludesareasusedfortheproductionofadaptedcropsforharvest,includingbothcultivatedandnon‐cultivatedlands.Cultivatedcropsincluderowcropsorclose‐growncropsandalsohayorpastureinrotationwithcultivatedcrops.Non‐cultivatedcroplandincludescontinuoushay,perennialcrops(e.g.,orchards),andhorticulturalcropland.Croplandalsoincludeslandwithalleycroppingandwindbreaks,aswellaslandsintemporaryfalloworenrolledinconservationreserveprograms(i.e.,set‐asides).Roadsthroughcropland,includinginterstatehighways,Statehighways,otherpavedroads,gravelroads,dirtroads,andrailroadsareexcludedfromcroplandareaestimatesandare,instead,classifiedassettlements.
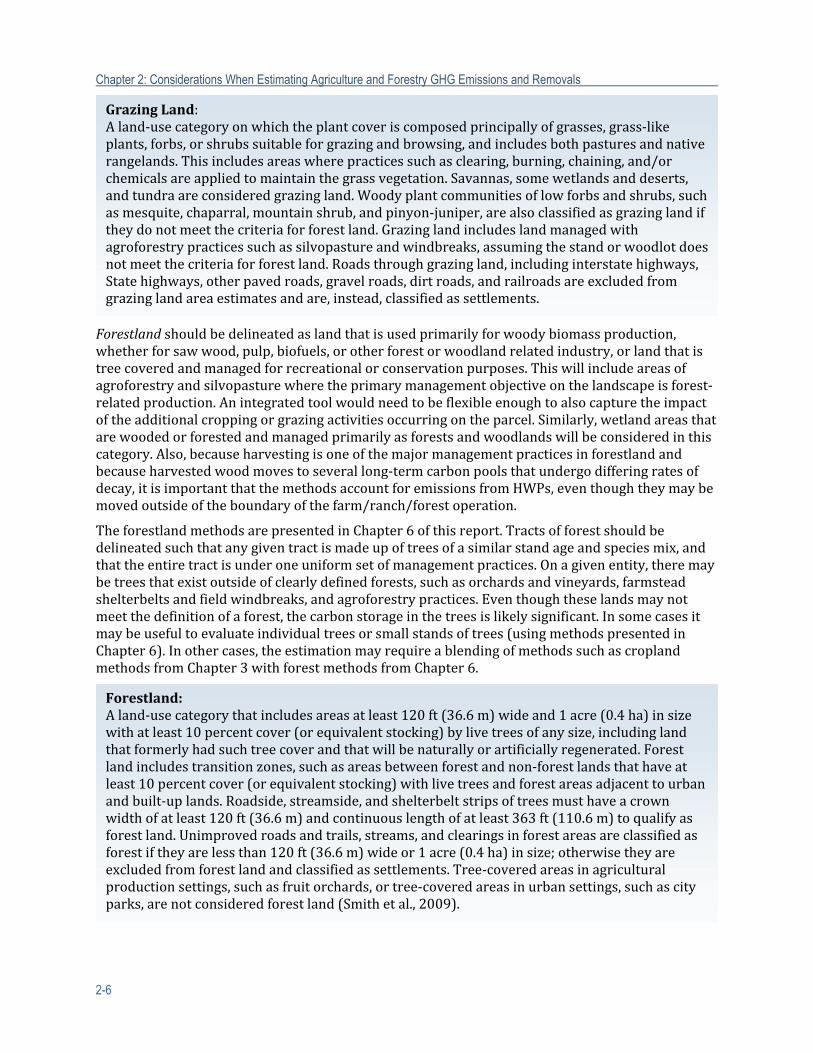
Chapter 2: Considerations When Estimating Agriculture and Forestry GHG Emissions and Removals
2-6
Forestlandshouldbedelineatedaslandthatisusedprimarilyforwoodybiomassproduction,whetherforsawwood,pulp,biofuels,orotherforestorwoodlandrelatedindustry,orlandthatistreecoveredandmanagedforrecreationalorconservationpurposes.Thiswillincludeareasofagroforestryandsilvopasturewheretheprimarymanagementobjectiveonthelandscapeisforest‐relatedproduction.Anintegratedtoolwouldneedtobeflexibleenoughtoalsocapturetheimpactoftheadditionalcroppingorgrazingactivitiesoccurringontheparcel.Similarly,wetlandareasthatarewoodedorforestedandmanagedprimarilyasforestsandwoodlandswillbeconsideredinthiscategory.Also,becauseharvestingisoneofthemajormanagementpracticesinforestlandandbecauseharvestedwoodmovestoseverallong‐termcarbonpoolsthatundergodifferingratesofdecay,itisimportantthatthemethodsaccountforemissionsfromHWPs,eventhoughtheymaybemovedoutsideoftheboundaryofthefarm/ranch/forestoperation.
TheforestlandmethodsarepresentedinChapter6ofthisreport.Tractsofforestshouldbedelineatedsuchthatanygiventractismadeupoftreesofasimilarstandageandspeciesmix,andthattheentiretractisunderoneuniformsetofmanagementpractices.Onagivenentity,theremaybetreesthatexistoutsideofclearlydefinedforests,suchasorchardsandvineyards,farmsteadshelterbeltsandfieldwindbreaks,andagroforestrypractices.Eventhoughtheselandsmaynotmeetthedefinitionofaforest,thecarbonstorageinthetreesislikelysignificant.Insomecasesitmaybeusefultoevaluateindividualtreesorsmallstandsoftrees(usingmethodspresentedinChapter6).Inothercases,theestimationmayrequireablendingofmethodssuchascroplandmethodsfromChapter3withforestmethodsfromChapter6.
GrazingLand:Aland‐usecategoryonwhichtheplantcoveriscomposedprincipallyofgrasses,grass‐likeplants,forbs,orshrubssuitableforgrazingandbrowsing,andincludesbothpasturesandnativerangelands.Thisincludesareaswherepracticessuchasclearing,burning,chaining,and/orchemicalsareappliedtomaintainthegrassvegetation.Savannas,somewetlandsanddeserts,andtundraareconsideredgrazingland.Woodyplantcommunitiesoflowforbsandshrubs,suchasmesquite,chaparral,mountainshrub,andpinyon‐juniper,arealsoclassifiedasgrazinglandiftheydonotmeetthecriteriaforforestland.Grazinglandincludeslandmanagedwithagroforestrypracticessuchassilvopastureandwindbreaks,assumingthestandorwoodlotdoesnotmeetthecriteriaforforestland.Roadsthroughgrazingland,includinginterstatehighways,Statehighways,otherpavedroads,gravelroads,dirtroads,andrailroadsareexcludedfromgrazinglandareaestimatesandare,instead,classifiedassettlements.
Forestland:Aland‐usecategorythatincludesareasatleast120ft(36.6m)wideand1acre(0.4ha)insizewithatleast10percentcover(orequivalentstocking)bylivetreesofanysize,includinglandthatformerlyhadsuchtreecoverandthatwillbenaturallyorartificiallyregenerated.Forestlandincludestransitionzones,suchasareasbetweenforestandnon‐forestlandsthathaveatleast10percentcover(orequivalentstocking)withlivetreesandforestareasadjacenttourbanandbuilt‐uplands.Roadside,streamside,andshelterbeltstripsoftreesmusthaveacrownwidthofatleast120ft(36.6m)andcontinuouslengthofatleast363ft(110.6m)toqualifyasforestland.Unimprovedroadsandtrails,streams,andclearingsinforestareasareclassifiedasforestiftheyarelessthan120ft(36.6m)wideor1acre(0.4ha)insize;otherwisetheyareexcludedfromforestlandandclassifiedassettlements.Tree‐coveredareasinagriculturalproductionsettings,suchasfruitorchards,ortree‐coveredareasinurbansettings,suchascityparks,arenotconsideredforestland(Smithetal.,2009).
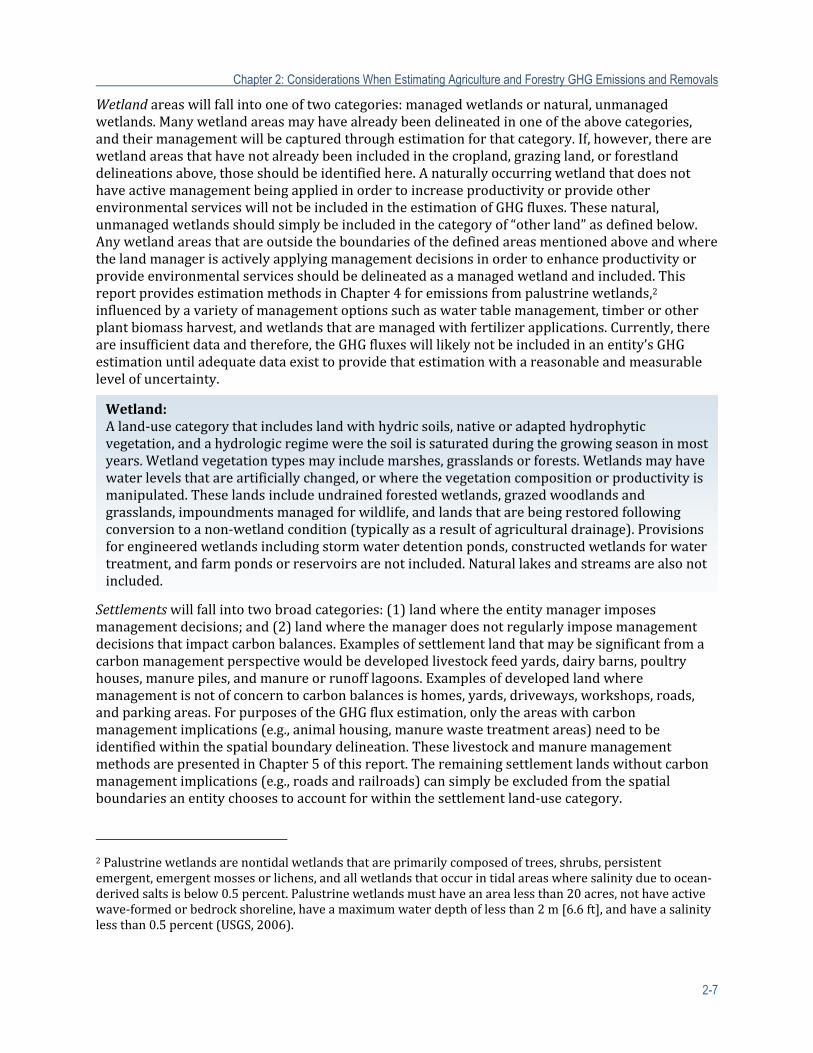
Chapter 2: Considerations When Estimating Agriculture and Forestry GHG Emissions and Removals
2-7
Wetlandareaswillfallintooneoftwocategories:managedwetlandsornatural,unmanagedwetlands.Manywetlandareasmayhavealreadybeendelineatedinoneoftheabovecategories,andtheirmanagementwillbecapturedthroughestimationforthatcategory.If,however,therearewetlandareasthathavenotalreadybeenincludedinthecropland,grazingland,orforestlanddelineationsabove,thoseshouldbeidentifiedhere.AnaturallyoccurringwetlandthatdoesnothaveactivemanagementbeingappliedinordertoincreaseproductivityorprovideotherenvironmentalserviceswillnotbeincludedintheestimationofGHGfluxes.Thesenatural,unmanagedwetlandsshouldsimplybeincludedinthecategoryof“otherland”asdefinedbelow.Anywetlandareasthatareoutsidetheboundariesofthedefinedareasmentionedaboveandwherethelandmanagerisactivelyapplyingmanagementdecisionsinordertoenhanceproductivityorprovideenvironmentalservicesshouldbedelineatedasamanagedwetlandandincluded.ThisreportprovidesestimationmethodsinChapter4foremissionsfrompalustrinewetlands,2influencedbyavarietyofmanagementoptionssuchaswatertablemanagement,timberorotherplantbiomassharvest,andwetlandsthataremanagedwithfertilizerapplications.Currently,thereareinsufficientdataandtherefore,theGHGfluxeswilllikelynotbeincludedinanentity’sGHGestimationuntiladequatedataexisttoprovidethatestimationwithareasonableandmeasurablelevelofuncertainty.
Settlementswillfallintotwobroadcategories:(1)landwheretheentitymanagerimposesmanagementdecisions;and(2)landwherethemanagerdoesnotregularlyimposemanagementdecisionsthatimpactcarbonbalances.Examplesofsettlementlandthatmaybesignificantfromacarbonmanagementperspectivewouldbedevelopedlivestockfeedyards,dairybarns,poultryhouses,manurepiles,andmanureorrunofflagoons.Examplesofdevelopedlandwheremanagementisnotofconcerntocarbonbalancesishomes,yards,driveways,workshops,roads,andparkingareas.ForpurposesoftheGHGfluxestimation,onlytheareaswithcarbonmanagementimplications(e.g.,animalhousing,manurewastetreatmentareas)needtobeidentifiedwithinthespatialboundarydelineation.TheselivestockandmanuremanagementmethodsarepresentedinChapter5ofthisreport.Theremainingsettlementlandswithoutcarbonmanagementimplications(e.g.,roadsandrailroads)cansimplybeexcludedfromthespatialboundariesanentitychoosestoaccountforwithinthesettlementland‐usecategory.
2Palustrinewetlandsarenontidalwetlandsthatareprimarilycomposedoftrees,shrubs,persistentemergent,emergentmossesorlichens,andallwetlandsthatoccurintidalareaswheresalinityduetoocean‐derivedsaltsisbelow0.5percent.Palustrinewetlandsmusthaveanarealessthan20acres,nothaveactivewave‐formedorbedrockshoreline,haveamaximumwaterdepthoflessthan2m[6.6ft],andhaveasalinitylessthan0.5percent(USGS,2006).
Wetland:Aland‐usecategorythatincludeslandwithhydricsoils,nativeoradaptedhydrophyticvegetation,andahydrologicregimewerethesoilissaturatedduringthegrowingseasoninmostyears.Wetlandvegetationtypesmayincludemarshes,grasslandsorforests.Wetlandsmayhavewaterlevelsthatareartificiallychanged,orwherethevegetationcompositionorproductivityismanipulated.Theselandsincludeundrainedforestedwetlands,grazedwoodlandsandgrasslands,impoundmentsmanagedforwildlife,andlandsthatarebeingrestoredfollowingconversiontoanon‐wetlandcondition(typicallyasaresultofagriculturaldrainage).Provisionsforengineeredwetlandsincludingstormwaterdetentionponds,constructedwetlandsforwatertreatment,andfarmpondsorreservoirsarenotincluded.Naturallakesandstreamsarealsonotincluded.

Chapter 2: Considerations When Estimating Agriculture and Forestry GHG Emissions and Removals
2-8
Anylandthatisactivelymanagedinsuchawayastoimpactbiomassgrowthorotherwiseimpactproduction‐relatedGHGemissionsshouldhavebeencapturedwithinthespatialboundariesdefinedfortheland‐usecategorieslistedabove.AnyremaininglandshouldbecategorizedasotherlandsorunmanagedlandandwillnotbeconsideredintheestimationofGHGfluxes.Thisincludesthewetlandanddevelopedareasthatwerepreviouslynotedasnothavingactivemanagement—i.e.,unmanagedwetlandsandunmanagedsettlements.Italsoincludesanyotherareaswithintheentityboundarythatrepresentbarren,mined,abandoned,orotherwiseunmanagedland—i.e.,otherland.
Land‐coverchangeissimplyavariationfromyeartoyearinwhatisgrowingonaparcelofland,suchasrotatingcornandsoybeancrops,andisnotconsideredland‐usechange.Incontrast,land‐usechangeisafundamentalshiftinpurposeorproductionofaparcel,suchasashiftfromcroppingtoforestproductionorviceversa.Land‐usechangeneedstobeaccountedforintheannualGHGflux,astheimpact(eitherpositiveornegative)onbiomassandsoilcarboncanbesignificant.Theseland‐usechangemethodsarepresentedinChapter7ofthisreport.
Animalproductionisnotnecessarilyaspatiallydefinedactivitywithintheentity,buthastobeconsideredaspartofthephysicalboundaryofthemanager’soperation.TherearethreemainareasthatneedtobeconsideredasimportanttoestimatingGHGemissionsfromananimalproductionsystem:methaneemissionsfromtheanimals,methaneandnitrousoxideemissionsfrommanagementofmanure,andanyemissionsimpactsrelatedtoanimalhousing.Animalproductioninthechapterisdiscussedbyanimalsystemtype,includingbeef,dairy,sheep,swine,andpoultry.Thecollectivenounforagroupofanimalstypicallyvariesbyspecies,butforthepurposesofthisreport,wewillrefertoanygroupofanimalsofthesameanimaltypethatarekepttogetherunderacommonsetofproductionmanagementpracticesasaherd.Followingthisdefinition,theentity’smanagermayhaveseveraldistinctlydifferentherdsthatmakeuptheentity.GHGemissionsfromanimalproductionwillvarygreatlydependinguponspecies(digestiveprocesses),growthstage,diet,andmanurestorageandmanagement.Timingisalsoachallengeinestimatingemissionsfromtheanimalproductionsector,asemissionsperanimalchangedramaticallyasayounganimalgrowsandmatures,asfeedlotcattlearefinished,orasdairycowscyclebetweengestatingandlactating.Insomecases,itwilllikelybenecessaryfortheusertoestimateemissionsforaherdusingaverageweight,averageage,andotherrepresentativecharacteristicstorepresenttheherdpopulation.Inothercases,itwillbenecessarytogeneralizebyseasons—manuremanagementmaybedifferentinwinterthansummer,animalfeedmixturemayvarybyseasonorbyanimalgrowthstage.Averaging
Settlements:Aland‐usecategoryrepresentingdevelopedareasconsistingofunitsof0.25acres(0.1ha)ormorethatincludesresidential,industrial,commercial,andinstitutionalland;constructionsites;publicadministrativesites;railroadyards;cemeteries;airports;golfcourses;sanitarylandfills;sewagetreatmentplants;watercontrolstructuresandspillways;parkswithinurbanandbuilt‐upareas;andhighways,railroads,andothertransportationfacilities.Alsoincludedaretractsoflessthan10acres(4.05ha)thatmaymeetthedefinitionsforforestland,cropland,grassland,orotherlandbutarecompletelysurroundedbyurbanorbuilt‐upland,andsoareincludedinthesettlementcategory.Ruraltransportationcorridorslocatedwithinotherlanduses(e.g.,forestland,cropland,andgrassland)arealsoincludedinsettlements.
OtherLand:Aland‐usecategorythatincludesbaresoil,rock,ice,andalllandareasthatdonotfallintoanyoftheotherfiveland‐usecategories,whichallowsthetotalofidentifiedlandareastomatchtheidentifiedlandbase.
Chapter 2: Considerations When Estimating Agriculture and Forestry GHG Emissions and Removals
2-9
andgeneralizinginthiswayshouldbeadequateincapturingtheinformationneededtoprovideareasonableestimateofGHGemissionsaslongasthemanagerappliesassumptionsconsistentlyacrosstheherdsandthroughoutthetimeunderconsideration.Forexample,assuminganaveragefinishweightforfeederanimalsintheherdshouldprovideareasonableGHGestimateaslongastheassumedweightdoesnotchangefromyeartoyear,unlessaspecificmanagementdecision(suchasachangeinanimaldiet)resultsinanactualchangeinfinishingweight,inwhichcasethechangeinaverageswouldbeappropriate.SpecificmethodsforanimalproductionsystemsarepresentedinChapter5ofthereport.Insomecases,suchasmanureappliedtocropland,methodsfromChapter3willbeutilizedaswell.
Occasionally,physicalboundarieswillchangeovertime.Whetheraportionofacroplandfieldisconvertedtoananimalfeedlot,shelterbeltorripariantreesareplantedontoformercropland,orabandonedlandrevertstograzinglandorforestland,thesechangescouldresultintheneedforanewdelineationofparcelboundariesoradissectionofoneparcelintoseveralparcelswithmorethanonemanagementstrategy.Fortheportionoftheparcelwherethischangehasoccurred,theland‐usechangemethods(Chapter7)willbeusedtoestimateGHGfluxes.
Figure2‐1canbeusedtohelplandownersdeterminethelandusecategoryfortheirlandarea,accordingtothedefinitionsabove.
2.1.2.2 TemporalBoundaries
Temporalissuesincludesuchconsiderationsasthefrequencyofthereportedestimates,thetreatmentofactivitiesthatoccurwithinanaccountingperiodbuthavelong‐termimplicationsforcarbonbalances(e.g.,changesinsoilcarbonfollowingachangeintillagepractices),andhowtoaccountforshort‐termmanagementorshort‐termadjustmentstolong‐termmanagementdecisions.Alsosignificantishowtoaddressmovementofspatialboundariesovertimeandwithland‐usechange.ThissectionwillattempttoresolvesomeofthesetemporalissuesaroundGHGemissionestimationandreporting.
ThemethodsreportedhereareintendedtoprovideameansofannualaccountingandreportingofGHGfluxes.Annualchangesinsomeemissionsareeasilyquantified,butforothersitismuchmoredifficult.Carbonstoredintrees,forexample,mayneedtobeestimatedoveralongerperiod,withthechangethenconvertedtoanannualizedestimate.
Thereportmethodologiesassumeanaccountingperiodofonecalendaryear(e.g.,365days)whenestimatingannualizedemissionsinaparticularsectororsourcecategory.
Managementdecisionsalsoaresignificanttotheaccountingtimehorizon.Forexample,aforestmanagementplanmightcallfortimberharvestorthinning.Intheyearofharvest,theannualaccountingwillreflectalossofstandingliveand/orstandingdeadcarbonstocks,yetinthelongertermmanagementstrategy,thenetresultcouldbeanincreaseintotalcarbonstocks.Ifalandmanagerhasamanagementplanthatprescribesforestthinning,butthenharvestsmoreaggressivelythantheplan,considerationshouldbegivenastowhetherthisconstitutesachangeinforestmanagement,whichwouldbediscussedintheforestmanagementmethods(seeChapter6).
Therearealsotimeswhenmanagementhastotakecorrectiveactionortemporarilydeviatefromalong‐termmanagementplan.Thiscouldbethecasewhereacroplandmanagerhasadoptedano‐tillmanagementstrategy,butafterseveralyearshastousetillageoneyearbecauseofweather,pests,orotherextenuatingcircumstances.Inthiscase,themethodswillideallybesensitiveenoughtocapturetheGHGimpactofthedeviationfromthemanagementplan.
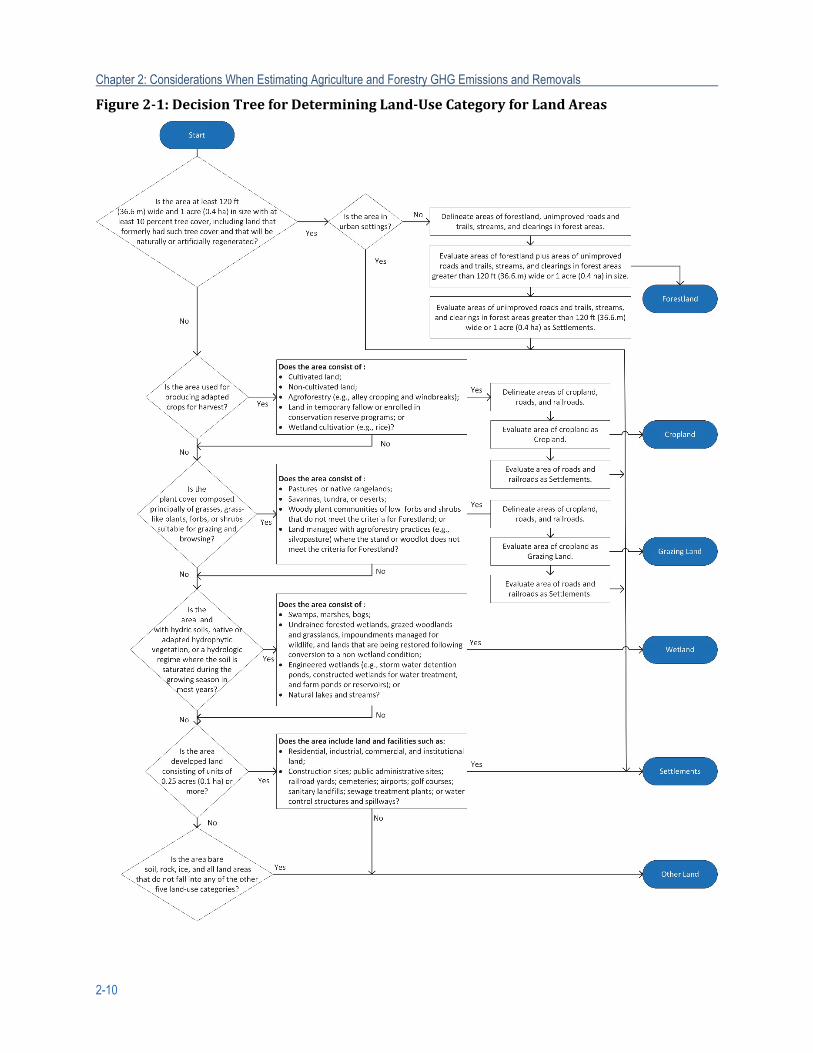
Chapter 2: Considerations When Estimating Agriculture and Forestry GHG Emissions and Removals
2-10
Figure2‐1:DecisionTreeforDeterminingLand‐UseCategoryforLandAreas
Chapter 2: Considerations When Estimating Agriculture and Forestry GHG Emissions and Removals
2-11
2.1.2.3 ActivityBoundaries
Itisimportanttodistinguishwhichactivitieswithinanentityaresubjecttoaccounting.Thisaccountingsystemisfocusedonland‐basedactivitiessuchastillageandharvesting,andnotonemissionsofGHGsthatarerelatedtofossilfueluse.Thus,emissionsfromtractorfuelorfuelusedforcropdryingarenotcounted,noraretheenergyinputsrequiredtomanufacturefertilizerorfarmtools,ortoheatfarmbuildings—i.e.,indirectGHGemissions(seeChapter1).However,asmentionedinChapter1,wherethereareobviouschangesinthelevelofcombustionduetoachangeinpractices,thatchangeisqualitativelydiscussed.Forexample,ashiftfromconventionaltillagetonotillcanresultinalargereductioninfuelconsumptionbecauseoffewertripsacrossthefield.Theserelationshipsarenotedqualitativelyinthereport,butquantitativemethodsarenotproposed.MethodsforquantifyingemissionsfromstationaryormobilecombustionsareavailablefromotherFederalagencies.
Aspreviouslymentioned,themethodsinthisreportdonotconstitutealife‐cycleassessmentfortwoprimaryreasons.Firsttheactivityboundariesdonotincludeemissionsfromfossil‐fueluse.Second,thetemporalboundariesarefocusedonannualreportinganddonotencompasstherangeofactivitiessuchascapitalinvestment,materialsupplies,anddisposal.
2.1.2.4 MaterialBoundaries
MaterialboundariesincludetheGHGsthataretobeconsideredintheestimationandshouldalsodelineatewhatsourcesofthosegasesareincludedandwhatareexcluded.Alsoincludedinthissectionisadiscussionoftheglobalwarmingpotentials(GWPs)usedthroughoutthereport.Itisimportanttodetermineupfrontwhichgasesareincludedandwhicharenot.Itisalsoimportanttodeterminehowmuchfreedomtheuserhasinwhatisestimatedandwheretheseboundarieslieinordertoensurethatachangeinmanagementthatreducesemissionsinonesectordoesnotinadvertentlycauseemissionstoriseoutsideoftheboundariesbeingreported.
ThereportincludesestimationmethodologiescoveringtheGHGemissionsfromthecroplandsandgrazinglands,wetlands,animalproduction,forestry,andland‐usechangesectors.Withinthesesectorsandsourcecategories,emissionsandremovalsofthemainGHGs—carbondioxide(CO2),methane(CH4),andnitrousoxide(N2O)—areaccountedfor.Itshouldbenotedthatcarbonsequestration(i.e.,increasesincarbonstocks)isestimatedintermsofcarbondioxideequivalents(CO2‐eq).Itshouldalsobenotedthattheanimalproductionchapterincludesdiscussionofammonia(NH3),asthisisanimportantprecursortoN2Oemissionsfrommanuremanagement.EstimatingNH3emissionsisbeyondthescopeofthisreport—NH3isnotconsideredaGHG—butsinceNH3issignificantasaprecursortoN2O,understandingchangesinNH3emissionsresultingfromchangesinmanagementisimportant.
Emissionsandsequestrationvaluesarepresentedinthisreportintermsofthemass(notvolume)ofeachgas,usingmetricunits(e.g.,metrictonsofmethane).Intheintegratedtool,themassesofeachgaswillbeconvertedintoCO₂equivalentunitsusingtheGWPsforeachgasintheInternationalPanelonClimateChange(IPCC)SecondAssessmentReport.
AGWPisanindexusedtocomparetherelativeradiativeforcingofdifferentgaseswithoutdirectlycalculatingthechangesinatmosphericconditions.GWPsarecalculatedastheratiooftheradiativeforcingthatwouldresultfromtheemissionsofonekilogramofaGHGtothatfromtheemissionsofonekilogramofCO₂overadefinedperiodoftime,suchas100years.EmissionsintermsofCO₂equivalents(CO2‐eq)areestimatedbymultiplyingthemassofaparticularGHG(e.g.,CH4,N2O)bytherespectiveGWPforthatparticularGHG.TheGWPsusedinthisreportareshowninTable2‐1below.
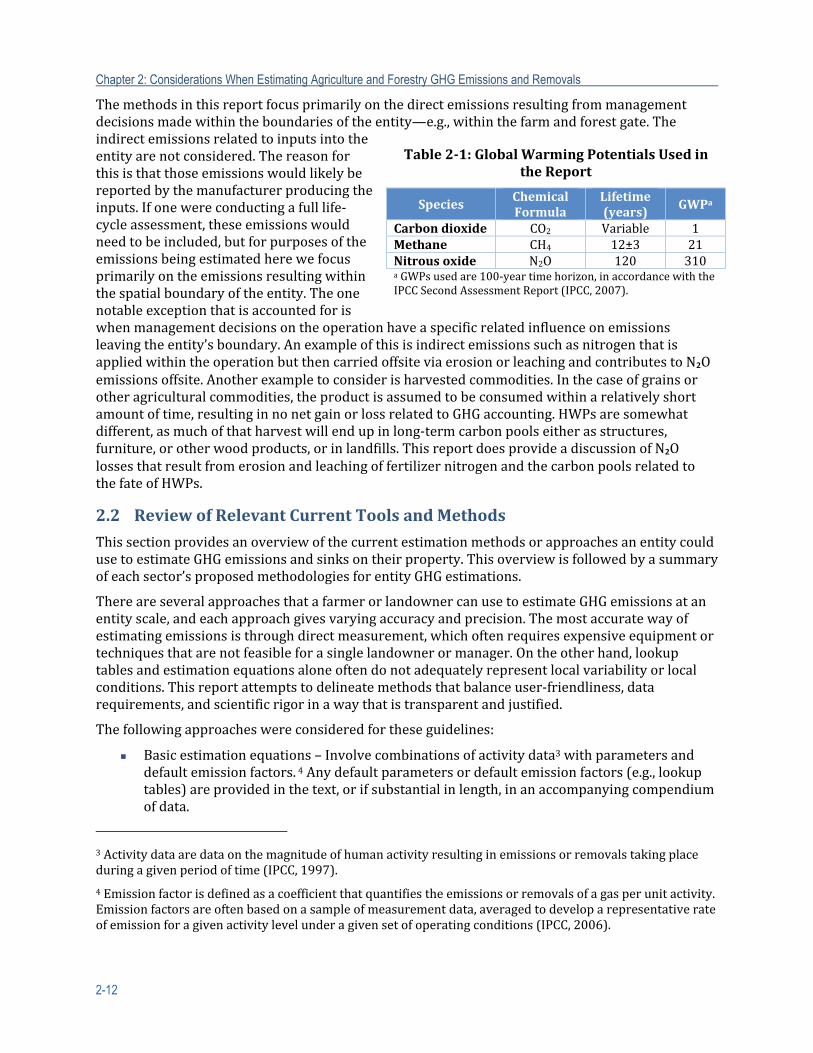
Chapter 2: Considerations When Estimating Agriculture and Forestry GHG Emissions and Removals
2-12
Themethodsinthisreportfocusprimarilyonthedirectemissionsresultingfrommanagementdecisionsmadewithintheboundariesoftheentity—e.g.,withinthefarmandforestgate.Theindirectemissionsrelatedtoinputsintotheentityarenotconsidered.Thereasonforthisisthatthoseemissionswouldlikelybereportedbythemanufacturerproducingtheinputs.Ifonewereconductingafulllife‐cycleassessment,theseemissionswouldneedtobeincluded,butforpurposesoftheemissionsbeingestimatedherewefocusprimarilyontheemissionsresultingwithinthespatialboundaryoftheentity.Theonenotableexceptionthatisaccountedforiswhenmanagementdecisionsontheoperationhaveaspecificrelatedinfluenceonemissionsleavingtheentity’sboundary.AnexampleofthisisindirectemissionssuchasnitrogenthatisappliedwithintheoperationbutthencarriedoffsiteviaerosionorleachingandcontributestoN₂Oemissionsoffsite.Anotherexampletoconsiderisharvestedcommodities.Inthecaseofgrainsorotheragriculturalcommodities,theproductisassumedtobeconsumedwithinarelativelyshortamountoftime,resultinginnonetgainorlossrelatedtoGHGaccounting.HWPsaresomewhatdifferent,asmuchofthatharvestwillendupinlong‐termcarbonpoolseitherasstructures,furniture,orotherwoodproducts,orinlandfills.ThisreportdoesprovideadiscussionofN₂OlossesthatresultfromerosionandleachingoffertilizernitrogenandthecarbonpoolsrelatedtothefateofHWPs.
2.2 ReviewofRelevantCurrentToolsandMethods
ThissectionprovidesanoverviewofthecurrentestimationmethodsorapproachesanentitycouldusetoestimateGHGemissionsandsinksontheirproperty.Thisoverviewisfollowedbyasummaryofeachsector’sproposedmethodologiesforentityGHGestimations.
ThereareseveralapproachesthatafarmerorlandownercanusetoestimateGHGemissionsatanentityscale,andeachapproachgivesvaryingaccuracyandprecision.Themostaccuratewayofestimatingemissionsisthroughdirectmeasurement,whichoftenrequiresexpensiveequipmentortechniquesthatarenotfeasibleforasinglelandownerormanager.Ontheotherhand,lookuptablesandestimationequationsaloneoftendonotadequatelyrepresentlocalvariabilityorlocalconditions.Thisreportattemptstodelineatemethodsthatbalanceuser‐friendliness,datarequirements,andscientificrigorinawaythatistransparentandjustified.
Thefollowingapproacheswereconsideredfortheseguidelines:
Basicestimationequations–Involvecombinationsofactivitydata3withparametersanddefaultemissionfactors.4Anydefaultparametersordefaultemissionfactors(e.g.,lookuptables)areprovidedinthetext,orifsubstantialinlength,inanaccompanyingcompendiumofdata.
3Activitydataaredataonthemagnitudeofhumanactivityresultinginemissionsorremovalstakingplaceduringagivenperiodoftime(IPCC,1997).
4Emissionfactorisdefinedasacoefficientthatquantifiestheemissionsorremovalsofagasperunitactivity.Emissionfactorsareoftenbasedonasampleofmeasurementdata,averagedtodeveloparepresentativerateofemissionforagivenactivitylevelunderagivensetofoperatingconditions(IPCC,2006).
Table2‐1:GlobalWarmingPotentialsUsedintheReport
SpeciesChemicalFormula
Lifetime(years) GWPa
Carbondioxide CO2 Variable 1Methane CH4 12±3 21Nitrousoxide N2O 120 310a GWPsusedare100‐yeartimehorizon,inaccordancewiththeIPCCSecondAssessmentReport(IPCC,2007).
Chapter 2: Considerations When Estimating Agriculture and Forestry GHG Emissions and Removals
2-13
Models–Usecombinationsofactivitydatawithparametersanddefaultemissionfactors.Theinputsforthesemodelscanbeancillarydata5(e.g.,temperature,precipitation,elevation,andsoilnutrientlevelsthatmaybepulledfromanunderlyingsource),biologicalvariables(e.g.,plantdiversity),orsite‐specificdata(e.g.,numberofacres,numberofanimals).Theaccuracyofthemodelsisdependentontherobustnessofthemodelandtheaccuracyoftheinputs.
Fieldmeasurements–Actualmeasurementsthatafarmerorlandownerwouldneedtotaketomoreaccuratelyestimatethepropertiesofthesoil,forest,orfarmtoestimateactualemissions.Measuringactualemissionsonthelandrequiresspecialequipmentthatmonitorstheflowofgasesfromthesourceintotheatmosphere.Thisequipmentisnotreadilyavailabletomostentities,somoreoftenfieldmeasurementsareincorporatedintoothermethodsdescribedinthissectiontocreateahybridapproach.Afieldmeasurementsuchasasamplemeantreediametercouldbeincorporatedintoothermodelsorequationstogiveamoreaccurateinput.
Inference–UsesState,regional,ornationalemissions/sequestrationfactorsthatapproximateemissions/sequestrationperunitoftheinput.Theinputdataisthenmultipliedbythisfactortodeterminethetotalonsiteemissions.Thisfactorcanhavevaryingdegreesofaccuracyandoftendoesnotcapturethemitigationpracticesonthefarmortheuniquesoilconditions,climate,livestockdiet,livestockgenetics,oranyfarm‐specificcharacteristics,althoughtheycanbedevelopedwithspecificsoiltypes,livestockcategories,orclimacticregions.
Hybridestimationapproaches–Anapproachthatusesacombinationoftheapproachesdescribedabove.Theapproachoftenusesfieldmeasurementsormodelstogenerateinputsusedforaninference‐basedapproachtoimprovetheaccuracyoftheestimate.
2.3 SelectionofMostAppropriateMethodandMitigationPracticestoInclude
Indraftingthereport,anumberofselectioncriteriawereconsidered(e.g.,transparency,consistency,comparability,completeness,accuracy,costeffectiveness,easeofuse).Adescriptionofeachappearsbelow:
Transparency–Theassumptionsandmethodologiesusedforaninventoryshouldbeclearlyexplainedtofacilitatereplicationandassessmentoftheinventorybyusersofthereportedinformation.Thetransparencyofinventoriesisfundamentaltothesuccessoftheprocessforthecommunicationandconsiderationofinformation.
Consistency–Themethodsusedtogenerateinventoryestimatesshouldbeinternallyconsistentinallitselementsandtheestimatesshouldbeconsistentwithotheryears.Aninventoryisconsistentifthesamemethodologiesareusedforthebaseandallsubsequentyearsandifconsistentdatasetsareusedtoestimateemissionsorremovalsfromsourcesorsinks.Consistencyisanimportantconsiderationinmergingdifferingestimationtechniquesfromdiversetechnologiesandmanagementpractices.
Comparability–Fortheguidelinestobecomparable,theestimatesofemissionsandsequestrationbeingreportedbyoneentityarecomparabletotheestimatesbeingreportedbyothers.Forthispurpose,entitiesshouldusecommonmethodologiesandformatsfor
5Ancillarydataareadditionaldatanecessarytosupporttheselectionofactivitydataandemissionfactorsfortheestimationandcharacterizationofemissions.Dataonsoil,croporanimaltypes,treespecies,operatingconditions,andgeographicallocationareexamplesofancillarydata.
Chapter 2: Considerations When Estimating Agriculture and Forestry GHG Emissions and Removals
2-14
estimatingandreportinginventories.Consequently,ingeneral,themethodsspecifyonemethodforanytechnologyormanagementpractice(i.e.,methodssuggestedinthisreportdonotallowuserstoselectfromamenuofmethods).
Completeness–Themethodsmustaccountforallsourcesandsinks,aswellasallGHGstothegreatestextentpossible.Completenessalsomeansfullcoverageofsourcesandsinksunderthecontroloftheentity.Completenessisanimportantconsiderationtobebalancedwitheaseofuseinreportingappropriatelyforanentitythatmayhaveaminoractivityoranactivitywithseverelylimiteddataavailability.
Accuracy–Arelativemeasureoftheexactnessofanemissionorremovalestimate.Estimatesshouldbeaccurateinthesensethattheyaresystematicallyneitherovernorundertrueemissionsorremovals,asfarascanbejudged,andthatuncertaintiesarereducedasfaraspracticable.
Costeffectiveness–Ameasureoftherelativecostsandbenefitsofadditionaleffortstoimproveinventoryestimatesorreduceuncertainty.Forexamplethereisabalancebetweentherelativecostsandbenefitsofadditionaleffortstoreduceuncertainty.
Easeofuse–Ameasureofthecomplexityoftheuserinterfaceandunderlyingdatarequirements.
Theworkinggroupsdevelopedthefollowingselectioncriteriaforthemitigationpracticesthatcouldbeincludedinthemethods:
1. Thesciencereflectsamechanisticunderstandingofthepractice'sinfluenceonanemissionsource.
2. Publishedresearchsupportsareasonablelevelofrepeatability/consistency(canuseinternationalstudiesifsimilarmanagement,climate,andsoilsasU.S.conditions).
3. Thereisgeneralagreementthatatleastthesignandrangeofresponsesarereasonablywellunderstood.
4. Thereisconsensusoftheauthorsthatthepracticecanbeadequatelyincluded.Toreachconsensus,theauthorsdiscussedissuessuchas:Wouldleavingamitigationpracticeoutmakethereportincomplete?Istherestrongenoughevidencethatthemethodwillholdupforthispracticeforatleastthenextfiveyears?
Thereweremitigationpracticesthatdidnotfulfillthesecriteria,andthosepracticeswerecitedasareasthatrequiremoreresearchinordertofullyunderstandtheeffectofchangesinthepracticetoGHGemissions.TheseresearchgapsareintendedtobecomeareasthatUSDA,non‐governmentalorganizations,universities,andotherresearchinstitutionswillconsiderasimportantareastofocusagricultureandforestryclimate‐changeresearchpriorities.Othertopics,suchasalbedoeffects,werenotconsidered.Currently,withtheexceptionofurbanareas,albedoeffectsarehighlyvariableandaredifficulttoreliablyquantify.
2.4 OverviewofSectors
Thisreportcoversemissionssourcesandsinksfromcroplands/grazinglands,managedwetlands,animalproductionsystems,andforestry,alongwithchangesinlanduse.Figure2‐2canbeusedtohelplandownersdeterminewhichchaptercanbeusedtoestimatetheirGHGsourcesandsinksfromtheirland.
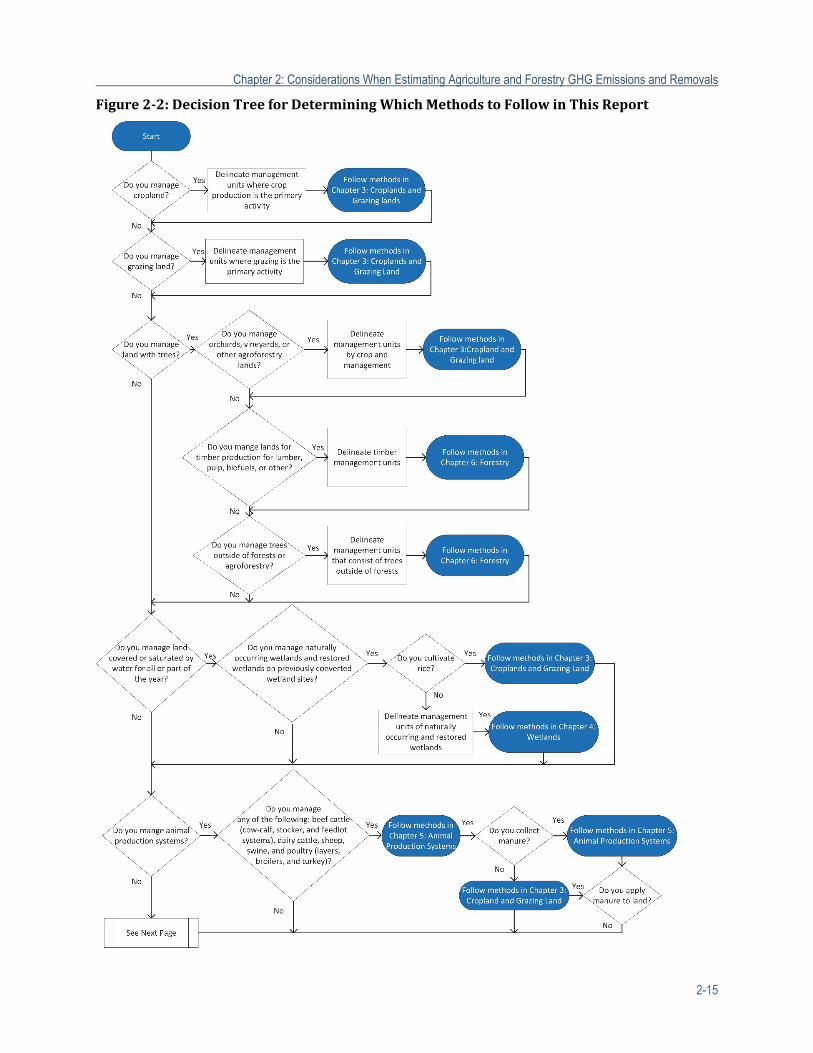
Chapter 2: Considerations When Estimating Agriculture and Forestry GHG Emissions and Removals
2-15
Figure2‐2:DecisionTreeforDeterminingWhichMethodstoFollowinThisReport
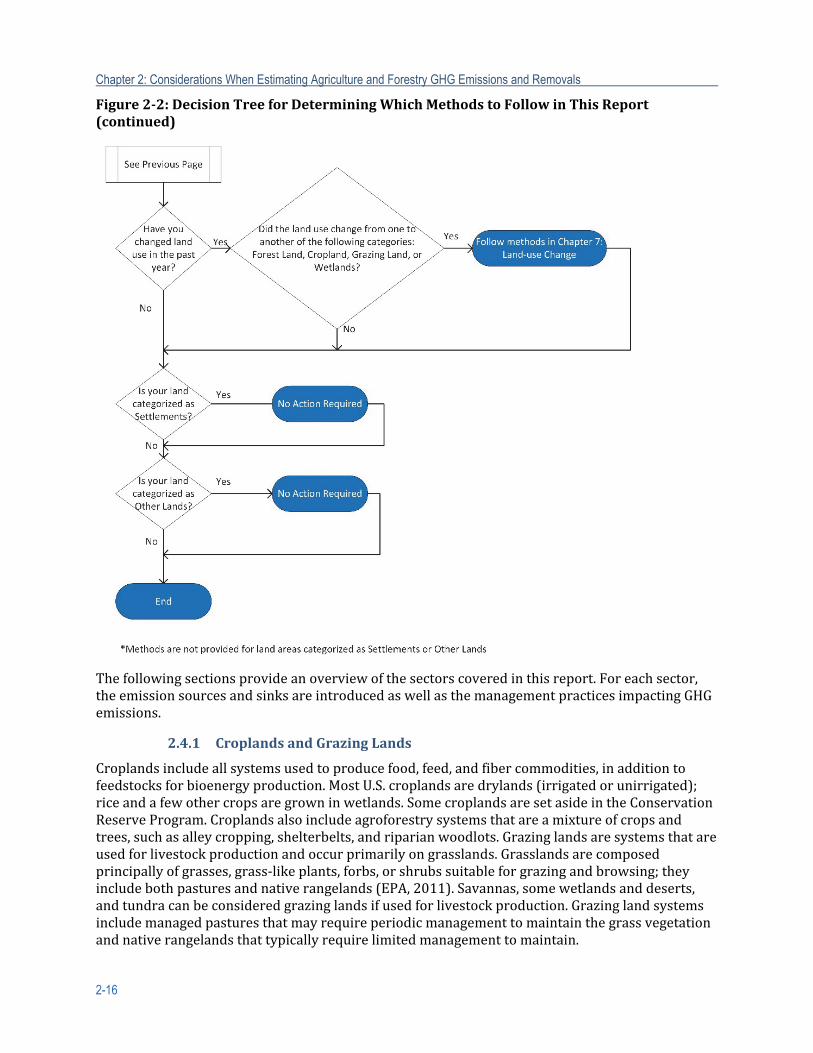
Chapter 2: Considerations When Estimating Agriculture and Forestry GHG Emissions and Removals
2-16
Figure2‐2:DecisionTreeforDeterminingWhichMethodstoFollowinThisReport(continued)
Thefollowingsectionsprovideanoverviewofthesectorscoveredinthisreport.Foreachsector,theemissionsourcesandsinksareintroducedaswellasthemanagementpracticesimpactingGHGemissions.
2.4.1 CroplandsandGrazingLands
Croplandsincludeallsystemsusedtoproducefood,feed,andfibercommodities,inadditiontofeedstocksforbioenergyproduction.MostU.S.croplandsaredrylands(irrigatedorunirrigated);riceandafewothercropsaregrowninwetlands.SomecroplandsaresetasideintheConservationReserveProgram.Croplandsalsoincludeagroforestrysystemsthatareamixtureofcropsandtrees,suchasalleycropping,shelterbelts,andriparianwoodlots.Grazinglandsaresystemsthatareusedforlivestockproductionandoccurprimarilyongrasslands.Grasslandsarecomposedprincipallyofgrasses,grass‐likeplants,forbs,orshrubssuitableforgrazingandbrowsing;theyincludebothpasturesandnativerangelands(EPA,2011).Savannas,somewetlandsanddeserts,andtundracanbeconsideredgrazinglandsifusedforlivestockproduction.Grazinglandsystemsincludemanagedpasturesthatmayrequireperiodicmanagementtomaintainthegrassvegetationandnativerangelandsthattypicallyrequirelimitedmanagementtomaintain.
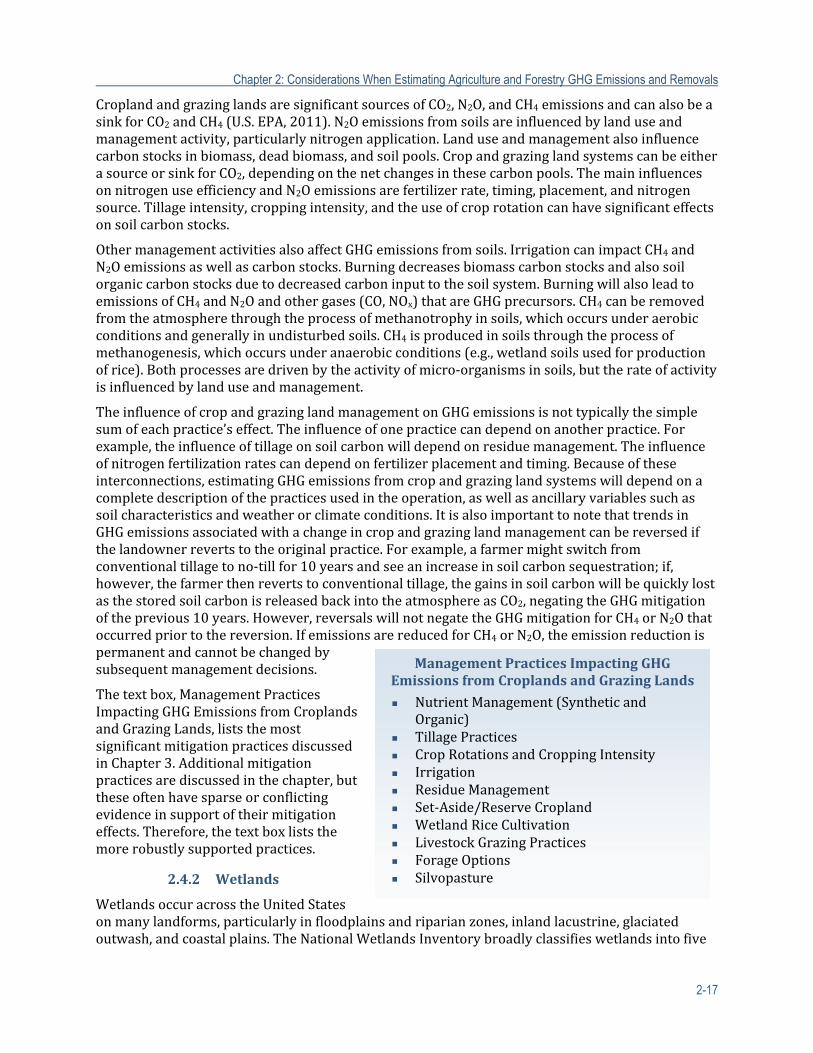
Chapter 2: Considerations When Estimating Agriculture and Forestry GHG Emissions and Removals
2-17
CroplandandgrazinglandsaresignificantsourcesofCO2,N2O,andCH4emissionsandcanalsobeasinkforCO2andCH4(U.S.EPA,2011).N2Oemissionsfromsoilsareinfluencedbylanduseandmanagementactivity,particularlynitrogenapplication.Landuseandmanagementalsoinfluencecarbonstocksinbiomass,deadbiomass,andsoilpools.CropandgrazinglandsystemscanbeeitherasourceorsinkforCO2,dependingonthenetchangesinthesecarbonpools.ThemaininfluencesonnitrogenuseefficiencyandN2Oemissionsarefertilizerrate,timing,placement,andnitrogensource.Tillageintensity,croppingintensity,andtheuseofcroprotationcanhavesignificanteffectsonsoilcarbonstocks.
OthermanagementactivitiesalsoaffectGHGemissionsfromsoils.IrrigationcanimpactCH4andN2Oemissionsaswellascarbonstocks.Burningdecreasesbiomasscarbonstocksandalsosoilorganiccarbonstocksduetodecreasedcarboninputtothesoilsystem.BurningwillalsoleadtoemissionsofCH4andN2Oandothergases(CO,NOx)thatareGHGprecursors.CH4canberemovedfromtheatmospherethroughtheprocessofmethanotrophyinsoils,whichoccursunderaerobicconditionsandgenerallyinundisturbedsoils.CH4isproducedinsoilsthroughtheprocessofmethanogenesis,whichoccursunderanaerobicconditions(e.g.,wetlandsoilsusedforproductionofrice).Bothprocessesaredrivenbytheactivityofmicro‐organismsinsoils,buttherateofactivityisinfluencedbylanduseandmanagement.
TheinfluenceofcropandgrazinglandmanagementonGHGemissionsisnottypicallythesimplesumofeachpractice’seffect.Theinfluenceofonepracticecandependonanotherpractice.Forexample,theinfluenceoftillageonsoilcarbonwilldependonresiduemanagement.Theinfluenceofnitrogenfertilizationratescandependonfertilizerplacementandtiming.Becauseoftheseinterconnections,estimatingGHGemissionsfromcropandgrazinglandsystemswilldependonacompletedescriptionofthepracticesusedintheoperation,aswellasancillaryvariablessuchassoilcharacteristicsandweatherorclimateconditions.ItisalsoimportanttonotethattrendsinGHGemissionsassociatedwithachangeincropandgrazinglandmanagementcanbereversedifthelandownerrevertstotheoriginalpractice.Forexample,afarmermightswitchfromconventionaltillagetono‐tillfor10yearsandseeanincreaseinsoilcarbonsequestration;if,however,thefarmerthenrevertstoconventionaltillage,thegainsinsoilcarbonwillbequicklylostasthestoredsoilcarbonisreleasedbackintotheatmosphereasCO2,negatingtheGHGmitigationoftheprevious10years.However,reversalswillnotnegatetheGHGmitigationforCH4orN2Othatoccurredpriortothereversion.IfemissionsarereducedforCH4orN2O,theemissionreductionispermanentandcannotbechangedbysubsequentmanagementdecisions.
Thetextbox,ManagementPracticesImpactingGHGEmissionsfromCroplandsandGrazingLands,liststhemostsignificantmitigationpracticesdiscussedinChapter3.Additionalmitigationpracticesarediscussedinthechapter,buttheseoftenhavesparseorconflictingevidenceinsupportoftheirmitigationeffects.Therefore,thetextboxliststhemorerobustlysupportedpractices.
2.4.2 Wetlands
WetlandsoccuracrosstheUnitedStatesonmanylandforms,particularlyinfloodplainsandriparianzones,inlandlacustrine,glaciatedoutwash,andcoastalplains.TheNationalWetlandsInventorybroadlyclassifieswetlandsintofive
ManagementPracticesImpactingGHGEmissionsfromCroplandsandGrazingLands
NutrientManagement(SyntheticandOrganic)
TillagePractices CropRotationsandCroppingIntensity Irrigation ResidueManagement Set‐Aside/ReserveCropland WetlandRiceCultivation LivestockGrazingPractices ForageOptions Silvopasture
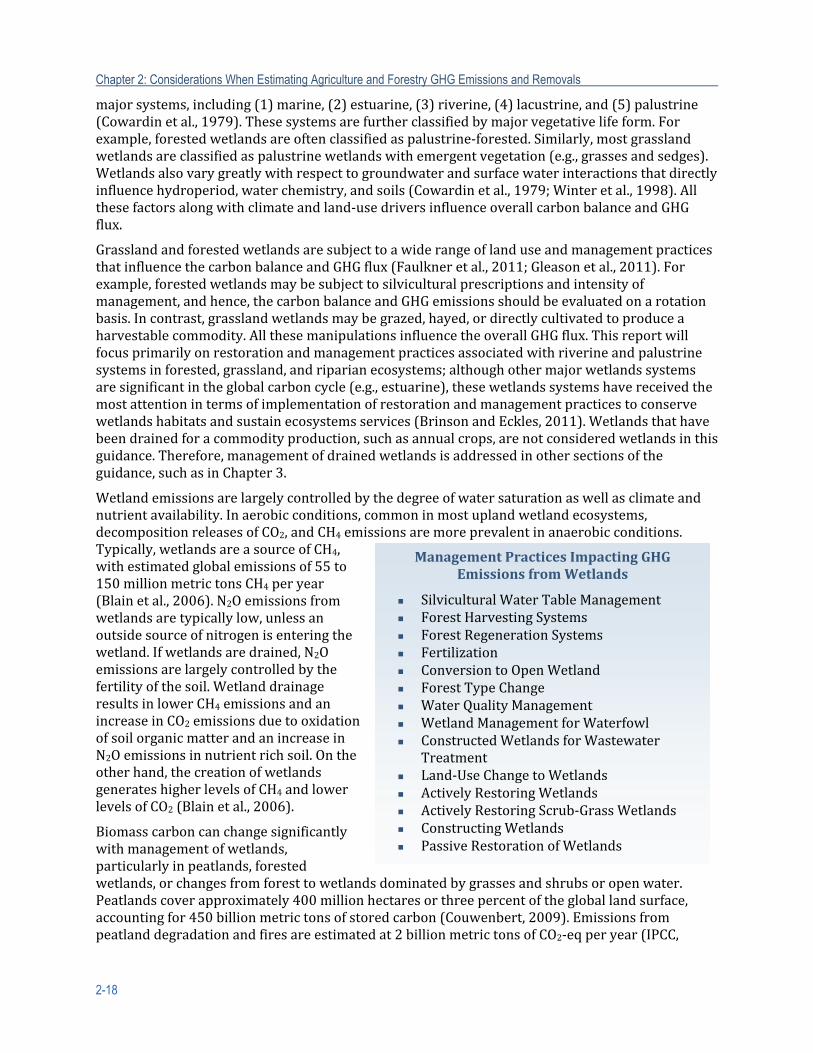
Chapter 2: Considerations When Estimating Agriculture and Forestry GHG Emissions and Removals
2-18
majorsystems,including(1)marine,(2)estuarine,(3)riverine,(4)lacustrine,and(5)palustrine(Cowardinetal.,1979).Thesesystemsarefurtherclassifiedbymajorvegetativelifeform.Forexample,forestedwetlandsareoftenclassifiedaspalustrine‐forested.Similarly,mostgrasslandwetlandsareclassifiedaspalustrinewetlandswithemergentvegetation(e.g.,grassesandsedges).Wetlandsalsovarygreatlywithrespecttogroundwaterandsurfacewaterinteractionsthatdirectlyinfluencehydroperiod,waterchemistry,andsoils(Cowardinetal.,1979;Winteretal.,1998).Allthesefactorsalongwithclimateandland‐usedriversinfluenceoverallcarbonbalanceandGHGflux.
GrasslandandforestedwetlandsaresubjecttoawiderangeoflanduseandmanagementpracticesthatinfluencethecarbonbalanceandGHGflux(Faulkneretal.,2011;Gleasonetal.,2011).Forexample,forestedwetlandsmaybesubjecttosilviculturalprescriptionsandintensityofmanagement,andhence,thecarbonbalanceandGHGemissionsshouldbeevaluatedonarotationbasis.Incontrast,grasslandwetlandsmaybegrazed,hayed,ordirectlycultivatedtoproduceaharvestablecommodity.AllthesemanipulationsinfluencetheoverallGHGflux.Thisreportwillfocusprimarilyonrestorationandmanagementpracticesassociatedwithriverineandpalustrinesystemsinforested,grassland,andriparianecosystems;althoughothermajorwetlandssystemsaresignificantintheglobalcarboncycle(e.g.,estuarine),thesewetlandssystemshavereceivedthemostattentionintermsofimplementationofrestorationandmanagementpracticestoconservewetlandshabitatsandsustainecosystemsservices(BrinsonandEckles,2011).Wetlandsthathavebeendrainedforacommodityproduction,suchasannualcrops,arenotconsideredwetlandsinthisguidance.Therefore,managementofdrainedwetlandsisaddressedinothersectionsoftheguidance,suchasinChapter3.
Wetlandemissionsarelargelycontrolledbythedegreeofwatersaturationaswellasclimateandnutrientavailability.Inaerobicconditions,commoninmostuplandwetlandecosystems,decompositionreleasesofCO2,andCH4emissionsaremoreprevalentinanaerobicconditions.Typically,wetlandsareasourceofCH4,withestimatedglobalemissionsof55to150millionmetrictonsCH4peryear(Blainetal.,2006).N2Oemissionsfromwetlandsaretypicallylow,unlessanoutsidesourceofnitrogenisenteringthewetland.Ifwetlandsaredrained,N2Oemissionsarelargelycontrolledbythefertilityofthesoil.WetlanddrainageresultsinlowerCH4emissionsandanincreaseinCO2emissionsduetooxidationofsoilorganicmatterandanincreaseinN2Oemissionsinnutrientrichsoil.Ontheotherhand,thecreationofwetlandsgenerateshigherlevelsofCH4andlowerlevelsofCO2(Blainetal.,2006).
Biomasscarboncanchangesignificantlywithmanagementofwetlands,particularlyinpeatlands,forestedwetlands,orchangesfromforesttowetlandsdominatedbygrassesandshrubsoropenwater.Peatlandscoverapproximately400millionhectaresorthreepercentofthegloballandsurface,accountingfor450billionmetrictonsofstoredcarbon(Couwenbert,2009).Emissionsfrompeatlanddegradationandfiresareestimatedat2billionmetrictonsofCO2‐eqperyear(IPCC,
ManagementPracticesImpactingGHGEmissionsfromWetlands
SilviculturalWaterTableManagement ForestHarvestingSystems ForestRegenerationSystems Fertilization ConversiontoOpenWetland ForestTypeChange WaterQualityManagement WetlandManagementforWaterfowl ConstructedWetlandsforWastewater
Treatment Land‐UseChangetoWetlands ActivelyRestoringWetlands ActivelyRestoringScrub‐GrassWetlands ConstructingWetlands PassiveRestorationofWetlands
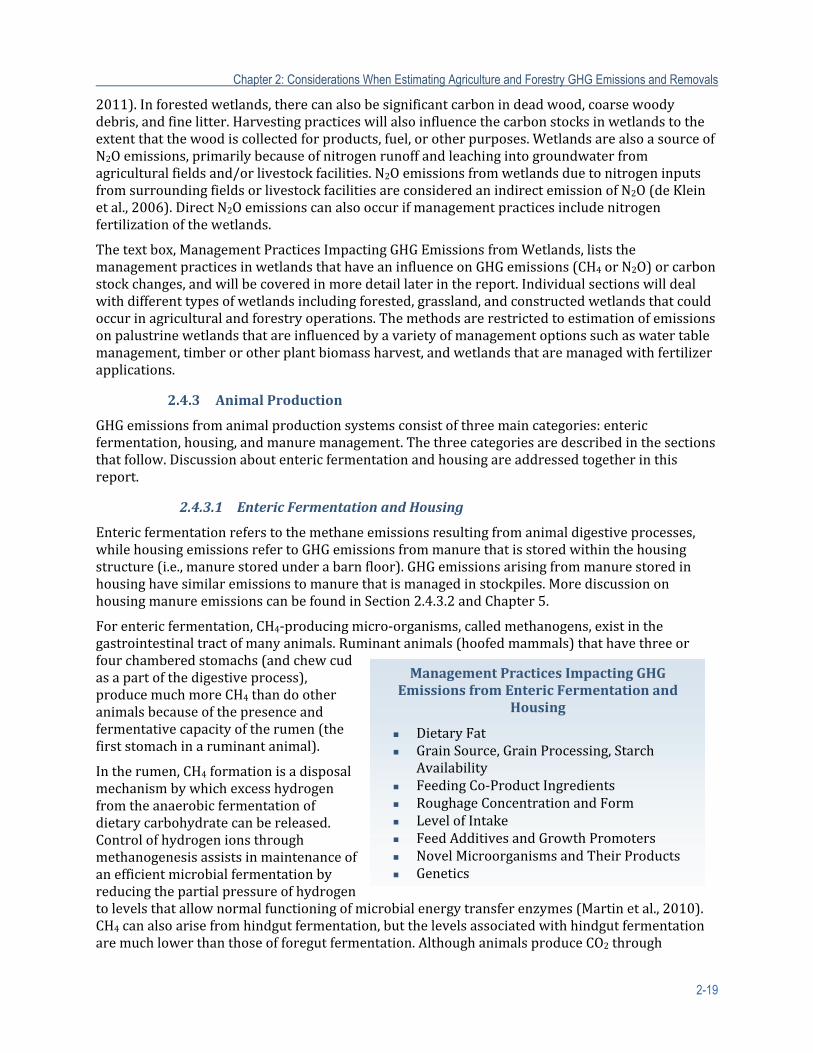
Chapter 2: Considerations When Estimating Agriculture and Forestry GHG Emissions and Removals
2-19
2011).Inforestedwetlands,therecanalsobesignificantcarbonindeadwood,coarsewoodydebris,andfinelitter.Harvestingpracticeswillalsoinfluencethecarbonstocksinwetlandstotheextentthatthewoodiscollectedforproducts,fuel,orotherpurposes.WetlandsarealsoasourceofN2Oemissions,primarilybecauseofnitrogenrunoffandleachingintogroundwaterfromagriculturalfieldsand/orlivestockfacilities.N2OemissionsfromwetlandsduetonitrogeninputsfromsurroundingfieldsorlivestockfacilitiesareconsideredanindirectemissionofN2O(deKleinetal.,2006).DirectN2Oemissionscanalsooccurifmanagementpracticesincludenitrogenfertilizationofthewetlands.
Thetextbox,ManagementPracticesImpactingGHGEmissionsfromWetlands,liststhemanagementpracticesinwetlandsthathaveaninfluenceonGHGemissions(CH4orN2O)orcarbonstockchanges,andwillbecoveredinmoredetaillaterinthereport.Individualsectionswilldealwithdifferenttypesofwetlandsincludingforested,grassland,andconstructedwetlandsthatcouldoccurinagriculturalandforestryoperations.Themethodsarerestrictedtoestimationofemissionsonpalustrinewetlandsthatareinfluencedbyavarietyofmanagementoptionssuchaswatertablemanagement,timberorotherplantbiomassharvest,andwetlandsthataremanagedwithfertilizerapplications.
2.4.3 AnimalProduction
GHGemissionsfromanimalproductionsystemsconsistofthreemaincategories:entericfermentation,housing,andmanuremanagement.Thethreecategoriesaredescribedinthesectionsthatfollow.Discussionaboutentericfermentationandhousingareaddressedtogetherinthisreport.
2.4.3.1 EntericFermentationandHousing
Entericfermentationreferstothemethaneemissionsresultingfromanimaldigestiveprocesses,whilehousingemissionsrefertoGHGemissionsfrommanurethatisstoredwithinthehousingstructure(i.e.,manurestoredunderabarnfloor).GHGemissionsarisingfrommanurestoredinhousinghavesimilaremissionstomanurethatismanagedinstockpiles.MorediscussiononhousingmanureemissionscanbefoundinSection2.4.3.2andChapter5.
Forentericfermentation,CH4‐producingmicro‐organisms,calledmethanogens,existinthegastrointestinaltractofmanyanimals.Ruminantanimals(hoofedmammals)thathavethreeorfourchamberedstomachs(andchewcudasapartofthedigestiveprocess),producemuchmoreCH4thandootheranimalsbecauseofthepresenceandfermentativecapacityoftherumen(thefirststomachinaruminantanimal).
Intherumen,CH4formationisadisposalmechanismbywhichexcesshydrogenfromtheanaerobicfermentationofdietarycarbohydratecanbereleased.Controlofhydrogenionsthroughmethanogenesisassistsinmaintenanceofanefficientmicrobialfermentationbyreducingthepartialpressureofhydrogentolevelsthatallownormalfunctioningofmicrobialenergytransferenzymes(Martinetal.,2010).CH4canalsoarisefromhindgutfermentation,butthelevelsassociatedwithhindgutfermentationaremuchlowerthanthoseofforegutfermentation.AlthoughanimalsproduceCO2through
ManagementPracticesImpactingGHGEmissionsfromEntericFermentationand
Housing
DietaryFat GrainSource,GrainProcessing,Starch
Availability FeedingCo‐ProductIngredients RoughageConcentrationandForm LevelofIntake FeedAdditivesandGrowthPromoters NovelMicroorganismsandTheirProducts Genetics
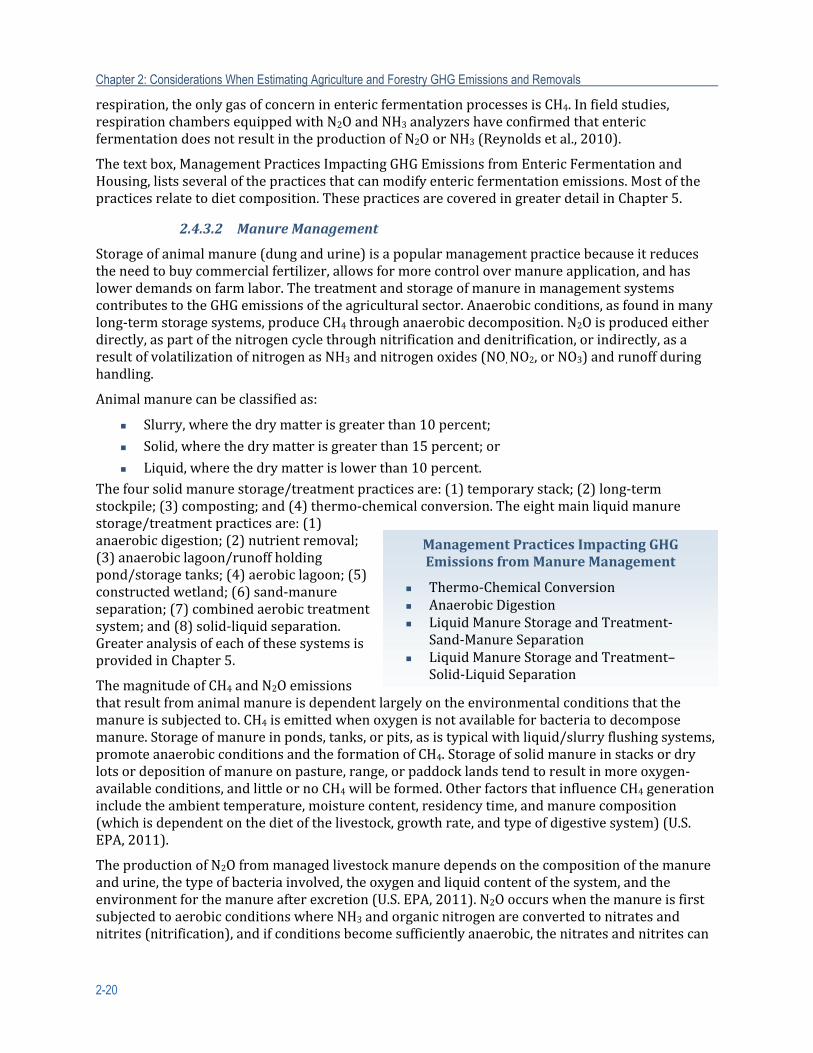
Chapter 2: Considerations When Estimating Agriculture and Forestry GHG Emissions and Removals
2-20
respiration,theonlygasofconcerninentericfermentationprocessesisCH4.Infieldstudies,respirationchambersequippedwithN2OandNH3analyzershaveconfirmedthatentericfermentationdoesnotresultintheproductionofN2OorNH3(Reynoldsetal.,2010).
Thetextbox,ManagementPracticesImpactingGHGEmissionsfromEntericFermentationandHousing,listsseveralofthepracticesthatcanmodifyentericfermentationemissions.Mostofthepracticesrelatetodietcomposition.ThesepracticesarecoveredingreaterdetailinChapter5.
2.4.3.2 ManureManagement
Storageofanimalmanure(dungandurine)isapopularmanagementpracticebecauseitreducestheneedtobuycommercialfertilizer,allowsformorecontrolovermanureapplication,andhaslowerdemandsonfarmlabor.ThetreatmentandstorageofmanureinmanagementsystemscontributestotheGHGemissionsoftheagriculturalsector.Anaerobicconditions,asfoundinmanylong‐termstoragesystems,produceCH4throughanaerobicdecomposition.N2Oisproducedeitherdirectly,aspartofthenitrogencyclethroughnitrificationanddenitrification,orindirectly,asaresultofvolatilizationofnitrogenasNH3andnitrogenoxides(NO,NO2,orNO3)andrunoffduringhandling.
Animalmanurecanbeclassifiedas:
Slurry,wherethedrymatterisgreaterthan10percent;
Solid,wherethedrymatterisgreaterthan15percent;or
Liquid,wherethedrymatterislowerthan10percent.Thefoursolidmanurestorage/treatmentpracticesare:(1)temporarystack;(2)long‐termstockpile;(3)composting;and(4)thermo‐chemicalconversion.Theeightmainliquidmanurestorage/treatmentpracticesare:(1)anaerobicdigestion;(2)nutrientremoval;(3)anaerobiclagoon/runoffholdingpond/storagetanks;(4)aerobiclagoon;(5)constructedwetland;(6)sand‐manureseparation;(7)combinedaerobictreatmentsystem;and(8)solid‐liquidseparation.GreateranalysisofeachofthesesystemsisprovidedinChapter5.
ThemagnitudeofCH4andN2Oemissionsthatresultfromanimalmanureisdependentlargelyontheenvironmentalconditionsthatthemanureissubjectedto.CH4isemittedwhenoxygenisnotavailableforbacteriatodecomposemanure.Storageofmanureinponds,tanks,orpits,asistypicalwithliquid/slurryflushingsystems,promoteanaerobicconditionsandtheformationofCH4.Storageofsolidmanureinstacksordrylotsordepositionofmanureonpasture,range,orpaddocklandstendtoresultinmoreoxygen‐availableconditions,andlittleornoCH4willbeformed.OtherfactorsthatinfluenceCH4generationincludetheambienttemperature,moisturecontent,residencytime,andmanurecomposition(whichisdependentonthedietofthelivestock,growthrate,andtypeofdigestivesystem)(U.S.EPA,2011).
TheproductionofN2Ofrommanagedlivestockmanuredependsonthecompositionofthemanureandurine,thetypeofbacteriainvolved,theoxygenandliquidcontentofthesystem,andtheenvironmentforthemanureafterexcretion(U.S.EPA,2011).N2OoccurswhenthemanureisfirstsubjectedtoaerobicconditionswhereNH3andorganicnitrogenareconvertedtonitratesandnitrites(nitrification),andifconditionsbecomesufficientlyanaerobic,thenitratesandnitritescan
ManagementPracticesImpactingGHGEmissionsfromManureManagement
Thermo‐ChemicalConversion AnaerobicDigestion LiquidManureStorageandTreatment‐
Sand‐ManureSeparation LiquidManureStorageandTreatment–
Solid‐LiquidSeparation
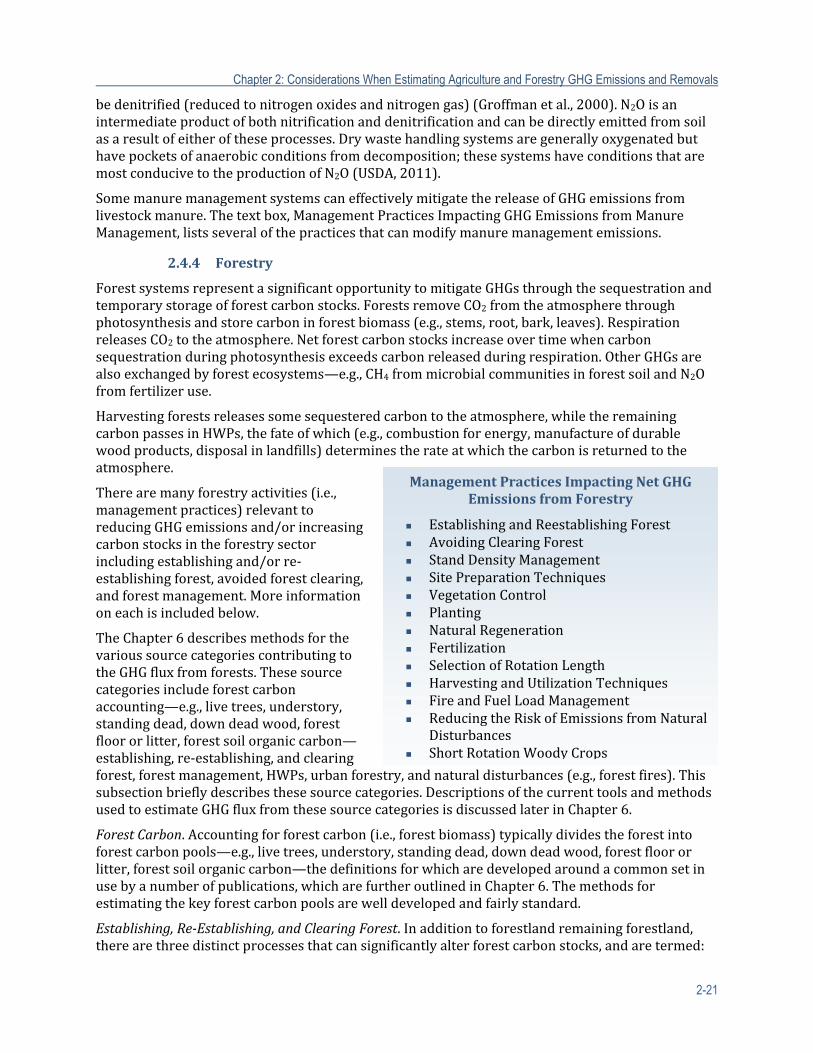
Chapter 2: Considerations When Estimating Agriculture and Forestry GHG Emissions and Removals
2-21
bedenitrified(reducedtonitrogenoxidesandnitrogengas)(Groffmanetal.,2000).N2Oisanintermediateproductofbothnitrificationanddenitrificationandcanbedirectlyemittedfromsoilasaresultofeitheroftheseprocesses.Drywastehandlingsystemsaregenerallyoxygenatedbuthavepocketsofanaerobicconditionsfromdecomposition;thesesystemshaveconditionsthataremostconducivetotheproductionofN2O(USDA,2011).
SomemanuremanagementsystemscaneffectivelymitigatethereleaseofGHGemissionsfromlivestockmanure.Thetextbox,ManagementPracticesImpactingGHGEmissionsfromManureManagement,listsseveralofthepracticesthatcanmodifymanuremanagementemissions.
2.4.4 Forestry
ForestsystemsrepresentasignificantopportunitytomitigateGHGsthroughthesequestrationandtemporarystorageofforestcarbonstocks.ForestsremoveCO2fromtheatmospherethroughphotosynthesisandstorecarboninforestbiomass(e.g.,stems,root,bark,leaves).RespirationreleasesCO2totheatmosphere.Netforestcarbonstocksincreaseovertimewhencarbonsequestrationduringphotosynthesisexceedscarbonreleasedduringrespiration.OtherGHGsarealsoexchangedbyforestecosystems—e.g.,CH4frommicrobialcommunitiesinforestsoilandN2Ofromfertilizeruse.
Harvestingforestsreleasessomesequesteredcarbontotheatmosphere,whiletheremainingcarbonpassesinHWPs,thefateofwhich(e.g.,combustionforenergy,manufactureofdurablewoodproducts,disposalinlandfills)determinestherateatwhichthecarbonisreturnedtotheatmosphere.
Therearemanyforestryactivities(i.e.,managementpractices)relevanttoreducingGHGemissionsand/orincreasingcarbonstocksintheforestrysectorincludingestablishingand/orre‐establishingforest,avoidedforestclearing,andforestmanagement.Moreinformationoneachisincludedbelow.
TheChapter6describesmethodsforthevarioussourcecategoriescontributingtotheGHGfluxfromforests.Thesesourcecategoriesincludeforestcarbonaccounting—e.g.,livetrees,understory,standingdead,downdeadwood,forestfloororlitter,forestsoilorganiccarbon—establishing,re‐establishing,andclearingforest,forestmanagement,HWPs,urbanforestry,andnaturaldisturbances(e.g.,forestfires).Thissubsectionbrieflydescribesthesesourcecategories.DescriptionsofthecurrenttoolsandmethodsusedtoestimateGHGfluxfromthesesourcecategoriesisdiscussedlaterinChapter6.
ForestCarbon.Accountingforforestcarbon(i.e.,forestbiomass)typicallydividestheforestintoforestcarbonpools—e.g.,livetrees,understory,standingdead,downdeadwood,forestfloororlitter,forestsoilorganiccarbon—thedefinitionsforwhicharedevelopedaroundacommonsetinusebyanumberofpublications,whicharefurtheroutlinedinChapter6.Themethodsforestimatingthekeyforestcarbonpoolsarewelldevelopedandfairlystandard.
Establishing,Re‐Establishing,andClearingForest.Inadditiontoforestlandremainingforestland,therearethreedistinctprocessesthatcansignificantlyalterforestcarbonstocks,andaretermed:
ManagementPracticesImpactingNetGHGEmissionsfromForestry
EstablishingandReestablishingForest AvoidingClearingForest StandDensityManagement SitePreparationTechniques VegetationControl Planting NaturalRegeneration Fertilization SelectionofRotationLength HarvestingandUtilizationTechniques FireandFuelLoadManagement ReducingtheRiskofEmissionsfromNatural
Disturbances ShortRotationWoodyCrops
Chapter 2: Considerations When Estimating Agriculture and Forestry GHG Emissions and Removals
2-22
forestestablishment(i.e.,afforestation),forestre‐establishment(i.e.,reforestation),andforestclearing(i.e.,deforestation).Eachoftheseprocessesaltersstocksofcarboninabovegroundandbelowgroundcarbonpools.Establishmentinvolvestheintentionalplanting(orallowingthenaturalprocessofsecondarysuccession)onlandthatwasnotpreviouslyforest.Reestablishmentisreturninglandthatwasrecentlyforestbackintoforest.Ineithercase,establishingforestwillgenerallyincreasethecarbonstocksinabovegroundandbelowgroundcarbonpoolsovertime.Forestclearingistheremovaland/orconversionofaforestsystemintoanotherlandcover(cropland,grazingland,etc.)andisthemostsignificantsourceofGHGemissionsfromforests.
ForestManagement.Forestmanagementdescribestherangeofpracticesemployedbylandownerstomeettheirobjectives(e.g.,timberproduction)whilesatisfyingbiological,economic,andsocialconstraints.Anumberofthepracticesusedbyforestmanagerstoachievetheirobjectivesimpactthecarbondynamicsinforestseitherbyenhancingforestgrowthoracceleratingthelossofforestcarbon.Themanagementpracticesinclude:standdensitymanagement(e.g.,underplanting,pre‐commercialandcommercialthinning);sitepreparationtechniques(e.g.,mechanicalmethods,chemicalapplication,prescribedburning);vegetationcontrol;planting(e.g.,plantingdensity,speciesselection,geneticimprovement);naturalregeneration;fertilization(e.g.,nitrogenandphosphorousfertilizerapplication);selectionofrotationlengths;harvestingandutilizationtechniques;fireandfuelloadmanagement;reducingtheriskofemissionsfrompestsanddisease;andestablishingbiomassplantations(i.e.,shortrotationwoodycrops).
HarvestedWoodProducts.Aproportionofthewoodcarbonharvestedfromforestsendsupinsolidwood,paper,orotherproducts,whicharecollectivelyknownasHWPs.Thecarboncontainedintheseproductscanremainstoredforyearsordecadesdependingontheenduse,andmayeventuallybecombusted,decay,orbedivertedtolandfills.
UrbanForestry.Urban(orurbancommunity)forestdescribesthepopulationoftreeswithinanurbanarea.Urbantreesdirectlystoreatmosphericcarbonaswoodybiomassandalsoaffectlocalclimate(e.g.,secondaryeffects).ThemaintenanceofurbantreesalsoaffectsGHGemissionsinurbanareas(i.e.,indirecteffects).
NaturalDisturbances.Naturaldisturbancesinforestsystems(e.g.,forestfires,pestsanddisease,storms)cansignificantlyimpactforestcarbonstockseitherdirectlyinthecaseofcombustionfromforestfiresorindirectlybyconvertinglivebiomasstodeadorconvertingstandingtreestodowneddeadwoodandacceleratingdecomposition.
Thetextbox,ManagementPracticesImpactingNetGHGEmissionsfromForestry,liststhemanagementpracticesrelevanttoreducingGHGemissionsand/orincreasingcarbonstocksintheforestrysectorincludingestablishingand/orreestablishingforest,avoidingforestclearing,andimprovingforestmanagement.
2.5 Land‐UseChange
Convertinglandparcelsfromoneland‐usecategorytoanothercanhaveasignificanteffectonaparcel’scarbonstocks.Forexample,carbonstockgainscanberealizedbyconvertingcroplandsoilstowetlandsorforestland,whilecarbonstocklossesoftenresultfromaconversionfromforestlandstograzinglands.Aland‐usecategorizationsystemthatisconsistentandcomplete(bothtemporallyandspatially)isneededinordertoassesslanduseandland‐usechangestatuswithinanentity’sboundaries.Allofthelandwithinanentity’sboundaryshouldbeclassifiedaccordingtothefollowingland‐usetypes:cropland,grazingland,forestland,wetland,settlements(e.g.,residentialandcommercialbuildings),andotherland(e.g.,baresoil,rock);seedefinitionsprovidedabove.Individualparcelareasshouldsumtothetotallandareabeforeandafterland‐usechange.
Chapter 2: Considerations When Estimating Agriculture and Forestry GHG Emissions and Removals
2-23
Inmanycases,themethodsproposedtoestimatecontributionstotheGHGfluxresultingfromland‐usechangearethesameasthoseusedtoestimatecarbonstockchangesintheindividualcroplandandgrazingland,wetland,andforestrychapters;although,inspecificcases,guidanceisalsoprovidedonreconcilingcarbon‐stockestimatesbetweendiscretedatasetsandestimationmethods(e.g.,reconcilingforestsoilcarbonestimatesandcroplandsoilcarbonestimatesforland‐usechangefromforestlandtocropland).ThemethodsforquantifyingGHGfluxfromland‐usechangeareintendedforuseattheentityscaleonlandsmanagedtoenhancetheproductionoffood,feed,fiber,andrenewableenergy.Methodsarecurrentlynotprovidedforestimatingemissionsfromenergyusedwhenconvertinglandusefromonecategorytoanother.Neitheraremethodsprovidedforland‐usechangefromsettlementsorthe“otherland”categorytocropland,grazingland,wetlandorforestland.ThemethodshavebeendevelopedforU.S.conditionsandareconsideredapplicabletoagriculturalandforestryproductionsystemsintheUnitedStates.Thissubsectionbrieflydescribesthesourcecategoriescovered.FurtherdescriptionsofthecurrenttoolsandmethodsusedtoestimateGHGfluxfromthesesourcecategoriesarediscussedlaterinChapter7.
AnnualChangeinCarbonStocksinDeadWoodandLitterDuetoLandConversion.Liveanddeadbiomasscarbonstocksandsoilorganiccarbonconstituteasignificantcarbonsinkinmanyforestandagriculturallands.Followingland‐useconversion,theestimationofdeadbiomasscarbonstockchangesduringtransitionperiodsrequiresthattheareasubjecttoland‐usechangeontheentity’soperationbetrackedforthedurationofa20‐yeartransitionperiod.
ChangeinSoilOrganicCarbonStocksforMineralSoils.Soilorganiccarbonstocksareinfluencedbyland‐usechange(Aaldeetal.,2006)duetochangesinproductivitythatinfluencecarboninputsandtochangesinsoilmanagementthatinfluencecarbonoutputs(DavidsonandAckerman,1993;Ogleetal.,2005;PostandKwon,2000).Themostsignificantchangesinsoilorganiccarbonoccurwithland‐usechange,particularlyconversionstocroplands,duetochangesinthedisturbanceregimesandassociatedeffectsonsoilaggregatedynamics(Sixetal.,2000).
SpecificmitigationpracticesarenotexplicitlydescribedinChapter7;however,avoidingland‐useconversionsthatresultinsignificantcarbonlossescouldmitigatenetGHGemissions(e.g.,avoidingtheconversionofforestlandstograzinglands).
2.6 Uncertainty
QuantifyingtheuncertaintyofGHGemissionsandreductionsfromagricultureandforestrypracticesisanimportantaspectofdecisionmakingforfarmersandlandownersastheuncertaintyrangeforeachGHGestimatecommunicatesourlevelofconfidencethattheestimatereflectstheactualbalanceofGHGexchangebetweenthebiosphereandtheatmosphere.Inparticular,afarm,ranch,orforestlandownermaybemoreinclinedtoinvestinmanagementpracticesthatreducenetGHGemissionsiftheuncertaintyrangeforanestimateislow,meaningthathigherconfidenceintheestimatesexists.Thisreportpresentstheapproachforaccountingfortheuncertaintyintheestimatednetemissionsbasedonthemethodspresentedinthisreport.6AMonteCarloapproach
6TheIPCCGoodPracticeGuidance(IPCC,2000)recommendstwoapproaches—Tier1andTier2—fordevelopingquantitativeestimatesofuncertaintyforemissionsestimatesforsourcecategories.TheTier1methoduseserrorpropagationequations.Theseequationscombinetheuncertaintyassociatedwiththeactivitydataandtheuncertaintyassociatedwiththeemission(orother)factors.Thisapproachisappropriatewhereemissions(orremovals)areestimatedastheproductofactivitydataandanemissionfactororasthesumofindividualsub‐sourcecategoryvalues.TheTier2methodutilizestheMonteCarloStochasticSimulationtechnique.Usingthistechnique,anestimateofemission(orremoval)foraparticularsourcecategoryisgeneratedmanytimesviaanuncertaintymodel,resultinginanapproximatePDFfortheestimate.
Chapter 2: Considerations When Estimating Agriculture and Forestry GHG Emissions and Removals
2-24
wasselectedasthemethodforestimatingtheuncertaintyaroundtheoutputsfromthemethodologiesinthisreport,asitiscurrentlythemostcomprehensive,soundmethodavailabletoassesstheuncertaintyattheentityscale.Limitationsanddatagapsexist;however,asnewdatabecomeavailable,themethodcanbeimprovedovertime.ImplementationofaMonteCarloanalysisiscomplicatedandrequirestheuseofastatisticaltooltoproduceaprobabilitydensityfunction(PDF)7aroundtheGHGemissionsestimate.8Fromtheprobabilitydensityfunction,theuncertaintyestimatecanbederivedandreported.
Chapter2References
Aalde,H.,P.Gonzalez,M.Gytarski,T.Krug,etal.2006.Chapter2:Genericmethodologiesapplicabletomultipleland‐usecategories.In2006IPCCGuidelinesforNationalGreenhouseGasInventories,S.Eggleston,L.Buendia,K.Miwa,T.NgaraandK.Tanabe(eds.).Japan:IGES.
Blain,D.,C.Row,J.Alm,K.Byrne,etal.2006.2006IPCCGuidelinesforNationalGreenhouseGasInventories,PreparedbytheNationalGreenhouseGasInventoriesProgramme,Wetlands:Volume4,Chapter7:IntergovernmentalPanelonClimateChange.http://www.ipcc‐nggip.iges.or.jp/public/2006gl/pdf/4_Volume4/V4_07_Ch7_Wetlands.pdf.
Brinson,M.M.,andS.D.Eckles.2011.U.S.DepartmentofAgricultureconservationprogramandpracticeeffectsonwetlandecosystemservices:asynthesis.EcologicalApplications,21(sp1):S116‐S127.
Couwenbert,J.2009.Emissionfactorsformanagedpeatsoils(organicsoils,histosols).AnanalysisofIPCCdefaultvalues..Greifswald,Germany:WetlandsInternational.
Cowardin,L.M.,V.Carter,F.C.Golet,andE.T.LaRoe.1979.ClassificationofwetlandsanddeepwaterhabitatsoftheUnitedStates.(FWS/OBS‐79/31).
Davidson,E.,andI.Ackerman.1993.Changesinsoilcarboninventoriesfollowingcultivationofpreviouslyuntilledsoils.Biogeochemistry,20(3):161‐193.
deKlein,C.,R.S.A.Novoa,S.Ogle,K.A.Smith,etal.2006.Chapter11:N2Oemissionsfrommanagedsoil,andCO2emissionsfromlimeandureaapplication.In2006IPCCguidelinesfornationalgreenhousegasinventories,Vol.4:Agriculture,forestryandotherlanduse,S.Eggleston,L.Buendia,K.Miwa,T.NgaraandK.Tanabe(eds.).Kanagawa,Japan:IGES.
Faulkner,S.,W.Barrow,B.Keeland,S.Walls,etal.2011.EffectsofconservationpracticesonwetlandecosystemservicesintheMississippiAlluvialValley.EcologicalApplications,21(sp1):S31‐S48.
Gleason,R.A.,N.H.Euliss,B.A.Tangen,M.K.Laubhan,etal.2011.USDAconservationprogramandpracticeeffectsonwetlandecosystemservicesinthePrairiePotholeRegion.EcologicalApplications,21(sp1):S65‐S81.
Wheresufficientandreliableuncertaintydatafortheinputvariablesareavailable,theTier2methodisthepreferredoption.
7TheintegralofaPDFoveragivenintervalofvaluesistheprobabilityforarandomvariabletotakeonsomevalueintheinterval.Thatis,thePDFisafunctiongivingprobability“densities”anditsintegralgivesprobabilities.AnarrowerPDFforanestimateindicatessmallervariancearoundthecentral/mostlikelyvalue,i.e.,ahigherprobabilityofthevaluetobeclosertothecentral/mostlikelyvalue.Theuncertaintyforsuchanestimateislower.
8GiventhecomplexityofMonteCarloanalysisandthenecessityforatool,theapproachpresentedhereisnotintendedfordevelopmentbyalandowner,ratheritisintendedforuseindevelopingatoolthatalandownerwouldusetoassessuncertaintyestimates.
Chapter 2: Considerations When Estimating Agriculture and Forestry GHG Emissions and Removals
2-25
Groffman,P.M.,A.J.Gold,andK.Addy.2000.Nitrousoxideproductioninriparianzonesanditsimportancetonationalemissioninventories.Chemosphere:GlobalChangeScience,2(3):291‐299.
IPCC.1997.Revised1996IPCCGuidelinesforNationalGreenhouseGasInventories,PreparedbytheNationalGreenhouseGasInventoriesProgramme.Bracknell,UK:IntergovernmentalPanelonClimateChange.http://www.ipcc‐nggip.iges.or.jp/public/gl/invs1.html.
IPCC.2000.GoodPracticeGuidanceandUncertaintyManagementinNationalGreenhouseGasInventories.http://www.ipcc‐nggip.iges.or.jp/public/gp/english/index.html.
IPCC.2006.2006IPCCGuidelinesforNationalGreenhouseGasInventories,PreparedbytheNationalGreenhouseGasInventoriesProgramme.EditedbyH.S.Eggleston,L.Buendia,K.Miwa,T.NgaraandK.Tanabe.Japan:IGES.http://www.ipcc‐nggip.iges.or.jp/public/2006gl/vol4.html.
IPCC.2007.ContributionofWorkingGroupsI,IIandIIItotheFourthAssessmentReportoftheIntergovernmentalPanelonClimateChangeCoreWritingTeam.Geneva,Switzerland:IntergovernmentalPanelonClimateChange.
IPCC.2011.IPCCExpertMeetingonHWP,WetlandsandSoilN2O.Geneval,Switzerland.Martin,C.,D.P.Morgavi,andM.Doreau.2010.Methanemitigationinruminants:frommicrobeto
thefarmscale.Animal,4:351‐365.Ogle,S.M.,F.J.Breidt,andK.Paustian.2005.Agriculturalmanagementimpactsonsoilorganic
carbonstorageundermoistanddryclimaticconditionsoftemperateandtropicalregions.Biogeochemistry,72(1):87–121.
Post,W.M.,andK.C.Kwon.2000.SoilCarbonSequestrationandLand‐UseChange:ProcessesandPotential.GlobalChangeBiology,6:317‐327.
Reynolds,C.K.,J.A.N.Mills,L.A.Crompton,D.I.Givens,etal.2010.Ruminantnutritionregimestoreducegreenhousegasemissionsindairycows.InEnergyandProteinmetabolismandnutrition,G.M.Crovetto(ed.).
Six,J.,E.T.Elliot,andK.Paustian.2000.Soilmacroaggregateturnoverandmicroaggregateformation:amechanismforCsequestrationunderno‐tillageagriculture.SoilBiol.Biochem.,32:2099‐2103.
Smith,W.B.,P.D.Miles,C.H.Perry,andS.A.Pugh.2009.ForestResourcesoftheUnitedStates,2007.Washington,DC:U.S.DepartmentofAgricultureForestService.
U.S.EPA.2011.InventoryofU.S.GreenhouseGasEmissionsandSinks:1990‐2009.Washington,DC:U.S.EnvironmentalProtectionAgency.
USDA.2011.U.S.AgricultureandForestGreenhouseGasInventory:1990‐2008.Washington,DC:U.S.DepartmentofAgriculture.
Winter,T.C.,J.W.Harvey,andO.L.Franke.1998.Groundwaterandsurfacewater:asingleresource:U.S.GeologicalSurvey.

Chapter 2: Considerations When Estimating Agriculture and Forestry GHG Emissions and Removals
2-26
Thispageisintentionallyleftblank.
Authors:StephenM.Ogle,ColoradoStateUniversity(LeadAuthor)PaulR.Adler,USDAAgriculturalResearchServiceJayBreidt,ColoradoStateUniversityStephenDelGrosso,USDAAgriculturalResearchServiceJustinDerner,USDAAgriculturalResearchServiceAlanFranzluebbers,USDAAgriculturalResearchServiceMarkLiebig,USDAAgriculturalResearchServiceBruceLinquist,UniversityofCalifornia,DavisPhilRobertson,MichiganStateUniversityMicheleSchoeneberger,USDAForestServiceJohanSix,UniversityofCalifornia,Davis;SwissFederalInstituteofTechnology,ETH‐ZurichChrisvanKessel,UniversityofCalifornia,DavisRodVenterea,USDAAgriculturalResearchServiceTristramWest,PacificNorthwestNationalLaboratory
Contents:
3 QuantifyingGreenhouseGasSourcesandSinksinCroplandandGrazingLandSystems..... .........................................................................................................................................................................3‐4
3.1 Overview...........................................................................................................................................................3‐53.1.1 OverviewofManagementPracticesandResultingGHGEmissions...........3‐63.1.2 SystemBoundariesandTemporalScale..............................................................3‐103.1.3 SummaryofSelectedMethods/ModelsSourcesofData...............................3‐103.1.4 OrganizationofChapter/Roadmap........................................................................3‐11
3.2 CroplandManagement..............................................................................................................................3‐123.2.1 ManagementInfluencingGHGEmissionsinUplandSystems.....................3‐123.2.2 ManagementInfluencingGHGEmissionsinFloodedCroppingSystems........
...............................................................................................................................................3‐253.2.3 Land‐UseChangetoCropland..................................................................................3‐28
3.3 GrazingLandManagement......................................................................................................................3‐293.3.1 ManagementActivityInfluencingGHGEmissions...........................................3‐303.3.2 Land‐UseChangetoGrazingLands........................................................................3‐36
3.4 Agroforestry..................................................................................................................................................3‐373.4.1 CarbonStocks..................................................................................................................3‐393.4.2 NitrousOxide...................................................................................................................3‐413.4.3 Methane.............................................................................................................................3‐413.4.4 ManagementInteractions...........................................................................................3‐42
Chapter 3
Quantifying Greenhouse Gas Sources and Sinks in Cropland and Grazing Land Systems
Chapter 3: Quantifying Greenhouse Gas Sources and Sinks in Cropland and Grazing Land Systems
3-2
3.5 EstimationMethods...................................................................................................................................3‐423.5.1 BiomassCarbonStockChanges...............................................................................3‐433.5.2 LitterCarbonStockChanges.....................................................................................3‐493.5.3 SoilCarbonStockChanges.........................................................................................3‐493.5.4 SoilNitrousOxide..........................................................................................................3‐583.5.5 MethaneUptakebySoils.............................................................................................3‐743.5.6 MethaneandNitrousOxidefromFloodedRiceCultivation.........................3‐773.5.7 CO2fromLiming.............................................................................................................3‐833.5.8 Non‐CO2EmissionsfromBiomassBurning........................................................3‐863.5.9 CO2fromUreaFertilizerApplications...................................................................3‐90
3.6 SummaryofResearchGapsforCropandGrazingLandManagement..................................3‐92Appendix3‐A:SoilN2OModelingFrameworkSpecifications...............................................................3‐97
3‐A.1DescriptionofProcess‐BasedModels.....................................................................3‐993‐A.2EmpiricalScalarsforBaseEmissionRates.........................................................3‐1063‐A.3Practice‐BasedScalingFactors................................................................................3‐108
Appendix3‐B:GuidanceforCropsNotIncludedintheDAYCENTModel....................................3‐113Chapter3References..........................................................................................................................................3‐116
Ogle,S.M.,P.R.Adler,F.J.Breidt,S.DelGrosso,J.Derner,A.Franzluebbers,M.Liebig,B.Linquist,G.P.Robertson,M.Schoeneberger,J.Six,C.vanKessel,R.Venterea,T.West,2014.Chapter3:QuantifyingGreenhouseGasSourcesandSinksinCroplandandGrazingLandSystems.InQuantifyingGreenhouseGasFluxesinAgricultureandForestry:MethodsforEntity‐ScaleInventory.TechnicalBulletinNumber1939.OfficeoftheChiefEconomist,U.S.DepartmentofAgriculture,Washington,DC.606pages.July2014.Eve,M.,D.Pape,M.Flugge,R.Steele,D.Man,M.Riley‐Gilbert,andS.Biggar,Eds.
USDAisanequalopportunityproviderandemployer.
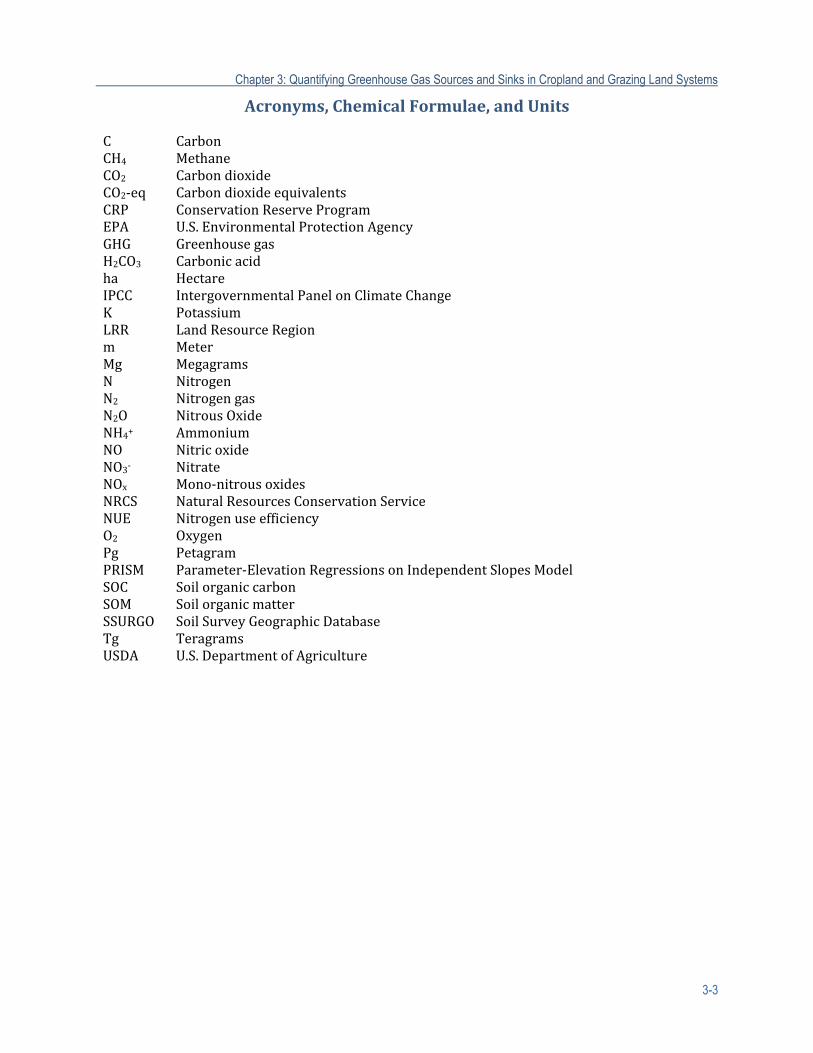
Chapter 3: Quantifying Greenhouse Gas Sources and Sinks in Cropland and Grazing Land Systems
3-3
Acronyms,ChemicalFormulae,andUnits
C CarbonCH4 MethaneCO2 CarbondioxideCO2‐eq CarbondioxideequivalentsCRP ConservationReserveProgramEPA U.S.EnvironmentalProtectionAgencyGHG GreenhousegasH2CO3 Carbonicacidha HectareIPCC IntergovernmentalPanelonClimateChangeK PotassiumLRR LandResourceRegionm MeterMg MegagramsN NitrogenN2 NitrogengasN2O NitrousOxideNH4+ AmmoniumNO NitricoxideNO3‐ NitrateNOx Mono‐nitrousoxidesNRCS NaturalResourcesConservationServiceNUE NitrogenuseefficiencyO2 OxygenPg PetagramPRISM Parameter‐ElevationRegressionsonIndependentSlopesModelSOC SoilorganiccarbonSOM SoilorganicmatterSSURGO SoilSurveyGeographicDatabaseTg TeragramsUSDA U.S.DepartmentofAgriculture

Chapter 3: Quantifying Greenhouse Gas Sources and Sinks in Cropland and Grazing Land Systems
3-4
Thispageisintentionallyleftblank.
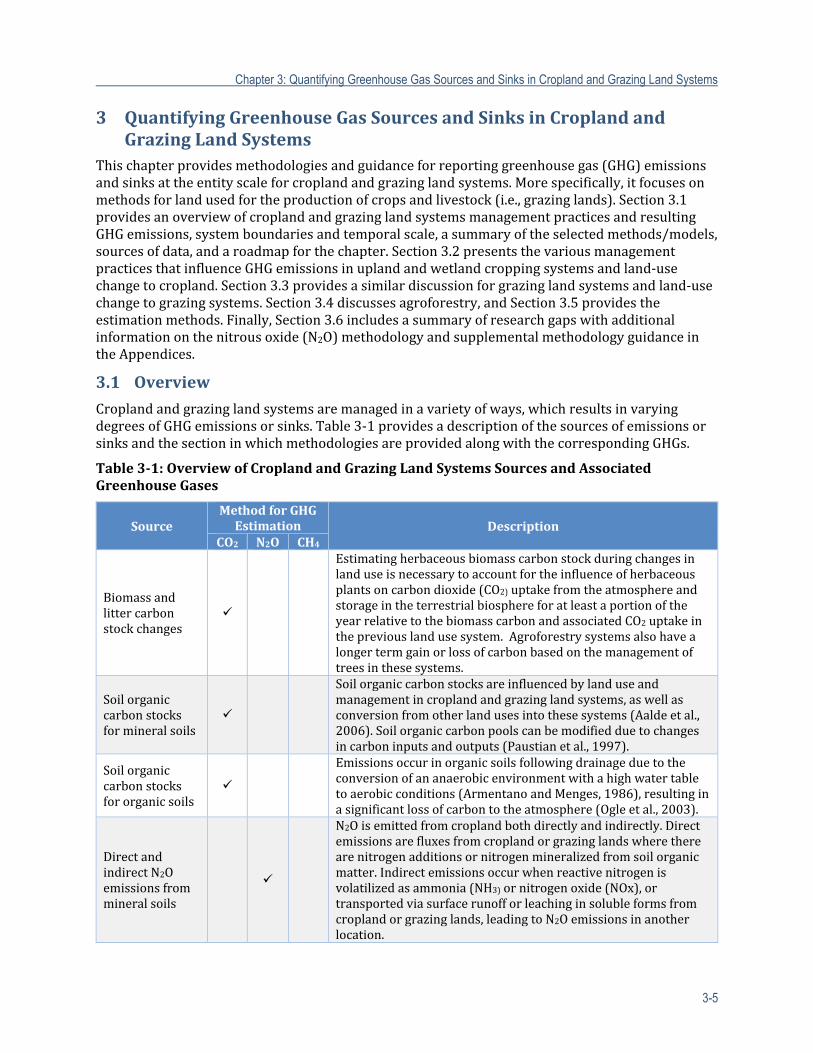
Chapter 3: Quantifying Greenhouse Gas Sources and Sinks in Cropland and Grazing Land Systems
3-5
3 QuantifyingGreenhouseGasSourcesandSinksinCroplandandGrazingLandSystems
Thischapterprovidesmethodologiesandguidanceforreportinggreenhousegas(GHG)emissionsandsinksattheentityscaleforcroplandandgrazinglandsystems.Morespecifically,itfocusesonmethodsforlandusedfortheproductionofcropsandlivestock(i.e.,grazinglands).Section3.1providesanoverviewofcroplandandgrazinglandsystemsmanagementpracticesandresultingGHGemissions,systemboundariesandtemporalscale,asummaryoftheselectedmethods/models,sourcesofdata,andaroadmapforthechapter.Section3.2presentsthevariousmanagementpracticesthatinfluenceGHGemissionsinuplandandwetlandcroppingsystemsandland‐usechangetocropland.Section3.3providesasimilardiscussionforgrazinglandsystemsandland‐usechangetograzingsystems.Section3.4discussesagroforestry,andSection3.5providestheestimationmethods.Finally,Section3.6includesasummaryofresearchgapswithadditionalinformationonthenitrousoxide(N2O)methodologyandsupplementalmethodologyguidanceintheAppendices.
3.1 Overview
Croplandandgrazinglandsystemsaremanagedinavarietyofways,whichresultsinvaryingdegreesofGHGemissionsorsinks.Table3‐1providesadescriptionofthesourcesofemissionsorsinksandthesectioninwhichmethodologiesareprovidedalongwiththecorrespondingGHGs.
Table3‐1:OverviewofCroplandandGrazingLandSystemsSourcesandAssociatedGreenhouseGases
SourceMethodforGHGEstimation Description
CO2 N2O CH4
Biomassandlittercarbonstockchanges
Estimating herbaceousbiomasscarbon stockduringchangesinlanduseisnecessarytoaccountfortheinfluenceofherbaceousplantsoncarbondioxide(CO2)uptakefromtheatmosphereandstorageintheterrestrialbiosphereforatleastaportionoftheyearrelativetothebiomasscarbonandassociatedCO2uptakeinthepreviouslandusesystem.Agroforestrysystemsalsohavealongertermgainorlossofcarbonbasedonthemanagementoftreesinthesesystems.
Soilorganiccarbonstocksformineralsoils
Soilorganiccarbon stocksareinfluencedbylanduseandmanagementincroplandandgrazinglandsystems,aswellasconversionfromotherlandusesintothesesystems(Aaldeetal.,2006).Soilorganiccarbonpoolscanbemodifiedduetochangesincarboninputsandoutputs(Paustianetal.,1997).
Soilorganiccarbonstocksfororganicsoils
Emissionsoccurinorganicsoilsfollowingdrainageduetotheconversionofananaerobicenvironmentwithahighwatertabletoaerobicconditions(ArmentanoandMenges,1986),resultinginasignificantlossofcarbontotheatmosphere(Ogleetal.,2003).
DirectandindirectN2Oemissionsfrommineralsoils
N2Oisemittedfromcroplandbothdirectlyandindirectly.Directemissionsarefluxesfromcroplandorgrazinglandswheretherearenitrogenadditionsornitrogenmineralizedfromsoilorganicmatter.Indirectemissionsoccurwhenreactivenitrogenisvolatilizedasammonia(NH3)ornitrogenoxide(NOx),ortransportedviasurfacerunofforleachinginsolubleformsfromcroplandorgrazinglands,leadingtoN2Oemissionsinanotherlocation.
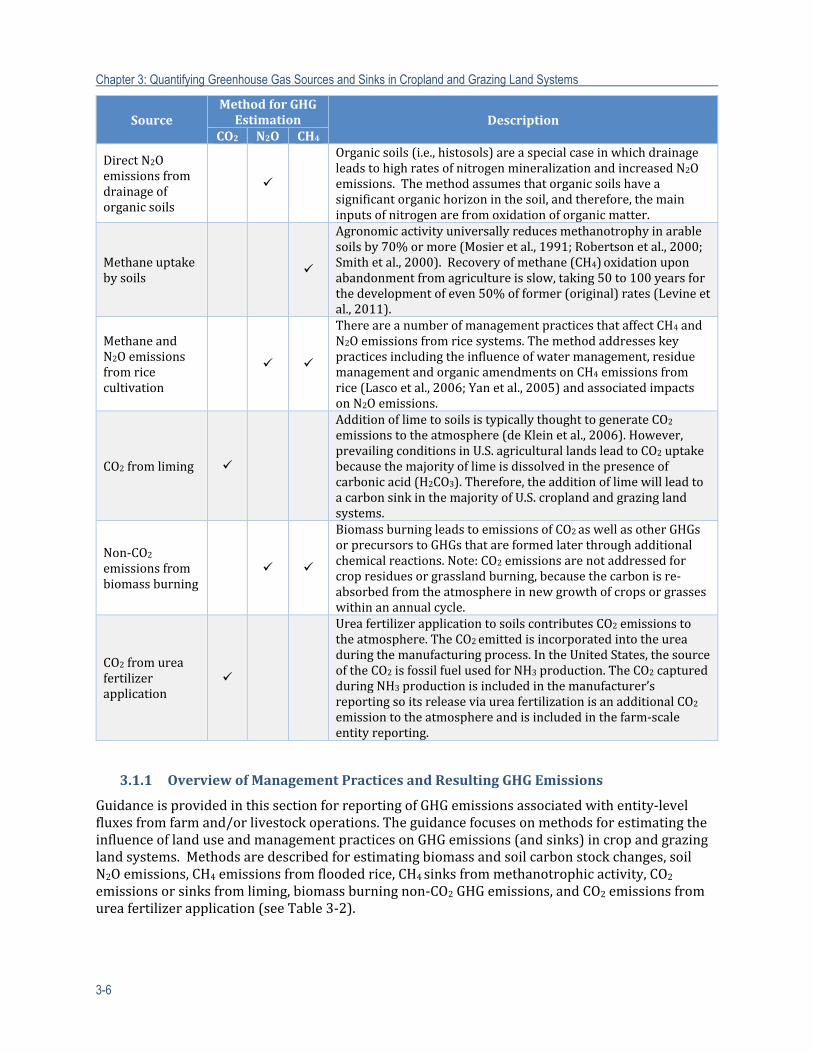
Chapter 3: Quantifying Greenhouse Gas Sources and Sinks in Cropland and Grazing Land Systems
3-6
SourceMethodforGHGEstimation Description
CO2 N2O CH4
DirectN2Oemissionsfromdrainageoforganicsoils
Organicsoils (i.e.,histosols) areaspecialcaseinwhichdrainageleadstohighratesofnitrogenmineralizationandincreasedN2Oemissions.Themethodassumesthatorganicsoilshaveasignificantorganichorizoninthesoil,andtherefore,themaininputsofnitrogenarefromoxidationoforganicmatter.
Methaneuptakebysoils
Agronomicactivityuniversallyreducesmethanotrophyinarablesoilsby70%ormore(Mosieretal.,1991;Robertsonetal.,2000;Smithetal.,2000).Recoveryofmethane(CH4)oxidationuponabandonmentfromagricultureisslow,taking50to100yearsforthedevelopmentofeven50%offormer(original)rates(Levineetal.,2011).
MethaneandN2Oemissionsfromricecultivation
ThereareanumberofmanagementpracticesthataffectCH4 andN2Oemissionsfromricesystems.Themethodaddresseskeypracticesincludingtheinfluenceofwatermanagement,residuemanagementandorganicamendmentsonCH4emissionsfromrice(Lascoetal.,2006;Yanetal.,2005)andassociatedimpactsonN2Oemissions.
CO2fromliming
AdditionoflimetosoilsistypicallythoughttogenerateCO2emissionstotheatmosphere(deKleinetal.,2006).However,prevailingconditionsinU.S.agriculturallandsleadtoCO2uptakebecausethemajorityoflimeisdissolvedinthepresenceofcarbonicacid(H2CO3).Therefore,theadditionoflimewillleadtoacarbonsinkinthemajorityofU.S.croplandandgrazinglandsystems.
Non‐CO2emissionsfrombiomassburning
BiomassburningleadstoemissionsofCO2aswellasotherGHGsorprecursorstoGHGsthatareformedlaterthroughadditionalchemicalreactions.Note:CO2emissionsarenotaddressedforcropresiduesorgrasslandburning,becausethecarbonisre‐absorbedfromtheatmosphereinnewgrowthofcropsorgrasseswithinanannualcycle.
CO2fromureafertilizerapplication
UreafertilizerapplicationtosoilscontributesCO2emissions totheatmosphere.TheCO2emittedisincorporatedintotheureaduringthemanufacturingprocess.IntheUnitedStates,thesourceoftheCO2isfossilfuelusedforNH3production.TheCO2capturedduringNH3productionisincludedinthemanufacturer’sreportingsoitsreleaseviaureafertilizationisanadditionalCO2emissiontotheatmosphereandisincludedinthefarm‐scaleentityreporting.
3.1.1 OverviewofManagementPracticesandResultingGHGEmissions
GuidanceisprovidedinthissectionforreportingofGHGemissionsassociatedwithentity‐levelfluxesfromfarmand/orlivestockoperations.TheguidancefocusesonmethodsforestimatingtheinfluenceoflanduseandmanagementpracticesonGHGemissions(andsinks)incropandgrazinglandsystems.Methodsaredescribedforestimatingbiomassandsoilcarbonstockchanges,soilN2Oemissions,CH4emissionsfromfloodedrice,CH4sinksfrommethanotrophicactivity,CO2emissionsorsinksfromliming,biomassburningnon‐CO2GHGemissions,andCO2emissionsfromureafertilizerapplication(seeTable3‐2).
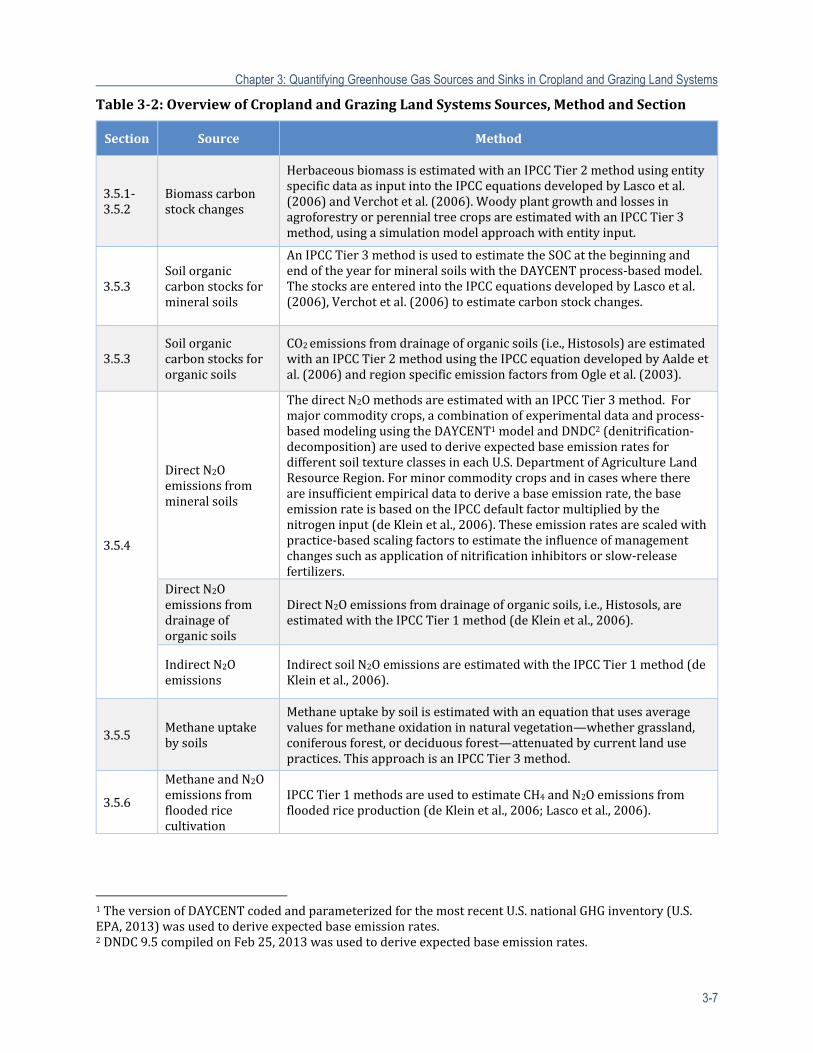
Chapter 3: Quantifying Greenhouse Gas Sources and Sinks in Cropland and Grazing Land Systems
3-7
Table3‐2:OverviewofCroplandandGrazingLandSystemsSources,MethodandSection
Section Source Method
3.5.1‐3.5.2
Biomasscarbonstockchanges
HerbaceousbiomassisestimatedwithanIPCCTier2methodusingentityspecificdataasinputintotheIPCCequationsdevelopedbyLascoetal.(2006)andVerchotetal.(2006).WoodyplantgrowthandlossesinagroforestryorperennialtreecropsareestimatedwithanIPCCTier3method,usingasimulationmodelapproachwithentityinput.
3.5.3Soilorganiccarbonstocksformineralsoils
AnIPCCTier3methodisusedtoestimatetheSOCatthebeginningandendoftheyearformineralsoilswiththeDAYCENTprocess‐basedmodel.ThestocksareenteredintotheIPCCequationsdevelopedbyLascoetal.(2006),Verchotetal.(2006)toestimatecarbonstockchanges.
3.5.3Soilorganiccarbonstocksfororganicsoils
CO2emissionsfromdrainageoforganicsoils(i.e.,Histosols)areestimatedwithanIPCCTier2methodusingtheIPCCequationdevelopedbyAaldeetal.(2006)andregionspecificemissionfactorsfromOgleetal.(2003).
3.5.4
DirectN2Oemissionsfrommineralsoils
ThedirectN2OmethodsareestimatedwithanIPCCTier3method.Formajorcommoditycrops,acombinationofexperimentaldataandprocess‐basedmodelingusingtheDAYCENT1modelandDNDC2(denitrification‐decomposition)areusedtoderiveexpectedbaseemissionratesfordifferentsoiltextureclassesineachU.S.DepartmentofAgricultureLandResourceRegion.Forminorcommoditycropsandincaseswherethereareinsufficientempiricaldatatoderiveabaseemissionrate,thebaseemissionrateisbasedontheIPCCdefaultfactormultipliedbythenitrogeninput(deKleinetal.,2006).Theseemissionratesarescaledwithpractice‐basedscalingfactorstoestimatetheinfluenceofmanagementchangessuchasapplicationofnitrificationinhibitorsorslow‐releasefertilizers.
DirectN2Oemissionsfromdrainageoforganicsoils
DirectN2Oemissionsfromdrainageoforganicsoils,i.e.,Histosols,areestimatedwiththeIPCCTier1method(deKleinetal.,2006).
IndirectN2Oemissions
IndirectsoilN2OemissionsareestimatedwiththeIPCCTier1method(deKleinetal.,2006).
3.5.5Methaneuptakebysoils
Methaneuptakebysoilisestimatedwithanequationthatusesaveragevaluesformethaneoxidationinnaturalvegetation—whethergrassland,coniferousforest,ordeciduousforest—attenuatedbycurrentlandusepractices.ThisapproachisanIPCCTier3method.
3.5.6
MethaneandN2Oemissionsfromfloodedricecultivation
IPCCTier1methodsareusedtoestimateCH4andN2Oemissionsfromfloodedriceproduction(deKleinetal.,2006;Lascoetal.,2006).
1TheversionofDAYCENTcodedandparameterizedforthemostrecentU.S.nationalGHGinventory(U.S.EPA,2013)wasusedtoderiveexpectedbaseemissionrates.2DNDC9.5compiledonFeb25,2013wasusedtoderiveexpectedbaseemissionrates.
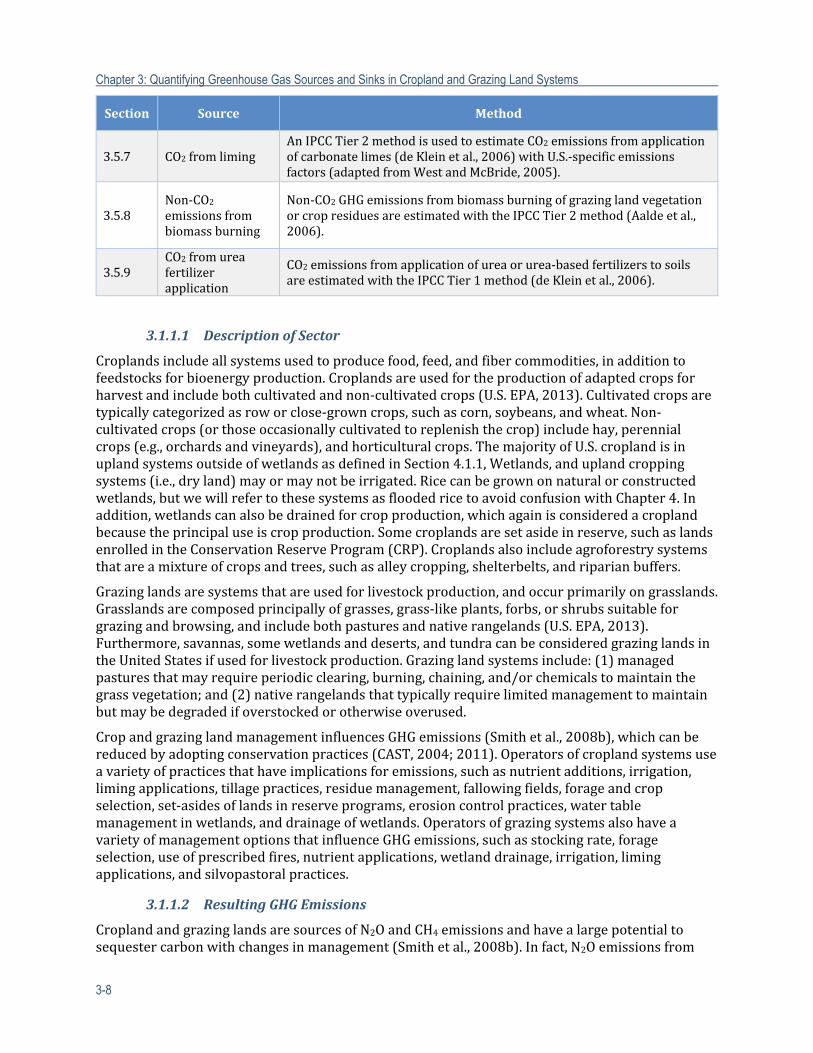
Chapter 3: Quantifying Greenhouse Gas Sources and Sinks in Cropland and Grazing Land Systems
3-8
Section Source Method
3.5.7 CO2fromlimingAnIPCCTier2methodisusedtoestimateCO2emissionsfromapplicationofcarbonatelimes(deKleinetal.,2006)withU.S.‐specificemissionsfactors(adaptedfromWestandMcBride,2005).
3.5.8Non‐CO2emissionsfrombiomassburning
Non‐CO2GHGemissionsfrombiomassburningofgrazinglandvegetationorcropresiduesareestimatedwiththeIPCCTier2method(Aaldeetal.,2006).
3.5.9CO2fromureafertilizerapplication
CO2emissionsfromapplicationofureaorurea‐basedfertilizerstosoilsareestimatedwiththeIPCCTier1method(deKleinetal.,2006).
3.1.1.1 DescriptionofSector
Croplandsincludeallsystemsusedtoproducefood,feed,andfibercommodities,inadditiontofeedstocksforbioenergyproduction.Croplandsareusedfortheproductionofadaptedcropsforharvestandincludebothcultivatedandnon‐cultivatedcrops(U.S.EPA,2013).Cultivatedcropsaretypicallycategorizedasroworclose‐growncrops,suchascorn,soybeans,andwheat.Non‐cultivatedcrops(orthoseoccasionallycultivatedtoreplenishthecrop)includehay,perennialcrops(e.g.,orchardsandvineyards),andhorticulturalcrops.ThemajorityofU.S.croplandisinuplandsystemsoutsideofwetlandsasdefinedinSection4.1.1,Wetlands,anduplandcroppingsystems(i.e.,dryland)mayormaynotbeirrigated.Ricecanbegrownonnaturalorconstructedwetlands,butwewillrefertothesesystemsasfloodedricetoavoidconfusionwithChapter4.Inaddition,wetlandscanalsobedrainedforcropproduction,whichagainisconsideredacroplandbecausetheprincipaluseiscropproduction.Somecroplandsaresetasideinreserve,suchaslandsenrolledintheConservationReserveProgram(CRP).Croplandsalsoincludeagroforestrysystemsthatareamixtureofcropsandtrees,suchasalleycropping,shelterbelts,andriparianbuffers.
Grazinglandsaresystemsthatareusedforlivestockproduction,andoccurprimarilyongrasslands.Grasslandsarecomposedprincipallyofgrasses,grass‐likeplants,forbs,orshrubssuitableforgrazingandbrowsing,andincludebothpasturesandnativerangelands(U.S.EPA,2013).Furthermore,savannas,somewetlandsanddeserts,andtundracanbeconsideredgrazinglandsintheUnitedStatesifusedforlivestockproduction.Grazinglandsystemsinclude:(1)managedpasturesthatmayrequireperiodicclearing,burning,chaining,and/orchemicalstomaintainthegrassvegetation;and(2)nativerangelandsthattypicallyrequirelimitedmanagementtomaintainbutmaybedegradedifoverstockedorotherwiseoverused.
CropandgrazinglandmanagementinfluencesGHGemissions(Smithetal.,2008b),whichcanbereducedbyadoptingconservationpractices(CAST,2004;2011).Operatorsofcroplandsystemsuseavarietyofpracticesthathaveimplicationsforemissions,suchasnutrientadditions,irrigation,limingapplications,tillagepractices,residuemanagement,fallowingfields,forageandcropselection,set‐asidesoflandsinreserveprograms,erosioncontrolpractices,watertablemanagementinwetlands,anddrainageofwetlands.OperatorsofgrazingsystemsalsohaveavarietyofmanagementoptionsthatinfluenceGHGemissions,suchasstockingrate,forageselection,useofprescribedfires,nutrientapplications,wetlanddrainage,irrigation,limingapplications,andsilvopastoralpractices.
3.1.1.2 ResultingGHGEmissions
CroplandandgrazinglandsaresourcesofN2OandCH4emissionsandhavealargepotentialtosequestercarbonwithchangesinmanagement(Smithetal.,2008b).Infact,N2Oemissionsfrom
Chapter 3: Quantifying Greenhouse Gas Sources and Sinks in Cropland and Grazing Land Systems
3-9
managementofagriculturalsoilsareakeysourceofGHGemissionsintheUnitedStates(U.S.EPA,2013).N2Oemissionsresultfromtheprocessesofnitrificationanddenitrification,whichareinfluencedbylanduseandmanagementactivity.Landuseandmanagementcanalsoinfluencecarbonstocksinbiomass,deadbiomass,andsoilpools.Carbonstockscanbeenhancedorreduceddependingonlanduseandmanagementpractices(CAST,2004;IPCC,2000;Smithetal.,2008b).Consequently,cropandgrazinglandsystemscanbeeitherasourceorsinkforCO2,dependingonthenetchangesinbiomass,deadbiomass,andsoilcarbon.Burningbiomassisapracticethatcaninitiallyreducebiomasscarbonstockbutcanprovidesufficientstimulustoenhanceensuingecosystemcarbonstorage.Ingeneralthough,burningcausesadeclineinsoilorganiccarbonstocksduetolossofcarboninputfromplantlitterandroots.Burningwillalsoleadtonon‐CO2GHGemissions—CH4,N2O,andotheraerosolgases(CO,NOx)—thatcanbelaterconvertedtoGHGsintheatmosphereoroncedepositedontosoil.
SoilsincropandgrazinglandsystemscanalsobeasourceorsinkforCH4dependingontheconditionsandmanagementofsoil.CH4canberemovedfromtheatmospherethroughtheprocessofmethanotrophyinsoils.Methanotrophyoccursunderaerobicconditionsandiscommoninmostsoilsthatdonothavestandingwater.Incontrast,CH4isproducedinsoilsthroughtheprocessofmethanogenesis,whichoccursunderanaerobicconditions(e.g.,soilswithstandingwatersuchassoilsusedforfloodedriceproduction).Bothoftheseprocessesaredrivenbytheactivityofmicroorganismsinsoils,andtheirrateofactivityisinfluencedbylanduseandmanagement.
3.1.1.3 Managementinteractions
TheinfluenceofcropandgrazinglandmanagementonGHGemissionsisnottypicallythesimplesumofeachpractice’seffect.Theinfluenceofonepracticecandependonanotherpractice.Forexample,theinfluenceoftillageonsoilcarbonwilldependonresiduemanagement.Theinfluenceofnitrogenfertilizationratescandependontheapplicationofnitrificationinhibitors.AvarietyofexamplesisgiveninSection3.2andSection3.3.Becauseofthesesynergies,estimatingGHGemissionsfromcropandgrazinglandsystemswilldependonacompletedescriptionofthepracticesusedintheoperation,includingpastmanagementtocapturelegacyeffectsonGHGemissions,aswellasancillaryvariablessuchassoilcharacteristicsandweatherorclimateconditions.
3.1.1.4 RiskofReversals
AnytrendinGHGemissionsassociatedwithachangeincropandgrazinglandmanagementcanbereversediftheoperatorrevertstotheoriginalpractice.ReversalswillnotnegatetheGHGmitigationforCH4orN2Othatoccurredpriortothereversion.IfemissionsarereducedforCH4orN2O,theemissionreductionispermanentandcannotbechangedbysubsequentmanagementdecisions.
Reversalscanoccurwithcarbonsequestrationinbiomassandsoils.CO2canberemovedfromtheatmospherethroughcropandforageproductionandsequesteredinbiomassorsoilsfollowingtheadoptionofaconservationpractice,suchasno‐till(CAST,2004;USDA,2011).Ifcarbonisincreasinginthebiomassorsoils,thenthepracticeeffectivelyreducestheamountofCO2intheatmosphere.However,netCO2canbereturnedtotheatmosphereifthereisareversioninmanagementtothepreviouspracticethatcausesadeclineinthebiomassorsoilcarbonstocks.Forexample,enrollmentoflandintheCRPhasincreasedtheamountofcarboninsoils(i.e.,increaseinsoilcarbonstock),andthusmitigatesCO2emissionstotheatmosphereassociatedwithotheremissionssources,suchasfossilfuelcombustion(USDA,2011).However,tillingformerCRPlandswillleadtoadeclineinsoilcarbonstocks,therebyreversingthetrendforCO2uptakefromtheatmosphereandleadingtoCO2emissiontotheatmosphere.Ingeneral,GHGemissionsinvolving
Chapter 3: Quantifying Greenhouse Gas Sources and Sinks in Cropland and Grazing Land Systems
3-10
carbonstocksinbiomass,deadbiomass,orsoilscanbeconsideredreversible,dependingonfuturemanagementdecisions.Consequently,reversalsinvolvingcarbonstocksnotonlyaffectfutureemissiontrends,butalsohaveconsequencesonpastmitigationeffortsbyreturningpreviouslysequesteredCO2totheatmosphere.
3.1.2 SystemBoundariesandTemporalScale
Systemboundariesaredefinedbythecoverage,extent,andresolutionoftheestimationmethods.ThecoverageofmethodsinthisguidancecanbeusedtoestimateGHGemissionsourcesthatoccuronfarmandranchoperations,includingemissionsassociatedwithbiomasscarbon,littercarbon,andsoilscarbonstockchanges;CH4andN2Ofluxesfromsoils;emissionsfromburningofbiomass;andCO2fluxesassociatedwithureafertilizationandadditionofcarbonatelimes.GHGemissionsalsooccurwithproductionofmanagementinputs,suchassyntheticfertilizersandpesticides,andtheprocessingoffood,feed,fiber,andbioenergyfeedstockproductsfollowingharvest;butmethodsarenotprovidedtoestimatetheseemissions.Moreover,emissionsfromenergyuse,includingthoseoccurringontheentity’soperation,arenotaddressedinthemethods.
Themethodsprovidedforcropandgrazinglandsystemshavearesolutionofanindividualparceloflandorfieldandincludethespatialextentofallfieldsintheentity’soperation.Fieldsareareasusedtoproduceasinglecroporrotationofcrops,ortoraiselivestock(i.e.,pasture,rangeland).Fieldsareoften,butnotalways,dividedbyfences.Emissionsareestimatedforeachindividualfieldthatisusedforcroplandandgrazinglandontheoperation,andthentheemissionsareaddedtogethertoestimatethetotalemissionsfromthecropandgrazinglandsystemsintheentity’soperation.Thetotalsarethencombinedwithemissionsfromforestandlivestocktodeterminetheoverallemissionsfromtheoperationbasedonthemethodsprovidedinthisguidance.EmissionsareestimatedonanannualbasisforasmanyyearsasneededforGHGemissionsreporting.
3.1.3 SummaryofSelectedMethods/ModelsSourcesofData
TheIntergovernmentalPanelonClimateChange(IPCC)(IPCC,2006)hasdevelopedasystemofmethodologicaltiersrelatedtothecomplexityofdifferentapproachesforestimatingGHGemissions.Tier1representsthesimplestmethods,usingdefaultequationsandemissionfactorsprovidedintheIPCCguidance.Tier2usesdefaultmethods,butemissionfactorsthatarespecifictodifferentregions.Tier3usescountry‐specificestimationmethods,suchasaprocess‐basedmodel.ThemethodsprovidedinthisreportrangefromthesimpleTier1approachestothemostcomplexTier3approaches.Higher‐tiermethodsareexpectedtoreduceuncertaintiesintheemissionestimates,ifsufficientactivitydataandtestingareavailable.
Tier1methodsareusedforestimatingCO2emissionsfromureafertilization,CH4emissionsfromfloodedrice,indirectsoilN2Oemissions,anddirectsoilN2Oemissionsfromdrainedorganicsoils.Thesemethodsarethemostgeneralizedglobally,andlackabilitytocapturespecificconditionsatlocalsites,andconsequentlyhavemoreuncertaintyforestimatingemissionsfromanentity’soperation.SoilN2Oemissions,CO2emissionsorsinksfromliming,biomasscarbonstockchanges,soilcarbonstockchangesfordrainedorganicsoils,andbiomassburningnon‐CO2GHGemissionsallhaveelementsofTier2methods,butmayrelypartlyonemissionfactorsprovidedbytheIPCC(2006).ThesemethodsincorporatesomeinformationaboutconditionsspecifictoU.S.agriculturalsystemsandtheinfluenceonemissionrates,butagainlackspecificityforlocalsiteconditionsinmanycases.SoilcarbonstockchangesformineralsoilsareestimatedusingaTier3methodwithaprocess‐basedsimulationmodel(i.e.,DAYCENT).CH4sinksfrommethanotrophicactivityarealsoestimatedwithaTier3method,duetotheabsenceofIPCCguidanceforestimatinglanduseandmanagementeffectsonCH4uptakeinsoils.TheTier3methodassociatedwithsoilcarbonstockchangesinmineralsoilshasthegreatestpotentialforestimatingtheinfluenceoflocalconditionson
Chapter 3: Quantifying Greenhouse Gas Sources and Sinks in Cropland and Grazing Land Systems
3-11
GHGemissions.Theapplicationhasageneralsetofparametersthathavebeencalibratedacrossanationalsetofexperiments.However,themodeldoesincorporatedriversassociatedwithlocalconditions,includingspecificmanagementpractices,soilcharacteristics,andweatherpatterns,providingestimatesofGHGemissionsthataremorespecifictotheentity’soperation.FutureresearchandrefinementsofthecroplandandgrazinglandmethodswilllikelyincorporatemoreTier3methodsinthefuture,andthusprovideamoreaccurateestimationofGHGemissionsforentityreporting.
Allmethodsincludearangeofdatasourcesfromvaryinglevelsofspecificityonoperation‐specificdatatonationaldatasets.Operation‐specificdatawillneedtobecollectedbytheentity,andgenerallyareactivitydatarelatedtothefarmandlivestockmanagementpractices(e.g.,tillagepractices,grazingpractices,fertilizerusage).Nationaldatasetsarerecommendedforancillarydatarequirementsthatareusedinmethods,suchasclimatedataandsoilcharacteristics.However,theentitydoeshavetheoptiontouseoperation‐specificdataforclimate(i.e.,weatherdata)andsoils.
3.1.4 OrganizationofChapter/Roadmap
Thecroplands/grazinglandsportionofthisreportisorganizedintofourprimarysections.Sections3.2and3.3provideadescriptionofmanagementimpactsonGHGemissionsincropandgrazinglandsystems.Section3.2isfurthersubdividedintosectionsfocusedonuplandagriculture,floodedmanagementforcropproduction,andtheinfluenceofland‐usechange.Section3.3issubdividedintoageneraldescriptionofmanagementpracticesandtheinfluenceofland‐usechange.ThefirsttwosectionsprovidethescientificbasisforhowmanagementpracticesinfluenceGHGemissions.Thesetwosectionsalsodiscussmanagementoptionsthatrequirefurtherstudy.Section3.4providesanoverviewofagroforestrysystems.AgeneraldescriptionofthevariousGHGemissionsandsinksthatresultfrommanagementpracticesandpotentialmanagementinteractionsisprovidedinthissection.
Section3.5describesthemethods.Eachmethodincludesageneraldescription(includingequationsandfactorsifappropriate),activitydatarequirements,ancillarydatarequirements,limitationsofthemethod,anduncertaintiesassociatedwiththeestimation.AsinglemethodisprovidedforeachoftheGHGemissionsources(andsinks),basedonthebestavailablemethodforapplicationinanoperationalsystemforentity‐scalereporting.Asinglemethodwasselectedtoensureconsistencyinemissionestimationbyallreportingentities.Moreadvancedapproachesmaybeadoptedinthefutureasthemethodsmature.
Section3.6providesasummaryofresearchgaps.Thegapshighlightkeyresearchareasthatrequirefurtherstudyforoneoftworeasons.ThefirstreasonisthatapracticelackssufficientevidenceoraclearimpactonGHGemissionsbasedonexistingresearch.Thisgapismostoftenrelatedtoalackofmechanisticunderstandingoftheprocessesinfluencedbythepractice.Thesepracticesmaybeincludedinfuturerevisionstothemethodsiffurtherstudyleadstoaconsensusthatthepracticehasanimpactonemissions.Thesecondreasonforidentifyingtheneedforfurtherstudyisthatthepracticeisincludedinestimationmethods,butthereisneedforfurtherresearchtoreduceuncertainty.Thissecondgapmayinvolvefurthermechanisticstudy,butcouldalsorequirefurthermethodsofdevelopmentorrefinement.
Finally,Appendix3‐AprovidesamorecomprehensivedescriptionofthesoilN2Omodelingframeworkspecifications.Thisappendixincludesadiscussionoftheprocess‐basedmodelsusedinthemethodology;theempiricalscalarsforthebaseemissionrates;andthepractice‐basedscalingfactors.Appendix3‐BprovidesalternativemethodologiesincaseswhereanentityismanagingcropsnotincludedintheDAYCENTmodel.
Chapter 3: Quantifying Greenhouse Gas Sources and Sinks in Cropland and Grazing Land Systems
3-12
3.2 CroplandManagement
HowcroplandismanagedcanhaveasignificanteffectonGHGemissionsandremovals.ThissectionprovidesasummaryofthecurrentstateofthescienceanddescribeshowmanagementpracticesdriveGHGemissionsorsinksinuplandcroplandsystems.
3.2.1 ManagementInfluencingGHGEmissionsinUplandSystems
ThecroplandmanagementpracticespresentedbelowfocusprimarilyonmitigationpotentialforsoilN2O,CH4emissions,andcarbonsequestration.EachsubsectiondescribesthepracticeandtheunderlyingGHGphenomenonthatinfluencemitigationpotential.
3.2.1.1 NutrientManagement(ManufacturedandOrganic)
Nutrientmanagementreferstotheadditionandmanagementofsyntheticandorganicfertilizerstocroplandsoils,primarilytoaugmentthesupplyofnutrientstothecrop.Nitrogenisgenerallythemostimportantnutrientfromanagronomicstandpoint,becauseitisusuallytheprimarynutrientlimitingcropyieldsandoftenmustbeaddedmorefrequentlyandingreateramountsthanothernutrientssuchasphosphorusandpotassium(ERS,2011;RobertsonandVitousek,2009).NitrogenisalsotheprimarynutrientofconcernwithregardtoGHGemissions,becauseoncefertilizernitrogenentersthesoilitcanbedirectlyconvertedtoN2Obysoilbiologicalprocessesand,insomecases,chemicalreactions(FirestoneandDavidson,1989;Kooletal.,2011;Venterea,2007).WhilerelativelylittleofthefertilizernitrogenappliedisconvertedtoN2O,theseemissionsaregenerallyalargecomponentofthetotalGHGbudgetofcroplands(e.g.,Mosieretal.,2005;Robertsonetal.,2000)becauseN2Ohas310timestheglobalwarmingpotentialofCO2(IPCC,2007).Otherformsofnitrogenoriginatingfromfertilizersmayalsobelosttotheenvironment,includingNH3,nitricoxide(NO),andnitrate(NO3‐).Oncetransportedtodownwindordownstreamecosystems,theseothernitrogenspeciescanbeconvertedtoN2O;suchemissionsarereferredtoas“indirect”N2Oemissions(Beaulieuetal.,2011;deKleinetal.,2006).
NutrientmanagementcanalsoaffectGHGemissionsotherthanN2O,mostnotablythesequestrationofcarbonuponmanureadditionandcropresidueretentionoraddition.Theadditionoforganiccarbonamendments,suchasmanureorresidues,canincreasesoilcarbonwithintheboundariesofthelandparcelreceivingtheamendment(Ogleetal.,2005).However,soilcarbonlossesmayoccurfromthesourcefield(Schlesinger,2000)dependingonthemanagement(Izaurraldeetal.,2001).Manufacturednitrogenadditionscanalsoleadtocarbonsequestration(Ladhaetal.,2011)whereadditionsleadtoincreasedresiduereturntosoil.
Fertilizerrate,timing,placement,andformulationstronglyaffectN2Ofluxes.Ingeneral,anypracticethatincreasescropnitrogenuseefficiency(NUE)wouldbeexpectedtoreduceN2Oemissions,becauseappliednitrogenthatistakenupbycropsorcovercropsisnotavailabletothesoilprocessesthatgenerateN2O,atleastintheshortterm;thisalsomaypreventnitrogenleaching.Thus,strategiestoreduceN2OemissionscanalsoreducethelossofNO3‐andotherformsofreactivenitrogenfromcroppingsystems.
However,practicesthatimproveNUEwillnotalwaysreduceN2Oemissions.Differentfertilizerformulations,forexample,canresultindifferentN2OemissionsirrespectiveofNUEeffects(e.g.,GagnonandZiadi,2010;Gagnonetal.,2011).Likewise,bandedfertilizerplacementcanincreaseNUE(e.g.,Yadvinder‐Singhetal.,1994)butalsocanincreaseratherthandecreaseN2Oemissions(e.g.,Engeletal.,2010),andtillagemanagementcanalsoincreaseNUEwithoutreducingN2Oemissions(Grandyetal.,2006).Thus,NUEisgenerallyimportantbutnotbyitselfsufficienttopredictormanageN2Oemissions.Fertilizerrate,timing,placement,andformulationcanaffectNUEandN2Oemissionsindependently.
Chapter 3: Quantifying Greenhouse Gas Sources and Sinks in Cropland and Grazing Land Systems
3-13
FertilizerRate:Morethananyotherfactor,theamountofnitrogenfertilizerappliedtosoilaffectstheamountofN2Oemitted;inmanycasesothernitrogen‐usestrategies(timing,placement,andformulation)providetheirbenefitbyeffectivelyreducingfertilizernitrogenavailableinthesoil.Inthissense,fertilizerrateintegratestheeffectsofmultiplepracticesandisthebasisfortheIPCCTier1N2Oaccountingmethod(deKleinetal.,2006),wherebyN2Oemissionsareassumedtobeasimplefractionofnitrogeninputs.
Irrespectiveofotherpractices,however,fertilizerrateitselfcanberefinedtoreduceN2Oemissionssolongasratesarenotreducedtothepointthatyieldsdecline.Otherwisemarketleakage—theneedtomakeupyieldselsewherewithmoreintensivefertilizeruseandconcomitantN2Oloss—maylimitthebenefitofreducinglocalfertilizerrates.Thequestionthenbecomeswhethernitrogenfertilizerratescanbereducedwithoutreducingyieldsinaparticularfield.Atleastforcorn,recentchangesinrecommendedfertilizerratesformanyMidwestStatessuggestthatthereislatitudeforreducingfertilizernitrogenratesforsomefarmers.Sincethe1970s,mostfertilizernitrogenrecommendationshavebeenbasedonyieldgoals,whichuseexpectedmaximumyieldmultipliedbynitrogenyieldfactorstocalculatefertilizerrecommendations(Stanford,1973).Precedinglegumecrops,manureinputs,andsoilnitrogentestsarethenusedtofurtherrefineorreducerecommendednitrogenapplicationrates(AndraskiandBundy,2002).
Analternativetotheyield‐goalapproachistheMaximumReturntoNitrogenapproach(Sawyeretal.,2006),wherebytherateofnitrogenfertilizerappliedisbasedonthemaximumfertilizerratethatgeneratessufficientadditionalyieldtojustifythefertilizercost.Theratesaredeterminedfromcropnitrogenresponsecurves.Typically(butnotalways)thisrateissignificantlylessthanthatrecommendedbytheyieldgoalapproach.MaximumReturntoNitrogencalculatorsforcornhavebeenadoptedinatleastsevenStatesintheMidwest.Thiscalculatorandsimilardecisionsupporttoolshavethepotentialforreducingtheamountoffertilizernitrogenappliedtocropsandmorepreciselymatchcropnitrogenrequirements,withoutaffectingthenetreturns(Archeretal.,2008),andwithconcomitantdecreasesinN2Oemissions(Millaretal.,2010).
Hundredsoffertilizeradditionexperimentsworldwidehaveshownthattypically0.5to3percentofnitrogenaddedtosoilisemittedasN2O(Bouwmanetal.,2002;Linquistetal.,2011;StehfestandBouwman,2006).Site‐to‐sitevariationiswellrecognizedandistobeexpectedbasedonsoils,climate,andfertilizerpractices—includingrate.Recentevidencesuggeststhatemissionratesmaybeevenhigheratnitrogeninputlevelsthatexceedcropdemand(Hobenetal.,2011;Maetal.,2010;McSwineyandRobertson,2005;VanGroenigenetal.,2010).
FertilizerTiming:Amajorchallengeinmanagingnitrogenfertilizerforcropproductionissynchronizingnitrogenavailabilityinthesoilwiththecrop’sdemandfornitrogen.Ingeneral,cropdemandfornitrogenisminimalearlyinthegrowingseasonandincreasesseveralweeksafterplanting.
Inmanycases,itmaybemostconvenientand/orcost‐effectivefortheproducertoapplynitrogenfertilizerpriortoplantingorsoonafterplantemergence.InmanypartsoftheU.S.CornBelt,however,applicationofnitrogenfertilizercommonlyoccursinthefallpriortothegrowingseason(Biermanetal.,2011;Ribaudoetal.,2011).Intheabsenceofanactiveandwell‐developedrootsystemtoutilizethefertilizernitrogen,thesepracticesincreasethepotentialforsoilmicrobialandchemicalprocessestotransformtheappliednitrogenintoN2OandothermobileformssuchasNO3,whichcancontributetoindirectN2Oemissions.
Improvingthesynchronybetweensoilnitrogenavailabilityandcropnitrogendemandcanbeachievedbyswitchingfromfalltospringnitrogenapplication;applyingnitrogenseveralweeksafterplantingwith“sidedress”fertilizerapplicationsthataretimedtocoincidewithplantgrowthstages;andusingmultiple“split”applicationsdistributedintimeoverthegrowingseason.Eachof
Chapter 3: Quantifying Greenhouse Gas Sources and Sinks in Cropland and Grazing Land Systems
3-14
thesestrategieshasthepotentialtoreduceN2Oemissions,butthisisnotalwaysthecase.Switchingfromfalltospringnitrogenfertilizer,forexample,hasbeenshowntoreduceN2Oemissionsinsomecases(Burtonetal.,2008a;Haoetal.,2001)butnotalways(Burtonetal.,2008a).Similarly,switchingfrompre‐planttopost‐plantapplicationshasbeenshowntoreduceN2Oemissionsinsomestudies(Matsonetal.,1998),butonlypartofthetimeornotatallinotherstudies(Burtonetal.,2008b;Phillipsetal.,2009;Zebarthetal.,2008b).Somestudieshavefoundreducednitrateleaching,whichimpliesreducedindirectN2Oemissions,withfertilizerapplicationlaterintheseason(e.g.,Errebhietal.,1998).
FertilizerPlacement:ThemannerinwhichnitrogenfertilizerisappliedtosoilcanaffectitsavailabilityforcropuptakeandthereforeitssusceptibilitytosoiltransformationandN2Oproduction.ThreeaspectsoffertilizerplacementaresignificanttoN2Oemissions:(1)broadcastapplicationversusbandingwithinthecroprow;(2)thesoildepthtowhichnitrogenisapplied;and(3)addingfertilizeruniformlyacrossafieldversusapplyingataspatiallyvariablerate.
ThereissomeevidencethatapplyingnitrogenfertilizerinnarrowbandscanimprovecropNUE(MalhiandNyborg,1985).However,bandingalsocreateszonesofhighlyconcentratedsoilnitrogen,whichcanincreaseN2Oproductioncomparedwithbroadcastapplications(Engeletal.,2010).OtherstudieshavefoundnodifferencesinN2Oemissionsinbroadcastversusbandedapplications(Burtonetal.,2008a;Sehyetal.,2003).DirectcomparisonsofapplicationdeptheffectsonN2Oemissionshavealsoshowninconsistentresults(e.g.,BreitenbeckandBremner,1986b;Druryetal.,2006;Fujinumaetal.,2011;Hosenetal.,2002;Liuetal.,2006).However,variablerateapplicationusesdifferentnitrogenratesfordifferentareasoffield,basedonexpectedvariationsincropnitrogendemand.Thisisanewtechniquethatappearspromisingbasedonitsabilitytosubstantiallyimprovefertilizeruseefficiencyatthefieldscale(Mamoetal.,2003;Scharfetal.,2005),andatleastoneearlystudyhasshownreducedN2Oemissionswhennitrogenratewasvariedtomatchcropyieldpotential(Sehyetal.,2003).
FertilizerFormulationandAdditives:ThemostcommonlyusedformsofsyntheticnitrogenfertilizerintheUnitedStatesincludeanhydrousammonia(35percentoftotaluse),urea(24percent),andliquidsolutions,includingureaammoniumnitrate(29percent)(ERS,2011).AvailableevidencesuggeststhatN2Oemissionsfollowingapplicationsofanhydrousammoniaaregreaterthanemissionsfollowingbroadcasturea,althoughinsomestudiesthismaybepartlyduetofertilizerplacement.Infivestudies,anhydrousammoniaresultedin40to200percentgreaterN2Oemissionscomparedwithbroadcasturea(BreitenbeckandBremner,1986a;Fujinumaetal.,2011;Thorntonetal.,1996;Ventereaetal.,2005).Onestudy(Burtonetal.,2008a)foundnodifferenceinN2Oemissionsbetweenanhydrousammoniaandbroadcastureawhenbothwereappliedatalowerrate(80kgNha‐1year‐1)comparedwiththeotherstudies(≥120kgNha‐1).Consequently,theremaybeathresholdintheapplicationratebeforethereisasignificanteffectonemissions.
Thechemicalformofnitrogenfertilizerinfluenceslossesofnitrogenfromthreemajorpathways:surfacevolatilization,soilmicrobialprocesses,andNO3‐leaching.Allfertilizersaresusceptibletodenitrificationoncenitrifiedto(orappliedas)NO3‐.Ammonium‐basedfertilizers,includinganhydrousammonia,urea,andorganicsourcessuchasmanure,arealsosusceptibletoN2Olossduringnitrification.Urea,anhydrousammonia,andmanureareadditionallysusceptibletosurfacevolatilizationasNH3undersomeconditions.VolatilizedNH3andleachedNO3‐contributetoindirectN2Oloss.
Chemicaladditiveshavebeendevelopedtoreleasefertilizernitrogenintothesoilmoregraduallyandtodelaythenitrificationofnitrogenfromammonium(NH4+)toNO3‐inordertoimprovethesynchronybetweencropnitrogendemandandsoilnitrogenavailability.Polymer‐coatedureaslowlyreleasesnitrogenwithincreasingsoiltemperatureandwater,andisintendedtomake
Chapter 3: Quantifying Greenhouse Gas Sources and Sinks in Cropland and Grazing Land Systems
3-15
nitrogensupplymoresynchronouswithplantnitrogendemandandreducenitrogenlosses.EffectsonN2Oproduction,however,appearmixed,withsomestudiesshowingreducedN2Oforpolymer‐coatedurea(e.g.,Hyattetal.,2010)andothersshowingnoimpactorevenhigheremissions(Ventereaetal.,2011a).Arecentmeta‐analysisof13studiesofmostlyvolcanicandwetland‐derivedsoilsfoundthatpolymer‐coatedureareducedN2Oemissionsby35percentonaveragecomparedwithconventionalfertilizers,butresultsaredifficulttogeneralizebecausemostofthesoilsincludedintheanalysiswerenottypicalforU.S.croppingsystems(Akiyamaetal.,2010).
Fertilizersformulatedwithnitrificationinhibitorscanpotentiallyreduceemissionsfromnitrificationanddenitrification,aswellasNO3‐leaching.SomeU.S.fieldstudiesshowsubstantialreductionsinN2Oemissionswhenfertilizerswithnitrificationinhibitorsareaddedcomparedwithconventionalfertilizers(e.g.,Halvorsonetal.,2010a),whileothersshowlittleornoimpact(e.g.,ParkinandHatfield,2010a).Ameta‐analysisofsome28studiesworldwidereportedanaveragereductionof38percent(Akiyamaetal.,2010),butagainresultsaredifficulttogeneralizeduetothesmallsamplesizeandsoilsthatarenottypicalofU.S.croppingsystems.
Onereasontheimpactsoffertilizersdesignedtoreduceemissionsareinconsistentisthattheformofnitrogenappliedinteractswithotherfactorstocontrolnitrogenlosses.Amongthesefactorsisweather,whichdirectlyaffectstheprocessesthatleadtogaseousnitrogenlossesandNO3‐leaching,andindirectlyaffectstheseprocessesbycontrollingplantnitrogenuptake.Soilpropertiessuchastextureandhydraulicstatusarealsoimportant.Ingeneral,nitrificationisimportantinwell‐aeratedsoils,whiledenitrificationismoreimportantinpoorlydrainedsoils.Thenitrogensourcealsointeractswithothermanagementpractices.Forexample,polymer‐coatedureasubstantiallyreducedN2Oemissionsunderno‐tillbutnotfulltillcultivationforirrigatedcorninColorado(Halvorsonetal.,2010a).
OrganicFertilizerEffectsonN2OEmissions:LandapplicationofanimalmanurehasbeenrelatedtoN2Oemissions.Mosieretal.(1998)andPetersen(1999)measuredincreasesinN2Oemissionswithmanureapplication.KaiserandRuser(2000)measuredannualemissionsoftheaddednitrogeninslurryrangingfrom0.74to2.86percent,andDeKleinetal.(2001)foundthatannualN2O‐Nlossesrangedfromzerotofivepercentoftheorganicnitrogenappliedtosoils.Others(e.g.,BartonandSchipper,2001)foundN2OemissionsfollowingtheadditionofmanureslurriesexceededemissionsfromanequivalentamountofmanufacturedN,likelyduetotheslurry’screatingenhancedconditionsfordenitrification.However,GHGemissionsalsooccurifmanureismanagedinpits,lagoons,orsolidstorage.
Injectionofmanureisacommonpracticetoavoidsurfacerunoffandreduceobjectionableodorsfrommanureapplication.BothFlessaandBesse(2000)andWulfetal.(2002)suggestedthatinjectionofswinemanurewouldcreatemorefavorableconditionsforN2OandCH4formationbecauseofthereducedaerationwithinthesoil.However,Dendoovenetal.(1998)didnotfinddifferencesineitherN2OorCH4emissionsfrominjectedorsurface‐appliedswineslurryontoaloamysoil.Thesefindingssuggestthattherate,timing,placement,andformulationofmanureisimportanttoN2Oproduction,similartomanufacturednitrogenfertilizer,butthereisaneedforadditionalresearch.
CO2EmissionsGeneratedfromUreaFertilizerApplications:Unlikeothernitrogenfertilizers,urearesultsinthedirectproductionofCO2inadditiontowhateverN2Omightbesubsequentlyproducedbymicrobes(deKleinetal.,2006).Sinceureais20percentC,everymetrictonofureaappliedtosoilresultsinthedirectemissionof20kgCO2‐C;alternatively,everykilogramofnitrogenappliedasurearesultsinthedirectemissionsof0.43kgCO2‐C.UreaismanufacturedbyreactingNH3andCO2toformammoniumcarbamate,whichisthendehydratedtoformureaprills.IntheUnited
Chapter 3: Quantifying Greenhouse Gas Sources and Sinks in Cropland and Grazing Land Systems
3-16
StatestheCO2inureaiscapturedfromthefossilfuelusedtomanufactureNH3,sothesoilCO2producedrepresentsafossilfuelemission.
ManagementSystemInteractions:NitrogenmanagementpracticescaninteractwithothercroplandmanagementcomponentsinregulatingGHGemissions.Asemphasizedabove,anyfactorthataffectscropNUEhasthepotentialtoaffectN2Oemissions.Therefore,optimizingotherpractices—includingtillageandthemanagementofsoilpH,pests,irrigation,drainage,andotherfactors—willtendtoincreasenitrogenfertilizeruptakebythecropandthereforereduceN2Oemissions.Forthisreason,nutrientmanagementeffectsonGHGemissionsshouldbeconsideredinthecontextoftheentiresetofcroplandmanagementpractices.Forexample,thereisevidencethatfertilizerplacementcaninteractwithtillagemanagementincontrollingN2Oemissions(Ventereaetal.,2005),andthatinadequatemanagementofothernutrients(e.g.,phosphorusandpotassium)canreduceNUE(Snyderetal.,2009).EffortstominimizeorremediatewaterqualityimpactsofnitratetransportfromfarmtoaquaticsystemsmayalsoreduceindirectN2Oemissions.Forexample,theuseofsubsurfacebioreactorstoremovenitratefromdrainagewaterhasbeneficialimpactsonindirectN2O.However,todatethesebioreactorshavenotbeenimplementedatlarge(field)scalesandtherearealsoquestionsaboutreleaseofN2OandCH4duringthetreatmentprocessthatneedtobeansweredbeforetheirneteffectonGHGscanbeassessed(Elgoodetal.,2010).Also,environmentalandclimatefactors,whicharegenerallynotundermanagementcontrol,mayaffectN2Oemissions;forexample,nitrogenfertilizerappliedjustbeforelargerainfalleventscanstimulateincreasedemissions(Lietal.,1992).
3.2.1.2 TillagePractices
Differenttillagepracticesaregenerallyclassifiedintooneofthreecategories:fulltillage,reducedtillage,ornotillage.Tillageintensityisbasedonimplements,numberofpasses,andthepercentageofsurfaceanddepthoftillagedisturbance.Toolsareavailabletodeterminetillageintensity(e.g.,theSTIRModel;seeUSDANRCS,2008).No‐tillagepracticesarecharacterizedbytheuseofseeddrillsandfertilizerorpesticideapplicatorswithnoadditionaltillageeventsorimplements.Surfaceresiduesarenotincorporatedintothesoilwhenfollowingno‐tillagepractices,andthereislimiteddisturbancetothesoilprofile;consequentlyno‐tillagemanagementincreasessoilcoverandimprovesaggregatestability(Sixetal.,2000).Incontrast,examplesoffulltillage(oftenreferredtoasconventionaltillage)includeoneormorepasseswiththefollowingtillageimplements:moldboardplow,diskplow,diskchisel,twistedpointchiselplow,heavydutyoffsetdisk,subsoilchiselplow,andbedderordiskripper.Systemsarealsoclassifiedasfulltillageiftherearetwoormorepasseswithoneofthefollowingimplements:chiselplow,singledisk,tandemdisk,offsetdisk‐lightduty,one‐waydisk,heavy‐dutycultivator,ridgetill,orrototiller.Systemswithothertillagepractices,suchasasinglepasswitharidgetillimplement,mulchtill,orchiselplow,leadtointermediatedisturbanceofthesoilandareclassifiedasreducedtillage.
Changesintillagepracticescaninfluenceverticaldistributionofcarboninthesoilprofileandtotalsoilcarbonstocks(Paustianetal.,1997).Historically,fulltillagehasresultedinthereductionofsoilcarbonstocks(Laletal.,2004).Asynthesisofpreviousanalysesestimatedthatlong‐termfulltillagecandecreasesoilcarbonstocksby30percent(Ogleetal.,2005;Westetal.,2004).ChangingfromfulltillagetonotillagecanreversehistoriclossesofsoilC.No‐tillagepracticescanleadtoaccumulationofsoilcarbonintheuppersoilprofile(0to30cm),withlittletonochangeinthelowersoilprofile(30to60cm)(Syswerdaetal.,2011).Theopposite,adecreaseintheuppersoilhorizonwithanincreaseinthelowersoilhorizon,cansometimesoccurwithachangefromnotillagetofulltillage(Bakeretal.,2007).However,changesinthelowersoilprofiletendtobemorevariable,therebyrequiringalargersamplesizetodetectsignificantdifferences(KravchenkoandRobertson,2011).Areductionincarboninputassociatedwiththeinfluenceofno‐tillmanagementoncropproductionmayalsoleadtolossesofsoilcarbon,particularlyincoolerandwetterclimates
Chapter 3: Quantifying Greenhouse Gas Sources and Sinks in Cropland and Grazing Land Systems
3-17
(Ogleetal.,2012).However,whiledifferencesintheresponseofsoilcarbonstockstotillageoccuramongfieldexperiments,comprehensiveanalysesofavailablefielddataindicatethat,onaverage,soilcarbonstocksincreasewithachangefromfulltillagetoreducedtillageornotillage,especiallywithlong‐termadoptionofnotillage(Ogleetal.,2005;Sixetal.,2004;WestandMarland,2002).
Decreasedtillageintensityincreasessoilcarbonbecauseofreduceddisturbancetosoilaggregates,reducedexposureofsoilorganicmattertoweatheringprocesses,anddecreaseddecompositionrates(Paustianetal.,2000).Theextenttowhichsoilcarbonaccumulationoccursafterareductionintillageintensityisdeterminedbythehistoryoflandmanagement,soilattributes,regionalclimate,andcurrentcarbonstocks(WestandSix,2007).Ingeneral,greatersoilcarbonaccumulationwillbeobservedinC‐poorsoils(i.e.,duetolong‐termcultivation)withaclayeytextureunderhighbiomasscroppingsystemsintemperatehumidandwarmclimates(FranzluebbersandSteiner,2002;Planteetal.,2006;Sixetal.,2004).Insomecases,intermittenttillage,duringlong‐termreducedornotillage,isneededtoreducesoilcompaction,forweedcontrol,ortoreducepestsorpathogens.Whileintermittenttillagecancauseadecreaseinsoilstocks,upto80percentofsoilgainsfromno‐tillagepracticescanbemaintainedwhenimplementingnotillagewithintermittenttillage(Conantetal.,2007;Ventereaetal.,2006).
TheeffectoftillagemanagementchangesonsoilN2Oemissionsisvariableandnotfullyunderstood.Increases(Rochette,2008),decreases(Mosieretal.,2006),andnochanges(Grandyetal.,2006;Lemkeetal.,1998)insoilN2Oemissionshavebeenobserved.However,thosedifferencesarenottotallyrandomandpastmeta‐analyseshaveconcludedthatclimateregime,durationofpractice,andnitrogenfertilizerplacementhaveinfluencedtillageeffectsonN2Oemissions(Sixetal.,2004;vanKesseletal.,2012).Othervariablessuchassoiltexturemayalsobeimportant.
RegionalclimatehasalsobeenidentifiedasamajordriverforthechangeinN2Oemissionswithadoptionofno‐tillagepractices,withemissionsincreasinginhumidclimatesanddecreasingindryclimates(Sixetal.,2004).However,timesinceadoptionofnotillagemightalsoplayarolewithhigheremissionsinitiallyafteradoptionofnotillageinbothhumidanddryclimates,butovertimeemissionsfromno‐tillagesystemsmaydeclineinhumidclimatesrelativetopreviousemissionsfromfulltillagesystems.Nevertheless,variousfieldstudieshaveshownmixedresults,bothsupportingandcontradictingthefinding.StudiesindrierclimatesoftheGreatPlainshaveshownadecreaseinemissionsevenwhenno‐tillagepracticeshadbeenadoptedforlessthan10years(Kessavalouetal.,1998;Mosieretal.,2006).Long‐termnotillageinmoistclimatesofMinnesotaandCanadaledtobothhigherandloweremissionsofN2O(Druryetal.,2006;Ventereaetal.,2005).
AnotherimportantfactorinfluencingN2Oemissionsundernotillage,andonethatfarmerscanactivelymanage,isfertilizerplacement(vanKesseletal.,2012).Ventereaetal.(2005)foundthatwhennitrogenfertilizerwasplacedonthesurface,N2Oemissionsweregreaterundernotillagethanfulltillage,butthereversewasfoundwhennitrogenfertilizerwasplacedbelow10centimeters.FertilizerplacementingeneralhasbeenfoundtohavedifferingresultsonN2Oemissions,asdiscussedinSection3.2.1.1.However,thefindingsofVentereaetal.(2005)aswellasotherstudies(e.g.,Groffman,1985;VentereaandStanenas,2008)indicatethatdeepernitrogenplacementtendstodecreaseN2Oemissionswhenaccompanyingno‐tillorreduced‐tillagepractices,atleastrelativetofulltillagecroppingsystemsatthesamelocation.TheconflictingresultsassociatedwithN2Oemissionsfromfertilizerapplicationsmaybepartlyexplainedbythetillagepractice.
Inaddition,Lemkeetal.(1998)determinedthatsoilclaycontentexplained92percentofthevariationinN2OemissionsbetweenfulltillageandnotillageacrossmultiplesitesinAlberta.Similarly,Burfordetal.(1981)foundthatemissionsfromno‐tillagepracticesweregreaterthan
Chapter 3: Quantifying Greenhouse Gas Sources and Sinks in Cropland and Grazing Land Systems
3-18
fromfulltillageonsoilswithhigherclaycontentsatastudysiteintheUnitedKingdom.ItisarguedthatsoilswithhigherclaycontentshavehighermoisturecontentandthereforehaveagreaterpotentialforincreasedN2Oemissionsundernotillage.Indeed,Rochette(2008)attributedhigherratesofN2Ofluxfromminimumversusstandardtillagetogreatersoilcompaction,poorsoildrainage,reducedgasdiffusivity,andair‐filledporosityinhighclaysoils.
3.2.1.3 CropRotations,CoverCrops,andCroppingIntensity
Croprotationreferstothesequenceofcropsplantedinafield,withinoracrossyears.Croprotationsvarybylocationandgrowingregion,andmaybepracticedforavarietyofreasonssuchasimprovedeconomicreturns,pestmanagement,diseasecontrol,nutrientmanagementandwateravailability.Asimplerotationmaybeasequenceofcornandsoybeansthatisrepeatedovertime,whilemorecomplexrotationsmightincludeperennialcropssuchasalfalfawithcornandsunflowerrotationoverfiveyears,withthreeyearsofalfalfaandoneyeareachofcornandsunflower.Theactualrotationscanalsovaryfromastrictordertothesequence,particularlyinresponsetomarketdemand,i.e.,opportunisticrotations.Rotationswithhighbiomass‐yieldingcropsorperennialhaycropsorgrasscovercanincreasesoilcarbonstocks(Ogleetal.,2005).
Croppingintensitycanvaryacrossyears,duetovariationsinfallowfrequencyanduseofmultiplegrowingseasonswithmorethanonecropplantedandharvestedinasingleyear.Forexample,insemi‐aridenvironments,croprotationsoftenincludeayear‐longfallowperiodinordertoincreasetheamountofwaterstoredinthesoilprofileforthesubsequentcrop.Thislimitstheamountoforganicmatterinputtothesoil,andwiththeseverewaterlimitation,thesecroppingsystemsproducesmallamountsofbiomass,leadingtoareductioninsoilcarbonstocks(Doranetal.,1998).Consequently,intensifyingcropproductionbyreducingfallowfrequency,whichwillgenerallyinvolveadoptionofno‐tillagepractices,willincreasecarboninputacrossthewholerotationandpossiblytheamountofsoilorganiccarbon(Sherrodetal.,2003;2005).
Wintercovercropscanalsobeusedtoprovideplantcoveroutsideofthenormalgrowingseason.Priortoplantingthefollowingsummercrop,thecovercropiseitherlefttodecomposeasagreencoverorharvestedforforage.Ingeneral,theinclusionofacovercropinacroprotationwillleadtoanincreaseinsoilcarbonduetotheincreasedcarboninputderivedfromthecovercrop(Kongetal.,2005),especiallycovercroproots(KongandSix,2010).Covercropscanalsobeusedeffectivelyfornitrogenmanagement.InthefallandspringtheycancapturesoilnitrogenthatwouldotherwisebetransformeddirectlytoN2ObysoilmicrobesorleachtogroundwaterandcontributetoindirectN2Oemissions(i.e.,offsiteemissionsduetonitrogenlossesfromthesite).Additionally,whenkilledpriortoplantingthemaincrop,theirdecompositioncanprovidenitrogenthatwilldisplacesomeportionofcropfertilizationrequirements(whethermanufacturedororganic).Therefore,covercropscanreduceindirectN2Oemissionsandpossiblyoffsetfertilizationrates.However,therearenostudiesdemonstratingthataddingnitrogentosoilsincovercropsratherthanthroughfertilizationwillreducedirectN2Oemissions.Inthefuture,covercropbiomassmayalsobeharvestedforcellulosicethanolfeedstock,leavingrootstoenhancesoilcarbonstockssimilartoperennialplantsgrowninrotation(Ogleetal.,2005).
Theeffectsofcroprotationandintensityonsoilorganiccarboncanalsointeractwithothermanagementpractices,suchasresiduemanagement,tillage,andirrigation(Eghballetal.,1994).Consequently,managementinteractionsamongpracticesincludingtillageandirrigationwillbeimportantindeterminingtheinfluenceofcroprotationsonGHGemissions.Additionally,cropselectionasacomponentofcroprotationcanhaveamajoreffectonN2Oemissions(CavigelliandParkin,2012)insofarascropscanvaryintheirnitrogenuseefficienciesandnitrogenfertilizerneeds.Thisisparticularlythecasewhenlong‐livedperennialcropsaresubstitutedforannualcropsinforageorcellulosicbiofuelcroppingsystems(Robertsonetal.,2011).
Chapter 3: Quantifying Greenhouse Gas Sources and Sinks in Cropland and Grazing Land Systems
3-19
3.2.1.4 Irrigation
Typesofirrigationsystemsincludesurfaceorfloodirrigation,(micro‐)sprinklerirrigation,subsurfacedripirrigation,andsubirrigation.Ingeneral,irrigationincreasessoilwatercontent,evapotranspirationrates,andrelativehumidity;decreasessoilandairtemperatures;andcanleadtoincreasedregionalprecipitation(LobellandBonfils,2008;Pielkeetal.,2007).ThesechangesaffectimportantprocessessuchasplantgrowthratesandsoilmicrobialactivitythatcontrolnetGHGfluxes.
Assoilwatercontentapproachessaturation,oxygen(O2)diffusionisinhibited,resultinginanaerobicconditionsthatcanenhanceCH4emissions(ChanandParkin,2001;Delgadoetal.,1996),oratleastreducetheCH4sinkstrengthofotherwiseaerobicsoils(Livesleyetal.,2010).SaturatedconditionsalsoenhancedenitrificationratesandpotentiallyN2Oemissions(Delgadoetal.,1996;Jambertetal.,1997;Livesleyetal.,2010),butnotethatpeakN2OemissionsfromdenitrificationoftenoccuratwatercontentslowerthansaturationbecausewhenO2isextremelylimiting,N2OislikelytobefurtherreducedtoN2beforediffusingfromthesoilsurfacetotheatmosphere(Davidson,1991;Dunfieldetal.,1995).Furthermore,nitrificationratespeakatapproximately50percentofsaturation,andwatercontentsclosetofieldcapacity(60to70percentofsaturation)areexpectedtosupportmaximumtotalN2Oemissionrates(Davidson,1991).Inaddition,irrigationcanincreaseindirectN2OemissionsbyenhancingNO3‐leachingandrunoffifmorewaterisaddedthanisevaporated(Gehletal.,2005;Spaldingetal.,2001).
WettingofdrysoilstypicallyincreasesCO2emissions(FiererandSchimel,2002).However,irrigationalsoincreasesplantgrowthratesand,therefore,soilorganiccarbonlevelstypicallyincreaseafteruplandcroppingisconvertedtoirrigatedcropping,althoughlossofsoilcarbonfromerosioncanalsoincreaseunderirrigation(Follett,2001;Laletal.,1998).Furthermore,irrigationcanaffectinorganiccarbonlevels,butcurrentavailabledatashowcontrastingresults(Blanco‐Canquietal.,2010;Denefetal.,2008;Entryetal.,2004).
FloodandSurfaceIrrigation:Floodirrigationinvolvesfloodingtheentirefieldwithwater.Undercontinuouslyfloodedconditions,soilsarehighlyanoxic,thusfacilitatinghighmethanogenesisanddenitrificationrates(Mosieretal.,2004).However,highdenitrificationratesdonotnecessarilyimplyhighN2OemissionsbecausetheextremelyanoxicconditionsfacilitatefurtherreductionofN2OtoN2beforeitisemittedfromthesoil(Mahmoodetal.,2008).ThisissupportedbyobservationsshowinghigherN2Oemissionsfromintermittentcomparedtocontinuouslyfloodedricesystems(Katayanagietal.,2012;Xuetal.,2012),althoughitremainsdifficulttopredicttherelativeportionofdenitrifiednitrogenthatisemittedasN2OrelativetoN2.
Surfaceirrigationalsoinvolvessupplyinglargeamountsofwatertothesurfaceofsoils,butinthiscasethewaterisaddedthroughfurrowsadjacenttocropbeds.Thesesystemsareoftennotveryefficient,becausewaterlossesfromevaporationandseepagecanbelarge.TheimpactoffurrowirrigationonGHGemissionsdependsonhowoftenandtheextenttowhichfurrowsarefilledwithwater.WettinganddryingcyclesarelikelytoemitlargepulsesofNOandN2O(Davidson,1992),aswellasCO2(FiererandSchimel,2002).Spatialvariabilitycanalsobehigh,suchasthehigherN2Oemissionsfromfurrowscomparedwithbedsthathavebeenobservedforirrigatedcottoncropping(Graceetal.,2010).Inaddition,microtolandscapescaleheterogeneityinenvironmentalconditions,duetotopographyandotherfactors,contributetomultiscalevariabilityinN2Oemissions(Hénaultetal.,2012;Yatesetal.,2006).ThisspatialandtemporalheterogeneityinenvironmentalconditionsandfluxratesmakesitverydifficulttoquantifyGHGfluxesfromthesetypesofsystemswithhighlevelsofaccuracyandprecision.
SprinklerSystems:Sprinklersystemsdeliverwatertovegetationandthesoilfromabovethesurfaceusingoverheadsprinklersorguns.Thisisusuallymoreefficientthansurfaceirrigation,but
Chapter 3: Quantifying Greenhouse Gas Sources and Sinks in Cropland and Grazing Land Systems
3-20
evaporativelossesfromwaterinterceptedbyvegetation,litter,andthesoilsurfacecanstillbesubstantial.Duringandshortlyafterirrigationevents,soilmaybecomesaturatedandemitpulsesofN2O,butbecausethesoilisnotcontinuouslysaturated,N2Oemissionsareexpectedtobelowercomparedwithsurfaceirrigation(NelsonandTerry,1996).BothN2Oemissionsandsoilcarbonlevelsareexpectedtoincreasewithsprinklerirrigationcomparedwithuplandcropping.
SurfaceandSubsurfaceDripIrrigation:Surfacedripirrigationsupplieswaterfromdriplinesplacedadjacenttocroprows.Evaporativelossesshouldbelesscomparedwithabove‐surfacesprinklersystems,becauselesswaterisinterceptedbygrowingvegetation.However,evaporativelossescanstilloccurtotheextentthatsurfacelitterandsoillayersabsorbwaterfromthedripsprinkler.TheimpactsofsurfacedripirrigationonGHGfluxesareexpectedtobesimilartothoseofsprinklersystems,althoughthereisearlyevidencethatbothsurfaceandsubsurfacedripirrigationleadstolessemissionsofCH4andN2O(Kallenbachetal.,2010;Kennedyetal.,2013).
Subsurfacedripirrigationtargetswaterdeliverytotherootzoneusingburiedpipesandtubing.Thesesystemscanbeveryefficient,becausewaterisconcentratedintherootzoneataslow,steadyrate,henceminimizingoreliminatingevaporationlossesandavoidingsaturationofthewholesoilprofile.Consequently,thesesystemsarenotexpectedtobelargeCH4sources(DelGrossoetal.,2000a).Soilwatercontenthaslesstemporalvariationwithsubsurfacedripirrigationcomparedwithsprinklerandsurfacesystems,sopulsesofN2OandCO2emissionsarealsoexpectedtobeofsmallermagnitude(Kallenbachetal.,2010).Similarly,subsurfacedripirrigation/fertigationofhighvaluescrops,suchastomatoes,hasbeenshowntoreduceN2Oemissionscomparedwithfurrowirrigation(Kennedyetal.,2013).
Subirrigation:Subirrigationisusedinareaswithrelativelyhighwatertablesandinvolvesartificiallyraisingthewatertabletoallowthesoiltobemoistenedfrombelowtherootzone.Becausewaterissuppliedtorootsfrombelow,evaporationlossesarenotenhancedastheywouldbewithsurfaceirrigationsystems.ThissystemcandecreaseNO3‐leaching(Elmietal.,2003)butmayincreaseN2Olossesfromdenitrification(Munozetal.,2005).
ManagementInteractions:Irrigationsystemsinteractwithothercropmanagementstrategiessuchaschangesincroprotation,croppingintensity,tillage,andfertilizeramounttocontrolnetGHGfluxes.IrrigationtendstoamplifytheeffectsofthesefactorsonN2OandCH4emissionsatthesametimeasthepracticesincreasecropyieldsandsoilcarbonstocks.However,theresponseofsoilcarbontoirrigationiscomplexanddrivenbyinteractingfactors.Whenwaterandnutrientstressarereducedthroughirrigationandfertilization,theportionoftotalplantproductionallocatedbelowgroundcandecrease,butabsolutebelowgroundproductionandsoilorganiccarboncanincrease(Bhatetal.,2007).Howevernotallexperimentsshowincreasedsoilcarbonwithirrigation(Denefetal.,2008).Consequently,theirrigationbenefitsofincreasedyieldsandpotentialcarbonstoragemaybecounter‐balancedwiththeincreasedN2OandCH4fluxes.
However,therearealsooptionsforlimitingemissions,particularlywithfertilization.Fertigationaddsnutrientstotheirrigationsystemtodeliverwateralongwithsolublenutrientstotherootzone.Thesesystemshavethepotentialtobeveryefficientfrombothnutrientandwateruseperspectives(Spaldingetal.,2001),becausetheslowandtimedsupplyofnutrientsandwaterismoresynchronouswithplantdemandandtheyareconcentratedintherootzone.Consequently,N2Oandothernitrogenlossesareminimizedwhileplantgrowth,carboninputs,andcarbonsequestrationcanbemaximized.Similarly,CH4emissionsareminimizedbecausesoilsaturationisavoided.
Chapter 3: Quantifying Greenhouse Gas Sources and Sinks in Cropland and Grazing Land Systems
3-21
3.2.1.5 ErosionControl
Soilerosionprocessesincludesoildetachment,transport,anddeposition.Soilerosioncanpotentiallyreducesoilcarbonstocksandincreasenetcarbonfluxtotheatmospherethroughdecreasedplantproductivityandsubsequentdecreasedorganicmatterinputtosoilandincreaseddecompositionoftheerodedsoilfraction(Lal,2003).However,soilerosioncanalsopotentiallyincreasenetsoilcarbonstocksanddecreasenetcarbonfluxtotheatmospherethroughdynamicreplacementofsoilcarbononerodedlandscapesanddecreaseddecompositionratesinzonesofsoildeposition(Hardenetal.,1999;Stallard,1998).
Lal(2003)estimatedthat20percentofcarboninerodedsoilisemittedtotheatmosphere,duetooxidationofsoilorganiccarbonfollowingthedisruptionofsoilaggregatescausedbydetachmentandtransport.However,inananalysisof1,400soilprofiles,VanOostetal.(2007)foundnegligiblecarbonlossasadirectresultofsoildetachmentandtransport.Atsiteswherethetransportedsoilwasdeposited,therewasaslight(~onepercent)decreaseinsoilcarbondecompositionrates,resultinginslightlyhighersoilcarbonaccumulation.Moreimportantly,itwasfoundthatonaverage,25percentoferodedcarbonwasreplacedontheerodedsitesovera50‐yearperiod(Hardenetal.,2008).Thecombinationofthesefindingssupportsanapproximate26percentsinkcapacityoferodedsoil(VanOostetal.,2007).
Theaccumulationofsoilcarbononerodedlocationswithinlandscapesisreferredtoasdynamicreplacement(Hardenetal.,1999).Dynamicreplacementoccursasaresultofsoilcarbonbuildingtowardasteadystateofsoilcarboncontent,constrainedbysoiltypeandclimate(WestandSix,2007).Steadystateoccurswhensoilcarbonaccumulationequalssoilcarbonlosses.BothVanOostetal.(2007)andLalandPimentel(2008)notethatthedynamicreplacementratemaybelowinareaswithlowercroplandproductioninputs.Forexample,dynamicreplacementmaybelowincropsystemswithlowresidueproduction,suchascottonandtobaccointheUnitedStates,whichhavelowercarbonaccumulationratesthanhighresidueinputscrops(Ogleetal.,2005).
Notethatwhilewatererosioncangenerateasmallcarbonsink,thebenefitofacarbonsinkisoffsetbyothernegativeimpactsfromsoilerosion.Forexample,soilerosioncanresultinwaterpollutionduetosedimentloading,airpollutionfromairborneparticulatematter(PM10),anddecreasedsoilfertilityresultinginsubsequentyielddeclines.
3.2.1.6 ManagementofDrainedWetlands
Drainageofwetlandseffectivelycreatesanuplandcroppingsystembyloweringwatertableswithtilesorditchestoproduceannualcrops.Themostobviouseffectofwetlanddrainageisincreasedoxidationandtillageofsoils.Forexample,conversionofnativewetlandsandgrasslandsintocroplandhasbeenshowntodepletenativesoilcarbonstocksby20tomorethan50percent(BlankandFosberg,1989;Eulissetal.,2006;Mann,1986).Inturn,CO2emissionsincreasewithhigherdecompositionrates,particularlyinorganicsoils,i.e.,Histosols(Allen,2012;ArmentanoandMenges,1986).LossoftheorganiclayerhascausedtremendoussubsidenceinU.S.croplands(Stephensetal.,1984)suchastheFloridaEverglades(Shihetal.1998)andtheCaliforniaDeltaregion(Broadbent,1960;Weir,1950),whereratesvaryfrom0.46to2.3cmyear‐1(DeverelandRojstaczer,1996;Devereletal.,1998;RojstaczerandDeverel,1995).SimilarsubsidencerateshavealsooccurredinotherregionssuchastheFloridaEverglades.
Manipulationofwaterlevelscanhavemultipleeffectsonnutrientcyclinginwetlands.Drainagealsomayresultinmoreoptimalsoilmoistureconditions(e.g.,40to60%water‐filledporespace)thatenhanceformationofN2Oasabyproductofnitrificationanddenitrificationreactions(Davidsonetal.,2000).DrainageincreasesnitrogenmineralizationrateswithconversionfromanaerobictoaerobicconditionsandenhancesN2Oemissions(Duxburyetal.,1982;Kasimir‐
Chapter 3: Quantifying Greenhouse Gas Sources and Sinks in Cropland and Grazing Land Systems
3-22
Klemedtssonetal.,1997).Incontrast,drainagedecreasesCH4emissionsbyreducingthefrequencyanddurationofsoilsaturationrequiredforCH4productionaswellasenhancingfrequencyofmethanotrophicactivity(Dorretal.,1993;Gleasonetal.,2009;PhillipsandBeeri,2008).However,insituationswherewetlandsareinacropproduction,butnotdirectlydrained,CH4productioncanactuallybeenhancedduetoincreasedrunofffromadjacentcroplandsorconsolidationdrainage,whichincreaseswaterdepthandhydroperiods(Gleasonetal.,2009).
ManagingthewatertablebyraisingthedepthofdrainagetotheextentpossiblehasbeenaneffectivemeasuretoreducelossofCO2andotherGHGsfromdrainedorganicsoils(Jongedyketal.,1950;Shihetal.,1998).RecentresearchsuggeststhatevenperiodicfloodingoforganicsoilsthataredrainedforcropproductionmaybeeffectiveinreducingCO2emissions(Morrisetal.,2004).Thereislimitedinformationontheeffectofdrainageinmineralsoilswithahighwatertable(i.e.,hydricsoils),buttheinfluenceonGHGemissionsislikelylesssignificantthanindrainedorganicsoils.Itisimportanttonotethatwetlandsareaffordedsomeprotectionbylaws(e.g.,CleanWaterAct)andconservationprogramsthatrecognizetheimportanceofwetlands,suchasforwildlifehabitat,andprovideagriculturalproducersincentivestoavoiddrainingwetlands(e.g.,the“Swampbuster”provisionoftheFoodSecurityAct).
3.2.1.7 LimeAmendments
Agriculturallimeconsistsprimarilyofcrushedlimestone(CaCO3)anddolomite(CaMg(CO3)2)invaryingproportions.Agriculturallime,hereinafterreferredtoaslime,isappliedtosoilstodecreasesoilacidity.Limeiscommonlyappliedtoagriculturallandswherenitrogenousfertilizersarecontinuouslyusedandwhereprecipitationexceedsevapotranspiration.
TheapplicationoflimetosoilscancreateasinkorsourceofCO2totheatmosphere(Hamiltonetal.,2007),dependingonthestrengthoftheweatheringagent.Weatheringoflimebycarbonicacid(H2CO3),formedwhenCO2isdissolvedinwater,resultsintheuptakeofonemoleofCO2foreverymoleoflime‐derivedcarbondissolved(Eq.1).Carbonicacidweatheringproducesbicarbonate(HCO3‐)thatcontributestoalkalinityingroundwater,streams,andrivers(OhandRaymond,2006;Raymondetal.,2008).Alternatively,whenlimereactswiththestrongernitricacid(HNO3),whichisproducedwhennitrifyingbacteriaconvertNH4+basedfertilizerandothersourcesofNH4+tonitrate(NO3‐),carboninlimeisdissolvedandreleaseddirectlytotheatmosphere(Eq.2).
CaCO3+H2O+CO2=Ca2++2HCO3‐ Eq.1
CaCO3+2HNO3=Ca2++2NO3‐+H2O+CO2 Eq.2
Fieldmeasurementsandmodelinganalysesindicatethatmorelimeisdissolvedbycarbonicacidthanbynitricacid.Forexample,WestandMcBride(2005)estimatedthat62percentoflimewasdissolvedbycarbonicacidweathering,Hamiltonetal.(2007)estimated75to88percent,andOhandRaymond(2006)estimated66percent.Biasietal.(2008)usedchamberfluxmeasurementstoestimate15percentlossoflime‐derivedcarbonbydissolutionwithstrongacidsandinferredthat85percentisdissolvedbycarbonicacid.
WestandMcBride(2005)alsoestimatedtheprecipitationofHCO3‐backtoCaCO3onceHCO3‐reachestheocean,therebyreleasingCO2totheatmosphere.However,thelongtimeperiod(manydecadestocenturies)overwhichprecipitationwouldoccurintheocean(Hamiltonetal.,2007)effectivelyresultsincarbonsequestrationforannualaccountingpurposes.
Currentconsensusofleacheddrainagesamples,streamgaugedata,andmassbalancemodelingindicatesthatabout66percentofcarboninappliedlimeisessentiallytransferredfromonelong‐livedpool(CaCO3ingeologicformations)toanother(HCO3‐inoceans),andisthereforenotcountedasnewsequestration.However,theatmosphericCO2newlycapturedbythisprocessdoes
Chapter 3: Quantifying Greenhouse Gas Sources and Sinks in Cropland and Grazing Land Systems
3-23
representsequestrationwhencorrectedforthe33percentreleasedtotheatmosphereasCO2;thisresultsinanet33percentsinkstrengthpercarboninlime.ThisestimateissimilartothatofOhandRaymond(2006)andWestandMcBride(2005),andiswithintherangeofHamiltonetal.(2007).Whilelimecanincreasesoilcarbonviaeffectsonsoilmicrobialactivity(Fornaraetal.,2011),inmostsoilsliminghasnodirectcarboneffect(Pageetal.,2009).
3.2.1.8 ResidueManagement
Cropresiduesaretheresidualremainingafterharvestoftheeconomicpartofthecrop.Theamountofcropresiduevarieswiththecropandtheharvestoperationmethod.Forexample,cottonharvestcontributesverylittleabovegroundresiduetothesoilduetotheplant’slowleafareaindexandsmallamountofplantmaterialafterleafdrop.SoybeanandotherlegumecropsalsohavesmallamountsofabovegroundresiduethatrapidlydecomposebecauseoflowC:Nratios.Incontrast,cropslikecorncanleavesubstantialamountsofresidueonthesoilsurfaceunlessthewholeplantisharvestedforsilageortheresidueiscollectedforbeddingorotherpurposes.
Abovegroundresiduemanagemententailsfivepotentialstrategies:(1)leavetheresidueonthesoilsurfacetodecayandbeincorporatedintothesoil(requiresno‐tillmanagement);(2)incorporatetheresidueintothesoilviatillage;(3)removetheresiduethroughaharvestingoperation(i.e.,silageorcellulosicbiomassharvest);(4)allowlivestocktograzeontheresidue;or(5)burntheresidue.EachofthesemanagementpracticeshasthepotentialtoaffectGHGemissions.LeavingcropresidueonthesurfaceandincorporatingitintothesoilafterdecaybymicroorganismsaffectsCO2releasefromthesoilduetotheenhancedbiologicalactivity,andpotentiallyincreasesN2Oemissionsthroughanalterationofthenitrogenbalanceinthesoil.Asimilarprocessoccurswhenresidueisincorporatedintothesoilviatillage.Notethattillagealsocausesreductionsinsoilcarbonstocks,andadditionalCO2isreleasedthroughburningfueltoruntillageequipment.HarvestingtheresiduereleasesCO2fromburningfuelintheengineslinkedwiththeharvestingprocess,althoughresidueharvestedforbiofuelproductionmaycreatenetfossilfueloffsetcredits.BurningcropresiduesinthefieldreleasesCO2,CH4,andN2O(aswellasCOandNOx)emissionstotheatmosphere.Ingeneral,butnotalways,residueremovalreducessoilcarbonstocks(GreggandIzaurralde,2010;Wilhelmetal.,2007).
ManagementinteractionsarealsoimportantwhenconsideringtheinfluenceofresiduemanagementonGHGemissions.Forexample,theinfluenceofresiduemanagementonsoilorganiccarbonwillbeaffectedbythetillagepractices(Malhietal.,2006).
3.2.1.9 Set‐Aside/ReserveCropland
The1985FarmBillestablishedtheConservationReserveProgram(CRP)topayproducerstoconverthighlyerodiblecroplandorotherenvironmentallysensitiveagriculturalareasintovegetativecover.Theseareascouldbeconvertedintograssland,nativebunchgrasses,pollinatorhabitat,shelterbelts,filterorbufferstrips,orriparianbuffers.Areasareremovedfromproductionandseededwithannualandperennialspeciestoformacoverthatwouldbeundisturbedforaminimumof10years.Inreturn,producersorlandownersreceivedapaymentforenrollingtheselandareasintotheCRP.ThroughouttheagriculturalhistoryoftheUnitedStates,therehavebeentimesinwhichagriculturallandsweresetasidetoreduceagriculturalsurpluses;however,thetimeperiodofremovalwastypicallyshort‐term(onetotwoyears)andmaintainedinaweed‐freestate.
TheprimaryaimsofCRParetodecreaseerosion,restorewildlifehabitat,andsafeguardgroundandsurfacewaterquality.Animportantancillaryaimiscarboncapture:CRPlandssequestercarboninsoilandlong‐livedplants,andthusrepresentavaluablemitigationopportunity.Inameta‐analysisofpairedsoils,Ogleetal.(2005)foundthat20yearsofset‐asideresultedintemperateregionsoils’accumulating82to93percentofthecarbonlevelsunderoriginalnative
Chapter 3: Quantifying Greenhouse Gas Sources and Sinks in Cropland and Grazing Land Systems
3-24
vegetation,onaverage.PostandKwon(2000)concludedfromaglobalmeta‐analysisthat,onaverage,soilcarbonsequestrationratesonlandconvertedfromagriculturalproductiontograsslandis33gCm‐2year‐1.At39pairedCRP‐cropsitesinWisconsin,Kucharik(2007)foundsequestrationratesof50gCm‐2year‐1onMollisolsand44gCm‐2y‐1onAlfisols.Follettetal.(2009)estimatethatCRPsoilssequester~50gCm‐2year‐1onaverage.TheCouncilforAgriculturalScienceandTechnology(2011)estimatesthatCRPlandsarecurrentlyresponsiblefor6.3Tgofsoilcarbonsequestrationperyear.Gebhartetal.(1994)reportedamean18.8percentincreaseonfiveCRPsitesduringasix‐yearperiod.However,therearestudiesshowinglittleornoincreaseinC,leadingtouncertaintyintheeffectofset‐asidelandinareserveprogram(JelinskiandKucharik,2009;Karlenetal.,1999;Reederetal.,1998).Forexample,Karlenetal.(1999)comparedCRPlandwithperennialgrassestocroplandacrossfiveStatesandfoundthatonlyonesiteofthefiveshowedasignificantdifferenceintotalorganiccarboncontentinthesoilafterbeinginCRP.
IncreasesinsoilcarbonresultingfromsettingasidecroplandinCRPcanbereversedbyconvertingtheselandsbackintoproduction.Gilleyetal.(1997)foundthatthepositivechangesinCRPlanddisappearedimmediatelywhenthesoilsweretilleduponconversionbackintocropproduction.However,manystudiesindicatethatiflandunderCRPisreturnedtocultivation,someorallofthesoilcarboncanpotentiallyberetainedifthelandiscultivatedwithno‐tillpractices(BowmanandAnderson,2002;Daoetal.,2002;Olsonetal.,2005).Inadditiontochangesinsoilcarbonstocks,changeswillalsooccurinN2Oemissionsdependingonthenutrientmanagementpractices.Gelfandetal.(2011)measuredanetcarboncostof10.6MgCO2‐eqha‐1(289gC‐eqm‐2)forthefirstyearofno‐tillsoybeansfollowing20yearsofCRPgrassland,andasignificantportionofthenetemissionwasduetoN2Oproducedintheconversionyear.
3.2.1.10 Biochar
Biocharisasoilamendmentthatispromotedforitsabilitytoimprovecropproductionandsequestercarboninsoils(Atkinsonetal.,2010;Lehmann,2007a;2007b).Biocharischarcoalproducedwhenwoodorotherplantbiomassisburnedunderlow‐oxygenconditions,knownaspyrolysis.Whenappliedtosoils,biocharcanpersistforlongperiodsoftime;itschemicalstructuremakesitresistanttomicrobialattackundermostsoilconditions.However,itspersistencecanvarygreatlyforreasonsnotyetcompletelyunderstood.BiocharisacommoncomponentofmostU.S.agriculturalsoils(Skjemstadetal.,2002),leftfromfiresthatoccurredpriortoconversionoftheoriginalforestorprairie.Addingbiochartosoilshasbeenproposedasawaytosequestercarbon(Lehmann,2007a)becauseofthispotentialtopersistforcenturies(KimetuandLehmann,2010;Nguyenetal.,2008).Butbiochar’slongevityinsoildependsonanumberoffactorsincludingpyrolysisconditions(e.g.,pyrolysistemperature)andthechemicalcompositionofthebiocharfeedstock(Spokas,2010).Climateandsoilfactorssuchasmineralogyandpre‐existingorganicmattercontentalsoaffectbiochar’spersistenceinsoil.
Anadditionalbenefitofbiocharisitspositiveeffectsonagriculturalsoilfertility(Atkinsonetal.,2010;Lairdetal.,2010),largelybyprovidingadvantagessimilartootherformsofsoilorganicmatter:improvedsoilstructure,waterholdingcapacity,andcation‐exchangecapacity.BiocharhasalsobeenshowntoreducesoilN2Oemissionsinsomelaboratorystudies,butthesmallnumberoffieldtrialssofarreportedhavedocumentednosignificanteffectsunderfieldconditions(e.g.,Scheeretal.,2011).
Itistooearlytoknowifpromisingresultsfromlaboratoryandshort‐termfieldexperimentscanbegeneralizedtolong‐termfieldconditions.Biocharsoiladditionsmaybeafuturesourceofcarboncreditsforpyrolysiswasteiflong‐termfieldexperimentsconfirmresultsfromshortertermstudies.Theclimateadvantageofaddingbiochartosoilislessclear,however,relativetootherpotentialusesofplantbiomass.Lifecycleanalyses(e.g.,Robertsetal.,2010)suggestthatbiocharmay
Chapter 3: Quantifying Greenhouse Gas Sources and Sinks in Cropland and Grazing Land Systems
3-25
increaseordecreasenetemissionsdependingonalternativeusesoftheoriginalbiomassandlifecyclesystemboundaries.Furthermore,ifthebiomass(orbiochar)wasburneddirectlyforenergythenthesourceofdisplacedenergymustalsobeconsidered(Robertsetal.,2010).Nevertheless,boththesequestrationandN2Osuppressionpotentialofbiocharmeritfurtherstudy.
3.2.2 ManagementInfluencingGHGEmissionsinFloodedCroppingSystems
ThereareavarietyoffloodedcroppingsystemsintheUnitedStates,includingsystemsforrice,wildrice,cranberries,andtaro.Apartfromrice,thesesystemsarerelativelyminor(specialtycrops)andthereislittletonoresearchorinformationontheirGHGemissions.RicesystemsemitbothCH4andN2O;however,manyreportsshowaninverserelationshipbetweenCH4andN2Oduringthericecroppingseason,withCH4occurringunderanaerobicconditionsandN2Oemissionsoccurringunderaerobicconditions(Zouetal.,2005).Therefore,toaccuratelydetermineamitigationstrategyoneneedstoconsiderthenetcumulativeeffectofGHGemissionsbyevaluatingbothCH4andN2O.WaterandresiduemanagementhavereceivedthemostattentionintermsofofferingpossibilitiesformitigatingCH4emissions.Othermitigationoptionshavealsobeenexaminedandshowpromise(e.g.,Fengetal.,2013;Linquistetal.,2012;Majumdar,2003;WassmannandPathak,2007;Yagietal.,1997)andfurtherresearchisrequiredinmanyareasbeforetheseoptionscanbescaledup.TheintenthereisnottoprovideareviewoftheliteraturebuttoprovideabriefoverviewofsomefactorsaffectingGHGemissionsfromfloodedricesystems.
3.2.2.1 WaterManagementinFloodedRice
IntheUnitedStates,riceisplantedinoneoftwoways:(1)waterseeded,whereseedsaresownbyairplaneinfloodedfields;or(2)dry‐seeded,whereseedsaredrilledorbroadcast(thenincorporated)intodryfields.WaterseedingisthepredominantpracticeinCaliforniaandpartsofLouisiana,whiledryseedingispredominantinmuchofthesouthernUnitedStates(e.g.,Arkansas,Mississippi,Missouri,andTexas).Watermanagementvariesbetweenthesetwoestablishedpractices.Inwater‐seededrice,thefieldsaretypicallyfloodedfortheentireseason.However,inLouisiana,thefieldmaybedrainedwithapinpointfloodsystem(threetofivedays)orwithadelayedflood(upto20days)afterseeding.Indry‐seededrice,rainfallorflushirrigationeventsarerelieduponduringthefirstthreetofiveweeksofestablishmentandthenfloodedfortherestoftheseason.Inallcases,fieldsaretypicallydrainedafewweeksbeforeharvesttoallowthesoiltodryoutenoughtosupportharvestequipment.FurtherdetailsofU.S.riceproductionsystemscanbefoundinSnyderandSlaton(2001)andStreetandBollich(2003).
MidseasondrainorintermittentirrigationisastrategytomitigateCH4emissions.Thispracticeresultsinaerobicconditionsthatareunfavorableformethanogens.However,suchconditionsarefavorableforN2Oemissions(e.g.,Zouetal.,2005).MoststudiesreportthatmidseasondrainssignificantlydecreaseCH4emissionsbutincreaseN2Oemissionsrelativetocontinuousflooding.Regardless,netGHGemissionsinricesystemsareusuallydecreasedwithmidseasondraindespitetheincreaseinN2O.Wassmanetal.(2000)reportedthatCH4emissionreductionsrangedfromsevenpercentto80percent.ThereductioninCH4emissionsdependsonthenumberofdrainageeventsduringthecroppingseasonandonothermanagementfactorsandsoilproperties.Yanetal.(2005)reportedthatCH4fluxesfromricefieldswithsingleandmultipledrainageeventswerereducedby60percentand52percentcomparedtocontinuouslyfloodedricefields.ThispracticehasnotbeenwidelyevaluatedintheUnitedStates,anditmaybedifficulttodrainandre‐floodthelargerelativelyflatparcelsoflandthatarecommonlyusedforriceproductionintheUnitedStates.Furthermore,suchpracticescanleadtoincreasedweedanddiseasepressurealongwithloweryieldsandgrainquality.
Chapter 3: Quantifying Greenhouse Gas Sources and Sinks in Cropland and Grazing Land Systems
3-26
Soilcarbonstocksarealsoinfluencedbywatermanagement.Forexample,carbonstocksinChinesericesystemsarehigherthaninuplandcrops,presumablyduetotheaccumulationofcarbonunderthefloodedconditions(Panetal.,2010;Wu,2011).ItremainsunknownifeffortstomitigateCH4emissionsintheUnitedStatesusingintermittentfloodingwillleadtoareductioninsoilcarbonstocks.
TheuseofmidseasondrainagehasbeenshowntodelayharvestinCalifornia.Therefore,inclimateswithashortgrowingseason,theuseofamidseasondrainwillincreaseriskofcropfailure,andthereforewillbealessappealingalternativetogrowers.
3.2.2.2 ResidueManagement
StrawmanagementhasalargeimpactonCH4production.Strawadditions,particularlythosewithahighcarbontonitrogenratio,increaseCH4emissionsbuthavethepotentialtoreduceN2Oemissions(e.g.,Zouetal.,2005).ThisreductioninN2OmaybeduetoincreasednitrogenimmobilizationormoreeffectiveconversiontoN2.LowcarbontonitrogenorganicmaterialstendtoincreaseN2Oemissions(Kaewpraditetal.,2008).Yanetal.(2005)reportedthatthetimingofstrawapplicationisalsoanimportantfactor.Forexample,applyingricestrawbeforetransplantingincreasedCH4emissionsby2.1times,whileapplyingricestrawinthepreviousseasonincreasedCH4emissionsby0.8times.SeveralstudieshavedemonstratedthatcompostingricestrawpriortoincorporationreducesCH4emissions(Wassmannetal.,2000);however,thisrequiresadditionalenergytocollectthestrawandthenspreaditbackonthefieldaftercomposting.
IncontrasttothepotentialforreducingCH4emissionswithremovalofricestraw,thereisalsothepotentialtoreducesoilcarbonstocksduetolesscarboninputtosoils.Othernutrients(particularlyK)areremovedinlargeamountswithresidues,andtheseneedtobereplacedtomaintaintheproductivityofthesystem.
3.2.2.3 OrganicAmendments
Variousorganicamendmentscanbeappliedtoricefields,includingfarmyardmanurespecialtymixesoforganicfertilizers,andgreenmanures(e.g.,covercrops).Basedonameta‐analysisbyLinquistetal.(2012),livestockmanureincreasesCH4emissionsby26percentandgreenmanuresincreasedCH4by192percent.NeithermanuresourcehadasignificanteffectonN2Oemissions.FewstudieshaveevaluatedtheinfluenceofdifferentmanurestorageandprocessingtechniquesonCH4emissions.OneexampleisastudybyWassmanetal.(2000),whofoundthatfermentationoffarmyardmanurepriortoapplicationcanreduceCH4emissions.FarmyardmanurewillalsoinfluencesoilcarbonstockandsoilN2Oemissions.
3.2.2.4 Varieties,RatoonCropping,andFallowManagement
SeasonalCH4(Lindauetal.,1995)andN2O(Chen‐Ching,1996)emissionsareaffectedbyricevariety.Thecauseofvarietaldifferencesvarybutmaybeduetogastransportthrougharenchymacells,differentrootingstructures,ordifferencesamongvarietiesintermsofrootexudates(WassmannandAulakh,2000).IdentifyingthemechanismsforvarietaldifferencesmayenablebreedingprogramstoselectvarietiesthathavelowerCH4emissions.
InsomeStates,theclimateallowsre‐sproutingofasecond,orratooncrop,thatgrowsfromthestubbleofthefirstcropafterharvesting.Ratooncropyieldsaresmallerthanthefirstcrop,butcanaddsubstantiallytotheoverallannualyield,therebyreducingcostsofproductionperunit.Inaddition,ittakesfewerresourcesandlesstimetogrowaratooncropthantogrowthefirstcrop.However,ratooninghashigherCH4emissionrates(abouttwotothreetimeshigher)thanthefirstcrop,becausethestrawfromthefirstcropremainsinthefieldunderanaerobicconditionsduringtheratoonperiodratherthanthefieldbeingdrainedsothatthestubblecandecayaerobically
Chapter 3: Quantifying Greenhouse Gas Sources and Sinks in Cropland and Grazing Land Systems
3-27
(Lindauetal.,1995).Therefore,theamountofCH4producingorganicmaterial(i.e.,materialavailableforanaerobicdecomposition)isconsiderablyhigherthanwiththeprimarycrop.
ManagementofricefieldsduringthewinterhasasignificanteffectonannualGHGemissions.Forexample,inCalifornia,legislationinthe1990shaslimitedtheburningofricestrawtoamaximumof25percentofanarea,althoughinrealityonlyabout10percentofriceproductionfieldsareburned.Currently,ricestrawisincorporatedafterharvestonabout85percentofthericeproductionfieldsinCalifornia,andinthesefieldsabouthalfareintentionallyfloodedtofacilitatestrawdecomposition,althoughthisvaluecanvarywidelyfromyeartoyear.WinterfloodinghasincreasedannualCH4emissions(Devitoetal.,2000),butithasalsoincreasedthequalityofhabitatforoverwinteringwaterfowlinthePacificFlyway.Ricestrawisbaledandremovedonaboutfivepercentofthearea.
3.2.2.5 NitrificationandUreaseInhibitorsinFloodedRice
NitrificationinhibitorspreventorslowtheconversionofNH4+toNO3‐andthusreduceN2Oemissionsfromnitrificationandsubsequentdenitrification.Inameta‐analysisoftheseproducts,Akiyamaetal.(2010)foundthatinricesystemstheuseofnitrificationinhibitorsonaveragereducedN2Oemissionsby30percent,althoughsomeproductsweremoreeffectivethanothers.Certainnitrificationinhibitors(i.e.,dicyandiamide,thiosulfate,andencapsulatedcalciumcarbide)canmitigatebothCH4andN2Oemissions.ReducedCH4emissionsusingdicyandiamidewasattributedtoahigherredoxpotential,lowerpH,lowerFe2+,andlowerreadilymineralizablecarboncontent(Bharatietal.,2000).
Ureaseinhibitors,suchashydroquinone,slowthemicrobialconversionofureatoNH4+,thusreducingtheamountofnitrogenavailablefornitrificationanddentrification.BothCH4andN2Oemissionswerereducedwiththeuseofhydroquinone(Boeckxetal.,2005).ItissuggestedthatureaseinhibitorsmitigateCH4emissionbyinhibitingthemethanogenicfermentationofacetate(Wangetal.,1991).Furthermore,acombinationofaureaseinhibitor(hydroquinone)andanitrificationinhibitor(dicyandiamide)wasshowntoresultinlowerGHGemissionscomparedwithusingonlyoneoftheproducts(Boeckxetal.,2005).SeeSection3.2.1.1formoreinformationonnitrificationandureaseinhibitors.
3.2.2.6 FertilizerPlacementinFloodedRice
Incorporating/injectingorplacingfertilizerdeepintothesoilhasbeenshowninsomestudiestoreducebothCH4(Wassmannetal.,2000)andN2O(Keerthisingheetal.,1995)emissions.Whilemuchofafloodedricefield’ssoilisanaerobic,thefloodwaterandtopfewcentimetersofsoiltypicallyremainaerobicwhilesoilbelowfivecentimetersexistsinananaerobic,reducedstate(KeeneyandSahrawat,1986).Thusmineralnitrogeninthetopfewcentimetersofsoilmayundergonitrificationanddenitrification,whichcanleadtoN2Oemissions;butmineralnitrogeninlowersoildepthswillremainasammonium.Incontrast,nitrogenfertilizerthatisappliedtothesoilsurface(eitherpreseasonormidseason)tendsbemoresusceptibletolosseseitherfromammoniavolatilizationormorerapidnitrification‐denitrificationprocesses(Griggsetal.,2007).Byplacingnitrogenintoanaerobicsoillayers,itisbetterprotectedfromlossesandremainsavailableforcropnitrogenuptake(Linquistetal.,2009).TheeffectofdeepfertilizerplacementonCH4reductionremainsuncertain.SeeSection3.2.1.1formoreinformationonfertilizerplacement.
3.2.2.7 SulfurProducts
Sulfur‐containingfertilizers(i.e.,ammoniumsulfate,calciumsulfate,phosphogypsum,andsinglesuperphosphate)reduceCH4emissions(Lindauetal.,1998).ThemagnitudeofCH4reductionisdependentonfertilizationratewithaveragesbetween208and992kgSha‐1,reducingCH4
Chapter 3: Quantifying Greenhouse Gas Sources and Sinks in Cropland and Grazing Land Systems
3-28
emissionsby28percentand53percent,respectively(Linquistetal.,2012).Atlowlevelsofsulfurfertilization,whicharecommoninrecommendedrates,theeffectonCH4emissionswillbelimited(Linquistetal.,2012).SulfurmitigatesCH4emissionsintwoways.First,SO4additionstosoiladdelectronacceptors,thusslowingsoilreduction(Majumdar,2003).Second,theproductofSO4reduction(H2S)mayinhibitmethanogenicbacteriaandthusdepressCH4production.Unfortunately,moststudieshavenotexaminedtheeffectonN2Oemissions.
3.2.3 Land‐UseChangetoCropland
Conversionfromoneland‐usecategory(e.g.,forestland,wetlands)tocroplandcanhavesignificanteffectsontheGHGemissionsandremovalsassociatedwiththelandunderconversion.Whenlandisconvertedtocropland,thereisoftenalossofcarbon,anincreaseinN2OandCH4emissions,areductioninCH4oxidation,andifbiomassisburned,anincreaseinnon‐CO2GHGemissions.Anumberofvariablesinfluencethedirectionandmagnitudeoftheemissionsandsinksincludingpriorlanduse,climate,andmanagement.Theinfluenceofland‐usechangeoncarbon,nitrogen,methane,andnon‐CO2GHGsarediscussedbelow.
3.2.3.1 InfluenceonCarbonStocks
Land‐useconversiontocroplandcanhavesignificanteffectsonbiomass,litter,andsoilcarbon(IPCC,2000).Houghtonetal.(1999)estimatedthatlandclearanceintheUnitedStateshasledtoalossof27PgCtotheatmospheresincethe1700s,althoughrecentlysomecarbonhasbeenrestoredwithconversionofcroplandbacktootherusesandalsoimprovedsoilmanagement(U.S.EPA,2010).ClearingforestleadstoalargelossofabovegroundandbelowgroundbiomassandlitterC;grasslandconversioncanalsoreducetheamountofcarboninthesepools,buttoalesserextentthanforestconversionbecausegrasslandshavelessbiomass.Soilcarbonlossescanbesignificantwithconversiontocultivatedcropmanagement(DavidsonandAckerman,1993),withrelativelossesintemperateregionsfrom20to30percentonaverage(Ogleetal.,2005).
Ultimately,thenetinfluenceoflandconversionwilldependonthepreviouslanduse,vegetationcomposition,andmanagement,andtheresultingcroplandsystemanditsassociatedvegetationcompositionandmanagement.Forexample,conversionofgrasslandtotreecrops,suchasorchards,mayleadtogainsincarbonrelativetothegrasslandduetoaccumulationofcarboninwoodybiomass.
3.2.3.2 InfluenceonSoilNitrousOxide
Theconversionoflandtocroplandgenerallyacceleratesnitrogencycling,withsubsequenteffectsonN2OandCH4fluxes.SoilnitrogenavailabilityisthefactorthatmostoftenlimitssoilN2Oemissions(seeSection3.2.1.1),soanypracticethatincreasestheconcentrationofinorganicnitrogeninsoilislikelytoalsoaccelerateN2Oemissions.Asnotedabove,land‐usechangetypicallyresultsinfastersoilorganicmatterturnoverandassociatednitrogenmineralization,whichmeansthatevenintheabsenceofnitrogenfertilizer,soilN2Ofluxeswillbehigheronconvertedland.Additionalnitrogenfromfertilizers,whethersyntheticororganic,orfromplantedlegumeswillfurtherenhanceN2Ofluxes,aswilltillage—insofarastillagestimulatesnitrogenmineralization.
TheconversionofunmanagedlandtocellulosicbiofuelproductionmayavoidadditionalGHGloadingifcareistakentoavoidsoilcarbonoxidationandexcesssoilnitrogenavailability(Robertsonetal.,2011).Thismightoccur,forexample,ifexistingperennialvegetationwereharvestedforfeedstockorwhennewperennialgrassesweredirect‐seededintoanotherwiseundisturbedsoilprofile,andwhennoorminimalnitrogeninputsareused.Althoughthecurrentmarketforcellulosicbiomassisnascentatbest,asitdevelopsinresponsetolegislativemandatesandenergydemandtherewillbepressuretoconvertlandsnowunmanagedintobiofuelcropping
Chapter 3: Quantifying Greenhouse Gas Sources and Sinks in Cropland and Grazing Land Systems
3-29
systems.MinimizingtheGHGimpactoftheseconversionswillbecrucialforavoidinglong‐termcarbondebtthatwillotherwiseleadtocarbonsourcesratherthancarbonsinks,irrespectiveoftheircapacitytogeneratefossilfueloffsetcredits(Fargioneetal.,2008;Gelfandetal.,2011;Pineiroetal.,2009).
3.2.3.3 InfluenceonMethanotrophicActivity
Methanotrophicbacteriacapableofconsuming(oxidizing)atmosphericCH4arefoundinmostaerobicsoils.CH4uptakeinsoilsisgloballyimportant;thesizeofthesoilsinkisthesamemagnitudeastheatmosphericincreaseinCH4(IPCC,2001),suggestingthatsignificantchangesinthestrengthofthesoilsinkcouldsignificantlyaffectatmosphericCH4concentrationsifuptakedeclinesduetolanduseandmanagement.Inunmanageduplandecosystems,CH4uptakeiscontrolledlargelybytherateatwhichitdiffusestothesoilmicrositesinhabitedbyactivemethanotrophs.Diffusionisregulatedbyphysicalfactors—principallymoisturebutalsotemperature,soilstructure,andtheconcentrationofCH4inthesoil.
AgriculturalmanagementtypicallydiminishessoilCH4oxidationby70percentormore(Mosieretal.,1991;Robertsonetal.,2000;Smithetal.,2000)foratleastaslongasthesoilisfarmed.Themechanismforthissuppressionisnotwellunderstood;likelyitisrelatedtonitrogenavailabilityasaffectedbyenhancednitrogenmineralization,fertilizer,andothernitrogeninputs(Steudleretal.,1989;SuwanwareeandRobertson,2005).NH4+isknowntocompetitivelyinhibitmethanemonooxygenase,theprincipalenzymeresponsibleforoxidationatatmosphericconcentrations.Microbialdiversityalsoseemstoplayanimportantrole(Levineetal.,2011).
TherearenoknownagronomicpracticesthatpromotesoilCH4oxidation;althoughabetterunderstandingofthemechanismsresponsibleforitssuppressionmayeventuallysuggestmitigationopportunities.Todate,recoveryofsignificantCH4oxidationcapacityfollowingagriculturalmanagementhasonlybeendocumenteddecadesafterconversiontoforestorgrassland;completerecoveryappearstotakeacenturyorlonger(Robertsonetal.,2000;Smithetal.,2000).
3.2.3.4 Non‐CO2GHGEmissionsfromBurning
Burningcanbeconductedonlandsinpreparationforcultivationtofacilitateaccessforequipment,removestandingaccumulatedbiomass,andprovideorganicmaterial(ash)forincorporationintosoils.Burningofthebiomasscanbeanimportantsourceofnon‐CO2GHGs(N2O,CH4)aswellasprecursorstoGHGformation(CO,NOx)followingadditionalchemicalreactionsintheatmosphereorsoils.MoreinformationonburningofgrazinglandsvegetationcanbefoundinSection3.3.1.5,andburningoftheremainingbiomasswithclearingofforestcanbefoundinSection6.4.1.9.
3.3 GrazingLandManagement
Rangelandsaredefinedaslandonwhichtheclimaxorpotentialplantcoveriscomposedprincipallyofnativegrasses,grass‐likeplants,forbsorshrubssuitableforgrazingandbrowsing,andintroducedforagespeciesmanagedforgrazingandbrowsing.Conversely,pasturelandsrepresentlandmanagedprimarilyfortheproductionofintroducedforageplantsforlivestockgrazing,withmanagementconsistingoffertilization,weedcontrol,irrigation,reseedingorrenovation,andcontrolofgrazing(USDA,2009).HowgrazinglandsaremanagedinfluencesthepotentialforcarbonsequestrationorGHGemissions.TheparagraphsbelowhighlightsomeofthekeymanagementpracticesandtheirassociatedGHGemissionsandremovalssummarizingthecurrentstateofthescience.
Chapter 3: Quantifying Greenhouse Gas Sources and Sinks in Cropland and Grazing Land Systems
3-30
3.3.1 ManagementActivityInfluencingGHGEmissions
Soilorganiccarbondominatestheterrestrialcarbonpoolingrazinglands.Abovegroundcarbonis<fivepercentofthetotalecosystemcarbonpoolinmostnon‐woodyplantdominatedecosystems,butupto25percentingrassland‐shrublandecosystems.Grazinglandscanbecarbonsinks,withratesofsoilorganiccarbonsequestrationupto0.5MgCha‐1year‐1forrangelands(DernerandSchuman,2007;Liebigetal.,2010)and1.4MgCha‐1year‐1forpastures(Franzluebbers,2005;2010a).Actualratesareoftenlessthantheseapparentmaximalratesofsoilorganiccarbonsequestrationduetomanagement,climate,weather,andotherenvironmentalconstraints.Potentiallyhighratesofsoilorganiccarbonaccumulationarepredictedinnewlyestablishedpasturesandrestorationofdegradedrangelands,whileimpropermanagementanddroughtcanresultinsignificantcarbonreleases.Duetothelargelandarea,themovementofcarbonintoandoutofthesoilreservoiringrazinglandcanbeanimportantcomponentoftheglobalcarboncycle.InadditiontosoilorganicC,alargepoolofsoilinorganiccarbonoccursascarbonatesinsemi‐aridandaridrangelandsoilsthatcanleadtoeithersequestrationorreleaseofCO2(Emmerich,2003).However,thedirectionandmagnitudeofsoilinorganiccarbonstocksarecurrentlypoorlyunderstood(Follettetal.,2001;Liebigetal.,2006;Svejcaretal.,2008).
Twoimportantmanagementfactorsthatcontrolthefateofsoilorganiccarboningrazinglandsarelong‐termchangesinproductionandqualityofabovegroundandbelowgroundbiomassthatcanalterthequantityofnitrogenavailableandtheC‐to‐Nratioofsoilorganicmatter(Pineiroetal.,2010),andgrazing‐inducedeffectsonvegetationcomposition,whichcanbeasimportantasthedirectimpactofgrazing(e.g.,grazingintensity)onsoilorganiccarbonsequestration(DernerandSchuman,2007).Therateofsoilorganiccarbonsequestrationcanbelinearfordecades(Franzluebbersetal.,2012),buteventuallydiminishestoasteady‐statelevelwithnofurtherchangeinthestockfollowingseveraldecadesofamanagementpractice(DernerandSchuman,2007).Additionalpositivechangesinmanagementorinputsareoftenneededtosequesteradditionalsoilorganiccarbon(Conantetal.,2001),butnegativechangesinmanagementcausinglossofsoilstructureandsurfacelittercovercanleadtoerosionandlossofproductivityresultinginadeclineinsoilorganiccarbon(Pineiroetal.,2010).
MethanefluxfromgrazinglandsiscontrolledbythebalanceofentericandmanureemissionsfromruminantanimalsanduptakeofCH4bysoil.(EmissionsandmethodsforestimatingCH4emissionsfromruminantsarediscussedfurtherinSection5.3).InthewesternUnitedStates,grasslandshavegreaterCH4uptakebysoilthandoneighboringcroplands(Liebigetal.,2005),probablyduetogreatersurfacesoilorganicmatterthatpromotesthegrowthofmethanotrophicbacteria.InanassessmentofGHGemissionsfromthreegrazinglandsystemsinNorthDakota,entericemissionsofCH4fromgrazingcattlewerethreetoninetimesgreater(onaCO2equivalentbasis)thanCH4uptakebysoil(Liebigetal.,2010).WithCH4emissionsdirectlytiedtonumberofcattle,fertilizedgrasslandsareoftenanetcarbonsourceduetoenhancedCH4emissionfromcattleandpotentiallygreaterN2Oemissions,whileunfertilizedgrasslandsareoftenanetcarbonsink(Luoetal.,2010;Tunneyetal.,2010).
3.3.1.1 LivestockGrazingPractices
Livestockgrazingpractices(i.e.,stockingrateandgrazingmethod)aresummarizedbelowalongwithdataontheinfluencethesepracticeshaveonGHGemissionsandremovals.
StockingRate:Stockingrateisthenumberofanimalspermanagementunitutilizedoveraspecifiedtimeperiod,e.g.,numberofsteersperacrepermonth.Basedonpublishedstudies,responsesofsoilorganiccarbontostockingrateandgrazingintensityhavebeenvariable,despitegrazingeithercausinganincreaseorhavinglittleeffectonthemorecommonlymeasuredpropertyofsoilbulkdensity(GreenwoodandMcKenzie,2001;Schumanetal.,1999).Innorthernmixed‐grassprairie,

Chapter 3: Quantifying Greenhouse Gas Sources and Sinks in Cropland and Grazing Land Systems
3-31
soilorganiccarbonhasincreasedingrazedcomparedwithungrazedareas,partlyresultingfromincreasingdominanceofshallow‐rooted,grazing‐resistantspecies,suchasbluegrama(Boutelouagracilis),whichincorporatesalargeramountofrootmassintheuppersoilprofilethanthemid‐grassspeciesthatitreplacesduringgrazing(Derneretal.,2006).Furtherresearchisneededtodeterminetheextentofdifferentrootdistributionsontotalcarbonstorageinanentiresoilprofile.Increasingstockingratebeyondanoptimumforachievingmaximumlivestockproductionperunitlandarea(Bement,1969;Dunnetal.,2010)wouldbeexpectedtoresultinalossofsoilorganiccarbonduetoreducedplantvigorandrootdistributioninthesoilprofile.Withsuboptimalstockingrate,vigorofpastureforagesmaydeclineasplantresiduesdevelopathicklitterlayeratthesoilsurface.However,insemi‐aridregions,thehighUVlightintensitymaysignificantlyreducelitteronthesoilsurfacethroughphotochemicaldecompositionprocesses,regardlessofgrazingintensity(Brandtetal.,2010).Vegetationcompositionshiftsthatchangethequantityandqualityofplantmaterialproducedcaninfluencetheamountofcarboninputstosoils.Inmanagedpastures,ithasbeenshownthatsoilorganiccarboncanbeoptimizedwithamoderatestockingratecomparedwithnograzingorheavy,continuousgrazing(Franzluebbers,2010b).Anoptimizedstockingrateforaparticularregion(climaticconditions),vegetationcomposition,andsoiltypeisthoughttomaximizetheamountofsoilorganiccarbonsequestered.
Limitedevidenceshowsthatgrazingatmoderatelevelscanfurtherincreaseenvironmentalbenefitsoverthoseofgrasslandestablishmentalone,inadditiontoprovidinganimportanteconomicreturntoproducers.Ifsoilorganiccarbonweretodeclinewithovergrazing,therewouldalsobeadeclineinanimalproductivityduetolackofforage.Therefore,anegativerelationshipbetweensoilorganiccarbonstorageandanimalproductivityislikelywhengrazingintensityexceedsamoderatelevel.ThisresponseislikelymodifiedundermoderategrazingpressureduetothefactthatgreateranimalproductperheadcanbeachievedwithlowerGHGemissions.Limitingtheeffectofhighstockingrateonsoilorganiccarbonlevelsmaybeachievablewithhighnitrogenfertilizerinputs,anoutcomewithanuncertaincarbonfootprintrelativetoGHGintensity.StockingrateandfertilizernitrogeninputinteractionsneedtobequantifiedtoaccuratelyassesstotalGHGintensity.SomeevidenceinthehumidUnitedStatessuggeststhatovergrazingcanleadtoincreasedsoilerosionandareductioninsoilquality.Literaturefromotherregionshasalsoshownincreasingsoilerosionanddecliningsoilqualitywithexcessivestockingrates.Whileevidenceislacking,anassumptionisthatsoilorganiccarbonfollowsthissamepositiveresponsetomoderategrazingandnegativeresponsetoovergrazing.
EmissionsofN2Ofromgrazinglandsareaffectedbygrazing,butnetfluxcanbeincreasedordecreased,dependingonstockingrate,grazingsystem,andseason(Allardetal.,2007).StockingratehadlittleinfluenceonN2Oemissionsfrommixed‐grassprairieinNorthDakota(Liebigetal.,2010).WhileelevatedN2Oemissionsmaybeexpectedunderincreasedstockingrate,Wolfetal.(2010)suggestedthatgrazingcancounteractpotentialN‐inducedemissionsonrangelandsbyreducingsurfacebiomass,resultinginmoreextremesoiltemperatures,lowersoilmoisture,andcorrespondinginhibitionofmicrobialactivityresponsibleforN2Oemissions.Ifgrazingintensityonpastureswereviewedasafertilizereffectwithincreasinganimalmanuredeposition,thenN2Ofluxfromagrazingeffectdoesnotbehaveinthesamemannerasmanufacturednitrogenfertilizerinputs.Interactionsbetweenstockingrateandnitrogenfertilizerinputshavenotbeenquantified,despitesuchdiversityinmanagementlikelyoccursamongproducers.StockingrateandmanureandfertilizernitrogeninputsareareasrequiringfurtherresearchtobetterunderstandthecomplexsetofcontrollingfactorsinadditiontosoiltextureandenvironmentalconditionsonN2Oemissionsingrazinglands.Onrangelands,theabundanceofN‐fixinglegumesintheplantcommunitybecomesmorecriticalforincreasingSOC,particularlysincefertilizeradditionsandmanurearenotassignificantforreturningnitrogentothesoilcomparedtopasturesystems.ThisisanarearequiringfurtherresearchtobetterunderstandthecontrollingfactorsonN2Oemissions.
Chapter 3: Quantifying Greenhouse Gas Sources and Sinks in Cropland and Grazing Land Systems
3-32
GrazingMethod:Grazingmethodsvarybasedonproducergoalsandthetypeofforageavailable(Scheafferetal.,2009).Twodistinctgrazingmethods,continuousandrotationalgrazing,representtheprevalentmethodsemployedongrazinglandsintheUnitedStatestomanagethelivestock.Continuousgrazingallowsanimalstofreelymoveandhavefullaccesstoagrazingarea,whereasrotationalgrazingismorecontrolled,involvingmovementofanimalsbasedonmonitoringforagecondition,suchasplantheight,betweentwoormorepaddockssubdividedfromalargergrazingarea.Rotationalgrazingterminologyhasbeenconfusedwithtermssuchasholisticgrazing,plannedgrazing,prescribedgrazing,andmanagement‐intensivegrazing,whichcontinuetobeusedwithmultipleandambiguousmeaningsdespiteattemptstostandardizedefinitions(SRM,1998).Termstodefineintentionsofrotationalgrazingsystemsincluderest‐rotation,deferred‐rotation,high‐intensity‐short‐duration,andseason‐longgrazing(Briskeetal.,2008;Briskeetal.,2011).Herewedefinerotationalgrazingasthemovementoflivestockbetweentwoormoresubunitsofgrazinglandsuchthatalternatingperiodsofgrazingandnograzing(‘rest’)occurwithinasinglegrowingseason(HeitschmidtandTaylor,1991).
Rotationalgrazinglimitsplantsfromreachingreproductivestagesinwhichforagequalityrapidlydeclines.Thiscontrastswithcontinuousgrazinginwhichthereismoreselectivegrazingofthehighestqualityforages.Assuch,foragequalitymaybemaintainedatahighlevellongerintothegrowingseason.Therefore,rotationalstockinginthehumidUnitedStatescouldprovidemoreuniformforageconsumptionacrosspasturesandallowsufficientresttoforagespeciesbetweengrazingeventstopromotegreaterproduction.Pastureswithgreaterplantproductionviaanimprovedstockingmethodwouldbeexpectedtohavelowersoilerosionandgreatersoilorganiccarbonstorage.Althoughtheseexpectationsseemintuitive,therearelimiteddatainthescientificliteraturetosupportthem.Twostudieshavesuggestedanincreaseinsoilorganiccarbonwithrotationalgrazingcomparedwithcontinualseason‐longgrazing(Conantetal.,2003;Teagueetal.,2010),andanotherstudyfoundnodifferencebetweensystems(Manleyetal.,1995).Sincerotationalgrazingdataaremostlyavailableforrangelandandfewstudiesconductedonpastures,thereisnotenoughevidencetoevaluatehowrotationalgrazingmightaffectsoilorganiccarboninpastures.Giventhatthepreponderanceofevidencesuggeststhatrotationalgrazingdoesnotinfluencevegetationproductioninrangelands(Briskeetal.,2008),changesinsoilorganiccarbonwithrotationalgrazingwouldbeexpectedonlyifsubstantialvegetationchangeoccurredindependentlyfromstockingrate.Rangelandstypicallyhaveamuchhigherdiversityandmultiplegrowthpatternsofforbs,cool‐seasonandwarm‐seasongrasses,whichwouldresultinasmallerinfluenceofstockingmethodonvegetationphenology(i.e.,keepingforageinavegetativeratherthanareproductivestate)thanwouldoccurinmonocultureorsimplemixturesofforagesinpastures.Muchmoreresearchongrazingmethodisneeded,duetothehighadoptionrateandpromotionofthebenefitsofimprovedgrazingmethodsforsoilorganiccarbonsequestrationbyproducersandagriculturaladvisors(BeetzandRhinehart,2010).
3.3.1.2 ForageOptions
Cool‐andwarm‐seasonforageshavegrowthactivityatdifferenttimesoftheyear,therebyaffectingwhenrootandlittercarboninputsaresuppliedtosoil.Dependingonenvironmentalgrowingconditions(i.e.,relativelyshort,cool,andwetsummerwithlong,coldwinterversuslong,hot,anddrysummerwithmild,wetwinter),theperformanceofcool‐versuswarm‐seasonforageswillvaryacrossregions.InthesoutheasternUnitedStates,perennialcool‐seasonforages(e.g.,tallfescue)haveproducedgreatersoilorganiccarbonthanwarm‐seasonforage(e.g.,bermudagrass)ingrazinglandsystems,despitethemorevigorousgrowinghabitofbermudagrass(Franzluebbersetal.,2000).Thisresultislikelyduetotheopportunitiesofforagesforgrowthandthebalanceofwaterinsoilthatremainsformicrobialdecompositionoforganicmatter.
Chapter 3: Quantifying Greenhouse Gas Sources and Sinks in Cropland and Grazing Land Systems
3-33
Timingofforagegrazingcanaffectplantproductivity,wildlifehabitat,andcompactionofsoil.Eachoftheseeffectscan,inturn,affectsoilorganiccarbonsequestrationandGHGemissions.Thecapacityofsoiltowithstandcompactionforcesofanimaltreading,resultinginsignificantdeformation,destabilization,lossofinfiltrationcapacity,andsoilorganiccarbonsequestration,canbeexceeded—especiallyunderwetconditions(Bilottaetal.,2007).Soilsaturationduringwinterandspringleadtosevereeffectsfromanimaltrampling.InnorthernlatitudesandrangelandsofthewesternUnitedStatessubjecttofreeze‐thawcycles,sandyandloamysoilsarelesslikelytobeaffectedbythenegativeimpactsofcompaction.Intuitively,deferringgrazingtoperiodsoflimitedactiveforagegrowth(e.g.,winterandspring)mightcontributetoincreasedsoilcompaction.However,allowingforagetoaccumulatetofullcanopypriortograzingmightbebeneficialtocontrollingerosionbyprovidingalongerperiodofforageandresiduecover.Grazingofwintercovercropsmayalsobeaneffectivefarm‐diversitystrategy,buttheeffectsonsoilerosioncontrolandsoilconditionneedtobequantified.Wildlifemanagementguidelinesonrangelandsuggestlonger‐term(>oneyear)resttoaccumulatevegetationstructureforcertainbirdsneedinghabitat.Timingofgrazingcouldbeacriticalfactorincontrollingcompaction,susceptibilitytoerosion,andsoilorganiccarbonsequestration,sothesequenceofwhenpasturesaregrazedshouldberotatedamongyearstoensurethatplantcommunitiesarenotalwaysgrazedatthesametimetoensuregreatercommunitysustainability.
Organicmatter‐richsurfacesoilabsorbscompactiveforcesofgrazingmuchlikeasponge,inwhichsoiloftenreboundsinvolumeonceforcesareremoved.However,effectsofwintergrazingofdeferredgrowthmaybedifferentincolderthaninwarmerregions:frozensoilmayavoidcompaction,butnutrientrunoffmaybecomemoreimportant(Clarketal.,2004).InthesouthernUnitedStates,perennialcool‐seasongrassesareoftengrazedduringlatewinterandthroughoutspringduringtypicallywetconditions,butduetoactiveforagegrowth,soilcanalsodryquicklyandtramplingmaynotalwayscausedamage.InGeorgia,soilorganiccarbonwasgreaterunderlong‐termstandsofcool‐seasontallfescue(typicallygrazedinspringandautumn)thanunderwarm‐seasonbermudagrass(typicallygrazedinsummer)(Franzluebbersetal.,2000).
InthesoutheasternUnitedStates,annualcool‐seasonforagesareoftenplantedasacovercropfollowingsummercropsorsod‐seededintoperennialgrasspastures.ThispracticecanenhanceforageproductionandshouldincreasesoilorganicC,althoughlimiteddataareavailabletosupportthisconclusion.Inanintegratedcrop/livestocksysteminthesoutheasternUnitedStates,therewasalimitedeffectofgrazingannualcovercropsonsoilorganicC,eitherinthesummerorwintercomparedwithungrazedcovercrops(FranzluebbersandStuedemann,2009).
3.3.1.3 Irrigation
WaterisalimitingfactorintheabilityofplantstofixcarbonandsubsequentlyproducethecarboninputnecessarytoaccumulatesoilorganicC.ItisalsoafactorlimitingdecompositionofsoilorganicC.Whiletheextentofirrigationingrazinglandsislimited,whereitoccursthereareconsequencesforsoilorganiccarbonstorage.Forexample,someproductivemeadowsinthewesternUnitedStatesareirrigated.Howirrigationaffectssoilorganiccarbonwilldependonthequantity,frequency,andtimingofirrigationevents.Irrigationonlyatpeakplantgrowthstageswilllikelycauseamuchgreaterpositiveimpactonforagecarbonfixationthananegativeimpactonsoilorganiccarbondecomposition.Inthesamemanner,irrigationquantity,frequency,andtimingwilllikelyaffectN2OandCH4emissions,althoughpulsedresponsesoftheseGHGscouldlikelybemuchmoredramatic.Unfortunately,thereareonlylimitedstudiesonthesepotentialimpacts.SeeSection3.2.1.4formoreinformationonirrigationmethods.
Inacomparisonofagriculturalsystemswithsurroundingaridandsemi‐aridnaturalvegetation,Entryetal.(2002)foundthatsoilorganiccarbonwasgreaterinirrigatedagriculturalsystemsdue
Chapter 3: Quantifying Greenhouse Gas Sources and Sinks in Cropland and Grazing Land Systems
3-34
toenhancedproductivity.EmissionofN2Ofromirrigatedsystemsoccursfollowingcloselytimedirrigationandnitrogenfertilizerapplicationsincroplandconditions,andthiswouldbeexpectedundergrazinglandsaswell,buttherearefewdataavailable(Liebigetal.,2006;Liebigetal.,2012).
3.3.1.4 NutrientManagement(SyntheticandOrganic)
Fertilizersareoftenappliedtopastures,duetothehighyieldresponsewithadequateprecipitation,butarelesscommoninwesternrangelandsduetoinconsistentyieldresponseandriskycost‐effectivenesswithlimitedandvariableprecipitation.NitrogenavailabilityinsoildeterminestoalargeextenttheemissionsofN2O.Grazinglandstypicallyhavelowernitrogenavailabilityinsoilthancroplands,andthereforehavelowerN2Oemissions(Liebigetal.,2005).However,applicationoffertilizernitrogentorangelandhasbeenfoundtoconsistentlystimulateN2Oemissions(Flechardetal.,2007).Liebigetal.(2010)observedtwo‐foldgreaterN2Oemissionsfromfertilizedcrestedwheatgrasscomparedwithunfertilizedmixed‐grassprairie.AdditionoffertilizernitrogentopastureinMichiganhadanegligibleeffectonN2Oemissions(AmbusandRobertson,2006),whereasapplicationofpoultrymanureonabermudagrasspastureinArkansasincreasedN2Oemissionsby45percentcomparedwithpasturewithoutmanure;N2Ofluxandsoilnitratedynamicswerepositivelyassociated(Saueretal.,2009).Astrategytoreducesoilnitratebyinterseedingannualryegrassonmanure‐amendedsoildecreasedN2Oemissionsby50percent.Similartocropland,reducingsoilnitratetolowlevelsduringperiodsoflowrootactivityandhighlevelsduringperiodsofhighrootactivitywillgenerallyenhanceplantnitrogenuptakeandreduceN2Oemissions.ApplicationofcompostedgreenwastecouldsequesterC,butthisresearchtopichasnotbeenfullyevaluated.AsignificantincreaseinsoilorganiccarbonhasonlybeendemonstratedatoneoftwositesinCalifornia(Ryalsetal.,2014).Frommodelsimulations,compostapplicationhasbeenshowntoreducetheoverallGHGemissiononCO2equivalentbasis,bysequesteringcarbonandreducingN2Oemissions,whilemanureslurryandinorganicfertilizerapplicationsledtonetGHGemissionsonCO2equivalentbasis(DeLongeetal.,2013).Formoreinformationonmanagementoptionsassociatedwithfertilizationpractices,seeSection3.2.1.1.
3.3.1.5 PrescribedFires
Burninghasthepotentialtoaltersoilorganiccarbonthrougheffectsonphotosynthesis,soil,andcanopyrespiration,andthroughspecieschanges,inadditiontostabilizingorincreasinglivestockgains,improvinghabitatdiversity,andreducingfuelloads(Bouttonetal.,2009;Toombsetal.,2010).Althoughcarbonlossfromburninggrazinglandsisaminorcomponentoftheannualcarbonemissions,burningrangelandswithasignificantwoodyabovegroundplantbiomasscanresultinsubstantialimmediateecosystemcarbonloss(BremerandHam,2010;Rauetal.,2010).However,prescribedburningofgrazinglandscouldalsoaffectlong‐livedcharthataccumulatesinsoil,andthereforewouldinfluencesoilcarbonstocks.Burningalsoleadstonon‐CO2GHGemissions,whichcanbesignificantduetothehigherglobalwarmingpotentialofthesegasescomparedwithCO2(IPCC,2006).Formoreinformationonnon‐CO2GHGemissionsfromburning,seeSection3.2.3.4.
3.3.1.6 ErosionControl
Riparianbufferscanbeasignificantsinkforexcessnutrientsrunningoffneighboringgrazinglands.Thefateofnutrientsisdependentontheflowcharacteristicsandtypeofvegetation.ExcessnitrateinsaturatedsoilofriparianareascanleadtosignificantN2Oemissions—althoughtheseemissionsaretypicallytreatedasindirect,withtheemissionsassociatedwiththefieldorlivestockfacilitythatiscontributingtheexcessnutrients(SeeSection3.2.1.1).TransportofsolublecarbonintoriparianareascouldalsoenhanceCH4emissionsfromsaturatedsoil.
Chapter 3: Quantifying Greenhouse Gas Sources and Sinks in Cropland and Grazing Land Systems
3-35
3.3.1.7 ManagementofDrainedWetlands
DrainageofwetlandorhydricsoilsthatareusedforgrazinghasimplicationsforsoilorganiccarbonandGHGemissions,similartodrainageforcropproduction.Thewaterregimeandplantcommunitiesaresignificantlyalteredandsoilsaremodifiedfromanaerobictoaerobicconditions.Increasingoxygeninsoilwillcauseorganicmattertodecomposemorerapidlythanundersaturatedconditions,resultinginreleaseofCO2(Eagleetal.,2010;FranzluebbersandSteiner,2002;IPCC,2006;Liebigetal.,2012).LargeemissionsofCO2resultfromdrainageofwetlands(Allen,2007;2012),anddrainagecanalsoincreasenitrogenmineralizationandenhanceN2Oemissionsdirectly(IPCC,2006).EmissionsofCH4arereducedconsiderablywithdrainage,butthisimpactisoftennotconsideredinestimationofGHGemissions(IPCC,2006).Alargeproportionofgrasslandwetlandshavebeendirectlydrainedormodifiedtoenhanceagriculturalproduction(DahlandJohnson,1991),andmanyotherwetlandsareindirectlyaffectedbysubsurfacetiledrainsandagriculturalpracticesinsurroundingcatchments.SeeSection3.2.1.6formoreinformationaboutmanagementofdrainedsoils.
3.3.1.8 LimeAmendments
LimeamendmentsareneededwhensoilpHislow(e.g.,pH<5)toenhanceproductivityandsupportbalancednutrientlevelsingrazinglandsoils.Typicallimingmaterialsingrazinglandsarecalciticlimestone(CaCO3),dolomiticlimestone(CaMg(CO3)2),andconfinedlivestockmanure,particularlypoultrylitter,whichhaslimingactivityfromlimeadditivetothefeedration.Whencarbonatelimeisappliedtosoilitdissolvesinsolutionovertime,withthecationandcarbonatedissociating.ThereispotentialforreleasingCO2totheatmospheredependingonwhetherthelimereactswithcarbonicornitricacidinthesoilsolution.Theenhancedplantnutrientofferedbylimingcanhaveanetpositiveeffectonthecarbonbalanceforanextendedperiodoftime.SeeSection3.2.1.7formoreinformationonlimeandtheconsequencesforGHGemissions.
3.3.1.9 WoodyPlantEncroachment
Woodyplantencroachment3leadstocarbonaccumulationinabove‐groundandrootbiomassandmayincreaseoverallecosystemcarbonstorage,butcandegradeagriculturalproductivityofgrazingland(McClaranetal.,2008).Overthepastcenturyinwesternrangelands,soilorganiccarbonhasincreasedinnear‐surfacesoilswithwoodyplantencroachment(Bouttonetal.,2009;Creameretal.,2011;Liaoetal.,2006;Liebigetal.,2012).Removalofwoodyplantsbyfireorothermechanismsdepletestheseshallow,relativelysusceptiblesoilorganiccarbonstoresassociatedwithencroachment(Neffetal.,2009;Rauetal.,2010);butdoesnothaveaneffectonSOCortotalnitrogenstocksatdepthsof>20cm(Daietal.,2006).Regardless,removalofthewoodyplantswillcauseadeclineinabovegroundbiomasscarbonstocks(Rauetal.,2010).
InasummaryofresearchonCH4emissionsfromgrazinglands,Liebigetal.(2012)reportedCH4uptakeundermesquite,butnetCH4productionundergrasslandanddeadmesquitestumps.Methaneuptakeundermesquitewasassociatedwithreducedsoilbulkdensityandincreasedsoilmoisture(McLainandMartens,2006),aswellasgreaternitrogenaccrual/accumulationassociatedintheareaaroundmesquiteplants(10meters)(BouttonandLiao,2010;Liaoetal.,2006;Liuetal.,2010).Methaneuptakeundermesquitewasalsoassociatedwithalteredsoilmicrobialcommunities(Hollisteretal.,2010;LiaoandBoutton,2008),whichcanaffectNOxandN2Orates,whileCH4productionfromgrasslandandwoodydetrituswaslikelycausedbytermiteactivity.The
3Woodyencroachmentwilleventuallyleadtoatransitionfromgrazinglandtoaforest.SeeChapter7:LandUseChangefordefinitionofforestlandtodeterminewhenwoodyencroachmentwillleadtoatransitiontoforestland.
Chapter 3: Quantifying Greenhouse Gas Sources and Sinks in Cropland and Grazing Land Systems
3-36
roleofmesquitetofixN,therebyalteringnitrogendynamics,resultedinN2Oemissionsundermesquitecanopyfour‐foldgreaterthanundergrassesorwoodydetritus(McLainetal.,2008).
3.3.2 Land‐UseChangetoGrazingLands
Land‐useconversiontograzinglandsinfluencesthecarbonstocksandGHGemissionsofaparcel.Priorlanduse,climate,soiltype,andmanagementpracticesarejustafewofthefactorsinfluencingthemagnitudeanddirectionofGHGemissionsandremovalsresultingfromaland‐useconversiontograzinglands.Theparagraphsbelowsummarizethecurrentstateofthescienceontheinfluenceofaland‐useconversiononcarbonstocks,soilN2O,CH4,andnon‐CO2GHGsresultingfrombiomassburning.
3.3.2.1 InfluenceonCarbonStocks
Establishmentofpasturesonpreviouscroplandhelpsreducesoilerosionandimprovessoilquality(Singeretal.,2009).Thereissubstantialevidencethatestablishmentofpasturesleadstosignificantsoilorganiccarbonsequestration.Therateofaccumulationacrossanumberofstudiesaveraged0.84MgCha‐1year‐1(Franzluebbers,2010a).Literatureisinadequatetodeterminewhetherforagecompositionorsoiltypehaveadiscernibleinfluenceonsoilorganiccarbonstock(seeSection3.3.1.2).Thequantityofforageproducedandthequantityofresiduesfromsurfacelitterandrootbiomassarelikelykeydeterminantsofsoilorganiccarbonaccumulation.Thesequantitiescanbeinfluencedbyfactorssuchasforagemixture,climaticconditions,soiltype,inherentsoilfertility,fertilizerapplication,andliming.
3.3.2.2 InfluenceonSoilNitrousOxide
Dependinguponpreviouslanduse,grasslandestablishmentmayormaynotaffectnetN2Oemissionsduringland‐usechange.Ingeneral,emissionsofN2Oarecontrolledbysoilnitrogenavailabilitywithadditionalinfluenceofsoiloxygenandsolublecarbonavailability.Ifthepreviouslandusewasforexample,anutrient‐limitedforest,convertedsubsequentlytohigh‐fertilitypasture,thenN2Oemissionswouldlikelyincrease.Ifthepreviouslandusewasnutrient‐richcroplandconvertedtopasture,thenN2OemissionswouldlikelydeclineduetogreateropportunityforperennialforagespeciestoassimilateavailablesoilnitrogenandthusreduceopportunitiesforsoilnitrogentransformationstoN2O.Thisisanarearequiringfurtherresearchtoobtainquantitativeresponses,however.
3.3.2.3 InfluenceonMethanotrophicActivity
Land‐usechangetograzingland,particularlyfromforestland,mayinvolvefertilizationtoenhanceforageproduction.NitrogenfertilizationcausesareductionofmethanotrophicactivityinsoilsandthereforereducestheuptakeofCH4fromtheatmosphere(AmbusandRobertson,2006).SeeSection3.2.3.3formoreinformationontheimpactofland‐usechangeonmethanotrophicactivity.
3.3.2.4 Non‐CO2GHGEmissionsfromBurning
BiomassburningingrazinglandcanbeanimportantsourceofGHGs(CO2,N2O,CH4)(Aaldeetal.,2006;AndreaeandMerlet,2001;Badarinathetal.,2009;IPCC,2006).Whileconversionofcroplandtograzinglandrarelyinvolvesburning,conversionofforesttograzinglandcaninvolveburningofthewoodand/orslashleftfromlandclearing.TheeffectonGHGemissionsfrombiomassburningisdiscussedfurtherinthecroplandsection(Section3.2.3.4)andintheforestlandsection(Section6.4.1.9).
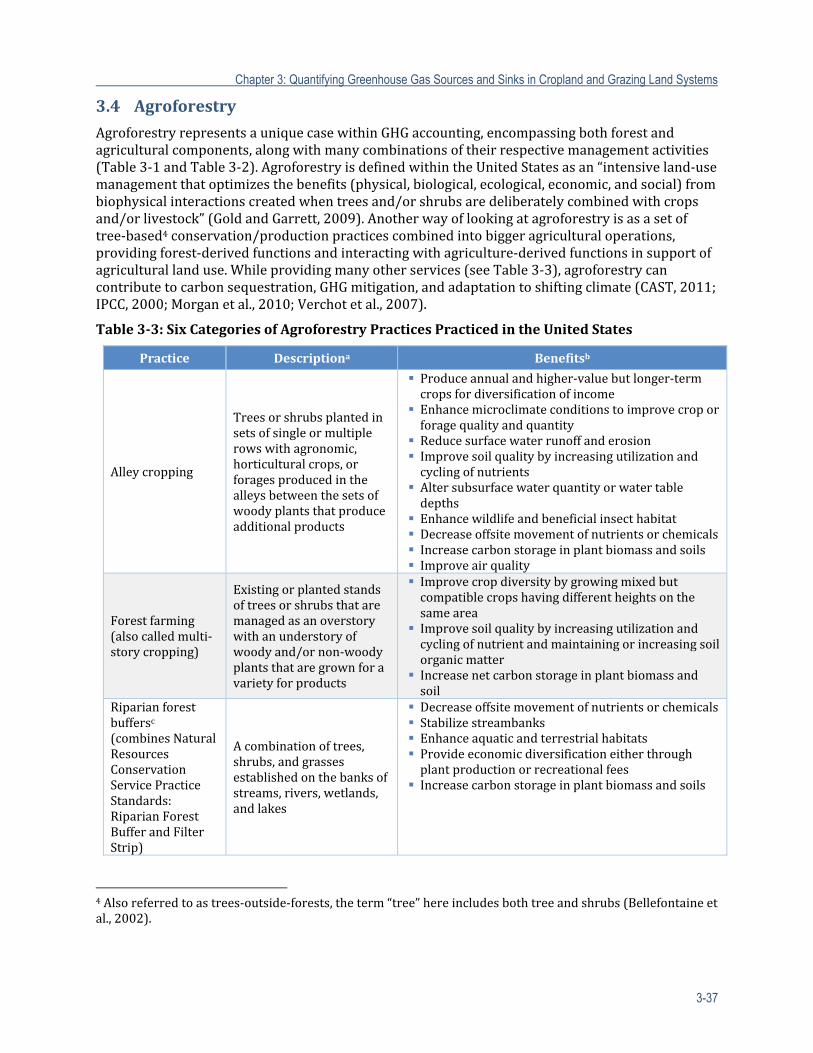
Chapter 3: Quantifying Greenhouse Gas Sources and Sinks in Cropland and Grazing Land Systems
3-37
3.4 Agroforestry
AgroforestryrepresentsauniquecasewithinGHGaccounting,encompassingbothforestandagriculturalcomponents,alongwithmanycombinationsoftheirrespectivemanagementactivities(Table3‐1andTable3‐2).AgroforestryisdefinedwithintheUnitedStatesasan“intensiveland‐usemanagementthatoptimizesthebenefits(physical,biological,ecological,economic,andsocial)frombiophysicalinteractionscreatedwhentreesand/orshrubsaredeliberatelycombinedwithcropsand/orlivestock”(GoldandGarrett,2009).Anotherwayoflookingatagroforestryisasasetoftree‐based4conservation/productionpracticescombinedintobiggeragriculturaloperations,providingforest‐derivedfunctionsandinteractingwithagriculture‐derivedfunctionsinsupportofagriculturallanduse.Whileprovidingmanyotherservices(seeTable3‐3),agroforestrycancontributetocarbonsequestration,GHGmitigation,andadaptationtoshiftingclimate(CAST,2011;IPCC,2000;Morganetal.,2010;Verchotetal.,2007).
Table3‐3:SixCategoriesofAgroforestryPracticesPracticedintheUnitedStates
Practice Descriptiona Benefitsb
Alleycropping
Treesorshrubsplantedinsetsofsingleormultiplerowswithagronomic,horticulturalcrops,orforagesproducedinthealleysbetweenthesetsofwoodyplantsthatproduceadditionalproducts
Produceannualandhigher‐valuebutlonger‐termcropsfordiversificationofincome
Enhancemicroclimateconditionstoimprovecroporforagequalityandquantity
Reducesurfacewaterrunoffanderosion Improvesoilqualitybyincreasingutilizationandcyclingofnutrients
Altersubsurfacewaterquantityorwatertabledepths
Enhancewildlifeandbeneficialinsecthabitat Decreaseoffsitemovementofnutrientsorchemicals Increasecarbonstorageinplantbiomassandsoils Improveairquality
Forestfarming(alsocalledmulti‐storycropping)
Existingorplantedstandsoftreesorshrubsthataremanagedasanoverstorywithanunderstoryofwoodyand/ornon‐woodyplantsthataregrownforavarietyforproducts
Improvecropdiversitybygrowingmixedbutcompatiblecropshavingdifferentheightsonthesamearea
Improvesoilqualitybyincreasingutilizationandcyclingofnutrientandmaintainingorincreasingsoilorganicmatter
Increasenetcarbonstorageinplantbiomassandsoil
Riparianforestbuffersc(combinesNaturalResourcesConservationServicePracticeStandards:RiparianForestBufferandFilterStrip)
Acombinationoftrees,shrubs,andgrassesestablishedonthebanksofstreams,rivers,wetlands,andlakes
Decreaseoffsitemovementofnutrientsorchemicals Stabilizestreambanks Enhanceaquaticandterrestrialhabitats Provideeconomicdiversificationeitherthroughplantproductionorrecreationalfees
Increasecarbonstorageinplantbiomassandsoils
4Alsoreferredtoastrees‐outside‐forests,theterm“tree”hereincludesbothtreeandshrubs(Bellefontaineetal.,2002).
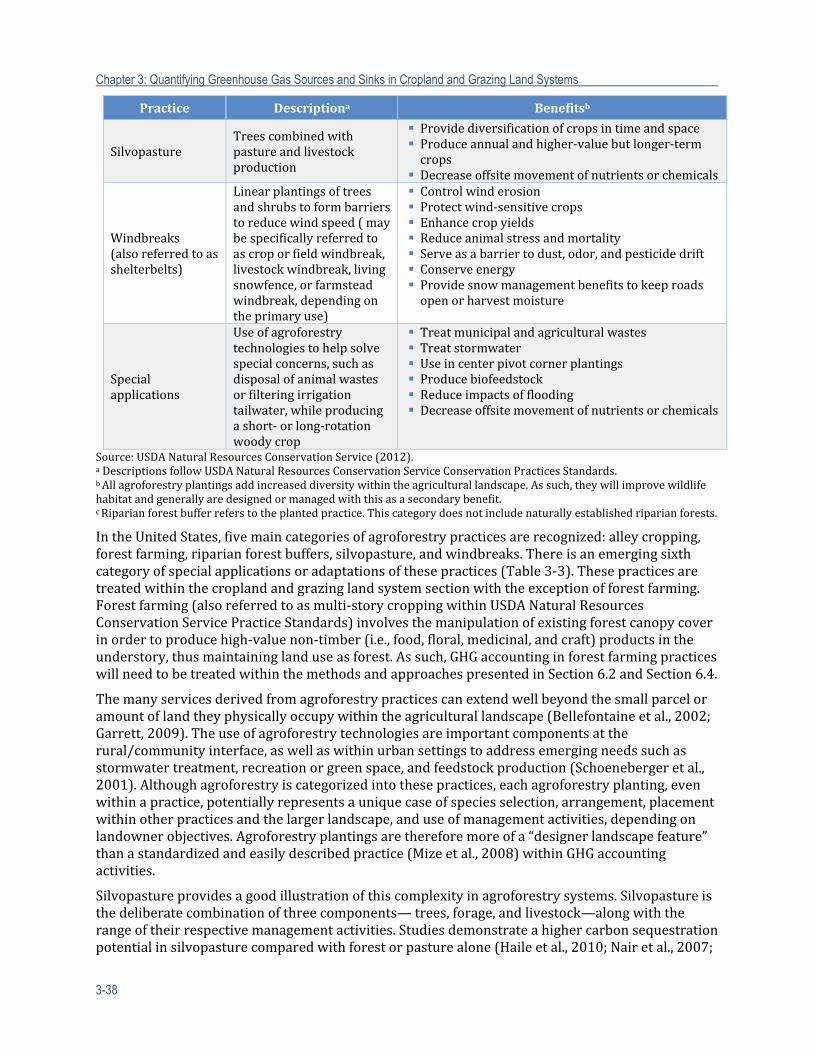
Chapter 3: Quantifying Greenhouse Gas Sources and Sinks in Cropland and Grazing Land Systems
3-38
Practice Descriptiona Benefitsb
SilvopastureTreescombinedwithpastureandlivestockproduction
Providediversificationofcropsintimeandspace Produceannualandhigher‐valuebutlonger‐termcrops
Decreaseoffsitemovementofnutrientsorchemicals
Windbreaks(alsoreferredtoasshelterbelts)
Linearplantingsoftreesandshrubstoformbarrierstoreducewindspeed(maybespecificallyreferredtoascroporfieldwindbreak,livestockwindbreak,livingsnowfence,orfarmsteadwindbreak,dependingontheprimaryuse)
Controlwinderosion Protectwind‐sensitivecrops Enhancecropyields Reduceanimalstressandmortality Serveasabarriertodust,odor,andpesticidedrift Conserveenergy Providesnowmanagementbenefitstokeeproadsopenorharvestmoisture
Specialapplications
Useofagroforestrytechnologiestohelpsolvespecialconcerns,suchasdisposalofanimalwastesorfilteringirrigationtailwater,whileproducingashort‐orlong‐rotationwoodycrop
Treatmunicipalandagriculturalwastes Treatstormwater Useincenterpivotcornerplantings Producebiofeedstock Reduceimpactsofflooding Decreaseoffsitemovementofnutrientsorchemicals
Source:USDANaturalResourcesConservationService(2012).aDescriptionsfollowUSDANaturalResourcesConservationServiceConservationPracticesStandards.bAllagroforestryplantingsaddincreaseddiversitywithintheagriculturallandscape.Assuch,theywillimprovewildlifehabitatandgenerallyaredesignedormanagedwiththisasasecondarybenefit.cRiparianforestbufferreferstotheplantedpractice.Thiscategorydoesnotincludenaturallyestablishedriparianforests.
IntheUnitedStates,fivemaincategoriesofagroforestrypracticesarerecognized:alleycropping,forestfarming,riparianforestbuffers,silvopasture,andwindbreaks.Thereisanemergingsixthcategoryofspecialapplicationsoradaptationsofthesepractices(Table3‐3).Thesepracticesaretreatedwithinthecroplandandgrazinglandsystemsectionwiththeexceptionofforestfarming.Forestfarming(alsoreferredtoasmulti‐storycroppingwithinUSDANaturalResourcesConservationServicePracticeStandards)involvesthemanipulationofexistingforestcanopycoverinordertoproducehigh‐valuenon‐timber(i.e.,food,floral,medicinal,andcraft)productsintheunderstory,thusmaintaininglanduseasforest.Assuch,GHGaccountinginforestfarmingpracticeswillneedtobetreatedwithinthemethodsandapproachespresentedinSection6.2andSection6.4.
Themanyservicesderivedfromagroforestrypracticescanextendwellbeyondthesmallparceloramountoflandtheyphysicallyoccupywithintheagriculturallandscape(Bellefontaineetal.,2002;Garrett,2009).Theuseofagroforestrytechnologiesareimportantcomponentsattherural/communityinterface,aswellaswithinurbansettingstoaddressemergingneedssuchasstormwatertreatment,recreationorgreenspace,andfeedstockproduction(Schoenebergeretal.,2001).Althoughagroforestryiscategorizedintothesepractices,eachagroforestryplanting,evenwithinapractice,potentiallyrepresentsauniquecaseofspeciesselection,arrangement,placementwithinotherpracticesandthelargerlandscape,anduseofmanagementactivities,dependingonlandownerobjectives.Agroforestryplantingsarethereforemoreofa“designerlandscapefeature”thanastandardizedandeasilydescribedpractice(Mizeetal.,2008)withinGHGaccountingactivities.
Silvopastureprovidesagoodillustrationofthiscomplexityinagroforestrysystems.Silvopastureisthedeliberatecombinationofthreecomponents—trees,forage,andlivestock—alongwiththerangeoftheirrespectivemanagementactivities.Studiesdemonstrateahighercarbonsequestrationpotentialinsilvopasturecomparedwithforestorpasturealone(Haileetal.,2010;Nairetal.,2007;

Chapter 3: Quantifying Greenhouse Gas Sources and Sinks in Cropland and Grazing Land Systems
3-39
SharrowandIsmail,2004).Muchofthisnewcarbonisinthewoodybiomass,butsoilcarbonalsohasthepotentialtoincreaseasaconsequenceofcarboninputsfromthetrees,whichovertimeextendfurtherintotheforagecomponent(Peichletal.,2006),aswellasmanagementoftheforageandofthelivestock(seeFranzluebbersandStuedemann,2009;Karkietal.,2009).Managementactivitieswithinasilvopasturemayincludefertilization,liming,cultivation,andharvestingoftheforagecrop(insomeyears);periodicharvestingofpineneedlesforpinestraw;incorporationofprunedwoodymaterialintotheforagecomponent;anddifferentgrazingintensitiesandrotations.Thefrequencyandintensityofmanagementactivitiesandinputsfromallthreecomponentscanvarysignificantlyfromyeartoyear,whichmakesaccountingforthesequesteredcarboninasilvopastureoperationchallenging.
RatesandamountsofGHGemissionswithineachagroforestryplantingwillvarydependingonpriorlandmanagementandcurrentconditions(i.e.,site,climate),aswellasbystanddevelopment.Theseratesandamountswillalsobedependentonlandowners’decisionsthatdetermineplantingdesign,aswellasmanagementactivities—agricultural,forestry,andgrazing—usedoverthelifetimeofanagroforestrysystem(Table3‐4).
Table3‐4:ManagementActivities5andOtherFactorsWithinAgroforestryPracticesThatMayAlterCarbonSequestrationandGHGEmissionAmounts
Practice ManagementActivities
Windbreaks
Establishmentdisturbancetosoilduringsitepreparation Depositionofwind‐andwater‐transportedsediments,nutrients,andotheragriculturalchemicalsintotheplanting Windbreakrenovation(removalofdeadanddyingtreesovertime)
Riparianforestbuffers
Establishmentdisturbancetosoilduringsitepreparation Depositionofwind‐andwater‐transportedsediments,nutrients,andotheragriculturalchemicalsintotheplanting HarvestingofherbaceousmaterialsplantedinZone3(zoneclosesttocrop/grazingsystem)andofwoodymaterialsplantedinZone2(middlezone)
Alleycropping
Establishmentdisturbancetosoilduringsitepreparation Weedcontrol(mechanicalorchemical) Pruning,thinning,andharvestingofwoodymaterial(amountandfrequencyvarygreatlydependingonshort‐andlong‐termobjectiveofpractice) Fertilizationforalleycropandoccasionallyneededfortreesinrows Tillageinalleys(frequencyandintensity) Cropspeciesusedinalleyproduction Complexharvestingschedulesstratifiedinspaceandtime
Silvopasture
Establishmentdisturbancetosoilduringsitepreparation Weedcontrol(mechanicalorchemical) Pruning,thinning,andharvestingofwoodymaterial(amountandfrequencyvarygreatlydependingonshort‐andlong‐termobjectiveofpractice) Fertilizationofforagecomponent Tillageinforagecomponent(frequencyandintensity) Cropspeciesusedinforagecomponent Grazingmanagement(timing,intensity,frequency) Complexharvestingschedulesstratifiedinspaceandtime
3.4.1 CarbonStocks
Agroforestry’spotentialforsequesteringlargeamountsofcarbonperunitareaiswellrecognized(Dixonetal.,1994;KumarandNair,2011;Nairetal.,2010),withsequestrationratesbeinggreater
5ForestFarmingisnotincludedintheseconsiderations.
Chapter 3: Quantifying Greenhouse Gas Sources and Sinks in Cropland and Grazing Land Systems
3-40
thanmanyoftheotheragriculturaloptions(IPCC,2000).Carbonissequestereddirectlyintothewoodybiomassandsoil.Indirectly,agroforestrypracticescanaltercarboncyclingbyenhancingcropandforageproduction(upto15H—heightoftrees—distancefromthewindbreak)andtrappingwind‐blownandrunofferosion(Brandleetal.,2009).Lackofdatalimitsaccountingoftheseothercarbonfluxesimpactedbytheadditionoftreesandisbeyondthescopeofthiseffort.
WoodyBiomass:Themajorityofnewcarboncontributedtoasitebyagroforestrywillbefromtheproductionofwoodybiomass,withthelargercontributionbeingfromtheabovegroundwoodybiomass,asgenerallyobservedinforestestablishmentplantings(NuiandDuiker,2006).Themoreopenenvironmentcreatedinagroforestryplantingsresultsinthetreeshavingdifferentgrowthformsthanencounteredunderforestconditions—e.g.,greaterbranchproduction(Zhou,1999)andspecificgravity(Zhouetal.,2011)—whichwillneedtobetakenintoaccountwhenestimatingtheabovegroundwoodybiomass.
Thebelowgroundbiomasspoolinagroforestryplantingswillalsobeasignificantportionofnewcarbonaddedtothesite.However,measuring,estimating,and/orverifyingthiscomponentisverydifficultandexpensive.Thecontributionsfromrootbiomasscanbeestimatedusingvariousapproachesthatrelyonknowingtheabovegroundportion.
ForestProductsandOtherRemovedMaterials:Windbreaksandriparianforestbuffersareplantedforpurposesthatrequirethetreestobeinplaceforthetargetedfunction(s)(i.e.,alterationofmicroclimate;interceptionofsediments,nutrients,andchemicals).Windbreakrenovation(removalofdeadtreesandreplanting)isrecommendedtomaintainmicroclimatebenefits(Brandleetal.,2009).Periodicharvestingofplantmaterialsintheherbaceouszone(adjacenttocropfield)andmiddlewoodyzoneisalsorecommendedinriparianforestbufferstomaintainhigherratesofnutrientuptakeandthereforewaterqualityservices(Dosskeyetal.,2010).Moreinnovativeanddiversifiedplantingdesignsthatincorporatebioenergyfeedstocksarebeingconsideredforbothofthesepractices,whichwouldincreaselevelsofharvestingwithinthesesystems.Inthecaseofriparianforestbuffers,harvestingoftheherbaceousandwoodymiddlezoneforbioenergyfeedstockswouldservetoreplenishahighernutrientuptakerateandthuswaterqualityservices,aswellasprovideanadditionalincomestream(Schoenebergeretal.,2008).Manyalleycroppingandsilvopasturesystemsaremanagedforhigh‐valueveneerandsaw‐timber.Thesetrees,alongwithsomespecialapplicationsofagroforestrytechnologies,arealsobeinginvestigatedfortheiruseinproducingbioenergyfeedstocks.Fortheseplantings,removalorharvestingofabovegroundwoodymaterialcanoccurasearlyasthreeyearsto75yearsormore,dependingontheproduct.Harvestedmaterialscanalsoincludestem‐pruning,generallyupto15feetoverseveralyearstoattainacleanbole,toperiodicthinninginordertomaintainacanopycoverthatisoptimalforthegrowthofthetreeaswellasthecropbeinggrowninthealleys.Thematerialmaybeleftonsitetocreatewildlifehabitat,choppedandincorporatedintothesoil,ortakenoff‐siteandburned.
Soil:StudieshavedocumentedthatU.S.agroforestrypracticesgenerallyhavegreatersoilcarbonstocks(underthewholepractice,whichmayvaryfromjustunderawindbreaktounderthewholetree/cropsystem,suchasalleycropping)whencomparedwiththatinconventionalagriculturalandgrazingpractices(Nairetal.,2010).However,estimatingchangeorfluxinsoilcarbonstocksinagroforestryplantingsischallengingduetoitsinherentlyhighspatialandtemporalvariability.Forinstance,SharrowandIsmail(2004)foundvariabilityofsoilcarbontobetwotothreetimesgreaterinanon‐grazedsilvopasturesystemthanintheadjacentforestorpasturealone.
Soilcarboncanincreaseinagroforestrysystemsduetoaddedcarboninputsfromthetrees,theeliminationofcarbonlossduetoannualcroppingactivities(i.e.,conservationtillage),andpotentiallytheadditionofcarbonthroughotheragriculturalmanagementactivities,suchasincorporationofdifferentcrops,covercrops,residuemanagement,andfertilizationregimes.
Chapter 3: Quantifying Greenhouse Gas Sources and Sinks in Cropland and Grazing Land Systems
3-41
ChangesinsoilcarbonstockshavebeenestimatedinanumberofforestestablishmentplotsfromtheMidwest,andwerefoundtovaryfrom‐0.07to0.58MgCha‐1year‐1and‐0.85to0.56MgCha‐1year‐1indeciduousandconiferousplots,respectively.Pauletal.(2003)attributedthevariationtotheimpactandvariablerecoveryfromtreeplanting,butalsomentionedthepossibilitythatvariationmaybeduetotheuseofpresent‐daycroppingfieldsasthecarbonbaselineforcomparison.Manyagroforestrystudiesarereportingcomparableratesofsoilsequestration(seeNairetal.,2010).Resultsfromtemperateagroforestrystudiesindicate,especiallyforalleysreceivinghighleveloforganicmatterinputfromthetrees,thatitmaybeseveralyearsbeforesignificantlymeasurablecarbondifferencesaredetectablebetweentheagroforestryplantingandtraditionalsolecroppingsystem(Peichletal.,2006;Udawattaetal.,2009).Theamountanddurationofsoilorganicmatteraccumulationinagriculturalsoilswithagroforestrymanagementwilldependonthedegreetowhichpriorsoilcarbonstocksaredepleted.Inaddition,itwilldependonthesoilsingeneral,climate,placementwithinalandscape,typeofvegetation,andmostimportantly,bytheadditionalmanagementactivitiesemployedinthemixedtree/agriculturalsystem(Table3‐4).
NotethatcarbonincreasesfromnitrogeninputsmaybeoffsetthroughenhancedN2Oemissions,dependingonanumberoffactors(seeSection6.4.1.6).Manyagroforestryplantings,suchaswindbreaksandriparianforestbuffers,arepurposefullydesignedtointerceptsoilinwinderosionandsurfacerunoff,whichisanotheradditionofcarbontothispool(Saueretal.,2007).DepositionofsedimentwillinfluencecyclingofbothelementsandthereforenetGHGvalues(McCartyandRitchie,2002;SudmeyerandScott,2002).Wecurrentlylacktheunderstandinganddataneededforadequatelymodelingandthereforepredictingtheseintra‐andinter‐soilcarbontransfersfromerosionanddeposition.
3.4.2 NitrousOxide
DataondirectN2Oemissionsinagroforestryplantingsaresparse.Thefewstudiesto‐datefoundreducedN2Oemissionsinafforestedplotsthatwereolderthanfiveyears(Allenetal.,2009),underwindbreaks(RyskowskiandKedziora,2007)andriparianforestbuffers(Kim,2008).AlleycroppingsystemsreducedN2Oemissionsby0.7kgha‐1year‐1comparedwiththeannualcroppingsystemswithnotreecover(ThevathasanandGordon,2004).Thesestudiessuggestthetreescanactasa“nitrogen‐safetynet”inthesystem,takingupthe“extra”nitrogenthatmightotherwiseresultinN2Oemissions.Inaddition,reducednitrogenleachinghasbeendocumentedwithinagroforestryplantingscomparedwiththeannualcroppingsystemwithnotreecover(Allenetal.,2004;Lopez‐Diazetal.,2011;Nairetal.,2007).ThereducedleachingimpliesthatlessnitrogenisavailableforindirectsoilN2Oemissions,whichcouldbebeneficialinthoseagroforestryplantingsrequiringfertilization(i.e.,alleycroppingandsilvopasturesystems)orthatreceivelargeinputsofnitrogenthroughsurfaceandsubsurfacerunoff(i.e.,riparianforestbuffers).Asmanyagroforestryplantingsarepurposefullydesignedandplantedtoprovidetighternutrientcyclingcapabilitiesasameanstoprotectwaterquality(Olsonetal.,2000),thecapabilityandcapacityofthesesystemstoreduceN2OemissionsinagriculturalsystemswarrantsfurtherstudytodeterminewhetherandhowitshouldbeaccountedforinGHGaccountingmethods.
3.4.3 Methane
VerylittleresearchhasbeendonetodeterminewhethertheestablishmentofagroforestryplantingscanleadtoanychangeinCH4sinksorsourcesinsoilsduetochangesinmethanotrophyormethanogenesis,respectively.Kimetal.(2010)didnotfindanyevidenceinestablishedriparianforestbuffersinIowa(sevento17yearsold)thatCH4fluxdifferedfromneighboringcropfields.RiparianforestbufferscouldpotentiallyserveasaCH4emittergiventheperiodicfloodingthatmayoccurwithintheseplantings.However,riparianforestbuffersestablishedonagriculturallandsmay
Chapter 3: Quantifying Greenhouse Gas Sources and Sinks in Cropland and Grazing Land Systems
3-42
notbesignificantemittersofCH4becausethehydrologicalconnectionswithintheselandscapeshavebeendecoupled.Thisindicatesuseofriparianforest(naturallyoccurring)deriveddatamayresultinoverestimatingsink/sourcecapacityofriparianforestbuffers.Ingeneral,thereisinsufficientdatatomodelandpredictmethanefluxesinagroforestryatthistime.
3.4.4 ManagementInteractions
Agroforestrypracticescanindirectlyaltercarboncyclingbyenhancingcropandforageproductionandtrappingwindblownandsurfacerunoffsediments.ExaminingthecarbonpotentialofwindbreaksintheGreatPlains,Brandleetal.(1992)estimatedindirectcarbonbenefitscouldpotentiallybedoubletheamountofthecarbonsequesteredinthewood.Althoughprojectstoexamineindirectcarbonbenefitsfromseveraloftheagroforestrypracticesareongoing,wecurrentlylacktheabilitytomodelorpredicttheseimpacts.
3.5 EstimationMethods
ThissectionprovidesmethodsforestimatingGHGemissionsfromcroplandandgrazinglandsystemsonanentity’sland.Themethodsareappliedforbothlandremainingincroplandorgrazinglands,aswellasland‐usechangetocroplandorgrazinglands.Themethodsprovidedareforestimatingtheemissionlevelsforagivenyearonaparcelofland.Aparcelisafieldintheentity’soperationwithuniformmanagement.Ifmanagementvariesacrossthefield,thenthefieldshouldbesubdividedintoseparateparcelsforestimatingtheemissions.
Trendsacrossyearsorcomparisonstobaselinescanbemadeusingtheannualemissionestimates.Guidanceisnotgivenhereonhowtodevelopbaselinesorsubsequenttrendsforemissionestimation.Thelevelofemissionsforcarbonstocksisbasedonestimatingthechangeinstockfromthebeginningandendoftheyear,whilethelevelofemissionsforN2OandCH4arebasedonestimatingthetotalannualemissions.Methodsarealsoprovidedforestimatingtotalemissionsofprecursorgasesemittedduringbiomassburning,aswellasnitrogencompoundsthatarevolatilizedorsubjecttoleachingandrunofffromanentity’scroplandorgrazinglandthatarelaterconvertedintoGHGs.
Themethodsrangeincomplexityforthedifferentemissionsourcecategoriesaccordingtothestateofthescienceandpriormethoddevelopment.Simplemethodsareselectedforseveraloftheemissionorcarbonstockchangesourcecategories;becausethemorecomplexmethodsarenotfullydevelopedforoperationalaccountingofemissionsorthesimplemethodsprovideareasonablyaccurateandpreciseresult.Althoughsimplicitymaybepreferredfortransparencyinestimation,someofthemethodsusemorecomplexapproaches,suchasprocess‐basedsimulationmodels,becausethesemethodsgreatlyimprovetheaccuracyand/orprecisionoftheresult.
Chapter 3: Quantifying Greenhouse Gas Sources and Sinks in Cropland and Grazing Land Systems
3-43
3.5.1 BiomassCarbonStockChanges
3.5.1.1 RationaleforSelectedMethod
BothIPCC(2006)andtheU.S.EnvironmentalProtectionAgency(2011)considerherbaceousbiomasscarbonstockstobeephemeral,andrecognizethattherearenonetemissionstotheatmospherefollowingcropgrowthandsenescenceduringoneannualcropcycle(Westetal.,2011).However,withrespecttochangesinlanduse(e.g.,foresttocropland),theIPCC(Lascoetal.,2006)recommendsthatcroplandbiomassbecountedintheyearthatlandconversionoccurs,andthesameassumptionalsoappliesforgrassland(Verchotetal.,2006).AccordingtotheIPCC,accountingfortheherbaceousbiomasscarbonstockduringchangesinlanduseisnecessarytoaccountfortheinfluenceofherbaceousplantsonCO2uptakefromtheatmosphereandstorageintheterrestrialbiosphere.However,thismethoddoesnotrecognizechangesinherbaceousbiomassthatoccurwithchangesincroprotations,nordoesitrecognizelong‐termincreasesinannualcropyields.ThemethodisaconsideredaTier2methodasdefinedbytheIPCCbecauseitincorporatesfactorsthatarebasedonU.S.specificdata.
Agroforestry,alongwithotherwoodyvegetationincroplands,suchasorchardsandvineyards,sequestersignificantamountsofnewcarbonwithinlong‐livedbiomassovertimewithtreegrowth.MethodsforestimatingtheabovegroundwoodyandwholetreebiomassfortreesgrowingunderforestconditionsaredescribedintheForestrySectionofthisreport.However,thesemethods,developedfromforest‐derived(i.e.,greatercanopyclosure)conditions,donotaccuratelyreflectconditionsencounteredinagroforestryorwoodycrops.Treesgrowingunderwindbreakandotherlinear‐typeplantingshavebeendocumentedtodifferfromforest‐growntreesintermsofarchitectureandproperties,suchascrown:trunkallocation(Zhou,1999),specificgravity(Zhouetal.,2011),andtaper(Zhouetal.,inreview).Moreover,theForestInventoryandAnalysisprogramoftheUSDAForestServiceandNationalResourceInventoryoftheUSDANaturalResourcesConservationServicedonotcollectagroforestryorwoodycropdatathroughtheirsurveys(Perryetal.,2005).Therefore,aTier3methodusingprocess‐basedmodelsisaviablealternativeforestimatingthecarbonstockchangesassociatedwithagroforestryandwoodycropswithoutdirectmeasurementthroughasurvey.Specifically,theDAYCENTmodelhasbeenparameterizedtosimulatetreegrowthandhasbeenadoptedforestimatingwoodybiomasscarbonforagroforestryandwoodycrops.
MethodforEstimatingBiomassCarbonStockChanges
AmodifiedversionofthemethodologydevelopedbytheIPCC(Lascoetal.,2006;Verchotetal.,2006)hasbeenadoptedforentity‐scaleestimationofherbaceousandwoodybiomassstockchangesassociatedwithlanduse.
TheDAYCENTprocess‐basedsimulationmodelorthetraditionalforestinventoryapproachesareusedtoestimatecarbonforabovegroundbiomassforagroforestry.
U.S.specificdefaultvalues(Westetal.,2010)areusedforestimatingbiomasscarbonforannualcropsandgrazinglands.TheIPCCdefaultisusedforestimatingthecarbonfractionvalue.YieldinunitsofdrymattercanbeestimatedbytheentityoraveragevaluesfromUSDA‐NationalAgriculturalStatisticsServicestatisticscanbeused.
Thismethodwaschosenbecauseitcapturestheinfluenceofland‐usechangeoncroporforagespeciesonbiomasscarbonstocksbyusingU.S.specificdefaultvalueswhereentityspecificactivitydataarenotavailableandaprocess‐basedsimulationmodelforagroforestrysystems.
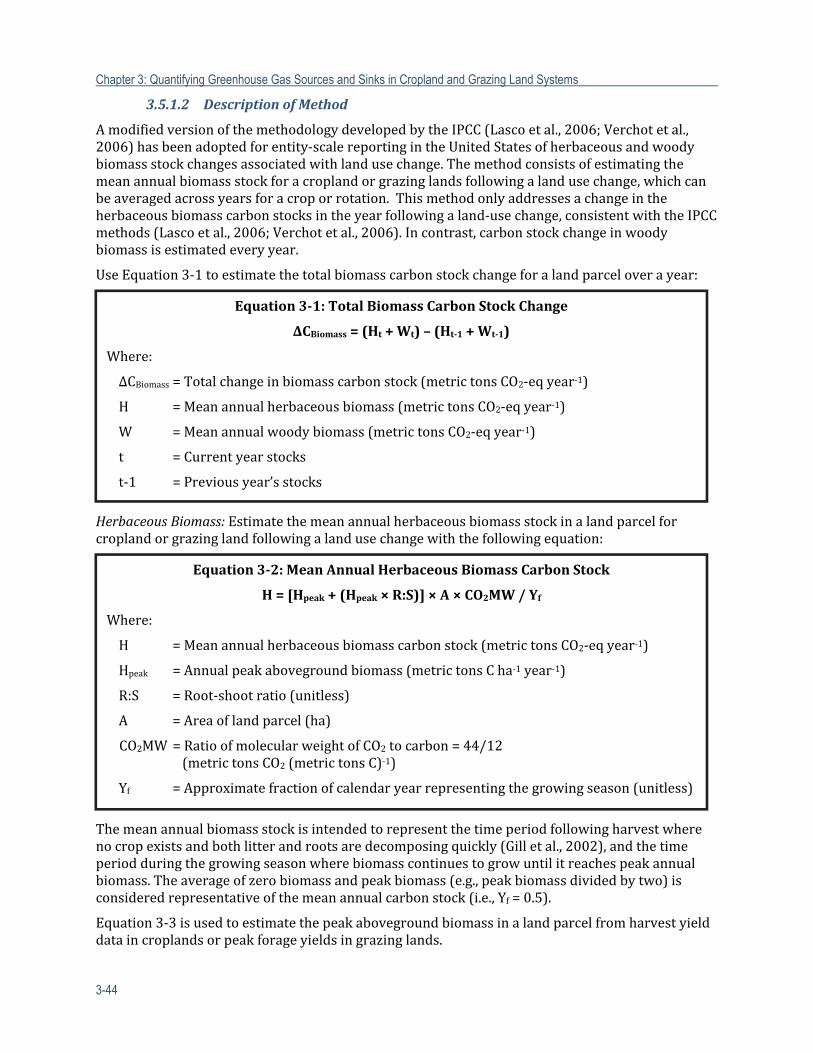
Chapter 3: Quantifying Greenhouse Gas Sources and Sinks in Cropland and Grazing Land Systems
3-44
3.5.1.2 DescriptionofMethod
AmodifiedversionofthemethodologydevelopedbytheIPCC(Lascoetal.,2006;Verchotetal.,2006)hasbeenadoptedforentity‐scalereportingintheUnitedStatesofherbaceousandwoodybiomassstockchangesassociatedwithlandusechange.Themethodconsistsofestimatingthemeanannualbiomassstockforacroplandorgrazinglandsfollowingalandusechange,whichcanbeaveragedacrossyearsforacroporrotation.Thismethodonlyaddressesachangeintheherbaceousbiomasscarbonstocksintheyearfollowingaland‐usechange,consistentwiththeIPCCmethods(Lascoetal.,2006;Verchotetal.,2006).Incontrast,carbonstockchangeinwoodybiomassisestimatedeveryyear.
UseEquation3‐1toestimatethetotalbiomasscarbonstockchangeforalandparceloverayear:
HerbaceousBiomass:Estimatethemeanannualherbaceousbiomassstockinalandparcelforcroplandorgrazinglandfollowingalandusechangewiththefollowingequation:
Themeanannualbiomassstockisintendedtorepresentthetimeperiodfollowingharvestwherenocropexistsandbothlitterandrootsaredecomposingquickly(Gilletal.,2002),andthetimeperiodduringthegrowingseasonwherebiomasscontinuestogrowuntilitreachespeakannualbiomass.Theaverageofzerobiomassandpeakbiomass(e.g.,peakbiomassdividedbytwo)isconsideredrepresentativeofthemeanannualcarbonstock(i.e.,Yf=0.5).
Equation3‐3isusedtoestimatethepeakabovegroundbiomassinalandparcelfromharvestyielddataincroplandsorpeakforageyieldsingrazinglands.
Equation3‐1:TotalBiomassCarbon StockChange
ΔCBiomass=(Ht+Wt)–(Ht‐1+Wt‐1)
Where:
ΔCBiomass=Totalchangeinbiomasscarbonstock(metrictonsCO2‐eqyear‐1)
H =Meanannualherbaceousbiomass(metrictonsCO2‐eqyear‐1)
W =Meanannualwoodybiomass(metrictonsCO2‐eqyear‐1)
t =Currentyearstocks
t‐1 =Previousyear’sstocks
Equation3‐2:MeanAnnualHerbaceousBiomassCarbon Stock
H=[Hpeak+(Hpeak×R:S)]×A×CO2MW/Yf
Where:
H =Meanannualherbaceousbiomasscarbonstock(metrictonsCO2‐eqyear‐1)
Hpeak =Annualpeakabovegroundbiomass(metrictonsCha‐1year‐1)
R:S =Root‐shootratio(unitless)
A =Areaoflandparcel(ha)
CO2MW=RatioofmolecularweightofCO2tocarbon=44/12(metrictonsCO2(metrictonsC)‐1)
Yf =Approximatefractionofcalendaryearrepresentingthegrowingseason(unitless)
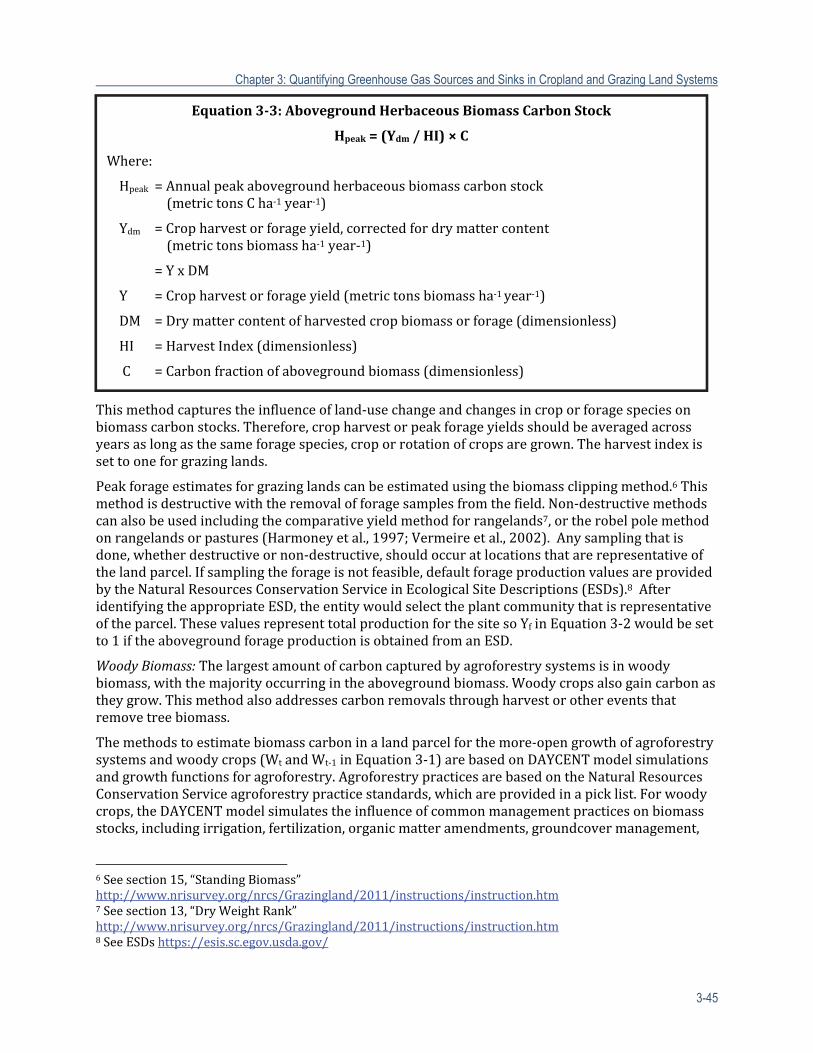
Chapter 3: Quantifying Greenhouse Gas Sources and Sinks in Cropland and Grazing Land Systems
3-45
Thismethodcapturestheinfluenceofland‐usechangeandchangesincroporforagespeciesonbiomasscarbonstocks.Therefore,cropharvestorpeakforageyieldsshouldbeaveragedacrossyearsaslongasthesameforagespecies,croporrotationofcropsaregrown.Theharvestindexissettooneforgrazinglands.
Peakforageestimatesforgrazinglandscanbeestimatedusingthebiomassclippingmethod.6Thismethodisdestructivewiththeremovalofforagesamplesfromthefield.Non‐destructivemethodscanalsobeusedincludingthecomparativeyieldmethodforrangelands7,ortherobelpolemethodonrangelandsorpastures(Harmoneyetal.,1997;Vermeireetal.,2002).Anysamplingthatisdone,whetherdestructiveornon‐destructive,shouldoccuratlocationsthatarerepresentativeofthelandparcel.Ifsamplingtheforageisnotfeasible,defaultforageproductionvaluesareprovidedbytheNaturalResourcesConservationServiceinEcologicalSiteDescriptions(ESDs).8AfteridentifyingtheappropriateESD,theentitywouldselecttheplantcommunitythatisrepresentativeoftheparcel.ThesevaluesrepresenttotalproductionforthesitesoYfinEquation3‐2wouldbesetto1iftheabovegroundforageproductionisobtainedfromanESD.
WoodyBiomass:Thelargestamountofcarboncapturedbyagroforestrysystemsisinwoodybiomass,withthemajorityoccurringintheabovegroundbiomass.Woodycropsalsogaincarbonastheygrow.Thismethodalsoaddressescarbonremovalsthroughharvestorothereventsthatremovetreebiomass.
Themethodstoestimatebiomasscarboninalandparcelforthemore‐opengrowthofagroforestrysystemsandwoodycrops(WtandWt‐1inEquation3‐1)arebasedonDAYCENTmodelsimulationsandgrowthfunctionsforagroforestry.AgroforestrypracticesarebasedontheNaturalResourcesConservationServiceagroforestrypracticestandards,whichareprovidedinapicklist.Forwoodycrops,theDAYCENTmodelsimulatestheinfluenceofcommonmanagementpracticesonbiomassstocks,includingirrigation,fertilization,organicmatteramendments,groundcovermanagement,
6Seesection15,“StandingBiomass”http://www.nrisurvey.org/nrcs/Grazingland/2011/instructions/instruction.htm7Seesection13,“DryWeightRank”http://www.nrisurvey.org/nrcs/Grazingland/2011/instructions/instruction.htm8SeeESDshttps://esis.sc.egov.usda.gov/
Equation3‐3:AbovegroundHerbaceousBiomassCarbonStock
Hpeak=(Ydm/HI)×C
Where:
Hpeak=Annualpeakabovegroundherbaceousbiomasscarbonstock (metrictonsCha‐1year‐1)
Ydm =Cropharvestorforageyield,correctedfordrymattercontent (metrictonsbiomassha‐1year‐1)
=YxDM
Y =Cropharvestorforageyield(metrictonsbiomassha‐1year‐1)
DM =Drymattercontentofharvestedcropbiomassorforage(dimensionless)
HI =HarvestIndex(dimensionless)
C =Carbonfractionofabovegroundbiomass(dimensionless)
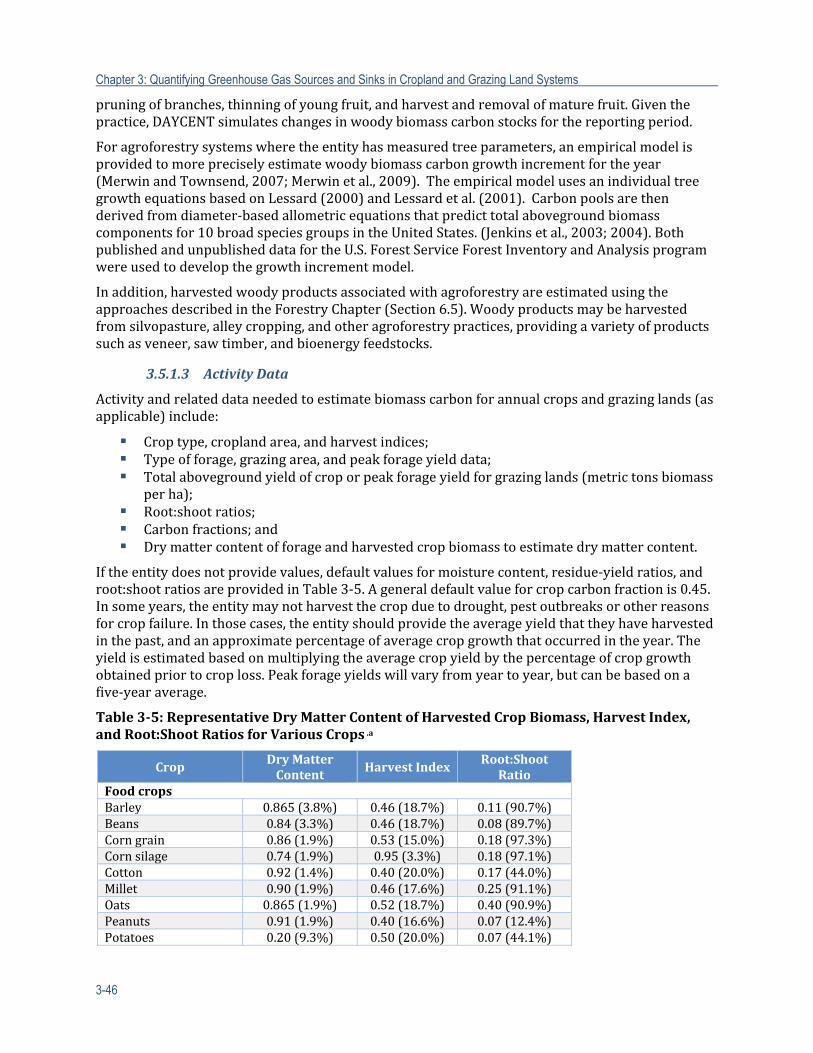
Chapter 3: Quantifying Greenhouse Gas Sources and Sinks in Cropland and Grazing Land Systems
3-46
pruningofbranches,thinningofyoungfruit,andharvestandremovalofmaturefruit.Giventhepractice,DAYCENTsimulateschangesinwoodybiomasscarbonstocksforthereportingperiod.
Foragroforestrysystemswheretheentityhasmeasuredtreeparameters,anempiricalmodelisprovidedtomorepreciselyestimatewoodybiomasscarbongrowthincrementfortheyear(MerwinandTownsend,2007;Merwinetal.,2009).TheempiricalmodelusesanindividualtreegrowthequationsbasedonLessard(2000)andLessardetal.(2001).Carbonpoolsarethenderivedfromdiameter‐basedallometricequationsthatpredicttotalabovegroundbiomasscomponentsfor10broadspeciesgroupsintheUnitedStates.(Jenkinsetal.,2003;2004).BothpublishedandunpublisheddatafortheU.S.ForestServiceForestInventoryandAnalysisprogramwereusedtodevelopthegrowthincrementmodel.
Inaddition,harvestedwoodyproductsassociatedwithagroforestryareestimatedusingtheapproachesdescribedintheForestryChapter(Section6.5).Woodyproductsmaybeharvestedfromsilvopasture,alleycropping,andotheragroforestrypractices,providingavarietyofproductssuchasveneer,sawtimber,andbioenergyfeedstocks.
3.5.1.3 ActivityData
Activityandrelateddataneededtoestimatebiomasscarbonforannualcropsandgrazinglands(asapplicable)include:
Croptype,croplandarea,andharvestindices; Typeofforage,grazingarea,andpeakforageyielddata; Totalabovegroundyieldofcroporpeakforageyieldforgrazinglands(metrictonsbiomass
perha); Root:shootratios; Carbonfractions;and Drymattercontentofforageandharvestedcropbiomasstoestimatedrymattercontent.
Iftheentitydoesnotprovidevalues,defaultvaluesformoisturecontent,residue‐yieldratios,androot:shootratiosareprovidedinTable3‐5.Ageneraldefaultvalueforcropcarbonfractionis0.45.Insomeyears,theentitymaynotharvestthecropduetodrought,pestoutbreaksorotherreasonsforcropfailure.Inthosecases,theentityshouldprovidetheaverageyieldthattheyhaveharvestedinthepast,andanapproximatepercentageofaveragecropgrowththatoccurredintheyear.Theyieldisestimatedbasedonmultiplyingtheaveragecropyieldbythepercentageofcropgrowthobtainedpriortocroploss.Peakforageyieldswillvaryfromyeartoyear,butcanbebasedonafive‐yearaverage.
Table3‐5:RepresentativeDryMatterContentofHarvestedCropBiomass,HarvestIndex,andRoot:ShootRatiosforVariousCrops.a
CropDryMatterContent
HarvestIndexRoot:ShootRatio
FoodcropsBarley 0.865(3.8%) 0.46(18.7%) 0.11(90.7%)Beans 0.84(3.3%) 0.46(18.7%) 0.08(89.7%)Corngrain 0.86(1.9%) 0.53(15.0%) 0.18(97.3%)Cornsilage 0.74(1.9%) 0.95(3.3%) 0.18(97.1%)Cotton 0.92(1.4%) 0.40(20.0%) 0.17(44.0%)Millet 0.90(1.9%) 0.46(17.6%) 0.25(91.1%)Oats 0.865(1.9%) 0.52(18.7%) 0.40(90.9%)Peanuts 0.91(1.9%) 0.40(16.6%) 0.07(12.4%)Potatoes 0.20(9.3%) 0.50(20.0%) 0.07(44.1%)
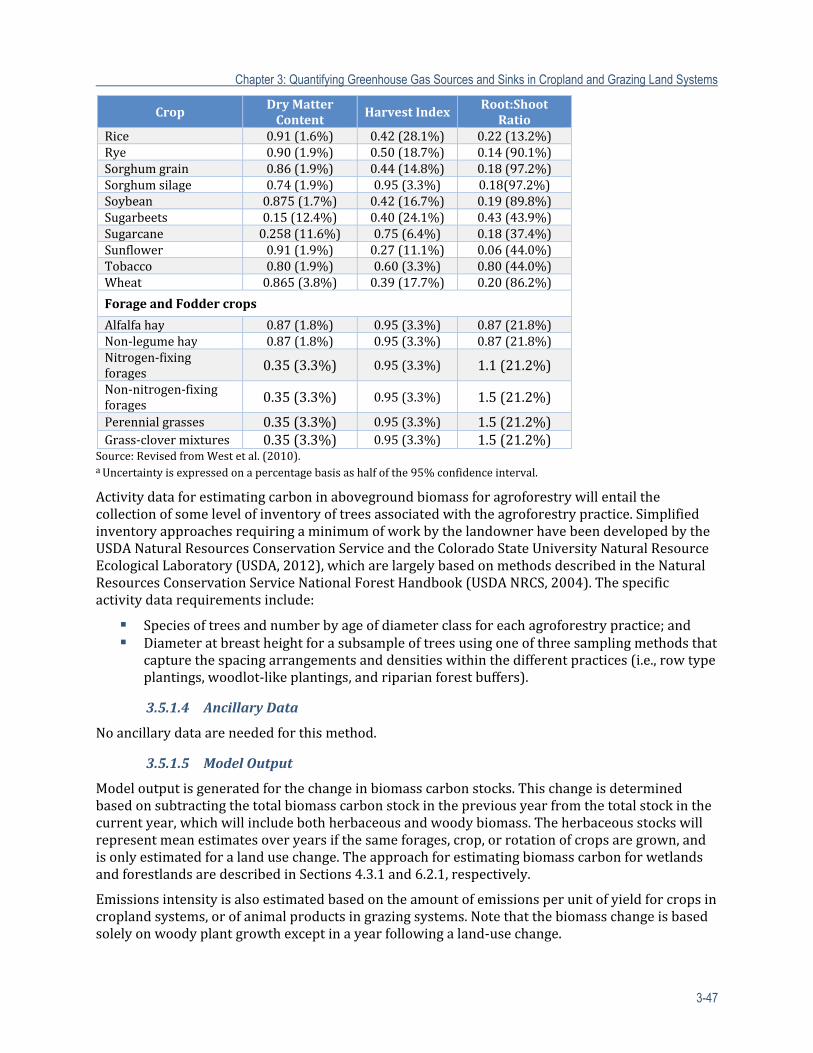
Chapter 3: Quantifying Greenhouse Gas Sources and Sinks in Cropland and Grazing Land Systems
3-47
CropDryMatterContent
HarvestIndexRoot:ShootRatio
Rice 0.91(1.6%) 0.42(28.1%) 0.22(13.2%)Rye 0.90(1.9%) 0.50(18.7%) 0.14(90.1%)Sorghumgrain 0.86(1.9%) 0.44(14.8%) 0.18(97.2%)Sorghumsilage 0.74(1.9%) 0.95(3.3%) 0.18(97.2%)Soybean 0.875(1.7%) 0.42(16.7%) 0.19(89.8%)Sugarbeets 0.15(12.4%) 0.40(24.1%) 0.43(43.9%)Sugarcane 0.258(11.6%) 0.75(6.4%) 0.18(37.4%)Sunflower 0.91(1.9%) 0.27(11.1%) 0.06(44.0%)Tobacco 0.80(1.9%) 0.60(3.3%) 0.80(44.0%)Wheat 0.865(3.8%) 0.39(17.7%) 0.20(86.2%)
ForageandFoddercrops
Alfalfahay 0.87(1.8%) 0.95(3.3%) 0.87(21.8%)Non‐legumehay 0.87(1.8%) 0.95(3.3%) 0.87(21.8%)Nitrogen‐fixingforages 0.35(3.3%) 0.95(3.3%) 1.1(21.2%)
Non‐nitrogen‐fixingforages 0.35(3.3%) 0.95(3.3%) 1.5(21.2%)
Perennialgrasses 0.35(3.3%) 0.95(3.3%) 1.5(21.2%)Grass‐clovermixtures 0.35(3.3%) 0.95(3.3%) 1.5(21.2%)
Source:RevisedfromWestetal.(2010).aUncertaintyisexpressedonapercentagebasisashalfofthe95%confidenceinterval.
Activitydataforestimatingcarboninabovegroundbiomassforagroforestrywillentailthecollectionofsomelevelofinventoryoftreesassociatedwiththeagroforestrypractice.SimplifiedinventoryapproachesrequiringaminimumofworkbythelandownerhavebeendevelopedbytheUSDANaturalResourcesConservationServiceandtheColoradoStateUniversityNaturalResourceEcologicalLaboratory(USDA,2012),whicharelargelybasedonmethodsdescribedintheNaturalResourcesConservationServiceNationalForestHandbook(USDANRCS,2004).Thespecificactivitydatarequirementsinclude:
Speciesoftreesandnumberbyageofdiameterclassforeachagroforestrypractice;and Diameteratbreastheightforasubsampleoftreesusingoneofthreesamplingmethodsthat
capturethespacingarrangementsanddensitieswithinthedifferentpractices(i.e.,rowtypeplantings,woodlot‐likeplantings,andriparianforestbuffers).
3.5.1.4 AncillaryData
Noancillarydataareneededforthismethod.
3.5.1.5 ModelOutput
Modeloutputisgeneratedforthechangeinbiomasscarbonstocks.Thischangeisdeterminedbasedonsubtractingthetotalbiomasscarbonstockinthepreviousyearfromthetotalstockinthecurrentyear,whichwillincludebothherbaceousandwoodybiomass.Theherbaceousstockswillrepresentmeanestimatesoveryearsifthesameforages,crop,orrotationofcropsaregrown,andisonlyestimatedforalandusechange.TheapproachforestimatingbiomasscarbonforwetlandsandforestlandsaredescribedinSections4.3.1and6.2.1,respectively.
Emissionsintensityisalsoestimatedbasedontheamountofemissionsperunitofyieldforcropsincroplandsystems,orofanimalproductsingrazingsystems.Notethatthebiomasschangeisbasedsolelyonwoodyplantgrowthexceptinayearfollowingaland‐usechange.
Chapter 3: Quantifying Greenhouse Gas Sources and Sinks in Cropland and Grazing Land Systems
3-48
Theemissionsintensityisestimatedwiththefollowingequation:
3.5.1.6 LimitationsandUncertainty
Uncertaintyinherbaceouscarbonstockchangeswillresultfromlackofprecisionincroporforageyields,residue‐yieldratios,root‐shootratios,andcarbonfractions,aswellastheuncertaintiesassociatedwithestimatingthebiomasscarbonstocksfortheotherlanduses.Emissionsintensitywillalsoincludeuncertaintyinthetotalyieldforthecrop,meat,ormilkproduct.Thisherbaceousbiomassmethodisbasedontheassumptionthathalfofthecropharvestyieldsorpeakforageamountsprovideanaccurateestimateofthemeanannualcarbonstockincroplandorgrazinglands.Thisassumptionwarrantsfurtherstudy,andthemethodmayneedtoberefinedinthefuture.
UncertaintiesinmodelparametersarecombinedusingaMonteCarlosimulationapproach.Uncertaintyisassumedtobeminorforthemanagementactivitydataprovidedbytheentity.Table3‐6providestherelativeuncertaintyfortheDAYCENTmodelandthecarbonfractionofbiomass.
Table3‐6:AvailableUncertaintyDataforBiomassCarbonStockChanges
Parameter Mean UnitsRelativeUncertainty
Distribution DataSourceLow(%) High(%)
DAYCENT(empiricaluncertainty)
NS Various NS NS NormalOgleetal.(2007);EPA(2013)
Carbonfractionofabovegroundbiomass
0.45 Fraction 11 11 Normal IPCC(1997)
NS=NotShown.Dataarenotshownforparametersthathave100’sto1000’sofvalues(denotedasNS).
Theuncertaintydifferswhetheritisherbaceousbiomassortrees.Uncertaintyassociatedwithestimatingcarboninlivetreesisinfluencedbyanumberoffactors,includingsamplingandmeasurementerroranderrorassociatedwithregressionmodels(seeMelsonetal.2011;furtherdiscussioninForestrySection).Estimatingcarboninagroforestrytrees,especiallyforyoungseedlingsandsaplings(upto10yearsorsodependingonspeciesandgrowingconditions)remainshighlyuncertainparticularlysincetraditionalforestry‐derivedequationshavebeenshowntounderestimatewhole‐treebiomassinagroforestrysystemsandrequiresadditionalfieldworktofurtherdocumentbiomasscarbonallocationdifferences.Melsonetal.(2011)notedintheirforest‐basedworkthatestimationoflive‐treecarbonwassensitivetomodelselection(withmodel‐selectionerrorofpotentially20to40percent),andthatmodelselectioncouldbeimprovedbymatchingtreeformtoexistingequationsforuseinthemodels.On‐goingworkcomparingagroforestry‐derivedequationswithavarietyofforest‐derivedequationsintheGreatPlainsregionindicateuncertaintycouldbereducedthroughuseofacorrectionfactor.Currentlybelowgroundbiomass/Cestimatesarecalculatedusingtwoapproaches:root:shootratios(seeBirdsey,1992),
Equation3‐4:EmissionsIntensityofBiomassCarbon StockChange
EIBiomassC=ΔCBiomass/Y
Where:
EIBiomassC =Emissionsintensity(metrictonsCO2permetrictondrymattercropyield,metrictonsCO2perkgcarcassyield,ormetrictonsCO2perkgfluidmilkyield)
ΔCBiomass =ChangeinbiomassstockinCO2equivalents(metrictonsCO2‐eqyear‐1)
Y =Totalyieldofcrop(metrictonsdrymattercropyield),meat(kgcarcassyield)ormilkproduction(kgfluidmilkyield)
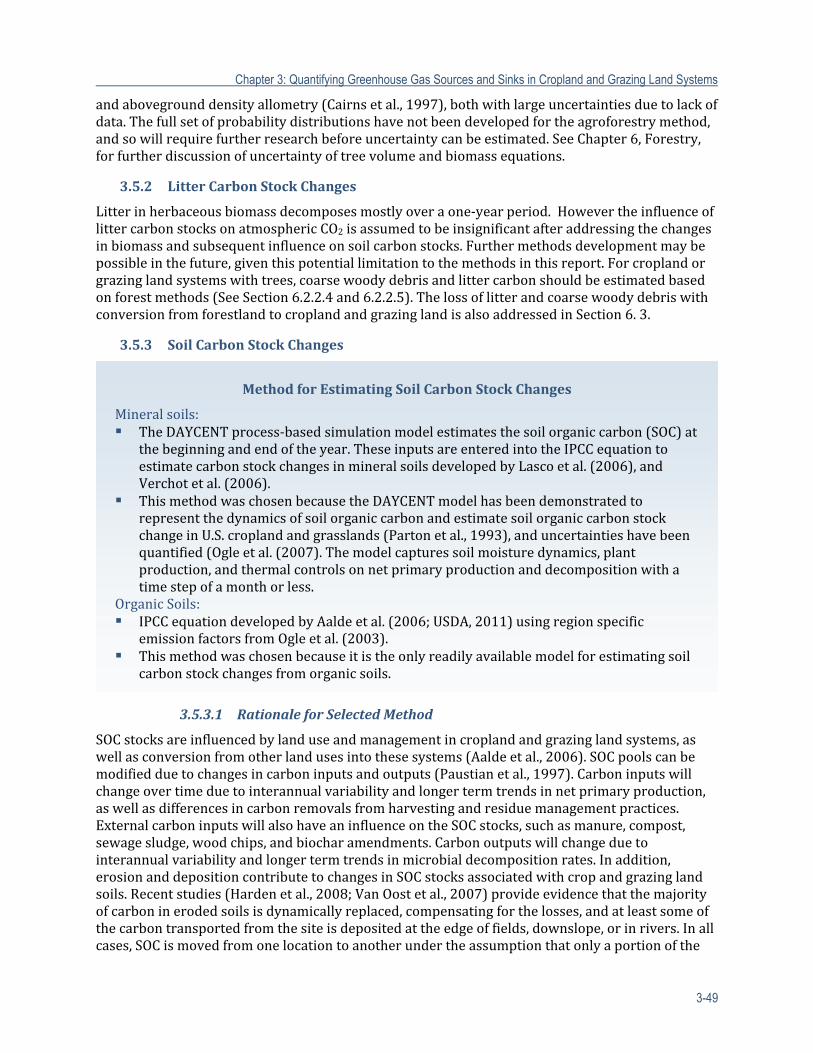
Chapter 3: Quantifying Greenhouse Gas Sources and Sinks in Cropland and Grazing Land Systems
3-49
andabovegrounddensityallometry(Cairnsetal.,1997),bothwithlargeuncertaintiesduetolackofdata.Thefullsetofprobabilitydistributionshavenotbeendevelopedfortheagroforestrymethod,andsowillrequirefurtherresearchbeforeuncertaintycanbeestimated.SeeChapter6,Forestry,forfurtherdiscussionofuncertaintyoftreevolumeandbiomassequations.
3.5.2 LitterCarbonStockChanges
Litterinherbaceousbiomassdecomposesmostlyoveraone‐yearperiod.HowevertheinfluenceoflittercarbonstocksonatmosphericCO2isassumedtobeinsignificantafteraddressingthechangesinbiomassandsubsequentinfluenceonsoilcarbonstocks.Furthermethodsdevelopmentmaybepossibleinthefuture,giventhispotentiallimitationtothemethodsinthisreport.Forcroplandorgrazinglandsystemswithtrees,coarsewoodydebrisandlittercarbonshouldbeestimatedbasedonforestmethods(SeeSection6.2.2.4and6.2.2.5).ThelossoflitterandcoarsewoodydebriswithconversionfromforestlandtocroplandandgrazinglandisalsoaddressedinSection6.3.
3.5.3 SoilCarbonStockChanges
3.5.3.1 RationaleforSelectedMethod
SOCstocksareinfluencedbylanduseandmanagementincroplandandgrazinglandsystems,aswellasconversionfromotherlandusesintothesesystems(Aaldeetal.,2006).SOCpoolscanbemodifiedduetochangesincarboninputsandoutputs(Paustianetal.,1997).Carboninputswillchangeovertimeduetointerannualvariabilityandlongertermtrendsinnetprimaryproduction,aswellasdifferencesincarbonremovalsfromharvestingandresiduemanagementpractices.ExternalcarboninputswillalsohaveaninfluenceontheSOCstocks,suchasmanure,compost,sewagesludge,woodchips,andbiocharamendments.Carbonoutputswillchangeduetointerannualvariabilityandlongertermtrendsinmicrobialdecompositionrates.Inaddition,erosionanddepositioncontributetochangesinSOCstocksassociatedwithcropandgrazinglandsoils.Recentstudies(Hardenetal.,2008;VanOostetal.,2007)provideevidencethatthemajorityofcarboninerodedsoilsisdynamicallyreplaced,compensatingforthelosses,andatleastsomeofthecarbontransportedfromthesiteisdepositedattheedgeoffields,downslope,orinrivers.Inallcases,SOCismovedfromonelocationtoanotherundertheassumptionthatonlyaportionofthe
MethodforEstimatingSoilCarbonStockChanges
Mineralsoils: TheDAYCENTprocess‐basedsimulationmodelestimatesthesoilorganiccarbon(SOC)at
thebeginningandendoftheyear.TheseinputsareenteredintotheIPCCequationtoestimatecarbonstockchangesinmineralsoilsdevelopedbyLascoetal.(2006),andVerchotetal.(2006).
ThismethodwaschosenbecausetheDAYCENTmodelhasbeendemonstratedtorepresentthedynamicsofsoilorganiccarbonandestimatesoilorganiccarbonstockchangeinU.S.croplandandgrasslands(Partonetal.,1993),anduncertaintieshavebeenquantified(Ogleetal.(2007).Themodelcapturessoilmoisturedynamics,plantproduction,andthermalcontrolsonnetprimaryproductionanddecompositionwithatimestepofamonthorless.
OrganicSoils: IPCCequationdevelopedbyAaldeetal.(2006;USDA,2011)usingregionspecific
emissionfactorsfromOgleetal.(2003). Thismethodwaschosenbecauseitistheonlyreadilyavailablemodelforestimatingsoil
carbonstockchangesfromorganicsoils.
Chapter 3: Quantifying Greenhouse Gas Sources and Sinks in Cropland and Grazing Land Systems
3-50
carbonintransportislosttotheatmosphere.Thisassumptionmayhavesignificantvariationduetothediversityofenvironmentalconditionsinwhicherodedcarbonistransportedandsubsequentlyresides.Otherenvironmentaldriverswillalsoinfluencecarbondynamicsinsoils,particularlyweatherandsoilcharacteristics.
Process‐basedmodels,whichareconsideredanIPCCTier3methodology,havebeendevelopedandsufficientlyevaluatedforapplicationinanoperationaltooltoestimateSOCstockchangesinmineralsoils.TheDAYCENTprocess‐basedmodel(Partonetal.,1987;Parton,1998)hasbeenselectedbecauseitiswell‐testedforestimatingsoilcarbondynamicsincroplandandgrazinglandsystems(Partonetal.,1993)andisalsousedintheU.S.nationalGHGinventory(Ogleetal.,2010;U.S.EPA,2011).DelGrossoetal.(2011)demonstratedthereductioninuncertaintyassociatedwiththemoreadvancedapproachusingtheDAYCENTmodelcomparedtothelowertiermethods.TheDAYCENTmodelsimulatesplantproductionbyrepresentinglong‐termeffectsoflanduseandmanagementonnetprimaryproduction(NPP),asinfluencedbyselectionofcropsandforagegrasses.TheinfluenceofmanagementpracticesonNPParealsosimulated,includingmineralfertilization,organicamendments,irrigationandfertigation,liming,greenmanuresandcovercrops,croppingintensity,hayorpastureinrotationwithannualcrops,grazingintensityandstockingrate,andbarefallow.Nutrientandmoisturedynamicsareinfluencedbysoilcharacteristics,suchassoiltexture.ThemethodaddressesinterannualvariabilityduetoannualchangesinmanagementandtheeffectofweatheronNPP.
IntheDAYCENTmodel,threesoilorganiccarbonpoolsareincludedrepresentingactive,slow,andpassivesoilorganicmatter,whichhavedifferentturnovertimes.Itisgenerallyconsideredthattheactivecarbonpoolismicrobialbiomassandassociatedmetaboliteshavingarapidturnover(monthstoyears),theslowcarbonpoolhasintermediatestabilityandturnovertimes(decades),andthepassivecarbonpoolrepresentshighlyprocessedandhumifieddecompositionproductswithlongerturnovertimes(centuries).However,thesepoolsarekineticallydefinedanddonotnecessarilyrepresentexplicitfractionsofsoilorganiccarbonthatcanbeisolated.Soiltexture,temperature,moistureavailability,aeration,burning,andotherfactorsarerepresentedinthesimulationsthatinfluencethedecompositionandlossofcarbonfromthesepools.
Themodelsimulatesmanagementpracticesinfluencingsoilorganiccarbonpools.Thesepracticesincludeadditionofcarboninmanureandotherorganicamendments,suchascompost,woodchips,andbiochar;tillageintensity;residuemanagement(retentionofresiduesinfieldwithoutincorporation,retentioninthefieldwithincorporation,andremovalwithharvest,burning,orgrazing).Theinfluenceofbareandvegetatedfallowsisrepresented,inadditiontoirrigationeffectsondecompositionincroplandandgrazinglandsystems.Themodelcanalsosimulatesetting‐asidecroplandfromproduction;theinfluenceoffireonoxidationofsoilorganicmatter;andwoodyplantencroachment,agroforestry,andsilvopastureeffectsoncarboninputsandoutputs.
Awater/soilmoisturesubmodel(e.g.,Partonetal.,1987)isusedtorepresenttheinfluenceofweather,irrigation,croptype,andmanagementonsoilmoisturedynamics.Thisimpactisparticularlyimportantbecausemoisturetendstobeamoreproximalfactorcontrollingsoilorganiccarbondynamics,which,inturn,isinfluencedbylanduseandmanagementactivity.Forexample,irrigationinfluencesplantproductionandcarboninputsbecauseofthemodificationtothemoistureregime.
ThemodeledestimatesfromDAYCENTarecombinedwithmeasurementdatafromamonitoringnetworktoformallyevaluateuncertainty.Thisapproachleveragesthescalabilityofthemodelwhileprovidinganunderlyingmeasurement‐basisforthemethod(Conantetal.,2011;Ogleetal.,2007).
Chapter 3: Quantifying Greenhouse Gas Sources and Sinks in Cropland and Grazing Land Systems
3-51
Erosionanddepositioninfluencesoilorganiccarbonstocks(Izaurraldeetal.,2007)andthereforearerepresentedinthemethod,althoughthereisuncertaintyintheneteffectonCO2exchangebetweenthebiosphereandatmosphere.Moreover,thereisalsosomeriskofdouble‐countingcarbonasitistransferredacrossownershipboundaries,intermsofwhoreceivescreditfortheerodedcarbonintheiraccounting.Regardless,erosionclearlyhasanimpactoncarbonstocksinafield,whichcanbeestimatedwithreasonableaccuracyusingerosioncalculators,suchastheRevisedUniversalSoilLossEquation,Version2(RUSLE2)forwatererosion(USDA,2003)andWindErosionPredictionSystem(WEPS)forwinderosion(USDA,2004).Therefore,thecurrentmethodwillincludeanestimateoferosion‐relatedcarbonlossfromafield,butneitherthefateoferodedC,northedepositionofcarbonfromotherareasontoalandparcel,willbeestimated.Asmorestudiesareconducted,carbontransportanddepositioncanbeincorporatedinfutureversionsofthemethod.
Drainageoforganicsoilsforcropproductionleadstonetannualemissionsduetoincreaseddecompositionoftheorganicmatterafterloweringthewatertableandcreatingaerobicconditionsintheupperlayersofthesoil(Allen,2012;ArmentanoandMenges,1986).Therehasbeenlessevaluationofprocess‐basedmodelsfororganicsoils,particularlythesimulationofwatertabledynamicsthroughouttheyear,whichwillinfluencetheemissionrate.Consequently,theapproachisbasedonmoresimplisticemissionfactorapproachdevelopedbytheIPCC(Aaldeetal.,2006).ThemethodincorporatesU.S.emissionratesassociatedwithregion‐specificdrainagepatterns(Ogleetal.,2003),soitisaTier2methodasdefinedbytheIPCC.
3.5.3.2 DescriptionofMethod
ThemethodrepresentingtheinfluenceoflanduseandmanagementonSOCandassociatedCO2fluxtotheatmosphereisestimatedwithacarbonstockchangeapproach(Aaldeetal.,2006).Formineralsoils,themethodwillrequireestimatesofcarbonstocksatthebeginningandendoftheyearinordertoestimatetheannualchangeusingtheequationbelow.Incontrast,carbonstockchangesinorganicsoils(i.e.,Histosols)willaddressonlytheemissionsoccurringwithdrainage,whichisthetypicalsituationincropland.Emissionsoccurinorganicsoilsfollowingdrainageduetotheconversionofananaerobicenvironmentwithahighwatertabletoaerobicconditions(ArmentanoandMenges,1986),resultinginasignificantlossofcarbontotheatmosphere(Ogleetal.,2003).Recentdataonsubsidencewereusedtoderivetheseestimates(e.g.,Shihetal.,1998).
MineralSoils:ThemodeltoestimatechangesinSOCstocksformineralsoilshasbeenadaptedfromthemethoddevelopedbyIPCC(Aaldeetal.,2006).Theannualchangeinstockstoa30centimeterdepthforalandparcelisestimatedusingthefollowingequation:
Equation3‐5:ChangeinSoilOrganicCarbon StocksforMineralSoils
ΔCMineral=[(SOCt‐SOCt‐1)/t]×A×CO2MW
Where:
ΔCMineral =Annualchangeinmineralsoilorganiccarbonstock(metrictonsCO2‐eqyear‐1)
SOCt =Soilorganiccarbonstockattheendoftheyear(metrictonsCha‐1)
SOCt‐1 =Soilorganiccarbonstockatthebeginningoftheyear(metrictonsCha‐1)
t =1year
A =Areaofparcel(ha)
CO2MW =RatioofmolecularweightofCO2tocarbon =44/12(metrictonsCO2(metrictonsC)‐1)
Chapter 3: Quantifying Greenhouse Gas Sources and Sinks in Cropland and Grazing Land Systems
3-52
TheDAYCENTmodelisusedtosimulatetheSOCstocksatthebeginningandendofeachyearforEquation3‐5basedonrecentmanagementpracticesforalandparcel.InitialvaluesforDAYCENTareneededfortheSOCt‐1andarebasedonasimulationofhistoricalmanagementtoprovideaccuratestocksanddistributionoforganiccarbonamongthepoolsrepresentedinthemodel(active,slow,andpassivesoilorganicmatterpools).Eachpoolhasadifferentturnoverrate(representingtheheterogeneousnatureofsoilorganicmatter),andtheamountofcarbonineachpoolatanypointintimeinfluencestheforwardtrajectoryofthetotalsoilorganiccarbonstorage(Partonetal.,1987).Bysimulatingthehistoricallanduse,thedistributionsofcarboninactive,slow,andpassivepoolsareestimatedinanunbiasedway.
Threestepsarerequiredtoestimatetheinitialvalues.Thefirststepinvolvesrunningthemodeltoasteady‐statecondition(e.g.,equilibrium)undernativevegetation,historicalclimatedata,andthesoilphysicalattributesforthelandparcel.Thesecondstepistosimulateperiodoftimefromthe1800’sto1980and1980to2000.Theentityisprovidedalistofoptionsforselectingthepracticesthatbestmatchthelandmanagementfortheparcel.From2000totheinitialyearforreporting,theentityentersmorespecificdataoncropsplanted,tillagepractices,fertilizationpractices,irrigation,andothermanagementactivity(SeeSection3.5.3.3formoreinformation).Thesimulatedcarbonstockattheendofthesimulationprovidestheinitialbaselinevalue(SOCt‐1).
Thestockattheendofayear(SOCt)isestimatedbytheDAYCENTmodelbasedonsimulatingmanagementactivityduringthespecificyear.Theentityprovidesthemanagementactivityforthelandparcel,includingcropsplanted,tillagepractices,fertilizationpractices,irrigationandothermanagementactivitydata(SeeSection3.5.3.3formoreinformation).ThechangeinSOCstocksareestimatedforadditionalyearsbyusingtheendingstockfromthepreviousyearastheinitialSOCstock(SOCt‐1)andthensimulatingthemanagementforanotheryeartoproducethestockattheendofthenextyear(SOCt).
ErodedcarbonisestimatedwiththeRUSLE2forwatererosion(USDA,2003)andWEPSforwinderosion(USDA,2004).NeitherthedepositionofcarbononthesitenorthefateoferodedcarbonisinthisversionoftheUSDAmethods.TheerodedcarbonestimateisreportedseparatelytoaccountforuncertaintyassociatedwiththepotentialeffectoferosiononSOCstocks,andmaybeusedasadiscountfortheSOCstockchangesestimatewithEquation3‐5.
TheDAYCENTmodelisnotabletoestimatesoilorganiccarbonstocksinmineralsoilsforallcrops.IninstanceswhereacropisnotestimatedbytheDAYCENTmodel,themethoddevelopedbytheIPCC(2006)(i.e.,aTier1methodology)maybeused(SeeAppendix3‐B).
OrganicSoils:ThemethodologyforestimatingsoilcarbonstockchangesindrainedorganicsoilshasbeenadoptedfromIPCC(Aaldeetal.,2006).ThemethodappliestoHistosolsandsoilsthathavehighorganicmattercontentanddevelopedundersaturated,anaerobicconditionsforatleastpartoftheyear,whichincludesHistels,Historthels,andHistoturbels.Thefollowingequationisusedtoestimateemissionsfromalandparcel:
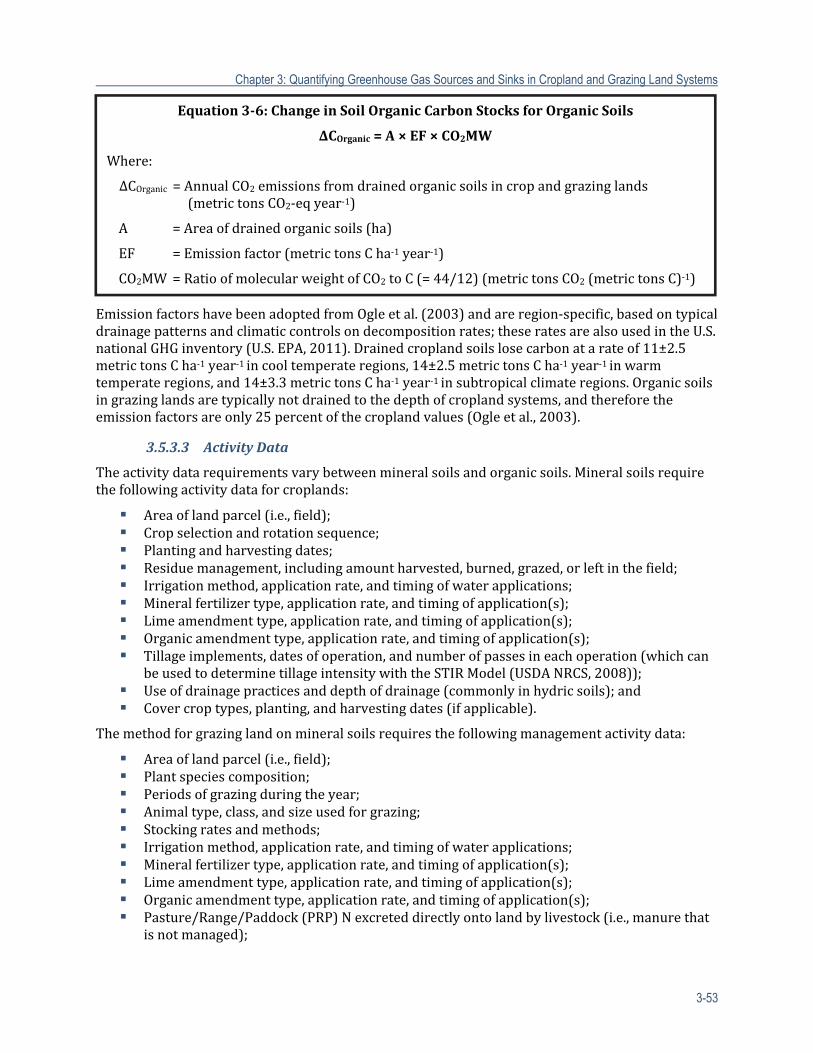
Chapter 3: Quantifying Greenhouse Gas Sources and Sinks in Cropland and Grazing Land Systems
3-53
EmissionfactorshavebeenadoptedfromOgleetal.(2003)andareregion‐specific,basedontypicaldrainagepatternsandclimaticcontrolsondecompositionrates;theseratesarealsousedintheU.S.nationalGHGinventory(U.S.EPA,2011).Drainedcroplandsoilslosecarbonatarateof11±2.5metrictonsCha‐1year‐1incooltemperateregions,14±2.5metrictonsCha‐1year‐1inwarmtemperateregions,and14±3.3metrictonsCha‐1year‐1insubtropicalclimateregions.Organicsoilsingrazinglandsaretypicallynotdrainedtothedepthofcroplandsystems,andthereforetheemissionfactorsareonly25percentofthecroplandvalues(Ogleetal.,2003).
3.5.3.3 ActivityData
Theactivitydatarequirementsvarybetweenmineralsoilsandorganicsoils.Mineralsoilsrequirethefollowingactivitydataforcroplands:
Areaoflandparcel(i.e.,field); Cropselectionandrotationsequence; Plantingandharvestingdates; Residuemanagement,includingamountharvested,burned,grazed,orleftinthefield; Irrigationmethod,applicationrate,andtimingofwaterapplications; Mineralfertilizertype,applicationrate,andtimingofapplication(s); Limeamendmenttype,applicationrate,andtimingofapplication(s); Organicamendmenttype,applicationrate,andtimingofapplication(s); Tillageimplements,datesofoperation,andnumberofpassesineachoperation(whichcan
beusedtodeterminetillageintensitywiththeSTIRModel(USDANRCS,2008)); Useofdrainagepracticesanddepthofdrainage(commonlyinhydricsoils);and Covercroptypes,planting,andharvestingdates(ifapplicable).
Themethodforgrazinglandonmineralsoilsrequiresthefollowingmanagementactivitydata:
Areaoflandparcel(i.e.,field); Plantspeciescomposition; Periodsofgrazingduringtheyear; Animaltype,class,andsizeusedforgrazing; Stockingratesandmethods; Irrigationmethod,applicationrate,andtimingofwaterapplications; Mineralfertilizertype,applicationrate,andtimingofapplication(s); Limeamendmenttype,applicationrate,andtimingofapplication(s); Organicamendmenttype,applicationrate,andtimingofapplication(s); Pasture/Range/Paddock(PRP)Nexcreteddirectlyontolandbylivestock(i.e.,manurethat
isnotmanaged);
Equation3‐6:ChangeinSoilOrganicCarbon StocksforOrganicSoils
ΔCOrganic=A×EF×CO2MW
Where:
ΔCOrganic=AnnualCO2emissionsfromdrainedorganicsoilsincropandgrazinglands (metrictonsCO2‐eqyear‐1)
A =Areaofdrainedorganicsoils(ha)
EF =Emissionfactor(metrictonsCha‐1year‐1)
CO2MW=RatioofmolecularweightofCO2toC(=44/12)(metrictonsCO2(metrictonsC)‐1)
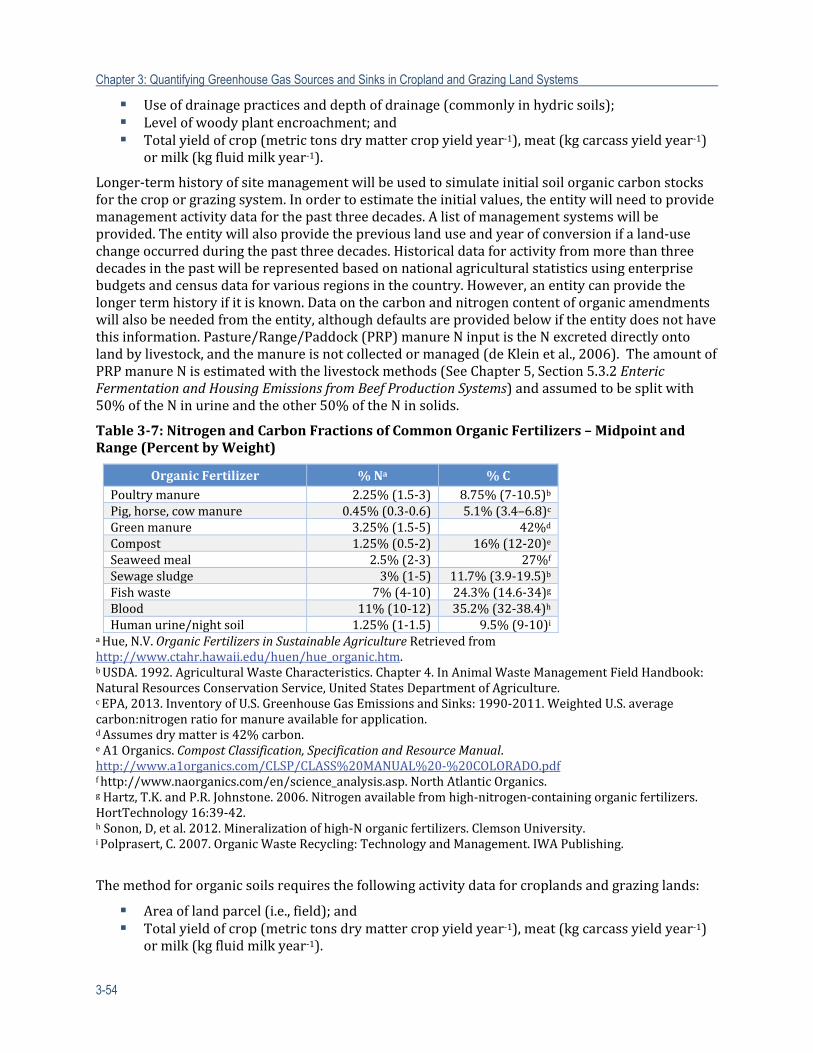
Chapter 3: Quantifying Greenhouse Gas Sources and Sinks in Cropland and Grazing Land Systems
3-54
Useofdrainagepracticesanddepthofdrainage(commonlyinhydricsoils); Levelofwoodyplantencroachment;and Totalyieldofcrop(metrictonsdrymattercropyieldyear‐1),meat(kgcarcassyieldyear‐1)
ormilk(kgfluidmilkyear‐1).
Longer‐termhistoryofsitemanagementwillbeusedtosimulateinitialsoilorganiccarbonstocksforthecroporgrazingsystem.Inordertoestimatetheinitialvalues,theentitywillneedtoprovidemanagementactivitydataforthepastthreedecades.Alistofmanagementsystemswillbeprovided.Theentitywillalsoprovidethepreviouslanduseandyearofconversionifaland‐usechangeoccurredduringthepastthreedecades.Historicaldataforactivityfrommorethanthreedecadesinthepastwillberepresentedbasedonnationalagriculturalstatisticsusingenterprisebudgetsandcensusdataforvariousregionsinthecountry.However,anentitycanprovidethelongertermhistoryifitisknown.Dataonthecarbonandnitrogencontentoforganicamendmentswillalsobeneededfromtheentity,althoughdefaultsareprovidedbelowiftheentitydoesnothavethisinformation.Pasture/Range/Paddock(PRP)manureNinputistheNexcreteddirectlyontolandbylivestock,andthemanureisnotcollectedormanaged(deKleinetal.,2006).TheamountofPRPmanureNisestimatedwiththelivestockmethods(SeeChapter5,Section5.3.2EntericFermentationandHousingEmissionsfromBeefProductionSystems)andassumedtobesplitwith50%oftheNinurineandtheother50%oftheNinsolids.
Table3‐7:NitrogenandCarbonFractionsofCommonOrganicFertilizers–MidpointandRange(PercentbyWeight)
OrganicFertilizer %Na %CPoultrymanure 2.25%(1.5‐3) 8.75%(7‐10.5)b
Pig,horse,cowmanure 0.45%(0.3‐0.6) 5.1%(3.4–6.8)c
Greenmanure 3.25%(1.5‐5) 42%d
Compost 1.25%(0.5‐2) 16%(12‐20)e
Seaweedmeal 2.5%(2‐3) 27%f
Sewagesludge 3%(1‐5) 11.7%(3.9‐19.5)b
Fishwaste 7%(4‐10) 24.3%(14.6‐34)g
Blood 11%(10‐12) 35.2%(32‐38.4)h
Humanurine/nightsoil 1.25%(1‐1.5) 9.5%(9‐10)iaHue,N.V.OrganicFertilizersinSustainableAgricultureRetrievedfromhttp://www.ctahr.hawaii.edu/huen/hue_organic.htm.bUSDA.1992.AgriculturalWasteCharacteristics.Chapter4.InAnimalWasteManagementFieldHandbook:NaturalResourcesConservationService,UnitedStatesDepartmentofAgriculture.cEPA,2013.InventoryofU.S.GreenhouseGasEmissionsandSinks:1990‐2011.WeightedU.S.averagecarbon:nitrogenratioformanureavailableforapplication.dAssumesdrymatteris42%carbon.eA1Organics.CompostClassification,SpecificationandResourceManual.http://www.a1organics.com/CLSP/CLASS%20MANUAL%20‐%20COLORADO.pdffhttp://www.naorganics.com/en/science_analysis.asp.NorthAtlanticOrganics.gHartz,T.K.andP.R.Johnstone.2006.Nitrogenavailablefromhigh‐nitrogen‐containingorganicfertilizers.HortTechnology16:39‐42.hSonon,D,etal.2012.Mineralizationofhigh‐Norganicfertilizers.ClemsonUniversity.iPolprasert,C.2007.OrganicWasteRecycling:TechnologyandManagement.IWAPublishing.
Themethodfororganicsoilsrequiresthefollowingactivitydataforcroplandsandgrazinglands:
Areaoflandparcel(i.e.,field);and Totalyieldofcrop(metrictonsdrymattercropyieldyear‐1),meat(kgcarcassyieldyear‐1)
ormilk(kgfluidmilkyear‐1).
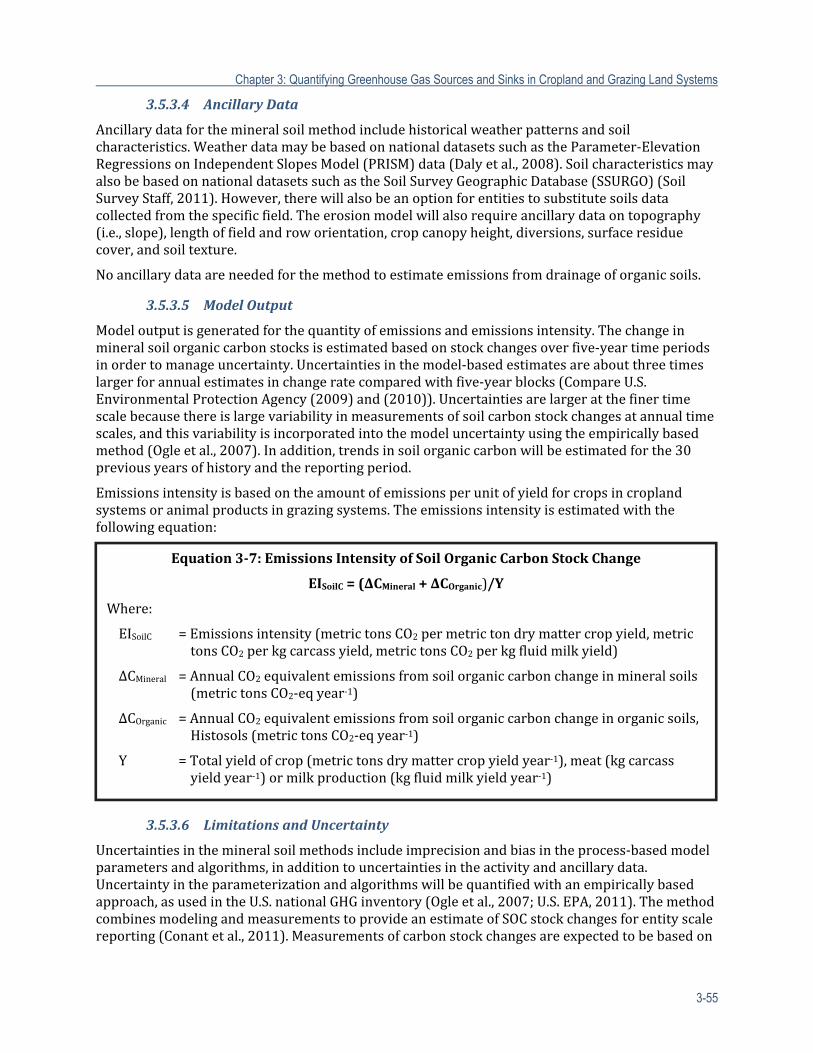
Chapter 3: Quantifying Greenhouse Gas Sources and Sinks in Cropland and Grazing Land Systems
3-55
3.5.3.4 AncillaryData
Ancillarydataforthemineralsoilmethodincludehistoricalweatherpatternsandsoilcharacteristics.WeatherdatamaybebasedonnationaldatasetssuchastheParameter‐ElevationRegressionsonIndependentSlopesModel(PRISM)data(Dalyetal.,2008).SoilcharacteristicsmayalsobebasedonnationaldatasetssuchastheSoilSurveyGeographicDatabase(SSURGO)(SoilSurveyStaff,2011).However,therewillalsobeanoptionforentitiestosubstitutesoilsdatacollectedfromthespecificfield.Theerosionmodelwillalsorequireancillarydataontopography(i.e.,slope),lengthoffieldandroworientation,cropcanopyheight,diversions,surfaceresiduecover,andsoiltexture.
Noancillarydataareneededforthemethodtoestimateemissionsfromdrainageoforganicsoils.
3.5.3.5 ModelOutput
Modeloutputisgeneratedforthequantityofemissionsandemissionsintensity.Thechangeinmineralsoilorganiccarbonstocksisestimatedbasedonstockchangesoverfive‐yeartimeperiodsinordertomanageuncertainty.Uncertaintiesinthemodel‐basedestimatesareaboutthreetimeslargerforannualestimatesinchangeratecomparedwithfive‐yearblocks(CompareU.S.EnvironmentalProtectionAgency(2009)and(2010)).Uncertaintiesarelargeratthefinertimescalebecausethereislargevariabilityinmeasurementsofsoilcarbonstockchangesatannualtimescales,andthisvariabilityisincorporatedintothemodeluncertaintyusingtheempiricallybasedmethod(Ogleetal.,2007).Inaddition,trendsinsoilorganiccarbonwillbeestimatedforthe30previousyearsofhistoryandthereportingperiod.
Emissionsintensityisbasedontheamountofemissionsperunitofyieldforcropsincroplandsystemsoranimalproductsingrazingsystems.Theemissionsintensityisestimatedwiththefollowingequation:
3.5.3.6 LimitationsandUncertainty
Uncertaintiesinthemineralsoilmethodsincludeimprecisionandbiasintheprocess‐basedmodelparametersandalgorithms,inadditiontouncertaintiesintheactivityandancillarydata.Uncertaintyintheparameterizationandalgorithmswillbequantifiedwithanempiricallybasedapproach,asusedintheU.S.nationalGHGinventory(Ogleetal.,2007;U.S.EPA,2011).ThemethodcombinesmodelingandmeasurementstoprovideanestimateofSOCstockchangesforentityscalereporting(Conantetal.,2011).Measurementsofcarbonstockchangesareexpectedtobebasedon
Equation3‐7:EmissionsIntensityofSoilOrganicCarbon StockChange
EISoilC=(ΔCMineral+ΔCOrganic)/Y
Where:
EISoilC =Emissionsintensity(metrictonsCO2permetrictondrymattercropyield,metrictonsCO2perkgcarcassyield,metrictonsCO2perkgfluidmilkyield)
ΔCMineral =AnnualCO2equivalentemissionsfromsoilorganiccarbonchangeinmineralsoils(metrictonsCO2‐eqyear‐1)
ΔCOrganic =AnnualCO2equivalentemissionsfromsoilorganiccarbonchangeinorganicsoils,Histosols(metrictonsCO2‐eqyear‐1)
Y =Totalyieldofcrop(metrictonsdrymattercropyieldyear‐1),meat(kgcarcassyieldyear‐1)ormilkproduction(kgfluidmilkyieldyear‐1)
Chapter 3: Quantifying Greenhouse Gas Sources and Sinks in Cropland and Grazing Land Systems
3-56
anationalsoilmonitoringnetwork(Spenceretal.,2011).Thenetworkshouldincludesamplesfromdifferentregionsofthecountryandsoiltypesthatareusedforcropproductionorgrazing,andarandomsamplingofthemanagementsystemsineachoftheregions.ThesamplingplotswillneedtobedesignedforresamplingovertimeinordertoevaluatethemodeledchangesinSOCstocks(Conantetal.,2003).Uncertaintiesinnationaldatasetsforweatherwillbebasedoninformationincludedwiththedataset,whileuncertaintiesintheSSURGOshouldbequantifiedusingtheunderlyingfielddatathatformthebasisforthemappingexercise,oranindependentaccuracyassessmentofthemapproduct.Otherinputdataisassumedtobeknownbytheentity,suchasthecropplants,yields,tillage,andresiduemanagementpractices.
Thelimitationsofthemineralsoilcarbonmethodincludenoassessmentoftheeffectoflanduseandmanagementinsub‐surfacelayersofthesoilprofile(below30centimeters),noassessmentofthelocationoftransportanddepositionoferodedC,andlimiteddatatoassessuncertaintyintheparametersandalgorithmsusingtheempiricallybasedmethod.Foragroforestry,theDAYCENTmodelhasbeenusedintheCOMET‐Farmvoluntarycarbonreportingtooltosimulatesoilorganiccarbonstockchanges.However,thereareseveralunknownswiththeuseoftheDAYCENTmodelforestimatingsoilorganiccarbonstockchangesinagroforestry,includingwhetherthemodelisabletotakeintoaccounttheinteractionsoccurringbetweenwoodyandherbaceousvegetationandrespectivemanagementactivities.OelbermannandVoroney(2011)evaluatedtheuseoftheCenturymodel,themonthlytime‐stepversionoftheDAYCENTmodel,topredictsoilorganiccarbonintemperateandtropicalalleycroppingsystemsthatwere13and19yearsold,respectively.Theyfoundthatthemodelunderestimatedthelevelsofsoilorganiccarboncomparedwithmeasuredvalues.Withmoretesting,themethodsmayberevisedinthefuturetousetheDAYCENTmodelforthepurposesofestimatingsoilorganiccarbonstockchangesinagroforestrysystems.
Biocharresearchhasbeenanareaofrapiddevelopmentoverthepastfewyears,buttherearestilluncertainties.Biocharisaproductofcombustedbiomassthathasavarietyofchemicalstructuresdependingonthebiomassandpyrolysismethod,andthevariationhasimplicationsforthestabilityofthecarboninthesoil(Spokas,2010).BiocharcanhaveconcomitantimpactsonemissionsofotherGHGssuchasCH4andN2O(Cayuelaetal.,2010;Malghanietal.,2013;Yuetal.,2013),althoughsomestudieshaveshownnoeffect(Caseetal.,2013;Cloughetal.,2010).SoilamendmentswithbiocharmayalsoprimethedecompositionofthenativesoilorganicmatteralthoughtheCO2emissionsfromprimingappeartobeconsiderablysmallerthanthecarbonaddedinthebiochar(Stewartetal.,2013;WoolfandLehmann,2012).Otherresearchsuggeststhattheremayevenbe“negative”primingleadingtoareductioninheterotrophicrespiration(Caseetal.,2013).Furthermore,thetemporaldurationoftheGHGmitigationpotentialofbiocharisalsouncertainbutappearstobeofashorttermnature(Spokas,2013).TheinfluenceofbiocharonemissionsandprimingneedsmoreresearchbeforethefulleffectofbiocharoncarbonsequestrationandGHGemissionscanbeincorporatedintomodelsandGHGreportingframeworks.Microbialdegradationofbiocharcanoccurovertimescalesrangingfromaslittleasafewdecadesto1000sofyears(Spokas,2010).Inthetechnicalmethods,biocharistreatedasahighcarbontolownitrogenamendmentintheDAYCENTmodelframework,butwithaconservativeresidencetimeofthecarbonfromdecadestoacentury.Thesemethodscanbefurtherrefinedinthefutureasthedifferenttypesandresidencetimesofbiochararefurtherresolved.
Themethodfororganicsoilsalsohaslimitations,particularlytheinabilitytoestimatetheeffectofmitigationmeasuressuchaswatertablemanagementbecauseemissionfactorsaresetforeachclimateregion(i.e.,currentlyscalingfactorsarenotavailabletorevisetheemissionfactorsforwatertablemanagement).Onlycompleterestorationofthewetlandwithnofurtherdrainagecanbeaddressedwiththemethod(i.e.,assumesnofurtheremissionsofCO2).However,ifcrop
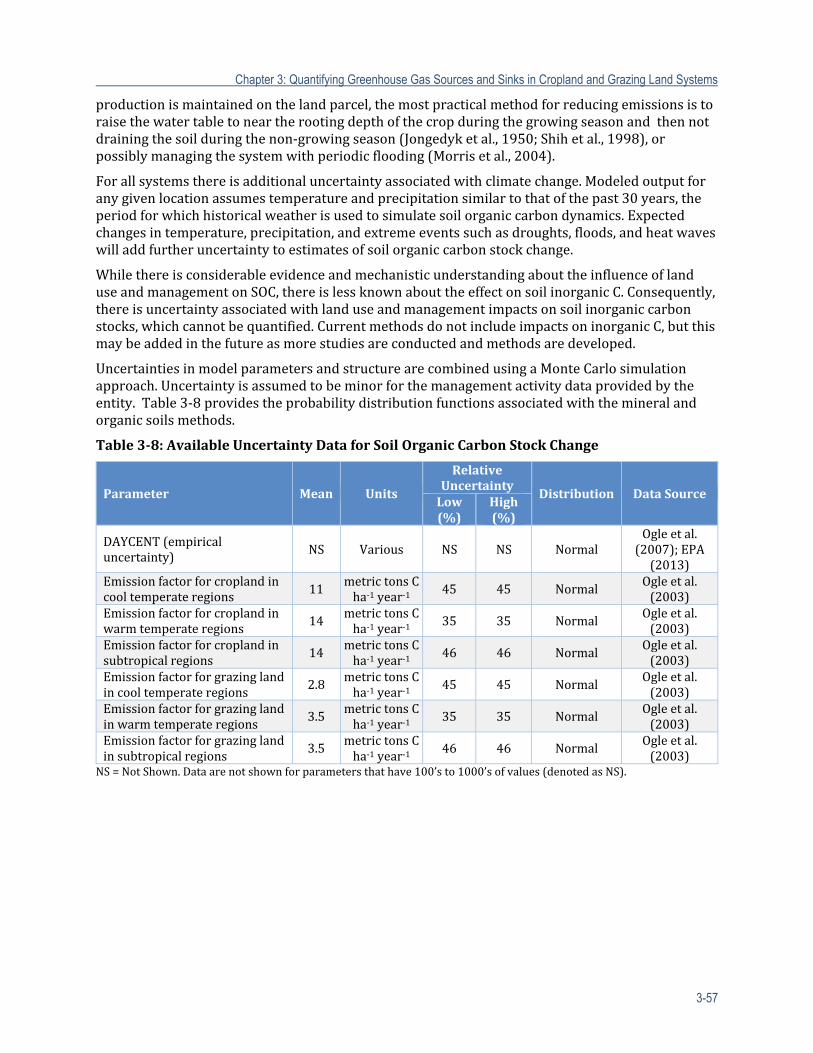
Chapter 3: Quantifying Greenhouse Gas Sources and Sinks in Cropland and Grazing Land Systems
3-57
productionismaintainedonthelandparcel,themostpracticalmethodforreducingemissionsistoraisethewatertabletoneartherootingdepthofthecropduringthegrowingseasonandthennotdrainingthesoilduringthenon‐growingseason(Jongedyketal.,1950;Shihetal.,1998),orpossiblymanagingthesystemwithperiodicflooding(Morrisetal.,2004).
Forallsystemsthereisadditionaluncertaintyassociatedwithclimatechange.Modeledoutputforanygivenlocationassumestemperatureandprecipitationsimilartothatofthepast30years,theperiodforwhichhistoricalweatherisusedtosimulatesoilorganiccarbondynamics.Expectedchangesintemperature,precipitation,andextremeeventssuchasdroughts,floods,andheatwaveswilladdfurtheruncertaintytoestimatesofsoilorganiccarbonstockchange.
WhilethereisconsiderableevidenceandmechanisticunderstandingabouttheinfluenceoflanduseandmanagementonSOC,thereislessknownabouttheeffectonsoilinorganicC.Consequently,thereisuncertaintyassociatedwithlanduseandmanagementimpactsonsoilinorganiccarbonstocks,whichcannotbequantified.CurrentmethodsdonotincludeimpactsoninorganicC,butthismaybeaddedinthefutureasmorestudiesareconductedandmethodsaredeveloped.
UncertaintiesinmodelparametersandstructurearecombinedusingaMonteCarlosimulationapproach.Uncertaintyisassumedtobeminorforthemanagementactivitydataprovidedbytheentity.Table3‐8providestheprobabilitydistributionfunctionsassociatedwiththemineralandorganicsoilsmethods.
Table3‐8:AvailableUncertaintyDataforSoilOrganicCarbonStockChange
Parameter Mean Units
RelativeUncertainty
Distribution DataSourceLow(%)
High(%)
DAYCENT(empiricaluncertainty) NS Various NS NS Normal
Ogleetal.(2007);EPA(2013)
Emissionfactorforcroplandincooltemperateregions 11
metrictonsCha‐1year‐1 45 45 Normal
Ogleetal.(2003)
Emissionfactorforcroplandinwarmtemperateregions 14
metrictonsCha‐1year‐1 35 35 Normal
Ogleetal.(2003)
Emissionfactorforcroplandinsubtropicalregions 14
metrictonsCha‐1year‐1 46 46 Normal
Ogleetal.(2003)
Emissionfactorforgrazinglandincooltemperateregions
2.8metrictonsCha‐1year‐1
45 45 NormalOgleetal.(2003)
Emissionfactorforgrazinglandinwarmtemperateregions
3.5metrictonsCha‐1year‐1
35 35 NormalOgleetal.(2003)
Emissionfactorforgrazinglandinsubtropicalregions
3.5metrictonsCha‐1year‐1
46 46 NormalOgleetal.(2003)
NS=NotShown.Dataarenotshownforparametersthathave100’sto1000’sofvalues(denotedasNS).
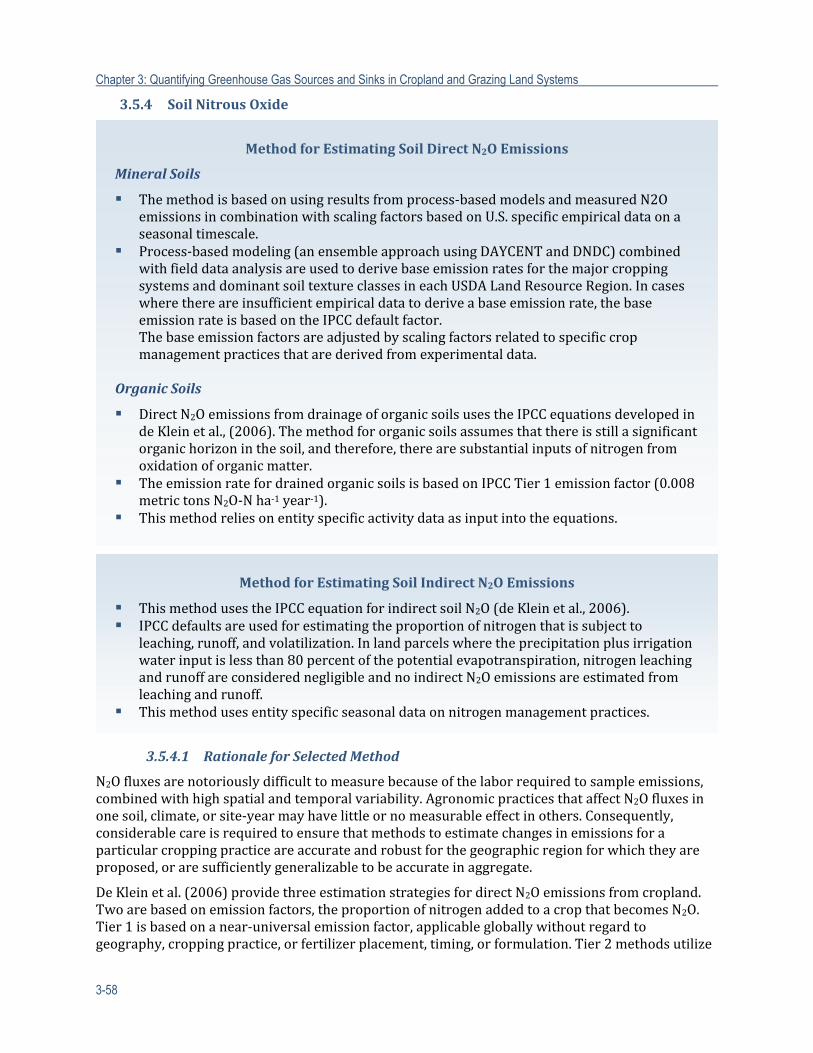
Chapter 3: Quantifying Greenhouse Gas Sources and Sinks in Cropland and Grazing Land Systems
3-58
3.5.4 SoilNitrousOxide
3.5.4.1 RationaleforSelectedMethod
N2Ofluxesarenotoriouslydifficulttomeasurebecauseofthelaborrequiredtosampleemissions,combinedwithhighspatialandtemporalvariability.AgronomicpracticesthataffectN2Ofluxesinonesoil,climate,orsite‐yearmayhavelittleornomeasurableeffectinothers.Consequently,considerablecareisrequiredtoensurethatmethodstoestimatechangesinemissionsforaparticularcroppingpracticeareaccurateandrobustforthegeographicregionforwhichtheyareproposed,oraresufficientlygeneralizabletobeaccurateinaggregate.
DeKleinetal.(2006)providethreeestimationstrategiesfordirectN2Oemissionsfromcropland.Twoarebasedonemissionfactors,theproportionofnitrogenaddedtoacropthatbecomesN2O.Tier1isbasedonanear‐universalemissionfactor,applicablegloballywithoutregardtogeography,croppingpractice,orfertilizerplacement,timing,orformulation.Tier2methodsutilize
MethodforEstimatingSoilDirectN2OEmissions
MineralSoils
Themethodisbasedonusingresultsfromprocess‐basedmodelsandmeasuredN2OemissionsincombinationwithscalingfactorsbasedonU.S.specificempiricaldataonaseasonaltimescale.
Process‐basedmodeling(anensembleapproachusingDAYCENTandDNDC)combinedwithfielddataanalysisareusedtoderivebaseemissionratesforthemajorcroppingsystemsanddominantsoiltextureclassesineachUSDALandResourceRegion.Incaseswherethereareinsufficientempiricaldatatoderiveabaseemissionrate,thebaseemissionrateisbasedontheIPCCdefaultfactor.Thebaseemissionfactorsareadjustedbyscalingfactorsrelatedtospecificcropmanagementpracticesthatarederivedfromexperimentaldata.
OrganicSoils
DirectN2OemissionsfromdrainageoforganicsoilsusestheIPCCequationsdevelopedindeKleinetal.,(2006).Themethodfororganicsoilsassumesthatthereisstillasignificantorganichorizoninthesoil,andtherefore,therearesubstantialinputsofnitrogenfromoxidationoforganicmatter.
TheemissionratefordrainedorganicsoilsisbasedonIPCCTier1emissionfactor(0.008metrictonsN2O‐Nha‐1year‐1).
Thismethodreliesonentityspecificactivitydataasinputintotheequations.
MethodforEstimatingSoilIndirectN2OEmissions
ThismethodusestheIPCCequationforindirectsoilN2O(deKleinetal.,2006). IPCCdefaultsareusedforestimatingtheproportionofnitrogenthatissubjectto
leaching,runoff,andvolatilization.Inlandparcelswheretheprecipitationplusirrigationwaterinputislessthan80percentofthepotentialevapotranspiration,nitrogenleachingandrunoffareconsiderednegligibleandnoindirectN2Oemissionsareestimatedfromleachingandrunoff.
Thismethodusesentityspecificseasonaldataonnitrogenmanagementpractices.
Chapter 3: Quantifying Greenhouse Gas Sources and Sinks in Cropland and Grazing Land Systems
3-59
geographic,crop,orpractice‐specificemissionfactorswherefieldtestsshowthatafactordifferentfromtheonepercentTier1factoriswarranted.AtpresentthereisonlyoneTier2exampleintheprimaryliteraturethatisspecifictoconditionsintheUnitedStates,anditisforcornintheNorthCentralregion(Millaretal.,2010).ThismethodhasbeenincorporatedintoseveralN2Oreductionprotocols(VerifiedCarbonStandard,AmericanCarbonRegistry,andClimateActionReserve).ThethirdoptionforestimatingdirectN2Oemissions,orTier3,isameasurementorprocess‐basedmodelingapproach.Inthiscase,emissionsaremonitoredspecificallyfortheentity’sfieldbydeployinginstrumentsinameasurementsystemorbygatheringtheinformationspecifictothefieldconditionstosimulateN2Oemissionswithaprocess‐basedmodel.Thisthirdoptionisthemostprecise,butrequiresmoreresourcesandsufficienttestingpriortoimplementation.
InSection3.2.1.1,severalpracticesarediscussedthathavebeenshowntoreduceN2Oemissionsinfieldexperiments.However,manyoftheexperimentshavebeenconductedforalimitednumberofspecificcroppingsystemsandregions.Consequently,therearenomitigationpracticesforwhichemissionreductionshavebeenquantifiedunderallconditionsintheUnitedStates.Nevertheless,formanypracticesthereissufficientknowledgeatthecroppingsystemandregionallevelstoestablishthatadoptionwillreducesoilN2Oemissions.
Process‐basedsimulationmodelsuseknowledgeofC,N,andwaterprocesses(amongothers)topredictecosystemresponsestoclimateandotherenvironmentalfactors,includingcropandgrazinglandmanagement(seesoilcarbonmethodologyinSection3.5.3).N2Ofluxescanbepredictedusingsimulationmodels(Chenetal.,2008;DelGrossoetal.,2010).Akeyadvantageofsimulationmodelsisthattheyaregeneralizabletoawidevarietyofsoils,climates,andcroppingsystems,allowingfactorstointeractincomplexwaysthatmaybedifficulttopredictwithlesssophisticatedapproaches.However,adisadvantageisthatcomplexitycanlimittheirtransparency,andatpresenttherearestillsubstantialdatagapsthatlimitourabilitytofullytestavailablemodelsfortheirsensitivitytodifferentmanagementpracticesacrossvariousregionsandcropsintheUnitedStates.
Toovercomethesechallenges,ahybridapproachthatutilizesprocess‐basedsimulationmodelsandfielddatawasdevelopedtoestimateN2Oemissions.Themethodusesabaseemissionrateassociatedwiththetypicalamountofnitrogenapplied,andthenadjustmentsareappliedviascalingfactorstoaccountformanagementpracticesthataffectN2Oemissions.ThisapproachisaTier3methodasdefinedbytheIPCC.
Baseemissionratesareestimatedforeachdominantcropandthreesoiltextureclasses(coarse,medium,fine)withinaclimaticregionusingprocess‐basedsimulationmodeling.ThefactorsaredevelopedatthescaleofUSDALandResourceRegions(LRR).FielddataindicatethatN2Oemissionsgenerallyincreaseastheamountofappliednitrogenincreases,especiallywhennitrogenapplicationratesexceedcropuptakerates(Hobenetal.,2011;Kimetal.,2013;McSwineyandRobertson,2005;Shcherbaketal.,inpress)Researchdatafromfieldexperimentswerecompiledandusedtoadjusttheemissionratesfornitrogenfertilizerapplicationratesthatexceededthetypicalnitrogenapplicationrateforthecropinalandresourceregion.Forcropswheresufficientdataarenotavailabletosimulatethebaseemissionratewithaprocess‐basedmodel,thestandardIPCCTier1emissionfactorisapplied.Inaddition,forlandparcelsthathaveamixofcropswhereonlysomecanbesimulated,thestandardIPCCTier1approachshouldalsobeapplied.
Emissionsareaffectedbyspecificfarmmanagementpracticessuchasreducingtillageintensity;addingnitrificationinhibitors,orchanginghow,whenandwherenitrogenfertilizersareapplied.ToaccountfortheeffectofmanagementpracticesonN2Oemission,scalingfactorsweredevelopedtoadjustthebaseemissionrates.Thescalingfactorswereestimatedfromavailableresearchdata(SeeAppendix3‐Aformoreinformation).Managementpracticesotherthanthoseincludedinthe
Chapter 3: Quantifying Greenhouse Gas Sources and Sinks in Cropland and Grazing Land Systems
3-60
equationmayalsomitigateN2Oemissions,buttherearenotcurrentlysufficientdatatocreategeneralizedscalingfactors.Additionaldatamayleadtotheirinclusioninfutureupdatestothemethod.
ThismethodincorporatesmoreinformationthanamethodbasedsolelyontheIPCCmodel.Itprovidesatransparentandscience‐basedmeansofestimatingannualizedN2Oemissionsfromcropandgrazinglands,anditfacilitatestheestimationofuncertainty.ForN2Oemissionsfromcropandgrazinglands,anIPCCTier1approachisonlysensitivetonitrogenapplicationrate,andthereforedoesnotreflectthefullsuiteoffactorsthatareknowntoinfluenceN2Oemissionsincludingclimate,soils,crops,andmanagementpracticesthatrangefromtillagetocovercropstofertilizertiming,placement,formulation,andadditives.DynamicprocessmodelsasembodiedintheIPCCTier3approachcan,inconcept,accountformostofthesefactorsbuttodatehavenotbeensufficientlyevaluatedformanyU.S.locations,crops,andmanagementpractices.Thisreporttakesahybridapproachthatrepresentsthebestavailablescienceatthetimeofpublication:dynamicprocessmodelstoestimatebaselineN2Oemissionsforthosecropsandlocationssufficientlyevaluated,thenscaledbymanagementpracticestotheextentsupportedbyavailableresearchresults.InitialtestingindicatesthatthismethodismoresensitivetoU.S.nutrientmanagementpracticesthantheIPCCTier1approach.Theauthorsanticipatepublicationofanaddendumthatwillprovidetestresultsandsuggestfurthertuningofthemethod.Overtime,asdynamicprocessmodelsarefurtherdevelopedandtested.ThemethodwilllikelymigratetowardsanexclusiveTier3approachtobetteraccountformanagementeffectsgiventhelocalvariablesandconditions.Intheinterim,inadditiontoprovidingbest‐availableandreliableestimatesofN2Oemissionsfromcropandgrazinglands,themethodoutlinedhereisexpectedtosetaresearchagendathatprovidesforbroaderevaluationofenvironmentalconditionsandmanagementpracticesinfluencingN2Oemissionsaswellasfurtherdevelopmentofmodelstomoreaccuratelyestimateemissions.
OffsiteorindirectN2Oemissions,whichoccurwhenreactivenitrogenescapestodownwindordownstreamecosystemswherefavorableconditionsforN2Oproductionexist,areevenmoredifficulttoestimatethandirectemissionsbecausethereisuncertaintyinboththeamountofreactivenitrogenthatescapesandtheportionofthisnitrogenthatisconvertedtoN2O.Ideally,fluxesofvolatileandsolublereactivenitrogenleavingtheentity’sparceloflandwouldbecombinedwithatmospherictransportandhydrologicmodelstosimulatethefateofreactiveN.Atpresenttherearenolinkedmodelingapproachessufficientlytestedtobeusedinanoperationalframework.Consequently,theindirectN2OemissionsarebasedontheIPCCTier1method(deKleinetal.,2006).
Similarly,directN2OemissionsfromdrainageoforganicsoilsarebasedontheIPCCTier1methods(deKleinetal.,2006).AlthoughresearchisongoingtoprovideimprovedemissionfactorsandmethodsforestimatingN2Oemissionsfromdrainageoforganicsoils(Allen,2012),moretestingwillbeneededbeforeincorporatingthemintoanoperationalmethod.Futurerevisionstothesemethodswillneedtoconsideradvancementsandrevisethemethodsaccordingly.
3.5.4.2 DescriptionofMethod
N2Oisemittedfromcroplandbothdirectlyandindirectly.Directemissionsarefluxesfromcroplandorgrazinglandswheretherearenitrogenadditionsornitrogenmineralizedfromsoilorganicmatter.IndirectemissionsoccurwhenreactivenitrogenisvolatilizedasNH3orNOxortransportedviasurfacerunofforleachinginsolubleformsfromcroplandorgrazinglands,leadingtoN2Oemissionsinanotherlocation.
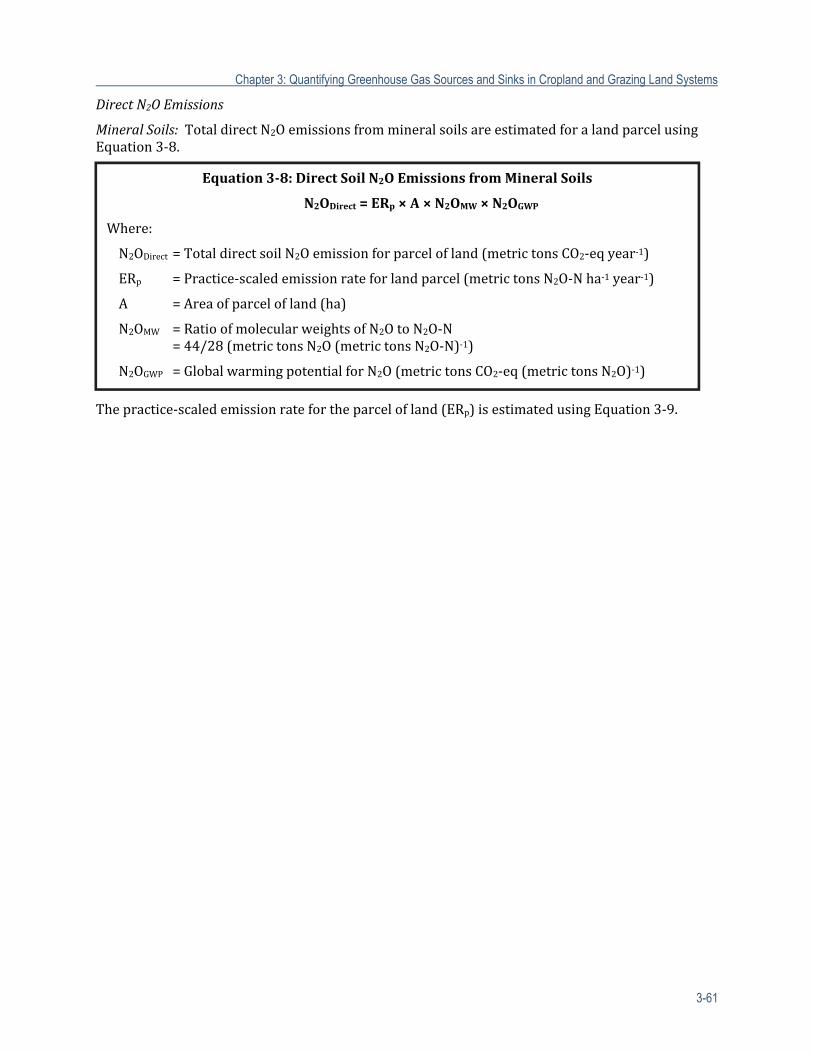
Chapter 3: Quantifying Greenhouse Gas Sources and Sinks in Cropland and Grazing Land Systems
3-61
DirectN2OEmissions
MineralSoils:TotaldirectN2OemissionsfrommineralsoilsareestimatedforalandparcelusingEquation3‐8.
Thepractice‐scaledemissionratefortheparcelofland(ERp)isestimatedusingEquation3‐9.
Equation3‐8:DirectSoilN2OEmissionsfromMineralSoils
N2ODirect=ERp×A×N2OMW×N2OGWP
Where:
N2ODirect=TotaldirectsoilN2Oemissionforparcelofland(metrictonsCO2‐eqyear‐1)
ERp =Practice‐scaledemissionrateforlandparcel(metrictonsN2O‐Nha‐1year‐1)
A =Areaofparcelofland(ha)
N2OMW =RatioofmolecularweightsofN2OtoN2O‐N =44/28(metrictonsN2O(metrictonsN2O‐N)‐1)
N2OGWP =GlobalwarmingpotentialforN2O(metrictonsCO2‐eq(metrictonsN2O)‐1)
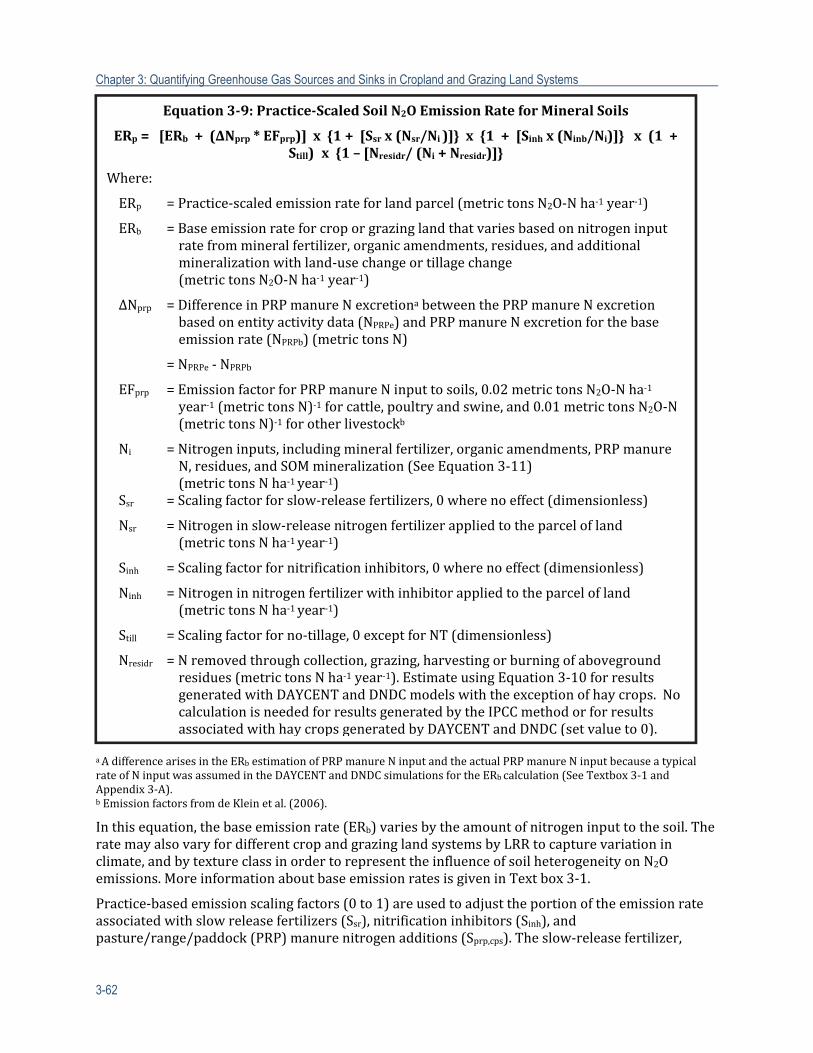
Chapter 3: Quantifying Greenhouse Gas Sources and Sinks in Cropland and Grazing Land Systems
3-62
aAdifferencearisesintheERbestimationofPRPmanureNinputandtheactualPRPmanureNinputbecauseatypicalrateofNinputwasassumedintheDAYCENTandDNDCsimulationsfortheERbcalculation(SeeTextbox3‐1andAppendix3‐A).bEmissionfactorsfromdeKleinetal.(2006).
Inthisequation,thebaseemissionrate(ERb)variesbytheamountofnitrogeninputtothesoil.TheratemayalsovaryfordifferentcropandgrazinglandsystemsbyLRRtocapturevariationinclimate,andbytextureclassinordertorepresenttheinfluenceofsoilheterogeneityonN2Oemissions.MoreinformationaboutbaseemissionratesisgiveninTextbox3‐1.
Practice‐basedemissionscalingfactors(0to1)areusedtoadjusttheportionoftheemissionrateassociatedwithslowreleasefertilizers(Ssr),nitrificationinhibitors(Sinh),andpasture/range/paddock(PRP)manurenitrogenadditions(Sprp,cps).Theslow‐releasefertilizer,
Equation3‐9:Practice‐Scaled SoilN2OEmissionRateforMineralSoils
ERp=[ERb+(ΔNprp*EFprp)]x{1+[Ssrx(Nsr/Ni)]}x{1+[Sinhx(Ninb/Ni)]}x(1+Still)x{1–[Nresidr/(Ni+Nresidr)]}
Where:
ERp =Practice‐scaledemissionrateforlandparcel(metrictonsN2O‐Nha‐1year‐1)
ERb =Baseemissionrateforcroporgrazinglandthatvariesbasedonnitrogeninputratefrommineralfertilizer,organicamendments,residues,andadditionalmineralizationwithland‐usechangeortillagechange
(metrictonsN2O‐Nha‐1year‐1)
ΔNprp =DifferenceinPRPmanureNexcretionabetweenthePRPmanureNexcretionbasedonentityactivitydata(NPRPe)andPRPmanureNexcretionforthebaseemissionrate(NPRPb)(metrictonsN)
=NPRPe‐NPRPb
EFprp =EmissionfactorforPRPmanureNinputtosoils,0.02metrictonsN2O‐Nha‐1year‐1(metrictonsN)‐1forcattle,poultryandswine,and0.01metrictonsN2O‐N(metrictonsN)‐1forotherlivestockb
Ni =Nitrogeninputs,includingmineralfertilizer,organicamendments,PRPmanureN,residues,andSOMmineralization(SeeEquation3‐11)
(metrictonsNha‐1year‐1)Ssr =Scalingfactorforslow‐releasefertilizers,0wherenoeffect(dimensionless)
Nsr =Nitrogeninslow‐releasenitrogenfertilizerappliedtotheparcelofland (metrictonsNha‐1year‐1)
Sinh =Scalingfactorfornitrificationinhibitors,0wherenoeffect(dimensionless)
Ninh =Nitrogeninnitrogenfertilizerwithinhibitorappliedtotheparcelofland (metrictonsNha‐1year‐1)
Still =Scalingfactorforno‐tillage,0exceptforNT(dimensionless)
Nresidr =Nremovedthroughcollection,grazing,harvestingorburningofabovegroundresidues(metrictonsNha‐1year‐1).EstimateusingEquation3‐10forresultsgeneratedwithDAYCENTandDNDCmodelswiththeexceptionofhaycrops.NocalculationisneededforresultsgeneratedbytheIPCCmethodorforresultsassociatedwithhaycropsgeneratedbyDAYCENTandDNDC(setvalueto0).
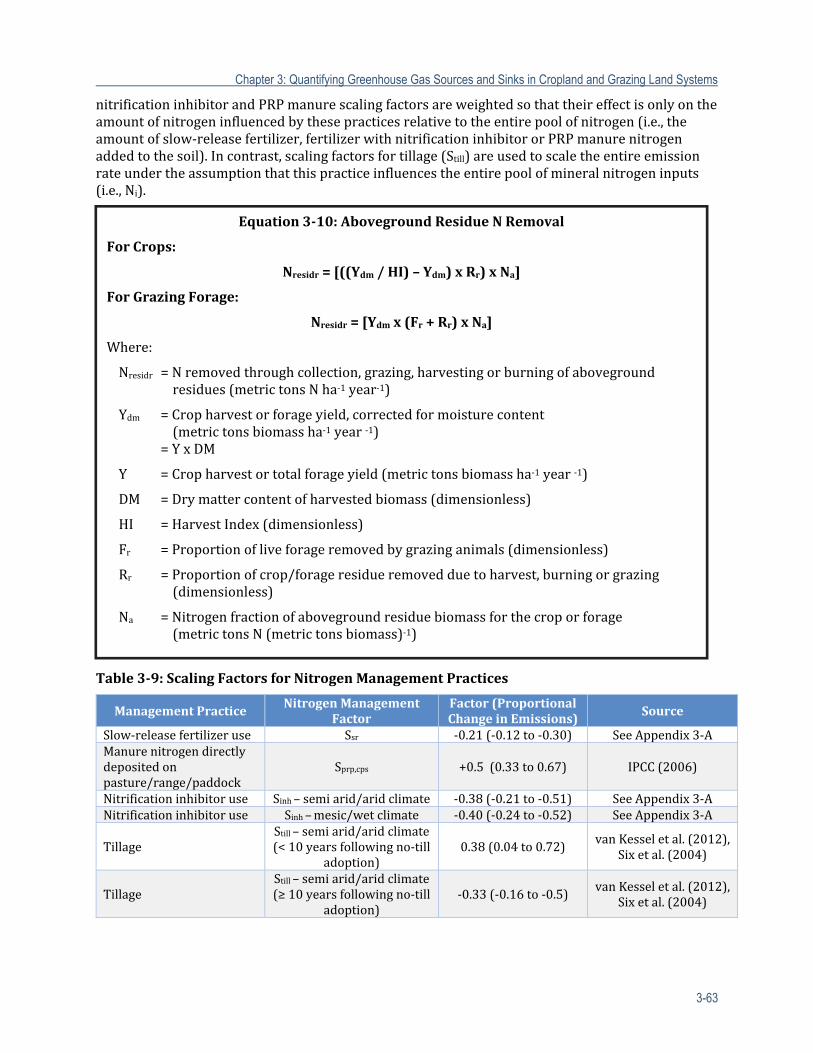
Chapter 3: Quantifying Greenhouse Gas Sources and Sinks in Cropland and Grazing Land Systems
3-63
nitrificationinhibitorandPRPmanurescalingfactorsareweightedsothattheireffectisonlyontheamountofnitrogeninfluencedbythesepracticesrelativetotheentirepoolofnitrogen(i.e.,theamountofslow‐releasefertilizer,fertilizerwithnitrificationinhibitororPRPmanurenitrogenaddedtothesoil).Incontrast,scalingfactorsfortillage(Still)areusedtoscaletheentireemissionrateundertheassumptionthatthispracticeinfluencestheentirepoolofmineralnitrogeninputs(i.e.,Ni).
Table3‐9:ScalingFactorsforNitrogenManagementPractices
ManagementPracticeNitrogen Management
FactorFactor(ProportionalChangeinEmissions) Source
Slow‐releasefertilizeruse Ssr ‐0.21(‐0.12to‐0.30) SeeAppendix3‐AManurenitrogendirectlydepositedonpasture/range/paddock
Sprp,cps +0.5(0.33to0.67) IPCC(2006)
Nitrificationinhibitoruse Sinh–semiarid/aridclimate ‐0.38(‐0.21to‐0.51) SeeAppendix3‐ANitrificationinhibitoruse Sinh–mesic/wetclimate ‐0.40(‐0.24to‐0.52) SeeAppendix3‐A
TillageStill–semiarid/aridclimate(<10yearsfollowingno‐till
adoption)0.38(0.04to0.72)
vanKesseletal.(2012),Sixetal.(2004)
TillageStill–semiarid/aridclimate(≥10yearsfollowingno‐till
adoption)‐0.33(‐0.16to‐0.5)
vanKesseletal.(2012),Sixetal.(2004)
Equation3‐10:AbovegroundResidueN Removal
ForCrops:
Nresidr=[((Ydm/HI)–Ydm)xRr)xNa]
ForGrazingForage:
Nresidr=[Ydmx(Fr+Rr)xNa]
Where:
Nresidr=Nremovedthroughcollection,grazing,harvestingorburningofabovegroundresidues(metrictonsNha‐1year‐1)
Ydm =Cropharvestorforageyield,correctedformoisturecontent (metrictonsbiomassha‐1year‐1) =YxDM
Y =Cropharvestortotalforageyield(metrictonsbiomassha‐1year‐1)
DM =Drymattercontentofharvestedbiomass(dimensionless)
HI =HarvestIndex(dimensionless)
Fr =Proportionofliveforageremovedbygrazinganimals(dimensionless)
Rr =Proportionofcrop/forageresidueremovedduetoharvest,burningorgrazing(dimensionless)
Na =Nitrogenfractionofabovegroundresiduebiomassforthecroporforage (metrictonsN(metrictonsbiomass)‐1)
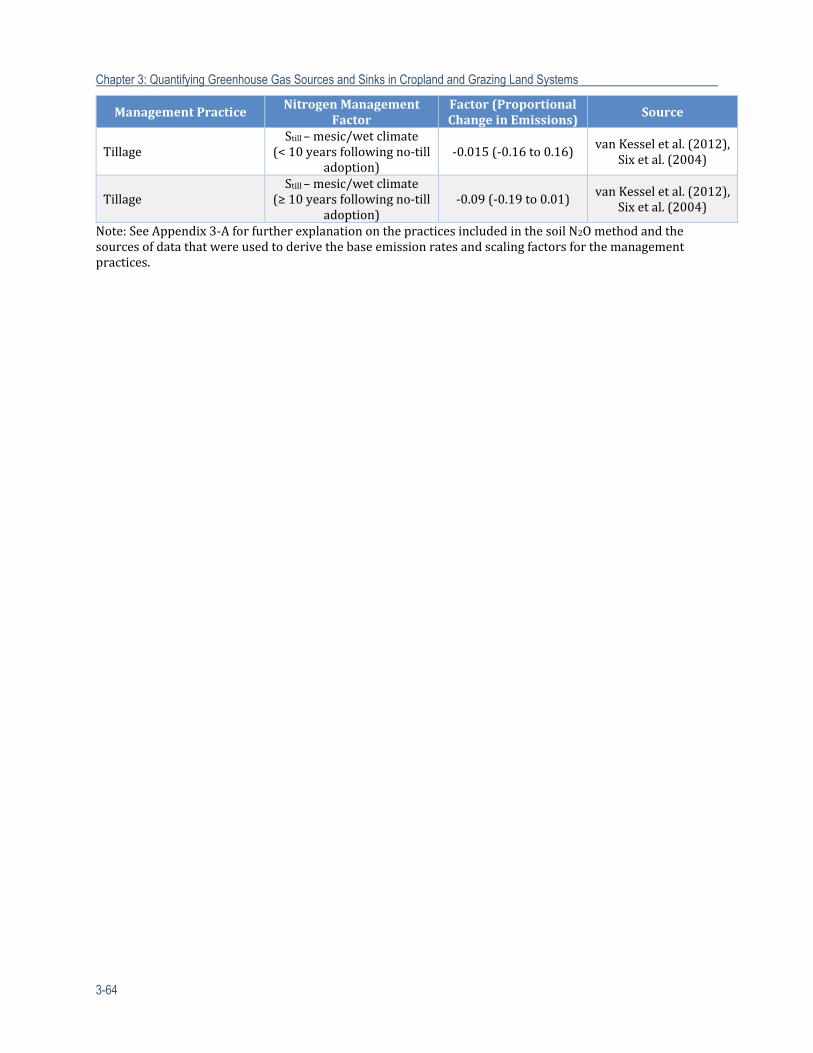
Chapter 3: Quantifying Greenhouse Gas Sources and Sinks in Cropland and Grazing Land Systems
3-64
ManagementPracticeNitrogen Management
FactorFactor(ProportionalChangeinEmissions)
Source
TillageStill–mesic/wetclimate
(<10yearsfollowingno‐tilladoption)
‐0.015(‐0.16to0.16)vanKesseletal.(2012),
Sixetal.(2004)
TillageStill–mesic/wetclimate
(≥10yearsfollowingno‐tilladoption)
‐0.09(‐0.19to0.01) vanKesseletal.(2012),Sixetal.(2004)
Note:SeeAppendix3‐AforfurtherexplanationonthepracticesincludedinthesoilN2Omethodandthesourcesofdatathatwereusedtoderivethebaseemissionratesandscalingfactorsforthemanagementpractices.
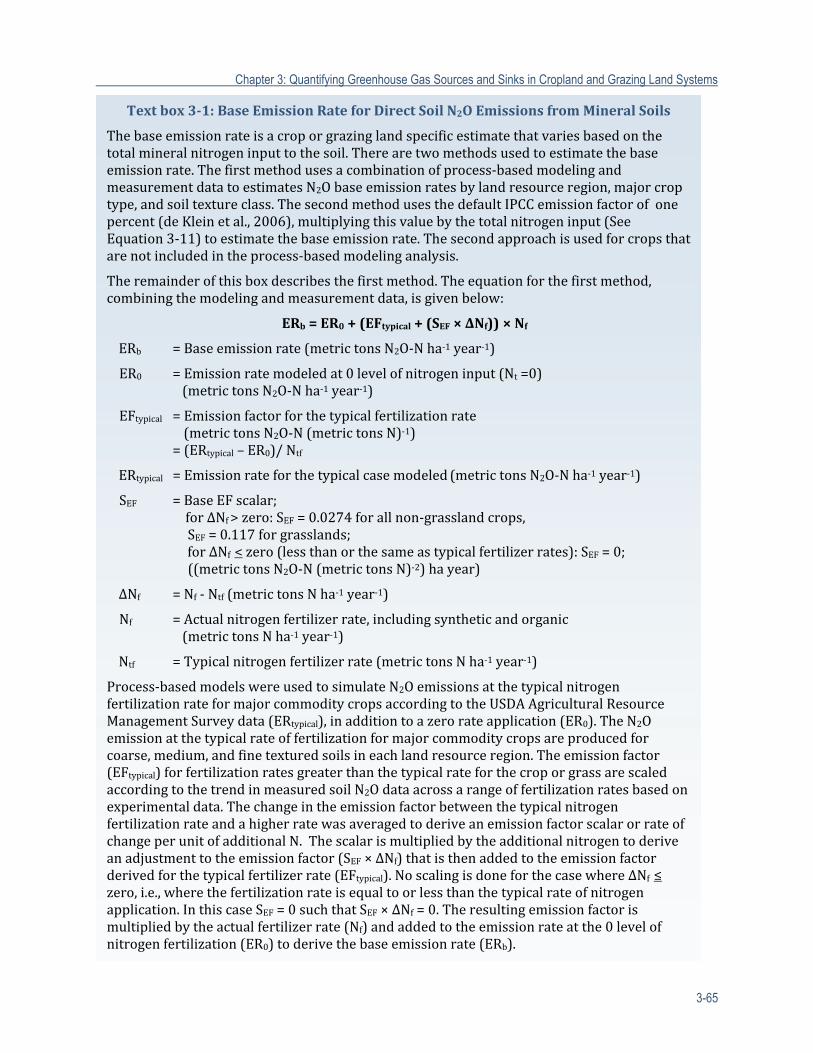
Chapter 3: Quantifying Greenhouse Gas Sources and Sinks in Cropland and Grazing Land Systems
3-65
Textbox3‐1:BaseEmissionRateforDirectSoilN2OEmissionsfromMineralSoils
Thebaseemissionrateisacroporgrazinglandspecificestimatethatvariesbasedonthetotalmineralnitrogeninputtothesoil.Therearetwomethodsusedtoestimatethebaseemissionrate.Thefirstmethodusesacombinationofprocess‐basedmodelingandmeasurementdatatoestimatesN2Obaseemissionratesbylandresourceregion,majorcroptype,andsoiltextureclass.ThesecondmethodusesthedefaultIPCCemissionfactorofonepercent(deKleinetal.,2006),multiplyingthisvaluebythetotalnitrogeninput(SeeEquation3‐11)toestimatethebaseemissionrate.Thesecondapproachisusedforcropsthatarenotincludedintheprocess‐basedmodelinganalysis.
Theremainderofthisboxdescribesthefirstmethod.Theequationforthefirstmethod,combiningthemodelingandmeasurementdata,isgivenbelow:
ERb=ER0+(EFtypical+(SEF×ΔNf))×Nf
ERb =Baseemissionrate(metrictonsN2O‐Nha‐1year‐1)
ER0 =Emissionratemodeledat0levelofnitrogeninput(Nt=0) (metrictonsN2O‐Nha‐1year‐1)
EFtypical =Emissionfactorforthetypicalfertilizationrate(metrictonsN2O‐N(metrictonsN)‐1) =(ERtypical–ER0)/Ntf
ERtypical=Emissionrateforthetypicalcasemodeled(metrictonsN2O‐Nha‐1year‐1)
SEF =BaseEFscalar; forΔNf>zero:SEF=0.0274forallnon‐grasslandcrops,
SEF=0.117forgrasslands; forΔNf<zero(lessthanorthesameastypicalfertilizerrates):SEF=0; ((metrictonsN2O‐N(metrictonsN)‐2)hayear)
ΔNf =Nf‐Ntf(metrictonsNha‐1year‐1)
Nf =Actualnitrogenfertilizerrate,includingsyntheticandorganic(metrictonsNha‐1year‐1)
Ntf =Typicalnitrogenfertilizerrate(metrictonsNha‐1year‐1)
Process‐basedmodelswereusedtosimulateN2OemissionsatthetypicalnitrogenfertilizationrateformajorcommoditycropsaccordingtotheUSDAAgriculturalResourceManagementSurveydata(ERtypical),inadditiontoazerorateapplication(ER0).TheN2Oemissionatthetypicalrateoffertilizationformajorcommoditycropsareproducedforcoarse,medium,andfinetexturedsoilsineachlandresourceregion.Theemissionfactor(EFtypical)forfertilizationratesgreaterthanthetypicalrateforthecroporgrassarescaledaccordingtothetrendinmeasuredsoilN2Odataacrossarangeoffertilizationratesbasedonexperimentaldata.ThechangeintheemissionfactorbetweenthetypicalnitrogenfertilizationrateandahigherratewasaveragedtoderiveanemissionfactorscalarorrateofchangeperunitofadditionalN.Thescalarismultipliedbytheadditionalnitrogentoderiveanadjustmenttotheemissionfactor(SEF×ΔNf)thatisthenaddedtotheemissionfactorderivedforthetypicalfertilizerrate(EFtypical).NoscalingisdoneforthecasewhereΔNf≤zero,i.e.,wherethefertilizationrateisequaltoorlessthanthetypicalrateofnitrogenapplication.InthiscaseSEF=0suchthatSEF×ΔNf=0.Theresultingemissionfactorismultipliedbytheactualfertilizerrate(Nf)andaddedtotheemissionrateatthe0levelofnitrogenfertilization(ER0)toderivethebaseemissionrate(ERb).
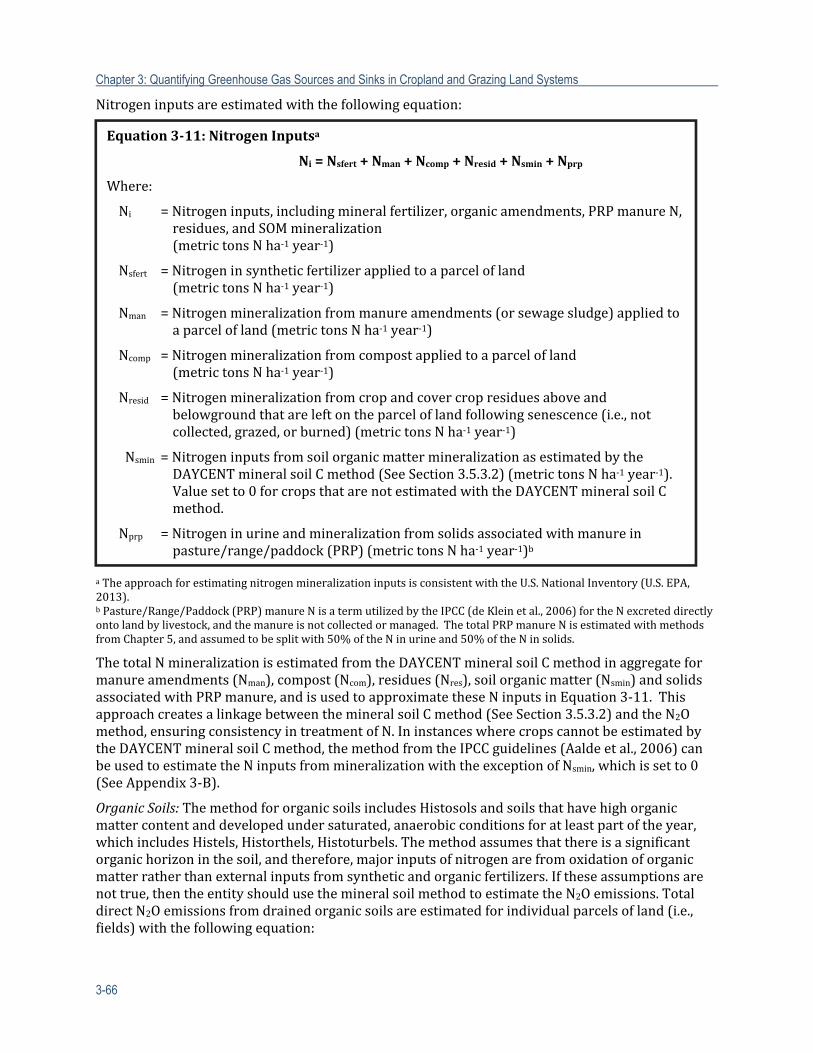
Chapter 3: Quantifying Greenhouse Gas Sources and Sinks in Cropland and Grazing Land Systems
3-66
Nitrogeninputsareestimatedwiththefollowingequation:
aTheapproachforestimatingnitrogenmineralizationinputsisconsistentwiththeU.S.NationalInventory(U.S.EPA,2013).bPasture/Range/Paddock(PRP)manureNisatermutilizedbytheIPCC(deKleinetal.,2006)fortheNexcreteddirectlyontolandbylivestock,andthemanureisnotcollectedormanaged.ThetotalPRPmanureNisestimatedwithmethodsfromChapter5,andassumedtobesplitwith50%oftheNinurineand50%oftheNinsolids.
ThetotalNmineralizationisestimatedfromtheDAYCENTmineralsoilCmethodinaggregateformanureamendments(Nman),compost(Ncom),residues(Nres),soilorganicmatter(Nsmin)andsolidsassociatedwithPRPmanure,andisusedtoapproximatetheseNinputsinEquation3‐11.ThisapproachcreatesalinkagebetweenthemineralsoilCmethod(SeeSection3.5.3.2)andtheN2Omethod,ensuringconsistencyintreatmentofN.IninstanceswherecropscannotbeestimatedbytheDAYCENTmineralsoilCmethod,themethodfromtheIPCCguidelines(Aaldeetal.,2006)canbeusedtoestimatetheNinputsfrommineralizationwiththeexceptionofNsmin,whichissetto0(SeeAppendix3‐B).
OrganicSoils:ThemethodfororganicsoilsincludesHistosolsandsoilsthathavehighorganicmattercontentanddevelopedundersaturated,anaerobicconditionsforatleastpartoftheyear,whichincludesHistels,Historthels,Histoturbels.Themethodassumesthatthereisasignificantorganichorizoninthesoil,andtherefore,majorinputsofnitrogenarefromoxidationoforganicmatterratherthanexternalinputsfromsyntheticandorganicfertilizers.Iftheseassumptionsarenottrue,thentheentityshouldusethemineralsoilmethodtoestimatetheN2Oemissions.TotaldirectN2Oemissionsfromdrainedorganicsoilsareestimatedforindividualparcelsofland(i.e.,fields)withthefollowingequation:
Equation3‐11:NitrogenInputsa
Ni=Nsfert+Nman+Ncomp+Nresid+Nsmin+Nprp
Where:
Ni =Nitrogeninputs,includingmineralfertilizer,organicamendments,PRPmanureN,residues,andSOMmineralization
(metrictonsNha‐1year‐1)
Nsfert =Nitrogeninsyntheticfertilizerappliedtoaparcelofland (metrictonsNha‐1year‐1)
Nman =Nitrogenmineralizationfrommanureamendments(orsewagesludge)appliedtoaparcelofland(metrictonsNha‐1year‐1)
Ncomp =Nitrogenmineralizationfromcompostappliedtoaparcelofland (metrictonsNha‐1year‐1)
Nresid =Nitrogenmineralizationfromcropandcovercropresiduesaboveandbelowgroundthatareleftontheparceloflandfollowingsenescence(i.e.,notcollected,grazed,orburned)(metrictonsNha‐1year‐1)
Nsmin=NitrogeninputsfromsoilorganicmattermineralizationasestimatedbytheDAYCENTmineralsoilCmethod(SeeSection3.5.3.2)(metrictonsNha‐1year‐1).Valuesetto0forcropsthatarenotestimatedwiththeDAYCENTmineralsoilCmethod.
Nprp =Nitrogeninurineandmineralizationfromsolidsassociatedwithmanureinpasture/range/paddock(PRP)(metrictonsNha‐1year‐1)b
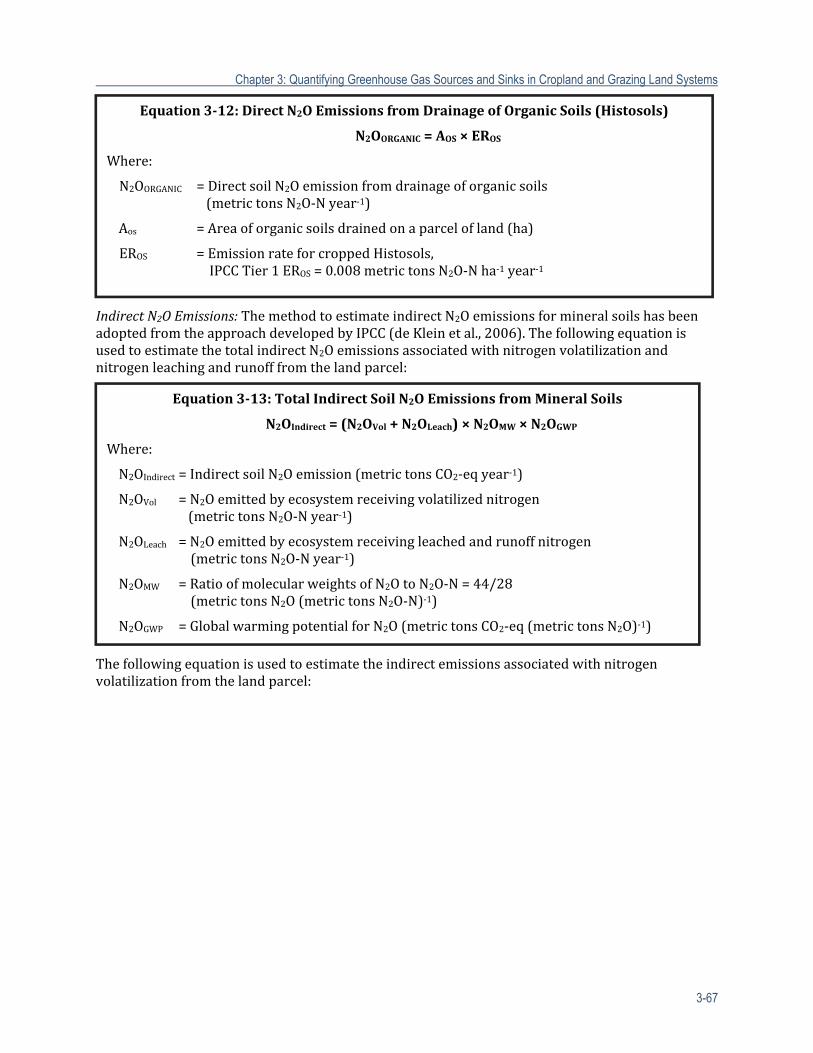
Chapter 3: Quantifying Greenhouse Gas Sources and Sinks in Cropland and Grazing Land Systems
3-67
IndirectN2OEmissions:ThemethodtoestimateindirectN2OemissionsformineralsoilshasbeenadoptedfromtheapproachdevelopedbyIPCC(deKleinetal.,2006).ThefollowingequationisusedtoestimatethetotalindirectN2Oemissionsassociatedwithnitrogenvolatilizationandnitrogenleachingandrunofffromthelandparcel:
Thefollowingequationisusedtoestimatetheindirectemissionsassociatedwithnitrogenvolatilizationfromthelandparcel:
Equation3‐12:DirectN2OEmissionsfromDrainageofOrganicSoils(Histosols)
N2OORGANIC=AOS×EROS
Where:
N2OORGANIC =DirectsoilN2Oemissionfromdrainageoforganicsoils (metrictonsN2O‐Nyear‐1)
Aos =Areaoforganicsoilsdrainedonaparcelofland(ha)
EROS =EmissionrateforcroppedHistosols, IPCCTier1EROS=0.008metrictonsN2O‐Nha‐1year‐1
Equation3‐13:TotalIndirectSoilN2OEmissionsfromMineralSoils
N2OIndirect=(N2OVol+N2OLeach)×N2OMW×N2OGWP
Where:
N2OIndirect=IndirectsoilN2Oemission(metrictonsCO2‐eqyear‐1)
N2OVol =N2Oemittedbyecosystemreceivingvolatilizednitrogen (metrictonsN2O‐Nyear‐1)
N2OLeach =N2Oemittedbyecosystemreceivingleachedandrunoffnitrogen (metrictonsN2O‐Nyear‐1)
N2OMW =RatioofmolecularweightsofN2OtoN2O‐N=44/28 (metrictonsN2O(metrictonsN2O‐N)‐1)
N2OGWP =GlobalwarmingpotentialforN2O(metrictonsCO2‐eq(metrictonsN2O)‐1)
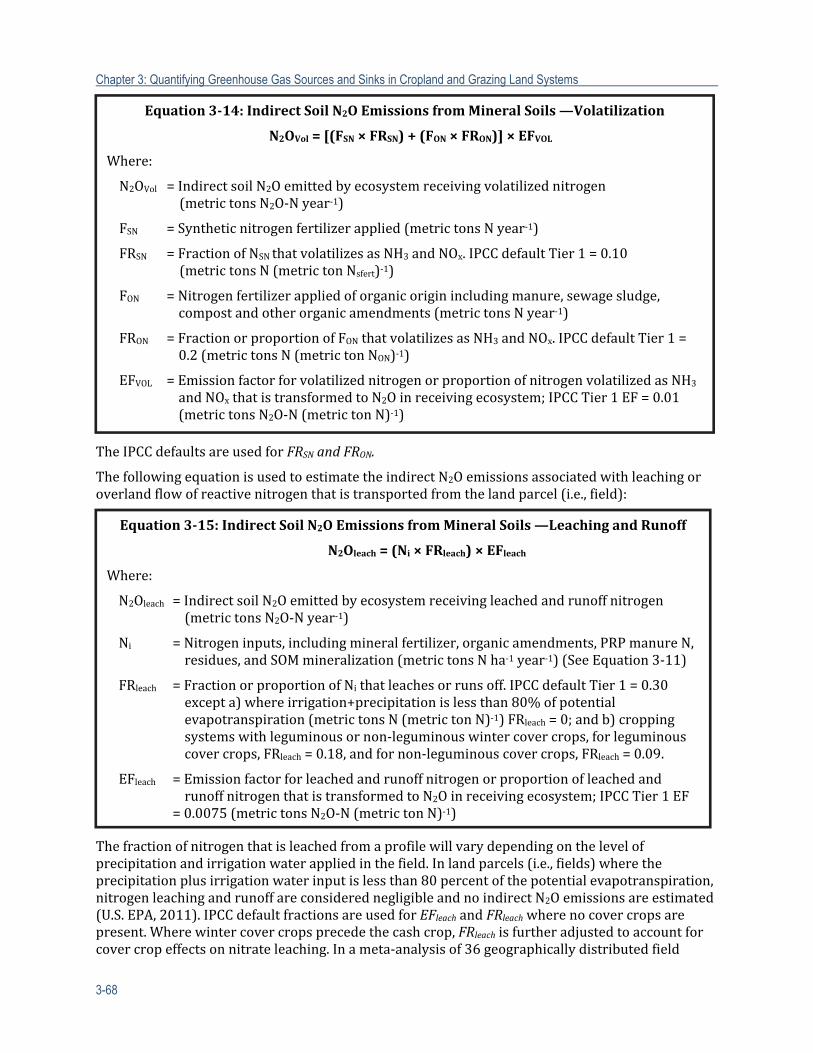
Chapter 3: Quantifying Greenhouse Gas Sources and Sinks in Cropland and Grazing Land Systems
3-68
TheIPCCdefaultsareusedforFRSNandFRON.
ThefollowingequationisusedtoestimatetheindirectN2Oemissionsassociatedwithleachingoroverlandflowofreactivenitrogenthatistransportedfromthelandparcel(i.e.,field):
Thefractionofnitrogenthatisleachedfromaprofilewillvarydependingonthelevelofprecipitationandirrigationwaterappliedinthefield.Inlandparcels(i.e.,fields)wheretheprecipitationplusirrigationwaterinputislessthan80percentofthepotentialevapotranspiration,nitrogenleachingandrunoffareconsiderednegligibleandnoindirectN2Oemissionsareestimated(U.S.EPA,2011).IPCCdefaultfractionsareusedforEFleachandFRleachwherenocovercropsarepresent.Wherewintercovercropsprecedethecashcrop,FRleachisfurtheradjustedtoaccountforcovercropeffectsonnitrateleaching.Inameta‐analysisof36geographicallydistributedfield
Equation3‐14:IndirectSoilN2OEmissionsfromMineralSoils—Volatilization
N2OVol=[(FSN×FRSN)+(FON×FRON)]×EFVOL
Where:
N2OVol =IndirectsoilN2Oemittedbyecosystemreceivingvolatilizednitrogen (metrictonsN2O‐Nyear‐1)
FSN =Syntheticnitrogenfertilizerapplied(metrictonsNyear‐1)
FRSN =FractionofNSNthatvolatilizesasNH3andNOx.IPCCdefaultTier1=0.10 (metrictonsN(metrictonNsfert)‐1)
FON =Nitrogenfertilizerappliedoforganicoriginincludingmanure,sewagesludge,compostandotherorganicamendments(metrictonsNyear‐1)
FRON =FractionorproportionofFONthatvolatilizesasNH3andNOx.IPCCdefaultTier1=0.2(metrictonsN(metrictonNON)‐1)
EFVOL =EmissionfactorforvolatilizednitrogenorproportionofnitrogenvolatilizedasNH3andNOxthatistransformedtoN2Oinreceivingecosystem;IPCCTier1EF=0.01(metrictonsN2O‐N(metrictonN)‐1)
Equation3‐15:IndirectSoilN2OEmissionsfromMineralSoils—LeachingandRunoff
N2Oleach=(Ni×FRleach)×EFleach
Where:
N2Oleach =IndirectsoilN2Oemittedbyecosystemreceivingleachedandrunoffnitrogen(metrictonsN2O‐Nyear‐1)
Ni =Nitrogeninputs,includingmineralfertilizer,organicamendments,PRPmanureN,residues,andSOMmineralization(metrictonsNha‐1year‐1)(SeeEquation3‐11)
FRleach =FractionorproportionofNithatleachesorrunsoff.IPCCdefaultTier1=0.30excepta)whereirrigation+precipitationislessthan80%ofpotentialevapotranspiration(metrictonsN(metrictonN)‐1)FRleach=0;andb)croppingsystemswithleguminousornon‐leguminouswintercovercrops,forleguminouscovercrops,FRleach=0.18,andfornon‐leguminouscovercrops,FRleach=0.09.
EFleach =EmissionfactorforleachedandrunoffnitrogenorproportionofleachedandrunoffnitrogenthatistransformedtoN2Oinreceivingecosystem;IPCCTier1EF
=0.0075(metrictonsN2O‐N(metrictonN)‐1)
Chapter 3: Quantifying Greenhouse Gas Sources and Sinks in Cropland and Grazing Land Systems
3-69
studies,Tonittoetal.(2006)founda40percentand70percentreductioninnitrateleachingwiththeuseoflegumeandnon‐legumecovercrops,respectively.Accordingly,FRleach,isreducedto0.18forlegumecovercrops(0.3×(1‐0.4);or18%oftotalnitrogeninputs)and0.09fornon‐legumecovercrops(0.3×(1‐0.7);orninepercentoftotalnitrogeninputs).
3.5.4.3 ActivityData
Calculatingemissionsrequiresthefollowingactivitydataforcroplands:
Areaoflandparcel(i.e.,field); Prior‐yearcroptype,drymatteryields,andresidue‐yieldratiostocalculatecropresidue
nitrogeninput,includingcovercrop(ifpresent); Residuemanagement,includingamountharvested,burned,grazed,orleftinthefield; Syntheticfertilizertype(chemicalformulation)andcoatings(ifpresent); Syntheticandorganicfertilizerapplicationrate,applicationmethod(broadcast,banded,or
injected,includingdepthofinjection),timingofapplication(s); Typeofnitrificationinhibitorapplications(ifused); Tillageimplements,datesofoperation,andnumberofpassesineachoperation(whichcan
beusedtodeterminetillageintensitywiththeSTIRModel),(USDANRCS,2008); Irrigationmethod,applicationrateandtimingofapplications; Totaldrymatteryieldofcrop(metrictonsdrymatteryear‐1),drymattercontentofyield,
andharvestindex;and Covercroptypes,planting,andharvestingdates(ifapplicable).
Themethodforgrazinglandrequiresthefollowingmanagementactivitydata:
Areaoflandparcel(i.e.,field); Prior‐yeargrasstypeanddrymatterproductiontocalculategrassnitrogeninput; Syntheticfertilizertype(chemicalformulation)andcoatings(ifpresent); Organicamendmenttypesandtiming; Syntheticandorganicamendmentapplicationrate,applicationmethod(broadcast,banded,
orinjected,includingdepthofinjection),timingofapplication(s); Pasture/range/paddock(PRP)Nexcreteddirectlyontolandbylivestock(i.e.,manurethat
isnotmanaged); Typeofnitrificationinhibitorapplications(ifused); Tillageimplements,datesofoperation,andnumberofpassesineachoperationwhichcan
beusedtodeterminetillageintensitywiththeSTIRModel,(USDANRCS,2008); Irrigationmethod,applicationrate,andtimingofapplications; Periodsofgrazingduringtheyear; Animaltype,class,andsizeusedforgrazing; Stockingratesandmethods;and Totalyieldofmeat(kgcarcassyieldyear‐1)ormilk(kgfluidmilkyear‐1).
Cropyieldsareprovidedbytheentityforthecropsystem,orpeakforageamountsforgrazingsystems.Insomeyears,theentitymaynotharvestthecropduetodrought,pestoutbreaks,orotherreasonsforcropfailure.Inthosecases,theentityshouldprovidetheaverageyieldthattheyhaveharvestedinthepastfiveyears,andanapproximatepercentageofcropgrowththatoccurredpriortocropfailure.Theyieldisestimatedbasedonmultiplyingtheaveragecropyieldbythepercentageofcropgrowthobtainedpriortofailure.
Tocalculatetheamountofsyntheticfertilizernitrogenappliedtosoils,thetypeoffertilizerappliedanditsnitrogencontentarerequired.Table3‐10providesnitrogencontentinformationforcommontypesofsyntheticfertilizers.
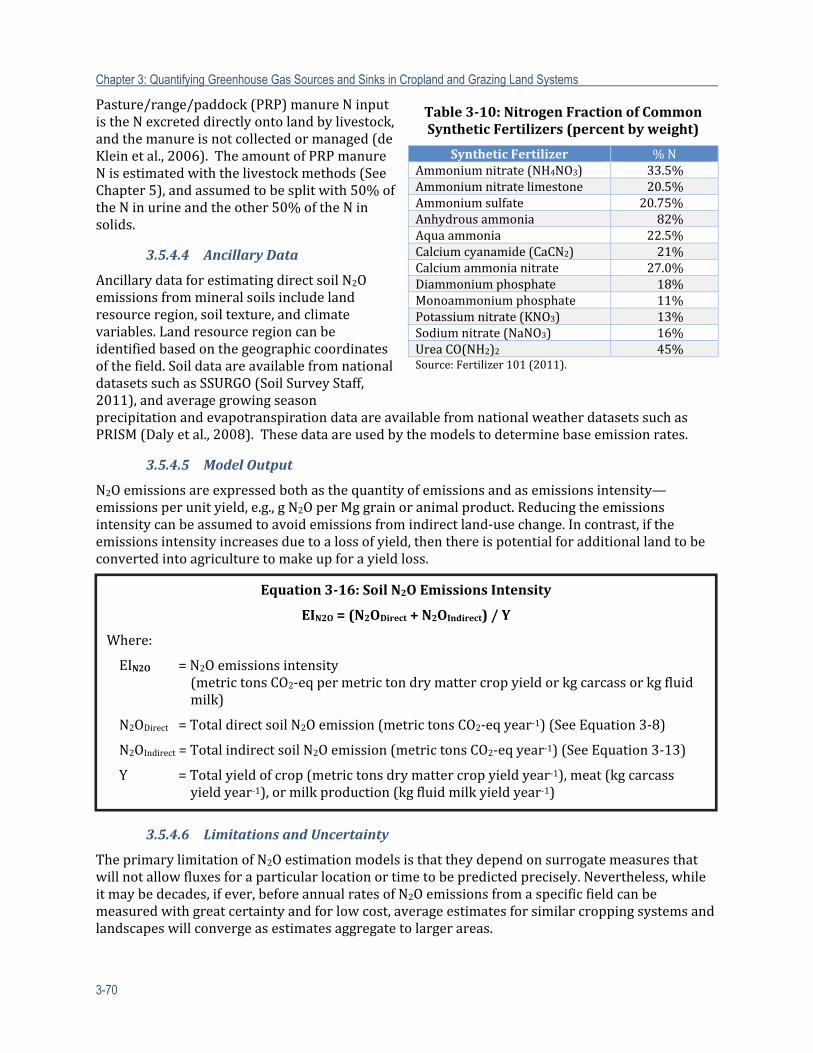
Chapter 3: Quantifying Greenhouse Gas Sources and Sinks in Cropland and Grazing Land Systems
3-70
Pasture/range/paddock(PRP)manureNinputistheNexcreteddirectlyontolandbylivestock,andthemanureisnotcollectedormanaged(deKleinetal.,2006).TheamountofPRPmanureNisestimatedwiththelivestockmethods(SeeChapter5),andassumedtobesplitwith50%oftheNinurineandtheother50%oftheNinsolids.
3.5.4.4 AncillaryData
AncillarydataforestimatingdirectsoilN2Oemissionsfrommineralsoilsincludelandresourceregion,soiltexture,andclimatevariables.Landresourceregioncanbeidentifiedbasedonthegeographiccoordinatesofthefield.SoildataareavailablefromnationaldatasetssuchasSSURGO(SoilSurveyStaff,2011),andaveragegrowingseasonprecipitationandevapotranspirationdataareavailablefromnationalweatherdatasetssuchasPRISM(Dalyetal.,2008).Thesedataareusedbythemodelstodeterminebaseemissionrates.
3.5.4.5 ModelOutput
N2Oemissionsareexpressedbothasthequantityofemissionsandasemissionsintensity—emissionsperunityield,e.g.,gN2OperMggrainoranimalproduct.Reducingtheemissionsintensitycanbeassumedtoavoidemissionsfromindirectland‐usechange.Incontrast,iftheemissionsintensityincreasesduetoalossofyield,thenthereispotentialforadditionallandtobeconvertedintoagriculturetomakeupforayieldloss.
3.5.4.6 LimitationsandUncertainty
TheprimarylimitationofN2Oestimationmodelsisthattheydependonsurrogatemeasuresthatwillnotallowfluxesforaparticularlocationortimetobepredictedprecisely.Nevertheless,whileitmaybedecades,ifever,beforeannualratesofN2Oemissionsfromaspecificfieldcanbemeasuredwithgreatcertaintyandforlowcost,averageestimatesforsimilarcroppingsystemsandlandscapeswillconvergeasestimatesaggregatetolargerareas.
Table3‐10:NitrogenFractionofCommonSyntheticFertilizers(percentbyweight)
SyntheticFertilizer %NAmmoniumnitrate(NH4NO3) 33.5%Ammoniumnitratelimestone 20.5%Ammoniumsulfate 20.75%Anhydrousammonia 82%Aquaammonia 22.5%Calciumcyanamide(CaCN2) 21%Calciumammonianitrate 27.0%Diammoniumphosphate 18%Monoammoniumphosphate 11%Potassiumnitrate(KNO3) 13%Sodiumnitrate(NaNO3) 16%UreaCO(NH2)2 45%Source:Fertilizer101(2011).
Equation3‐16:SoilN2OEmissionsIntensity
EIN2O=(N2ODirect+N2OIndirect)/Y
Where:
EIN2O =N2Oemissionsintensity (metrictonsCO2‐eqpermetrictondrymattercropyieldorkgcarcassorkgfluid
milk)
N2ODirect =TotaldirectsoilN2Oemission(metrictonsCO2‐eqyear‐1)(SeeEquation3‐8)
N2OIndirect=TotalindirectsoilN2Oemission(metrictonsCO2‐eqyear‐1)(SeeEquation3‐13)
Y =Totalyieldofcrop(metrictonsdrymattercropyieldyear‐1),meat(kgcarcassyieldyear‐1),ormilkproduction(kgfluidmilkyieldyear‐1)
Chapter 3: Quantifying Greenhouse Gas Sources and Sinks in Cropland and Grazing Land Systems
3-71
Limitationsinthemethodalsooccurdueto:
Lackofknowledgeofhowdifferentpracticesaffectfluxesinsomeregionsandcroppingsystems.
LackofknowledgeabouthowsomeofthemanagementpracticesinteractwitheachotherandwithsoilandclimatefactorstoaffectthefundamentalprocessesdrivingN2Oemissions—e.g.,nitrification,denitrification,gasdiffusion,etc.—andincorporationoftheseeffectsintoprocessmodels.
Limitednumberofdatasetscurrentlyavailabletotesttheefficacyofpracticestomitigatefluxesandtoevaluateprocess‐basedmodels.
Limitednumberofdatasetswithmorethantwofertilizerratestoestimatethescalarsforemissionfactorsassociatedwiththebaseemissionrates,particularlythepossibilityfornon‐linearscalars.
ThemineralsoilsmethodassumesaonepercentemissionfactorforindirectN2Oemissionsfromvolatilizednitrogenand0.75percentemissionfactorforleachedNO3‐.However,thereisevidencethattheEFforNO3‐leachingvariesfrom0.75%,dependingonthetypeofwaterway(Beaulieuetal.,2011)anditisalsolikelythatthesoilN2Oemissionsfromatmosphericdepositionofnitrogenwillvarydependingonthenitrogenstatusofthereceivingecosystem.
Thefractionofnitrogenthatisvolatilized(assumedtobe10percentforinorganicnitrogensourcesand20percentfororganicnitrogensourcesinEquation3‐15)isveryuncertain.Likewise,thefractionofnitrogenthatisleachedfromaprofileorrunsoffishighlyuncertain(assumedtobe30percentofallnitrogensourcesexceptwhereprecipitationplusirrigationislessthan80percentofpotentialevapotranspiration;U.S.EnvironmentalProtectionAgency,2011).Experimentssuggestthatgrossgeneralizationsarenotvalidandthatmanypracticescanreducebothvolatilizednitrogenandthenitrogenthatislostbyleachingandrunoff.9
ClimatechangewillaffectmodeloutputinsofarasbaselineN2Oestimatesaresimulatedforanygivenlocationusingtemperatureandprecipitationdistributionsforthepast30years.Expectedchangesintemperature,precipitation,andextremeeventssuchasdroughts,floods,andheatwaveswilladdfurtheruncertaintytoestimatesofallN2Oemissionsandpotentiallyinteractwithscalingfactors.Cropnitrogenmanagementmayfurtherchangewithclimatechange(Robertson,2013).
UncertaintiesinmodelparametersarecombinedusingaMonteCarlosimulationapproach.UncertaintyisassumedtobeminorforthemanagementactivitydataprovidedbytheentityTable3‐11providestheprobabilitydistributionfunctionstoestimateuncertaintyinthedirectandindirectsoilN2Oemissions.DataarenotshownforDNDCandDAYCENToutputthataredelineatedbyLRR,soiltype,andclimate.
9TheIPCCfactorsassumethatthemaximumabovegroundnitrogenrecoverybycropsis50to60percent.However,ratesofnitrogenrecoverycanbesignificantlyhigherwithbestpractices.
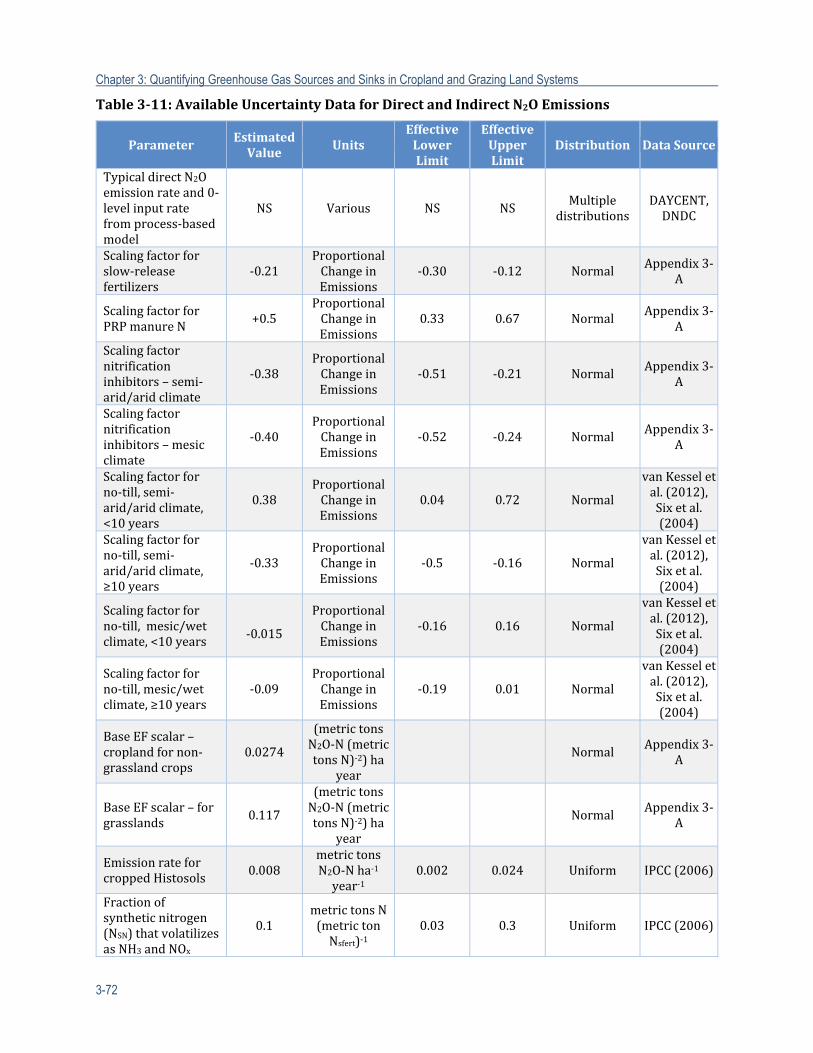
Chapter 3: Quantifying Greenhouse Gas Sources and Sinks in Cropland and Grazing Land Systems
3-72
Table3‐11:AvailableUncertaintyDataforDirectandIndirectN2OEmissions
ParameterEstimatedValue Units
EffectiveLowerLimit
EffectiveUpperLimit
Distribution DataSource
TypicaldirectN2Oemissionrateand0‐levelinputratefromprocess‐basedmodel
NS Various NS NSMultiple
distributionsDAYCENT,DNDC
Scalingfactorforslow‐releasefertilizers
‐0.21ProportionalChangeinEmissions
‐0.30 ‐0.12 Normal Appendix3‐A
ScalingfactorforPRPmanureN
+0.5ProportionalChangeinEmissions
0.33 0.67 NormalAppendix3‐
A
Scalingfactornitrificationinhibitors–semi‐arid/aridclimate
‐0.38ProportionalChangeinEmissions
‐0.51 ‐0.21 Normal Appendix3‐A
Scalingfactornitrificationinhibitors–mesicclimate
‐0.40ProportionalChangeinEmissions
‐0.52 ‐0.24 NormalAppendix3‐
A
Scalingfactorforno‐till,semi‐arid/aridclimate,<10years
0.38ProportionalChangeinEmissions
0.04 0.72 Normal
vanKesseletal.(2012),Sixetal.(2004)
Scalingfactorforno‐till,semi‐arid/aridclimate,≥10years
‐0.33ProportionalChangeinEmissions
‐0.5 ‐0.16 Normal
vanKesseletal.(2012),Sixetal.(2004)
Scalingfactorforno‐till,mesic/wetclimate,<10years
‐0.015
ProportionalChangeinEmissions
‐0.16 0.16 Normal
vanKesseletal.(2012),Sixetal.(2004)
Scalingfactorforno‐till,mesic/wetclimate,≥10years
‐0.09ProportionalChangeinEmissions
‐0.19 0.01 Normal
vanKesseletal.(2012),Sixetal.(2004)
BaseEFscalar–croplandfornon‐grasslandcrops
0.0274
(metrictonsN2O‐N(metrictonsN)‐2)ha
year
NormalAppendix3‐
A
BaseEFscalar–forgrasslands 0.117
(metrictonsN2O‐N(metrictonsN)‐2)ha
year
NormalAppendix3‐
A
EmissionrateforcroppedHistosols 0.008
metrictonsN2O‐Nha‐1year‐1
0.002 0.024 Uniform IPCC(2006)
Fractionofsyntheticnitrogen(NSN)thatvolatilizesasNH3andNOx
0.1metrictonsN(metrictonNsfert)‐1
0.03 0.3 Uniform IPCC(2006)
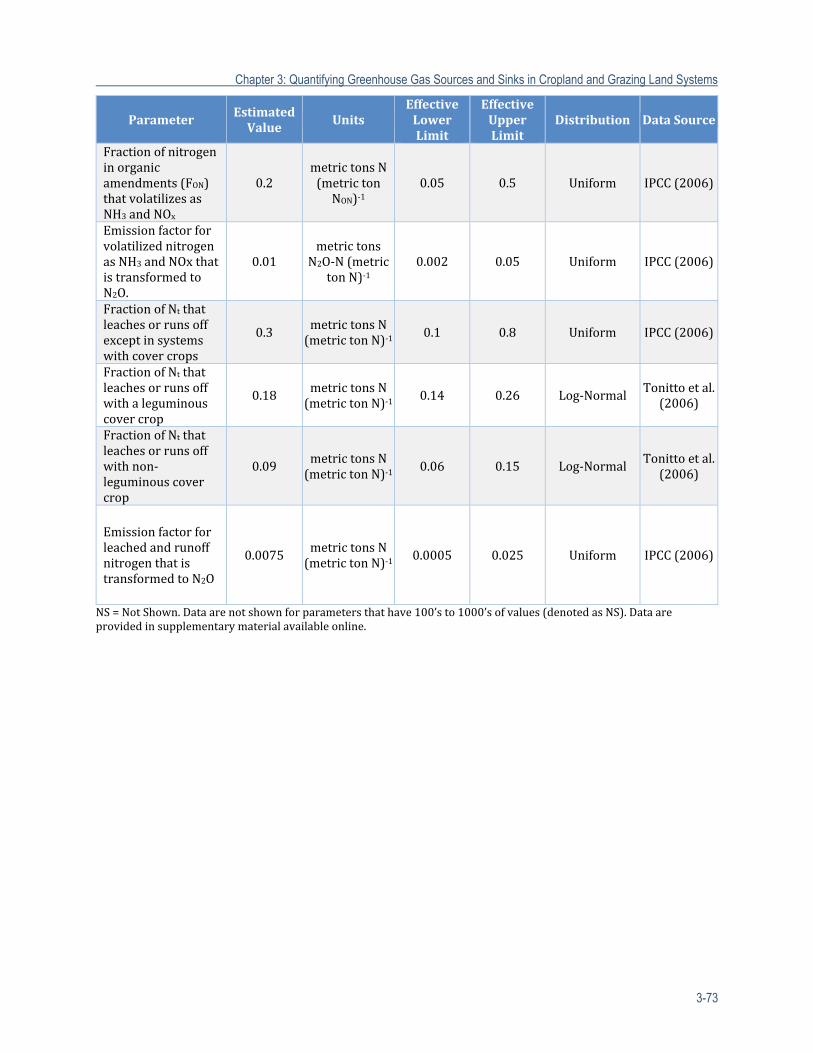
Chapter 3: Quantifying Greenhouse Gas Sources and Sinks in Cropland and Grazing Land Systems
3-73
ParameterEstimatedValue Units
EffectiveLowerLimit
EffectiveUpperLimit
Distribution DataSource
Fractionofnitrogeninorganicamendments(FON)thatvolatilizesasNH3andNOx
0.2metrictonsN(metrictonNON)‐1
0.05 0.5 Uniform IPCC(2006)
EmissionfactorforvolatilizednitrogenasNH3andNOxthatistransformedtoN2O.
0.01metrictonsN2O‐N(metric
tonN)‐10.002 0.05 Uniform IPCC(2006)
FractionofNtthatleachesorrunsoffexceptinsystemswithcovercrops
0.3metrictonsN(metrictonN)‐1 0.1 0.8 Uniform IPCC(2006)
FractionofNtthatleachesorrunsoffwithaleguminouscovercrop
0.18 metrictonsN(metrictonN)‐1
0.14 0.26 Log‐Normal Tonittoetal.(2006)
FractionofNtthatleachesorrunsoffwithnon‐leguminouscovercrop
0.09metrictonsN(metrictonN)‐1
0.06 0.15 Log‐NormalTonittoetal.(2006)
EmissionfactorforleachedandrunoffnitrogenthatistransformedtoN2O
0.0075metrictonsN(metrictonN)‐1 0.0005 0.025 Uniform IPCC(2006)
NS=NotShown.Dataarenotshownforparametersthathave100’sto1000’sofvalues(denotedasNS).Dataareprovidedinsupplementarymaterialavailableonline.
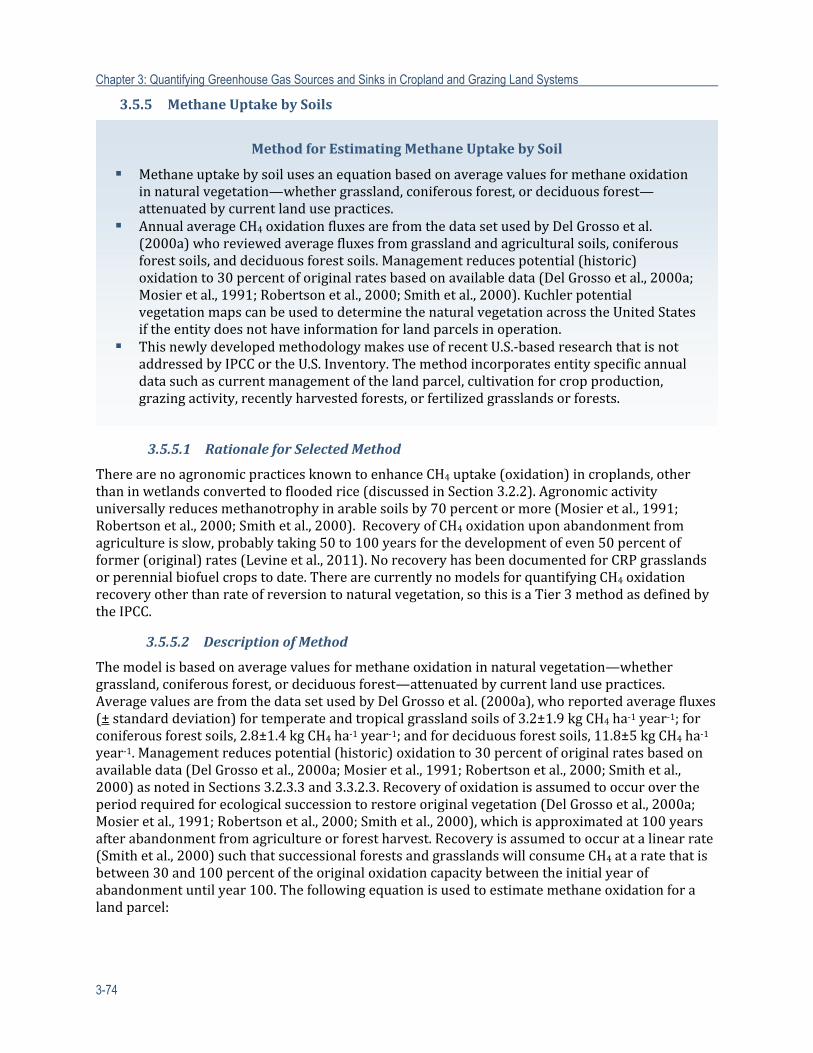
Chapter 3: Quantifying Greenhouse Gas Sources and Sinks in Cropland and Grazing Land Systems
3-74
3.5.5 MethaneUptakebySoils
3.5.5.1 RationaleforSelectedMethod
TherearenoagronomicpracticesknowntoenhanceCH4uptake(oxidation)incroplands,otherthaninwetlandsconvertedtofloodedrice(discussedinSection3.2.2).Agronomicactivityuniversallyreducesmethanotrophyinarablesoilsby70percentormore(Mosieretal.,1991;Robertsonetal.,2000;Smithetal.,2000).RecoveryofCH4oxidationuponabandonmentfromagricultureisslow,probablytaking50to100yearsforthedevelopmentofeven50percentofformer(original)rates(Levineetal.,2011).NorecoveryhasbeendocumentedforCRPgrasslandsorperennialbiofuelcropstodate.TherearecurrentlynomodelsforquantifyingCH4oxidationrecoveryotherthanrateofreversiontonaturalvegetation,sothisisaTier3methodasdefinedbytheIPCC.
3.5.5.2 DescriptionofMethod
Themodelisbasedonaveragevaluesformethaneoxidationinnaturalvegetation—whethergrassland,coniferousforest,ordeciduousforest—attenuatedbycurrentlandusepractices.AveragevaluesarefromthedatasetusedbyDelGrossoetal.(2000a),whoreportedaveragefluxes(±standarddeviation)fortemperateandtropicalgrasslandsoilsof3.2±1.9kgCH4ha‐1year‐1;forconiferousforestsoils,2.8±1.4kgCH4ha‐1year‐1;andfordeciduousforestsoils,11.8±5kgCH4ha‐1year‐1.Managementreducespotential(historic)oxidationto30percentoforiginalratesbasedonavailabledata(DelGrossoetal.,2000a;Mosieretal.,1991;Robertsonetal.,2000;Smithetal.,2000)asnotedinSections3.2.3.3and3.3.2.3.Recoveryofoxidationisassumedtooccurovertheperiodrequiredforecologicalsuccessiontorestoreoriginalvegetation(DelGrossoetal.,2000a;Mosieretal.,1991;Robertsonetal.,2000;Smithetal.,2000),whichisapproximatedat100yearsafterabandonmentfromagricultureorforestharvest.Recoveryisassumedtooccuratalinearrate(Smithetal.,2000)suchthatsuccessionalforestsandgrasslandswillconsumeCH4ataratethatisbetween30and100percentoftheoriginaloxidationcapacitybetweentheinitialyearofabandonmentuntilyear100.Thefollowingequationisusedtoestimatemethaneoxidationforalandparcel:
MethodforEstimatingMethaneUptakebySoil
Methaneuptakebysoilusesanequationbasedonaveragevaluesformethaneoxidationinnaturalvegetation—whethergrassland,coniferousforest,ordeciduousforest—attenuatedbycurrentlandusepractices.
AnnualaverageCH4oxidationfluxesarefromthedatasetusedbyDelGrossoetal.(2000a)whoreviewedaveragefluxesfromgrasslandandagriculturalsoils,coniferousforestsoils,anddeciduousforestsoils.Managementreducespotential(historic)oxidationto30percentoforiginalratesbasedonavailabledata(DelGrossoetal.,2000a;Mosieretal.,1991;Robertsonetal.,2000;Smithetal.,2000).KuchlerpotentialvegetationmapscanbeusedtodeterminethenaturalvegetationacrosstheUnitedStatesiftheentitydoesnothaveinformationforlandparcelsinoperation.
ThisnewlydevelopedmethodologymakesuseofrecentU.S.‐basedresearchthatisnotaddressedbyIPCCortheU.S.Inventory.Themethodincorporatesentityspecificannualdatasuchascurrentmanagementofthelandparcel,cultivationforcropproduction,grazingactivity,recentlyharvestedforests,orfertilizedgrasslandsorforests.
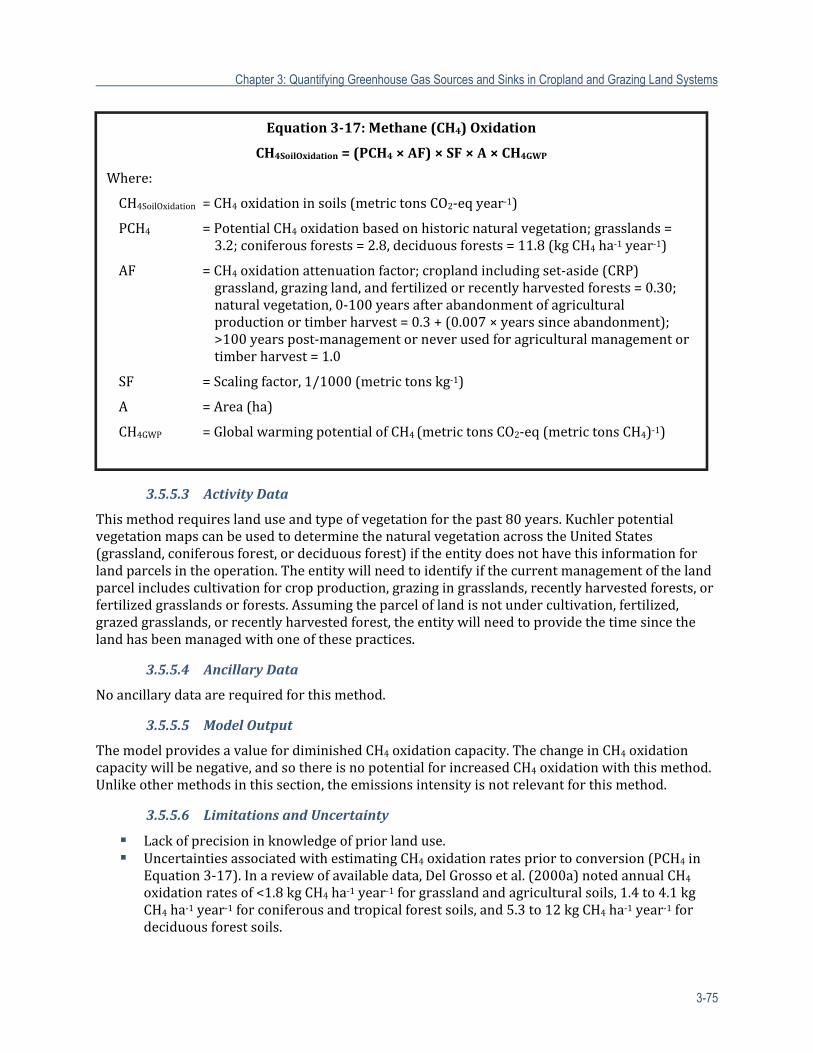
Chapter 3: Quantifying Greenhouse Gas Sources and Sinks in Cropland and Grazing Land Systems
3-75
3.5.5.3 ActivityData
Thismethodrequireslanduseandtypeofvegetationforthepast80years.KuchlerpotentialvegetationmapscanbeusedtodeterminethenaturalvegetationacrosstheUnitedStates(grassland,coniferousforest,ordeciduousforest)iftheentitydoesnothavethisinformationforlandparcelsintheoperation.Theentitywillneedtoidentifyifthecurrentmanagementofthelandparcelincludescultivationforcropproduction,grazingingrasslands,recentlyharvestedforests,orfertilizedgrasslandsorforests.Assumingtheparceloflandisnotundercultivation,fertilized,grazedgrasslands,orrecentlyharvestedforest,theentitywillneedtoprovidethetimesincethelandhasbeenmanagedwithoneofthesepractices.
3.5.5.4 AncillaryData
Noancillarydataarerequiredforthismethod.
3.5.5.5 ModelOutput
ThemodelprovidesavaluefordiminishedCH4oxidationcapacity.ThechangeinCH4oxidationcapacitywillbenegative,andsothereisnopotentialforincreasedCH4oxidationwiththismethod.Unlikeothermethodsinthissection,theemissionsintensityisnotrelevantforthismethod.
3.5.5.6 LimitationsandUncertainty
Lackofprecisioninknowledgeofpriorlanduse. UncertaintiesassociatedwithestimatingCH4oxidationratespriortoconversion(PCH4in
Equation3‐17).Inareviewofavailabledata,DelGrossoetal.(2000a)notedannualCH4
oxidationratesof<1.8kgCH4ha‐1year‐1forgrasslandandagriculturalsoils,1.4to4.1kgCH4ha‐1year‐1forconiferousandtropicalforestsoils,and5.3to12kgCH4ha‐1year‐1fordeciduousforestsoils.
Equation3‐17:Methane(CH4)Oxidation
CH4SoilOxidation=(PCH4×AF)×SF×A×CH4GWP
Where:
CH4SoilOxidation=CH4oxidationinsoils(metrictonsCO2‐eqyear‐1)
PCH4 =PotentialCH4oxidationbasedonhistoricnaturalvegetation;grasslands=3.2;coniferousforests=2.8,deciduousforests=11.8(kgCH4ha‐1year‐1)
AF =CH4oxidationattenuationfactor;croplandincludingset‐aside(CRP)grassland,grazingland,andfertilizedorrecentlyharvestedforests=0.30;naturalvegetation,0‐100yearsafterabandonmentofagriculturalproductionortimberharvest=0.3+(0.007×yearssinceabandonment);>100yearspost‐managementorneverusedforagriculturalmanagementortimberharvest=1.0
SF =Scalingfactor,1/1000(metrictonskg‐1)
A =Area(ha)
CH4GWP =GlobalwarmingpotentialofCH4(metrictonsCO2‐eq(metrictonsCH4)‐1)
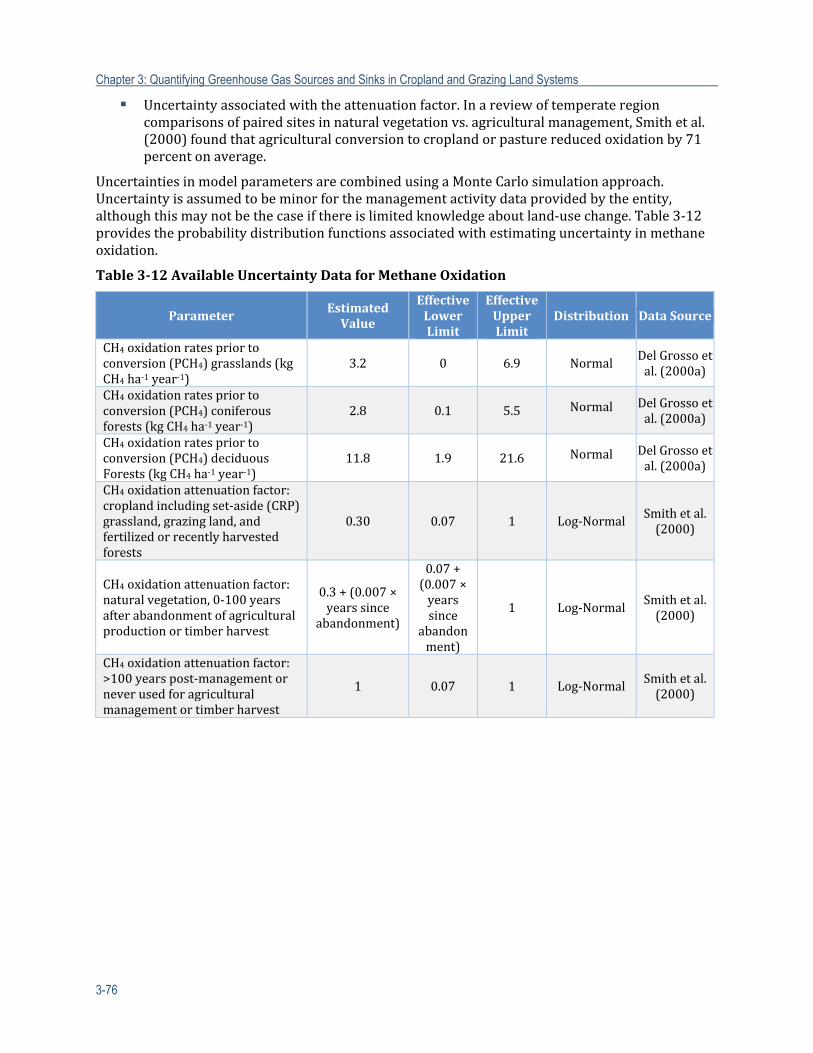
Chapter 3: Quantifying Greenhouse Gas Sources and Sinks in Cropland and Grazing Land Systems
3-76
Uncertaintyassociatedwiththeattenuationfactor.Inareviewoftemperateregioncomparisonsofpairedsitesinnaturalvegetationvs.agriculturalmanagement,Smithetal.(2000)foundthatagriculturalconversiontocroplandorpasturereducedoxidationby71percentonaverage.
UncertaintiesinmodelparametersarecombinedusingaMonteCarlosimulationapproach.Uncertaintyisassumedtobeminorforthemanagementactivitydataprovidedbytheentity,althoughthismaynotbethecaseifthereislimitedknowledgeaboutland‐usechange.Table3‐12providestheprobabilitydistributionfunctionsassociatedwithestimatinguncertaintyinmethaneoxidation.
Table3‐12AvailableUncertaintyDataforMethaneOxidation
ParameterEstimatedValue
EffectiveLowerLimit
EffectiveUpperLimit
Distribution DataSource
CH4oxidationratespriortoconversion(PCH4)grasslands(kgCH4ha‐1year‐1)
3.2 0 6.9 NormalDelGrossoetal.(2000a)
CH4oxidationratespriortoconversion(PCH4)coniferousforests(kgCH4ha‐1year‐1)
2.8 0.1 5.5 Normal DelGrossoetal.(2000a)
CH4oxidationratespriortoconversion(PCH4)deciduousForests(kgCH4ha‐1year‐1)
11.8 1.9 21.6 Normal DelGrossoetal.(2000a)
CH4oxidationattenuationfactor:croplandincludingset‐aside(CRP)grassland,grazingland,andfertilizedorrecentlyharvestedforests
0.30 0.07 1 Log‐NormalSmithetal.(2000)
CH4oxidationattenuationfactor:naturalvegetation,0‐100yearsafterabandonmentofagriculturalproductionortimberharvest
0.3+(0.007×yearssince
abandonment)
0.07+(0.007×yearssince
abandonment)
1 Log‐NormalSmithetal.(2000)
CH4oxidationattenuationfactor:>100yearspost‐managementorneverusedforagriculturalmanagementortimberharvest
1 0.07 1 Log‐Normal Smithetal.(2000)
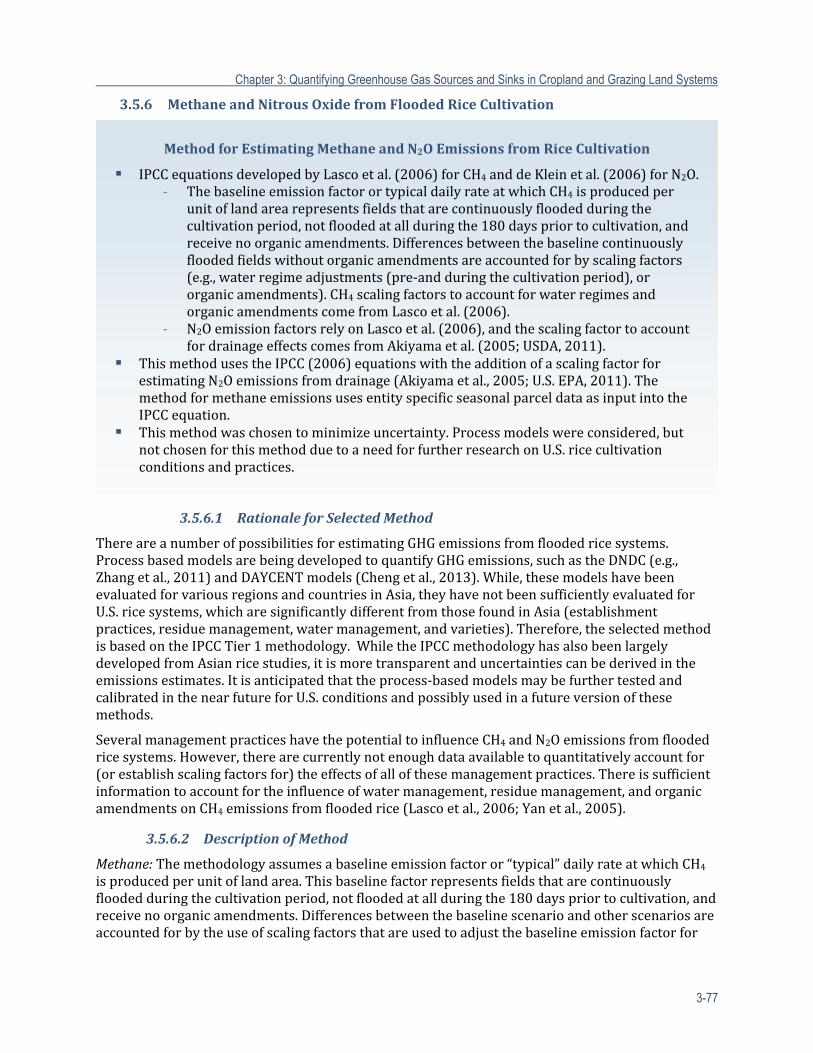
Chapter 3: Quantifying Greenhouse Gas Sources and Sinks in Cropland and Grazing Land Systems
3-77
3.5.6 MethaneandNitrousOxidefromFloodedRiceCultivation
3.5.6.1 RationaleforSelectedMethod
ThereareanumberofpossibilitiesforestimatingGHGemissionsfromfloodedricesystems.ProcessbasedmodelsarebeingdevelopedtoquantifyGHGemissions,suchastheDNDC(e.g.,Zhangetal.,2011)andDAYCENTmodels(Chengetal.,2013).While,thesemodelshavebeenevaluatedforvariousregionsandcountriesinAsia,theyhavenotbeensufficientlyevaluatedforU.S.ricesystems,whicharesignificantlydifferentfromthosefoundinAsia(establishmentpractices,residuemanagement,watermanagement,andvarieties).Therefore,theselectedmethodisbasedontheIPCCTier1methodology.WhiletheIPCCmethodologyhasalsobeenlargelydevelopedfromAsianricestudies,itismoretransparentanduncertaintiescanbederivedintheemissionsestimates.Itisanticipatedthattheprocess‐basedmodelsmaybefurthertestedandcalibratedinthenearfutureforU.S.conditionsandpossiblyusedinafutureversionofthesemethods.
SeveralmanagementpracticeshavethepotentialtoinfluenceCH4andN2Oemissionsfromfloodedricesystems.However,therearecurrentlynotenoughdataavailabletoquantitativelyaccountfor(orestablishscalingfactorsfor)theeffectsofallofthesemanagementpractices.Thereissufficientinformationtoaccountfortheinfluenceofwatermanagement,residuemanagement,andorganicamendmentsonCH4emissionsfromfloodedrice(Lascoetal.,2006;Yanetal.,2005).
3.5.6.2 DescriptionofMethod
Methane:Themethodologyassumesabaselineemissionfactoror“typical”dailyrateatwhichCH4isproducedperunitoflandarea.Thisbaselinefactorrepresentsfieldsthatarecontinuouslyfloodedduringthecultivationperiod,notfloodedatallduringthe180dayspriortocultivation,andreceivenoorganicamendments.Differencesbetweenthebaselinescenarioandotherscenariosareaccountedforbytheuseofscalingfactorsthatareusedtoadjustthebaselineemissionfactorfor
MethodforEstimatingMethaneandN2OEmissionsfromRiceCultivation
IPCCequationsdevelopedbyLascoetal.(2006)forCH4anddeKleinetal.(2006)forN2O.‐ ThebaselineemissionfactorortypicaldailyrateatwhichCH4isproducedper
unitoflandarearepresentsfieldsthatarecontinuouslyfloodedduringthecultivationperiod,notfloodedatallduringthe180dayspriortocultivation,andreceivenoorganicamendments.Differencesbetweenthebaselinecontinuouslyfloodedfieldswithoutorganicamendmentsareaccountedforbyscalingfactors(e.g.,waterregimeadjustments(pre‐andduringthecultivationperiod),ororganicamendments).CH4scalingfactorstoaccountforwaterregimesandorganicamendmentscomefromLascoetal.(2006).
‐ N2OemissionfactorsrelyonLascoetal.(2006),andthescalingfactortoaccountfordrainageeffectscomesfromAkiyamaetal.(2005;USDA,2011).
ThismethodusestheIPCC(2006)equationswiththeadditionofascalingfactorforestimatingN2Oemissionsfromdrainage(Akiyamaetal.,2005;U.S.EPA,2011).ThemethodformethaneemissionsusesentityspecificseasonalparceldataasinputintotheIPCCequation.
Thismethodwaschosentominimizeuncertainty.Processmodelswereconsidered,butnotchosenforthismethodduetoaneedforfurtherresearchonU.S.ricecultivationconditionsandpractices.
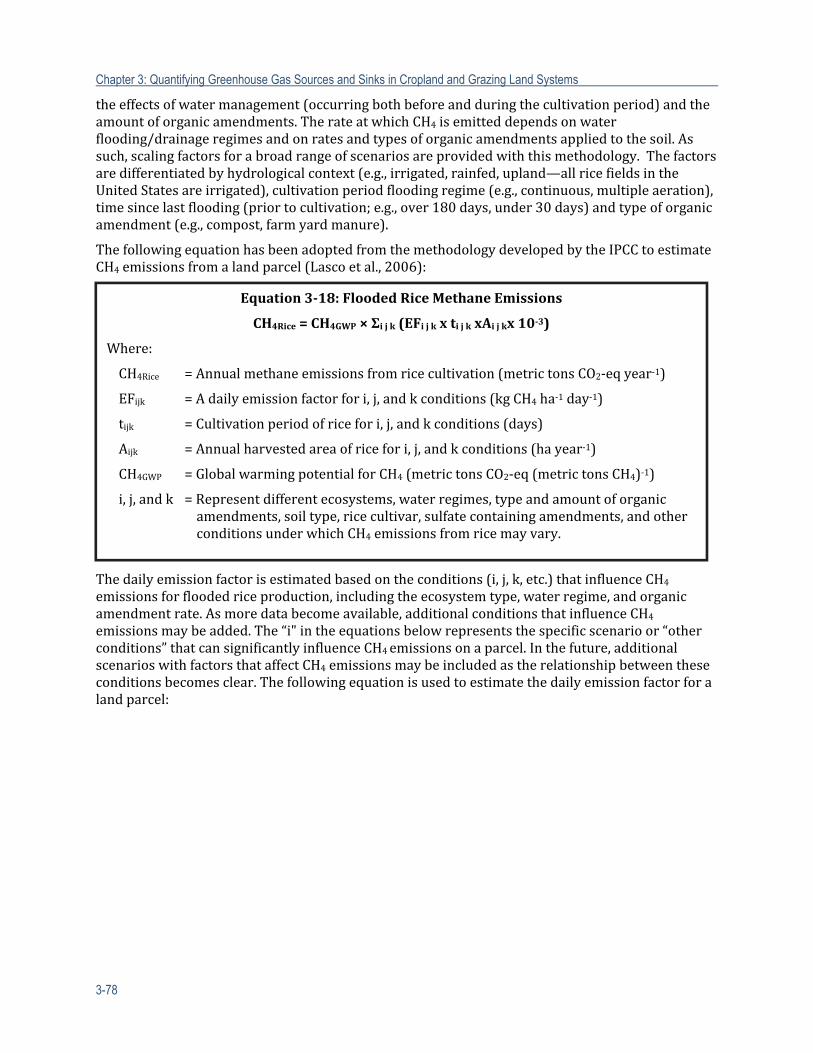
Chapter 3: Quantifying Greenhouse Gas Sources and Sinks in Cropland and Grazing Land Systems
3-78
theeffectsofwatermanagement(occurringbothbeforeandduringthecultivationperiod)andtheamountoforganicamendments.TherateatwhichCH4isemitteddependsonwaterflooding/drainageregimesandonratesandtypesoforganicamendmentsappliedtothesoil.Assuch,scalingfactorsforabroadrangeofscenariosareprovidedwiththismethodology.Thefactorsaredifferentiatedbyhydrologicalcontext(e.g.,irrigated,rainfed,upland—allricefieldsintheUnitedStatesareirrigated),cultivationperiodfloodingregime(e.g.,continuous,multipleaeration),timesincelastflooding(priortocultivation;e.g.,over180days,under30days)andtypeoforganicamendment(e.g.,compost,farmyardmanure).
ThefollowingequationhasbeenadoptedfromthemethodologydevelopedbytheIPCCtoestimateCH4emissionsfromalandparcel(Lascoetal.,2006):
Thedailyemissionfactorisestimatedbasedontheconditions(i,j,k,etc.)thatinfluenceCH4emissionsforfloodedriceproduction,includingtheecosystemtype,waterregime,andorganicamendmentrate.Asmoredatabecomeavailable,additionalconditionsthatinfluenceCH4emissionsmaybeadded.The“i"intheequationsbelowrepresentsthespecificscenarioor“otherconditions”thatcansignificantlyinfluenceCH4emissionsonaparcel.Inthefuture,additionalscenarioswithfactorsthataffectCH4emissionsmaybeincludedastherelationshipbetweentheseconditionsbecomesclear.Thefollowingequationisusedtoestimatethedailyemissionfactorforalandparcel:
Equation3‐18:Flooded RiceMethaneEmissions
CH4Rice=CH4GWP×Σijk(EFijkxtijkxAijkx10‐3)
Where:
CH4Rice =Annualmethaneemissionsfromricecultivation(metrictonsCO2‐eqyear‐1)
EFijk =Adailyemissionfactorfori,j,andkconditions(kgCH4ha‐1day‐1)
tijk =Cultivationperiodofricefori,j,andkconditions(days)
Aijk =Annualharvestedareaofricefori,j,andkconditions(hayear‐1)
CH4GWP =GlobalwarmingpotentialforCH4(metrictonsCO2‐eq(metrictonsCH4)‐1)
i,j,andk =Representdifferentecosystems,waterregimes,typeandamountoforganicamendments,soiltype,ricecultivar,sulfatecontainingamendments,andotherconditionsunderwhichCH4emissionsfromricemayvary.
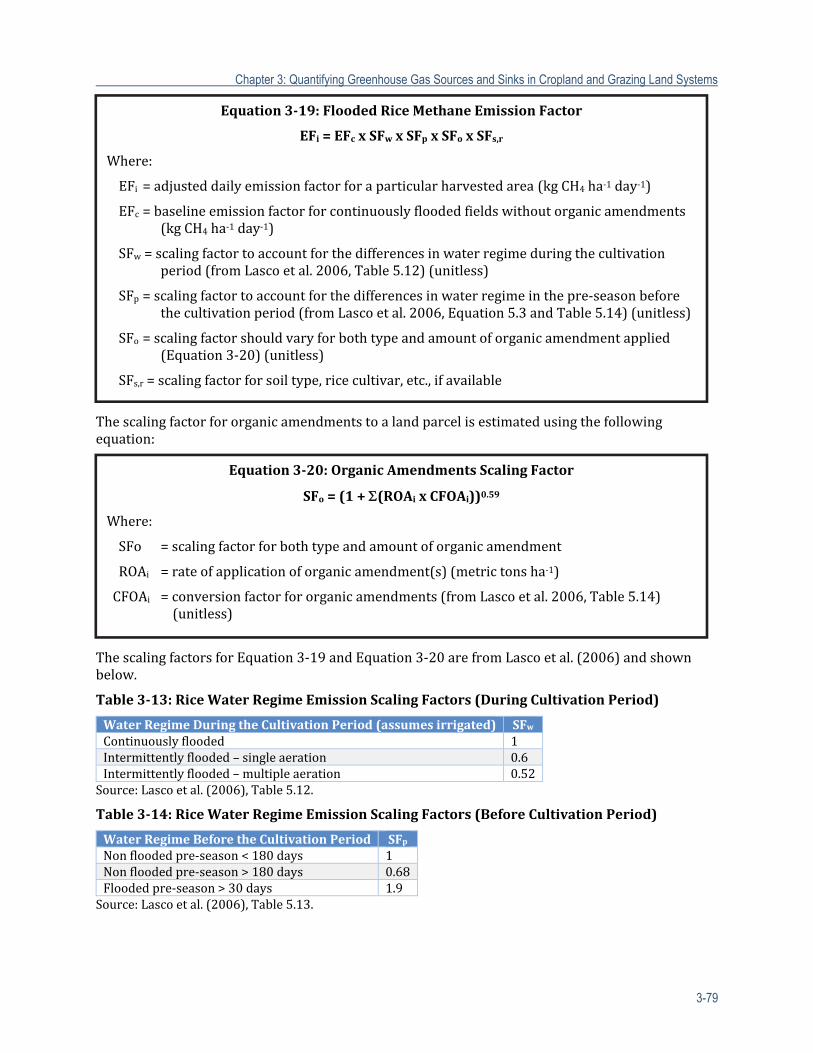
Chapter 3: Quantifying Greenhouse Gas Sources and Sinks in Cropland and Grazing Land Systems
3-79
Thescalingfactorfororganicamendmentstoalandparcelisestimatedusingthefollowingequation:
ThescalingfactorsforEquation3‐19andEquation3‐20arefromLascoetal.(2006)andshownbelow.
Table3‐13:RiceWaterRegimeEmissionScalingFactors(DuringCultivationPeriod)
WaterRegimeDuringtheCultivationPeriod(assumesirrigated) SFwContinuouslyflooded 1Intermittentlyflooded–singleaeration 0.6Intermittentlyflooded–multipleaeration 0.52Source:Lascoetal.(2006),Table5.12.
Table3‐14:RiceWaterRegimeEmissionScalingFactors(BeforeCultivationPeriod)
WaterRegimeBeforetheCultivationPeriod SFpNonfloodedpre‐season<180days 1Nonfloodedpre‐season>180days 0.68Floodedpre‐season>30days 1.9Source:Lascoetal.(2006),Table5.13.
Equation3‐19:Flooded RiceMethaneEmissionFactor
EFi=EFcxSFwxSFpxSFoxSFs,r
Where:
EFi=adjusteddailyemissionfactorforaparticularharvestedarea(kgCH4ha‐1day‐1)
EFc=baselineemissionfactorforcontinuouslyfloodedfieldswithoutorganicamendments(kgCH4ha‐1day‐1)
SFw=scalingfactortoaccountforthedifferencesinwaterregimeduringthecultivationperiod(fromLascoetal.2006,Table5.12)(unitless)
SFp=scalingfactortoaccountforthedifferencesinwaterregimeinthepre‐seasonbeforethecultivationperiod(fromLascoetal.2006,Equation5.3andTable5.14)(unitless)
SFo=scalingfactorshouldvaryforbothtypeandamountoforganicamendmentapplied(Equation3‐20)(unitless)
SFs,r=scalingfactorforsoiltype,ricecultivar,etc.,ifavailable
Equation3‐20:OrganicAmendmentsScalingFactor
SFo=(1+(ROAixCFOAi))0.59
Where:
SFo =scalingfactorforbothtypeandamountoforganicamendment
ROAi=rateofapplicationoforganicamendment(s)(metrictonsha‐1)
CFOAi =conversionfactorfororganicamendments(fromLascoetal.2006,Table5.14)(unitless)
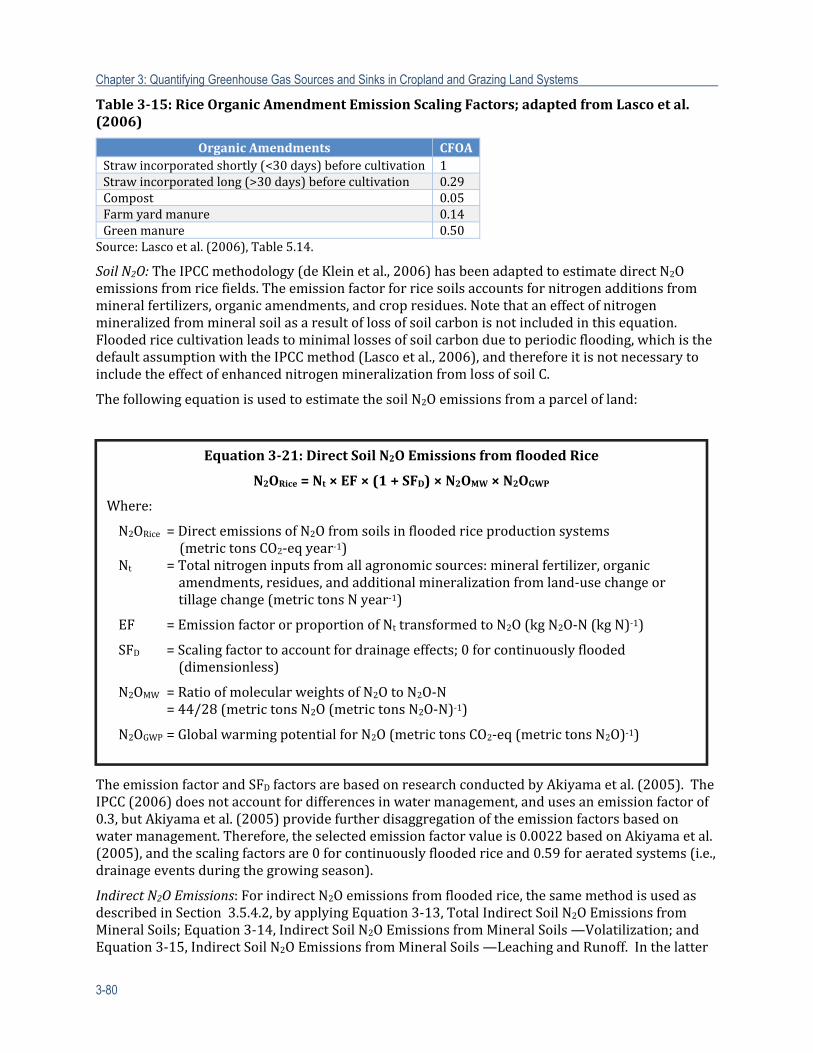
Chapter 3: Quantifying Greenhouse Gas Sources and Sinks in Cropland and Grazing Land Systems
3-80
Table3‐15:RiceOrganicAmendmentEmissionScalingFactors;adaptedfromLascoetal.(2006)
OrganicAmendments CFOAStrawincorporatedshortly(<30days)beforecultivation 1Strawincorporatedlong(>30days)beforecultivation 0.29Compost 0.05Farmyardmanure 0.14Greenmanure 0.50Source:Lascoetal.(2006),Table5.14.
SoilN2O:TheIPCCmethodology(deKleinetal.,2006)hasbeenadaptedtoestimatedirectN2Oemissionsfromricefields.Theemissionfactorforricesoilsaccountsfornitrogenadditionsfrommineralfertilizers,organicamendments,andcropresidues.Notethataneffectofnitrogenmineralizedfrommineralsoilasaresultoflossofsoilcarbonisnotincludedinthisequation.Floodedricecultivationleadstominimallossesofsoilcarbonduetoperiodicflooding,whichisthedefaultassumptionwiththeIPCCmethod(Lascoetal.,2006),andthereforeitisnotnecessarytoincludetheeffectofenhancednitrogenmineralizationfromlossofsoilC.
ThefollowingequationisusedtoestimatethesoilN2Oemissionsfromaparcelofland:
TheemissionfactorandSFDfactorsarebasedonresearchconductedbyAkiyamaetal.(2005).TheIPCC(2006)doesnotaccountfordifferencesinwatermanagement,andusesanemissionfactorof0.3,butAkiyamaetal.(2005)providefurtherdisaggregationoftheemissionfactorsbasedonwatermanagement.Therefore,theselectedemissionfactorvalueis0.0022basedonAkiyamaetal.(2005),andthescalingfactorsare0forcontinuouslyfloodedriceand0.59foraeratedsystems(i.e.,drainageeventsduringthegrowingseason).
IndirectN2OEmissions:ForindirectN2Oemissionsfromfloodedrice,thesamemethodisusedasdescribedinSection3.5.4.2,byapplyingEquation3‐13,TotalIndirectSoilN2OEmissionsfromMineralSoils;Equation3‐14,IndirectSoilN2OEmissionsfromMineralSoils—Volatilization;andEquation3‐15,IndirectSoilN2OEmissionsfromMineralSoils—LeachingandRunoff.Inthelatter
Equation3‐21:DirectSoilN2OEmissionsfromfloodedRice
N2ORice=Nt×EF×(1+SFD)×N2OMW×N2OGWP
Where:
N2ORice=DirectemissionsofN2Ofromsoilsinfloodedriceproductionsystems(metrictonsCO2‐eqyear‐1)
Nt =Totalnitrogeninputsfromallagronomicsources:mineralfertilizer,organicamendments,residues,andadditionalmineralizationfromland‐usechangeortillagechange(metrictonsNyear‐1)
EF =EmissionfactororproportionofNttransformedtoN2O(kgN2O‐N(kgN)‐1)
SFD =Scalingfactortoaccountfordrainageeffects;0forcontinuouslyflooded(dimensionless)
N2OMW=RatioofmolecularweightsofN2OtoN2O‐N=44/28(metrictonsN2O(metrictonsN2O‐N)‐1)
N2OGWP=GlobalwarmingpotentialforN2O(metrictonsCO2‐eq(metrictonsN2O)‐1)
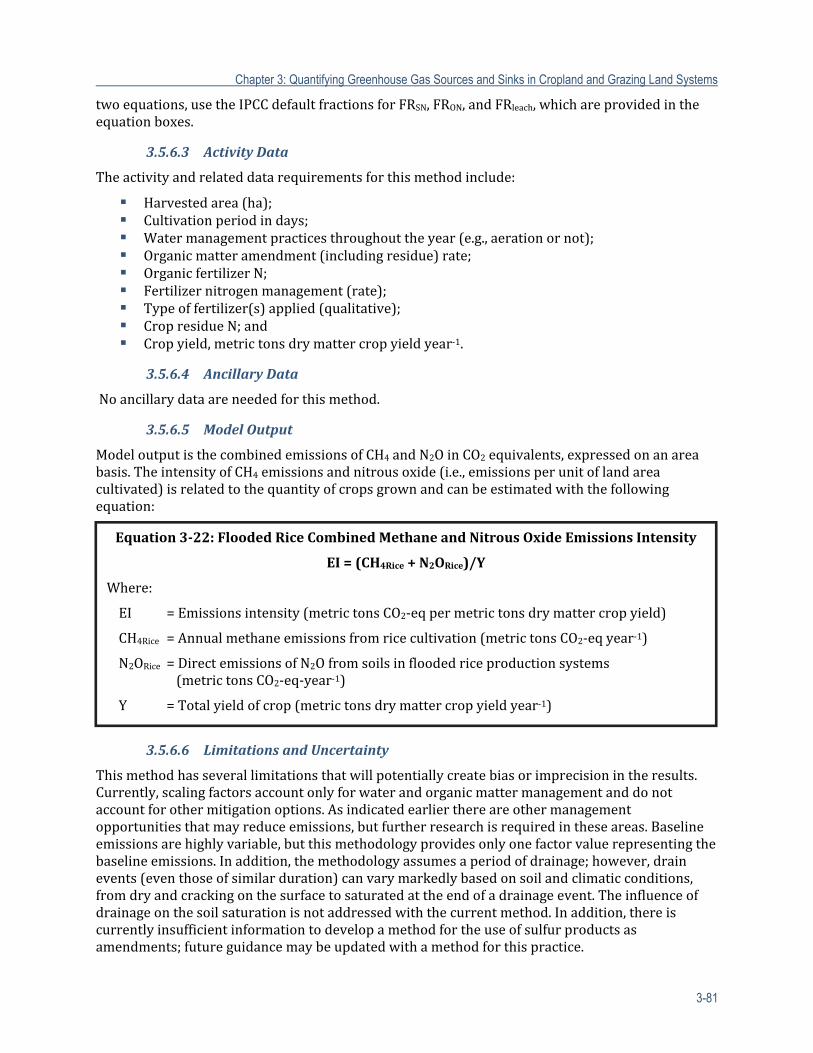
Chapter 3: Quantifying Greenhouse Gas Sources and Sinks in Cropland and Grazing Land Systems
3-81
twoequations,usetheIPCCdefaultfractionsforFRSN,FRON,andFRleach,whichareprovidedintheequationboxes.
3.5.6.3 ActivityData
Theactivityandrelateddatarequirementsforthismethodinclude:
Harvestedarea(ha); Cultivationperiodindays; Watermanagementpracticesthroughouttheyear(e.g.,aerationornot); Organicmatteramendment(includingresidue)rate; OrganicfertilizerN; Fertilizernitrogenmanagement(rate); Typeoffertilizer(s)applied(qualitative); CropresidueN;and Cropyield,metrictonsdrymattercropyieldyear‐1.
3.5.6.4 AncillaryData
Noancillarydataareneededforthismethod.
3.5.6.5 ModelOutput
ModeloutputisthecombinedemissionsofCH4andN2OinCO2equivalents,expressedonanareabasis.TheintensityofCH4emissionsandnitrousoxide(i.e.,emissionsperunitoflandareacultivated)isrelatedtothequantityofcropsgrownandcanbeestimatedwiththefollowingequation:
3.5.6.6 LimitationsandUncertainty
Thismethodhasseverallimitationsthatwillpotentiallycreatebiasorimprecisionintheresults.Currently,scalingfactorsaccountonlyforwaterandorganicmattermanagementanddonotaccountforothermitigationoptions.Asindicatedearlierthereareothermanagementopportunitiesthatmayreduceemissions,butfurtherresearchisrequiredintheseareas.Baselineemissionsarehighlyvariable,butthismethodologyprovidesonlyonefactorvaluerepresentingthebaselineemissions.Inaddition,themethodologyassumesaperiodofdrainage;however,drainevents(eventhoseofsimilarduration)canvarymarkedlybasedonsoilandclimaticconditions,fromdryandcrackingonthesurfacetosaturatedattheendofadrainageevent.Theinfluenceofdrainageonthesoilsaturationisnotaddressedwiththecurrentmethod.Inaddition,thereiscurrentlyinsufficientinformationtodevelopamethodfortheuseofsulfurproductsasamendments;futureguidancemaybeupdatedwithamethodforthispractice.
Equation3‐22:FloodedRiceCombinedMethaneandNitrousOxideEmissionsIntensity
EI=(CH4Rice+N2ORice)/Y
Where:
EI =Emissionsintensity(metrictonsCO2‐eqpermetrictonsdrymattercropyield)
CH4Rice=Annualmethaneemissionsfromricecultivation(metrictonsCO2‐eqyear‐1)
N2ORice=DirectemissionsofN2Ofromsoilsinfloodedriceproductionsystems(metrictonsCO2‐eq‐year‐1)
Y =Totalyieldofcrop(metrictonsdrymattercropyieldyear‐1)
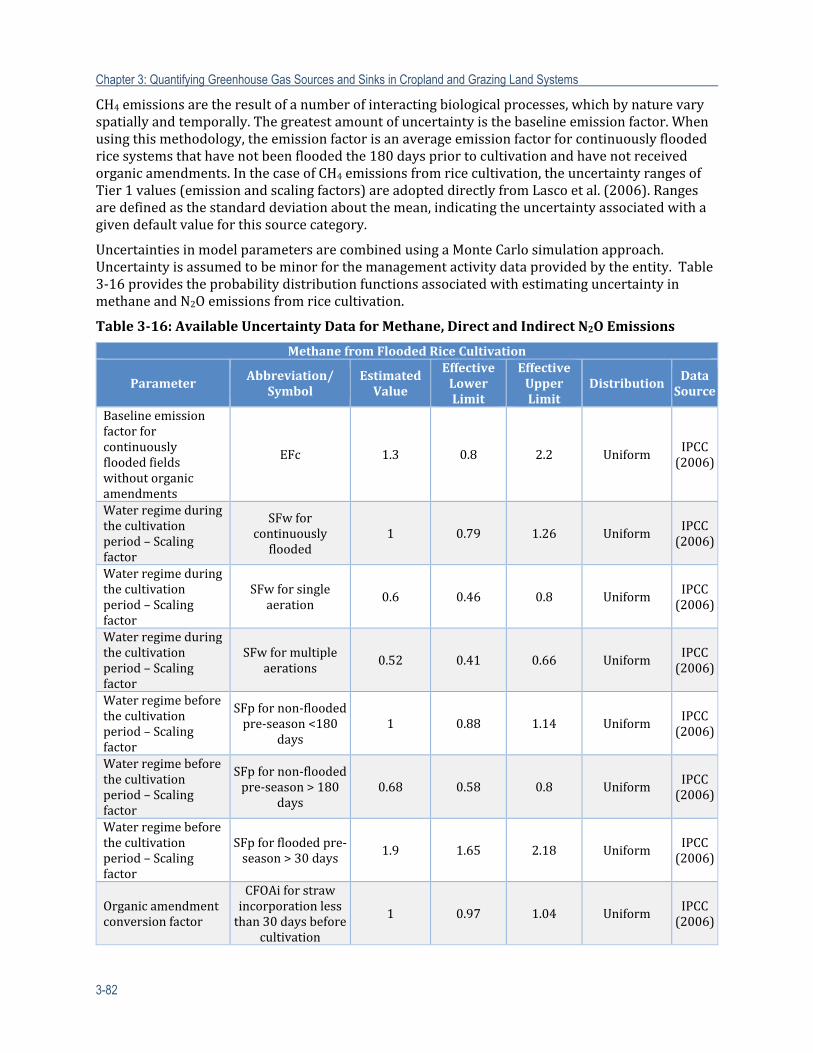
Chapter 3: Quantifying Greenhouse Gas Sources and Sinks in Cropland and Grazing Land Systems
3-82
CH4emissionsaretheresultofanumberofinteractingbiologicalprocesses,whichbynaturevaryspatiallyandtemporally.Thegreatestamountofuncertaintyisthebaselineemissionfactor.Whenusingthismethodology,theemissionfactorisanaverageemissionfactorforcontinuouslyfloodedricesystemsthathavenotbeenfloodedthe180dayspriortocultivationandhavenotreceivedorganicamendments.InthecaseofCH4emissionsfromricecultivation,theuncertaintyrangesofTier1values(emissionandscalingfactors)areadopteddirectlyfromLascoetal.(2006).Rangesaredefinedasthestandarddeviationaboutthemean,indicatingtheuncertaintyassociatedwithagivendefaultvalueforthissourcecategory.
UncertaintiesinmodelparametersarecombinedusingaMonteCarlosimulationapproach.Uncertaintyisassumedtobeminorforthemanagementactivitydataprovidedbytheentity.Table3‐16providestheprobabilitydistributionfunctionsassociatedwithestimatinguncertaintyinmethaneandN2Oemissionsfromricecultivation.
Table3‐16:AvailableUncertaintyDataforMethane,DirectandIndirectN2OEmissions
MethanefromFloodedRiceCultivation
ParameterAbbreviation/
SymbolEstimatedValue
EffectiveLowerLimit
EffectiveUpperLimit
DistributionDataSource
Baselineemissionfactorforcontinuouslyfloodedfieldswithoutorganicamendments
EFc 1.3 0.8 2.2 UniformIPCC(2006)
Waterregimeduringthecultivationperiod–Scalingfactor
SFwforcontinuouslyflooded
1 0.79 1.26 UniformIPCC(2006)
Waterregimeduringthecultivationperiod–Scalingfactor
SFwforsingleaeration
0.6 0.46 0.8 UniformIPCC(2006)
Waterregimeduringthecultivationperiod–Scalingfactor
SFwformultipleaerations
0.52 0.41 0.66 UniformIPCC(2006)
Waterregimebeforethecultivationperiod–Scalingfactor
SFpfornon‐floodedpre‐season<180
days1 0.88 1.14 Uniform IPCC
(2006)
Waterregimebeforethecultivationperiod–Scalingfactor
SFpfornon‐floodedpre‐season>180
days0.68 0.58 0.8 Uniform IPCC
(2006)
Waterregimebeforethecultivationperiod–Scalingfactor
SFpforfloodedpre‐season>30days
1.9 1.65 2.18 Uniform IPCC(2006)
Organicamendmentconversionfactor
CFOAiforstrawincorporationlessthan30daysbefore
cultivation
1 0.97 1.04 Uniform IPCC(2006)
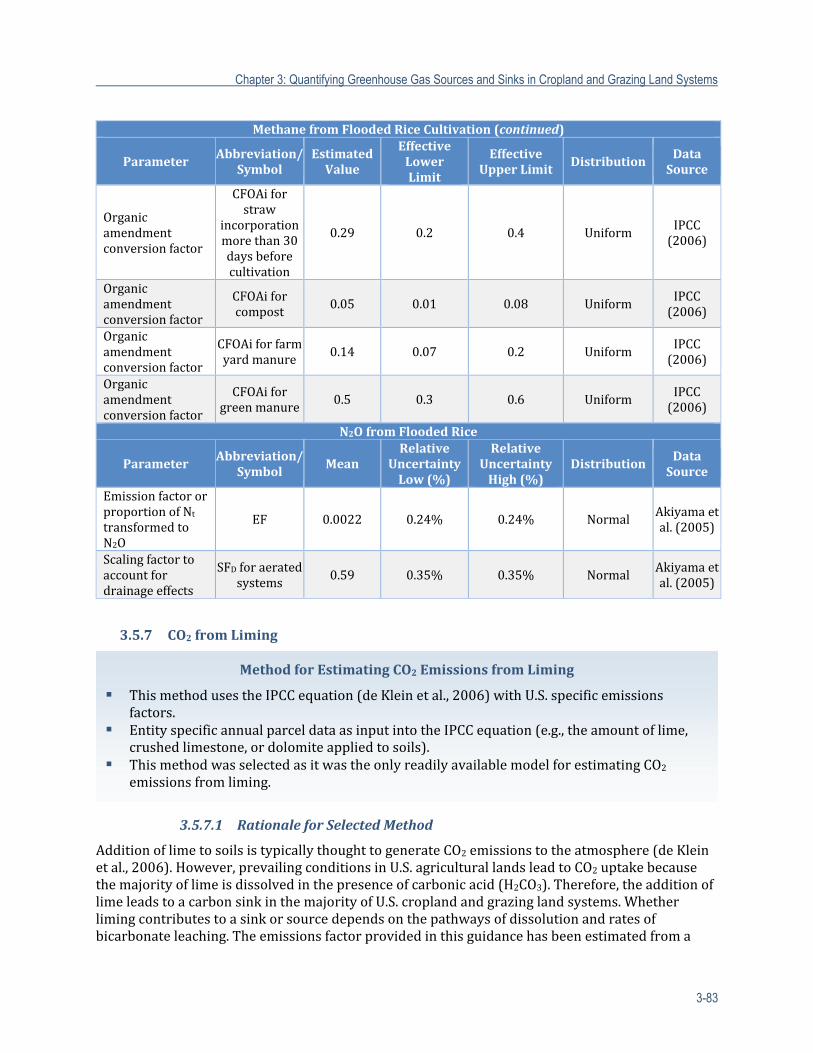
Chapter 3: Quantifying Greenhouse Gas Sources and Sinks in Cropland and Grazing Land Systems
3-83
MethanefromFloodedRiceCultivation (continued)
ParameterAbbreviation/
SymbolEstimatedValue
EffectiveLowerLimit
EffectiveUpperLimit Distribution
DataSource
Organicamendmentconversionfactor
CFOAiforstraw
incorporationmorethan30daysbeforecultivation
0.29 0.2 0.4 Uniform IPCC(2006)
Organicamendmentconversionfactor
CFOAiforcompost
0.05 0.01 0.08 UniformIPCC(2006)
Organicamendmentconversionfactor
CFOAiforfarmyardmanure 0.14 0.07 0.2 Uniform
IPCC(2006)
Organicamendmentconversionfactor
CFOAiforgreenmanure
0.5 0.3 0.6 Uniform IPCC(2006)
N2OfromFloodedRice
ParameterAbbreviation/
SymbolMean
RelativeUncertaintyLow(%)
RelativeUncertaintyHigh(%)
DistributionDataSource
EmissionfactororproportionofNttransformedtoN2O
EF 0.0022 0.24% 0.24% Normal Akiyamaetal.(2005)
Scalingfactortoaccountfordrainageeffects
SFDforaeratedsystems 0.59 0.35% 0.35% Normal
Akiyamaetal.(2005)
3.5.7 CO2fromLiming
3.5.7.1 RationaleforSelectedMethod
AdditionoflimetosoilsistypicallythoughttogenerateCO2emissionstotheatmosphere(deKleinetal.,2006).However,prevailingconditionsinU.S.agriculturallandsleadtoCO2uptakebecausethemajorityoflimeisdissolvedinthepresenceofcarbonicacid(H2CO3).Therefore,theadditionoflimeleadstoacarbonsinkinthemajorityofU.S.croplandandgrazinglandsystems.Whetherlimingcontributestoasinkorsourcedependsonthepathwaysofdissolutionandratesofbicarbonateleaching.Theemissionsfactorprovidedinthisguidancehasbeenestimatedfroma
MethodforEstimatingCO2 EmissionsfromLiming
ThismethodusestheIPCCequation(deKleinetal.,2006)withU.S.specificemissionsfactors.
EntityspecificannualparceldataasinputintotheIPCCequation(e.g.,theamountoflime,crushedlimestone,ordolomiteappliedtosoils).
ThismethodwasselectedasitwastheonlyreadilyavailablemodelforestimatingCO2
emissionsfromliming.
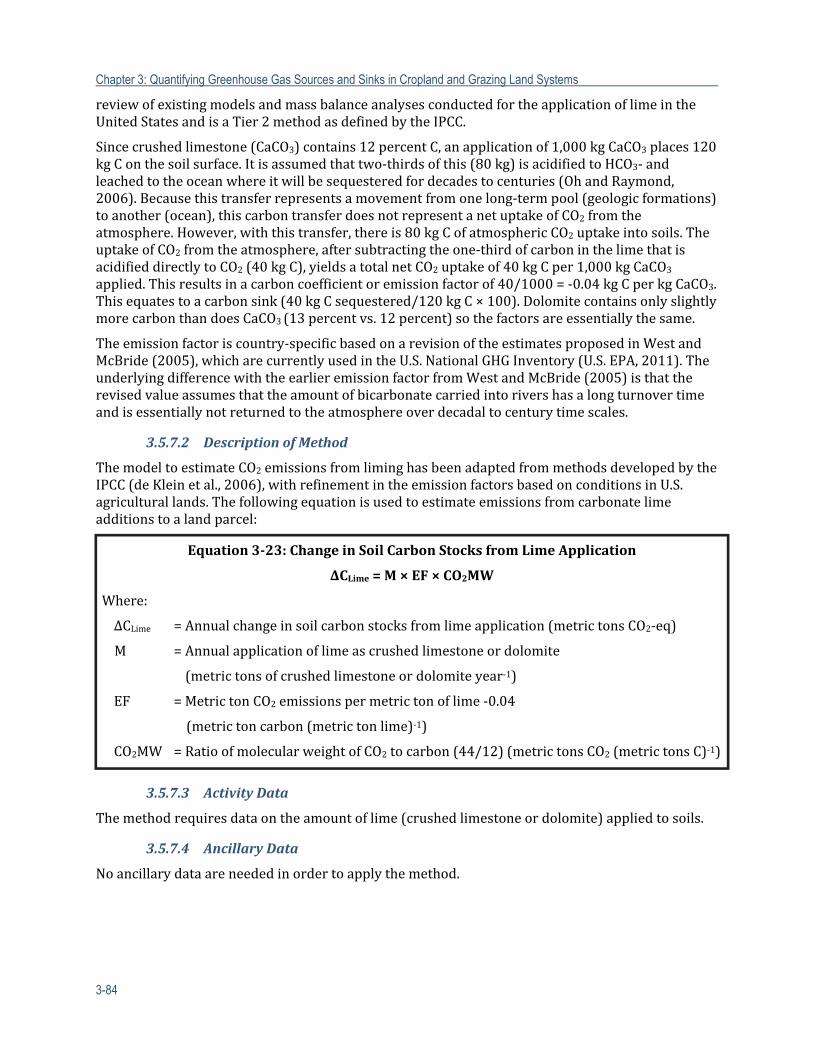
Chapter 3: Quantifying Greenhouse Gas Sources and Sinks in Cropland and Grazing Land Systems
3-84
reviewofexistingmodelsandmassbalanceanalysesconductedfortheapplicationoflimeintheUnitedStatesandisaTier2methodasdefinedbytheIPCC.
Sincecrushedlimestone(CaCO3)contains12percentC,anapplicationof1,000kgCaCO3places120kgConthesoilsurface.Itisassumedthattwo‐thirdsofthis(80kg)isacidifiedtoHCO3‐andleachedtotheoceanwhereitwillbesequesteredfordecadestocenturies(OhandRaymond,2006).Becausethistransferrepresentsamovementfromonelong‐termpool(geologicformations)toanother(ocean),thiscarbontransferdoesnotrepresentanetuptakeofCO2fromtheatmosphere.However,withthistransfer,thereis80kgCofatmosphericCO2uptakeintosoils.TheuptakeofCO2fromtheatmosphere,aftersubtractingtheone‐thirdofcarboninthelimethatisacidifieddirectlytoCO2(40kgC),yieldsatotalnetCO2uptakeof40kgCper1,000kgCaCO3applied.Thisresultsinacarboncoefficientoremissionfactorof40/1000=‐0.04kgCperkgCaCO3.Thisequatestoacarbonsink(40kgCsequestered/120kgC×100).DolomitecontainsonlyslightlymorecarbonthandoesCaCO3(13percentvs.12percent)sothefactorsareessentiallythesame.
Theemissionfactoriscountry‐specificbasedonarevisionoftheestimatesproposedinWestandMcBride(2005),whicharecurrentlyusedintheU.S.NationalGHGInventory(U.S.EPA,2011).TheunderlyingdifferencewiththeearlieremissionfactorfromWestandMcBride(2005)isthattherevisedvalueassumesthattheamountofbicarbonatecarriedintorivershasalongturnovertimeandisessentiallynotreturnedtotheatmosphereoverdecadaltocenturytimescales.
3.5.7.2 DescriptionofMethod
ThemodeltoestimateCO2emissionsfromliminghasbeenadaptedfrommethodsdevelopedbytheIPCC(deKleinetal.,2006),withrefinementintheemissionfactorsbasedonconditionsinU.S.agriculturallands.Thefollowingequationisusedtoestimateemissionsfromcarbonatelimeadditionstoalandparcel:
3.5.7.3 ActivityData
Themethodrequiresdataontheamountoflime(crushedlimestoneordolomite)appliedtosoils.
3.5.7.4 AncillaryData
Noancillarydataareneededinordertoapplythemethod.
Equation3‐23:ChangeinSoilCarbon StocksfromLimeApplication
ΔCLime=M×EF×CO2MW
Where:
ΔCLime =Annualchangeinsoilcarbonstocksfromlimeapplication(metrictonsCO2‐eq)
M =Annualapplicationoflimeascrushedlimestoneordolomite
(metrictonsofcrushedlimestoneordolomiteyear‐1)
EF =MetrictonCO2emissionspermetrictonoflime‐0.04
(metrictoncarbon(metrictonlime)‐1)
CO2MW =RatioofmolecularweightofCO2tocarbon(44/12)(metrictonsCO2(metrictonsC)‐1)
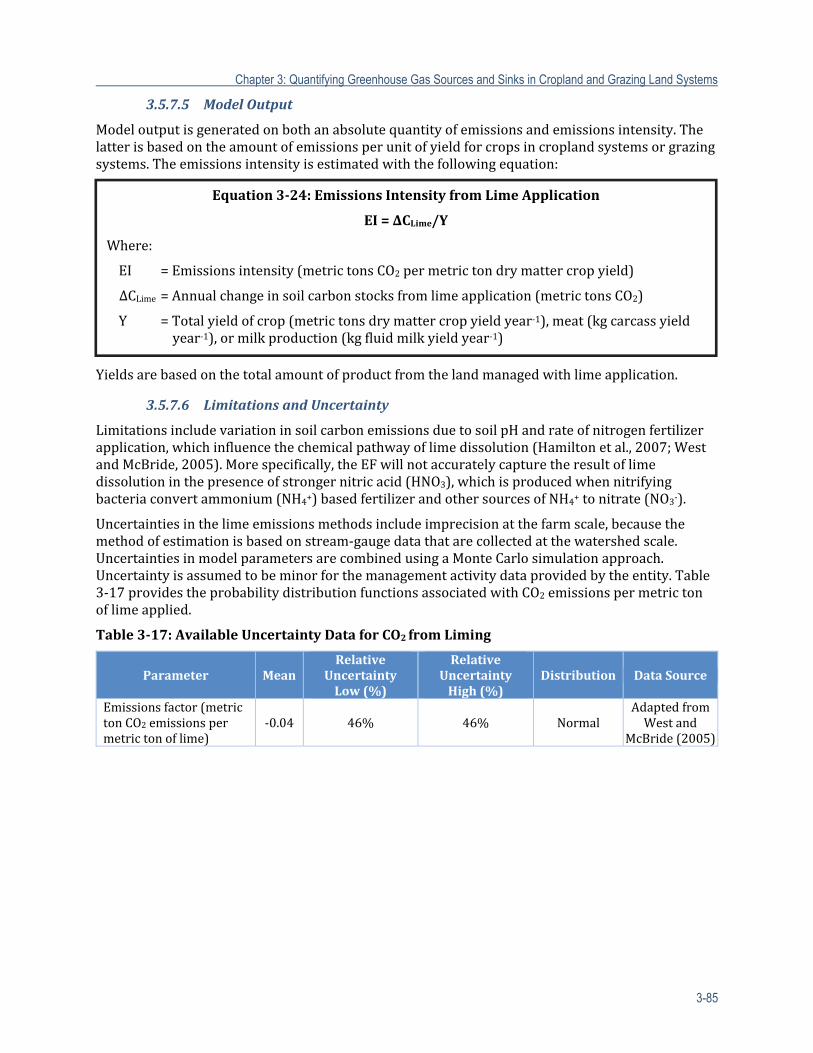
Chapter 3: Quantifying Greenhouse Gas Sources and Sinks in Cropland and Grazing Land Systems
3-85
3.5.7.5 ModelOutput
Modeloutputisgeneratedonbothanabsolutequantityofemissionsandemissionsintensity.Thelatterisbasedontheamountofemissionsperunitofyieldforcropsincroplandsystemsorgrazingsystems.Theemissionsintensityisestimatedwiththefollowingequation:
Yieldsarebasedonthetotalamountofproductfromthelandmanagedwithlimeapplication.
3.5.7.6 LimitationsandUncertainty
LimitationsincludevariationinsoilcarbonemissionsduetosoilpHandrateofnitrogenfertilizerapplication,whichinfluencethechemicalpathwayoflimedissolution(Hamiltonetal.,2007;WestandMcBride,2005).Morespecifically,theEFwillnotaccuratelycapturetheresultoflimedissolutioninthepresenceofstrongernitricacid(HNO3),whichisproducedwhennitrifyingbacteriaconvertammonium(NH4+)basedfertilizerandothersourcesofNH4+tonitrate(NO3‐).
Uncertaintiesinthelimeemissionsmethodsincludeimprecisionatthefarmscale,becausethemethodofestimationisbasedonstream‐gaugedatathatarecollectedatthewatershedscale.UncertaintiesinmodelparametersarecombinedusingaMonteCarlosimulationapproach.Uncertaintyisassumedtobeminorforthemanagementactivitydataprovidedbytheentity.Table3‐17providestheprobabilitydistributionfunctionsassociatedwithCO2emissionspermetrictonoflimeapplied.
Table3‐17:AvailableUncertaintyDataforCO2fromLiming
Parameter MeanRelative
UncertaintyLow(%)
RelativeUncertaintyHigh(%)
Distribution DataSource
Emissionsfactor(metrictonCO2emissionspermetrictonoflime)
‐0.04 46% 46% NormalAdaptedfromWestand
McBride(2005)
Equation3‐24:EmissionsIntensityfromLimeApplication
EI=ΔCLime/Y
Where:
EI =Emissionsintensity(metrictonsCO2permetrictondrymattercropyield)
ΔCLime =Annualchangeinsoilcarbonstocksfromlimeapplication(metrictonsCO2)
Y =Totalyieldofcrop(metrictonsdrymattercropyieldyear‐1),meat(kgcarcassyieldyear‐1),ormilkproduction(kgfluidmilkyieldyear‐1)
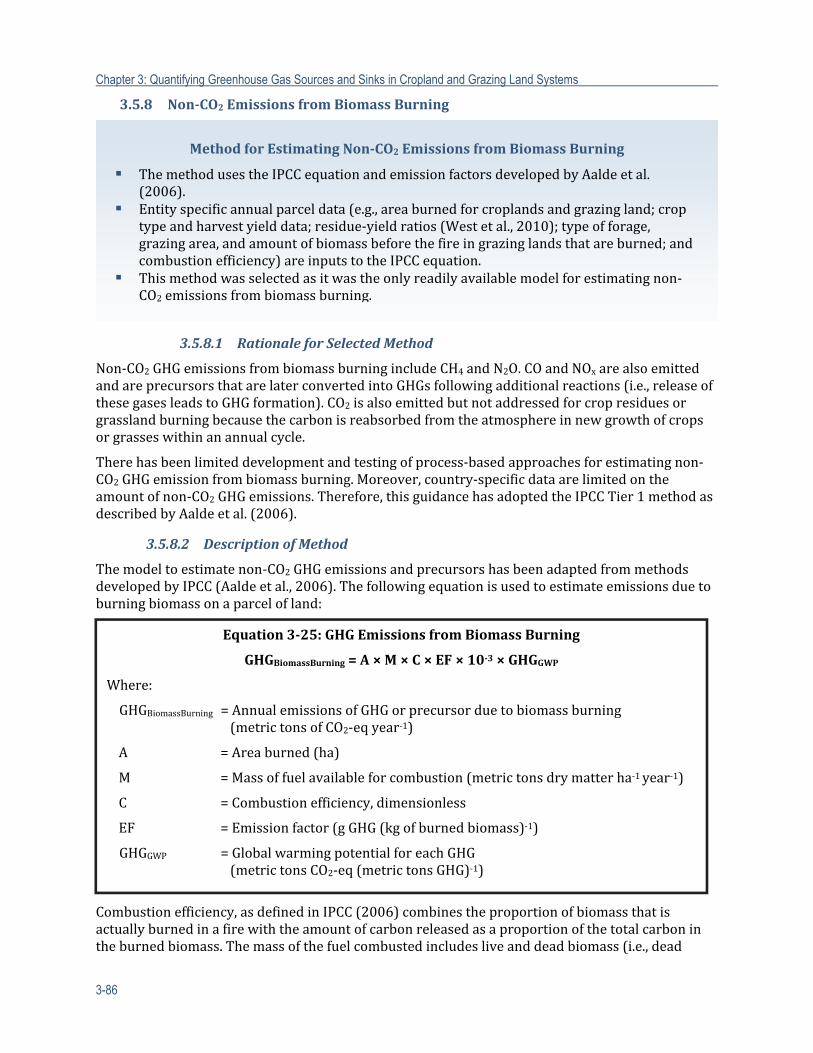
Chapter 3: Quantifying Greenhouse Gas Sources and Sinks in Cropland and Grazing Land Systems
3-86
3.5.8 Non‐CO2EmissionsfromBiomassBurning
3.5.8.1 RationaleforSelectedMethod
Non‐CO2GHGemissionsfrombiomassburningincludeCH4andN2O.COandNOxarealsoemittedandareprecursorsthatarelaterconvertedintoGHGsfollowingadditionalreactions(i.e.,releaseofthesegasesleadstoGHGformation).CO2isalsoemittedbutnotaddressedforcropresiduesorgrasslandburningbecausethecarbonisreabsorbedfromtheatmosphereinnewgrowthofcropsorgrasseswithinanannualcycle.
Therehasbeenlimiteddevelopmentandtestingofprocess‐basedapproachesforestimatingnon‐CO2GHGemissionfrombiomassburning.Moreover,country‐specificdataarelimitedontheamountofnon‐CO2GHGemissions.Therefore,thisguidancehasadoptedtheIPCCTier1methodasdescribedbyAaldeetal.(2006).
3.5.8.2 DescriptionofMethod
Themodeltoestimatenon‐CO2GHGemissionsandprecursorshasbeenadaptedfrommethodsdevelopedbyIPCC(Aaldeetal.,2006).Thefollowingequationisusedtoestimateemissionsduetoburningbiomassonaparcelofland:
Combustionefficiency,asdefinedinIPCC(2006)combinestheproportionofbiomassthatisactuallyburnedinafirewiththeamountofcarbonreleasedasaproportionofthetotalcarbonintheburnedbiomass.Themassofthefuelcombustedincludesliveanddeadbiomass(i.e.,dead
MethodforEstimatingNon‐CO2 EmissionsfromBiomassBurning
ThemethodusestheIPCCequationandemissionfactorsdevelopedbyAaldeetal.(2006).
Entityspecificannualparceldata(e.g.,areaburnedforcroplandsandgrazingland;croptypeandharvestyielddata;residue‐yieldratios(Westetal.,2010);typeofforage,grazingarea,andamountofbiomassbeforethefireingrazinglandsthatareburned;andcombustionefficiency)areinputstotheIPCCequation.
Thismethodwasselectedasitwastheonlyreadilyavailablemodelforestimatingnon‐CO2emissionsfrombiomassburning.
Equation3‐25:GHGEmissionsfromBiomassBurning
GHGBiomassBurning=A×M×C×EF×10‐3×GHGGWP
Where:
GHGBiomassBurning=AnnualemissionsofGHGorprecursorduetobiomassburning(metrictonsofCO2‐eqyear‐1)
A =Areaburned(ha)
M =Massoffuelavailableforcombustion(metrictonsdrymatterha‐1year‐1)
C =Combustionefficiency,dimensionless
EF =Emissionfactor(gGHG(kgofburnedbiomass)‐1)
GHGGWP =GlobalwarmingpotentialforeachGHG(metrictonsCO2‐eq(metrictonsGHG)‐1)
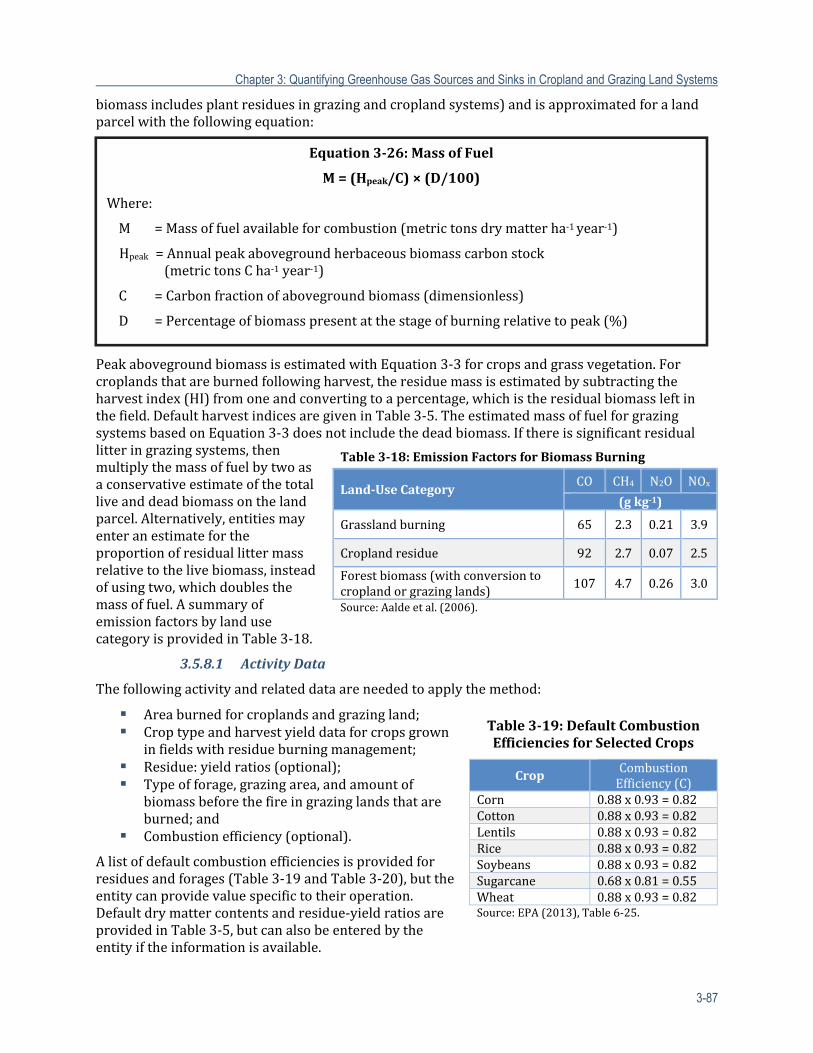
Chapter 3: Quantifying Greenhouse Gas Sources and Sinks in Cropland and Grazing Land Systems
3-87
biomassincludesplantresiduesingrazingandcroplandsystems)andisapproximatedforalandparcelwiththefollowingequation:
PeakabovegroundbiomassisestimatedwithEquation3‐3forcropsandgrassvegetation.Forcroplandsthatareburnedfollowingharvest,theresiduemassisestimatedbysubtractingtheharvestindex(HI)fromoneandconvertingtoapercentage,whichistheresidualbiomassleftinthefield.DefaultharvestindicesaregiveninTable3‐5.TheestimatedmassoffuelforgrazingsystemsbasedonEquation3‐3doesnotincludethedeadbiomass.Ifthereissignificantresiduallitteringrazingsystems,thenmultiplythemassoffuelbytwoasaconservativeestimateofthetotalliveanddeadbiomassonthelandparcel.Alternatively,entitiesmayenteranestimatefortheproportionofresiduallittermassrelativetothelivebiomass,insteadofusingtwo,whichdoublesthemassoffuel.AsummaryofemissionfactorsbylandusecategoryisprovidedinTable3‐18.
3.5.8.1 ActivityData
Thefollowingactivityandrelateddataareneededtoapplythemethod:
Areaburnedforcroplandsandgrazingland; Croptypeandharvestyielddataforcropsgrown
infieldswithresidueburningmanagement; Residue:yieldratios(optional); Typeofforage,grazingarea,andamountof
biomassbeforethefireingrazinglandsthatareburned;and
Combustionefficiency(optional).
Alistofdefaultcombustionefficienciesisprovidedforresiduesandforages(Table3‐19andTable3‐20),buttheentitycanprovidevaluespecifictotheiroperation.Defaultdrymattercontentsandresidue‐yieldratiosareprovidedinTable3‐5,butcanalsobeenteredbytheentityiftheinformationisavailable.
Table3‐18:EmissionFactorsforBiomassBurning
Land‐UseCategoryCO CH4 N2O NOx
(gkg‐1)
Grasslandburning 65 2.3 0.21 3.9
Croplandresidue 92 2.7 0.07 2.5
Forestbiomass(withconversiontocroplandorgrazinglands)
107 4.7 0.26 3.0
Source:Aaldeetal.(2006).
Table3‐19:DefaultCombustionEfficienciesforSelectedCrops
Crop CombustionEfficiency(C)
Corn 0.88x0.93=0.82Cotton 0.88x0.93=0.82Lentils 0.88x0.93=0.82Rice 0.88x0.93=0.82Soybeans 0.88x0.93=0.82Sugarcane 0.68x0.81=0.55Wheat 0.88x0.93=0.82Source:EPA(2013),Table6‐25.
Equation3‐26:MassofFuel
M=(Hpeak/C)×(D/100)
Where:
M =Massoffuelavailableforcombustion(metrictonsdrymatterha‐1year‐1)
Hpeak =Annualpeakabovegroundherbaceousbiomasscarbonstock(metrictonsCha‐1year‐1)
C =Carbonfractionofabovegroundbiomass(dimensionless)
D =Percentageofbiomasspresentatthestageofburningrelativetopeak(%)
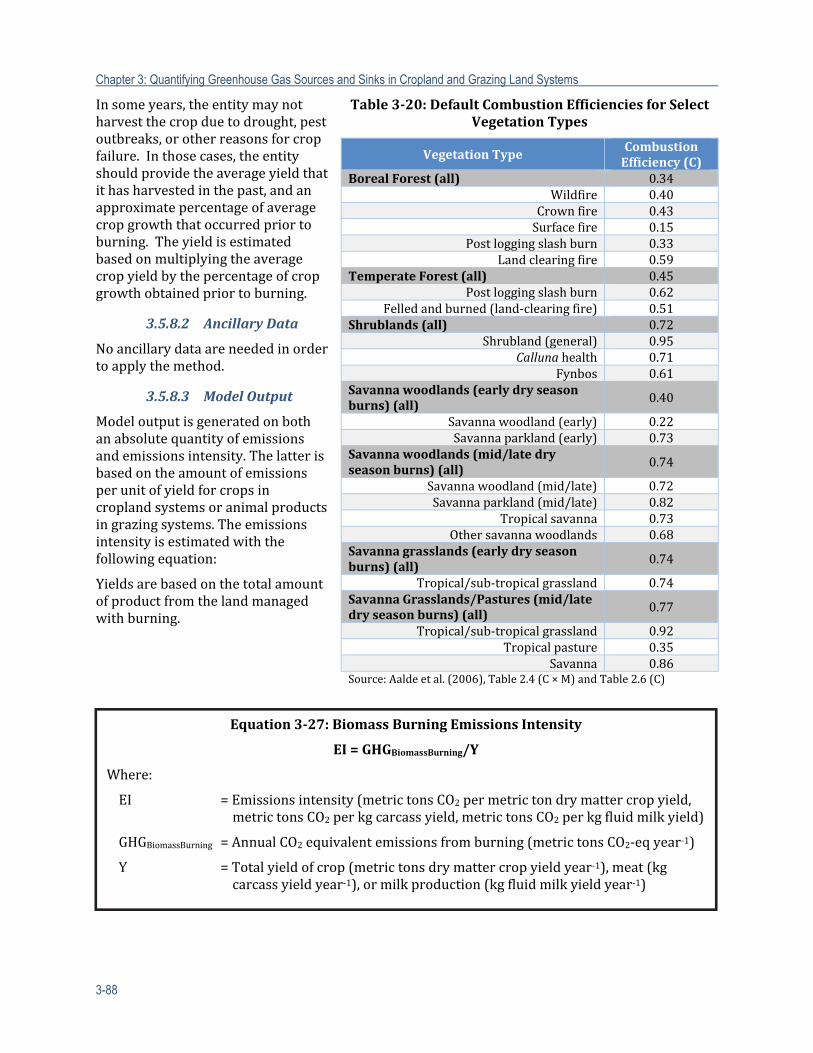
Chapter 3: Quantifying Greenhouse Gas Sources and Sinks in Cropland and Grazing Land Systems
3-88
Insomeyears,theentitymaynotharvestthecropduetodrought,pestoutbreaks,orotherreasonsforcropfailure.Inthosecases,theentityshouldprovidetheaverageyieldthatithasharvestedinthepast,andanapproximatepercentageofaveragecropgrowththatoccurredpriortoburning.Theyieldisestimatedbasedonmultiplyingtheaveragecropyieldbythepercentageofcropgrowthobtainedpriortoburning.
3.5.8.2 AncillaryData
Noancillarydataareneededinordertoapplythemethod.
3.5.8.3 ModelOutput
Modeloutputisgeneratedonbothanabsolutequantityofemissionsandemissionsintensity.Thelatterisbasedontheamountofemissionsperunitofyieldforcropsincroplandsystemsoranimalproductsingrazingsystems.Theemissionsintensityisestimatedwiththefollowingequation:
Yieldsarebasedonthetotalamountofproductfromthelandmanagedwithburning.
Table3‐20:DefaultCombustionEfficienciesforSelectVegetationTypes
VegetationTypeCombustionEfficiency(C)
BorealForest(all) 0.34Wildfire 0.40
Crownfire 0.43Surfacefire 0.15
Postloggingslashburn 0.33Landclearingfire 0.59
TemperateForest(all) 0.45Postloggingslashburn 0.62
Felledandburned(land‐clearingfire) 0.51Shrublands(all) 0.72
Shrubland(general) 0.95Calluna health 0.71
Fynbos 0.61Savannawoodlands(earlydryseasonburns)(all)
0.40
Savannawoodland(early) 0.22Savannaparkland(early) 0.73
Savannawoodlands(mid/latedryseasonburns)(all)
0.74
Savannawoodland(mid/late) 0.72Savannaparkland(mid/late) 0.82
Tropicalsavanna 0.73Othersavannawoodlands 0.68
Savannagrasslands(earlydryseasonburns)(all)
0.74
Tropical/sub‐tropicalgrassland 0.74SavannaGrasslands/Pastures(mid/latedryseasonburns)(all) 0.77
Tropical/sub‐tropicalgrassland 0.92Tropicalpasture 0.35
Savanna 0.86Source:Aaldeetal.(2006),Table2.4(C×M)andTable2.6(C)
Equation3‐27:BiomassBurningEmissionsIntensity
EI=GHGBiomassBurning/Y
Where:
EI =Emissionsintensity(metrictonsCO2permetrictondrymattercropyield,metrictonsCO2perkgcarcassyield,metrictonsCO2perkgfluidmilkyield)
GHGBiomassBurning=AnnualCO2equivalentemissionsfromburning(metrictonsCO2‐eqyear‐1)
Y =Totalyieldofcrop(metrictonsdrymattercropyieldyear‐1),meat(kgcarcassyieldyear‐1),ormilkproduction(kgfluidmilkyieldyear‐1)
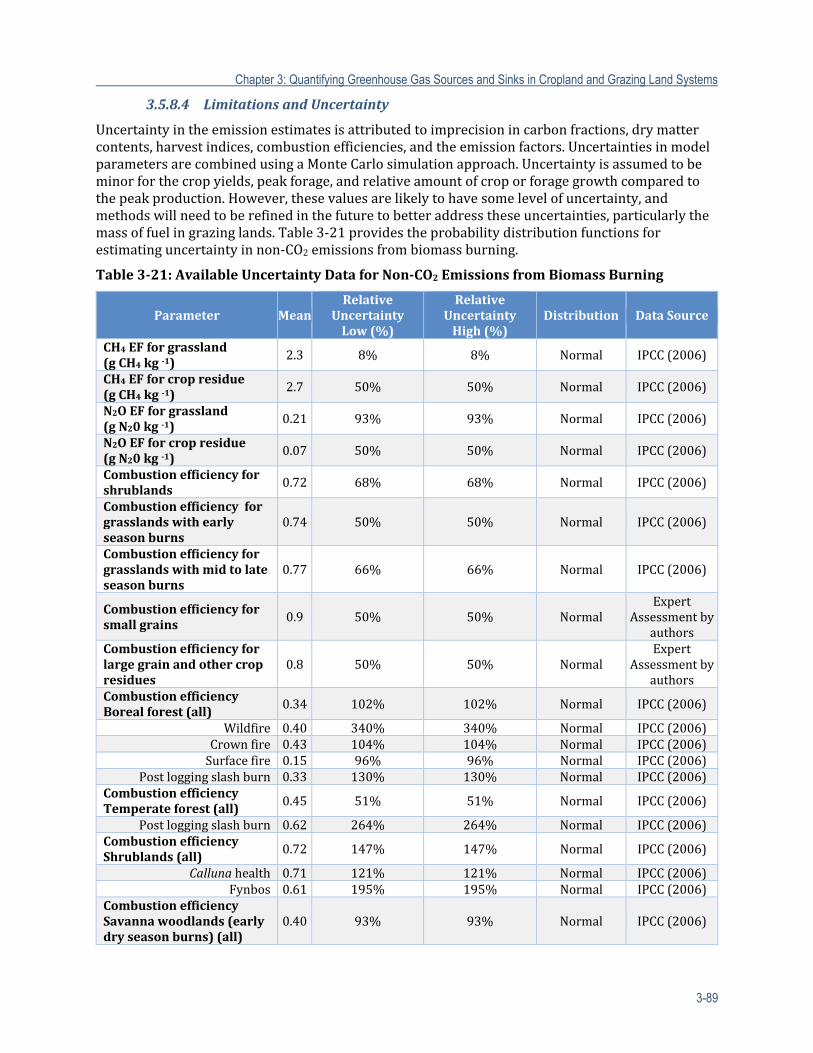
Chapter 3: Quantifying Greenhouse Gas Sources and Sinks in Cropland and Grazing Land Systems
3-89
3.5.8.4 LimitationsandUncertainty
Uncertaintyintheemissionestimatesisattributedtoimprecisionincarbonfractions,drymattercontents,harvestindices,combustionefficiencies,andtheemissionfactors.UncertaintiesinmodelparametersarecombinedusingaMonteCarlosimulationapproach.Uncertaintyisassumedtobeminorforthecropyields,peakforage,andrelativeamountofcroporforagegrowthcomparedtothepeakproduction.However,thesevaluesarelikelytohavesomelevelofuncertainty,andmethodswillneedtoberefinedinthefuturetobetteraddresstheseuncertainties,particularlythemassoffuelingrazinglands.Table3‐21providestheprobabilitydistributionfunctionsforestimatinguncertaintyinnon‐CO2emissionsfrombiomassburning.
Table3‐21:AvailableUncertaintyDataforNon‐CO2EmissionsfromBiomassBurning
Parameter MeanRelative
UncertaintyLow(%)
RelativeUncertaintyHigh(%)
Distribution DataSource
CH4EFforgrassland(gCH4kg‐1)
2.3 8% 8% Normal IPCC(2006)
CH4EFforcropresidue(gCH4kg‐1)
2.7 50% 50% Normal IPCC(2006)
N2OEFforgrassland(gN20kg‐1)
0.21 93% 93% Normal IPCC(2006)
N2OEFforcropresidue(gN20kg‐1)
0.07 50% 50% Normal IPCC(2006)
Combustionefficiencyforshrublands
0.72 68% 68% Normal IPCC(2006)
Combustionefficiencyforgrasslandswithearlyseasonburns
0.74 50% 50% Normal IPCC(2006)
Combustionefficiencyforgrasslandswithmidtolateseasonburns
0.77 66% 66% Normal IPCC(2006)
Combustionefficiencyforsmallgrains
0.9 50% 50% NormalExpert
Assessmentbyauthors
Combustionefficiencyforlargegrainandothercropresidues
0.8 50% 50% NormalExpert
Assessmentbyauthors
CombustionefficiencyBorealforest(all) 0.34 102% 102% Normal IPCC(2006)
Wildfire 0.40 340% 340% Normal IPCC(2006)Crownfire 0.43 104% 104% Normal IPCC(2006)Surfacefire 0.15 96% 96% Normal IPCC(2006)
Postloggingslashburn 0.33 130% 130% Normal IPCC(2006)CombustionefficiencyTemperateforest(all) 0.45 51% 51% Normal IPCC(2006)
Postloggingslashburn 0.62 264% 264% Normal IPCC(2006)CombustionefficiencyShrublands(all)
0.72 147% 147% Normal IPCC(2006)
Callunahealth 0.71 121% 121% Normal IPCC(2006)Fynbos 0.61 195% 195% Normal IPCC(2006)
CombustionefficiencySavannawoodlands(earlydryseasonburns)(all)
0.40 93% 93% Normal IPCC(2006)
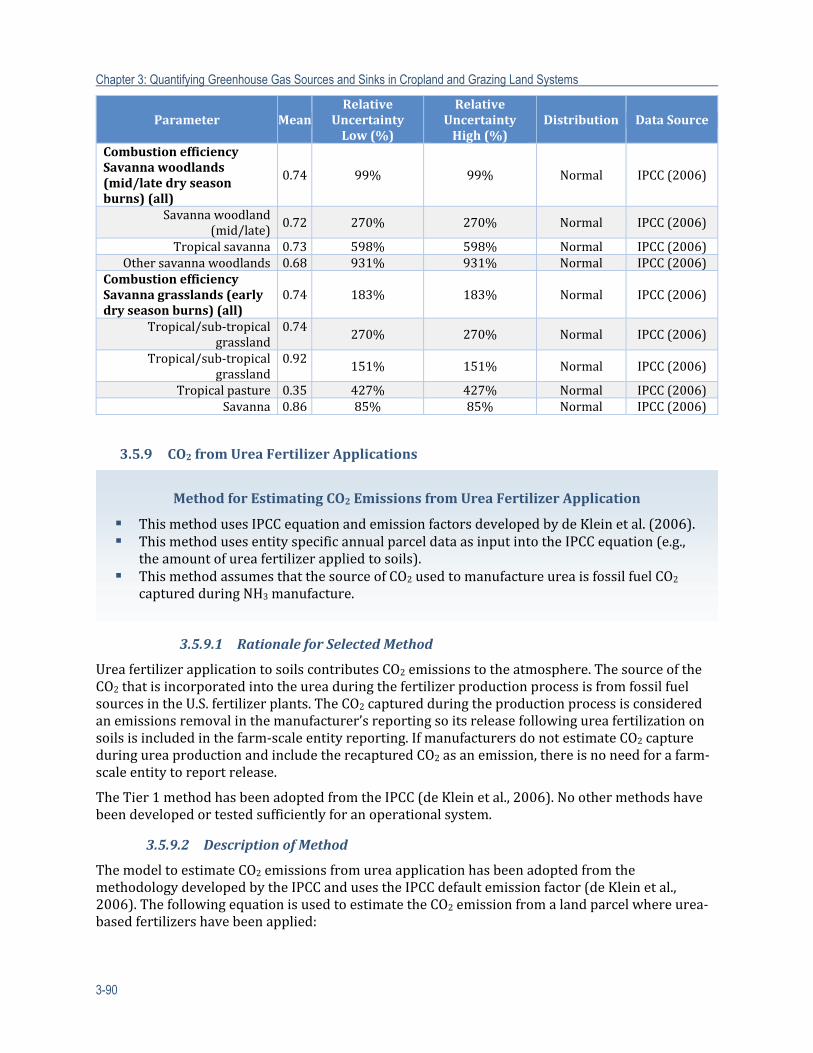
Chapter 3: Quantifying Greenhouse Gas Sources and Sinks in Cropland and Grazing Land Systems
3-90
Parameter MeanRelative
UncertaintyLow(%)
RelativeUncertaintyHigh(%)
Distribution DataSource
CombustionefficiencySavannawoodlands(mid/latedryseasonburns)(all)
0.74 99% 99% Normal IPCC(2006)
Savannawoodland(mid/late)
0.72 270% 270% Normal IPCC(2006)
Tropicalsavanna 0.73 598% 598% Normal IPCC(2006)Othersavannawoodlands 0.68 931% 931% Normal IPCC(2006)CombustionefficiencySavannagrasslands(earlydryseasonburns)(all)
0.74 183% 183% Normal IPCC(2006)
Tropical/sub‐tropicalgrassland
0.74270% 270% Normal IPCC(2006)
Tropical/sub‐tropicalgrassland
0.92151% 151% Normal IPCC(2006)
Tropicalpasture 0.35 427% 427% Normal IPCC(2006)Savanna 0.86 85% 85% Normal IPCC(2006)
3.5.9 CO2fromUreaFertilizerApplications
3.5.9.1 RationaleforSelectedMethod
UreafertilizerapplicationtosoilscontributesCO2emissionstotheatmosphere.ThesourceoftheCO2thatisincorporatedintotheureaduringthefertilizerproductionprocessisfromfossilfuelsourcesintheU.S.fertilizerplants.TheCO2capturedduringtheproductionprocessisconsideredanemissionsremovalinthemanufacturer’sreportingsoitsreleasefollowingureafertilizationonsoilsisincludedinthefarm‐scaleentityreporting.IfmanufacturersdonotestimateCO2captureduringureaproductionandincludetherecapturedCO2asanemission,thereisnoneedforafarm‐scaleentitytoreportrelease.
TheTier1methodhasbeenadoptedfromtheIPCC(deKleinetal.,2006).Noothermethodshavebeendevelopedortestedsufficientlyforanoperationalsystem.
3.5.9.2 DescriptionofMethod
ThemodeltoestimateCO2emissionsfromureaapplicationhasbeenadoptedfromthemethodologydevelopedbytheIPCCandusestheIPCCdefaultemissionfactor(deKleinetal.,2006).ThefollowingequationisusedtoestimatetheCO2emissionfromalandparcelwhereurea‐basedfertilizershavebeenapplied:
MethodforEstimatingCO2 EmissionsfromUreaFertilizerApplication
ThismethodusesIPCCequationandemissionfactorsdevelopedbydeKleinetal.(2006). ThismethodusesentityspecificannualparceldataasinputintotheIPCCequation(e.g.,
theamountofureafertilizerappliedtosoils). ThismethodassumesthatthesourceofCO2usedtomanufactureureaisfossilfuelCO2
capturedduringNH3manufacture.
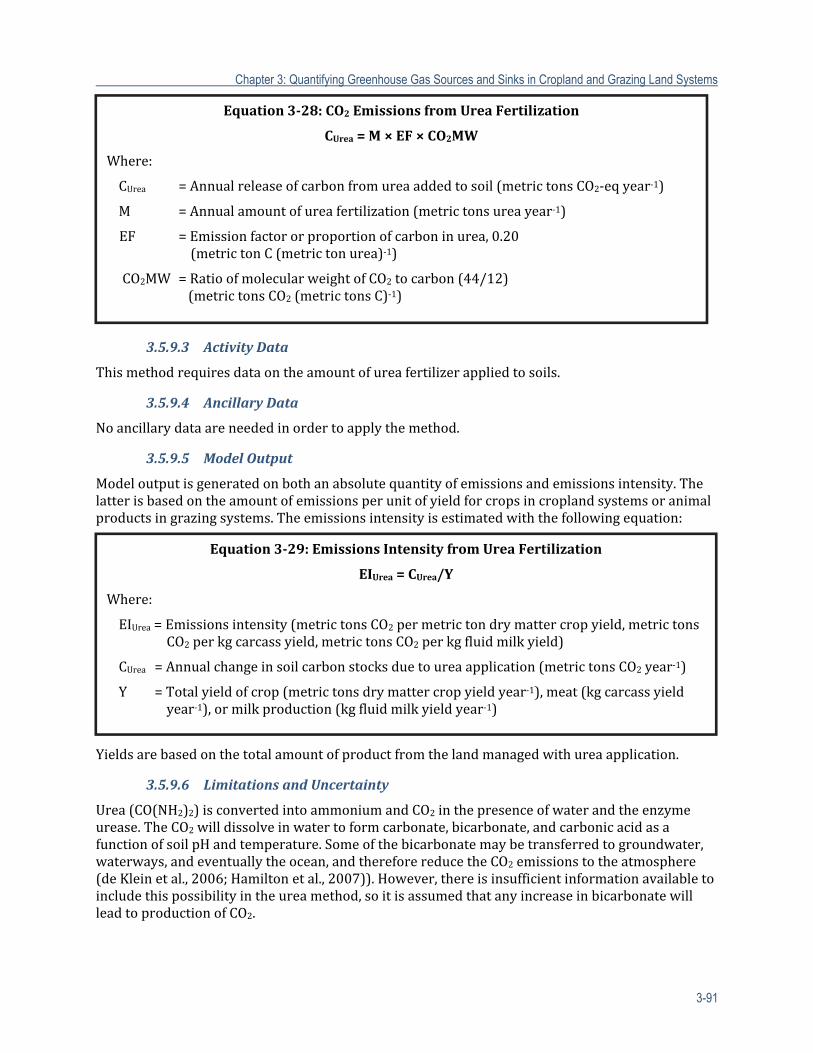
Chapter 3: Quantifying Greenhouse Gas Sources and Sinks in Cropland and Grazing Land Systems
3-91
3.5.9.3 ActivityData
Thismethodrequiresdataontheamountofureafertilizerappliedtosoils.
3.5.9.4 AncillaryData
Noancillarydataareneededinordertoapplythemethod.
3.5.9.5 ModelOutput
Modeloutputisgeneratedonbothanabsolutequantityofemissionsandemissionsintensity.Thelatterisbasedontheamountofemissionsperunitofyieldforcropsincroplandsystemsoranimalproductsingrazingsystems.Theemissionsintensityisestimatedwiththefollowingequation:
Yieldsarebasedonthetotalamountofproductfromthelandmanagedwithureaapplication.
3.5.9.6 LimitationsandUncertainty
Urea(CO(NH2)2)isconvertedintoammoniumandCO2inthepresenceofwaterandtheenzymeurease.TheCO2willdissolveinwatertoformcarbonate,bicarbonate,andcarbonicacidasafunctionofsoilpHandtemperature.Someofthebicarbonatemaybetransferredtogroundwater,waterways,andeventuallytheocean,andthereforereducetheCO2emissionstotheatmosphere(deKleinetal.,2006;Hamiltonetal.,2007)).However,thereisinsufficientinformationavailabletoincludethispossibilityintheureamethod,soitisassumedthatanyincreaseinbicarbonatewillleadtoproductionofCO2.
Equation3‐28:CO2 EmissionsfromUreaFertilization
CUrea=M×EF×CO2MW
Where:
CUrea =Annualreleaseofcarbonfromureaaddedtosoil(metrictonsCO2‐eqyear‐1)
M =Annualamountofureafertilization(metrictonsureayear‐1)
EF =Emissionfactororproportionofcarboninurea,0.20 (metrictonC(metrictonurea)‐1)
CO2MW=RatioofmolecularweightofCO2tocarbon(44/12) (metrictonsCO2(metrictonsC)‐1)
Equation3‐29:EmissionsIntensityfromUreaFertilization
EIUrea=CUrea/Y
Where:
EIUrea=Emissionsintensity(metrictonsCO2permetrictondrymattercropyield,metrictonsCO2perkgcarcassyield,metrictonsCO2perkgfluidmilkyield)
CUrea =Annualchangeinsoilcarbonstocksduetoureaapplication(metrictonsCO2year‐1)
Y =Totalyieldofcrop(metrictonsdrymattercropyieldyear‐1),meat(kgcarcassyieldyear‐1),ormilkproduction(kgfluidmilkyieldyear‐1)
Chapter 3: Quantifying Greenhouse Gas Sources and Sinks in Cropland and Grazing Land Systems
3-92
Uncertaintyisassumedtobeminorforthemanagementactivitydataprovidedbytheentity,althoughthismaynotbethecaseifthereislimitedknowledgeaboutlandusehistoryforindividualparcels.Uncertaintymayalsoexistintheemissionfactor,assumingthatsomeofthebicarbonateisnotconvertedtoCO2.However,themethodassumesallCO2isemittedbecauseuncertaintyestimatesarenotavailableforthisemissionfactor.Therefore,nouncertaintyisestimatedforthissourceofGHGemissionsbasedonthisconservativeassumptionthatallCO2isemitted.
3.6 SummaryofResearchGapsforCropandGrazingLandManagement
ThissectiondiscussesresearchgapsassociatedwithcroplandandgrazinglandmanagementimpactsonsoilcarbonstockchangesandGHGemissions.Thelistisnotnecessarilyexhaustive,buthighlightssomekeygapsthatwillneedfurtherresearchbeforethereissufficientevidenceforadditionalcriteriatobeincludedinthemethodology.Ingeneral,themajorityofpriorexperimentaleffortshavefocusedoncomponentsofGHGs,butfewstudieshavebeenconductedontotalGHGbudgetstoincludeCO2,N2O,andCH4incombination,whichisneededtoquantifyinteractingeffectsonthenetemissionsofthesegases(Liebigetal.,2010).Inaddition,limitedresearchhasbeenconductedtoaddresstheinfluenceofcatastrophicweathereventsonGHGemissions,suchasmajorfloods,tornadoes,andhurricanes.
CarbonStocks:10Thefollowingprocessesandpracticesrequirefurtherstudytoimprovethefundamentalunderstandingorfilldatagapsinthecarboninventorymethods.Inparticular,deficienciesinunderstandingcontinuetounderminethedevelopmentofrobustestimatesofnetGHGemissionsinrangelandsandpastures.Suchdeficienciesstemfromalackofmeasurementsacrossthemajorgrasslandecoregions,aswellaslimitationsassociatedwithbasicunderstandingofmechanisticprocessesrelatedtoGHGfluxes.Therearealsomajorgapswithrespecttoagroforestry,woodyplantencroachment,andperennialwoodycropsystems.
Moredataonallometricrelationshipsforagroforestry,woodyplantencroachment,andperennialwoodycropsystems,suchasorchards.
Improvedabilitytoquantifytheinfluenceofagroforestry,woodyplantencroachment,andperennialwoodycropsonsoilorganiccarbonstocks,includingoptimaldensityoftrees,thetypeoftrees,andthelandscapepositionofsilvopasturesystems.
Improvedmechanisticunderstandingandabilitytoquantifythefateofcarbonwithtransportandsedimentationfollowingerosionevents.
Fieldestimatesoftheamountofcarbonaddedtosoilsthroughdynamicreplacementonerodiblelands.
Improvedmechanisticunderstandingofcarbondynamicsinthesubsoilhorizons. Furtherstudyontheeffectofirrigationonplantproductionanddecompositiontoquantify
theneteffectonsoilorganiccarbonstocks. Furtherresearchonthevariationintypesandresidencetimesofbiocharamendments,in
additiontobiocharimpactonotherGHGemissions,primingofsoilorganicmatterdecomposition,andtheoverallphysicalbreakdownanddisintegrationofbiocharovertime(Jafféetal.,2013).
Dataonlong‐termresponsesofsoilorganiccarbontovariationinstockingrate,grazingmethod(i.e.,continuous,rotational,short‐durationrotational,andultra‐highstockingdensity),andvegetationcomposition(i.e.,forbandgrassmixtures,cool‐andwarm‐seasongrassmixtures,grassandlegumemixtures,grassandwoodymixtures,andplantarchitecturetypes),andwhethertheseresponsesaremediatedbydifferentsoilstypes,climaticconditions,botanicalcomposition,grazingmethodused,fertilizerregime,etc.
10Exceptagroforestrycarbonstockchanges,whicharecoveredlaterinthissection.
Chapter 3: Quantifying Greenhouse Gas Sources and Sinks in Cropland and Grazing Land Systems
3-93
FurtherstudytoaddressmitigationofGHGsinaridrangelands,particularlyinshrublands,includinginteractionsbetweenmanagementandenvironmentalconditions(Ingrametal.,2008).Additionaldatacollectionandmodelimprovementarealsoneededinaridrangelands,asuncertaintyisextremelylargeforthesoilcarbonsequestrationestimatesassociatedwithreducedstockingratesandseedingoflegumes(Brownetal.,2010;Brown,2010).OurbasicknowledgeofcarbonsequestrationandGHGmitigationinaridandsemiaridenvironmentsislimited,andtheeffectofmanagementisrelativelyunderstudied.
Needforlife‐cycleassessmentofgrazingsystemswithparticularattentiontobalanceofsoilorganiccarbon,N2Oemissionsfromsoil,andCH4emissionsfromruminantsandsoil,dependingonstockingrate,stockingmethod,foragetypeassociatedwithqualityofintake,andenvironmentalconditionsofgrazingsystem.
DatafromadaptivemanagementapproachestoinformunderstandingofsoilorganiccarbonsequestrationandGHGemissionsunderdifferentgrazingmanagementstrategies.Thisapproachcouldhelpstrengthenconservation‐orientedprogramstoobtaingreaterimpactforreducingGHGemissionsandsequesteringsoilorganicC.
Additionalfieldexperimentsanddataonsoilcarbonemissionsresultingfromthecombinedapplicationoflimeandnitrogenfertilizers.
SoilNitrousOxideEmissions:Thefollowingpracticeshave,insomestudies,significantlyaffectedN2Oemissions,butrequireadditionalresearchinside‐by‐sidecomparisonstudiesacrossdifferentsoiltypesandclimate,especiallyforextensivelygrownrowcropsthatreceivehighlevelsofnitrogenfertilizers(cornandwheatinparticular):
EffectsofsplitordelayednitrogenapplicationsonloweringN2OfluxesandonincreasingNUEtoprovideequivalentyieldsatlowertotalnitrogeninput.
Capacityofspatiallyprecisefertilizerapplicationtechnology(variablerateapplicators)tolowerN2Ofluxes(bothdirectandindirect)andincreaseNUE.
Effectsofbandednitrogenfertilizerapplications,showninsomestudiestoincreaseNUEandinotherstoincreaseN2Oemissions.
ThegeneralizabilityofhigherN2OEFsandnitratelossatnitrogenfertilizerratesgreaterthancropneeds(i.e.,atratesgreaterthanthoserecommendedbyMaximumReturntoNitrogenapproaches).
ThegeneralizabilityofdifferentfertilizerformulationsonN2Oemissions,inparticularforureavs.anhydrousammoniavs.injectedsolutions.
Thegeneralizabilityofcoatedfertilizerssuchaspolymercoatedurea,ureaseinhibitors,biocharadditions,andnitrificationinhibitorsforloweringN2Oemissionsandnitrateloss.
MoreresearchontheresponsesofsoilN2Oemissionstovariationsinstockingrates,grazingmethods(continuous,rotational,short‐durationrotational,andultra‐highstockingdensity),andvegetationcomposition(forbandgrassmixtures,cool‐andwarm‐seasongrassmixtures,grassandlegumemixtures,grassandwoodymixtures,andplantarchitecturetypes),bothindividuallyandincombinations.
ThepotentialformobilewaterandsheltersourcesinpasturestoreduceN2Oemissionsbyallowingforamoreevendistributionofmanure.
InfluenceofcropresidueharvestingonN2Oemissions,aswellassoilorganiccarbonstocks,giventheinterestinusingcropresiduesasafeedstockforbioenergyproduction.
InfluenceofcovercropsonN2Oemissions,includingeffectsofplanttype(e.g.,legumevs.nonlegume)andresiduemanagement(e.g.,harvestedvs.incorporated).
InfluenceofmanureandcompostonN2Oemissionsinsofaraseffectsmaydifferfromsyntheticnitrogeninputswithrespecttorate,timing,placement,andformoforganicnitrogenadded(e.g.,liquidvs.drymanurevs.compostwithdifferentC:Nratios).
Chapter 3: Quantifying Greenhouse Gas Sources and Sinks in Cropland and Grazing Land Systems
3-94
ImprovedquantificationofspatialandtemporalvariationofN2Oemissionsindifferentcroppingsystemsandlandscapestoprovideamoreaccurateassessmentofseasonalandannualemissionsacrosswholefields.
Improvedestimatesofindirectemissions,andinparticularthepercentageofnitrogenthatislostfromafieldthroughvolatilizationorleaching/runoff,andlaterconvertedtoN2Oindownstreamanddownwindecosystems.AdditionalstudyonpracticesthatcanreducenitratelossesaswellaspracticesthatcanreduceNH3andNOxlosses.
ResearchisalsoneededtoimprovemodelingandempiricalquantificationofsoilN2OemissionsinordertoprovideestimatesofN2Ofluxesthatintegrateacrossmultiplemanagementpracticessimultaneously:
FurtherdevelopmentandvalidationofquantitativesimulationmodelscapableofaccuratelypredictingN2Ofluxesinresponsetodifferingmanagementpractices,withparticularrespecttorate,timing,placement,andformulationofaddedfertilizers,bothsyntheticandorganic;tillagetypeandintensity;andresiduemanagement.
MoredataregardingseasonalandannualN2Oemissions,includingemissionsduringthenon‐growingseasonandinparticularwinterandfreeze‐thawperiods.
BetterknowledgeoffluxesacrossallLandResourceRegions(LRRs)concentratedespeciallyinthoseareasandcroppingandgrazedsystemsexpectedtocontributemosttolocalandregionalN2Ofluxes,withside‐by‐sidecomparisonsofdifferentmanagementpractices.
DevelopmentofstandardizedmethodologiesandcreationofnewtechnologiesforrapidassessmentofN2Ofluxesinthefield.
AnimprovedunderstandingofthesourcesofN2Oincroppedsoils(e.g.,nitrificationvs.denitrification)andconsequencesforfeedbacksamongadaptivemanagement,soilphysicalandbiologicalattributes,andSOCdynamics.
DevelopmentofasetofgeographicallystratifiedtestsitesatwhichfactorsknowntoaffectagronomicN2Oemissionscouldbetestedinthecontextofdifferentmanagementsystems.ThiswouldprovidearobustempiricaldatasetforestablishingTier2and3models.
FloodedRiceProductionEmissions:TheprimaryresearchgapisthelimitedamountofresearchconductedintheUnitedStatesonGHGfromricesystems.Therefore,mostofthecurrentconclusionsaboutmanagementinfluencesonriceCH4emissionsarebasedonAsianstudieswherericeistransplantedasopposedtodirectseeded.ThismaybeproblematicbecausewaterismanageddifferentlyinAsiantransplantedfloodedricesystemsduringtheestablishmentperiodthaninU.S.systems.Untilrecently,nostudiesevaluatedseasonalorannualN2OemissionsfromricesystemsintheUnitedStates(Adviento‐Borbeetal.,2007;Pittelkowetal.,2013).IntheUnitedStates,muchoftheresearchonGHGemissionscomesfromLouisiana,Texas,andCalifornia.Lindau’slabconductedonstationresearchinLouisianatoevaluateCH4emissions(e.g.,Lindauetal.,1995;Lindauetal.,1998).Sass’sgroupalsoevaluatedCH4emissionsonexperimentalstationsinTexas(e.g.,Huangetal.,1997;Sassetal.,1994).InCalifornia,variousresearchergroups(e.g.,Bossioetal.,1999;Fitzgeraldetal.,2000)havebeenconductingresearchbothonstationandoffstationandhaverecentlyalsoincludedN2Omeasurements(Adviento‐Borbeetal.,2007;Pittelkowetal.,2013).
ThefollowingpracticeshaveinsomestudiessignificantlyaffectedCH4orN2Oemissionsbutrequirefurtherside‐by‐sidecomparisonswithexperimentaldesignsacrossdifferentsoiltypesandclimateswithintheUnitedStates.
Watermanagementpractices(inparticularmidseasondrainsorintermittentirrigation)areoftensuggestedasviableoptionstomitigateCH4emissions.Whiledatasupportthisconclusion,thesemanagementpracticeshavenotbeenwidelytestedintheUnitedStates.In
Chapter 3: Quantifying Greenhouse Gas Sources and Sinks in Cropland and Grazing Land Systems
3-95
studieswherethesoilhasbeendrainedduringtheseason,investigatorshavereporteddelayedcropmaturation(aproblemintemperateclimateswithrelativelyshortgrowingseasons),reducedyieldsandgrainquality,andincreasedweedanddiseasepressure.Therefore,althoughmidseasondrainageismentionedasamitigationoption,moreresearchisrequiredbeforeitisrecommendedforuseinU.S.ricesystems.
ReturningricestrawtosoiloftenresultsinincreasedCH4emissions,buttheremovalofstrawrequiresenergyandtime.Furthercompoundingtheproblemisthattherearerelativelyfewusesforricestraw.Theremovalofricestrawalsoremovesnutrientswhichwouldneedtobereplaced.Ofparticularconcernispotassium,asricestrawcontainsanaverageof1.4percentofpotassium.Therefore,itispossibletoremovemorethan100kg/haofpotassiumthroughremovalofricestraw,whichwillneedtobereplacedinordertomaintainasustainablecroppingsystem.
InCalifornia,farmerstypicallyincorporatericestrawandfloodtofacilitatestrawdecompositionduringthewinter.ThispracticeincreasesCH4emissionsfromricefieldsduringthewinterandthefollowinggrowingseason.However,ithasalsosignificantlyimprovedhabitatforoverwinteringwaterfowlinthePacificFlyway.Fitzgeraldetal.(2000)reportedthatuptohalfoftheannualCH4emissionsoccurredduringthewinterfallowperiodwhenstrawwasincorporatedandflooded.Recentstudiessuggestthat50percentmaybeahighestimateandthatfurtherresearchisneeded(Adviento‐Borbeetal.,2007;Pittelkowetal.,2013).
WhilemanystudieshaveshownvarietaldifferencesinhowmuchCH4isemitted,thesestudiesareallrelativelyoldandmanyofthevarietiesarenolongerwidelyused.Furtherresearchoncurrentvarietiesneedstobeconducted.
LimiteddataonnitrogenplacementsuggeststhatdeepplacementoffertilizerreducesCH4emissions,butmoreresearchisneededtoconfirmthefindings.
Side‐by‐sidecomparisonswithexperimentaldesignsareneededofwet‐anddry‐seededricetoevaluatetheirinfluenceonCH4andN2Oemissions.ThesearethetwomostcommonriceestablishmentpracticesintheUnitedStates.
SomestudiesfromChinasuggestthatmorecarbonissequesteredinricesystemsthaninupland(aerobic)systems,butthishasnotbeenevaluatedintheUnitedStates.
Agroforestry:Asufficientdatabasefordevelopingthemethodstoreadilymeasureand/ormodelthevariousGHGimpactsofagroforestryiscurrentlylacking.FullGHGmonitoringandaccountinginagroforestrywillrequireamixofmethodologiesfromamongtheGHGaccountingframeworksbecauseofthediversityinusesassociatedwithagroforestrysystems.Thefollowingresearchgapsarehighlighted.
Assessmentofapproachesforestimatingwoodybiomassinagroforestryplantings,whichincludescomparisonofexistingequationsandlookuptableswithagroforestry‐generatedvolumeandbiomassequationstodeterminebestapproachforestimatingcarboninthewoodybiomassofagroforestryplantings.
Developmentofeffectivestrategiesformeasuring/monitoringcarbonsequestrationandGHGemissionsinsoilandwoodycomponents.
EffectofdifferentspeciesmixturesandcombinationsofmanagementactivitiesonsoilcarbonsequestrationandminimizingtotalGHGemissions.
ImpactofmanagementoptionsandenvironmentinteractionsoncarbonsequestrationandtotalGHGemissionswithinagroforestrysystems.
Developmentoftoolsrelevanttotheinventory/measurement/estimationofthese“treesoutsideofforests.”Inaddition,testingthevalidityofcurrentcarbonaccountingtools(e.g.,DAYCENT,HOLOS)inprovidingaccurateestimatesofcarbonsequesteredinthewoodybiomassofagroforestryplantings.
Chapter 3: Quantifying Greenhouse Gas Sources and Sinks in Cropland and Grazing Land Systems
3-96
Understandingsoilcarbondynamicsinagroforestrysystems,alongwiththeimpactofsoilerosion,transportanddepositiononcarbonstocks.
Developinginventorymethodologies(suchastheuseofLightDetectionandRanging)toestablishacost‐effectivenationalagroforestryinventorycompatibleforinclusionwithcurrentinventoriescontributingtoregional/nationalGHGassessments.
Developingstandardizedexperimentalprocedures,measurement,andmonitoringprotocols,suchasthosebeingdevelopedthroughtheGreenhouseGasReductionthroughAgriculturalCarbonEnhancementnetwork(GRACEnet)11toagroforestrypracticeswiththestandardizedmeasurementandmonitoringforagriculturalN2Oemissions.
MethaneOxidationinSoils:SoilCH4oxidationisknowntodecreaseby~70percentuponconversionoflongstandingnaturalvegetationtocropandpastureland(seeSection3.5.5).CH4oxidationratesforsoilsundernaturalvegetationarenotwellknownforallclimatesandsoils,soadditionalmeasurementswouldbeuseful.AswithN2O,thefurtherdevelopmentandvalidationofquantitativesimulationmodelscapableofaccuratelypredictingCH4fluxeswouldalsobehelpfulforbettergeneralizingeffectsandforfutureinclusionoffactorsthatmaybediscoveredtorestoreoxidationincroppedsoils.ThereisalsolimitedresearchontheeffectofgrazinglandmanagementonCH4oxidationalthoughvariationinstockingrates,grazingmethods,andassociatedpracticesmayhaveaninfluenceonthisprocess.
InorganicSoilCarbon:TheeffectofmanagementonsoilinorganiccarbondynamicsandexchangeofCO2withtheatmosphereisalsoinneedoffurtherresearch.ThefollowinglistisabriefsummaryofsomeofthekeygapsidentifiedforquantificationofGHGemissions:
Wheninorganiccarbonisaddedtosoilasagriculturallimeorasabreakdownproductofurea,partoftheinorganiccarbonbecomesbicarbonate.ImprovedunderstandingofthefateofthisbicarbonateindifferentsoilsandlandscapeswouldhelptobettercharacterizethepresenceandstrengthoftheresultingbicarbonateCO2sink.
ImprovedquantificationofemissionsoruptakeofatmosphericCO2withadditionofcarbonatelimestosoilswillrequiremethodstodeterminethedominanceofweatheringduetocarbonicacid(H2CO3)vs.thestrongernitricacid(HNO3)incroplandandgrazinglandsoils.
Improvedmechanisticunderstandingandquantificationofinorganiccarbondynamicsareneededinirrigatedsystems,aswellasinnonirrigatedsystems—particularlyinaridandsemiaridregions.
11GRACEnetisaresearchprograminitiatedbyUSDAAgriculturalResearchServiceto“identifyandfurtherdevelopagriculturalpracticesthatwillenhancecarbonsequestrationinsoils,promotesustainability,andprovideasoundscientificbasisforcarboncreditsandtradingprograms”(USDAARS,2013).
Chapter 3: Quantifying Greenhouse Gas Sources and Sinks in Cropland and Grazing Land Systems
3-97
Appendix3‐A:SoilN2OModelingFrameworkSpecifications
SoilN2Oemissionsareestimatedusingacombinationofprocess‐basedmodeling,empiricalscalarsbasedonexperimentaldata,andscalingfactorsforpracticesinfluencingtheN2Oemissionsasrepresentedinthebaseemissionrates(Section3.5.4.1,Equations3‐8and3‐9,andTextbox3‐1).Thisappendixprovidesmoreinformationabouttheprocess‐basedmodels,inadditiontothederivationofempiricalscalarsandthepractice‐basedscalingfactors.
DAYCENTandDNDCmodelswereusedtoestimateN2Oemissionsforthetypicalfertilizerrateanda0‐levelnitrogenfertilizationrateassociatedwithmajorcropsineachUSDALRR.CropssimulatedarelistedinTable3‐A.1;baseemissionratesforothercrops(e.g.,sugarcane,millet,rye)wereestimatedusingtheTier1emissionfactor(onepercentofnitrogeninputs).Toestimateemissionfactorsfromthemodeloutput,theN2Oemissionsatthe0‐leveladditionwassubtractedfromtheN2Oemissionforthetypicalfertilizationrate.Thedifferencewasthendividedbythesyntheticagronomicnitrogeninputtoestimatetheemissionfactoratthetypicalrateoffertilization.ScalarswereusedtoscaletheN2Oemissionsforfertilizationratesthatweregreaterthanthetypicalrate.Thescalarswerederivedfromempiricaldatabasedonthechangeinemissionfactorsacrossarangeoffertilizationrates.SeeTextbox3‐1formoreinformationabouthowtheresultingemissionfactorswereusedtoestimatebaseemissionratesforthedirectsoilN2Omethod.
Meta‐analyseswereusedtoderivepractice‐basedscalingfactorsfromexperimentaldata.ThescalingfactorswereusedtoadjustthebaseemissionratesforspecificpracticesthatinfluencesoilN2Oemissions.Thescalingfactorsincludedtheeffectofnitrificationinhibitors(Sinh),slow‐releasefertilizers(SSR),pasture/range/paddockmanure(SPRP),andtillage(Still).TheresultingscalingfactorsareusedinEquation3‐9toscalethebaseemissionratesforlandparcelsmanagedwiththesepractices.
Figure3‐A.1providesanoverviewofthedecisionsandstepsinvolvedinestimatingN2Oemissionsfrommineralsoils.
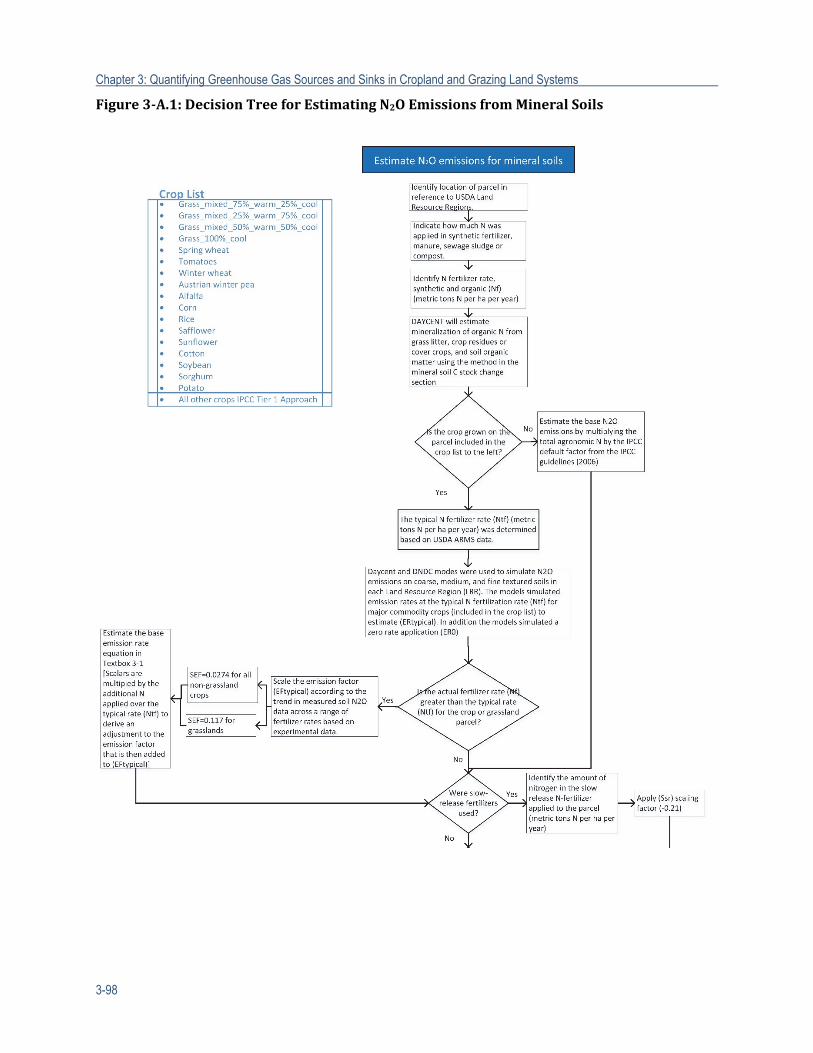
Chapter 3: Quantifying Greenhouse Gas Sources and Sinks in Cropland and Grazing Land Systems
3-98
Figure3‐A.1:DecisionTreeforEstimatingN2OEmissionsfromMineralSoils
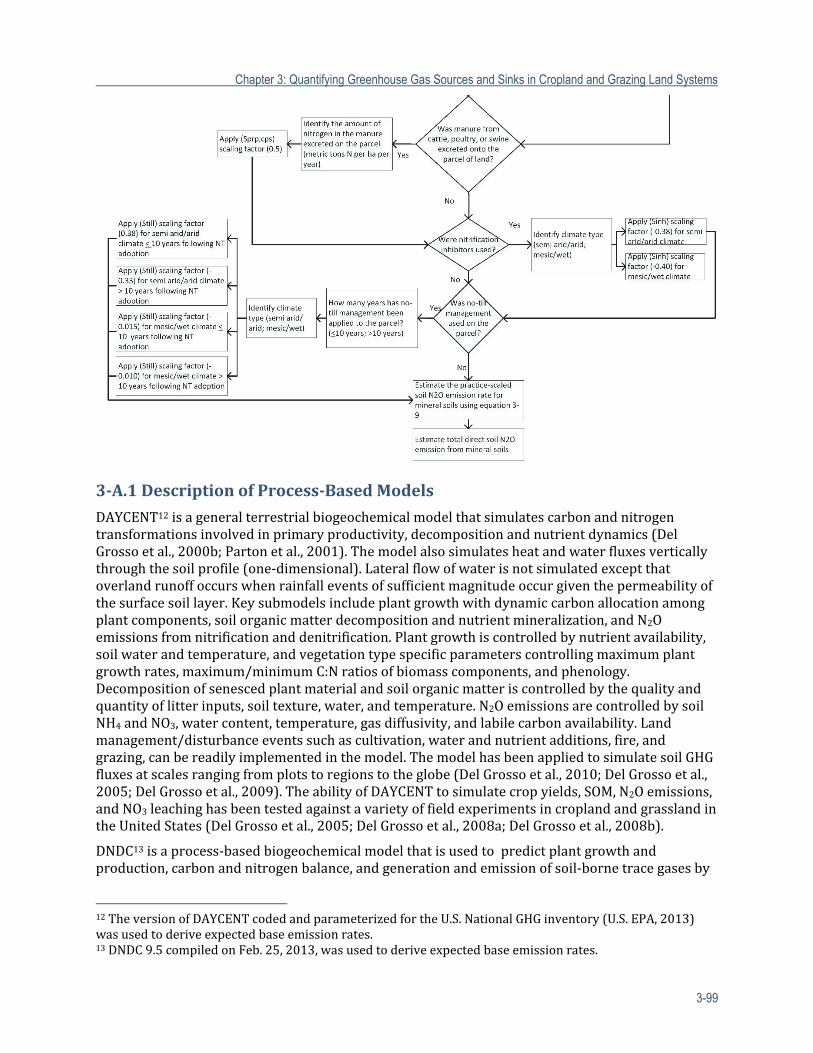
Chapter 3: Quantifying Greenhouse Gas Sources and Sinks in Cropland and Grazing Land Systems
3-99
3‐A.1DescriptionofProcess‐BasedModels
DAYCENT12isageneralterrestrialbiogeochemicalmodelthatsimulatescarbonandnitrogentransformationsinvolvedinprimaryproductivity,decompositionandnutrientdynamics(DelGrossoetal.,2000b;Partonetal.,2001).Themodelalsosimulatesheatandwaterfluxesverticallythroughthesoilprofile(one‐dimensional).Lateralflowofwaterisnotsimulatedexceptthatoverlandrunoffoccurswhenrainfalleventsofsufficientmagnitudeoccurgiventhepermeabilityofthesurfacesoillayer.Keysubmodelsincludeplantgrowthwithdynamiccarbonallocationamongplantcomponents,soilorganicmatterdecompositionandnutrientmineralization,andN2Oemissionsfromnitrificationanddenitrification.Plantgrowthiscontrolledbynutrientavailability,soilwaterandtemperature,andvegetationtypespecificparameterscontrollingmaximumplantgrowthrates,maximum/minimumC:Nratiosofbiomasscomponents,andphenology.Decompositionofsenescedplantmaterialandsoilorganicmatteriscontrolledbythequalityandquantityoflitterinputs,soiltexture,water,andtemperature.N2OemissionsarecontrolledbysoilNH4andNO3,watercontent,temperature,gasdiffusivity,andlabilecarbonavailability.Landmanagement/disturbanceeventssuchascultivation,waterandnutrientadditions,fire,andgrazing,canbereadilyimplementedinthemodel.ThemodelhasbeenappliedtosimulatesoilGHGfluxesatscalesrangingfromplotstoregionstotheglobe(DelGrossoetal.,2010;DelGrossoetal.,2005;DelGrossoetal.,2009).TheabilityofDAYCENTtosimulatecropyields,SOM,N2Oemissions,andNO3leachinghasbeentestedagainstavarietyoffieldexperimentsincroplandandgrasslandintheUnitedStates(DelGrossoetal.,2005;DelGrossoetal.,2008a;DelGrossoetal.,2008b).
DNDC13isaprocess‐basedbiogeochemicalmodelthatisusedtopredictplantgrowthandproduction,carbonandnitrogenbalance,andgenerationandemissionofsoil‐bornetracegasesby
12TheversionofDAYCENTcodedandparameterizedfortheU.S.NationalGHGinventory(U.S.EPA,2013)wasusedtoderiveexpectedbaseemissionrates.13DNDC9.5compiledonFeb.25,2013,wasusedtoderiveexpectedbaseemissionrates.
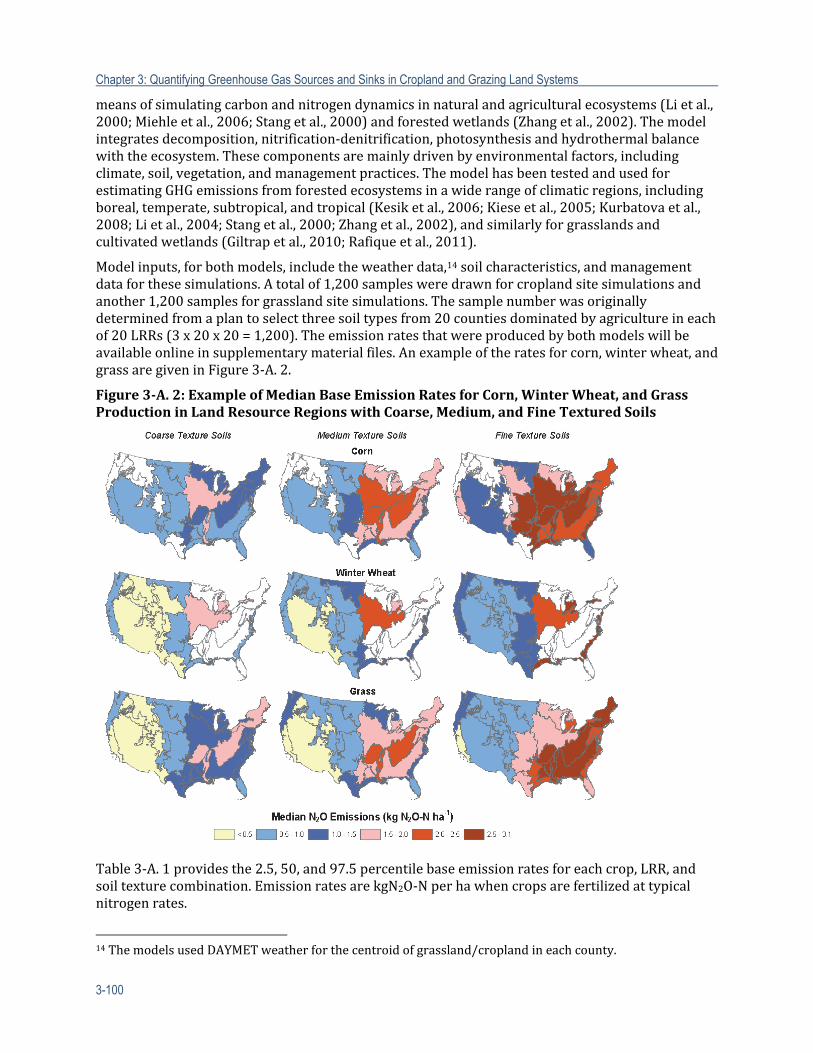
Chapter 3: Quantifying Greenhouse Gas Sources and Sinks in Cropland and Grazing Land Systems
3-100
meansofsimulatingcarbonandnitrogendynamicsinnaturalandagriculturalecosystems(Lietal.,2000;Miehleetal.,2006;Stangetal.,2000)andforestedwetlands(Zhangetal.,2002).Themodelintegratesdecomposition,nitrification‐denitrification,photosynthesisandhydrothermalbalancewiththeecosystem.Thesecomponentsaremainlydrivenbyenvironmentalfactors,includingclimate,soil,vegetation,andmanagementpractices.ThemodelhasbeentestedandusedforestimatingGHGemissionsfromforestedecosystemsinawiderangeofclimaticregions,includingboreal,temperate,subtropical,andtropical(Kesiketal.,2006;Kieseetal.,2005;Kurbatovaetal.,2008;Lietal.,2004;Stangetal.,2000;Zhangetal.,2002),andsimilarlyforgrasslandsandcultivatedwetlands(Giltrapetal.,2010;Rafiqueetal.,2011).
Modelinputs,forbothmodels,includetheweatherdata,14soilcharacteristics,andmanagementdataforthesesimulations.Atotalof1,200samplesweredrawnforcroplandsitesimulationsandanother1,200samplesforgrasslandsitesimulations.Thesamplenumberwasoriginallydeterminedfromaplantoselectthreesoiltypesfrom20countiesdominatedbyagricultureineachof20LRRs(3x20x20=1,200).Theemissionratesthatwereproducedbybothmodelswillbeavailableonlineinsupplementarymaterialfiles.Anexampleoftheratesforcorn,winterwheat,andgrassaregiveninFigure3‐A.2.
Figure3‐A.2:ExampleofMedianBaseEmissionRatesforCorn,WinterWheat,andGrassProductioninLandResourceRegionswithCoarse,Medium,andFineTexturedSoils
Table3‐A.1providesthe2.5,50,and97.5percentilebaseemissionratesforeachcrop,LRR,andsoiltexturecombination.EmissionratesarekgN2O‐Nperhawhencropsarefertilizedattypicalnitrogenrates.
14ThemodelsusedDAYMETweatherforthecentroidofgrassland/croplandineachcounty.
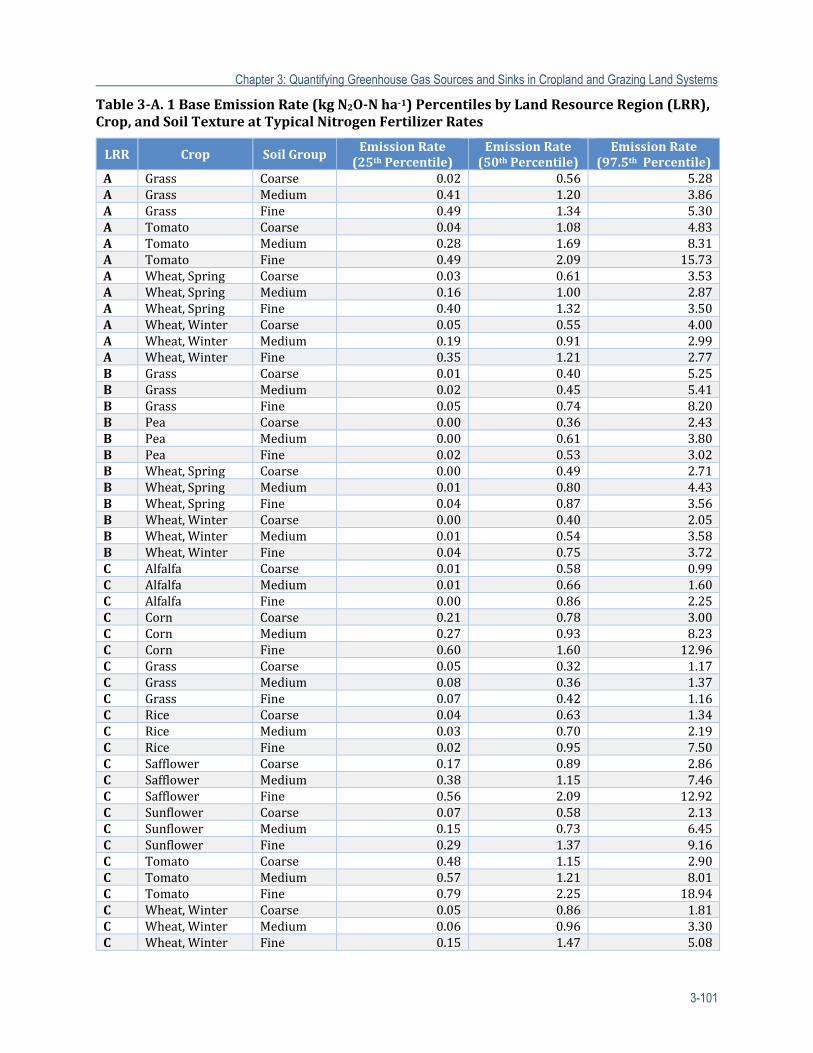
Chapter 3: Quantifying Greenhouse Gas Sources and Sinks in Cropland and Grazing Land Systems
3-101
Table3‐A.1BaseEmissionRate(kgN2O‐Nha‐1)PercentilesbyLandResourceRegion(LRR),Crop,andSoilTextureatTypicalNitrogenFertilizerRates
LRR Crop SoilGroupEmissionRate(25thPercentile)
EmissionRate(50thPercentile)
EmissionRate(97.5thPercentile)
A Grass Coarse 0.02 0.56 5.28A Grass Medium 0.41 1.20 3.86A Grass Fine 0.49 1.34 5.30A Tomato Coarse 0.04 1.08 4.83A Tomato Medium 0.28 1.69 8.31A Tomato Fine 0.49 2.09 15.73A Wheat,Spring Coarse 0.03 0.61 3.53A Wheat,Spring Medium 0.16 1.00 2.87A Wheat,Spring Fine 0.40 1.32 3.50A Wheat,Winter Coarse 0.05 0.55 4.00A Wheat,Winter Medium 0.19 0.91 2.99A Wheat,Winter Fine 0.35 1.21 2.77B Grass Coarse 0.01 0.40 5.25B Grass Medium 0.02 0.45 5.41B Grass Fine 0.05 0.74 8.20B Pea Coarse 0.00 0.36 2.43B Pea Medium 0.00 0.61 3.80B Pea Fine 0.02 0.53 3.02B Wheat,Spring Coarse 0.00 0.49 2.71B Wheat,Spring Medium 0.01 0.80 4.43B Wheat,Spring Fine 0.04 0.87 3.56B Wheat,Winter Coarse 0.00 0.40 2.05B Wheat,Winter Medium 0.01 0.54 3.58B Wheat,Winter Fine 0.04 0.75 3.72C Alfalfa Coarse 0.01 0.58 0.99C Alfalfa Medium 0.01 0.66 1.60C Alfalfa Fine 0.00 0.86 2.25C Corn Coarse 0.21 0.78 3.00C Corn Medium 0.27 0.93 8.23C Corn Fine 0.60 1.60 12.96C Grass Coarse 0.05 0.32 1.17C Grass Medium 0.08 0.36 1.37C Grass Fine 0.07 0.42 1.16C Rice Coarse 0.04 0.63 1.34C Rice Medium 0.03 0.70 2.19C Rice Fine 0.02 0.95 7.50C Safflower Coarse 0.17 0.89 2.86C Safflower Medium 0.38 1.15 7.46C Safflower Fine 0.56 2.09 12.92C Sunflower Coarse 0.07 0.58 2.13C Sunflower Medium 0.15 0.73 6.45C Sunflower Fine 0.29 1.37 9.16C Tomato Coarse 0.48 1.15 2.90C Tomato Medium 0.57 1.21 8.01C Tomato Fine 0.79 2.25 18.94C Wheat,Winter Coarse 0.05 0.86 1.81C Wheat,Winter Medium 0.06 0.96 3.30C Wheat,Winter Fine 0.15 1.47 5.08
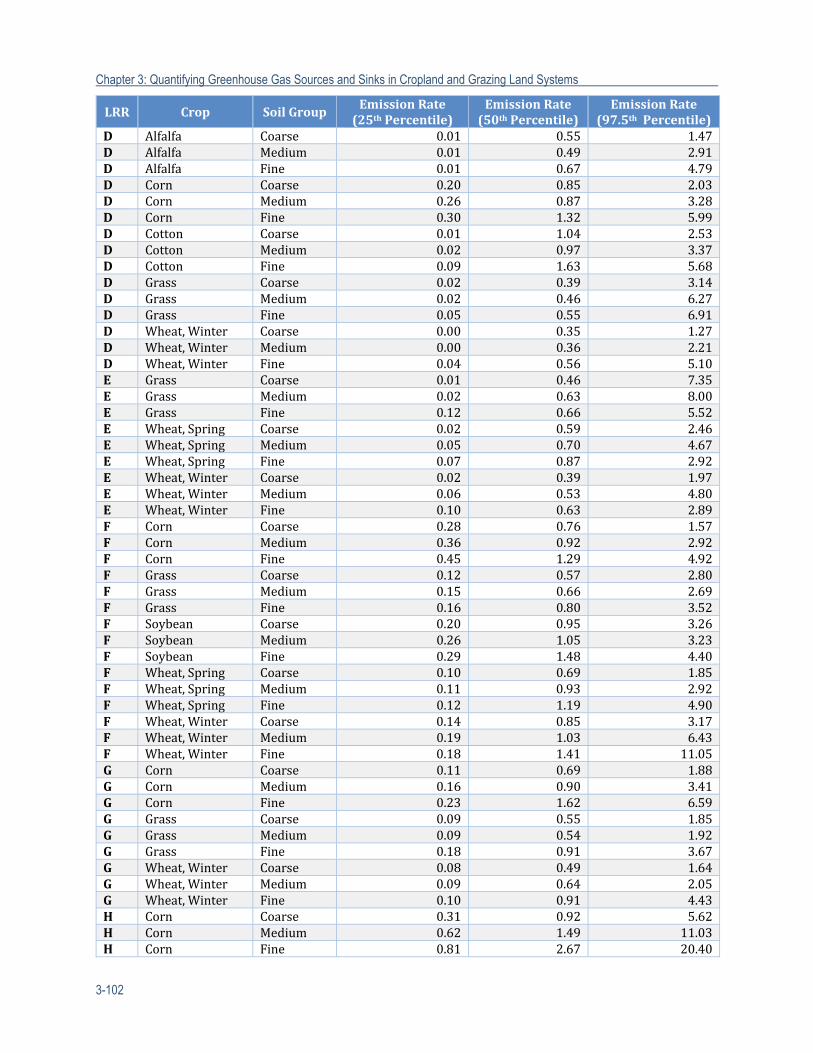
Chapter 3: Quantifying Greenhouse Gas Sources and Sinks in Cropland and Grazing Land Systems
3-102
LRR Crop SoilGroupEmissionRate(25thPercentile)
EmissionRate(50thPercentile)
EmissionRate(97.5thPercentile)
D Alfalfa Coarse 0.01 0.55 1.47D Alfalfa Medium 0.01 0.49 2.91D Alfalfa Fine 0.01 0.67 4.79D Corn Coarse 0.20 0.85 2.03D Corn Medium 0.26 0.87 3.28D Corn Fine 0.30 1.32 5.99D Cotton Coarse 0.01 1.04 2.53D Cotton Medium 0.02 0.97 3.37D Cotton Fine 0.09 1.63 5.68D Grass Coarse 0.02 0.39 3.14D Grass Medium 0.02 0.46 6.27D Grass Fine 0.05 0.55 6.91D Wheat,Winter Coarse 0.00 0.35 1.27D Wheat,Winter Medium 0.00 0.36 2.21D Wheat,Winter Fine 0.04 0.56 5.10E Grass Coarse 0.01 0.46 7.35E Grass Medium 0.02 0.63 8.00E Grass Fine 0.12 0.66 5.52E Wheat,Spring Coarse 0.02 0.59 2.46E Wheat,Spring Medium 0.05 0.70 4.67E Wheat,Spring Fine 0.07 0.87 2.92E Wheat,Winter Coarse 0.02 0.39 1.97E Wheat,Winter Medium 0.06 0.53 4.80E Wheat,Winter Fine 0.10 0.63 2.89F Corn Coarse 0.28 0.76 1.57F Corn Medium 0.36 0.92 2.92F Corn Fine 0.45 1.29 4.92F Grass Coarse 0.12 0.57 2.80F Grass Medium 0.15 0.66 2.69F Grass Fine 0.16 0.80 3.52F Soybean Coarse 0.20 0.95 3.26F Soybean Medium 0.26 1.05 3.23F Soybean Fine 0.29 1.48 4.40F Wheat,Spring Coarse 0.10 0.69 1.85F Wheat,Spring Medium 0.11 0.93 2.92F Wheat,Spring Fine 0.12 1.19 4.90F Wheat,Winter Coarse 0.14 0.85 3.17F Wheat,Winter Medium 0.19 1.03 6.43F Wheat,Winter Fine 0.18 1.41 11.05G Corn Coarse 0.11 0.69 1.88G Corn Medium 0.16 0.90 3.41G Corn Fine 0.23 1.62 6.59G Grass Coarse 0.09 0.55 1.85G Grass Medium 0.09 0.54 1.92G Grass Fine 0.18 0.91 3.67G Wheat,Winter Coarse 0.08 0.49 1.64G Wheat,Winter Medium 0.09 0.64 2.05G Wheat,Winter Fine 0.10 0.91 4.43H Corn Coarse 0.31 0.92 5.62H Corn Medium 0.62 1.49 11.03H Corn Fine 0.81 2.67 20.40
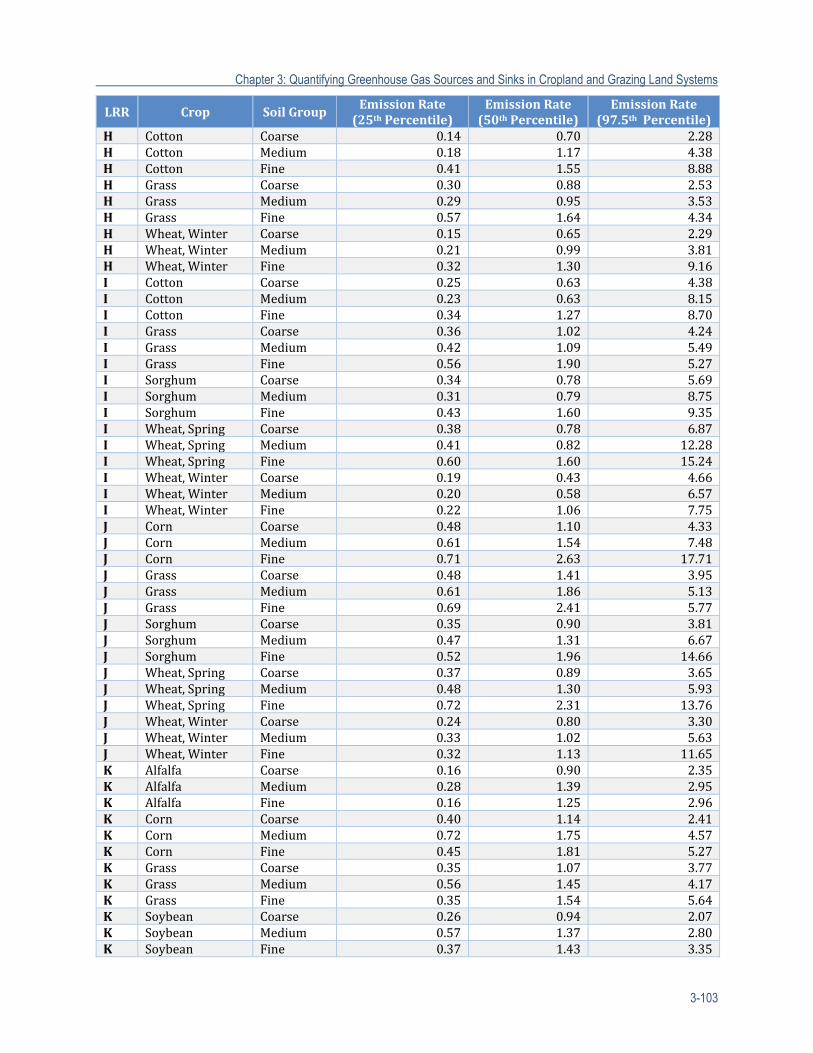
Chapter 3: Quantifying Greenhouse Gas Sources and Sinks in Cropland and Grazing Land Systems
3-103
LRR Crop SoilGroupEmissionRate(25thPercentile)
EmissionRate(50thPercentile)
EmissionRate(97.5thPercentile)
H Cotton Coarse 0.14 0.70 2.28H Cotton Medium 0.18 1.17 4.38H Cotton Fine 0.41 1.55 8.88H Grass Coarse 0.30 0.88 2.53H Grass Medium 0.29 0.95 3.53H Grass Fine 0.57 1.64 4.34H Wheat,Winter Coarse 0.15 0.65 2.29H Wheat,Winter Medium 0.21 0.99 3.81H Wheat,Winter Fine 0.32 1.30 9.16I Cotton Coarse 0.25 0.63 4.38I Cotton Medium 0.23 0.63 8.15I Cotton Fine 0.34 1.27 8.70I Grass Coarse 0.36 1.02 4.24I Grass Medium 0.42 1.09 5.49I Grass Fine 0.56 1.90 5.27I Sorghum Coarse 0.34 0.78 5.69I Sorghum Medium 0.31 0.79 8.75I Sorghum Fine 0.43 1.60 9.35I Wheat,Spring Coarse 0.38 0.78 6.87I Wheat,Spring Medium 0.41 0.82 12.28I Wheat,Spring Fine 0.60 1.60 15.24I Wheat,Winter Coarse 0.19 0.43 4.66I Wheat,Winter Medium 0.20 0.58 6.57I Wheat,Winter Fine 0.22 1.06 7.75J Corn Coarse 0.48 1.10 4.33J Corn Medium 0.61 1.54 7.48J Corn Fine 0.71 2.63 17.71J Grass Coarse 0.48 1.41 3.95J Grass Medium 0.61 1.86 5.13J Grass Fine 0.69 2.41 5.77J Sorghum Coarse 0.35 0.90 3.81J Sorghum Medium 0.47 1.31 6.67J Sorghum Fine 0.52 1.96 14.66J Wheat,Spring Coarse 0.37 0.89 3.65J Wheat,Spring Medium 0.48 1.30 5.93J Wheat,Spring Fine 0.72 2.31 13.76J Wheat,Winter Coarse 0.24 0.80 3.30J Wheat,Winter Medium 0.33 1.02 5.63J Wheat,Winter Fine 0.32 1.13 11.65K Alfalfa Coarse 0.16 0.90 2.35K Alfalfa Medium 0.28 1.39 2.95K Alfalfa Fine 0.16 1.25 2.96K Corn Coarse 0.40 1.14 2.41K Corn Medium 0.72 1.75 4.57K Corn Fine 0.45 1.81 5.27K Grass Coarse 0.35 1.07 3.77K Grass Medium 0.56 1.45 4.17K Grass Fine 0.35 1.54 5.64K Soybean Coarse 0.26 0.94 2.07K Soybean Medium 0.57 1.37 2.80K Soybean Fine 0.37 1.43 3.35
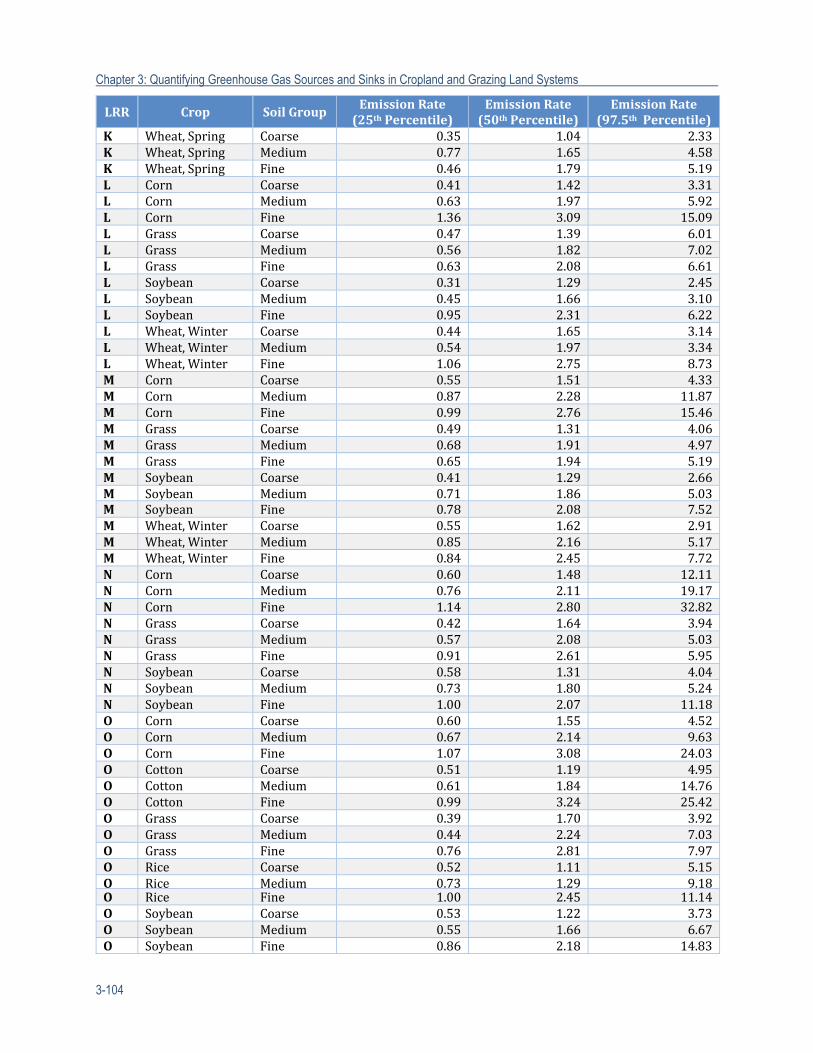
Chapter 3: Quantifying Greenhouse Gas Sources and Sinks in Cropland and Grazing Land Systems
3-104
LRR Crop SoilGroupEmissionRate(25thPercentile)
EmissionRate(50thPercentile)
EmissionRate(97.5thPercentile)
K Wheat,Spring Coarse 0.35 1.04 2.33K Wheat,Spring Medium 0.77 1.65 4.58K Wheat,Spring Fine 0.46 1.79 5.19L Corn Coarse 0.41 1.42 3.31L Corn Medium 0.63 1.97 5.92L Corn Fine 1.36 3.09 15.09L Grass Coarse 0.47 1.39 6.01L Grass Medium 0.56 1.82 7.02L Grass Fine 0.63 2.08 6.61L Soybean Coarse 0.31 1.29 2.45L Soybean Medium 0.45 1.66 3.10L Soybean Fine 0.95 2.31 6.22L Wheat,Winter Coarse 0.44 1.65 3.14L Wheat,Winter Medium 0.54 1.97 3.34L Wheat,Winter Fine 1.06 2.75 8.73M Corn Coarse 0.55 1.51 4.33M Corn Medium 0.87 2.28 11.87M Corn Fine 0.99 2.76 15.46M Grass Coarse 0.49 1.31 4.06M Grass Medium 0.68 1.91 4.97M Grass Fine 0.65 1.94 5.19M Soybean Coarse 0.41 1.29 2.66M Soybean Medium 0.71 1.86 5.03M Soybean Fine 0.78 2.08 7.52M Wheat,Winter Coarse 0.55 1.62 2.91M Wheat,Winter Medium 0.85 2.16 5.17M Wheat,Winter Fine 0.84 2.45 7.72N Corn Coarse 0.60 1.48 12.11N Corn Medium 0.76 2.11 19.17N Corn Fine 1.14 2.80 32.82N Grass Coarse 0.42 1.64 3.94N Grass Medium 0.57 2.08 5.03N Grass Fine 0.91 2.61 5.95N Soybean Coarse 0.58 1.31 4.04N Soybean Medium 0.73 1.80 5.24N Soybean Fine 1.00 2.07 11.18O Corn Coarse 0.60 1.55 4.52O Corn Medium 0.67 2.14 9.63O Corn Fine 1.07 3.08 24.03O Cotton Coarse 0.51 1.19 4.95O Cotton Medium 0.61 1.84 14.76O Cotton Fine 0.99 3.24 25.42O Grass Coarse 0.39 1.70 3.92O Grass Medium 0.44 2.24 7.03O Grass Fine 0.76 2.81 7.97O Rice Coarse 0.52 1.11 5.15O Rice Medium 0.73 1.29 9.18O Rice Fine 1.00 2.45 11.14O Soybean Coarse 0.53 1.22 3.73O Soybean Medium 0.55 1.66 6.67O Soybean Fine 0.86 2.18 14.83
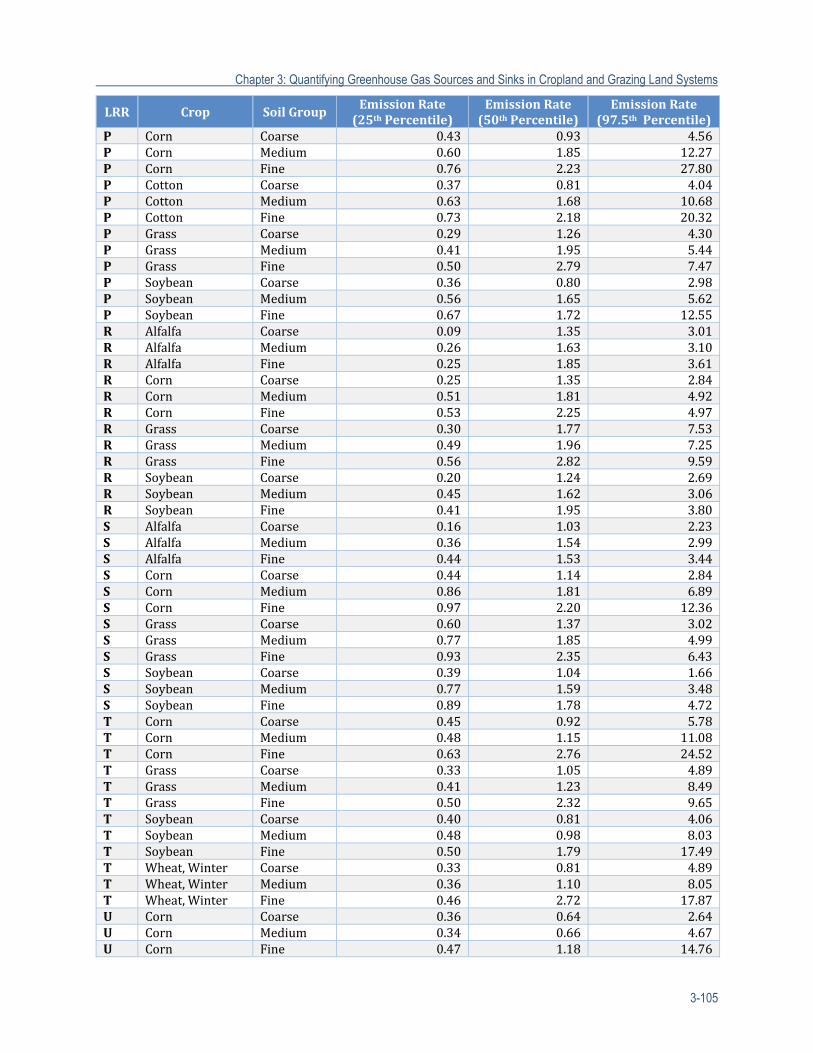
Chapter 3: Quantifying Greenhouse Gas Sources and Sinks in Cropland and Grazing Land Systems
3-105
LRR Crop SoilGroupEmissionRate(25thPercentile)
EmissionRate(50thPercentile)
EmissionRate(97.5thPercentile)
P Corn Coarse 0.43 0.93 4.56P Corn Medium 0.60 1.85 12.27P Corn Fine 0.76 2.23 27.80P Cotton Coarse 0.37 0.81 4.04P Cotton Medium 0.63 1.68 10.68P Cotton Fine 0.73 2.18 20.32P Grass Coarse 0.29 1.26 4.30P Grass Medium 0.41 1.95 5.44P Grass Fine 0.50 2.79 7.47P Soybean Coarse 0.36 0.80 2.98P Soybean Medium 0.56 1.65 5.62P Soybean Fine 0.67 1.72 12.55R Alfalfa Coarse 0.09 1.35 3.01R Alfalfa Medium 0.26 1.63 3.10R Alfalfa Fine 0.25 1.85 3.61R Corn Coarse 0.25 1.35 2.84R Corn Medium 0.51 1.81 4.92R Corn Fine 0.53 2.25 4.97R Grass Coarse 0.30 1.77 7.53R Grass Medium 0.49 1.96 7.25R Grass Fine 0.56 2.82 9.59R Soybean Coarse 0.20 1.24 2.69R Soybean Medium 0.45 1.62 3.06R Soybean Fine 0.41 1.95 3.80S Alfalfa Coarse 0.16 1.03 2.23S Alfalfa Medium 0.36 1.54 2.99S Alfalfa Fine 0.44 1.53 3.44S Corn Coarse 0.44 1.14 2.84S Corn Medium 0.86 1.81 6.89S Corn Fine 0.97 2.20 12.36S Grass Coarse 0.60 1.37 3.02S Grass Medium 0.77 1.85 4.99S Grass Fine 0.93 2.35 6.43S Soybean Coarse 0.39 1.04 1.66S Soybean Medium 0.77 1.59 3.48S Soybean Fine 0.89 1.78 4.72T Corn Coarse 0.45 0.92 5.78T Corn Medium 0.48 1.15 11.08T Corn Fine 0.63 2.76 24.52T Grass Coarse 0.33 1.05 4.89T Grass Medium 0.41 1.23 8.49T Grass Fine 0.50 2.32 9.65T Soybean Coarse 0.40 0.81 4.06T Soybean Medium 0.48 0.98 8.03T Soybean Fine 0.50 1.79 17.49T Wheat,Winter Coarse 0.33 0.81 4.89T Wheat,Winter Medium 0.36 1.10 8.05T Wheat,Winter Fine 0.46 2.72 17.87U Corn Coarse 0.36 0.64 2.64U Corn Medium 0.34 0.66 4.67U Corn Fine 0.47 1.18 14.76
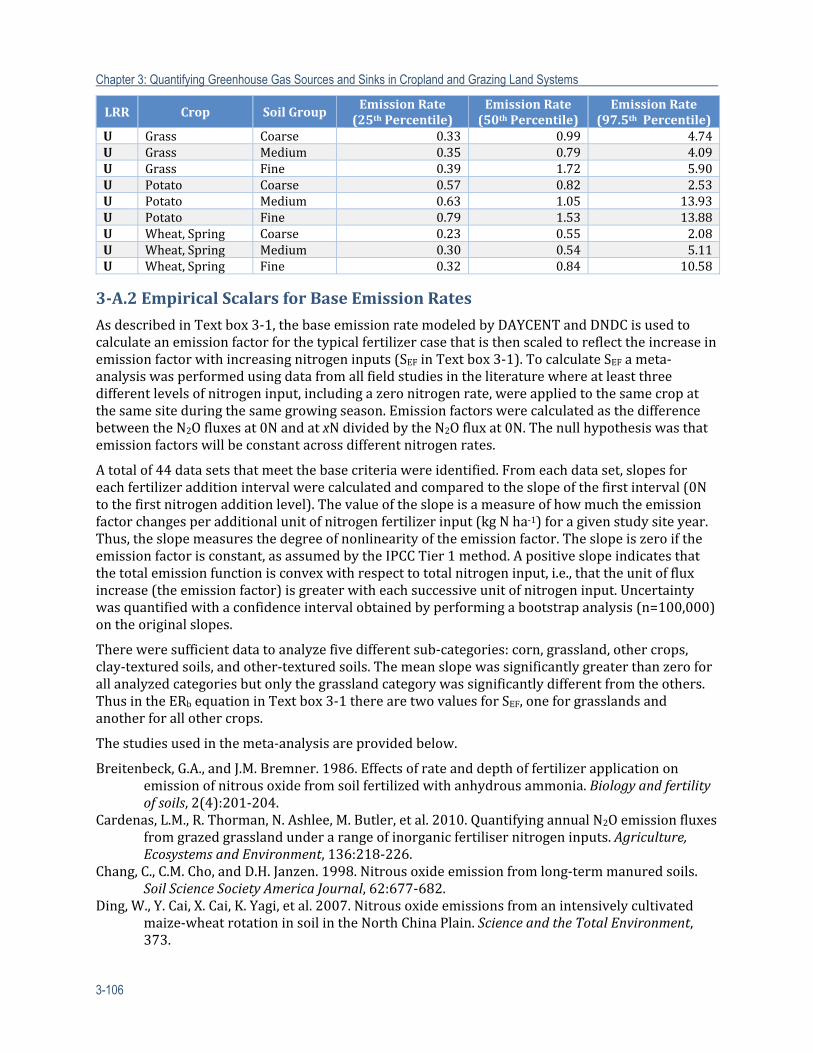
Chapter 3: Quantifying Greenhouse Gas Sources and Sinks in Cropland and Grazing Land Systems
3-106
LRR Crop SoilGroupEmissionRate(25thPercentile)
EmissionRate(50thPercentile)
EmissionRate(97.5thPercentile)
U Grass Coarse 0.33 0.99 4.74U Grass Medium 0.35 0.79 4.09U Grass Fine 0.39 1.72 5.90U Potato Coarse 0.57 0.82 2.53U Potato Medium 0.63 1.05 13.93U Potato Fine 0.79 1.53 13.88U Wheat,Spring Coarse 0.23 0.55 2.08U Wheat,Spring Medium 0.30 0.54 5.11U Wheat,Spring Fine 0.32 0.84 10.58
3‐A.2EmpiricalScalarsforBaseEmissionRates
AsdescribedinTextbox3‐1,thebaseemissionratemodeledbyDAYCENTandDNDCisusedtocalculateanemissionfactorforthetypicalfertilizercasethatisthenscaledtoreflecttheincreaseinemissionfactorwithincreasingnitrogeninputs(SEFinTextbox3‐1).TocalculateSEFameta‐analysiswasperformedusingdatafromallfieldstudiesintheliteraturewhereatleastthreedifferentlevelsofnitrogeninput,includingazeronitrogenrate,wereappliedtothesamecropatthesamesiteduringthesamegrowingseason.EmissionfactorswerecalculatedasthedifferencebetweentheN2Ofluxesat0NandatxNdividedbytheN2Ofluxat0N.Thenullhypothesiswasthatemissionfactorswillbeconstantacrossdifferentnitrogenrates.
Atotalof44datasetsthatmeetthebasecriteriawereidentified.Fromeachdataset,slopesforeachfertilizeradditionintervalwerecalculatedandcomparedtotheslopeofthefirstinterval(0Ntothefirstnitrogenadditionlevel).Thevalueoftheslopeisameasureofhowmuchtheemissionfactorchangesperadditionalunitofnitrogenfertilizerinput(kgNha‐1)foragivenstudysiteyear.Thus,theslopemeasuresthedegreeofnonlinearityoftheemissionfactor.Theslopeiszeroiftheemissionfactorisconstant,asassumedbytheIPCCTier1method.Apositiveslopeindicatesthatthetotalemissionfunctionisconvexwithrespecttototalnitrogeninput,i.e.,thattheunitoffluxincrease(theemissionfactor)isgreaterwitheachsuccessiveunitofnitrogeninput.Uncertaintywasquantifiedwithaconfidenceintervalobtainedbyperformingabootstrapanalysis(n=100,000)ontheoriginalslopes.
Thereweresufficientdatatoanalyzefivedifferentsub‐categories:corn,grassland,othercrops,clay‐texturedsoils,andother‐texturedsoils.Themeanslopewassignificantlygreaterthanzeroforallanalyzedcategoriesbutonlythegrasslandcategorywassignificantlydifferentfromtheothers.ThusintheERbequationinTextbox3‐1therearetwovaluesforSEF,oneforgrasslandsandanotherforallothercrops.
Thestudiesusedinthemeta‐analysisareprovidedbelow.
Breitenbeck,G.A.,andJ.M.Bremner.1986.Effectsofrateanddepthoffertilizerapplicationonemissionofnitrousoxidefromsoilfertilizedwithanhydrousammonia.Biologyandfertilityofsoils,2(4):201‐204.
Cardenas,L.M.,R.Thorman,N.Ashlee,M.Butler,etal.2010.QuantifyingannualN2Oemissionfluxesfromgrazedgrasslandunderarangeofinorganicfertilisernitrogeninputs.Agriculture,EcosystemsandEnvironment,136:218‐226.
Chang,C.,C.M.Cho,andD.H.Janzen.1998.Nitrousoxideemissionfromlong‐termmanuredsoils.SoilScienceSocietyAmericaJournal,62:677‐682.
Ding,W.,Y.Cai,X.Cai,K.Yagi,etal.2007.Nitrousoxideemissionsfromanintensivelycultivatedmaize‐wheatrotationinsoilintheNorthChinaPlain.ScienceandtheTotalEnvironment,373.
Chapter 3: Quantifying Greenhouse Gas Sources and Sinks in Cropland and Grazing Land Systems
3-107
Halvorson,A.D.,S.J.DelGrosso,andC.A.Reule.2008.Nitrogen,Tillage,andCropRotationEffectsonNitrousOxideEmissionsfromIrrigatedCroppingSystems.JournalofEnvironmentalQuality,37(4):1337‐1344.
Hoben,J.P.,R.J.Gehl,N.Millar,P.R.Grace,etal.2011.Nonlinearnitrousoxide(N2O)responsetonitrogenfertilizerinon‐farmcorncropsoftheUSMidwest.GlobalChangeBiology,17(2):1140‐1152.
Kaiser,E.A.,K.Kohrs,M.Kücke,E.Schnug,etal.1998.Nitrousoxidereleasefromarablesoil:importanceofN‐fertilization,cropsandtemporalvariation.SoilBiologyandBiochemistry,30:1553‐1563.
Kammann,C.,L.Grünhage,C.Müller,S.Jacobi,andH.‐J.Jäger.1998.SeasonalvariabilityandmitigationoptionsforN2Oemissionsfromdifferentlymanagedgrasslands.EnvironmentalPollution,102(S1):179‐186.
Kim,D.‐G.,G.Hernandez‐Ramirez,andD.Giltrap.2013.Linearandnonlineardependencyofdirectnitrousoxideemissionsonfertilizernitrogeninput:ameta‐analysis.Agriculture,EcosystemsandEnvironment,168:53‐65.
Letica,S.A.,C.A.M.deKlein,C.J.Hoogendoorn,R.W.Tillman,etal.2010.Short‐termmeasurementofN2Oemissionsfromsheep‐grazedpasturereceivingincreasingratesoffertilisernitrogeninOtago,NewZealand.AnimalProductionScience,50:17‐24.
Lin,S.,J.Iqbal,R.Hu,J.Wu,etal.2011.Nitrousoxideemissionsfromrapefieldasaffectedbynitrogenfertilizermanagement:acasestudyincentralChina.AtmosphericEnvironment,45:1775‐1779.
Ma,B.L.,T.Y.Wu,N.Tremblay,W.Deen,etal.2010.Nitrousoxidefluxesfromcornfields:on‐farmassessmentoftheamountandtimingofnitrogenfertilizer.GlobalChangeBiology,16(1):156‐170.
McSwiney,C.P.,andG.P.Robertson.2005.NonlinearresponseofN2Ofluxtoincrementalfertilizeradditioninacontinuousmaize(ZeamaysL.)croppingsystem.GlobalChangeBiology,11(10):1712‐1719.
Mosier,A.R.,A.D.Halvorson,C.A.Reule,andX.J.Liu.2006.NetglobalwarmingpotentialandgreenhousegasintensityinirrigatedcroppingsystemsinnortheasternColorado.JournalofEnvironmentalQuality,35(4):1584‐1598.
Signor,D.,C.E.P.Cerri,andR.Conant.2013.N2OemissionsduetonitrogenfertilizerapplicationsintworegionsofsugarcanecultivationinBrazil.EnvironmentalResearchLetters,8(1):015013.
Song,C.,andJ.Zhang.2009.Effectsofsoilmoisture,temperature,andnitrogenfertilizationonsoilrespirationandnitrousoxideemissionduringmaizegrowthperiodinnortheastChina.ActaAgriculturaeScandinavia,59:97‐106.
vanGroenigen,J.W.,G.J.Kasper,G.L.Velthof,A.vandenPol‐vanDasselar,etal.2004.Nitrousoxideemissionsfromsilagemaizefieldsunderdifferentmineralnitrogenfertilizerandslurryapplications.PlantandSoil,263.
Velthof,G.L.,O.Oenema,R.Postma,andM.L.VanBeusichem.1997.Effectsoftypeandamountofappliednitrogenfertilizeronnitrousoxidefluxesfromintensivelymanagedgrassland.NutrientCyclinginAgroecosystems,46:257‐267.
Zebarth,B.J.,P.Rochette,andD.L.Burton.2008.N2Oemissionsfromspringbarleyproductionasinfluencedbyfertilizernitrogenrate.CanadianJournalofSoilScience,88:197‐205.
Zhang,J.,andX.Han.2008.N2Oemissionfromthesemi‐aridecosystemundermineralfertilizer(ureaandsuperphosphate)andincreasedprecipitationinnorthernChina.AtmosphericEnvironment,42:291‐302.
Chapter 3: Quantifying Greenhouse Gas Sources and Sinks in Cropland and Grazing Land Systems
3-108
3‐A.3Practice‐BasedScalingFactors
Datawereanalyzedtoderivescalingfactorsforthefollowingpractices:nitrogenfertilizerplacement,nitrificationinhibitors,no‐tillmanagement,andslow‐releasefertilizers.PracticeswereincludediftherewassufficientevidencefromfieldexperimentstosuggestthatthepracticeinfluencedN2Oemissions,orforwhichapreviousmeta‐analysishadbeenconductedandshownthatthepracticehadaneffectonN2Oemissions(i.e.,no‐tillmanagement;vanKesseletal.,2012).AllpracticeswerefoundtohaveasignificanteffectonN2Oemissionwiththeexceptionofnitrogenplacement.ThescalingfactorsareprovidedinTable3‐9.
Documentationfortheno‐tillscalingfactorcanbefoundinvanKesseletal.Scalingfactorsfornitrificationinhibitorswerederivedusingalinearmixed‐effectmodelingapproach(PinheiroandBates,2000),similartothemethodusedbyOgleetal.(2005)toderivefactorsthatwereusedinthe2006IPCCGuidelines(IPCC,2006).Variancesassociatedwithindividualexperimentalresultswerenottakenintoconsiderationinthemeta‐analysesbecausemanystudiesdidnotprovidethisinformation.AgoalforfutureanalysessupportingtheUSDAmethodswillbetoincludevariances,undertheassumptionthatstudieswillreportthisinformationinfuturepublications.Covariateswereincludedintheanalysistodetermineifthepracticehadadifferenteffectdependingonthelanduse,climate,soiltype,watermanagement,tillagepractice,orcroptype.Covariateswereretainedinthemodelifthevariablewassignificantatanalphalevelof0.05.Forotherscalingfactors,therewereinsufficientdatatousethelinearmixed‐effectmodelingapproach,andsoaveragedifferencesbetweenthecontrolandtreatmentswereestimatedfromthestudiestoestimateascalingfactor.Theresultingestimateswereevaluatedforstatisticalsignificantfromavalueof0(ornoeffect)usinganalphalevelof0.05.A95percentconfidenceintervalwasderivedforeachscalingfactorandprovidedinTable3‐6asanupperandlowerboundontheestimatedfactor.
Thestudiesusedineachmeta‐analysisareprovidedbelow.
NitrogenFertilizerPlacement:Burton,D.L.,X.Li,andC.A.Grant.2008.Influenceoffertilizernitrogensourceandmanagement
practiceonN2OemissionsfromtwoBlackChernozemicsoils.CanadianJournalofSoilScience,88:219‐227.
Drury,C.F.,W.D.Reynolds,C.S.Tan,T.W.Welacky,etal.2006.EmissionsofNitrousOxideandCarbonDioxide.SoilScienceSocietyofAmericaJournal,70(2):570‐581.
Engel,R.,D.L.Liang,R.Wallander,andA.Bembenek.2010.InfluenceofUreaFertilizerPlacementonNitrousOxideProductionfromaSiltLoamSoil.JournalofEnvironmentalQuality,39(1):115‐125.
Halvorson,A.D.,andS.J.DelGrosso.2013.Nitrogenplacementandsourceeffectsonnitrousoxideemissionsandyieldsofirrigatedcorn.JournalofEnvironmentalQuality,42(Inpress).
Hou,A.X.,andH.Tsuruta.2003.NitrousoxideandnitricoxidefluxesfromanuplandfieldinJapan:effectofureatype,placement,andcropresidues.NutrientCyclinginAgroecosystems,65:191‐200.
Hultgreen,G.,andP.Leduc.2003.Theeffectofnitrogenfertilizerplacement,formulation,timing,andrateongreenhousegasemissionsandagronomicperformance:AgricultureAgri‐FoodCanada,PrairieAgriculturalMachineryInstitute.
Liu,X.J.,A.R.Mosier,A.D.Halvorson,andF.S.Zhang.2005.Tillageandnitrogenapplicationeffectsonnitrousandnitricoxideemissionsfromirrigatedcornfields.PlantandSoil,276:235‐249.
Maharjan,B.,andR.T.Venterea.Inreview.Nitritedynamicsexplainfertilizermanagementeffectsonnitrousoxideemissionsinmaize.SubmittedtoSoilBiologyandBiochemistry.
Zebarth,B.J.,P.Rochette,D.L.Burton,andM.Price.2008.EffectoffertilizernitrogenmanagementonN2Oemissionsincommercialcornfields.CanadianJournalofSoilScience,88:189‐195.
Chapter 3: Quantifying Greenhouse Gas Sources and Sinks in Cropland and Grazing Land Systems
3-109
NitrificationInhibitors:Akiyama,H.,H.Tsuruta,andT.Watanabe.2000.N2OandNoEmissionsfromSoilsafterthe
ApplicationofDifferentChemicalFertilizers.Chemosphere‐GlobalChangeScience,2(3):313‐320.
Ball,B.C.,K.C.Cameron,H.J.Di,andS.Moore.2012.EffectsofTramplingofaWetDairyPastureSoilonSoilPorosityandonMitigationofNitrousOxideEmissionsbyaNitrificationInhibitor,Dicyandiamide.SoilUseandManagement,28(2):194‐201.
Bremner,J.M.,G.A.Breitenbeck,andA.M.Blackmer.1981.EffectofNitrapyrinonEmissionofNitrousOxidefromSoilFertilizedwithAnhydrousAmmonia.GeophysicalResearchLetters,8(4):353‐356.
Bronson,K.F.,A.R.Mosier,andS.R.Bishnoi.1992.NitrousOxideEmissionsinIrrigatedCornasAffectedbyNitrificationInhibitors.SoilScienceSocietyofAmericaJournal,56(1):161‐165.
Cui,M.,X.C.Sun,C.X.Hu,H.J.Di,etal.2011.EffectiveMitigationofNitrateLeachingandNitrousOxideEmissionsinIntensiveVegetableProductionSystemsUsingaNitrificationInhibitor,Dicyandiamide.JournalofSoilsandSediments,11(5):722‐730.
deKlein,C.A.M.,K.C.Cameron,H.J.Di,G.Rys,etal.2011.RepeatedAnnualUseoftheNitrificationInhibitorDicyandiamide(Dcd)DoesNotAlterItsEffectivenessinReducingN2OEmissionsfromCowUrine.AnimalFeedScienceandTechnology,166‐167:480‐491.
Delgado,J.A.,andA.R.Mosier.1996.MitigationAlternativestoDecreaseNitrousOxidesEmissionsandUrea‐NitrogenLossandTheirEffectonMethaneFlux.JournalofEnvironmentalQuality,25(5):1105‐1111.
Dittert,K.,R.Bol,R.King,D.Chadwick,etal.2001.UseofanovelnitrificationinhibitortoreducenitrousoxideemissionfromN15‐labelleddairyslurryinjectedintosoil.RapidCommunicationsinMassSpectrometry,15:1291‐1296.
Dobbie,K.E.,andK.A.Smith.2003.ImpactofDifferentFormsofNFertilizeronN2OEmissionsfromIntensiveGrassland.NutrientCyclinginAgroecosystems,67(1):37‐46.
Ghosh,S.,D.Majumdar,andM.C.Jain.2003.MethaneandNitrousOxideEmissionsfromanIrrigatedRiceofNorthIndia.Chemosphere,51(3):181‐195.
Hadi,A.,O.Jumadi,K.Inubushi,andK.Yagi.2008.MitigationOptionsforN2OEmissionfromaCornFieldinKalimantan,Indonesia.Soilscienceandplantnutrition,54(4):644‐649.
Halvorson,A.D.,S.J.DelGrosso,andC.A.Reule.2008.Nitrogen,Tillage,andCropRotationEffectsonNitrousOxideEmissionsfromIrrigatedCroppingSystems.JournalofEnvironmentalQuality,37(4):1337‐1344.
Halvorson,A.D.,S.J.DelGrosso,andF.Alluvione.2010.TillageandInorganicNitrogenSourceEffectsonNitrousOxideEmissionsfromIrrigatedCroppingSystems.SoilScienceSocietyofAmericaJournal,74(2):436‐445.
Halvorson,A.D.,S.J.DelGrosso,andC.P.Jantalia.2011.NitrogenSourceEffectsonSoilNitrousOxideEmissionsfromStrip‐TillCorn.JournalofEnvironmentalQuality,40(6):1775‐1786.
Halvorson,A.D.,andS.J.D.Grosso.2012.NitrogenSourceandPlacementEffectsonSoilNitrousOxideEmissionsfromNo‐TillCorn.JournalofEnvironmentalQuality,41(5):1349‐1360.
Halvorson,A.D.,C.S.Snyder,A.D.Blaylock,andS.J.DelGrosso.Inreview.EnhancedEfficiencyNitrogenFertilizers:PotentialRoleinNitrousOxideEmissionMitigation.AgronomyJournal.
Jumadi,O.,Y.Hala,A.Muis,A.Ali,M.Palennari,K.Yagi,andK.Inubushi.2008.InfluencesofChemicalFertilizersandaNitrificationInhibitoronGreenhouseGasFluxesinaCorn(ZeaMaysL.)FieldinIndonesia.Microbesandenvironments,23(1):29‐34.
Kelly,K.B.,F.A.Phillips,andR.Baigent.2008.ImpactofdicyandiamideapplicationonnitrousoxideemissionsfromurinepatchesinnorthernVictoria,Australia.AustralianJournalofExperimentalAgriculture,48:156‐159.
Chapter 3: Quantifying Greenhouse Gas Sources and Sinks in Cropland and Grazing Land Systems
3-110
Kumar,U.,M.C.Jain,H.Pathak,S.Kumar,etal.2000.NitrousOxideEmissionfromDifferentFertilizersandItsMitigationbyNitrificationInhibitorsinIrrigatedRice.Biologyandfertilityofsoils,32(6):474‐478.
Linzmeier,W.,R.Gutser,andU.Schmidhalter.2001.NitrousOxideEmissionfromSoilandfromaNitrogen‐15‐LabelledFertilizerwiththeNewNitrificationInhibitor3,4‐DimethylpyrazolePhosphate(Dmpp).Biologyandfertilityofsoils,34(2):103‐108.
Macadam,X.M.B.,A.Prado,P.Merino,J.M.Estavillo,etal.2003.Dicyandiamideand3,4‐DimethylPyrazolePhosphateDecreaseN2OEmissionsfromGrasslandbutDicyandiamideProducesDeleteriousEffectsinClover.Journalofplantphysiology,160(12):1517‐1523.
Magalhaes,A.M.T.,P.M.Chalk,andW.M.Strong.1984.EffectofNitrapyrinonNitrousOxideEmissionfromFallowSoilsFertilizedwithAnhydrousAmmonia.NutrientCyclinginAgroecosystems,5(4):411‐421.
Majumdar,D.,S.Kumar,H.Pathak,M.C.Jain,etal.2000.ReducingNitrousOxideEmissionfromanIrrigatedRiceFieldofNorthIndiawithNitrificationInhibitors.Agriculture,ecosystems&environment,81(3):163‐169.
Majumdar,D.,H.Pathak,S.Kumar,andM.C.Jain.2002.NitrousOxideEmissionfromaSandyLoamInceptisolunderIrrigatedWheatinIndiaasInfluencedbyDifferentNitrificationInhibitors.Agriculture,ecosystems&environment,91(1):283‐293.
Malla,G.,A.Bhatia,H.Pathak,S.Prasad,etal.2005.MitigatingNitrousOxideandMethaneEmissionsfromSoilinRice‐WheatSystemoftheIndo‐GangeticPlainwithNitrificationandUreaseInhibitors.Chemosphere,58(2):141‐147.
McTaggart,I.P.,H.Clayton,J.Parker,L.Swan,etal.1997.NitrousOxideEmissionsfromGrasslandandSpringBarley,FollowingNFertiliserApplicationwithandwithoutNitrificationInhibitors.Biologyandfertilityofsoils,25(3):261‐268.
Menendez,S.,P.Merino,M.Pinto,C.González‐Murua,etal.2006.3,4‐DimethylpyrazolPhosphateEffectonNitrousOxide,NitricOxide,Ammonia,andCarbonDioxideEmissionsfromGrasslands.JournalofEnvironmentalQuality,35(4):973‐981.
Merino,P.,J.M.Estavillo,L.A.Graciolli,M.Pinto,etal.2002.MitigationofN2OEmissionsfromGrasslandbyNitrificationInhibitorandActilithF2AppliedwithFertilizerandCattleSlurry.SoilUseandManagement,18(2):135‐141.
Parkin,T.B.,andJ.L.Hatfield.2010.InfluenceofNitrapyrinonN2OLossesfromSoilReceivingFall‐AppliedAnhydrousAmmonia.Agriculture,ecosystems&environment,136(1):81‐86.
Pathak,H.,A.Bhatia,S.Prasad,S.Singh,etal.2002.EmissionofNitrousOxidefromRice‐WheatSystemsofIndo‐GangeticPlainsofIndia.Environmentalmonitoringandassessment,77(2):163‐178.
Sanz‐Cobena,A.,L.Sánchez‐Martín,L.García‐Torres,andA.Vallejo.2012.GaseousemissionsofN2OandNOandNO3‐leachingfromureaappliedwithureaseandnitrificationinhibitorstoamaize(Zeamays)crop.Agriculture,ecosystems&environment,149:64‐73.
Shoji,S.,J.Delgado,A.Mosier,andY.Miura.2001.UseofControlledReleaseFertilizersandNitrificationInhibitorstoIncreaseNitrogenUseEfficiencyandtoConserveAirAndwaterQuality.CommunicationsinSoilScienceandPlantAnalysis,32(7‐8):1051‐1070.
Smith,L.C.,C.A.M.deKlein,andW.D.Catto.2008.EffectofDicyandiamideAppliedinaGranularFormonNitrousOxideEmissionsfromaGrazedDairyPastureinSouthland,NewZealand.NewZealandJournalofAgriculturalResearch,51(4):387‐396.
Vallejo,A.,L.Garcia‐Torres,J.A.Diez,A.Arce,etal.2005.ComparisonofNlosses(NO3‐,N2O,NO)fromsurfaceapplied,injectedoramended(DCD)pigslurryofanirrigatedsoilinaMediterraneanclimate.PlantandSoil,272:313‐325.
Vallejo,A.,U.M.Skiba,L.Garcia‐Torres,A.Arce,etal.2006.Nitrogenoxidesemissionfromsoilsbearingapotatocropasinfluencedbyfertilizationwithtreatedpigslurriesandcomposts.SoilBiologyandBiochemistry,38:2782‐2793.
Chapter 3: Quantifying Greenhouse Gas Sources and Sinks in Cropland and Grazing Land Systems
3-111
Venterea,R.T.,B.Maharjan,andM.S.Dolan.2011.Fertilizersourceandtillageeffectsonyield‐scaledN2Oemissionsinacorncroppingsystem.JournalofEnvironmentalQuality.
Weiske,A.,G.Benckiser,andJ.C.G.Ottow.2001.EffectoftheNewNitrificationInhibitorDmppinComparisontoDcdonNitrousOxide(N2O)EmissionsandMethane(CH4)OxidationDuring3YearsofRepeatedApplicationsinFieldExperiments.NutrientCyclinginAgroecosystems,60(1):57‐64.
Zaman,M.,M.L.Nguyen,J.D.Blennerhassett,andB.F.Quin.2008.ReducingNH3,N2Oand‐NLossesfromaPastureSoilwithUreaseorNitrificationInhibitorsandElementalS‐AmendedNitrogenousFertilizers.Biologyandfertilityofsoils,44(5):693‐705.
Slow‐releaseFertilizers:Akiyama,H.,H.Tsuruta,andT.Watanabe.2000.N2OandNOEmissionsfromSoilsafterthe
ApplicationofDifferentChemicalFertilizers.Chemosphere‐GlobalChangeScience,2(3):313‐320.
Akiyama,H.,andH.Tsuruta.2002.EffectofchemicalfertilizerformonN2O,NOandNO2fluxesfromAndisolfield.NutrientCyclinginAgroecosystems,63:219‐230.
Ball,B.C.,K.C.Cameron,H.J.Di,andS.Moore.2012.EffectsofTramplingofaWetDairyPastureSoilonSoilPorosityandonMitigationofNitrousOxideEmissionsbyaNitrificationInhibitor,Dicyandiamide.SoilUseandManagement,28(2):194‐201.
Burton,D.L.,X.Li,andC.A.Grant.2008.InfluenceoffertilizernitrogensourceandmanagementpracticeonN2OemissionsfromtwoBlackChernozemicsoils.CanadianJournalofSoilScience,88:219‐227.
Cheng,W.,Y.Nakajima,S.Sudo,H.Akiyama,etal.2002.N2OandNOemissionsfromafieldofChinesecabbageasinfluencedbybandapplicationofureaorcontrolled‐releaseureafertilizers.NutrientCyclinginAgroecosystems,63:231‐238.
Chu,H.Y.,Y.Hosen,andK.Yagi.2007.NO,N2O,CH4andfluxesinwinterbarleyfieldofJapaneseAndisolasaffectedbyNfertilizermanagement.SoilBiology&Biochemistry,39:330‐339.
Delgado,J.A.,andA.R.Mosier.1996.MitigationAlternativestoDecreaseNitrousOxidesEmissionsandUrea‐NitrogenLossandTheirEffectonMethaneFlux.JournalofEnvironmentalQuality,25(5):1105‐1111.
Dobbie,K.E.,andK.A.Smith.2003.ImpactofDifferentFormsofNFertilizeronN2OEmissionsfromIntensiveGrassland.NutrientCyclinginAgroecosystems,67(1):37‐46.
Hadi,A.,O.Jumadi,K.Inubushi,andK.Yagi.2008.MitigationOptionsforN2OEmissionfromaCornFieldinKalimantan,Indonesia.Soilscienceandplantnutrition,54(4):644‐649.
Halvorson,A.D.,S.J.DelGrosso,andF.Alluvione.2010a.NitrogenSourceEffectsonNitrousOxideEmissionsfromIrrigatedNo‐TillCorn.JournalofEnvironmentalQuality,39(5):1554‐1562.
Halvorson,A.D.,S.J.DelGrosso,andF.Alluvione.2010b.TillageandInorganicNitrogenSourceEffectsonNitrousOxideEmissionsfromIrrigatedCroppingSystems.SoilScienceSocietyofAmericaJournal,74(2):436‐445.
Halvorson,A.D.,S.J.DelGrosso,andC.P.Jantalia.2011.NitrogenSourceEffectsonSoilNitrousOxideEmissionsfromStrip‐TillCorn.JournalofEnvironmentalQuality,40(6):1775‐1786.
Halvorson,A.D.,andS.J.D.Grosso.2012.NitrogenSourceandPlacementEffectsonSoilNitrousOxideEmissionsfromNo‐TillCorn.JournalofEnvironmentalQuality,41(5):1349‐1360.
Halvorson,A.D.,andS.J.DelGrosso.2013.Nitrogenplacementandsourceeffectsonnitrousoxideemissionsandyieldsofirrigatedcorn.JournalofEnvironmentalQuality,42(Inpress).
Hou,A.X.,andH.Tsuruta.2003.NitrousoxideandnitricoxidefluxesfromanuplandfieldinJapan:effectofureatype,placement,andcropresidues.NutrientCyclinginAgroecosystems,65:191‐200.
Chapter 3: Quantifying Greenhouse Gas Sources and Sinks in Cropland and Grazing Land Systems
3-112
Hyatt,C.R.,R.T.Venterea,C.J.Rosen,M.McNearney,etal.2010.Polymer‐CoatedUreaMaintainsPotatoYieldsandReducesNitrousOxideEmissionsinaMinnesotaLoamySand.SoilScienceSocietyofAmericaJournal,74(2):419‐428.
Ji,Y.,G.Liu,J.Ma,H.Xu,etal.2012.Effectofcontrolled‐releasefertilizeronnitrousoxideemissionfromawinterwheatfield.NutrientCyclinginAgroecosystems,94:111‐122.
Jiang,J.Y.,Z.H.Hu,W.J.Sun,andY.Huang.2010.NitrousoxideemissionsfromChinesecroplandfertilizedwitharangeofslow‐releasenitrogencompounds.AgricultureEcosystems&Environment,135:216‐225.
Jumadi,O.,Y.Hala,A.Muis,A.Ali,M.Palennari,K.Yagi,andK.Inubushi.2008.InfluencesofChemicalFertilizersandaNitrificationInhibitoronGreenhouseGasFluxesinaCorn(ZeaMaysL.)FieldinIndonesia.Microbesandenvironments,23(1):29‐34.
Maharjan,B.,R.T.Venterea,andC.Rosen.2013.FertilizerandIrrigationManagementEffectsonNitrousOxideEmissionsandNitrateLeaching.AgronomyJournal.
Maharjan,B.,andR.T.Venterea.Inreview.Nitritedynamicsexplainfertilizermanagementeffectsonnitrousoxideemissionsinmaize.SubmittedtoSoilBiologyandBiochemistry.
Nash,P.R.2010.Alternativetillageandnitrogenmanagementoptionstoincreasecropproductionandreducenitrousoxideemissionsfromclaypansoils:M.S.Thesis,UniversityofMissouri.
Shoji,S.,J.Delgado,A.Mosier,andY.Miura.2001.UseofControlledReleaseFertilizersandNitrificationInhibitorstoIncreaseNitrogenUseEfficiencyandtoConserveAirAndwaterQuality.CommunicationsinSoilScienceandPlantAnalysis,32(7‐8):1051‐1070.
Venterea,R.T.,B.Maharjan,andM.S.Dolan.2011.Fertilizersourceandtillageeffectsonyield‐scaledN2Oemissionsinacorncroppingsystem.JournalofEnvironmentalQuality.
Yan,X.Y.,Y.Hosen,andK.Yagi.2001.NitrousoxideandnitricoxideemissionsfrommaizefieldplotsasaffectedbyNfertilizertypeandapplicationmethod.Biologyandfertilityofsoils,34:297‐303.
Zebarth,B.J.,E.Snowdon,D.L.Burton,C.Goyer,etal.2012.Controlledreleasefertilizerproducteffectsonpotatocropresponseandnitrousoxideemissionsunderrain‐fedproductiononamedium‐texturedsoil.CanadianJournalofSoilScience,92:759‐769.
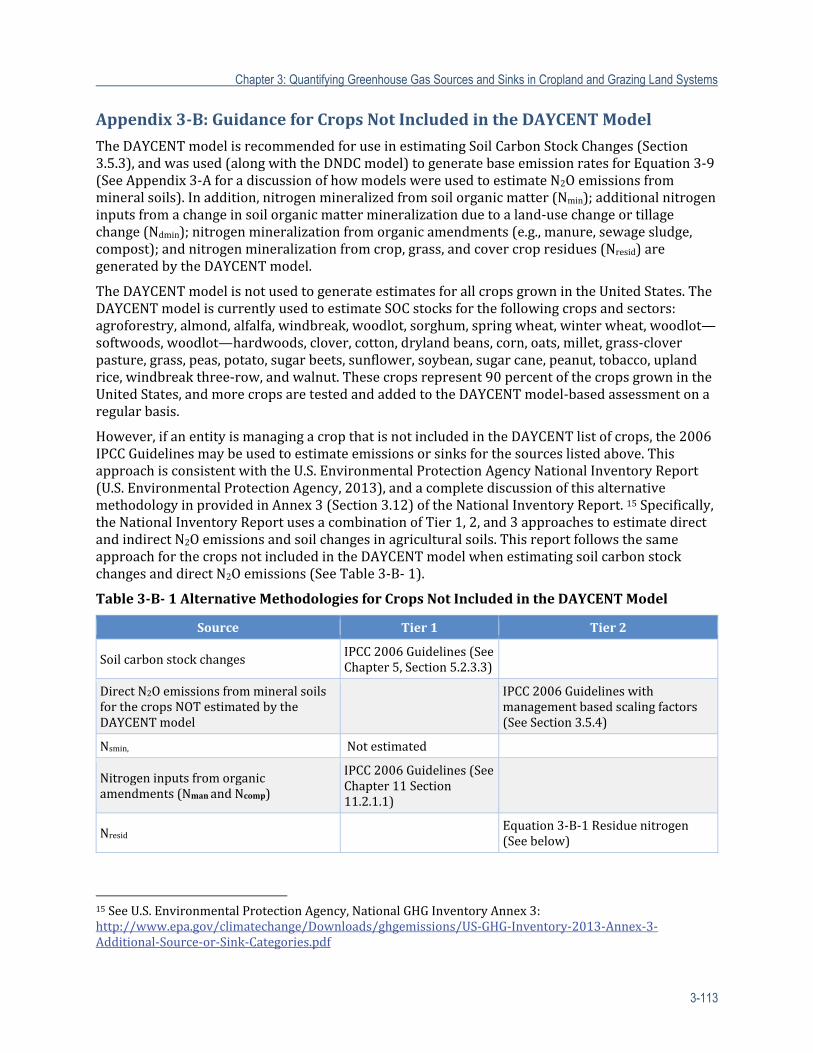
Chapter 3: Quantifying Greenhouse Gas Sources and Sinks in Cropland and Grazing Land Systems
3-113
Appendix3‐B:GuidanceforCropsNotIncludedintheDAYCENTModel
TheDAYCENTmodelisrecommendedforuseinestimatingSoilCarbonStockChanges(Section3.5.3),andwasused(alongwiththeDNDCmodel)togeneratebaseemissionratesforEquation3‐9(SeeAppendix3‐AforadiscussionofhowmodelswereusedtoestimateN2Oemissionsfrommineralsoils).Inaddition,nitrogenmineralizedfromsoilorganicmatter(Nmin);additionalnitrogeninputsfromachangeinsoilorganicmattermineralizationduetoaland‐usechangeortillagechange(Ndmin);nitrogenmineralizationfromorganicamendments(e.g.,manure,sewagesludge,compost);andnitrogenmineralizationfromcrop,grass,andcovercropresidues(Nresid)aregeneratedbytheDAYCENTmodel.
TheDAYCENTmodelisnotusedtogenerateestimatesforallcropsgrownintheUnitedStates.TheDAYCENTmodeliscurrentlyusedtoestimateSOCstocksforthefollowingcropsandsectors:agroforestry,almond,alfalfa,windbreak,woodlot,sorghum,springwheat,winterwheat,woodlot—softwoods,woodlot—hardwoods,clover,cotton,drylandbeans,corn,oats,millet,grass‐cloverpasture,grass,peas,potato,sugarbeets,sunflower,soybean,sugarcane,peanut,tobacco,uplandrice,windbreakthree‐row,andwalnut.Thesecropsrepresent90percentofthecropsgrownintheUnitedStates,andmorecropsaretestedandaddedtotheDAYCENTmodel‐basedassessmentonaregularbasis.
However,ifanentityismanagingacropthatisnotincludedintheDAYCENTlistofcrops,the2006IPCCGuidelinesmaybeusedtoestimateemissionsorsinksforthesourceslistedabove.ThisapproachisconsistentwiththeU.S.EnvironmentalProtectionAgencyNationalInventoryReport(U.S.EnvironmentalProtectionAgency,2013),andacompletediscussionofthisalternativemethodologyinprovidedinAnnex3(Section3.12)oftheNationalInventoryReport.15Specifically,theNationalInventoryReportusesacombinationofTier1,2,and3approachestoestimatedirectandindirectN2Oemissionsandsoilchangesinagriculturalsoils.ThisreportfollowsthesameapproachforthecropsnotincludedintheDAYCENTmodelwhenestimatingsoilcarbonstockchangesanddirectN2Oemissions(SeeTable3‐B‐1).
Table3‐B‐1AlternativeMethodologiesforCropsNotIncludedintheDAYCENTModel
Source Tier1 Tier2
SoilcarbonstockchangesIPCC2006Guidelines(SeeChapter5,Section5.2.3.3)
DirectN2OemissionsfrommineralsoilsforthecropsNOTestimatedbytheDAYCENTmodel
IPCC2006Guidelineswithmanagementbasedscalingfactors(SeeSection3.5.4)
Nsmin, Notestimated
Nitrogeninputsfromorganicamendments(NmanandNcomp)
IPCC2006Guidelines(SeeChapter11Section11.2.1.1)
Nresid Equation3‐B‐1Residuenitrogen(Seebelow)
15SeeU.S.EnvironmentalProtectionAgency,NationalGHGInventoryAnnex3:http://www.epa.gov/climatechange/Downloads/ghgemissions/US‐GHG‐Inventory‐2013‐Annex‐3‐Additional‐Source‐or‐Sink‐Categories.pdf
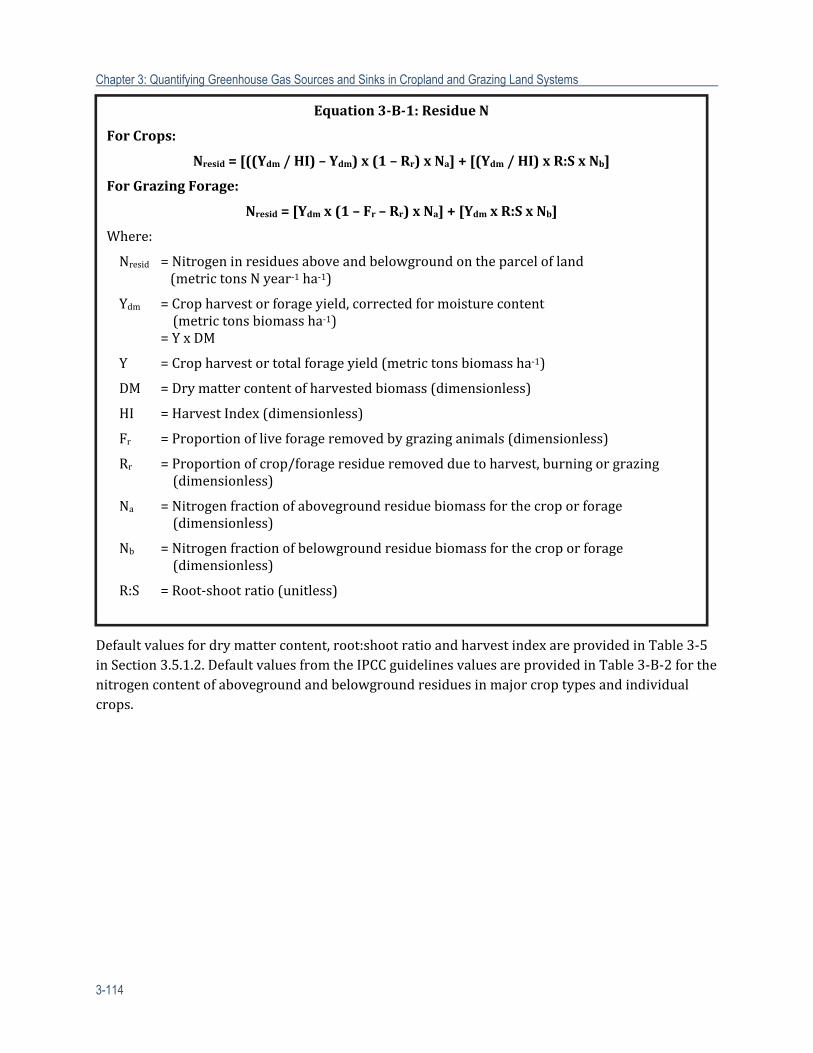
Chapter 3: Quantifying Greenhouse Gas Sources and Sinks in Cropland and Grazing Land Systems
3-114
Defaultvaluesfordrymattercontent,root:shootratioandharvestindexareprovidedinTable3‐5inSection3.5.1.2.DefaultvaluesfromtheIPCCguidelinesvaluesareprovidedinTable3‐B‐2forthenitrogencontentofabovegroundandbelowgroundresiduesinmajorcroptypesandindividualcrops.
Equation3‐B‐1:ResidueN
ForCrops:
Nresid=[((Ydm/HI)–Ydm)x(1–Rr)xNa]+[(Ydm/HI)xR:SxNb]
ForGrazingForage:
Nresid=[Ydmx(1–Fr–Rr)xNa]+[YdmxR:SxNb]
Where:
Nresid =Nitrogeninresiduesaboveandbelowgroundontheparcelofland (metrictonsNyear‐1ha‐1)
Ydm =Cropharvestorforageyield,correctedformoisturecontent (metrictonsbiomassha‐1) =YxDM
Y =Cropharvestortotalforageyield(metrictonsbiomassha‐1)
DM =Drymattercontentofharvestedbiomass(dimensionless)
HI =HarvestIndex(dimensionless)
Fr =Proportionofliveforageremovedbygrazinganimals(dimensionless)
Rr =Proportionofcrop/forageresidueremovedduetoharvest,burningorgrazing(dimensionless)
Na =Nitrogenfractionofabovegroundresiduebiomassforthecroporforage(dimensionless)
Nb =Nitrogenfractionofbelowgroundresiduebiomassforthecroporforage(dimensionless)
R:S =Root‐shootratio(unitless)
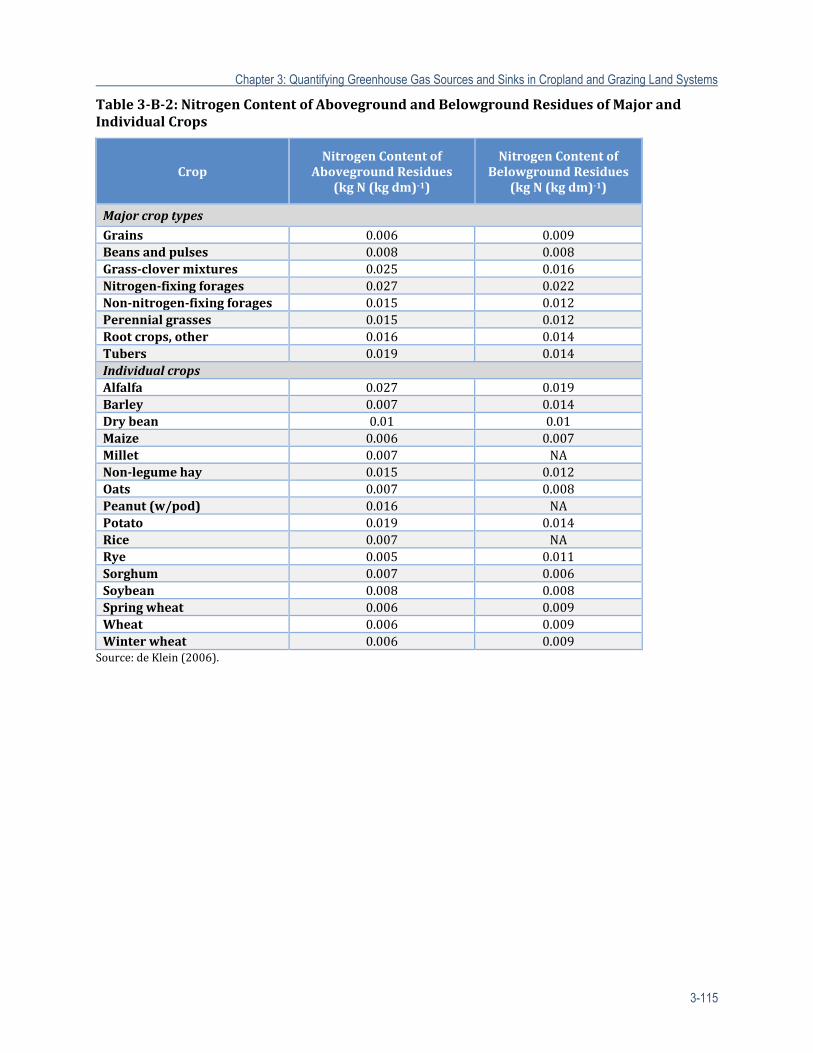
Chapter 3: Quantifying Greenhouse Gas Sources and Sinks in Cropland and Grazing Land Systems
3-115
Table3‐B‐2:NitrogenContentofAbovegroundandBelowgroundResiduesofMajorandIndividualCrops
CropNitrogenContentof
AbovegroundResidues(kgN(kgdm)‐1)
NitrogenContentofBelowgroundResidues
(kgN(kgdm)‐1)
Majorcroptypes
Grains 0.006 0.009Beansandpulses 0.008 0.008Grass‐clovermixtures 0.025 0.016Nitrogen‐fixingforages 0.027 0.022Non‐nitrogen‐fixingforages 0.015 0.012Perennialgrasses 0.015 0.012Rootcrops,other 0.016 0.014Tubers 0.019 0.014IndividualcropsAlfalfa 0.027 0.019Barley 0.007 0.014Drybean 0.01 0.01Maize 0.006 0.007Millet 0.007 NANon‐legumehay 0.015 0.012Oats 0.007 0.008Peanut(w/pod) 0.016 NAPotato 0.019 0.014Rice 0.007 NARye 0.005 0.011Sorghum 0.007 0.006Soybean 0.008 0.008Springwheat 0.006 0.009Wheat 0.006 0.009Winterwheat 0.006 0.009Source:deKlein(2006).
Chapter 3: Quantifying Greenhouse Gas Sources and Sinks in Cropland and Grazing Land Systems
3-116
Chapter3References
Aalde,H.,P.Gonzalez,M.Gytarski,T.Krug,etal.2006.Chapter2:Genericmethodologiesapplicabletomultipleland‐usecategories.In2006IPCCGuidelinesforNationalGreenhouseGasInventories,S.Eggleston,L.Buendia,K.Miwa,T.NgaraandK.Tanabe(eds.).Japan:IGES.
Adviento‐Borbe,M.A.A.,M.L.Haddix,D.L.Binder,D.T.Walters,etal.2007.Soilgreenhousegasfluxesandglobalwarmingpotentialinfourhigh‐yieldingmaizesystems.GlobalChangeBiology,13(9):1972‐1988.
Akiyama,H.,H.Tsuruta,andT.Watanabe.2000.N2OandNOEmissionsfromSoilsaftertheApplicationofDifferentChemicalFertilizers.Chemosphere‐GlobalChangeScience,2(3):313‐320.
Akiyama,H.,andH.Tsuruta.2002.EffectofchemicalfertilizerformonN2O,NOandNO2fluxesfromAndisolfield.NutrientCyclinginAgroecosystems,63:219‐230.
Akiyama,H.,K.Yagi,andX.Yan.2005.DirectN2Oemissionsfromricepaddyfields:Summaryofavailabledata.GlobalBiogeochemicalCycles,19.
Akiyama,H.,X.Yan,andK.Yagi.2010.Evaluationofeffectivenessofenhanced‐efficiencyfertilizersasmitigationoptionsforN2OandNOemissionsfromagriculturalsoils:meta‐analysis.GlobalChangeBiology,16(6):1837‐1846.
Allard,V.,J.F.Soussana,R.Falcimagne,P.Berbigier,etal.2007.Theroleofgrazingmanagementforthenetbiomeproductivityandgreenhousegasbudget(CO2,N2OandCH4)ofsemi‐naturalgrassland.Agriculture,Ecosystems&Environment,121(1‐2):47‐58.
Allen,D.E.,D.S.Mendham,B.Singh,A.Cowie,etal.2009.Nitrousoxideandmethaneemissionsfromsoilarereducedfollowingaforestationofpasturelandsinthreecontrastingclimaticzones.AustralianJournalofSoilResearch,47:443‐458.
Allen,L.H.J.2007.CarbonbalanceofsugarcaneagricultureonhistosolsoftheEvergladesAgriculturalArea:review,analysis,andglobalenergyperspectives.SoilandCropScienceSocietyofFloridaProceedings,66:7‐14.
Allen,L.H.J.2012.GreenhousegasfluxesofdrainedorganicandfloodedmineralagriculturalsoilsintheUnitedStates.InManagingAgriculturalGreenhouseGases,M.A.Liebig,A.J.FranzluebbersandR.F.Follett(eds.).SanDiego,CA:AcademicPress.
Allen,S.,S.Jose,P.K.R.Nair,B.J.Brecke,etal.2004.Safetynetroleoftreeroots:experimentalevidencefromanalleycroppingsystem.ForEcolManage,192:395‐407.
Ambus,P.,andG.Robertson.2006.TheEffectofIncreasedNDepositiononNitrousOxide,MethaneandCarbonDioxideFluxesfromUnmanagedForestandGrasslandCommunitiesinMichigan.Biogeochemistry,79(3):315‐337.
Andraski,T.W.,andL.G.Bundy.2002.UsingthePresidedressSoilNitrateTestandOrganicNitrogenCreditingtoImproveCornNitrogenRecommendations.AgronomyJournal,94(6):1411‐1418.
Andreae,M.O.,andP.Merlet.2001.Emissionoftracegasesandaerosolsfrombiomassburning.GlobalBiogeochemicalCycles,15(4):955‐966.
Archer,D.W.,A.D.Halvorson,andC.A.Reule.2008.EconomicsofIrrigatedContinuousCornunderConventional‐TillandNo‐TillinNorthernColorado.AgronomyJournal,100(4):1166‐1172.
Armentano,T.V.,andE.S.Menges.1986.Patternsofchangeinthecarbonbalanceoforganicsoil.Atkinson,C.,J.Fitzgerald,andN.Hipps.2010.Potentialmechanismsforachievingagricultural
benefitsfrombiocharapplicationtotemperatesoils:areview.PlantandSoil,337(1):1‐18.Badarinath,K.V.S.,T.R.KiranChand,andV.KrishnaPrasad.2009.Emissionsfromgrassland
burninginKazirangaNationalPark,India‐AnalysisfromIRS‐P6AWiFSsatelliteremotesensingdatasets.GeocartoInternational,24(2):89‐97.
Chapter 3: Quantifying Greenhouse Gas Sources and Sinks in Cropland and Grazing Land Systems
3-117
Baker,J.M.,T.E.Ochsner,R.T.Venterea,andT.J.Griffis.2007.Tillageandsoilcarbonsequestration—Whatdowereallyknow?Agriculture,Ecosystems&Environment,118(1‐4):1‐5.
Ball,B.C.,K.C.Cameron,H.J.Di,andS.Moore.2012.EffectsofTramplingofaWetDairyPastureSoilonSoilPorosityandonMitigationofNitrousOxideEmissionsbyaNitrificationInhibitor,Dicyandiamide.SoilUseandManagement,28(2):194‐201.
Barton,L.,andL.A.Schipper.2001.RegulationofNitrousOxideEmissionsfromSoilsIrrigatedwithDairyFarmEffluentJournalofEnvironmentalQuality,30:1881‐1887.
Beaulieu,J.J.,J.L.Tank,S.K.Hamilton,W.M.Wollheim,etal.2011.Nitrousoxideemissionfromdenitrificationinstreamandrivernetworks.ProceedingsoftheNationalAcademyofSciences.
Beetz,A.E.,andL.Rhinehart.Rotationalgrazing.Retrievedfromwww.attra.ncat.org/attra‐pub/rotgraze.html.
Bellefontaine,R.,S.Petit,M.Pain‐Orcet,P.Deleporte,etal.2002.Treesoutsideforests:Towardsabetterawareness.Rome:CIRADandFAO.
Bement,R.E.1969.Astocking‐rateguideforbeefproductiononblue‐gramarange.JournalofRangeManagement,22:83‐86.
Bharati,K.,S.R.Mohanty,P.V.L.Padmavathi,V.R.Rao,etal.2000.InfluenceofSixNitrificationInhibitorsonMethaneProductioninaFloodedAlluvialSoil.NutrientCyclinginAgroecosystems,58(1):389‐394.
Bhat,R.,S.Sujatha,andD.Balasimha.2007.Impactofdripfertigationonproductivityofarecanut(ArecacatechuL.).AgriculturalWaterManagement,90:101‐111.
Biasi,C.,S.E.Lind,N.M.Pekkarinen,J.T.Huttunen,etal.2008.DirectexperimentalevidenceforthecontributionoflimetoCO2releasefrommanagedpeatsoil.SoilBiologyandBiochemistry,40(10):2660‐2669.
Bierman,P.,C.J.Rosen,R.T.Venterea,andJ.Lamb.2011.SurveyofnitrogenfertilizeruseoncorninMinnesota.AgriculturalSystems.
Bilotta,G.S.,R.E.Brazier,andP.M.Haygarth.2007.Theimpactsofgrazinganimalsonthequalityofsoils,vegetation,andsurfacewatersinintensivelymanagedgrasslands.AdvancesinAgronomy,94:237‐280.
Birdsey,R.A.1992.CarbonstorageandaccumulationinUnitedStatesforestecosystems.WashingtonDC:USDAForestService.
Blanco‐Canqui,H.,N.L.Klocke,A.J.Schlegel,L.R.Stone,etal.2010.ImpactsofDeficitIrrigationonCarbonSequestrationandSoilPhysicalPropertiesunderNo‐Till.SoilScienceSocietyofAmericaJournal,74(4):1301‐1309.
Blank,R.R.,andM.A.Fosberg.1989.CultivatedandAdjacentVirginSoilsinNorthcentralSouthDakota:I.ChemicalandPhysicalComparisonsII.MineralogicalandMicromorphologicalComparisons.SoilScienceSocietyofAmericaJournal,53:1484‐1490.
Boeckx,P.,X.Xu,andO.vanCleemput.2005.MitigationofN2OandCH4emissionfromriceandwheatcroppingsystemsusingdicyandiamideandhydroquinone.NutrientCyclinginAgroecosystems,72:41‐49.
Bossio,D.A.,W.R.Horwath,R.G.Mutters,andC.vanKessel.1999.Methanepoolandfluxdynamicsinaricefieldfollowingstrawincorporation.SoilBiologyandBiochemistry,31:1313‐1322.
Boutton,T.W.,J.D.Liao,T.R.Filley,andS.R.Archer.2009.Belowgroundcarbonstorageanddynamicsaccompanyingwoodyplantencroachmentinasubtropicalsavanna.InSoilcarbonsequestrationandthegreenhouseeffect,2ndedition,R.LalandR.F.Follett(eds.).Madison,WI:SSSASpecialPublication.
Boutton,T.W.,andJ.D.Liao.2010.Changesinsoilnitrogenstorageandδ15Nwithwoodyplantencroachmentinasubtropicalsavannaparklandlandscape.JournalofGeophysicalResearch,115.
Chapter 3: Quantifying Greenhouse Gas Sources and Sinks in Cropland and Grazing Land Systems
3-118
Bouwman,A.F.,L.J.M.Boumans,andN.H.Batjes.2002.EmissionsofN2OandNOfromfertilizedfields:Summaryofavailablemeasurementdata.GlobalBiogeochemicalCycles,16(4):1058.
Bowman,R.A.,andR.L.Anderson.2002.ConservationReserveProgram:EffectsonsoilorganiccarbonandpreservationwhenconvertingbacktocroplandinnortheasternColorado.JournalofSoilandWaterConservation,57(2):121‐126.
Brandle,J.,L.Hodges,J.Tyndall,andR.Sudmeyer.2009.Windbreakpractices.InNorthAmericanAgroforestry,anintegratedscienceandpractice,G.HE(ed.).Madison,WI:AmericanSocietyofAgronomy.
Brandle,J.R.,B.B.Johnson,andT.Akeson.1992.Fieldwindbreaks:Aretheyeconomical?JournalofProductionAgriculture,5:393‐398.
Brandt,L.,J.King,S.Hobbie,D.Milchunas,etal.2010.TheRoleofPhotodegradationinSurfaceLitterDecompositionAcrossaGrasslandEcosystemPrecipitationGradient.Ecosystems,13(5):765‐781.
Breitenbeck,G.A.,andJ.M.Bremner.1986a.Effectsofvariousnitrogenfertilizersonemissionofnitrousoxidefromsoils.BiologyandFertilityofSoils,2(4):195‐199.
Breitenbeck,G.A.,andJ.M.Bremner.1986b.Effectsofrateanddepthoffertilizerapplicationonemissionofnitrousoxidefromsoilfertilizedwithanhydrousammonia.BiologyandFertilityofSoils,2(4):201‐204.
Bremer,D.J.,andJ.M.Ham.2010.NetCarbonFluxesOverBurnedandUnburnedNativeTallgrassPrairie.RangelandEcology&Management,63(1):72‐81.
Bremner,J.M.,G.A.Breitenbeck,andA.M.Blackmer.1981.EffectofNitrapyrinonEmissionofNitrousOxidefromSoilFertilizedwithAnhydrousAmmonia.GeophysicalResearchLetters,8(4):353‐356.
Briske,D.D.,J.D.Derner,J.R.Brown,S.D.Fuhlendorf,etal.2008.RotationalGrazingonRangelands:ReconciliationofPerceptionandExperimentalEvidence.RangelandEcology&Management,61:3‐17.
Briske,D.D.,N.F.Sayre,L.Huntsinger,M.Fernandez‐Gimenez,etal.2011.Origin,persistence,andresolutionoftherotationalgrazingdebate:Integratinghumandimensionsintorangelandresearch.RangelandEcology&Management,64:325‐334.
Broadbent,F.E.1960.FactorsinfluencingthedecompositionoforganicsoilsoftheCaliforniadelta:UniversityofCalifornia.
Bronson,K.F.,A.R.Mosier,andS.R.Bishnoi.1992.NitrousOxideEmissionsinIrrigatedCornasAffectedbyNitrificationInhibitors.SoilScienceSocietyofAmericaJournal,56(1):161‐165.
Brown,J.,J.Angerer,S.W.Salley,R.Blaisdell,etal.2010.ImprovingestimatesofrangelandcarbonsequestrationpotentialintheUSSouthwest.RangelandEcology&Management,61(1):147‐154.
Brown,J.R.2010.EcologicalSites:TheirHistory,Status,andFuture.Rangelands,32(6):5‐8.Burford,J.R.,R.J.Dowdell,andR.Crees.1981.Emissionofnitrousoxidetotheatmospherefrom
direct‐drilledandploughedclaysoils.JournaloftheScienceofFoodandAgriculture,32(3):219‐223.
Burton,D.L.,X.Li,andC.A.Grant.2008a.InfluenceoffertilizernitrogensourceandmanagementpracticeonN2OemissionsfromtwoBlackChernozemicsoils.CanadianJournalofSoilScience,88:219‐227.
Burton,D.L.,B.J.Zebarth,K.M.Gillarn,andJ.A.MacLeod.2008b.EffectofsplitapplicationoffertilizernitrogenonN2Oemissionsfrompotatoes.CanadianJournalofSoilScience,88:229‐239.
Cairns,M.A.,S.Brown,E.H.Helmer,andG.A.Baumgardner.1997.Rootbiomassallocationintheworld'suplandforests.Oecologia,111(1).
Chapter 3: Quantifying Greenhouse Gas Sources and Sinks in Cropland and Grazing Land Systems
3-119
Cardenas,L.M.,R.Thorman,N.Ashlee,M.Butler,etal.2010.QuantifyingannualN2Oemissionfluxesfromgrazedgrasslandunderarangeofinorganicfertilisernitrogeninputs.Agriculture,Ecosystems&Environment,136:218‐226.
Case,S.D.C.,N.McNamara,D.Reay,andJ.Whitaker.2013.CanbiocharreducesoilgreenhousegasemissionsfromaMiscanthusbioenergycrop?GCBBioenergy,6(1):76‐89.
CAST.2004.ClimateChangeandGreenhouseGasMitigation:ChallengesandOpportunitiesforAgriculture.Ames,Iowa:CouncilforAgriculturalScienceandTechnology.
CAST.2011.CarbonSequestrationandGreenhouseGasFluxesinAgriculture:ChallengesandOpportunities:CouncilforAgriculturalScienceandTechnology.
Cavigelli,M.,andT.Parkin.2012.CroplandManagementContributionstoGreenhouseGasFlux:CentralandEasternU.S.InManagingAgriculturalGreenhouseGasesM.Liebig,A.FranzluebbersandR.Follett(eds.).London,UK:AcademicPress.
Cayuela,M.L.,L.vanZweiten,B.P.Singh,S.Jeffrey,etal.2010.UnweatheredWoodBiocharImpactonNitrousOxideEmissionsfromaBovine‐Urine‐AmendedPastureSoil.SoilScienceSocietyofAmericaJournal,74:852‐860.
Chan,A.S.K.,andT.B.Parkin.2001.Effectoflanduseonmethanefluxfromsoil.JournalofEnvironmentalQuality,30(3):786‐797.
Chang,C.,C.M.Cho,andD.H.Janzen.1998.Nitrousoxideemissionfromlong‐termmanuredsoils.SoilScienceSocietyAmericaJournal,62:677‐682.
Chen‐Ching,C.1996.TheN2Oemissionfrompaddysoil:Effectsofinorganicnitrogenfertilizerandricevarieties.JournaloftheAgriculturalAssociationofChina,174:111‐133.
Chen,D.,Y.Li,P.R.Grace,andA.Mosier.2008.N2Oemissionsfromagriculturallands:asynthesisofsimulationapproachesPlantandSoil,309:169‐189.
Cheng,K.,S.M.Ogle,W.J.Parton,andG.Pan.2013.PredictingmethanogenesisfromricepaddiesusingtheDAYCENTecosystemmodel.EcologicalModeling,261‐262:19‐31.
Cheng,W.,Y.Nakajima,S.Sudo,H.Akiyama,etal.2002.N2OandNOemissionsfromafieldofChinesecabbageasinfluencedbybandapplicationofureaorcontrolled‐releaseureafertilizers.NutrientCyclinginAgroecosystems,63:231‐238.
Chu,H.Y.,Y.Hosen,andK.Yagi.2007.NO,N2O,CH4andfluxesinwinterbarleyfieldofJapaneseAndisolasaffectedbyNfertilizermanagement.SoilBiology&Biochemistry,39:330‐339.
Clark,J.T.,J.R.Russell,D.L.Karlen,P.L.Singleton,etal.2004.Soilsurfacepropertyandsoybeanyieldresponsetocornstovergrazing.AgronomyJournal,96:1364‐1371.
Clough,T.J.,J.E.Bertram,J.L.Ray,L.M.Condron,etal.2010.UnweatheredWoodBiocharImpactonNitrousOxideEmissionsfromaBovine‐Urine‐AmendedPastureSoil.SoilScienceSocietyofAmericaJournal,74(3):852‐860.
Conant,R.,J.Six,andK.Paustian.2003.LanduseeffectsonsoilcarbonfractionsinthesoutheasternUnitedStates.I.Management‐intensiveversusextensivegrazing.BiologyandFertilityofSoils,38(6):386‐392.
Conant,R.T.,K.Paustian,andE.T.Elliott.2001.Grasslandmanagementandconversionintograssland:Effectsonsoilcarbon.EcologicalApplications,11(2):343–355.
Conant,R.T.,M.Easter,K.Paustian,A.Swan,etal.2007.ImpactsofperiodictillageonsoilCstocks:Asynthesis.Soil&TillageResearch,95(1‐2):1‐10.
Conant,R.T.,M.G.Ryan,G.I.Ågren,H.E.Birge,etal.2011.Temperatureandsoilorganicmatterdecompositionrates–synthesisofcurrentknowledgeandawayforward.GlobalChangeBiology,17(11):3392‐3404.
Creamer,C.,T.R.Filley,I.Kantola,andT.W.Boutton.2011.Controlsonsoilcarbonaccumulationduringwoodyplantencroachmentintograsslands:Evidencefromphysicalfractionation,soilrespiration,andtheisotopiccompositionofrespiredCO2.SoilBiologyandBiochemistry,(inpress).
Chapter 3: Quantifying Greenhouse Gas Sources and Sinks in Cropland and Grazing Land Systems
3-120
Cui,M.,X.C.Sun,C.X.Hu,H.J.Di,etal.2011.EffectiveMitigationofNitrateLeachingandNitrousOxideEmissionsinIntensiveVegetableProductionSystemsUsingaNitrificationInhibitor,Dicyandiamide.JournalofSoilsandSediments,11(5):722‐730.
Dahl,T.E.,andC.E.Johnson.1991.WetlandslossesintheUnitedStates,1780'sto1980's.ReporttotheCongress.Washington,DC:U.S.FishandWildlifeService.
Dai,X.,T.W.Ansley,M.Hailemichael,andK.E.Jessup.2006.Soilcarbonandnitrogenstorageinresponsetofireinatemperatemixed‐grasssavanna.JournalofEnvironmentalQuality,35:1620‐1628.
Daly,C.,M.Halbleib,J.I.Smith,W.P.Gibson,etal.2008.PhysiographicallysensitivemappingofclimatologicaltemperatureandprecipitationacrosstheconterminousUnitedStates.InternationalJournalofClimatology,28:2031‐2064.
Dao,T.H.,J.H.Stiegler,J.C.Banks,L.B.Boerngen,etal.2002.PostcontractlanduseeffectsonsoilcarbonandnitrogeninConservationReservegrasslands.AgronomyJournal,94:146‐152.
Davidson,E.,andI.Ackerman.1993.Changesinsoilcarboninventoriesfollowingcultivationofpreviouslyuntilledsoils.Biogeochemistry,20(3):161‐193.
Davidson,E.,M.Keller,H.E.Erickson,L.Verchot,etal.2000.Testingaconceptualmodelofsoilemissionsofnitrousandnitricoxide.Bioscience,50:667‐680.
Davidson,E.A.1991.Fluxesofnitrousoxideandnitricoxidefromterrestrialecosystems.InMicrobialProductionandConsumptionofGreenhouseGases:Methane,NitrousOxide,andHalomethanesD.E.RogersandW.B.Whitman(eds.).Washington:AmericanSocietyforMicrobiology.
Davidson,E.A.1992.Sourcesofnitricoxideandnitrousoxidefollowingwettingofdrysoil.SoilScienceSocietyofAmericaJournal,56:95‐102.
deKlein,C.,R.S.A.Novoa,S.Ogle,K.A.Smith,etal.2006.Chapter11:N2Oemissionsfrommanagedsoil,andCO2emissionsfromlimeandureaapplication.In2006IPCCguidlinesfornationalgreenhousegasinventories,Vol.4:Agriculture,forestryandotherlanduse,S.Eggleston,L.Buendia,K.Miwa,T.NgaraandK.Tanabe(eds.).Kanagawa,Japan:IGES.
deKlein,C.A.M.,R.R.Sherlock,K.C.Cameron,andT.J.vanderWeerden.2001.NitrousoxideemissionsfromagriculturalsoilsinNewZealand—Areviewofcurrentknowledgeanddirectionsforfutureresearch.JournaloftheRoyalSocietyofNewZealand,31(3):543‐574.
deKlein,C.A.M.,K.C.Cameron,H.J.Di,G.Rys,etal.2011.RepeatedAnnualUseoftheNitrificationInhibitorDicyandiamide(Dcd)DoesNotAlterItsEffectivenessinReducingN2OEmissionsfromCowUrine.AnimalFeedScienceandTechnology,166‐167:480‐491.
DelGrosso,S.,W.Parton,A.Mosier,D.S.Ojima,etal.2000a.GeneralCH4oxidationmodelandcomparisonsofCH4oxidationinnaturalandmanagedsystems.GlobalBiogeochemicalCycles,14:999‐1019.
DelGrosso,S.,S.Ogle,W.Parton,andF.J.Breidt.2010.EstimatinguncertaintyinN2OemissionsfromU.S.croplandsoils.GlobalBiogeochemicalCycles,24(1).
DelGrosso,S.J.,W.J.Parton,A.R.Mosier,D.S.Ojima,etal.2000b.GeneralmodelforN2OandN2gasemissionsfromsoilsduetodenitrification.GlobalBiogeochemicalCycles,14:1045‐1060.
DelGrosso,S.J.,A.R.Mosier,W.J.Parton,andD.S.Ojima.2005.DAYCENTmodelanalysisofpastandcontemporarysoilN2OandnetgreenhousegasfluxformajorcropsintheUSA.SoilTillageResearch,83:9‐24.
DelGrosso,S.J.,A.D.Halvorson,andW.J.Parton.2008a.TestingDAYCENTModelSimulationsofCornYieldsandNitrousOxideEmissionsinIrrigatedTillageSystemsinColorado.JournalofEnvironmentalQuality,37(4):1383‐1389.
DelGrosso,S.J.,T.Wirth,S.M.Ogle,andW.J.Parton.2008b.EstimatingAgriculturalNitrousOxideEmissions.EOS,Transactions,AmericanGeophysicalUnion,89(51):529‐540.
Chapter 3: Quantifying Greenhouse Gas Sources and Sinks in Cropland and Grazing Land Systems
3-121
DelGrosso,S.J.,D.S.Ojima,W.J.Parton,E.Stehfest,etal.2009.GlobalscaleDAYCENTmodelanalysisofgreenhousegasemissionsandmitigationstrategiesforcroppedsoils.GlobalandPlanetaryChange,67(1‐2):44‐50.
DelGrosso,S.J.,W.J.Parton,C.A.Keough,andM.Reyes‐Fox.2011.SpecialFeaturesoftheDayCentModelingPackageandAdditionalProceduresforParameterization,Calibration,Validation,andApplications.InMethodsofIntroducingSystemModelsintoAgriculturalResearch,L.R.AhujaandL.Ma(eds.).Madison,WI:SoilScienceSocietyofAmerica.
Delgado,J.A.,andA.R.Mosier.1996.MitigationAlternativestoDecreaseNitrousOxidesEmissionsandUrea‐NitrogenLossandTheirEffectonMethaneFlux.JournalofEnvironmentalQuality,25(5):1105‐1111.
Delgado,J.A.,A.R.Mosier,R.H.Follett,R.F.Follet,etal.1996.EffectsofNmanagementonN2OandCH4fluxesand15N.NutrientCyclinginAgroecosystems,46(2):127‐134.
DeLonge,M.S.,R.Ryals,andW.L.Silver.2013.ALifecycleModeltoEvaluateCarbonSequestrationPotentialandGreenhouseGasDynamicsofManagedGrasslands.EcosystemsandEnvironment,16:962‐979.
Dendooven,L.,E.Bonhomme,R.Merckx,andK.Vlassak.1998.Injectionofpigslurryanditseffectsondynamicsofnitrogenandcarboninaloamysoilunterlaboratoryconditions.BiologyandFertilityofSoils,27(1):5‐8.
Denef,K.,C.E.Stewart,J.Brenner,andK.Paustian.2008.Doeslong‐termcenter‐pivotirrigationincreasesoilcarbonstocksinsemi‐aridagro‐ecosystems?Geoderma,145(1‐2):121‐129.
Derner,J.D.,T.W.Boutton,andD.D.Brisk.2006.GrazingandecosystemcarbonstorageintheNorthAmericanGreatPlains.PlantSoil,280(77‐90).
Derner,J.D.,andG.E.Schuman.2007.Carbonsequestrationandrangelands:Asynthesisoflandmanagementandprecipitationeffects.JournalofSoilandWaterConservation,62(2):77–85.
Deverel,S.J.,andS.Rojstaczer.1996.SubsidenceofAgriculturalLandsintheSacramento‐SanJoaquinDelta,California:RoleofAqueousandGaseousCarbonFluxes.WaterResourcesResearch,32(8):2359‐2367.
Deverel,S.J.,B.Wang,andS.Rojstaczer.1998.Subsidenceoforganicsoils,Sacramento‐SanJoaquinDelta,California.InLandSubsidenceCaseStudiesandCurrentResearch,J.W.Borchers(ed.):AssociationofEngineeringGeologistSpecialPublicationNo.8.
Devito,K.J.,D.Fitzgerald,A.R.Hill,andR.Aravena.2000.Nitratedynamicsinrelationtolithologyandhydrologicflowpathinariverriparianzone.JournalofEnvironmentalQuality,29(4):1075‐1084.
Ding,W.,Y.Cai,X.Cai,K.Yagi,etal.2007.Nitrousoxideemissionsfromanintensivelycultivatedmaize‐wheatrotationinsoilintheNorthChinaPlain.ScienceandtheTotalEnvironment,373.
Dittert,K.,R.Bol,R.King,D.Chadwick,etal.2001.UseofanovelnitrificationinhibitortoreducenitrousoxideemissionfromN15‐labelleddairyslurryinjectedintosoil.RapidCommunicationsinMassSpectrometry,15:1291‐1296.
Dixon,R.K.,A.M.Solomon,S.Brown,R.A.Houghton,etal.1994.CarbonPoolsandFluxofGlobalForestEcosystems.Science,263(5144):185‐190.
Dobbie,K.E.,andK.A.Smith.2003.ImpactofDifferentFormsofNFertilizeronN2OEmissionsfromIntensiveGrassland.NutrientCyclinginAgroecosystems,67(1):37‐46.
Doran,J.W.,E.T.Elliott,andK.Paustian.1998.Soilmicrobialactivity,nitrogencycling,andlong‐termchangesinorganiccarbonpoolsasrelatedtofallowtillagemanagement.Soil&TillageResearch,49:3‐18.
Dorr,H.,L.Katru,andI.Levin.1993.Soiltextureparameterizationofthemethaneuptakeinaeratedsoils.Chemosphere,26(697‐713).
Chapter 3: Quantifying Greenhouse Gas Sources and Sinks in Cropland and Grazing Land Systems
3-122
Dosskey,M.G.,P.Vidon,N.P.Gurwick,C.J.Allan,etal.2010.Theroleofriparianvegetationinprotectingandimprovingchemicalwaterqualityinstreams.JournaloftheAmericanWaterResourcesAssociation,46(2):261‐277.
Drury,C.F.,W.D.Reynolds,C.S.Tan,T.W.Welacky,etal.2006.EmissionsofNitrousOxideandCarbonDioxide.SoilScienceSocietyofAmericaJournal,70(2):570‐581.
Dunfield,P.,E.Topp,C.Archambault,andR.Knowles.1995.EffectofnitrogenfertilizersandmoisturecontentonCH4andN2Ofluxesinahumisol:Measurementsinthefieldandintactsoilcores.Biogeochemistry,29(3):199‐222.
Dunn,B.H.,A.J.Smart,R.N.Gates,P.S.Johnson,etal.2010.Long‐TermProductionandProfitabilityFromGrazingCattleintheNorthernMixedGrassPrairie.RangelandEcology&Management,63(2):233‐242.
Duxbury,J.M.,D.R.Bouldin,R.E.Terry,andR.L.Tate.1982.Emissionsofnitrousoxidefromsoils.Nature,298(5873):462‐464.
Eagle,A.J.,L.R.Henry,L.P.Olander,K.Haugen‐Kozyra,etal.2010.GreenhouseGasMitigationPotentialofAgriculturalLandManagementintheUnitedStates.ASynthesisoftheLiterature:NicholasInstituteEnvironmentalPolicySolutions.
Eghball,B.,L.N.Mielke,D.L.McCallister,andJ.W.Doran.1994.Distributionoforganiccarbonandinorganicnitrogeninasoilundervarioustillageandcropsequences.JournalofSoilandWaterConservation,49(2):201‐205.
Elgood,Z.,W.D.Robertson,S.L.Schiff,andR.Elgood.2010.Greenhousegasproductioninastreambedbioreactorfornitrateremoval.EcologicalEngineering,36:1575‐1580.
Elmi,A.,C.Madramootoo,C.Hamel,andA.Liu.2003.Denitrificationandnitrousoxidetonitrousoxideplusdinitrogenratiosinthesoilprofileunderthreetillagesystems.BiologyandFertilityofSoils,38(6):340‐348.
Emmerich,W.E.2003.Carbondioxidefluxesinasemiaridenvironmentwithhighcarbonatesoils.AgriculturalandForestMeteorology,116:91‐102.
Engel,R.,D.L.Liang,R.Wallander,andA.Bembenek.2010.InfluenceofUreaFertilizerPlacementonNitrousOxideProductionfromaSiltLoamSoil.JournalofEnvironmentalQuality,39(1):115‐125.
Entry,J.A.,R.E.Sojka,andG.E.Shewmaker.2002.Managementofirrigatedagriculturetoincreaseorganiccarbonstorageinsoil.SoilScienceSocietyofAmericaJournal,66:1957‐1964.
Entry,J.A.,R.E.Sojka,andG.E.Shewmaker.2004.Irrigationincreasesinorganiccarboninagriculturalsoils.EnvironmentalManagement,33:S309‐S317.
Errebhi,M.,C.J.Rosen,S.C.Gupta,andD.E.Birong.1998.PotatoYieldResponseandNitrateLeachingasInfluencedbyNitrogenManagement.AgronomyJournal,90(1):10‐15.
ERS.2011.U.S.FertilizerUseandPriceUSDAEconomicResearchService.RetrievedJune17fromhttp://www.ers.usda.gov/Data/FertilizerUse/.
Euliss,N.H.,Jr.,N.Bliss,S.Bristol,W.Dean,etal.2006.TheEfficacyofaNationalModeltoAssessandQuantifytheEcosystemServicesProvidedbyUSDAandUSDOIConservationPrograms:ThePrairiePotholeRegionasaRegionalPilot.Jamestown,ND:U.S.GeologicalSurvey,NorthernPrairieWildlifeResearchCenter.
Fargione,J.,J.Hill,D.Tilman,S.Polasky,etal.2008.LandClearingandtheBiofuelCarbonDebt.Science,319(5867):1235‐1238.
Feng,J.,C.Chen,Y.Zhang,Z.Song,etal.2013.Impactsofcroppingpracticesonyield‐scaledgreenhousegasemissionsfromricefieldsinChina:Ameta‐analysis.Agriculture.EcosystemsandEnvironment,164:220‐228.
Fertilizer101.DictionaryRetrievedfromhttp://www.fertilizer101.org/dictionary/.Fierer,N.,andJ.P.Schimel.2002.Effectsofdrying‐rewettingfrequencyonsoilcarbonandnitrogen
transformations.SoilBiologyandBiochemistry,34(6):777‐787.
Chapter 3: Quantifying Greenhouse Gas Sources and Sinks in Cropland and Grazing Land Systems
3-123
Firestone,M.,andE.Davidson.1989.MicrobiologicalbasisofNOandN2Oproductionandconsumptioninsoil.InExchangeoftracegasesbetweenterrestrialecosystemsandtheatmosphere,M.AndreaeandD.Schimel(eds.).Chichester,UK:JohnWiley&Sons.
Fitzgerald,G.J.,K.M.Scow,andJ.E.Hill.2000.FallowseasonstrawandwatermanagementeffectsonmethaneemissionsinCaliforniarice.GlobalBiogeochem.Cycles,14(3).
Fitzgerald,G.J.,Scow,K.M.,Hill,J.E.2000.FallowseasonstrawandwatermanagementeffectsonmethaneemissionsinCaliforniarice.GlobalBiogeochemicalCycles,14(3):767‐776.
Flechard,C.R.,P.Ambus,U.Skiba,R.M.Rees,etal.2007.EffectsofclimateandmanagementintensityonnitrousoxideemissionsingrasslandsystemsacrossEurope.Agriculture,Ecosystems&Environment,121(1‐2):135‐152.
Flessa,H.,andF.Beese.2000.Laboratoryestimatesoftracegasemissionsfollowingsurfaceapplicationandinjectionofcattleslurry.JournalofEnvironmentalQuality,29(1):262‐268.
Follett,R.F.2001.Soilmanagementconceptsandcarbonsequestrationincroplandsoils.Soil&TillageResearch,61(1‐2):77–92.
Follett,R.F.,J.M.Kimble,andR.Lal.2001.ThepotentialofU.S.grazinglandstosequestercarbonandmitigatethegreenhouseeffect.BocaRaton,FL:CRCPress.
Follett,R.F.,J.M.Kimble,E.G.Pruessner,S.Samson‐Liebig,etal.2009.SoilorganicCstockswithdepthandlanduseatvariousUSsites.Madison,WI:ASA‐CSSA‐SSSA.
Fornara,D.A.,S.Steinbeiss,N.P.McNamara,G.Gleixner,etal.2011.Increasesinsoilorganiccarbonsequestrationcanreducetheglobalwarmingpotentialoflong‐termlimingtopermanentgrassland.GlobalChangeBiology,17(5):1925‐1934.
Franzluebbers,A.J.,J.A.Stuedemann,H.H.Schomberg,andS.R.Wilkinson.2000.SoilorganicCandNpoolsunderlong‐termpasturemanagementintheSouthernPiedmontUSA.SoilBiologyandBiochemistry,32(4):469‐478.
Franzluebbers,A.J.,andJ.L.Steiner.2002.Climaticinfluencesonsoilorganiccarbonstoragewithnotillage.InAgriculturalPracticesandPoliciesforCarbonSequestrationinSoil,J.M.Kimble,R.LalandR.F.Follett(eds.).BocaRaton,FL:CRCPress.
Franzluebbers,A.J.2005.SoilorganiccarbonsequestrationandagriculturalgreenhousegasemissionsinthesoutheasternUSA.Soil&TillageResearch,83(1):120–147.
Franzluebbers,A.J.,andJ.A.Stuedemann.2009.Soil‐profileorganiccarbonandtotalnitrogenduring12yearsofpasturemanagementintheSouthernPiedmontUSA.Agriculture,Ecosystems&Environment,129(1‐3):28‐36.
Franzluebbers,A.J.2010a.AchievingsoilorganiccarbonsequestrationwithconservationagriculturalsystemsinthesoutheasternUnitedStates.SoilScienceSocietyofAmericaJournal,74(2):347–357.
Franzluebbers,A.J.2010b.SoilorganiccarboninmanagedpasturesofthesoutheasternUnitedStatesofAmerica.InGrasslandcarbonsequestration:Management,policyandeconomics,M.Abberton,R.T.ConantandC.Batello(eds.).Rome,Italy:FAO,Integr.CropManage.
Franzluebbers,A.J.,L.B.Owens,G.C.Sigua,C.A.Cambardella,etal.2012.Soilorganiccarbonunderpasturemanagement.InManagingagriculturalGHGs:CoordinatedagriculturalresearchthroughGRACEnettoaddressourchangingclimate.SanDiego,CA:AcademicPress.
Fujinuma,R.,R.T.Venterea,andC.J.Rosen.2011.BroadcastureareducesN2OemissionsbutincreasesNOemissionscomparedwithconventionalandshallow‐appliedanhydrousammoniainacoarse‐texturedsoil.SubmittedtoJournalofEnvironmentalQuality.
Gagnon,B.,andN.Ziadi.2010.Graincornandsoilnitrogenresponsestosidedressnitrogensourcesandapplication.AgronomyJournal,102:1014‐1022.
Gagnon,B.,N.Ziadi,P.Rochette,M.H.Chantigny,etal.2011.FertilizerSourceInfluencedNitrousOxideEmissionsfromaClaySoilunderCorn.SoilScienceSocietyofAmericaJournal,75(2):595‐604.
Chapter 3: Quantifying Greenhouse Gas Sources and Sinks in Cropland and Grazing Land Systems
3-124
Garrett,H.E.2009.NorthAmericanAgroforestry:AnIntegratedScienceandPractice,2nded.Madison,WI:AmericanSocietyofAgronomy,Inc.
Gebhart,D.L.,H.B.Johnson,H.S.Mayeux,andH.W.Polley.1994.TheCRPincreasessoilorganiccarbon.JournalofSoilandWaterConservation,49(5):488‐492.
Gehl,R.J.,J.P.Schmidt,L.R.Stone,A.J.Schlegel,etal.2005.Insitumeasurementsofnitrateleachingimplicatepoornitrogenandirrigationmanagementonsandysoils.JournalofEnvironmentalQuality,34:2243‐2254.
Gelfand,I.,T.Zenone,P.Jasrotia,J.Chen,etal.2011.CarbondebtofConservationReserveProgram(CRP)grasslandsconvertedtobioenergyproduction.ProceedingsoftheNationalAcademyofSciences,108(33):13864‐13869.
Ghosh,S.,D.Majumdar,andM.C.Jain.2003.MethaneandNitrousOxideEmissionsfromanIrrigatedRiceofNorthIndia.Chemosphere,51(3):181‐195.
Gill,R.A.,I.C.Burke,W.K.Lauenroth,andD.Milchunas.2002.Longevityandturnoverofrootsintheshortgrasssteppe:influenceofdiameteranddepth..PlantEcology,159:241‐251.
Gilley,J.E.,J.W.Doran,D.L.Karlen,andT.C.Kaspar.1997.Runoff,erosion,andsoilqualitycharacteristicsofaformerConservationReserveProgramsite.JournalofSoilandWaterConservation,52(3):189‐193.
Giltrap,D.,C.Li,andS.Saggar.2010.DNDC:Aprocess‐basedmodelforgreenhousegasfluxesfromagriculturalsoils.Agriculture,EcosystemsandEnvironment,136:292‐300.
Gleason,R.,N.H.Euliss,Jr.,B.A.Tangen,M.Laubhan,etal.2009.USDAConservationProgramandPracticeEffectsonWetlandEcosystemServicesinthePrairiePotholeRegion.EcologicalApplications,21(3):S65‐S81.
Gold,M.A.,andH.E.Garrett.2009.Agroforestrynomenclature,conceptsandpractices.Madison,WI:AmericanSocietyofAgronomy.
Grace,P.R.,D.Rowlings,I.Rochester,R.Kiese,etal.2010.NitrousoxideemissionsfromirrigatedcottonsoilsofnorthernAustralia.InSoilSolutionsforaChangingWorld:Proceedingsofthe19thWorldCongressofSoilScience,1‐6August2010,R.GilkesandN.Prakongkep(eds.).Brisbane,Australia.
Grandy,A.S.,T.D.Loecke,S.Parr,andG.P.Robertson.2006.Long‐TermTrendsinNitrousOxideEmissions,SoilNitrogen,andCropYieldsofTillandNo‐TillCroppingSystems.JournalofEnvironmentalQuality,35(4):1487‐1495.
Greenwood,K.L.,andB.M.McKenzie.2001.Grazingeffectsonsoilphysicalpropertiesandtheconsequencesforpastures:areview.AustralianJournalofExperimentalAgriculture,41(8):1231‐1250.
Gregg,J.S.,andR.C.Izaurralde.2010.Effectofcropresidueharvestonlong‐termcropyield,soilerosionandnutrientbalance:trade‐offsforasustainablebioenergyfeedstock.Biofuels,1(1):69‐83.
Griggs,B.R.,R.J.Norman,C.E.Wilson,andN.A.Slaton.2007.AmmoniaVolatilizationandNitrogenUptakeforConventionalandConservationTilledDry‐Seeded,Delayed‐FloodRice.SoilScienceSocietyofAmericaJournal,71(3):745‐751.
Groffman,P.M.1985.NitrificationandDenitrificationinConventionalandNo‐TillageSoils.SoilScienceSocietyofAmericaJournal,49(2):329‐334.
Hadi,A.,O.Jumadi,K.Inubushi,andK.Yagi.2008.MitigationOptionsforN2OEmissionfromaCornFieldinKalimantan,Indonesia.Soilscienceandplantnutrition,54(4):644‐649.
Haile,S.G.,V.D.Nair,andP.K.R.Nair.2010.ContributionoftreestocarbonstorageinsoilsofsilvopastoralsystemsinFlorida,USA.GlobalChangeBiology,16(1):427‐438.
Halvorson,A.D.,S.J.DelGrosso,andC.A.Reule.2008.Nitrogen,Tillage,andCropRotationEffectsonNitrousOxideEmissionsfromIrrigatedCroppingSystems.JournalofEnvironmentalQuality,37(4):1337‐1344.
Chapter 3: Quantifying Greenhouse Gas Sources and Sinks in Cropland and Grazing Land Systems
3-125
Halvorson,A.D.,S.J.DelGrosso,andF.Alluvione.2010a.NitrogenSourceEffectsonNitrousOxideEmissionsfromIrrigatedNo‐TillCorn.JournalofEnvironmentalQuality,39(5):1554‐1562.
Halvorson,A.D.,S.J.DelGrosso,andF.Alluvione.2010b.TillageandInorganicNitrogenSourceEffectsonNitrousOxideEmissionsfromIrrigatedCroppingSystems.SoilScienceSocietyofAmericaJournal,74(2):436‐445.
Halvorson,A.D.,S.J.DelGrosso,andC.P.Jantalia.2011.NitrogenSourceEffectsonSoilNitrousOxideEmissionsfromStrip‐TillCorn.JournalofEnvironmentalQuality,40(6):1775‐1786.
Halvorson,A.D.,andS.J.D.Grosso.2012.NitrogenSourceandPlacementEffectsonSoilNitrousOxideEmissionsfromNo‐TillCorn.JournalofEnvironmentalQuality,41(5):1349‐1360.
Halvorson,A.D.,andS.J.DelGrosso.2013.Nitrogenplacementandsourceeffectsonnitrousoxideemissionsandyieldsofirrigatedcorn.JournalofEnvironmentalQuality,42(Inpress).
Halvorson,A.D.,C.S.Snyder,A.D.Blaylock,andS.J.DelGrosso.Inreview.EnhancedEfficiencyNitrogenFertilizers:PotentialRoleinNitrousOxideEmissionMitigation.AgronomyJournal.
Hamilton,S.K.,A.L.Kurzman,C.Arango,L.Jin,etal.2007.Evidenceforcarbonsequestrationbyagriculturalliming.GlobalBiogeochemicalCycles,21(2):GB2021.
Hao,X.,C.Chang,J.M.Carefoot,H.H.Janzen,etal.2001.Nitrousoxideemissionsfromanirrigatedsoilasaffectedbyfertilizerandstrawmanagement.NutrientCyclinginAgroecosystems,60(1):1‐8.
Harden,J.W.,J.M.Sharpe,W.J.Parton,D.S.Ojima,etal.1999.Dynamicreplacementandlossofsoilcarbononerodingcropland.GlobalBiogeochemicalCycles,13:885‐901.
Harden,J.W.,A.A.Berhe,M.Torn,J.Harte,etal.2008.Soilerosion:datasayCsink.Science,320(5873):178‐179.
Harmoney,K.R.,K.J.Moore,J.R.George,E.C.Brummer,etal.1997.Determinationofpasturebiomassusingfourindirectmethods.AgronomyJournal,89:665‐672.
Hartz,T.K.,andP.R.Johnstone.2006.Nitrogenavailablefromhigh‐nitrogen‐containingorganicfertilizers.HortTechnology,16:39‐42.
Heitschmidt,R.K.,andC.A.J.Taylor.1991.Livestockproduction.InGrazingManagement:AnEcologicalPerspective,R.K.H.a.J.W.Stuth(ed.).Portland,OR:TimberPress.
Hénault,C.,A.Grossel,B.Mary,M.Roussel,etal.2012.Nitrousoxideemissionbyagriculturalsoils:areviewofspatialandtemporalvariabilityformitigation.Pedosphere,22:426‐433.
Hoben,J.P.,R.J.Gehl,N.Millar,P.R.Grace,etal.2011.Nonlinearnitrousoxide(N2O)responsetonitrogenfertilizerinon‐farmcorncropsoftheUSMidwest.GlobalChangeBiology,17(2):1140‐1152.
Hollister,E.B.,C.W.Schadt,A.V.Palumbo,R.JamesAnsley,etal.2010.StructuralandfunctionaldiversityofsoilbacterialandfungalcommunitiesfollowingwoodyplantencroachmentinthesouthernGreatPlains.SoilBiologyandBiochemistry,42(10):1816‐1824.
Hosen,Y.,K.Paisancharoen,andH.Tsuruta.2002.EffectsofdeepapplicationofureaonNOandN2OemissionsfromanAndisol.NutrientCyclinginAgroecosystems,63(2):197‐206.
Hou,A.X.,andH.Tsuruta.2003.NitrousoxideandnitricoxidefluxesfromanuplandfieldinJapan:effectofureatype,placement,andcropresidues.NutrientCyclinginAgroecosystems,65:191‐200.
Houghton,R.A.,J.L.Hackler,andK.T.Lawrence.1999.TheU.S.CarbonBudget:ContributionsfromLand‐UseChange.Science,285(5427):574‐578.
Huang,Y.,R.L.Sass,andF.M.F.Jr.1997.MethaneemissionfromTexasricepaddysoils.1.Quantitativemulti‐yeardependenceofCH4emissiononsoil,cultivarandgrainyield.GlobalChangeBiology,3:479‐489.
Hue,N.V.OrganicFertilizersinSustainableAgricultureRetrievedfromhttp://www.ctahr.hawaii.edu/huen/hue_organic.htm.
Chapter 3: Quantifying Greenhouse Gas Sources and Sinks in Cropland and Grazing Land Systems
3-126
Hultgreen,G.,andP.Leduc.2003.Theeffectofnitrogenfertilizerplacement,formulation,timing,andrateongreenhousegasemissionsandagronomicperformance:AgricultureAgri‐FoodCanada,PrairieAgriculturalMachineryInstitute.
Hyatt,C.R.,R.T.Venterea,C.J.Rosen,M.McNearney,etal.2010.Polymer‐CoatedUreaMaintainsPotatoYieldsandReducesNitrousOxideEmissionsinaMinnesotaLoamySand.SoilScienceSocietyofAmericaJournal,74(2):419‐428.
Ingram,L.J.,P.D.Stahl,G.E.Schuman,J.S.Buyer,etal.2008.GrazingImpactsOnSoilCarbonAndMicrobialCommunitiesInAMixed‐grassEcosystem.SoilScienceSocietyofAmericaJournal,72(4):939‐948.
IPCC.1997.Revised1996IPCCGuidelinesforNationalGreenhouseGasInventories,PreparedbytheNationalGreenhouseGasInventoriesProgramme.Bracknell,UK:IntergovernmentalPanelonClimateChange.http://www.ipcc‐nggip.iges.or.jp/public/2006gl/vol4.html.
IPCC.2000.LandUse,Land‐UseChange,andForestry.UK:IntergovernmentalPanelonClimateChange.
IPCC.2001.ClimateChange2001:TheScientificBasis.ContributionforWorkingGroupItotheThirdAssessmentReportoftheIntergovernmentalPanelonClimateChange.NewYork,NY.
IPCC.2006.IPCCGuidelinesforNationalGreenhouseGasInventories.Japan:IGES.IPCC.2007.ContributionofWorkingGroupsI,IIandIIItotheFourthAssessmentReportofthe
IntergovernmentalPanelonClimateChangeCoreWritingTeam.Geneva,Switzerland:IntergovernmentalPanelonClimateChange.
Izaurralde,R.C.,W.B.McGill,J.A.Robertson,N.G.Juma,etal.2001.CarbonBalanceoftheBretonClassicalPlotsoverHalfaCentury.SoilScienceSocietyofAmericaJournal,65:431‐441.
Izaurralde,R.C.,J.R.Williams,W.M.Post,A.Thomson,etal.2007.Long‐termmodelingofsoilCerosionandsequestrationatthesmallwatershedscale.ClimaticChange,80:73‐90.
Jaffé,R.,Y.Ding,J.Niggemann,A.V.Vähätalo,etal.2013.GlobalCharcoalMobilizationfromSoilsviaDissolutionandRiverineTransporttotheOceans.Science,340(6130):345‐347.
Jambert,C.,R.Delmas,D.Serça,L.Thouron,etal.1997.N2OandCH4emissionsfromfertilizedagriculturalsoilsinsouthwestFrance.NutrientCyclinginAgroecosystems,48(1):105‐114.
Jelinski,N.A.,andC.J.Kucharik.2009.Land‐useEffectsonSoilCarbonandNitrogenonaU.S.MidwesternFloodplain.SoilScienceSocietyofAmericaJournal,73(1):217‐225.
Jenkins,J.C.,D.C.Chojnacky,L.S.Heath,andR.A.Birdsey.2003.National‐scalebiomassestimatorsforUnitedStatestreespecies.ForestScience,49(1):12‐35.
Jenkins,J.C.,D.C.Chojnacky,L.S.Heath,andR.A.Birdsey.2004.Comprehensivedatabaseofdiameter‐basedbiomassregressionsforNorthAmericantreespecies.NewtownSquare,PA:U.S.DepartmentofAgriculture,ForestService,NorthernResearchStation.
Ji,Y.,G.Liu,J.Ma,H.Xu,etal.2012.Effectofcontrolled‐releasefertilizeronnitrousoxideemissionfromawinterwheatfield.NutrientCyclinginAgroecosystems,94:111‐122.
Jiang,J.Y.,Z.H.Hu,W.J.Sun,andY.Huang.2010.NitrousoxideemissionsfromChinesecroplandfertilizedwitharangeofslow‐releasenitrogencompounds.Agriculture,Ecosystems&Environment,135:216‐225.
Jongedyk,H.A.,R.B.Hickok,I.D.Mayer,andN.K.Ellis.1950.SubsidenceofmucksoilsinnorthernIndiana.Indiana:PurdueUniversityAgriculturalExperimentStation.
Jumadi,O.,Y.Hala,A.Muis,A.Ali,etal.2008.InfluencesofChemicalFertilizersandaNitrificationInhibitoronGreenhouseGasFluxesinaCorn(ZeaMaysL.)FieldinIndonesia.Microbesandenvironments,23(1):29‐34.
Kaewpradit,W.,B.Toomsan,P.Vityakon,V.Limpinuntana,etal.2008.RegulatingmineralNreleaseandgreenhousegasemissionsbymixinggroundnutresiduesandricestrawunderfieldconditions.EuropeanJournalofSoilScience,59(4):640‐652.
Chapter 3: Quantifying Greenhouse Gas Sources and Sinks in Cropland and Grazing Land Systems
3-127
Kaiser,E.‐A.,andR.Ruser.2000.NitrousoxideemissionsfromarablesoilsinGermany—Anevaluationofsixlong‐termfieldexperiments.JournalofPlantNutritionandSoilScience,163(3):249‐259.
Kaiser,E.A.,K.Kohrs,M.Kücke,E.Schnug,etal.1998.Nitrousoxidereleasefromarablesoil:importanceofN‐fertilization,cropsandtemporalvariation.SoilBiologyandBiochemistry,30:1553‐1563.
Kallenbach,C.M.,D.E.Rolston,andW.R.Horwath.2010.CovercroppingaffectssoilN2OandCO2emissionsdifferentlydependingontypeofirrigation.Agriculture,Ecosystems&Environment,137(3‐4):251‐260.
Kammann,C.,L.Grünhage,C.Müller,S.Jacobi,andH.‐J.Jäger.1998.SeasonalvariabilityandmitigationoptionsforN2Oemissionsfromdifferentlymanagedgrasslands.EnvironmentalPollution,102(S1):179‐186.
Karki,U.,M.S.Goodman,andS.S.Sladden.2009.Nitrogensourceinfluencesonforageandsoilinyoungsouthern‐pinesilvopasture.Agriculture,Ecosystems&Environment,131(70‐76).
Karlen,D.L.,M.J.Rosek,J.C.Gardner,D.L.Allan,etal.1999.ConservationReserveProgrameffectsonsoilqualityindicators.JournalofSoilandWaterConservation,54(1):439‐444.
Kasimir‐Klemedtsson,Å.,L.Klemedtsson,K.Berglund,P.Martikainen,etal.1997.Greenhousegasemissionsfromfarmedorganicsoils:areview.SoilUseandManagement,13:245‐250.
Katayanagi,N.,Y.Furukawa,T.Fumoto,andY.Hosen.2012.ValidationoftheDNDC‐RicemodelbyusingCH4andN2Ofluxdatafromricecultivatedinpotsunderalternatewettinganddryingirrigationmanagement.Soilscienceandplantnutrition,58:360‐372.
Keeney,D.R.,andK.L.Sahrawat.1986.Nitrogentransformationsinfloodedsoils.FertilizerResearch,9:15‐38.
Keerthisinghe,D.G.,L.Xin‐Jian,L.Qi‐xiang,andA.R.Mosier.1995.EffectofencapsulatedcalciumcarbideandureaapplicationmethodsondenitrificationandNlossfromfloodedrice.NutrientCyclinginAgroecosystems,45(1):31‐36.
Kelly,K.B.,F.A.Phillips,andR.Baigent.2008.ImpactofdicyandiamideapplicationonnitrousoxideemissionsfromurinepatchesinnorthernVictoria,Australia.AustralianJournalofExperimentalAgriculture,48:156‐159.
Kennedy,T.L.,E.Suddick,andJ.Six.2013.ReducednitrousoxideemissionsandincreasedyieldsinCaliforniatomatocroppingsystemsunderdripirrigationandfertigation.Agriculture,Ecosystems&Environment,170:16‐27.
Kesik,M.,N.Brüggemann,R.Forkel,R.Kiese,etal.2006.FuturescenariosofN2OandNOemissionsfromEuropeanforestsoils.J.Geophys.Res.,111:2018‐2022.
Kessavalou,A.,R.A.Drijber,A.R.Mosier,J.W.Doran,etal.1998.Fluxesofcarbondioxide,nitrousoxide,andmethaneingrasssodandwinterwheat‐fallowtillagemanagement.JournalofEnvironmentalQuality,27(5):1094‐1104.
Kiese,R.,C.Li,D.W.Hilbert,H.Papen,etal.2005.RegionalapplicationofPnET‐DNDCforestimatingtheN2OsourcetrengthoftropicrainforestsintheWetTropicsofAustralia.GlobalChangeBiology,11:128‐144.
Kim,D.‐G.2008.Nitrousoxideandmethanefluxesinriparianbuffersandadjacentcropfields:IowaStateUniversity.
Kim,D.‐G.,T.M.Isenhart,T.B.Parkin,R.C.Schultz,etal.2010.MethaneFluxInCroplandAndAdjacentRiparianBuffersWithDifferentVegetationCovers.JournalofEnvironmentalQuality,39(1):97‐105.
Kim,D.‐G.,G.Hernandez‐Ramirez,andD.Giltrap.2013.Linearandnonlineardependencyofdirectnitrousoxideemissionsonfertilizernitrogeninput:ameta‐analysis.Agriculture,Ecosystems&Environment,168:53‐65.
Kimetu,J.M.,andJ.Lehmann.2010.Stabilityandstabilisationofbiocharandgreenmanureinsoilwithdifferentorganiccarboncontents.AustralianJournalofSoilRes.,48:577‐585.
Chapter 3: Quantifying Greenhouse Gas Sources and Sinks in Cropland and Grazing Land Systems
3-128
Kong,A.Y.,J.Six,D.C.Bryant,R.F.Denison,etal.2005.Therelationshipbetweencarboninput,aggregation,andsoilorganiccarbonstabilizationinsustainablecroppingsystems.SoilScienceSocietyofAmericaJournal,69:1078‐1085.
Kong,A.Y.,andJ.Six.2010.Tracingcovercroprootversusresiduecarbonintosoilsfromconventional,low‐Input,andorganiccroppingsystems.SoilScienceSocietyofAmericaJournal,74:1201‐1210.
Kool,D.M.,J.Dolfing,N.Wrage,andJ.W.VanGroenigen.2011.Nitrifierdenitrificationasadistinctandsignificantsourceofnitrousoxidefromsoil.SoilBiologyandBiochemistry,43(1):174‐178.
Kravchenko,A.N.,andG.P.Robertson.2011.Whole‐profilesoilcarbonstocks:Thedangerofassumingtoomuchfromanalysesoftoolittle.SoilScienceSocietyofAmericaJournal,75:235‐240.
Kucharik,C.J.2007.Impactofprairieageandsoilorderoncarbonandnitrogensequestration.SoilScienceSocietyofAmericaJournal,71:430‐441.
Kumar,B.M.,andP.K.R.Nair.2011.CarbonSequestrationPotentialofAgroforestrySystems:OpportunitiesandChallenges.AdvancesinAgronomy,8.
Kumar,U.,M.C.Jain,H.Pathak,S.Kumar,etal.2000.NitrousOxideEmissionfromDifferentFertilizersandItsMitigationbyNitrificationInhibitorsinIrrigatedRice.BiologyandFertilityofSoils,32(6):474‐478.
Kurbatova,J.,C.Li,A.Varlagin,X.Xiao,etal.2008.ModelingcarbondynamicsintwoadjacentspruceforestswithdifferentsoilconditionsinRussia.Biogeosciences,5:969‐980.
Ladha,J.K.,C.K.Reddy,A.T.Padre,andC.v.Kessel.2011.RoleofNitrogenFertilizationinSustainingOrganicMatterinCultivatedSoils.JournalofEnvironmentalQuality,40:1756‐1766.
Laird,D.A.,P.Fleming,D.D.Davis,R.Horton,etal.2010.ImpactofbiocharamendmentsonthequalityofatypicalMidwesternagriculturalsoil.Geoderma,158(3–4):443–449.
Lal,R.,J.M.Kimble,R.F.Follett,andC.Cole.1998.ThepotentialofUScroplandtosequesterCandmitigatethegreenhouseeffect.Chelsea,MI:AnnArborSciencePublishers.
Lal,R.2003.Soilerosionandtheglobalcarbonbudget.EnvironmentInternational,29(4):437‐450.Lal,R.,M.Griffin,J.Apt,L.Lave,etal.2004.ManagingSoilCarbon.Science,304(5669):393.Lal,R.,andD.Pimentel.2008.Soilerosion:acarbonsinkorsource?Science,319(5866):1040‐1042.Lasco,R.D.,S.Ogle,J.Raison,L.Verchot,etal.2006.Chapter5:Cropland.In2006IPCCGuidelinesfor
NationalGreenhouseGasInventories,S.Eggleston,L.Buendia,K.Miwa,T.NgaraandK.Tanabe(eds.).Japan:IGES,IPCCNationalGreenhouseGasInventoriesProgram.
Lehmann,J.2007a.Ahandfulofcarbon.Nature,447:143‐144.Lehmann,J.2007b.Bio‐energyintheblack.FrontiersinEcologyandtheEnvironment,5(7):381‐387.Lemke,R.L.,R.C.Izaurralde,andM.Nyborg.1998.Seasonaldistributionofnitrousoxideemissions
fromsoilsintheParklandregion.SoilScienceSocietyofAmericaJournal,62(5):1320‐1326.Lessard,V.C.2000.UpdatingIndianaannualforestinventoryandanalysisplotdatausingeastern
broadleafforestdiametergrowthmodels.ProceedingsoftheProceedingsoftheSecondAnnualForestInventoryandAnalysisSymposium,October17‐18,2000,SaltLakeCity,UT.
Lessard,V.C.,R.E.McRoberts,andM.R.Holdaway.2001.DiametergrowthmodelsusingMinnesotaforestinventoryandanalysisdata.ForestScience,47:301‐310.
Letica,S.A.,C.A.M.deKlein,C.J.Hoogendoorn,R.W.Tillman,etal.2010.Short‐termmeasurementofN2Oemissionsfromsheep‐grazedpasturereceivingincreasingratesoffertilisernitrogeninOtago,NewZealand.AnimalProductionScience,50:17‐24.
Levine,U.,K.Teal,G.Robertson,andT.M.Schmidt.2011.Agriculture’simpactonmicrobialdiversityandassociatedfluxesofcarbondioxideandmethane.InternationalSocietyforMicrobialEcology.
Li,C.,S.Frolking,andT.A.Frolking.1992.AModelofNitrousOxideEvolutionFromSoilDrivenbyRainfallEvents:2.ModelApplications.JournalofGeophysicalResearch,97(D9):9777‐9783.
Chapter 3: Quantifying Greenhouse Gas Sources and Sinks in Cropland and Grazing Land Systems
3-129
Li,C.,J.Aber,F.Stange,K.Butterbach‐Bahl,etal.2000.Aprocess‐orientedmodelofN2OandNOemissionsfromforestsoils:1.ModeldevelopmentJ.Geophys.Res.,105(D4):4369–4384.
Li,C.,J.Cui,G.Sun,andC.Trettin.2004.ModelingImpactsofManagementonCarbonSequestrationandTraceGasEmissionsinForestedWetlandEcosystems.EnvironmentalManagement,33:S176‐S186.
Liao,J.D.,T.W.Boutton,andJ.D.Jastrow.2006.Storageanddynamicsofcarbonandnitrogeninsoilphysicalfractionsfollowingwoodyplantinvasionofgrassland.SoilBiologyandBiochemistry,38(11):3184‐3196.
Liao,J.D.,andT.W.Boutton.2008.Soilmicrobialbiomassresponsetowoodyplantinvasionofgrassland.SoilBiologyandBiochemistry,40(5):1207‐1216.
Liebig,M.A.,J.A.Morgan,J.D.Reeder,B.H.Ellert,etal.2005.GreenhousegascontributionsandmitigationpotentialofagriculturalpracticesinnorthwesternUSAandwesternCanada.Soil&TillageResearch,83(1):25‐52.
Liebig,M.A.,J.R.Gross,S.L.Kronberg,J.D.Hanson,etal.2006.Soilresponsetolong‐termgrazinginthenorthernGreatPlainsofNorthAmerica.Agriculture,Ecosystems&Environment,115(1‐4):270‐276.
Liebig,M.A.,J.R.Gross,S.L.Kronberg,R.L.Phillips,etal.2010.Grazingmanagementcontributionstonetglobalwarmingpotential:along‐termevaluationintheNorthernGreatPlains.JournalofEnvironmentalQuality,39(3):799‐809.
Liebig,M.A.,X.Dong,J.E.T.McLain,andC.J.Dell.2012.GreenhousegasfluxfrommanagedgrasslandsintheU.S.,Chapter3.3.InManagingagriculturalGHGs:CoordinatedagriculturalresearchthroughGRACEnettoaddressourchangingclimate.SanDiego,CA:AcademicPress.
Lin,S.,J.Iqbal,R.Hu,J.Wu,etal.2011.Nitrousoxideemissionsfromrapefieldasaffectedbynitrogenfertilizermanagement:acasestudyincentralChina.AtmosphericEnvironment,45:1775‐1779.
Lindau,C.W.,P.K.Bollich,andR.D.DeLaune.1995.EffectofricevarietyonmethaneemissionfromLouisianarice.Agriculture,Ecosystems&Environment,54(1‐2):109‐114.
Lindau,C.W.,P.Wickersham,R.D.DeLaune,J.W.Collins,etal.1998.Methaneandnitrousoxideevolutionand15Nand226RauptakeasaffectedbyapplicationofgypsumandphosphogypsumtoLouisianarice.Agriculture,Ecosystems&Environment,68(1–2):165‐173.
Linquist,B.,K.J.vanGroenigen,M.A.Adviento‐Borbe,C.Pittelkow,etal.2011.Anagronomicassessmentofgreenhousegasemissionsfrommajorcerealcrops.GlobalChangeBiology:n/a‐n/a.
Linquist,B.A.,J.E.Hill,R.G.Mutters,C.A.Greer,etal.2009.AssessingtheNecessityofSurface‐AppliedPreplantNitrogenFertilizerinRiceSystems.AgronomyJournal,101(4):906‐915.
Linquist,B.A.,M.A.Adviento‐Borbe,C.M.Pittelkow,C.v.Kessel,etal.2012.Fertilizermanagementpracticesandgreenhousegasemissionsfromricesystems:Aquantitativereviewandanalysis.FieldCropsResearch,135:10‐21.
Linzmeier,W.,R.Gutser,andU.Schmidhalter.2001.NitrousOxideEmissionfromSoilandfromaNitrogen‐15‐LabelledFertilizerwiththeNewNitrificationInhibitor3,4‐DimethylpyrazolePhosphate(Dmpp).BiologyandFertilityofSoils,34(2):103‐108.
Liu,F.,X.BenWu,E.Bai,T.W.Boutton,etal.2010.SpatialscalingofecosystemCandNinasubtropicalsavannalandscape.GlobalChangeBiology,16(8):2213‐2223.
Liu,X.,A.Mosier,A.Halvorson,andF.Zhang.2006.TheImpactofNitrogenPlacementandTillageonNO,N2O,CH4;andCO2;FluxesfromaClayLoamSoil.PlantandSoil,280(1):177‐188.
Liu,X.J.,A.R.Mosier,A.D.Halvorson,andF.S.Zhang.2005.Tillageandnitrogenapplicationeffectsonnitrousandnitricoxideemissionsfromirrigatedcornfields.PlantandSoil,276:235‐249.
Livesley,S.,B.Dougherty,A.Smith,D.Navaud,etal.2010.Soil‐atmosphereexchangeofcarbondioxide,methaneandnitrousoxideinurbangardensystems:impactofirrigation,fertiliserandmulch.UrbanEcosystems,13(3):273‐293.
Chapter 3: Quantifying Greenhouse Gas Sources and Sinks in Cropland and Grazing Land Systems
3-130
Lobell,D.B.,andC.Bonfils.2008.TheEffectofIrrigationonRegionalTemperatures:ASpatialandTemporalAnalysisofTrendsinCalifornia,1934–2002.JournalofClimate,21(10):2063‐2071.
Lopez‐Diaz,M.L.,V.Rolo,andG.Moreno.2011.Trees'RoleinNitrogenLeachingafterOrganic,MineralFertilization:AGreenhouseExperiment.JournalofEnvironmentalQuality,40(3):853‐859.
Luo,J.,C.A.M.deKlein,S.F.Ledgard,andS.Saggar.2010.Managementoptionstoreducenitrousoxideemissionsfromintensivelygrazedpastures:Areview.Agriculture,Ecosystems&Environment,136(3‐4):282‐291.
Ma,B.L.,T.Y.Wu,N.Tremblay,W.Deen,etal.2010.Nitrousoxidefluxesfromcornfields:on‐farmassessmentoftheamountandtimingofnitrogenfertilizer.GlobalChangeBiology,16(1):156‐170.
Macadam,X.M.B.,A.Prado,P.Merino,J.M.Estavillo,etal.2003.Dicyandiamideand3,4‐DimethylPyrazolePhosphateDecreaseN2OEmissionsfromGrasslandbutDicyandiamideProducesDeleteriousEffectsinClover.Journalofplantphysiology,160(12):1517‐1523.
Magalhaes,A.M.T.,P.M.Chalk,andW.M.Strong.1984.EffectofNitrapyrinonNitrousOxideEmissionfromFallowSoilsFertilizedwithAnhydrousAmmonia.NutrientCyclinginAgroecosystems,5(4):411‐421.
Maharjan,B.,R.T.Venterea,andC.Rosen.2013.FertilizerandIrrigationManagementEffectsonNitrousOxideEmissionsandNitrateLeaching.AgronomyJournal.
Maharjan,B.,andR.T.Venterea.Inreview.Nitritedynamicsexplainfertilizermanagementeffectsonnitrousoxideemissionsinmaize.SubmittedtoSoilBiologyandBiochemistry.
Mahmood,T.,R.Ali,J.Iqbal,andU.Robab.2008.Nitrousoxideemissionfromanirrigatedcottonfieldundersemiaridsubtropicalconditions.BiologyandFertilityofSoils,44(5):773‐781.
Majumdar,D.,S.Kumar,H.Pathak,M.C.Jain,etal.2000.ReducingNitrousOxideEmissionfromanIrrigatedRiceFieldofNorthIndiawithNitrificationInhibitors.Agriculture,Ecosystems&Environment,81(3):163‐169.
Majumdar,D.,H.Pathak,S.Kumar,andM.C.Jain.2002.NitrousOxideEmissionfromaSandyLoamInceptisolunderIrrigatedWheatinIndiaasInfluencedbyDifferentNitrificationInhibitors.Agriculture,Ecosystems&Environment,91(1):283‐293.
Majumdar,D.2003.Methaneandnitrousoxideemissionfromirrigatedricefields:Proposedmitigationstrategies.CurrentScience,84:1317‐1326.
Malghani,S.,G.Gleixner,andS.Trumbore.2013.Charsproducedbyslowpyrolysisandhydrothermalcarbonizationvaryincarbonsequestrationpotentialandgreenhousegasesemissions.SoilBiologyandBiochemistry,62:137‐146.
Malhi,S.S.,andM.Nyborg.1985.Methodsofplacementforincreasingtheefficiencyofnitrogenfertilizersappliedinthefall.AgronomyJournal,77:27‐32.
Malhi,S.S.,R.Lemke,Z.H.Wang,andB.S.Chhabra.2006.Tillage,nitrogenandcropresidueeffectsoncropyield,nutrientuptake,soilquality,andgreenhousegasemissions.Soil&TillageResearch,90(1‐2):171‐183.
Malla,G.,A.Bhatia,H.Pathak,S.Prasad,etal.2005.MitigatingNitrousOxideandMethaneEmissionsfromSoilinRice‐WheatSystemoftheIndo‐GangeticPlainwithNitrificationandUreaseInhibitors.Chemosphere,58(2):141‐147.
Mamo,M.,G.L.Malzer,D.J.Mulla,D.R.Huggins,etal.2003.Spatialandtemporalvariationineconomicallyoptimumnitrogenrateforcorn.AgronomyJournal,95:958‐964.
Manley,J.T.,G.E.Schuman,J.D.Reeder,andR.H.Hart.1995.Rangelandsoilcarbonandnitrogenresponsestograzing.JournalofSoilandWaterConservation,50(3):294‐298.
Mann,L.K.1986.Changesinsoilcarbonstorageaftercultivation.SoilScience,142(5):279‐288.Matson,P.A.,R.Naylor,andI.Ortiz‐Monasterio.1998.IntegrationofEnvironmental,Agronomic,
andEconomicAspectsofFertilizerManagement.Science,280(5360):112‐115.
Chapter 3: Quantifying Greenhouse Gas Sources and Sinks in Cropland and Grazing Land Systems
3-131
McCarty,G.W.,andJ.C.Ritchie.2002.Impactofsoilmovementoncarbonsequestrationinagriculturalecosystems.EnvironmentalPollution,116(3):423‐430.
McClaran,M.P.,J.Moore‐Kucera,D.A.Martens,J.vanHaren,etal.2008.Soilcarbonandnitrogeninrelationtoshrubsizeanddeathinasemi‐aridgrassland.Geoderma,145(1‐2):60‐68.
McLain,J.E.T.,andD.A.Martens.2006.Moisturecontrolsontracegasfluxesinsemiaridripariansoils.SoilScienceSocietyofAmericaJournal,70:367‐377.
McLain,J.E.T.,D.A.Martens,andM.P.McClaran.2008.Soilcyclingoftracegasesinresponsetomesquitemanagementinasemiaridgrassland.JournalofAridEnvironments,72:1654‐1665.
McSwiney,C.P.,andG.P.Robertson.2005.NonlinearresponseofN2Ofluxtoincrementalfertilizeradditioninacontinuousmaize(ZeamaysL.)croppingsystem.GlobalChangeBiology,11(10):1712‐1719.
McTaggart,I.P.,H.Clayton,J.Parker,L.Swan,etal.1997.NitrousOxideEmissionsfromGrasslandandSpringBarley,FollowingNFertiliserApplicationwithandwithoutNitrificationInhibitors.BiologyandFertilityofSoils,25(3):261‐268.
Melson,S.L.,M.E.Harmon,J.S.Fried,andJ.B.Domingo.2011.Estimatesoflive‐treecarbonstoresinthePacificNorthwestaresensitivetomodelselection.CarbonBalanceandManagement,6(1).
Menendez,S.,P.Merino,M.Pinto,C.González‐Murua,etal.2006.3,4‐DimethylpyrazolPhosphateEffectonNitrousOxide,NitricOxide,Ammonia,andCarbonDioxideEmissionsfromGrasslands.JournalofEnvironmentalQuality,35(4):973‐981.
Merino,P.,J.M.Estavillo,L.A.Graciolli,M.Pinto,etal.2002.MitigationofN2OEmissionsfromGrasslandbyNitrificationInhibitorandActilithF2AppliedwithFertilizerandCattleSlurry.SoilUseandManagement,18(2):135‐141.
Merwin,M.L.,andL.R.Townsend.2007.Onlinetoolforestimatingcarbonstorageinagroforestrypractices.EditedbyA.OliverandS.Campeau,WhenTreesandCropsGetTogether:EconomicOpportunitiesandEnvironmentalBenefitsfromAgroforestry:Proc.10thNorthAmericanAgroforestryConf.QuebecCity,Canada,June10‐13,2007:UniversitéLaval,Québec,Canada.
Merwin,M.L.,M.Easter,L.R.Townsend,R.C.Vining,etal.2009.Estimatingcarbonstockchangeinagroforestryandfamilyforestrypractices.InAgroforestryComesofAge:PuttingScienceintoPractice:Proc.11thNorthAmericanAgroforestryConf,M.A.GoldandM.M.Hall(eds.).Columbia,MO,May31‐June3,2009.
Miehle,P.,S.J.Livesley,P.M.Feikema,C.Li,etal.2006.AssessingproductivityandcarbonsequestrationcapabilityofEucalyptusglobulusplantationsusingtheprocessmodelForest‐DNDC:Calibrationandvalidation.EcologicalModelling,192:83‐94.
Millar,N.,G.P.Robertson,P.R.Grace,R.J.Gehl,etal.2010.Nitrogenfertilizermanagementfornitrousoxide(N2O)mitigationinintensivecorn(Maize)production:anemissionsreductionprotocolforU.S.Midwestagriculture.MitigationandAdaptionStrategiesforGlobalChange,15(2):185‐204.
Mize,C.W.,J.R.Brandle,M.M.Schoeneberger,andG.Bentrup.2008.EcologicaldevelopmentandfunctionofshelterbeltsintemperateNorthAmerica.InTowardAgroforestryDesign‐AnEcologicalApproach.AdvancesinAgroforestryVol4,S.JoseandA.M.Gorden(eds.):Springer.
Morgan,J.A.,R.F.Follett,L.H.Allen,S.DelGrosso,etal.2010.CarbonsequestrationinagriculturallandsoftheUnitedStates.JournalofSoilandWaterConservation,65(1):6A‐13A.
Morris,D.R.,B.Glaz,andS.H.Daroub.2004.Organicsoiloxidationpotentialduetoperiodicfloodanddrainagedepthundersugarcane.SoilScience,169:600‐608.
Mosier,A.,D.Schimel,D.Valentine,K.Bronson,etal.1991.Methaneandnitrousoxidefluxesinnative,fertilizedandcultivatedgrasslands.Nature,350(6316):330‐332.
Chapter 3: Quantifying Greenhouse Gas Sources and Sinks in Cropland and Grazing Land Systems
3-132
Mosier,A.,R.Wassmann,L.Verchot,J.King,etal.2004.Methaneandnitrogenoxidefluxesintropicalagriculturalsoils:sources,sinksandmechanisms.Environment,DevelopmentandSustainability,6(11‐49).
Mosier,A.R.,J.M.Duxbury,J.R.Freney,O.Heinemeyer,etal.1998.AssessingandMitigatingN2OEmissionsfromAgriculturalSoils.ClimaticChange,40(1):7‐38.
Mosier,A.R.,A.D.Halvorson,G.A.Peterson,G.P.Robertson,etal.2005.MeasurementofNetGlobalWarmingPotentialinThreeAgroecosystems.NutrientCyclinginAgroecosystems,72(1):67‐76.
Mosier,A.R.,A.D.Halvorson,C.A.Reule,andX.J.Liu.2006.NetglobalwarmingpotentialandgreenhousegasintensityinirrigatedcroppingsystemsinnortheasternColorado.JournalofEnvironmentalQuality,35(4):1584‐1598.
Munoz,F.,R.S.Mylavarapu,andC.M.Hutchinson.2005.Environmentallyresponsiblepotatoproductionsystems:Areview.JournalofPlantNutrition,28:1287‐1309.
Nair,P.K.R.,V.D.Nair,B.M.Kumar,andJ.M.Showalter,(eds.).2010.Carbonsequestrationinagroforestrysystems.EditedbyD.Sparks.Vol.108,AdvancesinAgronomy.SanDiego,CA:AcademicPress.
Nair,V.D.,P.K.R.Nair,R.S.Kalmbacher,andI.V.Ezenwa.2007.Reducingnutrientlossfromfarmsthroughsilvopastoralpracticesincoarse‐texturedsoilsofFlorida,USA.EcologicalEngineering,29(2):192‐199.
Nash,P.R.2010.Alternativetillageandnitrogenmanagementoptionstoincreasecropproductionandreducenitrousoxideemissionsfromclaypansoils:M.S.Thesis,UniversityofMissouri.
Neff,J.C.,N.N.Barger,W.T.Baisden,D.P.Fernandez,etal.2009.Soilcarbonstorageresponsestoexpandingpinyon‐juniperpopulationsinsouthernUtah.EcologicalApplications,19(6):1405‐1416.
Nelson,S.D.,andR.E.Terry.1996.TheEffectsofSoilPhysicalPropertiesandIrrigationMethodonDenitrification.SoilScience,161(4):242‐249.
Nguyen,B.T.,J.Lehmann,J.Kinyangi,R.Smernik,etal.2008.Long‐termblackcarbondynamicsincultivatedsoil.Biogeochemistry,89(3):295‐308.
Nui,X.,andS.W.Duiker.2006.CarbonsequestrationpotentialbyafforestationofmarginalagriculturallandinthemidwesternU.S..ForEcolManage,223:415‐427.
Oelbermann,M.,andR.P.Voroney.2011.AnevaluationoftheCenturymodeltopredictsoilorganiccarbonintropicalandtemperateagroforestrysystems.AgroforestrySystems,81:37‐45.
Ogle,S.M.,F.JayBreidt,M.D.Eve,andK.Paustian.2003.UncertaintyinestimatinglanduseandmanagementimpactsonsoilorganiccarbonstorageforUSagriculturallandsbetween1982and1997.GlobalChangeBiology,9(11):1521‐1542.
Ogle,S.M.,F.J.Breidt,andK.Paustian.2005.Agriculturalmanagementimpactsonsoilorganiccarbonstorageundermoistanddryclimaticconditionsoftemperateandtropicalregions.Biogeochemistry,72(1):87–121.
Ogle,S.M.,F.J.Breidt,M.Easter,S.Williams,etal.2007.Anempiricallybasedapproachforestimatinguncertaintyassociatedwithmodellingcarbonsequestrationinsoils.EcologicalModelling,205:453‐463.
Ogle,S.M.,F.J.Breidt,M.Easter,S.Williams,etal.2010.ScaleanduncertaintyinmodeledsoilorganiccarbonstockchangesforUScroplandsusingaprocess‐basedmodel.GlobalChangeBiology,16(2):810‐822.
Ogle,S.M.,A.Swan,andK.Paustian.2012.No‐tillmanagementimpactsoncropproductivity,carboninputandsoilcarbonsequestration.Agriculture,Ecosystems&Environment,149:37‐49.
Oh,N.H.,andP.A.Raymond.2006.ContributionofagriculturallimingtoriverinebicarbonateexportandCO2sequestrationintheOhioRiverbasin.GlobalBiogeochemicalCycles,20(3):GB3012.
Olson,K.R.,J.M.Lang,andS.A.Ebelhar.2005.Soilorganiccarbonchangesafter12yearsofno‐tillageandtillageofGrantsburgsoilsinsouthernIllinois.Soil&TillageResearch,81(2):217‐225.
Chapter 3: Quantifying Greenhouse Gas Sources and Sinks in Cropland and Grazing Land Systems
3-133
Olson,R.,M.Schoeneberger,andS.Aschmann.2000.Anecologicalfoundationfortemperateagroforestry.InNorthAmericanAgroforestry:AnIntegratedScienceandPractice,H.E.Garrett,W.J.RietveldandR.F.Fisher(eds.).Madison,WI:ASASpecialPublication.
Page,K.L.,D.E.Allen,R.C.Dalal,andW.Slattery.2009.ProcessesandmagnitudeofCO2,CH4,andN2OfluxesfromlimingofAustralianacidicsoils:areview.SoilResearch,47(8):747‐762.
Pan,G.,X.Xu,P.Smith,W.Pan,etal.2010.AnincreaseintopsoilSOCstockofChina'scroplandsbetween1985and2006revealedbysoilmonitoring.Agriculture,Ecosystems&Environment,136(1‐2):133‐138.
Parkin,T.B.,andJ.L.Hatfield.2010a.InfluenceofnitrapyrinonN2Olossesfromsoilreceivingfall‐appliedanhydrousammonia.Agriculture,Ecosystems&Environment,136(1‐2):81‐86.
Parkin,T.B.,andJ.L.Hatfield.2010b.InfluenceofNitrapyrinonN2OLossesfromSoilReceivingFall‐AppliedAnhydrousAmmonia.Agriculture,Ecosystems&Environment,136(1):81‐86.
Parton,W.J.,D.S.Schimel,C.V.Cole,andD.S.Ojima.1987.AnalysisoffactorscontrollingsoilorganicmatterlevelsinGreatPlainsgrasslands.SoilScienceSocietyofAmericaJournal,51:1173‐1179.
Parton,W.J.,J.M.O.Scurlock,D.S.Ojima,T.G.Gilmanov,etal.1993.Observationsandmodelingofbiomassandsoilorganicmatterdynamicsforgrasslandbiomesworldwide.GlobalBiogeochemicalCycles,7:785‐809.
Parton,W.J.,E.A.Holland,S.J.DelGrosso,M.D.Hartman,etal.2001.GeneralizedmodelforNOxandN2Oemissionsfromsoils.JournalofGeophysicalResearch,106(D15):17403‐17420.
Parton,W.J.,M.D.Hartman,D.S.Ojima,andD.S.Schimel1998.DAYCENT:ItsLandSurfaceSubmodel:DescriptionandTesting.GlobalandPlanetaryChange,19:35‐48.
Pathak,H.,A.Bhatia,S.Prasad,S.Singh,etal.2002.EmissionofNitrousOxidefromRice‐WheatSystemsofIndo‐GangeticPlainsofIndia.Environmentalmonitoringandassessment,77(2):163‐178.
Paul,E.A.,S.J.Morris,J.Six,K.Paustian,etal.2003.InterpretationofSoilCarbonandNitrogenDynamicsinAgriculturalandAfforestedSoils.SoilScienceSocietyofAmericaJournal,67(5):1620‐1628.
Paustian,K.,O.Andrén,H.H.Janzen,R.Lal,etal.1997.AgriculturalsoilsasasinktomitigateCO2emissions.SoilUseandManagement,13:230‐244.
Paustian,K.,J.Six,E.T.Elliott,andH.W.Hunt.2000.ManagementoptionsforreducingCO2emissionsfromagriculturalsoils.Biogeochemistry,48(1):147‐163.
Peichl,M.,N.V.Thevathasan,A.M.Gordon,J.Huss,etal.2006.Carbonsequestrationpotentialsintemperatetree‐basedintercroppingsystems,southernOntario,Canada.AgroforestrySystems,66:243‐257.
Perry,C.H.,C.W.Woodall,andM.M.Schoeneberger.2005.InventoryingTreesinAgriculturalLandscapes:TowardsanAccountingofWorkingTrees.InMovingAgroforestryintheMainstream,K.N.BrooksandP.F.Folliott(eds.).St.Paul,MN:DepartmentofForestResources,UniversityofMinnesota,St.Paul.
Petersen,S.O.1999.NitrousOxideEmissionsfromManureandInorganicFertilizersAppliedtoSpringBarley.JournalofEnvironmentalQuality,28(5):1610‐1618.
Phillips,R.L.,andO.Beeri.2008.Scaling‐upknowledgeofgrowing‐seasonnetecosystemexchangeforlong‐termassessmentofNorthDakotagrasslandsundertheConservationReserveProgram.GlobalChangeBiology,14(5):1008‐1017.
Phillips,R.L.,D.L.Tanaka,D.W.Archer,andJ.D.Hanson.2009.FertilizerApplicationTimingInfluencesGreenhouseGasFluxesOveraGrowingSeason.JournalofEnvironmentalQuality,38(4):1569‐1579.
Pielke,R.A.,J.Adegoke,A.Beltran‐Przekurat,C.A.Hiemstra,etal.2007.Anoverviewofregionalland‐useandland‐coverimpactsonrainfall.TellusB,59(3):587‐601.
Chapter 3: Quantifying Greenhouse Gas Sources and Sinks in Cropland and Grazing Land Systems
3-134
Pineiro,G.,E.Jobbagy,J.Baker,B.Murray,etal.2009.Set‐asidescanbebetterclimateinvestmentthancornethanol.EcologicalApplications,19(2):277‐282.
Pineiro,G.,J.Paruelo,M.Oesterheld,andE.Jobbagy.2010.PathwaysofGrazingEffectsonSoilOrganicCarbonandNitrogen.RangelandEcology&Management,63(1):109‐119.
Pinheiro,J.C.,andD.M.Bates.2000.Mixed‐effectsmodelsinSandS‐Plus.NewYork,NY:Springer.Pittelkow,C.M.,M.A.Adviento‐Borbe,J.E.Hill,J.Six,etal.2013.Yield‐scaledglobalwarming
potentialofannualnitrousoxideandmethaneemissionsfromcontinuouslyfloodedricesystemsinresponsetonitrogeninput.Agriculture,Ecosystems&Environment,177:10‐20.
Plante,A.F.,R.T.Conant,C.E.Stewart,K.Paustian,etal.2006.Impactofsoiltextureonthedistributionofsoilorganicmatterinphysicalandchemicalfractions.SoilScienceSocietyofAmericaJournal,70:287‐296.
Polprasert,C.2007.OrganicWasteRecycling:TechnologyandManagement:IWAPublishing.Post,W.M.,andK.C.Kwon.2000.SoilCarbonSequestrationandLand‐UseChange:Processesand
Potential.GlobalChangeBiology,6:317‐327.Rafique,R.,D.Henessy,andG.Kiely.2011.Evaluatingmanagementeffectsonnitrousoxide
emissionsfromgrasslandsusingtheprocess‐basedDeNitrificationDeComposition(DNDC)model.Atmospheric,Environment,45:6029‐6039.
Rau,B.M.,R.Tausch,A.Reiner,D.W.Johnson,etal.2010.Influenceofprescribedfireonecosystembiomass,carbon,andnitrogeninapinyonjuniperwoodland.RangelandEcology&Management,63:197‐202.
Raymond,P.A.,N.‐H.Oh,R.E.Turner,andW.Broussard.2008.AnthropogenicallyenhancedfluxesofwaterandcarbonfromtheMississippiRiver.Nature,451(7177):449‐452.
Reeder,J.D.,G.E.Schuman,andR.A.Bowman.1998.SoilCandNchangesonConservationReserveProgramlandsintheCentralGreatPlains.Soil&TillageResearch,47(3‐4):339‐349.
Ribaudo,M.,J.Delgado,L.T.Hansen,M.J.Livingston,etal.2011.NitrogeninAgriculturalSystems:ImplicationsforConservationPolicy:U.S.DepartmentofAgriculture,EconomicResearchService.
Roberts,K.G.,B.A.Gloy,S.Joseph,N.R.Scott,etal.2010.Lifecycleassessmentofbiocharsystems:Estimatingtheenergetic,economic,andclimatechangepotential.EnvironmentalScienceandTechnology,44:827‐833.
Robertson,G.,S.K.Hamilton,W.Parton,andS.DelGrosso.2011.Thebiogeochemistryofbioenergylandscapes:Carbon,nitrogen,andwaterconsiderations.EcologicalApplications,(inpress).
Robertson,G.P.,E.A.Paul,andR.R.Harwood.2000.GreenhouseGasesinIntensiveAgriculture:ContributionsofIndividualGasestotheRadiativeForcingoftheAtmosphere.Science,289(5486):1922‐1925.
Robertson,G.P.,andP.M.Vitousek.2009.NitrogeninAgriculture:BalancingtheCostofanEssentialResource.AnnualReviewofEnvironmentandResources,34(1):97‐125.
Robertson,G.P.,T.W.Bruulsema,R.J.Gehl,D.Kanter,D.L.Mauzerall,C.A.Rotz,andC.O.Williams.2013.Nitrogen‐climateinteractionsinU.S.agriculture.Biogeochemistry,114:41‐70.
Rochette,P.2008.No‐tillonlyincreasesN2Oemissionsinpoorly‐aeratedsoils.Soil&TillageResearch,101(1‐2):97‐100.
Rojstaczer,S.,andS.J.Deverel.1995.LandsubsidenceindrainedhistosolsandhighlyorganicmineralsoilsoftheSacramento‐SanJoaquinDelta.SoilScienceSocietyofAmericaJournal,59:1162‐1167.
Ryals,R.,M.Kaisser,M.S.Torn,A.A.Berhe,etal.2014.Impactsoforganicmatteramendmentsoncarbonandnitrogendynamicsingrasslandsoils.SoilBiology&Biochemistry,68:52‐61.
Ryskowski,L.,andA.Kedziora.2007.Modificationofwaterflowsandnitrogenfluxesbyshelterbelts.EcologicalEngineering,29:388‐400.
Chapter 3: Quantifying Greenhouse Gas Sources and Sinks in Cropland and Grazing Land Systems
3-135
Sanz‐Cobena,A.,L.Sánchez‐Martín,L.García‐Torres,andA.Vallejo.2012.GaseousemissionsofN2OandNOandNO3‐leachingfromureaappliedwithureaseandnitrificationinhibitorstoamaize(Zeamays)crop.Agriculture,Ecosystems&Environment,149:64‐73.
Sass,R.L.,F.M.Fisher,S.T.Lewis,M.J.Jund,etal.1994.Methaneemissionsfromricefields:Effectofsoilproperties.GlobalBiogeochemicalCycles,8:135‐140.
Sauer,T.J.,C.A.Cambardella,andJ.R.Brandle.2007.Soilcarbonandtreelitterdynamicsinaredcedar‐scotchpineshelterbeltAgroforestrySystems,71:163‐174.
Sauer,T.J.,S.R.Compston,C.P.West,G.Hernandez‐Ramirez,etal.2009.Nitrousoxideemissionsfromabermudagrasspasture:Interseededwinterryeandpoultrylitter.SoilBiologyandBiochemistry,41(7):1417‐1424.
Sawyer,J.E.,E.D.Nafziger,G.W.Randall,L.G.Bundy,etal.2006.Conceptsandrationaleforregionalnitrogenrateguidelinesforcorn.Ames,Iowa.
Scharf,P.C.,N.R.Kitchen,K.A.Sudduth,J.G.Davis,etal.2005.Field‐scalevariabilityinoptimalnitrogenfertilizerrateforcorn.AgronomyJournal,97:452‐461.
Scheaffer,C.C.,D.L.Wyse,andN.J.Ehlke.2009.PalatabilityandNutritiveValueofNativeLegumes.NativePlantsJournal,10(3):224‐231.
Scheer,C.,P.Grace,D.Rowlings,S.Kimber,etal.2011.Effectofbiocharamendmentonthesoil‐atmosphereexchangeofgreenhousegasesfromanintensivesubtropicalpastureinnorthernNewSouthWales,Australia.InPlantandSoil.
Schlesinger,W.H.2000.Carbonsequestrationinsoils:Somecautionamidstoptimism.Agriculture,Ecosystems&Environment,82:121‐127.
Schoeneberger,M.M.,G.Bentrup,andC.A.Francis.2001.Ecobelts:reconnectingagricultureandcommunities.InInteractionsbetweenAgroecosystemsandRuralHumanCommunities,C.Flora(ed.).BocaRaton,FL:CRCPress.
Schoeneberger,M.M.,G.Bentrup,D.Current,B.Wight,etal.2008.Buildingbiggerbetterbuffersforbioenergy.WaterResourcesImpact,10:22‐26.
Schuman,G.E.,J.D.Reeder,J.T.Manley,R.H.Hart,etal.1999.Impactofgrazingmanagementonthecarbonandnitrogenbalanceofamixed‐grassrangeland.EcologicalApplications,9(1):65‐71.
Sehy,U.,R.Ruser,andJ.C.Munch.2003.Nitrousoxidefluxesfrommaizefields:relationshiptoyield,site‐specificfertilization,andsoilconditions.Agriculture,Ecosystems&Environment,99(1‐3):97‐111.
Sharrow,S.H.,andS.Ismail.2004.Carbonandnitrogenstorageinagroforests,treeplantations,andpasturesinwesternOregon,USA.AgroforestrySystems,60(2):123‐130.
Shcherbak,I.,N.Millar,andG.P.Robertson.inpress.Aglobalmeta‐analysisofthenonlinearresponseofsoilnitrousoxide(N2O)emissionstofertilizernitrogen.ProceedingsoftheNationalAcademyofSciencesoftheUnitedStatesofAmerica,inpress.
Sherrod,L.,G.A.Peterson,D.G.Westfall,andL.R.Ahuja.2003.Croppingintensityenhancessoilorganiccarbonandnitrogeninano‐tillagroecosystem.SoilScienceSocietyofAmericaJournal,67:1533‐1543.
Sherrod,L.,G.A.Peterson,D.G.Westfall,andL.R.Ahuja.2005.SoilOrganicCarbonPoolsAfter12YearsinNo‐TillDrylandAgroecosystems.SoilScienceSocietyofAmericaJournal,69(1600‐1608).
Shih,S.F.,B.Glaz,andR.E.J.Barnes.1998.Subsidenceoforganicsoilsintheevergladesagriculturalareaduringthepast19years.SoilandCropScienceSocietyofFloridaProceedings,57:20‐29.
Shoji,S.,J.Delgado,A.Mosier,andY.Miura.2001.UseofControlledReleaseFertilizersandNitrificationInhibitorstoIncreaseNitrogenUseEfficiencyandtoConserveAirandWaterQuality.CommunicationsinSoilScienceandPlantAnalysis,32(7‐8):1051‐1070.
Signor,D.,C.E.P.Cerri,andR.Conant.2013.N2OemissionsduetonitrogenfertilizerapplicationsintworegionsofsugarcanecultivationinBrazil.EnvironmentalResearchLetters,8(1):015013.
Chapter 3: Quantifying Greenhouse Gas Sources and Sinks in Cropland and Grazing Land Systems
3-136
Singer,J.W.,A.J.Franzluebbers,andD.L.Karlen.2009.Grass‐basedFarmingSystems:SoilConservationandEnvironmentalQuality.Madison,WI:AmericanSocietyofAgronomy,CropScienceSocietyofAmerica,SoilSocietyofAmerica.
Six,J.,E.T.Elliott,andK.Paustian.2000.Soilmacroaggregateturnoverandmicroaggregateformation:amechanismforCsequestrationunderno‐tillageagriculture.SoilBiologyandBiochemistry,32(14):2099‐2103.
Six,J.,S.M.Ogle,F.J.Breidt,R.T.Conant,etal.2004.Thepotentialtomitigateglobalwarmingwithno‐tillagemanagementisonlyrealizedwhenpractisedinthelongterm.GlobalChangeBiology,10(2):155–160.
Skjemstad,J.O.,D.C.Reicosky,A.R.Wilts,andJ.A.McGowan.2002.CharcoalcarboninU.S.agriculturalsoils.SoilScienceSocietyofAmericaJournal,66:1249‐1255.
Smith,K.A.,K.E.Dobbie,B.C.Ball,L.R.Bakken,etal.2000.OxidationofatmosphericmethaneinNorthernEuropeansoils,comparisonwithotherecosystems,anduncertaintiesintheglobalterrestrialsink.GlobalChangeBiology,6(7):791‐803.
Smith,L.C.,C.A.M.D.Klein,andW.D.Catto.2008a.EffectofDicyandiamideAppliedinaGranularFormonNitrousOxideEmissionsfromaGrazedDairyPastureinSouthland,NewZealand.NewZealandJournalofAgriculturalResearch,51(4):387‐396.
Smith,P.,D.Martino,Z.Cai,D.Gwary,etal.2008b.Greenhousegasmitigationinagriculture.PhilosophicalTransactionsoftheRoyalSocietyB:BiologicalSciences,363(1492):789‐813.
Snyder,C.S.,andN.A.Slaton.2001.RiceproductionintheUnitedStates‐anoverview.BetterCrops,85(3):3‐7.
Snyder,C.S.,T.W.Bruulsema,T.L.Jensen,andP.E.Fixen.2009.Reviewofgreenhousegasemissionsfromcropproductionsystemsandfertilizermanagementeffects.Agriculture,Ecosystems&Environment,133(3‐4):247‐266.
SoilSurveyStaff.2011.SoilSurveyGeographic(SSURGO)Database:U.S.DepartmentofAgriculture,NaturalResourcesConservationService.
Song,C.,andJ.Zhang.2009.Effectsofsoilmoisture,temperature,andnitrogenfertilizationonsoilrespirationandnitrousoxideemissionduringmaizegrowthperiodinnortheastChina.ActaAgriculturaeScandinavia,59:97‐106.
Sonon,L.,D.Kissel,andU.Saha.2012.Mineralizationofhigh‐Norganicfertilizers:ClemsonUniversity.
Spalding,R.F.,D.G.Watts,J.S.Schepers,M.E.Burbach,etal.2001.Controllingnitrateleachinginirrigatedagriculture.JournalofEnvironmentalQuality,30:1184‐1194.
Spencer,S.,S.M.Ogle,F.J.Breidt,J.Goebel,etal.2011.Designinganationalsoilcarbonmonitoringnetworktosupportclimatechangepolicy:acaseexampleforUSagriculturallands.GreenhouseGasManagement&Measurement,1:167‐178.
Spokas,K.A.2010.Reviewofthestabilityofbiocharinsoils:predictabilityofO:Cmolarratios.CarbonManagement,1:289‐303.
Spokas,K.A.2013.Impactofbiocharfieldagingonlaboratorygreenhousegasproductionpotentials.GCBBioenergy,5:165‐176.
SRM.1998.Aglossaryoftermsusedinrangemanagement.Lakewood,CO:SocietyforRangeManagement.
Stallard,R.F.1998.Terrestrialsedimentationandthecarboncycle:couplingweatheringanderosiontocarbonburial.GlobalBiogeochemicalCycles,12:231‐257.
Stanford,G.1973.Rationaleforoptimumnitrogenfertilizationincornproduction.JournalofEnvironmentalQuality,2:159‐166.
Stang,F.,K.Butterbach‐Bahl,andH.Papen.2000.Aprocess‐orientedmodelofN2OandNOemissionsfromforestsoils.2.Sensitivityanalysisandvalidation.J.Geophys.Res.,105:4385‐4398.
Chapter 3: Quantifying Greenhouse Gas Sources and Sinks in Cropland and Grazing Land Systems
3-137
Stehfest,E.,andL.Bouwman.2006.N2OandNOemissionfromagriculturalfieldsandsoilsundernaturalvegetation:summarizingavailablemeasurementdataandmodelingofglobalannualemissions.NutrientCyclinginAgroecosystems,74(3):207‐228.
Stephens,J.C.,L.H.AllenJr.,andE.Chen.1984.Organicsoilsubsidence.InReviewsinEngineeringGeology,vol.VI,T.L.Holzer(ed.).Boulder,CO:GeologicalSocietyofAmerica.
Steudler,P.A.,R.D.Bowden,J.M.Melillo,andJ.D.Aber.1989.Influenceofnitrogenfertilizationonmethaneuptakeintemperateforestsoils.Nature,341(6240):314‐316.
Stewart,C.E.,J.Zheng,J.Botte,andM.F.Cotrufo.2013.Co‐generatedfastpyrolysisbiocharmitigatesgreenhousegasemissionsandincreasescarobnsequestrationintemperatesoils.GCBBioenergy,5:153‐164.
Street,J.E.,andP.K.Bollich.2003.Riceprodcution.InRice:Origins,History,Technology,andProduction,C.W.SmithandR.H.Dilday(eds.).Hoboken,NJ:JohnWiley&Sons.
Sudmeyer,R.A.,andP.R.Scott.2002.CharacterisationofawindbreaksystemonthesouthcoastofWesternAustralia.AustralianJournalofExperimentalAgriculture,42:703‐727.
Suwanwaree,P.,andG.Robertson.2005.Methaneoxidationinforest,successional,andno‐tillagriculturalecosystems:Effectsofnitrogenandsoildisturbance.SoilScienceSocietyofAmericaJournal,69:1722‐1729.
Svejcar,T.,R.Angell,J.A.Bradford,W.Dugas,etal.2008.CarbonfluxesonNorthAmericanrangelands.RangelandEcology&Management,61:465‐474.
Syswerda,S.P.,A.T.Corbin,D.L.Mokma,A.N.Kravchenko,etal.2011.Agriculturalmanagementandsoilcarbonstorageinsurfacevs.deeplayers.SoilScienceSocietyofAmericaJournal,75:92‐101.
Teague,W.R.,S.L.Dowhower,S.A.Baker,R.J.Ansley,etal.2010.Soilandherbaceousplantresponsestosummerpatchburnsundercontinuousandrotationalgrazing.Agriculture,Ecosystems&Environment,137:113‐123.
Thevathasan,N.V.,andA.M.Gordon.2004.EcologyoftreeintercroppingsystemsintheNorthtemperateregion:ExperiencesfromsouthernOntario,Canada.AgroforestrySystems,61‐62(1):257‐268.
Thornton,F.C.,B.R.Bock,andD.D.Tyler.1996.SoilEmissionsofNitricOxideandNitrousOxidefromInjectedAnhydrousAmmoniumandUrea.JournalofEnvironmentalQuality,25(6):1378‐1384.
Tonitto,C.,M.B.David,andL.E.Drinkwater.2006.Replacingbarefallowswithcovercropsinfertilizer‐intensivecroppingsystems:Ameta‐analysisofcropyieldandNdynamics.Agriculture,Ecosystems&Environment,112:58‐72.
Toombs,T.P.,J.D.Derner,D.J.Augustine,B.Krueger,etal.2010.Managingforbiodiversityandlivestock−Ascale‐dependentapproachforpromotingvegetationheterogeneityinwesternGreatPlainsgrasslands.Rangelands,32:10‐15.
Tunney,H.,L.Kirwan,W.Fu,N.Culleton,etal.2010.Long‐termphosphorusgrasslandexperimentforbeefproduction–impactsonsoilphosphoruslevelsandliveweightgains.SoilUseandManagement,26(3):237‐244.
U.S.EPA.2009.InventoryofU.S.GreenhouseGasEmissionsandSinks:1990‐2007.Washington,DC:U.S.EnvironmentalProtectionAgency.
U.S.EPA.2010.InventoryofU.S.GreenhouseGasEmissionsandSinks:1990‐2008.Washington,DC:U.S.EnvironmentalProtectionAgency.
U.S.EPA.2011.InventoryofU.S.greenhousegasemissionsandsinks:1990‐2009.Washington,D.C.:EnvironmentalProtectionAgency.
U.S.EPA.2013.InventoryofU.S.greenhousegasemissionsandsinks:1990‐2011.Washington,D.C.:EnvironmentalProtectionAgency.
Chapter 3: Quantifying Greenhouse Gas Sources and Sinks in Cropland and Grazing Land Systems
3-138
Udawatta,R.P.,R.J.Kremer,H.E.Garrett,andS.H.Anderson.2009.Soilenzymeactivitiesandphysicalpropertiesinawatershedmanagedunderagroforestryandrow‐cropsystems.Agriculture,Ecosystems&Environment,131:98‐104.
USDA.1992.AgriculturalWasteCharacteristics.Chapter4.InAnimalWasteManagementFieldHandbook:NaturalResourcesConservationService,UnitedStatesDepartmentofAgriculture.
USDA.2003.User’sGuide‐RevisedUniversalSoilLossEquationVersion2,RUSL2.WashingtonDC:UnitedStatesDepartmentofAgriculture,AgriculturalResearchService.
USDA.2004.TheWindErosionPredictionSystem‐WEPS1.0.UserManual.WashingtonDC:UnitedStatesDepartmentofAgriculture,AgriculturalResearchService.
USDA.2009.SummaryReport:2007NationalResourcesInventory.Washington,DC:U.S.DepartmentofAgriculture,NaturalResourcesConservationService.
USDA.2011.U.S.AgricultureandForestGreenhouseGasInventory:1990‐2008.Washington,DC:U.S.DepartmentofAgriculture.
USDA.2012.CarbonManagementTool:AgroforestrySamplingMethods.RetrievedJune11fromhttp://www.comet2.colostate.edu/agroforestry/samplingMethods.asp.
USDAARS.2013.NationalProgram212:ClimateChange,Soils,andEmissionsandNP214:Agricultural&IndustrialByproductsU.S.DepartmentofAgriculture,AgriculturalResearchService.http://www.ars.usda.gov/research/programs/programs.htm?np_code=212&docid=21223.
USDANRCS.2004.NationalForestryHandbook,Title190:U.S.DepartmentofAgriculture,NaturalResourcesConservationService.ftp://ftp‐fc.sc.egov.usda.gov/NSSC/National_Forestry_Handbook/nfh_2004.pdf.
USDANRCS.2008.SoilTillageIntensityRating(STIR).Pennsylvania.http://www.pa.nrcs.usda.gov/technical/Fact_Sheets/STIR_May08.pdf.
USDANRCS.2012.NationalConservationPracticeStandards.UnitedStatesDepartmentofAgriculture.RetrievedJune11fromhttp://www.nrcs.usda.gov/wps/portal/nrcs/main/national/technical/alphabetical/ncps.
Vallejo,A.,L.Garcia‐Torres,J.A.Diez,A.Arce,etal.2005.ComparisonofNlosses(NO3‐,N2O,NO)fromsurfaceapplied,injectedoramended(DCD)pigslurryofanirrigatedsoilinaMediterraneanclimate.PlantandSoil,272:313‐325.
Vallejo,A.,U.M.Skiba,L.Garcia‐Torres,A.Arce,etal.2006.Nitrogenoxidesemissionfromsoilsbearingapotatocropasinfluencedbyfertilizationwithtreatedpigslurriesandcomposts.SoilBiologyandBiochemistry,38:2782‐2793.
vanGroenigen,J.W.,G.J.Kasper,G.L.Velthof,A.vandenPol‐vanDasselar,etal.2004.Nitrousoxideemissionsfromsilagemaizefieldsunderdifferentmineralnitrogenfertilizerandslurryapplications.PlantandSoil,263.
VanGroenigen,J.W.,G.L.Velthof,O.Oenema,K.J.VanGroenigen,etal.2010.TowardsanagronomicassessmentofN2Oemissions:acasestudyforarablecrops.EuropeanJournalofSoilScience,61(6):903‐913.
vanKessel,C.,R.Venterea,J.Six,M.A.Adviento‐Borbe,etal.2012.Climate,duration,andNplacementdetermineN2Oemissionsinreducedtillagesystems:ameta‐analysis.GlobalChangeBiology,19(1):33‐44.
VanOost,K.,T.A.Quine,G.Govers,S.DeGryze,etal.2007.TheImpactofAgriculturalSoilErosionontheGlobalCarbonCycle.Science,318(5850):626‐629.
Velthof,G.L.,O.Oenema,R.Postma,andM.L.VanBeusichem.1997.Effectsoftypeandamountofappliednitrogenfertilizeronnitrousoxidefluxesfromintensivelymanagedgrassland.NutrientCyclinginAgroecosystems,46:257‐267.
Venterea,R.,andA.J.Stanenas.2008.Profileanalysisandmodelingofreducedtillageeffectsonsoilnitrousoxideflux.JournalofEnvironmentalQuality,37:1360‐1367.
Chapter 3: Quantifying Greenhouse Gas Sources and Sinks in Cropland and Grazing Land Systems
3-139
Venterea,R.T.,M.Burger,andK.A.Spokas.2005.NitrogenOxideandMethaneEmissionsunderVaryingTillageandFertilizerManagement.JournalofEnvironmentalQuality,34(5):1467‐1477.
Venterea,R.T.,J.M.Baker,M.S.Dolan,andK.A.Spokas.2006.CarbonandNitrogenStorageareGreaterunderBiennialTillageinaMinnesotaCorn–SoybeanRotation.SoilScienceSocietyofAmericaJournal,70(5):1752‐1762.
Venterea,R.T.2007.Nitrite‐drivennitrousoxideproductionunderaerobicsoilconditions:kineticsandbiochemicalcontrols.GlobalChangeBiology,13(8):1798‐1809.
Venterea,R.T.,M.Bijesh,andM.S.Dolan.2011a.FertilizerSourceandTillageEffectsonYield‐ScaledNitrousOxideEmissionsinaCornCroppingSystem.JournalofEnvironmentalQuality,40(5):1521‐1531.
Venterea,R.T.,B.Maharjan,andM.S.Dolan.2011b.Fertilizersourceandtillageeffectsonyield‐scaledN2Oemissionsinacorncroppingsystem.JournalofEnvironmentalQuality.
Verchot,L.,T.Krug,R.D.Lasco,S.Ogle,etal.2006.Chapter5:Grassland.In2006IPCCGuidelinesforNationalGreenhouseGasInventories,S.Eggleston,L.Buendia,K.Miwa,T.NgaraandD.L.Tanaka(eds.).Japan:IGES.
Verchot,L.,M.VanNoordwijk,S.Kandji,T.Tomich,etal.2007.Climatechange:linkingadaptationandmitigationthroughagroforestry.MitigationandAdaptationStrategiesforGlobalChange,12(5):901‐918.
Vermeire,L.T.,A.C.Ganguli,andR.L.Gillen.2002.Arobustmodelforestimatingstandingcropacrossvegetationtypes.JournalofRangeManagement,55:494‐497.
Wang,Y.T.,H.D.Gabbard,andP.C.Pai.1991.Inhibitionofacetatemethanogenesisbyphenols.JournalofEnvironmentalEngineeringASCE,117:487‐500.
Wassmann,R.,andM.S.Aulakh.2000.Theroleofriceplantsinregulatingmechanismsofmethanemissions.BiologyandFertilityofSoils,31(1):20‐29.
Wassmann,R.,R.S.Lantin,H.U.Neue,L.V.Buendia,etal.2000.CharacterizationofMethaneEmissionsfromRiceFieldsinAsia.III.MitigationOptionsandFutureResearchNeeds.NutrientCyclinginAgroecosystems,58(1):23‐36.
Wassmann,R.,andH.Pathak.2007.Introducinggreenhousegasmitigationasadevelopmentobjectiveinrice‐basedagriculture:II.Cost–benefitassessmentfordifferenttechnologies,regionsandscales.AgriculturalSystems,94(3):826‐840.
Weir,W.W.1950.SubsidenceofpeatlandsoftheSacramento‐SanJoaquinDelta,California.Weiske,A.,G.Benckiser,andJ.C.G.Ottow.2001.EffectoftheNewNitrificationInhibitorDMPPin
ComparisontoDCDonNitrousOxide(N2O)EmissionsandMethane(CH4)OxidationDuring3YearsofRepeatedApplicationsinFieldExperiments.NutrientCyclinginAgroecosystems,60(1):57‐64.
West,T.,andJ.Six.2007.Consideringtheinfluenceofsequestrationdurationandcarbonsaturationonestimatesofsoilcarboncapacity.ClimaticChange,80(1):25‐41.
West,T.O.,andG.Marland.2002.Asynthesisofcarbonsequestration,carbonemissions,andnetcarbonfluxinagriculture:comparingtillagepracticesintheUnitedStates.Agriculture,Ecosystems&Environment,91(1–3):217‐232.
West,T.O.,G.Marland,A.W.King,W.M.Post,etal.2004.Carbonmanagementresponsecurves:estimatesoftemporalsoilcarbondynamics.EnvironmentalManagement,33:507‐518.
West,T.O.,andA.C.McBride.2005.ThecontributionofagriculturallimetocarbondioxideemissionsintheUnitedStates:dissolution,transport,andnetemissions.Agriculture,Ecosystems&Environment,108(2):145‐154.
West,T.O.,C.C.Brandt,L.M.Baskaran,C.M.Hellwinckel,etal.2010.CroplandcarbonfluxesintheUnitedStates:increasinggeospatialresolutionofinventory‐basedcarbonaccounting.EcologicalApplications,20:1074‐1086.
Chapter 3: Quantifying Greenhouse Gas Sources and Sinks in Cropland and Grazing Land Systems
3-140
West,T.O.,V.Bandaru,C.C.Brandt,A.E.Schuh,etal.2011.RegionaluptakeandreleaseofcropCintheUnitedStates.Biogeosciences,8:2037‐2046.
Wilhelm,W.W.,J.M.F.Johnson,D.L.Karlen,andD.T.Lightle.2007.Cornstovertosustainsoilorganiccarbonfurtherconstrainsbiomasssupply.AgronomyJournal,99:1665‐1667.
Wolf,B.,X.Zheng,N.Bruggemann,W.Chen,etal.2010.Grazing‐inducedreductionofnaturalnitrousoxidereleasefromcontinentalsteppe.Nature,464(7290):881‐884.
Woolf,D.,andJ.Lehmann.2012.Modellingthelong‐termresponsetopositiveandnegativeprimingofsoilorganiccarbonbyblackcarbon.Biogeochemistry,111:83‐95.
Wu,J.2011.CarbonaccumulationinpaddyecosystemsinsubtropicalChina:evidencefromlandscapestudies.EuropeanJournalofSoilScience,62(1):29‐34.
Wulf,S.,M.Maeting,andJ.Clemens.2002.ApplicationTechniqueandSlurryCo‐FermentationEffectsonAmmonia,NitrousOxide,andMethaneEmissionsafterSpreading.JournalofEnvironmentalQuality,31(6):1795‐1801.
Xu,J.Z.,S.Z.Peng,H.J.Hou,S.H.Yang,etal.2012.Gaseouslossesofnitrogenbyammoniavolatilizationandnitrousoxideemissionsfromricepaddieswithdifferentirrigationmanagement.IrrigationScience,August.
Yadvinder‐Singh,Y.‐S.,S.S.Malhi,M.Nyborg,andE.G.Beauchamp.1994.Largegranules,nestsorbands:Methodsofincreasingefficiencyoffall‐appliedureaforsmallcerealgrainsinNorthAmerica.NutrientCyclinginAgroecosystems,38(1):61‐87.
Yagi,K.,H.Tsuruta,andK.Minami.1997.Possibleoptionsformitigatingmethaneemissionfromricecultivation.NutrientCyclinginAgroecosystems,49(1‐3):213‐220.
Yan,X.,K.Yagi,H.Akiyama,andH.Akimoto.2005.Statisticalanalysisofthemajorvariablescontrollingmethaneemissionfromricefields.GlobalChangeBiology,11(7):1131‐1141.
Yan,X.Y.,Y.Hosen,andK.Yagi.2001.NitrousoxideandnitricoxideemissionsfrommaizefieldplotsasaffectedbyNfertilizertypeandapplicationmethod.BiologyandFertilityofSoils,34:297‐303.
Yates,T.T.,B.C.Si,R.E.Farrell,andD.J.Pennock.2006.Probabilitydistributionandspatialdependenceofnitrousoxideemission:temporalchangeinhummockyterrain.SoilScienceSocietyofAmericaJournal,70:753‐762.
Yu,L.,J.Tang,R.Zhang,Q.Wu,etal.2013.Effectsofbiocharapplicationonsoilmethaneemissionatdifferentsoilmoisturelevels.BiologyandFertilityofSoils,49:119‐128.
Zaman,M.,M.L.Nguyen,J.D.Blennerhassett,andB.F.Quin.2008.ReducingNH3,N2Oand‐NLossesfromaPastureSoilwithUreaseorNitrificationInhibitorsandElementalS‐AmendedNitrogenousFertilizers.BiologyandFertilityofSoils,44(5):693‐705.
Zebarth,B.J.,P.Rochette,andD.L.Burton.2008a.N2Oemissionsfromspringbarleyproductionasinfluencedbyfertilizernitrogenrate.CanadianJournalofSoilScience,88:197‐205.
Zebarth,B.J.,P.Rochette,D.L.Burton,andM.Price.2008b.EffectoffertilizernitrogenmanagementonN2Oemissionsincommercialcornfields.CanadianJournalofSoilScience,88:189‐195.
Zebarth,B.J.,E.Snowdon,D.L.Burton,C.Goyer,etal.2012.Controlledreleasefertilizerproducteffectsonpotatocropresponseandnitrousoxideemissionsunderrain‐fedproductiononamedium‐texturedsoil.CanadianJournalofSoilScience,92:759‐769.
Zhang,J.,andX.Han.2008.N2Oemissionfromthesemi‐aridecosystemundermineralfertilizer(ureaandsuperphosphate)andincreasedprecipitationinnorthernChina.AtmosphericEnvironment,42:291‐302.
Zhang,Y.,C.Li,C.C.Trettin,andG.Sun.2002.Anintegratedmodelofsoil,hydrologyandvegetationforcarbondynamicsinwetlandecosystems.GlobalBiogeochemicalCycles,16:1‐17.
Zhang,Y.,Y.Y.Wang,S.L.Su,andC.S.Li.2011.QuantifyingmethaneemissionsfromricepaddiesinNortheeastChinabyintegratingremotesensingwithbiogeochemicalmode.Biogeosciences,8:1225‐1235.
Chapter 3: Quantifying Greenhouse Gas Sources and Sinks in Cropland and Grazing Land Systems
3-141
Zhou,X.,J.R.Brandle,T.Awada,M.M.Schoeneberger,etal.2011.Theuseofforest‐derivedspecificgravityfortheconversionofvolumetobiomassforopen‐growntreesonagriculturalland.BiomassBioenergy,35(5):1721‐1731.
Zhou,X.,M.M.Schoeneberger,J.R.Brandle,T.N.Awada,etal.inreview.Analyzingtheuncertaintiesinuseofforest‐derivedbiomassequationsforopen‐growntreesinagriculturalland.ForestScience.
Zhou,X.H.1999.Onthethree‐dimensionalaerodynamicstructureofshelterbelts.PhDThesis,UniversityofNebraska,Lincoln,NE.
Zou,J.,Y.Huang,J.Jiang,X.Zheng,etal.2005.A3‐yearfieldmeasurementofmethaneandnitrousoxideemissionsfromricepaddiesinChina:Effectsofwaterregime,cropresidue,andfertilizerapplication.GlobalBiogeochemicalCycles,19:doi:10.1029/2004GB002401.

Chapter 3: Quantifying Greenhouse Gas Sources and Sinks in Cropland and Grazing Land Systems
3-142
Thispageisintentionallyleftblank.
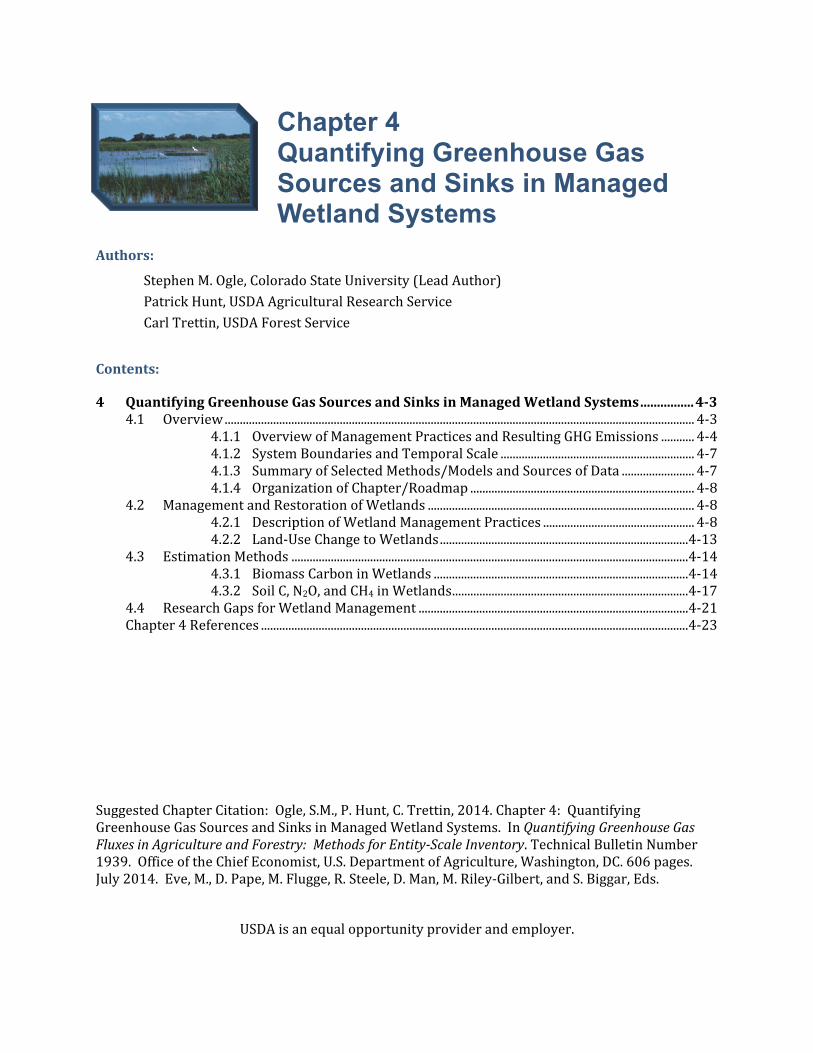
Authors:
StephenM.Ogle,ColoradoStateUniversity(LeadAuthor)PatrickHunt,USDAAgriculturalResearchServiceCarlTrettin,USDAForestService
Contents:
4 QuantifyingGreenhouseGasSourcesandSinksinManagedWetlandSystems................4‐34.1 Overview...........................................................................................................................................................4‐3
4.1.1 OverviewofManagementPracticesandResultingGHGEmissions...........4‐44.1.2 SystemBoundariesandTemporalScale................................................................4‐74.1.3 SummaryofSelectedMethods/ModelsandSourcesofData........................4‐74.1.4 OrganizationofChapter/Roadmap..........................................................................4‐8
4.2 ManagementandRestorationofWetlands........................................................................................4‐84.2.1 DescriptionofWetlandManagementPractices..................................................4‐84.2.2 Land‐UseChangetoWetlands..................................................................................4‐13
4.3 EstimationMethods...................................................................................................................................4‐144.3.1 BiomassCarboninWetlands....................................................................................4‐144.3.2 SoilC,N2O,andCH4inWetlands..............................................................................4‐17
4.4 ResearchGapsforWetlandManagement.........................................................................................4‐21Chapter4References.............................................................................................................................................4‐23
SuggestedChapterCitation:Ogle,S.M.,P.Hunt,C.Trettin,2014.Chapter4:QuantifyingGreenhouseGasSourcesandSinksinManagedWetlandSystems.InQuantifyingGreenhouseGasFluxesinAgricultureandForestry:MethodsforEntity‐ScaleInventory.TechnicalBulletinNumber1939.OfficeoftheChiefEconomist,U.S.DepartmentofAgriculture,Washington,DC.606pages.July2014.Eve,M.,D.Pape,M.Flugge,R.Steele,D.Man,M.Riley‐Gilbert,andS.Biggar,Eds.
USDAisanequalopportunityproviderandemployer.
Chapter 4
Quantifying Greenhouse Gas Sources and Sinks in Managed Wetland Systems
Chapter 4: Quantifying Greenhouse Gas Sources and Sinks in Managed Wetland Systems
4-2
Acronyms,ChemicalFormulae,andUnits
C CarbonCH4 MethaneCO2 CarbondioxideCO2‐eq CarbondioxideequivalentsDNDC Denitrification‐DecompositionEPA EnvironmentalProtectionAgencyFVS ForestVegetationSimulatorGHG Greenhousegasha HectareIPCC IntergovernmentalPanelonClimateChangeN NitrogenN2O NitrousoxideNOx Mono‐nitrogenoxidesNRCS USDANaturalResourcesConservationServiceP PhosphorousSOC SoilorganiccarbonTg TeragramsUSDA U.S.DepartmentofAgricultureUSDA‐ARS U.S.DepartmentofAgriculture, AgriculturalResearchService
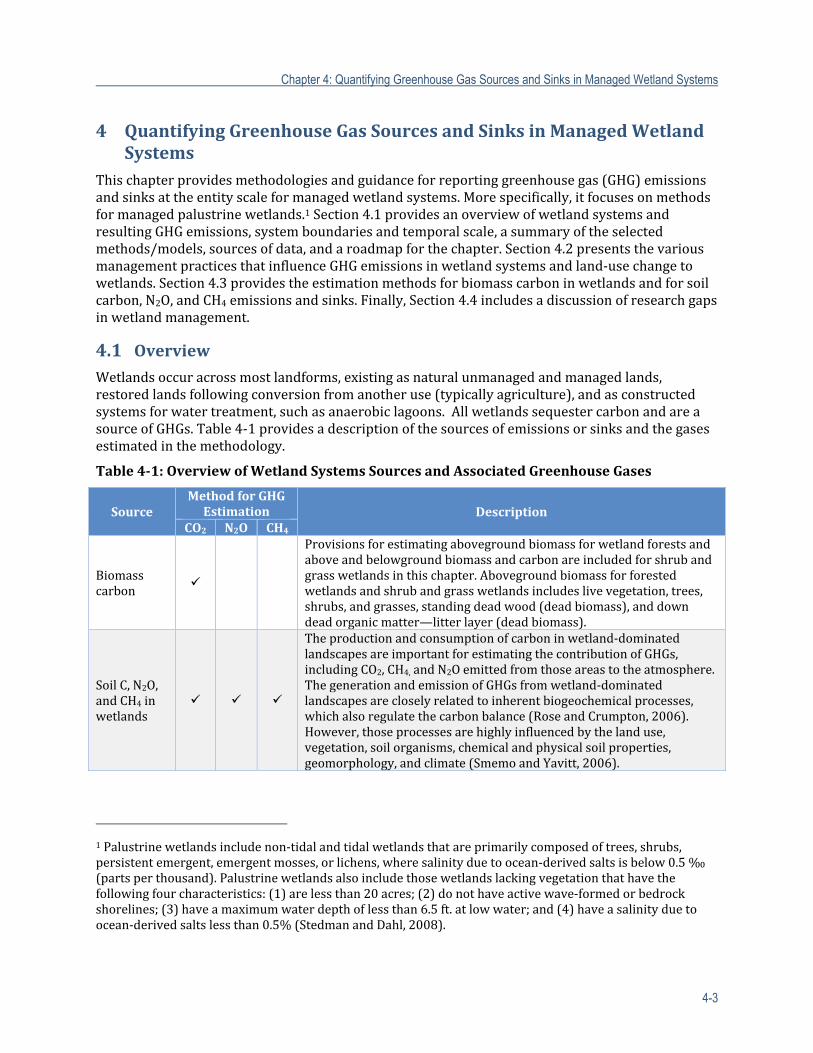
Chapter 4: Quantifying Greenhouse Gas Sources and Sinks in Managed Wetland Systems
4-3
4 QuantifyingGreenhouseGasSourcesandSinksinManagedWetlandSystems
Thischapterprovidesmethodologiesandguidanceforreportinggreenhousegas(GHG)emissionsandsinksattheentityscaleformanagedwetlandsystems.Morespecifically,itfocusesonmethodsformanagedpalustrinewetlands.1Section4.1providesanoverviewofwetlandsystemsandresultingGHGemissions,systemboundariesandtemporalscale,asummaryoftheselectedmethods/models,sourcesofdata,andaroadmapforthechapter.Section4.2presentsthevariousmanagementpracticesthatinfluenceGHGemissionsinwetlandsystemsandland‐usechangetowetlands.Section4.3providestheestimationmethodsforbiomasscarboninwetlandsandforsoilcarbon,N2O,andCH4emissionsandsinks.Finally,Section4.4includesadiscussionofresearchgapsinwetlandmanagement.
4.1 OverviewWetlandsoccuracrossmostlandforms,existingasnaturalunmanagedandmanagedlands,restoredlandsfollowingconversionfromanotheruse(typicallyagriculture),andasconstructedsystemsforwatertreatment,suchasanaerobiclagoons.AllwetlandssequestercarbonandareasourceofGHGs.Table4‐1providesadescriptionofthesourcesofemissionsorsinksandthegasesestimatedinthemethodology.
Table4‐1:OverviewofWetlandSystemsSourcesandAssociatedGreenhouseGases
SourceMethodforGHGEstimation Description
CO2 N2O CH4
Biomasscarbon
Provisionsforestimatingabovegroundbiomassforwetlandforestsandaboveandbelowgroundbiomassandcarbonareincludedforshrubandgrasswetlandsinthischapter.Abovegroundbiomassforforestedwetlandsandshrubandgrasswetlandsincludeslivevegetation,trees,shrubs,andgrasses,standingdeadwood(deadbiomass),anddowndeadorganicmatter—litterlayer(deadbiomass).
SoilC,N2O,andCH4inwetlands
Theproductionandconsumptionofcarbon inwetland‐dominatedlandscapesareimportantforestimatingthecontributionofGHGs,includingCO2,CH4,andN2Oemittedfromthoseareastotheatmosphere.ThegenerationandemissionofGHGsfromwetland‐dominatedlandscapesarecloselyrelatedtoinherentbiogeochemicalprocesses,whichalsoregulatethecarbonbalance(RoseandCrumpton,2006).However,thoseprocessesarehighlyinfluencedbythelanduse,vegetation,soilorganisms,chemicalandphysicalsoilproperties,geomorphology,andclimate(SmemoandYavitt,2006).
1Palustrinewetlandsincludenon‐tidalandtidalwetlandsthatareprimarilycomposedoftrees,shrubs,persistentemergent,emergentmosses,orlichens,wheresalinityduetoocean‐derivedsaltsisbelow0.5‰(partsperthousand).Palustrinewetlandsalsoincludethosewetlandslackingvegetationthathavethefollowingfourcharacteristics:(1)arelessthan20acres;(2)donothaveactivewave‐formedorbedrockshorelines;(3)haveamaximumwaterdepthoflessthan6.5ft.atlowwater;and(4)haveasalinityduetoocean‐derivedsaltslessthan0.5%(StedmanandDahl,2008).
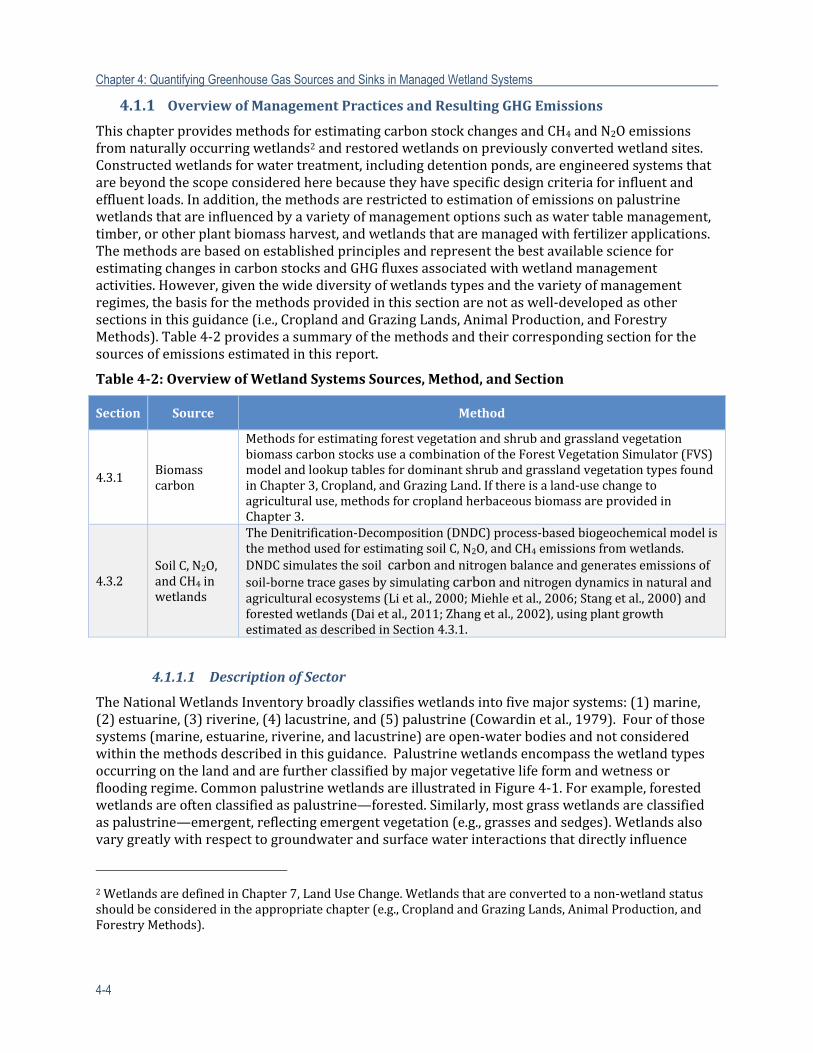
Chapter 4: Quantifying Greenhouse Gas Sources and Sinks in Managed Wetland Systems
4-4
4.1.1 OverviewofManagementPracticesandResultingGHGEmissions
ThischapterprovidesmethodsforestimatingcarbonstockchangesandCH4andN2Oemissionsfromnaturallyoccurringwetlands2andrestoredwetlandsonpreviouslyconvertedwetlandsites.Constructedwetlandsforwatertreatment,includingdetentionponds,areengineeredsystemsthatarebeyondthescopeconsideredherebecausetheyhavespecificdesigncriteriaforinfluentandeffluentloads.Inaddition,themethodsarerestrictedtoestimationofemissionsonpalustrinewetlandsthatareinfluencedbyavarietyofmanagementoptionssuchaswatertablemanagement,timber,orotherplantbiomassharvest,andwetlandsthataremanagedwithfertilizerapplications.ThemethodsarebasedonestablishedprinciplesandrepresentthebestavailablescienceforestimatingchangesincarbonstocksandGHGfluxesassociatedwithwetlandmanagementactivities.However,giventhewidediversityofwetlandstypesandthevarietyofmanagementregimes,thebasisforthemethodsprovidedinthissectionarenotaswell‐developedasothersectionsinthisguidance(i.e.,CroplandandGrazingLands,AnimalProduction,andForestryMethods).Table4‐2providesasummaryofthemethodsandtheircorrespondingsectionforthesourcesofemissionsestimatedinthisreport.
Table4‐2:OverviewofWetlandSystemsSources,Method,andSection
Section Source Method
4.3.1Biomasscarbon
MethodsforestimatingforestvegetationandshrubandgrasslandvegetationbiomasscarbonstocksuseacombinationoftheForestVegetationSimulator(FVS)modelandlookuptablesfordominantshrubandgrasslandvegetationtypesfoundinChapter3,Cropland,andGrazingLand.Ifthereisaland‐usechangetoagriculturaluse,methodsforcroplandherbaceousbiomassareprovidedinChapter3.
4.3.2SoilC,N2O,andCH4inwetlands
TheDenitrification‐Decomposition (DNDC) process‐basedbiogeochemicalmodelisthemethodusedforestimatingsoilC,N2O,andCH4emissionsfromwetlands.DNDCsimulatesthesoilcarbonandnitrogenbalanceandgeneratesemissionsofsoil‐bornetracegasesbysimulatingcarbonandnitrogendynamicsinnaturalandagriculturalecosystems(Lietal.,2000;Miehleetal.,2006;Stangetal.,2000)andforestedwetlands(Daietal.,2011;Zhangetal.,2002),usingplantgrowthestimatedasdescribedinSection4.3.1.
4.1.1.1 DescriptionofSector
TheNationalWetlandsInventorybroadlyclassifieswetlandsintofivemajorsystems:(1)marine,(2)estuarine,(3)riverine,(4)lacustrine,and(5)palustrine(Cowardinetal.,1979).Fourofthosesystems(marine,estuarine,riverine,andlacustrine)areopen‐waterbodiesandnotconsideredwithinthemethodsdescribedinthisguidance.Palustrinewetlandsencompassthewetlandtypesoccurringonthelandandarefurtherclassifiedbymajorvegetativelifeformandwetnessorfloodingregime.CommonpalustrinewetlandsareillustratedinFigure4‐1.Forexample,forestedwetlandsareoftenclassifiedaspalustrine—forested.Similarly,mostgrasswetlandsareclassifiedaspalustrine—emergent,reflectingemergentvegetation(e.g.,grassesandsedges).Wetlandsalsovarygreatlywithrespecttogroundwaterandsurfacewaterinteractionsthatdirectlyinfluence
2WetlandsaredefinedinChapter7,LandUseChange.Wetlandsthatareconvertedtoanon‐wetlandstatusshouldbeconsideredintheappropriatechapter(e.g.,CroplandandGrazingLands,AnimalProduction,andForestryMethods).
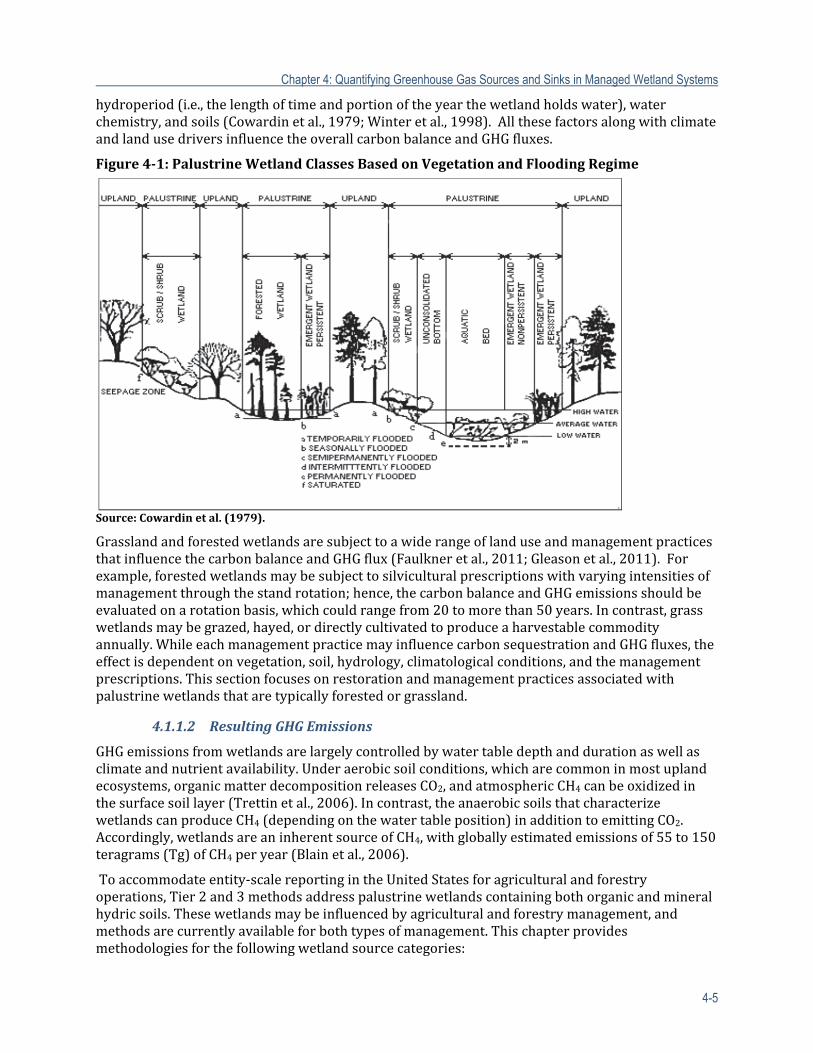
Chapter 4: Quantifying Greenhouse Gas Sources and Sinks in Managed Wetland Systems
4-5
hydroperiod(i.e.,thelengthoftimeandportionoftheyearthewetlandholdswater),waterchemistry,andsoils(Cowardinetal.,1979;Winteretal.,1998).AllthesefactorsalongwithclimateandlandusedriversinfluencetheoverallcarbonbalanceandGHGfluxes.
Figure4‐1:PalustrineWetlandClassesBasedonVegetationandFloodingRegime
Source:Cowardinetal.(1979).
GrasslandandforestedwetlandsaresubjecttoawiderangeoflanduseandmanagementpracticesthatinfluencethecarbonbalanceandGHGflux(Faulkneretal.,2011;Gleasonetal.,2011).Forexample,forestedwetlandsmaybesubjecttosilviculturalprescriptionswithvaryingintensitiesofmanagementthroughthestandrotation;hence,thecarbonbalanceandGHGemissionsshouldbeevaluatedonarotationbasis,whichcouldrangefrom20tomorethan50years.Incontrast,grasswetlandsmaybegrazed,hayed,ordirectlycultivatedtoproduceaharvestablecommodityannually.WhileeachmanagementpracticemayinfluencecarbonsequestrationandGHGfluxes,theeffectisdependentonvegetation,soil,hydrology,climatologicalconditions,andthemanagementprescriptions.Thissectionfocusesonrestorationandmanagementpracticesassociatedwithpalustrinewetlandsthataretypicallyforestedorgrassland.
4.1.1.2 ResultingGHGEmissions
GHGemissionsfromwetlandsarelargelycontrolledbywatertabledepthanddurationaswellasclimateandnutrientavailability.Underaerobicsoilconditions,whicharecommoninmostuplandecosystems,organicmatterdecompositionreleasesCO2,andatmosphericCH4canbeoxidizedinthesurfacesoillayer(Trettinetal.,2006).Incontrast,theanaerobicsoilsthatcharacterizewetlandscanproduceCH4(dependingonthewatertableposition)inadditiontoemittingCO2.Accordingly,wetlandsareaninherentsourceofCH4,withgloballyestimatedemissionsof55to150teragrams(Tg)ofCH4peryear(Blainetal.,2006).
Toaccommodateentity‐scalereportingintheUnitedStatesforagriculturalandforestryoperations,Tier2and3methodsaddresspalustrinewetlandscontainingbothorganicandmineralhydricsoils.Thesewetlandsmaybeinfluencedbyagriculturalandforestrymanagement,andmethodsarecurrentlyavailableforbothtypesofmanagement.Thischapterprovidesmethodologiesforthefollowingwetlandsourcecategories:
Chapter 4: Quantifying Greenhouse Gas Sources and Sinks in Managed Wetland Systems
4-6
1. Biomasscarboninforested,shrub,andgrasswetlands;2. Soilcarbonsinksinwetlands;and3. N2OandCH4emissionsinwetlands.
Biomasscarboncanchangesignificantlywithmanagementofwetlands,particularlyinforestedwetlands,changesfromforesttowetlandsdominatedbygrassesandshrubs,oropenwater.Inforestedwetlands,therecanalsobesignificantcarbonindeadwood,coarsewoodydebris,andfinelitter.Harvestingpracticeswillalsoinfluencethecarbonstocksinwetlandstotheextentthewoodiscollectedforproducts,fuel,orotherpurposes.
WetlandsarealsoasourceofsoilN2Oemissions,primarilybecauseofnitrogenrunofffromadjoininguplandsandleachingintogroundwaterfromagriculturalfieldsand/oranimalproductionfacilities.N2OemissionsfromwetlandsduetonitrogeninputsfromsurroundingfieldsoranimalproductionareconsideredindirectemissionsofN2O(deKleinetal.,2006).MethodologiesforestimatingindirectN2Oareprovidedintherespectivesourcechapter(i.e.,Chapter3,CroplandandGrazingLands,orChapter5,AnimalProduction).However,directN2Oemissionsoccurinwetlandsifmanagementpracticesincludenitrogenfertilization,hence,guidanceisprovidedforthissourceofemissions.
4.1.1.3 RiskofReversals
Wetlandsinherentlyaccumulatecarboninthesoilsduetoanaerobicconditions,andtheyarenaturalsourcesofCO2andCH4totheatmosphere.Managementmayalterconditionsthataffectboththepoolsandfluxes.Forexample,accumulatedsoilcarboncanbereturnedtotheatmosphereifthewetlandisdrained(ArmentanoandMenges,1986).Incontrast,silviculturalwatermanagementinwetlandscanleadtohigherbiomassproduction,whichmaypartiallyoffsetincreasedsoilorganicmatteroxidation.Conversely,thesoilcarbonpoolinconvertedwetlandsistypicallylowerthantheunmanagedsoil,andrestoringwetlandconditionsmayincreasecarbonstorageovertimeifinherenthydricsoilconditionsaremaintainedwithconsistentorganicmatterinputs.
Reversalsofemissiontrendscanoccurifamanagerrevertstoapriorconditionoranearlierpractice.Forexample,anentitymaydecidetoreturnawetlandthathadbeendrainedandcroppedbacktoaforestedwetlandcondition.Anothercommonexamplewouldbeifarestoredforestedwetlandisrevertedbacktoagriculture.ThesereversalsdonotnegatethemitigationofCH4orN2Oemissionstotheatmospherethathadoccurredpreviously,totheextentthatwetlandrestorationorchangeinmanagementcanreduceorchangetheseemissions.Correspondingly,thestartingpointfromthereversionwilldeterminetheeffectoncarbonsequestrationandGHGflux.Forexample,inarestoredforestedwetland,reversionofthesitetocropproductionwouldreturncarbonsequesteredduringtherestorationperiodtotheatmosphereovertime.
Thereisatrade‐offinCH4andN2Oemissionswithmanagementofthewatertableposition.WetlandswithanaerobicsoilconditionsthatarepersistentnearthesurfaceforalongerperiodduringtheyearwilltendtohavehigherCH4emissionsandloweremissionsofN2O.N2Oemissionsaregreatlyreducedifsoilsaresaturatedbecausethereislittleinherentnitrification,anddenitrificationwillleadtoN2production(Davidsonetal.,2000).Forexample,restorationofwetlandswillnormallyleadtoahigherwatertableforalongerperiodoftheyear,andthuscontributetohigheremissionsofCH4butloweremissionsofN2O.Thesetrendscanbereversedifthewatertableisloweredthroughmanagementordrought,whichwilltendtoenhanceN2Oemissionsifthereisasourceofnitrate,whilereducingemissionsofCH4.Figure4‐2providesanillustrationofthecarboncycletypicallyfoundinwetlandforestandgrasslandwetlandsandrepresentsthescopeofthemethodspresentedinthisguidance.
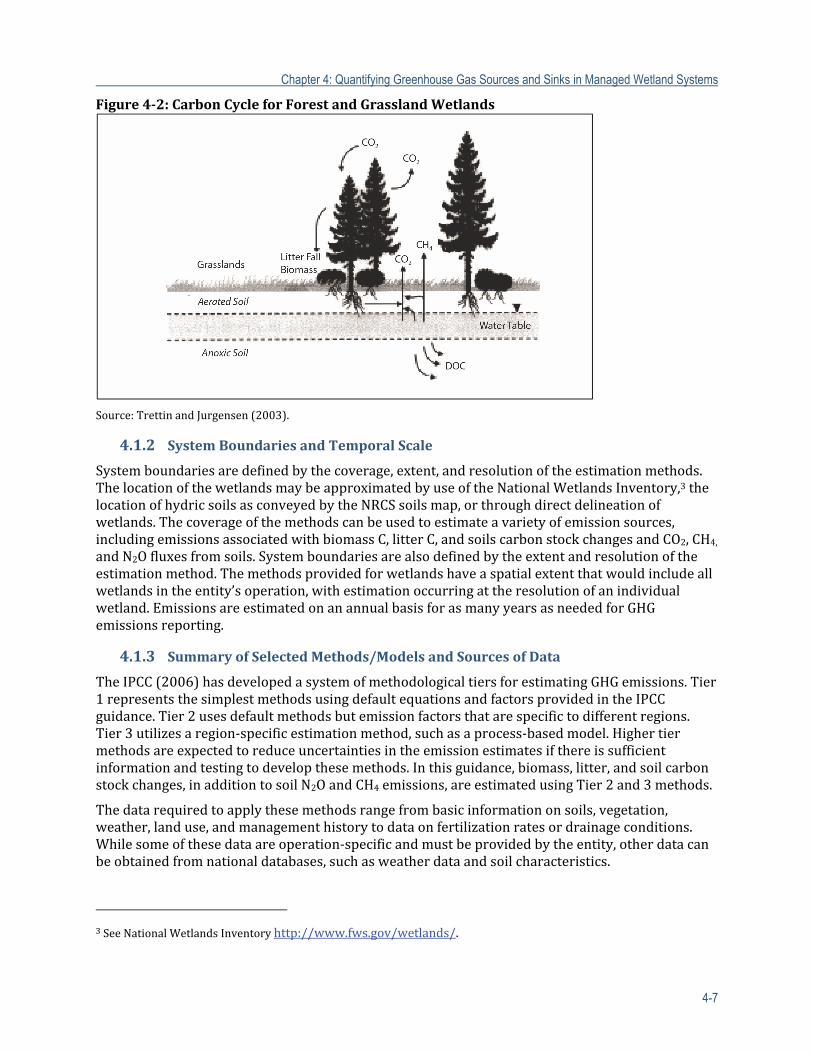
Chapter 4: Quantifying Greenhouse Gas Sources and Sinks in Managed Wetland Systems
4-7
Figure4‐2:CarbonCycleforForestandGrasslandWetlands
Source:TrettinandJurgensen(2003).
4.1.2 SystemBoundariesandTemporalScale
Systemboundariesaredefinedbythecoverage,extent,andresolutionoftheestimationmethods.ThelocationofthewetlandsmaybeapproximatedbyuseoftheNationalWetlandsInventory,3thelocationofhydricsoilsasconveyedbytheNRCSsoilsmap,orthroughdirectdelineationofwetlands.Thecoverageofthemethodscanbeusedtoestimateavarietyofemissionsources,includingemissionsassociatedwithbiomassC,litterC,andsoilscarbonstockchangesandCO2,CH4,andN2Ofluxesfromsoils.Systemboundariesarealsodefinedbytheextentandresolutionoftheestimationmethod.Themethodsprovidedforwetlandshaveaspatialextentthatwouldincludeallwetlandsintheentity’soperation,withestimationoccurringattheresolutionofanindividualwetland.EmissionsareestimatedonanannualbasisforasmanyyearsasneededforGHGemissionsreporting.
4.1.3 SummaryofSelectedMethods/ModelsandSourcesofData
TheIPCC(2006)hasdevelopedasystemofmethodologicaltiersforestimatingGHGemissions.Tier1representsthesimplestmethodsusingdefaultequationsandfactorsprovidedintheIPCCguidance.Tier2usesdefaultmethodsbutemissionfactorsthatarespecifictodifferentregions.Tier3utilizesaregion‐specificestimationmethod,suchasaprocess‐basedmodel.Highertiermethodsareexpectedtoreduceuncertaintiesintheemissionestimatesifthereissufficientinformationandtestingtodevelopthesemethods.Inthisguidance,biomass,litter,andsoilcarbonstockchanges,inadditiontosoilN2OandCH4emissions,areestimatedusingTier2and3methods.
Thedatarequiredtoapplythesemethodsrangefrombasicinformationonsoils,vegetation,weather,landuse,andmanagementhistorytodataonfertilizationratesordrainageconditions.Whilesomeofthesedataareoperation‐specificandmustbeprovidedbytheentity,otherdatacanbeobtainedfromnationaldatabases,suchasweatherdataandsoilcharacteristics.
3SeeNationalWetlandsInventoryhttp://www.fws.gov/wetlands/.
Chapter 4: Quantifying Greenhouse Gas Sources and Sinks in Managed Wetland Systems
4-8
4.1.4 OrganizationofChapter/Roadmap
Thewetlandssectionofthisreportisorganizedintothreeprimarysections.Section4.2providesadescriptionofwetlandmanagementeffectsonGHGemissions,elaboratingonthescientificbasisforhowvariouspracticesinfluenceGHGemissions.Section4.3providesarationalefortheselectedmethod,adescriptionofthemethod,includingageneraldescription(withequationsandfactors),activitydatarequirements,ancillarydatarequirements,limitationsofthemethod,anduncertaintiesassociatedwiththeestimation.Asinglemethodisprovidedforeachsourcepresentedinthischapter(i.e.,biomasscarboninforested,shrub,andgrasswetlands;soilcarbonandCH4inwetlands;anddirectN2Oemissionsinwetlands).Asinglemethodwasselectedtoensureconsistencyinemissionestimationbyallreportingentities,andtheselectedmethodisconsideredthebestoptionamongpossibilitiesforentity‐scalereporting.Methodsmayberefinedinthefutureastheyarefurtherdeveloped.Thelastsectionprovidesasummaryofselectedresearchgaps.
4.2 ManagementandRestorationofWetlandsHowwetlandsaremanagedcanhaveasignificanteffectonGHGemissionsandsinks,whichareprimarilyinfluencedbythedegreeofwatersaturation,climate,andnutrientavailability.Inamajorityofwetlands,90percentofcarboningrossprimaryproductionisreturnedtotheatmospherethroughdecay,andtheremaining10percentaccumulatesinthebottomofthewaterbodyaccumulatingonpreviouslydepositedmaterials(Blainetal.,2006).ManagementofthewatertablewithinawetlandwillresultinbothlowerCH4emissionsduetodecreasedproductionandoxidationofCH4producedinthesubsoilandanincreaseinCO2emissionsduetoincreasedoxidationofsoilorganicmatter.N2Oemissionsfromwetlandsaretypicallylow,unlessananthropogenicsourceofnitrogenentersthewetland.Indrainedwetlands,N2Oemissionsarelargelycontrolledbythefertilityofthesoilandwatermanagementregime.Incontrast,restoredandconstructedwetlandsgeneratehigherlevelsofCH4andlowerlevelsofCO2becauseofthechangeinawatertabledepth(Blainetal.,2006).
4.2.1 DescriptionofWetlandManagementPractices
ThissectionprovidesadescriptionofmanagementpracticesinwetlandsthatinfluenceGHGemissions(CH4orN2O)orcarbonstocks.Individualsectionsdealwithforestedandgrasswetlandsthatcouldoccurinagriculturalandforestryoperations.Itisimportanttonotethatdrainageofwetlandsforcommodityproduction,suchasannualcrops,orforotherpurposesarenotconsideredwetlandsintheseguidelines.MethodsfordrainedwetlandscanbefoundinChapter3,CroplandsandGrazingLands,orChapter6,ForestLands,dependingonthelanduseafterdrainageofthewetland.
4.2.1.1 SilviculturalWaterTableManagement
Silviculturalwatermanagementsystemsareprincipallyusedtoregulatethewatertabledepthinordertoreducesoildisturbanceassociatedwithharvestingoperationsandalleviatestressfromsaturatedsoilconditionsonartificiallyregeneratedplantations.Thesilviculturalwatermanagementsystemshouldnoteliminatethewetlandconditionsofthesite.
SilviculturalwatermanagementsystemsaffectthecarbonbalanceandGHGemissionsfromthesite(Bridghametal.,2006).Typicallyorganicmatterdecompositionisenhancedwiththeimpositionofadrainagesystem,CH4emissionsarereduced,andN2Oemissionsmayincrease(Lietal.,2004).Carbonsequestrationinbiomassmaybeenhancedonsiteswithsilviculturaldrainagesystemsduetoincreasedtreeproductivity(MinkkinenandLaine,1998).
Chapter 4: Quantifying Greenhouse Gas Sources and Sinks in Managed Wetland Systems
4-9
4.2.1.2 ForestHarvestingSystems
Therearetwogeneraltypesofsystemsusedtoharvesttreesfromforestedwetlands:partialcuttingandclearcutting.Apartialcutinvolvestheremovalofselectedtreesfromthestand.Thenumberoftreesremovedortheresidualdensityofthestandwilldependonthestandtype,species,intendedproduct(s),andstandage.Theamountoftreebiomassremovedduringthepartialcutmayalsovary;topsmaybeleftonsiteifonlylogsareremoved,ortheymaybeconcentratedinalandingifwhole‐treeharvestingisused.Withthelattersystem,thetopsmayalsobeutilizedandremovedfromthesite.Partialcuttingistypicallyusedinriparianzonesandsitesthataremanagedforsolidwoodproducts.Clearcuttingresultsintheremovalofalloverstorytreesfromthesite.ClearcuttingistypicallyusedonnaturalstandsoccurringinfloodplainsofthesoutheasterncoastalplainandlacustrineandoutwashplainsoftheupperMidwest.Clearcuttingisalsothetypicalsystememployedtoharvestconiferandhardwoodplantations.
Partialcuttingaffectsthecarbonbalanceofthesitebydirectremovalofbiomass;increasedbiomassontheforestfloor,whichisthensubjecttodecayprocesses;andincreasedgrowthoftheremainingtreesforseveralyears.Decompositionofdeadbiomasswithinthestandmaybeacceleratedtemporarilyduetothechangesinambientconditionsandtheaddedresiduefromtheharvest.
Clearcuttingaffectscarbonstocksofthesitebydirectlyremovingthebiomass;increasingamountsofbiomassaddedtotheforestfloor;alteringthecarbonsequestrationforseveralyears,dependingonthetypeofregeneration;andalteringtherateoforganicmatterdecompositionintheforestfloorandsoil(Lockabyetal.,1999).Clearcuttingaffectstheambientconditionsofthesitebecauseoftheremovaloftheoverstoryvegetation.Italsoaltersthewaterbalanceofthewetlandduetothereductioninevapotranspirationfollowingharvesting.Typically,asaresultoflowerevapotranspiration,thewatertablerises,andthesitewillexhibitlongerperiodsofsaturation.ThischangeinthewatertablepositionhasdirecteffectsontheproductionofCH4andN2Oandsubsequentfluxestotheatmosphere(Lietal.,2004).
4.2.1.3 ForestRegenerationSystems
Therearetwobasicforestregenerationsystems,characterizedas(a)naturalregeneration,and(b)artificialregeneration.Naturalregeneration,asthenameimplies,reliesuponregenerationofthetreesfromseedorsproutsthatareleftbyharvestedtrees.Naturalregenerationisusedinbothpartial‐cutandclear‐cutharvestsystems.Naturalregenerationwillleadtoeven‐agedstandsofshade‐intolerantorearlysuccessionalcommunities,typicallyinfloodplainsinthesoutheasternUnitedStatesandtheconiferousplainsoftheupperMidwest.
Artificialregenerationresultsfromplantingseedlingsonapreparedsite.Thesitepreparationpracticesmayinvolveremovaloftheharvestresiduebiomass,mechanicalscarificationand/ortheapplicationofherbicidetotemporarilyreduceweedcompetitionwithseedlings,andthecreationofplantingbeds.
TheeffectoftheforestregenerationsystemoncarbonstocksandtraceGHGemissionsdependsonthetypeofharvestingsystemthatwasused(Lockabyetal.,1999;Trettinetal.,1995).Thecombinationofpartialcuttingandnaturalregenerationhaslittleadditiveeffectbecausetheextentofregenerationistypicallyquitelowfollowingapartialcutthatremoveslessthanhalfofthebasalarea.Carbonstocksfollowingclear‐cutharvestingwithnaturalregenerationisaffectedbytherateofgrowthoftheregeneration,changesinambientconditions,andchangesinthesoilwaterregime.Thosefactorsalsoaffectartificialregenerationsystems;additionally,thetypeandextentofsitepreparationalsoaffectsthecarbonstocks.
Chapter 4: Quantifying Greenhouse Gas Sources and Sinks in Managed Wetland Systems
4-10
4.2.1.4 Fertilization
Fertilizationisusedprimarilyinforestedwetlands,suchastreeplantations,toenhancegrowth(Albaughetal.,2004).Grasswetlandsalsoreceivefertilizerasaresultofadjacentagriculturalactivities,andwhendryconditionspermit,aredirectlytilled,planted,andfertilized.Nitrogenisthemostcommonlyappliedfertilizer,andincreasednitrogeninputsareknowntoincreaseemissionsofN2O(Bedard‐Haughnetal.,2006;Davidsonetal.,2000;Gleasonetal.,2009;Merbachetal.,2002;PhillipsandBeeri,2008;ThorntonandValente,1996).NitrogenfertilizerswillalsoenhanceN2Oemissionsbothdirectlyonthesiteandindirectlyifnitrogenislostfromthesiteasnitrateingroundwaterorrunoff,aswellasvolatilizationofnitrogenasammoniaorNOx.TheindirectlosseswillcontributetoN2Oemissionsatothersites.
Theeffectoffertilizationoncarbonstocksisprincipallyrealizedthroughchangesintreegrowthrates.Theeffectwouldresultfromnitrogenfertilizers,butphosphorusmayalsobeappliedinthesoutheasternUnitedStates.
4.2.1.5 ConversiontoOpen‐WaterWetland
Theconversionofwetlandtoopenwateroccursprimarilyasaresultofbeaverimpoundmentsandtoalesserdegreeimproperlyinstalledroadsorotherartificialembankmentsthroughawetlandthatimpedesnaturaldrainage.Theconversiontoopenwatersignificantlyreducescarbonsequestrationthroughplantgrowth,becauseuptakeislimitedtosubmergedaquaticvegetation.ThehigherwatertableforalongerperiodoftheyearwillalsotendtoincreaseCH4flux.
4.2.1.6 ForestTypeChange
Changingamanagedforesttoacharacteristicnativeconditionisalsoconsideredaformofrestoration.TheeffectoftherestorationactivitiesonthecarbonstocksandCH4emissionsdependsontheextentofthehydrologicmodificationsthatwereemployedintheprevioussilviculturalsystem.Thetwomostcommonsituationsareasitethathasbeenmanagedforaparticularspeciesorproductwithouthydrologicmodification;theothercommonsituationiswherethesitehasbeenmanagedforplantationforestryandthehydrologyandvegetationhavebeenextensivelymodified.
4.2.1.7 WaterQualityManagement
Riparianzonesalongstreams,rivers,andlakesmaybemanagedtoprotectwaterqualitybymitigatingnonpointsourcepollution(Balestrinietal.,2011;Chaubeyetal.,2010).4Pollutantsareremovedbyphysicalfiltration,chemicaladsorption,plantuptake,andmicrobialtransformations(Abu‐Zreigetal.,2003;Borinetal.,2005).5However,riparianbuffersarelimitedintheiradsorptioncapacitiesforsomeconstituents,whichmaythenflowintowaterways.Thebufferzonesizeandconfigurationvariesaccordingtorunoffpatternsofthesite,phosphorus/nitrogeninputs,hydrologicconnectivity,organiccarbon,mineralcontent,andoxidative/reductivestate(Abu‐Zreigetal.,2003;Hoffmannetal.,2009;Novaketal.,2002;YoungandBriggs,2008).
Riparianbufferzonesarecomprisedofnativeandnon‐nativevegetationormayalsocontaincultivatedplantsinsomecases.Managementactivitiesofthenativevegetationbufferzonesaretypicallyconstrainedorlimitedtosmallremovals.Inthecaseofforestriparianbuffers,aselective‐4Additionalreferencesinclude(Choetal.,2010;Fliteetal.,2001;Hoffmannetal.,2009;Huntetal.,2004;Leeetal.,2004;Lowranceetal.,2007;Montreuiletal.,2010;PeterjohnandCorrell,1984;RanalliandMacalady,2010;Schoonoveretal.,2005;Tabacchietal.,1998;YoungandBriggs,2008).5Additionalreferencesinclude(Dillahaetal.,1989;Dillahaetal.,1988;Hoffmannetal.,2009;Jordanetal.,2003;Kellyetal.,2007;Novaketal.,2002;Vellidisetal.,2003;YoungandBriggs,2008).
Chapter 4: Quantifying Greenhouse Gas Sources and Sinks in Managed Wetland Systems
4-11
harvestregimewouldbeusedthatinfluencesbothcarbonstocksandGHGemissions.Inmixedbuffers(i.e.,grassstripsfollowedbyforest),themanagementofthecultivatedbufferwouldlargelydeterminetheeffectofthepractice,whichwillbeanalogoustohaycultivation.Riparianzonesmaycontainamosaicofhydric(wetland)andnon‐hydricsoils;accordingly,thedistributionofsoiltypesisimportantforassessingtheeffectofthemanagementactivity.
Whereasriparianbuffersoccupylowlandscapepositionsandaretypicallywet,theyareoftenveryeffectiveinremovingnitrogenviadenitrification(Ambus,1991;Davisetal.,2008;Dodlaetal.,2008;Hilletal.,2000;Huntetal.,2007;Jordanetal.,1998;Roobroecketal.,2010;Smithetal.,2006;Stoneetal.,1998;Woodwardetal.,2009),whichleadstoindirectN2Oemissions(Jetten,2008).Denitrificationinriparianbuffersisoftenspatiallyunevenbecauseriparianbuffersvaryconsiderablyintheirsizeandlandscapepositionsaswellastheirsoil,vegetative,andhydrologicalconditions(Bowdenetal.,1992;BrulandandMacKenzie,2010;Fliteetal.,2001;Hilletal.,2000).StudieshavesuggestedthatN2Oemissionsinriparianzoneswerenotasignificant“pollution‐swappingphenomenon”(Dhondtetal.,2004;Kimetal.,2009a;Kimetal.,2009b).Significantemissionsarelikelytobelimitedtospatialandtemporalhotspots(Groffmanetal.,2000;Huntetal.,2007;Kimetal.,2009b).Moreover,someriparianwetlandsystemscanserveassinksfornitrogen(Roobroecketal.,2010).WhilemanyfactorsaffectthemicrobialproductionofN2O,oneofthemostdominatingfactorsisthecarbontonitrogenratio;largerratiosgenerallyhavelowN2Oemissionsbecausenitrogenisimmobilizedinthesoilorganicmatter(Huntetal.,2007;Klemedtssonetal.,2005).However,itisimportanttonotethatindirectN2Oemissionsareattributedtothesourceofthenitrogen,whichcanbeaneighboringfieldorlivestockfacility;sothemethodstoestimateindirectN2Oemissionsareprovidedinothersectionsofthisreport(i.e.,Chapter3,CroplandandGrazingLands,orChapter5,AnimalProduction).
RiparianbufferscanserveasbothsourcesandsinksofCH4(Hopfenspergeretal.,2009;Soosaaretal.,2011).TheirhydrologyandbiogeochemicalcharacteristicsexhibitsignificantinfluenceonthenetCH4emission.Thesecharacteristicsincludewatertableposition,temperature,oxidative/reductivepotential,andplantcommunitycompositions(Pennocketal.,2010;Whalen,2005).Moreover,N2Oemissionsfromdenitrificationcanbesignificantlyinfluencedbymethanotrophs(Costaetal.,2000;Knowles,2005;Modinetal.,2007;Osakaetal.,2008).
Similarbuffersexistforgrasswetlands,eitheraspartofaconservationprogramorasanaturallyoccurringareaaroundawetlandwheremoist‐soilconditionspreventtillage.Grassbuffersreducerunoffandinterceptsedimentsthatwouldaffectwaterqualitybyincreasingturbidityandinputsoffertilizersandagrichemicals.Moreover,plantingtheentirecatchmentwithgrasscanreduceCH4emissionsbydecreasingtheartificiallyhighwaterlevelsandextendedhydroperiodsthatoftenareassociatedwithcroplandsites(EulissJrandMushet,1996;Gleasonetal.,2009;vanderKampetal.,2003).
4.2.1.8 WetlandManagementforWaterfowl
Wetlandsmaybemanagedforwaterfowlhabitat.ActivitiesthatarespecifictowetlandwaterfowlmanagementhavedirectinfluencesoncarbonstocksandGHGemissions,includingregulationofthewaterregime,specificallydepthanddurationofinundation,aswellasplantingandcultivationofcropsforfoodandhabitat.Waterregimesimposedforwaterfowlmanagementmaybedifferentthanthenaturalwatertablecycleofthesite.Accordingly,changingthewatertablealterstheperiodsofsoilaerationandsaturationinfluencingratesofCH4andN2O,aswellascarbonstockchangesintimberstandsandotherwetlandvegetation.CultivatingcropsinwetlandsmanagedforwaterfowlwillalsoinfluencecarbonstocksandN2Oemissionsbasedonselectionofcropsand/orrotationpractice,tillage,liming,andnutrientmanagement.
Chapter 4: Quantifying Greenhouse Gas Sources and Sinks in Managed Wetland Systems
4-12
4.2.1.9 ConstructedWetlandsforWastewaterTreatment,SedimentCapture,andDrainageWaterAbatement
Constructedwetlandsareengineeredsystemsforwastewatertreatment,captureofsediments,anddrainagewaterabatementinagriculturalandforestryoperations(Chenetal.,2011;Elgoodetal.,2010).Surface‐flowandsubsurfaceflowsystemsarethetwoprincipaltypesofconstructedwetlands(KadlecandKnight,1996).Theprincipaldifferencebetweenthesetwotypesofconstructedwetlandsisthewaterflowpath.Inthecaseofthesubsurfaceflowwetlands,allthewaterflowsarebeneaththesoilsurface;thesurface‐flowsystemshaveflowbothaboveandwithinthesoil.
Thesubsurfacewetlandstypicallyconsistofwetlandplantsgrowinginabedofhighlyporousmediasuchasgravelorwoodchipsthathaveawatertablefromonetotwometersabovethesoilsurfacewitharectangularshape.ThereislackofagreementabouttherelativeimpactofmicrobialandplantprocessesinthefunctionofsubsurfacewetlandsincludingGHGemissions.However,plantsandmicrobesaretypicallyinterdependentlyinvolvedintheprocessesthatcontributetoemissions(Faubertetal.,2010;Luetal.,2010;Piceketal.,2007;TannerandHeadley,2011;Wangetal.,2008;Zhuetal.,2007).WhilethemicrobialcommunitydrivesthebiogeochemicalprocessesthatspecificallyemitGHGs(Dodlaetal.,2008;Faulwetteretal.,2009;Huntetal.,2003;Tanneretal.,1997;Zhuetal.,2010),theplantcommunitymodifiestheenvironmentalconditionscontributingtoemissionrates,includingtransportingoxygenintothedepthofthewetlands,providingrootsurfacesforrhizospherereactions,andventinggasestotheatmosphere.Theplantprocessesaresignificantlyimpactedbyplantcommunitycompositionandweatherconditions(Steinetal.,2006;SteinandHook,2005;Tayloretal.,2010;Towleretal.,2004;Wangetal.,2008;Zhuetal.,2007).
SurfaceflowwetlandshaveamuchmoredirectexchangeofoxygenandGHGswiththeatmosphere.Theycanbevariableinshapeandaregenerallylessthan0.5metersindepth.Surfacewetlandsminimizecloggingproblems,buttheycanhaveasignificantlossoftreatmentasaresultofchannelflow.Theyaretypicallydesignedforeithercarbonornitrogenremoval(Steinetal.,2006;Steinetal.,2007;Stoneetal.,2002;Stoneetal.,2004),includingthepreventionofexcessiveammoniaemissions(Poachetal.,2004;Poachetal.,2002).
Constructedwetlandsaretypicallycreatedinuplandsettings(e.g.,non‐wetland);accordingly,thesiteassumesthesamebiogeochemicalprocessesthatareinherenttonaturalwetlands.CarbonstocksandGHGemissionsareaffectedbythetypeandquantityofeffluentbeingtreated,thetypeofvegetationinthewetlandcells,andmanagementofthehydrologicregimeswithinthecells.ThemanagementofCH4andN2OfromconstructedwetlandsissomewhatsimilartomanagingGHGemissionsfromwetlandricesystems(Feyetal.,1999;Freemanetal.,1997;Johanssonetal.,2003;Maltais‐Landryetal.,2009;Manderetal.,2005a;Manderetal.,2005b;Piceketal.,2007;Tanneretal.,1997;TeiterandMander,2005;Wuetal.,2009).Ofparticularimportanceisthemaintenanceofwetlandoxidative/reductivepotentialsthataresufficientlypositivetoavoidCH4production(InsamandWett,2008;SeoandDeLaune,2010;Tanneretal.,1997).Thisrequireshigherlevelsofoxygenandlowerlevelsofavailablecarbon.ThemanagementofN2Oemissionsiscomplicatedbythefactthatnitratesareoftenpresentinthewastewatersordrainagewaters,andsoGHGemissionscanbereducedintheconstructedwetlandsifN2gasisemittedinsteadofN2O.CompletedenitrificationtoN2gasrequireshighercarbon/nitrogenratios(Huntetal.,2007;Hwangetal.,2006;Klemedtssonetal.,2005).Thus,thereisanimportantbalancebetweensufficientcarbonforcompletedenitrificationandcopiouscarbonthatdriveswetlandsintothelowredoxconditionsassociatedwithCH4production.
Chapter 4: Quantifying Greenhouse Gas Sources and Sinks in Managed Wetland Systems
4-13
Thissectionisincludedforcompleteness,butnomethodforconstructedwetlandsisprovidedinthissection.Section5.4.10inChapter5,AnimalAgriculture,providesaqualitativediscussionofestimatingemissionsfromliquidmanurestorageandtreatment‐constructedwetlands.However,Chapter5doesnotprovidemethodstoestimategreenhousegasemissionsfromconstructedwetlands.
4.2.2 Land‐UseChangetoWetlands
Conversionoflandtowetlandsmayinvolverestoringagriculturallandintoafunctioningwetland.However,wetlandscanberestoredfrompreviouslydrainedforestorgrasslands,andthechangetendstovaryfordifferentregionsoftheUnitedStates.Wetlandscanalsobeconstructedinanylocationforwastewatertreatment.Theoriginalconversionofwetlandstoanotherusetypicallyinvolvesanalterationofthenaturalwetlandhydrology.Chapter7,LandUseChange,addressesthistypeofconversion.Restorationofwetlandsentailsreestablishmentoftherequisitehydrologytosupportforest,scrub‐shrub,sedge,oremergentwetlandplantcommunitiesandoccursinfloodplains,riparianzones,depressions,andslopesandvalleys.
4.2.2.1 ActivelyRestoringWetlands
TheeffectofrestoringbothforestedandgrasswetlandswillleadtocarbonsequestrationandCH4emissionsthatwouldbecharacteristicforthatwetlandtype.However,theextenttowhichcarbonsequestration,organicmatterturnover,andgasfluxesreturntoratestypicalforthewetlandtypedependsonmanyfactors,particularlythedegreeofalteration,timesincerestoration,hydrology,anddevelopmentofthevegetation.Ingeneral,restoredsiteswillbecarbonsinksduetosequestrationinthedevelopingbiomass(e.g.,foreststand)andsoils(EulissJretal.,2008).Soilcarbonisexpectedtoincreaseslowlyinforestedsettingsandsomewhatmorerapidlyingrasslandsites(Gleasonetal.,2009);however,theextentandratesofchangeareuncertain.ReestablishmentofthewetlandhydrologywillalsoaltertheCH4fluxfromtherestoredsitesincehydrologicmodificationsforotherlanduseswilltypicallyinvolvedrainageordiversions.RaisingthewatertableandincreasingtheperiodoftimethatthesoilsurfaceiscoveredwithwaterwillincreaseCH4production.However,manyrestoredgrasslandsitesarenotdirectlydrained,andreestablishmentofgrassesinthecatchmentcanshortenthehydroperiod(VanDerKampetal.,1999;Voldsethetal.,2007),thusreducingCH4production.
Conversionofscrub‐shrubwetlandstypicallyinvolvesdrainagetoanon‐wetlandstate,andtheimpositionofcultivationorotherpracticesdependingonthelanduse.Accordingly,therestorationofprior‐convertedscrub‐shrubwetlandstypicallyinvolvesreestablishmentofthenaturalwetlandhydrologyandselectiveplantingtoestablishnativevegetation.ThedevelopmentofthecharacteristicwetlandhydrologyistheprincipalfactoraffectingthecarbonstocksandGHGemissionsfromthesitefollowingconversion,butthetypeofvegetationandtimesinceestablishmentwillalsohavesomeinfluence.
4.2.2.2 CreatedWetlands
Createdwetlandsareengineeredintonon‐wetlandoruplandsites.Typicalexamplesincludemitigationsites,anaerobiclagoons(SeeSection5.4.10inChapter5,AnimalAgriculture)onlivestockoperations,andstormwaterdetentionbasins.TheprincipalactivityaffectingthecarbonstocksandGHGemissionsistheimpositionofahydrologicregimethatinduceshydricsoilpropertiesandsupportshydrophyticplants,inadditiontoclearingofthepreviousvegetationthatmayleadtoachangeinbiomasscarbonstocks.
Chapter 4: Quantifying Greenhouse Gas Sources and Sinks in Managed Wetland Systems
4-14
4.2.2.3 PassiveRestorationofWetlands
Allowinganareatoregeneratethroughnaturalsuccessionisalsoconsideredaformofrestoration.TheeffectoftherestorationactivitiesonthecarbonstocksandCH4emissionsdependsonwhethertherewashydrologicremediationandthedegreeofvegetationchangeovertime.
4.3 EstimationMethodsSection4.3.1providesmethodsforestimatingliveanddeadbiomassinforested,shrub,andgrasslandwetlands.Section4.3.2providesmethodsforestimatingsoilC,N2O,andCH4emissionsfrommanagednaturallyoccurringwetlands.
4.3.1 BiomassCarboninWetlands
4.3.1.1 RationaleforSelectedMethod
Variousapproachesareusedforestimatingtreebiomasscarbon,butultimatelyeachreliesonallometricrelationshipsdevelopedfromacharacteristicsubsetoftrees.TheForestVegetationSimulator(FVS)hasbeenselectedasthemethodtoestimatetreebiomass.FVSismodel‐basedapproachthatisspecifictoU.S.conditionsandaTier3methodasdefinedbytheIPCC.ThesimulatoristhemostcompletemodelintheUnitedStatestoestimatetreebiomass.RegionalversionsofFVShavebeenrefinedbasedonlargedatabasesdevelopedfrommanyyearsofdatacollectiononforeststandsthroughouttheUnitedStates,therebyprovidingimprovedestimateswhilerequiringfewinputparametersfromtheuser.
BothIPCC(2006)andEPA(2011)considerherbaceousbiomasscarbonstockstobeephemeral,andrecognizethattherearenonetemissionstotheatmospherefollowinggrowthandsenescence.However,withrespecttochangesinlanduse(e.g.,foresttocropland),theIPCC(Lascoetal.,2006)recommendsthatgrazinglandbiomassbecountedintheyearthatlandconversionoccurs(Verchotetal.,2006).AccordingtotheIPCC,accountingfortheherbaceousbiomasscarbonstockduringchangesinlanduseisnecessarytoaccountfortheinfluenceofherbaceousplantsonCO2uptakefromtheatmosphereandstorageintheterrestrialbiosphere.ThemethodisconsideredaTier2methodasdefinedbytheIPCCbecauseitincorporatesfactorsthatarebasedonU.S.specificdata.
Themethodspresentedinthissectionarebasedonthefollowingdefinitions.
Livevegetationbiomass:Livevegetationincludestrees,shrubs,andgrasses.Thetreecarbonpoolincludesabovegroundandbelowgroundcarbonmassoflivetrees,asdefinedinSection6.2.3.1,andtheabovegroundbiomassoftheforestunderstoryisdefinedinSection6.2.3.2.Themethodstoestimatefull‐treeandabovegroundbiomassfortreesgreaterthanoneinchindiameteratbreastheightarebasedonthemodelsprovidedintheforestsection.
MethodforEstimatingLiveandDeadBiomassCarboninWetlands
MethodsforestimatingforestvegetationandshrubandgrasslandvegetationbiomasscarbonstocksuseacombinationoftheForestVegetationSimulatormodelandthebiomasscarbonstockchangesmethodinSection3.5.1ofChapter3,CroplandandGrazingLand.Ifthereisaland‐usechangetoagriculturaluse,methodsforcroplandherbaceousbiomassareprovidedinChapter3.
Thesemethodswerechosenbecausetheyofferthemostconsistentapproachwithinthecontextofthisreport.
Chapter 4: Quantifying Greenhouse Gas Sources and Sinks in Managed Wetland Systems
4-15
Theforestunderstoryvegetationincludesallbiomassofundergrowthplantsinaforest,includingwoodyshrubsandtreeslessthanoneinchindiameteratbreastheight.
Standingdeadwood(deadbiomass):ThecarbonpoolofstandingdeadwoodinaforestedwetlandisdefinedandestimatedaccordingtothemethodsinSection6.2.3.3ofChapter6,Forestry.
Downdeadorganicmatter—litterlayer(deadbiomass):Downdeadorganicmatterincludesthelitterlayercomposedofsmallpiecesofdeadwood,branches,leaves,androotsinvariousstagesofdecay.Thislayeristypicallydesignatedastheorganiclayerofthesoil.Thispoolalsoincludeslogsinvariousstagesofdecaythatlieonthesoilsurface(e.g.,Section6.2.3.4,down‐deadwood,andSection6.2.3.5,forestfloororlitter).
4.3.1.2 DescriptionofMethod
Provisionsforestimatingabovegroundbiomassforwetlandforestsandaboveandbelowgroundbiomassandcarbonareincludedforshrubandgrasswetlandsinthissection.Sincethevegetativecoveronwetlandsmayvaryfromnaturalcommunitiestoagriculturalcrops,cross‐referencesaremadetoensurecongruitywithSection3.5.1ofChapter3,Croplands,andGrazingLands,andSection6.2.3ofChapter6,Forestry.
Forestvegetation:BiomasscarbonstocksareestimatedforforestsinwetlandsusingthemethodsdescribedinSection6.2.3ofChapter6,Forestry.TheapproachusestheFVS,whichisasystemofgrowthandyieldmodelsthatestimategrowthandyieldforU.S.forests.FVSisanindividualtreemodelandcanestimatebiomasscarbonstockchangefornearlyanytypeofforeststand.TheFireandFuelsExtensiontoFVScanbeusedtogeneratereportsofallliveanddeadbiomasscarbonpoolsinadditiontoharvestedwoodproducts.RegionalvariantsareavailableforFVSthatallowforregion‐specificfocusonspeciesandforestvegetationcommunities.Thedriverforproductivityistheavailabilityofsiteindexcurves,6andtheregionalvariantsincludemanywetlandtreespecies.RegionalvariantsofFVSmayalsoprovideprovisionsforrefiningthebasisforestimatingproductivitybyclassifyingtheareaofinterestintoecologicalunits,habitattype,orplantassociations.However,ifaspecies‐specificcurveisnotavailable,thenadefaultfunctionisusedtoestimatecarbonstockchanges.
Grasslandvegetation:Thechangeincarbonstockforgrasswetlandsisgenerallysmallunlesstherearedroughtconditionsortheareaisactivelymanaged.Incaseswherereportingisrequired,biomasscarbonstockchangescanbeestimatedfollowingalandusechangeusingthemethodinSection3.5.1ofChapter3,CroplandsandGrazingLands.Therearenomethodscurrentlyavailabletoestimatetheshrubcover.
4.3.1.3 ActivityData
Forestedwetlands:ThedataandrequirementsforestimatingthechangesincarbonstocksinwetlandforestsarethesameasthosedescribedforuplandforestsinSection6.2.3.
Grasslandvegetation:ThedataandrequirementsforestimatingthechangesincarbonstocksingrasslandvegetationarethesameasthosedescribedfortotalbiomasscarbonstockchangespresentedintheCroplands/GrazingLandsSections3.5.1.
6Siteindexisthemeasureofaforest’spotentialproductivity.Theheightofthedominantorco‐dominanttreesataspecifiedageinastandarecalculatedinanequationthatusesthetree’sheightandage.Siteindexequationsdifferbytreespeciesandregion.Siteindexcurvesareconstructedbyusingthetreeheightsatabaseageandanequationisderivedfromthecurvestoestimatethesiteindexwhenanindividualtree’sageisnotthesameasthebaseage(Hansonetal.,2002).
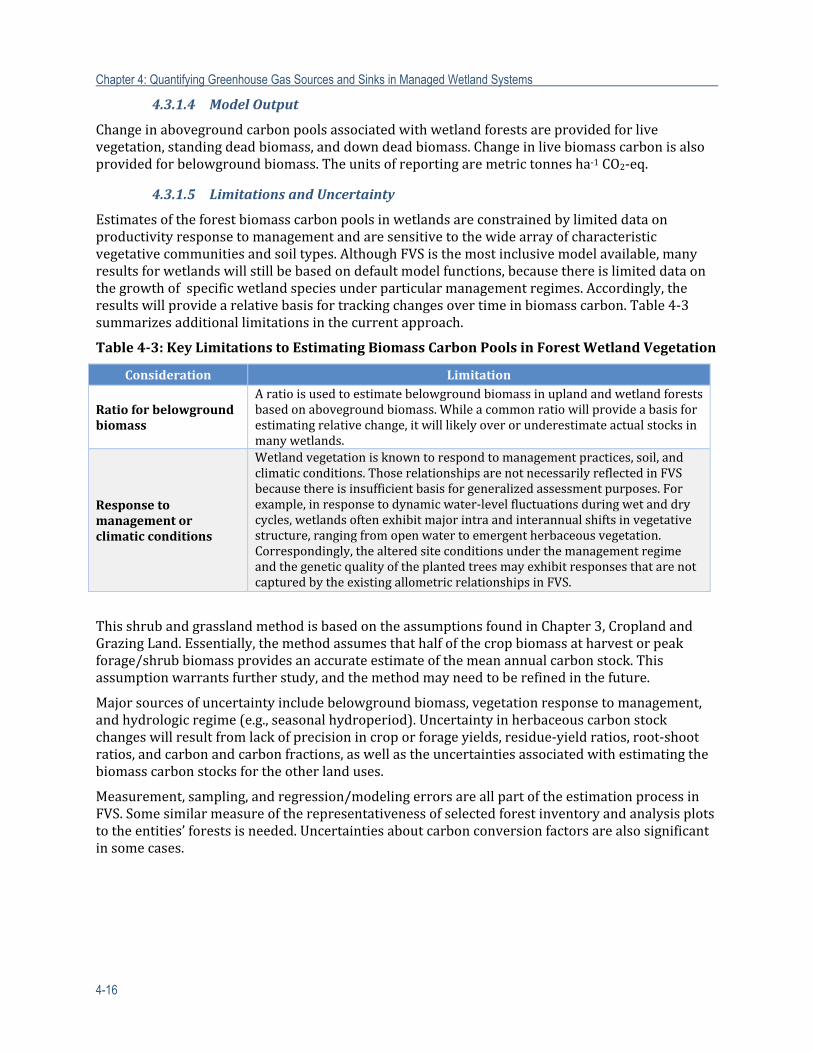
Chapter 4: Quantifying Greenhouse Gas Sources and Sinks in Managed Wetland Systems
4-16
4.3.1.4 ModelOutput
Changeinabovegroundcarbonpoolsassociatedwithwetlandforestsareprovidedforlivevegetation,standingdeadbiomass,anddowndeadbiomass.Changeinlivebiomasscarbonisalsoprovidedforbelowgroundbiomass.Theunitsofreportingaremetrictonnesha‐1CO2‐eq.
4.3.1.5 LimitationsandUncertainty
Estimatesoftheforestbiomasscarbonpoolsinwetlandsareconstrainedbylimiteddataonproductivityresponsetomanagementandaresensitivetothewidearrayofcharacteristicvegetativecommunitiesandsoiltypes.AlthoughFVSisthemostinclusivemodelavailable,manyresultsforwetlandswillstillbebasedondefaultmodelfunctions,becausethereislimiteddataonthegrowthofspecificwetlandspeciesunderparticularmanagementregimes.Accordingly,theresultswillprovidearelativebasisfortrackingchangesovertimeinbiomasscarbon.Table4‐3summarizesadditionallimitationsinthecurrentapproach.
Table4‐3:KeyLimitationstoEstimatingBiomassCarbonPoolsinForestWetlandVegetation
Consideration Limitation
Ratioforbelowgroundbiomass
Aratioisused toestimatebelowgroundbiomassinuplandandwetlandforestsbasedonabovegroundbiomass.Whileacommonratiowillprovideabasisforestimatingrelativechange,itwilllikelyoverorunderestimateactualstocksinmanywetlands.
Responsetomanagementorclimaticconditions
Wetlandvegetationisknowntorespondtomanagementpractices,soil, andclimaticconditions.ThoserelationshipsarenotnecessarilyreflectedinFVSbecausethereisinsufficientbasisforgeneralizedassessmentpurposes.Forexample,inresponsetodynamicwater‐levelfluctuationsduringwetanddrycycles,wetlandsoftenexhibitmajorintraandinterannualshiftsinvegetativestructure,rangingfromopenwatertoemergentherbaceousvegetation.Correspondingly,thealteredsiteconditionsunderthemanagementregimeandthegeneticqualityoftheplantedtreesmayexhibitresponsesthatarenotcapturedbytheexistingallometricrelationshipsinFVS.
ThisshrubandgrasslandmethodisbasedontheassumptionsfoundinChapter3,CroplandandGrazingLand.Essentially,themethodassumesthathalfofthecropbiomassatharvestorpeakforage/shrubbiomassprovidesanaccurateestimateofthemeanannualcarbonstock.Thisassumptionwarrantsfurtherstudy,andthemethodmayneedtoberefinedinthefuture.
Majorsourcesofuncertaintyincludebelowgroundbiomass,vegetationresponsetomanagement,andhydrologicregime(e.g.,seasonalhydroperiod).Uncertaintyinherbaceouscarbonstockchangeswillresultfromlackofprecisionincroporforageyields,residue‐yieldratios,root‐shootratios,andcarbonandcarbonfractions,aswellastheuncertaintiesassociatedwithestimatingthebiomasscarbonstocksfortheotherlanduses.
Measurement,sampling,andregression/modelingerrorsareallpartoftheestimationprocessinFVS.Somesimilarmeasureoftherepresentativenessofselectedforestinventoryandanalysisplotstotheentities’forestsisneeded.Uncertaintiesaboutcarbonconversionfactorsarealsosignificantinsomecases.
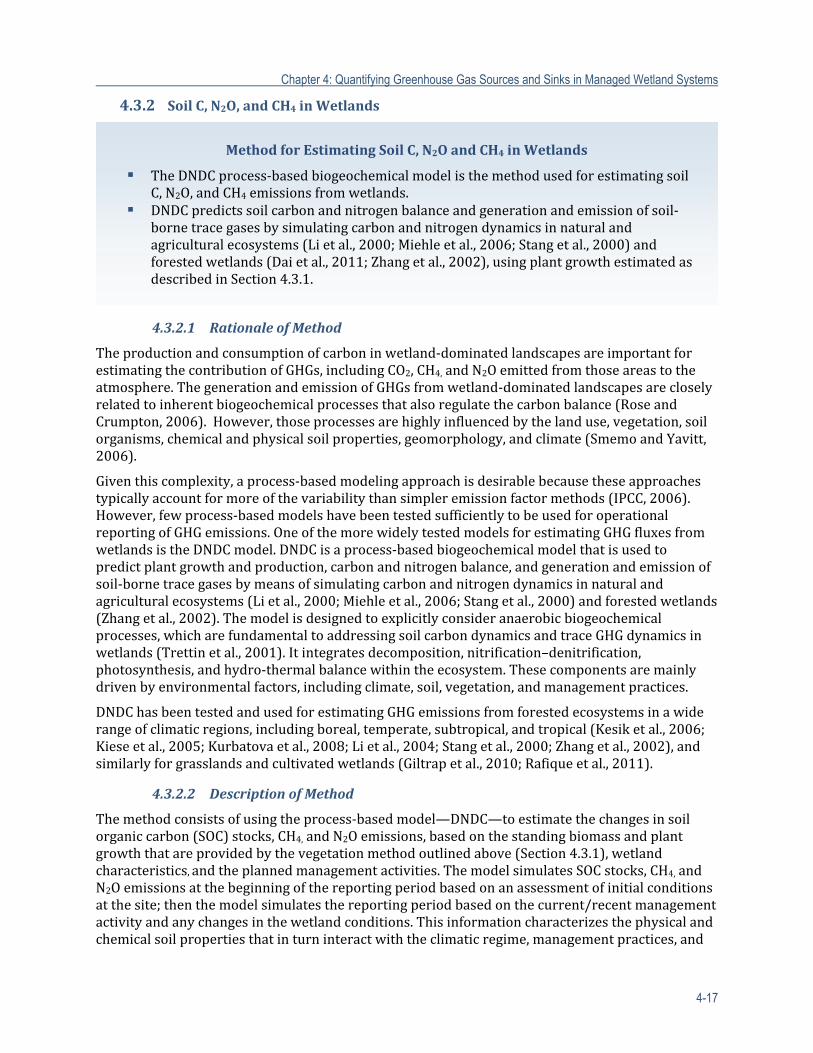
Chapter 4: Quantifying Greenhouse Gas Sources and Sinks in Managed Wetland Systems
4-17
4.3.2 SoilC,N2O,andCH4inWetlands
4.3.2.1 RationaleofMethod
Theproductionandconsumptionofcarboninwetland‐dominatedlandscapesareimportantforestimatingthecontributionofGHGs,includingCO2,CH4,andN2Oemittedfromthoseareastotheatmosphere.ThegenerationandemissionofGHGsfromwetland‐dominatedlandscapesarecloselyrelatedtoinherentbiogeochemicalprocessesthatalsoregulatethecarbonbalance(RoseandCrumpton,2006).However,thoseprocessesarehighlyinfluencedbythelanduse,vegetation,soilorganisms,chemicalandphysicalsoilproperties,geomorphology,andclimate(SmemoandYavitt,2006).
Giventhiscomplexity,aprocess‐basedmodelingapproachisdesirablebecausetheseapproachestypicallyaccountformoreofthevariabilitythansimpleremissionfactormethods(IPCC,2006).However,fewprocess‐basedmodelshavebeentestedsufficientlytobeusedforoperationalreportingofGHGemissions.OneofthemorewidelytestedmodelsforestimatingGHGfluxesfromwetlandsistheDNDCmodel.DNDCisaprocess‐basedbiogeochemicalmodelthatisusedtopredictplantgrowthandproduction,carbonandnitrogenbalance,andgenerationandemissionofsoil‐bornetracegasesbymeansofsimulatingcarbonandnitrogendynamicsinnaturalandagriculturalecosystems(Lietal.,2000;Miehleetal.,2006;Stangetal.,2000)andforestedwetlands(Zhangetal.,2002).Themodelisdesignedtoexplicitlyconsideranaerobicbiogeochemicalprocesses,whicharefundamentaltoaddressingsoilcarbondynamicsandtraceGHGdynamicsinwetlands(Trettinetal.,2001).Itintegratesdecomposition,nitrification–denitrification,photosynthesis,andhydro‐thermalbalancewithintheecosystem.Thesecomponentsaremainlydrivenbyenvironmentalfactors,includingclimate,soil,vegetation,andmanagementpractices.
DNDChasbeentestedandusedforestimatingGHGemissionsfromforestedecosystemsinawiderangeofclimaticregions,includingboreal,temperate,subtropical,andtropical(Kesiketal.,2006;Kieseetal.,2005;Kurbatovaetal.,2008;Lietal.,2004;Stangetal.,2000;Zhangetal.,2002),andsimilarlyforgrasslandsandcultivatedwetlands(Giltrapetal.,2010;Rafiqueetal.,2011).
4.3.2.2 DescriptionofMethod
Themethodconsistsofusingtheprocess‐basedmodel—DNDC—toestimatethechangesinsoilorganiccarbon(SOC)stocks,CH4,andN2Oemissions,basedonthestandingbiomassandplantgrowththatareprovidedbythevegetationmethodoutlinedabove(Section4.3.1),wetlandcharacteristics,andtheplannedmanagementactivities.ThemodelsimulatesSOCstocks,CH4,andN2Oemissionsatthebeginningofthereportingperiodbasedonanassessmentofinitialconditionsatthesite;thenthemodelsimulatesthereportingperiodbasedonthecurrent/recentmanagementactivityandanychangesinthewetlandconditions.Thisinformationcharacterizesthephysicalandchemicalsoilpropertiesthatinturninteractwiththeclimaticregime,managementpractices,and
MethodforEstimatingSoilC,N2OandCH4 inWetlands
TheDNDCprocess‐basedbiogeochemicalmodelisthemethodusedforestimatingsoilC,N2O,andCH4emissionsfromwetlands.
DNDCpredictssoilcarbonandnitrogenbalanceandgenerationandemissionofsoil‐bornetracegasesbysimulatingcarbonandnitrogendynamicsinnaturalandagriculturalecosystems(Lietal.,2000;Miehleetal.,2006;Stangetal.,2000)andforestedwetlands(Daietal.,2011;Zhangetal.,2002),usingplantgrowthestimatedasdescribedinSection4.3.1.
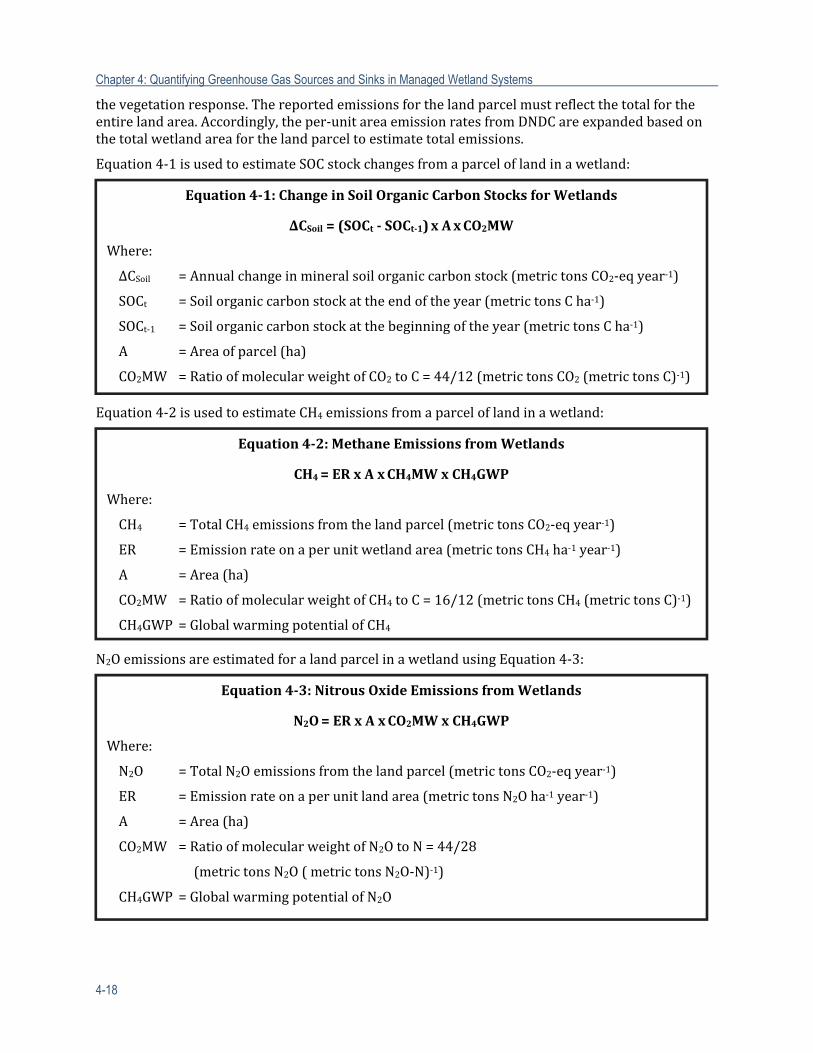
Chapter 4: Quantifying Greenhouse Gas Sources and Sinks in Managed Wetland Systems
4-18
thevegetationresponse.Thereportedemissionsforthelandparcelmustreflectthetotalfortheentirelandarea.Accordingly,theper‐unitareaemissionratesfromDNDCareexpandedbasedonthetotalwetlandareaforthelandparceltoestimatetotalemissions.
Equation4‐1isusedtoestimateSOCstockchangesfromaparceloflandinawetland:
Equation4‐2isusedtoestimateCH4emissionsfromaparceloflandinawetland:
N2OemissionsareestimatedforalandparcelinawetlandusingEquation4‐3:
Equation4‐1:ChangeinSoilOrganicCarbon StocksforWetlands
ΔCSoil=(SOCt‐SOCt‐1)xAxCO2MW
Where:
ΔCSoil =Annualchangeinmineralsoilorganiccarbonstock(metrictonsCO2‐eqyear‐1)
SOCt =Soilorganiccarbonstockattheendoftheyear(metrictonsCha‐1)
SOCt‐1 =Soilorganiccarbonstockatthebeginningoftheyear(metrictonsCha‐1)
A =Areaofparcel(ha)
CO2MW =RatioofmolecularweightofCO2toC=44/12(metrictonsCO2(metrictonsC)‐1)
Equation4‐2:MethaneEmissionsfromWetlands
CH4=ERxAxCH4MWxCH4GWP
Where:
CH4 =TotalCH4emissionsfromthelandparcel(metrictonsCO2‐eqyear‐1)
ER =Emissionrateonaperunitwetlandarea(metrictonsCH4ha‐1year‐1)
A =Area(ha)
CO2MW =RatioofmolecularweightofCH4toC=16/12(metrictonsCH4(metrictonsC)‐1)
CH4GWP =GlobalwarmingpotentialofCH4
Equation4‐3:NitrousOxideEmissionsfromWetlands
N2O=ERxAxCO2MWxCH4GWP
Where:
N2O =TotalN2Oemissionsfromthelandparcel(metrictonsCO2‐eqyear‐1)
ER =Emissionrateonaperunitlandarea(metrictonsN2Oha‐1year‐1)
A =Area(ha)
CO2MW =RatioofmolecularweightofN2OtoN=44/28
(metrictonsN2O(metrictonsN2O‐N)‐1)
CH4GWP =GlobalwarmingpotentialofN2O
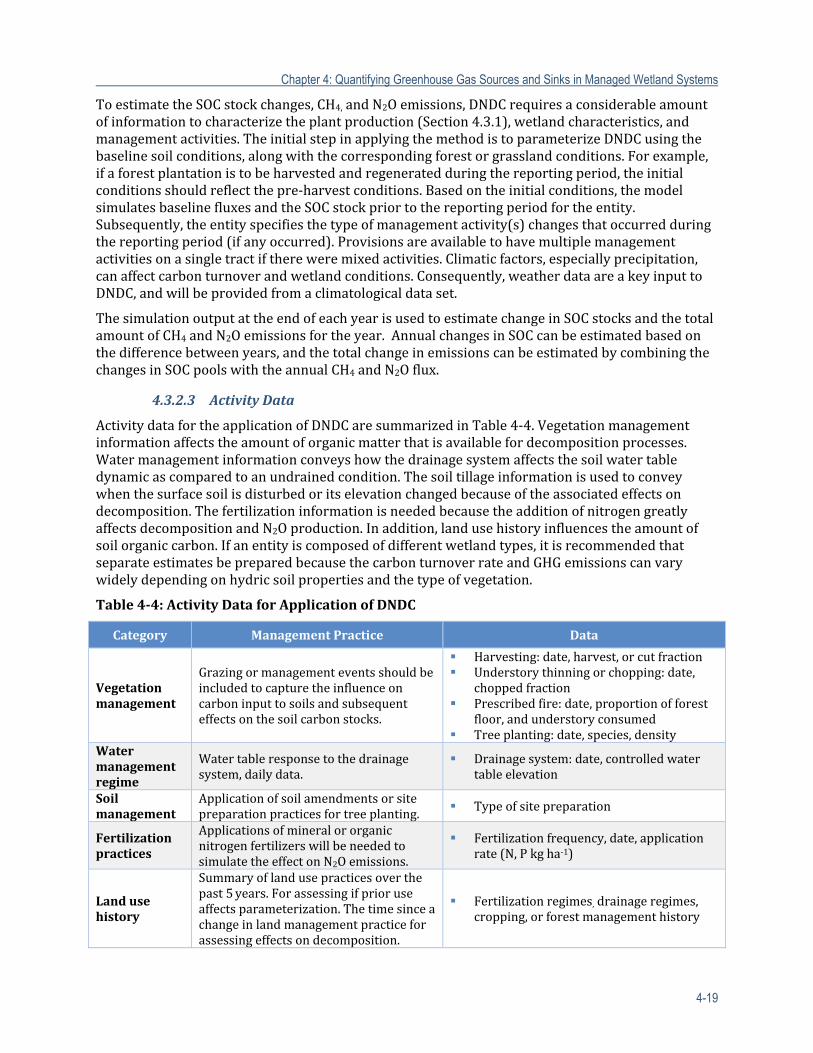
Chapter 4: Quantifying Greenhouse Gas Sources and Sinks in Managed Wetland Systems
4-19
ToestimatetheSOCstockchanges,CH4,andN2Oemissions,DNDCrequiresaconsiderableamountofinformationtocharacterizetheplantproduction(Section4.3.1),wetlandcharacteristics,andmanagementactivities.TheinitialstepinapplyingthemethodistoparameterizeDNDCusingthebaselinesoilconditions,alongwiththecorrespondingforestorgrasslandconditions.Forexample,ifaforestplantationistobeharvestedandregeneratedduringthereportingperiod,theinitialconditionsshouldreflectthepre‐harvestconditions.Basedontheinitialconditions,themodelsimulatesbaselinefluxesandtheSOCstockpriortothereportingperiodfortheentity.Subsequently,theentityspecifiesthetypeofmanagementactivity(s)changesthatoccurredduringthereportingperiod(ifanyoccurred).Provisionsareavailabletohavemultiplemanagementactivitiesonasingletractifthereweremixedactivities.Climaticfactors,especiallyprecipitation,canaffectcarbonturnoverandwetlandconditions.Consequently,weatherdataareakeyinputtoDNDC,andwillbeprovidedfromaclimatologicaldataset.
ThesimulationoutputattheendofeachyearisusedtoestimatechangeinSOCstocksandthetotalamountofCH4andN2Oemissionsfortheyear.AnnualchangesinSOCcanbeestimatedbasedonthedifferencebetweenyears,andthetotalchangeinemissionscanbeestimatedbycombiningthechangesinSOCpoolswiththeannualCH4andN2Oflux.
4.3.2.3 ActivityData
ActivitydatafortheapplicationofDNDCaresummarizedinTable4‐4.Vegetationmanagementinformationaffectstheamountoforganicmatterthatisavailablefordecompositionprocesses.Watermanagementinformationconveyshowthedrainagesystemaffectsthesoilwatertabledynamicascomparedtoanundrainedcondition.Thesoiltillageinformationisusedtoconveywhenthesurfacesoilisdisturbedoritselevationchangedbecauseoftheassociatedeffectsondecomposition.ThefertilizationinformationisneededbecausetheadditionofnitrogengreatlyaffectsdecompositionandN2Oproduction.Inaddition,landusehistoryinfluencestheamountofsoilorganiccarbon.Ifanentityiscomposedofdifferentwetlandtypes,itisrecommendedthatseparateestimatesbepreparedbecausethecarbonturnoverrateandGHGemissionscanvarywidelydependingonhydricsoilpropertiesandthetypeofvegetation.
Table4‐4:ActivityDataforApplicationofDNDC
Category ManagementPractice Data
Vegetationmanagement
Grazingormanagementeventsshouldbeincludedtocapturetheinfluenceoncarboninputtosoilsandsubsequenteffectsonthesoilcarbonstocks.
Harvesting:date,harvest,orcutfraction Understorythinningorchopping:date,
choppedfraction Prescribedfire:date,proportionofforest
floor,andunderstoryconsumed Treeplanting:date,species,density
Watermanagementregime
Watertableresponsetothedrainagesystem,dailydata.
Drainagesystem:date,controlledwatertableelevation
Soilmanagement
Applicationofsoilamendmentsorsitepreparationpracticesfortreeplanting. Typeofsitepreparation
Fertilizationpractices
ApplicationsofmineralororganicnitrogenfertilizerswillbeneededtosimulatetheeffectonN2Oemissions.
Fertilizationfrequency,date,applicationrate(N,Pkgha‐1)
Landusehistory
Summaryoflandusepracticesoverthepast5years.Forassessingifprioruseaffectsparameterization.Thetimesinceachangeinlandmanagementpracticeforassessingeffectsondecomposition.
Fertilizationregimes,drainageregimes,cropping,orforestmanagementhistory
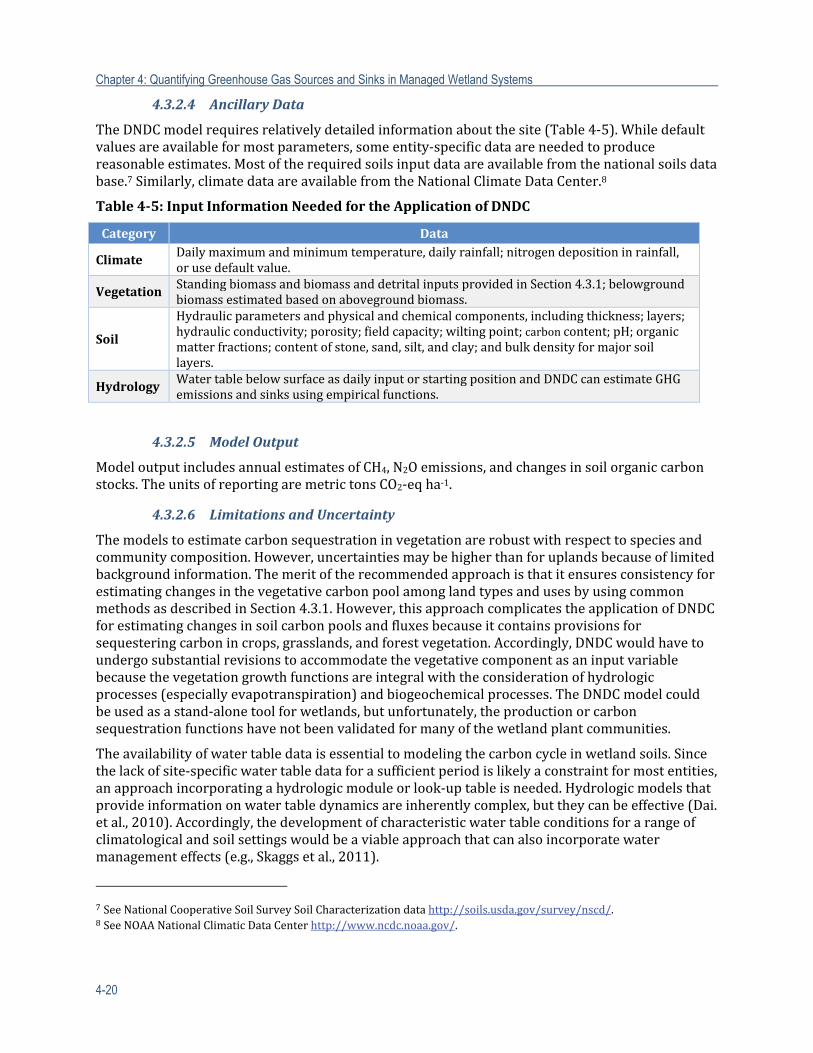
Chapter 4: Quantifying Greenhouse Gas Sources and Sinks in Managed Wetland Systems
4-20
4.3.2.4 AncillaryData
TheDNDCmodelrequiresrelativelydetailedinformationaboutthesite(Table4‐5).Whiledefaultvaluesareavailableformostparameters,someentity‐specificdataareneededtoproducereasonableestimates.Mostoftherequiredsoilsinputdataareavailablefromthenationalsoilsdatabase.7Similarly,climatedataareavailablefromtheNationalClimateDataCenter.8
Table4‐5:InputInformationNeededfortheApplicationofDNDC
Category Data
ClimateDailymaximumandminimumtemperature,dailyrainfall; nitrogendepositioninrainfall,orusedefaultvalue.
Vegetation StandingbiomassandbiomassanddetritalinputsprovidedinSection4.3.1;belowgroundbiomassestimatedbasedonabovegroundbiomass.
Soil
Hydraulicparametersandphysicalandchemicalcomponents, includingthickness;layers;hydraulicconductivity;porosity;fieldcapacity;wiltingpoint;carboncontent;pH;organicmatterfractions;contentofstone,sand,silt,andclay;andbulkdensityformajorsoillayers.
Hydrology WatertablebelowsurfaceasdailyinputorstartingpositionandDNDCcanestimateGHGemissionsandsinksusingempiricalfunctions.
4.3.2.5 ModelOutput
ModeloutputincludesannualestimatesofCH4,N2Oemissions,andchangesinsoilorganiccarbonstocks.TheunitsofreportingaremetrictonsCO2‐eqha‐1.
4.3.2.6 LimitationsandUncertainty
Themodelstoestimatecarbonsequestrationinvegetationarerobustwithrespecttospeciesandcommunitycomposition.However,uncertaintiesmaybehigherthanforuplandsbecauseoflimitedbackgroundinformation.ThemeritoftherecommendedapproachisthatitensuresconsistencyforestimatingchangesinthevegetativecarbonpoolamonglandtypesandusesbyusingcommonmethodsasdescribedinSection4.3.1.However,thisapproachcomplicatestheapplicationofDNDCforestimatingchangesinsoilcarbonpoolsandfluxesbecauseitcontainsprovisionsforsequesteringcarbonincrops,grasslands,andforestvegetation.Accordingly,DNDCwouldhavetoundergosubstantialrevisionstoaccommodatethevegetativecomponentasaninputvariablebecausethevegetationgrowthfunctionsareintegralwiththeconsiderationofhydrologicprocesses(especiallyevapotranspiration)andbiogeochemicalprocesses.TheDNDCmodelcouldbeusedasastand‐alonetoolforwetlands,butunfortunately,theproductionorcarbonsequestrationfunctionshavenotbeenvalidatedformanyofthewetlandplantcommunities.
Theavailabilityofwatertabledataisessentialtomodelingthecarboncycleinwetlandsoils.Sincethelackofsite‐specificwatertabledataforasufficientperiodislikelyaconstraintformostentities,anapproachincorporatingahydrologicmoduleorlook‐uptableisneeded.Hydrologicmodelsthatprovideinformationonwatertabledynamicsareinherentlycomplex,buttheycanbeeffective(Dai.etal.,2010).Accordingly,thedevelopmentofcharacteristicwatertableconditionsforarangeofclimatologicalandsoilsettingswouldbeaviableapproachthatcanalsoincorporatewatermanagementeffects(e.g.,Skaggsetal.,2011).
7SeeNationalCooperativeSoilSurveySoilCharacterizationdatahttp://soils.usda.gov/survey/nscd/.8SeeNOAANationalClimaticDataCenterhttp://www.ncdc.noaa.gov/.
Chapter 4: Quantifying Greenhouse Gas Sources and Sinks in Managed Wetland Systems
4-21
Tidalfreshwaterforestedwetlands,whichoccurtoalimitedextentalongtheAtlantic,Gulf,andPacificcoasts,areaspecialcase.Thetidalinfluenceonwatertabledynamicscanmakecharacterizingthewatertableregimeofsuchsitesmoredifficult.ForDNDCtosimulatethecarbondynamicswouldrequiredetaileddataondailywatertabledynamics,andsuchdetaileddataareunavailable.
WhiletheeffectsofthevariousmanagementregimesonsoilcarbonpoolsandGHGfluxeshavenotbeenwidelystudied,thisismoreofaconsiderationwithrespecttouncertaintiesintheestimatesasopposedtoalimitationtoitsapplication.TheDNDCframeworkisrobustbecauseitisaprocess‐basedmodelthathasbeenvalidatedinawidevarietyofwetlandtypesandsoils.However,ithasnotbeenextensivelytestedonHistosolsorpeatsoils,especiallywithrespecttochangesinsoilcarbonstocks.ThemodelwasvalidatedsuccessfullyforestimatingCH4frommicotopographicpositionsinapeatland(Zhangetal.,2002),butadditionalworkisneededtobetteraddressthewidearrayofmanagedHistosolsthatexistacrossthecountry.
Similarly,thismethodisnotapplicabletoconstructedwetlands,impoundments,orshallowreservoirsystemsthathaveextendedperiodsofponding;thosesiteswouldtendtohavedynamicsmoresimilartoalakeorpondasopposedtoaterrestrialecosystem.
Withrespecttotheforestmodel,accuracyoftheestimatesisdependentonapplicabilityoftheavailablesiteindexcurves.Whilethegeneralcurvesareavailableforallspecies,theymaynotaccuratelyrepresentthesiteortheentity’smanagementregime.ProvisionsareincludedwithinFVSforcustomizingthetreesiteindexcurves,whichcouldbeimportantforanentityespeciallyifgenetically‐improvedplantingstockandfertilizationregimesareemployed.
Detritalorganicmatteristhesourcefordecompositionprocesses.Theeffectofvegetationonwetlandcarbondynamicsispromulgatedthroughtheamountoforganicmatterandthewaterregime(e.g.,evapotranspiration).Accordingly,theaccuracyofthevegetationproductivityandturnoverwillaffecttheestimatesofthesoilcarbonpoolsandGHGflux.
WatertablepositionisthemostcriticalfactoraffectingCH4andN2Ofluxfromthewetlandsoil(Trettinetal.,2006).Accordingly,considerationstoimprovethatestimateasdiscussedinSection4.3.2willimprovetheestimatesofGHGemissionsfromthesoil.Thereareotheruncertaintiesintheactivityandancillarydata,aswellasmodelstructurethatcancreatebiasandimprecisionintheresultingestimates.Wetlandstypicallyexistinamosaicwithuplandforests,grasslands,andcultivatedlands.Accordingly,theaccuracyofpartitioningtheentityintoupland(agriculture,forest)andwetlandswillaffecttheaccuracyoftheestimates.
4.4 ResearchGapsforWetlandManagementWetlandmanagement,anditsinfluenceonGHGemissions,isnotaswellstudiedassomeoftheothermanagementpracticesinthisreport,suchastillageincroplandsorforestharvestingpracticesinuplands.ThereisthepotentialforimprovingtheestimationofGHGemissionsassociatedwithdifferentmanagementpracticesinthefutureiftherearemonitoringactivitiesandstudiestofillinformationgaps.Aselectnumberofinformationneedsandresearchgapsareidentifiedhere.
The2013Supplementtothe2006IntergovernmentalPanelonClimateChange(IPCC)Guidelinesprovidenewguidanceforestimatingemissionsfromdrainedinlandorganicsoils,rewettedorganicsoils,coastalwetlands,inlandwetlandmineralsoils,andconstructedwetlandsforwastewatertreatment(Blainetal.,2013).Thesenewlydevelopedguidelineswillbecomparedtothetechnicalmethodsprovidedinthisreport.
Chapter 4: Quantifying Greenhouse Gas Sources and Sinks in Managed Wetland Systems
4-22
Watertablepositionistheprincipalfactoraffectingcarbondynamicsinwetlands;unfortunatelythereisalackoflong‐termdata,whichisneededtocharacterizethewatertableresponsetoamanagementregimeandtoprovideabasisforvalidatingassessmenttools.EstablishmentofanetworkofwatertablemonitoringsiteswithinselectedUSDAForestServiceexperimentalforestsandrangesandUSDA‐AgriculturalResearchService(ARS)experimentstationscouldprovidethecontinuityinmeasurementsandlinkageswithcommonmanagementpracticestorepresentthemajorsoilandclimaticconditionintheUnitedStates.
Improvingmodelingcapabilitiesthatintegratesurroundingareaswiththewetlandsthatreceivesurfaceandsubsurfacedrainagewaterswillallowformodelingtheflowsofnutrientsandorganicmatterintowetlandsandsubsequentlossestootherwetlandsbeyondtheentity’soperation.Thistypeofassessmentframeworkisusedinseveralestablishedspatially‐explicithydrologicmodels;theneedistointegratethebiogeochemistry.Linkedmodelscanbeusedatpresent;butdevelopmentofafunctionally‐integratedsystemisneededtosupportbroad‐basedapplications.
Thereisaneed,generally,forimprovedinformationonbiomassproductionandallocationinmanagedwetlands.ThesedatacouldbeobtainedthroughacoordinatedmonitoringprogramemployingUSDA‐ForestServiceexperimentalforestsandranges,USDA‐ARSexperimentstations,andU.S.DepartmentoftheInteriorwildliferefugestomonitorproductionofkeyspeciesorvegetationtypesinassociationwithcommonmanagementprescriptions.Thereisalsoneedformoredetailedmechanisticresearchtoprovideinformationonenergy,water,andGHGdynamicsonselectedmanagedsites;thisinformationiscriticalforvalidatingprocess‐basedmodels.
Field‐basedstudiesareneededtodevelopmorecompletedatabasesthatprovideancillarydataforGHGestimation,particularityCH4emissionsforDNDCorsimilarprocess‐basedmodels,ratherthanrelyingonentityinput,whichwilllikelybechallenging.Akeyattributeofthisworkshouldbetheconsiderationoftheinherentspatialandtemporalvariabilitywithinasite.
FurtherquantificationofthecontrollingandthresholdparametersandassociateduncertaintywithinDNDCorsimilarprocess‐basedmodelstoestimatetracegasemissionsiswarranted.ThisworkcouldalsosuggestapathtowardsdevelopmentofanassessmenttoolthatwasnotreliantonawidearrayofparameterstoeffectivelysimulatetheGHGdynamicsofthesite.
AmorerobustandextensivedatabaseonGHGemissionsfromfreshwatertidal(salinity<0.5‰)palustrinewetlandsisneededtomorefullyunderstandthedriversofemissions,inadditiontoprovidingamorecompletedatasetforparameterizationandevaluationofprocess‐basedmodels.
Studiesonindividualsitesandmeta‐analysesofexistingdataareneededtofullyevaluatethenetGHGfluxforCH4,N2O,andsoilcarbon.MoststudiesonlyconsideroneoftheGHGsandmaymasksomeofthedifferencesinfluxesamongtheGHGsassociatedwithamanagementactivity.
ConstructedwetlandsarediscussedqualitativelyinSection5.4.10ofChapter5,AnimalProductionSystemsforLiquidManureStorageandTreatmentinConstructedWetlands.Moreresearchisneededinthisareatoaccuratelyestimateemissionsfromconstructedwetlands.
ThislistisnotexhaustivebutisintendedtoprovidesomedirectionforimprovingtheestimationmethodsforGHGemissionfromwetlands.
Chapter 4: Quantifying Greenhouse Gas Sources and Sinks in Managed Wetland Systems
4-23
Chapter4References
Abu‐Zreig,M.,R.P.Rudra,H.R.Whiteley,M.N.Lalonde,etal.2003.PhosphorusRemovalinVegetatedFilterStrips.J.Environ.Qual.,32(2):613‐619.
Albaugh,T.J.,H.L.Allen,P.M.Dougherty,andK.H.Johnsen.2004.Long‐termgrowthresponsesofloblollypinetooptimalnutrientandwaterresourceavailability.ForestEcologyandManagement,192(3‐A):19.
Ambus,L.P.1991.Comparisonofdenitrificationintworipariansoils.SoilScienceSocietyofAmericaJournal,55(994‐997).
Armentano,T.V.,andE.S.Menges.1986.Patternsofchangeinthecarbonbalanceoforganicsoil‐wetlandsofthetemperatezone.JournalofEcology,74:755‐774.
Balestrini,R.,C.Arese,C.A.Delconte,A.Lotti,etal.2011.NitrogenremovalinsubsurfacewaterbynarrowbufferstripsintheintensivefarminglandscapeofthePoRiverwatershed,Italy.EcologicalEngineering,37:148‐157.
Bedard‐Haughn,A.,A.L.Matson,andD.J.Pennock.2006.Landuseeffectsongrossnitrogenmineralization,nitrification,andN2Oemissionsinephemeralwetlands.SoilBiologyandBiochemistry,38(12):3398‐3406.
Blain,D.,C.Row,J.Alm,K.Byrne,etal.2006IPCCGuidelinesforNationalGreenhouseGasInventories.Retrievedfromhttp://www.ipcc‐nggip.iges.or.jp/public/2006gl/pdf/4_Volume4/V4_07_Ch7_Wetlands.pdf.
Blain,D.,R.Boer,S.Eggleston,S.Gonzalez,etal.2013.2013Supplementtothe2006IntergovernmentalPanelonClimateChangeGuidelinesforNationalGreenhouseGasInventories:Wetlands.http://www.ipcc‐nggip.iges.or.jp/home/docs/wetlands/Wetlands_Supplement_precopyedit.pdf.
Borin,M.,M.Vianello,F.Morari,andG.Zanin.2005.EffectivenessofbufferstripsinremovingpollutantsinrunofffromacultivatedfieldinNorth‐EastItaly.Agriculture,Ecosystems&Environment,105(1‐2):101‐114.
Bowden,W.,W.McDowell,C.Asbury,andA.Finley.1992.Ripariannitrogendynamicsintwogeomorphologicallydistincttropicalrainforestwatersheds:nitrousoxidefluxes.Biogeochemistry,18(2):77‐99.
Bridgham,S.,J.Megonigal,J.Keller,N.Bliss,etal.2006.ThecarbonbalanceofNorthAmericanwetlands.Wetlands,26(4):889‐916.
Bruland,G.L.,andR.A.MacKenzie.2010.NitrogenSourceTrackingwithδ15NContentofCoastalWetlandPlantsinHawaii.JournalofEnvironmentalQuality,39:409‐419.
Chaubey,I.,L.Chiang,M.W.Gitau,andS.Mohamed.2010.Effectivenessofbestmanagementpracticesinimprovingwaterqualityinapasture‐dominatedwatershed.JournalofSoilandWaterConservation,65(6):424‐437.
Chen,G.Q.,L.Shao,Z.M.Chen,Z.Li,etal.2011.Low‐carbonassessmentforecologicalwastewatertreatmentbyaconstructedwetlandinBeijing.EcologicalEngineering,37(4):622‐628.
Cho,J.,G.Vellidis,D.D.Bosch,R.Lowrance,etal.2010.WaterqualityeffectsofsimulatedconservationpracticescenariosintheLittleRiverExperimentalwatershed.JournalofSoilandWaterConservation,65(6):463‐473.
Costa,C.,C.Dijkema,M.Friedrich,P.Garcia‐Encina,etal.2000.Denitrificationwithmethaneaselectrondonorinoxygen‐limitedbioreactors.AppliedMicrobiologyandBiotechnology,53(6):754‐762.
Cowardin,L.M.,V.Carter,F.C.Golet,andE.T.LaRoe.1979.ClassificationofwetlandsanddeepwaterhabitatsoftheUnitedStates.(FWS/OBS‐79/31).
Dai,Z.,C.Trettin,C.Li,H.Li,etal.2011.EffectofassessmentscaleonspatialandtemporalvariationsinCH4,C02,andN20fluxesinaforestedwetland.Water,Air,andSoilPollution1‐13.
Chapter 4: Quantifying Greenhouse Gas Sources and Sinks in Managed Wetland Systems
4-24
Dai.,Z.,C.Trettin,G.Sun,D.Amatya,etal.2010.Bi‐CriteriaevaluationoftheMIKESHEmodelforaforestedwatershedontheSouthCarolinacoastalplain.Hydrol.EarthSyst.Sci.,14:1033‐1046.
Davidson,E.A.,M.Keller,H.E.Erickson,L.V.Verchot,etal.2000.TestingaConceptualModelofSoilEmissionsofNitrousandNitricOxides.BioScience,50(8):667‐680.
Davis,J.H.,S.M.Griffith,W.R.Horwath,J.J.Steiner,etal.2008.Denitrificationandnitrateconsumptioninanherbaceousriparianareaandperennialryegrassseedcroppingsystem.SoilScienceSocietyofAmericaJournal,72:1299‐1310.
deKlein,C.,R.S.A.Novoa,S.Ogle,K.A.Smith,etal.2006.Chapter11:N2Oemissionsfrommanagedsoil,andCO2emissionsfromlimeandureaapplication.In2006IPCCguidelinesfornationalgreenhousegasinventories,Vol.4:Agriculture,forestryandotherlanduse,S.Eggleston,L.Buendia,K.Miwa,T.NgaraandK.Tanabe(eds.).Kanagawa,Japan:IGES.
Dhondt,K.,P.Boeckx,G.Hofman,andO.VanCleemput.2004.Temporalandspatialpatternsofdenitrificationenzymeactivityandnitrousoxidefluxesinthreeadjacentvegetatedriparianbufferzones.BiologyandFertilityofSoils,40(4):243‐251.
Dillaha,T.A.,J.H.Sherrard,D.Lee,S.Mostaghimi,etal.1988.Evaluationofvegetativefilterstripsasabestmanagementpracticeforfeedlots.JournaloftheWaterPollutionControlFederation,60:1231‐1238.
Dillaha,T.A.,R.B.Reneau,S.Mostaghimi,andD.Lee.1989.Vegetativefilterstripsforagriculturalnonpointsourcepollutioncontrol.TransactionsoftheAmericanSocietyofAgriculturalEngineers,32:513‐519.
Dodla,S.K.,J.J.Wang,R.D.DeLaune,andR.L.Cook.2008.Denitrificationpotentialanditsrelationtoorganiccarbonqualityinthreecoastalwetlandsoils.ScienceoftheTotalEnvironment,407(1):471‐480.
Elgood,Z.,W.D.Robertson,S.L.Schiff,andR.Elgood.2010.Nitrateremovalandgreenhousegasproductioninastream‐beddenitrifyingbioreactor.EcologicalEngineering,36(11):1575‐1580.
EulissJr,N.H.,andD.M.Mushet.1996.Water‐levelfluctuationinwetlandsasafunctionoflandscapeconditionintheprairiepotholeregion.Wetlands,16:587–593.
EulissJr,N.H.,L.M.Smith,D.A.Wilcox,andB.A.Browne.2008.LinkingEcosystemProcesseswithWetlandManagementGoals:ChartingaCourseforaSustainableFuture.Wetlands,28(3):553‐562.
Faubert,P.,P.Tiiva,Å.Rinnan,S.Räty,etal.2010.Effectofvegetationremovalandwatertabledrawdownonthenon‐methanebiogenicvolatileorganiccompoundemissionsinborealpeatlandmicrocosms.AtmosphericEnvironment,44(35):4432‐4439.
Faulkner,S.,W.Barrow,B.Keeland,S.Walls,etal.2011.EffectsofconservationpracticesonwetlandecosystemservicesintheMississippiAlluvialValley.EcologicalApplications,21(sp1):S31‐S48.
Faulwetter,J.L.,V.Gagnon,C.Sundberg,F.Chazarenc,etal.2009.Microbialprocessesinfluencingperformanceoftreatmentwetlands:Areview.EcologicalEngineering,35(6):987‐1004.
Fey,A.,G.Benckiser,andJ.C.G.Ottow.1999.Emissionsofnitrousoxidefromaconstructedwetlandusingagroundfilterandmacrophytesinwaste‐waterpurificationofadairyfarm.BiologyandFertilityofSoils,29(4):354‐359.
Flite,O.P.,R.D.Shannon,R.R.Schnabel,andR.R.Parizek.2001.NitrateRemovalinaRiparianWetlandoftheAppalachianValleyandRidgePhysiographicProvince.J.Environ.Qual.,30(1):254‐261.
Freeman,C.,M.A.Lock,S.Hughes,B.Reynolds,etal.1997.Nitrousoxideemissionsandtheuseofwetlandsforwaterqualityamelioration.EnvironmentalScienceandTechnology,31(8):2438‐2440.
Chapter 4: Quantifying Greenhouse Gas Sources and Sinks in Managed Wetland Systems
4-25
Giltrap,D.,C.Li,andS.Saggar.2010.DNDC:Aprocess‐basedmodelforgreenhousegasfluxesfromagriculturalsoils.Agriculture,EcosystemsandEnvironment,136:292‐300.
Gleason,R.A.,B.A.Tangen,B.A.Browne,andN.H.EulissJr.2009.GreenhousegasfluxfromcroplandandrestoredwetlandsinthePrairiePotholeRegion.SoilBiologyandBiochemistry,41(12):2501‐2507.
Gleason,R.A.,N.H.Euliss,B.A.Tangen,M.K.Laubhan,etal.2011.USDAconservationprogramandpracticeeffectsonwetlandecosystemservicesinthePrairiePotholeRegion.EcologicalApplications,21(sp1):S65‐S81.
Groffman,P.M.,A.J.Gold,andK.Addy.2000.Nitrousoxideproductioninriparianzonesanditsimportancetonationalemissioninventories.Chemosphere:GlobalChangeScience,2(3):291‐299.
Hanson,E.J.,D.L.Azuma,andB.A.Hiserote.2002.SiteIndexEquationsandMeanAnnualIncrementEquationsforPacificNorthwestResearchStationForestInventoryandAnalysisInventories,1985‐2001.Portland,OR:U.S.DepartmentofAgriculture,ForestService,PacificNorthwestResearchStation.http://www.fs.fed.us/pnw/pubs/pnw_rn533.pdf.
Hill,A.R.,K.J.Devito,S.Campagnolo,andK.Sanmugadas.2000.Subsurfacedenitrificationinaforestriparianzone:Interactionsbetweenhydrologyandsuppliesofnitrateandorganiccarbon.Biogeochemistry,51(2):193‐223.
Hoffmann,C.C.,C.Kjaergaard,J.Uusi‐Kamppa,H.C.BruunHansen,etal.2009.Phosphorusretentioninriparianbuffers:Reviewoftheirefficiency.J.Environ.Qual.,38:1942‐1955.
Hopfensperger,K.N.,C.M.Gault,andP.M.Groffman.2009.Influenceofplantcommunitiesandsoilpropertiesontracegasfluxesinripariannorthernhardwoodforests.ForestEcologyandManagement,258(9):2076‐2082.
Hunt,P.G.,T.A.Matheny,andA.A.Szogi.2003.Denitrificationinconstructedwetlandsusedfortreatmentofswinewastewater.JournalofEnvironmentalQuality,32(2):727‐735.
Hunt,P.G.,T.A.Matheny,andK.C.Stone.2004.Denitrificationinacoastalplainriparianzonecontiguoustoaheavilyloadedswinewastewatersprayfield.JournalofEnvironmentalQuality,33:2367‐2374.
Hunt,P.G.,T.A.Matheny,andK.S.Ro.2007.Nitrousoxideaccumulationinsoilsfromriparianbuffersofacoastalplainwatershedcarbon/nitrogenratiocontrol.JEnvironQual,36(5):1368‐1376.
Hwang,S.,K.Jang,H.Jang,J.Song,etal.2006.FactorsAffectingNitrousOxideProduction:AComparisonofBiologicalNitrogenRemovalProcesseswithPartialandCompleteNitrification.Biodegradation,17(1):19‐29.
Insam,H.,andB.Wett.2008.ControlofGHGemissionatthemicrobialcommunitylevel.WasteManagement,28(4):699‐706.
IPCC.2006.2006IntergovernmentalPanelonClimateChangeNationalGreenhouseGasInventoryGuidelines.Hayama,Japan:IGES.
Jetten,M.S.M.2008.Themicrobialnitrogencycle.EnvironmentalMicrobiology,10:2903‐2909.Johansson,A.E.,Å.KasimirKlemedtsson,L.Klemedtsson,andB.H.Svensson.2003.Nitrousoxide
exchangeswiththeatmosphereofaconstructedwetlandtreatingwastewater:Parametersandimplicationsforemissionfactors.Tellus,SeriesB:ChemicalandPhysicalMeteorology,55(3):737‐750.
Jordan,T.E.,D.E.Weller,andD.L.Correll.1998.Denitrificationinsurfacesoilsofariparianforest:Effectsofwater,nitrateandsucroseadditions.SoilBiologyandBiochemistry,30(7):833‐843.
Jordan,T.E.,D.F.Whigham,K.H.Hofmockel,andM.A.Pittek.2003.Nutrientandsedimentremovalbyarestoredwetlandreceivingagriculturalrunoff.JEnvironQual,32(4):1534‐1547.
Kadlec,R.H.,andR.L.Knight.1996.TreatmentWetlands.BocaRation,FL:LewisPublishers.
Chapter 4: Quantifying Greenhouse Gas Sources and Sinks in Managed Wetland Systems
4-26
Kelly,J.M.,J.L.Kovar,R.Sokolowsky,andT.B.Moorman.2007.Phosphorusuptakeduringfouryearsbydifferentvegetativecovertypesinariparianbuffer.NutrientCyclinginAgroecosystems,78:239‐251.
Kesik,M.,N.Brüggemann,R.Forkel,R.Kiese,etal.2006.FuturescenariosofN2OandNOemissionsfromEuropeanforestsoils.J.Geophys.Res.,111:2018‐2022.
Kiese,R.,C.Li,D.W.Hilbert,H.Papen,etal.2005.RegionalapplicationofPnET‐DNDCforestimatingtheN2OsourcetrengthoftropicrainforestsintheWetTropicsofAustralia.GlobalChangeBiology,11:128‐144.
Kim,D.G.,T.M.Isenhart,T.B.Parkin,R.C.Schultz,etal.2009a.Nitrateanddissolvednitrousoxideingroundwaterwithincroppedfieldsandriparianbuffers.BiogeosciencesDiscuss.,6(1):651‐685.
Kim,D.G.,T.M.Isenhart,T.B.Parkin,R.C.Schultz,etal.2009b.Nitrousoxideemissionsfromriparianforestbuffers,warm‐seasonandcool‐seasongrassfilters,andcropfields.BiogeosciencesDiscuss.,6(1):607‐650.
Klemedtsson,L.,K.VonArnold,P.Weslien,andP.Gundersen.2005.SoilCNratioasascalarparametertopredictnitrousoxideemissions.GlobalChangeBiology,11(7):1142‐1147.
Knowles,R.2005.Denitrifiersassociatedwithmethanotrophsandtheirpotentialimpactonthenitrogencycle.EcologicalEngineering,24(5):441‐446.
Kurbatova,J.,C.Li,A.Varlagin,X.Xiao,etal.2008.ModelingcarbondynamicsintwoadjacentspruceforestswithdifferentsoilconditionsinRussia.Biogeosciences,5:969‐980.
Lasco,R.D.,S.Ogle,J.Raison,L.Verchot,etal.2006.Chapter5:Cropland.In2006IPCCGuidelinesforNationalGreenhouseGasInventories,S.Eggleston,L.Buendia,K.Miwa,T.NgaraandK.Tanabe(eds.).Japan:IGES,IPCCNationalGreenhouseGasInventoriesProgram.
Lee,P.,C.Smyth,andS.Boutin.2004.QuantitativereviewofriparianbufferwidthguidelinesfromCanadaandtheUnitedStates.JournalofEnvironmentalManagement,70(2):165‐180.
Li,C.,J.Aber,F.Stange,K.Butterbach‐Bahl,etal.2000.Aprocess‐orientedmodelofN2OandNOemissionsfromforestsoils:1.ModeldevelopmentJ.Geophys.Res.,105(D4):4369–4384.
Li,C.,J.Cui,G.Sun,andC.Trettin.2004.ModelingImpactsofManagementonCarbonSequestrationandTraceGasEmissionsinForestedWetlandEcosystems.EnvironmentalManagement,33:S176‐S186.
Lockaby,B.G.,C.Trettin,andS.Shoenholtz.1999.Effectsofsilviculturalactivitiesonwetlandbiogeochemistry.JEnvironQual,28:1687‐1698.
Lowrance,R.,J.M.Sheridan,R.G.Williams,D.D.Bosch,etal.2007.Waterqualityandhydrologyinfarm‐scalecoastalplainwatersheds:Effectsofagriculture,impoundments,andriparianzones.JournalofSoilandWaterConservation,62(2):65‐76.
Lu,S.Y.,P.Y.Zhang,andW.H.Cui.2010.Impactofplantharvestingonnitrogenandphosphorusremovalinconstructedwetlandstreatingagriculturalregionwastewater.InternationalJournalofEnvironmentandPollution,43(4):339‐353.
Maltais‐Landry,G.,R.Maranger,J.Brisson,andF.Chazarenc.2009.Greenhousegasproductionandefficiencyofplantedandartificiallyaeratedconstructedwetlands.EnvironmentalPollution,157(3):748‐754.
Mander,U.,K.Lohmus,S.Teiter,K.Nurk,etal.2005a.Gaseousfluxesfromsubsurfaceflowconstructedwetlandsforwastewatertreatment.JournalofEnvironmentalScienceandHealth‐PartAToxic/HazardousSubstancesandEnvironmentalEngineering,40(6‐7):1215‐1226.
Mander,U.,S.Teiter,andJ.Augustin.2005b.Emissionofgreenhousegasesfromconstructedwetlandsforwastewatertreatmentandfromriparianbufferzones.WaterScienceandTechnology,52(10‐11):167‐176.
Merbach,W.,T.Kalettka,C.Rudat,andJ.Augustin.2002.TracegasemissionsfromriparianareasofsmalleutrophicinlandwatersinNortheastGermany.InWetlandsinCentralEurope‐Soil
Chapter 4: Quantifying Greenhouse Gas Sources and Sinks in Managed Wetland Systems
4-27
Organisms,SoilEcologicalProcessesandTraceGasEmissions,G.Broll,W.MerbachandE.‐M.Pfeiffer(eds.).Berlin,Germany:Springer‐Verlag.
Miehle,P.,S.J.Livesley,P.M.Feikema,C.Li,etal.2006.AssessingproductivityandcarbonsequestrationcapabilityofEucalyptusglobulusplantationsusingtheprocessmodelForest‐DNDC:Calibrationandvalidation.EcologicalModelling,192:83‐94.
Minkkinen,K.,andJ.Laine.1998.Long‐termeffectofforestdrainageonthepeatcarbonstoresofpinemiresinFinland.CanadianJournalofForestResearch,28(9):1267‐1275.
Modin,O.,K.Fukushi,andK.Yamamoto.2007.Denitrificationwithmethaneasexternalcarbonsource.WaterResearch,41(12):2726‐2738.
Montreuil,O.,P.Merot,andP.Marmonier.2010.Estimationofnitrateremovalbyriparianwetlandsandstreamsinagriculturalcatchments:effectofdischargeandstreamorder.FreshwaterBiology,55(11):2305‐2318.
Novak,J.M.,P.G.Hunt,K.C.Stone,D.W.Watts,etal.2002.RiparianzoneimpactonphosphorusmovementtoaCoastalPlainblackwaterstream.JournalofSoilandWaterConservation,57(3):127‐133.
Osaka,T.,Y.Ebie,S.Tsuneda,andY.Inamori.2008.Identificationofthebacterialcommunityinvolvedinmethane‐dependentdenitrificationinactivatedsludgeusingDNAstable‐isotopeprobing.FEMSMicrobiologyEcology,64(3):494‐506.
Pennock,D.,T.Yates,A.Bedard‐Haughn,K.Phipps,etal.2010.LandscapecontrolsonN2OandCH4emissionsfromfreshwatermineralsoilwetlandsoftheCanadianPrairiePotholeregion.Geoderma,155(3‐4):308‐319.
Peterjohn,W.T.,andD.L.Correll.1984.NutrientDynamicsinanAgriculturalWatershed:ObservationsontheRoleofaRiparianForest.Ecology,65(5):1466‐1475.
Phillips,R.,andO.Beeri.2008.Theroleofhydropedologicvegetationzonesingreenhousegasemissionsforagriculturalwetlandlandscapes.CATENA,72(3):386‐394.
Picek,T.,H.Čížková,andJ.Dušek.2007.Greenhousegasemissionsfromaconstructedwetland‐Plantsasimportantsourcesofcarbon.EcologicalEngineering,31(2):98‐106.
Poach,M.E.,P.G.Hunt,E.J.Sadler,T.A.Matheny,etal.2002.Ammoniavolatilizationfromconstructedwetlandsthattreatswinewastewater.TransactionsoftheAmericanSocietyofAgriculturalEngineers,45(3):619‐627.
Poach,M.E.,P.G.Hunt,G.B.Reddy,K.C.Stone,etal.2004.Ammoniavolatilizationfrommarsh‐pond‐marshconstructedwetlandstreatingswinewastewater.JournalofEnvironmentalQuality,33(3):844‐851.
Rafique,R.,D.Henessy,andG.Kiely.2011.Evaluatingmanagementeffectsonnitrousoxideemissionsfromgrasslandsusingtheprocess‐basedDeNitrificationDeComposition(DNDC)model.Atmospheric,Environment,45:6029‐6039.
Ranalli,A.J.,andD.L.Macalady.2010.Theimportanceoftheriparianzoneandin‐streamprocessesinnitrateattenuationinundisturbedandagriculturalwatersheds‐Areviewofthescientificliterature.JournalofHydrology,389(3‐4):406‐415.
Roobroeck,D.,K.Butterbach‐Bahl,N.Brüggemann,andP.Boeckx.2010.Dinitrogenandnitrousoxideexchangesfromanundrainedmonolithfen:short‐termresponsesfollowingnitrateaddition.EuropeanJournalofSoilScience,61(5):662‐670.
Rose,C.,andW.G.Crumpton.2006.SpatialPatternsinDisssolvedOxygenandMethaneConcentrationsinaPrairiePotholeWetlandinIowa,USA.Wetlands,26:1020‐1025.
Schoonover,J.,K.Williard,J.Zaczek,J.Mangun,etal.2005.NutrientAttenuationinAgriculturalSurfaceRunoffbyRiparianBufferZonesinSouthernIllinois,USA.AgroforestrySystems,64(2):169‐180.
Seo,D.C.,andR.D.DeLaune.2010.Fungalandbacterialmediateddenitrificationinwetlands:Influenceofsedimentredoxcondition.WaterResearch,44(8):2441‐2450.
Chapter 4: Quantifying Greenhouse Gas Sources and Sinks in Managed Wetland Systems
4-28
Skaggs,R.W.,B.D.Phillips,G.M.Chescheir,andC.C.Trettin.2011.Effectofminordrainageonhydrologyofforestedwetlands.TransactionsoftheASABE,54(6):2139‐2149.
Smemo,K.A.,andJ.B.Yavitt.2006.AMulti‐yearPerspectiveonMethaneCyclinginaShallowPeatFeninCentralNewYorkState,USA.Wetlands,26:20‐29.
Smith,T.A.,D.L.Osmond,andJ.W.Gilliam.2006.Riparianbufferwidthandnitrateremovalinalagoon‐effluentirrigatedagriculturalarea.JournalofSoilandWaterConservation,61(5):273‐281.
Soosaar,K.,U.Mander,M.Maddison,A.Kanal,etal.2011.Dynamicsofgaseousnitrogenandcarbonfluxesinriparianalderforests.EcologicalEngineering,37:40‐53.
Stang,F.,K.Butterbach‐Bahl,andH.Papen.2000.Aprocess‐orientedmodelofN2OandNOemissionsfromforestsoils.2.Sensitivityanalysisandvalidation.J.Geophys.Res.,105:4385‐4398.
Stedman,S.,andT.E.Dahl.2008.StatusandtrendsofwetlandsinthecoastalwatershedsoftheEasternUnitedStates1998to2004:NationalOceanicandAtmosphericAdministration,NationalMarineFisheriesServiceandU.S.DepartmentoftheInterior,FishandWildlifeService.
Stein,O.R.,andP.B.Hook.2005.Temperature,plants,andoxygen:Howdoesseasonaffectconstructedwetlandperformance?JournalofEnvironmentalScienceandHealth‐PartAToxic/HazardousSubstancesandEnvironmentalEngineering,40(6‐7):1331‐1342.
Stein,O.R.,J.A.Biederman,P.B.Hook,andW.C.Allen.2006.Plantspeciesandtemperatureeffectsonthek‐C*first‐ordermodelforCODremovalinbatch‐loadedSSFwetlands.EcologicalEngineering,26(2):100‐112.
Stein,O.R.,B.W.Towler,P.B.Hook,andJ.A.Biederman.2007.Onfittingthek‐C*firstordermodeltobatchloadedsub‐surfacetreatmentwetlands.WaterScienceandTechnology,56(3):93‐99.
Stone,K.C.,P.G.Hunt,F.J.Humenik,andM.H.Johnson.1998.Impactofswinewasteapplicationongroundandstreamwaterqualityinaneasterncoastalplainwatershed.TransactionsoftheAmericanSocietyofAgriculturalEngineers,41:1665‐1670.
Stone,K.C.,P.G.Hunt,A.A.Szogi,F.J.Humenik,etal.2002.Constructedwetlanddesignandperformanceforswinelagoonwastewatertreatment.TransactionsoftheAmericanSocietyofAgriculturalEngineers,45(3):723‐730.
Stone,K.C.,M.E.Poach,P.G.Hunt,andG.B.Reddy.2004.Marsh‐pond‐marshconstructedwetlanddesignanalysisforswinelagoonwastewatertreatment.EcologicalEngineering,23(2):127‐133.
Tabacchi,E.,D.L.Correll,R.Hauer,G.Pinay,etal.1998.Development,maintenanceandroleofriparianvegetationintheriverlandscape.FreshwaterBiology,40(3):497‐516.
Tanner,C.C.,D.D.Adams,andM.T.Downes.1997.Methaneemissionsfromconstructedwetlandstreatingagriculturalwastewaters.JournalofEnvironmentalQuality,26(4):1056‐1062.
Tanner,C.C.,andT.R.Headley.2011.Componentsoffloatingemergentmacrophytetreatmentwetlandsinfluencingremovalofstormwaterpollutants.EcologicalEngineering,37(3):474‐486.
Taylor,C.R.,P.B.Hook,O.R.Stein,andC.A.Zabinski.2010.Seasonaleffectsof19plantspeciesonCODremovalinsubsurfacetreatmentwetlandmicrocosms.EcologicalEngineering.
Teiter,S.,andU.Mander.2005.EmissionofN2O,N2,CH4,andCO2fromconstructedwetlandsforwastewatertreatmentandfromriparianbufferzones.EcologicalEngineering,25(5):528‐541.
Thornton,F.C.,andR.J.Valente.1996.Soilemissionsofnitricoxideandnitrousoxidefromno‐tillcorn.SoilScienceSocietyofAmericaJournal,60:1127‐1133.
Towler,B.W.,J.E.Cahoon,andO.R.Stein.2004.Evapotranspirationcropcoefficientsforcattailandbulrush.JournalofHydrologicEngineering,9(3):235‐239.
Chapter 4: Quantifying Greenhouse Gas Sources and Sinks in Managed Wetland Systems
4-29
Trettin,C.,M.F.Jurgensen,M.R.Gale,andJ.W.McLaughlin.1995.Soilcarboninnorthernforestedwetlands:impactsofsilviculturalpractices.InCarbonFormsandFunctions,W.W.McFeeandJ.M.Kelly(eds.).Madison,WI:SoilScienceSocietyofAmerica.
Trettin,C.C.,B.Song,M.F.Jurgensen,andC.Li.2001.Existingsoilcarbonmodelsdonotapplytoforestedwetlands,Gen.Tech.Rep.SRS‐46.Asheville,NC:U.S.DepartmentofAgriculture,ForestService,SouthernResearchStation.
Trettin,C.C.,andM.F.Jurgensen.2003.Carboncyclinginwetlandforestsoils.InThepotentialofU.S.forestsoilstosequestercarbonandmitigatethegreenhouseeffect,J.M.Kimble,L.S.Heath,R.A.BirdseyandR.Lal(eds.).BocaRaton,FL:CRCPressLLC.
Trettin,C.C.,R.Laiho,K.Minkkinnen,andJ.Laine.2006.Influenceofclimatechangefactorsoncarbondynamicsinnorthernforestedpeatlands.CanadianJournalofSoilScience,86:269‐280.
U.S.EPA.2011.InventoryofU.S.GreenhouseGasEmissionsandSinks:1990‐2009.Washington,D.C.:U.S.EnvironmentalProtectionAgency.http://epa.gov/climatechange/emissions/usinventoryreport.html.
VanDerKamp,G.,W.J.Stolte,andR.G.Clark.1999.Dryingoutofsmallprairiewetlandsafterconversionoftheircatchmentsfromcultivationtopermanentbromegrass.HydrologicalSciencesJournal,44(3):387‐397.
vanderKamp,G.,M.Hayashi,andD.Gallén.2003.ComparingthehydrologyofgrassedandcultivatedcatchmentsinthesemiaridCanadianprairies.HydrologicalProcesses,17:559‐575.
Vellidis,G.,R.Lowrance,P.Gay,andR.K.Hubbard.2003.Nutrienttransportinarestoredriparianwetland.JEnvironQual,32(2):711‐726.
Verchot,L.,T.Krug,R.D.Lasco,S.Ogle,etal.2006.Chapter5:Grassland.In2006IPCCGuidelinesforNationalGreenhouseGasInventories,S.Eggleston,L.Buendia,K.Miwa,T.NgaraandD.L.Tanaka(eds.).Japan:IGES.
Voldseth,R.A.,W.C.Johnson,T.Gilmanov,G.R.Guntenspergen,etal.2007.Modelestimationofland‐useeffectsonwaterlevelsofnorthernprairiewetlands.EcolAppl,17(2):527‐540.
Wang,Y.,R.Inamori,H.Kong,K.Xu,etal.2008.Influenceofplantspeciesandwastewaterstrengthonconstructedwetlandmethaneemissionsandassociatedmicrobialpopulations.EcologicalEngineering,32(1):22‐29.
Whalen,S.C.2005.BiogeochemistryofMethaneExchangebetweenNaturalWetlandsandtheAtmosphere.EnvironmentalEngineeringScience,22(1):73‐94.
Winter,T.C.,J.W.Harvey,andO.L.Franke.1998.Groundwaterandsurfacewater:asingleresource:U.S.GeologicalSurvey.
Woodward,K.B.,C.S.Fellows,C.L.Conway,andH.M.Hunter.2009.Nitrateremoval,denitrificationandnitrousoxideproductionintheriparianzoneofanephemeralstream.SoilBiologyandBiochemistry,41(4):671‐680.
Wu,J.,J.Zhang,W.L.Jia,H.J.Xie,etal.2009.Nitrousoxidefluxesofconstructedwetlandstotreatsewagewastewater.HuanjingKexue/EnvironmentalScience,30(11):3146‐3151.
Young,E.O.,andR.D.Briggs.2008.Phosphorusconcentrationsinsoilandsubsurfacewater:afieldstudyamongcroplandandriparianbuffers.JEnvironQual,37(1):69‐78.
Zhang,Y.,C.Li,C.C.Trettin,andG.Sun.2002.Anintegratedmodelofsoil,hydrologyandvegetationforcarbondynamicsinwetlandecosystems.GlobalBiogeochemicalCycles,16:1‐17.
Zhu,G.,M.S.M.Jetten,P.Kuschk,K.F.Ettwig,etal.2010.Potentialrolesofanaerobicammoniumandmethaneoxidationinthenitrogencycleofwetlandecosystems.AppliedMicrobiologyandBiotechnology,86(4):1043‐1055.
Zhu,N.,P.An,B.Krishnakumar,L.Zhao,etal.2007.Effectofplantharvestonmethaneemissionfromtwoconstructedwetlandsdesignedforthetreatmentofwastewater.JournalofEnvironmentalManagement,85(4):936‐943.

Chapter 4: Quantifying Greenhouse Gas Sources and Sinks in Managed Wetland Systems
4-30
Thispageisintentionallyleftblank.
Authors:WendyPowers,MichiganStateUniversity(LeadAuthor)BrentAuvermann,TexasA&MUniversityN.AndyCole,USDAAgriculturalResearchServiceCurtGooch,CornellUniversityRichGrant,PurdueUniversityJerryHatfield,USDAAgriculturalResearchServicePatrickHunt,USDAAgriculturalResearchServiceKristenJohnson,WashingtonStateUniversityAprilLeytem,USDAAgriculturalResearchServiceWeiLiao,MichiganStateUniversityJ.MarkPowell,USDAAgriculturalResearchService
Contents:5 QuantifyingGreenhouseGasSourcesandSinksinAnimalProductionSystems..............5‐5
5.1 Overview...........................................................................................................................................................5‐55.1.1 OverviewofManagementPracticesandResultingGHGEmissions.........................5‐55.1.2 SystemBoundariesandTemporalScale............................................................................5‐125.1.3 SummaryofSelectedMethods/Models/SourcesofData...........................................5‐125.1.4 OrganizationofChapter/Roadmap......................................................................................5‐14
5.2 AnimalProductionSystems....................................................................................................................5‐185.2.1 DairyProductionSystems........................................................................................................5‐185.2.2 BeefProductionSystems..........................................................................................................5‐225.2.3 SheepProductionSystems.......................................................................................................5‐255.2.4 SwineProductionSystems......................................................................................................5‐255.2.5 PoultryProductionSystems....................................................................................................5‐28
5.3 EmissionsfromEntericFermentationandHousing.....................................................................5‐305.3.1 EntericFermentationandHousingEmissionsfromDairyProductionSystems.......
.............................................................................................................................................................5‐315.3.2 EntericFermentationandHousingEmissionsfromBeefProductionSystems.5‐445.3.3 EntericFermentationandHousingEmissionsfromSheep.......................................5‐525.3.4 EntericFermentationandHousingEmissionsfromSwineProductionSystems......
.............................................................................................................................................................5‐535.3.5 HousingEmissionsfromPoultryProductionSystems................................................5‐605.3.6 EntericFermentationandHousingEmissionsfromOtherAnimals......................5‐645.3.7 FactorsAffectingEntericFermentationEmissions.......................................................5‐665.3.8 LimitationsandUncertaintyinEntericFermentationandHousingEmissionsEstimates.........................................................................................................................................................5‐73
5.4 ManureManagement.................................................................................................................................5‐75
Chapter 5Quantifying Greenhouse Gas Sources and Sinks in Animal Production Systems
Chapter 5: Quantifying Greenhouse Gas Sources and Sinks in Animal Production Systems
5-2
5.4.1 TemporaryStackandLong‐TermStockpile.....................................................................5‐775.4.2 Source:U.S.EPA(2011).Composting..................................................................................5‐815.4.3 AerobicLagoon.............................................................................................................................5‐855.4.4 AnaerobicLagoon,RunoffHoldingPond,StorageTanks............................................5‐865.4.5 AnaerobicDigesterwithBiogasUtilization......................................................................5‐915.4.6 CombinedAerobicTreatmentSystems..............................................................................5‐935.4.7 Sand‐ManureSeparation..........................................................................................................5‐945.4.8 NutrientRemoval........................................................................................................................5‐945.4.9 Solid–LiquidSeparation............................................................................................................5‐955.4.10 ConstructedWetland.................................................................................................................5‐975.4.11 Thermo‐ChemicalConversion................................................................................................5‐985.4.12 LimitationsandUncertaintyinManureManagementEmissionsEstimates......5‐99
5.5 ResearchGaps............................................................................................................................................5‐1055.5.1 EntericFermentation..............................................................................................................5‐1055.5.2 ManureManagement..............................................................................................................5‐106
Appendix5‐A:EntericCH4fromFeedlotCattle–MethaneConversionFactor(Ym)..............5‐109Appendix5‐B:FeedstuffsCompositionTable...........................................................................................5‐113Appendix5‐C:EstimationMethodsforAmmoniaEmissionsfromManureManagementSystems.....................................................................................................................................................................5‐123
5‐C.1 MethodforEstimatingAmmoniaEmissionsUsingEquationsfromIntegratedFarmSystemModel...............................................................................................................................5‐123
5‐C.1.1RationaleforSelectedMethod...............................................................................5‐1235‐C.1.2ActivityData..................................................................................................................5‐1235‐C.1.3AncillaryData...............................................................................................................5‐124
5‐C.2 MethodforAmmoniaEmissionsfromTemporaryStack,Long‐TermStockpile,AnaerobicLagoons/RunoffHoldingPonds/StorageTanks,andAerobicLagoons.....5‐1245‐C.3 MethodforEstimatingAmmoniaEmissionsfromCompostingUsingIPCCTier2Equations....................................................................................................................................................5‐128
5‐C.3.1RationaleforSelectedMethod...............................................................................5‐1285‐C.3.2ActivityData..................................................................................................................5‐1295‐C.3.3AncillaryData...............................................................................................................5‐129
5‐C.4 MethodforAmmoniaEmissionsfromComposting..................................................5‐1295‐C.5 UncertaintyinAmmoniaEmissionsEstimates...........................................................5‐129
Appendix5‐D:ManureManagementSystemsShapeFactors( )...................................................5‐131Appendix5‐E:ModelReview:ReviewofEntericFermentationModels.......................................5‐134Chapter5References..........................................................................................................................................5‐139
SuggestedChapterCitation:Powers,W.,B.Auvermann,A.Cole,C.Gooch,R.Grant,J.Hatfield,P.Hunt,K.Johnson,A.Leytem,W.Liao,J.M.Powell,2014.Chapter5:QuantifyingGreenhouseGasSourcesandSinksinAnimalProductionSystems.InQuantifyingGreenhouseGasFluxesinAgricultureandForestry:MethodsforEntity‐ScaleInventory.TechnicalBulletinNumber1939,OfficeoftheChiefEconomist,U.S.DepartmentofAgriculture,Washington.DC.606pages.July2014.Eve,M.,D.Pape,M.Flugge,R.Steele,D.Man,M.Riley‐Gilbert,andS.Biggar,Eds.
USDAisanequalopportunityproviderandemployer.
Chapter 5: Quantifying Greenhouse Gas Sources and Sinks in Animal Production Systems
5-3
Acronyms,ChemicalFormulae,andUnitsAA AminoacidsAD AnaerobicdigestionADF AciddetergentfiberAGP AntibioticgrowthpromotersASABE AmericanSocietyofAgricultural andBiological EngineersB0 MaximummethaneproductioncapacitiesbLS backwardLagrangianstochasticBNR BiologicalnitrogenremovalBW BodyweightCH4 MethaneCNCPS CornellNetCarbohydrateandProteinSystemCO2‐eq CarbondioxideequivalentsCP CrudeproteinCSTR ContinuousstirredtankreactorDDGS DrieddistillersgrainswithsolublesDE DigestibleenergyDFM DirectfedmicrobialsDGS DistillersgrainswithsolublesDIP DietarycrudeproteinDMI DrymatterintakeDRC Dry‐rolledcornEF Emissionfactorg GramsGg GigagramsGEI GrossenergyintakeGHG GreenhousegasHCW HotcarcassweightHMC High‐moisturecornIFSM IntegratedFarmSystemModelkcal Kilocaloriekg Kilogramslb(s) Pound(s)LCA LifecycleanalysisLU Livestockunitm MetersMCF MethaneconversionfactorME Metabolizableenergymg MilligramMGA MelengestrolacetateMJ MillijoulesNE NetenergyNex NitrogenexcretedN NitrogenN2O NitrousoxideNDF NeutraldetergentfiberNFC Non‐fibercarbohydrateNH3 AmmoniaNPN Non‐proteinnitrogen
Chapter 5: Quantifying Greenhouse Gas Sources and Sinks in Animal Production Systems
5-4
NSP Non‐starchpolysaccharideO2 OxygenOM Organicmatterppb partsperbillionppm partspermillionRDP RuminaldegradableproteinRFI ResidualfeedintakeRMSPE ResidualmeansquarepredictionerrorSF6 SulfurhexafluorideSFC Steam‐flakedcornTAN TotalammoniacalnitrogenTDN TotaldigestiblenutrientsTKN TotalKjeldahlnitrogenTMR TotalmixedrationUASB UpflowanaerobicsludgeblanketUP UnprocessedU.S.EPA U.S.EnvironmentalProtectionAgencyVFA VolatilefattyacidsVS VolatilesolidsWDGS WetdistillersgrainswithsolublesYm Methaneconversionfactor,percentofgrossenergyinfeedconverted
tomethane
Chapter 5: Quantifying Greenhouse Gas Sources and Sinks in Animal Production Systems
5-5
5 QuantifyingGreenhouseGasSourcesandSinksinAnimalProductionSystems
Thischapterprovidesguidanceforreportinggreenhousegas(GHG)emissionsassociatedwithentity‐levelfluxesfromanimalproductionsystems.Inparticular,itfocusesonmethodsforestimatingemissionsfrombeefcattle(cow‐calf,stocker,andfeedlotsystems),dairycattle,sheep,swine,andpoultry(layers,broilers,andturkey).Informationprovidedisbasedonavailabledataatthetimeofwriting.Inmanycasessystemsareoversimplifiedbecauseoflimiteddataavailability.Itisexpectedthatmoredatawillbecomeavailableovertime.Thischapterprovidesinsightintothecurrentstateofthescienceandservesasastartingpointforfutureassessments.
Section5.1summarizesanimalmanagementpracticesandtheresultingGHGemissions. Section5.2presentsanoverviewofeachproductionsystemandageneraldiscussionof
commonmanagementsystemsandpractices.
Section5.3describesthemethodsforestimatingGHGemissionsfromentericfermentationandhousing(entericfermentationbeingamuchmoresignificantemissionssourcethan
housing).
Section5.4describesmethodsforestimatingGHGsfrommanuremanagementsystems. Section5.5identifiesresearchgapsthatexistforquantifyingGHGsfromanimalproduction
systems.Theintentofidentifyingresearchgapsistohighlightwhereimprovementsin
knowledgecanbestimprovetheusefulnessofthisdocumentatfarm‐,regional‐,and
industry‐scales.
5.1 Overview
ThissectionsummarizesthekeypracticesinanimalmanagementandtheresultingGHGemissionsthatarediscussedindetailinthischapter.Theagriculturalpracticesdiscussedincludethoserequiredtobreedandhouselivestock,includingthemanagementofresultantlivestockwaste.Emissionsconsideredhereincludethosefromentericfermentation(resultingfromlivestockdigestiveprocesses),livestockwasteinhousingareas,andlivestockwastemanagedinsystems(suchasstockpiles,lagoons,digesters,solidseparation,andothers).OptionsformanagementchangesthatmayresultinchangesinGHGemissionsarealsodiscussed.
5.1.1 OverviewofManagementPracticesandResultingGHGEmissions
Animalproductionsystemsincludeagriculturalpracticesthatinvolvebreedingandrearinglivestockformeat,eggs,dairy,andotheranimalproductssuchasleather,wool,fur,andindustrial
AmmoniaEmissionsinAnimalProductionSystems
Ammonia(NH3),althoughnotaGHG,isemittedinlargequantitiesfromanimalhousingandmanuremanagementsystemsandisanindirectprecursortonitrousoxide(N2O)emissionsaswellasanenvironmentalconcern.Insidebarnsandhousingunits,NH3isconsideredanindoorairqualityconcernbecauseitcanhaveanegativeimpactonanimalhealthandproduction.Volatilizedammoniacanreactwithothercompoundsintheairtoformparticulatematterwithadiameterof2.5microns.Thisfineparticulatemattercanpenetrateintothelungs,causingrespiratoryandcardiovascularproblems,andcontributetotheformationofhaze.
InformationaboutammoniahasbeenincludedinthischapterandproposedquantificationmethodsarepresentedinAppendix5‐C.
Chapter 5: Quantifying Greenhouse Gas Sources and Sinks in Animal Production Systems
5-6
productslikeglueoroils.Farmersandotherfacilityownersraiseanimalsineitherconfined,semi‐confinement,orunconfinedspaces;thepracticesusedtoraisethemaredependentonanimaltype,region,landavailability,andindividualpreferences(e.g.,conventionalor“organic”standards).Regardlessoftheconditionsinwhichanimalsareraisedandhoused,theyproduceGHGemissions.Themagnitudeofemissionsdependsprimarilyonthequalityofthediet,theanimals’requirementsandintake(e.g.,grazing,pregnant,lactating,performingwork),andthetypesofsystemsinplacetomanagemanure.Theprimarysourceofmethane(CH4)emissionsfromanimalproductionsystemsisentericfermentation,whichisaresultofbacterialfermentationduringdigestionoffeedinruminantanimals.Thesecondlargestsourceofemissionsfromanimalproductionsystemsisfromthemanagementoflivestockmanure.Methaneemissionsalsooccurfromthedigestiveprocessesinmonogastricanimals;however,thequantityissignificantlylessthantheseothertwosources.Forsimplicity,inthereport,thetermentericfermentationreferstoemissionsfromthedigestiveprocessofbothruminantandmonogastricanimals.
Manuremanagementisthecollection,storage,transfer,andtreatmentofanimalurineandfeces.Storageofanimalmanurehasbecomeincreasinglypopularasitallowssynchronizationoflandapplicationofmanurenutrientswithcropneeds,reducestheneedforpurchasedcommercialfertilizer,andreducespotentialforsoilcompactionduetopoortimingofmanureapplication.Dependingonthestorageandtreatmentpractices,manuremanagementhastheaddedbenefitofreducingairandwaterpollution.However,manurestoredinanaerobicconditionsresultsintheproductionandpotentialreleaseofGHGsandodors.Greenhousegasemissionsfromthreesolidmanurestorage/treatmentpractices(temporarystackandlong‐termstockpile,composting,andthermo‐chemicalconversion)andeightliquidmanurestorage/treatmentpractices(aerobiclagoon,anaerobiclagoon/runoffholdingpond/storagetanks,anaerobicdigestion,combinedaerobictreatmentsystem,sand‐manureseparation,nutrientremoval,solid‐liquidseparation,andconstructedwetland)areconsideredinthereport.
Figure5‐1providesanoverviewoftheconnectionsbetweenfeed,animals,manure,andGHGemissionsinananimalproductionsystem.Atthetopoftheconceptualmodel,livestockarefedavarietyofdiets.Ruminantanimalseatfeedstuffsand,throughfermentationbytheruminalmicrobes,CH4isproduced.Poultryandswine,althoughtheydonotreleaseasignificantamountofCH4throughentericfermentation,depositmanureintobedding,anduponmanuredecomposition,mayreleasenitrousoxide(N2O),CH4andammonia(NH3)intotheatmosphere.Methodologytoestimateemissionsfrombeddinganddrymanureinhousingissimilarto,andoftenparallelto,themethoddescribedfordrymanurehandlingandstoragesystems.Manurefromgrazinglivestockisleftonfieldsorpaddocks,andthemanuremaybecollectedtobetreatedandstored.Manurethathasbeencollectedandstoredcanbeappliedtocroplands.GHGemissionsfromgrazinglandsandcroplandsareaddressedinChapter3,QuantifyingGreenhouseGasSourcesandSinksinCroplandandGrazingLandSystems.
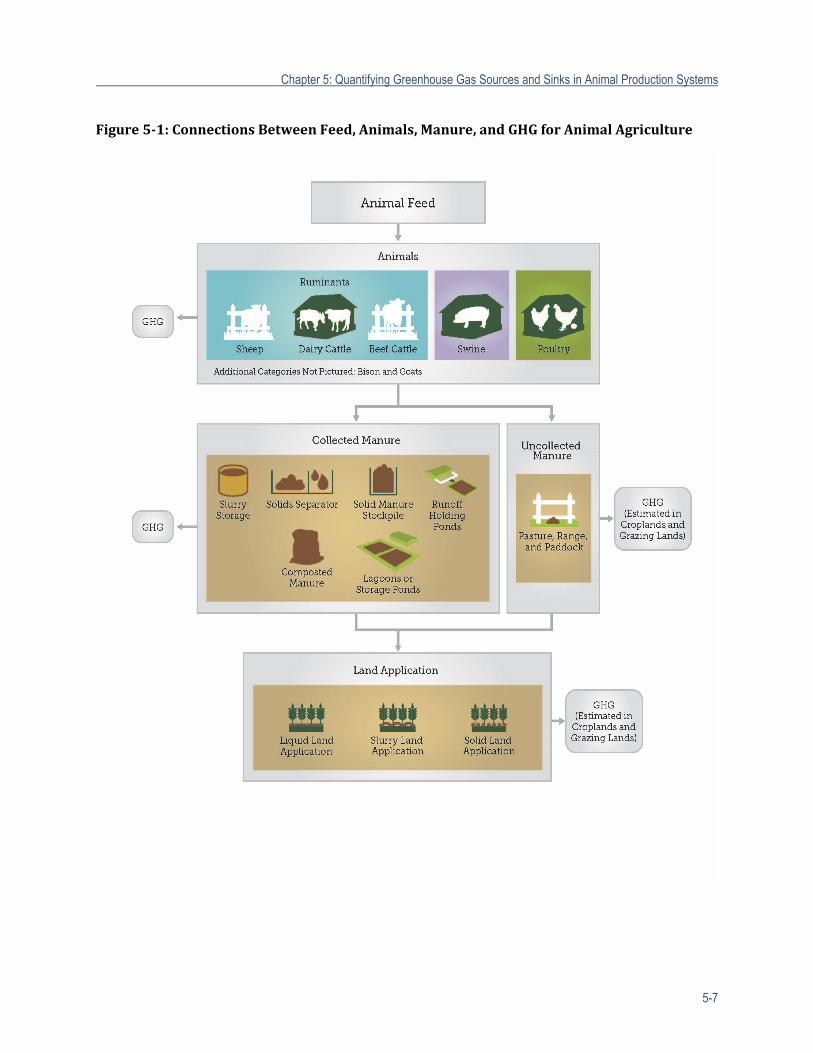
Chapter 5: Quantifying Greenhouse Gas Sources and Sinks in Animal Production Systems
5-7
Figure5‐1:ConnectionsBetweenFeed,Animals,Manure,andGHGforAnimalAgriculture
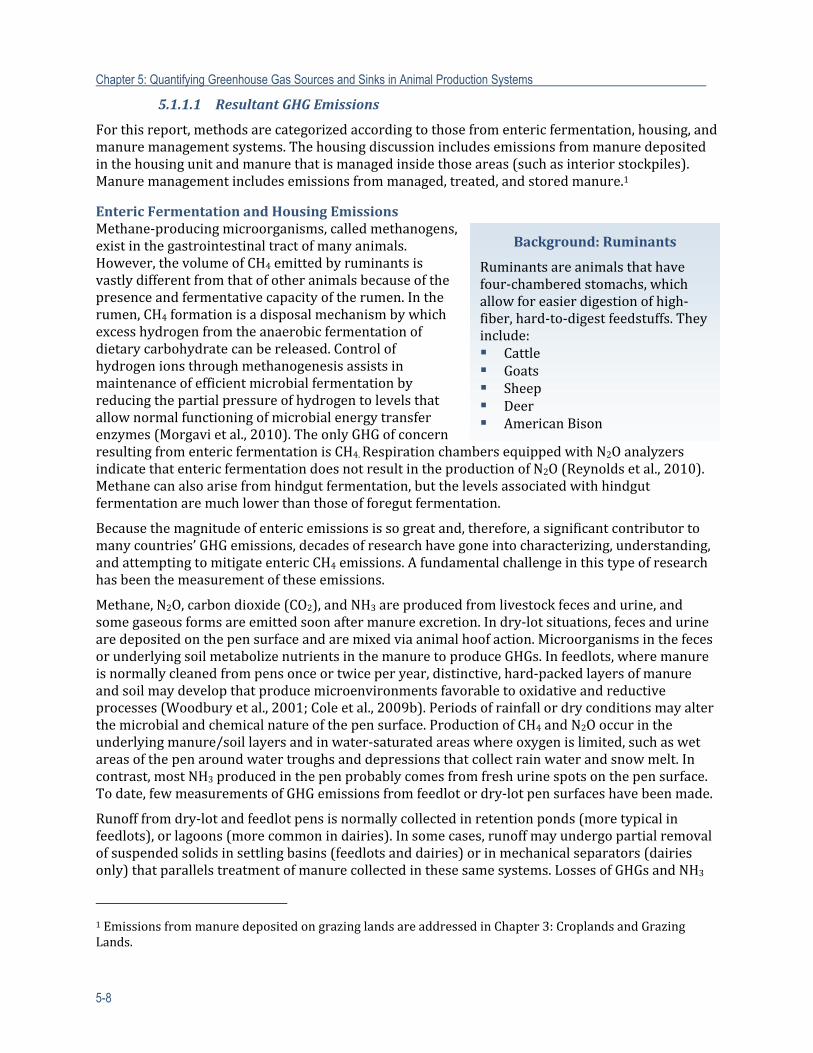
Chapter 5: Quantifying Greenhouse Gas Sources and Sinks in Animal Production Systems
5-8
5.1.1.1 ResultantGHGEmissions
Forthisreport,methodsarecategorizedaccordingtothosefromentericfermentation,housing,andmanuremanagementsystems.Thehousingdiscussionincludesemissionsfrommanuredepositedinthehousingunitandmanurethatismanagedinsidethoseareas(suchasinteriorstockpiles).Manuremanagementincludesemissionsfrommanaged,treated,andstoredmanure.1
EntericFermentationandHousingEmissionsMethane‐producingmicroorganisms,calledmethanogens,existinthegastrointestinaltractofmanyanimals.However,thevolumeofCH4emittedbyruminantsisvastlydifferentfromthatofotheranimalsbecauseofthepresenceandfermentativecapacityoftherumen.Intherumen,CH4formationisadisposalmechanismbywhichexcesshydrogenfromtheanaerobicfermentationofdietarycarbohydratecanbereleased.Controlofhydrogenionsthroughmethanogenesisassistsinmaintenanceofefficientmicrobialfermentationbyreducingthepartialpressureofhydrogentolevelsthatallownormalfunctioningofmicrobialenergytransferenzymes(Morgavietal.,2010).TheonlyGHGofconcernresultingfromentericfermentationisCH4.RespirationchambersequippedwithN2OanalyzersindicatethatentericfermentationdoesnotresultintheproductionofN2O(Reynoldsetal.,2010).Methanecanalsoarisefromhindgutfermentation,butthelevelsassociatedwithhindgutfermentationaremuchlowerthanthoseofforegutfermentation.
Becausethemagnitudeofentericemissionsissogreatand,therefore,asignificantcontributortomanycountries’GHGemissions,decadesofresearchhavegoneintocharacterizing,understanding,andattemptingtomitigateentericCH4emissions.Afundamentalchallengeinthistypeofresearchhasbeenthemeasurementoftheseemissions.
Methane,N2O,carbondioxide(CO2),andNH3areproducedfromlivestockfecesandurine,andsomegaseousformsareemittedsoonaftermanureexcretion.Indry‐lotsituations,fecesandurinearedepositedonthepensurfaceandaremixedviaanimalhoofaction.MicroorganismsinthefecesorunderlyingsoilmetabolizenutrientsinthemanuretoproduceGHGs.Infeedlots,wheremanureisnormallycleanedfrompensonceortwiceperyear,distinctive,hard‐packedlayersofmanureandsoilmaydevelopthatproducemicroenvironmentsfavorabletooxidativeandreductiveprocesses(Woodburyetal.,2001;Coleetal.,2009b).Periodsofrainfallordryconditionsmayalterthemicrobialandchemicalnatureofthepensurface.ProductionofCH4andN2Ooccurintheunderlyingmanure/soillayersandinwater‐saturatedareaswhereoxygenislimited,suchaswetareasofthepenaroundwatertroughsanddepressionsthatcollectrainwaterandsnowmelt.Incontrast,mostNH3producedinthepenprobablycomesfromfreshurinespotsonthepensurface.Todate,fewmeasurementsofGHGemissionsfromfeedlotordry‐lotpensurfaceshavebeenmade.
Runofffromdry‐lotandfeedlotpensisnormallycollectedinretentionponds(moretypicalinfeedlots),orlagoons(morecommonindairies).Insomecases,runoffmayundergopartialremovalofsuspendedsolidsinsettlingbasins(feedlotsanddairies)orinmechanicalseparators(dairiesonly)thatparallelstreatmentofmanurecollectedinthesesamesystems.LossesofGHGsandNH3
1EmissionsfrommanuredepositedongrazinglandsareaddressedinChapter3:CroplandsandGrazingLands.
Background:Ruminants
Ruminantsareanimalsthathavefour‐chamberedstomachs,whichallowforeasierdigestionofhigh‐fiber,hard‐to‐digestfeedstuffs.Theyinclude: Cattle Goats Sheep Deer AmericanBison
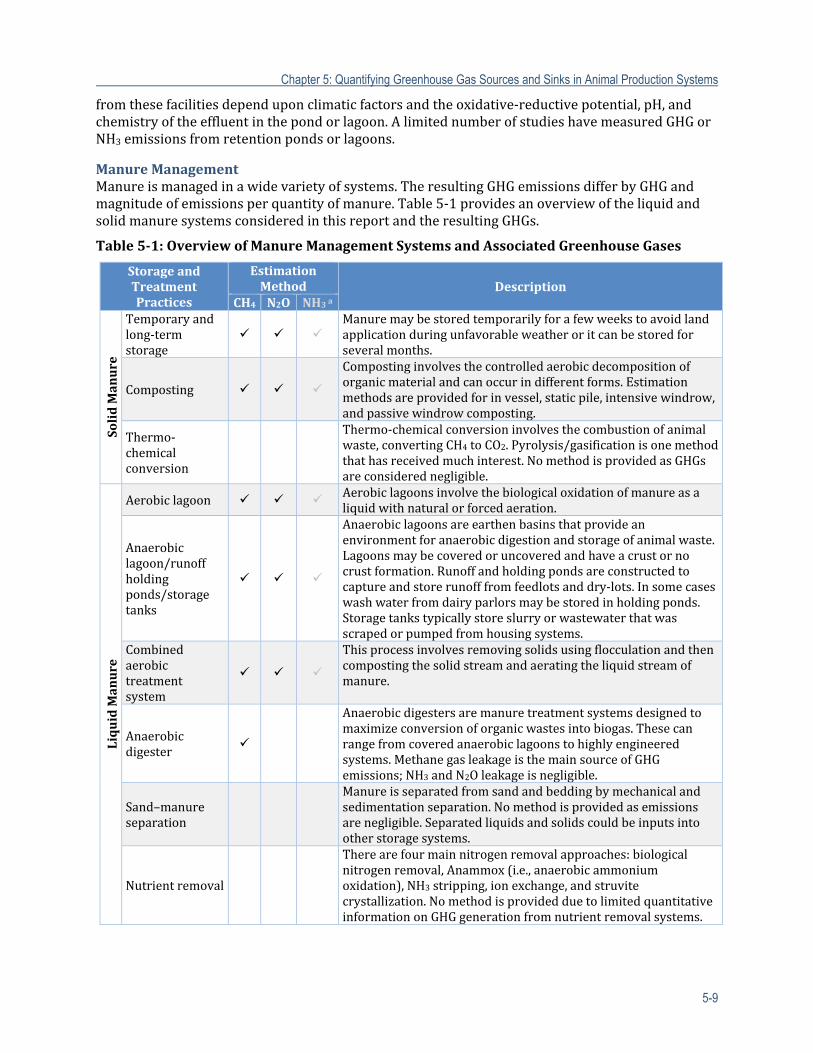
Chapter 5: Quantifying Greenhouse Gas Sources and Sinks in Animal Production Systems
5-9
fromthesefacilitiesdependuponclimaticfactorsandtheoxidative‐reductivepotential,pH,andchemistryoftheeffluentinthepondorlagoon.AlimitednumberofstudieshavemeasuredGHGorNH3emissionsfromretentionpondsorlagoons.
ManureManagementManureismanagedinawidevarietyofsystems.TheresultingGHGemissionsdifferbyGHGandmagnitudeofemissionsperquantityofmanure.Table5‐1providesanoverviewoftheliquidandsolidmanuresystemsconsideredinthisreportandtheresultingGHGs.
Table5‐1:OverviewofManureManagementSystemsandAssociatedGreenhouseGases
StorageandTreatmentPractices
EstimationMethod Description
CH4 N2O NH3a
SolidManure
Temporaryandlong‐termstorage
Manuremaybestoredtemporarilyforafewweekstoavoidlandapplicationduringunfavorableweatheroritcanbestoredforseveralmonths.
Composting
Compostinginvolvesthecontrolledaerobicdecompositionoforganicmaterialandcanoccurindifferentforms.Estimationmethodsareprovidedforinvessel,staticpile,intensivewindrow,andpassivewindrowcomposting.
Thermo‐chemicalconversion
Thermo‐chemicalconversioninvolvesthecombustionofanimalwaste,convertingCH4toCO2.Pyrolysis/gasificationisonemethodthathasreceivedmuchinterest.NomethodisprovidedasGHGsareconsiderednegligible.
LiquidManure
Aerobiclagoon Aerobiclagoonsinvolvethebiologicaloxidationofmanureasaliquidwithnaturalorforcedaeration.
Anaerobiclagoon/runoffholdingponds/storagetanks
Anaerobiclagoonsareearthenbasinsthatprovideanenvironmentforanaerobicdigestionandstorageofanimalwaste.Lagoonsmaybecoveredoruncoveredandhaveacrustornocrustformation.Runoffandholdingpondsareconstructedtocaptureandstorerunofffromfeedlotsanddry‐lots.Insomecaseswashwaterfromdairyparlorsmaybestoredinholdingponds.Storagetankstypicallystoreslurryorwastewaterthatwasscrapedorpumpedfromhousingsystems.
Combinedaerobictreatmentsystem
Thisprocessinvolvesremovingsolidsusingflocculationandthencompostingthesolidstreamandaeratingtheliquidstreamofmanure.
Anaerobicdigester
Anaerobicdigestersaremanuretreatmentsystemsdesignedtomaximizeconversionoforganicwastesintobiogas.Thesecanrangefromcoveredanaerobiclagoonstohighlyengineeredsystems.MethanegasleakageisthemainsourceofGHGemissions;NH3andN2Oleakageisnegligible.
Sand–manureseparation
Manureisseparatedfromsandandbeddingbymechanicalandsedimentationseparation.Nomethodisprovidedasemissionsarenegligible.Separatedliquidsandsolidscouldbeinputsintootherstoragesystems.
Nutrientremoval
Therearefourmainnitrogenremovalapproaches:biologicalnitrogenremoval,Anammox(i.e.,anaerobicammoniumoxidation),NH3stripping,ionexchange,andstruvitecrystallization.NomethodisprovidedduetolimitedquantitativeinformationonGHGgenerationfromnutrientremovalsystems.
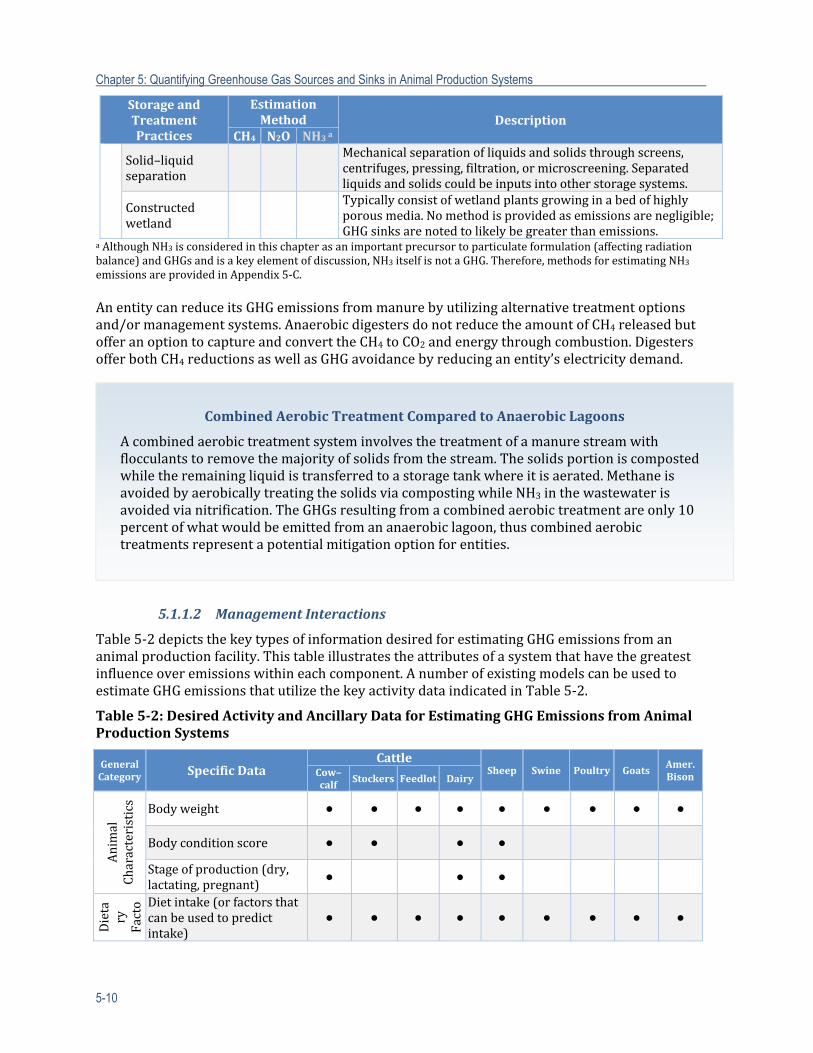
Chapter 5: Quantifying Greenhouse Gas Sources and Sinks in Animal Production Systems
5-10
StorageandTreatmentPractices
EstimationMethod Description
CH4 N2O NH3a
Solid–liquidseparation
Mechanicalseparationofliquidsandsolidsthroughscreens,centrifuges,pressing,filtration,ormicroscreening.Separatedliquidsandsolidscouldbeinputsintootherstoragesystems.
Constructedwetland
Typicallyconsistofwetlandplantsgrowinginabedofhighlyporousmedia.Nomethodisprovidedasemissionsarenegligible;GHGsinksarenotedtolikelybegreaterthanemissions.
aAlthoughNH3isconsideredinthischapterasanimportantprecursortoparticulateformulation(affectingradiationbalance)andGHGsandisakeyelementofdiscussion,NH3itselfisnotaGHG.Therefore,methodsforestimatingNH3emissionsareprovidedinAppendix5‐C.
AnentitycanreduceitsGHGemissionsfrommanurebyutilizingalternativetreatmentoptionsand/ormanagementsystems.AnaerobicdigestersdonotreducetheamountofCH4releasedbutofferanoptiontocaptureandconverttheCH4toCO2andenergythroughcombustion.DigestersofferbothCH4reductionsaswellasGHGavoidancebyreducinganentity’selectricitydemand.
5.1.1.2 ManagementInteractions
Table5‐2depictsthekeytypesofinformationdesiredforestimatingGHGemissionsfromananimalproductionfacility.Thistableillustratestheattributesofasystemthathavethegreatestinfluenceoveremissionswithineachcomponent.AnumberofexistingmodelscanbeusedtoestimateGHGemissionsthatutilizethekeyactivitydataindicatedinTable5‐2.
Table5‐2:DesiredActivityandAncillaryDataforEstimatingGHGEmissionsfromAnimalProductionSystems
GeneralCategory SpecificData
CattleSheep Swine Poultry Goats
Amer.BisonCow–
calfStockers Feedlot Dairy
Animal
Characteristics Bodyweight ● ● ● ● ● ● ● ● ●
Bodyconditionscore ● ● ● ●
Stageofproduction(dry,lactating,pregnant)
● ● ●
Dieta
ry
Facto Dietintake(orfactorsthatcanbeusedtopredictintake)
● ● ● ● ● ● ● ● ●
CombinedAerobicTreatmentComparedtoAnaerobicLagoons
Acombinedaerobictreatmentsysteminvolvesthetreatmentofamanurestreamwithflocculantstoremovethemajorityofsolidsfromthestream.Thesolidsportioniscompostedwhiletheremainingliquidistransferredtoastoragetankwhereitisaerated.MethaneisavoidedbyaerobicallytreatingthesolidsviacompostingwhileNH3inthewastewaterisavoidedvianitrification.TheGHGsresultingfromacombinedaerobictreatmentareonly10percentofwhatwouldbeemittedfromananaerobiclagoon,thuscombinedaerobictreatmentsrepresentapotentialmitigationoptionforentities.
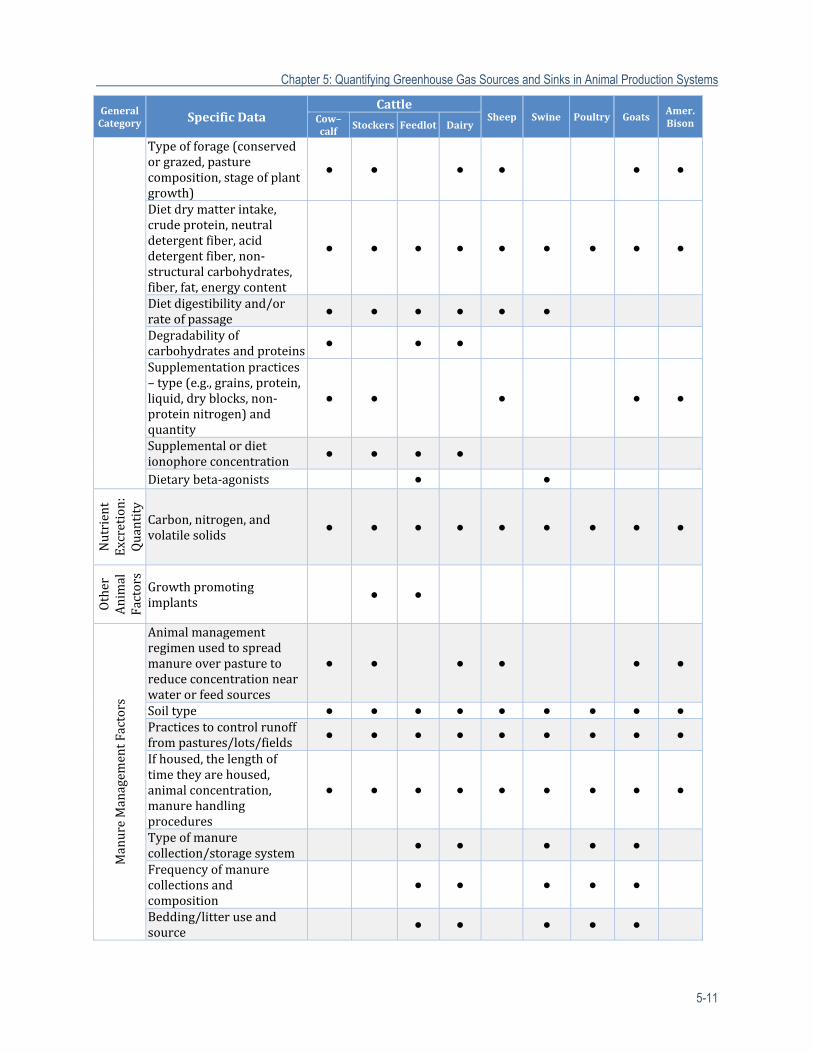
Chapter 5: Quantifying Greenhouse Gas Sources and Sinks in Animal Production Systems
5-11
GeneralCategory SpecificData
CattleSheep Swine Poultry Goats
Amer.BisonCow–
calfStockers Feedlot Dairy
Typeofforage(conservedorgrazed,pasturecomposition,stageofplantgrowth)
● ● ● ● ● ●
Dietdrymatterintake,crudeprotein,neutraldetergentfiber,aciddetergentfiber,non‐structuralcarbohydrates,fiber,fat,energycontent
● ● ● ● ● ● ● ● ●
Dietdigestibilityand/orrateofpassage
● ● ● ● ● ●
Degradabilityofcarbohydratesandproteins
● ● ●
Supplementationpractices– type(e.g.,grains,protein,liquid,dryblocks,non‐proteinnitrogen)andquantity
● ● ● ● ●
Supplementalordietionophoreconcentration
● ● ● ●
Dietarybeta‐agonists ● ●
Nutrient
Excretion:
Quantity
Carbon,nitrogen,andvolatilesolids
● ● ● ● ● ● ● ● ●
Other
Animal
Factors
Growthpromotingimplants
● ●
ManureManagem
entFactors
Animalmanagementregimenusedtospreadmanureoverpasturetoreduceconcentrationnearwaterorfeedsources
● ● ● ● ● ●
Soiltype ● ● ● ● ● ● ● ● ● Practicestocontrolrunofffrompastures/lots/fields
● ● ● ● ● ● ● ● ●
Ifhoused,thelengthoftimetheyarehoused,animalconcentration,manurehandlingprocedures
● ● ● ● ● ● ● ● ●
Typeofmanurecollection/storagesystem
● ● ● ● ●
Frequencyofmanurecollectionsandcomposition
● ● ● ● ●
Bedding/litteruseandsource
● ● ● ● ●
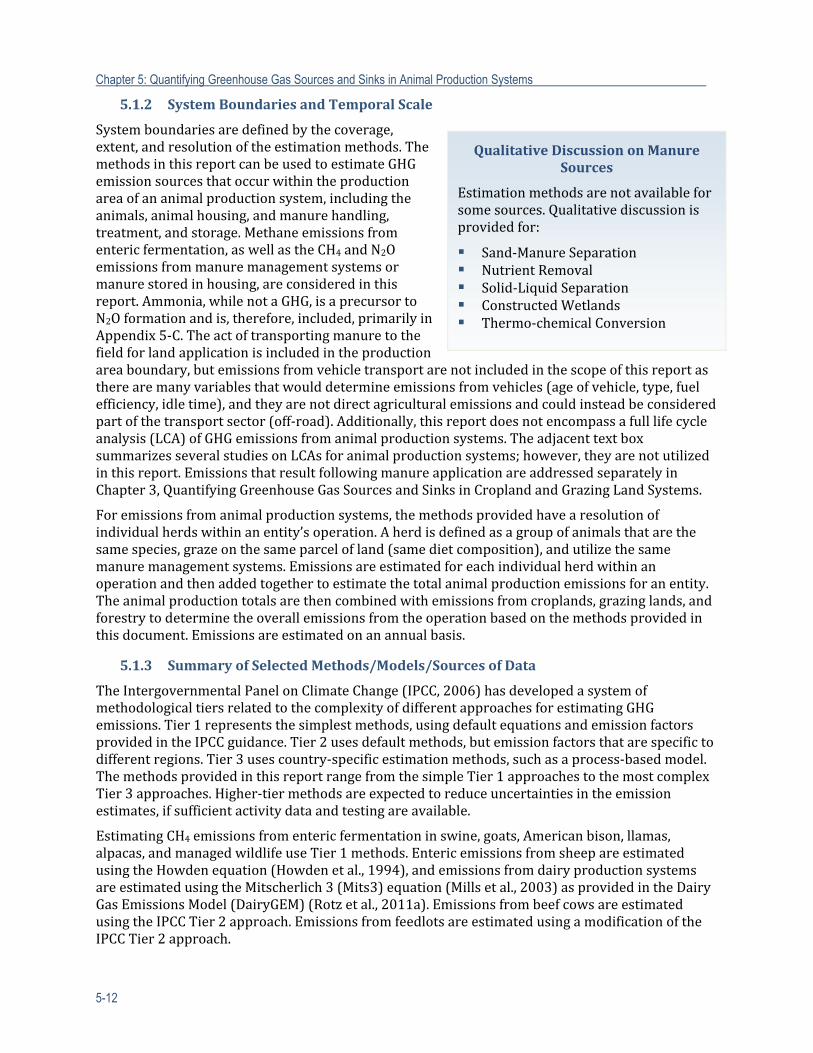
Chapter 5: Quantifying Greenhouse Gas Sources and Sinks in Animal Production Systems
5-12
5.1.2 SystemBoundariesandTemporalScale
Systemboundariesaredefinedbythecoverage,extent,andresolutionoftheestimationmethods.ThemethodsinthisreportcanbeusedtoestimateGHGemissionsourcesthatoccurwithintheproductionareaofananimalproductionsystem,includingtheanimals,animalhousing,andmanurehandling,treatment,andstorage.Methaneemissionsfromentericfermentation,aswellastheCH4andN2Oemissionsfrommanuremanagementsystemsormanurestoredinhousing,areconsideredinthisreport.Ammonia,whilenotaGHG,isaprecursortoN2Oformationandis,therefore,included,primarilyinAppendix5‐C.Theactoftransportingmanuretothefieldforlandapplicationisincludedintheproductionareaboundary,butemissionsfromvehicletransportarenotincludedinthescopeofthisreportastherearemanyvariablesthatwoulddetermineemissionsfromvehicles(ageofvehicle,type,fuelefficiency,idletime),andtheyarenotdirectagriculturalemissionsandcouldinsteadbeconsideredpartofthetransportsector(off‐road).Additionally,thisreportdoesnotencompassafulllifecycleanalysis(LCA)ofGHGemissionsfromanimalproductionsystems.TheadjacenttextboxsummarizesseveralstudiesonLCAsforanimalproductionsystems;however,theyarenotutilizedinthisreport.EmissionsthatresultfollowingmanureapplicationareaddressedseparatelyinChapter3,QuantifyingGreenhouseGasSourcesandSinksinCroplandandGrazingLandSystems.
Foremissionsfromanimalproductionsystems,themethodsprovidedhavearesolutionofindividualherdswithinanentity’soperation.Aherdisdefinedasagroupofanimalsthatarethesamespecies,grazeonthesameparcelofland(samedietcomposition),andutilizethesamemanuremanagementsystems.Emissionsareestimatedforeachindividualherdwithinanoperationandthenaddedtogethertoestimatethetotalanimalproductionemissionsforanentity.Theanimalproductiontotalsarethencombinedwithemissionsfromcroplands,grazinglands,andforestrytodeterminetheoverallemissionsfromtheoperationbasedonthemethodsprovidedinthisdocument.Emissionsareestimatedonanannualbasis.
5.1.3 SummaryofSelectedMethods/Models/SourcesofData
TheIntergovernmentalPanelonClimateChange(IPCC,2006)hasdevelopedasystemofmethodologicaltiersrelatedtothecomplexityofdifferentapproachesforestimatingGHGemissions.Tier1representsthesimplestmethods,usingdefaultequationsandemissionfactorsprovidedintheIPCCguidance.Tier2usesdefaultmethods,butemissionfactorsthatarespecifictodifferentregions.Tier3usescountry‐specificestimationmethods,suchasaprocess‐basedmodel.ThemethodsprovidedinthisreportrangefromthesimpleTier1approachestothemostcomplexTier3approaches.Higher‐tiermethodsareexpectedtoreduceuncertaintiesintheemissionestimates,ifsufficientactivitydataandtestingareavailable.
EstimatingCH4emissionsfromentericfermentationinswine,goats,Americanbison,llamas,alpacas,andmanagedwildlifeuseTier1methods.EntericemissionsfromsheepareestimatedusingtheHowdenequation(Howdenetal.,1994),andemissionsfromdairyproductionsystemsareestimatedusingtheMitscherlich3(Mits3)equation(Millsetal.,2003)asprovidedintheDairyGasEmissionsModel(DairyGEM)(Rotzetal.,2011a).EmissionsfrombeefcowsareestimatedusingtheIPCCTier2approach.EmissionsfromfeedlotsareestimatedusingamodificationoftheIPCCTier2approach.
QualitativeDiscussiononManureSources
Estimationmethodsarenotavailableforsomesources.Qualitativediscussionisprovidedfor:
Sand‐ManureSeparation NutrientRemoval Solid‐LiquidSeparation ConstructedWetlands Thermo‐chemicalConversion
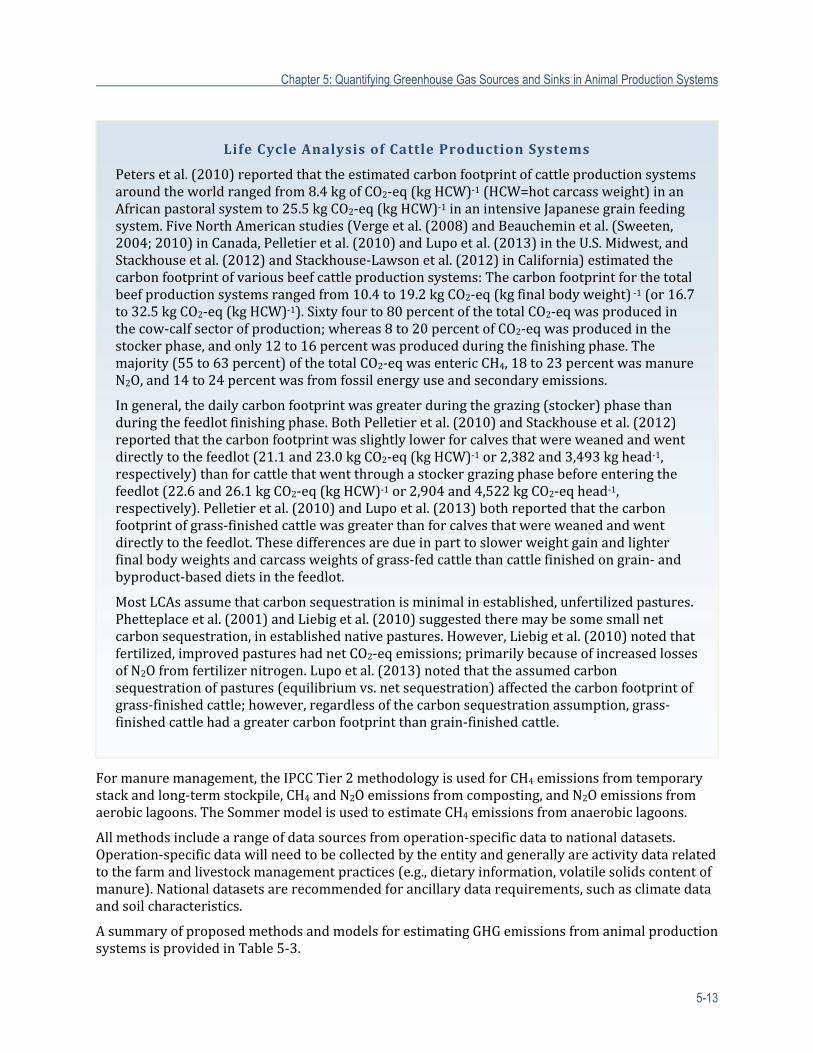
Chapter 5: Quantifying Greenhouse Gas Sources and Sinks in Animal Production Systems
5-13
Formanuremanagement,theIPCCTier2methodologyisusedforCH4emissionsfromtemporarystackandlong‐termstockpile,CH4andN2Oemissionsfromcomposting,andN2Oemissionsfromaerobiclagoons.TheSommermodelisusedtoestimateCH4emissionsfromanaerobiclagoons.
Allmethodsincludearangeofdatasourcesfromoperation‐specificdatatonationaldatasets.Operation‐specificdatawillneedtobecollectedbytheentityandgenerallyareactivitydatarelatedtothefarmandlivestockmanagementpractices(e.g.,dietaryinformation,volatilesolidscontentofmanure).Nationaldatasetsarerecommendedforancillarydatarequirements,suchasclimatedataandsoilcharacteristics.
AsummaryofproposedmethodsandmodelsforestimatingGHGemissionsfromanimalproductionsystemsisprovidedinTable5‐3.
Life Cycle Analysis of Cattle Production Systems
Petersetal.(2010)reportedthattheestimatedcarbonfootprintofcattleproductionsystemsaroundtheworldrangedfrom8.4kgofCO2‐eq(kgHCW)‐1(HCW=hotcarcassweight)inanAfricanpastoralsystemto25.5kgCO2‐eq(kgHCW)‐1inanintensiveJapanesegrainfeedingsystem.FiveNorthAmericanstudies(Vergeetal.(2008)andBeaucheminetal.(Sweeten,2004;2010)inCanada,Pelletieretal.(2010)andLupoetal.(2013)intheU.S.Midwest,andStackhouseetal.(2012)andStackhouse‐Lawsonetal.(2012)inCalifornia)estimatedthecarbonfootprintofvariousbeefcattleproductionsystems:Thecarbonfootprintforthetotalbeefproductionsystemsrangedfrom10.4to19.2kgCO2‐eq(kgfinalbodyweight)‐1(or16.7to32.5kgCO2‐eq(kgHCW)‐1).Sixtyfourto80percentofthetotalCO2‐eqwasproducedinthecow‐calfsectorofproduction;whereas8to20percentofCO2‐eqwasproducedinthestockerphase,andonly12to16percentwasproducedduringthefinishingphase.Themajority(55to63percent)ofthetotalCO2‐eqwasentericCH4,18to23percentwasmanureN2O,and14to24percentwasfromfossilenergyuseandsecondaryemissions.
Ingeneral,thedailycarbonfootprintwasgreaterduringthegrazing(stocker)phasethanduringthefeedlotfinishingphase.BothPelletieretal.(2010)andStackhouseetal.(2012)reportedthatthecarbonfootprintwasslightlylowerforcalvesthatwereweanedandwentdirectlytothefeedlot(21.1and23.0kgCO2‐eq(kgHCW)‐1or2,382and3,493kghead‐1,respectively)thanforcattlethatwentthroughastockergrazingphasebeforeenteringthefeedlot(22.6and26.1kgCO2‐eq(kgHCW)‐1or2,904and4,522kgCO2‐eqhead‐1,respectively).Pelletieretal.(2010)andLupoetal.(2013)bothreportedthatthecarbonfootprintofgrass‐finishedcattlewasgreaterthanforcalvesthatwereweanedandwentdirectlytothefeedlot.Thesedifferencesaredueinparttoslowerweightgainandlighterfinalbodyweightsandcarcassweightsofgrass‐fedcattlethancattlefinishedongrain‐andbyproduct‐baseddietsinthefeedlot.
MostLCAsassumethatcarbonsequestrationisminimalinestablished,unfertilizedpastures.Phetteplaceetal.(2001)andLiebigetal.(2010)suggestedtheremaybesomesmallnetcarbonsequestration,inestablishednativepastures.However,Liebigetal.(2010)notedthatfertilized,improvedpastureshadnetCO2‐eqemissions;primarilybecauseofincreasedlossesofN2Ofromfertilizernitrogen.Lupoetal.(2013)notedthattheassumedcarbonsequestrationofpastures(equilibriumvs.netsequestration)affectedthecarbonfootprintofgrass‐finishedcattle;however,regardlessofthecarbonsequestrationassumption,grass‐finishedcattlehadagreatercarbonfootprintthangrain‐finishedcattle.
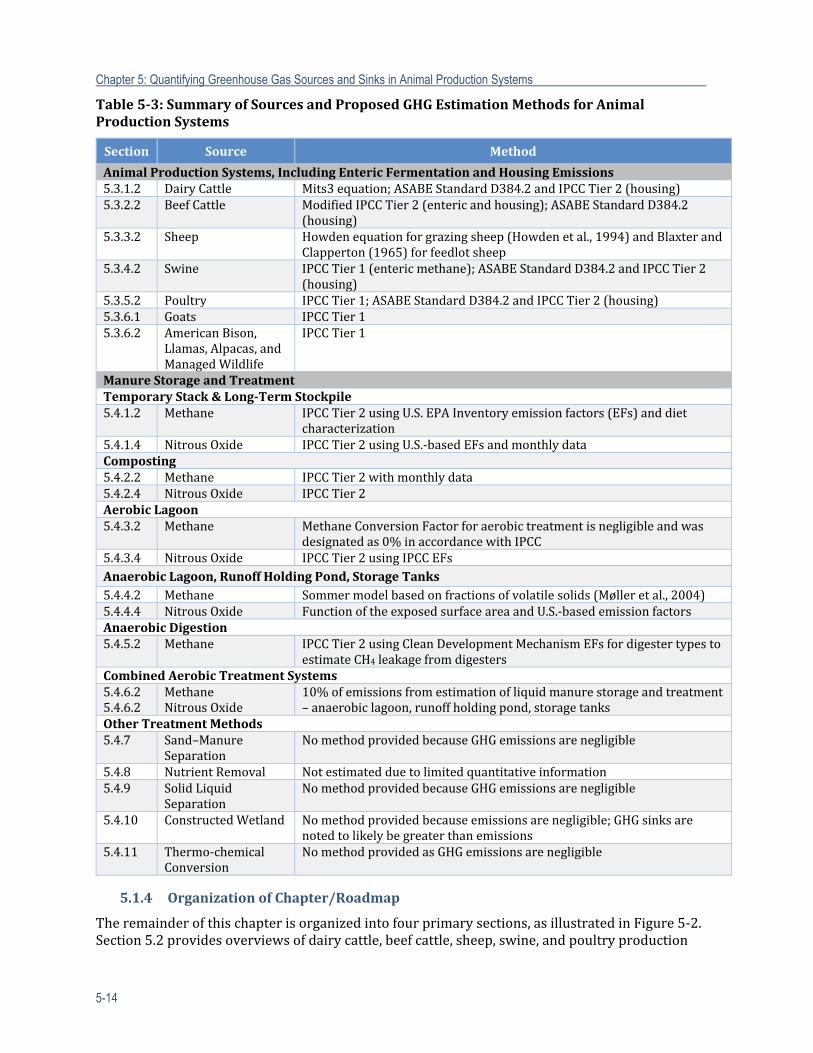
Chapter 5: Quantifying Greenhouse Gas Sources and Sinks in Animal Production Systems
5-14
Table5‐3:SummaryofSourcesandProposedGHGEstimationMethodsforAnimalProductionSystems
Section Source Method
AnimalProductionSystems,IncludingEntericFermentationandHousingEmissions5.3.1.2 DairyCattle Mits3equation; ASABEStandardD384.2andIPCCTier2(housing)5.3.2.2 BeefCattle ModifiedIPCCTier2 (entericandhousing);ASABEStandardD384.2
(housing)5.3.3.2 Sheep Howdenequationforgrazingsheep(Howden etal.,1994)andBlaxterand
Clapperton(1965)forfeedlotsheep5.3.4.2 Swine IPCCTier1 (entericmethane);ASABEStandardD384.2andIPCCTier2
(housing)5.3.5.2 Poultry IPCCTier1;ASABEStandardD384.2andIPCCTier2(housing)5.3.6.1 Goats IPCCTier15.3.6.2 AmericanBison,
Llamas,Alpacas,andManagedWildlife
IPCCTier1
ManureStorageandTreatmentTemporaryStack&Long‐TermStockpile5.4.1.2 Methane IPCCTier2usingU.S.EPAInventoryemissionfactors(EFs)anddiet
characterization5.4.1.4 NitrousOxide IPCCTier2usingU.S.‐basedEFsandmonthlydataComposting5.4.2.2 Methane IPCCTier2withmonthlydata5.4.2.4 NitrousOxide IPCCTier2AerobicLagoon5.4.3.2 Methane MethaneConversionFactor foraerobictreatmentisnegligibleandwas
designatedas0%inaccordancewithIPCC5.4.3.4 NitrousOxide IPCCTier2usingIPCCEFsAnaerobicLagoon,RunoffHoldingPond,StorageTanks5.4.4.2 Methane Sommermodelbasedon fractionsofvolatilesolids(Mølleretal.,2004)5.4.4.4 NitrousOxide FunctionoftheexposedsurfaceareaandU.S.‐basedemissionfactorsAnaerobicDigestion5.4.5.2 Methane IPCCTier2usingCleanDevelopmentMechanismEFsfordigestertypesto
estimateCH4leakagefromdigestersCombinedAerobicTreatmentSystems5.4.6.25.4.6.2
MethaneNitrousOxide
10%ofemissionsfromestimationofliquidmanurestorageandtreatment–anaerobiclagoon,runoffholdingpond,storagetanks
OtherTreatmentMethods5.4.7 Sand–Manure
SeparationNomethodprovidedbecause GHGemissionsarenegligible
5.4.8 NutrientRemoval Notestimatedduetolimitedquantitativeinformation5.4.9 SolidLiquid
SeparationNomethodprovidedbecause GHGemissionsarenegligible
5.4.10 ConstructedWetland Nomethodprovidedbecauseemissionsarenegligible;GHGsinksarenotedtolikelybegreaterthanemissions
5.4.11 Thermo‐chemicalConversion
NomethodprovidedasGHGemissionsarenegligible
5.1.4 OrganizationofChapter/Roadmap
Theremainderofthischapterisorganizedintofourprimarysections,asillustratedinFigure5‐2.Section5.2providesoverviewsofdairycattle,beefcattle,sheep,swine,andpoultryproduction
Chapter 5: Quantifying Greenhouse Gas Sources and Sinks in Animal Production Systems
5-15
systemsandprovidesinformationondietandhousing.Section5.3providesthemethodsforestimatingGHGsfromhousing,primarilyfocusingonGHGsfromentericfermentation.MethodsarealsoprovidedforallthespeciesdescribedinSection5.2,plusadditionalanimaltypes(i.e.,goats,Americanbison,llamas,alpacas,andmanagedwildlife).Section5.4providesthemethodologyforestimatingemissionsfromdifferentmanuremanagementsystems.MethodologyisprovidedtoestimateCH4andN2Ofromtemporarystackandlong‐termstockpiles,composting,aerobiclagoons,anaerobiclagoons,andcombinedaerobictreatmentsystems.Section5.4alsoprovidesmethodsforestimatingCH4fromanaerobicdigestion.Aqualitativediscussionisprovidedforsand‐manureseparation,nutrientremoval,solid‐liquidseparation,constructedwetlands,orthermo‐chemicalconversion.Section5.5presentsresearchgapsforbothentericfermentationandmanuremanagement.
Therearefiveappendicestotheanimalproductionsystemschapterofthisreport.Appendix5‐AprovidesYmadjustmentfactorsforcalculatingentericCH4fromfeedlotcattle.Appendix5‐Bprovidesnutritionalinformationaboutanimalfeedstuffs(Ewan,1989;Preston,2013).Appendix5‐CdiscussesavailablemethodologiesforestimatingNH3emissionsfromanimalproductionsystems.Appendix5‐DdescribestheshapefactorsandrelatedequationsthatcanbeappliedinAppendix5‐Ctomoreaccuratelyestimateemissionsfrommanurestockpilesthatareshapeddifferently(assurfaceareapartiallydeterminesemissions).Appendix5‐Eprovidesadetailedreviewofmodelsevaluatedforsuitabilityforestimatingemissionsfromanimalproductionsystems.
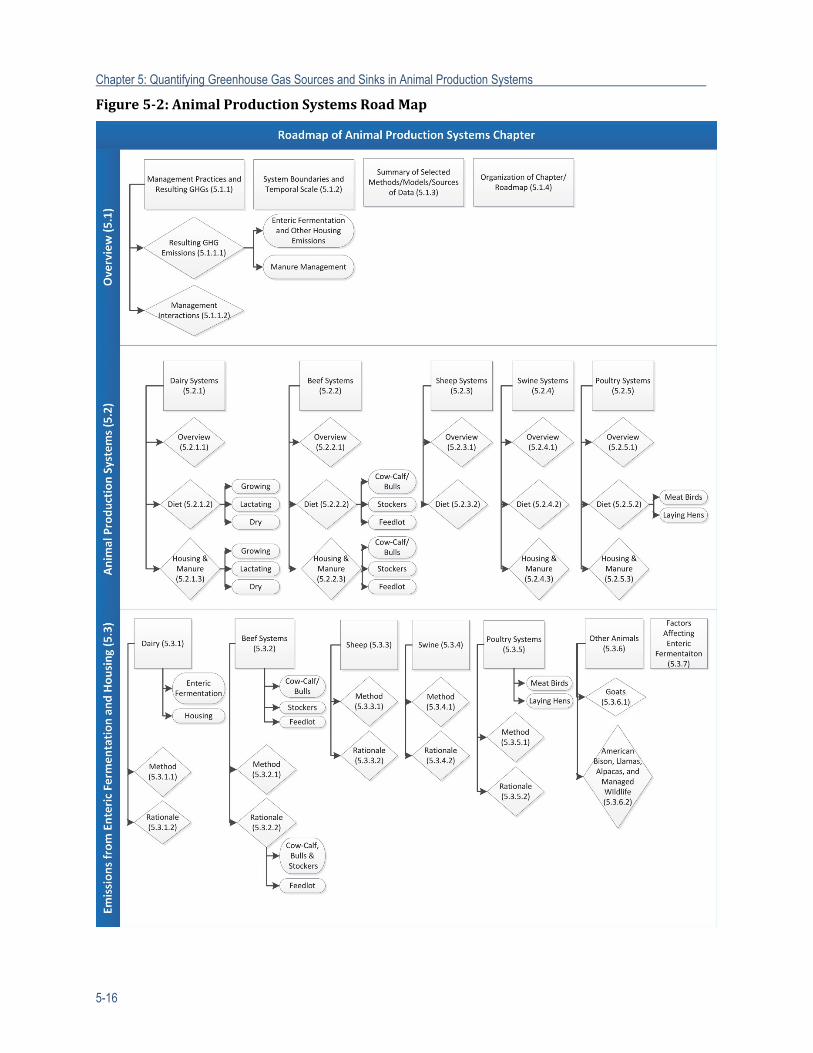
Chapter 5: Quantifying Greenhouse Gas Sources and Sinks in Animal Production Systems
5-16
Figure5‐2:AnimalProductionSystemsRoadMap
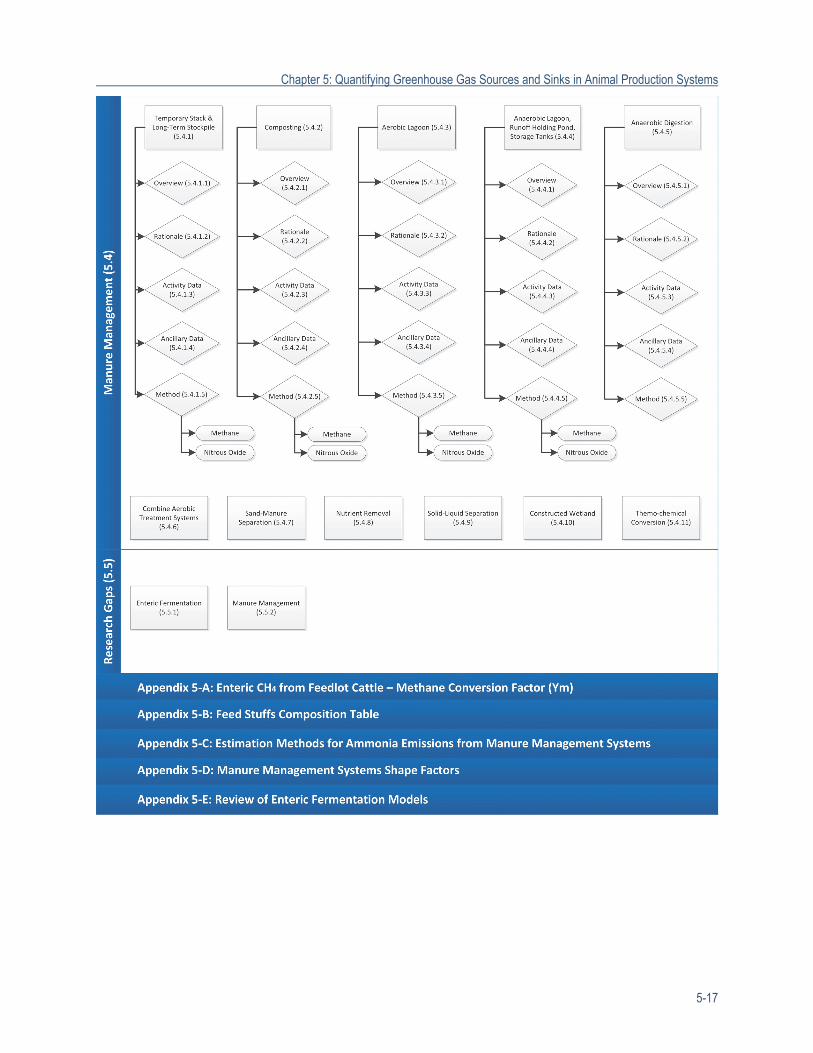
Chapter 5: Quantifying Greenhouse Gas Sources and Sinks in Animal Production Systems
5-17
Chapter 5: Quantifying Greenhouse Gas Sources and Sinks in Animal Production Systems
5-18
5.2 AnimalProductionSystems
Thissectionprovidesdiscussionontheproductionsystemsforbeefanddairycattle,sheep,swine,andpoultry.ThisprovidesthebackgroundnecessaryforunderstandingSection5.3,whichcoversGHGemissionsfromanimalproductionsystems.
5.2.1 DairyProductionSystems
5.2.1.1 OverviewofDairyProductionSystems
TheU.S.dairyproductionsystemiscomprisedofseveralkeyprocessesfordairycattle,theirmanure,andtheirendproducts(meat,dairy)asdepictedinFigure5‐3.Thisconceptualmodelprovidesanoverviewofthetypicaldairysystem,followingcattlefrombirthtoslaughterandfollowingmanurefromtheanimalthroughamanagementsystem.Manureisproducedduringeachstage,anddependingonthelocation,ismanageddifferently.ThemanagementoftheresultantmanurehasimplicationsonthequantityofGHGemissionsandsinks;thekeypracticesarediscussedindetailbelow.Theestimationmethodsinthischapterincludediscussionsforemissionsfromentericfermentation,housing,andmanuremanagementandarenotafullLCA.
TheU.S.dairyindustryiscomposedprimarilyoffourmajorsegmentsofproduction:1)calfrearing;2)replacementheifers;3)lactatingcows;and4)nonlactating(dry)cows.TheU.S.dairycattlepopulationin2012consistedofapproximately9.2millionmilkcowsandfirstcalfheifersandapproximately4.6millionreplacementheifers.ThemajorityofdairycattleintheUnitedStatesareHolstein(Holstein‐Friesian),followedbyJersey,withsmallernumbersofGuernsey,BrownSwiss,andAyrshire.Overthelast65yearstherehavebeendramaticincreasesinmilkproductionperanimal,duetochangesinherdmanagement,nutrition,composition,andbreedingprograms.Present‐daydairyherdsaredominatedbyHolsteincows(90percent)asopposedtoamixofthefivemostcommonbreeds(Jersey,Guernsey,Ayrshire,BrownSwiss,andHolstein)aswascommoninthe1940s.Withachangeinbreeddominanceandenhancedgenetics,thetypicalmilkproductionpercowhasincreasedfrom2,074to9,193kgofmilkperyear(Capperetal.,2009).
5.2.1.2 DietsforDairyCattle
Cowsinintensivedairyproductionsystemsarefeddietsthatreflectregionallyavailablefeedsandtypicallycontainbetween40and60percentconcentrates,suchasfeedgrains,proteinsupplements,andbyproductssuchasdistiller’sgrains.Typicaldietsincludecornsilage,alfalfaorgrasssilage,alfalfahay,groundorhigh‐moistureshelledcorn,soybeanmeal,fuzzywholecottonseed,andoftenbyproductfeeds(e.g.,corngluten,distiller’sgrains,soybeanhulls,citruspulp,beetpulp).Byproductfeedsmaymakeupalargeportionofthedietcomposition,providingkeynutrientsandameansofdisposalforotherwiselandfilledingredients.Proximitytocropprocessingplantsandindustriesmaydictatetheavailabilityofbyproductfeedsbyregion.
GrowingHeifersDietsforgrowingheifersareformulatedbasedongrowthrateandstageofrumendevelopment.Dietsrangefromliquiddiets(e.g.,milkormilkreplacer)innewborncalvestopelletedcompletefeedsinthegrowingcalf(e.g.,calfstarter)todietsthataresimilartothatofferedtolactatingcowsasthecowsgrowandrumensdevelop.Roughagecontentofthedietincreasesastherumendevelopswithhayorsilageoftenofferedinconjunctionwithacalfstarterduringatransitionperiod.Followingthattransition,typicalfeedsincludethoselistedabove.FeedsareoftenmixedtogetherinamixerandfedasaTotalMixedRation(TMR).Insomecases,feednotconsumedbythelactatingherdisfedtogrowingheiferswhentherumenisfullydeveloped(>9monthsofage).
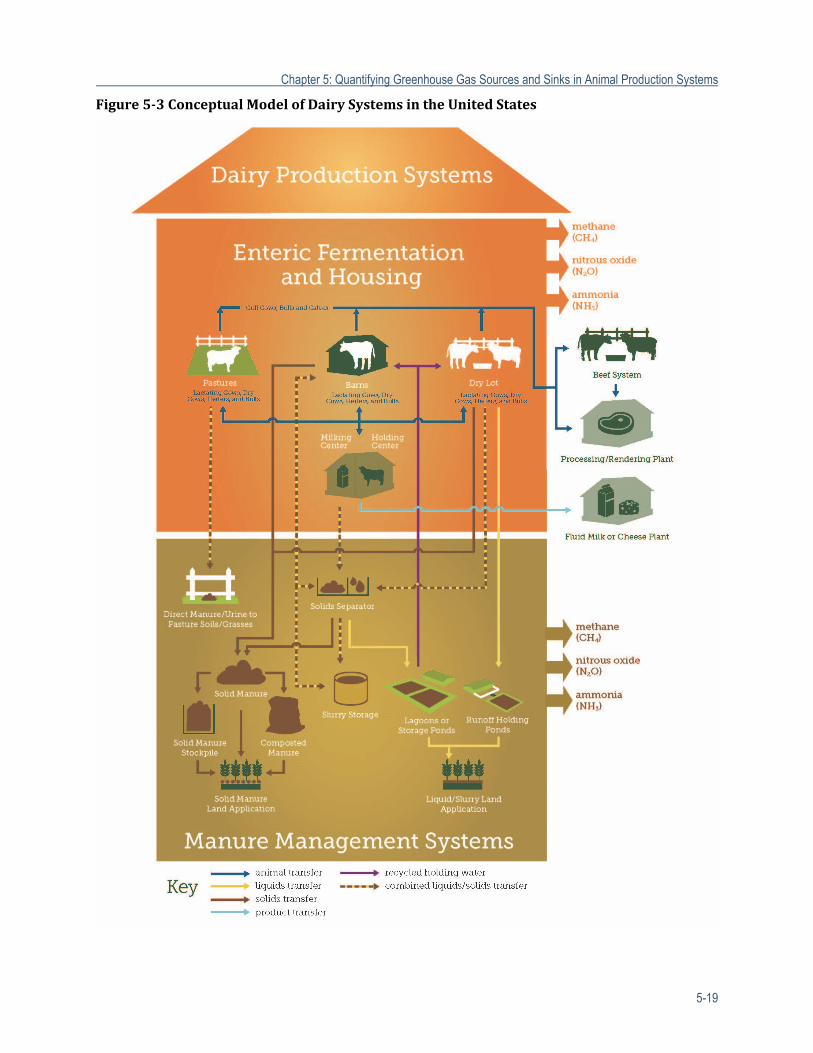
Chapter 5: Quantifying Greenhouse Gas Sources and Sinks in Animal Production Systems
5-19
Figure5‐3ConceptualModelofDairySystemsintheUnitedStates
Chapter 5: Quantifying Greenhouse Gas Sources and Sinks in Animal Production Systems
5-20
LactatingCowsDietsforlactatingcowsareformulatedbytargetmilkproductionorstageoflactation,whichreflectsthedifferencesinenergyandproteinrequiredfordifferentamountsofmilkproduced.Peaklactationoccursabout60daysaftercalving,andproductionslowlydeclinesoverthenextseveralmonths.FeedstuffsarecommonlyblendedtogetherinamixerandfedasaTMR.
DryCowsDrycowdietsareoftenformulatedintotwostages:far‐offdryandclose‐updry.Duringthefar‐offdryperiod,cowsarefeddietswithhighforagecontent(>60%)usingingredientssimilartothatfedtothelactatingherd.Asdrycowsapproachcalving,energycontentofthedietincreasesbydecreasingforagetoincludemoreconcentratefeedsandmineralformulationchangesinordertoavoidpre‐andpost‐partummetabolicdisordersthatoftencenteraroundcalciummobilizationasthecowbeginstolactate.FeedstuffsarecommonlyblendedtogetherinamixerandfedasaTMR
5.2.1.3 DairyHousingandManureHandling
TwogeneraldairyfarmtypescanbedistinguishedintheUnitedStates:confinementfeedingsystems(includingbarnsanddry‐lots)andpasture‐basedsystems(USDA,2004a).Typicalhousingsystemsforconfinementfeedingoperationsincludetiestallbarns,freestallbarns,freestallbarnswithdrylotaccess,anddrylots.Drylotsystemsconsistofhousinganimalsinpenssimilartobeefcattlefeedlots,butatalowerstockingdensity.Inpasture‐basedsystems,cattlegrazepastureforperiodsoftime,basedonfeedavailabilityandenvironmentalconditions,andarehousedinbarnsandfedstoredfeedwhenpastureisnotavailable.Thedairycattlelifecycleproductionphaseisgenerallydividedintothreesegments:growinganimals(calvesandreplacementheifers),lactatingmaturecows,anddrymaturecows.Nutrientneeds,andthereforediets,andintakeareverydifferentbetweenthedifferentlifecyclephases:growingcattle(calvesandheifers),lactatingcows,anddrycows.Housingandmanuremanagementsystemsvaryconsiderablythroughoutthecountryandcandifferinaregionandbythesizeoftheherd.Incaseswherehousingandmanuremanagementvariesbyanimalgroup(e.g.,heifers,dry,andlactatingcows),estimatesofGHGemissionsfromonegrouparenotapplicabletoothergroups.Whenhousingandmanuremanagementaresimilarbetweengroups(e.g.,allcattleondry‐lots),dietandintakeadjustmentfactorscanbeusedtocompareGHGemissionsforthedifferentgroups.
Withtheexceptionofcalves,replacementheifersanddrycowsmaybehousedandmanagedinsimilarwaysaslactatingcows.Whenthisisthecase,muchofthediscussionisrelevanttothethreegroups.Incaseswherethelactatingherdismanagedinconfinementbutreplacementanddryanimalsaremanagedonpastureorindry‐lots,emissionsfromlactatingcattlearenotapplicablenotonlyduetodifferencesindietandintakebutalsoduetohousingdifferences.Therearenoreadilyavailablestudiesthathavefocusedstrictlyonemissionsfromdairycalfmanagementandhousing.Summarizedbelowarekeycharacteristicsofdifferenceinhousingbylifecyclephaseofadairycow.
Growing(calvesandreplacementheifers).Followingbirth,calvesareusuallyremovedfromthecowwithinafewhoursandaretypicallyrearedonmilkormilkreplacerincalfhutchesorbarnsforthreetosevenweeksuntilweaning.Femalecalves(replacementheifers)aretypicallymovedtogrouphousing(e.g.,superhutches,transitionbarns,openhousing,orpasture)untiltheyreachappropriatebreedingweightatabout14to15monthsofage.Somereplacementsarecontract‐rearedbyheifergrowersorsold.Followingbreeding,heifersareoftenraisedinlots,pasture,orbarnsuntiltheyarereadytocalve.Manureingrouphousingmaybehandledasasolid(beddedpackorcompostbarn)orasaslurry,similartothatdescribedbelowforlactatingcowsinfreestallbarns.
Chapter 5: Quantifying Greenhouse Gas Sources and Sinks in Animal Production Systems
5-21
LactatingCows.Heiferstypicallyhavetheirfirstcalfatabout23to24monthsofage,afterwhichtheyjointheproductionherd.Acowtypicallyremainsintheherduntilaboutfiveyearsofage,althoughmanycowsarecapableofremainingproductiveintheherdfor12to15years.Eachperiodofproductionorlactationlastsfor11to14monthsorlongerandspansthetimeperiodfromcalvingtodry‐off,whichiswhenmilkingisterminatedabout40to60daysbeforethenextanticipatedcalving.Thus,cowsarebredwhiletheyareproducingmilk,usuallybeginningatabout60daysaftercalving,tomaintainayearlycalvingschedule.Followingthe35to60‐daydryperiod,thecowcalvesagain,andthelactationcyclebeginsanew.Cowsaverageabout2.8lactations,althoughmanyremainproductiveconsiderablylonger(Hareetal.,2006).
Lactatingcowsmaybehousedintiestall(stanchion)barns,whichlimitthecows’mobilitybecausethecowsaretethered,fed,andmilkedinthestalls.Agutterisusedtoremovethemanurebyabarncleaner,whichtypicallyplacesthemanuredirectlyintoamanurespreaderorinatemporarystoragepile.Freestallbarnsallowthecowstomovefreelyinandoutofstalls,andthecowsaremovedtoaseparatearea(milkingcenterorparlor)formilking.Manuretypicallyaccumulatesinalleywaysandisremovedviascraping,vacuuming,orflushingwitheithercleanorrecirculatedwater.Somefreestallbarnshaveslottedfloorswithlong‐termmanurestoragebelowthefloors.Manureisgenerallyworkednaturallythroughtheslotsbythecows’feetandwithassistanceviamechanicalscrapingequipment.Dairyfacilitiesmayalsousepasturesanddry‐lotstohouselactatingcows.Lotsarescrapedperiodically,asarepasturesoccasionally,andthesolidmanureiscollected.Althoughnotprevalent,somedairyfacilitiesmayhouselactatingcowsinbeddedpackorcompostbarns,againhandlingmanureasasolidmaterial.
DryCows.Muchlikegrowingcows,housingoptionsfordrycowsarethesameasdescribedaboveforlactatingcows.Thekeydeterminantismanagementpreferenceforthefarmownerand/orfacilityavailability.
Manureandsoiledbeddingfrombarnscanbehandledinanumberofways.Manurecanberemovedfromthebarnsmechanicallyanddirectlyloadedintomanurespreaders,althoughthisisnotcommononmediumandlargefarms.Manurecanalsobeprocessedinananaerobicdigesterwherebacteriacanbreakdownmanuretoproducebiogasthatcanbeflaredorcapturedforenergypurposespriortostorageofdigestereffluent.Whenmanurehasalowersolidscontent,itmaybestoredinatankorpitasaslurry,ortransportedtoasolid‐liquidseparationsystemwiththeliquidfractionconveyed(pumpedorbygravity)toalong‐termstoragepond,whilethesolidscanbedewaterednaturallyandreusedasbedding,composted,land‐applied,and/orsold.Indry‐lotsystems,themanureinthepensistypicallystackedandfollowingstorageiseitherland‐appliedorcomposted.Lotrunoffandmilkingparlorwashwaterispumpedtoastoragepond.Therearesomedry‐lotdairiesthatuseaflushsystemtocleanmanurefromalleywaysbehindthefeedbunks;thiswashwateriseventuallystoredinawastewaterpond.Openfreestalldairieshaveacombinationofbarnswithexerciseyardsbetweenthebarns,andthereforemanureishandledsimilarlyasinatraditionalfreestallbarnanddry‐lotproductionsystem.Wastewaterfrommilkingcenters(manure,clean‐in‐placewater,andfloorwashdownwater)istypicallycombinedwithbarnmanuredestinedforlong‐termstorage,andmaygothroughasolid‐liquidseparationprocessfirst.Inpasture‐basedsystems,manureisdepositeddirectlyontothepastureandthereforenotintensivelymanaged,butmayaccumulateinareaswhereanimalstendtocongregate(e.g.,wateringareas,shade).

Chapter 5: Quantifying Greenhouse Gas Sources and Sinks in Animal Production Systems
5-22
5.2.2 BeefProductionSystems
5.2.2.1 OverviewofBeefProductionSystems
TheU.S.beefproductionsystemiscomprisedofseveralkeycomponentsforbeefcattle,theirwaste,andtheirendproducts,asdepictedinFigure5‐4.Thisconceptualmodelprovidesanoverviewofthetypicalbeefprocessingsystems,followingthesegmentsofthebeefcattleindustry(i.e.,cow‐calf,stocker,feeder/finisher,andpacker)frombirthtoslaughterandfollowingwastefromtheanimalthroughamanagementsystem.Wasteisproducedduringeachstageofactivityoccurringinthesystem,anddependingonthelocation,ismanageddifferently.
Ofthe90millionbeefcattleintheUnitedStates,approximately50millionarematurecowsandtheircalvesoncow‐calfoperations(USDANASS,2012),whichrangeinsizefromafewcowstoseveralthousandcows.Theseoperationsarenormallybasedonforages,eitherimprovedpasturesornativerange,andvaryinsizefromafewacrestohundredsofsections.Typically,whencalvesare150to220daysofagetheyareweanedandmovedtopastureforperiodsof60to200days(thestockerphase),althoughsomemaymovedirectlytoafeedlot.Thepasturesmaybenativerange,improvedperennialpastures,orannualssuchaswheatpasture,forage‐sorghums,andcropresiduessuchascornstalks.Afterthestockerphase,calvesnormallymovetofeedlotswheretheyarefedgrain‐andbyproduct‐baseddietsfor110to160days,untiltheyarereadyforharvest.Inaddition,steersandcullheifersfromdairyoperationsarealsofed.Approximately23millioncattlearefedinfeedlotsannuallyintheUnitedStates.Feedlotsrangeinsizefromafewhundredheadtomorethan100,000headcapacity.
5.2.2.2 DietInformationforBeefCattle
Cow‐CalfandBullsGrazingpasturesmaybenativerange,improvedperennialpastures,orannualssuchaswheatpasture,forage‐sorghums,andcropresiduessuchascornstalks.Beefcowsandbullsaretypicallyfedsupplementalfeedsduringtimeswhenpastureorrangeforagedoesnotmeettheirnutritionalrequirements,usuallyinwinter.Arecentsurveyofthebeefcow‐calfindustryfoundthat74percentofoperationsfedaproteinsupplementand51percentfedanenergysupplement(USDA,2010).Overallproteinwassupplementedforanaverageof173days(SE=9.6)andenergyfor162days(SE=12.7),butthiswashighlyvariableacrossregionsofthecountry.Ninety‐sevenpercentofoperationsinthesurveysupplementedthecowherdwithroughageforanaverageof154days(SE=7.0).Theproteinsupplementswerereportedasplantproteinorurea‐based.Cornwasreportedastheprimaryenergysupplement.Theamountofsupplementfedperheadperdaywasnotincludedinthereport.
StockersStockersgrazeforage,includingwheatpasture,improvedpastures,range,andcropresidues.Stockercattlemayalsoreceivesupplementalproteinorenergyfeedstoincreaseperformanceand/orextendpastureforage.Supplementsmayormaynotcontainanionophore.Somestockercalvesmaybeimplantedwithagrowthpromotingimplant;othersarenot.
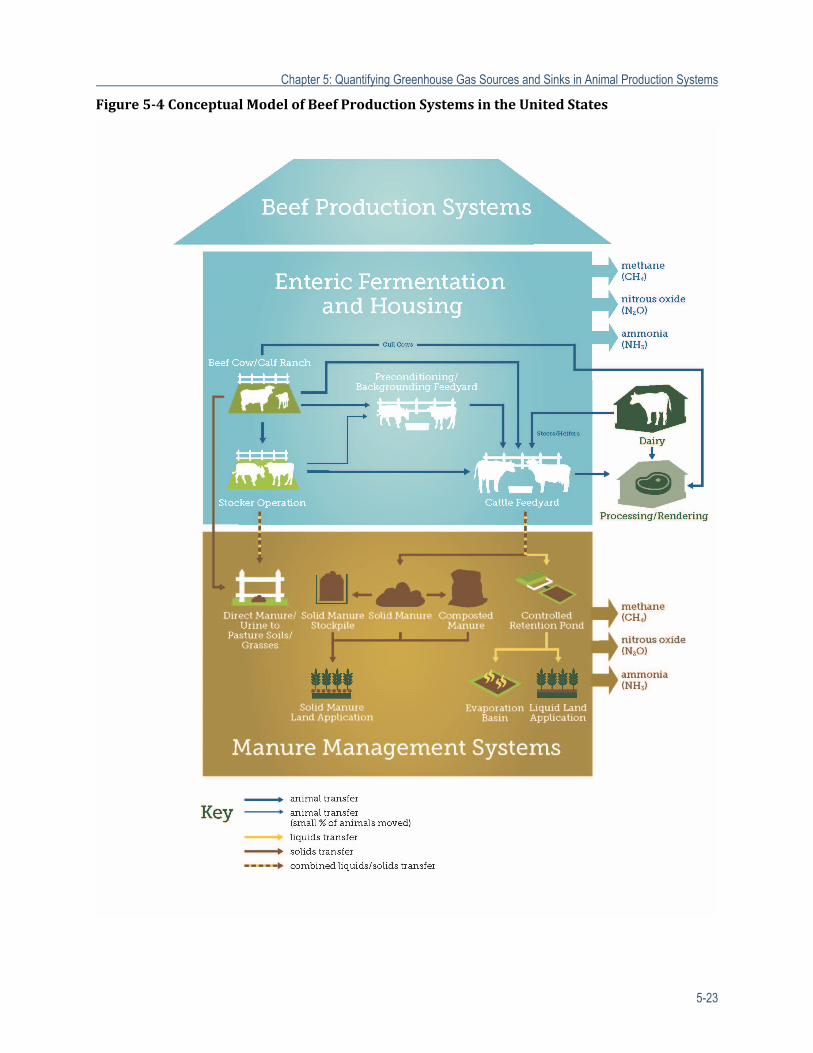
Chapter 5: Quantifying Greenhouse Gas Sources and Sinks in Animal Production Systems
5-23
Figure5‐4ConceptualModelofBeefProductionSystemsintheUnitedStates
Chapter 5: Quantifying Greenhouse Gas Sources and Sinks in Animal Production Systems
5-24
FeedlotCattletypicallyenterfeedyardsbetweentheagesof100and350daysweighing200to350kg,andgotoslaughterweighingbetween500to700kg.Theyarefedhigh‐concentrateorhigh‐byproductdietsfor100to200days.Ofthecattlefed,approximately55percentarebeefsteers,25to30percentarebeefheifers,and12to20percentaredairysteersandheifers.ThevastmajorityofcattlefedarebeefbreedsofBritishorContinentalbreeding.However,manycattlewithBrahmangeneticsarealsofed,mostlyinthesouthernplains.Inareaswithasignificantdairyindustry,steersandheifersofdairybreeding(mostlyHolstein)arealsofed.
Typicalfeedlotdietscontainhighconcentrationsofgrain(75percentormore)and/orbyproductssuchasdistillersgrainsandglutenfeed.Theyarenormallybalancedforprotein,energy,vitamins,andminerals(VasconcelosandGalyean,2007).Becausemanybyproductscontainhighconcentrationsofproteinandmineralssuchasphosphorusandsulfur,whenthesebyproductsarefed,dietaryconcentrationsofproteinandsomemineralsmayexceedanimalrequirements.FeedingofionophoressuchasmonensiniscommonintheUnitedStates,asistheuseofgrowth‐promotingimplants.Thedietsfedinfeedyardstendtodifferbetweenthenorthernandsouthernplains.Finishingdietsbasedondry‐rolledcorn(DRC)andhigh‐moisturecorn(HMC)dominateintheNorth,whereasdietsbasedonsteam‐flakedcorn(SFC)dominateintheSouth.Theuseofbioethanolco‐productssuchasdistiller’sgrainsandcorn‐millingco‐productssuchascornglutenfeedinfinishingdietsisgreaterinthenorthernplainsbecauseofthegreateravailabilityoftheseco‐products,buttheiruseisincreasinginthesouthernplains.
5.2.2.3 BeefCattleHousingandManureHandling
Cow‐CalfandBullsCowherdsandreplacementheifersaremostoftenhousedonpasture.Fecesandurinearedepositedonpasturesandrangelandandmaybeconcentratedinareasinwhichfeedingorwateringtakesplace.
StockersStockersareusuallyhousedonpastureandthusnomanurehandlingisusedandGHGemissionsareapartofthecroplandssection(seeChapter3,QuantifyingGreenhouseGasSourcesandSinksinCroplandandGrazingLandSystems).Calvestobeusedasstockerscanbehousedforshortperiodsoftimeindry‐lots.
FeedlotHousingandmanuremanagementatmostbeefcattlefeedingoperationsdiffergreatlyfromthoseusedinotherlivestockspecies,withthevastmajoritybeingfinishedindry‐lotpenswithsoilsurfaces.Manureisnormallydepositedonthepensurfaceandscrapedfromthepensaftereachgroupofcattlegoestomarket.Partofthemanuremaybestackedinthepentoprovidemoundsthatimprovependrainageandassurethatcattlehaveadryplacetolieafterrains.Manureremovedfromthepenmaybeimmediatelyappliedtofieldsnearthefeedlot,stockpiledforlateruse,orcompostedinwindrows.Manurescrapedfromthepensnormallyhasamoisturecontentof30to50percentandmaycontainsomesoilfromthepen.Becausethemanuremayremaininthepenorinstockpilesforseveralmonthsbeforeitisappliedtothefield,aportionofthenitrogenandcarbonmaybelostbeforethemanureiscollectedorappliedtoland.Runofffrompensisnormallycollectedinretentionponds.Settlingbasinsmaybeusedtolimitthequantityofmanuresolidsandsoilparticlesthatreachtheretentionpond.
IntheNorthernUnitedStates,andinareaswithhighrainfall,cattlemaybefedinnaturallyventilatedbarnswithslottedfloorsforcollectionofurineandfecesorindeep‐beddedbarnswithconcretefloorsinwhichthemanureandbedding(normallystraworstalks)areallowedto
Chapter 5: Quantifying Greenhouse Gas Sources and Sinks in Animal Production Systems
5-25
accumulateduringthefeedingperiod(Spiehsetal.,2011).Addingbeddingwillincreasethequantityofcarbon(andpossiblynitrogen)availabletobemetabolizedbymicrobesinthepen.Thesefacilitiesarecharacterizedbytheabsenceofrunoffcontrolsystems.
5.2.3 SheepProductionSystems
5.2.3.1 OverviewofSheepProductionSystems
Thereare81,000sheepandlamboperationsintheUnitedStates,withaninventoryof5.53millionsheepandlambsasofJanuary1,2011(USDANASS,2011).Mostbreedingflocksaresmallandconsistoflessthan100headofewes.Thelambfeedingindustryisalsodiverseinsize,withsmallfeedlotslocatedthroughoutthefarmflockareasandlargefeedingoperationslocatedincloseproximitytolocalgrainproductioncapacity(Shiflett,2011).
5.2.3.2 Diets,Housing,andManureHandlingforSheep
Lambingseasonmayoccuratvarioustimesduringtheyear,dependingonproductionobjectives,feedresources,environmentalconditions,andmarkettargets.Whenlambingoccurs,JanuarythroughMarch,ewesaregenerallyhousedinbeddedbarns.Beddingisremovedandspreadafteranimalsareturnedoutonpasture.EwesaregenerallybredonpastureinSeptemberthroughNovemberand,dependingonweather,willbemovedintobarnspriortolambing—orearlierasforageavailabilityandweatherdictate.Dietsconsistofpastureorgrazingcropresiduefromspringturnoutthroughearly‐andmid‐gestation.Whengrazedforageisnolongeravailable,ewesarehousedormovedtodry‐lotsandfedhayand/orhayandgraindietsasgestationrequirementsdictate.Theprimaryforagesourceisalfalfa,andcornisthepredominantgrain.Dietsrangefrom100percenthayto60:40percentforage:concentratewhilelactating.Mostlambsareweanedatapproximately90daysand41kgandsenttofeedlotsforfinishing.
Pasturelambingisanotherfarmflockproductionsystemthatisusedtomaximizenutrientsprovidedbygrazedforages.InthiscasetheeweisbredinNovemberorDecembertolambonpastureinAprilorMay.Lambsareweanedatapproximately120daysand32kgandmaybesenttothefeedlotorfinishedongrass.Ewesarenotfedgrain,andharvestedforageisprovidedonlywhengrowingseasonsandweatherdictate.Theseflockswillbehousedinbeddedbarnsinareasrequiringprotectionfromwinterweatherconditions.RangeproductionsystemsincludelambinginAprilorMay,wheremost(andinsomecasesall)dietsareprovidedbygrazedforages.Supplementationwithharvestedfeedsorgrainsisusuallyinresponsetounpredictableweatherandenvironmentalconditions.
Mostlambsarefinishedinfeedlotsandfeddietscontaining85to90percentgrain.Lengthoffeedingperiodswillrangefromweekstomonthsdependingonin‐weightsandtimerequiredtoreachfinalweight(industryaveragefinalweight=61kg).Sheepfeedlotsareprimarilydry‐lots,andmanureisscrapedfromthepenssimilarlytobeefcattlefeedlots.
5.2.4 SwineProductionSystems
5.2.4.1 OverviewofSwineProductionSystems
Theconceptualmodel(Figure5‐5)oftheU.S.swineproductionsystemprovidesanoverviewoftypicalproductionsystems,followinganimalsfrombirthtoharvestandfollowingmanurefromtheanimalthroughamanagementsystem.Manureisproducedduringeachstageofproductionoccurringinthesystem,anddependingonthelocation,ismanageddifferently.ThishasimplicationsonthequantityofGHGemissionsandsinks,someofwhicharediscussedindetailintheemissionsdiscussionsection(Section5.3.4).
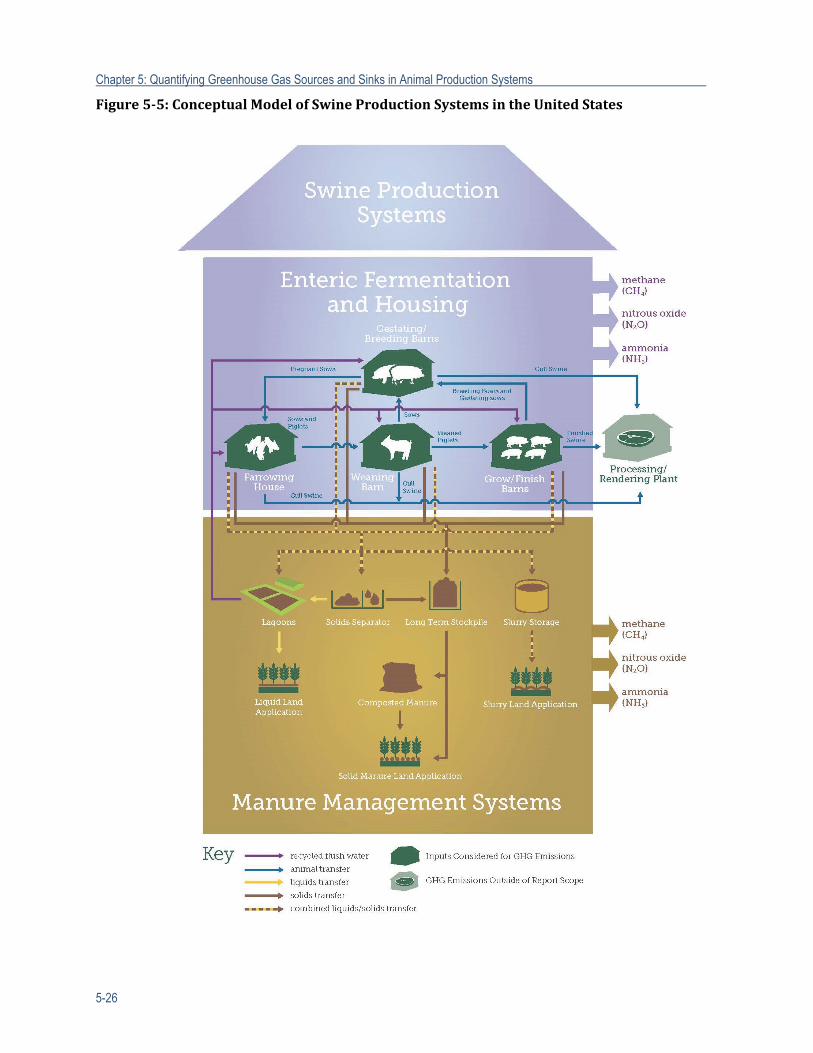
Chapter 5: Quantifying Greenhouse Gas Sources and Sinks in Animal Production Systems
5-26
Figure5‐5:ConceptualModelofSwineProductionSystemsintheUnitedStates
Chapter 5: Quantifying Greenhouse Gas Sources and Sinks in Animal Production Systems
5-27
SwineproductionintheUnitedStatesremainsimportanttoboththenation’sdietandeconomy(Davies,2011),withsignificantlevelsofconsumption,imports,andexports.AccordingtotheU.S.DepartmentofAgriculture’sNationalAgriculturalStatisticsService,the2011populationwasnearly66millionhead(USDANASS,2012).
Swinearepredominantlygrownwithproductionofporkoccurringinatwo‐stageorthree‐stagesystem:
Stage1:Sowoperation,pigletsleaveatweaning. Stage2(optional):Nurseryoperation,weaning(10daysofage/17lbs)to42daysofage/45
lbs. Stage3:Severaloptions:
− Afinishingoperation(16‐weekproductionsitewherepigletsaredeliveredfromanurserysiteatapproximately42daysofage/45lbsandstayuntil154daysofage(22weeks)or
− Awean‐to‐finishoperation(24‐weekproductionsitewherepigsaredeliveredatweaningdirectlyfromasowoperation(10daysofage/17lbs)andstayuntil178daysofage(25.5weeks)).
Themanuremanagementsystemsassociatedwiththeseproductionoperationsallhavethebasicelementsofcollection,storage,treatment,transport,andutilization.Mostswinefacilitieshandlemanureasaslurryeitherwithinthebuilding(deeppitfinishingbarnsorshallowpitnursery,gestationorfinishingbarns)orinoutsidestorage(pull‐plugsystemsfornurseries,sows,orfinishingpigs).Collectionandstorageisgenerallyaccomplishedbystorageofthewasteunderthefacility,dischargetoaseparatestoragetank,orflushingtoananaerobiclagoon.Inthecaseofin‐housemanurestorage,littlewaterisaddedtothestoragestructure,andanaerobicconditionsprevailwithlittlebiologicalprocessingofmanuretakingplace.Outsidestoragestructuresthatcontainslurrywithlittledilutionwaterofferminimalbiologicaltreatmentaswell.However,lagoonsystemswheremanureisflushedfromhousingandadditionaldilutionwaterisaddedoffermoretreatment.Drysystemsordeep‐beddedsystemsexisttoamuchlesserextent,primarilyforsoworfinishingproduction.Inthesecasesbeddingmaterial,oftenstraw,isprovidedandmanureplusbeddingishandledassolidmaterial,sometimescomposted.
IntheMidwest,thesystemofmovingstoredswinewastetocropfieldsiswelldefinedandunderstood(HatfieldandPfeiffer,2005;Maloneetal.,2007;Jareckietal.,2008;Vanottietal.,2008;BrooksandMcLaughlin,2009;Jareckietal.,2009;Agnewetal.,2010;Cambardellaetal.,2010;Lovanhetal.,2010).Yetthesesystemscontinuetoevolvetoaddressbotholdandnewissues,suchasfrozenground,applicationtiming,andemissionsassociatedwithsoilapplicationvianewequipment.AllofthemanuremanagementsystemsresultinGHGemissions,buttheyvaryintermsofpointandnon‐pointsources.
5.2.4.2 DietInformationforSwine
Theswineindustryfeedsprimarilyacorn‐soybeanmealbaseddiet.Drieddistillersgrainswithsolubles(DDGS)areoftenfedtobothsowsandfinishingpigsand,asavailabilityofthisfeedincreases,theamountfedincreasestoasmuchas40percentofdietdrymatterintake(DMI).Similarly,whensyntheticaminoacidsourcespricecompetitivelywithfeedproteinsources,thenumberofsyntheticaminoacidsincludedinfinishingpigdietsincreases.Two(lysineandmethionine)ormore(threonine,perhapstryptophan)syntheticaminoacidsarefedcommonlytodaywiththebenefitofreducingtotalnitrogenfed,andthereforeexcreted,byswine.
Chapter 5: Quantifying Greenhouse Gas Sources and Sinks in Animal Production Systems
5-28
5.2.4.3 SwineHousingandManureHandling
Mostcommercially‐raisedfinishingswinearehousedindoorstoprovideabiosecureenvironmentandreducediseasepressures.Manureishandledasslurrywithlittleornobeddingaddedtothesystemandminimaladditionofwater.Asmallbutgrowingportionofthecommercialswineindustryhousebothfinishingpigsandsowsinhoopbarns.Inthesecases,beddingmaterial,oftenstraw,isprovided,andmanureplusbeddingishandledassolidmaterial.
5.2.5 PoultryProductionSystems
5.2.5.1 OverviewofPoultryProductionSystems
TheU.S.poultryproductionsystemiscomprisedofseveralkeyprocessesforpoultry,theirmanure/litter,andtheirendproducts(meat,eggs)asdepictedinFigure5‐6.
Thefigureprovidesanoverviewofthetypicalproductionsystems,followingboththelayerandbroilerphases.Thisconceptualmodelprovidesanoverviewofthetypicalpoultryproductionsystems,followingbirdsfrombirthtoslaughterandfollowingmanurefromtheanimalthroughamanagementsystem.Manureisproducedduringeachstageofactivitiesoccurringinthesystem,anddependingonthelocation,ismanageddifferently.TheemissionsfrommanuremanagementarediscussedindetailinSection5.3.
TheU.S.poultryindustryistheworld'slargestproducerandsecondlargestexporterofpoultrymeat.TheU.S.isalsoamajoreggproducer.Thepoultryandeggindustryisamajorfeedgrainuser,accountingforapproximately45.4billionkg(100billionlbs)offeedyearly.
Theeggincubationperiodforachickenis21days.Followinghatch,broilerchickensarerearedfor42to49days(sixtosevenflocksperyear),dependinguponthemarketintent(e.g.,roasters).U.S.eggoperationsproducemorethan90billioneggsannually.Morethan75percentofeggproductionisforhumanconsumption(thetable‐eggmarket).Theremainderofproductionisforthehatchingmarket.Theseeggsarehatchedtoprovidereplacementbirdsfortheegg‐layingflocksandtoproducebroilerchicksforgrow‐outoperations.Followinga16to22weekgrowthperiod,hensstartlayingeggs.
TheU.S.turkeyindustryproducesmorethanone‐quarterofabillionbirdsannually,withtheliveweightofeachbirdaveragingmorethan25lbs.Theeggincubationperiodforaturkeyis28days.Followinghatch,turkeypoultsarerearedfor15to22weeks(onetothreeflocksperyear)dependingonthemarketintent(e.g.,roasters).
5.2.5.2 DietandGrowthInformationforPoultry
Dietsformeatbirdsconsistlargelyofcornandsoybeanmeal(commonly85to92percentofthediet);however,alternateingredientssuchasdrieddistillersgrainswithsolubles(DDGS)andotherco‐products,andsyntheticaminoacidsareincreasinglyused.Hendietsaremostcommonlycomposedofcornandsoybeanmeal.Otheringredients,suchasDDGS,maybeincluded(rarelymorethan20percentofthediet).Ingredientvariabilityislargelyinsourcesofsupplementalenergy,minerals,andadditivestoimproveanimalhealthandperformance.Dietsareformulatedbasedongrowthrateandeggproductionandfedaseitheramashorapellet.Bonestrengthisanimportantcharacteristicofmeatbirdqualitythereforeprovisionofmineralssuchascalciumandphosphorusarecarefullyconsideredwhendietsareformulated.Similarly,eggshellqualityiskeyforlayinghens,andasaresult,calciumutilizationisakeyelementindietformulation.
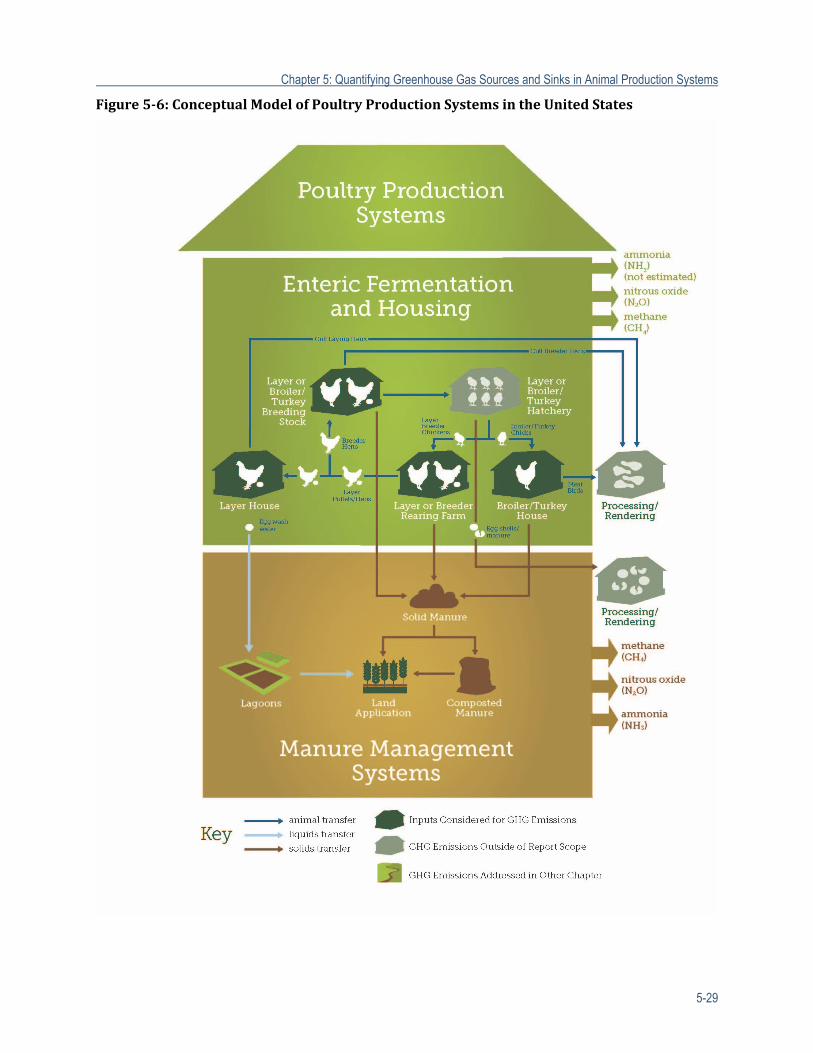
Chapter 5: Quantifying Greenhouse Gas Sources and Sinks in Animal Production Systems
5-29
Figure5‐6:ConceptualModelofPoultryProductionSystemsintheUnitedStates
Chapter 5: Quantifying Greenhouse Gas Sources and Sinks in Animal Production Systems
5-30
Poultrybreedschangerapidly,demonstratingimprovedproductionefficiency,andassuch,dietsareincreasinglydensewithenergyandprotein.Thesechangesareduetoacombinationofgeneticsandmanagement,includingdietformulation.2WhiledietandgeneticinfluenceswereconsideredinastudybyHavensteinetal.(2007),theresultssuggestthatthedietchangesthatoccurredbetween1966and2003interactedwithotherfactors(flockage,ambienttemperature)toinfluencebirdgrowth.Someestimatethat85percentoftheimprovementinthegrowthrateofbroilerchickensisattributabletogenetics(Havensteinetal.,2003).3
IntheUnitedStatesthereisnoban,atpresent,onuseofantibioticgrowthpromoters(AGPs)inpoultryproduction(meatbirds).However,thetrendistowardconsumerswantingproductsthathavenotusedAGP.FindingreplacementsforAGPwilllikelyinvolvetheuseofmultipleproductsinthediet,eachwithsomeofthebenefitsofAGP,andmanagementchangeswillplayakeyroleinmaintaininganimalproductivityintheirabsence.Itisunlikelythatasinglereplacementwillbefoundthatwillprovetobeeconomicallyviable(DibnerandRichards,2005).
5.2.5.3 PoultryHousingandManureHandling
Thevastmajorityoftheindustryraisesbirdsonlitterinmechanicallyventilatedornaturallyventilatedhouses.Reuseoflitterandnumberofflocksgrownonthesamelitterisvariableacrossthecountry,andcanrangefromaslowasasingleflocktoasmanyas18flocksonthesamelittersource.Litterdrymattercontentcanvaryfrom40to80percent,dependingonmanagement.
Layinghenandpullethousingtypesrangefromhigh‐risehouseswherehensareincagesandmanureaccumulatesinabasementunderthecagesandisremovedannually,toamanure‐belthousewherehensareincagesandmanureisremoveddailyormorefrequentlyfromthebasementtoanexternalshedandstackedbeforeperiodicremovalforlandapplication(onceortwiceperyear),toaviarieswherehensareraisedonlitter(inlargeroomsasopposedtocages)thatisremovedfromtheaviaryannuallyormorefrequently.Whenmanureisremovedfromthehouseitmaybeimmediatelyappliedtofields,stockpiled,orcomposted.Moisturecontentmayvaryfrom80percentmoisturedownto20percentmoisture(aviaries).
5.3 EmissionsfromEntericFermentationandHousing
Emissionsfromanimalproductionsystemsincludethosefrombothentericfermentationandfromanimalhousing(includinganimalmanureinhousingareasthatmayultimatelybeflushedorscrapedandthentransportedtoanexternalmanuremanagementsystem).TheproductionofGHGsinlivestocksystemsoriginatesfromavarietyofsources,includingdirectlyfromtheanimalsthemselves;manureinlotsandbarns;stockpiledandcompostingmanures;manureslurriesorwatersintanks,pits,lagoons,retentionponds,settlingcells,etc.;andfromsoilsaftermanureapplication.Emissionsfromthesesourcesdependonanimalsizeandage,diet,manureproduction,handlingandstoragesystem,lotsurfaceandsoilcharacteristics,andambientweatherconditions(i.e.,temperature,wind,humidity,andprecipitation).Foreachanimaltype,thissectionsummarizes2Havensteinetal.(2007)compared1966strainsto2003strainsandobserveda20percentbettercumulativefeedconversionratiointhe2003tomturkeyfeda2003dietrelativetoa1966tomfedadiettypicalof1966.Feedefficiencyto11kgbodyweightwasapproximately50percentbetter(2.13at98daysofagein2003toms,comparedwith4.21at196daysfor1966toms).
3Havensteinetal.(2003)comparedthe1957Athens‐CanadianRandombredControlstrainandthe2001Ross308strainofbroilerswhenfedrepresentative1957and2001diets.The42‐dayfeedconversionsfortheRoss308birdsfedthe2001and1957feedswere1.62and1.92,respectively(withaveragebodyweightof2,672and2,126g).The42‐dayfeedconversionsfortheAthens‐CanadianRandombredControlwere2.14and2.34(averagebodyweightof578and539g,respectively).
Chapter 5: Quantifying Greenhouse Gas Sources and Sinks in Animal Production Systems
5-31
thecurrentunderstandingofentericfermentationandlivestockhousingemissionsandpresentsrecommendedmodelsforestimatingsuchemissions,includingtherationaleforselectingmethods.
ActualfieldmeasurementsofGHGsfromentericfermentationoverthepastseveraldecadeshavebeeninstrumentalinimprovingourunderstandingoftheunderlyingscienceandtheresultingmodelspresentedinthissection.Fordairyanimals,mostoftheemissionsestimatesavailablerepresentthelactatinganimal.Theequationsforgrowingbeefanimalsarelikelyappropriateforgrowingdairyanimalsifdietcompositionisconsidered.Thetextboxesonthefollowingpagessummarizeseveralofthekeytechniquesthathavebeenusedinmeasurementstudiesforbothindividualanimalsandgroupsofanimals.FurtherstudiesofthistypewillbeneededtoaddressresearchgapsinSection5.5.
ThissectionprovidestherecommendedmethodforestimatingGHGsfromentericfermentationandapplicablehousingemissions.Quantitativemethodsareprovidedfordairy,beef,sheep,swine,poultry,andotheranimals(i.e.,goats,Americanbison,llama,alpacas,andmanagedwildlife).Foreachsection,backgroundinformationisprovidedontherangeofemissionsandexistingmodelsforestimatingemissionsandtherationaleforthemethodselected.Forestimatingemissionsfromentericfermentation,theactivitydataisthesameforallanimaltypes.Ancillarydataincludesthepropertiesofthediets(e.g.,crudeprotein(CP),digestibleenergy(DE),neutraldetergentfiber(NDF)).Forsimplicity,activitydataandancillarydataarelistedinTable5‐2andarenotrepeatedbelowforeachanimaltype.
5.3.1 EntericFermentationandHousingEmissionsfromDairyProductionSystems
Althoughthedairyindustryisprimarilycomposedofthreelivestocktypes[growing(i.e.,calves,replacementheifers),lactatingcows,anddrycows],mostofthelimitedemissionsresearchconductedtodatehasbeentargetedatlactatingcows,whichtypicallyproduceatleast50percentmoreentericCH4perheadthanotherdairycattle.Fewemissionsdataexistforcalves,heifers,anddrycows.Therefore,thediscussionherefocusesprimarilyonlactatingcows.
Dataneededtoestimateemissionsincludehousingsystem(pasture,barntype,dry‐lot),animalcharacteristics(breed,bodyweight,growthpotential,stageoflactation,milkingfrequency,andmilkproduction)andpopulation,dietaryinformation(DMI,dietaryCP—alsoNDF,fat,DE,metabolizableenergy(ME),netenergy(NE),nutrientexcretion(N,C,andvolatilesolids),useofrecombinantbovinesomatotropin,useofmonensin,typeofmanurehandlingsystem,frequencyofmanureremoval,typeofbedding,andmanurecharacteristics(totalammoniumnitrogen,pH).
EntericFermentationEntericCH4productionvarieswithproductionstageindairycattle,withthehighestratesbeingproducedbylactatingcows(Table5‐4).Thistableillustrates,conceptually,theobservedvariationincattleatdifferentstagesofmaturityandactivity,butitisnotintendedtoprovideadepictionofabsolutedifferences.TherearemanyfactorsthataffectentericCH4production,andthereforealteringdairycattledietscouldhaveanimpactonentericCH4production.Foranin‐depthdiscussionofdietaryeffectsonentericCH4production,seeSection5.3.7(FactorsAffectingEntericFermentationEmissions).However,theresultsinTable5‐4clearlyillustratethedifferenceinentericemissions;inparticular,emissionsfromdairycattlearerelativelyhigherthanthosefromgrowing(i.e.,heifers)anddrycattle.
Table5‐4:ExamplesofCH4EmissionsMeasuredinDairyCattle
AnimalType CH4EmissionMethodUsedto
MeasureEmissions Reference
Dairycattle 260ganimal‐1day‐1CalculatedBlaxterandClapperton Crutzenetal.(1986)
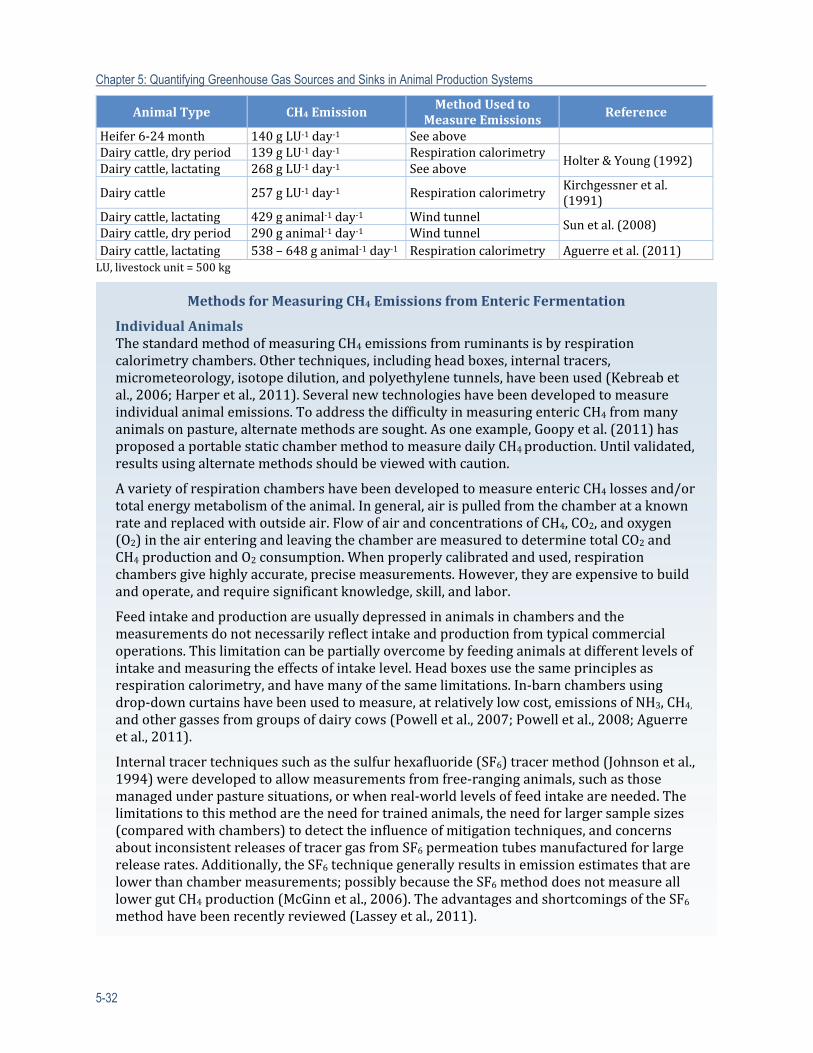
Chapter 5: Quantifying Greenhouse Gas Sources and Sinks in Animal Production Systems
5-32
AnimalType CH4EmissionMethodUsedto
MeasureEmissionsReference
Heifer6‐24month 140gLU‐1day‐1 SeeaboveDairycattle,dryperiod 139gLU‐1day‐1 Respirationcalorimetry
Holter&Young(1992)Dairycattle,lactating 268gLU‐1day‐1 Seeabove
Dairycattle 257gLU‐1day‐1 Respirationcalorimetry Kirchgessneretal.(1991)
Dairycattle,lactating 429ganimal‐1 day‐1 WindtunnelSunetal.(2008)
Dairycattle,dryperiod 290ganimal‐1 day‐1 WindtunnelDairycattle,lactating 538–648ganimal‐1day‐1 Respirationcalorimetry Aguerreetal.(2011)LU,livestockunit=500kg
MethodsforMeasuringCH4 EmissionsfromEntericFermentation
IndividualAnimalsThestandardmethodofmeasuringCH4emissionsfromruminantsisbyrespirationcalorimetrychambers.Othertechniques,includingheadboxes,internaltracers,micrometeorology,isotopedilution,andpolyethylenetunnels,havebeenused(Kebreabetal.,2006;Harperetal.,2011).Severalnewtechnologieshavebeendevelopedtomeasureindividualanimalemissions.ToaddressthedifficultyinmeasuringentericCH4frommanyanimalsonpasture,alternatemethodsaresought.Asoneexample,Goopyetal.(2011)hasproposedaportablestaticchambermethodtomeasuredailyCH4production.Untilvalidated,resultsusingalternatemethodsshouldbeviewedwithcaution.
AvarietyofrespirationchambershavebeendevelopedtomeasureentericCH4lossesand/ortotalenergymetabolismoftheanimal.Ingeneral,airispulledfromthechamberataknownrateandreplacedwithoutsideair.FlowofairandconcentrationsofCH4,CO2,andoxygen(O2)intheairenteringandleavingthechamberaremeasuredtodeterminetotalCO2andCH4productionandO2consumption.Whenproperlycalibratedandused,respirationchambersgivehighlyaccurate,precisemeasurements.However,theyareexpensivetobuildandoperate,andrequiresignificantknowledge,skill,andlabor.
Feedintakeandproductionareusuallydepressedinanimalsinchambersandthemeasurementsdonotnecessarilyreflectintakeandproductionfromtypicalcommercialoperations.Thislimitationcanbepartiallyovercomebyfeedinganimalsatdifferentlevelsofintakeandmeasuringtheeffectsofintakelevel.Headboxesusethesameprinciplesasrespirationcalorimetry,andhavemanyofthesamelimitations.In‐barnchambersusingdrop‐downcurtainshavebeenusedtomeasure,atrelativelylowcost,emissionsofNH3,CH4,andothergassesfromgroupsofdairycows(Powelletal.,2007;Powelletal.,2008;Aguerreetal.,2011).
Internaltracertechniquessuchasthesulfurhexafluoride(SF6)tracermethod(Johnsonetal.,1994)weredevelopedtoallowmeasurementsfromfree‐ranginganimals,suchasthosemanagedunderpasturesituations,orwhenreal‐worldlevelsoffeedintakeareneeded.Thelimitationstothismethodaretheneedfortrainedanimals,theneedforlargersamplesizes(comparedwithchambers)todetecttheinfluenceofmitigationtechniques,andconcernsaboutinconsistentreleasesoftracergasfromSF6permeationtubesmanufacturedforlargereleaserates.Additionally,theSF6techniquegenerallyresultsinemissionestimatesthatarelowerthanchambermeasurements;possiblybecausetheSF6methoddoesnotmeasurealllowergutCH4production(McGinnetal.,2006).TheadvantagesandshortcomingsoftheSF6methodhavebeenrecentlyreviewed(Lasseyetal.,2011).
Chapter 5: Quantifying Greenhouse Gas Sources and Sinks in Animal Production Systems
5-33
Methods for Measuring CH4 Emissions from Enteric Fermentation
Group of Animals
MicrometeorologymethodshavebeenusedextensivelytomeasureCH4andNH3emissionsfrompastures,wholefeedyards,orportionsofthefeedyard(pens,retentionponds,manurestockpiles,etc.).Thesemethodshavebeenreviewed(Fowleretal.,2001;Fleschetal.,2005;Harperetal.,2011).Laubacketal.(2008)comparedtheSF6methodwiththreemicrometeorologicalmethods(integratedhorizontalflux,fluxgradient,andbackwardLagrangianstochastic(bLS))usingsteersgrazingpaddocks.Ingeneral,themicrometeorologicalmethodsgavehigherCH4measurementsthantheSF6method,withthedifferencebeinggreaterwhenanimalswerewithin22metersoftheCH4sampler.Thiseffectwasespeciallytrueforthefluxgradientmethod.ThelowervaluesfortheSF6methodcouldbedueinparttothefactthattheSF6methoddoesnotmeasureemissionsfromthelowergutorfromfermentationoffecesonthepaddocksurface.
Tomkinsetal.(2011)comparedentericCH4emissionsofsteersonpastureusingthebLSmethodandrespirationchambers.EmissionsestimatedusingthebLSmodelwereslightlygreaterthanwithrespirationchambers(136.1vs.114.3gheaddaily‐1).HoweveremissionspergramofDMIweresimilar(29.7vs.30.1gCH4kgDMI‐1,respectively),suggestingthatthebLSmodelmaybesuitableforestimatingentericemissions.
Mostdispersionmodelsandmicrometeorologicalmethodsassumethatemissionsareuniformlydistributedoverthesourcearea.Insomecases,suchasforindividualcattleinapenorfield,thisisnottrue.Therefore,McGinnetal.(2011)developedamethodthatusedapoint‐sourcedispersionmodelandatmosphericCH4concentrationsmeasuredusingmultipleopen‐pathlaserstomeasureCH4emissionsfromapaddockcontaining18cattle.MeasuredentericCH4emissionsweresimilartovaluesmeasuredusingothertechniques.However,recoveriesofknownCH4releasesaveragedonly77percentusingthismethod.Themethodgavemorereliablemeasurementsduringthedaytimewhenatmosphericconditionswereunstablethanatnightwhenatmosphericconditionswerestable.
Methods for Measuring Emissions from Manure
Estimatingemissionsfromlargeopensourceareastypicallyassociatedwithbothdairyandbeefcattleproductionisverychallenging,duetotheinabilitytocontainandmeasurethesourcearea.Instrumentsandtechniquestomeasureambientatmosphericgasesfromtheselargesourceareas(i.e.,dry‐lotbeefanddairycattleyards,freestalldairieswithnaturallyventilatedcurtainsidewallbarns,andgrazingland)mustbeabletodetectlowerconcentrationsthanthoseencounteredintypicalenclosedconfinedanimalproductionsystems,becauseofthelowconcentrationsandhighvariabilityresultingfromhighandvariableventilationrates.Alargerchallengewithmeasuringemissionsfromopenfacilitiesistheabilitytoestimateairflowduetothelackofadefined,constantairinletandairoutlet.ReportedbackgroundNH3concentrationstypicallyrangefrom<1.3to53.3partsperbillion(ppb)(Toddetal.,2005),backgroundatmosphericN2Oconcentrationsnearfeedyardsaverageabout319ppb(Michaletal.,2010),andbackgroundCH4concentrationstypicallyrunintheareaof1,780ppb(Michaletal.,2010).
Chapter 5: Quantifying Greenhouse Gas Sources and Sinks in Animal Production Systems
5-34
Methods for Measuring Emissions from Manure (Continued)
NumerousfactorscanaffectatmosphericconcentrationsofNH3andGHGnearlivestockoperationsincludingsamplingheight,atmosphericstability,windspeed,backgroundconcentrations,stockingdensity,samplingsite,samplingtime,temperature,andwinddirection(fetch).AveragedailyNH3concentrationsmeasuredatavarietyofsimilarsourceareasrangedfromapproximately100to2,000µgm‐3.Measuredmaximumconcentrationsrarelyexceed2,000µgm‐3.Ammoniaconcentrationsdecreaserapidlydownwindofsourceareas(Miner,1975),approachingbackgroundconcentrationsinlessthan800meters(McGinnetal.,2003;Sweeten,2004).
AtmosphericCH4concentrationsmeasuredatfeedlotsanddrylotdairieshaverangedfrom3.3to4.7partspermillion(ppm)(Michaletal.,2010),andfrombackground(approximately1.78ppm)to6.20ppm(Bjornebergetal.,2009),respectively.Nitrousoxideconcentrationsmeasuredatfeedlotsrangedfrom319ppb(background)to443ppbandaveraged396±16ppb(Michaletal.,2010).Nitrousoxideconcentrationswerehighestfollowingarainfallevent.Afterarain,CH4concentrationsaveraged3.7±0.1ppm.Atdry‐lotdairies,medianN2Oconcentrationsrangedfrom314ppbto330ppb,whichareveryclosetoglobalbackgroundvalues(Bjornebergetal.,2009).
SmallfluxchambersandwindtunnelshavebeenusedtoestimateemissionsofNH3,CH4,andN2Ofromfarmlands,pastures,pensurfaces,lagoons,andretentionponds(HutchinsonandMosier,1981;Ventereaetal.,2009;Venterea,2010;Harperetal.,2011;Hristovetal.,2011).Ingeneral,chambersalterthemicroenvironmentofthesurfaceandmayalteremissions.Thus,theaccuracyofthesemethodsfordeterminingemissionfactorsforsomegases(especiallyNH3)hasbeenquestioned(GaoandYates,1998;Harper,2005;Ventereaetal.,2009;Parkeretal.,2010;Venterea,2010;Harperetal.,2011).MeasuresofNH3emissionsusingfluxchambersandwindtunnelsarehighlydependentuponairflowandairturnoverratesinthechamber(Coleetal.,2007b;Parkeretal.,2010).Basedontheconventionaltwo‐filmmodelusedtodescribevolatilizationfromasolute‐solventmixture(Parkeretal.,2010),manygaseousemissionsarecontrolledbythegasfilmabovetheliquidortheupperportionoftheliquid(liquidfilm)definedbytheHenry’slawconstant.Ifvolatilizationisinhibitedbyhighconcentrationsinthegasphase(i.e.,gas‐filmcontrolled),increasesingaseousconcentration—suchaswithfluxchambers—willleadtosignificantunderestimationoftrueflux.Venterea(2010)reportedthatemissionsofN2Oestimatedusingstaticchamberswereunderestimatedbyapproximatelythreeto38percent,dependinguponsoilwatercontent,typeofregressionperformed(linearvs.quadraticvs.nonlinear),andotherfactors.Thepercentageofunderestimationtendedtobegreaterwithdrysoils,probablybecauseN2Ofluxislowerwhensoilsaredry.Sommeretal.(2004)reportedthatGHGemissionsfromcompoststockpilesmeasuredusingstaticchamberswereonly12to22percentofvaluesmeasuredusingtheintegratedhorizontalfluxmethod.
Becauseofthesefactors,fluxchambersshouldbeusedtoexaminerelativedifferences,ratherthanemissionfactorsofNH3,CH4,andN2Oemissionsfrompensurfaces,lagoons,retentionponds,manurestockpiles,orcompostwindrows.Inaddition,thesurfaceofpasturesandfeedlotpensistemporallyandspatiallyheterogeneous,withdryareas,areaswithfreshfeces,andareaswithurineofdifferentages(Woodburyetal.,2001;Coleetal.,2009a;Coleetal.,2009b).Toadequatelyrepresentthesurface,thenumberofchambermeasurementsrequired(estimatedasthecoefficientofvariationsquared/100:Kienbusch,1986)canbeverylarge(i.e.,onechamber/quaremeter:Coleetal.,2007b).
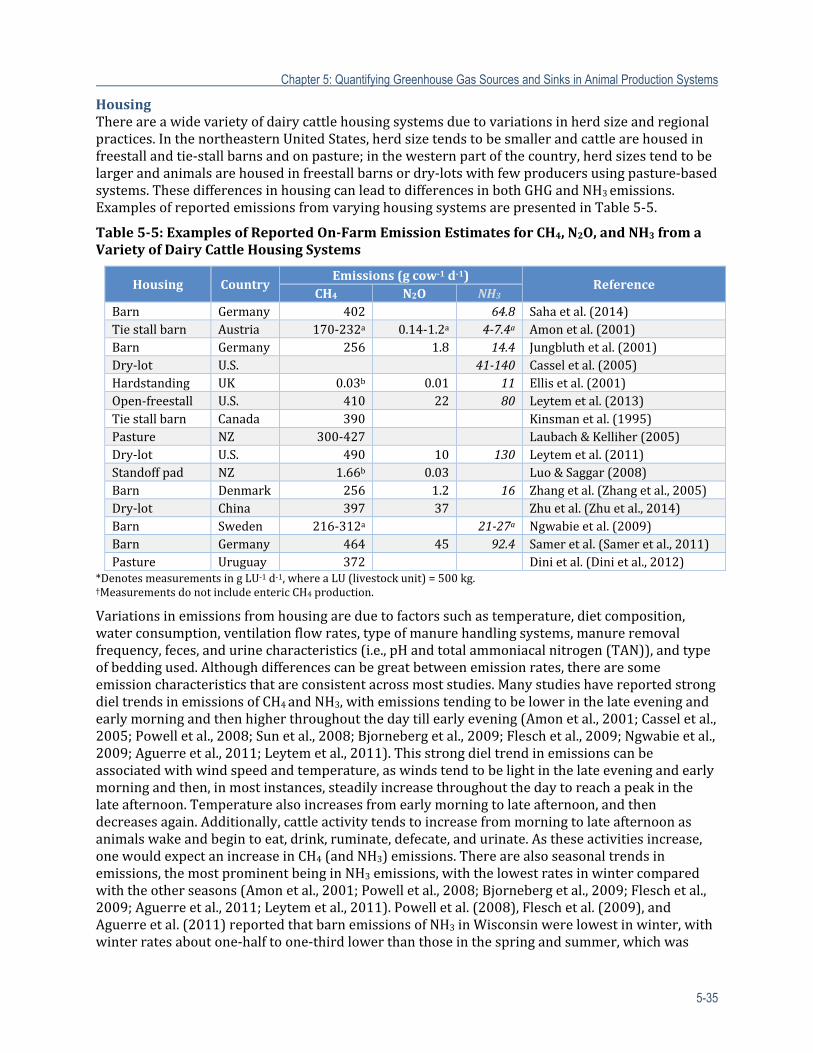
Chapter 5: Quantifying Greenhouse Gas Sources and Sinks in Animal Production Systems
5-35
HousingThereareawidevarietyofdairycattlehousingsystemsduetovariationsinherdsizeandregionalpractices.InthenortheasternUnitedStates,herdsizetendstobesmallerandcattlearehousedinfreestallandtie‐stallbarnsandonpasture;inthewesternpartofthecountry,herdsizestendtobelargerandanimalsarehousedinfreestallbarnsordry‐lotswithfewproducersusingpasture‐basedsystems.ThesedifferencesinhousingcanleadtodifferencesinbothGHGandNH3emissions.ExamplesofreportedemissionsfromvaryinghousingsystemsarepresentedinTable5‐5.
Table5‐5:ExamplesofReportedOn‐FarmEmissionEstimatesforCH4,N2O,andNH3fromaVarietyofDairyCattleHousingSystems
Housing CountryEmissions(gcow‐1d‐1)
ReferenceCH4 N2O NH3
Barn Germany 402 64.8 Sahaetal.(2014)Tiestallbarn Austria 170‐232a 0.14‐1.2a 4‐7.4a Amonetal.(2001)Barn Germany 256 1.8 14.4 Jungbluthetal.(2001)Dry‐lot U.S. 41‐140 Casseletal.(2005)Hardstanding UK 0.03b 0.01 11 Ellisetal.(2001)Open‐freestall U.S. 410 22 80 Leytemetal.(2013)Tiestallbarn Canada 390 Kinsmanetal.(1995)Pasture NZ 300‐427 Laubach&Kelliher(2005)Dry‐lot U.S. 490 10 130 Leytemetal.(2011)Standoffpad NZ 1.66b 0.03 Luo&Saggar(2008)Barn Denmark 256 1.2 16 Zhangetal.(Zhangetal.,2005)Dry‐lot China 397 37 Zhuetal.(Zhuetal.,2014)Barn Sweden 216‐312a 21‐27a Ngwabieetal.(2009)Barn Germany 464 45 92.4 Sameretal.(Sameretal.,2011)Pasture Uruguay 372 Dinietal.(Dinietal.,2012)
*DenotesmeasurementsingLU‐1d‐1,whereaLU(livestockunit)=500kg.†MeasurementsdonotincludeentericCH4production.
Variationsinemissionsfromhousingareduetofactorssuchastemperature,dietcomposition,waterconsumption,ventilationflowrates,typeofmanurehandlingsystems,manureremovalfrequency,feces,andurinecharacteristics(i.e.,pHandtotalammoniacalnitrogen(TAN)),andtypeofbeddingused.Althoughdifferencescanbegreatbetweenemissionrates,therearesomeemissioncharacteristicsthatareconsistentacrossmoststudies.ManystudieshavereportedstrongdieltrendsinemissionsofCH4andNH3,withemissionstendingtobelowerinthelateeveningandearlymorningandthenhigherthroughoutthedaytillearlyevening(Amonetal.,2001;Casseletal.,2005;Powelletal.,2008;Sunetal.,2008;Bjornebergetal.,2009;Fleschetal.,2009;Ngwabieetal.,2009;Aguerreetal.,2011;Leytemetal.,2011).Thisstrongdieltrendinemissionscanbeassociatedwithwindspeedandtemperature,aswindstendtobelightinthelateeveningandearlymorningandthen,inmostinstances,steadilyincreasethroughoutthedaytoreachapeakinthelateafternoon.Temperaturealsoincreasesfromearlymorningtolateafternoon,andthendecreasesagain.Additionally,cattleactivitytendstoincreasefrommorningtolateafternoonasanimalswakeandbegintoeat,drink,ruminate,defecate,andurinate.Astheseactivitiesincrease,onewouldexpectanincreaseinCH4(andNH3)emissions.Therearealsoseasonaltrendsinemissions,themostprominentbeinginNH3emissions,withthelowestratesinwintercomparedwiththeotherseasons(Amonetal.,2001;Powelletal.,2008;Bjornebergetal.,2009;Fleschetal.,2009;Aguerreetal.,2011;Leytemetal.,2011).Powelletal.(2008),Fleschetal.(2009),andAguerreetal.(2011)reportedthatbarnemissionsofNH3inWisconsinwerelowestinwinter,withwinterratesaboutone‐halftoone‐thirdlowerthanthoseinthespringandsummer,whichwas
Chapter 5: Quantifying Greenhouse Gas Sources and Sinks in Animal Production Systems
5-36
Ammonia Emissions in Dairy Cattle Housing
Asmentionedearlier,ammoniaisnotagreenhousegas,however,ammoniaemissionsareestimatedaspartofthenitrogenbalanceapproach.EmissionsofNH3fromdairycattlehousingsystemshavebeenstronglylinkedtodietarynitrogenintake,asthisaffectstheamountofureanitrogenexcretedinurine.Ofthenitrogeninthetotalcrudeprotein(CP)typicallyconsumedbyadairycowoncommercialdairyfarms,20to35percentissecretedinmilkandtheremainingnitrogenfromCPisexcretedaboutequallyinfecesandurine.Feednitrogen(N=CP÷6.25)useefficiency(percentageoffeednitrogensecretedasmilknitrogen)andthe50:50fecalnitrogen:urinarynitrogenexcretionratiocanbeinfluencedgreatly,however,bywhatisfedtothecow.Feedingnitrogeninexcessofnutritionalrequirementshasveryfewsignificantimpactsonmilkproductionorquality;itdecreasesfeednitrogenuseefficiencyandincreasestherelativeamountofureanitrogenexcretedinurine.Theureanitrogencontainedincowurine(whichis55to80percentofthenitrogencontainedinurine,dependingonconcentrationsofCPintheration)isthemajorsourceofNH3emissionfromdairyfarms.Ureaisproducedwhennitrogen‐richproteinsand/ornon‐proteinnitrogensourcesbreakdown(mainlyinthecowrumen),formingNH3gasthatmaybeusedbyruminalmicrobestoproducemicrobialproteinsorcanbeabsorbedthroughtheruminalwalltothebloodstream.Inthekidney,bloodNH3fromthedigestivetractortissuemetabolismiseventuallyconvertedtoureabeforebeingexcretedintheurine.Ureaseenzymes,whicharepresentinfecesandsoil,rapidlyconvertexcretedureatoammonium,whichcanbehydrolyzedquicklyintoNH3gasandlosttotheatmosphere.Thus,theincreaseinureanitrogenexcretionduetoexcessiverationCPincreasesNH3emissionsduringthecollection,storage,andlandapplicationofmanure(Rotz,2004;Misselbrooketal.,2005;Powelletal.,2008;Arriagaetal.,2010).
Pauletal.(1998)examinedtheeffectsofalteringdietaryCPonNH3lossesfromdairycows.TheyreportedthatNH3emissionsduringthefirst24hoursfollowingmanureexcretionwere38and23percentofthetotalmanurenitrogenfromdietswith16.4and12.3percentCPconcentrations,respectively,and22and15percentoftotalmanurenitrogenfromdietscontaining18.3and15.3percentdietaryCP,respectively.Misselbrooketal.(Misselbrooketal.,2005)reportedthatreducingdietaryCPcontentresultedinlesstotalnitrogenexcretionandasmallerproportionoftheexcretednitrogenbeingpresentinurine;urinenitrogenconcentrationwas90percentgreaterforthehigh‐CPthanthelow‐CPdiet.
However,Lietal.(2009)foundnoeffectofloweringdietaryCPinlactatingdairycattleonNH3emissionsfromthefloorofanaturallyventilatedfreestalldairybarnatlowandmoderatetemperatures(0to20°C).ThislackofresponsetoCPislikelyduetothefactthatureaseactivityisnegligibleattemperaturesbelow10°C(Bluteauetal.,2009).FactorsthatareessentialindeterminingNH3emissionsaremanureorurinepHandthetotalammoniacalnitrogencontent,bothofwhicharerelatedtothedietaryCPlevel.
ThemajorityofNH3emissionsfromhousingsystemsareduetothevolatilizationofNH3fromurinedeposition.Asdiscussedabove,nitrogenintakedrivestheamountofureathatisexcretedintheurine.Asthisurineisdepositedonbarnfloors,pastures,ordry‐lots,itmixeswithureasefromeitherfecesorsoilandisthenhydrolyzedtoammoniumand,viaeffectsofpH,convertedtoNH3andlosttotheatmosphere.ThelossofNH3happensrapidly,withmostNH3lossesoccurringwithin24hoursfollowingdeposition.Therefore,estimationofNH3emissionsneedstotakeintoaccounttheamountofureageneratedbythecow,pH(urine,manure,orsoil),temperature,andairflowoverthesource.StrategiesthatreducenitrogenexcretionwillbeverybeneficialinreducingNH3emissionsfromhousing/pasturesystems.
Chapter 5: Quantifying Greenhouse Gas Sources and Sinks in Animal Production Systems
5-37
attributedtocoldwintertemperatures.Ingeneral,N2Oemissionsfromhousingwerefoundtobelowandshowednodiscernibledielorseasonaltrends(Bjornebergetal.,2009;Ngwabieetal.,2009;Adviento‐Borbeetal.,2010;Leytemetal.,2011),suggestingthattheseemissionsfromthissectoroftheproductionsystemareofrelativelylittleconcern.ThereareconsistentreportsofbothdielandseasonalvariationsinbothCH4andNH3emissions,soitisimperativethatthesefactorsbecapturedinanyestimationofemissionsforagivenproductionsystem.
EmissionsofCH4aredominatedbyentericfermentationinhousing/pasturesystems.Amonetal.(2001)examinedCH4emissionsfromatie‐stalldairybarninAustriausingeitheraslurry‐basedsystemorstraw‐basedsystem.Inbothsystems,about80percentofthenetCH4emissionswereduetoentericfermentation,withtheremainingamountcomingfromthemanure.Sunetal.(2008)measuredCH4emissionfromdairycowsandfreshmanureinchambers,andreportedthatfreshmanurealonedidnotproducenoticeableCH4fluxes.Insomedairyproductionsystems,manureisremovedfromtheanimalhousingareafrequently;therefore,CH4emissionsfromanimalhousingareasofadairycanbelargelyattributedtoentericemissions.
N2Oemissionstendtobenegligiblefrombothanimalsandfreshmanure.ThemajorityofN2Oemissionsresultfrommanurestorage,pasture,andlandapplicationofmanures.Therefore,themainsourcesofN2Oemissionsfromanimalhousingwouldbefromdry‐lotdairiesandstand‐offpads,becausethereispotentialfordepositednitrogentobenitrifiedanddenitrifiedunderwetconditionsandlostasN2O.LuoandSaggar(2008)measuredN2OandCH4emissionsfromadairyfarmstand‐offpadinNewZealandandreportedN2Ofluxesfrom0to3gN2O‐Nday‐1,whichtheyattributedtotheconcentrationsofwaterandnitrateinthepadmaterials.Overall,only54gofN2O‐Nwasemittedfromthepadoverthetimeofuse,representing~0.01percentoftheexcretanitrogendepositedonthepad.
Whiletherehavebeenoverallimprovementsinmilkproductionwithbreedingprograms,thereisnoevidencethatanybreedofdairycowproduceslessentericCH4.MüngerandKreuzer(MüngerandKreuzer,2008)measuredentericCH4productionfromHolstein,Simmental,andJerseycowsandfoundnopersistentdifferencesinCH4yields,withaverageentericCH4beingapproximately25gCH4kgDMI‐1.
5.3.1.1 MethodforEstimatingEmissionsfromDairyProductionSystems
Methodfor Estimating CH4 Emissions from Enteric Fermentation in Dairy Cows
Millsetal.(2003)developedaseriesofsubmodelstoestimateentericCH4emissionsfromdairyandbeefcattle.TheoptimalmodelappearedtobeanonlinearMits3equation,whichisutilizedbytheDairyGEMModel(asubsetofIFSM)(Rotzetal.,2011b)andisshowninEquation5‐1(Mits3equation)isbasedprimarilyonmetabolizableenergyintake,aciddetergentfiber(ADF),andstarchcontentofdiet.
Datasourcesareuserinputondietaryintake,aswellasdietarydatafromtheFeedstuffsCompositionTable(Ewan,1989;Preston,2013).
UseoftheDairyGEM/Mits3equationisrecommendedovertheIPCCTier2equation(IPCC,2006)becauseithasproventobemoreaccurate,ingeneral,fordairycows.
Chapter 5: Quantifying Greenhouse Gas Sources and Sinks in Animal Production Systems
5-38
TheEmaxisconstantforallanimalsat45.98MJ/head/day.Theshapeparameter“c”iscalculatedfromthedietarynon‐fibercarbohydrate(NFC)toaciddetergentfiber(ADF)ratioinEquation5‐2.
Millsetal.(2003)notedthatnonlinearmodelshavetwoadvantagesoverlinearmodels:1)amaximumemissionisset;and2)itisexplainablefromabiologicalsense.Thefeedstuffcharacteristicsneededtocalculateemissionsfromdairycattleareincludedintheexamplebelow(Ewan,1989;Preston,2013).ThefulltablecanbefoundinAppendix5‐B.
Table5‐6:ExampleFeedstuffsTablea
FeedstuffDM%
Energy Protein FiberEE%
ASH%
Ca%
P%
K%
Cl%
S%
ZnppmTDN
%NEm NEg NEl
(Mcal/cwt.)
DE(%ofGE)*
CP%
UIP%
CF%
ADF%
NDF%
eNDF%
AlfalfaCubes
x91 57 57 25 57 18 30 29 36 46 40 2.0 11 1.30 0.23 1.9 0.37 0.33 20
Alfalfadehydrated17%CP
92 61 62 31 61 65.16 19 60 26 34 45 6 3.0 11 1.42 0.25 2.5 0.45 0.28 21
Alfalfafresh
24 61 62 31 61 62.54 19 18 27 34 46 41 3.0 9 1.35 0.27 2.6 0.40 0.29 18
Source:Preston(2013).
Equation5‐1:Non‐LinearMits3Equation
exp .
Where:
CH4 =Entericmethaneemissionsperday(kgCH4head‐1day‐1)
Emax =MaximumpossibleCH4emissions(MJhead‐1day‐1)
c =Shapeparameterdeterminingemissionchangewithincreasingmetabolizableenergyintake(seeEquation5‐2)
x =Metabolizableenergyintake(MJhead‐1day‐1)
0.018=ConversionofMJtokgofCH4(kgCH4MJ‐1)
Equation5‐2:CalculatingShapeParameter
. .
Where:
c =Shapeparameterdeterminingemissionchangewithincreasingmetabolizableenergyintake(unitless)
NFC =[(100‐NDF+CP+EE)/100]xDMI(kghead‐1day‐1)
DMI =Drymatterintake(kgdryfeedanimal‐1day‐1)
ADF =AcidDetergentFiber(kghead‐1day‐1)
NDF =NeutralDetergentFiber(%)
CP =CrudeProtein(%)
EE =Etherextract(%)
Chapter 5: Quantifying Greenhouse Gas Sources and Sinks in Animal Production Systems
5-39
aColumnheadings:DM =Drymatter GE = Grossenergy ASH =AshTDN =Totaldigestiblenutrients CP =Crudeprotein Ca =CalciumNEm =Netenergyformaintenance UIP = Undegradableintakeprotein P =PhosphorousNEg =Netenergyforgrowth CF = Crudefiber K =PotassiumNEl =Netenergyforlactation ADF = Aciddetergentfiber Cl =ChlorineMcal =Megacalories NDF = Neutraldetergentfiber S =Sulfurcwt =Centumweight(hundredweight) eNDF = effectiveneutraldetergentfiber Zn =ZincDE =Digestibleenergy EE = Etherextract ppm =partspermillion
MethaneEmissionsfromDairyCows’Housing
TheDairyGEMModel(Rotzetal.,2011a)calculatesCH4emissionsfrombarnfloorsusinganempiricalmodeldevelopedfromthreefreestallbarns(Chianeseetal.,2009c).
Whenmanureisallowedtoaccumulateasastockpile,onadry‐lot,orinapitbelowtheanimalconfinement,theDairyGEMmodelusestheIPCC(2006)Tier2methodtoestimateCH4emissions(Equation5‐4).Thisisthesameequationusedforestimatingemissionsfrommanurethatismanagedoutsideofhousing(seeSection5.4.1TemporaryStackandLong‐TermStockpileand5.4.2 Composting for details).
Methodfor Estimating Dairy Cows’ GHG Emissions from Housing
Methane
TheDairyGEMModel(asubsetofIFSM)(Rotzetal.,2011a)calculatesCH4emissionsfromhousingsurfaces.
DairyGEMusestheIPCC(2006)Tier2methodtoestimateCH4emissionswhenmanureisallowedtoaccumulateinthehousing.
NitrousOxide
NitrogenexcretedestimatedusingequationsprovidedinASABED384.2. IPCC(2006)Tier2approachforN2Oemissionsfrommanureinhousing.
Equation5‐3:CalculatingCH4EmissionsfromBarnFloors (Chianeseetal.,2009c)
. , .
Where:
CH4=Methaneemissionsperday(kgCH4head‐1day‐1)
T =Barntemperature(˚C)
Abarn =Areaofthebarnfloorcoveredwithmanure(m2)
Chapter 5: Quantifying Greenhouse Gas Sources and Sinks in Animal Production Systems
5-40
ThemaximumCH4producingcapacity(B0)formanurevariesbyanimalcategoryandisprovidedinTable5‐19.TheCH4conversionfactors(MCF)formanuredepositedonadry‐lot,storedinadeeppit,orfromcattlebeddingcanbefoundinTable5‐7.TheMCFsformanurestoredasastockpileareprovidedinTable5‐20throughTable5‐22.TheMCFsformanurecompostedwithinhousingareprovidedinTable5‐24.
Table5‐7:MethaneConversionFactorsforDry‐Lots,PitStorageBelowAnimalConfinement,andCattle/SwineBedding
Temperature Dry‐Lot
PitStorageBelowAnimalConfinementand
Cattle/SwineDeepBedding
<1month >1month
Cool
≤10°C
1% 3%
17%11°C 19%12°C 20%13°C 22%14°C 25%
Tem
perate
15°C
1.5% 3%
27%16°C 29%17°C 32%18°C 35%19°C 39%20°C 42%21°C 46%22°C 50%23°C 55%24°C 60%25°C 65%
Warm 26°C
2% 30%71%
27°C 78%≥28°C 80%
Source:IPCC(2006).
Equation5‐4:IPCCTier2ApproachforEstimatingCH4 EmissionsinHousing
.
Where:
ECH4 =CH4emissionsperday(kgCH4day‐1)
m =Totaldrymanureperdaya(kgdrymanureday‐1)
VS =Volatilesolids(kgVS(kgdrymanure)‐1)
B0 =MaximumCH4producingcapacityformanure(m3CH4(kgVS)‐1)
MCF =CH4conversionfactorforthemanuremanagementsystem(%)
0.67 =Conversionfactorofm3CH4tokgCH4
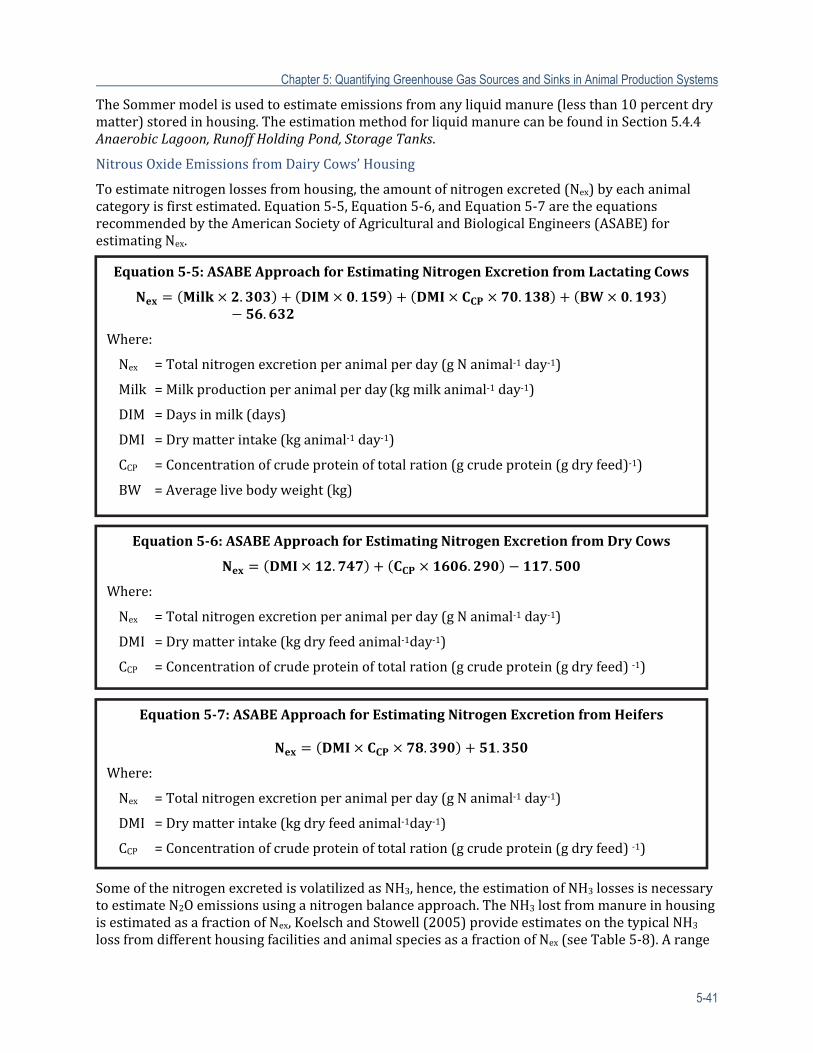
Chapter 5: Quantifying Greenhouse Gas Sources and Sinks in Animal Production Systems
5-41
TheSommermodelisusedtoestimateemissionsfromanyliquidmanure(lessthan10percentdrymatter)storedinhousing.TheestimationmethodforliquidmanurecanbefoundinSection5.4.4AnaerobicLagoon,RunoffHoldingPond,StorageTanks.
NitrousOxideEmissionsfromDairyCows’Housing
Toestimatenitrogenlossesfromhousing,theamountofnitrogenexcreted(Nex)byeachanimalcategoryisfirstestimated.Equation5‐5,Equation5‐6,andEquation5‐7aretheequationsrecommendedbytheAmericanSocietyofAgriculturalandBiologicalEngineers(ASABE)forestimatingNex.
SomeofthenitrogenexcretedisvolatilizedasNH3,hence,theestimationofNH3lossesisnecessarytoestimateN2Oemissionsusinganitrogenbalanceapproach.TheNH3lostfrommanureinhousingisestimatedasafractionofNex,KoelschandStowell(2005)provideestimatesonthetypicalNH3lossfromdifferenthousingfacilitiesandanimalspeciesasafractionofNex(seeTable5‐8).Arange
Equation5‐5:ASABEApproachforEstimatingNitrogenExcretionfromLactatingCows
. . . ..
Where:
Nex =Totalnitrogenexcretionperanimalperday(gNanimal‐1day‐1)
Milk=Milkproductionperanimalperday(kgmilkanimal‐1day‐1)
DIM =Daysinmilk(days)
DMI =Drymatterintake(kganimal‐1day‐1)
CCP =Concentrationofcrudeproteinoftotalration(gcrudeprotein(gdryfeed)‐1)
BW =Averagelivebodyweight(kg)
Equation5‐6:ASABEApproachforEstimatingNitrogenExcretionfromDryCows
. . .
Where:
Nex =Totalnitrogenexcretionperanimalperday(gNanimal‐1day‐1)
DMI =Drymatterintake(kgdryfeedanimal‐1day‐1)
CCP =Concentrationofcrudeproteinoftotalration(gcrudeprotein(gdryfeed)‐1)
Equation5‐7:ASABEApproachforEstimatingNitrogenExcretionfromHeifers
. .
Where:
Nex =Totalnitrogenexcretionperanimalperday(gNanimal‐1day‐1)
DMI =Drymatterintake(kgdryfeedanimal‐1day‐1)
CCP =Concentrationofcrudeproteinoftotalration(gcrudeprotein(gdryfeed)‐1)
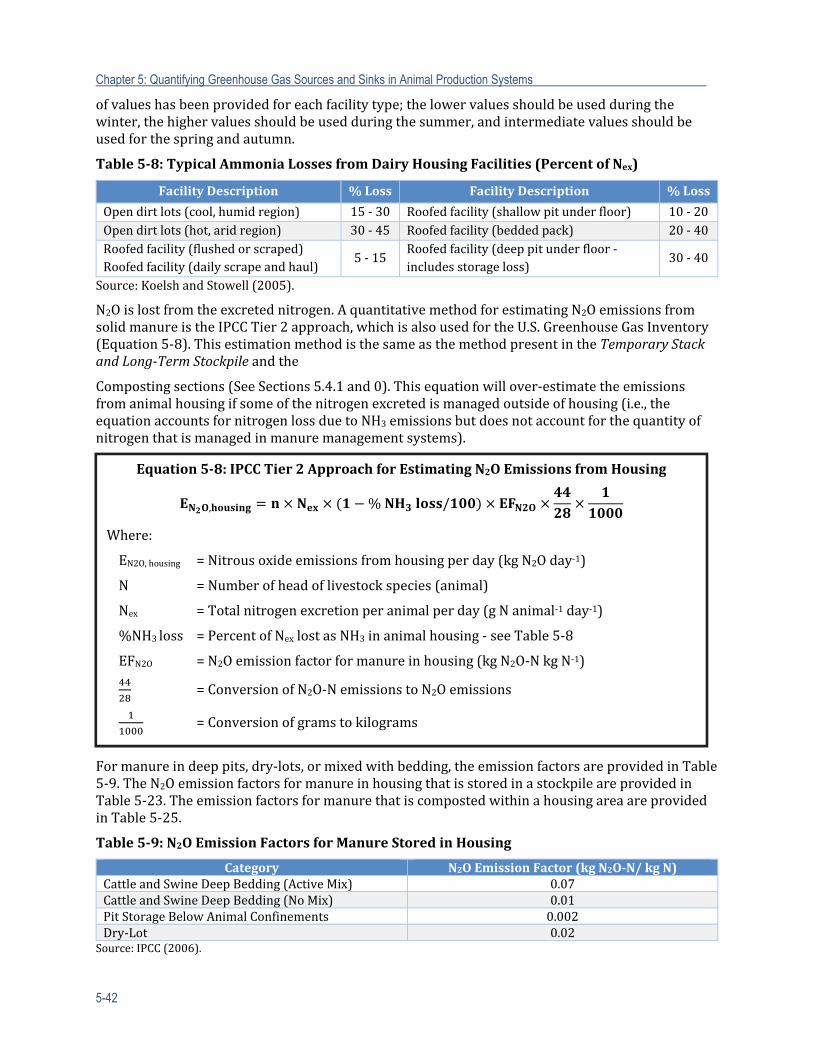
Chapter 5: Quantifying Greenhouse Gas Sources and Sinks in Animal Production Systems
5-42
ofvalueshasbeenprovidedforeachfacilitytype;thelowervaluesshouldbeusedduringthewinter,thehighervaluesshouldbeusedduringthesummer,andintermediatevaluesshouldbeusedforthespringandautumn.
Table5‐8:TypicalAmmoniaLossesfromDairyHousingFacilities(PercentofNex)
FacilityDescription %Loss FacilityDescription %Loss
Opendirtlots(cool,humidregion) 15‐ 30 Roofedfacility(shallowpitunderfloor) 10‐ 20Opendirtlots(hot,aridregion) 30‐ 45 Roofedfacility(beddedpack) 20‐ 40Roofedfacility(flushedorscraped)Roofedfacility(dailyscrapeandhaul)
5‐15Roofedfacility(deeppitunderfloor‐includesstorageloss)
30‐40
Source:KoelshandStowell(2005).
N2Oislostfromtheexcretednitrogen.AquantitativemethodforestimatingN2OemissionsfromsolidmanureistheIPCCTier2approach,whichisalsousedfortheU.S.GreenhouseGasInventory(Equation5‐8).ThisestimationmethodisthesameasthemethodpresentintheTemporaryStackandLong‐TermStockpileandthe
Compostingsections(SeeSections5.4.1and0).Thisequationwillover‐estimatetheemissionsfromanimalhousingifsomeofthenitrogenexcretedismanagedoutsideofhousing(i.e.,theequationaccountsfornitrogenlossduetoNH3emissionsbutdoesnotaccountforthequantityofnitrogenthatismanagedinmanuremanagementsystems).
Formanureindeeppits,dry‐lots,ormixedwithbedding,theemissionfactorsareprovidedinTable5‐9.TheN2OemissionfactorsformanureinhousingthatisstoredinastockpileareprovidedinTable5‐23.TheemissionfactorsformanurethatiscompostedwithinahousingareaareprovidedinTable5‐25.
Table5‐9:N2OEmissionFactorsforManureStoredinHousing
Category N2OEmissionFactor(kgN2O‐N/kgN)CattleandSwineDeepBedding(ActiveMix) 0.07CattleandSwineDeepBedding(NoMix) 0.01PitStorageBelowAnimalConfinements 0.002Dry‐Lot 0.02
Source:IPCC(2006).
Equation5‐8:IPCCTier2ApproachforEstimatingN2OEmissionsfromHousing
, % /
Where:
EN2O,housing =Nitrousoxideemissionsfromhousingperday(kgN2Oday‐1)
N =Numberofheadoflivestockspecies(animal)
Nex =Totalnitrogenexcretionperanimalperday(gNanimal‐1day‐1)
%NH3loss =PercentofNexlostasNH3inanimalhousing‐seeTable5‐8
EFN2O =N2Oemissionfactorformanureinhousing(kgN2O‐NkgN‐1)
=ConversionofN2O‐NemissionstoN2Oemissions
=Conversionofgramstokilograms
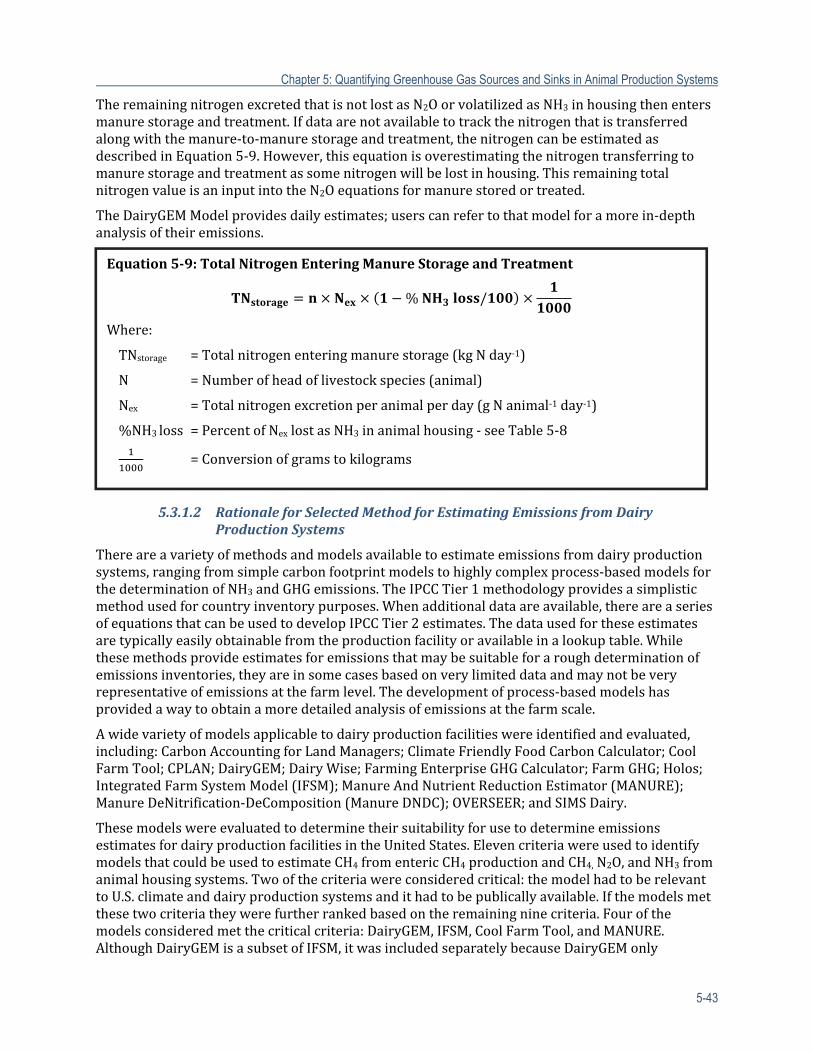
Chapter 5: Quantifying Greenhouse Gas Sources and Sinks in Animal Production Systems
5-43
TheremainingnitrogenexcretedthatisnotlostasN2OorvolatilizedasNH3inhousingthenentersmanurestorageandtreatment.Ifdataarenotavailabletotrackthenitrogenthatistransferredalongwiththemanure‐to‐manurestorageandtreatment,thenitrogencanbeestimatedasdescribedinEquation5‐9.However,thisequationisoverestimatingthenitrogentransferringtomanurestorageandtreatmentassomenitrogenwillbelostinhousing.ThisremainingtotalnitrogenvalueisaninputintotheN2Oequationsformanurestoredortreated.
TheDairyGEMModelprovidesdailyestimates;userscanrefertothatmodelforamorein‐depthanalysisoftheiremissions.
5.3.1.2 RationaleforSelectedMethodforEstimatingEmissionsfromDairyProductionSystems
Thereareavarietyofmethodsandmodelsavailabletoestimateemissionsfromdairyproductionsystems,rangingfromsimplecarbonfootprintmodelstohighlycomplexprocess‐basedmodelsforthedeterminationofNH3andGHGemissions.TheIPCCTier1methodologyprovidesasimplisticmethodusedforcountryinventorypurposes.Whenadditionaldataareavailable,thereareaseriesofequationsthatcanbeusedtodevelopIPCCTier2estimates.Thedatausedfortheseestimatesaretypicallyeasilyobtainablefromtheproductionfacilityoravailableinalookuptable.Whilethesemethodsprovideestimatesforemissionsthatmaybesuitableforaroughdeterminationofemissionsinventories,theyareinsomecasesbasedonverylimiteddataandmaynotbeveryrepresentativeofemissionsatthefarmlevel.Thedevelopmentofprocess‐basedmodelshasprovidedawaytoobtainamoredetailedanalysisofemissionsatthefarmscale.
Awidevarietyofmodelsapplicabletodairyproductionfacilitieswereidentifiedandevaluated,including:CarbonAccountingforLandManagers;ClimateFriendlyFoodCarbonCalculator;CoolFarmTool;CPLAN;DairyGEM;DairyWise;FarmingEnterpriseGHGCalculator;FarmGHG;Holos;IntegratedFarmSystemModel(IFSM);ManureAndNutrientReductionEstimator(MANURE);ManureDeNitrification‐DeComposition(ManureDNDC);OVERSEER;andSIMSDairy.
ThesemodelswereevaluatedtodeterminetheirsuitabilityforusetodetermineemissionsestimatesfordairyproductionfacilitiesintheUnitedStates.ElevencriteriawereusedtoidentifymodelsthatcouldbeusedtoestimateCH4fromentericCH4productionandCH4,N2O,andNH3fromanimalhousingsystems.Twoofthecriteriawereconsideredcritical:themodelhadtoberelevanttoU.S.climateanddairyproductionsystemsandithadtobepublicallyavailable.Ifthemodelsmetthesetwocriteriatheywerefurtherrankedbasedontheremainingninecriteria.Fourofthemodelsconsideredmetthecriticalcriteria:DairyGEM,IFSM,CoolFarmTool,andMANURE.AlthoughDairyGEMisasubsetofIFSM,itwasincludedseparatelybecauseDairyGEMonly
Equation5‐9:TotalNitrogenEnteringManureStorageandTreatment
% /
Where:
TNstorage =Totalnitrogenenteringmanurestorage(kgNday‐1)
N =Numberofheadoflivestockspecies(animal)
Nex =Totalnitrogenexcretionperanimalperday(gNanimal‐1day‐1)
%NH3loss =PercentofNexlostasNH3inanimalhousing‐seeTable5‐8
=Conversionofgramstokilograms
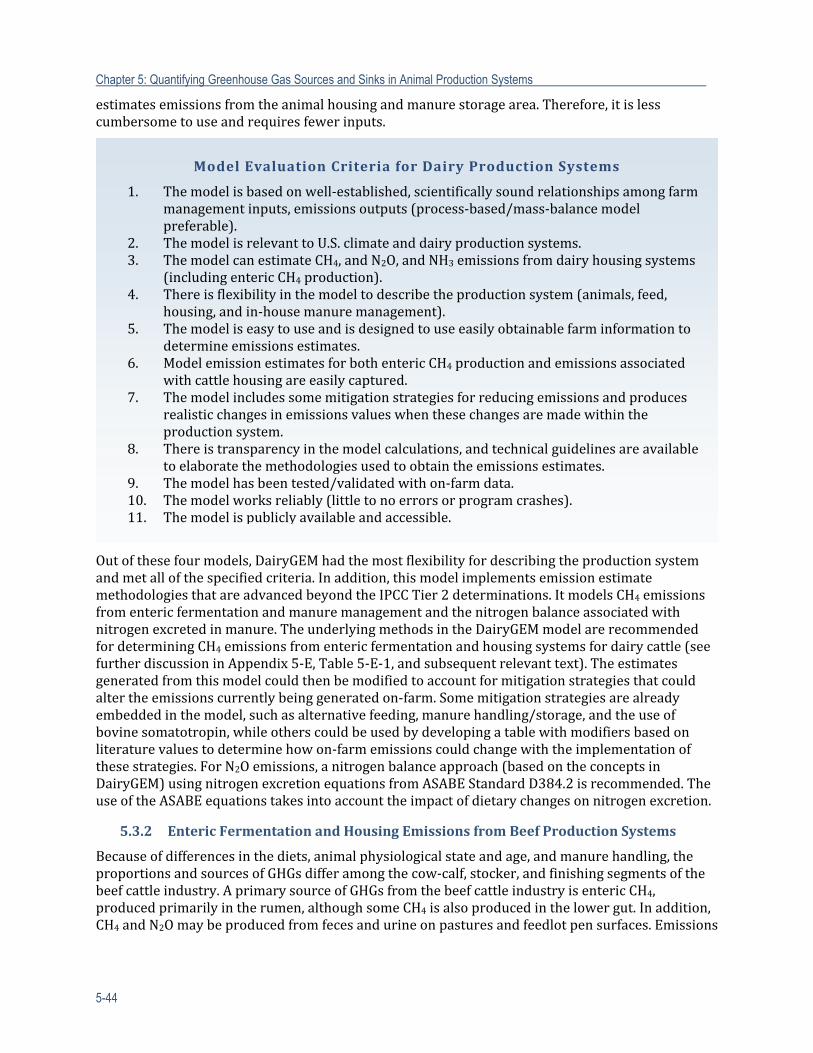
Chapter 5: Quantifying Greenhouse Gas Sources and Sinks in Animal Production Systems
5-44
estimatesemissionsfromtheanimalhousingandmanurestoragearea.Therefore,itislesscumbersometouseandrequiresfewerinputs.
Outofthesefourmodels,DairyGEMhadthemostflexibilityfordescribingtheproductionsystemandmetallofthespecifiedcriteria.Inaddition,thismodelimplementsemissionestimatemethodologiesthatareadvancedbeyondtheIPCCTier2determinations.ItmodelsCH4emissionsfromentericfermentationandmanuremanagementandthenitrogenbalanceassociatedwithnitrogenexcretedinmanure.TheunderlyingmethodsintheDairyGEMmodelarerecommendedfordeterminingCH4emissionsfromentericfermentationandhousingsystemsfordairycattle(seefurtherdiscussioninAppendix5‐E,Table5‐E‐1,andsubsequentrelevanttext).Theestimatesgeneratedfromthismodelcouldthenbemodifiedtoaccountformitigationstrategiesthatcouldaltertheemissionscurrentlybeinggeneratedon‐farm.Somemitigationstrategiesarealreadyembeddedinthemodel,suchasalternativefeeding,manurehandling/storage,andtheuseofbovinesomatotropin,whileotherscouldbeusedbydevelopingatablewithmodifiersbasedonliteraturevaluestodeterminehowon‐farmemissionscouldchangewiththeimplementationofthesestrategies.ForN2Oemissions,anitrogenbalanceapproach(basedontheconceptsinDairyGEM)usingnitrogenexcretionequationsfromASABEStandardD384.2isrecommended.TheuseoftheASABEequationstakesintoaccounttheimpactofdietarychangesonnitrogenexcretion.
5.3.2 EntericFermentationandHousingEmissionsfromBeefProductionSystems
Becauseofdifferencesinthediets,animalphysiologicalstateandage,andmanurehandling,theproportionsandsourcesofGHGsdifferamongthecow‐calf,stocker,andfinishingsegmentsofthebeefcattleindustry.AprimarysourceofGHGsfromthebeefcattleindustryisentericCH4,producedprimarilyintherumen,althoughsomeCH4isalsoproducedinthelowergut.Inaddition,CH4andN2Omaybeproducedfromfecesandurineonpasturesandfeedlotpensurfaces.Emissions
Model Evaluation Criteria for Dairy Production Systems
1. Themodelisbasedonwell‐established,scientificallysoundrelationshipsamongfarmmanagementinputs,emissionsoutputs(process‐based/mass‐balancemodelpreferable).
2. ThemodelisrelevanttoU.S.climateanddairyproductionsystems.3. ThemodelcanestimateCH4,andN2O,andNH3emissionsfromdairyhousingsystems
(includingentericCH4production).4. Thereisflexibilityinthemodeltodescribetheproductionsystem(animals,feed,
housing,andin‐housemanuremanagement).5. Themodeliseasytouseandisdesignedtouseeasilyobtainablefarminformationto
determineemissionsestimates.6. ModelemissionestimatesforbothentericCH4productionandemissionsassociated
withcattlehousingareeasilycaptured.7. Themodelincludessomemitigationstrategiesforreducingemissionsandproduces
realisticchangesinemissionsvalueswhenthesechangesaremadewithintheproductionsystem.
8. Thereistransparencyinthemodelcalculations,andtechnicalguidelinesareavailabletoelaboratethemethodologiesusedtoobtaintheemissionsestimates.
9. Themodelhasbeentested/validatedwithon‐farmdata.10. Themodelworksreliably(littletonoerrorsorprogramcrashes).11. Themodelispubliclyavailableandaccessible.
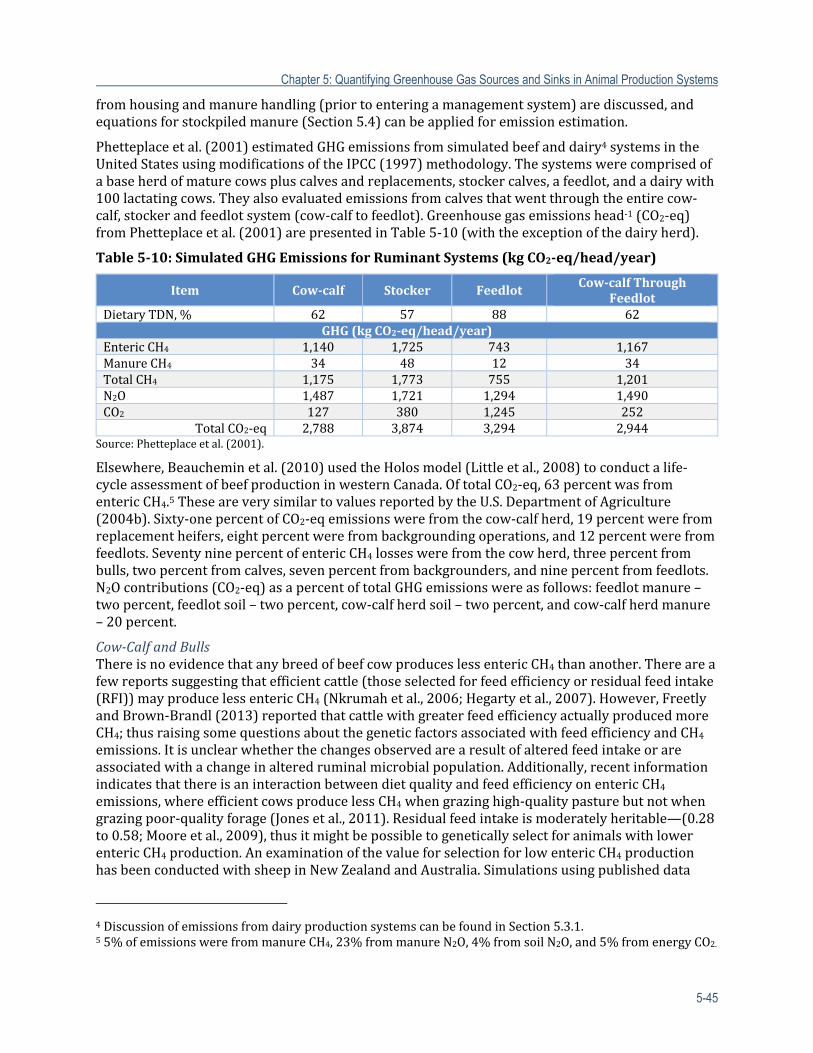
Chapter 5: Quantifying Greenhouse Gas Sources and Sinks in Animal Production Systems
5-45
fromhousingandmanurehandling(priortoenteringamanagementsystem)arediscussed,andequationsforstockpiledmanure(Section5.4)canbeappliedforemissionestimation.
Phetteplaceetal.(2001)estimatedGHGemissionsfromsimulatedbeefanddairy4systemsintheUnitedStatesusingmodificationsoftheIPCC(1997)methodology.Thesystemswerecomprisedofabaseherdofmaturecowspluscalvesandreplacements,stockercalves,afeedlot,andadairywith100lactatingcows.Theyalsoevaluatedemissionsfromcalvesthatwentthroughtheentirecow‐calf,stockerandfeedlotsystem(cow‐calftofeedlot).Greenhousegasemissionshead‐1(CO2‐eq)fromPhetteplaceetal.(2001)arepresentedinTable5‐10(withtheexceptionofthedairyherd).
Table5‐10:SimulatedGHGEmissionsforRuminantSystems(kgCO2‐eq/head/year)
Item Cow‐calf Stocker Feedlot Cow‐calfThroughFeedlot
DietaryTDN,% 62 57 88 62GHG(kgCO2‐eq/head/year)
EntericCH4 1,140 1,725 743 1,167ManureCH4 34 48 12 34TotalCH4 1,175 1,773 755 1,201N2O 1,487 1,721 1,294 1,490CO2 127 380 1,245 252
TotalCO2‐eq 2,788 3,874 3,294 2,944Source:Phetteplaceetal.(2001).
Elsewhere,Beaucheminetal.(2010)usedtheHolosmodel(Littleetal.,2008)toconductalife‐cycleassessmentofbeefproductioninwesternCanada.OftotalCO2‐eq,63percentwasfromentericCH4.5TheseareverysimilartovaluesreportedbytheU.S.DepartmentofAgriculture(2004b).Sixty‐onepercentofCO2‐eqemissionswerefromthecow‐calfherd,19percentwerefromreplacementheifers,eightpercentwerefrombackgroundingoperations,and12percentwerefromfeedlots.SeventyninepercentofentericCH4losseswerefromthecowherd,threepercentfrombulls,twopercentfromcalves,sevenpercentfrombackgrounders,andninepercentfromfeedlots.N2Ocontributions(CO2‐eq)asapercentoftotalGHGemissionswereasfollows:feedlotmanure–twopercent,feedlotsoil–twopercent,cow‐calfherdsoil–twopercent,andcow‐calfherdmanure–20percent.
Cow‐CalfandBullsThereisnoevidencethatanybreedofbeefcowproduceslessentericCH4thananother.Thereareafewreportssuggestingthatefficientcattle(thoseselectedforfeedefficiencyorresidualfeedintake(RFI))mayproducelessentericCH4(Nkrumahetal.,2006;Hegartyetal.,2007).However,FreetlyandBrown‐Brandl(2013)reportedthatcattlewithgreaterfeedefficiencyactuallyproducedmoreCH4;thusraisingsomequestionsaboutthegeneticfactorsassociatedwithfeedefficiencyandCH4emissions.Itisunclearwhetherthechangesobservedarearesultofalteredfeedintakeorareassociatedwithachangeinalteredruminalmicrobialpopulation.Additionally,recentinformationindicatesthatthereisaninteractionbetweendietqualityandfeedefficiencyonentericCH4emissions,whereefficientcowsproducelessCH4whengrazinghigh‐qualitypasturebutnotwhengrazingpoor‐qualityforage(Jonesetal.,2011).Residualfeedintakeismoderatelyheritable—(0.28to0.58;Mooreetal.,2009),thusitmightbepossibletogeneticallyselectforanimalswithlowerentericCH4production.AnexaminationofthevalueforselectionforlowentericCH4productionhasbeenconductedwithsheepinNewZealandandAustralia.Simulationsusingpublisheddata
4DiscussionofemissionsfromdairyproductionsystemscanbefoundinSection5.3.1.55%ofemissionswerefrommanureCH4,23%frommanureN2O,4%fromsoilN2O,and5%fromenergyCO2.
Chapter 5: Quantifying Greenhouse Gas Sources and Sinks in Animal Production Systems
5-46
indicatethatwithoutaccuratefeedintakeinformationandamethodbywhichmanyanimalscanbescreenedforCH4emissions,selectionforlowerentericCH4productionisnotlikelytobeeconomicallyviable(Cottleetal.,2011).
MeasurementofentericCH4fromgrazingcattlehasbeenconductedprimarilyfromanimalsgrazingimprovedpasturesusingmicrometeorologicalmethodsandtracertechniques.Lassey(2007)summarizedmuchoftheCH4emissionsdatathathadbeencollectedusingtheSF6tracertechnique.Intakewaseithercalculatedfromarequirementsmodelorfromuseofmarkers(Cr2O3orYb2O3).Estimatedforagedigestibility(invitro)rangedfrom48.7to83percent,whichresultedinestimatedCH4conversionfactors[i.e.,entericCH4asapercentageofgrossenergyintake(GEI)]rangingfrom3.7to9.5percent.ThemeanYmfromallofthestudieswas6.25andagreesreasonablywellwiththatusedbyIPCC(2006)forcattleonpasture.Methaneemissionsfromcowsgrazingimprovedpasture,Kentuckyfescue,andBermudagrassinthesouthernUnitedStateswerereportedbyPavao‐Zuckermanetal.(1999)andDeRamusetal.(2003).InbothofthesestudiessignificantreductionsinentericCH4unit‐1ofanimalweightgainresultedfromtheimplementationofbestmanagementpracticesdesignedtoimprovepasturequality.
Entericemissionsestimatescanbemadeusingmicrometeorologicalmethodsandtracertechniques.OnereportinwhichCH4emissionsweremeasuredfrombeefcowsgrazingnativerangeinOctoberandMayillustratedalargevariationinentericemissions.InOctober,whencowswerelosingBW,theyproduced87gCH4headdaily‐1,andonthesamepastureinMaytheyproduced252gCH4headdaily‐1(Olsonetal.,2000).Westbergetal.(2001)measuredCH4fromcowsgrazingthesamepastureacrossseasonsandfoundsimilarresults,withhigherCH4emissionsfromcowsgrazinglushspringgrowthandthelowestemissionsfromgrazingstockpiledfallpasture.ThesedifferencesareattributabletodifferencesinbothDMIandforagequality.Ingeneral,asforagequalityincreases,DMIalsoincreases.Some"rulesofthumb"forDMIonpastureincludethefollowing:
Poorqualitypasture‐DMI=1to1.75percentofbodyweight; Mediumqualityforage‐DMI=1.75to2.25percentofbodyweight; HighqualityforageDMI=2.25to3percentofbodyweight.
StockersEntericCH4emissionsofstockerswhilegrazinghavebeenmeasuredbyLaubachetal.(2008),Tomkinsetal.(2011),McGinnetal.(2011),andBoadietal.(2002),usingavarietyoftechniquesincludingtheSF6tracer,andseveralmicrometeorologicalapproaches.ThesamefactorsthataffectCH4emissionsfromgrazingbeefcowsareimportantinstockercattle.Thosefactorsareleveloffeedintake,digestibilityofforageconsumed,supplementation,andthechemicalcompositionoftheplantsconsumed.Entericemissionsestimatescanbemadeusingmicrometeorologicalmethodsor,tracertechniquesorcanbepredictedfromIPCCTier2methods(seeentericdiscussion).Criticalvariablesincludemeasurementsorestimationsoffeedintakeandfeedquality(chemicalcomposition).Manyoftheequationscurrentlyavailablemaynotaccuratelypredictmeasuredentericemissionsfromgrazingcattle(Tomkinsetal.,2011).
FeedlotMostestimatesofentericmethaneemissionfromfinishingbeefcattlearebasedonworkusinganimalsconfinedtorespirationchambers,althoughafewstudieshaveusedmicrometeorologicalmethodsinopenfeedlots.EntericCH4lossesfromfinishingbeefcattlenormallyrangefrom50to200Lhead‐1daily(JohnsonandJohnson,1995;McGinnetal.,2004;Beaucheminetal.,2008;Lohetal.,2008;Halesetal.,2012;2013;Halesetal.,2014;Toddetal.,2014a;Toddetal.,2014b).InmoststudiesintheU.S.,dietshavebeenbasedonDRCorSFC;whereasmoststudiesinCanadathedietsarebasedonbarley.TheIPCCTier2(2006)entericCH4conversionfactor(Ym)forfeedlotcattleis
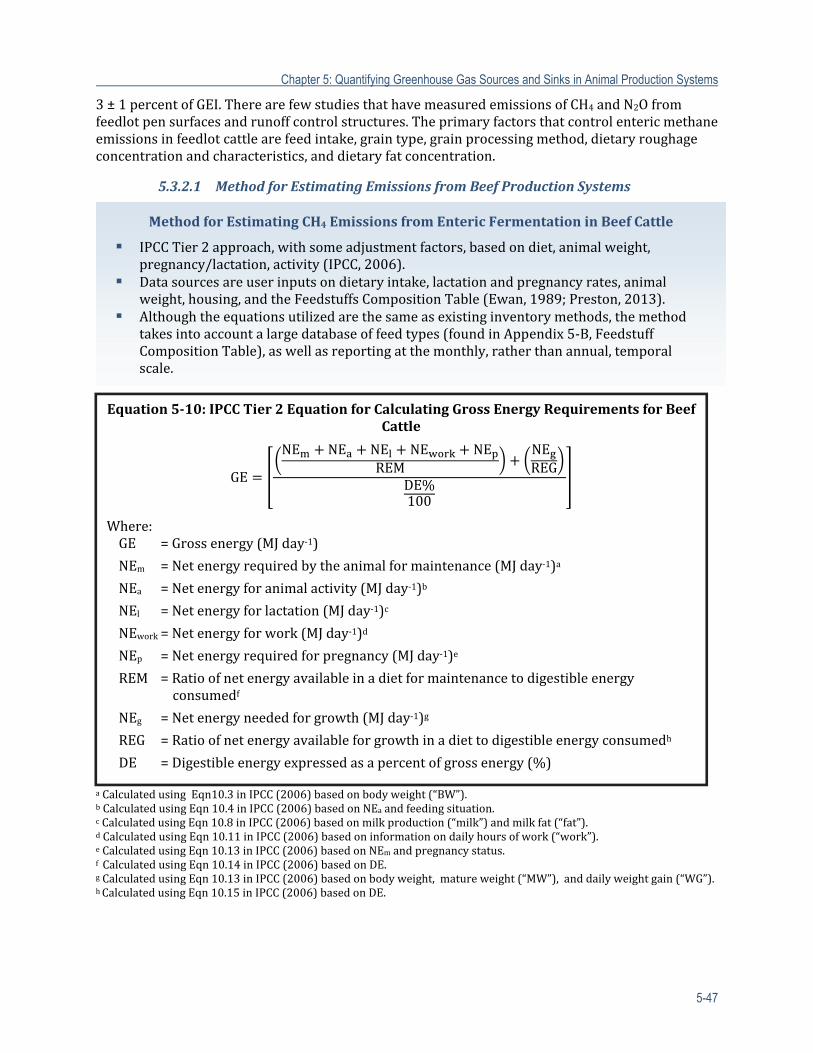
Chapter 5: Quantifying Greenhouse Gas Sources and Sinks in Animal Production Systems
5-47
3±1percentofGEI.TherearefewstudiesthathavemeasuredemissionsofCH4andN2Ofromfeedlotpensurfacesandrunoffcontrolstructures.Theprimaryfactorsthatcontrolentericmethaneemissionsinfeedlotcattlearefeedintake,graintype,grainprocessingmethod,dietaryroughageconcentrationandcharacteristics,anddietaryfatconcentration.
5.3.2.1 MethodforEstimatingEmissionsfromBeefProductionSystems
aCalculatedusingEqn10.3inIPCC(2006)basedonbodyweight(“BW”).bCalculatedusingEqn10.4inIPCC(2006)basedonNEaandfeedingsituation.cCalculatedusingEqn10.8inIPCC(2006)basedonmilkproduction(“milk”)andmilkfat(“fat”).dCalculatedusingEqn10.11inIPCC(2006)basedoninformationondailyhoursofwork(“work”).eCalculatedusingEqn10.13inIPCC(2006)basedonNEmandpregnancystatus.fCalculatedusingEqn10.14inIPCC(2006)basedonDE.gCalculatedusingEqn10.13inIPCC(2006)basedonbodyweight,matureweight(“MW”),anddailyweightgain(“WG”).hCalculatedusingEqn10.15inIPCC(2006)basedonDE.
MethodforEstimatingCH4EmissionsfromEntericFermentationinBeefCattle
IPCCTier2approach,withsomeadjustmentfactors,basedondiet,animalweight,pregnancy/lactation,activity(IPCC,2006).
Datasourcesareuserinputsondietaryintake,lactationandpregnancyrates,animalweight,housing,andtheFeedstuffsCompositionTable(Ewan,1989;Preston,2013).
Althoughtheequationsutilizedarethesameasexistinginventorymethods,themethodtakesintoaccountalargedatabaseoffeedtypes(foundinAppendix5‐B,FeedstuffCompositionTable),aswellasreportingatthemonthly,ratherthanannual,temporalscale.
Equation5‐10:IPCCTier2EquationforCalculatingGrossEnergyRequirementsforBeefCattle
GE
NE NE NE NE NEREM
NEREG
DE%100
Where:GE =Grossenergy(MJday‐1)
NEm =Netenergyrequiredbytheanimalformaintenance(MJday‐1)a
NEa =Netenergyforanimalactivity(MJday‐1)b
NEl =Netenergyforlactation(MJday‐1)c
NEwork=Netenergyforwork(MJday‐1)d
NEp =Netenergyrequiredforpregnancy(MJday‐1)e
REM =Ratioofnetenergyavailableinadietformaintenancetodigestibleenergyconsumedf
NEg =Netenergyneededforgrowth(MJday‐1)g
REG =Ratioofnetenergyavailableforgrowthinadiettodigestibleenergyconsumedh
DE =Digestibleenergyexpressedasapercentofgrossenergy(%)
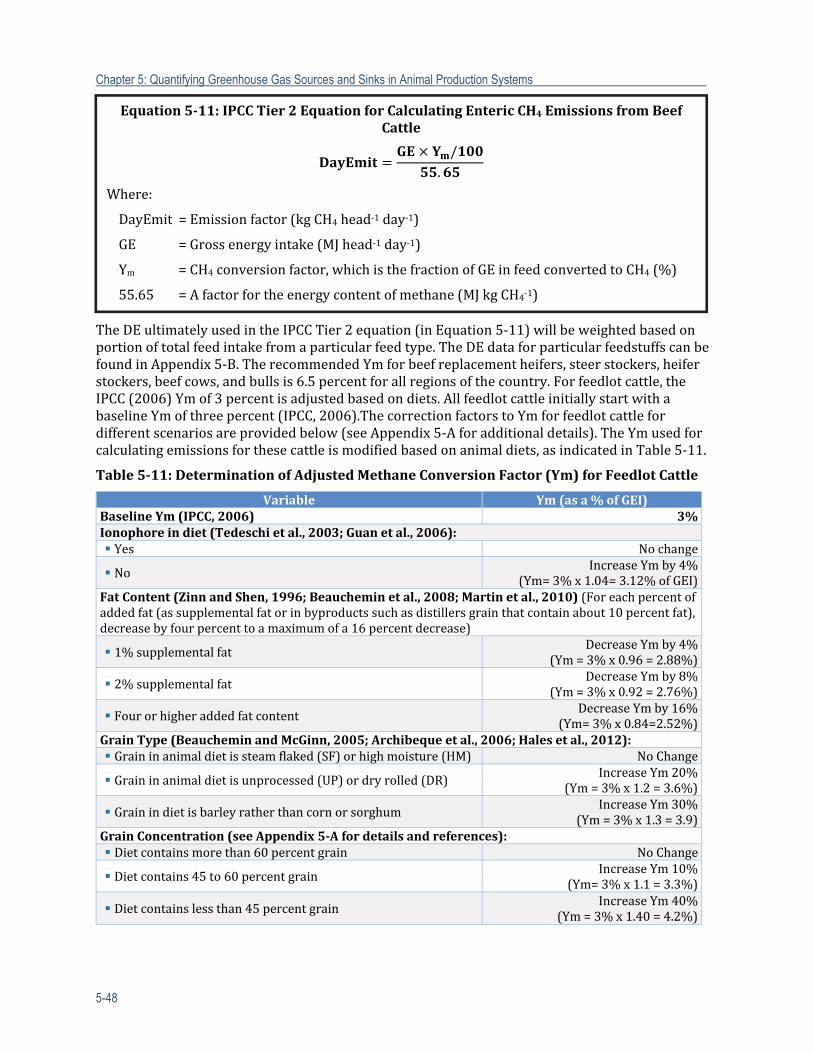
Chapter 5: Quantifying Greenhouse Gas Sources and Sinks in Animal Production Systems
5-48
TheDEultimatelyusedintheIPCCTier2equation(inEquation5‐11)willbeweightedbasedonportionoftotalfeedintakefromaparticularfeedtype.TheDEdataforparticularfeedstuffscanbefoundinAppendix5‐B.TherecommendedYmforbeefreplacementheifers,steerstockers,heiferstockers,beefcows,andbullsis6.5percentforallregionsofthecountry.Forfeedlotcattle,theIPCC(2006)Ymof3percentisadjustedbasedondiets.AllfeedlotcattleinitiallystartwithabaselineYmofthreepercent(IPCC,2006).ThecorrectionfactorstoYmforfeedlotcattlefordifferentscenariosareprovidedbelow(seeAppendix5‐Aforadditionaldetails).TheYmusedforcalculatingemissionsforthesecattleismodifiedbasedonanimaldiets,asindicatedinTable5‐11.
Table5‐11:DeterminationofAdjustedMethaneConversionFactor(Ym)forFeedlotCattle
Variable Ym(asa%ofGEI)BaselineYm(IPCC,2006) 3%Ionophoreindiet(Tedeschietal.,2003;Guanetal.,2006): Yes Nochange
No IncreaseYmby4%(Ym=3%x1.04=3.12%ofGEI)
FatContent(ZinnandShen,1996;Beaucheminetal.,2008;Martinetal.,2010)(Foreachpercentofaddedfat(assupplementalfatorinbyproductssuchasdistillersgrainthatcontainabout10percentfat),decreasebyfourpercenttoamaximumofa16percentdecrease)
1%supplementalfatDecreaseYmby4%
(Ym=3%x0.96=2.88%)
2%supplementalfatDecreaseYmby8%
(Ym=3%x0.92=2.76%)
Fourorhigheraddedfatcontent DecreaseYmby16%(Ym=3%x0.84=2.52%)
GrainType(BeaucheminandMcGinn,2005;Archibequeetal.,2006;Halesetal.,2012): Graininanimaldietissteamflaked(SF)orhighmoisture(HM) NoChange
Graininanimaldietisunprocessed(UP)ordryrolled(DR)IncreaseYm20%
(Ym=3%x1.2=3.6%)
GrainindietisbarleyratherthancornorsorghumIncreaseYm30%
(Ym=3%x1.3=3.9)GrainConcentration(seeAppendix5‐A fordetailsandreferences): Dietcontainsmorethan60percentgrain NoChange
Dietcontains45to60percentgrain IncreaseYm10%(Ym=3%x1.1=3.3%)
Dietcontainslessthan45percentgrainIncreaseYm40%
(Ym=3%x1.40=4.2%)
Equation5‐11:IPCCTier2EquationforCalculatingEntericCH4 EmissionsfromBeefCattle
/.
Where:
DayEmit =Emissionfactor(kgCH4head‐1day‐1)
GE =Grossenergyintake(MJhead‐1day‐1)
Ym =CH4conversionfactor,whichisthefractionofGEinfeedconvertedtoCH4(%)
55.65 =Afactorfortheenergycontentofmethane(MJkgCH4‐1)
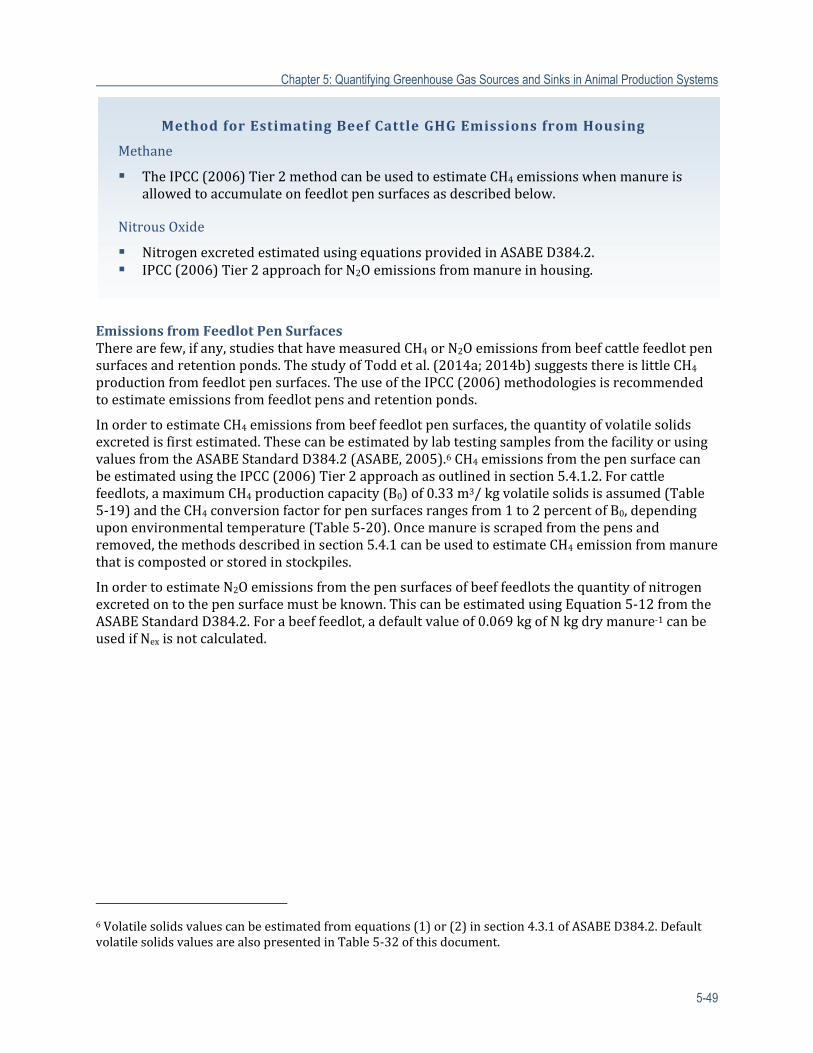
Chapter 5: Quantifying Greenhouse Gas Sources and Sinks in Animal Production Systems
5-49
EmissionsfromFeedlotPenSurfacesTherearefew,ifany,studiesthathavemeasuredCH4orN2Oemissionsfrombeefcattlefeedlotpensurfacesandretentionponds.ThestudyofToddetal.(2014a;2014b)suggeststhereislittleCH4productionfromfeedlotpensurfaces.TheuseoftheIPCC(2006)methodologiesisrecommendedtoestimateemissionsfromfeedlotpensandretentionponds.
InordertoestimateCH4emissionsfrombeeffeedlotpensurfaces,thequantityofvolatilesolidsexcretedisfirstestimated.ThesecanbeestimatedbylabtestingsamplesfromthefacilityorusingvaluesfromtheASABEStandardD384.2(ASABE,2005).6CH4emissionsfromthepensurfacecanbeestimatedusingtheIPCC(2006)Tier2approachasoutlinedinsection5.4.1.2.Forcattlefeedlots,amaximumCH4productioncapacity(B0)of0.33m3/kgvolatilesolidsisassumed(Table5‐19)andtheCH4conversionfactorforpensurfacesrangesfrom1to2percentofB0,dependinguponenvironmentaltemperature(Table5‐20).Oncemanureisscrapedfromthepensandremoved,themethodsdescribedinsection5.4.1canbeusedtoestimateCH4emissionfrommanurethatiscompostedorstoredinstockpiles.
InordertoestimateN2Oemissionsfromthepensurfacesofbeeffeedlotsthequantityofnitrogenexcretedontothepensurfacemustbeknown.ThiscanbeestimatedusingEquation5‐12fromtheASABEStandardD384.2.Forabeeffeedlot,adefaultvalueof0.069kgofNkgdrymanure‐1canbeusedifNexisnotcalculated.
6Volatilesolidsvaluescanbeestimatedfromequations(1)or(2)insection4.3.1ofASABED384.2.DefaultvolatilesolidsvaluesarealsopresentedinTable5‐32ofthisdocument.
Methodfor Estimating Beef Cattle GHG Emissions from Housing
Methane
TheIPCC(2006)Tier2methodcanbeusedtoestimateCH4emissionswhenmanureisallowedtoaccumulateonfeedlotpensurfacesasdescribedbelow.
NitrousOxide
NitrogenexcretedestimatedusingequationsprovidedinASABED384.2. IPCC(2006)Tier2approachforN2Oemissionsfrommanureinhousing.
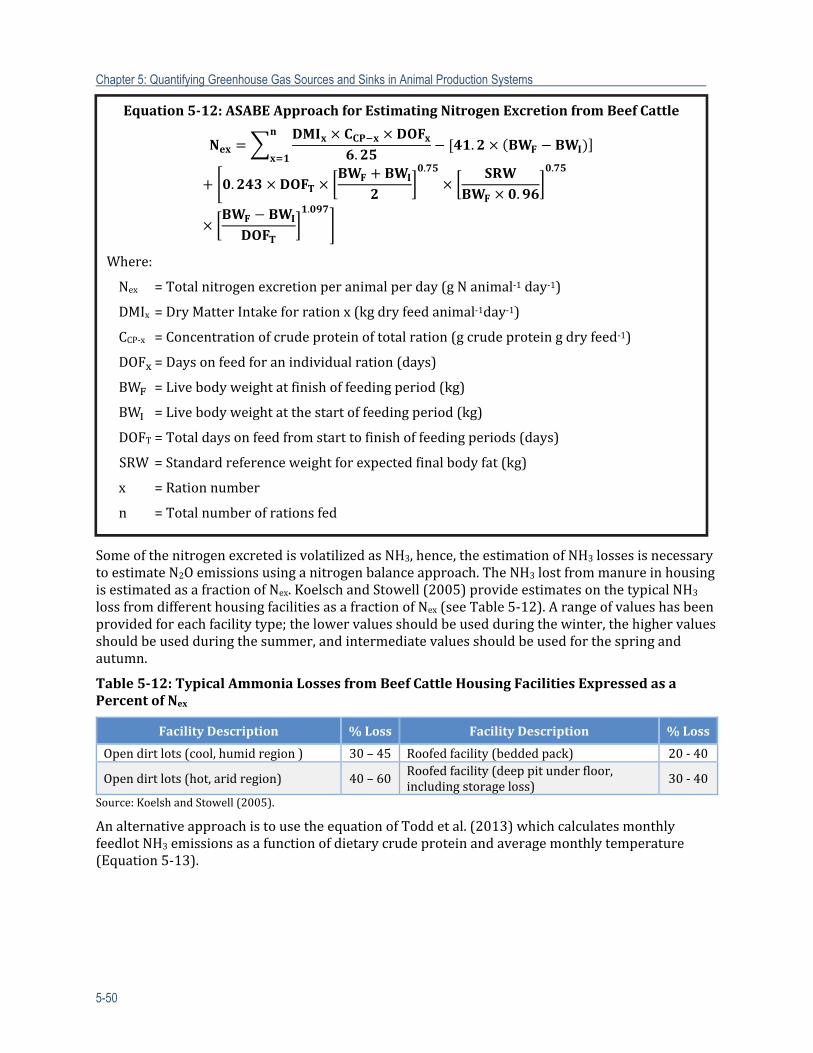
Chapter 5: Quantifying Greenhouse Gas Sources and Sinks in Animal Production Systems
5-50
SomeofthenitrogenexcretedisvolatilizedasNH3,hence,theestimationofNH3lossesisnecessarytoestimateN2Oemissionsusinganitrogenbalanceapproach.TheNH3lostfrommanureinhousingisestimatedasafractionofNex.KoelschandStowell(2005)provideestimatesonthetypicalNH3lossfromdifferenthousingfacilitiesasafractionofNex(seeTable5‐12).Arangeofvalueshasbeenprovidedforeachfacilitytype;thelowervaluesshouldbeusedduringthewinter,thehighervaluesshouldbeusedduringthesummer,andintermediatevaluesshouldbeusedforthespringandautumn.
Table5‐12:TypicalAmmoniaLossesfromBeefCattleHousingFacilitiesExpressedasaPercentofNex
FacilityDescription %Loss FacilityDescription %Loss
Opendirtlots(cool,humidregion) 30–45 Roofedfacility(beddedpack) 20‐40
Opendirtlots(hot,aridregion) 40–60Roofedfacility(deeppitunderfloor,includingstorageloss)
30‐40
Source:KoelshandStowell(2005).
AnalternativeapproachistousetheequationofToddetal.(2013)whichcalculatesmonthlyfeedlotNH3emissionsasafunctionofdietarycrudeproteinandaveragemonthlytemperature(Equation5‐13).
Equation5‐12:ASABEApproachforEstimatingNitrogenExcretionfromBeefCattle
..
..
.
.
.
Where:
Nex =Totalnitrogenexcretionperanimalperday(gNanimal‐1day‐1)
DMIx=DryMatterIntakeforrationx(kgdryfeedanimal‐1day‐1)
CCP‐x =Concentrationofcrudeproteinoftotalration(gcrudeproteingdryfeed‐1)
DOF =Daysonfeedforanindividualration(days)
BW =Livebodyweightatfinishoffeedingperiod(kg)
BW =Livebodyweightatthestartoffeedingperiod(kg)
DOFT=Totaldaysonfeedfromstarttofinishoffeedingperiods(days)
SRW =Standardreferenceweightforexpectedfinalbodyfat(kg)
x =Rationnumber
n =Totalnumberofrationsfed
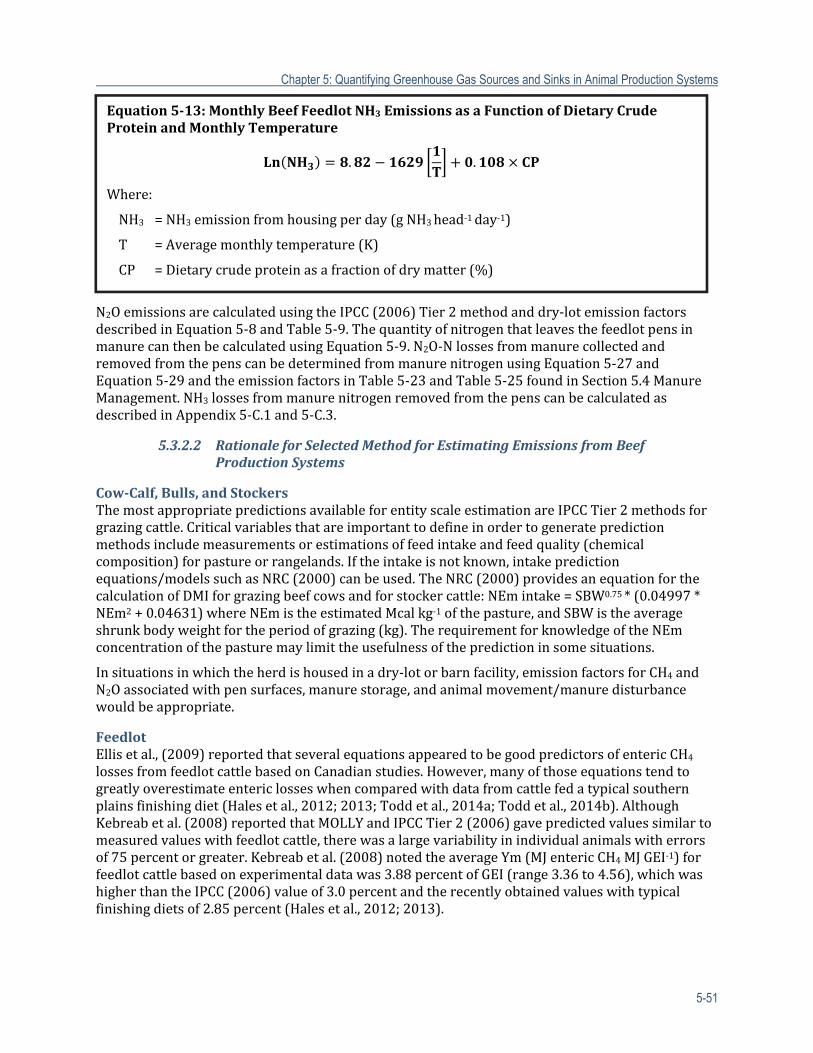
Chapter 5: Quantifying Greenhouse Gas Sources and Sinks in Animal Production Systems
5-51
N2OemissionsarecalculatedusingtheIPCC(2006)Tier2methodanddry‐lotemissionfactorsdescribedinEquation5‐8andTable5‐9.ThequantityofnitrogenthatleavesthefeedlotpensinmanurecanthenbecalculatedusingEquation5‐9.N2O‐NlossesfrommanurecollectedandremovedfromthepenscanbedeterminedfrommanurenitrogenusingEquation5‐27andEquation5‐29andtheemissionfactorsinTable5‐23andTable5‐25foundinSection5.4ManureManagement.NH3lossesfrommanurenitrogenremovedfromthepenscanbecalculatedasdescribedinAppendix5‐C.1and5‐C.3.
5.3.2.2 RationaleforSelectedMethodforEstimatingEmissionsfromBeefProductionSystems
Cow‐Calf,Bulls,andStockersThemostappropriatepredictionsavailableforentityscaleestimationareIPCCTier2methodsforgrazingcattle.Criticalvariablesthatareimportanttodefineinordertogeneratepredictionmethodsincludemeasurementsorestimationsoffeedintakeandfeedquality(chemicalcomposition)forpastureorrangelands.Iftheintakeisnotknown,intakepredictionequations/modelssuchasNRC(2000)canbeused.TheNRC(2000)providesanequationforthecalculationofDMIforgrazingbeefcowsandforstockercattle:NEmintake=SBW0.75*(0.04997*NEm2+0.04631)whereNEmistheestimatedMcalkg‐1ofthepasture,andSBWistheaverageshrunkbodyweightfortheperiodofgrazing(kg).TherequirementforknowledgeoftheNEmconcentrationofthepasturemaylimittheusefulnessofthepredictioninsomesituations.
Insituationsinwhichtheherdishousedinadry‐lotorbarnfacility,emissionfactorsforCH4andN2Oassociatedwithpensurfaces,manurestorage,andanimalmovement/manuredisturbancewouldbeappropriate.
FeedlotEllisetal.,(2009)reportedthatseveralequationsappearedtobegoodpredictorsofentericCH4lossesfromfeedlotcattlebasedonCanadianstudies.However,manyofthoseequationstendtogreatlyoverestimateentericlosseswhencomparedwithdatafromcattlefedatypicalsouthernplainsfinishingdiet(Halesetal.,2012;2013;Toddetal.,2014a;Toddetal.,2014b).AlthoughKebreabetal.(2008)reportedthatMOLLYandIPCCTier2(2006)gavepredictedvaluessimilartomeasuredvalueswithfeedlotcattle,therewasalargevariabilityinindividualanimalswitherrorsof75percentorgreater.Kebreabetal.(2008)notedtheaverageYm(MJentericCH4MJGEI‐1)forfeedlotcattlebasedonexperimentaldatawas3.88percentofGEI(range3.36to4.56),whichwashigherthantheIPCC(2006)valueof3.0percentandtherecentlyobtainedvalueswithtypicalfinishingdietsof2.85percent(Halesetal.,2012;2013).
Equation5‐13:MonthlyBeefFeedlotNH3 EmissionsasaFunctionofDietaryCrudeProteinandMonthlyTemperature
. .
Where:
NH3 =NH3emissionfromhousingperday(gNH3head‐1day‐1)
T =Averagemonthlytemperature(K)
CP =Dietarycrudeproteinasafractionofdrymatter(%)
Chapter 5: Quantifying Greenhouse Gas Sources and Sinks in Animal Production Systems
5-52
Currently,IPCCTier2maybethemostusefulmethodologyforpredictionofentericemissionsfromfeedlotbeefcattle.Unfortunately,theTier2methoddoesnotallowforestimatingchangesinentericemissionsrelatedtochangesindietormanagement.
Therefore,amodifiedIPCC(2006)methodisrecommendedtoestimateentericCH4emissionsfrombeefcattlefedhighconcentratefinishingdiets.TheCH4conversionfactor(Ym)willbeadjustedbyfactorsintheanimals’dietsasdescribedinSection5.3.2.1.AbaselinescenariobasedontypicalU.S.beefcattlefeedingconditionsisestablished,andtheYmvaluesareadjustedbasedonpublishedresearch.Emissionvaluesaremodifiedusingcorrectionfactorsthatarebasedonchangesinanimalmanagementandfeedingconditionsfromthebaselinescenario.
5.3.3 EntericFermentationandHousingEmissionsfromSheep
GHGemissionsassociatedwithsheepproductionincludeentericCH4emissions,manureandbeddingemissions,andemissionsassociatedwithgrazingandmanureapplicationtoland.
TheNewZealandMinistryfortheEnvironment(2010)estimatedthatsheepyoungerthanayearofageemit5.1percentofGEIasentericCH4,andadultsheepemit6.3percentoftheirGEIasCH4.Theseemissionfactors,whencombinedwithpopulationestimates,resultinbaselineentericemissionsof11.60kgCH4head‐1year‐1.Sheeparealsoestimatedtodeposit15.9kgNhead‐1year‐1.
Lassey(2007)summarizedtheentericemissionsmeasurementsfromgrazingsheeptrialsfromNewZealandandAustraliainwhichtheSF6tracertechniquewasused.Foragecharacteristicsrangedfromlush(invitrodigestibilityestimateof82percent)topoorquality(called“dead,”withaninvitrodigestibilityof54percent).Intakewasmeasuredusingcompletefecalcollectionoramarker(n‐alkane).EntericCH4emissionsrangedfrom11.7gday‐1forsheepfedforageofhigherquality(6.9percentofGEI)to35.2gday‐1forsheepfedforageoflowerquality(6.3percentofGEI).Theaverageentericemissionswere5.39percentofGEI,or23.5gday‐1.Ingeneral,lowerforagequalityresultedinagreateramountofCH4emittedasaproportionoftheenergyintakethandidhigherforagequality.
NewZealandpasturesgrazedbysheephadelevatedN2Oemissions(7.4gN2O‐Nha‐1day‐1vs.3.4gN2O‐Nha‐1day‐1)comparedwithcontrol,butsignificantlylessthanthatobservedwhencattlegrazed(32.0gN2O‐Nha‐1day‐1)(Saggaretal.,2007).ThedatawereusedtoevaluatetheNZ‐DNDCmodel,aprocess‐basedNewZealandwholefarmmodel.ToourknowledgetherearenopublishedestimatesofGHGemissionfromsheepmanuresystems.
5.3.3.1 MethodforEstimatingEmissionsfromSheep
MethodforEstimatingEntericFermentationCH4 EmissionsfromSheep
Howdenequation(Howdenetal.,1994),basedondietaryDMI. TheequationfromHowdenetal.(1994)estimatesemissionsbasedsolelyonDMI;hence,
emissionfactorsnotutilized.
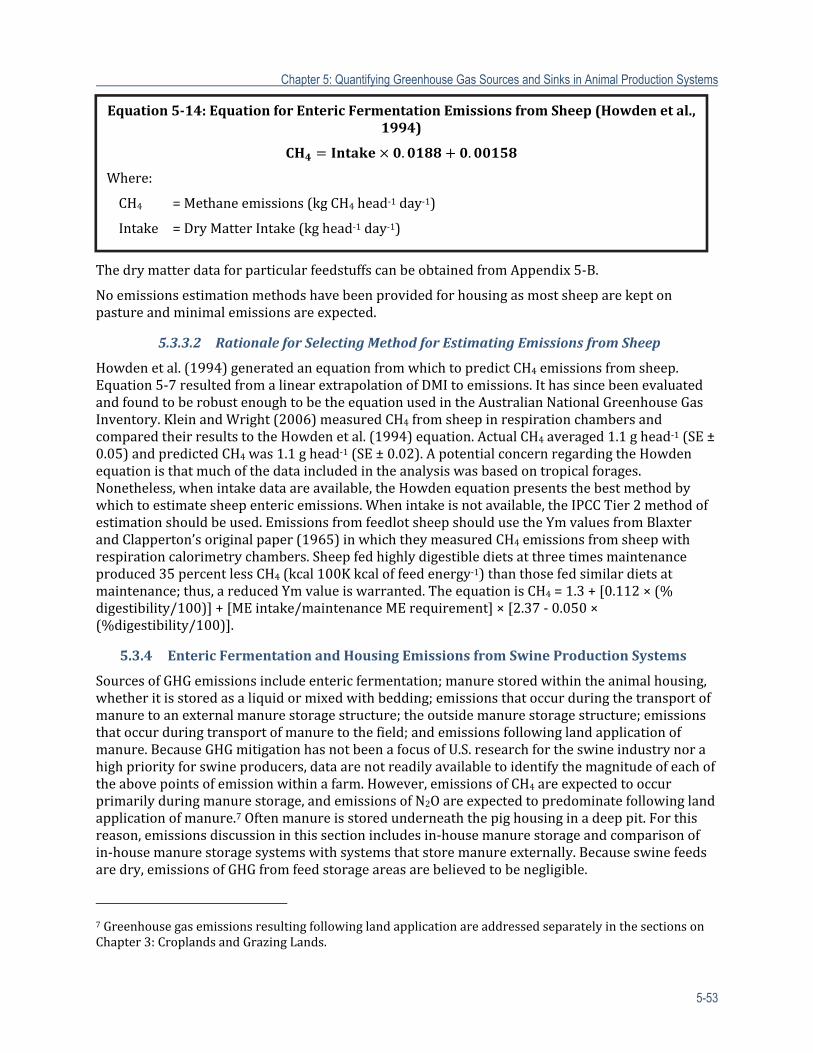
Chapter 5: Quantifying Greenhouse Gas Sources and Sinks in Animal Production Systems
5-53
ThedrymatterdataforparticularfeedstuffscanbeobtainedfromAppendix5‐B.
Noemissionsestimationmethodshavebeenprovidedforhousingasmostsheeparekeptonpastureandminimalemissionsareexpected.
5.3.3.2 RationaleforSelectingMethodforEstimatingEmissionsfromSheep
Howdenetal.(1994)generatedanequationfromwhichtopredictCH4emissionsfromsheep.Equation5‐7resultedfromalinearextrapolationofDMItoemissions.IthassincebeenevaluatedandfoundtoberobustenoughtobetheequationusedintheAustralianNationalGreenhouseGasInventory.KleinandWright(2006)measuredCH4fromsheepinrespirationchambersandcomparedtheirresultstotheHowdenetal.(1994)equation.ActualCH4averaged1.1ghead‐1(SE±0.05)andpredictedCH4was1.1ghead‐1(SE±0.02).ApotentialconcernregardingtheHowdenequationisthatmuchofthedataincludedintheanalysiswasbasedontropicalforages.Nonetheless,whenintakedataareavailable,theHowdenequationpresentsthebestmethodbywhichtoestimatesheepentericemissions.Whenintakeisnotavailable,theIPCCTier2methodofestimationshouldbeused.EmissionsfromfeedlotsheepshouldusetheYmvaluesfromBlaxterandClapperton’soriginalpaper(1965)inwhichtheymeasuredCH4emissionsfromsheepwithrespirationcalorimetrychambers.Sheepfedhighlydigestibledietsatthreetimesmaintenanceproduced35percentlessCH4(kcal100Kkcaloffeedenergy‐1)thanthosefedsimilardietsatmaintenance;thus,areducedYmvalueiswarranted.TheequationisCH4=1.3+[0.112×(%digestibility/100)]+[MEintake/maintenanceMErequirement]×[2.37‐0.050×(%digestibility/100)].
5.3.4 EntericFermentationandHousingEmissionsfromSwineProductionSystems
SourcesofGHGemissionsincludeentericfermentation;manurestoredwithintheanimalhousing,whetheritisstoredasaliquidormixedwithbedding;emissionsthatoccurduringthetransportofmanuretoanexternalmanurestoragestructure;theoutsidemanurestoragestructure;emissionsthatoccurduringtransportofmanuretothefield;andemissionsfollowinglandapplicationofmanure.BecauseGHGmitigationhasnotbeenafocusofU.S.researchfortheswineindustrynorahighpriorityforswineproducers,dataarenotreadilyavailabletoidentifythemagnitudeofeachoftheabovepointsofemissionwithinafarm.However,emissionsofCH4areexpectedtooccurprimarilyduringmanurestorage,andemissionsofN2Oareexpectedtopredominatefollowinglandapplicationofmanure.7Oftenmanureisstoredunderneaththepighousinginadeeppit.Forthisreason,emissionsdiscussioninthissectionincludesin‐housemanurestorageandcomparisonofin‐housemanurestoragesystemswithsystemsthatstoremanureexternally.Becauseswinefeedsaredry,emissionsofGHGfromfeedstorageareasarebelievedtobenegligible.
7GreenhousegasemissionsresultingfollowinglandapplicationareaddressedseparatelyinthesectionsonChapter3:CroplandsandGrazingLands.
Equation5‐14:EquationforEntericFermentationEmissionsfromSheep(Howdenetal.,1994)
. .
Where:
CH4 =Methaneemissions(kgCH4head‐1day‐1)
Intake =DryMatterIntake(kghead‐1day‐1)
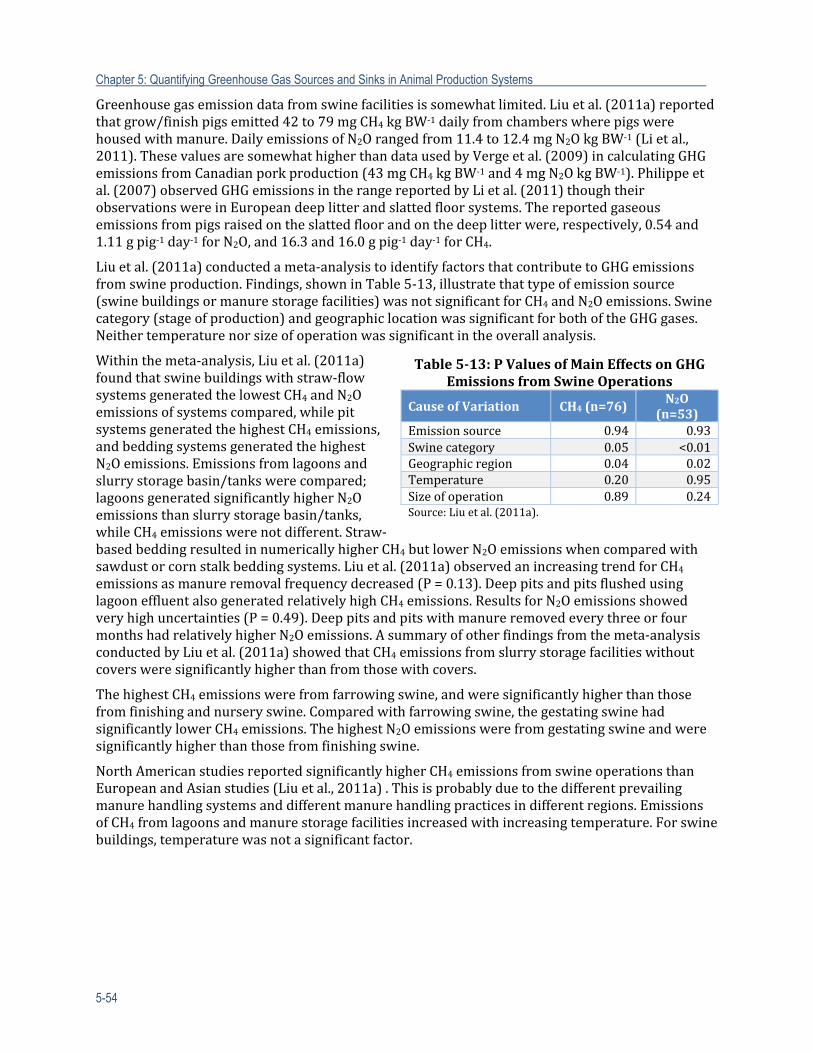
Chapter 5: Quantifying Greenhouse Gas Sources and Sinks in Animal Production Systems
5-54
Greenhousegasemissiondatafromswinefacilitiesissomewhatlimited.Liuetal.(2011a)reportedthatgrow/finishpigsemitted42to79mgCH4kgBW‐1dailyfromchamberswherepigswerehousedwithmanure.DailyemissionsofN2Orangedfrom11.4to12.4mgN2OkgBW‐1(Lietal.,2011).ThesevaluesaresomewhathigherthandatausedbyVergeetal.(2009)incalculatingGHGemissionsfromCanadianporkproduction(43mgCH4kgBW‐1and4mgN2OkgBW‐1).Philippeetal.(2007)observedGHGemissionsintherangereportedbyLietal.(2011)thoughtheirobservationswereinEuropeandeeplitterandslattedfloorsystems.Thereportedgaseousemissionsfrompigsraisedontheslattedfloorandonthedeeplitterwere,respectively,0.54and1.11gpig‐1day‐1forN2O,and16.3and16.0gpig‐1day‐1forCH4.
Liuetal.(2011a)conductedameta‐analysistoidentifyfactorsthatcontributetoGHGemissionsfromswineproduction.Findings,showninTable5‐13,illustratethattypeofemissionsource(swinebuildingsormanurestoragefacilities)wasnotsignificantforCH4andN2Oemissions.Swinecategory(stageofproduction)andgeographiclocationwassignificantforbothoftheGHGgases.Neithertemperaturenorsizeofoperationwassignificantintheoverallanalysis.
Withinthemeta‐analysis,Liuetal.(2011a)foundthatswinebuildingswithstraw‐flowsystemsgeneratedthelowestCH4andN2Oemissionsofsystemscompared,whilepitsystemsgeneratedthehighestCH4emissions,andbeddingsystemsgeneratedthehighestN2Oemissions.Emissionsfromlagoonsandslurrystoragebasin/tankswerecompared;lagoonsgeneratedsignificantlyhigherN2Oemissionsthanslurrystoragebasin/tanks,whileCH4emissionswerenotdifferent.Straw‐basedbeddingresultedinnumericallyhigherCH4butlowerN2Oemissionswhencomparedwithsawdustorcornstalkbeddingsystems.Liuetal.(2011a)observedanincreasingtrendforCH4emissionsasmanureremovalfrequencydecreased(P=0.13).DeeppitsandpitsflushedusinglagooneffluentalsogeneratedrelativelyhighCH4emissions.ResultsforN2Oemissionsshowedveryhighuncertainties(P=0.49).DeeppitsandpitswithmanureremovedeverythreeorfourmonthshadrelativelyhigherN2Oemissions.Asummaryofotherfindingsfromthemeta‐analysisconductedbyLiuetal.(2011a)showedthatCH4emissionsfromslurrystoragefacilitieswithoutcoversweresignificantlyhigherthanfromthosewithcovers.
ThehighestCH4emissionswerefromfarrowingswine,andweresignificantlyhigherthanthosefromfinishingandnurseryswine.Comparedwithfarrowingswine,thegestatingswinehadsignificantlylowerCH4emissions.ThehighestN2Oemissionswerefromgestatingswineandweresignificantlyhigherthanthosefromfinishingswine.
NorthAmericanstudiesreportedsignificantlyhigherCH4emissionsfromswineoperationsthanEuropeanandAsianstudies(Liuetal.,2011a).Thisisprobablyduetothedifferentprevailingmanurehandlingsystemsanddifferentmanurehandlingpracticesindifferentregions.EmissionsofCH4fromlagoonsandmanurestoragefacilitiesincreasedwithincreasingtemperature.Forswinebuildings,temperaturewasnotasignificantfactor.
Table5‐13:PValuesofMainEffectsonGHGEmissionsfromSwineOperations
CauseofVariation CH4(n=76)N2O
(n=53)Emissionsource 0.94 0.93Swinecategory 0.05 <0.01Geographicregion 0.04 0.02Temperature 0.20 0.95Sizeofoperation 0.89 0.24Source:Liuetal.(2011a).
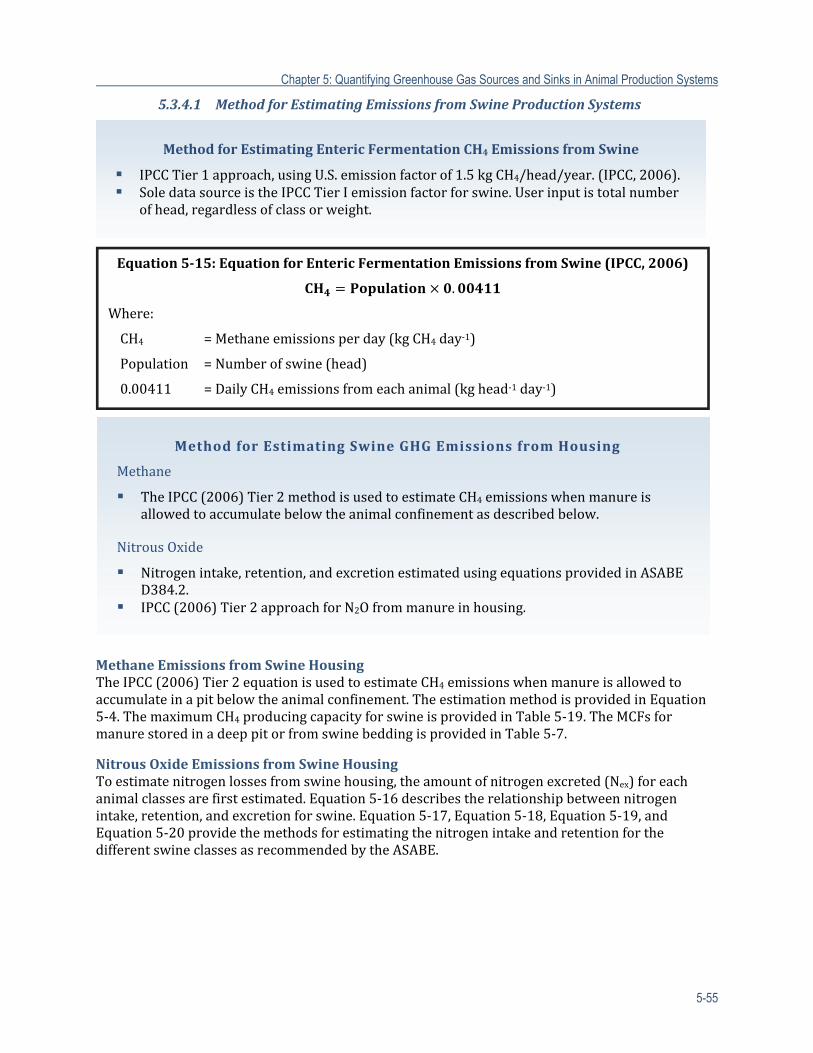
Chapter 5: Quantifying Greenhouse Gas Sources and Sinks in Animal Production Systems
5-55
5.3.4.1 MethodforEstimatingEmissionsfromSwineProductionSystems
MethaneEmissionsfromSwineHousingTheIPCC(2006)Tier2equationisusedtoestimateCH4emissionswhenmanureisallowedtoaccumulateinapitbelowtheanimalconfinement.TheestimationmethodisprovidedinEquation5‐4.ThemaximumCH4producingcapacityforswineisprovidedinTable5‐19.TheMCFsformanurestoredinadeeppitorfromswinebeddingisprovidedinTable5‐7.
NitrousOxideEmissionsfromSwineHousingToestimatenitrogenlossesfromswinehousing,theamountofnitrogenexcreted(Nex)foreachanimalclassesarefirstestimated.Equation5‐16describestherelationshipbetweennitrogenintake,retention,andexcretionforswine.Equation5‐17,Equation5‐18,Equation5‐19,andEquation5‐20providethemethodsforestimatingthenitrogenintakeandretentionforthedifferentswineclassesasrecommendedbytheASABE.
MethodforEstimatingEntericFermentationCH4 EmissionsfromSwine
IPCCTier1approach,usingU.S.emissionfactorof1.5kgCH4/head/year.(IPCC,2006). SoledatasourceistheIPCCTierIemissionfactorforswine.Userinputistotalnumber
ofhead,regardlessofclassorweight.
Equation5‐15:EquationforEntericFermentationEmissionsfromSwine(IPCC,2006)
.
Where:
CH4 =Methaneemissionsperday(kgCH4day‐1)
Population =Numberofswine(head)
0.00411 =DailyCH4emissionsfromeachanimal(kghead‐1day‐1)
Methodfor Estimating Swine GHG Emissions from Housing
Methane
TheIPCC(2006)Tier2methodisusedtoestimateCH4emissionswhenmanureisallowedtoaccumulatebelowtheanimalconfinementasdescribedbelow.
NitrousOxide
Nitrogenintake,retention,andexcretionestimatedusingequationsprovidedinASABED384.2.
IPCC(2006)Tier2approachforN2Ofrommanureinhousing.
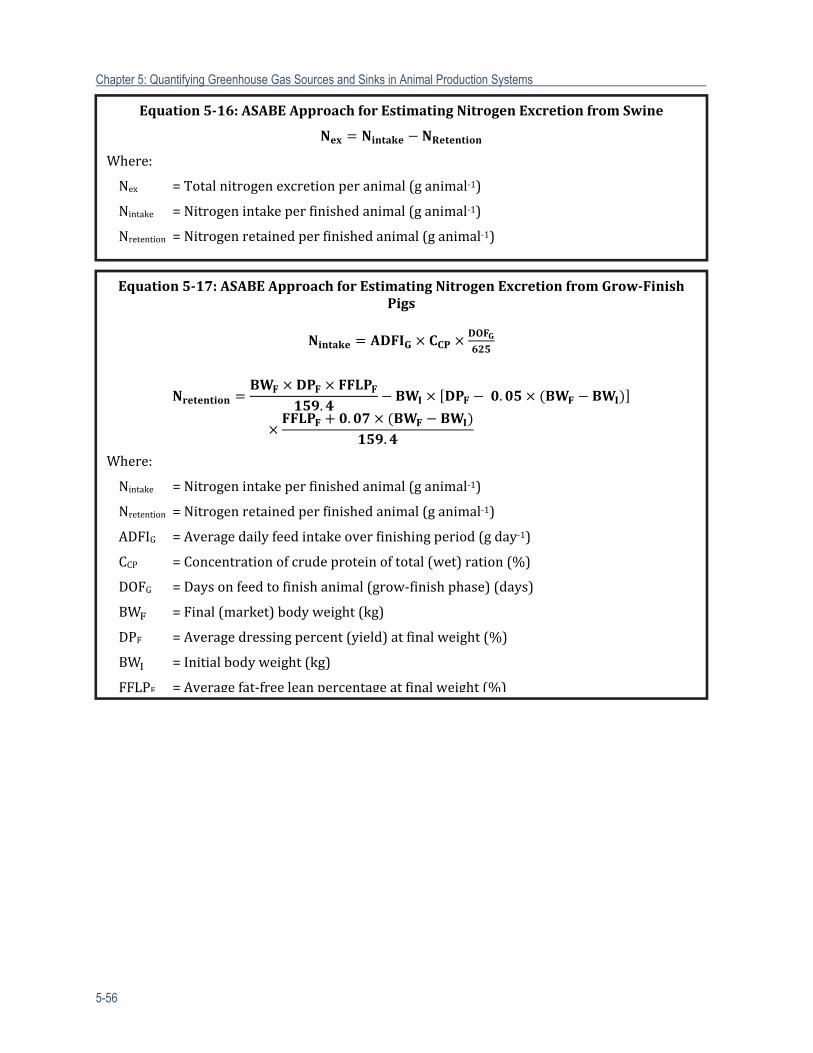
Chapter 5: Quantifying Greenhouse Gas Sources and Sinks in Animal Production Systems
5-56
Equation5‐16:ASABEApproachforEstimatingNitrogenExcretionfromSwine
Where:
Nex =Totalnitrogenexcretionperanimal(ganimal‐1)
Nintake =Nitrogenintakeperfinishedanimal(ganimal‐1)
Nretention =Nitrogenretainedperfinishedanimal(ganimal‐1)
Equation5‐17:ASABEApproachforEstimatingNitrogenExcretionfromGrow‐FinishPigs
. .
..
Where:
Nintake =Nitrogenintakeperfinishedanimal(ganimal‐1)
Nretention =Nitrogenretainedperfinishedanimal(ganimal‐1)
ADFIG =Averagedailyfeedintakeoverfinishingperiod(gday‐1)
CCP =Concentrationofcrudeproteinoftotal(wet)ration(%)
DOFG =Daysonfeedtofinishanimal(grow‐finishphase)(days)
BW =Final(market)bodyweight(kg)
DPF =Averagedressingpercent(yield)atfinalweight(%)
BW =Initialbodyweight(kg)
FFLPF =Averagefat‐freeleanpercentageatfinalweight(%)
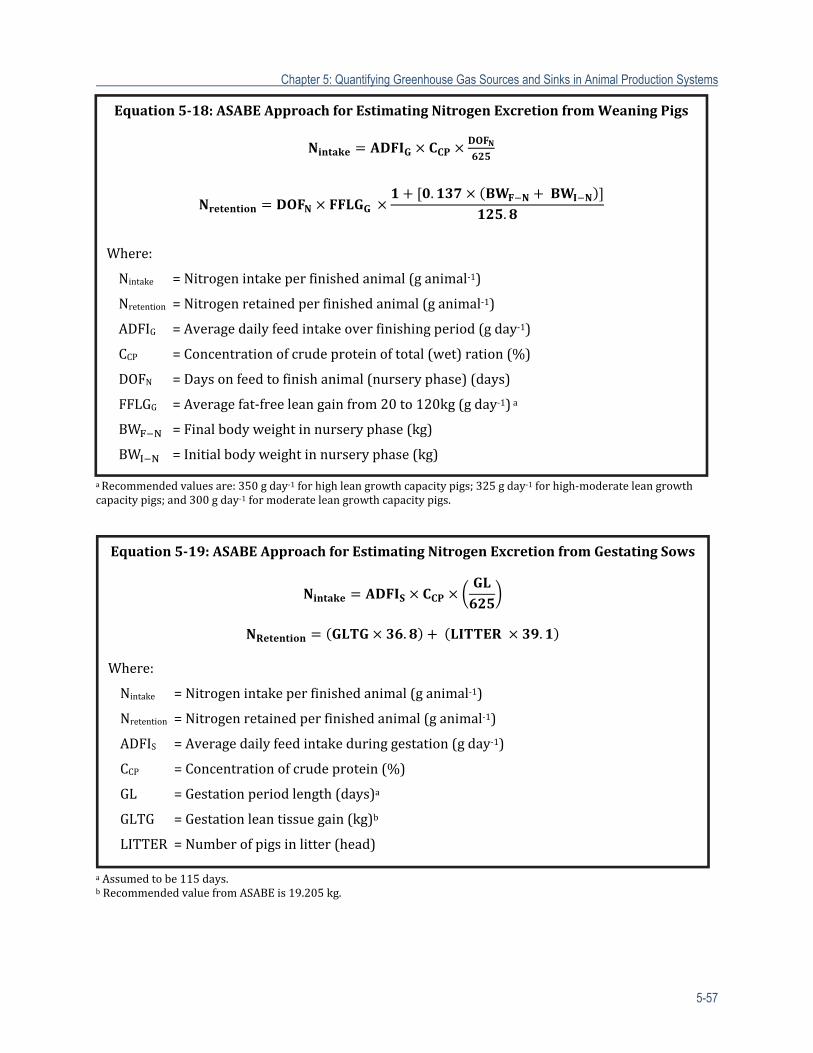
Chapter 5: Quantifying Greenhouse Gas Sources and Sinks in Animal Production Systems
5-57
aRecommendedvaluesare:350gday‐1forhighleangrowthcapacitypigs;325gday‐1forhigh‐moderateleangrowthcapacitypigs;and300gday‐1formoderateleangrowthcapacitypigs.
aAssumedtobe115days.bRecommendedvaluefromASABEis19.205kg.
Equation5‐18:ASABEApproachforEstimatingNitrogenExcretionfromWeaningPigs
.
.
Where:
Nintake =Nitrogenintakeperfinishedanimal(ganimal‐1)
Nretention =Nitrogenretainedperfinishedanimal(ganimal‐1)
ADFIG =Averagedailyfeedintakeoverfinishingperiod(gday‐1)
CCP =Concentrationofcrudeproteinoftotal(wet)ration(%)
DOFN =Daysonfeedtofinishanimal(nurseryphase)(days)
FFLGG =Averagefat‐freeleangainfrom20to120kg(gday‐1)a
BW =Finalbodyweightinnurseryphase(kg)
BW =Initialbodyweightinnurseryphase(kg)
Equation5‐19:ASABEApproachforEstimatingNitrogen ExcretionfromGestatingSows
. .
Where:
Nintake =Nitrogenintakeperfinishedanimal(ganimal‐1)
Nretention =Nitrogenretainedperfinishedanimal(ganimal‐1)
ADFIS =Averagedailyfeedintakeduringgestation(gday‐1)
CCP =Concentrationofcrudeprotein(%)
GL =Gestationperiodlength(days)a
GLTG =Gestationleantissuegain(kg)b
LITTER =Numberofpigsinlitter(head)
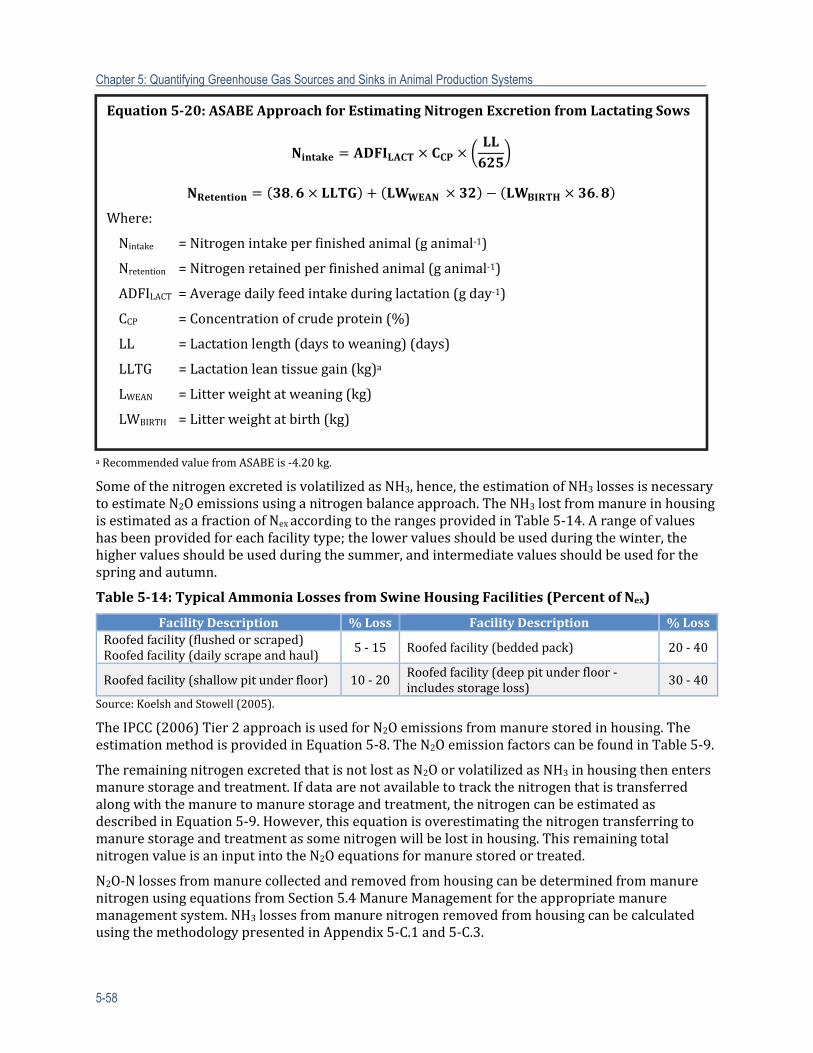
Chapter 5: Quantifying Greenhouse Gas Sources and Sinks in Animal Production Systems
5-58
aRecommendedvaluefromASABEis‐4.20kg.
SomeofthenitrogenexcretedisvolatilizedasNH3,hence,theestimationofNH3lossesisnecessarytoestimateN2Oemissionsusinganitrogenbalanceapproach.TheNH3lostfrommanureinhousingisestimatedasafractionofNexaccordingtotherangesprovidedinTable5‐14.Arangeofvalueshasbeenprovidedforeachfacilitytype;thelowervaluesshouldbeusedduringthewinter,thehighervaluesshouldbeusedduringthesummer,andintermediatevaluesshouldbeusedforthespringandautumn.
Table5‐14:TypicalAmmoniaLossesfromSwineHousingFacilities(PercentofNex)
FacilityDescription %Loss FacilityDescription %LossRoofedfacility(flushedorscraped)Roofedfacility(dailyscrapeandhaul)
5‐15 Roofedfacility(beddedpack) 20‐40
Roofedfacility(shallowpitunderfloor) 10‐20Roofedfacility(deeppitunderfloor‐includesstorageloss) 30‐40
Source:KoelshandStowell(2005).
TheIPCC(2006)Tier2approachisusedforN2Oemissionsfrommanurestoredinhousing.TheestimationmethodisprovidedinEquation5‐8.TheN2OemissionfactorscanbefoundinTable5‐9.
TheremainingnitrogenexcretedthatisnotlostasN2OorvolatilizedasNH3inhousingthenentersmanurestorageandtreatment.Ifdataarenotavailabletotrackthenitrogenthatistransferredalongwiththemanuretomanurestorageandtreatment,thenitrogencanbeestimatedasdescribedinEquation5‐9.However,thisequationisoverestimatingthenitrogentransferringtomanurestorageandtreatmentassomenitrogenwillbelostinhousing.ThisremainingtotalnitrogenvalueisaninputintotheN2Oequationsformanurestoredortreated.
N2O‐NlossesfrommanurecollectedandremovedfromhousingcanbedeterminedfrommanurenitrogenusingequationsfromSection5.4ManureManagementfortheappropriatemanuremanagementsystem.NH3lossesfrommanurenitrogenremovedfromhousingcanbecalculatedusingthemethodologypresentedinAppendix5‐C.1and5‐C.3.
Equation5‐20:ASABEApproachforEstimatingNitrogenExcretionfromLactatingSows
. .
Where:
Nintake =Nitrogenintakeperfinishedanimal(ganimal‐1)
Nretention =Nitrogenretainedperfinishedanimal(ganimal‐1)
ADFILACT =Averagedailyfeedintakeduringlactation(gday‐1)
CCP =Concentrationofcrudeprotein(%)
LL =Lactationlength(daystoweaning)(days)
LLTG =Lactationleantissuegain(kg)a
LWEAN =Litterweightatweaning(kg)
LWBIRTH =Litterweightatbirth(kg)
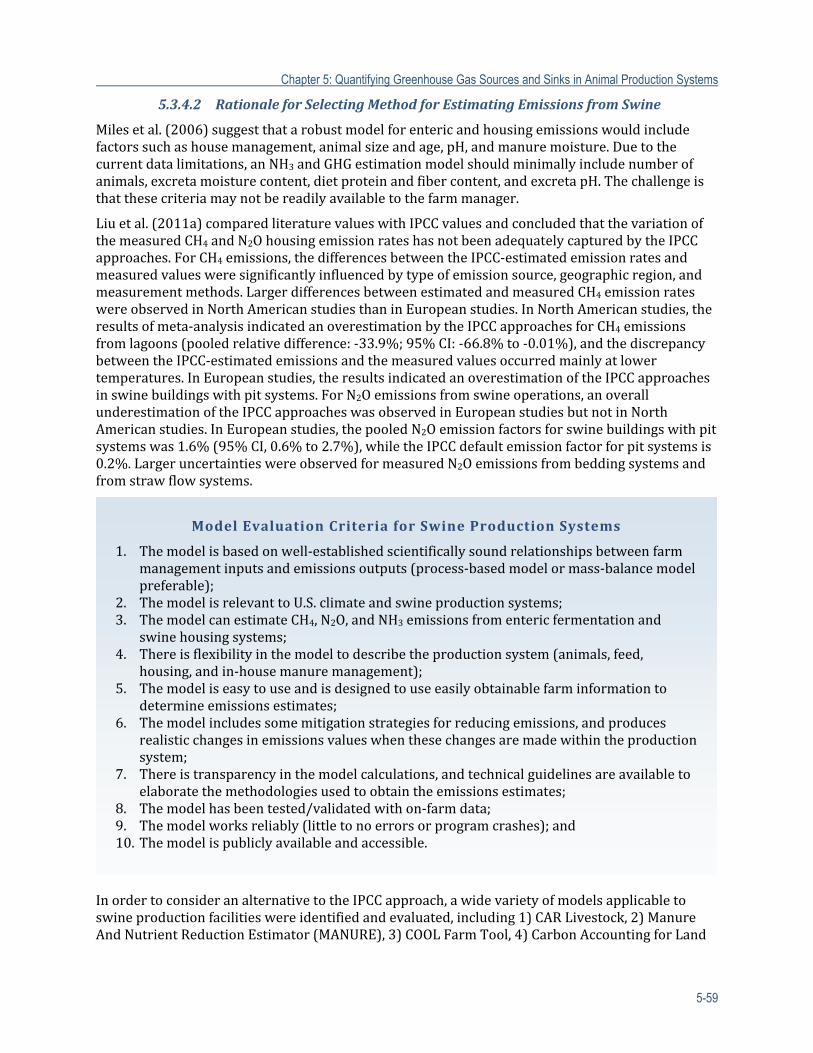
Chapter 5: Quantifying Greenhouse Gas Sources and Sinks in Animal Production Systems
5-59
5.3.4.2 RationaleforSelectingMethodforEstimatingEmissionsfromSwine
Milesetal.(2006)suggestthatarobustmodelforentericandhousingemissionswouldincludefactorssuchashousemanagement,animalsizeandage,pH,andmanuremoisture.Duetothecurrentdatalimitations,anNH3andGHGestimationmodelshouldminimallyincludenumberofanimals,excretamoisturecontent,dietproteinandfibercontent,andexcretapH.Thechallengeisthatthesecriteriamaynotbereadilyavailabletothefarmmanager.
Liuetal.(2011a)comparedliteraturevalueswithIPCCvaluesandconcludedthatthevariationofthemeasuredCH4andN2OhousingemissionrateshasnotbeenadequatelycapturedbytheIPCCapproaches.ForCH4emissions,thedifferencesbetweentheIPCC‐estimatedemissionratesandmeasuredvaluesweresignificantlyinfluencedbytypeofemissionsource,geographicregion,andmeasurementmethods.LargerdifferencesbetweenestimatedandmeasuredCH4emissionrateswereobservedinNorthAmericanstudiesthaninEuropeanstudies.InNorthAmericanstudies,theresultsofmeta‐analysisindicatedanoverestimationbytheIPCCapproachesforCH4emissionsfromlagoons(pooledrelativedifference:‐33.9%;95%CI:‐66.8%to‐0.01%),andthediscrepancybetweentheIPCC‐estimatedemissionsandthemeasuredvaluesoccurredmainlyatlowertemperatures.InEuropeanstudies,theresultsindicatedanoverestimationoftheIPCCapproachesinswinebuildingswithpitsystems.ForN2Oemissionsfromswineoperations,anoverallunderestimationoftheIPCCapproacheswasobservedinEuropeanstudiesbutnotinNorthAmericanstudies.InEuropeanstudies,thepooledN2Oemissionfactorsforswinebuildingswithpitsystemswas1.6%(95%CI,0.6%to2.7%),whiletheIPCCdefaultemissionfactorforpitsystemsis0.2%.LargeruncertaintieswereobservedformeasuredN2Oemissionsfrombeddingsystemsandfromstrawflowsystems.
InordertoconsideranalternativetotheIPCCapproach,awidevarietyofmodelsapplicabletoswineproductionfacilitieswereidentifiedandevaluated,including1)CARLivestock,2)ManureAndNutrientReductionEstimator(MANURE),3)COOLFarmTool,4)CarbonAccountingforLand
Model Evaluation Criteria for SwineProduction Systems
1. Themodelisbasedonwell‐establishedscientificallysoundrelationshipsbetweenfarmmanagementinputsandemissionsoutputs(process‐basedmodelormass‐balancemodelpreferable);
2. ThemodelisrelevanttoU.S.climateandswineproductionsystems;3. ThemodelcanestimateCH4,N2O,andNH3emissionsfromentericfermentationand
swinehousingsystems;4. Thereisflexibilityinthemodeltodescribetheproductionsystem(animals,feed,
housing,andin‐housemanuremanagement);5. Themodeliseasytouseandisdesignedtouseeasilyobtainablefarminformationto
determineemissionsestimates;6. Themodelincludessomemitigationstrategiesforreducingemissions,andproduces
realisticchangesinemissionsvalueswhenthesechangesaremadewithintheproductionsystem;
7. Thereistransparencyinthemodelcalculations,andtechnicalguidelinesareavailabletoelaboratethemethodologiesusedtoobtaintheemissionsestimates;
8. Themodelhasbeentested/validatedwithon‐farmdata;9. Themodelworksreliably(littletonoerrorsorprogramcrashes);and10. Themodelispubliclyavailableandaccessible.
Chapter 5: Quantifying Greenhouse Gas Sources and Sinks in Animal Production Systems
5-60
Managers,5)FarmingEnterpriseGHGCalculator,6)CPLAN,and7)Holos.Thesemodelswereevaluatedby10criteria(seebox)todeterminetheirsuitabilityforuseindeterminingemissionsestimatesforswineproductionfacilitiesintheUnitedStates.Twoofthesecriteriawereconsideredtobecritical,inthatiftheywerenotmetbythemodel,theycouldnotbeconsideredforuse(i.e.,themodelhadtoberelevanttoU.S.climateandswineproductionsystemsandhadtobepubliclyavailable).
TheHolosmodelconsidereddiet(standard,lowcrudeprotein,orhigh‐digestibilityfeeds)andmanurehandlingoptions(anaerobicdigestion,coveredoruncoveredslurrystorage,deeppit,orsolidstorage).Inaddition,theHolosmodelprovidedanestimateofuncertaintyforthemodeloutput.TheMANUREmodel(WRI,2009)collectedthemostcomprehensivedataandallowedforeasycomparisonoftheimpactofchangesinmanurehandlinganduseonemissionsofNH3,N2O(directandindirect),andCH4.Ontheanimalside,MANUREbaseditscalculationssolelyonanimalnumbers;feedingwasnotconsidered.Theothermodelsconsidered,whilemeetingminimumcriteria,lackedanyimprovementsovertheIPCCapproach.Consequently,theIPCCmethodwasselected(i.e.,HolosutilizestheIPCCTier1approachforhousing)withnitrogenexcretionestimatedusingASABEequationsthataccountfordiets.
5.3.5 HousingEmissionsfromPoultryProductionSystems
MeatBirdsGreenhousegasemissionswithinthefarmboundaryofabroilerchickenfarmwilloriginatealmostexclusivelyfromtheanimalhousing,whichalsoservesasthestoragelocationformanure.Liuetal.(2011a)reportedthatfora20‐weekgrow‐outofturkeysonlitter,averagedailyN2Oemissionswere0.045g(kgbodyweight)‐1,anddailyCH4emissionswere0.08g(kgbodyweight)‐1.EmissionsourcesexternaltothehousingincludeGHGemissionsfromfarmvehicles.Ifahouseiscleanedordecaked(removalofthetop,crustedportionofthelitter)andstoredonthefarm,GHGandNH3productionandemissionscouldoccur;Appendix5‐CprovidesfurtherdiscussiononNH3emissionsfromhousing.Practicestodecakeandthetimingoflandapplicationofcakeandlittervaryfromsitetositeandmayormaynotincludefurthercomposting.
LayingHensGreenhousegasemissionswithinthefarmboundaryofaneggfarmmayoriginatefromthehousingorthemanurestoragelocation.EmissionsourcesexternaltothehousingincludeGHGemissionsfromfarmvehicles.Externaltothefarmitself,GHGemissionsresultfromlandapplicationoflitterorstockpilingofthelitterinfieldspriortolandapplication.
Layinghenhousingsystemswithoutlitterwouldlikelyexhibitgreateremissionsthanlittersystems,butcomparisonofestimatesaresparse.Layinghenhousestypicallystoreexcretainabasementormaymoveexcretaoutofthehousefrequently(dailyormoreoften);thiswouldrelocateemissionstoastorageshedratherthanchangethecumulativeemissionsunlesssomeformofprocessing(drying)tookplacepriortostorage.Lietal.(2010)reporteddailyCH4emissionsof39.3to45.4mghen‐1andN2Oemissionsof58.6mghen‐1(henbodyweightaverage=1.9kg)inabasement‐typesystem.Thiscomparestoalittersystemfora20‐weekgrow‐outofturkeyswhereaveragedailyN2Oemissionswere0.045gkg‐1bodyweightanddailyCH4emissionswere0.08gkg‐1bodyweight(Liuetal.,2011a).Basedonthecomparisonofthesetwostudies,differencesinGHGemissionsfromdrylittersystemsandwetter,stackedlayinghensystemswouldbeexpected.
ManagementpracticestoreducelittermoistureofferthemostpromiseforreducingemissionsofCH4andN2O.Quantitativeestimatesofhowemissionsvarywithlittermoisturearenotavailable,butwouldlikelyfollowsimilardynamicsassoilmoisturecontent.Reuseoflitteranddecaking
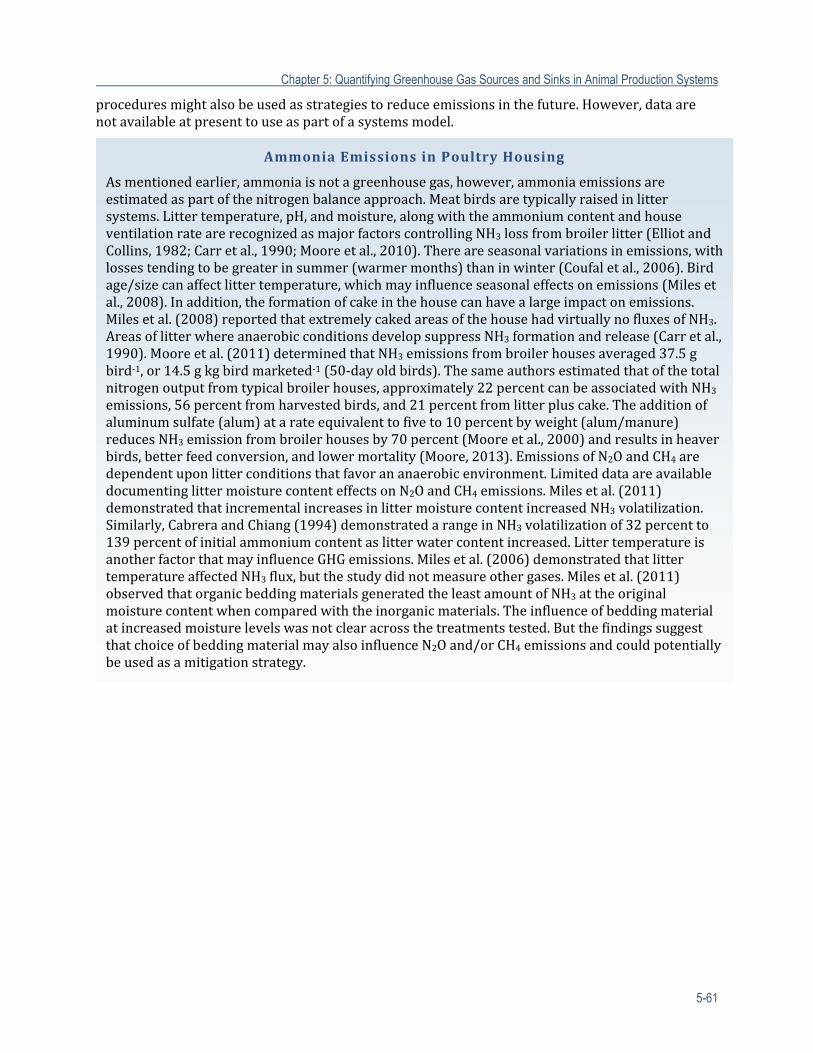
Chapter 5: Quantifying Greenhouse Gas Sources and Sinks in Animal Production Systems
5-61
proceduresmightalsobeusedasstrategiestoreduceemissionsinthefuture.However,dataarenotavailableatpresenttouseaspartofasystemsmodel.
Ammonia Emissions in Poultry Housing
Asmentionedearlier,ammoniaisnotagreenhousegas,however,ammoniaemissionsareestimatedaspartofthenitrogenbalanceapproach.Meatbirdsaretypicallyraisedinlittersystems.Littertemperature,pH,andmoisture,alongwiththeammoniumcontentandhouseventilationratearerecognizedasmajorfactorscontrollingNH3lossfrombroilerlitter(ElliotandCollins,1982;Carretal.,1990;Mooreetal.,2010).Thereareseasonalvariationsinemissions,withlossestendingtobegreaterinsummer(warmermonths)thaninwinter(Coufaletal.,2006).Birdage/sizecanaffectlittertemperature,whichmayinfluenceseasonaleffectsonemissions(Milesetal.,2008).Inaddition,theformationofcakeinthehousecanhavealargeimpactonemissions.Milesetal.(2008)reportedthatextremelycakedareasofthehousehadvirtuallynofluxesofNH3.AreasoflitterwhereanaerobicconditionsdevelopsuppressNH3formationandrelease(Carretal.,1990).Mooreetal.(2011)determinedthatNH3emissionsfrombroilerhousesaveraged37.5gbird‐1,or14.5gkgbirdmarketed‐1(50‐dayoldbirds).Thesameauthorsestimatedthatofthetotalnitrogenoutputfromtypicalbroilerhouses,approximately22percentcanbeassociatedwithNH3emissions,56percentfromharvestedbirds,and21percentfromlitterpluscake.Theadditionofaluminumsulfate(alum)atarateequivalenttofiveto10percentbyweight(alum/manure)reducesNH3emissionfrombroilerhousesby70percent(Mooreetal.,2000)andresultsinheaverbirds,betterfeedconversion,andlowermortality(Moore,2013).EmissionsofN2OandCH4aredependentuponlitterconditionsthatfavorananaerobicenvironment.LimiteddataareavailabledocumentinglittermoisturecontenteffectsonN2OandCH4emissions.Milesetal.(2011)demonstratedthatincrementalincreasesinlittermoisturecontentincreasedNH3volatilization.Similarly,CabreraandChiang(1994)demonstratedarangeinNH3volatilizationof32percentto139percentofinitialammoniumcontentaslitterwatercontentincreased.LittertemperatureisanotherfactorthatmayinfluenceGHGemissions.Milesetal.(2006)demonstratedthatlittertemperatureaffectedNH3flux,butthestudydidnotmeasureothergases.Milesetal.(2011)observedthatorganicbeddingmaterialsgeneratedtheleastamountofNH3attheoriginalmoisturecontentwhencomparedwiththeinorganicmaterials.Theinfluenceofbeddingmaterialatincreasedmoisturelevelswasnotclearacrossthetreatmentstested.ButthefindingssuggestthatchoiceofbeddingmaterialmayalsoinfluenceN2Oand/orCH4emissionsandcouldpotentiallybeusedasamitigationstrategy.
Chapter 5: Quantifying Greenhouse Gas Sources and Sinks in Animal Production Systems
5-62
5.3.5.1 MethodforEstimatingEmissionsfromPoultryProductionSystems
NitrousOxideandAmmoniaEmissionsfromPoultryHousingToestimatenitrogenlossesfromhousing,theamountofnitrogenexcreted(Nex)byeachanimalcategoryisfirstestimated.Equation5‐22andEquation5‐23aretheequationsrecommendedbytheAmericanSocietyofAgriculturalEngineers(ASABE)forestimatingNexfrombroilers,turkeys,ducks,andlayinghens.
Methodfor Estimating Emissions from Poultry Production Systems
Methane
IPCCTier1approach,utilizingbarncapacityandmanureCH4emissionsfactorsperpoultrytype.
IPCCemissionfactorforpoultryentericCH4productionis0.Emissionsfromhindgutfermentationaresmallandgenerallyconsideredpartofhousingemissions.
NitrousOxide
NitrogenexcretionestimatedusingequationsprovidedinASABED384.2. IPCC(2006)Tier2approachforN2Ofrommanureinhousing.
Equation5‐21:MethaneEmissionsfromPoultryHousing(IPCC,2006)
_
Where:
CH4 =Methaneemissionsperyear(kgCH4year‐1)
Rate =Manuremethaneemissions(kgCH4head‐1year‐1)
Barn_Capacity=Capacityofbarn(head)
Equation5‐22:ASABEApproachforEstimatingNitrogenExcretionfromBroilers,Turkeys,andDucks
.
Where:
Nex =Totalnitrogenexcretionperfinishedanimal(gN(finishedanimal)‐1)
FIx =Feedintakeperphase(gfeed(finishedanimal)‐1)
CCP‐X =Concentrationofcrudeproteinoftotalrationineachphase(gcrudeprotein(g(wet)feed)‐1)
NRF =Retentionfactorfornitrogen(fraction)
Chapter 5: Quantifying Greenhouse Gas Sources and Sinks in Animal Production Systems
5-63
aDefaulteggweightis60gforlightlayerstrainsand63gforheavylayerstrains.bDefaultfractionis0.80.
TheNH3lostfrommanureformeatandegg‐producingbirdsisestimatedasafractionofNex.KoelschandStowell(2005)provideestimatesonthetypicalNH3lossfromdifferenthousingfacilitiesasafractionofNex(seeTable5‐15).Arangeofvalueshasbeenprovidedforeachfacilitytype;thelowervaluesshouldbeusedduringthewinter,thehighervaluesshouldbeusedduringthesummer,andintermediatevaluesshouldbeusedforthespringandautumn.
Table5‐15:TypicalAmmoniaLossesfromPoultryHousingFacilities(PercentofNex)
FacilityDescriptionApplicableSpecies %Loss FacilityDescription
ApplicableSpecies %Loss
Roofedfacility(litter)Meat
producingbirds
25‐50Roofedfacility(stackedmanureunderfloor‐includesstorageloss)
Egg‐producingbirds
25‐50
Source:KoelshandStowell(2005).
N2O can also be lost from the excreted nitrogen. A quantitative method for estimating N2O emissions from solid manure is the IPCC Tier 2 approach, which is also used for the U.S. Greenhouse Gas Inventory (Equation 5-8). This estimation method is the same as the method present in the Temporary Stack and Long-Term Stockpile and the Composting sections (see sections 5.4.1 and 5.4.2 for more details). The N2O emission factors for poultry manure in housing is 0.001 (kg N2O-N/ kg N) for poultry manure with or without bedding IPCC (2006).
TheremainingnitrogenexcretedthatisnotvolatilizedasNH3orlostasN2Oinhousingthenentersmanurestorageandtreatment.Ifdataarenotavailabletotrackthenitrogenthatistransferredalongwiththemanuretomanurestorageandtreatment,thenitrogencanbeestimatedasdescribedinEquation5‐9.However,thisequationisoverestimatingthenitrogentransferringtomanurestorageandtreatmentassomenitrogenwillbelostinhousing.ThisremainingtotalnitrogenvalueisaninputintotheN2Oequationsformanurestoredortreated.
5.3.5.2 RationaleforSelectingMethodforEstimatingEmissionsfromPoultryProductionSystems
Milesetal.(2006)suggestthatarobustmodelwouldincludefactorssuchashousemanagement,birdsizeandage,cakemanagement,pH,andlittermoisture.Duetocurrentdatalimitations,anNH3andGHGestimationmodelshouldminimallyincludenumberofanimals,litter/excretamoisturecontent,dietaryproteinandfibercontent,andlitter/excretapH.Avarietyofmodelsapplicableto
Equation5‐23:ASABEApproachforEstimatingNitrogenExcretionfromLayingHens
..
Where:
Nex =Totalnitrogenexcretionperanimalperday(gNanimal‐1day‐1)
FI =Feedintake(gfeed(finishedanimal)‐1)
CCP =Concentrationofcrudeproteinoftotalration(gcrudeprotein(g(wet)feed)‐1)
Egg =Eggweighta(g)
Egg =Fractionofeggsproducedeachdayb(eggshen‐1day‐1)
Chapter 5: Quantifying Greenhouse Gas Sources and Sinks in Animal Production Systems
5-64
poultryproductionfacilitieswereidentifiedandevaluated,includingCarbonAccountingforLandManagers;CFFCarbonCalculator;CPLAN;and4)Holos.Thesemodelswereevaluatedwithrespectto10criteria(seebox)todeterminetheirsuitabilityforuseindeterminingemissionsestimatesforpoultryproductionfacilitiesintheUnitedStates.
Twoofthesecriteriawereconsideredtobecritical,inthatiftheywerenotmetbythemodel,theycouldnotbeconsideredforuse(i.e.,themodelhadtoberelevanttoU.S.climateandpoultryproductionsystemsandhadtobepubliclyavailable).TheHolosmodeldidconsiderwetordrymanurehandlingforlayinghenoperations.Forallpoultrytypes,theCarbonAccountingforLandManagersmodelrequestedinformationrelatedtoburningofmanureandtimebirdsspendinafree‐rangesystem.Thisinformationwasthenusedtocalculatethemassofmanureavailablefordirectandindirectemissions.Nomodelrequestedinformationondietorin‐houselittermanagementpractices.ForCH4emissions,onlytheHolosmodelprovidedanestimateofconfidenceofmodeloutput.SpecifictoestimatesofpoultrymanureCH4emissions,themodelhadanuncertaintyunder20percentforbroilers,turkeys,layersinwetmanurehandlingsystems,andlayersindrymanurehandlingsystems.Consequently,theIPCCmethodwasselected(i.e.,HolosutilizestheIPCCTier1approachforhousing).ForN2Oemissions,theIPCCTier2wasusedwithnitrogenexcretionestimatedusingASABEequationsthataccountfordiets.
5.3.6 EntericFermentationandHousingEmissionsfromOtherAnimals
AlthoughthemajorityofemissionsfromlivestockintheUnitedStatesarefromcattle,sheep,swine,andpoultry,emissionsfromotheranimalscanalsobeimportanttoconsider,particularlyattheentitylevel.Overall,populationsoftheanimalsdiscussedinthissection(goats,Americanbison,llamas,alpacas,andmanagedwildlife)aremuchfewerthanthoseoftheanimalsdiscussedinpriorsections.However,theavailabilityofresearchonemissionsfromtheseanimalsallowsustoexplorethematleastatanintroductorylevel.Attheentitylevel,populationsoftheseanimalsmaybesignificantenoughtowarrantcalculatingtheiremissions.ThisreportrecommendsmethodsforestimatingCH4emissionsfromgoatsandAmericanbison(Equation5‐24andEquation5‐25).
Model Evaluation Criteria for Poultry Production Systems
1. Themodelisbasedonwell‐establishedscientificallysoundrelationshipsbetweenfarmmanagementinputsandemissionsoutputs(process‐basedmodelormass‐balancemodelpreferable).
2. ThemodelisrelevanttoU.S.climateandproductionsystems.3. ThemodelcanestimateCH4,N2O,andNH3emissionsfrompoultryhousingsystems.4. Thereisflexibilityinthemodeltodescribetheproductionsystem(animals,feed,
housing,andin‐housemanuremanagement).5. Themodeliseasytouseandisdesignedtouseeasilyobtainablefarminformationto
determineemissionsestimates.6. Themodelincludessomemitigationstrategiesforreducingemissionsandproduces
realisticchangesinemissionsvalueswhenthesechangesaremadewithintheproductionsystem.
7. Thereistransparencyinthemodelcalculations,andtechnicalguidelinesareavailabletoelaboratethemethodologiesusedtoobtaintheemissionsestimates.
8. Themodelhasbeentested/validatedwithon‐farmdata.9. Themodelworksreliably(littletonoerrorsorprogramcrashes).10. Themodelispubliclyavailableandaccessible.
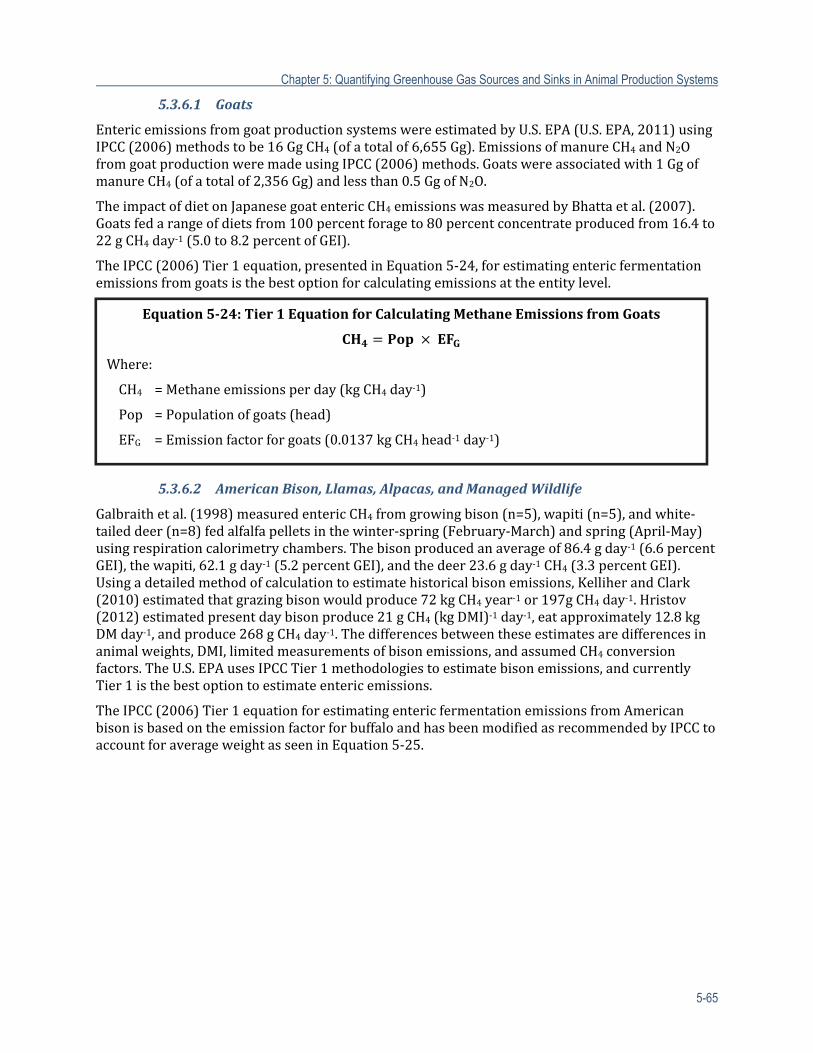
Chapter 5: Quantifying Greenhouse Gas Sources and Sinks in Animal Production Systems
5-65
5.3.6.1 Goats
EntericemissionsfromgoatproductionsystemswereestimatedbyU.S.EPA(U.S.EPA,2011)usingIPCC(2006)methodstobe16GgCH4(ofatotalof6,655Gg).EmissionsofmanureCH4andN2OfromgoatproductionweremadeusingIPCC(2006)methods.Goatswereassociatedwith1GgofmanureCH4(ofatotalof2,356Gg)andlessthan0.5GgofN2O.
TheimpactofdietonJapanesegoatentericCH4emissionswasmeasuredbyBhattaetal.(2007).Goatsfedarangeofdietsfrom100percentforageto80percentconcentrateproducedfrom16.4to22gCH4day‐1(5.0to8.2percentofGEI).
TheIPCC(2006)Tier1equation,presentedinEquation5‐24,forestimatingentericfermentationemissionsfromgoatsisthebestoptionforcalculatingemissionsattheentitylevel.
5.3.6.2 AmericanBison,Llamas,Alpacas,andManagedWildlife
Galbraithetal.(1998)measuredentericCH4fromgrowingbison(n=5),wapiti(n=5),andwhite‐taileddeer(n=8)fedalfalfapelletsinthewinter‐spring(February‐March)andspring(April‐May)usingrespirationcalorimetrychambers.Thebisonproducedanaverageof86.4gday‐1(6.6percentGEI),thewapiti,62.1gday‐1(5.2percentGEI),andthedeer23.6gday‐1CH4(3.3percentGEI).Usingadetailedmethodofcalculationtoestimatehistoricalbisonemissions,KelliherandClark(2010)estimatedthatgrazingbisonwouldproduce72kgCH4year‐1or197gCH4day‐1.Hristov(2012)estimatedpresentdaybisonproduce21gCH4(kgDMI)‐1day‐1,eatapproximately12.8kgDMday‐1,andproduce268gCH4day‐1.Thedifferencesbetweentheseestimatesaredifferencesinanimalweights,DMI,limitedmeasurementsofbisonemissions,andassumedCH4conversionfactors.TheU.S.EPAusesIPCCTier1methodologiestoestimatebisonemissions,andcurrentlyTier1isthebestoptiontoestimateentericemissions.
TheIPCC(2006)Tier1equationforestimatingentericfermentationemissionsfromAmericanbisonisbasedontheemissionfactorforbuffaloandhasbeenmodifiedasrecommendedbyIPCCtoaccountforaverageweightasseeninEquation5‐25.
Equation5‐24:Tier1EquationforCalculatingMethaneEmissionsfromGoats
Where:
CH4 =Methaneemissionsperday(kgCH4day‐1)
Pop =Populationofgoats(head)
EFG =Emissionfactorforgoats(0.0137kgCH4head‐1day‐1)
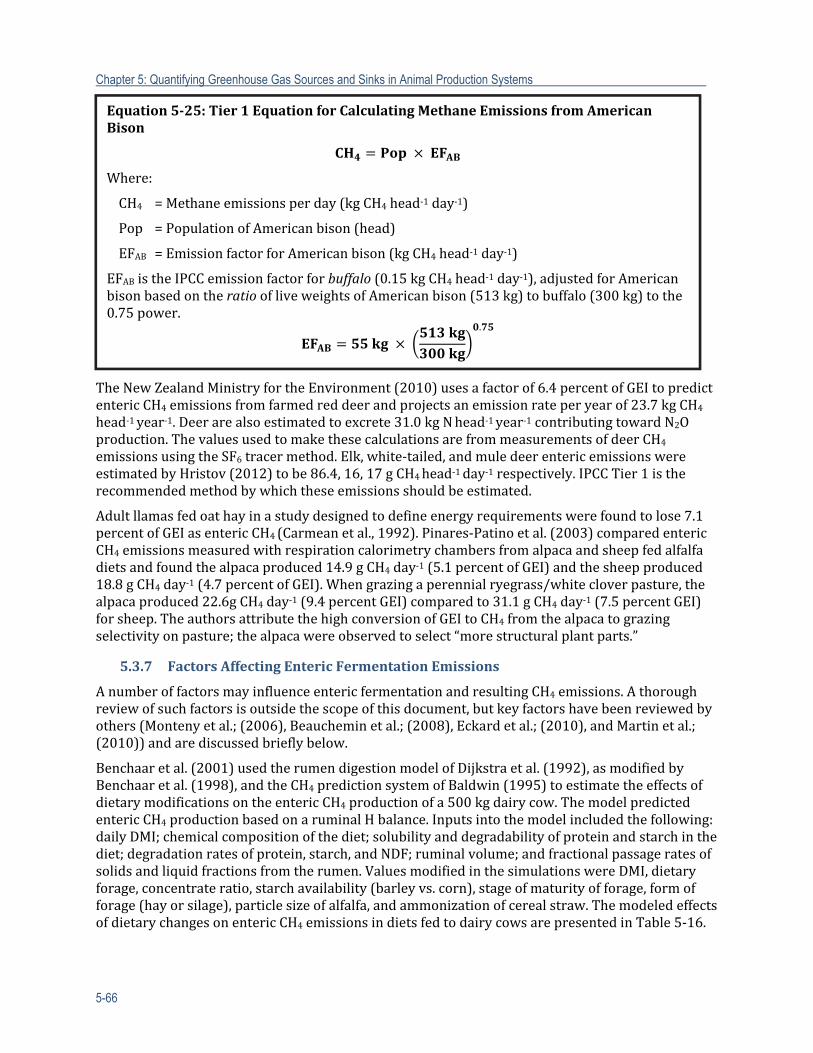
Chapter 5: Quantifying Greenhouse Gas Sources and Sinks in Animal Production Systems
5-66
TheNewZealandMinistryfortheEnvironment(2010)usesafactorof6.4percentofGEItopredictentericCH4emissionsfromfarmedreddeerandprojectsanemissionrateperyearof23.7kgCH4
head‐1year‐1.Deerarealsoestimatedtoexcrete31.0kgNhead‐1year‐1contributingtowardN2Oproduction.ThevaluesusedtomakethesecalculationsarefrommeasurementsofdeerCH4emissionsusingtheSF6tracermethod.Elk,white‐tailed,andmuledeerentericemissionswereestimatedbyHristov(2012)tobe86.4,16,17gCH4head‐1day‐1respectively.IPCCTier1istherecommendedmethodbywhichtheseemissionsshouldbeestimated.
Adultllamasfedoathayinastudydesignedtodefineenergyrequirementswerefoundtolose7.1percentofGEIasentericCH4(Carmeanetal.,1992).Pinares‐Patinoetal.(2003)comparedentericCH4emissionsmeasuredwithrespirationcalorimetrychambersfromalpacaandsheepfedalfalfadietsandfoundthealpacaproduced14.9gCH4day‐1(5.1percentofGEI)andthesheepproduced18.8gCH4day‐1(4.7percentofGEI).Whengrazingaperennialryegrass/whitecloverpasture,thealpacaproduced22.6gCH4day‐1(9.4percentGEI)comparedto31.1gCH4day‐1(7.5percentGEI)forsheep.TheauthorsattributethehighconversionofGEItoCH4fromthealpacatograzingselectivityonpasture;thealpacawereobservedtoselect“morestructuralplantparts.”
5.3.7 FactorsAffectingEntericFermentationEmissions
AnumberoffactorsmayinfluenceentericfermentationandresultingCH4emissions.Athoroughreviewofsuchfactorsisoutsidethescopeofthisdocument,butkeyfactorshavebeenreviewedbyothers(Montenyetal.;(2006),Beaucheminetal.;(2008),Eckardetal.;(2010),andMartinetal.;(2010))andarediscussedbrieflybelow.
Benchaaretal.(2001)usedtherumendigestionmodelofDijkstraetal.(1992),asmodifiedbyBenchaaretal.(1998),andtheCH4predictionsystemofBaldwin(1995)toestimatetheeffectsofdietarymodificationsontheentericCH4productionofa500kgdairycow.ThemodelpredictedentericCH4productionbasedonaruminalHbalance.Inputsintothemodelincludedthefollowing:dailyDMI;chemicalcompositionofthediet;solubilityanddegradabilityofproteinandstarchinthediet;degradationratesofprotein,starch,andNDF;ruminalvolume;andfractionalpassageratesofsolidsandliquidfractionsfromtherumen.ValuesmodifiedinthesimulationswereDMI,dietaryforage,concentrateratio,starchavailability(barleyvs.corn),stageofmaturityofforage,formofforage(hayorsilage),particlesizeofalfalfa,andammonizationofcerealstraw.ThemodeledeffectsofdietarychangesonentericCH4emissionsindietsfedtodairycowsarepresentedinTable5‐16.
Equation5‐25:Tier1EquationforCalculatingMethaneEmissionsfromAmericanBison
Where:
CH4 =Methaneemissionsperday(kgCH4head‐1day‐1)
Pop =PopulationofAmericanbison(head)
EFAB=EmissionfactorforAmericanbison(kgCH4head‐1day‐1)
EFABistheIPCCemissionfactorforbuffalo(0.15kgCH4head‐1day‐1),adjustedforAmericanbisonbasedontheratioofliveweightsofAmericanbison(513kg)tobuffalo(300kg)tothe0.75power.
.
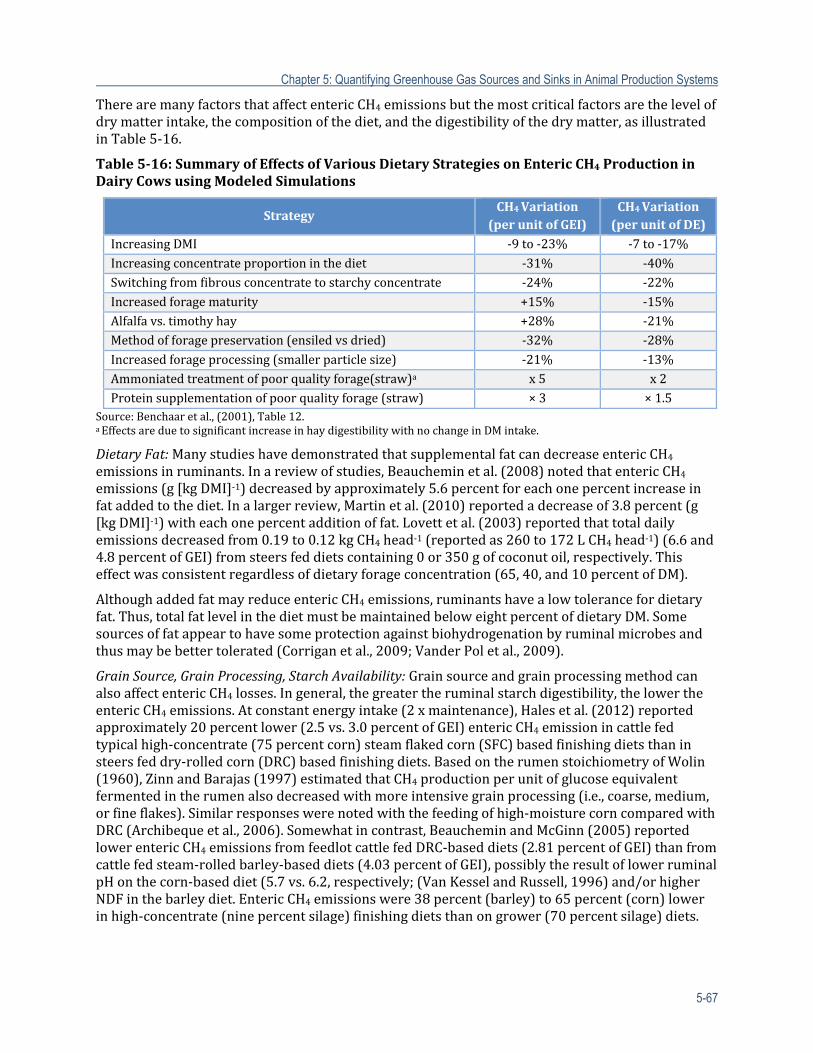
Chapter 5: Quantifying Greenhouse Gas Sources and Sinks in Animal Production Systems
5-67
TherearemanyfactorsthataffectentericCH4emissionsbutthemostcriticalfactorsarethelevelofdrymatterintake,thecompositionofthediet,andthedigestibilityofthedrymatter,asillustratedinTable5‐16.
Table5‐16:SummaryofEffectsofVariousDietaryStrategiesonEntericCH4ProductioninDairyCowsusingModeledSimulations
StrategyCH4Variation(perunitofGEI)
CH4Variation(perunitofDE)
IncreasingDMI ‐9to‐23% ‐7to‐17%Increasingconcentrateproportioninthediet ‐31% ‐40%Switchingfromfibrousconcentratetostarchyconcentrate ‐24% ‐22%Increasedforagematurity +15% ‐15%Alfalfavs.timothyhay +28% ‐21%Methodofforagepreservation(ensiledvsdried) ‐32% ‐28%Increasedforageprocessing(smallerparticlesize) ‐21% ‐13%Ammoniatedtreatmentofpoorqualityforage(straw)a x5 x2Proteinsupplementationofpoorqualityforage(straw) ×3 ×1.5
Source:Benchaaretal.,(2001),Table12.aEffectsareduetosignificantincreaseinhaydigestibilitywithnochangeinDMintake.
DietaryFat:ManystudieshavedemonstratedthatsupplementalfatcandecreaseentericCH4emissionsinruminants.Inareviewofstudies,Beaucheminetal.(2008)notedthatentericCH4emissions(g[kgDMI]‐1)decreasedbyapproximately5.6percentforeachonepercentincreaseinfataddedtothediet.Inalargerreview,Martinetal.(2010)reportedadecreaseof3.8percent(g[kgDMI]‐1)witheachonepercentadditionoffat.Lovettetal.(2003)reportedthattotaldailyemissionsdecreasedfrom0.19to0.12kgCH4head‐1(reportedas260to172LCH4head‐1)(6.6and4.8percentofGEI)fromsteersfeddietscontaining0or350gofcoconutoil,respectively.Thiseffectwasconsistentregardlessofdietaryforageconcentration(65,40,and10percentofDM).
AlthoughaddedfatmayreduceentericCH4emissions,ruminantshavealowtolerancefordietaryfat.Thus,totalfatlevelinthedietmustbemaintainedbeloweightpercentofdietaryDM.Somesourcesoffatappeartohavesomeprotectionagainstbiohydrogenationbyruminalmicrobesandthusmaybebettertolerated(Corriganetal.,2009;VanderPoletal.,2009).
GrainSource,GrainProcessing,StarchAvailability:GrainsourceandgrainprocessingmethodcanalsoaffectentericCH4losses.Ingeneral,thegreatertheruminalstarchdigestibility,thelowertheentericCH4emissions.Atconstantenergyintake(2xmaintenance),Halesetal.(2012)reportedapproximately20percentlower(2.5vs.3.0percentofGEI)entericCH4emissionincattlefedtypicalhigh‐concentrate(75percentcorn)steamflakedcorn(SFC)basedfinishingdietsthaninsteersfeddry‐rolledcorn(DRC)basedfinishingdiets.BasedontherumenstoichiometryofWolin(1960),ZinnandBarajas(1997)estimatedthatCH4productionperunitofglucoseequivalentfermentedintherumenalsodecreasedwithmoreintensivegrainprocessing(i.e.,coarse,medium,orfineflakes).Similarresponseswerenotedwiththefeedingofhigh‐moisturecorncomparedwithDRC(Archibequeetal.,2006).Somewhatincontrast,BeaucheminandMcGinn(2005)reportedlowerentericCH4emissionsfromfeedlotcattlefedDRC‐baseddiets(2.81percentofGEI)thanfromcattlefedsteam‐rolledbarley‐baseddiets(4.03percentofGEI),possiblytheresultoflowerruminalpHonthecorn‐baseddiet(5.7vs.6.2,respectively;(VanKesselandRussell,1996)and/orhigherNDFinthebarleydiet.EntericCH4emissionswere38percent(barley)to65percent(corn)lowerinhigh‐concentrate(ninepercentsilage)finishingdietsthanongrower(70percentsilage)diets.
Chapter 5: Quantifying Greenhouse Gas Sources and Sinks in Animal Production Systems
5-68
FeedingCoproductIngredients:Distillersgrainswithsolubles(DGS)andothercoproductsofthemillingandethanolindustriesarewidelyusedascattlefeeds.Theeffectsoffeeding30to35percentDGS(DMbasis)onentericCH4emissionhavebeenvariable,rangingfromasignificantdecreaseof25to30percent(McGinnetal.,2009)tonoeffect(Halesetal.,2012),toanincrease(Halesetal.,2013).Thesedifferingresultswereprobablyduetodifferencesinforageandfatintake.InthestudybyMcGinnetal.(2009)thedietcontained65percentsilage,anddietaryfatintakeincreasedbyapproximatelythreepercentageunits8whendriedDGSwereaddedtothediet.Incontrast,Halesetal.(2012;2013)feddietsthatcontainedonly10percentforageandwereequalintotalfatconcentration.
RoughageConcentrationandForm:TheconcentrationandformofroughageinthedietwillaffectbothentericandmanureCH4production(Halesetal.,2014).Usingaruminalvolatilefattyacids(VFA)stoichiometrymodel,Dijkstraetal.(2007)suggestedthatCH4lossesfromcarbohydratessubstrates(gkg‐1substrate)inaconcentratedietwithruminalpHvariationandapHof6.5were2.11,3.18,3.38,and3.10forstarch,solublesugars,hemicellulose,andcellulose,respectively.Similarly,withdairycows,MoeandTyrrell(1979)reportedthatentericCH4productionperunitcarbohydratedigestedwasthreetimesgreaterforcellulosethanforhemicellulose.Aguerreetal.(2011)foundthatlactatingdairycattleemittedmoreCH4whentheforage:concentrateratiowaschangedfrom47:53to68:32,0.54kgCH4day‐1vs.0.65kgCH4day‐1respectively.
Ingeneral,astheconcentrationofforageinthedietincreases,entericCH4productionincreasesandthequantityofvolatilesolidsexcretedincreases.Usingamicrometeorologicalmassdifferencemethod,Harperetal.(1999)reportedCH4emissionsof230ganimal‐1daily(7.7to8.1percentofGEI)infeedercattleonpasture,butonly70ghead‐1daily(1.9to2.2percentofGEI)incattlefedhigh‐concentratediets.MeasuredCH4lossesforpasturecattlewerehigherthanvaluespredictedusingtheIPCC(1997;2006)CH4conversionfactors(MCForYm),orAustralianmethodology(NGGIC,1996).Incontrast,measuredCH4lossesforfeedlotcattlewereabout67percentofthoseestimatedusingtheIPCC(2006)YmofthreepercentofGEIortheAustralianmethodology(NGGIC,1996),butweresimilartovaluesreportedbyBranineandJohnson(1990),BlaxterandWainman(1964),andHalesetal.(2012;2013;Halesetal.,2014).
EntericfermentationoftropicalgrassesandlegumesmayalsobedifferentthanpredictedbyIPCCornationalGHGinventorymethods.KennedyandCharmley(2012)measuredentericCH4productionofcattlefedAustraliantropicalgrassesandlegumestobe5.0to7.2percentofGEintakewhichissimilartoIPCC(2006)Tier2estimates(5.5to7.5percentofGEintake)ofcattlefedforagedietsbutsomewhatlowerthantheAustralianNationalGreenhouseAccountsNationalInventoryReport(2007)of8.7to9.6percentofGEintake.
BlaxterandWainman(1964)comparedtheeffectsoffeedingdietswithsixvaryinghay:flakedcornratios(100:0,80:20,60:40,40:60,20:80,5:95)onentericCH4emissionswhenfedattwotimesthemaintenancelevelofintake.CH4emissionsasapercentageofGEIincreasedslightlybetweenthe100:0diet(7.44percent)andthe60:40diet(8.17percent),thendecreasedtothe5:95diet(3.4percent).
InIreland,Lovettetal.(2003)reportedtotaldailyentericCH4emissionsof0.15,0.19,and0.12kghead‐1(reportedas207,270,and170Lhead‐1)forheifersfeddietscontaining65,40,and10percentforage(theremainderasconcentrate),respectively.AsapercentageofGEI,losseswere6.1,6.6,and4.4percent,respectively.
8Theterm“percentageunits”inthisdocumentisusedtorefertochangesindietsoremissionsthatarenotproportionaltotheirbaselines.Forexample,areductioninemissionsfromthreepercenttoonepercentisa2“percentageunit”reductionora67percentreduction.
Chapter 5: Quantifying Greenhouse Gas Sources and Sinks in Animal Production Systems
5-69
Usingsteersfedall‐foragediets,Ominskietal.(2006)reportedthat,withintherangeofforagequalitiestested(alfalfa‐grasssilagecontaining61,53,51,or46percentNDF,DMbasis),entericCH4emissionsofsteers,asapercentageofGEI,werenotsignificantlyaffectedbyNDFcontent(5.1to5.9percent),althoughdailyCH4productiontendedtobehighestforthe53percentNDFdiet(0.12,0.15,0.13,and0.14kghead‐1day‐1,respectively).Similarly,usinggrazingsheep,MilanoandClark(2008)reportednoeffectofforagequality(ryegrass–52or47percentNDF,77or67percentorganicmatter[OM]digestibility)onentericCH4emissions.
AlthoughdietaryforagequalitymaysometimesnotaffectentericCH4emissions,itwillaffectforagedigestibilityandthusfecalexcretionofvolatilesolids.Thus,feedingmoredigestibleforagesorconcentratesmaydecreaseGHGemissionsfrommanure.
LevelofIntake:BlaxterandWainman(1964)comparedtheeffectsoffeedingsixdietsattwolevelsofintake.EntericCH4emissions,asapercentofGEI,were23percentgreaterinsteersfedatmaintenancethaninsteersfedat2Xmaintenance(8.1vs.6.6percentofGEI,respectively).However,inastudyevaluatingemissionsfromcattlefedryegrassdiets,MilanoandClark(2008)reportedthatasDMIincreasedfrom0.75percentofmaintenanceto2Xmaintenance,entericCH4emissions(gday‐1)increasedlinearly(r2=0.80to0.84).EmissionsasapercentageofGEIwerenotaffectedbyDMI,andrangedfrom4.9to9.5percentofGEI(15.9to30.4g[kgDMI]‐1).
Usingahigh‐forage(70percentbarleysilage)ormedium‐forage(30percentsilage)dietfedatlevelsfrom1Xtoapproximately1.8Xmaintenance,BeaucheminandMcGinn(2006b)notedthatentericCH4emissions,asapercentofGEI,decreasedbyapproximately0.77percentageunitsforeachunitincreaseinfeedintake(expressedasleveloffeedintakeabovemaintenance).ThiswaslessthantheestimateusingtheBlaxterandClapperton(1965)equation(0.93to1.28percentpercentageunits)orthe1.6percentageunitssuggestedbyJohnsonandJohnson(1995).
FeedAdditivesandGrowthPromoters:Cooprideretal.(2011)notedthatthedailyCH4andmanureN2Oproductionofcattlefedthrougha“natural”programwithnouseofantibiotics,ionophores,orgrowthpromotersweresimilartocattlefedinmoretraditionalsystemsthatusedanabolicimplantsanddietsthatcontainedionophoresandbeta‐agonists.However,typicalcattlehadgreateraveragedailyweightgain(1.85vs.1.35kgday‐1)andthustook42fewerdaystoreachthesameendpoint(596kgbodyweight[BW]).Thus,overall,cattlefedusingmoderngrowthtechnologieshad31percentlowerGHGemissionsperhead.CH4emissionskgofBWgain‐1was1.1kggreaterforthe“natural”cattle(5.02vs.3.92CO2‐eqkgBWgain‐1)thanthetraditionalcattle.
MonensindecreasesentericCH4emissionsinfinishingcattleby10to25percent(Tedeschietal.,2003;McGinnetal.,2004).However,infeedlotcattletheeffectsappeartobetransitory,lastingfor30daysorless(Guanetal.,2006).Incontrast,Odongoetal.(2007)reportedthatmonensin(24ppm)indairydietsdecreasedentericCH4byseventoninepercentforuptosixmonths.Waghornetal.(2008)foundnoeffectofmonensincontrolled‐releasecapsulesonCH4productionofpasture‐feddairycows,andHamiltonetal.(2010)alsofoundnochangeinentericCH4productionfrommonensinfedtodairycowsofferedatotalmixedration.
AnumberofstudieshavedemonstratedthatavarietyofhalogenatedanalogueshavethepotentialtodramaticallydecreaseruminalCH4production(Johnson,1972;Treietal.,1972;Johnson,1974;ColeandMcCroskey,1975;TomkinsandHunter,2004;Tomkinsetal.,2009).Ingeneraltheeffectwasgreaterincattlefedhigh‐foragedietsthanincattlefedhigh‐concentratediets.WhenCH4lossesweredramaticallyreduced,asignificantquantityofhydrogencouldbelost(onetotwopercentofGEI)viaeructation,suggestinganalternativeelectronsinkisalsoneeded.Ingeneral,thecompoundsdidnotimproveproductionefficiencysignificantly.Inaddition,thepotentialtoxicityofthesecompoundsmadethemimpracticalforroutineuse.
Chapter 5: Quantifying Greenhouse Gas Sources and Sinks in Animal Production Systems
5-70
Anumberofnitrocompounds(nitropropanol,nitroethane,nitroethanol)havealsosignificantlydecreasedruminalCH4productioninvitro(Andersonetal.,2003),withaconcomitantincreaseinhydrogenproduction/release.Theeffectappearedtobeenhancedwhenanitratereducingbacteriumwasaddedtotheculture(AndersonandRasmussen,1998).
SeveralstudieshavesuggestedthatfeedingofcondensedtanninscandecreaseentericCH4productionby13to16percent;eitherthroughadirecttoxiceffectonruminalmethanogensorindirectlyviaadecreaseinfeedintakeanddietdigestibility(Eckardetal.,2010).Tanninsmayalsoshiftnitrogenexcretionawayfromurinetofecesandinhibitureaseactivityinfeces,whichcouldpotentiallydecreaseNH3andN2Oemissionsfrommanure(Powelletal.,2009;Powelletal.,2011).
Feedingyeastcultures,enzymes,dicarboxylicacids(fumarate,malate,acrylate),andplantsecondarycompounds,suchassaponins,maydecreaseentericCH4emissionsundersomefeedingconditions(McGinnetal.,2004;BeaucheminandMcGinn,2006a;Ungerfeldetal.,2007;Beaucheminetal.,2008;Eckardetal.,2010;Martinetal.,2010).
NovelMicroorganismsandtheirProducts:KlieveandHegarty(1999)notedthatentericCH4productionmaybebiocontrolleddirectlybyuseofvirusesandbacteriocins.Leeetal.(2002)reportedthatabacteriocin(BovicinHC5)fromStreptococcusbovisreducedinvitroCH4productionbyupto50percent.Itappeared,thatincontrasttoresultswithmonensin,theruminalmicroorganismsdidnotadapttothebacteriocin.
AustralianresearchershavesuggestedthatvaccinatingagainstmethanogenscandecreaseCH4emissions.However,theresultshavenotbeenconsistent(Wrightetal.,2004;Eckardetal.,2010)becauseefficacyisdependentonthespecificmethanogenpopulationandthatisdependentondiet,location,andotherfactors.
Genetics:Aspreviouslynoted,severalstudieshavesuggestedthatcattleselectedforlowerRFI(i.e.,increasedfeeduseefficiency)tendtohavelowerruminalentericCH4production(Nkrumahetal.,2006;Hegartyetal.,2007),althoughtheeffectmaydependonstageofproduction(lactationvs.dryandpregnant)and/orqualityofthedietconsumed(Jonesetal.,2011).RFIismoderatelyheritable(0.28to0.58)(Mooreetal.,2009),thusitmightbepossibletogeneticallyselectforanimalswithlowerentericCH4production.However,FreetlyandBrown‐Brandl(2013)foundhigherCH4emissionsfrommoreefficientanimals.Thus,moreinformationisneededtodefineunderwhatconditionsCH4emissionsarerelatedtofeedefficiencyortogenetics.
FactorsAffectingEmissionsfromSheepSheep,likecattle,areruminantanimalsandthusthesamedietaryfactorswillpositivelyornegativelyaffectemissionsfromentericfermentation.
FactorsAffectingEmissionsfromSwineDietarymodificationscaneffectivelyreducenitrogenexcretionsandmitigateairemissions(especiallyNH3,aprecursorforN2O)fromlivestockoperations(Suttonetal.,1996;Canhetal.,1998b).FeedingstrategiestoreducenitrogenexcretionsincludereducedCPdietssupplementedwithsyntheticaminoacids(AA)(Panettaetal.,2006),andmodifyingthedietaryelectrolytestoreduceurinarypH(Canhetal.,1998a).Inbothhogandpoultryoperations,reductionsinNH3emissionshavebeenreportedbysupplementingwithAAandreducingCPindiets.
ReducingdietaryCPcontenthasbeenshowntobeaneffectivewaytoreducetheamountofnitrogenexcreted(Lenis,1993;HartungandPhillips,1994).ThiscanbeachievedwithoutanynegativeeffectonanimalperformancebysupplementingwithanimprovedsyntheticAAbalance,resultinginareductionofexcessCPexcreted(Canhetal.,1998b;Ferketetal.,2002).InU.S.‐typediets(corn‐soybeanmealbased)themostlimitingaminoacidsareLysine,Methionine,Threonine,
Chapter 5: Quantifying Greenhouse Gas Sources and Sinks in Animal Production Systems
5-71
andTryptophan,followedbyIsoleucine,Valine,andHistidine(Outor‐Monteiroetal.,2010).Suttonetal.(1996)reportedthatnitrogenexcretiondecreasedby28percentwhendietCPcontentdecreasedfrom13percentto10percent(corn‐soybeanmeal)forgrowing‐finishingpigdietssupplementedwithLys,Met,Thr,andTrp.SeveralstudiesreportedreductionsinnitrogenexcretionandsubsequentdecreasesinNH3emissionsinnon‐ruminants(swineandpoultry)(HartungandPhillips,1994;Canhetal.,1997;Canhetal.,1998a;Canhetal.,1998b;Hayesetal.,2004).Powersetal.(2007)observedthat,asaresultoffeedingreducedCPdietswithincreasedamountsofsyntheticAA,NH3emissionswerereducedby22percent(threeAA)and48percent(fiveAA)comparedwiththecontroldietcontainingonlyoneAA,anddiethadnoeffectonpigperformance.
Canhetal.(1998b)andNdegwaetal.(2008)reportedthatsomenitrogenexcretioncouldbeshiftedfromurinetofecesbyincreasingdietaryfibercontent,orbyreducingdietarynitrogencontent,withnosignificantdifferencesinanimalperformanceorgrowth.Urinarynitrogenispredominantlyinorganicinnatureandfecalnitrogenismostlyorganic.TheconversionofureafromurinetoNH3isafastprocess,whileconversionoforganicnitrogentovolatileNH3infecesisaslowprocess.
ThereductioninNH3emissionassociatedwithlowerCPdietsnotonlycomesfromreductioninnitrogenexcretion,butalsofromlowermanurepH.Portejoieetal.(2004)reportedthatslurrypHdecreasedby1.3unitswhendietaryCPdecreasedfrom20to12percent,andslurryfrompigsfedthelowerCPdiethadahigherDMcontentandlowerTANandTKNcontents.Leetal.(2008),Hannietal.(2007),andCanhetal.(1998b)alsoreportedthatlowermanurepHresultedfromfeedinglowerCPindiets.Itshouldbenotedthatwaterintakewasoftenrestrictedinearlierstudies.
AarninkandVerstegen(2007)summarizedfourdietarystrategiestoreduceNH3emissions:1)loweringCPintakeincombinationwiththeadditionoflimitingAA;2)shiftingnitrogenexcretionfromurinetofecesbyincludingfermentablecarbohydratesinthediet;3)loweringurinarypHwiththeadditionofacidifyingsaltstothediet;and4)loweringfecespHwiththeinclusionoffermentablecarbohydratesinthediet.Theyclaimedthatbycombiningthesestrategies,NH3emissionsingrowing‐finishingpigscouldbereducedbyatotalof70percent.Toreduceodorfrompigmanure,Leetal.(2007)suggestthatdietarysulfur‐containingAAshouldbeminimizedtojustmeettherecommendedrequirements.
CurrentresearchhasconcentratedonfarmproductionefficiencyandreducingNH3emissions;littlehasfocusedonGHGemissionsmitigation(Bhattietal.,2005).BallandMöhn(2003)showedthatlowCPdietscanreducetotalGHGemissionsfromgrowingpigsby25to30percent(directlyfromtheanimalsaswellasfromthemanureafterexcretion)andfromsowsby10to15percent.Atakoraetal.(2003)reporteda27.3percentdecreaseinCH4emissionsinpigsfed16percentCP(supplementedwithAA)diets,comparedwith19.0percentCPdiets.Atakoraetal.(2004)reportedthattheCO2equivalentsemittedbyfinishingpigsandsowsfedwheat‐barley‐canoladietswerereducedby14.3to16.5percentwhenfeedingthereducedCP,AA‐supplementeddiets,andweresimilarforfinishingpigsandsows.Thereductionwasonly7.5percentwhenfeedingthecorn‐soybeanmeal‐basedreducedCPdiet.Misselbrooketal.(1998)foundthatCH4emissionsduringstoragewerelessatlowthanatahighdietaryCPcontent.TheemissionofCH4wassignificantlyrelatedtocontentofdrymatter,totalcarbon,andVFAinthemanure.Misselbrooketal.(1998)claimedthatthe50percentreductioninCH4emissionfromtheslurryobservedwhenpigswerefedthelowerCPdietwasprobablytheresultofthereducedvolatilefattyacids(VFA)contentoftheslurry,andCH4emissionsweremorecloselyrelatedtoVFAcontentthantototalcarboncontent.ThereappearstobeacloserelationshipbetweenfermentablecarbohydratesinthedietandCH4production(Kirchgessneretal.,1991).ManurepHalsoinfluencesCH4production.Kimetal.(2004)noteda14percentreductioninCH4emissionwhenidealpHwasreducedoneunitthroughaddition
Chapter 5: Quantifying Greenhouse Gas Sources and Sinks in Animal Production Systems
5-72
ofacidogeniccalciumandphosphorussourcestopigdiets.IncreasingfermentablecarbohydratelevelsinthediettolowerthepHofmanure,withthegoalofreducingNH3emissions,mightincreaseCH4production(AarninkandVerstegen,2007).Canhetal.(1998a)observedthatforeach100‐gincreaseintheintakeofdietarynon‐starchpolysaccharide(NSP),theslurrypHdecreasedbyapproximately0.12unitsandtheNH3emissionfromslurrydecreasedby5.4percentwhendietaryNSPrangedfrom150to340gNSPkgDM‐1.
Feedingofdrieddistillersgrainswithsolubles(DDGS)hasbecomecommonpracticeintheswineindustry.Lietal.(2011)demonstratedthatfeedingdietscontaining20percentDDGSincreasedemissionsofCH4butnotN2OwhencomparedtocontroldietswithoutDDGS.ObservedincreasesinCH4emissionsapproximated18percent.Ammoniaemissionsresultingfromfeeding20percentDDGSwereeitherhigherorlowerthandietswithoutDDGS,dependingontheformoftracemineralsincludedinthediet.DietsincludinginorganicformsoftracemineralshadsevenpercentgreaterNH3emissions,whilefeedingorganicformsoftracemineralsdecreasedNH3emissionsalmost20percentcomparedtocontroldiets(Liuetal.,2011a).
Inarecentmeta‐analysis,Liuetal.(2011a)used32datapointsinasubgroupofstudiesthatincludeddietCPinformationtoanalyzetheeffectofdietCPonGHGemissions.Threefactors(dietCP,geographicregion,andswineproductionphase)wereconsideredintheregressionanalysis.DietCPwasnotasignificantfactor.EmissionsofCH4arepositivelycorrelatedwithdietcrudeproteininswineproduction,mostsignificantlyforlagoonandslurrystoragesystems(Liuetal.,2011a).Clarketal.(2005)determinedthatreducingdietaryCPmayactuallyincreaseCH4emissions,soresultsarevaried.IthadbeenexpectedthatalowerCPdietmayresultinlowernitrogenexcretion,andthusmightbeabletoreduceN2Oemissionsfrommanure.However,thishypothesiswasnotsupportedbytheresultsofthemeta‐analysis.
Dietformulationateachstageofthelifecycleinfluencesnutrientsexcretedinmanure,aswellasemissionsthatresultfromthatmanureduringstorageandpotentiallyfollowinglandapplication.Fromamodelingperspective,thefocusneedstobeonmanagementfactors,includingdietformulationandmanurehandlingpractices.
Feedefficiencyimprovementscanreduceemissionsthroughouttheentirefoodproductioncyclebyreducingtheamountoffeedneededformeatproduction,therebyreducinginputsintofeedproductionaswellasreducingmanurenutrientsthatmustbemanaged.Feedefficiencyistheproductofgeneticsandenvironment(management).Geneticdifferencesaredifficulttoassess,becausethisinformationisretainedbycompanies.Geneticimprovementsarenotinsignificantovertimeandmayinfactbealargercontributortogainsthanmanagement.However,fromamodelingperspective,thefocusneedstobeonmanagementfactors,includingdietformulationandin‐housemanure/litterpractices.FeedefficiencycouldbeamodelcomponentinthefutureoncemoredataontheimpactsoffeedefficiencyonGHGemissionsareavailable.
FactorsAffectingEmissionsfromMeatBirdsEmissionsofbothN2OandNH3canberestrictedbyreducingthelitternitrogencontentthroughdietmodification.Fergusonetal.(1998a;1998b)fedreduceddietaryproteindietstobroilerchickens.Althoughperformancewashinderedinbothstudies,NH3concentrationandlitternitrogencontentwerereducedsignificantlyasaresultofthelow‐proteindiets.Applegateetal.(2008)reportedsimilarlitternitrogeneffectswhenturkeytomswerefedreduced‐proteindiets.Noperformancedifferenceswereobserved.ThesedietswerethenfedtoturkeytomsbyLiuetal.(2011a),whoobserveda12percentreductioninNH3emissionsasaresultofreducingcumulativenitrogenintakeby9percent.FeedingspecificAAallowedforsimilarnitrogenintakesacrosstreatments,butreducedNH3emissionsby25percent(Liuetal.,2011a)andnitrogeninlitterby12percent(Liuetal.,2011b),becausenitrogenwasbetterutilizedbythebirds.Acrossalldiets,N2O
Chapter 5: Quantifying Greenhouse Gas Sources and Sinks in Animal Production Systems
5-73
emissionsmadeuplessthanonepercentofnitrogenoutput(Liuetal.,2011b),suggestingthatreducingdietarynitrogenmayhavelessinfluenceonN2Oemissionsthanotherfactors.
FactorsAffectingEmissionsfromLayingHensDietfactorscanalterairemissionsfromlayinghenfacilities.MuchoftheworktodatehasfocusedonreducingNH3emissions.Robertsetal.(2007)showedthatinclusionofdietarycornDDGS,wheatmiddlings,orsoyhullsloweredtheseven‐daycumulativemanureNH3emissionfrom3.9gkgofdrymanure‐1forthecontrolto1.9,2.1,and2.3gkgofdrymanure‐1,respectively;italsoloweredthedailyNH3emissionrate.ReducingtheCPcontentbyonepercenthadnomeasurableeffectonNH3emission.Wu‐Haanetal.(2007b)fedareduced‐emissionsdietcontaining6.9percentofaCaSO4‐zeolitemixtureandslightlyreducedproteinto21‐,38‐,and59‐week‐oldHy‐LineW‐36hens;theyobservedthatdailyNH3emissionsfromhensfedthereduced‐emissionsdiets(185.5,312.2,and333.5mgbird‐1)werelessthanemissionsfromhensfedthecontroldiet(255.1,560.6,and616.3mgbird‐1)fortrials1,2,and3,respectively.Totalnitrogenexcretionfromhensfedthecontrolandreduced‐proteindietswasnotdifferent(Wu‐Haanetal.,2007a).Becauseoftheacidifyingnatureofthediets,themassofnitrogenremaininginexcretafollowingathree‐weekstorageperiodwaslessfromhensfedthecontroldietthanfromhensfedthereduced‐proteindiet(Wu‐Haanetal.,2007a).Lietal.(2010)foundthatfeedingcornDDGSdecreasedthemassofNH3emitteddailyby80mghen‐1(592vs.512mghen‐1day‐1forzeropercentand20percentDDGS,respectively),andby14percentpereggproduced,anddailyCH4emissionsby13to15percent(39.3vs.45.4mghen‐1day‐1;and0.70vs.0.82mggegg‐1day‐1).
5.3.8 LimitationsandUncertaintyinEntericFermentationandHousingEmissionsEstimates
Attheentitylevel,uncertaintyinentericCH4productionincattletypicallyresultsfrom,lackofprecisioninestimatingenergyintake,feedtypeandintake,characteristicsofparticularfeedstuffs(i.e.,aciddetergentfiber,starch,etc.),DE,maximumpossibleCH4emissions,CH4conversionfactors(Ym),synergiesorcountereffectsbetweenmitigationoptions,andnetenergyexpenditurebytheanimal.TheassumptionsaboutimplicationsofdietarychangesonentericCH4productionarebasedonliteraturevalues(includingempiricalfieldstudies)andmaynotbeindicativeoftruechangesinemissionsforparticularanimaltypes,asthiswillvarydependingonanindividualanimal’shealth,managementpractices,animalactivities,andbaselinediet.Forswine,goats,AmericanBison,llamas,alpacas,andmanagedwildlife,therecommendedestimationmethodsforemissionsfromentericfermentationarebasedontheIPCCTier1approach,whichhasanuncertaintyof30to50percent.
MethaneemissionsfromdairycattlehousingareasareestimatedusingequationsfromDairyGEM(IFSM).Inpredictingemissions,uncertaintywillresultfromalackofprecisioninestimatingexcretedvolatilesolidsandnitrogenexcreted,pH,temperature,airvelocity,andsurfaceareaofexposedmanure,beddingpack,CH4conversionfactors(MCFs),andmaximumCH4‐producingcapacityformanures.Comparisonofmodeledvalueswithon‐farmevaluationshasfoundthemodelpredictson‐farmemissionswithinfiveto20percent(unpublisheddata).
MethaneemissionsfrompoultryhousingareasareestimatedusingtheIPCCTier1method.Uncertaintyinpredictionsofemissionsresultfromalackofprecisioninestimatingfeedintake,nitrogenexcretedandvolatilesolids,MCF,volatilizationfraction,andinsomeinstancesemissionfactorsthatwerechoseninthemodel.UnfortunatelythereisalackofpublishedinformationrelatedtoGHGemissionsfrompoultryandtothebestofourknowledgethismodelhasnotbeenvalidated/testedusingon‐farmdata.
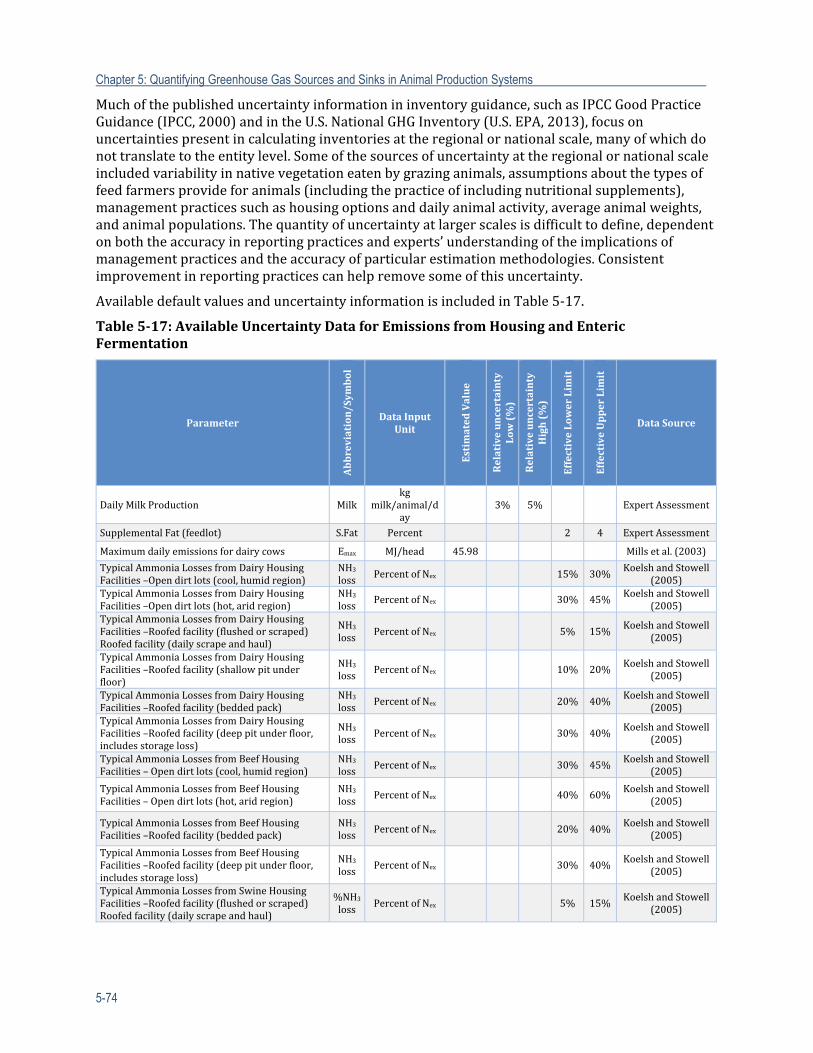
Chapter 5: Quantifying Greenhouse Gas Sources and Sinks in Animal Production Systems
5-74
Muchofthepublisheduncertaintyinformationininventoryguidance,suchasIPCCGoodPracticeGuidance(IPCC,2000)andintheU.S.NationalGHGInventory(U.S.EPA,2013),focusonuncertaintiespresentincalculatinginventoriesattheregionalornationalscale,manyofwhichdonottranslatetotheentitylevel.Someofthesourcesofuncertaintyattheregionalornationalscaleincludedvariabilityinnativevegetationeatenbygrazinganimals,assumptionsaboutthetypesoffeedfarmersprovideforanimals(includingthepracticeofincludingnutritionalsupplements),managementpracticessuchashousingoptionsanddailyanimalactivity,averageanimalweights,andanimalpopulations.Thequantityofuncertaintyatlargerscalesisdifficulttodefine,dependentonboththeaccuracyinreportingpracticesandexperts’understandingoftheimplicationsofmanagementpracticesandtheaccuracyofparticularestimationmethodologies.Consistentimprovementinreportingpracticescanhelpremovesomeofthisuncertainty.
AvailabledefaultvaluesanduncertaintyinformationisincludedinTable5‐17.
Table5‐17:AvailableUncertaintyDataforEmissionsfromHousingandEntericFermentation
Parameter
Abbreviation/Sym
bol
DataInputUnit
EstimatedValue
Relativeuncertainty
Low(%)
Relativeuncertainty
High(%)
EffectiveLowerLimit
EffectiveUpperLimit
DataSource
DailyMilkProduction Milkkg
milk/animal/day
3% 5% ExpertAssessment
SupplementalFat(feedlot) S.Fat Percent 2 4 ExpertAssessment
Maximumdailyemissionsfordairycows Emax MJ/head 45.98 Millsetal.(2003)
TypicalAmmoniaLossesfromDairyHousingFacilities–Opendirtlots(cool,humidregion)
NH3loss
PercentofNex 15% 30%KoelshandStowell
(2005)TypicalAmmoniaLossesfromDairyHousingFacilities–Opendirtlots(hot,aridregion)
NH3loss
PercentofNex 30% 45%KoelshandStowell
(2005)TypicalAmmoniaLossesfromDairyHousingFacilities–Roofedfacility(flushedorscraped)Roofedfacility(dailyscrapeandhaul)
NH3loss
PercentofNex 5% 15%KoelshandStowell
(2005)
TypicalAmmoniaLossesfromDairyHousingFacilities–Roofedfacility(shallowpitunderfloor)
NH3loss
PercentofNex 10% 20%KoelshandStowell
(2005)
TypicalAmmoniaLossesfromDairyHousingFacilities–Roofedfacility(beddedpack)
NH3loss
PercentofNex 20% 40%KoelshandStowell
(2005)TypicalAmmoniaLossesfromDairyHousingFacilities–Roofedfacility(deeppitunderfloor,includesstorageloss)
NH3loss
PercentofNex 30% 40%KoelshandStowell
(2005)
TypicalAmmoniaLossesfromBeefHousingFacilities–Opendirtlots(cool,humidregion)
NH3loss
PercentofNex 30% 45%KoelshandStowell
(2005)
TypicalAmmoniaLossesfromBeefHousingFacilities–Opendirtlots(hot,aridregion)
NH3loss
PercentofNex 40% 60%KoelshandStowell
(2005)
TypicalAmmoniaLossesfromBeefHousingFacilities–Roofedfacility(beddedpack)
NH3loss
PercentofNex 20% 40%KoelshandStowell
(2005)
TypicalAmmoniaLossesfromBeefHousingFacilities–Roofedfacility(deeppitunderfloor,includesstorageloss)
NH3loss
PercentofNex 30% 40%KoelshandStowell
(2005)
TypicalAmmoniaLossesfromSwineHousingFacilities–Roofedfacility(flushedorscraped)Roofedfacility(dailyscrapeandhaul)
%NH3loss
PercentofNex 5% 15%KoelshandStowell
(2005)
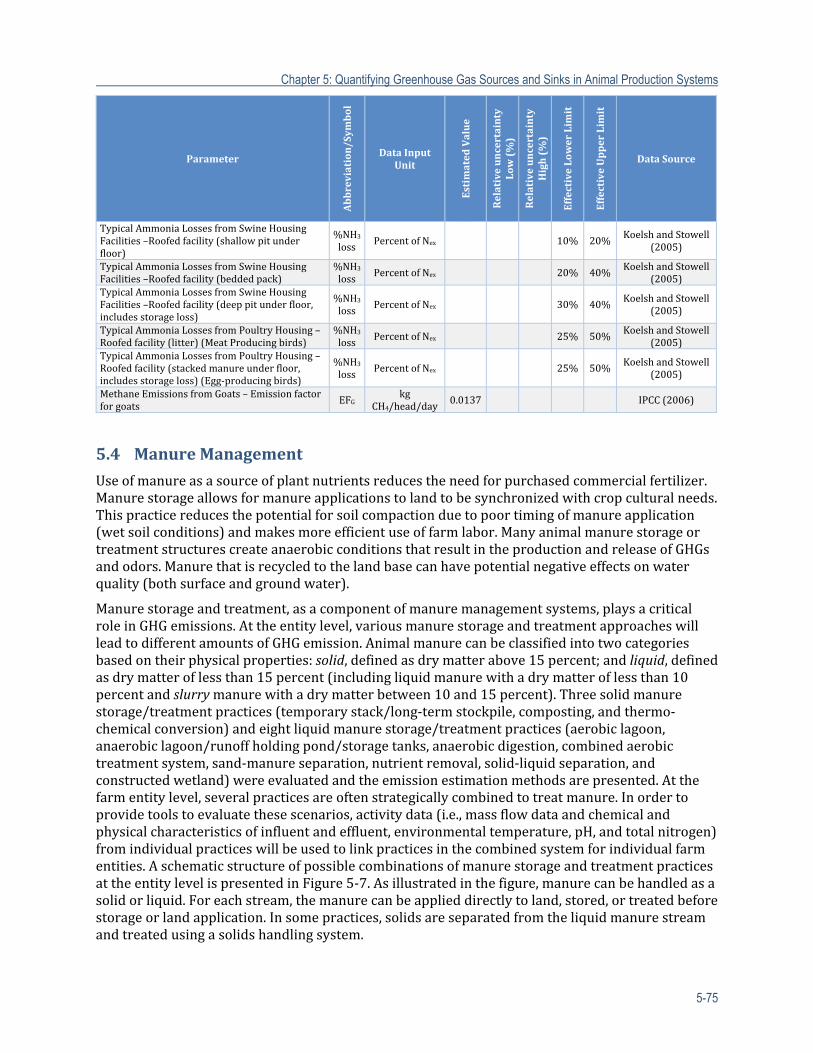
Chapter 5: Quantifying Greenhouse Gas Sources and Sinks in Animal Production Systems
5-75
Parameter
Abbreviation/Sym
bol
DataInputUnit
EstimatedValue
Relativeuncertainty
Low(%)
Relativeuncertainty
High(%)
EffectiveLowerLimit
EffectiveUpperLimit
DataSource
TypicalAmmoniaLossesfromSwineHousingFacilities–Roofedfacility(shallowpitunderfloor)
%NH3loss
PercentofNex 10% 20%KoelshandStowell
(2005)
TypicalAmmoniaLossesfromSwineHousingFacilities–Roofedfacility(beddedpack)
%NH3loss
PercentofNex 20% 40%KoelshandStowell
(2005)TypicalAmmoniaLossesfromSwineHousingFacilities–Roofedfacility(deeppitunderfloor,includesstorageloss)
%NH3loss
PercentofNex 30% 40%KoelshandStowell
(2005)
TypicalAmmoniaLossesfromPoultryHousing–Roofedfacility(litter)(MeatProducingbirds)
%NH3loss
PercentofNex 25% 50%KoelshandStowell
(2005)TypicalAmmoniaLossesfromPoultryHousing–Roofedfacility(stackedmanureunderfloor,includesstorageloss)(Egg‐producingbirds)
%NH3loss
PercentofNex 25% 50%KoelshandStowell
(2005)
MethaneEmissionsfromGoats–Emissionfactorforgoats
EFGkg
CH4/head/day0.0137 IPCC(2006)
5.4 ManureManagement
Useofmanureasasourceofplantnutrientsreducestheneedforpurchasedcommercialfertilizer.Manurestorageallowsformanureapplicationstolandtobesynchronizedwithcropculturalneeds.Thispracticereducesthepotentialforsoilcompactionduetopoortimingofmanureapplication(wetsoilconditions)andmakesmoreefficientuseoffarmlabor.ManyanimalmanurestorageortreatmentstructurescreateanaerobicconditionsthatresultintheproductionandreleaseofGHGsandodors.Manurethatisrecycledtothelandbasecanhavepotentialnegativeeffectsonwaterquality(bothsurfaceandgroundwater).
Manurestorageandtreatment,asacomponentofmanuremanagementsystems,playsacriticalroleinGHGemissions.Attheentitylevel,variousmanurestorageandtreatmentapproacheswillleadtodifferentamountsofGHGemission.Animalmanurecanbeclassifiedintotwocategoriesbasedontheirphysicalproperties:solid,definedasdrymatterabove15percent;andliquid,definedasdrymatteroflessthan15percent(includingliquidmanurewithadrymatteroflessthan10percentandslurrymanurewithadrymatterbetween10and15percent).Threesolidmanurestorage/treatmentpractices(temporarystack/long‐termstockpile,composting,andthermo‐chemicalconversion)andeightliquidmanurestorage/treatmentpractices(aerobiclagoon,anaerobiclagoon/runoffholdingpond/storagetanks,anaerobicdigestion,combinedaerobictreatmentsystem,sand‐manureseparation,nutrientremoval,solid‐liquidseparation,andconstructedwetland)wereevaluatedandtheemissionestimationmethodsarepresented.Atthefarmentitylevel,severalpracticesareoftenstrategicallycombinedtotreatmanure.Inordertoprovidetoolstoevaluatethesescenarios,activitydata(i.e.,massflowdataandchemicalandphysicalcharacteristicsofinfluentandeffluent,environmentaltemperature,pH,andtotalnitrogen)fromindividualpracticeswillbeusedtolinkpracticesinthecombinedsystemforindividualfarmentities.AschematicstructureofpossiblecombinationsofmanurestorageandtreatmentpracticesattheentitylevelispresentedinFigure5‐7.Asillustratedinthefigure,manurecanbehandledasasolidorliquid.Foreachstream,themanurecanbeapplieddirectlytoland,stored,ortreatedbeforestorageorlandapplication.Insomepractices,solidsareseparatedfromtheliquidmanurestreamandtreatedusingasolidshandlingsystem.
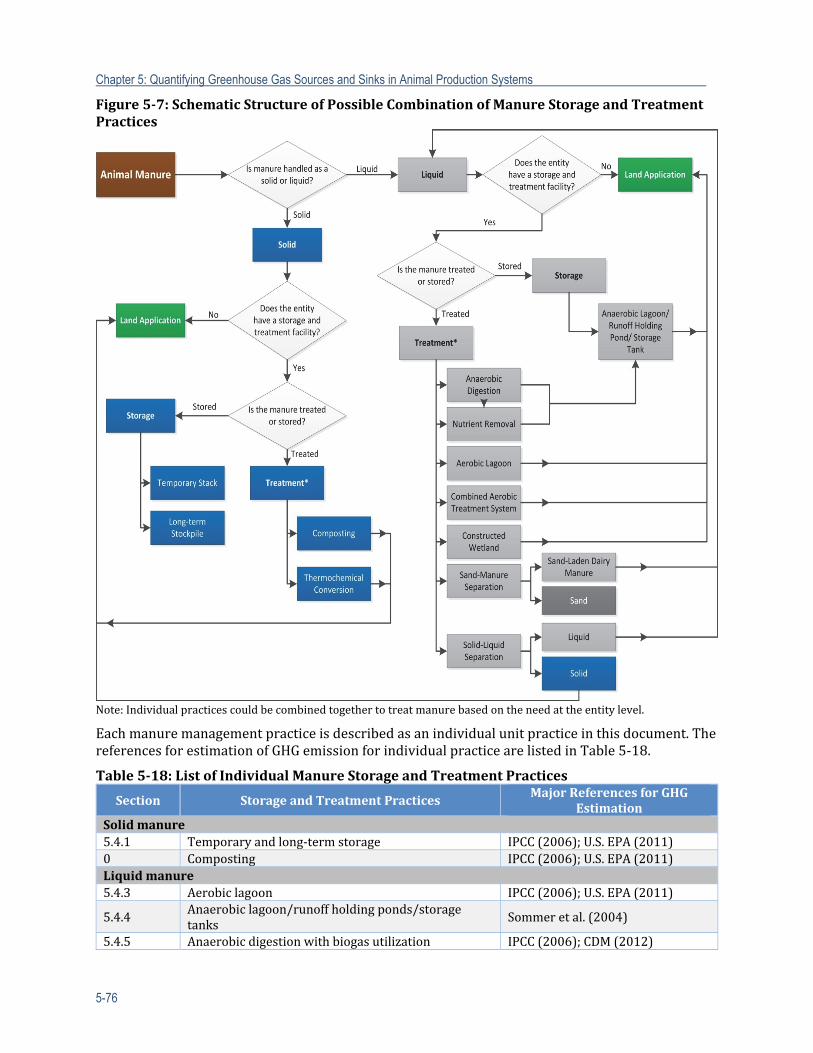
Chapter 5: Quantifying Greenhouse Gas Sources and Sinks in Animal Production Systems
5-76
Figure5‐7:SchematicStructureofPossibleCombinationofManureStorageandTreatmentPractices
Note:Individualpracticescouldbecombinedtogethertotreatmanurebasedontheneedattheentitylevel.
Eachmanuremanagementpracticeisdescribedasanindividualunitpracticeinthisdocument.ThereferencesforestimationofGHGemissionforindividualpracticearelistedinTable5‐18.
Table5‐18:ListofIndividualManureStorageandTreatmentPractices
Section StorageandTreatmentPracticesMajorReferencesforGHG
EstimationSolidmanure5.4.1 Temporaryandlong‐termstorage IPCC(2006);U.S.EPA(2011)0 Composting IPCC(2006);U.S.EPA(2011)Liquidmanure5.4.3 Aerobiclagoon IPCC(2006);U.S.EPA(2011)
5.4.4Anaerobiclagoon/runoffholdingponds/storagetanks
Sommeretal.(2004)
5.4.5 Anaerobicdigestionwithbiogasutilization IPCC(2006);CDM(2012)
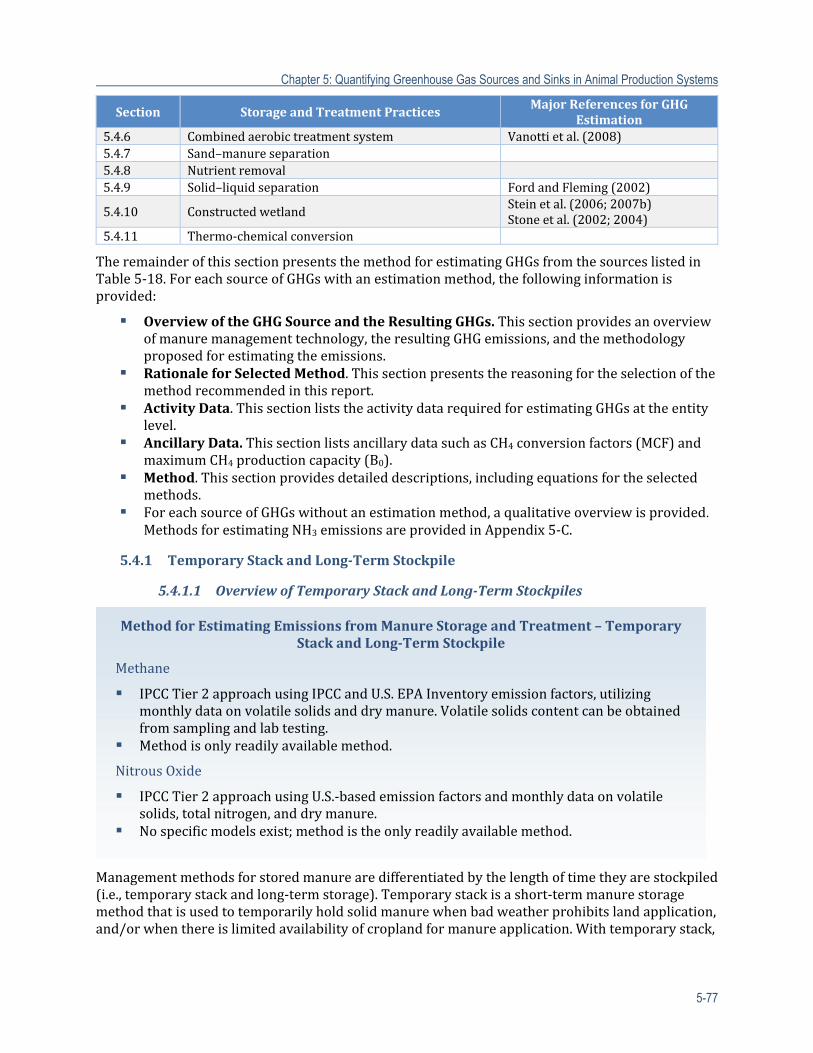
Chapter 5: Quantifying Greenhouse Gas Sources and Sinks in Animal Production Systems
5-77
Section StorageandTreatmentPracticesMajorReferencesforGHG
Estimation5.4.6 Combinedaerobictreatmentsystem Vanottietal.(2008)5.4.7 Sand–manureseparation5.4.8 Nutrientremoval5.4.9 Solid–liquidseparation FordandFleming(2002)
5.4.10 ConstructedwetlandSteinetal.(2006;2007b)Stoneetal.(2002;2004)
5.4.11 Thermo‐chemicalconversion
TheremainderofthissectionpresentsthemethodforestimatingGHGsfromthesourceslistedinTable5‐18.ForeachsourceofGHGswithanestimationmethod,thefollowinginformationisprovided:
OverviewoftheGHGSourceandtheResultingGHGs.Thissectionprovidesanoverviewofmanuremanagementtechnology,theresultingGHGemissions,andthemethodologyproposedforestimatingtheemissions.
RationaleforSelectedMethod.Thissectionpresentsthereasoningfortheselectionofthemethodrecommendedinthisreport.
ActivityData.ThissectionliststheactivitydatarequiredforestimatingGHGsattheentitylevel.
AncillaryData.ThissectionlistsancillarydatasuchasCH4conversionfactors(MCF)andmaximumCH4productioncapacity(B0).
Method.Thissectionprovidesdetaileddescriptions,includingequationsfortheselectedmethods.
ForeachsourceofGHGswithoutanestimationmethod,aqualitativeoverviewisprovided.MethodsforestimatingNH3emissionsareprovidedinAppendix5‐C.
5.4.1 TemporaryStackandLong‐TermStockpile
5.4.1.1 OverviewofTemporaryStackandLong‐TermStockpiles
Managementmethodsforstoredmanurearedifferentiatedbythelengthoftimetheyarestockpiled(i.e.,temporarystackandlong‐termstorage).Temporarystackisashort‐termmanurestoragemethodthatisusedtotemporarilyholdsolidmanurewhenbadweatherprohibitslandapplication,and/orwhenthereislimitedavailabilityofcroplandformanureapplication.Withtemporarystack,
MethodforEstimatingEmissionsfromManureStorageandTreatment–TemporaryStackandLong‐TermStockpile
Methane
IPCCTier2approachusingIPCCandU.S.EPAInventoryemissionfactors,utilizingmonthlydataonvolatilesolidsanddrymanure.Volatilesolidscontentcanbeobtainedfromsamplingandlabtesting.
Methodisonlyreadilyavailablemethod.
NitrousOxide
IPCCTier2approachusingU.S.‐basedemissionfactorsandmonthlydataonvolatilesolids,totalnitrogen,anddrymanure.
Nospecificmodelsexist;methodistheonlyreadilyavailablemethod.
Chapter 5: Quantifying Greenhouse Gas Sources and Sinks in Animal Production Systems
5-78
themanureisremovedandappliedtolandwithinafewweeksofpiling.Temporarystorageisnotapreferredmethodtostoremanurebecauseitrequiresthemanuretobehandledtwice.
Long‐termstorageisapermanentmanurestoragemethodinwhichsolidmanureispiledonaconfinedareaorstoredinadeeppitforlongerthansixmonths.Inlow‐rainfallareas,thestockpilecanbepiledonthefieldwiththeinstallationofnutrientrunoffcontrol.Inhigherrainfallareas,aconcretepadandwallareconstructedtostoresolidmanureandpreventnutrientrunofffromheavyrain.
Greenhousegasesgeneratedfrombothstoragemethodshaveapatternsimilartothatofentericfermentation.CarbonandnitrogencompoundsinmanurearebrokendownbymicrobestoCH4,andN2O.ThemainfactorsinfluencingGHGemissionsfromstoragearetemperatureandstoragetime.Duetothelongerstoragetime,long‐termstockpilesolidmanurestoragegeneratesasignificantamountofGHGs.Temporarystack,asashort‐termmanurestoragemethod,generateslessGHGsthanthelong‐termstockpilesolidstorage.However,itisstillnecessarytoquantitativelydelineatetheemissionsinordertoassistlivestockandpoultryfarmsinevaluatingtheirmanuremanagementoperations.Temporarystackandlong‐termstockpilesofmanurealsoproduceNH3;proposedmethodstoestimateNH3emissionsarepresentedinAppendix5‐C.
TheIPCCTier2methodologyisprovidedforestimatingCH4emissionsfromtemporarystacksorlong‐termstockpiles.ThismethodologyusesacombinationofIPCCandcountry‐specificemissionfactorsfromtheU.S.EPAGHGInventory.Theamountofmanure,volatilesolidscontent,andtemperaturearespecifictotheentity.ThemethodforcalculatingN2OemissionsisthesameastheequationpresentedintheU.S.GHGInventory.
RationaleforSelectedMethodTheIPCCequationsaretheonlyavailablemethodsforestimatingCH4,andN2Oemissionsfromtemporarystackandlong‐termstockpiles.Thesemethodologiesbestdescribethequantitativerelationshipamongactivitydataattheentitylevel.
ActivityDataInordertoestimatethedailyCH4emissions,thefollowinginformationisneeded:9
Animaltype Totaldrymanure Volatilesolidsofdrymanure10 Temperatures(localambienttemperatureandmanuretemperature)
InordertoestimatethedailyN2Oemission,thefollowinginformationisneeded:
Totaldrymanure Totalnitrogencontentofthemanure
ThetotalnitrogencontentofthemanureenteringstoragesystemscanbeestimatedaccordingtothenitrogenbalancemethodasdescribedinEquation5‐9:TotalNitrogenEnteringManureStorageandTreatmentThefractionofnitrogenexcretedbyananimalthatisnotemittedasagasistheportionthatentersstorage.
9Althoughdailyestimatesfortheactivitydataareoptimal,trackingthislevelofdetailwouldbeburdensome.Annualestimatesdon’tallowforseasonalvariationindietsandclimate.Consequently,disaggregationofthedatabyseasonorbyperiodsofmajorshiftsinanimalpopulationissuggested.
10Volatilesolids,totalnitrogencontent,andammonia‐nitrogencontentshouldbeobtainedthroughsamplingandlabtesting.
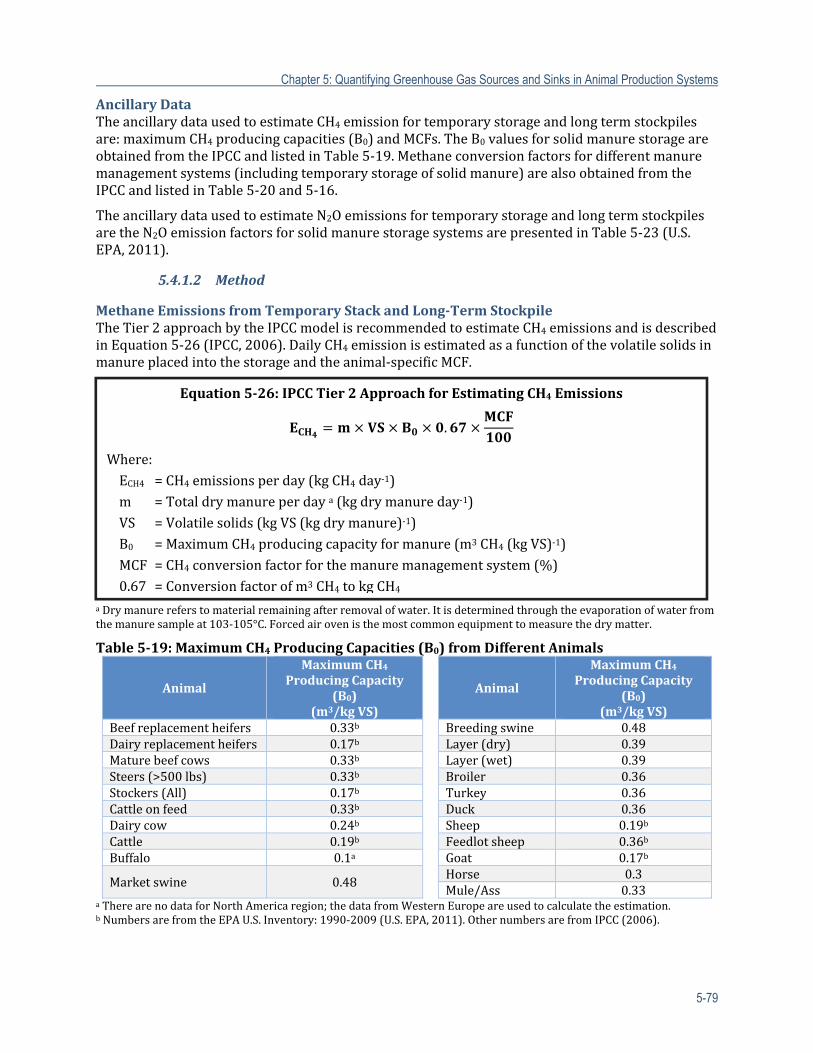
Chapter 5: Quantifying Greenhouse Gas Sources and Sinks in Animal Production Systems
5-79
AncillaryDataTheancillarydatausedtoestimateCH4emissionfortemporarystorageandlongtermstockpilesare:maximumCH4producingcapacities(B0)andMCFs.TheB0valuesforsolidmanurestorageareobtainedfromtheIPCCandlistedinTable5‐19.Methaneconversionfactorsfordifferentmanuremanagementsystems(includingtemporarystorageofsolidmanure)arealsoobtainedfromtheIPCCandlistedinTable5‐20and5‐16.
TheancillarydatausedtoestimateN2OemissionsfortemporarystorageandlongtermstockpilesaretheN2OemissionfactorsforsolidmanurestoragesystemsarepresentedinTable5‐23(U.S.EPA,2011).
5.4.1.2 Method
MethaneEmissionsfromTemporaryStackandLong‐TermStockpileTheTier2approachbytheIPCCmodelisrecommendedtoestimateCH4emissionsandisdescribedinEquation5‐26(IPCC,2006).DailyCH4emissionisestimatedasafunctionofthevolatilesolidsinmanureplacedintothestorageandtheanimal‐specificMCF.
aDrymanurereferstomaterialremainingafterremovalofwater.Itisdeterminedthroughtheevaporationofwaterfromthemanuresampleat103‐105°C.Forcedairovenisthemostcommonequipmenttomeasurethedrymatter.
Table5‐19:MaximumCH4ProducingCapacities(B0)fromDifferentAnimals
Animal
MaximumCH4
ProducingCapacity(B0)
(m3/kgVS)
Animal
MaximumCH4
ProducingCapacity(B0)
(m3/kgVS)Beefreplacementheifers 0.33b Breedingswine 0.48Dairyreplacementheifers 0.17b Layer(dry) 0.39Maturebeefcows 0.33b Layer(wet) 0.39Steers(>500lbs) 0.33b Broiler 0.36Stockers(All) 0.17b Turkey 0.36Cattleonfeed 0.33b Duck 0.36Dairycow 0.24b Sheep 0.19bCattle 0.19b Feedlotsheep 0.36bBuffalo 0.1a Goat 0.17b
Marketswine 0.48Horse 0.3Mule/Ass 0.33
aTherearenodataforNorthAmericaregion;thedatafromWesternEuropeareusedtocalculatetheestimation.bNumbersarefromtheEPAU.S.Inventory:1990‐2009(U.S.EPA,2011).OthernumbersarefromIPCC(2006).
Equation5‐26:IPCCTier2ApproachforEstimatingCH4 Emissions
.
Where:ECH4 =CH4emissionsperday(kgCH4day‐1)m =Totaldrymanureperdaya(kgdrymanureday‐1)VS =Volatilesolids(kgVS(kgdrymanure)‐1)B0 =MaximumCH4producingcapacityformanure(m3CH4(kgVS)‐1)MCF =CH4conversionfactorforthemanuremanagementsystem(%)0.67=Conversionfactorofm3CH4 tokgCH4
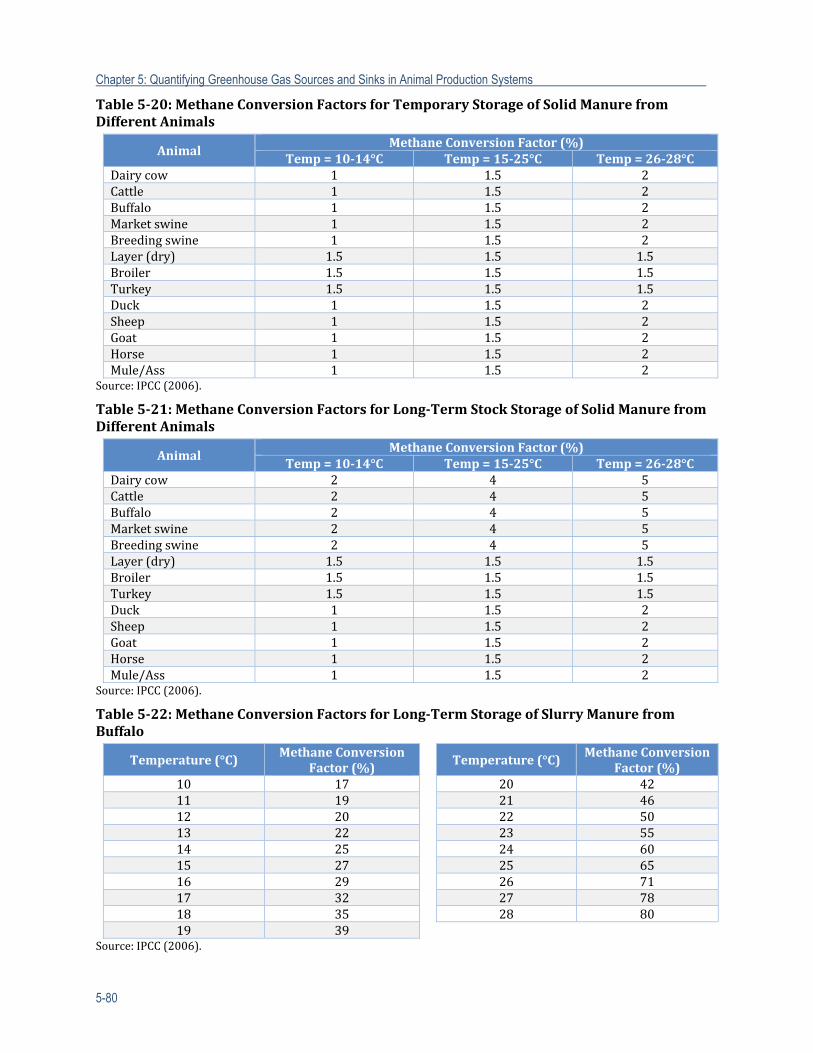
Chapter 5: Quantifying Greenhouse Gas Sources and Sinks in Animal Production Systems
5-80
Table5‐20:MethaneConversionFactorsforTemporaryStorageofSolidManurefromDifferentAnimals
AnimalMethaneConversionFactor(%)
Temp=10‐14°C Temp=15‐25°C Temp=26‐28°CDairycow 1 1.5 2Cattle 1 1.5 2Buffalo 1 1.5 2Marketswine 1 1.5 2Breedingswine 1 1.5 2Layer(dry) 1.5 1.5 1.5Broiler 1.5 1.5 1.5Turkey 1.5 1.5 1.5Duck 1 1.5 2Sheep 1 1.5 2Goat 1 1.5 2Horse 1 1.5 2Mule/Ass 1 1.5 2
Source:IPCC(2006).
Table5‐21:MethaneConversionFactorsforLong‐TermStockStorageofSolidManurefromDifferentAnimals
AnimalMethaneConversionFactor(%)
Temp= 10‐14°C Temp=15‐25°C Temp=26‐28°CDairycow 2 4 5Cattle 2 4 5Buffalo 2 4 5Marketswine 2 4 5Breedingswine 2 4 5Layer(dry) 1.5 1.5 1.5Broiler 1.5 1.5 1.5Turkey 1.5 1.5 1.5Duck 1 1.5 2Sheep 1 1.5 2Goat 1 1.5 2Horse 1 1.5 2Mule/Ass 1 1.5 2
Source:IPCC(2006).
Table5‐22:MethaneConversionFactorsforLong‐TermStorageofSlurryManurefromBuffalo
Temperature(°C)Methane Conversion
Factor(%)Temperature(°C)
MethaneConversionFactor(%)
10 17 20 4211 19 21 4612 20 22 5013 22 23 5514 25 24 6015 27 25 6516 29 26 7117 32 27 7818 35 28 8019 39
Source:IPCC(2006).
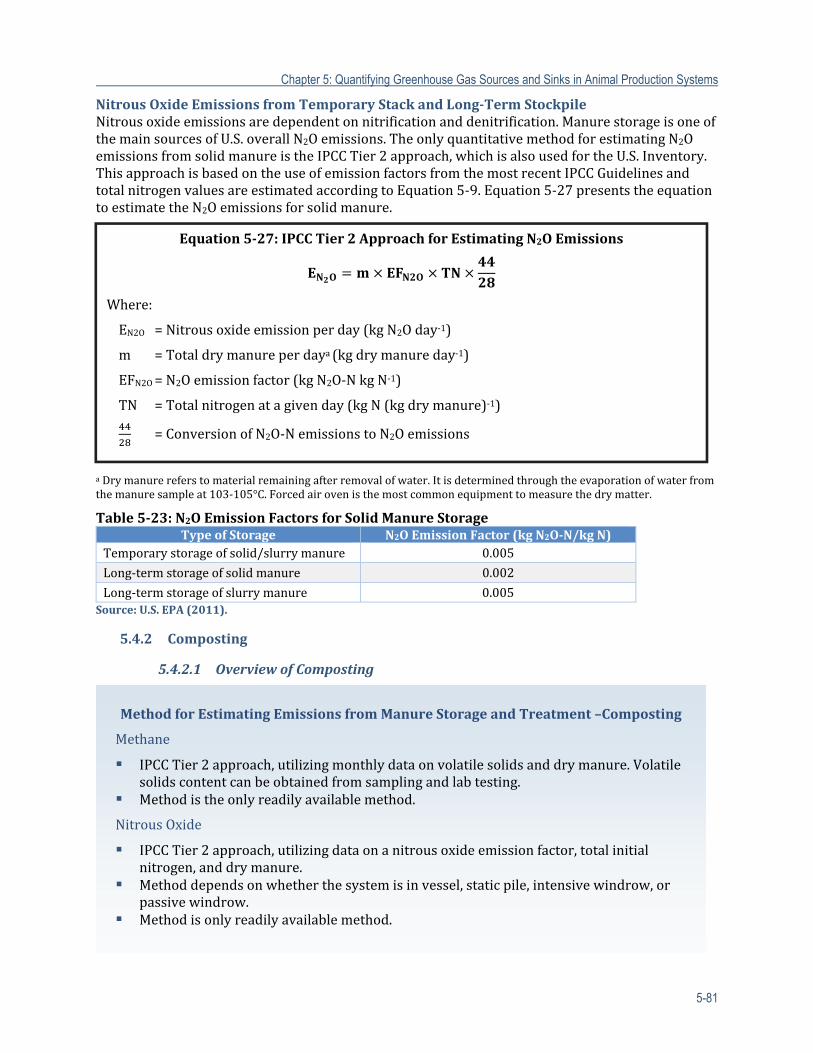
Chapter 5: Quantifying Greenhouse Gas Sources and Sinks in Animal Production Systems
5-81
NitrousOxideEmissionsfromTemporaryStackandLong‐TermStockpileNitrousoxideemissionsaredependentonnitrificationanddenitrification.ManurestorageisoneofthemainsourcesofU.S.overallN2Oemissions.TheonlyquantitativemethodforestimatingN2OemissionsfromsolidmanureistheIPCCTier2approach,whichisalsousedfortheU.S.Inventory.ThisapproachisbasedontheuseofemissionfactorsfromthemostrecentIPCCGuidelinesandtotalnitrogenvaluesareestimatedaccordingtoEquation5‐9.Equation5‐27presentstheequationtoestimatetheN2Oemissionsforsolidmanure.
aDrymanurereferstomaterialremainingafterremovalofwater.Itisdeterminedthroughtheevaporationofwaterfromthemanuresampleat103‐105°C.Forcedairovenisthemostcommonequipmenttomeasurethedrymatter.
Table5‐23:N2OEmissionFactorsforSolidManureStorageTypeofStorage N2OEmissionFactor(kgN2O‐N/kgN)
Temporarystorageofsolid/slurrymanure 0.005
Long‐termstorageofsolidmanure 0.002
Long‐termstorageofslurrymanure 0.005Source:U.S.EPA(2011).
5.4.2 Composting
5.4.2.1 OverviewofComposting
Equation5‐27:IPCCTier2ApproachforEstimatingN2OEmissions
Where:
EN2O =Nitrousoxideemissionperday(kgN2Oday‐1)
m =Totaldrymanureperdaya(kgdrymanureday‐1)
EFN2O=N2Oemissionfactor(kgN2O‐NkgN‐1)
TN =Totalnitrogenatagivenday(kgN(kgdrymanure)‐1)
=ConversionofN2O‐NemissionstoN2Oemissions
MethodforEstimatingEmissionsfromManureStorageandTreatment–Composting
Methane
IPCCTier2approach,utilizingmonthlydataonvolatilesolidsanddrymanure.Volatilesolidscontentcanbeobtainedfromsamplingandlabtesting.
Methodistheonlyreadilyavailablemethod.
NitrousOxide
IPCCTier2approach,utilizingdataonanitrousoxideemissionfactor,totalinitialnitrogen,anddrymanure.
Methoddependsonwhetherthesystemisinvessel,staticpile,intensivewindrow,orpassivewindrow.
Methodisonlyreadilyavailablemethod.
Chapter 5: Quantifying Greenhouse Gas Sources and Sinks in Animal Production Systems
5-82
Compostingisthecontrolledaerobicdecompositionoforganicmaterialintoastable,humus‐likeproduct(USDANRCS,2007).Animalmanuremaybecompostedinavarietyofdifferentsystems,includingin‐vesselsystems,windrows,orstaticpiles.In‐vesselsystemshandlecompostinaclosedsystemsuchasarotarydrumorboxthatincorporatesregularmovementtoensureproperaeration.Thelargestcompostingoperationsdivideupthecompostintolongheapsforwindrowcompostingorintoonelargepileforaeratedstaticpilecomposting.Intheformermethod,properoxygenflowcanbemaintainedviamanualturningorpipesystems,whereasinthelattermethod,itismaintainedthroughpipesystems.Compostinghasbecomeapopularmethodinsomeregionstodecreasethevolumeandweightoflivestockmanureandtoproduceaproductthatisoftenmoreacceptabletofarmersasafertilizer.Duringa100‐to120‐daycompostingperiod,theweightandvolumeofmanuremaybedecreasedby15to70percent(Eghballetal.,1997;Inbaretal.,1993;Lopez‐Real&Baptista,1996).Furthermore,theheatgeneratedthroughthecompostingprocesscankillparasites,pathogens,andweedseedsfoundinanimalwaste,creatingasaferproductforcropapplication.
ThequantityofGHGemissionsisaffectedbythecompostingmethodemployed.Haoetal.(2001)reportedthatGHGemissionsfromcattlemanurecompostincreasedabouttwofoldwhenthecompostwasactivelycompostedratherthanpassivelycompostedinwindrows.Activewindrowswereturnedsixtimes(days14,21,29,50,70,and84).Passivewindrowswereneverturned,butairwasintroducedintothewindrowsbyaseriesofopen‐endedperforatedsteelpipes.TotheextentthattherateofGHGformationdependsonoxygensaturationintheporespace,aerationmethod(i.e.,forced‐airvs.passive/convective)andrate(orturningfrequency)willaffectthemagnitudeofGHGemissionsduringthecompostingprocess.
Eghballetal.(1997)reportedthat19to45percentofthenitrogenpresentinmanurewaslostduringcomposting,withthemajorityofthispresumablyasNH3.Usingchangesinthenitrogen:phosphorusratiooffeedlotmanurethatwasplacedincompostwindrowsandthenitrogen:phosphorusratioof“finished”compost,Coleetal.(2011)estimatedthat10to20percentofnitrogenwaslostduringcomposting.TheU.S.EPAcurrentlyassumesthatoneto10percentofnitrogenenteringcompostsystemsislostasN2O(IPCC,2006;U.S.EPA,2009).
TheIPCCTier2methodologyisprovidedforestimatingCH4andN2Oemissionsfromcomposting.Thismethodologyusescountry‐specificemissionfactorsfromtheU.S.EPAGHGInventory.Theamountofmanure,volatilesolidscontent,andtemperaturearespecifictotheentity.TheGHGestimationmethodformanurecompostingdoesnotconsiderotherorganiccarbonsourcesthatmightbeaddedintomanurecomposting.
RationaleforSelectedMethodTheIPCCequationsaretheonlyavailablemethodsforestimatingCH4andN2Oemissionsfromcomposting.Thesemethodologiesbestdescribethequantitativerelationshipamongstactivitydataattheentitylevel.
5.4.2.2 ActivityData
InordertoestimatethedailyCH4emissions,thefollowinginformationisneeded:
Animaltype Totaldrymanure Volatilesolidsofdrymanure Temperatures(localambienttemperatureandmanuretemperature)
InordertoestimatethedailyN2Oemissions,thefollowinginformationisneeded:
Totaldrymanureinthestorage
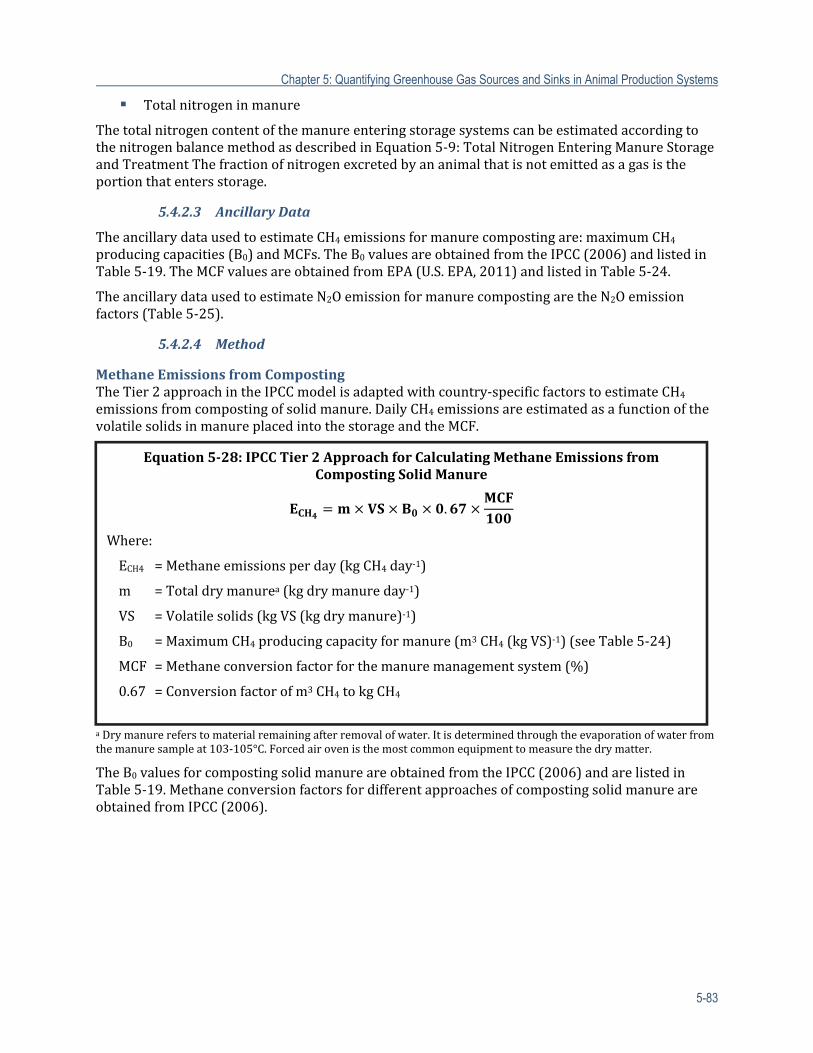
Chapter 5: Quantifying Greenhouse Gas Sources and Sinks in Animal Production Systems
5-83
Totalnitrogeninmanure
ThetotalnitrogencontentofthemanureenteringstoragesystemscanbeestimatedaccordingtothenitrogenbalancemethodasdescribedinEquation5‐9:TotalNitrogenEnteringManureStorageandTreatmentThefractionofnitrogenexcretedbyananimalthatisnotemittedasagasistheportionthatentersstorage.
5.4.2.3 AncillaryData
TheancillarydatausedtoestimateCH4emissionsformanurecompostingare:maximumCH4producingcapacities(B0)andMCFs.TheB0valuesareobtainedfromtheIPCC(2006)andlistedinTable5‐19.TheMCFvaluesareobtainedfromEPA(U.S.EPA,2011)andlistedinTable5‐24.
TheancillarydatausedtoestimateN2OemissionformanurecompostingaretheN2Oemissionfactors(Table5‐25).
5.4.2.4 Method
MethaneEmissionsfromCompostingTheTier2approachintheIPCCmodelisadaptedwithcountry‐specificfactorstoestimateCH4emissionsfromcompostingofsolidmanure.DailyCH4emissionsareestimatedasafunctionofthevolatilesolidsinmanureplacedintothestorageandtheMCF.
aDrymanurereferstomaterialremainingafterremovalofwater.Itisdeterminedthroughtheevaporationofwaterfromthemanuresampleat103‐105°C.Forcedairovenisthemostcommonequipmenttomeasurethedrymatter.
TheB0valuesforcompostingsolidmanureareobtainedfromtheIPCC(2006)andarelistedinTable5‐19.MethaneconversionfactorsfordifferentapproachesofcompostingsolidmanureareobtainedfromIPCC(2006).
Equation5‐28:IPCCTier2ApproachforCalculatingMethaneEmissionsfromCompostingSolidManure
.
Where:
ECH4 =Methaneemissionsperday(kgCH4day‐1)
m =Totaldrymanurea(kgdrymanureday‐1)
VS =Volatilesolids(kgVS(kgdrymanure)‐1)
B0 =MaximumCH4producingcapacityformanure(m3CH4(kgVS)‐1)(seeTable5‐24)
MCF =Methaneconversionfactorforthemanuremanagementsystem(%)
0.67 =Conversionfactorofm3CH4tokgCH4
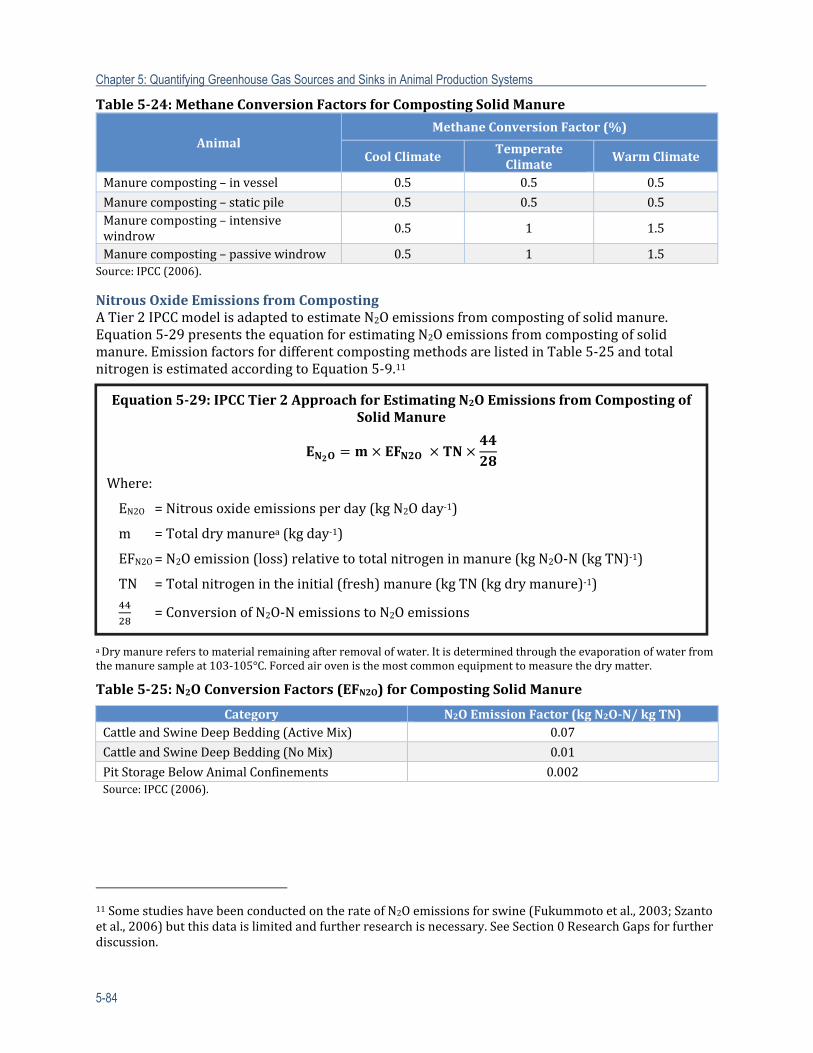
Chapter 5: Quantifying Greenhouse Gas Sources and Sinks in Animal Production Systems
5-84
Table5‐24:MethaneConversionFactorsforCompostingSolidManure
AnimalMethaneConversionFactor(%)
CoolClimate TemperateClimate
WarmClimate
Manurecomposting–invessel 0.5 0.5 0.5
Manurecomposting–staticpile 0.5 0.5 0.5Manurecomposting–intensivewindrow
0.5 1 1.5
Manurecomposting–passivewindrow 0.5 1 1.5Source:IPCC(2006).
NitrousOxideEmissionsfromCompostingATier2IPCCmodelisadaptedtoestimateN2Oemissionsfromcompostingofsolidmanure.Equation5‐29presentstheequationforestimatingN2Oemissionsfromcompostingofsolidmanure.EmissionfactorsfordifferentcompostingmethodsarelistedinTable5‐25andtotalnitrogenisestimatedaccordingtoEquation5‐9.11
aDrymanurereferstomaterialremainingafterremovalofwater.Itisdeterminedthroughtheevaporationofwaterfromthemanuresampleat103‐105°C.Forcedairovenisthemostcommonequipmenttomeasurethedrymatter.
Table5‐25:N2OConversionFactors(EFN2O)forCompostingSolidManure
Category N2OEmissionFactor(kgN2O‐N/kgTN)CattleandSwineDeepBedding(ActiveMix) 0.07
CattleandSwineDeepBedding(NoMix) 0.01
PitStorageBelowAnimalConfinements 0.002Source:IPCC(2006).
11SomestudieshavebeenconductedontherateofN2Oemissionsforswine(Fukummotoetal.,2003;Szantoetal.,2006)butthisdataislimitedandfurtherresearchisnecessary.SeeSection0ResearchGapsforfurtherdiscussion.
Equation5‐29:IPCCTier2ApproachforEstimatingN2OEmissionsfromCompostingofSolidManure
Where:
EN2O =Nitrousoxideemissionsperday(kgN2Oday‐1)
m =Totaldrymanurea(kgday‐1)
EFN2O=N2Oemission(loss)relativetototalnitrogeninmanure(kgN2O‐N(kgTN)‐1)
TN =Totalnitrogenintheinitial(fresh)manure(kgTN(kgdrymanure)‐1)
=ConversionofN2O‐NemissionstoN2Oemissions
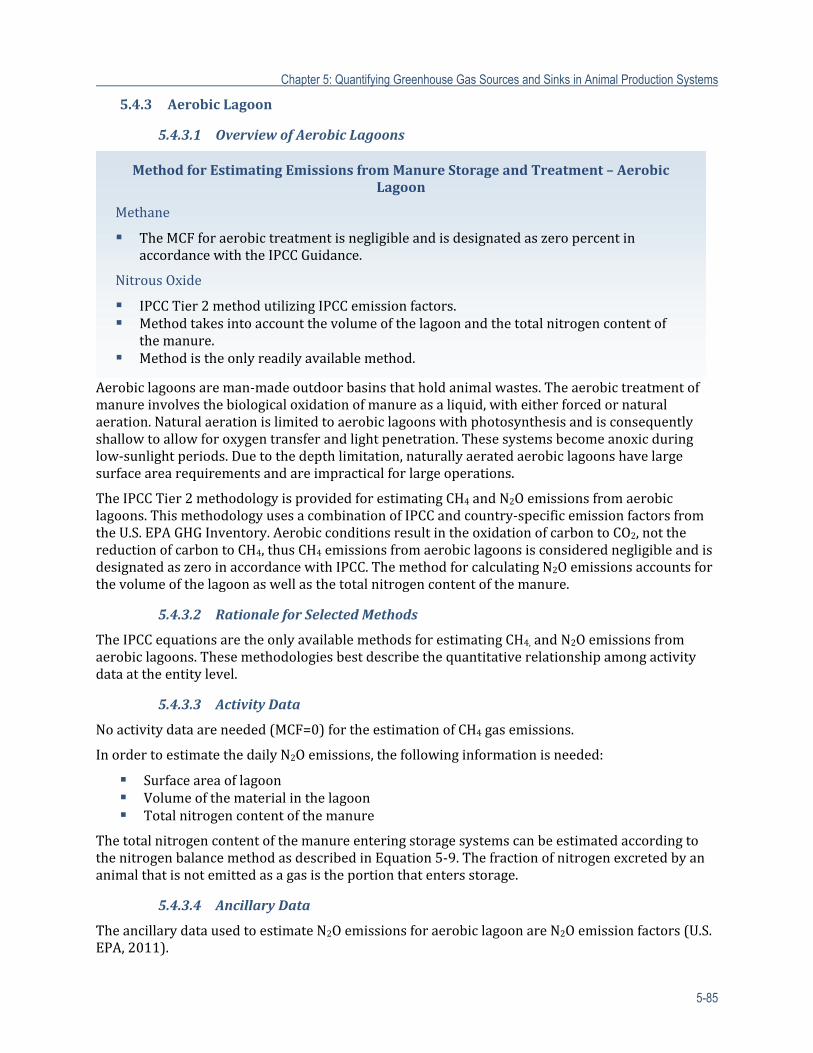
Chapter 5: Quantifying Greenhouse Gas Sources and Sinks in Animal Production Systems
5-85
5.4.3 AerobicLagoon
5.4.3.1 OverviewofAerobicLagoons
Aerobiclagoonsareman‐madeoutdoorbasinsthatholdanimalwastes.Theaerobictreatmentofmanureinvolvesthebiologicaloxidationofmanureasaliquid,witheitherforcedornaturalaeration.Naturalaerationislimitedtoaerobiclagoonswithphotosynthesisandisconsequentlyshallowtoallowforoxygentransferandlightpenetration.Thesesystemsbecomeanoxicduringlow‐sunlightperiods.Duetothedepthlimitation,naturallyaeratedaerobiclagoonshavelargesurfacearearequirementsandareimpracticalforlargeoperations.
TheIPCCTier2methodologyisprovidedforestimatingCH4andN2Oemissionsfromaerobiclagoons.ThismethodologyusesacombinationofIPCCandcountry‐specificemissionfactorsfromtheU.S.EPAGHGInventory.AerobicconditionsresultintheoxidationofcarbontoCO2,notthereductionofcarbontoCH4,thusCH4emissionsfromaerobiclagoonsisconsiderednegligibleandisdesignatedaszeroinaccordancewithIPCC.ThemethodforcalculatingN2Oemissionsaccountsforthevolumeofthelagoonaswellasthetotalnitrogencontentofthemanure.
5.4.3.2 RationaleforSelectedMethods
TheIPCCequationsaretheonlyavailablemethodsforestimatingCH4,andN2Oemissionsfromaerobiclagoons.Thesemethodologiesbestdescribethequantitativerelationshipamongactivitydataattheentitylevel.
5.4.3.3 ActivityData
Noactivitydataareneeded(MCF=0)fortheestimationofCH4gasemissions.
InordertoestimatethedailyN2Oemissions,thefollowinginformationisneeded:
Surfaceareaoflagoon Volumeofthematerialinthelagoon Totalnitrogencontentofthemanure
ThetotalnitrogencontentofthemanureenteringstoragesystemscanbeestimatedaccordingtothenitrogenbalancemethodasdescribedinEquation5‐9.Thefractionofnitrogenexcretedbyananimalthatisnotemittedasagasistheportionthatentersstorage.
5.4.3.4 AncillaryData
TheancillarydatausedtoestimateN2OemissionsforaerobiclagoonareN2Oemissionfactors(U.S.EPA,2011).
MethodforEstimatingEmissionsfromManureStorageandTreatment–AerobicLagoon
Methane
TheMCFforaerobictreatmentisnegligibleandisdesignatedaszeropercentinaccordancewiththeIPCCGuidance.
NitrousOxide
IPCCTier2methodutilizingIPCCemissionfactors. Methodtakesintoaccountthevolumeofthelagoonandthetotalnitrogencontentof
themanure. Methodistheonlyreadilyavailablemethod.
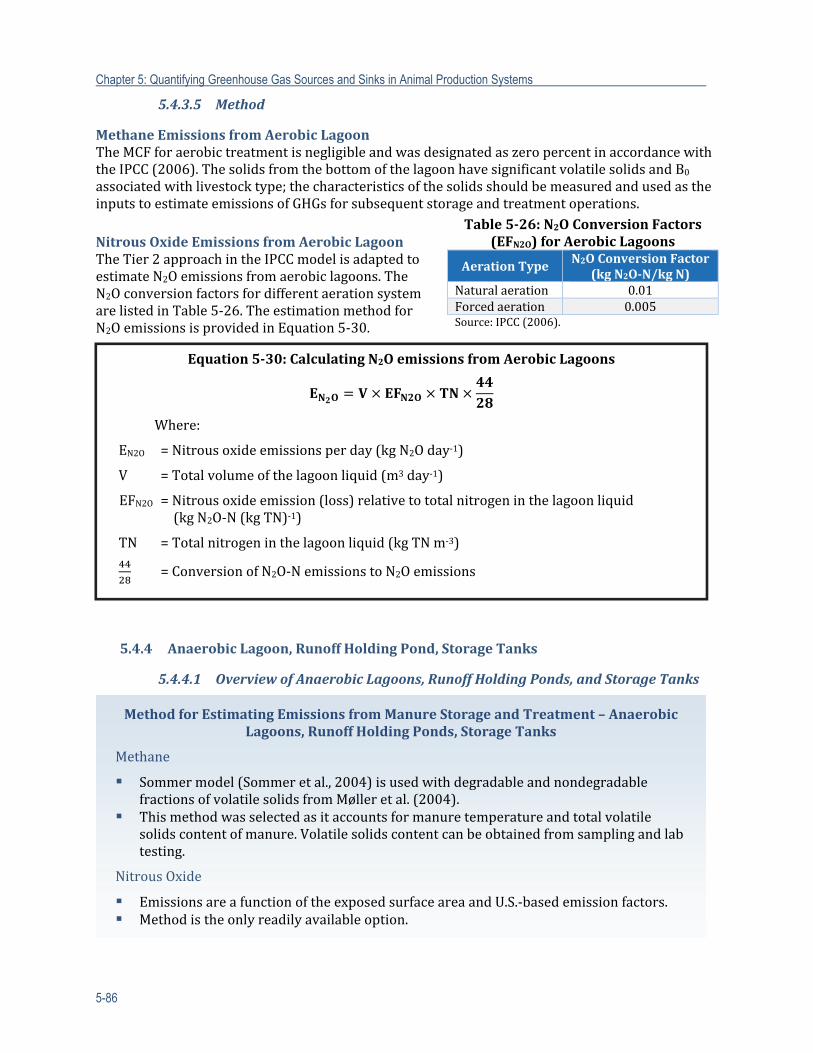
Chapter 5: Quantifying Greenhouse Gas Sources and Sinks in Animal Production Systems
5-86
5.4.3.5 Method
MethaneEmissionsfromAerobicLagoonTheMCFforaerobictreatmentisnegligibleandwasdesignatedaszeropercentinaccordancewiththeIPCC(2006).ThesolidsfromthebottomofthelagoonhavesignificantvolatilesolidsandB0associatedwithlivestocktype;thecharacteristicsofthesolidsshouldbemeasuredandusedastheinputstoestimateemissionsofGHGsforsubsequentstorageandtreatmentoperations.
NitrousOxideEmissionsfromAerobicLagoonTheTier2approachintheIPCCmodelisadaptedtoestimateN2Oemissionsfromaerobiclagoons.TheN2OconversionfactorsfordifferentaerationsystemarelistedinTable5‐26.TheestimationmethodforN2OemissionsisprovidedinEquation5‐30.
5.4.4 AnaerobicLagoon,RunoffHoldingPond,StorageTanks
5.4.4.1 OverviewofAnaerobicLagoons,RunoffHoldingPonds,andStorageTanks
Table5‐26:N2OConversionFactors(EFN2O)forAerobicLagoons
AerationTypeN2OConversion Factor
(kgN2O‐N/kgN)Naturalaeration 0.01Forcedaeration 0.005Source:IPCC(2006).
Equation5‐30:CalculatingN2OemissionsfromAerobicLagoons
Where:
EN2O =Nitrousoxideemissionsperday(kgN2Oday‐1)
V =Totalvolumeofthelagoonliquid(m3day‐1)
EFN2O=Nitrousoxideemission(loss)relativetototalnitrogeninthelagoonliquid (kgN2O‐N(kgTN)‐1)
TN =Totalnitrogeninthelagoonliquid(kgTNm‐3)
=ConversionofN2O‐NemissionstoN2Oemissions
MethodforEstimatingEmissionsfromManureStorageandTreatment–AnaerobicLagoons,RunoffHoldingPonds,StorageTanks
Methane
Sommermodel(Sommeretal.,2004)isusedwithdegradableandnondegradablefractionsofvolatilesolidsfromMølleretal.(2004).
Thismethodwasselectedasitaccountsformanuretemperatureandtotalvolatilesolidscontentofmanure.Volatilesolidscontentcanbeobtainedfromsamplingandlabtesting.
NitrousOxide
EmissionsareafunctionoftheexposedsurfaceareaandU.S.‐basedemissionfactors. Methodistheonlyreadilyavailableoption.
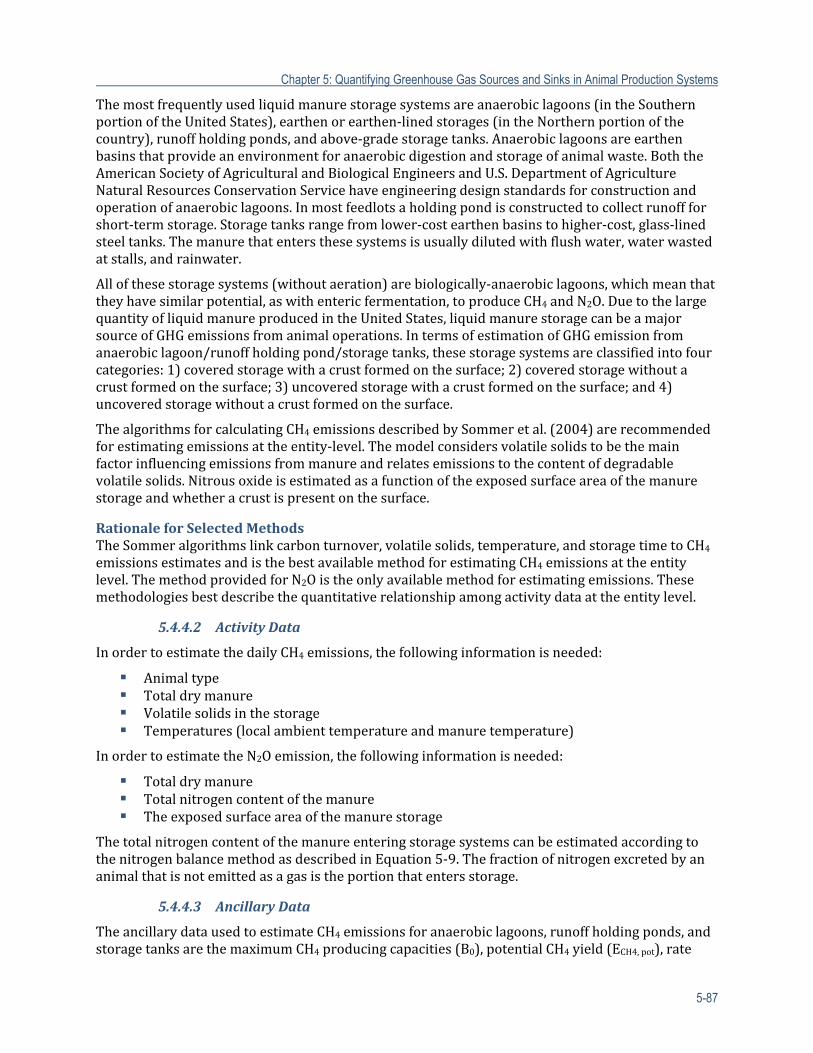
Chapter 5: Quantifying Greenhouse Gas Sources and Sinks in Animal Production Systems
5-87
Themostfrequentlyusedliquidmanurestoragesystemsareanaerobiclagoons(intheSouthernportionoftheUnitedStates),earthenorearthen‐linedstorages(intheNorthernportionofthecountry),runoffholdingponds,andabove‐gradestoragetanks.Anaerobiclagoonsareearthenbasinsthatprovideanenvironmentforanaerobicdigestionandstorageofanimalwaste.BoththeAmericanSocietyofAgriculturalandBiologicalEngineersandU.S.DepartmentofAgricultureNaturalResourcesConservationServicehaveengineeringdesignstandardsforconstructionandoperationofanaerobiclagoons.Inmostfeedlotsaholdingpondisconstructedtocollectrunoffforshort‐termstorage.Storagetanksrangefromlower‐costearthenbasinstohigher‐cost,glass‐linedsteeltanks.Themanurethatentersthesesystemsisusuallydilutedwithflushwater,waterwastedatstalls,andrainwater.
Allofthesestoragesystems(withoutaeration)arebiologically‐anaerobiclagoons,whichmeanthattheyhavesimilarpotential,aswithentericfermentation,toproduceCH4andN2O.DuetothelargequantityofliquidmanureproducedintheUnitedStates,liquidmanurestoragecanbeamajorsourceofGHGemissionsfromanimaloperations.IntermsofestimationofGHGemissionfromanaerobiclagoon/runoffholdingpond/storagetanks,thesestoragesystemsareclassifiedintofourcategories:1)coveredstoragewithacrustformedonthesurface;2)coveredstoragewithoutacrustformedonthesurface;3)uncoveredstoragewithacrustformedonthesurface;and4)uncoveredstoragewithoutacrustformedonthesurface.
ThealgorithmsforcalculatingCH4emissionsdescribedbySommeretal.(2004)arerecommendedforestimatingemissionsattheentity‐level.Themodelconsidersvolatilesolidstobethemainfactorinfluencingemissionsfrommanureandrelatesemissionstothecontentofdegradablevolatilesolids.Nitrousoxideisestimatedasafunctionoftheexposedsurfaceareaofthemanurestorageandwhetheracrustispresentonthesurface.
RationaleforSelectedMethodsTheSommeralgorithmslinkcarbonturnover,volatilesolids,temperature,andstoragetimetoCH4emissionsestimatesandisthebestavailablemethodforestimatingCH4emissionsattheentitylevel.ThemethodprovidedforN2Oistheonlyavailablemethodforestimatingemissions.Thesemethodologiesbestdescribethequantitativerelationshipamongactivitydataattheentitylevel.
5.4.4.2 ActivityData
InordertoestimatethedailyCH4emissions,thefollowinginformationisneeded:
Animaltype Totaldrymanure Volatilesolidsinthestorage Temperatures(localambienttemperatureandmanuretemperature)
InordertoestimatetheN2Oemission,thefollowinginformationisneeded:
Totaldrymanure Totalnitrogencontentofthemanure Theexposedsurfaceareaofthemanurestorage
ThetotalnitrogencontentofthemanureenteringstoragesystemscanbeestimatedaccordingtothenitrogenbalancemethodasdescribedinEquation5‐9.Thefractionofnitrogenexcretedbyananimalthatisnotemittedasagasistheportionthatentersstorage.
5.4.4.3 AncillaryData
TheancillarydatausedtoestimateCH4emissionsforanaerobiclagoons,runoffholdingponds,andstoragetanksarethemaximumCH4producingcapacities(B0),potentialCH4yield(ECH4,pot),rate
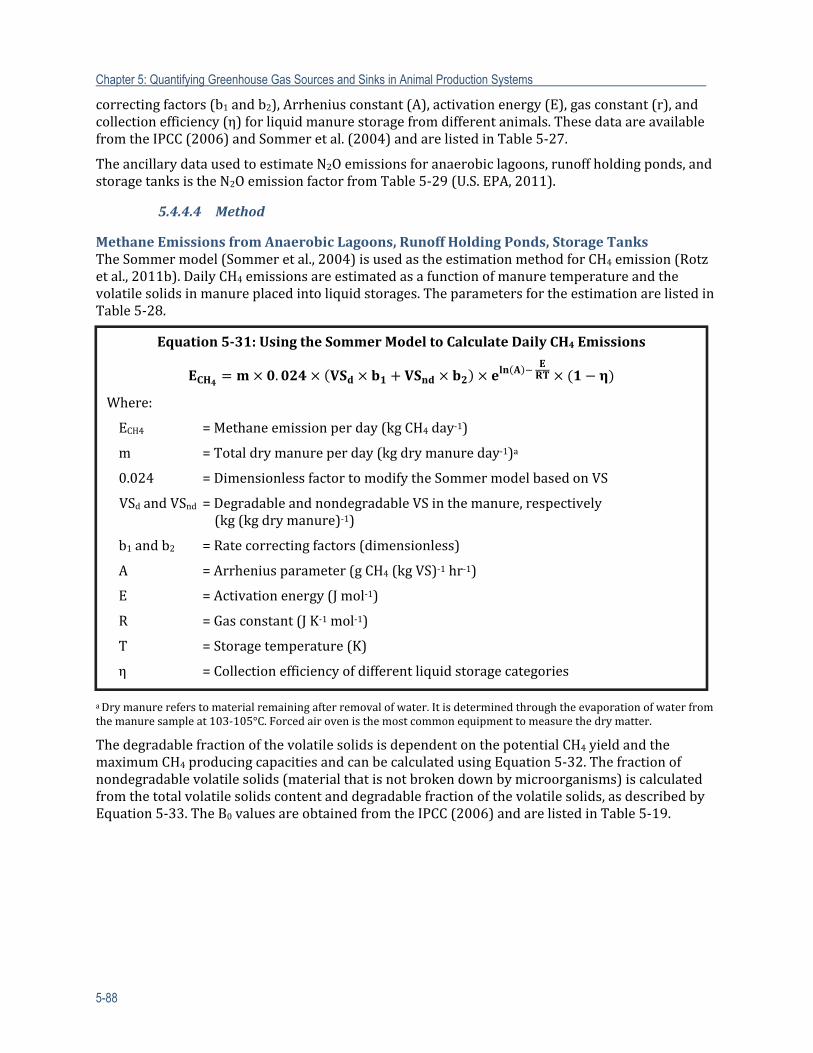
Chapter 5: Quantifying Greenhouse Gas Sources and Sinks in Animal Production Systems
5-88
correctingfactors(b1andb2),Arrheniusconstant(A),activationenergy(E),gasconstant(r),andcollectionefficiency(η)forliquidmanurestoragefromdifferentanimals.ThesedataareavailablefromtheIPCC(2006)andSommeretal.(2004)andarelistedinTable5‐27.
TheancillarydatausedtoestimateN2Oemissionsforanaerobiclagoons,runoffholdingponds,andstoragetanksistheN2OemissionfactorfromTable5‐29(U.S.EPA,2011).
5.4.4.4 Method
MethaneEmissionsfromAnaerobicLagoons,RunoffHoldingPonds,StorageTanksTheSommermodel(Sommeretal.,2004)isusedastheestimationmethodforCH4emission(Rotzetal.,2011b).DailyCH4emissionsareestimatedasafunctionofmanuretemperatureandthevolatilesolidsinmanureplacedintoliquidstorages.TheparametersfortheestimationarelistedinTable5‐28.
aDrymanurereferstomaterialremainingafterremovalofwater.Itisdeterminedthroughtheevaporationofwaterfromthemanuresampleat103‐105°C.Forcedairovenisthemostcommonequipmenttomeasurethedrymatter.
ThedegradablefractionofthevolatilesolidsisdependentonthepotentialCH4yieldandthemaximumCH4producingcapacitiesandcanbecalculatedusingEquation5‐32.Thefractionofnondegradablevolatilesolids(materialthatisnotbrokendownbymicroorganisms)iscalculatedfromthetotalvolatilesolidscontentanddegradablefractionofthevolatilesolids,asdescribedbyEquation5‐33.TheB0valuesareobtainedfromtheIPCC(2006)andarelistedinTable5‐19.
Equation5‐31:UsingtheSommerModeltoCalculateDailyCH4Emissions
.
Where:
ECH4 =Methaneemissionperday(kgCH4day‐1)
m =Totaldrymanureperday(kgdrymanureday‐1)a
0.024 =DimensionlessfactortomodifytheSommermodelbasedonVS
VSdandVSnd =DegradableandnondegradableVSinthemanure,respectively (kg(kgdrymanure)‐1)
b1andb2 =Ratecorrectingfactors(dimensionless)
A =Arrheniusparameter(gCH4(kgVS)‐1hr‐1)
E =Activationenergy(Jmol‐1)
R =Gasconstant(JK‐1mol‐1)
T =Storagetemperature(K)
η =Collectionefficiencyofdifferentliquidstoragecategories
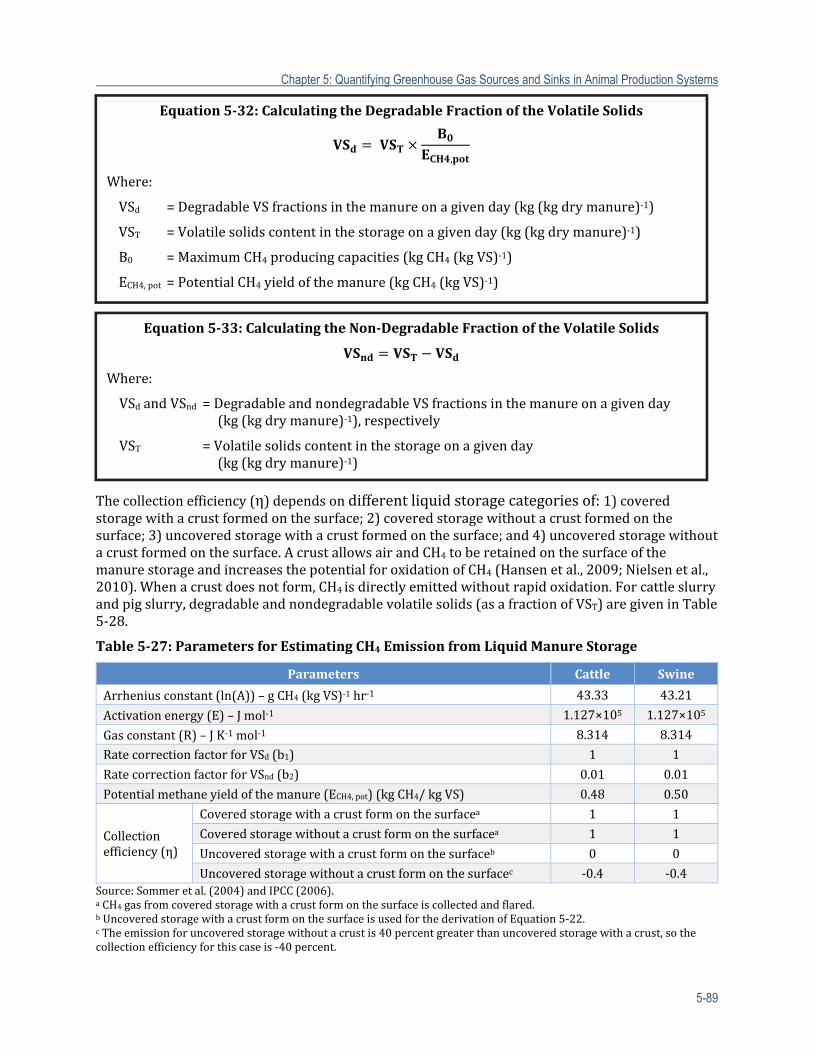
Chapter 5: Quantifying Greenhouse Gas Sources and Sinks in Animal Production Systems
5-89
Thecollectionefficiency(η)dependsondifferentliquidstoragecategoriesof:1)coveredstoragewithacrustformedonthesurface;2)coveredstoragewithoutacrustformedonthesurface;3)uncoveredstoragewithacrustformedonthesurface;and4)uncoveredstoragewithoutacrustformedonthesurface.AcrustallowsairandCH4toberetainedonthesurfaceofthemanurestorageandincreasesthepotentialforoxidationofCH4(Hansenetal.,2009;Nielsenetal.,2010).Whenacrustdoesnotform,CH4isdirectlyemittedwithoutrapidoxidation.Forcattleslurryandpigslurry,degradableandnondegradablevolatilesolids(asafractionofVST)aregiveninTable5‐28.
Table5‐27:ParametersforEstimatingCH4EmissionfromLiquidManureStorage
Parameters Cattle Swine
Arrheniusconstant(ln(A))–gCH4(kgVS)‐1hr‐1 43.33 43.21
Activationenergy(E)–Jmol‐1 1.127×10⁵ 1.127×10⁵
Gasconstant(R)–JK‐1mol‐1 8.314 8.314
RatecorrectionfactorforVSd(b1) 1 1
RatecorrectionfactorforVSnd(b2) 0.01 0.01
Potentialmethaneyieldofthemanure(ECH4,pot)(kgCH4/kgVS) 0.48 0.50
Collectionefficiency(η)
Coveredstoragewithacrustformonthesurfacea 1 1
Coveredstoragewithoutacrustformonthesurfacea 1 1
Uncoveredstoragewithacrustformonthesurfaceb 0 0
Uncoveredstoragewithoutacrustformonthesurfacec ‐0.4 ‐0.4Source:Sommeretal.(2004)andIPCC(2006).aCH4gasfromcoveredstoragewithacrustformonthesurfaceiscollectedandflared.bUncoveredstoragewithacrustformonthesurfaceisusedforthederivationofEquation5‐22.cTheemissionforuncoveredstoragewithoutacrustis40percentgreaterthanuncoveredstoragewithacrust,sothecollectionefficiencyforthiscaseis‐40percent.
Equation5‐32:CalculatingtheDegradableFractionoftheVolatileSolids
,
Where:
VSd =DegradableVSfractionsinthemanureonagivenday(kg(kgdrymanure)‐1)
VST =Volatilesolidscontentinthestorageonagivenday(kg(kgdrymanure)‐1)
B0 =MaximumCH4producingcapacities(kgCH4(kgVS)‐1)
ECH4,pot =PotentialCH4yieldofthemanure(kgCH4(kgVS)‐1)
Equation5‐33:CalculatingtheNon‐DegradableFractionoftheVolatileSolids
Where:
VSdandVSnd =DegradableandnondegradableVSfractionsinthemanureonagivenday (kg(kgdrymanure)‐1),respectively
VST =Volatilesolidscontentinthestorageonagivenday (kg(kgdrymanure)‐1)
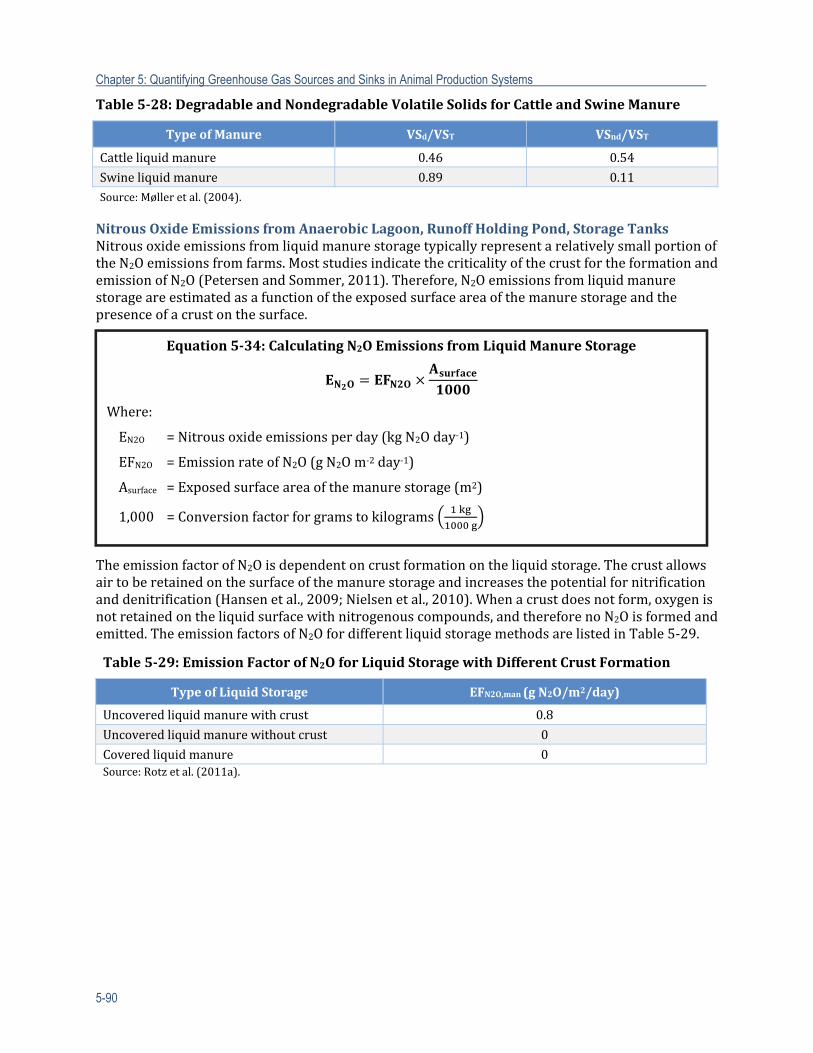
Chapter 5: Quantifying Greenhouse Gas Sources and Sinks in Animal Production Systems
5-90
Table5‐28:DegradableandNondegradableVolatileSolidsforCattleandSwineManure
TypeofManure VSd/VST VSnd/VST
Cattleliquidmanure 0.46 0.54
Swineliquidmanure 0.89 0.11Source:Mølleretal.(2004).
NitrousOxideEmissionsfromAnaerobicLagoon,RunoffHoldingPond,StorageTanksNitrousoxideemissionsfromliquidmanurestoragetypicallyrepresentarelativelysmallportionoftheN2Oemissionsfromfarms.MoststudiesindicatethecriticalityofthecrustfortheformationandemissionofN2O(PetersenandSommer,2011).Therefore,N2Oemissionsfromliquidmanurestorageareestimatedasafunctionoftheexposedsurfaceareaofthemanurestorageandthepresenceofacrustonthesurface.
TheemissionfactorofN2Oisdependentoncrustformationontheliquidstorage.Thecrustallowsairtoberetainedonthesurfaceofthemanurestorageandincreasesthepotentialfornitrificationanddenitrification(Hansenetal.,2009;Nielsenetal.,2010).Whenacrustdoesnotform,oxygenisnotretainedontheliquidsurfacewithnitrogenouscompounds,andthereforenoN2Oisformedandemitted.TheemissionfactorsofN2OfordifferentliquidstoragemethodsarelistedinTable5‐29.
Table5‐29:EmissionFactorofN2OforLiquidStoragewithDifferentCrustFormation
TypeofLiquidStorage EFN2O,man(gN2O/m2/day)
Uncoveredliquidmanurewithcrust 0.8
Uncoveredliquidmanurewithoutcrust 0
Coveredliquidmanure 0Source:Rotzetal.(2011a).
Equation5‐34:CalculatingN2OEmissionsfromLiquidManureStorage
Where:
EN2O =Nitrousoxideemissionsperday(kgN2Oday‐1)
EFN2O =EmissionrateofN2O(gN2Om‐2day‐1)
Asurface =Exposedsurfaceareaofthemanurestorage(m2)
1,000 =Conversionfactorforgramstokilograms
Chapter 5: Quantifying Greenhouse Gas Sources and Sinks in Animal Production Systems
5-91
5.4.5 AnaerobicDigesterwithBiogasUtilization
5.4.5.1 OverviewofAnaerobicDigesterwithBiogasUtilization
OneofthemostcommonlydiscussedwastemanagementalternativesforGHGreductionandenergygenerationisanaerobicdigestion.Anaerobicdigestionisanatural,biologicalconversionprocessthathasbeenproveneffectiveatconvertingwetorganicwastesintobiogas(approximately60percentCH4and40percentCO2).Biogascanbeusedasafuelsourceforengine‐generatorsets,producingrelativelycleanelectricitywhilealsoreducingsomeoftheenvironmentalconcernsassociatedwithmanure.Thedigestercanbeassimpleasacoveredanaerobiclagoon(Gould‐WellsandWilliams,2004)orassophisticatedasthermophilicormediamatrix(attachedgrowth)digesters(Cantrelletal.,2008a).Thereareawidevarietyofanaerobicdigestionconfigurations,suchascontinuousstirredtankreactor(CSTR),coveredlagoon,plug‐flow,temperaturephased,upflowanaerobicsludgeblanket(UASB),packed‐bed,andfixedfilm.Thedigestionisalsocategorizedbasedonculturetemperature:thermophilicdigestioninwhichmanureisfermentedatatemperatureofaround55°C,ormesophilicdigestionatatemperatureofaround35°C.Amongthesetechnologies,CSTR,plug‐flow,andcoveredlagoon,allundermesophilicconditions,arethemostoften‐usedmethods.
Duringanaerobicdigestion,agroupofmicrobesworktogethertoconvertorganicmatterintoCH4,
CO2,andothersimplemolecules.Themainadvantagesofapplyinganaerobicdigestiontoanimalmanuresareodorreduction,electricitygeneration,andthereductionofGHGemissionsandmanure‐bornepathogens.Anaerobicdigestionisalsoanexcellentpre‐treatmentprocessforsubsequentmanuretreatmenttoremoveorganicmatterandconcentratephosphorus.ConsideringthesmallamountofN2Oexistinginbiogas,N2Oemissionsarenotestimatedfortheanaerobicdigestionofliquidmanure.
Thechallengesassociatedwithanaerobicdigestionrelatetoinitialcapitalcost,operation,andmaintenanceandothergasesthatmaybegenerated(e.g.,nitricoxides).Theeconomicsrelatetoaccesstotheelectricalgridandsufficientgreen‐electricityoffsetstomaketheoperationprofitable.Profitableconditionsarerelativelyscarce.Finally,thedigestersludgemustbemanaged.Anotherconversionalternativewithenergycreationpotentialisthermochemicalconversion(Cantrelletal.,2008a).Systemsthatusethermochemicalconversionstosyngases,bio‐oil,andbiocharforelectricityandfuelareemerging,butarenotyetestablished.
SinceananaerobicdigestionsystemconvertsorganiccarboninmanureintoCH4andsubsequentlycombustsCH4intoCO2,theGHGemissionsfrommanureanaerobicdigestionoperationaremainly
MethodforEstimatingEmissionsfromManureStorageandTreatment–AnaerobicDigesterwithBiogasUtilization
Methane
IPCCTier2usingCleanDevelopmentMechanismEFsfordigestertypestoestimateCH4leakagefromdigesters.
AnaerobicdigestersystemsconvertorganicmatterinmanureintoCH4andsubsequentlycombustCH4intoCO2.
GasleakagefromdigestersisthemainsourceofGHGemission. LeakageofCH4fromtheanaerobicdigestersystemisestimated.
NitrousOxide N2Oleakagefromdigestersisfairlysmallandnegligible.
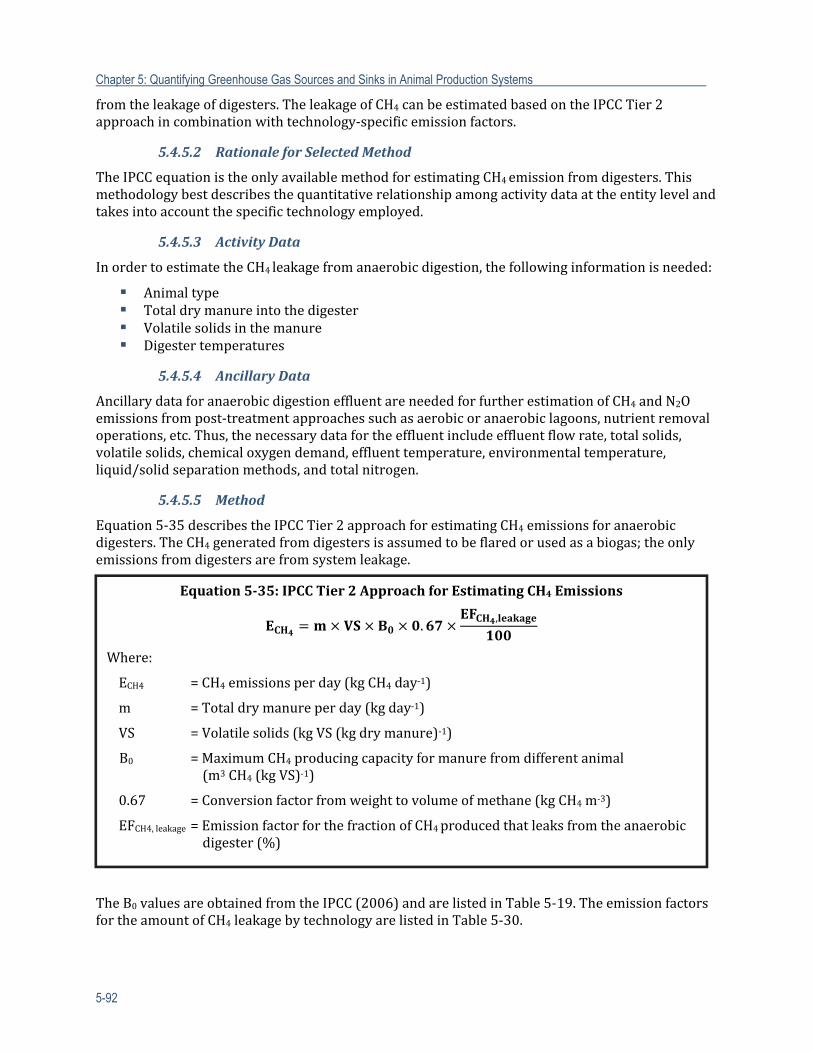
Chapter 5: Quantifying Greenhouse Gas Sources and Sinks in Animal Production Systems
5-92
fromtheleakageofdigesters.TheleakageofCH4canbeestimatedbasedontheIPCCTier2approachincombinationwithtechnology‐specificemissionfactors.
5.4.5.2 RationaleforSelectedMethod
TheIPCCequationistheonlyavailablemethodforestimatingCH4emissionfromdigesters.Thismethodologybestdescribesthequantitativerelationshipamongactivitydataattheentitylevelandtakesintoaccountthespecifictechnologyemployed.
5.4.5.3 ActivityData
InordertoestimatetheCH4leakagefromanaerobicdigestion,thefollowinginformationisneeded:
Animaltype Totaldrymanureintothedigester Volatilesolidsinthemanure Digestertemperatures
5.4.5.4 AncillaryData
AncillarydataforanaerobicdigestioneffluentareneededforfurtherestimationofCH4andN2Oemissionsfrompost‐treatmentapproachessuchasaerobicoranaerobiclagoons,nutrientremovaloperations,etc.Thus,thenecessarydatafortheeffluentincludeeffluentflowrate,totalsolids,volatilesolids,chemicaloxygendemand,effluenttemperature,environmentaltemperature,liquid/solidseparationmethods,andtotalnitrogen.
5.4.5.5 Method
Equation5‐35describestheIPCCTier2approachforestimatingCH4emissionsforanaerobicdigesters.TheCH4generatedfromdigestersisassumedtobeflaredorusedasabiogas;theonlyemissionsfromdigestersarefromsystemleakage.
TheB0valuesareobtainedfromtheIPCC(2006)andarelistedinTable5‐19.TheemissionfactorsfortheamountofCH4leakagebytechnologyarelistedinTable5‐30.
Equation5‐35:IPCCTier2ApproachforEstimatingCH4 Emissions
.,
Where:
ECH4 =CH4emissionsperday(kgCH4day‐1)
m =Totaldrymanureperday(kgday‐1)
VS =Volatilesolids(kgVS(kgdrymanure)‐1)
B0 =MaximumCH4producingcapacityformanurefromdifferentanimal (m3CH4(kgVS)‐1)
0.67 =Conversionfactorfromweighttovolumeofmethane(kgCH4m‐3)
EFCH4,leakage=EmissionfactorforthefractionofCH4producedthatleaksfromtheanaerobicdigester(%)
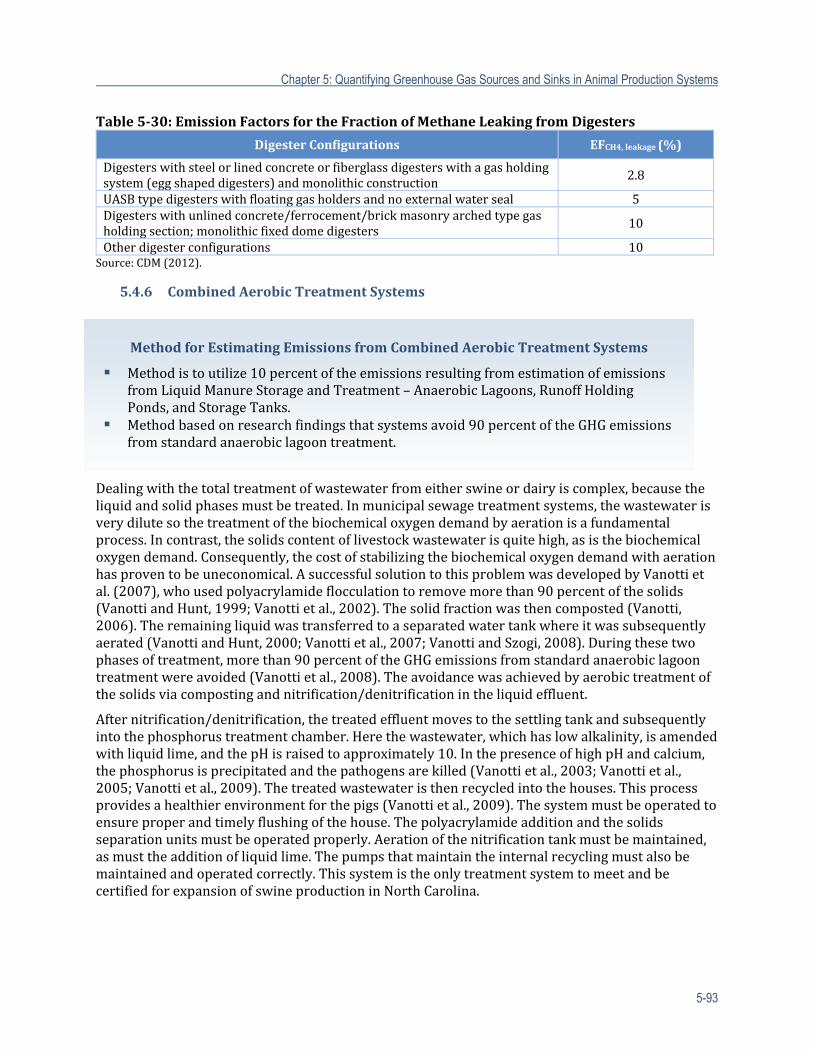
Chapter 5: Quantifying Greenhouse Gas Sources and Sinks in Animal Production Systems
5-93
Table5‐30:EmissionFactorsfortheFractionofMethaneLeakingfromDigesters
DigesterConfigurations EFCH4,leakage(%)
Digesterswithsteelorlinedconcreteorfiberglassdigesterswithagasholdingsystem(eggshapeddigesters)andmonolithicconstruction
2.8
UASBtypedigesterswithfloatinggasholdersandnoexternalwaterseal 5Digesterswithunlinedconcrete/ferrocement/brickmasonryarchedtypegasholdingsection;monolithicfixeddomedigesters 10
Otherdigesterconfigurations 10Source:CDM(2012).
5.4.6 CombinedAerobicTreatmentSystems
Dealingwiththetotaltreatmentofwastewaterfromeitherswineordairyiscomplex,becausetheliquidandsolidphasesmustbetreated.Inmunicipalsewagetreatmentsystems,thewastewaterisverydilutesothetreatmentofthebiochemicaloxygendemandbyaerationisafundamentalprocess.Incontrast,thesolidscontentoflivestockwastewaterisquitehigh,asisthebiochemicaloxygendemand.Consequently,thecostofstabilizingthebiochemicaloxygendemandwithaerationhasproventobeuneconomical.AsuccessfulsolutiontothisproblemwasdevelopedbyVanottietal.(2007),whousedpolyacrylamideflocculationtoremovemorethan90percentofthesolids(VanottiandHunt,1999;Vanottietal.,2002).Thesolidfractionwasthencomposted(Vanotti,2006).Theremainingliquidwastransferredtoaseparatedwatertankwhereitwassubsequentlyaerated(VanottiandHunt,2000;Vanottietal.,2007;VanottiandSzogi,2008).Duringthesetwophasesoftreatment,morethan90percentoftheGHGemissionsfromstandardanaerobiclagoontreatmentwereavoided(Vanottietal.,2008).Theavoidancewasachievedbyaerobictreatmentofthesolidsviacompostingandnitrification/denitrificationintheliquideffluent.
Afternitrification/denitrification,thetreatedeffluentmovestothesettlingtankandsubsequentlyintothephosphorustreatmentchamber.Herethewastewater,whichhaslowalkalinity,isamendedwithliquidlime,andthepHisraisedtoapproximately10.InthepresenceofhighpHandcalcium,thephosphorusisprecipitatedandthepathogensarekilled(Vanottietal.,2003;Vanottietal.,2005;Vanottietal.,2009).Thetreatedwastewateristhenrecycledintothehouses.Thisprocessprovidesahealthierenvironmentforthepigs(Vanottietal.,2009).Thesystemmustbeoperatedtoensureproperandtimelyflushingofthehouse.Thepolyacrylamideadditionandthesolidsseparationunitsmustbeoperatedproperly.Aerationofthenitrificationtankmustbemaintained,asmusttheadditionofliquidlime.Thepumpsthatmaintaintheinternalrecyclingmustalsobemaintainedandoperatedcorrectly.ThissystemistheonlytreatmentsystemtomeetandbecertifiedforexpansionofswineproductioninNorthCarolina.
MethodforEstimatingEmissionsfromCombinedAerobicTreatmentSystems
Methodistoutilize10percentoftheemissionsresultingfromestimationofemissionsfromLiquidManureStorageandTreatment–AnaerobicLagoons,RunoffHoldingPonds,andStorageTanks.
Methodbasedonresearchfindingsthatsystemsavoid90percentoftheGHGemissionsfromstandardanaerobiclagoontreatment.
Chapter 5: Quantifying Greenhouse Gas Sources and Sinks in Animal Production Systems
5-94
Toestimateemissionsforcombinedaerobictreatmentsystems,themethodologyforanaerobiclagoons,runoffholdingponds,andstoragetanksisappliedtothesystem.GasemissionsofCH4andN2Oareestimatedusing10percentofthevaluesforemissionsfromanaerobiclagoontreatment.
5.4.7 Sand‐ManureSeparation
Sandisoneofthestandardmaterialsfordairycowbedding.Itprovidessuperiorcowcomfort,environmentforudderhealth(andconsequentlybettermilkquality),andtractionwhencomparedwithorganicbeddingmaterials.Sandseparationsystemscanbeclassifiedasmechanicalseparationandsedimentationseparation.Sedimentationseparationusesdilutionwaterandgravitytoallowsandtopassivelysettleinsandtraps.Duetothehighorganicmaterialcontentcontainedinthesettledsand,thesandrecoveredfromthesandtrapneedstobedrainedmultipletimesanddriedpriortoreuse.Mechanicalsand‐manureseparationsystemsuserecycledliquidmanureandaerationtosuspendmanuresolids,settlesandatthebottomoftheseparator,andrecoverthesandusingaheavydutyauger.Sandisgenerallydischargedwithlessthantwopercentorganicmatter.Themechanicallyseparatedsandcanbereusedforbedding.
Sincesand‐manureseparationisrelativelyquick(comparedwithotherstorageandtreatmentmethods),GHGemissionsfromtheoperationareminimal.TheprocessofseparatingsandandmanureisnotassumedtocontributetoGHGemissions.Aftersand‐manureseparation,theseparatedliquidmanureistreatedastheinfluentforthenextstepofstorageandtreatmentoperations.ThevariousstorageandtreatmentoperationoptionsareshowninFigure5‐7.Theparametersofvolatilesolids,totalnitrogen,organicnitrogen,andmanuretemperatureoftheseparatedliquidmanureshouldbemeasured,andusedastheinputstoestimateemissionsofGHGs.
5.4.8 NutrientRemoval
Nitrogenandphosphorusaretheprimaryelementsthatcauseeutrophicationinsurfacewaters.WithincreasedFederal,Stateandlocalattentiononnon‐pointwastesources,moreandmoreanimaloperationswilllikelyusenutrientremovalapproachestotreatliquidmanurebeforelandapplicationandotheruses.Comparedtophosphorus,nitrogeninmanurecontributestoN2Oemission;removingitcansignificantlyalleviateemissions.NitrogeninmanurecomprisesNH3,particulateorganicnitrogen,andsolubleorganicnitrogen.Fivemainnitrogenremoval
MethodforEstimatingEmissionsfromLiquidManureStorageandTreatment–Sand/ManureSeparation
NomethodisprovidedasGHGemissionsarenegligiblefromthesand/manureseparationprocess.However,resultingvolatilesolids,totalnitrogen,organicnitrogen,andmanuretemperatureoftheseparatedliquidmanureshouldbemeasuredandusedastheinputstoestimateemissionsofGHGsforsubsequentstorageandtreatmentoperations.
MethodforEstimatingEmissionsfromLiquidManureStorageandTreatment–NutrientRemoval
NotestimatedduetolimitedquantitativeinformationonGHGsfromnitrogenremovalprocesses.
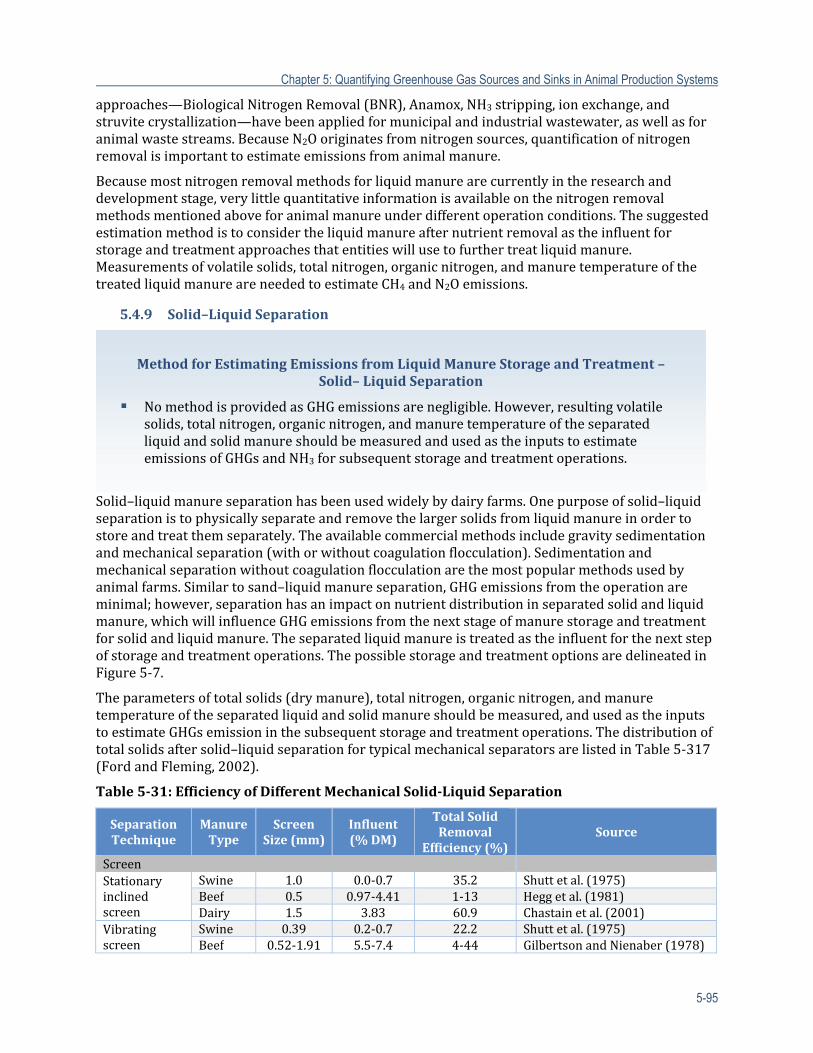
Chapter 5: Quantifying Greenhouse Gas Sources and Sinks in Animal Production Systems
5-95
approaches—BiologicalNitrogenRemoval(BNR),Anamox,NH3stripping,ionexchange,andstruvitecrystallization—havebeenappliedformunicipalandindustrialwastewater,aswellasforanimalwastestreams.BecauseN2Ooriginatesfromnitrogensources,quantificationofnitrogenremovalisimportanttoestimateemissionsfromanimalmanure.
Becausemostnitrogenremovalmethodsforliquidmanurearecurrentlyintheresearchanddevelopmentstage,verylittlequantitativeinformationisavailableonthenitrogenremovalmethodsmentionedaboveforanimalmanureunderdifferentoperationconditions.Thesuggestedestimationmethodistoconsidertheliquidmanureafternutrientremovalastheinfluentforstorageandtreatmentapproachesthatentitieswillusetofurthertreatliquidmanure.Measurementsofvolatilesolids,totalnitrogen,organicnitrogen,andmanuretemperatureofthetreatedliquidmanureareneededtoestimateCH4andN2Oemissions.
5.4.9 Solid–LiquidSeparation
Solid–liquidmanureseparationhasbeenusedwidelybydairyfarms.Onepurposeofsolid–liquidseparationistophysicallyseparateandremovethelargersolidsfromliquidmanureinordertostoreandtreatthemseparately.Theavailablecommercialmethodsincludegravitysedimentationandmechanicalseparation(withorwithoutcoagulationflocculation).Sedimentationandmechanicalseparationwithoutcoagulationflocculationarethemostpopularmethodsusedbyanimalfarms.Similartosand–liquidmanureseparation,GHGemissionsfromtheoperationareminimal;however,separationhasanimpactonnutrientdistributioninseparatedsolidandliquidmanure,whichwillinfluenceGHGemissionsfromthenextstageofmanurestorageandtreatmentforsolidandliquidmanure.Theseparatedliquidmanureistreatedastheinfluentforthenextstepofstorageandtreatmentoperations.ThepossiblestorageandtreatmentoptionsaredelineatedinFigure5‐7.
Theparametersoftotalsolids(drymanure),totalnitrogen,organicnitrogen,andmanuretemperatureoftheseparatedliquidandsolidmanureshouldbemeasured,andusedastheinputstoestimateGHGsemissioninthesubsequentstorageandtreatmentoperations.Thedistributionoftotalsolidsaftersolid–liquidseparationfortypicalmechanicalseparatorsarelistedinTable5‐317(FordandFleming,2002).
Table5‐31:EfficiencyofDifferentMechanicalSolid‐LiquidSeparation
SeparationTechnique
ManureType
ScreenSize(mm)
Influent(%DM)
TotalSolidRemoval
Efficiency(%)Source
ScreenStationaryinclinedscreen
Swine 1.0 0.0‐0.7 35.2 Shuttetal.(1975)Beef 0.5 0.97‐4.41 1‐13 Heggetal.(1981)Dairy 1.5 3.83 60.9 Chastainetal.(2001)
Vibratingscreen
Swine 0.39 0.2‐0.7 22.2 Shuttetal.(1975)Beef 0.52‐1.91 5.5‐7.4 4‐44 GilbertsonandNienaber(1978)
MethodforEstimatingEmissionsfromLiquidManureStorageandTreatment–Solid–LiquidSeparation
NomethodisprovidedasGHGemissionsarenegligible.However,resultingvolatilesolids,totalnitrogen,organicnitrogen,andmanuretemperatureoftheseparatedliquidandsolidmanureshouldbemeasuredandusedastheinputstoestimateemissionsofGHGsandNH3forsubsequentstorageandtreatmentoperations.
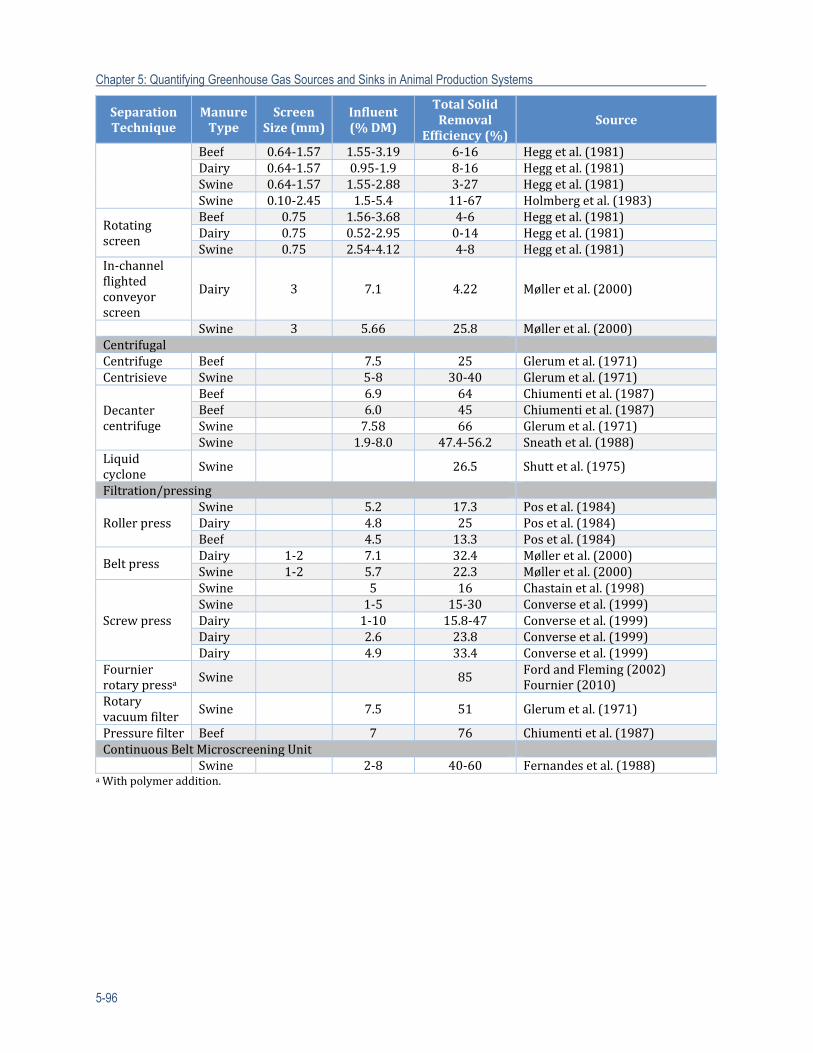
Chapter 5: Quantifying Greenhouse Gas Sources and Sinks in Animal Production Systems
5-96
SeparationTechnique
ManureType
ScreenSize(mm)
Influent(%DM)
TotalSolidRemoval
Efficiency(%)Source
Beef 0.64‐1.57 1.55‐3.19 6‐16 Heggetal.(1981)Dairy 0.64‐1.57 0.95‐1.9 8‐16 Heggetal.(1981)Swine 0.64‐1.57 1.55‐2.88 3‐27 Heggetal.(1981)Swine 0.10‐2.45 1.5‐5.4 11‐67 Holmbergetal.(1983)
Rotatingscreen
Beef 0.75 1.56‐3.68 4‐6 Heggetal.(1981)Dairy 0.75 0.52‐2.95 0‐14 Heggetal.(1981)Swine 0.75 2.54‐4.12 4‐8 Heggetal.(1981)
In‐channelflightedconveyorscreen
Dairy 3 7.1 4.22 Mølleretal.(2000)
Swine 3 5.66 25.8 Mølleretal.(2000)CentrifugalCentrifuge Beef 7.5 25 Glerumetal.(1971)Centrisieve Swine 5‐8 30‐40 Glerumetal.(1971)
Decantercentrifuge
Beef 6.9 64 Chiumentietal.(1987)Beef 6.0 45 Chiumentietal.(1987)Swine 7.58 66 Glerumetal.(1971)Swine 1.9‐8.0 47.4‐56.2 Sneathetal.(1988)
Liquidcyclone
Swine 26.5 Shuttetal.(1975)
Filtration/pressing
RollerpressSwine 5.2 17.3 Posetal.(1984)Dairy 4.8 25 Posetal.(1984)Beef 4.5 13.3 Posetal.(1984)
BeltpressDairy 1‐2 7.1 32.4 Mølleretal.(2000)Swine 1‐2 5.7 22.3 Mølleretal.(2000)
Screwpress
Swine 5 16 Chastainetal.(1998)Swine 1‐5 15‐30 Converseetal.(1999)Dairy 1‐10 15.8‐47 Converseetal.(1999)Dairy 2.6 23.8 Converseetal.(1999)Dairy 4.9 33.4 Converseetal.(1999)
Fournierrotarypressa
Swine 85 FordandFleming(2002)Fournier(2010)
Rotaryvacuumfilter Swine 7.5 51 Glerumetal.(1971)
Pressurefilter Beef 7 76 Chiumentietal.(1987)ContinuousBeltMicroscreeningUnit
Swine 2‐8 40‐60 Fernandesetal.(1988)aWithpolymeraddition.
Chapter 5: Quantifying Greenhouse Gas Sources and Sinks in Animal Production Systems
5-97
5.4.10 ConstructedWetland
Globally,constructedwetlandsareusedforthetreatmentofwastewaters,captureofsediments,
anddrainagewaterabatement(Hammer,1989;KadlecandKnight,1996;Tanneretal.,1997;Huntetal.,2002;Huntetal.,2003;Piceketal.,2007;HarringtonandMcInnes,2009;Mustafaetal.,2009;Soosaaretal.,2009;Elgoodetal.,2010;HarringtonandScholz,2010;VanderZaagetal.,2010;Chenetal.,2011;Lockeetal.,2011;TannerandHeadley,2011;TannerandSukias,2011;Vymazal,2011).Constructedwetlandsaregenerallyclassifiedassub‐surfaceorsurfaceflowwetlands(KadlecandKnight,1996).Thesub‐surfacewetlandstypicallyconsistofwetlandplantsgrowinginabedofhighlyporousmedia,suchasgravelorwoodchips.Theyarecommonlyusedtoimprovedrainagewaterquality.Thesewetlandsaregenerallyrectangularinshapeandonetotwometersindepth.Thereislackofagreementabouttherelativeimpactofmicrobialandplantprocessesinthefunctionofsubsurfacewetlands,includingGHGproductionandemissions.However,itisaccuratetosaythatplantsandmicrobesaretypicallyinterdependentlyinvolved(Piceketal.,2007;Zhuetal.,2007;Wangetal.,2008;Faubertetal.,2010;Luetal.,2010;TannerandHeadley,2011).Themicrobialcommunityadvancesbiogeochemicalprocesses(Tanneretal.,1997;Huntetal.,2003;Zhuetal.,2007;Dodlaetal.,2008;Faulwetteretal.,2009),whiletheplantcommunityadvancestransportedoxygenintothedepthofthewetlands,providesrootsurfacesforrhizospherereactions,andventsgasestotheatmosphere.Theplantprocessesaresignificantlyaffectedbyplantcommunitycompositionandweatherconditions(Towleretal.,2004;SteinandHook,2005;Steinetal.,2006;Zhuetal.,2007;Wangetal.,2008;Tayloretal.,2010).
Surfaceflowwetlandshaveamuchmoredirectinterchangewiththeatmosphereforthesupplyofoxygenandnitrogen,aswellastheemissionsofGHGs.Theycanbevariableinshapeandaregenerallylessthan0.5metersdeep.Surfacewetlandsminimizecloggingproblems,buttheycanhavesignificantlossoftreatmentasaresultofchannelflow.Therearereasonablyfunctionalmodelsforwetlanddesignoptimizedforeithercarbonornitrogenremoval(Stoneetal.,2002;Stoneetal.,2004;Steinetal.,2006;Steinetal.,2007a).ThemanagementofGHGs(principallyCH4andN2O)fromtreatmentwetlandsissomewhatsimilartomanagingGHGsinrice(Freemanetal.,1997;Tanneretal.,1997;Feyetal.,1999;Johanssonetal.,2003;Manderetal.,2005a;Manderetal.,2005b;TeiterandMander,2005;Piceketal.,2007;Maltais‐Landryetal.,2009;Wuetal.,2009).
Ofparticularimportanceisthemaintenanceofwetlandoxidative/reductivepotentialconditionssufficientlypositivetoavoidCH4production(Tanneretal.,1997;InsamandWett,2008;SeoandDeLaune,2010).Thisrequireshigherlevelsofoxygenandlowerlevelsofavailablecarbon.IthasbeenreportedthatthefluxesofN2OandCH4fromtreatmentwetlandsaregenerallybelow10mgN2O‐Nm‐2d‐1and300mgCH4‐Cm‐2d‐1(Manderetal.,2005a;Søviketal.,2006).ThemanagementofN2Oemissionsiscomplicatedbythefactthatnitratesareoftenpresentinthewastewatersordrainagewaters.Thisnitratewillbedenitrifiedundertheprevailinganaerobicconditionofthetreatmentwetlands—itisoneoftreatmentwetland’scriticalfunctions.However,itisimportantthatthepreponderanceofdenitrificationproceedstocompletion,withtheultimateproductionofinertdi‐nitrogengas.Completedenitrificationrequireshighercarbon/nitrogenratios
MethodforEstimatingEmissionsfromLiquidManureStorageandTreatment–ConstructedWetland
Currentlynomethodisprovidedtoestimategasemissionfromconstructedwetlandofanimalmanure,althoughGHGsinksarenotedtolikelybegreaterthanCH4andN2Oemissions,whichareconsiderednegligible.
Chapter 5: Quantifying Greenhouse Gas Sources and Sinks in Animal Production Systems
5-98
(Klemedtssonetal.,2005;Hwangetal.,2006;Huntetal.,2007).Thus,thereisanimportantbalancebetweensufficientcarbonforcompletedenitrificationandcopiouscarbonthatcandrivewetlandsintothelowreduction/oxidationconditionsassociatedwithCH4production.
Estimationmethodsareverycomplicatedandcase‐based.Inanapproximateestimationmannerthatconsiderswetlandsverysimilartocropland,treatmentwetlandsofanimalmanureareGHGsinksmorethansources.TheCH4andN2Oemissionfromwetlandtreatmentofanimalmanurecouldbenegligible.Thecriticalactivitydataincludehydraulicload;inflowwatercomposition,especiallycarbonandnitrogen;pretreatmentssuchassolidsremovalornitrification;amendments;anddryingcycles.Criticalancillarydataincluderainfall,temperature,windspeed,stormevents,changesinlivestockstockingrates,cropping/tillagesystems,andfertilizationtiming/rates.
5.4.11 Thermo‐ChemicalConversion
Combustion,themostprimitiveandexothermicformofthermochemicaltreatmentoflivestockwaste,hasbeeninusesinceantiquity;however,itsuseforlarge‐scalelivestockwastetreatmenthasgenerallybeenhamperedbyeconomic,health,andenvironmentalqualityissues(Florinetal.,2009).Principalamongtheseissueshasbeencomponentsthatdegradeairquality,includingGHGs(mainlyCO2).Nonetheless,thermochemicaltreatmentoflivestockmanurehasattributesthatcontinuetoattracteffortstomakeiteconomicallyandenvironmentallyeffective(Ramanetal.,1980;Heetal.,2000;Heetal.,2001;Ocfemiaetal.,2006;Roetal.,2007;Cantrelletal.,2008a;Cantrelletal.,2008b;Powlsonetal.,2008;Cantrelletal.,2009;Dongetal.,2009;Jinetal.,2009;Roetal.,2009;Xiuetal.,2009;Cantrelletal.,2010a;Cantrelletal.,2010b;Stoneetal.,2010;Wangetal.,2011;Xiuetal.,2011).
Recently,pyrolysis/gasificationhasreceivedmuchinterestforitstreatmentoflivestockwaste.Therehavealsobeenadvancesinthecleaningofexhaustgases(Heetal.,2001;Roetal.,2007;Cantrelletal.,2008a;Dongetal.,2009;Xiuetal.,2009;Xiuetal.,2011).Pyrolysis/gasificationoffersthreeprincipalendproducts:syngas,bio‐oil,andbiochar(Cantrelletal.,2008a;Xiuetal.,2011).Thequalityandquantityofendproductswillvarywithfeedstock,exposuretime,andpyrolysis/gasificationtemperature.Thesyngascanbeusedfordirectcombustionortorunanelectricalgenerator(Roetal.,2010).ItcanalsobeusedviaFischer‐Tropschconversionforproductionofliquidfuel(Cantrelletal.,2008a).Pyrolysis/gasificationforsyngasandeventualliquidfuelproductionisaveryattractivepotentialbusinessmodelforspecificagriculturalfuels.
IntermsofGHGemission,treatmentoffluegasfromcombustionandutilizationofsyngasfrompyrolysis/gasificationarecritical.Thethermalprocesseswithafluegasclean‐upunitandsyngasutilizationunitshouldminimizetheGHGemissionfromthethermalconversionprocesses.
InordertoestimatethedailyemissionsofCH4andN2Othefollowinginformationisneeded:typeofthermalconversionprocesses;detailedinformationontheprocess,suchaswith/withoutfluegasclean‐upunitorsyngasutilizationunit;inflowcomposition,suchasmoisture,carbon,andnitrogen;andmassflowthroughtheprocess,includingmassin,fluegas/syngas,andash/biochar.Themeasurementscanbebasedondietarychangesorseasonaltimeframe,whichisdecidedbyindividualfarmentity.However,duetothedynamicnatureofmanurepilesandtherapidchangesthatcanoccurinchemicalandphysicalcomposition,frequentmeasurementsarerecommendedtoensureaccuracyoftheestimation.Thetotalenergybalanceofthesystemshouldalsobeknown.For
MethodforEstimatingEmissionsfromSolidManureStorageandTreatment–ThermochemicalConversion
NomethodisprovidedasCH4andN2Oemissionsareconsiderednegligible.
Chapter 5: Quantifying Greenhouse Gas Sources and Sinks in Animal Production Systems
5-99
instance,thecarboncreditsofbiocharcannotbeclaimedwhileignoringtheenergyrequiredtocreatethebiochar.Theeffectivenessoftheexhaustgascleaningprocessinremovingairqualitydegradingcomponentsmustbecertified.
Duetothenatureofthermalconversion,muchloweremissions(CH4andN2O,)aregeneratedfromthethermalconversioncomparedwithotherstorageortreatmentmethods.TheCH4andN2Oemissionsfromcompletethermalconversionprocessesarerelativelysmallandnegligible.
5.4.12 LimitationsandUncertaintyinManureManagementEmissionsEstimates
Fortemporaryandlong‐termstorage,composting,andaerobiclagoons,theIPCCTier2methodologyisusedtoestimateCH4emissions.ThemaximumCH4productioncapabilities(B0)forruminantanimalsareU.S.specificvaluesfromtheU.S.EPAInventoryofU.S.GHGEmissionsandSinks.IPCCestimatesthattheuncertaintyassociatedwiththesecountry‐specificfactorsis±20percent.B0valuesforotheranimalvaluesareIPCCdefaultsandhaveanassociateduncertaintyof±30percent.TheMCFsprovidedintheGuidelinesforsolid,slurry,andsolid/slurrymanurearefromtheIPCCGuidanceandhaveanestimateduncertaintyof±30percent.TheB0andMCFvaluesprovidedareintendedforuseatthenationallevel,thusapplicationofthesefactorsattheentitylevelmayresultinhigheruncertainty.
AmodifiedTier2approachisprovidedforestimatingCH4emissionsfromanaerobicdigesters.TheleakratesfordifferentdigestertypesistakenfromtheCleanDevelopmentMechanism’smethodologicaltoolforprojectandleakageemissionsfromanaerobicdigesters(CDM,2012).TheCleanDevelopmentMechanism’sleakratesarebasedonIPCC(2006),Fleschetal.(2011),andKurup(2003).TheleakageratetakenfromFleschetal.(2011)isbasedonmeasurementstakenfromanIntegratedManureUtilizationSysteminstalledinAlberta,Canada.Thesystemprocesses100metrictonsofmanuredailyandwasthemosttechnologicallyadvancedsystemavailableatthetimeofthestudy.ThestudiesperformedbyKurup(2003)werebasedonasystemlocatedinKerala,India.Nouncertaintyestimatesareprovidedfortheseleakrates;however,theactualleakrateofanentitymaydifferduetodifferencesintechnology,maintenance,orotherfactors.
TheSommermodel(Sommeretal.,2004)isrecommendedforestimatingCH4emissionsfromanaerobiclagoons,runoffholdingponds,andstoragetanks.SimilartotheIPCCTier2methodsusedforstockpiles,composting,andaerobiclagoons,theSommermodelrequiresB0valuesfromIPCC.ThedegradableandnondegradablevolatilesolidscanbecalculatedusingtheB0andpotentialCH4yieldoradefaultvaluefromMølleratal.(2004).ThedefaultvaluespresentedarebasedontypicalconcentrationsonDanishcattleandpigslurries;valuesdonotdifferentiatebetweentypeofcattleordietoftheanimalandthusthereishigherrelativeuncertaintyassociatedwithusingthedefaultvalues.
Sommeretal.(2004)performedananalysistodeterminethesensitivityofemissionestimatestowardsdifferentfactors.OnefactorconsideredistheeffectofslurrystoragetemperatureonCH4emissions.Sommeretal.(2004)appliedaveragemonthlytemperaturesforsevendifferentlocations(allNordiccountries)atconstantvolatilesolidsandmanagement.WhencomparedtothemodelresultsforDenmark(whicharecalibratedtocorrespondwithIPCCmethodology),theemissionsestimatesvariedfrom‐1to+36percentforpigslurryand‐23to+1percentforcattleslurry.GiventhattheclimaticconditionsoftheUnitedStatesdiffersfromNordiccountries,thevariationasaresultofslurrystoragetemperatureisexpectedtobegreater.
IPCCmethodologyormodifiedmethodologyisusedtoestimatetheN2Oemissionsfromtemporarystackandlong‐termstorage,composting,andaerobiclagoons.IPCCreportslargeuncertaintieswiththedefaultemissionfactorsapplied(‐50percentto+100percent).Theseemissionfactorswereintendedforuseatthenationallevelanddonottakeintoaccountvaryingtemperature,moisture
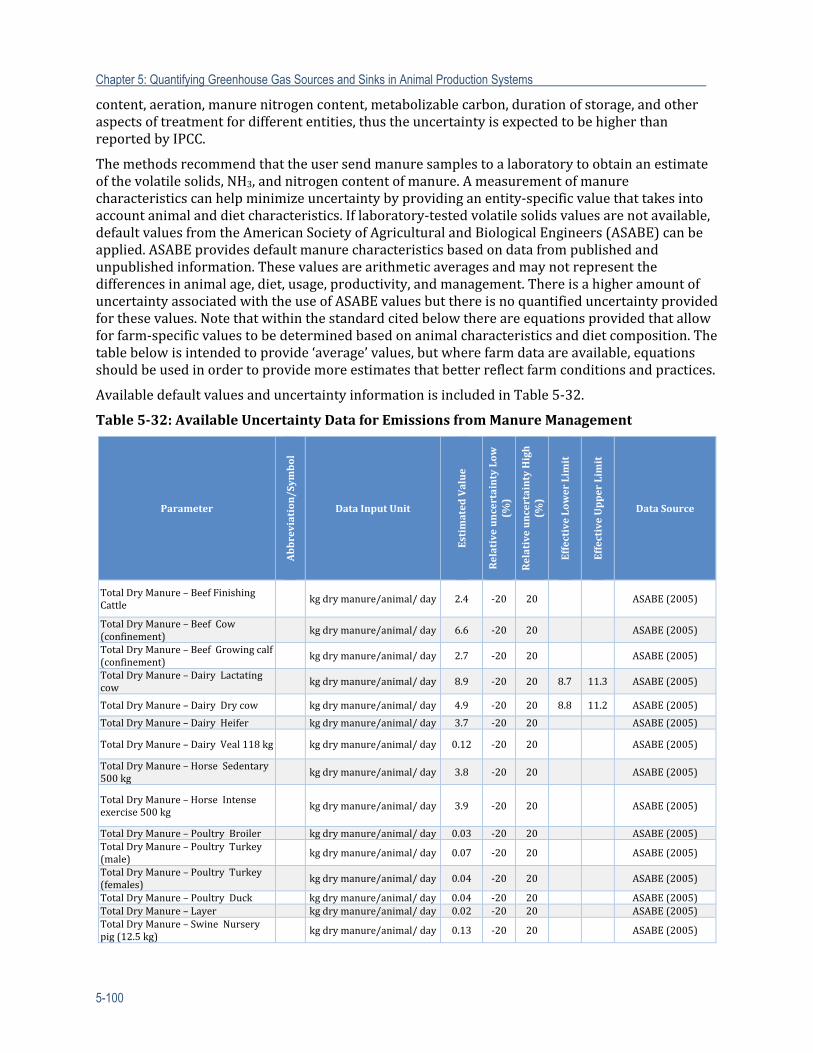
Chapter 5: Quantifying Greenhouse Gas Sources and Sinks in Animal Production Systems
5-100
content,aeration,manurenitrogencontent,metabolizablecarbon,durationofstorage,andotheraspectsoftreatmentfordifferententities,thustheuncertaintyisexpectedtobehigherthanreportedbyIPCC.
Themethodsrecommendthattheusersendmanuresamplestoalaboratorytoobtainanestimateofthevolatilesolids,NH3,andnitrogencontentofmanure.Ameasurementofmanurecharacteristicscanhelpminimizeuncertaintybyprovidinganentity‐specificvaluethattakesintoaccountanimalanddietcharacteristics.Iflaboratory‐testedvolatilesolidsvaluesarenotavailable,defaultvaluesfromtheAmericanSocietyofAgriculturalandBiologicalEngineers(ASABE)canbeapplied.ASABEprovidesdefaultmanurecharacteristicsbasedondatafrompublishedandunpublishedinformation.Thesevaluesarearithmeticaveragesandmaynotrepresentthedifferencesinanimalage,diet,usage,productivity,andmanagement.ThereisahigheramountofuncertaintyassociatedwiththeuseofASABEvaluesbutthereisnoquantifieduncertaintyprovidedforthesevalues.Notethatwithinthestandardcitedbelowthereareequationsprovidedthatallowforfarm‐specificvaluestobedeterminedbasedonanimalcharacteristicsanddietcomposition.Thetablebelowisintendedtoprovide‘average’values,butwherefarmdataareavailable,equationsshouldbeusedinordertoprovidemoreestimatesthatbetterreflectfarmconditionsandpractices.
AvailabledefaultvaluesanduncertaintyinformationisincludedinTable5‐32.
Table5‐32:AvailableUncertaintyDataforEmissionsfromManureManagement
Parameter
Abbreviation/Sym
bol
DataInputUnit
EstimatedValue
RelativeuncertaintyLow
(%
)
RelativeuncertaintyHigh
(%)
EffectiveLowerLimit
EffectiveUpperLimit
DataSource
TotalDryManure–BeefFinishingCattle
kgdrymanure/animal/day 2.4 ‐20 20 ASABE(2005)
TotalDryManure–BeefCow(confinement)
kgdrymanure/animal/day 6.6 ‐20 20 ASABE(2005)
TotalDryManure–BeefGrowingcalf(confinement)
kgdrymanure/animal/day 2.7 ‐20 20 ASABE(2005)
TotalDryManure–DairyLactatingcow
kgdrymanure/animal/day 8.9 ‐20 20 8.7 11.3 ASABE(2005)
TotalDryManure–DairyDrycow kgdrymanure/animal/day 4.9 ‐20 20 8.8 11.2 ASABE(2005)
TotalDryManure–DairyHeifer kgdrymanure/animal/day 3.7 ‐20 20 ASABE(2005)
TotalDryManure–DairyVeal118kg kgdrymanure/animal/day 0.12 ‐20 20 ASABE(2005)
TotalDryManure–HorseSedentary500kg
kgdrymanure/animal/day 3.8 ‐20 20 ASABE(2005)
TotalDryManure–HorseIntenseexercise500kg
kgdrymanure/animal/day 3.9 ‐20 20 ASABE(2005)
TotalDryManure–PoultryBroiler kgdrymanure/animal/day 0.03 ‐20 20 ASABE(2005)TotalDryManure–PoultryTurkey(male)
kgdrymanure/animal/day 0.07 ‐20 20 ASABE(2005)
TotalDryManure–PoultryTurkey(females)
kgdrymanure/animal/day 0.04 ‐20 20 ASABE(2005)
TotalDryManure–PoultryDuck kgdrymanure/animal/day 0.04 ‐20 20 ASABE(2005)TotalDryManure–Layer kgdrymanure/animal/day 0.02 ‐20 20 ASABE(2005)TotalDryManure–SwineNurserypig(12.5kg)
kgdrymanure/animal/day 0.13 ‐20 20 ASABE(2005)
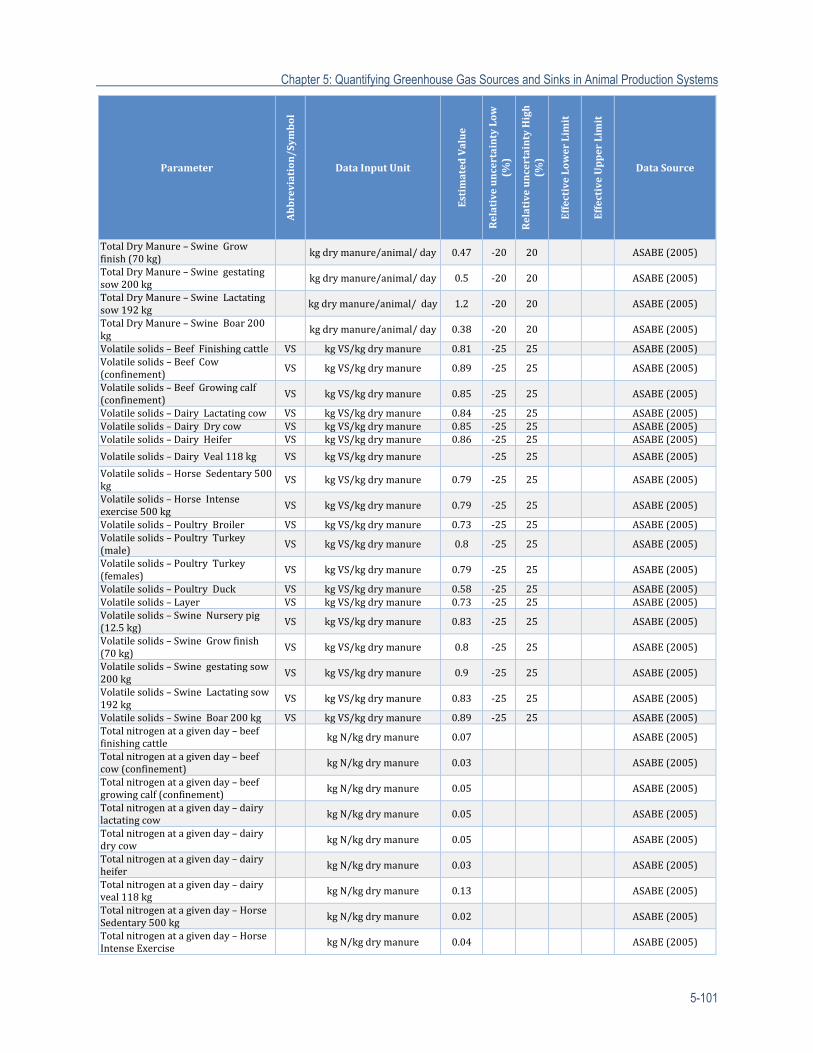
Chapter 5: Quantifying Greenhouse Gas Sources and Sinks in Animal Production Systems
5-101
Parameter
Abbreviation/Sym
bol
DataInputUnit
EstimatedValue
RelativeuncertaintyLow
(%
)
RelativeuncertaintyHigh
(%)
EffectiveLowerLimit
EffectiveUpperLimit
DataSource
TotalDryManure–SwineGrowfinish(70kg)
kgdrymanure/animal/day 0.47 ‐20 20 ASABE(2005)
TotalDryManure–Swinegestatingsow200kg
kgdrymanure/animal/day 0.5 ‐20 20 ASABE(2005)
TotalDryManure–SwineLactatingsow192kg
kgdrymanure/animal/day 1.2 ‐20 20 ASABE(2005)
TotalDryManure–SwineBoar200kg
kgdrymanure/animal/day 0.38 ‐20 20 ASABE(2005)
Volatilesolids–BeefFinishingcattle VS kgVS/kgdrymanure 0.81 ‐25 25 ASABE(2005)Volatilesolids–BeefCow(confinement)
VS kgVS/kgdrymanure 0.89 ‐25 25 ASABE(2005)
Volatilesolids–BeefGrowingcalf(confinement)
VS kgVS/kgdrymanure 0.85 ‐25 25 ASABE(2005)
Volatilesolids–DairyLactatingcow VS kgVS/kgdrymanure 0.84 ‐25 25 ASABE(2005)Volatilesolids–DairyDrycow VS kgVS/kgdrymanure 0.85 ‐25 25 ASABE(2005)Volatilesolids–DairyHeifer VS kgVS/kgdrymanure 0.86 ‐25 25 ASABE(2005)
Volatilesolids–DairyVeal118kg VS kgVS/kgdrymanure ‐25 25 ASABE(2005)
Volatilesolids–HorseSedentary500kg
VS kgVS/kgdrymanure 0.79 ‐25 25 ASABE(2005)
Volatilesolids–HorseIntenseexercise500kg
VS kgVS/kgdrymanure 0.79 ‐25 25 ASABE(2005)
Volatilesolids–PoultryBroiler VS kgVS/kgdrymanure 0.73 ‐25 25 ASABE(2005)Volatilesolids–PoultryTurkey(male)
VS kgVS/kgdrymanure 0.8 ‐25 25 ASABE(2005)
Volatilesolids–PoultryTurkey(females)
VS kgVS/kgdrymanure 0.79 ‐25 25 ASABE(2005)
Volatilesolids–PoultryDuck VS kgVS/kgdrymanure 0.58 ‐25 25 ASABE(2005)Volatilesolids–Layer VS kgVS/kgdrymanure 0.73 ‐25 25 ASABE(2005)Volatilesolids–SwineNurserypig(12.5kg)
VS kgVS/kgdrymanure 0.83 ‐25 25 ASABE(2005)
Volatilesolids–SwineGrowfinish(70kg)
VS kgVS/kgdrymanure 0.8 ‐25 25 ASABE(2005)
Volatilesolids–Swinegestatingsow200kg
VS kgVS/kgdrymanure 0.9 ‐25 25 ASABE(2005)
Volatilesolids–SwineLactatingsow192kg
VS kgVS/kgdrymanure 0.83 ‐25 25 ASABE(2005)
Volatilesolids–SwineBoar200kg VS kgVS/kgdrymanure 0.89 ‐25 25 ASABE(2005)Totalnitrogenatagivenday–beeffinishingcattle
kgN/kgdrymanure 0.07 ASABE(2005)
Totalnitrogenatagivenday–beefcow(confinement)
kgN/kgdrymanure 0.03 ASABE(2005)
Totalnitrogenatagivenday–beefgrowingcalf(confinement)
kgN/kgdrymanure 0.05 ASABE(2005)
Totalnitrogenatagivenday–dairylactatingcow
kgN/kgdrymanure 0.05 ASABE(2005)
Totalnitrogenatagivenday–dairydrycow
kgN/kgdrymanure 0.05 ASABE(2005)
Totalnitrogenatagivenday–dairyheifer
kgN/kgdrymanure 0.03 ASABE(2005)
Totalnitrogenatagivenday–dairyveal118kg
kgN/kgdrymanure 0.13 ASABE(2005)
Totalnitrogenatagivenday–HorseSedentary500kg
kgN/kgdrymanure 0.02 ASABE(2005)
Totalnitrogenatagivenday–HorseIntenseExercise
kgN/kgdrymanure 0.04 ASABE(2005)
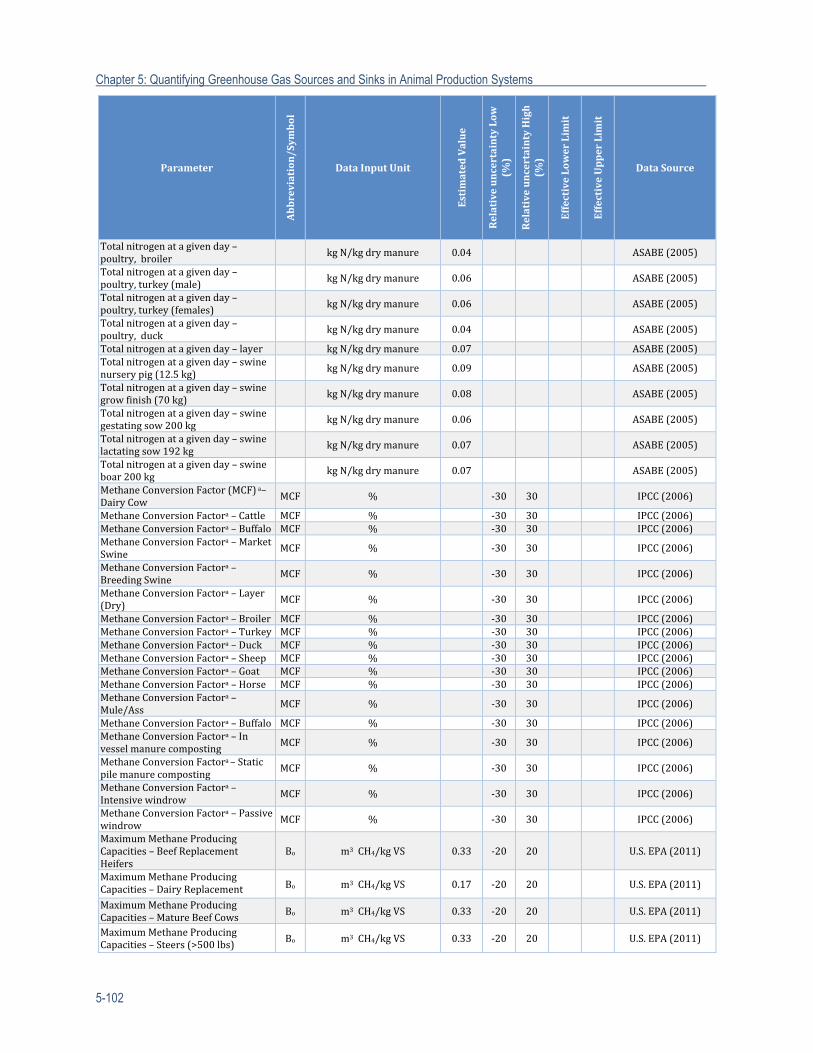
Chapter 5: Quantifying Greenhouse Gas Sources and Sinks in Animal Production Systems
5-102
Parameter
Abbreviation/Sym
bol
DataInputUnit
EstimatedValue
RelativeuncertaintyLow
(%
)
RelativeuncertaintyHigh
(%)
EffectiveLowerLimit
EffectiveUpperLimit
DataSource
Totalnitrogenatagivenday–poultry,broiler
kgN/kgdrymanure 0.04 ASABE(2005)
Totalnitrogenatagivenday–poultry,turkey(male)
kgN/kgdrymanure 0.06 ASABE(2005)
Totalnitrogenatagivenday–poultry,turkey(females)
kgN/kgdrymanure 0.06 ASABE(2005)
Totalnitrogenatagivenday–poultry,duck
kgN/kgdrymanure 0.04 ASABE(2005)
Totalnitrogenatagivenday–layer kgN/kgdrymanure 0.07 ASABE(2005)Totalnitrogenatagivenday–swinenurserypig(12.5kg)
kgN/kgdrymanure 0.09 ASABE(2005)
Totalnitrogenatagivenday–swinegrowfinish(70kg)
kgN/kgdrymanure 0.08 ASABE(2005)
Totalnitrogenatagivenday–swinegestatingsow200kg
kgN/kgdrymanure 0.06 ASABE(2005)
Totalnitrogenatagivenday–swinelactatingsow192kg
kgN/kgdrymanure 0.07 ASABE(2005)
Totalnitrogenatagivenday–swineboar200kg
kgN/kgdrymanure 0.07 ASABE(2005)
MethaneConversionFactor(MCF)a–DairyCow
MCF % ‐30 30 IPCC(2006)
MethaneConversionFactora–Cattle MCF % ‐30 30 IPCC(2006)MethaneConversionFactora–Buffalo MCF % ‐30 30 IPCC(2006)MethaneConversionFactora–MarketSwine
MCF % ‐30 30 IPCC(2006)
MethaneConversionFactora–BreedingSwine
MCF % ‐30 30 IPCC(2006)
MethaneConversionFactora–Layer(Dry)
MCF % ‐30 30 IPCC(2006)
MethaneConversionFactora–Broiler MCF % ‐30 30 IPCC(2006)MethaneConversionFactora–Turkey MCF % ‐30 30 IPCC(2006)MethaneConversionFactora–Duck MCF % ‐30 30 IPCC(2006)MethaneConversionFactora–Sheep MCF % ‐30 30 IPCC(2006)MethaneConversionFactora–Goat MCF % ‐30 30 IPCC(2006)MethaneConversionFactora–Horse MCF % ‐30 30 IPCC(2006)MethaneConversionFactora–Mule/Ass
MCF % ‐30 30 IPCC(2006)
MethaneConversionFactora–Buffalo MCF % ‐30 30 IPCC(2006)MethaneConversionFactora–Invesselmanurecomposting
MCF % ‐30 30 IPCC(2006)
MethaneConversionFactora–Staticpilemanurecomposting
MCF % ‐30 30 IPCC(2006)
MethaneConversionFactora–Intensivewindrow
MCF % ‐30 30 IPCC(2006)
MethaneConversionFactora–Passivewindrow
MCF % ‐30 30 IPCC(2006)
MaximumMethaneProducingCapacities–BeefReplacementHeifers
Bo m3CH4/kgVS 0.33 ‐20 20 U.S.EPA(2011)
MaximumMethaneProducingCapacities–DairyReplacement Bo m3CH4/kgVS 0.17 ‐20 20 U.S.EPA(2011)
MaximumMethaneProducingCapacities–MatureBeefCows
Bo m3CH4/kgVS 0.33 ‐20 20 U.S.EPA(2011)
MaximumMethaneProducingCapacities–Steers(>500lbs)
Bo m3CH4/kgVS 0.33 ‐20 20 U.S.EPA(2011)
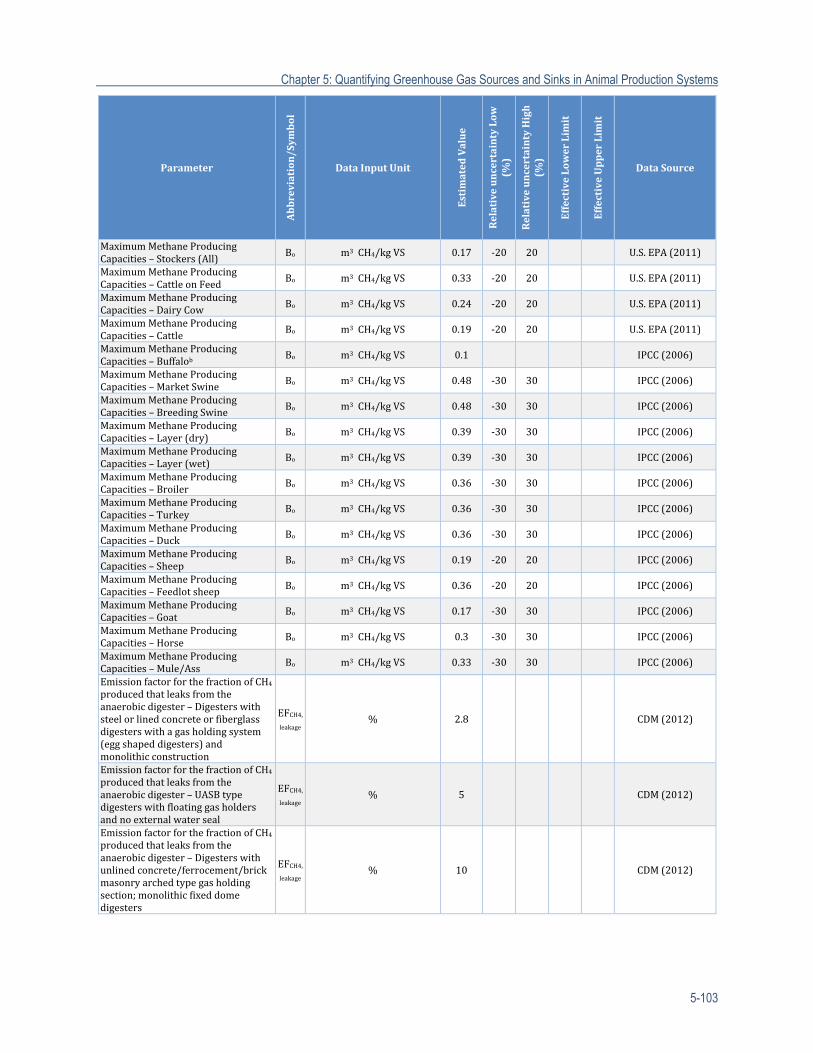
Chapter 5: Quantifying Greenhouse Gas Sources and Sinks in Animal Production Systems
5-103
Parameter
Abbreviation/Sym
bol
DataInputUnit
EstimatedValue
RelativeuncertaintyLow
(%
)
RelativeuncertaintyHigh
(%)
EffectiveLowerLimit
EffectiveUpperLimit
DataSource
MaximumMethaneProducingCapacities–Stockers(All)
Bo m3CH4/kgVS 0.17 ‐20 20 U.S.EPA(2011)
MaximumMethaneProducingCapacities–CattleonFeed
Bo m3CH4/kgVS 0.33 ‐20 20 U.S.EPA(2011)
MaximumMethaneProducingCapacities–DairyCow
Bo m3CH4/kgVS 0.24 ‐20 20 U.S.EPA(2011)
MaximumMethaneProducingCapacities–Cattle
Bo m3CH4/kgVS 0.19 ‐20 20 U.S.EPA(2011)
MaximumMethaneProducingCapacities–Buffalob
Bo m3CH4/kgVS 0.1 IPCC(2006)
MaximumMethaneProducingCapacities–MarketSwine Bo m3CH4/kgVS 0.48 ‐30 30 IPCC(2006)
MaximumMethaneProducingCapacities–BreedingSwine
Bo m3CH4/kgVS 0.48 ‐30 30 IPCC(2006)
MaximumMethaneProducingCapacities–Layer(dry) Bo m3CH4/kgVS 0.39 ‐30 30 IPCC(2006)
MaximumMethaneProducingCapacities–Layer(wet)
Bo m3CH4/kgVS 0.39 ‐30 30 IPCC(2006)
MaximumMethaneProducingCapacities–Broiler Bo m3CH4/kgVS 0.36 ‐30 30 IPCC(2006)
MaximumMethaneProducingCapacities–Turkey
Bo m3CH4/kgVS 0.36 ‐30 30 IPCC(2006)
MaximumMethaneProducingCapacities–Duck Bo m3CH4/kgVS 0.36 ‐30 30 IPCC(2006)
MaximumMethaneProducingCapacities–Sheep
Bo m3CH4/kgVS 0.19 ‐20 20 IPCC(2006)
MaximumMethaneProducingCapacities–Feedlotsheep Bo m3CH4/kgVS 0.36 ‐20 20 IPCC(2006)
MaximumMethaneProducingCapacities–Goat
Bo m3CH4/kgVS 0.17 ‐30 30 IPCC(2006)
MaximumMethaneProducingCapacities–Horse Bo m3CH4/kgVS 0.3 ‐30 30 IPCC(2006)
MaximumMethaneProducingCapacities–Mule/Ass
Bo m3CH4/kgVS 0.33 ‐30 30 IPCC(2006)
EmissionfactorforthefractionofCH4producedthatleaksfromtheanaerobicdigester–Digesterswithsteelorlinedconcreteorfiberglassdigesterswithagasholdingsystem(eggshapeddigesters)andmonolithicconstruction
EFCH4,leakage
% 2.8 CDM(2012)
EmissionfactorforthefractionofCH4producedthatleaksfromtheanaerobicdigester–UASBtypedigesterswithfloatinggasholdersandnoexternalwaterseal
EFCH4,leakage
% 5 CDM(2012)
EmissionfactorforthefractionofCH4producedthatleaksfromtheanaerobicdigester–Digesterswithunlinedconcrete/ferrocement/brickmasonryarchedtypegasholdingsection;monolithicfixeddomedigesters
EFCH4,leakage
% 10 CDM(2012)
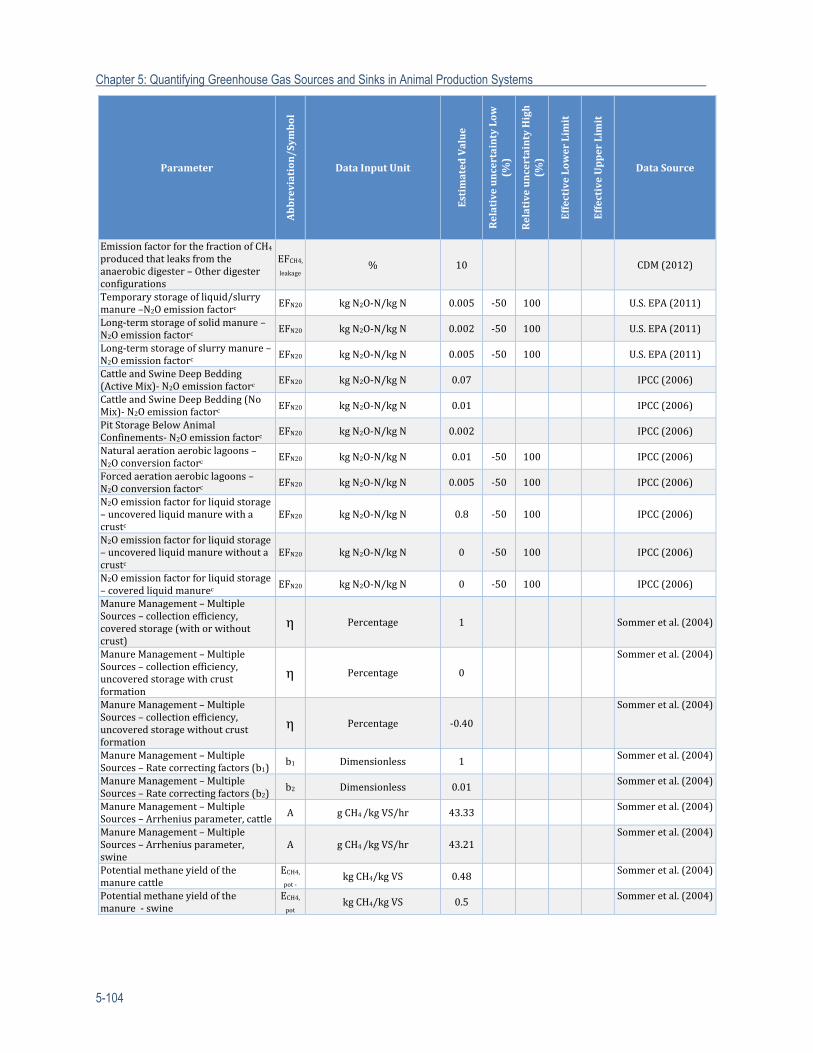
Chapter 5: Quantifying Greenhouse Gas Sources and Sinks in Animal Production Systems
5-104
Parameter
Abbreviation/Sym
bol
DataInputUnit
EstimatedValue
RelativeuncertaintyLow
(%
)
RelativeuncertaintyHigh
(%)
EffectiveLowerLimit
EffectiveUpperLimit
DataSource
EmissionfactorforthefractionofCH4producedthatleaksfromtheanaerobicdigester–Otherdigesterconfigurations
EFCH4,leakage
% 10 CDM(2012)
Temporarystorageofliquid/slurrymanure–N2Oemissionfactorc
EFN20 kgN2O‐N/kgN 0.005 ‐50 100 U.S.EPA(2011)
Long‐termstorageofsolidmanure–N2Oemissionfactorc
EFN20 kgN2O‐N/kgN 0.002 ‐50 100 U.S.EPA(2011)
Long‐termstorageofslurrymanure–N2Oemissionfactorc
EFN20 kgN2O‐N/kgN 0.005 ‐50 100 U.S.EPA(2011)
CattleandSwineDeepBedding(ActiveMix)‐N2Oemissionfactorc
EFN20 kgN2O‐N/kgN 0.07 IPCC(2006)
CattleandSwineDeepBedding(NoMix)‐N2Oemissionfactorc
EFN20 kgN2O‐N/kgN 0.01 IPCC(2006)
PitStorageBelowAnimalConfinements‐N2Oemissionfactorc
EFN20 kgN2O‐N/kgN 0.002 IPCC(2006)
Naturalaerationaerobiclagoons–N2Oconversionfactorc
EFN20 kgN2O‐N/kgN 0.01 ‐50 100 IPCC(2006)
Forcedaerationaerobiclagoons–N2Oconversionfactorc
EFN20 kgN2O‐N/kgN 0.005 ‐50 100 IPCC(2006)
N2Oemissionfactorforliquidstorage–uncoveredliquidmanurewithacrustc
EFN20 kgN2O‐N/kgN 0.8 ‐50 100 IPCC(2006)
N2Oemissionfactorforliquidstorage–uncoveredliquidmanurewithoutacrustc
EFN20 kgN2O‐N/kgN 0 ‐50 100 IPCC(2006)
N2Oemissionfactorforliquidstorage–coveredliquidmanurec
EFN20 kgN2O‐N/kgN 0 ‐50 100 IPCC(2006)
ManureManagement–MultipleSources–collectionefficiency,coveredstorage(withorwithoutcrust)
η Percentage 1 Sommeretal.(2004)
ManureManagement–MultipleSources–collectionefficiency,uncoveredstoragewithcrustformation
η Percentage 0
Sommeretal.(2004)
ManureManagement–MultipleSources–collectionefficiency,uncoveredstoragewithoutcrustformation
η Percentage ‐0.40
Sommeretal.(2004)
ManureManagement–MultipleSources–Ratecorrectingfactors(b1)
b1 Dimensionless 1 Sommeretal.(2004)
ManureManagement–MultipleSources–Ratecorrectingfactors(b2)
b2 Dimensionless 0.01Sommeretal.(2004)
ManureManagement–MultipleSources–Arrheniusparameter,cattle
A gCH4/kgVS/hr 43.33 Sommeretal.(2004)
ManureManagement–MultipleSources–Arrheniusparameter,swine
A gCH4/kgVS/hr 43.21Sommeretal.(2004)
Potentialmethaneyieldofthemanurecattle
ECH4,pot‐
kgCH4/kgVS 0.48 Sommeretal.(2004)
Potentialmethaneyieldofthemanure‐swine
ECH4,pot
kgCH4/kgVS 0.5Sommeretal.(2004)
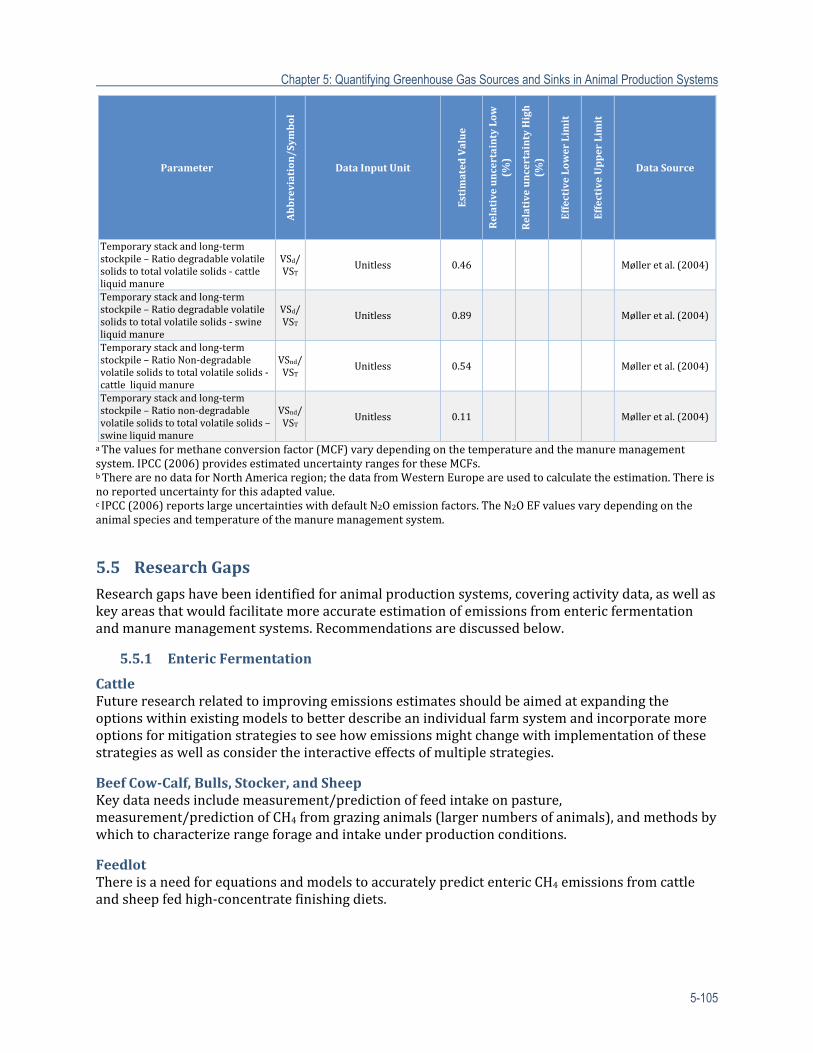
Chapter 5: Quantifying Greenhouse Gas Sources and Sinks in Animal Production Systems
5-105
Parameter
Abbreviation/Sym
bol
DataInputUnit
EstimatedValue
RelativeuncertaintyLow
(%
)
RelativeuncertaintyHigh
(%)
EffectiveLowerLimit
EffectiveUpperLimit
DataSource
Temporarystackandlong‐termstockpile–Ratiodegradablevolatilesolidstototalvolatilesolids‐cattleliquidmanure
VSd/VST
Unitless 0.46 Mølleretal.(2004)
Temporarystackandlong‐termstockpile–Ratiodegradablevolatilesolidstototalvolatilesolids‐swineliquidmanure
VSd/VST
Unitless 0.89 Mølleretal.(2004)
Temporarystackandlong‐termstockpile–RatioNon‐degradablevolatilesolidstototalvolatilesolids‐cattleliquidmanure
VSnd/VST
Unitless 0.54 Mølleretal.(2004)
Temporarystackandlong‐termstockpile–Rationon‐degradablevolatilesolidstototalvolatilesolids–swineliquidmanure
VSnd/VST
Unitless 0.11 Mølleretal.(2004)
aThevaluesformethaneconversionfactor(MCF)varydependingonthetemperatureandthemanuremanagementsystem.IPCC(2006)providesestimateduncertaintyrangesfortheseMCFs.bTherearenodataforNorthAmericaregion;thedatafromWesternEuropeareusedtocalculatetheestimation.Thereisnoreporteduncertaintyforthisadaptedvalue.cIPCC(2006)reportslargeuncertaintieswithdefaultN2Oemissionfactors.TheN2OEFvaluesvarydependingontheanimalspeciesandtemperatureofthemanuremanagementsystem.
5.5 ResearchGaps
Researchgapshavebeenidentifiedforanimalproductionsystems,coveringactivitydata,aswellaskeyareasthatwouldfacilitatemoreaccurateestimationofemissionsfromentericfermentationandmanuremanagementsystems.Recommendationsarediscussedbelow.
5.5.1 EntericFermentation
CattleFutureresearchrelatedtoimprovingemissionsestimatesshouldbeaimedatexpandingtheoptionswithinexistingmodelstobetterdescribeanindividualfarmsystemandincorporatemoreoptionsformitigationstrategiestoseehowemissionsmightchangewithimplementationofthesestrategiesaswellasconsidertheinteractiveeffectsofmultiplestrategies.
BeefCow‐Calf,Bulls,Stocker,andSheepKeydataneedsincludemeasurement/predictionoffeedintakeonpasture,measurement/predictionofCH4fromgrazinganimals(largernumbersofanimals),andmethodsbywhichtocharacterizerangeforageandintakeunderproductionconditions.
FeedlotThereisaneedforequationsandmodelstoaccuratelypredictentericCH4emissionsfromcattleandsheepfedhigh‐concentratefinishingdiets.
Chapter 5: Quantifying Greenhouse Gas Sources and Sinks in Animal Production Systems
5-106
DairyOneofthelargestresearchgapsisthelackofbasicdatarelatedtoemissionsfromcalves,heifers,anddrycowhousingsystems.Inaddition,thereisaneedforequallyconsistentandreliablemethodsformeasuringrelativedifferencesinemissionsassociatedwiththeimplementationofavarietyofmanagementpractices.Furthermodeldevelopmentforestimatingemissionsshouldincludeanexpansionofoptionstodescribetheproductionfacilityandinclusionofmanagementpracticesthatcanbeadoptedtomitigateemissions.
SwineFutureresearchrelatedtoimprovingemissionsestimatesshouldbeaimedatexpandingtheoptionswithinthesemodelstobetterdescribeanindividualfarmsystemandincorporatemoreoptionsformanagementandmitigationstrategiestoseehowemissionsmightchangewithimplementationofdifferentpractices.Minimally,thedietconsiderationsinHolosneedtobeincorporatedintotheMANUREmodelandexpandedtoreflectproductionphase.
PoultryFutureresearchrelatedtoimprovingemissionsestimatesshouldbeaimedatexpandingtheoptionswithinthesemodelstobetterdescribeanindividualfarmsystemandincorporatemoreoptionsformanagementandmitigationstrategiestoseehowemissionsmightchangewithimplementationofdifferentpractices.
5.5.2 ManureManagement
Greenhousegasemissionsfromavarietyofmanuremanagementsystemshavebeendevelopedfromalimitednumberofstudiesandalimitednumberofpotentialvariationsinmanagementandtheenvironmentalconditionsaroundaparticularmanuremanagementsystem.ThelargestdeficiencyinthecurrentGHGstudiesisthelackofcharacterizationofthetemporalvariationintheGHGemissionsfromdifferentsystemsandthespatialvariationinGHGemissionsinducedbymeteorologicalconditionsamongspecificlocations.Ingeneral,theresearchneededtodevelopamorecompleteunderstandingoftheGHGemissionscanbesummarizedas:
Developdatabasesfromresearchobservationsofcommercialfacilitiesthatcharacterizethestoragesystem,timeinstorage,environmentalconditionsandlocation,andtheattributesofthemanuresource,e.g.,typeofanimal,diet,loadingrate.
UtilizethedatabasestoderivesimulationmodelstoquantifytheGHGemissionsfromdifferentmanuremanagementsystems.
ValidatethemodelsusingindependentobservationsfrommanuremanagementsystemsdistributedaroundtheUnitedStates.
Developoperationalmodelscapableofbeingappliedtoproductionscalesystemswhichutilizesimpleparametersasinputvariablesandproduceresultsinagreementwiththemorecomplexsimulationmodels.
UtilizethesemodelstodeveloppotentialstrategieswhichcouldbeemployedtomitigateGHGemissionsfrommanuremanagementsystems.
TemporaryStackandLong‐TermStockpileMethaneemissiondatafromsolidstoragesindifferentregionsunderdifferentclimatesarelimited.InordertodevelopamoreaccuratemodeltoestimatetheCH4emissionfromsolidmanurestorages,in‐depthstudiesareneededtointegratetemperature,storagetime,storagemethod,andmassflowwithCH4emissionindifferentregions.AsforN2Oemission,systematicallycollectingmoreintensedata(avarietyofspatialandtemporalscales)fromdifferentregionswillbeagoodfirststeptowardaccurateN2Oemissionmodels.Oncethesedataarecollectedandusedtodevelop/validatemodels,workwilllikelybeneededtodevelopfarmer‐friendlymodelsusing
Chapter 5: Quantifying Greenhouse Gas Sources and Sinks in Animal Production Systems
5-107
simplefarmparametersasinputvariables,resultinginemissionsestimatesthatarecorrelatedwiththoseofmorecomplexmodels.Forexample,thesemodels,ifsynchronized,couldformpartofacomprehensivemanurestewardshiptoolkit.
ThereisapaucityofdataonCH4andN2Oemissionsfromopenlot(beeffeedlotsanddairies)pensurfacesandrunoffcontrolstructuresandonthechemicalandphysicalfactorscontrollingthoseemissions.
CompostingGreenhousegasemissionsdatafromcompostingindifferentregionsunderdifferentoperationalconditionsarelimited.AgoodfirststeptowardanaccurateGHGemissionsmodelwouldbetocollectmoredatafromdifferentregionsanddifferentoperationalconditions.Consequently,in‐depthstudiesintegratingcompostpilesize/surfacearea,pileshape,aerationrate,storagetime,compostingtemperature,etc.,withGHGemissionsneedtobeconductedtodevelopcomplexmodelsdescribingGHGemissionsfromcomposting.Furthermore,workwilllikelybeneededtodevelopfarmer‐friendlymodelsusingsimplefarmparametersasinputvariables,resultinginemissionestimationsthatarecorrelatedwiththoseofmorecomplexmodels.
TherehavebeensomestudiesperformedtoestimatetheemissionfactorsforN2Ofromcompostingmanureindifferentsystemsandfordifferentlivestockcategories.(Fukummotoetal.,2003;Szantoetal.,2006)haveconductedstudiesoncompostingswinemanureatspecificambienttemperatures.Factorshavebeenpresentedinthestudiesbutthereissignificantuncertaintyduetothelimiteddataavailable.Furtherresearchisneededtorefinetheseemissionfactorsaswellasdevelopfactorsforotheranimals.
AerobicLagoonIn‐depthstudiesareneededtointegratelagoondepths,aerationrate,pH,temperature,andnutrientconditionsofmanurewithGHGemissions,whichwillfacilitatethedevelopmentofcomprehensivemodelstopredictGHGemissionsunderdifferentoperationalandclimateconditions.Simplifiedandfarm‐friendlymodelsusingfarmoperationalparametersasinputsshouldbedevelopedtohelpfarmsestimatetheGHGemissionsattheentitylevel.
AnaerobicLagoon,RunoffHoldingPond,andStorageTanksAllmodelstoestimateGHGemissionsfromliquidmanurestoragearerelativelyinaccurate,duetothecomplexityandvarietyoflivestockmanureoperations.Inordertodevelopamoreaccuratemodeltoestimateemissionsfromliquidmanurestorages,in‐depthstudiesareneededtointegratemanurestorageconfiguration,temperature,storagetime,storagemethod,massflow,andsurfaceturbulencewithemissionsindifferentregions.Inaddition,systematicallycollectingmoredatafromdifferentregionswillbeveryhelpfultodevelopmorestatisticallyaccuratemodelstoestimateGHGemissions.
AnaerobicDigestionChangesinchemicaloxygendemand,volatilesolids,totalsolids,andnitrogenintheanaerobicdigestionprocessareindirectlylinkedtoGHGemissionsfrompost‐treatmentofanaerobicdigestioneffluent.TheeffectivenessofanaerobicdigestionatmitigatingGHGemissionshasbeenstudiedintensively.However,anaerobicdigestioneffluentcanleadtoGHGemissions.Morein‐depthstudiesareneededtodevelopintegratedmodelsthatcanaccuratelypredicttheoverallGHGemissionfromthecombinationofanaerobicdigestionandpost‐treatmentapproaches.
CombinedAerobicTreatmentSystemsMethodsandtechniquestoreducethecapitalandoperatingcostsareneeded.Thereisalsoaneedtodevelopbetterwaystoconserveandderiveenergyfromthewastematerial.Thereisapaucityof
Chapter 5: Quantifying Greenhouse Gas Sources and Sinks in Animal Production Systems
5-108
dataonGHGemissionsfromthesesystemsanddevelopmentofemissionmodelswillrequireintegrationofdatacharacterizingthesesystemsandtheclimaticconditionsinordertodevelopthesemodels.Thesemodelswillneedtobevalidatedagainstobserveddata.
NutrientRemovalVariousmethodsofnitrogenremoval,suchasbiologicalnitrogenremoval,Anamox,NH3stripping,ionexchange,andstruvitecrystallization,shouldbeinvestigatedatcommercial‐scaleanimaloperationsunderdifferentclimateconditions.Characteristicsofmanure,massflow,andgasemissionsshouldbecloselymonitoredinordertoprovidethedataneededtoconstructrelativelypreciseestimationmodels.Inaddition,furtherresearchisneededtopilotinnovativebeefanddairyGHGemissionreductionstrategiesinfeedlotsanddairies.
ConstructedWetlandAlthoughtherearenumerouspaperspublishedaboutvariousaspectsoftreatmentwetlandeffectivenessandemissions,therecurrentlyisnotanestablishedmethodforcalculationofGHGemissionsfromanyofthetreatmentwetlandtypes.Moreover,therearenotsufficientunifyingpublicationstosuggestthatareliablemethodcouldbeestablishedwithinthescopeofthisreport.AmorerobustandextensivedatabaseonGHGemissionsfromtreatmentwetlandsisneeded.Concomitantly,thereisaneedforbetterpredictiveequationandmodels.
Thermo‐ChemicalConversionMorestudiesareneededontheeffectsofthermalconversionofanimalmanureonGHGemissioninordertoconcludedetailedemissionprofilescorrespondingtodifferenttypeofmanure.ThesestudieswouldentaildetailedobservationsofthemanureconversionsystemalongwithGHGemissionsandinformationontheenvironmentalconditions.
Chapter 5: Quantifying Greenhouse Gas Sources and Sinks in Animal Production Systems
5-109
Appendix5‐A:EntericCH4fromFeedlotCattle–MethaneConversionFactor(Ym)AsnotedintheBeefProductionSystemssection(Section5.3.2.2),amodifiedIPCC(2006)methodisproposedtoestimateentericCH4emissionsfromfinishingbeefcattle.Forthisreport,abaselinescenariobasedontypicalU.S.beefcattlefeedingconditionswasestablishedandbaselinevaluesweresetbasedonpublishedresearch.Toestimatemethaneemissions,emissionvaluesaremodifiedusingadjustmentfactorsthatarebasedonchangesinanimalmanagementandfeedingconditionsfromthebaselinescenario.Thisappendixpresentsbackgroundinformationonthebaselinescenarioandadjustmentfactors.
ThefollowingbaselinescenariosareestablishedforbeefcattleinU.S.feedlots:
1. Mediumtolargeframesteer(orheifer)yearlingsarefedahighconcentratefinishingdietcontaining<=10percentforageindietdrymatter(=to8to18percentNDF)indry‐lot,soil‐surfacedpens.
2. Thegrainportionofthedietisatleast70percentofdietdrymatter.3. Thegrainsourceissteamflaked(SFC)orhighmoisturecorn(HMC).4. Thedietarycrudeproteinconcentrationis12.5to13.5percentofdietdrymatter
(VasconcelosandGalyean,2007).5. Thedietaryruminallydegradableprotein(DIPorRDP)concentrationis7.5to9percentof
dietdrymatter(VasconcelosandGalyean,2007).6. Thedietcontainsmonensin(Rumensin,ElancoAnimalHealth)atrecommended
concentrations(VasconcelosandGalyean,2007).7. Dietsforheiferscontainmelengestrolacetate(MGA)attherecommendedconcentrations
(VasconcelosandGalyean,2007).8. Cattleareimplantedwithanestrogenicimplantthroughoutthefeedingperiod(Vasconcelos
andGalyean,2007).9. Nobeta‐agonistisfed.10. Thedietcontainsnosupplementalfat(vegetableoil,yellowgrease,etc.)andhasatotalfat
concentrationoflessthan4.5percentofdietdrymatter.11. EntericCH4emissionisthreepercentofgrossenergyintake(GEI:(IPCC,2006).12. Thedietaryforageischoppedalfalfa,sorghum,orgrasshayatsevento10percentofdiet
drymatter.13. Thedietcontainsmineralsandvitaminsattherecommendedlevel(NRC,2000).14. Temperaturesaremild/moderateduringthefeedingperiod.15. Cattleareslaughteredatanaveragebodyweightofapproximately582kg(1,280lb.)(KSU,
2012).16. Averagedressingpercentis61percent.17. Cattlearefed150days.
TheYmadjustmentfactorsforfeedlotcattlefedhigh‐concentratedietsinTable5‐11weredeterminedbasedonthefollowingliteraturereviewsandanalyses.
Ionophores:Onaverage,thefeedingofionophoresdecreasesDMIbyaboutfivepercent(Delfinoetal.,1988;Vogel,1995;RobinsonandOkine,2001;Tedeschietal.,2003)anddecreasesADGbyabouttwopercent(Delfinoetal.,1988;Tedeschietal.,2003).Feedingionophoresdecreasesentericmethaneemissionsapproximately20percentforthefirsttwotofourweeksonfeed(Tedeschietal.,2003;Guanetal.,2006).Therefore,overa150‐dayfeedingperiod,overallentericmethane
Chapter 5: Quantifying Greenhouse Gas Sources and Sinks in Animal Production Systems
5-110
emissionsaredecreasedapproximately4percent.Becauseofanincreaseinthegain:feedratio,entericmethaneemissionsperunitofproductionaredecreasedwhenionophoresarefed.
SupplementalFat:Foreachonepercentincreaseinsupplementalfat(uptoamaximumoffourpercentaddedfat),entericmethaneemissions(asapercentageofgrossenergyintake)decreaseapproximately3.8to5.6percent(ZinnandShen,1996;Beaucheminetal.,2008;Martinetal.,2010).AconservativevalueoffourpercentperonepercentincreaseinsupplementalfatisrecommendedbecausemanyfatsourcesusedintheindustryarepartiallysaturatedandmayhavelesseffectonentericCH4productionthanthehighlyunsaturatedfatsusedinmoststudies.Forexampleifthreepercentsupplementalfatisaddedtothediet,thenCH4productionisdecreased12percent(threepercentaddedfattimesfourpercentisequivalenttoa12percentdecrease).TherevisedentericCH4emissionis2.64percentofGEI(threepercentbaseline*0.88=2.64percentofGEI).Manydistiller’sgrainscontainapproximately8to12percentfat.Additionofdistiller’sgrainmayserveasasourceofsupplementalfat,andthusdecreaseentericCH4(McGinnetal.,2009).HoweverHalesetal.(2013)notedthatfeedingincreasingconcentrationsofWetDistillersGrainswithSolubles(WDGS)inequal‐fatdietsincreasedentericCH4,likelyduetotheincreasedNDFintake.12
Grainprocessing&Grainsource:GrainprocessingdirectlyaffectsentericCH4productionviaitseffectsonruminalfermentation.EntericCH4emissions,asapercentofGEI,are20percentgreaterwithdietsbasedonDRCthanindietsbasedonsteam‐flakedcorn(SFC)orhighmoisturecorn(HMC)(Archibequeetal.,2006;Halesetal.,2012).Moreextensivegrainprocessingmayalsoimprovethegain:feedratioabout10percent(Owensetal.,1997;ZinnandBarajas,1997)andmay,decreasemanureCH4emissionsviadecreasedfecalstarchexcretion(ZinnandBarajas,1997;Halesetal.,2012).EntericCH4emissionsare20to40percentgreaterwithfinishingdietsbasedonbarleythandietsbasedoncorn;presumablybecauseofthelowerstarchandhigherfibercontentofbarley(Benchaaretal.,2001;BeaucheminandMcGinn,2005).Amean(30%)forthesestudiesisrecommendedforabarleyadjustmentfactor.
DietaryForageandGrainConcentrationeffects:LimiteddataexiststoevaluateeffectsofdietaryforageandgrainconcentrationonentericmethaneproductionfrombeefcattlethatarefedtypicalU.S‐based,highconcentratefinishingdiets.EquationsfromEllisetal.(2007;2009)illustratetheeffectsofdietaryforage,NDF,andstarchonentericCH4production.Inparticular,thefollowing10equationsillustratetherelationships:
CH4(MJ/day)=3.96+0.561×DMI(kg/day) CH4(MJ/day)=4.79+0.0492×Forage(%) CH4(MJ/day)=5.58+0.848×NDF(kg/day) CH4(MJ/day)=5.70+1.41×ADF(kg/day) CH4(MJ/day)=2.29+0.670×DMI(kg/day) CH4(MJ/day)=4.72+1.13×Starch(kg/day) CH4(MJ/day)=‐1.01+2.76×NDF(kg/day)+0.722×Starch(kg/day) CH4(MJ/day)=2.68–1.14(Starch:NDF)+0.786×DMI(kg/day) CH4(MJ/day)=2.50=0.367×Starch(kg/day)+0.766×DMI(kg/day) CH4(MJ/day)=2.70+(1.16×DMI(kg/day))–(15.8×etherextract(kg/day))
12Ymisadjustedfordistillergrainsbychangesinfatcontentandgrainconcentration.Forexample,a30percentconcentrationofdistillergrainsinthefinishingdietwilltypicallyincreasethedietaryfatlevelby2to3percentanddecreasethegraincontentby25to30percent.TheresultingchangeinYmisadecreaseby8percenttoaccountforincreaseinfatcontentandanincreaseof10percenttoaccountforadecreaseingraincontent(i.e.,Ym=3%x0.92x1.10=3.036%).
Chapter 5: Quantifying Greenhouse Gas Sources and Sinks in Animal Production Systems
5-111
Todevelopadjustmentfactorsforgrainconcentrationsindiets,artificialdatasetswerecreatedthatvariedinforage(rangeof5to25percent),NDF(range10to20percent),fat(rangeof3to6percent),andstarch(rangeof30to60percentofdietdrymatter)content.Usingthesedatasets,entericCH4emissionswereestimatedusingtheappropriateequation(s)ofEllisetal.(2007;2009).EffectsofdietarychangesonentericCH4werethendeterminedbylinearregressionanalysis.Onaverage,entericCH4production(MJ/day)increasedfivepercentforeachonepercentincreaseindietaryforageconcentration;increased13percentforeachonekgincreaseindietaryNDFintake,increasedfivepercentforeachonekgincreaseinstarchintakeanddecreasedfivepercentforeachoneunitincreaseinthedietarystarch:NDFratio.SmallincreasesinforageconcentrationfromthebaselinevaluehadsmalleffectsonYm;whereas,greaterincreaseshadalargereffect(Halesetal.,2012;Halesetal.,2014).AnevaluationofthesefactorsindicatedanentericCH4Ymadjustmentfactorof10%forsmallincreasesinforage(anddecreasesingrainconcentration)andalargercorrectionfactorof40percentforgreaterchanges(dietconcentratelessthan45percent).Thesefactorsarerecommendedforaccountingforthegrainconcentrationinfinishingdiets.
NoYmadjustmentfactorwasexplicitlymodeledtoaccountforthefollowingdietarymanagementfactors:13
Beta‐agonists:Beta‐agonistsdonotdirectlyaffecttheYm(i.e.,entericCH4emissionsperunitofgrossenergyintake),thereforenoadjustmentfactorisrecommended.However,becauseofa4percentincreaseinfeedefficiency,a2.5to3.5%increaseinhotcarcassweight(HCW),andanincreaseinlivebodyweight(Vasconcelosetal.,2008;Elametal.,2009;Montgomeryetal.,2009;Delmoreetal.,2010;Radunz,2011),entericCH4emissionsperunitofproductionaredecreasedwhenbeta‐agonistsarefed.
Melengestrolacetate(MGA:heifersonly):FeedingMGAtoheifersdoesnotdirectlyaffectentericCH4emissions.However,becauseofaninepercentincreaseinthegain:feedratio(Hilletal.,1988;KreikemeierandMader,2004)entericCH4emissionsperunitofproductionaredecreasedwhenMGAisfed.
DirectFedMicrobials:MostdirectfedmicrobialsdonotappeartodirectlyaffectentericCH4emissionsandeffectsonanimalperformancearesomewhatvariable(Krehbieletal.,2003).Noadjustmentfactorisrecommendedforthefeedingofdirectfedmicrobials.
DietaryCrudeProteinandRuminalDegradableProtein(RDP):DietaryproteinmaypotentiallyaffectanimalperformanceandentericCH4emissionsviaeffectsonruminalfermentation.However,thereisnoreadilyavailabledatawithmodernfeedlotdietswithwhichtocompare(BergerandMerchen,1995;RobinsonandOkine,2001;Gleghornetal.,2004;Coleetal.,2006;Wagneretal.,2010).ThereisnorecommendedYmadjustmentfactorfordietaryprotein.Dietaryproteinmayaffectemissionsofmanuregreenhousegases(N2O)anddefinitelyaffectsNH3emissions(Toddetal.,2013).
Implantingregimens:ImplantsdonotdirectlyaffectentericCH4emissions.Howeverbecauseofanincreaseinfeedefficiency,livebodyweight,andHCW(Herschleretal.,1995;RobinsonandOkine,2001;Wilemanetal.,2009),entericCH4emissionsperunitofproductionaredecreasedwhenimplantsareused.
Ambienttemperature:ColdandhottemperaturesmaypotentiallyaffectentericCH4emissionduetoeffectsonfeedintake,ruminaldigestionandrateofpassage(Young,1981);however,theactualeffectsarenotclear.Thereforenoadjustmentfactorforenvironmentaltemperatureisused.ColdtemperaturesmaydecreaseCH4,N2OandNH3lossesfrompen
13AlthoughthesemanagementfactorsarenotmodeledtoimpactYm,someofthemdoimpactentericCH4perunitofproduction.Hence,inevaluatingmethaneintensityperunitofproduction,thesefactorswouldhaveanimpact.
Chapter 5: Quantifying Greenhouse Gas Sources and Sinks in Animal Production Systems
5-112
surfacesviaeffectsonmicrobialactivityinthemanure.Conversely,warmtemperaturesmayincreaseemissionsfrommanureviaincreasedmicrobialactivity.
TheIPCCTier2modeliscurrentlythemostusefulforpredictingemissionsfromcow‐calfandstockerproduction,aswell,asnotedintheearliercow‐calfandstockerSections(5.3.2.2).EntericemissionsfromallcattleotherthandairycowsanddairyheifersareestimatedusingtheIPCCTier2equationorthemodifiedIPCCTier2previouslydiscussedforfeedlotcattle.Tousetheseequations,itisnecessarytomakesuretheinputstotheequationsareasaccurateaspossible.ForDE(asapercentageofGE),werecommendusingthefeedstuffscompositiontableprovidedinNRC(1989)andEwan(1989).SeveralfeedstuffsfromthetableareincludedinTable5‐C‐1.Afterreviewofthemodels,theirstrengthsandlimitations,modelsbasedontheMillsequations(e.g.,DairyGEM,COWPOLL,IFSM)appeartobethemostusefulforpredictingemissionsfromdairycattle.TheMits3equationrecommendedforcalculatingentericCH4emissionsfromdairycowsanddairyheifers(usedinDairyGEM/IFSM)requiresdifferentdietaryinputinformationthanthatrequiredfortheIPCCTierIIequation.Specifically,DairyGEM/IFSMrequiresthestarchandADFcontentoffeeds.BecausestarchisnearlyequivalenttoNFC(whichisstarch+sugar+pectin)inhighforagediets(dairydiets),weuseNFCintheMits3equation(NFC=100–(NDF+CP+EE+Ash)).ThesevaluescanbefoundinAppendix5‐B.
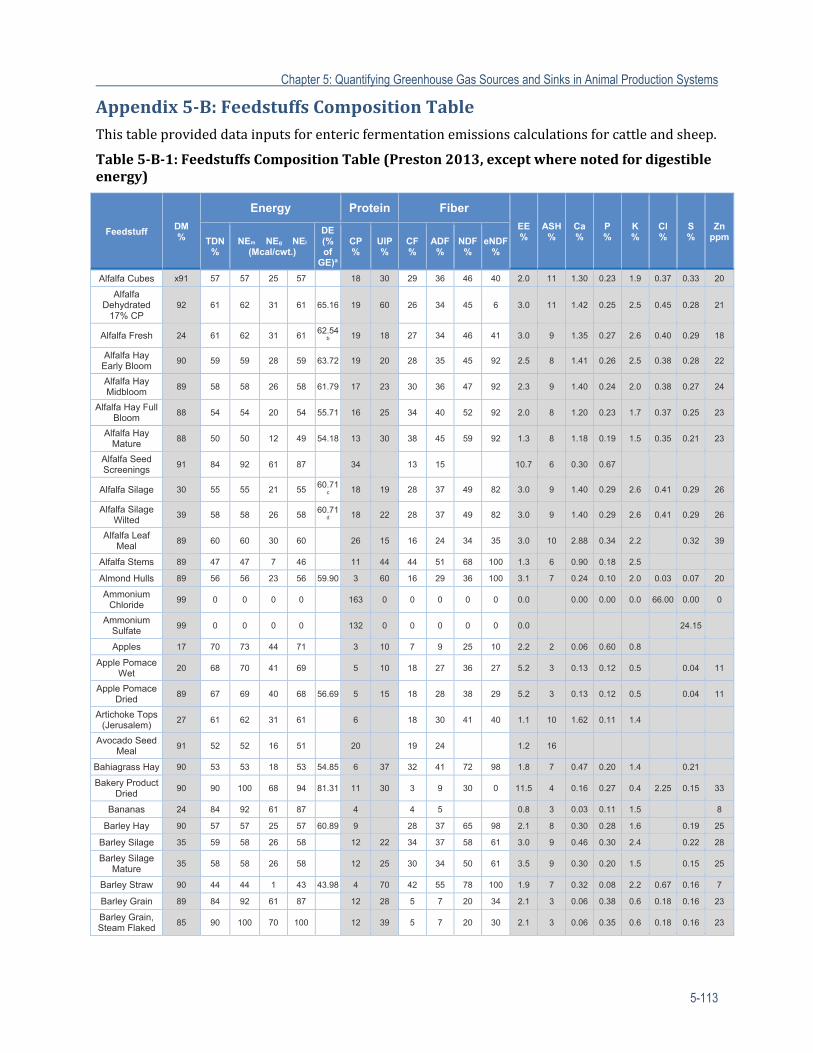
Chapter 5: Quantifying Greenhouse Gas Sources and Sinks in Animal Production Systems
5-113
Appendix5‐B:FeedstuffsCompositionTableThistableprovideddatainputsforentericfermentationemissionscalculationsforcattleandsheep.
Table5‐B‐1:FeedstuffsCompositionTable(Preston2013,exceptwherenotedfordigestibleenergy)
Feedstuff DM %
Energy Protein Fiber
EE%
ASH%
Ca %
P %
K %
Cl%
S %
Zn ppmTDN
% NEm NEg NEl
(Mcal/cwt.)
DE (% of
GE)a
CP%
UIP%
CF%
ADF%
NDF%
eNDF%
Alfalfa Cubes x91 57 57 25 57 18 30 29 36 46 40 2.0 11 1.30 0.23 1.9 0.37 0.33 20
Alfalfa Dehydrated
17% CP 92 61 62 31 61 65.16 19 60 26 34 45 6 3.0 11 1.42 0.25 2.5 0.45 0.28 21
Alfalfa Fresh 24 61 62 31 61 62.54
b 19 18 27 34 46 41 3.0 9 1.35 0.27 2.6 0.40 0.29 18
Alfalfa Hay Early Bloom
90 59 59 28 59 63.72 19 20 28 35 45 92 2.5 8 1.41 0.26 2.5 0.38 0.28 22
Alfalfa Hay Midbloom
89 58 58 26 58 61.79 17 23 30 36 47 92 2.3 9 1.40 0.24 2.0 0.38 0.27 24
Alfalfa Hay Full Bloom
88 54 54 20 54 55.71 16 25 34 40 52 92 2.0 8 1.20 0.23 1.7 0.37 0.25 23
Alfalfa Hay Mature
88 50 50 12 49 54.18 13 30 38 45 59 92 1.3 8 1.18 0.19 1.5 0.35 0.21 23
Alfalfa Seed Screenings
91 84 92 61 87 34 13 15 10.7 6 0.30 0.67
Alfalfa Silage 30 55 55 21 55 60.71
c 18 19 28 37 49 82 3.0 9 1.40 0.29 2.6 0.41 0.29 26
Alfalfa Silage Wilted
39 58 58 26 58 60.71
d 18 22 28 37 49 82 3.0 9 1.40 0.29 2.6 0.41 0.29 26
Alfalfa Leaf Meal
89 60 60 30 60 26 15 16 24 34 35 3.0 10 2.88 0.34 2.2 0.32 39
Alfalfa Stems 89 47 47 7 46 11 44 44 51 68 100 1.3 6 0.90 0.18 2.5
Almond Hulls 89 56 56 23 56 59.90 3 60 16 29 36 100 3.1 7 0.24 0.10 2.0 0.03 0.07 20
Ammonium Chloride
99 0 0 0 0 163 0 0 0 0 0 0.0 0.00 0.00 0.0 66.00 0.00 0
Ammonium Sulfate
99 0 0 0 0 132 0 0 0 0 0 0.0 24.15
Apples 17 70 73 44 71 3 10 7 9 25 10 2.2 2 0.06 0.60 0.8
Apple Pomace Wet
20 68 70 41 69 5 10 18 27 36 27 5.2 3 0.13 0.12 0.5 0.04 11
Apple Pomace Dried
89 67 69 40 68 56.69 5 15 18 28 38 29 5.2 3 0.13 0.12 0.5 0.04 11
Artichoke Tops (Jerusalem)
27 61 62 31 61 6 18 30 41 40 1.1 10 1.62 0.11 1.4
Avocado Seed Meal
91 52 52 16 51 20 19 24 1.2 16
Bahiagrass Hay 90 53 53 18 53 54.85 6 37 32 41 72 98 1.8 7 0.47 0.20 1.4 0.21
Bakery Product Dried
90 90 100 68 94 81.31 11 30 3 9 30 0 11.5 4 0.16 0.27 0.4 2.25 0.15 33
Bananas 24 84 92 61 87 4 4 5 0.8 3 0.03 0.11 1.5 8
Barley Hay 90 57 57 25 57 60.89 9 28 37 65 98 2.1 8 0.30 0.28 1.6 0.19 25
Barley Silage 35 59 58 26 58 12 22 34 37 58 61 3.0 9 0.46 0.30 2.4 0.22 28
Barley Silage Mature
35 58 58 26 58 12 25 30 34 50 61 3.5 9 0.30 0.20 1.5 0.15 25
Barley Straw 90 44 44 1 43 43.98 4 70 42 55 78 100 1.9 7 0.32 0.08 2.2 0.67 0.16 7
Barley Grain 89 84 92 61 87 12 28 5 7 20 34 2.1 3 0.06 0.38 0.6 0.18 0.16 23
Barley Grain, Steam Flaked
85 90 100 70 100 12 39 5 7 20 30 2.1 3 0.06 0.35 0.6 0.18 0.16 23
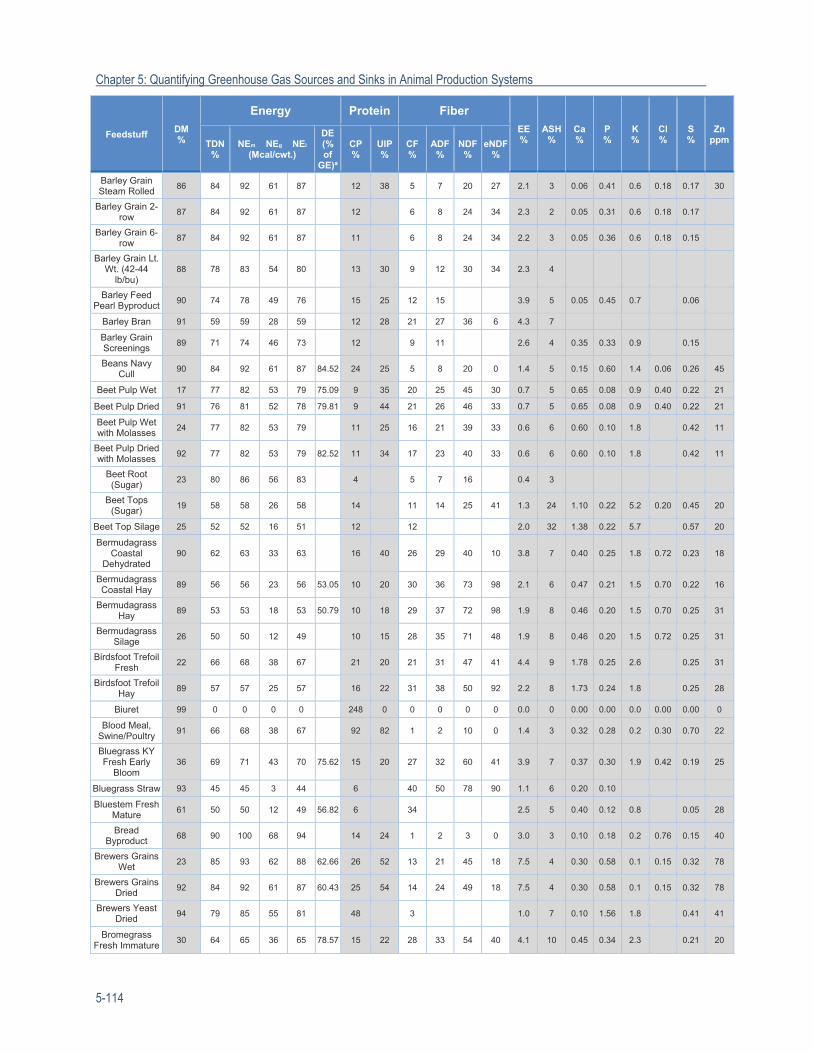
Chapter 5: Quantifying Greenhouse Gas Sources and Sinks in Animal Production Systems
5-114
Feedstuff DM %
Energy Protein Fiber
EE%
ASH%
Ca %
P %
K %
Cl%
S %
Zn ppmTDN
% NEm NEg NEl
(Mcal/cwt.)
DE (% of
GE)a
CP%
UIP%
CF%
ADF%
NDF%
eNDF%
Barley Grain Steam Rolled
86 84 92 61 87 12 38 5 7 20 27 2.1 3 0.06 0.41 0.6 0.18 0.17 30
Barley Grain 2-row
87 84 92 61 87 12 6 8 24 34 2.3 2 0.05 0.31 0.6 0.18 0.17
Barley Grain 6-row
87 84 92 61 87 11 6 8 24 34 2.2 3 0.05 0.36 0.6 0.18 0.15
Barley Grain Lt. Wt. (42-44
lb/bu) 88 78 83 54 80 13 30 9 12 30 34 2.3 4
Barley Feed Pearl Byproduct
90 74 78 49 76 15 25 12 15 3.9 5 0.05 0.45 0.7 0.06
Barley Bran 91 59 59 28 59 12 28 21 27 36 6 4.3 7
Barley Grain Screenings
89 71 74 46 73 12 9 11 2.6 4 0.35 0.33 0.9 0.15
Beans Navy Cull
90 84 92 61 87 84.52 24 25 5 8 20 0 1.4 5 0.15 0.60 1.4 0.06 0.26 45
Beet Pulp Wet 17 77 82 53 79 75.09 9 35 20 25 45 30 0.7 5 0.65 0.08 0.9 0.40 0.22 21
Beet Pulp Dried 91 76 81 52 78 79.81 9 44 21 26 46 33 0.7 5 0.65 0.08 0.9 0.40 0.22 21
Beet Pulp Wet with Molasses
24 77 82 53 79 11 25 16 21 39 33 0.6 6 0.60 0.10 1.8 0.42 11
Beet Pulp Dried with Molasses
92 77 82 53 79 82.52 11 34 17 23 40 33 0.6 6 0.60 0.10 1.8 0.42 11
Beet Root (Sugar)
23 80 86 56 83 4 5 7 16 0.4 3
Beet Tops (Sugar)
19 58 58 26 58 14 11 14 25 41 1.3 24 1.10 0.22 5.2 0.20 0.45 20
Beet Top Silage 25 52 52 16 51 12 12 2.0 32 1.38 0.22 5.7 0.57 20
Bermudagrass Coastal
Dehydrated 90 62 63 33 63 16 40 26 29 40 10 3.8 7 0.40 0.25 1.8 0.72 0.23 18
Bermudagrass Coastal Hay
89 56 56 23 56 53.05 10 20 30 36 73 98 2.1 6 0.47 0.21 1.5 0.70 0.22 16
Bermudagrass Hay
89 53 53 18 53 50.79 10 18 29 37 72 98 1.9 8 0.46 0.20 1.5 0.70 0.25 31
Bermudagrass Silage
26 50 50 12 49 10 15 28 35 71 48 1.9 8 0.46 0.20 1.5 0.72 0.25 31
Birdsfoot Trefoil Fresh
22 66 68 38 67 21 20 21 31 47 41 4.4 9 1.78 0.25 2.6 0.25 31
Birdsfoot Trefoil Hay
89 57 57 25 57 16 22 31 38 50 92 2.2 8 1.73 0.24 1.8 0.25 28
Biuret 99 0 0 0 0 248 0 0 0 0 0 0.0 0 0.00 0.00 0.0 0.00 0.00 0
Blood Meal, Swine/Poultry
91 66 68 38 67 92 82 1 2 10 0 1.4 3 0.32 0.28 0.2 0.30 0.70 22
Bluegrass KY Fresh Early
Bloom 36 69 71 43 70 75.62 15 20 27 32 60 41 3.9 7 0.37 0.30 1.9 0.42 0.19 25
Bluegrass Straw 93 45 45 3 44 6 40 50 78 90 1.1 6 0.20 0.10
Bluestem Fresh Mature
61 50 50 12 49 56.82 6 34 2.5 5 0.40 0.12 0.8 0.05 28
Bread Byproduct
68 90 100 68 94 14 24 1 2 3 0 3.0 3 0.10 0.18 0.2 0.76 0.15 40
Brewers Grains Wet
23 85 93 62 88 62.66 26 52 13 21 45 18 7.5 4 0.30 0.58 0.1 0.15 0.32 78
Brewers Grains Dried
92 84 92 61 87 60.43 25 54 14 24 49 18 7.5 4 0.30 0.58 0.1 0.15 0.32 78
Brewers Yeast Dried
94 79 85 55 81 48 3 1.0 7 0.10 1.56 1.8 0.41 41
Bromegrass Fresh Immature
30 64 65 36 65 78.57 15 22 28 33 54 40 4.1 10 0.45 0.34 2.3 0.21 20
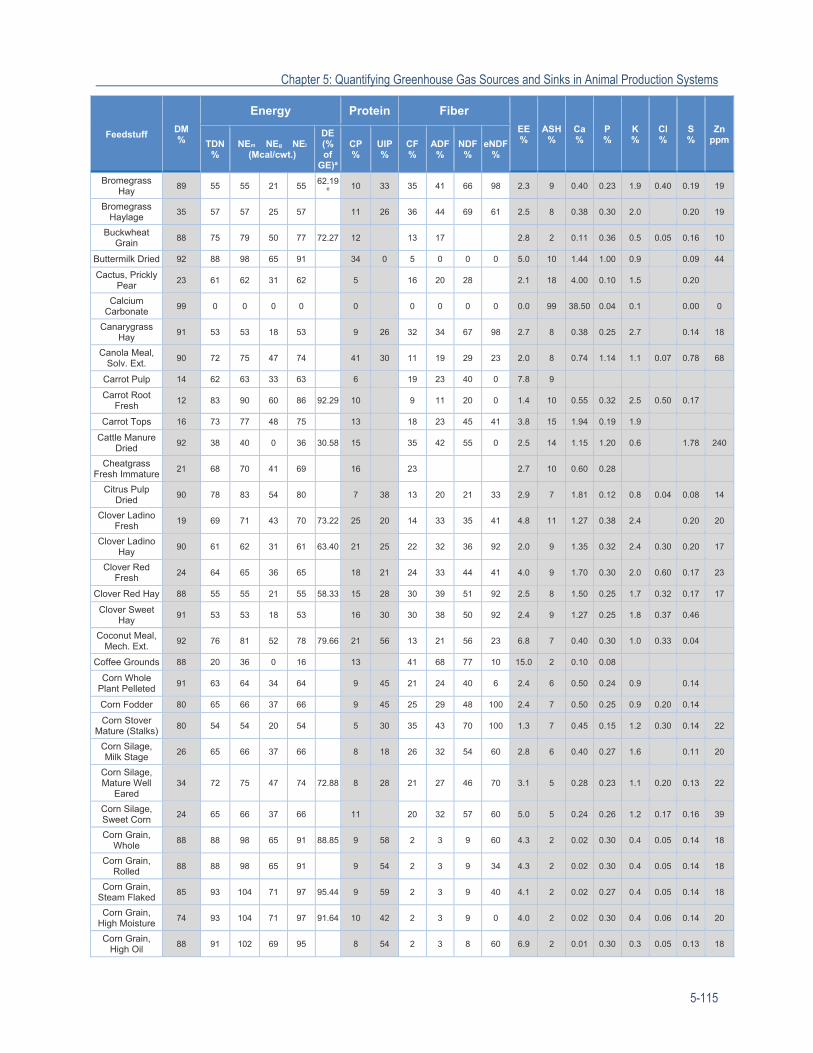
Chapter 5: Quantifying Greenhouse Gas Sources and Sinks in Animal Production Systems
5-115
FeedstuffDM %
Energy Protein Fiber
EE%
ASH%
Ca %
P %
K %
Cl%
S %
Zn ppmTDN
%NEm NEg NEl
(Mcal/cwt.)
DE (% of
GE)a
CP%
UIP%
CF%
ADF%
NDF%
eNDF%
Bromegrass Hay
89 55 55 21 55 62.19
e 10 33 35 41 66 98 2.3 9 0.40 0.23 1.9 0.40 0.19 19
Bromegrass Haylage
35 57 57 25 57 11 26 36 44 69 61 2.5 8 0.38 0.30 2.0 0.20 19
Buckwheat Grain
88 75 79 50 77 72.27 12 13 17 2.8 2 0.11 0.36 0.5 0.05 0.16 10
Buttermilk Dried 92 88 98 65 91 34 0 5 0 0 0 5.0 10 1.44 1.00 0.9 0.09 44
Cactus, Prickly Pear
23 61 62 31 62 5 16 20 28 2.1 18 4.00 0.10 1.5 0.20
Calcium Carbonate
99 0 0 0 0 0 0 0 0 0 0.0 99 38.50 0.04 0.1 0.00 0
Canarygrass Hay
91 53 53 18 53 9 26 32 34 67 98 2.7 8 0.38 0.25 2.7 0.14 18
Canola Meal, Solv. Ext.
90 72 75 47 74 41 30 11 19 29 23 2.0 8 0.74 1.14 1.1 0.07 0.78 68
Carrot Pulp 14 62 63 33 63 6 19 23 40 0 7.8 9
Carrot Root Fresh
12 83 90 60 86 92.29 10 9 11 20 0 1.4 10 0.55 0.32 2.5 0.50 0.17
Carrot Tops 16 73 77 48 75 13 18 23 45 41 3.8 15 1.94 0.19 1.9
Cattle Manure Dried
92 38 40 0 36 30.58 15 35 42 55 0 2.5 14 1.15 1.20 0.6 1.78 240
Cheatgrass Fresh Immature
21 68 70 41 69 16 23 2.7 10 0.60 0.28
Citrus Pulp Dried
90 78 83 54 80 7 38 13 20 21 33 2.9 7 1.81 0.12 0.8 0.04 0.08 14
Clover Ladino Fresh
19 69 71 43 70 73.22 25 20 14 33 35 41 4.8 11 1.27 0.38 2.4 0.20 20
Clover Ladino Hay
90 61 62 31 61 63.40 21 25 22 32 36 92 2.0 9 1.35 0.32 2.4 0.30 0.20 17
Clover Red Fresh
24 64 65 36 65 18 21 24 33 44 41 4.0 9 1.70 0.30 2.0 0.60 0.17 23
Clover Red Hay 88 55 55 21 55 58.33 15 28 30 39 51 92 2.5 8 1.50 0.25 1.7 0.32 0.17 17
Clover Sweet Hay
91 53 53 18 53 16 30 30 38 50 92 2.4 9 1.27 0.25 1.8 0.37 0.46
Coconut Meal, Mech. Ext.
92 76 81 52 78 79.66 21 56 13 21 56 23 6.8 7 0.40 0.30 1.0 0.33 0.04
Coffee Grounds 88 20 36 0 16 13 41 68 77 10 15.0 2 0.10 0.08
Corn Whole Plant Pelleted
91 63 64 34 64 9 45 21 24 40 6 2.4 6 0.50 0.24 0.9 0.14
Corn Fodder 80 65 66 37 66 9 45 25 29 48 100 2.4 7 0.50 0.25 0.9 0.20 0.14
Corn Stover Mature (Stalks)
80 54 54 20 54 5 30 35 43 70 100 1.3 7 0.45 0.15 1.2 0.30 0.14 22
Corn Silage, Milk Stage
26 65 66 37 66 8 18 26 32 54 60 2.8 6 0.40 0.27 1.6 0.11 20
Corn Silage, Mature Well
Eared 34 72 75 47 74 72.88 8 28 21 27 46 70 3.1 5 0.28 0.23 1.1 0.20 0.13 22
Corn Silage, Sweet Corn
24 65 66 37 66 11 20 32 57 60 5.0 5 0.24 0.26 1.2 0.17 0.16 39
Corn Grain, Whole
88 88 98 65 91 88.85 9 58 2 3 9 60 4.3 2 0.02 0.30 0.4 0.05 0.14 18
Corn Grain, Rolled
88 88 98 65 91 9 54 2 3 9 34 4.3 2 0.02 0.30 0.4 0.05 0.14 18
Corn Grain, Steam Flaked
85 93 104 71 97 95.44 9 59 2 3 9 40 4.1 2 0.02 0.27 0.4 0.05 0.14 18
Corn Grain, High Moisture
74 93 104 71 97 91.64 10 42 2 3 9 0 4.0 2 0.02 0.30 0.4 0.06 0.14 20
Corn Grain, High Oil
88 91 102 69 95 8 54 2 3 8 60 6.9 2 0.01 0.30 0.3 0.05 0.13 18
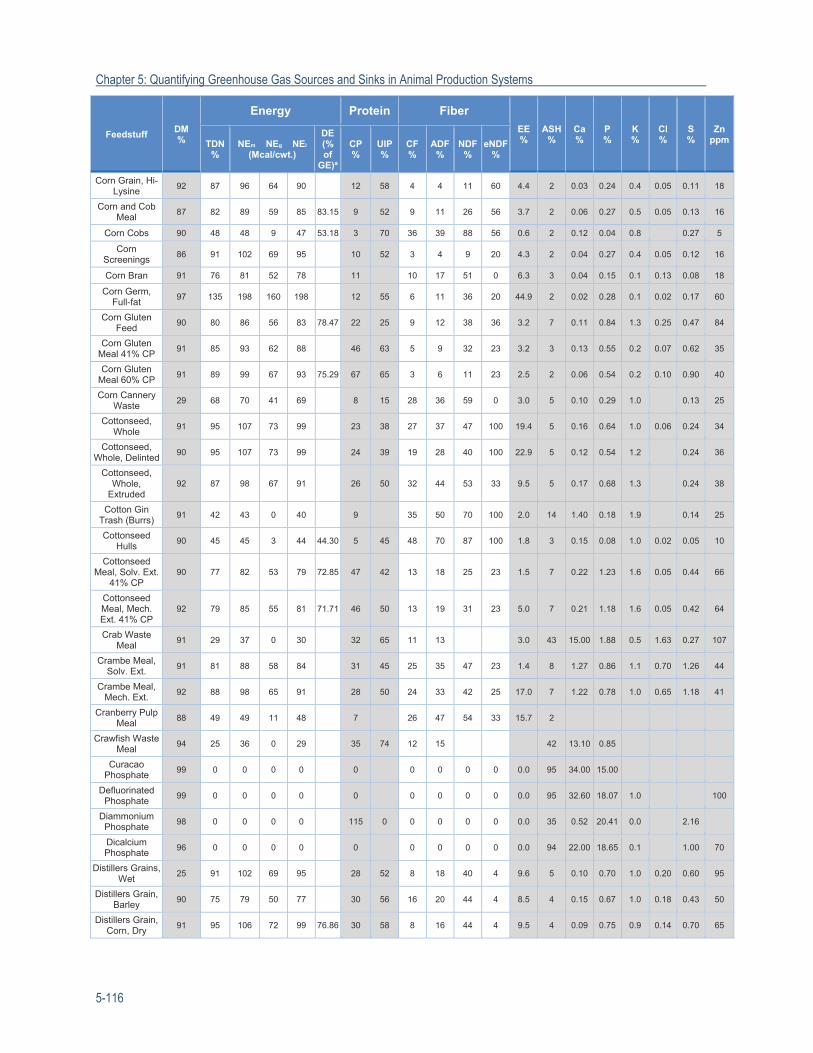
Chapter 5: Quantifying Greenhouse Gas Sources and Sinks in Animal Production Systems
5-116
Feedstuff DM %
Energy Protein Fiber
EE%
ASH%
Ca %
P %
K %
Cl%
S %
Zn ppmTDN
% NEm NEg NEl
(Mcal/cwt.)
DE (% of
GE)a
CP%
UIP%
CF%
ADF%
NDF%
eNDF%
Corn Grain, Hi-Lysine
92 87 96 64 90 12 58 4 4 11 60 4.4 2 0.03 0.24 0.4 0.05 0.11 18
Corn and Cob Meal
87 82 89 59 85 83.15 9 52 9 11 26 56 3.7 2 0.06 0.27 0.5 0.05 0.13 16
Corn Cobs 90 48 48 9 47 53.18 3 70 36 39 88 56 0.6 2 0.12 0.04 0.8 0.27 5
Corn Screenings
86 91 102 69 95 10 52 3 4 9 20 4.3 2 0.04 0.27 0.4 0.05 0.12 16
Corn Bran 91 76 81 52 78 11 10 17 51 0 6.3 3 0.04 0.15 0.1 0.13 0.08 18
Corn Germ, Full-fat
97 135 198 160 198 12 55 6 11 36 20 44.9 2 0.02 0.28 0.1 0.02 0.17 60
Corn Gluten Feed
90 80 86 56 83 78.47 22 25 9 12 38 36 3.2 7 0.11 0.84 1.3 0.25 0.47 84
Corn Gluten Meal 41% CP
91 85 93 62 88 46 63 5 9 32 23 3.2 3 0.13 0.55 0.2 0.07 0.62 35
Corn Gluten Meal 60% CP
91 89 99 67 93 75.29 67 65 3 6 11 23 2.5 2 0.06 0.54 0.2 0.10 0.90 40
Corn Cannery Waste
29 68 70 41 69 8 15 28 36 59 0 3.0 5 0.10 0.29 1.0 0.13 25
Cottonseed, Whole
91 95 107 73 99 23 38 27 37 47 100 19.4 5 0.16 0.64 1.0 0.06 0.24 34
Cottonseed, Whole, Delinted
90 95 107 73 99 24 39 19 28 40 100 22.9 5 0.12 0.54 1.2 0.24 36
Cottonseed, Whole,
Extruded 92 87 98 67 91 26 50 32 44 53 33 9.5 5 0.17 0.68 1.3 0.24 38
Cotton Gin Trash (Burrs)
91 42 43 0 40 9 35 50 70 100 2.0 14 1.40 0.18 1.9 0.14 25
Cottonseed Hulls
90 45 45 3 44 44.30 5 45 48 70 87 100 1.8 3 0.15 0.08 1.0 0.02 0.05 10
Cottonseed Meal, Solv. Ext.
41% CP 90 77 82 53 79 72.85 47 42 13 18 25 23 1.5 7 0.22 1.23 1.6 0.05 0.44 66
Cottonseed Meal, Mech. Ext. 41% CP
92 79 85 55 81 71.71 46 50 13 19 31 23 5.0 7 0.21 1.18 1.6 0.05 0.42 64
Crab Waste Meal
91 29 37 0 30 32 65 11 13 3.0 43 15.00 1.88 0.5 1.63 0.27 107
Crambe Meal, Solv. Ext.
91 81 88 58 84 31 45 25 35 47 23 1.4 8 1.27 0.86 1.1 0.70 1.26 44
Crambe Meal, Mech. Ext.
92 88 98 65 91 28 50 24 33 42 25 17.0 7 1.22 0.78 1.0 0.65 1.18 41
Cranberry Pulp Meal
88 49 49 11 48 7 26 47 54 33 15.7 2
Crawfish Waste Meal
94 25 36 0 29 35 74 12 15 42 13.10 0.85
Curacao Phosphate
99 0 0 0 0 0 0 0 0 0 0.0 95 34.00 15.00
Defluorinated Phosphate
99 0 0 0 0 0 0 0 0 0 0.0 95 32.60 18.07 1.0 100
Diammonium Phosphate
98 0 0 0 0 115 0 0 0 0 0 0.0 35 0.52 20.41 0.0 2.16
Dicalcium Phosphate
96 0 0 0 0 0 0 0 0 0 0.0 94 22.00 18.65 0.1 1.00 70
Distillers Grains, Wet
25 91 102 69 95 28 52 8 18 40 4 9.6 5 0.10 0.70 1.0 0.20 0.60 95
Distillers Grain, Barley
90 75 79 50 77 30 56 16 20 44 4 8.5 4 0.15 0.67 1.0 0.18 0.43 50
Distillers Grain, Corn, Dry
91 95 106 72 99 76.86 30 58 8 16 44 4 9.5 4 0.09 0.75 0.9 0.14 0.70 65
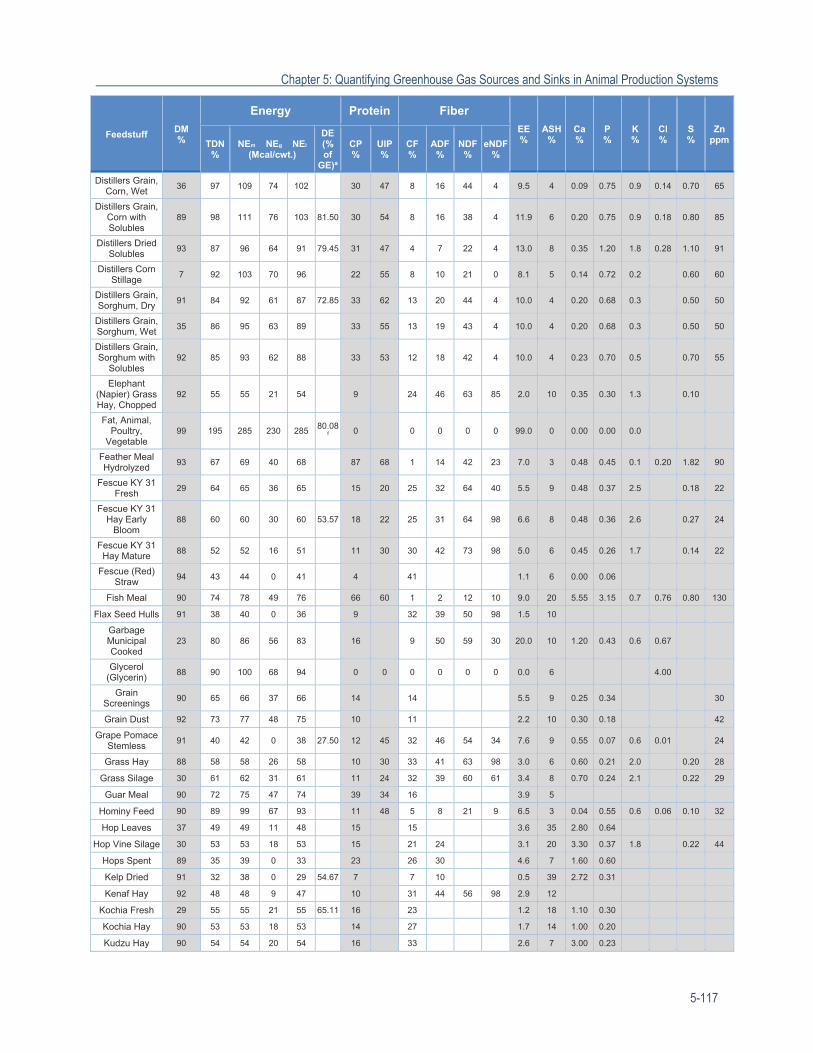
Chapter 5: Quantifying Greenhouse Gas Sources and Sinks in Animal Production Systems
5-117
Feedstuff DM %
Energy Protein Fiber
EE%
ASH%
Ca %
P %
K %
Cl%
S %
Zn ppmTDN
% NEm NEg NEl
(Mcal/cwt.)
DE (% of
GE)a
CP%
UIP%
CF%
ADF%
NDF%
eNDF%
Distillers Grain, Corn, Wet
36 97 109 74 102 30 47 8 16 44 4 9.5 4 0.09 0.75 0.9 0.14 0.70 65
Distillers Grain, Corn with Solubles
89 98 111 76 103 81.50 30 54 8 16 38 4 11.9 6 0.20 0.75 0.9 0.18 0.80 85
Distillers Dried Solubles
93 87 96 64 91 79.45 31 47 4 7 22 4 13.0 8 0.35 1.20 1.8 0.28 1.10 91
Distillers Corn Stillage
7 92 103 70 96 22 55 8 10 21 0 8.1 5 0.14 0.72 0.2 0.60 60
Distillers Grain, Sorghum, Dry
91 84 92 61 87 72.85 33 62 13 20 44 4 10.0 4 0.20 0.68 0.3 0.50 50
Distillers Grain, Sorghum, Wet
35 86 95 63 89 33 55 13 19 43 4 10.0 4 0.20 0.68 0.3 0.50 50
Distillers Grain, Sorghum with
Solubles 92 85 93 62 88 33 53 12 18 42 4 10.0 4 0.23 0.70 0.5 0.70 55
Elephant (Napier) Grass Hay, Chopped
92 55 55 21 54 9 24 46 63 85 2.0 10 0.35 0.30 1.3 0.10
Fat, Animal, Poultry,
Vegetable 99 195 285 230 285
80.08f
0 0 0 0 0 99.0 0 0.00 0.00 0.0
Feather Meal Hydrolyzed
93 67 69 40 68 87 68 1 14 42 23 7.0 3 0.48 0.45 0.1 0.20 1.82 90
Fescue KY 31 Fresh
29 64 65 36 65 15 20 25 32 64 40 5.5 9 0.48 0.37 2.5 0.18 22
Fescue KY 31 Hay Early
Bloom 88 60 60 30 60 53.57 18 22 25 31 64 98 6.6 8 0.48 0.36 2.6 0.27 24
Fescue KY 31 Hay Mature
88 52 52 16 51 11 30 30 42 73 98 5.0 6 0.45 0.26 1.7 0.14 22
Fescue (Red) Straw
94 43 44 0 41 4 41 1.1 6 0.00 0.06
Fish Meal 90 74 78 49 76 66 60 1 2 12 10 9.0 20 5.55 3.15 0.7 0.76 0.80 130
Flax Seed Hulls 91 38 40 0 36 9 32 39 50 98 1.5 10
Garbage Municipal Cooked
23 80 86 56 83 16 9 50 59 30 20.0 10 1.20 0.43 0.6 0.67
Glycerol (Glycerin)
88 90 100 68 94 0 0 0 0 0 0 0.0 6 4.00
Grain Screenings
90 65 66 37 66 14 14 5.5 9 0.25 0.34 30
Grain Dust 92 73 77 48 75 10 11 2.2 10 0.30 0.18 42
Grape Pomace Stemless
91 40 42 0 38 27.50 12 45 32 46 54 34 7.6 9 0.55 0.07 0.6 0.01 24
Grass Hay 88 58 58 26 58 10 30 33 41 63 98 3.0 6 0.60 0.21 2.0 0.20 28
Grass Silage 30 61 62 31 61 11 24 32 39 60 61 3.4 8 0.70 0.24 2.1 0.22 29
Guar Meal 90 72 75 47 74 39 34 16 3.9 5
Hominy Feed 90 89 99 67 93 11 48 5 8 21 9 6.5 3 0.04 0.55 0.6 0.06 0.10 32
Hop Leaves 37 49 49 11 48 15 15 3.6 35 2.80 0.64
Hop Vine Silage 30 53 53 18 53 15 21 24 3.1 20 3.30 0.37 1.8 0.22 44
Hops Spent 89 35 39 0 33 23 26 30 4.6 7 1.60 0.60
Kelp Dried 91 32 38 0 29 54.67 7 7 10 0.5 39 2.72 0.31
Kenaf Hay 92 48 48 9 47 10 31 44 56 98 2.9 12
Kochia Fresh 29 55 55 21 55 65.11 16 23 1.2 18 1.10 0.30
Kochia Hay 90 53 53 18 53 14 27 1.7 14 1.00 0.20
Kudzu Hay 90 54 54 20 54 16 33 2.6 7 3.00 0.23
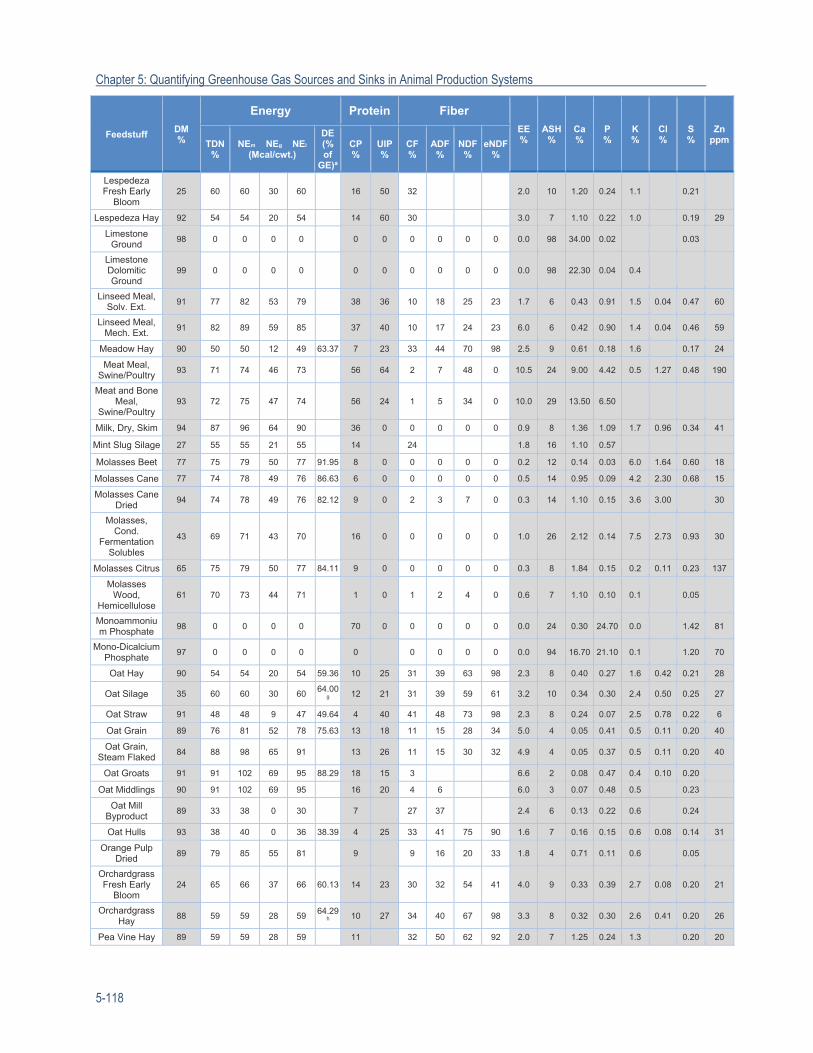
Chapter 5: Quantifying Greenhouse Gas Sources and Sinks in Animal Production Systems
5-118
FeedstuffDM %
Energy Protein Fiber
EE%
ASH%
Ca %
P %
K %
Cl%
S %
Zn ppmTDN
%NEm NEg NEl
(Mcal/cwt.)
DE (% of
GE)a
CP%
UIP%
CF%
ADF%
NDF%
eNDF%
Lespedeza Fresh Early
Bloom 25 60 60 30 60 16 50 32 2.0 10 1.20 0.24 1.1 0.21
Lespedeza Hay 92 54 54 20 54 14 60 30 3.0 7 1.10 0.22 1.0 0.19 29
Limestone Ground
98 0 0 0 0 0 0 0 0 0 0 0.0 98 34.00 0.02 0.03
Limestone Dolomitic Ground
99 0 0 0 0 0 0 0 0 0 0 0.0 98 22.30 0.04 0.4
Linseed Meal, Solv. Ext.
91 77 82 53 79 38 36 10 18 25 23 1.7 6 0.43 0.91 1.5 0.04 0.47 60
Linseed Meal, Mech. Ext.
91 82 89 59 85 37 40 10 17 24 23 6.0 6 0.42 0.90 1.4 0.04 0.46 59
Meadow Hay 90 50 50 12 49 63.37 7 23 33 44 70 98 2.5 9 0.61 0.18 1.6 0.17 24
Meat Meal, Swine/Poultry
93 71 74 46 73 56 64 2 7 48 0 10.5 24 9.00 4.42 0.5 1.27 0.48 190
Meat and Bone Meal,
Swine/Poultry 93 72 75 47 74 56 24 1 5 34 0 10.0 29 13.50 6.50
Milk, Dry, Skim 94 87 96 64 90 36 0 0 0 0 0 0.9 8 1.36 1.09 1.7 0.96 0.34 41
Mint Slug Silage 27 55 55 21 55 14 24 1.8 16 1.10 0.57
Molasses Beet 77 75 79 50 77 91.95 8 0 0 0 0 0 0.2 12 0.14 0.03 6.0 1.64 0.60 18
Molasses Cane 77 74 78 49 76 86.63 6 0 0 0 0 0 0.5 14 0.95 0.09 4.2 2.30 0.68 15
Molasses Cane Dried
94 74 78 49 76 82.12 9 0 2 3 7 0 0.3 14 1.10 0.15 3.6 3.00 30
Molasses, Cond.
Fermentation Solubles
43 69 71 43 70 16 0 0 0 0 0 1.0 26 2.12 0.14 7.5 2.73 0.93 30
Molasses Citrus 65 75 79 50 77 84.11 9 0 0 0 0 0 0.3 8 1.84 0.15 0.2 0.11 0.23 137
Molasses Wood,
Hemicellulose 61 70 73 44 71 1 0 1 2 4 0 0.6 7 1.10 0.10 0.1 0.05
Monoammonium Phosphate
98 0 0 0 0 70 0 0 0 0 0 0.0 24 0.30 24.70 0.0 1.42 81
Mono-Dicalcium Phosphate
97 0 0 0 0 0 0 0 0 0 0.0 94 16.70 21.10 0.1 1.20 70
Oat Hay 90 54 54 20 54 59.36 10 25 31 39 63 98 2.3 8 0.40 0.27 1.6 0.42 0.21 28
Oat Silage 35 60 60 30 60 64.00
g 12 21 31 39 59 61 3.2 10 0.34 0.30 2.4 0.50 0.25 27
Oat Straw 91 48 48 9 47 49.64 4 40 41 48 73 98 2.3 8 0.24 0.07 2.5 0.78 0.22 6
Oat Grain 89 76 81 52 78 75.63 13 18 11 15 28 34 5.0 4 0.05 0.41 0.5 0.11 0.20 40
Oat Grain, Steam Flaked
84 88 98 65 91 13 26 11 15 30 32 4.9 4 0.05 0.37 0.5 0.11 0.20 40
Oat Groats 91 91 102 69 95 88.29 18 15 3 6.6 2 0.08 0.47 0.4 0.10 0.20
Oat Middlings 90 91 102 69 95 16 20 4 6 6.0 3 0.07 0.48 0.5 0.23
Oat Mill Byproduct
89 33 38 0 30 7 27 37 2.4 6 0.13 0.22 0.6 0.24
Oat Hulls 93 38 40 0 36 38.39 4 25 33 41 75 90 1.6 7 0.16 0.15 0.6 0.08 0.14 31
Orange Pulp Dried
89 79 85 55 81 9 9 16 20 33 1.8 4 0.71 0.11 0.6 0.05
Orchardgrass Fresh Early
Bloom 24 65 66 37 66 60.13 14 23 30 32 54 41 4.0 9 0.33 0.39 2.7 0.08 0.20 21
Orchardgrass Hay
88 59 59 28 59 64.29
h 10 27 34 40 67 98 3.3 8 0.32 0.30 2.6 0.41 0.20 26
Pea Vine Hay 89 59 59 28 59 11 32 50 62 92 2.0 7 1.25 0.24 1.3 0.20 20
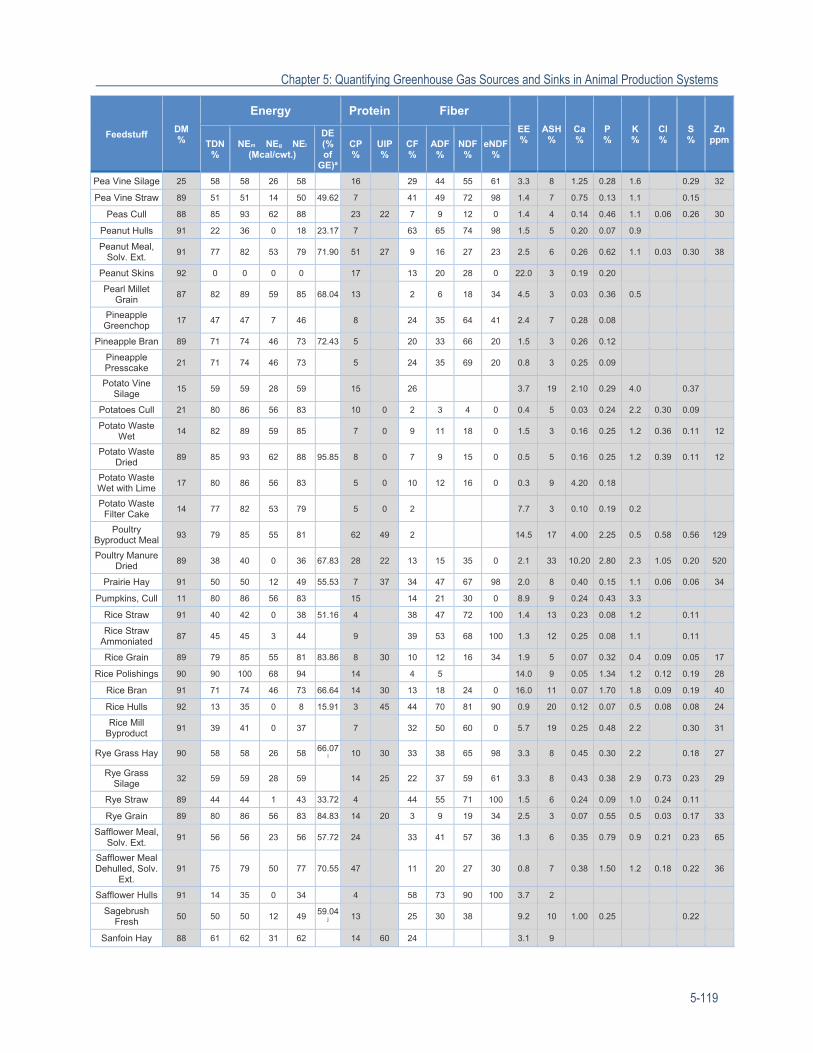
Chapter 5: Quantifying Greenhouse Gas Sources and Sinks in Animal Production Systems
5-119
FeedstuffDM %
Energy Protein Fiber
EE%
ASH%
Ca %
P %
K %
Cl%
S %
Zn ppmTDN
%NEm NEg NEl
(Mcal/cwt.)
DE (% of
GE)a
CP%
UIP%
CF%
ADF%
NDF%
eNDF%
Pea Vine Silage 25 58 58 26 58 16 29 44 55 61 3.3 8 1.25 0.28 1.6 0.29 32
Pea Vine Straw 89 51 51 14 50 49.62 7 41 49 72 98 1.4 7 0.75 0.13 1.1 0.15
Peas Cull 88 85 93 62 88 23 22 7 9 12 0 1.4 4 0.14 0.46 1.1 0.06 0.26 30
Peanut Hulls 91 22 36 0 18 23.17 7 63 65 74 98 1.5 5 0.20 0.07 0.9
Peanut Meal, Solv. Ext.
91 77 82 53 79 71.90 51 27 9 16 27 23 2.5 6 0.26 0.62 1.1 0.03 0.30 38
Peanut Skins 92 0 0 0 0 17 13 20 28 0 22.0 3 0.19 0.20
Pearl Millet Grain
87 82 89 59 85 68.04 13 2 6 18 34 4.5 3 0.03 0.36 0.5
Pineapple Greenchop
17 47 47 7 46 8 24 35 64 41 2.4 7 0.28 0.08
Pineapple Bran 89 71 74 46 73 72.43 5 20 33 66 20 1.5 3 0.26 0.12
Pineapple Presscake
21 71 74 46 73 5 24 35 69 20 0.8 3 0.25 0.09
Potato Vine Silage
15 59 59 28 59 15 26 3.7 19 2.10 0.29 4.0 0.37
Potatoes Cull 21 80 86 56 83 10 0 2 3 4 0 0.4 5 0.03 0.24 2.2 0.30 0.09
Potato Waste Wet
14 82 89 59 85 7 0 9 11 18 0 1.5 3 0.16 0.25 1.2 0.36 0.11 12
Potato Waste Dried
89 85 93 62 88 95.85 8 0 7 9 15 0 0.5 5 0.16 0.25 1.2 0.39 0.11 12
Potato Waste Wet with Lime
17 80 86 56 83 5 0 10 12 16 0 0.3 9 4.20 0.18
Potato Waste Filter Cake
14 77 82 53 79 5 0 2 7.7 3 0.10 0.19 0.2
Poultry Byproduct Meal
93 79 85 55 81 62 49 2 14.5 17 4.00 2.25 0.5 0.58 0.56 129
Poultry Manure Dried
89 38 40 0 36 67.83 28 22 13 15 35 0 2.1 33 10.20 2.80 2.3 1.05 0.20 520
Prairie Hay 91 50 50 12 49 55.53 7 37 34 47 67 98 2.0 8 0.40 0.15 1.1 0.06 0.06 34
Pumpkins, Cull 11 80 86 56 83 15 14 21 30 0 8.9 9 0.24 0.43 3.3
Rice Straw 91 40 42 0 38 51.16 4 38 47 72 100 1.4 13 0.23 0.08 1.2 0.11
Rice Straw Ammoniated
87 45 45 3 44 9 39 53 68 100 1.3 12 0.25 0.08 1.1 0.11
Rice Grain 89 79 85 55 81 83.86 8 30 10 12 16 34 1.9 5 0.07 0.32 0.4 0.09 0.05 17
Rice Polishings 90 90 100 68 94 14 4 5 14.0 9 0.05 1.34 1.2 0.12 0.19 28
Rice Bran 91 71 74 46 73 66.64 14 30 13 18 24 0 16.0 11 0.07 1.70 1.8 0.09 0.19 40
Rice Hulls 92 13 35 0 8 15.91 3 45 44 70 81 90 0.9 20 0.12 0.07 0.5 0.08 0.08 24
Rice Mill Byproduct
91 39 41 0 37 7 32 50 60 0 5.7 19 0.25 0.48 2.2 0.30 31
Rye Grass Hay 90 58 58 26 58 66.07
i 10 30 33 38 65 98 3.3 8 0.45 0.30 2.2 0.18 27
Rye Grass Silage
32 59 59 28 59 14 25 22 37 59 61 3.3 8 0.43 0.38 2.9 0.73 0.23 29
Rye Straw 89 44 44 1 43 33.72 4 44 55 71 100 1.5 6 0.24 0.09 1.0 0.24 0.11
Rye Grain 89 80 86 56 83 84.83 14 20 3 9 19 34 2.5 3 0.07 0.55 0.5 0.03 0.17 33
Safflower Meal, Solv. Ext.
91 56 56 23 56 57.72 24 33 41 57 36 1.3 6 0.35 0.79 0.9 0.21 0.23 65
Safflower Meal Dehulled, Solv.
Ext. 91 75 79 50 77 70.55 47 11 20 27 30 0.8 7 0.38 1.50 1.2 0.18 0.22 36
Safflower Hulls 91 14 35 0 34 4 58 73 90 100 3.7 2
Sagebrush Fresh
50 50 50 12 49 59.04
j 13 25 30 38 9.2 10 1.00 0.25 0.22
Sanfoin Hay 88 61 62 31 62 14 60 24 3.1 9

Chapter 5: Quantifying Greenhouse Gas Sources and Sinks in Animal Production Systems
5-120
Feedstuff DM %
Energy Protein Fiber
EE%
ASH%
Ca %
P %
K %
Cl%
S %
Zn ppmTDN
% NEm NEg NEl
(Mcal/cwt.)
DE (% of
GE)a
CP%
UIP%
CF%
ADF%
NDF%
eNDF%
Shrimp Waste Meal
90 48 48 9 47 50 60 11 5.5 25 8.50 1.75 1.15
Sodium Tripolyphosphat
e 96 0 0 0 0 0 0 0 0 0 0.0 96 0.00 25.98 0.0 0.00
Sorghum Stover 87 54 54 20 54 5 33 41 65 100 1.8 10 0.50 0.12 1.2
Sorghum Silage 32 59 59 28 59 65.58 9 25 27 38 59 70 2.7 6 0.48 0.21 1.7 0.45 0.11 30
Sorghum Grain (Milo), Ground
89 82 89 59 85 11 55 3 6 15 5 3.1 2 0.04 0.32 0.4 0.10 0.14 18
Sorghum Grain (Milo), Flaked
82 90 100 68 94 11 62 3 6 15 38 3.1 2 0.04 0.28 0.4 0.10 0.14 18
Soybean Hay 89 52 52 16 51 54.10 16 33 40 55 92 3.5 8 1.28 0.29 1.0 0.15 0.24 24
Soybean Straw 88 42 43 0 40 45.98 5 44 54 70 100 1.4 6 1.59 0.06 0.6 0.26
Soybeans Whole
88 92 103 70 96 41 28 8 11 15 100 18.8 5 0.27 0.64 1.9 0.03 0.34 56
Soybeans Whole,
Extruded 88 93 104 71 97 40 35 9 11 15 100 18.8 5 0.27 0.64 2.0 0.03 0.34 56
Soybeans Whole, Roasted
88 93 104 71 97 40 48 9 11 15 100 18.8 5 0.27 0.64 2.0 0.03 0.34 56
Soybean Hulls 90 77 82 52 79 66.86 13 28 39 48 62 28 2.3 5 0.60 0.19 1.3 0.02 0.12 38
Soybean Meal, Solv. Ext. 44%
CP 89 84 92 61 87 79.50 49 35 7 10 15 23 1.5 7 0.36 0.70 2.2 0.07 0.41 62
Soybean Meal, Solv. Ext. 49%
CP 89 87 96 64 90 54 36 4 6 8 23 1.3 7 0.28 0.71 2.2 0.08 0.45 61
Soybean Mill Feed
90 50 50 12 49 15 36 46 1.9 6 0.46 0.19 1.7 0.07
Spelt Grain 88 75 79 50 77 77.18 13 27 10 17 21 34 2.1 4 0.04 0.40 0.4 0.15 47
Sudangrass Fresh Immature
18 70 73 44 71 73.27 17 23 29 55 41 3.9 9 0.46 0.36 2.0 0.11 24
Sudangrass Hay
88 57 57 25 57 62.67 9 30 36 43 67 98 1.8 10 0.50 0.22 2.2 0.80 0.12 26
Sudangrass Silage
31 58 58 26 58 60.29 10 28 30 42 64 61 3.1 10 0.58 0.27 2.4 0.52 0.14 29
Sunflower Meal, Solv. Ext.
92 65 66 37 66 44.89 40 27 18 22 36 23 2.8 8 0.44 0.97 1.1 0.15 0.33 55
Sunflower Meal with Hulls
91 57 57 25 57 31 35 27 32 44 37 2.4 7 0.40 1.03 1.0 0.30 85
Sunflower Seed Hulls
90 40 42 0 38 4 65 52 63 73 90 2.2 3 0.00 0.11 0.2 0.19 200
Sugar Cane Bagasse
91 39 41 0 37 52.15 1 49 60 86 100 0.6 4 0.90 0.29 0.5 0.10
Tapioca Meal, Cassava
Byproduct 89 82 89 59 85 1 5 8 34 0.8 3 0.03 0.05
Timothy Fresh Pre-Bloom
26 64 65 36 65 11 20 31 36 59 41 3.8 7 0.40 0.28 1.9 0.57 0.15 28
Timothy Hay Early Bloom
88 59 59 28 59 60.75 11 22 32 39 63 98 2.7 6 0.58 0.26 1.9 0.51 0.21 30
Timothy Hay Full Bloom
88 57 57 25 57 58.68 8 30 34 40 65 98 2.6 5 0.43 0.20 1.8 0.62 0.13 25
Timothy Silage 34 59 59 28 59 59.32 10 25 34 45 70 61 3.4 7 0.50 0.27 1.7 0.15
Tomatoes 6 69 71 43 70 16 9 11 4.0 6 0.14 0.35 4.2
Tomato Pomace Dried
92 64 65 36 65 53.98 23 26 50 55 34 10.6 6 0.43 0.59 3.6
Triticale Hay 90 56 56 23 56 10 34 41 69 98 0.30 0.26 2.3 25
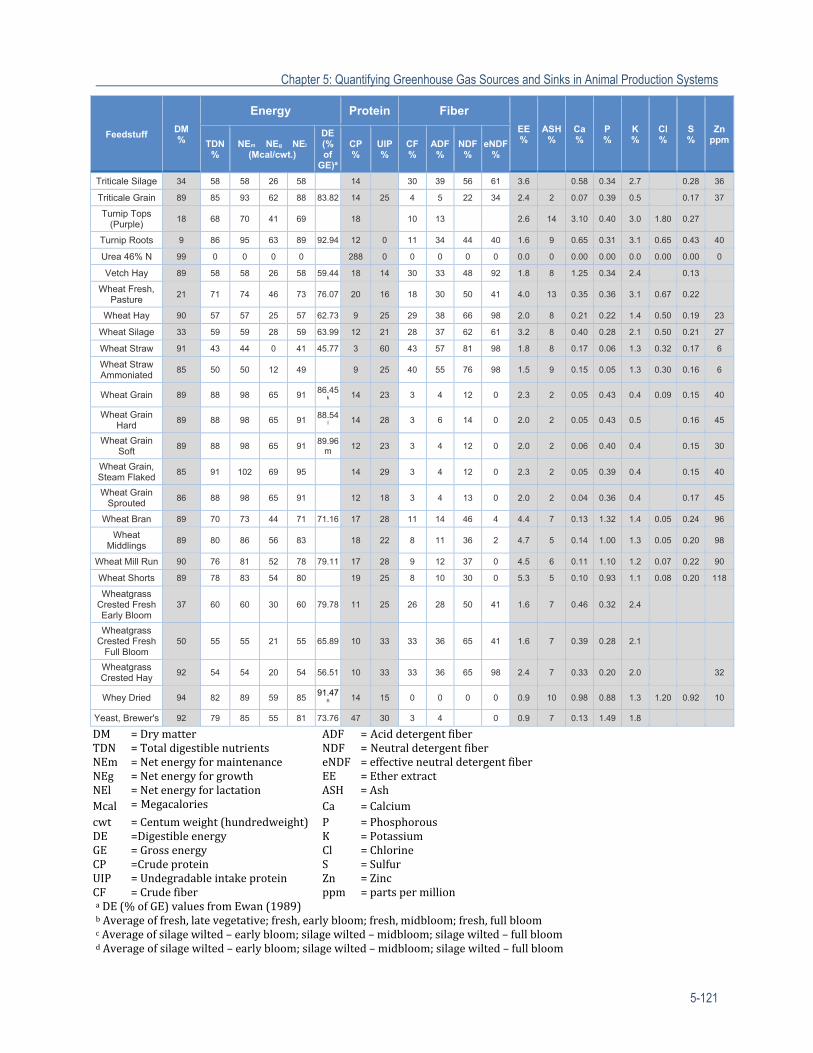
Chapter 5: Quantifying Greenhouse Gas Sources and Sinks in Animal Production Systems
5-121
Feedstuff DM %
Energy Protein Fiber
EE%
ASH%
Ca %
P %
K %
Cl%
S %
Zn ppmTDN
% NEm NEg NEl
(Mcal/cwt.)
DE (% of
GE)a
CP%
UIP%
CF%
ADF%
NDF%
eNDF%
Triticale Silage 34 58 58 26 58 14 30 39 56 61 3.6 0.58 0.34 2.7 0.28 36
Triticale Grain 89 85 93 62 88 83.82 14 25 4 5 22 34 2.4 2 0.07 0.39 0.5 0.17 37
Turnip Tops (Purple)
18 68 70 41 69 18 10 13 2.6 14 3.10 0.40 3.0 1.80 0.27
Turnip Roots 9 86 95 63 89 92.94 12 0 11 34 44 40 1.6 9 0.65 0.31 3.1 0.65 0.43 40
Urea 46% N 99 0 0 0 0 288 0 0 0 0 0 0.0 0 0.00 0.00 0.0 0.00 0.00 0
Vetch Hay 89 58 58 26 58 59.44 18 14 30 33 48 92 1.8 8 1.25 0.34 2.4 0.13
Wheat Fresh, Pasture
21 71 74 46 73 76.07 20 16 18 30 50 41 4.0 13 0.35 0.36 3.1 0.67 0.22
Wheat Hay 90 57 57 25 57 62.73 9 25 29 38 66 98 2.0 8 0.21 0.22 1.4 0.50 0.19 23
Wheat Silage 33 59 59 28 59 63.99 12 21 28 37 62 61 3.2 8 0.40 0.28 2.1 0.50 0.21 27
Wheat Straw 91 43 44 0 41 45.77 3 60 43 57 81 98 1.8 8 0.17 0.06 1.3 0.32 0.17 6
Wheat Straw Ammoniated
85 50 50 12 49 9 25 40 55 76 98 1.5 9 0.15 0.05 1.3 0.30 0.16 6
Wheat Grain 89 88 98 65 91 86.45
k 14 23 3 4 12 0 2.3 2 0.05 0.43 0.4 0.09 0.15 40
Wheat Grain Hard
89 88 98 65 91 88.54
l 14 28 3 6 14 0 2.0 2 0.05 0.43 0.5 0.16 45
Wheat Grain Soft
89 88 98 65 91 89.96
m 12 23 3 4 12 0 2.0 2 0.06 0.40 0.4 0.15 30
Wheat Grain, Steam Flaked
85 91 102 69 95 14 29 3 4 12 0 2.3 2 0.05 0.39 0.4 0.15 40
Wheat Grain Sprouted
86 88 98 65 91 12 18 3 4 13 0 2.0 2 0.04 0.36 0.4 0.17 45
Wheat Bran 89 70 73 44 71 71.16 17 28 11 14 46 4 4.4 7 0.13 1.32 1.4 0.05 0.24 96
Wheat Middlings
89 80 86 56 83 18 22 8 11 36 2 4.7 5 0.14 1.00 1.3 0.05 0.20 98
Wheat Mill Run 90 76 81 52 78 79.11 17 28 9 12 37 0 4.5 6 0.11 1.10 1.2 0.07 0.22 90
Wheat Shorts 89 78 83 54 80 19 25 8 10 30 0 5.3 5 0.10 0.93 1.1 0.08 0.20 118
Wheatgrass Crested Fresh Early Bloom
37 60 60 30 60 79.78 11 25 26 28 50 41 1.6 7 0.46 0.32 2.4
Wheatgrass Crested Fresh
Full Bloom 50 55 55 21 55 65.89 10 33 33 36 65 41 1.6 7 0.39 0.28 2.1
Wheatgrass Crested Hay
92 54 54 20 54 56.51 10 33 33 36 65 98 2.4 7 0.33 0.20 2.0 32
Whey Dried 94 82 89 59 85 91.47
n 14 15 0 0 0 0 0.9 10 0.98 0.88 1.3 1.20 0.92 10
Yeast, Brewer's 92 79 85 55 81 73.76 47 30 3 4 0 0.9 7 0.13 1.49 1.8
DM =Drymatter ADF = AciddetergentfiberTDN =Totaldigestiblenutrients NDF = NeutraldetergentfiberNEm =Netenergyformaintenance eNDF = effectiveneutraldetergentfiberNEg =Netenergyforgrowth EE = EtherextractNEl =Netenergyforlactation ASH =AshMcal =Megacalories Ca =Calciumcwt =Centumweight(hundredweight) P =PhosphorousDE =Digestibleenergy K = PotassiumGE =Grossenergy Cl =ChlorineCP =Crudeprotein S =SulfurUIP =Undegradableintakeprotein Zn =ZincCF =Crudefiber ppm =partspermillionaDE(%ofGE)valuesfromEwan(1989)bAverageoffresh,latevegetative;fresh,earlybloom;fresh,midbloom;fresh,fullbloomcAverageofsilagewilted–earlybloom;silagewilted–midbloom;silagewilted–fullbloomdAverageofsilagewilted–earlybloom;silagewilted–midbloom;silagewilted–fullbloom

Chapter 5: Quantifying Greenhouse Gas Sources and Sinks in Animal Production Systems
5-122
eAverageofhay–sun‐cured,latevegetative;hay–sun‐cured,latebloomfAverageoffat,animalpoultry;oil,vegetablegAverageofsilage,latevegetative;silage,doughstagehAverageofhay,sun‐cured,earlybloom;hay,sun‐cured,latebloomiAverageofryegrass,ItalianLoliummultiflorum:hay,sun‐cured,latevegetative;hay,sun‐cured,earlybloom;averageofryegrass,perennialLoliumperenne:hay,sun‐curedjAverageofsagebrush,bigArtemisiatridentate:browse,fresh,stem‐cured;sagebrush,budArtemisiaspinescens:browse,fresh,earlyvegetative;browse,fresh,latevegetative;andsagebrush,fringedArtemisiafrigida:browse,fresh,midbloom;browse,fresh,maturekAverageofwheat,DurumTriticumdurumandwheatTriticumaestivumgrainlAverageofgrain,hardredspring;grain,hardwintermAverageofgrain,softredwinter;grain,softwhitewinter;grain,softwhitewinter,pacificcoastnAverageofdehydrated(cattle)andlowlactose,lowlactose,dehydrated(driedwheyproduct)(cattle)
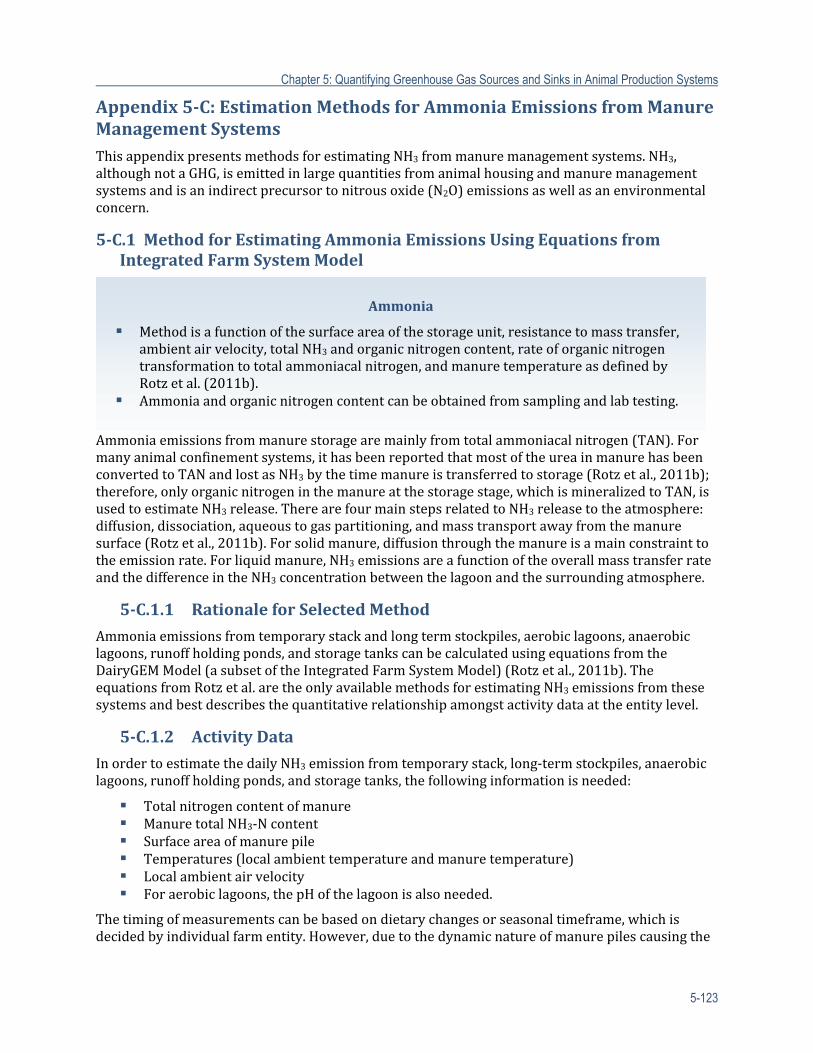
Chapter 5: Quantifying Greenhouse Gas Sources and Sinks in Animal Production Systems
5-123
Appendix5‐C:EstimationMethodsforAmmoniaEmissionsfromManureManagementSystemsThisappendixpresentsmethodsforestimatingNH3frommanuremanagementsystems.NH3,althoughnotaGHG,isemittedinlargequantitiesfromanimalhousingandmanuremanagementsystemsandisanindirectprecursortonitrousoxide(N2O)emissionsaswellasanenvironmentalconcern.
5‐C.1 MethodforEstimatingAmmoniaEmissionsUsingEquationsfromIntegratedFarmSystemModel
Ammoniaemissionsfrommanurestoragearemainlyfromtotalammoniacalnitrogen(TAN).Formanyanimalconfinementsystems,ithasbeenreportedthatmostoftheureainmanurehasbeenconvertedtoTANandlostasNH3bythetimemanureistransferredtostorage(Rotzetal.,2011b);therefore,onlyorganicnitrogeninthemanureatthestoragestage,whichismineralizedtoTAN,isusedtoestimateNH3release.TherearefourmainstepsrelatedtoNH3releasetotheatmosphere:diffusion,dissociation,aqueoustogaspartitioning,andmasstransportawayfromthemanuresurface(Rotzetal.,2011b).Forsolidmanure,diffusionthroughthemanureisamainconstrainttotheemissionrate.Forliquidmanure,NH3emissionsareafunctionoftheoverallmasstransferrateandthedifferenceintheNH3concentrationbetweenthelagoonandthesurroundingatmosphere.
5‐C.1.1 RationaleforSelectedMethod
Ammoniaemissionsfromtemporarystackandlongtermstockpiles,aerobiclagoons,anaerobiclagoons,runoffholdingponds,andstoragetankscanbecalculatedusingequationsfromtheDairyGEMModel(asubsetoftheIntegratedFarmSystemModel)(Rotzetal.,2011b).TheequationsfromRotzetal.aretheonlyavailablemethodsforestimatingNH3emissionsfromthesesystemsandbestdescribesthequantitativerelationshipamongstactivitydataattheentitylevel.
5‐C.1.2 ActivityData
InordertoestimatethedailyNH3emissionfromtemporarystack,long‐termstockpiles,anaerobiclagoons,runoffholdingponds,andstoragetanks,thefollowinginformationisneeded:
Totalnitrogencontentofmanure ManuretotalNH3‐Ncontent Surfaceareaofmanurepile Temperatures(localambienttemperatureandmanuretemperature) Localambientairvelocity Foraerobiclagoons,thepHofthelagoonisalsoneeded.
Thetimingofmeasurementscanbebasedondietarychangesorseasonaltimeframe,whichisdecidedbyindividualfarmentity.However,duetothedynamicnatureofmanurepilescausingthe
Ammonia
Methodisafunctionofthesurfaceareaofthestorageunit,resistancetomasstransfer,ambientairvelocity,totalNH3andorganicnitrogencontent,rateoforganicnitrogentransformationtototalammoniacalnitrogen,andmanuretemperatureasdefinedbyRotzetal.(2011b).
Ammoniaandorganicnitrogencontentcanbeobtainedfromsamplingandlabtesting.
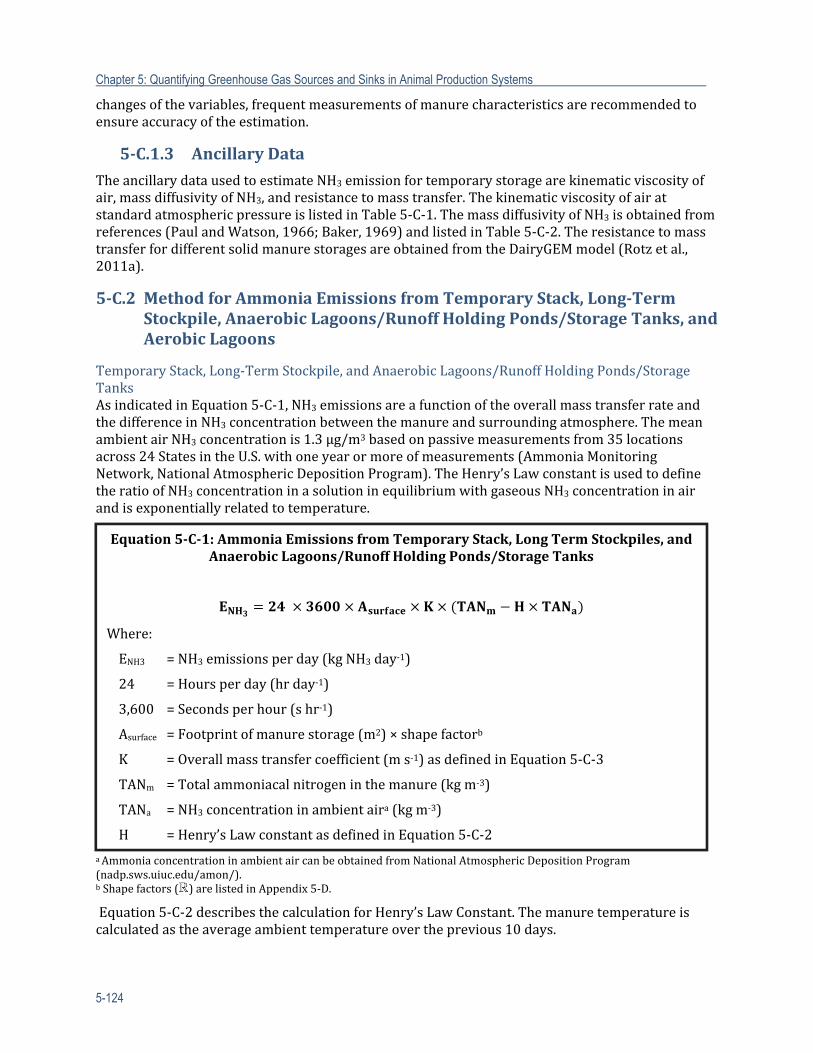
Chapter 5: Quantifying Greenhouse Gas Sources and Sinks in Animal Production Systems
5-124
changesofthevariables,frequentmeasurementsofmanurecharacteristicsarerecommendedtoensureaccuracyoftheestimation.
5‐C.1.3 AncillaryData
TheancillarydatausedtoestimateNH3emissionfortemporarystoragearekinematicviscosityofair,massdiffusivityofNH3,andresistancetomasstransfer.ThekinematicviscosityofairatstandardatmosphericpressureislistedinTable5‐C‐1.ThemassdiffusivityofNH3isobtainedfromreferences(PaulandWatson,1966;Baker,1969)andlistedinTable5‐C‐2.TheresistancetomasstransferfordifferentsolidmanurestoragesareobtainedfromtheDairyGEMmodel(Rotzetal.,2011a).
5‐C.2 MethodforAmmoniaEmissionsfromTemporaryStack,Long‐TermStockpile,AnaerobicLagoons/RunoffHoldingPonds/StorageTanks,andAerobicLagoons
TemporaryStack,Long‐TermStockpile,andAnaerobicLagoons/RunoffHoldingPonds/StorageTanksAsindicatedinEquation5‐C‐1,NH3emissionsareafunctionoftheoverallmasstransferrateandthedifferenceinNH3concentrationbetweenthemanureandsurroundingatmosphere.ThemeanambientairNH3concentrationis1.3µg/m3basedonpassivemeasurementsfrom35locationsacross24StatesintheU.S.withoneyearormoreofmeasurements(AmmoniaMonitoringNetwork,NationalAtmosphericDepositionProgram).TheHenry’sLawconstantisusedtodefinetheratioofNH3concentrationinasolutioninequilibriumwithgaseousNH3concentrationinairandisexponentiallyrelatedtotemperature.
aAmmoniaconcentrationinambientaircanbeobtainedfromNationalAtmosphericDepositionProgram(nadp.sws.uiuc.edu/amon/).bShapefactors( )arelistedinAppendix5‐D.
Equation5‐C‐2describesthecalculationforHenry’sLawConstant.Themanuretemperatureiscalculatedastheaverageambienttemperatureovertheprevious10days.
Equation5‐C‐1:AmmoniaEmissionsfromTemporaryStack,LongTermStockpiles,andAnaerobicLagoons/RunoffHoldingPonds/StorageTanks
Where:
ENH3 =NH3emissionsperday(kgNH3day‐1)
24 =Hoursperday(hrday‐1)
3,600 =Secondsperhour(shr‐1)
Asurface =Footprintofmanurestorage(m2)×shapefactorb
K =Overallmasstransfercoefficient(ms‐1)asdefinedinEquation5‐C‐3
TANm =Totalammoniacalnitrogeninthemanure(kgm‐3)
TANa =NH3concentrationinambientaira(kgm‐3)
H =Henry’sLawconstantasdefinedinEquation5‐C‐2
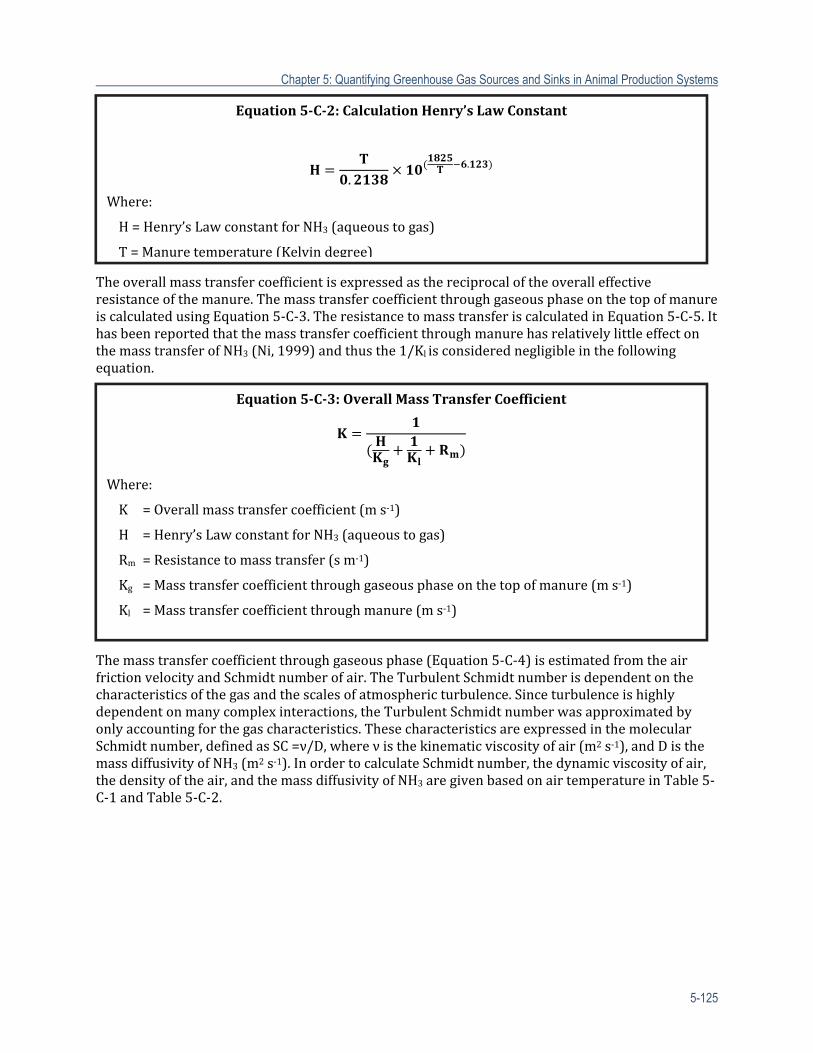
Chapter 5: Quantifying Greenhouse Gas Sources and Sinks in Animal Production Systems
5-125
Theoverallmasstransfercoefficientisexpressedasthereciprocaloftheoveralleffectiveresistanceofthemanure.ThemasstransfercoefficientthroughgaseousphaseonthetopofmanureiscalculatedusingEquation5‐C‐3.TheresistancetomasstransferiscalculatedinEquation5‐C‐5.IthasbeenreportedthatthemasstransfercoefficientthroughmanurehasrelativelylittleeffectonthemasstransferofNH3(Ni,1999)andthusthe1/Klisconsiderednegligibleinthefollowingequation.
Themasstransfercoefficientthroughgaseousphase(Equation5‐C‐4)isestimatedfromtheairfrictionvelocityandSchmidtnumberofair.TheTurbulentSchmidtnumberisdependentonthecharacteristicsofthegasandthescalesofatmosphericturbulence.Sinceturbulenceishighlydependentonmanycomplexinteractions,theTurbulentSchmidtnumberwasapproximatedbyonlyaccountingforthegascharacteristics.ThesecharacteristicsareexpressedinthemolecularSchmidtnumber,definedasSC=ν/D,whereνisthekinematicviscosityofair(m2s‐1),andDisthemassdiffusivityofNH3(m2s‐1).InordertocalculateSchmidtnumber,thedynamicviscosityofair,thedensityoftheair,andthemassdiffusivityofNH3aregivenbasedonairtemperatureinTable5‐C‐1andTable5‐C‐2.
Equation5‐C‐2:CalculationHenry’sLawConstant
..
Where:
H=Henry’sLawconstantforNH3(aqueoustogas)
T=Manuretemperature(Kelvindegree)
Equation5‐C‐3:OverallMassTransferCoefficient
Where:
K =Overallmasstransfercoefficient(ms‐1)
H =Henry’sLawconstantforNH3(aqueoustogas)
Rm =Resistancetomasstransfer(sm‐1)
Kg =Masstransfercoefficientthroughgaseousphaseonthetopofmanure(ms‐1)
Kl =Masstransfercoefficientthroughmanure(ms‐1)
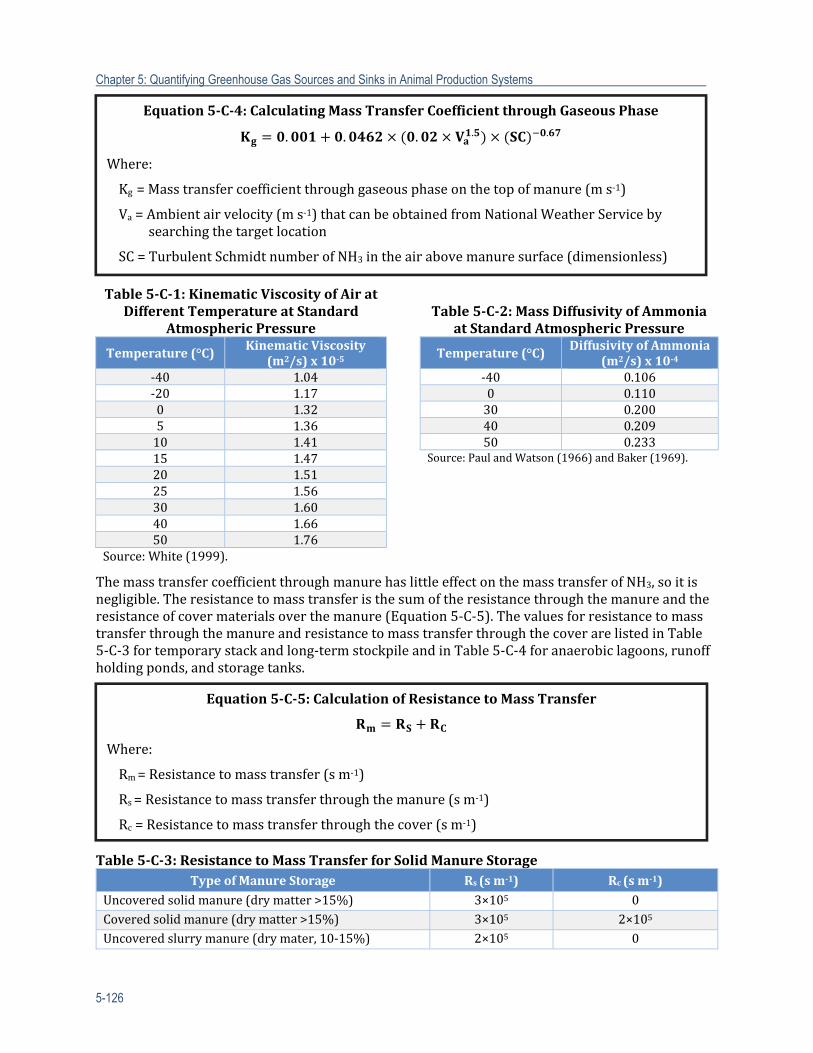
Chapter 5: Quantifying Greenhouse Gas Sources and Sinks in Animal Production Systems
5-126
ThemasstransfercoefficientthroughmanurehaslittleeffectonthemasstransferofNH3,soitisnegligible.Theresistancetomasstransferisthesumoftheresistancethroughthemanureandtheresistanceofcovermaterialsoverthemanure(Equation5‐C‐5).ThevaluesforresistancetomasstransferthroughthemanureandresistancetomasstransferthroughthecoverarelistedinTable5‐C‐3fortemporarystackandlong‐termstockpileandinTable5‐C‐4foranaerobiclagoons,runoffholdingponds,andstoragetanks.
Table5‐C‐3:ResistancetoMassTransferforSolidManureStorageTypeofManureStorage Rs(sm‐1) Rc(sm‐1)
Uncoveredsolidmanure(drymatter>15%) 3×10⁵ 0Coveredsolidmanure(drymatter>15%) 3×10⁵ 2×10⁵Uncoveredslurrymanure(drymater,10‐15%) 2×10⁵ 0
Table5‐C‐1:KinematicViscosityofAiratDifferentTemperatureatStandard
AtmosphericPressure
Temperature(°C)KinematicViscosity
(m2/s)x10‐5‐40 1.04‐20 1.170 1.325 1.3610 1.4115 1.4720 1.5125 1.5630 1.6040 1.6650 1.76
Source:White(1999).
Table5‐C‐2:Mass DiffusivityofAmmoniaatStandardAtmosphericPressure
Temperature(°C)DiffusivityofAmmonia
(m2/s)x10‐4‐40 0.1060 0.11030 0.20040 0.20950 0.233
Source:PaulandWatson (1966)andBaker(1969).
Equation5‐C‐4:CalculatingMassTransferCoefficientthroughGaseousPhase
. . . . .
Where:
Kg=Masstransfercoefficientthroughgaseousphaseonthetopofmanure(ms‐1)
Va=Ambientairvelocity(ms‐1)thatcanbeobtainedfromNationalWeatherServicebysearchingthetargetlocation
SC=TurbulentSchmidtnumberofNH3intheairabovemanuresurface(dimensionless)
Equation5‐C‐5:CalculationofResistancetoMassTransfer
Where:
Rm=Resistancetomasstransfer(sm‐1)
Rs=Resistancetomasstransferthroughthemanure(sm‐1)
Rc=Resistancetomasstransferthroughthecover(sm‐1)
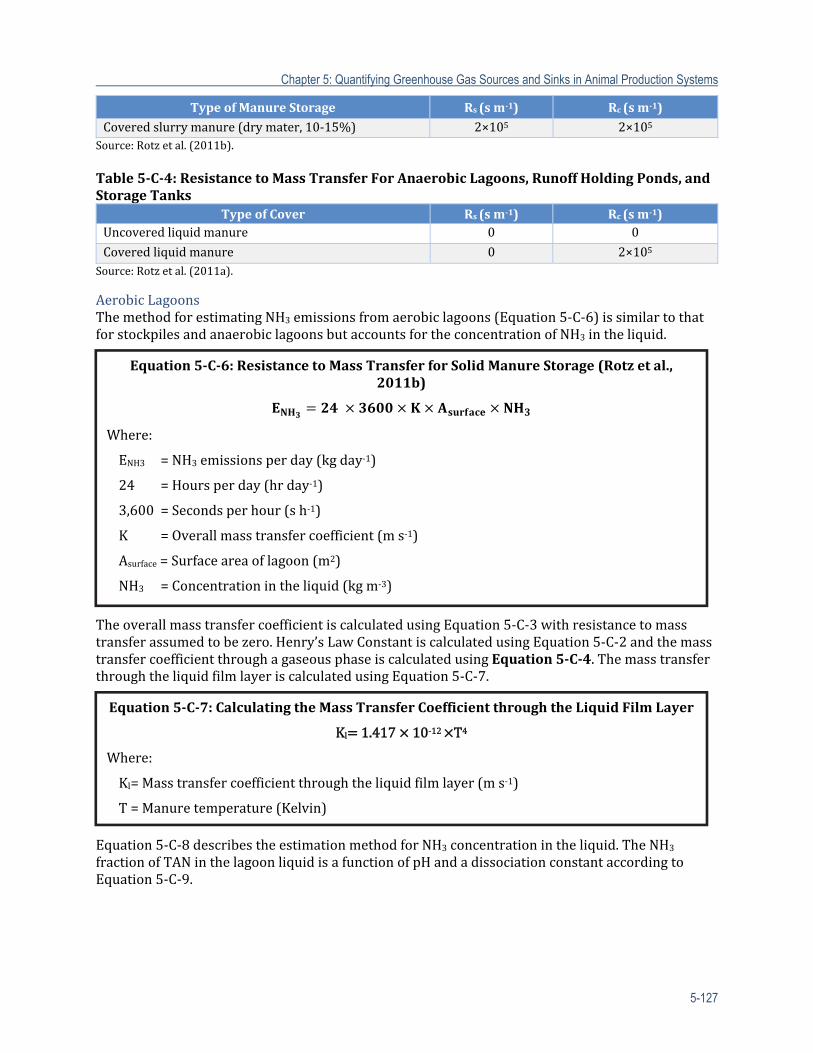
Chapter 5: Quantifying Greenhouse Gas Sources and Sinks in Animal Production Systems
5-127
TypeofManureStorage Rs(sm‐1) Rc(sm‐1)Coveredslurrymanure(drymater,10‐15%) 2×10⁵ 2×10⁵
Source:Rotzetal.(2011b).Table5‐C‐4:ResistancetoMassTransferForAnaerobicLagoons,RunoffHoldingPonds,andStorageTanks
TypeofCover Rs(sm‐1) Rc(sm‐1)Uncoveredliquidmanure 0 0
Coveredliquidmanure 0 2×10⁵Source:Rotzetal.(2011a).
AerobicLagoonsThemethodforestimatingNH3emissionsfromaerobiclagoons(Equation5‐C‐6)issimilartothatforstockpilesandanaerobiclagoonsbutaccountsfortheconcentrationofNH3intheliquid.
TheoverallmasstransfercoefficientiscalculatedusingEquation5‐C‐3withresistancetomasstransferassumedtobezero.Henry’sLawConstantiscalculatedusingEquation5‐C‐2andthemasstransfercoefficientthroughagaseousphaseiscalculatedusingEquation5‐C‐4.ThemasstransferthroughtheliquidfilmlayeriscalculatedusingEquation5‐C‐7.
Equation5‐C‐8describestheestimationmethodforNH3concentrationintheliquid.TheNH3fractionofTANinthelagoonliquidisafunctionofpHandadissociationconstantaccordingtoEquation5‐C‐9.
Equation5‐C‐6:ResistancetoMassTransferforSolidManureStorage(Rotzetal.,2011b)
Where:
ENH3 =NH3emissionsperday(kgday‐1)
24 =Hoursperday(hrday‐1)
3,600=Secondsperhour(sh‐1)
K =Overallmasstransfercoefficient(ms‐1)
Asurface=Surfaceareaoflagoon(m2)
NH3 =Concentrationintheliquid(kgm‐3)
Equation5‐C‐7:CalculatingtheMassTransferCoefficientthroughtheLiquidFilmLayer
Kl 1.417 10‐12 T4
Where:
Kl=Masstransfercoefficientthroughtheliquidfilmlayer(ms‐1)
T=Manuretemperature(Kelvin)
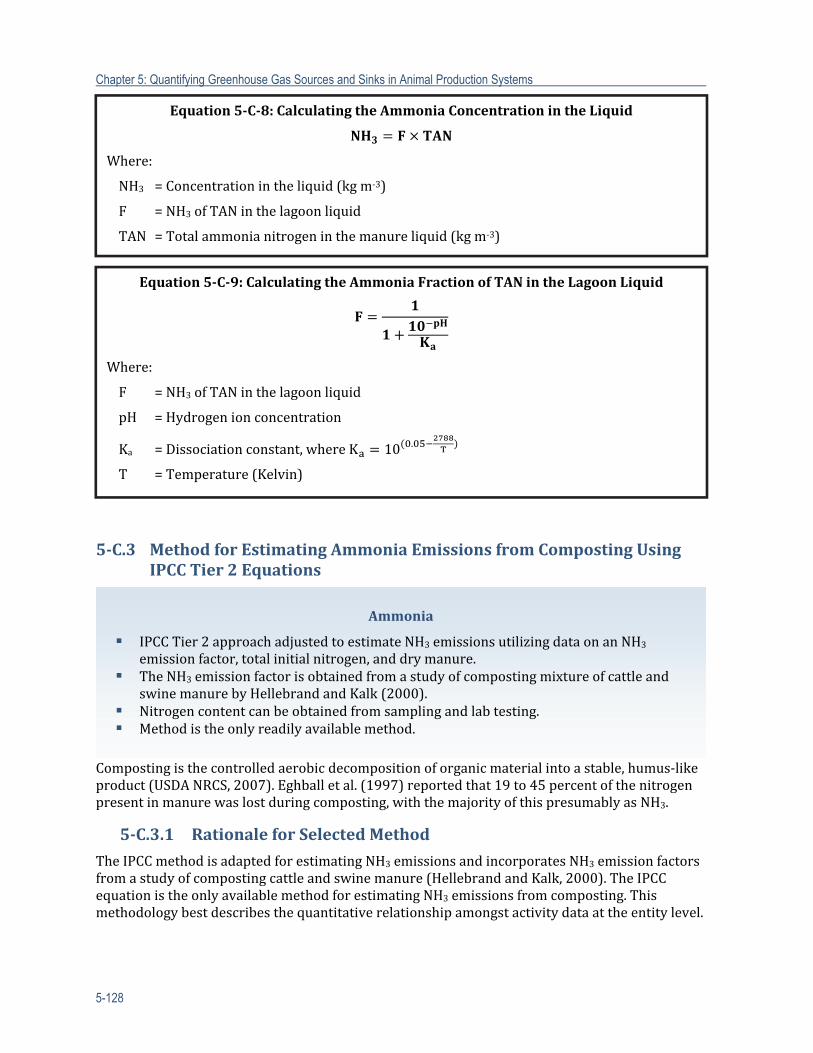
Chapter 5: Quantifying Greenhouse Gas Sources and Sinks in Animal Production Systems
5-128
5‐C.3 MethodforEstimatingAmmoniaEmissionsfromCompostingUsingIPCCTier2Equations
Compostingisthecontrolledaerobicdecompositionoforganicmaterialintoastable,humus‐likeproduct(USDANRCS,2007).Eghballetal.(1997)reportedthat19to45percentofthenitrogenpresentinmanurewaslostduringcomposting,withthemajorityofthispresumablyasNH3.
5‐C.3.1 RationaleforSelectedMethod
TheIPCCmethodisadaptedforestimatingNH3emissionsandincorporatesNH3emissionfactorsfromastudyofcompostingcattleandswinemanure(HellebrandandKalk,2000).TheIPCCequationistheonlyavailablemethodforestimatingNH3emissionsfromcomposting.Thismethodologybestdescribesthequantitativerelationshipamongstactivitydataattheentitylevel.
Equation5‐C‐8:CalculatingtheAmmoniaConcentrationintheLiquid
Where:
NH3 =Concentrationintheliquid(kgm‐3)
F =NH3ofTANinthelagoonliquid
TAN =Totalammonianitrogeninthemanureliquid(kgm‐3)
Equation5‐C‐9:CalculatingtheAmmoniaFractionofTANintheLagoonLiquid
Where:
F =NH3ofTANinthelagoonliquid
pH =Hydrogenionconcentration
Ka =Dissociationconstant,whereK 10 .
T =Temperature(Kelvin)
Ammonia
IPCCTier2approachadjustedtoestimateNH3emissionsutilizingdataonanNH3emissionfactor,totalinitialnitrogen,anddrymanure.
TheNH3emissionfactorisobtainedfromastudyofcompostingmixtureofcattleandswinemanurebyHellebrandandKalk(2000).
Nitrogencontentcanbeobtainedfromsamplingandlabtesting. Methodistheonlyreadilyavailablemethod.
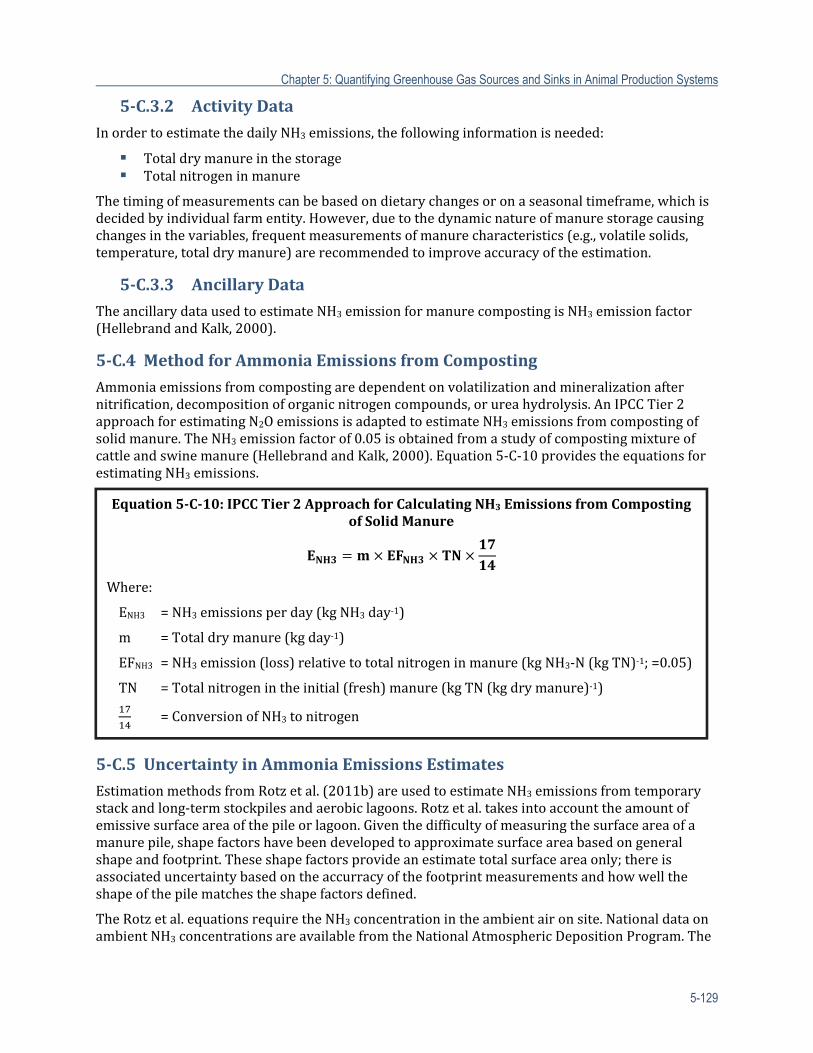
Chapter 5: Quantifying Greenhouse Gas Sources and Sinks in Animal Production Systems
5-129
5‐C.3.2 ActivityData
InordertoestimatethedailyNH3emissions,thefollowinginformationisneeded:
Totaldrymanureinthestorage Totalnitrogeninmanure
Thetimingofmeasurementscanbebasedondietarychangesoronaseasonaltimeframe,whichisdecidedbyindividualfarmentity.However,duetothedynamicnatureofmanurestoragecausingchangesinthevariables,frequentmeasurementsofmanurecharacteristics(e.g.,volatilesolids,temperature,totaldrymanure)arerecommendedtoimproveaccuracyoftheestimation.
5‐C.3.3 AncillaryData
TheancillarydatausedtoestimateNH3emissionformanurecompostingisNH3emissionfactor(HellebrandandKalk,2000).
5‐C.4 MethodforAmmoniaEmissionsfromComposting
Ammoniaemissionsfromcompostingaredependentonvolatilizationandmineralizationafternitrification,decompositionoforganicnitrogencompounds,orureahydrolysis.AnIPCCTier2approachforestimatingN2OemissionsisadaptedtoestimateNH3emissionsfromcompostingofsolidmanure.TheNH3emissionfactorof0.05isobtainedfromastudyofcompostingmixtureofcattleandswinemanure(HellebrandandKalk,2000).Equation5‐C‐10providestheequationsforestimatingNH3emissions.
5‐C.5 UncertaintyinAmmoniaEmissionsEstimates
EstimationmethodsfromRotzetal.(2011b)areusedtoestimateNH3emissionsfromtemporarystackandlong‐termstockpilesandaerobiclagoons.Rotzetal.takesintoaccounttheamountofemissivesurfaceareaofthepileorlagoon.Giventhedifficultyofmeasuringthesurfaceareaofamanurepile,shapefactorshavebeendevelopedtoapproximatesurfaceareabasedongeneralshapeandfootprint.Theseshapefactorsprovideanestimatetotalsurfaceareaonly;thereisassociateduncertaintybasedontheaccurracyofthefootprintmeasurementsandhowwelltheshapeofthepilematchestheshapefactorsdefined.
TheRotzetal.equationsrequiretheNH3concentrationintheambientaironsite.NationaldataonambientNH3concentrationsareavailablefromtheNationalAtmosphericDepositionProgram.The
Equation5‐C‐10:IPCCTier2ApproachforCalculatingNH3 EmissionsfromCompostingofSolidManure
Where:
ENH3 =NH3emissionsperday(kgNH3day‐1)
m =Totaldrymanure(kgday‐1)
EFNH3 =NH3emission(loss)relativetototalnitrogeninmanure(kgNH3‐N(kgTN)‐1;=0.05)
TN =Totalnitrogenintheinitial(fresh)manure(kgTN(kgdrymanure)‐1)
=ConversionofNH3tonitrogen
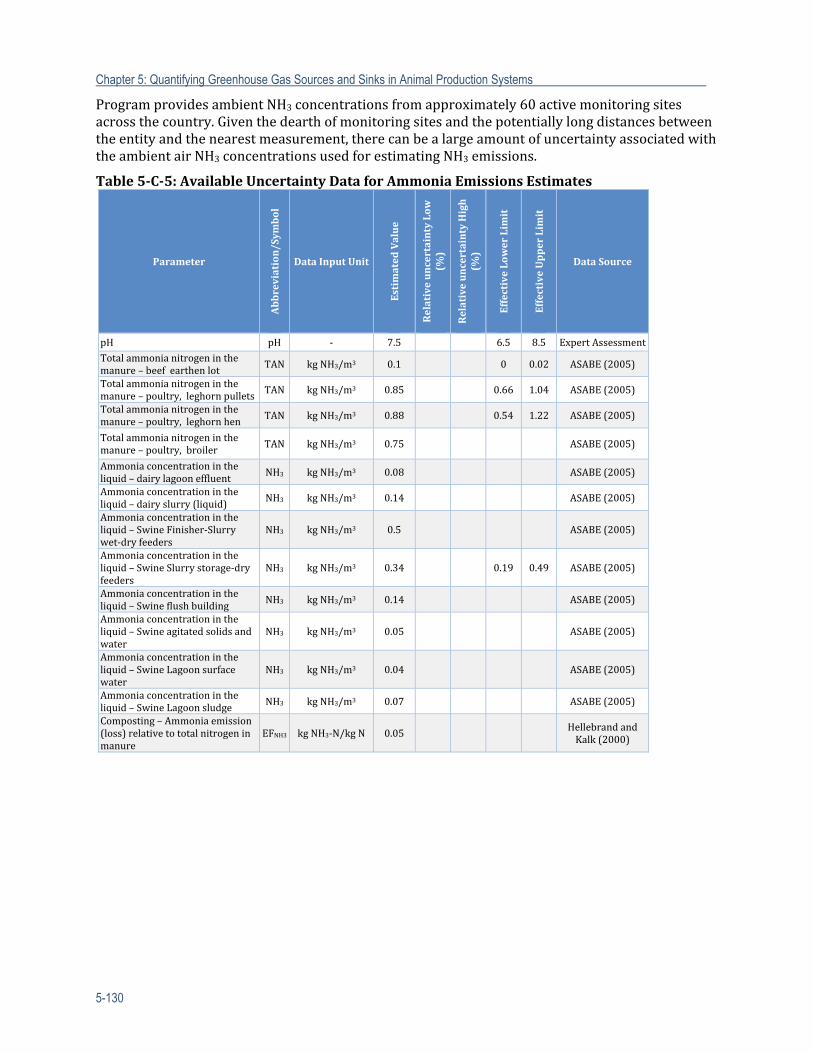
Chapter 5: Quantifying Greenhouse Gas Sources and Sinks in Animal Production Systems
5-130
ProgramprovidesambientNH3concentrationsfromapproximately60activemonitoringsitesacrossthecountry.Giventhedearthofmonitoringsitesandthepotentiallylongdistancesbetweentheentityandthenearestmeasurement,therecanbealargeamountofuncertaintyassociatedwiththeambientairNH3concentrationsusedforestimatingNH3emissions.
Table5‐C‐5:AvailableUncertaintyDataforAmmoniaEmissionsEstimates
ParameterAbbreviation/Sym
bol
DataInputUnit
EstimatedValue
RelativeuncertaintyLow
(%
)
RelativeuncertaintyHigh
(%)
EffectiveLowerLimit
EffectiveUpperLimit
DataSource
pH pH ‐ 7.5 6.5 8.5 ExpertAssessment
Totalammonianitrogeninthemanure–beefearthenlot
TAN kgNH3/m3 0.1 0 0.02 ASABE(2005)
Totalammonianitrogeninthemanure–poultry,leghornpullets
TAN kgNH3/m3 0.85 0.66 1.04 ASABE(2005)
Totalammonianitrogeninthemanure–poultry,leghornhen
TAN kgNH3/m3 0.88 0.54 1.22 ASABE(2005)
Totalammonianitrogeninthemanure–poultry,broiler
TAN kgNH3/m3 0.75 ASABE(2005)
Ammoniaconcentrationintheliquid–dairylagooneffluent
NH3 kgNH3/m3 0.08 ASABE(2005)
Ammoniaconcentrationintheliquid–dairyslurry(liquid)
NH3 kgNH3/m3 0.14 ASABE(2005)
Ammoniaconcentrationintheliquid–SwineFinisher‐Slurrywet‐dryfeeders
NH3 kgNH3/m3 0.5 ASABE(2005)
Ammoniaconcentrationintheliquid–SwineSlurrystorage‐dryfeeders
NH3 kgNH3/m3 0.34 0.19 0.49 ASABE(2005)
Ammoniaconcentrationintheliquid–Swineflushbuilding
NH3 kgNH3/m3 0.14 ASABE(2005)
Ammoniaconcentrationintheliquid–Swineagitatedsolidsandwater
NH3 kgNH3/m3 0.05 ASABE(2005)
Ammoniaconcentrationintheliquid–SwineLagoonsurfacewater
NH3 kgNH3/m3 0.04 ASABE(2005)
Ammoniaconcentrationintheliquid–SwineLagoonsludge
NH3 kgNH3/m3 0.07 ASABE(2005)
Composting–Ammoniaemission(loss)relativetototalnitrogeninmanure
EFNH3 kgNH3‐N/kgN 0.05 HellebrandandKalk(2000)
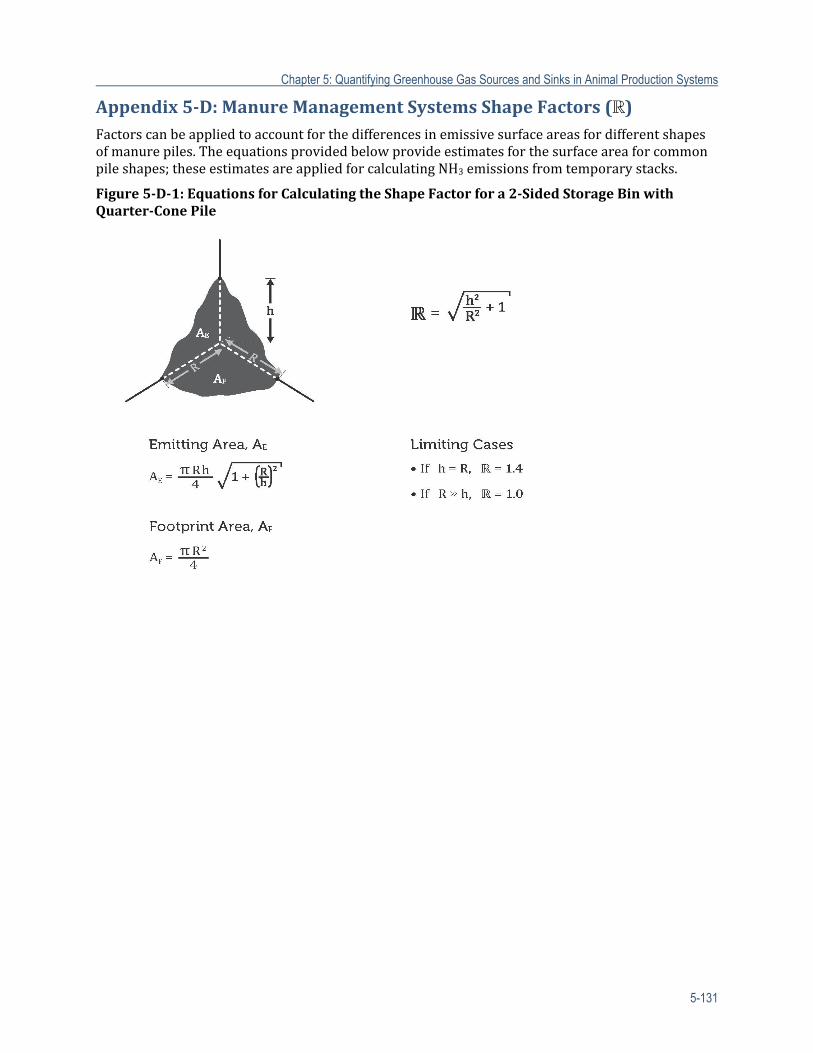
Chapter 5: Quantifying Greenhouse Gas Sources and Sinks in Animal Production Systems
5-131
Appendix5‐D:ManureManagementSystemsShapeFactors( )Factorscanbeappliedtoaccountforthedifferencesinemissivesurfaceareasfordifferentshapesofmanurepiles.Theequationsprovidedbelowprovideestimatesforthesurfaceareaforcommonpileshapes;theseestimatesareappliedforcalculatingNH3emissionsfromtemporarystacks.
Figure5‐D‐1:EquationsforCalculatingtheShapeFactorfora2‐SidedStorageBinwithQuarter‐ConePile
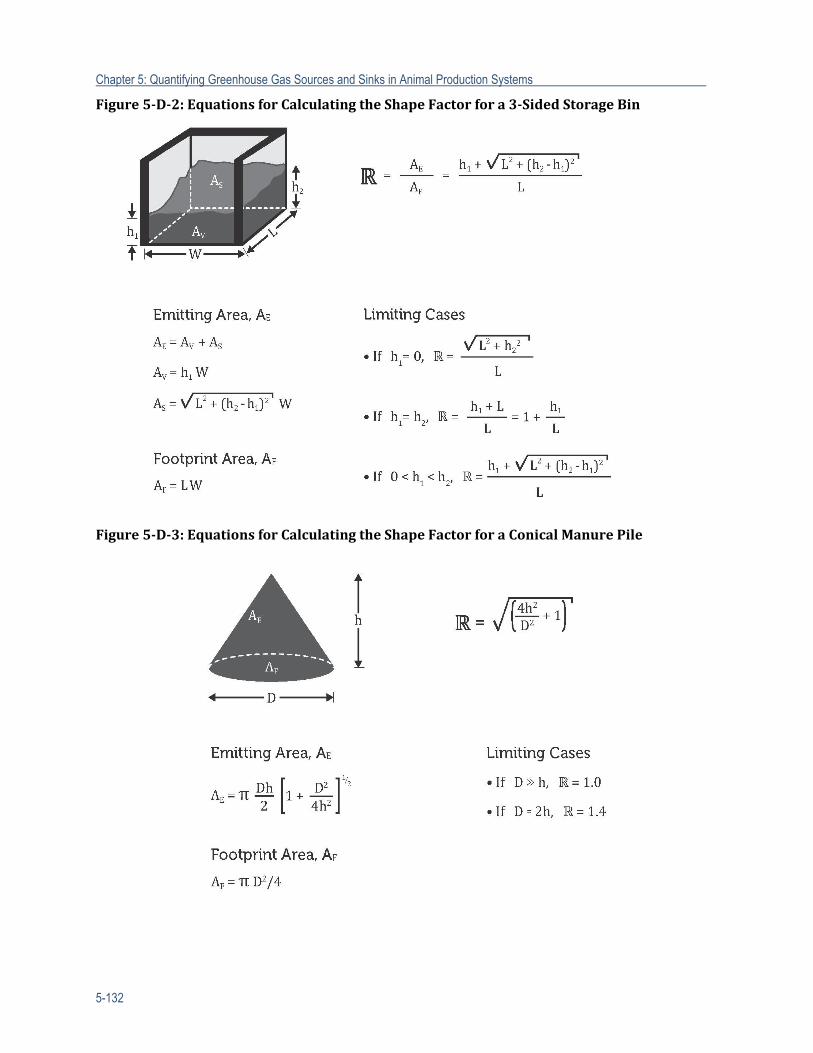
Chapter 5: Quantifying Greenhouse Gas Sources and Sinks in Animal Production Systems
5-132
Figure5‐D‐2:EquationsforCalculatingtheShapeFactorfora3‐SidedStorageBin
Figure5‐D‐3:EquationsforCalculatingtheShapeFactorforaConicalManurePile
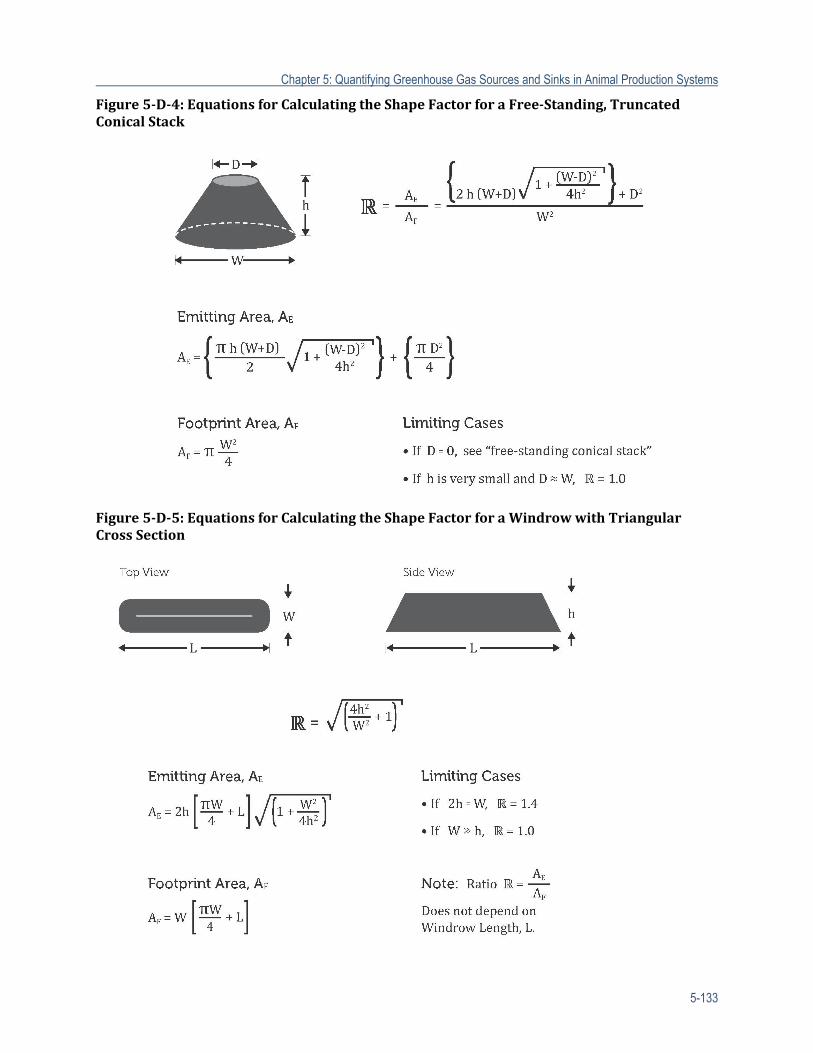
Chapter 5: Quantifying Greenhouse Gas Sources and Sinks in Animal Production Systems
5-133
Figure5‐D‐4:EquationsforCalculatingtheShapeFactorforaFree‐Standing,TruncatedConicalStack
Figure5‐D‐5:EquationsforCalculatingtheShapeFactorforaWindrowwithTriangularCrossSection
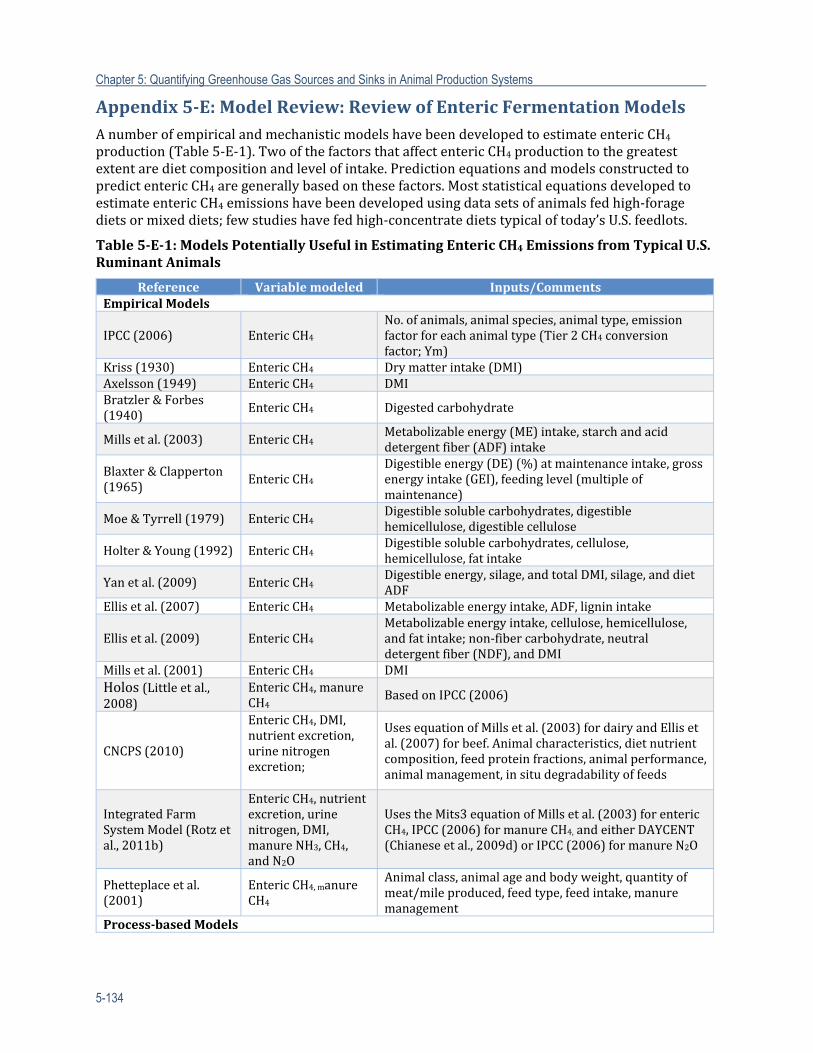
Chapter 5: Quantifying Greenhouse Gas Sources and Sinks in Animal Production Systems
5-134
Appendix5‐E:ModelReview:ReviewofEntericFermentationModelsAnumberofempiricalandmechanisticmodelshavebeendevelopedtoestimateentericCH4
production(Table5‐E‐1).TwoofthefactorsthataffectentericCH4productiontothegreatestextentaredietcompositionandlevelofintake.PredictionequationsandmodelsconstructedtopredictentericCH4aregenerallybasedonthesefactors.MoststatisticalequationsdevelopedtoestimateentericCH4emissionshavebeendevelopedusingdatasetsofanimalsfedhigh‐foragedietsormixeddiets;fewstudieshavefedhigh‐concentratedietstypicaloftoday’sU.S.feedlots.
Table5‐E‐1:ModelsPotentiallyUsefulinEstimatingEntericCH4EmissionsfromTypicalU.S.RuminantAnimals
Reference Variablemodeled Inputs/CommentsEmpiricalModels
IPCC(2006) EntericCH4No.ofanimals,animalspecies,animaltype,emissionfactorforeachanimaltype(Tier2CH4conversionfactor;Ym)
Kriss(1930) EntericCH4 Drymatterintake(DMI)Axelsson(1949) EntericCH4 DMIBratzler&Forbes(1940)
EntericCH4 Digestedcarbohydrate
Millsetal.(2003) EntericCH4Metabolizableenergy(ME)intake,starchandaciddetergentfiber(ADF)intake
Blaxter&Clapperton(1965)
EntericCH4Digestibleenergy(DE)(%)atmaintenanceintake,grossenergyintake(GEI),feedinglevel(multipleofmaintenance)
Moe&Tyrrell(1979) EntericCH4Digestiblesolublecarbohydrates,digestiblehemicellulose,digestiblecellulose
Holter&Young(1992) EntericCH4Digestiblesolublecarbohydrates,cellulose,hemicellulose,fatintake
Yanetal.(2009) EntericCH4Digestibleenergy,silage,andtotalDMI,silage,anddietADF
Ellisetal.(2007) EntericCH4 Metabolizableenergyintake,ADF,ligninintake
Ellisetal.(2009) EntericCH4Metabolizableenergyintake,cellulose,hemicellulose,andfatintake;non‐fibercarbohydrate,neutraldetergentfiber(NDF),andDMI
Millsetal.(2001) EntericCH4 DMIHolos(Littleetal.,2008)
EntericCH4,manureCH4
BasedonIPCC(2006)
CNCPS(2010)
EntericCH4,DMI,nutrientexcretion,urinenitrogenexcretion;
UsesequationofMillsetal.(2003)fordairyandEllisetal.(2007)forbeef.Animalcharacteristics,dietnutrientcomposition,feedproteinfractions,animalperformance,animalmanagement,insitudegradabilityoffeeds
IntegratedFarmSystemModel(Rotzetal.,2011b)
EntericCH4,nutrientexcretion,urinenitrogen,DMI,manureNH3,CH4,andN2O
UsestheMits3equationofMillsetal.(2003)forentericCH4,IPCC(2006)formanureCH4,andeitherDAYCENT(Chianeseetal.,2009d)orIPCC(2006)formanureN2O
Phetteplaceetal.(2001)
EntericCH4,manureCH4
Animalclass,animalageandbodyweight,quantityofmeat/mileproduced,feedtype,feedintake,manuremanagement
Process‐basedModels
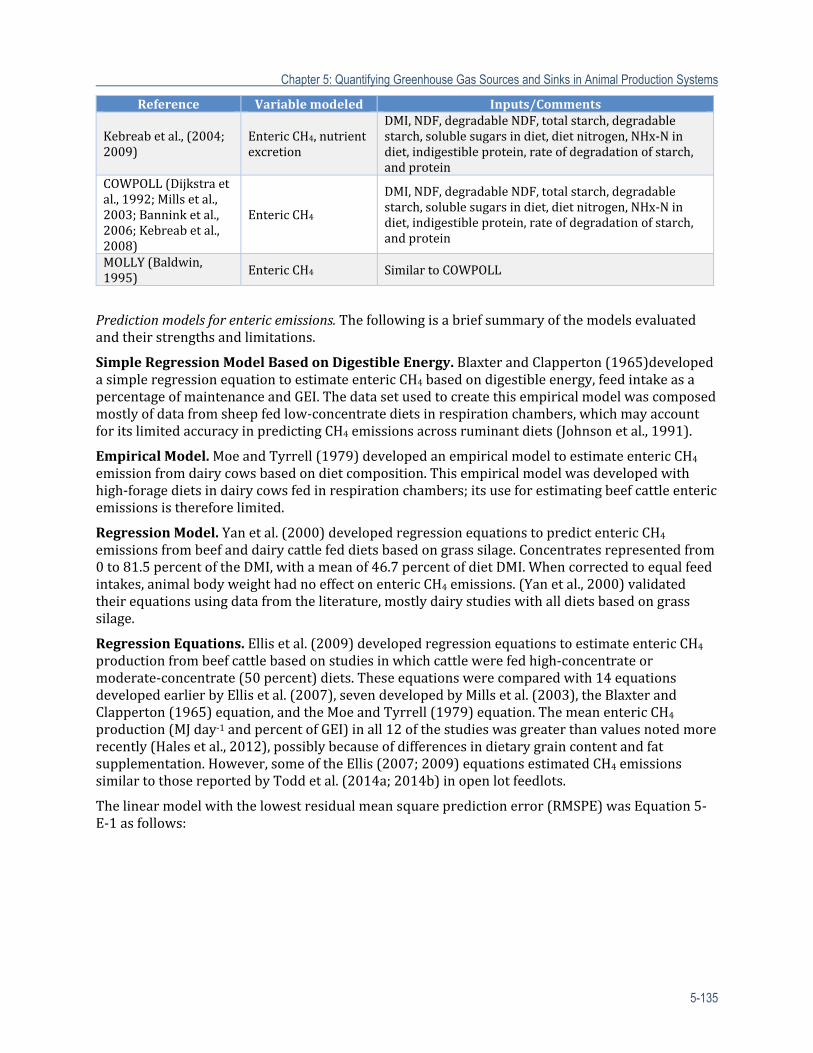
Chapter 5: Quantifying Greenhouse Gas Sources and Sinks in Animal Production Systems
5-135
Reference Variablemodeled Inputs/Comments
Kebreabetal.,(2004;2009)
EntericCH4,nutrientexcretion
DMI,NDF,degradableNDF,totalstarch,degradablestarch,solublesugarsindiet,dietnitrogen,NHx‐Nindiet,indigestibleprotein,rateofdegradationofstarch,andprotein
COWPOLL(Dijkstraetal.,1992;Millsetal.,2003;Banninketal.,2006;Kebreabetal.,2008)
EntericCH4
DMI,NDF,degradableNDF,totalstarch,degradablestarch,solublesugarsindiet,dietnitrogen,NHx‐Nindiet,indigestibleprotein,rateofdegradationofstarch,andprotein
MOLLY(Baldwin,1995)
EntericCH4 SimilartoCOWPOLL
Predictionmodelsforentericemissions.Thefollowingisabriefsummaryofthemodelsevaluatedandtheirstrengthsandlimitations.
SimpleRegressionModelBasedonDigestibleEnergy.BlaxterandClapperton(1965)developedasimpleregressionequationtoestimateentericCH4basedondigestibleenergy,feedintakeasapercentageofmaintenanceandGEI.Thedatasetusedtocreatethisempiricalmodelwascomposedmostlyofdatafromsheepfedlow‐concentratedietsinrespirationchambers,whichmayaccountforitslimitedaccuracyinpredictingCH4emissionsacrossruminantdiets(Johnsonetal.,1991).
EmpiricalModel.MoeandTyrrell(1979)developedanempiricalmodeltoestimateentericCH4emissionfromdairycowsbasedondietcomposition.Thisempiricalmodelwasdevelopedwithhigh‐foragedietsindairycowsfedinrespirationchambers;itsuseforestimatingbeefcattleentericemissionsisthereforelimited.
RegressionModel.Yanetal.(2000)developedregressionequationstopredictentericCH4emissionsfrombeefanddairycattlefeddietsbasedongrasssilage.Concentratesrepresentedfrom0to81.5percentoftheDMI,withameanof46.7percentofdietDMI.Whencorrectedtoequalfeedintakes,animalbodyweighthadnoeffectonentericCH4emissions.(Yanetal.,2000)validatedtheirequationsusingdatafromtheliterature,mostlydairystudieswithalldietsbasedongrasssilage.
RegressionEquations.Ellisetal.(2009)developedregressionequationstoestimateentericCH4productionfrombeefcattlebasedonstudiesinwhichcattlewerefedhigh‐concentrateormoderate‐concentrate(50percent)diets.Theseequationswerecomparedwith14equationsdevelopedearlierbyEllisetal.(2007),sevendevelopedbyMillsetal.(2003),theBlaxterandClapperton(1965)equation,andtheMoeandTyrrell(1979)equation.ThemeanentericCH4production(MJday‐1andpercentofGEI)inall12ofthestudieswasgreaterthanvaluesnotedmorerecently(Halesetal.,2012),possiblybecauseofdifferencesindietarygraincontentandfatsupplementation.However,someoftheEllis(2007;2009)equationsestimatedCH4emissionssimilartothosereportedbyToddetal.(2014a;2014b)inopenlotfeedlots.
Thelinearmodelwiththelowestresidualmeansquarepredictionerror(RMSPE)wasEquation5‐E‐1asfollows:
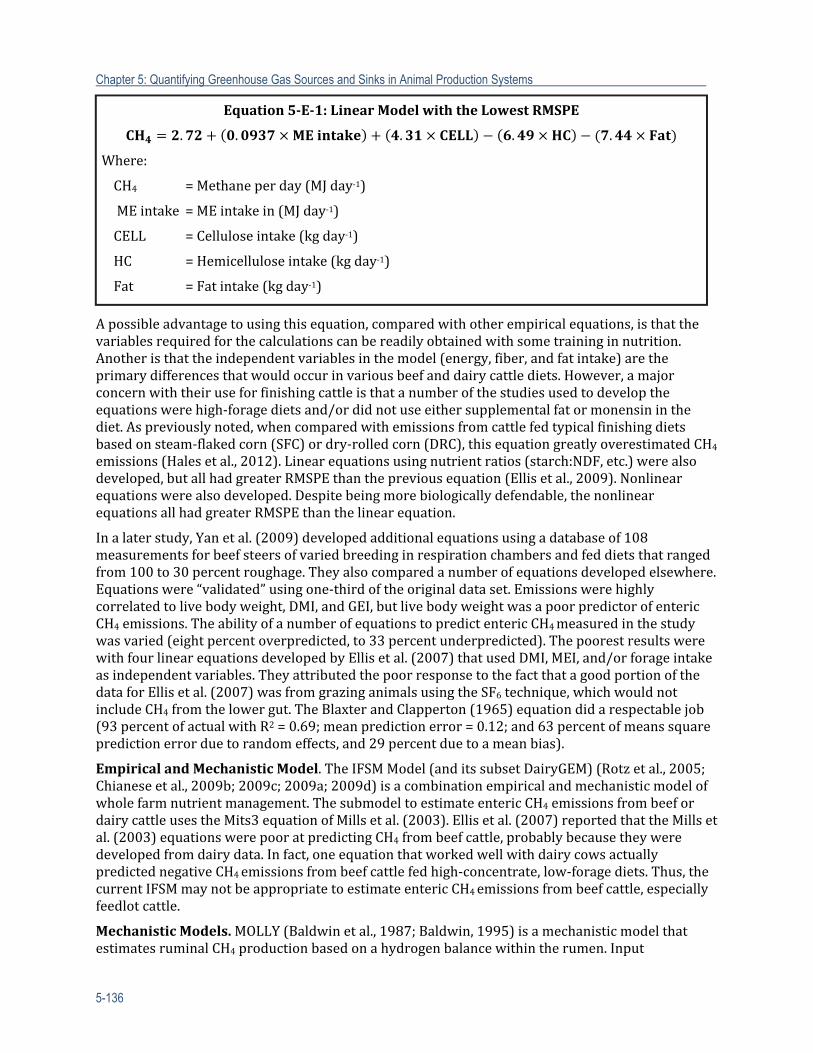
Chapter 5: Quantifying Greenhouse Gas Sources and Sinks in Animal Production Systems
5-136
Apossibleadvantagetousingthisequation,comparedwithotherempiricalequations,isthatthevariablesrequiredforthecalculationscanbereadilyobtainedwithsometraininginnutrition.Anotheristhattheindependentvariablesinthemodel(energy,fiber,andfatintake)aretheprimarydifferencesthatwouldoccurinvariousbeefanddairycattlediets.However,amajorconcernwiththeiruseforfinishingcattleisthatanumberofthestudiesusedtodeveloptheequationswerehigh‐foragedietsand/ordidnotuseeithersupplementalfatormonensininthediet.Aspreviouslynoted,whencomparedwithemissionsfromcattlefedtypicalfinishingdietsbasedonsteam‐flakedcorn(SFC)ordry‐rolledcorn(DRC),thisequationgreatlyoverestimatedCH4emissions(Halesetal.,2012).Linearequationsusingnutrientratios(starch:NDF,etc.)werealsodeveloped,butallhadgreaterRMSPEthanthepreviousequation(Ellisetal.,2009).Nonlinearequationswerealsodeveloped.Despitebeingmorebiologicallydefendable,thenonlinearequationsallhadgreaterRMSPEthanthelinearequation.
Inalaterstudy,Yanetal.(2009)developedadditionalequationsusingadatabaseof108measurementsforbeefsteersofvariedbreedinginrespirationchambersandfeddietsthatrangedfrom100to30percentroughage.Theyalsocomparedanumberofequationsdevelopedelsewhere.Equationswere“validated”usingone‐thirdoftheoriginaldataset.Emissionswerehighlycorrelatedtolivebodyweight,DMI,andGEI,butlivebodyweightwasapoorpredictorofentericCH4emissions.TheabilityofanumberofequationstopredictentericCH4measuredinthestudywasvaried(eightpercentoverpredicted,to33percentunderpredicted).ThepoorestresultswerewithfourlinearequationsdevelopedbyEllisetal.(2007)thatusedDMI,MEI,and/orforageintakeasindependentvariables.TheyattributedthepoorresponsetothefactthatagoodportionofthedataforEllisetal.(2007)wasfromgrazinganimalsusingtheSF6technique,whichwouldnotincludeCH4fromthelowergut.TheBlaxterandClapperton(1965)equationdidarespectablejob(93percentofactualwithR2=0.69;meanpredictionerror=0.12;and63percentofmeanssquarepredictionerrorduetorandomeffects,and29percentduetoameanbias).
EmpiricalandMechanisticModel.TheIFSMModel(anditssubsetDairyGEM)(Rotzetal.,2005;Chianeseetal.,2009b;2009c;2009a;2009d)isacombinationempiricalandmechanisticmodelofwholefarmnutrientmanagement.ThesubmodeltoestimateentericCH4emissionsfrombeefordairycattleusestheMits3equationofMillsetal.(2003).Ellisetal.(2007)reportedthattheMillsetal.(2003)equationswerepooratpredictingCH4frombeefcattle,probablybecausetheyweredevelopedfromdairydata.Infact,oneequationthatworkedwellwithdairycowsactuallypredictednegativeCH4emissionsfrombeefcattlefedhigh‐concentrate,low‐foragediets.Thus,thecurrentIFSMmaynotbeappropriatetoestimateentericCH4emissionsfrombeefcattle,especiallyfeedlotcattle.
MechanisticModels.MOLLY(Baldwinetal.,1987;Baldwin,1995)isamechanisticmodelthatestimatesruminalCH4productionbasedonahydrogenbalancewithintherumen.Input
Equation5‐E‐1:LinearModelwiththeLowestRMSPE
. . . . .
Where:
CH4 =Methaneperday(MJday‐1)
MEintake=MEintakein(MJday‐1)
CELL =Celluloseintake(kgday‐1)
HC =Hemicelluloseintake(kgday‐1)
Fat =Fatintake(kgday‐1)
Chapter 5: Quantifying Greenhouse Gas Sources and Sinks in Animal Production Systems
5-137
parameterstothemodelaredailyDMI,chemicalcompositionofthediet,solubilityofproteinandstarch,degradability,ruminalpassagerates,ruminalvolume,andruminalpH.COWPOLL(Dijkstraetal.,1992;Millsetal.,2001)isanothermechanisticmodel.InputparameterstothemodelaresimilartoMOLLY.MOLLYandCOWPOLLbothuseanH‐balancetoestimateentericCH4production.However,theyusedifferentVFAstoichiometrysubmodels.Bothmodelsrequiresignificantinputsthatareprobablybeyondthescopeoftypicalproducers.However,theyareexcellentresearchtools.
TheCornellNetCarbohydrateandProteinSystemmodel(CNCPS,2010)calculatesnutrientrequirements,nutrientinputs,animalproduction(weightgainand/ormilkproduction),andnutrientexcretioninbeefanddairycattle.Itrecentlyaddedasubmodel(VanAmburghetal.,2010)tocalculateentericCH4emissions.ThesubmodelusesanequationofMillsetal.(2003)toestimateentericemissionsfromdairycowsandanequationofEllisetal.(2007)toestimateentericemissionsfrombeefcattle.Atpresent,toourknowledgetherearenocomparisonsorindependentvalidationsofthenewsubmodelsthathavebeenpublished,andtheextenttowhichthemodelisresponsivetomitigationstrategiesisunclear.
ComparativeAnalysesusingIndependentDataSets.SeveralstudieshaveattemptedtoevaluatethepredictiveabilityofentericCH4modelsbyusinganindependentdataset.Benchaaretal.(1998)comparedtwomechanistic(Baldwinetal.,1987;Dijkstraetal.,1992;Baldwin,1995);andtwolinear(BlaxterandClapperton,1965;MoeandTyrrell,1979)modelswithadatasetof32dietsfrom13publicationsintheliterature.Theynotedthatthemechanisticmodelswerebetterpredictorsthantheregressionequations.Thelinearregressionmodelscouldonlyexplain42to57percentofthevariationinpredictedvalues,whereasthemechanisticmodelsexplainedmorethan70percentofthevariation.ThemodelofDijkstraetal.(1992)tendedtounderestimateactualCH4
production(meanerror=0.30Mcalday‐1),withtheerrorbeinggreaterathigherCH4productions.ThemodelofBaldwin(Baldwinetal.,1987;Baldwin,1995)overestimatedCH4productionbyabout0.93Mcalday‐1,primarilyduetoahighintercept.TheequationsofMoeandTyrrell(1979)andBlaxterandClapperton(1965)tendedtooverestimateCH4production,especiallyatlowproductionrates.
ComparativeAnalysis/LactatingandNonlactatingCows.Wilkersonetal.(1995)comparedseveralpublishedequations(Kriss,1930;BratzlerandForbes,1940;Axelsson,1949;BlaxterandClapperton,1965;MoeandTyrrell,1979;HolterandYoung,1992)fortheirabilitytopredictentericCH4productionfromlactatingandnonlactatingHolsteincows.Ingeneral,equationsthatwerebasedontotalDMIoronintakeofdigestedcellulose,hemicellulose,andnonfibercarbohydrates,providedthehighestcorrelationandlowesterrorsofprediction.PredictionequationsthatusedaquadraticfunctionofDMIwerepooratpredictingentericCH4.Ingeneral,theequationspredictedemissionsfromnonlactatingcowsmoreaccuratelythanfromlactatingcows.
ComparativeAnalysisLinearModels.Kebreabetal.(2006)comparedtwolinearmodels(MoeandTyrrell,1979;Millsetal.,2003),anonlinearmodel(Millsetal.,2003),theIPCCTier1andTier2models(IPCC,1997),andadynamicmechanisticmodel(Kebreabetal.,2004)usingdatafromstudiesconductedinNorthAmerica.Theyrecommendedthatthelinearmodelsbeusedwhenthereislimitedinformationonnutrientintakeandwhentheexpectedemissionsarewithintherangeofdatafromwhichthemodelwasdeveloped.ThenonlinearmodelofMillsetal.(2003)couldbeusedforextrapolatingbeyondtherangeofdatausedtodeveloptheequation,butthemechanisticmodelwasrecommendedforevaluationofmitigationoptions.TheIPCCTier1modelwasfoundtobeadequateforgeneralinventorypurposes.ThepredictiveabilityoftheTier2model,whilemostuseful,waslimited.
Chapter 5: Quantifying Greenhouse Gas Sources and Sinks in Animal Production Systems
5-138
ComparativeAnalysisMechanisticModels.Kebreabetal.(2008)alsocomparedtwomechanisticmodels,MOLLY(Baldwinetal.,1987;Baldwin,1995)andCOWPOLL(Dijkstraetal.,1992;Millsetal.,2001;Banninketal.,2006),totheIPCCTier2(2006)andlinearequationofMoeandTyrrell(1979).Usingabeefcattledataset,MOLLYandIPCCtendedtobemoreaccuratethantheothermodels,althoughMOLLYwasmoreprecise.MOLLYandIPCCTier2hadminimalmeanbias,whereasCOWPOLLandtheMoeandTyrrell(1979)equationgreatlyoverpredictedaverageemissions.COWPOLL,whichisbasedontheentericCH4predictionequationsofMillsetal.(2001)andtheupdatedrumenstoichiometryforlactatingcows(Banninketal.,2006),hadthepoorestabilitytopredictentericCH4emissionfromfeedlotcattleandtendedtooverpredictCH4emissions(MJday‐1)byasmuchas50percent.AlthoughonaverageMOLLYandIPCCTier2(2006)gavepredictedvaluessimilartomeasuredvalues,therewasalargevariabilityinindividualanimals,witherrorsof75percentorgreater.Thelargevariabilityinpredictedvaluesindicatesthattherecanbelargeanimal‐to‐animalvariationinentericCH4production,evenwhenanimalsarefedthesamedietsatsimilarfeedintakes.
ComparativeAnalysis/Feedlots.McGinnetal.(2008)comparedmeasured(usingbLSmodel)CH4emissions(entericpluspensurface)fromfeedlotsinAustraliaandCanadawithestimatesusingtheIPCCTier1,IPCCTier2,BlaxterandClapperton(1965),andMoeandTyrrell(1979)equations.TheTier2methodunderestimatedCH4atbothlocations.EstimatesusingtheIPCCTier1methodswereclosetomeasuredvaluesinAustralia;however,Tier1underestimatedvaluesfortheCanadafeedlot.EstimatesmadeusingtheBlaxterandClapperton(1965)andMoeandTyrrell(1979)equationswereclosetomeasuredvaluesinCanada,butoverestimatedvaluesinAustralia.Methaneemissionshadasignificantdielpatternindicatingthatshort‐termmeasurementofCH4emissionsatfeedlotsmayoverestimateorunderestimatedailyemissions.
ComparativeAnalysisofStoichiometricModels.Alemuetal.(2011)comparedentericCH4emissionsfromdairycowsusingavarietyofstoichiometricmodelsofruminalfermentation(Murphyetal.,1982;Banninketal.,2006;Sveinbjornssonetal.,2006;Nozièreetal.,2010),andnotedthatmechanisticmodelssuchasBanninketal.(2006)aremoreaccurateforpredictingentericCH4fromdairycowsthantheIPCCTier2(2006)method.However,thesemodelsrequiredaconsiderablequantityofdataregardingtheanimalsandtheirdiet.
ComparativeAnalysisMeasurementDataandModels.Tomkinsetal.(2011)measuredentericCH4emissionsofsteersonpastureusingamicrometeorologicalmethodandrespirationchambers.EmissionsestimatedusinganEllis(2009)equation(CH4,MJday‐1=3.272+0.736(DMI,kgday‐1))weresimilar(112.7gday‐1)tomeasuredemissions.EstimatesusingtheequationsofKuriharaetal.(1999)asmodifiedbyHunter(2007)(109.1gday‐1),Yanetal.(2009)(105.6gday‐1),andCharmleyetal.(2008)(2008:NABCEMS;100.2gday‐1)wereslightlylower,butnotaslowastheIPCC(2006)model(82.7gday‐1).
ComparativeAnalyses/Models.Legesseetal.(2011)comparedentericCH4emissionestimatesusingMOLLY,COWPOLL,IPCCTier2,andoneequationofEllisetal.(2007)undervariousCanadianbeefcow‐calfmanagementsystems.Differencesamongthemodels(26to35percent)weremuchgreaterthandifferencesamongmanagementsystems(threetofivepercent).Theauthorssuggestedthatthesedifferenceslimitedthemodel’sutilityinpredictingCH4emissionfrombeefcowsystems.
EvaluationofModels.Yanetal.(2000;2009)notedthatCH4production(percentofGEIordigestibleenergy)decreasedwithincreasingDMI(asmultiplesofmaintenance)andwithincreasingforageinthediet.Thus,theysuggestedthatmodelsthatdonotconsiderfeedinglevelwillunderpredictCH4atlowplanesofnutritionandoverpredictentericCH4athighlevelsoffeeding.Similarly,Kebreabetal.(2006)notedthatlinearmodelstendtogiveunrealisticallyhigh
Chapter 5: Quantifying Greenhouse Gas Sources and Sinks in Animal Production Systems
5-139
emissionvalueswhenDMIincreases,whereasnonlinearmodelsgavevaluesapproachingthetheoreticalmaximumemission,whichisbiologicallyreasonable.
AlthoughseveralequationsofEllisetal.(2009)appearedtobegoodpredictorsofentericCH4lossesfromfeedlotcattlebasedonCanadianstudies,whencomparedwithdatafromcattlefedatypicalcorn‐basedfinishingdiet(Halesetal.,2012)mosttendedtogreatlyoverestimateentericlosses.Atthepresenttime,theIPCCTier2modelwithsomemodificationsmaybethemostusefulforpredictionofentericemissionsfromfeedlotbeefcattle.
Chapter5References
Aarnink,A.J.A.,andM.W.A.Verstegen.2007.Nutrition,keyfactortoreduceenvironmentalloadfrompigproduction.LivestockScience,109(1–3):194‐203.
Adviento‐Borbe,M.A.A.,E.F.Wheeler,N.E.Brown,P.A.Topper,etal.2010.Ammoniaandgreenhousegasfluxfrommanureinfreestallbarnwithdairycowsonprecisionfedrations.TransactionsoftheASABE,53:1251‐1266.
Agnew,J.,C.Laguë,J.Schoenau,andR.Farrell.2010.Greenhousegasemissionsmeasured24hoursaftersurfaceandsubsurfaceapplicationofdifferentmanuretypes.TransactionsoftheASABE,53(5):1689‐1701.
Aguerre,M.J.,M.A.Wattiaux,J.M.Powell,G.A.Broderick,etal.2011.Effectofforage‐to‐concentrateratioindairycowdietsonemissionofmethane,carbondioxide,andammonia,lactationperformance,andmanureexcretion.JournalofDairyScience,94(6):3081‐3093.
Alemu,A.W.,J.Dijkstra,A.Bannink,J.France,etal.2011.Rumenstoichiometricmodelsandtheircontributionandchallengesinpredictingentericmethaneproduction.AnimalFeedScienceandTechnology,166‐167(0):761‐778.
Amon,B.,T.Amon,J.Boxberger,andC.Alt.2001.EmissionsofNH3,N2OandCH4fromdairycowshousedinafarmyardmanuretyingstall(housing,manurestorage,manurespreading).NutrientCyclinginAgroecosystems,60(1):103‐113.
Anderson,R.C.,andM.A.Rasmussen.1998.Useofanovelnitrotoxin‐metabolizingbacteriumtoreduceruminalmethaneproduction.BioresourceTechnology,64(2):89‐95.
Anderson,R.C.,T.R.Callaway,J.A.S.VanKessel,Y.S.Jung,etal.2003.Effectofselectnitrocompoundsonruminalfermentation;aninitiallookattheirpotentialtoreduceeconomicandenvironmentalcostsassociatedwithruminalmethanogenesis.BioresourceTechnology,90(1):59‐63.
Applegate,T.,W.Powers,R.Angel,andD.Hoehler.2008.EffectofAminoAcidFormulationandAminoAcidSupplementationonPerformanceandNitrogenExcretioninTurkeyToms.PoultryScience,87(3):514‐520.
Archibeque,S.L.,D.N.Miller,H.C.Freetly,andC.L.Ferrell.2006.Feedinghigh‐moisturecorninsteadofdry‐rolledcornreducesodorouscompoundproductioninmanureoffinishingbeefcattlewithoutdecreasingperformance.JournalofAnimalScience,84(7):1767‐1777.
Arriaga,H.,G.Salcedo,L.Martínez‐Suller,S.Calsamiglia,etal.2010.Effectofdietarycrudeproteinmodificationonammoniaandnitrousoxideconcentrationonatie‐stalldairybarnfloor.JournalofDairyScience,93(7):3158‐3165.
ASABE.2005.ManureProductionandCharacteristics,ASABEStandardD384.2MAR2005(R2010).St.Joseph,MI:AmericanSocietyofAgriculturalandBiologicalEngineers.
Atakora,J.K.A.,S.Möhn,andR.O.Ball.2003.Lowproteindietsmaintainperformanceandreducegreenhousegasproductioninfinisherpigs.Proceedingsofthe2003BanffPorkSeminar,Alberta,Canada.
Atakora,J.K.A.,S.Möhn,andR.O.Ball.2004.Effectsofdietaryproteinreductionongreenhousegasemissionfrompigs.Proceedingsofthe2004BanffPorkSeminar,Alberta,Canada.
Chapter 5: Quantifying Greenhouse Gas Sources and Sinks in Animal Production Systems
5-140
AustralianGreenhouseOffice.2007.Nationalgreenhousegasinventory2005.Canberra,Australia:Dept.oftheEnvironmentandWaterResources.
Axelsson,J.1949.TheamountofproducedmethaneenergyintheEuropeanmetabolicexperimentswithadultcattle.AnnalsoftheRoyalAgriculturalCollegeofSweden,16:404‐419.
Baker,C.1969.Temperaturedependenceofself‐diffusioncoefficientsforgaseousammonia.WashingtonD.C.:LewisResearchCenter,NationalAeronauticsandSpaceAdministration.
Baldwin,R.L.,J.H.M.Thornley,andD.E.Beever.1987.Metabolismofthelactatingcow:II.Digestiveelementsofamechanisticmodel.JournalofDairyResearch,54(01):107‐131.
Baldwin,R.L.1995.ModelingruminantDigestionandMetabolism.London,UK:Chapman&Hall.Ball,R.O.,andS.Möhn.2003.Feedingstrategiestoreducegreenhousegasemissionsfrompigs.
Proceedingsofthe2003BanffPorkSeminar,Alberta,Canada.Bannink,A.,J.Kogut,J.Dijkstra,J.France,etal.2006.Estimationofthestoichiometryofvolatile
fattyacidproductionintherumenoflactatingcows.JournalofTheoreticalBiology,238(1):36‐51.
Beauchemin,K.,M.Kreuzer,F.O’Mara,andT.McAllister.2008.Nutritionalmanagementforentericmethaneabatement:areview.AustralianJournalofExperimentalAgriculture,48:21‐27.
Beauchemin,K.A.,andS.M.McGinn.2005.Methaneemissionsfromfeedlotcattlefedbarleyorcorndiets.JournalofAnimalScience,83(3):653‐661.
Beauchemin,K.A.,andS.M.McGinn.2006a.Methaneemissionsfrombeefcattle:Effectsoffumaricacid,essentialoil,andcanolaoil.JournalofAnimalScience,84(6):1489‐1496.
Beauchemin,K.A.,andS.M.McGinn.2006b.Entericmethaneemissionsfromgrowingbeefcattleasaffectedbydietandlevelofintake.CanadianJournalofAnimalScience,86(3):401‐408.
Beauchemin,K.A.,H.HenryJanzen,S.M.Little,T.A.McAllister,etal.2010.LifecycleassessmentofgreenhousegasemissionsfrombeefproductioninwesternCanada:Acasestudy.AgriculturalSystems,103(6):371‐379.
Benchaar,C.,J.Rivest,C.Pomar,andJ.Chiquette.1998.Predictionofmethaneproductionfromdairycowsusingexistingmechanisticmodelsandregressionequations.JournalofAnimalScience,76(2):617‐627.
Benchaar,C.,C.Pomar,andJ.Chiquette.2001.Evaluationofdietarystrategiestoreducemethaneproductioninruminants:Amodelingapproach.CanadianJournalofAnimalScience,81:563‐574.
Berger,L.L.,andN.R.Merchen.1995.Influenceofproteinlevelonintakeoffeedlotcattle–Roleofruminalammoniasupply.Symposium.IntakeofFeedlotCattle.OklahomaStateUniv.July,1995:942:272‐280.
Bhatta,R.,K.Tajima,N.Takusari,K.Higuchi,etal.2007.Comparisonofinvivoandinvitrotechniquesformethaneproductionfromruminantdiets.Asian‐AustralasianJournalofAnimalSciences,20:1049‐1056.
Bhatti,J.S.,R.Lal,M.A.Price,andM.J.Apps,(eds.).2005.ClimateChangeandManagedEcosystems.BocaRaton,FL:CRCPress.
Bjorneberg,D.L.,A.B.Leytem,D.T.Westermann,P.R.Griffiths,etal.2009.Measurementofatmosphericammonia,methane,andnitrousoxideataconcentrateddairyproductionfacilityinsouthernIdahousingopen‐pathFTIRspectrometry.TransactionsoftheASABE,52(5):1749‐1756.
Blaxter,K.L.,andF.W.Wainman.1964.Theutilizationoftheenergyofdifferentrationsbysheepandcattleformaintenanceandforfattening.JournalofAgriculturalScience,63(01):113‐128.
Blaxter,K.L.,andJ.L.Clapperton.1965.Predictionoftheamountofmethaneproducedbyruminants.BritishJournalofNutrition,19:511‐522.
Bluteau,C.V.,D.I.Massé,andR.Leduc.2009.AmmoniaemissionratesfromdairylivestockbuildingsinEasternCanada.BiosystemsEngineering,103(4):480‐488.
Chapter 5: Quantifying Greenhouse Gas Sources and Sinks in Animal Production Systems
5-141
Boadi,D.A.,K.M.Wittenberg,andW.McCaughey.2002.Effectsofgrainsupplementationonmethaneproductionofgrazingsteersusingthesulphur(SF6)tracergastechnique.CanadianJournalofAnimalScience,82(2):151‐157.
Branine,M.E.,andD.E.Johnson.1990.Levelofintakeeffectsonruminantmethanelossacrossawiderangeofdiets.JournalofAnimalScience,68(Suppl.1):509‐510.
Bratzler,J.W.,andE.B.Forbes.1940.Theestimationofmethaneproductionbycattle.JournalofNutrition,19:611‐613.
Brooks,J.P.,andM.R.McLaughlin.2009.Antibioticresistantbacterialprofilesofanaerobicswinelagooneffluent.JournalofEnvironmentalQuality,38(6):2431‐2437.
Cabrera,M.L.,andS.C.Chiang.1994.WaterContentEffectonDenitrificationandAmmoniaVolatilizationinPoultryLitter.SoilSci.Soc.Am.J.,58(3):811‐816.
Cambardella,C.A.,T.B.Moorman,andJ.W.Singer.2010.Soilnitrogenresponsetocouplingcovercropswithmanureinjection.NutrientCyclinginAgroecosystems,87(3):383‐393.
Canh,T.T.,M.W.A.Verstegen,A.J.A.Aarnink,andJ.W.Schrama.1997.Influenceofdietaryfactorsonnitrogenpartitioningandcompositionofurineandfecesoffatteningpigs.JournalofAnimalScience,75:700‐706.
Canh,T.T.,A.J.A.Aarnink,Z.Mroz,A.W.Jongbloed,etal.1998a.Influenceofelectrolytebalanceandacidifyingcalciumsaltsinthedietofgrowing‐finishingpigsonurinarypH,slurrypHandammoniavolatilisationfromslurry.Livest.Prod.Sci.,56:1‐13.
Canh,T.T.,A.J.A.Aarnink,J.B.Schutte,A.L.Sutton,etal.1998b.Dietaryproteinaffectsnitrogenexcretionandammoniaemissionfromslurryofgrowingfinishingpigs.LivestockProductionScience,56:181‐191.
Cantrell,K.B.,T.Ducey,K.S.Ro,andP.G.Hunt.2008a.Livestockwaste‐to‐bioenergygenerationopportunities.BioresourceTechnology,99(17):7941‐7953.
Cantrell,K.B.,K.S.Ro,andP.G.Hunt.2008b.Thermalcharacterizationofswinemanure:Bioenergyfeedstockpotential.
Cantrell,K.B.,K.C.Stone,P.G.Hunt,K.S.Ro,etal.2009.BioenergyfromCoastalbermudagrassreceivingsubsurfacedripirrigationwithadvance‐treatedswinewastewater.BioresourceTechnology,100(13):3285‐3292.
Cantrell,K.B.,P.G.Hunt,K.S.Ro,K.C.Stone,etal.2010a.Thermogravimetriccharacterizationofirrigatedbermudagrassasacombustionfeedstock.TransactionsoftheASABE,53(2):413‐420.
Cantrell,K.B.,J.H.MartinIi,andK.S.Ro.2010b.Applicationofthermogravimetricanalysisfortheproximateanalysisoflivestockwastes.JournalofASTMInternational,7(3).
Capper,J.L.,R.A.Cady,andD.E.Bauman.2009.Theenvironmentalimpactofdairyproduction:1944comparedwith2007.JournalofAnimalScience,87(6):2160‐2167.
Carmean,B.R.,K.A.Johnson,D.E.Johnson,andL.W.Johnson.1992.Maintenanceenergyrequirementofllama.AmericanJournalofVeterinaryReserach,53:1696‐1698.
Carr,L.E.,F.W.Wheaton,andL.W.Douglass.1990.Empiricalmodelstodetermineammoniaconcentrationsfrombroilerchickenlitter.Trans.ASAE,33:1337‐1342.
Cassel,T.,L.Ashbaugh,R.Flocchini,andD.Meyer.2005.Ammoniaemissionfactorsforopen‐lotdairies:Directmeasurementsandestimationbynitrogenintake.JournaloftheAir&WasteManagementAssociation,55:826‐833.
CDM.2012.Projectandleakageemissionsfromanaerobicdigesters.Ver.01.0.0:CleanDevelopmentMechanism.
Charmley,E.,M.L.Stephens,andP.M.Kennedy.2008.PredictinglivestockproductivityandmethaneemissionsinnorthernAustralia:developmentofabio‐economicmodelingapproach.AustralianJournalofExperimentalAgriculture,49:109‐113.
Chapter 5: Quantifying Greenhouse Gas Sources and Sinks in Animal Production Systems
5-142
Chastain,J.P.,W.D.Lucas,J.E.Albrecht,J.C.Pardue,etal.1998.SolidsandNutrientRemovalFromLiquidSwineManureUsingaScrewPressSeparator,ASAEPaperNo.98‐4110.St.Joseph,MI:AmericanSocietyofAgriculturalEngineers.
Chastain,J.P.,M.B.Vanotti,andM.M.Wingfield.2001.EffectivenessofLiquid‐SolidSeparationforTreatmentofFlushedDairyManure:ACaseStudy.TransactionsoftheAmericanSocietyofAgriculturalEngineers,17(3):343‐354.
Chen,G.Q.,L.Shao,Z.M.Chen,Z.Li,etal.2011.Low‐carbonassessmentforecologicalwastewatertreatmentbyaconstructedwetlandinBeijing.EcologicalEngineering,37(4):622‐628.
Chianese,D.S.,C.A.Rotz,andT.L.Richard.2009a.Simulationofcarbondioxideemissionsfromdairyfarmstoassessgreenhousegasreductionstrategies.Trans.ASABE,52:1301‐1312.
Chianese,D.S.,C.A.Rotz,andT.L.Richard.2009b.Whole‐farmgreenhousegasemissions:AreviewwithapplicationtoaPennsylvaniadairyfarm.AppliedEngineeringinAgriculture,25:431‐442.
Chianese,D.S.,C.A.Rotz,andT.L.Richard.2009c.Simulationofmethaneemissionsfromdairyfarmstoassessgreenhousegasreductionstrategies.Trans.ASABE,52:1313‐1323.
Chianese,D.S.,C.A.Rotz,andT.L.Richard.2009d.Simulationofnitrousoxideemissionsfromdairyfarmstoassessgreenhousegasreductionstrategies.Trans.ASABE,52:1325‐1335.
Chiumenti,R.,L.Donatoni,andS.Guercini.1987.Liquid/SolidSeparationTestsonBeefCattleManure.ProceedingsoftheSeminarofthe2ndTechnicalSectionoftheC.I.G.R.,UbranaChampaign,IL,June22‐26,1987.
Clark,O.,S.Moehn,J.Edeogu,J.Price,etal.2005.Manipulationofdietaryproteinandnonstarchpolysaccharidetocontrolswinemanureemissions.JournalofEnvironmentalQuality,34:1461‐1466.
CNCPS.CornellNetCarbohydrateandProteinSystem.Retrievedfromhttp://www.cncps.cornell.edu.
Cole,N.A.,andJ.E.McCroskey.1975.EffectsofHemiacetalofChloralandStarchonthePerformanceofBeefSteers.JournalofAnimalScience,41(6):1735‐1741.
Cole,N.A.,P.J.Defoor,M.L.Galyean,G.C.Duff,etal.2006.Effectsofphasefeedingofcrudeproteinonperformance,carcasscharacteristics,serumureanitrogenconcentrationsandmanurenitrogeninfinishingbeesteers.JournalofAnimalScience,84:3421‐3432.
Cole,N.A.,R.W.Todd,D.B.Parker,andM.Rhoades.2007b.Challengesinusingfluxchamberstomeasureammoniaemissionsformsimulatedfeedlotpensurfacesandretentionponds.ProceedingsoftheInternationalSymposiumOnAirQualityandWasteManagementforAgriculture,Sept.16‐19,2007,Broomfield,CO.
Cole,N.A.,A.M.Mason,R.W.Todd,andD.B.Parker.2009a.Effectsofurineapplicationonchemistryoffeedlotpensurfaces.JournalofAnimalScience,87:ESuppl.2:148(Abstract).
Cole,N.A.,A.M.Mason,R.W.Todd,M.Rhoades,etal.2009b.ChemicalCompositionofPenSurfaceLayersofBeefCattleFeedyards.TheProfessionalAnimalScientist,25(5):541‐552.
Converse,J.C.,R.G.Koegel,andR.J.Straub.1999.NutrientandSolidsSeparationofDairyandSwineManureUsingaScrewPressSeparator,ASAEPaperNo.99‐4050.St.Joseph,MI:AmericanSocietyofAgriculturalEngineers.
Cooprider,K.L.,F.M.Mitloehner,T.R.Famula,E.Kebreab,etal.2011.Feedlotefficiencyimplicationsongreenhousegasemissionandsustainability.JournalofAnimalScience,(inpress).
CornellUniversityDepartmentofAnimalScience.2010.CNCPS.Corrigan,M.E.,T.J.Klopfenstein,G.E.Erickson,N.F.Meyer,etal.2009.Effectsoflevelofcondensed
distiller’ssolublesincorndrieddistillersgrainsonintake,dailyweightgain,anddigestibilityingrowingsteersfedforagediets.JournalofAnimalScience,87:4073‐4081.
Cottle,D.J.,J.V.Nolan,andS.G.Wiedemann.2011.Ruminantentericmethanemitigation:areview.AnimalProductionScience,51(6):491‐514.
Chapter 5: Quantifying Greenhouse Gas Sources and Sinks in Animal Production Systems
5-143
Coufal,C.,C.Chavez,P.Niemeyer,andJ.Carey.2006.Nitrogenemissionsfrombroilersmeasuredbymassbalanceovereighteenconsecutiveflocks.PoultryScience,85(3):384‐391.
Crutzen,P.J.,I.Aselmann,andW.Seiler.1986.Methaneproductionbydomesticanimals,wildruminants,otherherbivorousfauna,andhumans.TellusB,38B(3‐4):271‐284.
Davies,P.R.2011.Intensiveswineproductionandporksafety.FoodbornePathogensandDisease,8(2):189‐201.
Delfino,J.,G.W.Mathison,andM.W.Smith.1988.Effectoflasalocidonfeedlotperformanceandenergypartitioningincattle.JournalofAnimalScience,66:236‐241.
Delmore,R.J.,J.M.Hodgen,andB.J.Johnson.2010.PerspectivesontheapplicationofzilpaterolhydrochlorideintheUnitedStatesbeefindustry.JournalofAnimalScience,88:2825‐2828.
DeRamus,H.,T.Clement,D.Giampola,andP.Dickison.2003.Methaneemissionsofbeefcattleonforages:efficiencyofgrazingmanagementsystems.JournalofEnvironmentalQuality,21:269‐277.
Dibner,J.,andJ.Richards.2005.Antibioticgrowthpromotersinagriculture:historyandmodeofaction.PoultryScience,84(4):634‐643.
Dijkstra,J.,H.D.S.C.Neal,D.E.Beever,andJ.France.1992.Simulationofnutrientdigestion,absorptionandoutflowintherumen:modeldescription.JournalofNutrition,122(1992):2239‐2256.
Dijkstra,J.,E.Kebreab,J.A.N.Mills,W.F.Pellikaan,etal.2007.Predictingtheprofileofnutrientsavailableforabsorption:fromnutrientrequirementtoanimalresponseandenvironmentalimpact.Animal,1(1):99‐111.
Dini,Y.,J.Gere,C.Briano,M.Manetti,etal.2012.MethaneemissionandmilkproductionofdairycowsgrazingpasturesrighinlegumesorrichingrassesinUruguay.Animals,2:288‐300.
Dodla,S.K.,J.J.Wang,R.D.DeLaune,andR.L.Cook.2008.Denitrificationpotentialanditsrelationtoorganiccarbonqualityinthreecoastalwetlandsoils.ScienceoftheTotalEnvironment,407(1):471‐480.
Dong,R.,Y.Zhang,L.L.Christianson,T.L.Funk,etal.2009.ProductdistributionandimplicationofhydrothermalconversionofswinemanureatlowTemperatures.TransactionsoftheASABE,52(4):1239‐1248.
Eckard,R.J.,C.Grainger,andC.A.M.deKlein.2010.Optionsfortheabatementofmethaneandnitrousoxidefromruminantproduction:Areview.130(1):47‐56.
Elam,N.A.,J.T.Vasconcelos,G.Hilton,D.L.VanOverbeke,etal.2009.Effectofzilpaterolhydrochloridedurationoffeedingonperformanceandcarcasscharacteristicsoffeedlotcattle.JournalofAnimalScience,87:2133‐2141.
Elgood,Z.,W.D.Robertson,S.L.Schiff,andR.Elgood.2010.Nitrateremovalandgreenhousegasproductioninastream‐beddenitrifyingbioreactor.EcologicalEngineering,36(11):1575‐1580.
Elliot,H.A.,andN.E.Collins.1982.Factorsaffectingammoniareleaseinbroilerhouses.Trans.ASAE,25:413‐418.
Ellis,J.L.,E.Kebreab,N.E.Odongo,B.W.McBride,etal.2007.PredictionofMethaneProductionfromDairyandBeefCattle.JournalofDairyScience,90(7):3456‐3466.
Ellis,J.L.,E.Kebreab,N.E.Odongo,K.Beauchemin,etal.2009.Modelingmethaneproductionfrombeefcattleusinglinearandnonlinearapproaches.JournalofAnimalScience,87(4):1334‐1345.
Ellis,S.,J.Webb,T.Misselbrook,andD.Chadwick.2001.Emissionofammonia(NH3),nitrousoxide(N2O)andmethane(CH4)fromadairyhardstandingintheUK.NutrientCyclinginAgroecosystems,60(1):115‐122.
Ewan,R.C.1989.Predictingtheenergyutilizationofdietsandfeedingredientsbypigs.InEnergyMetabolism,EuropeanAssociationofAnimalProductionBulletinNo.43,Y.v.d.HoningandW.H.Close(eds.).PudocWageningen,Netherlands.
Chapter 5: Quantifying Greenhouse Gas Sources and Sinks in Animal Production Systems
5-144
Faubert,P.,P.Tiiva,Å.Rinnan,S.Räty,etal.2010.Effectofvegetationremovalandwatertabledrawdownonthenon‐methanebiogenicvolatileorganiccompoundemissionsinborealpeatlandmicrocosms.AtmosphericEnvironment,44(35):4432‐4439.
Faulwetter,J.L.,V.Gagnon,C.Sundberg,F.Chazarenc,etal.2009.Microbialprocessesinfluencingperformanceoftreatmentwetlands:Areview.EcologicalEngineering,35(6):987‐1004.
Ferguson,N.,R.Gates,J.Taraba,A.Cantor,etal.1998a.Theeffectofdietarycrudeproteinongrowth,ammoniaconcentration,andlittercompositioninbroilers.PoultryScience,77(10):1481‐1487.
Ferguson,N.,R.Gates,J.Taraba,A.Cantor,etal.1998b.Theeffectofdietaryproteinandphosphorusonammoniaconcentrationandlittercompositioninbroilers.PoultryScience,77(8):1085‐1093.
Ferket,P.,E.Heugten,T.Kempen,andR.Angel.2002.Nutritionalstrategiestoreduceenvironmentalemissionfromnonruminants.JournalofAnimalScience,80(Suppl.2):168‐182.
Fernandes,L.,E.McKyes,andL.Obidniak.1988.Performanceofacontinuousbeltmicroscreeningunitforsolidliquidseparationofswinewaste.TransactionsoftheCSAE,30(1):151‐155.
Fey,A.,G.Benckiser,andJ.C.G.Ottow.1999.Emissionsofnitrousoxidefromaconstructedwetlandusingagroundfilterandmacrophytesinwaste‐waterpurificationofadairyfarm.BiologyandFertilityofSoils,29(4):354‐359.
Flesch,T.K.,J.D.Wilson,L.A.Harper,andB.P.Crenna.2005.Estimatinggasemissionsfromafarmwithaninverse‐dispersiontechnique.AtmosphericEnvironment,39(27):4863‐4874.
Flesch,T.K.,L.A.Harper,J.M.Powell,andJ.D.Wilson.2009.Inverse‐dispersioncalculationofammoniaemissionsfromWisconsindairyfarms,52:TransactionsoftheASABE.
Flesch,T.K.,R.L.Desjardins,andD.Worth.2011.Fugitivemethaneemissionsfromanagriculturalbiodigester.BiomassandBioenergy,35(9):3927‐3935.
Florin,N.H.,A.R.Maddocks,S.Wood,andA.T.Harris.2009.High‐temperaturethermaldestructionofpoultryderivedwastesforenergyrecoveryinAustralia.WasteManagement,29(4):1399‐1408.
Ford,M.,andR.Fleming.2002.MechnicalSolid‐LiquidSeparationofLivestockManureLiteratureReview:UniversityofGuelph.
Fournier.RotaryPress.Retrievedfromhttp://www.rotary‐press.com/.Fowler,D.,M.Coyle,C.Flechard,K.Hargreaves,etal.2001.Advancesinmicrometeorological
methodsforthemeasurementandinterpretationofgasandparticlenitrogenfluxes.PlantandSoil,228(1):117‐129.
Freeman,C.,M.A.Lock,S.Hughes,B.Reynolds,etal.1997.Nitrousoxideemissionsandtheuseofwetlandsforwaterqualityamelioration.EnvironmentalScienceandTechnology,31(8):2438‐2440.
Freetly,H.C.,andT.M.Brown‐Brandl.2013.Entericmethaneproductionfrombeefcattlethatvaryinfeedefficiency.JournalofAnimalScience,91(10):4826‐4831.
Fukummoto,Y.,T.Osada,D.Hanajima,andK.Haga.2003.PatternsandquantitiesofNH3,N2O,andCH4emissionsduringswinemanurecompostingwithoutforcedaeration‐effectofcompostpilescale.BioresourceTechnology,89:109‐114.
Galbraith,J.K.,G.W.Mathison,R.J.Hudson,T.A.McAllister,etal.1998.Intake,digestibility,methaneandheatproductioninbison,wapitiandwhite‐taileddeer.Canadianjournalofanimalscience.,78(4):681‐691.
Gao,F.,andS.R.Yates.1998.Simulationofenclosure‐basedmethodsformeasuringgasemissionsfromsoiltotheatmosphere.JournalofGeophysicalResearch,103(D20):26127‐26136.
Gilbertson,C.B.,andJ.A.Nienaber.1978.SeparationofCoarseSolidsfromBeefCattleManure.TransactionsoftheAmericanSocietyofAgriculturalEngineers,21(6):1185‐1188.
Chapter 5: Quantifying Greenhouse Gas Sources and Sinks in Animal Production Systems
5-145
Gleghorn,J.F.,N.A.Elam,M.L.Galyean,G.C.Duff,etal.2004.Effectsofcrudeproteinconcentrationanddegradabilityonperformance,carcasscharacteristics,andserumureanitrogenconcentrationsinfinishingbeefsteers.JournalofAnimalScience,82:2705‐2717.
Glerum,J.C.,G.Klomp,andH.R.Poelma.1971.TheSeparationofSolidandLiquidPartsofPigSlurry.Proceedingsofthe1stInternationalSymposiumonLivestockWastes,Columbus,OH,April19‐22,1971.
Goopy,J.P.,R.Woodgate,A.Donaldson,D.L.Robinson,etal.2011.Validationofashort‐termmethanemeasurementusingportablestaticchamberstoestimatedailymethaneproductioninsheep.AnimalFeedScienceandTechnology,166‐167(0):219‐226.
Gould‐Wells,D.,andD.W.Williams.2004.Biogasproductionfromacoveredlagoondigesterandutilizationinamicroturbine.
Guan,H.,K.M.Wittenberg,K.H.Ominski,andD.O.Krause.2006.Efficacyofionophoresincattledietsformitigationofentericmethane.JournalofAnimalScience,84(7):1896‐1906.
Hales,K.E.,N.A.Cole,andJ.C.MacDonald.2012.Effectsofcornprocessingmethodanddietaryinclusionofwetdistillersgrainwithsolublesonenergymetabolismandentericmethaneemissionsoffinishingcattle.JournalofAnimalScience,90:3174‐3185.
Hales,K.E.,N.A.Cole,andJ.C.MacDonald.2013.Effectsofincreasingconcentrationsofwetdistillersgrainswithsolublesinsteam‐flakedcorn‐baseddietsonenergymetabolism,carbon‐nitrogenbalance,andentericmethaneemissionsofcattle.JournalofAnimalScience,91:819‐828.
Hales,K.E.,T.M.Brown‐Brandl,andH.C.Freetly.2014.Effectsofdecreaseddietaryroughageconcentrationonenergymetabolismandnutrientbalanceinfinishingbeefcattle.JournalofAnimalScience,92:264‐271.
Hamilton,S.W.,E.J.DePeters,J.A.McGarvey,J.Lathrop,etal.2010.GreenhouseGas,AnimalPerformance,andBacterialPopulationStructureResponsestoDietaryMonensinFedtoDairyCows.JournalofEnvironmentalQuality,39(1):106‐114.
Hammer,D.A.,(ed.)1989.ConstructedWetlandsforWastewaterTreatment:Municipal,IndustrialandAgricultural.Chelsea,MI:LewisPublishers.
Hanni,S.,J.DeRouchey,M.Tokach,R.Goodband,etal.2007.Theeffectsofdietarychicoryandreducednutrientdietsoncompositionandodorofstoredswinemanure.TheProfessionalAnimalScientist,23:438‐447.
Hansen,R.R.,D.A.Nielsen,A.Schramm,L.P.Nielsen,etal.2009.Greenhousegasmicrobiologyinwetanddrystrawcrustcoveringpigslurry.JournalofEnvironmentalQuality,38(3):1311‐1319.
Hare,E.,H.D.Norman,andJ.R.Wright.2006.SurvivalrateandproductiveherdlifeofdairycattleintheUnitedStates.JournalofDairyScience,89(3713‐3720).
Harper,L.A.,O.T.Denmead,J.R.Freney,andF.M.Byers.1999.Directmeasurementsofmethaneemissionsfromgrazingandfeedlotcattle.JournalofAnimalScience,77(6):1392‐1401.
Harper,L.A.2005.Ammonia:MeasurementIssues.InMicrometeorologyinAgriculturalSystems,J.L.HatfieldandJ.M.Baker(eds.).Madison,WI:AmericanSocietyofAgronomy,CropScienceSocietyofAmerica,SoilScienceSocietyofAmerica.
Harper,L.A.,O.T.Denmead,andT.K.Flesch.2011.Micrometeorologicaltechniquesformeasurementofentericgreenhousegasemissions.AnimalFeedScienceandTechnology,166‐167(0):227‐239.
Harrington,C.,andM.Scholz.2010.Assessmentofpre‐digestedpiggerywastewatertreatmentoperationswithsurfaceflowintegratedconstructedwetlandsystems.BioresourceTechnology,101(20):7713‐7723.
Harrington,R.,andR.McInnes.2009.IntegratedConstructedWetlands(ICW)forlivestockwastewatermanagement.BioresourceTechnology,100(22):5498‐5505.
Hartung,J.,andV.Phillips.1994.Controlofgaseousemissionsfromlivestockbuildingsandmanurestores.JournalofAgriculturalEngineeringResearch,57:173‐189.
Chapter 5: Quantifying Greenhouse Gas Sources and Sinks in Animal Production Systems
5-146
Hatfield,J.L.,andR.L.Pfeiffer.2005.Evaluationoftechnologiesforambientairmonitoringatconcentratedanimalfeedingoperations.
Havenstein,G.,P.Ferket,andM.Qureshi.2003.Growth,livability,andfeedconversionof1957versus2001broilerswhenfedrepresentative1957and2001broilerdiets.PoultryScience,82(10):1500‐1508.
Havenstein,G.B.,P.R.Ferket,J.L.Grimes,M.A.Qureshi,etal.2007.ComparisonofthePerformanceof1966‐Versus2003‐TypeTurkeysWhenFedRepresentative1966and2003TurkeyDiets:GrowthRate,Livability,andFeedConversion.PoultryScience,86(2):232‐240.
Hayes,E.,A.Leek,T.Curran,V.Dodd,etal.2004.Theinfluenceofdietcrudeproteinlevelonodourandammoniaemissionsfromfinishingpighouses.BioresourceTechnology,91:309‐315.
He,B.,Y.Zhang,Y.Yin,T.L.Funk,etal.2001.EffectsoffeedstockpH,initialCOaddition,andtotalsolidscontentonthethermochemicalconversionprocessofswinemanure.TransactionsoftheAmericanSocietyofAgriculturalEngineers,44(3):697‐701.
He,B.J.,Y.Zhang,Y.Yin,T.L.Funk,etal.2000.Operatingtemperatureandretentiontimeeffectsonthethermochemicalconversionprocessofswinemanure.TransactionsoftheAmericanSocietyofAgriculturalEngineers,43(6):1821‐1825.
Hegarty,R.S.,J.P.Goopy,R.M.Herd,andB.McCorkell.2007.Cattleselectedforlowerresidualfeedintakehavereduceddailymethaneproduction.JournalofAnimalScience,85(6):1479‐1486.
Hegg,R.O.,R.E.Larson,andJ.A.Moore.1981.MechanicalLiquid‐SolidSeparationinBeef,Dairy,andSwineWasteSlurries.24(1):0159‐0163.
Hellebrand,H.J.,andW.D.Kalk.2000.Emissionscausedbymanurecomposting.AgrartechnischeForschung,6(2):26‐31.
Herschler,R.C.,A.W.Olmsted,A.J.Edwards,R.L.Hale,etal.1995.Productionresponsestovariousdosesandratiosofestradiolbenzoateandtrenboloneacetateimplantsinsteersandheifers.JournalofAnimalScience,73:2873‐2881.
Hill,G.M.,K.L.Richardson,andP.R.Utley.1988.Feedlotperformanceandpregnancyinhibitionofheiferstreatedwithdepot‐formulatedmelengestrolacetate.JournalofAnimalScience,66:2435‐2442.
Holmberg,R.D.,D.T.Hill,T.J.Prince,andN.J.VanDyke.1983.PotentialofSolid‐LiquidSeparationofSwineWastesforMethaneProduction.TransactionsoftheAmericanSocietyofAgriculturalEngineers,26(6):1803‐1807.
Holter,J.B.,andA.J.Young.1992.MethanePredictioninDryandLactatingHolsteinCows.JournalofDairyScience,75(8):2165‐2175.
Howden,S.M.,D.H.White,G.M.McKeon,J.C.Scanlan,etal.1994.Methodsforexploringmanagementoptionstoreducegreenhousegasemissionsfromtropicalgrazingsystems.ClimaticChange,27(1):49‐70.
Hristov,A.N.,M.Hanigan,A.Cole,R.Todd,etal.2011.Review:Ammoniaemissionsfromdairyfarmsandbeeffeedlots1.CanadianJournalofAnimalScience,91(1):1‐35.
Hristov,A.N.2012.Historic,preEuropeansettlement,andpresent‐daycontributionofwildruminantstoentericmethaneemissionsintheUnitedStates.JournalofAnimalScience,90:1371‐1375.
Hunt,P.G.,A.A.Szögi,F.J.Humenik,J.M.Rice,etal.2002.Constructedwetlandsfortreatmentofswinewastewaterfromananaerobiclagoon.TransactionsoftheASAE,45(3):639‐647.
Hunt,P.G.,T.A.Matheny,andA.A.Szogi.2003.Denitrificationinconstructedwetlandsusedfortreatmentofswinewastewater.JournalofEnvironmentalQuality,32(2):727‐735.
Hunt,P.G.,M.A.Matheny,andK.S.Ro.2007.Nitrousoxideaccumulationinsoilsfromriparianbuffersofacoastalplainwatershed‐carbon/nitrogenratiocontrol.J.Environ.Qual.,36:1368‐1376.
Hunter,R.A.2007.Methaneproductionbycattleinthetropics.BritishJournalofNutrition,98(03):657‐657.
Chapter 5: Quantifying Greenhouse Gas Sources and Sinks in Animal Production Systems
5-147
Hutchinson,G.L.,andA.R.Mosier.1981.ImprovedSoilCoverMethodforFieldMeasurementofNitrousOxideFluxes1.SoilSci.Soc.Am.J.,45(2):311‐316.
Hwang,S.,K.Jang,H.Jang,J.Song,etal.2006.Factorsaffectingnitrousoxideproduction:Acomparisonofbiologicalnitrogenremovalprocesseswithpartialandcompletenitrification.Biodegradation,17(1):19‐29.
Insam,H.,andB.Wett.2008.ControlofGHGemissionatthemicrobialcommunitylevel.WasteManagement,28(4):699‐706.
IPCC.1997.Revised1996IPCCGuidelinesforNationalGreenhouseGasInventories,PreparedbytheNationalGreenhouseGasInventoriesProgramme.Bracknell,UK:IntergovernmentalPanelonClimateChange.http://www.ipcc‐nggip.iges.or.jp/public/2006gl/vol4.html.
IPCC.2000.GoodPracticeGuidanceandUncertaintyManagementinNationalGreenhouseGasInventories:IntergovernmentalPanelonClimateChange.
IPCC.2006.2006IPCCGuidelinesforNationalGreenhouseGasInventories,PreparedbytheNationalGreenhouseGasInventoriesProgramme.Japan:IntergovernmentalPanelonClimateChange.http://www.ipcc‐nggip.iges.or.jp/public/2006gl/vol4.html.
Jarecki,M.K.,T.B.Parkin,A.S.K.Chan,J.L.Hatfield,etal.2008.Greenhousegasemissionsfromtwosoilsreceivingnitrogenfertilizerandswinemanureslurry.JournalofEnvironmentalQuality,37(4):1432‐1438.
Jarecki,M.K.,T.B.Parkin,A.S.K.Chan,T.C.Kaspar,etal.2009.Covercropeffectsonnitrousoxideemissionfromamanure‐treatedMollisol.Agriculture,EcosystemsandEnvironment,134(1‐2):29‐35.
Jin,Y.,Z.Hu,andZ.Wen.2009.Enhancinganaerobicdigestibilityandphosphorusrecoveryofdairymanurethroughmicrowave‐basedthermochemicalpretreatment.WaterResearch,43(14):3493‐3502.
Johansson,A.E.,Å.KasimirKlemedtsson,L.Klemedtsson,andB.H.Svensson.2003.Nitrousoxideexchangeswiththeatmosphereofaconstructedwetlandtreatingwastewater:Parametersandimplicationsforemissionfactors.Tellus,SeriesB:ChemicalandPhysicalMeteorology,55(3):737‐750.
Johnson,D.E.1972.EffectsofaHemiacetalofChloralandStarchonMethaneProductionandEnergyBalanceofSheepFedaPelletedDiet.JournalofAnimalScience,35(5):1064‐1068.
Johnson,D.E.1974.AdaptationalResponsesinNitrogenandEnergyBalanceofLambsFedaMethaneInhibitor.JournalofAnimalScience,38(1):154‐157.
Johnson,D.E.,T.M.Hill,B.R.Carmen,M.E.Branine,etal.1991.Newperspectivesonruminantmethaneemissions.InEnergyMetabolismofFarmAnimals,C.WenkandM.Boessinger(eds.).Zurich,Switzerland:EuropeanAssociationforAnimalProduction.
Johnson,K.,M.Huyler,H.Westberg,B.Lamb,etal.1994.Measurementofmethaneemissionsfromruminantlivestockusingasulfurhexafluoridetracertechnique.EnvironmentalScience&Technology,28(2):359‐362.
Johnson,K.A.,andD.E.Johnson.1995.Methaneemissionsfromcattle.JournalofAnimalScience,73(8):2483‐2492.
Jones,F.M.,F.A.Phillips,T.Naylor,andN.B.Mercer.2011.MethaneemissionsfromgrazingAngusbeefcowsselectedfordivergentresidualfeedintake.AnimalFeedScienceandTechnology,166‐167(0):302‐307.
Jungbluth,T.,E.Hartung,andG.Brose.2001..Greenhousegasemissionsfromanimalhousingandmanurestores.NutrientCyclinginAgroecosystems,60:133‐145.
Kadlec,R.H.,andR.L.Knight.1996.TreatmentWetlands.BocaRation,FL:LewisPublishers.Kebreab,E.,J.A.N.Mills,L.A.Crompton,A.Bannink,etal.2004.Anintegratedmathematicalmodelto
evaluatenutrientpartitionindairycattlebetweentheanimalanditsenvironment.AnimalFeedScienceandTechnology,112(1‐4):131‐154.
Chapter 5: Quantifying Greenhouse Gas Sources and Sinks in Animal Production Systems
5-148
Kebreab,E.,K.Clark,C.Wagner‐Riddle,andJ.France.2006.MethaneandnitrousoxideemissionsfromCanadiananimalagriculture:Areview.Canadianjournalofanimalscience.,86(2):135‐137.
Kebreab,E.,K.A.Johnson,S.L.Archibeque,D.Pape,etal.2008.ModelforestimatingentericmethaneemissionsfromUnitedStatesdairyandfeedlotcattle.JournalofAnimalScience,86(10):2738‐2748.
Kebreab,E.,J.Dijkstra,A.Bannink,andJ.France.2009.Recentadvancesinmodelingnutrientutilizationinruminants.JournalofAnimalScience,87(14suppl):E111‐E122.
Kelliher,F.M.,andH.Clark.2010.Methaneemissionsfrombison‐AnhistoricherdestimatefortheNorthAmericanGreatPlains.AgriculturalandForestMeteorology,150:473‐477.
Kennedy,P.M.,andE.Charmley.2012.MethaneyieldsfromBrahmancattlefedtropicalgrassesandlegumes.AnimalProductionScience,52(4):225‐239.
Kienbusch,M.R.1986.Measurementofgaseousemissionratesfromlandsurfacesusinganemission‐isolationfluxchamber.User'sguide.PB‐86‐223161/XABUnitedStatesWedFeb0615:30:17EST2008NTIS,PCA04/MFA01.GRA;ERA‐12‐001567;EDB‐86‐185667English.
Kim,I.,P.Ferket,W.Powers,H.Stein,etal.2004.Effectsofdifferentdietaryacidifiersourcesofcalciumandphosphorusonammonia,methaneandodorantemissionfromgrowing‐finishingpigs..Asian‐AustralasianJournalofAnimalSciences,17:1131‐1138.
Kinsman,R.,F.D.Sauer,H.A.Jackson,andM.S.Wolynetz.1995.MethaneandCarbonDioxideEmissionsfromDairyCowsinFullLactationMonitoredoveraSix‐MonthPeriod.JournalofDairyScience,78(12):2760‐2766.
Kirchgessner,M.,M.Kreuzer,H.Muller,andW.Windisch.1991.Releaseofmethaneandcarbondioxidebythepig.AgriculturalandBiologicalResearch,44:103‐133.
Klein,L.,andA.D.G.Wright.2006.Constructionandoperationofopen‐circuitmethanechambersforsmallruminants.Australianjournalofexperimentalagriculture.,46(10):1257‐1262.
Klemedtsson,L.,K.VonArnold,P.Weslien,andP.Gundersen.2005.SoilCNratioasascalarparametertopredictnitrousoxideemissions.GlobalChangeBiology,11(7):1142‐1147.
Klieve,A.V.,andR.S.Hegarty.1999.Opportunitiesforbiologicalcontrolofruminalmethanogenesis:CSIRO.
Koelsch,R.,andR.Stowell.2005.AmmoniaEmissionsEstimator.Lincoln,NE:UniversityofNebraska.http://www.msue.msu.edu/objects/content_revision/download.cfm/revision_id.515204/workspace_id.27335/Forms%20for%20Estimating%20Swine%20and%20Dairy%20Emissions.pdf/.
Krehbiel,C.R.,S.R.Rust,G.Zhang,andS.E.Gilliland.2003.Bacterialdirect‐fedmicrobialsinruminantdiets:Performanceresponseandmodeofaction.JournalofAnimalScience,81(E.Suppl.2):E120‐E132.
Kreikemeier,W.M.,andT.L.Mader.2004.Effectsofgrowth‐promotingagentsandseasononyearlingfeedlotheiferperformance.JournalofAnimalScience,82:2481‐2488.
Kriss,M.1930.Quantitativerelationsofthedrymatterofthefoodconsumed,theheatproduction,thegaseousoutgo,andtheinsensiblelossinbodyweightofcattle.JournalofAgriculturalResearch,40:283‐295.
KSU.2012.FocusonFeedlots.RetrievedDecember20fromhttp://www.asi.ksu.edu/p.aspx?tabid=302.
Kurihara,M.,T.Magner,R.A.Hunter,andG.J.McCrabb.1999.Methaneproductionandenergypartitionofcattleinthetropics.BritishJournalofNutrition,81(03):227‐234.
Kurup,R.2003.Performanceofaresidentialscaleplugflowanaerobicreactorfordomesticorganicwastetreatmentandbiogasgeneration.InORBIT2003OrganicRecoveryandBIologicalTreatmentProceedingsoftheFourthInternationalConferenceofORBITAssociationon
Chapter 5: Quantifying Greenhouse Gas Sources and Sinks in Animal Production Systems
5-149
BiologicalProcessingofOrganics:AdvancesforaSustainableSociety.Perth,WesternAustralia.
Lassey,K.R.2007.Livestockmethaneemission:Fromtheindividualgrazinganimalthroughnationalinventoriestotheglobalmethanecycle.AgriculturalandForestMeteorology,142(2‐4):120‐132.
Lassey,K.R.,C.S.Pinares‐Patiño,R.J.Martin,G.Molano,etal.2011.EntericmethaneemissionratesdeterminedbytheSF6tracertechnique:Temporalpatternsandaveragingperiods.AnimalFeedScienceandTechnology,166–167(0):183‐191.
Laubach,J.,andF.M.Kelliher.2005.Measuringmethaneemissionratesofadairycowherd(II):resultsfromabackward‐Lagrangianstochasticmodel.AgriculturalandForestMeteorology,129(3‐4):137‐150.
Laubach,J.,F.M.Kelliher,T.W.Knight,H.Clark,etal.2008.Methaneemissionsfrombeefcattle—acomparisonofpaddock‐andanimal‐scalemeasurements.AustralianJournalofExperimentalAgriculture,48:132‐137.
Le,P.,A.Aarnink,A.Jongbloed,C.vanderPeetSchwering,etal.2008.Interactiveeffectsofdietarycrudeproteinandfermentablecarbohydratelevelsonodourfrompigmanure.LivestockScience,114:48–61.
Le,P.D.,A.J.A.Aarnink,A.W.Jongbloed,C.M.C.vanderPeetSchwering,etal.2007.Effectsofcrystallineaminoacidsupplementationtothedietonodorfrompigmanure.JournalofAnimalScience,85(3):791‐801.
Lee,S.S.,J.‐T.Hsu,H.C.Mantovani,andJ.B.Russell.2002.TheeffectofbovicinHC5,abacteriocinfromStreptococcusbovisHC5,onruminalmethaneproductioninvitro1.FEMSMicrobiologyLetters,217(1):51‐55.
Legesse,G.,J.A.Small,S.L.Scott,G.H.Crow,etal.2011.Predictionsofentericmethaneemissionsforvarioussummerpastureandwinterfeedingstrategiesforcowcalfproduction.AnimalFeedScienceandTechnology,166‐167(0):678‐687.
Lenis,N.1993.Lowernitrogenexcretioninpighusbandrybyfeeding:Currentandfuturepossibilities.ProceedingsoftheFirstInter.Symp.NitrogenFlowinPigProductionandEnvironmentalConsequences.,Pudoc,Wageningen,Netherlands.
Leytem,A.B.,R.S.Dungan,D.L.Bjorneberg,andA.C.Koehn.2011.EmissionsofAmmonia,Methane,CarbonDioxide,andNitrousOxidefromDairyCattleHousingandManureManagementSystems.JournalofEnvironmentalQuality,40(5):1383‐1394.
Leytem,A.B.,R.S.Dungan,D.L.Bjorneberg,andA.C.Koehn.2013.Greenhousegasandammoniaemissionsfromanopen‐freestalldairyinsouthernIdaho.JournalofEnvironmentalQuality,42:10‐20.
Li,L.,J.Cyriac,K.F.Knowlton,L.C.Marr,etal.2009.Effectsofreducingdietarynitrogenonammoniaemissionsfrommanureonthefloorofanaturallyventilatedfreestalldairybarnatlow(0‐20C)temperatures.JournalofEnvironmentalQuality,38:2172‐2181.
Li,W.,W.J.Powers,D.Karcher,C.R.Angel,etal.2010.EffectofDDGSandmineralsourcesonairemissionsfromlayinghens.PoultryScience,89(E‐Suppl.1).
Li,W.,W.Powers,andG.M.Hill.2011.FeedingDDGStoswineandresultingimpactonairemissions.JournalofAnimalScience,89:3286‐3299.
Liebig,M.A.,J.R.Gross,S.L.Kronberg,R.L.Phillips,etal.2010.Grazingmanagementcontributionstonetglobalwarmingpotential:Along‐termevaluationintheNorthernGreatPlains.JournalofEnvironmentalQuality,39:799‐809.
Little,S.,J.Linderman,K.MacLean,andH.Janzen.2008.Holos–atooltoestimateandreducegreenhousegasesfromfarms.Methodologyandalgorithmsforversions1.1x:AgricultureandAgri‐FoodCanada.http://www4.agr.gc.ca/AAFC‐AAC/display‐afficher.do?id=1226606460726&lang=eng#s1.
Chapter 5: Quantifying Greenhouse Gas Sources and Sinks in Animal Production Systems
5-150
Liu,Z.,H.Liu,andW.Powers.2011a.Meta‐analysisofGreenhouseGasEmissionsfromswineoperations.ProceedingsoftheASABEAnnualMeeting,August7‐10,2011,Louisville,KY.
Liu,Z.,W.Powers,D.Karcher,R.Angel,etal.2011b.Effectofaminoacidformulationandsupplementationonnutrientmassbalanceinturkeys.PoultryScience,90(6):1153‐1161.
Liu,Z.,W.Powers,D.Karcher,R.Angel,etal.2011a.Effectofaminoacidformulationandsupplementationonairemissionsfromturkeys.Trans.ASABE,54:617‐628.
Locke,M.A.,M.A.Weaver,R.M.Zablotowicz,R.W.Steinriede,etal.2011.Constructedwetlandsasacomponentoftheagriculturallandscape:Mitigationofherbicidesinsimulatedrunofffromuplanddrainageareas.Chemosphere.
Loh,Z.,D.Chen,M.Bai,T.Naylor,etal.2008.MeasurementofgreenhousegasemissionsfromAustralianfeedlotbeefproductionusingopen‐pathspectroscopyandatmosphericdispersionmodeling.AustralianJournalofExperimentalAgriculture,48:244‐247.
Lovanh,N.,J.Warren,andK.Sistani.2010.Determinationofammoniaandgreenhousegasemissionsfromlandapplicationofswineslurry:Acomparisonofthreeapplicationmethods.BioresourceTechnology,101(6):1662‐1667.
Lovett,D.,S.Lovell,L.Stack,J.Callan,etal.2003.Effectofforage/concentrateratioanddietarycoconutoillevelonmethaneoutputandperformanceoffinishingbeefheifers.LivestockProductionScience,84(2):135‐146.
Lu,S.Y.,P.Y.Zhang,andW.H.Cui.2010.Impactofplantharvestingonnitrogenandphosphorusremovalinconstructedwetlandstreatingagriculturalregionwastewater.InternationalJournalofEnvironmentandPollution,43(4):339‐353.
Luo,J.,andS.Saggar.2008.Nitrousoxideandmethaneemissionsfromadairyfarmstand‐offpad.AustralianJournalofExperimentalAgriculture,48:179‐182.
Lupo,C.D.,D.E.Clay,J.L.Benning,andJ.J.Stone.2013.Life‐CycleAssessmentoftheBeefCattleProductionSystemfortheNorthernGreatPlains,USA.JournalofEnvironmentalQuality,42(5):1386‐1394.
Malone,R.W.,L.Ma,P.Heilman,D.L.Karlen,etal.2007.SimulatedNmanagementeffectsoncornyieldandtile‐drainagenitrateloss.Geoderma,140(3):272‐283.
Maltais‐Landry,G.,R.Maranger,J.Brisson,andF.Chazarenc.2009.Greenhousegasproductionandefficiencyofplantedandartificiallyaeratedconstructedwetlands.EnvironmentalPollution,157(3):748‐754.
Mander,U.,K.Lohmus,S.Teiter,K.Nurk,etal.2005a.Gaseousfluxesfromsubsurfaceflowconstructedwetlandsforwastewatertreatment.JournalofEnvironmentalScienceandHealth‐PartAToxic/HazardousSubstancesandEnvironmentalEngineering,40(6‐7):1215‐1226.
Mander,U.,S.Teiter,andJ.Augustin.2005b.Emissionofgreenhousegasesfromconstructedwetlandsforwastewatertreatmentandfromriparianbufferzones.
Martin,C.,D.P.Morgavi,andM.Doreau.2010.Methanemitigationinruminants:frommicrobetothefarmscale.Animal,4(03):351‐365.
McGinn,S.M.,H.H.Janzen,andT.Coates.2003.AtmosphericAmmonia,VolatileFattyAcids,andOtherOdorantsnearBeefFeedlots.JournalofEnvironmentalQuality,32(4):1173‐1182.
McGinn,S.M.,K.A.Beauchemin,T.Coates,andD.Colombatto.2004.Methaneemissionsfrombeefcattle:Effectsofmonensin,sunfloweroil,enzymes,yeast,andfumaricacid.JournalofAnimalScience,82(11):3346‐3356.
McGinn,S.M.,K.A.Beauchemin,A.D.Iwaasa,andT.McAllister.2006.Assessmentofthsulfurhexafluoride(SF6)tracertechniqueformeasuringentericmethaneemissionsfromcatttle.JournalofEnvironmentalQuality,35:1686‐1691.
McGinn,S.M.,D.Chen,Z.Loh,J.Hill,etal.2008.MethaneemissionsfromfeedlotcattleinAustraliaandCanada.AustralianJournalofExperimentalAgriculture,48:183‐185.
Chapter 5: Quantifying Greenhouse Gas Sources and Sinks in Animal Production Systems
5-151
McGinn,S.M.,Y.‐H.Chung,K.A.Beauchemin,A.D.Iwaasa,etal.2009.Useofcorndistillers’driedgrainstoreduceentericmethanelossfrombeefcattle.CanadianJournalofAnimalScience,89(3):409‐413.
McGinn,S.M.,D.Turner,N.Tomkins,E.Charmley,etal.2011.MethaneEmissionsfromGrazingCattleUsingPoint‐SourceDispersion.JournalofEnvironmentalQuality,40(1):22‐27.
Michal,J.J.,E.Allwine,S.Spogen,S.Pressley,etal.2010.Nitrousoxideandmethaneemissionsformalargebeeffeedlot.ProceedingsoftheGreenhouseGasinAnimalAgricultureConference,Banff,Alberta,Canada.
Milano,G.,andH.Clark.2008.Theeffectoflevelofintakeandforagequalityonmethaneproductionbysheep.AustralianJournalofExperimentalAgriculture,48:219‐222.
Miles,D.,P.Owens,andD.Rowe.2006.Spatialvariabilityoflittergaseousfluxwithinacommercialbroilerhouse:ammonia,nitrousoxide,carbondioxide,andmethane.PoultryScience,85(2):167‐172.
Miles,D.M.,D.E.Rowe,andP.R.Owens.2008.Winterbroilerlittergasesandnitrogencompounds:Temporalandspatialtrends.AtmosphericEnvironment,42(14):3351‐3363.
Miles,D.M.,D.E.Rowe,andT.C.Cathcart.2011.Litterammoniageneration:Moisturecontentandorganicversusinorganicbeddingmaterials.PoultryScience,90(6):1162‐1169.
Mills,J.A.,J.Dijkstra,A.Bannink,S.B.Cammell,etal.2001.Amechanisticmodelofwhole‐tractdigestionandmethanogenesisinthelactatingdairycow:modeldevelopment,evaluation,andapplication.JournalofAnimalScience,79(6):1584‐1597.
Mills,J.A.N.,E.Kebreab,C.M.Yates,L.A.Crompton,etal.2003.Alternativeapproachestopredictingmethaneemissionsfromdairycows.JournalofAnimalScience,81(12):3141‐3150.
Miner,J.R.1975.Evaluationofalternativeapproachestocontrolodorsfromanimalfeedlots.Moscow,ID:IdahoResearchFoundation.
Misselbrook,T.,D.Chadwick,B.Pain,andD.Headon.1998.DietarymanipulationasameansofdecreasingNlossesandmethaneemissionsandimprovingherbageNuptakefollowingapplicationofpigslurrytograssland.TheJournalofAgriculturalScience,130:183‐191.
Misselbrook,T.H.,J.M.Powell,G.A.Broderick,andJ.H.Grabber.2005.DietaryManipulationinDairyCattle:LaboratoryExperimentstoAssesstheInfluenceonAmmoniaEmissions.JournalofDairyScience,88(5):1765‐1777.
Moe,P.W.,andH.F.Tyrrell.1979.MethaneProductioninDairyCows.JournalofDairyScience,62(10):1583‐1586.
Møller,H.B.,S.G.Sommer,andB.K.Ahring.2004.Methaneproductivityofmanure,strawandsolidfractionsofmanure.BiomassandBioenergy,26(5):485‐495.
Møller,H.G.,I.Lund,andS.G.Sommer.2000.Solid‐liquidseparationoflivestockslurry:efficiencyandcost.BioresourceTechnology,74(2000):223‐229.
Monteny,G.‐J.,A.Bannink,andD.Chadwick.2006.Greenhousegasabatementstrategiesforanimalhusbandry.Agriculture,Ecosystems&Environment,112(2‐3):163‐170.
Montgomery,J.L.,C.R.Krehbiel,J.J.Cranston,D.A.Yates,etal.2009.Dietaryzilpaterolhydrochloride.I.Feedlotperformanceandcarcasstraitsofsteersandheifers.JournalofAnimalScience,87:1374‐1383.
Moore,P.A.,T.C.Daniel,andD.R.Edwards.2000.Reducingphosphorusrunoffandinhibitingammonialossfrompoultrymanurewithaluminumsulfate.JournalofEnvironmentalQuality,29(37‐49).
Moore,P.A.,D.Miles,R.Burns,D.Pote,etal.2011.Ammoniaemissionfactorsfrombroilerlitterinbarns,instorage,andafterlandapplication.JournalofEnvironmentalQuality,40:1395‐1404.
Moore,P.A.2013.TreatingpoultrylitterwithaluminumSulfate(Alum):EmissionManagementPracticesFactSheet.USDALivestockGRACEnet,U.S.DepartmentofAgriculture.
Chapter 5: Quantifying Greenhouse Gas Sources and Sinks in Animal Production Systems
5-152
Moore,P.A.J.,D.Miles,R.Burns,D.Pote,etal.2010.Ammoniaemissionfactorsfromboilerlitterinbarns,instorage,andafterlandapplication.JournalofEnvironmentalQuality,40:1395‐1404.
Moore,S.S.,F.D.Mujibi,andE.L.Sherman.2009.Molecularbasisforresidualfeedintakeinbeefcattle.JournalofAnimalScience,87(14suppl):E41‐E47.
Morgavi,D.P.,E.Forano,C.Martin,andC.J.Newbold.2010.Microbialecosystemandmethanogenesisinruminants.Animal,4(SpecialIssue07):1024‐1036.
Münger,A.,andM.Kreuzer.2008.Absenceofpersistentmethaneemissiondifferencesinthreebreedsofdairycows.AustralianJournalofExperimentalAgriculture,48:77‐82.
Murphy,M.R.,R.L.Baldwin,andL.J.Koong.1982.EstimationofStoichiometricParametersforRumenFermentationofRoughageandConcentrateDiets.JournalofAnimalScience,55(2):411‐421.
Mustafa,A.,M.Scholz,R.Harrington,andP.Carroll.2009.Long‐termperformanceofarepresentativeintegratedconstructedwetlandtreatingfarmyardrunoff.EcologicalEngineering,35(5):779‐790.
Ndegwa,P.,A.Hristov,J.Arogo,andR.Sheffield.2008.AReviewofAmmoniaEmissionTechniquesforConcentratedAnimalfeedingOperations.BiosystemsEngineering,100:453‐469.
NewZealandMinistryfortheEnvironment.2010.ProjectedbalanceofemissionsunitsduringthefirstcommitmentperiodoftheKyotoProtocol.http://www.mfe.govt.nz/publications/climate/projected‐balance‐units‐may05/html/page10.html.
NGGIC.1996.AustralianMethodologyfortheEstimationofGreenhouseGasEmissionsandSinks.Agriculture,WorkbookforLivestock,Workbook6.1,Revision1.Canberra,Australia:NationalGreenhouseInventoryCommittee,DepartmentoftheEnvironment,Sport,andTerritories.
Ngwabie,N.M.,K.H.Jeppsson,S.Nimmermark,C.Swensson,etal.2009.Multi‐locationmeasurementsofgreenhousegasesandemissionratesofmethaneandammoniafromanaturally‐ventilatedbarnfordairycows.BiosystemsEngineering,103(1):68‐77.
Ni,J.Q.1999.Mechanisticmodelsofammoniareleasefromliquidmanure:areview.JournalofAgriculturalEngineeringResearch,72(1):1‐17.
Nielsen,D.A.,L.P.Nielsen,A.Schramm,andN.P.Revsbech.2010.OxygenDistributionandPotentialAmmoniaOxidationinFloating,LiquidManureCrusts.JournalofEnvironmentalQuality,39(5):1813‐1820.
Nkrumah,J.D.,E.K.Okine,G.W.Mathison,K.Schmid,etal.2006.Relationshipsoffeedlotfeedefficiency,performance,andfeedingbehaviorwithmetabolicrate,methaneproduction,andenergypartitioninginbeefcattle.JournalofAnimalScience,84(1):145‐153.
Nozière,P.,I.Ortigues‐Marty,C.Loncke,andD.Sauvant.2010.Carbohydratequantitativedigestionandabsorptioninruminants:fromfeedstarchandfibretonutrientsavailablefortissues.Animal,4(SpecialIssue07):1057‐1074.
NRC.1989.NutrientRequirementsofDairyCattle.Washington,DC:NationalResearchCouncil,NationalAcademyofScience,.
NRC.2000.NutrientRequirementsofBeefCattleUpdate2000.Washington,DC:Natl.Acad.Press.Ocfemia,K.S.,Y.Zhang,andT.Funk.2006.Hydrothermalprocessingofswinemanuretooilusinga
continuousreactorsystem:Effectsofoperatingparametersonoilyieldandquality.TransactionsoftheASABE,49(6):1897‐1904.
Odongo,N.E.,R.Bagg,G.Vessie,P.Dick,etal.2007.Long‐TermEffectsofFeedingMonensinonMethaneProductioninLactatingDairyCows.JournalofDairyScience,90(4):1781‐1788.
Olson,K.C.,J.A.Walker,C.A.Stonecipher,B.R.Bowman,etal.2000.Effectofgrassspeciesonmethaneemissionsbybeefcattle.Soc.RangeManage.AnnualMeeting.
Chapter 5: Quantifying Greenhouse Gas Sources and Sinks in Animal Production Systems
5-153
Ominski,K.H.,D.A.Boadi,andK.M.Wittenberg.2006.Entericmethaneemissionsfrombackgroundedcattleconsumingall‐foragediets.CanadianJournalofAnimalScience,86(3):393‐400.
Outor‐Monteiro,D.,V.M.CarvalhoPinheiro,L.J.MedeirosMourão,andM.A.MachadoRodrigues.2010.Strategiesformitigationofnitrogenenvironmentalimpactfromswineproduction.R.Bras.Zootec,39:317‐325.
Owens,F.N.,D.S.Secrist,W.J.Hill,andD.R.Gill.1997.Theeffectofgrainsourceandgrainprocessingonperformanceoffeedlotcattle:Areview.75(868‐879).
Panetta,D.M.,W.J.Powers,H.Xin,B.Kerr,etal.2006.Nitrogenexcretionandammoniaemissionsfrompigsfedmodifieddiets.JournalofEnvironmentalQuality,35(4):1297‐1308.
Parker,D.B.,E.A.Caraway,M.B.Rhoades,N.A.Cole,etal.2010.EffectofwindtunnelairvelocityonVOCfluxfromstandardsolutionsandCAFOmanure/wastewater.Trans.ASABE,53:831‐845.
Paul,J.W.,N.E.Dinn,T.Kannangara,andL.J.Fisher.1998.ProteinContentinDairyCattleDietsAffectsAmmoniaLossesandFertilizerNitrogenValue.JournalofEnvironmentalQuality,27(3):528‐534.
Paul,R.,andW.W.Watson.1966.THERMALDIFFUSIONANDSELF‐DIFFUSIONINAMMONIA.JournalofChemicalPhysics,45(7):2675‐&.
Pavao‐Zuckerman,M.A.,J.C.Waller,T.Ingle,andH.A.Fribourg.1999.MethaneEmissionsofBeefCattleGrazingTallFescuePasturesatThreeLevelsofEndophyteInfestation.JournalofEnvironmentalQuality,28(6):1963‐1969.
Pelletier,N.,R.Pirog,andR.Rasmussen.2010.ComparativelifecycleenvironmentalimpactsofthreebeefproductionstrategiesintheUpperMidwesternUnitedStates.AgriculturalSystems,103:380‐389.
Peters,G.M.,H.V.Rowley,S.Wiedemann,R.Tucker,etal.2010.RedmeatproductioninAustralia:Lifecycleassessmentandcomparisonwithoverseasstudies.EnvironmentalScienceandTechnology,44:1327‐1332.
Petersen,S.O.,andS.G.Sommer.2011.Ammoniaandnitrousoxideinteractions:Rolesofmanureorganicmattermanagement.AnimalFeedScienceandTechnology,166–167:503‐513.
Phetteplace,H.,D.Johnson,andA.Seidl.2001.GreenhousegasemissionsfromsimulatedbeefanddairylivestocksystemsintheUnitedStates.NutrientCyclinginAgroecosystems,60(1):99‐102.
Philippe,F.‐X.,M.Laitat,B.Canart,M.Vandenheede,etal.2007.Comparisonofammoniaandgreenhousegasemissionsduringthefatteningofpigs,kepteitheronfullyslattedfloororondeeplitter.LivestockScience,111:144‐152.
Picek,T.,H.Čížková,andJ.Dušek.2007.Greenhousegasemissionsfromaconstructedwetland‐Plantsasimportantsourcesofcarbon.EcologicalEngineering,31(2):98‐106.
Pinares‐Patiño,C.S.,M.J.Ulyatt,G.C.Waghorn,K.R.Lassey,etal.2003.Methaneemissionbyalpacaandsheepfedonlucernehayorgrazedonpasturesofperennialryegrass/whitecloverorbirdsfoottrefoil.JournalofAgriculturalScience,140(02):215‐226.
Portejoie,S.,J.Dourmad,J.Martinez,andY.Lebreton.2004.Effectofloweringcrudeproteinonnitrogenexcretion,manurecompositionandammoniaemissionfromfatteningpigs..LivestockProd.Sci.,91:45‐55.
Pos,J.,R.Trapp,andM.Harvey.1984.PerformanceofaBrushedScreen/RollerPressManureSeparator,ASAEPaperNo.83‐4065.St.Joseph,MI:AmericanSocietyofAgriculturalEngineers.
Powell,J.M.,P.R.Cusick,T.H.Misselbrook,andB.J.Holmes.2007.Designandcalibrationofchambersformeasuringammoniaemissionsfromtie‐stalldairybarns.Trans.ASABE,49(4):1139‐1149.
Chapter 5: Quantifying Greenhouse Gas Sources and Sinks in Animal Production Systems
5-154
Powell,J.M.,G.A.Broderick,andT.H.Misselbrook.2008.SeasonalDietAffectsAmmoniaEmissionsfromTie‐StallDairyBarns.JournalofDairyScience,91(2):857‐869.
Powell,J.M.,G.A.Broderick,J.H.Grabber,andU.C.Hymes‐Fecht.2009.Technicalnote:Effectsofforageprotein‐bindingpolyphenolsonchemistryofdairyexcreta.JournalofDairyScience,92(4):1765‐1769.
Powell,J.M.,M.J.Aguerre,andM.A.Wattiaux.2011.TanninExtractsAbateAmmoniaEmissionsfromSimulatedDairyBarnFloors.JournalofEnvironmentalQuality,40(3):907‐914.
Powers,W.,S.Zamzow,andB.Kerr.2007.Reducedcrudeproteineffectsonaerialemissionsfromswine.AppliedEngineeringinAgriculture,23:539‐546.
Powlson,D.S.,A.B.Riche,K.Coleman,M.J.Glendining,etal.2008.CarbonsequestrationinEuropeansoilsthroughstrawincorporation:Limitationsandalternatives.WasteManagement,28(4):741‐746.
Preston,R.L.2013.NutrientValuesfor300CattleFeeds.BeefMagazine.Radunz,A.2011.OptaflexxandZilmax:Betaagonists:Growthpromotingfeedadditivesforbeef
cattle:UniversityofWyomingExtensionReport.Raman,K.P.,W.P.Walawender,andL.T.Fan.1980.Gasificationoffeedlotmanureinafluidizedbed
reactor.Theeffectoftemperature.Industrial&EngineeringChemistryProcessDesignandDevelopment,19(4):623‐629.
Reynolds,C.K.,J.A.N.Mills,L.A.Crompton,D.I.Givens,etal.2010.Ruminantnutritionregimestoreducegreenhousegasemissionsindairycows.InEnergyandproteinmetabolismandnutrition,G.M.Crovetto(ed.):EEAP
Ro,K.S.,K.Cantrell,D.Elliott,andP.G.Hunt.2007.Catalyticwetgasificationofmunicipalandanimalwastes.IndustrialandEngineeringChemistryResearch,46(26):8839‐8845.
Ro,K.S.,K.B.Cantrell,P.G.Hunt,T.F.Ducey,etal.2009.Thermochemicalconversionoflivestockwastes:Carbonizationofswinesolids.BioresourceTechnology,100(22):5466‐5471.
Ro,K.S.,K.B.Cantrell,andP.G.Hunt.2010.High‐temperaturepyrolysisofblendedanimalmanuresforproducingrenewableenergyandvalue‐addedbiochar.IndustrialandEngineeringChemistryResearch,49(20):10125‐10131.
Roberts,S.A.,H.Xin,B.J.Kerr,J.R.Russell,etal.2007.EffectsofDietaryFiberandReducedCrudeProteinonAmmoniaEmissionfromLaying‐HenManure.PoultryScience,86(8):1625‐1632.
Robinson,B.,andE.Okine.2001.Feedintakeinfeedlotcattle.AlbertaFeedlotManagementGuide,2ndEdition.http://www1.agric.gov.ab.ca/$department/deptdocs.nsf/all/beef4873.
Rotz,C.A.2004.Managementtoreducenitrogenlossesinanimalproduction.JournalofAnimalScience,82(13suppl):E119‐E137.
Rotz,C.A.,D.R.Buckmaster,andJ.W.Comerford.2005.Abeefherdmodelforsimulatingfeedintake,animalperformance,andmanureexcretioninfarmsystems.JournalofAnimalScience,83(1):231‐242.
Rotz,C.A.,D.S.Chianese,F.Montes,andS.Hafner.2011a.Dairygasemissionsmodel:Referencemanual:U.S.DepartmentofAgriculture,AgriculturalResearchService.
Rotz,C.A.,M.S.Corson,D.S.Chianese,F.Montes,etal.2011b.Integratedfarmsystemmodel:ReferenceManual.UniversityPark,PA:U.S.DepartmentofAgriculture,AgriculturalResearchService.http://ars.usda.gov/SP2UserFiles/Place/19020000/ifsmreference.pdf.
Saggar,S.,C.B.Hedley,D.L.Giltrap,andS.M.Lambie.2007.Measuredandmodelledestimatesofnitrousoxideemissionandmethaneconsumptionfromasheep‐grazedpasture.Agriculture,Ecosystems&Environment,122(3):357‐365.
Saha,C.K.,C.Ammon,W.Berg,M.Fiedler,etal.2014.Seasonalanddielvariationsofammoniaandmethaneemissionsfromanaturallyventilateddairybuildingandtheassociatedfactorsinfluencingemissions.ScienceoftheTotalEnvironment,468:469‐462.
Chapter 5: Quantifying Greenhouse Gas Sources and Sinks in Animal Production Systems
5-155
Samer,M.,M.Fiedler,H.J.Müller,M.Gläser,etal.2011.Wintermeasurementsofairexchangeratesusingtracergastechniqueandquantificationofgaseousemissionsfromanaturallyventilateddairybarn.AppliedEngineeringinAgriculture.
Seo,D.C.,andR.D.DeLaune.2010.Fungalandbacterialmediateddenitrificationinwetlands:Influenceofsedimentredoxcondition.WaterResearch,44(8):2441‐2450.
Shiflett,J.S.2011.SheepandLambIndustryEconomicImpactAnalysis:AmericanSheepIndustryAssociationhttp://www.sheepusa.org/user_files/file_865.pdf
Shutt,J.W.,R.K.White,E.P.Taiganides,andC.R.Mote.1975.EvaluationofSolidsSeparationDevices.Proceedingsofthe3rdInternationalSymposiumonLivestockWastes,Urbana‐Champaign,IL,April21‐24,1975.
Sneath,R.W.,M.Shaw,andA.G.Williams.1988.Centrifugationforseparatingpiggeryslurry1.Theperformanceofadecantingcentrifuge.JournalofAgriculturalEngineeringResearch,39(3):181‐190.
Sommer,S.G.,S.O.Petersen,andH.B.Møller.2004.Algorithmsforcalculatingmethaneandnitrousoxideemissionsfrommanuremanagement.NutrientCyclinginAgroecosystems,69:143‐154.
Soosaar,K.,M.Maddison,andÜ.Mander.2009.Waterqualityandemissionratesofgreenhousegasesinatreatmentreedbed.
Søvik,A.K.,J.Augustin,K.Heikkinen,J.T.Huttunend,etal.2006.EmissionoftheGreenhouseGasesNitrousOxideandMethanefromConstructedWetlandsinEurope.JournalofEnvironmentalQuality,35(6):2360‐2373.
Spiehs,M.J.,B.L.Woodbury,B.E.Doran,R.A.Eigenberg,etal.2011.Environmentalconditionsindeep‐beddedmono‐slopefacilities:Adescriptivestudy.Trans.ASABE,54:663‐673.
Stackhouse‐Lawson,K.R.,C.A.Rotz,J.W.Oltjen,andF.M.Mitloehner.2012.CarbonfootprintandammoniaemissionsofCaliforniabeefproductionsystems.JournalofAnimalScience,90:4641‐4655.
Stackhouse,K.R.,C.A.Rotz,J.W.Oltjen,andF.M.Mitloehner.2012.Growthpromotingtechnologiesreducethecarbonfootprint,ammoniaemissions,andcostofCaliforniabeefproductionsystems.JournalofAnimalScience,90:4656‐4665.
Stein,O.R.,andP.B.Hook.2005.Temperature,plants,andoxygen:Howdoesseasonaffectconstructedwetlandperformance?JournalofEnvironmentalScienceandHealth‐PartAToxic/HazardousSubstancesandEnvironmentalEngineering,40(6‐7):1331‐1342.
Stein,O.R.,J.A.Biederman,P.B.Hook,andW.C.Allen.2006.Plantspeciesandtemperatureeffectsonthek‐C*first‐ordermodelforCODremovalinbatch‐loadedSSFwetlands.EcologicalEngineering,26(2):100‐112.
Stein,O.R.,B.W.Towler,P.B.Hook,andJ.A.Biederman.2007a.Onfittingthek‐C*firstordermodeltobatchloadedsub‐surfacetreatmentwetlands.WaterScienceandTechnology,56(3):93‐99.
Stein,O.R.,B.W.Towler,P.B.Hook,andJ.A.Biederman.2007b.Onfittingthek‐C*firstordermodeltobatchloadedsub‐surfacetreatmentwetlands.
Stone,K.C.,P.G.Hunt,A.A.Szogi,F.J.Humenik,etal.2002.Constructedwetlanddesignandperformanceforswinelagoonwastewatertreatment.TransactionsoftheAmericanSocietyofAgriculturalEngineers,45(3):723‐730.
Stone,K.C.,M.E.Poach,P.G.Hunt,andG.B.Reddy.2004.Marsh‐pond‐marshconstructedwetlanddesignanalysisforswinelagoonwastewatertreatment.EcologicalEngineering,23(2):127‐133.
Stone,K.C.,P.G.Hunt,K.B.Cantrell,andK.S.Ro.2010.Thepotentialimpactsofbiomassfeedstockproductiononwaterresourceavailability.BioresourceTechnology,101(6):2014‐2025.
Sun,H.,S.L.Trabue,K.Scoggin,W.A.Jackson,etal.2008.Alcohol,VolatileFattyAcid,Phenol,andMethaneEmissionsfromDairyCowsandFreshManure.JournalofEnvironmentalQuality,37(2):615‐622.
Chapter 5: Quantifying Greenhouse Gas Sources and Sinks in Animal Production Systems
5-156
Sutton,A.,K.Kephardt,J.Patterson,R.Mumma,etal.1996.Manipulatingswinedietstoreduceammoniaandodoremissions.Proceedingsofthe1stInternationalConferenceonAirPollutionfromAgriculturalOperations,KansasCity,MO.
Sveinbjornsson,P.,P.Huhtanen,andJ.Uden.2006.TheNordicdairycowmodel,Karoline–developmentofvolatilefattyacidsubmodel.InNutrientDigestionandUtilizationinFarmAnimals:ModelingApproach,E.Kebreab,J.Dijkstra,A.Bannink,W.J.J.GerritsandJ.France(eds.).Wallingford,UK:CABPublishing.
Sweeten,J.2004.AirQuality:Odor,Dust,andGaseousEmissionsfromConcentratedAnimalFeedingOperationsintheSouthernGreatPlains,ProjectNo.2003‐34466‐13146/CSREESProject#TS‐2003‐06007:U.S.DepartmentofAgriculture,CSREESSpecialResearchGrantsProgram
Szanto,G.L.,H.V.M.Hamelers,W.H.Rulkens,andA.H.M.BVeeken.2006.NH3,N2OandCH4emissionsduringpassivelyaeratedcompostingofstraw‐richpigmanure.BioresourceTechnology,98:2659‐2670.
Tanner,C.C.,D.D.Adams,andM.T.Downes.1997.Methaneemissionsfromconstructedwetlandstreatingagriculturalwastewaters.JournalofEnvironmentalQuality,26(4):1056‐1062.
Tanner,C.C.,andT.R.Headley.2011.Componentsoffloatingemergentmacrophytetreatmentwetlandsinfluencingremovalofstormwaterpollutants.EcologicalEngineering,37(3):474‐486.
Tanner,C.C.,andJ.P.S.Sukias.2011.Multiyearnutrientremovalperformanceofthreeconstructedwetlandsinterceptingtiledrainflowsfromgrazedpastures.JournalofEnvironmentalQuality,40(2):620‐633.
Taylor,C.R.,P.B.Hook,O.R.Stein,andC.A.Zabinski.2010.Seasonaleffectsof19plantspeciesonCODremovalinsubsurfacetreatmentwetlandmicrocosms.EcologicalEngineering.
Tedeschi,L.O.,D.G.Fox,andT.P.Tylutki.2003.PotentialEnvironmentalBenefitsofIonophoresinRuminantDiets.JournalofEnvironmentalQuality,32(5):1591‐1602.
Teiter,S.,andU.Mander.2005.EmissionofN2O,N2,CH4,andCO2fromconstructedwetlandsforwastewatertreatmentandfromriparianbufferzones.EcologicalEngineering,25(5):528‐541.
Todd,R.W.,N.A.Cole,L.A.Harper,T.K.Flesch,etal.2005.Ammoniaandgaseousnitrogenemissionsfromacommercialbeefcattlefeedyardestimatedusingtheflux‐gradientmethodandN/Pratioanalysis.ProceedingsoftheStateoftheScience:Animalmanureandwastemanagement,Jan5‐7,2005,NationalCenterformanureandWasteManagement,SanAntonio,TX.
Todd,R.W.,N.A.Cole,H.M.Waldrip,andR.M.Aiken.2013.Arrheniusequationformodelingfeedyardammoniaemissionusingtemperatureanddietcrudeprotein.JournalofEnvironmentalQuality,42:666‐671.
Todd,R.W.,M.Altman,N.A.Cole,andH.M.Waldrip.2014a.MethaneemissiosnsfromabeefcattlefeedyardduringwinterandsummerontheSouthernHighPlainsofTexas.JournalofEnvironmentalQuality(inpress).
Todd,R.W.,H.M.Waldrip,M.Altman,andN.A.Cole.2014b.Methaneemissionsfromabeefcattlefeedyard:measurementsandmodels.ProceedingsoftheAmericanMeteorologicalSociety's31stConferenceonAgriculturalandForestMeteolorology,May12‐15,2014,Portland,OR.
Tomkins,N.W.,andR.A.Hunter.2004.Methanemitigationinbeefcattleusingapatentedanti‐methanogen.Proceedingsofthe2ndJointAustraliaandNewZealandForumonNon‐CO2GreenhouseGasEmissionsfromAgriculture,October2003,LancemoreHill,Canberra.
Tomkins,N.W.,S.M.Colegate,andR.A.Hunter.2009.Abromochloromethaneformulationreducesentericmethanogenesisincattlefedgrain‐baseddiets.AnimalProductionScience,49(12):1053‐1058.
Tomkins,N.W.,S.M.McGinn,D.A.Turner,andE.Charmley.2011.Comparisonofopen‐circuitrespirationchamberswithamicrometeorologicalmethodfordeterminingmethane
Chapter 5: Quantifying Greenhouse Gas Sources and Sinks in Animal Production Systems
5-157
emissionsfrombeefcattlegrazingatropicalpasture.AnimalFeedScienceandTechnology,166‐167(0):240‐247.
Towler,B.W.,J.E.Cahoon,andO.R.Stein.2004.Evapotranspirationcropcoefficientsforcattailandbulrush.JournalofHydrologicEngineering,9(3):235‐239.
Trei,J.E.,G.C.Scott,andR.C.Parish.1972.InfluenceofMethaneInhibitiononEnergeticEfficiencyofLambs.JournalofAnimalScience,34(3):510‐515.
U.S.EPA.2011.U.S.GHGInventory1990‐2009:U.S.EnvrionmentalProtectionAgency.http://www.epa.gov/climatechange/emissions/downloads11/US‐GHG‐Inventory‐2011‐Chapter‐6‐Agriculture.pdf.
U.S.EPA.2013.InventoryofU.S.greenhousegasemissionsandsinks:1990‐2011.Washington,D.C.:EnvironmentalProtectionAgency.
Ungerfeld,E.M.,R.A.Kohn,R.J.Wallace,andC.J.Newbold.2007.Ameta‐analysisoffumarateeffectsonmethaneproductioninruminalbatchcultures.JournalofAnimalScience,85(10):2556‐2563.
USDA.2004a.Dairy2002.NutrientManagementandtheU.S.DairyIndustryin2002.Washington,DC:USDAAnimalandPlantHealthInspectionService.http://nahms.aphis.usda.gov/dairy/dairy02/Dairy02Nutrient_mgmt_rept.pdf.
USDA.2004b.USDAAgricultureandForestryGreenhouseGasInventory:1990‐2001.Washington,DC:U.S.DepartmentofAgriculture.http://www.usda.gov/oce/climate_change/ghg_inventory.htm.
USDA.2010.Beef2007‐08,PartV:ReferenceofBeefCow‐calfmanagementpracticesintheUnitedStates,2007‐2008.FortCollins,CO:USDA‐APHIS‐VS,CEAH.
USDANASS.2011.ChartsandMaps‐SheepandLamb:U.S.DepartmentofAgriculture,NationalAgriculturalStatisticsService.http://www.nass.usda.gov/Charts_and_Maps/Sheep_and_Lambs/index.asp.
USDANASS.2012.QuickStats:AgriculturalStatisticsDatabase.Washington,DC:U.S.DepartmentofAgriculture,NationalAgricultureStatisticsService.http://quickstats.nass.usda.gov/.
USDANRCS.2007.CompostingManure–What’sgoingoninthedark?,May2007,Number1.Washington,DC:U.S.DepartmentofAgriculture,NaturalResourcesConservationService.
VanKessel,J.A.S.,andJ.B.Russell.1996.TheeffectofpHonruminalmethanogenesis.FEMSMicrobiologyEcology,20(4):205‐210.
VanAmburgh,M.,L.Chase,T.Overton,E.Recktenwald,etal.2010.2010UpdatestotheCornellNetCarbohydrateandProteinSystemv6.1.ProceedingsoftheCornellNutritionConference.
VanderPol,K.J.,M.K.Luebbe,G.I.Crawford,G.E.Erickson,etal.2009.Performanceanddigestibilitycharacteristicsoffinishingdietscontainingdistillersgrains,compositesofcornprocessingcoproducts,orsupplementalcornoil.JournalofAnimalScience,87(2):639‐652.
VanderZaag,A.C.,R.J.Gordon,D.L.Burton,R.C.Jamieson,etal.2010.Greenhousegasemissionsfromsurfaceflowandsubsurfaceflowconstructedwetlandstreatingdairywastewater.JournalofEnvironmentalQuality,39(2):460‐471.
Vanotti,M.B.,andP.G.Hunt.1999.Solidsandnutrientremovalfromflushedswinemanureusingpolyacrylamides.TransactionsoftheAmericanSocietyofAgriculturalEngineers,42(6):1833‐1840.
Vanotti,M.B.,andP.G.Hunt.2000.Nitrificationtreatmentofswinewastewaterwithacclimatednitrifyingsludgeimmobilizedinpolymerpellets.TransactionsoftheASAE,43(2):405‐413.
Vanotti,M.B.,D.M.C.Rashash,andP.G.Hunt.2002.Solid‐liquidseparationofflushedswinemanurewithPAM:Effectofwastewaterstrength.TransactionsoftheAmericanSocietyofAgriculturalEngineers,45(6):1959‐1969.
Vanotti,M.B.,A.A.Szogi,andP.G.Hunt.2003.Extractionofsolublephosphorusfromswinewastewater.TransactionsoftheAmericanSocietyofAgriculturalEngineers,46(6):1665‐1674.
Chapter 5: Quantifying Greenhouse Gas Sources and Sinks in Animal Production Systems
5-158
Vanotti,M.B.,P.D.Millner,P.G.Hunt,andA.Q.Ellison.2005.Removalofpathogenandindicatormicroorganismsfromliquidswinemanureinmulti‐stepbiologicalandchemicaltreatment.BioresourceTechnology,96(2):209‐214.
Vanotti,M.B.,A.A.Szogi,P.G.Hunt,P.D.Millner,etal.2007.DevelopmentofenvironmentallysuperiortreatmentsystemtoreplaceanaerobicswinelagoonsintheUSA.BioresourceTechnology,98(17):3184‐3194.
Vanotti,M.B.,andA.A.Szogi.2008.Waterqualityimprovementsofwastewaterfromconfinedanimalfeedingoperationsafteradvancedtreatment.JournalofEnvironmentalQuality,37(SUPPL.5):S86‐S96.
Vanotti,M.B.,A.A.Szogi,andC.A.Vives.2008.Greenhousegasemissionreductionandenvironmentalqualityimprovementfromimplementationofaerobicwastetreatmentsystemsinswinefarms.WasteManagement,28(4):759‐766.
Vanotti,M.B.,A.A.Szogi,P.D.Millner,andJ.H.Loughrin.2009.Developmentofasecond‐generationenvironmentallysuperiortechnologyfortreatmentofswinemanureintheUSA.BioresourceTechnology,100(22):5406‐5416.
Vanotti,M.B.,Millner,P.D.,Szogi,A.A.,Campbell,C.R.,Fetterman,L.M..2006.Aerobiccompostingofswinemanuresolidsmixedwithcottonginwaste.ASABEAnnualInternationalMeeting,Portland,Oregon.
Vasconcelos,J.T.,andM.L.Galyean.2007.Nutritionalrecommendationsoffeedlotconsultingnutritionists:The2007TexasTechUniversitysurvey.JournalofAnimalScience,85(10):2772‐2781.
Vasconcelos,J.T.,R.J.Rathmann,R.R.Reuter,J.Leibovish,etal.2008.Effectsofdurationofzilpaterolhydrochloridefeedinganddaysofthefinishingdietonfeedlotcattleperformanceandcarcasstraits.JournalofAnimalScience,86:2005‐2012.
Venterea,R.T.,K.A.Spokas,andJ.M.Baker.2009.AccuracyandPrecisionAnalysisofChamber‐BasedNitrousOxideGasFluxEstimates.SoilSci.Soc.Am.J.,73(4):1087‐1093.
Venterea,R.T.2010.SimplifiedMethodforQuantifyingTheoreticalUnderestimationofChamber‐BasedTraceGasFluxes.JournalofEnvironmentalQuality,39(1):126‐135.
Verge,X.P.C.,J.A.Dyer,R.L.Desjardins,andD.Worth.2008.GreenhousegasemissionsfromtheCanadianbeefindustry.AgriculturalSystems,98:126‐134.
Verge,X.P.X.,J.A.Dyer,R.L.Desjardins,andD.Worth.2009.GreenhousegasemissionsfromtheCanadianporkindustry.LivestockScience,121:92‐101.
Vogel,G.1995.Effectsofionophoresonfeedintakebyfeedlotcattle.ProceedingsoftheSymposiumonIntakeofFeedlotCattle,OklahomaStateUniv.July,1995.
Vymazal,J.2011.Enhancingecosystemservicesonthelandscapewithcreated,constructedandrestoredwetlands.EcologicalEngineering,37(1):1‐5.
Waghorn,G.C.,H.Clark,V.Taufa,andA.Cavanagh.2008.Monensincontrolled‐releasecapsulesformethanemitigationinpasture‐feddairycows.AustralianJournalofExperimentalAgriculture,48:65‐68.
Wagner,J.J.,T.E.Engle,andT.C.Bryant.2010.Theeffectofrumendegradableandrumenundegradableintakeproteinonfeedlotperformanceandcarcassmeritinheavyyearlingsteers.JournalofAnimalScience,88:1073‐1081.
Wang,L.,A.Shahbazi,andM.A.Hanna.2011.Characterizationofcornstover,distillergrainsandcattlemanureforthermochemicalconversion.BiomassandBioenergy,35(1):171‐178.
Wang,Y.,R.Inamori,H.Kong,K.Xu,etal.2008.Influenceofplantspeciesandwastewaterstrengthonconstructedwetlandmethaneemissionsandassociatedmicrobialpopulations.EcologicalEngineering,32(1):22‐29.
Westberg,H.,B.Lamb,K.A.Johnson,andM.Huyler.2001.InventoryofmethaneemissionsfromU.S.cattle.JournalofGeophysicalResearch,106(D12):12633‐12642.
White,F.1999.FluidMechanics.Boston,MA:McGraw‐HillScience/Engineering/Math.
Chapter 5: Quantifying Greenhouse Gas Sources and Sinks in Animal Production Systems
5-159
Wileman,B.W.,D.U.Thomson,C.D.Reinhardt,andD.G.Renter.2009.Analysisofmoderntechnologiescommonlyusedinbeefcattleproduction:Conventionalbeefproductionversusnonconventionalproductionusingmeta‐analysis.JournalofAnimalScience,87:3418‐3426.
Wilkerson,V.A.,D.P.Casper,andD.R.Mertens.1995.ThePredictionofMethaneProductionofHolsteinCowsbySeveralEquations.JournalofDairyScience,78(11):2402‐2414.
Wolin,M.J.1960.ATheoreticalRumenFermentationBalance.JournalofDairyScience,43(10):1452‐1459.
Woodbury,B.L.,D.N.Miller,J.A.Nienaber,andR.A.Eigenberg.2001.Seasonalandspatialvariationsofdenitrifyingenzymeactivityinfeedlotsoil.Trans.ASABE,44:1635‐1642.
WRI.2009.DocumentationofEmissionsCalculationsforVersion1.2oftheManureandNutrientReductionEstimator(MANURE)Tool.Arlington,VA:ERT‐WinrockInternational.http://app6.erg.com/manure/docs/manure_calculations.pdf.
Wright,A.D.G.,P.Kennedy,C.J.O’Neill,A.F.Toovey,etal.2004.Reducingmethaneemissionsinsheepbyimmunizationagainstrumenmethanogens.Vaccine,22(29‐30):3976‐3985.
Wu‐Haan,W.,W.J.Powers,C.R.Angel,C.E.Hale,III,etal.2007a.NutrientDigestibilityandMassBalanceinLayingHensFedaCommercialorAcidifyingDiet.PoultryScience,86(4):684‐690.
Wu‐Haan,W.,W.J.Powers,C.R.Angel,C.E.Hale,III,etal.2007b.EffectofanAcidifyingDietCombinedwithZeoliteandSlightProteinReductiononAirEmissionsfromLayingHensofDifferentAges.PoultryScience,86(1):182‐190.
Wu,J.,J.Zhang,W.L.Jia,H.J.Xie,etal.2009.Nitrousoxidefluxesofconstructedwetlandstotreatsewagewastewater.HuanjingKexue/EnvironmentalScience,30(11):3146‐3151.
Xiu,S.,Y.Zhang,andA.Shahbazi.2009.Swinemanuresolidsseparationandthermochemicalconversiontoheavyoil.BioResources,4(2):458‐470.
Xiu,S.,A.Shahbazi,C.W.Wallace,L.Wang,etal.2011.Enhancedbio‐oilproductionfromswinemanureco‐liquefactionwithcrudeglycerol.EnergyConversionandManagement,52(2):1004‐1009.
Yan,T.,R.E.Agnew,F.J.Gordon,andM.G.Porter.2000.Predictionofmethaneenergyoutputindairyandbeefcattleofferedgrasssilage‐baseddiets.LivestockProductionScience,64(2‐3):253‐263.
Yan,T.,M.G.Porter,andC.S.Mayne.2009.Predictionofmethaneemissionfrombeefcattleusingdatameasuredinindirectopen‐circuitrespirationcalorimeters.Animal,3(10):1455‐1462.
Young,B.A.1981.Coldstressasitaffectsanimalproduction.JournalofAnimalScience,52:154‐163.Zhang,G.,J.S.Strøm,B.Li,H.B.Rom,etal.2005.Emissionofammoniaandothercontaminantgases
fromnaturallyventilateddairycattlebuildings.BiosystemsEngineering,92(3):355‐364.Zhu,G.,Z.Ma,Z.Gao,W.Ma,etal.2014.CharaterizingCH4andN2Oemissionsfromanintensive
dairyoperationinsummerandfallinChina.AtmosphericEnvironment,83:245‐253.Zhu,N.,P.An,B.Krishnakumar,L.Zhao,etal.2007.Effectofplantharvestonmethaneemission
fromtwoconstructedwetlandsdesignedforthetreatmentofwastewater.JournalofEnvironmentalManagement,85(4):936‐943.
Zinn,R.A.,andY.Shen.1996.Interactionofdietarycalciumandsupplementalfatondigestivefunctionandgrowthperformanceinfeedlotsteers.JournalofAnimalScience,74:2303‐2309.
Zinn,R.A.,andR.Barajas.1997.Influenceofflakedensityonthecomparativefeedingvalueofabarley‐cornblendforfeedlotcattle.JournalofAnimalScience,75(4):904‐909.

Chapter 5: Quantifying Greenhouse Gas Sources and Sinks in Animal Production Systems
5-160
Thispageisintentionallyleftblank.
Authors:
CoeliHoover,USDAForestService(LeadAuthor)RichardBirdsey,USDAForestService(Co‐LeadAuthor)BruceGoines,USDAForestServicePeterLahm,USDAForestServiceGreggMarland,AppalachianStateUniversityDavidNowak,USDAForestServiceStephenPrisley,VirginiaPolytechnicInstituteandStateUniversityElizabethReinhardt,USDAForestServiceKenSkog,USDAForestServiceDavidSkole,MichiganStateUniversityJamesSmith,USDAForestServiceCarlTrettin,USDAForestServiceChristopherWoodall,USDAForestService
Contents:
6 QuantifyingGreenhouseGasSourcesandSinksinManagedForestSystems....................6‐46.1 Overview.........................................................................................................................................................6‐5
6.1.1 OverviewofManagementPracticesandResultingGHGEmissions.........................6‐66.1.2 SystemBoundariesandTemporalScale..............................................................................6‐96.1.3 SummaryofSelectedMethods/Models..............................................................................6‐106.1.4 SourcesofData..............................................................................................................................6‐116.1.5 OrganizationofChapter/Roadmap......................................................................................6‐12
6.2 ForestCarbonAccounting......................................................................................................................6‐156.2.1 DescriptionofForestCarbonAccounting..........................................................................6‐156.2.2 DataCollectionforForestCarbonAccounting.................................................................6‐236.2.3 EstimationMethods....................................................................................................................6‐256.2.4 Limitations,Uncertainty,andResearchGaps...................................................................6‐28
6.3 Establishing,Re‐establishing,andClearingForests....................................................................6‐296.3.1 Description.....................................................................................................................................6‐296.3.2 ActivityDataCollection.............................................................................................................6‐336.3.3 EstimationMethods....................................................................................................................6‐346.3.4 SpecificProtocolforComputation........................................................................................6‐376.3.5 ActualGHGRemovalsandEmissionsbySourcesandSinksfromForestClearing...
.............................................................................................................................................................6‐436.3.6 LimitationsandUncertainty....................................................................................................6‐44
6.4 ForestManagement..................................................................................................................................6‐45
Chapter 6Quantifying Greenhouse Gas Sources and Sinks in Managed Forest Systems
Chapter 6: Quantifying Greenhouse Gas Sources and Sinks in Managed Forest Systems
6-2
6.4.1 Description.....................................................................................................................................6‐456.4.2 ActivityData...................................................................................................................................6‐536.4.3 ManagementIntensityCategories........................................................................................6‐576.4.4 EstimationMethods....................................................................................................................6‐646.4.5 LimitationsandUncertainty....................................................................................................6‐66
6.5 HarvestedWoodProducts.....................................................................................................................6‐666.5.1 GeneralAccountingIssues.......................................................................................................6‐666.5.2 EstimationMethods....................................................................................................................6‐686.5.3 ActivityDataCollection.............................................................................................................6‐696.5.4 Limitations,Uncertainty,andResearchGaps...................................................................6‐70
6.6 UrbanForests..............................................................................................................................................6‐716.6.1 Description.....................................................................................................................................6‐716.6.2 ActivityDataCollection.............................................................................................................6‐736.6.3 EstimationMethods....................................................................................................................6‐746.6.4 LimitationsandUncertainty....................................................................................................6‐80
6.7 NaturalDisturbance–WildfireandPrescribedFire...................................................................6‐826.7.1 Description.....................................................................................................................................6‐826.7.2 ActivityDataCollection.............................................................................................................6‐826.7.3 EstimationMethods....................................................................................................................6‐826.7.4 LimitationsandUncertainty....................................................................................................6‐87
Appendix6‐A:HarvestedWoodProductsLookupTables.....................................................................6‐88Chapter6References..........................................................................................................................................6‐107
SuggestedChapterCitation:Hoover,C.,R.Birdsey,B.Goines,P.Lahm,GMarland,D.Nowak,S.Prisley,E.Reinhardt,K.Skog,D.Skole,J.Smith,C.Trettin,C.Woodall,2014.Chapter6:QuantifyingGreenhouseGasSourcesandSinksinManagedForestSystems.InQuantifyingGreenhouseGasFluxesinAgricultureandForestry:MethodsforEntity‐ScaleInventory.TechnicalBulletinNumber1939.OfficeoftheChiefEconomist,U.S.DepartmentofAgriculture,Washington,DC.606pages.July2014.Eve,M.,D.Pape,M.Flugge,R.Steele,D.Man,M.Riley‐Gilbert,andS.Biggar,Eds.
USDAisanequalopportunityproviderandemployer.
Chapter 6: Quantifying Greenhouse Gas Sources and Sinks in Managed Forest Systems
6-3
Acronyms,ChemicalFormulae,andUnitsBA BasalareaC CarbonCH4 Methanecm CentimetersCO2 CarbondioxideCO2‐eq CarbondioxideequivalentsCOLE CarbonOnLineEstimatorCRM ComponentratiomethodDBH DiameteratbreastheightDDW DowndeadwoodDOE DepartmentofEnergyEPA EnvironmentalProtectionAgencyFFE FireandFuelsExtensionFIA ForestInventoryandAnalysisFIADB ForestInventoryandAnalysisDatabaseFIDO ForestInventoryDataOnlineFOFEM FirstOrderFireEffectsModelFVS ForestVegetationSimulator modelft Feetg GramGHG GreenhousegasH Heightha Hectarehp Horsepowerhr HourHW HardwoodHWP Harvestedwoodproductsin Incheslbs PoundsIPCC IntergovernmentalPanelonClimateChangem Metersmm MillimetersMcf ThousandcubicfeetN2O NitrousoxideNOx Mono‐nitrousoxidesO2 OxygenPW PulpwoodSL SawlogsSOC SoilorganiccarbonSSURGO SoilSurveyGeographicdatabaseSTATSGO StateSoilGeographicdatabaseSW SoftwoodTg TeragramsUFORE UrbanForestEffectsmodelUNFCCC UnitedNationsFrameworkConventiononClimateChangeUSDA U.S.DepartmentofAgriculture

Chapter 6: Quantifying Greenhouse Gas Sources and Sinks in Managed Forest Systems
6-4
Thispageisintentionallyleftblank.
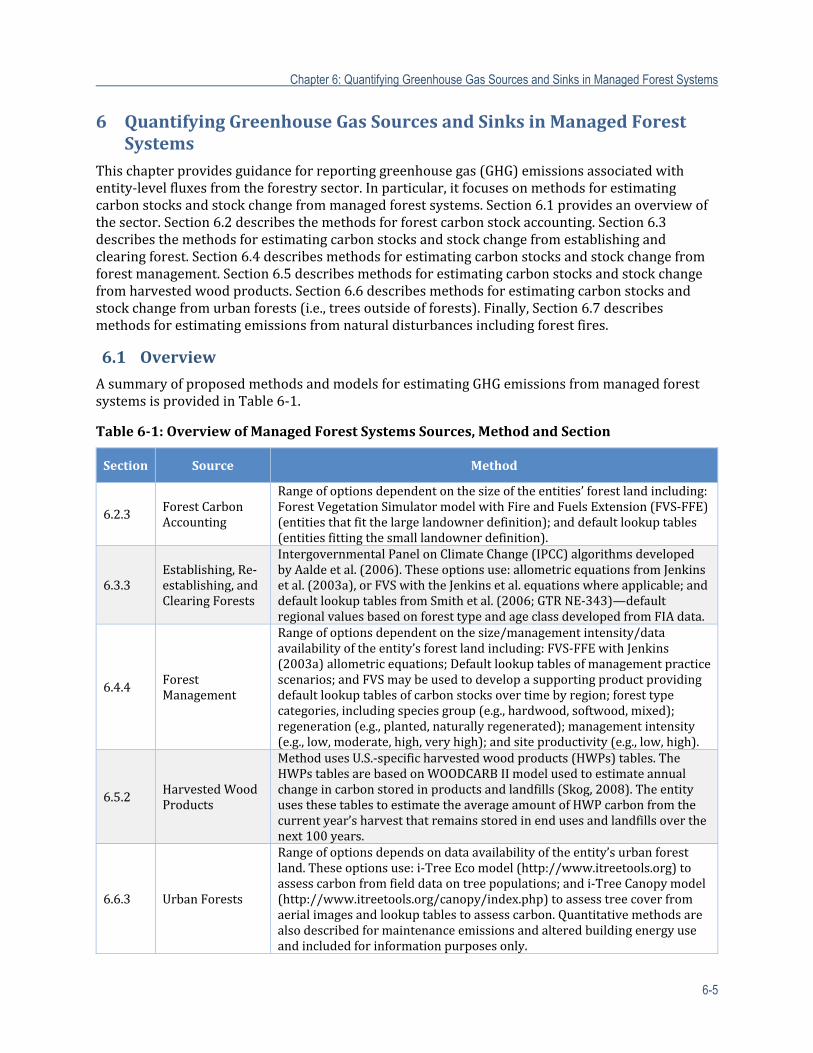
Chapter 6: Quantifying Greenhouse Gas Sources and Sinks in Managed Forest Systems
6-5
6 QuantifyingGreenhouseGasSourcesandSinksinManagedForestSystems
Thischapterprovidesguidanceforreportinggreenhousegas(GHG)emissionsassociatedwithentity‐levelfluxesfromtheforestrysector.Inparticular,itfocusesonmethodsforestimatingcarbonstocksandstockchangefrommanagedforestsystems.Section6.1providesanoverviewofthesector.Section6.2describesthemethodsforforestcarbonstockaccounting.Section6.3describesthemethodsforestimatingcarbonstocksandstockchangefromestablishingandclearingforest.Section6.4describesmethodsforestimatingcarbonstocksandstockchangefromforestmanagement.Section6.5describesmethodsforestimatingcarbonstocksandstockchangefromharvestedwoodproducts.Section6.6describesmethodsforestimatingcarbonstocksandstockchangefromurbanforests(i.e.,treesoutsideofforests).Finally,Section6.7describesmethodsforestimatingemissionsfromnaturaldisturbancesincludingforestfires.
6.1 Overview
AsummaryofproposedmethodsandmodelsforestimatingGHGemissionsfrommanagedforestsystemsisprovidedinTable6‐1.
Table6‐1:OverviewofManagedForestSystemsSources,MethodandSection
Section Source Method
6.2.3 ForestCarbonAccounting
Rangeofoptionsdependentonthesizeoftheentities’forestlandincluding:ForestVegetationSimulatormodelwithFireandFuelsExtension(FVS‐FFE)(entitiesthatfitthelargelandownerdefinition);anddefaultlookuptables(entitiesfittingthesmalllandownerdefinition).
6.3.3Establishing,Re‐establishing,andClearingForests
IntergovernmentalPanelonClimateChange (IPCC) algorithmsdevelopedbyAaldeetal.(2006).Theseoptionsuse:allometricequationsfromJenkinsetal.(2003a),orFVSwiththeJenkinsetal.equationswhereapplicable;anddefaultlookuptablesfromSmithetal.(2006;GTRNE‐343)—defaultregionalvaluesbasedonforesttypeandageclassdevelopedfromFIAdata.
6.4.4 ForestManagement
Rangeofoptionsdependentonthesize/managementintensity/dataavailabilityoftheentity’sforestlandincluding:FVS‐FFEwithJenkins(2003a)allometricequations;Defaultlookuptablesofmanagementpracticescenarios;andFVSmaybeusedtodevelopasupportingproductprovidingdefaultlookuptablesofcarbonstocksovertimebyregion;foresttypecategories,includingspeciesgroup(e.g.,hardwood,softwood,mixed);regeneration(e.g.,planted,naturallyregenerated);managementintensity(e.g.,low,moderate,high,veryhigh);andsiteproductivity(e.g.,low,high).
6.5.2 HarvestedWoodProducts
MethodusesU.S.‐specificharvestedwoodproducts(HWPs)tables.TheHWPstablesarebasedonWOODCARBIImodelusedtoestimateannualchangeincarbonstoredinproductsandlandfills(Skog,2008).TheentityusesthesetablestoestimatetheaverageamountofHWPcarbonfromthecurrentyear’sharvestthatremainsstoredinendusesandlandfillsoverthenext100years.
6.6.3 UrbanForests
Rangeofoptionsdependsondataavailabilityoftheentity’surbanforestland.Theseoptionsuse:i‐TreeEcomodel(http://www.itreetools.org)toassesscarbonfromfielddataontreepopulations;andi‐TreeCanopymodel(http://www.itreetools.org/canopy/index.php)toassesstreecoverfromaerialimagesandlookuptablestoassesscarbon.Quantitativemethodsarealsodescribedformaintenanceemissionsandalteredbuildingenergyuseandincludedforinformationpurposesonly.
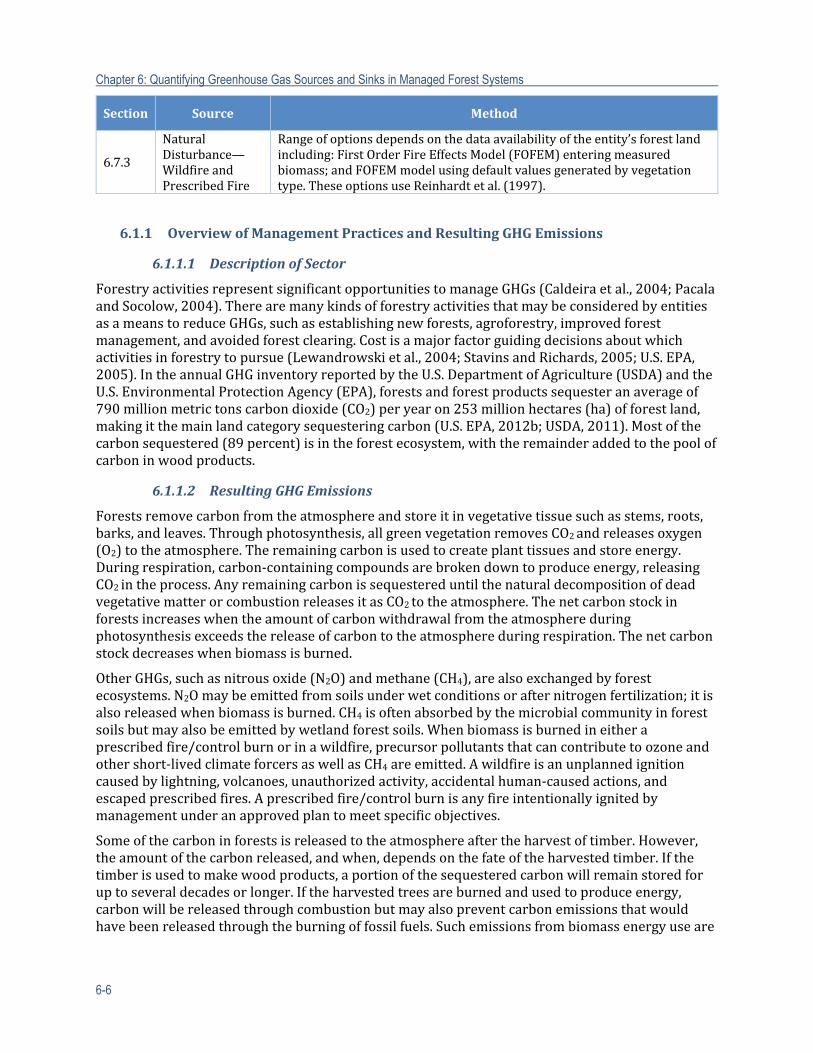
Chapter 6: Quantifying Greenhouse Gas Sources and Sinks in Managed Forest Systems
6-6
Section Source Method
6.7.3
NaturalDisturbance—WildfireandPrescribedFire
Rangeofoptionsdepends onthedataavailabilityoftheentity’sforestlandincluding:FirstOrderFireEffectsModel(FOFEM)enteringmeasuredbiomass;andFOFEMmodelusingdefaultvaluesgeneratedbyvegetationtype.TheseoptionsuseReinhardtetal.(1997).
6.1.1 OverviewofManagementPracticesandResultingGHGEmissions
6.1.1.1 DescriptionofSector
ForestryactivitiesrepresentsignificantopportunitiestomanageGHGs(Caldeiraetal.,2004;PacalaandSocolow,2004).TherearemanykindsofforestryactivitiesthatmaybeconsideredbyentitiesasameanstoreduceGHGs,suchasestablishingnewforests,agroforestry,improvedforestmanagement,andavoidedforestclearing.Costisamajorfactorguidingdecisionsaboutwhichactivitiesinforestrytopursue(Lewandrowskietal.,2004;StavinsandRichards,2005;U.S.EPA,2005).IntheannualGHGinventoryreportedbytheU.S.DepartmentofAgriculture(USDA)andtheU.S.EnvironmentalProtectionAgency(EPA),forestsandforestproductssequesteranaverageof790millionmetrictonscarbondioxide(CO2)peryearon253millionhectares(ha)offorestland,makingitthemainlandcategorysequesteringcarbon(U.S.EPA,2012b;USDA,2011).Mostofthecarbonsequestered(89percent)isintheforestecosystem,withtheremainderaddedtothepoolofcarboninwoodproducts.
6.1.1.2 ResultingGHGEmissions
Forestsremovecarbonfromtheatmosphereandstoreitinvegetativetissuesuchasstems,roots,barks,andleaves.Throughphotosynthesis,allgreenvegetationremovesCO2andreleasesoxygen(O2)totheatmosphere.Theremainingcarbonisusedtocreateplanttissuesandstoreenergy.Duringrespiration,carbon‐containingcompoundsarebrokendowntoproduceenergy,releasingCO2intheprocess.AnyremainingcarbonissequestereduntilthenaturaldecompositionofdeadvegetativematterorcombustionreleasesitasCO2totheatmosphere.Thenetcarbonstockinforestsincreaseswhentheamountofcarbonwithdrawalfromtheatmosphereduringphotosynthesisexceedsthereleaseofcarbontotheatmosphereduringrespiration.Thenetcarbonstockdecreaseswhenbiomassisburned.
OtherGHGs,suchasnitrousoxide(N2O)andmethane(CH4),arealsoexchangedbyforestecosystems.N2Omaybeemittedfromsoilsunderwetconditionsorafternitrogenfertilization;itisalsoreleasedwhenbiomassisburned.CH4isoftenabsorbedbythemicrobialcommunityinforestsoilsbutmayalsobeemittedbywetlandforestsoils.Whenbiomassisburnedineitheraprescribedfire/controlburnorinawildfire,precursorpollutantsthatcancontributetoozoneandothershort‐livedclimateforcersaswellasCH4areemitted.Awildfireisanunplannedignitioncausedbylightning,volcanoes,unauthorizedactivity,accidentalhuman‐causedactions,andescapedprescribedfires.Aprescribedfire/controlburnisanyfireintentionallyignitedbymanagementunderanapprovedplantomeetspecificobjectives.
Someofthecarboninforestsisreleasedtotheatmosphereaftertheharvestoftimber.However,theamountofthecarbonreleased,andwhen,dependsonthefateoftheharvestedtimber.Ifthetimberisusedtomakewoodproducts,aportionofthesequesteredcarbonwillremainstoredforuptoseveraldecadesorlonger.Iftheharvestedtreesareburnedandusedtoproduceenergy,carbonwillbereleasedthroughcombustionbutmayalsopreventcarbonemissionsthatwouldhavebeenreleasedthroughtheburningoffossilfuels.Suchemissionsfrombiomassenergyuseare
Chapter 6: Quantifying Greenhouse Gas Sources and Sinks in Managed Forest Systems
6-7
typicallycombustedwithhigherefficiencyascomparedtoopenbiomassburningaswouldoccurinawildfiresituationnettinglowercarbonemissions.
6.1.1.3 ForestSectorSchematic
Figure6‐1isasimplifiedrepresentationofthekeyforestcarbonpools,carbontransfers,andGHGfluxesfortheforestsystem.Atthistime,CO2isthemainGHGrepresentedcomprehensively.Emissionsofnon‐CO2GHGsinteractwithothersectors;atthistime,potentialfluxesofnon‐CO2GHGsarerepresentedinageneralmannerontheschematic.Theproportionoftotalsystemcarbonineachpoolcanvaryovertimedependingonavarietyoffactors;ratesofcarbontransferarealsovariable.
6.1.1.4 ManagementInteractions
Forestrypracticestypicallytriggerecosystemresponsesthatchangeovertime.Forexample,anewlyestablishedforestwilltakeupcarbonatalowrateinitially,andthenpassintoaperiodofrelativelyrapidcarbonaccumulation.Thecarbonuptakeratewillthentypicallydeclineasheterotrophicandautotrophicrespirationincreaseandgrowthisbalancedagainstmortalityintheolderforest.Fromthispointintime,standinglivetreebiomassmaynotincrease,butevidencesuggeststhatcarbonmaycontinuetoflowintootherforestcarbonpoolsuntiltheforestisremovedbyharvestoranaturaldisturbanceevent.
Theneteffectsofmanagementactivitiesoncarbonflowsinforestecosystemsincludechangesinmanydifferentpoolsofcarbon(suchasabovegroundbiomass,belowgroundbiomass,litter,soil,etc.).Carbonaccountingshouldbecomprehensive,addressingtheneteffectsofactivitiesonallcarbonflows.Forestryactivitiescausecarbontomovebetweenthevariouspoolsandto/fromtheatmosphere.Forexample,forestmanagementmaybeveryeffectiveatincreasingtheaccumulationofbiomassincommerciallyvaluableforms—thatis,inthetrunksofcommercialtreespecies.Thisincreasedgrowthmaysimplyresultfromreducingcompetitionfromothertypesoftrees,causingatransferofcarbonuptakefromonegroupoftreestoanother.Forestryactivitiescanalsohaveeffectsonforestsoils,woodydebris,andtheamountofcarboninwoodproducts.Thenetcarbonfloweffectsofanyactivitywillbethesumofalltheindividualeffectsonthedifferentcarbonpools.
Inaddition,theremaybeinteractionsbetweenbiologicalandphysicalprocessesthatareaffectedbyforestmanagementtreatmentsornaturaldisturbances(e.g.,changesinalbedoduringforestregeneration,afterwildfires).Whiletheseinteractionsoccur,researchinthisfieldisintheearlystagesandsuchinteractionsarebeyondthescopeofthisguidance.
6.1.1.5 RiskofReversals
Carbonthatissequesteredinsoils,vegetation,orwoodproductsisnotnecessarilypermanentlyremovedfromtheatmosphere.Forestryactivitiesintendedforonepurposemaybechangedbyadifferentlandownerorachangeinmanagementobjectives.Landownersmaychangetheirpractices,causingthereleaseofstoredcarbon,ornaturaldisturbancesmaycausethelossofstoredcarbontotheatmosphere.Insectepidemics,drought,orwildfiremayhappenatanytimeandmayaffectalloronlyaportionofthelandareawithinactivityorentityboundaries.Naturaldisturbancesmayberareevents,inwhichcasetheeffectsonestimatedcarbonflowsmaybesmallwhenaveragedoverlargeforestedareasorlongperiodsoftime.Catastrophicdisturbancessuchaswindstormsmaycauseobviousandeasilyestimatedchangesincarbonstocks,whileinothercases,suchasaone‐yearperiodofinsectdefoliation,itmaybedifficultafterafewyearstoseparatetheeffectsofthenaturaldisturbancefromotherfactors.ItshouldbenotedthatGHGregistriesgenerallyrequireentitiestocalculatecarbonstocksandfluxesandgenerallyrequireentitiestoconductanassessmentofriskofreversalofprojectedcarbonvalues.Suchassessmentsgenerally
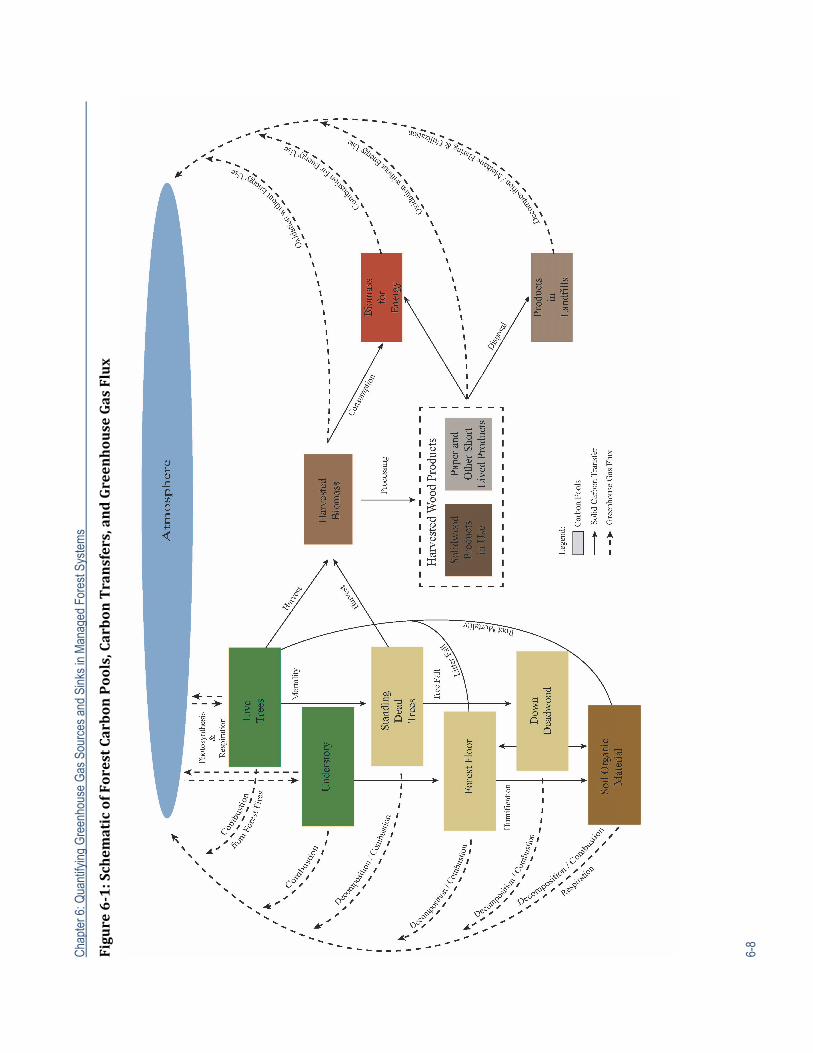
Cha
pter
6: Q
uant
ifyin
g G
reen
hous
e G
as S
ourc
es a
nd S
inks
in M
anag
ed F
ores
t Sys
tem
s
6-8
Figure6‐1:Schem
aticofForestCarbonPools,CarbonTransfers,andGreenhouseGasFlux
Chapter 6: Quantifying Greenhouse Gas Sources and Sinks in Managed Forest Systems
6-9
includeriskofnaturaldisturbancessuchasfire,drought,insectanddiseasemortality,windthrow(hurricane,tornado,highwindevents),aswellasfinancialrisks,managementrisks,andsocialpoliticalrisks.Theseriskassessmentsarecommonlyusedtogenerateavaluethatdiscountstheprojectedcarbonvalueofmanagementactivitiesandtoprovidean“insurancepolicy”againstreversalsthatmaybeusedtoensurethataprogram’sclimatebenefitsarerealized.Manyforestmanagementpracticescanreducethesenaturalhazardrisks(suchasfuelhazardreduction,forestthinningforgrowthorresiliencetodroughts,climatechange,insectordiseaseagents,anduseofprescribedfiretoreduceriskoffires).Reducingtheriskofreversalthroughmanagementmayleadtoreducedemissions,long‐termnetincreaseincarbonstocks,andimprovedresultsinariskassessment.
6.1.2 SystemBoundariesandTemporalScale
Forthisreport,thenominalsystemboundariesaretheextentofthelandowner’sproperty.Estimationmethodspresentedinthissectionarefortheforestsector;however,wheretheforestsectormayinteractwiththeanimalagricultureorcroplandsandgrazinglandssectors,theseinstancesarenotedandlandownersshouldrefertotherelevantsectorguidance.AlandownermayneedtouseestimationmethodsforseveralsectorstoachieveacomprehensivereportofGHGsourcesandsinksfortheirproperty,ensuringthatdoublecountingdoesnotoccur.Inaddition,ifland‐usetransitionsoccurwithintheproperty,thesemustbeaccountedforsothatapparentchangesincarbonstocksorfluxesare“real”andnottheresultofanunrecordedtransferfromonesectortoanother.WhileGHGfluxeswilloccuracrossthesystemboundary,thesearegenerallynotestimatedexceptintheinstanceofharvestedwoodproducts(HWPs).
Theforestsectorpresentsanaccountingchallengerelatedtotemporalscalethatmaynotoccurinothersectors.Whilemanyfarmsoperateonanannualcycle,forestryoperations,bytheirnature,occurovermultipleyearsanddecades.Whileannualestimationandreportingarerequired,annualmeasurementsofforestcarbonpoolsarenoteconomicallyfeasible,norarechangesincarbonstocksgenerallydetectablewithinacceptableerrorlevelsonanannualbasis.ThisnecessitatestheuseofmodelsandprojectionstoassessthecarbonconsequencesofmanagementpracticesandevaluatethepossibleGHGbenefitsofachangeinmanagementpractices.Throughouttheforestguidance,referenceswillbemadetoseveraltypesofestimatesthatmaybegenerated.ATypeIestimateistheestimateofthecarbonstockinthecurrentyear(orarecentpastyear)basedonfieldmeasurementsandotherdata.Toassessthecarbonimpactsofapracticeovertime,anecessarysteptogenerateanannualestimate,projectionsoffuturecarbonstocksmustbemade.ThiswillbereferredtoasaTypeIIestimateandwillrequiretheuseoflookuptables,simulationmodels,orothertools.ATypeIIIestimateisusedtoassessthechangeintheGHGfootprintasaresultofachangeinmanagementpractice.TogenerateaTypeIIIestimate,alandownerwillneedtoproduceTypeIIestimatesforthecurrentpracticeandthepracticeunderconsiderationandcomparethetwo.Whilesomelandownersmayrequireonlyanestimateofcurrentcarbonstocks(TypeIestimate),manywillbeinterestedingeneratingestimatesoftherateofcarbonstorageovertime(TypeIIestimate),whichnecessitatestheuseofmodelstoprojectforestgrowth.TheoverallgoalofthisguidanceistoenablealandownertodevelopanestimateoftheirGHGfootprintandtoassessthepotentialeffectsofchangesinmanagementpracticesorlanduseonthisfootprint(forforestsystems,thiswillbedominatedbycarbon).TypeIIestimatescanbegeneratedandcomparedforthecurrentmanagementschemeandmultiplealternatives(whichmayincludea“noaction”scenario).Comparingtheestimatespermitslandownerstoevaluatethepotentialimpactsofawiderangeofpossiblefactors,includingforegonegrowth,land‐usechange,andchangesinmanagementpractices.
Generally,entitiesreportannuallyforthelifeofaproject.Sinceforestsmaylastindefinitely,thereisnobiologicalending,althougheventssuchasland‐usechange,anaturaldisturbance,orbiome
Chapter 6: Quantifying Greenhouse Gas Sources and Sinks in Managed Forest Systems
6-10
shiftfromclimatechangemayeffectivelyendthelifeofaspecificforestorforesttype.Variousprogramsmayimposetimelimitsforreporting,ortheentitymaychooseaprojectlengththatisconsistentwithmanagementobjectives.Theaccountingmethodsarenotaffectedbyprojectorreportingperiodlength;thereforenospecificrecommendationsaremadeinthisguidance.
6.1.3 SummaryofSelectedMethods/Models
6.1.3.1 FieldMeasurementsofCarbonPoolsandFluxes
Methodsforestimatingthekeyforestcarbonpoolsarewelldevelopedandfairlystandard.PoolsaredefinedinSection6.2,althoughdetailedmethodsarenotgiven.Methodsformeasuringforestcarbonstocksaredescribedinavarietyofpublications,includingtheIPCCGoodPracticeGuidanceforLandUse,LandUseChange,andForestry(IPCC,2003),Pearsonetal.(2007),andHoover(2008),amongothers.AstheForestInventoryandAnalysis(FIA)programoftheUSDAForestServiceistheFederalprogramtaskedwithprovidingnational‐scaleestimatesoftheU.S.forestcarbonstocks/flux(Heathetal.,2011),documentedinventoryproceduresfromthisprogram(USDAForestService,2010a;2010b)serveasabasisformanyfacetsofentitylevelcarbonreportingprescribedinthisdocument.
6.1.3.2 LookupTablesandRegionalEstimates
ThemostcomprehensivecollectionoftablesofcarbonstockestimatesisSmithetal.(2006).Estimationmethodsaredescribed,andestimatesforeachcarbonpoolareprovidedbyforesttypeforeachregionoftheconterminousUnitedStates.ThevolumeincludesmethodsandtablestoestimatecarboninHWPs.
6.1.3.3 Models
Avarietyofmodelsmaybeusedtoassistintheestimationofforestcarbonstocksandstockchanges.Modelswillbedescribedinmoredetailinthesectionsthatfollow,butforreferencepurposes,briefsummariesofthemostcommonlyusedmodelsareprovidedbelow.Someofthesemodelsarecomplexandmayrequireasubstantialtimeinvestment.Interactingwithsomeofthesemodelsoftenrequiresspecialistknowledgeortrainingorboth.Forsuchmodels,anonlineestimationtoolcouldbedevelopedsothatlandownerswouldnotneedtolearneachindividualmodel,butwouldinteractwiththemthroughtheinterfaceofanestimationtool,whilethecomponentsoperateinthebackground.Whileallmodelshavestrengthsandlimitations,themodelsrecommendedforuseineachsectionofthisreportwereselectedbecauseoftheirnationwidecoverage,historyofperformance,andsuitabilityforthistask.
ForestVegetationSimulatorandFireandFuelsExtensionCarbonReports.TheForestVegetationSimulator(FVS)isanationalsystemofgrowthandyieldmodels,withmultipleregionalvariants,thatcanbeusedtosimulategrowthandyieldforU.S.forests.FVSisastand‐levelmodelandcansimulatenearlyanytypeofforestmanagementpractice.TheFireandFuelsExtension(FFE)toFVScanbeusedtogeneratereportsofallcarbonpoolsexceptsoilbutincludingHWPs;nonCO2GHGsarenotincluded.1Anumberofgeographicvariantsareavailable,eachwithregionallyspecificequationsanddefaultvalues.2
i‐Tree.Twoofthetoolsini‐Treeestimatecarbonstoragewithinurbantrees,annualcarbonsequestration,andcarbonemissionsavoidedthroughenergyconservationduetourbantrees.Onetool,theUrbanForestEffects(UFORE)model,focusesonanentireurbanforest.Theothertool,
1Seehttp://www.fs.fed.us/fmsc/fvs/index.shtml2Suggestedvariantsmaybefoundhere:http://www.fs.fed.us/fmsc/fvs/whatis/index.shtml
Chapter 6: Quantifying Greenhouse Gas Sources and Sinks in Managed Forest Systems
6-11
STRATUM,focusesonstreettreepopulations.Treesample(e.g.,fromrandomfieldplots)orinventorydataarerequiredtorunthemodel.Modelstoestimatefuturecarboneffectsbasedonlocalfielddataanduser‐definedmortalityandplantingrateshavealsobeendeveloped.3
FirstOrderFireEffectModel.TheFirstOrderFireEffectsModel(FOFEM)isanationallevelmodelwithgeographicvariants,designedtopredicttreemortality,fuelconsumption,smokeproduction,andsoilheatingcausedbyprescribedfireorwildfire.4
COMSUME.CONSUMEisadecision‐makingtooldesignedtoassistresourcemanagersinplanningforprescribedfireandimpactsofwildfire.CONSUMEpredictsfuelconsumption,pollutantemissions,andheatreleasebasedonfuelloadings,fuelmoisture,andotherenvironmentalfactors.5ItallowsestimationofGHGemissionsandconsumptionfrompost‐harvestandthinningactivities.
6.1.4 SourcesofData
SourcesofavailabledatathatmaybeappropriateforuseindevelopingestimatesofGHGemissionsandcarbonsequestrationvarybycarbonpool(orflux).Inallcases,fieldcollectionofdataispossible,andmaybetheonlyavailableapproachforthoseinstanceswherecredibledefaultvalueshavenotbeendevelopedand/orlookuptablesarenotavailable;thismaybeparticularlyrelevantforagroforestryandurbanforestryapplications.Inthecaseofmanyofthenon‐livingforestcarbonpools,regionaldefaultvaluesareavailablefordowndeadwood(DDW),forestfloor,andstandingdeadwoodthroughtheFIAprogram,aswellasanumberofdocumentsdevelopedinsupportofofficialU.S.governmentestimates.AllFIAdataareavailablethroughanumberofportals,includingtheFIAdatabasetools—ForestInventoryDateOnline(FIDO)andEVALIDator—andtheCarbonOnLineEstimator(COLE),6whichinteractsdirectlywiththeFIAdatabase.SeeTable6‐2forapartiallistofpotentialdatasources.
Currently,valuesforsoilorganiccarbon(SOC)stocksaredrawnfromtheStateSoilGeographic(STATSGO)database,andareofcoarsespatialresolution.Alimitedamountoffield‐sampledSOCdataarealsoavailablethroughtheFIAdatabaseaspartoftheForestHealthMonitoringportionoftheinventoryprocess.CarboninlivetreebiomassisalsoavailablefromFIAandlikeothervariablescanberetrievedatthecountylevel.TheFIAsamplingdesignisintendedtomeetaspecifiederrortargetatlargeareasofforestland;soFIAdatamaynotbeappropriateforuseatsmallerspatialscales.Estimatesbasedonasmallnumberofplotsmaypresentanunacceptableerrorlevel.COLEandEVALIDatorprovideerrorestimatesforallvariables;thesevaluesshouldbecarefullyconsideredbeforethedataareusedtodevelopestimatesforaparticularsite.
DataforemissionsofotherGHGsfromforestsarenotwidelyavailable,althoughestimatesandcalculationmethodsarebetterdevelopedforN2OthanCH4.TheU.S.EPAandIPCCprovideestimationmethodsandemissionsfactorsforbothgasesfromwildfires,andforN2Ofromforestfertilization(IPCC,2006;U.S.EPA,2011).TheU.S.EPApublishesaNationalEmissionsInventoryeverythreeyears,whichprovidesestimatesforwildfireaswellasprescribedfireforcriteriapollutantsaswellashazardousairpollutants,includingsomeGHGspecies(U.S.EPA,2012a).
3Seehttp://www.itreetools.org/4Seehttp://www.firelab.org/science‐applications/fire‐fuel/111‐fofem5Seehttp://www.fs.fed.us/pnw/fera/research/smoke/consume/index.shtml6Seehttp://www.ncasi2.org/COLE/index.html.COLEwasdevelopedthroughUSDAForestServicefinancialsupport,butiscurrentlyhostedbyNCASI.
Chapter 6: Quantifying Greenhouse Gas Sources and Sinks in Managed Forest Systems
6-12
6.1.5 OrganizationofChapter/Roadmap
ThischapterprovidesguidanceonestimatingcarbonsequestrationandGHGemissionsfortheforestsector.Incaseswherealandowner’sholdingsinvolvemultiplelanduses,guidancefortheothersectorsshouldbeconsulted.Inthischapter,attemptstonoteareaswherecross‐sectorinteractionsarelikelytooccurhavebeenmade.Wetlandsandhydrologicallymanagedsoilsareimportantinseveralsectors,andforthisreasonguidanceforestimatingGHGemissionsandsequestrationfromwetlandsystemsiscoveredinaseparatesection,outsideofthecroplands/grazinglandsandforestsectors.
Thechapterisorganizedtoprovideanoverviewoftheelementsofforestcarbonaccounting,includingdefinitionsofthekeycarbonpoolsandbasicmethodsfortheirestimation.Nextisasectionrelatingtoestimationmethodsincaseswhereforestshavebeenestablished,re‐established,and/orcleared.TheforestmanagementsectionconsiderstheGHGimplicationsofavarietyofcommonlyemployedmanagementpractices,andisfollowedbyguidanceontheestimationofcarboninHWPs.Whileagroforestrysystemsandurbanforestsmaynotbeconsideredastraditionalforestlandscapes,theworkinggrouprecognizestheimportanceoftreeslocatedoutsideofforests.Sincethemostimportantcomponentinthesesystemsisoftenthelivebiomass,urbansystemshavebeenincludedintheforestsector.Agroforestryisacomplextopic,combiningaspectsofforestry,croplandagriculture,andanimalagriculture.Sinceagroforestryismostlikelytobepracticedonlandsprimarilyusedforagriculture,theestimationguidanceisprovidedinthecroplandsandgrazinglandssectionofthedocument.Itisimportanttonotethatagroforestryhasmanycross‐sectorlinkages,andacompleteestimateoftheGHGimplicationsofagroforestrypracticesmaynecessitateconsultationoftheforestmethodsprovidedhere.Asnotedabove,naturaldisturbanceisoneoftheimportantrisksofreversalintheforestsector,andthefinalsectionprovidesguidanceonestimatingtheimpactsfromnaturaldisturbanceinforestedsystems.
Theremainderofthischapterisorganizedasfollows:
Section6.2:ForestCarbonAccounting
Section6.3:Establishing,Re‐establishing,andClearingForest
Section6.4:ForestManagement
Section6.5:HarvestedWoodProducts
Section6.6:UrbanForests
Section6.7:NaturalDisturbances
Table6‐2showsinternetsitesavailableforinformationoncarbonestimation.Figure6‐2showsadecisiontreefortheforestsectorshowingwhichforestchaptersections(i.e.,sourcecategories)arerelevantdependingonwhichforestactivitiesaretakingplaceforanentity.
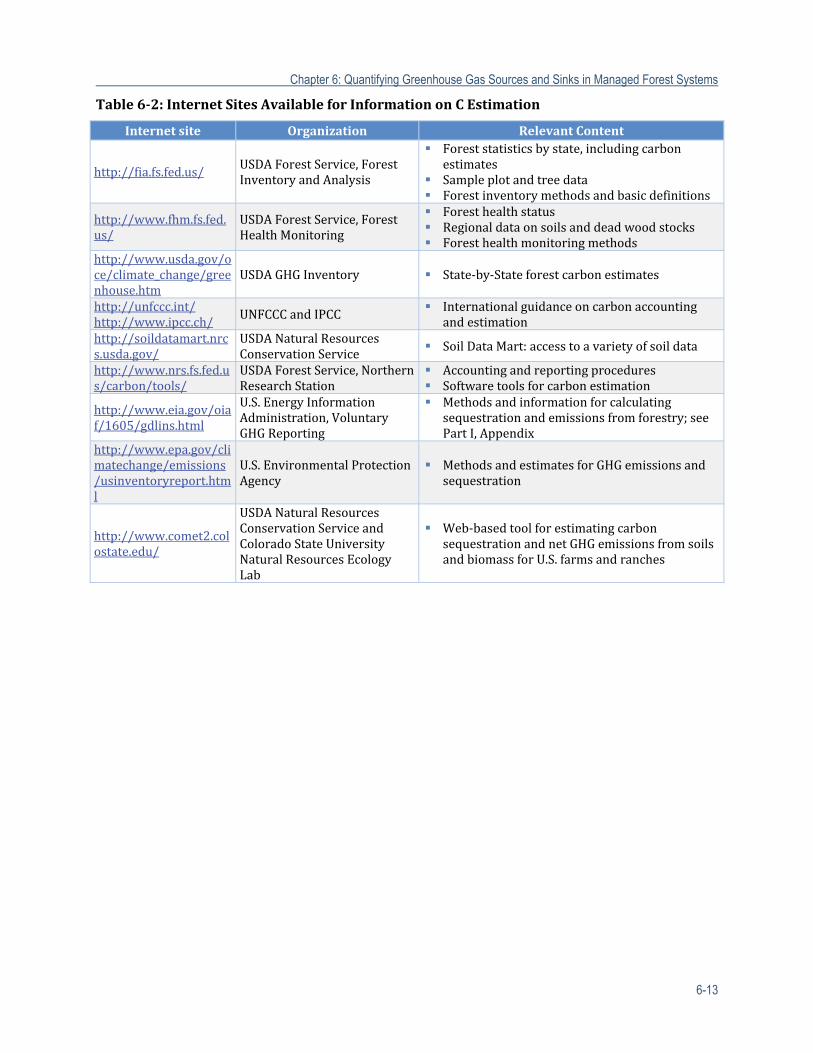
Chapter 6: Quantifying Greenhouse Gas Sources and Sinks in Managed Forest Systems
6-13
Table6‐2:InternetSitesAvailableforInformationonCEstimation
Internetsite Organization RelevantContent
http://fia.fs.fed.us/ USDAForestService,ForestInventoryandAnalysis
Foreststatisticsbystate,includingcarbonestimates
Sampleplotandtreedata Forestinventorymethodsandbasicdefinitions
http://www.fhm.fs.fed.us/
USDAForestService,ForestHealthMonitoring
Foresthealthstatus Regionaldataonsoilsanddeadwoodstocks Foresthealthmonitoringmethods
http://www.usda.gov/oce/climate_change/greenhouse.htm
USDAGHGInventory State‐by‐Stateforestcarbonestimates
http://unfccc.int/http://www.ipcc.ch/
UNFCCCandIPCC Internationalguidanceoncarbonaccounting
andestimationhttp://soildatamart.nrcs.usda.gov/
USDANaturalResourcesConservationService
SoilDataMart:accesstoavarietyofsoildata
http://www.nrs.fs.fed.us/carbon/tools/
USDAForestService,NorthernResearchStation
Accountingandreportingprocedures Softwaretoolsforcarbonestimation
http://www.eia.gov/oiaf/1605/gdlins.html
U.S.EnergyInformationAdministration,VoluntaryGHGReporting
Methodsandinformationforcalculatingsequestrationandemissionsfromforestry;seePartI,Appendix
http://www.epa.gov/climatechange/emissions/usinventoryreport.html
U.S.EnvironmentalProtectionAgency
MethodsandestimatesforGHGemissionsandsequestration
http://www.comet2.colostate.edu/
USDANaturalResourcesConservationServiceandColoradoStateUniversityNaturalResourcesEcologyLab
Web‐basedtoolforestimatingcarbonsequestrationandnetGHGemissionsfromsoilsandbiomassforU.S.farmsandranches
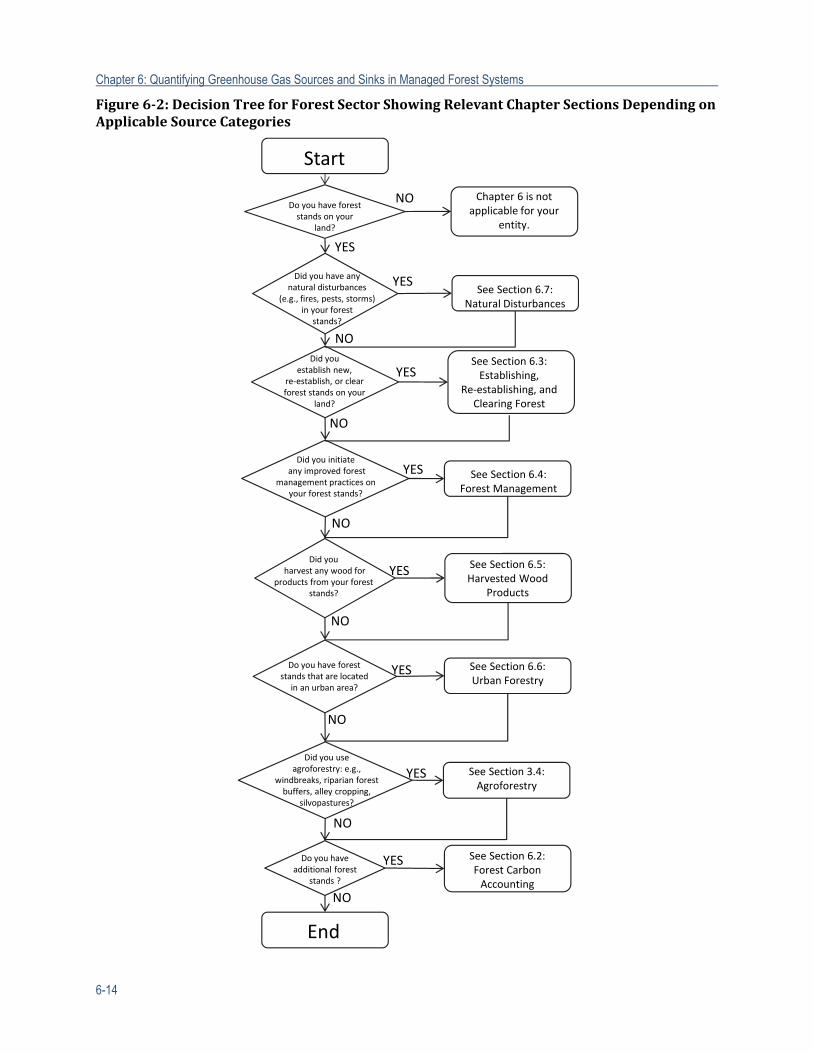
Chapter 6: Quantifying Greenhouse Gas Sources and Sinks in Managed Forest Systems
6-14
Figure6‐2:DecisionTreeforForestSectorShowingRelevantChapterSectionsDependingonApplicableSourceCategories
NO
NO
YES
YES
NO
See Section 6.7:Natural Disturbances
YES
YES
NO
Start
Chapter 6 is not applicable for your
entity.
Did you have any natural disturbances
(e.g., fires, pests, storms) in your forest
stands?
Did you establish new,
re‐establish, or clear forest stands on your
land?
Did you initiateany improved forest
management practices on your forest stands?
Did youharvest any wood for
products from your forest stands?
Do you have forest stands that are located
in an urban area?
See Section 6.3:Establishing,
Re‐establishing, and Clearing Forest
See Section 6.4:Forest Management
See Section 6.2:Forest Carbon Accounting
See Section 6.6:Urban Forestry
See Section 6.5: Harvested Wood
Products
YES
NO
NO
YES
NO
YES
YES
Do you have forest stands on your
land?
Do you have additional forest
stands ?
End
NO
Did you useagroforestry: e.g.,
windbreaks, riparian forest buffers, alley cropping,
silvopastures?
See Section 3.4: Agroforestry
Chapter 6: Quantifying Greenhouse Gas Sources and Sinks in Managed Forest Systems
6-15
6.2 ForestCarbonAccounting
6.2.1 DescriptionofForestCarbonAccounting
Thebasicquestioninherentwithinthebroadercontextofforestcarbonestimationis:“Howmuchcarbonisinthisforest?”AnydiscussionofforestsorforestryactivitiesinthecontextofGHGsdependsonquantifyingforestcarbon.Forestecosystemsaregenerallyrecognizedassignificantstocksofcarbon,andaggrading,orgrowing,forestscanbestrongcarbonsinks.Disturbancesandforestmanagementinfluencethesizeandratesofchangeofthesestocks.Itisimportanttonotethatforestcarbongenerallyisnotmeasureddirectly(e.g.,collectingforestbiomasssamplesforlaboratorydeterminationofcarboncontent).Itisusuallyquantifiedindirectlyfromstandardforestinventoriesandassociatedcarbonmodels(e.g.,littercarbondependentonforesttypeandstandage).Forlivetreepools,forestinventoriesoftenonlymeasurelimiteddimensionalattributes(e.g.,diameterandheight)ofindividualtreesandusebiomasscomponentmodels(e.g.,boleandcrowns)andwooddensityvaluestoconvertthesevaluesintoanestimateoftotaltreebiomass.Onceanestimateofbiomassisattained,astandardcarbonconversionconstantisappliedtoproduceacarbonstockestimate.Carbonconversionsvaryslightly,but50percentofdryweightisausefulroundvalueapplicabletoallvegetationandsoundwood(IPCC,2006).Forotherpools,suchaslitterlayersandsoilorganicmatter,specificcarboncontentperunitvolumedependsondecayandcompositionofthematerialandisgenerallylessthan50percentcarbon.Giventhediversityofestimationproceduresandcarbonpooldefinitions,areasonableselectionofmethodologiesshouldbeavailableforentitieswishingtoassesstheirforestcarbon.
Amajorattributeofcarbon“accounting”istoexplicitlydocumentanddefineaccountingproceduressuchthatforestcarbonreportsarecomparableacrossownershipsandforestecosystems.Absolutequantitiesofcarbon,orcarbonmass,arenotonlyafunctionofaspecificforestbutalsodependentonhowpoolsaredefinedandhowthemassofcarbonwithinthepoolisestimated.Forexample,bothremotelysensedimagesandground‐basedtreemeasurementscanprovideseparateestimatesofthesameforest.Thesetwotechniquesareunlikelytoprovideidenticalestimatesduetomethodologicaldifferences,includingthefactthateachapproachmaydefinedifferentpopulationsofinterestandthusaccountfordifferentsetsoftrees.Identifyingandresolvingsuchissuesisanobjectiveofforestcarbonresearch.Notallforestcarbonassessmentsormanagementplansneedtoencompassallcarbon(orGHGs)poolsifthecarbonisproperlyidentified.Measuringthecurrentstateofaforest’scarbonstocksandrecentchangesisapartof
MethodsforForestCarbonAccountingUtilizedinthisGuidance
Rangeofoptionsdependentonthesizeoftheentities’forestlandincluding:
− FVS‐FFEmodule(entitiesthatfitthelargelandownerdefinition),and
− Defaultlookuptables(entitiesfittingthesmalllandownerdefinition).
Theseoptionsuse:
− AllometricequationsfromJenkinsetal.(2003a),and
− DefaultlookuptablesfromSmithetal.(2006;GTRNE‐343)—defaultregionalvaluesbasedonforesttypeandageclassdevelopedfromFIAdata.
Thesemethodswereselectedbecausetheyprovidearangeofoptionsdependentonthesizeoftheentities'forestland.
Chapter 6: Quantifying Greenhouse Gas Sources and Sinks in Managed Forest Systems
6-16
developingabaseline,whichcanthenbeusedforadditionalanalysis.Abaselineofpastcarbonstocksandchangecanbeconstructedandusedwithmodelingtodetermineprojectionsoflikelyfuturecarbon.Similarly,abaselineisnecessaryforanalysisofalternatemanagementoptionstoevaluatepotentialforsequestration/emission.Thetechnicalspecificationsofbaselines(e.g.,startingyearandincludedstockcategories)areoftenasocial/politicaldecision,andarebeyondthepurviewofthisdocument.However,tostandardizeforestcarbonaccountingoptionsforthepurposeofentityreporting(e.g.,woodlandowners),thisdocumentwillproposeasinglesetofforestcarbonpooldefinitions.Thespecificrecommendationsincludedhereareintendedtodirectlandownerstotoolsanddatasourcesspeciallydevelopedforquantifyingforestcarbon.Notethattheselistedprocessesarenotintendedtoexcludealternativedatasummariesthatmaybeavailabletoentities.Detailsarediscussedbelowinthediscussionoftherespectiveforestcarbonpools,butthegeneraloptionslistedindecreasingaccuracy(andcost)includethefollowing:
(1) Measure/sampleyourforestandestimatecarbonfromthesedata(reducesampledatasoastothenapplyavailablebiomassequationsorothercarbonconversionfactors);
(2) Characterizeyourforestaccordingtoclassifications(i.e.,lookuptables)basedonstandorsiteattributesderivedfromrecordsinthenation’sforestinventorydatabase(FIADB)(Woodalletal.,2010;Woudenbergetal.,2010);or
(3) Useassociatedmodels(FIDO,COLE,etc.),whichbaseyourforest’scarbonestimatesonrepresentativedatasampledbyotherswithcriticaldependentuservariableinput(e.g.,standage).
Notethattheabovethreeoptionsarenotnecessarilymutuallyexclusive.Forexample,FIADBdataorsimilarmodels(Option2)arebasedonpermanentinventoryplotsamplingandcarbonconversion(Option1),andlookuptables(Option3)arebasedontheFIADB(Option2).Therecommendedforestcarboninventoryoptionsinvolvetradeoffsincostsandlevelofinformationuniquetotheentities’forestland.
Theprocessofobtainingforestcarbonestimatesdependsoncircumstancesuniquetoeachentity,butmostlydependsontheintendedaudienceandtheresourcesavailableforforestinventory.Forthisguidance,atwo‐tiersystemisinplace.Thegoalistobeasinclusiveaspossiblewhilenotcreatingameasurementburden.Smallerholdingsthatarenotactivelymanagedareunlikelytobeinventoried;atwo‐tierapproachpermitsownersofsuchholdingstoestimatetheirfootprintandthepotentialchangesfromchangesinpracticesappliedwithoutincurringthecostsofmeasurement.Smallerlandownerswhohaveinventorydataorwhowishtoacquireitshouldusethetoolsandprotocolsdescribedforlargelandowners.
Landownersizeclassesaredefinedasfollows:
Landownerswhohold200ormoreacres(80.9hectares[ha])offorestlandshouldfollowthemethodsforlargelandowners.Also,landownerswhoholdlessthan200acres(80.9ha)offorestlandshouldfollowthemethodsforlargelandownersifthreeormoreofthefollowingaretrue:
Landownerownsormanagesmorethan50forestedacres(20.2ha)
Landowner’sforestiscertified
Landownerhasdevelopedaforestmanagementplan
Landowner’sforestedpropertyhasahistoryoftimberharvesting
LandownerparticipatesinStateforesttaxabatementprograms
Landownersnotmeetingthedefinitionoflargelandownershouldfollowthemethodsforsmalllandowners.
Chapter 6: Quantifying Greenhouse Gas Sources and Sinks in Managed Forest Systems
6-17
Recommendedmethodsdependonforestlandownersize.Smalllandownersmayusegeneralizedlookuptablesbasedonregion,foresttype,andageclasstoestimatecarbonstocks.LargelandownersshouldcollectstandardforestinventorydataandusetheFVS‐FFEmodulewithJenkinsetal.(2003a)allometricequations.ItshouldbenotedthatFVSandtheFFEarelargeandcomplicatedmodels;anytoolthatimplementsthesemethodswillrequiredevelopmentofasimplifieduserinterfacethatinteractswithFVSandFFE.
Atthistime,theJenkinsetal.(2003a)equationsarespecifiedsincetheyarenationallyconsistent.FuturedevelopmentislikelytoincludetheimplementationofamorerecentFIAbiomassestimationmethodinFVS,enablingtheproductionofestimatesthatmatchtheofficialU.S.forestcarbonestimates.Whilelocalvolumeorbiomassequationsmaybemoreaccurateforagivenlocation,useofsuchequationswillresultinadditionalinconsistenciesinresults,sonootherequationsareapprovedforuseatthistimeunderthismethodology.
Althoughcarbonreportingbeyondthatoftheentitylevel(e.g.,majortimberlandownerornationalforest)mayuserefinedmeasurementprotocols,expandedcarbonpooldefinitions,and/orancillarydata(e.g.,remotelysensedimagery),theproposedpoolsandinventorymethodologiesinthisdocumentserveasastartingpoint.Classificationofcarbonestimateswithinmulti‐tieredsystems,andlinkstomodelstoprojectfuturechangeunderalternatescenariosareaddressedattheendofSection6.2.
Tofacilitateaccounting,forestcarbonistypicallyclassifiedintoafewdiscretepools,whichshouldbecomprehensive(allorganiccarbon)withnogapsandnooverlap.Thepurposeofestablishingtheseseparatepools,orbins,offorestcarbonistwofold:(1)toalignappropriatedatawithecosystem/productcomponents(e.g.,treeinventoriesandlivetreecarbonpool),oralternativelytoidentifygaps;and(2)asapartoftheaccountingprocess,notallreportedstockorchangenecessarilyneedstoincludeallofthecarbonpools,butwhatisincludedmustbeunambiguouslyidentified.Notethatthecarbonpools(orbinsorclassifications)focusoncarbonfromphytomass.Strictlyspeaking,totalcarbonstockswithinaforestincludeanon‐plant(notoriginatingfromtheplantkingdom)percentage,butsuchpoolsarenotdefinedbecausethisisgenerallyaninsignificantproportion.Exceptionsaretheforestfloorandsoilpools,whichincludedecomposersandsoilfauna.Asometimessignificantamountofcarbonisremovedfromforestsaswoodisharvestedandusedinwoodproducts.Someofthatcarbonremainssequesteredforlongperiodsoftime,dependingontheproducts.Thus,harvestedwoodshouldbeincludedinforestcarbonestimates.
Figure6‐3isadecisiontreefortheforestcarbonaccountingsourcecategoryshowingwhichcarbonaccountingassumptions(e.g.,simulationmodels,allometricequations,biomassexpansionfactors,lookuptables)arerecommendedforanentitydependingonthetypeofactivitydataavailable.However,itshouldbenotedthatfornationalreporting—i.e.,theannualGHGinventoryreportedbyUSDAandU.S.EPA—whereindividualtreemeasurementsfromFIA’sinventoryplotsareavailable,thecomponentratiomethod(CRM)forestimatingbiomass(Woodalletal.,2011)iscurrentlyused.Again,futuredevelopmentwilllikelybringthesemethodsintoalignment.
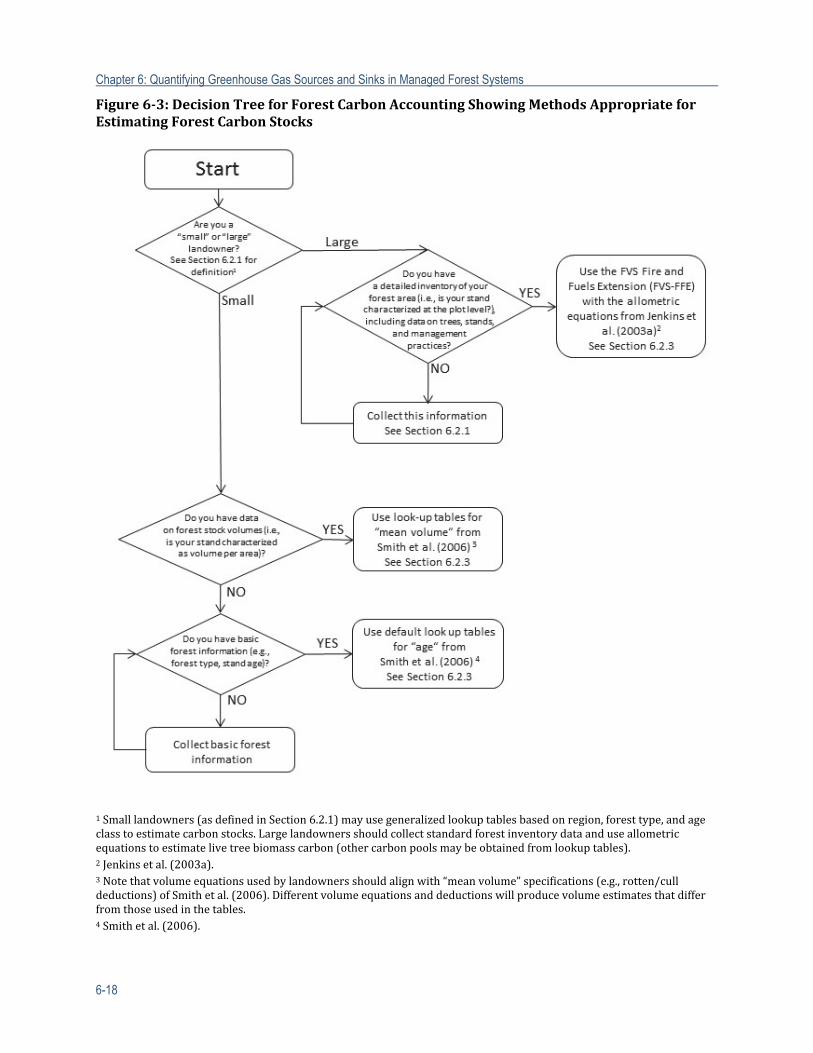
Chapter 6: Quantifying Greenhouse Gas Sources and Sinks in Managed Forest Systems
6-18
Figure6‐3:DecisionTreeforForestCarbonAccountingShowingMethodsAppropriateforEstimatingForestCarbonStocks
1Smalllandowners(asdefinedinSection6.2.1)mayusegeneralizedlookuptablesbasedonregion,foresttype,andageclasstoestimatecarbonstocks.Largelandownersshouldcollectstandardforestinventorydataanduseallometricequationstoestimatelivetreebiomasscarbon(othercarbonpoolsmaybeobtainedfromlookuptables).2Jenkinsetal.(2003a).3Notethatvolumeequationsusedbylandownersshouldalignwith“meanvolume”specifications(e.g.,rotten/culldeductions)ofSmithetal.(2006).Differentvolumeequationsanddeductionswillproducevolumeestimatesthatdifferfromthoseusedinthetables.4Smithetal.(2006).
Chapter 6: Quantifying Greenhouse Gas Sources and Sinks in Managed Forest Systems
6-19
Anotheraspectofacarbonaccountingframeworkisconsistentorcomparablerepresentationofchange,whichgoesbeyondtheidentificationofcarbonpools.Changeisaffectedbyprocessesofrecruitmentandgrowthaswellasdisturbance,mortality,andharvest.Inthemostbasicsense,changecanbethedifferencebetweentwosuccessivestockestimates.ThisiscommonforGHGreportingbasedonstandardforestinventories.Somecomponentsofchangecanbemeasuredwithintensivesamplingatsmallscales,butingeneralchangeisestimatedfrommeasurementsattwosuccessiveinventorytimes(e.g.,totalstockchange,orgrowth/removals/mortalityestimates,orremotelysenseddata),orbasedonmodelsofecosystemorbiogeochemicalchange.Abasicapproachtoquantifyingchangeinforestcarbonisbasedonthequantitiesdefinedforforestcarbonstocks.Netannualcarbonstockchangesarecalculatedbytakingthedifferencebetweentheinventoriesanddividingbythenumberofyearsbetweentheinventoriesforaselectedforestorforestarea(e.g.,Δstock=(stock2–stock1)/time).Thisstock‐changeapproach(IPCC,2006)isthechangemethodappliedtoFIAstrategic‐scaleinventoriesforthestock‐changevaluesreportedintheU.S.NationalGHGInventories(e.g.,U.S.EPA,2011).
SixStepstoForestEntityCarbonEstimation
Theapproachtoestimationofcarbonstocksandfluxesintheforestsectorisasfollows:
Step1:Determinelandownersizeclassbasedonforestarea.Basedontheacreageunderconsideration,landownersaredividedintotwogroups:“small”landownersand“large”landownersasdefinedinSection6.2.1.
Step2:Collectforestdata.Forbothsizeclassesoflandowners,somelevelofforestinventory(i.e.,fieldsurvey)dataisrequired.However,therearedifferingdatarequirementsforsmalllandownersandlargelandowners.
Smalllandownersshouldcollectbasicdataonspeciesmix(i.e.,typeofforest)andstandage(ortimesincelastmajordisturbance)withintheirforest.Greaterinventorydetailcanleadtomorepreciseestimatesofcarbon,butevenbroadgeneralizationsabouttheregion,age(and/ormeanvolume),andtypeofforestcanleadtoacarbonestimate.Theobjectiveistoobtainreasonableandconsistentestimatesovertimeatthelowestcost.Ifasmalllandownerwishestoconductaninventoryandfollowtherecommendedguidanceforlargelandowners,theyarefreetochoosethisoption.Theprincipaltradeoffisbetweencostandaccuracy;collectinginventorydataincreasesthecostofdevelopingestimatesbutincreasesaccuracy.
Largelandownersshouldgathermoreextensivedataaboutforestandstandcharacteristics.AthoroughforestinventoryiscreatedusingindustrystandardsandpracticesofthetypedescribedinGTRNRS‐18:MeasurementGuidelinesfortheSequestrationofForestCarbon.Variablesconsideredmustincludedominantspecies,dominantageclass,standdensity,andsiteclass.Inclusionofadditionalvariables,whilenotrequired,willimproveaccuracyofcarbonestimates.
Step3:Estimateinitialforestcarbonstockandannualfluxes.Quantitiesofcarbonchangeovertime.Forestcarbonestimatesaredividedintosixdiscrete,mutuallyexclusivepools,includinglivetrees,standingdeadtrees,understoryvegetation,downdeadwood,forestfloor,andsoilorganiccarbon.Anumberofpool‐specificcarbonconversionmethodsareavailable;thesemethodsusetheinventorydatagatheredinStep2toquantifycarbonforeachpool.However,thespecificmethodstobeuseddifferdependingonthelandownersizeclass.
(Continued)
Chapter 6: Quantifying Greenhouse Gas Sources and Sinks in Managed Forest Systems
6-20
(Continued)
Smalllandowners,aftercollectingobservationaldata,canuselookuptablesfromSmithetal.(2006)(alsoknownasGTR‐NE‐343:MethodsforcalculatingforestecosystemandharvestedcarbonwithstandardestimatesforforesttypesoftheUnitedStates)toestimatecarbonstocksandcarbonstockchanges.Thelookuptablesarecategorizedbyregion,foresttype,previouslanduse,andinsomecases,managementactivity.Usersmustidentifythecategoriesfortheirforestsandestimatetheareaofforestland.TofacilitateuseofthedatafromGTR‐NE‐343,atoolcouldincorporatethedatasuchthat,inmostcases,landownerswouldbeabletoselecttheirstandcharacteristicsfromadrop‐downmenuofdefaults.Basedonthelandowner’sselectionsfromthedefaultmenus,thetoolwouldproduceestimatesofcarbonstocksineachofthesixcarbonpools.
LargelandownersshouldusethedatacollectedintheirforestsurveystoperformmodelrunsusingtheFVSmodel.FVSwillusethesite‐andstand‐specificdatatoprovidemoreaccurateestimatesofcarbonstocksineachofthecarbonpools(excludingsoilcarbon,whichFVSdoesnotestimate).Soilcarbonestimatescanbedeterminedfromarangeofmethodsincludingsamplingorexistingforestsoilcarbonestimatedatasetsdependingonaspecificentity’scircumstances.
Thoughthemethodsdifferforsmalllandownersandlargelandowners,bothcalculateinitialcarbonstocksandexpectedannualratesofaccumulationunderaverageconditions(repeatingthefieldsurveyatprescribedintervalswillhelpcalibrateorvalidatethestockchangeestimates).
ThemethodsalsoallowforadjustmentsduetoHWPs(Step4),forestmanagementpractices(Step5),andnaturaldisturbances(Step6).
Step4:AdjustcarbonestimatesduetoHWPs.Harvestingactivitiescanhaveconsiderableimpactoncarbonquantityacrossthesixforestcarbonpools.Intermsofemissions,thefateoftheharvestedmaterialmustbeconsideredaswell,includingwhetherthematerialisusedinHWPsorforenergy.Asabove,themethodsforestimatingtheseimpactsdifferdependingonthelandownersizeclass.
ForHWPs,smalllandownersshouldrelyondataprovidedinlookuptablesinGTR‐NE‐343,whichprovidesfactorsforcalculationofcarboninHWPsbasedonregion,timbertype,andindustrialroundwoodcategory.Thelookuptablesdividetheharvestedforestmaterialspoolintofourdistinctfates:productsinuse,landfill,emittedwithenergycapture,andemittedwithoutenergycapture.Carbonemissionsdifferdependingonthefate,whichinturndependsontheregionandharvestmaterialcharacteristics.Byusingthelookuptables,landownerscanadjustcarbonestimatesaccordingly.
LargelandownersshouldrelyonFVStomodelforestmanagementpractices,resultinginestimatesofthecarbonimpactofthesepractices(e.g.,harvesting).Forexample,FVScanconsiderthetypeofharvest(e.g.,clearcutversusstrategicthinning)andprojecttheresultsofthisharvestoncarbonstocks,thusallowinguserstoquantifythecarbonimpactofvariousharvestingactivities,aswellasadjustingfortheultimatefateofharvestedmaterials.TheharvestedforestmaterialpoolisdividedbyFVSintothesamefourdistinctfatesasforGTR‐NE‐343:productsinuse,landfill,emittedwithenergycapture,andemittedwithoutenergycapture.Harvestsalsoimpactforestgrowthovertime,whichismodeledbyFVS.
(Continued)
Chapter 6: Quantifying Greenhouse Gas Sources and Sinks in Managed Forest Systems
6-21
6.2.1.1 ForestCarbonPools
Carbonreporting—suchasfortheU.S.reportingcommitmenttotheUnitedNationsFrameworkConventiononClimateChange(UNFCCC),whichismetbytheU.S.EPA’sofficialGHGinventory(e.g.,
(Continued)
Step5:Adjustcarbonestimatesduetoimprovedforestmanagement.Forestmanagementpractices,suchasthinningorfertilization,mayimpactcarbonfluxesaswell.Asabove,themethodsforestimatingtheseimpactsdifferdependingonthelandownersizeclass.
FVSallowslargelandownerstoquantifytheimpactofvariousforestmanagementpractices.Forexample,usingkeywords(orcombinationsofkeywords)providedbyFVS,userscangenerateestimatesfortheimpactofstanddensitymanagement,sitepreparationmethods,vegetationcontrols,variousdensitiesofplantingstock,fertilization,rotationlengthmanagement,prescribedfire/controlburnsandfuelloadmanagement,andpestanddiseasecontrol.Withgivenstandandtree‐listdata,userscandevelopabaseline,whichcanthenbecomparedtoalternativemanagementstrategies.Thisallowsforassessmentofcarbonimpactofimplementingthosemanagementpractices.ItshouldbenotedthatFVSistherecommendedmethod,evenifalargelandownerhasitsowncustominventoryandmodelingsystem,whichmightbeconsideredsuperiortoregionalmodelssuchasFVS.Theadoptionofasingle,recommendedmethodforlandownersallowsfortransparent,consistent,comparable,andcompleteestimatesacrosslandownersappreciatingthattherewillbealikelytradeoffintheaccuracy,costeffectiveness,andeaseofuseofthemethodforthoselandownerswithcustomsystems.Futuredevelopmentmayincludeameansforlargelandownerstousecustommodelsinthisframework,butthisoptionisnotavailableatthistime.
Unfortunately,thelookuptablesdonotallowforestimatesassociatedwithimprovedforestmanagement.Ifprescribedfire/controlburningisusedbyeitherlandownertype,itisrecommendedthattheemissionsfortheactivitybecalculatedasguidedinStep6.
Step6:Adjustcarbonestimatesduetoforestfiresandothernaturaldisturbances.Naturaldisturbances,suchasforestfires,storms,wind,drought,orpest/insectinfestation,canalsohaveconsiderableimpactoncarbonquantitiesacrossthesixforestcarbonpools.Landownersshouldestimatethecarbonimpactofnaturaldisturbances.
Forforestfires,wildfires,andprescribed/controlledburns,bothsmallandlargelandownersshouldrelyonFOFEMtogeneratecarbonestimates.FOFEMinputrequirementsincludebasicforesttype,sitelocation,anddominantspeciesdata,butalsoallowsuserstoinputadditionalinformation,dependingonaspecificentity’scircumstances,onamountofduff,moisturecontent,andothervariablesassociatedwithfire.Theseverityofthefirecanbecategorizedbypercentofthelandaffected.Theresultingoutputincludesestimatesofcarbonemissions.
Themethodsassumesmalllandownerscanprovideobservationalestimatesfortheimpactsofnaturaldisturbancessuchaspests,basedonthepercentageofforestlandaffectedbythedisturbance.LargelandownersmaymodelimpactsofpeststhroughavailablekeywordsandextensionsprovidedbyFVS.
Thephilosophybehindthesesixstepsisthattheyallowtheentitytoassesswhatcarbonstockstheyhaveunderanypresentconditionsandwhatstockstheymightexpectgivenimplementationofaparticularharvestingregime,changeinforestmanagementpractices,and/oravarietyofnaturaldisturbances.
Chapter 6: Quantifying Greenhouse Gas Sources and Sinks in Managed Forest Systems
6-22
U.S.EPA,2011)—providesaframeworkforthepoolsdescribedhere.However,thepoolsaremodifiedtomorecloselycorrespondtotypesofforestinventorydata.Forexample,forestcarboncanbeeasilycategorizedaccordingtoabovegroundversusbelowground,orlivingversusdeadplantmaterial.Inpractice,classificationsofcarbonpoolsdependontheforestdataandhowtheyareused.Assuch,thepoolsdescribedbelowarejointlydefinedbyUNFCCCreportingrequirementsandtheuseofFIAforestinventoryastheprimarydatasource.Inotherwords,thepoolsdefinedbelowareaconvenientset,butdefinitionsandboundariesaroundpoolscanvaryaccordingtospecificcarbonestimationprocedures/capabilitiesandreportingneeds(seeFigure6‐4).
Figure6‐4:ForestCarbonPoolHierarchyShowingHowForestCarbonPoolsCanBeDelineatedintoEvenSmallerPoolsDependentontheEntityNeedsandInventoryCapabilities
Livetrees:Alargewoodyperennialplant(capableofreachingatleast15feet(4.6m)inheight)withadiameteratbreastheight(DBH)oratrootcollar(ifmultistemmedwoodlandspecies)greaterthan1inch(2.5centimeters[cm]).Includesthecarbonmassinroots(i.e.,livebelowgroundbiomass)withdiametersgreaterthan0.08in(2millimeters[mm],stems,branches,andfoliage.
Understory:Roots,stems,branches,andfoliageoftreeseedlings,shrubs,herbs,forbs,andgrasses.
Standingdeadtrees:Deadtreesofatleast1inch(2.5cm)DBHthathavenotyetfallen,includingcarbonmassofcoarseroots,stems,andbranches,butthatdonotleanmorethan45degreesfromvertical(Woudenbergetal.,2010),includingcoarsenonlivingrootsmorethan0.08in(2mm)indiameter.
Downdeadwood(alsoknownascoarsewoodydebris):Allnonlivingwoodybiomasswithadiameterofatleast3inches(7.6cm)attransectintersection,lyingontheground.Thispoolalso
Chapter 6: Quantifying Greenhouse Gas Sources and Sinks in Managed Forest Systems
6-23
includessomeless‐than‐obviouscomponentsofDDW:(1)debrispiles,usuallyfrompastlogging;and(2)previouslystandingdeadtreesthathavelostenoughheightorvolume,orleangreaterthan45degreesfromvertical,sotheydonotqualifyasstandingdeadtrees.
Forestfloor:Thelitter,fulvic,andhumiclayers,andallfinewoodydebriswithadiameterlessthan3inches(7.6cm)attransectintersection,lyingonthegroundabovethemineralsoil.
SoilorganicC:Allorganicmaterialinsoiltoadepthofgenerally3.3feet(1meter[m]),includingthefineroots(e.g.,lessthan0.08in(2mm)indiameter)oftheliveandstandingdeadtreepools,butexcludingthecoarserootsofthepoolsmentionedearlier.
Harvestedwood:Woodremovedfromtheforestecosystemforprocessingintoproducts,notincludingloggingdebris(slash)leftintheforestafterharvesting.
Thesepooldefinitionsaredevelopedaroundacommonsetinusebyanumberofpublications(e.g.,Smithetal.,2006)andattheforeststandlevel,whichinturndifferfromstockdefinitionsusedbytheUnitedStatestomeetUNFCCCnationalreportingrequirements.
Alsonotable(inthereportinglist)istheinclusionofHWP(coveredindetailinSection6.5),whichassumesthatameasurableportionofwoodremovedatharvestremainssequesteredfromreemissiontotheatmosphereforaperiodoftimethatcanbeestimated.PoolsandestimationofstocksareorganizedprimarilyaccordingtodatacollectionandestimationwithFIA’spermanentinventoryplots(phasetwo(P2),thestandardinventorymeasurements;andphasethree(P3),theforesthealthmeasurements).Notethatpooldefinitionsarenotindependentofrelatedestimators;detailsrelatedtoestimationarenotaddresseduntilsubsequentsectionsofthisguidance.
6.2.2 DataCollectionforForestCarbonAccounting
Forestcarbonistypicallyestimatedindirectly,throughapplyingconversionconstantstoastandardforestinventory,usingalocalizedbiogeochemicalmodel,orsimplylookingupspecificforestattributes(e.g.,standage,foresttype)inalookuptable(e.g.,Smithetal.,2006).Forthepurposesofthisdocumentation,astandardsetofcarbonpooldefinitionsthatarepartofFIA’snationalinventoryaredelineatedthatcorrespondtoavailablelookuptables(Smithetal.,2006).
6.2.2.1 LiveTrees
Thetreecarbonpoolsincludeabovegroundandbelowground(coarseroot)carbonmassoflivetrees.Separateestimatesaremadeforfull‐treeandaboveground‐onlybiomasstoestimatethebelowgroundcomponent.TreecarbonestimateswithintheFIADB(USDAForestService,2012;Woudenbergetal.,2010)arebasedonWoodalletal.(2011)andJenkinsetal.(2003a).Theper‐treecarbonestimatesareafunctionoftreespecies,diameter,height,andvolumeofwood.Belowgroundbiomassiscalculatedasavaryingproportionofabovegroundbiomass.Again,thisisdependentonspeciesandsizeofindividualtrees.ThepooloflivetreeswithintheFIADBisdefinedastrees,orwoodybiomasswithgreaterorequalto1inch(2.5cm)DBH.However,treeslessthan5inches(12.7cm)DBHaresampleddifferentlythanthosethatare5inches(12.7cm)ormore.Thesedifferencesshouldnotaffectprecisionintheoverallamountoftreecarbonorstandleveldensity.Saplingsaretreesatleast1inch(2.5cm)butlessthan5inches(12.7cm)DBH.The“sapling”versuslargertreedistinctionisbasedonsamplingdifferencesontheFIAplots.Thisillustratesthatpoolclassificationisdependentonboththeobviousphysicalandspatialseparationinastandaswellasdatasources.
6.2.2.2 Understory
Understoryvegetationisaminorcomponentofbiomassortheliveplantcomponent.Understoryvegetationisdefinedasallbiomassofundergrowthplantsinaforest,includingwoodyshrubsand
Chapter 6: Quantifying Greenhouse Gas Sources and Sinks in Managed Forest Systems
6-24
treeslessthan1inch(2.5cm)DBH.InFIADB‐basedcarboninventory,itisassumedthat10percentofunderstorycarbonmassisbelowground.Thisgeneralroot‐to‐shootratio(0.11)isnearthelowerrangeoftemperateforestvaluesprovidedinIPCC(2006)andwasselectedbasedontwogeneralassumptions:ratiosarelikelytobelowerforlight‐limitedunderstoryvegetationcomparedwithlargertrees,andagreaterproportionofallrootmasswillbelessthan0.08in(2mm)indiameter.EstimatesofcarbondensityarebasedoninformationinBirdsey(1996),whichwasappliedtoFIApermanentplots.
6.2.2.3 StandingDead
Thestandingdeadtreecarbonpoolsincludeabovegroundandbelowground(coarseroot)mass.Estimatesandallometryareessentiallysimilartothoseforlivetrees,withsomeadditionalconsiderationsfordecayandmechanical/structuraldamage(Domkeetal.,2011;Harmonetal.,2011).Carbonconversionsvaryslightly,but50percentisausefulroundvaluefordeadwood.However,specificcarboncontentislessforthelitterandorganiclayersoftheforestfloor.Thereisnotadeadplantmaterialpoolcorrespondingtounderstory;itisassumedtheseveryquicklybecomelitterorsmallwoodydebris.Pairingpooldefinitions(boundaries)withdatasourcesisalsoveryimportantwiththepoolsofdeadplantmaterial,becausemeasurementsspecifictoestimatesaremuchlesslikelyforDDW,forestfloor,etc.IntheFIADBthedistinctionbetween“standing”and“down”deadwoodisbasedonangleofleanandisappliedtoP2(phasetwo,“standard”forestinventoryplot)andP3(phasethree,asmallernumberofplotsthatincludeadditionalmeasurementssuchassoilsandforestfloor)data;otherdefinitionsmayvary.Forsmalldiameterstandingdeadtrees,estimatesexistbutareproblematic:FIAdataonlyprovidesamplesofstandingdeadtreesat5inches(12.7cm)DBHorlarger.Estimatesofsaplings(1–5inch(2.5—12.7cm)DBHtrees)necessarilywillbemodeled(Woodalletal.,2012).
6.2.2.4 DownDeadWood
DDWisdefinedaspiecesofdeadwoodnolongerapartofstandingdeadorsnags,yetdistinctfromsmalleroradvanceddecayedwoodoftheforestfloor.ThedefinitionlargelycorrespondstotheP3downwoodymaterialpool,andrepresentsaslightchangefromthepastdefinition.Thispoolalsoincludessomeless‐than‐obviouscomponentsofDDW:(1)debrispiles,usuallyfrompastlogging;(2)previouslystandingdeadtreesthathavelostenoughheightorvolumeorleangreaterthan45degreesfromverticalsotheydonotqualifyasstandingdead;(3)stumpswithcoarseroots(aspreviouslydefined);and(4)nonlivingvegetationthatotherwisewouldfallunderthedefinitionofunderstory.
6.2.2.5 ForestFloororLitter
Theforestflooristhelayersoflitter,oftenclassifiedasthefibric(Oi),hemic(Oe),andsapric(Oa)organiclayersabovethemineralsoilandsmallerthanDDW.Thisclassificationrepresentsachangefromthepastdefinition,whichalsoincludedthesmallwoodydebrisfromtheDDWpool.Organicsoilspresentadditionalchallengeswhendelimitingthispool.
6.2.2.6 ForestSoilOrganicCarbon(SOC)
Thispoolisorganiccarbonwithinthesoilbutexcludingcoarserootsasdefinedforlivetrees,understory,standingdeadtrees,andstumps—allasdefinedabove.Byconvention,largepiecesofwoodymaterialthatareseparatelyandindependentlyestimatedthroughsamplingandallometryareexcluded.Depthisarbitraryandsofarhasbeendefinedbythedatasetinuse.Thedatasetshouldrepresentsamplesofasmuchoftheorganiccarbonaspossible,althoughpeatlandspresentauniqueproblem.Acommonsamplingdepthis1m,althoughthisisnotanIPCCstandard.Adequatesamplingdepthmaybeascertainedthroughlocalknowledge;3.9to7.9inches(10to20
Chapter 6: Quantifying Greenhouse Gas Sources and Sinks in Managed Forest Systems
6-25
cm)maybeadequateforsomeforestecosystems,whileothersrequiregreaterdepths.Datasetsofsoilmapsfromsurveysareanothersourceofdata(inadditiontoP3plots).SOCvariabilityextendstorelativelylarge‐scalemapssuchaslocationssurroundingP2/P3plots.Thatis,soilsmapsarebasedondatawiththesamevariabilityasseenintheP3subplot‐to‐subplotprecision.
NotethatthepooldefinitionsusedbyFVSdonotmatchdefinitionsusedbyFIAinallcases.Whilethemaincategoriesofliveanddeadbiomasswillincludethesameelements,theFIAdefinitionofforestfloorincludesfinewoodydebris,whiletheFVS‐FFEdefinitionplacesfinewoodydebrisintheDDWcategory.FIAconsiderstreesunder1inch(2.5cm)DBHtobepartoftheunderstorypool,whileFVStrackstheseastreesregardlessofsize.FutureworkislikelytoincludethecapabilityofFVS‐FFEtogenerateacarbonreportwithpoolscorrespondingtothedefinitionsusedbyFIAinnationalaccounting.
6.2.3 EstimationMethods
Theflexibilityinusingthebestobtainabledatabalancedwiththeneedsandresourcesofeachindividualforestownercanprovidegood/validforestcarbonestimatesifsomebasicguidelinesarefollowed:
Carbonpoolsshouldbeexplicitlyidentifiedtomakeitpossibletoidentifypossiblegapsoroverlapsbetweenpools.Identifyingandrecognizingthatagapexists(forexample,therearenoseedlingdata,orstandingdeadtreeswerenotmeasured)ismoreusefulthanfuzzyboundariesbetweenpools.
Consistentpooldefinitionsandmethodsforcarbonestimationwithinthosepoolsarerequiredforvalidestimatesofchange.Thatis,changeshouldbebasedonthesamepoolsandmethodsatbothtime1andtime2.
6.2.3.1 LiveTrees
Variousapproachesareusedforestimatesoftreebiomassorcarboncontent;ultimately,eachreliesonallometricrelationshipsdevelopedfromacharacteristicsubsetoftrees.Here,livetreesincludestemswithDBHofatleast1inch(2.5cm).Allometrycanincorporatewholetreesorcomponentssuchascoarseroots(greaterthan0.08to0.20inches(0.2to0.5cm);publisheddistinctionsbetweenfineandcoarserootsarenotalwaysclear),stems,branches,andfoliage.Livetreebelowgroundcarbonestimatescanbetroublesome,butoverallaccuracyisbestiftheboundaryissettoconformtoavailabledataratherthanapredefinedthreshold.
Recommendedoptionsforobtainingestimatesofcarbonstockoflivetreesare:
Smalllandowners(asdefinedinSection6.2.1):Valuesobtainedfromlookuptables(e.g.,eitherthoseinSmithetal.,2006,orasotherwiseprovided)categorizedbygeographicregion,foresttype,andageclass.
Largelandowners(asdefinedinSection6.2.1):Standardforestinventory,estimatescalculatedusingindividualtreemeasurement(diameter)andtheFVS‐FFEmodulewiththeJenkinsbiomassequations(Jenkinsetal.,2003a).
Biomassequationsmustbeappliedappropriately;usingequationsoutsidethediameterorgeographicrangesforwhichtheyweredevelopedwillintroduceadditionalerrortotheestimates.GiventhehundredsofdifferenttreespeciesgrowingindiversehabitatsacrosstheUnitedStates,itisbeyondthescopeofthisdocumenttosuggestthemagnitudeoftheeffectofalternativetreevolumemodelsbeyondthenational‐scalemodelssuggestedherein.Regardlessoftheestimationapproachselected,itiscriticaltousethatmethodconsistentlyovertime.Estimatesproducedfromdifferentmethodswillvary;changingestimationmethodsovertimewillintroduceadditionalerror.
Chapter 6: Quantifying Greenhouse Gas Sources and Sinks in Managed Forest Systems
6-26
AlthoughwearecurrentlyspecifyingonlytheuseofbiomassequationsbyJenkinsetal.(2003a),itisunderstoodthattheseequationsmaynotbethemostappropriateinallcircumstances.Forexample,usingequationsoutsidethediameterorgeographicrangesforwhichtheyweredevelopedwillintroduceadditionalerrortotheestimates.SomeJenkinsequationshavelimitstotheallowablediameters.SpecificguidancewillbedevelopedinthefuturetofacilitatetheuseofdifferentbiomassequationssuchasthoseusedbyFIAbasedontheCRMandlocally‐specificequations.RefertoFigure6‐3foradecisiontreefortheforestcarbonaccountingsourcecategoryshowingwhichcarbonaccountingassumptions(e.g.,simulationmodel,allometricequations,andlookuptables)arerecommendedforanentitydependingonthesizeclassandtypeofactivitydataavailable.
SamplingandAllometry.Recommendedapproachesarebasedontheapplicationofallometricrelationshiptosampledinventorydata.TheFIADB‐basedestimatesoflivetreecarbonarebasedontheplotdata–P2dataandCRMbiomassestimation(Woodalletal.,2011).Inaddition,alargenumberofotherallometricrelationshipshavebeendevelopedfortreebiomass(biomassregressionequations).Manybiomassequationsareavailableforavarietyofforesttypes;forexample,possibleoldercitationsareTer‐MikaelinandKorzukhin(1997);seealsocitationsinJenkinsetal.(2003b).TheequationsrecommendedinthisreportaretheJenkinsetal.(2003a)equations,whicharenationallyconsistentandstraightforwardtoapply.FuturedevelopmentorintegrationofthismethodintoasoftwaretoolshouldconsiderimplementationoftheCRMbiomassestimationmethodinordertobetteralignwiththemethodsusedforU.S.GHGinventoryreporting.TheCRMapproachiscomputationallycomplex,andisnotincludedatthistime.
Inventorydesignsandprotocolsarewelldocumentedbyavarietyofauthorsandwillnotbediscussedfurtherhere.AgoodexampleisPearsonetal.(2007),whichiswrittenspecificallyforcarboninventories.
LookupTables.Publishedsummaryvaluesofsimilarorrepresentativeforestsprovidequickandinexpensivemeansofroughlyassessinglikelyforestcarbon.Agoodexampleofsuchlookupvaluesarethepastrevised1605(b)guidelines,withtheforesttablespublishedasSmithetal.(2006).AlternativeversionsofrepresentativevaluesincludeFIAonlineapplicationssuchasFIDOorEVALIDator,FIA‐relatedapplicationssuchasCOLE,ormodelsfromspatialdatasuchastheFIAbiomassmaportheNationalLandCoverDatasetlayers.
Simulations/Modeling.Notonlydoforestbiometricalmodelsprovideaplatformforestimatingfuturescenariosofforestcarbonstocks,buttheycanalsobearapidmethodologyforentity‐levelcalculationofcurrentforestcarbonstocks.TheFVSisonesuchsimulationtoolthatcanprovideestimatesofcurrentforestcarbonstocksgivenanelementaryforestinventorywasconducted(e.g.,numberoftrees,size,andspecies).Inaddition,andperhapsamorepowerfulaspectofsuchatool,isthatprojectionsoffuturestandattributescanbeacquired(e.g.,forestcarbonstocks50yearsfrompresent)asdescribedinDixon(2002)andHooverandRebain(2008;2011).
6.2.3.2 Understory
Estimationproceduresanddatasourcesarelimitedforthispool.Unlessanentityhasthecapabilitytodeveloplocalizedunderstorymodelsandallometricrelationships,thedevelopmentofcarbonestimatesforthesepoolswillbelimitedtolookuptablesandsimulations/modeling.ValuesareprovidedintheSmithetal.(2006)lookuptables,whicharebasedonBirdsey(1996)andmodifiedtoapplytoFIAdata;seeU.S.EPAAnnex3.12(2010)foradditionaldetails.TheFIADBconditiontableincludesestimatesbasedonthismodel,soestimatesbasedonsimilarstandscanbeobtainedfromtheFIADB.UnderstoryvaluesareprovidedinthecarbonreportsinFVSandareregionaldefaultvaluessetwithinthemodel.
Chapter 6: Quantifying Greenhouse Gas Sources and Sinks in Managed Forest Systems
6-27
6.2.3.3 StandingDead
Theprevailingdifferenceinvolume/biomass/carbonestimationofstandingdeadtreesfromlivetreesistheincorporationofdecayreductionfactorsandrotting/missing/cullcomponents(Domkeetal.,2011;Harmonetal.,2011).
SamplingandAllometry.FIAinventory‐basedestimationforstandingdeadtreesisfromP2plot,condition,andtreerecords.TreemassintheFIADBiscalculatedaccordingtoCRMmethods(Woodalletal.,2011)withrefinementstotheCRMapproachspecifictostandingdeadtreesproposedbyDomkeetal.(2011).Duringastandardforestinventory,standingdeadtreesaremeasuredandtallied,andlargelandownerscanusethisinformationwithFVStoproduceestimatesofthebiomassandcarboninthispool.
LookupTables.Publishedsummaryvaluesofsimilarorrepresentativeforestsprovidequickandinexpensivemeansofroughlyassessinglikelyforestcarbon.Agoodexampleofsuchlookupvaluesarethepastrevised1605(b)guidelines,withtheforesttablespublishedasSmithetal.(2006).AlternativeversionsofrepresentativevaluesincludeFIAonlineapplicationssuchasFIDOorEVALIDATOR,andFIA‐relatedapplicationssuchasCOLE.Notethatsomedifferencesmayappearamongpoolestimatescomparedtothesampleestimates,becausesomeorallarebasedonempiricalmodels(regressions)andnotthedirectplot‐levelmeasurementsthatarenowavailablewithintheFIADB.SmalllandownerscanobtainestimatesofthestandingdeadpoolusingtheSmithetal.(2006)lookuptables.
6.2.3.4 DownDeadWood
TherecommendedmethodforobtainingestimatesofcarbonstockofDDWforlargelandownersisestimationfromtransectdatacollectedduringtheinventory.CareshouldbetakentoadheretotheboundsbetweentheDDWandforestfloorpools(notingthatfinewoodydebrisisconsideredpartoftheforestfloorpoolinthisguidance).Smalllandownersmayrefertothelookuptablesforpoolestimates.
SamplingandAllometry.AvarietyofsamplingandestimationprotocolsisavailablefortheDDWpool;astraightforwardandcommonlyusedapproachcanbefoundinPearsonetal.(2007).
LookupTables.RegionalaveragesbyforesttypeareasdescribedinSmithetal.(2006),orestimatescanbesummarizedandextractedfromtheFIADBconditiontabletocorrespondtotheentity’sforest.However,notethatthecurrentFIADB’sDDWfromtheconditiontableisamodelindependentofP3sampling.SeeSmithetal.(2006),U.S.EPAAnnex3.12(2010),Woodalletal.(2013),andDomkeetal.(2013)fordetails.
Simulations/Modeling.DDWcarbonvaluesareprovidedinthecarbonreportsinFVS.Valuesmaybesuppliedbythelandowner;ifthesedataarenotavailable,regionaldefaultvaluesbasedonP3dataoravailabledatafortheregionandforesttypeareautomaticallyinputbythemodel.
6.2.3.5 ForestFloororLitter
Recommendedoptionsforobtainingestimatesofcarbonstockofforestfloorforalllandownersistheuseoflookuptablesbasedonforesttype,region,andstandage.Largelandownerswhoarechanginglandusesfromnon‐foresttoforestmaywishtocollectdataforthispool.
SamplingandAllometry.LandownerswishingtoestimatethesepoolsfromfielddatacanusefinewoodydebrissamplingandcarbonconversionaccordingtoWoodallandMonleon(2008),andforestfloorusingtheapproachdescribedbyPearsonetal.(2007).NotethatwhilePearsonetal.(2007)applyamasstocarbonconversionfactorof0.5(Smithetal.,2006)),othersuseaconversion
Chapter 6: Quantifying Greenhouse Gas Sources and Sinks in Managed Forest Systems
6-28
factorof0.37.Landownerswhoareestimatingtheforestfloorpoolusingfielddatashouldapplythe0.37conversionfactor.
LookupTables.RegionalaveragesbyforesttypeareasdescribedinSmithetal.(2006);estimatescanalsobesummarizedandextractedfromtheFIADBconditiontabletocorrespondtotheentity’sforest.TheseestimatesarebasedonsimulationsdescribedinSmithandHeath(2002).NotethatthecurrentFIADBconditiontableestimatesofforestfloorarethesemodeledvaluesindependentoftheP3sampling.
Simulations/Modeling.ForestfloorcarbonvaluesareprovidedinthecarbonreportsinFVS.Valuesmaybesuppliedbythelandowner;ifthesedataarenotavailable,regionaldefaultvaluesbasedonP3dataoravailabledatafortheregionandforesttypeareautomaticallyinputbythemodel(FVSemploysthe0.37masstocarbonconversionfactorwhenestimatingthispool).
6.2.3.6 SoilOrganicCarbon
PossibleoptionsforobtainingestimatesofSOCstocksare:
Sampling,followingstandardfieldmethods;
DatasetssuchastheSoilSurveyGeographic(SSURGO)Database,StateSoilGeographic(STATSGO)Database,ortheDigitalGeneralSoilMapoftheUnitedStates(STATSGO2);and
Stand/forestclassification:extractrangeofmodeledestimatesfromFIADBconditiontable.
SamplingandAllometry.SoilsamplingandcarbonestimationaccordingtoFIAP3plotprotocolscanbefoundattheUSDAForestServiceFIALibrary:FieldGuidesforStandards(Phase3)Measurements;7methodsarealsoavailableinPearsonetal.(2007),Hoover(2008),andothers.
Soilsdataaregenerallyconsidereddifficulttomeasureandspatiallyquitevariable.Theconsequenceisthatthecostsarehighandthepayoffislikelylow.Ourrecommendationisthatsamplingisonlyusefulifthereisanimportantreasontodoso,suchasachangefromnon‐foresttoforestorviceversa.Ifawildfireoccursandthereissignificantconsumptionofpeatlands,samplingshouldbeconductedandemissionscalculatedusingFOFEMand/orCONSUMEmodels.ThissituationismostlikelytobefoundintheSoutheastorNorthCentralStates.
LookupTables.Forestsoilorganiccarbonestimates—representativevaluesorlookuptables.DatasetssuchasSTATSGOorSSURGOarepossiblesources.EstimatescanbesummarizedandextractedfromtheFIADBconditiontabletocorrespondtotheentity’sforest;thesearebasedonaSTATSGO/P2overlay(Smithetal.,2006;U.S.EPA,2010).
6.2.4 Limitations,Uncertainty,andResearchGaps
Thereisoftentremendousuncertaintyassociatedwithestimatesofforestcarbonbaselines,suchthatevenatlargescales(e.g.,state‐level)thepowertodetectstatisticallysignificantchangesinforestcarbonstocksislimitedtomajordisturbances(Westfalletal.,2013).Compoundingthesamplingerroroftenassociatedwithforestinventories,thereismeasurementandmodelerrorthatmaynotbeacknowledged.Usersofanyinventories,lookuptables,ormodelsshouldremainawareofthesepotentialerrorsduringtheirapplicationofinformation.
Thereisalevelofuncertaintyassociatedwithnotonlytreevolume/biomassequations,butalsowiththevariousforestcarbonpools(e.g.,belowgroundtoforestfloor)foundacrossadiversityofforestecosystems(e.g.,tropicaltoboreal)intheUnitedStates.Researchtorefineapproachestoforestcarbonaccountingandrefinementsofassociatedmodelsiscurrentlyinprogress.Perhaps7http://fia.fs.fed.us/library/field‐guides‐methods‐proc/
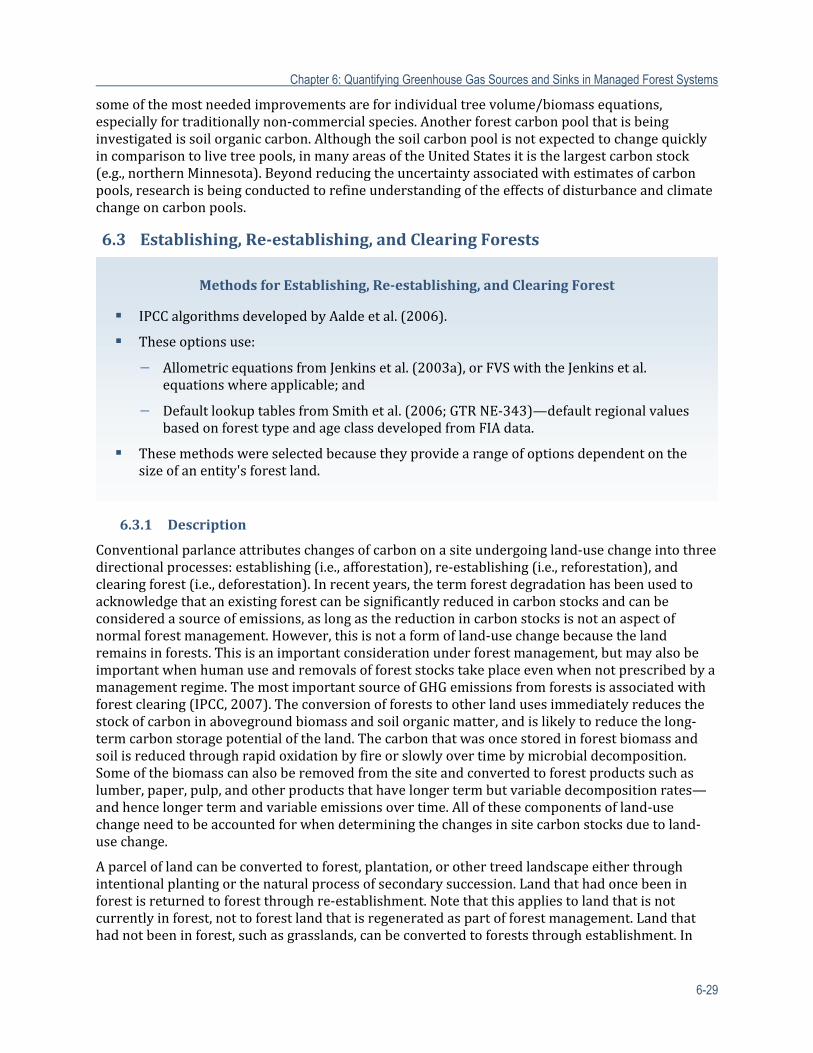
Chapter 6: Quantifying Greenhouse Gas Sources and Sinks in Managed Forest Systems
6-29
someofthemostneededimprovementsareforindividualtreevolume/biomassequations,especiallyfortraditionallynon‐commercialspecies.Anotherforestcarbonpoolthatisbeinginvestigatedissoilorganiccarbon.Althoughthesoilcarbonpoolisnotexpectedtochangequicklyincomparisontolivetreepools,inmanyareasoftheUnitedStatesitisthelargestcarbonstock(e.g.,northernMinnesota).Beyondreducingtheuncertaintyassociatedwithestimatesofcarbonpools,researchisbeingconductedtorefineunderstandingoftheeffectsofdisturbanceandclimatechangeoncarbonpools.
6.3 Establishing,Re‐establishing,andClearingForests
6.3.1 Description
Conventionalparlanceattributeschangesofcarbononasiteundergoingland‐usechangeintothreedirectionalprocesses:establishing(i.e.,afforestation),re‐establishing(i.e.,reforestation),andclearingforest(i.e.,deforestation).Inrecentyears,thetermforestdegradationhasbeenusedtoacknowledgethatanexistingforestcanbesignificantlyreducedincarbonstocksandcanbeconsideredasourceofemissions,aslongasthereductionincarbonstocksisnotanaspectofnormalforestmanagement.However,thisisnotaformofland‐usechangebecausethelandremainsinforests.Thisisanimportantconsiderationunderforestmanagement,butmayalsobeimportantwhenhumanuseandremovalsofforeststockstakeplaceevenwhennotprescribedbyamanagementregime.ThemostimportantsourceofGHGemissionsfromforestsisassociatedwithforestclearing(IPCC,2007).Theconversionofforeststootherlandusesimmediatelyreducesthestockofcarboninabovegroundbiomassandsoilorganicmatter,andislikelytoreducethelong‐termcarbonstoragepotentialoftheland.Thecarbonthatwasoncestoredinforestbiomassandsoilisreducedthroughrapidoxidationbyfireorslowlyovertimebymicrobialdecomposition.Someofthebiomasscanalsoberemovedfromthesiteandconvertedtoforestproductssuchaslumber,paper,pulp,andotherproductsthathavelongertermbutvariabledecompositionrates—andhencelongertermandvariableemissionsovertime.Allofthesecomponentsofland‐usechangeneedtobeaccountedforwhendeterminingthechangesinsitecarbonstocksduetoland‐usechange.
Aparceloflandcanbeconvertedtoforest,plantation,orothertreedlandscapeeitherthroughintentionalplantingorthenaturalprocessofsecondarysuccession.Landthathadoncebeeninforestisreturnedtoforestthroughre‐establishment.Notethatthisappliestolandthatisnotcurrentlyinforest,nottoforestlandthatisregeneratedaspartofforestmanagement.Landthathadnotbeeninforest,suchasgrasslands,canbeconvertedtoforeststhroughestablishment.In
MethodsforEstablishing,Re‐establishing,andClearingForest
IPCCalgorithmsdevelopedbyAaldeetal.(2006).
Theseoptionsuse:
− AllometricequationsfromJenkinsetal.(2003a),orFVSwiththeJenkinsetal.equationswhereapplicable;and
− DefaultlookuptablesfromSmithetal.(2006;GTRNE‐343)—defaultregionalvaluesbasedonforesttypeandageclassdevelopedfromFIAdata.
Thesemethodswereselectedbecausetheyprovidearangeofoptionsdependentonthesizeofanentity'sforestland.
Chapter 6: Quantifying Greenhouse Gas Sources and Sinks in Managed Forest Systems
6-30
eithercase,generallyspeaking,thestockofcarboninbiomassandsoilorganicmatterwillincreaseovertimeasaresultofthistypeofland‐usechange.Biomassincreasespredictablyastreesandothervegetationareestablishedonthesite.Soilorganicmatteralsochanges,butinlesspredictableways.Forinstance,theestablishmentofaforestplantationongrasslandincooltemperateregionsmayresultinatemporarylossofcarboninsoilorganicmatterbeforeitbuildsupagainaftertheplantationisfullyestablished.Forbothaccountingandplanningpurposes,thesechangesinstocksofcarbonmustbeestimatedandaccountedforwhenassessingtheeffectsofland‐usechange.
Currentinternationaldefinitionsarepresentedbelowanddrawadistinctionbetweenlandsthathaveneverbeenunderforestcoverandthosewhichwereinforestcoverinthepastbuthavenotbeenforestedrecently(e.g.,forthelast50years).Thesedefinitionsarepresentedherebecausetheyarecommonlyusedintheliterature;however,intermsofcarbonaccountingforlivebiomass,thereisnopracticaldifferencebetweenthetwocategories.Thegreatestimpactisonthesoilcarbonpool.Wheretheaimistoestimateentity‐levelGHGfluxes,thesetwocategorieswillbetreatedtogetherandtermed“establishingforest”inthisguidance.
6.3.1.1 EstablishingForest
Establishmentistheconversionofanon‐forestsitethatisnotnaturallyaforestedortreedecosystemorhadneverbeeninforesttoaforestorsimilartree‐dominatedlandcover.Examplesofestablishmentincludetheconversionofbarelandtoaforestandconversionofgrasslandstoforestsorplantation.Inpracticalterms,andforthesakeofthisguidance,landthathadbeeninagricultureorothernon‐forestlandcoverforalongtime(e.g.,morethan50years)thatisconvertedtotreecovercanalsobeviewedasestablishment.Hence,establishedforestlandisthatwhichhasnotbeendominatedbytreesformorethan50years.
6.3.1.2 Re‐establishingForest
Re‐establishmentisthereversionofforestsortreecoveronsitesthathadformerlyandrecentlybeen(e.g.,lessthan50years)inforestordominatedbytreecover.Examplesofre‐establishmentincludenaturalregenerationofadisturbedorclearedparcelofforesttoasecondaryforest,conversionofagriculturallandtoaforest,andestablishmentofaplantationonasitethathadoncebeenforestbutisnowinanotherlanduse(suchascropland).Itisimportanttodistinguishbetweenre‐establishmentasaland‐usechangeandforestregrowthaspartofforestmanagementortheresultofanaturaldisturbance.Forexample,aland‐usechangefromagriculturetoforestisconsideredhereasre‐establishment,whereforestregenerationfollowingawindthroworclear‐cuttingisnotconsideredaland‐usechangeresultinginre‐establishment.
Intheinternationalconventions,theIPCCSpecialReportonLandUse,Land‐UseChange,andForestry(IPCC,2000),whichwasdevelopedexplicitlyforcarboninventory,definesre‐establishmentas"theestablishmentoftreesonlandthathasbeenclearedofforestwithintherelativelyrecentpast;theplantingofforestsonlandswhichhave,historically,previouslycontainedforestsbutwhichhavebeenconvertedtosomeotheruse." Establishmentandre‐establishmentbothrefertoestablishmentoftreesonnon‐treedland.Re‐establishmentreferstocreationofforestonlandthathadrecenttreecover,whereasestablishmentreferstolandthathasbeenwithoutforestformuchlonger.Avarietyofdefinitionsdifferentiatebetweenthesetwoprocesses.Somedefinitionsofestablishmentarebasedonphrasessuchas"hasnotsupportedforestinhistoricaltime;"othersrefertoaspecificperiodofyears,andsomemakereferencetootherprocesses,suchas"undercurrentclimateconditions."TheIPCCGuidelinesdefineestablishmentasthe"plantingofnewforestsonlandswhich,historically,havenotcontainedforests"(IPCC,2000).
Asnotedabove,forthepracticalpurposesofreportingunderthesemethods,achangefromnon‐foresttoforestcoverwillbetermedestablishingforest,andthe50yeartimehorizonwillnotapply.
Chapter 6: Quantifying Greenhouse Gas Sources and Sinks in Managed Forest Systems
6-31
6.3.1.3 ClearingForest
Clearingistheconversionofaforestortree‐dominatedsitetoanotherlanduseotherthanforestoratree‐dominatedsite.Oftenclearingresultsinthecompleteremovalofabovegroundlivebiomass.Examplesofclearingincludetheconversionofaforestwoodlottocroplandorpasture,conversionofaforestwoodlottocommercialorresidentialuse,andconversionofanaturalforesttoagriculture.
6.3.1.4 OtherImportantConsiderations
DistinctionbetweenLand‐UseChangeandLand‐CoverChange.Itisveryimportanttounderstandanddelineatethedifferencebetweenland‐coverchangeandland‐usechange.Becausetheterms“landuse”and“landmanagement”areoftenconfusedorusedinterchangeablythedistinctionisdefinedhere.Abasicdefinitionoflandcoveris“theobservedphysicalandbiologicalcoveroftheEarth’slandasvegetationorhuman‐madefeatures.”Abasicdefinitionoflanduseis“thetotalofarrangements,activities,andinputsundertakeninacertainland‐covertype(asetofhumanactions).Thesocialandeconomicpurposesforwhichlandismanaged(e.g.,grazing,timberextraction,conservation).”Theconventionsfoundintheliterature—Turneretal.(1994),Skole(1994),andLambinetal.(2006)—arefollowedandwereadoptedbytheIPCCin2000.Itisrecognizedthatinadoptionoftheterminologyoflanduse,land‐usechange,andforestry,theIPCCGoodPracticeGuidancedocument(IPCC,2006)generalizedtheuseoftermstoincludethesixbroadland‐usecategoriesdefinedinIPCC(2003)Chapter2andrecognizedthattheseland‐usecategoriesareamixtureoflandcover(e.g.,forest,grassland,wetlands)andlanduse(e.g.,cropland,settlements)classes.Forconvenience,theyareherereferredtoasland‐usecategories.
Werecognizeherethatthetermland‐usechangecanbeadoptedtoincludeland‐coverchanges,aswellasland‐usechanges.Thus,forthisguidance,aswithIPCC,land‐usechangewillbetheconversionofthe“typeofvegetation”fromonecovertype,suchasaforestdominatedbytrees,toacompletelydifferentcovertype,suchascroplanddominatedbynon‐woodyfoodcrops.Thedirectionofcoverchangedeterminesthenatureofthechangeincarbonstocks(e.g.,forestclearingversusestablishment).Generallyspeaking,land‐usechangeisthemostimportantconsiderationforalandowner,sincethisprocessusuallyresultsinthelargestchangeinonsitecarbon.
However,wealsorecognizethatlandownerswillhaveimportantchangestotheirlandsthroughthemanagementactivitiesthattheydeploy,andtheseactivitiescanhaveimportantimplicationsforcarbonstocksandGHGemissionsandremovals.Thus,wealsorecognizetheconceptandterminologyofland‐managementchange,whichisachangeinthetypeofactivitybeingcarriedoutonaunitofland,andthushowitismanagedorused,suchaschangingthemanagementpracticeswithinaforestfromselectiveharvesttoprotection.Land‐managementchangemayormaynothaveasignificantimpactoncarbonandotherGHGs.
Landmanagementexplicitlyreferstohowthelandisbeingmanagedorused,whilelandusereferstowhatisontheland.Anexampleoflandmanagementisatree‐dominatedsitethatisusedasaworkingforestorwoodlot.Assuch,alandownercanchangethemanagementplanforthesite—forinstance,changingitsusetoaforestreserve—withoutradicallychangingitscover.Nonetheless,evensuchchangeinusecanaffecttheamountofcarbonstoredonthesiteandinthesoils.Typically,whenaforeststandlandmanagementischangedwithoutaffectingitscovertypeitisconsideredamanagedforest,anditsaccountingprotocolsfollowthoseforforestmanagementratherthanforestablishingforests.Thusitisimportanttodetermineanddocumentboththeland‐useandland‐managementchangesthatoccuronthesite,andexplicitlyassociatethecarbonestimationapproachtoeitherestablishing/clearingforests(Section6.3)orforestmanagement(Section6.4),butnotboth.
Chapter 6: Quantifying Greenhouse Gas Sources and Sinks in Managed Forest Systems
6-32
EstablishingandClearingForestversusForestManagement.Forreasonsoforderandconsistency,establishingandclearingforestisdistinguishedfrommanagement,whichisaddressedinSection6.4.Forestryoperationssuchasthinning,artificialregeneration,andharvestingareassociatedwithmanagedforestsystems.Unlessforestryactivitiesleadtoachangefromonelandusetoanotherland‐use,theseactivitiesarenottreatedusingestablishingandclearingforestaccountingprinciples.Theinitialconversionfromforesttoagriculture,forexample,wouldusetheestablishingandclearingforestrules,followedbytheapplicationofrulesforagriculture.Similarly,whenanon‐forestlandcoverisconvertedtoamanagedforesttheinitialconversionwouldbetreatedasestablishingforestandusethesemethods,butsubsequentmanagementofthestandwouldfollowforestmanagement(e.g.,forestcarbonaccountingandforestmanagement)methods.
TypesofForest.Fromastrictcarbonaccountingpointofview,theland‐coverdesignationdoesnotmatter,nordoesitschangeincovertypeaslongasonehasgoodestimatesofcarbonstocks,andcanmeasureorestimatetheirchanges.However,datausedtoestimatechangesincarbonareoftenreportedandorganizedbyforesttype,sothecompositionandstructureoftheforestoftencomesintothecomputationmethods.Moreover,toavoiddoublecounting,itisimportanttodefinewhattypeoflandscapescanbeconsideredasaforestforestablishingandclearingforest.Therearetwoelementsofadefinitionofforeststhatarewarranted.Thefirstisabasicdefinitionofaforest.Therearearangeofconditionsoftreedlandscapeswhereestablishingandclearingforestactivitiescantakeplace,frompreservedforeststowoodlotstoopenandwidelyspacedtreelandscapesandurbantreedlandscapes.Therearehundredsofvariationsofdefinitionsofforest(Lund,1999)andforeachofthesetherearesubtypes.Examiningtheimplicationsofeachvariantwouldnotbefruitful;theresultwouldbegreaterconfusion,ratherthantheclaritysought.Inastrictsense,aforestisdefinedhereusingtheU.S.‐specificdefinitionofforestland(Smithetal.,2009).Thesearelandswithtreecrowncover(orequivalentstockinglevel)ofmorethan10percent,widthofatleast120feet(36.6m),andareaof1acre(0.4ha).Treesshouldbeabletoreachaminimumheightof6.6–16.4feet(2–5m)atmaturityinsitu.Aforest‐landunitmayconsistofclosedforestformationswheretreesofvariousstoriesandundergrowthcoverahighproportionofground,oropenforestformationswithacontinuousvegetationcoverinwhichtreecrowncoverexceeds10percent.
Second,landownersmayhaveadiverselandbasethatisaffectedbydifferentforestryactivities,managedatdifferentintensities,orthathasavarietyofexistingdata.Oneofthefirststepsinpreparingentity‐wideorsub‐entityestimatesofcarbonfluxesfromforestsistoorganizetheunderlyingdataonlandconditionsintomanageableunits,referredtohereasforeststrata.Landshouldbegroupedintoforeststratausingalogicalframeworkthataggregatessimilarlandunits.Forexample,landcouldbepartitionedbyaveragetreeage,foresttype,productivityclass,andmanagementintensity.Inmanycasesforeststratawillbecontiguous,althoughthisisnotanecessarycondition.Thelandownercanselectthetypeofstratificationschemetoemploy;andthereareseveralguidesavailabletodothis.Thebetterthestratification,themoreaccurateandprecisearethecarbonestimationswiththeminimalamountofdatacollection.
Thedefinitionofaforestisusefulforconsistencyinreportingandcoversawiderangeofconditions.However,notethatthetechnicalmethodscanapplytoanytreedlandscape.Theadoptionoftheinternationalnomenclatureforforestsallowstheconsiderationofarangeofsiteconditionsandsituations.ForestsintheUnitedStatesarevaried,fromscrubwoodlandsinsemi‐aridzonestomaturedeciduousandconiferouscomplexesinthehumidzones.Inaddition,humanmanagedsystems,suchaswoodlotsandplantations,areconsideredasforests.
SimilarModalitiesandVariantsofEstablishing,Re‐establishing,andClearingForest.Thissectionrecognizesthatestablishingandclearingforestaresimilartoandindeedconceptuallyrelatedtoseveralotherland‐coverchangemodalities,whicharetreatedinotherprotocols.Theseincludebutarenotlimitedtoagro‐forestry,whichinvolvestheuseoftreesonfarms;urbanforests
Chapter 6: Quantifying Greenhouse Gas Sources and Sinks in Managed Forest Systems
6-33
andwidelyspacedtreecomplexes;treesonlandscapesoutsideofforests;woodlandsandsavannasystems;orchards;andpalmandhorticulturecomplexes.Althoughthemeasurementandestimationmethodsdescribedheremaybeeasilyadaptedtotheselandcoversandlanduses,theyarenottreatedinthissection.
6.3.2 ActivityDataCollection
Activitydataaremeasurementsorestimationsofmagnitudeofhumanactivityresultinginemissionsorremovalstakingplaceduringagivenperiodoftime.Mostoftentheareaoflandthatisconvertedfromonelandusetoanotheristhemostimportanttypeofactivitydata.Dataonareaburned,managementpractices,andlimeandfertilizeruseareotherexamplesofactivitydata.Forestablishingandclearingforest,activitydataconsistsmostlyofinformation,preferablyinmapformwithdelineatedboundaries.Forsmalllandowners,itispossibletodelineateanareaofland‐coverchangebyfootusingsimpledistancemeasurementsorwiththeaidofaGPS.Alandownermayhavedifferentactivitiesoccurringonasingleproperty,andthuseachoftheforeststratashouldbemappedandhaveseparatelydelineatedactivities.Remotesensingoraerialphotographycanbeusefulforanylandownerwithaccesstothesedata,butareespeciallyusefulforlargerlandunits.Historicalinformationonchangesintheareasoflandusesonapropertyisalsoimportant,andthesedataarefrequentlyfoundinairphotoarchivesorothermaprecords.Inadditiontotheareasandratesofclearingand/orestablishment,itisnecessarytocollectdataonspecificaspectsanddetailsoftheseactivities.Thismayincludedataontreetypes,biomass,clearingintensity,woodremovals,treeplantingdensities,andotherfactorsthatdescribedthemodalityoftheestablishingandclearingforestactivities.
6.3.2.1 EstablishingForest
Foranestablishmentactivity,itisimportanttogatherbasicinformationontheareaandlocationofeachstratumoflandusethatisbeingestablished.Forthemostpartanestablishmentactivitywillbeaplantationorsimilartypeofestablishment/forestationactivity.Thus,basicinformationonsitepreparation,speciesselection,anddensitiesofplantingscanbeusedwithaprojectionofthelong‐termplanforthesitetomakeareasonableex‐antecalculation.Ifnaturalregenerationistheprimarymeansofestablishment,estimatesofseedlingcountscanbeusedtodevelopagrowthprojection.Alternatively,regionalyieldtablesmaybeusedtoestimateprojectedstocks.Theprioruseandmanagementofthestratumorlanduseshouldalsobedocumented,sincethehistoricaluseofthelandinfluencescarbonstockandstockchangeestimates.Forinstanceestablishmentofaforeststandongrasslandwillhaveadifferentresultintermsofcarbonthanestablishmentonarowcropagriculturalfield.Onceaforestiswellestablished,forallpracticalpurposesitbecomesamanagedforestandshouldbetreatedusingthemethodsinthenextsectiononforestmanagement.Weconsidertheland‐usestratumtobeaforestwhenthecharacteristicsofthestandmeetthedefinitionofaforest.Mostoftenthiswillbewhenthesiteiswellstockedtothedefinitionalcrowncoverandheightoftrees.
6.3.2.2 ClearingForest
Themostimportantactivitydatatocollectaretheareaandratesofforestclearingforeachstratumorparcelintheprojectarea.Itisalsoimportanttoknowtheintensityofclearingandifthereareremainingtreesorothervegetationleftonsiteafterclearing.Toestimateemissions,itisnecessarytoknowalsothecharacteristicsofthestratumthatistobecleared,includingthebiomassandsoilorganicmatterofthesite.Theprocessofclearingasiteisanactivitythatcanalsobecharacterized.Informationneededincludesthefractionoftheabovegroundbiomassthatwouldbeburned,thefractionthatisleftbehindonsiteasslashanddebris,thefractionthatwouldberemovedintheformofwoodproducts,andthefractionthatisremovedintheformofotherproducts.
Chapter 6: Quantifying Greenhouse Gas Sources and Sinks in Managed Forest Systems
6-34
6.3.3 EstimationMethods
Thissectionlaysouttheminimumnecessarypartsofacomputationschemeforestimatingcarbonstocksandcarbonemissionsinbiomassandsoilassociatedwithestablishingandclearingforest.Thedescriptionslaidoutherearegeneralized.Thebasicconceptbehindthemissimple:thestock,ormass,ofcarbononasitechanges,andthetaskofestimationistocomputethedifferenceinstocksbetweenthelandusebeforeandaftertheinterventionordisturbance.Whenasiteiscleared,stocksgodownandthisresultsinemissionstotheatmosphere.Whenasiteisestablished,stocksgoupandthisresultsinremovalsfromtheatmosphere.
6.3.3.1 UnitsofMeasurement
Allstockcomputationsareperformedintermsofmassofcarboninkilogramsormetrictonsperunitareainmetricsystemunits(carbonperhectareorCha−1).Ratedataarereportedintermsofchangeincarbonperhaovertime,asincarbonperhectareperyear(Cha−1year−1).Allcarbonbiomassisreferencedtoitsdryweightbasisandthefractionofbiomassincarbon.Forthepurposeofthisguidance,thefractionofdrybiomassthatiscarbonis0.5.Anexamplestockis100metrictonsCha−1,andanexamplestockchangeis100metrictonsCha−1year−1.ItisimportanttodifferentiatebetweenunitsofcarbonandCO2equivalents(CO2‐eq)andreporttheappropriateunitstothereportingentity.Forexample,somereportingprograms(e.g.,carbonmarkets)requiretheconversionofmetrictonsofcarbontometrictonsCO2‐eq.ThisconventionplacesallcarbonmassestimatesintounitsofCO2,whichcanbederivedbymultiplyingthecarbonmassby44/12.
6.3.3.2 StocksandFluxes
Thestockofcarbonistheamountofcarboninbiomassandsoilonasite.Thestockchangeisthedifferenceinthestocksfromonetimeperiodtothenext.Thischangecanbepositiveornegative,dependingonwhetherthesiteisexperiencingclearing,degradation,restoration,orestablishment.Decliningstocksovertimefromclearingordegradationresultinemissions,whileaccumulatingstocksovertimefromestablishmentorrestorationarereferredtoassequestration.
6.3.3.3 DelineatingandCharacterizingtheSiteUsedinComputation
Toestimatecarbonstocksandfluxes,itisnecessarytodefinethemappedextentandthefeaturesofthesite.Forsmallareas,suchasafarmwoodlotorforeststand,theboundariesaredefinedgeographicallyusingaGPSdevice.Ifsurveyors’reportsorotherformsofmapsandphotossuchasaerialimageryareavailable,theycanbeused.Thereareagrowingnumberofonlinetoolsthatareavailable(e.g.,GoogleMaps)thatprovidedetailedimageryoflandthatcanbeusedtodrawboundariesoftheproposedsites.Afterdefiningthepreciseboundaries,aland‐coverclassificationshouldbeperformedtodefinethevariousvegetation,cover,orsoilstratawithinthesite.Forinstance,are‐establishmentprojectwithtwozoneswithintheboundaries,oneforacommercialplantationandtheotherfornaturalregeneration,wouldbestratifiedintotwostands.Iftheprojectorpropertyistobeasinglecover,suchasanaturalregenerationforestoraplantationforest,theprojectsitecanbeasinglestratum;butotherfactorsmaybeimportant,suchaslandslopeorsoilconditions.Iftherewillbeafuturemanagementactivityassociatedwiththeproject,thisstratumshouldalsobedelineated.Inshort,anyareawithintheprojectboundarythatwouldhavedifferentcoverorcarboncharacteristicsshouldbeseparatelydelineated.Standardmappingcoordinates,projections,andgeodeticdatumsshouldbeused.
6.3.3.4 CarbonPoolsunderConsideration
Generally,IPCCandothersourcesreferencefivepoolsofcarbontomeasure—abovegroundlivebiomass,belowgroundlivebiomass,standingdeadanddowneddebris,litter,andsoilorganic
Chapter 6: Quantifying Greenhouse Gas Sources and Sinks in Managed Forest Systems
6-35
carbon.Thelandownerorprojectdevelopershouldidentifyfromthebeginningthepoolsthatwillbeaccounted.Allpoolsshouldbeincluded,unlessonecanshowthatapool’sstockchangesaresmallandunimportant—thedeminimisassumption(lessthan10percentofthetotalbaselinestock,seemorebelow)—orcanshowthatapoolwouldnothavestocklossesoremissions(e.g.,forestclearing).Inthesecases,thelandownerischoosingtobeconservativeinestimationoftheimpactoftheestablishingandclearingforestontheatmosphereforthatpool.Forinstance,inanestablishmentprojectwheretheestimationofsoilcarbonchangemaybedifficult,timeconsuming,orcostly,andthesoilcarbonchangeisassumedtobedeminimisinmagnitude,itmaybeeliminated.Or,ifitcanbedemonstratedthatthesoilpoolwillbeaccumulatingcarbon,thelandownermayselecttonotcountthatpoolandthusbeconservativeinthesequestrationpotentialoftheproject.Woodproductsthatareremovedfromthesitethroughharvestarenotbythemselvesconsideredaseparatepool,butthelandownerisadvisedtodocumentthisamountanditsfate,wherebyfatecanbe,forexamplehardwoodproducts,paperproducts,orfirewood(seeSection6.5).
6.3.3.5 InitialCarbonStockMeasurement
Thecarbonstocksinthemeasuredpoolsthataretobereportedneedtobedeterminedatthebeginningoftheprojectinordertodefineareferencecarbonamounttowhichfuturechangeswillbecompared.Whetherthesiteisaforestbeforeitsconversionoragriculturallandbeforere‐establishmentoftreecover,theinitialconditionsintermsofcarbonmustbereported.Theinitialcarbonstocksinallstrataareindividuallydeterminedfromlookuptables,satelliteimagery,orFIAdatabase,oraremeasuredandreportedaccordingtothedetailedmeasurementmethodsgivenbelow.Thereportingofthebaselinecangetcomplicatedinsomecases.Typicallythebaselineisthecurrentcarbonstocks.However,insituationswherethecarbonstocksarechanging,thebaselineiscomputedovertimeastheforwardlookingcarbonstocksthatwouldoccurintheabsenceoftheprojectorintervention.
6.3.3.6 TheEx‐AnteComputation
Onceinitialcarbonstocksaredetermined(theTypeIestimate),theprojectdeveloperneedstomakeaforwardprojectionoftheexpectedcarbonstockchanges,anditsdeviationfromwhatwouldhaveoccurredonthesitewithouttheinterventionofaprojectorland‐coverchange(TypeIIandIIIestimates).Thisissomewhatproblematicsinceitisnotpossibletopredictthefuturewithcertainty.However,anumberoftoolsandmethodsareavailabletomaketheseprojectionswithreasonablecertainty(seeTable6‐3).Animportantreasonformakingthiscomputationisthatthecarbonstockwouldchangeovertimeintheabsenceoftheproject’sintervention.Forexample,anabandonedfarmfieldcouldbeexpectedtonaturallygothroughold‐fieldsuccessionevenwithoutareestablishmentproject.Hence,theproject‐relatedcarbonchangesneedtobecomparedwiththenointervention/noactionestimateovertime,notjustfromthestartoftheproject,togetatrueaccountingofnetcarbonbenefits.Landownerswouldwanttomaketheex‐antecomputationsothattheycanevaluatearangeoffutureestablishment,clearing,ormanagementoptionstoselecttheonethatbestsuitstheircarbonandotheroutcomeneeds.
6.3.3.7 MeasurementandMonitoring
Aftertheinitiationoftheprojectintervention(e.g.,treeplanting),ongoingmeasurementsofactualcarbonstockchangesneedtooccur.Thisisoftenreferredtoasthemonitoringphaseoftheproject.Methodsforongoingmeasurementaredescribedbelow.Theprojectdevelopershouldkeeporganizedrecordsofthemeasurementsmadeoveraroutineandstandardtimeframe.Annualmeasurementsareusuallyeithernotlogisticallypossibleortootime‐consumingandexpensive.
Chapter 6: Quantifying Greenhouse Gas Sources and Sinks in Managed Forest Systems
6-36
Thus,itisrecommendedthataftertheinitialmeasurement,thesemeasurementsarerepeatedevery5years.
6.3.3.8 PermanentSamplePlots
Forsmallprojectssuchasfarmwoodlots,ortreeandforeststands,acompleteinventoryofcarboninthereportingpools,strata,andprojectlandcanbeperformed.However,forlargeareas,installinganddelineatinganumberofsampleplotsisrequired.Thesesampleplotsareestablishedintheprojectareaonastratifiedbasis,laidoutrandomlyorsystematically—i.e.,eachlandcoverstratumhasanestablishednumberofsystematicallyorrandomlyplacedplots.Methodsforforestinventoryarewelldescribedandavailablefromavarietyofsourcesandwillnotbefurtherdescribedhere(e.g.,Pearsonetal.,2007).Boththenumberandlocationoftheplotsneedtobeconsidered.Itisimportanttorememberthattheplotsareestablishedforthepurposeofsamplingaforeststandorprojectstratum.Thesampleestimatewillbeasaccurateasthenumberandlocationofthesampleplotspermit.Thenumberofplotswillrelatetotheaccuracyoftheestimates;insimplestratasuchasplantations,thenumberofsampleplotscanbeextremelylow,butincomplexnaturalstandsthenumberwillhavetobegreater.Agoodstratificationwillreducethenecessarynumberofplots.Thelocationoftheplotsisimportanttocapturethespatialheterogeneityofthestand.Theplotsaretobewellmarkedandmadepermanentforrepeatmeasurementsovermanyyears.Forforestclearingcomputations,itisnotnecessarytomakepermanentplotsunlesstheprocessofclearingisselectivedegradationoveralongperiodoftime.Forforestclearing,lotsonlyneedtobemeasuredoncebeforetheinterventionandonceaftertheinterventionhasbeencompleted.
6.3.3.9 MeasurementversusEstimation
Insomecases,itwillnotbepossibletomeasuretheinitialcarbonstocksorpost‐interventioncarbondirectly.Forinstance,aforestclearingeventmayoccurwithouttheopportunitytoestablishplotsintheforest,oritmaynotbepossibletomeasurealarge‐areaestablishmentevent.Inthesecases,regionalsummaryvaluesoftheforestcarbonstocksmaybeofuse(Smithetal.,2006).
6.3.3.10 Allometry,BiomassExpansionFactors,andStandardValues
Theconventionalapproachtobiomassestimationistouseallometricequationsbasedonspecies‐specificinformation(Jenkinsetal.,2003b;2003a).AnallometricapproachcanbebasedonDBHoracombinationofDBH,canopyheight(H),andwooddensityonanindividualtreebasisfortheentirestandorfortreesinthepermanentplots.Theallometricequationpredictseithervolumeofwoodinthemainstemorwholetreebiomassorcarbon.Intheformercase,itisthennecessarytoestimateawholetreebiomassexpansionfactor(Smithetal.,2003).Alternatively,theentitycanusestandardvaluesforstocksandgrowthratesbasedonlookuptables(DOE,1992;Smithetal.,2006).Forlargeareasofforestsconvertedthroughclearing,itmaybeacceptabletousestandardvaluesforstocksperunitarea,suchasthosepublishedbyIPCC(2003;2006).
6.3.3.11 StocksversusChangeinStocksoverTime
Forestimationofforestestablishmentitisnecessarytocomputethechangeinstocksovertime,whichwillbeameasurementofnetsinksofcarbonthroughsequestration.Forestclearingcomputationisessentiallythesamebutwiththeoppositesigntoindicateemissions.Thesubtledifferenceisthatestablishmentrequiressomemeanstoestimatetheaccumulationofcarbonontheprojectsiteovertime.Thisisaccomplishedusingeitherdirectmeasuresoryieldmodels.Forforestclearing,itisnecessarytoknowtheinitialstockofcarbonintheforeststand,andhowitthenchangeswithdisturbance.Thelatterrequiresdataonthepartitioningofpost‐disturbancecarboncomponents,asremovals,andslashanddebrisleftonsite.
Chapter 6: Quantifying Greenhouse Gas Sources and Sinks in Managed Forest Systems
6-37
6.3.3.12 ForestClearingRemovalsandDeadMaterialonSite
Thedifferenceofcarbonstocksbeforeandafterforestclearingisthecarbonthathasbeenremovedbyharvestaswoodproductsorotherproducts(e.g.,energyfeedstocks),andthatleftbehindonthesiteasslashanddebris(Skog,2008).Ifthesemassamountsareknown,theycanbeincludeddirectlyintothecomputations.Iftheyarenotknown,theycanbeestimatedandrepresentedasfractionsoftheoriginalstandingstockspriortodisturbance.Allremovalssuchastheseconstituteimmediateandfutureemissionsources,astheydecayoverdifferenttimescales.Therefore,itisnecessarytoassignmassamountstofourlong‐termdecaypoolswithturnovertimesof1,10,100,and1,000years.Theemissionsarecomputedalonganexponentialdecayfunctionrelatedtotheturnovertimeofthepool.Forexample,carbonlostduetoimmediateoxidationbyfireisplacedintothe1‐yearpool,andthecharcoalcomponentisplacedintothe1,000‐yearpool.Otherremovalsareplacedintothe10‐and100‐yearpools.
6.3.4 SpecificProtocolforComputation
6.3.4.1 ActualCarbonRemovalsbySinksinEstablishingForest
Thebasicapproachtoestimationofemissionsto,orremovalsfrom,theatmosphereistomultiplytheactivitydatabyemissionfactorsor,inthiscase,multiplytheland‐usechangeareabysitebiomasscarbonandsoilorganicmattercarbon.Theseproceduresdescribetherecommendedmethodofestimatingcarbon—usingallometricequationstoestimatebiomassdirectlyfromDBHusingtheequationsofJenkinsetal.(2003a).
Stratificationoftheprojectareamaybecarriedouttoimprovetheaccuracyandtheprecisionofthecarbonestimates.Whererequired,stratificationcouldbemadeaccordingtotreespecies,ageclasses,orforestmanagementpractices.Figure6‐5showsadecisiontreeindicatingwhichmethodismoreapplicableforaparticularlandowner.
Thisprotocolwillfollowthetwo‐tierapproachdescribedearlierinthedocument.Smalllandownerscanusedefaulttables(i.e.,Smithetal.,2006)andequationsfortheappropriateregionandforesttypegrouptoestimatebiomassoftheirforestsystems.Largelandownersshouldusebasicforestdatacollectedinthefieldonsampleplotswithallometricequations(Jenkinsetal.,2003a)toestimatethebiomassofindividualtreesandentirestands.Ifsmalllandownerswanttousesampleplotsandallometricequations,theyarefreetodoso.Smalllandownersshouldcontactaconsultingforesterorperhapsauniversityextensionpersontobestunderstandrequirementsforfieldsampling.
Whilemostofthefluxesfromanestablishmentprojectareremovalsfromtheatmosphere,theremaybesomeemissionsassociatedwithsomeaspectsoftheproject.TheactualnetCO2removalsbysinkscanbeestimatedusingtheequationsinthissection.Whenapplyingtheseequationsforex‐antecalculationsofnetanthropogenicCO2removalsbysinks,landownerswillprovideestimatesofthevaluesofthoseparametersthatarenotavailablebeforethestartoftheprojectperiodandcommencementofthemonitoringactivities.Participantsshouldretainaconservativeapproachinapplyingtheseestimates.
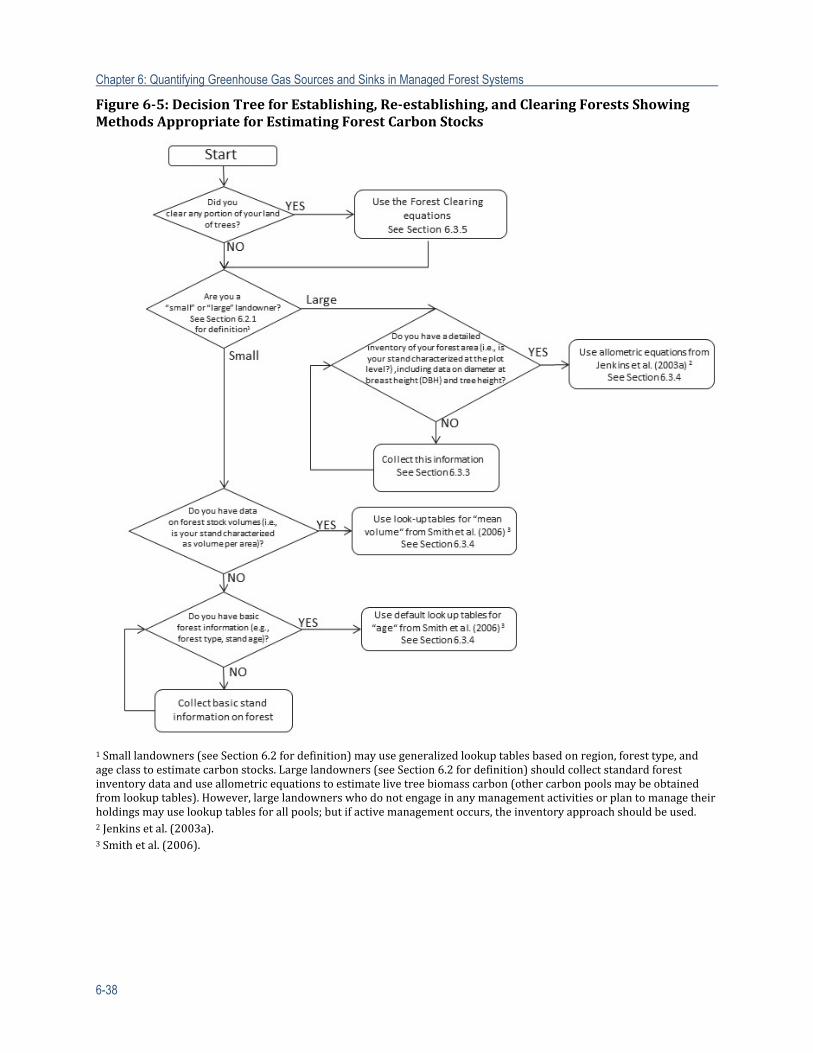
Chapter 6: Quantifying Greenhouse Gas Sources and Sinks in Managed Forest Systems
6-38
Figure6‐5:DecisionTreeforEstablishing,Re‐establishing,andClearingForestsShowingMethodsAppropriateforEstimatingForestCarbonStocks
1Smalllandowners(seeSection6.2fordefinition)mayusegeneralizedlookuptablesbasedonregion,foresttype,andageclasstoestimatecarbonstocks.Largelandowners(seeSection6.2fordefinition)shouldcollectstandardforestinventorydataanduseallometricequationstoestimatelivetreebiomasscarbon(othercarbonpoolsmaybeobtainedfromlookuptables).However,largelandownerswhodonotengageinanymanagementactivitiesorplantomanagetheirholdingsmayuselookuptablesforallpools;butifactivemanagementoccurs,theinventoryapproachshouldbeused.2Jenkinsetal.(2003a).3Smithetal.(2006).
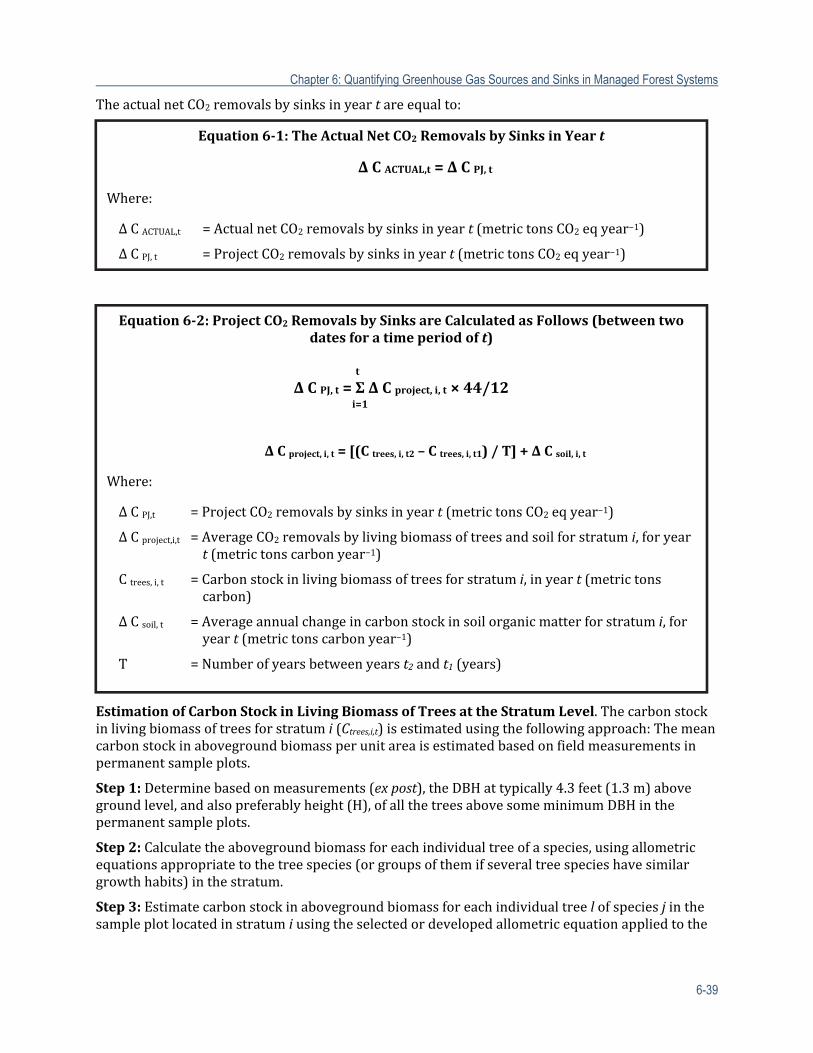
Chapter 6: Quantifying Greenhouse Gas Sources and Sinks in Managed Forest Systems
6-39
TheactualnetCO2removalsbysinksinyeartareequalto:
EstimationofCarbonStockinLivingBiomassofTreesattheStratumLevel.Thecarbonstockinlivingbiomassoftreesforstratumi(Ctrees,i,t)isestimatedusingthefollowingapproach:Themeancarbonstockinabovegroundbiomassperunitareaisestimatedbasedonfieldmeasurementsinpermanentsampleplots.
Step1:Determinebasedonmeasurements(expost),theDBHattypically4.3feet(1.3m)abovegroundlevel,andalsopreferablyheight(H),ofallthetreesabovesomeminimumDBHinthepermanentsampleplots.
Step2:Calculatetheabovegroundbiomassforeachindividualtreeofaspecies,usingallometricequationsappropriatetothetreespecies(orgroupsofthemifseveraltreespecieshavesimilargrowthhabits)inthestratum.
Step3:Estimatecarbonstockinabovegroundbiomassforeachindividualtreelofspeciesjinthesampleplotlocatedinstratumiusingtheselectedordevelopedallometricequationappliedtothe
Equation6‐1:TheActualNetCO2 RemovalsbySinksinYeart
ΔCACTUAL,t=ΔCPJ,t
Where:
ΔCACTUAL,t =ActualnetCO2removalsbysinksinyeart(metrictonsCO2eqyear−1)
ΔCPJ,t =ProjectCO2removalsbysinksinyeart(metrictonsCO2eqyear−1)
Equation6‐2:ProjectCO2RemovalsbySinksareCalculatedasFollows(betweentwodatesforatimeperiodoft)
tΔCPJ,t=ΣΔCproject,i,t×44/12
i=1
ΔCproject,i,t=[(Ctrees,i,t2–Ctrees,i,t1)/T]+ΔCsoil,i,t
Where:
ΔCPJ,t =ProjectCO2removalsbysinksinyeart(metrictonsCO2eqyear−1)
ΔCproject,i,t =AverageCO2removalsbylivingbiomassoftreesandsoilforstratumi,foryeart(metrictonscarbonyear−1)
Ctrees,i,t =Carbonstockinlivingbiomassoftreesforstratumi,inyeart(metrictonscarbon)
ΔCsoil,t =Averageannualchangeincarbonstockinsoilorganicmatterforstratumi,foryeart(metrictonscarbonyear−1)
T =Numberofyearsbetweenyearst2andt1(years)
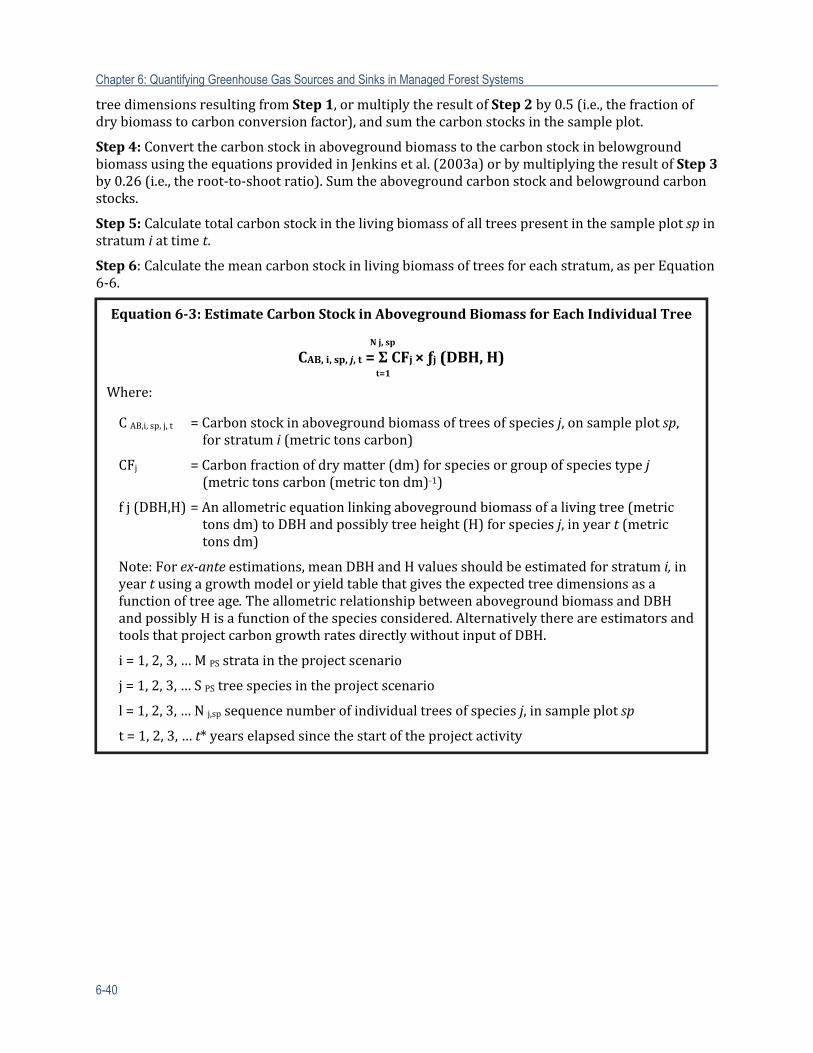
Chapter 6: Quantifying Greenhouse Gas Sources and Sinks in Managed Forest Systems
6-40
treedimensionsresultingfromStep1,ormultiplytheresultofStep2by0.5(i.e.,thefractionofdrybiomasstocarbonconversionfactor),andsumthecarbonstocksinthesampleplot.
Step4:ConvertthecarbonstockinabovegroundbiomasstothecarbonstockinbelowgroundbiomassusingtheequationsprovidedinJenkinsetal.(2003a)orbymultiplyingtheresultofStep3by0.26(i.e.,theroot‐to‐shootratio).Sumtheabovegroundcarbonstockandbelowgroundcarbonstocks.
Step5:Calculatetotalcarbonstockinthelivingbiomassofalltreespresentinthesampleplotspinstratumiattimet.
Step6:Calculatethemeancarbonstockinlivingbiomassoftreesforeachstratum,asperEquation6‐6.
Equation6‐3:EstimateCarbonStockinAbovegroundBiomassforEachIndividualTree
Nj,sp
CAB,i,sp,j,t=ΣCFj׃j(DBH,H)t=1
Where:
CAB,i,sp,j,t =Carbonstockinabovegroundbiomassoftreesofspeciesj,onsampleplotsp,forstratumi(metrictonscarbon)
CFj =Carbonfractionofdrymatter(dm)forspeciesorgroupofspeciestypej(metrictonscarbon(metrictondm)‐1)
fj(DBH,H)=Anallometricequationlinkingabovegroundbiomassofalivingtree(metrictonsdm)toDBHandpossiblytreeheight(H)forspeciesj,inyeart(metrictonsdm)
Note:Forex‐anteestimations,meanDBHandHvaluesshouldbeestimatedforstratumi,inyeartusingagrowthmodeloryieldtablethatgivestheexpectedtreedimensionsasafunctionoftreeage.TheallometricrelationshipbetweenabovegroundbiomassandDBHandpossiblyHisafunctionofthespeciesconsidered.AlternativelythereareestimatorsandtoolsthatprojectcarbongrowthratesdirectlywithoutinputofDBH.
i=1,2,3,…MPSstrataintheprojectscenario
j=1,2,3,…SPStreespeciesintheprojectscenario
l=1,2,3,…Nj,spsequencenumberofindividualtreesofspeciesj,insampleplotsp
t=1,2,3,…t*yearselapsedsincethestartoftheprojectactivity
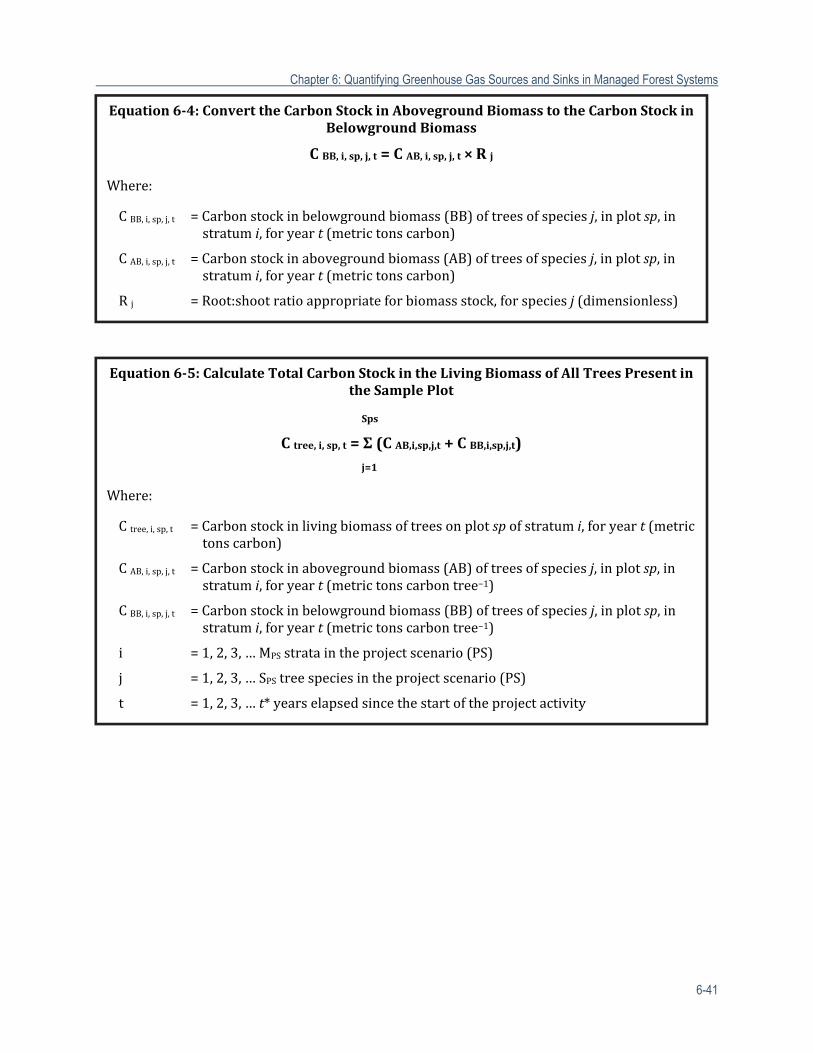
Chapter 6: Quantifying Greenhouse Gas Sources and Sinks in Managed Forest Systems
6-41
Equation6‐4:ConverttheCarbonStockinAbovegroundBiomasstotheCarbonStockinBelowgroundBiomass
CBB,i,sp,j,t=CAB,i,sp,j,t×Rj
Where:
CBB,i,sp,j,t =Carbonstockinbelowgroundbiomass(BB)oftreesofspeciesj,inplotsp,instratumi,foryeart(metrictonscarbon)
CAB,i,sp,j,t =Carbonstockinabovegroundbiomass(AB)oftreesofspeciesj,inplotsp,instratumi,foryeart(metrictonscarbon)
Rj =Root:shootratioappropriateforbiomassstock,forspeciesj(dimensionless)
Equation6‐5:CalculateTotalCarbonStockintheLivingBiomassofAllTreesPresentintheSamplePlot
Sps
Ctree,i,sp,t=Σ(CAB,i,sp,j,t+CBB,i,sp,j,t)
j=1
Where:
Ctree,i,sp,t =Carbonstockinlivingbiomassoftreesonplotspofstratumi,foryeart(metrictonscarbon)
CAB,i,sp,j,t =Carbonstockinabovegroundbiomass(AB)oftreesofspeciesj,inplotsp,instratumi,foryeart(metrictonscarbontree−1)
CBB,i,sp,j,t =Carbonstockinbelowgroundbiomass(BB)oftreesofspeciesj,inplotsp,instratumi,foryeart(metrictonscarbontree−1)
i =1,2,3,…MPSstrataintheprojectscenario(PS)
j =1,2,3,…SPStreespeciesintheprojectscenario(PS)
t =1,2,3,…t*yearselapsedsincethestartoftheprojectactivity
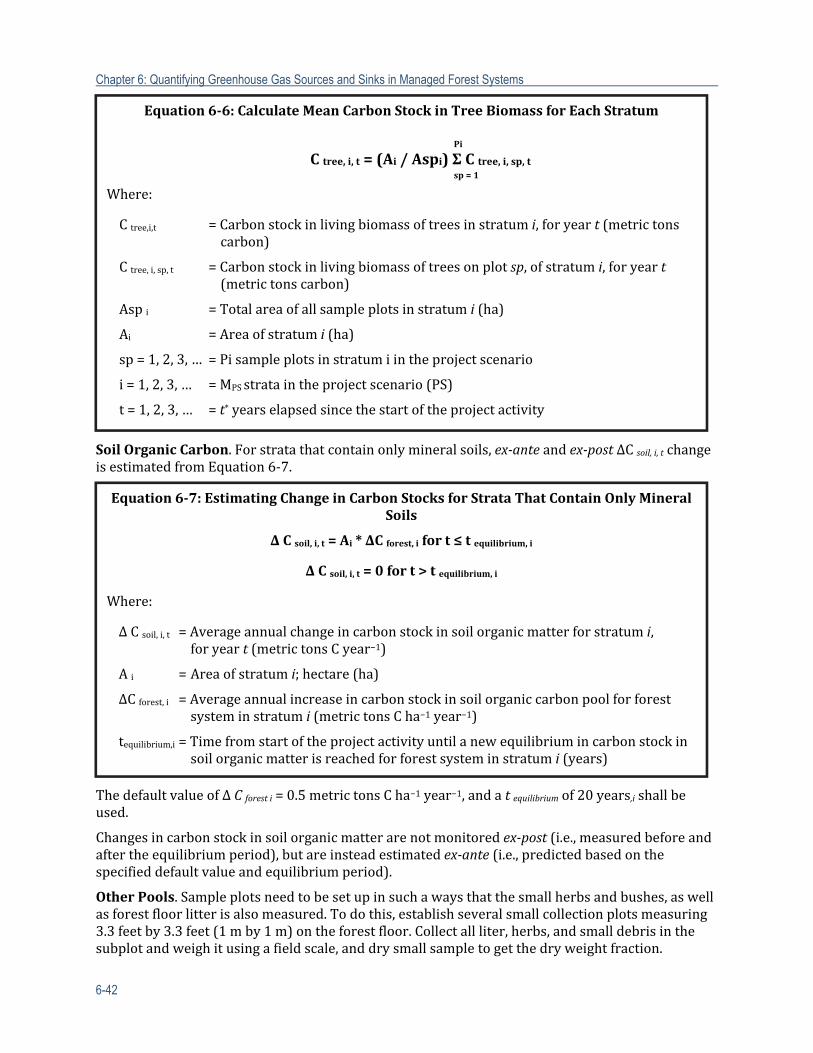
Chapter 6: Quantifying Greenhouse Gas Sources and Sinks in Managed Forest Systems
6-42
SoilOrganicCarbon.Forstratathatcontainonlymineralsoils,ex‐anteandex‐postΔCsoil,i,tchangeisestimatedfromEquation6‐7.
ThedefaultvalueofΔCforesti=0.5metrictonsCha−1year−1,andatequilibriumof20years,ishallbeused.
Changesincarbonstockinsoilorganicmatterarenotmonitoredex‐post(i.e.,measuredbeforeandaftertheequilibriumperiod),butareinsteadestimatedex‐ante(i.e.,predictedbasedonthespecifieddefaultvalueandequilibriumperiod).
OtherPools.Sampleplotsneedtobesetupinsuchawaysthatthesmallherbsandbushes,aswellasforestfloorlitterisalsomeasured.Todothis,establishseveralsmallcollectionplotsmeasuring3.3feetby3.3feet(1mby1m)ontheforestfloor.Collectallliter,herbs,andsmalldebrisinthesubplotandweighitusingafieldscale,anddrysmallsampletogetthedryweightfraction.
Equation6‐6:CalculateMeanCarbonStockinTreeBiomassforEachStratum
Pi
Ctree,i,t=(Ai/Aspi)ΣCtree,i,sp,t sp=1
Where:
Ctree,i,t =Carbonstockinlivingbiomassoftreesinstratumi,foryeart(metrictonscarbon)
Ctree,i,sp,t =Carbonstockinlivingbiomassoftreesonplotsp,ofstratumi,foryeart(metrictonscarbon)
Aspi =Totalareaofallsampleplotsinstratumi(ha)
Ai =Areaofstratumi(ha)
sp=1,2,3,… =Pisampleplotsinstratumiintheprojectscenario
i=1,2,3,… =MPSstrataintheprojectscenario(PS)
t=1,2,3,… =t*yearselapsedsincethestartoftheprojectactivity
Equation6‐7:EstimatingChangeinCarbonStocksforStrataThatContainOnlyMineralSoils
ΔCsoil,i,t=Ai*ΔCforest,ifort≤tequilibrium,i
ΔCsoil,i,t=0fort>tequilibrium,i
Where:
ΔCsoil,i,t =Averageannualchangeincarbonstockinsoilorganicmatterforstratumi,foryeart(metrictonsCyear−1)
Ai =Areaofstratumi;hectare(ha)
ΔCforest,i =Averageannualincreaseincarbonstockinsoilorganiccarbonpoolforforestsysteminstratumi(metrictonsCha−1year−1)
tequilibrium,i=Timefromstartoftheprojectactivityuntilanewequilibriumincarbonstockinsoilorganicmatterisreachedforforestsysteminstratumi(years)
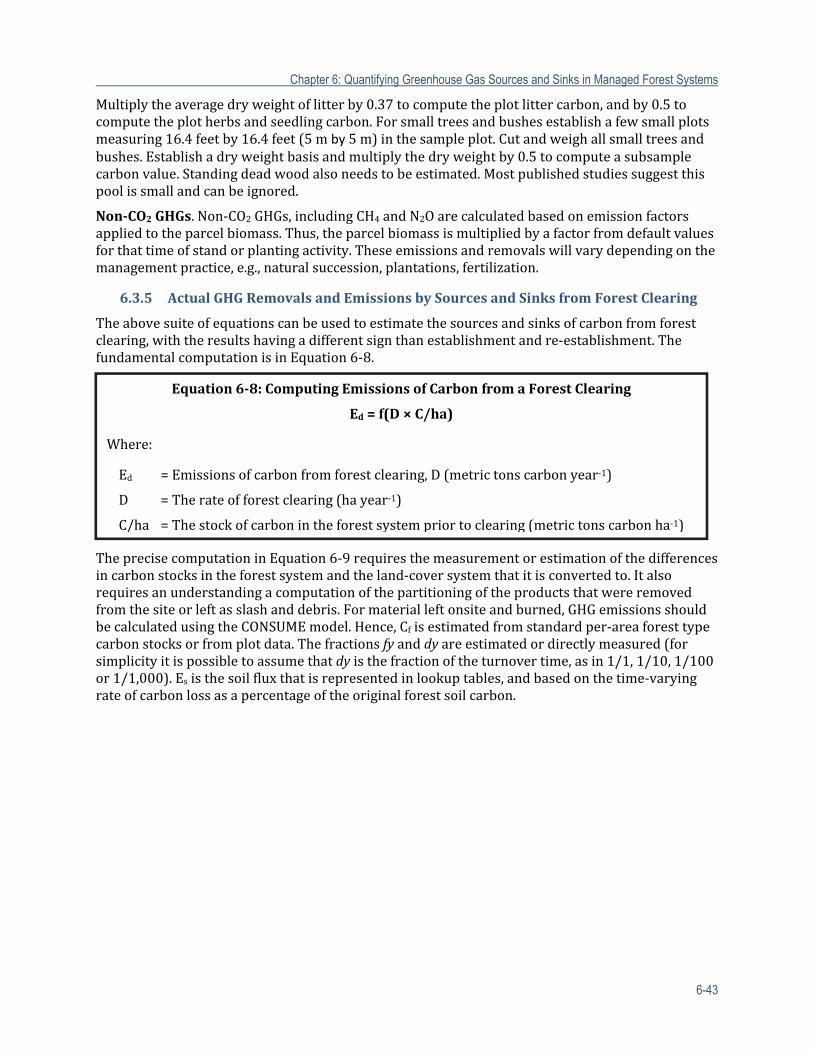
Chapter 6: Quantifying Greenhouse Gas Sources and Sinks in Managed Forest Systems
6-43
Multiplytheaveragedryweightoflitterby0.37tocomputetheplotlittercarbon,andby0.5tocomputetheplotherbsandseedlingcarbon.Forsmalltreesandbushesestablishafewsmallplotsmeasuring16.4feetby16.4feet(5mby5m)inthesampleplot.Cutandweighallsmalltreesandbushes.Establishadryweightbasisandmultiplythedryweightby0.5tocomputeasubsamplecarbonvalue.Standingdeadwoodalsoneedstobeestimated.Mostpublishedstudiessuggestthispoolissmallandcanbeignored.
Non‐CO2GHGs.Non‐CO2GHGs,includingCH4andN2Oarecalculatedbasedonemissionfactorsappliedtotheparcelbiomass.Thus,theparcelbiomassismultipliedbyafactorfromdefaultvaluesforthattimeofstandorplantingactivity.Theseemissionsandremovalswillvarydependingonthemanagementpractice,e.g.,naturalsuccession,plantations,fertilization.
6.3.5 ActualGHGRemovalsandEmissionsbySourcesandSinksfromForestClearing
Theabovesuiteofequationscanbeusedtoestimatethesourcesandsinksofcarbonfromforestclearing,withtheresultshavingadifferentsignthanestablishmentandre‐establishment.ThefundamentalcomputationisinEquation6‐8.
TheprecisecomputationinEquation6‐9requiresthemeasurementorestimationofthedifferencesincarbonstocksintheforestsystemandtheland‐coversystemthatitisconvertedto.Italsorequiresanunderstandingacomputationofthepartitioningoftheproductsthatwereremovedfromthesiteorleftasslashanddebris.Formaterialleftonsiteandburned,GHGemissionsshouldbecalculatedusingtheCONSUMEmodel.Hence,Cfisestimatedfromstandardper‐areaforesttypecarbonstocksorfromplotdata.Thefractionsfyanddyareestimatedordirectlymeasured(forsimplicityitispossibletoassumethatdyisthefractionoftheturnovertime,asin1/1,1/10,1/100or1/1,000).Esisthesoilfluxthatisrepresentedinlookuptables,andbasedonthetime‐varyingrateofcarbonlossasapercentageoftheoriginalforestsoilcarbon.
Equation6‐8:ComputingEmissionsofCarbonfromaForestClearing
Ed=f(D×C/ha)
Where:
Ed =Emissionsofcarbonfromforestclearing,D(metrictonscarbonyear‐1)
D =Therateofforestclearing(hayear‐1)
C/ha =Thestockofcarbonintheforestsystempriortoclearing(metrictonscarbonha‐1)
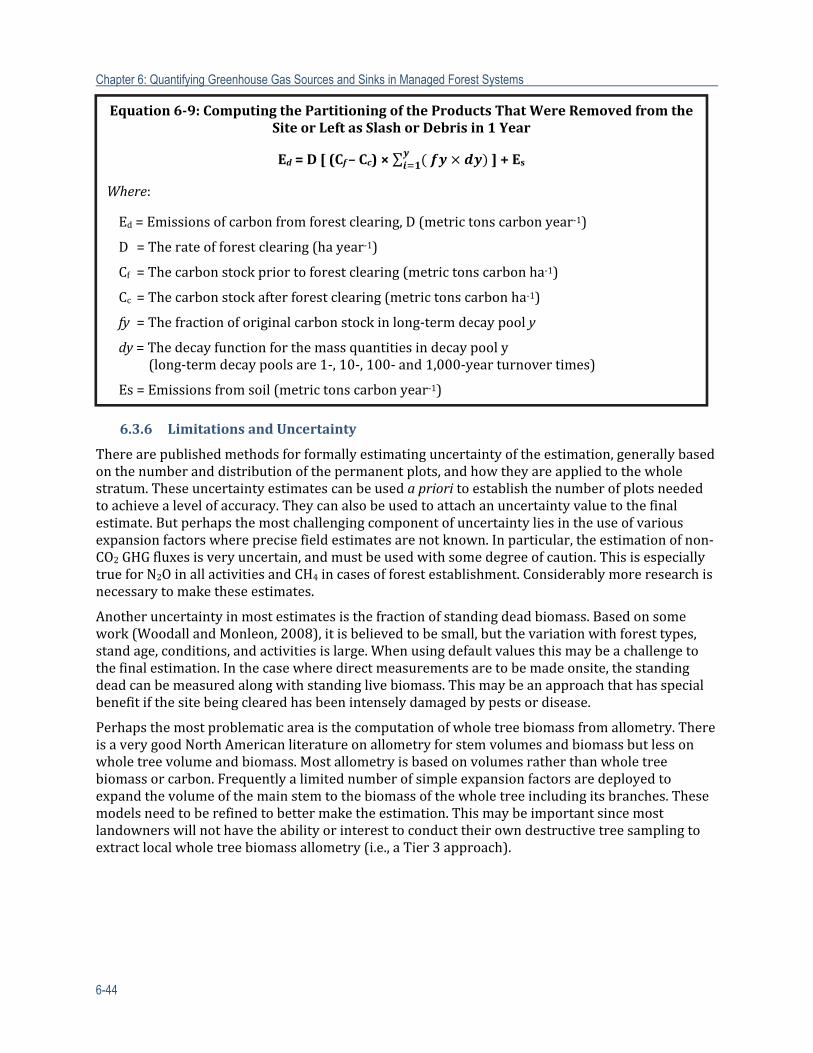
Chapter 6: Quantifying Greenhouse Gas Sources and Sinks in Managed Forest Systems
6-44
6.3.6 LimitationsandUncertainty
Therearepublishedmethodsforformallyestimatinguncertaintyoftheestimation,generallybasedonthenumberanddistributionofthepermanentplots,andhowtheyareappliedtothewholestratum.Theseuncertaintyestimatescanbeusedaprioritoestablishthenumberofplotsneededtoachievealevelofaccuracy.Theycanalsobeusedtoattachanuncertaintyvaluetothefinalestimate.Butperhapsthemostchallengingcomponentofuncertaintyliesintheuseofvariousexpansionfactorswhereprecisefieldestimatesarenotknown.Inparticular,theestimationofnon‐CO2GHGfluxesisveryuncertain,andmustbeusedwithsomedegreeofcaution.ThisisespeciallytrueforN2OinallactivitiesandCH4incasesofforestestablishment.Considerablymoreresearchisnecessarytomaketheseestimates.
Anotheruncertaintyinmostestimatesisthefractionofstandingdeadbiomass.Basedonsomework(WoodallandMonleon,2008),itisbelievedtobesmall,butthevariationwithforesttypes,standage,conditions,andactivitiesislarge.Whenusingdefaultvaluesthismaybeachallengetothefinalestimation.Inthecasewheredirectmeasurementsaretobemadeonsite,thestandingdeadcanbemeasuredalongwithstandinglivebiomass.Thismaybeanapproachthathasspecialbenefitifthesitebeingclearedhasbeenintenselydamagedbypestsordisease.
Perhapsthemostproblematicareaisthecomputationofwholetreebiomassfromallometry.ThereisaverygoodNorthAmericanliteratureonallometryforstemvolumesandbiomassbutlessonwholetreevolumeandbiomass.Mostallometryisbasedonvolumesratherthanwholetreebiomassorcarbon.Frequentlyalimitednumberofsimpleexpansionfactorsaredeployedtoexpandthevolumeofthemainstemtothebiomassofthewholetreeincludingitsbranches.Thesemodelsneedtoberefinedtobettermaketheestimation.Thismaybeimportantsincemostlandownerswillnothavetheabilityorinteresttoconducttheirowndestructivetreesamplingtoextractlocalwholetreebiomassallometry(i.e.,aTier3approach).
Equation6‐9:ComputingthePartitioningoftheProductsThatWereRemovedfromtheSiteorLeftasSlashorDebrisin1Year
Ed=D[(Cf–Cc)×∑ ]+Es
Where:
Ed=Emissionsofcarbonfromforestclearing,D(metrictonscarbonyear‐1)
D=Therateofforestclearing(hayear‐1)
Cf=Thecarbonstockpriortoforestclearing(metrictonscarbonha‐1)
Cc=Thecarbonstockafterforestclearing(metrictonscarbonha‐1)
fy=Thefractionoforiginalcarbonstockinlong‐termdecaypooly
dy=Thedecayfunctionforthemassquantitiesindecaypooly (long‐termdecaypoolsare1‐,10‐,100‐and1,000‐yearturnovertimes)
Es=Emissionsfromsoil(metrictonscarbonyear‐1)
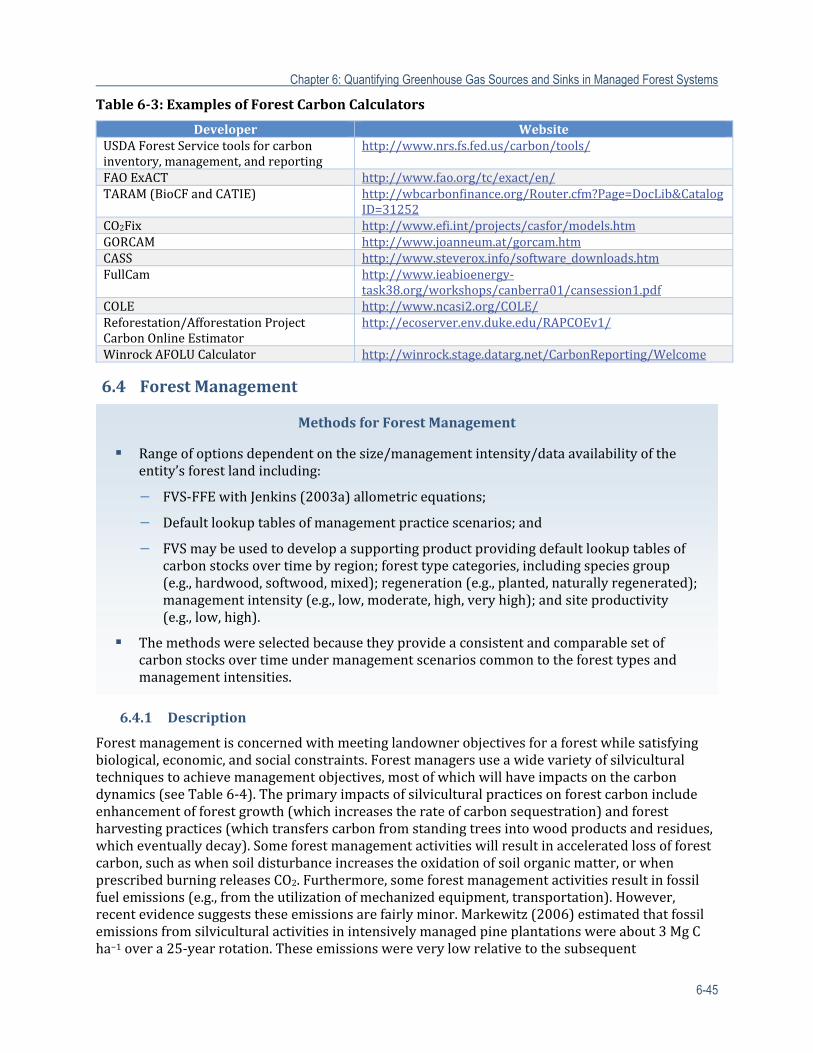
Chapter 6: Quantifying Greenhouse Gas Sources and Sinks in Managed Forest Systems
6-45
Table6‐3:ExamplesofForestCarbonCalculators
Developer WebsiteUSDAForestServicetoolsforcarboninventory,management,andreporting
http://www.nrs.fs.fed.us/carbon/tools/
FAOExACT http://www.fao.org/tc/exact/en/TARAM(BioCFandCATIE) http://wbcarbonfinance.org/Router.cfm?Page=DocLib&Catalog
ID=31252CO2Fix http://www.efi.int/projects/casfor/models.htmGORCAM http://www.joanneum.at/gorcam.htmCASS http://www.steverox.info/software_downloads.htmFullCam http://www.ieabioenergy‐
task38.org/workshops/canberra01/cansession1.pdfCOLE http://www.ncasi2.org/COLE/Reforestation/AfforestationProjectCarbonOnlineEstimator
http://ecoserver.env.duke.edu/RAPCOEv1/
WinrockAFOLUCalculator http://winrock.stage.datarg.net/CarbonReporting/Welcome
6.4 ForestManagement
6.4.1 Description
Forestmanagementisconcernedwithmeetinglandownerobjectivesforaforestwhilesatisfyingbiological,economic,andsocialconstraints.Forestmanagersuseawidevarietyofsilviculturaltechniquestoachievemanagementobjectives,mostofwhichwillhaveimpactsonthecarbondynamics(seeTable6‐4).Theprimaryimpactsofsilviculturalpracticesonforestcarbonincludeenhancementofforestgrowth(whichincreasestherateofcarbonsequestration)andforestharvestingpractices(whichtransferscarbonfromstandingtreesintowoodproductsandresidues,whicheventuallydecay).Someforestmanagementactivitieswillresultinacceleratedlossofforestcarbon,suchaswhensoildisturbanceincreasestheoxidationofsoilorganicmatter,orwhenprescribedburningreleasesCO2.Furthermore,someforestmanagementactivitiesresultinfossilfuelemissions(e.g.,fromtheutilizationofmechanizedequipment,transportation).However,recentevidencesuggeststheseemissionsarefairlyminor.Markewitz(2006)estimatedthatfossilemissionsfromsilviculturalactivitiesinintensivelymanagedpineplantationswereabout3MgCha−1overa25‐yearrotation.Theseemissionswereverylowrelativetothesubsequent
MethodsforForestManagement
Rangeofoptionsdependentonthesize/managementintensity/dataavailabilityoftheentity’sforestlandincluding:
− FVS‐FFEwithJenkins(2003a)allometricequations;
− Defaultlookuptablesofmanagementpracticescenarios;and
− FVSmaybeusedtodevelopasupportingproductprovidingdefaultlookuptablesofcarbonstocksovertimebyregion;foresttypecategories,includingspeciesgroup(e.g.,hardwood,softwood,mixed);regeneration(e.g.,planted,naturallyregenerated);managementintensity(e.g.,low,moderate,high,veryhigh);andsiteproductivity(e.g.,low,high).
Themethodswereselectedbecausetheyprovideaconsistentandcomparablesetofcarbonstocksovertimeundermanagementscenarioscommontotheforesttypesandmanagementintensities.
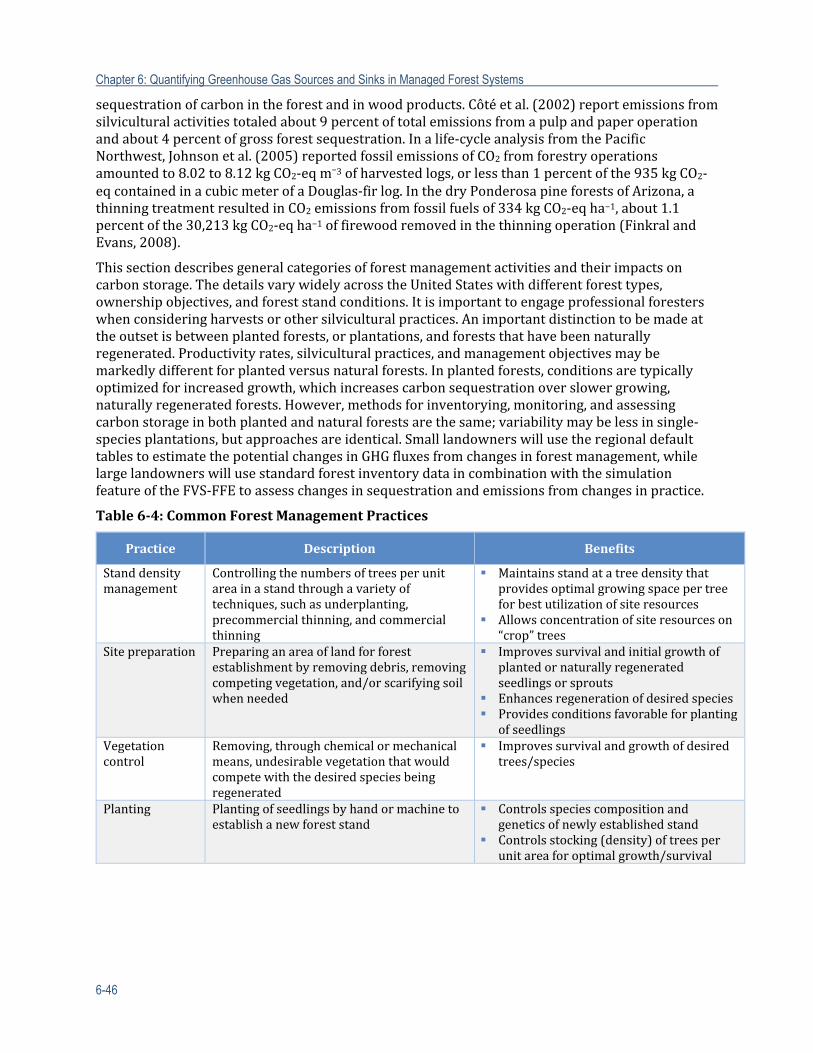
Chapter 6: Quantifying Greenhouse Gas Sources and Sinks in Managed Forest Systems
6-46
sequestrationofcarbonintheforestandinwoodproducts.Côtéetal.(2002)reportemissionsfromsilviculturalactivitiestotaledabout9percentoftotalemissionsfromapulpandpaperoperationandabout4percentofgrossforestsequestration.Inalife‐cycleanalysisfromthePacificNorthwest,Johnsonetal.(2005)reportedfossilemissionsofCO2fromforestryoperationsamountedto8.02to8.12kgCO2‐eqm−3ofharvestedlogs,orlessthan1percentofthe935kgCO2‐eqcontainedinacubicmeterofaDouglas‐firlog.InthedryPonderosapineforestsofArizona,athinningtreatmentresultedinCO2emissionsfromfossilfuelsof334kgCO2‐eqha−1,about1.1percentofthe30,213kgCO2‐eqha−1offirewoodremovedinthethinningoperation(FinkralandEvans,2008).
Thissectiondescribesgeneralcategoriesofforestmanagementactivitiesandtheirimpactsoncarbonstorage.ThedetailsvarywidelyacrosstheUnitedStateswithdifferentforesttypes,ownershipobjectives,andforeststandconditions.Itisimportanttoengageprofessionalforesterswhenconsideringharvestsorothersilviculturalpractices.Animportantdistinctiontobemadeattheoutsetisbetweenplantedforests,orplantations,andforeststhathavebeennaturallyregenerated.Productivityrates,silviculturalpractices,andmanagementobjectivesmaybemarkedlydifferentforplantedversusnaturalforests.Inplantedforests,conditionsaretypicallyoptimizedforincreasedgrowth,whichincreasescarbonsequestrationoverslowergrowing,naturallyregeneratedforests.However,methodsforinventorying,monitoring,andassessingcarbonstorageinbothplantedandnaturalforestsarethesame;variabilitymaybelessinsingle‐speciesplantations,butapproachesareidentical.SmalllandownerswillusetheregionaldefaulttablestoestimatethepotentialchangesinGHGfluxesfromchangesinforestmanagement,whilelargelandownerswillusestandardforestinventorydataincombinationwiththesimulationfeatureoftheFVS‐FFEtoassesschangesinsequestrationandemissionsfromchangesinpractice.
Table6‐4:CommonForestManagementPractices
Practice Description Benefits
Standdensitymanagement
Controllingthenumbersoftreesperunitareainastandthroughavarietyoftechniques,suchasunderplanting,precommercialthinning,andcommercialthinning
Maintainsstandatatreedensitythatprovidesoptimalgrowingspacepertreeforbestutilizationofsiteresources
Allowsconcentrationofsiteresourceson“crop”trees
Sitepreparation Preparinganareaoflandforforestestablishmentbyremovingdebris,removingcompetingvegetation,and/orscarifyingsoilwhenneeded
Improvessurvivalandinitialgrowthofplantedornaturallyregeneratedseedlingsorsprouts
Enhancesregenerationofdesiredspecies Providesconditionsfavorableforplanting
ofseedlingsVegetationcontrol
Removing,throughchemicalormechanicalmeans,undesirablevegetationthatwouldcompetewiththedesiredspeciesbeingregenerated
Improvessurvivalandgrowthofdesiredtrees/species
Planting Plantingofseedlingsbyhandormachinetoestablishanewforeststand
Controlsspeciescompositionandgeneticsofnewlyestablishedstand
Controlsstocking(density)oftreesperunitareaforoptimalgrowth/survival
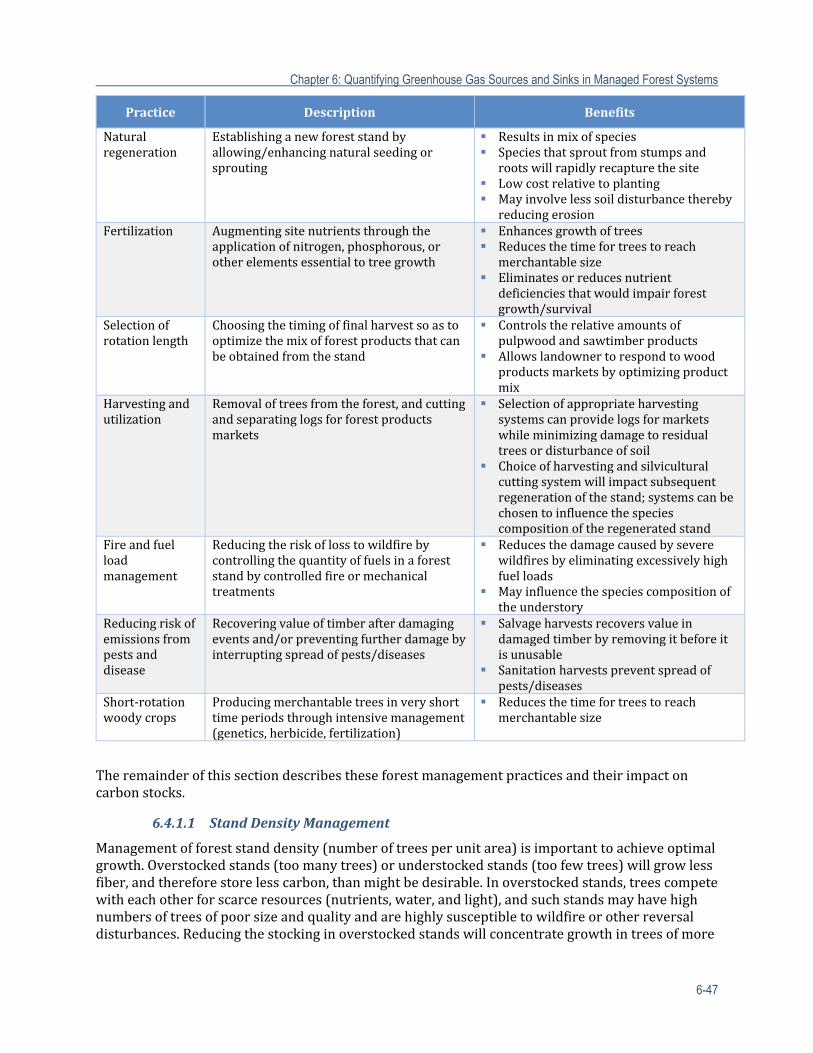
Chapter 6: Quantifying Greenhouse Gas Sources and Sinks in Managed Forest Systems
6-47
Practice Description Benefits
Naturalregeneration
Establishinganewforeststandbyallowing/enhancingnaturalseedingorsprouting
Resultsinmixofspecies Speciesthatsproutfromstumpsand
rootswillrapidlyrecapturethesite Lowcostrelativetoplanting Mayinvolvelesssoildisturbancethereby
reducingerosionFertilization Augmentingsitenutrientsthroughthe
applicationofnitrogen,phosphorous,orotherelementsessentialtotreegrowth
Enhancesgrowthoftrees Reducesthetimefortreestoreach
merchantablesize Eliminatesorreducesnutrient
deficienciesthatwouldimpairforestgrowth/survival
Selectionofrotationlength
Choosingthetimingoffinalharvestsoastooptimizethemixofforestproductsthatcanbeobtainedfromthestand
Controlstherelativeamountsofpulpwoodandsawtimberproducts
Allowslandownertorespondtowoodproductsmarketsbyoptimizingproductmix
Harvestingandutilization
Removaloftreesfromtheforest,andcuttingandseparatinglogsforforestproductsmarkets
Selectionofappropriateharvestingsystemscanprovidelogsformarketswhileminimizingdamagetoresidualtreesordisturbanceofsoil
Choiceofharvestingandsilviculturalcuttingsystemwillimpactsubsequentregenerationofthestand;systemscanbechosentoinfluencethespeciescompositionoftheregeneratedstand
Fireandfuelloadmanagement
Reducingtheriskoflosstowildfirebycontrollingthequantityoffuelsinaforeststandbycontrolledfireormechanicaltreatments
Reducesthedamagecausedbyseverewildfiresbyeliminatingexcessivelyhighfuelloads
Mayinfluencethespeciescompositionoftheunderstory
Reducingriskofemissionsfrompestsanddisease
Recoveringvalueoftimberafterdamagingeventsand/orpreventingfurtherdamagebyinterruptingspreadofpests/diseases
Salvageharvestsrecoversvalueindamagedtimberbyremovingitbeforeitisunusable
Sanitationharvestspreventspreadofpests/diseases
Short‐rotationwoodycrops
Producingmerchantabletreesinveryshorttimeperiodsthroughintensivemanagement(genetics,herbicide,fertilization)
Reducesthetimefortreestoreachmerchantablesize
Theremainderofthissectiondescribestheseforestmanagementpracticesandtheirimpactoncarbonstocks.
6.4.1.1 StandDensityManagement
Managementofforeststanddensity(numberoftreesperunitarea)isimportanttoachieveoptimalgrowth.Overstockedstands(toomanytrees)orunderstockedstands(toofewtrees)willgrowlessfiber,andthereforestorelesscarbon,thanmightbedesirable.Inoverstockedstands,treescompetewitheachotherforscarceresources(nutrients,water,andlight),andsuchstandsmayhavehighnumbersoftreesofpoorsizeandqualityandarehighlysusceptibletowildfireorotherreversaldisturbances.Reducingthestockinginoverstockedstandswillconcentrategrowthintreesofmore
Chapter 6: Quantifying Greenhouse Gas Sources and Sinks in Managed Forest Systems
6-48
desirablespeciesandquality.Understockedstandsdonotfullyutilizetheresourcesofthesiteandthereforedonotachievethegrowthpotentialofafullystockedstand.Standdensitymanagementseekstomaintainafullystockedstand.
Densityofanexistingforeststandmaybeincreasedbyunderplanting,whichinvolvesplantingadditionaltrees(possiblyofdifferentspecies)beneathanexistingtreecanopy.Thistreatmentmaybedesirableforstandsinwhichadequateadvancedregenerationofdesiredspeciesislacking.Underplantingisdesignedtoincreasethelikelihoodofsuccessfulregenerationfollowingtheeventualharvestoftheoverstory.Thus,whiletheimmediatecarbonimpactofthistreatmentislow,theremaybesubstantialeventualimprovementincarbonstockscomparedwithastandwithoutunderplanting.
Decreasingthedensityofaforeststandisaccomplishedthroughthinning,orcuttingsomeproportionofthetreesinastand.Thismaybedoneasprecommercialthinning,inwhichcasemostofthetreestobecutaretoosmalltoeconomicallyjustifytheirremovalfromtheforest,andtheyareleftinthestandtodecaynaturally.Whileprecommercialthinningprovidesnoimmediateeconomicbenefits,itmaybeusedtoimprovethestockinglevel,speciescomposition,andoverallhealthofastand;itrepresentsaninvestmentincreatingamorevaluable,productiveforest.Precommercialthinningandstanddensitymanagementalsocanreducetheriskofreversalfromdrought,insects,disease,andpossiblyfire.Fromacarbonstandpoint,precommercialthinningwillremovecarbonfromthelivetreepoolandincreasethecarboninthedeadwoodpool.Iftheslashisburned,theGHGemissionsshouldbeaccountedforusingtheCONSUMEmodelwhentheburnoccurred.
Iftreestobethinnedareofproperspecies,size,andquality,commercialthinningmaybeperformed.Incommercialthinning,treesaretargetedforremovalbasedontheirspecies,size,andthemanagementobjectives.Thinnedtreesareremovedfromthestandandsoldtoappropriateforestproductsmarkets.Thus,commercialthinningwillshiftcarbonfromthelivetreepoolandintodeadwoodandlitter(branches,foliage,andstumpsremaininginthestandafterharvest),andHWPpools.
6.4.1.2 SitePreparationTechniques
Regeneratingaforeststandafterharvestmayrequiretreatmentstocreatethemostdesirableconditionsfordevelopmentofthenewstand.Thismayinvolveremovingdebrisfromthepriorstand,removingundesirablecompetingvegetation,scarifyingordisturbingthesoilforenhancedregenerationofspeciesthatrequiresuchconditions,andcreatingspaceorproperconditionsforplantingtrees.
Awidevarietyoftechniquesareavailabletomeetthespecificregenerationobjectives;theyvaryconsiderablyacrossgeographicregions,topography,siteconditions,andforestspeciesundermanagement.Generalcategoriesofsitepreparationtechniquesincludemechanicalmethods,chemicalapplications,andprescribedfire.
Mechanicalmethodsdisplaceunwantedvegetation,moveorbreakdownloggingresidues,and/orcultivatethesoil(Nyland,2002).Mechanicalsitepreparationusesavarietyofmachinesandequipment,andmaybelimitedbysitefactorssuchasterrainandsoilconditions.Becausemechanicalsitepreparationinvolvessoildisturbance,thereisincreasedoxidationandemissionofCO2fromthesoilorganicmatterforaperiodoftimeaftersitepreparation.
Chemicalapplicationsinvolvetheuseofherbicidestargetedatcontrollingundesirablevegetationsothatthepreferredspeciesoftreeshaveimprovedsurvival.Chemicalsmaybeappliedthroughgroundorairsprayingorinjectionintoindividualtrees.Chemicalsitepreparationinvolveslittletonosoildisturbanceandhasminimaleffectonsoilcarbonemissions.
Chapter 6: Quantifying Greenhouse Gas Sources and Sinks in Managed Forest Systems
6-49
Prescribedburningmaybeusedtoreducetheamountofdebris(limbs,tops,andfoliage)frompriorharvests,killadvancedregenerationoftreesofundesirablespecies,andcontrolpeststhatinhabitdecayingwoodleftfromthepriorstand.Somefire‐adaptedspeciesrequireburningtoopenconesanddisperseseedforthenewstand.Clearly,prescribedfireforsitepreparationwillresultincombustionandemissionofCO2fromwoodymaterialsleftonthesite,butwillavoidthesoildisturbanceofmechanicaltechniques.TheFOFEMmodelfornaturalfuelsandtheCOMSUMEmodelforactivitygeneratedfuelscanbeusedtoaddressthistypeofburningandallowsestimationofGHGemissionsandconsumption.
6.4.1.3 VegetationControl
Controlofcompetingvegetationisonemeansofenhancingthegrowthofdesirabletreesinaforest.Forexample,inapineplantation,wherepinetreesarethespeciesofprimaryinterest,growthofpinesisincreasedwhenhardwoodcompetitionisremoved.Vegetationcontrolmaybeaccomplishedmechanically(suchasgirdlingundesirabletrees)orchemically.Vegetationcontrolisespeciallyimportantattwostagesinthelifeofastand:atestablishment(plantingorregeneration)andlaterintherotationbutbeforetreesarepastthesaplingstage.
Atestablishment(e.g.,ofaplantation),theprimarycompetitionmaycomefromherbaceousvegetationthatcanquicklyoutgrowtheplantedtreesandsuppresstheirgrowthorincreasemortality.Herbicidesmaybeeffectiveatcontrollingherbaceouscompetitionandprovidingthenewlyplantedtreesachancetogrowsufficientlytocapturethesite.Mid‐rotationreleaseoftreesmayrequireanadditionalapplicationofchemicalcontroltoreducecompetitionandfocusgrowthondesirabletrees.
Vegetationcontrolhasbeenestimatedtohavecontributed35percentofthesubstantialgaininplantationproductivityrelativetounimprovedplantations(Stanturfetal.,2003).Theprimarycarbonstockimpactofvegetationcontrolisatransferofcarbonstockfromthelivetreetostandingdeadbiomasspool.Treesreleasedfromcompetitionwillusuallyexhibitagrowthresponsetobalancethelossofgrowthonthevegetationremoved(i.e.,overallforestproductivityandsequestrationwillremainunchanged).
6.4.1.4 Planting
Onepopularformofregeneratingaforeststandfollowingclearcuttingistoestablishaplantationbyplantingtreesofadesirable,fast‐growingspecies,potentiallyutilizinganimprovedgeneticsource,ataconsistentspacingselectedtooptimizegrowth.Plantationmanagementpracticesincludecombinationsoftreatmentstocontrolcompetingvegetationandmanagetreenutritionthroughfertilization,thinning,anduseofgeneticallyimprovedstock(Vanceetal.,2010).Becauseoftheseefforts,plantationsmaybeuptosixtimesmoreproductivethannaturallyregeneratedstandsofthesamespecies(CarterandFoster,2006).Successfulplantationestablishmententailscarefulselectionofspecies,genetics,andspacing(plantingdensity).
Speciesusedinplantedstandstypicallyareselectedforhighgrowthrates,lowsusceptibilitytodamagefrominsectsanddisease,andqualityandvalue.Forexample,intheU.S.South,loblollypineisthemostwidelyplantedtreespeciesbecauseitisnativetothearea,fast‐growingrelativetootherpines,andresistanttodisease(Schultz,1997).Longstandinggeneticimprovementprogramshaveledtotheproductionofimprovedgeneticsourcesforforestplantationspecies.Geneticallyimprovedseedlingsareavailablefromcommercialandstatetreenurseries;essentiallyallofthe1.2billionloblollypineseedlingsplantedannuallyintheU.S.Southaretheresultoftreeimprovementprograms(McKeandetal.,2003).InthePacificNorthwest,geneticimprovementinDouglasfirtreeshasledtoincreasesinproductivity(volumeproduction)inexcessof25percent(St.Clairetal.,2004).Finally,selectionofplantingdensity(treesperunitarea)canaffectoverallstand
Chapter 6: Quantifying Greenhouse Gas Sources and Sinks in Managed Forest Systems
6-50
productivity,necessityforthinning,abilitytoaccessthestandwithequipmenttoconductsilviculturaloperations,andtimerequireduntiltreesreachmerchantablediameters.Allofthesefactorscombinetodeterminethelikelysurvivalandgrowthratesofaforestplantation.Plantationproductivityisdirectlyrelatedtorateofforestsequestration.Anyactivityincreasingproductivitywillimprovesequestrationrates.
6.4.1.5 NaturalRegeneration
Certainforesttypesareregeneratedmostefficientlyusingnaturalregeneration,inwhichseedlingsandsproutsfromarecentlyharvestedordisturbedforestwillgrowquicklyafterremovalofaportionoralloftheforestoverstory.Inthiscase,thespecieswillbepredictablebasedonthespeciescompositionofadvancedregenerationfromthepreviousstand,orifspeciespresentinthepreviousstandareprolificinsprouting.Thespeciescanalsobepredictedbasedonpost‐harvestregenerationofseedlingsfromresidualoverstorytreesorfromsurroundingstands.Densitywillnotbecontrolledduringtheregenerationprocess;frequentlynaturalregenerationresultsinverydensevegetationthatthengoesthroughanaturalprocessofcompetition.
Becauseneitherthegeneticsourcenordensityarecontrolledduringnaturalregeneration,thesestandsarefrequentlylessproductivethanplantationsbutmaybemoredesirablebasedontheobjectivesofthelandowner(e.g.,forrecreation,wildlife,ordifferentproductsthanplantationswouldprovide).Theprocessofnaturalregenerationmayentailminimal(ifany)sitepreparationandlesssoildisturbanceandcostthanwouldplantations.Dependingonthelevelofsoildisturbancefromtheharvestofthepreviousstand,earlysoilCO2emissionsmaybelowerthaninplantedstands.
6.4.1.6 Fertilization
Fertilizationhasbeenshowntodramaticallyimprovetheproductivityofforeststandsinwhichnutrientsarelimitingplantgrowth.Forexample,intheU.S.South,nitrogenandphosphorusarecommonlydeficientinpineplantations(Foxetal.,2007).Intheseareas,phosphorusfertilizationmayincreasevolumeproductionbymorethan100percent(Jokelaetal.,1991).Nitrogenandphosphorusfertilizationhasbeenshowntoincreasegrowthby1.6tonsacre−1year−1(Foxetal.,2007).
ThetwoprimarytypesofforestfertilizationcurrentlypracticedintheSoutharephosphorus‐fertilizationondeficientsites(usuallyatorneartimeofplanting),andnitrogenandphosphorusfertilizationinmid‐rotationstands(e.g.,ages8to12).Volumegainsvary,withhighestgainswherestandsaremostnutrient‐limited.
Thedirectcarbonimpactoffertilizationofforestsistheobservableincreaseingrowthandthereforesequestration.Otherimpactshavebeennotedinagriculturalsettings,includingincreasedemissionsofotherGHGssuchasNOxandN2O.Resultsfromagriculturalfertilizerapplicationsmaynotbedirectlyapplicabletoforestryoperations.RecentresearchinwesternCanadianforestsshowedsoilGHGfluxeswereneutralfollowingfertilization(Basilikoetal.,2009).InananalysisoffertilizationofpineplantationsinthesoutheasternUnitedStates,Albaughetal.(2012)foundthatcarbonsequestrationinforestgrowthfarexceededtheemissionsassociatedwithfertilizerproduction,transport,andapplication(8.70Tgyear−1CO2sequestrationversus0.36Tgyear−1emissions).Thus,forestfertilizationwhenappliedappropriatelycandramaticallyincreasecarbonsequestrationwhencomparedtounfertilizedstands.
6.4.1.7 SelectionofRotationLength
Onesignificantdecisionthatforestmanagersmakeistheselectionoftherotationlength,ortargetageatwhicharegenerationharvest(finalharvest;oftenbutnotnecessarilyaclearcut)willoccur.
Chapter 6: Quantifying Greenhouse Gas Sources and Sinks in Managed Forest Systems
6-51
Thedecisionaffectsthetimingofotherstandtreatments.Forexample,thinningsandsomefertilizationtreatmentsaretargetedforacertaintimebeforefinalharvest.Italsoaffectsthemixofforestproductsthatmightbeexpectedfromtheharvestedstand.Standsharvestedatrelativelyyoungageswillyieldprimarilytreessuitableforpulpwoodmarkets,whilelongerrotationsmayinvolvemorethinningsandwillincreasetheproportionofsawtimber‐sizedtreesinthestand.Becausethesedifferentproductshavedifferentlongevities(seeSection6.5),therotationlengthwillhaveasignificantimpactontheoverallcarbondynamicsofaforest(anditssubsequentpoolofcarboninHWPs).Furthermore,longerrotationsresultingreateraveragecarbonstorageintheforest,withresultinghigherlevelsofsequestration(StainbackandAlavalapati,2002).Itiswidelyrecognizedthatincreasingrotationsfromharvestingatfinancialmaturitytoharvestingclosertoagesatwhichstandsreachasteadystatebetweengrowthandmortalitycanbebeneficialforcarbonstorage(vanKootenetal.,1995).
Avarietyofdecisioncriteriaareavailableforidentifyingtheoptimalrotationlengthfordifferentsetsofobjectives.Ifcarbonstorageisoneoftheimportantobjectives,longerrotationswillbebeneficial(Liskietal.,2001).
6.4.1.8 HarvestingandUtilizationTechniques
Regenerationharvests(alsocalledrotationharvestsorfinalharvests)areconductedtoharvesttreesforforestproductsmarketsandtopromotetheregenerationofdesirablespeciesforthenextstand.Tomeetthetwinobjectivesofregenerationandproductionofmerchantabletimber,forestmanagersmaychoosefromawidearrayoftechniquesandoperationalapproaches.Thesilviculturalsystemwillbechosentodeterminewhichtreesaretoberemovedfromthestand,andaharvestingsystemwillbechosentodeterminethebestloggingapproachtodoso.
Thesilviculturalsystemdetermineswhatproportionoftheforeststandistoberemovedintheharvest,andwilldictatewhethertheresultingstandwillbeeven‐aged(astandoftreesofasingleageclass)oruneven‐aged(astandoftreeswiththreeormoreageclasses)(Helms,1998).Harvestsrangefromclearcuts,inwhichmostoralloftheoverstoryisremoved,toavarietyofpartialharvests.Partialharvestsincludesystemssuchasseed‐tree,shelterwood,groupselection,individualtreeselection,diameter‐limit,andothers.Harvesttechniquesthatopenmostorallofthecanopy(suchasclearcuttingorseed‐treeharvests)willpromotetheregenerationofspeciesthatthriveinsunlightanddonottolerateshade.Clearcuttingisalsothepreferredtechniquewhenthenextstandistobeestablishedbyplantingratherthannaturalregeneration.
Afterselectionofasilviculturalsystemforregeneration,forestmanagerswillselectaharvestingsystemforthefellingandextractionoftreesfromthesite.Againawidevarietyofsystemsareavailable,fromindividualtree‐fellingbychainsawwithextractionbyhorseteams,tohighlymechanizedsystemsinvolvingskidders,feller‐bunchers,forwarders,andothertypesofequipment.Whenterrainconditionspreventground‐basedvehicularextractionoffelledtrees,itmaybedoneusingcableyardingsystemsorhelicopters.Loggingsystemsthatminimizesoildisturbanceandimpactsonunharvestedtreesandunderstorymayreducetheseharvest‐associatedemissions.
Whentreesareharvestedfromaforest,theymayproduceavarietyofproductsforspecificmarkets.Forexample,large‐diametertreesofcertainspeciesarepreferredforsawtimbermarkets,whilepulpwoodmarketsacceptroundwoodwithsmallerdiametersorevenchips.Thus,aharvestingoperationwillofteninvolvemerchandising—thesorting,cutting,andseparatingoflogsfordeliverytodifferentmarkets.Dependingonthesilviculturalsystemchosen,treeswithoutmarketvalue(e.g.,toosmall,poorform,orundesirablespecies)maybecutandleftonsitetodecay.Inaddition,agreatdealoflogging“slash”maybeproduced;thismaterialmayconsistofbranches,portionsoftreesbeyondmerchantabilitylimits(tops),roots,andfoliage.Wherebiomassenergymarketsexist,someofthismaterialmayberemovedandusedtoreplacefossilenergyGHGsources;
Chapter 6: Quantifying Greenhouse Gas Sources and Sinks in Managed Forest Systems
6-52
otherwiseitmaybeleftonsitetodecayorbeburnedduringsitepreparationwithassociatedGHGemissions.Theproportionofwoodymaterialremovedfromaharvestingoperationistermedutilization;highlevelsofutilizationmeanmorewoodybiomassisremovedandlessremainsonsite.
Therearemanycarbonconsequencestotheselectionofasilviculturalandharvestsystem.Partialharvestswillleavesubstantialcarboninlivetreesonthesite,whereasclearcutharvestwillleaveverylittle.Oncertainsoils,mechanizedsystemsforfellingandextractingtreeswillresultinmoresoildisturbanceandsubsequentCO2emissionsthanlow‐impactsystems(Naveetal.,2010).Theharvestingimpactonsoilcarbonisgreaterfortheforestfloorthanforcarboninthemineralsoil,buttheseeffectsareshorterlivedandmaybemodestoverlongertimeintervals(Naveetal.,2010).Theavailabilityofmarketsforsmaller‐diametermaterialortreesofnonmerchantablespecieswillaffecthowmuchresidue(slash)isleftonthesite.Availabilityofstrongmarketswillgenerallyleadtohigherutilizationandlessresidue.Itisimportanttokeepaccountingboundariesinmindtoensurethatthereisnoomissionordoublecountingofemissionsorremovals.TheIPCCmethodologieshaveadoptedtheconventionthatemissionsfromburningbiomassforenergyshouldnotbeaccountedintheenergysector,butshouldbeaccountedintheland‐usesector.Weconformtothisconvention.If,forexample,forestresiduesareburnedforenergy,theCO2emissionsarenotcountedintheenergysector,andthereshouldbeareductionintheamountoffossilfuelburned.ButtheCO2emissionsfromtheburnedresiduewillbeaccountedasadecreaseincarbonstocksintheland‐usesector,andemissionswillbenodifferentthaniftheresidueshadbeenpiledandburnedintheforest.Thatis,acompleteaccountingofemissionswhenresiduesareburnedforenergywillshowemissionssavedintheenergysectorbutnochangeintheland‐usesector.
6.4.1.9 FireandFuelLoadManagement
Manyforesttypeshaveanaturaldependenceondisturbancefromfire.Asmentionedpreviously,itmayplayaroleinnaturalregeneration,butithasmanyotherfunctionsincludingnutrientrelease,naturalthinningandpruning,aswellasmodifyingfuelstructureandloading.Withoutprescribedfire,manyforesttypesmaybeatamuchhigherriskofreversalofgrowingcarbonstock.Inregionsofthecountrywherewildfireisaconcern,forestmanagersmaytakeamoreactiveroleinmanagingthelevelsofpotentialfuelsinaforest.Fuelmanagementcannotpreventignitionsofwildfires,butcandecreaselevelsofintensity,severity,andspread.Twocommonapproachestofuelloadmanagementareprescribedburningandmechanicalfueltreatments.
Prescribedfireisanyfireintentionallyignitedbymanagementunderanapprovedplantomeetspecificobjectives.Whenforestfuelsareburnedundercarefullyselectedconditions(weather,fuel,moisture,etc.),fuelscanbereducedtolevelsthatdecreasetheriskofdamagingwildfires.Otherobjectivesforuseoffireandcontrolledburnmaybetoreducethreatfromnon‐nativeinvasivespeciesandmaintenanceofmanyendangeredspeciesthroughouttheUnitedStates.
Mechanicalfueltreatmentsaresimilartoharvestingoperations,inthatspecificclassesoftreesarecutandremoved.Forexample,alltreesbelowathresholddiametermayberemovedinathinning(Johnsonetal.,2007).Theresultshouldbedecreasedavailabilityoffuelsthatwouldincreasewildfireseverity.
Thecarbonimpactoffueltreatmentsistwo‐fold.First,itinevitablyresultsinemissionsofCO2fromthematerialremovedorburned.However,second,itsgoalistoreducethepotentialformuchlargerfutureemissions(andincreasedenvironmentaldamage)fromwildfiresinareaswheretheyareathreat.Awildfirecouldresultinareversalofthepreviousgainsincarbononthesite.Wildfireintensityandresultantlossofcarbonishighlyvariableanddependsuponsitespecificconditionsandeffects.Wildfirecanoccuratlowtomoderateintensity,whichlikeaprescribedfiremayresultinamoreresilientandproductivesiteoverthelongterm.ThechallengeisthattheimmediateCO2
Chapter 6: Quantifying Greenhouse Gas Sources and Sinks in Managed Forest Systems
6-53
emissionsfromawildfireorprescribedfire/controlburnarereadilyquantifiable,whereastheavoidedemissionsfrompotentialwildfiresarenotand,becausetreatmentsmaynottakeplaceintheareaswherewildfireoccurs,theycouldcreateextraemissionsthatwouldnototherwisehavehappened.Recentresearchindicatesthatprescribedburninghasaminimalimpactonforestcarbonbudgets,especiallyintheeasternUnitedStates.Impactsobservedfrommechanicalandfiretreatmentswerealsofairlyshort‐lived(Boerneretal.,2008).DispositionofremovedmaterialsisakeyfactortoconsiderwhenassessingtheGHGimplicationsoffuelmanagementtreatments.Prescribedfirecanhavesignificanteffectsonreducingtheriskofreversalthatcouldresultfromawildfire.
6.4.1.10 ReducingRiskofEmissionsfromPestsandDisease
Silviculturalinterventionmayalsobecalledforwhenforestsaredamagedbyweather,insects,ordisease.Forexample,wheninsectoutbreakssuchaspinebeetleinfestationskillpatchesoftrees,removaloftreesatorneartheinfestationsitemaypreventpopulationsofharmfulinsectsfromspreadingfurther.Whenharvestsaredesignedtorespondtopestanddiseaseproblems,theymaybecalledsanitationharvests.
Whenweathereventssuchasicestorms,hurricanes,orseverewinds(orawildfire)causeextensivedamagetoforeststands,quickremovalofthedownedtimbermayprovideanopportunitytorecoversomeofthefinancialvalueofthetimberandmaypreventthebuildupofverylargefuelloads.Wheneconomicvalueiscapturedfromaharvestofdamagedtimber,itistermedasalvageharvest.
Bothsalvageandsanitationharvestsremovetrees,sometimeswithmarketvalueandsometimeswithout.Thecarbonimpactsarereflectedintheamountofwoodymaterialremovedfromtheforestandwhetherthematerialremovedentersmarketsforwoodproductsorforenergy.Similartowildfiretreatments,inbothsanitationandsalvageharvests,however,theremovalofbiomassmaybecomparedwiththealternativeofleavingthematerialintheforesttodecayorburn,resultinginCO2emissions.Forsomecarbonaccountingsystems,thisdifferenceiscrucial;theassumptionthatemissionswouldhaveoccurredwithouttheactivityaffectsbaselineassumptionsagainstwhichcarbonsequestrationismeasured.
6.4.1.11 Short‐RotationWoodyCrops
Short‐rotationwoodycrops,alsocalledbiomassplantationsorbiomassenergyplantations,aretreeplantationsmanagedwithaveryhighintensitytoproducefibercropsinarelativelyshorttimeframe(e.g.,5–10years).Theseplantationsaremorelikeagriculturalcropsinthelevelofintensityoftreatments(e.g.,fertilization,weedcontrol,andsometimesirrigation).Woodgrowninthismannerisusuallysuitableforusebybiomassenergyfacilitiesorpossiblypulpmills,butthecosttoproducethiswoodisveryhighcomparedwithtraditionalplantations.Forsomespecies,itispossibletoregeneratethesestandsbycoppicing,orcuttingtopromotesproutingfromintactrootsystems,whichavoidsthecostofplantingnewtrees.Regenerationbysproutscanresultindensestandsexhibitingveryfastgrowth.
Thecarbondynamicsinashort‐rotationwoodycropsystemaresimilartoconventionalplantations,exceptfortheacceleratedgrowthandreducedrotationlength.Insomeshort‐rotationwoodycropsystems,covercropsmaybegrowntopreventerosionandmaintainsoilfertility.Covercropswouldalsoservetoincreasecarbonstorageonsite.
6.4.2 ActivityData
Carbonstoragefromforestmanagementactivitiesisestimatedapplyingthreedifferenttypesofestimates.EstimateTypeIfocusesontheeffectsofmanagementactivitiesoncarbonstocksfora
Chapter 6: Quantifying Greenhouse Gas Sources and Sinks in Managed Forest Systems
6-54
givenyear.EstimateTypeIIfocusesontheeffectsofmanagementactivitiesoncarbonstocksoveraperiodofyearsinthefutureandmustbebasedonprojections.EstimateTypeIIIexaminesthedifferenceinprojectedcarbonstocksbetweensetsofalternativescenariosofpotentialmanagement.Thissectionwilldiscusstheactivitydataneedsforeachofthetypesofestimatesforthevariousforestmanagementactivities.Ingeneral,however,theestimationapproachesanddataneedswillbeoftwotypes:(1)forestinventorydata;and(2)standprojectionmodels.
ForTypeI,incaseswhereamanagementactivityhasalteredthecarbonstockinspecificpools,thebestestimatesmaybeobtainedbyhavingforestinventorydatabeforeandafterthetreatment,suchthatthedifferencecanbeattributedtothemanagementactivity.Forestinventorydatashouldincludemeasurementsobtainedintheforestataseriesofplots,withlistsofthetreesineachplot.Usuallyforeachtreeitisnecessarytoknowthespecies,diameter,andsometimesheight.Fromthesemeasurements,stand‐levelestimatesoftreedensity(treesperunitarea),basalarea(cross‐sectionalboleareaat4.5feet(1.4m)fromtheground),speciescomposition,andtreevolumeandbiomasscanbecomputed.
Anotherapproach,usedforTypeIIandTypeIIIestimates,requirestheuseofstandprojectionmodelstoestimatetheresponsesoftheforesttomanagementactivities.Suchmodelshavebeencreatedforawidevarietyofforesttypesandtreatments;anexampleistheFVSfamilyofmodelsdiscussedearlier.Projectionmodelsforforecastingforestconditions(andcarbonstocks)typicallyrequiremeasuresorindicesofforestproductivity.Acommonlyusedmeasureofforestproductivityissiteindex,whichrepresentstheheightthattreesonasitewillreachbyacertainbaseage.Forexample,onlandwithasiteindexof65(baseage25),theaverageheightofdominantandco‐dominanttreesinastandwillbe65feet(19.8m)whenthetreesreachage25.
ThemostaccurateTypeIIandTypeIIIestimatesarefrommodelsdevelopedspecificallyforagivenplantationspeciesornarrowlydefinedforesttype.Forexample,therearemanymodelsavailabletoestimateeffectsofmanagementoncommonlyplantedandhighlyresearchedspeciessuchasDouglasfirorloblollypine(e.g.,AmateisandBurkhart,2005;Burkhart,2008;Carlsonetal.,2008;Lietal.,2007;Sucreetal.,2008).Atthistime,theFVSfamilyofmodelsistherecommendedmethodforestimatingforestcarbonstocks.Inincorporatingthismethodintoanysoftwaretool,adataportalthatallowstheusertoloadtheirexistingstanddataandmanagementactivitydatafortranslationintotheFVSformatisrecommendedandwouldproveuseful.Futuredevelopmentmayalsopermitcustommodelstointerfacewithanestimationtool.Atthistime,however,suchcapabilityisnotavailable.Incaseswheresuchmodelsarenotavailable,itmaybenecessarytogeneralizebyaggregatingforesttypesandmanagementactivitiesandperformprojectionsbasedoncategoriesofmanagementintensityforgeneralforesttypes.ManagementintensitycategoriesaredefinedinSection6.4.3.
Theremainderofthissectionisorganizedasfollows:
StandDensityManagement
SitePreparationTechniques
VegetationControl
Planting
NaturalRegeneration
Fertilization
SelectionofRotationLength
HarvestingandUtilizationTechniques
FireandFuelLoadManagement
Chapter 6: Quantifying Greenhouse Gas Sources and Sinks in Managed Forest Systems
6-55
ReducingRiskofEmissionsfromPestsandDisease
Short‐RotationWoodyCrops
6.4.2.1 StandDensityManagement
Standdensitymanagementactivitiesincludeunderplanting,precommercialthinning,andcommercialthinning.Ineachcase,theprimarydatarequirementsforTypeIestimatesaretreeinventoriesbeforeandafterthetreatment,whichcanindicatethechangeinstockinglevelsandthequantityofbiomassremovedduringthinnings.Inthecaseofthinnings,itisimportanttoknowthevolumeorbiomassdirectedtodifferentwoodproductsmarkets(e.g.,pulpwood,sawtimber,orenergy)toproperlyaccountforthecarboninHWPs.
ForTypeIIandIIIestimatesofthefuturecarbondynamicsofthestandafterthesetreatments,standprojectionmodelswillrequireameasureofsiteindexinadditiontotheinventoryinformationcollectedforTypeIestimates.
6.4.2.2 SitePreparation
Theprimaryinformationrequirementforestimatesofstockchangesduetositepreparationiswhethersoildisturbancehasoccurredduringsitepreparation.Mechanicalsitepreparationtechniquesthatinvolvesoildisturbancewillbeassumedtoleadtoashort‐termlossofsoilcarbonstoragefollowedbyarecovery.Chemicalorothertreatmentsthatdon’tinvolvesoildisturbancewillnotresultinsoilCO2emissionsbeyondwhatmayhaveoccurredduringharvesting.ForTypeIIandIIIestimates,thesitepreparationtechniqueshouldberecordedintheeventthatmodelsmaydifferentiatebetweengrowthratescorrespondingtovarioussitepreparationtechniques.
6.4.2.3 VegetationControl
ForTypeIestimates,itisnecessarytohaveinventoryinformationbeforeandaftervegetationcontroltreatmentsifthevegetationcontrolinvolveswoodymaterial.(Carbonstocksarenotexpectedtobesubstantiallydifferentforherbaceouscontroltreatmentsneartimeofplanting.)Whenvegetationiskilledbutnotremoved,thecarbonstockimpactsinvolveprimarilytheredirectionofstockfromonepool(livetrees)toanother(standingdeadtrees).
ForTypeIIandIIIestimates,somemodelsmayprojectstandgrowthdifferentlyifcompetingvegetationisremoved.Insuchcases,similarinventoryinformationbeforeandaftertreatmentwillbenecessary.
6.4.2.4 Planting
Theactofplantingitselfinvolvesanegligiblecarbonstockchangefortheyearofplanting.Thus,aTypeIestimatewouldshownocarbonstockchangefollowingaplanting.
Forallsubsequentyears,however,criticalparametersarethespeciesplanted,theoriginalplantingdensity(treesperacre),andthesurvivalrate(inpercent)afteronegrowingseason.Becausemostearlymortalityoccurswithinoneyearofplanting,thepercentageoftreessurvivingatyearoneprovidesarobustestimateofstanddensityforgrowthprojections.ItwillalsobeimportantforTypeIIandIIIestimatestorecordthegeneticstockused(e.g.,firstgeneration,open‐pollinated,mass‐controlledpollinated,clonal)intheeventthatprojectionmodelsaredevelopedforspecificgeneticsources.Somemeasureofsiteproductivity(e.g.,siteindex)willbeneededaswell.
6.4.2.5 NaturalRegeneration
Asinthecaseofplantationestablishment,carbonstockchangesatthetimeofnaturalregenerationarenegligible.
Chapter 6: Quantifying Greenhouse Gas Sources and Sinks in Managed Forest Systems
6-56
TypeIIandIIIestimateswillrequireinformationonspeciesmix,standdensity,andsomeinformationonstandproductivity.Incasesinwhichstandproductivitycannotbemeasureddirectly(bymeasuringexistingtreesforsiteindex),someestimatescanbederivedfromsoilsdatabasessuchasSSURGO,orfromfieldcharacterizationofsoilseriesandreferencetosoilmapsandmanuals.
6.4.2.6 Fertilization
TypeIestimateswillshownoimmediatecarbonstockchangesrelativetofertilizationfortheyearinwhichtheactivityoccurred.N2Oemissionswilloccurattimeoffertilization;activitydatashouldincludenumberofacresfertilized,applicationrate,andtypeofnitrogenapplied.
TypeIIandIIIestimatesinvolvingstandprojectionmaymakeuseofmodelswhichincorporateinformationaboutthefertilizationtreatment.Applicationrates(poundsperacre)andelementalcomposition(nitrogen,phosphorus,potassium)shouldberecorded.
6.4.2.7 SelectionofRotationLength
TypeIestimatesarenotapplicabletoselectionofrotationlength.TypeIIandIIIestimatesmayentailexperimentationwithrotationlengthsinmodelingexercisestotestthecarbonstockimplicationsofdifferentrotationlengthstrategies.Suchexperimentationwillsimplyinvolvethecomparisonofmodelsrunwithallparametersheldconstantexceptforrotationlength.
6.4.2.8 HarvestingandUtilizationTechniques
Harvestinghasthelargestimmediateimpactonforestcarbonstocks.Consequently,forTypeIestimates,thelandownerneedstocollectaccurateandsufficientlydetailedforestinventoryinformationbeforeharvestandafterharvestinthecaseofpartialcutting.Becauseongoingsequestrationofcarbonstocksfollowsdifferentpathwaysfordifferentforestproducts,thedispositionoftheharvestedmaterialintodifferentproductpools(e.g.,pulpwood,sawtimber)needstoberecorded.Thisinformationshouldbereadilyavailableaspartofsalesrecords.Defaultfactorsareavailabletoestimatecarboninharvestingresidues(slash).
Inthecaseofpartialharvests(wherethereisaresidualstandtoproject),orprojectionsofimpactsofdifferentharvestingorsilviculturalsystems,completeinventorydataandproductivityestimates(e.g.,siteindex)forthestandareneeded.
6.4.2.9 FireandFuelLoadManagement
ForTypeIestimates,pre‐treatmentdataonfuelloadingwithfocusonthematerialtoberemovedinthetreatmentneedstobecollected.AnexampleofdatacollectionprotocolsforfueldatacanbefoundinBrown(1974).Post‐treatmentassessmentofresidualmaterialwillindicatetheamountremovedinthetreatment.Thetypeoftreatment(burnormechanical)andthedispositionoffuel(consumed,leftonsite,removed)shouldberecorded.Ifconsumed,FOFEMorCONSUMEcanbeusedtocalculatetheGHGemissionsfromaprescribedburn.
TypeIIandIIIestimatesofthecarbonstockimpactsoffueltreatmentswillrequirespecializedfiremodelsthatcouldindicatelikelyoutcomesofthefueltreatmentrelativetonotreatmentandasubsequentwildfire;availabletoolsincludemodelssuchasCONSUME(JointFireScienceProgram,2009)andtheFVS‐FFEmodule(ReinhardtandCrookston,2003).SeeTable6‐13wherealow‐severityfirecouldbecomparedtothecrownfireeffectbasedonFOFEMoutputs.
6.4.2.10 ReducingRiskofEmissionsfromPestsandDisease
Forestimatesofcarbonstockimpactsofsanitationandsalvageharvests,pretreatmentandpost‐
Chapter 6: Quantifying Greenhouse Gas Sources and Sinks in Managed Forest Systems
6-57
treatmentinventoriesarerequired.Inthepretreatmentinventory,theextentandnatureofdamageareneededtoestimatethecarbonstockthathasshiftedfromlivetodeadbiomasspriortotreatment.
ModelingforTypeIIandIIIestimatesmayentailsimplyprojectingtheresidual(post‐treatment)stand.Tofullyevaluatethecarbonstockimpactsofthetreatment,modelsorassumptionsareneededforestimatingthespreadoftheinsectordiseaseabsentthetreatment.Toolsforsuchmodelingorassumptionsmaybehardtoobtain.
6.4.2.11 Short‐RotationWoodyCrops
Estimationofcarbonstockimpactsfromplantationsofshort‐rotationwoodycropswouldfollowthesamegeneralprocedureasotherplantationestimates.Nostockchangeswouldbeexpectedattimeofplanting(carboninseedlingsorplantingstockisnegligible).ProjectionsforTypeIIandIIIestimatesrequiretheavailabilityofmodelstoprojectgrowthandyieldofthespeciesplantedunderthemanagementscenariosenvisioned.
6.4.3 ManagementIntensityCategories
Intheprevioussection,theuseofmodelstopredictforestresponsestomanagementactivitieswasdiscussed.Manysuchmodelsareavailableforspecificmanagementpracticesinplantationsofcertainspeciesorinspecificforesttypes.Thesemodelsarevariedintheirinputrequirementsandtheirapplications.Todevelopanationallyconsistentapproach,theinfinitecombinationsofsequencesofspecificmanagementactivitiesandforesttypesneedtobegeneralized.Usingasinglemodelingframework,suchasFVS(Dixon,2002)andcategoriesofmanagementintensities,allowsforthesimulationofsuitesofmanagementactivitiesinawidevarietyofforesttypesandconditionswithasinglesetofinputs.ThisapproachtodefiningmanagementintensitycategoriesissimilartothatusedbySiry(2002).
Therefore,inthissectioncategoriesofforesttypesandmanagementintensitiesthatrepresentbroadcombinationsofcommonlyappliedactivitiesintheforesttypesoftheUnitedStatesaredefined.Defaulttablesofcarbonstocksforthesecategoriescouldthenbedevelopedtoprovideconsistentandusefulinformationaboutlikelycarbonstockimplicationsofforestmanagementactivitiesacrossthecountry.
6.4.3.1 DefiningForestTypeCategories
Thefirstdistinctionindefiningmanagementintensitycategoriesistheidentificationofthebroadspeciesgrouping:hardwood,softwood,ormixed.Hardwoodforesttypesaredominatedbyhardwoodtreespeciessuchasoak,maple,cottonwood,birch.Softwoodtypesaredominatedbysoftwoodtreespeciessuchaspine,spruce,orDouglasfir.Mixedtypesexhibitnocleardominanceofonespeciesgroup.Thesecondmajordistinctioniswhetherthestandwasplantedornaturallyregenerated.Certainmanagementactivitiesarefarmorelikelytobeappliedtoplantationsthannaturalstands.Mostplantationsaresoftwoods,withtheexceptionofsomeshort‐rotationwoodycropsofhardwoodtypessuchascottonwood,willow,hybridpoplar,oraspen.
6.4.3.2 DefiningCategoriesofManagementIntensity
Fourcategoriesofmanagementintensityaredefinedbasedoncommonlyencounteredpractices.Forexample,almostallforestfertilizationisappliedtoplantationsratherthannaturallyregeneratedstands,sofertilizationwillbeconsideredpartofmanagementintensitiesrelatedonlytoplantations.Similarly,standsthatarefertilizedareusuallyalsotreatedwithherbicidetocontrolcompetingvegetationsothatthefertilizationbenefitaccruestothedesiredcropspecies.
Chapter 6: Quantifying Greenhouse Gas Sources and Sinks in Managed Forest Systems
6-58
Thefourcategoriesofmanagementintensityarelow,moderate,high,andveryhigh.Lowintensitygenerallyreferstominimalmanagementintervention(e.g.,naturalregenerationoroldersoftwoodplantationswithoutgeneticallyimprovedstock).Moderateintensityincorporatessomelevelofactivemanagementsuchasintermediateharvests(e.g.,thinnings).Highintensityappliesonlytoplantationsandincorporatestheuseofsuperiorgeneticstockandvegetationcontrol.Veryhighintensitymanagementappliestoaggressivelymanagedsoftwoodorhardwoodplantationsinwhichsubstantialeffortismadetomaximizegrowthusinggenetics,vegetationcontrol,andfertilization.Theresultingcombinationsofforesttypes,intensities,andmanagementpracticesaresummarizedinTable6‐5.
Table6‐5:ManagementIntensityCategories
ForestTypea/ManagementIntensityb
StandDensityMgmt
Planting SuperiorGenetics
VegetationControl
Fertilization
Hardwood/low
Hardwood/moderate X Mixed/low Mixed/moderate X Softwood(Nat)/low Softwood(Nat)/moderate X Softwood(Plt)/low X Softwood(Plt)/moderate X X X Softwood(Plt)/high X X X XSoftwood(Plt)/veryhigh X X X X XHardwood(Plt)/veryhighc X X X X XaForesttypereferstothecombinationofspeciesgroupandregeneration(Nat=naturallyregenerated;Plt=Planted).bAnXindicatesthatthepracticeindicatedisappliedforthemanagementintensitycategory.cVeryhighintensityhardwoodplantationsareusuallyencounteredinthecontextofshort‐rotationwoodcropsorbiomassplantations.
Figure6‐6showsthespecificregions(e.g.,PacificNorthwest,West;PacificNorthwest,East;PacificSouthwest;RockyMountainNorth;RockyMountainSouth;GreatPlains;NorthernLakeStates;Central;SouthCentral;Northeast;andSoutheast)forwhichsilviculturaloptionsbythemostcommonlymanagedforesttypeweredeveloped.
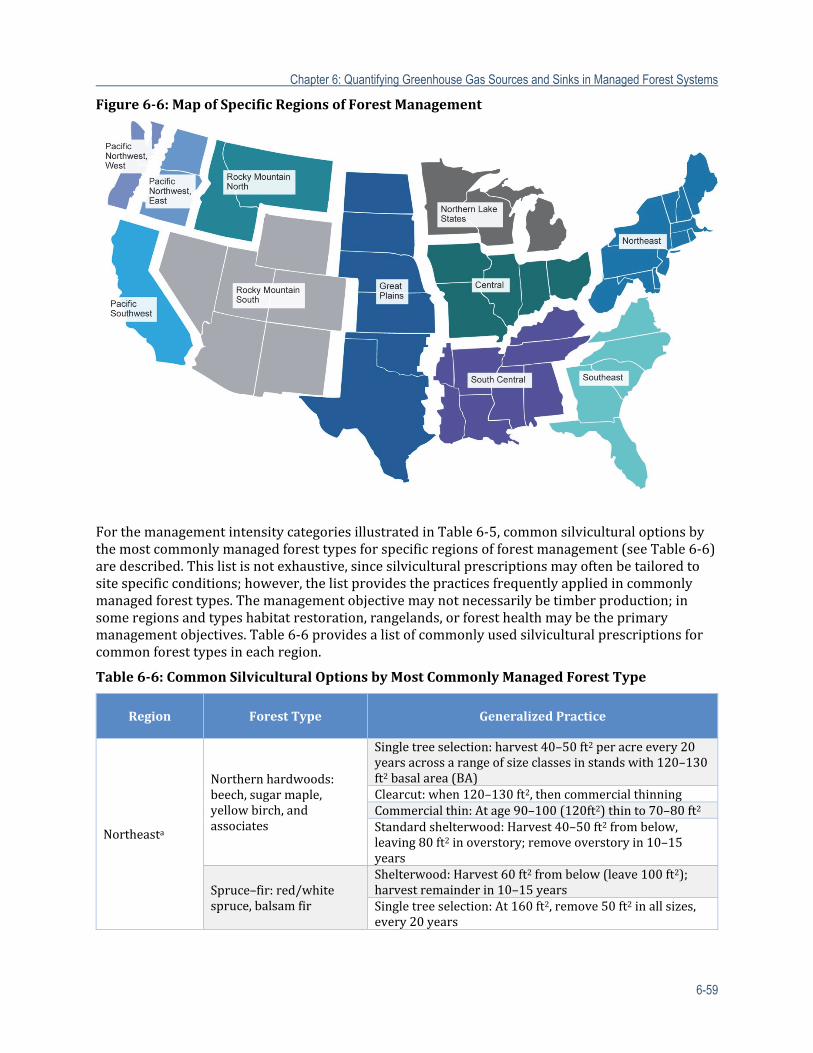
Chapter 6: Quantifying Greenhouse Gas Sources and Sinks in Managed Forest Systems
6-59
Figure6‐6:MapofSpecificRegionsofForestManagement
ForthemanagementintensitycategoriesillustratedinTable6‐5,commonsilviculturaloptionsbythemostcommonlymanagedforesttypesforspecificregionsofforestmanagement(seeTable6‐6)aredescribed.Thislistisnotexhaustive,sincesilviculturalprescriptionsmayoftenbetailoredtositespecificconditions;however,thelistprovidesthepracticesfrequentlyappliedincommonlymanagedforesttypes.Themanagementobjectivemaynotnecessarilybetimberproduction;insomeregionsandtypeshabitatrestoration,rangelands,orforesthealthmaybetheprimarymanagementobjectives.Table6‐6providesalistofcommonlyusedsilviculturalprescriptionsforcommonforesttypesineachregion.
Table6‐6:CommonSilviculturalOptionsbyMostCommonlyManagedForestType
Region ForestType GeneralizedPractice
Northeasta
Northernhardwoods:beech,sugarmaple,yellowbirch,andassociates
Singletreeselection:harvest40–50ft2peracreevery20yearsacrossarangeofsizeclassesinstandswith120–130ft2basalarea(BA)Clearcut:when120–130ft2,thencommercialthinningCommercialthin:Atage90–100(120ft2)thinto70–80ft2
Standardshelterwood:Harvest40–50ft2frombelow,leaving80ft2inoverstory;removeoverstoryin10–15years
Spruce–fir:red/whitespruce,balsamfir
Shelterwood:Harvest60ft2 frombelow(leave100ft2);harvestremainderin10–15yearsSingletreeselection:At160ft2,remove50ft2inallsizes,every20years
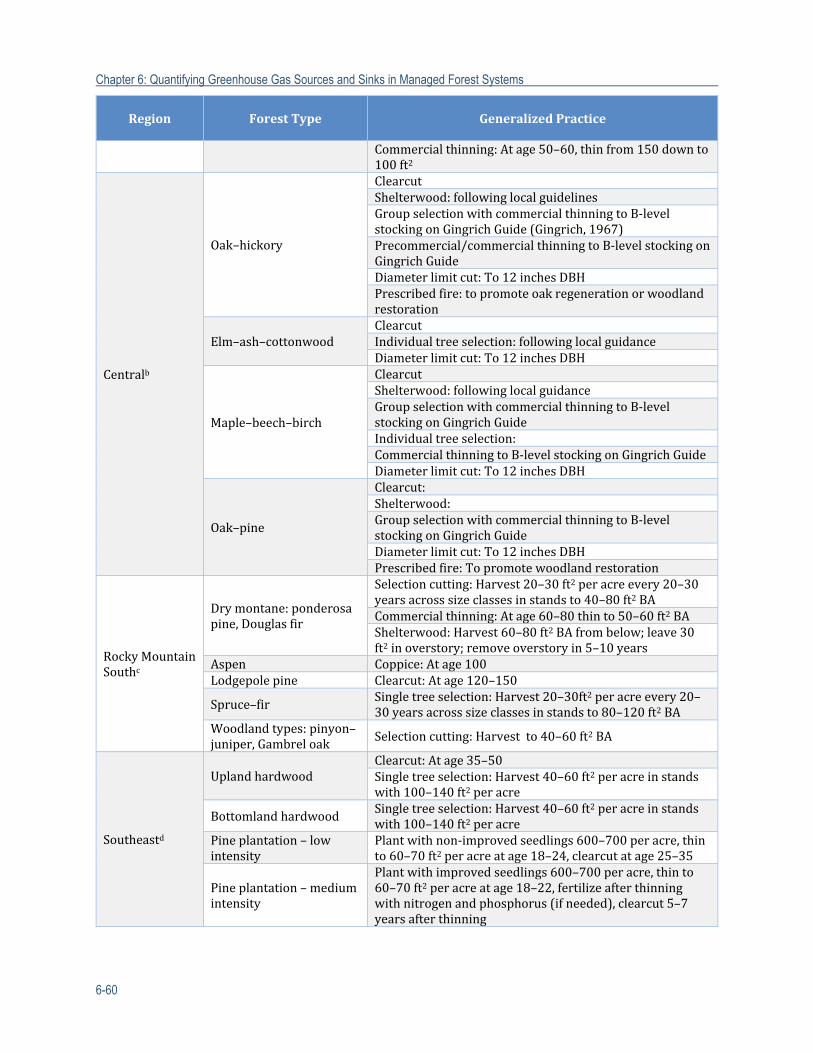
Chapter 6: Quantifying Greenhouse Gas Sources and Sinks in Managed Forest Systems
6-60
Region ForestType GeneralizedPractice
Commercialthinning:Atage50–60,thinfrom150downto100ft2
Centralb
Oak–hickory
ClearcutShelterwood: followinglocalguidelinesGroupselectionwithcommercialthinningtoB‐levelstockingonGingrichGuide(Gingrich,1967)Precommercial/commercialthinningtoB‐levelstockingonGingrichGuideDiameterlimitcut:To12inchesDBHPrescribedfire:topromoteoakregenerationorwoodlandrestoration
Elm–ash–cottonwoodClearcutIndividualtreeselection: followinglocalguidanceDiameterlimitcut:To12inchesDBH
Maple–beech–birch
ClearcutShelterwood: followinglocalguidanceGroupselectionwithcommercialthinningtoB‐levelstockingonGingrichGuideIndividualtreeselection:CommercialthinningtoB‐levelstockingonGingrichGuideDiameterlimitcut:To12inchesDBH
Oak–pine
Clearcut:Shelterwood:GroupselectionwithcommercialthinningtoB‐levelstockingonGingrichGuideDiameterlimitcut:To12inchesDBHPrescribedfire:Topromote woodlandrestoration
RockyMountainSouthc
Drymontane:ponderosapine,Douglasfir
Selectioncutting:Harvest20–30ft2peracreevery20–30yearsacrosssizeclassesinstandsto40–80ft2BACommercialthinning:Atage60–80thinto50–60ft2 BAShelterwood:Harvest60–80ft2 BAfrombelow;leave30ft2inoverstory;removeoverstoryin5–10years
Aspen Coppice: Atage100Lodgepolepine Clearcut: Atage120–150
Spruce–firSingletreeselection:Harvest20–30ft2peracreevery20–30yearsacrosssizeclassesinstandsto80–120ft2BA
Woodlandtypes:pinyon–juniper,Gambreloak Selectioncutting:Harvestto40–60ft2BA
Southeastd
UplandhardwoodClearcut:Atage35–50Singletreeselection:Harvest40–60ft2peracreinstandswith100–140ft2peracre
BottomlandhardwoodSingletreeselection:Harvest40–60ft2peracreinstandswith100–140ft2peracre
Pineplantation–lowintensity
Plantwithnon‐improvedseedlings600–700peracre,thinto60–70ft2peracreatage18–24,clearcutatage25–35
Pineplantation–mediumintensity
Plantwithimprovedseedlings600–700peracre,thinto60–70ft2peracreatage18–22,fertilizeafterthinningwithnitrogenandphosphorus(ifneeded),clearcut5–7yearsafterthinning
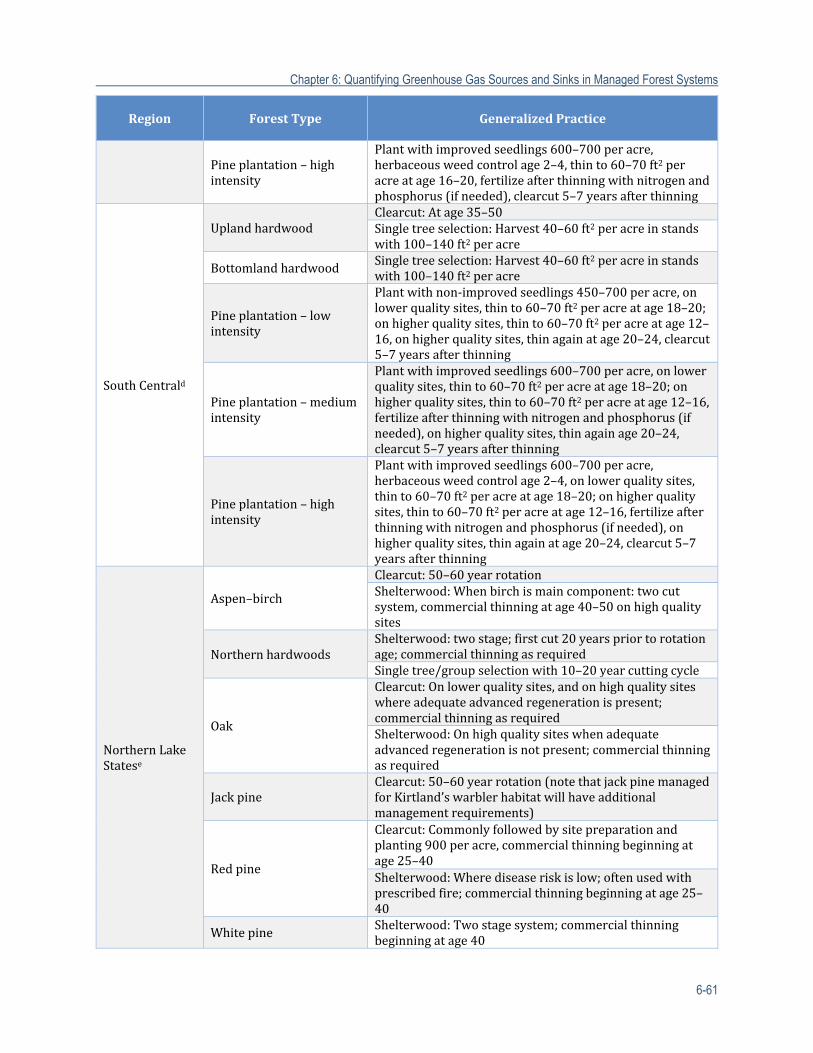
Chapter 6: Quantifying Greenhouse Gas Sources and Sinks in Managed Forest Systems
6-61
Region ForestType GeneralizedPractice
Pineplantation–highintensity
Plantwithimprovedseedlings600–700peracre,herbaceousweedcontrolage2–4,thinto60–70ft2peracreatage16–20,fertilizeafterthinningwithnitrogenandphosphorus(ifneeded),clearcut5–7yearsafterthinning
SouthCentrald
UplandhardwoodClearcut:Atage35–50Singletreeselection:Harvest40–60ft2peracreinstandswith100–140ft2peracre
Bottomlandhardwood Singletreeselection:Harvest40–60ft2peracreinstandswith100–140ft2peracre
Pineplantation–lowintensity
Plantwithnon‐improvedseedlings450–700peracre, onlowerqualitysites,thinto60–70ft2peracreatage18–20;onhigherqualitysites,thinto60–70ft2peracreatage12–16,onhigherqualitysites,thinagainatage20–24,clearcut5–7yearsafterthinning
Pineplantation–mediumintensity
Plantwithimprovedseedlings600–700peracre,onlowerqualitysites,thinto60–70ft2peracreatage18–20;onhigherqualitysites,thinto60–70ft2peracreatage12–16,fertilizeafterthinningwithnitrogenandphosphorus(ifneeded),onhigherqualitysites,thinagainage20–24,clearcut5–7yearsafterthinning
Pineplantation–highintensity
Plantwithimprovedseedlings600–700peracre,herbaceousweedcontrolage2–4,onlowerqualitysites,thinto60–70ft2peracreatage18–20;onhigherqualitysites,thinto60–70ft2peracreatage12–16,fertilizeafterthinningwithnitrogenandphosphorus(ifneeded),onhigherqualitysites,thinagainatage20–24,clearcut5–7yearsafterthinning
NorthernLakeStatese
Aspen–birch
Clearcut:50–60yearrotationShelterwood:Whenbirchismaincomponent:twocutsystem,commercialthinningatage40–50onhighqualitysites
NorthernhardwoodsShelterwood:twostage;firstcut20yearspriortorotationage;commercialthinningasrequiredSingletree/groupselectionwith10–20yearcuttingcycle
Oak
Clearcut:Onlowerqualitysites,andonhighqualitysiteswhereadequateadvancedregenerationispresent;commercialthinningasrequiredShelterwood:Onhighqualitysiteswhenadequateadvancedregenerationisnotpresent;commercialthinningasrequired
JackpineClearcut:50–60yearrotation (notethatjackpinemanagedforKirtland’swarblerhabitatwillhaveadditionalmanagementrequirements)
Redpine
Clearcut:Commonlyfollowedbysitepreparationandplanting900peracre,commercialthinningbeginningatage25–40Shelterwood:Wherediseaseriskislow;oftenusedwithprescribedfire;commercialthinningbeginningatage25–40
WhitepineShelterwood:Twostagesystem;commercialthinningbeginningatage40
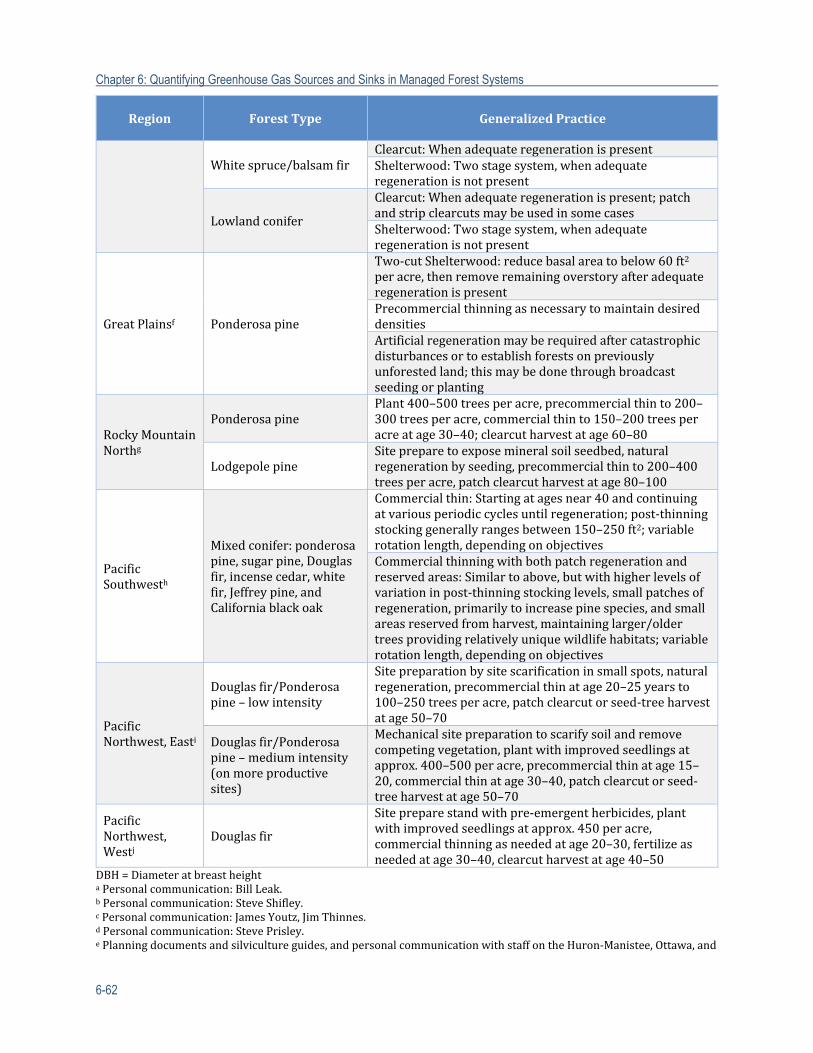
Chapter 6: Quantifying Greenhouse Gas Sources and Sinks in Managed Forest Systems
6-62
Region ForestType GeneralizedPractice
Whitespruce/balsamfirClearcut:WhenadequateregenerationispresentShelterwood:Twostagesystem,whenadequateregenerationisnotpresent
Lowlandconifer
Clearcut:Whenadequateregenerationispresent; patchandstripclearcutsmaybeusedinsomecasesShelterwood:Twostagesystem,whenadequateregenerationisnotpresent
GreatPlainsf Ponderosapine
Two‐cutShelterwood:reducebasalareatobelow60ft2peracre,thenremoveremainingoverstoryafteradequateregenerationispresentPrecommercialthinningasnecessarytomaintaindesireddensitiesArtificialregenerationmayberequiredaftercatastrophicdisturbancesortoestablishforestsonpreviouslyunforestedland;thismaybedonethroughbroadcastseedingorplanting
RockyMountainNorthg
PonderosapinePlant400–500trees peracre,precommercialthinto200–300treesperacre,commercialthinto150–200treesperacreatage30–40;clearcutharvestatage60–80
LodgepolepineSitepreparetoexposemineralsoilseedbed,naturalregenerationbyseeding,precommercialthinto200–400treesperacre,patchclearcutharvestatage80–100
PacificSouthwesth
Mixedconifer:ponderosapine,sugarpine,Douglasfir,incensecedar,whitefir,Jeffreypine,andCaliforniablackoak
Commercialthin:Startingatagesnear40andcontinuingatvariousperiodiccyclesuntilregeneration;post‐thinningstockinggenerallyrangesbetween150–250ft2;variablerotationlength,dependingonobjectivesCommercialthinningwithbothpatchregenerationandreservedareas:Similartoabove,butwithhigherlevelsofvariationinpost‐thinningstockinglevels,smallpatchesofregeneration,primarilytoincreasepinespecies,andsmallareasreservedfromharvest,maintaininglarger/oldertreesprovidingrelativelyuniquewildlifehabitats;variablerotationlength,dependingonobjectives
PacificNorthwest,Easti
Douglasfir/Ponderosapine–lowintensity
Sitepreparationbysitescarificationinsmallspots,naturalregeneration,precommercialthinatage20–25yearsto100–250treesperacre,patchclearcutorseed‐treeharvestatage50–70
Douglasfir/Ponderosapine–mediumintensity(onmoreproductivesites)
Mechanicalsitepreparationtoscarifysoilandremovecompetingvegetation,plantwithimprovedseedlingsatapprox.400–500peracre,precommercialthinatage15–20,commercialthinatage30–40,patchclearcutorseed‐treeharvestatage50–70
PacificNorthwest,Westj
Douglasfir
Sitepreparestandwithpre‐emergentherbicides,plantwithimprovedseedlingsatapprox.450peracre,commercialthinningasneededatage20–30,fertilizeasneededatage30–40,clearcutharvestatage40–50
DBH=DiameteratbreastheightaPersonalcommunication:BillLeak.bPersonalcommunication:SteveShifley.cPersonalcommunication:JamesYoutz,JimThinnes.dPersonalcommunication:StevePrisley.ePlanningdocumentsandsilvicultureguides,andpersonalcommunicationwithstaffontheHuron‐Manistee,Ottawa,and
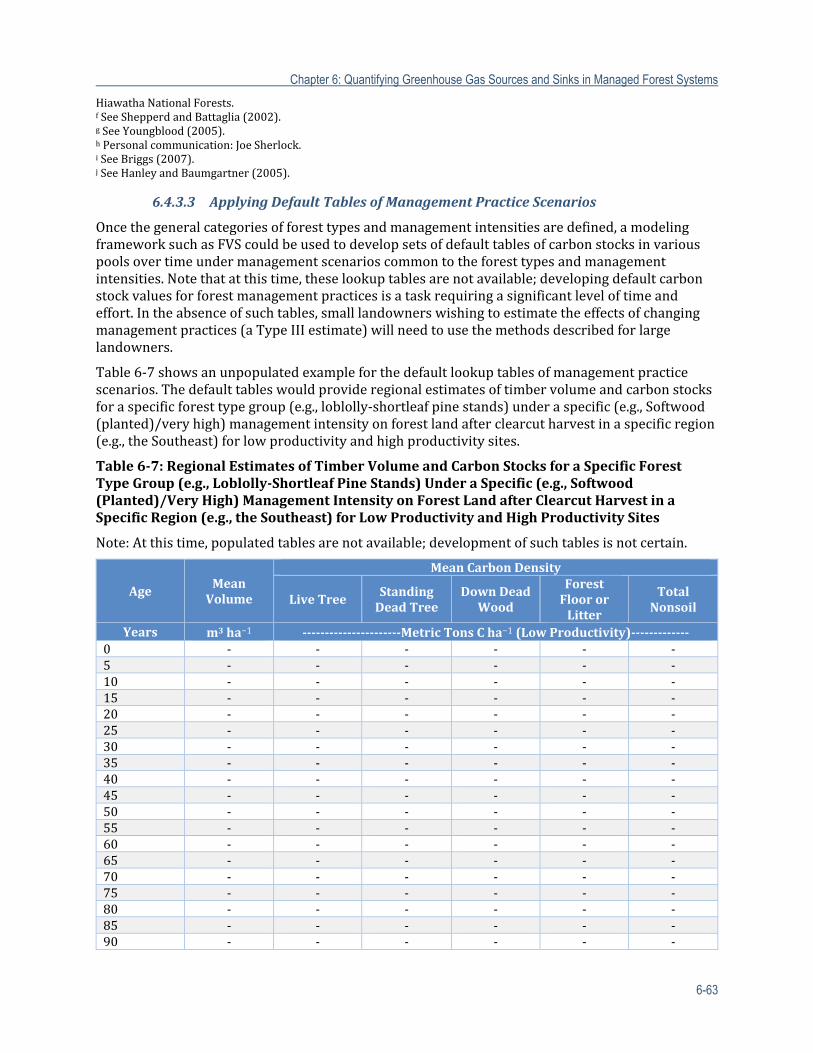
Chapter 6: Quantifying Greenhouse Gas Sources and Sinks in Managed Forest Systems
6-63
HiawathaNationalForests.fSeeShepperdandBattaglia(2002).gSeeYoungblood(2005).hPersonalcommunication:JoeSherlock.iSeeBriggs(2007).jSeeHanleyandBaumgartner(2005).
6.4.3.3 ApplyingDefaultTablesofManagementPracticeScenarios
Oncethegeneralcategoriesofforesttypesandmanagementintensitiesaredefined,amodelingframeworksuchasFVScouldbeusedtodevelopsetsofdefaulttablesofcarbonstocksinvariouspoolsovertimeundermanagementscenarioscommontotheforesttypesandmanagementintensities.Notethatatthistime,theselookuptablesarenotavailable;developingdefaultcarbonstockvaluesforforestmanagementpracticesisataskrequiringasignificantleveloftimeandeffort.Intheabsenceofsuchtables,smalllandownerswishingtoestimatetheeffectsofchangingmanagementpractices(aTypeIIIestimate)willneedtousethemethodsdescribedforlargelandowners.
Table6‐7showsanunpopulatedexampleforthedefaultlookuptablesofmanagementpracticescenarios.Thedefaulttableswouldprovideregionalestimatesoftimbervolumeandcarbonstocksforaspecificforesttypegroup(e.g.,loblolly‐shortleafpinestands)underaspecific(e.g.,Softwood(planted)/veryhigh)managementintensityonforestlandafterclearcutharvestinaspecificregion(e.g.,theSoutheast)forlowproductivityandhighproductivitysites.
Table6‐7:RegionalEstimatesofTimberVolumeandCarbonStocksforaSpecificForestTypeGroup(e.g.,Loblolly‐ShortleafPineStands)UnderaSpecific(e.g.,Softwood(Planted)/VeryHigh)ManagementIntensityonForestLandafterClearcutHarvestinaSpecificRegion(e.g.,theSoutheast)forLowProductivityandHighProductivitySites
Note:Atthistime,populatedtablesarenotavailable;developmentofsuchtablesisnotcertain.
AgeMeanVolume
MeanCarbonDensity
LiveTree StandingDeadTree
DownDeadWood
ForestFloororLitter
TotalNonsoil
Years m3ha−1 ‐‐‐‐‐‐‐‐‐‐‐‐‐‐‐‐‐‐‐‐‐‐MetricTonsCha−1(LowProductivity)‐‐‐‐‐‐‐‐‐‐‐‐‐0 ‐ ‐ ‐ ‐ ‐ ‐5 ‐ ‐ ‐ ‐ ‐ ‐10 ‐ ‐ ‐ ‐ ‐ ‐15 ‐ ‐ ‐ ‐ ‐ ‐20 ‐ ‐ ‐ ‐ ‐ ‐25 ‐ ‐ ‐ ‐ ‐ ‐30 ‐ ‐ ‐ ‐ ‐ ‐35 ‐ ‐ ‐ ‐ ‐ ‐40 ‐ ‐ ‐ ‐ ‐ ‐45 ‐ ‐ ‐ ‐ ‐ ‐50 ‐ ‐ ‐ ‐ ‐ ‐55 ‐ ‐ ‐ ‐ ‐ ‐60 ‐ ‐ ‐ ‐ ‐ ‐65 ‐ ‐ ‐ ‐ ‐ ‐70 ‐ ‐ ‐ ‐ ‐ ‐75 ‐ ‐ ‐ ‐ ‐ ‐80 ‐ ‐ ‐ ‐ ‐ ‐85 ‐ ‐ ‐ ‐ ‐ ‐90 ‐ ‐ ‐ ‐ ‐ ‐
Chapter 6: Quantifying Greenhouse Gas Sources and Sinks in Managed Forest Systems
6-64
AgeMeanVolume
MeanCarbonDensity
LiveTree StandingDeadTree
DownDeadWood
ForestFloororLitter
TotalNonsoil
Years m3ha−1 ‐‐‐‐‐‐‐‐‐‐‐‐‐‐‐‐‐‐‐‐‐‐MetrictonsCha−1(highproductivity)‐‐‐‐‐‐‐‐‐‐‐‐ 0 ‐ ‐ ‐ ‐ ‐ ‐5 ‐ ‐ ‐ ‐ ‐ ‐10 ‐ ‐ ‐ ‐ ‐ ‐15 ‐ ‐ ‐ ‐ ‐ ‐20 ‐ ‐ ‐ ‐ ‐ ‐25 ‐ ‐ ‐ ‐ ‐ ‐30 ‐ ‐ ‐ ‐ ‐ ‐35 ‐ ‐ ‐ ‐ ‐ ‐40 ‐ ‐ ‐ ‐ ‐ ‐45 ‐ ‐ ‐ ‐ ‐ ‐50 ‐ ‐ ‐ ‐ ‐ ‐55 ‐ ‐ ‐ ‐ ‐ ‐60 ‐ ‐ ‐ ‐ ‐ ‐65 ‐ ‐ ‐ ‐ ‐ ‐70 ‐ ‐ ‐ ‐ ‐ ‐75 ‐ ‐ ‐ ‐ ‐ ‐80 ‐ ‐ ‐ ‐ ‐ ‐85 ‐ ‐ ‐ ‐ ‐ ‐90 ‐ ‐ ‐ ‐ ‐ ‐
6.4.4 EstimationMethods
6.4.4.1 StandDensityManagement
TypeIestimatesmaybedevelopedforstanddensitymanagement.Forunderplanting,carbonstocksareessentiallyunchangedimmediatelyafterthetreatment.Forprecommercialthinnings,carbonismovedfromthelivetreepooltothestandingdeadpooland/orforestfloorpool;quantitieswillbelowandessentiallyjustacceleratethenaturalmortalityofthesesmallertrees,thusaccountingforthisactivitymaybeunnecessary.Forcommercialthinning,thelivetreecarbonstockisreducedandcarbonismovedintoHWPs,sothesepoolsneedtobeestimatedusingproceduresoutlinedinSection6.2andSection6.5.
TypeIIandIIIestimatesmaybedevelopedusingforestgrowthmodels(i.e.,FVS)specifictotheforesttypeandpracticesused.
6.4.4.2 SitePreparationTechniques
Carbonstockchangesthatareduetomechanicalsitepreparationtechniqueswillconsistofsomeoxidationofsoilorganiccarbonthatwillbereplacedovertimebyforestgrowth.Forlong‐termmonitoring,itmaybeassumedthatsoilcarbonstockswillbestableundersustainableforestmanagement(Smithetal.,2006).Thus,TypeIestimatescouldreflectshort‐termlossesofsoilcarbonstocksbasedonassumptionsappropriatetotheforesttypeandregion.
6.4.4.3 VegetationControl
Controlofwoodyvegetationwillexhibitpatternssimilartoprecommercialthinning:transferofcarbonstocksfromlivetreetodeadtreepools.Quantitieswilllikelybesmallandtheeffectofshortduration;henceaccountingfortheseimpactsusingTypeIestimatesmaybeunnecessary.
ForTypeIIandIIIestimates,vegetationcontrolmaybeexpectedtohaveabeneficialimpactonthe
Chapter 6: Quantifying Greenhouse Gas Sources and Sinks in Managed Forest Systems
6-65
growthoftheresidualstandthatshouldbemodeledaccordingly.
6.4.4.4 Planting
Negligiblecarbonstockchangesareexpectedatthetimeofestablishmentofanewplantation,soTypeIestimateswillshownostockchanges.ForTypeIIandIIIestimates,theplantationactivityestablishesanewstandthatcanthenbemodeledbasedonspecies,siteindex,andinitialstocking(plantingdensitytimesyear1survivalpercent).
6.4.4.5 NaturalRegeneration
Asinthecaseofplantationestablishment,carbonstockchangesatthetimeofnaturalregenerationarenegligible.ForTypeIIandIIIestimatesinvolvingprojectionsofstandgrowthovertime,initialstocking,speciesmix,andsiteproductivitywilldefinethestandparametersforgrowthprojections.
6.4.4.6 HarvestingandUtilization
Dependingontheharvestingandsilviculturalsystemused,multiplestockchangesoccurwitharotationharvest.Livetreebiomassstocksarereducedbytheamountofharvestedwood(upto100percentofthelivetreebiomasspool).TheseremovalsshouldbebalancedbyadditionstoHWPpoolsandslash/residueintheforestflooranddeadwoodpools.Becauselossestosoilorganiccarbonpoolsfromdisturbancebymechanizedharvestingsystemsareofrelativelyshortduration,itiscommontoconsiderthelossandrecaptureasasteadystate(e.g.,Smithetal.,2006),thoughthismaydifferdependingonsoilcharacteristics.
Inthecaseofpartialharvests,thereisaresidualstandforwhichcarbonstocksremaintobeprojectedovertime.Post‐harvestinventoryinformationprovidesthecriticalstandparameterstobeinputintogrowthmodels.Intheabsenceofapost‐harvestinventory,pre‐harvestinventorydatacanbeadjustedtoreflectthelossoftreesremovedbytheharvest(e.g.,bydecreasingthenumbersoftreesbyspeciesanddiameterclassbasedonharvestrecords).
6.4.4.7 FireandFuelLoadManagement
TypeIestimatesofcarbonstockchangesduetofueltreatmentsorprescribedfireshouldreflectlossestolivetreebiomassaccordingtothematerialburned,killed,orremoved(frompreandpost‐treatmentinventorydata).Foraprescribedfire,emissionscanbecalculatedusingFOFEM.Ifslashisleftfromthefueltreatment,CONSUMEmayalsobeused.
TypeIIandIIIestimatessimplyinvolveprojectingthestandbasedoninformationfromthepost‐treatmentinventory.
6.4.4.8 ReducingRiskofEmissionsfromPestsandDisease
TypeIcarbonstockestimateswillinvolvecomputationoflossestolivetreebiomassfromthesanitationorsalvageharvest,withadditionstoHWPpoolsasappropriate.
TypeIIandIIIestimatessimplyinvolveprojectingthestandbasedoninformationfromthepost‐treatmentinventory.
6.4.4.9 Short‐RotationWoodyCrops
Negligiblecarbonstockchangesareexpectedatthetimeofestablishmentofanewplantation,soTypeIestimateswillshownostockchanges.ForTypeIIandIIIestimates,theplantationactivityestablishesanewstandthatcanthenbemodeledbasedonspecies,siteindex,andinitialstocking(plantingdensitytimesyear1survivalpercent).
Chapter 6: Quantifying Greenhouse Gas Sources and Sinks in Managed Forest Systems
6-66
6.4.5 LimitationsandUncertainty
6.4.5.1 MeasurementUncertainties
Forestinventorydata,fromwhichmostestimatesinthissectionarederived,containuncertaintyasaresultofsamplingandmeasurementerror.Furthermore,equationsareusedtoestimatebiomassfromtreemeasurements(species,diameters,heights),andtheseequationsintroduceadditionalerrors.Theseuncertainties,however,arewelldocumentedandcanbequantified.
6.4.5.2 ModelUncertainties
ForthedevelopmentofTypeIIandTypeIIIestimates,modelsareusedtoprojectcurrentconditionsintothefuture.Thesetypesofestimatesarebasedinitiallyoninventorydataandaresubjecttothemeasurementuncertaintiesdiscussedabove,butarealsosubjecttomodelingerror.Modelingerrorcanbedocumentedinpartbasedonthediagnosticsreported(ifany)fromthemodeldevelopmentprocess.Greateruncertaintiesareintroducedwhenmodelsareappliedbeyondtheconditionsforwhichtheyweredeveloped(e.g.,biomassequationsappliedtospeciesforwhichnobiomassdatawerecollected,forestgrowthmodelsappliedtostandsreceivingdifferentmanagementthanthestandsusedformodeldevelopment,etc.).Modeluncertaintiesalsoincreasewiththeprojectionperiod(thedistanceintothefutureforwhichestimatesareobtained).Someofthemodeluncertaintiesarecancelledoutwhenresultsfromtwosimilarmodelrunsarecompared(i.e.,aTypeIIIestimate).Forexample,ifamodelslightlyoverestimatescarbonstockinaforestwithandwithoutsometreatment,thedifferencebetweenthetwomodelestimatesmaybeaccurateeveniftheindividualestimatesarenot.
6.4.5.3 GeneralizationUncertainties
ForthepurposeofapplyingnationallyconsistentestimationmethodstoTypeIIandIIIestimates,itisnecessarytogeneralizesituationsintobroadforesttypesandmanagementintensities.Thus,someprecisionislostinapplyingageneralized,aggregatedestimatetoaparticularsetofmanagementactivities.
6.5 HarvestedWoodProducts
6.5.1 GeneralAccountingIssues
Whenforestlandownersharvestwoodforproducts,aportionofthewoodcarbonendsupinsolidwoodorpaperproductsinenduses,andeventuallyinlandfills,andcanremainstoredforyearsordecades.Thisreportsuggestsaspecificmeasure,alongwithestimationmethods,that
MethodforHarvestedWoodProducts
MethodusesU.S.‐specificHWPstables.
TheHWPstablesarebasedonWOODCARBIImodelusedtoestimateannualchangeincarbonstoredinproductsandlandfills(Skog,2008).
TheentityusesthesetablestoestimatetheaverageamountofHWPcarbonfromthecurrentyear’sharvestthatremainsstoredinendusesandlandfillsoverthenext100years.
Thismethodwasselectedbecauseitissuitabletorepresenttheamountofcarbonstoredinproductsinuseandinlandfills.
Chapter 6: Quantifying Greenhouse Gas Sources and Sinks in Managed Forest Systems
6-67
forestlandownerscanusetoreportcarbonadditionstothestockofHWPsfromwoodtheyharvest.TheaccountingframeworkusedtotrackHWPcarbonissimilartotheframeworkthattheUnitedStatesusestoreportnational‐levelannualchangesinHWPcarbonstocksunderUNFCCC.
Thenationalaccountingframeworkandthesemethodsadopttheproductionapproach,whichentailsthefollowing:(1)estimatingtheannualcarbonadditionstoandremovalsfromthestockofcarbonheldinwoodproductsinuseandinlandfills,(2)trackingonlycarboninwoodthatwasharvestedintheUnitedStates(U.S.EPA,2011),and(3)providingestimatesthattrackwoodcarbonheldinproducts,evenifistheproductsareexportedtoothercountries.
EstimatesoftheannualcontributionofHWPstocarbonstocksmaybemadeforTypeI,TypeII,andTypeIIIestimatesofforestcarbonchangeasoutlinedinSection6.2:
ForTypeIestimates,thefocusisonestimatingtheannualcontributionofHWPstocarbonstocksforagivencurrentyearorrecentpastyears.
ForTypeIIestimates,thefocusisonestimatingtheannualcontributionofHWPstocarbonstocksforaprojectedperiodofyearsinthefuture.
ForTypeIIIestimates,thefocusisonestimatingthechangeintheannualcontributionofHWPstocarbonstocksbetween:(1)abasecasewithonescenarioforforestmanagement(andharvest);and(2)asecondscenarioforforestmanagement(andharvest)thatisintendedtochangecarbonflux.
ForeachoftheTypeI,II,orIIIestimates,thesemethodsrecommendthatforestlandownersreporttheannualcontributionofHWPstocarbonstocksusingaspecificmeasureintendedtoapproximatetheclimatemitigationbenefitassociatedwithstoringcarboninHWPsovertime.TherecommendedmeasureistheestimatedaverageamountofHWPcarbonfromthecurrentyear’sharvestthatremainsstoredinendusesandlandfillsoverthesubsequent100years.
Theintentofthismeasureistoapproximatetheaverageannualclimatebenefitofwithholdingcarbonfromtheatmospherebyacertainamounteachyearfor100yearsasdescribedbya“decay”curve.Thisaveragebenefitisonethatcanbecreditedintheyearofharvest.ThisestimateofaverageeffectisconceptuallysimilartothemeasureoftheradiativeforcingimpactofacurrentyearemissionofCO2,CH4,orotherGHG.OnetonofCO2emissions—inGHGaccounting—isequatedtotheradiativeforcingitcausesoverthe100yearsfollowingtheemission.Theradiativeforcingcausedineachyearisweightedthesameovereachofthe100years.Wearesuggestingthesameconventioninweightingthecarbonstorageinwoodproductsequallyforeachof100years.
AnestimateofaveragefractionofHWPcarbonstoredover100years(averageamountstoredover100yearsdividedbytheoriginalproductcarbonproduced)isnotexactlythesameasthefractionofradiativeforcingavoidedbystoringwoodproductscarbon(andemittingcarbonslowly)over100years.FordecaycurveswhereaconstantfractionofremainingHWPcarbonisemittedeachyearthefractionofradiativeforcingavoidedover100yearscanbe0to14percentlessthantheaveragefractionofHWPcarbonstoredover100yearsdependingonthedecayrate.8Estimatesofthefractionofradiativeforcingavoidedover100yearscouldbeusedinplaceoftheaveragecarbonstorage.Giventheuncertaintyindecayratesasaninfluenceonestimatesandthegreatercomplexityoftheradiativeforcingmeasure,werecommendthemeasureofaveragecarbonstoredasanadequateproxyfortheeffectofwoodproductsproducedinthecurrentyearandstoredover
8Thefractionofradiativeforcingavoidedover100yearswasestimated(andcomparedtoaveragecarbonstoredover100years)assumingarangeofdecayratesforfirstorderdecaycurvesforwoodproductsandusingtheCO2radiativeforcingresponsecurvefromtheIPCCWorkingI4thAssessmentReport(footnotea,p.213)(IPCC,2007).
Chapter 6: Quantifying Greenhouse Gas Sources and Sinks in Managed Forest Systems
6-68
100years.
Themeasure—averagecarbonstoredinHWPover100years(withvariationsonhowlandfillcarbonisincluded)—isusedintheClimateActionReserve(2010)ForestProjectProtocolsadoptedbytheCaliforniaAirResourcesBoard.Theprotocolsindicatehowtocalculatethelevelofannualcarboncreditsthatmaybesoldbyforestlandownerswhoentercarboncontracts.
Notethatuseoftheproductionapproachtoaccountingisnotalife‐cycleassessmentaccountingapproachthatcouldtakeintoaccounthowcarbonemissionsfromincreasedwoodburningorincreaseduseofwoodproductsmightoffsetfossilfuelemissionsoremissionsfrommakingnon‐woodproductsovertime.TheestimatesofannualchangeincarboninHWPsarenotintendedtoindicatethetotalimpactonGHGlevelsintheatmosphereofusingHWPs(includinguseofwoodforenergy),noraretheyintendedtoindicatethattheemissiontotheatmospheretookplaceintheUnitedStatesversusothercountrieswhereproductswereexported.EstimationofTypeIIIsecondaryGHGreductioneffectsofsubstitutionofwoodforfossilfuelsornon‐woodconstructionproductsarecomplexandwouldrequirespecificationofabaselinefromwhichchangeismeasuredandotherassumptionsthatarebeyondthescopeofthesemethods.
Theproductionapproachisusedtoacknowledgethatharvestingofforestsdoesnotimmediatelyreleaseallofthecontainedcarbontotheatmosphere;theaccountingcountsonlythecarbonchangeinHWPsinordertoallowannualcarbonchangesinHWPstobedeductedoraddedtoannualemissionsintheenergyandmanufacturingsectorsandcarbonchangesinforests,sotherewillbenoomissionordoublecountingofsequestrationoremissionstotheatmosphere.Inthenationalaccountingframework,theannualemissionsfromwoodenergyareaccountedforaspartoftheaggregatedannualchangeinforestplusHWPcarbon.
6.5.2 EstimationMethods
6.5.2.1 WoodProductsFate/Longevity
ToallowforestlandownerstoestimatecarbonadditionstoHWPstocks—usingaveragecarbonstoredinHWPover100years—lookuptablesareprovidedthatgiveestimatesofcarbonremainingstoredafterharvestoutto100years.
Therearetwotypesoflookuptables:a“roundwood”typeanda“primaryproduct”type.
Fortheroundwoodtype,thelandownerneedsestimatesofthecarboninharvestedamountsofindustrialroundwood:hardwood(HW)orsoftwood(SW),sawlogs(SL),orpulpwood(PW).Industrialroundwoodiswoodusedforsolidwoodorpaperproductsandexcludesbarkandfuelwood.Thelandownercanbeginwithestimatesincubicunitsandconvertthemtocarbonweightorwoodweightunitsthenconvertthemtocarbonweight(assuming0.5metrictonscarbonpermetrictondrywood).Separatelookup“decay”tablesareprovidedbymajorU.S.regionandroundwoodtype(HWorSW,SL,orPW)thatshowthefractionofcarboninwoodtypicallystoredinwoodproductsinuseandinlandfills,outto100yearsaftertheyearofharvest,andtheaveragefractionstoredover100years.
Fortheprimaryproducttypeoflookuptables,thelandownerneedsestimatesoftheprimarywoodproductsmadefromthewoodharvested;i.e.,SWorHWlumber,SWorHWplywood,orientedstrandboard,orpaper(inconventionalproductunits).Thelandownerthenconvertstheseamountstocarbonweight.Foreachprimaryproduct,thelookup“decay”tablesshowthefractionofwoodcarbonthatistypicallystoredinwoodproductsinuseandinlandfills,fromtheyearofharvestoutto100years,andtheaveragefractionofcarbonstoredover100years.
Chapter 6: Quantifying Greenhouse Gas Sources and Sinks in Managed Forest Systems
6-69
6.5.3 ActivityDataCollection
6.5.3.1 PrimaryProductDecayTables
Inordertoconstructtheprimaryproducttypedecaytables,dataareusedforeachU.S.regionon:
Thedispositionofeachprimaryproduct(e.g.,lumber,structuralpanels)tomajorenduses(e.g.,percentageofproductgoingtoresidentialhousing,non‐residentialhousing,manufacturing(furniture)),andpercentagegoingtoexports;
Thedecayfunctionsindicatinghowquicklyproductsgooutofuseforeachenduse;
Thefractionofmaterialgoingoutofusethatgoestolandfills;and
Thefractionofmaterialinlandfillsthatdoesnotdecay,andthedecayrateformaterialinlandfillsthatdoesdecay.
ItisassumedthatthereisanationalmarketforprimaryproductsandthepercentageofprimaryproductsgoingtoeachendusewillbethesameforeachU.S.region.ItisalsoassumedthatprimaryproductsexportedfromtheUnitedStatesareusedinthesamewayasdomesticproducts.Thatis,thereisanationalmarketforeachoftheprimarywoodandpaperproducts.Dataforitems(1)through(4)comefromtheWOODCARBIImodelusedtoestimateannualchangeincarbonstoredinproductsandlandfillsfortheU.S.InventoryofGHGEmissionsandSinksreport(Skog,2008;U.S.EPA,2010).
Ifalandownerknowsthetraditionalnumberofunitsofprimaryproducts(e.g.,thousandboardfeetoflumber)thatweremadefromthetimberharvestedfromtheirlandinagivenyear,theycanuseTables6‐A‐1,6‐A‐2,and6‐A‐3toestimatethecarboncontentsintheseproducts(Table6‐A‐1)andestimatetheamountofcarbonstoredintheseproducts(inuseandinlandfills)outto100yearsandtheaverageamountofcarbonstoredover100years(Table6‐A‐2[inuse]andTable6‐A‐3[inlandfills]).
Theaverageamountofcarbonstoredover100yearsforaparticularprimaryproductisthetotaloftheaveragesforproductsinuseandproductsinlandfillsshowninTables6‐A‐2(inuse)andTable6‐A‐3(inlandfills).
6.5.3.2 RoundwoodDecayTables
Inordertoconstructtheroundwoodtypeofdecaytables,dataareneededforeachregiononthepercentageofHWorSW,SL,orPWthatgoestovariousprimarywoodproducts;forexample,thefractionofSWSLsintheSouththatgoestolumber,panels,andpaper.Aftertheamountsofprimarywoodproductsareestimated,theprimaryproductstypedecaytablescanbeusedtoconstructroundwooddecaytables.DataneededtodivideroundwoodintoprimaryproductsforeachregionincludeForestServiceFIAtimberproductoutputdataandnationaldataonprimarywoodproductsproduction(Howard,2012;Smithetal.,2007).
Ifalandownerknowsthecubicfeetofroundwood,intheformofHWorSWSLsorPWthatisharvestedfromtheirlandinagivenyear,theycanuseTable6‐A‐4and6‐A‐5to(1)estimatetheweightofwoodharvested;(2)convertweightofwoodtocarbonbymultiplyingby0.5(i.e.,thefractionofdrybiomasstocarbonconversionfactor);and(3)estimatethetotalamountofcarbonstoredintheproducts(thesumofamountsinuseandinlandfills)eachyearoutto100years,andtheaveragestoredover100years.
Ifthelandownerknowstheweightofroundwoodharvestedratherthancubicfeet,itwouldusesteps2and3above.
AnnualHWPcarbon(averagestoredover100years)isgivenforeachregionandroundwoodtype
Chapter 6: Quantifying Greenhouse Gas Sources and Sinks in Managed Forest Systems
6-70
inTable6‐A‐5.
Ifthelandownerismakingforestgrowthandharvestprojections(TypeIIandTypeIIIestimates)andonlyknowsthecubicfeet(orweight)ofgrowingstockofHWandSWSLsandPWthatwillbeharvestedingivenfutureyears,thenTable6‐A‐6canbeusedtoestimatethetotalamountofroundwoodthatcanexpectedtobeharvested(growingstockandnon‐growingstock).Thesetotalamountsofroundwood(HWandSWSLsandPWmaythenconvertedtocarbonandtocarbonstored(andaveragecarbonstoredover100years)usingTable6‐A‐4andTable6‐A‐5,asdiscussedabove.Toconvert1cubicfootofdrywoodtopoundsmultiplydensityby62.4lbsft−3.Toconvert1cubicfoottokilogramsmultiplydensityby28.3kgft−3.
Aspreadsheetisavailableshowingalltheparametersandcalculationsthatproducethecarbonstoragetablesthatstartwithprimaryproductsorroundwoodharvest(Skog,2013).
6.5.4 Limitations,Uncertainty,andResearchGaps
6.5.4.1 UncertaintyinCchangeestimate
Generalestimatesofuncertainty,givenasthe95percentconfidenceintervals,canbemadeforHWPmeasureusedinTypeIcarbonchangeestimates(currentyearorrecentpastyears).Theseestimatesofuncertaintycouldbeprovidedwitheachofthetwotypesoflookuptables,andcanbemadeusingMonteCarlosimulationsandassumptionsaboutHWPuncertaintythatareusedfortheInventoryofU.S.GreenhouseGasEmissionsandSinksreport(U.S.EPA,2011).Uncertaintycouldbespecifiedforkeyvariablesincluding:(1)fractionsofSLsPWgoingtovariousprimaryproducts;(2)fractionsofprimaryproductsgoingtovariousenduses;(3)rateatwhichproductsarediscardedfromeachenduse;(4)fractionofdiscardedwoodorpaperthatgoestolandfills;(5)fractionofwoodorpapersettolandfillsthatissubjecttodecay;and(6)rateofdecayinlandfillsofdegradablewood/papercarbon.
AspreadsheetisavailablethecouldbeusedasabasisforMonteCarlosimulationstoestimateoveralluncertaintyforestimatesofaveragecarbonstoredover100years(Skog,2013).
ItwouldbepossiblebutmorecomplextomakeuncertaintyestimatesforTypeIIandTypeIIIcarbonchangeestimatesbyaddingestimatesofuncertaintyinparametersusedtomakeprojectionsofharvest.
Additionalresearchisneededtoimprovedifferentiationofthevariousratesatwhichsolidwoodproductsarediscardedfromusessuchaspallets,railroad,railcars,andfurniturethatarecurrentlygroupedintoonecategory.Thisfurtherdifferentiationwouldrefineestimatesofaveragecarbonstoredwhenthelandownerknowswhichprimarywoodproductsaremadefromthewoodthatisharvestedontheirland.Alternatecurvesfordiscardratesfromenduses,particularlydiscardsfromhousing,ifempiricallyverified,couldimproveestimatesofaveragecarbonstored.Estimatesofuncertaintyinparametersover100yearprojectionsareneededtogiveasoundestimateoftheuncertaintyinaveragecarbonstoredover100years.
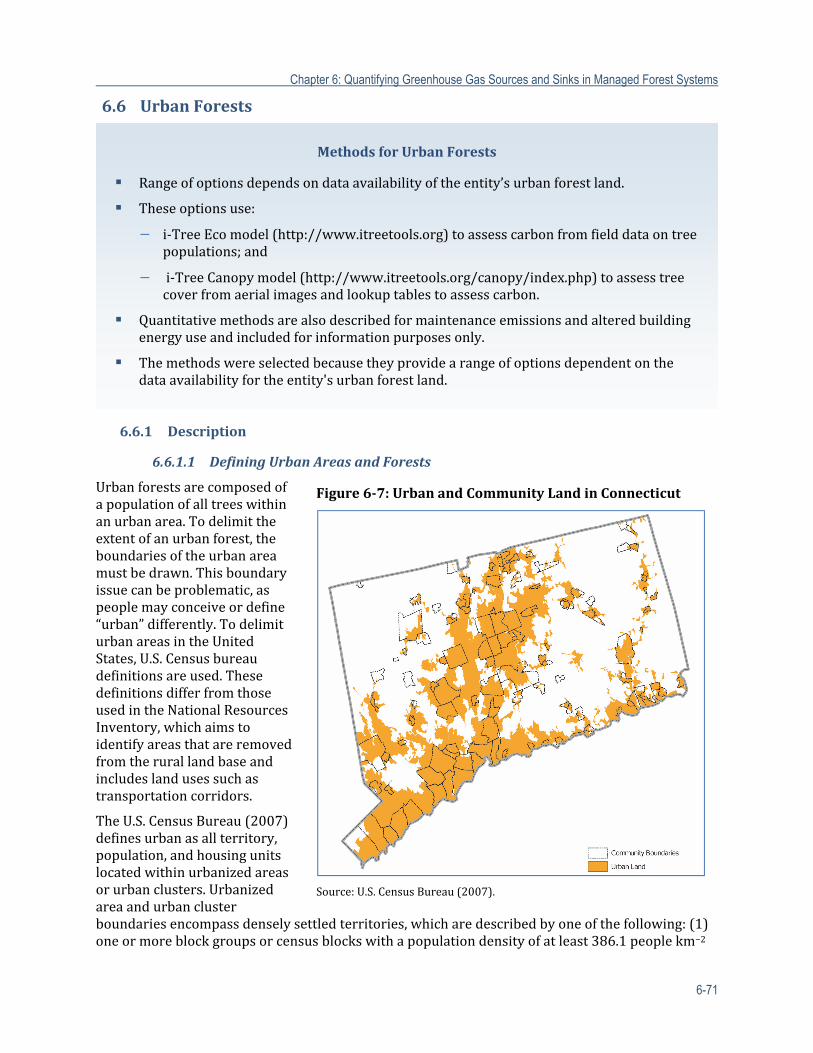
Chapter 6: Quantifying Greenhouse Gas Sources and Sinks in Managed Forest Systems
6-71
6.6 UrbanForests
6.6.1 Description
6.6.1.1 DefiningUrbanAreasandForests
Urbanforestsarecomposedofapopulationofalltreeswithinanurbanarea.Todelimittheextentofanurbanforest,theboundariesoftheurbanareamustbedrawn.Thisboundaryissuecanbeproblematic,aspeoplemayconceiveordefine“urban”differently.TodelimiturbanareasintheUnitedStates,U.S.Censusbureaudefinitionsareused.ThesedefinitionsdifferfromthoseusedintheNationalResourcesInventory,whichaimstoidentifyareasthatareremovedfromtherurallandbaseandincludeslandusessuchastransportationcorridors.
TheU.S.CensusBureau(2007)definesurbanasallterritory,population,andhousingunitslocatedwithinurbanizedareasorurbanclusters.Urbanizedareaandurbanclusterboundariesencompassdenselysettledterritories,whicharedescribedbyoneofthefollowing:(1)oneormoreblockgroupsorcensusblockswithapopulationdensityofatleast386.1peoplekm−2
Figure6‐7:UrbanandCommunityLandinConnecticut
Source:U.S.CensusBureau(2007).
MethodsforUrbanForests
Rangeofoptionsdependsondataavailabilityoftheentity’surbanforestland.
Theseoptionsuse:
− i‐TreeEcomodel(http://www.itreetools.org)toassesscarbonfromfielddataontreepopulations;and
− i‐TreeCanopymodel(http://www.itreetools.org/canopy/index.php)toassesstreecoverfromaerialimagesandlookuptablestoassesscarbon.
Quantitativemethodsarealsodescribedformaintenanceemissionsandalteredbuildingenergyuseandincludedforinformationpurposesonly.
Themethodswereselectedbecausetheyprovidearangeofoptionsdependentonthedataavailabilityfortheentity'surbanforestland.
Chapter 6: Quantifying Greenhouse Gas Sources and Sinks in Managed Forest Systems
6-72
(1,000peoplemile−2);(2)surroundingblockgroupsandcensusblockswithapopulationdensityof193.1peoplekm−2(500peoplemile−2);and(3)lessdenselysettledblocksthatformenclavesorindentationsorareusedtoconnectdiscontinuousareas.Morespecifically,urbanizedareasconsistofterritoriesof50,000ormorepeople.Urbanclusters,aconceptnewtothe2000Census,consistofterritorieswithatleast2,500peoplebutfewerthan50,000people.
Inadditiontourbanland,theCensusBureaudesignatesplacesthatdelimitpopulationconcentrationsbasedonincorporatedorunincorporatedplaces,suchasacity,town,village,andcensus‐designatedplace.Theseplaces,or“communities,”alsodefineareaswherepeoplereside,butoftenwithalowerpopulationdensity.Thegeographicareasofurbanandcommunitiesoverlap(seeFigure6‐7),andeitherorbothcouldbeusedtodefineurbanforests.Theurbanlanddesignationdelimitshigherpopulationdensities,butdoesnotfollowtheboundariesofcitiesortownsthatmostpeoplecanrelateto.Theplaceorcommunityboundariesfollowthesepoliticalboundaries,butoftenincludebothruralandurbanland.
Urbanlandisdefinedbasedonpopulationdensity,andcommunitylandisoftenbasedonpoliticalboundaries.Thus,urbanforestlandoverlapswithforestlands.Thatis,forestedstandsthataremeasuredaspartofotherprogramscanexistwithinurbanorcommunityboundaries.Assessmentsofurbanforesteffectsthushavethepotentialtodouble‐counteffectsfoundinforestswithinregionalornationalscaleassessments.Theamountofthisoverlapisestimatedas13.8percentofurbanareaor1.5percentofforestareaintheconterminousUnitedStates(Nowaketal.,2013)andisanimportantconsiderationforlargerscaleassessments.ThissectionfocusesonassessingthecarboneffectsofurbanorcommunitytreesandforestsintheUnitedStates.
Urbanorcommunityforests(hereafterreferredtoasurbanforests)affectthecarboncyclebydirectlystoringatmosphericcarbonwithinthewoodyvegetation,butalsobyaffectingthelocalclimateandtherebyalteringcarbonemissionsaffectedbylocalclimaticconditions.Urbantreemaintenanceactivitiesalsoaffectcarbonemissionsinurbanareas.Foratrueaccountingofcarboneffects,allofthesefactorsneedtobeconsidered.Thisreportfocusesontrees(definedaswoodyvegetationwithadiameterofatleast1inch(2.5cm)DBH),butsimilaraccountingcouldbeconductedforallurbanvegetation.
6.6.1.2 AccountingforPrimaryUrbanForestCarbonEffects
Treessequesterandstorecarbonintheirtissueatdifferingratesandamounts,basedonsuchfactorsastreesize,lifespan,andgrowthrate.Afteratreeisremoved,thetreecandecomposewiththecarbonstoredinthattreeemittedbacktotheatmosphere,orthecarbonmaybestoredinwoodproductsorthesoil.Thus,inordertoaccountforthetotalcarboninthesystematonetime,oneneedstounderstandhowmanytreesthereareinthesystemalongwithinformationsuchasspeciesandsize(e.g.,NowakandCrane,2002).Toaccountforhowthecarbonstockwillchangethroughtime,onemustalsoaccountforgrowthrates,treemortalityandremovals,andthedispositionofthewoodafterremoval(e.g.,chipping,burning,products),whichaffectdecompositionratesandcarbonemissions.Inaddition,thenumberofnewtreesenteringthesystemthroughtreeplantingandnaturalregenerationmustbeconsidered.
6.6.1.3 AccountingforSecondaryEffects
Inadditiontothecarbonstoredintrees,theurbanforesthassecondaryimpactsonatmosphericcarbonbyaffectingcarbonemissionsfromurbanareas.Treecareandmaintenancepracticesoftenreleasecarbonbacktotheatmosphereviafossil‐fuelemissionsfrommaintenanceequipment(e.g.,chainsaws,trucks,chippers).Thus,someofthecarbongainsfromtreegrowthareoffsetbycarbonlossestotheatmosphereviafossilfuelsusedinmaintenanceactivities(Nowaketal.,2002).Treesstrategicallylocatedaroundbuildingscanreducebuildingenergyuse(e.g.,Heisler,1986),and
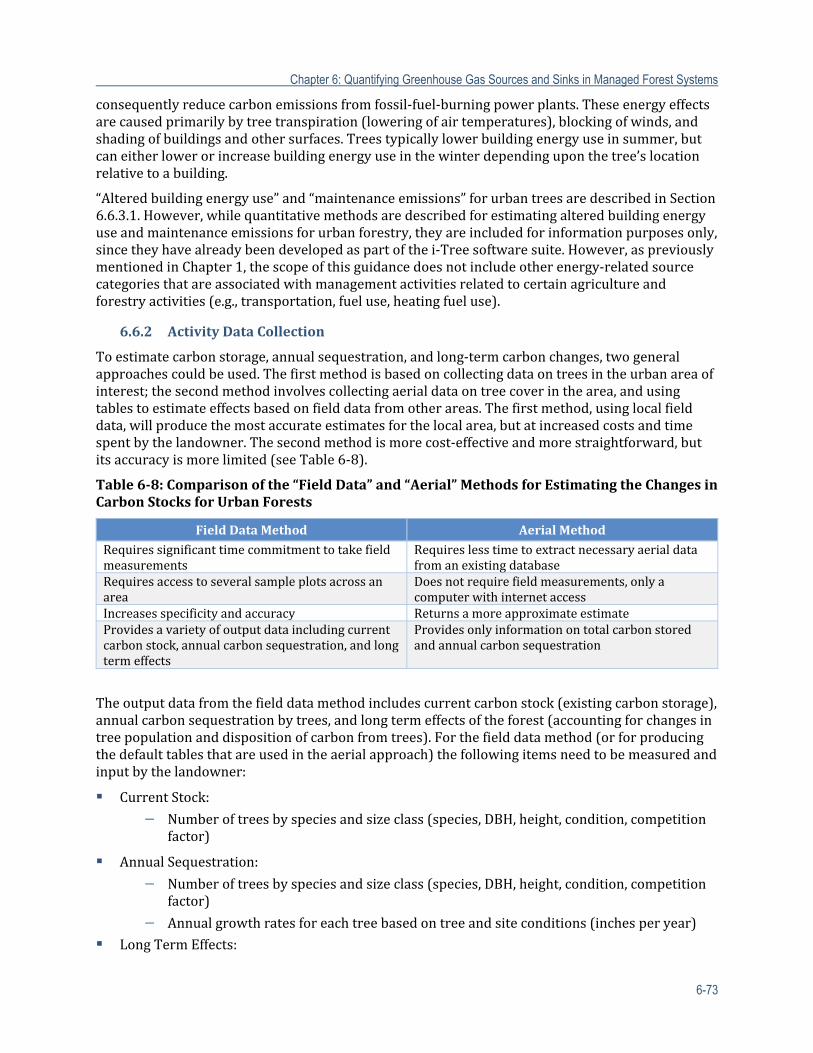
Chapter 6: Quantifying Greenhouse Gas Sources and Sinks in Managed Forest Systems
6-73
consequentlyreducecarbonemissionsfromfossil‐fuel‐burningpowerplants.Theseenergyeffectsarecausedprimarilybytreetranspiration(loweringofairtemperatures),blockingofwinds,andshadingofbuildingsandothersurfaces.Treestypicallylowerbuildingenergyuseinsummer,butcaneitherlowerorincreasebuildingenergyuseinthewinterdependinguponthetree’slocationrelativetoabuilding.
“Alteredbuildingenergyuse”and“maintenanceemissions”forurbantreesaredescribedinSection6.6.3.1.However,whilequantitativemethodsaredescribedforestimatingalteredbuildingenergyuseandmaintenanceemissionsforurbanforestry,theyareincludedforinformationpurposesonly,sincetheyhavealreadybeendevelopedaspartofthei‐Treesoftwaresuite.However,aspreviouslymentionedinChapter1,thescopeofthisguidancedoesnotincludeotherenergy‐relatedsourcecategoriesthatareassociatedwithmanagementactivitiesrelatedtocertainagricultureandforestryactivities(e.g.,transportation,fueluse,heatingfueluse).
6.6.2 ActivityDataCollection
Toestimatecarbonstorage,annualsequestration,andlong‐termcarbonchanges,twogeneralapproachescouldbeused.Thefirstmethodisbasedoncollectingdataontreesintheurbanareaofinterest;thesecondmethodinvolvescollectingaerialdataontreecoverinthearea,andusingtablestoestimateeffectsbasedonfielddatafromotherareas.Thefirstmethod,usinglocalfielddata,willproducethemostaccurateestimatesforthelocalarea,butatincreasedcostsandtimespentbythelandowner.Thesecondmethodismorecost‐effectiveandmorestraightforward,butitsaccuracyismorelimited(seeTable6‐8).
Table6‐8:Comparisonofthe“FieldData”and“Aerial”MethodsforEstimatingtheChangesinCarbonStocksforUrbanForests
FieldDataMethod AerialMethod
Requiressignificanttimecommitmenttotakefieldmeasurements
Requireslesstimetoextractnecessaryaerialdatafromanexistingdatabase
Requiresaccesstoseveralsampleplotsacrossanarea
Doesnotrequirefieldmeasurements,onlyacomputerwithinternetaccess
Increasesspecificityandaccuracy ReturnsamoreapproximateestimateProvidesavarietyofoutputdataincludingcurrentcarbonstock,annualcarbonsequestration,andlongtermeffects
Providesonlyinformationontotalcarbonstoredandannualcarbonsequestration
Theoutputdatafromthefielddatamethodincludescurrentcarbonstock(existingcarbonstorage),annualcarbonsequestrationbytrees,andlongtermeffectsoftheforest(accountingforchangesintreepopulationanddispositionofcarbonfromtrees).Forthefielddatamethod(orforproducingthedefaulttablesthatareusedintheaerialapproach)thefollowingitemsneedtobemeasuredandinputbythelandowner:
CurrentStock:
− Numberoftreesbyspeciesandsizeclass(species,DBH,height,condition,competitionfactor)
AnnualSequestration:
− Numberoftreesbyspeciesandsizeclass(species,DBH,height,condition,competitionfactor)
− Annualgrowthratesforeachtreebasedontreeandsiteconditions(inchesperyear)
LongTermEffects:
Chapter 6: Quantifying Greenhouse Gas Sources and Sinks in Managed Forest Systems
6-74
− Numberoftreesbyspeciesandsizeclass(species,DBH,height,condition,competitionfactor)
− Annualgrowthratesforeachtreebasedontreeandsiteconditions(inchesperyear)
− Changesintreepopulationduetotreedeathandremovals,andnewtreesplantedornaturallyregenerated(numbersoftreesdyingbyspeciesandsizeclass,numberofnewtreesbyspeciesandsizeclass)(numberperyear)
Proportionofremovedtreebiomassthatis:
− Chipped/mulched
− Burned
− Burnedtoproduceenergy(e.g.,heatbuildings)
− Belowthegroundinroots
− Usedforlong‐termwoodproducts
− Leftonthegroundtodecomposenaturally
− Putinlandfills
Decomposed;decompositionratesforwoodfromremovedtrees:
− Percentageofbiomassperyeardecomposedperremovalclassabove
MaintenanceEmissions:
− Amount(numberandhoursperyear)ofmaintenanceequipmentused(e.g.,vehicles,chippers,chainsaws)forvegetationmaintenance(e.g.,planting,maintenance,treeremoval)
− Emissionfactors(gChr−1)foreachmaintenanceequipmentused
AlteredBuildingEnergyUse:
− Numberoftreesbyspeciesandsizeclasswithin60feet(18.3m)ofresidentialbuildingbycardinalandordinaldirection
Forestimatingtreecoverusingtheaerialapproach,onewouldneedtoknowtheextent(ha)oftheurbanareaandthepercentageoftreecoverwithinthearea,anduseadefaulttableofvaluestoconverthaoftreecovertoprimaryandsecondarytreeeffectsinacity.Toestimatechangeinthepopulation,thetreecoverwouldneedtobere‐measuredthroughtime.
Aspreviouslymentioned,alteredbuildingenergyuseandmaintenanceemissionsforurbantreesaredescribedinSection6.6.3.1.However,whilequantitativemethodsaredescribedforestimatingalteredbuildingenergyuseandmaintenanceemissionsforurbanforestry,theyareincludedforinformationpurposesonly,astheyarepartofthei‐Treesoftwaresuiteorcanbecalculatedfromi‐Treedata.
6.6.3 EstimationMethods
Themethodsforestimatingcarboneffectsinanurbanforestwillbedetailedforthefielddataandaerialapproachesseparately.ThefielddatamethodandaerialmethodforurbanforestsaredescribedinSection6.6.3.1andSection6.6.3.2.Figure6‐8showsadecisiontreeindicatingwhichmethodismoreapplicableforeachtypeofactivitydata.
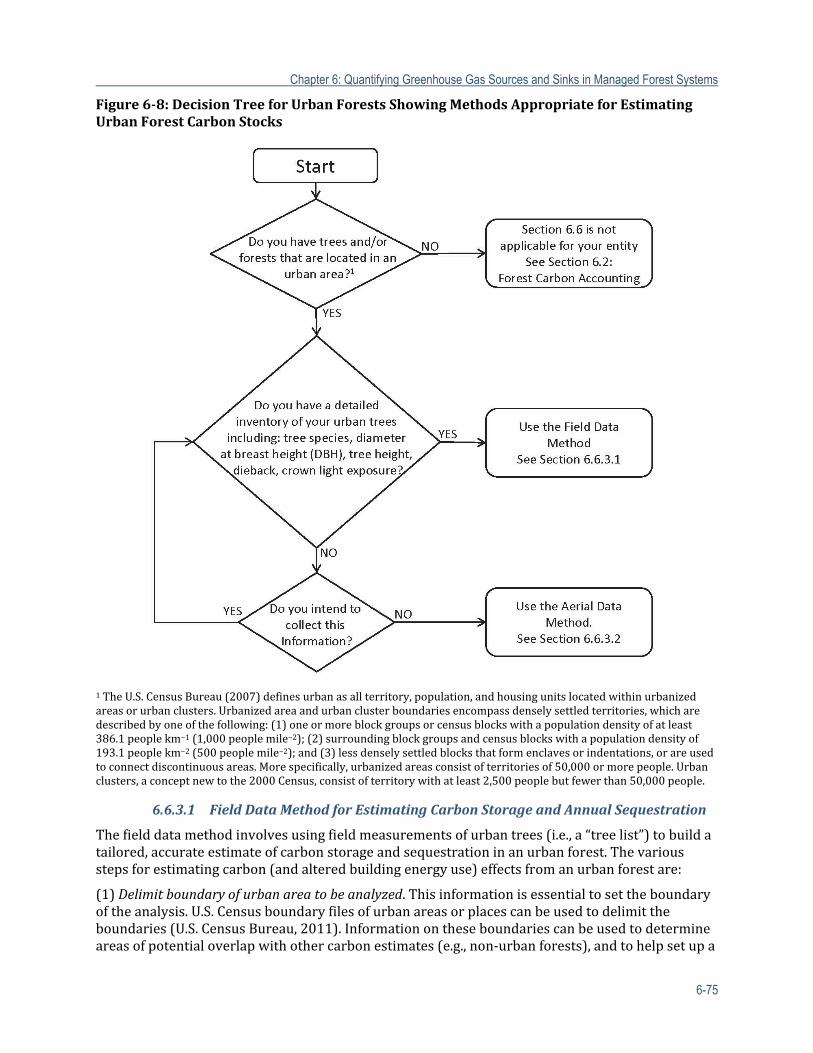
Chapter 6: Quantifying Greenhouse Gas Sources and Sinks in Managed Forest Systems
6-75
Figure6‐8:DecisionTreeforUrbanForestsShowingMethodsAppropriateforEstimatingUrbanForestCarbonStocks
1TheU.S.CensusBureau(2007)definesurbanasallterritory,population,andhousingunitslocatedwithinurbanizedareasorurbanclusters.Urbanizedareaandurbanclusterboundariesencompassdenselysettledterritories,whicharedescribedbyoneofthefollowing:(1)oneormoreblockgroupsorcensusblockswithapopulationdensityofatleast386.1peoplekm−1(1,000peoplemile−2);(2)surroundingblockgroupsandcensusblockswithapopulationdensityof193.1peoplekm−2(500peoplemile−2);and(3)lessdenselysettledblocksthatformenclavesorindentations,orareusedtoconnectdiscontinuousareas.Morespecifically,urbanizedareasconsistofterritoriesof50,000ormorepeople.Urbanclusters,aconceptnewtothe2000Census,consistofterritorywithatleast2,500peoplebutfewerthan50,000people.
6.6.3.1 FieldDataMethodforEstimatingCarbonStorageandAnnualSequestration
Thefielddatamethodinvolvesusingfieldmeasurementsofurbantrees(i.e.,a“treelist”)tobuildatailored,accurateestimateofcarbonstorageandsequestrationinanurbanforest.Thevariousstepsforestimatingcarbon(andalteredbuildingenergyuse)effectsfromanurbanforestare:
(1)Delimitboundaryofurbanareatobeanalyzed.Thisinformationisessentialtosettheboundaryoftheanalysis.U.S.Censusboundaryfilesofurbanareasorplacescanbeusedtodelimittheboundaries(U.S.CensusBureau,2011).Informationontheseboundariescanbeusedtodetermineareasofpotentialoverlapwithothercarbonestimates(e.g.,non‐urbanforests),andtohelpsetupa
Chapter 6: Quantifying Greenhouse Gas Sources and Sinks in Managed Forest Systems
6-76
samplingdesigntocollectnecessaryfielddataasdesiredbythelandowner.
(2)Measurealltreeswithintheurbanareaorsamplethetreepopulation.Withinthedefinedgeography,alltreescanbemeasured,orarandomdistributionoffieldplotscanbemeasuredtoquantifytheurbantreepopulationasdesiredbythelandowner.Toconductthisfieldsamplingandanalysis,thei‐TreeEcomodel(formerlyUFOREmodel)isavailablefreeofchargeatwww.itreetools.org.Fieldmanualsexistonhowtorandomlyselectplotslocationsandcollecttheneededfielddata(http://www.itreetools.org/resources/manuals.php).Detailsonmodelmethodsalsoexist(e.g.,NowakandCrane,2002;Nowaketal.,2008).
Thebasicfielddataprocedureistorecordinformationonalltreeswithinthefieldplots.Thisinformationincludes:
Treespecies
DBH
Treeheight
Dieback
Crownlightexposure
Distanceanddirectiontobuildings
Thesevariablesareneededtoassesscarboneffects,butothertreevariables(e.g.,crownwidth,percentageofcrownmissing)canalsobecollectedtoassessotherecosystemservices(e.g.,airpollutionremoval,volatileorganiccompoundemissions,effectsonbuildingenergyuse,rainfallinterception,andrunoff).
(3)Enterdataintoi‐Treeandrunanalyses.Afterfielddataarecollected(viapaperformsoronamobiledevice),dataareenteredintoi‐Tree,andtheprogramproducesstandardtables,graphs,andreportsthatdetailcarbonandotherecosystemserviceinformation.Inrelationtocarbon,resultsalongwithsamplingstandarderrorsarespecificallyproducedbyspeciesandlanduseregarding:
Carbonstorage:amountofcarboncurrentlyintheexistingtreestock;
Grossannualcarbonsequestration:one‐yearestimateassequestrationbasedonestimatedannualtreegrowth,whichvariesbylocation,treecondition,andcrowncompetition;and
Netannualcarbonsequestration:grosssequestrationminusestimatedcarbonlostfromdeadorremovedtreesduetodecomposition.
AlteredBuildingEnergyUse.Inadditiontothecarboneffectsestimatedbythefielddatamethod,thei‐TreeprogramcanestimatetreeeffectsonresidentialbuildingenergyuseandconsequentcarbonemissionsusingmethodsdetailedinMcPhersonandSimpson(1999).
MaintenanceEmissions.Forestimatingmaintenanceemissioneffects,thefollowingstepsaresuggested:
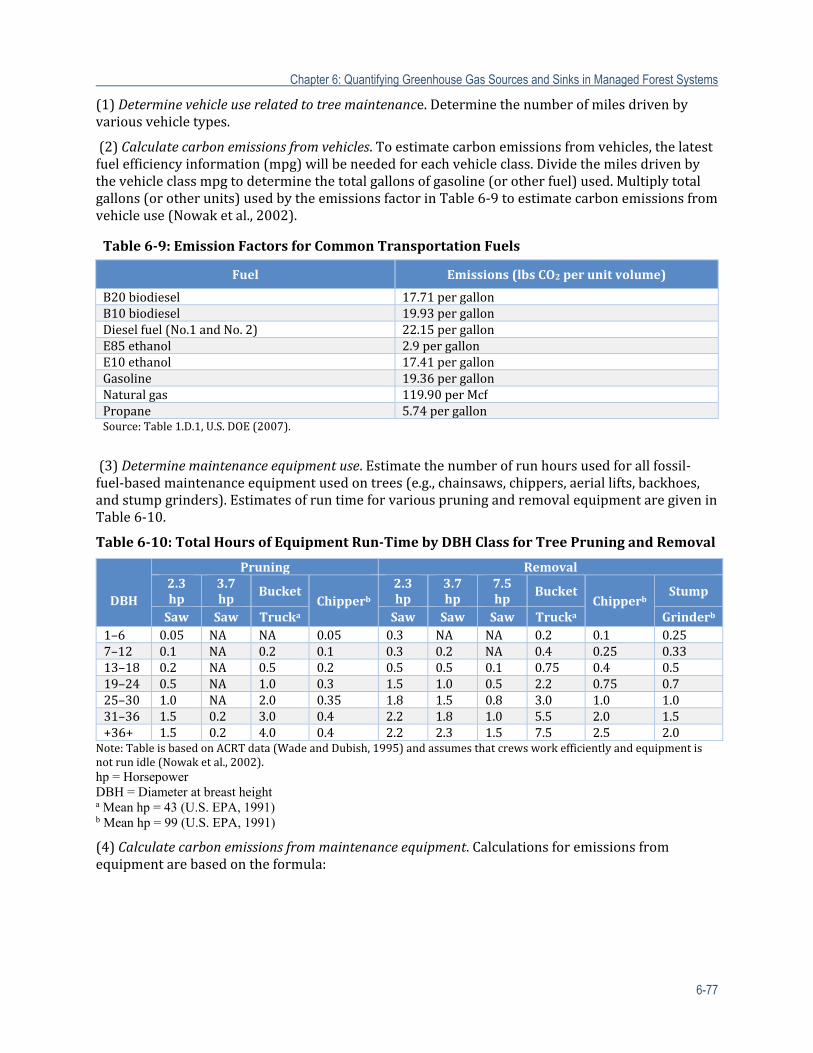
Chapter 6: Quantifying Greenhouse Gas Sources and Sinks in Managed Forest Systems
6-77
(1)Determinevehicleuserelatedtotreemaintenance.Determinethenumberofmilesdrivenbyvariousvehicletypes.
(2)Calculatecarbonemissionsfromvehicles.Toestimatecarbonemissionsfromvehicles,thelatestfuelefficiencyinformation(mpg)willbeneededforeachvehicleclass.Dividethemilesdrivenbythevehicleclassmpgtodeterminethetotalgallonsofgasoline(orotherfuel)used.Multiplytotalgallons(orotherunits)usedbytheemissionsfactorinTable6‐9toestimatecarbonemissionsfromvehicleuse(Nowaketal.,2002).
Table6‐9:EmissionFactorsforCommonTransportationFuels
Fuel Emissions(lbsCO2perunitvolume)
B20biodiesel 17.71 pergallonB10biodiesel 19.93 pergallonDieselfuel(No.1andNo.2) 22.15 pergallonE85ethanol 2.9 pergallonE10ethanol 17.41 pergallonGasoline 19.36 pergallonNaturalgas 119.90 perMcfPropane 5.74 pergallonSource:Table1.D.1,U.S.DOE(2007).
(3)Determinemaintenanceequipmentuse.Estimatethenumberofrunhoursusedforallfossil‐fuel‐basedmaintenanceequipmentusedontrees(e.g.,chainsaws,chippers,aeriallifts,backhoes,andstumpgrinders).EstimatesofruntimeforvariouspruningandremovalequipmentaregiveninTable6‐10.
Table6‐10:TotalHoursofEquipmentRun‐TimebyDBHClassforTreePruningandRemoval
DBH
Pruning Removal2.3hp
3.7hp
BucketChipperb
2.3hp
3.7hp
7.5hp
BucketChipperb
Stump
Saw Saw Trucka Saw Saw Saw Trucka Grinderb
1–6 0.05 NA NA 0.05 0.3 NA NA 0.2 0.1 0.257–12 0.1 NA 0.2 0.1 0.3 0.2 NA 0.4 0.25 0.3313–18 0.2 NA 0.5 0.2 0.5 0.5 0.1 0.75 0.4 0.519–24 0.5 NA 1.0 0.3 1.5 1.0 0.5 2.2 0.75 0.725–30 1.0 NA 2.0 0.35 1.8 1.5 0.8 3.0 1.0 1.031–36 1.5 0.2 3.0 0.4 2.2 1.8 1.0 5.5 2.0 1.5+36+ 1.5 0.2 4.0 0.4 2.2 2.3 1.5 7.5 2.5 2.0
Note:TableisbasedonACRTdata(WadeandDubish,1995)andassumesthatcrewsworkefficientlyandequipmentisnotrunidle(Nowaketal.,2002).hp = Horsepower DBH = Diameter at breast height a Mean hp = 43 (U.S. EPA, 1991) b Mean hp = 99 (U.S. EPA, 1991)
(4)Calculatecarbonemissionsfrommaintenanceequipment.Calculationsforemissionsfromequipmentarebasedontheformula:
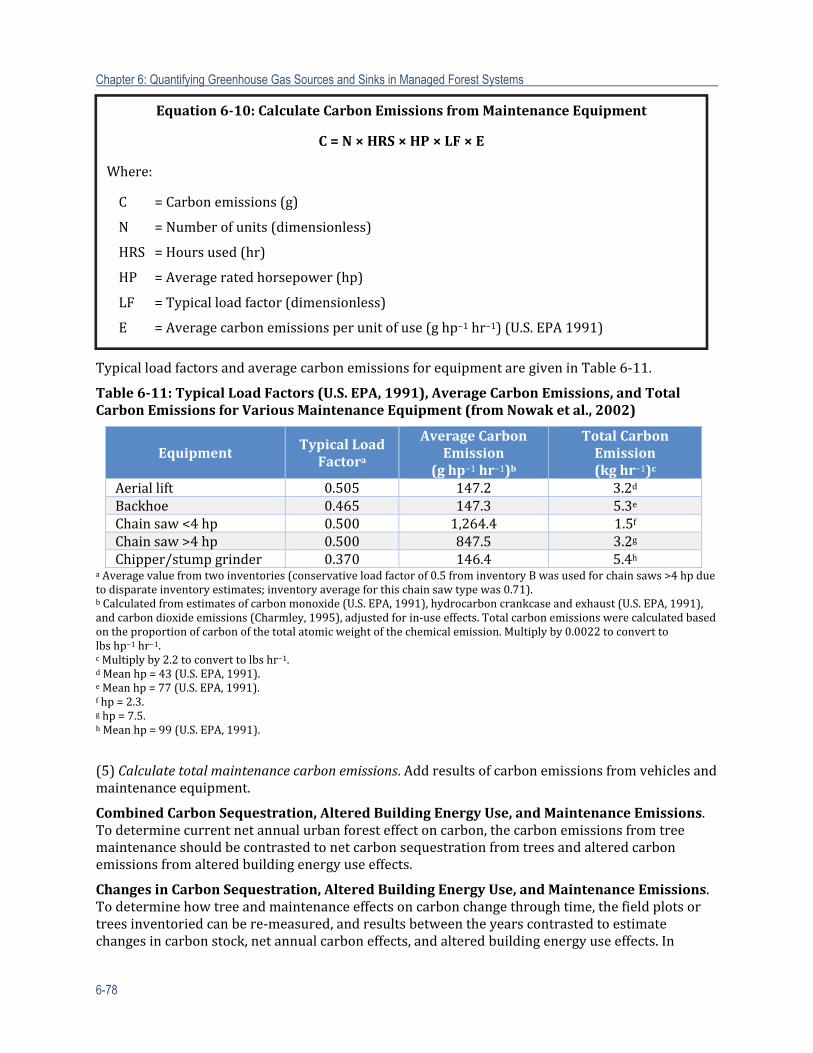
Chapter 6: Quantifying Greenhouse Gas Sources and Sinks in Managed Forest Systems
6-78
TypicalloadfactorsandaveragecarbonemissionsforequipmentaregiveninTable6‐11.
Table6‐11:TypicalLoadFactors(U.S.EPA,1991),AverageCarbonEmissions,andTotalCarbonEmissionsforVariousMaintenanceEquipment(fromNowaketal.,2002)
Equipment TypicalLoadFactora
Average CarbonEmission
(ghp−1hr−1)b
TotalCarbonEmission(kghr−1)c
Aeriallift 0.505 147.2 3.2dBackhoe 0.465 147.3 5.3eChainsaw<4hp 0.500 1,264.4 1.5fChainsaw>4hp 0.500 847.5 3.2gChipper/stumpgrinder 0.370 146.4 5.4h
aAveragevaluefromtwoinventories(conservativeloadfactorof0.5frominventoryBwasusedforchainsaws>4hpduetodisparateinventoryestimates;inventoryaverageforthischainsawtypewas0.71).bCalculatedfromestimatesofcarbonmonoxide(U.S.EPA,1991),hydrocarboncrankcaseandexhaust(U.S.EPA,1991),andcarbondioxideemissions(Charmley,1995),adjustedforin‐useeffects.Totalcarbonemissionswerecalculatedbasedontheproportionofcarbonofthetotalatomicweightofthechemicalemission.Multiplyby0.0022toconverttolbshp−1hr−1.cMultiplyby2.2toconverttolbshr−1.dMeanhp=43(U.S.EPA,1991).eMeanhp=77(U.S.EPA,1991).fhp=2.3.ghp=7.5.hMeanhp=99(U.S.EPA,1991).
(5)Calculatetotalmaintenancecarbonemissions.Addresultsofcarbonemissionsfromvehiclesandmaintenanceequipment.
CombinedCarbonSequestration,AlteredBuildingEnergyUse,andMaintenanceEmissions.Todeterminecurrentnetannualurbanforesteffectoncarbon,thecarbonemissionsfromtreemaintenanceshouldbecontrastedtonetcarbonsequestrationfromtreesandalteredcarbonemissionsfromalteredbuildingenergyuseeffects.
ChangesinCarbonSequestration,AlteredBuildingEnergyUse,andMaintenanceEmissions.Todeterminehowtreeandmaintenanceeffectsoncarbonchangethroughtime,thefieldplotsortreesinventoriedcanbere‐measured,andresultsbetweentheyearscontrastedtoestimatechangesincarbonstock,netannualcarboneffects,andalteredbuildingenergyuseeffects.In
Equation6‐10:CalculateCarbon EmissionsfromMaintenanceEquipment
C=N×HRS×HP×LF×E
Where:
C =Carbonemissions(g)
N =Numberofunits(dimensionless)
HRS =Hoursused(hr)
HP =Averageratedhorsepower(hp)
LF =Typicalloadfactor(dimensionless)
E =Averagecarbonemissionsperunitofuse(ghp−1hr−1)(U.S.EPA1991)
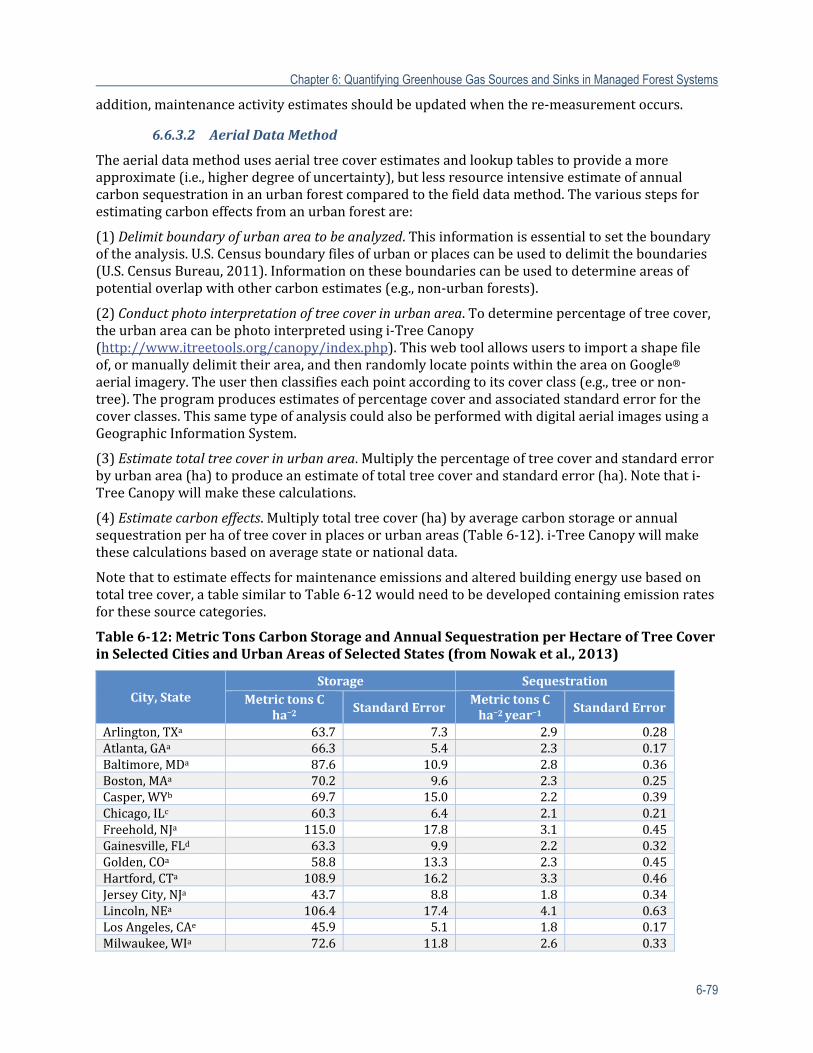
Chapter 6: Quantifying Greenhouse Gas Sources and Sinks in Managed Forest Systems
6-79
addition,maintenanceactivityestimatesshouldbeupdatedwhenthere‐measurementoccurs.
6.6.3.2 AerialDataMethod
Theaerialdatamethodusesaerialtreecoverestimatesandlookuptablestoprovideamoreapproximate(i.e.,higherdegreeofuncertainty),butlessresourceintensiveestimateofannualcarbonsequestrationinanurbanforestcomparedtothefielddatamethod.Thevariousstepsforestimatingcarboneffectsfromanurbanforestare:
(1)Delimitboundaryofurbanareatobeanalyzed.Thisinformationisessentialtosettheboundaryoftheanalysis.U.S.Censusboundaryfilesofurbanorplacescanbeusedtodelimittheboundaries(U.S.CensusBureau,2011).Informationontheseboundariescanbeusedtodetermineareasofpotentialoverlapwithothercarbonestimates(e.g.,non‐urbanforests).
(2)Conductphotointerpretationoftreecoverinurbanarea.Todeterminepercentageoftreecover,theurbanareacanbephotointerpretedusingi‐TreeCanopy(http://www.itreetools.org/canopy/index.php).Thiswebtoolallowsuserstoimportashapefileof,ormanuallydelimittheirarea,andthenrandomlylocatepointswithintheareaonGoogle®aerialimagery.Theuserthenclassifieseachpointaccordingtoitscoverclass(e.g.,treeornon‐tree).Theprogramproducesestimatesofpercentagecoverandassociatedstandarderrorforthecoverclasses.ThissametypeofanalysiscouldalsobeperformedwithdigitalaerialimagesusingaGeographicInformationSystem.
(3)Estimatetotaltreecoverinurbanarea.Multiplythepercentageoftreecoverandstandarderrorbyurbanarea(ha)toproduceanestimateoftotaltreecoverandstandarderror(ha).Notethati‐TreeCanopywillmakethesecalculations.
(4)Estimatecarboneffects.Multiplytotaltreecover(ha)byaveragecarbonstorageorannualsequestrationperhaoftreecoverinplacesorurbanareas(Table6‐12).i‐TreeCanopywillmakethesecalculationsbasedonaveragestateornationaldata.
Notethattoestimateeffectsformaintenanceemissionsandalteredbuildingenergyusebasedontotaltreecover,atablesimilartoTable6‐12wouldneedtobedevelopedcontainingemissionratesforthesesourcecategories.
Table6‐12:MetricTonsCarbonStorageandAnnualSequestrationperHectareofTreeCoverinSelectedCitiesandUrbanAreasofSelectedStates(fromNowaketal.,2013)
City,StateStorage Sequestration
MetrictonsCha−2 StandardError
MetrictonsCha−2year−1
StandardError
Arlington,TXa 63.7 7.3 2.9 0.28Atlanta,GAa 66.3 5.4 2.3 0.17Baltimore,MDa 87.6 10.9 2.8 0.36Boston,MAa 70.2 9.6 2.3 0.25Casper,WYb 69.7 15.0 2.2 0.39Chicago,ILc 60.3 6.4 2.1 0.21Freehold,NJa 115.0 17.8 3.1 0.45Gainesville,FLd 63.3 9.9 2.2 0.32Golden,COa 58.8 13.3 2.3 0.45Hartford,CTa 108.9 16.2 3.3 0.46JerseyCity,NJa 43.7 8.8 1.8 0.34Lincoln,NEa 106.4 17.4 4.1 0.63LosAngeles,CAe 45.9 5.1 1.8 0.17Milwaukee,WIa 72.6 11.8 2.6 0.33
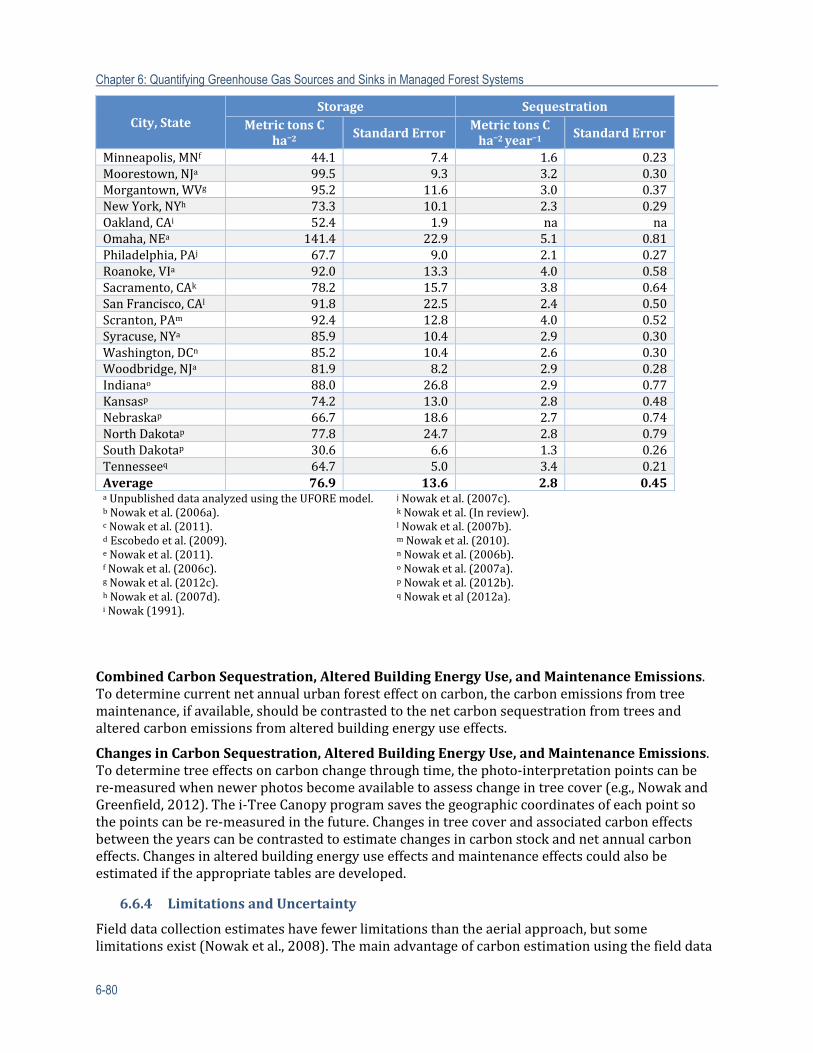
Chapter 6: Quantifying Greenhouse Gas Sources and Sinks in Managed Forest Systems
6-80
City,StateStorage Sequestration
MetrictonsCha−2 StandardError
MetrictonsCha−2year−1
StandardError
Minneapolis,MNf 44.1 7.4 1.6 0.23Moorestown,NJa 99.5 9.3 3.2 0.30Morgantown,WVg 95.2 11.6 3.0 0.37NewYork,NYh 73.3 10.1 2.3 0.29Oakland,CAi 52.4 1.9 na naOmaha,NEa 141.4 22.9 5.1 0.81Philadelphia,PAj 67.7 9.0 2.1 0.27Roanoke,VIa 92.0 13.3 4.0 0.58Sacramento,CAk 78.2 15.7 3.8 0.64SanFrancisco,CAl 91.8 22.5 2.4 0.50Scranton,PAm 92.4 12.8 4.0 0.52Syracuse,NYa 85.9 10.4 2.9 0.30Washington,DCn 85.2 10.4 2.6 0.30Woodbridge,NJa 81.9 8.2 2.9 0.28Indianao 88.0 26.8 2.9 0.77Kansasp 74.2 13.0 2.8 0.48Nebraskap 66.7 18.6 2.7 0.74NorthDakotap 77.8 24.7 2.8 0.79SouthDakotap 30.6 6.6 1.3 0.26Tennesseeq 64.7 5.0 3.4 0.21Average 76.9 13.6 2.8 0.45aUnpublisheddataanalyzedusingtheUFOREmodel.bNowaketal.(2006a).cNowaketal.(2011).dEscobedoetal.(2009).eNowaketal.(2011).fNowaketal.(2006c).gNowaketal.(2012c).hNowaketal.(2007d).iNowak(1991).
j Nowaketal.(2007c).kNowaketal.(Inreview).lNowaketal.(2007b).mNowaketal.(2010).nNowaketal.(2006b).oNowaketal.(2007a).pNowaketal.(2012b).qNowaketal(2012a).
CombinedCarbonSequestration,AlteredBuildingEnergyUse,andMaintenanceEmissions.Todeterminecurrentnetannualurbanforesteffectoncarbon,thecarbonemissionsfromtreemaintenance,ifavailable,shouldbecontrastedtothenetcarbonsequestrationfromtreesandalteredcarbonemissionsfromalteredbuildingenergyuseeffects.
ChangesinCarbonSequestration,AlteredBuildingEnergyUse,andMaintenanceEmissions.Todeterminetreeeffectsoncarbonchangethroughtime,thephoto‐interpretationpointscanbere‐measuredwhennewerphotosbecomeavailabletoassesschangeintreecover(e.g.,NowakandGreenfield,2012).Thei‐TreeCanopyprogramsavesthegeographiccoordinatesofeachpointsothepointscanbere‐measuredinthefuture.Changesintreecoverandassociatedcarboneffectsbetweentheyearscanbecontrastedtoestimatechangesincarbonstockandnetannualcarboneffects.Changesinalteredbuildingenergyuseeffectsandmaintenanceeffectscouldalsobeestimatediftheappropriatetablesaredeveloped.
6.6.4 LimitationsandUncertainty
Fielddatacollectionestimateshavefewerlimitationsthantheaerialapproach,butsomelimitationsexist(Nowaketal.,2008).Themainadvantageofcarbonestimationusingthefielddata
Chapter 6: Quantifying Greenhouse Gas Sources and Sinks in Managed Forest Systems
6-81
approachandi‐Treeishavingaccurateestimatesofthetreepopulation(e.g.,species,size,distribution)withacalculatedlevelofprecision.Themodeledcarbonvaluesareestimatesbasedonforest‐derivedallometricequations(Nowak,1994;NowakandCrane,2002).Thecarbonestimatesyieldastandarderroroftheestimatebasedonsamplingerror,ratherthanerrorofestimation.Estimationerrorisunknown,andlikelylargerthanthereportedsamplingerror.Estimationerrorincludestheuncertaintyofusingbiomassequationsandconversionfactors,whichmaybelarge,aswellasmeasurementerror,whichistypicallysmall.Thestandardizedcarbonvalues(e.g.,kgCha−1orlbsC(acreoftreecover)−1)fallinlinewithvaluesforforests(BirdseyandHeath,1995),butvaluesforcities(places)canbehigher(Table6‐12),likelyduetoalargerproportionoflargetreesincityenvironmentsandrelativelyfastgrowthratesduetoamoreopenurbanforeststructure(NowakandCrane,2002).
Therearevariousmeanstohelpimprovethecarbonstorageandsequestrationestimatesforurbantrees.Carbonestimatesforopen‐grownurbantreesareadjusteddownwardbasedonfieldmeasurementsoftreesintheChicagoarea(Nowak,1994).Thisadjustmentmayleadtoconservativeestimatesofcarbon.Moreresearchisneededontheapplicabilityofforest‐derivedequationstourbantrees.Inaddition,moreurbantreegrowthdataareneededtobetterunderstandregionalvariabilityofurbantreegrowthunderdifferingsiteconditions(e.g.,treecompetition)forbetterannualsequestrationestimates.Averageregionalgrowthestimatesareusedbasedonlimitedmeasuredurbantreegrowthdatastandardizedtolengthofgrowingseasonandcrowncompetition.
Therearecurrentlyaverylimitednumberofbiomassequationsfortropicaltreesini‐Tree.Themodelneedstobeupdatedwithtropicaltreebiomassequationsformoreaccurateestimatesintropicalcities.Futureresearchisneededtoobtainbiomassequationsforurbanorornamentaltreespecies.Estimatesoftreedecayandnetannualsequestrationini‐Treearequiterudimentary(Nowaketal.,2010),andcanbeimprovedwithfutureresearch.Thedegreeofuncertaintyofthenetcarbonsequestrationestimatesisunknown.
Estimatesofmaintenanceemissionsandalteredbuildingenergyuseeffectsarealsorathercrude.Accuratemaintenanceemissionsestimatesrequiregoodestimatesofvehicleandmaintenanceequipmentuse;thentheyrelyonanaveragemultiplierforemissionsfromtheliterature.Energyeffectsestimatesarebasedonsamplingproximityoftreesnearbuildingswithinvarioustreesize,distance,anddirectionclassesfromabuilding.Energyfactors,convertedtocarbonemissionfactorsbasedonstateaverageenergydistribution(e.g.,electricity,oil)areappliedtotreesineachbuildinglocationclassbasedonU.S.climatezoneandaveragebuildingtypesinastatetoestimateenergyeffects(seeMcPhersonandSimpson,1999).Thoughtheseestimatesarecrude,withanunknowncertainty,theyarebasedonreasonableapproachesthatprovidefirst‐orderestimatesofeffects.Itshouldbenotedthatemissionreductionsfromalteredbuildingenergyuseeffectsmightalsobeimplicitlyincludedinanyemissionestimationanentitymightperformbasedonactualenergyusedata(e.g.,meterreadings)forthebuildinginquestion.
Estimatesbasedonaerialtreecanopyeffectshavethesamelimitationsasfielddataapproaches,plussomeadditionallimitationsandadvantages.Theadvantagesincludeasimple,quick,andaccuratemeanstoassesstheamountofcanopycoverinanarea,withmeasuresthatarerepeatablethroughtime.Thedisadvantagesarethattheusermustusealookupvaluefromatable(e.g.,meanvalueperunitofcanopycover)toestimatecarboneffects.Thoughthetreecoverestimatewillbeaccuratewithknownuncertainty(i.e.,standarderror),thecarbonmultipliersmaybeoffdependingupontheurbanforestcharacteristics.Ifaveragemultipliersareused,theaccuracyofthoseestimateswilldeclineasthedifferenceincreasesbetweenthelocalurbancharacteristicsandthevaluesoftheaveragemultipliers.Iflocalfielddataarenotcollected,thenthediscrepancybetweentheurbanforest’scharacteristicsandthoseofaveragevaluesisunknown.Iftheaveragevaluesin
Chapter 6: Quantifying Greenhouse Gas Sources and Sinks in Managed Forest Systems
6-82
Table6‐12trulyrepresentaverages,theestimatesoveralargepopulationofurbanareasshouldbereliable.However,localestimatesmaybeinaccuratedependingupontheextenttowhichcharacteristicsofthelocalurbanforestdivergefromtheaveragevalues.
Bothapproachescanprovidecarbonestimatesforurbanareas,withdifferingdegreesofuncertaintyandworkrequired.Bothapproachescanalsobeimprovedwithmorefielddatacollectioninurbanareas,andwithmodelandmethodimprovementsrelatedtocarbonestimation.
6.7 NaturalDisturbance–WildfireandPrescribedFire
6.7.1 Description
FireproducesGHGemissionsdirectlythroughfuelconsumption.Emissionsproducedaredirectlyproportionaltofuelconsumed.Fuelconsumptionisinturninfluencedbyfuelquantityandfuelcharacteristicssuchassize,moisturecontent,fireweather,andfireseverity.Algorithmsexistforestimatingfuelconsumptionforavarietyoffueltypesandconditions.Fireandotherdisturbancesalsoconvertlivevegetationtodead,alteringsubsequentcarbondynamicsonthesitebyreducingcarboncapturedbyphotosynthesisintheshortrunduetoreducedvegetativecover,andincreasingemissionsfromdecompositionofdeadvegetation.Fireseverity,whichisdrivenbytheonsitefactorsthatdriveconsumptionaswellasotherphysicalfactors,willdrivethesubsequentcarbondynamicsandareawherereversalofcarbonretentionmayoccur.
6.7.2 ActivityDataCollection
Foralldisturbances,keyactivitydataistheareaaffected.Asimpledescriptorisusedtocharacterizetheseverityoftheevent.Forbothwildfireandprescribedfire/controlburns,descriptorsofseverityincludecrownfire,stand‐replacementunderburn,mixed‐severityunderburn(sometreemortality),andlow‐severityunderburn.Typicallywildfirewillbemoreweightedtowardscrownfireandhigherseverityversuslowerseverityfromprescribedfire.Forotherdisturbances,thepercentageoflivetreeskilled(orpercentagebasalareamortality)andthepercentageofkilledtreesthatarestillstandingaswascoveredpreviouslyinSection6.4.2.10andSection6.4.4.8areused.
6.7.3 EstimationMethods
FOFEM9(Reinhardtetal.,1997)isrecommendedforestimatingGHGemissions,becauseitisapplicablenationally,computercodeisavailablethatcanbelinkedtoorincorporatedintoother
9http://www.firelab.org/science‐applications/fire‐fuel/111‐fofem
MethodsforEmissionsfromNaturalDisturbances
Rangeofoptionsdependsonthedataavailabilityoftheentity’sforestlandincluding:
− FOFEMmodelenteringmeasuredbiomass;and
− FOFEMmodelusingdefaultvaluesgeneratedbyvegetationtype.
TheseoptionsuseReinhardtetal.(1997).
Themethodswereselectedbecausetheyprovidearangeofoptionsdependentonthedataavailabilityoftheentity'sdisturbedforestland.
Chapter 6: Quantifying Greenhouse Gas Sources and Sinks in Managed Forest Systems
6-83
code,andinputsaredefinedsothatmeasuredbiomasscanbeenteredordefaultvaluesgeneratedbyvegetationtype.FOFEMproducesdirectestimatesoftotalCO2,CO,CH4,andNOxemitted,aswellasestimatesoffuelconsumptionbycomponent,whichcanbeusedtodetermineresidualfuelquantitiesforestimatingsubsequentdecomposition.FOFEMand/orCONSUME(JointFireScienceProgram,2009)canalsobeuseddirectlytocomputeemissionsandconsumptionfromfire.FOFEMalgorithmscanalsobeusedtocomputetreemortalityinordertoupdateestimatesofliveanddeadbiomass.AlthoughanotheroptionistouseFVS‐FFE10(Rebain,2010;ReinhardtandCrookston,2003),itisnottherecommendedapproachforwildfireGHGcalculation.FVS‐FFEusesmanyofthesameinternalalgorithmsforestimatingtreemortality,fuelconsumption,andemissionsasFOFEM,butalsosimulatesstand,fuel,andcarbondynamicsovertime.Itisamorepowerfulpredictivetool,butsubstantiallymoreworkisinvolvedinunderstandingthemodelingframework,settingupmodelrunsanddatapreparation.Alternatively,lookuptablescanbebuiltusingthesetoolsforarangeofvegetationtypes,fuelloadingsfromnaturaland/ormanagementprocesses,andfireseverities,orasimplifiedalgorithmcanbedevelopedasinthe2006IPCCGuidelinesforNationalGHGInventories(IPCC,2006).
10http://www.fs.fed.us/fmsc/fvs/whatis/index.shtml
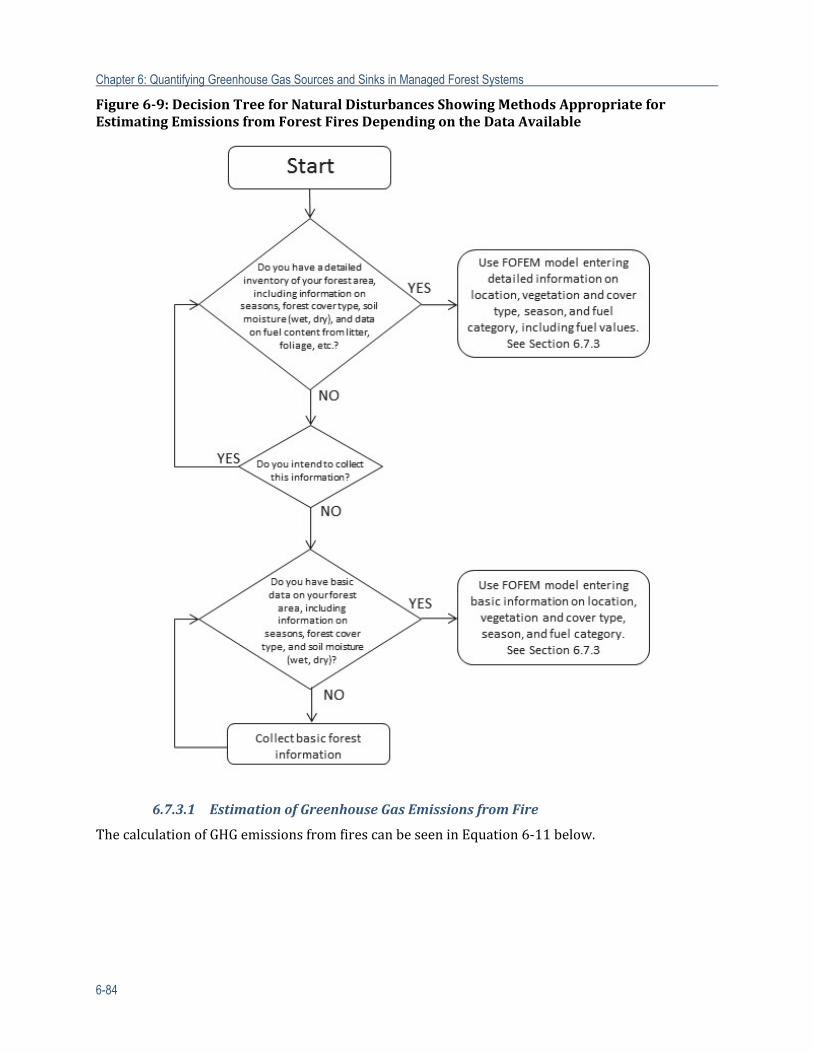
Chapter 6: Quantifying Greenhouse Gas Sources and Sinks in Managed Forest Systems
6-84
Figure6‐9:DecisionTreeforNaturalDisturbancesShowingMethodsAppropriateforEstimatingEmissionsfromForestFiresDependingontheDataAvailable
6.7.3.1 EstimationofGreenhouseGasEmissionsfromFire
ThecalculationofGHGemissionsfromfirescanbeseeninEquation6‐11below.
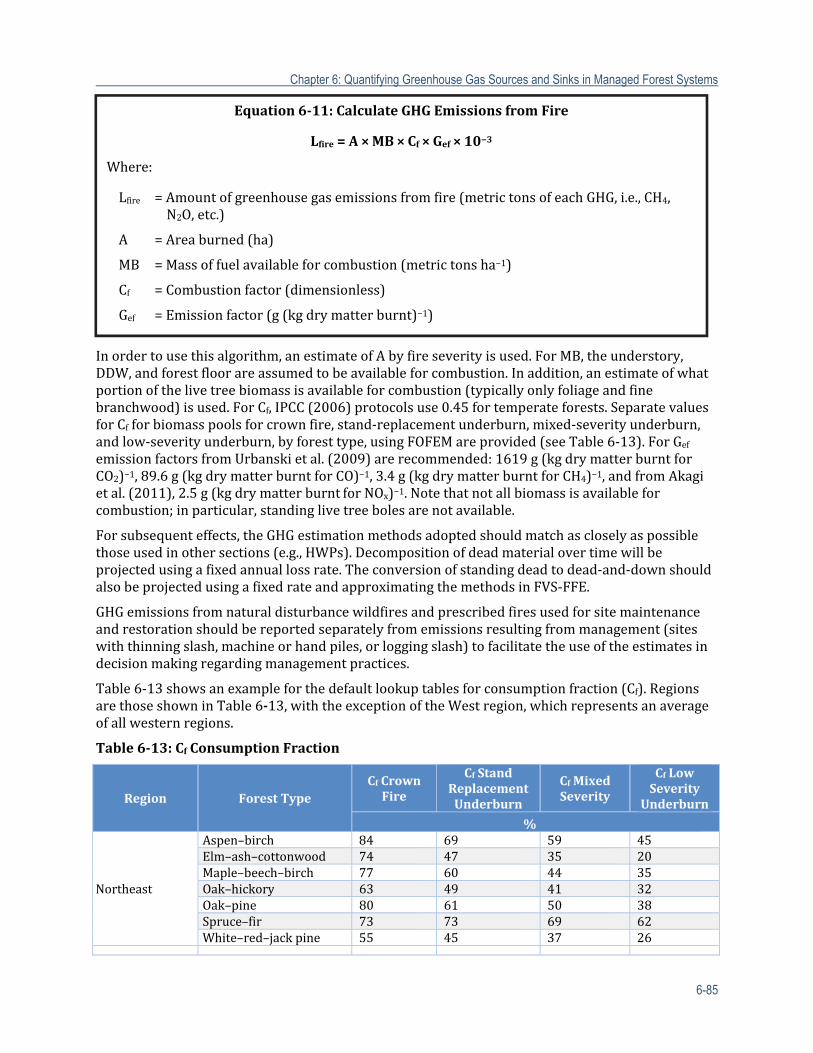
Chapter 6: Quantifying Greenhouse Gas Sources and Sinks in Managed Forest Systems
6-85
Inordertousethisalgorithm,anestimateofAbyfireseverityisused.ForMB,theunderstory,DDW,andforestfloorareassumedtobeavailableforcombustion.Inaddition,anestimateofwhatportionofthelivetreebiomassisavailableforcombustion(typicallyonlyfoliageandfinebranchwood)isused.ForCf,IPCC(2006)protocolsuse0.45fortemperateforests.SeparatevaluesforCfforbiomasspoolsforcrownfire,stand‐replacementunderburn,mixed‐severityunderburn,andlow‐severityunderburn,byforesttype,usingFOFEMareprovided(seeTable6‐13).ForGefemissionfactorsfromUrbanskietal.(2009)arerecommended:1619g(kgdrymatterburntforCO2)−1,89.6g(kgdrymatterburntforCO)−1,3.4g(kgdrymatterburntforCH4)−1,andfromAkagietal.(2011),2.5g(kgdrymatterburntforNOx)−1.Notethatnotallbiomassisavailableforcombustion;inparticular,standinglivetreebolesarenotavailable.
Forsubsequenteffects,theGHGestimationmethodsadoptedshouldmatchascloselyaspossiblethoseusedinothersections(e.g.,HWPs).Decompositionofdeadmaterialovertimewillbeprojectedusingafixedannuallossrate.Theconversionofstandingdeadtodead‐and‐downshouldalsobeprojectedusingafixedrateandapproximatingthemethodsinFVS‐FFE.
GHGemissionsfromnaturaldisturbancewildfiresandprescribedfiresusedforsitemaintenanceandrestorationshouldbereportedseparatelyfromemissionsresultingfrommanagement(siteswiththinningslash,machineorhandpiles,orloggingslash)tofacilitatetheuseoftheestimatesindecisionmakingregardingmanagementpractices.
Table6‐13showsanexampleforthedefaultlookuptablesforconsumptionfraction(Cf).RegionsarethoseshowninTable6‐13,withtheexceptionoftheWestregion,whichrepresentsanaverageofallwesternregions.
Table6‐13:CfConsumptionFraction
Region ForestTypeCfCrownFire
Cf StandReplacementUnderburn
CfMixedSeverity
Cf LowSeverity
Underburn
%
Northeast
Aspen–birch 84 69 59 45Elm–ash–cottonwood 74 47 35 20Maple–beech–birch 77 60 44 35Oak–hickory 63 49 41 32Oak–pine 80 61 50 38Spruce–fir 73 73 69 62White–red–jackpine 55 45 37 26
Equation6‐11:CalculateGHGEmissionsfromFire
Lfire=A×MB×Cf×Gef×10−3
Where:
Lfire =Amountofgreenhousegasemissionsfromfire(metrictonsofeachGHG,i.e.,CH4,N2O,etc.)
A =Areaburned(ha)
MB =Massoffuelavailableforcombustion(metrictonsha−1)
Cf =Combustionfactor(dimensionless)
Gef =Emissionfactor(g(kgdrymatterburnt)−1)
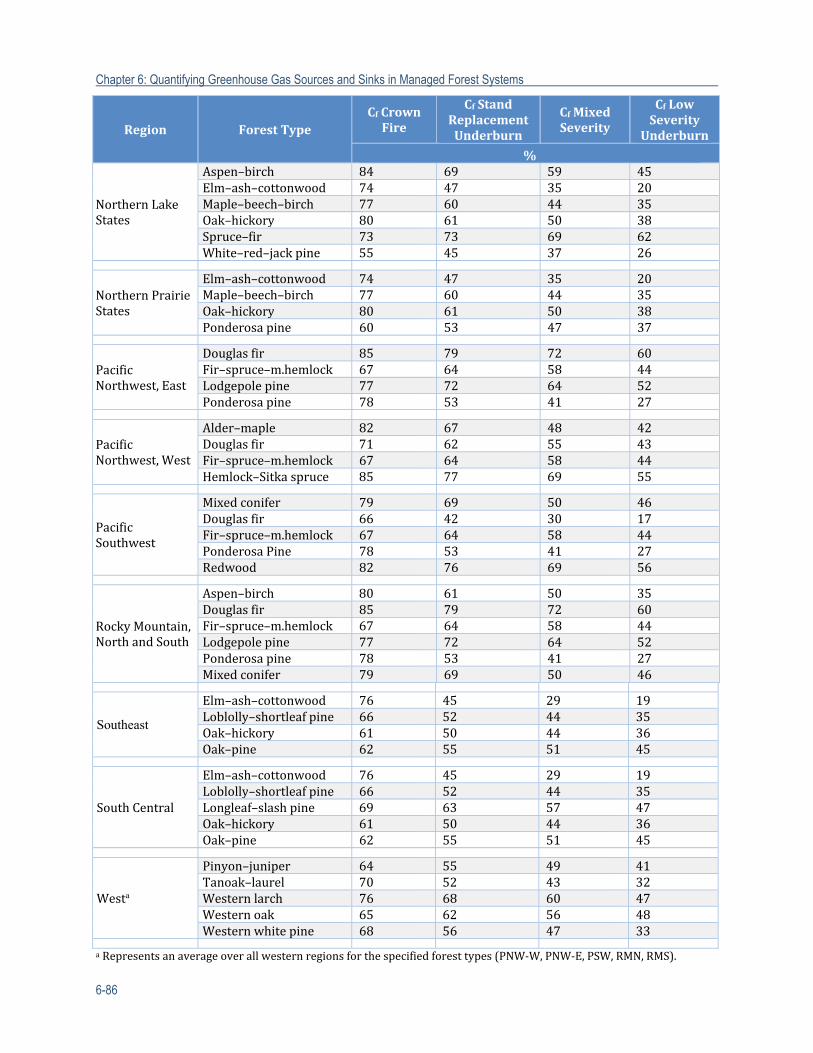
Chapter 6: Quantifying Greenhouse Gas Sources and Sinks in Managed Forest Systems
6-86
Region ForestTypeCfCrownFire
Cf StandReplacementUnderburn
CfMixedSeverity
Cf LowSeverity
Underburn
%
NorthernLakeStates
Aspen–birch 84 69 59 45Elm–ash–cottonwood 74 47 35 20Maple–beech–birch 77 60 44 35Oak–hickory 80 61 50 38Spruce–fir 73 73 69 62White–red–jackpine 55 45 37 26
NorthernPrairieStates
Elm–ash–cottonwood 74 47 35 20Maple–beech–birch 77 60 44 35Oak–hickory 80 61 50 38Ponderosapine 60 53 47 37
PacificNorthwest,East
Douglasfir 85 79 72 60Fir–spruce–m.hemlock 67 64 58 44Lodgepolepine 77 72 64 52Ponderosapine 78 53 41 27
PacificNorthwest,West
Alder–maple 82 67 48 42Douglasfir 71 62 55 43Fir–spruce–m.hemlock 67 64 58 44Hemlock–Sitkaspruce 85 77 69 55
PacificSouthwest
Mixedconifer 79 69 50 46Douglasfir 66 42 30 17Fir–spruce–m.hemlock 67 64 58 44PonderosaPine 78 53 41 27Redwood 82 76 69 56
RockyMountain,NorthandSouth
Aspen–birch 80 61 50 35Douglasfir 85 79 72 60Fir–spruce–m.hemlock 67 64 58 44Lodgepolepine 77 72 64 52Ponderosapine 78 53 41 27Mixedconifer 79 69 50 46
Southeast
Elm–ash–cottonwood 76 45 29 19Loblolly–shortleafpine 66 52 44 35Oak–hickory 61 50 44 36Oak–pine 62 55 51 45
SouthCentral
Elm–ash–cottonwood 76 45 29 19Loblolly–shortleafpine 66 52 44 35Longleaf–slashpine 69 63 57 47Oak–hickory 61 50 44 36Oak–pine 62 55 51 45
Westa
Pinyon–juniper 64 55 49 41Tanoak–laurel 70 52 43 32Westernlarch 76 68 60 47Westernoak 65 62 56 48Westernwhitepine 68 56 47 33
aRepresentsanaverageoverallwesternregionsforthespecifiedforesttypes(PNW‐W,PNW‐E,PSW,RMN,RMS).
Chapter 6: Quantifying Greenhouse Gas Sources and Sinks in Managed Forest Systems
6-87
6.7.3.2 EstimationofGreenhouseGasEmissionsfromOtherDisturbances
Forotherdisturbances,theprimaryeffectsareindirect:byconvertinglivebiomasstodead—andinsomecasesstandingtreestodead,downtrees—decompositionisaccelerated.Currentlygroupingnon‐firedisturbanceintotwocategoriesissuggested:disturbancesthatleavedeadtreesstanding(insectanddisease‐causedmortality)anddisturbancethatleavesthetreesontheground(windoricestorms).Thelandownerwillhavetoestimatemortality(Section6.7.2);thenasindecompositionoffire‐killedtrees,afixeddecompositionrate(defaultvalue0.015)willbeusedtosimulatesubsequentdecomposition.
Forinsectorpathogen‐causedmortality,thetreesareassumedtobeinitiallystandingafterdeath.Conversionofstandingdeadtodead‐and‐downwillbeprojectedusingafixedrateandapproximatingthemethodsinFVS‐FEE.Oncedown,thedefaultdecompositionratefromFVS‐FFEof0.015fordeadanddownwoodwillbeusedtosimulatedecomposition.Forblowdownsoricestorms,theimpactedtreesareassumedtobedeadanddown.Inthiscasedecompositionbeginsimmediately.
6.7.4 LimitationsandUncertainty
Amajorsourceofuncertaintyinpredictingfireemissionsisthepreburnfuelquantities.Iflandownersaredoingsomekindofinventoryofliveanddeadbiomass(seeSection6.7.2)theywillhaverelativelyrobustestimatesofavailablefuel.Iftheyareusinglookuptablevaluesbyforesttype,therewillbemoreuncertaintyassociatedwiththeestimatessincefuelquantitiesvarygreatlywithinforesttype.
Arelatedchallengeisdeterminingtheappropriatedegreeofspecificityfortrackingbiomassbypools(e.g.,live,dead).Anykindofmanagementordisturbancechangesbiomassatthetimeofoccurrence,andalsothesubsequenttrajectory.Subsequentmanagementordisturbanceshouldbeappliedtothechangedandchangingvalues,nottheoriginalvalues.ThiscanresultinacomplicatedsimulationmodellikeFVS,ratherthanacalculator.Sinceprefirefuelquantityisthestrongestpredictoroffuelconsumption,determiningtheappropriatedegreeofspecificityfortrackingbiomassbypoolsisnotacompletelyacademicquestion.
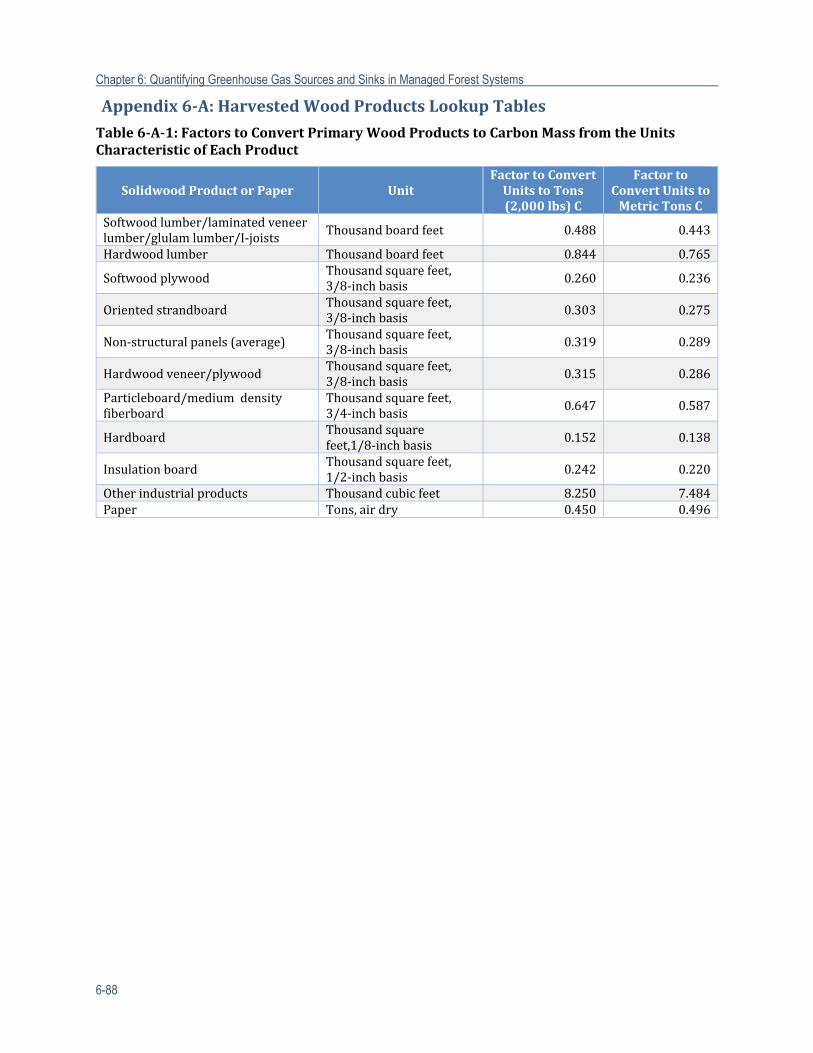
Chapter 6: Quantifying Greenhouse Gas Sources and Sinks in Managed Forest Systems
6-88
Appendix6‐A:HarvestedWoodProductsLookupTables
Table6‐A‐1:FactorstoConvertPrimaryWoodProductstoCarbonMassfromtheUnitsCharacteristicofEachProduct
SolidwoodProductorPaper UnitFactortoConvertUnitstoTons(2,000lbs)C
FactortoConvertUnitstoMetricTonsC
Softwoodlumber/laminatedveneerlumber/glulamlumber/I‐joists
Thousandboardfeet 0.488 0.443
Hardwoodlumber Thousandboardfeet 0.844 0.765
Softwoodplywood Thousandsquarefeet,3/8‐inchbasis
0.260 0.236
Orientedstrandboard Thousandsquarefeet,3/8‐inchbasis
0.303 0.275
Non‐structuralpanels(average)Thousandsquarefeet,3/8‐inchbasis 0.319 0.289
Hardwoodveneer/plywoodThousandsquarefeet,3/8‐inchbasis 0.315 0.286
Particleboard/mediumdensityfiberboard
Thousandsquarefeet,3/4‐inchbasis 0.647 0.587
HardboardThousandsquarefeet,1/8‐inchbasis
0.152 0.138
InsulationboardThousandsquarefeet,1/2‐inchbasis
0.242 0.220
Otherindustrialproducts Thousandcubicfeet 8.250 7.484Paper Tons,airdry 0.450 0.496
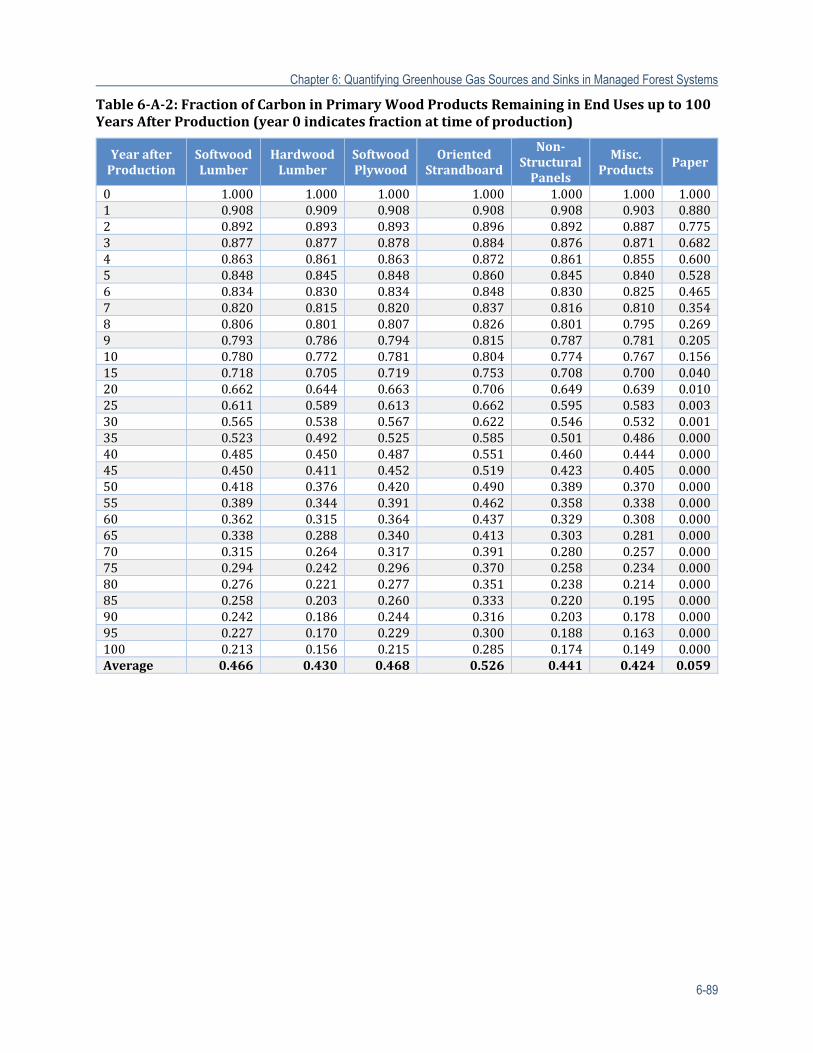
Chapter 6: Quantifying Greenhouse Gas Sources and Sinks in Managed Forest Systems
6-89
Table6‐A‐2:FractionofCarboninPrimaryWoodProductsRemaininginEndUsesupto100YearsAfterProduction(year0indicatesfractionattimeofproduction)
YearafterProduction
SoftwoodLumber
HardwoodLumber
SoftwoodPlywood
OrientedStrandboard
Non‐StructuralPanels
Misc.Products Paper
0 1.000 1.000 1.000 1.000 1.000 1.000 1.0001 0.908 0.909 0.908 0.908 0.908 0.903 0.8802 0.892 0.893 0.893 0.896 0.892 0.887 0.7753 0.877 0.877 0.878 0.884 0.876 0.871 0.6824 0.863 0.861 0.863 0.872 0.861 0.855 0.6005 0.848 0.845 0.848 0.860 0.845 0.840 0.5286 0.834 0.830 0.834 0.848 0.830 0.825 0.4657 0.820 0.815 0.820 0.837 0.816 0.810 0.3548 0.806 0.801 0.807 0.826 0.801 0.795 0.2699 0.793 0.786 0.794 0.815 0.787 0.781 0.20510 0.780 0.772 0.781 0.804 0.774 0.767 0.15615 0.718 0.705 0.719 0.753 0.708 0.700 0.04020 0.662 0.644 0.663 0.706 0.649 0.639 0.01025 0.611 0.589 0.613 0.662 0.595 0.583 0.00330 0.565 0.538 0.567 0.622 0.546 0.532 0.00135 0.523 0.492 0.525 0.585 0.501 0.486 0.00040 0.485 0.450 0.487 0.551 0.460 0.444 0.00045 0.450 0.411 0.452 0.519 0.423 0.405 0.00050 0.418 0.376 0.420 0.490 0.389 0.370 0.00055 0.389 0.344 0.391 0.462 0.358 0.338 0.00060 0.362 0.315 0.364 0.437 0.329 0.308 0.00065 0.338 0.288 0.340 0.413 0.303 0.281 0.00070 0.315 0.264 0.317 0.391 0.280 0.257 0.00075 0.294 0.242 0.296 0.370 0.258 0.234 0.00080 0.276 0.221 0.277 0.351 0.238 0.214 0.00085 0.258 0.203 0.260 0.333 0.220 0.195 0.00090 0.242 0.186 0.244 0.316 0.203 0.178 0.00095 0.227 0.170 0.229 0.300 0.188 0.163 0.000100 0.213 0.156 0.215 0.285 0.174 0.149 0.000Average 0.466 0.430 0.468 0.526 0.441 0.424 0.059
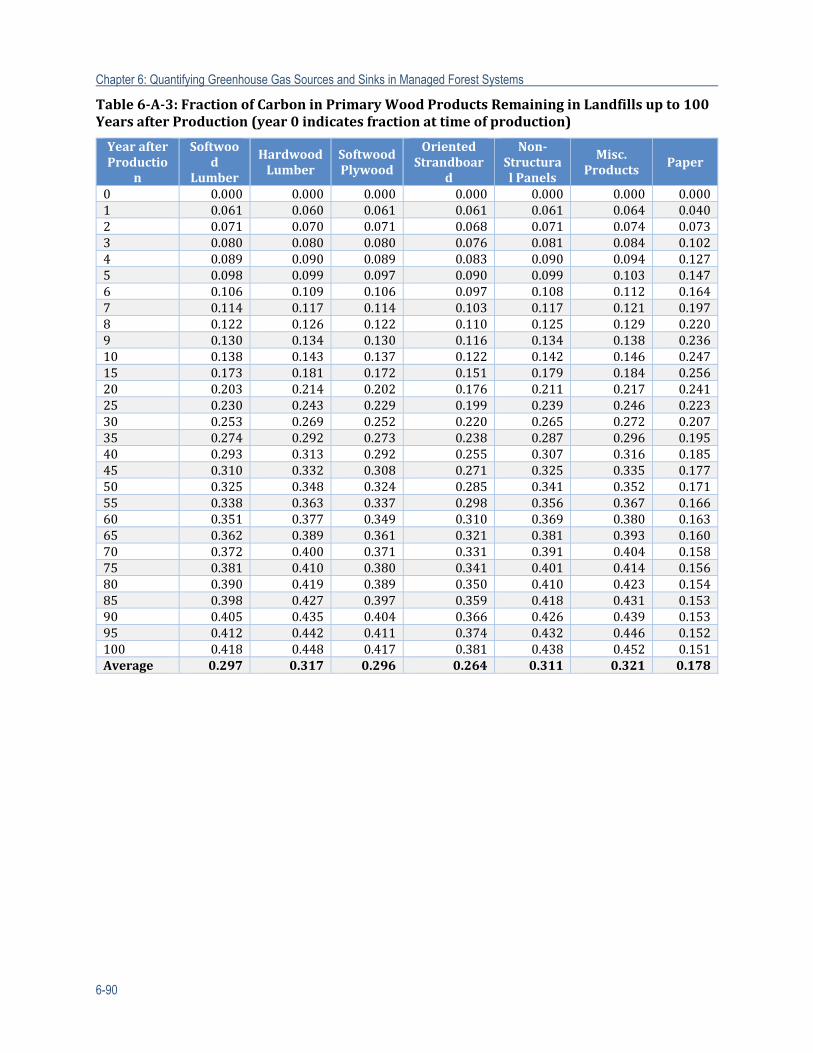
Chapter 6: Quantifying Greenhouse Gas Sources and Sinks in Managed Forest Systems
6-90
Table6‐A‐3:FractionofCarboninPrimaryWoodProductsRemaininginLandfillsupto100YearsafterProduction(year0indicatesfractionattimeofproduction)
YearafterProductio
n
Softwood
Lumber
HardwoodLumber
SoftwoodPlywood
OrientedStrandboar
d
Non‐StructuralPanels
Misc.Products Paper
0 0.000 0.000 0.000 0.000 0.000 0.000 0.0001 0.061 0.060 0.061 0.061 0.061 0.064 0.0402 0.071 0.070 0.071 0.068 0.071 0.074 0.0733 0.080 0.080 0.080 0.076 0.081 0.084 0.1024 0.089 0.090 0.089 0.083 0.090 0.094 0.1275 0.098 0.099 0.097 0.090 0.099 0.103 0.1476 0.106 0.109 0.106 0.097 0.108 0.112 0.1647 0.114 0.117 0.114 0.103 0.117 0.121 0.1978 0.122 0.126 0.122 0.110 0.125 0.129 0.2209 0.130 0.134 0.130 0.116 0.134 0.138 0.23610 0.138 0.143 0.137 0.122 0.142 0.146 0.24715 0.173 0.181 0.172 0.151 0.179 0.184 0.25620 0.203 0.214 0.202 0.176 0.211 0.217 0.24125 0.230 0.243 0.229 0.199 0.239 0.246 0.22330 0.253 0.269 0.252 0.220 0.265 0.272 0.20735 0.274 0.292 0.273 0.238 0.287 0.296 0.19540 0.293 0.313 0.292 0.255 0.307 0.316 0.18545 0.310 0.332 0.308 0.271 0.325 0.335 0.17750 0.325 0.348 0.324 0.285 0.341 0.352 0.17155 0.338 0.363 0.337 0.298 0.356 0.367 0.16660 0.351 0.377 0.349 0.310 0.369 0.380 0.16365 0.362 0.389 0.361 0.321 0.381 0.393 0.16070 0.372 0.400 0.371 0.331 0.391 0.404 0.15875 0.381 0.410 0.380 0.341 0.401 0.414 0.15680 0.390 0.419 0.389 0.350 0.410 0.423 0.15485 0.398 0.427 0.397 0.359 0.418 0.431 0.15390 0.405 0.435 0.404 0.366 0.426 0.439 0.15395 0.412 0.442 0.411 0.374 0.432 0.446 0.152100 0.418 0.448 0.417 0.381 0.438 0.452 0.151Average 0.297 0.317 0.296 0.264 0.311 0.321 0.178
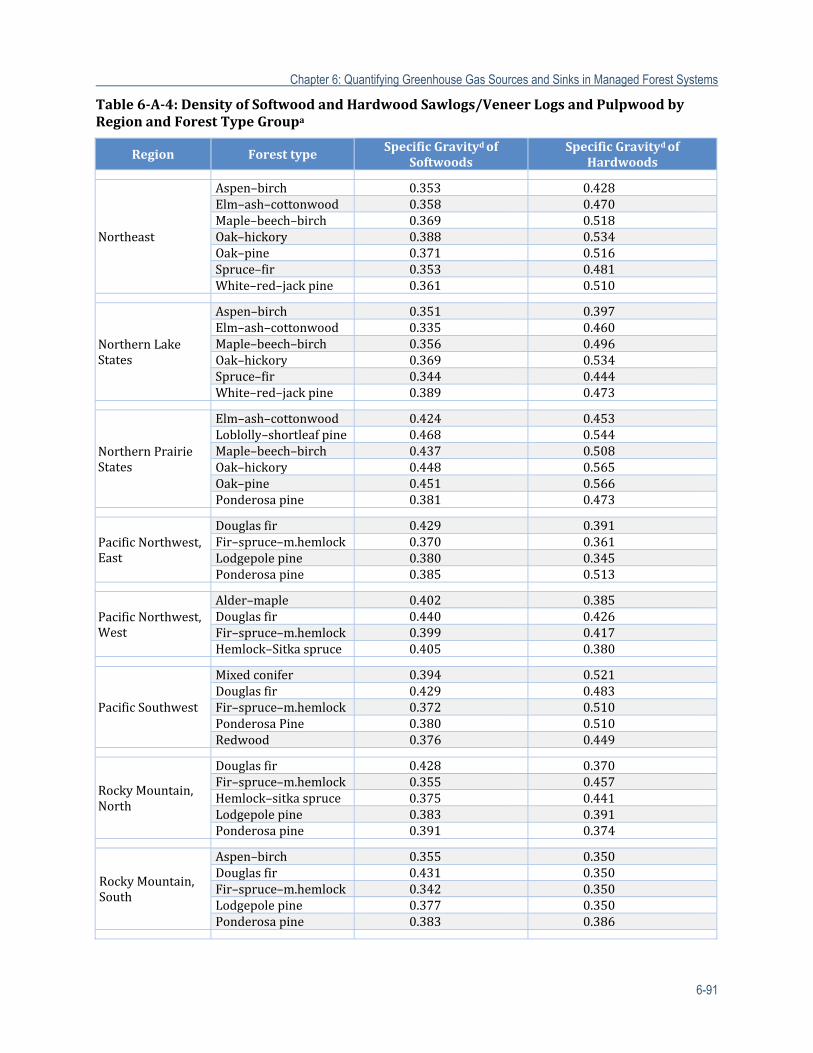
Chapter 6: Quantifying Greenhouse Gas Sources and Sinks in Managed Forest Systems
6-91
Table6‐A‐4:DensityofSoftwoodandHardwoodSawlogs/VeneerLogsandPulpwoodbyRegionandForestTypeGroupa
Region ForesttypeSpecific Gravitydof
SoftwoodsSpecificGravitydof
Hardwoods
Northeast
Aspen–birch 0.353 0.428Elm–ash–cottonwood 0.358 0.470Maple–beech–birch 0.369 0.518Oak–hickory 0.388 0.534Oak–pine 0.371 0.516Spruce–fir 0.353 0.481White–red–jackpine 0.361 0.510
NorthernLakeStates
Aspen–birch 0.351 0.397Elm–ash–cottonwood 0.335 0.460Maple–beech–birch 0.356 0.496Oak–hickory 0.369 0.534Spruce–fir 0.344 0.444White–red–jackpine 0.389 0.473
NorthernPrairieStates
Elm–ash–cottonwood 0.424 0.453Loblolly–shortleafpine 0.468 0.544Maple–beech–birch 0.437 0.508Oak–hickory 0.448 0.565Oak–pine 0.451 0.566Ponderosapine 0.381 0.473
PacificNorthwest,East
Douglasfir 0.429 0.391Fir–spruce–m.hemlock 0.370 0.361Lodgepolepine 0.380 0.345Ponderosapine 0.385 0.513
PacificNorthwest,West
Alder–maple 0.402 0.385Douglasfir 0.440 0.426Fir–spruce–m.hemlock 0.399 0.417Hemlock–Sitkaspruce 0.405 0.380
PacificSouthwest
Mixedconifer 0.394 0.521Douglasfir 0.429 0.483Fir–spruce–m.hemlock 0.372 0.510PonderosaPine 0.380 0.510Redwood 0.376 0.449
RockyMountain,North
Douglasfir 0.428 0.370Fir–spruce–m.hemlock 0.355 0.457Hemlock–sitkaspruce 0.375 0.441Lodgepolepine 0.383 0.391Ponderosapine 0.391 0.374
RockyMountain,South
Aspen–birch 0.355 0.350Douglasfir 0.431 0.350Fir–spruce–m.hemlock 0.342 0.350Lodgepolepine 0.377 0.350Ponderosapine 0.383 0.386
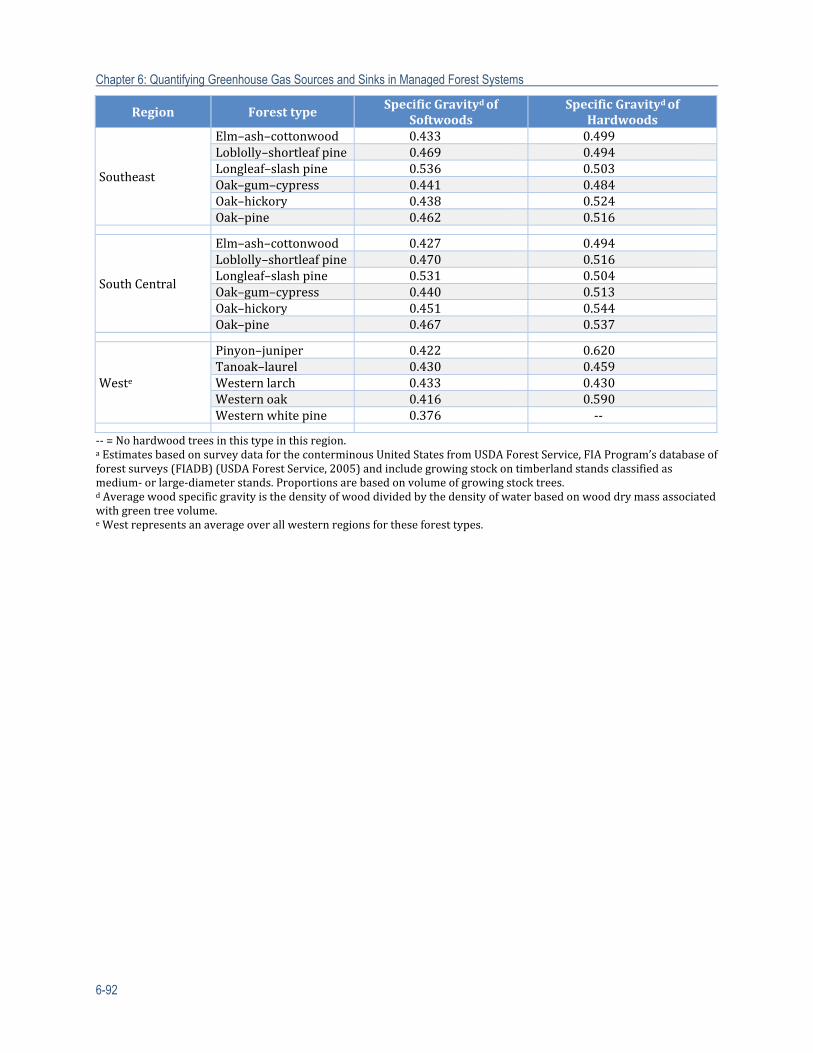
Chapter 6: Quantifying Greenhouse Gas Sources and Sinks in Managed Forest Systems
6-92
Region ForesttypeSpecific Gravitydof
SoftwoodsSpecificGravitydof
Hardwoods
Southeast
Elm–ash–cottonwood 0.433 0.499Loblolly–shortleafpine 0.469 0.494Longleaf–slashpine 0.536 0.503Oak–gum–cypress 0.441 0.484Oak–hickory 0.438 0.524Oak–pine 0.462 0.516
SouthCentral
Elm–ash–cottonwood 0.427 0.494Loblolly–shortleafpine 0.470 0.516Longleaf–slashpine 0.531 0.504Oak–gum–cypress 0.440 0.513Oak–hickory 0.451 0.544Oak–pine 0.467 0.537
Weste
Pinyon–juniper 0.422 0.620Tanoak–laurel 0.430 0.459Westernlarch 0.433 0.430Westernoak 0.416 0.590Westernwhitepine 0.376 ‐‐
‐‐=Nohardwoodtreesinthistypeinthisregion.aEstimatesbasedonsurveydatafortheconterminousUnitedStatesfromUSDAForestService,FIAProgram’sdatabaseofforestsurveys(FIADB)(USDAForestService,2005)andincludegrowingstockontimberlandstandsclassifiedasmedium‐orlarge‐diameterstands.Proportionsarebasedonvolumeofgrowingstocktrees.dAveragewoodspecificgravityisthedensityofwooddividedbythedensityofwaterbasedonwooddrymassassociatedwithgreentreevolume.eWestrepresentsanaverageoverallwesternregionsfortheseforesttypes.
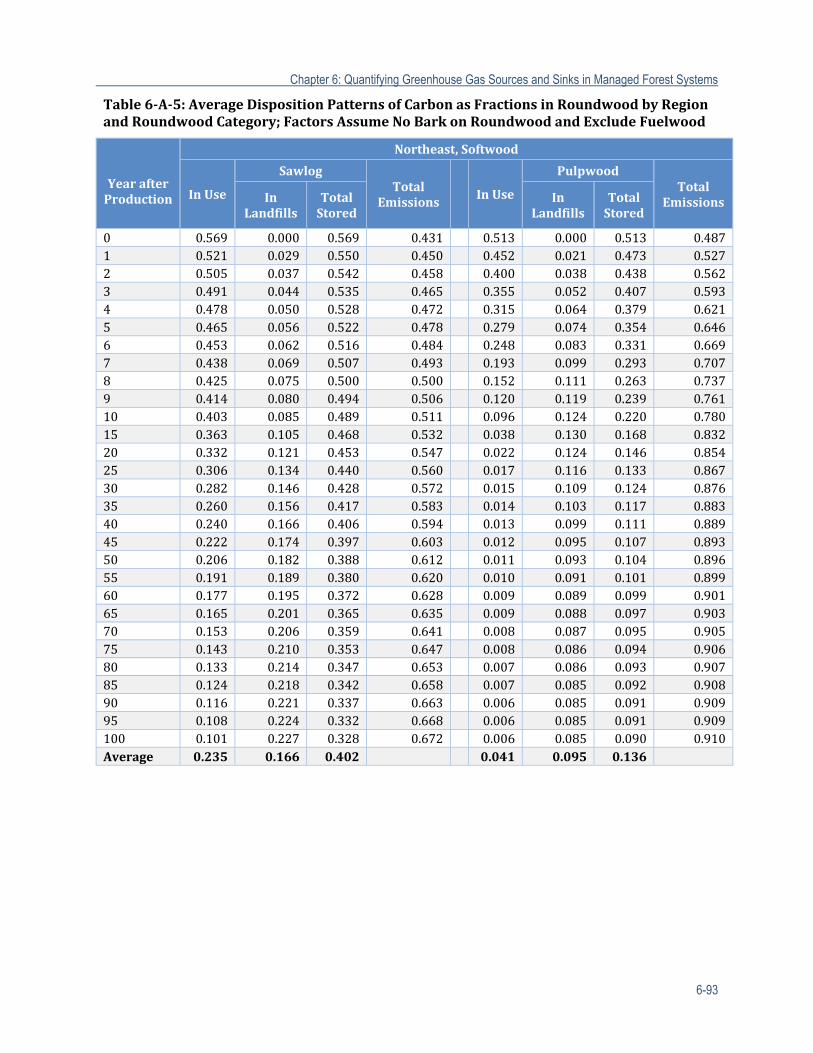
Chapter 6: Quantifying Greenhouse Gas Sources and Sinks in Managed Forest Systems
6-93
Table6‐A‐5:AverageDispositionPatternsofCarbon asFractions inRoundwoodby RegionandRoundwoodCategory;FactorsAssumeNoBarkonRoundwoodandExcludeFuelwood
YearafterProduction
Northeast,Softwood
InUse
SawlogTotal
Emissions InUse
PulpwoodTotal
EmissionsInLandfills
TotalStored
InLandfills
TotalStored
0 0.569 0.000 0.569 0.431 0.513 0.000 0.513 0.4871 0.521 0.029 0.550 0.450 0.452 0.021 0.473 0.5272 0.505 0.037 0.542 0.458 0.400 0.038 0.438 0.5623 0.491 0.044 0.535 0.465 0.355 0.052 0.407 0.5934 0.478 0.050 0.528 0.472 0.315 0.064 0.379 0.6215 0.465 0.056 0.522 0.478 0.279 0.074 0.354 0.6466 0.453 0.062 0.516 0.484 0.248 0.083 0.331 0.6697 0.438 0.069 0.507 0.493 0.193 0.099 0.293 0.7078 0.425 0.075 0.500 0.500 0.152 0.111 0.263 0.7379 0.414 0.080 0.494 0.506 0.120 0.119 0.239 0.76110 0.403 0.085 0.489 0.511 0.096 0.124 0.220 0.78015 0.363 0.105 0.468 0.532 0.038 0.130 0.168 0.83220 0.332 0.121 0.453 0.547 0.022 0.124 0.146 0.85425 0.306 0.134 0.440 0.560 0.017 0.116 0.133 0.86730 0.282 0.146 0.428 0.572 0.015 0.109 0.124 0.87635 0.260 0.156 0.417 0.583 0.014 0.103 0.117 0.88340 0.240 0.166 0.406 0.594 0.013 0.099 0.111 0.88945 0.222 0.174 0.397 0.603 0.012 0.095 0.107 0.89350 0.206 0.182 0.388 0.612 0.011 0.093 0.104 0.89655 0.191 0.189 0.380 0.620 0.010 0.091 0.101 0.89960 0.177 0.195 0.372 0.628 0.009 0.089 0.099 0.90165 0.165 0.201 0.365 0.635 0.009 0.088 0.097 0.90370 0.153 0.206 0.359 0.641 0.008 0.087 0.095 0.90575 0.143 0.210 0.353 0.647 0.008 0.086 0.094 0.90680 0.133 0.214 0.347 0.653 0.007 0.086 0.093 0.90785 0.124 0.218 0.342 0.658 0.007 0.085 0.092 0.90890 0.116 0.221 0.337 0.663 0.006 0.085 0.091 0.90995 0.108 0.224 0.332 0.668 0.006 0.085 0.091 0.909100 0.101 0.227 0.328 0.672 0.006 0.085 0.090 0.910Average 0.235 0.166 0.402 0.041 0.095 0.136
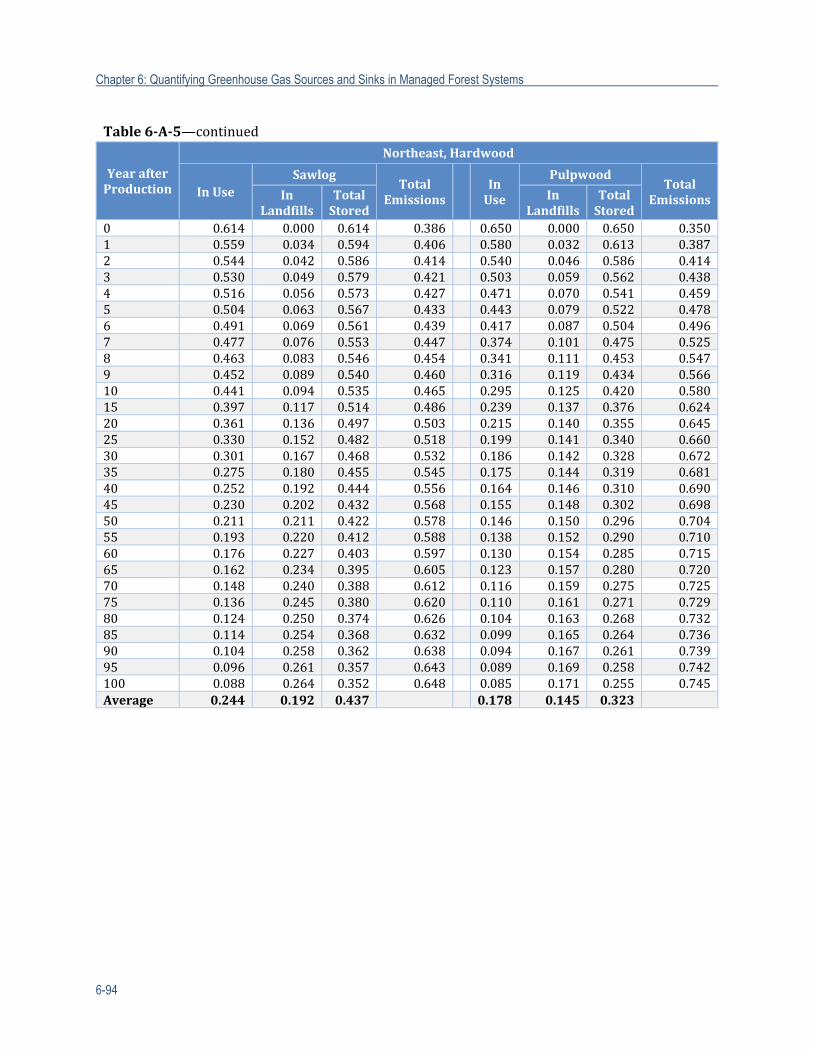
Chapter 6: Quantifying Greenhouse Gas Sources and Sinks in Managed Forest Systems
6-94
Table6‐A‐5—continued
YearafterProduction
Northeast,Hardwood
InUseSawlog
TotalEmissions
InUse
PulpwoodTotal
EmissionsInLandfills
TotalStored
InLandfills
TotalStored
0 0.614 0.000 0.614 0.386 0.650 0.000 0.650 0.3501 0.559 0.034 0.594 0.406 0.580 0.032 0.613 0.3872 0.544 0.042 0.586 0.414 0.540 0.046 0.586 0.4143 0.530 0.049 0.579 0.421 0.503 0.059 0.562 0.4384 0.516 0.056 0.573 0.427 0.471 0.070 0.541 0.4595 0.504 0.063 0.567 0.433 0.443 0.079 0.522 0.4786 0.491 0.069 0.561 0.439 0.417 0.087 0.504 0.4967 0.477 0.076 0.553 0.447 0.374 0.101 0.475 0.5258 0.463 0.083 0.546 0.454 0.341 0.111 0.453 0.5479 0.452 0.089 0.540 0.460 0.316 0.119 0.434 0.56610 0.441 0.094 0.535 0.465 0.295 0.125 0.420 0.58015 0.397 0.117 0.514 0.486 0.239 0.137 0.376 0.62420 0.361 0.136 0.497 0.503 0.215 0.140 0.355 0.64525 0.330 0.152 0.482 0.518 0.199 0.141 0.340 0.66030 0.301 0.167 0.468 0.532 0.186 0.142 0.328 0.67235 0.275 0.180 0.455 0.545 0.175 0.144 0.319 0.68140 0.252 0.192 0.444 0.556 0.164 0.146 0.310 0.69045 0.230 0.202 0.432 0.568 0.155 0.148 0.302 0.69850 0.211 0.211 0.422 0.578 0.146 0.150 0.296 0.70455 0.193 0.220 0.412 0.588 0.138 0.152 0.290 0.71060 0.176 0.227 0.403 0.597 0.130 0.154 0.285 0.71565 0.162 0.234 0.395 0.605 0.123 0.157 0.280 0.72070 0.148 0.240 0.388 0.612 0.116 0.159 0.275 0.72575 0.136 0.245 0.380 0.620 0.110 0.161 0.271 0.72980 0.124 0.250 0.374 0.626 0.104 0.163 0.268 0.73285 0.114 0.254 0.368 0.632 0.099 0.165 0.264 0.73690 0.104 0.258 0.362 0.638 0.094 0.167 0.261 0.73995 0.096 0.261 0.357 0.643 0.089 0.169 0.258 0.742100 0.088 0.264 0.352 0.648 0.085 0.171 0.255 0.745Average 0.244 0.192 0.437 0.178 0.145 0.323
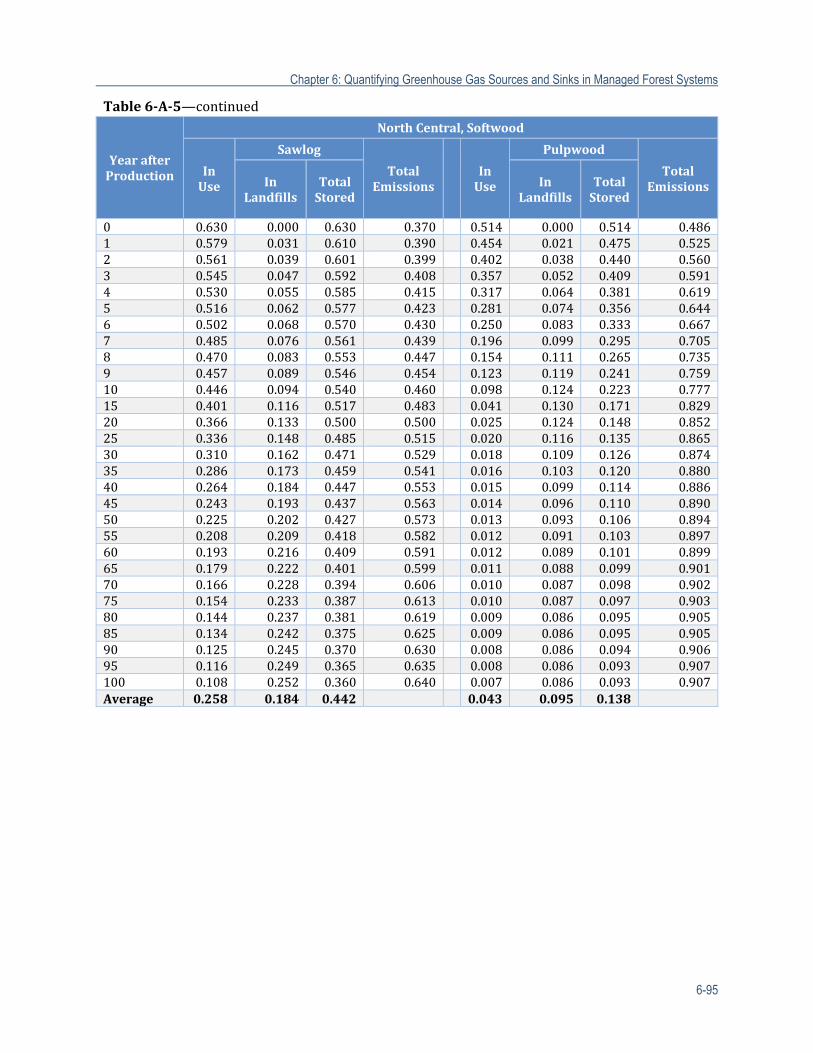
Chapter 6: Quantifying Greenhouse Gas Sources and Sinks in Managed Forest Systems
6-95
Table6‐A‐5—continued
YearafterProduction
NorthCentral,Softwood
InUse
Sawlog
TotalEmissions
InUse
Pulpwood
TotalEmissionsIn
LandfillsTotalStored
InLandfills
TotalStored
0 0.630 0.000 0.630 0.370 0.514 0.000 0.514 0.4861 0.579 0.031 0.610 0.390 0.454 0.021 0.475 0.5252 0.561 0.039 0.601 0.399 0.402 0.038 0.440 0.5603 0.545 0.047 0.592 0.408 0.357 0.052 0.409 0.5914 0.530 0.055 0.585 0.415 0.317 0.064 0.381 0.6195 0.516 0.062 0.577 0.423 0.281 0.074 0.356 0.6446 0.502 0.068 0.570 0.430 0.250 0.083 0.333 0.6677 0.485 0.076 0.561 0.439 0.196 0.099 0.295 0.7058 0.470 0.083 0.553 0.447 0.154 0.111 0.265 0.7359 0.457 0.089 0.546 0.454 0.123 0.119 0.241 0.75910 0.446 0.094 0.540 0.460 0.098 0.124 0.223 0.77715 0.401 0.116 0.517 0.483 0.041 0.130 0.171 0.82920 0.366 0.133 0.500 0.500 0.025 0.124 0.148 0.85225 0.336 0.148 0.485 0.515 0.020 0.116 0.135 0.86530 0.310 0.162 0.471 0.529 0.018 0.109 0.126 0.87435 0.286 0.173 0.459 0.541 0.016 0.103 0.120 0.88040 0.264 0.184 0.447 0.553 0.015 0.099 0.114 0.88645 0.243 0.193 0.437 0.563 0.014 0.096 0.110 0.89050 0.225 0.202 0.427 0.573 0.013 0.093 0.106 0.89455 0.208 0.209 0.418 0.582 0.012 0.091 0.103 0.89760 0.193 0.216 0.409 0.591 0.012 0.089 0.101 0.89965 0.179 0.222 0.401 0.599 0.011 0.088 0.099 0.90170 0.166 0.228 0.394 0.606 0.010 0.087 0.098 0.90275 0.154 0.233 0.387 0.613 0.010 0.087 0.097 0.90380 0.144 0.237 0.381 0.619 0.009 0.086 0.095 0.90585 0.134 0.242 0.375 0.625 0.009 0.086 0.095 0.90590 0.125 0.245 0.370 0.630 0.008 0.086 0.094 0.90695 0.116 0.249 0.365 0.635 0.008 0.086 0.093 0.907100 0.108 0.252 0.360 0.640 0.007 0.086 0.093 0.907Average 0.258 0.184 0.442 0.043 0.095 0.138
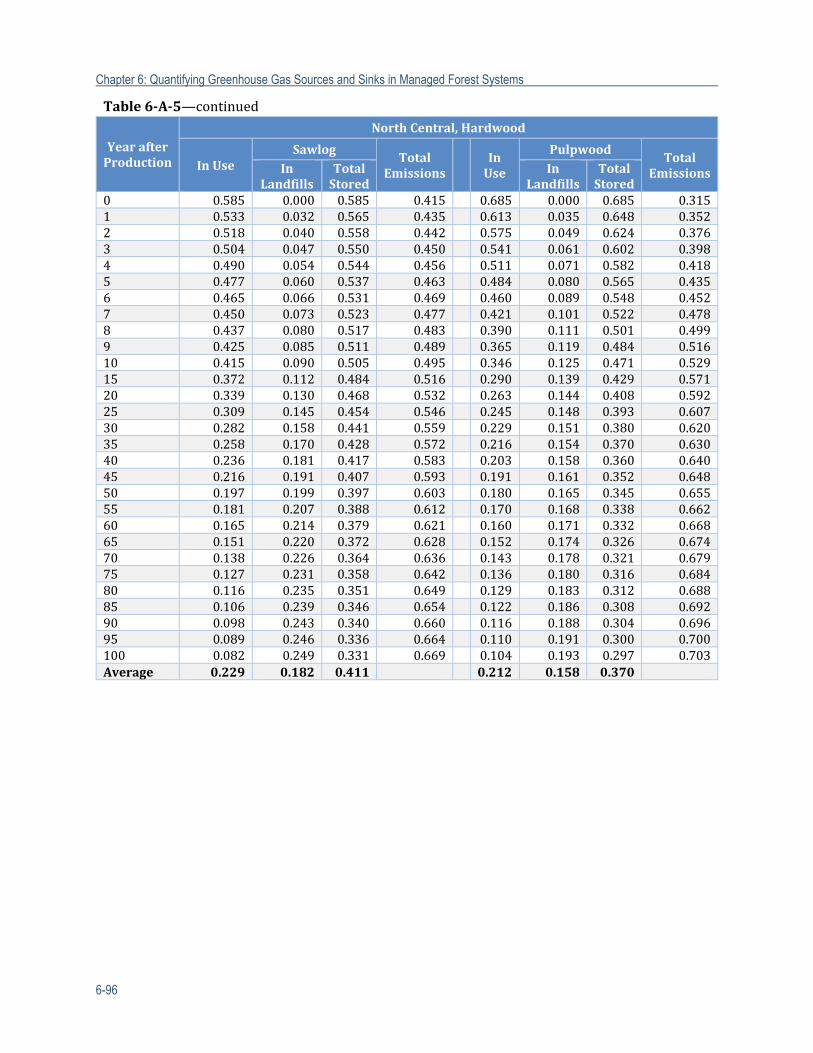
Chapter 6: Quantifying Greenhouse Gas Sources and Sinks in Managed Forest Systems
6-96
Table6‐A‐5—continued
YearafterProduction
NorthCentral,Hardwood
InUseSawlog
TotalEmissions
InUse
PulpwoodTotal
EmissionsInLandfills
TotalStored
InLandfills
TotalStored
0 0.585 0.000 0.585 0.415 0.685 0.000 0.685 0.3151 0.533 0.032 0.565 0.435 0.613 0.035 0.648 0.3522 0.518 0.040 0.558 0.442 0.575 0.049 0.624 0.3763 0.504 0.047 0.550 0.450 0.541 0.061 0.602 0.3984 0.490 0.054 0.544 0.456 0.511 0.071 0.582 0.4185 0.477 0.060 0.537 0.463 0.484 0.080 0.565 0.4356 0.465 0.066 0.531 0.469 0.460 0.089 0.548 0.4527 0.450 0.073 0.523 0.477 0.421 0.101 0.522 0.4788 0.437 0.080 0.517 0.483 0.390 0.111 0.501 0.4999 0.425 0.085 0.511 0.489 0.365 0.119 0.484 0.51610 0.415 0.090 0.505 0.495 0.346 0.125 0.471 0.52915 0.372 0.112 0.484 0.516 0.290 0.139 0.429 0.57120 0.339 0.130 0.468 0.532 0.263 0.144 0.408 0.59225 0.309 0.145 0.454 0.546 0.245 0.148 0.393 0.60730 0.282 0.158 0.441 0.559 0.229 0.151 0.380 0.62035 0.258 0.170 0.428 0.572 0.216 0.154 0.370 0.63040 0.236 0.181 0.417 0.583 0.203 0.158 0.360 0.64045 0.216 0.191 0.407 0.593 0.191 0.161 0.352 0.64850 0.197 0.199 0.397 0.603 0.180 0.165 0.345 0.65555 0.181 0.207 0.388 0.612 0.170 0.168 0.338 0.66260 0.165 0.214 0.379 0.621 0.160 0.171 0.332 0.66865 0.151 0.220 0.372 0.628 0.152 0.174 0.326 0.67470 0.138 0.226 0.364 0.636 0.143 0.178 0.321 0.67975 0.127 0.231 0.358 0.642 0.136 0.180 0.316 0.68480 0.116 0.235 0.351 0.649 0.129 0.183 0.312 0.68885 0.106 0.239 0.346 0.654 0.122 0.186 0.308 0.69290 0.098 0.243 0.340 0.660 0.116 0.188 0.304 0.69695 0.089 0.246 0.336 0.664 0.110 0.191 0.300 0.700100 0.082 0.249 0.331 0.669 0.104 0.193 0.297 0.703Average 0.229 0.182 0.411 0.212 0.158 0.370
Chapter 6: Quantifying Greenhouse Gas Sources and Sinks in Managed Forest Systems
6-97
Table6‐A‐5—continued
YearafterProduction
PacificNorthwest,East,Softwood
InUse
AllTotal
Emissions
InLandfills
TotalStored
0 0.637 0.000 0.637 0.363 1 0.574 0.036 0.610 0.390 2 0.551 0.046 0.597 0.403 3 0.530 0.055 0.585 0.415 4 0.511 0.063 0.574 0.426 5 0.494 0.070 0.564 0.436 6 0.478 0.077 0.555 0.445 7 0.455 0.086 0.541 0.459 8 0.436 0.093 0.529 0.471 9 0.420 0.100 0.520 0.480 10 0.406 0.105 0.512 0.488 15 0.359 0.125 0.484 0.516 20 0.327 0.139 0.466 0.534 25 0.301 0.150 0.451 0.549 30 0.278 0.160 0.438 0.562 35 0.258 0.169 0.427 0.573 40 0.239 0.177 0.416 0.584 45 0.222 0.185 0.406 0.594 50 0.206 0.191 0.397 0.603 55 0.191 0.198 0.389 0.611 60 0.178 0.203 0.381 0.619 65 0.166 0.208 0.374 0.626 70 0.155 0.213 0.368 0.632 75 0.145 0.217 0.362 0.638 80 0.136 0.221 0.356 0.644 85 0.127 0.224 0.351 0.649 90 0.119 0.227 0.347 0.653 95 0.112 0.230 0.342 0.658 100 0.105 0.233 0.338 0.662 Average 0.238 0.177 0.415
Chapter 6: Quantifying Greenhouse Gas Sources and Sinks in Managed Forest Systems
6-98
Table6‐A‐5—continued
YearafterProduction
PacificNorthwest,West,Softwoods
InUse
SawlogTotal
Emissions InUse
PulpwoodTotal
EmissionsInLandfills
TotalStored
InLandfills
TotalStored
0 0.740 0.000 0.740 0.260 0.500 0.000 0.500 0.500
1 0.674 0.039 0.713 0.287 0.440 0.020 0.460 0.540
2 0.652 0.049 0.702 0.298 0.387 0.037 0.424 0.576
3 0.632 0.059 0.691 0.309 0.341 0.051 0.392 0.608
4 0.613 0.068 0.681 0.319 0.300 0.063 0.364 0.636
5 0.596 0.076 0.672 0.328 0.264 0.074 0.338 0.662
6 0.579 0.083 0.663 0.337 0.233 0.082 0.315 0.685
7 0.558 0.093 0.651 0.349 0.177 0.099 0.276 0.724
8 0.539 0.101 0.640 0.360 0.134 0.111 0.245 0.755
9 0.524 0.108 0.631 0.369 0.102 0.119 0.221 0.779
10 0.510 0.114 0.624 0.376 0.078 0.124 0.202 0.798
15 0.457 0.139 0.596 0.404 0.020 0.129 0.149 0.851
20 0.418 0.158 0.576 0.424 0.005 0.122 0.127 0.873
25 0.384 0.174 0.558 0.442 0.001 0.113 0.114 0.886
30 0.355 0.188 0.543 0.457 0 0.105 0.105 0.895
35 0.328 0.201 0.529 0.471 0 0.098 0.099 0.901
40 0.303 0.213 0.516 0.484 0 0.093 0.093 0.907
45 0.281 0.223 0.504 0.496 0 0.090 0.090 0.910
50 0.260 0.232 0.493 0.507 0 0.086 0.086 0.914
55 0.242 0.241 0.482 0.518 0 0.084 0.084 0.916
60 0.224 0.248 0.473 0.527 0 0.082 0.082 0.918
65 0.209 0.255 0.464 0.536 0 0.080 0.080 0.920
70 0.194 0.261 0.456 0.544 0 0.079 0.079 0.921
75 0.181 0.267 0.448 0.552 0 0.078 0.078 0.922
80 0.169 0.272 0.441 0.559 0 0.078 0.078 0.922
85 0.158 0.276 0.434 0.566 0 0.077 0.077 0.923
90 0.148 0.281 0.428 0.572 0 0.077 0.077 0.923
95 0.138 0.285 0.423 0.577 0 0.076 0.076 0.924
100 0.129 0.288 0.417 0.583 0 0.076 0.076 0.924
Average 0.298 0.213 0.511 0.030 0.090 0.119
Chapter 6: Quantifying Greenhouse Gas Sources and Sinks in Managed Forest Systems
6-99
Table6‐A‐5—continued
YearafterProduction
PacificNorthwest,West,Hardwood PacificSouthwest,Softwood
InUseAll
TotalEmissions
InUse
AllTotal
EmissionsInLandfills
TotalStored
InLandfills
TotalStored
0 0.531 0.000 0.531 0.469 0.675 0.000 0.675 0.325
1 0.476 0.027 0.503 0.497 0.611 0.036 0.647 0.353
2 0.447 0.038 0.485 0.515 0.587 0.047 0.634 0.366
3 0.421 0.048 0.469 0.531 0.566 0.056 0.622 0.378
4 0.397 0.057 0.454 0.546 0.546 0.065 0.611 0.389
5 0.376 0.064 0.440 0.560 0.528 0.072 0.600 0.400
6 0.357 0.071 0.428 0.572 0.511 0.080 0.591 0.409
7 0.327 0.081 0.408 0.592 0.488 0.089 0.577 0.423
8 0.303 0.089 0.393 0.607 0.468 0.097 0.565 0.435
9 0.284 0.096 0.380 0.620 0.451 0.104 0.555 0.445
10 0.269 0.101 0.369 0.631 0.437 0.110 0.547 0.453
15 0.222 0.115 0.337 0.663 0.387 0.131 0.518 0.482
20 0.197 0.122 0.319 0.681 0.353 0.146 0.499 0.501
25 0.179 0.127 0.306 0.694 0.324 0.159 0.483 0.517
30 0.164 0.132 0.295 0.705 0.299 0.170 0.469 0.531
35 0.150 0.136 0.286 0.714 0.276 0.180 0.457 0.543
40 0.137 0.140 0.278 0.722 0.256 0.190 0.445 0.555
45 0.126 0.144 0.270 0.730 0.237 0.198 0.435 0.565
50 0.115 0.148 0.263 0.737 0.220 0.205 0.425 0.575
55 0.106 0.151 0.257 0.743 0.204 0.212 0.416 0.584
60 0.097 0.155 0.252 0.748 0.189 0.218 0.408 0.592
65 0.089 0.157 0.247 0.753 0.176 0.224 0.400 0.600
70 0.082 0.160 0.242 0.758 0.164 0.229 0.393 0.607
75 0.075 0.163 0.238 0.762 0.153 0.233 0.387 0.613
80 0.069 0.165 0.234 0.766 0.143 0.238 0.381 0.619
85 0.064 0.167 0.231 0.769 0.133 0.241 0.375 0.625
90 0.059 0.169 0.227 0.773 0.125 0.245 0.370 0.630
95 0.054 0.171 0.224 0.776 0.117 0.248 0.365 0.635
100 0.050 0.172 0.222 0.778 0.109 0.251 0.361 0.639
Average 0.145 0.139 0.284 0.254 0.190 0.444
Chapter 6: Quantifying Greenhouse Gas Sources and Sinks in Managed Forest Systems
6-100
Table6‐A‐5—continued
YearafterProduction
RockyMountain,Softwood
InUse
All Total
Emissions
In
LandfillsTotalStored
0 0.704 0.000 0.704 0.296 1 0.640 0.037 0.677 0.323 2 0.615 0.048 0.663 0.337 3 0.592 0.057 0.650 0.350 4 0.572 0.066 0.638 0.362 5 0.552 0.075 0.627 0.373 6 0.535 0.082 0.617 0.383 7 0.510 0.092 0.602 0.398 8 0.489 0.101 0.590 0.410 9 0.472 0.108 0.579 0.421 10 0.457 0.114 0.571 0.429 15 0.404 0.136 0.540 0.460 20 0.368 0.152 0.520 0.480 25 0.338 0.166 0.504 0.496 30 0.312 0.177 0.489 0.511 35 0.288 0.188 0.476 0.524 40 0.266 0.198 0.464 0.536 45 0.247 0.206 0.453 0.547 50 0.229 0.214 0.443 0.557 55 0.212 0.221 0.433 0.567 60 0.197 0.228 0.425 0.575 65 0.183 0.234 0.417 0.583 70 0.170 0.239 0.409 0.591 75 0.159 0.244 0.403 0.597 80 0.148 0.248 0.396 0.604 85 0.138 0.252 0.390 0.610 90 0.129 0.256 0.385 0.615 95 0.121 0.259 0.380 0.620 100 0.113 0.262 0.375 0.625 Average 0.265 0.198 0.463
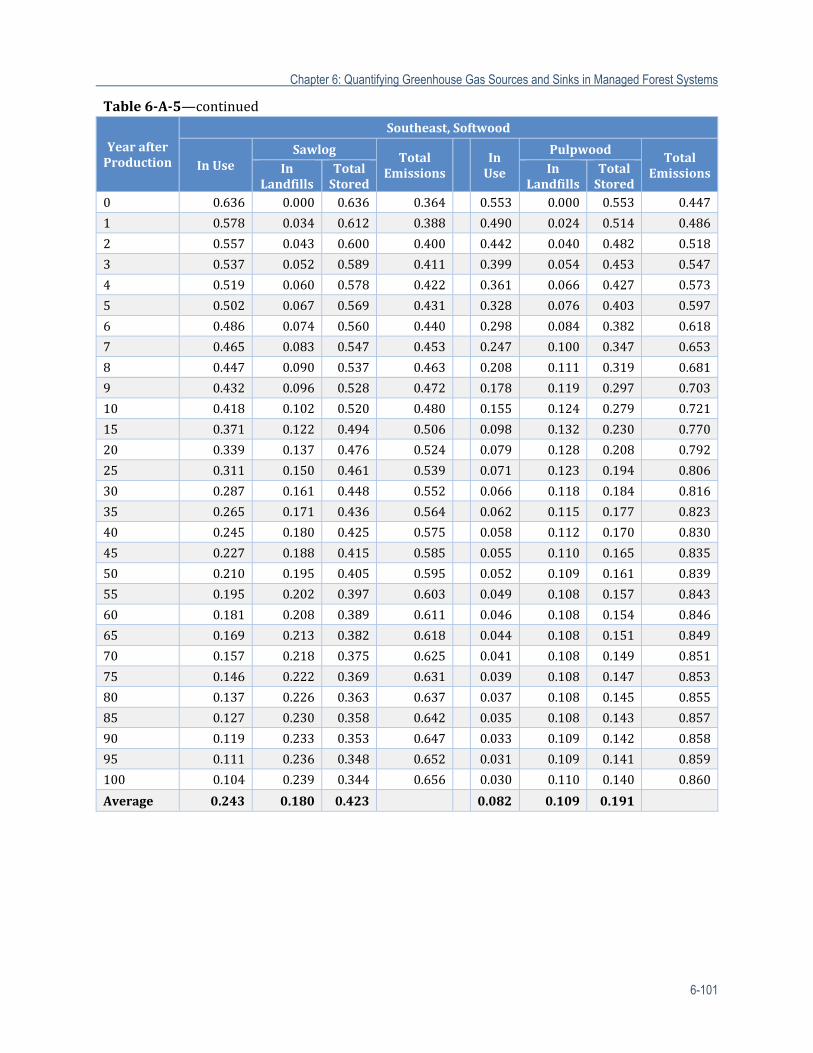
Chapter 6: Quantifying Greenhouse Gas Sources and Sinks in Managed Forest Systems
6-101
Table6‐A‐5—continued
YearafterProduction
Southeast,Softwood
InUseSawlog
TotalEmissions
InUse
PulpwoodTotal
EmissionsInLandfills
TotalStored
InLandfills
TotalStored
0 0.636 0.000 0.636 0.364 0.553 0.000 0.553 0.447
1 0.578 0.034 0.612 0.388 0.490 0.024 0.514 0.486
2 0.557 0.043 0.600 0.400 0.442 0.040 0.482 0.518
3 0.537 0.052 0.589 0.411 0.399 0.054 0.453 0.547
4 0.519 0.060 0.578 0.422 0.361 0.066 0.427 0.573
5 0.502 0.067 0.569 0.431 0.328 0.076 0.403 0.597
6 0.486 0.074 0.560 0.440 0.298 0.084 0.382 0.618
7 0.465 0.083 0.547 0.453 0.247 0.100 0.347 0.653
8 0.447 0.090 0.537 0.463 0.208 0.111 0.319 0.681
9 0.432 0.096 0.528 0.472 0.178 0.119 0.297 0.703
10 0.418 0.102 0.520 0.480 0.155 0.124 0.279 0.721
15 0.371 0.122 0.494 0.506 0.098 0.132 0.230 0.770
20 0.339 0.137 0.476 0.524 0.079 0.128 0.208 0.792
25 0.311 0.150 0.461 0.539 0.071 0.123 0.194 0.806
30 0.287 0.161 0.448 0.552 0.066 0.118 0.184 0.816
35 0.265 0.171 0.436 0.564 0.062 0.115 0.177 0.823
40 0.245 0.180 0.425 0.575 0.058 0.112 0.170 0.830
45 0.227 0.188 0.415 0.585 0.055 0.110 0.165 0.835
50 0.210 0.195 0.405 0.595 0.052 0.109 0.161 0.839
55 0.195 0.202 0.397 0.603 0.049 0.108 0.157 0.843
60 0.181 0.208 0.389 0.611 0.046 0.108 0.154 0.846
65 0.169 0.213 0.382 0.618 0.044 0.108 0.151 0.849
70 0.157 0.218 0.375 0.625 0.041 0.108 0.149 0.851
75 0.146 0.222 0.369 0.631 0.039 0.108 0.147 0.853
80 0.137 0.226 0.363 0.637 0.037 0.108 0.145 0.855
85 0.127 0.230 0.358 0.642 0.035 0.108 0.143 0.857
90 0.119 0.233 0.353 0.647 0.033 0.109 0.142 0.858
95 0.111 0.236 0.348 0.652 0.031 0.109 0.141 0.859
100 0.104 0.239 0.344 0.656 0.030 0.110 0.140 0.860
Average 0.243 0.180 0.423 0.082 0.109 0.191

Chapter 6: Quantifying Greenhouse Gas Sources and Sinks in Managed Forest Systems
6-102
Table6‐A‐5—continued
YearafterProduction
Southeast,Hardwood
InUse
SawlogTotal
Emissions InUse
PulpwoodTotal
EmissionsInLandfills
TotalStored
InLandfills
TotalStored
0 0.609 0.000 0.609 0.391 0.591 0.000 0.591 0.409
1 0.552 0.035 0.587 0.413 0.525 0.027 0.552 0.448
2 0.534 0.043 0.577 0.423 0.480 0.043 0.522 0.478
3 0.518 0.051 0.569 0.431 0.439 0.056 0.495 0.505
4 0.503 0.058 0.561 0.439 0.404 0.067 0.471 0.529
5 0.488 0.065 0.553 0.447 0.372 0.077 0.449 0.551
6 0.475 0.071 0.546 0.454 0.344 0.085 0.430 0.570
7 0.457 0.079 0.537 0.463 0.296 0.100 0.397 0.603
8 0.442 0.086 0.528 0.472 0.260 0.111 0.371 0.629
9 0.429 0.092 0.521 0.479 0.231 0.119 0.350 0.650
10 0.418 0.097 0.515 0.485 0.209 0.124 0.334 0.666
15 0.373 0.119 0.492 0.508 0.153 0.134 0.287 0.713
20 0.338 0.136 0.475 0.525 0.132 0.133 0.265 0.735
25 0.309 0.151 0.460 0.540 0.121 0.130 0.251 0.749
30 0.282 0.164 0.446 0.554 0.113 0.127 0.240 0.760
35 0.258 0.176 0.434 0.566 0.106 0.126 0.232 0.768
40 0.236 0.186 0.422 0.578 0.100 0.125 0.225 0.775
45 0.216 0.196 0.412 0.588 0.094 0.125 0.218 0.782
50 0.198 0.204 0.402 0.598 0.089 0.125 0.213 0.787
55 0.181 0.212 0.393 0.607 0.084 0.125 0.209 0.791
60 0.166 0.218 0.384 0.616 0.079 0.126 0.205 0.795
65 0.152 0.224 0.376 0.624 0.075 0.126 0.201 0.799
70 0.139 0.230 0.369 0.631 0.071 0.127 0.198 0.802
75 0.127 0.235 0.362 0.638 0.067 0.128 0.195 0.805
80 0.117 0.239 0.356 0.644 0.063 0.129 0.193 0.807
85 0.107 0.243 0.350 0.650 0.060 0.130 0.190 0.810
90 0.098 0.247 0.345 0.655 0.057 0.131 0.188 0.812
95 0.090 0.250 0.340 0.660 0.054 0.132 0.186 0.814
100 0.083 0.253 0.336 0.664 0.051 0.133 0.185 0.815
Average 0.231 0.187 0.417 0.119 0.123 0.242
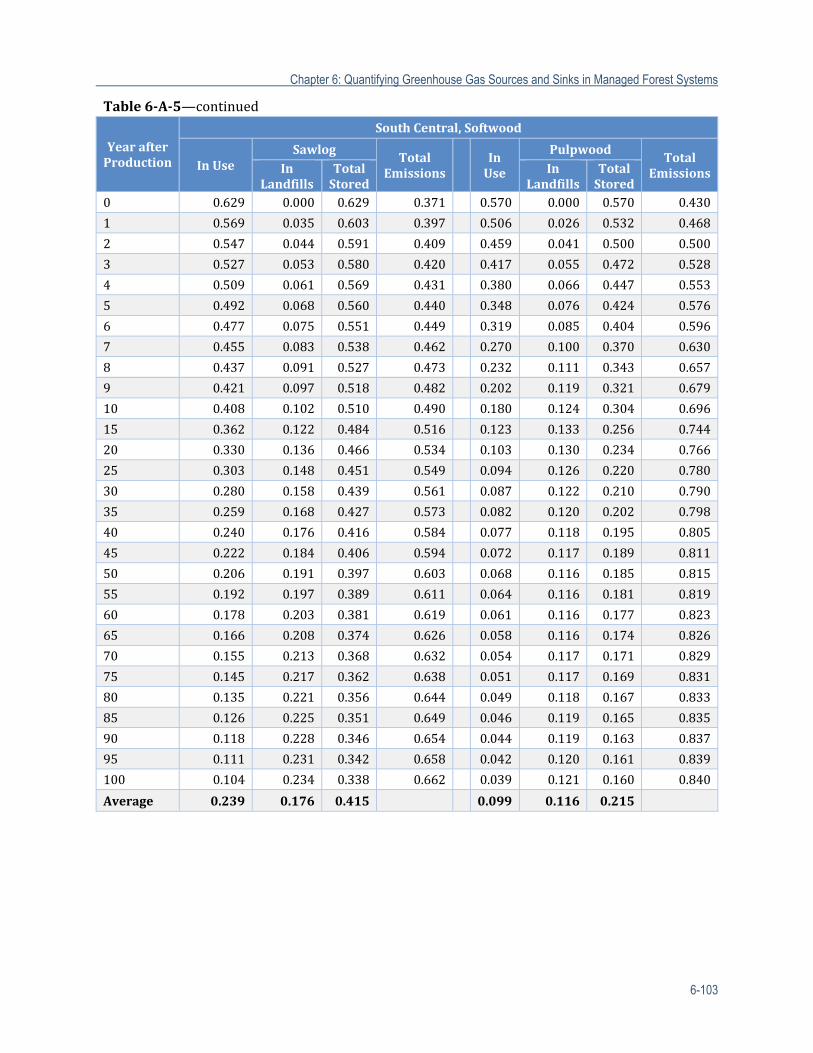
Chapter 6: Quantifying Greenhouse Gas Sources and Sinks in Managed Forest Systems
6-103
Table6‐A‐5—continued
YearafterProduction
SouthCentral,Softwood
InUseSawlog
TotalEmissions
InUse
PulpwoodTotal
EmissionsInLandfills
TotalStored
InLandfills
TotalStored
0 0.629 0.000 0.629 0.371 0.570 0.000 0.570 0.430
1 0.569 0.035 0.603 0.397 0.506 0.026 0.532 0.468
2 0.547 0.044 0.591 0.409 0.459 0.041 0.500 0.500
3 0.527 0.053 0.580 0.420 0.417 0.055 0.472 0.528
4 0.509 0.061 0.569 0.431 0.380 0.066 0.447 0.553
5 0.492 0.068 0.560 0.440 0.348 0.076 0.424 0.576
6 0.477 0.075 0.551 0.449 0.319 0.085 0.404 0.596
7 0.455 0.083 0.538 0.462 0.270 0.100 0.370 0.630
8 0.437 0.091 0.527 0.473 0.232 0.111 0.343 0.657
9 0.421 0.097 0.518 0.482 0.202 0.119 0.321 0.679
10 0.408 0.102 0.510 0.490 0.180 0.124 0.304 0.696
15 0.362 0.122 0.484 0.516 0.123 0.133 0.256 0.744
20 0.330 0.136 0.466 0.534 0.103 0.130 0.234 0.766
25 0.303 0.148 0.451 0.549 0.094 0.126 0.220 0.780
30 0.280 0.158 0.439 0.561 0.087 0.122 0.210 0.790
35 0.259 0.168 0.427 0.573 0.082 0.120 0.202 0.798
40 0.240 0.176 0.416 0.584 0.077 0.118 0.195 0.805
45 0.222 0.184 0.406 0.594 0.072 0.117 0.189 0.811
50 0.206 0.191 0.397 0.603 0.068 0.116 0.185 0.815
55 0.192 0.197 0.389 0.611 0.064 0.116 0.181 0.819
60 0.178 0.203 0.381 0.619 0.061 0.116 0.177 0.823
65 0.166 0.208 0.374 0.626 0.058 0.116 0.174 0.826
70 0.155 0.213 0.368 0.632 0.054 0.117 0.171 0.829
75 0.145 0.217 0.362 0.638 0.051 0.117 0.169 0.831
80 0.135 0.221 0.356 0.644 0.049 0.118 0.167 0.833
85 0.126 0.225 0.351 0.649 0.046 0.119 0.165 0.835
90 0.118 0.228 0.346 0.654 0.044 0.119 0.163 0.837
95 0.111 0.231 0.342 0.658 0.042 0.120 0.161 0.839
100 0.104 0.234 0.338 0.662 0.039 0.121 0.160 0.840
Average 0.239 0.176 0.415 0.099 0.116 0.215
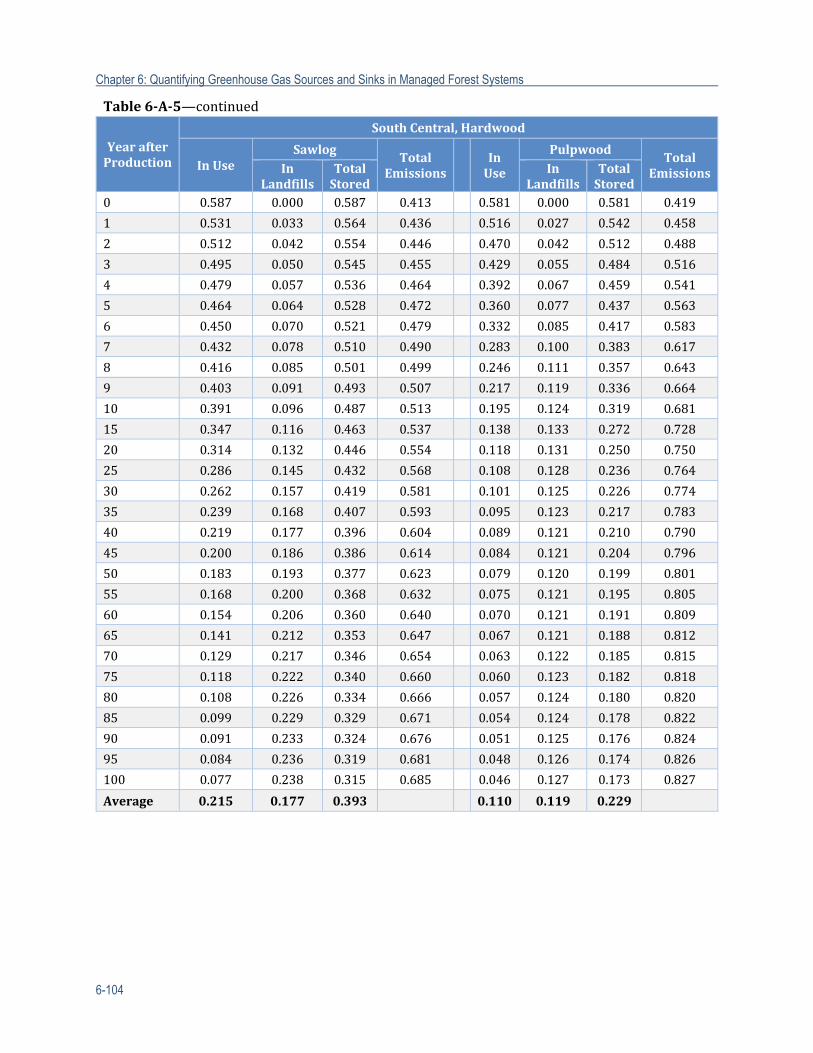
Chapter 6: Quantifying Greenhouse Gas Sources and Sinks in Managed Forest Systems
6-104
Table6‐A‐5—continued
YearafterProduction
SouthCentral,Hardwood
InUseSawlog
TotalEmissions
InUse
PulpwoodTotal
EmissionsInLandfills
TotalStored
InLandfills
TotalStored
0 0.587 0.000 0.587 0.413 0.581 0.000 0.581 0.419
1 0.531 0.033 0.564 0.436 0.516 0.027 0.542 0.458
2 0.512 0.042 0.554 0.446 0.470 0.042 0.512 0.488
3 0.495 0.050 0.545 0.455 0.429 0.055 0.484 0.516
4 0.479 0.057 0.536 0.464 0.392 0.067 0.459 0.541
5 0.464 0.064 0.528 0.472 0.360 0.077 0.437 0.563
6 0.450 0.070 0.521 0.479 0.332 0.085 0.417 0.583
7 0.432 0.078 0.510 0.490 0.283 0.100 0.383 0.617
8 0.416 0.085 0.501 0.499 0.246 0.111 0.357 0.643
9 0.403 0.091 0.493 0.507 0.217 0.119 0.336 0.664
10 0.391 0.096 0.487 0.513 0.195 0.124 0.319 0.681
15 0.347 0.116 0.463 0.537 0.138 0.133 0.272 0.728
20 0.314 0.132 0.446 0.554 0.118 0.131 0.250 0.750
25 0.286 0.145 0.432 0.568 0.108 0.128 0.236 0.764
30 0.262 0.157 0.419 0.581 0.101 0.125 0.226 0.774
35 0.239 0.168 0.407 0.593 0.095 0.123 0.217 0.783
40 0.219 0.177 0.396 0.604 0.089 0.121 0.210 0.790
45 0.200 0.186 0.386 0.614 0.084 0.121 0.204 0.796
50 0.183 0.193 0.377 0.623 0.079 0.120 0.199 0.801
55 0.168 0.200 0.368 0.632 0.075 0.121 0.195 0.805
60 0.154 0.206 0.360 0.640 0.070 0.121 0.191 0.809
65 0.141 0.212 0.353 0.647 0.067 0.121 0.188 0.812
70 0.129 0.217 0.346 0.654 0.063 0.122 0.185 0.815
75 0.118 0.222 0.340 0.660 0.060 0.123 0.182 0.818
80 0.108 0.226 0.334 0.666 0.057 0.124 0.180 0.820
85 0.099 0.229 0.329 0.671 0.054 0.124 0.178 0.822
90 0.091 0.233 0.324 0.676 0.051 0.125 0.176 0.824
95 0.084 0.236 0.319 0.681 0.048 0.126 0.174 0.826
100 0.077 0.238 0.315 0.685 0.046 0.127 0.173 0.827
Average 0.215 0.177 0.393 0.110 0.119 0.229
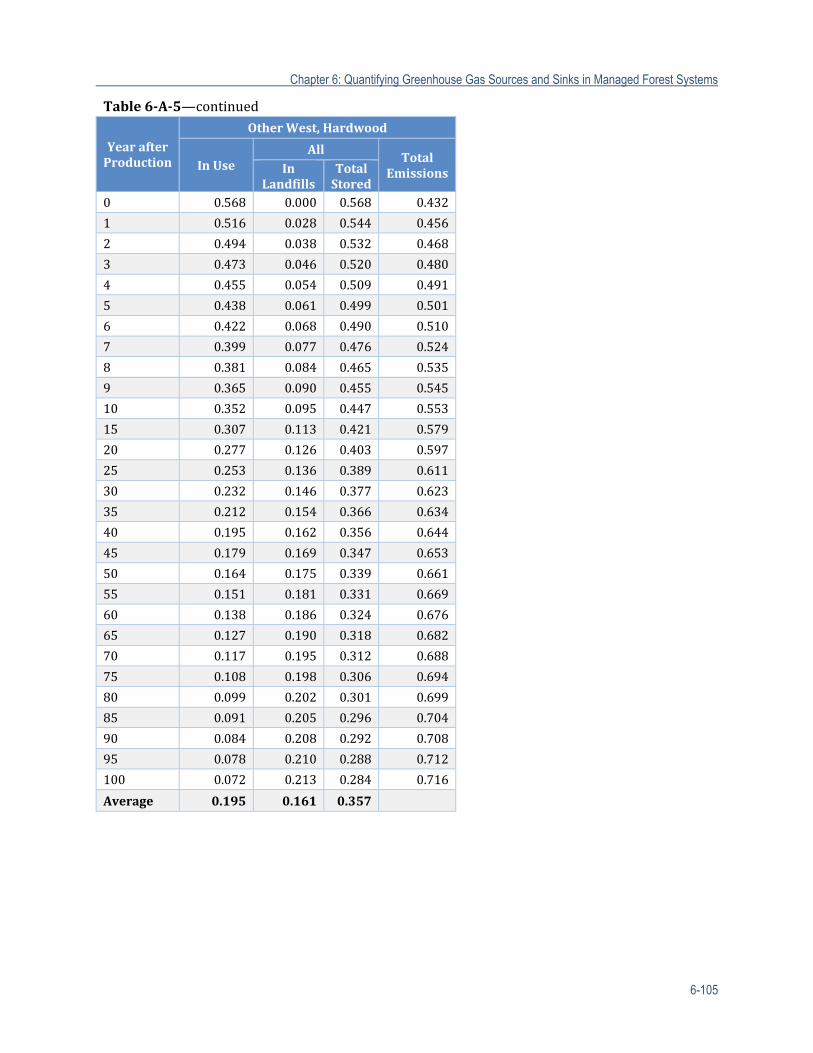
Chapter 6: Quantifying Greenhouse Gas Sources and Sinks in Managed Forest Systems
6-105
Table6‐A‐5—continued
YearafterProduction
OtherWest,Hardwood
InUseAll
TotalEmissions
In
LandfillsTotalStored
0 0.568 0.000 0.568 0.432 1 0.516 0.028 0.544 0.456 2 0.494 0.038 0.532 0.468 3 0.473 0.046 0.520 0.480 4 0.455 0.054 0.509 0.491 5 0.438 0.061 0.499 0.501 6 0.422 0.068 0.490 0.510 7 0.399 0.077 0.476 0.524 8 0.381 0.084 0.465 0.535 9 0.365 0.090 0.455 0.545 10 0.352 0.095 0.447 0.553 15 0.307 0.113 0.421 0.579 20 0.277 0.126 0.403 0.597 25 0.253 0.136 0.389 0.611 30 0.232 0.146 0.377 0.623 35 0.212 0.154 0.366 0.634 40 0.195 0.162 0.356 0.644 45 0.179 0.169 0.347 0.653 50 0.164 0.175 0.339 0.661 55 0.151 0.181 0.331 0.669 60 0.138 0.186 0.324 0.676 65 0.127 0.190 0.318 0.682 70 0.117 0.195 0.312 0.688 75 0.108 0.198 0.306 0.694 80 0.099 0.202 0.301 0.699 85 0.091 0.205 0.296 0.704 90 0.084 0.208 0.292 0.708 95 0.078 0.210 0.288 0.712 100 0.072 0.213 0.284 0.716 Average 0.195 0.161 0.357
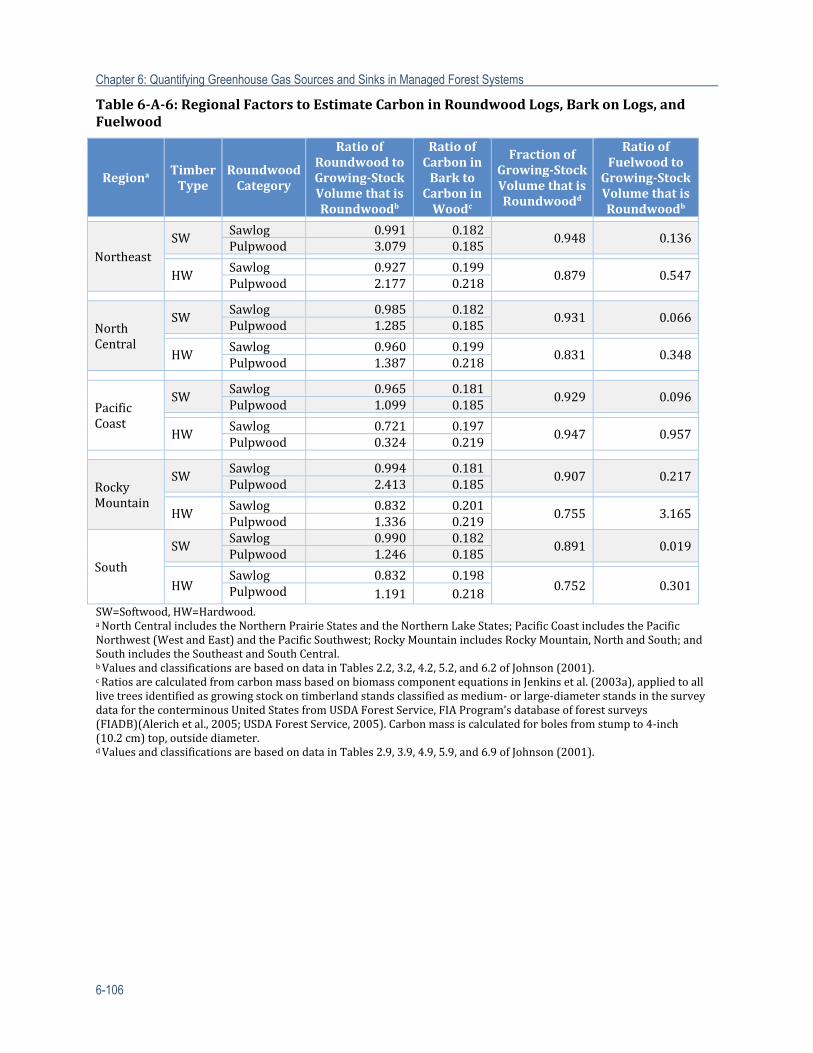
Chapter 6: Quantifying Greenhouse Gas Sources and Sinks in Managed Forest Systems
6-106
Table6‐A‐6:RegionalFactorstoEstimateCarboninRoundwoodLogs,BarkonLogs,andFuelwood
RegionaTimberType
RoundwoodCategory
RatioofRoundwoodtoGrowing‐StockVolumethatisRoundwoodb
RatioofCarboninBarktoCarboninWoodc
FractionofGrowing‐StockVolumethatisRoundwoodd
RatioofFuelwoodtoGrowing‐StockVolumethatisRoundwoodb
NortheastSW
Sawlog 0.991 0.1820.948 0.136
Pulpwood 3.079 0.185
HWSawlog 0.927 0.199
0.879 0.547Pulpwood 2.177 0.218
NorthCentral
SWSawlog 0.985 0.182
0.931 0.066Pulpwood 1.285 0.185
HWSawlog 0.960 0.199
0.831 0.348Pulpwood 1.387 0.218
PacificCoast
SWSawlog 0.965 0.181
0.929 0.096Pulpwood 1.099 0.185
HWSawlog 0.721 0.197
0.947 0.957Pulpwood 0.324 0.219
RockyMountain
SWSawlog 0.994 0.181
0.907 0.217Pulpwood 2.413 0.185
HWSawlog 0.832 0.201
0.755 3.165Pulpwood 1.336 0.219
South
SWSawlog 0.990 0.182
0.891 0.019Pulpwood 1.246 0.185
HWSawlog 0.832 0.198
0.752 0.301Pulpwood 1.191 0.218SW=Softwood,HW=Hardwood.aNorthCentralincludestheNorthernPrairieStatesandtheNorthernLakeStates;PacificCoastincludesthePacificNorthwest(WestandEast)andthePacificSouthwest;RockyMountainincludesRockyMountain,NorthandSouth;andSouthincludestheSoutheastandSouthCentral.bValuesandclassificationsarebasedondatainTables2.2,3.2,4.2,5.2,and6.2ofJohnson(2001).cRatiosarecalculatedfromcarbonmassbasedonbiomasscomponentequationsinJenkinsetal.(2003a),appliedtoalllivetreesidentifiedasgrowingstockontimberlandstandsclassifiedasmedium‐orlarge‐diameterstandsinthesurveydatafortheconterminousUnitedStatesfromUSDAForestService,FIAProgram’sdatabaseofforestsurveys(FIADB)(Alerichetal.,2005;USDAForestService,2005).Carbonmassiscalculatedforbolesfromstumpto4‐inch(10.2cm)top,outsidediameter.dValuesandclassificationsarebasedondatainTables2.9,3.9,4.9,5.9,and6.9ofJohnson(2001).
Chapter 6: Quantifying Greenhouse Gas Sources and Sinks in Managed Forest Systems
6-107
Chapter6References
Aalde,H.,P.Gonzalez,M.Gytarski,T.Krug,etal.2006.Chapter2:Genericmethodologiesapplicabletomultipleland‐usecategories.In2006IPCCGuidelinesforNationalGreenhouseGasInventories,S.Eggleston,L.Buendia,K.Miwa,T.NgaraandK.Tanabe(eds.).Japan:IGES.
Akagi,S.K.,R.J.Yokelson,C.Wiedinmyer,M.J.Alvarado,etal.2011.Emissionfactorsforopenanddomesticbiomassburningforuseinatmosphericmodels.Atmos.Chem.Phys.,11:4039‐4072.
Albaugh,T.J.,E.D.Vance,C.Gaudreault,T.R.Fox,etal.2012.CarbonemissionsandsequestrationfromfertilizationofpineinthesoutheasternUnitedStates.ForestScience,58(5):419‐429.
Alerich,C.L.,L.Klevgard,C.Liff,P.D.Miles,etal.Theforestinventoryandanalysisdatabase:databasedescriptionandusersguideversion2.0.U.S.DepartmentofAgriculture,ForestService.Retrievedfromhttp://ncrs2.fs.fed.us/4801/fiadb/fiadb_documentation/FIADB_DOCUMENTATION.htm
Amateis,R.L.,andH.E.Burkhart.2005.TheInfluenceofThinningontheProportionofPeeler,Sawtimber,andPulpwoodTreesinLoblollyPinePlantations.SouthernJournalofAppliedForestry,29(3):158‐162.
Basiliko,N.,A.Khan,C.E.Prescott,R.Roy,etal.2009.SoilgreenhousegasandnutrientdynamicsinfertilizedwesternCanadianplantationforests.CanadianJournalofForestResearch,39(6):1220‐1235.
Birdsey,R.A.,andL.S.Heath.1995.ClimatechangesinU.S.forests.InClimatechangeandtheproductivityofAmerica'sforests,L.A.Joyce(ed.).FortCollins,CO:USDAForestService
Birdsey,R.A.1996.CarbonstorageformajorforesttypesandregionsintheconterminousUnitedStates.Forestsandglobalchange:forestmanagementopportunitiesformitigatingcarbonemissions,2:1‐26,261‐372.
Boerner,R.E.J.,J.Huang,andS.C.Hart.2008.Fire,thinning,andthecarboneconomy:Effectsoffireandfiresurrogatetreatmentsonestimatedcarbonstorageandsequestrationrate.ForestEcologyandManagement,255(8–9):3081‐3097.
Briggs,D.2007.Managementpracticesonpacificnorthwestwest‐sideindustrialforestlands,1991–2005:withprojectionsto2010:StandManagementCooperativeSMCWorkingPaperNumber6.www.cfr.washington.edu/research.smc/working_papers/smc_working_paper_6.pdf.
Brown,J.K.1974.HandbookforInventoryingDownedWoodyMaterial.Ogden,Utah:U.S.DepartmentofAgriculture,ForestService,IntermountainForestandRangeExperimentStation.
Burkhart,H.E.2008.Modellinggrowthandyieldforintensivelymanagedforests.Jour.For.Sci.,24:119‐126.
Caldeira,K.,M.Morgan,B.Granger,andD.Baldocci.2004.Aportfolioofcarbonmanagementoptions.InTheGlobalCarbonCycle,C.B.FieldandM.R.Raupach(eds.).Washington,DC:IslandPress.
Carlson,C.A.,H.E.Burkhart,H.L.Allen,andT.R.Fox.2008.AbsoluteandrelativechangesintreegrowthratesandchangestothestanddiameterdistributionofPinustaedaasaresultofmidrotationfertilizerapplications.CanadianJournalofForestResearch,38(7):2063‐2071.
Carter,M.C.,andC.D.Foster.2006.Milestonesandmillstones:Aretrospectiveon50yearsofresearchtoimproveproductivityinloblollypineplantations.ForestEcologyandManagement,227(1–2):137‐144.
Charmley,W.1995.PersonalCommunication.AscitedinNowak,D.J.,J.C.Stevens,S.M.Sisinni,andC.J.Luley.2002.Effectsofurbantreemanagementandspeciesselectiononatmosphericcarbondioxide.J.Arboric,28(3):113‐122.
ClimateActionReserve.2010.ForestProjectProtocol.LosAngeles,CA:ClimateActionReserve.Côté,W.A.,R.J.Young,K.B.Risse,A.F.Costanza,etal.2002.Acarbonbalancemethodforpaperand
woodproducts.EnvironmentalPollution,116:S1‐S6.
Chapter 6: Quantifying Greenhouse Gas Sources and Sinks in Managed Forest Systems
6-108
Dixon,G.E.C.2002.EssentialFVS:Auser’sguidetotheForestVegetationSimulator.FortCollins,CO:U.S.DepartmentofAgriculture,ForestService,ForestManagementServiceCenter.http://www.fs.fed.us/fmsc/fvs/documents/gtrs.php.
DOE.1992.TechnicalGuidelinesforVoluntaryReportingofGreenhouseGasProgramChapter1,EmissionInventories,PartI,Appendix:Forestry.WashingtonDC:OfficeofPolicyandInternationalAffairsUnitedStatesDepartmentofEnergy.
Domke,G.,C.Woodall,andJ.Smith.2011.Accountingfordensityreductionandstructurallossinstandingdeadtrees:ImplicationsforforestbiomassandcarbonstockestimatesintheUnitedStates.CarbonBalanceandManagement,6(1):1‐11.
Domke,G.M.,C.W.Woodall,B.F.Walters,andJ.E.Smith.2013.Frommodelstomeasurements:comparingdowndeadwoodcarbonstockestimatesintheU.S.forestinventory.PLOSOne,8:e59949.
Escobedo,F.,J.A.Seitz,andW.Zipperer.2009.CarbonSequestrationandStorageGainesville'sUrbanForestUniversityofFloridaExtensionPublicationhttp://edis.ifas.ufl.edu/fr272
Finkral,A.J.,andA.M.Evans.2008.TheeffectsofathinningtreatmentoncarbonstocksinanorthernArizonaPonderosapineforest.ForestEcologyandManagement,255:2743‐2750.
Fox,T.R.,H.L.Allen,T.J.Albaugh,R.Rubilar,etal.2007.TreeNutritionandForestFertilizationofPinePlantationsintheSouthernUnitedStates.SouthernJournalofAppliedForestry,31(1):5‐11.
Gingrich,S.F.1967.MeasuringandevaluatingstockingandstanddensityinuplandhardwoodforestsintheCentralStates.ForestScience,13:38‐53.
Hanley,D.P.,andD.M.Baumgartner.2005.SilvicultureforWashingtonFamilyForests:WSUExtension.http://cru.cahe.wsu.edu/CEPublications/eb2000/eb2000.pdf.
Harmon,M.E.,C.W.Woodall,B.Fasth,J.Sexton,etal.2011.Differencesbetweenstandinganddowneddeadtreewooddensityreductionfactors:Acomparisonacrossdecayclassesandtreespecies,Res.Pap.15:USDAForestService,NorthernResearchStation.
Heath,L.S.,J.E.Smith,K.E.Skog,D.J.Nowak,etal.2011.ManagedforestcarbonestimatesfortheUSgreenhousegasinventory,1990‐2008.JournalofForestry,109(3):167‐173.
Heisler,G.M.1986.Energysavingswithtrees.J.Arboric,12(5):113‐125.Helms,J.A.,(ed.)1998.TheDictionaryofForestry.Washington,D.C.:SocietyofAmericanForesters.Hoover,C.M.,andS.A.Rebain.2008.TheKaneExperimentalForestcarboninventory:carbon
reportingwithFVS.ProceedingsoftheThirdForestVegetationSimulatorConference,FortCollins,CO.
Hoover,C.M.,andS.A.Rebain.2011.ForestcarbonestimationusingtheForestVegetationSimulator:Seventhingsyouneedtoknow.NewtownSquare,PA:U.S.DepartmentofAgriculture,ForestService,NorthernResearchStation.
Hoover,C.M.,(ed.)2008.FieldMeasurementsforForestCarbonMonitoring:ALandscape‐ScaleApproach.NewYork,NY:Springer.
Howard,J.L.2012.U.S.Timberproduction,trade,consumption,andpricestatistics,1965‐2009.Inpreparation.
IPCC.2000.LandUse,Land‐UseChange,andForestry.UK:IntergovernmentalPanelonClimateChange.
IPCC.2003.GoodPracticeGuidanceforLandUse,Land‐UseChangeandForestry.Kanagawa,Japan.:IntergovernmentalPanelonClimateChange.IPCCNationalGreenhouseGasInventoriesProgramme.http://www.ipcc‐nggip.iges.or.jp/public/gpglulucf/gpglulucf.html.
IPCC.2006.2006IPCCGuidelinesforNationalGreenhouseGasInventories,PreparedbytheNationalGreenhouseGasInventoriesProgramme.EditedbyH.S.Eggleston,L.Buendia,K.Miwa,T.NgaraandK.Tanabe.Japan:IGES.http://www.ipcc‐nggip.iges.or.jp/public/2006gl/vol4.html.
IPCC.2007.ContributionofWorkingGroupsI,IIandIIItotheFourthAssessmentReportofthe
Chapter 6: Quantifying Greenhouse Gas Sources and Sinks in Managed Forest Systems
6-109
IntergovernmentalPanelonClimateChangeCoreWritingTeam.Geneva,Switzerland:IntergovernmentalPanelonClimateChange.
Jenkins,J.C.,D.C.Chojnacky,L.S.Heath,andR.A.Birdsey.2003a.National‐ScaleBiomassEstimatorsforUnitedStatesTreeSpecies.ForestScience,49(1):12‐35.
Jenkins,J.C.,D.C.Chojnacky,L.S.Heath,andR.A.Birdsey.2003b.Comprehensivedatabaseofdiameter‐basedbiomassregressionsforNorthAmericantreespecies.NewtownSquare,PA:U.S.DepartmentofAgriculture,ForestService,NortheastResearchStation.
Johnson,l.R.,B.Lippke,J.D.Marshall,andJ.Comnick.2005.Life‐cycleimpactsofforestresourceactivitiesinthePacificNorthwestandSoutheastUnitedStates.WoodandFiberScience,37(CORRIMSpecialIssue):30‐46.
Johnson,M.C.,D.L.Peterson,andC.L.Raymond.2007.GuidetofueltreatmentsindryforestsoftheWesternUnitedStates:assessingforeststructureandfirehazard.Portland,OR:USDAForestService,PacificNorthwestResearchStation.
Johnson,T.G.,(ed.).2001.UnitedStatestimberindustry‐anassessmentoftimberproductoutputanduse,1996,Gen.Tech.Rep.SRS‐45.Asheville,NC:U.S.DepartmentofAgriculture,ForestService,SouthernResearchStation.
JointFireScienceProgram.2009.Consume3.0‐‐asoftwaretoolforcomputingfuelconsumption.FireScienceBrief(55):6.
Jokela,E.J.,H.L.Allen,andW.W.McFee.1991.Fertilizationofsouthernpinesatestablishment.InForestRegenerationManual,M.DuryeaandP.Dougherty(eds.).Netherlands:KluwerAcademicPublishers.
Lambin,E.F.,Geist,H.,andRindfus,R.R..2006.Introduction:localprocesseswithglobalimpacts.InLandUseandLandCoverChange,E.F.LambinandH.Geist(eds.).Verlag,Berlin:Springer.
Lewandrowski,J.,M.Sperow,M.Peters,M.Eve,etal.2004.EconomicsofsequesteringcarbonintheU.S.agriculturalsector.Washington,DC:U.S.DepartmentofAgriculture,EconomicResearchService.
Li,Y.,E.C.Turnblom,andD.G.Briggs.2007.EffectsofdensitycontrolandfertilizationongrowthandyieldofyoungDouglas‐firplantationsinthePacificNorthwest.CanadianJournalofForestResearch,37(2):449‐461.
Liski,J.,A.Pussinen,K.Pingoud,auml,etal.2001.Whichrotationlengthisfavourabletocarbonsequestration?CanadianJournalofForestResearch,31(11):2004‐2013.
Lund,H.G.1999.DefinitionsofForest,Deforestation,AfforestationandReforestation.Manassas,VA:ForestInformationServices.
Markewitz,D.2006.Fossilfuelcarbonemissionsfromsilviculture:Impactsonnetcarbonsequestrationinforests.ForestEcologyandManagement,236(2–3):153‐161.
McKeand,S.,T.Mullin,T.Byram,andT.White.2003.DeploymentofGeneticallyImprovedLoblollyandSlashPinesintheSouth.JournalofForestry,101(3):32‐37.
McPherson,E.G.,andJ.R.Simpson.1999.Carbondioxidereductionthroughurbanforestry:Guidelinesforprofessionalandvolunteertreeplanters.Albany,CA:USDAForestService,PacificSouthwestResearchStation.
Nave,L.E.,E.D.Vance,C.W.Swanston,andP.S.Curtis.2010.Harvestimpactsonsoilcarbonstorageintemperateforests.ForestEcologyandManagement,259(5):857‐866.
Nowak,D.J.1991.UrbanForestDevelopmentandStructure:AnalysisofOakland,California:UniversityofCalifornia,Berkeley.
Nowak,D.J.1994.AtmosphericcarbondioxidereductionbyChicago'surbanforest.InChicago'sUrbanForestEcosystem:ResultsoftheChicagoUrbanForestClimateProject,E.G.McPherson,D.J.NowakandR.A.Rowntree(eds.):USDAForestServiceGeneralTechnicalReportNE‐186.
Nowak,D.J.,andD.E.Crane.2002.CarbonstorageandsequestrationbyurbantreesintheUSA.EnvironmentalPollution,116(3):381‐389.
Chapter 6: Quantifying Greenhouse Gas Sources and Sinks in Managed Forest Systems
6-110
Nowak,D.J.,J.C.Stevens,S.M.Sisinni,andC.J.Luley.2002.Effectsofurbantreemanagementandspeciesselectiononatmosphericcarbondioxide.J.Arboric,28(3):113‐122.
Nowak,D.J.,R.Hoehn,D.E.Crane,J.C.Stevens,etal.2006a.Assessingurbanforesteffectsandvalues:Casper,WY’surbanforest.NewtownSquare,PA:USDAForestService.
Nowak,D.J.,R.Hoehn,D.E.Crane,J.C.Stevens,etal.2006b.Assessingurbanforesteffectsandvalues:WashingtonD.C.’surbanforest.NewtownSquare,PA:USDAForestService.
Nowak,D.J.,R.Hoehn,D.E.Crane,J.C.Stevens,etal.2006c.Assessingurbanforesteffectsandvalues:Minneapolis’urbanforest:USDAForestService.
Nowak,D.J.,A.B.Cumming,D.B.Twardus,R.Hoehn,etal.2007a.NationalForestHealthMonitoringProgram,MonitoringUrbanForestsinIndiana:PilotStudy2002,Part2:StatewideEstimatesUsingtheUFOREModel:NortheasternAreaReportNA‐FR‐01‐07.
Nowak,D.J.,R.Hoehn,D.E.Crane,J.C.Stevens,etal.2007b.Assessingurbanforesteffectsandvalues:SanFrancisco’surbanforest.NewtownSquare,PA:USDAForestService.
Nowak,D.J.,R.Hoehn,D.E.Crane,J.C.Stevens,etal.2007c.Assessingurbanforesteffectsandvalues:Philadelphia’surbanforest.NewtownSquare,PA:USDAForestService.
Nowak,D.J.,R.Hoehn,D.E.Crane,J.C.Stevens,etal.2007d.Assessingurbanforesteffectsandvalues:NewYorkCity’surbanforest.NewtownSquare,PA:USDAForestService.
Nowak,D.J.,R.Hoehn,D.E.Crane,J.C.Stevens,etal.2008.Aground‐basedmethodofassessingurbanforeststructureandecosystemservices.Arboric.Urb.For.,34(6):347‐358.
Nowak,D.J.,R.Hoehn,D.E.Crane,J.C.Stevens,etal.2010.Assessingurbanforesteffectsandvalues:Scranton’surbanforest.NewtownSquare,PA:USDAForestService.
Nowak,D.J.,R.Hoehn,D.E.Crane,J.C.Stevens,etal.2011.Assessingurbanforesteffectsandvalues:Chicago’surbanforest.NewtownSquare,PA:USDAForestService.
Nowak,D.J.,A.B.Cumming,D.B.Twardus,R.Hoehn,etal.2012a.UrbanForestsofTennessee.Ashville,NC:U.S.DepartmentofAgriculture,ForestServiceGen.Tech.Rep.SRS‐149.
Nowak,D.J.,andE.J.Greenfield.2012.TreeandimperviouscoverchangeinU.S.cities.UrbanForestryandUrbanGreening,11:21‐30.
Nowak,D.J.,R.Hoehn,D.E.Crane,andA.Bodine.2012b.AssessingurbanforesteffectsandvaluesintheGreatPlainsStates:Kansas,Nebraska,NorthDakota,SouthDakota.NewtownSquare,PA:U.S.DepratmentofAgriculture,ForestService,NorthernResourceBulletinNRS‐71.
Nowak,D.J.,R.Hoehn,D.E.Crane,J.Cumming,etal.2012c.Assessingurbanforesteffectsandvalues:Morgantown’surbanforest.NewtownSquare,PA:U.S.DepartmentofAgriculture,ForestService,NorthernResearchStation,ResourceBulletinNRS‐70.
Nowak,D.J.,E.J.Greenfield,R.Hoehn,andE.LaPoint.2013.CarbonstorageandsequestrationbytreesinurbanandcommunityareasoftheUnitedStates.EnvironmentalPollution,178:229‐236.
Nowak,D.J.,R.Hoehn,D.E.Crane,E.G.McPherson,etal.Inreview.Assessingurbanforesteffectsandvalues:Sacramento’surbanforest.NewtownSquare,PA:USDAForestService.
Nyland,R.D.2002.SilvicultureConceptsandApplications.2ndEditioned.NewYork:McGraw‐Hill.Pacala,S.,andR.Socolow.2004.Stabilizationwedges:solvingtheclimateproblemforthenext50
yearswithcurrenttechnologies.Science,305:968‐972.Pearson,T.R.H.,S.L.Brown,andR.A.Birdsey.2007.Measurementguidelinesforthesequestrationof
forestcarbon.NewtownSquare,PA:USDepartmentofAgriculture,ForestService,NorthernResearchStation.
Rebain,S.A.2010.TheFireandFuelsExtensiontotheForestVegetationSimulator:UpdatedModelDocumentation.FortCollins,CO:U.S.DepartmentofAgriculture,ForestService,ForestManagementServiceCenter.http://www.fs.fed.us/fmsc/ftp/fvs/docs/gtr/FFEguide.pdf.
Reinhardt,E.D.,R.E.Keane,andJ.K.Brown.1997.FirstOrderFireEffectsModel:FOFEM4.0,User'sGuide.
Reinhardt,E.D.,andN.L.Crookston.2003.TheFireandFuelsExtensiontotheForestVegetation
Chapter 6: Quantifying Greenhouse Gas Sources and Sinks in Managed Forest Systems
6-111
Simulator:RockyMountainResearchStation.Schultz,R.P.1997.LoblollyPine:TheEcologyandCultureofLoblollyPine(PinustaedaL.).
WashingtonDC:USDAForestService.Shepperd,W.D.,andM.A.Battaglia.2002.Ecology,Silviculture,andManagementofBlackHills
PonderosaPine,Gen.Tech.Rep.RMRS‐GTR‐97.FortCollins,CO:U.S.DepartmentofAgriculture,ForestService,RockyMountainResearchStation.
Siry,J.2002.Intensivetimbermanagementpractices.InSouthernforestresourceassessment,D.WearandJ.Greis(eds.).Asheville,NC:USDAForestService,SouthernResearchStation.
Skog,K.E.2008.SequestrationofcarboninharvestedwoodproductsfortheUnitedStates.ForestProductsJournal,58(6):56‐72.
Skog,K.E.2013.PersonalcommunicationwithCoeliHoover,U.S.DepartmentofAgriculture,ForestService.
Skole,D.L.1994.Dataongloballandcoverchange:acquisition,assessment,andanalysis.InChangesinLandUseandLandCover:aGlobalPerpsective,W.B.a.T.Meyer,B.L.(ed.).CambridgeEngland;NewYork,NY:CambridgeUniversityPress
Smith,J.E.,andL.S.Heath.2002.AmodelofforestfloorcarbonmassforUnitedStatesforesttypes.NewtownSquare,PA:U.S.DepartmentofAgriculture,ForestService,NortheasternResearchStation.
Smith,J.E.,L.S.Heath,andJ.C.Jenkins.2003.Forestvolume‐to‐biomassmodelsandestimatesofmassforliveandstandingdeadtreesofU.S.forests.NewtownSquare,PA:U.S.DepartmentofAgriculture,ForestService,NortheasternResearchStation.
Smith,J.E.,L.S.Heath,K.E.Skog,andR.A.Birdsey.2006.MethodsforcalculatingforestecosystemandharvestedcarbonwithstandardestimatesforforesttypesoftheUnitedStates.NewtownSquare,PA:USDepartmentofAgriculture,ForestService,NorthernResearchStation.
Smith,W.B.,P.D.Miles,C.H.Perry,andS.A.Pugh.2007.ForestResourcesoftheUnitedStates,Gen.Tech.Rep.WO‐78.Washington,DC:U.S.DepartmentofAgriculture,ForestService,WashingtonOffice.
Smith,W.B.,P.D.Miles,C.H.Perry,andS.A.Pugh.2009.ForestResourcesoftheUnitedStates,2007.Washington,DC:U.S.DepartmentofAgriculture,ForestService.
St.Clair,J.B.,N.L.Mandel,andK.J.S.Jayawickrama.2004.EarlyrealizedgeneticgainsforcoastalDouglas‐firinthenorthernOregonCascades.WesternJournalofAppliedForestry,19(3):195‐201.
Stainback,A.G.,andJ.R.R.Alavalapati.2002.EconomicanalysisofslashpineforestcarbonsequestrationinthesouthernU.S.JournalofForestEconomics,8(2):105‐117.
Stanturf,J.A.,R.C.Kellison,F.S.Broerman,andS.B.Jones.2003.ProductivityofSouthernPinePlantations:WhereAreWeandHowDidWeGetHere?JournalofForestry,101(3):26‐31.
Stavins,R.N.,andK.R.Richards.2005.ThecostofU.S.forest‐basedcarbonsequestration.Arlington,VA:ThePewCenteronGlobalClimateChange.
Sucre,E.B.,R.B.Harrison,E.C.Turnblom,andD.G.Briggs.2008.TheuseofvarioussoilandsitevariablesforestimatinggrowthresponseofDouglas‐firtomultipleapplicationsofureaanddeterminingpotentiallong‐termeffectsonsoilproperties.CanadianJournalofForestResearch,38(6):1458‐1469.
Ter‐Mikaelian,M.T.,andM.D.Korzukhin.1997.Biomassequationsforsixty‐fiveNorthAmericantreespecies.ForestEcologyandManagement,97(1):1‐24.
Turner,B.L.,W.B.Meyer,andD.L.Skole.1994.Globalland‐use/land‐coverchange:Towardsan integratedstudy.Ambio,23(1):91‐95.
U.S.CensusBureau.U.S.CensusData.U.S.CensusBureau.RetrievedJanuary2007fromwww.census.gov.
U.S.CensusBureau.2011.Cartographicboundaryfiles.U.S.CensusBureau.RetrievedJunefromhttp://www.census.gov/geo/www/cob/bdy_files.html.
Chapter 6: Quantifying Greenhouse Gas Sources and Sinks in Managed Forest Systems
6-112
U.S.DOE.2011.TechnicalGuidelines:VoluntaryReportingofGreenhouseGases(1605(b))Program.U.S.DepartmentofEnergy,OfficeofPolicyandInternationalAffairs.RetrievedDecemberfromhttp://www.eia.gov/oiaf/1605/January2007_1605bTechnicalGuidelines.pdf.
U.S.EPA.1991.Non‐roadengineandvehicleemissionstudy‐report.AnnArbor,MI:U.S.EnvironmentalProtectionAgency,OfficeofMobileServices.
U.S.EPA.2005.GreenhouseGasMitigationPotentialinU.S.ForestryandAgriculture.Washington,DC:U.S.EnvironmentalProtectionAgency.
U.S.EPA.2010.InventoryofU.S.GreenhouseGasEmissionsandSinks:1990‐2008.Washington,DC:U.S.EnvironmentalProtectionAgency.http://epa.gov/climatechange/emissions/usinventoryreport.html.
U.S.EPA.2011.InventoryofU.S.GreenhouseGasEmissionsandSinks:1990‐2009.Washington,D.C.:U.S.EnvironmentalProtectionAgency.http://epa.gov/climatechange/emissions/usinventoryreport.html.
U.S.EPA.2012a.2008NationalEmissionsInventory,version2:U.S.EnvironmentalProtectionAgency.http://www.epa.gov/ttnchie1/net/2008inventory.html.
U.S.EPA.2012b.InventoryofU.S.GreenhouseGasEmissionsandSinks:1990‐2010.Washington,DC:U.S.EnvironmentalProtectionAgency.http://epa.gov/climatechange/emissions/usinventoryreport.html.
Urbanski,S.P.,W.M.Hao,andS.Baker.2009.ChemicalCompositionofWildlandFireEmissions.TheNetherlands.
USDA.2011.U.S.AgricultureandForestGreenhouseGasInventory:1990‐2008.Washington,DC:U.S.DepartmentofAgriculture.
USDAForestService.ForestService.2005.Forestinventorymapmaker,RPAtabler,andFIADBdownloadfiles.Retrievedfromhttp://ncrs2.fs.fed.us/4801/fiadb/index.htm.
USDAForestService.2010a.ForestInventoryandAnalysisfieldmethodsforphase3measurements.Version5.0:U.S.DepartmentofAgriculture,ForestService.Unpublishedinformationonfileathttp://www.fia.fs.fed.us/library/field‐guides‐methods‐proc/.
USDAForestService.2010b.ForestInventoryandAnalysisNationalCoreFieldGuide:fielddatacollectionproceduresforphase2plots.Version5.0:Unpublishedinformationonfileathttp://fia.fs.fed.us/library/field‐guides‐methods‐proc/.
USDAForestService.2012.ForestInventoryandAnalysis(FIA)Database.Arlington,VA:U.S.DepartmentofAgriculture,ForestService.
vanKooten,G.C.,C.S.Binkley,andG.Delcourt.1995.Effectofcarbontaxesandsubsidiesonoptimalforestrotationageandsupplyofcarbonservices.AmericanJournalofAgriculturalEconomics,77(2):365‐374.
Vance,E.D.,D.A.Maguire,andR.S.Zalesny.2010.ResearchStrategiesforIncreasingProductivityofIntensivelyManagedForestPlantations.JournalofForestry,108(4):183‐192.
Wade,D.,andP.Dubish.1995.PersonalCommunication.AscitedinNowak,D.J.,J.C.Stevens,S.M.Sisinni,andC.J.Luley.2002.Effectsofurbantreemanagementandspeciesselectiononatmosphericcarbondioxide.J.Arboric,28(3):113‐122.
Westfall,J.A.,C.W.Woodall,andM.A.Hatfield.2013.Astatisticalpoweranalysisofwoodycarbonfluxfromforestinventorydata.ClimaticChange,118(3‐4):919‐931.
Woodall,C.W.,andV.J.Monleon.2008.Samplingprotocol,estimation,andanalysisproceduresforthedownwoodymaterialsindicatoroftheFIAprogram.NewtownSquare,PA:U.S.DepartmentofAgriculture,ForestService,NorthernResearchStation.
Woodall,C.W.,B.L.Conkling,M.C.Amacher,J.W.Coulston,etal.2010.TheForestInventoryandAnalysisDatabaseVersion4.0:DescriptionandUsersManualforPhase3.NewtownSquare,PA:U.S.DepartmentofAgriculture,ForestService,NorthernResearchStation.
Woodall,C.W.,L.S.Heath,G.M.Domke,andM.Nichols.2011.Methodsandequationsforestimatingvolume,biomass,andcarbonfortreesintheU.S.’snationalforestinventory,2010.Newtown
Chapter 6: Quantifying Greenhouse Gas Sources and Sinks in Managed Forest Systems
6-113
Square,PA:U.S.DepartmentofAgriculture,ForestService,NorthernResearchStation.Woodall,C.W.,G.M.Domke,D.W.MacFarlane,andC.M.Oswalt.2012.Comparingfield‐andmodel‐
basedstandingdeadtreecarbonstockestimatesacrossforestsoftheUnitedStates.Forestry,85:125‐133.
Woodall,C.W.,B.F.Walters,S.N.Oswalt,G.M.Domke,etal.2013.BiomassandcarbonattributesofdownedwoodymaterialsinforestsoftheUnitedStates.ForestEcologyandManagement,305:48‐59.
Woudenberg,S.W.,B.Conkling,L.,B.M.O’Connell,E.B.LaPoint,etal.2010.TheForestInventoryandAnalysisDatabase:Databasedescriptionandusersmanualversion4.0forPhase2.FortCollins,CO:U.S.DepartmentofAgriculture,ForestService,RockyMountainResearchStation.
Youngblood,A.2005.SilviculturalSystemsforManagingPonderosaPineProceedingsoftheSymposiumonPonderosaPine:Issues,Trends,andManagement,2004October18‐21,KlamathFalls,OR.

Chapter 6: Quantifying Greenhouse Gas Sources and Sinks in Managed Forest Systems
6-114
Thispageisintentionallyleftblank.
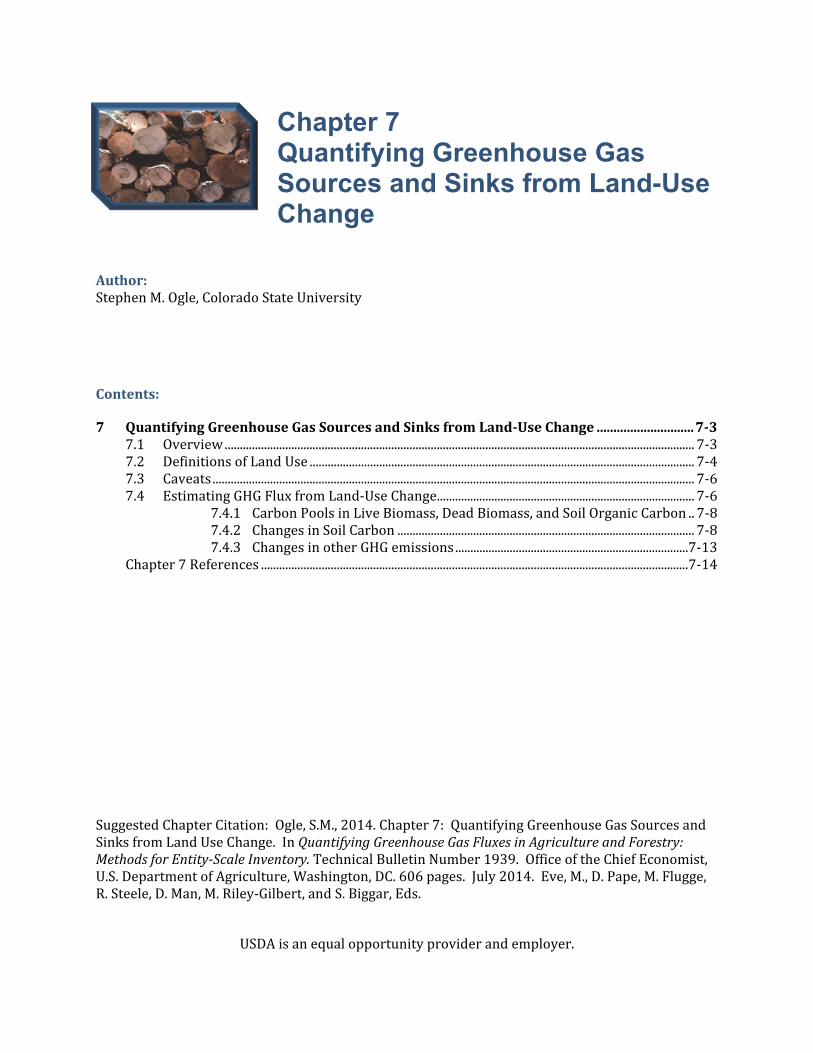
Author:StephenM.Ogle,ColoradoStateUniversity
Contents:
7 QuantifyingGreenhouseGasSourcesandSinksfromLand‐UseChange.............................7‐37.1 Overview...........................................................................................................................................................7‐37.2 DefinitionsofLandUse...............................................................................................................................7‐47.3 Caveats...............................................................................................................................................................7‐67.4 EstimatingGHGFluxfromLand‐UseChange.....................................................................................7‐6
7.4.1 CarbonPoolsinLiveBiomass,DeadBiomass,andSoilOrganicCarbon..7‐87.4.2 ChangesinSoilCarbon..................................................................................................7‐87.4.3 ChangesinotherGHGemissions.............................................................................7‐13
Chapter7References.............................................................................................................................................7‐14
SuggestedChapterCitation:Ogle,S.M.,2014.Chapter7:QuantifyingGreenhouseGasSourcesandSinksfromLandUseChange.InQuantifyingGreenhouseGasFluxesinAgricultureandForestry:MethodsforEntity‐ScaleInventory.TechnicalBulletinNumber1939.OfficeoftheChiefEconomist,U.S.DepartmentofAgriculture,Washington,DC.606pages.July2014.Eve,M.,D.Pape,M.Flugge,R.Steele,D.Man,M.Riley‐Gilbert,andS.Biggar,Eds.
USDAisanequalopportunityproviderandemployer.
Chapter 7
Quantifying Greenhouse Gas Sources and Sinks from Land-Use Change
Chapter 7: Quantifying Greenhouse Gas Sources and Sinks from Land-Use Change
7-2
Acronyms,ChemicalFormulae,andUnits
C CarbonCH4 MethaneCO2 CarbondioxideCO2‐eq CarbondioxideequivalentsDOM DeadorganicmatterEPA EnvironmentalProtectionAgencyFIA ForestInventoryandAnalysisGHG Greenhousegasha HectareIPCC IntergovernmentalPanelonClimateChangeN2O NitrousOxideNRI NaturalResourcesInventoryPRISM Parameter‐ElevationRegressionsonIndependentSlopesModelSOC SoilorganiccarbonSSURGO SoilSurveyGeographicDatabaseUSDA U.S.DepartmentofAgriculture
Chapter 7: Quantifying Greenhouse Gas Sources and Sinks from Land-Use Change
7-3
7 QuantifyingGreenhouseGasSourcesandSinksfromLand‐UseChange
Thischapterprovidesguidanceonestimatingthenetgreenhousegas(GHG)fluxresultingfromchangesbetweenlandusetypes—i.e.,conversionsintoandoutofcropland,wetland,grazingland,orforestland—attheentityscale.Insomecases,itissufficienttoestimatethenetGHGfluxassociatedwiththenewlanduse.Ifchangingfromonelandusetoanotherhasasignificanteffectoncarbonstocks(e.g.,changesinforestcarbonstocks,changesinsoilcarbon),itwillbenecessarytorepresentthatinfluenceassociatedwithaspecificland‐usechange(e.g.,wetlandtocropland,grazinglandtocropland,forestlandtocropland).Table7‐1providesasummaryanddescriptionofthesourcescoveredinthischapter.
Table7‐1:OverviewofLand‐UseChangeSourcesandAssociatedGHGs
SourceMethodforGHGEstimation Description
CO2 N2O CH4Annualchangeincarbonstocksindeadwoodandlitterduetolandconversion
Liveanddeadbiomasscarbonstocksandsoilorganiccarbonconstitutesasignificantcarbonsinkinmanyforestandagriculturallands.Followingland‐useconversion,theestimationofdeadbiomasscarbonstockchangesduringtransitionperiodsrequiresthattheareasubjecttoland‐usechangeontheentity’soperationbetrackedforthedurationofthe20‐yeartransitionperiod.
Changeinsoilorganiccarbonstocksformineralsoils
Soilorganiccarbonstocksareinfluencedbyland‐usechange(Aaldeetal.,2006)duetochangesinproductivitythatinfluencecarboninputs,andtochangesinsoilmanagementthatinfluencecarbonoutputs(DavidsonandAckerman,1993;Ogleetal.,2005;PostandKwon,2000).Themostsignificantchangesinsoilorganiccarbonoccurwithland‐usechange,particularlyconversionstocroplands,duetochangesinthedisturbanceregimesandassociatedeffectsonsoilaggregatedynamics(Sixetal.,2000).
7.1 Overview
Inmanycases,themethodsproposedtoestimatecontributionstotheGHGfluxresultingfromland‐usechangearethesameasthoseusedtoestimatecarbonstockchangesintheindividualchaptersonCroplandandGrazingLand,Forestry,andWetlands;although,inspecificcasesguidanceisalsoprovidedonreconcilingcarbon‐stockestimatesbetweendiscretedatasetsandestimationmethods(e.g.,reconcilingforestsoilcarbonestimatesandcroplandsoilcarbonestimatesforland‐usechangefromforestlandtocropland).Table7‐2presentsthemethodologiesforeachsourceandindicatestheirsection.
Chapter 7: Quantifying Greenhouse Gas Sources and Sinks from Land-Use Change
7-4
Table7‐2:OverviewofCroplandandGrazingLandSystemsSources,MethodandSection
Section Source ProposedMethod
7.4.1 Annualchangeincarbonstocksindeadwoodandlitterduetolandconversion
Thechangeincarbonstocksindeadwoodandlitterduetolandconversionisestimatedasthedifferenceincarbonstocksintheoldandnewland‐usecategoriesappliedintheyearoftheconversion(carbonlosses),ordistributeduniformlyoverthelengthofthetransitionperiod(carbongains)(Aaldeetal.,2006).
7.4.2 Changeinsoilorganiccarbonstocksformineralsoils
ThemethodologiestoestimatesoilcarbonstockchangesfororganicsoilsandmineralsoilsareadoptedfromIPCC(Aaldeetal.,2006).
Theremainderofthischapterisorganizedasfollows:
Definitions
Caveats
StepsforestimatingGHGfluxfromland‐usechange
Overlaps,issues,andassemblyinstructionsforGHGfluxestimationfromland‐usechange
7.2 DefinitionsofLandUse
Aland‐usecategorizationsystemthatisconsistentandcomplete(bothtemporallyandspatially)isneededtoassesslanduseandland‐usechangestatuswithinanentity’sboundaries.Eachentityshouldensurethatitcharacterizesallofthelandwithinitsboundaryaccordingtothefollowingland‐usetypes:cropland,grazingland,forestland,wetland,settlements(e.g.,residential,farm,andcommercialbuildings),andotherland(e.g.,baresoil,rock).Theland‐usedefinitionsprovidedbelowareexpectedtobeadoptedbyentitiesusingthisreport.Itiscriticalthatindividualparcelareasareestimatedaccuratelyandwhencombinedadduptothetotallandareareportedbytheentitybeforeandaftertheland‐usechange.
CurrentdefinitionsforlandusethatareconsistentwithotherpolicyprogramsrelatedtoGHGestimation(e.g.,IntergovernmentalPanelonClimateChange(IPCC),NaturalResourcesInventory(NRI))areprovidedbelow.ThesedefinitionsarespecifictotheUnitedStatesandarebasedpredominantlyoncriteriausedintheland‐usesurveysfortheUnitedStates.Specifically,thedefinitionofforestlandisbasedontheForestInventoryandAnalysis(FIA)definitionofforest,1whiledefinitionsofcropland,grazingland,andsettlementsarebasedontheNRI.2ThedefinitionsforotherlandandwetlandsarebasedontheIPCC(2006)definitionsforthesecategories.
ForestLand:Aland‐usecategorythatincludesareasatleast36.6meterswideand0.4hectaresinsizewithatleast10percentcover(orequivalentstocking)bylivetreesofanysize,includinglandthatformerlyhadsuchtreecoverandthatwillbenaturallyorartificiallyregenerated.Forestlandincludestransitionzones,suchasareasbetweenforestandnon‐forestlandsthathaveatleast10percentcover(orequivalentstocking)withlivetreesandforestareasadjacenttourbanandbuilt‐uplands.Roadside,streamside,andshelterbeltstripsoftreesmusthaveacrownwidthofatleast36.6metersandcontinuouslengthofatleast110.6meterstoqualifyasforestland.Unimprovedroadsandtrails,
1SeeFIAGlossaryhttp://socrates.lv‐hrc.nevada.edu/fia/ab/issues/pending/glossary/Glossary_5_30_06.pdf2SeeNationalResourceInventoryGlossaryofSelectedTerms(p.9)http://www.nrcs.usda.gov/Internet/FSE_DOCUMENTS/stelprdb1041379.pdf
Chapter 7: Quantifying Greenhouse Gas Sources and Sinks from Land-Use Change
7-5
streams,andclearingsinforestareasareclassifiedasforestsiftheyarelessthan36.6meterswideor0.4hectaresinsize;otherwisetheyareexcludedfromforestlandandclassifiedassettlements.Tree‐coveredareasinagriculturalproductionsettings,suchasfruitorchards,ortree‐coveredareasinurbansettings,suchascityparks,arenotconsideredforestland(Smithetal.,2009).
Cropland:Aland‐usecategorythatincludesareasusedfortheproductionofadaptedcropsforharvest;thiscategoryincludesbothcultivatedandnon‐cultivatedlands.Cultivatedcropsincluderowcropsorclosegrowncropsandalsohayorpastureinrotationwithcultivatedcrops.Non‐cultivatedcroplandincludescontinuoushay,perennialcrops(e.g.,orchards),andhorticulturalcropland.Croplandalsoincludeslandwithalleycroppingandwindbreaks,aswellaslandsintemporaryfalloworenrolledinconservationreserveprograms(i.e.,set‐asides3).Roadsthroughcropland,includinginterstatehighways,statehighways,otherpavedroads,gravelroads,dirtroads,andrailroadsareexcludedfromcroplandareaestimatesandare,instead,classifiedassettlements.
GrazingLand:4Aland‐usecategoryunderwhichtheplantcoveriscomposedprincipallyofgrasses,grass‐likeplants,forbs,orshrubssuitableforgrazingandbrowsing.Thiscategoryincludesbothpasturesandnativerangelandsandareaswherepracticessuchasclearing,burning,chaining,and/orchemicalsareappliedtomaintainthegrassvegetation.Savannas,somewetlandsanddeserts,andtundraareconsideredgrazingland.Woodyplantcommunitiesoflowforbsandshrubs,suchasmesquite,chaparral,mountainshrub,andpinyon‐juniper,arealsoclassifiedasgrazinglandiftheydonotmeetthecriteriaforforestland.Grazinglandincludeslandmanagedwithagroforestrypracticessuchassilvopastureandwindbreaks,assumingthestandorwoodlotdoesnotmeetthecriteriaforforestland.Roadsthroughgrazingland,includinginterstatehighways,statehighways,otherpavedroads,gravelroads,dirtroads,andrailroadsareexcludedfromgrazinglandareaestimatesandare,instead,classifiedasSettlements.
Wetlands:5Aland‐usecategorythatincludeslandwithhydricsoils,nativeoradaptedhydrophyticvegetation,andahydrologicregimewerethesoilissaturatedduringthegrowingseasoninmostyears.Wetlandvegetationtypesmayincludemarshes,grasslands,orforests.Wetlandsmayhavewaterlevelsthatareartificiallychanged,orwherethevegetationcompositionorproductivityismanipulated.Theselandsincludeundrainedforestedwetlands,grazedwoodlandsandgrasslands,impoundmentsmanagedforwildlife,andlandsthatarebeingrestoredfollowingconversiontoanon‐wetlandcondition(typicallyasaresultofagriculturaldrainage).Provisionsforengineeredwetlandsincluding
3Aset‐asideiscroplandthathasbeentakenoutofactivecroppingandconvertedtosometypeofvegetativecover,including,forexample,nativegrassesortrees.4Notethatthisdefinitionisthe“grassland”definitionfromtheNIRwith“grassland”replacedwith“grazingland.”5Thejurisdictionaldefinitionofawetlandis“thoseareasthatareinundatedorsaturatedbysurfaceorgroundwateratafrequencyanddurationsufficienttosupport,andthatundernormalcircumstancesdosupport,aprevalenceofvegetationtypicallyadaptedforlifeinsaturatedsoilconditions.Wetlandsgenerallyincludeswamps,marshes,bogs,andsimilarareas”(EPA,1980).The1987CorpsofEngineersWetlandDelimitationManual&RegionalSupplements(U.S.ArmyCorpsofEngineers,1987)isusedtoidentifywetlandsinthefield.
Chapter 7: Quantifying Greenhouse Gas Sources and Sinks from Land-Use Change
7-6
stormwaterdetentionponds,constructedwetlandsforwatertreatment,andfarmpondsorreservoirsarenotincluded.Naturallakesandstreamsarealsonotincluded.
Settlements:Aland‐usecategoryrepresentingdevelopedareasconsistingofunitsof0.25acres(0.1ha)ormorethatincludesresidential,industrial,commercial,andinstitutionalland;constructionsites;publicadministrativesites;railroadyards;cemeteries;airports;golfcourses;sanitarylandfills;sewagetreatmentplants;watercontrolstructuresandspillways;parkswithinurbanandbuilt‐upareas;andhighways,railroads,andothertransportationfacilities.Alsoincludedaretractsoflessthan10acres(4.05ha)thatmaymeetthedefinitionsforForestLand,Cropland,Grassland,orOtherLandbutarecompletelysurroundedbyurbanorbuilt‐upland,andsoareincludedinthesettlementcategory.Ruraltransportationcorridorslocatedwithinotherlanduses(e.g.,ForestLand,Cropland,andGrassland)arealsoincludedinSettlements.
OtherLand:Aland‐usecategorythatincludesbaresoil,rock,ice,andalllandareasthatdonotfallintoanyoftheotherfiveland‐usecategories,whichallowsthetotalofidentifiedlandareastomatchthemanagedlandbase.
7.3 Caveats
ThemethodspresentedhereforquantifyingGHGfluxfromland‐usechangeareintendedforuseattheentityscaleonlandsmanagedtoenhancetheproductionoffood,feed,fiber,andrenewableenergy.Methodsarecurrentlynotprovidedforestimatingemissionsfromenergyusedwhenconvertinglandusefromonecategorytoanother.Methodsarealsonotprovidedforland‐usechangefromsettlementsorthe“otherland”categorytoforestland,cropland,grazingland,orwetlands.ThesemethodshavebeendevelopedforU.S.conditionsandareconsideredapplicabletoagriculturalandforestryproductionsystemsintheUnitedStates.
7.4 EstimatingGHGFluxfromLand‐UseChange
RationaleforSelectedMethodThismethodisbasedontheIPCC2006Guidelines(IPCC,2006)andrepresentsthemostconsistentmethodforestimatingemissionsfromland‐usechange.Othermethodsareprovidedforlandparcelsthatarenotundergoinglandusechange,andarguablythosemethodsaremorecomprehensiveforestimatingemissionsforthespecificlanduse.However,itiscriticalthatanindividuallandparcelhasaconsistent,seamlessmethodforestimatingcarbonstockchangesthroughoutthetimeseries.Otherwiseartificialchangesinstockscanbeestimatedduetoachange
MethodforEstimatingGHGFluxfromLand‐UseChange
TheGHGfluxassociatedwithland‐usechangeisestimatedbasedonthebalanceofcarbonlossesfromthepreviouslandusefollowingconversionandthecarbongainswiththecurrentlanduse.
Thissectiononlycoversmethodologiesfordeadorganicmattercarbonandsoilorganicmattercarbon.Guidanceonbiomasscarbonmethodsareprovidedintheland‐use‐specificsections(Cropland,Grazingland,ForestLand,andWetlands).
Thechangeincarbonstocksindeadwoodandlitterduetolandconversionisestimatedasthedifferenceincarbonstocksintheoldandnewland‐usecategoriesappliedintheyearoftheconversion(carbonlosses),ordistributeduniformlyoverthelengthofthetransitionperiod(carbongains).
ThemethodologiestoestimatesoilcarbonstockchangesfororganicsoilsandmineralsoilsareadoptedfromIPCC(Aaldeetal.,2006).
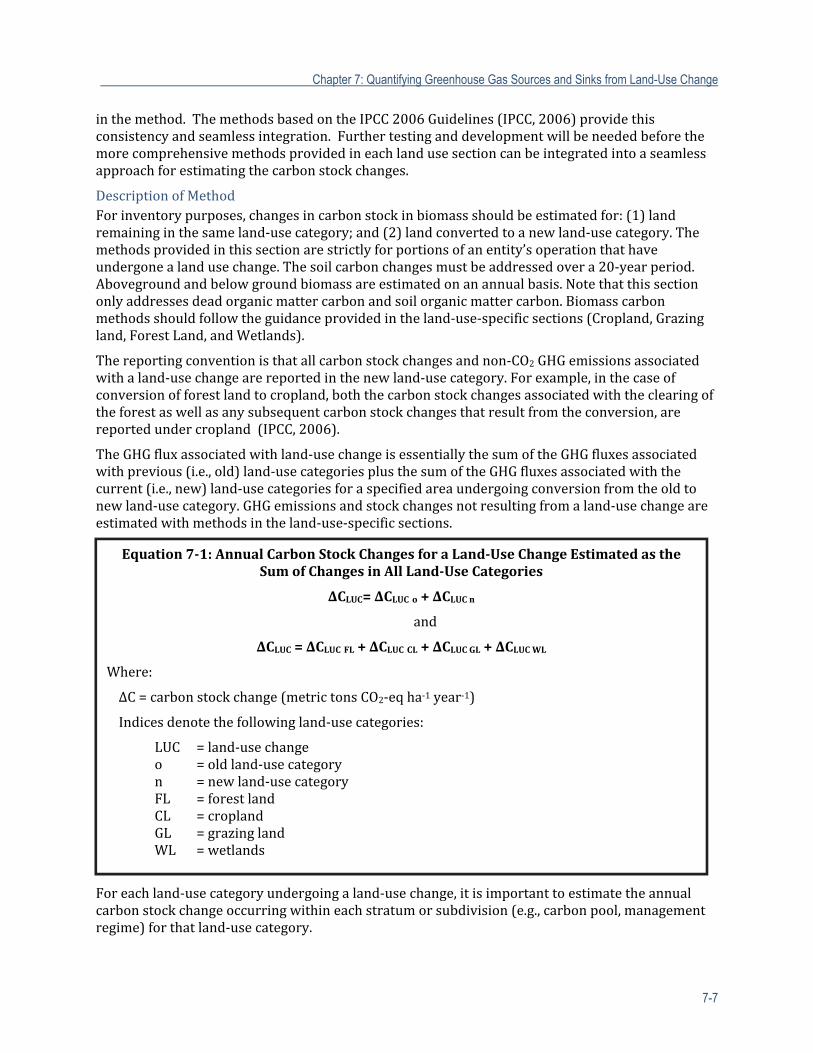
Chapter 7: Quantifying Greenhouse Gas Sources and Sinks from Land-Use Change
7-7
inthemethod.ThemethodsbasedontheIPCC2006Guidelines(IPCC,2006)providethisconsistencyandseamlessintegration.Furthertestinganddevelopmentwillbeneededbeforethemorecomprehensivemethodsprovidedineachlandusesectioncanbeintegratedintoaseamlessapproachforestimatingthecarbonstockchanges.
DescriptionofMethodForinventorypurposes,changesincarbonstockinbiomassshouldbeestimatedfor:(1)landremaininginthesameland‐usecategory;and(2)landconvertedtoanewland‐usecategory.Themethodsprovidedinthissectionarestrictlyforportionsofanentity’soperationthathaveundergonealandusechange.Thesoilcarbonchangesmustbeaddressedovera20‐yearperiod.Abovegroundandbelowgroundbiomassareestimatedonanannualbasis.Notethatthissectiononlyaddressesdeadorganicmattercarbonandsoilorganicmattercarbon.Biomasscarbonmethodsshouldfollowtheguidanceprovidedintheland‐use‐specificsections(Cropland,Grazingland,ForestLand,andWetlands).
Thereportingconventionisthatallcarbonstockchangesandnon‐CO2GHGemissionsassociatedwithaland‐usechangearereportedinthenewland‐usecategory.Forexample,inthecaseofconversionofforestlandtocropland,boththecarbonstockchangesassociatedwiththeclearingoftheforestaswellasanysubsequentcarbonstockchangesthatresultfromtheconversion,arereportedundercropland(IPCC,2006).
TheGHGfluxassociatedwithland‐usechangeisessentiallythesumoftheGHGfluxesassociatedwithprevious(i.e.,old)land‐usecategoriesplusthesumoftheGHGfluxesassociatedwiththecurrent(i.e.,new)land‐usecategoriesforaspecifiedareaundergoingconversionfromtheoldtonewland‐usecategory.GHGemissionsandstockchangesnotresultingfromaland‐usechangeareestimatedwithmethodsintheland‐use‐specificsections.
Foreachland‐usecategoryundergoingaland‐usechange,itisimportanttoestimatetheannualcarbonstockchangeoccurringwithineachstratumorsubdivision(e.g.,carbonpool,managementregime)forthatland‐usecategory.
Equation7‐1:AnnualCarbonStockChangesforaLand‐UseChangeEstimatedastheSumofChangesinAllLand‐UseCategories
ΔCLUC=ΔCLUCo+ΔCLUCn
and
ΔCLUC=ΔCLUCFL+ΔCLUCCL+ΔCLUCGL+ΔCLUCWL
Where:
ΔC=carbonstockchange(metrictonsCO2‐eqha‐1year‐1)
Indicesdenotethefollowingland‐usecategories:
LUC =land‐usechangeo =oldland‐usecategoryn =newland‐usecategoryFL =forestlandCL =croplandGL =grazinglandWL =wetlands
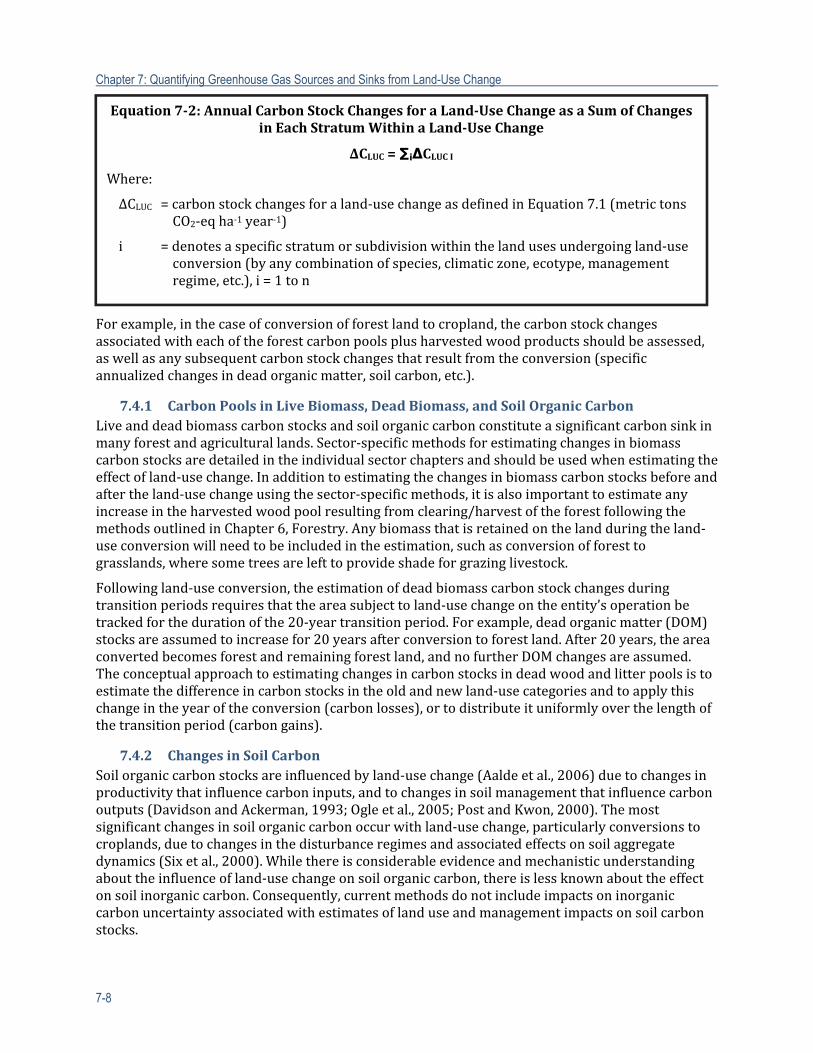
Chapter 7: Quantifying Greenhouse Gas Sources and Sinks from Land-Use Change
7-8
Forexample,inthecaseofconversionofforestlandtocropland,thecarbonstockchangesassociatedwitheachoftheforestcarbonpoolsplusharvestedwoodproductsshouldbeassessed,aswellasanysubsequentcarbonstockchangesthatresultfromtheconversion(specificannualizedchangesindeadorganicmatter,soilcarbon,etc.).
7.4.1 CarbonPoolsinLiveBiomass,DeadBiomass,andSoilOrganicCarbonLiveanddeadbiomasscarbonstocksandsoilorganiccarbonconstituteasignificantcarbonsinkinmanyforestandagriculturallands.Sector‐specificmethodsforestimatingchangesinbiomasscarbonstocksaredetailedintheindividualsectorchaptersandshouldbeusedwhenestimatingtheeffectofland‐usechange.Inadditiontoestimatingthechangesinbiomasscarbonstocksbeforeandaftertheland‐usechangeusingthesector‐specificmethods,itisalsoimportanttoestimateanyincreaseintheharvestedwoodpoolresultingfromclearing/harvestoftheforestfollowingthemethodsoutlinedinChapter6,Forestry.Anybiomassthatisretainedonthelandduringtheland‐useconversionwillneedtobeincludedintheestimation,suchasconversionofforesttograsslands,wheresometreesarelefttoprovideshadeforgrazinglivestock.
Followingland‐useconversion,theestimationofdeadbiomasscarbonstockchangesduringtransitionperiodsrequiresthattheareasubjecttoland‐usechangeontheentity’soperationbetrackedforthedurationofthe20‐yeartransitionperiod.Forexample,deadorganicmatter(DOM)stocksareassumedtoincreasefor20yearsafterconversiontoforestland.After20years,theareaconvertedbecomesforestandremainingforestland,andnofurtherDOMchangesareassumed.Theconceptualapproachtoestimatingchangesincarbonstocksindeadwoodandlitterpoolsistoestimatethedifferenceincarbonstocksintheoldandnewland‐usecategoriesandtoapplythischangeintheyearoftheconversion(carbonlosses),ortodistributeituniformlyoverthelengthofthetransitionperiod(carbongains).
7.4.2 ChangesinSoilCarbonSoilorganiccarbonstocksareinfluencedbyland‐usechange(Aaldeetal.,2006)duetochangesinproductivitythatinfluencecarboninputs,andtochangesinsoilmanagementthatinfluencecarbonoutputs(DavidsonandAckerman,1993;Ogleetal.,2005;PostandKwon,2000).Themostsignificantchangesinsoilorganiccarbonoccurwithland‐usechange,particularlyconversionstocroplands,duetochangesinthedisturbanceregimesandassociatedeffectsonsoilaggregatedynamics(Sixetal.,2000).Whilethereisconsiderableevidenceandmechanisticunderstandingabouttheinfluenceofland‐usechangeonsoilorganiccarbon,thereislessknownabouttheeffectonsoilinorganiccarbon.Consequently,currentmethodsdonotincludeimpactsoninorganiccarbonuncertaintyassociatedwithestimatesoflanduseandmanagementimpactsonsoilcarbonstocks.
Equation7‐2:AnnualCarbonStockChangesforaLand‐UseChangeasaSumofChangesinEachStratumWithinaLand‐UseChange
ΔCLUC=∑i∆CLUCI
Where:
ΔCLUC =carbonstockchangesforaland‐usechangeasdefinedinEquation7.1(metrictonsCO2‐eqha‐1year‐1)
i =denotesaspecificstratumorsubdivisionwithinthelandusesundergoingland‐useconversion(byanycombinationofspecies,climaticzone,ecotype,managementregime,etc.),i=1ton
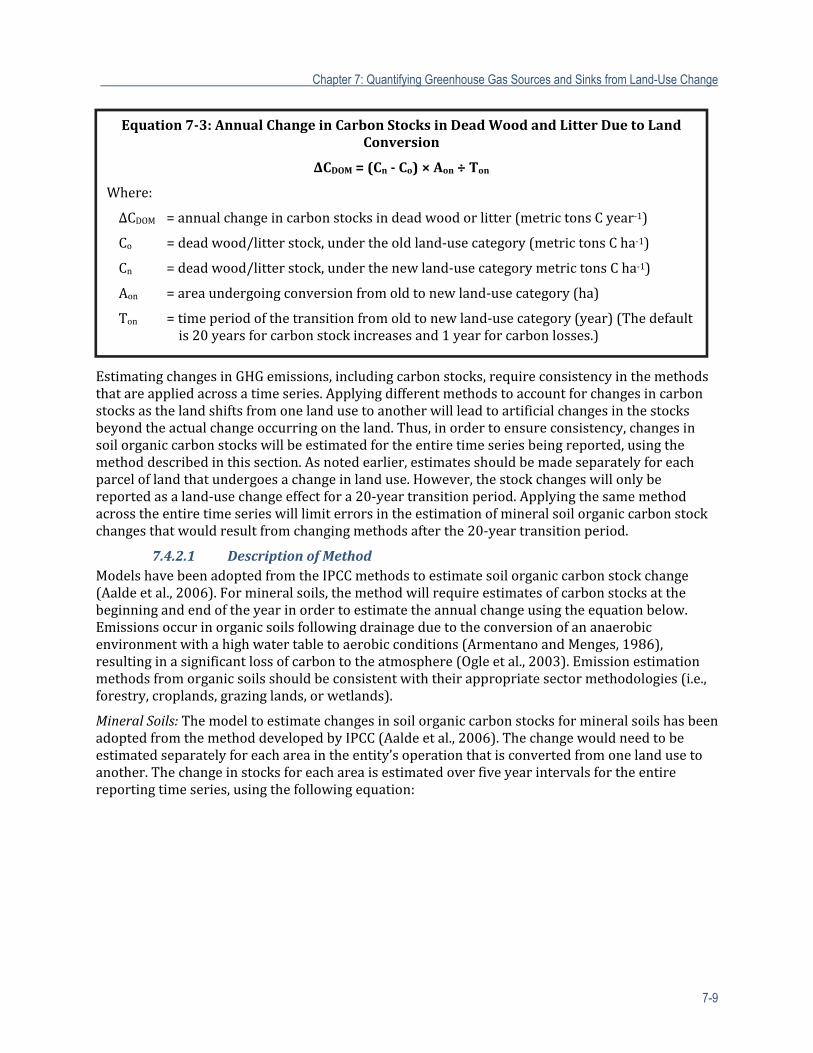
Chapter 7: Quantifying Greenhouse Gas Sources and Sinks from Land-Use Change
7-9
EstimatingchangesinGHGemissions,includingcarbonstocks,requireconsistencyinthemethodsthatareappliedacrossatimeseries.Applyingdifferentmethodstoaccountforchangesincarbonstocksasthelandshiftsfromonelandusetoanotherwillleadtoartificialchangesinthestocksbeyondtheactualchangeoccurringontheland.Thus,inordertoensureconsistency,changesinsoilorganiccarbonstockswillbeestimatedfortheentiretimeseriesbeingreported,usingthemethoddescribedinthissection.Asnotedearlier,estimatesshouldbemadeseparatelyforeachparceloflandthatundergoesachangeinlanduse.However,thestockchangeswillonlybereportedasaland‐usechangeeffectfora20‐yeartransitionperiod.Applyingthesamemethodacrosstheentiretimeserieswilllimiterrorsintheestimationofmineralsoilorganiccarbonstockchangesthatwouldresultfromchangingmethodsafterthe20‐yeartransitionperiod.
7.4.2.1 DescriptionofMethodModelshavebeenadoptedfromtheIPCCmethodstoestimatesoilorganiccarbonstockchange(Aaldeetal.,2006).Formineralsoils,themethodwillrequireestimatesofcarbonstocksatthebeginningandendoftheyearinordertoestimatetheannualchangeusingtheequationbelow.Emissionsoccurinorganicsoilsfollowingdrainageduetotheconversionofananaerobicenvironmentwithahighwatertabletoaerobicconditions(ArmentanoandMenges,1986),resultinginasignificantlossofcarbontotheatmosphere(Ogleetal.,2003).Emissionestimationmethodsfromorganicsoilsshouldbeconsistentwiththeirappropriatesectormethodologies(i.e.,forestry,croplands,grazinglands,orwetlands).
MineralSoils:ThemodeltoestimatechangesinsoilorganiccarbonstocksformineralsoilshasbeenadoptedfromthemethoddevelopedbyIPCC(Aaldeetal.,2006).Thechangewouldneedtobeestimatedseparatelyforeachareaintheentity’soperationthatisconvertedfromonelandusetoanother.Thechangeinstocksforeachareaisestimatedoverfiveyearintervalsfortheentirereportingtimeseries,usingthefollowingequation:
Equation7‐3:AnnualChangeinCarbonStocksinDeadWoodandLitterDuetoLandConversion
ΔCDOM=(Cn‐Co)×Aon÷Ton
Where:
ΔCDOM =annualchangeincarbonstocksindeadwoodorlitter(metrictonsCyear‐1)
Co =deadwood/litterstock,undertheoldland‐usecategory(metrictonsCha‐1)
Cn =deadwood/litterstock,underthenewland‐usecategorymetrictonsCha‐1)
Aon =areaundergoingconversionfromoldtonewland‐usecategory(ha)
Ton =timeperiodofthetransitionfromoldtonewland‐usecategory(year)(Thedefaultis20yearsforcarbonstockincreasesand1yearforcarbonlosses.)
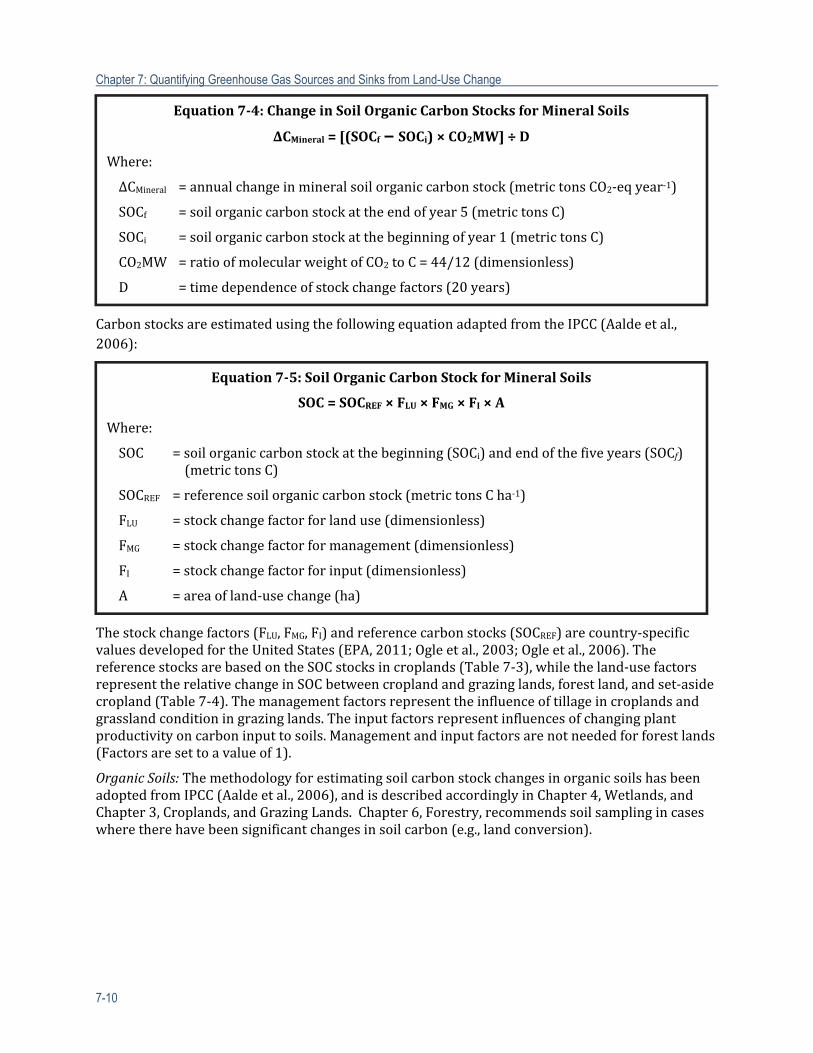
Chapter 7: Quantifying Greenhouse Gas Sources and Sinks from Land-Use Change
7-10
CarbonstocksareestimatedusingthefollowingequationadaptedfromtheIPCC(Aaldeetal.,2006):
Thestockchangefactors(FLU,FMG,FI)andreferencecarbonstocks(SOCREF)arecountry‐specificvaluesdevelopedfortheUnitedStates(EPA,2011;Ogleetal.,2003;Ogleetal.,2006).ThereferencestocksarebasedontheSOCstocksincroplands(Table7‐3),whiletheland‐usefactorsrepresenttherelativechangeinSOCbetweencroplandandgrazinglands,forestland,andset‐asidecropland(Table7‐4).Themanagementfactorsrepresenttheinfluenceoftillageincroplandsandgrasslandconditioningrazinglands.Theinputfactorsrepresentinfluencesofchangingplantproductivityoncarboninputtosoils.Managementandinputfactorsarenotneededforforestlands(Factorsaresettoavalueof1).
OrganicSoils:ThemethodologyforestimatingsoilcarbonstockchangesinorganicsoilshasbeenadoptedfromIPCC(Aaldeetal.,2006),andisdescribedaccordinglyinChapter4,Wetlands,andChapter3,Croplands,andGrazingLands.Chapter6,Forestry,recommendssoilsamplingincaseswheretherehavebeensignificantchangesinsoilcarbon(e.g.,landconversion).
Equation7‐4:ChangeinSoilOrganicCarbon StocksforMineralSoils
ΔCMineral=[(SOCf−SOCi)×CO2MW]÷D
Where:
ΔCMineral =annualchangeinmineralsoilorganiccarbonstock(metrictonsCO2‐eqyear‐1)
SOCf =soilorganiccarbonstockattheendofyear5(metrictonsC)
SOCi =soilorganiccarbonstockatthebeginningofyear1(metrictonsC)
CO2MW =ratioofmolecularweightofCO2toC=44/12(dimensionless)
D =timedependenceofstockchangefactors(20years)
Equation7‐5:SoilOrganicCarbon StockforMineralSoils
SOC=SOCREF×FLU×FMG×FI×A
Where:
SOC =soilorganiccarbonstockatthebeginning(SOCi)andendofthefiveyears(SOCf)(metrictonsC)
SOCREF =referencesoilorganiccarbonstock(metrictonsCha‐1)
FLU =stockchangefactorforlanduse(dimensionless)
FMG =stockchangefactorformanagement(dimensionless)
FI =stockchangefactorforinput(dimensionless)
A =areaofland‐usechange(ha)
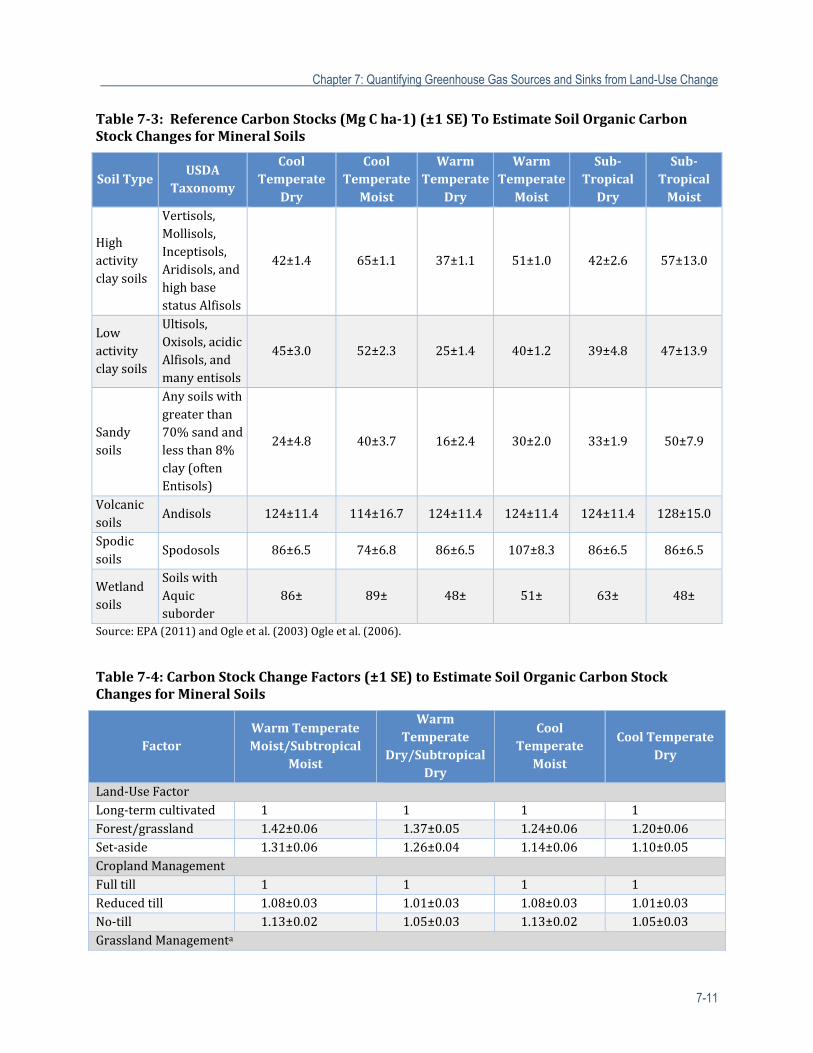
Chapter 7: Quantifying Greenhouse Gas Sources and Sinks from Land-Use Change
7-11
Table7‐3:ReferenceCarbonStocks(MgCha‐1)(±1SE)ToEstimateSoilOrganicCarbonStockChangesforMineralSoils
SoilTypeUSDA
Taxonomy
CoolTemperate
Dry
CoolTemperateMoist
WarmTemperate
Dry
WarmTemperateMoist
Sub‐TropicalDry
Sub‐TropicalMoist
Highactivityclaysoils
Vertisols,Mollisols,Inceptisols,Aridisols,andhighbasestatusAlfisols
42±1.4 65±1.1 37±1.1 51±1.0 42±2.6 57±13.0
Lowactivityclaysoils
Ultisols,Oxisols,acidicAlfisols,andmanyentisols
45±3.0 52±2.3 25±1.4 40±1.2 39±4.8 47±13.9
Sandysoils
Anysoilswithgreaterthan70%sandandlessthan8%clay(oftenEntisols)
24±4.8 40±3.7 16±2.4 30±2.0 33±1.9 50±7.9
Volcanicsoils
Andisols 124±11.4 114±16.7 124±11.4 124±11.4 124±11.4 128±15.0
Spodicsoils
Spodosols 86±6.5 74±6.8 86±6.5 107±8.3 86±6.5 86±6.5
Wetlandsoils
SoilswithAquicsuborder
86± 89± 48± 51± 63± 48±
Source:EPA(2011)andOgleetal.(2003)Ogleetal.(2006).
Table7‐4:CarbonStockChangeFactors(±1SE)toEstimateSoilOrganicCarbonStockChangesforMineralSoils
FactorWarmTemperateMoist/Subtropical
Moist
WarmTemperate
Dry/SubtropicalDry
CoolTemperateMoist
CoolTemperateDry
Land‐UseFactorLong‐termcultivated 1 1 1 1Forest/grassland 1.42±0.06 1.37±0.05 1.24±0.06 1.20±0.06Set‐aside 1.31±0.06 1.26±0.04 1.14±0.06 1.10±0.05CroplandManagementFulltill 1 1 1 1Reducedtill 1.08±0.03 1.01±0.03 1.08±0.03 1.01±0.03No‐till 1.13±0.02 1.05±0.03 1.13±0.02 1.05±0.03GrasslandManagementa
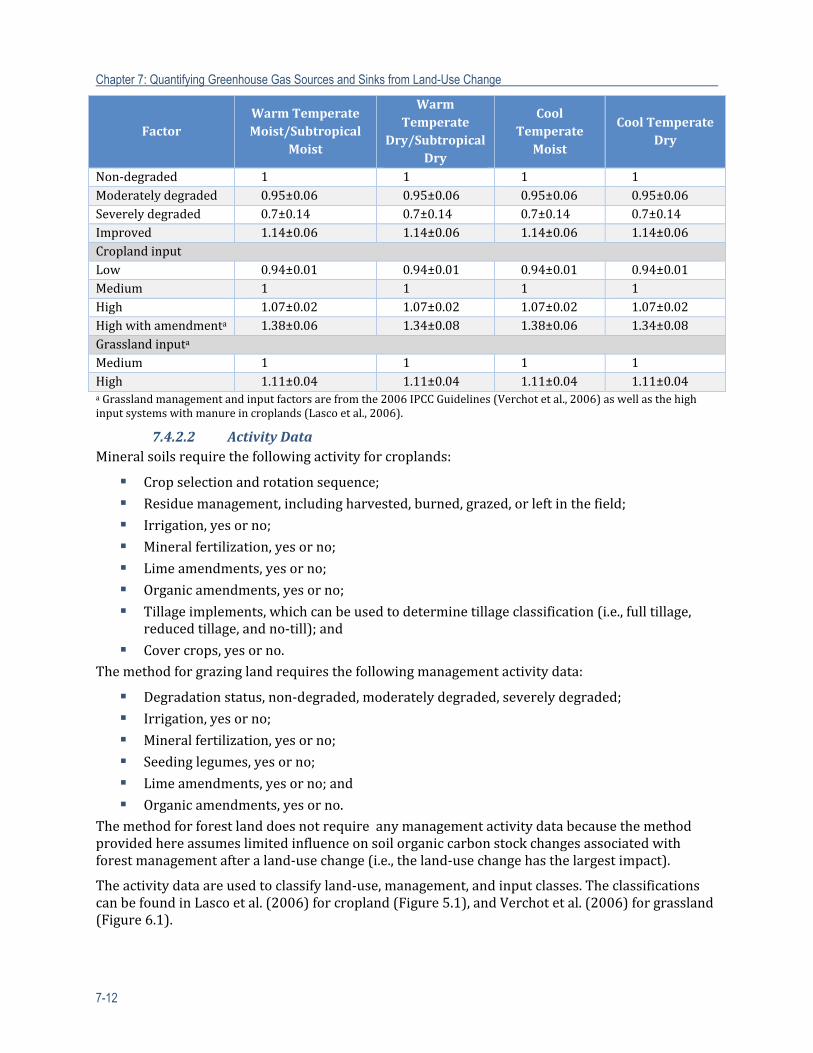
Chapter 7: Quantifying Greenhouse Gas Sources and Sinks from Land-Use Change
7-12
FactorWarmTemperateMoist/Subtropical
Moist
WarmTemperate
Dry/SubtropicalDry
CoolTemperateMoist
CoolTemperateDry
Non‐degraded 1 1 1 1Moderatelydegraded 0.95±0.06 0.95±0.06 0.95±0.06 0.95±0.06Severelydegraded 0.7±0.14 0.7±0.14 0.7±0.14 0.7±0.14Improved 1.14±0.06 1.14±0.06 1.14±0.06 1.14±0.06CroplandinputLow 0.94±0.01 0.94±0.01 0.94±0.01 0.94±0.01Medium 1 1 1 1High 1.07±0.02 1.07±0.02 1.07±0.02 1.07±0.02Highwithamendmenta 1.38±0.06 1.34±0.08 1.38±0.06 1.34±0.08GrasslandinputaMedium 1 1 1 1High 1.11±0.04 1.11±0.04 1.11±0.04 1.11±0.04aGrasslandmanagementandinputfactorsarefromthe2006IPCCGuidelines(Verchotetal.,2006)aswellasthehighinputsystemswithmanureincroplands(Lascoetal.,2006).
7.4.2.2 ActivityDataMineralsoilsrequirethefollowingactivityforcroplands:
Cropselectionandrotationsequence;
Residuemanagement,includingharvested,burned,grazed,orleftinthefield;
Irrigation,yesorno;
Mineralfertilization,yesorno;
Limeamendments,yesorno;
Organicamendments,yesorno;
Tillageimplements,whichcanbeusedtodeterminetillageclassification(i.e.,fulltillage,reducedtillage,andno‐till);and
Covercrops,yesorno.Themethodforgrazinglandrequiresthefollowingmanagementactivitydata:
Degradationstatus,non‐degraded,moderatelydegraded,severelydegraded;
Irrigation,yesorno;
Mineralfertilization,yesorno;
Seedinglegumes,yesorno;
Limeamendments,yesorno;and
Organicamendments,yesorno.Themethodforforestlanddoesnotrequireanymanagementactivitydatabecausethemethodprovidedhereassumeslimitedinfluenceonsoilorganiccarbonstockchangesassociatedwithforestmanagementafteraland‐usechange(i.e.,theland‐usechangehasthelargestimpact).
Theactivitydataareusedtoclassifyland‐use,management,andinputclasses.TheclassificationscanbefoundinLascoetal.(2006)forcropland(Figure5.1),andVerchotetal.(2006)forgrassland(Figure6.1).
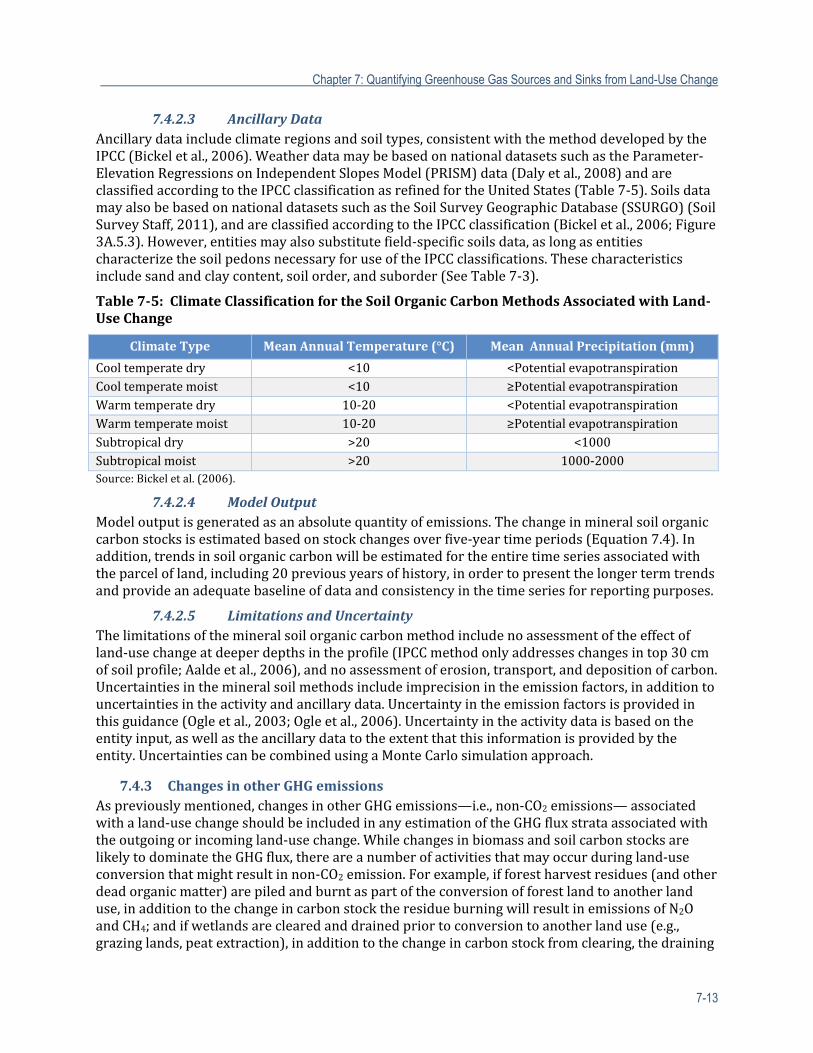
Chapter 7: Quantifying Greenhouse Gas Sources and Sinks from Land-Use Change
7-13
7.4.2.3 AncillaryDataAncillarydataincludeclimateregionsandsoiltypes,consistentwiththemethoddevelopedbytheIPCC(Bickeletal.,2006).WeatherdatamaybebasedonnationaldatasetssuchastheParameter‐ElevationRegressionsonIndependentSlopesModel(PRISM)data(Dalyetal.,2008)andareclassifiedaccordingtotheIPCCclassificationasrefinedfortheUnitedStates(Table7‐5).SoilsdatamayalsobebasedonnationaldatasetssuchastheSoilSurveyGeographicDatabase(SSURGO)(SoilSurveyStaff,2011),andareclassifiedaccordingtotheIPCCclassification(Bickeletal.,2006;Figure3A.5.3).However,entitiesmayalsosubstitutefield‐specificsoilsdata,aslongasentitiescharacterizethesoilpedonsnecessaryforuseoftheIPCCclassifications.Thesecharacteristicsincludesandandclaycontent,soilorder,andsuborder(SeeTable7‐3).
Table7‐5:ClimateClassificationfortheSoilOrganicCarbonMethodsAssociatedwithLand‐UseChange
ClimateType MeanAnnualTemperature(°C) MeanAnnualPrecipitation(mm)
Cooltemperatedry <10 <PotentialevapotranspirationCooltemperatemoist <10 ≥PotentialevapotranspirationWarmtemperatedry 10‐20 <PotentialevapotranspirationWarmtemperatemoist 10‐20 ≥PotentialevapotranspirationSubtropicaldry >20 <1000Subtropicalmoist >20 1000‐2000Source:Bickeletal.(2006).
7.4.2.4 ModelOutputModeloutputisgeneratedasanabsolutequantityofemissions.Thechangeinmineralsoilorganiccarbonstocksisestimatedbasedonstockchangesoverfive‐yeartimeperiods(Equation7.4).Inaddition,trendsinsoilorganiccarbonwillbeestimatedfortheentiretimeseriesassociatedwiththeparcelofland,including20previousyearsofhistory,inordertopresentthelongertermtrendsandprovideanadequatebaselineofdataandconsistencyinthetimeseriesforreportingpurposes.
7.4.2.5 LimitationsandUncertaintyThelimitationsofthemineralsoilorganiccarbonmethodincludenoassessmentoftheeffectofland‐usechangeatdeeperdepthsintheprofile(IPCCmethodonlyaddresseschangesintop30cmofsoilprofile;Aaldeetal.,2006),andnoassessmentoferosion,transport,anddepositionofcarbon.Uncertaintiesinthemineralsoilmethodsincludeimprecisionintheemissionfactors,inadditiontouncertaintiesintheactivityandancillarydata.Uncertaintyintheemissionfactorsisprovidedinthisguidance(Ogleetal.,2003;Ogleetal.,2006).Uncertaintyintheactivitydataisbasedontheentityinput,aswellastheancillarydatatotheextentthatthisinformationisprovidedbytheentity.UncertaintiescanbecombinedusingaMonteCarlosimulationapproach.
7.4.3 ChangesinotherGHGemissionsAspreviouslymentioned,changesinotherGHGemissions—i.e.,non‐CO2emissions—associatedwithaland‐usechangeshouldbeincludedinanyestimationoftheGHGfluxstrataassociatedwiththeoutgoingorincomingland‐usechange.WhilechangesinbiomassandsoilcarbonstocksarelikelytodominatetheGHGflux,thereareanumberofactivitiesthatmayoccurduringland‐useconversionthatmightresultinnon‐CO2emission.Forexample,ifforestharvestresidues(andotherdeadorganicmatter)arepiledandburntaspartoftheconversionofforestlandtoanotherlanduse,inadditiontothechangeincarbonstocktheresidueburningwillresultinemissionsofN2OandCH4;andifwetlandsareclearedanddrainedpriortoconversiontoanotherlanduse(e.g.,grazinglands,peatextraction),inadditiontothechangeincarbonstockfromclearing,thedraining
Chapter 7: Quantifying Greenhouse Gas Sources and Sinks from Land-Use Change
7-14
willresultinareductioninemissionsofCH4,andapossibleincreaseinemissionsofN2O,dependingonthenitrogencontentofthewetlandsoil(i.e.,peat).
Sector‐specificmethodsforestimatingchangesinbiomassburningnon‐CO2emissions(e.g.,forcroplandandgrazinglandsystems)andsoilnon‐CO2emissions(e.g.,forwetlandsystems)aredetailedintheindividualsectorchapters.
Chapter7References
Aalde,H.,P.Gonzalez,M.Gytarski,T.Krug,etal.2006.Chapter2:Genericmethodologiesapplicabletomultipleland‐usecategories.In2006IPCCGuidelinesforNationalGreenhouseGasInventories,S.Eggleston,L.Buendia,K.Miwa,T.NgaraandK.Tanabe(eds.).Japan:IGES.
Armentano,T.V.,andE.S.Menges.1986.Patternsofchangeinthecarbonbalanceoforganicsoil.Bickel,K.,G.Richards,M.Kohl,R.L.V.Rodrigues,etal.2006.Chapter3:Consistentrepresentationof
land.In2006IPCCGuidelinesforNationalGreenhouseGasInventories,S.Eggleston,L.Buendia,K.Miwa,T.NgaraandK.Tanabe(eds.).Japan:IGES.
Daly,C.,M.Halbleib,J.I.Smith,W.P.Gibson,etal.2008.PhysiographicallysensitivemappingofclimatologicaltemperatureandprecipitationacrosstheconterminousUnitedStates.InternationalJournalofClimatology,28:2031‐2064.
Davidson,E.,andI.Ackerman.1993.Changesinsoilcarboninventoriesfollowingcultivationofpreviouslyuntilledsoils.Biogeochemistry,20(3):161‐193.
EPA.1980.USEPARegulation40CFR230.3(t):U.S.EnvironmentalProtectionAgency.EPA.2011.InventoryofU.S.greenhousegasemissionsandsinks:1990‐2009.Washington,D.C.:
EnvironmentalProtectionAgency.IPCC.2006.IPCCGuidelinesforNationalGreenhouseGasInventories.TheNationalGreenhouseGas
InventoriesProgramme.Hayama,Kanagawa,Japan:TheIntergovernmentalPanelonClimateChange.
Lasco,R.D.,S.Ogle,J.Raison,L.Verchot,etal.2006.Chapter5:Cropland.In2006IPCCGuidelinesforNationalGreenhouseGasInventories,S.Eggleston,L.Buendia,K.Miwa,T.NgaraandK.Tanabe(eds.).Japan:IGES,IPCCNationalGreenhouseGasInventoriesProgram.
Ogle,S.M.,F.J.Breidt,M.D.Eve,andK.Paustian.2003.UncertaintyinestimatinglanduseandmanagementimpactsonsoilorganiccarbonstorageforUSagriculturallandsbetween1982and1997.GlobalChangeBiology,9(11):1521‐1542.
Ogle,S.M.,F.J.Breidt,andK.Paustian.2005.Agriculturalmanagementimpactsonsoilorganiccarbonstorageundermoistanddryclimaticconditionsoftemperateandtropicalregions.Biogeochemistry,72(1):87–121.
Ogle,S.M.,F.J.Breidt,andK.Paustian.2006.Biasandvarianceinmodelresultsassociatedwithspatialscalingofmeasurementsforparameterizationinregionalassessments.GlobalChangeBiology,12:516‐523.
Post,W.M.,andK.C.Kwon.2000.SoilCarbonSequestrationandLand‐UseChange:ProcessesandPotential.GlobalChangeBiology,6:317‐327.
Six,J.,E.T.Elliot,andK.Paustian.2000.Soilmacroaggregateturnoverandmicroaggregateformation:amechanismforCsequestrationunderno‐tillageagriculture.SoilBiol.Biochem.,32:2099‐2103.
Smith,W.B.,P.D.Miles,C.H.Perry,andS.A.Pugh.2009.ForestResourcesoftheUnitedStates,2007.Washington,DC:U.S.DepartmentofAgricultureForestService.
SoilSurveyStaff.2011.SoilSurveyGeographic(SSURGO)Database:NaturalResourceConservationServiceandUnitedStatesDepartmentofAgriculture.

Chapter 7: Quantifying Greenhouse Gas Sources and Sinks from Land-Use Change
7-15
U.S.ArmyCorpsofEngineers.1987.WetlandDelimitationManual&RegionalSupplementsWetlandsResearchProgramTechnicalReportY‐87‐1:U.S.ArmyCorpsofEngineers,EnvironmentalLaboratory,.http://www.usace.army.mil/Missions/CivilWorks/RegulatoryProgramandPermits/reg_supp.aspx.
Verchot,L.,T.Krug,R.D.Lasco,S.Ogle,etal.2006.Chapter5:Grassland.In2006IPCCGuidelinesforNationalGreenhouseGasInventories,S.Eggleston,L.Buendia,K.Miwa,T.NgaraandD.L.Tanaka(eds.).Japan:IGES.

Chapter 7: Quantifying Greenhouse Gas Sources and Sinks from Land-Use Change
7-16
Thispageisintentionallyleftblank.
E
Authors:1JayBreidt,ColoradoStateUniversityStephenM.Ogle,ColoradoStateUniversityWendyPowers,MichiganStateUniversityCoeliHoover,USDAForestService
Contents:
8 UncertaintyAssessmentforQuantifyingGreenhouseGasSourcesandSinks...................8‐3 ComponentsandInputstoanEntity‐ScaleMonteCarloUncertaintyAssessment............8‐48.1
8.1.1 ParameterUncertainty..................................................................................................8‐58.1.2 SamplingMethodUncertainty....................................................................................8‐68.1.3 LargeDatasetUncertainty............................................................................................8‐98.1.4 ModelUncertainty.........................................................................................................8‐16
ResearchGaps...............................................................................................................................................8‐208.2Appendix8‐A:ExampleOutputFilefromFVSSamplingUncertaintyBootstrappingApplicationFVSBoot(asprovidedinGreggandHummel,2002)................................................................................8‐21Appendix8‐B:UncertaintyTables....................................................................................................................8‐22Chapter8References.............................................................................................................................................8‐55
SuggestedChapterCitation:Breidt,F.J.,Ogle,S.M.,Powers,W.,Hover,C.,2014.Chapter8:UncertaintyAssessmentforQuantifyingGreenhouseGasSourcesandSinks.InQuantifyingGreenhouseGasFluxesinAgricultureandForestry:MethodsforEntity‐ScaleInventory.TechnicalBulletinNumber1939.OfficeoftheChiefEconomist,U.S.DepartmentofAgriculture,Washington,DC.606pages.July2014.Eve,M.,D.Pape,M.Flugge,R.Steele,D.Man,M.Riley‐Gilbert,andS.Biggar,Eds.
USDAisanequalopportunityproviderandemployer.
1AllauthorsofChapters3,4,5,and6providedstrategicinputintheparametersintheuncertaintychapter.
Chapter 8
Uncertainty Assessment for Quantifying Greenhouse Gas Sources and Sinks
Chapter 8: Uncertainty Assessment for Quantifying Greenhouse Gas Sources and Sinks
8-2
Acronyms,ChemicalFormulae,andUnitsCONUSSTATSGO ContinentalUnitedStatesSoilGeographicDatabaseDBH DiameteratbreastheightDNDC DeNitrification‐DeCompositionEPA U.S.EnvironmentalProtectionAgencyERS USDAEconomicResearchServiceFOFEM FirstOrderFireEffectsModelFVS ForestVegetationSimulatorGHG GreenhousegasIPCC IntergovernmentalPanelonClimateChangeNADP NationalAtmosphericDepositionProgramNARR NorthAmericanRegionalReanalysisNASS USDANationalAgriculturalStatisticsServiceNCEP NationalCentersforEnvironmentalPredictionNLCD NationalLandCoverDatabaseNOAA NationalOceanicandAtmosphericAdministrationNRCS USDANaturalResourcesConservationServiceNRI NationalResourceInventoryPDF ProbabilitydensityfunctionPRISM Parameter‐elevationRegressionsonIndependentSlopesModelSOC SoilorganiccarbonSSURGO SoilSurveyGeographicUSDA U.S.DepartmentofAgriculture
Chapter 8: Uncertainty Assessment for Quantifying Greenhouse Gas Sources and Sinks
8-3
8 UncertaintyAssessmentforQuantifyingGreenhouseGasSourcesandSinks
Quantifyingtheuncertaintyofgreenhousegas(GHG)emissionsandreductionsfromagricultureandforestrypracticesisanimportantaspectofdecision‐makingforfarmers,ranchersandforestlandownersastheuncertaintyrangeforeachGHGestimatecommunicatesourlevelofconfidencethattheestimatereflectstheactualbalanceofGHGexchangebetweenthebiosphereandtheatmosphere.Inparticular,afarm,ranch,orforestlandownermaybemoreinclinedtoinvestinmanagementpracticesthatreducenetGHGemissionsiftheuncertaintyrangeforanestimateislow,meaningthathigherconfidenceintheestimatesexists.Thischapterpresentstheapproachforaccountingfortheuncertaintyintheestimatednetemissionsbasedonthemethodspresentedinthisreport.2AMonteCarloapproachwasselectedasthemethodforestimatingtheuncertaintyaroundtheoutputsfromthemethodologiesinthisreportasitiscurrentlythemostcomprehensive,soundmethodavailabletoassesstheuncertaintyattheentityscale.Limitationsanddatagapsexist;however,asnewdatabecomeavailablethemethodcanbeimprovedovertime.ImplementationofaMonteCarloanalysisiscomplicatedandrequirestheuseofastatisticaltooltoproduceaprobabilitydensityfunction(PDF)3aroundtheGHGemissionsestimate.4FromthePDF,theuncertaintyestimatecanbederivedandreported.
2TheIPCCGoodPracticeGuidance(IPCC,2000)recommendstwoapproaches—Tier1andTier2—fordevelopingquantitativeestimatesofuncertaintyforemissionsestimatesforsourcecategories.TheTier1methoduseserrorpropagationequations.Theseequationscombinetheuncertaintyassociatedwiththeactivitydataandtheuncertaintyassociatedwiththeemission(orother)factors.Thisapproachisappropriatewhereemissions(orremovals)areestimatedastheproductofactivitydataandanemissionfactororasthesumofindividualsub‐sourcecategoryvalues.TheTier2methodutilizestheMonteCarloStochasticSimulationtechnique.Usingthistechnique,anestimateofemission(orremoval)foraparticularsourcecategoryisgeneratedmanytimesviaanuncertaintymodel,resultinginanapproximatePDFfortheestimate.Wheresufficientandreliableuncertaintydatafortheinputvariablesareavailable,theTier2methodisthepreferredoption.3TheintegralofaPDFoveragivenintervalofvaluesistheprobabilityforarandomvariabletotakeonsomevalueintheinterval.Thatis,thePDFisafunctiongivingprobability“densities”anditsintegralgivesprobabilities.AnarrowerPDFforanestimateindicatessmallervariancearoundthecentral/mostlikelyvalue,i.e.,ahigherprobabilityofthevaluetobeclosertothecentral/mostlikelyvalue.Theuncertaintyforsuchanestimateislower.4GiventhecomplexityofMonteCarloanalysisandthenecessityforatool,theapproachpresentedhereisnotintendedfordevelopmentbyalandowner,ratheritisintendedforuseindevelopingatoolthatalandownerwouldusetoassessuncertaintyestimates.
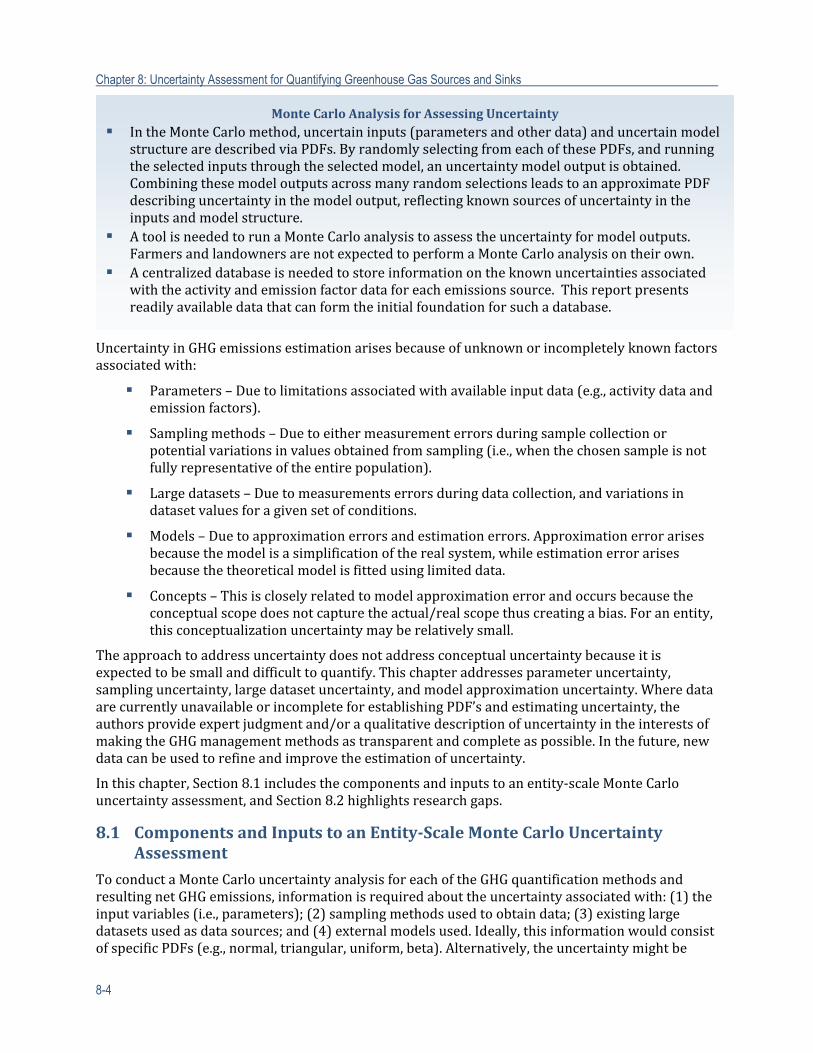
Chapter 8: Uncertainty Assessment for Quantifying Greenhouse Gas Sources and Sinks
8-4
UncertaintyinGHGemissionsestimationarisesbecauseofunknownorincompletelyknownfactorsassociatedwith:
Parameters–Duetolimitationsassociatedwithavailableinputdata(e.g.,activitydataandemissionfactors).
Samplingmethods–Duetoeithermeasurementerrorsduringsamplecollectionorpotentialvariationsinvaluesobtainedfromsampling(i.e.,whenthechosensampleisnotfullyrepresentativeoftheentirepopulation).
Largedatasets–Duetomeasurementserrorsduringdatacollection,andvariationsindatasetvaluesforagivensetofconditions.
Models–Duetoapproximationerrorsandestimationerrors.Approximationerrorarisesbecausethemodelisasimplificationoftherealsystem,whileestimationerrorarisesbecausethetheoreticalmodelisfittedusinglimiteddata.
Concepts–Thisiscloselyrelatedtomodelapproximationerrorandoccursbecausetheconceptualscopedoesnotcapturetheactual/realscopethuscreatingabias.Foranentity,thisconceptualizationuncertaintymayberelativelysmall.
Theapproachtoaddressuncertaintydoesnotaddressconceptualuncertaintybecauseitisexpectedtobesmallanddifficulttoquantify.Thischapteraddressesparameteruncertainty,samplinguncertainty,largedatasetuncertainty,andmodelapproximationuncertainty.WheredataarecurrentlyunavailableorincompleteforestablishingPDF’sandestimatinguncertainty,theauthorsprovideexpertjudgmentand/oraqualitativedescriptionofuncertaintyintheinterestsofmakingtheGHGmanagementmethodsastransparentandcompleteaspossible.Inthefuture,newdatacanbeusedtorefineandimprovetheestimationofuncertainty.
Inthischapter,Section8.1includesthecomponentsandinputstoanentity‐scaleMonteCarlouncertaintyassessment,andSection8.2highlightsresearchgaps.
ComponentsandInputstoanEntity‐ScaleMonteCarloUncertainty8.1Assessment
ToconductaMonteCarlouncertaintyanalysisforeachoftheGHGquantificationmethodsandresultingnetGHGemissions,informationisrequiredabouttheuncertaintyassociatedwith:(1)theinputvariables(i.e.,parameters);(2)samplingmethodsusedtoobtaindata;(3)existinglargedatasetsusedasdatasources;and(4)externalmodelsused.Ideally,thisinformationwouldconsistofspecificPDFs(e.g.,normal,triangular,uniform,beta).Alternatively,theuncertaintymightbe
MonteCarloAnalysisforAssessingUncertainty IntheMonteCarlomethod,uncertaininputs(parametersandotherdata)anduncertainmodel
structurearedescribedviaPDFs.ByrandomlyselectingfromeachofthesePDFs,andrunningtheselectedinputsthroughtheselectedmodel,anuncertaintymodeloutputisobtained.CombiningthesemodeloutputsacrossmanyrandomselectionsleadstoanapproximatePDFdescribinguncertaintyinthemodeloutput,reflectingknownsourcesofuncertaintyintheinputsandmodelstructure.
AtoolisneededtorunaMonteCarloanalysistoassesstheuncertaintyformodeloutputs.FarmersandlandownersarenotexpectedtoperformaMonteCarloanalysisontheirown.
Acentralizeddatabaseisneededtostoreinformationontheknownuncertaintiesassociatedwiththeactivityandemissionfactordataforeachemissionssource.Thisreportpresentsreadilyavailabledatathatcanformtheinitialfoundationforsuchadatabase.
Chapter 8: Uncertainty Assessment for Quantifying Greenhouse Gas Sources and Sinks
8-5
describedwithsummarystatistics,suchaslowerandupperboundsforintervalswithspecifiedconfidence,minimum,maximum,mean,andstandarddeviation.ThissummaryinformationformsthebasisforconstructingapproximatePDFsfortheMonteCarlomethod.RepeatedselectionsaremadefromthesePDFs.TheseselectionsrepresenttherangeofpossibleoutcomesfromeachPDF.RandomsamplingfromthePDFswillensuresuchrepresentativeness.5ByrandomlyselectingfromeachofthesePDFsandrunningtheselectedinputsthroughthemodel,arangeofoutputsisobtained.CombiningthesemodeloutputsacrossmanyrandomselectionsleadstoanoutputPDFthatcanbeusedtodescribeuncertaintyintheestimate,accountingforknownsourcesofuncertaintyintheinputsandmodelstructure.
Thissectionpresentsreadilyavailableinformationoneachofthekeycomponentsofuncertainty.Insummary,althoughinformationonallthecomponentsaredescribedhere,theMonteCarlomethodforassessingnetGHGemissionsuncertaintyreliesmostheavilyonparameteruncertainty,forwhichthebestPDFdataandinformationareavailable.Othercomponentsofuncertaintyarediscussed,includinglimitationssuchascharacterizingtheuncertaintyassociatedwithothercomponents.Thesecomponentscanbereadilyimprovedorrefinedintheuncertaintyanalysisasadditionalinformationbecomesavailable.Overalluncertaintyistypicallygreaterthananyparticularuncertaintycomponent(e.g.,sampling,largedatasets,models)andcanbereadilyimprovedorrefinedasadditionalinformationbecomesavailable.Astheuncertaintyassociatedwiththeothercomponentsisaddressed,theuncertaintywillincrease(i.e.,addressingonlyparameteruncertaintysetsalowerboundforoveralluncertainty).Therefore,thequantificationofparameteruncertaintysetsalowerboundforoveralluncertainty.
8.1.1 ParameterUncertainty
ParameteruncertaintyistheprimarysourceofuncertaintyinthenetGHGestimates.ThissectionpresentsreadilyavailableinformationonparametersusedtoestimatenetGHGemissionsfromanimalproductionsystems,croplandsandgrazinglands,andforestryGHGestimationmethods.Foreachinputvariable,readilyavailableinformationwascollectedontheprobabilitydistribution;variance;standarddeviation;expectedmean,median,andmode;mostlikelyvalue;minimum;maximum;relativeuncertaintyabsolutevalues;confidenceinterval;anddatasources.Theinformationwascollectedprimarilyfrompublishedliterature,suchastheIntergovernmentalPanelonClimateChange(IPCC)Guidelines(2006),theU.S.NationalGHGInventoryReport(U.S.EPA,2012),andpeer‐reviewedjournals.Intheabsenceofpublisheddata,defaultfactorsareindicatedbasedonexpertjudgmentobtainedfromtheWorkingGroups.TheinformationobtainedtodateispresentedinAppendix8‐B.6,7,8
5AnalternativeapproachtoselectingfromthePDFsisLatinhypercubesampling(McKayetal.,1979;HeltonandDavis,2003).6Uncertaintyfortheforestrysectorismainlydrivenbymodelingandsamplinguncertainty;consequently,onlyafewparametershavebeenlistedinAppendix8‐B.7TheWetlandsChaptermethodssuggestuseoftheFVSandDNDCmodelsincombinationwiththelookuptablesfordominantshrubandgrasslandvegetationtypesfoundinChapter3,forestimatingbiomasscarbon,soilcarbon,N2O,andCH4emissionsandremovalsinwetlands.Descriptionsofthesemodelsandtheuncertaintyassociatedwiththelook‐uptablesareincludedintheUncertaintyAssessment(Chapter8).8AnuncertaintyassessmentwasnotcompletedfortheLand‐useChangeChaptermethods(i.e.,annualchangeincarbonstocksindeadwoodandlitterduetolandconversion,changeinsoilorganiccarbonstocksformineralsoils)astheyarebaseduponIPCC2006GuidanceandnoU.S.specificcustomizationsweremadetothesemethods.Uncertaintyassessmentsforeachland‐useandtransitionintooroutofaland‐usecategory
Chapter 8: Uncertainty Assessment for Quantifying Greenhouse Gas Sources and Sinks
8-6
Inordertomaketheuncertaintyestimationprocessfeasibleandconsistentattheentityscaleforusebyanentityorlandowner,atoolwillbeneededthatprovidesthefollowinguncertaintyinformationforinputvariables:
PDFsordistributions–Default
Emissionfactors–Default
Activitydata–Default,butcustomizable
Withdefaultuncertaintyinformationavailable,itisfeasibletoquantifyparameteruncertaintyviaPDFsandtocombinetheuncertaintyviaMonteCarlomethods.ThesePDFsareoftenrelativelycrude,relyingondefaultvaluesandconservativeexpertjudgment.OptionstoimprovethePDFs(i.e.,improveparameteruncertaintyquantification)areto:(1)developamethodtohelpelicitandrefinetheseuncertaintydistributionsatanentityscale;and(2)conductnewresearchtobetterunderstandthekeyparametersidentifiedinthisreportandtoquantifytheiruncertainties.9
TheuncertaintyassociatedwiththevariousinputstotheGHGestimationequationormodelsarecombinedtoestimateoveralluncertaintyattheentitylevelfor:(1)eachsourcecategoryemissionestimate;and(2)totalemissionestimatearrivedatbyaggregatingeachsourcecategory’sestimate.Althoughmostinputswithinacategoryandacrosscategoriesareindependent,certainvariablesmightbethesame,similar,orhighlyco‐related,andwillneedtobeaccountedforappropriatelyintheuncertaintyanalysis.
8.1.2 SamplingMethodUncertainty
Somesamplingmethods(i.e.,fieldmeasurements)willbeconductedtosupporttheestimationofemissionsusingtheGHGquantificationmethods.Forexample,fortheforestrysector,conductingfieldmeasurementsonsamplingplotsforlargeforestandonurbanforestsisusedtodetermineaggregateforestcharacteristics(e.g.,treecover).Additionally,somelargedatasetsandexternalmodelsthatthemethodsusealsoutilizedatathatwereobtainedfromavarietyofoutsidesamplingmethods.Forexample,forestinventorydatausedintheforestvegetationsimulator(FVS)modelandthe averagecarbonsequestrationratesusedinthei‐Treemodelusedataobtainedthroughsamplingmethods.Inaddition,thereareinstancesintheseexternalmodelsandlargedatasetswherethevariationinmeasurementsobtainedfromthesamplingmethodsisnottakenintoaccount,buttheycanimpactuncertainty.
Ifforeststandsamplingisconductedatanentitylevelusingaformalprobabilitysamplingdesign,thenunbiasedestimatesofsamplingerrorvariancecanbecomputedviastandardtechniquesfromthefieldofsurveystatistics.Theexactformofthevarianceestimatedependsontheparticulardesignusedforthestandsampling.Thoughadditionaluncertaintiesarisefromtheactualmeasurementprotocolsusedinthefield,thesamplingerrorvarianceisamajorpartofthesamplinguncertainty.AcurrentlyfeasibleapproachtoincorporatinginformationonsamplingerrorvariancesintotheuncertaintyanalysisistomodelthesamplingerrorPDFasanormaldistributionwithzeroasitsmeanandtheestimatedsamplingerrorvarianceasitsvariance.10Thissection
arecontainedintheassociatedland‐usecategorychapterofthe2006IPCCGuidelines.http://www.ipcc‐nggip.iges.or.jp/public/2006gl/vol4.html9Atoolcouldprovideanoptiontousepre‐definedvaluessuchasthoseprovidedinAppendix8‐Boruser(i.e.,landowner)suppliedvaluestodefinePDFs.10Similarly,estimatesderivedfromexistingsurveysandtoolssuchasForestInventoryDataOnlineintheForestInventoryandAnalysisNationalProgramortheUSDANaturalResourcesInventory(NRI)SummaryReportshaveassociatedsamplingerrorvariancesfromwell‐establishedstatisticalprocedures.Inthesecases,
Chapter 8: Uncertainty Assessment for Quantifying Greenhouse Gas Sources and Sinks
8-7
providesthesamplingmethodsandtheirpotentialsourcesofuncertainty.However,giventhecomplexityinincorporatinginformationonuncertaintyforsamplingdataintheMonteCarlouncertaintyassessment,atoolwillbeneededtoquantifytheimpactofsamplinguncertaintyontheestimateofnetGHGemissions.11
8.1.2.1 ForestStandSamplingwithPlotsforUsewiththeForestVegetationSimulatorModel
TheFVSmodelisafamilyofforestgrowthsimulationmodelvariants.FVSestimatesforestcarbonstocksbasedonsampledataparameters(e.g.,thediameter,height,species,andcanopydensityoftreesfromrepresentativesampleplotsestablishedacrosstheforest).Forsamplingpurposes,anumberofplotsareestablishedwithinaforestthatcanserveasarepresentativesampleoftheentireforest.Asthevarianceinforesttypesincreases,thenumberofplotswillincrease.Thesizeandnumberofplotsshouldbedeterminedbasedonthevarianceincarbonstocksbetweenplots.Completeforestestimateshavesamplinguncertainty,butlargerandmorenumerousplotshelptocreateamorerepresentativesampleandlowertheuncertaintyassociatedwithcarbonstockestimatesproducedbyFVS.Bothpermanentandtemporaryplotscanbeusedinsampling;however,alargeruncertaintyisassociatedwithtemporaryplots.Notethattheuseofpermanentplotsisrecommendedinthisreport.Thistypeofsamplingmethodologyiscommonlyreferredtoasaforestinventory.
Onceplotshavebeendefined,alltreesaboveacertaindiameteratbreastheight(DBH)(commonly2.5cm.or1in.)aremeasuredandrecorded.12DBH,height,andavarietyofothermeasurementsarerecorded,butDBHaloneissufficientforusewithFVS.FVSusesDBHandavailableinformationtodevelopcarbondensityestimatesfortheentireforest.Ifprovided,FVSmodelsgrowthestimatesforfutureyearsbasedonaveragegrowthratesandvariablessuchasthinning.13SelectingplotstorepresententireforestsmeansFVSoutputsaresubjecttothesamplingmethoduncertainty.However,uncertaintyintheFVSoutputscanbelowered(i.e.,morerepresentativecarbonstockestimatescanbeobtained)bycollectingmoredetailedtreedatabeyondDBHaswellasensuringthatsampleplotsarelargeandnumerousenoughtocoverthevarietyoftreegrowthsettingsinaforest.
TheforestinventorydatarecommendedforusewithFVSinthisreportisbasedonthesamplingmethodsdescribedintheU.S.DepartmentofAgriculture(USDA)MeasurementGuidelinesfortheSequestrationofCarbon(Pearsonetal.,2007).Theseguidelinesalsodescribethepotentialuncertaintyassociatedwithsuchsamplingmethods.Accordingtothesemeasurementguidelines,areasonableestimateofthenetchangeincarbonstockswouldbewithin10percentofthetruevalueofthemeanatthe95percentconfidencelevelthatcanbeachievedbyhavingasufficientlylargesamplesize(Pearsonetal.,2007).Differentcarbonpoolsinaforestcanhavedifferentvariances;however,focusingonthestandinglivetreecomponentforforestryactivitiescancapturemostofthetotalvariance.
itmaybefeasibletousetheseestimatedvariancesfairlydirectly.Inothercases,itmightbenecessarytoconsidersmallareaestimationtechniquestodescribeuncertaintyaslarge‐scalesurveydataaredownscaledtoentitylevels.Describingthistypeofuncertaintywouldrequirebuildingstatisticalmodelsforcomplexsurveydataand,hence,isnotaddressedinthisreportasadditionalresearchisrequired.11Forexample,inaddressinguncertaintyingrowthofforestbiomass,algorithmstoaccountfornonlineargrowthpatternswillbeneeded.12Undercommonstandexams,eventreeslessthan2.5cmor1incanbemeasured,butthesetreesareoftenconsideredtobepartoftheunderstory(e.g.,byFIA).13Othervariables,suchasfertilization,onlyapplytoafewFVSvariants.
Chapter 8: Uncertainty Assessment for Quantifying Greenhouse Gas Sources and Sinks
8-8
TheforestinventorydatathatisusedformodelingthechangesinforeststandsislikelythelargestsourceofparameteruncertaintyfortheinputsandassumptionsusedintheFVSmodel;inaddition,therearemanycomponentsintheFVSmodelwherevariationinmeasurementsforthisdataisnottakenintoaccount.Forexample,thepotentialerrordistributionfrommonthtomonthincarbonstorageassociatedwithleavesandfoliageisnotaccountedforintheFVSmodel.
InaresearchpaperonobtainingsamplinguncertaintyinFVS,expertsnotethechallengeofreportingdistributionsofmodelinputsthatincludesamplinguncertaintyinFVSprojections(GreggandHummel,2002).Theystateintheirintroductionthat,“ithasn’tbeenpossibletocomputetheeffectsofsamplinguncertaintybecauseclassicalstatisticalmethodsarenotavailabletomakeinferencesaboutFVSprojections.Avarianceestimatorisnotavailablefortheresultsofsimulation.”
AsprovidedinAppendix8‐A,theFVSmodelprovidesquantitativeinformationontherangeandvariabilityofsamplingdata.ThisFVSapplication,calledFVSBoot,uses“bootstraps”todeterminefluctuationinestimateoutcomes(GreggandHummel,2002)(i.e.,allowsmodelertoempiricallyapproximatethesamplingdistributionofanystatistic/FVSattributeforwhichthemodelerwantstomakeinferences).
Bootstrapsampling14usingtheFVSBootprogramcanbeusedtoempiricallyapproximatethesamplingdistributionofstatisticsforwhichinferencesaretobedrawn.Newsamplesofstandconditionscanbegeneratedbysamplingtheoriginalplotswithreplacementtocreateabootstrapsample.Abootstrapmeancanbegeneratedfromthebootstrapsample.RepeatingthisprocessmultipletimeswillgenerateaMonteCarloapproximationofthedistributionofbootstrapmeans.Thestandarddeviationofthisapproximationwillbeanestimationofthetruestandarddeviationfortheentirepopulation.FVSBootdoesnotcoverallpotentialsourcesofvariationbutitcangiveameasureofimportantcomponentsofuncertaintyinFVSmodelprojections.WhiletheFVSBootprogramcanbeusedtodeterminethesamplinguncertaintyinFVS,itwasnotdevelopedoriginallytoproduceanoveralluncertaintyestimateforFVSoutputs.However,FVSBoothasbeenusedforsensitivityanalysisofsomeFVSoutputs(Hummeletal.,2013).AtoolwouldbeneededtofacilitatedevelopinganestimateoftheuncertaintybasedonacombinationoftheresultsfromtheFVSBootprogramandunderlyingequationsusedintheFVSmodel.
8.1.2.2 UrbanTreePopulationSamplingforUsewiththeFieldDataMethodUsingthei‐TreeEcoModel
Thei‐TreeEcomodelestimatesurbanforestcarbonstocksandgrossandnetannualcarbonsequestrationbasedonsampledataparameters(e.g.,thetreespecies,diameter,height,dieback,andcrownlightexposure)withacalculatedlevelofprecision.Asdesiredbythelandowner,alltreescanbemeasuredorarandomdistributionoffieldplotscanbemeasuredtoquantifytheurbantreepopulation.Largerandmorenumerousplotshelptocreateamorerepresentativesampleandlowertheuncertaintyassociatedwiththesampling.Thei‐TreeEcomodelusesthesampledataparametersandforest‐derivedallometricequationstoestimatecarbonvalues.Themodelalsoestimatesthestandarderroroftheestimatedcarbonvalue,whichisbasedonthesamplinguncertainty,ratherthantheerrorofestimationfromapplyingtheallometricequations.Estimationerrorisunknownandlikelylargerthanthereportedsamplingerror.AMonteCarlo
14Bootstrappingistheprocessofestimatingvariancebyrepeatedrandomsamplingwithreplacementofanexistingdataset.Forexample,todeterminetheprobabilitydistributionofaverageDBHforasampleof100trees,resamplesofthedatasetof100treescanbetakentoapproximatethevariance.
Chapter 8: Uncertainty Assessment for Quantifying Greenhouse Gas Sources and Sinks
8-9
analysistoolcouldusethestandarderroroftheestimatedcarbonvaluetoevaluatetheuncertaintyassociatedwithanentity’stotalnetGHGemissions.
8.1.2.3 SamplingandDAYCENTforEstimatingBiomassCarboninGrazingLandandAgroforestrySystems
SamplinguncertaintywillexistwhenestimatingbiomasscarbonusingthemethodprovidedinChapter3.Forexample,peakforageestimatesforgrazinglandscanbesampledusingthebiomassclippingmethod.15Thismethodisdestructivewiththeremovalofforagesamplesfromthefield.Thismethodhasbeenshowntoproduceestimateswithlowuncertainty(Lauenrothetal.,2006;Byrneetal.,2011).Non‐destructivemethodscanalsobeusedincludingthecomparativeyieldmethodforrangelands,16ortherobelpolemethodonrangelandsorpastures(Harmoneyetal.,1997;Vermeireetal.,2002).Thebiomassclippingmethodandcomparativeyieldmethodshavelessuncertaintythantherobelpoleorvisualobstructionmethod.Destructivesamplingmethods,however,aremoretimeandlaborintensive.UncertaintyassociatedwiththerobelpolemethodwasassessedintheBlackHillsofSouthDakotainastudybyUreskandBenzon(2007).Theauthorscompareddestructive(clipping)methodsforestimatingbiomassandtherobelpolemethod.Theyfoundtherewasalinearrelationshipbetweenthetwomethodsandthestandarderroroftherobelpoleestimateforasinglemeanwas373kgha‐1.Thestudyfurtherrecommendsthataminimumofthreetransectsbesampledformonitoringareaslessthan259hatobewithin20percentofthemeanand80percentconfident(UreskandBenzon,2007).InasimilarstudybyVermeireetal.,(2002),asinglevisualobstructionmodel(i.e.,robelpolemethod)effectivelyestimatedherbagestandingcropacrossrangetypesandproducedacoefficientofdeterminationof0.93.Anysamplingthatisdone,whetherdestructiveornon‐destructive,shouldoccuratlocationsthatarerepresentativeofthelandparcel.Ifsamplingtheforageisnotfeasible,defaultforageproductionvaluesareprovidedbytheUSDANaturalResourcesConservationService(USDA‐NRCS)inEcologicalSiteDescriptions.17Thesamplinguncertaintywilldependonthemethodusedtocollectthesampleandshouldbeprovidedbythefarmerorlandowner.
8.1.3 LargeDatasetUncertainty
InformationfromseverallargedatasetswillbeusedwiththeGHGquantificationmethodstoestimateemissionsfromtheanimalagriculture,croplandandgrazingland,andforestrysectors.Largedatasetscanbeconsideredanygroupingofdatapointsthatcoverawidetime‐seriesand/orlevelofreportedvariables.Thesedatasetsincludemultipledatalayers,GISdata,databases,andothersuchreportingcatalogues.
ThelargedatasetstobeusedincludetheSmithetal.(2006,alsoknownasGTR‐NE‐343),ForestInventoryandAnalysis,FVS,Daymet,andthedatasetfromthei‐Treemodel.Thesedatasetsprovidevaluesforestimationequationandmodelinputs.Theseinputsincluderegion‐andspecies‐specifictreegrowthrates,landandtreecover,inferredandobservedmeteorologicaldata,soiltypeanddistribution,ammoniacontent,andhistoricalclimatedatafortheNorthAmericancontinent.Thesedatawillbeusedtoinformthecarbondensitiesofsmallforestholdings,coverageofurbantrees,directandindirectN2Oemissions,soilpH,organicmattervalues,ambientairammoniaconcentrations,anddailyairtemperatureandvelocity.
15SeeSection15,“StandingBiomass”(USDANRCS,2011b).16SeeSection13,“DryWeightRank”(USDANRCS,2011b).17SeeUSDANRCS(2011a).
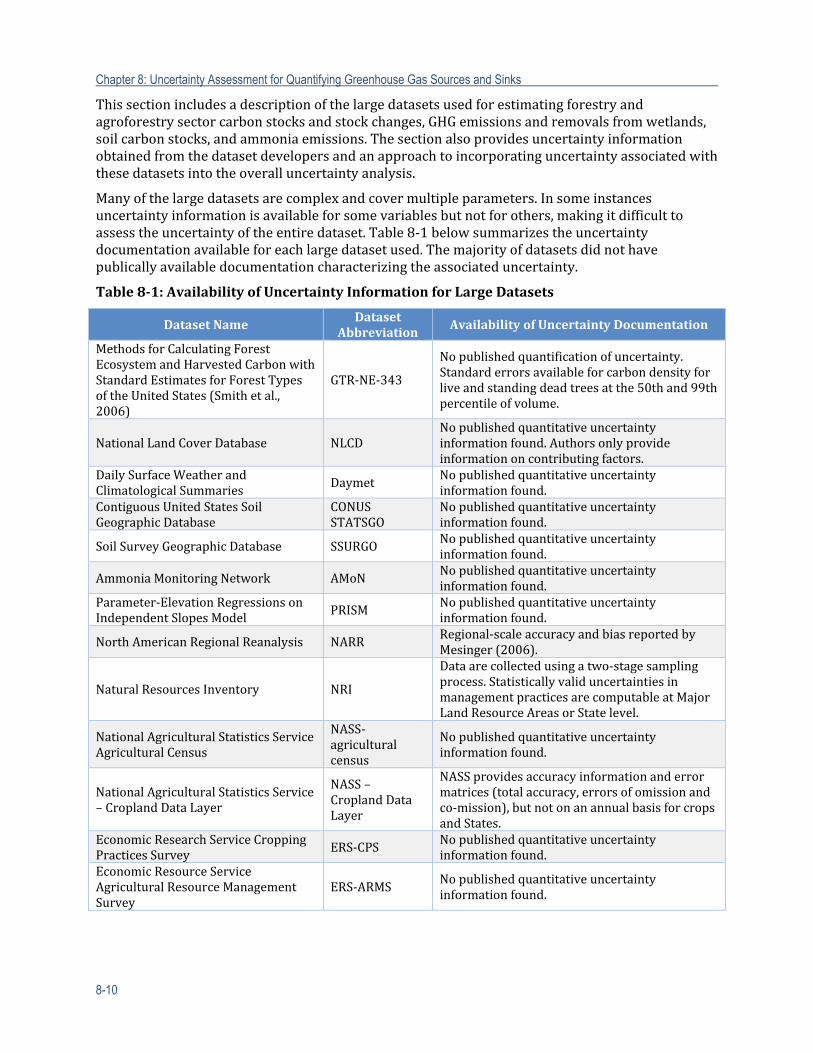
Chapter 8: Uncertainty Assessment for Quantifying Greenhouse Gas Sources and Sinks
8-10
Thissectionincludesadescriptionofthelargedatasetsusedforestimatingforestryandagroforestrysectorcarbonstocksandstockchanges,GHGemissionsandremovalsfromwetlands,soilcarbonstocks,andammoniaemissions.Thesectionalsoprovidesuncertaintyinformationobtainedfromthedatasetdevelopersandanapproachtoincorporatinguncertaintyassociatedwiththesedatasetsintotheoveralluncertaintyanalysis.
Manyofthelargedatasetsarecomplexandcovermultipleparameters.Insomeinstancesuncertaintyinformationisavailableforsomevariablesbutnotforothers,makingitdifficulttoassesstheuncertaintyoftheentiredataset.Table8‐1belowsummarizestheuncertaintydocumentationavailableforeachlargedatasetused.Themajorityofdatasetsdidnothavepublicallyavailabledocumentationcharacterizingtheassociateduncertainty.
Table8‐1:AvailabilityofUncertaintyInformationforLargeDatasets
DatasetName DatasetAbbreviation
AvailabilityofUncertaintyDocumentation
MethodsforCalculatingForestEcosystemandHarvestedCarbonwithStandardEstimatesforForestTypesoftheUnitedStates(Smithetal.,2006)
GTR‐NE‐343
Nopublishedquantificationofuncertainty.Standarderrorsavailableforcarbondensityforliveandstandingdeadtreesatthe50thand99thpercentileofvolume.
NationalLandCoverDatabase NLCDNopublishedquantitativeuncertaintyinformationfound.Authorsonlyprovideinformationoncontributingfactors.
DailySurfaceWeatherandClimatologicalSummaries
Daymet Nopublishedquantitativeuncertaintyinformationfound.
ContiguousUnitedStatesSoilGeographicDatabase
CONUSSTATSGO
Nopublishedquantitativeuncertaintyinformationfound.
SoilSurveyGeographicDatabase SSURGO Nopublishedquantitativeuncertaintyinformationfound.
AmmoniaMonitoringNetwork AMoNNopublishedquantitativeuncertaintyinformationfound.
Parameter‐ElevationRegressionsonIndependentSlopesModel PRISM
Nopublishedquantitativeuncertaintyinformationfound.
NorthAmericanRegionalReanalysis NARRRegional‐scaleaccuracyandbiasreportedbyMesinger(2006).
NaturalResourcesInventory NRI
Dataarecollectedusingatwo‐stagesamplingprocess.StatisticallyvaliduncertaintiesinmanagementpracticesarecomputableatMajorLandResourceAreasorStatelevel.
NationalAgriculturalStatisticsServiceAgriculturalCensus
NASS‐agriculturalcensus
Nopublishedquantitativeuncertaintyinformationfound.
NationalAgriculturalStatisticsService–CroplandDataLayer
NASS–CroplandDataLayer
NASSprovides accuracyinformationanderrormatrices(totalaccuracy,errorsofomissionandco‐mission),butnotonanannualbasisforcropsandStates.
EconomicResearchServiceCroppingPracticesSurvey
ERS‐CPS Nopublishedquantitativeuncertaintyinformationfound.
EconomicResourceServiceAgriculturalResourceManagementSurvey
ERS‐ARMSNopublishedquantitativeuncertaintyinformationfound.
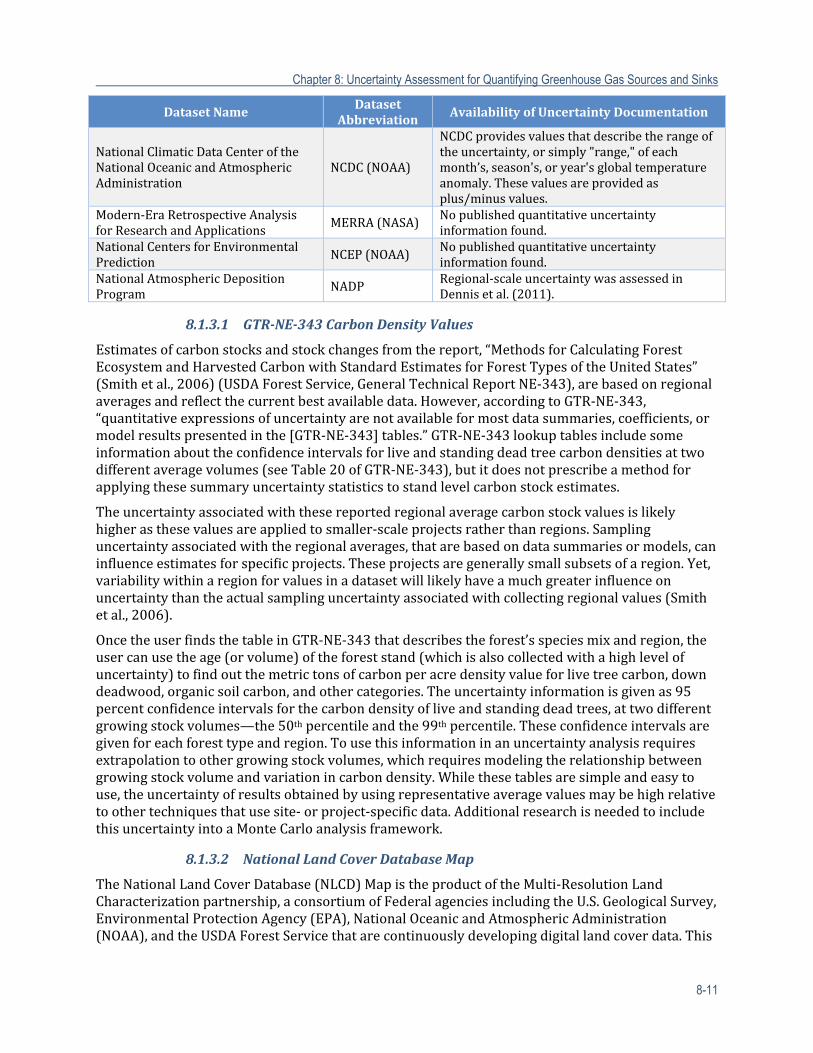
Chapter 8: Uncertainty Assessment for Quantifying Greenhouse Gas Sources and Sinks
8-11
DatasetNameDataset
AbbreviationAvailabilityofUncertaintyDocumentation
NationalClimaticDataCenteroftheNationalOceanicandAtmosphericAdministration
NCDC(NOAA)
NCDCprovidesvaluesthatdescribetherangeoftheuncertainty,orsimply"range,"ofeachmonth’s,season's,oryear'sglobaltemperatureanomaly.Thesevaluesareprovidedasplus/minusvalues.
Modern‐EraRetrospectiveAnalysisforResearchandApplications
MERRA(NASA) Nopublishedquantitativeuncertaintyinformationfound.
NationalCentersforEnvironmentalPrediction NCEP(NOAA)
Nopublishedquantitativeuncertaintyinformationfound.
NationalAtmosphericDepositionProgram NADP
Regional‐scaleuncertaintywasassessedinDennisetal.(2011).
8.1.3.1 GTR‐NE‐343CarbonDensityValues
Estimatesofcarbonstocksandstockchangesfromthereport,“MethodsforCalculatingForestEcosystemandHarvestedCarbonwithStandardEstimatesforForestTypesoftheUnitedStates”(Smithetal.,2006)(USDAForestService,GeneralTechnicalReportNE‐343),arebasedonregionalaveragesandreflectthecurrentbestavailabledata.However,accordingtoGTR‐NE‐343,“quantitativeexpressionsofuncertaintyarenotavailableformostdatasummaries,coefficients,ormodelresultspresentedinthe[GTR‐NE‐343]tables.”GTR‐NE‐343lookuptablesincludesomeinformationabouttheconfidenceintervalsforliveandstandingdeadtreecarbondensitiesattwodifferentaveragevolumes(seeTable20ofGTR‐NE‐343),butitdoesnotprescribeamethodforapplyingthesesummaryuncertaintystatisticstostandlevelcarbonstockestimates.
Theuncertaintyassociatedwiththesereportedregionalaveragecarbonstockvaluesislikelyhigherasthesevaluesareappliedtosmaller‐scaleprojectsratherthanregions.Samplinguncertaintyassociatedwiththeregionalaverages,thatarebasedondatasummariesormodels,caninfluenceestimatesforspecificprojects.Theseprojectsaregenerallysmallsubsetsofaregion.Yet,variabilitywithinaregionforvaluesinadatasetwilllikelyhaveamuchgreaterinfluenceonuncertaintythantheactualsamplinguncertaintyassociatedwithcollectingregionalvalues(Smithetal.,2006).
OncetheuserfindsthetableinGTR‐NE‐343thatdescribestheforest’sspeciesmixandregion,theusercanusetheage(orvolume)oftheforeststand(whichisalsocollectedwithahighlevelofuncertainty)tofindoutthemetrictonsofcarbonperacredensityvalueforlivetreecarbon,downdeadwood,organicsoilcarbon,andothercategories.Theuncertaintyinformationisgivenas95percentconfidenceintervalsforthecarbondensityofliveandstandingdeadtrees,attwodifferentgrowingstockvolumes—the50thpercentileandthe99thpercentile.Theseconfidenceintervalsaregivenforeachforesttypeandregion.Tousethisinformationinanuncertaintyanalysisrequiresextrapolationtoothergrowingstockvolumes,whichrequiresmodelingtherelationshipbetweengrowingstockvolumeandvariationincarbondensity.Whilethesetablesaresimpleandeasytouse,theuncertaintyofresultsobtainedbyusingrepresentativeaveragevaluesmaybehighrelativetoothertechniquesthatusesite‐orproject‐specificdata.AdditionalresearchisneededtoincludethisuncertaintyintoaMonteCarloanalysisframework.
8.1.3.2 NationalLandCoverDatabaseMap
TheNationalLandCoverDatabase(NLCD)MapistheproductoftheMulti‐ResolutionLandCharacterizationpartnership,aconsortiumofFederalagenciesincludingtheU.S.GeologicalSurvey,EnvironmentalProtectionAgency(EPA),NationalOceanicandAtmosphericAdministration(NOAA),andtheUSDAForestServicethatarecontinuouslydevelopingdigitallandcoverdata.This
Chapter 8: Uncertainty Assessment for Quantifying Greenhouse Gas Sources and Sinks
8-12
associationhassuccessfullyprovidedlandcoverdataforthelower48States,Hawaii,Alaska,andPuertoRicofromdecadalLandsatsatelliteimageryandotherassociatedimagingdatasets.ThedatabaseprovidesLandsat‐based,30‐meterresolution,landcoveragecharacteristicsincludingthematicclass(e.g.,urban,agriculture,andforest),percentimpervioussurface,andpercenttreecanopycover.
Regardinguncertainty,theNLCDmapdocumentationindicates,“Unfortunately,thereisnoreadilyavailablereferencedatasetwithwhichtocomparetheinventorytogenerateaccuracystatistics.Referencedatahavetobespecificallygeneratedthroughmanualinterpretationofremotesensingdataforasampleoflocations,ashasbeendoneforaccuracyassessmentoflandcovermaps.Inlieuofsuchanapproach,whichisoutsidethescopeofthisstudy,thebestthatcanbedonecurrentlytodescribetheuncertaintyoftheinventorydataistoidentifytheknownconditionsthatcontributetoit”(NationalLandCoverDatabase,2008).
8.1.3.3 ContinentalUnitedStatesSoilGeographicDatabase
TheContinentalUnitedStatesSoilGeographicDatabase(CONUSSTATSGO)isadigitalgeneralsoilassociationmapthathasbeendevelopedbytheNationalCooperativeSoilSurveyanddistributedbytheUSDANRCS.Itconsistsofbroadbasedinventoryofsoilsandnon‐soilareasthatoccurinarepeatablepatternonthelandscapeandthatcanbecartographicallyshownatscaleandmapped.Noinformationisreadilyavailableontheuncertaintyassociatedwiththisdataset.
8.1.3.4 SoilSurveyGeographicDatabase
TheSoilSurveyGeographic(SSURGO)databasehasbeendevelopedbytheNationalGeospatialManagementCenter,formerlytheNationalCartographyandGeospatialCenter.TheSSURGOdatabasedepictsinformationaboutthekindsofsoilsanddistributionofsoilsonthelandscape.Thisdatasetisadigitalsoilsurveyandgenerallyisthemostdetailedlevelofsoilgeographicdataavailable.Uncertaintyinformationwasnotreadilyavailableforthisdatabasebeyondthedisclaimerthattheaccuracyofdatapoints‘metnationalmapaccuracystandards.’
8.1.3.5 AmmoniaMonitoringNetwork
TheAmmoniaMonitoringNetworkispartoftheNationalAtmosphericDepositionProgram(NADP),andwasoriginallyinitiatedbytheU.S.StateAgriculturalExperimentStations.Thedatasetprovidesconsistent,longtermrecordofammoniagasconcentrationsintheUnitedStates,drawingfrom50monitoringsitesacross37statesintotal.Uncertaintywasnotdirectlyaddressedinthedatasetmaterials,asidefromthedisclaimerthattheNADP’sCentralAnalyticalLaboratory(CAL)analyzes,qualityassures,andprovidestheanalyticaldatatotheNADP(2011).
8.1.3.6 Parameter‐elevationRegressionsonIndependentSlopesModel
TheParameter‐elevationRegressionsonIndependentSlopesModel(PRISM)isaclimatemappingsystemdevelopedbythePRISMClimateGroup.PRISMisaknowledge‐basedsystemthatusespointmeasurementsofprecipitation,temperature,andotherclimaticfactorstoproducecontinuous,digitalgridestimatesofmonthly,yearly,andevent‐basedclimaticparameters.Noinformationisreadilyavailableontheuncertaintyassociatedwiththisdataset.
8.1.3.7 DaymetWeatherDataset
DaymetisaweathermodeldevelopedbyOakRidgeNationalLaboratorythatprovidesinterpolationsextractedfromdailymeteorologicalobservationsontoagriddeddatasetwherenosuchobservationsarepresent.Daymetprovidesoutputparametersincludingtemperature,precipitation,humidity,solarradiation,andsnowwaterequivalent.TheDaymetdatasetisbasedon
Chapter 8: Uncertainty Assessment for Quantifying Greenhouse Gas Sources and Sinks
8-13
thespatialconvolutionofatruncatedGaussianweightingfilterwiththesetofstationlocations.Sensitivitytothetypicalheterogeneousdistributionofstationsincomplexterrainisaccomplishedwithaniterativestationdensityalgorithm.TheweatherdatasetsareproducedasoutputsfromtheDaymetmodelrun.ThisdatasetisusedasaninputforestimatingGHGemissionsfromcroplandsandgrazinglands,andammoniaemissionsfrommanuremanagement.Noinformationisreadilyavailableonuncertaintyassociatedwiththisdataset.
8.1.3.8 NorthAmericanRegionalReanalysisWeatherDataset
TheDAYCENTmodelsimulationsusetheNorthAmericanRegionalReanalysis(NARR)dataproductfordailytemperatureandprecipitation.TheNARRdatasetwaschosenbecauseitprovidesfull,gap‐filledcoveragefortheconterminousU.S.andismaintainedandupdatedregularly.AsdescribedbyMesinger(2006),“TheNationalCentersforEnvironmentalPrediction(NCEP)NorthAmericanRegionalReanalysis(NARR)isalong‐term,dynamicallyconsistent,high‐resolution,high‐frequency,atmosphericandlandsurfacehydrologydatasetfortheNorthAmericandomain.Itcoversthe25‐yearperiod1979–2003,andisbeingcontinuedinnear‐realtimeastheRegionalClimateDataAssimilationSystem,R‐CDAS.EssentialcomponentsofthesystemusedtogenerateNARRarethelateralboundariesfromandthedatausedfortheNCEP/DOEGlobalReanalysis,theNCEPEtaModelanditsDataAssimilationSystem,arecentversionoftheNOAAlandsurfacemodel,andtheuseofnumerousdatasetsadditionaltoorimprovedcomparedtothoseoftheGlobalReanalyses.Inparticular,NARRhassuccessfullyassimilatedhighqualityanddetailedprecipitationobservationsintotheatmosphericanalysis.Consequently,theforcingtothelandsurfacemodelcomponentofthesystemismoreaccuratethaninpreviousreanalyses,sothatNARRprovidesamuchimprovedanalysisoflandhydrologyandland‐atmosphereinteraction.”Noquantitativeinformationisreadilyavailableonuncertaintyassociatedwiththisdataset.
8.1.3.9 DAYCENTLandManagementDataSets
Dataonpastlanduseandmanagement(priortotheyear2000)arethebasisforrepresentativecroplandmanagementsystems,selectedbytheentitylandowner,thatareusedtoinitialize(“spinup”)theDAYCENTmodelforcomputingsoilorganiccarbonstockchanges.TheattributesofthemanagementsystemsarebasedprimarilyonthreelargedatasetsfortheUS:theNationalResourcesInventory(NRI),theNationalAgriculturalStatisticsService(NASS)croplandsurveys,andUSDAEconomicResearchServiceCroppingPracticesSurvey.TheuseofrepresentativecropmanagementsystemsfortheDAYCENTinitializationprocessintroducessomeuncertaintywhenappliedtoaspecificfarmorranchentity(whichhasauniquemanagementhistorythatmaybedifferentfromtheregionally‐basedrepresentativemanagementhistoriesspecifiedbyMajorLandResourceAreas.However,themajoruncertaintyforthemodelinitializationisdrivenbythetimingofmajorland‐coverchange(e.g.,conversionofgrasslandtocropland)whichcanbeuser‐specifiedfortheparticularentityandlandparcel.
NationalResourcesInventory.TheNRIisaninventoryoflandcoveranduse,soilerosion,primefarmland,wetlands,andothernaturalresourcecharacteristics.NRIwasdesignedasatooltoassessconditionsandtrendsforsoil,water,andrelatednaturalresourcesprimarilyonnon‐FederallandsoftheUnitedStates(NusserandGoebel,1997).TheNRIisastratifiedtwo‐stageareasampleofoverseveralhundredthousandpointsdistributedacrosstheUnitedStatesandCaribbean.Eachpointinthesurveyisassignedanareaweight(i.e.,expansionfactor)basedonotherknownareasandland‐useinformationsothateachpointhasastatisticallyassignedareathatitrepresents(NusserandGoebel,1997).Itshouldbenotedthatthereissomeuncertaintyassociatedwithscalingthepointdatatoaregionorthecountryusingtheexpansionfactors.Ingeneral,thoseuncertaintiesdeclineatlargerscales,suchasStatescomparedtosmallercountyunits,becauseofalargersamplesize.
Chapter 8: Uncertainty Assessment for Quantifying Greenhouse Gas Sources and Sinks
8-14
NationalAgriculturalStatisticsServiceCropSurveys.DatafromtheNASScountyagriculturalproductionsurveyswereusedtoconstructrepresentativecroprotationsfortheperiodpriorto(i.e.,before1979)thedatarecordintheNRI.NASSconductsthousandsofsurveyseachyearcoveringmanyfacetsofU.S.agriculture.Estimatesincludecropacreage,yield,production,irrigation,andlivestocknumbers.State‐levelcropestimatesareavailablefromasearlyas1866dependingontheStateandvariableofinterest.Somecounty‐levelcropdataisavailablefromasearlyas1915,withmostcropsavailableformostStatesbyabout1960.Dataaggregatedtothecountylevelaresubjecttoahighlevelofqualitycontrol,includingdatascreeningforoutliers,doublecheckingwithprimarydatacollectorsandcomparisonswithotheraggregatedatasetssuchasfromtheUSDAFarmServicesAgency.
USDAEconomicResearchService(ERS)CroppingPracticesSurvey.AncillarydataonhistoricalmanagementpracticesusedintheDAYCENTmodelinitializationincludenitrogenfertilizerrates(USDAERS,1997;2011).Meanfertilizerratessince1990wereestimatedforallmajorcrops,summarizedbyERSattheState‐level.IfaStatewasnotsurveyedforaparticularcroporiftherewerenotenoughdatatoproduceaStatelevelestimate,thendatawereaggregatedtoUSDAFarmProductionRegionsinordertoestimateameanandstandarddeviationforfertilizationrates(FarmProductionRegionsaregroupsofStateswithsimilaragriculturalcommodities).Crop‐specificregionalfertilizerratespriorto1990werebasedlargelyonextrapolationorinterpolationoffertilizerratesfromtheyearswithavailabledata.Forcropsinsomeagriculturalregions,littleornodatawereavailable,and,therefore,ageographicregionalmeanwasusedtosimulatenitrogenfertilizationrates(e.g.,nodataareavailablefortheStateofAlabamaduringthe1970sand1980sforcornfertilizationrates;therefore,meanvaluesfromthesoutheasternUnitedStateswereusedtosimulatefertilizationtocornfields).Nouncertaintydataareavailableforthisdataset.
8.1.3.10 DNDCInputDatasets
TheDeNitrification‐DeComposition(DNDC)modelisproposedtoestimateGHGemissionsandremovalsfromwetlandssystems.DNDCisasoilbiochemistrymodelthatsimulatesthermodynamicandreactionkineticprocessesofcarbon,nitrogen,andwaterdrivenbytheplantandmicrobialactivitiesinecosystems(OlanderandHaugen‐Kozyra,2011).TheDNDCmodelreliesonspecificinputdatasetsthatcanbecategorizedintofivesources:(1)cropland/land‐usedata;(2)cropmanagementdata;(3)soilsdata;(4)weatherdata;and(5)atmosphericdepositiondata(Salasetal.,2012).Theseprimarysourcesofdataanduncertaintyassociatedwiththedatasetareprovidedbelow.
NationalAgriculturalStatisticsServiceCroplandDataLayerdataset.TheDNDCmodelusestheNASSCroplandDataLayerasasourceofcropland/land‐usedata.TheNASSCroplandDataLayerisanonlinegeospatialexploringtoolgeneratedfromsatelliteimageobservationsata30meterresolution.NASSprovidesaccuracyinformationanderrormatrices(totalaccuracy,errorsofomissionandco‐mission),butnotonanannualbasisforcropsandStates.NASSAgriculturalCensus.Thecensusisavailableeveryfiveyears,andusedatthecountyscale.ItprovidesinformationonU.S.farmsandranchesandistheonlysourceofuniform,comprehensiveagriculturaldataatthecountylevel.Farmersandranchersareaskedtorespondtothecensusbymailoronline.Informationincludingproductionexpenses,marketvalueofproducts,andoperationcharacteristicsareafewofthecategoriesofdata.Uncertaintyisnotassessedforthesedata.RemoteSensing.DNDCusesremotesensingtobuildregionaldatabasesoncroplandonaprojectandasneededbasis.TherangeofsensorsusedincludesRapidEye,Landsat,MODIS,andSAR(PALSAR,Radarsat,ENVISAT,etc.).Remotesensingisusedforestimatinghydroperiods(i.e.,wherethewatertableisatanygiventime).AsDNDCdoesnothaveagroundwatermodelingcomponent,
Chapter 8: Uncertainty Assessment for Quantifying Greenhouse Gas Sources and Sinks
8-15
remotesensingisusedtoidentifywhenwetlandsareflooded.Uncertaintyisnotassessedforthesedata.USDA,ERSAgriculturalResourceManagementSurvey(ARMS).ARMSdataareusedtopopulatethecropmanagementcomponentoftheDNDCmodule.USDAERSARMSprovidedataonthefinancialcondition,productionpractices,andresourceuseoffarmersatthefieldlevelwithintheUnitedStates.ARMSdataarereleasedand/orrevisedtwiceayear.Uncertaintyisnotassessedforthesedata.CONUSSTATSGO(Seedescriptionabove).Thesedataareusedtoassociatesoiltypesanduncertaintyofsoilsdatawithinthemodel.SSURGO(Seedescriptionabove).SSURGOdataareretrievedbyDNDCviaanautomatedretrievalscriptandextractfourkeysoilattributes:claycontent(texture),bulkdensity,organicmatter(soilorganiccarbon),andpH.NOAANationalClimaticDataCenter.DNDCusesstationdatafromtheNOAANationalClimaticDataCenter(NCDC)toinputtemperature,dewpoint,relativehumidity,precipitation,windspeedanddirection,visibility,andatmosphericpressure.Dataareprovidedatthesubhourly,hourly,daily,monthly,annual,andmultiyeartimescale.NCDCprovidesvaluesthatdescribetherangeoftheuncertainty,orsimply"range,"ofeachmonth,season,oryearglobaltemperatureanomaly.Thesevaluescanbeusedasplus/minusvalueswithinanoverallMonteCarloframework;however,atoolisneededtoutilizethisinformation.Daymet(Seedescriptionabove).TheseweatherdataareusedbyDNDCandhavebeenavailableformuchofNorthAmericafrom1980to2012.Uncertaintyinformationisnotavailableforthisdataset.NationalAeronauticsandSpaceAdministrationModern‐EraRetrospectiveAnalysisforResearchandApplications(MERRA).TheDNDCmodelreliesonMERRAsatellitedataasinputforthehydrologicalcycle.MERRAprovidesglobaldataonvariousaspectsofmoisturedistributionandvariability.Nearly30yearsofdataareavailableandhasundergoneanonlinebiascorrectionforsatelliteradianceobservations.Thiswasdonetocalibrateobservationsfromdifferentsatellites.UncertaintydataarenotavailableforMERRAoutput.NationalOceanicandAtmosphericAdministrationNationalCenterforEnvironmentalPrediction(NCEP).DNDCinputsNCEPnationalweather,water,andclimatedataintotheNCEPmodel.NCEPcreatesclimate,water,ocean,space,andenvironmentalhazardoutputs.UncertaintydataarenotavailableforNCEPoutput.NationalAtmosphericDepositionProgramNationalTrendsNetwork(NTN)Stations.DNDCrequirestotalnitrogendepositionandestimatesofaverageconcentration.DNDCreliesontheNADPNTNstationstoinputtotalnitrogendeposition(NO3andNH4)intothemodel.NADPNTNstationscollectprecipitationandchemistrysamplesawayfromurbanareaandpointsourcesofpollution.Thestation’sCentralAnalyticalLaboratoryreviewsdataforcompletenessandaccuracyandflagssamplesthatweremishandledorcompromised.SampledataarefurtherreviewedbytheNADPprogramofficetodoafinalchecktoresolvediscrepancies.Oncedataaremadeavailableonline,DNDCcalculatesmeannitrogendepositionforthesimulationtimeperiodandincorporatesthedataintotheprojectdatabase.NADPNTNstationdatadonothaveassociateduncertaintydataavailable,howeverregionaluncertaintywasanalyzedinapresentationbyDennisetal.(2011).
Chapter 8: Uncertainty Assessment for Quantifying Greenhouse Gas Sources and Sinks
8-16
8.1.3.11 ApproachforIncorporatingLargeDatasetUncertainty
AmongthelargedatasetstobeusedfortheGHGquantificationmethods,onlyGTR‐NE‐343hassomequantifieduncertaintyinformationforuseinaMonteCarloassessmentofnetGHGemissions.Becauseconfidenceintervalsforonlytwostockvolumesareavailable,onlyalinearrelationshipcanbemodeledwithGTR‐NE‐343information,andnodeparturesfromlinearitycanbeassessed.Furtheranalysisofcarbondensityatothergrowingstockvolumesrequirescomputationofadditionalconfidenceintervals.
Giventhelackofuncertaintyinformationformostoftherelevantlargedatasets,estimatingthissourceofuncertaintyisnotfeasible.Instead,relianceofthemethodsonthelargedatasetsisexplicitlyacknowledgedandreadilyavailableinformationonuncertaintyissummarizedasprovidedabove.
Somelarge“wall‐to‐wall”datasetsareformedviainterpolationofexistingdatafromafixedsetofmeasurementlocations.Forsuchdatasets,apotentialnear‐termnextstepmightbetoincorporateuncertaintybyimputingmeasurementsfromrandomly‐selectedmeasurementlocations.Thisrandomselectioncoulduseprobabilitiesinverselyproportionaltothedistancebetweenthemeasurementlocationsandtheentity.Ifmostlocationsarefarfromtheentity,thentheimputationsareincreasinglyuncertain.
Inthelongerterm,bothnewresearchandsynthesisofexistingresearchwillberequiredtoquantifylargedatasetuncertainty.Methodsfromgeostatistics,forexample,mightbeusedtodescribeanuncertainlargedatasetobtainedbyinterpolation.
8.1.4 ModelUncertainty
Inthecaseoftheexternalmodels,itishardtoappropriatelyaccountforapproximationerrorandoftenonlyonemodelexiststorepresentorestimateemissions(orremovals)fromaspecificactivityorprocess.Sincecomparablemodelsdonotexist,itisalmostimpossibletoestimatetheuncertaintyassociatedwithusingoneparticularmodelversusanother.Whilethisreportspecifiestheuseofseveralexternalmodels—DAYCENT,DNDC,FVS,i‐TreeCanopy,i‐TreeEco,FirstOrderFireEffectsModel(FOFEM)—giventheaboveconsiderations,limitedpublisheddatawasfoundonexternalmodeluncertaintyinherentwiththesemodels.
Thissectionincludesadescriptionoftheexternalmodelsusedforestimatingcarbonstocksandstockchangesfromthecroplandsandgrazinglands,wetlands,andforestrysectors,uncertaintyinformationobtainedfromthemodeldevelopers.Thesemodelshelpprovideaquantitativeandgeographicalviewintotheemissionsassociatedwithavarietyoffactorsfromagriculturalandforestrysystems.Forexample,giveninputssuchasarea,treediameter,treeheight,species,soiltype,andgeography,thesuiteofforestrymodelscanprovideemissionestimatesfromfiredisturbances,approximatechangesinforestcarbonstocks,orprovideurbanforestcarbonstockdata.Table8‐2belowsummarizestheuncertaintyinformationobtainedfromthemodeldevelopersforeachofthemodelsusedtoestimatenetGHGemissions.Giventhelackofquantitativeinformationonmodeluncertainty,thiscomponentofuncertaintywillnotbepartoftheMonteCarlouncertaintyassessment.
Table8‐2:UncertaintyInformationforProcess‐basedModels
ModelAvailabilityofUncertainty
DocumentationOccurrenceofUncertaintyBiases
DAYCENT Ogleetal.,2010BiasesbypracticearequantifiedinOgleetal.(2010).
DNDCa Inputuncertainty:Lietal.(2002) andZhangetal.(2009).Therehavebeen
AMonteCarloapproachorMostSensitiveFactoranalysiscanberunoncertaininputparameters
Chapter 8: Uncertainty Assessment for Quantifying Greenhouse Gas Sources and Sinks
8-17
ModelAvailabilityofUncertainty
DocumentationOccurrenceofUncertaintyBiases
nopapersfocusedonquantificationofDNDCmodelstructuraluncertainty.
(i.e.,soilmeasurements)toassessthevariabilityoftheparameters(includesexcerptsfromC_AGGwhitepaperbySalasetal.,2012).
ForestVegetationSimulator
Nopublishedquantificationofmodeluncertaintywasfound.
Existsbutnotquantifiableaccordingtoexperts.
i‐TreeCanopy(AerialDataMethod)
Nopublishedquantificationofmodeluncertaintyfound.
Modelbiasislikelylow,accordingtomodeldeveloper.
i‐TreeEco(FieldDataMethod)
Nopublishedquantificationofmodeluncertaintyfound.
Valuesarestandardized,biasisminimized.Unknownbiasfornationaldensityestimates.
FirstOrderFireEffectsModel
Nopublishedquantificationofmodeluncertaintyfound.
Regionalbiases(NorthRockyMountains,PacificNorthwestregions).
aDNDCdoesnotprovideuncertaintyparameterizationofoutputsatthesitelevel,however,theregionalmodelprovidesanoptionforassessinguncertaintyduetoinputuncertainty.
8.1.4.1 DAYCENTModel
TheDAYCENTmodelhasinherentuncertaintyassociatedwithpredictingsoilorganiccarbon(SOC)stockchanges(Ogleetal.,2010;U.S.EPA,2013).Theuncertaintyisassociatedwithimperfectsimulationoftheplantandsoilprocessesassociatedwiththealgorithmsandparameters.Toaddressthisuncertainty,thesimulatedmodelpredictionsofSOCstocksneedtobecomparedtomeasurements.Thecomparisonleveragesthescalabilityoftheprocess‐basedmodeltothewiderangeofconditionsthatexistinagriculturallands,whilehavinganunderlyingmeasurementbasistosupportthereporting(Conantetal.,2011).
ThedifferencesbetweenmeasurementsandsimulatedSOCstocksandstockchangeshavebeenanalyzedusinganempiricallybasedapproachinwhichastatisticalmodelwasdevelopedthatquantifiestheaccuracyandprecisioninthesimulatedpredictions(Ogleetal.,2007).Thelinearmixed‐effectmodelingapproachwasusedforthisanalysis,andvariousenvironmentalconditions(e.g.,climateandsoilcharacteristics)andmanagementpracticeswereevaluatedtodetermineifthemodelismoreaccurateorpreciseforparticularconditionsormanagementsystems.TheapproachreliedonmeasurementsofSOCstocksfromanetworkofsitesacrosstheU.S.agriculturallands.AnetworkiscurrentlybeingexpandedbytheUSDANRCSthatisexpectedtoprovideadditionalmeasurementssupportingtheentity‐scalemethodsforestimatingSOCstockchanges.ThisuncertaintyanalysiswillbeupdatedasnewmeasurementsbecomeavailablefromthenetworkandwillbeincorporatedintoaMonteCarloassessment.
8.1.4.2 DNDCModel
Structuraluncertaintyisrelatedtotheinherentuncertaintyofamodelthatremainsevenifnoneoftheinputdatahadanyvariability.Estimatingmodelstructuraluncertaintyrequirestheuseofindependentvalidationdata(i.e.,fieldmeasurementdatathatwerenotusedtodevelopthemodelalgorithms).Thisapproachrequiresnotonlyaccesstosufficientindependentfielddata,butalsothatthedataincludealltheinputdatathatDNDCrequires.AnumberofvalidationtestswithindependentfielddatahavebeenpublishedalthoughsummarystudiesarecurrentlynotavailabletoquantifyDNDCstructuraluncertainty.
Chapter 8: Uncertainty Assessment for Quantifying Greenhouse Gas Sources and Sinks
8-18
8.1.4.3 ForestVegetationSimulator
Aspreviouslydescribed,asourceofuncertaintyfortheFVSmodelissamplinguncertaintyassociatedwiththetreelist(themainuserinput).Theadditionaluncertaintyassociatedwiththemodeluncertaintyisdifficulttoquantify.
IntheFVSmodel,diametergrowthistheonlyvariablethatisconsideredstochastic.Forthediametergrowthmodule,arandomseedisusedforprojectionsofchangesinforeststandsratherthanusingthemeandiametervaluetoavoidunderestimatinggrowth.Thisprocessincreaseserrorpropagationbecausetheresultsofthediametergrowthmoduleareusedtomakefurtherestimatesinthemodel,e.g.,usinggrowthandyieldequations(i.e.,Jenkinsequations).However,thestochasticityofdiametergrowthisnotthemaindriverofmodeluncertainty.UncertaintyassociatedwiththeFVSmodeliscomplexbecauseitisderivedfrom20differentregionallyspecificmodelvariantsthatweredevelopedindependently.Eachmodelrunoranalysishastobecalibratedtoaccountforlocaltreevarietyandgrowthrates,introducinganotherlevelofcomplexity(VanDyck,2012).Additionally,errorsmaypropagatefromthebiasinregionalfactors,adjustingtolocalgeographies,climates,theuseoffielddata,andsamplinguncertainty.Giventheoverallcomplexityinherentinthemodel,FVSdoesnotincorporateuncertaintyintheoutputorpost‐analysisofmodelrunsandadditionalresearchisrequiredtoquantifymodeluncertainty.
8.1.4.4 i‐TreeModel
i‐Tree(formerlytheUrbanForestEffectsmodel)isanurbanforestryanalysismodeldevelopedbyDavidJ.Nowak(USDAFS),DanielE.Crane(NRS),andPatrickMcHale(SUNYCollegeofEnvironmentalScienceandForestry).Thei‐Treemodelhelpsquantifythestructureofcommunitytreesandtheenvironmentalservicesthattheyprovide.Itprovidessixanalyticaltoolsincluding:
i‐TreeEco:Providesafullpictureoftheentireurbanforest(usedintheFieldDataMethod)
i‐TreeStreets:Quantifiesbenefitsfromamunicipalitiesstreetleveltrees
i‐TreeHydro:Modelstheeffectsoftreesonwatershedstreamflowandwaterquality
i‐TreeVue:UsesNLCDsatelliteimagerytoassesstreecanopy
i‐TreeDesign:Assessesmultipletreesatparcellevel
i‐TreeCanopy:Providesaquantifiableestimateoftreecoverandotherlandcovertypes(usingintheAerialDataMethod)
i‐TreeEcoandi‐TreeCanopyarerecommendedinthisreportforusebyanentitytoestimatethechangeincarbonstocksintheirurbanforests.
i‐TreeEcoUncertaintyInformation:Thei‐TreeEcomodelproducesuncertaintyestimatesbasedonsamplingerror,butitdoesnotcalculateamodelestimationerror.Accordingtoi‐Treedevelopers,estimationerrorisbasedontheuncertaintyinherentinthebiomassconversionequationsandemissionfactors.Thedevelopersalsonotethatmodelbiasislikelylowgiventhattheinputassumesagivenrandomsampleoftrees,andtreespeciesequationsareselectedbasedonstandheight.Ifaparticularspeciesequationisnotavailablethemodelusestheaverageofavailableequationsfromtheclosestgenera(Nowak,2012).AMonteCarloanalysistoolcouldusethestandarderroroftheestimatedcarbonvaluetoevaluatetheuncertaintyassociatedwithanentity’stotalnetGHGemissions.
i‐TreeCanopyUncertaintyInformation:Thei‐TreeCanopymodelproducesastatisticalestimateofthestandarderrorofthepercenttreecoverestimatebasedontheratioofsamplepoints
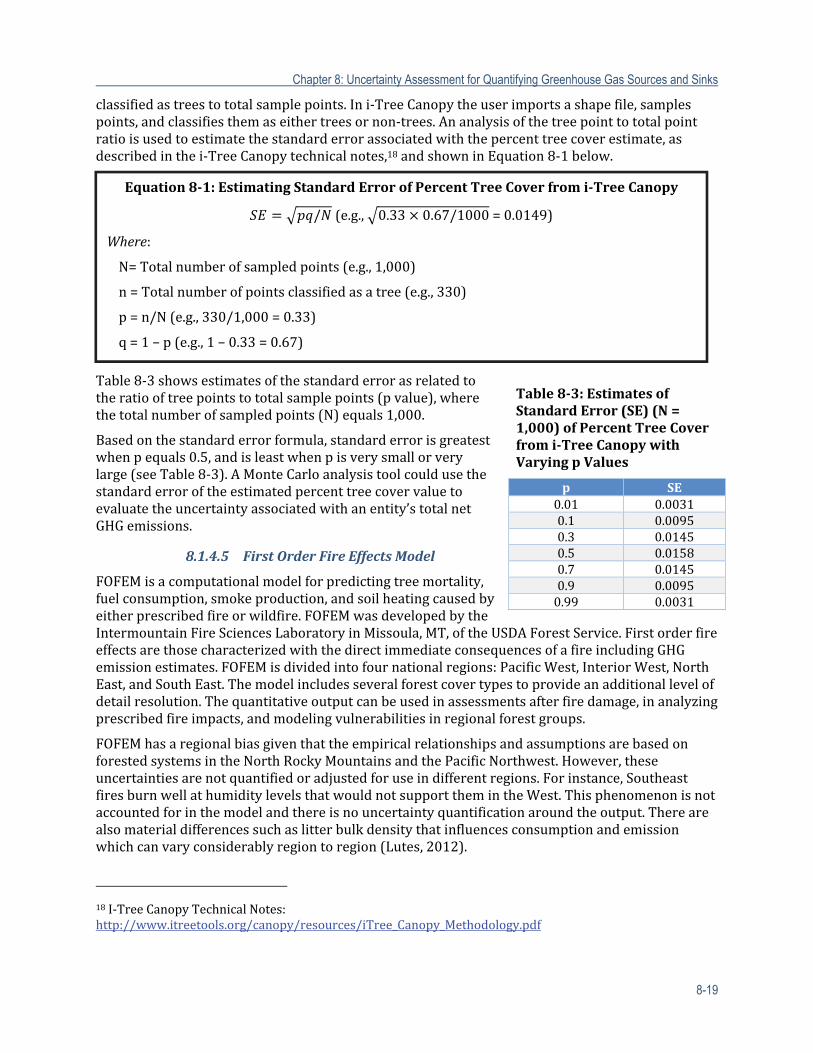
Chapter 8: Uncertainty Assessment for Quantifying Greenhouse Gas Sources and Sinks
8-19
classifiedastreestototalsamplepoints.Ini‐TreeCanopytheuserimportsashapefile,samplespoints,andclassifiesthemaseithertreesornon‐trees.Ananalysisofthetreepointtototalpointratioisusedtoestimatethestandarderrorassociatedwiththepercenttreecoverestimate,asdescribedinthei‐TreeCanopytechnicalnotes,18andshowninEquation8‐1below.
Table8‐3showsestimatesofthestandarderrorasrelatedtotheratiooftreepointstototalsamplepoints(pvalue),wherethetotalnumberofsampledpoints(N)equals1,000.
Basedonthestandarderrorformula,standarderrorisgreatestwhenpequals0.5,andisleastwhenpisverysmallorverylarge(seeTable8‐3).AMonteCarloanalysistoolcouldusethestandarderroroftheestimatedpercenttreecovervaluetoevaluatetheuncertaintyassociatedwithanentity’stotalnetGHGemissions.
8.1.4.5 FirstOrderFireEffectsModel
FOFEMisacomputationalmodelforpredictingtreemortality,fuelconsumption,smokeproduction,andsoilheatingcausedbyeitherprescribedfireorwildfire.FOFEMwasdevelopedbytheIntermountainFireSciencesLaboratoryinMissoula,MT,oftheUSDAForestService.FirstorderfireeffectsarethosecharacterizedwiththedirectimmediateconsequencesofafireincludingGHGemissionestimates.FOFEMisdividedintofournationalregions:PacificWest,InteriorWest,NorthEast,andSouthEast.Themodelincludesseveralforestcovertypestoprovideanadditionallevelofdetailresolution.Thequantitativeoutputcanbeusedinassessmentsafterfiredamage,inanalyzingprescribedfireimpacts,andmodelingvulnerabilitiesinregionalforestgroups.
FOFEMhasaregionalbiasgiventhattheempiricalrelationshipsandassumptionsarebasedonforestedsystemsintheNorthRockyMountainsandthePacificNorthwest.However,theseuncertaintiesarenotquantifiedoradjustedforuseindifferentregions.Forinstance,SoutheastfiresburnwellathumiditylevelsthatwouldnotsupportthemintheWest.Thisphenomenonisnotaccountedforinthemodelandthereisnouncertaintyquantificationaroundtheoutput.Therearealsomaterialdifferencessuchaslitterbulkdensitythatinfluencesconsumptionandemissionwhichcanvaryconsiderablyregiontoregion(Lutes,2012).
18I‐TreeCanopyTechnicalNotes:http://www.itreetools.org/canopy/resources/iTree_Canopy_Methodology.pdf
Table8‐3:EstimatesofStandardError(SE)(N=1,000)ofPercentTreeCoverfromi‐TreeCanopywithVaryingpValues
p SE0.01 0.00310.1 0.00950.3 0.01450.5 0.01580.7 0.01450.9 0.00950.99 0.0031
Equation8‐1:EstimatingStandardErrorofPercentTreeCoverfromi‐TreeCanopy
/ (e.g., 0.33 0.67/1000=0.0149)
Where:
N=Totalnumberofsampledpoints(e.g.,1,000)
n=Totalnumberofpointsclassifiedasatree(e.g.,330)
p=n/N(e.g.,330/1,000=0.33)
q=1− p(e.g.,1− 0.33=0.67)
Chapter 8: Uncertainty Assessment for Quantifying Greenhouse Gas Sources and Sinks
8-20
8.1.4.6 ApproachforIncorporatingModelUncertainty
Giventhelackofuncertaintyinformationformostoftherelevantexternalmodels,itisnotcurrentlyfeasiblefortheGHGquantificationmethodstoquantifythissourceofuncertainty.Instead,relianceofthemethodsonthemodelswillbeexplicitlyacknowledged.Thepotentialimpactsofuncertainmodelsontheaccuracyandprecisionoftheresultingestimatesisdescribedqualitativelyintheprevioussections.
Itmaybepossibleintheneartermtoelicitexpertjudgmentsonthelevelofmodeluncertaintyattheentitylevel.ModelsusedintheGHGquantificationmethodsaretypicallyconstructedatscalesnosmallerthantheentitylevel.Itisexpectedthatthemodeluncertaintyattheentitylevelwouldbenosmallerthanthemodeluncertaintyatthemodel’sscale,andpossiblylargerduetoadditionalerrorfromdownscalingtotheentitylevel.
Inthelongerterm,moreresearchisneededtoevaluatemodelpredictionswithindependentdata,notusedinthedevelopmentofthemodel.Thedifferencesbetweenmodelpredictionsandindependentdataarethebestpossiblesourceofinformationregardingmodeluncertainty.
ResearchGaps8.2
ThereadilyavailableinformationonparameteruncertaintyisprovidedinthetablesinAppendix8‐B.Asindicated,muchoftheinformationtocharacterizetheuncertaintyisnotavailableandthedatathatareprovidedaremostlydefaultvaluesfromtheliteratureandassumedprobabilitydensityfunctions.ToconductaMonteCarloanalysisforuncertaintyestimation,itisimportanttoobtainprobabilitydensityfunctionsorsummarystatisticsforalluncertainvariables.SignificantresearchisneededtoobtainnewdataandtosynthesizeexistingandnewdatainordertotrulyassessuncertaintyassociatedwitharangeoffactorscausinguncertaintyintheGHGestimatesdevelopedusingtherecommendedmethodsdescribedinthisreport.Inparticular,moreresearchisneededtoassessparameter,sampling,largedatasets,andmodeluncertainties.
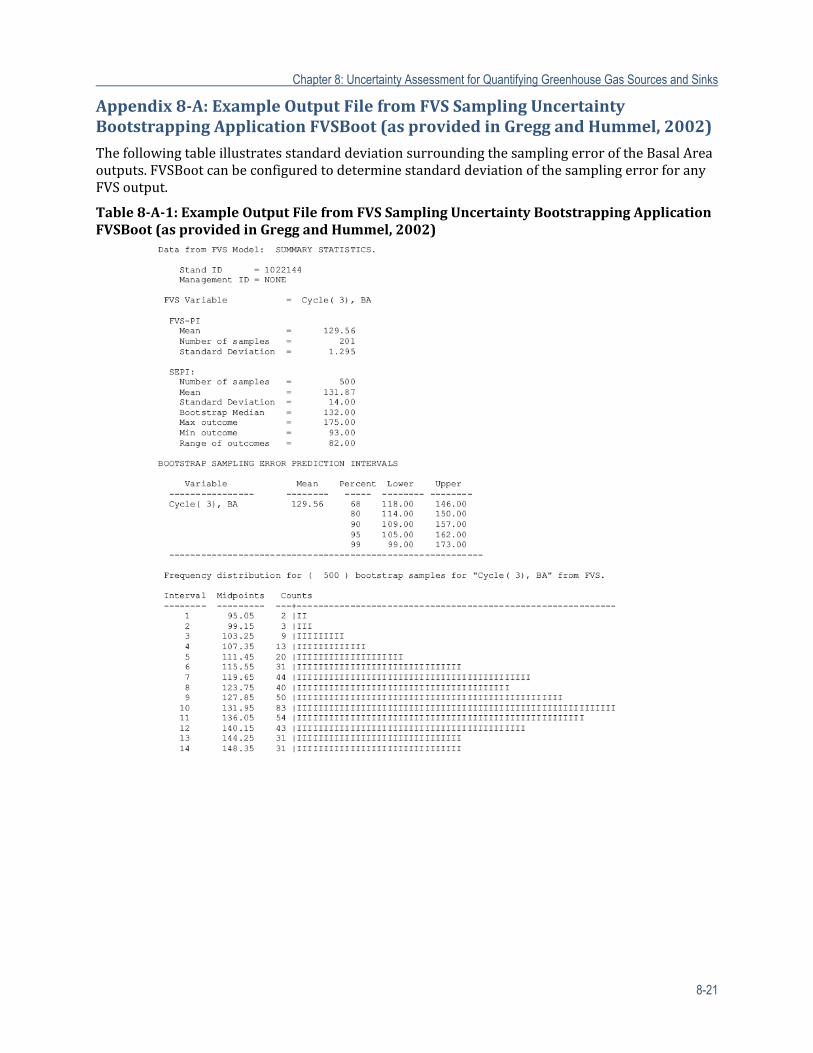
Chapter 8: Uncertainty Assessment for Quantifying Greenhouse Gas Sources and Sinks
8-21
Appendix8‐A:ExampleOutputFilefromFVSSamplingUncertaintyBootstrappingApplicationFVSBoot(asprovidedinGreggandHummel,2002)
ThefollowingtableillustratesstandarddeviationsurroundingthesamplingerroroftheBasalAreaoutputs.FVSBootcanbeconfiguredtodeterminestandarddeviationofthesamplingerrorforanyFVSoutput.
Table8‐A‐1:ExampleOutputFilefromFVSSamplingUncertaintyBootstrappingApplicationFVSBoot(asprovidedinGreggandHummel,2002)
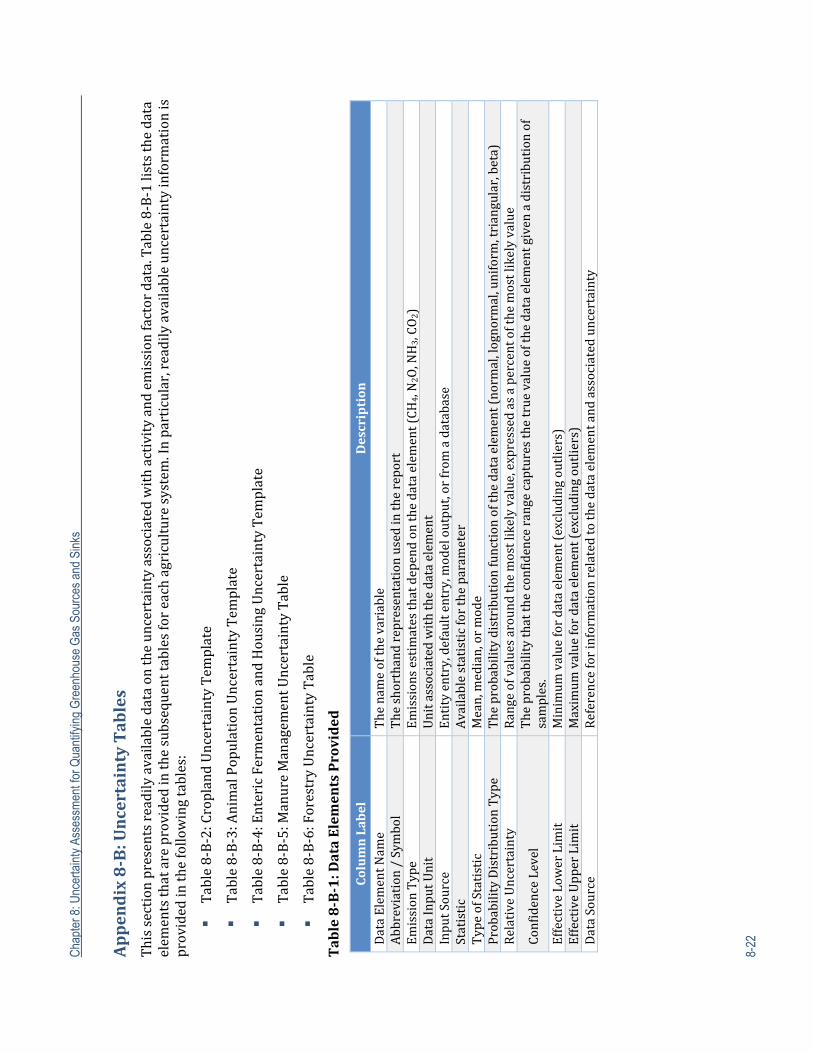
Cha
pter
8: U
ncer
tain
ty A
sses
smen
t for
Qua
ntify
ing
Gre
enho
use
Gas
Sou
rces
and
Sin
ks
8-22
Appendix8‐B:UncertaintyTables
Thissectionpresentsreadilyavailabledataontheuncertaintyassociatedwithactivityandemissionfactordata.Table8‐B‐1liststhedata
elem
entsthatareprovidedinthesubsequenttablesforeachagriculturesystem.Inparticular,readilyavailableuncertaintyinform
ationis
providedinthefollowingtables:
Table8‐B‐2:CroplandUncertaintyTem
plate
Table8‐B‐3:AnimalPopulationUncertaintyTem
plate
Table8‐B‐4:EntericFermentationandHousingUncertaintyTem
plate
Table8‐B‐5:M
anureManagem
entUncertaintyTable
Table8‐B‐6:ForestryUncertaintyTable
Table8‐B‐1:DataElem
entsProvided
ColumnLabel
Description
DataElem
entNam
eThenam
eofthevariable
Abbreviation/Symbol
Theshorthandrepresentationusedinthereport
EmissionType
Emissionsestimatesthatdependonthedataelement(CH
4,N2O,NH3,CO
2)DataInputUnit
Unitassociatedwiththedataelement
InputSource
Entityentry,defaultentry,m
odeloutput,orfrom
adatabase
Statistic
Availablestatisticfortheparameter
TypeofStatistic
Mean,median,ormode
ProbabilityDistributionType
Theprobabilitydistributionfunctionofthedataelem
ent(normal,lognormal,uniform,triangular,beta)
RelativeUncertainty
Rangeofvaluesaroundthemostlikelyvalue,expressedasapercentofthemostlikelyvalue
ConfidenceLevel
Theprobabilitythattheconfidencerangecapturesthetruevalueofthedataelem
entgivenadistributionof
samples.
EffectiveLowerLimit
Minimum
valuefordataelement(excludingoutliers)
EffectiveUpperLimit
Maximum
valuefordataelement(excludingoutliers)
DataSource
Referenceforinformationrelatedtothedataelementandassociateduncertainty
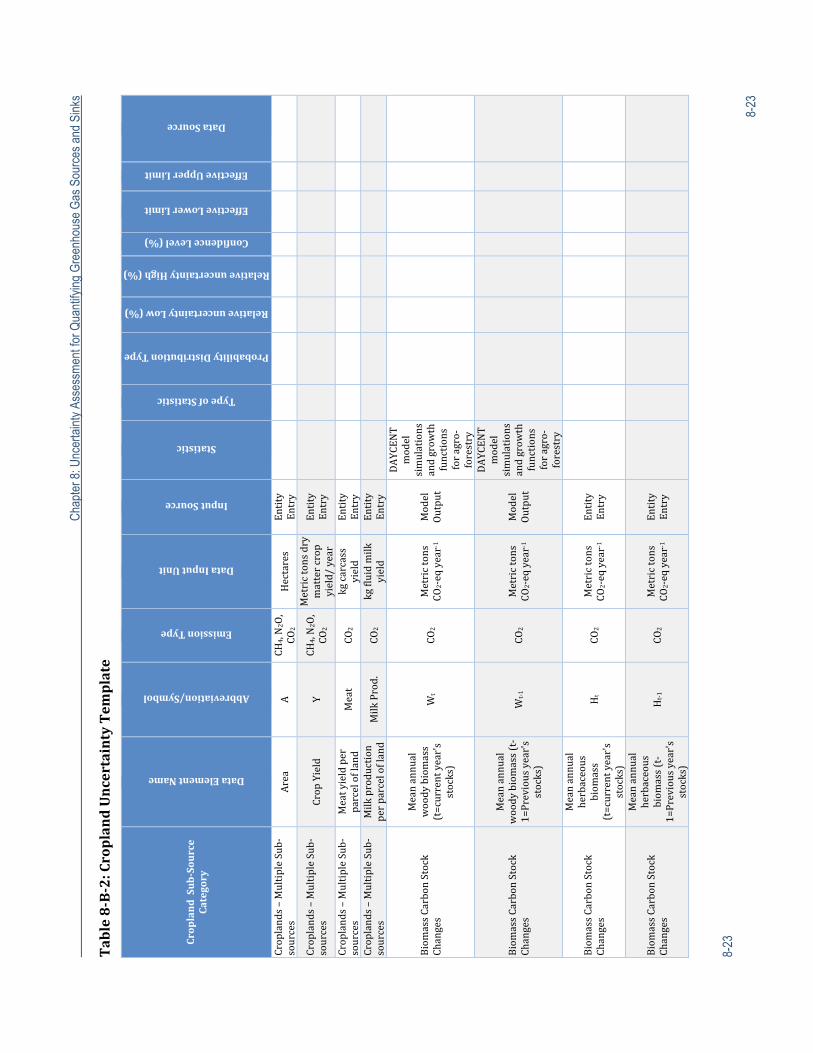
C
hapt
er 8
: Unc
erta
inty
Ass
essm
ent f
or Q
uant
ifyin
g G
reen
hous
e G
as S
ourc
es a
nd S
inks
8-23
8-23
Table8‐B‐2:CroplandUncertaintyTem
plate
CroplandSub‐Source
Category
DataElementName
Abbreviation/Symbol
EmissionType
DataInputUnit
InputSource
Statistic
TypeofStatistic
ProbabilityDistributionType
RelativeuncertaintyLow(%)
RelativeuncertaintyHigh(%)
ConfidenceLevel(%)
EffectiveLowerLimit
EffectiveUpperLimit
DataSource
Croplands–MultipleSub‐
sources
Area
A
CH4,N2O,
CO2
Hectares
Entity
Entry
Croplands–MultipleSub‐
sources
CropYield
YCH
4,N2O,
CO2
Metrictonsdry
mattercrop
yield/year
Entity
Entry
Croplands–MultipleSub‐
sources
Meatyieldper
parcelofland
Meat
CO2
kgcarcass
yield
Entity
Entry
Croplands–MultipleSub‐
sources
Milkproduction
perparcelofland
MilkProd.
CO2
kgfluidmilk
yield
Entity
Entry
BiomassCarbonStock
Changes
Meanannual
woodybiomass
(t=currentyear's
stocks)
Wt
CO2
Metrictons
CO2‐eqyear‐1
Model
Output
DAYCEN
T
model
simulations
andgrow
th
functions
foragro‐
forestry
BiomassCarbonStock
Changes
Meanannual
woodybiomass(t‐
1=Previousyear's
stocks)
Wt‐1
CO2
Metrictons
CO2‐eqyear‐1
Model
Output
DAYCEN
T
model
simulations
andgrow
th
functions
foragro‐
forestry
BiomassCarbonStock
Changes
Meanannual
herbaceous
biom
ass
(t=currentyear's
stocks)
Ht
CO2
Metrictons
CO2‐eqyear‐1
Entity
Entry
BiomassCarbonStock
Changes
Meanannual
herbaceous
biom
ass(t‐
1=Previousyear's
stocks)
Ht‐1
CO2
Metrictons
CO2‐eqyear‐1
Entity
Entry
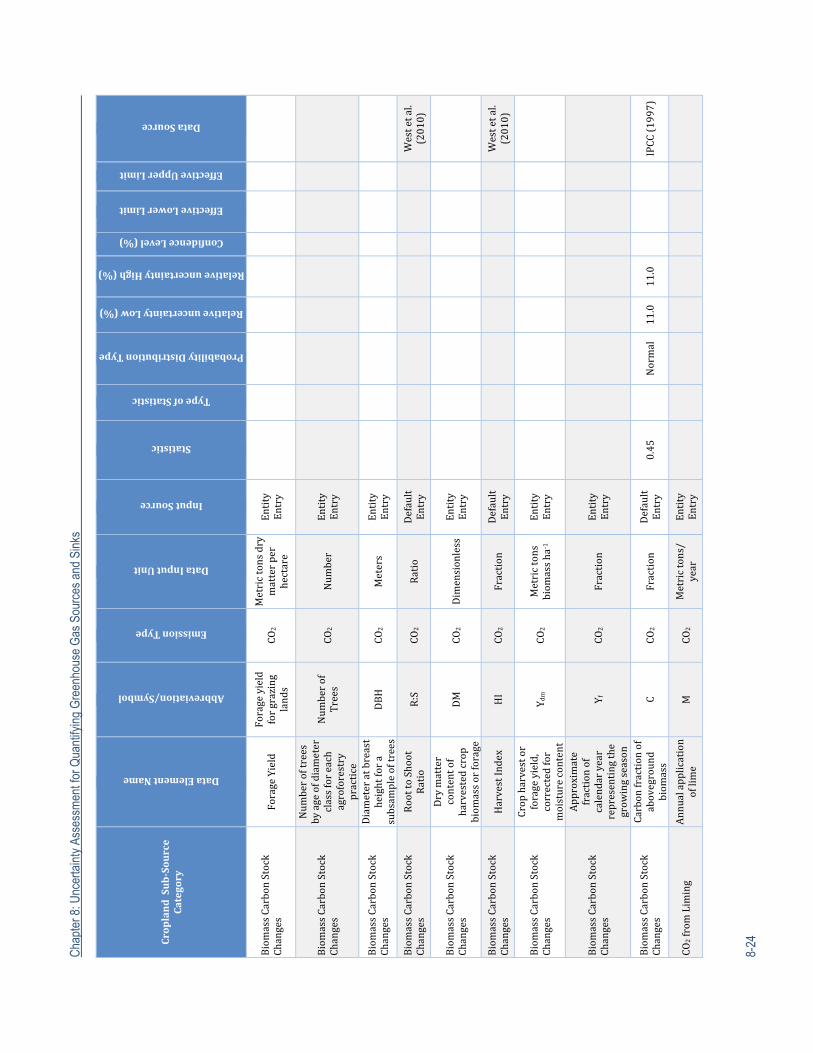
Cha
pter
8: U
ncer
tain
ty A
sses
smen
t for
Qua
ntify
ing
Gre
enho
use
Gas
Sou
rces
and
Sin
ks
8-24
CroplandSub‐Source
Category
DataElementName
Abbreviation/Symbol
EmissionType
DataInputUnit
InputSource
Statistic
TypeofStatistic
ProbabilityDistributionType
RelativeuncertaintyLow(%)
RelativeuncertaintyHigh(%)
ConfidenceLevel(%)
EffectiveLowerLimit
EffectiveUpperLimit
DataSource
BiomassCarbonStock
Changes
ForageYield
Forageyield
forgrazing
lands
CO2
Metrictonsdry
matterper
hectare
Entity
Entry
BiomassCarbonStock
Changes
Num
beroftrees
byageofdiameter
classforeach
agroforestry
practice
Num
berof
Trees
CO2
Num
ber
Entity
Entry
BiomassCarbonStock
Changes
Diameteratbreast
heightfora
subsam
pleoftrees
DBH
CO2
Meters
Entity
Entry
BiomassCarbonStock
Changes
RoottoShoot
Ratio
R:S
CO2
Ratio
Default
Entry
Westetal.
(2010)
BiomassCarbonStock
Changes
Drymatter
contentof
harvestedcrop
biom
assorforage
DM
CO2
Dimensionless
Entity
Entry
BiomassCarbonStock
Changes
HarvestIndex
HI
CO2
Fraction
Default
Entry
Westetal.
(2010)
BiomassCarbonStock
Changes
Cropharvestor
forageyield,
correctedfor
moisturecontent
Y dm
CO2
Metrictons
biom
assha
‐1
Entity
Entry
BiomassCarbonStock
Changes
Approximate
fractionof
calendaryear
representingthe
grow
ingseason
Y f
CO2
Fraction
Entity
Entry
BiomassCarbonStock
Changes
Carbonfractionof
aboveground
biom
ass
CCO
2Fraction
Default
Entry
0.45
Normal
11.0
11.0
IPCC(1997)
CO2fromLiming
Annualapplication
oflime
M
CO2
Metrictons/
year
Entity
Entry
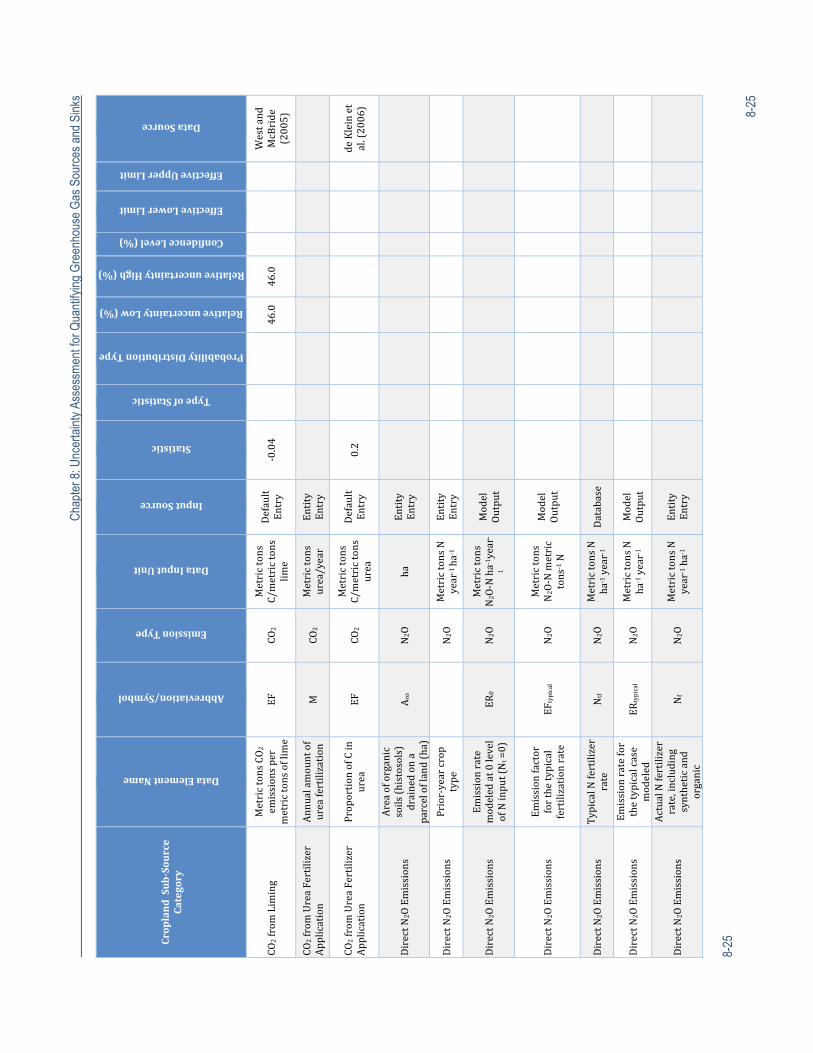
C
hapt
er 8
: Unc
erta
inty
Ass
essm
ent f
or Q
uant
ifyin
g G
reen
hous
e G
as S
ourc
es a
nd S
inks
8-25
8-25
CroplandSub‐Source
Category
DataElementName
Abbreviation/Symbol
EmissionType
DataInputUnit
InputSource
Statistic
TypeofStatistic
ProbabilityDistributionType
RelativeuncertaintyLow(%)
RelativeuncertaintyHigh(%)
ConfidenceLevel(%)
EffectiveLowerLimit
EffectiveUpperLimit
DataSource
CO2fromLiming
MetrictonsCO2
emissionsper
metrictonsoflime
EF
CO2
Metrictons
C/metrictons
lime
Default
Entry
‐0.04
46.0
46.0
Westand
McBride
(2005)
CO2fromUreaFertilizer
Application
Annualamountof
ureafertilization
M
CO2
Metrictons
urea/year
Entity
Entry
CO2fromUreaFertilizer
Application
ProportionofCin
urea
EF
CO2
Metrictons
C/metrictons
urea
Default
Entry
0.2
deKleinet
al.(2006)
DirectN
2OEmissions
Areaoforganic
soils(histosols)
drainedona
parcelofland(ha)
Aos
N2O
ha
Entity
Entry
DirectN
2OEmissions
Prior‐yearcrop
type
N2O
MetrictonsN
year
‐1 ha‐1
Entity
Entry
DirectN
2OEmissions
Emissionrate
modeledat0level
ofNinput(Nt=0)
ER0
N2O
Metrictons
N2O‐Nha‐1 year‐
1
Model
Output
DirectN
2OEmissions
Emissionfactor
forthetypical
fertilizationrate
EFtypical
N2O
Metrictons
N2O‐Nmetric
tons
‐1N
Model
Output
DirectN
2OEmissions
TypicalNfertilizer
rate
Ntf
N2O
MetrictonsN
ha‐1year‐1
Database
DirectN
2OEmissions
Emissionratefor
thetypicalcase
modeled
ERtypical
N2O
MetrictonsN
ha‐1year‐1
Model
Output
DirectN
2OEmissions
ActualNfertilizer
rate,including
syntheticand
organic
Nf
N2O
MetrictonsN
year
‐1ha‐1
Entity
Entry
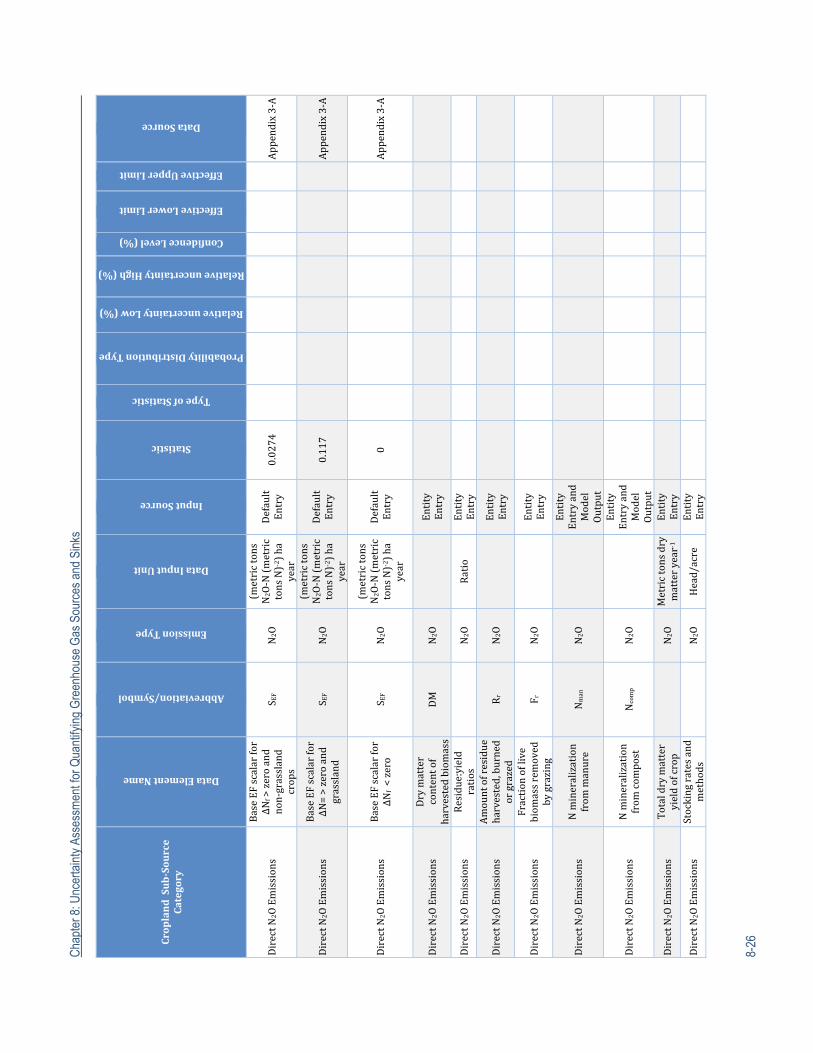
Cha
pter
8: U
ncer
tain
ty A
sses
smen
t for
Qua
ntify
ing
Gre
enho
use
Gas
Sou
rces
and
Sin
ks
8-26
CroplandSub‐Source
Category
DataElementName
Abbreviation/Symbol
EmissionType
DataInputUnit
InputSource
Statistic
TypeofStatistic
ProbabilityDistributionType
RelativeuncertaintyLow(%)
RelativeuncertaintyHigh(%)
ConfidenceLevel(%)
EffectiveLowerLimit
EffectiveUpperLimit
DataSource
DirectN
2OEmissions
BaseEFscalarfor
ΔNf>zeroand
non‐grassland
crops
S EF
N2O
(metrictons
N2O‐N(metric
tonsN)‐2 )ha
year
Default
Entry
0.0274
Appendix3‐A
DirectN
2OEmissions
BaseEFscalarfor
ΔN=>zeroand
grassland
S EF
N2O
(metrictons
N2O‐N(metric
tonsN)‐2 )ha
year
Default
Entry
0.117
Appendix3‐A
DirectN
2OEmissions
BaseEFscalarfor
ΔNf<zero
S EF
N2O
(metrictons
N2O‐N(metric
tonsN)‐2 )ha
year
Default
Entry
0
Appendix3‐A
DirectN
2OEmissions
Drymatter
contentof
harvestedbiom
ass
DM
N2O
Entity
Entry
DirectN
2OEmissions
Residue:yield
ratios
N2O
Ratio
Entity
Entry
DirectN
2OEmissions
Amountofresidue
harvested,burned
orgrazed
Rr
N2O
Entity
Entry
DirectN
2OEmissions
Fractionoflive
biom
assremoved
bygrazing
F r
N2O
Entity
Entry
DirectN
2OEmissions
Nmineralization
from
manure
Nman
N2O
Entity
Entryand
Model
Output
DirectN
2OEmissions
Nmineralization
from
com
post
Ncomp
N2O
Entity
Entryand
Model
Output
DirectN
2OEmissions
Totaldrymatter
yieldofcrop
N2O
Metrictonsdry
matteryear
‐1
Entity
Entry
DirectN
2OEmissions
Stockingratesand
methods
N2O
Head/acre
Entity
Entry
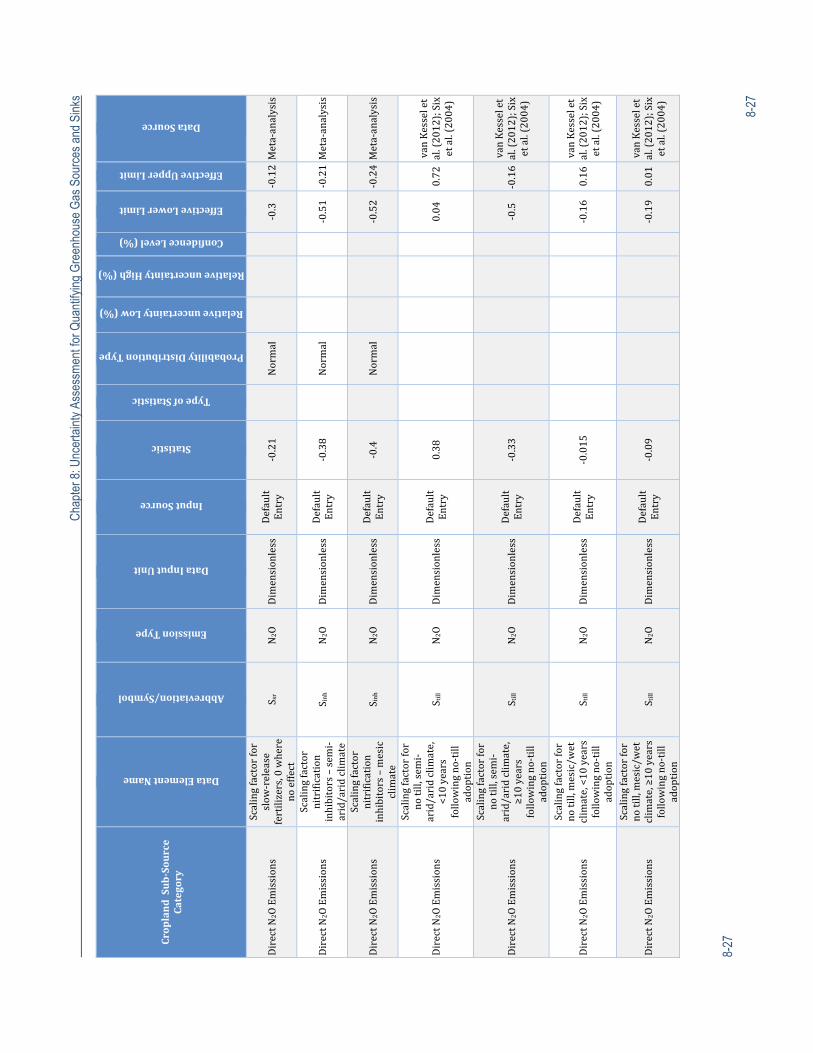
C
hapt
er 8
: Unc
erta
inty
Ass
essm
ent f
or Q
uant
ifyin
g G
reen
hous
e G
as S
ourc
es a
nd S
inks
8-27
8-27
CroplandSub‐Source
Category
DataElementName
Abbreviation/Symbol
EmissionType
DataInputUnit
InputSource
Statistic
TypeofStatistic
ProbabilityDistributionType
RelativeuncertaintyLow(%)
RelativeuncertaintyHigh(%)
ConfidenceLevel(%)
EffectiveLowerLimit
EffectiveUpperLimit
DataSource
DirectN
2OEmissions
Scalingfactorfor
slow
‐release
fertilizers,0where
noeffect
S sr
N2O
Dimensionless
Default
Entry
‐0.21
Normal
‐0.3
‐0.12Meta‐analysis
DirectN
2OEmissions
Scalingfactor
nitrification
inhibitors–sem
i‐arid/aridclimate
S inh
N2O
Dimensionless
Default
Entry
‐0.38
Normal
‐0.51
‐0.21Meta‐analysis
DirectN
2OEmissions
Scalingfactor
nitrification
inhibitors–mesic
climate
S inh
N2O
Dimensionless
Default
Entry
‐0.4
Normal
‐0.52
‐0.24Meta‐analysis
DirectN
2OEmissions
Scalingfactorfor
notill,sem
i‐arid/aridclimate,
<10years
followingno‐till
adoption
S till
N2O
Dimensionless
Default
Entry
0.38
0.04
0.72
vanKesselet
al.(2012);Six
etal.(2004)
DirectN
2OEmissions
Scalingfactorfor
notill,sem
i‐arid/aridclimate,
≥10years
followingno‐till
adoption
S till
N2O
Dimensionless
Default
Entry
‐0.33
‐0.5
‐0.16
vanKesselet
al.(2012);Six
etal.(2004)
DirectN
2OEmissions
Scalingfactorfor
notill,mesic/w
et
climate,<10years
followingno‐till
adoption
S till
N2O
Dimensionless
Default
Entry
‐0.015
‐0.16
0.16
vanKesselet
al.(2012);Six
etal.(2004)
DirectN
2OEmissions
Scalingfactorfor
notill,mesic/w
et
climate,≥10years
followingno‐till
adoption
S till
N2O
Dimensionless
Default
Entry
‐0.09
‐0.19
0.01
vanKesselet
al.(2012);Six
etal.(2004)
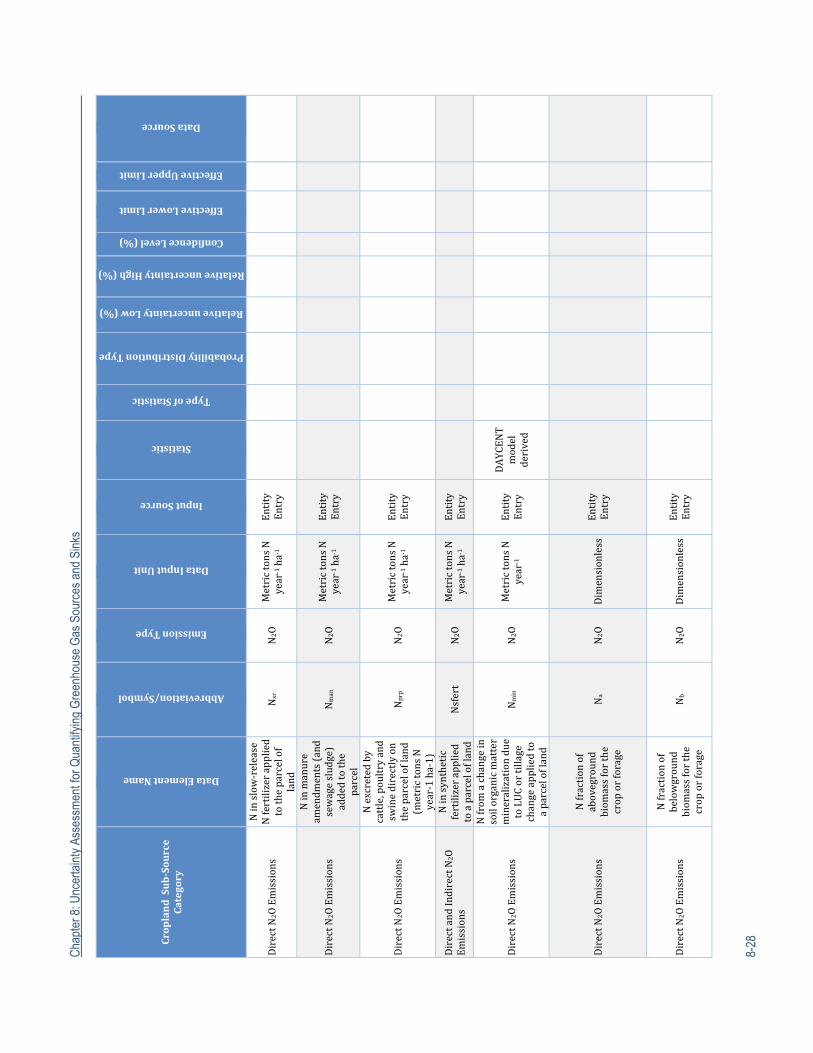
Cha
pter
8: U
ncer
tain
ty A
sses
smen
t for
Qua
ntify
ing
Gre
enho
use
Gas
Sou
rces
and
Sin
ks
8-28
CroplandSub‐Source
Category
DataElementName
Abbreviation/Symbol
EmissionType
DataInputUnit
InputSource
Statistic
TypeofStatistic
ProbabilityDistributionType
RelativeuncertaintyLow(%)
RelativeuncertaintyHigh(%)
ConfidenceLevel(%)
EffectiveLowerLimit
EffectiveUpperLimit
DataSource
DirectN
2OEmissions
Ninslow‐release
Nfertilizerapplied
totheparcelof
land
Nsr
N2O
MetrictonsN
year
‐1ha‐1
Entity
Entry
DirectN
2OEmissions
Ninmanure
amendm
ents(and
sewagesludge)
addedtothe
parcel
Nman
N2O
MetrictonsN
year
‐1ha‐1
Entity
Entry
DirectN
2OEmissions
Nexcretedby
cattle,poultryand
swinedirectlyon
theparcelofland
(metrictonsN
year‐1ha‐1)
Nprp
N2O
MetrictonsN
year
‐1ha‐1
Entity
Entry
DirectandIndirectN
2O
Emissions
Ninsynthetic
fertilizerapplied
toaparcelofland
Nsfert
N2O
MetrictonsN
year
‐1ha‐1
Entity
Entry
DirectN
2OEmissions
Nfrom
achangein
soilorganicmatter
mineralizationdue
toLUCortillage
changeappliedto
aparcelofland
Nmin
N2O
MetrictonsN
year
‐1
Entity
Entry
DAYCEN
T
model
derived
DirectN
2OEmissions
Nfractionof
aboveground
biom
assforthe
croporforage
Na
N2O
Dimensionless
Entity
Entry
DirectN
2OEmissions
Nfractionof
belowground
biom
assforthe
croporforage
Nb
N2O
Dimensionless
Entity
Entry
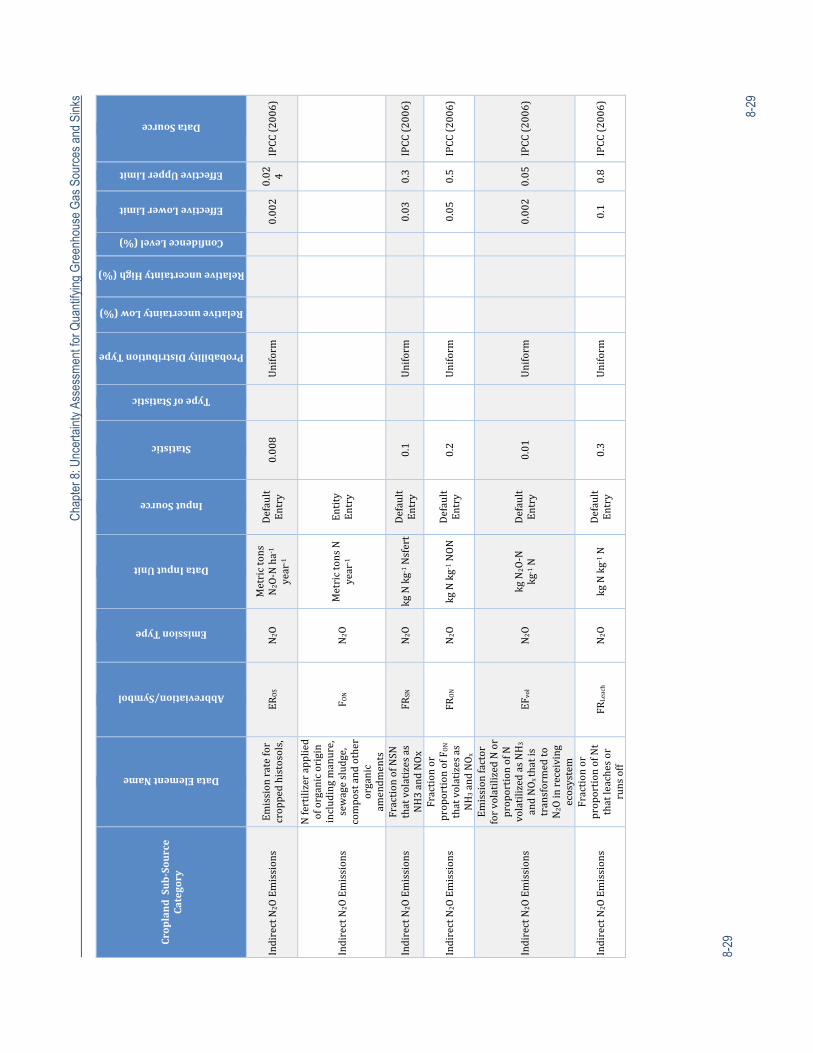
C
hapt
er 8
: Unc
erta
inty
Ass
essm
ent f
or Q
uant
ifyin
g G
reen
hous
e G
as S
ourc
es a
nd S
inks
8-29
8-29
CroplandSub‐Source
Category
DataElementName
Abbreviation/Symbol
EmissionType
DataInputUnit
InputSource
Statistic
TypeofStatistic
ProbabilityDistributionType
RelativeuncertaintyLow(%)
RelativeuncertaintyHigh(%)
ConfidenceLevel(%)
EffectiveLowerLimit
EffectiveUpperLimit
DataSource
IndirectN
2OEmissions
Emissionratefor
croppedhistosols,
EROS
N2O
Metrictons
N2O‐Nha‐1
year
‐1
Default
Entry
0.008
Uniform
0.002
0.02 4
IPCC(2006)
IndirectN
2OEmissions
Nfertilizerapplied
oforganicorigin
includingmanure,
sewagesludge,
compostandother
organic
amendm
ents
F ON
N2O
MetrictonsN
year
‐1
Entity
Entry
IndirectN
2OEmissions
FractionofNSN
thatvolatizesas
NH3andNOx
FRSN
N2O
kgNkg‐1 N
sfert
Default
Entry
0.1
Uniform
0.03
0.3
IPCC(2006)
IndirectN
2OEmissions
Fractionor
proportionofF
ON
thatvolatizesas
NH3andNOx
FRON
N2O
kgNkg‐1 N
ON
Default
Entry
0.2
Uniform
0.05
0.5
IPCC(2006)
IndirectN
2OEmissions
Emissionfactor
forvolatilizedNor
proportionofN
volatilizedasNH3
andNOxthatis
transformedto
N2Oinreceiving
ecosystem
EFvol
N2O
kgN
2O‐N
kg‐1N
Default
Entry
0.01
Uniform
0.002
0.05
IPCC(2006)
IndirectN
2OEmissions
Fractionor
proportionofNt
thatleachesor
runsoff
FRLeach
N2O
kgNkg‐1 N
Default
Entry
0.3
Uniform
0.1
0.8
IPCC(2006)
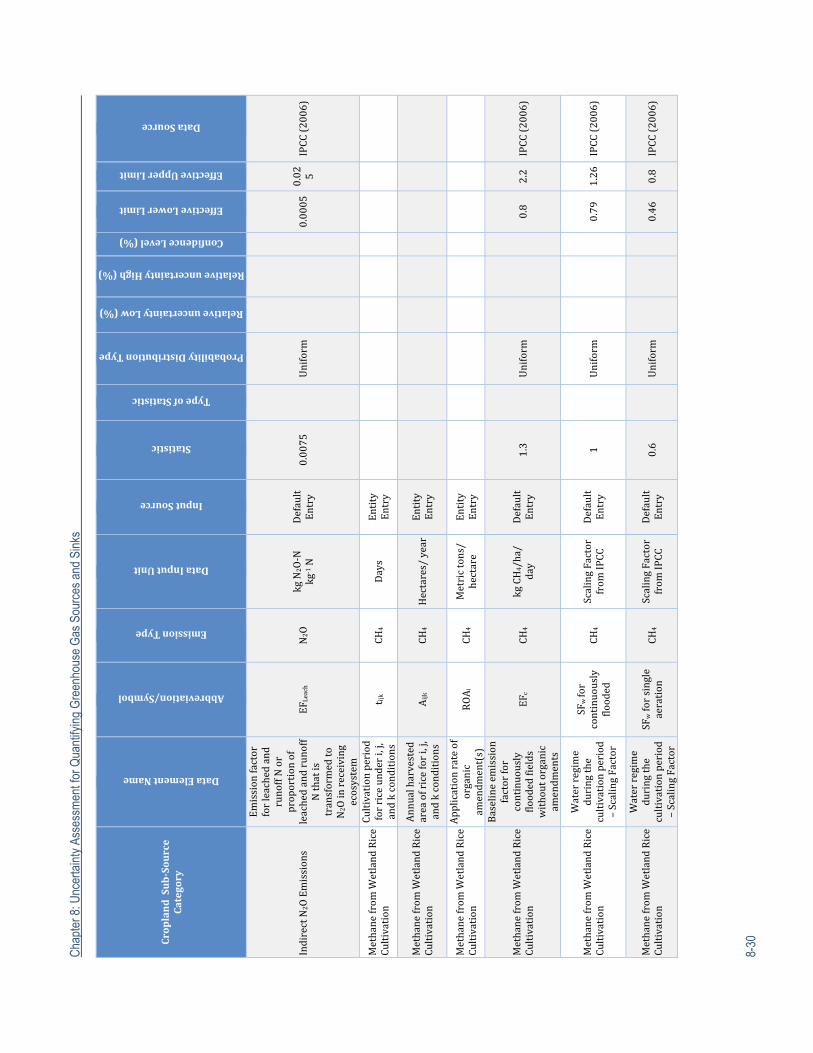
Cha
pter
8: U
ncer
tain
ty A
sses
smen
t for
Qua
ntify
ing
Gre
enho
use
Gas
Sou
rces
and
Sin
ks
8-30
CroplandSub‐Source
Category
DataElementName
Abbreviation/Symbol
EmissionType
DataInputUnit
InputSource
Statistic
TypeofStatistic
ProbabilityDistributionType
RelativeuncertaintyLow(%)
RelativeuncertaintyHigh(%)
ConfidenceLevel(%)
EffectiveLowerLimit
EffectiveUpperLimit
DataSource
IndirectN
2OEmissions
Emissionfactor
forleachedand
runoffNor
proportionof
leachedandrunoff
Nthatis
transformedto
N2Oinreceiving
ecosystem
EFLeach
N2O
kgN
2O‐N
kg‐1N
Default
Entry
0.0075
Uniform
0.0005
0.02 5
IPCC(2006)
Methanefrom
WetlandRice
Cultivation
Cultivationperiod
forriceunderi,j,
andkconditions
t ijk
CH4
Days
Entity
Entry
Methanefrom
WetlandRice
Cultivation
Annualharvested
areaofricefori,j,
andkconditions
Aijk
CH4
Hectares/year
Entity
Entry
Methanefrom
WetlandRice
Cultivation
Applicationrateof
organic
amendm
ent(s)
ROAi
CH4
Metrictons/
hectare
Entity
Entry
Methanefrom
WetlandRice
Cultivation
Baselineem
ission
factorfor
continuously
floodedfields
withoutorganic
amendm
ents
EFc
CH4
kgCH4/ha/
day
Default
Entry
1.3
Uniform
0.8
2.2
IPCC(2006)
Methanefrom
WetlandRice
Cultivation
Waterregime
duringthe
cultivationperiod
–ScalingFactor
SFwfor
continuously
flooded
CH4
ScalingFactor
from
IPCC
Default
Entry
1
Uniform
0.79
1.26
IPCC(2006)
Methanefrom
WetlandRice
Cultivation
Waterregime
duringthe
cultivationperiod
–ScalingFactor
SFwforsingle
aeration
CH4
ScalingFactor
from
IPCC
Default
Entry
0.6
Uniform
0.46
0.8
IPCC(2006)
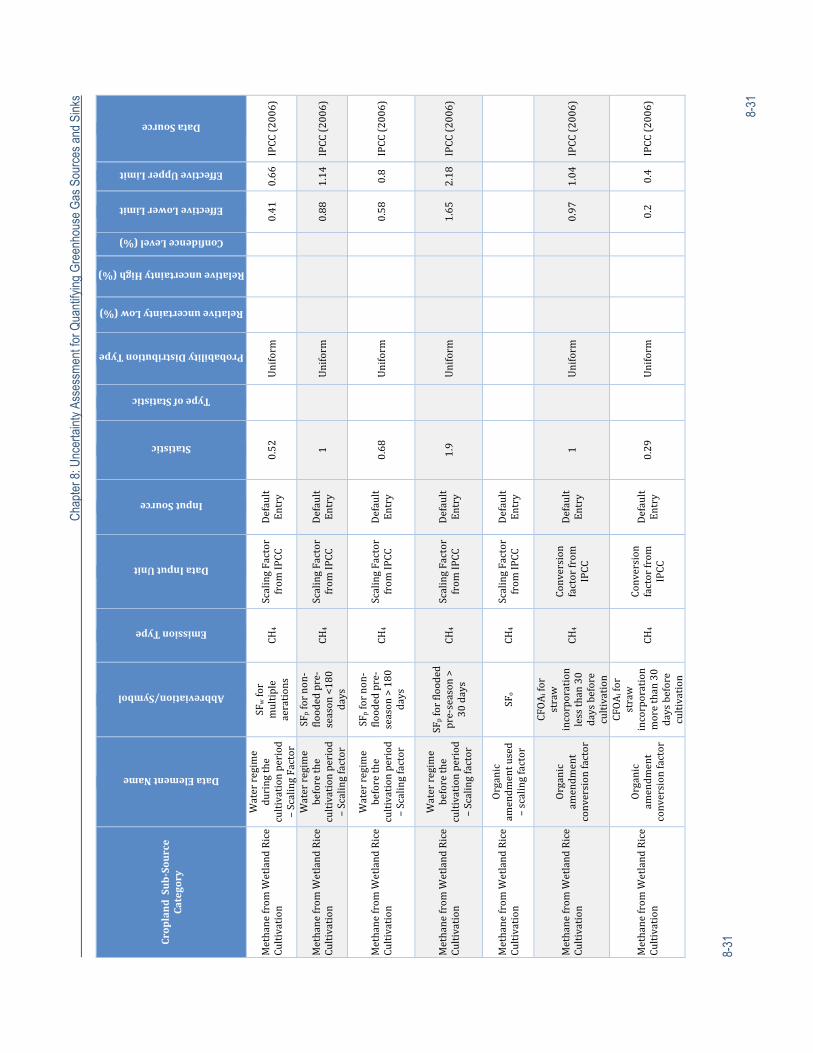
C
hapt
er 8
: Unc
erta
inty
Ass
essm
ent f
or Q
uant
ifyin
g G
reen
hous
e G
as S
ourc
es a
nd S
inks
8-31
8-31
CroplandSub‐Source
Category
DataElementName
Abbreviation/Symbol
EmissionType
DataInputUnit
InputSource
Statistic
TypeofStatistic
ProbabilityDistributionType
RelativeuncertaintyLow(%)
RelativeuncertaintyHigh(%)
ConfidenceLevel(%)
EffectiveLowerLimit
EffectiveUpperLimit
DataSource
Methanefrom
WetlandRice
Cultivation
Waterregime
duringthe
cultivationperiod
–ScalingFactor
SFwfor
multiple
aerations
CH4
ScalingFactor
from
IPCC
Default
Entry
0.52
Uniform
0.41
0.66
IPCC(2006)
Methanefrom
WetlandRice
Cultivation
Waterregime
beforethe
cultivationperiod
–Scalingfactor
SFpfornon‐
floodedpre‐
season<180
days
CH4
ScalingFactor
from
IPCC
Default
Entry
1
Uniform
0.88
1.14
IPCC(2006)
Methanefrom
WetlandRice
Cultivation
Waterregime
beforethe
cultivationperiod
–Scalingfactor
SFpfornon‐
floodedpre‐
season>180
days
CH4
ScalingFactor
from
IPCC
Default
Entry
0.68
Uniform
0.58
0.8
IPCC(2006)
Methanefrom
WetlandRice
Cultivation
Waterregime
beforethe
cultivationperiod
–Scalingfactor
SFpforflooded
pre‐season>
30days
CH4
ScalingFactor
from
IPCC
Default
Entry
1.9
Uniform
1.65
2.18
IPCC(2006)
Methanefrom
WetlandRice
Cultivation
Organic
amendm
entused
–scalingfactor
SFo
CH4
ScalingFactor
from
IPCC
Default
Entry
Methanefrom
WetlandRice
Cultivation
Organic
amendm
ent
conversionfactor
CFOAifor
straw
incorporation
lessthan30
daysbefore
cultivation
CH4
Conversion
factorfrom
IPCC
Default
Entry
1
Uniform
0.97
1.04
IPCC(2006)
Methanefrom
WetlandRice
Cultivation
Organic
amendm
ent
conversionfactor
CFOAifor
straw
incorporation
morethan30
daysbefore
cultivation
CH4
Conversion
factorfrom
IPCC
Default
Entry
0.29
Uniform
0.2
0.4
IPCC(2006)
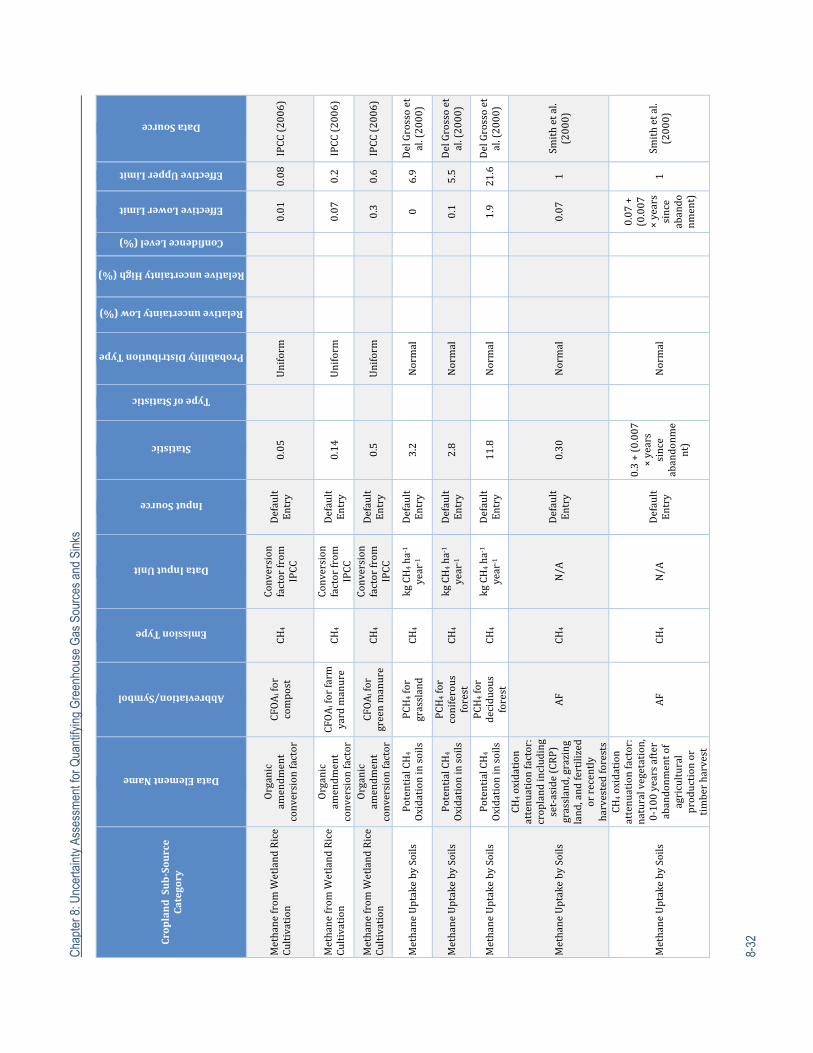
Cha
pter
8: U
ncer
tain
ty A
sses
smen
t for
Qua
ntify
ing
Gre
enho
use
Gas
Sou
rces
and
Sin
ks
8-32
CroplandSub‐Source
Category
DataElementName
Abbreviation/Symbol
EmissionType
DataInputUnit
InputSource
Statistic
TypeofStatistic
ProbabilityDistributionType
RelativeuncertaintyLow(%)
RelativeuncertaintyHigh(%)
ConfidenceLevel(%)
EffectiveLowerLimit
EffectiveUpperLimit
DataSource
Methanefrom
WetlandRice
Cultivation
Organic
amendm
ent
conversionfactor
CFOAifor
compost
CH4
Conversion
factorfrom
IPCC
Default
Entry
0.05
Uniform
0.01
0.08
IPCC(2006)
Methanefrom
WetlandRice
Cultivation
Organic
amendm
ent
conversionfactor
CFOAiforfarm
yardmanure
CH4
Conversion
factorfrom
IPCC
Default
Entry
0.14
Uniform
0.07
0.2
IPCC(2006)
Methanefrom
WetlandRice
Cultivation
Organic
amendm
ent
conversionfactor
CFOAifor
greenmanure
CH4
Conversion
factorfrom
IPCC
Default
Entry
0.5
Uniform
0.3
0.6
IPCC(2006)
MethaneUptakebySoils
PotentialCH4
Oxidationinsoils
PCH4for
grassland
CH4
kgCH4ha‐1
year
‐1
Default
Entry
3.2
Normal
0
6.9
DelGrossoet
al.(2000)
MethaneUptakebySoils
PotentialCH4
Oxidationinsoils
PCH4for
coniferous
forest
CH4
kgCH4ha‐1
year
‐1
Default
Entry
2.8
Normal
0.1
5.5
DelGrossoet
al.(2000)
MethaneUptakebySoils
PotentialCH4
Oxidationinsoils
PCH4for
deciduous
forest
CH4
kgCH4ha‐1
year
‐1
Default
Entry
11.8
Normal
1.9
21.6
DelGrossoet
al.(2000)
MethaneUptakebySoils
CH4oxidation
attenuationfactor:
croplandincluding
set‐aside(CRP)
grassland,grazing
land,andfertilized
orrecently
harvestedforests
AF
CH4
N/A
Default
Entry
0.30
Normal
0.07
1Sm
ithetal.
(2000)
MethaneUptakebySoils
CH4oxidation
attenuationfactor:
naturalvegetation,
0‐100yearsafter
abandonm
entof
agricultural
productionor
timberharvest
AF
CH4
N/A
Default
Entry
0.3+(0.007
×years
since
abandonm
ent)
Normal
0.07+
(0.007
×years
since
abando
nment)
1Sm
ithetal.
(2000)
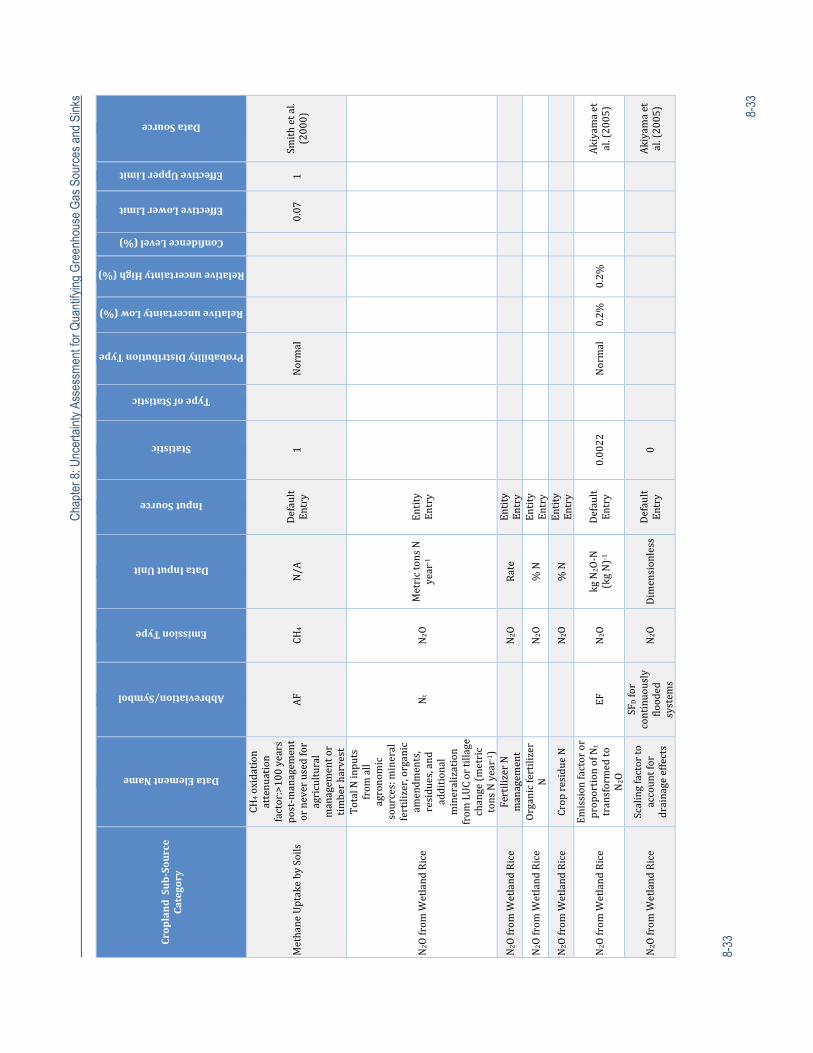
C
hapt
er 8
: Unc
erta
inty
Ass
essm
ent f
or Q
uant
ifyin
g G
reen
hous
e G
as S
ourc
es a
nd S
inks
8-33
8-33
CroplandSub‐Source
Category
DataElementName
Abbreviation/Symbol
EmissionType
DataInputUnit
InputSource
Statistic
TypeofStatistic
ProbabilityDistributionType
RelativeuncertaintyLow(%)
RelativeuncertaintyHigh(%)
ConfidenceLevel(%)
EffectiveLowerLimit
EffectiveUpperLimit
DataSource
MethaneUptakebySoils
CH4oxidation
attenuation
factor:>100years
post‐managem
ent
orneverusedfor
agricultural
managem
entor
timberharvest
AF
CH4
N/A
Default
Entry
1
Normal
0.07
1Sm
ithetal.
(2000)
N2Ofrom
WetlandRice
TotalNinputs
from
all
agronomic
sources:mineral
fertilizer,organic
amendm
ents,
residues,and
additional
mineralization
from
LUCortillage
change(metric
tonsNyear‐1 )
Nt
N2O
MetrictonsN
year
‐1
Entity
Entry
N2Ofrom
WetlandRice
FertilizerN
managem
ent
N2O
Rate
Entity
Entry
N2Ofrom
WetlandRice
Organicfertilizer
N
N2O
%N
Entity
Entry
N2Ofrom
WetlandRice
CropresidueN
N2O
%N
Entity
Entry
N2Ofrom
WetlandRice
Emissionfactoror
proportionofN
ttransformedto
N2O
EF
N2O
kgN
2O‐N
(kgN)‐1
Default
Entry
0.0022
Normal
0.2%
0.2%
Akiyamaet
al.(2005)
N2Ofrom
WetlandRice
Scalingfactorto
accountfor
drainageeffects
SFDfor
continuously
flooded
system
s
N2O
Dimensionless
Default
Entry
0
Akiyamaet
al.(2005)
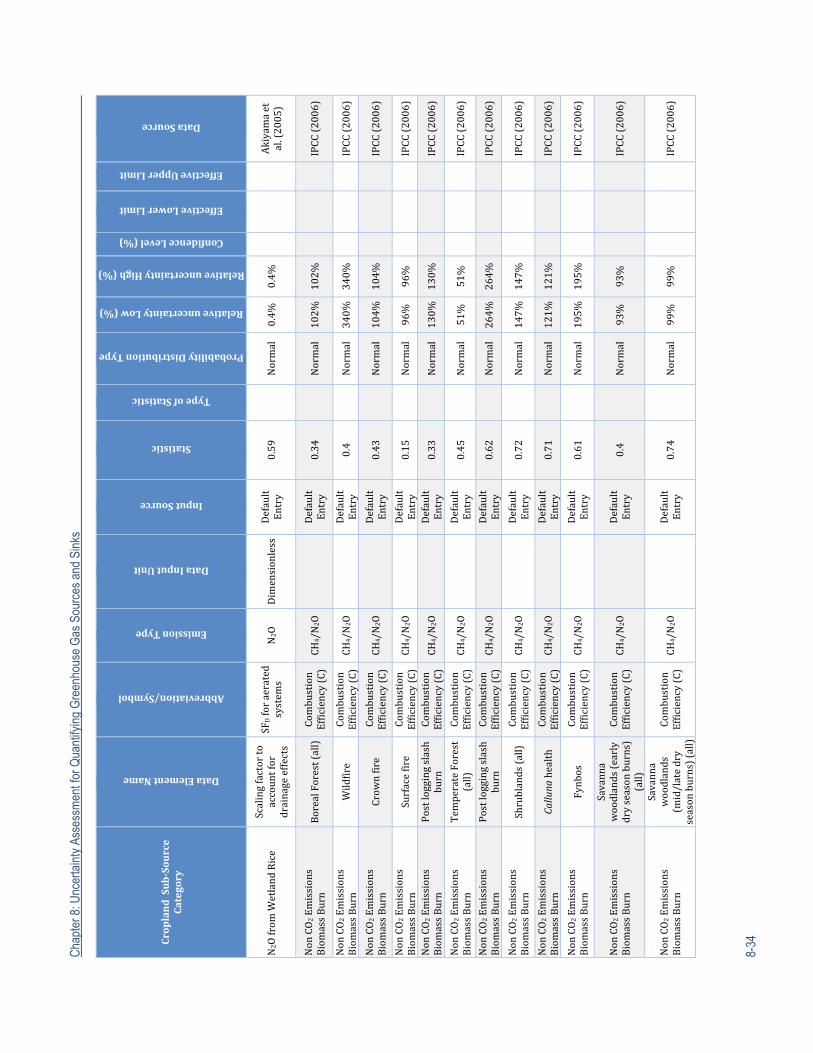
Cha
pter
8: U
ncer
tain
ty A
sses
smen
t for
Qua
ntify
ing
Gre
enho
use
Gas
Sou
rces
and
Sin
ks
8-34
CroplandSub‐Source
Category
DataElementName
Abbreviation/Symbol
EmissionType
DataInputUnit
InputSource
Statistic
TypeofStatistic
ProbabilityDistributionType
RelativeuncertaintyLow(%)
RelativeuncertaintyHigh(%)
ConfidenceLevel(%)
EffectiveLowerLimit
EffectiveUpperLimit
DataSource
N2Ofrom
WetlandRice
Scalingfactorto
accountfor
drainageeffects
SFDforaerated
system
sN2O
Dimensionless
Default
Entry
0.59
Normal
0.4%
0.4%
Akiyamaet
al.(2005)
NonCO2Emissions
BiomassBurn
BorealForest(all)
Combustion
Efficiency(C)
CH4/N2O
Default
Entry
0.34
Normal102%
102%
IPCC(2006)
NonCO2Emissions
BiomassBurn
Wildfire
Combustion
Efficiency(C)
CH4/N2O
Default
Entry
0.4
Normal340%
340%
IPCC(2006)
NonCO2Emissions
BiomassBurn
Crow
nfire
Combustion
Efficiency(C)
CH4/N2O
Default
Entry
0.43
Normal104%
104%
IPCC(2006)
NonCO2Emissions
BiomassBurn
Surfacefire
Combustion
Efficiency(C)
CH4/N2O
Default
Entry
0.15
Normal
96%
96%
IPCC(2006)
NonCO2Emissions
BiomassBurn
Postloggingslash
burn
Combustion
Efficiency(C)
CH4/N2O
Default
Entry
0.33
Normal130%
130%
IPCC(2006)
NonCO2Emissions
BiomassBurn
Tem
perateForest
(all)
Combustion
Efficiency(C)
CH4/N2O
Default
Entry
0.45
Normal
51%
51%
IPCC(2006)
NonCO2Emissions
BiomassBurn
Postloggingslash
burn
Combustion
Efficiency(C)
CH4/N2O
Default
Entry
0.62
Normal264%
264%
IPCC(2006)
NonCO2Emissions
BiomassBurn
Shrublands(all)
Combustion
Efficiency(C)
CH4/N2O
Default
Entry
0.72
Normal147%
147%
IPCC(2006)
NonCO2Emissions
BiomassBurn
Callunahealth
Combustion
Efficiency(C)
CH4/N2O
Default
Entry
0.71
Normal121%
121%
IPCC(2006)
NonCO2Emissions
BiomassBurn
Fynbos
Combustion
Efficiency(C)
CH4/N2O
Default
Entry
0.61
Normal195%
195%
IPCC(2006)
NonCO2Emissions
BiomassBurn
Savanna
woodlands(early
dryseasonburns)
(all)
Combustion
Efficiency(C)
CH4/N2O
Default
Entry
0.4
Normal
93%
93%
IPCC(2006)
NonCO2Emissions
BiomassBurn
Savanna
woodlands
(mid/latedry
seasonburns)(all)
Combustion
Efficiency(C)
CH4/N2O
Default
Entry
0.74
Normal
99%
99%
IPCC(2006)
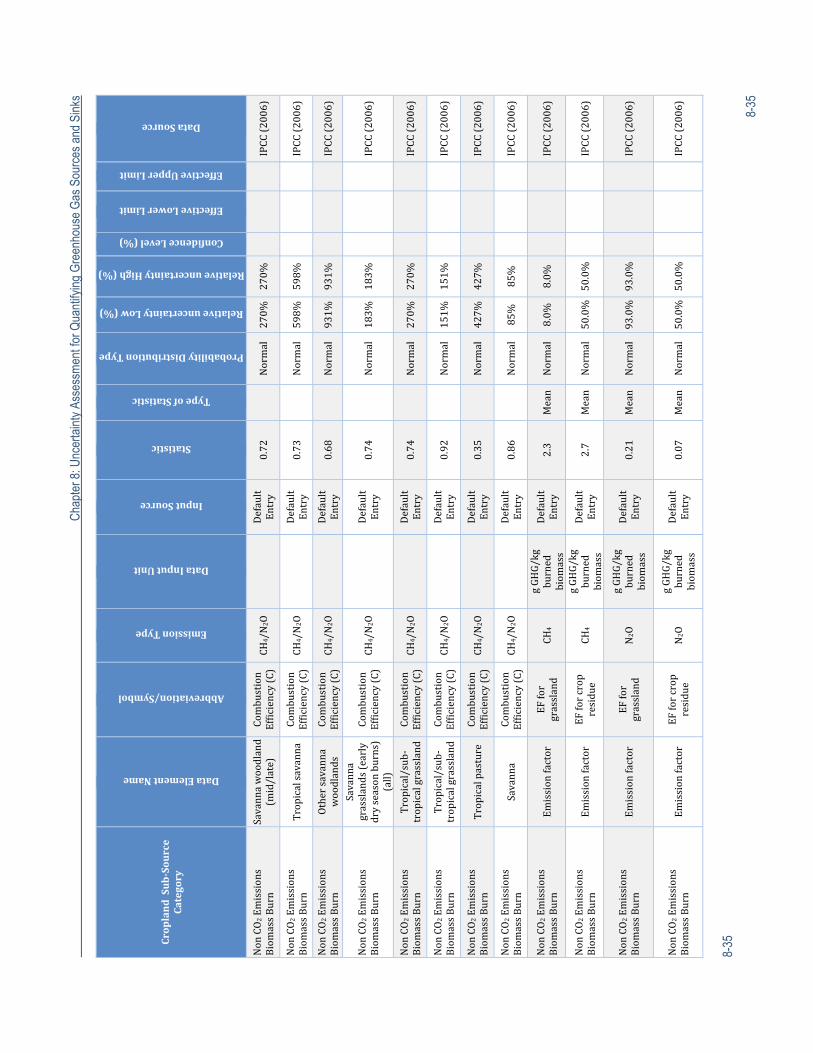
C
hapt
er 8
: Unc
erta
inty
Ass
essm
ent f
or Q
uant
ifyin
g G
reen
hous
e G
as S
ourc
es a
nd S
inks
8-35
8-35
CroplandSub‐Source
Category
DataElementName
Abbreviation/Symbol
EmissionType
DataInputUnit
InputSource
Statistic
TypeofStatistic
ProbabilityDistributionType
RelativeuncertaintyLow(%)
RelativeuncertaintyHigh(%)
ConfidenceLevel(%)
EffectiveLowerLimit
EffectiveUpperLimit
DataSource
NonCO2Emissions
BiomassBurn
Savannawoodland
(mid/late)
Combustion
Efficiency(C)
CH4/N2O
Default
Entry
0.72
Normal270%
270%
IPCC(2006)
NonCO2Emissions
BiomassBurn
Tropicalsavanna
Combustion
Efficiency(C)
CH4/N2O
Default
Entry
0.73
Normal598%
598%
IPCC(2006)
NonCO2Emissions
BiomassBurn
Othersavanna
woodlands
Combustion
Efficiency(C)
CH4/N2O
Default
Entry
0.68
Normal931%
931%
IPCC(2006)
NonCO2Emissions
BiomassBurn
Savanna
grasslands(early
dryseasonburns)
(all)
Combustion
Efficiency(C)
CH4/N2O
Default
Entry
0.74
Normal183%
183%
IPCC(2006)
NonCO2Emissions
BiomassBurn
Tropical/sub‐
tropicalgrassland
Combustion
Efficiency(C)
CH4/N2O
Default
Entry
0.74
Normal270%
270%
IPCC(2006)
NonCO2Emissions
BiomassBurn
Tropical/sub‐
tropicalgrassland
Combustion
Efficiency(C)
CH4/N2O
Default
Entry
0.92
Normal151%
151%
IPCC(2006)
NonCO2Emissions
BiomassBurn
Tropicalpasture
Combustion
Efficiency(C)
CH4/N2O
Default
Entry
0.35
Normal427%
427%
IPCC(2006)
NonCO2Emissions
BiomassBurn
Savanna
Combustion
Efficiency(C)
CH4/N2O
Default
Entry
0.86
Normal
85%
85%
IPCC(2006)
NonCO2Emissions
BiomassBurn
Emissionfactor
EFfor
grassland
CH4
gGHG/kg
burned
biom
ass
Default
Entry
2.3
Mean
Normal
8.0%
8.0%
IPCC(2006)
NonCO2Emissions
BiomassBurn
Emissionfactor
EFforcrop
residue
CH4
gGHG/kg
burned
biom
ass
Default
Entry
2.7
Mean
Normal50.0%
50.0%
IPCC(2006)
NonCO2Emissions
BiomassBurn
Emissionfactor
EFfor
grassland
N2O
gGHG/kg
burned
biom
ass
Default
Entry
0.21
Mean
Normal93.0%
93.0%
IPCC(2006)
NonCO2Emissions
BiomassBurn
Emissionfactor
EFforcrop
residue
N2O
gGHG/kg
burned
biom
ass
Default
Entry
0.07
Mean
Normal50.0%
50.0%
IPCC(2006)
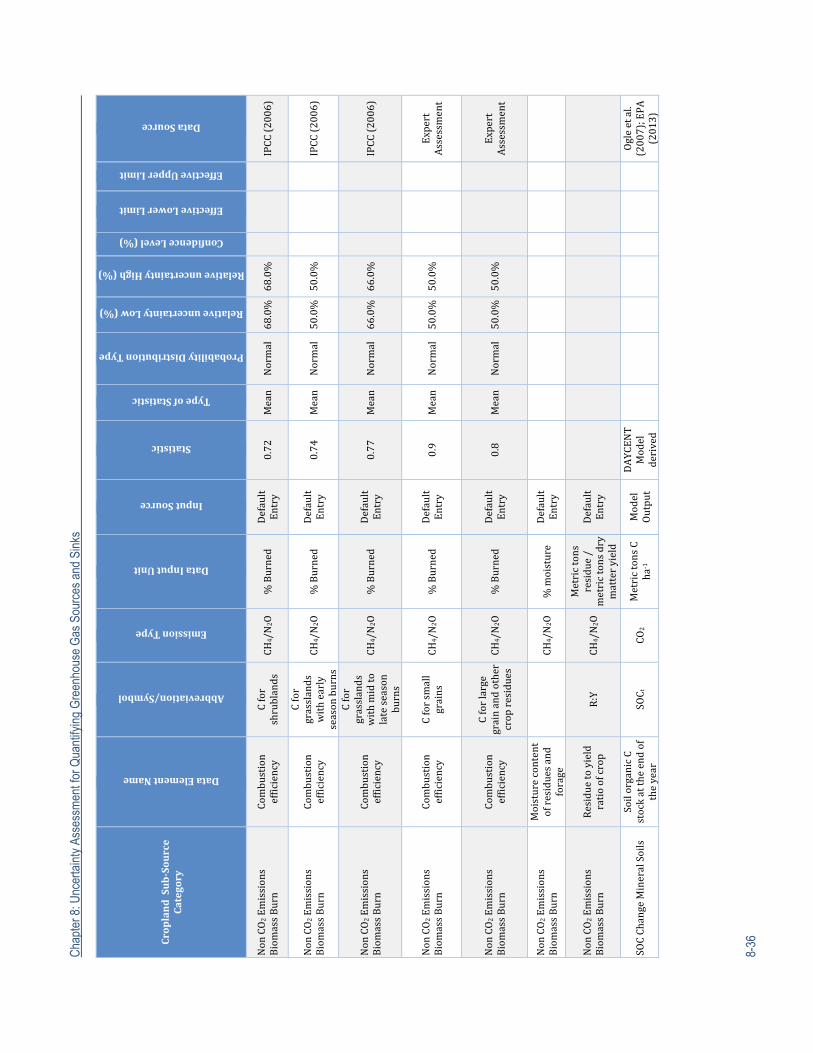
Cha
pter
8: U
ncer
tain
ty A
sses
smen
t for
Qua
ntify
ing
Gre
enho
use
Gas
Sou
rces
and
Sin
ks
8-36
CroplandSub‐Source
Category
DataElementName
Abbreviation/Symbol
EmissionType
DataInputUnit
InputSource
Statistic
TypeofStatistic
ProbabilityDistributionType
RelativeuncertaintyLow(%)
RelativeuncertaintyHigh(%)
ConfidenceLevel(%)
EffectiveLowerLimit
EffectiveUpperLimit
DataSource
NonCO2Emissions
BiomassBurn
Combustion
efficiency
Cfor
shrublands
CH4/N2O
%Burned
Default
Entry
0.72
Mean
Normal68.0%
68.0%
IPCC(2006)
NonCO2Emissions
BiomassBurn
Combustion
efficiency
Cfor
grasslands
withearly
seasonburns
CH4/N2O
%Burned
Default
Entry
0.74
Mean
Normal50.0%
50.0%
IPCC(2006)
NonCO2Emissions
BiomassBurn
Combustion
efficiency
Cfor
grasslands
withmidto
lateseason
burns
CH4/N2O
%Burned
Default
Entry
0.77
Mean
Normal66.0%
66.0%
IPCC(2006)
NonCO2Emissions
BiomassBurn
Combustion
efficiency
Cforsm
all
grains
CH4/N2O
%Burned
Default
Entry
0.9
Mean
Normal50.0%
50.0%
Expert
Assessm
ent
NonCO2Emissions
BiomassBurn
Combustion
efficiency
Cforlarge
grainandother
cropresidues
CH4/N2O
%Burned
Default
Entry
0.8
Mean
Normal50.0%
50.0%
Expert
Assessm
ent
NonCO2Emissions
BiomassBurn
Moisturecontent
ofresiduesand
forage
CH
4/N2O
%moisture
Default
Entry
NonCO2Emissions
BiomassBurn
Residuetoyield
ratioofcrop
R:Y
CH4/N2O
Metrictons
residue/
metrictonsdry
matteryield
Default
Entry
SOCChangeMineralSoils
SoilorganicC
stockattheendof
theyear
SOC t
CO2
MetrictonsC
ha‐1
Model
Output
DAYCEN
T
Model
derived
Ogleetal.
(2007);EPA
(2013)
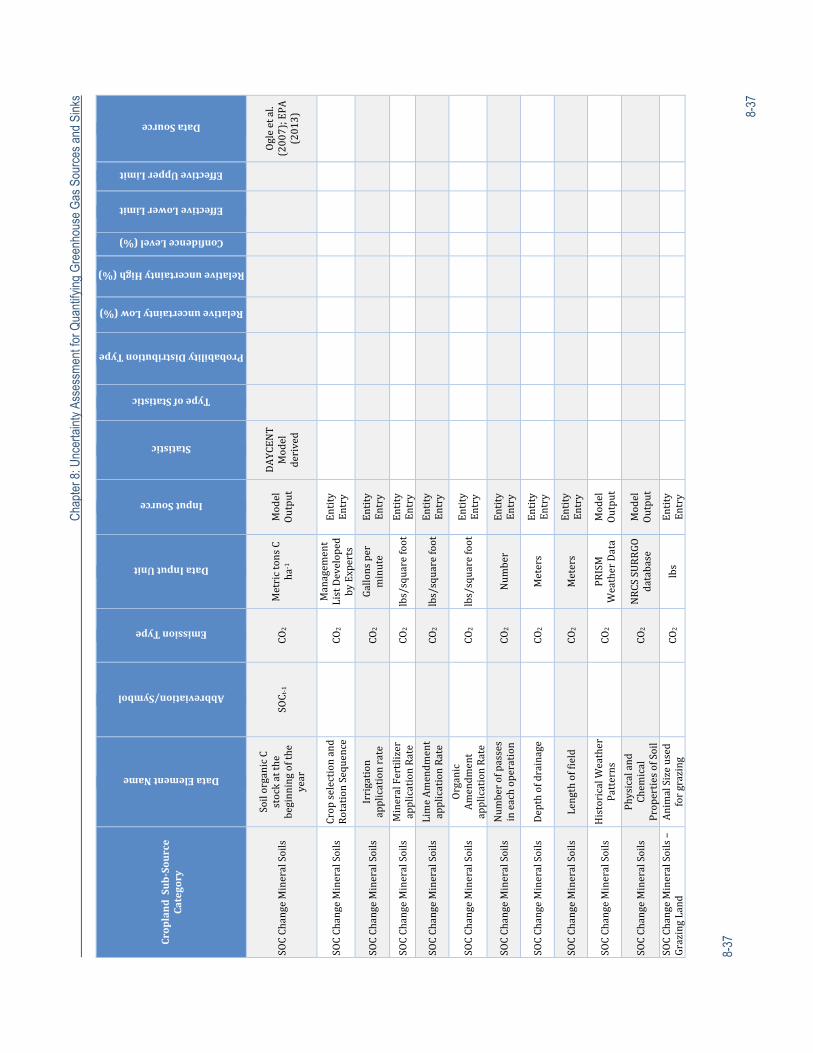
C
hapt
er 8
: Unc
erta
inty
Ass
essm
ent f
or Q
uant
ifyin
g G
reen
hous
e G
as S
ourc
es a
nd S
inks
8-37
8-37
CroplandSub‐Source
Category
DataElementName
Abbreviation/Symbol
EmissionType
DataInputUnit
InputSource
Statistic
TypeofStatistic
ProbabilityDistributionType
RelativeuncertaintyLow(%)
RelativeuncertaintyHigh(%)
ConfidenceLevel(%)
EffectiveLowerLimit
EffectiveUpperLimit
DataSource
SOCChangeMineralSoils
SoilorganicC
stockatthe
beginningofthe
year
SOC t‐1
CO2
MetrictonsC
ha‐1
Model
Output
DAYCEN
T
Model
derived
Ogleetal.
(2007);EPA
(2013)
SOCChangeMineralSoils
Cropselectionand
RotationSequence
CO
2Managem
ent
ListDeveloped
byExperts
Entity
Entry
SOCChangeMineralSoils
Irrigation
applicationrate
CO
2Gallonsper
minute
Entity
Entry
SOCChangeMineralSoils
MineralFertilizer
applicationRate
CO
2lbs/squarefoot
Entity
Entry
SOCChangeMineralSoils
LimeAmendm
ent
applicationRate
CO
2lbs/squarefoot
Entity
Entry
SOCChangeMineralSoils
Organic
Amendm
ent
applicationRate
CO
2lbs/squarefoot
Entity
Entry
SOCChangeMineralSoils
Num
berofpasses
ineachoperation
CO
2Num
ber
Entity
Entry
SOCChangeMineralSoils
Depthofdrainage
CO
2Meters
Entity
Entry
SOCChangeMineralSoils
Lengthoffield
CO
2Meters
Entity
Entry
SOCChangeMineralSoils
HistoricalW
eather
Patterns
CO
2PRISM
WeatherData
Model
Output
SOCChangeMineralSoils
Physicaland
Chem
ical
PropertiesofSoil
CO
2NRCSSURRGO
database
Model
Output
SOCChangeMineralSoils–
GrazingLand
AnimalSizeused
forgrazing
CO
2lbs
Entity
Entry
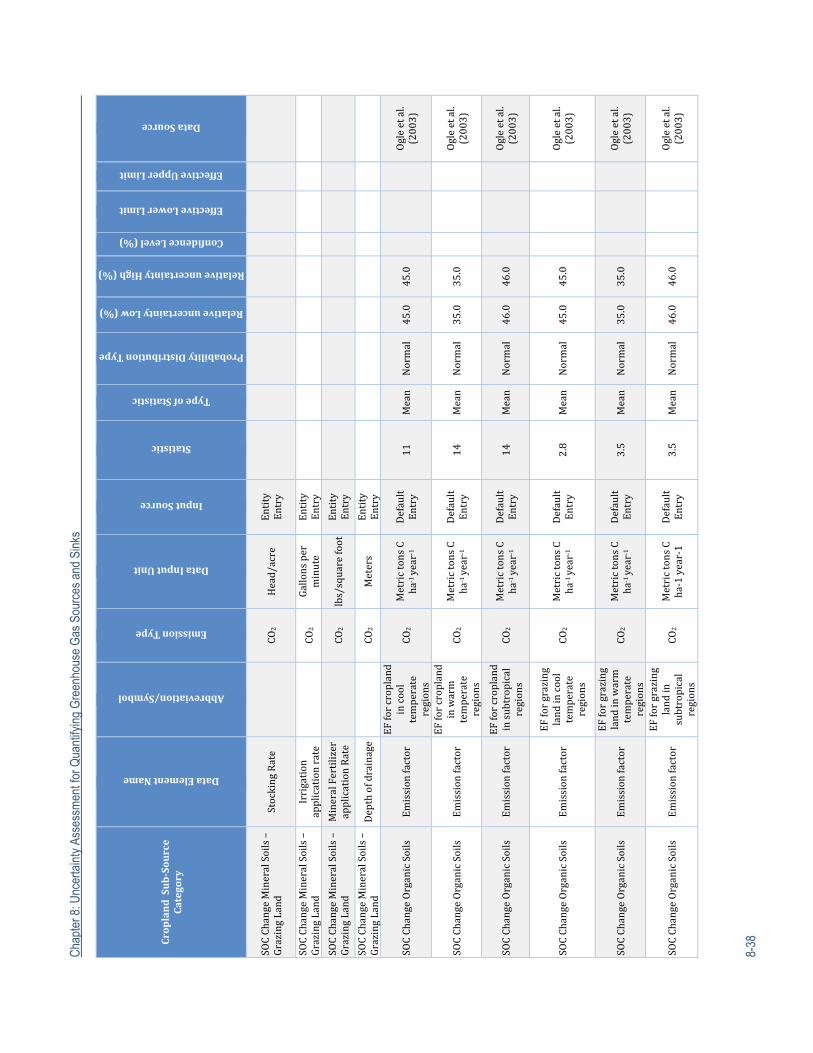
Cha
pter
8: U
ncer
tain
ty A
sses
smen
t for
Qua
ntify
ing
Gre
enho
use
Gas
Sou
rces
and
Sin
ks
8-38
CroplandSub‐Source
Category
DataElementName
Abbreviation/Symbol
EmissionType
DataInputUnit
InputSource
Statistic
TypeofStatistic
ProbabilityDistributionType
RelativeuncertaintyLow(%)
RelativeuncertaintyHigh(%)
ConfidenceLevel(%)
EffectiveLowerLimit
EffectiveUpperLimit
DataSource
SOCChangeMineralSoils–
GrazingLand
StockingRate
CO
2Head/acre
Entity
Entry
SOCChangeMineralSoils–
GrazingLand
Irrigation
applicationrate
CO
2Gallonsper
minute
Entity
Entry
SOCChangeMineralSoils–
GrazingLand
MineralFertilizer
applicationRate
CO
2lbs/squarefoot
Entity
Entry
SOCChangeMineralSoils–
GrazingLand
Depthofdrainage
CO
2Meters
Entity
Entry
SOCChangeOrganicSoils
Emissionfactor
EFforcropland
incool
temperate
regions
CO2
MetrictonsC
ha‐1 year‐1
Default
Entry
11
Mean
Normal
45.0
45.0
Ogleetal.
(2003)
SOCChangeOrganicSoils
Emissionfactor
EFforcropland
inwarm
temperate
regions
CO2
MetrictonsC
ha‐1 year‐1
Default
Entry
14
Mean
Normal
35.0
35.0
Ogleetal.
(2003)
SOCChangeOrganicSoils
EmissionfactorEFforcropland
insubtropical
regions
CO2
MetrictonsC
ha‐1 year‐1
Default
Entry
14
Mean
Normal
46.0
46.0
Ogleetal.
(2003)
SOCChangeOrganicSoils
Emissionfactor
EFforgrazing
landincool
temperate
regions
CO2
MetrictonsC
ha‐1 year‐1
Default
Entry
2.8
Mean
Normal
45.0
45.0
Ogleetal.
(2003)
SOCChangeOrganicSoils
Emissionfactor
EFforgrazing
landinwarm
temperate
regions
CO2
MetrictonsC
ha‐1 year‐1
Default
Entry
3.5
Mean
Normal
35.0
35.0
Ogleetal.
(2003)
SOCChangeOrganicSoils
Emissionfactor
EFforgrazing
landin
subtropical
regions
CO2
MetrictonsC
ha‐1year‐1
Default
Entry
3.5
Mean
Normal
46.0
46.0
Ogleetal.
(2003)
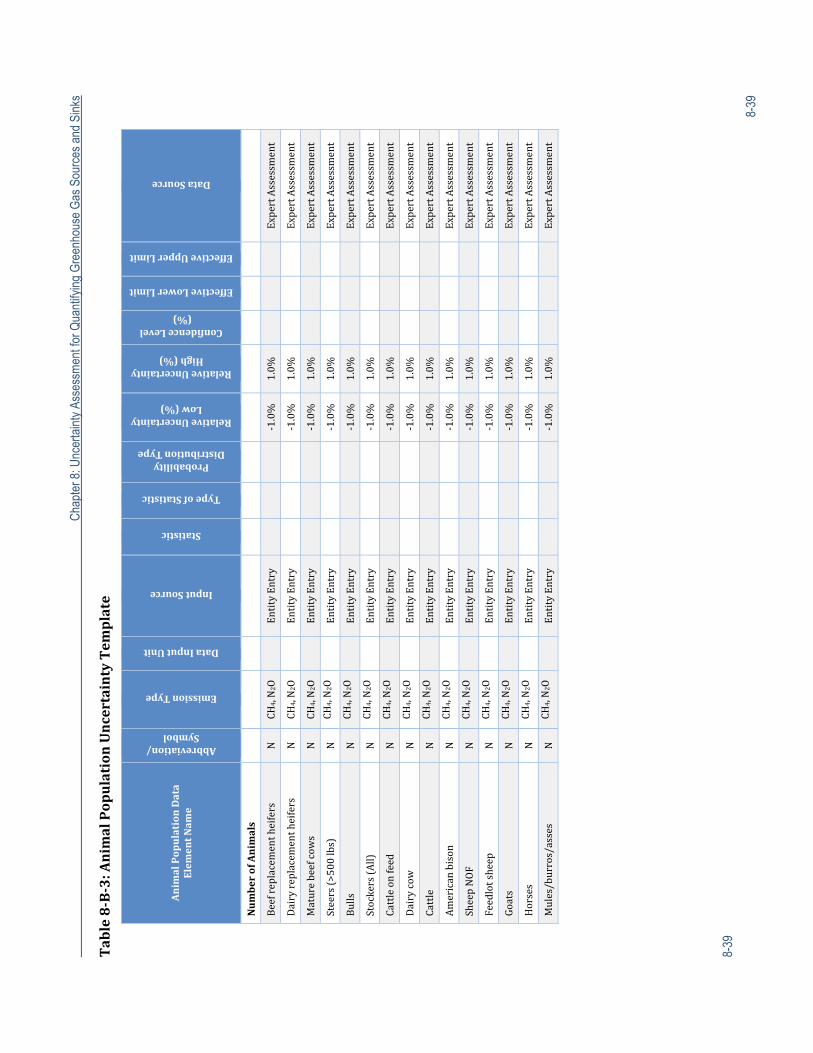
C
hapt
er 8
: Unc
erta
inty
Ass
essm
ent f
or Q
uant
ifyin
g G
reen
hous
e G
as S
ourc
es a
nd S
inks
8-39
8-39
Table8‐B‐3:AnimalPopulationUncertaintyTem
plate
AnimalPopulationData
Elem
entNam
e
Abbreviation/Symbol
EmissionType
DataInputUnit
InputSource
Statistic
TypeofStatistic
ProbabilityDistributionType
RelativeUncertaintyLow(%)
RelativeUncertaintyHigh(%)
ConfidenceLevel(%)
EffectiveLowerLimit
EffectiveUpperLimit
DataSource
NumberofAnimals
Beefreplacementheifers
N
CH4,N2O
EntityEntry
‐1.0%
1.0%
ExpertAssessm
ent
Dairyreplacementheifers
N
CH4,N2O
EntityEntry
‐1.0%
1.0%
ExpertAssessm
ent
Maturebeefcow
sN
CH4,N2O
EntityEntry
‐1.0%
1.0%
ExpertAssessm
ent
Steers(>500lbs)
N
CH4,N2O
EntityEntry
‐1.0%
1.0%
ExpertAssessm
ent
Bulls
N
CH4,N2O
EntityEntry
‐1.0%
1.0%
ExpertAssessm
ent
Stockers(All)
N
CH4,N2O
EntityEntry
‐1.0%
1.0%
ExpertAssessm
ent
Cattleonfeed
N
CH4,N2O
EntityEntry
‐1.0%
1.0%
ExpertAssessm
ent
Dairycow
N
CH4,N2O
EntityEntry
‐1.0%
1.0%
ExpertAssessm
ent
Cattle
N
CH4,N2O
EntityEntry
‐1.0%
1.0%
ExpertAssessm
ent
Americanbison
N
CH4,N2O
EntityEntry
‐1.0%
1.0%
ExpertAssessm
ent
SheepNOF
N
CH4,N2O
EntityEntry
‐1.0%
1.0%
ExpertAssessm
ent
Feedlotsheep
N
CH4,N2O
EntityEntry
‐1.0%
1.0%
ExpertAssessm
ent
Goats
N
CH4,N2O
EntityEntry
‐1.0%
1.0%
ExpertAssessm
ent
Horses
N
CH4,N2O
EntityEntry
‐1.0%
1.0%
ExpertAssessm
ent
Mules/burros/asses
N
CH4,N2O
EntityEntry
‐1.0%
1.0%
ExpertAssessm
ent
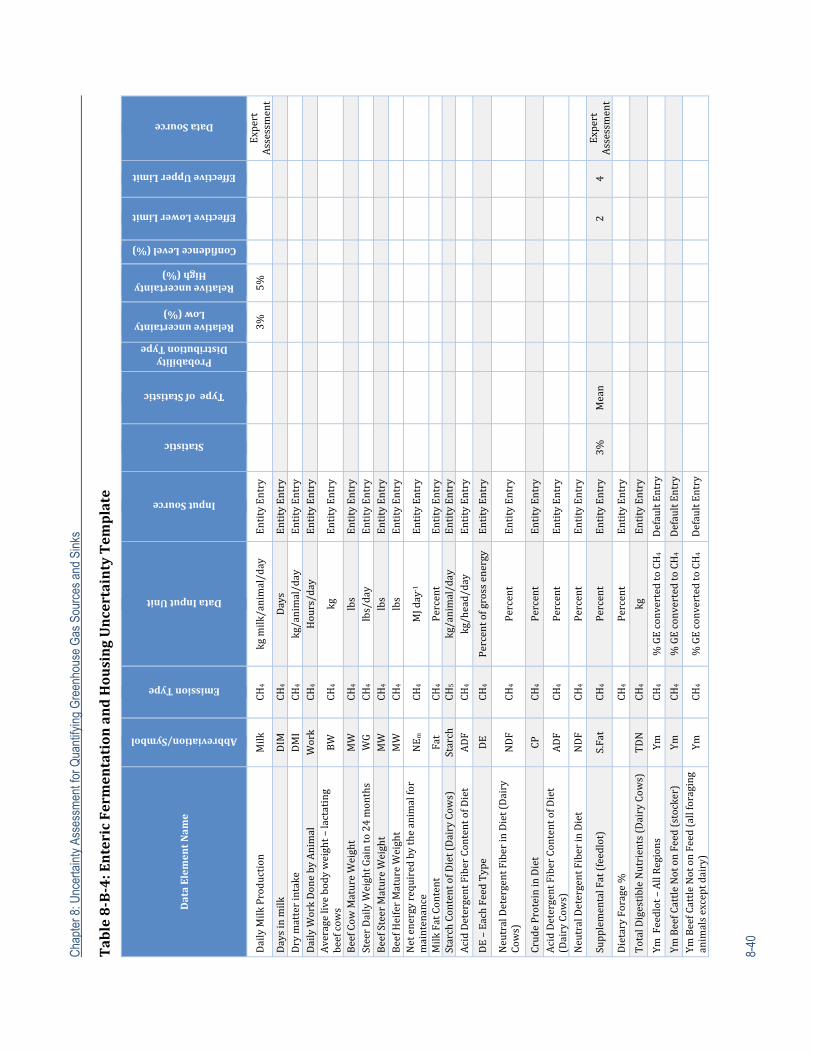
Cha
pter
8: U
ncer
tain
ty A
sses
smen
t for
Qua
ntify
ing
Gre
enho
use
Gas
Sou
rces
and
Sin
ks
8-40
Table8‐B‐4:EntericFerm
entationandHousingUncertaintyTem
plate
DataElem
entNam
e
Abbreviation/Symbol
EmissionType
DataInputUnit
InputSource
Statistic
TypeofStatistic
ProbabilityDistributionType
RelativeuncertaintyLow(%)
RelativeuncertaintyHigh(%)
ConfidenceLevel(%)
EffectiveLowerLimit
EffectiveUpperLimit
DataSource
DailyMilkProduction
Milk
CH4
kgmilk/animal/day
EntityEntry
3%
5%
Expert
Assessm
ent
Daysinmilk
DIM
CH4
Days
EntityEntry
Drymatterintake
DMI
CH4
kg/animal/day
EntityEntry
DailyWorkDonebyAnimal
Work
CH4
Hours/day
EntityEntry
Averagelivebodyweight–lactating
beefcow
sBW
CH4
kg
EntityEntry
BeefCow
MatureWeight
MW
CH4
lbs
EntityEntry
SteerDailyWeightGainto24months
WG
CH4
lbs/day
EntityEntry
BeefSteerMatureWeight
MW
CH4
lbs
EntityEntry
BeefHeiferMatureWeight
MW
CH4
lbs
EntityEntry
Netenergyrequiredbytheanimalfor
maintenance
NE m
CH4
MJday
‐1
EntityEntry
MilkFatContent
Fat
CH4
Percent
EntityEntry
StarchContentofDiet(DairyCow
s)
Starch
CH5
kg/animal/day
EntityEntry
AcidDetergentFiberContentofDiet
ADF
CH4
kg/head/day
EntityEntry
DE–EachFeedType
DE
CH4
Percentofgrossenergy
EntityEntry
NeutralDetergentFiberinDiet(Dairy
Cows)
NDF
CH4
Percent
EntityEntry
CrudeProteininDiet
CP
CH4
Percent
EntityEntry
AcidDetergentFiberContentofDiet
(DairyCow
s)
ADF
CH4
Percent
EntityEntry
NeutralDetergentFiberinDiet
NDF
CH4
Percent
EntityEntry
SupplementalFat(feedlot)
S.Fat
CH4
Percent
EntityEntry
3%
Mean
24
Expert
Assessm
ent
DietaryForage%
CH
4Percent
EntityEntry
TotalDigestibleNutrients(DairyCow
s)
TDN
CH4
kg
EntityEntry
YmFeedlot–AllRegions
Ym
CH4
%GEconvertedtoCH4
DefaultEntry
YmBeefCattleNotonFeed(stocker)
Ym
CH4
%GEconvertedtoCH4
DefaultEntry
Ym
BeefCattleNotonFeed(allforaging
animalsexceptdairy)
Ym
CH4
%GEconvertedtoCH4
DefaultEntry
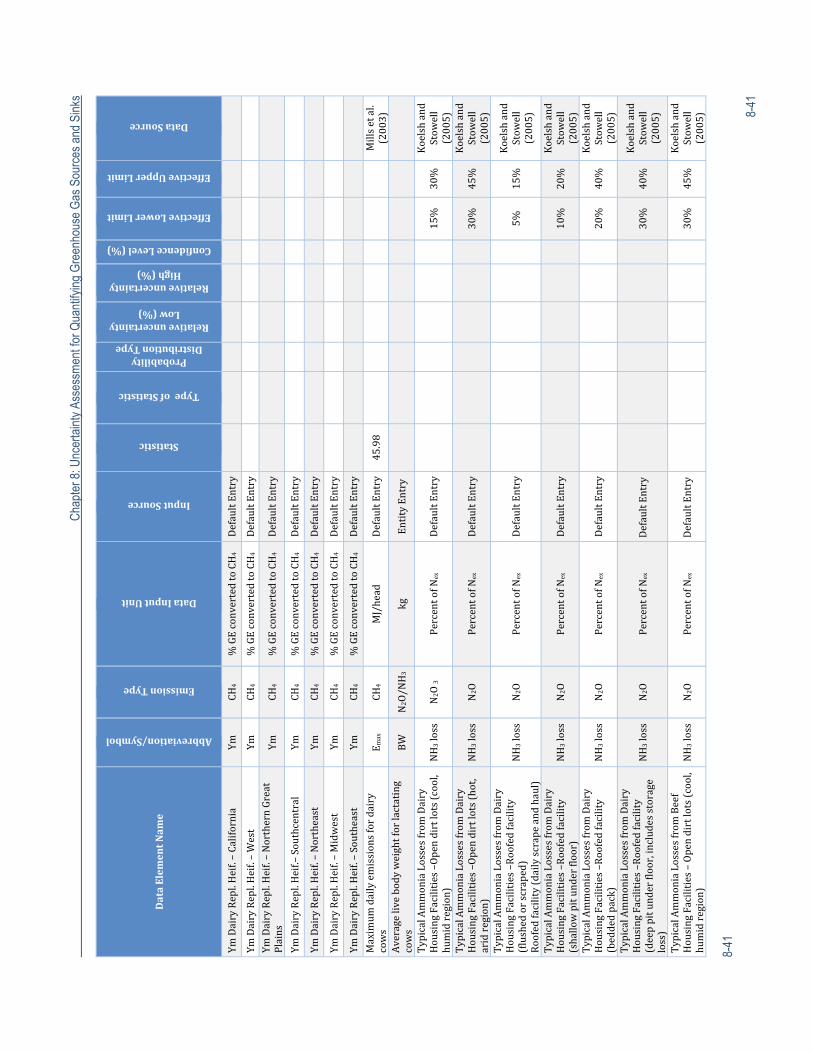
C
hapt
er 8
: Unc
erta
inty
Ass
essm
ent f
or Q
uant
ifyin
g G
reen
hous
e G
as S
ourc
es a
nd S
inks
8-41
8-41
DataElem
entNam
e
Abbreviation/Symbol
EmissionType
DataInputUnit
InputSource
Statistic
TypeofStatistic
ProbabilityDistributionType
RelativeuncertaintyLow(%)
RelativeuncertaintyHigh(%)
ConfidenceLevel(%)
EffectiveLowerLimit
EffectiveUpperLimit
DataSource
YmDairyRepl.Heif.–California
Ym
CH4
%GEconvertedtoCH4
DefaultEntry
YmDairyRepl.Heif.–West
Ym
CH4
%GEconvertedtoCH4
DefaultEntry
Ym
DairyRepl.Heif.–NorthernGreat
Plains
Ym
CH4
%GEconvertedtoCH4
DefaultEntry
YmDairyRepl.Heif.–Southcentral
Ym
CH4
%GEconvertedtoCH4
DefaultEntry
YmDairyRepl.Heif.–Northeast
Ym
CH4
%GEconvertedtoCH4
DefaultEntry
YmDairyRepl.Heif.–Midwest
Ym
CH4
%GEconvertedtoCH4
DefaultEntry
YmDairyRepl.Heif.–Southeast
Ym
CH4
%GEconvertedtoCH4
DefaultEntry
Maximum
dailyemissionsfordairy
cows
E max
CH4
MJ/head
DefaultEntry
45.98
Millsetal.
(2003)
Averagelivebodyweightforlactating
cows
BW
N2O/NH3
kg
EntityEntry
TypicalAmmoniaLossesfrom
Dairy
HousingFacilities–Opendirtlots(cool,
humidregion)
NH3loss
N2O 3
PercentofN
ex
DefaultEntry
15%
30%
Koelshand
Stow
ell
(2005)
TypicalAmmoniaLossesfrom
Dairy
HousingFacilities–Opendirtlots(hot,
aridregion)
NH3loss
N2O
PercentofN
ex
DefaultEntry
30%
45%
Koelshand
Stow
ell
(2005)
TypicalAmmoniaLossesfrom
Dairy
HousingFacilities–Roofedfacility
(flushedorscraped)
Roofedfacility(dailyscrapeandhaul)
NH3loss
N2O
PercentofN
ex
DefaultEntry
5%
15%
Koelshand
Stow
ell
(2005)
TypicalAmmoniaLossesfrom
Dairy
HousingFacilities–Roofedfacility
(shallowpitunderfloor)
NH3loss
N2O
PercentofN
ex
DefaultEntry
10%
20%
Koelshand
Stow
ell
(2005)
TypicalAmmoniaLossesfrom
Dairy
HousingFacilities–Roofedfacility
(beddedpack)
NH3loss
N2O
PercentofN
ex
DefaultEntry
20%
40%
Koelshand
Stow
ell
(2005)
TypicalAmmoniaLossesfrom
Dairy
HousingFacilities–Roofedfacility
(deeppitunderfloor,includesstorage
loss)
NH3loss
N2O
PercentofN
ex
DefaultEntry
30%
40%
Koelshand
Stow
ell
(2005)
TypicalAmmoniaLossesfrom
Beef
HousingFacilities–Opendirtlots(cool,
humidregion)
NH3loss
N2O
PercentofN
ex
DefaultEntry
30%
45%
Koelshand
Stow
ell
(2005)
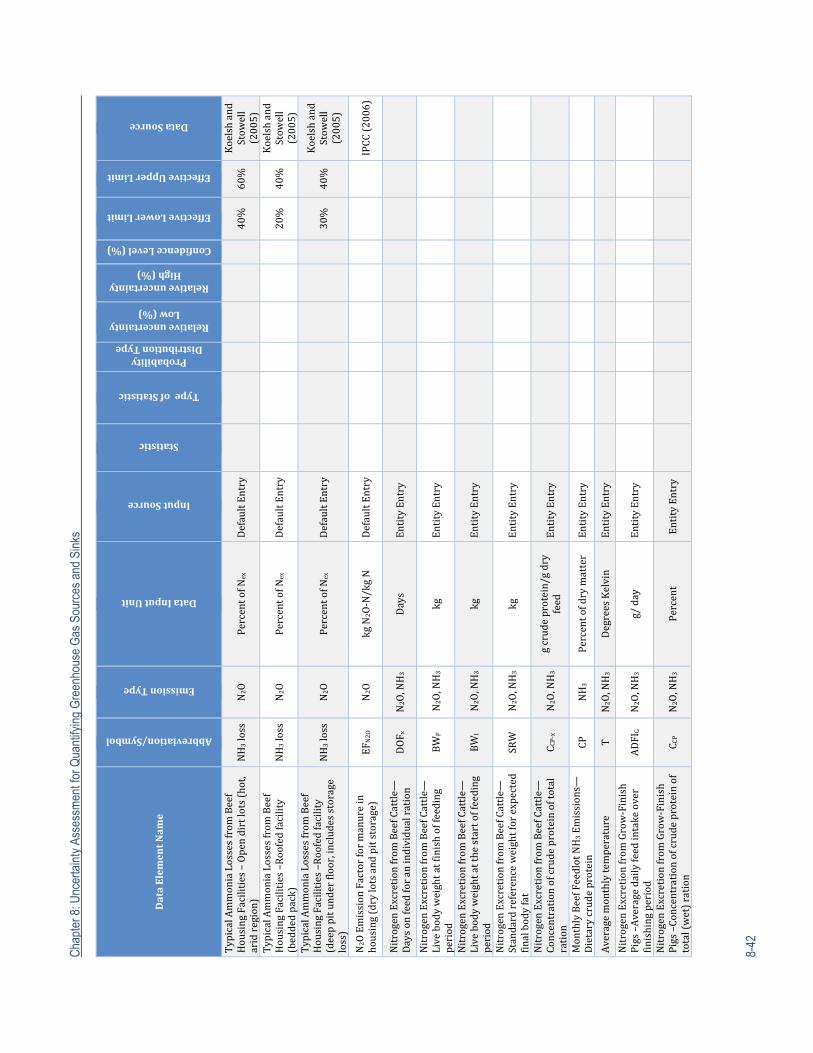
Cha
pter
8: U
ncer
tain
ty A
sses
smen
t for
Qua
ntify
ing
Gre
enho
use
Gas
Sou
rces
and
Sin
ks
8-42
DataElem
entNam
e
Abbreviation/Symbol
EmissionType
DataInputUnit
InputSource
Statistic
TypeofStatistic
ProbabilityDistributionType
RelativeuncertaintyLow(%)
RelativeuncertaintyHigh(%)
ConfidenceLevel(%)
EffectiveLowerLimit
EffectiveUpperLimit
DataSource
TypicalAmmoniaLossesfrom
Beef
HousingFacilities–Opendirtlots(hot,
aridregion)
NH3loss
N2O
PercentofN
ex
DefaultEntry
40%
60%
Koelshand
Stow
ell
(2005)
TypicalAmmoniaLossesfrom
Beef
HousingFacilities–Roofedfacility
(beddedpack)
NH3loss
N2O
PercentofN
ex
DefaultEntry
20%
40%
Koelshand
Stow
ell
(2005)
TypicalAmmoniaLossesfrom
Beef
HousingFacilities–Roofedfacility
(deeppitunderfloor,includesstorage
loss)
NH3loss
N2O
PercentofN
ex
DefaultEntry
30%
40%
Koelshand
Stow
ell
(2005)
N2OEmissionFactorformanurein
housing(drylotsandpitstorage)
EFN2O
N2O
kgN
2O‐N/kgN
DefaultEntry
IPCC(2006)
NitrogenExcretionfrom
BeefCattle—
Daysonfeedforanindividualration
DOF x
N2O,NH3
Days
EntityEntry
NitrogenExcretionfrom
BeefCattle—
Livebodyweightatfinishoffeeding
period
BW
FN
2O,NH3
kg
EntityEntry
NitrogenExcretionfrom
BeefCattle—
Livebodyweightatthestartoffeeding
period
BW
IN
2O,NH3
kg
EntityEntry
NitrogenExcretionfrom
BeefCattle—
Standardreferenceweightforexpected
finalbodyfat
SRW
N2O,NH3
kg
EntityEntry
NitrogenExcretionfrom
BeefCattle—
Concentrationofcrudeproteinoftotal
ration
C CP‐x
N2O,NH3
gcrudeprotein/gdry
feed
EntityEntry
MonthlyBeefFeedlotNH3Emissions—
Dietarycrudeprotein
CP
NH3
Percentofdrymatter
EntityEntry
Averagemonthlytemperature
T
N2O,NH3
DegreesKelvin
EntityEntry
NitrogenExcretionfrom
Grow‐Finish
Pigs–Averagedailyfeedintakeover
finishingperiod
ADFI
G
N2O,NH3
g/day
EntityEntry
NitrogenExcretionfrom
Grow‐Finish
Pigs–Concentrationofcrudeproteinof
total(wet)ration
C CP
N2O,NH3
Percent
EntityEntry
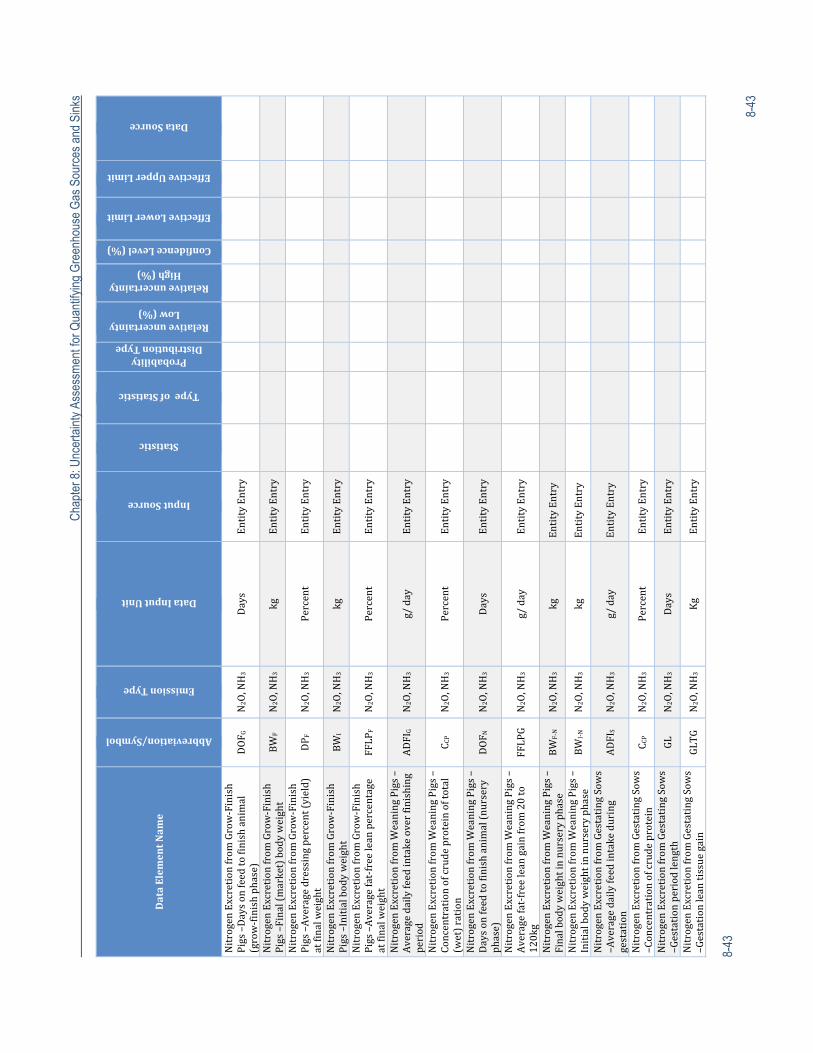
C
hapt
er 8
: Unc
erta
inty
Ass
essm
ent f
or Q
uant
ifyin
g G
reen
hous
e G
as S
ourc
es a
nd S
inks
8-43
8-43
DataElem
entNam
e
Abbreviation/Symbol
EmissionType
DataInputUnit
InputSource
Statistic
TypeofStatistic
ProbabilityDistributionType
RelativeuncertaintyLow(%)
RelativeuncertaintyHigh(%)
ConfidenceLevel(%)
EffectiveLowerLimit
EffectiveUpperLimit
DataSource
NitrogenExcretionfrom
Grow‐Finish
Pigs–Daysonfeedtofinishanimal
(grow‐finishphase)
DOF G
N2O,NH3
Days
EntityEntry
NitrogenExcretionfrom
Grow‐Finish
Pigs–Final(market)bodyweight
BW
FN2O,NH3
kg
EntityEntry
NitrogenExcretionfrom
Grow‐Finish
Pigs–Averagedressingpercent(yield)
atfinalw
eight
DP F
N2O,NH3
Percent
EntityEntry
NitrogenExcretionfrom
Grow‐Finish
Pigs–Initialbodyweight
BW
IN2O,NH3
kg
EntityEntry
NitrogenExcretionfrom
Grow‐Finish
Pigs–Averagefat‐freeleanpercentage
atfinalw
eight
FFLP
FN2O,NH3
Percent
EntityEntry
NitrogenExcretionfrom
WeaningPigs–
Averagedailyfeedintakeoverfinishing
period
ADFI
G
N2O,NH3
g/day
EntityEntry
NitrogenExcretionfrom
WeaningPigs–
Concentrationofcrudeproteinoftotal
(wet)ration
C CP
N2O,NH3
Percent
EntityEntry
NitrogenExcretionfrom
WeaningPigs–
Daysonfeedtofinishanimal(nursery
phase)
DOF N
N2O,NH3
Days
EntityEntry
NitrogenExcretionfrom
WeaningPigs–
Averagefat‐freeleangainfrom
20to
120kg
FFLPG
N2O,NH3
g/day
EntityEntry
NitrogenExcretionfrom
WeaningPigs–
Finalbodyweightinnurseryphase
BW
F‐N
N2O,NH3
kg
EntityEntry
NitrogenExcretionfrom
WeaningPigs–
Initialbodyweightinnurseryphase
BW
I‐N
N2O,NH3
kg
EntityEntry
NitrogenExcretionfrom
GestatingSow
s–Averagedailyfeedintakeduring
gestation
ADFI
SN2O,NH3
g/day
EntityEntry
NitrogenExcretionfrom
GestatingSow
s–Concentrationofcrudeprotein
C CP
N2O,NH3
Percent
EntityEntry
NitrogenExcretionfrom
GestatingSow
s–Gestationperiodlength
GL
N2O,NH3
Days
EntityEntry
NitrogenExcretionfrom
GestatingSow
s–Gestationleantissuegain
GLTG
N2O,NH3
Kg
EntityEntry
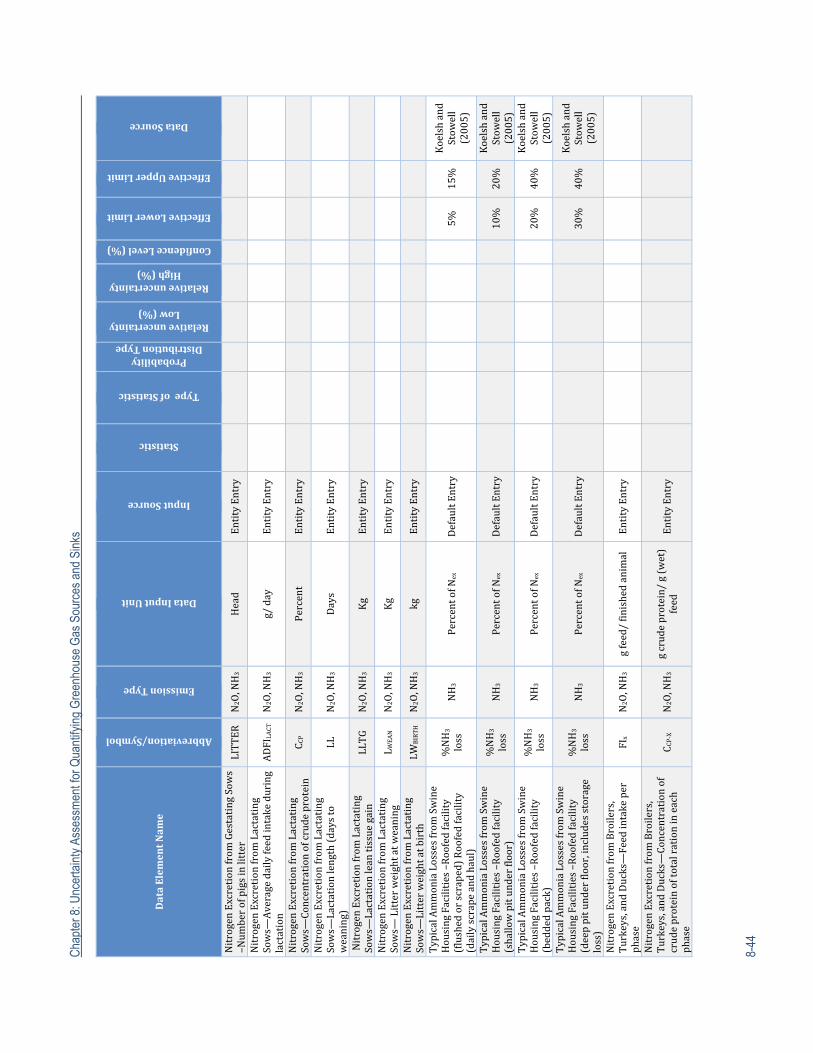
Cha
pter
8: U
ncer
tain
ty A
sses
smen
t for
Qua
ntify
ing
Gre
enho
use
Gas
Sou
rces
and
Sin
ks
8-44
DataElem
entNam
e
Abbreviation/Symbol
EmissionType
DataInputUnit
InputSource
Statistic
TypeofStatistic
ProbabilityDistributionType
RelativeuncertaintyLow(%)
RelativeuncertaintyHigh(%)
ConfidenceLevel(%)
EffectiveLowerLimit
EffectiveUpperLimit
DataSource
NitrogenExcretionfrom
GestatingSow
s–Num
berofpigsinlitter
LITTERN2O,NH3
Head
EntityEntry
NitrogenExcretionfrom
Lactating
Sows—
Averagedailyfeedintakeduring
lactation
ADFI
LACT
N2O,NH3
g/day
EntityEntry
NitrogenExcretionfrom
Lactating
Sows—
Concentrationofcrudeprotein
C CP
N2O,NH3
Percent
EntityEntry
NitrogenExcretionfrom
Lactating
Sows—
Lactationlength(daysto
weaning)
LL
N2O,NH3
Days
EntityEntry
NitrogenExcretionfrom
Lactating
Sows—
Lactationleantissuegain
LLTG
N2O,NH3
Kg
EntityEntry
NitrogenExcretionfrom
Lactating
Sows—
Litterweightatw
eaning
L WEAN
N2O,NH3
Kg
EntityEntry
NitrogenExcretionfrom
Lactating
Sows—
Litterweightatbirth
LWBIRTHN2O,NH3
kg
EntityEntry
TypicalAmmoniaLossesfrom
Swine
HousingFacilities–Roofedfacility
(flushedorscraped)Roofedfacility
(dailyscrapeandhaul)
%NH3
loss
NH3
PercentofN
ex
DefaultEntry
5%
15%
Koelshand
Stow
ell
(2005)
TypicalAmmoniaLossesfrom
Swine
HousingFacilities–Roofedfacility
(shallowpitunderfloor)
%NH3
loss
NH3
PercentofN
ex
DefaultEntry
10%
20%
Koelshand
Stow
ell
(2005)
TypicalAmmoniaLossesfrom
Swine
HousingFacilities–Roofedfacility
(beddedpack)
%NH3
loss
NH3
PercentofN
ex
DefaultEntry
20%
40%
Koelshand
Stow
ell
(2005)
TypicalAmmoniaLossesfrom
Swine
HousingFacilities–Roofedfacility
(deeppitunderfloor,includesstorage
loss)
%NH3
loss
NH3
PercentofN
ex
DefaultEntry
30%
40%
Koelshand
Stow
ell
(2005)
NitrogenExcretionfrom
Broilers,
Turkeys,andDucks—Feedintakeper
phase
FIx
N2O,NH3
gfeed/finishedanimal
EntityEntry
NitrogenExcretionfrom
Broilers,
Turkeys,andDucks—Concentrationof
crudeproteinoftotalrationineach
phase
C CP‐X
N2O,NH3
gcrudeprotein/g(wet)
feed
EntityEntry
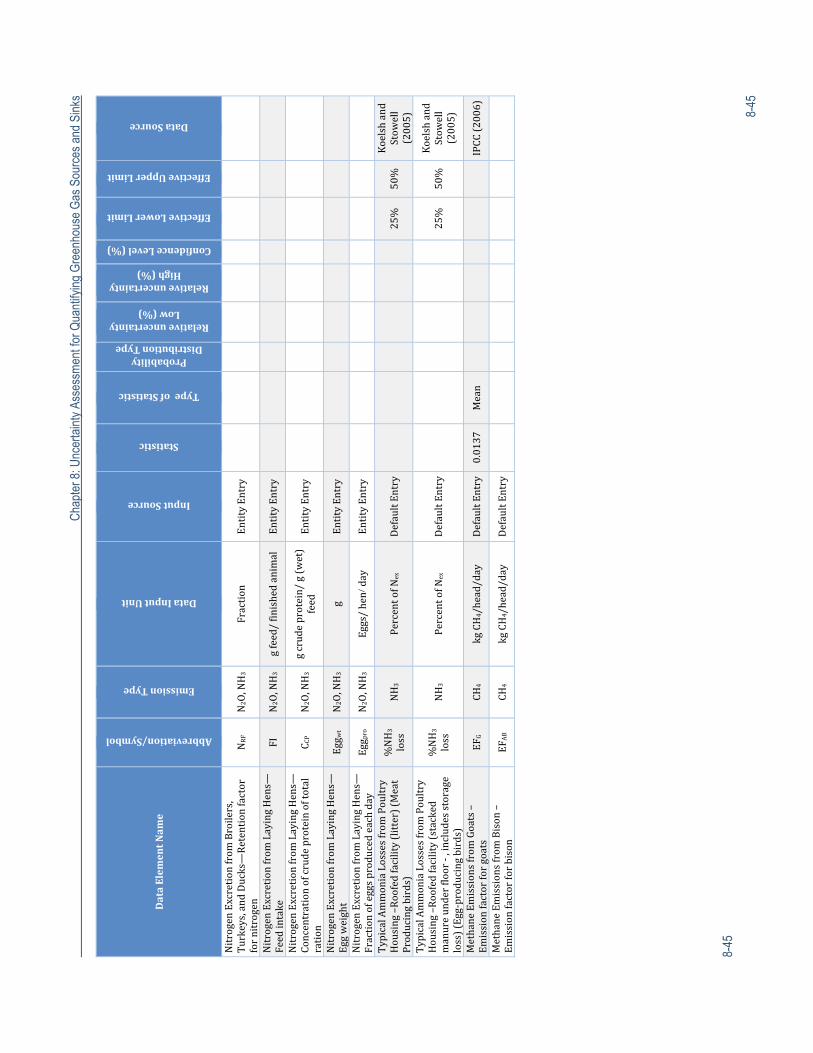
C
hapt
er 8
: Unc
erta
inty
Ass
essm
ent f
or Q
uant
ifyin
g G
reen
hous
e G
as S
ourc
es a
nd S
inks
8-45
8-45
DataElem
entNam
e
Abbreviation/Symbol
EmissionType
DataInputUnit
InputSource
Statistic
TypeofStatistic
ProbabilityDistributionType
RelativeuncertaintyLow(%)
RelativeuncertaintyHigh(%)
ConfidenceLevel(%)
EffectiveLowerLimit
EffectiveUpperLimit
DataSource
NitrogenExcretionfrom
Broilers,
Turkeys,andDucks—Retentionfactor
fornitrogen
NRF
N2O,NH3
Fraction
EntityEntry
NitrogenExcretionfrom
LayingHens—
Feedintake
FI
N2O,NH3
gfeed/finishedanimal
EntityEntry
NitrogenExcretionfrom
LayingHens—
Concentrationofcrudeproteinoftotal
ration
C CP
N2O,NH3
gcrudeprotein/g(wet)
feed
EntityEntry
NitrogenExcretionfrom
LayingHens—
Eggweight
Egg w
tN2O,NH3
gEntityEntry
NitrogenExcretionfrom
LayingHens—
Fractionofeggsproducedeachday
Egg p
ro
N2O,NH3
Eggs/hen/day
EntityEntry
TypicalAmmoniaLossesfrom
Poultry
Housing–Roofedfacility(litter)(Meat
Producingbirds)
%NH3
loss
NH3
PercentofN
ex
DefaultEntry
25%
50%
Koelshand
Stow
ell
(2005)
TypicalAmmoniaLossesfrom
Poultry
Housing–Roofedfacility(stacked
manureunderfloor‐,includesstorage
loss)(Egg‐producingbirds)
%NH3
loss
NH3
PercentofN
ex
DefaultEntry
25%
50%
Koelshand
Stow
ell
(2005)
MethaneEmissionsfrom
Goats–
Emissionfactorforgoats
EFG
CH4
kgCH4/head/day
DefaultEntry
0.0137
Mean
IPCC(2006)
MethaneEmissionsfrom
Bison–
Emissionfactorforbison
EFAB
CH4
kgCH4/head/day
DefaultEntry
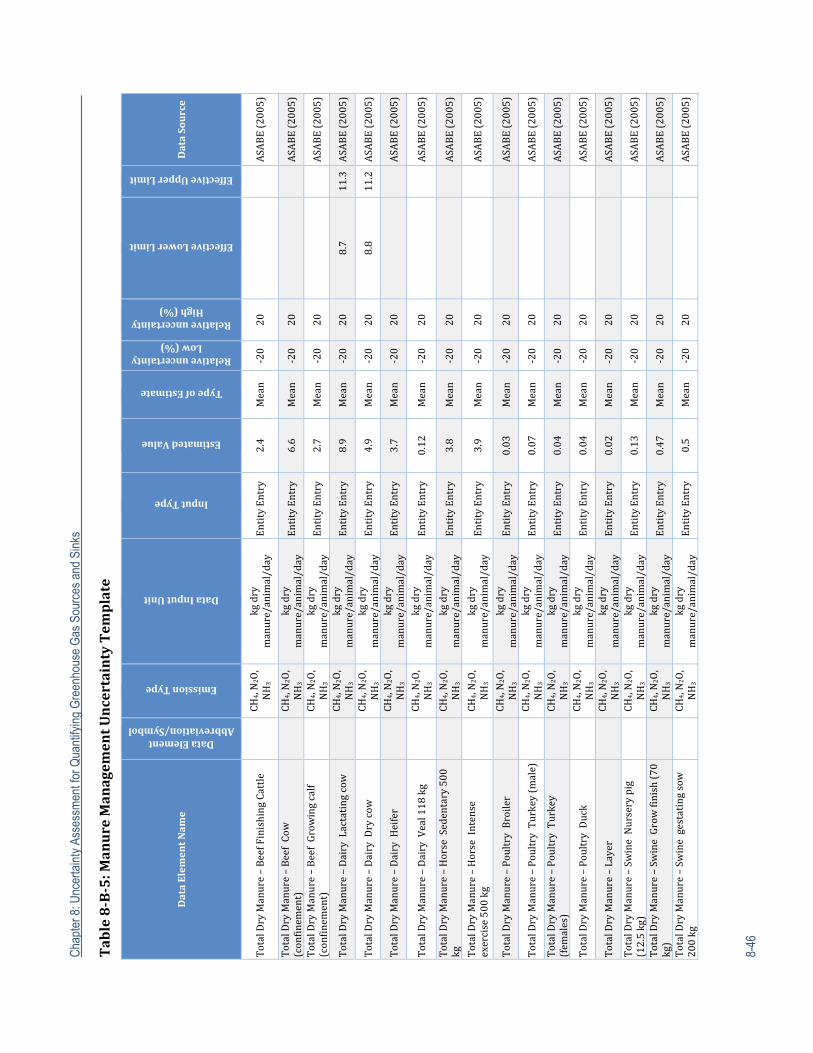
Cha
pter
8: U
ncer
tain
ty A
sses
smen
t for
Qua
ntify
ing
Gre
enho
use
Gas
Sou
rces
and
Sin
ks
8-46
Table8‐B‐5:M
anureManagem
entUncertaintyTem
plate
DataElem
entNam
e
DataElementAbbreviation/Symbol
EmissionType
DataInputUnit
InputType
EstimatedValue
TypeofEstimate
RelativeuncertaintyLow(%)
RelativeuncertaintyHigh(%)
EffectiveLowerLimit
EffectiveUpperLimit
DataSource
TotalDryManure–BeefFinishingCattle
CH
4,N2O,
NH3
kgdry
manure/animal/day
EntityEntry
2.4
Mean
‐20
20
ASABE(2005)
TotalDryManure–BeefCow
(confinem
ent)
CH
4,N2O,
NH3
kgdry
manure/animal/day
EntityEntry
6.6
Mean
‐20
20
ASABE(2005)
TotalDryManure–BeefGrowingcalf
(confinem
ent)
CH
4,N2O,
NH3
kgdry
manure/animal/day
EntityEntry
2.7
Mean
‐20
20
ASABE(2005)
TotalDryManure–DairyLactatingcow
CH4,N2O,
NH3
kgdry
manure/animal/day
EntityEntry
8.9
Mean
‐20
20
8.7
11.3
ASABE(2005)
TotalDryManure–DairyDrycow
CH4,N2O,
NH3
kgdry
manure/animal/day
EntityEntry
4.9
Mean
‐20
20
8.8
11.2
ASABE(2005)
TotalDryManure–DairyHeifer
CH
4,N2O,
NH3
kgdry
manure/animal/day
EntityEntry
3.7
Mean
‐20
20
ASABE(2005)
TotalDryManure–DairyVeal118kg
CH
4,N2O,
NH3
kgdry
manure/animal/day
EntityEntry
0.12
Mean
‐20
20
ASABE(2005)
TotalDryManure–HorseSedentary500
kg
CH
4,N2O,
NH3
kgdry
manure/animal/day
EntityEntry
3.8
Mean
‐20
20
ASABE(2005)
TotalDryManure–HorseIntense
exercise500kg
CH
4,N2O,
NH3
kgdry
manure/animal/day
EntityEntry
3.9
Mean
‐20
20
ASABE(2005)
TotalDryManure–PoultryBroiler
CH
4,N2O,
NH3
kgdry
manure/animal/day
EntityEntry
0.03
Mean
‐20
20
ASABE(2005)
TotalDryManure–PoultryTurkey(male)
CH
4,N2O,
NH3
kgdry
manure/animal/day
EntityEntry
0.07
Mean
‐20
20
ASABE(2005)
TotalDryManure–PoultryTurkey
(fem
ales)
CH
4,N2O,
NH3
kgdry
manure/animal/day
EntityEntry
0.04
Mean
‐20
20
ASABE(2005)
TotalDryManure–PoultryDuck
CH
4,N2O,
NH3
kgdry
manure/animal/day
EntityEntry
0.04
Mean
‐20
20
ASABE(2005)
TotalDryManure–Layer
CH
4,N2O,
NH3
kgdry
manure/animal/day
EntityEntry
0.02
Mean
‐20
20
ASABE(2005)
TotalDryManure–Sw
ineNurserypig
(12.5kg)
CH
4,N2O,
NH3
kgdry
manure/animal/day
EntityEntry
0.13
Mean
‐20
20
ASABE(2005)
TotalDryManure–Sw
ineGrowfinish(70
kg)
CH
4,N2O,
NH3
kgdry
manure/animal/day
EntityEntry
0.47
Mean
‐20
20
ASABE(2005)
TotalDryManure–Sw
inegestatingsow
200kg
CH
4,N2O,
NH3
kgdry
manure/animal/day
EntityEntry
0.5
Mean
‐20
20
ASABE(2005)
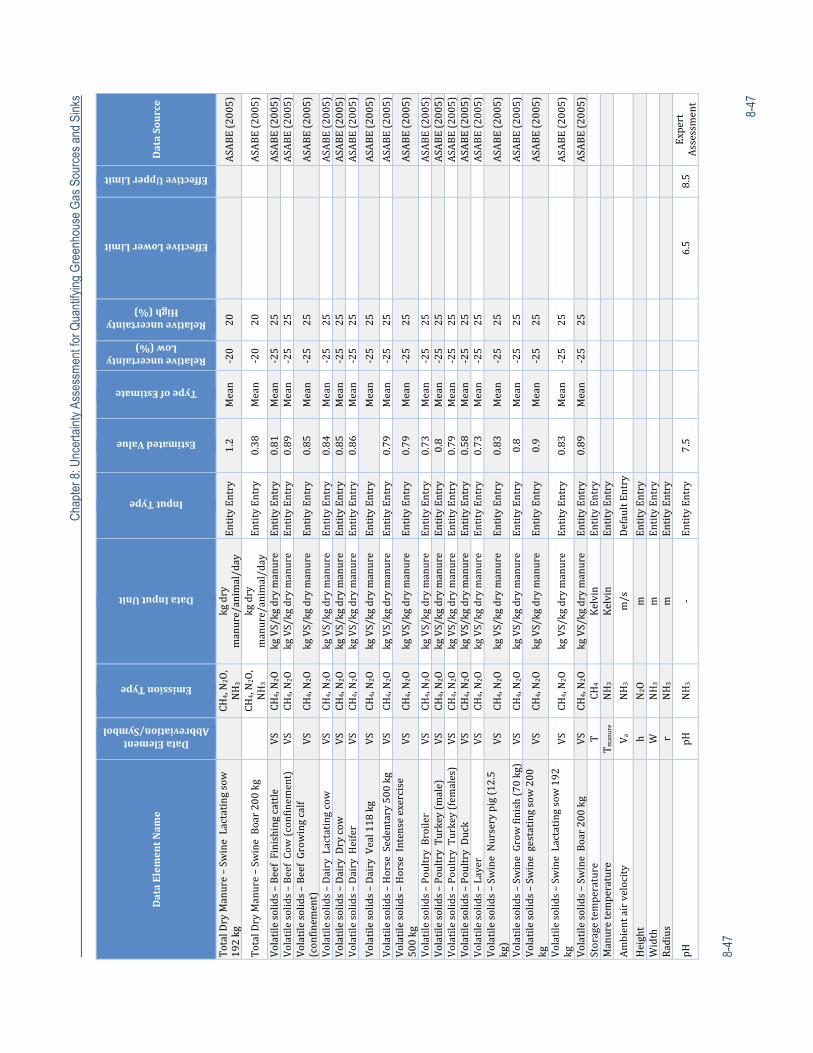
C
hapt
er 8
: Unc
erta
inty
Ass
essm
ent f
or Q
uant
ifyin
g G
reen
hous
e G
as S
ourc
es a
nd S
inks
8-47
8-47
DataElem
entNam
e
DataElementAbbreviation/Symbol
EmissionType
DataInputUnit
InputType
EstimatedValue
TypeofEstimate
RelativeuncertaintyLow(%)
RelativeuncertaintyHigh(%)
EffectiveLowerLimit
EffectiveUpperLimit
DataSource
TotalDryManure–Sw
ineLactatingsow
192kg
CH
4,N2O,
NH3
kgdry
manure/animal/day
EntityEntry
1.2
Mean
‐20
20
ASABE(2005)
TotalDryManure–Sw
ineBoar200kg
CH
4,N2O,
NH3
kgdry
manure/animal/day
EntityEntry
0.38
Mean
‐20
20
ASABE(2005)
Volatilesolids–BeefFinishingcattle
VS
CH4,N2O
kgVS/kgdrymanure
EntityEntry
0.81
Mean
‐25
25
ASABE(2005)
Volatilesolids–BeefCow(confinem
ent)
VS
CH4,N2O
kgVS/kgdrymanure
EntityEntry
0.89
Mean
‐25
25
ASABE(2005)
Volatilesolids–BeefGrowingcalf
(confinem
ent)
VS
CH4,N2O
kgVS/kgdrymanure
EntityEntry
0.85
Mean
‐25
25
ASABE(2005)
Volatilesolids–DairyLactatingcow
VS
CH4,N2O
kgVS/kgdrymanure
EntityEntry
0.84
Mean
‐25
25
ASABE(2005)
Volatilesolids–DairyDrycow
VS
CH4,N2O
kgVS/kgdrymanure
EntityEntry
0.85
Mean
‐25
25
ASABE(2005)
Volatilesolids–DairyHeifer
VS
CH4,N2O
kgVS/kgdrymanure
EntityEntry
0.86
Mean
‐25
25
ASABE(2005)
Volatilesolids–DairyVeal118kg
VS
CH4,N2O
kgVS/kgdrymanure
EntityEntry
Mean
‐25
25
ASABE(2005)
Volatilesolids–HorseSedentary500kg
VS
CH4,N2O
kgVS/kgdrymanure
EntityEntry
0.79
Mean
‐25
25
ASABE(2005)
Volatilesolids–HorseIntenseexercise
500kg
VS
CH4,N2O
kgVS/kgdrymanure
EntityEntry
0.79
Mean
‐25
25
ASABE(2005)
Volatilesolids–PoultryBroiler
VS
CH4,N2O
kgVS/kgdrymanure
EntityEntry
0.73
Mean
‐25
25
ASABE(2005)
Volatilesolids–PoultryTurkey(male)
VS
CH4,N2O
kgVS/kgdrymanure
EntityEntry
0.8
Mean
‐25
25
ASABE(2005)
Volatilesolids–PoultryTurkey(fem
ales)
VS
CH4,N2O
kgVS/kgdrymanure
EntityEntry
0.79
Mean
‐25
25
ASABE(2005)
Volatilesolids–PoultryDuck
VS
CH4,N2O
kgVS/kgdrymanure
EntityEntry
0.58
Mean
‐25
25
ASABE(2005)
Volatilesolids–Layer
VS
CH4,N2O
kgVS/kgdrymanure
EntityEntry
0.73
Mean
‐25
25
ASABE(2005)
Volatilesolids–Sw
ineNurserypig(12.5
kg)
VS
CH4,N2O
kgVS/kgdrymanure
EntityEntry
0.83
Mean
‐25
25
ASABE(2005)
Volatilesolids–Sw
ineGrowfinish(70kg)
VS
CH4,N2O
kgVS/kgdrymanure
EntityEntry
0.8
Mean
‐25
25
ASABE(2005)
Volatilesolids–Sw
inegestatingsow
200
kg
VS
CH4,N2O
kgVS/kgdrymanure
EntityEntry
0.9
Mean
‐25
25
ASABE(2005)
Volatilesolids–Sw
ineLactatingsow
192
kg
VS
CH4,N2O
kgVS/kgdrymanure
EntityEntry
0.83
Mean
‐25
25
ASABE(2005)
Volatilesolids–Sw
ineBoar200kg
VS
CH4,N2O
kgVS/kgdrymanure
EntityEntry
0.89
Mean
‐25
25
ASABE(2005)
Storagetemperature
T
CH4
Kelvin
EntityEntry
Manuretemperature
Tmanure
NH3
Kelvin
EntityEntry
Ambientairvelocity
Va
NH3
m/s
DefaultEntry
Height
hN2O
m
EntityEntry
Width
W
NH3
m
EntityEntry
Radius
rNH3
m
EntityEntry
pH
pH
NH3
‐EntityEntry
7.5
6.5
8.5
Expert
Assessm
ent
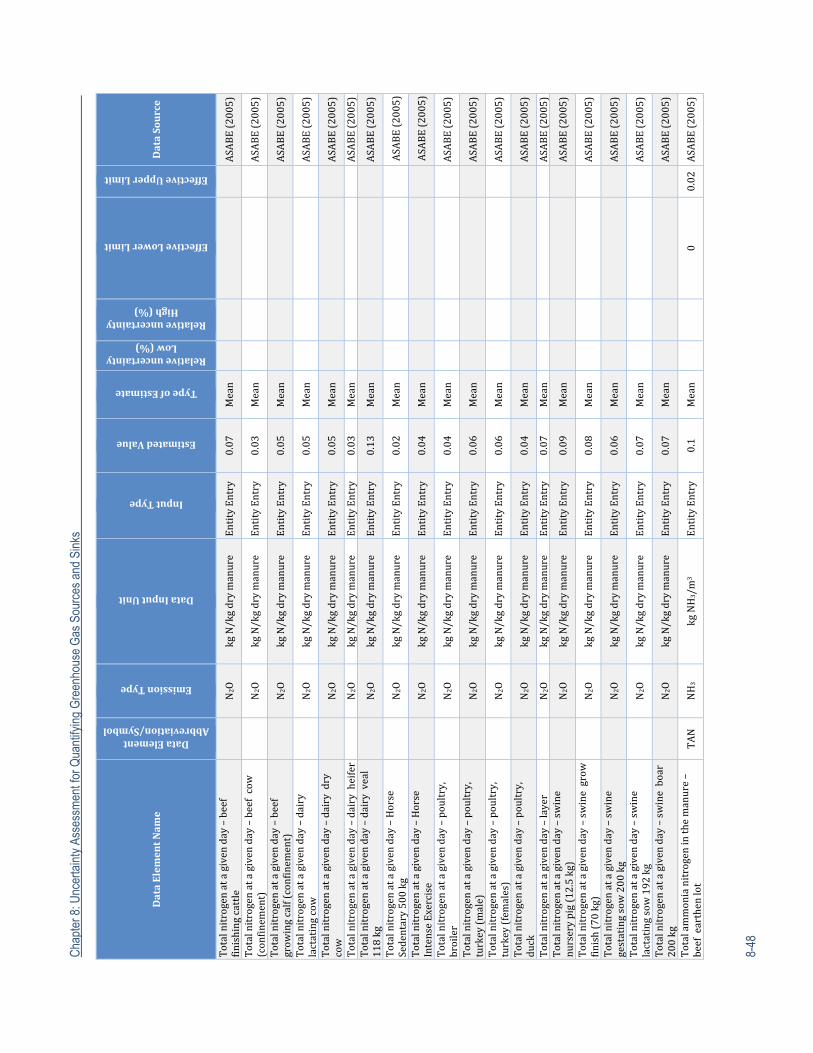
Cha
pter
8: U
ncer
tain
ty A
sses
smen
t for
Qua
ntify
ing
Gre
enho
use
Gas
Sou
rces
and
Sin
ks
8-48
DataElem
entNam
e
DataElementAbbreviation/Symbol
EmissionType
DataInputUnit
InputType
EstimatedValue
TypeofEstimate
RelativeuncertaintyLow(%)
RelativeuncertaintyHigh(%)
EffectiveLowerLimit
EffectiveUpperLimit
DataSource
Totalnitrogenatagivenday–beef
finishingcattle
N2O
kgN/kgdrymanure
EntityEntry
0.07
Mean
ASABE(2005)
Totalnitrogenatagivenday–beefcow
(confinem
ent)
N2O
kgN/kgdrymanure
EntityEntry
0.03
Mean
ASABE(2005)
Totalnitrogenatagivenday–beef
grow
ingcalf(confinem
ent)
N2O
kgN/kgdrymanure
EntityEntry
0.05
Mean
ASABE(2005)
Totalnitrogenatagivenday–dairy
lactatingcow
N2O
kgN/kgdrymanure
EntityEntry
0.05
Mean
ASABE(2005)
Totalnitrogenatagivenday–dairydry
cow
N2O
kgN/kgdrymanure
EntityEntry
0.05
Mean
ASABE(2005)
Totalnitrogenatagivenday–dairyheifer
N2O
kgN/kgdrymanure
EntityEntry
0.03
Mean
ASABE(2005)
Totalnitrogenatagivenday–dairyveal
118kg
N2O
kgN/kgdrymanure
EntityEntry
0.13
Mean
ASABE(2005)
Totalnitrogenatagivenday–Horse
Sedentary500kg
N2O
kgN/kgdrymanure
EntityEntry
0.02
Mean
ASABE(2005)
Totalnitrogenatagivenday–Horse
IntenseExercise
N2O
kgN/kgdrymanure
EntityEntry
0.04
Mean
ASABE(2005)
Totalnitrogenatagivenday–poultry,
broiler
N2O
kgN/kgdrymanure
EntityEntry
0.04
Mean
ASABE(2005)
Totalnitrogenatagivenday–poultry,
turkey(male)
N2O
kgN/kgdrymanure
EntityEntry
0.06
Mean
ASABE(2005)
Totalnitrogenatagivenday–poultry,
turkey(females)
N2O
kgN/kgdrymanure
EntityEntry
0.06
Mean
ASABE(2005)
Totalnitrogenatagivenday–poultry,
duck
N2O
kgN/kgdrymanure
EntityEntry
0.04
Mean
ASABE(2005)
Totalnitrogenatagivenday–layer
N2O
kgN/kgdrymanure
EntityEntry
0.07
Mean
ASABE(2005)
Totalnitrogenatagivenday–swine
nurserypig(12.5kg)
N2O
kgN/kgdrymanure
EntityEntry
0.09
Mean
ASABE(2005)
Totalnitrogenatagivenday–swinegrow
finish(70kg)
N2O
kgN/kgdrymanure
EntityEntry
0.08
Mean
ASABE(2005)
Totalnitrogenatagivenday–swine
gestatingsow200kg
N2O
kgN/kgdrymanure
EntityEntry
0.06
Mean
ASABE(2005)
Totalnitrogenatagivenday–swine
lactatingsow192kg
N2O
kgN/kgdrymanure
EntityEntry
0.07
Mean
ASABE(2005)
Totalnitrogenatagivenday–swineboar
200kg
N2O
kgN/kgdrymanure
EntityEntry
0.07
Mean
ASABE(2005)
Totalammonianitrogeninthemanure–
beefearthenlot
TAN
NH3
kgNH3/m
3 EntityEntry
0.1
Mean
00.02
ASABE(2005)
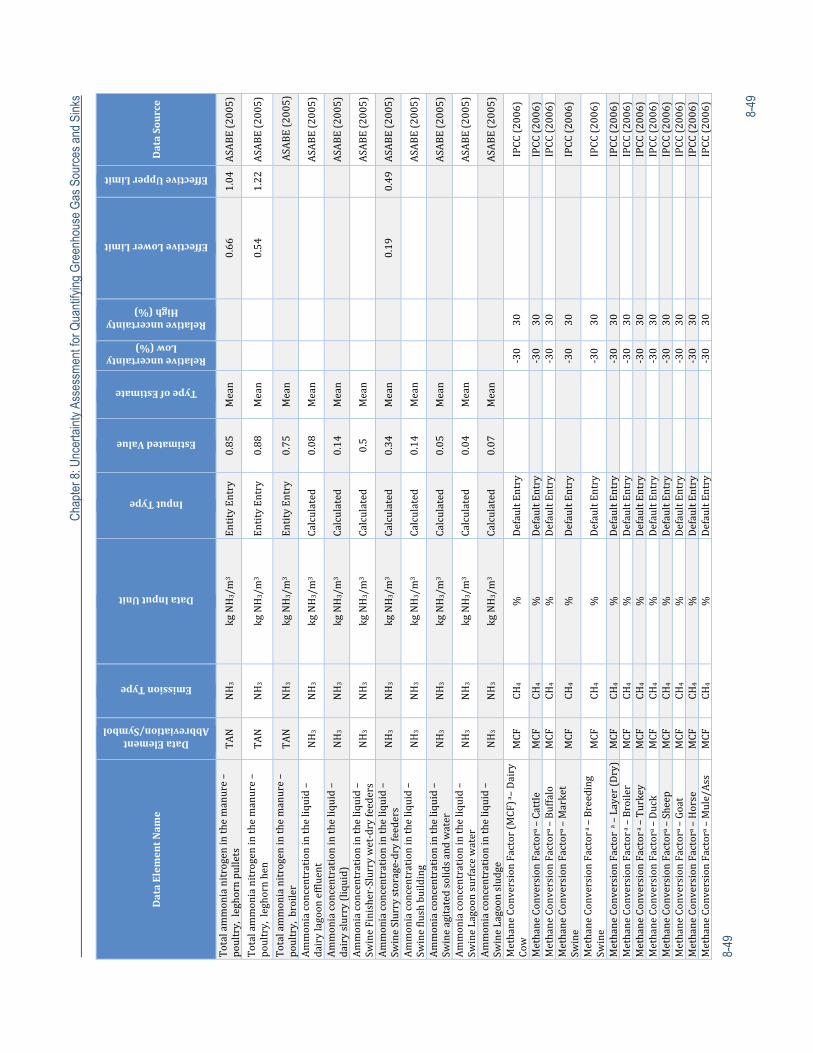
C
hapt
er 8
: Unc
erta
inty
Ass
essm
ent f
or Q
uant
ifyin
g G
reen
hous
e G
as S
ourc
es a
nd S
inks
8-49
8-49
DataElem
entNam
e
DataElementAbbreviation/Symbol
EmissionType
DataInputUnit
InputType
EstimatedValue
TypeofEstimate
RelativeuncertaintyLow(%)
RelativeuncertaintyHigh(%)
EffectiveLowerLimit
EffectiveUpperLimit
DataSource
Totalammonianitrogeninthemanure–
poultry,leghornpullets
TAN
NH3
kgNH3/m
3 EntityEntry
0.85
Mean
0.66
1.04
ASABE(2005)
Totalammonianitrogeninthemanure–
poultry,leghornhen
TAN
NH3
kgNH3/m
3 EntityEntry
0.88
Mean
0.54
1.22
ASABE(2005)
Totalammonianitrogeninthemanure–
poultry,broiler
TAN
NH3
kgNH3/m
3 EntityEntry
0.75
Mean
ASABE(2005)
Ammoniaconcentrationintheliquid–
dairylagooneffluent
NH3
NH3
kgNH3/m
3 Calculated
0.08
Mean
ASABE(2005)
Ammoniaconcentrationintheliquid–
dairyslurry(liquid)
NH3
NH3
kgNH3/m
3 Calculated
0.14
Mean
ASABE(2005)
Ammoniaconcentrationintheliquid–
SwineFinisher‐Slurrywet‐dryfeeders
NH3
NH3
kgNH3/m
3 Calculated
0.5
Mean
ASABE(2005)
Ammoniaconcentrationintheliquid–
SwineSlurrystorage‐dryfeeders
NH3
NH3
kgNH3/m
3 Calculated
0.34
Mean
0.19
0.49
ASABE(2005)
Ammoniaconcentrationintheliquid–
Swineflushbuilding
NH3
NH3
kgNH3/m
3 Calculated
0.14
Mean
ASABE(2005)
Ammoniaconcentrationintheliquid–
Swineagitatedsolidsandwater
NH3
NH3
kgNH3/m
3 Calculated
0.05
Mean
ASABE(2005)
Ammoniaconcentrationintheliquid–
SwineLagoonsurfacewater
NH3
NH3
kgNH3/m
3 Calculated
0.04
Mean
ASABE(2005)
Ammoniaconcentrationintheliquid–
SwineLagoonsludge
NH3
NH3
kgNH3/m
3 Calculated
0.07
Mean
ASABE(2005)
MethaneConversionFactor(MCF)a–Dairy
Cow
MCF
CH4
%
DefaultEntry
‐30
30
IPCC(2006)
MethaneConversionFactor
a –Cattle
MCF
CH4
%
DefaultEntry
‐30
30
IPCC(2006)
MethaneConversionFactor
a –Buffalo
MCF
CH4
%
DefaultEntry
‐30
30
IPCC(2006)
MethaneConversionFactor
a –Market
Swine
MCF
CH4
%
DefaultEntry
‐30
30
IPCC(2006)
MethaneConversionFactor
a–Breeding
Swine
MCF
CH4
%
DefaultEntry
‐30
30
IPCC(2006)
MethaneConversionFactora–Layer(Dry)
MCF
CH4
%
DefaultEntry
‐30
30
IPCC(2006)
MethaneConversionFactor
a–Broiler
MCF
CH4
%
DefaultEntry
‐30
30
IPCC(2006)
MethaneConversionFactor
a–Turkey
MCF
CH4
%
DefaultEntry
‐30
30
IPCC(2006)
MethaneConversionFactor
a –Duck
MCF
CH4
%
DefaultEntry
‐30
30
IPCC(2006)
MethaneConversionFactor
a –Sheep
MCF
CH4
%
DefaultEntry
‐30
30
IPCC(2006)
MethaneConversionFactor
a –Goat
MCF
CH4
%
DefaultEntry
‐30
30
IPCC(2006)
MethaneConversionFactor
a –Horse
MCF
CH4
%
DefaultEntry
‐30
30
IPCC(2006)
MethaneConversionFactor
a –Mule/Ass
MCF
CH4
%
DefaultEntry
‐30
30
IPCC(2006)
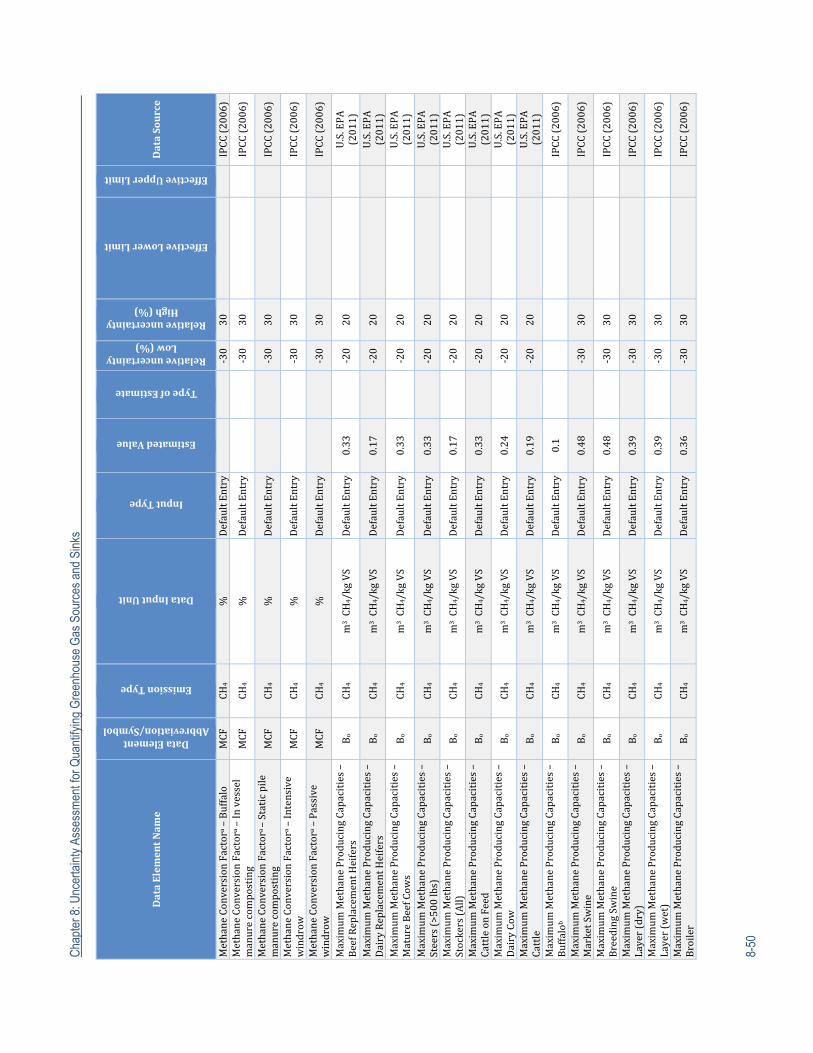
Cha
pter
8: U
ncer
tain
ty A
sses
smen
t for
Qua
ntify
ing
Gre
enho
use
Gas
Sou
rces
and
Sin
ks
8-50
DataElem
entNam
e
DataElementAbbreviation/Symbol
EmissionType
DataInputUnit
InputType
EstimatedValue
TypeofEstimate
RelativeuncertaintyLow(%)
RelativeuncertaintyHigh(%)
EffectiveLowerLimit
EffectiveUpperLimit
DataSource
MethaneConversionFactor
a –Buffalo
MCF
CH4
%
DefaultEntry
‐30
30
IPCC(2006)
MethaneConversionFactor
a –Invessel
manurecomposting
MCF
CH4
%
DefaultEntry
‐30
30
IPCC(2006)
MethaneConversionFactor
a–Staticpile
manurecomposting
MCF
CH4
%
DefaultEntry
‐30
30
IPCC(2006)
MethaneConversionFactor
a –Intensive
windrow
MCF
CH4
%
DefaultEntry
‐30
30
IPCC(2006)
MethaneConversionFactor
a –Passive
windrow
MCF
CH4
%
DefaultEntry
‐30
30
IPCC(2006)
Maximum
MethaneProducingCapacities–
BeefReplacementHeifers
Bo
CH4
m3 CH
4/kgVS
DefaultEntry
0.33
‐20
20
U.S.EPA
(2011)
Maximum
MethaneProducingCapacities–
DairyReplacementHeifers
Bo
CH4
m3 CH
4/kgVS
DefaultEntry
0.17
‐20
20
U.S.EPA
(2011)
Maximum
MethaneProducingCapacities–
MatureBeefCow
sBo
CH4
m3 CH
4/kgVS
DefaultEntry
0.33
‐20
20
U.S.EPA
(2011)
Maximum
MethaneProducingCapacities–
Steers(>500lbs)
Bo
CH4
m3 CH
4/kgVS
DefaultEntry
0.33
‐20
20
U.S.EPA
(2011)
Maximum
MethaneProducingCapacities–
Stockers(All)
Bo
CH4
m3 CH
4/kgVS
DefaultEntry
0.17
‐20
20
U.S.EPA
(2011)
Maximum
MethaneProducingCapacities–
CattleonFeed
Bo
CH4
m3 CH
4/kgVS
DefaultEntry
0.33
‐20
20
U.S.EPA
(2011)
Maximum
MethaneProducingCapacities–
DairyCow
Bo
CH4
m3 CH
4/kgVS
DefaultEntry
0.24
‐20
20
U.S.EPA
(2011)
Maximum
MethaneProducingCapacities–
Cattle
Bo
CH4
m3 CH
4/kgVS
DefaultEntry
0.19
‐20
20
U.S.EPA
(2011)
Maximum
MethaneProducingCapacities–
Buffalo
b Bo
CH4
m3 CH
4/kgVS
DefaultEntry
0.1
IPCC(2006)
Maximum
MethaneProducingCapacities–
MarketSwine
Bo
CH4
m3 CH
4/kgVS
DefaultEntry
0.48
‐30
30
IPCC(2006)
Maximum
MethaneProducingCapacities–
BreedingSw
ine
Bo
CH4
m3 CH
4/kgVS
DefaultEntry
0.48
‐30
30
IPCC(2006)
Maximum
MethaneProducingCapacities–
Layer(dry)
Bo
CH4
m3 CH
4/kgVS
DefaultEntry
0.39
‐30
30
IPCC(2006)
Maximum
MethaneProducingCapacities–
Layer(wet)
Bo
CH4
m3 CH
4/kgVS
DefaultEntry
0.39
‐30
30
IPCC(2006)
Maximum
MethaneProducingCapacities–
Broiler
Bo
CH4
m3 CH
4/kgVS
DefaultEntry
0.36
‐30
30
IPCC(2006)
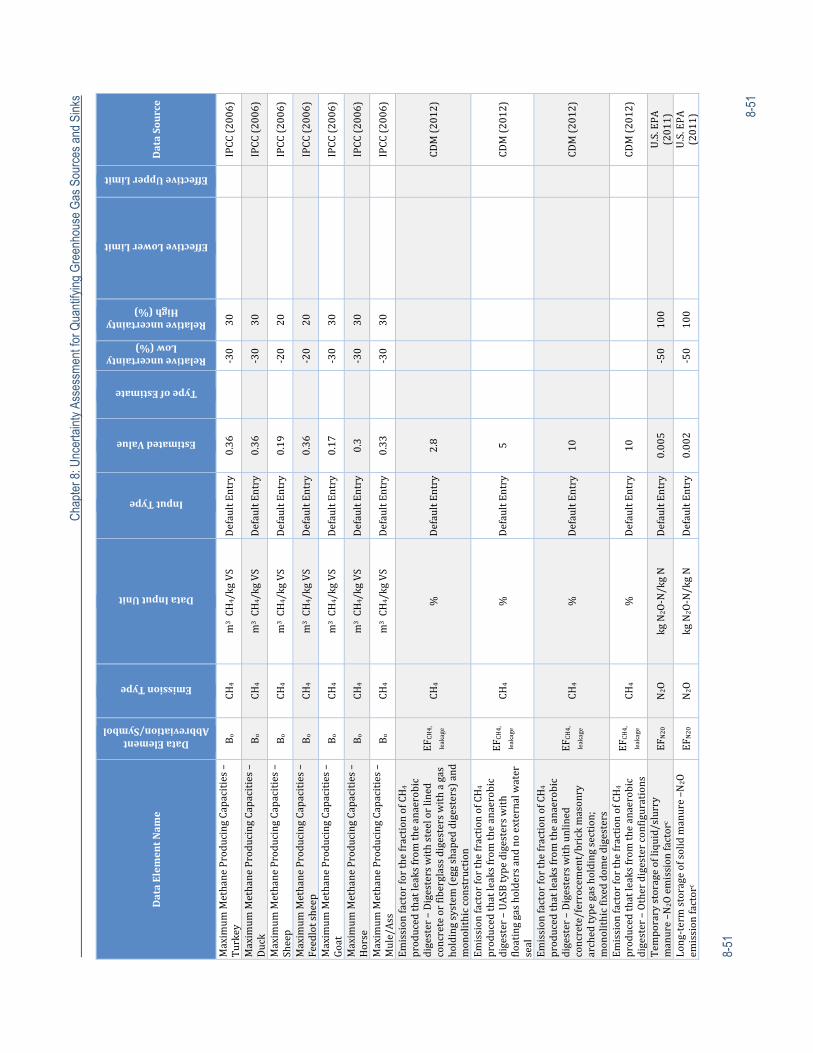
C
hapt
er 8
: Unc
erta
inty
Ass
essm
ent f
or Q
uant
ifyin
g G
reen
hous
e G
as S
ourc
es a
nd S
inks
8-51
8-51
DataElem
entNam
e
DataElementAbbreviation/Symbol
EmissionType
DataInputUnit
InputType
EstimatedValue
TypeofEstimate
RelativeuncertaintyLow(%)
RelativeuncertaintyHigh(%)
EffectiveLowerLimit
EffectiveUpperLimit
DataSource
Maximum
MethaneProducingCapacities–
Turkey
Bo
CH4
m3 CH
4/kgVS
DefaultEntry
0.36
‐30
30
IPCC(2006)
Maximum
MethaneProducingCapacities–
Duck
Bo
CH4
m3 CH
4/kgVS
DefaultEntry
0.36
‐30
30
IPCC(2006)
Maximum
MethaneProducingCapacities–
Sheep
Bo
CH4
m3 CH
4/kgVS
DefaultEntry
0.19
‐20
20
IPCC(2006)
Maximum
MethaneProducingCapacities–
Feedlotsheep
Bo
CH4
m3 CH
4/kgVS
DefaultEntry
0.36
‐20
20
IPCC(2006)
Maximum
MethaneProducingCapacities–
Goat
Bo
CH4
m3 CH
4/kgVS
DefaultEntry
0.17
‐30
30
IPCC(2006)
Maximum
MethaneProducingCapacities–
Horse
Bo
CH4
m3 CH
4/kgVS
DefaultEntry
0.3
‐30
30
IPCC(2006)
Maximum
MethaneProducingCapacities–
Mule/Ass
Bo
CH4
m3 CH
4/kgVS
DefaultEntry
0.33
‐30
30
IPCC(2006)
EmissionfactorforthefractionofCH4
producedthatleaksfrom
theanaerobic
digester–Digesterswithsteelorlined
concreteorfiberglassdigesterswithagas
holdingsystem
(eggshapeddigesters)and
monolithicconstruction
EFCH
4,
leakage
CH4
%
DefaultEntry
2.8
CDM(2012)
EmissionfactorforthefractionofCH4
producedthatleaksfrom
theanaerobic
digester–UASBtypedigesterswith
floatinggasholdersandnoexternalw
ater
seal
EFCH
4,
leakage
CH4
%
DefaultEntry
5
CDM(2012)
EmissionfactorforthefractionofCH4
producedthatleaksfrom
theanaerobic
digester–Digesterswithunlined
concrete/ferrocement/brickmasonry
archedtypegasholdingsection;
monolithicfixeddomedigesters
EFCH
4,
leakage
CH4
%
DefaultEntry
10
CDM(2012)
EmissionfactorforthefractionofCH4
producedthatleaksfrom
theanaerobic
digester–Otherdigesterconfigurations
EFCH
4,
leakage
CH4
%
DefaultEntry
10
CDM(2012)
Tem
porarystorageofliquid/slurry
manure–N
2Oemissionfactor
c EF
N20
N2O
kgN
2O‐N/kgN
DefaultEntry
0.005
‐50
100
U.S.EPA
(2011)
Long‐termstorageofsolidmanure–N
2O
emissionfactor
c EF
N20
N2O
kgN
2O‐N/kgN
DefaultEntry
0.002
‐50
100
U.S.EPA
(2011)
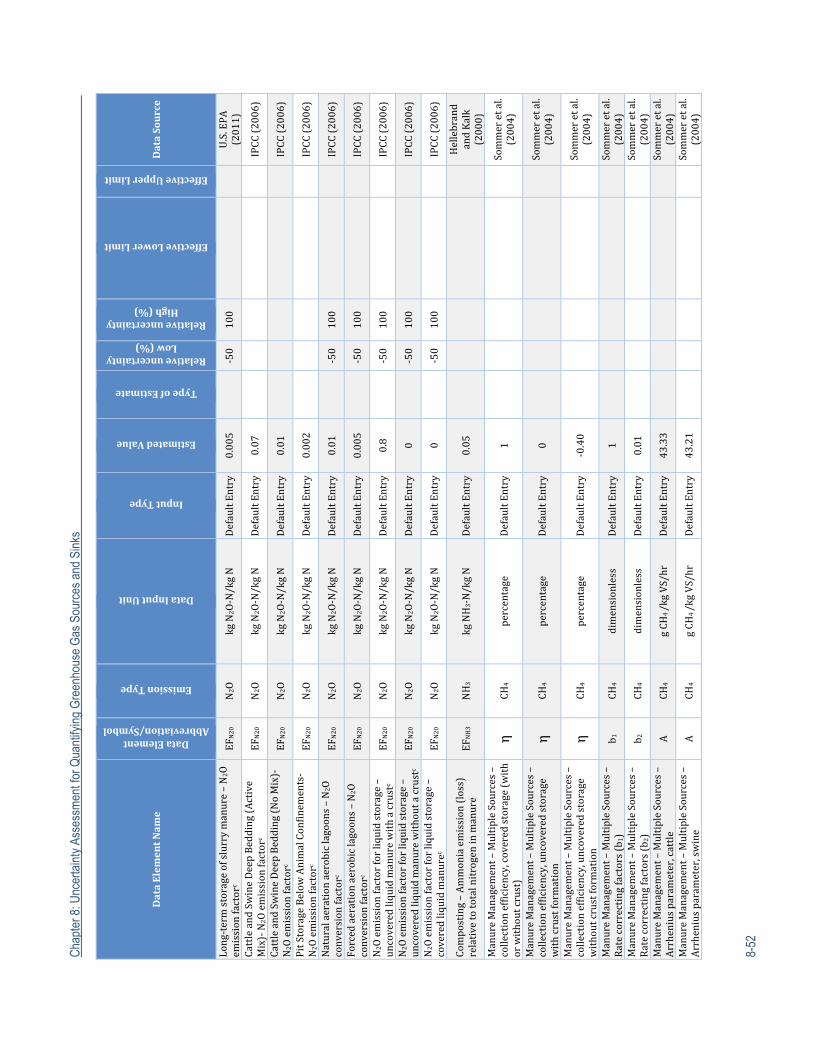
Cha
pter
8: U
ncer
tain
ty A
sses
smen
t for
Qua
ntify
ing
Gre
enho
use
Gas
Sou
rces
and
Sin
ks
8-52
DataElem
entNam
e
DataElementAbbreviation/Symbol
EmissionType
DataInputUnit
InputType
EstimatedValue
TypeofEstimate
RelativeuncertaintyLow(%)
RelativeuncertaintyHigh(%)
EffectiveLowerLimit
EffectiveUpperLimit
DataSource
Long‐termstorageofslurrymanure–N2O
emissionfactor
c EF
N20
N2O
kgN
2O‐N/kgN
DefaultEntry
0.005
‐50
100
U.S.EPA
(2011)
CattleandSwineDeepBedding(Active
Mix)‐N
2Oemissionfactor
c EF
N20
N2O
kgN
2O‐N/kgN
DefaultEntry
0.07
IPCC(2006)
CattleandSwineDeepBedding(NoMix)‐
N2Oemissionfactor
c EF
N20
N2O
kgN
2O‐N/kgN
DefaultEntry
0.01
IPCC(2006)
PitStorageBelow
AnimalConfinem
ents‐
N2Oemissionfactor
c EF
N20
N2O
kgN
2O‐N/kgN
DefaultEntry
0.002
IPCC(2006)
Naturalaerationaerobiclagoons–N2O
conversionfactor
c EF
N20
N2O
kgN
2O‐N/kgN
DefaultEntry
0.01
‐50
100
IPCC(2006)
Forcedaerationaerobiclagoons–N2O
conversionfactor
c EF
N20
N2O
kgN
2O‐N/kgN
DefaultEntry
0.005
‐50
100
IPCC(2006)
N2Oemissionfactorforliquidstorage–
uncoveredliquidmanurewithacrustc
EFN20
N2O
kgN
2O‐N/kgN
DefaultEntry
0.8
‐50
100
IPCC(2006)
N2Oemissionfactorforliquidstorage–
uncoveredliquidmanurewithoutacrustc
EFN20
N2O
kgN
2O‐N/kgN
DefaultEntry
0
‐50
100
IPCC(2006)
N2Oemissionfactorforliquidstorage–
coveredliquidmanurec
EFN20
N2O
kgN
2O‐N/kgN
DefaultEntry
0
‐50
100
IPCC(2006)
Composting–Ammoniaemission(loss)
relativetototalnitrogeninmanure
EFNH3
NH3
kgNH3‐N/kgN
DefaultEntry
0.05
Hellebrand
andKalk
(2000)
ManureManagem
ent–MultipleSources–
collectionefficiency,coveredstorage(with
orwithoutcrust)
ηCH
4percentage
DefaultEntry
1
Sommeretal.
(2004)
ManureManagem
ent–MultipleSources–
collectionefficiency,uncoveredstorage
withcrustformation
ηCH
4percentage
DefaultEntry
0
Sommeretal.
(2004)
ManureManagem
ent–MultipleSources–
collectionefficiency,uncoveredstorage
withoutcrustform
ation
ηCH
4percentage
DefaultEntry
‐0.40
Sommeretal.
(2004)
ManureManagem
ent–MultipleSources–
Ratecorrectingfactors(b
1)
b 1
CH4
dimensionless
DefaultEntry
1
Sommeretal.
(2004)
ManureManagem
ent–MultipleSources–
Ratecorrectingfactors(b
2)
b 2
CH4
dimensionless
DefaultEntry
0.01
Sommeretal.
(2004)
ManureManagem
ent–MultipleSources–
Arrheniusparam
eter,cattle
A
CH4
gCH
4/kgVS/hr
DefaultEntry
43.33
Sommeretal.
(2004)
ManureManagem
ent–MultipleSources–
Arrheniusparam
eter,swine
A
CH4
gCH
4/kgVS/hr
DefaultEntry
43.21
Sommeretal.
(2004)
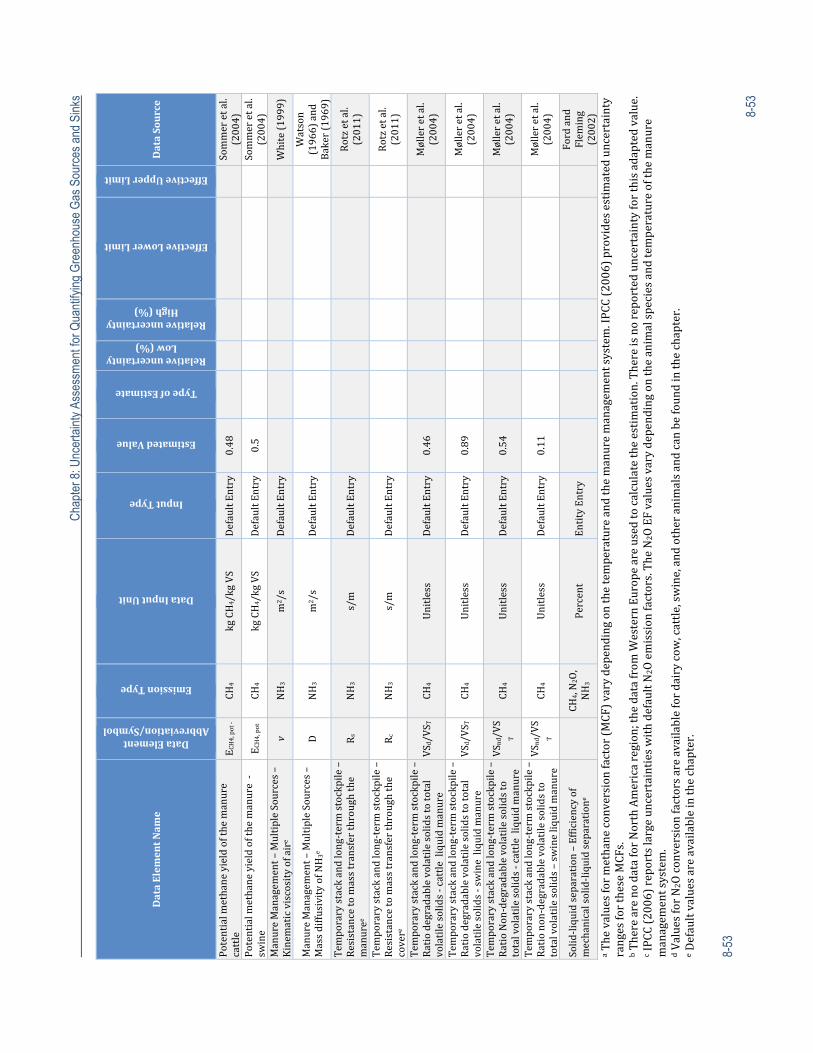
C
hapt
er 8
: Unc
erta
inty
Ass
essm
ent f
or Q
uant
ifyin
g G
reen
hous
e G
as S
ourc
es a
nd S
inks
8-53
8-53
DataElem
entNam
e
DataElementAbbreviation/Symbol
EmissionType
DataInputUnit
InputType
EstimatedValue
TypeofEstimate
RelativeuncertaintyLow(%)
RelativeuncertaintyHigh(%)
EffectiveLowerLimit
EffectiveUpperLimit
DataSource
Potentialm
ethaneyieldofthemanure
cattle
E CH4,pot‐
CH4
kgCH4/kgVS
DefaultEntry
0.48
Sommeretal.
(2004)
Potentialm
ethaneyieldofthemanure‐
swine
E CH4,pot
CH4
kgCH4/kgVS
DefaultEntry
0.5
Sommeretal.
(2004)
ManureManagem
ent–MultipleSources–
Kinem
aticviscosityofaire
vNH3
m2 /s
DefaultEntry
White(1999)
ManureManagem
ent–MultipleSources–
MassdiffusivityofNH3e
D
NH3
m2 /s
DefaultEntry
Watson
(1966)and
Baker(1969)
Tem
porarystackandlong‐termstockpile–
Resistancetomasstransferthroughthe
manuree
Rs
NH3
s/m
DefaultEntry
Rotzetal.
(2011)
Tem
porarystackandlong‐termstockpile–
Resistancetomasstransferthroughthe
covere
Rc
NH3
s/m
DefaultEntry
Rotzetal.
(2011)
Tem
porarystackandlong‐termstockpile–
Ratiodegradablevolatilesolidstototal
volatilesolids‐cattleliquidmanure
VS d/VS T
CH4
Unitless
DefaultEntry
0.46
Mølleretal.
(2004)
Tem
porarystackandlong‐termstockpile–
Ratiodegradablevolatilesolidstototal
volatilesolids‐swineliquidmanure
VS d/VS T
CH4
Unitless
DefaultEntry
0.89
Mølleretal.
(2004)
Tem
porarystackandlong‐termstockpile–
RatioNon‐degradablevolatilesolidsto
totalvolatilesolids‐cattleliquidmanure
VS n
d/VS
T
CH4
Unitless
DefaultEntry
0.54
Mølleretal.
(2004)
Tem
porarystackandlong‐termstockpile–
Rationon‐degradablevolatilesolidsto
totalvolatilesolids–swineliquidmanure
VS n
d/VS
T
CH4
Unitless
DefaultEntry
0.11
Mølleretal.
(2004)
Solid‐liquidseparation–Efficiencyof
mechanicalsolid‐liquidseparation
e
CH4,N2O,
NH3
Percent
EntityEntry
Fordand
Flem
ing
(2002)
a Thevaluesformethaneconversionfactor(MCF)varydependingonthetemperatureandthemanuremanagem
entsystem.IPCC(2006)providesestimateduncertainty
rangesfortheseMCFs.
b TherearenodataforNorthAmericaregion;thedatafrom
WesternEuropeareusedtocalculatetheestimation.Thereisnoreporteduncertaintyforthisadaptedvalue.
c IPCC(2006)reportslargeuncertaintieswithdefaultN
2Oemissionfactors.TheN
2OEFvaluesvarydependingontheanimalspeciesandtemperatureofthemanure
managem
entsystem.
d ValuesforN2Oconversionfactorsareavailablefordairycow,cattle,swine,andotheranimalsandcanbefoundinthechapter.
e Defaultvaluesareavailableinthechapter.
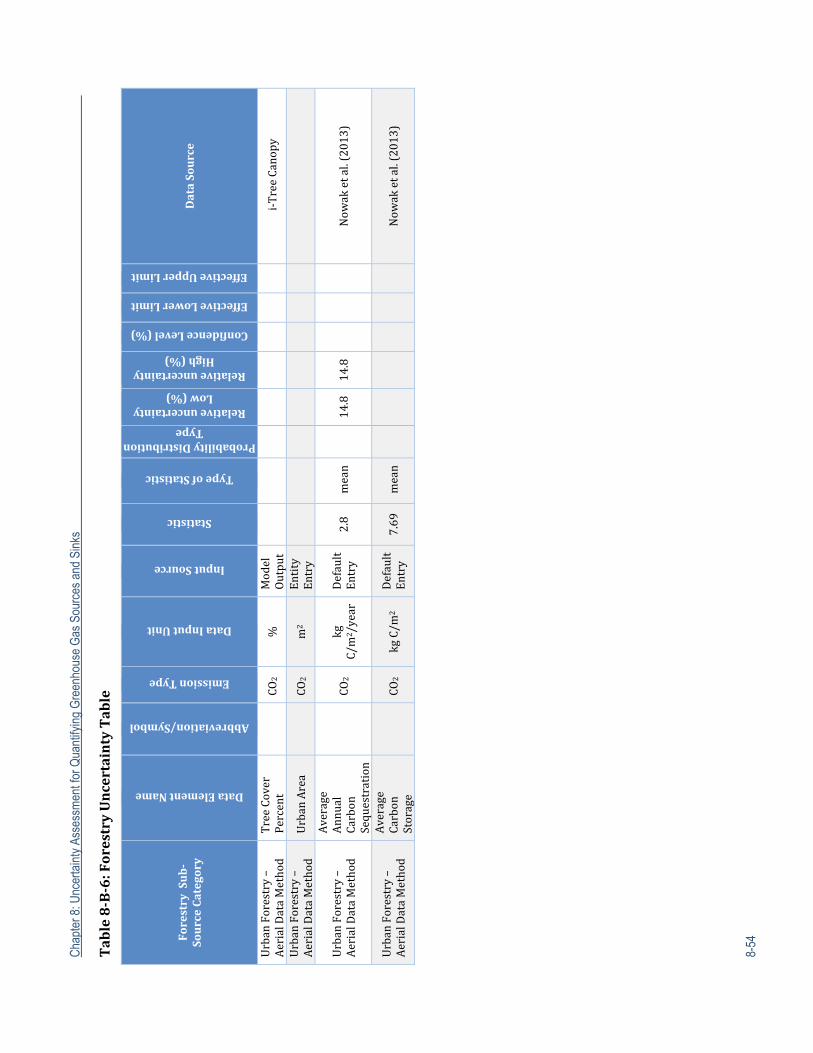
Cha
pter
8: U
ncer
tain
ty A
sses
smen
t for
Qua
ntify
ing
Gre
enho
use
Gas
Sou
rces
and
Sin
ks
8-54
Table8‐B‐6:ForestryUncertaintyTable
ForestrySub‐
SourceCategory
DataElementName
Abbreviation/Symbol
EmissionType
DataInputUnit
InputSource
Statistic
TypeofStatistic
ProbabilityDistributionType
RelativeuncertaintyLow(%)
RelativeuncertaintyHigh(%)
ConfidenceLevel(%)
EffectiveLowerLimit
EffectiveUpperLimit
DataSource
UrbanForestry–
AerialDataMethod
TreeCover
Percent
CO
2%
Model
Output
i‐TreeCanopy
UrbanForestry–
AerialDataMethod
UrbanArea
CO
2m
2 Entity
Entry
UrbanForestry–
AerialDataMethod
Average
Annual
Carbon
Sequestration
CO
2kg
C/m
2 /yearDefault
Entry
2.8
mean
14.814.8
Now
aketal.(2013)
UrbanForestry–
AerialDataMethod
Average
Carbon
Storage
CO
2kgC/m
2 Default
Entry
7.69
mean
Now
aketal.(2013)
Chapter 8: Uncertainty Assessment for Quantifying Greenhouse Gas Sources and Sinks
8-55
Chapter8References
Akiyama,H.,K.Yagi,andX.Yan.2005.DirectN2Oemissionsfromricepaddyfields:Summaryofavailabledata.GlobalBiogeochemicalCycles,19.
ASABE.2005.ManureProductionandCharacteristics,ASABEStandardD384.2MAR2005St.Joseph,MI:AmericanSocietyofAgriculturalandBiologicalEngineers.
Baker,C.E.1969.Self‐DiffusionCoefficientsforGaseousAmmonia.Washington,DC:NationalAeronauticsandSpaceAdministration.
Byrne,K.M.,W.K.Lauenroth,P.B.Adler,andC.M.Byrne.2011.EstimatingAbovegroundNetPrimaryProductioninGrasslands:AComparisonofNondestructiveMethods.RangelandEcologyandManagement,64(5):498‐505.
CDM.2012.Projectandleakageemissionsfromanaerobicdigesters.Ver.01.0.0:CleanDevelopmentMechanism,.
Conant,R.T.,S.M.Ogle,E.A.Paul,andK.Paustian.2011.Measuringandmonitoringsoilorganiccarbonstocksinagriculturallandsforclimatemitigation.FrontiersinEcology,9:169‐173.
deKlein,C.,R.S.A.Novoa,S.Ogle,K.A.Smith,etal.2006.Chapter11:N2Oemissionsfrommanagedsoil,andCO2emissionsfromlimeandureaapplication.In2006IPCCguidelinesfornationalgreenhousegasinventories,Vol.4:Agriculture,forestryandotherlanduse,S.Eggleston,L.Buendia,K.Miwa,T.NgaraandK.Tanabe(eds.).Kanagawa,Japan:IGES.
DelGrosso,S.,W.Parton,A.Mosier,D.S.Ojima,etal.2000.GeneralCH4oxidationmodelandcomparisonsofCH4oxidationinnaturalandmanagedsystems.GlobalBiogeochemicalCycles,14:999‐1019.
Dennis,R.L.,D.Schwede,J.Bash,andJ.Pleim.2011.ExplorationofNitrogenTotalDepositionBudgetUncertaintyattheRegionalScale.ProceedingsoftheNADPAnnualScientificSymposium,October25‐28,2011,Providence,RI.
Ford,M.,andR.Fleming.2002.MechnicalSolid‐LiquidSeparationofLivestockManureLiteratureReview:UniversityofGuelph.
Gregg,T.F.,andS.Hummel.2002.AssessingSamplingUncertaintyinFVSProjectionsUsingaBootstrappingResamplingMethod:U.S.DepartmentofAgriculture,ForestService.http://www.fs.fed.us/rm/pubs/rmrs_p025/rmrs_p025_164_167.pdf.
Harmoney,K.R.,K.J.Moore,J.R.George,E.C.Brummer,etal.1997.Determinationofpasturebiomassusingfourindirectmethods.Agronomy,89:665‐672.
Hellebrand,H.J.,andW.D.Kalk.2000.Emissionscausedbymanurecomposting.AgrartechnischeForschung,6(2):26‐31.
Helton,J.C.,andF.J.Davis.2003.Latinhypercubesamplingandthepropagationofuncertaintyinanalysesofcomplexsystems.ReliabilityEngineering&SystemSafety,81(1):23‐69.
Hummel,S.,M.Kennedy,andE.A.Steel.2013.AssessingforestvegetationandfiresimulationmodelperformanceaftertheColdSpringswildfire,WashingtonUSA.ForestEcologyandManagement,287:40‐52.
IPCC.1997.Revised1996IPCCGuidelinesforNationalGreenhouseGasInventories,PreparedbytheNationalGreenhouseGasInventoriesProgramme.Bracknell,UK:IntergovernmentalPanelonClimateChange.http://www.ipcc‐nggip.iges.or.jp/public/gl/invs1.html.
IPCC.2000.GoodPracticeGuidanceandUncertaintyManagementinNationalGreenhouseGasInventories.http://www.ipcc‐nggip.iges.or.jp/public/gp/english/index.html.
IPCC.2006.2006IPCCGuidelinesforNationalGreenhouseGasInventories,PreparedbytheNationalGreenhouseGasInventoriesProgramme.EditedbyH.S.Eggleston,L.Buendia,K.Miwa,T.NgaraandK.Tanabe.Japan:IGES.http://www.ipcc‐nggip.iges.or.jp/public/2006gl/vol4.html.
Koelsch,R.,andR.Stowell.2005.AmmoniaEmissionsEstimator.Lincoln,NE:UniversityofNebraska.
Chapter 8: Uncertainty Assessment for Quantifying Greenhouse Gas Sources and Sinks
8-56
http://www.msue.msu.edu/objects/content_revision/download.cfm/revision_id.515204/workspace_id.27335/Forms%20for%20Estimating%20Swine%20and%20Dairy%20Emissions.pdf/.
Lauenroth,W.K.,A.A.Wade,M.A.Williamson,B.E.Ross,etal.2006.UncertaintyinCalculationsofNetPrimaryProductionforGrasslands.Ecosystems,9:843‐851.
Li,C.,J.Qiu,S.Frolking,X.Xiao,etal.2002.Reducedmethaneemissionsfromlarge‐scalechangesinwatermanagementofChina’sricepaddiesduring1980–2000.GeophysicalResearchLetters,29(20):1421‐1434.
Lutes,D.2012.PersonalcommunicationwithDuncanLutes,U.S.DepartmentofAgriculture,RockyMountainResearchStation,FireScienceLab,ICFInternational,September,5,2012.
McKay,M.D.,R.J.Beckman,andW.J.Conover.1979.Acomparisonofthreemethodsforselectingvaluesofinputvariablesintheanalysisofoutputfromacomputercode.Technometrics,21(2):239‐245.
Mesinger,F.,G.DiMego,E.Kalnay,K.Mitchell,etal.2006.NorthAmericanregionalreanalysis.BulletinoftheAmericanMeteorologicalSociety,87:343‐360.
Mills,J.A.N.,E.Kebreab,C.M.Yates,L.A.Crompton,etal.2003.Alternativeapproachestopredictingmethaneemissionsfromdairycows.JournalofAnimalScience,81(12):3141‐3150.
Møller,H.B.,S.G.Sommer,andB.K.Ahring.2004.Methaneproductivityofmanure,strawandsolidfractionsofmanure.BiomassandBioenergy,26(5):485‐495.
NADP.2011.AmoniaGasMonitoringNetwork(AMoN):NationalAtmosphericDepostionProgram.http://nadp.sws.uiuc.edu/amon/AMoNfactsheet.pdf
NationalLandCoverDatabase.2008.ErrorSources,Uncertainty,Limitations,andUses.http://topochange.cr.usgs.gov/sources.php
Nowak,D.J.2012.PersonalcommunicationwithDavidJ.Nowak,USDAForestService,NorthernResearchStation,ICFInternational,September5,2012.
Nowak,D.J.,E.J.Greenfield,R.E.Hoehn,andE.Lapoint.2013.CarbonStorageandSequestrationbyTreesinUrbanandCommunityAreasoftheUnitedStates.EnvironmentalPollution,178:229‐236.
Nusser,S.M.,andJ.J.Goebel.1997.Thenationalresourcesinventory:alongtermmonitoringprogramme.EnvironmentalandEcologicalStatistics,4:181‐204.
Ogle,S.M.,F.JayBreidt,M.D.Eve,andK.Paustian.2003.UncertaintyinestimatinglanduseandmanagementimpactsonsoilorganiccarbonstorageforUSagriculturallandsbetween1982and1997.GlobalChangeBiology,9(11):1521‐1542.
Ogle,S.M.,F.J.Breidt,M.Easter,S.Williams,etal.2007.Empiricallybaseduncertaintyassociatedwithmodelingcarbonsequestrationinsoils.EcologicalModelling,205:453‐463.
Ogle,S.M.,F.J.Breidt,M.Easter,S.Williams,etal.2010.ScaleanduncertaintyinmodeledsoilorganiccarbonstockchangesforUScroplandsusingaprocess‐basedmodel.GlobalChangeBiology,16:810‐820.
Olander,L.P.,andK.Haugen‐Kozyra.2011.UsingBiogeochemicalProcessModelstoQuantifyGreenhouseGasMitigationfromAgriculturalManagementProjects,NIR11‐03.Durham,NC:DukeUniversity,NicholasInstituteforEnvironmtalPolicySolutions.
Pearson,T.R.H.,S.L.Brown,andR.A.Birdsey.2007.Measurementguidelinesforthesequestrationofforestcarbon.NewtownSquare,PA:USDepartmentofAgriculture,ForestService,NorthernResearchStation.
Rotz,C.A.,M.S.Corson,D.S.Chianese,F.Montes,etal.2011.Integratedfarmsystemmodel:ReferenceManual.UniversityPark,PA:U.S.DepartmentofAgriculture,AgriculturalResearchService.http://ars.usda.gov/SP2UserFiles/Place/19020000/ifsmreference.pdf.
Salas,W.,S.DeGryze,M.Ducey,D.Gunders,etal.2012.C‐AGGWhitePaper:UncertaintyinModelsandAgriculturalOffsetProtocols.http://c‐agg.org/cm_vault/files/docs/temp_file_C‐AGG_Uncertainty_White_Paper_7‐5‐121.pdf.

Chapter 8: Uncertainty Assessment for Quantifying Greenhouse Gas Sources and Sinks
8-57
Six,J.,S.M.Ogle,F.J.Breidt,R.T.Conant,etal.2004.Thepotentialtomitigateglobalwarmingwithno‐tillagemanagementisonlyrealizedwhenpractisedinthelongterm.GlobalChangeBiology,10(2):155–160.
Smith,J.E.,L.S.Heath,K.E.Skog,andR.A.Birdsey.2006.MethodsforcalculatingforestecosystemandharvestedcarbonwithstandardestimatesforforesttypesoftheUnitedStates.NewtownSquare,PA:USDepartmentofAgriculture,ForestService,NorthernResearchStation.
Smith,K.A.,K.E.Dobbie,B.C.Ball,L.R.Bakken,etal.2000.OxidationofatmosphericmethaneinNorthernEuropeansoils,comparisonwithotherecosystems,anduncertaintiesintheglobalterrestrialsink.GlobalChangeBiology,6(7):791‐803.
Sommer,S.G.,S.O.Petersen,andH.B.Møller.2004.Algorithmsforcalculatingmethaneandnitrousoxideemissionsfrommanuremanagement.NutrientCyclinginAgroecosystems,69:143‐154.
U.S.EPA.2012.InventoryofU.S.GreenhouseGasEmissionsandSinks:1990‐2010.Washington,DC:U.S.EnvironmentalProtectionAgency.http://epa.gov/climatechange/emissions/usinventoryreport.html.
U.S.EPA.2013.InventoryofU.S.GreenhouseGasEmissionsandSinks:1990‐2011.Washington,DC:U.S.EnvironmentalProtectionAgency.http://epa.gov/climatechange/emissions/usinventoryreport.html.
Uresk,D.W.,andT.A.Benzon.2007.MonitoringwithaModifiedRobelPoleonMeadowsintheCentralBlackHillsofSouthDakota.WesternNorthAmericanNaturalist,67(1):46‐50.
USDAERS.1997.CroppingPracticesSurveyData—1995:U.S.DepartmentofAgriculture,EconomicResearchService.http://www.ers.usda.gov/data/archive/93018/.
USDAERS.2011.AgriculturalResourceManagementSurvey(ARMS)FarmFinancialandCropProductionPractices:TailoredReports:U.S.DepartmentofAgriculture,EconomicResearchService.http://ers.usda.gov/Data/ARMS/CropOverview.htm.
USDANRCS.2011a.EcologicalSiteDescription:U.S.DepartmentofAgriculture,NaturalResourcesConservationService.https://esis.sc.egov.usda.gov/.
USDANRCS.2011b.2011NationalResourcesInventory(NRI)GrazingLandOn‐SiteDataCollection:HandbookofInstructions.:U.S.DepartmentofAgriculture,NaturalResourcesConservationService.http://www.nrisurvey.org/nrcs/Grazingland/2011/instructions/instruction.htm.
VanDyck,M.2012.Personalcommunication,MichaelVanDyck,USDAForestService,ForestManagementServiceCenter,September24,2012.
vanKessel,C.,R.Venterea,J.Six,M.A.Adviento‐Borbe,etal.2012.Climate,duration,andNplacementdetermineN2Oemissionsinreducedtillagesystems:ameta‐analysis.GlobalChangeBiology,19(1):33‐44.
Vermeire,L.T.,A.C.Ganguli,andR.L.Gillen.2002.Arobustmodelforestimatingstandingcropacrossvegetationtypes.JournalofRangeManagement,55(494‐497).
West,T.O.,andA.C.McBride.2005.ThecontributionofagriculturallimetocarbondioxideemissionsintheUnitedStates:dissolution,transport,andnetemissions.Agriculture,Ecosystems&Environment,108(2):145‐154.
West,T.O.,C.C.Brandt,L.M.Baskaran,C.M.Hellwinckel,etal.2010.CroplandcarbonfluxesintheUnitedStates:increasinggeospatialresolutionofinventory‐basedcarbonaccounting.EcologicalApplications,20:1074‐1086.
White,F.1999.FluidMechanics.Boston,MA:McGraw‐HillScience/Engineering/Math.Zhang,L.,D.Yu,X.Shi,D.Weindorf,etal.2009.Quantifyingmethaneemissionsfromricefieldsin
theTaihuLakeregion,Chinabycouplingadetailedsoildatabasewithbiogeochemicalmodel.Biogeosciences,6:739‐749.