Embed Size (px)
Citation preview
TitleQuantification of vocal tract configurations of olderchildren with Down syndrome using acoustic reflectiontechnology: a pilot study
Author(s) Xue, SA; Kaine, L; Ng, ML
Citation International Journal of Pediatric Otorhinolaryngology,2010, v. 74 n. 4, p. 378-383
Issue Date 2010
URL http://hdl.handle.net/10722/82538
Rights International Journal of Pediatric Otorhinolaryngology.Copyright © Elsevier Ltd.
1
Quantification of vocal tract configuration of older children
with Down syndrome: a pilot study
Steve An Xue* Division of Speech and Hearing Sciences, The University of Hong Kong, Pokfulam,
Hong Kong
Laura Kaine Department of Speech and Hearing Science, Portland State University, Portland,
USA
Manwa L. Ng Division of Speech and Hearing Sciences, The University of Hong Kong, Pokfulam,
Hong Kong
* Corresponding author. Tel.: +852 2859 0581; fax: +852 2559 0060.
E-mail address: [email protected] (Steve An Xue)
Objective: To quantify the vocal tract (VT) lumen of older children with Down
syndrome using Acoustic Reflection (AR) technology.
Design: Comparative study
Setting: Vocal tract lab with sound-proof booth
Participants: Ten children (4 male and 6 female), aged 9-17 years old diagnosed with
Down syndrome. Ten typically developing children (4 male and 6 female) matched for
age, gender, and race.
Intervention: Each participant’s vocal tract measurements were obtained by using an
Eccovision Acoustic Pharyngometer.
Main outcome measures: Six vocal tract dimensional parameters (oral length, oral
volume, pharyngeal length, pharyngeal volume, total vocal tract length, and total vocal
tract volume) from children with Down syndrome and the typically developing children
were measured and compared.
Results: Children with Down syndrome exhibited small oral cavities when compared
to control group (F (1, 18) = 6.55, p = 0.02). They also demonstrated a smaller vocal
tract volumes (F (1, 18) = 2.58, p = 0.13), although the results were not statistically
significant at the 0.05 level. Pharyngeal length, pharyngeal volume, and vocal tract
length were not significantly different between the two groups.
Conclusion: Children with Down syndrome had smaller oral cavities, and smaller
vocal tract volumes. No significant differences were found for pharyngeal length,
pharyngeal volume, and vocal tract length between these two groups.
*Manuscript
2
Keywords: Vocal Tract Configuration, Down syndrome, Acoustic reflection, Oral
cavity
1. Introduction
Down syndrome is the most common genetic disorder related to mental
retardation, and occurs in approximately 1 in 800-1000 infants [1,2]. The disorder is
caused by a trisomy of chromosome 21, resulting in a particular constellation of
physiological and cognitive symptoms, such as intellectual disability, cranio-facial
abnormalities, conductive hearing loss, and muscle hypotonia (flaccidity) [2-3].
Research has consistently shown that children with Down syndrome demonstrated
particular deficits in speech and language development [4-7]. Expressive language
skills were particularly compromised, affecting verbal expression, phonological
development, articulation, voice quality, and overall speech intelligibility [8-10].
Children with Down syndrome had a significantly higher prevalence rate of
articulatory impairments when compared to typically developing children or those with
other developmental disabilities [11]. Barnes et al. [12] found that in comparison to
children with congenital Fragile X syndrome, children born with Down syndrome made
significantly more errors on speech function tasks as a result of oral-motor difficulties.
They also found that motor impairments related to Down syndrome had a profound
effect on coordination and timing of articulatory movements. The participants in the
study demonstrated particular difficulties executing rapid alterations of speech
movements required for producing multi-syllabic words [13].
Structural abnormalities of the vocal tract in this population were extensively
reported. Westerman et al. [14] reported that the palatal dimensions of patients with
Down’s syndrome were narrower in width, shorter in depth, and lower in height.
Shapiro [15] and Uong et al. [16] suggested that Down syndrome was associated with
3
dramatically shorter palatal lengths. Panchon-Ruiz et al. [17] demonstrated slightly
shorter palatal length in Down syndrome patients. Skrinjaric et al. [18] reported that
patients with Down syndrome displayed significantly higher frequency of shelf-like or
"stair palate" than controls. These structural deviations could have contributed to the
speech deficits observed in this population [9,12].
Various research studies have indicated a relationship between structural
anomalies and oral-motor impairments for people with Down syndrome. In a study, [19]
three pairs of twins, ages 11 and 27 months, were studied and the findings indicated that
the children with Down syndrome exhibited a higher incidence rate of oral motor
impairments, including excessive tongue protrusion, inadequate lip closure, and
uncoordinated jaw function. A study found the general motor deficits in children with
Down syndrome impacted the ability to produce the “rapid, alternating movements and
timing” required to produce accurate speech [13(p233)].
It has long been expected that people with Down syndrome expressed a
different vocal tract configuration. Even today, speech disorders associated Down
syndrome were assumed to be attributed to macroglossia (enlarged tongues), which
resulted in tongue reduction surgeries (partial glossectomy) to improve speech
articulation [20-22]. However, efficacy outcomes for such procedures reflected no
improvements in speech as a result of the operations [23-25]. More recent studies have
supported an alternate hypothesis, suggesting that macroglossia typically associated
with the disorder might be actually the result of a reduced oral cavity creating the
appearance of a larger tongue size [16]. This reduced vocal tract volume may contribute
to speech difficulties by limiting the distance and range of movements of typical-sized
articulators, such as the tongue and velum [20]. In other words, articulatory difficulties
are more likely the result of limited tongue movement in the context of a reduced oral
4
cavity [26]. Smaller anterior facial skeletons and underdeveloped maxillas contribute to
a reduced oral cavity volume, and, thus, may affect speech resonance and range of
motion of the oral articulators [9,27-29].
Smaller mandibles, missing or poorly developed facial bones, and smaller,
wider jaws may indirectly affect speech articulation by creating smaller oral and
pharyngeal cavities, thereby impacting speech sounds resonance through the upper
airway [30]. Relatively enlarged tonsils and adenoids impinge upon the oral and
pharyngeal cavities, further reducing the area of the vocal tract lumen [16]. Similarly,
structural abnormalities of the upper airway may also heighten the risk for feeding and
swallowing difficulties for very young children with Down syndrome [31-32].
Uong et al. [16] used magnetic resonance imaging (MRI) to obtain length, area,
and volume measurements of the upper airway and surrounding tissues of children with
Down syndrome (age, 3.2 ± 1.4 yr) who had no evidence of obstructive sleep apnea
(OSA). By comparing the sequential T1- and T2-weighted spin-echo axial and sagittal
images of children with Down syndrome with those of the normal controls, they found
that children with Down syndrome had smaller airway volume (1.4 ± 0.4 versus
2.3 ± 0.8 cm3 in controls, p < 0.005), causing a smaller
mid- and lower face skeleton in
this population. They had a shorter mental spine-clivus distance, hard palate
length, and
mandible volume. Furthermore, the study also demonstrated that the reduced upper
airway size in children with Down syndrome was not due to increased adenoid and
tonsil size as reported in some previous investigations.
Despite the documented lumen abnormalities associated with Down syndrome,
little is known about the oral and pharyngeal dimensional characteristics of these
children. The objective of this study was to measure the vocal tract lumen of children
with Down syndrome by using Acoustic Reflection (AR) technology (Eccovision
5
Acoustic Pharyngometer; Sensormedics Corp., Yorba Linda, CA). Specifically, the
purposes of this study were to 1) quantify the vocal tract configurations of children with
Down syndrome; 2) compare this data against that of typically developing children to
determine if significant differences are observed between these two populations; 3)
locate specific structural differences along the vocal tract, thereby indicating a potential
relationship to speech and/or swallowing difficulties observed in children with Down
syndrome; and 4) establish preliminary data of the vocal tract configuration for this
population. The study applied non-invasive and cost-effective AR technology that was
quite suitable for similar studies that involved large numbers of participants,
particularly older children with different types of disorder.
2. Methods
2.1 Participants
This study compared the area-distance curves representing the upper airway of
children with Down syndrome against the typically developing controls. The study
included 10 older children (4 male and 6 female) diagnosed Down syndrome, aged 9-17
years old. The typically developing controls included 10 children (4 male and 6 female)
matched for age, gender, and race. The matching of age, gender and race was important
given the large range of ages of older children involved in the investigation, as well as
possible gender and race related differences in the VT of older children [33,34]. The
participants were recruited from disability advocacy groups in the Portland metro area.
Normative data was obtained from a data set used in a previous study [33,35]. using the
same procedures and study criteria. All participants were screened for the absence of
the following: (1) co-morbid structural anomalies, such as cleft lip or cleft palate; (2)
co-morbid neurological impairments; (3) upper respiratory infection at the time of
6
testing; (4) and previous oro-maxillo-facial surgeries. All participants passed a
pure-tone threshold hearing screening bilaterally at 30 dB (HL) for 500Hz, 1,000 Hz,
and 2,000 Hz, and 4,000 Hz. Although the normative growth patterns of Down
syndrome children are different from those of typically developing children [36], the
six VT parameters measured in this study were anatomical in nature, and were highly
correlated with body size [37,38], thus attempts were also made to control the
homogeneity of body sizes. A one-way ANOVA revealed no statistical significance for
weight (F (1, 18) = 1.32, p = 0.27), body mass index (F (1, 18) = 0.012, p = 0.91) and
height (F (1, 18) = 4.21, p > .05) between the two groups. Table 1 listed the
demographic information for the study groups. (Table 1 to be inserted here.). The
Institutional Review Board of Portland State University reviewed the study protocol
before data collection commenced, and oral and written informed consent was obtained
from the parents or legal guardians of all the participants according to the Declaration
of Helsinki.
2.2 Testing Equipment: Acoustic Reflection (AR) Technology
Pharyngometric measurements were obtained using an Eccovision Acoustic
Pharyngometer ™. This device consisted of two microphones and one sound generator
mounted on a 30-cm-long, 1.89-cm inner diameter wave tube, and a microcomputer
equipped with digital-to-analog and analog-to-digital converters for software and data
processing. The use of AR technology has been demonstrated as a viable option for
delineating the parameters of the human upper airway [39-44]. This procedure uses
acoustic energies, which are transmitted through a tube into the airway. A fraction of
the acoustic wave is reflected back at each point of discontinuity in the upper airway
and is recorded by a microphone attached to the mouthpiece [43]. The other end of the
7
transmitting tube is connected with the CPU that transforms the wave signal with
algorithms into dimensional values shown on the monitor (see Figure 1). The device
underwent an automatic self-calibration as set by the manufacturer each time a
participant was tested. The cross-sectional area of the vocal tract as a function of the
distance from the lips to the glottis was plotted (see Figure 2) according to the
amplitude and arrival times of acoustic returns. The measured area–distance curves
through mouth breathing, that correspond to major vocal tract morphological marks
were selected for analysis according to the following criteria: (a) the oral pharyngeal
juncture (OPJ that refers to the velum area demarcating oral cavity and pharyngeal
cavity) of the mouth-breathing curve best matched the OPJ of the nose-breathing curve,
and (b) the curve fluctuated with the smallest magnitude due to airflow changes. The
resultant volume–distance relationships were divided into two sections by
hand-marking to separate the oral cavity from the pharyngeal cavity as outlined by the
manufacturer, using the following standard criteria: an oral region extending from the
incisors to the anterior margin of OPJ and a pharyngeal region extending from the oral
pharynx to the end of hypo-pharynx (the glottis) (Figure 3). Six measured
volume–distance curves were obtained for each participant: oral volume, pharyngeal
volume, vocal tract volume (in cubic centimeters), oral length, pharyngeal length and
vocal tract length (in centimeters).
2.3 Testing Procedures
In accordance with manufactures guidelines, each participant was tested three
times using the following procedure:
1. All subjects were tested while sitting upright in a chair while demonstrating
good postural control and head support during normal tidal breathing.
8
2. A new, sanitized mouthpiece was selected for each participant and sized for
optimal fit to prevent air leakage. The wave tube was positioned so that it was
positioned parallel to the ground, creating a straight line to the pharyngometer.
3. Subjects were asked to focus on a certain point in space, which was indicated by
a picture the researcher attached to the wall. The researcher assisted the
participant in sitting up straight and remaining still. The participant was then
prompted to think silently of an “oooh” sound to relax the facial muscles, bring
the tongue to a neutral position, and close the velum thereby preventing air
leakage through the nasal cavity.
4. The clinician elicited three curves during normal mouth breathing. For those
children who had difficulty of maintaining mouth breathing, the clinician would
use index finger and thumb to approximate their nasal cavities towards the nasal
septum to seal nasal breathing. The calculations of these curves were averaged
for each participant across the six VT parameters. Note: for one participant,
only one valid trial was obtained; consequently, the values for this participant
were not based on an average of three trials.
3. Results
The group means and standard deviations of the oral length, oral volume,
pharyngeal length, pharyngeal volume, total vocal tract length, and total vocal tract
volume for typically developing children and children with Down syndrome were listed
in Table 2. (Table 2 to be inserted here). A one-way ANOVA test with Down syndrome
as the independent variable and the six vocal tract parameters as the dependent
variables was performed to determine if there were significant differences in the vocal
tract parameters between the two groups. Significant differences in vocal tract
9
dimensions of participants in the experimental group and the control group were found
in oral volume (F (1, 18) = 6.55, p= 0.02), suggesting that children with Down
syndrome exhibit small oral cavities when compared to their typically developing
cohorts. Additionally, children with Down syndrome demonstrated a trend toward
smaller vocal tract volumes (F (1, 18) = 2.58, p = 0.13), although these results were not
statistically significant at the 0.05 level. Pharyngeal length, pharyngeal volume, and
vocal tract length were not significantly different between the two groups. (Figure 4 to
be inserted here).
4. Discussion
AR technology has been extensively used as an objective diagnostic tool for
locating structural and functional abnormalities within the oral and pharyngeal cavities,
used in a variety of clinical applications, including 1) locating site and severity of vocal
tract obstructions for patients with sleep apnea [45,46]; 2) establishing degree of nasal
airway abnormalities [47,48]; and 3) determining optimal endotracheal tube
positioning [41], and 4) documenting changes in the vocal tract due to race and aging
[33-35,49]. AR can be a valuable alternative to other objective diagnostic techniques,
such as MRI, fluoroscopy, or ultrasound, for assessment of the vocal tract, as the
procedure is completely non-invasive and does not expose the participants to radiation.
Comparative studies by D’Urzo et al. [50] and Marshall et al. [51] found that AR
measurements could be used in lieu of MRI and CT for quantifying some aspects of
vocal tract configurations.
The current results indicated that children with Down syndrome had different
vocal tract configurations from those of typically developing children. Particularly, this
group may have smaller oral cavities compared to their normally developing cohorts.
10
This finding has direct clinical implications for speech-language pathologists and other
allied health professionals in assessing and treating speech and swallowing difficulties
for this population. Previous studies have indicated a correlation between Down
syndrome and enlarged tongue size; however, others argued that tongue size maybe
normal though it appeared larger within the context of a smaller oral cavity in Down
syndrome patients [20]. Uong et al. [16] used MRI to quantity the sizes of major
articulators and they found that Down syndrome children had similar tongue sizes with
the general population, but smaller mid- and lower face skeleton. Such anatomical
reports were in accordance with the findings of the present investigation. Macroglossia
(enlarged tongues) among Down syndrome children may not be the “standard” feature
of this population. Although larger numbers of Down syndrome participants and
typically developing controls with smaller age disparities are clearly needed for future
studies in order to anatomically confirm the smaller oral cavities among Down
syndrome children, these pilot data logically raised serious questions and concerns on
the continuous use of partial glossectomy as a therapeutic modality for Down syndrome
patients.
The current results showed no differences in the pharyngeal length and
volumes between Down syndrome and normal groups. Since most of the intrinsic
lingual musculatures do not extend into the pharyngeal cavities, reduction of lingual
motility and restricted range of motion of the oral articulators may contribute, to some
extent, to the articulatory difficulties associated with the disorder. A smaller oral cavity
together with typical-sized oral articulators may inhibit the coordination of the rapid,
alternating movements of the articulators required for speech, thereby reducing
intelligibility [13]. Such articulatory differences may also contribute to impairments in
speech-motor development. Structural differences “are likely to influence
11
speech-motor development and consequently negatively impact the articulatory and
phonatory abilities of children with Down syndrome” [10(p301)]. Since function and
structure are intrinsically reciprocal to each other, the restricted movements of the
articulators can also contribute to the development of structural differences in the Down
syndrome population. This is illustrated by the findings that there were more
similarities than differences between Down syndrome children and their typically
developing younger cohorts among younger children than older children [27,28].
Differences in vocal tract volumes are also correlated with changes in vocal
qualities. A recent line of research found that volumetric sizes of the vocal tract could
be linked to acoustic differences across different racial groups, as well as different age
groups [33-35]. These findings indicated some limitations of the traditional
tube-resonator model in which vocal tract length has been used as the primary factor in
predicting changes in formant frequencies. As the authors stated [35(p638)],
“morphological differences (especially vocal tract volumetric parameters) are partially
responsible for formant frequency differences”. Other studies have further supported
the hypothesis that volumetric differences of the vocal tract affect vocal quality. For
instance, Leddy [26(p71)] concluded that structural differences observed in Down
syndrome, “may create a smaller mouth and throat, which may influence how speech
sounds travel through those spaces and how vocal quality is produced”.
Differences in oral cavity volume may also be related to feeding and
swallowing difficulties in infants with Down syndrome. A smaller oral cavity can
result in difficulties with sucking, swallowing, and salivation [32]. Decreased sucking
pressure during feeding associated with Down syndrome may be exacerbated by
reduced oral cavity volume by causing the tongue to impinge upon the back of the
mouth, thereby inhibiting the coordinated, peristaltic tongue movements required for
12
proper feeding [52]. Furthermore, decreased oral cavity could contribute to an
open-mouth breathing posture during feeding, which is disadvantageous for
maintaining sufficient sucking pressure during feeding [52,53]. Restrictions in lingual
motility as a result of a smaller oral cavity may induce oral-phase swallowing
difficulties with regard to mastication, bolus formation, and oral transit times [52].
Understanding of these factors is critical for speech-language pathologists in devising
appropriate feeding interventions especially for Down syndrome children at very young
ages.
This pilot study was clearly limited by the small number of participants and the
large age disparities among the participants. Due to the difficulties of some
participating Down syndrome children to follow the examiners’ directions of mouth
breathing during pharyngometric recording, the testing procedures were not exactly
consistent across all participants. However, the investigation demonstrated that AR
technology could be used for large scale comparative studies of vocal tract
configurations when it is not feasible to use MRI and other conventional imaging
technologies. The findings of the study motivated the speech pathologists to develop
new therapies with the aim of enhancing the compromised mobility of the articulators
within smaller oral cavities of Down syndrome children. It also raised legitimate
concerns for the continuous use of partial glossectomy for treating children and adults
with Down syndrome.
Clinical Message
Children with Down syndrome may have smaller oral cavities, and smaller
vocal tract volumes when compared to the typically developing children. Therefore,
partial glossectomy as a rehabilitation treatment for this population is not clinically
justified.
13
Acknowledgements
We would like to thank all the children with Down syndrome and their normal
cohorts who participated in this investigation. The study was partially supported by the
Seed Funds for Faculty from the University of Hong Kong.
References
[1] Laws G. Contributions of phonological memory, language comprehension and
hearing to the expressive language of adolescents and young adults with down
syndrome. J Child Psychol Psychiatry 2004;45:1085-1095.
[2] McGrowther CW, Marshall B. Recent trends in incidence, morbidity, and
survival in down’s syndrome. J Ment Defic Res 1990;34:49-57.
[3] Kumin L. Intelligibility of speech in children with down syndrome in natural
settings: parents’ perspective. Percept Mot Skills 1994;78:307-313.
[4] Kumin L. Speech and language skills in children with down syndrome. Ment
Retard Dev Disabil Res Rev 1996;2:109-115.
[5] Buckley SJ. Improving the expressive language skills of teenagers with down
syndrome. Downs Syndr Res Pract 1995;3:110-115.
[6] Chapman R, Hesketh L. Behavioral phenotype of individuals with down
syndrome. Ment Retard Dev Disabil Res Rev 2000;6:84-95.
[7] Rondal J. Down’s syndrome. In: Bishop D, Mongford, editors. Language
development in exceptional circumstances. London: Lawrence Earlbaum
Associates, 1993;165-176.
[8] Chapman R. Language development in children and adolescents with down
syndrome. In: Fletcher P, MacWhinney B, editors. Handbook of child language.
Oxford: Blackwell Publishers, 1995;641-663.
[9] Miller J, Leddy M. Verbal fluency, speech intelligibility, and communicative
effectiveness. In: Miller J, Leddy M, Leavitt L, editors. In improving the
communication of people with Down syndrome. Baltimore: Paul H. Brooks
Publishing Co, 1999;81-91.
[10] Stoel-Gammon C. Down syndrome: effects on language development. ASHA
1990;32:42-44.
[11] Rosin M, Swift E, Khidr A, Bless D, Vetter D. Communication profiles of
adolescents with down syndrome. J Child. Commun Disord 1988;12:49-64.
[12] Barnes E, Roberts J, Mirrett P, Sideris J, Misenheimer J. A comparison of oral
structure and oral-motor function in young males with fragile x syndrome and
down syndrome. J Speech Lang Hear Res 2006;49:903-917.
[13] Miller J. Language and communication characteristics of children with Down
syndrome. In: Pueschel SM, editor. New perspectives in Down syndrome.
Baltimore: Paul Brookes Publishers, 1987;232-262.
[14] Westerman GH, Johnson R, Cohen MM.Variations of palatal dimensions in
patients with down’s syndrome. J Dent Res 1974;50:767-771.
[15] Shapiro BL. Amplified developmental instability in down’s syndrome. Ann Hum
Genet 1975;38:429-437.
[16] Uong EC, McDonough JM, Tayag-Kier CE, Zhao H, Haselgrove J, Mahboubi S
14
et al. Magnetic resonance imaging of the upper-airway in children with down
syndrome. Am J Respir Crit Care Med 2001;163:731-736.
[17] Panchon-Ruiz A, Jornett-Carrillo V, Sanchez del Campo F. Palate vault
morphology in down syndrome. J Craniofac Genet Dev Biol 2000;20:198-200.
[18] Skrinjaric T, Glavina D, Jukic J. Palatal and dental arch morphology in down
syndrome. Coll Antropol 2004;28:841-847.
[19] Spender Q, Stein A, Dennis J, Reilley S, Percy E, Cave D. An exploration of
feeding difficulties in children with DS. Dev Med Child Neurol 1996;38:681-694.
[20] Adran GM, Harker P, Kemp F. Tongue size in down syndrome. J Ment Defic
1972;16:160-166.
[21] Lemperle G, Radu D. Facial plastic surgery in children with down's syndrome.
Plast. Reconstr Surg 1980;66:337-345.
[22] Rozner L. Facial plastic surgery for down's syndrome. Lancet 1983;1:1320-1323.
[23] Margar-Bacal F, Witzel MA, Munro IR. Speech intelligibility after partial
glossectomy in children with down’s syndrome. Plast Reconstr Surg
1987;79:44-47.
[24] Klaiman P, Witzel MA, Margar-Bacal F, Munro IR. Changes in aesthetic
appearance and intelligibility of speech after partial glossectomy in patients with
down syndrome. Plast Reconstr Surg 1988;82:403-408.
[25] Parsons CL, Iacono TA, Rozner L. Effect of tongue reduction on articulation in
children with down syndrome. Am J Ment Defic 1987;91:328-332.
[26] Leddy M. The Relations among Select Vocal Function Characteristics of Adult
Males with Down Syndrome [Unpublished doctoral dissertation]. Madison:
University of Wisconsin, 1996.
[27] Farkas LG, Katic MJ, Forrest CR. Surface anatomy of
the face in down's syndrome: Anthropometric proportion indices in the
craniofacial regions. J Craniofac Surg 2001;12:519-526.
[28] Farkas LG, Katic MJ, Forrest CR. Age-related changes
in anthropometric measurements in the craniofacial regions and in height in
down's syndrome. J Craniofac Surg 2001;13:614-622.
[29] Farkas LG, Katic MJ, Forrest CR, Litsas L. Anatomical Landmarks: surface
anatomy of the face in down’s syndrome: linear and angular measurements in
craniofacial regions. J craniofac surg 2001;12:373-379.
[30] Pentz A. Formant amplitude of children with Down syndrome. Am J Ment Defic
1987;92:230-233.
[31] Field D, Garland M, Williams K. Correlates of specific childhood feeding
problems. J Paediatr Child Health 2003;39:299-304.
[32] Mizuno K, Ueda A. Development of sucking behavior in infants with down
syndrome. Acta Paediatr 2001;90:1384-1388.
[33] Xue S, Hao G. Developmental Changes in the Young Adolescents’ Vocal Tract
Dimensions. Proceedings of the 2003 American Speech-Language-Hearing
Convention: Chicago, 2003b.
[34] Xue S, Hao G, Mayo R. Volumetric measurements of vocal tracts for male
speakers from different races. Clin Linguist Phon 2006;20:691-702.
[35] Xue A, Hao G. Changes in the human vocal tract due to aging and the acoustic
correlates of speech production: a pilot study. J Speec Lang Hear Res
2003a;46:689-701.
[36] Myrelid A, Gustafsson J, Ollars B, Anneren G. Growth charts for down's
syndrome from birth to 18 years of age. Arch Dis Child 2002;87:97-103.
[37] Fitch WT. Vocal Tract Length Perception and the Evolution of Language
15
[Dissertation]. Providence: Brown University, 1994.
[38] Fitch WT. Vocal tract length and format frequency dispersion correlate with body
size in rhesus macaques. J Acoust Soc Am 1997;102:1213-1222.
[39] Brooks L, Byard P, Fouke J. Reproducibility of measurements of upper airway by
acoustic reflection. J Appl Physiol 1989;66:2901-2905.
[40] Brown I, Zamel N, Hoffstein V. Pharyngeal cross-sectional area in normal men
and women. J Appl Physiol 1986;61:890-895.
[41] Eckmann D, Glassenberg R, Gavriely N. Acoustic reflectometry and
endotracheal intubation. Anesth Analg 1996;83:1084-1089.
[42] Fredberg J, Wohl M, Glass G, Dorkin H. Airway area by acoustic reflection
measured at the mouth. J Appl Physiol 1980;48:749-758.
[43] Kamal I. Normal standard curve for acoustic pharyngometry. Otolaryngol Head
Neck Surg 2001;124:323-330.
[44] Louis B, Glass G, Fredberg J. Pulmonary airway area by the two-microphone
acoustic reflection method. J Appl Physiol 1994;76:2234-2240.
[45] Bradley T, Brown I, Grossman R, Zamel N, Martinex D, Phillipson E et al.
Pharyngeal size in snorers, nonsnorers, and patients with obstructive sleep apnea.
N Engl J Med 1986;315:1327-1331.
[46] Rivlin J, Hoffstein V, Kalbfeisch J, McNicholas W, Zamel N, Bryan A. Upper
airway morphology in patients with idiopathic obstructive sleep apnea. Am Rev
Respir Dis 1984;129:355-360.
[47] Corey J, Gungor A, Nelson R, Liu X, Fredberg J. Normative standards for nasal
cross-sectional areas and volumes obtained with acoustic rhinometry.
Otolaryngol Head Neck Surg 1998;117:349-354.
[48] Dang J, Honda K, Suzuki H. Morphological and acoustical analysis of the nasal
and prenasal cavities. J Acoustl Soc Am 1994;96:2088-2100.
[49] Xue A, Jian J, Lin E, Glassenberg R, Mueller P. Age-related changes in the
human vocal tract configurations and the effects on speakers’ vowel formant
frequencies: a pilot study. Logoped Phoniatr Vocol 1999;24:132-137.
[50] D’Urzo A, Lawson V, Vassal K, Rebuck A, Slutsky S, Hoffstein V. Airway area
by acoustic response measurements and computerized tomography. Am Rev
Respir Dis 1987;125:392-398.
[51] Marshall I, Maran N, Martin S, Jan M, Rimmington J, Best J et al. Acoustic
reflectometry for airway measurements in man: implementation and validation.
Physiol Meas 1993;14:157-169.
[52] Morris S, Klein M. Pre-feeding skills. 2nd ed. San Antonio: Therapy Skill
Builders, 2000;356-444.
[53] Wolf L, Glass R. Feeding and swallowing disorders in infancy: assessment and
management. San Antonio: Therapy Skill Builders, 1992;233-247.
16
Captions:
Figure 1. Schematic Chart of Pharygometer.
Figure 2. 3-D Illustration of Vocal Tract.
Figure 3. Area-distance curve of vocal tract dimensions from a pharyngometer. Note:
Pharyngeal Cavity is calculated by combining Oral Pharynx and Hypo-pharynx.
Figure 4. Average oral length (OL), pharyngeal length (PL), vocal tract length (VTL),
oral volume (OV), pharyngeal volume (PV), and vocal tract volume (VTV) for children
with Down syndrome (DS) and typically-developing children (TD).
Figure2. Oral
Volume (OV),
pharyngeal volume (PV), and
total vocal volume (VV) of
typically
developing children (TD)
and children with Down syndrome
(DS).
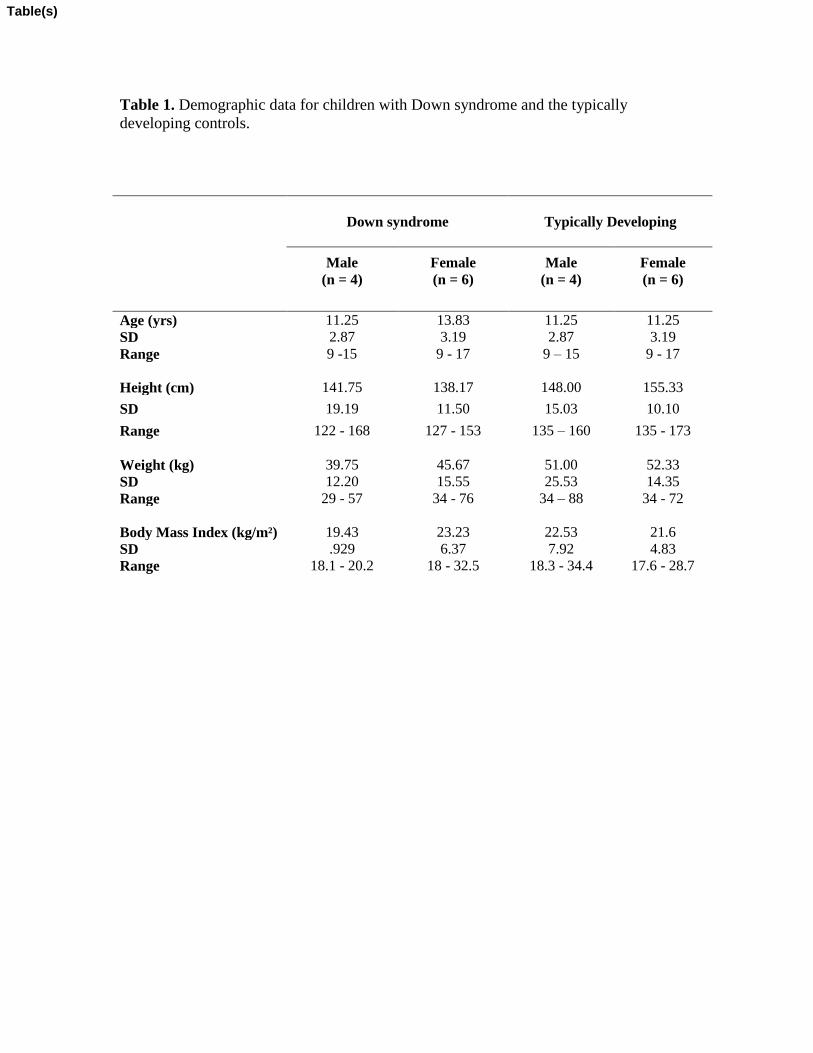
Table 1. Demographic data for children with Down syndrome and the typically
developing controls.
Down syndrome
Typically Developing
Male
(n = 4)
Female
(n = 6)
Male
(n = 4)
Female
(n = 6)
Age (yrs) 11.25 13.83 11.25 11.25
SD 2.87 3.19 2.87 3.19
Range 9 -15 9 - 17 9 – 15 9 - 17
Height (cm) 141.75 138.17 148.00 155.33
SD 19.19 11.50 15.03 10.10
Range 122 - 168 127 - 153 135 – 160 135 - 173
Weight (kg) 39.75 45.67 51.00 52.33
SD 12.20 15.55 25.53 14.35
Range 29 - 57 34 - 76 34 – 88 34 - 72
Body Mass Index (kg/m²) 19.43 23.23 22.53 21.6
SD .929 6.37 7.92 4.83
Range 18.1 - 20.2 18 - 32.5 18.3 - 34.4 17.6 - 28.7
Table(s)
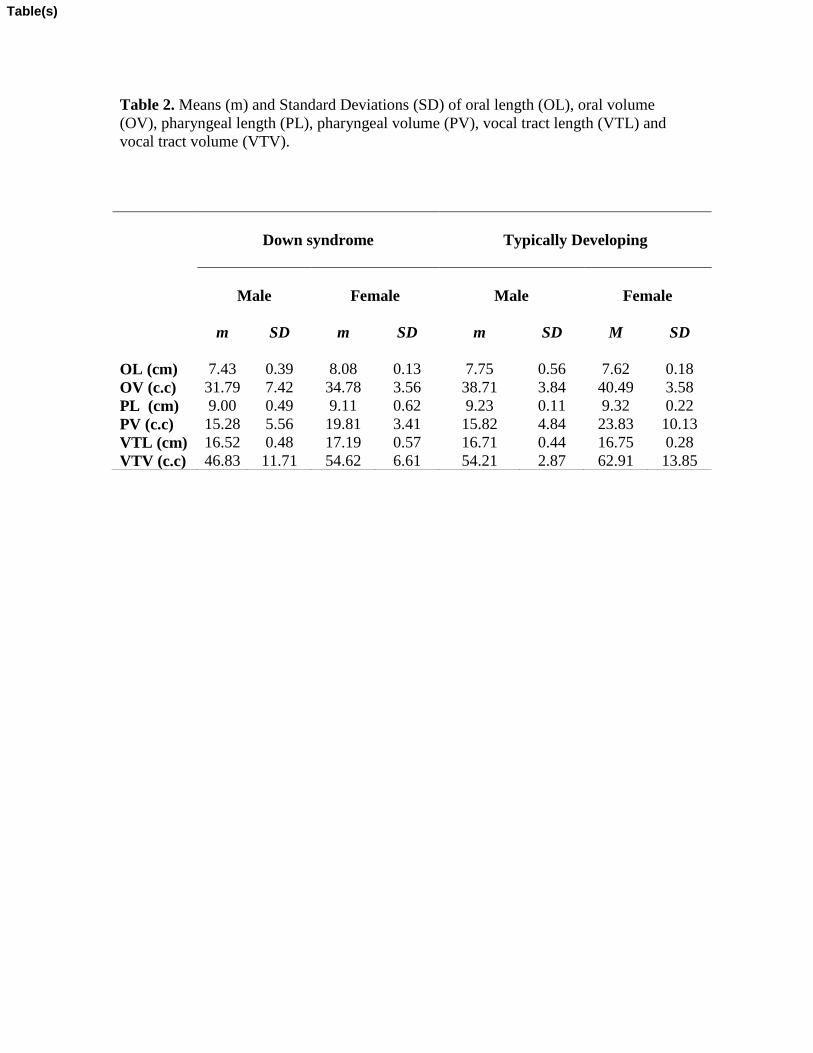
Table 2. Means (m) and Standard Deviations (SD) of oral length (OL), oral volume
(OV), pharyngeal length (PL), pharyngeal volume (PV), vocal tract length (VTL) and
vocal tract volume (VTV).
Down syndrome
Typically Developing
Male
Female
Male
Female
m
SD
m
SD
m
SD
M
SD
OL (cm) 7.43 0.39 8.08 0.13 7.75 0.56 7.62 0.18
OV (c.c) 31.79 7.42 34.78 3.56 38.71 3.84 40.49 3.58
PL (cm) 9.00 0.49 9.11 0.62 9.23 0.11 9.32 0.22
PV (c.c) 15.28 5.56 19.81 3.41 15.82 4.84 23.83 10.13
VTL (cm) 16.52 0.48 17.19 0.57 16.71 0.44 16.75 0.28
VTV (c.c) 46.83 11.71 54.62 6.61 54.21 2.87 62.91 13.85
Table(s)
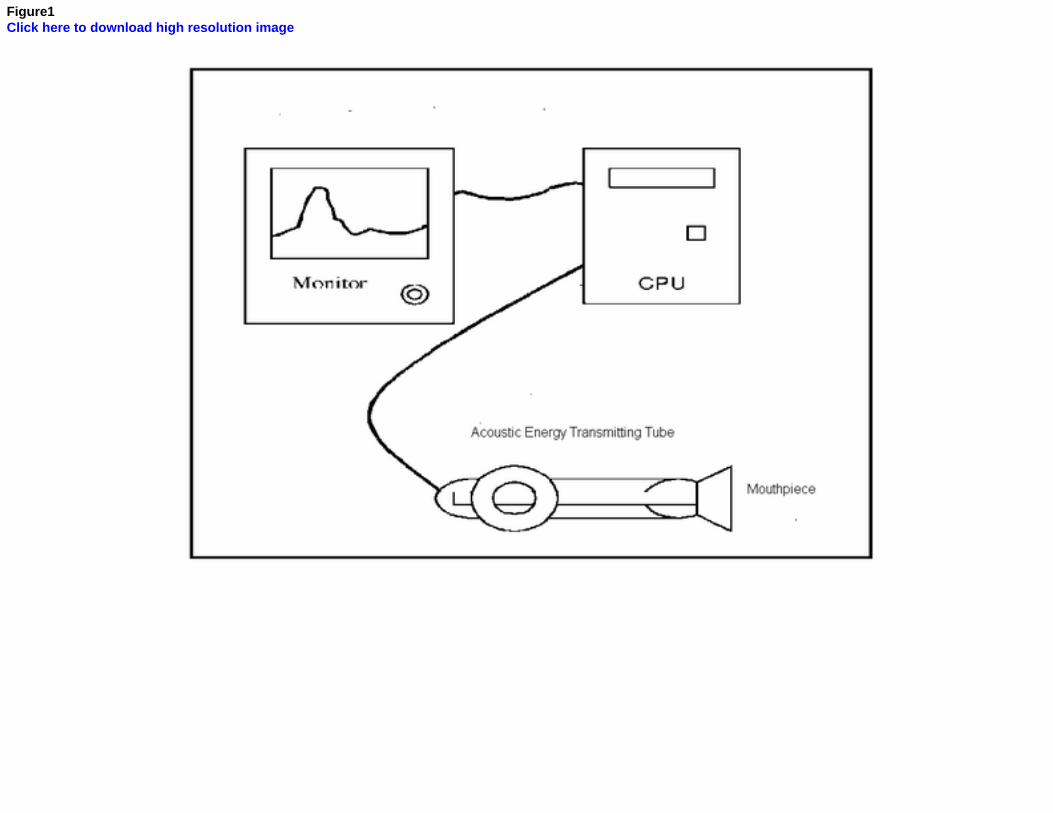
Figure1Click here to download high resolution image
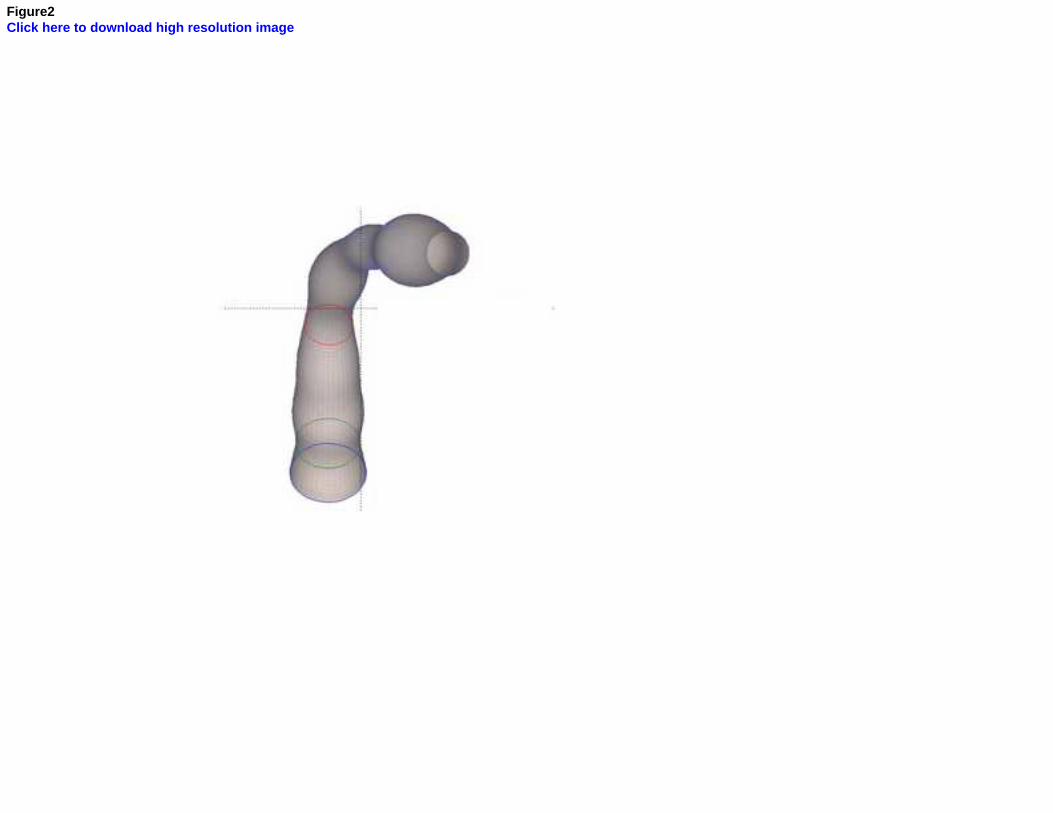
Figure2Click here to download high resolution image
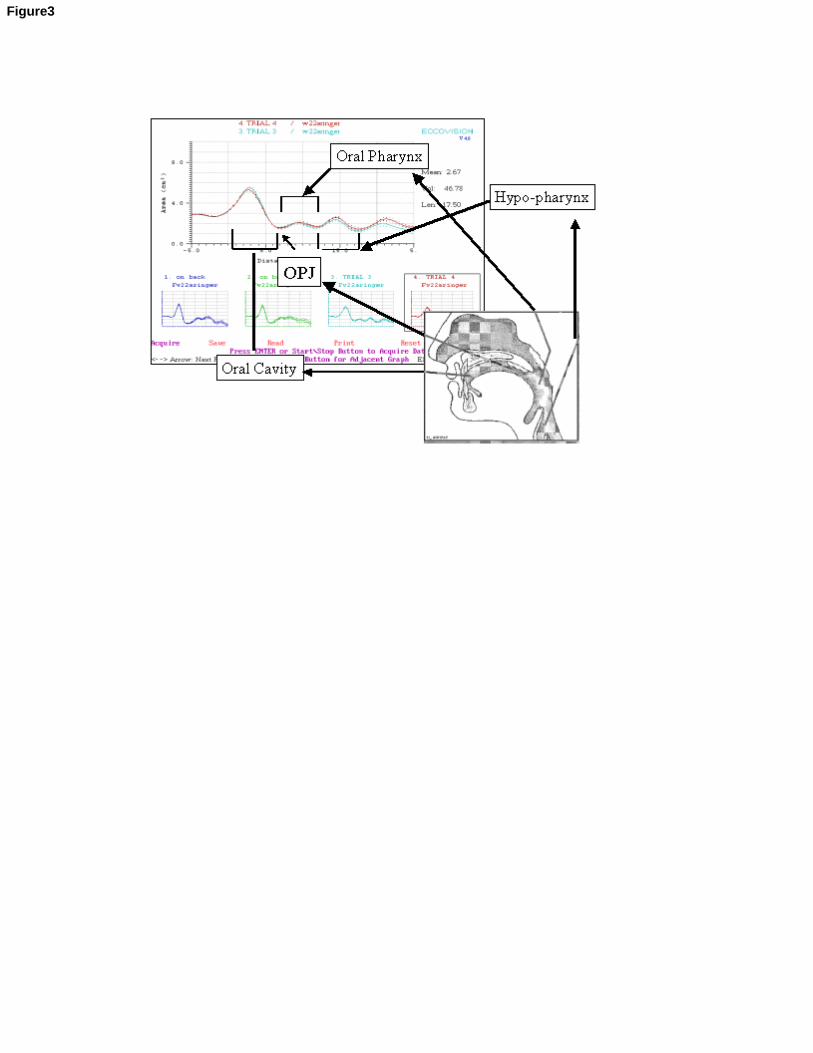
Figure3
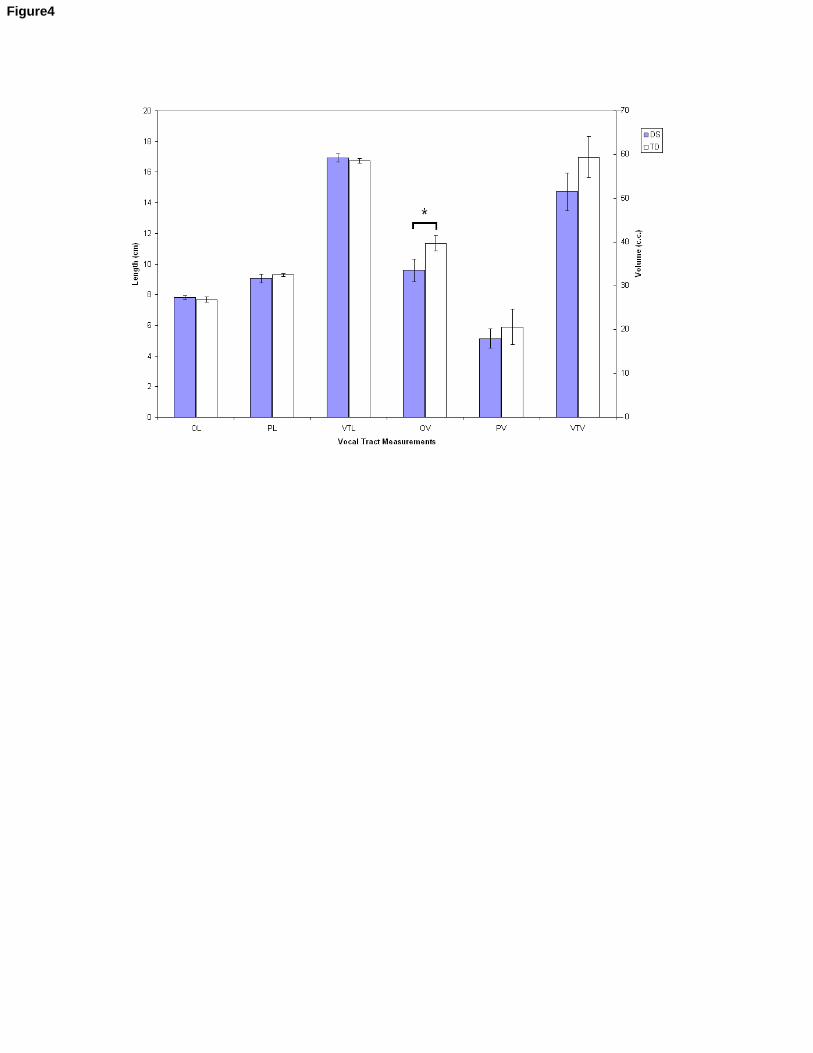
Figure4


