Embed Size (px)
Citation preview

Pyrolysis of switchgrass (Panicum virgatum) harvested
at several stages of maturity§
A.A. Boateng a,*, K.B. Hicks a, K.P. Vogel b
aU.S. Department of Agriculture, Agricultural Research Service, Eastern Regional Research Center,
600 E. Mermaid Lane, Wyndmoor, PA 19038, USAbU.S. Department of Agriculture, Agricultural Research Service, 344 Keim Hall, University of Nebraska,
PO Box 83093, Lincoln, NE 68583-0937, USA
Received 8 November 2004; accepted 1 March 2005
Available online 11 May 2005
www.elsevier.com/locate/jaap
J. Anal. Appl. Pyrolysis 75 (2006) 55–64
Abstract
The pyrolysis of switchgrass (Panicum virgatum) of the cultivar, ‘‘Cave-in-Rock’’ harvested at three stages of physiological maturity was
studied in a PY–GC/MS system at the 600–1050 8C temperature range. Under these conditions, the decomposition was complete within 20 s
yielding char, and two sets of pyrolysis gas, condensable and non-condensable. The former consisted of acetaldehyde (CH3CHO), acetic acid
(CH3COOH) and higher molecular weight compounds possibly from the hydroxyl group and from the methoxy groups of the cell wall
components. The non-condensable gases were mainly CO, CO2 and C1–C3 hydrocarbons. For these, there was a 900 8C temperature boundary
where dramatic change occurred in their evolution rates. Below this temperature, CO2 decreased but CO and the C1–C3 hydrocarbons increased
almost linearly with temperature. Above this temperature boundary, the hydrocarbons leveled off but there was a rapid rise in CO and CO2
evolution at a constant CO/CO2 ratio. These suggest the appearance of secondary or tertiary pyrolysis reactions involving rearrangement and
release of CO and hydrocarbons prior to this temperature boundary and the release of CO and CO2 from the tightly bond oxygen functionalities
including C–C bonds thereafter. At <750 8C, there were modest increases in condensable gas yield and decrease in non-condensable gas due to
differences in plant maturity at harvest. However, the effect of switchgrass physiological maturity on gas yield was statistically insignificant at
high temperatures. The energy content of the non-condensable gas measured was about 68% of the gross energy content of the biomass for the
early harvest crop and 80% for the mature crop. The activation energy for the decomposition, estimated assuming first order reaction kinetics,
showed a linear increase with plant physiological maturity. The results demonstrate that physiological maturity at harvest of switchgrass biomass
can result in different concentrations of pyrolysis products at different temperatures. These results also demonstrate the need for additional
research with a broader array of herbaceous biomass materials to develop a better understanding of the synergies of crop cultivation, harvesting
and processing of dedicated herbaceous biomass energy crops during their thermochemical conversion.
# 2005 Elsevier B.V. All rights reserved.
Keywords: Switchgrass; Pyrolysis; Thermochemical conversion; Bioenergy crop conversion
1. Introduction
To decrease US dependence on imported petroleum and
to ensure long-term sustainability in our economy and the
§ Mention of trade names or commercial products in this article is solely
for the purpose of providing specific information and does not imply
recommendation or endorsement by the U.S. Department of Agriculture.
* Corresponding author. Tel.: +1 215 233 6493; fax: +1 215 233 6406.
E-mail address: [email protected] (A.A. Boateng).
0165-2370/$ – see front matter # 2005 Elsevier B.V. All rights reserved.
doi:10.1016/j.jaap.2005.03.005
environment, government programs are currently in place
under the biomass initiative platform to conduct R&D that
supports the bioenergy concept. A long-term goal of these
programs is to invest in the development of biorefineries as
an alternative to petroleum refineries (http://www.eere.
energy.gov/biomass/integrated_biorefineries.html). This is
intended to substitute renewable biomass feedstock for
petroleum based resources and produce a wide array of fuels
and chemicals currently only possible with fossil-fuel
resources. Although the goal is achievable, the challenges

A.A. Boateng et al. / J. Anal. Appl. Pyrolysis 75 (2006) 55–6456
are many, including what conversion technologies to pursue,
what feedstock to employ and even what products to make
that will be economically competitive [1]. To this end,
several R&D programs have been instituted within the U.S.
Department of Energy (DOE) and the U.S. Department of
Agriculture (USDA) encompassing various milestones.
These include the feedstock interface, sugar, thermochemi-
cal and products platforms.
Because of the immense interest in developing alternative
liquid fuels, considerable research and development efforts
have been invested in recent years to convert crop residues,
herbaceous and woody crops, dedicated energy crops and
other types of biomass identified under the feedstock
platform into ethanol via the sugar platform. It is evident that
despite continued progress, the prospect of developing cost
effective processes for conversion of biomass into ethanol in
the next 10–20 years poses a big challenge [2]. Part of the
problem is attributed to the large variability in biomass
composition, which may require different enzymes or
chemical processes for hydrolysis of the biomass poly-
saccharides into fermentable sugars, and then the develop-
ment and use of recombinant organisms that can ferment the
C5 and C6 sugars produced. On the other hand, others have
shown that thermochemical conversion of biomass may be a
more practical and viable conversion option in the near- and
mid-term basis [3]. Thermal, steam and partial gasification
technologies currently under development around the world
have demonstrated that gasification (including catalytic
gasification coupled with steam-reform that takes advantage
of the water-gas shift reaction) holds most promise because
of increased hydrogen yield [4,5]. Hence, rather than
attempting to pretreat, hydrolyze and ferment complex
biomass materials into ethanol under the sugar platform, in
some instances, and in the near term, the thermochemical
platform may be an attractive alternative approach for
biomass conversion into renewable energy, i.e. through
pyrolytic and gasification processes. Additionally, co-
locating these systems with ethanol plants may yield
operational and economic synergies. This can be especially
attractive when the fibrous byproducts generated from the
ethanol process have little or no nutritional value, when the
energy is renewable, and when other valuable coproducts,
e.g. activated charcoal, fertilizer enhancers, etc. can be
developed [3].
Biomass pyrolysis can yield char, pyrolytic oils and
gaseous products comprising H2, CO, CO2 and lower
molecular weight hydrocarbon gases. A gas mixture rich in
CO and H2 (syngas) can itself be converted to mixed
alcohols (methanol, ethanol, etc.) via processes similar to
the Fischer Tropsch process [6,7]. Furthermore, pyrolytic
oils can undergo cracking to lower molecular weight gases
and can also be steam-reformed to CO and H2. Syngas can
also be used as a fuel to provide process heat, steam and
power generation within the plant. Although some economic
analyses [8] have shown that direct-firing, co-firing,
gasification and pyrolysis of biomass may, as stand-alone
unit operations, not be competitive with existing fossil-fuel
power generation facilities, developing improved gasifica-
tion processes might. Therefore, ideas to improve the
economics associated with thermochemical conversion have
included, for example, developing compact, mobile equip-
ment systems to do the conversion, especially if such mobile
systems can eliminate transportation costs for biomass to a
distant centralized facility. Another proposed approach to
achieving efficiency is to carry out the gasification in the
field to produce pyrolytic oil as an intermediate product
which can be easily stored, transported and hauled to a
central area for further reforming processes.
Many system analyses including that by Milne et al. [3]
have shown that irrespective of unfavorable economics
associated with biomass steam-reform as compared to
natural gas steam-reforming, the economics improve for
lower cost biomass such as certain herbaceous and woody
crop species [9] identified as energy crops under the
National energy roadmap program (http://www.biopro-
ducts-bioenergy.gov/pdf/Ag_Roadmap.pdf). Developing a
significant national capacity to utilize perennial forage crops
as biofuels could not only reduce foreign fuel dependency
and environmental hazards but could also benefit the
agricultural economy by providing new sources of income
for farmers [10]. Hence, in 1991, a decision was made by the
biomass feedstock development program to focus on
switchgrass (Panicum virgatum L.), a high yielding
perennial grass species which combines excellent conserva-
tion attributes and good compatibility with conventional
farming practices. Since then research including manage-
ment field trials, breeding, tissue culture and physiological/
genetic and other activities has been conducted to improve
the productivity of switchgrass grown as an energy crop
[11,12]. Switchgrass is an erect, warm–season perennial
which was native to most of North America except for the
areas west of the Rocky Mountains and north of 558N.
latitude [13]. It is a C4 species and has the anatomical and
physiological characteristics of C4 grasses. Switchgrass has
been seeded in pastures and rangeland in pure stands and
mixtures in the Great Plains for more than 60 years and in the
past 20 years, it has become increasingly important as a
pasture grass in the central and eastern USA [13].
In this submission, switchgrass samples developed
specifically for biomass conversion research were evaluated
for their pyrolysis characteristics [14]. The switchgrass
samples were produced using management conditions
optimal for production of switchgrass as a biomass energy
crop in the Midwest, USA and were harvested at three
distinct physiological stages of maturity representative of
potential harvest stages [13,14].
2. Experimental
Flash pyrolysis experiments were carried out in a
Pyroprobe (PY) 2000 (CDS Analytical, Oxford, PA). It

A.A. Boateng et al. / J. Anal. Appl. Pyrolysis 75 (2006) 55–64 57
comprises a quartz tube, which is heated by a platinum
filament, 2–3 mm diameter and 1 cm length and capable of
maintaining up to 1200 8C temperature. The interface
temperature was set at 300 8C. The pyrolyzer is interfaced to
a HP 6890N gas chromatograph (GC) and HP 5973 mass
spectrometer (Agilent Technologies). The pyroprobe/chro-
matograph/mass-spectrometer (PY–GC/MS) was used for
the identification of the variety of compounds formed during
flash pyrolysis. The GC analysis was performed using a
fused silica capillary column, CP-PoraBOND Q,
25 m � 0.25 mm (Varian, Palo Alto, CA) with the following
program: 3 min at 35 8C then ramped at 5 8C/min up to
150 8C followed by 10 8C/min up to 250 8C for a total time
of 36 min. MS detection was carried out under electron
impact (EI) ionization conditions in full scan from m/z 2–80
with a threshold at 300. This enabled the detection of the
yields of the major products of primary and secondary
pyrolysis reactions as functions of temperature and heating
conditions. Calibration curves were done using a standard
gas mixture comprising CO, CO2, CH4, C2H4, C2H6, C3H8
and C4H10 in helium (custom-mixed by Scott Specialty
Gases, Plumsteadville, PA) to quantify the yields of the non-
condensable gases as percentage of the initial biomass mass.
Char yield was determined gravimetrically. All other gases,
comprising the condensable gases such as pyrolytic oil
vapors and also the non-condensable ones that were not
calibrated were estimated as ‘‘tar.’’ This, including hydro-
carbon gases greater than C4 and hydrogen, was determined
as the difference between the biomass and the measured gas
plus the remaining char. Hydrogen could not be detected due
to the lack of a thermal conductivity detector (TCD) and was
assumed as part of the non-calibrated gas ‘‘tar’’ yield.
The switchgrass samples labeled MPV1, MPV2 and
MPV3 samples were produced specifically for research on
conversion technologies for production of ethanol and
pyrolysis products and their characteristics and composition
are fully described by Dien et al. [14]. In brief, the samples
are from established plots of the cultivar ‘Cave-in-Rock’ that
were fertilized with annual applications of 120 kg N/ha.
They were harvested at three different physiological stages
of maturity. MPV1 (Midwest P. virgatum sample 1) was
produced from a regrowth harvest that was harvested when
the regrowth was at the E3 stage of maturity [15]. At this
stage of maturity, the biomass is pre-boot and is primarily
leaf blades, sheaths and partially elongated stems. A farmer
would harvest switchgrass for high quality hay at this stage
of maturity because of its high digestibility [13]. MPV2 and
MPV3 were harvested at the R4 and post-frost senescence
stages (post-S5 stage) of maturity from total season growth,
respectively. Switchgrass biomass tissue at the R4 stage
consists of plants that have reached their maximum height
and yield and have flowered. Post-frost plants had fully
matured and set seed and represent biomass tissue that has
become fully mature and lignified. MPV2 and MPV3
represent the two main potential harvest stages for
optimizing biomass yield [13]. The harvesting height for
all samples was 10 cm [14]. After each harvest, the
harvested material was air dried on a greenhouse bench.
The dried material was then ground with a Wiley mill
through a 2 mm screen. The ground material was thoroughly
mixed and stored in plastic 5 gallon buckets with sealed lids
[14]. Pulverized switchgrass samples, 90% passing 500 mm,
were used for the pyrolysis experiments. The average weight
of the charge was about 1 mg and occupied about 1–1.5 mm
in height in the quartz tube pyrolyzer over packed quartz
wool. The experimental sample preparation procedure was
consistent with published works [16,17], which have
reported that samples weighing less than 2 mg give no
significant changes in hydrocarbon yield.
Although there is little or no heat resistance to the sample
itself given the small volume to surface area ratio, samples in
the pyroprobe do not follow the heating profile of the
platinum wire due to the heat capacity of the quartz tube
holding them. However, samples do not cool instantaneously
which thereby helps maintain the set-point temperature for
quite sometime when the power is turned off. Caballero et al.
[16] performed heat balance calculations for the heating and
cooling of lignin samples in a CDS Analytical’s Pyroprobe
1000 and found the heat transfer coefficient for heating to be
680 W/m2 K and that for the cooling to be 24 W/m2 K. With
these coefficients, they estimated about 200 8C temperature
lag at about 2.5 s for a 600 8C pyrolysis set-point
temperature. In the CDS Pyroprobe 2000 used in the
present experiments, heating rate selection is carried out
electronically by a computer as against electrical resistors in
the case of the older, e.g. CDS 100 series. This allows access
to a selection of a wider range of heating rates and time to
reach the set-point temperature. According to CDS
Analytical, the set-point temperature controls the filament
temperature so the time that is selected is the time at which
the set-point temperature is held at before cooling begins.
Experiments carried out by CDS Analytical [18] have shown
that the temperature lag between a typical sample in the
quartz tube and the filament of the Pyroprobe 2000 is about
100 8C for a 700 8C filament temperature.
In view of this, therefore, flash pyrolysis was carried out
at set-point temperatures of 600, 750, 900 and 1050 8C for
several retention times of 1, 3, 5, 10 and 20 s. The extended
temperature was to ensure that greater than 400 8C,
classified as the temperature delineation where secondary
pyrolysis begins, was assured. Within 10 s devolatilization
was virtually complete but 20 s was employed as the final
devolatilization time to ensure that no extra gas remained in
the pyrolyzer.
3. Results and discussion
Our goal was to determine if physiological maturity of
switchgrass biomass had an effect on pyrolysis yield. The
complete compositional profiles of the samples used in this
study are reported by Dien et al. [14]. There were major

A.A. Boateng et al. / J. Anal. Appl. Pyrolysis 75 (2006) 55–6458
Tab
le1
Aver
age
swit
chg
rass
py
roly
sis
pro
duct
saf
ter
20
sin
py
roly
zer
MP
V1
MP
V2
MP
V3
0.9
52
a0
.943
a0
.94
3a
1.0
17
a1
.04
3a
0.9
47
a0
.99
9a
1.0
03
a1
.01
4a
0.9
93
a0
.947
a1
.053
a
60
0b
75
0b
90
0b
10
50
b6
00
b7
50
b9
00
b1
05
0b
60
0b
75
0b
90
0b
10
50
b
Mea
sure
dp
rod
uct
s(m
ass
per
cen
to
fsa
mple
—m
ean
val
ue
(S.D
.))
CO
3.2
4(0
.39
)3
.73
(0.2
3)
3.9
1(0
.41
)6
.22
(0.7
6)
2.5
6(0
.31
)3
.01
(0.3
0)
3.5
1(0
.02
)7
.47
(0.2
2)
2.5
4(0
.1)
2.5
4(0
.02
)4
.08
(0.2
4)
7.2
2(0
.54
)
CO
21
8.1
1(1
.39
)1
3.8
3(1
.17
)1
1.2
2(1
.01
)1
6.7
0(0
.71
)1
2.2
3(0
.86
)1
1.1
2(0
.54
)1
0.0
0(0
.21
)1
4.7
3(0
.23
)1
1.2
6(0
.75
)9
.21
(0.3
0)
9.7
2(0
.51
)1
5.9
5(1
.20
)
CH
41
.11
(0)
2.1
1(0
.1)
2.8
3(0
.47
)2
.89
(0.3
7)
0.0
01
.30
(0.2
1)
3.2
6(0
.01
)3
.36
(0.1
3)
0.0
01
.17
(0.0
3)
2.8
7(0
.06
)3
.73
(0.4
0)
C2H
60
.00
0.0
00
.00
0.3
40
.00
0.1
3(0
.02
)0
.33
(0.0
5)
0.3
6(0
.02
)0
.00
0.0
9(0
.0)
0.3
8(0
.02
)0
.42
(0.0
4)
C3H
80
.03
(0.0
5)
0.4
10
.65
(0.1
2)
0.4
5(0
.09
)0
.00
0.2
4(0
.03
)0
.66
(0.0
8)
0.5
5(0
.03
)0
.00
0.1
8(0
.01
)0
.77
(0.0
1)
0.7
1(0
.14
)
To
tal
no
n-c
on
den
sab
leg
as2
2.5
02
0.0
81
8.6
12
6.6
01
4.7
91
5.7
91
7.7
62
6.4
71
3.8
01
3.1
91
7.8
22
8.0
3
Con
den
sab
leg
as,
‘‘ta
r’’
½H� 2þ
>C
4þ
H2O�
66
.43
70
.11
71
.58
67
.02
73
.23
73
.27
71
.02
67
.16
76
.57
76
.38
72
.45
58
.56
Char
11
.08
9.8
19
.81
6.3
91
1.9
91
0.9
51
1.2
26
.37
9.6
31
0.4
39
.73
13
.41
aS
amp
lem
ass
(mg
).b
Py
roly
sis
tem
per
atu
re(8
C).
differences as expected among samples for lignin, ash,
soluble and cell wall carbohydrates. As an example, Klason
lignin concentrations were 133, 154 and 173 g/kg dry matter
for MPV1, MPV2 and MPV3, respectively [14]. Sanderson
and Wolf [19] have shown that later harvest switchgrass
leads to lower ash content. In direct combustion, mature
switchgrass, and for that matter low ash content fuel, may
lead to less slagging and hence reduced fouling of heat
transfer equipment. During conversion by gasification/
pyrolysis, higher lignin content often associated with
maturity may result in a high calorific value gas. The latter
was the focus of this investigation.
Teng and Wei [20] interpreted differential thermogravi-
metric (DTG) data on rice hulls and asserted that the
hemicellulose decomposes first, followed by cellulose and
then lignin. They found the activation energy for the
decomposition reaction, established by assuming first order
reaction kinetics, to be greatest for cellulose then hemi-
cellulose with activation energy for lignin being the lowest
of the three. Caballero et al. [16] have reported that CH4 and
C2H6 yields increase with temperature similar to cellulose
and lignin but CO2 and H2O increases are greater for
cellulose than for lignin. Fushimi et al. [21] also have
observed that the onset of cellulose pyrolysis is 250 8Cbeginning with the formation of cellulose intermediates
followed by CO2 evolution after which the evolution of CO2,
CO and H2 proceed with CO and H2 increasing rapidly and
peaking at about 427 8C (700 K). They have also reported
that over 80% of the cellulose structure would have been
depolymerized at this temperature. However, lignin decom-
position occurs slowly over a broader temperature range
than cellulose and hemicellulose. Unlike cellulose, CO
evolution from lignin is reported to begin at 227 8C followed
by CO and CH4 instead of CO and H2 and increases
gradually up to about 500 8C before the onset of H2
evolution. All of these prior observations have led to the so-
called 400 8C temperature delineation between primary and
secondary pyrolysis reactions [22].
Fig. 1 presents a snapshot of a larger body of results from
the PY–GC/MS analysis. These chromatograms show the
evolution of two sets of pyrolysis gas products, the
condensable gaseous product which can be condensed to
form pyrolytic oils (bio-oil), and the non-condensable gas
(syngas). The components of the former that were detected
with the GC method we employed and mentioned earlier
consisted of water (H2O), acetaldehyde (CH3CHO), acetic
acid (CH3COOH) and 1-hydroxy-2-propanone (C3H6O2)
compounds probably from the hydroxyl group and from the
methoxy groups of the lignin component of biomass. It has
been reported [16] that these condensable gases do not
change beyond 550 8C which indicates that their evolution
might have peaked prior to the initial 600 8C temperature we
studied. The non-condensable gases detected were mainly
CO, CO2 and C1–C3 hydrocarbons as have been reported by
others for biomass decomposition [16,20]. In Table 1, we
present the full range of the yields we measured for all

A.A. Boateng et al. / J. Anal. Appl. Pyrolysis 75 (2006) 55–64 59
Fig. 1. (a) Chromatograms of switchgrass pyrolysis at 600 8C; (b) chromatograms of switchgrass pyrolysis at 750 8C showing the onset of lightweight
hydrocarbons; (c) chromatographs of switchgrass pyrolysis at 900 8C.
samples and all temperatures. The CO produced ranged from
2.55% at 600 8C to 7.47% at 1050 8C. CO2 yield ranged
from 9.2 to 18.11%, CH4 ranged from 0 to 3.73%, C2H6
ranged from 0 to 0.42% and C3H8 ranged from 0 to 0.77%
for all samples. Butane was not detected although it was one
of the gases we calibrated. The sum of the yield of the non-
condensable gases we quantified, i.e. CO2, CO, CH4, C2H6
and C3H8, ranged between 13.2–28.03%. Char yield ranged
from 6.37 to 13.4%. The condensable gas ‘‘tar’’ yield,
estimated by difference, ranged from 58.55 to 76.57%.
These results are consistent with published work on several
biomass species pyrolyzed within the same temperature
range [16,23] and under similar experimental conditions.
3.1. Temperature effects
The temperature effect on the non-condensable gas
yields is shown in Fig. 2. The effect on char yield is shown in
Fig. 3. There seems to be a 900 8C temperature boundary
where noticeable change occurs in the rate of evolution of
A.A. Boateng et al. / J. Anal. Appl. Pyrolysis 75 (2006) 55–6460
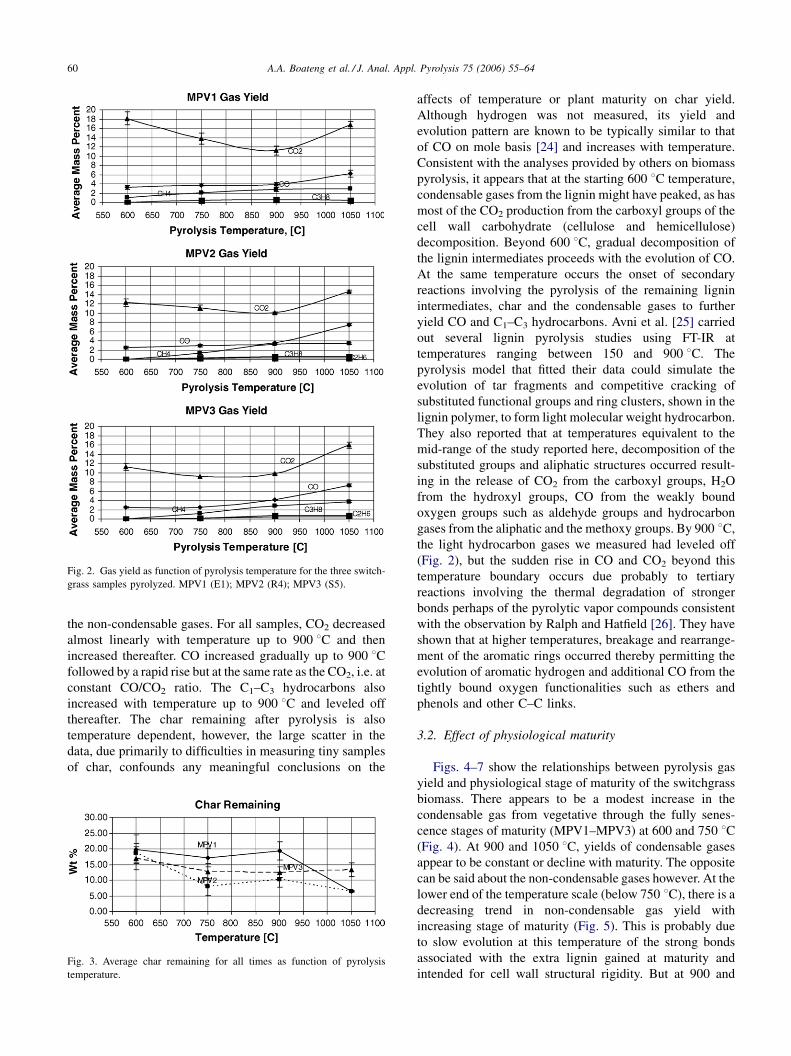
Fig. 2. Gas yield as function of pyrolysis temperature for the three switch-
grass samples pyrolyzed. MPV1 (E1); MPV2 (R4); MPV3 (S5).
the non-condensable gases. For all samples, CO2 decreased
almost linearly with temperature up to 900 8C and then
increased thereafter. CO increased gradually up to 900 8Cfollowed by a rapid rise but at the same rate as the CO2, i.e. at
constant CO/CO2 ratio. The C1–C3 hydrocarbons also
increased with temperature up to 900 8C and leveled off
thereafter. The char remaining after pyrolysis is also
temperature dependent, however, the large scatter in the
data, due primarily to difficulties in measuring tiny samples
of char, confounds any meaningful conclusions on the
Fig. 3. Average char remaining for all times as function of pyrolysis
temperature.
affects of temperature or plant maturity on char yield.
Although hydrogen was not measured, its yield and
evolution pattern are known to be typically similar to that
of CO on mole basis [24] and increases with temperature.
Consistent with the analyses provided by others on biomass
pyrolysis, it appears that at the starting 600 8C temperature,
condensable gases from the lignin might have peaked, as has
most of the CO2 production from the carboxyl groups of the
cell wall carbohydrate (cellulose and hemicellulose)
decomposition. Beyond 600 8C, gradual decomposition of
the lignin intermediates proceeds with the evolution of CO.
At the same temperature occurs the onset of secondary
reactions involving the pyrolysis of the remaining lignin
intermediates, char and the condensable gases to further
yield CO and C1–C3 hydrocarbons. Avni et al. [25] carried
out several lignin pyrolysis studies using FT-IR at
temperatures ranging between 150 and 900 8C. The
pyrolysis model that fitted their data could simulate the
evolution of tar fragments and competitive cracking of
substituted functional groups and ring clusters, shown in the
lignin polymer, to form light molecular weight hydrocarbon.
They also reported that at temperatures equivalent to the
mid-range of the study reported here, decomposition of the
substituted groups and aliphatic structures occurred result-
ing in the release of CO2 from the carboxyl groups, H2O
from the hydroxyl groups, CO from the weakly bound
oxygen groups such as aldehyde groups and hydrocarbon
gases from the aliphatic and the methoxy groups. By 900 8C,
the light hydrocarbon gases we measured had leveled off
(Fig. 2), but the sudden rise in CO and CO2 beyond this
temperature boundary occurs due probably to tertiary
reactions involving the thermal degradation of stronger
bonds perhaps of the pyrolytic vapor compounds consistent
with the observation by Ralph and Hatfield [26]. They have
shown that at higher temperatures, breakage and rearrange-
ment of the aromatic rings occurred thereby permitting the
evolution of aromatic hydrogen and additional CO from the
tightly bound oxygen functionalities such as ethers and
phenols and other C–C links.
3.2. Effect of physiological maturity
Figs. 4–7 show the relationships between pyrolysis gas
yield and physiological stage of maturity of the switchgrass
biomass. There appears to be a modest increase in the
condensable gas from vegetative through the fully senes-
cence stages of maturity (MPV1–MPV3) at 600 and 750 8C(Fig. 4). At 900 and 1050 8C, yields of condensable gases
appear to be constant or decline with maturity. The opposite
can be said about the non-condensable gases however. At the
lower end of the temperature scale (below 750 8C), there is a
decreasing trend in non-condensable gas yield with
increasing stage of maturity (Fig. 5). This is probably due
to slow evolution at this temperature of the strong bonds
associated with the extra lignin gained at maturity and
intended for cell wall structural rigidity. But at 900 and

A.A. Boateng et al. / J. Anal. Appl. Pyrolysis 75 (2006) 55–64 61
Fig. 4. Condensable gas including C4/H2O/tar yield grouped with switch-
grass maturity and pyrolysis temperature.
Fig. 5. Total non-condensable gas yield as function of forage sample
maturity and pyrolysis temperature. Switchgrass physiological maturity
increased from MPV1 to MPV3.
Fig. 7. Light hydrocarbon gas yield grouped with switchgrass maturity and
pyrolysis temperature.
1050 8C, yields are relatively constant at all three maturity
levels. Evidence of this lies in the declining of CO2
yield (Fig. 6), the absence of and the declining evolution
trends for some of the hydrocarbon gases particularly CH4,
and C3H8 (Fig. 7). At higher temperatures, however, the
effect of maturity on the release rates has diminished or is
only marginal because no extent of structural bond
Fig. 6. CO2 and CO yields as function of forage maturity and pyrolysis
temperature.
strengthening at the maturity stage could withstand the
thermal degradation.
3.3. Heat of combustion
The pyrolysis reactions result in a syngas whose quality is
dependent on pyrolysis temperature and in part by plant
maturity. Although we did not measure hydrogen separately,
we believe that modest conclusions can still be made about
of the heat of combustion of the gas produced. Fig. 8 shows
the heat content of the non-condensable gas calculated based
on the weight fractions of the components we measured. As
is seen here, the value peaks at the 900 8C temperature
boundary. At this temperature, the non-condensable gases
from both mature grass samples, MPV2 and MPV3, have
almost the same energy content of about 3500 kcal/kg,
which is higher than the MPV1 sample at 3000 kcal/kg.
Considering the fact that if burned ‘‘as is’’ switchgrass has a
gross energy content of 4398 kcal/kg on dry basis [10] then
the quality of the non-condensable gas at 900 8C pyrolysis
constitutes about 68% of this amount at boot and 80% at
senescent. This, in addition to the fact that there is still over
50% of the biomass weight available as condensable gas
(which can be recovered as pyrolytic oil) and about 10%
char (another energy source), makes thermochemical
conversion of this energy crop even more plausible.

A.A. Boateng et al. / J. Anal. Appl. Pyrolysis 75 (2006) 55–6462
Fig. 8. Heat of combustion of non-condensable gas.
3.4. Char morphology
In Fig. 9, we show SEM photomicrographs of char
remaining after exposing the sample in the pyrolyzer for 20 s
at 600 and 750 8C. Since the biomass sample comprised
whole herbage, it is difficult to tell which physiological
portion of the plant this char sample represents. This
notwithstanding, its morphology, in particular the pore
structure and volume, including their development are
important to the ultimate use of switchgrass as an energy
crop because the porous char can in itself constitute a
valuable byproduct. More characterization of the residual
char structure is underway.
3.5. Decomposition kinetics
At the temperature range we studied (600–1050 8C), the
evolution rates for the pyrolysis of switchgrass mimic
secondary and tertiary reaction patterns described for lignin
more than for cellulose and hemicellulose indicating that
within the study, conditions lignin decomposition might
have been the rate controlling factor. However, instead of
Fig. 9. (a) SEM photomicrograph of MPV1 (boot) switchgrass char remaining afte
switchgrass char remaining after 20 s in the pyrolyzer at 750 8C.
following the decomposition of each chemical component,
i.e. cellulose, hemicellulose and lignin into various gases as
described by Avni et al. [25], we represented the entire
biomass material to decompose to yield individual gases that
we calibrated. The kinetics of the evolution we employed
follows the generalized equation:
dm
dt¼ Ao exp
�� Em
RT
�ðmf � mÞn;
where m is the yield of any product of the gases quantified
(i.e. CO2, CO, CH4, C2H6, C2H4, C3H8 or their sum); Ao is
the frequency factor corresponding to product m, (1/s); Em is
the activation energy corresponding to product m (J/mol); R
is the universal gas constant (8.314 J/mol K); mf is the final
yield of product ‘‘m’’ (after 20 s); T is the temperature in
Kelvin (i.e., 873, 1023, 1173 and 1323 K).
Unlike most biomass pyrolysis kinetics reported in the
literature we assumed the decomposition of switchgrass to
follow multiple order reaction kinetics following Milosavl-
jevic and Suuberg [27]. They have shown that at
temperatures greater than 600 K, biomass decomposition
does not fit first order reaction kinetics because the
Arrhenius-type plots of the rate constant and temperature
do not always conform to linear relationships. In view of
this, we carried out a three parameter estimation of the
activation energy, E, the pre-exponential factor, Ao and the
reaction order, n, by calculating the least-square errors and
fitting the experimental data to the differential equation with
the multivariable parameter estimation model in MATLAB.
While there was a fit between model and experiments, the
activation energies and the frequency factors estimated with
the three parameter estimation were unrealistic. There was
an order of magnitude differences between the values for
r 20 s in the pyrolyzer at 600 8C; (b) SEM photomicrograph of MPV1 (boot)

A.A. Boateng et al. / J. Anal. Appl. Pyrolysis 75 (2006) 55–64 63
Table 2
First order reaction rate kinetic constants established using parameter
estimation model
A (1/s) E (J/mol)
MPV1
CO 1.2296 1613.80
CO2 1.2940 165.87
C3H8 0.9665 5937.05
Total non-condensable gas 1.8336 6971.34
MPV2
CO 1.1629 1958.35
CO2 1.3052 100.00
CH4 0.9100 4777.26
C3H8 0.8940 4350.30
Total non-condensable gas 4.1052 11887.32
MPV3
CO 0.5698 2106.43
CO2 0.8577 262.72
CH4 0.6707 2739.20
Total non-condensable gas 3.9726 16170.43
Fig. 11. Time resolved evolution of total non-condensable gas quantified
from the pyrolysis of switchgrass harvested at boot, mature and frost,
respectively.
switchgrass at the different maturity stages. While we
expected plant maturity would have some effect, the wide
disparity in A and E which resulted cast doubt on the
applicability of the model. In order to establish a better
relationship between grass maturity and activation energy,
we resolved to a two-parameter estimation model by
assuming first order reaction kinetics, e.g. Caballero et al.
[16], Garcia et al. [28] and Funazukuri et al. [29]. The
calculated frequency factor and the activation energies for
some non-condensable gases and their sum are shown in
Table 2. The frequency factor for the gases ranged between
0.55 and 3.97 s�1. This narrow range allowed fair
comparison of the activation energies for the samples from
the three maturity stages. The values calculated for the
decomposition of the non-condensable gas were 6971 J/mol
at E1 maturity, 11,887 J/mol at R4 maturity and 16,170 J/
mol at S5. This shows a linear increase in activation energy
for the switchgrass samples from the pre-boot vegetative
stage to post-frost senescent stage (Fig. 10) and is consistent
with the increased lignin concentration of the samples which
is typical of perennial grass cell walls as they mature.
Although higher activation energies of the order of 47–
56 kcal/mol have been reported for cellulose [4] they were
estimated using one-parameter estimation with a fixed
Fig. 10. Estimated first order activation energy as function of switchgrass
maturity.
frequency factor. Using a two-parameter estimation similar
to the current study, Caballero et al. [16] reported activation
energies in the order of 8–9 kcal/mol and frequency factor of
59 s�1 for lignin. Garcia et al. [28] have also reported
E = 8.7 kJ/mol and Ao = 5.8 s�1 for municipal solid waste.
These figures are comparable with that obtained in the
present study although the biomass is different. It is worth
mentioning that for biomass substrates such as cellulose, the
correlation between high temperature and low activation
energy has been rationalized by others [27].
The activation energies for CO2 were uncharacteristically
low. However, this may be attributed to either loose C–O
bonds associated with the decomposition of aldehydic
groups in the evolved tar at higher temperatures or simply to
the fact that it does not fit the Arrhenius representation.
Fisher et al. [22] found similar low activation energies and

A.A. Boateng et al. / J. Anal. Appl. Pyrolysis 75 (2006) 55–6464
pre-exponential factors corresponding to a reaction order of
2 with their TGA data on cellulose, xylan and pectin studied
under similar temperature conditions although they thought
their values were underestimated. But Milosavljevic and
Suuberg [27] had earlier pointed out the possibility of
encountering low activation energies at elevated pyrolysis
temperatures. The temperature effect on changes in
activation energy has also been reported previously for
grain pyrolysis [30]. The temporal events of the evolution of
various gases quantified for 600–1050 8C temperature range
are presented in Fig. 11 for the total non-condensable gas.
There appears to be a good fit between the calculated and
experimental yield values. Overall, the rate constant for the
total gas that we quantified increased with increased
maturity irrespective of the minor differences in the pre-
exponential factor.
4. Conclusions
The thermochemical platform is a viable option for the
conversion of switchgrass, a perennial herbaceous plant, into
gaseous and liquid fuels. It has been demonstrated here that
plant maturity determined by the time of harvest may play an
important role in the pyrolysis of switchgrass. To maximize
the yield and also the quality (heat of combustion) of the
non-condensable gas, allowing the plant cell walls to mature
by harvesting late and pyrolyzing at about 900 8C may be
beneficial (Fig. 8). To maximize condensable gases (which
can be refined to pyrolytic oils and chemicals), higher
maturity may also be beneficial, especially when coupled to
pyrolysis temperatures lower than 900 8C (Fig. 4). At the
temperatures studied, 600–1050 8C secondary pyrolysis
reaction dominated the pyrolysis reaction kinetics. There
was a linear increase in activation energy for gas
decomposition from the vegetative or pre-boot to senescent
stages of maturity consistent with lignin growth associated
with cell wall development as plant matures.
It is important to note that the samples analyzed in this
study represent single samples collected from one location at
three different stages of physiological maturity. The
conclusions drawn are valid for these particular samples
and other similar samples Additional research using
switchgrass samples from multi-year and multi-location
studies with defined agronomic and genetic characteristics is
in progress to determine the effects of management, genetics
and environmental effects on switchgrass composition and
pyrolysis products.
Acknowledgements
The authors wish to acknowledge Mr. Brett Newswanger,
a 2004 summer student from Columbia University, Dr. Peter
Cooke, Dr. Alberto Nunez and Mr. Rich Cook of ERRC for
technical assistance and Dr. Hans Joachim Jung of ARS
Plant Science Research Unit in St. Paul Minnesota for
providing chemical analysis of test samples.
References
[1] M.J. Realff, C. Abbas, J. Ind. Ecol. 7 (2004) 5.
[2] A. McAloon, personal communication (2004).
[3] T.A. Milne, C.C. Elam, R.J. Evans, Hydrogen from Biomass. State of
the Art and Research Challenges. NREL Report IEA/H2/TR-02/001.
Prepared for the Int’l Energy Agency Agreement of the Production and
Utilization of Hydrogen, Task 16, Hydrogen from Carbon-Containing
Materials, 2002.
[4] M.J. Antal Jr., G. Varhegyi, Ind. Eng. Chem. Res. 34 (1995) 703.
[5] P. McKendry, Bioresource Technol. 83 (2002) 47.
[6] M.J. Antal Jr., G. Varhegyi, E. Jacob, Ind. Eng. Chem. Res. 37 (1998)
1267.
[7] G.R. Jackson, D. Mahajan, U.S. Patent No. 6,248,796 (2001).
[8] W. Curtis, C. Ferland, J. McKissick, W. Barnes, University of Georgia
Report http://www.agecon.uga.edu/�caed/FeasibilityStudy603.pdf
(2003).
[9] D.G. Urgate, D.L. Torre, M.E. Walsh, H. Shapouri, S.P. Slinsky, The
Economic Impacts of Bioenergy Crop Production on U.S. Agriculture,
Agricultural Economic Report, No. 816, USDA (2003).
[10] S. McLaughlin, J. Bouton, D. Bransby, B. Conger, W. Ocumpaugh, D.
Parrish, C. Taliaferro, K. Vogel, S. Wullschleger, in: J. Janick (Ed.),
ASHS Press, Alexandria, VA, 1999, p. 282.
[11] S.B. McLaughlin, D.G. De La Torre Ugarte, Jr., C.T. Garten, L.R.
Lynd, M.A. Sanderson, in: V.R. Tolbert, D.D. Wolf (Eds.), High-value
Renewable Energy from Prairie Grasses, Environ. Sci. Technol. 36
(2002) 2122–2129.
[12] S.B. McLaughlin, L.A. Kszos, Biomass Bioenergy 28 (6) (2005) 515–
535.
[13] K.P. Vogel, Switchgrass, in: L.E. Moser, L. Sollenberger, B. Burson
(Eds.), Warm-season (C4) Grasses, ASA-CSSA-SSSA Monograph,
Madison, WI, 2004, pp. 561–588.
[14] B.S. Dien, H.G. Jung, K.P. Vogel, M.D. Casler, J.F.S. Lamb, P.J.
Weimer, L. Iten, R.B. Mitchell, G. Sarath, Chemical composition and
response to dilute-acid pretreatment and enzymatic saccharification of
alfalfa, reed canarygrass, and switchgrass, Biomass Bioenergy, 2005,
submitted.
[15] K.J. Moore, L.E. Moser, K.P. Vogel, S.S. Waller, B.E. Johnson, J.F.
Pedersen, Agron. J. 83 (6) (1991) 1073.
[16] J.A. Caballero, R. Font, A. Marcilla, A.N. Garcia, J. Anal. Appl.
Pyrolysis 27 (1993) 221.
[17] M. Nali, F. Corana, L. Montanari, L. Pellegrini, J. Anal. Appl.
Pyrolysis 29 (1994) 15.
[18] T.P. Wampler, CDS Analytical, personal communications (2005).
[19] M.A. Sanderson, D.D. Wolf, Agron. J. 88 (1996) 908.
[20] H. Teng, Y.-C. Wei, Ind. Eng. Chem. Res. 37 (1998) 3806.
[21] C. Fushimi, K. Araki, Y. Yamaguchi, A. Tsutsumi, Ind. Eng. Chem.
Res. 42 (2003) 3929.
[22] T. Fisher, M. Hajaligol, B. Waymack, D. Kellogg, J. Anal. Appl.
Pyrolysis 62 (2002) 331.
[23] C. Di Blasi, G. Signorelli, G. Portoricco, Ind. Eng. Chem. Res. 38
(1999) 2571.
[24] W.P. Walawender, personal communications (2004).
[25] E. Avni, R.W. Coughlin, P.R. Solomon, H.H. King, Fuel 64 (1985)
1495.
[26] J. Ralph, R.D. Hatfield, J. Agric. Food Chem. 39 (1991) 1426.
[27] I. Milosavljevic, E.M. Suuberg, Ind. Eng. Chem. Res. 34 (1995) 1081.
[28] A.N. Garcia, R. Font, A. Marcilla, J. Anal. Appl. Pyrolysis 23 (1992) 99.
[29] T. Funazukuri, R.R. Hudgins, P.L. Silveston, J. Anal. Appl. Pyrolysis
10 (1987) 225.
[30] A.A. Boateng, L.T. Fan, W.P. Walawender, C.S. Chee, S.M. Chern,
Chem. Eng. Commun. 113 (1992) 117.