Embed Size (px)
Citation preview
Young et al. BMC Plant Biology 2012, 12:117http://www.biomedcentral.com/1471-2229/12/117
RESEARCH ARTICLE Open Access
Karyotype variation is indicative of subgenomicand ecotypic differentiation in switchgrassHugh A Young1, Gautam Sarath2 and Christian M Tobias1*
Abstract
Background: Karyotypes can provide information about taxonomic relationships, genetic aberrations, and theevolutionary origins of species. However, differentiation of the tiny chromosomes of switchgrass (Panicum virgatum L.)and creation of a standard karyotype for this bioenergy crop has not been accomplished due to lack of distinguishingfeatures and polyploidy.
Results: A cytogenetic study was conducted on a dihaploid individual (2n= 2X= 18) of switchgrass to establish achromosome karyotype. Size differences, condensation patterns, and arm-length ratios were used as identifyingfeatures and fluorescence in-situ hybridization (FISH) assigned 5S and 45S rDNA loci to chromosomes 7 and 2respectively. Both a maize CentC and a native switchgrass centromeric repeat (PviCentC) that shared 73% sequenceidentity demonstrated a strong signal on chromosome 3. However, only the PviCentC probe labeled the centromeresof all chromosomes. Unexpected PviCentC and 5S rDNA hybidization patterns were consistent with severe reductionor total deletion of these repeats in one subgenome. These patterns were maintained in tetraploid and octoploidindividuals. The 45S rDNA repeat produced the expected number of loci in dihaploid, tetraploid and octoploidindividuals. Differences observed at the 5S rDNA loci between the upland and lowland ecotypes of switchgrassprovided a basis for distinguishing these subpopulations.
Conclusion: Collectively, these results provide a quantitative karyotype of switchgrass chromosomes. FISH analysesindicate genetic divergence between subgenomes and allow for the classification of switchgrass plants belonging todivergent genetic pools. Furthermore, the karyotype structure and cytogenetic analysis of switchgrass provides aframework for future genetic and genomic studies.
Keywords: Bioenergy, Switchgrass, Cytogenetics, CHIAS IV, Perennial biofeedstocks, Dihaploids, Renewable energy,Polyploidy
BackgroundPolyploidy, the heritable duplication of whole genomes,is a key feature of plant diversification and is found inmost, if not all, plant taxa [1]. Polyploidization can leadto speciation or creation of distinct reproductively-isolated cytotypes within a species. An ancient genome-doubling event and subsequent gene loss has shaped thegenomes of all grass species [2]. Though an estimated30-80% of angiosperms may be polyploid [3], the relativefrequencies of allopolyploids which arise throughhybridization of different species versus autopolyploids
* Correspondence: [email protected] and Gene Discovery Research Unit, USDA-Agricultural ResearchService, Western Regional Research Center, 800 Buchanan Street, Albany, CA94710, USAFull list of author information is available at the end of the article
© 2012 Young et al.; licensee BioMed CentralCommons Attribution License (http://creativecreproduction in any medium, provided the or
which arise within a single species are difficult to ascer-tain. Evolutionary processes that mask the origins ofpolyploid evolution such as introgression, deletion,concerted evolution, and mutation may create uncer-tainty. There is possible recurrent hybridization of gen-omes over time and interracial or close interspecifichybridization of genomes may produce similar out-comes. Incongruent tree-topologies from independentmarker sets such as chloroplast and nuclear markers cansuggest the presence of reticulate relationships, but theseare not conclusive [4].The interspecific relationships of taxa in the subgenus
Panicum sensu stricto (s.s.) that comprises approxi-mately 100 C4 grass species, including Panicum virgatumL. (switchgrass), haven’t yet been elucidated and likelyrepresent a complex situation [5]. Because switchgrass
Ltd. This is an Open Access article distributed under the terms of the Creativeommons.org/licenses/by/2.0), which permits unrestricted use, distribution, andiginal work is properly cited.
Young et al. BMC Plant Biology 2012, 12:117 Page 2 of 12http://www.biomedcentral.com/1471-2229/12/117
is being pursued as a promising feedstock for renewableenergy production in the United States and elsewhere,these relationships are of importance for understandingthe breadth of germplasm that might be useful in abreeding program. The plant’s broad geographic range,water- and nutrient-use efficiency, and perennialgrowth habit make it ideal as a bioenergy crop [6-8].The species encompasses multiple cytotypes with abasic chromosome number of nine [9,10], and a rangeof ploidy levels from diploid (2x) to duodecaploid (12x)[11-14]. As a polyploid species, switchgrass exhibitstwo basic subgenomes that are genetically divergent butmaintain complete or near complete disomic inherit-ance [15]. Two separate ecotypes are distinguishedcytologically and geographically [16]. Lowland acces-sions dominate the southern portion of the speciesrange and are mainly tetraploid, while the uplandaccessions are usually either tetraploid or octoploid anddominate northern latitudes [17]. Extensive aneuploidyhas also been described, especially within populationsof octoploids, but these are likely present in all popula-tions at varying levels [18].Although artificial crosses between switchgrass cyto-
types have been largely unsuccessful [19,20], questionsstill remain regarding historical hybridization betweencytotypes, between upland and lowland ecotypes, andbetween several closely related species in the Panicumsubgenus. These species may represent a common genepool that has undergone repeated hybridization during“secondary contacts” of once isolated populations [21].A recent analysis of switchgrass collections has demon-strated that there are two distinct centers of genetic di-versity for lowland accessions represented by theSouthern Great Plains and Eastern Gulf Coast while up-land accessions appear genetically as one broadly distrib-uted tetraploid and two octoploid lineages [22]. Usingchloroplast sequence polymorphisms, molecular clockestimates have indicated that lowland and upland acces-sions diverged as early as 1.3 million years ago, but havepossibly diverged on several occasions during recentcycles of glaciation [23,24].In light of these uncertainties, independent methods to
characterize genome structure would be useful for effect-ive evaluation and utilization of germplasm resources.Cytogenetic analysis using in situ hybridization techni-ques have proven very useful in resolving genome consti-tution in polyploids and is an important tool inchromosome karyotyping [25]. In polyploid plants withsmall and highly similar chromosomes, karyotyping isaided by fluorescence in situ hybridization (FISH) usinglabeled total genomic DNA, repetitive sequences, or sin-gle copy probes. In particular, variation found at rDNAloci (45S and 5S rDNA) can sometimes be used to differ-entiate subgenomes or to distinguish between ecotypes
of a species [26,27]. Chromosome reduction, breakage,or fusion during or after polyploidization can result ina gain or loss of these tandem repeat sequences. In theTriticeae, for example, both the location and order ofrDNA loci differ extensively among related species [28].FISH analyses using repetitive probes can further en-able chromosome identification, and have been success-fully employed in maize [29], rice [30], sugarcane [31],soybean [32], and pine [33].In complex polyploid organisms such as switchgrass,
the development of genotypes with reduced chromo-some numbers would prove useful for breeding and gen-etic research [34]. Haploid plants, whether derived froma diploid or a polyploid, have half the chromosomenumber of the euploid form. Therefore, “haploid” plantsderived from switchgrass tetraploids will have two copiesof the basic chromosome number of nine (2n= 2X= 18).With a true haploid number of nine, the term “diha-ploid” has been used to describe androgenic switchgrasslines containing two sets of homologous chromosomes[35] as well as gynogenic lines containing two sets ofnon-pairing homoeologous chromosomes [36]. The“dihaploid” terminology as well as the utility of suchplant lines has been previously described for potato, bar-ley, wheat, and several other species [37-39].Early cytological studies in switchgrass focused mainly
on overall counts of chromosomes rather than their in-dividual morphology and molecular structure [40]. Ourpurpose here is to describe a quantitative karyotype ofP. virgatum L. To simplify analysis, we have used a diha-ploid line (2n= 2X= 18) derived from a lowland tetra-ploid individual through gynogenesis [36]. The term“dihaploid” is used to indicate the polyploid origin of theline and the homoeologous constitution of its subge-nomes. Here we establish a standard reference karyotypethat identifies visible features of individual switchgrasschromosomes and allows their unique discrimination.We demonstrate the presence of both additive and non-additive loci associated with rDNA and centromericrepeats, indicating subgenome divergence. We alsodocument karyotype differences between upland andlowland genotypes.
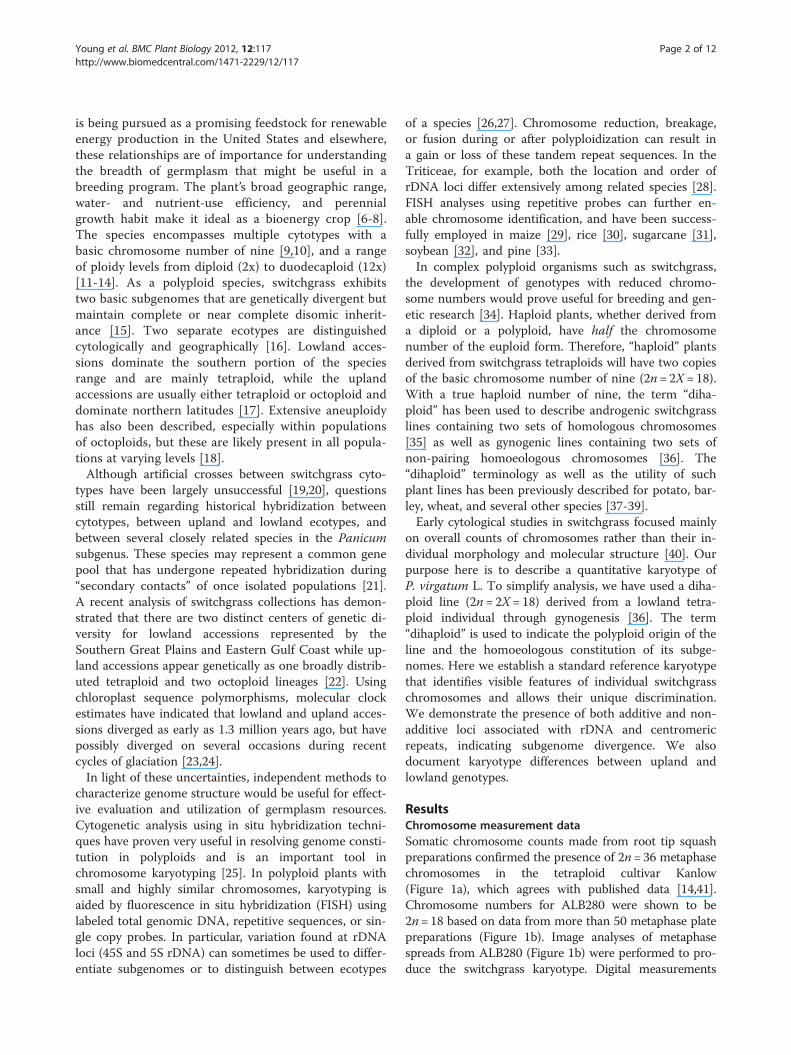
ResultsChromosome measurement dataSomatic chromosome counts made from root tip squashpreparations confirmed the presence of 2n=36 metaphasechromosomes in the tetraploid cultivar Kanlow(Figure 1a), which agrees with published data [14,41].Chromosome numbers for ALB280 were shown to be2n=18 based on data from more than 50 metaphase platepreparations (Figure 1b). Image analyses of metaphasespreads from ALB280 (Figure 1b) were performed to pro-duce the switchgrass karyotype. Digital measurements
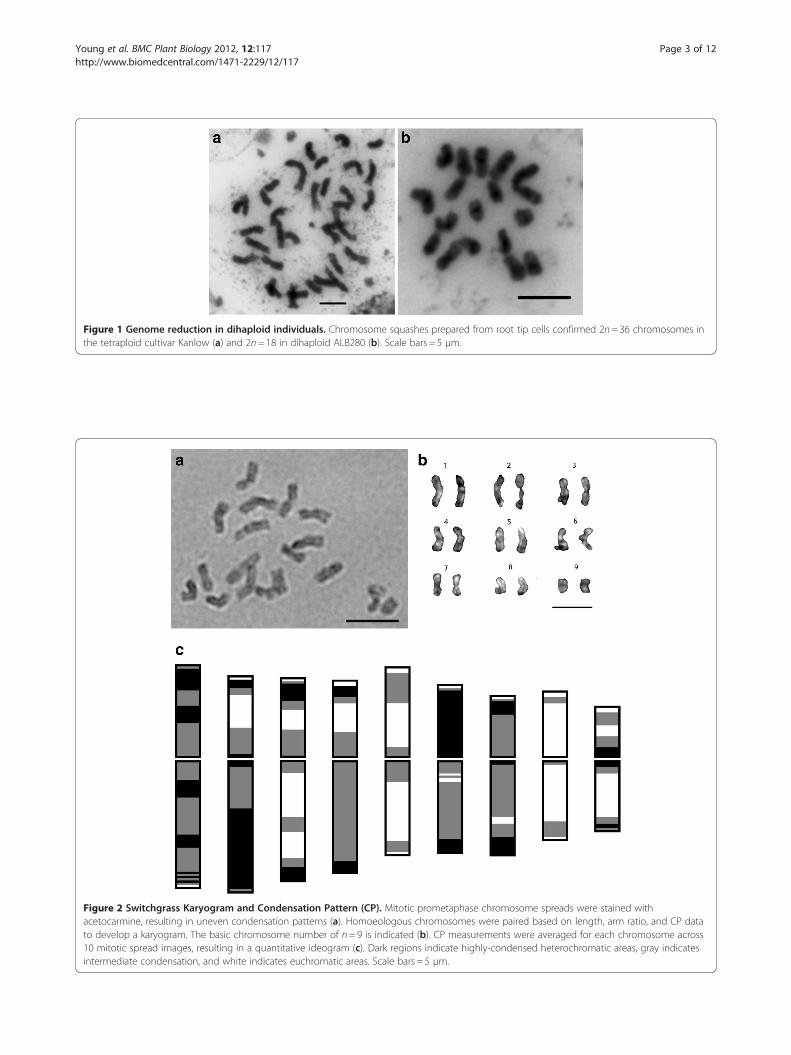
Figure 2 Switchgrass Karyogram and Condensation Pattern (CP). Mitotic prometaphase chromosome spreads were stained withacetocarmine, resulting in uneven condensation patterns (a). Homoeologous chromosomes were paired based on length, arm ratio, and CP datato develop a karyogram. The basic chromosome number of n= 9 is indicated (b). CP measurements were averaged for each chromosome across10 mitotic spread images, resulting in a quantitative ideogram (c). Dark regions indicate highly-condensed heterochromatic areas, gray indicatesintermediate condensation, and white indicates euchromatic areas. Scale bars = 5 μm.
Figure 1 Genome reduction in dihaploid individuals. Chromosome squashes prepared from root tip cells confirmed 2n= 36 chromosomes inthe tetraploid cultivar Kanlow (a) and 2n= 18 in dihaploid ALB280 (b). Scale bars = 5 μm.
Young et al. BMC Plant Biology 2012, 12:117 Page 3 of 12http://www.biomedcentral.com/1471-2229/12/117
Table 1 Morphology of P. virgatum chromosomes(ALB280)
Chromosome Lengtha (μm±SE) Arm Ratiob (r±SE) Centricity Class
1 4.10 ± 0.25 1.30 ± 0.09 m
2 3.73 ± 0.30 1.31 ± 0.06 m
3 3.38 ± 0.18 1.15 ± 0.07 m
4 3.26 ± 0.16 1.28 ± 0.13 m
5 3.05 ± 0.18 1.22 ± 0.16 m
6 2.82 ± 0.16 1.21 ± 0.06 m
7 2.61 ± 0.17 1.30 ± 0.08 m
8 2.35 ± 0.11 1.18 ± 0.06 m
9 2.05 ± 0.16 1.21 ± 0.04 maAverage value of 10 chromosome pairs (μm).bArm ratio r (long/short) according to Levan et al. [42].SE= standard error; m=metacentric.
Young et al. BMC Plant Biology 2012, 12:117 Page 4 of 12http://www.biomedcentral.com/1471-2229/12/117
allowed for homoeologous chromosomes to be paired to-gether and the base number n=9 to be presented in akaryogram, from longest to shortest (Figure 2a,b). Mor-phological data from ten complete and undistortedchromosome spreads are presented in Table 1, indicatingthat switchgrass chromosomes are small to medium inlength, ranging from 2.05± 0.16 μm to 4.10± 0.25 μm.Identification of the centromeres via FISH analyses (datapresented below) allowed for measurement of chromo-some arms and calculation of arm ratios (r). All chromo-somes were classified as metacentric (m) based onparameters described by Levan et al. [42].
Condensation patternChromosomes exhibit uneven staining due to variationin condensation pattern (CP) along their length. This dis-tinctive CP, especially at the prometaphase stage of mi-tosis, was utilized as a diagnostic measurement forchromosome identification. CHIAS IV software [43]takes advantage of this uneven staining pattern and wasused to generate a distinctive CP profile for each of thenine switchgrass chromosomes (Figure 2c). The same tenchromosome spread images used to generate the mor-phological data in Table 1 were analyzed with CHIAS IVsoftware. Homoeologous chromosomes were paired ineach prometaphase spread and then averaged togetherwith homologs across all ten spreads. The resulting ideo-gram based on chromosome length and CP is presentedin Figure 2c. Gray scale images allowed for distinctcharacterization of each switchgrass chromosome basedon features such as the large, condensed region on thelong arm of Chromosome 2, interstitial constrictions onboth arms of Chromosome 1, and the large white areasindicating euchromatic regions of Chromosomes 5 and 8(Figure 2c). Taken together with the length and arm ratiodata, CP profiles allow each chromosome to be distin-guished from all others in the karyotype.
Localization of centromeresA plasmid probe developed from the maize centromererepeat sequence CentC [44] (GenBank AF078922.1) wasused for FISH of switchgrass chromosomes. Only oneCentC signal was observed in mitotic chromosomespreads of dihaploid ALB280 (2n= 2X= 18) (Figure 3a).Upon FISH analysis of the lowland tetraploid cultivarAlamo (2n= 4X= 36), two CentC signals were evident(Figure 3b). Moreover, four CentC signals were presentin chromosome spreads of the upland octoploid cultivarGrenville (2n= 8X= 72) (Figure 3c). Chromosome lengthand arm ratio data of ALB280 were used to determinethat the CentC probe hybridizes to Chromosome 3 ofthe basic karyotype (Figure 4).BLAST analysis of switchgrass 454 sequence data using
the maize CentC and rice CentO sequences resulted in asubset of potential centromere-specific repeat sequencesfound in the switchgrass genome that, on average,were 73% identical to maize CentC (AF078922.1). Primersdesigned from the corresponding consensus sequencewere used to amplify and label a switchgrass-specificcentromere repeat sequence for FISH analysis. The labeledswitchgrass centromere probe (PviCentC) produced afluorescent signal on all 18 chromosomes of ALB280(Figure 3d). In addition, one chromosome of ALB280demonstrated a centromeric FISH signal significantlybrighter than all the others. This PviCentC signal patternwas also present in all tetraploid cytotypes tested, whereall centromeres were labeled and two chromosomesdemonstrated a very high level of fluorescence (Figure 3e,cv. Kanlow). Octoploid cytotypes maintained this pattern,demonstrating four strong FISH signals on specific chro-mosomes while all others contained equal intensity signalsat their centromeres (Figure 3f, cv. Cave-in-Rock). Length,arm ratio, and condensation pattern analyses identifiedthe high fluorescing chromosomes as Chromosome 3,which is consistent with the maize CentC probe fromwhich PviCentC was derived.
45S rDNA localizationThe distribution of 45S rDNA on mitotic metaphasechromosomes of switchgrass was detected with FISHusing the wheat pTa71 plasmid probe [45]. Theseresults demonstrate that one pair of 45S rDNA signalwas detected in chromosome spreads of ALB280, suggest-ing that the basic karyotype (n= 9) has one chromosomecontaining the 45S rDNA sequence (Figure 3g). When thetetraploid, lowland individual AP13 is probed, two pairs of45S rDNA signals are present (Figure 3h). This patternof one 45S rDNA signal per base genome (n = 9) alsopersisted in an individual from the octoploid uplandcultivar Caddo, where eight 45S rDNA signals arevisible (Figure 3i). Analysis of the morphology andFISH staining patterns in multiple spreads indicates
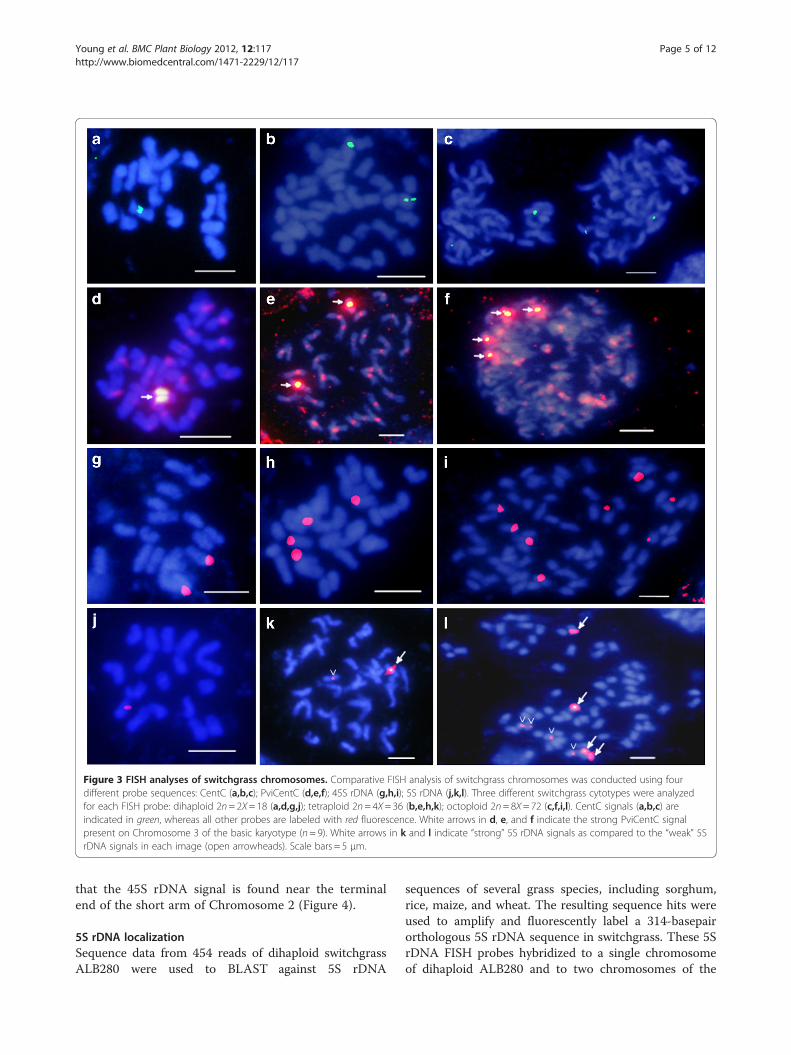
Figure 3 FISH analyses of switchgrass chromosomes. Comparative FISH analysis of switchgrass chromosomes was conducted using fourdifferent probe sequences: CentC (a,b,c); PviCentC (d,e,f); 45S rDNA (g,h,i); 5S rDNA (j,k,l). Three different switchgrass cytotypes were analyzedfor each FISH probe: dihaploid 2n= 2X= 18 (a,d,g,j); tetraploid 2n= 4X= 36 (b,e,h,k); octoploid 2n= 8X= 72 (c,f,i,l). CentC signals (a,b,c) areindicated in green, whereas all other probes are labeled with red fluorescence. White arrows in d, e, and f indicate the strong PviCentC signalpresent on Chromosome 3 of the basic karyotype (n= 9). White arrows in k and l indicate “strong” 5S rDNA signals as compared to the “weak” 5SrDNA signals in each image (open arrowheads). Scale bars = 5 μm.
Young et al. BMC Plant Biology 2012, 12:117 Page 5 of 12http://www.biomedcentral.com/1471-2229/12/117
that the 45S rDNA signal is found near the terminalend of the short arm of Chromosome 2 (Figure 4).
5S rDNA localizationSequence data from 454 reads of dihaploid switchgrassALB280 were used to BLAST against 5S rDNA
sequences of several grass species, including sorghum,rice, maize, and wheat. The resulting sequence hits wereused to amplify and fluorescently label a 314-basepairorthologous 5S rDNA sequence in switchgrass. These 5SrDNA FISH probes hybridized to a single chromosomeof dihaploid ALB280 and to two chromosomes of the
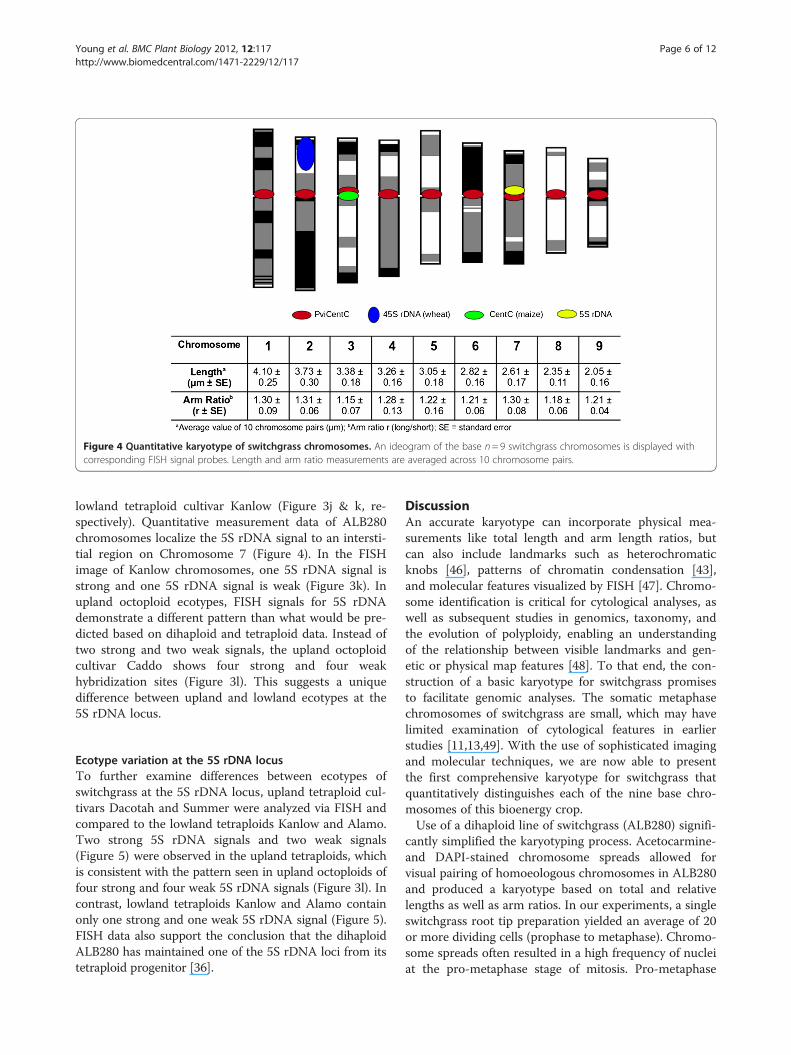
Figure 4 Quantitative karyotype of switchgrass chromosomes. An ideogram of the base n= 9 switchgrass chromosomes is displayed withcorresponding FISH signal probes. Length and arm ratio measurements are averaged across 10 chromosome pairs.
Young et al. BMC Plant Biology 2012, 12:117 Page 6 of 12http://www.biomedcentral.com/1471-2229/12/117
lowland tetraploid cultivar Kanlow (Figure 3j & k, re-spectively). Quantitative measurement data of ALB280chromosomes localize the 5S rDNA signal to an intersti-tial region on Chromosome 7 (Figure 4). In the FISHimage of Kanlow chromosomes, one 5S rDNA signal isstrong and one 5S rDNA signal is weak (Figure 3k). Inupland octoploid ecotypes, FISH signals for 5S rDNAdemonstrate a different pattern than what would be pre-dicted based on dihaploid and tetraploid data. Instead oftwo strong and two weak signals, the upland octoploidcultivar Caddo shows four strong and four weakhybridization sites (Figure 3l). This suggests a uniquedifference between upland and lowland ecotypes at the5S rDNA locus.
Ecotype variation at the 5S rDNA locusTo further examine differences between ecotypes ofswitchgrass at the 5S rDNA locus, upland tetraploid cul-tivars Dacotah and Summer were analyzed via FISH andcompared to the lowland tetraploids Kanlow and Alamo.Two strong 5S rDNA signals and two weak signals(Figure 5) were observed in the upland tetraploids, whichis consistent with the pattern seen in upland octoploids offour strong and four weak 5S rDNA signals (Figure 3l). Incontrast, lowland tetraploids Kanlow and Alamo containonly one strong and one weak 5S rDNA signal (Figure 5).FISH data also support the conclusion that the dihaploidALB280 has maintained one of the 5S rDNA loci from itstetraploid progenitor [36].
DiscussionAn accurate karyotype can incorporate physical mea-surements like total length and arm length ratios, butcan also include landmarks such as heterochromaticknobs [46], patterns of chromatin condensation [43],and molecular features visualized by FISH [47]. Chromo-some identification is critical for cytological analyses, aswell as subsequent studies in genomics, taxonomy, andthe evolution of polyploidy, enabling an understandingof the relationship between visible landmarks and gen-etic or physical map features [48]. To that end, the con-struction of a basic karyotype for switchgrass promisesto facilitate genomic analyses. The somatic metaphasechromosomes of switchgrass are small, which may havelimited examination of cytological features in earlierstudies [11,13,49]. With the use of sophisticated imagingand molecular techniques, we are now able to presentthe first comprehensive karyotype for switchgrass thatquantitatively distinguishes each of the nine base chro-mosomes of this bioenergy crop.Use of a dihaploid line of switchgrass (ALB280) signifi-
cantly simplified the karyotyping process. Acetocarmine-and DAPI-stained chromosome spreads allowed forvisual pairing of homoeologous chromosomes in ALB280and produced a karyotype based on total and relativelengths as well as arm ratios. In our experiments, a singleswitchgrass root tip preparation yielded an average of 20or more dividing cells (prophase to metaphase). Chromo-some spreads often resulted in a high frequency of nucleiat the pro-metaphase stage of mitosis. Pro-metaphase
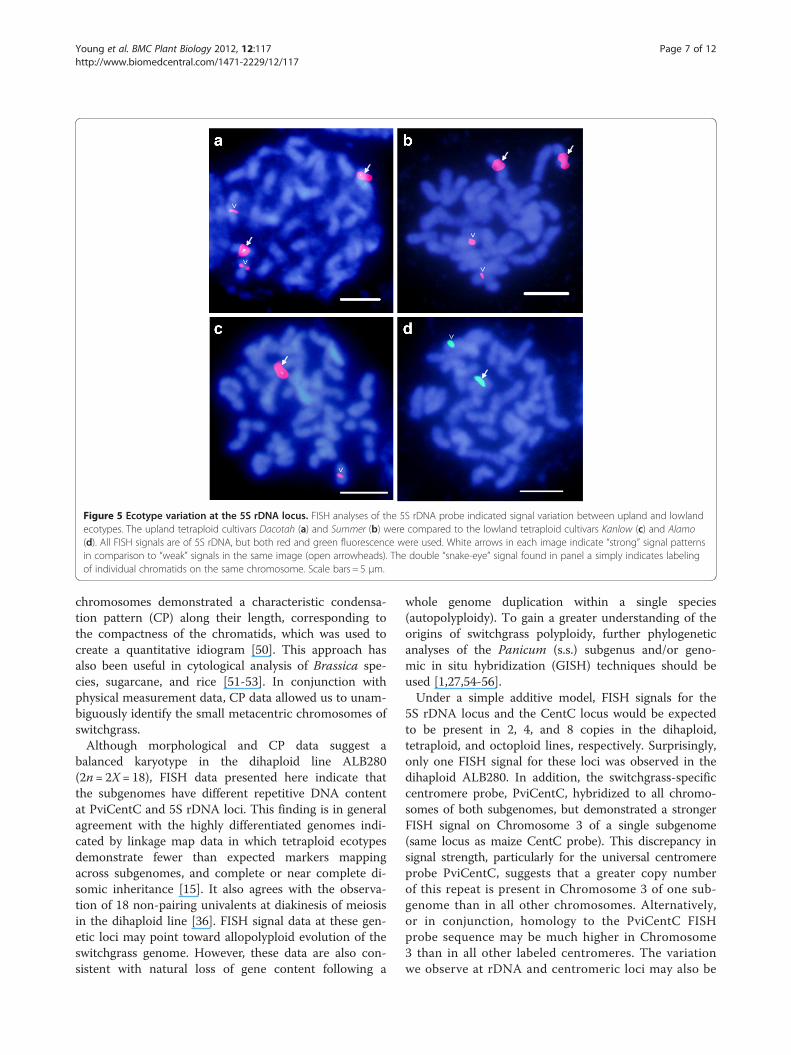
Figure 5 Ecotype variation at the 5S rDNA locus. FISH analyses of the 5S rDNA probe indicated signal variation between upland and lowlandecotypes. The upland tetraploid cultivars Dacotah (a) and Summer (b) were compared to the lowland tetraploid cultivars Kanlow (c) and Alamo(d). All FISH signals are of 5S rDNA, but both red and green fluorescence were used. White arrows in each image indicate “strong” signal patternsin comparison to “weak” signals in the same image (open arrowheads). The double “snake-eye” signal found in panel a simply indicates labelingof individual chromatids on the same chromosome. Scale bars = 5 μm.
Young et al. BMC Plant Biology 2012, 12:117 Page 7 of 12http://www.biomedcentral.com/1471-2229/12/117
chromosomes demonstrated a characteristic condensa-tion pattern (CP) along their length, corresponding tothe compactness of the chromatids, which was used tocreate a quantitative idiogram [50]. This approach hasalso been useful in cytological analysis of Brassica spe-cies, sugarcane, and rice [51-53]. In conjunction withphysical measurement data, CP data allowed us to unam-biguously identify the small metacentric chromosomes ofswitchgrass.Although morphological and CP data suggest a
balanced karyotype in the dihaploid line ALB280(2n= 2X= 18), FISH data presented here indicate thatthe subgenomes have different repetitive DNA contentat PviCentC and 5S rDNA loci. This finding is in generalagreement with the highly differentiated genomes indi-cated by linkage map data in which tetraploid ecotypesdemonstrate fewer than expected markers mappingacross subgenomes, and complete or near complete di-somic inheritance [15]. It also agrees with the observa-tion of 18 non-pairing univalents at diakinesis of meiosisin the dihaploid line [36]. FISH signal data at these gen-etic loci may point toward allopolyploid evolution of theswitchgrass genome. However, these data are also con-sistent with natural loss of gene content following a
whole genome duplication within a single species(autopolyploidy). To gain a greater understanding of theorigins of switchgrass polyploidy, further phylogeneticanalyses of the Panicum (s.s.) subgenus and/or geno-mic in situ hybridization (GISH) techniques should beused [1,27,54-56].Under a simple additive model, FISH signals for the
5S rDNA locus and the CentC locus would be expectedto be present in 2, 4, and 8 copies in the dihaploid,tetraploid, and octoploid lines, respectively. Surprisingly,only one FISH signal for these loci was observed in thedihaploid ALB280. In addition, the switchgrass-specificcentromere probe, PviCentC, hybridized to all chromo-somes of both subgenomes, but demonstrated a strongerFISH signal on Chromosome 3 of a single subgenome(same locus as maize CentC probe). This discrepancy insignal strength, particularly for the universal centromereprobe PviCentC, suggests that a greater copy numberof this repeat is present in Chromosome 3 of one sub-genome than in all other chromosomes. Alternatively,or in conjunction, homology to the PviCentC FISHprobe sequence may be much higher in Chromosome3 than in all other labeled centromeres. The variationwe observe at rDNA and centromeric loci may also be
Young et al. BMC Plant Biology 2012, 12:117 Page 8 of 12http://www.biomedcentral.com/1471-2229/12/117
a result of the allogamous habit and self-incompatibility of switchgrass [20]. In outbreedingspecies of the genus Secale, high levels of repeat DNApolymorphism between homologous chromosomeshave been documented [57]. Other outbreeding spe-cies in the Lolium and Lolium-Festuca complex dem-onstrate variation at rDNA loci [58,59], suggestingthat hemizygosity in switchgrass may result from out-crossing. Also contributing to non-additive FISH sig-nal data may be the high frequency of switchgrassaneuploids, particularly among octoploid cytotypes[18,40], which can lead to large-scale genetic changesand parental genome imbalance.In our analyses of 45S rDNA loci, pairs of telomeric
FISH signals demonstrated a regular, additive patternup the ploidy series. Among tetraploid cultivars, ourdata are consistent with those of Costich et al. [18] inwhich all tetraploids analyzed (upland and lowland)demonstrated two pairs of telomeric 45S rDNA signals.However, in octoploid cultivars, Costich et al. [18] de-scribe a large amount of variation in size, number, andlocation of 45S rDNA signals. The variation in 45SrDNA signal intensity seen in our analysis of the octo-ploid cv. Caddo (see Figure 3i) may suggest rDNA repeatvariation and/or differences in probe hybridization affinity.With only a single upland octoploid (cv. Caddo) analyzedwith 45S rDNA in this study, our results likely demon-strate one of many chromosomal constitutions for switch-grass octoploids. Overall, FISH analyses of tetraploid andoctoploid individuals support elimination of rDNA andcentromere sequences and demonstrates that patterns ofsubgenome differentiation are broadly maintained.Our data also demonstrate unique ecotype differences
at 5S rDNA loci. Variations in FISH signal patterns be-tween upland and lowland tetraploids (and between low-land tetraploids and upland octoploids) provide featuresthat distinguish these taxonomic divisions within switch-grass. We hypothesize that these variations in rDNA lociare related to both the phenotypic and geographic distri-bution differences observed between switchgrass eco-types. In Oryza species, polymorphisms in the number,the chromosomal location, and the repeat length of rDNAloci have revealed species-specific and subgenome-specificFISH patterns [60]. The authors suggest that specificinversions, rDNA amplification, and locus transpositionmay have occurred during the process of Oryza evolution.Such a scenario may also be true for the divergence ofswitchgrass upland and lowland ecotypes. Classified culti-vars of switchgrass are barely removed from the wild, andrapidly evolving rDNA loci are likely still undergoingchange. The additive pattern of 5S rDNA loci seen be-tween lowland tetraploids (2 signals) and upland tetra-ploids (4 signals) may be indicative of chromosomal
rearrangements and rDNA changes that ultimately resultin habitat adaptability differences between the two eco-types. In addition, the conserved doubling pattern of 5SrDNA loci from upland tetraploid to upland octoploid fur-ther supports the maintenance of ecotype divergenceacross different cytotypes.The presence of gene flow between switchgrass eco-
types and/or cytotypes has ramifications on the develop-ment and use of specific gene pools for switchgrassimprovement. Therefore, knowledge of chromosomearchitecture and ploidy relationships is critical for culti-var development. Cytogenetic data presented here can beused to classify switchgrass plants according to ecotypeand ultimately aid in identifying and isolating regionallyadapted cultivars [61,62]. Switchgrass improvementthrough trait identification and breeding for significantheterotic effects also warrants the maintenance of inde-pendent gene pools [63,64]. Recent analyses of severalputative upland and lowland accessions of switchgrasshave identified the presence of natural hybrids betweenecotypes as well as evidence of gene flow [22,23]. Resultsdemonstrated a mixture of both cytotypes and pheno-types within hybrid populations, suggesting a long his-tory of gene flow. In addition, genetic marker dataindicated that gene flow is bidirectional, from upland tolowland and from lowland to upland [23]. A quantitativeunderstanding of whole switchgrass chromosomes willhelp in distinguishing hybrid genotypes and aid in track-ing genome sources during directed breeding programs.The use of FISH and GISH can identify translocationsand/or introgression of new chromosome sources[25,65], but can also be used to identify ancestral gen-omes that contribute to the evolution of polyploid spe-cies such as switchgrass [27,66].The development of a species karyotype, with unam-
biguous identification of individual chromosomes, is alsocritical for the integration of genetic and physical mapdata. Genetic maps of switchgrass have been constructedusing SSR and STS markers [15]. Hybridization of thesegenetically mapped markers to switchgrass chromosomeswould lead to definitive assignment of linkage groups.Fluorescence detection of single- and low-copy sequencesthrough the use of BAC clones as probes has provenhighly successful in many species, including rice [67],maize [68], and sorghum [69]. BAC libraries for switch-grass have recently been developed and may be utilizedfor the integration of linkage and physical maps throughBAC-FISH probing. BAC sequences would also be usefulin flow sorting of chromosome fractions for physicalgene mapping and construction of chromosome-specificlibraries [70]. In this light, FISH technology will continueto be a valuable tool in understanding genome structurein switchgrass.
Young et al. BMC Plant Biology 2012, 12:117 Page 9 of 12http://www.biomedcentral.com/1471-2229/12/117
ConclusionsThe relatively small size and lack of distinguishing fea-tures among switchgrass chromosomes have likely de-terred detailed karyotype analysis in the past [11,40].Through the use of sophisticated molecular, cytological,and imaging techniques, we describe a quantitativekaryotype for P. virgatum L. that distinguishes individualchromosomes. Our data support the genetic divergenceof the two subgenomes within switchgrass and provide afoundation for studying the evolution of polyploidy inthis bioenergy crop. We also demonstrate karyotype dif-ferences between upland and lowland ecotypes that willaid in identifying and maintaining diverse gene pools forfuture breeding strategies. Additional cytogenetic ana-lyses of switchgrass chromosomes are necessary, butdata presented here provide a quantitative foundation onwhich genomic and genetic studies can continue to ad-vance. This karyotype will enable aneuploid stocks aswell as alien substitution and addition lines to be charac-terized and used by others for classical genetic analysisand introduction of new variation.
MethodsPlant material and growth conditionsDihaploid switchgrass plants (2n= 2X= 18) were identi-fied from among the progeny of a biparental cross be-tween two lowland tetraploid cultivars, Kanlow andAlamo, as previously described [36]. Tetraploid andoctoploid cultivars used in cytological and FISH analyseswere obtained either from colleagues in Lincoln, NE orfrom the National Genetic Resources Program (NGRP,Beltsville, MD). Cultivar accessions used in this studyare described in Additional file 1 Table S1. Seeds of allecotypes were stratified for 3 weeks at 4°C before ger-minating on wet filter paper and transplanting to thegreenhouse. Plants were maintained in the greenhouseat 72°F, under supplemental lighting (16 h day), wateredas needed, and fertilized weekly with general purpose20-20-20 fertilizer.
Mitotic chromosome preparationMitotic chromosome spreads were generated following aprotocol by Zhang and Friebe [71] with a few modifica-tions. Actively growing root tips were excised fromgreenhouse grown plants, pretreated in ice cold waterfor 18–24 h, and then fixed in 3:1 ratio of 95% ethanoland glacial acetic acid at 4°C, overnight. Root materialwas either used immediately for slide preparation orstored in fixative at −20°C for up to several months. Forslide preparation, the root tips (0.5-1.0 cm) were washedtwice for 5 min in 0.01 M citrate buffer and digested inan enzyme mixture of 50 mg/ml Onozuka R-10 cellulaseand 30 mg/ml Macerozyme (Phytotechnology Labs,Shawnee Mission, KS) at 37°C. Digestion times varied
from 30 mins to 2.5 h, depending on the thickness anddegree of lignification in the root tip. Softened root tipswere then washed for 5 min in 0.01 M citrate buffer andtransferred to a slide. Forceps and a scalpel were used tocarefully excise the white tissue just behind the rootcap containing actively dividing mitotic cells. All otherroot tissues were removed and the remaining cellswere macerated in a few drops of 1% acetocarminestain. A coverslip was placed over the stained tissueand even pressure was applied to generate mitoticchromosome spreads. Slides were viewed under phase-contrast microscopy to identify spreads optimal for usein FISH analysis.
Probe DNA labeling and fluorescence in situ hybridization(FISH)The clone pTa71 from Triticum aestivum L. [45] as usedto identify the 45S rDNA (18 S-5.8 S-25 S rRNA) genesequence. The CentC probe sequence [44] was gener-ously provided by Dr. Zac Cande as a plasmid clonederived from PCR products of Zea mays DNA. The 5SrDNA probe for switchgrass was designed using 5SrDNA sequences from maize, rice, and sorghum to iden-tify similar sequences from a database of switchgrass 454sequence reads from a cv. Alamo individual usingBLASTN. Primers (FP 5'-AGCACGCTTACGTTCGAGTTCTGA-3'; RP 5'-AGAATGGCTAGATGCGCGGAGAAT-3') were developed from the resultingBLASTN hits with highest e-values. The PviCentC probewas amplified from switchgrass gDNA using PCR pri-mers designed using 454 sequence reads that were iden-tified as similar to maize CentC and rice CentOsequences using BLASTN [72]. Analysis of resultingBLAST hits was used to infer the PviCentC sequencefrom existing switchgrass raw genome sequence data.The resulting consensus sequence was used to designprimers for the switchgrass-specific centromeric repeatprobe (FP 5'-CATGCCCAATCCACTTCTTTAGGC-3';RP 5'-CAACTTACGGGAAGCACAAAGTGG-3'). Theresulting 143-bp PCR product was labeled with eitherdigoxigenin-11-dUTP or biotin-16-dUTP using nicktranslation or PCR (Nick Translation Kit; PCR DIGProbe Synthesis Kit, Roche Applied Sciences, Indianapo-lis, IN), in accordance with manufacturer instructions.Hybridization and post-hybridization wash procedureswere performed as previously described [73]. Chromo-somes were counter-stained with 4',6-diamidino-2-phenylindole (DAPI).
Microscopy and image analysisDigital images were recorded using an Olympus BX51epifluorescence microscope (Olympus Corporation, Cen-ter Valley, PA) with a DP70 CCD (charge coupled device)camera and suitable monochrome filter sets (Chroma
Young et al. BMC Plant Biology 2012, 12:117 Page 10 of 12http://www.biomedcentral.com/1471-2229/12/117
Technology, Rockingham, VT). Images were processedusing GIMP 2.6 (GNU Image Manipulation Program) forLinux. Chromosome length measurements and armratios were determined manually using GIMP 2.6 andconfirmed with automated measurements in CHIAS IVsoftware (Chromosome Image Analyzing System IV)[43]. Analysis of chromosome condensation patternswere performed by the CHIAS IV system using themacro programs written by Seiji Kato, Nobuko Ohmido,and Kiichi Fukui. Analysis of FISH data was conducted inGIMP 2.6 by overlaying a probe signal image on top ofthe corresponding DAPI stain image. Adjustments weremade to the transparency of the top (FISH signal) layerto demonstrate signal and chromosome alignment.
Karyotype analysisKaryotype analyses were performed on ten undistortedand non-overlapping chromosome spreads from thedihaploid ecotype ALB280 (2n= 2X= 18). Homoeologouschromosomes from acetocarmine and/or DAPI stainedspreads were paired based on total length, arm ratio, andcondensation pattern. Physical length measurementswere taken for each chromosome using GIMP 2.6 andCHIAS IV imaging software and by converting pixellengths into microns. Statistical t tests were conducted toconfirm that homoeologous pairs were not significantlydifferent from one another. Chromosome arms weremeasured from the centromere to the tip of each armand the centricity class was determined from arm ratio(r = long-arm length/short-arm length), as previouslydescribed [42]. Whenever possible, FISH signal data wereused to pair homoeologous chromosomes and measure-ment data were averaged for each chromosome in thekaryotype across all ten mitotic spreads. Chromosomeswere numbered 1–9 from the longest to the shortest andpaired with FISH signal data to define the karyotype(n= 9). In addition, condensation patterns (CP) of all tenmitotic spreads were subjected to analysis with CHIASIV software to aid in distinguishing chromosomes.
Dihaploid lines of switchgrassKaryotype analysis of the base 9 chromosomes of switch-grass was significantly aided by the use of a dihaploid in-dividual (2n = 2X= 18) previously identified from amongthe progeny of a controlled cross between two tetraploidcultivars (2n = 4X=36), Kanlow and Alamo [36]. Thisdihaploid line (ALB280) was initially distinguished fromparental lines by its reduced heterozygosity and was sub-sequently confirmed through estimation of C values byflow cytometry. This analysis indicated that ALB280 hada 2 C value of 1.48, approximately half that of a tetra-ploid F1 reference individual (ALB881) and the Alamomale parent (ALBA4) which had 2 C values of 2.61 and2.75 pg, respectively [36].
Additional file
Additional file 1: Table S1. Switchgrass (Panicum virgatum L.) cultivarsincluded in this study [74].
Competing interestsThe authors declare no competing interests of any kind.
Authors’ contributionsCT, GS, and HY conceived and designed the study. GS and CT providedcritical plant and molecular materials and conducted sequence analysis forthe design of FISH molecular probes. HY performed the experiments andanalyzed the data. HY authored the manuscript with critical help from CTand GS. All authors read and approved the final manuscript.
AcknowledgmentsWe thank Denise Costich and Grace Chan for critical review of themanuscript. We also thank Bernd Friebe, Rachael Wang, and Denise Costichfor excellent technical advice. The U.S. Department of Agriculture,Agricultural Research Service, is an equal opportunity/affirmative actionemployer and all agency services are available without discrimination.Mention of commercial products and organizations in this manuscript issolely to provide specific information. It does not constitute endorsement byUSDA-ARS over other products and organizations not mentioned. This worksupported by the United States Department of Agriculture, AgricultureResearch Service (USDA-ARS) Current Research Information System (CRIS)5325-21000-017, USDA-ARS CRIS 5440-21000-028-00, and by a Joint USDA/Department of Energy Office of Science Feedstock genomics grant DE-AI02-09ER64829. The funders had no role in study design, data collection andanalysis, decision to publish, or preparation of the manuscript.
Author details1Genomics and Gene Discovery Research Unit, USDA-Agricultural ResearchService, Western Regional Research Center, 800 Buchanan Street, Albany, CA94710, USA. 2USDA Central-East Regional Biomass Center, 137 Keim Hall, EastCampus, UNL, Lincoln, NE 68583, USA.
Received: 23 February 2012 Accepted: 11 July 2012Published: 26 July 2012
References1. Wood TE, Takebayashi N, Barker MS, Mayrose I, Greenspoon PB,
Rieseberg LH: The frequency of polyploid speciation in vascular plants.Proc Natl Acad Sci 2009, 106:13875–13879.
2. Paterson AH, Bowers JE, Chapman BA: Ancient polyploidization predatingdivergence of the cereals, and its consequences for comparativegenomics. Proc Natl Acad Sci U S A 2004, 101:9903–9908.
3. Soltis PS, Soltis DE: The role of hybridization in plant speciation. Annu RevPlant Biol 2009, 60:561–588.
4. Doyle JJ, Doyle JL, Rauscher JT, Brown AHD: Diploid and PolyploidReticulate Evolution Throughout the History of the Perennial Soybeans(Glycine Subgenus Glycine). New Phytol 2004, 161:121–132.
5. Aliscioni SS, Giussani LM, Zuloaga FO, Kellogg EA: A molecular phylogenyof Panicum (Poaceae: Paniceae): tests of monophyly and phylogeneticplacement within the Panicoideae. Am J Bot 2003, 90:796–821.
6. Lewandowski I, Scurlock JMO, Lindvall E, Christou M: The development andcurrent status of perennial rhizomatous grasses as energy crops in theUS and Europe. Biomass Bioenergy 2003, 25:335–361.
7. McLaughlin SB, Adams Kszos L: Development of switchgrass (Panicumvirgatum) as a bioenergy feedstock in the United States. BiomassBioenergy 2005, 28:515–535.
8. Sanderson MA, Adler PR, Boateng AA, Casler MD, Sarath G: Switchgrass as abiofuels feedstock in the USA. Canadian Journal of Plant Science 2006,86:1315–1325.
9. Church GL: Meiotic Phenomena in Certain Gramineae. II. Paniceae andAndropogoneae. Bot Gaz 1929, 88:63–84.
10. Gould FW: The Grasses of Texas. College Station: Texas A&M UniversityPress; 1975.
11. Church GL: Cytotaxonomic Studies in the Gramineae Spartina,Andropogon and Panicum. Am J Bot 1940, 27:263–271.
Young et al. BMC Plant Biology 2012, 12:117 Page 11 of 12http://www.biomedcentral.com/1471-2229/12/117
12. Nielsen EL: Analysis of variation in Panicum virgatum L. Journal ofAgriculture Research 1944, 69:327–353.
13. Brunken JN, Estes JR: Cytological and Morphological Variation in Panicumvirgatum L. Southwest Nat 1975, 19:379–385.
14. Hopkins AA, Taliaferro CM, Murphy CD, Christian D: Chromosome Numberand Nuclear DNA Content of Several Switchgrass Populations. Crop Sci1996, 36:1192–1195.
15. Okada M, Lanzatella C, Saha MC, Bouton J, Wu R, Tobias CM: CompleteSwitchgrass Genetic Maps Reveal Subgenome Collinearity, PreferentialPairing and Multilocus Interactions. Genetics 2010, 185:745–760.
16. Vogel KP: Switchgrass. In Warm-Season (C4) Grasses. Edited by Moser L,Burson B. LE Sollenberger Madison: American Society of Agronomy;2004:561–588.
17. Casler MD: Ecotypic Variation among Switchgrass Populations from theNorthern USA. Crop Sci 2005, 45:388.
18. Costich DE, Friebe B, Sheehan MJ, Casler MD, Buckler ES: Genome-sizeVariation in Switchgrass (Panicum virgatum): Flow Cytometry andCytology Reveal Rampant Aneuploidy. The Plant Genome Journal 2010,3:130.
19. Taliaferro, Hopkins AA: Breeding characteristics and improvementpotential of switchgrass. In Proceedings of the Third Liquid Fuel Conference,Nashville. Edited by Cundiff JS. St Joseph, MI: TN 15–17 Sept 1996 ASAE;1996:2–9.
20. Martínez-Reyna JM, Vogel KP: Incompatibility Systems in Switchgrass. CropSci 2002, 42:1800.
21. Stebbins GL: Polyploidy, Hybridization, and the Invasion of New Habitats.Annals of the Missouri Botanical Garden 1985, 72:824–832.
22. Zhang Y, Zalapa JE, Jakubowski AR, Price DL, Acharya A, Wei Y, Brummer EC,Kaeppler SM, Casler MD: Post-glacial evolution of Panicum virgatum:centers of diversity and gene pools revealed by SSR markers and cpDNAsequences. Genetica 2011, 139:933–948.
23. Zhang Y, Zalapa J, Jakubowski AR, Price DL, Acharya A, Wei Y, Brummer EC,Kaeppler SM, Casler MD: Natural Hybrids and Gene Flow between Uplandand Lowland Switchgrass. Crop Sci 2011, 51:2626.
24. Young HA, Lanzatella CL, Sarath G, Tobias CM: Chloroplast genomevariation in upland and lowland switchgrass. PLoS One 2011, 6:e23980.
25. D’Hont A: Unraveling the genome structure of polyploids using FISH andGISH; examples of sugarcane and banana. Cytogenet Genome Res 2005,109:27–33.
26. Kitamura S, Tanaka A, Inoue M: Genomic relationships among Nicotianaspecies with different ploidy levels revealed by 5S rDNA spacersequences and FISH/GISH. Genes Genet. Syst. 2005, 80:251–260.
27. Lim KY, Soltis DE, Soltis PS, Tate J, Matyasek R, Srubarova H, Kovarik A,Pires JC, Xiong Z, Leitch AR: Rapid chromosome evolution in recentlyformed polyploids in Tragopogon (Asteraceae). PLoS One 2008, 3:e3353.
28. Castilho A, Heslop-Harrison JS: Physical mapping of 5S and 18S-25S rDNAand repetitive DNA sequences in Aegilops umbellulata. Genome 1995,38:91–96.
29. Kato A, Lamb JC, Birchler JA: Chromosome painting using repetitive DNAsequences as probes for somatic chromosome identification in maize.Proc Natl Acad Sci U S A 2004, 101:13554–13559.
30. Shishido R, Sano Y, Fukui K: Ribosomal DNAs: an exception to theconservation of gene order in rice genomes. Mol Gen Genet 2000,263:586–591.
31. D’Hont A, Ison D, Alix K, Roux C, Glaszmann JC: Determination of basicchromosome numbers in the genus Saccharum by physical mapping ofribosomal RNA genes. Genome 1998, 41:221–225.
32. Findley SD, Cannon S, Varala K, Du J, Ma J, Hudson ME, Birchler JA, Stacey G:A fluorescence in situ hybridization system for karyotyping soybean.Genetics 2010, 185:727–744.
33. Islam-Faridi MN, Nelson CD, Kubisiak TL: Reference karyotype andcytomolecular map for loblolly pine (Pinus taeda L.). Genome 2007,50:241–251.
34. Forster BP, Heberle-Bors E, Kasha KJ, Touraev A: The resurgence of haploidsin higher plants. Trends Plant Sci 2007, 12:368–375.
35. Conger BV: Development of In Vitro Systems for Switchgrass (Panicumvirgatum): Final Report for 1992 to 2002. UT-Battelle: Oak Ridge NationalLaboratory, UT-Battelle, US Dept. of Energy; 2002.
36. Young HA, Hernlem BJ, Anderton AL, Lanzatella CL, Tobias CM: DihaploidStocks of Switchgrass Isolated by a Screening Approach. Bioenerg. Res.2010, 3:305–313.
37. Maine MJD: An evaluation of the use of dihaploids and unreducedgametes in breeding for quantitative resistance to potato pathogens.J Agric Sci 1982, 99:79–83.
38. Toojinda T, Baird E, Booth A, Broers L, Hayes P, Powell W, Thomas W,Vivar H, Young G: Introgression of quantitative trait loci (QTLs)determining stripe rust resistance in barley: an example of marker-assisted line development. TAG Theor Appl Genet 1998, 96:123–131.
39. Yang Z, Gilbert J, Fedak G, Somers DJ: Genetic characterization of QTLassociated with resistance to Fusarium head blight in a doubled-haploidspring wheat population. Genome 2005, 48:187–196.
40. McMillan C, Weiler J: Cytogeography of Panicum virgatum in CentralNorth America. Am J Bot 1959, 46:590–593.
41. Lu K, Kaeppler SM, Vogel KP, Arumuganathan K, Lee DJ: Nuclear DNAcontent and chromosome numbers in switchgrass. Great Plains Res 1998,8:269–280.
42. Levan A, Fredga K, Sandberg A: Nomenclature for Centromeric Positionon Chromosomes. Hereditas 1964, 52:201–220.
43. Kato S, Fukui K: Condensation pattern (CP) analysis of plantchromosomes by an improved chromosome image analysing system,CHIAS III. Chromosome Res 1998, 6:473–479.
44. Ananiev EV, Phillips RL, Rines HW: Chromosome-specific molecularorganization of maize (Zea mays L.) centromeric regions. Proc Natl AcadSci U S A 1998, 95:13073–13078.
45. Gerlach WL, Bedbrook JR: Cloning and characterization of ribosomal RNAgenes from wheat and barley. Nucl. Acids Res. 1979, 7:1869–1885.
46. McClintock B: A Cytological Demonstration of the Location of anInterchange Between Two Non-homologous Chromosomes of Zea mays.Proc Natl Acad Sci U S A 1930, 16:791–796.
47. Speicher MR, Carter NP: The new cytogenetics: blurring the boundarieswith molecular biology. Nat Rev Genet 2005, 6:782–792.
48. Harper LC, Cande WZ: Mapping a new frontier; development ofintegrated cytogenetic maps in plants. Funct. Integr. Genomics 2000,1:89–98.
49. Hamoud M, Haroun S, MacLeod R, Richards A: Cytological relationships ofselected species of Panicum L. Biol Plant 1994, 36:37–45.
50. Fukui K, Iijima K: Somatic chromosome map of rice by imaging methods.Theoret. Appl. Genetics 1991, 81.
51. Fukui K, Nakayama S, Ohmido N, Yoshiaki H, Yamabe M: Quantitativekaryotyping of three diploid Brassica species by imaging methods andlocalization of 45s rDNA loci on the identified chromosomes. TAG TheorAppl Genet 1998, 96:325–330.
52. Ha S, Moore P, Heinz D, Kato S, Ohmido N, Fukui K: Quantitativechromosome map of the polyploid Saccharum spontaneum bymulticolor fluorescence in situ hybridization and imaging methods. PlantMol Biol 1999, 39:1165–1173.
53. Kato S, Ohmido N, Fukui K: Development of a quantitative pachytenechromosome map in Oryza sativa by imaging methods. Genes Genet. Syst2003, 78:155–161.
54. Langkjaer RB, Cliften PF, Johnston M, Piskur J: Yeast genome duplicationwas followed by asynchronous differentiation of duplicated genes.Nature 2003, 421:848–852.
55. Pendinen G, Gavrilenko T, Jiang J, Spooner DM: Allopolyploid speciation ofthe Mexican tetraploid potato species Solanum stoloniferum and S.hjertingii revealed by genomic in situ hybridization. Genome 2008,51:714–720.
56. Renny-Byfield S, Ainouche M, Leitch IJ, Lim KY, Le Comber SC, Leitch AR:Flow cytometry and GISH reveal mixed ploidy populations and Spartinanonaploids with genomes of S. alterniflora and S. maritima origin. AnnBot 2010, 105:527–533.
57. Cuadrado A, Jouve N: Evolutionary trends of different repetitive DNAsequences during speciation in the genus secale. J Hered 2002,93:339–345.
58. Thomas HM, Harper JA, Meredith MR, Morgan WG, Thomas ID, Timms E,King IP: Comparison of ribosomal DNA sites in Lolium species byfluorescence in situ hybridization. Chromosome Res. 1996, 4:486–490.
59. Hand ML, Cogan NOI, Stewart AV, Forster JW: Evolutionary history of tallfescue morphotypes inferred from molecular phylogenetics of theLolium-Festuca species complex. BMC Evol Biol 2010, 10:303.
60. Chung M-C, Lee Y-I, Cheng Y-Y, Chou Y-J, Lu C-F: Chromosomalpolymorphism of ribosomal genes in the genus Oryza. Theor Appl Genet2008, 116:745–753.
Young et al. BMC Plant Biology 2012, 12:117 Page 12 of 12http://www.biomedcentral.com/1471-2229/12/117
61. Casler MD, Stendal CA, Kapich L, Vogel KP: Genetic Diversity, PlantAdaptation Regions, and Gene Pools for Switchgrass. Crop Sci 2007,47:2261.
62. Zalapa JE, Price DL, Kaeppler SM, Tobias CM, Okada M, Casler MD:Hierarchical classification of switchgrass genotypes using SSR andchloroplast sequences: ecotypes, ploidies, gene pools, and cultivars.Theor Appl Genet 2011, 122:805–817.
63. Martinez-Reyna J, Vogel K: Heterosis in Switchgrass: Spaced Plants. CropSci 2008, 48:1312–1320.
64. Vogel K, Mitchell R: Heterosis in Switchgrass: Biomass Yield in Swards.Crop Sci 2008, 48:2159–2164.
65. Zhao N, Xu L, Zhu B, Li M, Zhang H, Qi B, Xu C, Han F, Liu B: Chromosomaland genome-wide molecular changes associated with initial stages ofallohexaploidization in wheat can be transit and incidental. Genome2011, 54:692–699.
66. Xiong Z, Gaeta RT, Pires JC: Homoeologous shuffling and chromosomecompensation maintain genome balance in resynthesized allopolyploidBrassica napus. Proc Natl Acad Sci 2011, 108:7908–7913.
67. Ohmido N, Akiyama Y, Fukui K: Physical mapping of unique nucleotidesequences on identified rice chromosomes. Plant Mol Biol 1998,38:1043–1052.
68. Wang C-JR, Harper L, Cande WZ: High-Resolution Single-Copy GeneFluorescence in Situ Hybridization and Its Use in the Construction of aCytogenetic Map of Maize Chromosome 9. Plant Cell 2006:tpc.105.037838.
69. Kim J-S, Childs KL, Islam-Faridi MN, Menz MA, Klein RR, Klein PE, Price HJ,Mullet JE, Stelly DM: Integrated karyotyping of sorghum by in situhybridization of landed BACs. Genome 2002, 45:402–412.
70. Doležel J, Kubaláková M, Cíhalíková J, Suchánková P, Simková H:Chromosome analysis and sorting using flow cytometry. Methods Mol.Biol 2011, 701:221–238.
71. Zhang P, Friebe B: FISH on Plant Chromosomes. In Fluorescence In SituHybridization (FISH) — Application Guide. Edited by Liehr T. Berlin,Heidelberg: Springer Berlin Heidelberg; 2009:365–394.
72. Altschul SF, Gish W, Miller W, Myers EW, Lipman DJ: Basic local alignmentsearch tool. J Mol Biol 1990, 215:403–410.
73. Jenkins G, Hasterok R: BAC “landing” on chromosomes of Brachypodiumdistachyon for comparative genome alignment. Nat. Protocols 2007,2:88–98.
74. Alderson JS, Sharp WC, Hanson AA, USDA: Grass varieties in the UnitedStates. Boca Raton: CRC Press; 1995.
doi:10.1186/1471-2229-12-117Cite this article as: Young et al.: Karyotype variation is indicative ofsubgenomic and ecotypic differentiation in switchgrass. BMC PlantBiology 2012 12:117.
Submit your next manuscript to BioMed Centraland take full advantage of:
• Convenient online submission
• Thorough peer review
• No space constraints or color figure charges
• Immediate publication on acceptance
• Inclusion in PubMed, CAS, Scopus and Google Scholar
• Research which is freely available for redistribution
Submit your manuscript at www.biomedcentral.com/submit


