Embed Size (px)
Citation preview
STATE INDUSTRIAL PROFILE
OF
PUNJAB
2015-16
MSME - Development InstituteGovt. of India, Ministry of MSMEIndustrial Area-B, Partap Chowk
Ludhiana-141003Ph: 0161-2531733-34-35, Fax: 0161-2533225
Website: w.w.w.msmedildh.gov.in e-mail: [email protected]
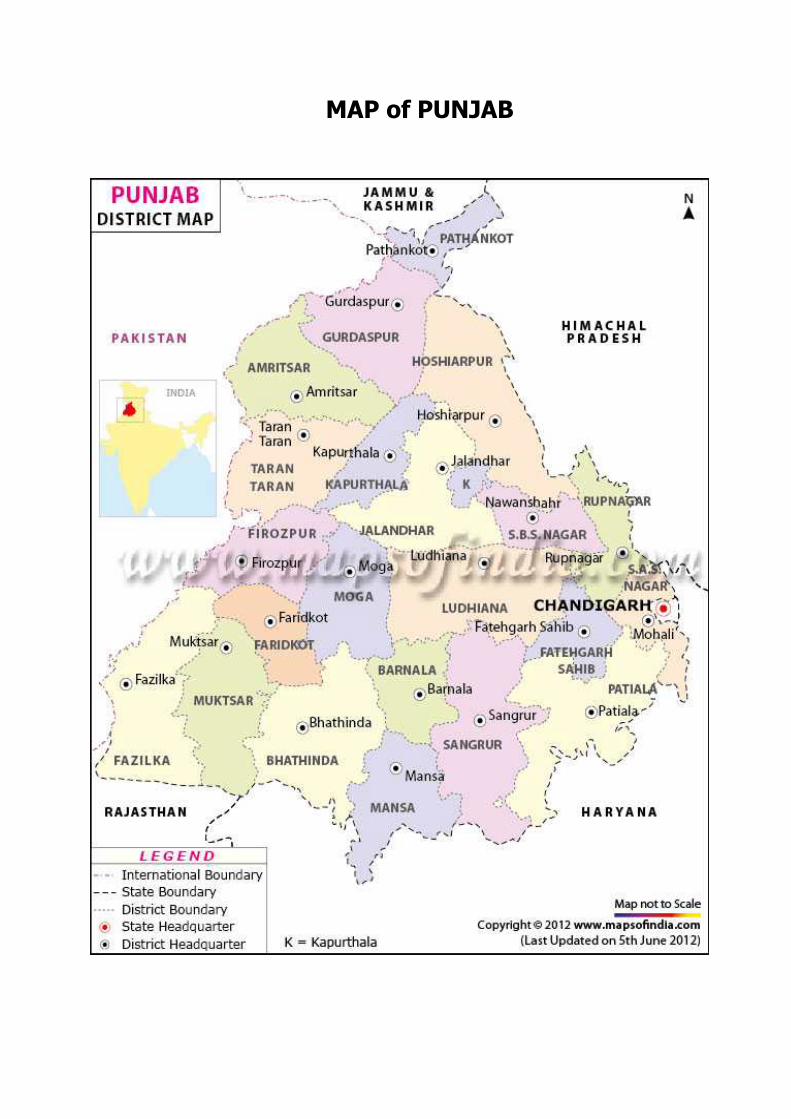
MAP of PUNJAB
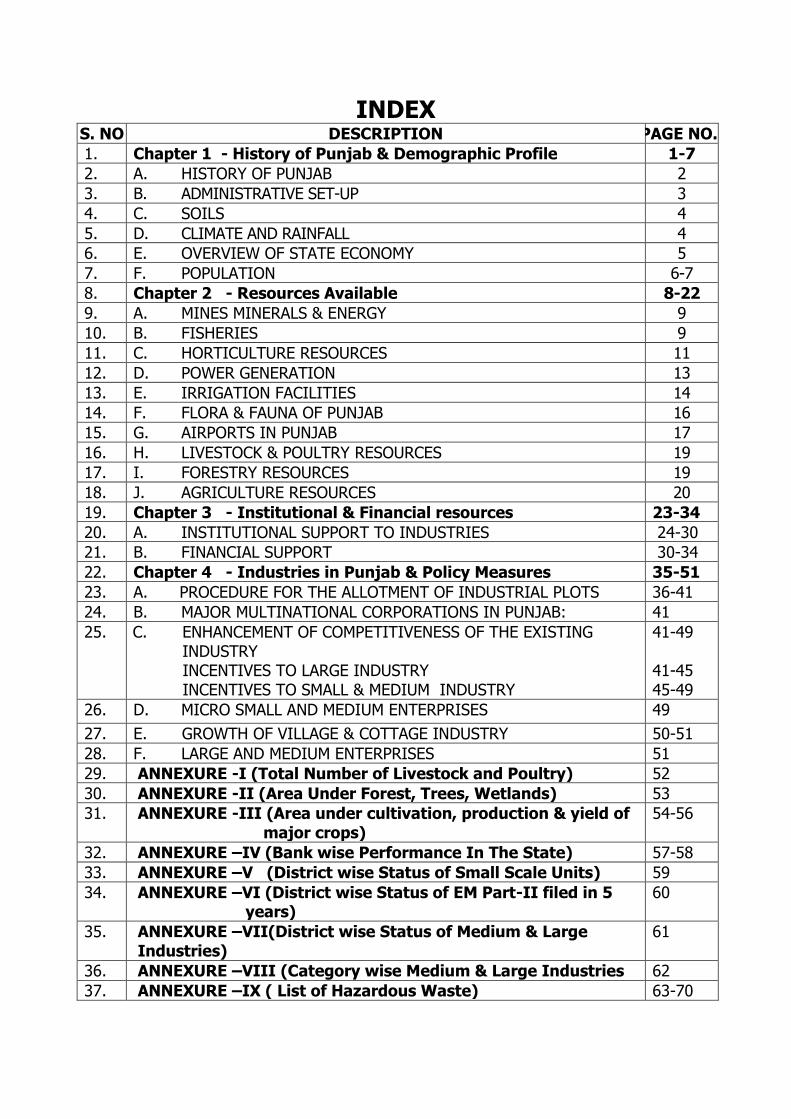
INDEXS. NO DESCRIPTION PAGE NO.1. Chapter 1 - History of Punjab & Demographic Profile 1-72. A. HISTORY OF PUNJAB 23. B. ADMINISTRATIVE SET-UP 34. C. SOILS 45. D. CLIMATE AND RAINFALL 46. E. OVERVIEW OF STATE ECONOMY 57. F. POPULATION 6-78. Chapter 2 - Resources Available 8-229. A. MINES MINERALS & ENERGY 910. B. FISHERIES 911. C. HORTICULTURE RESOURCES 1112. D. POWER GENERATION 1313. E. IRRIGATION FACILITIES 1414. F. FLORA & FAUNA OF PUNJAB 1615. G. AIRPORTS IN PUNJAB 1716. H. LIVESTOCK & POULTRY RESOURCES 1917. I. FORESTRY RESOURCES 1918. J. AGRICULTURE RESOURCES 2019. Chapter 3 - Institutional & Financial resources 23-3420. A. INSTITUTIONAL SUPPORT TO INDUSTRIES 24-3021. B. FINANCIAL SUPPORT 30-3422. Chapter 4 - Industries in Punjab & Policy Measures 35-5123. A. PROCEDURE FOR THE ALLOTMENT OF INDUSTRIAL PLOTS 36-4124. B. MAJOR MULTINATIONAL CORPORATIONS IN PUNJAB: 4125. C. ENHANCEMENT OF COMPETITIVENESS OF THE EXISTING
INDUSTRYINCENTIVES TO LARGE INDUSTRYINCENTIVES TO SMALL & MEDIUM INDUSTRY
41-49
41-4545-49
26. D. MICRO SMALL AND MEDIUM ENTERPRISES 4927. E. GROWTH OF VILLAGE & COTTAGE INDUSTRY 50-5128. F. LARGE AND MEDIUM ENTERPRISES 5129. ANNEXURE -I (Total Number of Livestock and Poultry) 5230. ANNEXURE -II (Area Under Forest, Trees, Wetlands) 5331. ANNEXURE -III (Area under cultivation, production & yield of
major crops)54-56
32. ANNEXURE –IV (Bank wise Performance In The State) 57-5833. ANNEXURE –V (District wise Status of Small Scale Units) 5934. ANNEXURE –VI (District wise Status of EM Part-II filed in 5
years)60
35. ANNEXURE –VII(District wise Status of Medium & LargeIndustries)
61
36. ANNEXURE –VIII (Category wise Medium & Large Industries 6237. ANNEXURE –IX ( List of Hazardous Waste) 63-70
FOREWORD
' Punjab is the land of lush green fields with vibrant entrepreneurial
culture. It is one of the fastest growing States of the country. With congenial
industrial climate, progressive and promotional steps taken by the punjab
Government and economic liberalization adopted by the Government of India,
the opportunities for setting up MSME ventures have increased manifold in
the State. In view of this, there is a need for providing firsthand information
pertaining to the development of MSMEs to the entrepreneurs for taking
investment decisions. The MSME - Development Institute, Ludhiana has,
therefore, revised and updated the Industrial Profile of Punjab. This document
contains details relating to human and material resources availability, existing
industrial structure, institutional support infrastructure, incentives and
concessions available for industrial development.
It is hoped that the entrepreneurs will find the document useful for
taking investment decisions, besides proving immensely helpful information to
various agencies engaged in the promotion and development of industries in
the state.
I appreciate the efforts put in by Sh. Piyush Agarwal, Assistant Director
(EI) in preparation of this document. I am also thankful to various
government departments, industrial associations and other agencies for
supplying information and data for compiling the document. Data has also
been obtained from the websites of concerned department.
Place: Ludhiana
Dated: eo,7,ZolS
nr#^^v
(VIJAY KUMAR)
DIRECTOR
-..'a .r.*-
1
CHAPTER - 1
HISTORY OF PUNJAB&
DEMOGRAPHIC PROFILE
2
A. HISTORY OF PUNJAB
Punjab also spelt Panjab, is a state in the northwest of the Republic of India, forming part of the
larger Punjab region. The state is bordered by the Indian states of Himachal Pradesh to the
east, Haryana to the south and southeast, Rajasthan to the southwest, and the Pakistani province
of Punjab to the west. To the north it is bounded by the Indian state of Jammu and Kashmir. The
state capital is located in Chandigarh, a Union Territory and also the capital of the neighboring
state of Haryana.
After the partition of India in 1947, the Punjab province of British India was divided between
India and Pakistan. The Indian Punjab was divided in 1966 with the formation of the new states
of Haryana and Himachal Pradesh alongside the current state of Punjab.
Punjab is the only state in India with a majority Sikh population.
The term Punjab comprises two words: "punj meaning five and ab meaning water, thus the land
of five rivers." The Greeks referred to Punjab as Pentapotamia, an inland delta of five converging
rivers. In Avesta, the sacred text of Zoroastrians, the Punjab region is associated with the
ancient hapta həndu or Sapta Sindhu, the Land of Seven Rivers. Historically, the Punjab region
has been the gateway to the Indian Subcontinent for most foreign invaders.
Punjabi civilization is one of the oldest on earth, with its distinguished language, culture, food,
attire, script, folklore, people, etc. Punjabi language has its originating source in Sanskrit (not
Hindi or Urdu as many young Indian Pakistanis believe), i.e. the family of Indo-European group
of languages which includes Persian and Latin. Punjab has always been land of great saints and
fighters. In 450 B.C (2450 years ago) Alexander invaded Punjab and conquered a great Punjabi
king named Porus whose kingdom was on the banks of river Chenab. He did not accepted defeat
and asked Greek king to show him the same respect as kings. He was restored back to his throne
by Alexander. Alexander returned to Greece right before crossing the river Beas, as his forces
refused to fight.
3
B. ADMINISTRATIVE SET-UP
Punjab has 22 districts, each under the administrative control of a District Collector. The districts
are subdivided into 82 Tehsils, which are under the administrative control of a Tehsildar. There
are 86 sub Tehsils. The state has 146 Blocks, 143 Towns and 74 Cities. The blocks consist of
revenue villages and the total number of villages in the state is 12,581. Apart from these there are
22 Zila Parishads, 159 Municipal Committees and 23 Improvement Trusts looking after 143
towns and 74 cities of Punjab.
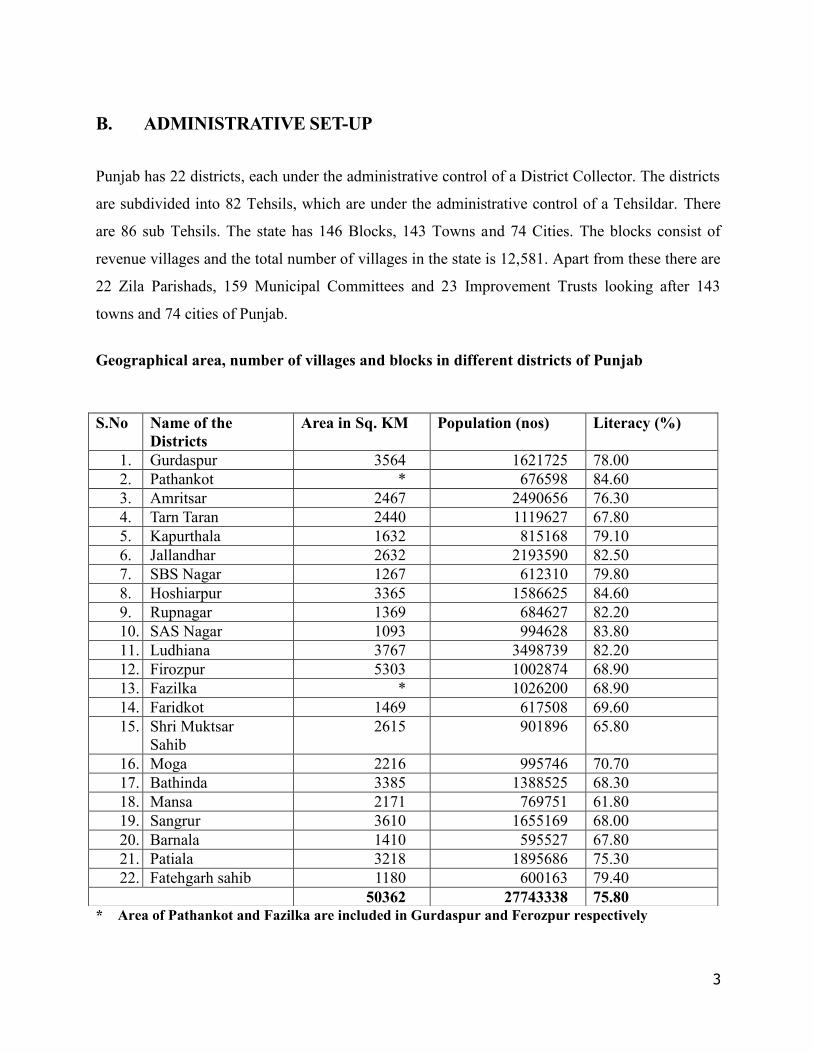
Geographical area, number of villages and blocks in different districts of Punjab
* Area of Pathankot and Fazilka are included in Gurdaspur and Ferozpur respectively
S.No Name of theDistricts
Area in Sq. KM Population (nos) Literacy (%)
1. Gurdaspur 3564 1621725 78.002. Pathankot * 676598 84.603. Amritsar 2467 2490656 76.304. Tarn Taran 2440 1119627 67.805. Kapurthala 1632 815168 79.106. Jallandhar 2632 2193590 82.507. SBS Nagar 1267 612310 79.808. Hoshiarpur 3365 1586625 84.609. Rupnagar 1369 684627 82.2010. SAS Nagar 1093 994628 83.8011. Ludhiana 3767 3498739 82.2012. Firozpur 5303 1002874 68.9013. Fazilka * 1026200 68.9014. Faridkot 1469 617508 69.6015. Shri Muktsar
Sahib2615 901896 65.80
16. Moga 2216 995746 70.7017. Bathinda 3385 1388525 68.3018. Mansa 2171 769751 61.8019. Sangrur 3610 1655169 68.0020. Barnala 1410 595527 67.8021. Patiala 3218 1895686 75.3022. Fatehgarh sahib 1180 600163 79.40
50362 27743338 75.80
4
C. SOILS
There are different classifications of soils of Punjab by different sources. The layman does not
easily understand the soil taxonomy classification. What follows is the simple texture based soil
classification on the basis of texture, climate, and topography and denudation process. The soils
of Punjab have been classified into the following major types:
Flood Plain or Bet Soils Loamy Soils Sandy Soils Desert Soils Kandi Soils Sierozems Grey- Brown Podzolic & Forest Soils Sodic and Saline Soils
D. CLIMATE AND RAINFALL
The climate of Punjab is mainly influenced by the Himalayas in the north and the Thar Desert in
the south and south-west. The periodic circulation of the moist air masses from the south-east and
north-western sectors decides the occurrence of two wet periods each followed by a dry period.
The presence of Himalayas in the north greatly modifies the temperature. As the distance from
the Himalayas increases the temperature also increases, whereas rainfall decreases. In general,
summers are hot and winters are cool.
The state experiences three distinct seasons, the hot season from April to June, the rainy season
from July to September and the winter season extending from October to March. The highest
temperature (between 44.2° and 44.7° C) in the state is recorded in the month of June and the
lowest (between 0° and 2.2°C) in December. The mean annual rainfall is 705 mm, which varies
from 1200 mm at Pathankot to less than 300 mm at Abohar, representing wettest and driest
stations, respectively. The major part of the rainfall occurs between the months of July and
September, and is essential for growing Kharif crops and subsequent sowing of Rabi crops.
Hence the climate of the state is dominantly semi-arid and monsoon type. The soil moisture
regimes are udic, ustic and aridic and the soil temperature regime is mainly hyper thermic.
5
Temperature: Day temperatures are more or less uniform over the plains except during winter
and monsoon season. In general the night temperature is lower in higher altitudes except during
the post monsoon when they are more or less uniform. June is the hottest month with mean
maximum temperature of 410 C in plains and with 2 to 50 lower temperatures at elevated places.
Highest temperature recorded in the plains is 450. January is the coldest month with mean
minimum temperature for the state on a whole is 5.50C, varying from 40 to 50C in the west to 60
to 70 C in the east. Both maximum and minimum temperature rise from January till June.
Rainfall: State receives about 648.8 mm of average annual rainfall. 75% of which is received
during monsoon months from July to Sept. July and August are rainiest months. Rainfall in the
state varies from 26 cm in extreme southwest parts to 72 cm in extreme southern parts and varies
from 42 cm in southern parts to 13.5 cm over northern parts. Districts north of Gurdaspur
constitute the area of maximum rainfall and districts southwest of Ferozepur receive minimum
amount of rainfall. These districts represent lowest and highest rainfall in the state.
E. OVERVIEW OF STATE ECONOMYEconomic activities in state are showing structural changes over a period of time and primary
sector is experiencing a decline in terms of share in State Domestic Product (SDP). GSDP of
Punjab at constant prices (2004 - 05) has increased from Rs 1, 23,223 crore in 2007 - 08 to
Rs 1, 48,069 crore in 2010 - 11. Overall economy of Punjab state has witnessed a growth rate of
5.85%, 6.29% and 6.81% during 2008-09, 2009-10 and 2010-11, respectively. At constant prices
(2004 - 05), the contribution of primary sector consisting of agricultural and allied activities
towards GSDP has increased from Rs 34,107 crore in 2007-08 to Rs 35,740 crore in 2010-11.
This sector had shown growth of 2.05 and 3.01% during 2008-09 and 2010-11, respectively.
However, its growth was recorded marginally negative during year 2009-10.
Secondary sector mainly consisting of manufacturing, construction and power sectors has
increased at rate of 4.22%, 8.79% and 6.93% during 2008-09, 2009-10 and 2010-11, respectively.
In absolute terms, contribution of this sector in GSDP increased from Rs 37,711 crore in 2007-08
to Rs 45,722 crore in 2010-11. The contribution of tertiary sector of state comprising trade,
transport, banking, insurance and public administration towards GSDP had increased from
Rs 51,405 crore in 2007- 08 to Rs 66,608 crore in 2010-11. Per annum increase in this sector was
recorded at 9.57%, 8.62% and 8.88% percent during 2008-09, 2009-10 and 2010-11,
6
respectively. The share of agriculture in GSDP at constant prices (2004-05), which was 17.51%
during 2007-08 declined to 15.47% during 2010-11. During the same period, the share of overall
primary sector including livestock, forestry, and allied agricultural activities along with
agriculture declined from 27.66% to 24.12%. On the other hand, over this period while the share
of secondary sector in GSDP remained almost constant at 31%; that of tertiary sector increased
from 41.72% to 44.98%. At current prices the Per Capita Income in Punjab state increased from
Rs 49,380 in 2007-08 to Rs 68,998 in 2010-11. At constant prices (2004-05), the Per Capita
Income which was Rs 39,567 during 2007-08 increased by 13.44% to Rs 44,885 in 2010-11.
F. POPULATION
Total population of Punjab, as per 2011 census is 2,77,43,338 of which male and female are
1,46,39,465 and 1,31,03,875 respectively. In 2001, total population was 24,358,999 in which
males were 12,985,045, while females were 11,373,954. The total population growth in this
decade was 13.73% while in previous decade it was 20.10%. The population of Punjab forms
2.29% of India in 2011. In 2001, the figure was 2.37%. Literacy rate in Punjab has seen upward
trend and is 76.68% as per 2011 population census. Of that, male literacy stands at 81.48% while
female literacy is at 71.34%. In 2001, literacy rate in Punjab stood at 69.65% of which male and
female were 75.23% and 63.36% literate, respectively. With total geographical area of Punjab at
50,362 sq. km the population density of Punjab is 550 per sq km which is higher than national
average of 382 per sq km. In 2001, density of Punjab was 484 per sq km, while national average
at that time was 324 per sq km. Sex Ratio of Punjab is 893 i.e. for each 1000 male, which is
below national average of 940. In 2001, the sex ratio of female was 876 per 1000 males in
Punjab. From 2001 to 2011, the share of rural population in the total population of state declined
from 66.08% to 62.51% where as that of urban population increased from 33.92% to 37.49%.
During this time period the rural literacy rate increased from 64.7 per cent to 72.45 per cent and
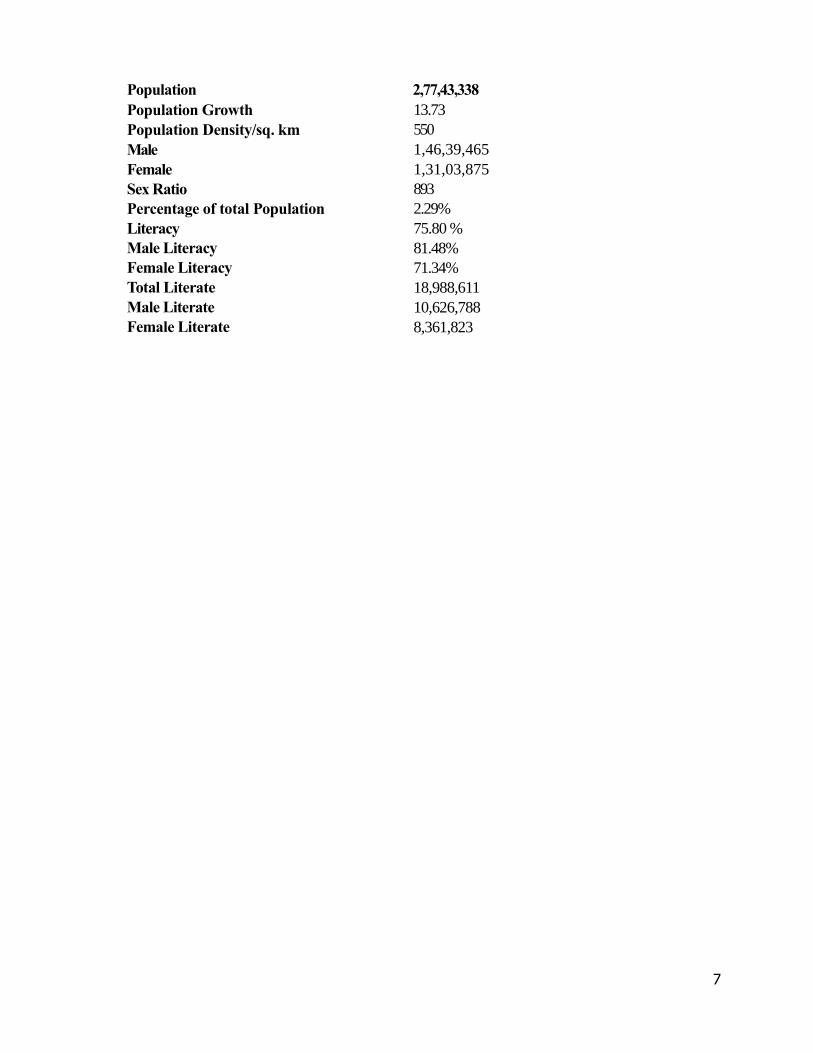
that of urban literacy from 79.1% to 83.70%. The details of population statistics is as follows:
7
Population 2,77,43,338Population GrowthPopulation Density/sq. kmMaleFemaleSex RatioPercentage of total PopulationLiteracyMale LiteracyFemale LiteracyTotal LiterateMale LiterateFemale Literate
13.735501,46,39,4651,31,03,8758932.29%75.80 %81.48%71.34%18,988,61110,626,7888,361,823

8
CHAPTER 2
RESOURCES AVAILABLE
9
A. MINES MINERALS & ENERGY
The basic mover of Punjab economy is its resources basically energy and the minerals. However,
there is a scarcity of minerals as well as energy resources. There are potential areas of petroleum
and oil bearing. Adequate as well as dependable availability of energy and minerals are
important to sustain growth in the economy of the state. The Renewable as well as non-
renewable sources of energy are the 2 forms of energy.
The Renewable energy sources consist of hydro-power, bio-gas, fuel wood, solar, wind, tidal
power and geo-thermal power.The Non-renewable energy sources can be got from coal, gas and
oil.In the state of Punjab, there is no availability of oil wells and coal mines and therefore the
state is basically dependent on hydel, thermal and solar power.
Because of the deficiency of energy and minerals, the Punjab resources have been growing
exponentially in the field of agricultural products and therefore, the state is the major agro-
economic sector in the country. The electricity form of Energy is the prominent input for the
development of economy.
B. FISHERIESFisheries department Punjab is one of the oldest department in the Fisheries Department in
the Country. The department was established in 1912 with the appointment of Mr. G.G.L. Howell
I.C.S. as Director & Warden of Fisheries. Main activity of the Fisheries Department was to exploit
and conserve Fisheries resources in the natural waters. The Punjab Fisheries Act was framed in
1914 under Fisheries Act, 1897. In addition to 5 major rivers in the State, there were large-stretches
of waters and lakes available for the production of fish. The catching fish on licensing system was
in vogue. Keeping in view, the economy in expenditure, after 1st World War, the department was
merged with the Agriculture Department and the post of Director and Warden of Fisheries was
reduced to the Warden of Fisheries. Mr. Donald became the Warden of Fisheries in 1915 and
afterward Dr. Khan took over as Warden of Fisheries till partition of the country in 1947.
After independence the Fisheries Department was managed by two Governments i.e.
Punjab Government and PEPSU Government. In PEPSU Fisheries Department was attached to
Forest Department while in Punjab it was attached to Animal Husbandry Department. The activity
of the Fisheries Department was to exploit and conserve the fishes in natural waters. In PEPSU
10
Government the fishing rights of the natural waters used to leased out to the contractor annually
whereas in Punjab the system of licensing was followed.
It was in PEPSU that Mirror Carp and scale carp, species of fish were introduced and made
to breed in the Fish Seed Farm, Patri Khan (Patiala) in 1952 for the first time in the country. In
1956 the Fisheries Department of PEPSU was merged with Fisheries Department of Punjab State.
During the first five year plan, Scheme for the stocking of village ponds in the three districts i.e.
Hoshiarpur, Gurdaspur and Amritsar was introduced for production of fish as food in the State.
The Punjab Fisheries Department was separated from Animal Husbandry Department in the year
1962 and started functioning as independent Department. Dr. D. Bhatia became the first Director
and Warden of Fisheries. The activity of the Fisheries Department was extended for covering more
pond water area under fish culture in addition to the conservation of fisheries in the natural water
bodies. During the year 1958-59, five cold storage plants at Amritsar, Ludhiana, Sonipat, Patiala
and Kapurthala were established for better preservation and storage of surplus fish under the cold
chain scheme of Government of India. During the year 1961-62 induced breeding of Indian Major
Carps was undertaken in the state for the first time in Northern India. The main activity of the
department was to develop Fisheries in Bhakhra reservoir, stocking of Chandigarh lake,
demonstration of fish culture in 400 hectare water area, setting up of 5 fish seed farms, providing
training to fisheries personals, survey of culturable waters and survey fish seed sources of the State
and establishment of Fisheries Research Station-cum-Aquarium. By the end of 1965-66. Punjab
Fisheries Department was responsible for stocking of fast growing fishes in Gobindsagar.
During the year 1966, under the reorganization of States Haryana and Himachal Pradesh States
were carved out from the combined Punjab State. Numerous good fisheries resources such as
GobindSagar, the river Yamuna became the part of Himachal Pradesh and Haryana. Sh.
A.K.Kawatra became the Director & Warden of Fisheries of the Fisheries Department in 1964.
Exploitation and Conservation of fisheries in natural water bodies was the main activity. New Fish
seed farms at Amritsar, Kapurthala, Gurdaspur and Patiala were established to produce quality fish
seed in the state. The scheme for the renovation of village ponds was introduced to increase the
scope of social fisheries.
A break through for the actual development of social fisheries was made during this period. Ist Fish
Farmer Development Agency in Gurdaspur district was established in the year 1976 to create a
unique class of trained fish farmers. New fish seed farms to supply quality fish seed to the fish
farmers at Katli(Ropar) and Haryiana (Hoshiarpur) under World Bank Scheme for development of
11
fisheries in Kandi Area. 2 New Fish seed farms at Dhandua (Shaheed Bhagat Singh Nagar) and
Phaganmajra (Fatehgarh Sahib) were constructed under Central Scheme National Fish Seed
Programme.
During the period 1983-91, 2 fish seed hatcheries were constructed and 6 more fish farmer
development agencies one each in the district of Ropar, Hoshiarpur, Bhatinda, Kapurthala,
Ferozepur and Faridkot were set-up covering the entire state under the fish farmers development
agency programme. Thus by the end of 7th five year plan, 12 fish seed farms were in full
operational form and the entire state had been brought under fish farmers development agency
programme. The introduction of fish farmers development agency programme proved a big success
and a step towards bringing blue revolution in the state and 12 fish farmer development agencies
had been set-up one in each district of the state. New fisheries rules for the conservation of fisheries
in natural waters were framed in 1985. Later on 4 more fish seed farms one each in the district
Sangrur, Bhatinda, Ferozepur and Faridkot were set up thus raising the number of govt. fish seed
farms to 14.
A State Fisheries Development Board has been set up in the State which has helped in boosting
fish culture in the State. Special emphasis is being laid down to bring more and more saline
affected water logged areas of the south-west districts viz Shri Mukatsar Sahib, Ferozepur, Mansa,
Fazilka and Faridkot of the State under fish culture. Various check dams and small reservoirs in the
State were notified during the years 1987(Dolbaha, Maili and January), 1997(Perch Dam,
Mehngrowal, chohal and Saleran), 2006(RanjitSagar Dam), 2012(Patiarhi, Thana and Jainti) and
2013(Mirzapur and Siswan). There are 13 notified reservoirs in the State. Punjab State is having
good inland resources comprising of 868 km of rivers, 11200 Km of Canals, 14510 acres of small
water reservoirs and lakes. In addition to this there are 9318 village ponds covering an area of
32597 acres in various districts of the State. The fishing rights of the check dams/reservoirs are
leased out for five years and those of rivers, canals etc are leased out annually in an open auction.
The revenue generated from auction of fishing rights of these water bodies during the year 2014-15
is Rs.2, 08, 02,000/- which is increasing steadily every year.
C. HORTICULTURE RESOURCESGeographical area of State is 5036 thousand hectares with estimated population of about 2.43
crores. The State has 22 districts and is classified as a sub-tropical region. There are three types
of agro-climatic zones i.e. Arid-irrigated zone, Sub mountain Zone and Central Zone. The soil is
mostly sandy loam with pH range 8-9. Therefore, it has good potential for cultivation of various
12
horticultural crops.
Potential of Horticulture in Punjab
Horticultural crops are being grown in the State in about 2.77 lakh hectares area with an annual
production of 51.74 lakh tonnes. The horticulture sector is contributing significantly to GDP in
agriculture of the State. Commodity-wise details are given below.
Crops Area ('000ha) Production ('000MTS)
Fruits 71.47 1409.86
Vegetables 178.00 3674.53
Flowers (Seed Production) 2.04 10.05
Spices & Aromatic crops 18.37 68.21
Flowers (fresh fruit) 7.12 1.29
TOTAL 277.25 5173.64
The Punjab State leads in citrus production among the fruit crops with the largest production of
Kinnow. This crop occupies an area of 38837 ha contributing 64.20% of the total fruit
production of Punjab. Likewise Potato is the major leading vegetable crop of Punjab having an
area of 84110 ha with 60.11 % the vegetable production. Apart from Kinnow, other fruit crops
like Guava, Peach and Pear has significant area in the state. Strength of Horticulture Due to the
sandy loam soil and agro climatic condition, Punjab State leads in Kinnow production. Based on
the regional natural growing conditions state has established Estates of different fruit viz. Citrus
Estate, Litchi Estate and Pear Estate for holistic development. End to end approach has been
followed resulting in uplifting the socio economic status of the farmers. Besides this, it also
leads in potato seed production and supply seed to the other states. State is self sufficient in
planting material. There are 85 nurseries in public & private sector. Apart from this about 7 T.C
units have been established which are supplying true to type planting material of Potato, Banana
& Papaya etc.
Focus Crops of the State
Main fruit crops of the State are Kinnow, Peach, Pear & Guava. Main vegetable crop of the State
is potato apart from the Pea, Cucurbits, & Carrot etc. Besides this seed production of flowers is
also done which has great export potential. Flower seeds are exported to Holland. Among spices
turmeric & garlic are grown. Emphasis will be given to promote high yielding and certified
varieties. District-wise details of crops covered under National Horticulture Mission (NHM) are
given below. Only the crops having potential are covered under NHM with end to end approach.
13
D. POWER GENERATIONPSPCL was incorporated as company on 16-04-2010 and was given the responsibility of operating
and maintenance of State's own generating projects. The business of Generation of power of
erstwhile PSEB was transferred to PSPCL.
Milestone
All the power Stations operated at their best plant load factor. Net Power generated during 2008-09
is 37,222 Million units, which is more than in 2006-07 by 2238 Million Units resulting of 6.40%
increase in two years. The 1980 MW (3x660) Talwandi Sabo Power Project awarded to M/s
Sterlite Energy Ltd. Mumbai on 4.7.08 and PPA signed on 1.9.08. Power purchase agreement with
M/S GVK for installing 2x270 MW thermal power station at Goindwal Sahib signed on 26 May
2009. The foundation stone has been laid and the company has started the construction.4.76 lakh
new connections including 61849 No. tube well connections were released during 2007-09. 24 Hrs.
Urban pattern supply made available to 12428 villages and 6158 Deras/ Dhanies with 5 or more
houses. To help SC & BPL consumers, free monthly consumption up to 200 units allowed for
connected load of 1000 watts w.e.f. 12-10-06 instead of earlier 500 watts. Strict measures have
been taken to reduce power theft. Disciplinary action taken against the erring employees and 5
numbers Anti Power Theft Police Stations have been set up. New technologies like electronic
meters, remote control of transformers, remote meter reading and HVDS system for AP/ Industries
introduced. 20.29 lakh meters out of 55.98 lakh General/ Industrial Consumers shifted out of their
premises as on 31.3.09 to curb theft of energy. All these measures have helped in reducing losses
by 4% from 23.92% (2006–07) to 19.91% (2008–09) / which resulted in substantial increase in
revenue. During 2007-09, 62 numbers New Grid substations erected and capacity at 132 number
Grid substations augmented besides addition of 1070 circuit km. Transmission line and 149 MVAR
shunt capacitors to State Grid.
Power plants
Guru Nanak Dev Thermal Plant, Bhatinda. It is a 460 MW (110x2 + 120x2 MW) coal-basedthermal power plant.
Guru Gobind Singh Super Thermal Power Plant, Ropar. It is a 1260 MW (6x210 MW) coal-based thermal power plant.
Guru Hargobind Thermal Plant, LehraMohabbat, Bhatinda. It is a 920 MW (2x210 MW,2x250 MW) coal-based thermal power plant.
14
Shanan Power House. It is a 110 MW hydro power plant. Rajpura Thermal Power Plant. It is a 700 MW thermal power plant.
E. IRRIGATION FACILITIES
After partition of the country, Indus water Treaty-1960 restricted India’s rights of usage to only
three Eastern rivers (Sutlej, Ravi and Beas), the three Western rivers (Indus, Chenab and Jhelum)
were earmarked for exclusive usage of Pakistan. Punjab does have a very well developed and
interlinked river system and widespread 14500 kms long Canal Systems.
These Systems are more than a century old and it is difficult to even imagine today to develop
such a system of high level strength and utility. The estimated value at the present price level of
Water Resource Infrastructure in the State is more than Rs.50, 000.00 crore. Punjab Irrigation
Department was set up in the year 1849 and has a number of milestones worth mentioning.
Construction of upper Bari Doab Canal from river Ravi at Madhopur, Sirhind Canal from river
Sutlej at Ropar, Eastern Canal & Bikaner Canal from river Sutlej at Hussainiwala headwork’s
date back to pre-independence era. Post-independence period is still brighter when monumental
multipurpose projects like Bhakra Dam on river Sutlej, Pong Dam on river Beas, Beas Sutlej
Link Project and Ranjitsagar Dam on river Ravi have been constructed in addition to
construction of Nangal Hydel Channel, Anandpur Sahib Hydel Channel, Bhakra Canal System,
Mukerian Hydel Channel,Shah Nehan Barrage, Harike Barrage etc.
Water Resources Organization
Water Resources Organization is primarily entrusted with Research and Development activities
relating to ground water and surface water. Various activities being undertaken by this
organization are Ground Water monitoring, collection of ground water data, preparations of
various maps to depict ground water level fluctuations, ground water investigations dynamic
ground water estimation, collection and storage of rainfall data and surface water data, up-
gradation of hydro meteorological and surface water observation sites in Punjab State. In
addition to this, this organization also deals with framing of policy matters like ground water
legislation, state water policy and other matters relating to water resources referred by
Government from time to time. Water Resources Organization is regularly collecting,
monitoring the ground water levels, rainfall data, preparing various maps and carrying out
15
Dynamic Ground Water Estimation Studies along with Surface Water Studies such as Feasibility
Studies of Low Dams in Kandi area of Punjab State to provide irrigation facilities in this area. So
far13 such low dams have been constructed and this has helped to improve the economic
conditions of the people of this area.
Five Rivers of Punjab
Sutlej River originates from Rakshasthal Lake adjacent to Mount Kailash in Tibet. This 1450
kms long river flows west throughout Himalayas, Himachal Pradesh and Punjab, then enters
Pakistani Punjab in southwest direction. Sutlej is the energy source of Himalayan area due to its
fast flow and about 50% of 20, 000MW power potential of Himachal Pradesh is generated from
the Sutlej Basin. Bhakra Dam is situated at Himachal Pradesh and Indian Punjab borders on
Sutlej River which is further used widely for irrigation.
Beas River is one of the “five rivers” of Punjab which has its source in great Himalaya’s
Rohtang Pass located at an elevation of 13100 feet in Himachal Pradesh. Beas River merges with
Sutlej River after flowing a distance of nearly 300 miles at HarikePattan situated towards the
south of Holy city of Amritsar to finally exhaust its stream into the Arabian Sea. The ancient
name of Beas River in Indian and Greek literature was Vipasa and Arjiki respectively. The
present Beas name may be the distortion of Vyas word related to the great sage Veda Vyas who
was the main architect behind the great Hindu epic Mahabharata. This river is still called
“Vipasa” in Himachal Pradesh by the academicians specially.
Ravi River comes out from the Himalaya’s range of Chamba district of Himachal Pradesh which
flows nearly 725 kms distance. The second largest city of Pakistan after Karachi and capital of
Pakistani Punjab, Lahore, is located near to Ravi River. This river is also the border river of India
and Pakistan and flows in the northern side of Lahore city. The famous Indus civilization,
Harappa, and one of its utmost cities was situated close to the earlier route of this River. The
fruitful water of Ravi River is used both for irrigation and drinking purposes.
Chenab River also has its source in the Himalayan range district of Lahaul and Spiti of
Himachal Pradesh state of India. The literary meaning of “Chenab” is “Moon River” and its
ancient Indian name was also “Chandrabhaga”. The Chenab River enters Jammu region of the
state of Jammu and Kashmir from Himachal Pradesh to reach further in Punjab plains. This river
16
has also been dammed for the purposes of irrigation and Hydroelectric generations and plays
significant role for energy source and agriculture for both India and Pakistan. Pakistan may
depend on more imported wheat if Indian side of Chenab River is blocked.
Jhelum River is located at the most western side of “five rivers” of Punjab. Jammu and Kashmir
is the originating state of this river which passes through the district of Srinagar to enter the
Jhelum district of Pakistani Punjab. The Jhelum River has 775 kms as a total flowing length.
This river like Chenab has also been dammed for irrigation and hydroelectric generation
purposes.
The land of “five rivers” (Pentapotamia in Greek) Punjab is one among the highly productive
regions on Earth. The Punjab region is generally referred as the “food bowl” of both India and
Pakistan. Wheat, Maize, Bajra, Barley, Paddy, Cotton and Sugar-cane are the chief crops of
Punjab.
F. FLORA & FAUNA OF PUNJAB
The plains in the state of Punjab do not have any thick forests, the only available patches are of
grass, small bush and shrubs. In the southern east part of state of Punjab and the areas of
Hoshiarpur and Multan, the delicious mango fruit is grown. The other varieties of fruits that are
grown in abundance here are orange, apple, fig, quince, almond, pomegranate, peach, mulberry,
apricot and plum. The region that has major cultivation of rich flora and fauna can be majorly
seen in the Shivalik ranges in the state of Punjab. Due to rich flora and fauna in the Shivalik
region, it has been also termed as the zone of micro-endemic in India. The variety of
angiosperms in the area includes 355 different types of herbs, trees of 70 different types; shrubs
all in big and small sizes are of 70 different kinds, climbers of 19 different types can also be seen
while 21 different types of twines can also be seen here. Other than angiosperms, other varieties
available are 31 kinds of pteridophytes, bryophytes of 27 different kinds while a special species
of gymnosperms named as Pinus Rox burghii can be seen in the ranges in state of Punjab. The
fauna of the area is also rich that has birds of 396 different types, Lepidoptera is of 214 different
kinds, 55 varieties of fish species can also be seen, reptiles of 20 different types are also
available and mammals of 19 different kinds can be seen in these ranges. The state of Punjab is
adored with large wetland area, number of bird sanctuaries that houses different varieties of
17
numerous species of birds and a large number of zoological parks. Few of them to be named are
wetland named as National wetland Hari-Ke-Pattan, the wetland of Kanjli, the wetlands of
Kapurthala Sutlej, the number of wildlife sanctuaries include the Harika wildlife in district of
Tarn Taran Sahib, Zoological Park in Ropar, ChhatbirBansar Garden located in
SangrurAamKhasBagh situated in Sirhind, Amritsar’s famous Ram Bagh, Shalimar Garden in
Kapurthala and the famous Baradari Garden in city of Patiala.
G. AIRPORTS IN PUNJAB
The place of five rivers, Punjab is well developed state equipped with excellent airport system.
Currently, this state is gaining significant importance because of its tourism concept.
Reachability is the vital factor which enhances the tourism department in Punjab. Decently
organized and well-positioned airports in Punjab saturate all the demands of an outstanding
airport system. This airport system provides strong connection between different regions inside
and outside Punjab. There are both international and domestic airports meeting the requirements
of both external and internal travel. Both types of airports are fully equipped with ultra-modern
amenities including dining spots, disabled care services, wheel chair access, juice corners, book
stalls, money exchange counters, ATM centers and much more.
The state possesses five civil airdromes. Among them, the most significant and largest airport is
Sri Guru Ram DassJee International Airport situated in Amritsar and also carries the credit of
being the second busiest airport in North India following Delhi Airdrome.
Punjab also carries other airports like.
Bhatinda AirportPathankot AirportPatiala AirportSahnewal Airport
Sri Guru Ram Dass Jee International Airport
International airport, Sri Guru Ram Dass Jee International Airport is located at 11 km northwest
direction of Amritsar city. The airport is situated on Amritsar-Ajnala road, besides Raja Sansi
village. The airport got its name from the founder and fourth Sikh guru of Amritsar, Sri Guru
Ram Das Ji. This airport does its service in Amritsar, other states of Punjab, Jammu region in
Jammu and Kashmir and also Himachal Pradesh. This is the largest aerodrome in Northern part
18
of India. The newly constructed terminal possesses double the space of old terminal. Thus,
Amritsar city has become the central hub for Punjab tourism.
Presently, this airport manages 100 commercial airplanes in a week including domestic and
international (Middle East and central Asia).
Bhatinda Airport
Bhatinda Airport in civil area at Bhisiana Air Force Station belongs to Indian Air Force. This
domestic airport was constructed besides Virk Kalan village, about 20 km northwest of the
region Bhatinda, Punjab.
This airport, Bhatinda Civil Enclave was constructed on 42 acres at the cost of Rs 25 crores by
Airports Authority of India (AAI). This land can inhabit two ATR 42 aircraft at a time whereas
the steel and glass building carries two conveyor belts, 30-seater security hold, 2 check-in
counters and a VIP lounge. There is also parking facility for 25 cars.
Pathankot Airport
This military airport is situated at Pathankot district of Punjab. This Airdrome is mostly occupied
by Indian Air Force. Squadron No. 108 and 26 operate from this airfield, maintained by No. 108
Wing Indian Air Force and also Western Air Command. IAF operates Mikoyan-Gurevich MIG-
21, the fighter aircraft. The airport is highly secured because of the presence of several
squadrons. This airport is located inside IAF cantonment.
Recently, they have initiated commercial flight operation connecting with Delhi and Kullu. This
airport was inaugurated by Mr. Praful Kumar on November 21st 2006 at Pathankot. There is
only domestic flight facility in Pathankot.
Patiala Airport
Patiala Aviation Complex or Patiala Airport is a civil airport located at Patiala, Punjab. This
airport was constructed by Patiala Maharaja Dhiraj Bhupinder Singh during first decade of 20th
century to operate his personal aircraft. After 1947, this aerodrome was taken by Indian
Government and transformed into civil airport.Patiala Aviation Complex comprises of 5 hangars
totally.
First Hangar serves Patiala Aviation Club (P.A.C), a flying training institute recognized by our
Directorate General of Civil Aviation (D.G.C.A).
Second Hangar was originally Government controlled Engine and Instrument overhauling
workshop followed by moderate usage of Northern India Flying Club (N.I.F.C).
19
Third Hangar functions as workshop of Punjab Aircraft Maintenance Engineering College
(P.A.M.E.C) where students are trained to transform themselves as future engineers.
Fourth Hangar is allocated to National Cadet Crops (N.C.C) Air Wing.
Fifth hangar otherwise known as ‘VIP Hangar’ is employed for housing and also maintenance
of V.I.P airplane possessed by Punjab Government.
Sahnewal Airport
Otherwise called as Ludhiana airport is a local aerodrome operating in Ludhiana city of Punjab.
The airport is situated besides Sahnewal town, about 5 km (3.1 miles) in southeast direction of
Ludhiana on Grand Trunk route.This airport covers 130 acres of land. Present arrival/departure
halls in this airport can inhabit 40 passengers. There is manual baggage delivery. Air India
operates Regional ATR flight three times a week.
H. LIVESTOCK & POULTRY RESOURCESLivestock population has increased substantially in some states including Punjab. As per the Report
of 19th Livestock Census conducted by Ministry of Agriculture, Govt. of India the states are
Gujarat (15.36%), Uttar Pradesh (14.01%), Assam (10.77%), Punjab (9.57%) Bihar
(8.56%); Sikkim (7.96%), Meghalaya (7.41%), and Chhattisgarh (4.34%). The Status of total
number of livestock and poultry in Punjab as per 19th Census is available at Annexure –I.
I. FORESTRY RESOURCES
Punjab State was reorganized in the year 1966 and was left with only 1875 Sq. Km of recorded
forest area in that year which has now increased to 3058 Sq. Km. i.e. about 6.1% of the State’s
Geographical area. Since the State has 84% of its Geographical area under agriculture with
intense competition among different land-uses, there is limited scope to increase the area under
forests except for bringing the available vacant wastelands/degraded lands under Tree Cover by
application of Agroforestry and Social Forestry in the Farmlands and Institutional lands.
Punjab Forest & Wildlife Preservation Department is making efforts to increase the forest/tree
cover in accordance with the National Forest Policy. Simultaneously, measures are being taken to
protect & conserve the existing tree species and fauna to arrest and reverse ecological degradation.
The area under Forest as in 2012-13 is 262 (000’ hectares)
20
ACTIVITIES
Besides plantation of quality tree species and conservation of forests and wildlife, the Department
undertakes scientific management of forest areas that helps to increase forest productivity, check
soil erosion in hilly areas and improve ground water recharge.
AT CITIZENS SERVICE
The Department encourages farmers to take-up agro-forestry on their farm lands by providing
technical guidance for plantation of tree species of economic importance. At times it cautions
farmers against plantation of spurious variants of tree species available in the market. It also
supplies saplings from forest nurseries at nominal rates to the public in general and farmers in
particular.
The Department inculcates participatory approach amongst the rural poor living in the backward
hill (Kandi) region of the State. To this end, in order to bring about an attitudinal change in
department, its personnel have been trained in Joint Forest Management. Under this approach, the
local stakeholders get a share of the forest produce in return for participating in forest development
and protection. This would help in improving both the ecological condition of the forest and the
economic condition of the people.
Under Punjab Apportionment of Tree Rules 2000, a benefit sharing mechanism has been devised
for farmers who own their cultivable lands adjoining the Road Strip Forests. This mechanism
entitles a farmer a reasonable proportion of revenue of the trees of Road Strip Forests in lieu of the
responsibility rendered by the farmer by way of protection of those trees from theft or illicit felling
or grazing or fire. The present status of area under forest, trees, wetlands etc is available at
Annexure –II.
J. AGRICULTURE RESOURCESPunjab holds place of pride among the Indian States for its outstanding achievements in
agricultural development. The state has witnessed tremendous increase in the agricultural
production during the Green Revolution period, mainly due to healthy mix of institutional and
technological factors. Agrarian economy, consolidation of landholdings, reclamation of new
agricultural lands, development of irrigation, use of biochemical inputs comprising high yielding
variety seeds, chemical fertilizers, insecticides and mechanical inputs were among the important
21
factors which helped Punjab agriculture in making rapid strides. Dominating rural based political
power with agricultural background provided favorable environment through thrust on rural and
agricultural development. In this context, extension of irrigation network, rural link roads, rural
electrification, establishment of focal points and agricultural market centers, efficient delivery
system of credit and other agricultural inputs along with effective implementation of agricultural
price policy for wheat and paddy played significant role in agriculture and rural development of
state. Consequently, the Punjab state comprising only 1.54 per cent of the total geographical area
of country now contributes 13-14 per cent towards the total food grain production of the country.
State has earned a name of granary of India through contributing 35-40 per cent of rice and 40 to
75 per cent of wheat to the central pool in the past two decades.
Green Revolution sustained till the eighties, after which the agricultural production in the
state showed the signs of stagnation. In nineties, the exalting cost of cultivation of major crops
further aggravated the situation through squeezing the profitability of agriculture adversely
affecting the socio-economic condition of farmers in the state. Thus, the agriculture in state has
reached a plateau making it very hard to make further progress under available technologies and
natural resource base. Its relative contribution in central pool of food grains both for wheat and
paddy has also been declining during last few years, though, still being the largest contributor of
wheat and second largest of paddy after Andhra Pradesh to central pool of the country. The
emerging scene of Punjab agriculture is not free from some serious concerns. The state cropping
pattern dominated by wheat-rice rotation is causing a serious damage to the state'snatural resource
base. Paddy in particular, a water-intensive crop is blamed for water-table depletion in tube-well
irrigated areas and water-logging in canal irrigated areas. Increasing incidence of nutrient
deficiency in the soils, including micronutrients and insect-pest attacks on the crops are also posing
major threats to productivity, food grain production and sustainability of agriculture in the long run.
Diversification of cropping pattern towards environment friendly high value crops with emphasis
on quality output and promotion of agro-processing industry is the need of hour.
In the wake of new technology, Punjab agriculture made rapid progress since mid-sixties.
This progress has been made possible by speedy adoption of improved seeds, irrigation and
increased use of non-conventional inputs like fertilizers, machinery and pesticides supported by the
natural resource base of state. The progress was spectacular in early phase due to rising agricultural
productivity and expansion in gross cropped area. However, of late the progress in agricultural
production has slowed down and signs of stagnation are visible.
22
Growth performance of Punjab Agriculture
The progress made by agriculture in Punjab state is unparalleled in the history of world agriculture.
The state which was deficit in food at the time of independence had made rapid strides in
agricultural development. Dominating agrarian structure, consolidation of holdings, development
of irrigation infrastructure and hardworking peasantry led to the early progress. With adoption of
new agricultural technology in mid-sixties backed with adequate agricultural policies, the state
turned surplus in food grains and became a model of India's successful green revolution strategy.
Punjab state with only 1.5 per cent geographical area of the country besides feeding its growing
population has been contributing 35-40 per cent of rice and 45-70 per cent wheat to the central pool
since last two decades. Selected agricultural growth indicators of state reveals that between 1971-
72 and 2010-11 the production of wheat in state has gone up by about three times from 5.62 million
tonnes to 16.5 million tonnes. Similarly, production of rice another major crop of state, during this
period increased by about twelve times from 0.92 million tonnes to 10.8 million tonnes. Total food
grain production over this period increased by more than three and half times. Yields of wheat,
paddy and total food grains nearly doubled over this period of time. Besides, production of cotton,
potato and milk during this period has been gone up by 1.76, 7.24 and 4.47 times, respectively. On
the other hand, the production of pulses and oilseeds went down drastically over this period and
that of sugarcane with some variations remained almost same. The reason of decline of production
of these crops was the drastic decline of area under these crops due to encroachment by paddy and
wheat. However, except pulses yields of these crops increased significantly during this time period.
It has 10.26% production cotton of India, 19.5% of wheat of India and 11% of rice of India. The
Ferozepur and Fazilka Districts are the highest wheat and rice producers of state. As far as the
world is concerned, Punjab in India grows 2% of world's cotton and 2% of wheat along with 1% of
rice. The largest crop cultivated here is wheat. Other prominent crops grown here are cotton, rice,
sugarcane, maize, pearl millet, fruit and barley. Wheat and rice are double cropped in state of
Punjab and rice stalks are being burned off across thousands of acres before wheat planting. The
practice done across large area is wasteful and polluting. The fertilizer consumption per hectare
here is 223.46 kg although it is 90 kg nationally. This state was honored with the National
Productivity Award for extension services of agriculture for 10 years from 1991-92 to 1998-99 as
well as from 2001-04. Recently, there has been productivity drop because of falling fertility level of
soil. Reason may be because of too much of use of pesticides and fertilizers over years. Details of
area under cultivation (A), production (P) & yield (Y) of major crops is available at Annexure III.
23
CHAPTER 3
INSTITUTIONAL&
FINANCIAL SUPPORTTO INDUSTRIES
24
A. INSTITUTIONAL SUPPORT TO INDUSTRIES
1. MSME - DEVELOPMENT INSTITUTE, LUDHIANA
The Micro, Small & Medium Enterprises Development Institute was set up at Ludhiana in 1956
(formerly known as SISI) to serve the erstwhile combined Punjab. At present, the Institute caters to
the needs of micro, small & medium industries sector in the State of Punjab and U.T. Chandigarh.
It is one of the 30 Institutes functioning all over the country under Ministry of MSME, Govt. of
India. Its Headquarters is situated at Nirman Bhawan, New Delhi under the Additional Secretary &
Development Commissioner, MSME. The main services provided by this institute are as below:1. Technical counseling 2. Managerial counseling3. Economic counseling 4. Management development training5. Modernization 6. Skill development training7. Marketing development to exporters 8. Ancillary development9. Technology upgradation 10. Sub-contract exchange11. Pollution control 12. Energy conservation13. Testing facilities by chemical laboratory 14. Quality management15. Common facility workshop (Engineering) 16. Vendor development17. Export Counseling & Training18. Cluster Development19. Bar Coding
20. Product/Process oriented entrepreneurshipdevelopment training
2 MSME TOOL ROOM, LUDHIANA
The Government of India established this MSME-Tool Room (previously known as Central Tool
Room) at Ludhiana in the year 1980-81 with financial and technical collaboration of the
Government of Federal Republic of Germany and the active support of the government of Punjab.
The Centre has been providing services to the industry in general and MSME units’ in particular
viz. Tooling development, Rapid prototyping, Heat treatment, technical consultancy and Training;
Short-Term courses address various topics in the field of Tool Engineering. Now they are mostly
dealing with CNC programming and machining as well as CAD/CAM.
3 MSME TOOL ROOM, JALANDHAR
The Government of India has set up this Tool Room at Jalandhar, with UNDP assistance and active
participation of Punjab Government. It was previously known as Central Institute of Hand Tools.
The Institute was registered as Society in 1983. The Centre provides comprehensive support in the
field of design and development of latest hand tools, consultancy and provides common facility
services to MSME entrepreneurs.
25
4 MECHANICAL ENGINEERING RESEARCH & DEVELOPMENT ORGN.
The Central Mechanical Engineering Research Institute (CMERI) Durgapur under the aegis of the
Council of Scientific & Industrial Research (CSIR) established a Centre in Ludhiana in 1965
known as MERADO to boost the Mechanical Engineering Research & Development in Punjab
State. The Centre helps the industry in the following fields:
Design, development and standardization of industrial machinery and equipment, farm machinery
and equipment and jigs, fixtures, tools and gauges, Testing of materials, components and products
for hardness, tensile, compression, bending and impact strength, internal flaws by ultra-sonic,
radiographic, magnetic and penetrate methods, measurement of coat thickness and crack depth,
precision measurements of linear and angular dimensions, profiles and surface finish, calibration of
instruments and gauges, performance testing of I. C. engines, pumps, sprayers etc. chemical
analysis of materials, microstructure analysis and foundry sand testing.
Preparation of feasibility reports for light and medium industry, Industrial consultancy, expert
guidance to foundry industry and precision jig boring etc.
5 BUREAU OF INDIAN STANDARDS (BIS)
The Bureau of Indian Standards has also set up an office at SCO 335-336,
Sec 34-A, Chandigarh Ph. 0172-601640, to provide quality testing of industrial products of the
State.
6 CENTRAL INSTITUTE OF PLASTICS ENGINEERING & TECHNOLOGY,
AMRITSAR.
The Institute core activities are as under:
Technology Support Services (TSS) is an integral part of the activities of CIPET. TSS of CIPET
renders quality services to its customers in Tooling, Precision Machining on CNC machines,
Design and Manufacturing of Moulds for Plastics products, CAD/CAM/CAE services, Plastics
product manufacturing through state of art Injection moulding machines, Blow moulding, PET
Stretch blow moulding, Pipe and Film extrusion etc, Testing and quality control for Plastics
Materials and products, Pre delivery inspection of plastics products like PVC and PE pipes, Woven
sacks, Water storage tanks, Micro-irrigation plastics implements, Engineered bamboo boards,
Polymer based composite doors etc. Project consultancy, technology consulting and assessment in
the field of Plastics are the important service portfolio of TSS. CIPET has successfully
26
accomplished consulting assignments in India and abroad. CIPET has created complete
infrastructure under one roof from testing stage to validation through testing. It offers TSS in the
following fields:
1. Design CAD/ CAM/ CAE services2. Tooling and Mould manufacturing for Plastics3. Plastic product manufacturing4. Plastic Testing and Quality Control5. Calibration6. Predelivery Inspection7. Consultancy on Plastic projects
7. ELECTRONIC TEST & DEVELOPMENT CENTRE, MOHALI
This Centre has been set up to provide testing facilities to electronic industries besides developing
the new techniques for the growth of electronics industries in the State.
8 NATIONAL INSTITUTE OF SECONDARY STEEL TECHNOLOGY, MANDI
GOBINDGARH
This Institute is providing technical services to secondary steel sector by arranging seminars and
workshops in the State and undertake consultative projects and pollution studies in the industry.
9 NATIONAL PRODUCTIVITY COUNCIL, CHANDIGARH
The Council is engaged in the improvement of productivity of SSI units in the State of Punjab.
10 CENTRAL SCIENTIFIC INSTRUMENTS ORGANISATION, CHANDIGARH
The Organization is equipped to carry out research, design and development in the electrical,
electronic, electro-mechanical, optical and medical instruments of different natures and
specifications.
11 CENTRAL LEATHER RESEARCH INSTITUTE, JALANDHAR
This Organization is providing testing facilities, training in leather manufacturing, leather garments,
research and development and extension services including common facilities services.
12 WOOL GRADING & MARKETING CENTRE, LUDHIANA
The Centre was set up at Ludhiana in 1968 to purchase quality wool and to save the producers and
the consumers from the exploitation of middlemen. The centre was established in collaboration and
assistance of the United Nations Development Programme (UNDP).
13 INSTITUTE FOR AUTO PARTS TECHNOLOGY, LUDHIANA
In order to accede to the long awaited and persistent demand of Auto parts industry in the State, the
27
Punjab Government with the assistance of UNDP/UNIDO has established above institute. This
institute is catering to the overall development and growth of auto parts industry in Punjab and
neighboring States. This institute is providing the following facilities.
1. Testing and Evaluation
2. Design and Development
3. CAD/CAM
4. Precision Engineering
5. Heat Treatment
6. Total Quality Management
7. Constancy Service and Training
14 INSTITUTE FOR MACHINE TOOLS TECHNOLOGY, BATALA
Institute for Machine Tools Technology is a Punjab Government project assisted by the
UNDP/UNIDO. It has come up on a plot area of 5.85 acres in the Industrial Focal Point of
Industrial Town Batala. UNDP is contributing in the shape of imported latest plant and machinery,
foreign experts, fellowship training of the staff at the renowned Institutes in India. The Institute
primarily assists SSI units to upgrade their technological base and quality of their products in
changing economic and technological environment. The capabilities are being established in the
areas relating to TQM, testing & evaluation, design, prototype development, heat treatment,
production process, CAD and R&D. The following facilities have been installed:
1. Tool Room and Manufacturing
2. Metallurgical Testing Lab
3. Metrology Lab
4. Heat Treatment
15 NORTHERN INDIA TECHNICAL CONSULTANCY ORGANISATION,
CHANDIGARH
The organisation provides a package of total consultancy services covering all stages in a project
implementation. It also provides consultancy services to the State Government Departments and
other Financial Institutions.
16 PUNJAB SMALL INDUSTRIES & EXPORT CORPORATION LIMITED
Punjab Small Industries & Export Corporation limited was set in 1962 with the objective ofsupporting the individual in his endeavor to set up his own industrial unit. And help him and thesmall-scale industry to grow in Punjab. Today PSIEC Ltd. has grown to become a Rs. 2000million profit making corporation, with committed workforce of about 1000 people. With
28
growing interests in infrastructure development, distribution of raw materials, promotion ofexports from state, providing marketing assistance to small scale industries & show casing &developing handicrafts through training & marketing finished products. As PSIEC Ltd. moveshand in hand with the individual in the 21st century, it envisages a border role for itself in layingthe infrastructure for the industrial development in Punjab.
Development of industrial infrastructure
PSIEC Ltd. has been acting as a Catalyst & springboard for all round development andpromotion of industries in Punjab through the development of Industrial infrastructure, namelyIndustrial Focal Points (IFP) ranging between 50 acres to 500 acres of land at various towns andcities of Punjab. Therefore to facilitate the spirit of industry, PSIEC Ltd. provides self-sufficientindustrial focal points. These industrial hubs, consist of developed plots equipped with powersubstations & distribution networks, telecommunication facilities, residential area for workers,common effluent treatment plants and parts for the clean environment.
PSIEC Ltd. has a distribution network of raw materials across Punjab. It is the handling agencyof SAIL, MMTC, IISCO, HZL, HCL. It is also First State Corporation to get itself accredited byJoint Accreditation system of Australia and New Zealand (JAS-ANZ) under ISO-9001.
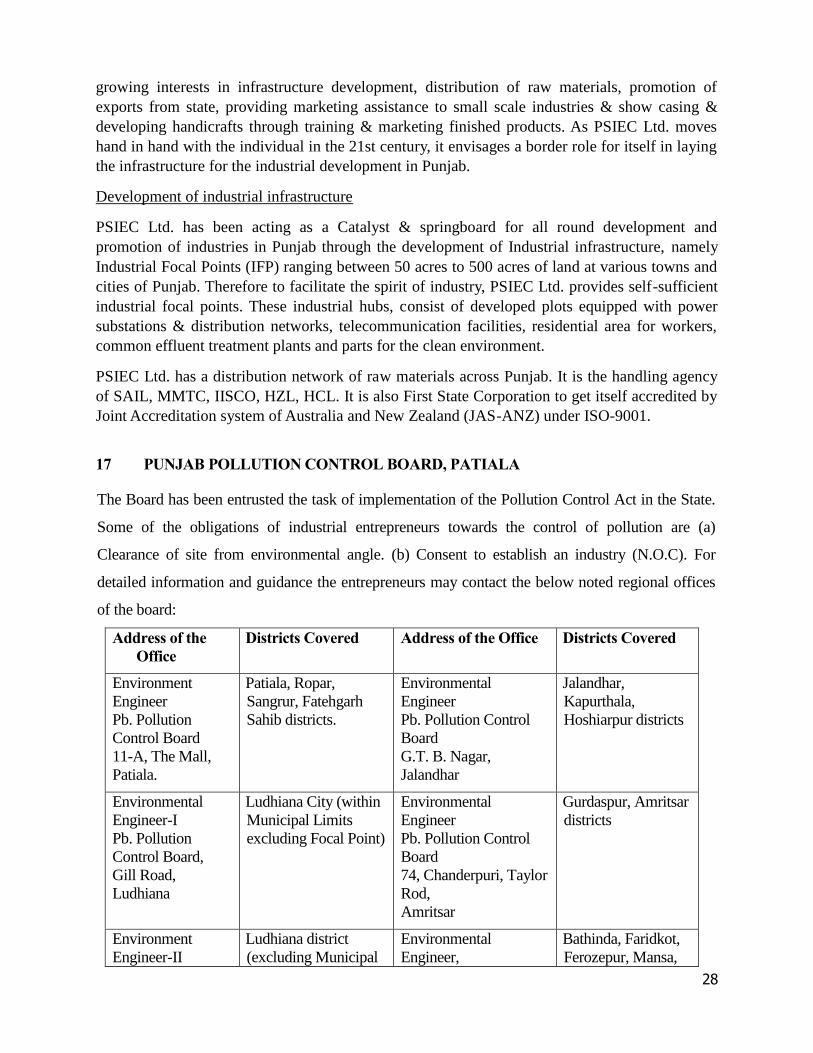
17 PUNJAB POLLUTION CONTROL BOARD, PATIALA
The Board has been entrusted the task of implementation of the Pollution Control Act in the State.
Some of the obligations of industrial entrepreneurs towards the control of pollution are (a)
Clearance of site from environmental angle. (b) Consent to establish an industry (N.O.C). For
detailed information and guidance the entrepreneurs may contact the below noted regional offices
of the board:
Address of theOffice
Districts Covered Address of the Office Districts Covered
EnvironmentEngineerPb. PollutionControl Board11-A, The Mall,Patiala.
Patiala, Ropar,Sangrur, FatehgarhSahib districts.
EnvironmentalEngineerPb. Pollution ControlBoardG.T. B. Nagar,Jalandhar
Jalandhar,Kapurthala,Hoshiarpur districts
EnvironmentalEngineer-IPb. PollutionControl Board,Gill Road,Ludhiana
Ludhiana City (withinMunicipal Limitsexcluding Focal Point)
EnvironmentalEngineerPb. Pollution ControlBoard74, Chanderpuri, TaylorRod,Amritsar
Gurdaspur, Amritsardistricts
EnvironmentEngineer-II
Ludhiana district(excluding Municipal
EnvironmentalEngineer,
Bathinda, Faridkot,Ferozepur, Mansa,
29
Pb. PollutionControl BoardGill Road,Ludhiana
Limits of Ludhianaincluding Focal Point)
Pb. Pollution ControlBoard,Government QualityMarking CentreBathinda
Moga, Muktsardistricts
18 PUNJAB STATE ELECTRONIC DEVELOPMENT CORPORATION
This corporation is engaged in the promotion of electronics industry in the State of Punjab in
public, joint and private sectors. It is also engaged in the creation of other infrastructure facilities
necessary for the growth of electronics industries.
19 PUNJAB ENERGY DEVELOPMENT AGENCY, CHANDIGARH
The agency assists in installation of wind water pumps and small aero generators for battery
charging and stand-alone power generator on subsidy.
20 SCIENCE & TECHNOLOGY ENTREPRENEURS PARK (STEP)
Science & TechnologyEntrepreneursPark is a unique and dynamic entity, which provides space and
environment for creative thinking/innovation, self-development, product development and venture
development for Science and Technology Entrepreneurs.
21 GOVT. TANNING INSTITUTE, NAKODAR ROAD, JALANDHAR
This institute is providing Diploma in Tanning & Footwear Technology and Training for Artisans.
22 CENTRAL INSTITUTE OF POST-HARVEST ENGINEERING AND
TECHNOLOGY (CIPHET)
Established in 1989 at Ludhiana and 1993 at Abohar (Punjab), Central Institute of Post-Harvest
Engineering and Technology (CIPHET) is a nodal institute for lead researches in the area of post-
harvest engineering and technology appropriate to the agricultural production catchments, agro-
processing industries, pilot plants, industrial liaison, technology transfer and national and
international cooperation to meet national needs.
23 NATIONAL INSTITUTE OF PHARMACEUTICAL EDUCATION AND
RESEARCH (NIPER) S.A.S. NAGAR
NIPER is the first national level institute in pharmaceutical sciences with a proclaimed objective of
becoming a Centre of excellence for advanced studies and research in pharmaceutical sciences. The
Government of India has declared NIPER as an 'Institute of National Importance'. It is an
autonomous body set up under the aegis of Ministry of Chemicals and Fertilizers, Government of
India. The Institute is conceived to provide leadership in pharmaceutical sciences and related areas
30
not only within the country, but also to the countries in South East Asia, South Asia and Africa.
NIPER is a member of Association of Indian Universities and Association of Commonwealth
Universities.
24 BICYCLE & SEWING MACHINE RESEARCH & DEVELOPMENT CENTRE,
LUDHIANA
Punjab Government has set up the Bicycle & Sewing Machine Research & Development Centre
with assistance of UNDP & UNIDO in 1984. The centre is working to initiate and implement R&D
in the field of Bicycle and Sewing machine for the upgradation of technology, improvement in
quality and productivity. The centre is fully equipped to provide the following facilities to the
Industry:
To design and develop new models of bicycle & Sewing Machines, Components, and accessoriesas per the latest trend.To develop complete package of production technology for new product.To develop special purpose testing and production machine, low cost semi-automatic and automaticmachine for small-scale industry.To develop special tooling, jigs, fixtures, and test rigs which are being used for producing qualitygoods for export.To train manpower in small-scale industry for energy conservation and pollution control.To give consultancy services for improvement in processing techniques, Low cost automations,Modernization of plant, effluent treatment and quality control.
25. CENTRAL POLLUTION CONTROL BOARD
Every person who is engaged in generation, processing, treatment, package, storage,transportation, use, collection, destruction, conversion, offering for sale , transfer or like of thehazardous waste as categorized in the Schedule-I & II ( Annexure IX) shall make an applicationin Form I duly completed in all respects, to the Punjab Pollution Control Board for the grant ofauthorization for any of the said activities. Annexure –I may please be seen as
B. FINANCIAL SUPPORT
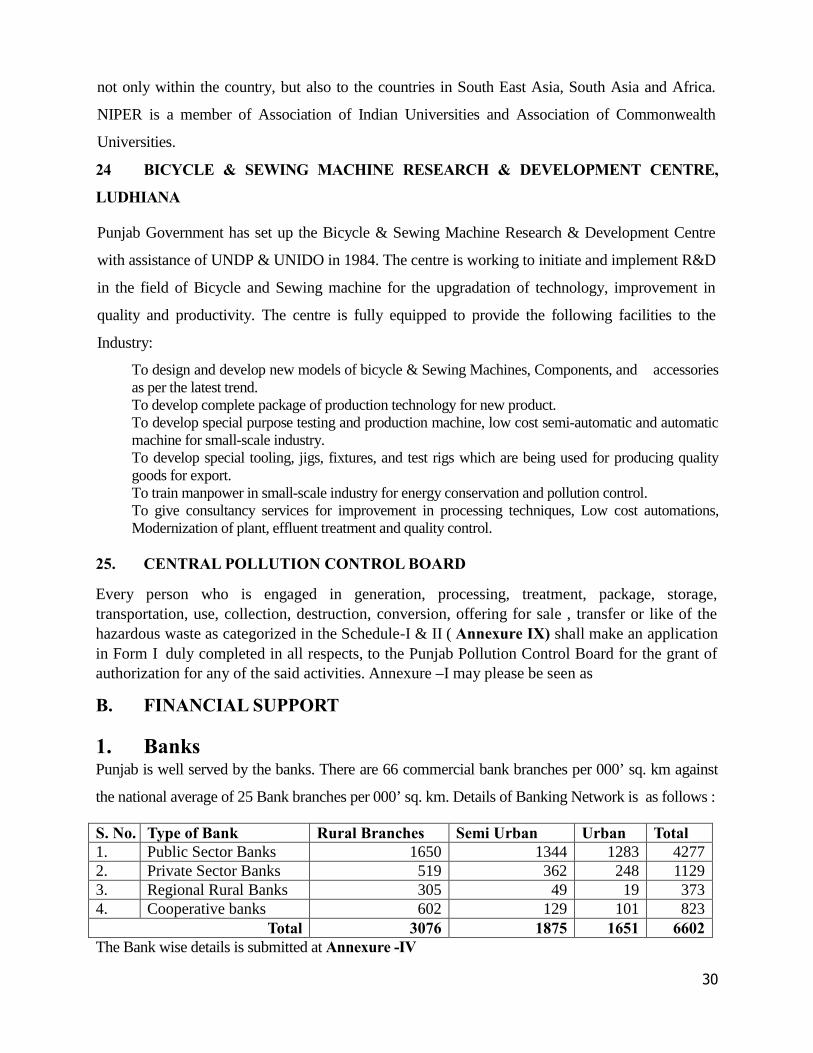
1. BanksPunjab is well served by the banks. There are 66 commercial bank branches per 000’ sq. km against
the national average of 25 Bank branches per 000’ sq. km. Details of Banking Network is as follows :
S. No. Type of Bank Rural Branches Semi Urban Urban Total1. Public Sector Banks 1650 1344 1283 42772. Private Sector Banks 519 362 248 11293. Regional Rural Banks 305 49 19 3734. Cooperative banks 602 129 101 823
Total 3076 1875 1651 6602The Bank wise details is submitted at Annexure -IV
31
2. SMALL INDUSTRIES DEVELOPMENT BANK OF INDIASIDBI is an apex institution established for promotion, financing and development of MSE
industries. All projects in the Small-Scale sector are normally eligible for assistance in the form of
refinance through primary lending institutions.
New Schemes
1. To enhance the export capabilities of SSI units.2. Scheme for Marketing Assistance.3. Infrastructure Development Scheme.4. Scheme for acquisition of ISO 9000 certification.5. Factoring Services and6. Bills Re-discounting Scheme against inland supply bills of SSIs.
For availing the SIDBI schemes entrepreneurs are advised to contactThe Branch ManagerSmall Industries Development Bank of IndiaSCO 145-146, 2nd Floor Sector-17C Email: [email protected] 017 Tel: 0172-5000652
The Deputy General ManagerSmall Industries Development Bank Of IndiaLudhiana BO Email: [email protected] 16 & 17, First Floor, Feroze Gandhi Market Tel: (0161)-2775763, 9417220505Ludhiana (Punjab) – 141001 Fax: (0161)-2774666
The Assistant General ManagerSmall Industries Development Bank Of IndiaJalandhar Retail BOUpper Ground Floor, Email : : [email protected]
Hotel Centrepoint Building, BMC Chowk Tel: (0181)-5061241, 9417293480Jalandhar (Punjab) – 144001 Fax: (0181)-2225110
3. NATIONAL SMALL INDUSTRIES CORPORATION (NSIC)
The NSIC supplies machinery and equipment on hire purchase and lease basis to the small
entrepreneurs. NSIC also provide finance for purchase of raw materials under the Government
Purchase Programme. NSIC Ltd has introduced a Single PointRegistration Scheme under which small
scale units are provided with different marketing assistance like supply of tenders free of cost,
exemption from payment of earnest money, waiver of security deposit and issue of competency
certificate. The corporation has opened a Prototype Development and Training Centre at Rajpura
32
(Punjab). Besides development of Prototypes the Centre is providing training facilities in the trade of
electronics, plastics and computer.
1. Supply of both indigenous and imported machines on lease/hire purchase terms. Specialconcessions have been introduced for units promoted by entrepreneurs from weakersections of the society, women entrepreneurs, Ex-servicemen and those units located inthe backward areas.
2. Marketing of small industry’s products within the country.3. Export of small industry’s products and developing export worthiness of small-scale
units.4. Enlistment of competent units and facilitating their participation in Government Stores
Purchase Programme.5. Development Prototypes of machines, equipment and tools which are then passed on to
small scale units for commercial production.6. Technical Training in several industrial trades with a view to create technical culture in
the young entrepreneurs.7. Development and Upgradation of technology and implementation of modernisation
programme.8. Supply and distribution of indigenous and imported raw materials.9. Supply of both indigenous and imported machines on easy lease terms to existing units
for diversification and modernisation.10. Providing of common facilities through Prototyped Development & Training Centres.11. Setting up of small-scale industries in other developing countries on turnkey basis.
For availing above incentives entrepreneurs are advised to contactThe Branch Manager,National Small Industries CorporationLtd.,GuruGobindSinghTower,G.T. Road, Ludhiana – 141003 (Punjab)Tel: 0161-2531946Email: [email protected]
The Branch Manager,National Small Industries CorporationLtd.,SCO - 378, 2nd Floor,Sector 32-D, Chandigarh (UT)Tel: 0172-2620538Email: [email protected]
The Branch Manager,National Small Industries CorporationLtd.,C/o CIHT Campus,G.T. Road, Bye Pass, Opp. SaheedBhagatSingh Colony, Jalandhar– 144008(Punjab)Tel: 0181-2292242Email: [email protected]
The Branch Manager,National Small Industries CorporationLtd.,C/o Central Warehousing Corporation,C-10 & H, Focal Point, Phagwara RoadHoshiarpur (Punjab)Tel: 0188-2249629
4. PUNJAB FINANCIAL CORPORATIONPunjab Financial Corporation, a premier lending Institution was set up in the year 1953 under
the State Financial Corporation’s Act 1951 to boost industrial growth in the State. It provides medium
33
and long-term loans to the entrepreneurs for setting up new industrial units under various schemes and
for expansion/diversification, renovation, modernisation and rehabilitation of existing units. The
Corporation also grants foreign exchange loans under IDA line of credit to entrepreneurs for setting up
units for new industrial products, and for designing, expansion, diversification and modernisation.
Assistance provided by Punjab Financial Corporation under different schemes is as following:
1. Special scheme for un-employed persons2. Composite loan scheme (AVIC)3. Single window scheme4. Scheme for scheduled castes/scheduled tribes.5. Scheme for physically handicapped entrepreneurs.6. Scheme for ex-servicemen (SEMFEX).7. Scheme for women entrepreneurs (MahilaUdhyamNidhi scheme)8. Scheme for quality control facilities9. Equipment finance scheme10. Special capital scheme11. Modernisation scheme12. Scheme for purchase of generating sets13. Scheme for hotel industry14. Scheme for rehabilitation of sick units15. General scheme16. Scheme for transport industry
For availing financial assistance, entrepreneurs are advised to the branch managers
1. Punjab Financial CorporationKothi No. A-99Ranjeet AvenueAmritsar
2. Punjab Financial CorporationBuilding No. 1, 1st FloorNear Sandhu HospitalDukhniwaran RoadPatiala
3. Punjab Financial CorporationSCO 24, Phase 1,Near Indian Overseas BankMohali
4. Punjab Financial CorporationOpp. Sangrur Central Co-op. Bank Ltd BambaGhar Road,Sangrur
5. Punjab Financial CorporationDIC, Malwal Road,Ferozepur
34
6. Punjab Financial CorporationAbove Bank of IndiaMain Garha RoadJalandhar
7. Punjab Financial CorporationB-5, Civil LinesBathinda
8. Punjab Financial CorporationSCO- 6, Indl. Dev. ColonyJalandhar Road,Hoshiarpur
9. Punjab Financial CorporationBank of Maharashtra, Link Road,Ludhiana
5. PUNJAB STATE INDUSTRIAL DEVELOPMENT CORPORATION,CHANDIGARH
The PSIDC was set up in 1966 to promote medium and large-scale industries in the State. The
corporation acts as an institutional entrepreneur for developing new industries in these sectors. The
corporation provides financial assistance to the projects promoted by private entrepreneurs in the State
in the form of direct participation and under-writing of equity and preference share capital. The
corporation also bridges the gaps in term lending in participation with other financial institutions.
Some important projects promoted by the Corporation are: manufacturing of tractors, dry cell
batteries, television sets, leather & footwear, steel billets, oxygen gas, food processing etc.
35
CHAPTER - 4
INDUSTRIES IN PUNJAB&
POLICY MEASURES
36
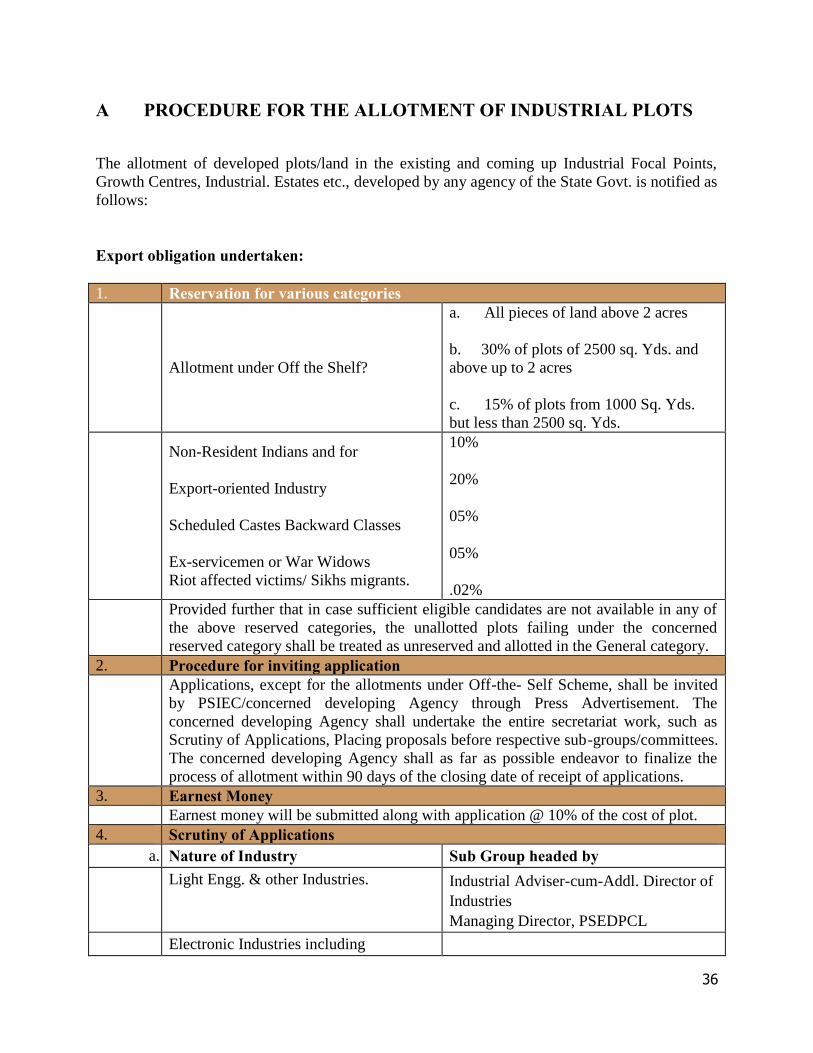
A PROCEDURE FOR THE ALLOTMENT OF INDUSTRIAL PLOTS
The allotment of developed plots/land in the existing and coming up Industrial Focal Points,Growth Centres, Industrial. Estates etc., developed by any agency of the State Govt. is notified asfollows:
Export obligation undertaken:
1. Reservation for various categories
Allotment under Off the Shelf?
a. All pieces of land above 2 acres
b. 30% of plots of 2500 sq. Yds. andabove up to 2 acres
c. 15% of plots from 1000 Sq. Yds.but less than 2500 sq. Yds.
Non-Resident Indians and for
Export-oriented Industry
Scheduled Castes Backward Classes
Ex-servicemen or War WidowsRiot affected victims/ Sikhs migrants.
10%
20%
05%
05%
.02%Provided further that in case sufficient eligible candidates are not available in any ofthe above reserved categories, the unallotted plots failing under the concernedreserved category shall be treated as unreserved and allotted in the General category.
2. Procedure for inviting applicationApplications, except for the allotments under Off-the- Self Scheme, shall be invitedby PSIEC/concerned developing Agency through Press Advertisement. Theconcerned developing Agency shall undertake the entire secretariat work, such asScrutiny of Applications, Placing proposals before respective sub-groups/committees.The concerned developing Agency shall as far as possible endeavor to finalize theprocess of allotment within 90 days of the closing date of receipt of applications.
3. Earnest MoneyEarnest money will be submitted along with application @ 10% of the cost of plot.
4. Scrutiny of Applicationsa. Nature of Industry Sub Group headed by
Light Engg. & other Industries. Industrial Adviser-cum-Addl. Director ofIndustriesManaging Director, PSEDPCL
Electronic Industries including
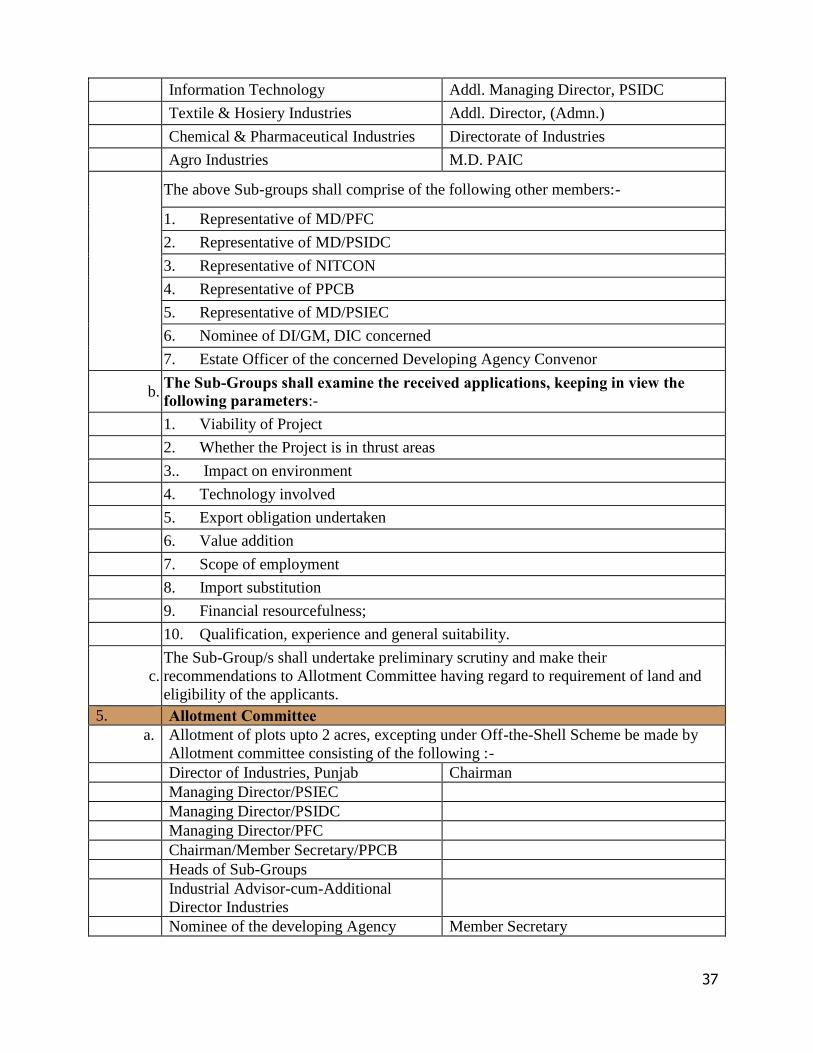
37
Information Technology Addl. Managing Director, PSIDCTextile & Hosiery Industries Addl. Director, (Admn.)Chemical & Pharmaceutical Industries Directorate of IndustriesAgro Industries M.D. PAIC
The above Sub-groups shall comprise of the following other members:-
1. Representative of MD/PFC2. Representative of MD/PSIDC3. Representative of NITCON4. Representative of PPCB5. Representative of MD/PSIEC6. Nominee of DI/GM, DIC concerned7. Estate Officer of the concerned Developing Agency Convenor
b. The Sub-Groups shall examine the received applications, keeping in view thefollowing parameters:-1. Viability of Project2. Whether the Project is in thrust areas3.. Impact on environment4. Technology involved5. Export obligation undertaken6. Value addition7. Scope of employment8. Import substitution9. Financial resourcefulness;10. Qualification, experience and general suitability.
c.The Sub-Group/s shall undertake preliminary scrutiny and make theirrecommendations to Allotment Committee having regard to requirement of land andeligibility of the applicants.
5. Allotment Committeea. Allotment of plots upto 2 acres, excepting under Off-the-Shell Scheme be made by
Allotment committee consisting of the following :-Director of Industries, Punjab ChairmanManaging Director/PSIECManaging Director/PSIDCManaging Director/PFCChairman/Member Secretary/PPCBHeads of Sub-GroupsIndustrial Advisor-cum-AdditionalDirector IndustriesNominee of the developing Agency Member Secretary
38
b. The recommendations of the Sub-Group/s shall be placed before the AllotmentCommittee for consideration and making allotments.
c. The decision of the Allotment Committee on applications for allotment of plots shallbe final and no appeal shall lie against it. The Allotment Committee would meet asand when required and devise its own procedure for conducting the business.
6 Issuance of Letter Intenda. The developing Agency will issue letter of Intent (LOI) to the allottee/s,
incorporating therein among other conditions that the LOI holder will be required toget the project appraised regarding techno-economic feasibility from financialinstitution, scheduled commercial banks or other public sector consultants and submitthe appraisal report to developing Agency within three months of issue of LOI.
b. The developing agency will hand over possession of land to the Allottee onsubmission of appraisal report.
c . The LOI holder will be required to deposit additional 30% of the cost of plot within 45days from the date of issue of LOI. The allottee will be required to complete thefollowing additional formalities within a period of Twelve Months from the date ofPossession:-1. Obtain provisional registration of his unit from the concerned GM/DIC or SIAregistration as applicable.2. Submit Building Plans/Drawings for scrutiny.3. Obtain consent of financial institution/bank to advance loan for the proposedproject. Or In case of self financing, submit proof of own sources.4. Obtain NOC/Consent to establish from PPCB5. Make application for power/electric connection.
d.In case an entrepreneur fails to complete the above formalities within the prescribedperiod of Twelve Months, he can apply, for seeking extension of LOI for additionalsix months, to the developing Agency, provided, he has taken partial effect steps.
e .However, another special extension of LOI for six months can be considered by thedeveloping Agency upon payment of extension fee @2.5% of the cost of plot inexceptional cases. No further extension shall be allowed under any circumstances.
7. Payment towards cost of Plots
a .
The LOI holder shall be required to deposit the balance 60% cost of the plot in sixequal half yearly instalments along with applicable interest etc. as may be decided bythe developing Agency, 10% rebate shall be given in case of lump sum payment byLOI holder.
b.
In the event of failure to complete the conditions of LOI or payment of dueinstalments within stipulated/ extended period, LOI shall be deemed to have beenwithdrawn/lapsed. In such an eventuality, the amount deposited by the LOI holdertowards earnest money and extension fee, if any, shall stand forfeited and amountover the above thereof shall be refunded to the entrepreneur, on which no interestshall be payable.
8. Allotment of Plots under ?Off-the-Shell Scheme?
a.
The applications under Off-the-Shell Scheme would be received in Udyog Sahayakand the entire secretarial work such as scrutiny of applications, placing the proposalbefore the sub-committee and allotment committee shall be done by the UdyogSahayak.
39
b. Earnest money will be submitted along with application @20% of the cost of the plotor Rs. 10 lac whichever is less.
c. The applications scrutinized by Udyog Sahayak shall be placed before a Sub-committee comprising of the following members:-Director of Industries & Commerce ChairmanChief Town Planner MemberChief Architect MemberMD/PSIEC MemberMD/PSIDC MemberMember Secretary, Punjab PollutionControl Board.
Member
Chief Coordinator, Udyog Sahayak ConvenerWhenever an application has been sponsored by a particular Corporation/Agency, therepresentative of that Corporation/Agency may be called to the Committee as aspecial invitee.
d.The Sub-committee will examine the applications keeping in view the parameters asgiven under clause 4.2 Preference will, however be given to the Joint Sector projectsor those who have signed MOU with Corporations.
e.The Sub-Committee will also make an assessment of the land requirement of theapplicant based on the project and building plans to be submitted along withapplication.
f.The recommendations of the Sub-committee will be placed before the Committeeunder the Chairmanship of Chief Secretary to Government, Punjab with the followingmembers.
1. Principal Secretary to Chief Minister, Punjab2. Principal Secretary Industries & Commerce3. Principal Secretary, Environment4. Principal Secretary, Power5. Principal Secretary, Housing & Urban Development6. Principal Secretary, Labour7. MD, PSIEC/concerned developing agency8. Director of Industries & Commerce-Convener.
g. The Allotment committee may coop other Administrative Secretaries/StateGovernment Officials as and when required.
h . The Allotment of Plots shall be subject to following conditions:
1. After approval of the Committee, an offer of allotment shall be issued by theconcerned agency in favor of applicant. The applicant in case of pieces of land above 2acres shall be required to deposit balance 80% of the cost of plot in 60 days while incase of plots of 2 acres and less he/she shall be required to deposit 30% of theremaining cost of plot within 30 days and balance 50% in 2 half yearly instalments.
2. After the applicant has made full payment, Letter of Intent containing amongothers the following conditions for compliance within 4 months, will be issued inhis/her favor.
40
a. LOI-holder shall get the project appraised regarding techno-economic feasibilityfrom financial institutions/ scheduled commercial banks or other public sectorconsultants and submit the appraisal report. This condition may be waived off by theAllotment Committee in exceptional circumstances after recording the reasons.
b. LOI holder shall obtain NOC/Consent to establish in principal from PollutionControl Board.
c. LOI holder shall obtain provisional registration of his unit from the concernedGeneral Manager, District Industries Centre or SIA registration as applicable.
3. The applicant shall be required to take following steps within one year from thedate of getting possession of land:
a. Start of construction of building and expenditure incurred up to 30% of the costof civil work as projected in the project report.
b. Place firm order for the purchase of plant and machinery.
c. Obtain NOC/Consent to establish from Pollution Control Board and also makeapplication for power connection.
d. Get the loan application appraised from the financial institution or submit proofof financial resources of the Project.
8.9 On completion of one year from the date of getting possession of land, the LOIholder will submit a report to the developing agency about the compliance of theeffective steps which were required to be taken by him. In cases where partialeffective steps have been taken the LOI holder may seek instance and on payment ofextension fee of 1% of the cost of plot for another automatically stands lapsed. TheLOI shall automatically stand lapsed in case the allottee fails to submit thecompliance report or to seek extension after one year from the date of gettingpossession of land. Consequent upon lapse of LOI the earnest money shall standforfeited and the remaining cost of plot shall be refunded to the applicant. No interestwill be payable on refundable amount.
9. Issuance of regular allotment letter. In the cases, where the LOI holder succeeds incompleting the required formalities of LOI within admissible extended time period,regular Letter of Allotment will be issued by the concerned developing Agency.
10. Project Implementation Period10.1 The allottee shall ensure to commence commercial production after completing
construction of factory building, within an overall period of three years from the dateof issue of possession.
10.2 However, under exceptional circumstances, the allottee can apply to the allottingAgency seeking extension in time period of commencement of commercialproduction for additional six months upon payment of extension fee @ 6,.5% of thecost of plot.
41
10.3 In the event of failure of the allottee to achieve commercial production withinadmissible/ extended period, the allotment of plot shall be cancelled / resumed. Uponcancellation/resumption 15% of the cost of plot upto 2 acres and 25% for thosemeasuring above 2 acres shall be forfeited by the allotting agency and amount overand above there of shall be refunded to the applicant. No interest shall be paid on therefundable amount.
10.4 However, in the cases of unit(s) having, fixed capital investment of Rupees OneHundred Crore or more, extension of LOI and period of commencement ofcommercial production shall be considered and allowed on merits of the case bySecretary industries & Commerce, Government of Punjab.
11. Transfer of Plots11.1 No transfer of LOI shall be admissible under any circumstances.11.2 However, transfer of plots, exception Off-the-Shelf, allotted under this policy shall be
allowed by the developing Agency, if the unit of the allottee has remained incommercial production as envisaged in the project at least for period of two years.The allottee shall be required to produce evidence of having gone into production inthe shape of Permanent SSI Registration Certificate issued by GM/DIC concerned orproof of production issued by any other Government Agency.
B. MAJOR MULTINATIONAL CORPORATIONS IN PUNJAB:
Nestle Glaxo Smithkline Pepsico GEC , USA Ollivetti , Italy Nippon Hitachi Fujitsu OKI of Japan Kenwood Motorola Dumax (M/S Vinton Healthcare Pvt.
Ltd.)
C. ENHANCEMENT OF COMPETITIVENESS OF THE EXISTING INDUSTRY(Initiatives from Industries Department, Government of Punjab)
INCENTIVES FOR LARGE MANUFACTURING SECTOR UNITS
2.0 VAT and CST Incentives2.1 VAT & CST incentives for new Units with Fixed Capital Investment of above Rs.25cr:
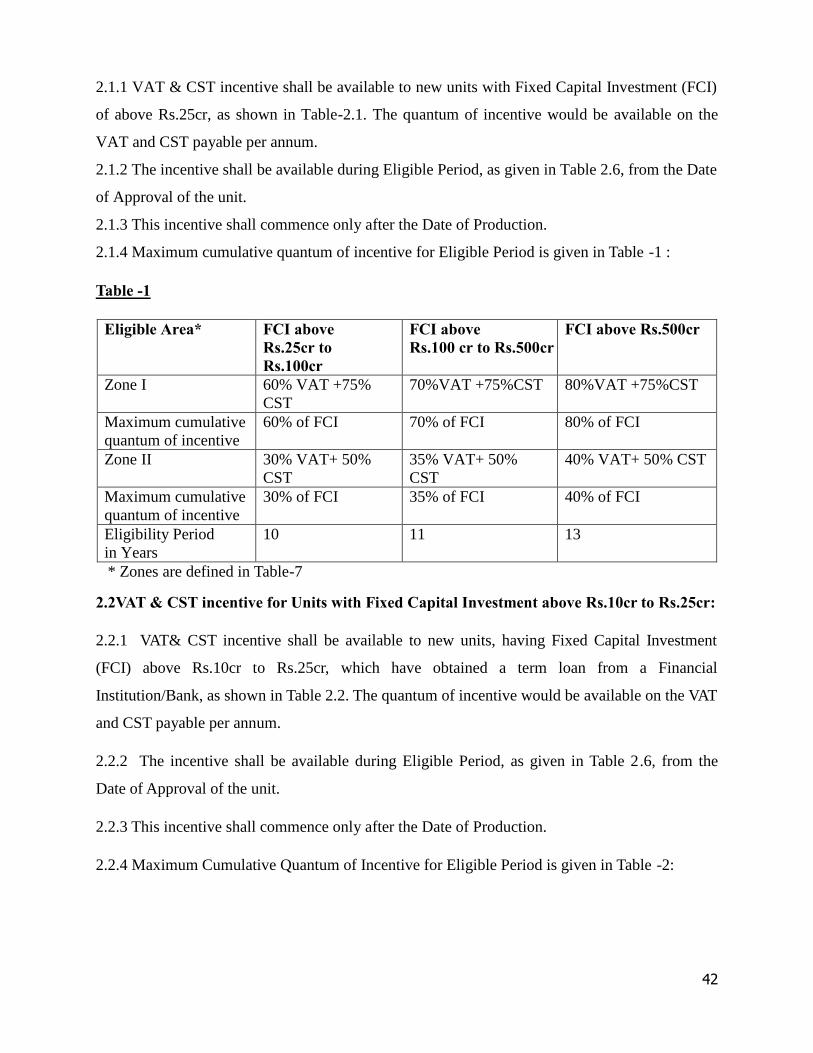
42
2.1.1 VAT & CST incentive shall be available to new units with Fixed Capital Investment (FCI)
of above Rs.25cr, as shown in Table-2.1. The quantum of incentive would be available on the
VAT and CST payable per annum.
2.1.2 The incentive shall be available during Eligible Period, as given in Table 2.6, from the Date
of Approval of the unit.
2.1.3 This incentive shall commence only after the Date of Production.
2.1.4 Maximum cumulative quantum of incentive for Eligible Period is given in Table -1 :
Table -1
Eligible Area* FCI aboveRs.25cr toRs.100cr
FCI aboveRs.100 cr to Rs.500cr
FCI above Rs.500cr
Zone I 60% VAT +75%CST
70%VAT +75%CST 80%VAT +75%CST
Maximum cumulativequantum of incentive
60% of FCI 70% of FCI 80% of FCI
Zone II 30% VAT+ 50%CST
35% VAT+ 50%CST
40% VAT+ 50% CST
Maximum cumulativequantum of incentive
30% of FCI 35% of FCI 40% of FCI
Eligibility Periodin Years
10 11 13
* Zones are defined in Table-7
2.2VAT & CST incentive for Units with Fixed Capital Investment above Rs.10cr to Rs.25cr:
2.2.1 VAT& CST incentive shall be available to new units, having Fixed Capital Investment
(FCI) above Rs.10cr to Rs.25cr, which have obtained a term loan from a Financial
Institution/Bank, as shown in Table 2.2. The quantum of incentive would be available on the VAT
and CST payable per annum.
2.2.2 The incentive shall be available during Eligible Period, as given in Table 2.6, from the
Date of Approval of the unit.
2.2.3 This incentive shall commence only after the Date of Production.
2.2.4 Maximum Cumulative Quantum of Incentive for Eligible Period is given in Table -2:
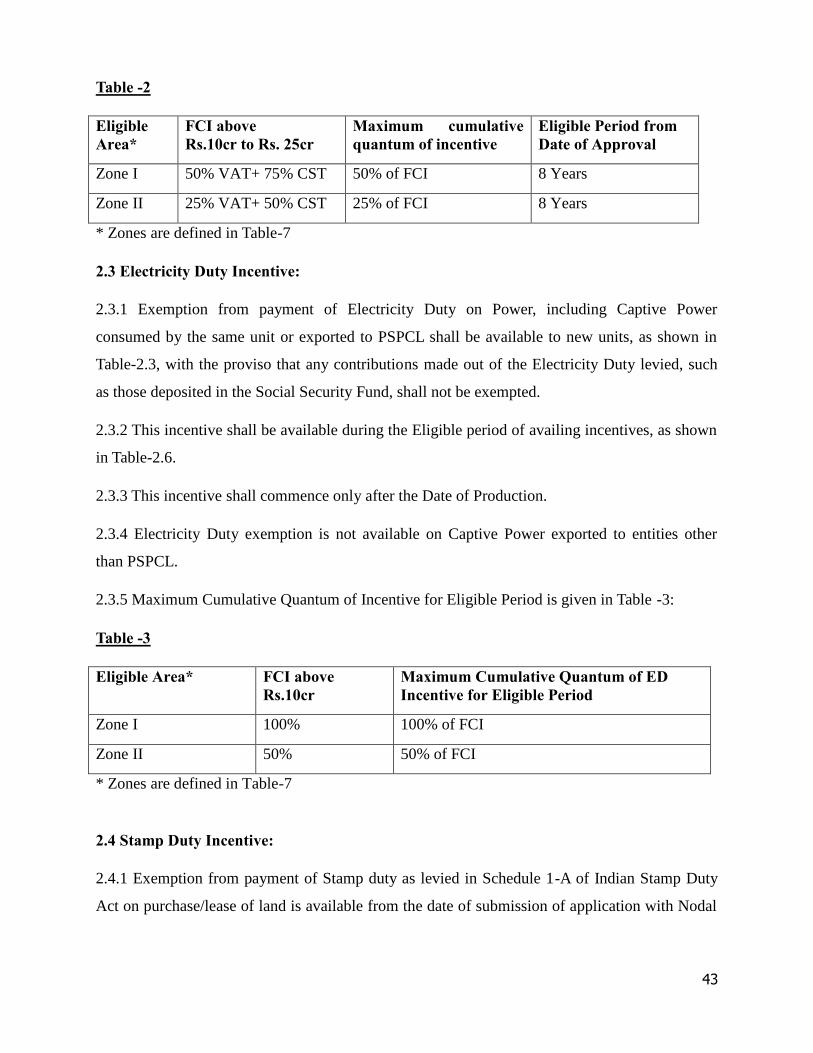
43
Table -2
EligibleArea*
FCI aboveRs.10cr to Rs. 25cr
Maximum cumulativequantum of incentive
Eligible Period fromDate of Approval
Zone I 50% VAT+ 75% CST 50% of FCI 8 Years
Zone II 25% VAT+ 50% CST 25% of FCI 8 Years
* Zones are defined in Table-7
2.3 Electricity Duty Incentive:
2.3.1 Exemption from payment of Electricity Duty on Power, including Captive Power
consumed by the same unit or exported to PSPCL shall be available to new units, as shown in
Table-2.3, with the proviso that any contributions made out of the Electricity Duty levied, such
as those deposited in the Social Security Fund, shall not be exempted.
2.3.2 This incentive shall be available during the Eligible period of availing incentives, as shown
in Table-2.6.
2.3.3 This incentive shall commence only after the Date of Production.
2.3.4 Electricity Duty exemption is not available on Captive Power exported to entities other
than PSPCL.
2.3.5 Maximum Cumulative Quantum of Incentive for Eligible Period is given in Table -3:
Table -3
Eligible Area* FCI aboveRs.10cr
Maximum Cumulative Quantum of EDIncentive for Eligible Period
Zone I 100% 100% of FCI
Zone II 50% 50% of FCI
* Zones are defined in Table-7
2.4 Stamp Duty Incentive:
2.4.1 Exemption from payment of Stamp duty as levied in Schedule 1-A of Indian Stamp Duty
Act on purchase/lease of land is available from the date of submission of application with Nodal
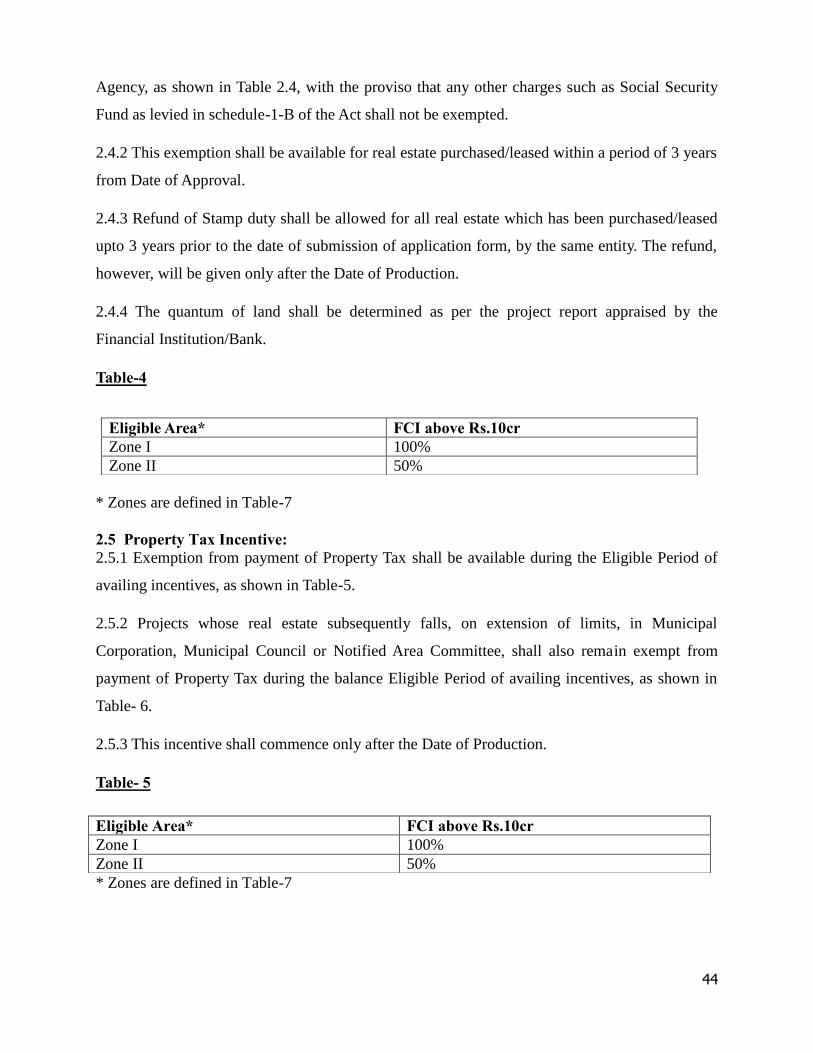
44
Agency, as shown in Table 2.4, with the proviso that any other charges such as Social Security
Fund as levied in schedule-1-B of the Act shall not be exempted.
2.4.2 This exemption shall be available for real estate purchased/leased within a period of 3 years
from Date of Approval.
2.4.3 Refund of Stamp duty shall be allowed for all real estate which has been purchased/leased
upto 3 years prior to the date of submission of application form, by the same entity. The refund,
however, will be given only after the Date of Production.
2.4.4 The quantum of land shall be determined as per the project report appraised by the
Financial Institution/Bank.
Table-4
* Zones are defined in Table-7
2.5 Property Tax Incentive:2.5.1 Exemption from payment of Property Tax shall be available during the Eligible Period of
availing incentives, as shown in Table-5.
2.5.2 Projects whose real estate subsequently falls, on extension of limits, in Municipal
Corporation, Municipal Council or Notified Area Committee, shall also remain exempt from
payment of Property Tax during the balance Eligible Period of availing incentives, as shown in
Table- 6.
2.5.3 This incentive shall commence only after the Date of Production.
Table- 5
* Zones are defined in Table-7
Eligible Area* FCI above Rs.10crZone I 100%Zone II 50%
Eligible Area* FCI above Rs.10crZone I 100%Zone II 50%
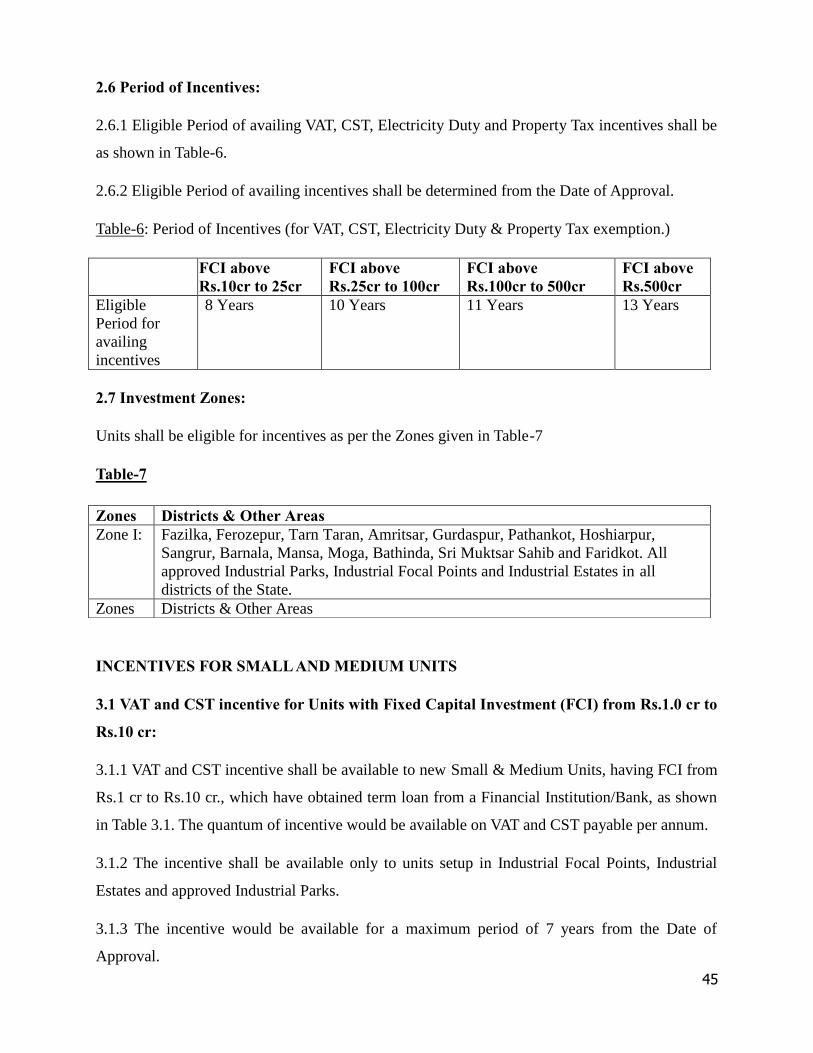
45
2.6 Period of Incentives:
2.6.1 Eligible Period of availing VAT, CST, Electricity Duty and Property Tax incentives shall be
as shown in Table-6.
2.6.2 Eligible Period of availing incentives shall be determined from the Date of Approval.
Table-6: Period of Incentives (for VAT, CST, Electricity Duty & Property Tax exemption.)
FCI aboveRs.10cr to 25cr
FCI aboveRs.25cr to 100cr
FCI aboveRs.100cr to 500cr
FCI aboveRs.500cr
EligiblePeriod foravailingincentives
8 Years 10 Years 11 Years 13 Years
2.7 Investment Zones:
Units shall be eligible for incentives as per the Zones given in Table-7
Table-7
INCENTIVES FOR SMALL AND MEDIUM UNITS
3.1 VAT and CST incentive for Units with Fixed Capital Investment (FCI) from Rs.1.0 cr to
Rs.10 cr:
3.1.1 VAT and CST incentive shall be available to new Small & Medium Units, having FCI from
Rs.1 cr to Rs.10 cr., which have obtained term loan from a Financial Institution/Bank, as shown
in Table 3.1. The quantum of incentive would be available on VAT and CST payable per annum.
3.1.2 The incentive shall be available only to units setup in Industrial Focal Points, Industrial
Estates and approved Industrial Parks.
3.1.3 The incentive would be available for a maximum period of 7 years from the Date of
Approval.
Zones Districts & Other AreasZone I: Fazilka, Ferozepur, Tarn Taran, Amritsar, Gurdaspur, Pathankot, Hoshiarpur,
Sangrur, Barnala, Mansa, Moga, Bathinda, Sri Muktsar Sahib and Faridkot. Allapproved Industrial Parks, Industrial Focal Points and Industrial Estates in alldistricts of the State.
Zones Districts & Other Areas
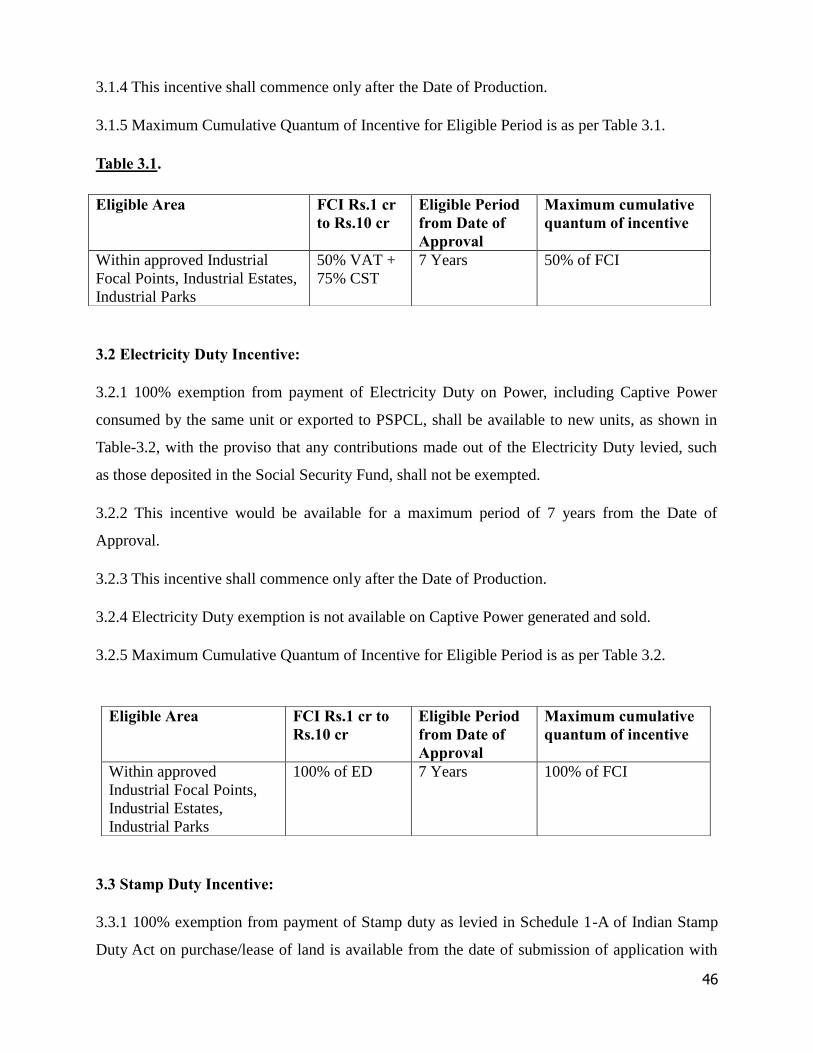
46
3.1.4 This incentive shall commence only after the Date of Production.
3.1.5 Maximum Cumulative Quantum of Incentive for Eligible Period is as per Table 3.1.
Table 3.1.
3.2 Electricity Duty Incentive:
3.2.1 100% exemption from payment of Electricity Duty on Power, including Captive Power
consumed by the same unit or exported to PSPCL, shall be available to new units, as shown in
Table-3.2, with the proviso that any contributions made out of the Electricity Duty levied, such
as those deposited in the Social Security Fund, shall not be exempted.
3.2.2 This incentive would be available for a maximum period of 7 years from the Date of
Approval.
3.2.3 This incentive shall commence only after the Date of Production.
3.2.4 Electricity Duty exemption is not available on Captive Power generated and sold.
3.2.5 Maximum Cumulative Quantum of Incentive for Eligible Period is as per Table 3.2.
3.3 Stamp Duty Incentive:
3.3.1 100% exemption from payment of Stamp duty as levied in Schedule 1-A of Indian Stamp
Duty Act on purchase/lease of land is available from the date of submission of application with
Eligible Area FCI Rs.1 crto Rs.10 cr
Eligible Periodfrom Date ofApproval
Maximum cumulativequantum of incentive
Within approved IndustrialFocal Points, Industrial Estates,Industrial Parks
50% VAT +75% CST
7 Years 50% of FCI
Eligible Area FCI Rs.1 cr toRs.10 cr
Eligible Periodfrom Date ofApproval
Maximum cumulativequantum of incentive
Within approvedIndustrial Focal Points,Industrial Estates,Industrial Parks
100% of ED 7 Years 100% of FCI
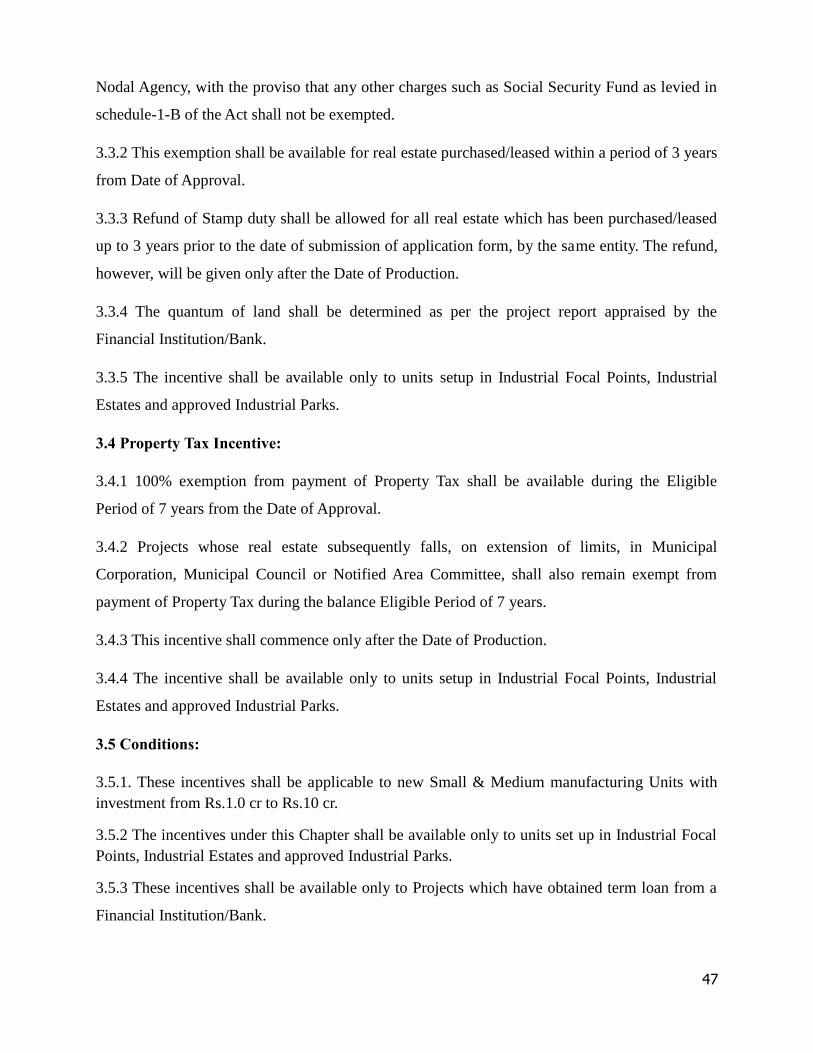
47
Nodal Agency, with the proviso that any other charges such as Social Security Fund as levied in
schedule-1-B of the Act shall not be exempted.
3.3.2 This exemption shall be available for real estate purchased/leased within a period of 3 years
from Date of Approval.
3.3.3 Refund of Stamp duty shall be allowed for all real estate which has been purchased/leased
up to 3 years prior to the date of submission of application form, by the same entity. The refund,
however, will be given only after the Date of Production.
3.3.4 The quantum of land shall be determined as per the project report appraised by the
Financial Institution/Bank.
3.3.5 The incentive shall be available only to units setup in Industrial Focal Points, Industrial
Estates and approved Industrial Parks.
3.4 Property Tax Incentive:
3.4.1 100% exemption from payment of Property Tax shall be available during the Eligible
Period of 7 years from the Date of Approval.
3.4.2 Projects whose real estate subsequently falls, on extension of limits, in Municipal
Corporation, Municipal Council or Notified Area Committee, shall also remain exempt from
payment of Property Tax during the balance Eligible Period of 7 years.
3.4.3 This incentive shall commence only after the Date of Production.
3.4.4 The incentive shall be available only to units setup in Industrial Focal Points, Industrial
Estates and approved Industrial Parks.
3.5 Conditions:
3.5.1. These incentives shall be applicable to new Small & Medium manufacturing Units withinvestment from Rs.1.0 cr to Rs.10 cr.
3.5.2 The incentives under this Chapter shall be available only to units set up in Industrial FocalPoints, Industrial Estates and approved Industrial Parks.
3.5.3 These incentives shall be available only to Projects which have obtained term loan from a
Financial Institution/Bank.
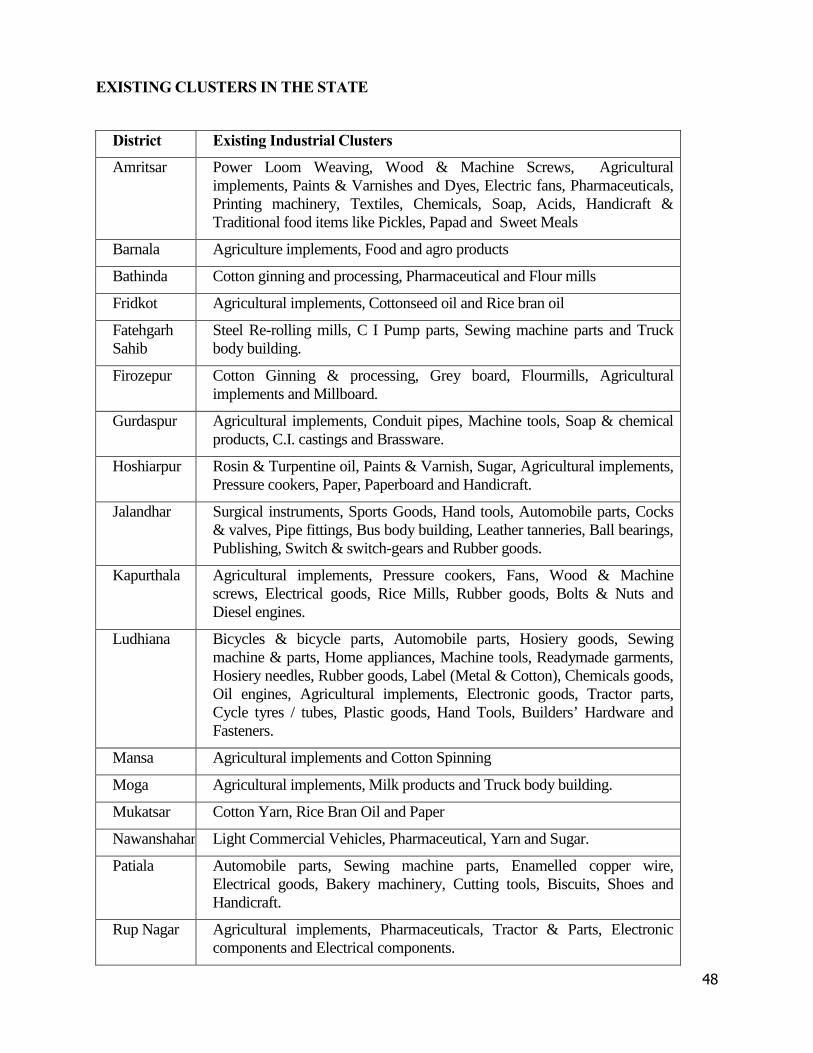
48
EXISTING CLUSTERS IN THE STATE
District Existing Industrial Clusters
Amritsar Power Loom Weaving, Wood & Machine Screws, Agriculturalimplements, Paints & Varnishes and Dyes, Electric fans, Pharmaceuticals,Printing machinery, Textiles, Chemicals, Soap, Acids, Handicraft &Traditional food items like Pickles, Papad and Sweet Meals
Barnala Agriculture implements, Food and agro products
Bathinda Cotton ginning and processing, Pharmaceutical and Flour mills
Fridkot Agricultural implements, Cottonseed oil and Rice bran oil
FatehgarhSahib
Steel Re-rolling mills, C I Pump parts, Sewing machine parts and Truckbody building.
Firozepur Cotton Ginning & processing, Grey board, Flourmills, Agriculturalimplements and Millboard.
Gurdaspur Agricultural implements, Conduit pipes, Machine tools, Soap & chemicalproducts, C.I. castings and Brassware.
Hoshiarpur Rosin & Turpentine oil, Paints & Varnish, Sugar, Agricultural implements,Pressure cookers, Paper, Paperboard and Handicraft.
Jalandhar Surgical instruments, Sports Goods, Hand tools, Automobile parts, Cocks& valves, Pipe fittings, Bus body building, Leather tanneries, Ball bearings,Publishing, Switch & switch-gears and Rubber goods.
Kapurthala Agricultural implements, Pressure cookers, Fans, Wood & Machinescrews, Electrical goods, Rice Mills, Rubber goods, Bolts & Nuts andDiesel engines.
Ludhiana Bicycles & bicycle parts, Automobile parts, Hosiery goods, Sewingmachine & parts, Home appliances, Machine tools, Readymade garments,Hosiery needles, Rubber goods, Label (Metal & Cotton), Chemicals goods,Oil engines, Agricultural implements, Electronic goods, Tractor parts,Cycle tyres / tubes, Plastic goods, Hand Tools, Builders’ Hardware andFasteners.
Mansa Agricultural implements and Cotton Spinning
Moga Agricultural implements, Milk products and Truck body building.
Mukatsar Cotton Yarn, Rice Bran Oil and Paper
Nawanshahar Light Commercial Vehicles, Pharmaceutical, Yarn and Sugar.
Patiala Automobile parts, Sewing machine parts, Enamelled copper wire,Electrical goods, Bakery machinery, Cutting tools, Biscuits, Shoes andHandicraft.
Rup Nagar Agricultural implements, Pharmaceuticals, Tractor & Parts, Electroniccomponents and Electrical components.
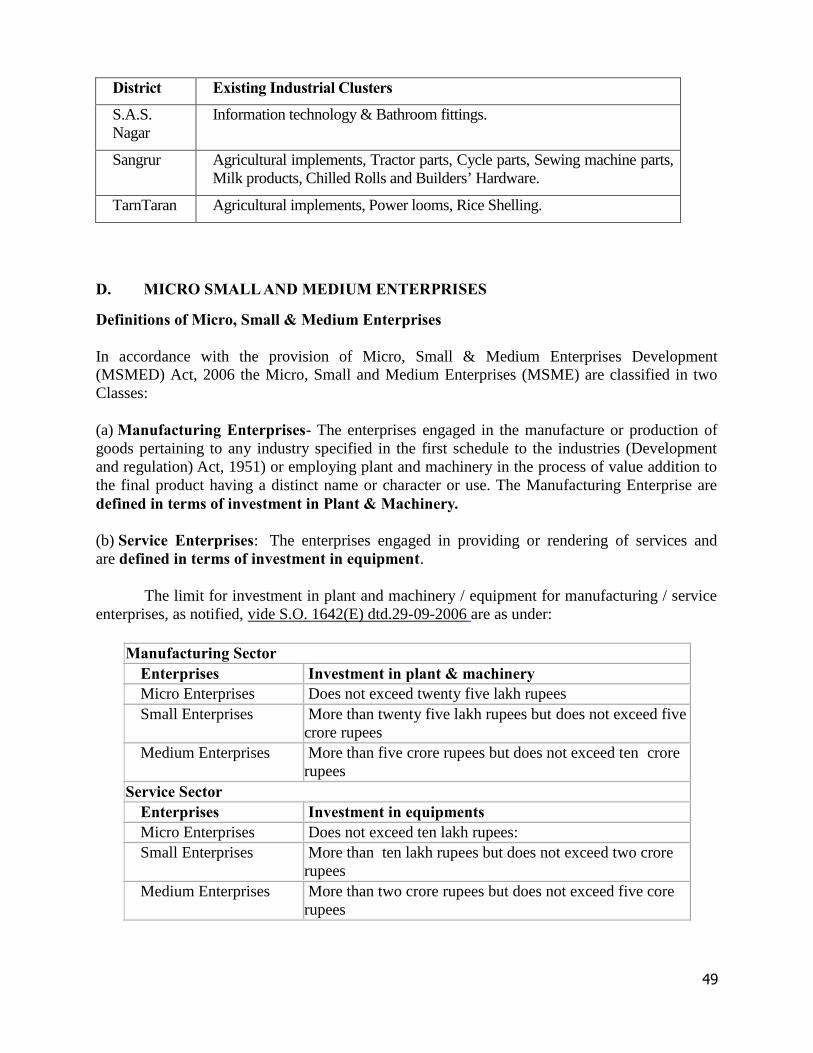
49
District Existing Industrial Clusters
S.A.S.Nagar
Information technology & Bathroom fittings.
Sangrur Agricultural implements, Tractor parts, Cycle parts, Sewing machine parts,Milk products, Chilled Rolls and Builders’ Hardware.
TarnTaran Agricultural implements, Power looms, Rice Shelling.
D. MICRO SMALL AND MEDIUM ENTERPRISES
Definitions of Micro, Small & Medium Enterprises
In accordance with the provision of Micro, Small & Medium Enterprises Development(MSMED) Act, 2006 the Micro, Small and Medium Enterprises (MSME) are classified in twoClasses:
(a) Manufacturing Enterprises- The enterprises engaged in the manufacture or production ofgoods pertaining to any industry specified in the first schedule to the industries (Developmentand regulation) Act, 1951) or employing plant and machinery in the process of value addition tothe final product having a distinct name or character or use. The Manufacturing Enterprise aredefined in terms of investment in Plant & Machinery.
(b) Service Enterprises: The enterprises engaged in providing or rendering of services andare defined in terms of investment in equipment.
The limit for investment in plant and machinery / equipment for manufacturing / serviceenterprises, as notified, vide S.O. 1642(E) dtd.29-09-2006 are as under:
Manufacturing SectorEnterprises Investment in plant & machineryMicro Enterprises Does not exceed twenty five lakh rupeesSmall Enterprises More than twenty five lakh rupees but does not exceed five
crore rupeesMedium Enterprises More than five crore rupees but does not exceed ten crore
rupeesService Sector
Enterprises Investment in equipmentsMicro Enterprises Does not exceed ten lakh rupees:Small Enterprises More than ten lakh rupees but does not exceed two crore
rupeesMedium Enterprises More than two crore rupees but does not exceed five core
rupees
50
The district wise cumulative number of small scale industries as on 31.3.2009 is 162559.The details is at Annexure V. The district wise EM Part-II filed in the State during the last fiveyears starting 2010-11 to 2013-14 is at Annexure VI.
E. GROWTH OF VILLAGE & COTTAGE INDUSTRY
A large number of persons and families are engaged in Village & Cottage industries in the
State such as pottery, black smithy & carpentry, weaving, leather & leather products,pulses & cereals
processing, gur & khandsari, repair shops etc. KVIC under Ministry of MSME runs several scheme
for employment generation and promotion of village and cottage industries as follows:
KVIC SCHEMES
PMEGP Guidelines PMEGP SFURTI RISC EXPORT INCENTIVE SCHEME INTEREST SUBSIDY SCHEME
KHADI SCHEMES
MARKET DEVELOPMENT ASSISTANCE (MDA) KHADI KARIGAR JANASHREE BIMA YOJANA INTEREST SUBSIDY ELIGIBILITY CERTIFICATE (ISEC) STRENGTHENING OF INFRASTRUCTURE OF EXISTING WEAK KHADI
INSTITUTIONS AND ASSISTANCE FOR MARKETING INFRASTRUCTURE SCHEME FOR ENHANCING PRODUCTIVITY & COMPETITIVENESS OF KHADI
INDUSTRY & ARTISANS WORKSHED SCHEME FOR KHADI ARTISANS
SCHEMES UNDER SCIENCE & TECHNOLOGY
Mahatma Gandhi Institute for Rural Industrialization (MGIRI)R&D activities under KVIC-Technical Interfaces
Performance of PMEGP being one of the main schemes of KVIC is as follows :
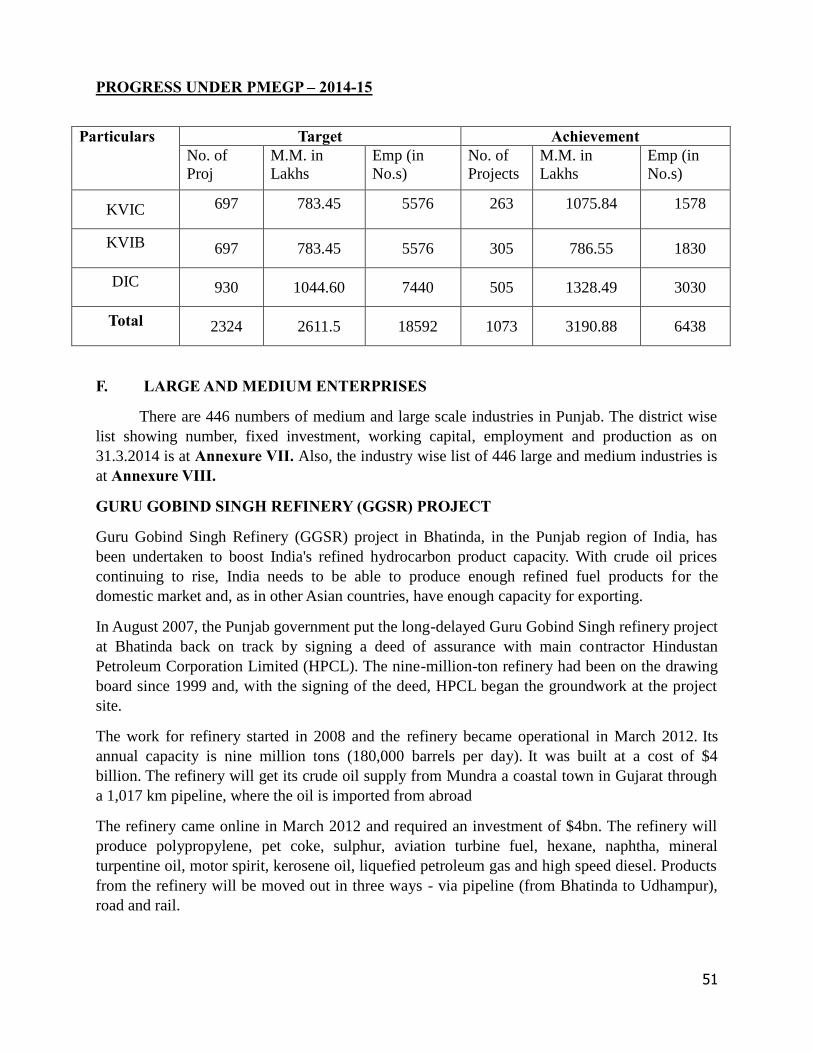
51
PROGRESS UNDER PMEGP – 2014-15
Particulars Target AchievementNo. ofProj
M.M. inLakhs
Emp (inNo.s)
No. ofProjects
M.M. inLakhs
Emp (inNo.s)
KVIC 697 783.45 5576 263 1075.84 1578
KVIB 697 783.45 5576 305 786.55 1830
DIC 930 1044.60 7440 505 1328.49 3030
Total 2324 2611.5 18592 1073 3190.88 6438
F. LARGE AND MEDIUM ENTERPRISES
There are 446 numbers of medium and large scale industries in Punjab. The district wiselist showing number, fixed investment, working capital, employment and production as on31.3.2014 is at Annexure VII. Also, the industry wise list of 446 large and medium industries isat Annexure VIII.
GURU GOBIND SINGH REFINERY (GGSR) PROJECT
Guru Gobind Singh Refinery (GGSR) project in Bhatinda, in the Punjab region of India, hasbeen undertaken to boost India's refined hydrocarbon product capacity. With crude oil pricescontinuing to rise, India needs to be able to produce enough refined fuel products for thedomestic market and, as in other Asian countries, have enough capacity for exporting.
In August 2007, the Punjab government put the long-delayed Guru Gobind Singh refinery projectat Bhatinda back on track by signing a deed of assurance with main contractor HindustanPetroleum Corporation Limited (HPCL). The nine-million-ton refinery had been on the drawingboard since 1999 and, with the signing of the deed, HPCL began the groundwork at the projectsite.
The work for refinery started in 2008 and the refinery became operational in March 2012. Itsannual capacity is nine million tons (180,000 barrels per day). It was built at a cost of $4billion. The refinery will get its crude oil supply from Mundra a coastal town in Gujarat througha 1,017 km pipeline, where the oil is imported from abroad
The refinery came online in March 2012 and required an investment of $4bn. The refinery willproduce polypropylene, pet coke, sulphur, aviation turbine fuel, hexane, naphtha, mineralturpentine oil, motor spirit, kerosene oil, liquefied petroleum gas and high speed diesel. Productsfrom the refinery will be moved out in three ways - via pipeline (from Bhatinda to Udhampur),road and rail.
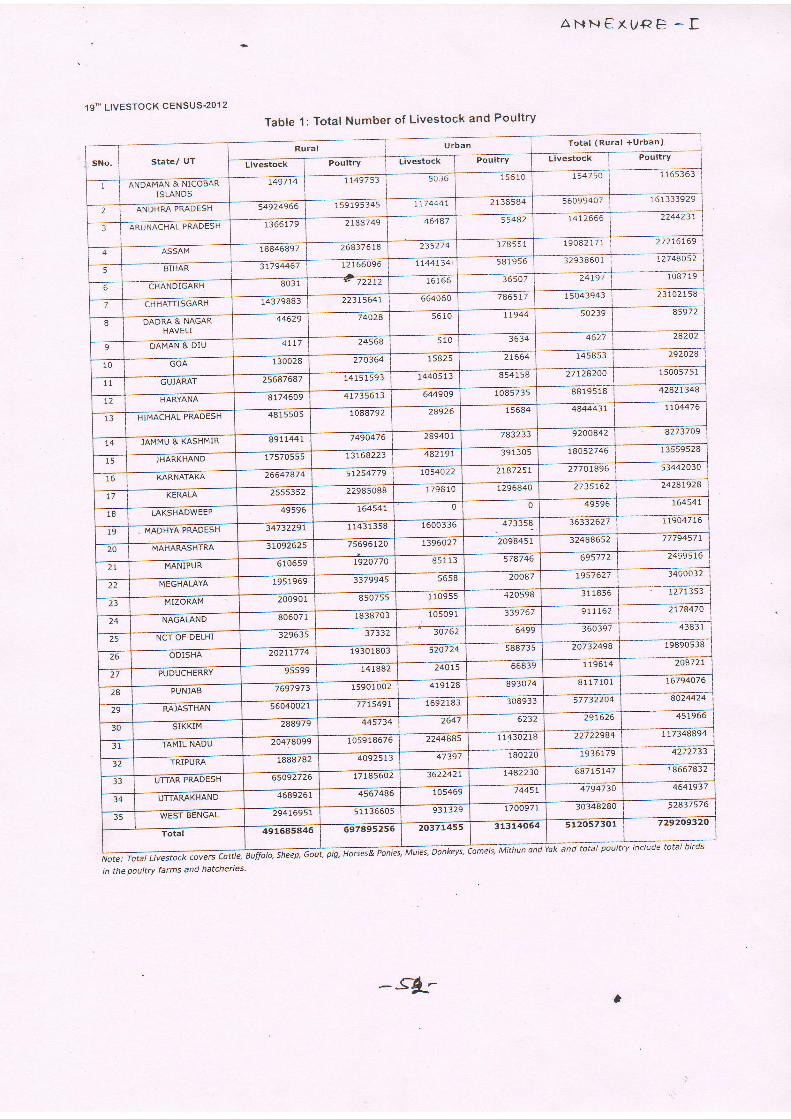
ANN€XUEB -T
19'" LIVESTOCK CENSUS.2Ol Z
Table 1: Total Number of Livestock and Poultry
hffinmnr*, *"t ri)uorsuse pooies, Muies, Donkeys, camels,
in the Doultry farms and hatcheries
a
SNo. state/ UT
Rural Urban iTotal (Rural
Livestock Poultry LivestocK
5036 1 5610 L54750 1 165363ANDAMAN & NICOBAR
ISLANDS
749714 11497 53
2 ANDHRA PRADESH 54924966 L 59 195345 t174447 2 1 38584i
3 ARU'IACHAL PMDESH 1 366 179 278A749 46+a7 55482
4 ASSAI''l 18846897 268376 18 23527 4 37A551 t908277 1
5
-l
BIHAR I 31794467 r.2166096 1144I34 5819s6 329
b CHANDIGARH I
803 1 7ZZ7 16165
22315647 664060 786517 15043943 23 102 1 587 CHHATTlSGARH
I DADM & NAGARHAVELI
44629 74028 5610 t1944 50239
9 DAMAN & DIU 24568 3634 4527
10
11
GOA 130028 270364 t 5825 21664 145853
GUJARAT 75687681 14151593 14405 1 3 854 1 5E
644909 108s73s 8819s18 42827344I2 HARYANA
1J HII"IACHAL PRADESH 48 1 5505 r0aa792 2a926 15684
74904 t6 289401 7A3733 9200842 8273709L4
l)
lo
]HARKHAND L7570555 13768223 482197 39 1305 ra052746
KARNATAKA 26647474 51254779 1054022 218725r 27707496
L7 KERALA Z)f,)J)Z 22985088 179E 10
0 0 49596 !645471B L,ersHaowerp I 4e5eb
t600 336 473358- 36j32627 I 19047 16
19
zo
"L
MADHYA PRAOESH 3473?291 I
MAHARASHTRA 3L092625 1i96027 2098.+51 32488652 7779457 7
MANIPUR 510659 -----lszozzol-est t: 57A746 695777
2? MEGHALAYA 1951969 3379945 | 5b5u 20087 L957627
7 1353-j MIZORAM 200901 8507 5s 1 109ss 42059E 1 1856
----+24 1
NAGALAND 806071 1838703-F;ost 339767 97116?
25 NCT OF DELHI 5ZYOJ> 37332 30762 6499 JbUJ9
26
nODISHA 202n774 1930 1BO3 52072 -_--'---
'I
PUDUCHERRY 95599 ! 14188 24015 66U
893074 8117101 t67940762A PUNJAB 7697973
56040021 777549L 1692 183 308933 5i7 32204
30 SlKKIM 284979 445 34 2647
31 TAMIL NADU zo47ao99 105918676 2244845
47397 r80220 1936179 427273332 TRiPURA
!77a5602 3622421 t4a2230 68775L433 UTTAR PRAIJts5H
34---- ttrrnnlrHeruo 4689261 4567486 105469 7445t
5 1 1 36605 93 1 329 170097r----JogaBzeo 52A37576
35 WEST BENGAL
2037t45s 3131 L_::-l::Yok and tota! Pou
| 729209321Ir-=--------.--*
try include tctal birds
Total 491545446
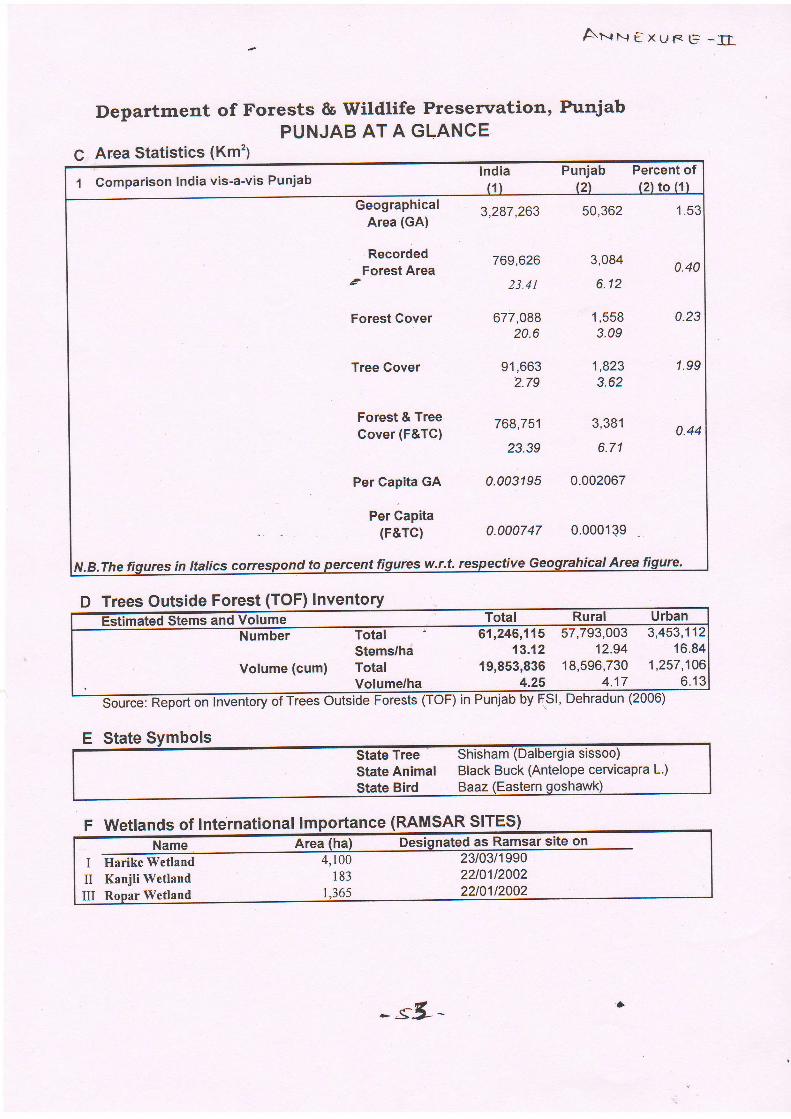
Axrrexur<L= --fI-
Department of Forests & Wildlife Presenration, PunjabPUNJAB AT A GLANCE
C Area Statistics (Km')
D Trees Outside Forest (TOF) Inventory
Sonrce: Report on Inventory of Trees Outside orests (TOF) in F,Sl, Dehradun (2006)
I Comparison India vis-a-vis Punjab U
India Puniab Percent of
Geographical 3,282,263 50,362 1.Area (GA)
RecordedForest Area 769'626 3'084
o.4ot 23.41 6.12
Forest Cover 677,088 1,558 0.2320.6 3.09
Tree Cover 91,663 'l,823 1.992.79 3.62
Forest&Tree T68,751 3,381Gover (F&TC) 0'44
23.39 6.71
Per GaPita GA 0.003195 0.002067
Per GaPita(F&TC) 0.000747 0.000139 ,
N.B.The figures in ltalics to w.r.t. respective Area fiqure,
Rural
Number
Volume (cum)
TotalStems/haTotalVolume/ha
61,246,115 57,793,003 3,453,11213.12 12.94 16.84
19,853,836 18,596,730 1 ,257 ,1064.25 4.17 6.13
State Animal Black Buck (Antelope cervicapra L')
Wetlands of International lmportance (RAMSAR SITES)nated as Ramsar site on
IIIII
llarike WetlandKanjli Wetland
23t03t199022t011200222t0112002
*s5-
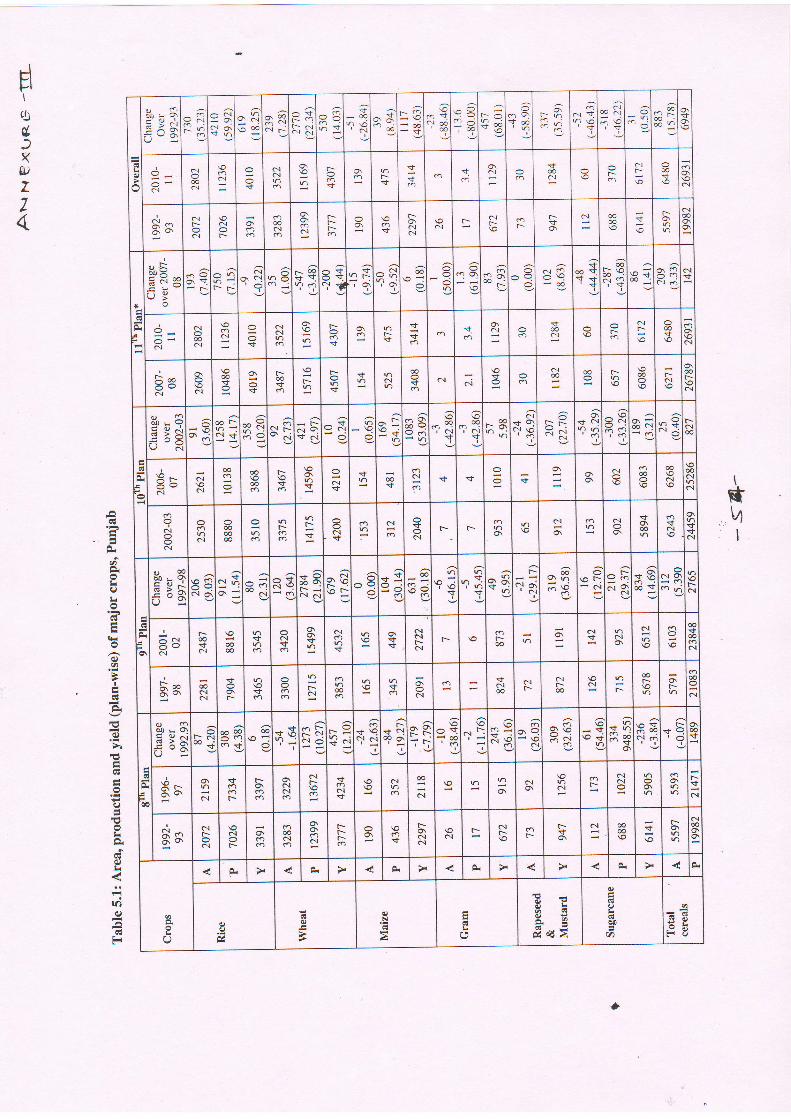
tsUl
I
go-FEXso'9
ucl -Nc)l o.
O.N\o€
^6;r c-{Nr
!ofNNN
-X-Y
=
$-@rl \o.N
o. .i's€ .-d c,n.,I €'x
YO
a+i^Yf,€
-oe)T€
.-fl n={vl \o'v.i
oFij
al^tr, rl+l€.ilA.l@ qrt-;l
-lvl-ll+F--t
d
N€cl
IN {
(\a{
r6 f-
$
s f ci c +@N a-
clt-- ^l-l3 loil.x l\ol- I-ltl
-A-,av.
C\r-N
GI
r-@al
o,o,GI
t--a-'r o\
\om
ro\Nc.l
\ocl
r clr\o rf-d
N €€ s\o
tr I$l
'l=
*
oh
=.vn':rr
dq' c'i'o
N€
!i: o5+n1
rri'r 6
ofi?o.
6o s3 cQ
qt i!-€
{6as+'$
!
6
Nca 6-.^lI nl$
-LN
No6c{
d
NN
t*'
srg
v $ ds€cl r r ^t*<13
-lN
FoovN d
@sst
r6v r
rs
vN
€.i. N c{
Yal6 @ r \o€
t,i l;Nti-li
I
e^xd >xvd
^Y
€rn-N<"*Rn-i cl il
-N-l-crqVN
o a{ro .;OIvj
6O\dqOo -.
09'r' a{strc
'N .f
6FqclsQcj \O "-QR;'l-N
+ c',1v?n xcli6m sil ^ln 9ll" ol(_:t
-l\lEI
IEc--oN
crN
@o €€
F-
=t 3 dv
€vN $ v
N o€ rcN
p\\m
GI
ol
oN
€€@
-, lRml.:
6c.l
c{m
sN
r t-o N c-l
oo
osN +v
N
go*3F th5 "il
5qNo\ ".x O6oo .i RqIFi- 91's
^):F:Yio t-' oq..f, €
€g o.3vvir
qr oi.Ne fr'l- ea rO l- c.l9t
=
oinN$ 3\e
€S
l-lle{ o\ll- ollo rillellt
rN
o\
;\N5oN
r-oo*at
€@
*lf
(.1ars
o\o\s $ln€l: $dc.lrc{
F- roo
d$ (\ N o @s
@mc{
h@E\ ot
€N
\t
r so^lhXl-);l I Gl
frln6l:ol
sN
scl€ rarl\orld6lr t..
@l-F-lo\\olFr
&N
Ho-oiE 9x "-fr€+ 5fro<-
@
sgmri-: c!Ol C)
.-9!6i
VYc.l Nr+c!
oP o,6O.F\ OY-i oo'o
cl'l -.\o.r li
c.torQ
c!Aq;; e.l
iS
r) ;@'vsgl*8q3l '3 00
.<r
PsE\ o\
c.t
oot--
r6
Nc.l
c.lt'- Slpctl:Go
6
c.l
alC.l t--
c.lolntmo'ln
rN
A*6Ei o\
Nt-.c{
N
r o
CO€e.l o(\
f-.-.r m
<t
c*C.lN
(\ f- f- F.r:f, N oo6 slo,
-lh\oln
c{@
q
Q
>t<
N
a
,
ad>J:P
o
oo
U)
-ttl
I
r!u
xwzz4
U'
L
q)o
I
6)
(J
tr
q)
rr.)q)
F
a
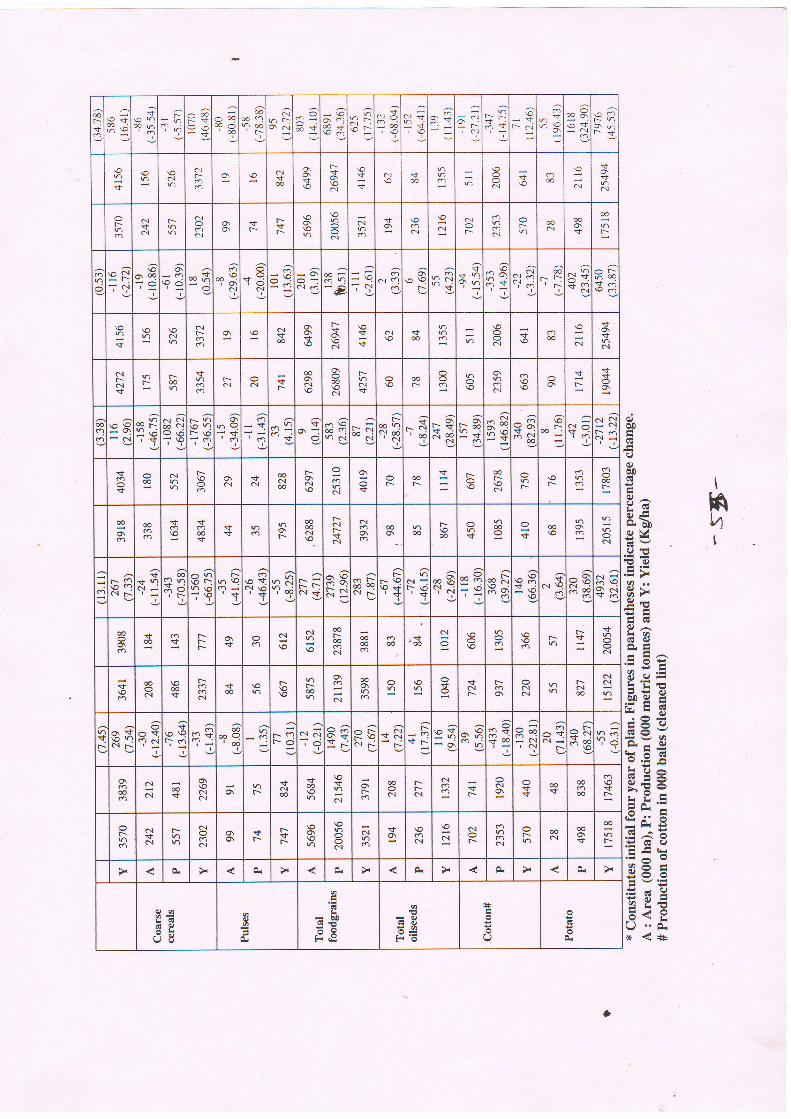
t
nv)t
o0
(uo0
!'l ^6tabEv9ElEq)
o..E>
q,) ^tc/,
69 o)
F.g == r.E,$E HEE r :'?
*FgiI 3ra
€;tR irritr/.- s€;' 5cg -=-11 (!9-=E=
sRE q
.Ec9-E 24_E< eI "0rx {+r
6c:rf,m
\t v?09 r,
ti
r;vl F{
UO-Src-
'6
€@clvl€'r
Nnr:O.N €s €+\o6 G; ",X
---: €-!
N+:-: + :-r
rCl
a': r;+ rcr
^lqrl-, -al"r;lll
383
FfrOr,r<-
s\c)(\
clt-r o\ N+€ o. o,
cl
.i.!f, &
Ns €
N
oF. Ns
Nr c{ o, s
F-rr
o.\ool
NN
\oC\
N
r ciF- 6
N€o,*
€r
efl-iq ^€ oo*-o
-\o-, o\N
*9lod!
rrN6
6tsovl-E -c{or c1
mroP
r- -Rs
$$vlqn
o' o\ -sq-i€r\'r =o-N
i4 0g
sc{
Nr c|$€
rsv \o s€ : N
$ o€ (\
<i$N
Nrclqt--
c-€ sm
rc.l cl s
F-
@N oo
al
(-.
c{ar
o\
al
vF-
s
€no
\OP-d
mIn:;nol€NO\d
\o vl
-6
o\n\<TH :.i
'm rr -'vs
o\ -16\Ooo olvfc{
fNoo ci
r--pnl{oo.N
t.-.- q
I
Na
ai€N--$ xq69 a5Jo-d
6' cj oYr;Ni-r6t-fN-
so* € t-.
N$N
ac.r€
rN o
orr 6r
r @r6l f- r €r
@
m
€o
s m€s .+ o\t'-
€€N
t--olrs(\ol
o€ € t-.
@@
rd'€ o\
ol
r; Esc.l F-
s.f, v!di
€c?nv:rr
.XNr)\O'Y
a-nrP,v
.':,
o\o !qc{ \o's
l! c.I-r'6 F\c'r $$5FS
mt\od oq6lr
t-N\O'sf
c{-'<. sg.-
-3-\o
*\-0\
.^ \o sN\ sg SE
$s
oo *€ os a-a*r
o\$ oN GI 6
F-€mc.l
@00 oo
_*-@e{
o r f-+v
6l
\t6
@
N00d
rGI
s€ r F-€ol
€o
v sclrc-6 al
GI
rN€
C.let
a.efiNF-
O=Icl, e'l
!
vro'9r6 -SJ,
@ooQ'oo.: -i
r- c')F- c)
Nc{:c- Nr-
.dSN
rr-
st-=
eE o.H -?o-.<.€ s6-NtGl
N<r- 3$ 9ci
66
a.lC'l
@s Nd
Fr:Cc.a@
Y€\od
Nt..m
oo
c\r.,t-c{
a.lo sc-
N r+<f
€Y
@ooo
6
c-
r- e{9ctt-.nr)
Nt")N
o\ sF.
r-\fc-
o\r) C.l
C'l
ov o
N c.l(\r
r r'N
F-r)@N
@o\+
6
|-.
gog"Tg
()a
a
=bO815EO
q
"EF# Q
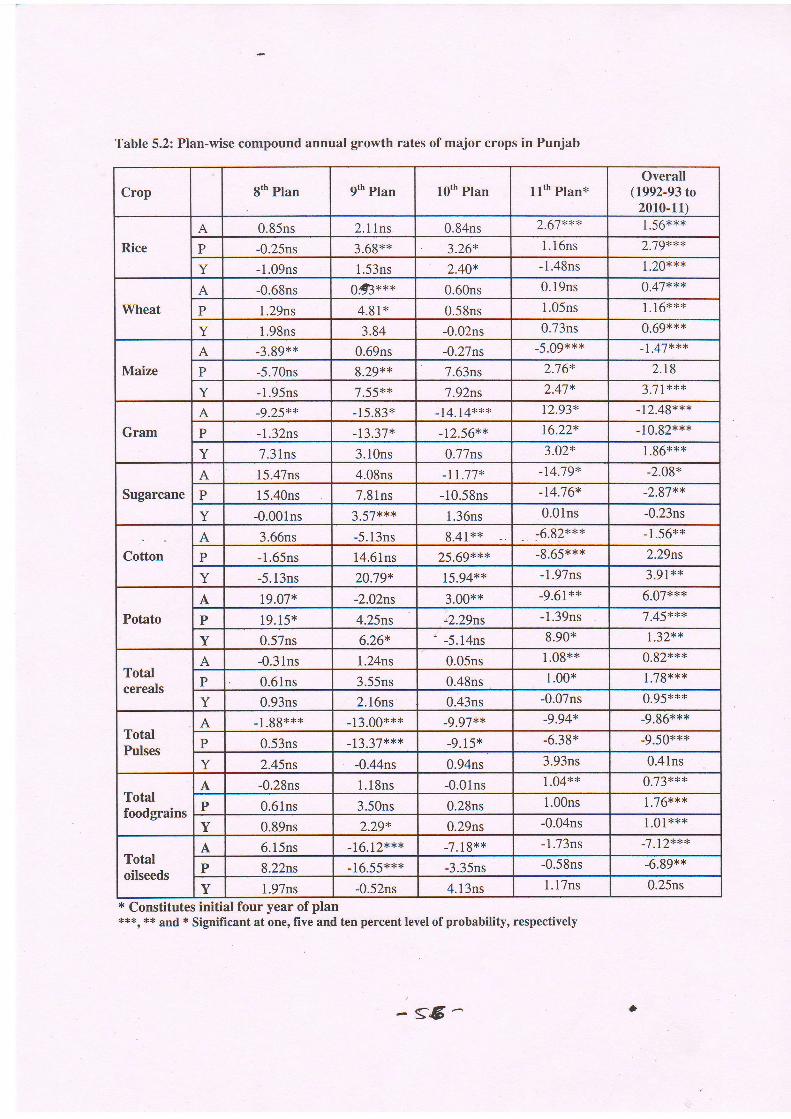
Table 5.2: Plan-wise compound annual growth rates of major crops in Punjab
* Constitutes initial four year of plan***, *{' and * Significant at one, five and ten percent level ofprobability, respectively
Crop 8th Plan 9th Plan loth Plan 11th Plan*Overall
(1992-93 to2010-11)
Rice
A 0.85ns 2.l lns 0.84ns 2.67*** 1.56**r,
P -0.25ns 3.68*x 3.26* 1.16ns 2.79*x*
Y -1.09ns l.53ns 2.40* 1.48ns 1.20*x*
Wheat
A -0.68ns gfix** 0.60ns 0.19ns o.47***
P l.29ns 4.81x 0.58ns l.05ns l. l6xxx
Y 1.98ns 3.84 -0.02ns 0.73ns 0.69***
Maize
A -3.89** 0.69ns -0.27ns -5.09**x _1.47***
P -5.70ns 8.29** 7.63ns 2.76* 2.r8
Y l.95ns 7.55*x 7.92ns 2.47* 3.71***
GramA -9.25** -15.83* _14.14*** t2.93x _12.49***
P 1.32ns -t3.37* -12.56** t6.22* _10.82***
Y 7.31ns 3.lOns 0.77ns 3.02* 1.86{<r<{<
Sugarcane
A l5.47ns 4.08ns 11.77* -14;79* -2.08x
P l5.40ns 7.81ns -10.58ns -14.76* -2.87**
Y -0.001ns 3.57x{<* l.36ns 0.01ns -0.23ns
CottonA 3.66ns -5.l3ns 8.41*x _6,82r<*{< -1.56**
P -1.65ns 14.61ns 25.69*** _8 65r<*x 2.29ns
Y -5.13ns 20.79* 15.94** l.97ns 3.91**
Potato
A 19.07* -2.02ns 3.00** -9.61** 6.07*:l'x
P 19. l5x 4.25ns '2.29ns 1.39ns 7.45***
Y 0.57ns 6.26* '-5.l4ns 8.90* 1.32**
Totalcereals
A -0.31ns 1.24ns 0.05ns 1.08** 0.82x*{.
P 0.61ns 3.55ns 0.48ns 1.00x 1.78{<xx
Y 0.93ns 2.l6ns 0.43ns -0.07ns 0.95*{<*
TotalPulses
A _1.88t ** _13.0O*r<* -9.97x* -9.94* _9.86xr!*
P 0.53ns _I3.37*** -9.15* -6.38x _9.50***
Y 2.45ns -0.44ns 0.94ns 3.93ns 0.41ns
Totalfoodgrains
A -0.28ns l.18ns -0.01ns 1.04** 0.73**x
P 0.6lns 3.50ns 0.28ns l.00ns 1.76***
Y 0.89ns 2.29* 0.29ns -0.04ns l.0l x{c*
Totaloilseeds
A 6. l5ns _16.12*** -7.18** l.73ns _7.12***
P 8.22ns _16.55*** -3.35ns -0.58ns -6.89**
Y 1.97ns -0.52ns 4. I 3ns l.17ns 0.25ns
-s6-
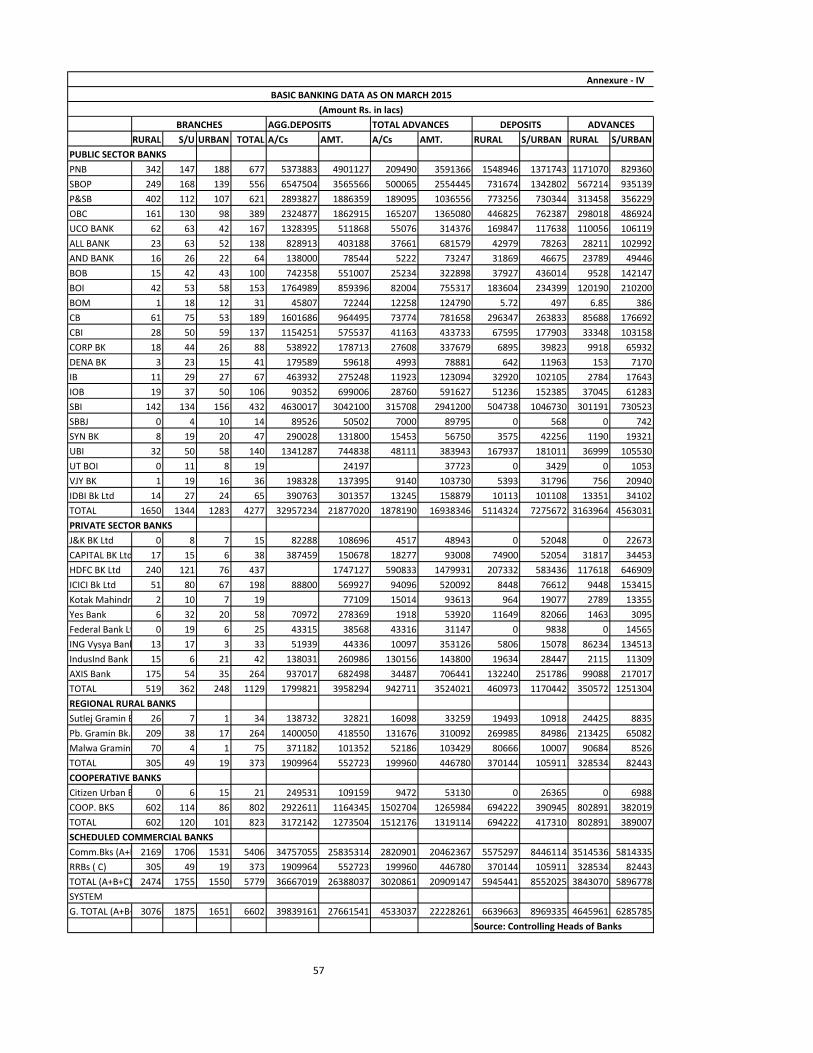
AGG.DEPOSITS TOTAL ADVANCESRURAL S/U URBAN TOTAL A/Cs AMT. A/Cs AMT. RURAL S/URBAN RURAL S/URBAN
PUBLIC SECTOR BANKSPNB 342 147 188 677 5373883 4901127 209490 3591366 1548946 1371743 1171070 829360SBOP 249 168 139 556 6547504 3565566 500065 2554445 731674 1342802 567214 935139P&SB 402 112 107 621 2893827 1886359 189095 1036556 773256 730344 313458 356229OBC 161 130 98 389 2324877 1862915 165207 1365080 446825 762387 298018 486924UCO BANK 62 63 42 167 1328395 511868 55076 314376 169847 117638 110056 106119ALL BANK 23 63 52 138 828913 403188 37661 681579 42979 78263 28211 102992AND BANK 16 26 22 64 138000 78544 5222 73247 31869 46675 23789 49446BOB 15 42 43 100 742358 551007 25234 322898 37927 436014 9528 142147BOI 42 53 58 153 1764989 859396 82004 755317 183604 234399 120190 210200BOM 1 18 12 31 45807 72244 12258 124790 5.72 497 6.85 386CB 61 75 53 189 1601686 964495 73774 781658 296347 263833 85688 176692CBI 28 50 59 137 1154251 575537 41163 433733 67595 177903 33348 103158CORP BK 18 44 26 88 538922 178713 27608 337679 6895 39823 9918 65932DENA BK 3 23 15 41 179589 59618 4993 78881 642 11963 153 7170IB 11 29 27 67 463932 275248 11923 123094 32920 102105 2784 17643IOB 19 37 50 106 90352 699006 28760 591627 51236 152385 37045 61283SBI 142 134 156 432 4630017 3042100 315708 2941200 504738 1046730 301191 730523SBBJ 0 4 10 14 89526 50502 7000 89795 0 568 0 742SYN BK 8 19 20 47 290028 131800 15453 56750 3575 42256 1190 19321UBI 32 50 58 140 1341287 744838 48111 383943 167937 181011 36999 105530UT BOI 0 11 8 19 24197 37723 0 3429 0 1053VJY BK 1 19 16 36 198328 137395 9140 103730 5393 31796 756 20940IDBI Bk Ltd 14 27 24 65 390763 301357 13245 158879 10113 101108 13351 34102TOTAL 1650 1344 1283 4277 32957234 21877020 1878190 16938346 5114324 7275672 3163964 4563031PRIVATE SECTOR BANKSJ&K BK Ltd 0 8 7 15 82288 108696 4517 48943 0 52048 0 22673CAPITAL BK Ltd 17 15 6 38 387459 150678 18277 93008 74900 52054 31817 34453HDFC BK Ltd 240 121 76 437 1747127 590833 1479931 207332 583436 117618 646909ICICI Bk Ltd 51 80 67 198 88800 569927 94096 520092 8448 76612 9448 153415Kotak Mahindra Bk. Ltd.2 10 7 19 77109 15014 93613 964 19077 2789 13355Yes Bank 6 32 20 58 70972 278369 1918 53920 11649 82066 1463 3095Federal Bank Ltd. 0 19 6 25 43315 38568 43316 31147 0 9838 0 14565ING Vysya Bank 13 17 3 33 51939 44336 10097 353126 5806 15078 86234 134513IndusInd Bank 15 6 21 42 138031 260986 130156 143800 19634 28447 2115 11309AXIS Bank 175 54 35 264 937017 682498 34487 706441 132240 251786 99088 217017TOTAL 519 362 248 1129 1799821 3958294 942711 3524021 460973 1170442 350572 1251304REGIONAL RURAL BANKSSutlej Gramin Bank 26 7 1 34 138732 32821 16098 33259 19493 10918 24425 8835Pb. Gramin Bk. 209 38 17 264 1400050 418550 131676 310092 269985 84986 213425 65082Malwa Gramin Bk. 70 4 1 75 371182 101352 52186 103429 80666 10007 90684 8526TOTAL 305 49 19 373 1909964 552723 199960 446780 370144 105911 328534 82443COOPERATIVE BANKSCitizen Urban Bank 0 6 15 21 249531 109159 9472 53130 0 26365 0 6988COOP. BKS 602 114 86 802 2922611 1164345 1502704 1265984 694222 390945 802891 382019TOTAL 602 120 101 823 3172142 1273504 1512176 1319114 694222 417310 802891 389007SCHEDULED COMMERCIAL BANKSComm.Bks (A+B) 2169 1706 1531 5406 34757055 25835314 2820901 20462367 5575297 8446114 3514536 5814335RRBs ( C) 305 49 19 373 1909964 552723 199960 446780 370144 105911 328534 82443TOTAL (A+B+C) 2474 1755 1550 5779 36667019 26388037 3020861 20909147 5945441 8552025 3843070 5896778SYSTEMG. TOTAL (A+B+C+D)3076 1875 1651 6602 39839161 27661541 4533037 22228261 6639663 8969335 4645961 6285785
Source: Controlling Heads of Banks
57
Annexure - IVBASIC BANKING DATA AS ON MARCH 2015
(Amount Rs. in lacs)BRANCHES DEPOSITS ADVANCES
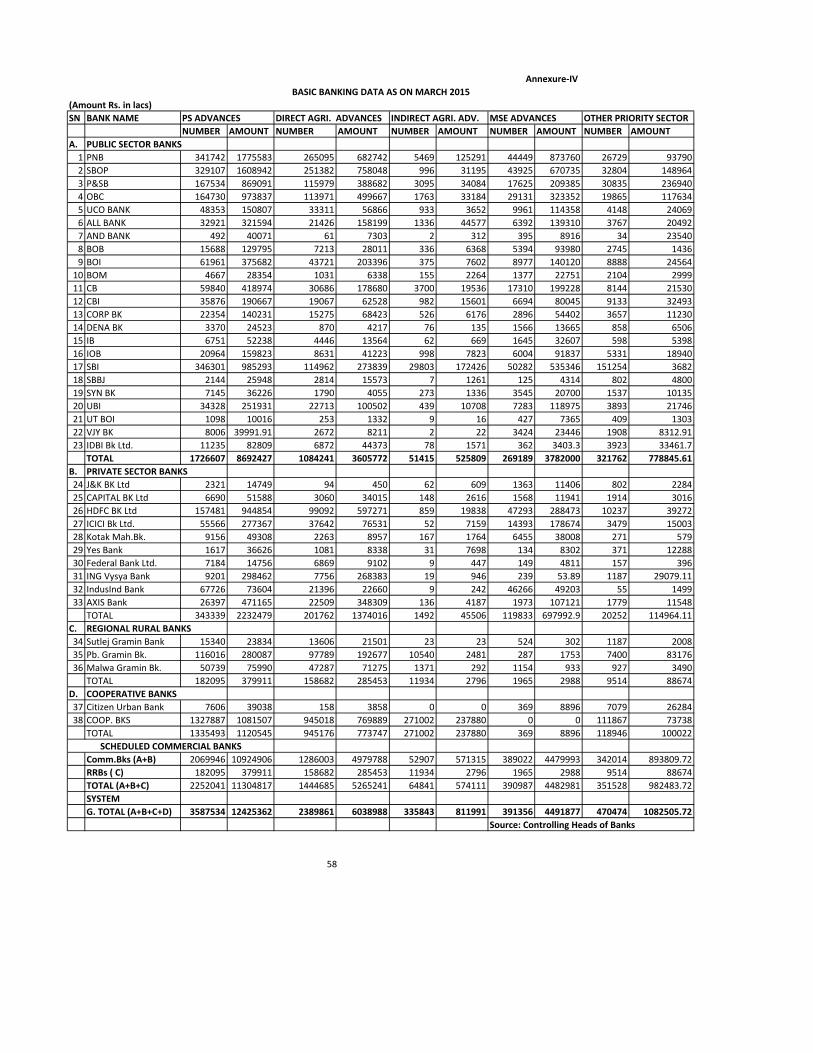
(Amount Rs. in lacs)SN BANK NAME PS ADVANCES DIRECT AGRI. ADVANCES INDIRECT AGRI. ADV. MSE ADVANCES OTHER PRIORITY SECTOR
NUMBER AMOUNT NUMBER AMOUNT NUMBER AMOUNT NUMBER AMOUNT NUMBER AMOUNTA. PUBLIC SECTOR BANKS
1 PNB 341742 1775583 265095 682742 5469 125291 44449 873760 26729 937902 SBOP 329107 1608942 251382 758048 996 31195 43925 670735 32804 1489643 P&SB 167534 869091 115979 388682 3095 34084 17625 209385 30835 2369404 OBC 164730 973837 113971 499667 1763 33184 29131 323352 19865 1176345 UCO BANK 48353 150807 33311 56866 933 3652 9961 114358 4148 240696 ALL BANK 32921 321594 21426 158199 1336 44577 6392 139310 3767 204927 AND BANK 492 40071 61 7303 2 312 395 8916 34 235408 BOB 15688 129795 7213 28011 336 6368 5394 93980 2745 14369 BOI 61961 375682 43721 203396 375 7602 8977 140120 8888 24564
10 BOM 4667 28354 1031 6338 155 2264 1377 22751 2104 299911 CB 59840 418974 30686 178680 3700 19536 17310 199228 8144 2153012 CBI 35876 190667 19067 62528 982 15601 6694 80045 9133 3249313 CORP BK 22354 140231 15275 68423 526 6176 2896 54402 3657 1123014 DENA BK 3370 24523 870 4217 76 135 1566 13665 858 650615 IB 6751 52238 4446 13564 62 669 1645 32607 598 539816 IOB 20964 159823 8631 41223 998 7823 6004 91837 5331 1894017 SBI 346301 985293 114962 273839 29803 172426 50282 535346 151254 368218 SBBJ 2144 25948 2814 15573 7 1261 125 4314 802 480019 SYN BK 7145 36226 1790 4055 273 1336 3545 20700 1537 1013520 UBI 34328 251931 22713 100502 439 10708 7283 118975 3893 2174621 UT BOI 1098 10016 253 1332 9 16 427 7365 409 130322 VJY BK 8006 39991.91 2672 8211 2 22 3424 23446 1908 8312.9123 IDBI Bk Ltd. 11235 82809 6872 44373 78 1571 362 3403.3 3923 33461.7
TOTAL 1726607 8692427 1084241 3605772 51415 525809 269189 3782000 321762 778845.61B. PRIVATE SECTOR BANKS24 J&K BK Ltd 2321 14749 94 450 62 609 1363 11406 802 228425 CAPITAL BK Ltd 6690 51588 3060 34015 148 2616 1568 11941 1914 301626 HDFC BK Ltd 157481 944854 99092 597271 859 19838 47293 288473 10237 3927227 ICICI Bk Ltd. 55566 277367 37642 76531 52 7159 14393 178674 3479 1500328 Kotak Mah.Bk. 9156 49308 2263 8957 167 1764 6455 38008 271 57929 Yes Bank 1617 36626 1081 8338 31 7698 134 8302 371 1228830 Federal Bank Ltd. 7184 14756 6869 9102 9 447 149 4811 157 39631 ING Vysya Bank 9201 298462 7756 268383 19 946 239 53.89 1187 29079.1132 IndusInd Bank 67726 73604 21396 22660 9 242 46266 49203 55 149933 AXIS Bank 26397 471165 22509 348309 136 4187 1973 107121 1779 11548
TOTAL 343339 2232479 201762 1374016 1492 45506 119833 697992.9 20252 114964.11C. REGIONAL RURAL BANKS34 Sutlej Gramin Bank 15340 23834 13606 21501 23 23 524 302 1187 200835 Pb. Gramin Bk. 116016 280087 97789 192677 10540 2481 287 1753 7400 8317636 Malwa Gramin Bk. 50739 75990 47287 71275 1371 292 1154 933 927 3490
TOTAL 182095 379911 158682 285453 11934 2796 1965 2988 9514 88674D. COOPERATIVE BANKS37 Citizen Urban Bank 7606 39038 158 3858 0 0 369 8896 7079 2628438 COOP. BKS 1327887 1081507 945018 769889 271002 237880 0 0 111867 73738
TOTAL 1335493 1120545 945176 773747 271002 237880 369 8896 118946 100022
Comm.Bks (A+B) 2069946 10924906 1286003 4979788 52907 571315 389022 4479993 342014 893809.72RRBs ( C) 182095 379911 158682 285453 11934 2796 1965 2988 9514 88674TOTAL (A+B+C) 2252041 11304817 1444685 5265241 64841 574111 390987 4482981 351528 982483.72SYSTEMG. TOTAL (A+B+C+D) 3587534 12425362 2389861 6038988 335843 811991 391356 4491877 470474 1082505.72
Source: Controlling Heads of Banks
SCHEDULED COMMERCIAL BANKS
58
Annexure-IVBASIC BANKING DATA AS ON MARCH 2015

ANNEXURE - V
DISTRICT-WISE STATUS OF SMALL SCALE UNITS AS ON 31.3.2009
Sr.No.
District No. ofunits
Employment FixedInvestment
(Cr. Rs.)
Production(Cr. Rs.)
1. Amritsar 25364 114921 712.68 4045.55
2. Barnala 1788 6816 62.39 366.48
3. Bathinda 4209 21810 181.28 1148.54
4. Faridkot 2188 13512 84.37 306.33
5. Fatehgarh Sahib 3087 18571 250.99 2577.33
6. Ferozepur 4340 19674 233.44 791.29
7. Gurdaspur 9435 56512 193.28 1050.27
8. Hoshiarpur 6457 27492 157.59 324.51
9. Jalandhar 22906 137723 527.97 2921.96
10. Kapurthala 4198 21150 104.30 416.36
11. Ludhiana 38393 308713 1443.42 21650.68
12. Mansa 1971 7144 43.36 402.74
13. Moga 3281 21729 168.94 562.92
14. Mukatsar 3368 18378 99.51 432.65
15. Nawanshahar 2380 8372 33.63 111.02
16. Patiala 7844 41447 508.95 1648.61
17. Ropar 2816 12138 98.77 277.63
18. S. A. S. Nagar 6063 30666 681.62 699.60
19. Sangrur 10636 52315 368.29 2091.88
20. Tarn Taran 1835 5158 17.48 70.45
Total 162559 944241 5972.25 41896.80
-59-
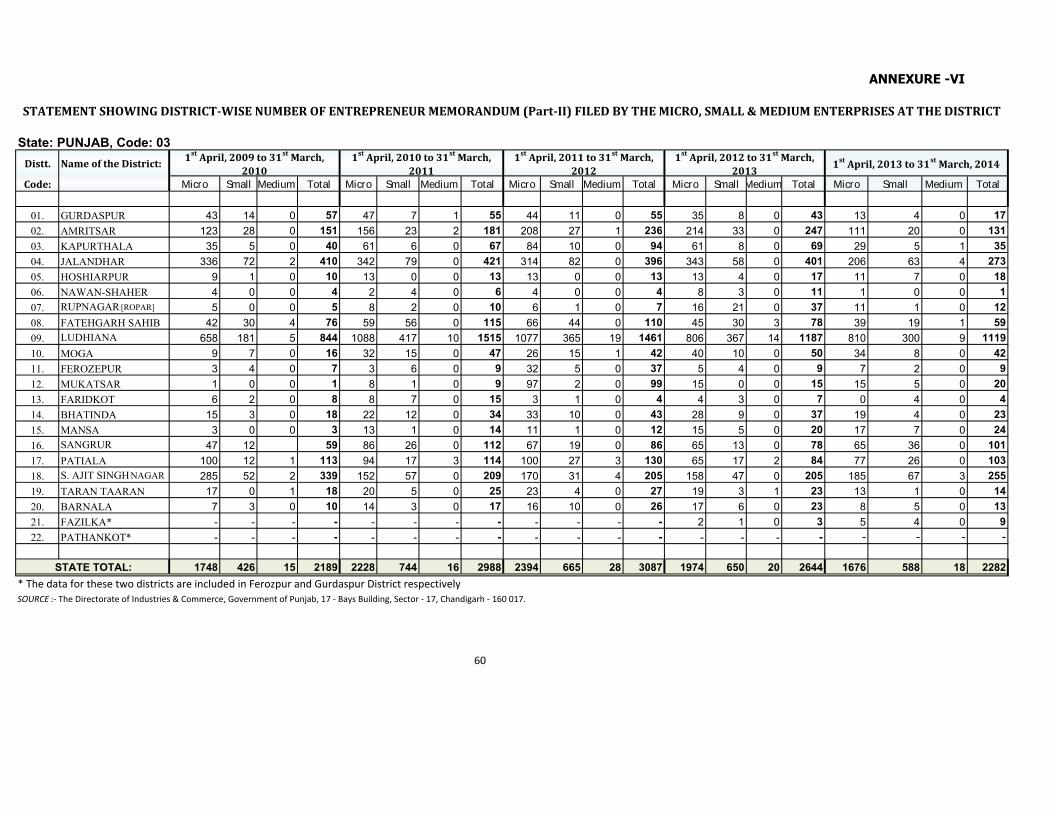
State: PUNJAB, Code: 03Distt. Name of the District:
Code: Micro Small Medium Total Micro Small Medium Total Micro Small Medium Total Micro Small Medium Total Micro Small Medium Total01. GURDASPUR 43 14 0 57 47 7 1 55 44 11 0 55 35 8 0 43 13 4 0 1702. AMRITSAR 123 28 0 151 156 23 2 181 208 27 1 236 214 33 0 247 111 20 0 13103. KAPURTHALA 35 5 0 40 61 6 0 67 84 10 0 94 61 8 0 69 29 5 1 3504. JALANDHAR 336 72 2 410 342 79 0 421 314 82 0 396 343 58 0 401 206 63 4 27305. HOSHIARPUR 9 1 0 10 13 0 0 13 13 0 0 13 13 4 0 17 11 7 0 1806. NAWAN-SHAHER 4 0 0 4 2 4 0 6 4 0 0 4 8 3 0 11 1 0 0 107. RUPNAGAR [ROPAR] 5 0 0 5 8 2 0 10 6 1 0 7 16 21 0 37 11 1 0 1208. FATEHGARH SAHIB 42 30 4 76 59 56 0 115 66 44 0 110 45 30 3 78 39 19 1 5909. LUDHIANA 658 181 5 844 1088 417 10 1515 1077 365 19 1461 806 367 14 1187 810 300 9 111910. MOGA 9 7 0 16 32 15 0 47 26 15 1 42 40 10 0 50 34 8 0 4211. FEROZEPUR 3 4 0 7 3 6 0 9 32 5 0 37 5 4 0 9 7 2 0 912. MUKATSAR 1 0 0 1 8 1 0 9 97 2 0 99 15 0 0 15 15 5 0 2013. FARIDKOT 6 2 0 8 8 7 0 15 3 1 0 4 4 3 0 7 0 4 0 414. BHATINDA 15 3 0 18 22 12 0 34 33 10 0 43 28 9 0 37 19 4 0 2315. MANSA 3 0 0 3 13 1 0 14 11 1 0 12 15 5 0 20 17 7 0 2416. SANGRUR 47 12 59 86 26 0 112 67 19 0 86 65 13 0 78 65 36 0 10117. PATIALA 100 12 1 113 94 17 3 114 100 27 3 130 65 17 2 84 77 26 0 10318. S. AJIT SINGHNAGAR 285 52 2 339 152 57 0 209 170 31 4 205 158 47 0 205 185 67 3 25519. TARAN TAARAN 17 0 1 18 20 5 0 25 23 4 0 27 19 3 1 23 13 1 0 1420. BARNALA 7 3 0 10 14 3 0 17 16 10 0 26 17 6 0 23 8 5 0 1321. FAZILKA* - - - - - - - - - - - - 2 1 0 3 5 4 0 922. PATHANKOT* - - - - - - - - - - - - - - - - - - - -
STATE TOTAL: 1748 426 15 2189 2228 744 16 2988 2394 665 28 3087 1974 650 20 2644 1676 588 18 2282
SOURCE :- The Directorate of Industries & Commerce, Government of Punjab, 17 - Bays Building, Sector - 17, Chandigarh - 160 017.
60
ANNEXURE -VI
* The data for these two districts are included in Ferozpur and Gurdaspur District respectively
STATEMENT SHOWING DISTRICT-WISE NUMBER OF ENTREPRENEUR MEMORANDUM (Part-II) FILED BY THE MICRO, SMALL & MEDIUM ENTERPRISES AT THE DISTRICT
1st April, 2009 to 31st March,2010
1st April, 2010 to 31st March,2011
1st April, 2011 to 31st March,2012
1st April, 2012 to 31st March,2013 1st April, 2013 to 31st March, 2014
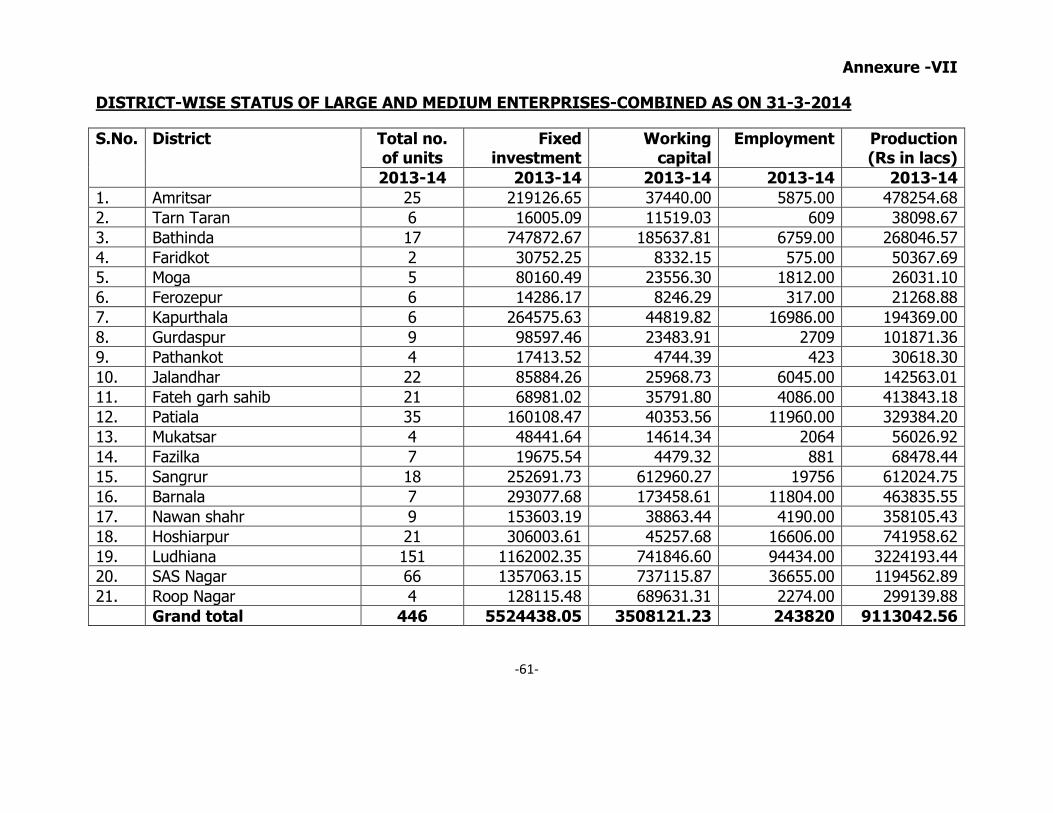
Annexure -VII
DISTRICT-WISE STATUS OF LARGE AND MEDIUM ENTERPRISES-COMBINED AS ON 31-3-2014
S.No. District Total no.of units
Fixedinvestment
Workingcapital
Employment Production(Rs in lacs)
2013-14 2013-14 2013-14 2013-14 2013-141. Amritsar 25 219126.65 37440.00 5875.00 478254.682. Tarn Taran 6 16005.09 11519.03 609 38098.673. Bathinda 17 747872.67 185637.81 6759.00 268046.574. Faridkot 2 30752.25 8332.15 575.00 50367.695. Moga 5 80160.49 23556.30 1812.00 26031.106. Ferozepur 6 14286.17 8246.29 317.00 21268.887. Kapurthala 6 264575.63 44819.82 16986.00 194369.008. Gurdaspur 9 98597.46 23483.91 2709 101871.369. Pathankot 4 17413.52 4744.39 423 30618.3010. Jalandhar 22 85884.26 25968.73 6045.00 142563.0111. Fateh garh sahib 21 68981.02 35791.80 4086.00 413843.1812. Patiala 35 160108.47 40353.56 11960.00 329384.2013. Mukatsar 4 48441.64 14614.34 2064 56026.9214. Fazilka 7 19675.54 4479.32 881 68478.4415. Sangrur 18 252691.73 612960.27 19756 612024.7516. Barnala 7 293077.68 173458.61 11804.00 463835.5517. Nawan shahr 9 153603.19 38863.44 4190.00 358105.4318. Hoshiarpur 21 306003.61 45257.68 16606.00 741958.6219. Ludhiana 151 1162002.35 741846.60 94434.00 3224193.4420. SAS Nagar 66 1357063.15 737115.87 36655.00 1194562.8921. Roop Nagar 4 128115.48 689631.31 2274.00 299139.88
Grand total 446 5524438.05 3508121.23 243820 9113042.56
-61-
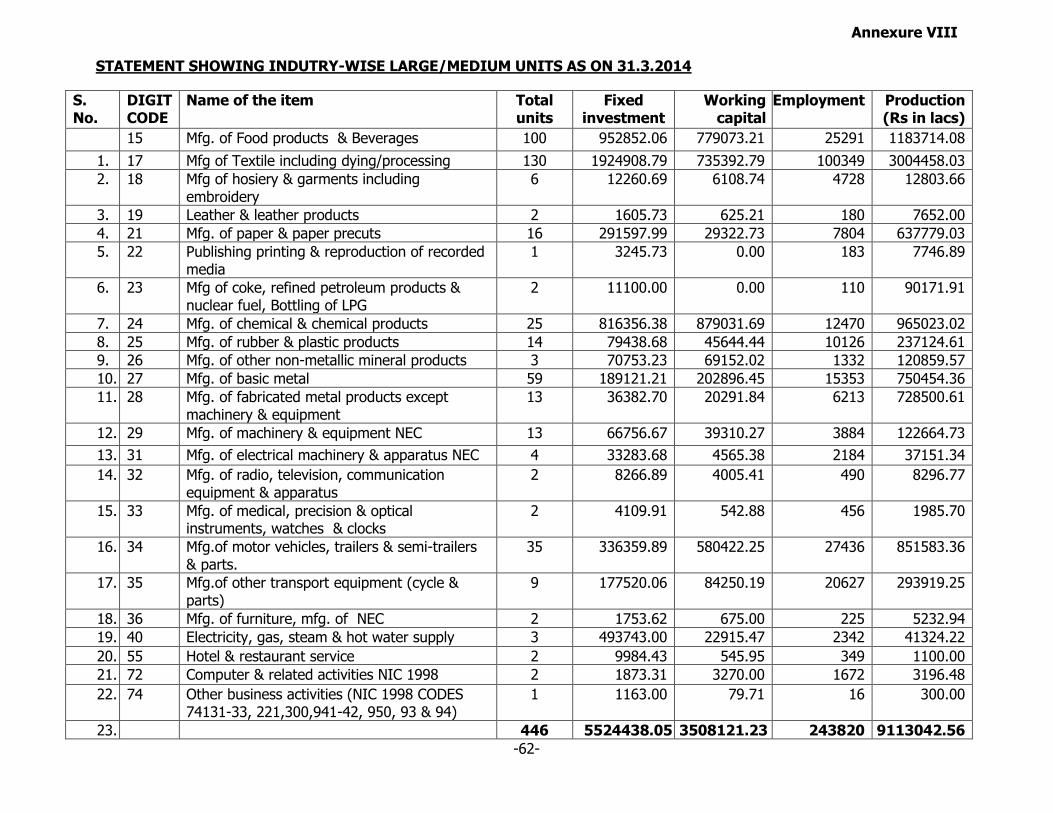
Annexure VIII
STATEMENT SHOWING INDUTRY-WISE LARGE/MEDIUM UNITS AS ON 31.3.2014
S.No.
DIGITCODE
Name of the item Totalunits
Fixedinvestment
Workingcapital
Employment Production(Rs in lacs)
15 Mfg. of Food products & Beverages 100 952852.06 779073.21 25291 1183714.081. 17 Mfg of Textile including dying/processing 130 1924908.79 735392.79 100349 3004458.032. 18 Mfg of hosiery & garments including
embroidery6 12260.69 6108.74 4728 12803.66
3. 19 Leather & leather products 2 1605.73 625.21 180 7652.004. 21 Mfg. of paper & paper precuts 16 291597.99 29322.73 7804 637779.035. 22 Publishing printing & reproduction of recorded
media1 3245.73 0.00 183 7746.89
6. 23 Mfg of coke, refined petroleum products &nuclear fuel, Bottling of LPG
2 11100.00 0.00 110 90171.91
7. 24 Mfg. of chemical & chemical products 25 816356.38 879031.69 12470 965023.028. 25 Mfg. of rubber & plastic products 14 79438.68 45644.44 10126 237124.619. 26 Mfg. of other non-metallic mineral products 3 70753.23 69152.02 1332 120859.5710. 27 Mfg. of basic metal 59 189121.21 202896.45 15353 750454.3611. 28 Mfg. of fabricated metal products except
machinery & equipment13 36382.70 20291.84 6213 728500.61
12. 29 Mfg. of machinery & equipment NEC 13 66756.67 39310.27 3884 122664.7313. 31 Mfg. of electrical machinery & apparatus NEC 4 33283.68 4565.38 2184 37151.3414. 32 Mfg. of radio, television, communication
equipment & apparatus2 8266.89 4005.41 490 8296.77
15. 33 Mfg. of medical, precision & opticalinstruments, watches & clocks
2 4109.91 542.88 456 1985.70
16. 34 Mfg.of motor vehicles, trailers & semi-trailers& parts.
35 336359.89 580422.25 27436 851583.36
17. 35 Mfg.of other transport equipment (cycle &parts)
9 177520.06 84250.19 20627 293919.25
18. 36 Mfg. of furniture, mfg. of NEC 2 1753.62 675.00 225 5232.9419. 40 Electricity, gas, steam & hot water supply 3 493743.00 22915.47 2342 41324.2220. 55 Hotel & restaurant service 2 9984.43 545.95 349 1100.0021. 72 Computer & related activities NIC 1998 2 1873.31 3270.00 1672 3196.4822. 74 Other business activities (NIC 1998 CODES
74131-33, 221,300,941-42, 950, 93 & 94)1 1163.00 79.71 16 300.00
23. 446 5524438.05 3508121.23 243820 9113042.56-62-
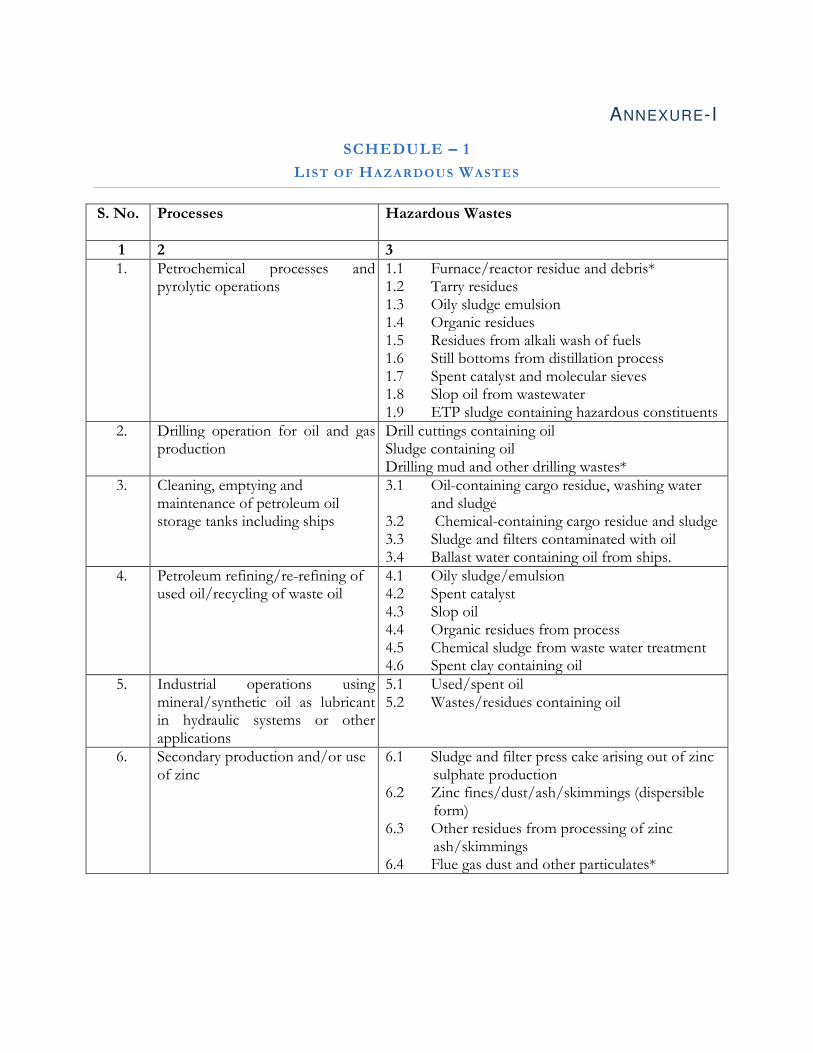
ANNEXURE-I
SCHEDULE −−−− 1
LIST OF HAZARDOUS WASTES
S. No. Processes
Hazardous Wastes
1 2 3
1.
Petrochemical processes and pyrolytic operations
1.1 Furnace/reactor residue and debris* 1.2 Tarry residues 1.3 Oily sludge emulsion 1.4 Organic residues 1.5 Residues from alkali wash of fuels 1.6 Still bottoms from distillation process 1.7 Spent catalyst and molecular sieves 1.8 Slop oil from wastewater 1.9 ETP sludge containing hazardous constituents
2. Drilling operation for oil and gas production
Drill cuttings containing oil Sludge containing oil Drilling mud and other drilling wastes*
3.
Cleaning, emptying and maintenance of petroleum oil storage tanks including ships
3.1 Oil-containing cargo residue, washing water and sludge
3.2 Chemical-containing cargo residue and sludge 3.3 Sludge and filters contaminated with oil 3.4 Ballast water containing oil from ships.
4.
Petroleum refining/re-refining of used oil/recycling of waste oil
4.1 Oily sludge/emulsion 4.2 Spent catalyst 4.3 Slop oil 4.4 Organic residues from process 4.5 Chemical sludge from waste water treatment 4.6 Spent clay containing oil
5.
Industrial operations using mineral/synthetic oil as lubricant in hydraulic systems or other applications
5.1 Used/spent oil 5.2 Wastes/residues containing oil
6.
Secondary production and/or use of zinc
6.1 Sludge and filter press cake arising out of zinc sulphate production
6.2 Zinc fines/dust/ash/skimmings (dispersible form)
6.3 Other residues from processing of zinc ash/skimmings
6.4 Flue gas dust and other particulates*
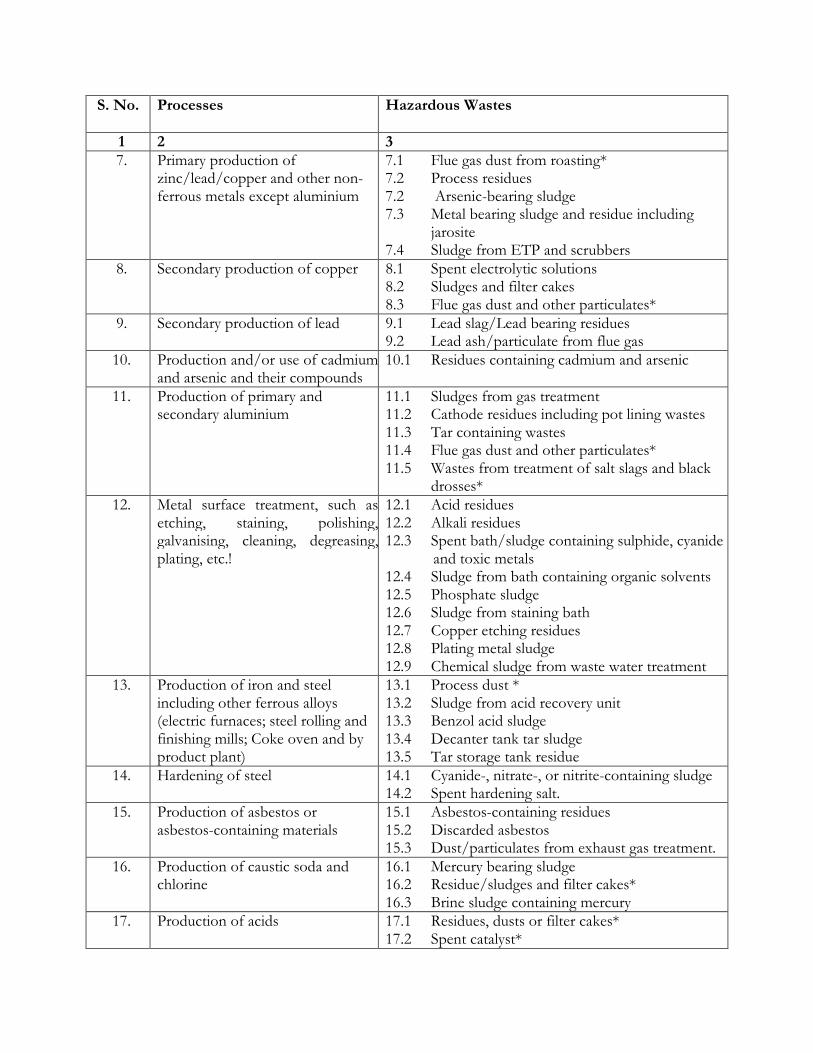
S. No. Processes
Hazardous Wastes
1 2 3
7.
Primary production of zinc/lead/copper and other non-ferrous metals except aluminium
7.1 Flue gas dust from roasting* 7.2 Process residues 7.2 Arsenic-bearing sludge 7.3 Metal bearing sludge and residue including
jarosite 7.4 Sludge from ETP and scrubbers
8.
Secondary production of copper
8.1 Spent electrolytic solutions 8.2 Sludges and filter cakes 8.3 Flue gas dust and other particulates*
9. Secondary production of lead 9.1 Lead slag/Lead bearing residues 9.2 Lead ash/particulate from flue gas
10.
Production and/or use of cadmium and arsenic and their compounds
10.1 Residues containing cadmium and arsenic
11.
Production of primary and secondary aluminium
11.1 Sludges from gas treatment 11.2 Cathode residues including pot lining wastes 11.3 Tar containing wastes 11.4 Flue gas dust and other particulates* 11.5 Wastes from treatment of salt slags and black
drosses* 12. Metal surface treatment, such as
etching, staining, polishing, galvanising, cleaning, degreasing, plating, etc.!
12.1 Acid residues 12.2 Alkali residues 12.3 Spent bath/sludge containing sulphide, cyanide
and toxic metals 12.4 Sludge from bath containing organic solvents 12.5 Phosphate sludge 12.6 Sludge from staining bath 12.7 Copper etching residues 12.8 Plating metal sludge 12.9 Chemical sludge from waste water treatment
13.
Production of iron and steel including other ferrous alloys (electric furnaces; steel rolling and finishing mills; Coke oven and by product plant)
13.1 Process dust * 13.2 Sludge from acid recovery unit 13.3 Benzol acid sludge 13.4 Decanter tank tar sludge 13.5 Tar storage tank residue
14. Hardening of steel
14.1 Cyanide-, nitrate-, or nitrite-containing sludge 14.2 Spent hardening salt.
15.
Production of asbestos or asbestos-containing materials
15.1 Asbestos-containing residues 15.2 Discarded asbestos 15.3 Dust/particulates from exhaust gas treatment.
16.
Production of caustic soda and chlorine
16.1 Mercury bearing sludge 16.2 Residue/sludges and filter cakes* 16.3 Brine sludge containing mercury
17.
Production of acids
17.1 Residues, dusts or filter cakes* 17.2 Spent catalyst*
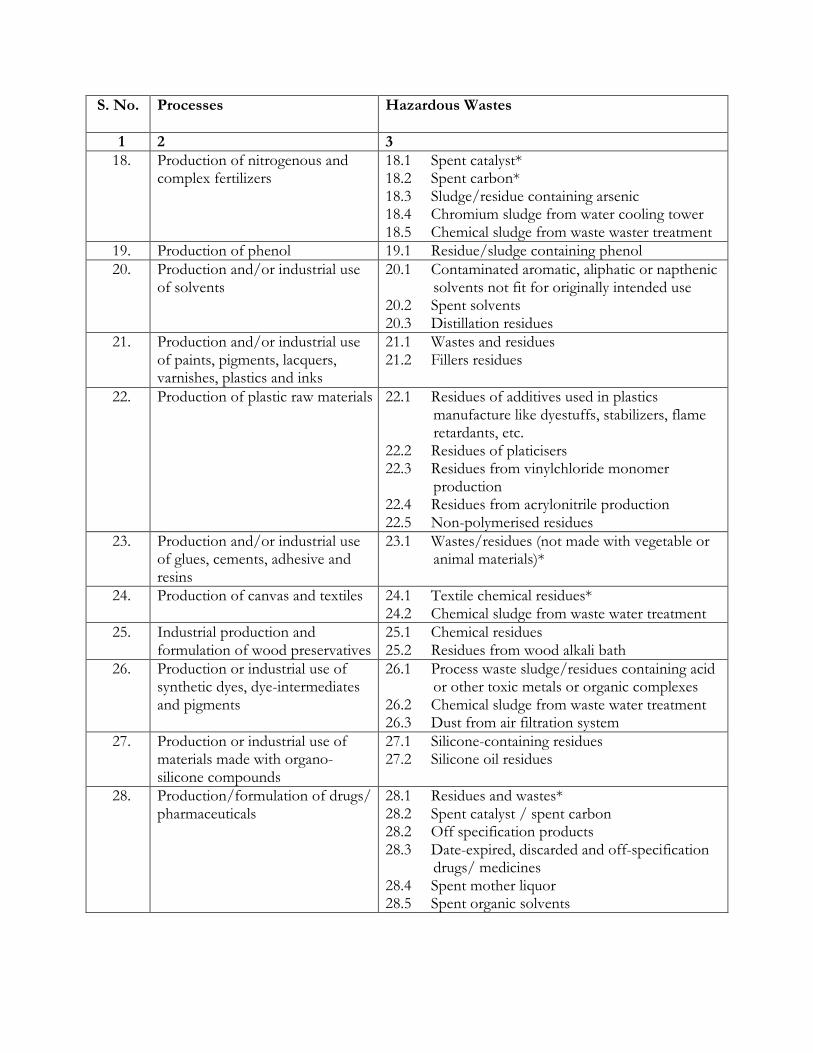
S. No. Processes
Hazardous Wastes
1 2 3
18.
Production of nitrogenous and complex fertilizers
18.1 Spent catalyst* 18.2 Spent carbon* 18.3 Sludge/residue containing arsenic 18.4 Chromium sludge from water cooling tower 18.5 Chemical sludge from waste waster treatment
19. Production of phenol 19.1 Residue/sludge containing phenol 20.
Production and/or industrial use of solvents
20.1 Contaminated aromatic, aliphatic or napthenic solvents not fit for originally intended use
20.2 Spent solvents 20.3 Distillation residues
21. Production and/or industrial use of paints, pigments, lacquers, varnishes, plastics and inks
21.1 Wastes and residues 21.2 Fillers residues
22. Production of plastic raw materials 22.1 Residues of additives used in plastics manufacture like dyestuffs, stabilizers, flame retardants, etc.
22.2 Residues of platicisers 22.3 Residues from vinylchloride monomer
production 22.4 Residues from acrylonitrile production 22.5 Non-polymerised residues
23.
Production and/or industrial use of glues, cements, adhesive and resins
23.1 Wastes/residues (not made with vegetable or animal materials)*
24.
Production of canvas and textiles
24.1 Textile chemical residues* 24.2 Chemical sludge from waste water treatment
25. Industrial production and formulation of wood preservatives
25.1 Chemical residues 25.2 Residues from wood alkali bath
26.
Production or industrial use of synthetic dyes, dye-intermediates and pigments
26.1 Process waste sludge/residues containing acid or other toxic metals or organic complexes
26.2 Chemical sludge from waste water treatment 26.3 Dust from air filtration system
27.
Production or industrial use of materials made with organo-silicone compounds
27.1 Silicone-containing residues 27.2 Silicone oil residues
28.
Production/formulation of drugs/ pharmaceuticals
28.1 Residues and wastes* 28.2 Spent catalyst / spent carbon 28.2 Off specification products 28.3 Date-expired, discarded and off-specification
drugs/ medicines 28.4 Spent mother liquor 28.5 Spent organic solvents
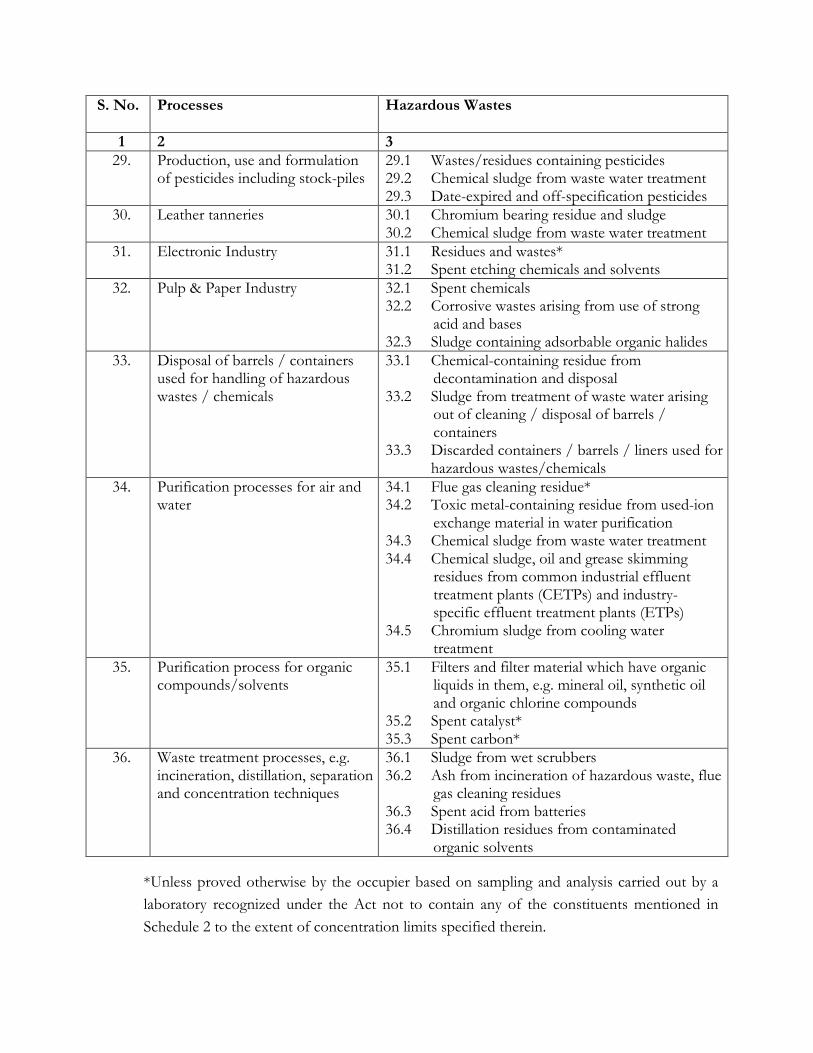
S. No. Processes
Hazardous Wastes
1 2 3
29.
Production, use and formulation of pesticides including stock-piles
29.1 Wastes/residues containing pesticides 29.2 Chemical sludge from waste water treatment 29.3 Date-expired and off-specification pesticides
30.
Leather tanneries
30.1 Chromium bearing residue and sludge 30.2 Chemical sludge from waste water treatment
31.
Electronic Industry
31.1 Residues and wastes* 31.2 Spent etching chemicals and solvents
32.
Pulp & Paper Industry
32.1 Spent chemicals 32.2 Corrosive wastes arising from use of strong
acid and bases 32.3 Sludge containing adsorbable organic halides
33.
Disposal of barrels / containers used for handling of hazardous wastes / chemicals
33.1 Chemical-containing residue from decontamination and disposal
33.2 Sludge from treatment of waste water arising out of cleaning / disposal of barrels / containers
33.3 Discarded containers / barrels / liners used for hazardous wastes/chemicals
34.
Purification processes for air and water
34.1 Flue gas cleaning residue* 34.2 Toxic metal-containing residue from used-ion
exchange material in water purification 34.3 Chemical sludge from waste water treatment 34.4 Chemical sludge, oil and grease skimming
residues from common industrial effluent treatment plants (CETPs) and industry-specific effluent treatment plants (ETPs)
34.5 Chromium sludge from cooling water treatment
35. Purification process for organic compounds/solvents
35.1 Filters and filter material which have organic liquids in them, e.g. mineral oil, synthetic oil and organic chlorine compounds
35.2 Spent catalyst* 35.3 Spent carbon*
36. Waste treatment processes, e.g. incineration, distillation, separation and concentration techniques
36.1 Sludge from wet scrubbers 36.2 Ash from incineration of hazardous waste, flue
gas cleaning residues 36.3 Spent acid from batteries 36.4 Distillation residues from contaminated
organic solvents
*Unless proved otherwise by the occupier based on sampling and analysis carried out by a
laboratory recognized under the Act not to contain any of the constituents mentioned in
Schedule 2 to the extent of concentration limits specified therein.
SCHEDULE – 2
[See rule 3(14)(b)]
LIST OF WASTES CONSTITUENTS WITH CONCENTRATION L IMITS*
Class A
Concentration limit: ≥ 50 mg/kg
A1 Antimony and antimony compounds
A2 Arsenic and arsenic compounds
A3 Beryllium and beryllium compounds
A4 Cadmium and cadmium compounds
A5 Chromium (VI) compounds
A6 Mercury and mercury compounds
A7 Selenium and selenium compounds
A8 Tellurium and tellurium compounds
A9 Thallium and thallium compounds
A10 Inorganic cyanide compounds
A11 Metal carbonyls
A12 Napthalene
A13 Anthracene
A14 Phenanthrene
A15 Chrysene, benzo (a) anthracene, fluoranthene, benzo (a) pyrene, benzo (K) fluoranthene,
indeno (1, 2, 3-cd) pyrene and benzo (ghi) perylene
A16 halogenated compounds of aromatic rings, e.g. polychlorinated biphenyls,
polychloroterphenyls and their derivatives
A17 Halogenated aromatic compounds
A18 Benzene
A19 Organo-chlorine pesticides
A20 Organo-tin Compounds
1. Waste constituents and their concentration limits given in this list are based on BAGA (the
Netherlands Environment Protection Agency) List of Hazardous Substances. In order to
decide whether a specific material listed above is hazardous or not, following points be taken
into consideration:
(i) If a component of the waste appears in one of the five risk classes listed above
(A,B,C,D or E) and the concentration of the component is equal to or more than the
limit for the relevant risks class, the material is then classified as hazardous waste.
(ii) If a chemical compound containing a hazardous constituent is present in the waste, the concentration limit does not apply to the compound, but only to the hazardous constituent itself.
(iii) If multiple hazardous constituents from the same class are present in the waste, the concentrations are added together.
(iv) If multiple hazardous constituents from different classes are present in the waste, the lowest concentration limit corresponding to the constituent(s) applies.
(v) For substances in water solution, the concentration limit for dry matter must be used. If the dry matter content is less than 0.1% by weight, the concentration limit, reduced by a factor of one thousand, applies to the solution.
Class B
Concentration limit: ≥ 5, 000 mg/kg
B1 Chromium (III) compounds B2 Cobalt compounds B3 Copper compounds B4 Lead and lead compounds B5 Molybdenum compounds B6 Nickel compounds B7 Inorganic Tin compounds B8 Vanadium compounds B9 Tungsten compounds B10 Silver compounds B11 Halogenated aliphatic compounds B12 Organo phosphorus compounds B13 Organic peroxides B14 Organic nitro-and nitroso-compounds B15 Organic azo-and azooxy compounds B16 Nitriles B17 Amines B18 (Iso-and thio-) cyanates B19 Phenol and phenolic compounds B20 Mercaptans B21 Asbestos B22 Halogen-silanes B23 Hydrazine (s) B24 Flourine B25 Chlorine B26 Bromine B27 White and red phosphorus
B28 Ferro-silicate and alloys B29 Manganese-silicate B30 Halogen-containing compounds which produce acidic vapours on contact with humid air or
water, e.g. silicon tetrachloride, aluminium chloride, titanium tetrachloride
Class C
Concentration limit; ≥ 20, 000 mg/kg
C1 Ammonia and ammonium compounds
C2 Inorganic peroxides
C3 Barium compounds except barium sulphate
C4 Fluorine compounds
C5 Phosphate compounds except phosphates of aluminium, calcium and iron
C6 Bromates, (hypo-bromites)
C7 Chlorates, (hypo-chlorites)
C8 Aromatic compounds other than those listed under A12 to A18
C9 Organic silicone compounds
C10 Organic sulphur compounds
C11 Iodates
C12 Nitrates, nitrites
C13 Sulphides
C14 Zinc compounds
C15 Salts of per-acids
C16 Acid amides
C17 Acid anhydrides
Class D
Concentration limit: ≥ 50, 000 mg/kg
D1 Total Sulphur
D2 Inorganic acids
D3 Metal hydrogen sulphates
D4 Oxides and hydroxides except those of hydrogen, carbon, silicon, iron, aluminum, titanium,
manganese, magnesium, calcium
D5 Total hydrocarbons other than those listed under A12 to A18
D6 Organic oxygen compounds
D7 Organic nitrogen compounds expressed as nitrogen
D8 Nitrides
D9 Hydrides
Class E

Regardless of concentration limit; Classified as hazardous wastes at all concentrations
E1 Flammable substances
E2 Substances which generate hazardous quantities of flammable gases
on contact with water or damp air


