Embed Size (px)
Citation preview

i
Theo J.H.M. Eggen and Bernard P. Veldkamp (Editors)
Psychometrics in Practice at RCEC
RCEC

ii
ISBN 978-90-365-3374-4
DOI http://dx.doi.org/10.3990/3.9789036533744
Copyright © RCEC, Cito/University of Twente, Enschede, Netherlands, 2012.
All rights reserved. No part of this book may be reproduced, stored in a retrieval system, or
transmitted, in any form or by any means, electronically, mechanically by photocopy, by
recording, or otherwise, without prior written permission of the editors.
Print: Ipskamp Drukkers, Enschede.

iii
Preface
Education is of paramount importance in the lives of many children and young adults. It
provides them with the necessary knowledge, skills and competences to participate in society.
Besides, since lifelong learning is advocated as a necessary condition to excel at within the
knowledge economy, it affects all of us. In the educational systems of the Netherlands
examinations play an important role. During the educational process decisions are being made
based on the results of assessment procedures, and examinations evaluate the performance of
individuals, the performance of schools, the quality of educational programs, and allow
entrance to higher levels of education. The future of individuals is often determined by
measurement of competences in theoretical or practical tests and exams.
Educational measurement has its scientific roots in psychometrics. Psychometrics is an
applied science serving developers and users of tests with methods that enable them to judge
and to enhance the quality of assessment procedures. It focuses on the construction of
instruments and procedures for measurement and deals with more fundamental issues related
to the development of theoretical approaches to measurement. Solid research is needed to
provide a knowledge base for examination and certification in the Netherlands.
For that reason the Research Center for Examinations and Certification (RCEC) was
founded. RCEC, a collaboration of Cito and the University of Twente, was founded in 2008.
Since its inception, RCEC has conducted a number of research projects often in cooperation
with partners from the educational field, both from the Netherlands and abroad. One of the
RCEC‘s main goals is to conduct scientific research on applied psychometrics. The RCEC is
a research center for questions dealing with examinations and certification in education. The
intention is that the results of its research should contribute to the improvement of the quality
of examination procedures in the Netherlands and abroad.
This book is especially written for Piet Sanders, the founding father and first director
of RCEC on the occasion of his retirement from Cito. All contributors to this volume worked
with him on various projects. We admire his enthusiasm and knowledge of the field of
educational measurement. It is in honor of him that we show some of the current results of his
initiative.

iv
A broad range of topics is dealt with in this volume: from combining the psychometric
generalizability and item response theories to the ideas for an integrated formative use of
data-driven decision making, assessment for learning and diagnostic testing. A number of
chapters pay attention to computerized (adaptive) and classification testing. Other chapters
treat the quality of testing in a general sense, but for topics like maintaining standards or the
testing of writing ability, the quality of testing is dealt with more specifically.
All authors are connected to RCEC as researchers. They present one of their current
research topics and provide some insight into the focus of RCEC. The selection of the topics
and the editing intends that the book should be of special interest to educational researchers,
psychometricians and practitioners in educational assessment.
Finally, we want to acknowledge the support of Cito and the University of Twente for
the opportunity they gave for doing our job. But most of all, we are grateful to the authors of
the chapters who gave their valuable time for creating the content of the chapters, and to
Birgit Olthof who took care of all the layout problems encountered in finishing the book.
Arnhem, Enschede, Princeton, May 2012.
Theo J.H.M. Eggen
Bernard P. Veldkamp

v
Contributors
Cees A. W. Glas, University of Twente, Enschede, Netherlands, [email protected]
Theo J.H.M. Eggen, Cito, Arnhem / University of Twente, Netherlands, [email protected]
Anton Béguin, Cito, Arnhem, Netherlands, [email protected]
Bernard P. Veldkamp, University of Twente, Enschede, Netherlands, [email protected]
Qiwei He, University of Twente, Enschede, Netherlands, [email protected]
Muirne C.S. Paap, University of Twente, Enschede, Netherlands, [email protected]
Hiske Feenstra, Cito, Arnhem, Netherlands, [email protected]
Maarten Marsman. Cito, Arnhem, Netherlands, [email protected]
Gunter Maris, Cito, Arnhem / University of Amsterdam, Netherlands, [email protected]
Timo Bechger, Cito, Arnhem, Netherlands, [email protected]
Saskia Wools, Cito, Arnhem, Netherlands, [email protected]
Marianne Hubregtse, KCH, Ede, Netherlands, [email protected]
Maaike M. van Groen, Cito, Arnhem, Netherlands, [email protected]
Sebastiaan de Klerk, ECABO, Amersfoort, Netherlands, [email protected]
Jorine A. Vermeulen, University of Twente, Enschede, Netherlands, [email protected]
Fabienne M. van der Kleij, Cito, Arnhem, Netherlands, [email protected]

vi
Contents
1 Generalizability Theory and Item Response Theory 1
Cees A.W. Glas
DOI http://dx.doi.org/10.3990/3.9789036533744.ch1
2 Computerized Adaptive Testing Item Selection in Computerized
Adaptive Learning Systems 11
Theo J.H.M. Eggen
DOI http://dx.doi.org/10.3990/3.9789036533744.ch2
3 Use of Different Sources of Information in Maintaining Standards:
Examples from the Netherlands 23
Anton Béguin
DOI http://dx.doi.org/10.3990/3.9789036533744.ch3
4 Ensuring the Future of Computerized Adaptive Testing 35
Bernard P. Veldkamp
DOI http://dx.doi.org/10.3990/3.9789036533744.ch4
5 Classifying Unstructured Textual Data Using the Product Score Model:
An Alternative Text Mining Algorithm 47
Qiwei He and Bernard P. Veldkamp
DOI http://dx.doi.org/10.3990/3.9789036533744.ch5
6 Minimizing the Testlet Effect: Identifying Critical Testlet Features by
Means of Tree-Based Regression 63
Muirne C.S. Paap and Bernard P. Veldkamp
DOI : http://dx.doi.org/10.3990/3.9789036533744.ch6

vii
7 Mixed Methods: Using a Combination of Techniques to Assess
Writing Ability 73
Hiske Feenstra
DOI http://dx.doi.org/10.3990/3.9789036533744.ch7
8 Don't Tie Yourself to an Onion: Don’t Tie Yourself to Assumptions
of Normality 85
Maarten Marsman, Gunter Maris and Timo Bechger
DOI http://dx.doi.org/10.3990/3.9789036533744.ch8
9 Towards a Comprehensive Evaluation System for the Quality of Tests
and Assessments 95
Saskia Wools
DOI http://dx.doi.org/10.3990/3.9789036533744.ch9
10 Influences on Classification Accuracy of Exam Sets: An Example from
Vocational Education and Training 107
Marianne Hubregtse and Theo J.H.M. Eggen
DOI http://dx.doi.org/10.3990/3.9789036533744.ch10
11 Computerized Classification Testing and Its Relationship to
the Testing Goal 125
Maaike M. van Groen
DOI http://dx.doi.org/10.3990/3.9789036533744.ch11
12 An Overview of Innovative Computer-Based Testing 137
Sebastiaan de Klerk
DOI http://dx.doi.org/10.3990/3.9789036533744.ch12
13 Towards an Integrative Formative Approach of Data-Driven Decision
Making, Assessment for Learning, and Diagnostic Testing 151
Jorine A. Vermeulen and Fabienne M. van der Kleij
DOI http://dx.doi.org/10.3990/3.9789036533744.ch13


1
Chapter 1
Generalizability Theory and Item Response Theory
Cees A.W. Glas
Abstract Item response theory is usually applied to items with a selected-response format, such as
multiple choice items, whereas generalizability theory is usually applied to constructed-response
tasks assessed by raters. However, in many situations, raters may use rating scales consisting of
items with a selected-response format. This chapter presents a short overview of how item response
theory and generalizability theory were integrated to model such assessments. Further, the precision
of the estimates of the variance components of a generalizability theory model in combination with
two- and three-parameter models is assessed in a small simulation study.
Keywords: Bayesian estimation, item response theory, generalizability theory, Markov chain
Monte Carlo
Introduction
I first encountered Piet Sanders when I started working at Cito in 1982. Piet and I came from
different psychometric worlds: He followed generalizability theory (GT), whereas I followed
item response theory (IRT). Whereas I spoke with reverence about Gerhard Fischer and
Darrell Bock, he spoke with the same reverence about Robert Brennan and Jean Cardinet.
Through the years, Piet invited all of them to Cito, and I had the chance to meet them in
person. With a slightly wicked laugh, Piet told me the amusing story that Robert Brennan
once took him aside to state, ―Piet, I have never seen an IRT model work.‖ Later, IRT played
an important role in the book Test Equating, Scaling, and Linking by Kolen and Brennan
(2004). Piet‘s and my views converged over time. His doctoral thesis ―The Optimization of
Decision Studies in Generalizability Theory‖ (Sanders, 1992) shows that he was clearly
inspired by optimization approaches to test construction from IRT.
On January 14 and 15, 2008, I attended a conference in Neuchâtel, Switzerland, in
honor of the 80th birthday of Jean Cardinet, the main European theorist of GT. My
presentation was called ―The Impact of Item Response Theory in Educational Assessment:
A Practical Point of View‖ and was later published in Mesure et Evaluation en
Education (Glas, 2008). I remember Jean Cardinet as a very friendly and civilized gentleman.
But he had a mission:

Cees A.W. Glas
2
It soon became clear that he wanted to show the psychometric world that GT was the better
way and far superior to modernisms such as IRT. I adapted my presentation to show that there
was no principled conflict between GT and IRT, and that they could, in fact, be combined.
Jean seemed convinced. Below, I describe how IRT and GT can be combined. But first I shall
present some earlier attempts of analyzing rating data with IRT.
Some History
Although in hindsight the combination of IRT and GT seems straightforward, creating the
combination took some time and effort. The first move in that direction, made by Linacre
(1989, 1999), was not very convincing. Linacre considered dichotomous item scores given by
raters. Let nriY be an item score given by a rater r (r = 1,…,Nr) on an item i (i = 1,…,K) when
assessing student n (n = 1,…,N). nriY is equal to 0 or 1. Define the logistic function (.) as
exp( )( ) .
1 exp( )
Conditional on a person ability parameter n , the probability of a positive item score is
defined as Pr 1| ( )nri n nri nriY P , with
nnri i r ,
where i is an item parameter and r is a rater effect. The model was presented as a
straightforward generalization of the Rasch model (Rasch, 1960); in fact, it was seen as a
straightforward application of the linear logistic test model (LLTM) (Fischer, 1983). That is,
the probability of the scores given to a respondent was given by
1(1 )nri nriy y
nri nri
i r
P P
.
In my PhD thesis, I argued that this is a misspecification, because the assumption of
local independence made here is violated: The responses of the different raters are dependent
because they depend on the response of the student (Glas, 1989).
(1)

1 Generalizability Theory and Item Response Theory
3
Patz and Junker (1999) criticize Linacre‘s approach on another ground: LLTMs require that
all items have a common slope or discrimination parameter; therefore, they suggest using the
logistic model given in Equation (1) with the argument
i n ri i inr ,
where i is a discrimination parameter and ri stands for the interaction between an item and
a rater. However, this does not solve the dependence between raters. Therefore, we consider
the following alternative. The discrimination parameter is dropped for convenience; the
generalization to a model with discrimination parameters is straightforward. Further, we
assume that the students are given tasks indexed t (t = 1,…,Nt), and the items are nested
within the tasks. A generalization to a situation where tasks and items are crossed is
straightforward. Further, item i pertains to task t(i). Consider the model given in Equation (1)
with the argument
( )n nnr t iti i r .
The parameter ( )nt i models the interaction between a student and a task. Further, Patz
and Junker (1999) define n and ( )nt i as random effects, that is, they are assumed to be
drawn from some distribution (i.e., the normal distribution). The parameters i and r may
be either fixed or random effects.
To assess the dependency structure implied by this model, assume nrti could be
directly observed. For two raters, say r and s, scoring the same item i, it holds that
( ) (
2
)
2( , ) ( , ) ( , )nrti nsti n n n nnt i nt i tCov Cov Cov . This also holds for two items related
to the same task. If two items, say i and j, are related to the same task, that is, if
( ) ( ) ,t i t j t then ( ) (
2
)
2( , ) ( , ) ( , )nrti nstj n n n nnt i nt j tCov Cov Cov .
If items are related to different tasks, that is, if ( ) ( ),t i t j then 2.( , )nrti nstjCov
So, 2
nt models the dependence of item responses within a task.

Cees A.W. Glas
4
Combining IRT and GT
The generalization of this model to a full-fledged generalizability model is achieved through
the introduction of random main effects for tasks t , random effects for the interaction
between students and raters nr , and students and tasks tr .The model then becomes the
logistic model in Equation (1) with the argument
( ) .n i r t ntnrt ii nr tr
The model can be conceptualized by factoring it into a measurement model and structural
model, that is, into an IRT measurement model and a structural random effects analysis of
variance (ANOVA) model. Consider the likelihood function
1
( ) ( ) ( )( )(1 ( )) ( )nri nriy y
nri nrt i nri nrt i nrt i
i r
P P N
where
ni r t nt nr tnr rt (2)
is a sum of random effects, ( )( )nri nrt iP is the probability of a correct response given nrt and
the item parameter i , and ( )( )nrt iN is the density of nrt , which is assumed to be a normal
density. If the distribution of nrt is normal, the model given in Equation (2) is completely
analogous to the GT model, which is a standard ANOVA model.
This combination of IRT measurement model and structural ANOVA model was
introduced by Zwinderman (1991) and worked out further by Fox and Glas (2001). The
explicit link with GT was made by Briggs and Wilson (2007).
They use the Rasch model as a measurement model and the GT model—that is, an
ANOVA model—as the structural model. The structural model implies a variance
decomposition
2 2 2 2 2 2 2 2
n t r nt nr tr e ,

1 Generalizability Theory and Item Response Theory
5
and these variance components can be used to construct the well-known agreement and
reliability indices as shown in Table 1.
Table 1 Indices for Agreement and Reliability for Random and Fixed Tasks
Type of Assessment Index
Random tasks,
agreement
2
2 2 2 2 2 2 2/ / / / / /
n
n t t r r nt t nr r tr r t e r tN N N N N N N N
Random tasks,
reliability
2
2 2 2 2 2/ / / /
n
n nt t nr r tr r t e r tN N N N N N
Fixed tasks, agreement 2 2
2 2 2 2 2 2/ / / /
n nt
n nt r r nr r tr r e rN N N N
Fixed tasks, reliability 2 2
2 2 2 2/ /
n nt
n nt r r e rN N
Note: Nt = number of tasks; Nr = number of raters.
Parameter Estimation
The model considered here seems quite complicated; however, conceptually, estimation in a
Bayesian framework using Markov chain Monte Carlo (MCMC) computational methods is
quite straightforward. The objective of the MCMC algorithm is to produce samples of the
parameters from their posterior distribution. Fox and Glas (2001) developed a Gibbs sampling
approach, which is a generalization of a procedure for estimation of the two-parameter normal
ogive (2PNO) model by Albert (1992). For a generalization of the three-parameter normal
ogive (3PNO) model, refer to Béguin and Glas (2001). Below, it will become clear that to
apply this approach, we first need to reformulate the model from a logistic representation to a
normal-ogive representation. That is, we assume that the conditional probability of a positive
item score is defined as Pr 1| ( )nrti nrti nrti nrtiY P , where (.) is the cumulative
normal distribution, i.e.,
1/2 2( ) 2 exp( / 2) .t dt
In the 3PNO model, the probability of a positive response is given by
(1 ) ( )nrti i i nrtiP

Cees A.W. Glas
6
where i is a guessing parameter.
Essential to Albert‘s approach is a data augmentation step (Tanner & Wong, 1987),
which maps the discrete responses to continuous responses. Given these continuous
responses, the posterior distributions of all other parameters become the distributions of
standard regression models, which are easy to sample from. We outline the procedure for the
2PNO model. We augment the observed data nrtiY with latent data nrtiZ , where nrtiZ is a
truncated normally distributed variable, i.e.,
( ,1) truncated at the left by 0 if 1| ~
( ,1) truncated at the right by 0 if 0.
nrti nrti
nrti nrti
nrti nrti
N YZ Y
N Y
(3)
Note that this data augmentation approach is based on the normal-ogive representation
of the IRT model, which entails the probability of a positive response is equal to the
probability mass left from the cut-off point nrti .
Gibbs sampling is an iterative process, where the parameters are divided into a number
of subsets, and a random draw of the parameters in each subset is made from its posterior
distribution given the random draws of all other subsets. This process is iterated until
convergence. In the present case, the augmented data nrtiZ are drawn given starting values of
all other parameters using Equation (3). Then the item parameters are drawn using the
regression model nrti nrt i ntriZ , with nrt n r t nt nr tr where all
parameters except i have normal priors. If discrimination parameters are included, the
regression model becomes nrti i nrt i ntriZ .
The priors for i can be either normal or uninformative, and the priors for i can be
normal, lognormal, or confined to the positive real numbers. Next, the other parameters are
estimated using the standard ANOVA model nrti i n r t nt nr tr nrtiZ .
These steps are iterated until the posterior distributions stabilize.

1 Generalizability Theory and Item Response Theory
7
A Small Simulation Study
The last section pertains to a small simulation to compare the use of the 2PNO model with the
use of the 3PNO model. The simulation is related to the so-called bias-variance trade-off.
When estimating the parameters of a statistical model, the mean-squared error (i.e., the mean
of the squared difference between the true value and the estimates over replications of the
estimation procedure) is the sum of two components: the squared bias and the sampling
variance (i.e., the squared standard error). The bias-variance trade-off pertains to the fact that,
on one hand, more elaborated models with more parameters tend to reduce the bias, whereas
on the other hand, adding parameters leads to increased standard errors. At some point, using
a better fitting, more precise model may be counterproductive because of the increased
uncertainty reflected in large standard errors. That is, at some point, there are not enough data
to support a too elaborate model.
In this simulation, the 3PNO model is the elaborate model, which may be true but hard
to estimate, and the 2PNO model is an approximation, which is beside the truth but easier to
estimate. The data were simulated as follows. Sample sizes of 1,000 and 2,000 students were
used. Each simulation was replicated 100 times. The test consisted of five tasks rated by two
raters both scoring five items per task. Therefore, the total number of item responses was 50,
or 25 for each of the two raters. The responses were generated using the 3PNO model. For
each replication, the item location parameters i were drawn from a standard normal
distribution, the item discrimination parameters i were drawn from a normal distribution
with a mean equal to 1.0 and a standard deviation equal to 0.25, and the guessing parameters
i were drawn from a beta distribution with parameters 5 and 20. The latter values imply an
average guessing parameter equal to 0.25. These distributions were also used as priors in the
estimation procedure.
The used variance components are shown in the first column of Table 2. The
following columns give estimates of the standard error and bias obtained over the 100
replications, using the two sample sizes and the 2PNO and 3PNO models, respectively.
In every replication, the estimates of the item parameters and the variance components
were obtained using the Bayesian estimation procedure by Fox and Glas (2001) and Béguin
and Glas (2001), outlined above. The posterior expectation (EAP) was used as a point
estimate. Besides a number of variance components, the reliability 2 for an assessment with
random tasks was estimated. The bias and standard errors for the reliability are given in the
last row of Table 2.

Cees A.W. Glas
8
Note that, overall, the standard errors of the EAPs obtained using the 2PNO model are smaller
than the standard errors obtained using the 3PNO model. On the other hand, the bias for the
2PNO model is generally larger. These results are in accordance with the author‘s
expectations.
Table 2 Comparing Variance Component Estimates for 2PNO and 3PNO Models
Variance
Components/
Reliability
Coefficient
N = 1,000 N = 2,000
True
Values
2PNO 3PNO 2PNO 3PNO
SE Bias SE Bias SE Bias SE Bias
2ˆn 1.0 .0032 .0032 .0036 .0028 .0021 .0024 .0028 .0009
2ˆnt 0.2 .0027 .0024 .0033 .0022 .0023 .0021 .0021 .0010
2ˆnr 0.2 .0043 .0039 .0054 .0036 .0022 .0036 .0043 .0027
2ˆtr 0.2 .0056 .0041 .0066 .0033 .0036 .0047 .0046 .0039
2ˆ 0.2 .0047 .0015 .0046 .0014 .0028 .0012 .0037 .0012
2 0.85 .0396 .0105 .0401 .0106 .0254 .0101 .0286 .0104
Note: 2PNO = two-parameter normal ogive; 3PNO = three-parameter normal ogive; SE = standard error
Conclusion
This chapter showed that psychometricians required some time and effort to come up with a
proper method for analyzing rating data using IRT. Essential to the solution was the
distinction between a measurement model (i.e., IRT) and a structural model (i.e., latent linear
regression model). The parameters of the combined measurement and structural models can
be estimated in a Bayesian framework using MCMC computational methods.
In this approach, the discrete responses are mapped to continuous latent variables,
which serve as the dependent variables in a linear regression model with normally distributed
components. This chapter outlined the procedure for dichotomous responses in combination
with the 2PNO model, but generalizations to the 3PNO model and to models for polytomous
responses—e.g., the partial credit model (Masters, 1982), the generalized partial credit model
(Muraki, 1992), the graded response model (Samejima, 1969), and the sequential model
(Tutz, 1990)—are readily available (see, for instance, Johnson & Albert, 1999).

1 Generalizability Theory and Item Response Theory
9
However, nowadays, developing specialized software for combinations of IRT measurement
models and structural models is no longer strictly necessary. Many applications can be created
in WinBUGS (Spiegelhalter, Thomas, Best, & Lunn, 2004). Briggs and Wilson (2007) give a
complete WinBUGS script to estimate the GT model in combination with the Rasch model.
Although WinBUGS is a valuable tool for the advanced practitioner, it also has a drawback
that is often easily overlooked: It is general-purpose software, and the possibilities for
evaluation of model fit are limited.
Regardless, the present chapter may illustrate that important advances in modeling
data from rating have been made over the past decade, and the combined IRT and GT model
is now just another member of the ever-growing family of latent variable models (for a nice
family picture, see, for instance, Skrondal & Rabe-Hesketh, 2004).
References
Albert, J. H. (1992). Bayesian estimation of normal ogive item response functions using
Gibbs sampling. Journal of Educational Statistics, 17, 251-269.
Béguin, A. A., & Glas, C. A. W. (2001). MCMC estimation and some model-fit analysis of
multidimensional IRT models. Psychometrika, 66, 541-562.
Briggs, D.C., & Wilson, M. (2007). Generalizability in item response modeling. Journal of
Educational Measurement, 44, 131-155.
Fischer, G. H. (1983). Logistic latent trait models with linear constraints. Psychometrika, 48,
3-26.
Fox, J. P., & Glas, C. A. W. (2001). Bayesian estimation of a multilevel IRT model using
Gibbs sampling. Psychometrika, 66, 271-288.
Glas, C. A. W. (1989). Contributions to estimating and testing Rasch models. Unpublished
PhD thesis, Enschede, University of Twente.
Glas, C. A. W. (2008). Item response theory in educational assessment and evaluation.
Mesure et Evaluation en Education, 31, 19-34.
Johnson, V. E., & Albert, J. H. (1999). Ordinal data modeling. New York: Springer.
Kolen, M. J., & Brennan, R. L. (2004). Test equating, scaling, and linking: Methods and
practices (2nd ed.). New York: Springer.
Linacre, J. M. (1989). Many-facet Rasch measurement. Chicago: MESA Press.
Linacre, J. M. (1999). FACETS (Version 3.17) [Computer software]. Chicago: MESA Press.
Masters, G. N. (1982). A Rasch model for partial credit scoring. Psychometrika, 47, 149-174.

Cees A.W. Glas
10
Muraki, E. (1992). A generalized partial credit model: Application of an EM algorithm.
Applied Psychological Measurement, 16, 159-176.
Patz, R. J., & Junker, B. (1999). Applications and extensions of MCMC in IRT: Multiple item
types, missing data, and rated responses. Journal of Educational and Behavioral
Statistics, 24, 342-366.
Rasch, G. (1960). Probabilistic models for some intelligence and attainment tests.
Copenhagen: Danish Institute for Educational Research.
Samejima, F. (1969). Estimation of latent ability using a pattern of graded scores.
Psychometrika, Monograph Supplement, No. 17.
Sanders, P. F. (1992). The optimization of decision studies in generalizability theory. Doctoral
thesis, University of Amsterdam.
Skrondal, A., & Rabe-Hesketh, S. (2004). Generalized latent variable modeling: Multilevel,
longitudinal, and structural equation models. Boca Raton, FL: Chapman & Hall/CRC.
Spiegelhalter, D., Thomas, A., Best, N., & Lunn, D. (2004). WinBUGS 1.4. Retrieved from
http://www.mrc-bsu.cam.ac.uk/bugs
Tanner, M. A., & Wong, W. H. (1987). The calculation of posterior distributions by data
augmentation [with discussion]. Journal of the American Statistical Association, 82,
528-540.
Tutz, G. (1990). Sequential item response models with an ordered response. British Journal of
Mathematical and Statistical Psychology, 43, 39-55.
Zwinderman, A. H. (1991). A generalized Rasch model for manifest predictors.
Psychometrika, 56, 589-600.

11
Chapter 2
Computerized Adaptive Testing Item Selection in Computerized
Adaptive Learning Systems
Theo J.H.M. Eggen
Abstract Item selection methods traditionally developed for computerized adaptive testing
(CAT) are explored for their usefulness in item-based computerized adaptive learning (CAL)
systems. While in CAT Fisher information-based selection is optimal, for recovering learning
populations in CAL systems item selection based on Kullback-Leibner information is an
alternative.
Keywords: Computer-based learning, computerized adaptive testing, item selection
Introduction
In the last few decades, many computerized learning systems have been developed. For an
overview of these systems and their main characteristics, see Wauters, Desmet and Van den
Noortgate (2010). In so-called intelligent tutoring systems (Brusilovsky, 1999), the learning
material is presented by learning tasks or items, which are to be solved by the learner. In some
of these systems, not only the content of the learning tasks but also the difficulty can be
adapted to the needs of the learner. The main goal in such a computerized adaptive learning
(CAL) system is to optimize the student‘s learning process. An example of such an item-
based CAL system is Franel (Desmet, 2006), a system developed for learning Dutch and
French. If in item-based learning systems feedback or hints are presented to the learner, the
systems can also be considered testing systems in which the main goal of testing is to support
the learning process, known as assessment for learning (William, 2011). With this, a link is
made between computerized learning systems and computerized testing systems.
Computerized testing systems have many successful applications. Computerized
adaptive testing (CAT) is based on the application of item response theory (IRT). (Wainer,
2000; Van der Linden & Glas, 2010). In CAT, for every test-taker a different test is
administered by selecting items from an item bank tailored to the ability of the test taker as
demonstrated by the responses given thus far. So, in principle, each test-taker is administered
a different test whose composition is optimized for the person.

Theo J.H.M. Eggen
12
The main result is that in CAT the measurement efficiency is optimized. It has been shown
several times that CAT need fewer items, only about 60%, to measure the test-taker‘s ability
with the same precision. CAT and item-based CAL systems have several similarities: in both
procedures, items are presented to persons dependent on earlier outcomes, using a
computerized item selection procedure. However, the systems differ because CAT is based on
psychometric models from IRT, while CAL is based on learning theory. In addition, the main
goal in CAT systems is optimal measurement efficiency and in CAL systems optimal learning
efficiency. Nevertheless, applying IRT and CAT in item-based CAL systems can be very
useful. However, a number of problems prevent the application of a standard CAT approach
in CAL systems. One important unresolved point is the item selection in such systems. In this
chapter, traditional item selection procedures used in CAT will be evaluated in the context of
using them in CAL systems. An alternative selection procedure, developed for better fit to the
goal in CAL systems, is presented and compared to the traditional ones.
Item Selection in CAT
The CAT systems considered in this chapter presupposes the availability of an IRT calibrated
item bank. The IRT model used is the two-parameter logistic model (2PL) (Birmbaum, 1968):
exp( ( ))( ) P( 1 )
1 exp( ( ))
i ii i
i i
a bp X
a b,
in which a specification is given of the relation between the ability, , of a person and the
probability of correctly answering item i , 1iX .ib is the location or difficulty parameter, and
ia the discrimination parameter.
In CAT, the likelihood function is used for estimating a student‘s ability. Given the scores on
k items , 1,...,ix i k this function is given by
(1 )
1
1
( ; ,..., ) ( ) (1 ( )
i i
kx x
k i i
i
L x x p p

2 Computerized Adaptive Testing Item Selection in Computerized Adaptive Learning Systems
13
In this chapter, a statistically sound estimation method, the value of maximizing a weighted
likelihood function (Warm, 1989), is used. This estimate after k items is given by:
),...,;())((maxˆ1
2/1
1
k
k
i
ik xxL
In this expression, the likelihood ),...,;( 1 kxxL is weighted by another function of the ability,
)(i . This function, the item information function, plays a major role in item selection in
CAT. In CAT, after every administered item, a new item that best fits the estimated ability is
selected from the item bank. The selection of an item is based on the Fisher information
function, which is defined as 2( ) (( ( ; )/ )/ ( ; ))i i iE L x L x . The item information
function, a function of the ability , expresses the contribution an item makes to the accuracy
of the measurement of the student‘s ability. This is readily seen, when it is realized that the
standard error of the ability estimate can be written in terms of the sum of the item
information of all the administered items:
1/2
1
ˆ ˆ( ) 1/( ( ))k
k i ki
se I
.
The item with maximum information at the current ability estimate, k̂ , is selected in
CAT. Because this selection method searches for each person the items on which he or she
has a success probability of 0.50, we will denote this method by FI50.
Item Selection in CAL Systems
Item selection methods in traditional CAT aim for precisely estimating ability; in CAL
systems, however, optimizing the learning process, not measuring, is the main aim. Although
learning can be defined in many ways, an obvious operationalization is to consider learning
effective if the student shows growth in ability. In an item-based learning system, a student
starts at a certain ability level, and the goal is that at the end his or her ability level is higher.
The ultimate challenge is then to have an item selection method that advances learning as
much as possible.

Theo J.H.M. Eggen
14
The possible item selection method explored here is based on Kullback-Leibner (K-L)
information. In K-L information-based item selection, the items that discriminate best
between two ability levels are selected. Eggen (1999) showed that selecting based on K-L
information is a successful alternative for Fisher information-based item selection when
classification instead of ability estimation is the main testing goal.
K-L information is in fact a distance measure between two probability distributions or, in this
context, the distance between the likelihood functions on two points on the ability scale.
Suppose we have for a person two ability estimates at two time points 1t and 2t .
Then we can formulate the hypotheses that H0: 1 2t t against H1: 1 2t t . H0
means that all observations are from the same distribution, and if H1 is true, this means that
there is real improvement between the two estimates in time. The K-L distance between these
hypotheses is given k items with response 1( ,..., )k kx x x have been administered is
If we now select items that maximize this K-L distance, we select the items that maximally
contribute to the power of the test to distinguish between the two hypotheses: H0, the ability
does not change, versus H1, growth in ability, or learning, has taken place.
In practice, there are several possibilities for selecting the two points between which
the K-L distance is maximized. In this chapter, we will study selection using the two ability
estimates based on the first and the second half of the administered items. (See, Eggen, 2011,
for other possibilities.) Thus, if the number of administered items is cl (the current test
length), the next item selected is the one that has the largest the K-L distance at
2 /2 1 /2ˆ ( , , .., ).t cl cl clx x x
and
1 1 2 /2( , ,...,ˆt clx x x . This selection method is denoted by K-Lmid.
Item selection methods based on the difficulty level of the items are often considered
in CAL systems. Theories relate the difficulty of the items to the motivation of learners and
possible establishing more efficient learning for students (Wauters, Desmet, & Van den
Noortgate, 2012). Thus, an alternative item selection method giving items with a high or low
difficulty level will be studied. If we select in CAT items with maximum Fisher information
at the current ability estimate, with a good item bank items will be selected for which a person
has a success probability of 0.50. Bergstrom.
2 2
2 1 2 11 11 1
( ; ) ( ; )ˆ ˆ ˆ ˆ( ) ln ln ( ).ˆ ˆ( ; ) ( ; )
k kt tk i
t t i t ti ik it t
L x L xK E E K
L x L x

2 Computerized Adaptive Testing Item Selection in Computerized Adaptive Learning Systems
15
Lunz and Gershon (1992) and Eggen and Verschoor (2006) developed methods for selecting
easier (or harder) items while at the same time maintaining the efficiency of estimating the
ability as much as possible. In this chapter, we consider selecting harder items with a success
probability of 0.35 at the current ability estimate. (We will label this method FI35.)
Comparing the Item Selection Methods for Possible Use in CAL Systems
In evaluating the usefulness of selection methods in CAL systems, simulation studies have
been conducted. In these simulation studies, it is not possible to evaluate the item selection
methods regarding whether the individuals‘ learning is optimized.
Instead, only the possibility of recovering learning is compared. If learning takes place
during testing, the ability estimates should show that.
In the simulation studies reported, the item bank used consisted of 300 items following
the 2PL model with ~ N(0,0.35) and ( ). Testing starts with one randomly
selected item of intermediate difficulty and has a fixed test length of 40 items. In the
simulation, samples of 1,....,j N =100.000 abilities were drawn from the normal distribution.
Three different populations were considered representing different learning scenarios.
1. Fixed population: all simulees are from the same population and do not change during
testing: ~N (0,0.35).
2. The population shows a step in growing in ability: in the first 20 items, ~N (0,0.35);
after that, from item 21 to 40 ~N ( ,0.35). >0 represents the learning step that
took place.
3. The population is growing linearly: is drawn from the normal distribution with
increasing mean with the item position in the test: ~N ( . /40, 0,0.35)
To evaluate the performance of item selection methods in a CAT simulation, the root mean
square error of the ability after administering items is commonly used:
1
1
/22
( .) ˆ / )(
j
N
jjr Nmse
This is a useful criterion for evaluating the estimation accuracy of the ability when simulees
with fixed abilities are considered.
Theo J.H.M. Eggen
16
However, if we want to evaluate the recovery of a growing ability, a related measure, the root
mean square of the difference in abilities ( )rmse , is more appropriate. If 2 1 j jj is the
difference between the true abilities on two points in time and 2 1 ˆ ˆ ˆ j jj is the difference
between the estimated abilities on the two time points in time, this is given by
1
1/22
( ) / )(
N
j jjr Nmse .
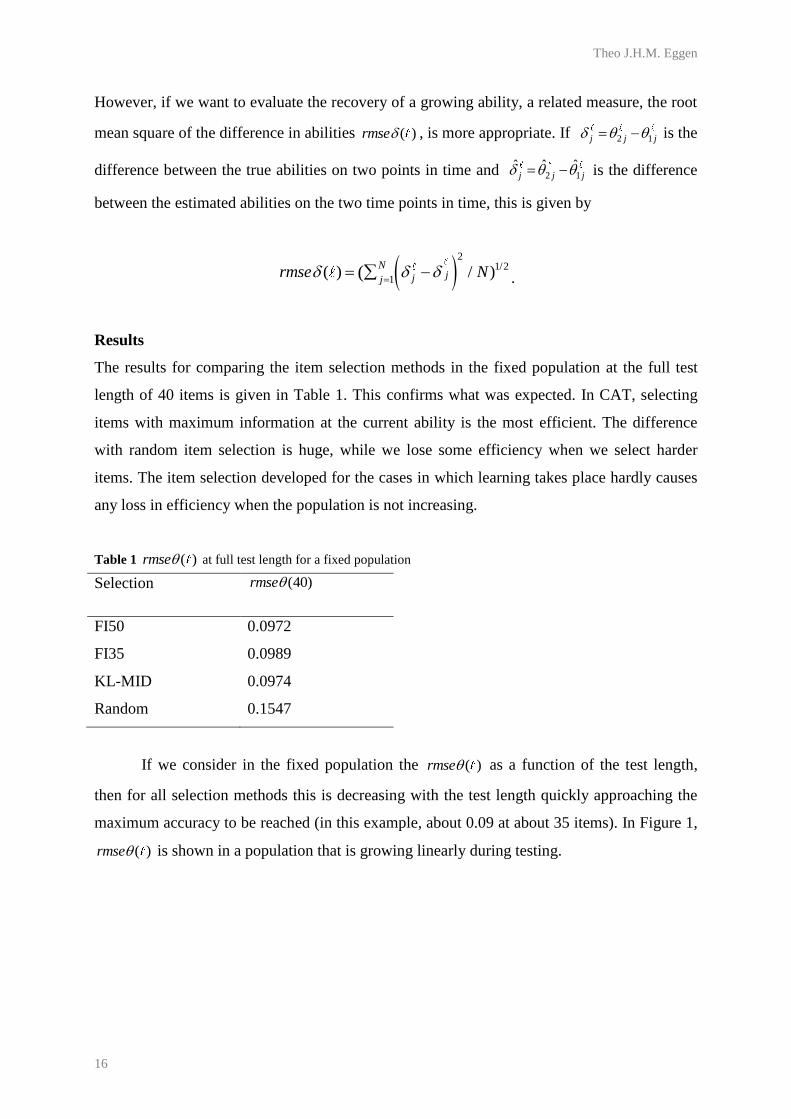
Results
The results for comparing the item selection methods in the fixed population at the full test
length of 40 items is given in Table 1. This confirms what was expected. In CAT, selecting
items with maximum information at the current ability is the most efficient. The difference
with random item selection is huge, while we lose some efficiency when we select harder
items. The item selection developed for the cases in which learning takes place hardly causes
any loss in efficiency when the population is not increasing.
Table 1 ( )rmse at full test length for a fixed population
Selection (40)rmse
FI50 0.0972
FI35 0.0989
KL-MID 0.0974
Random 0.1547
If we consider in the fixed population the ( )rmse as a function of the test length,
then for all selection methods this is decreasing with the test length quickly approaching the
maximum accuracy to be reached (in this example, about 0.09 at about 35 items). In Figure 1,
( )rmse is shown in a population that is growing linearly during testing.

2 Computerized Adaptive Testing Item Selection in Computerized Adaptive Learning Systems
17
Figure 1 True ability, estimated ability and ( )rmse in population growing linearly 0.175
In Figure 1, the dashed line (---) gives the true (growing) abilities, and the points (…) are the
estimated abilities; ( )rmse is given by the solid line ( ). In this situation, where the
estimated abilities always lag behind the development of true ability, the ( )rmse is first
decreasing and later increasing with the test length. This illustrates that it cannot be a good
criterion for judging the recovery of growth in ability.
Therefore, the selection methods are compared on the ( )rmse . In all the simulation
studies conducted, ( )rmse is monotone decreasing with growing test length. Thus, the
results in Table 2 are given for the full test length of 40 items. The results refer to the situation
in which the increase in ability during testing is 0.175 (0.5 SD [standard deviation] of the true
ability distribution).
Table 2 ( )rmse for fixed, stepwise and linearly growing population
Growth scenario
Selection Fixed Step Linear
FI50 0.192 0.196 0.195
FI35 0.195 0.199 0.197
KL-MID 0.192 0.195 0.194
Random 0.303 0.306 0.304
0
0,1
0,2
0,3
0,4
0,5
0,6
1 3 5 7 9 11 13 15 17 19 21 23 25 27 29 31 33 35 37 39

Theo J.H.M. Eggen
18
To recover growth in ability, the differences between the item selection methods show about
the same pattern as reported on the measurement accuracy in a fixed population: random item
selection performs badly, while selecting harder items also has a negative influence on the
( ).rmse The differences between selecting with FI50 and the KL-mid method are small;
however, in populations where there is growth in ability the selection method based on the K-
L information performs a bit better. Figure 2 shows where for which ability levels in the
population with linear growth the small difference between the FI50 and KL-Mid method
occurs.
Figure 2 ( )rmse for =40 for FI50 en KL-mid item selection as function of ability
Figure 2 shows there are only very small differences in performances for abilities
around the mean of the population, which could be possibly be due to the item bank, which
was constructed so that the distribution of difficulties is centered on the population mean of 0.
Differences between the item selection method may appear only when there are many items
of the appropriate difficulty available.
Discussion
In computerized adaptive testing, item selection with maximum Fisher information at the
ability estimate determined during testing based on the given response is most efficient for
measuring individuals‘ abilities.
0,165
0,167
0,169
0,171
0,173
0,175
0,177
0,179
FI50
KL-mid

2 Computerized Adaptive Testing Item Selection in Computerized Adaptive Learning Systems
19
In this chapter, a K-L information-based item selection procedure was proposed for
adaptively selecting items in a computerized adaptive learning system. It was explained that
selecting items in this way perhaps better fits the purpose of such a system to optimize the
efficiency of individuals‘ learning.
The proposed method was evaluated in simulation studies with the possibility of
learning growth recovery as measured by the ( )rmse expressing the accuracy by which real
growth in ability between two points in time is also estimated to be there. The results clearly
showed that randomly selecting items and selecting harder items, which could be motivating
in learning systems, have a negative effect. The differences between the Fisher information
method and the KL information method for item selection were small.
The simulation studies reported in this chapter cover only a few of the conditions that were
explored in the complete study (Eggen, 2011). In these studies, the differences were also
explored
- for a very large (10.000 items) one-parameter Rasch model item bank;
- for varying populations distributions with average abilities one or two standard
deviations above or below the population on which was reported here and which has a
mean at the mean of the difficulty of the items in the item bank;
- for varying speed in the growth during testing (small, intermediate, large);
- for three other K-L information-based selecting methods evaluated at two different
ability estimates; for instance, ability estimated based on only the first items and the
estimate based on all items; and
- for different maximum test lengths.
In all these conditions, the same trends were observed. In populations that grow in ability, the
K-L information selection method performs better than Fisher information-based selection
methods in recovering growth. The differences however are small. In 50 repeated simulations
with 10.000 students, the statistical significance of the differences was not proved.
The reasons for the lack of significant improvement are not clear. Maybe there are
despite the trends only significant improvements to be expected in certain conditions not
studied yet. Another reason could be that all selection methods depend on the accuracy of the
ability estimates.

Theo J.H.M. Eggen
20
The K-L information-based item selection could suffer more from this than Fisher
information-based selection because with K-L information two ability estimates based on
only parts of the administered item sets are needed.
The first exploration of a combination of both methods consisting of using for item
selection Fisher information in the beginning of the test and K-L information when at least a
quarter of the total test length is administered has been conducted (Eggen, 2011). However, in
this case the method performed only a tiny bit better. Nevertheless, the combination method
deserves more attention.
Finally it is recommended to combine the K-L information item selection method with
better estimation methods during test administration. In this context, the suggestion made by
Veldkamp, Matteucci, and Eggen (2011) to improve the performance of the selection method
by using collateral information about a student to get a better prediction of his or her ability
level at the start of the test could be useful.
However, even more important for the practice of computerized adaptive learning
system is having better continuously updated estimates of the individual‘s ability. The
application of the dynamic ability parameter estimation approach introduced by Brinkhuis and
Maris (2009) is very promising and should be considered.
References
Bergstrom, B.A., Lunz, M.E., & Gershon, R.C. (1992). Altering the level of difficulty in
computer adaptive testing. Applied Measurement in Education, 5, 137-149.
Birmbaum, A. (1968). Some latent trait models and their use in inferring an examinee‘s
ability. In F.M. Lord & M.R. Novick (Eds.). Statistical theories of mental test scores
(pp 397-479). Reading, MA: Addison Wesley.
Brinkhuis, M.J.S. & Maris, G. (2009). Dynamic parameter estimation in student monitoring
systems. Measurement and Research Department Reports (Rep. No. 2009-1). Arnhem:
Cito.
Brusilovsky, P. (1999). Adaptive and intelligent technologies for Web-based education.
Künstliche Intelligenz, 13, 19-25.
Desmet, P. (2006). L‘apprentisage/enseignement des langues á l‘ére du numérique: tendances
récentres et défis. Revue francaise de linguistique appliquée, 11, 119-138.
Eggen, T.J.H.M. (1999). Item selection in adaptive testing with the sequential probability
ratio test. Applied Psychological Measurement, 23, 249-261.

2 Computerized Adaptive Testing Item Selection in Computerized Adaptive Learning Systems
21
Eggen, T.J.H.M. (2011, October 4). What is the purpose of the Cat? Presidential address
Second International IACAT Conference, Pacific Grove.
Eggen, T.J.H.M. & Verschoor, A.J. (2006). Optimal testing with easy or difficult items in
computerized adaptive testing. Applied Psychological Measurement, 30, 379-393.
Van der Linden, W.J. & Glas, C.A.W. (Eds). (2010). Elements of adaptive testing. New York,
Springer.
Veldkamp, B.P., Matteucci, M., & Eggen, T.J.H.M. (2011). Computer adaptive testing in
computer assisted learning. In: Stefan de Wannemacker, Geraldine Claerebout, and
Patrick Decausmaeckers (Eds.). Interdisciplinary approaches to adaptive learning; a
look at the neighbours. Communications in Computer and Information Science, 126,
28-39.
Wainer, H. (Ed.). (2000). Computerized adaptive testing: A primer. London: Erlbaum.
Warm, T.A. (1989). Weighted likelihood estimation of ability in item response theory.
Psychometrika, 54, 427-450.
Wauters, K., Desmet, P., & Van den Noortgate, W. (2010). Adaptive item-based learning
environments based on item response theory: possibilities and challenges. Journal of
Computer Assisted Learning, 26, 549-562.
Wauters, K., Desmet, P., & Van den Noortgate, W. (2012). Disentangling the effects of item
difficulty level and person ability level on learning and motivation. Submitted to
Journal of Experimental Education.
Wiliam, D. (2011). What is assessment for learning? Studies in Educational Evaluation, 37,
3-14.

22

23
Chapter 3
Use of Different Sources of Information in Maintaining
Standards: Examples from the Netherlands
Anton Béguin
Abstract In the different tests and examinations that are used at a national level in the
Netherlands, a variety of equating and linking procedures are applied to maintain assessment
standards. This chapter presents an overview of potential sources of information that can be
used in the standard setting of tests and examinations. Examples from test practices in the
Netherlands are provided that apply some of these sources of information. This chapter
discusses how the different sources of information are applied and aggregated to set the levels.
It also discusses under which circumstances performance information of the population would
be sufficient to set the levels and when additional information is necessary.
Keywords: linking, random equivalent groups equating, nonequivalent groups equating
Introduction
In the different tests and examinations that are used at a national level in the Netherlands, a
variety of equating and linking procedures are applied to maintain assessment standards.
Three different types of approaches can be distinguished. First, equated scores are determined
to compare a new form of a test to an existing form, based on an anchor that provides
information on how the two tests relate in difficulty level and potentially in other statistical
characteristics. A special version of this equating procedure is applied in the construction and
application of item banks, in which the setting of the cut-score of a test form is based on the
underlying Item Response Theory (IRT) scale. Second, in certain instances—for example,
central examinations at the end of secondary education—heuristic procedures are developed
to incorporate different sources of information, such as pretest and anchor test data,
qualitative judgments about the difficulty level of a test, and the development over time of the
proficiency level of the population. For each source of the data, the optimal cut-scores on the
test are determined. Because the validity of assumptions and the accuracy of the data are
crucial factors, confidence intervals around the cut-scores are determined, and a heuristic is
applied to aggregate the results from the different data sources.

Anton Béguin
24
Third, in the standard setting of a test at the end of primary education, significant weight is
assigned to the assumption of random equivalent groups, whereas the other sources of
information (pretest data, results on similar tests, and anchor information) are mainly used as
a check on the validity of the equating. In the current chapter, an overview of potential
sources of information that can be used in the standard setting of examinations is presented.
The overview includes information on the following:
1. Linking data that can be used in equating and IRT linking procedures, with various
data collection designs and different statistical procedures available
2. Different types of qualitative judgments: estimates of difficulty level/estimates of
performance level
3. Assumptions made in relation to equivalent populations
4. The prior performance of the same students
5. The historical difficulty level of the test forms
Examples from test practices in the Netherlands are provided that apply some of these sources
of information, which are then aggregated and applied in the standard-setting procedure to set
the levels. This chapter discusses the advantages and disadvantages of some of the sources of
information, especially regarding under which circumstances random equivalent groups
equating—using only performance information of the population—would improve the quality
or efficiency of the level-setting procedure and when additional information is necessary.
Sources of Information for Standard Setting
Linking Data
To be able to compare different forms of a test, one needs either linking data or an assumption
of random equivalent groups. A number of different designs and data collection procedures
have been distinguished (Angoff, 1971; Béguin, 2000; Holland & Dorans, 2006; Kolen &
Brennan, 2004; Lord, 1980; Petersen, Kolen, & Hoover, 1989; Wright & Stone, 1979). In
these data collection procedures, a distinction can be drawn between designs that assume that
the test forms are administered to a single group or to random equivalent groups and
nonequivalent group designs for which the assumption of random equivalent groups may not
hold. In the context of examinations, the data collected during actual exams can theoretically
be treated as data from a random equivalent groups design.

3 Use of Different Sources of Information in Maintaining Standards: Examples from the Netherlands
25
Each form of the examination is administered to separate groups of respondents, but it is
assumed that these groups are randomly equivalent. More relevant in the current context are
the nonequivalent groups designs. Examples of such designs are anchor test designs, designs
using embedded items, and pretest designs.
A variety of equating procedures are available to compare test forms. These
procedures use the collected data to estimate the performance characteristics of a single group
on a number of different test forms (e.g., to estimate which scores are equivalent between
forms and how cut-scores can be translated from one form to the other).
The equating procedures either use only observable variables or assume latent
variables, such as a true score or a latent proficiency variable. Procedures using only
observable variables are, for example, the Tucker method (Gulliksen, 1950), Braun-Holland
method (Braun & Holland, 1982), and chained equipercentile method (Angoff, 1971). Latent
variable procedures include Levine‘s (1955) linear true score equating procedure and various
procedures based on IRT (e.g., Kolen & Brennan, 2004; Lord, 1980).
Item Banking
Item-banking procedures can be considered a special case of equating procedures. These
procedures often use a complex design to link new items to an existing item bank. They rely
heavily on statistical models, the assumption that the characteristics of items can be estimated,
and that these characteristics remain stable during at least a period of time. Typically, item
banks are maintained by embedding new items within live test versions or by the
administration of a separate pretest. If an IRT model is used, often parameters for difficulty,
discrimination, and guessing are estimated. To ensure that the new items are on the same
scale as the items in the bank, the new items are calibrated, together with the items for which
item characteristics are available in the bank. To evaluate whether the above procedure is
valid, it is crucial that the underlying assumptions are checked. For example, the stability of
the items‘ characteristics needs to be evaluated, comparing between the previous
administrations on which the item characteristics are based and the performance in the current
administration. The stability can be violated in cases where items are administered under time
constraints, order effects occur, or if items become known due to previous administrations.
Because of the potential adverse effect of these issues on the validity of the equating, it
is crucial to monitor the performance of the individual items and the validity of the link
between the new test version and the item bank.

Anton Béguin
26
Clearly, the variables of interest in level setting, such as equivalent cut-scores, are directly
affected by the quality and the stability of the equating procedure. The quality of the equating
of test forms largely depends on potential threads to validity in the data collection. For
example, the results of a pretest could potentially be biased if order effects and administration
effects are not dealt with appropriately. The stability of equating depends on the quality and
the size of the sample, characteristics of the data collection design, and the equating procedure
that is used (e.g., Hanson & Béguin, 2002; Kim & Cohen, 1998).
Qualitative Judgments
To set cut-scores on a test form, standard setting procedures based on qualitative judgments
about the difficulty level of the test form can be applied. Various procedures are available
(e.g., Cizek, 1996, 2001; Hambleton & Pitoniak, 2006), ranging from purely content-based
procedures (Angoff procedure, bookmark procedure), which focus on the content of the test,
to candidate-centered procedures (borderline, contrasting groups), which aim to estimate a
cut-score based on differences between groups of candidates. For example, in a contrasting-
groups procedure, raters are asked to distinguish between groups of candidates who perform
below the level necessary to pass the test and groups of candidates who perform above this
level. In this judgment, the raters do not use the test score. Then the test score distributions of
these groups are contrasted to select the cut-score that best distinguishes between the two
groups.
The quality of a level-setting procedure largely depends on the quality of the judges,
the number of judges involved, the characteristics of the procedure, and the quality of the
instruction. Often, relatively unstable or biased results are obtained in cases where the
instruction or the number of judges is insufficient.
Random Equivalent Groups
In contrast to many other sources of equating information, the performance level of the
population is often a very stable measure. Comparing the performance level of the population
between one year and the next will only result in large differences if the composition of the
population or the curriculum has changed. Differences in year-to-year performance could also
occur if there is an increasing or decreasing trend in performance. However, in a number of
cases, it is not unreasonable to make an assumption of random equivalent groups from one
year to the next. Based on this assumption, it is possible to apply level-setting procedures.

3 Use of Different Sources of Information in Maintaining Standards: Examples from the Netherlands
27
An extended version of the assumption of random equivalent groups takes background
variables into account. If the year-to-year populations differ in composition based on a
number of background variables, this difference can be corrected using weighing. In such
cases, groups of students with the same background variable are assumed to be a random
sample from the same population. Using weighing based on background variables, the
assumption of random equivalent groups will hold again in the total population.
Prior Performance of the Same Group
Procedures used to estimate the performance level based on prior attainment on a test a few
years earlier can be viewed as a special case of taking background information into account.
Two pieces of information can be derived from the prior attainment data: On one hand, the
data show whether the population deviates from the average. A correction for this would be
similar to the extended assumption of random equivalent groups described above. On the
other hand, the prior attainment data could provide information on the performance levels that
were reached earlier. Using the information on how the prior performance relates to the
standards on the new test form, the cut-scores on this new form can be estimated.
Historical Difficulty Level of the Test Forms
The variation in the difficulty level of the test forms constructed according to the same test
blueprint can be used to estimate the difficulty of the current test form. Assuming that the
current test form will not be significantly different from the previous forms (e.g., over the past
10 years) will result in a confidence interval. Using historical information, it is assumed that
the difficulty of this year‘s form will fall within this confidence interval.
Linking Procedures Used in Some of the Principal Tests in the Netherlands
Entrance Test to Teacher Training
During the first year of the teacher training program, students have to pass tests in
mathematics and in the Dutch language. Students will have a maximum of three opportunities
to pass these tests. If they fail these attempts, they are not allowed to continue their education.
The mathematics test is an adaptive test based on an underlying item bank calibrated
using the one-parameter logistic model (OPLM) (Verhelst, Glas, & Verstralen, 1994). The
item parameters are based on samples with at least 600 respondents for each item in the bank.
In addition to the data on the respondents from the teacher training program, these samples
may also include information collected from other fields of education.

Anton Béguin
28
The bank may contain, for example, items that originated in primary education. In such cases,
the original item parameters are based on the performance of students in primary education.
On a yearly basis, the parameters are updated based on the performance during the actual
administration of the test. New items are pretested on a yearly basis to enable collection of the
necessary data to estimate the item parameters on the same scale as the other in the bank.
Examinations at the End of Secondary Education
At the end of secondary education, the students take a set of final examinations in a number of
subjects that they selected earlier. After passing these examinations, they gain access to
different forms of further education. The final examinations in most subjects are divided into
two parts: a school examination and a national examination. The elements that are tested in
each examination are specified in the examination syllabus, which is approved by the College
voor Examens (CVE) (English translation: Board of Examinations, an arm‘s length body of
the Ministry of Education). The CVE is also responsible for the level setting of the
examinations. In the majority of examinations, the level-setting procedure is dominated by the
information obtained using the assumption of random equivalent groups. Some other
examinations have a small number of candidates; consequently, there is insufficient
information about the performance of candidates. In such cases, a content judgment is used as
the basis for the level setting. More elaborate data collection provides extra information for
specific examinations considered central to the examination system. These include
examinations in basic skills (Dutch language and mathematics), modern languages (English,
French, and German), science (physics, chemistry, and biology), and economics. For these
examinations, the additional data are collected using a pretest or posttest design (Alberts,
2001; Béguin, 2000). In these designs, parts of past and future examination forms are
combined into tests that are administered as a preparation test for the examination. In other
instances, the data are collected in different streams of education. Based on the collected data
and using a Rasch model, the new examination is linked to an old form of the test. In this
way, the standard on the new form can be equated to the standard on the old form.
The amount of data collected in the pretest or the posttest design is relatively limited
due to restrictions on security of the items. Consequently, the equated score is provided with a
confidence interval. As input to the level-setting meeting, the results of the above linking
procedure are combined with the results of linking based on an assumption of random
equivalent groups from year to year and, in some cases, content-based judgements about the
difficulty level of the examinations.

3 Use of Different Sources of Information in Maintaining Standards: Examples from the Netherlands
29
End of Primary School Test
At the end of primary education, schools are obliged to collect objective information about
the most appropriate type of secondary education for students. Most of the schools (about
85%) apply a test for this purpose called the Eindtoets Basisonderwijs (Cito, 2012; Van der
Lubbe, 2007), whereas the remainder apply other tests and assessments.
The Eindtoets Basisonderwijs contains a compulsory section composed of 200 multiple-
choice items on the Dutch language, as well as on arithmetic and study skills, and a voluntary
section composed of 90 items on history, geography, and science. Each year, a new form of
the test is constructed that contains only new items, and the results are linked to those of the
previous year‘s test. Three linking procedures based on different sources of information are
used in the standard setting in the Eindtoets Basisonderwijs. The linking procedures are based
on the following:
1) Pretest data in which the pretest forms combine items from multiple test forms of
different years in a complex incomplete design
2) Anchor data that are collected, using an internal anchor embedded within the test
forms of a sample of approximately 3,000 pupils taking the test, and noting that the
anchor counts to the final score of these pupils
3) An assumption of random equivalent groups based on a sample of 1,800 schools that
participated in the test for the past four years and in which no large shifts in the
performance or in the size of the school occurred in this period
In the pretest equating, a multidimensional equating procedure is applied in which each of the
13 domains in the test is modelled using a separate dimension that is correlated to the other
dimensions (Béguin, 2000; Glas, 1989).
Equating based on the pretest data is relatively unstable due to the small sample size of
approximately 600 pupils per item and its susceptibility to model imperfections when, for
example, order effects or time constraints are present.
The conditions under which the test is administered pose an additional threat to the
validity of the linking, i.e., often the stakes are low for the student because the outcome of the
test will have less importance to the student than the actual test. The administration condition
could have an effect on the motivation of the pupils and, therefore, result in bias of the
linking.

Anton Béguin
30
In the pretest, we tried to diminish this effect by collecting data in such a way that the
motivation of the students was similar for all the items. However, this step does not guarantee
that motivational effects will have no effect on the pretest equating. Equating using an anchor
test is far more robust due to its larger sample size and the fact that the test is administered
under high-stakes conditions. In addition, the design is simpler. Thus, potential problems
associated with time pressure and order effects are more easily detected and addressed.
A potential drawback with the anchor test design is that the anchor becomes known,
and this will result in an increase in performance on the anchor that does not reflect an actual
increase in proficiency. Finally, equating based on an assumption of random equivalent
groups is stable and robust if the composition of the population does not change over time. A
potential drawback of this approach is that if changes in the performance of the population do
occur, they will be ignored.
Over the past few years, significant weight has been given to the assumption of
random equivalent groups (Van Boxtel, Engelen, & De Wijs, 2012). This is because the
standard setting based on the other sources of information (pretest data and anchor
information) is, to some extent, inaccurate, whereas the trends in performance over time are
historically stable. For reporting at the student level, it is unlikely that the standard setting
based on the assumption of random equivalent groups compromises the standard because
year-to-year effects are very small compared with the differences among students. However,
to ensure that potential trends in performance are detected, all other sources of linking data
are analyzed and used as a check on the standard setting. The results of these analyses are
published in a report on the performance at the system level, which is available to the public a
few months later. This report includes the results based on the different sources of linking
information, together with the confidence intervals and corrected for background variables.
The type of detail that can be provided in such a report cannot be incorporated in the
operational standard setting because of time constraints and the impossibility of including
uncertainty in the reported cut-score.
Maintaining Performance Using Random Equivalent Groups Equating Instead of
Maintaining Standards Using Nonequivalent Group Designs?
A number of equating procedures have been described earlier in the chapter, with some
examples provided from tests in the Netherlands. In the level setting of both the central
examinations in secondary education and in the end of primary school test, it is considered
crucial that the standards are maintained over time.

3 Use of Different Sources of Information in Maintaining Standards: Examples from the Netherlands
31
In contrast to this, operationally the level setting depends at least partly on random equivalent
groups equating, which theoretically just maintains performance. The reason for this
seemingly invalid procedure is that in these tests the expected difference in performance level
between the years is expected to be smaller than the standard error of the equating procedures
used to maintain the standard.
As a consequence, maintaining performance will be expected to reduce the instability
of the level setting in a single year by trading the potential instability of the equating
procedure for the potential bias due to the assumption of random equivalent groups.
According to the argument above, random equivalent groups equating could theoretically be
used as the only source of information for level setting for these tests. However, there is a
drawback for the maintaining-performance-only approach: Over multiple years, the bias
would accumulate if a trend in performance in the population would occur. Another drawback
with this approach is that maintaining performance could potentially undermine trust in the
assessment system if the public considers that this procedure leads to a decrease in
performance.
To be able to respond to claims about decreasing performance, it is crucial that a trend
in performance can be evaluated at the system level and that standards can be maintained at
that level. Therefore, next to maintaining performance based on random equivalent groups
equating, equating information using additional data (like pretest and anchor test) also needs
to be available, such as is the case in the examinations in secondary education and the test at
the end of primary education. According to the additional data, it is possible to report on
trends in performance in a detailed and nuanced way.
For example, it is possible to publish results, together with a confidence interval, or to
report on different sources of equating information that contradict each other. Operationally,
reporting in this level of detail is possible only at the system level, because uncertainty about
standards cannot be included in a practical way in reports at pupil and school levels. In
practice, some situations will present a difference between the cut-scores based on random
equivalent groups equating and used for pupils and schools and the reported results of the
performance in relation to the standards that include more sources of information.
In these cases, a correction will need to be made to the basis used for comparison in
the test administered in the following year. This will prevent the accumulation of differences
over the years from compromising the standard.

Anton Béguin
32
In summary, using a system based on maintaining performance (using random equivalent
groups equating), combined with a number of equating procedures that are not necessarily all
used as direct input in level setting, seems operationally to be the best option in circumstances
where the expected differences in performance from year to year are smaller than the
expected standard error of the equating procedures. The result from the equating procedures
will be used in analyses at the system level to report on trends in performance in a detailed
and nuanced way.
Although this procedure will potentially lead to a (probably small) deviation from the
standard at the individual and school levels each year, the use of this approach over a number
of years will not necessarily result in the accumulation of bias.
References
Alberts, R. V. J. (2001). Equating exams as a prerequisite for maintaining standards:
Experience with Dutch centralised secondary examinations. Assessment in Education:
Principles, Policy & Practice, 8, 353-367.
Angoff, W. H. (1971). Scales, norms and equivalent scores. In R. L. Thorndike (Ed.),
Educational measurement (2nd ed., pp. 508-600). Washington, DC: American Council
on Education.
Béguin, A. A. (2000). Robustness of equating high-stakes tests. PhD thesis, University of
Twente, Enschede.
Braun, H. I., & Holland, P. W. (1982). Observed-score test equating: A mathematical analysis
of some ETS equating procedures. In P. W. Holland & D. B. Rubin (Eds.), Test
equating (pp. 9-49). New York: Academic Press.
Cito (2012).Handleiding Eindtoets Basisonderwijs [Manual End of Primary School Test],
Arnhem, the Netherlands: Cito.
Cizek, G. J. (1996). Setting passing scores. Educational Measurement: Issues and Practice,
15, 20-31.
Cizek, G. J. (2001). Setting performance standards: Concepts, methods, and perspectives.
Mahwah, NJ: Erlbaum.
Glas, C. A. W. (1989). Contributions to estimating and testing Rasch models. (Doctoral
Thesis.) Enschede: University of Twente.
Gulliksen, H. (1950). Theory of mental tests. New York: Wiley.

3 Use of Different Sources of Information in Maintaining Standards: Examples from the Netherlands
33
Hambleton, R. K., & Pitoniak, M. (2006). Setting performance standards. In R. L. Brennan
(Ed.), Educational measurement (pp. 433–470). Westport, CT: American Council on
Education.
Hanson, B. A., & Béguin, A. A. (2002). Obtaining a common scale for IRT item parameters
using separate versus concurrent estimation in the common item nonequivalent groups
equating design. Applied Psychological Measurement, 26, 3-24.
Holland, P. W., & Dorans, N. J. (2006). Linking and equating. In R. L. Brennan (Ed.),
Educational measurement (4th ed.). Westport, CT: American Council on Education and
Praeger Publishers.
Kim, S., & Cohen, A. S. (1998). A comparison of linking and concurrent calibration under
item response theory. Applied Psychological Measurement, 22, 131-143.
Kolen, M. J., & Brennan, R. L. (2004). Test equating (2nd ed.). New York: Springer.
Levine, R. E. (1955). Equating the score scales of alternative forms administered to samples
of different ability. Research Bulletin 55-23, Educational Testing Services, Princeton,NJ
Lord, F. M. (1980). Applications of item response theory to practical testing problems.
Hillsdale, NJ: Lawrence Erlbaum Associates.
Petersen, N. S., Kolen, M. J., & Hoover, H. D. (1989). Scaling, norming and equating. In R.
L. Linn (Ed.), Educational measurement (3rd ed. ,pp. 221-262). New York: American
Council on Education and Macmillan.
Van Boxtel, H., Engelen, R., & De Wijs, A. (2012). Verantwoording van de Eindtoets
Basisonderwijs 2010. Arnhem: Cito.
Van der Lubbe, M. (2007). The End of Primary School Test (better known as Citotest). Paper
presented at the 33rd annual conference of the International Association for Educational
Assessment, September 16-21, Baku, Azerbaijan.
Verhelst, N. D., Glas, C. A. W., & Verstralen, H. H. F. M. (1994). OPLM: Computer
program and manual. Arnhem: Cito.
Wright, B. D., & Stone, M. H. (1979). Best test design. Chicago: MESA Press University of
Chicago.

34

35
Chapter 4
Ensuring the Future of Computerized Adaptive Testing
Bernard P. Veldkamp
Abstract Capitalization on chance is a huge problem in computerized adaptive testing
(CAT) when Fisher information is used to select the items. Maximizing Fisher information
tends to favor items with positive estimation errors in the discrimination parameter and
negative estimation errors in the guessing parameter. As a result, information in the resulting
tests is overestimated and measurement precision is lower than expected. Since reduction of
test length is one of the most important selling points of CAT, this is a serious threat to both
the validity and viability of this test administration mode. In this chapter, robust test assembly
is presented as an alternative method that accounts for uncertainty in the item parameters
during test assembly.
Keywords: Automated test assembly, capitalization on chance, computerized adaptive testing,
item parameter uncertainty, 0-1 LP, robust test assembly
Introduction
In computerized adaptive testing (CAT), item administration is tailored to the test taker.
Tailoring the test turns out to entail a number of advantages. The candidate only has to answer
items that are paired to his or her ability level, test length can be reduced, and test
administration can be more flexible as a result of individualized testing. Besides, CATs could
be offered continuously, on flexible locations, and even via the Web. The advantages of CAT
turned out to be very appealing. Nowadays many CATs are run operationally in educational,
psychological, and health measurement. Various algorithms for tailoring the test have been
proposed. They generally consist of the following steps:
1. Before testing begins, the ability estimate of the candidate is initialized (e.g., at the
mode of the ability distribution, or based on historical data).

Bernard P. Veldkamp
36
2. Items are selected from an item bank to be maximally informative at the current ability
estimate. Sometimes, a number of specifications related to test content or other
attributes have to be met, which restricts the number of items available for selection.
In this step, an exposure-control method is commonly applied to prevent overexposure
of the most popular items.
3. Once an item is selected, it is administered to the candidate.
4. An update of the ability estimate is made after each administration of an item.
5. Finally, the test ends whenever a stopping criterion has been met, for example when a
fixed number of items have been administered or when a minimum level of
measurement precision has been obtained.
One of the assumptions underlying these CAT algorithms is that, for all items in the bank, the
item parameters are known and can be treated as fixed values during test administration to
calculate the amount of information provided. Unfortunately, this assumption is never met in
practice. Item parameters have been estimated based on finite samples of candidates. The
estimates might be unbiased, but they still have measurement error in them. This uncertainty
is a source of concern. When test information is maximized, those items with high
discrimination parameters will be selected from the bank. Positive estimation errors in the
discrimination parameters will increase the amount of information provided, and therefore
will increase the probability that the item will be selected. This phenomenon is also referred
to as the problem of capitalization on chance.
Hambleton & Jones (1994) were among the first to study the effects of item parameter
uncertainty on computerized construction of linear test forms from calibrated item banks.
They found out that not taking the uncertainty into account resulted in serious overestimation
of the amount of information in the test. Veldkamp (2012) illustrated this effect when he
simulated an item bank of 100 items with uncertainty in them. All 100 items had the same
parent, that is, all item parameters were drawn from the same multivariate distribution ( , )N
, with equal to the true item parameters ( 1.4, 0.0, 0.2)a b c and being the diagonal
matrix with the standard errors of estimation ( 0.05, 0.10, 0.02)SE a SE b SE c . As a result
the item parameters only varied due to uncertainty in the parameter estimates. Parameter
ranges were [1.29,1.52]a , [ 0.31,0.29]b , and [0.14,0.28]c . Ten items with highest Fisher
information at 0.0 were selected from this bank for a test.

4 Ensuring the Future of Computerized Adaptive Testing
37
The resulting test information function was compared to the test information function based
on the true item parameters ( 1.4, 0.0, 0.2)a b c . As can be seen in Figure 1, the test
information is overestimated by 20%, when uncertainty is not taken into account.
Figure 1 Test information function: ATA (dashed line) or true (solid line)
Hambleton & Jones (1994) demonstrated that the impact of item parameter
uncertainty on automated construction of linear tests depended on both the calibration sample
size and the ratio of item bank size to test length. When their findings are applied to CAT,
calibration sample size plays a comparable role. The ratio of item bank size to test length is
more of an issue in CAT, since only one item is selected at a time, which results in an even
less favorable ratio. Olea, Barrada, Abad, Ponsoda, & Cuevas (2012), studied the impact of
capitalization on chance for various settings of CAT in an extensive simulation study, and
they confirmed the observations of Hambleton and Jones (1994). In other words,
capitalization on chance is a huge problem in CAT when Fisher information is used to select
the items. The measurement precision of the test is vastly overestimated. Alternative
strategies for item selection in CAT will have to be used so as not to compromise the validity
of this test administration mode.
Robust Test Assembly
In combinatorial optimization, mathematical techniques are applied to find optimal solutions
within a finite set of possible solutions.
0
0,5
1
1,5
2
2,5
3
3,5
4
4,5
-3 -2,5 -2 -1,5 -1 -0,5 0 0,5 1 1,5 2 2,5 3

Bernard P. Veldkamp
38
The set of possible solutions is generally defined by a set of restrictions. Automated test
assembly (ATA) problems are a special case of combinatorial optimization problems. The
objective of ATA is often to maximize the information in the test, and the set of possible
solutions is generally defined by the test specifications, for example, by the content
constraints. An extensive introduction to the topic of formulating ATA problems as mixed
integer programming (MIP) problems can be found in van der Linden (2005).
To solve the problem of dealing with uncertainty in the item parameters in CAT, a
first step would be to search the literature for methods that have been proposed to deal with
parameter uncertainty in combinatorial optimization. Soyster (1973) was among the first to
present a method for dealing with uncertainty in combinatorial optimization problems. He
assumed that for every uncertain parameter an interval could be defined that contained all
possible values. He replaced each uncertain parameter by its infimum and solved the problem.
This solution served as a robust lower bound for the solution of the original problem.
Unfortunately, this method was very conservative. It assumed a maximum error in all the
parameters, which is highly unlikely in practice. The good thing, however, was that Soyster
(1973) opened up a new area of research: robust optimization. The ultimate goal of robust
optimization (Ben Tal, El Ghaoui, & Nemirovski, 2009) is to take data uncertainty into
account when the optimization problem is solved in order to ―immunize‖ resulting tests
against this uncertainty. Under this approach, a suboptimal solution is accepted in order to
ensure that the solution remains near optimal when the estimated parameters turn out to differ
from their real values. For ATA this means that uncertainty in the item parameters or in the
information function is taken into account during test assembly to immunize the test against
overestimation of the test information.
De Jong, Steenkamp, & Veldkamp (2009) applied a modified version of Soyster‘s
method to ATA,when they constructed country-specific versions of a small marketing scale.
Instead of replacing uncertain parameters by their infima, they subtracted one posterior
standard deviation from the estimated Fisher information as a robust alternative. Veldkamp,
Matteucci, & de Jong (2012) studied this modified Soyster method in more detail, for
example, they studied differences in effects of uncertainties in various item parameters in test
assembly.

4 Ensuring the Future of Computerized Adaptive Testing
39
Veldkamp (2012) studied a different approach based on the robust optimization method
developed by Bertsimas and Sim (2003). Instead of doing a small correction (minus one
standard deviation of the uncertainty distribution) for all items in the bank, a substantive
correction (replacing the parameters by their infima) is made only for the maximum number
of items assumed to affect the solution.
This resembles more closely the practice of ATA, where some items in the test will
have high positive estimation errors, while others will not. A robustness level (i.e., the
maximum number of item parameters that might be replaced) has to be defined beforehand.
can vary anywhere from zero (which resembles ATA) to all items in the test (which resembles
the Soyster method). When the ratio of item bank size to test length is small, many items will
be selected from the item bank. will be close to zero, because only a few of the selected
items will have high positive estimation errors. When the ratio of item bank size to test length
is high, only a very small proportion of the items will be selected from the bank.
Capitalization of chance will be more of an issue, and will be closer to the test length.
Bertsimas and Sim (2003) proved that finding an optimal solution for a combinatorial
optimization problem where at most parameters were allowed to change, was equal to
solving ( 1) MIP problems. For details of the method, see Veldkamp (2012).
Robust CAT Based on Expected Information
Even though relatively good results were obtained for some practical test assembly problems
with the modified Soyster method (see de Jong et al., 2009) and the Bertsimas and Sim
method (see Veldkamp, 2012), both methods do not use information known about the
distribution of the item parameter uncertainty. Uncertainty in the item parameters results from
parameter estimation, and it is assumed to follow a normal distribution with a mean equal to
the parameter estimates and a standard deviation equal to the standard error of estimation for
maximum likelihood estimation, or to the posterior standard deviation in a Bayesian
framework. This information could be used to calculate the expected information for each
item, taking the uncertainty distribution of the parameters into account. Lewis (1985) already
proposed using expected response functions (ERFs) to correct for uncertainty in the item
parameters (Mislevy, Wingersky, & Sheehan, 1994) for fixed-length linear tests. The same
idea might be applied at the item bank level as well, thus providing a starting point for a
robust test assembly procedure for CAT.

Bernard P. Veldkamp
40
Robust Item Pool
The first step in such a procedure would be to develop a robust item pool. Since the
uncertainties in the parameters are assumed to follow a normal distribution, the cumulative
distribution function can be used to calculate which percentage of the items is expected to
have which deviation. For example, 2.5% of the items are assumed to have a positive
deviation larger than 1.96 standard deviations.
Based on this information, robust item information can be calculated by subtracting
the expected deviation from the estimated item information. When all items in the bank are
ordered from smallest to largest with respect to their maximum information, the robust item
information can be calculated as:
( ) ( ) * ( ( )), 1,..., ,R
i i i iI I z SD I i I (1)
where i is the index of the item in the ordered bank, I is the number of items in the bank,
( )R
iI is the robust information provided at ability level , iz corresponds to the 100 / ( 1)i I
-th percentile of the cumulative normal distribution function, and ( ( ))iSD I is the standard
deviation of the information function based on estimated item parameters. Within a Bayesian
framework, a comparable procedure has to be applied, where the posterior distribution is used
to calculate iz .
Empirical Example
To illustrate the effects of expected information, robust item information was calculated for
all items of an operational item bank. 306 items were calibrated with a three-parameter
logistic model (3PLM):
( )
( )( ) (1 ) ,
1
a b
i a b
eP c c
e
(2)
where a is the discrimination, b is the difficulty, and c is the guessing parameter. The item
parameters were estimated using BILOG MG 3, for a sample of 41,500 candidates. The
estimated parameter ranges were [0.26,1.40]a , [ 3.15,2.51]b , and [0.00,0.50]c , and the
average uncertainties were ( 0.02, 0.044, 0.016)a b c .

4 Ensuring the Future of Computerized Adaptive Testing
41
The maximum amount of information over all theta levels (Hambleton, & Swaminathan,
1985, p.107) provided by the 50 most informative items is shown in Figure 2.
Max Inf
Item no.
Figure 2 Maximum amount of information provided by the 50 most informative items
All items were ranked with respect to their maximum amount of information over all
theta levels, and the robust information was calculated by subtracting the expected deviation
for all of the items. To illustrate how robust item information corrects for uncertainty in the
item parameters, its performance was compared with a number of simulated item banks.
Three item banks were simulated by randomly drawing item parameters from the multivariate
normal distribution with a mean equal to the estimated item parameters and standard
deviations equal to the errors of estimation. The deviance in maximum information between
the estimated item parameters on the one hand and the robust and simulated item parameters
on the other hand is shown in Figure 3.
0
0,2
0,4
0,6
0,8
1
1,2
1,4
0 5 10 15 20 25 30 35 40 45 50

Bernard P. Veldkamp
42
Deviation
Item no.
Figure 3 Deviations from the maximum information for the robust information (thick line) and various
simulated item banks (thin lines) for the 50 most informative items
As expected, the robust maximum information is generally smaller than the estimated
maximum information for the 50 most informative items, but the difference becomes smaller
and smaller when the items are less informative. Because of the differences in ( ( ))SD I for
the various items, the robust maximum information does not increase monotonically. As can
be seen in Figure 3, ( ( ))SD I for the second item is larger than ( ( ))SD I for the first item.
The curves of the deviances for the simulated item banks hover around zero. By chance, the
deviation will be positive for some of the items and negative for others. It can also be seen
that for individual items, the deviance for the simulated information could even be larger than
the deviation of the robust information, but for a test, which is for a group of items, the robust
maximum information serves pretty well as a lower bound.
Robust Item Selection
The robust item information is still conservative. It assumes that uncertainty hits where it
hurts most; that is, it assumes that the most informative items have the highest uncertainty in
them. In practice, however, this is not the case. This can also be seen in Figure 3, where for
the first 25 items, the robust maximum information is obviously smaller than the simulated
maximum information. To correct for this conservatism, the Bertsimas and Sim method can
be applied for item selection in the second step of robust CAT.
-0,25
-0,2
-0,15
-0,1
-0,05
0
0,05
0,1
0 5 10 15 20 25 30 35 40 45 50

4 Ensuring the Future of Computerized Adaptive Testing
43
This method assumes that uncertainty only affects the solution for at most items in the test.
The following pseudo-algorithm describes the application of the Bertsimas and Sim method
for selecting the gth
item in CAT for a fixed length test of G items:
1. Calculate 1 1( ) ( )g R g
i i id I I for all items.
2. Rank the items such that 1 2 ... nd d d
3. For 1,...,( ( 1)) 1l G g find the item that solves:
1
1 1
ˆmax ( ) ( ) min( , )I l
l g
i i i l i l
i i
G I x d d x G g d
(1)
subject to:
1
1g
i
i R
x g
(2)
1
I
i
i
x g
(3)
{0,1} 1,..., .ix i I (4)
4. Let *
1,...,arg max
l
l nl G .
5. Item g is the unadministered item in the solution of *lG .
In step 3 of the pseudo algorithm, (G-(g-1))+1 MIP are solved, where (G-(g-1)) is the
amount of items still to be selected. For the MIPs, it holds that ix denotes whether item i is
selected ( 1)ix or not ( 0)ix (see also Equation [6]), and 1gR is the set of items that have
been administered in the previous ( 1)g iterations.

Bernard P. Veldkamp
44
Equations (4)–(5) ensure that only one new item is selected. Finally, in (3) the amount of
robust information in the test is maximized. This objective function consists of a part where
the information is maximized and a part between square brackets that corrects for
overestimation of the information.
This correction term varies for each value of 1,...,( ( 1)) 1.l G g ld represents the
overestimation of the information in item l. When 1l , ld is equal to the largest
overestimation of item information at the estimated ability level in the item bank, and times
1d (or (G-(g-1)) 1d , when less than items are remaining) is subtracted as a correction. This
will be too conservative because there is only one item with the maximum overestimation of
the information. For larger values of l , the amount of overestimation is smaller, which
implies that the correction factor is smaller , and the solution is less conservative.
For these values of l it is taken into account that selecting one of the items with i<l
results in a larger overestimation, since, as a result of the ordering in step 2, .i ld d By
solving (G-(g-1))+1 MIPs and choosing the maximum, a robust alternative for the test
information that is not too conservative can be calculated. For details and proofs see
Veldkamp (2012) and Bersimas & Sim (2003).
Conclusion and Discussion
Capitalization on chance is a serious problem in CAT that might negatively affect both the
validity and viability of this test administration mode. In this chapter, the outline of a
procedure for robust CAT was presented as an answer to this problem. It accepts a suboptimal
solution that remains near optimal even when item parameters turn out to be seriously
overestimated. The next step in this research would be to carry out an extensive simulation
study to determine its strengths and weaknesses.
Other methods have been proposed in the literature to deal with the problem of
capitalization on chance. Belov and Armstrong (2005) proposed using an MCMC method for
test assembly that imposes upper and lower bounds on the amount of information in the test.
Since there is no maximization step in their approach, item selection is not affected by the
capitalization on chance problem. On the other hand, this approach does not take uncertainty
in the item parameters into account at all. This could lead to infeasibility problems (Huitzing,
Veldkamp, & Verschoor, 2005), as illustrated in Veldkamp (2012). Besides, MCMC test
assembly was developed for the assembly of linear test forms, and therefore application to
CAT is not straightforward.

4 Ensuring the Future of Computerized Adaptive Testing
45
Olea et al. (2012) propose using item exposure control to deal with this problem. When items
are selected based on maximum information, the most informative items tend to be selected
more often than the others. Exposure-control methods can be implemented to limit item
exposure and force less informative items to be selected. In this way, selection of the most
informative items due to capitalization on chance will be prevented. Olea et al. (2012) report
some promising results. Instead of correcting for uncertainty, this method limits the
probability that items most vulnerable to overestimation of their information will be selected.
A combination of robust CAT and item exposure control would probably result in a very
strong method to prevent the capitalization on chance problem in CAT.
Every operational CAT program seriously needs to consider the impact of uncertainty
in the item parameters on the reported measurement precision. Various simulation studies by
Hambleton and Jones (1994), Olea et al. (2012), Veldkamp (2012), and Veldkamp et al.
(2012) reported overestimation of the amount of information in the test of up to 40%. When
the uncertainty in the item parameters is known, simulation studies have to be carried out to
determine the impact on the specific CAT program at hand. Once the impact is known, one
can decide either to neglect the problem or to implement a method that deals with item
parameter uncertainty either implicitly (by applying exposure-control methods) or explicitly
by using robust CAT, or by a combination of both.
Acknowledgement
This chapter was written when the author was a visiting scholar at the Law School Admission
Council (LSAC). The opinions and conclusions contained in the chapter are those of the
author and do not necessarily reflect the positions or policy of LSAC.
References
Belov, D. I., & Armstrong, D. H. (2005). Monte Carlo test assembly for item pool analysis
and extension. Applied Psychological Measurement, 29, 239–261.
DOI:10.1177/0146621605275413
Ben-Tal, A., El Ghaoui, L., & Nemirovski, A. (2009). Robust optimization. Princeton, NJ:
Princeton University Press.
Bertsimas, D., & Sim, M. (2003). Robust discrete optimization and network flows.
Mathematical Programming, 98, 49–71, DOI:10.1007/s10107-003-0396-4

Bernard P. Veldkamp
46
De Jong, M. G., Steenkamp, J.-B. G. M., & Veldkamp, B. P. (2009). A model for the
construction of country-specific yet internationally comparable short-form marketing
scales. Marketing Science, 28, 674–689. DOI:10.1287/mksc.1080.0439
Hambleton, R. H., & Jones, R. W. (1994). Item parameter estimation errors and their
influence on test information functions. Applied Measurement in Education, 7, 171–
186. DOI 10.1207/s15324818ame0703_1
Hambleton, R.H., & Swaminathan, H. (1985). Item Response Theory, Principles and
Applications. Boston, MA: Kluwer Nijhoff Publishing
Huitzing, H. A., Veldkamp, B. P., & Verschoor, A. J. (2005). Infeasibility in automated test
assembly models: A comparison study of different methods. Journal of Educational
Measurement, 42, 223–243. DOI:10.1111/j.1745-3984.2005.00012.x
Lewis, C. (1985). Estimating individual abilities with imperfectly known item response
functions. Paper presented at the Annual Meeting of the Psychometric Society,
Nashville, TN.
Mislevy, R. J., Wingersky, M. S., & Sheehan, K.M. (1994). Dealing with uncertainty about
item parameters: Expected response functions (Research Report 94-28-ONR).
Princeton, NJ: Educational Testing Service.
Olea, J., Barrada, J. R., Abad, F. J., Ponsoda, V., & Cuevas, L. (2012). Computerized adaptive
testing: The capitalization on chance problem. The Spanish Journal of Psychology, 15,
424–441. DOI:10.5209/rev_SJOP.2012.v15.n1.37348
Soyster, A.L. (1973). Convex programming with set-inclusive constraints and applications to
inexact linear programming. Operations Research, 21. 1154-1157.
Van der Linden, W. J. (2005). Linear models for optimal test design. New York: Springer
Verlag.
Veldkamp, B. P. (2012). Application of robust optimization to automated test assembly
(Research Report 12-02). Newtown, PA: Law School Admission Council.
Veldkamp, B. P., Matteucci, M., & de Jong, M. (2012). Uncertainties in the item parameter
estimates and robust automated test assembly. Manuscript submitted for publication.
47
Chapter 5
Classifying Unstructured Textual Data Using the Product Score
Model: An Alternative Text Mining Algorithm
Qiwei He and Bernard P. Veldkamp
Abstract Unstructured textual data such as students‘ essays and life narratives can provide
helpful information in educational and psychological measurement, but often contain
irregularities and ambiguities, which creates difficulties in analysis. Text mining techniques
that seek to extract useful information from textual data sources through identifying interesting
patterns are promising. This chapter describes the general procedures of text classification
using text mining and presents an alternative machine learning algorithm for text
classification, named the product score model (PSM). Using the bag-of-words representation
(single words), we conducted a comparative study between PSM and two commonly used
classification models, decision tree and naïve Bayes. An application of these three models is
illustrated for real textual data. The results showed the PSM performed the most efficiently
and stably in classifying text. Implications of these results for the PSM are further discussed
and recommendations about its use are given.
Keywords: text classification, text mining, product score model, unstructured data
Introduction
Language is magic that diversifies our lives. The way individuals talk and write provides a
window into their emotional and cognitive worlds. Yet despite the interesting attributes of
textual data, analyzing them is not easy. One of the major reasons is that textual data are
generally more diverse than numerical data and are often unstructured, neither having a
predefined data model nor fitting well into relational patterns. The irregularities and
ambiguities make it even harder to classify textual data compared with structured data stored
in field form in databases. Thus, to address the challenge of exploiting textual information,
new methods need to be developed.
The development of information technology demonstrated breakthroughs in handling
unstructured textual data during the past decade. A promising technique is text mining, which
exploits information retrieval, information extraction, and corpus-based computational
linguistics. Analogous to data mining, text mining seeks to extract useful information from
textual data sources by identifying interesting patterns.

Qiwei He and Bernard P. Veldkamp
48
However, a preprocessing step is required to add transforming unstructured data stored in
texts into a more explicitly structured intermediate format (Feldman & Sanger, 2007).
Text mining techniques are used, for example, for text classification, where textual
objects from a universe are assigned to two or more classes (Manning & Schütze, 1999).
Common applications in educational measurement classify students‘ essays into different
grade levels with automated scoring algorithms, e.g., Project Essay Grade (PEG; Page, 2003)
and automated scoring of open answer questions, e.g., E-raters (Burstein, 2003). Feature
extraction and machine learning are the two essential sections in text classification, playing
influential roles in classification efficiency. During feature extraction, textual components are
transformed into structured data and labeled with one or more classes. Based on these
encoded data, the most discriminative lexical features are extracted by using computational
statistic models, such as the chi-square selection algorithm (Oakes, Gaizauskas, Fowkes,
Jonsson, & Beaulieu, 2001) and likelihood ratio functions (Dunning, 1993). In the machine
learning section, documents are allocated into the most likely classes by applying machine
learning algorithms such as decision trees (DTs), naïve Bayes (NB), support vector machines
(SVM), and the K nearest neighbor model (KNN). Although many machine learning
classifiers have been tested efficiently in text classification, new alternative models are still
being explored to further improve text classification performance and accelerate the speed of
word processing (see more in Duda, Hart, & Stork, 2001; Vapnik, 1998).
This chapter briefly describes the general procedure for supervised text classification
where the actual status (label) of the training data has been identified (―supervised‖),
introduces an effective and much used feature extraction model, i.e., the chi-square selection
algorithm, and presents an alternative machine learning algorithm for text classification,
named the product score model (PSM). To evaluate the PSM performance, a comparative
study was conducted between PSM and two standard classification models, DTs and NB,
based on an example application for real textual data. The research questions focus on (a)
whether the PSM performs more efficiently in classifying text compared to the standard
models, and (b) whether the PSM maintains stable and reliable agreement with the human
raters‘ assessment.
Supervised Text Classification
Supervised text classification is a commonly used approach for textual categorization, which
generally involves two phases, a training phase and a prediction phase (Jurafsky & Martin,
2009; see Figure 1).

5 Classifying Unstructured Textual Data Using the Product Score Model: An Alternative Text Mining Algorithm
49
During training, the most discriminative keywords for determining the class label are
extracted. The input for the machine learning algorithm consists of a set of prespecified
keywords that may potentially be present in a document and labels classifying each document.
The objective of the training phase is to ―learn‖ the relationship between the keywords and the
class labels. The prediction phase plays an important role in checking how well the trained
classifier model performs on a new dataset. The test set should consist of data that were not
used during training. In the testing procedure, the keywords extracted from the training are
scanned in each new input. Thus, the words that were systematically recognized are fed into
the ―trained‖ classifier model, which predicts the most likely label for each new self-narrative.
To ensure proper generalization capabilities for the text classification models, a cross-
validation procedure is generally applied.
Note: Supervised text classification generally involves two phases, training and prediction. The objective of the
training phase is to model (i.e., to learn) the relationship between the keywords and labels. The prediction is used
to check how well the trained classifier model performs on a new dataset.
Figure 1 The framework of supervised text classification

Qiwei He and Bernard P. Veldkamp
50
To improve the efficiency of the training and prediction procedure, a preprocessing routine is
often implemented. This involves screening digital numbers, deducting noninformative ―stop
words‖ (e.g., ―I‖, ―to‖), common punctuation marks (e.g., ―.‖, ―:‖), and frequently used
abbreviations (e.g., ―isnt‖, ―Im‖), and ―stemming‖ the rest of words, for instance, with the
Porter algorithm (Porter, 1980) to remove common morphological endings. For example, the
terms ―nightmares,‖ ―nightmaring,‖ and ―nightmared,‖ though in variant lexical forms, are
normalized in an identical stem ―nightmar‖1 by removing the suffixes and linguistic rule-
based indicators.
Chi-Square Feature Selection Algorithm
A classifier extraction can be designed to capture salient words or concepts from texts using a
feature selection algorithm that compares the frequency of each word type in the text corpus2
of interest to the frequency of that word type in the whole text corpora (Conway, 2010).
Forman (2003) reviewed many feature selection methods for text classification, in which the
chi-square selection algorithm (Oakes et al., 2001) was recommended for use due to its high
effectiveness in finding robust keywords and testing for the similarity between different
corpora. Thus, we briefly introduce this algorithm here and then apply it in the example data.
To apply the chi-square algorithm for feature selection, the N word types in the
training set are compiled into an N-by-2 table, schematically shown in Table 1. The two
columns correspond to the two corpora, 1C and
2C . Each row corresponds to a particular word
i . The number of word occurrences in 1C and
2C is indicated byin and
im , respectively. The
sum of the word occurrences in each corpus is defined as the corpus length,
k
i
i
k
i
i mClennClen1
2
1
1 )( ,)( (1)

5 Classifying Unstructured Textual Data Using the Product Score Model: An Alternative Text Mining Algorithm
51
Table 1 Structuralizing Textual Data in a Binary Classification
1C 2C
Word 1 45 1
Word 2 23 0
…
…
…
Word i in im
…
…
…
Word k kn km
Total )( 1Clen )( 2Clen
Note: C represents the class label of text corpus, andin and
im represent the number of occurrences of a word i
in two corpora, respectively
Table 2 Confusion Matrix for Word i in the 2-by-2 Chi-Square Score Calculation
1C 2C
Word i in im
¬ Word i inClen )( 1 imClen )( 2
Note: C represents the class label of text corpus, and in and
im represent the number of occurrences of a word i
in two corpora, respectively
Each word is then compiled into its own 2-by-2 contingency table as shown in Table
2. The values in each cell are called the observed frequencies (ijO ). Using the assumption of
independence, the expected frequencies (ijE ) are computed from the marginal probabilities.
The chi-square statistic sums the differences between the observed and the expected values in
all squares of the table, scaled by the magnitude of the expected values, as the following
formula:
2
2
,
( )ij ij
i j ij
O EX
E
. (2)

Qiwei He and Bernard P. Veldkamp
52
To ensure the reliability of the calculation, as Manning and Schütze (1999) suggested, in
practice features or words that occur fewer than five times are usually eliminated. However,
for a small sample, the number of word occurrences could be even lower, perhaps three times.
Based on the chi-square scores, all words are ranked in descending order, and those standing
at the top are extracted as robust classifiers.3 Further, if the ratio ii mn / is larger than the ratio
)(/)( 21 ClenClen , the word is regarded as more typical of corpus 1C (as a ―positive indicator‖);
otherwise, it is more typical of corpus 2C (as a ―negative indicator‖) (Oakes et al., 2001).
Text Classification Models
Training text classifiers is the procedure where machines ―learn‖ to automatically recognize
complex patterns, to distinguish between exemplars based on their different patterns, and to
make intelligent predictions on their class. Among various machine learning algorithms,
decision trees (C4.5; Quinlan, 1993) and naïve Bayes are two of the most widely used text
classification models (see more algorithms in Kotsiantis, 2007).
Decision Trees
A decision tree is a well-known machine learning approach to automatically induce
classification trees based on training data sets. In the tree structures, leaves represent class
labels, and branches represent conjunctions of features that lead to those class labels. The
feature that best divides the training data is the root node of the tree. There are numerous
methods for finding the feature that best divides the training data such as information gain
(Hunt, Marin, & Stone, 1966) and the Gini index (Breiman, 1984). The objects at each node
are split into piles in a way that gives maximum information gain and stopped until they are
categorized into a terminate class.
Naive Bayes
Naive Bayes is a probabilistic classifier applying Bayes‘s theorem with strong (naive)
independence assumptions (Lewis, 1998). It is simple but effective in practice (Hand & Yu,
2001). In text classification, the basic idea behind NB is to estimate probabilities of categories
given a text document by using the joint probabilities of words and categories with the
assumption of word independence. Namely,
)(
)|()(
),...,(
)|()...|()|()(),( 1
1
21
ww
p
CwpCp
wwp
CwpCwpCwpCpCP
k
i
i
k
k
, (3)

5 Classifying Unstructured Textual Data Using the Product Score Model: An Alternative Text Mining Algorithm
53
where C represents a specific class and w represents the keyword vectors. )(Cp is the prior
probability of a certain class, and )|( Cwp iis the conditional probability of a word occurs in a
certain class. In the binary classification, the two probabilities from categories 1C and
2C could
be simply compared in a ratio R . That is,
k
i
i
k
i
i
CwpCp
CwpCp
CP
CPR
1
22
1
11
2
1
)|()(
)|()(
),(
),(
w
w . (4)
If 1R , the object is classified in category 1C ; else it is classified in category
2C .
Product Score Model
The product score model (He, Veldkamp, & de Vries, 2012) is an alternative machine
learning algorithm, which features in assigning two weights for each keyword (in binary
classification)—the probability of the word i occurs in the two separate corpora, iU and iV —
to indicate to how much of a degree the word can represent the two classes. The weights are
calculated by
)(/)(
)(/)(
2
1
ClenamV
ClenanU
ii
ii. (5)
Note that a smoothing constant a (we use 5.0 a in this study) is added to the word
occurrence in Formula (5) to account for words that do not occur in the training set, but might
occur in new texts. (For more on smoothing rules, see Manning & Schütze, 1999; Jurafsky &
Martin, 2009.)
The name product score comes from a product operation to compute scores for each
class, i.e., 1S and 2S , for each input text based on the term weights. That is,
)(/)()()(
)(/)()()(
1
22
1
22
1
11
1
11
k
i
i
k
i
i
k
i
i
k
i
i
ClenamCPVCPS
ClenanCPUCPS (6)

Qiwei He and Bernard P. Veldkamp
54
where a is a constant, and )(CP is the prior probability for each category given the total
corpora. The classification rule is defined as:
else 2
)/log( if 1choose
21
C
bSSC, (7)
where b is a constant.4
To avoid mismatches caused by randomness, unclassification rules are also taken into
account. As mentioned above, based on the chi-square selection algorithm, the keywords are
labeled as two categories, positive indicator and negative indicator. Thus, we define a text as
―unclassified‖ when either one of the following conditions is met: (a) no keywords are found
in the text; (b) only one keyword is found in the text; (c) only two keywords are found in the
text, and one is labeled as a positive indicator while the other as a negative indicator.
Example Application
Data
As part of a larger study exploring the relationship between life narratives and students‘
personality adaption, 656 life stories were collected from 271 undergraduate students at
Northwestern University, in the United States. The classification target was to label the life
stories into four categories: redemption (RED), contamination (CON), redemption and
contamination (BOTH), and neither redemption nor contamination (NEITHER). In the
narrative research in the discipline of personality psychology, redemption and contamination
are the two most important sequences for revealing the ―change‖ tendency in people‘s
emotional well-being through writing (McAdams, 2008). In a redemption sequence, a
demonstrably ―bad‖ or emotionally negative event or circumstance leads to a happy outcome,
whereas in a contamination scene, a good or positive event or state becomes bad or negative.
Three experienced experts were invited to label each story based on McAdams‘s manual
coding system (McAdams, 2008). The Kappa agreement among the three human raters was
0.67.
The label for each story was defined as the decision made by at least two human raters,
and was identified as the ―standard‖ for the training process. According to the human raters‘
assessment, 231 stories were labeled ―change‖ (i.e., redemption or contamination or both),
and 425 stories were labeled ―no change‖ (i.e., neither redemption nor contamination).

5 Classifying Unstructured Textual Data Using the Product Score Model: An Alternative Text Mining Algorithm
55
Method
Given concerns about the common feature—―the change‖ tendency—in the redemption and
contamination sequences, a two-stage classification framework was constructed. On the first
stage, all the input was divided into two groups, ―change‖ and ―no change.‖ A further detailed
classification was conducted at the second stage to categorize the preliminary results as
redemption and contamination. To illustrate the application of the text classification models,
we focused only on the first stage in the present study. The dataset was randomly split into a
training set and a testing set, 70% and 30%, respectively. The ―stop word list‖ and the Porter
algorithm were used in the preprocessing to deduct the noninformative words and normalize
the words into their common lexical forms. The robust classifiers were extracted by using the
chi-square selection algorithm. Three machine learning models, DC, NB, and PSM, were
applied for a comparative study.
Six performance metrics, accuracy, sensitivity (recall), specificity, positive predictive
value (precision) (PPV), negative predict value (NPV), and F1 measure, were used to evaluate
the efficiency of the three employed machine learning algorithms. A contingency table was
used to perform calculations (see Table 3). All six indicators are defined in definitions (1)
through (6), respectively. Accuracy, the main metric used in classification, is the percentage
of correctly defined texts. Sensitivity and specificity measure the proportion of actual
positives and actual negatives that are correctly identified, respectively. These two indicators
do not depend on the prevalence (i.e., proportion of ―change‖ and ―no change‖ texts of the
total) in the corpus, and hence are more indicative of real-world performance. The predictive
values, PPV and NPV, are estimators of the confidence in predicting correct classification;
that is, the higher predictive values, the more reliable the prediction would be. The F1
measure combines the precision and recall in one metric, which is often used in information
retrieval to show classification efficiency. This measurement can be interpreted as a weighted
average of the precision and recall, where an F1 score reaches its best value at 1 and worst
value at 0.
Further, to check the stability of the three classification models, we explored all the
metrics with an increasing number of word classifiers by adding 10 keywords, five from
positive classifiers (i.e., ―change‖) and five from negative classifiers (i.e., ―no change‖), each
time. The number of keywords included in the textual assessment ranged from 10 to 2,600.

Qiwei He and Bernard P. Veldkamp
56
Table 3 Contingency Table for Calculating Classification Metrics
True Standard
1C 2C
Assigned 1C a B
Assigned 2C c d
Note: a is a true positive value (TP), b is a false
positive value (FP), c is a false negative value (FN),
and d is a true negative value (TN)
dcba
daAccuracy
1
ca
aySensitivit
2
db
dySpecificit
3
ba
a)Value (PPVredictive Positive P
4
dc
d)Value (NPVredictive Negative P
5
PPVySensitivit
PPVySensitivitF1-score
2
6
Notes:
1 The stemming algorithm is used to normalize lexical forms of words, which may generate stems without an
authentic word meaning, such as ―nightmar.‖
2 A body of texts is usually called a text corpus. The frequency of words within the text corpus can be interpreted
in two ways: word token and word type. Word token is defined as individual occurrence of words, i.e., the
repetition of words is considered, whereas word type is defined as the occurrence of different words, i.e.,
excluding repetition of words.
3 Since we are interested only in ranking the chi-square score for each word to find the optimal classifier,
assessing the significance of the chi-square test is not important in this way.
4 In principle, the scope of threshold b could be set to be infinite. However, in practice, (–5,+5) is recommended
as a priori for b.

5 Classifying Unstructured Textual Data Using the Product Score Model: An Alternative Text Mining Algorithm
57
Results
Among the top 20 robust positive classifiers (i.e., keywords representing a ―change‖
tendency), the expressions with negative semantics, e.g., ―death,‖ ―depress,‖ ―scare,‖ ―lost,‖
―anger,‖ ―die,‖ ―stop,‖ took a one-third proportion; whereas among the top 20 robust negative
classifiers (i.e., keywords representing ―no change‖ tendency), expressions with positive
semantics, e.g., ―peak,‖ ―dance,‖ ―high,‖ ―promo,‖ ―best,‖ ―excite,‖ ―senior,‖ accounted for
the most, around 35%.
This result implies that people generally describe life in a happy way. The words with
negative semantics would be informative for detecting the ―change‖ tendency in the life
stories.
The performances of three classification models are shown in Figure 2 with six
metrics. Note that the three models resulted in a similar overall accuracy rate of around 70%,
although the PSM was a bit superior to the other two, yet not robust. Further, the PSM ranked
the highest in the F1 measure, which suggested that this model performed more efficiently
than the DT and the NB in the text classification. In the sensitivity analysis, the NB yielded
the highest specificity (more than 90%) but sacrificed too much in sensitivity (around 10%).
The PSM performed worst on specificity (around 75%) but yielded the best result in
sensitivity (around 60%). The PSM was more sensitive in detecting ―change‖ life stories but a
bit less capable of finding ―no-change‖ stories than the other two models. However, among
the three models, the PSM was the most balanced between sensitivity and specificity; that is,
this model showed relatively satisfactory sensitivity without losing too much specificity.
Another noticeable point was that the PSM showed the highest value in the NPV. This implies
that we could have the most reliable prediction to deduct ―no-change‖ life stories from the
further stage by using the PSM rather than the DT and the NB. In the PPV plot, the NB curve
ranked highest but it waved substantially with the increasing number of keywords, whereas
the DT and the PSM remained stable throughout the whole processing.
The PSM and DT showed relatively low PPV values (around 60%), suggesting that
the confidence for reliable prediction of ―change‖ life stories was not that strong. However,
since at this preliminary stage we targeted discarding the ―no-change‖ life stories from further
classification, PPV is less important than NPV in this sense.

Qiwei He and Bernard P. Veldkamp
58
Note: The horizontal axis indicates the number of keywords included in the textual assessment. The text analysis
started with 10 keywords with the highest chi-square scores, i.e., five keywords labeled as positive classifiers
and five keywords labeled as negative classifiers, and ended with 2600 keywords, i.e., 1300 keywords from
either classifier label
Figure 2 Comparisons of text classification models, DT, NB and PSM based on the example application

5 Classifying Unstructured Textual Data Using the Product Score Model: An Alternative Text Mining Algorithm
59
Discussion
The example study demonstrated that the PSM is a promising machine learning algorithm for
text (binary) classification. Although the three classification models showed a similar overall
accuracy rate, the PSM performed the best in the F1 measure and remained stable as the
number of keywords increased, implying better efficiency in text classification and more
reliable agreement with the human raters‘ assessment than the other two standard models.
Similar results were found in a recent study by He et al. (2012), where the PSM was validated
in text classification for posttraumatic stress disorder (PTSD) patients‘ self-narratives
regarding their stressful events and physical and mental symptoms. Analogous to the example
application, the PSM successfully classified the self-narratives written by individuals with
PTSD and non-PTSD in high agreement (82%) with the psychiatrists‘ diagnoses and
presented stable results as the number of keywords increased.
Further, to help practitioners select an optimal algorithm for their own problems, the
following pros and cons of each model can be considered and compared. The DT model is
one of the most comprehensive models for visually tracking the path in classification. It is
easily understood why a decision tree classifies an instance as belonging to a specific class.
However, this model may result in low accuracy, especially for a small sample dataset. The
DT uses splits based on a single feature at each internal node. Thus, many features are
necessary to extract from the training set. Another frequent problem that may occur in
applying DT algorithms is the overfitting. The most straightforward way of using them is to
preprune the tree by not allowing it to its full size (Kotsiantis, 2007) or establish a nontrivial
termination criterion such as a threshold test for the feature quality metric (see more in
Elomaa, 1999; Bruha, 2000).
The major advantages of NB are its short computational time for training and its
simple form of a product with the assumption of independence among the features.
Unfortunately, the assumption of independence among words is not always correct, and thus,
the NB is usually less accurate than other more sophisticated learning algorithms. However,
the NB is still a very effective model in classification. Domingos and Pazzani (1997)
performed a large-scale comparison of the NB with state-of-the-art algorithms, e.g., DT,
instance-based learning, and rule induction, on standard benchmark datasets, and found it to
be sometimes superior to the other learning schemes, even on datasets with substantial feature
dependencies.

Qiwei He and Bernard P. Veldkamp
60
Despite adopting the same assumption of word independence in the NB, the PSM has more
flexibility in the model decision threshold. As shown in Formula (7), the decision threshold b
could be set as an unfixed constant in practice. For instance, in a clinical setting such as the
PTSD screening process, on one hand, psychiatrists may want to exclude people without
PTSD from further tests, which needs a relatively higher specificity value.
On the other hand, when psychiatrists focus on treatment for patients with PTSD, a
more sensitive result from the text analysis is probably required to detect potential patients as
precisely as possible. With the example data in the current study, to yield satisfactory
sensitivity in finding the ―change‖ elements in life stories without sacrificing too much
specificity, an optimal threshold of PSM log ratio score could be set at 4b . However, since
the PSM allocates a set of term weights for each key feature, more time and more storage
space are expected in the training and validation process, which might reduce the PSM‘s
effectiveness in a large sample.
In addition to the applications of text classification within the field of psychology and
psychiatry, the PSM is also expected to extend its usage in educational measurement. For
instance, this model might be used as an alternative approach to classify students‘ essays into
different grade levels, to retrieve information about students‘ noncognitive skills by analyzing
their writing components, e.g., diaries, posts, blogs, and short messages, and further to extract
patterns among students‘ noncognitive skills and their academic grades.
In conclusion, the present study introduced the general procedure of text classification
within the framework of text mining techniques and presented an alternative machine learning
algorithm, the PSM, for text classification. In the comparative study with two standard
models, DT and NB, the PSM was shown to be very promising in text (binary) classification.
It might be interesting to extend the PSM into a generalized multiple classification algorithm
in future work, and to find out whether and how educational measurement could benefit from
this new procedure.
References
Breiman, L. (1984). Classification and regression trees. Belmont, CA: Wadsworth.
Bruha, I. (2000). From machine learning to knowledge discovery: Survey of preprocessing
and postprocessing. Intelligent Data Analysis, 4, 363–374.
Burstein, J. (2003). The E-rater scoring engine: Automated essay scoring. In M. D. Shermis &
J. C. Burstein (Eds.), Automated essay scoring: A cross-disciplinary perspective (pp.
113–121). Mahwah, NJ: Erlbaum.

5 Classifying Unstructured Textual Data Using the Product Score Model: An Alternative Text Mining Algorithm
61
Conway, M. (2010). Mining a corpus of biographical texts using keywords. Literary and
Linguistic Computing, 25(1), 23–35.
Domingos, P., & Pazzani, M. (1997). On the optimality of the simple Bayesian classifier
under zero-one loss. Machine Learning, 29(2–3), 103–130.
Duda, R. O., Hart, P. E., & Stork, D. G. (2001). Pattern classification. New York, NY: Wiley.
Dunning, T. (1993). Accurate methods for the statistics of surprise and coincidence.
Computational Linguistics, 19, 61–74.
Elomaa, T. (1999). The biases of decision tree pruning strategies. Advances in Intelligent
Data Analysis Proceedings, 1642, 63–74.
Feldman, R., & Sanger, J. (2007). The text mining handbook: Advanced approaches in
analyzing unstructured data. Cambridge, England: Cambridge University Press.
Forman, G. (2003). An extensive empirical study of feature selection metrics for text
classification. Journal of Machine Learning Research, 3, 1289–1305.
Hand, D. J., & Yu, K. M. (2001). Idiot‘s Bayes - Not so stupid after all? International
Statistical Review, 69(3), 385–398.
He, Q., Veldkamp, B. P., & de Vries, T. (2012). Screening for posttraumatic stress disorder
using verbal features in self-narratives: A text mining approach. Psychiatry Research.
doi: 10.1016/j.psychres.2012.01.032
Hunt, E. B., Marin, J., & Stone, P. J. (1966). Experiments in induction. New York, NY:
Academic Press.
Jurafsky, D., & Martin, J. H. (2009). Speech and language processing: An introduction to
natural language processing, computational linguistics, and speech recognition.
Upper Saddle River, NJ: Pearson Prentice Hall.
Kotsiantis, S. B. (2007). Supervised machine learning: A review of classification techniques.
Informatica, 31, 249–268.
Lewis, D. (1998). Naive (Bayes) at forty: The independence assumption in information
retrieval. In C. Nedellec & C. Rouveirol (Eds.), Machine learning: ECML-98,
Proceedings from the 10th European Conference on Machine Learning, Chemnitz,
Germany (pp. 4–15). New York, NY: Springer.
Manning, C. D., & Schütze, H. (1999). Foundations of statistical natural language
processing. Cambridge, MA: MIT Press.
McAdams, D. P. (2008). Personal narratives and the life story. In O. P. John, R. W. Robins, &
L. A. Pervin (Eds.), Handbook of personality: Theory and research (pp. 242–264).
New York, NY: Guilford.

Qiwei He and Bernard P. Veldkamp
62
Oakes, M., Gaizauskas, R., Fowkes, H., Jonsson, W. A. V., & Beaulieu, M. (2001). A method
based on chi-square test for document classification. In: Proceedings of the 24th
Annual International ACM SIGIR Conference on Research and Development in
Information Retrieval (pp. 440–441). New York, NY: ACM.
Page, E. B. (2003). Project Essay Grade: PEG. In M. D. Shermis & J. C. Burstein (Eds.),
Automated essay scoring: A cross-disciplinary perspective (pp. 43–54). Mahwah, NJ:
Erlbaum.
Porter, M. F. (1980). An Algorithm for Suffix Stripping. Program-Automated Library and
Information Systems, 14(3), 130–137.
Quinlan, J. R. (1993). C4.5: Programs for machine learning. San Francisco, CA: Morgan
Kaufmann.
Vapnik, V. N. (1998). Statistical learning theory. New York, NY: Wiley.

63
Chapter 6
Minimizing the Testlet Effect: Identifying Critical Testlet
Features by Means of Tree-Based Regression
Muirne C.S. Paap and Bernard P. Veldkamp
Abstract Standardized tests often group items around a common stimulus. Such groupings of
items are called testlets. The potential dependency among items within a testlet is generally
ignored in practice, even though a basic assumption of item response theory (IRT) is that
individual items are independent of one another. A technique called tree-based regression (TBR)
was applied to identify key features of stimuli that could properly predict the dependence
structure of testlet data. Knowledge about these features might help to develop item sets with
small testlet effects. This study illustrates the merits of TBR in the analysis of test data.
Keywords: testlets, testlet effects, testlet response theory, tree-based regression
Introduction
Standardized educational tests (which are often high-stakes tests) commonly contain sets of
items grouped around a common stimulus, for example, a text passage, graph, table, or
multimedia fragment, creating a dependence structure among items belonging to the same
stimulus. Such groups of items are generally referred to as item sets or testlets (Wainer &
Kiely, 1987), and this kind of dependence has been referred to as passage dependence (Yen,
1993). Testlets are popular for several reasons, including time efficiency and cost constraints,
reducing the effects of context in adaptive testing, and circumventing concerns that a single
independent test might be too atomistic in nature (measuring a concept that is very specific or
narrow) (Wainer, Bradlow, & Du, 2000). In the Netherlands, testlets are, for example, used in
the final examinations at the end of secondary education and in the ―Cito test‖ (van Boxtel,
Engelen, & de Wijs, 2011).
In most high-stakes tests, item response theory (IRT) models (Lord, 1980) are applied
to relate the probability of a correct item response to the ability level of the candidate. A basic
assumption underlying these models is that the observed responses to any pair of items are
independent of each other given an individual‘s score on the latent variable (local
independence, or LID).

Muirne C.S. Paap and Bernard P. Veldkamp
64
However, for pairs of items grouped around the same testlet, responses might also depend on
the common stimulus. Examinees might misread or misinterpret the stimulus, not like the
topic, have particular expertise on the subject matter addressed by the stimulus, and so on.
In certain situations, the testlet structure could be accounted for by applying a
polytomous IRT model, like the partial credit model, at testlet level, where the sumscore of
the items in the testlets would function as the score on this polytomous item (e.g., Thissen,
Steinberg, & Mooney, 1989; Verhelst & Verstralen, 2008). This polytomous approach to
testlets would not result in any violations of local independence, and standardized software
could be applied to estimate the models. However, there are some drawbacks. Until now, this
approach has only been proposed for situations where the items within a testlet adhere to the
very strict Rasch model. Furthermore, in calculating sumscores, the exchangeability of items
is assumed, which may not be realistic in practice. Moreover, a guessing parameter at the item
level cannot be taken into account. Alternatively, an approach can be used that accounts for
the multilevel structure (items within testlets). Bradlow, Wainer, and Wang (1999) proposed
to model the testlet effect by introducing a new parameter to the IRT models that accounts for
the random effect of a person on items that belong to the same testlet, in order to adjust for the
nested structure. This parameter, , is referred to as the testlet effect for person n on testlet t.
It represents a random effect that exerts its influence through its variance: the larger the
variance , the larger the amount of local dependence (LD) between the items j within the
testlet d (Wainer & Wang, 2000).
Although several procedures for estimating testlet response models have been
developed and applications of testlet response theory (TRT) have been studied (Glas, Wainer,
& Bradlow, 2000; Wainer, Bradlow, & Wang, 2007), the dependency is often ignored in
practice, and standard IRT models are used instead. The reason is obvious: assuming that LID
holds, allows the use of simpler and well-known IRT analyses using easily accessible
software. However, ignoring LD may lead to underestimation of the standard error of the
ability estimates, as well as bias in the estimated item difficulty and discrimination parameter
if the testlet effect is of a medium to large size (Wainer & Wang, 2000; Yen, 1993).
One way to approach this issue is to design testlets that show a small testlet effect. In a
simulation study, Glas et al. (2000) investigated what the effect would be on the accuracy of
item calibration if the testlet structure were to be ignored.

6 Minimizing the Testlet Effect: Identifying Critical Testlet Features by Means of Tree-Based Regression
65
Their data-set was generated using the 3PL model and the following structure:
( ) ( ) ( ) They compared the outcomes for
the two values of : 0.25 and 1.00. It should be noted that values of 1.00 or larger are often
found in real data-sets. Their findings showed that the
value of 0.25 resulted in negligible
bias in item parameter estimates, whereas moderate effects were found for the
value of
1.00 (Glas et al., 2000). Thus, if the testlet effects are small, the LD violation would be in an
acceptable range, and models such as the 2PL or 3PL could be used without sacrificing the
quality of the parameter estimation. A requirement for designing such testlets, however, is
knowing which testlet characteristics are related to the testlet effect size.
Predicting Testlet Effects
In a recent study (Paap, He, & Veldkamp, submitted), which will be referred to here as ―study
1,‖ we used tree-based regression (TBR) to identify the key features of the stimuli that can
predict the testlet effect in a standardized test measuring analytical reasoning. TBR is a
popular method in the field of data mining, but it is becoming more popular in other fields as
well, including educational measurement (e.g., Gao & Rogers, 2011). Like in other forms of
regression analysis, TBR involves a set of independent variables and one or more dependent
variables. Independent variables can be nominal, ordinal, or interval variables. A dependent
variable is a continuous variable; if it is categorical in nature, a classification tree is generated.
Independent variables can enter the tree more than once. Among TBR‘s advantages are its
nonparametric nature, ease of interpretation, and flexibility in dealing with high-order
interaction terms. An example of such a high-order interaction can be found in Figure 1:
nodes 11 and 12, which are positioned in the right branch. These two nodes are the result of
an interaction between four independent variables!
TBR can be used to divide the set of testlets iteratively in increasingly homogeneous
subsets (so-called ―nodes‖). At each stage of the analysis, the testlet feature with the largest
influence on the dependent variable is identified by using a recursive partitioning algorithm
called the ―classification and regression tree‖ (CART) (Breiman, Friedman, Olshen, & Stone,
1984). The CART algorithm starts by growing a large initial tree which overfits the data so as
to not miss any important information.
In the next step, the tree is ―pruned‖: a nested sequence of subtrees is obtained and,
subsequently, one of them is selected based on pre-defined criteria. Typically, the final step
consists of cross-validating the tree to determine the quality of the final model further.

Muirne C.S. Paap and Bernard P. Veldkamp
66
Since we had a relatively small data-set (100 testlets)1 in our study, the cross-validation
resulted in trees with little explained variance, and there was a substantial effect of the
random splitting of the data-set on the findings. Therefore, we chose not to use cross-
validation in our study.
The dependent variable in our TBR is the standard deviation of the testlet parameter,
denoted as . Note that we deliberately chose to use as opposed to in our model,
since capitalizes on the difference between testlets and is thus more informative in this
setting. We estimated the testlet effect using a three-parameter normal ogive (3PNO) model,
which is highly similar to the well-known 3PL model. The responses were coded as = 1
for a correct response and = 0 for an incorrect response. The probability of a correct
response is given by
( ) ( ) ( ( )) (1)
where ( ) is the probability mass under the standard normal density, and ic is the guessing
parameter of item i. ( ) has a normal distribution; that is,
( ). (2)
The parameters were estimated in a fully Bayesian approach using an MCMC computation
method. For details, see Glas (2012). Note that the model fit of (1) will be investigated in a
future study. The average testlet effect estimated with the 3PNO equaled 0.71 (SD = 0.16). It
should be noted that a value of smaller than 0.50 has been shown to have a negligible
effect on parameter estimates, whereas an effect near the size of 1.00 has a more substantial
influence (Glas et al., 2000).
1 Each respondent was presented with four out of 100 testlets; the four testlets were comprised of around 26
items each.

6 Minimizing the Testlet Effect: Identifying Critical Testlet Features by Means of Tree-Based Regression
67
Identifying Testlet Characteristics
The features used as independent variables in our study can be divided into four categories:
(1) variables describing the logical structure of the stimuli, (2) variables describing the themes
contained in the stimuli, (3) surface linguistic variables, and (4) aggregated item
characteristics. Two raters independently coded the variables in categories 1 and 2. In the case
of discordant scorings, a consensus was reached through discussion; a discussion log was kept
for these stimuli. The surface linguistic features were generated by using the specialized text-
mining software Python (Python Software Foundation, 2009). The aggregated item
characteristics were computed by averaging the attributes over all of the items in a testlet. In
total, 22 independent variables were generated.
Study 1: Prediction Based on Testlet Features only
In our first study, we did not include information about the items in our prediction model. A
two-step procedure was applied to build the prediction model. First, separate models were
evaluated for each variable category (structure, theme, linguistic). The variables that were
selected by the algorithm were then retained for each category, and subsequently all of the
variables belonging to one of the other categories were added to the selected variables to see
if any of them would be selected in the regression tree. In the next step, all of the variables
that were not selected by the CART algorithm were removed from the list of independent
variables and the variables of the remaining category were added. We then removed the
variables that were not selected from the independent variable list again. In the case of
competing models, the final model was selected based on the amount of the explained
variance and the greatest number of splits resulting in a large difference in the mean testlet SD
for the resulting nodes.
Summary of Results
Four independent variables were selected for the final prediction model: the percentage of ―if‖
clauses, the predicate propositional density (the number of verbs divided by the total number
of words, excluding punctuation), theme/topic, and the number of entities (entities are defined
as the units in the stimulus that had to be assigned to positions). The latter two variables
entered the tree at several splits. The total explained variance equaled 37.5%. The final tree
consisted of 16 nodes. For every node, the mean value of was larger than 0.50. For 6
nodes, the value of exceeded 0.75. For all 6 nodes with a medium-large testlet effect, the
percentage of ―if‖ clauses was smaller or equal to 31%.

Muirne C.S. Paap and Bernard P. Veldkamp
68
The largest testlet effects were found for the stimuli with a predicate propositional density of
0.098 or larger: 0.898 for stimuli with more than 10 entities and 0.980 for stimuli with 4
entities or fewer. For stimuli with a predicate propositional density smaller than 0.098, the
largest testlet effect was found for the stimuli with the theme/topic that was either business,
education, transport, or nature related, which had 5 entities or less, and a predicate
propositional density between 0.071-0.097.
Study 2: Including Average Item Difficulty
Since a testlet effect is an additional source of variance in an item response function, the
question arises whether attributes of items belonging to the testlet can be used to predict the
testlet effect. In study 1, the focus was only on stimulus attributes. In this second study,
aggregated item attributes will be included as well. Several interesting questions have to be
answered, including whether there is a relationship between the average item difficulty in a
testlet and the size of the testlet effect, whether characteristics of the testlet are related to
average item difficulty, and whether there is an influence of item characteristics and the testlet
location on the testlet effect. We made a first step towards illuminating these issues by
investigating the relationship between average item difficulty within a testlet and the testlet
effect size. We did this by adding the average item difficulty per testlet to the TBR model
described in the previous study. The same two-step procedure for building the model was
applied. The only difference was that besides the structure, theme, and linguistic variables, a
fourth category of independent variables was added to the model.
Summary of Results
The resulting tree can be found in Figure 1. The total variance explained for this model was
41.4%, which implies that adding average difficulty as an independent variable improved the
model.

6 Minimizing the Testlet Effect: Identifying Critical Testlet Features by Means of Tree-Based Regression
69
Figure 1 Regression tree based on the final model in study 2 with the 3PNO-based testlet effect as a dependent

Muirne C.S. Paap and Bernard P. Veldkamp
70
When comparing study 2‘s model depicted in Figure 1 to the 3PNO-based model described in
study 1, there are several important similarities. First, all of the variables that were contained
in the tree described in study 1 were retained in the new model (Figure 1). Also, both models
suggest that a large number of entities is associated with a larger testlet effect, and in a subset
of testlets a low predicational propositional density score is associated with a larger testlet
effect. However, it is important to note that the average item difficulty is chosen for the first
split in the newer model, indicating its relative importance.
It can be seen that testlets containing easy items have a larger testlet effect.
Furthermore, testlets with an average item difficulty between -0.35 and 0.62 that also contain
14 entities or more are also associated with a high testlet effect. Finally, testlets with an
average item difficulty larger than -0.35; 13 entities or fewer; with a theme related to
business, recreation, education, transport, or intrapersonal relationships/family; containing
13.4% or less ―if‖ clauses; and that had a propositional density score of 0.049 or smaller also
showed a larger testlet effect.
Conclusion
Our findings indicate that, for most testlets, testlet characteristics are associated with the size
of the testlet effect, even when the average item difficulty has been accounted for. Three
exceptions were found, all testlets with a relatively low average item difficulty. If these
findings can be replicated, they may indicate that if testlets predominantly contain easy items,
testlet characteristics are either of less importance to the size of the testlet effect or show
considerable overlap with the information provided by the average item difficulty. In order to
unravel this issue, we will have to explore the relationship between testlet characteristics (as
independent variables) and average item difficulty per testlet (dependent variable) in a future
study. In addition, other aggregated item variables might have to be added to the model to
explore the relationship between item attributes and testlet effects more extensively.
In summary, we found evidence in our study for stimulus-related variables being
associated with the size of the testlet effect. Our findings can be used in item construction,
and the analyses we applied can be used as an example for others who construct and analyze
similar data-sets to ours. However, a little more research is needed before solid ―testlet
construction rules‖ can be formulated.

6 Minimizing the Testlet Effect: Identifying Critical Testlet Features by Means of Tree-Based Regression
71
Acknowledgement
This study received funding from the Law School Admission Council (LSAC). The opinions
and conclusions contained in this report are those of the author and do not necessarily reflect
the position or policy of LSAC.
References
Bradlow, E. T., Wainer, H., & Wang, X. H. (1999). A Bayesian random effects model for
testlets. Psychometrika, 64(2), 153–168.
Breiman, L., Friedman, J. H., Olshen, R. A., & Stone, C. J. (1984). Classification and
regression trees. Belmont, CA: Wadsworth International Group.
Gao, L., & Rogers, W. T. (2011). Use of tree-based regression in the analyses of L2 reading
test items. Language Testing, 28(1), 77–104. doi: 10.1177/0265532210364380
Glas, C. A. W. (2012). Estimating and testing the extended testlet model. LSAC Research
Report Series. Newtown, PA: Law School Admission Council.
Glas, C. A. W., Wainer, H., & Bradlow, E. T. (2000). MML and EAP estimation in testlet-
based adaptive testing. In W. J. van der Linden & C. A. W. Glas (Eds.), Computer
Adaptive Testing: Theory and Practice (pp. 271–288). Dordrecht, Netherlands:
Kluwer.
Lord, F. M. (1980). Applications of item response theory to practical testing problems.
Hillsdale, NJ: Erlbaum.
Paap, M. C. S., He, Q., & Veldkamp, B. P. (submitted). Identifying critical testlet features
using tree-based regression: An illustration with the analytical reasoning section of the
LSAT.
Thissen, D., Steinberg, L., & Mooney, J. A. (1989). Trace lines for testlets: A use of multiple-
categorical-response models. Journal of Educational Measurement, 26(3), 247–260.
doi: 10.1111/j.1745-3984.1989.tb00331.x
van Boxtel, H., Engelen, R., & de Wijs, A. (2011). Wetenschappelijke verantwoording van de
Eindtoets 2010. Arnhem: Cito.
Verhelst, N. D., & Verstralen, H. H. F. M. (2008). Some considerations on the partial credit
model. Psicologica, 29, 229–254.

Muirne C.S. Paap and Bernard P. Veldkamp
72
Wainer, H., Bradlow, E. T., & Du, Z. (2000). Testlet response theory: An analog for the 3PL
model useful in testlet-based adaptive testing. In W. J. van der Linden & C. A. W.
Glas (Eds.), Computerized adaptive testing: Theory and practise (pp. 245–270).
Dordrecht, Netherlands: Kluwer.
Wainer, H., Bradlow, E. T., & Wang, X. (2007). Testlet response theory and its applications.
New York: Cambridge University Press.
Wainer, H., & Kiely, G. (1987). Item clusters and computerized adaptive testing: A case for
testlets. Journal of Educational Measurement, 24, 185–202.
Wainer, H., & Wang, X. (2000). Using a new statistical model for testlets to score TOEFL.
Journal of Educational Measurement, 37(3), 203–220.
Yen, W. M. (1993). Scaling performance assessments: Strategies for managing local item
dependence. Journal of Educational Measurement, 30(3), 187–213.

73
Chapter 7
Mixed Methods: Using a Combination of Techniques to Assess
Writing Ability
Hiske Feenstra
Abstract A productive ability such as writing can be assessed only through a candidate‘s
performance on a task, giving rise to concerns about the reliability and validity of writing
assessments. In this chapter, it is argued that a combination of different techniques can help
improve the quality of an evaluation of writing ability. First, an indirect test can be applied to
reliably assess specific components of the writing process (e.g., revision), adding to the
validity of the assessment. Furthermore, an analytic rating procedure accompanied by anchor
essays allows raters to reliably evaluate the content and overall structure of written pieces.
And last, automated scoring techniques can be used to objectively score text features
considered important to text quality. Combining these methods provides an evaluation that is
solid and informative.
Keywords: writing ability, indirect measurement, anchor essays, automated scoring
Introduction
Measuring a productive language skill such as writing is notoriously complex. Candidates‘
writing ability is usually assessed through written products demonstrating their performance
on a writing task. As illustrated in several studies over time (Breland, Camp, Jones, Morris, &
Rock, 1987; Godshalk, Swineford, & Coffman, 1966; Knoch, 2011; Weigle, 2002), the
reliability and validity of writing assessments are often questioned. For instance, raters tend to
disagree on the quality of the same piece of writing, which impairs reliability, and the
discussion of the authenticity of writing assessments is a typical validity issue.
However, techniques such as indirect measurement and the evaluation of essays using
an analytic rating procedure accompanied by automated scoring techniques can account for a
valid and reliable assessment of specific aspects of the writing process and its end result: a
written product. Therefore, a clever mix of assessment techniques can provide for a sound and
informative evaluation of writing ability, as is argued in the last paragraph of this chapter.

Hiske Feenstra
74
Indirect Assessment of Writing
To overcome these issues, indirect writing tests were developed in the 1960s as an alternative
for retrieving information on a candidate‘s writing ability. These tests are aimed at
eliminating rater effects by offering objective tests on components of writing ability, such as
spelling or grammatical fluency. Since indirect tests rely on the assumption that writing
ability can be deducted via other skills, most research has focused on the correlation between
test scores on indirect and direct measures of writing, stating that a high correlation between
the two scores validates the use of an indirect instead of a direct measure. Table 1 summarizes
a sample of these studies.
Table 1 A Sample of Previous Studies on the Validity of Indirect Writing Assessments
Study (year) Age of
pupils
Number of
pupils
Correlation direct and
indirect measure
Godshalk et al. (1966) 16–17 646 0.71–0.77
Wesdorp (1974) 12 213 0.67–0.68
Breland and Gaynor (1979) 18 234–926 0.56–.074
Breland et al. (1987) >18 267 0.56–0.66
Nevertheless, instead of considering indirect tests as substitutes for active writing
tasks, perhaps a more valid application for these objective tests is to use them to evaluate
different aspects of the writing process. In the 1980s, studies on cognitive writing processes
changed the focus for research on writing. Nowadays, writing is no longer considered a single
action, but rather as a complicated process in which different components interact. One of the
most popular models for the writing process, presupposing interaction among the task
environment, long-term memory, and working memory, is shown in Figure 1 (Flower &
Hayes, 1981).

7 Mixed Methods: Using a Combination of Techniques to Assess Writing Ability
75
Figure 1 Model of the cognitive writing process by Flower and Hayes (1981)
Evaluation of a New Format for Revision Tests
A popular form of an indirect writing test is the revision test, where pupils are asked to correct
a text supposedly written by a peer. When mapping indirect writing tests to the model
composed by Flower and Hayes, this test assesses the part of the writing process referred to as
reviewing, where the writer reads and edits his or her text. Feenstra and Heesters (2011a,
2011b) developed a new version of this test as a pilot, changing the multiple-choice format
into a semi-open-ended version. In this new format, pupils are asked to actively revise a peer-
written text by deleting or adding words, changing tenses, correcting congruence, et cetera.
The sentences to be corrected (i.e. containing errors) were indicated by underlining. Table 2
lists the various options for correction. Since its format is more productive and less directive
than the original multiple-choice version of the test, the adapted test is thought to be a more
natural representation of reviewing a text.
Table 2 Correction Options in Revision Test
Afgelopen zaterdag ging ik naar mijn oma gegaan. Deleting
zijn
Mijn hobby‘s is tekenen, judo en gamen. Correcting
Als ik vrij ben, ik ga graag voetballen. Switching
naar
We gingen eerst buiten. Daarna maakten we teams. Adding

Hiske Feenstra
76
To evaluate the new format, both versions of the test (old and new) were incorporated in an
incomplete test design. A representative sample of 80 primary schools participated in the
study, resulting in a sample of 1,600 pupils. Table 3 reports the results of the pilot study,
comparing the test characteristics of the semi-open-ended test version to those of the multiple-
choice version.
Table 3 Results on Pilot Study Semi-Open-Ended Writing Test
Old New
Reliability 0.80a 0.83
a
Difficulty (p value) 0.73 0.62
Discriminating power 3.19 2.53
Note: aEstimate for 50-item test using the Spearman-Brown formula.
Given the above, a semi-open-ended indirect writing test appears to be a reliable tool
for assessing specific components of the writing process such as reviewing. Except for items
on revision skills, it might also be possible to construct item formats with which other aspects
of the writing process can be assessed. Paired with a writing assignment, an indirect writing
test can therefore be a useful addition to a valid and reliable assessment of writing.
The Use of Anchor Essays
When assessing writing via a writing assignment, several different rating procedures are
available to evaluate the essays. The most commonly used procedure in classroom assessment
is holistic scoring, in which raters assign a score to an essay based on their overall impression
of the writing performance (van den Bergh, 1990; Weigle, 2002). A more condensed form of
this rating procedure is the primary trait approach. The focus in this method is merely the
extent to which the essay reaches its communicative goal (Lloyd-Jones, 1977; van Gelderen,
Oostdam, & van Schooten, 2010). Since raters are asked only to give one overall evaluation,
both methods demand relatively little time and effort. As a result, however, these methods do
not provide many details on the ability being measured.
Within an analytical rating procedure, different aspects of the writing product are
evaluated, enabling a detailed report on writing ability. This analytical method was used in the
Dutch National Assessment in Education, where a group of raters used an analytical rating
scheme, assessing different aspects of writing (Krom et al., 2004).

7 Mixed Methods: Using a Combination of Techniques to Assess Writing Ability
77
One of the objectives of the analytic evaluation is to alleviate the task of raters by having
them answer simple yes/no questions on features of the essay. Consequently, raters only have
to identify certain features of the text (scoring), while the actual assigning of values (grading)
is done within the data analyses. Because of the relatively simple task for the raters, it was
believed that this method would provide high rater agreement. However, analyses show that
the inter-rater reliability was rather low for some of the aspects (Krom et al., 2004).
Adjusting the Rating Procedure
A writing assessment consists of numerous elements, all of them possible sources of
construct-irrelevant variance (Messick, 1989): for example, writing task, rating procedure,
and rater characteristics. Although recognized, not all of these sources can be eliminated
easily. For example, task effects can be ruled out by dramatically increasing the number of
tasks given to a student, and rater effects by increasing the number of raters per essay.
However, these methods are generally considered unsuitable, given the extra time and effort
they would require of both students and raters. Therefore, most studies focus on altering the
rating procedure to improve the reliability and validity of a writing assessment.
To achieve high reliability, raters should agree to a great extent on the scores assigned
to essays. Providing the raters with an empirically constructed reference, or benchmark, that
they can use to compare the quality of the writing products to be assessed could therefore
prove to be beneficial for the agreement between raters, and thus have a positive influence on
the rater reliability and validity of the writing scores. An empirical way of providing such a
reference is constructing a rating scale illustrated with several examples of writing products,
each representing a specific score point. The exemplars are taken from a sample of essays
evaluated by multiple assessors and vary from a poor performance on one end of the scale to
an excellent performance on the other end of the scale.
Van den Bergh and Rijlaarsdam (1986) developed a method to construct such a rating
scale. The authors described all the steps needed to create rating scales for different aspects of
writing. According to van den Bergh and Rijlaarsdam, using a rating scale with anchor essays
has two main advantages over the use of an analytic rating procedure.
First, the exemplars on the rating scale serve as reference points, supporting the raters in their
rating task and reducing instability in their rating. Moreover, using a fixed standard allows
scores to be compared between pupils and classes or scores to be monitored over time. In the
context of a national assessment, anchor essays can be particularly useful for illustrating
different levels of achievement.

Hiske Feenstra
78
In fact, anchor essays were used in earlier cycles of the national assessment for writing
(Sijtstra, 1997; Zwarts, 1990), but were eventually replaced in the next cycle owing to their
complicated scoring instructions.
Evaluating a Rating Scale with Anchor Essays
Feenstra (2010b) reported on the use of a rating with anchors essays to improve the inter-rater
reliability. In this study, three different essay tasks were selected from the pool of tasks in the
Dutch national assessment, covering a broad scope of text goals and text genres. Five Dutch
primary schools representing different regions, school sizes, and denominations volunteered
to participate in the study. A total of 584 pupils, age 8 to 12, participated. In total, 1,476
essays were collected. All essays were digitalized (i.e., retyped, maintaining layout, typos, and
punctuation) to facilitate reproduction and distribution. Moreover, handwriting quality can
influence the assessment of other aspects of text quality (De Glopper, 1988). Presenting the
essays in typescript eliminates this unwanted effect. As in the previous cycles of the national
assessment, three aspects of writing were to be rated, as shown in Table 4.
Table 4 Categorization of Writing Aspects Used within the Study
Aspect Description
Content Essential content elements, focus on text goal and public
Structure Composition, layout, coherence, cohesion
Correctness Syntax, spelling, punctuation
The procedure described by van den Bergh and Rijlaarsdam (1986) was adopted to
compose a rating scale with anchor essays for each aspect per task (Feenstra, 2010a), the
result being a rating scale with three anchor essays representing specific ability levels (Figure
1).
Figure 2 A rating scale with three exemplars

7 Mixed Methods: Using a Combination of Techniques to Assess Writing Ability
79
To select the anchor essays, four expert raters first agreed upon the average essay and then
evaluated a sample of essays. The anchor essays for each score point were then selected based
on their empirically defined value as an exemplar essay: agreement among the four different
raters.
A total of 26 raters scored a sample of 150 essays in an incomplete design, to evaluate
the quality and usefulness of the new rating procedure compared to the existing method. Each
rater was assigned to one of two conditions, where condition 1 represented the existing
analytical rating procedure, and condition 2 represented the adjusted version of the original
procedure, consisting of the analytical scale plus the additional rating scale with anchor
essays. Each essay was scored in both conditions, by a minimum of two out of the 13 raters
assigned to each condition. In Table 5, reliability scores are presented per aspect.
Table 5 Inter-Rater Agreement (Gower‘s Coefficient) for All Raters
Aspect Condition 1
Analytical
Condition 2
analytical + anchors
Content .85 .84
Structure .76 .81*
Correctness .76 .77
*significant (p = 0.008)
As shown in Table 5, the aspects Structure and Correctness seem to generally benefit
from the addition of anchor essays to an analytic rating scale. However, the improvement in
inter-rater reliability is modest and significant only for the aspect Structure.
On the Use of Anchor Essays for Different Aspects of Writing
Text structure was found to be the only aspect for which the use of anchor essays significantly
improved reliability. It might well be that for this aspect in particular having a complete essay
as a reference for scoring is beneficial. Apart from the structure within sentences, text
structure can be evaluated only by considering the text as a whole, which is encouraged by
comparing essays to an anchor. For example, when evaluating a letter, the layout and formal
structure of the text are important features that should be present not only in one or two parts
of the text. Instead, they should form the basis of the text structure.

Hiske Feenstra
80
An aspect such as Content, however, is more or less locally assessed within a text and less
dependent on the overall text quality. Different content elements are detected in the text and
scored accordingly: the higher the number of elements that are present, the higher the score.
This could be the reason that this aspect did not benefit from the comparison to anchor essays
when assessing it. To assess this particular aspect, a detailed analytical procedure seems to be
the best option.
In a way, the same holds for the aspect Correctness. This aspect actually requires the
impression of the whole text to be taken into account, but as with Content, the elements
diminishing the correctness can be more or less counted individually. Although this might
sound straightforward, raters tend to disagree relatively strong when scoring this aspect.
Apparently, differences in severity still come across, despite the supposed objectivity of the
items. These difference can be overcome when automatically scoring specific text features. In
the past decades, developments in computational linguistics, artificial intelligence, and
psycholinguistics, have enabled the rise of techniques to analyze text features automatically.
Several tools for automated essay scoring (AES) have been developed, and many validation
studies have been reported. Instead of automatically providing an essay score, programs for
text analyses could provide a score on different text features, thus contributing to a score for
the aspect Correctness.
Furthermore, when considering the actual anchor items (i.e., the items where raters
were prompted to place an essay on the scale) as individual items, an inter-rater agreement of
.82 is achieved for each aspect. However, these figures cannot be interpreted reliably yet,
because the raters were led to their final judgment by answering the analytical questions.
Further studies have to be conducted to gain insight into the individual strength of the
anchor items. Still, these one-item assessments look promising and might well be developed
into useful tools for classroom assessment because of their efficiency (cf. pair-wise
comparison: Pollitt, 2004).
Using a Combination of Methods to Assess Writing
As shown in the studies mentioned in this chapter, different aspects of writing ability require
different assessment methods. Since a writing product reveals very little about the cognitive
processes taking place while producing the text, an objective test on certain components of the
writing process (e.g., revision) can be a valuable addition.

7 Mixed Methods: Using a Combination of Techniques to Assess Writing Ability
81
Such an indirect writing test can account for a reliable assessment of specific aspects of
writing, shifting the focus from solely the product of the writing process to other relevant
components and thus adding to the validity of a writing assessment. Furthermore, while the
analytic evaluation of text structure benefits from the use of anchor essays, adopting merely
the analytic questions is sufficient when assessing the content of a text. Automated text
analyses, to conclude, can help in objectively scoring certain text features considered
important to text quality, thus contributing to a score for correctness. Hence, assessing writing
is not a matter of choice: a decent writing assessment should incorporate a mixture of
assessment techniques—and benefit from it.
References
Breland, H., Camp, R., Jones, R. J., Morris, M. M., & Rock, D. A. (1987). Assessing writing
skill. New York, NY: College Entrance Examination Board.
Breland, H., & Gaynor, J. L. (1979). A comparison of direct and indirect assessments of
writing skill. Journal of Educational Measurement, 76, 119–128.
de Glopper, K. (1988). Schrijven beschreven. Inhoud, opbrengsten en achtergronden van het
schrijfonderwijs in de eerste vier leerjaren van het voortgezet onderwijs [Writing
described. Content, outputs and background of writing education in the first four years
of secondary education] (Dissertation UvA). Den Haag, the Netherlands: SVO.
Feenstra, H. (2010a, June). Opstellen langs de meetlat. De constructie van een
beoordelingsschaal voor schrijfproducten [Constructing a rating scale for writing
products]. Poster presentation at the Onderwijs Research Dagen [Educational
Research Days] 2010, Enschede.
Feenstra, H. (2010b, November). Assessing writing ability: Using anchor essays to enhance
reliability. Paper presented at the 11th AEA-Europe Conference, Oslo, Norway.
Feenstra, H., & Heesters, K. (2011a, May). Assessing writing through objectively scored tests:
A study on validity. Paper presentation at the 8th EALTA Conference, Siena, Italy.
Feenstra, H., & Heesters, K. (2011b, June). Objectieve schrijfvaardigheidstoetsen: een
onderzoek naar validiteit [Objective writing tests: a study on validity]. Poster
presented at the Onderwijs Research Dagen [Educational Research Days] 2011,
Maastricht.
Flower, L., & Hayes, J. R. (1981). A cognitive process theory of writing. College
Composition and Communication, 32, 365–387.

Hiske Feenstra
82
Godshalk, F. I., Swineford, F., & Coffman, W. E. (1966). The measurement of writing ability.
New York, NY: College Entrance Examination Board.
Knoch, U. (2011). Rating scales for diagnostic assessment of writing: What should they look
like and where should the criteria come from? Assessing Writing, 16, 81–96.
Krom, R., van de Gein, J., van der Hoeven, J., van der Schoot, F., Verhelst, N., Veldhuijzen,
N., & Hemker, B. (2004). Balans van het schrijfonderwijs op de basisschool.
Uitkomsten van de peilingen in 1999: halverwege en einde basisonderwijs en speciaal
onderwijs [Report of the national assessment on writing education in primary schools.
Outcomes of the surveys in 1999: Mid and end of primary education and education for
special educational needs]. Arnhem, the Netherlands: Cito.
Lloyd-Jones, R. (1977). Primary trait scoring. In C. R. Cooper & L. Odell (Eds.), Evaluating
writing: Describing, measuring, judging (pp. 33–68). Urbana, IL: National Council of
Teachers of English.
Messick, S. (1989). Validity. In R. Linn (Ed.), Educational measurement (3rd ed.).
Washington, DC: American Council on Education.
Pollitt, A. (2004, June). Let’s stop marking exams. Paper presented at the IAEA Conference,
Philadelphia, PA.
Sijtstra, J. (Ed.). (1997). Balans van het taalonderwijs aan het einde van de basisschool 2.
Uitkomsten van de tweede taalpeiling einde basisonderwijs [Report of the language
education at the end of primary education 2. Outcomes of the second language survey
end primary education]. Arnhem, the Netherlands: Cito.
Van den Bergh, H. (1990). Schrijfvaardigheid getoetst in het centraal schriftelijk eindexamen
[Assessing writing ability within the central written examinations]. Levende Talen,
451, 225–229.
Van den Bergh, H., & Rijlaarsdam, G. (1986). Problemen met opstelbeoordeling? Een recept
[Issues with essay evaluation? A recipe]. Levende Talen, 413, 448–454.
Van Gelderen, A., Oostdam, R., & van Schooten, E. (2010). Does foreign language writing
benefit from increased lexical fluency? Evidence from a classroom experiment.
Language Learning, 61, 281–321.
Weigle, S. C. (2002). Assessing writing. Cambridge, England: Cambridge University Press.
Wesdorp, H. (1974). Het meten van de produktief-schriftelijke taalvaardigheid. Directe en
indirecte methoden: ‘opstelbeoordeling’ versus ‘schrijfvaardigheidstoetsing’
[Measuring productve-written language ability. Direct and indirect methods: ‗essay
rating‘ versus ‗writing tests‘]. Purmerend, the Netherlands: Muusses.

7 Mixed Methods: Using a Combination of Techniques to Assess Writing Ability
83
Zwarts, M. (Ed.). (1990). Balans van het taalonderwijs aan het einde van de basisschool.
Uitkomsten van de eerste taalpeiling einde basisonderwijs [Report of the language
education at the end of primary education 2]. Arnhem, the Netherlands: Cito.

84

85
Chapter 8
Don't Tie Yourself to an Onion: Don’t Tie Yourself to Assumptions
of Normality
Maarten Marsman, Gunter Maris and Timo Bechger
Abstract A structural measurement model (Adams, Wilson, & Wu, 1997) consists of an item
response theory model for responses conditional on ability and a structural model that describes
the distribution of ability in the population. As a rule, ability is assumed to be normally distributed
in the population. However, there are situations where there is reason to assume that the
distribution of ability is nonnormal. In this paper, we show that nonnormal ability distributions are
easily modeled in a Bayesian framework.
Keywords: Bayes estimates, finite mixture, item response theory, Gibbs sampler, Markov chain
Monte Carlo, one-parameter logistic model, plausible values
Introduction
A structural measurement model (Adams, Wilson, & Wu, 1997) consists of an item response
theory (IRT) model for responses conditional on ability and a structural model that describes the
distribution of ability in the population. At Cito, structural measurement models are used for test
equating and to relate student characteristics to response behavior.
As a rule, we assume that ability is normally distributed in the population. We do this
because it is easy and because we often do not have a clear alternative. However, there are
situations where we have reason to assume that ability is not normally distributed in the
population, for instance, when we know that the population consists of students who are selected
from a larger, possibly normal population, based on one of our own tests. Thus, the onion in our
title refers to the assumption of normality to which structural measurement models seem
intimately tied. The most common form of nonnormality of the ability distribution found in Cito
applications is skewness. This has enticed Molenaar (2007) and Verhelst (2008) to develop more
general models that can handle skew ability distributions. They developed complex procedures to
estimate these models using maximum likelihood methods, and the procedure developed by
Verhelst is implemented in the Cito program SAUL.

Maarten Marsman, Gunter Maris and Timo Bechger
86
We propose to use a (finite) mixture of normal distributions to model different forms of
nonnormality, such as skewness, kurtosis, and multimodality. The structural measurement model
is formulated in a Bayesian framework, and the Gibbs sampler is used to estimate the parameters.
The Gibbs sampler requires a sample from the posterior distribution of ability, and the mixture
plays the role of the prior distribution of ability. Draws from the posterior of ability are called
plausible values (PVs; Marsman, Maris, Bechger, & Glas, 2011; Mislevy, 1991), and once they
are obtained, estimating the parameters from the mixture becomes a routine exercise.
The structure of the paper is as follows. First, we introduce a real-data example to
motivate our concerns about the assumption of normality. Then, we outline a Bayesian procedure
that is then applied to the data of the motivating example. The paper ends with a discussion.
Motivating Example: Entreetoets Data
We use data of N = 136,495 students responding to k = 39 math items of the Cito Entreetoets.
The measurement model is the one-parameter logistic model (OPLM; Verhelst & Glas, 1995).
Since the OPLM is an exponential family (EF) IRT model, it can be fitted independently from the
structural model using conditional likelihood methods. The parameters were estimated and
showed reasonable fit.
We estimated the parameters of the structural model using the Gibbs sampler as described
in Marsman et al. (2011) using noninformative priors. Marsman et al. (2011) developed several
algorithms that use the method of composition (Tanner, 1993) to sample PVs from the posterior
distribution of ability conditional on the response data. Because the OPLM is in the EF, the
posterior of ability is characterized by its sufficient statistic, and the conditional composition
algorithm for EF IRT models (the CC-EF algorithm) can be used. Furthermore, Marsman et al.
show how recycling intermediate candidate values can increase efficiency when students come
from few marginal distributions using the CC-EF-R algorithm.
The Markov chain Monte Carlo (MCMC) algorithm ran for 1,000 iterations, which is
sufficient due to the low amount of autocorrelation and thus results in almost immediate
convergence of the Markov chain. The expected a posteriori (EAP) estimates and posterior
standard deviations are ̂ = 0.1804185 (0.0004750) and ̂ = 0.1599017 (0.0003887).
To study the fit of the estimated model, we compared the observed (weighted sum) score
distribution with the generated score distribution under the model; see Figure 1.

8 Don't Tie Yourself to an Onion: Don‘t Tie Yourself to Assumptions of Normality
87
Figure 1 Observed (solid) and replicated (dashed) weighted score distributions
There were discrepancies between the observed and generated data. The magnified
section in Figure 1 shows a section of the score distributions where they differ in approximately
3.5 score points. The geometric mean of the item weights in the OPLM model was set at 6, so a
difference of 3.5 points would be a little less than 0.6 raw score points.

Maarten Marsman, Gunter Maris and Timo Bechger
88
Table 1 Equating the Score Distributions
Score Observed Generated
with normal
Generated
with mixture
Difference
with normal
Difference
with mixture
0 0 8 0 8 0
25 11 282 45 271 34
50 455 1,602 700 1,147 245
75 3,309 4,981 3,514 1,672 205
100 11,000 11,358 10,730 358 270
125 23,671 22,080 23,672 1,591 1
150 41,325 38,513 41,757 2,812 432
175 64,197 62,108 64,184 2,089 13
200 92,872 93,487 92,882 615 10
225 125,543 126,655 125,473 1,112 70
The observed differences may have large implications in test equating. This is illustrated
in Table 1, which contains six columns. The first column is a score used as a possible cut-off
point in an equating procedure. The number of persons who received that score or lower as
observed in the sample or generated with a normal density are given in the second and third
columns, respectively. In the fifth column, we look at the difference between the number of
persons we observe with what we expect under the model. These differences are not anywhere
near zero, illustrating that model misfit can have large implications.
Using Plausible Values
To estimate the parameters from the structural model, we used PVs, which are draws from the
posterior of ability. We want the PVs to have the same distribution as ability in the population.

8 Don't Tie Yourself to an Onion: Don‘t Tie Yourself to Assumptions of Normality
89
However, since we do not know how ability is distributed, we introduce a structural model and
use it as a prior distribution. The posterior distribution now has two ingredients:
1. The likelihood (IRT model): we can add more items, which will make the likelihood
dominate the prior distribution so that the posterior converges to the true posterior
distribution.
2. The prior distribution: we can adjust the prior to match information in the likelihood,
so that the likelihood more easily dominates the prior and the posterior converges to
the true posterior distribution.
When the measurement model is firmly established, it is guaranteed that the distribution
of PVs is closer to the true posterior distribution than the estimated structural model. We
illustrate this in Figure 2(a), where a histogram of generated PVs with a normal distribution are
given along with the estimated normal density. Clearly, the measurement model makes the PV
distribution negatively skewed and as a result does not match the prior distribution.
(a) Normal population model. (b) Mixture population model.
Figure 2 Histograms of PVs and estimated density

Maarten Marsman, Gunter Maris and Timo Bechger
90
Motivating Example: Reanalysis
We can speed up convergence of the PV distribution to the true posterior distribution by
improving the fit of the structural model and adjusting it to better match the information in the
likelihood. We do this by using a mixture of two normal distributions. Standard methods for
estimating a normal mixture using Gibbs samplers are readily available, and we refer the
interested reader to Congdon (2010, Chapter 3) or Fox (2010, Chapter 6).
The assignment to a component was modeled as a binomial random variable and given a
flat Beta prior, uniform over the range [0,1]. The parameters from the structural model were
assigned noninformative priors as in the previous example. This is not convenient when there is a
risk of (almost) empty mixture components, in which case informative priors can be assigned.
The parameters from the mixture distribution were estimated using the Gibbs sampler, which ran
for 5,000 iterations. Convergence of the estimated distribution was relatively fast as can be seen
by inspecting the traceplots of the mean, variance, skewness, and kurtosis of the mixture model,
shown in Figure 3.

8 Don't Tie Yourself to an Onion: Don‘t Tie Yourself to Assumptions of Normality
91
(a) Mean of mixture model. (b) Variance of mixture model.
(c) Skewness of mixture model. (d) Kurtosis of mixture model.
Figure 3 Trace plots of the mean, variance, skewness, and kurtosis of the mixture distribution

Maarten Marsman, Gunter Maris and Timo Bechger
92
Because of more freely estimating the population model, the distribution of PVs converged to the
true posterior ability distribution. This can be seen in Figure 2(b), where a histogram of generated
PVs with the mixture distribution are given along with the estimated density. The distribution of
PVs and the estimated structural model are aligned, confirming that it has converged to the true
posterior distribution. Since PVs are now a sample from the structural model, we can use them
for other purposes. For instance, in large-scale educational surveys, such as the Program for
International Student Assessment (PISA) and the European Survey on Language Competences
(ESCL), PVs are provided for secondary analyses.
Figure 4 Observed (solid) and replicated (dashed) weighted score distributions at iteration 2,000
The fit of the structural measurement model was assessed via a comparison of observed
and replicated score distributions as before; see Figure 4. The mixture distribution provides a
better fit to the data than the normal distribution as provided.
The magnified section in Figure 4 shows that there are still discrepancies, although they
are less severe than those found in Figure 1. The observed difference of less than of 0.5 points on
the weighted score scale refers to less than 0.1 raw score points, approximately.

8 Don't Tie Yourself to an Onion: Don‘t Tie Yourself to Assumptions of Normality
93
This can still have a large effect in test equating. The fourth column in Table 1 shows the number
of persons who received the cut-off score or lower as generated with a mixture. The sixth column
shows the difference between the number of persons we observed with what we expected under
the mixture model. Clearly these numbers are still substantial. The question is: do we have to
explain the results to the parents of 2,812 or of 432 children, which is large either way, but
substantially larger under the normality assumption.
Discussion
As a rule, assumptions of normality (the onion) are introduced in test equating, although
situations exist where there is reason to believe that the ability distribution is not normal. In this
paper, we showed that we can easily model deviations from normality in a Bayesian framework
by using PVs and a mixture distribution as a prior. Compared to regular applications of mixture
distributions, we are not interested in its components but use it merely for curve-fitting. As an
illustration, we applied a mixture of two normal distributions to Entreetoets data. It is easy to
extend the mixture to include more components at a low cost in terms of additional parameters.
The mixture is flexible and can model many deviations from normality, such as skewness,
kurtosis, and multimodality.
In addition, ignoring deviations from normality can have serious effects on test equating.
Furthermore, if the ability distribution shows similar deviations in repeated assessments and these
deviations are ignored, the effects can add up in the equating procedure. As a result, the projected
norm can drift away from the originally proposed norm. Thus, it is very important to correctly
model the ability distribution to provide valid inference in test equating. The mixture solution is
easily applied in test equating, and the Entreetoets example shows that it can improve model fit
and consequently provide better predictions.

Maarten Marsman, Gunter Maris and Timo Bechger
94
References
Adams, R., Wilson, M., & Wu, M. (1997). Multilevel item response models: An approach to
errors in variables regression. Journal of Educational and Behavioral Statistics,22 ,47–76.
Congdon, P. (2010). Applied Bayesian hierarchical methods. Boca Raton, FL: Chapman &
Hall/CRC Press.
Fox, J. (2010). Bayesian item response modeling. New York, NY: Springer.
Marsman, M., Maris, G., Bechger, T., & Glas, C. (2011). A conditional composition algorithm
for latent regression. (Measurement and Research Department Report No. 11-2). Cito.
Mislevy, R. (1991). Randomization-based inference about latent variables from complex
samples. Psychometrika, 56, 177–196.
Molenaar, D. (2007). Accounting for non-normality in latent regression models using a
cumulative normal selection function. (Measurement and Research Department Report
No. 07-3). Cito.
Tanner, M. (1996). Tools for statistical inference (3rd ed.). New York, NY: Springer.
Verhelst, N. (2008). Untitled document containing updated theory and a short addition to the
manual for the structural analysis of a univariate latent variable (SAUL) program. Cito.
Verhelst, N., & Glas, C. (1995). Rasch models; foundations, recent developments, and
applications. In G. Fischer & I. Molenaar (Eds.), One Parameter logistic model (pp. 215-
238). New York, NY: Springer-Verlag.

95
Chapter 9
Towards a Comprehensive Evaluation System for the Quality of
Tests and Assessments
Saskia Wools
Abstract To evaluate the quality of educational assessments, several evaluation systems are
available. These systems are, however, focused around the evaluation of a single type of test.
Furthermore, within these systems, quality is defined as a non-flexible construct, whereas in this
paper it is argued that the evaluation of test quality should depend on the test‘s purpose. Within
this paper, we compare several available evaluation systems. From this comparison, design
principles are derived to guide the development of a new, comprehensive quality evaluation
system. The paper concludes with an outline of the new evaluation system, which intends to
incorporate an argument-based approach to quality.
Keywords: Standards, evaluation, quality, educational assessment, argument-based approach
Introduction
In all levels of education, students have to take tests and assessments to demonstrate their ability,
for example, to show whether they have fulfilled the course objectives or to guide them in their
further learning. In the context of high-stakes exams and assessments, the importance of good
quality decisions is clear. However, in other contexts, the assessment results need to be valid and
reliable too. In other words, despite the stakes of an exam, the results need to be appropriate for
its intended use. This can only occur when the assessment instruments that are used to assess the
students are of good quality. To evaluate test quality, several evaluation systems and standards
are available. The currently available evaluation systems, however, tend to focus around one
specific type of test or test use, for example, computer-based tests (Keuning, 2004), competence-
based assessments (Wools, Sanders, & Roelofs, 2007), examinations (Sanders, 2011), or
psychological tests (Evers, Lucassen, Meijer, & Sijtsma, 2010). Standards are often more broadly
defined, but are aimed at guiding test developers during the development process and are not
suited for an external evaluation of quality.

Saskia Wools
96
The purpose of this paper is to introduce the outline of a new evaluation system that will be more
flexible and comprehensive than the currently available evaluation systems. Furthermore, this
proposed evaluation system is not only suitable to guide test development, but can also be used as
an instrument for internal or external audits. In the first section of this paper, the available
standards and evaluation systems are described. In the second section, the principles that serve as
a basis for the new evaluation system are specified. From this second section, we will derive the
design of the new system that is described in the final section of this paper.
Section 1 - Guidelines, Standards and Evaluation Systems
To describe the currently available systems for the evaluation of test quality, we will compare
nine quality evaluation systems. The nine systems will be compared based on their purpose, their
intended audience, and their object of evaluation. We do not aim to include all of the available
evaluation systems, nor will we describe every aspect for every system that is mentioned, since
this section is meant mainly to exemplify the diversity of the systems.
We will differentiate between guidelines, standards, and evaluation systems. Guidelines suggest
quality aspects that you can comply with. Standards mention aspects of quality that you should
comply with, in order to develop sound and reliable tests. Evaluation systems focus on evaluating
a test, and prescribe what quality aspect must be met to ensure minimal quality. We will also add
criteria to the comparison that are mentioned by researchers as being important, but that are not
implemented in the guidelines, standards, or evaluation systems.
Systems for Comparison
Guidelines:
1. International guidelines for test use from International Testing Committee (ITC)
(Bartram, 2001)
Standards:
2. Standards for educational and psychological testing (AERA, APA, & NCME, 1999)
3. European framework of standards for educational assessment (AEA-Europe, 2012)

9 Towards a Comprehensive Evaluation System for the Quality of Tests and Assessments
97
4. ETS standards (Educational Testing Service (ETS), 2002)
5. Cambridge approach (Cambridge Assessment, 2009)
6. Code of fair testing practices in education (Joint Committee on Testing Practices (JCTP),
2004).
Evaluation systems:
7. COTAN evaluation system for test quality (Evers et al., 2010)
8. EFPA review model for the description and evaluation of psychological tests (Lindley,
Bartram, & Kennedy, 2004)
Criteria:
9. Quality criteria for competence assessment programs (Baartman, Bastiaens, Kirschner, &
van der Vleuten, 2006)

Saskia Wools
98
Table 1 Comparison of standards, guidelines, and evaluation systems
ITC
AERA
Standards
AEA-
Europe
ETS
Cambridge
Assessment
JCTP
COTAN
EFPA
Baartman
Purpose
Guide test
development
x x x x
Guide test use
x x x
x
Guide self-evaluation
x
x
Guide audits x x x x
Intended audience
Test specialists
x x
x x
Teachers
x
x
x
x
Users
x x
x x
x
Companies x x x
Object of evaluation
Construction process
Educational
assessment
x x x
Competence
assessment
x
Psychological tests x
Test product and use
Educational
assessment
x x x
(x)* x
Competence
assessment
x
Psychological tests x x
Note *Although COTAN‘s focus lies on psychological tests, the system is also used to evaluate
educational assessments
Table 1 displays all of the systems for comparison and the three aspects that they are
compared on. The object of evaluation is divided into two main objects: construction process and
test product and use. Systems aimed at evaluating the process tend to give guidelines for
developing solid tests, whereas systems that focus on the test product and use are meant for
auditing a fully developed test that is already in use. One element that stands out from this table is
that the AEA-Europe system is multi-functional.
That system aims to be a framework of standards that can be used in several different
ways and for all sorts of educational assessments. In the remainder of this section, we will
compare the systems in detail for each of the three aspects in Table 1.

9 Towards a Comprehensive Evaluation System for the Quality of Tests and Assessments
99
Purpose
In our comparison, we distinguished four main purposes for the quality evaluation systems,
guidelines, and standards. First, we looked at systems aiming to guide test development. These
systems try to help the test developer in constructing a sound test. Both the ETS standards and the
Cambridge approach are meant to guide test development. Another purpose is to help users apply
tests properly and to make them aware of the risks when they do not follow protocol. One
example of a system that has the purpose of helping users understand the interpretation of test
scores is the ITC document that has guidelines for test use. Some systems are meant for self-
evaluation by the test constructors, to help them identify the strong and weak points of their
assessment; Baartman formulated criteria for this specific purpose. Finally, we included systems
meant for audit purposes. In this case, an external expert audits the quality of the test by means of
an evaluation system, such as the COTAN system or the EFPA system.
Intended Audience
The intended audience of the evaluation systems can be test specialists, teachers, users, or
companies. However, most of the systems that we compare are developed for multiple audiences.
The systems that have only one intended audience are the ITC document (teachers), the
Cambridge approach and ETS standards (companies), and EFPA (test specialists). The COTAN
and AERA systems are meant for test specialists as well as teachers. The JCTP standards are
intended for both teachers and test users.
The Object of Evaluation
The definition of quality also varies across the different systems. Some systems focus on the
construction process, while others focus on the fully developed test and its use. For example,
COTAN focuses on the fully developed test product and not on the development process. ITC,
however, intends to evaluate the development process. At the same time, the type of test differs:
JCTP focuses on classroom assessment, while Baartman focuses on competence assessment
programs. The AEA-Europe framework of standards focuses on educational assessment in
general, where COTAN aims at both psychological and educational tests.

Saskia Wools
100
Issues With the Currently Available Systems
One problem with all of these evaluation systems is that quality is defined as a non-flexible
construct. These systems provide criteria that should be met, while it is actually more appropriate
to choose criteria that fit the intended use of the test. Doing this would also provide the
possibility of weighing the criteria according to the purpose of the test. This might solve the
problem of having to create a new evaluation system for every type of test. Once the purpose of
the test defines the selected criteria, we can also evaluate several types of tests with the system.
Another problem with these evaluation systems is the process of evaluating the tests. To
evaluate a test as part of an external audit, one needs to look through all of the testing materials
and supporting documents that include the results of the trial administrations of the test,
validation studies, and other evidence that is considered relevant for the audit. However, it
depends on the auditor whether all of the evidence is found. Moreover, going through all of these
documents is not a very time efficient way to evaluate tests, and a lot of both content and
methodology expertise is needed to evaluate a complete assessment (Wools, Sanders, Eggen,
Baartman, & Roelofs, 2011). When a new evaluation system can make classifying evidence a
task for test developers, the auditors only have to look through the relevant evidence. And when
all of the evidence is structured in advance, it is also possible to give a part of the test to an
auditor who knows the content and another part to an auditor who specializes in methodology.
These issues are addressed as principles in the outline of the proposed evaluation system.
The design of the new system tries to gain from existing evaluation systems as well. In the
remainder of this paper, the design of the new system is described.
Section 2 - Principles of the New Evaluation System
In the new evaluation system, quality is defined as the degree to which something is useful for its
intended purpose. In testing and assessment practice, the variety of intended purposes is very
large and, furthermore, the solutions chosen to reach those purposes are endless. And, when
quality is defined as being dependent on the purpose of a test, it seems hard, or even impossible,
to develop an evaluation system with fixed criteria that are suitable for all possible tests and
assessments. Therefore, we do not aim to develop the right set of criteria that can be used to
evaluate all possible tests.

9 Towards a Comprehensive Evaluation System for the Quality of Tests and Assessments
101
The main idea behind this system is for it to be used to build an argument that helps test
developers to show that a test or assessment is sufficiently useful for its intended purpose. To
build this argument, evidence is needed to convince the public of the test‘s usability. This
evidence is established, collected, and presented during the test‘s development process.
The argument-based approach to quality is derived from the argument-based approach to
validation, as described by Kane (2004; 2006). The remainder of this section extracts the
argument-based approach to quality into the underlying principles of the new evaluation system.
As a starting point for the specification of the principles, the purpose of the system is addressed.
Purpose
The purpose of the system is to evaluate the quality of tests and assessments on several occasions
during the construction of a test. It might be used during the development stage to indicate weak
spots that need attention or adaptation, or utilized to point out aspects that are in need of evidence
in order to enhance the plausibility of the argument that is being built. When the development
stage is finished, the system also needs to facilitate an external evaluation of the test. The criteria
used are derived from existing evaluation systems, and may be chosen or combined based on the
purpose of the test or the purpose of the evaluation.
Content
As mentioned before, quality is defined as the degree to which something is useful for its
purpose. By taking an argument-based approach to quality, it is possible to interpret quality as an
integral entity instead of a combination of isolated elements. This entails the possibility of an
assessment to compensate for weaker points with strong points. Furthermore, this view does
justice to the fact that all aspects of an assessment are linked and cannot be evaluated without
considering the others.
This view also implies that the instrument that is used to assess students and to generate
scores cannot be evaluated without considering the use of these scores. In an argument-based
approach to quality, the use of the scores, or the decision that is made based upon the scores,
guides the test developer in determining the appropriate quality standards. This means that, on
one hand, the intended decision resulting from a test is the main determiner in choosing the
criteria that are necessary to evaluate the appropriateness of the test.

Saskia Wools
102
On the other hand, the degree to which the test must comply with the standards is also based upon
the intended decision. For a high-stakes certification exam that consists of 40 multiple-choice
items, reliability, IRT model-fit, and validation by means of an external criterion might be more
appropriate than any coefficient of inter-rater reliability. Whereas, in a selection procedure where
two assessors are interviewing their own groups of students, inter-rater reliability and
comparability seem to be the most important aspects.
Process
According to the argument-based approach to quality, an argument is built and evidence is
collected, selected, and presented according to the shape of the argument. By selecting and
presenting the appropriate evidence, the evaluation is prepared during the test construction phase.
Once the (external) audit starts, the auditor does not need to go through all of the available
material, but only investigates the evidence that is presented according to the structure of the
argument. This not only makes the evaluation process more manageable for the auditor, but also
enhances the comparability of the ratings of different auditors, because they all took the same
evidence into account. Another advantage of structuring the evidence before auditing is that
different auditors with different competencies, for example, psychometricians and content
experts, can evaluate the parts that they specialize in.
Relationship to Other Evaluation Systems
One of the reasons to evaluate test quality is that it is necessary to decide whether the use of a
certain test for an intended decision is justified. We would like to know whether a test is good
enough for the stated purpose. An argument that is built and accompanied with evidence and that
is evaluated as plausible is, unfortunately, not an answer to the question of whether a test is good
enough.
Therefore, the new evaluation system also includes other evaluation systems‘ criteria that
do lead to a result that states whether a test is good enough. These criteria are built into the
system in such a way that, once the evidence is structured in the different elements of the
argument, the criteria will appear in clusters that match the order of the argument.

9 Towards a Comprehensive Evaluation System for the Quality of Tests and Assessments
103
The order of the criteria is different from the order in the original evaluation systems, but once
every criterion is answered, the results will be presented according to the elements of the original
evaluation systems. For example, COTAN‘s criteria are clustered differently, but the evaluation
results will be presented in the seven categories that are distinguished by COTAN.
Section 3 - Design of the New Evaluation System
The new evaluation system will be a computer application that consists of several modules. These
modules are: design, evidence, evaluation, and report. The application is designed for use during
the test development process, but can also be used for the evaluation of existing tests. However,
once the existing tests are evaluated, the test constructors have to prepare the evaluation by
designing and structuring the argument.
Design Module
This module delivers the outline of an argument. Therefore, several steps need to be taken. To
make sure a user will complete all of the necessary fields, this module is wizard based. It starts by
posing questions about the characteristics of the test. Once the general information about the test
is collected, the assumptions and inferences that underlie the quality argument are specified. To
build the argument, first the focus will be on the shape of the argument. The amount of inferences
that need to be specified depends, for example, on the purpose of the test. When the shape of the
argument and the characteristics of the test are known, the actual building of the argument starts.
For every inference, the underlying assumptions are described. Furthermore, possible counter
arguments are also made explicit.
Evidence Module
The evidence module consists of two parts. First, it facilitates the storage and structuring of the
sources of evidence. In this module, a user can upload documents, graphical representations,
research reports, or test materials.
For every document that is uploaded, it is possible to enter a short description and to add tags.
These tags can be used in the evaluation module to help auditors select the right sources of
evidence. Second, it focuses on structuring and classifying evidence. Evidence can be selected
and added to the inferences that are specified in the design module.

Saskia Wools
104
Graphics show which inferences are backed up with evidence so that the user can see which
inferences need more evidence.
Evaluation Module
This module is designed to facilitate the evaluation process by combining the information given
in the design and evidence module. Therefore, there are two main parts within this module:
prepare and evaluate.
Within the prepare section, the test developer can choose the evaluation system that will judge
the test and the argument can be reviewed. The evaluate section shows the specified argument
and the uploaded evidence. Furthermore, the criteria, questions, or aspects from the chosen
evaluation system are shown with every inference. An auditor can go through the inferences and
evaluate the quality of the evidence based upon the given criteria. Only the evidence that is a part
of an inference is shown, therefore, the auditor does not need to look for the appropriate
evidence.
Report Module
The report module can be used to retrieve the results of the evaluation. It can also be used to print
parts of the argument or the accompanying evidence, for example, to construct a test manual that
incorporates all of the evidence and that is structured according to the specified argument.
Conclusion
This paper outlines a new evaluation system for the quality of tests, assessments, and exams. The
new evaluation system will be developed as part of a study that will be shaped according to the
principles of design research (Plomp, 2007) and will be finished in the summer of 2013. This
system will incorporate an argument-based approach to quality, and we will suggest a computer
application that can be used to gather, structure, and evaluate the evidence of quality.
By explicitly using sources of evidence that are created during the different phases of the test
development process, this new evaluation system will bring new awareness of quality issues to
everyone involved in test development.

9 Towards a Comprehensive Evaluation System for the Quality of Tests and Assessments
105
The argument-based approach to quality is based upon a theory used in validation practice. This
gives us the opportunity to look at quality in a more comprehensive way. From here, it is also
possible to evaluate and weigh evidence in respect to the purpose of the test. Furthermore, where
other evaluation systems focus on the end product of the test development phase (the test), this
new evaluation system bridges the development efforts to the end product.
This new evaluation system will, however, also include existing quality criteria, which
makes an evaluation according to the existing evaluation systems still possible. In conclusion, the
proposed evaluation system will allow us to evaluate test quality in a flexible and comprehensive
way, and gives us a conclusion about test quality from other evaluation systems at the same time.
Could this be the system that combines the best of both worlds?
References
AEA-Europe. (2012). European framework of standards for educational assessment. Retrieved
from http://www.aea-europe.net/index.php/professional-development/standards-for-
educational-assessment
AERA, APA, & NCME. (1999). Standards for educational and psychological testing.
Washington, DC: American Educational Research Association.
Baartman, L., Bastiaens, T., Kirschner, P., & van der Vleuten, C. (2006). The wheel of
competency assessment: Presenting quality criteria for competency assessment programs.
Studies in Educational Evaluation, 32(2), 153–170.
Bartram, D. (2001). The development of international guidelines on test use: The international
test commission project. International Journal of Testing, 1(1), 33–53.
Cambridge Assessment. (2009). The Cambridge approach. Principles for designing,
administering and evaluating assessment. Cambridge: Cambridge Assessment.
Educational Testing Service (ETS). (2002). ETS standards for quality and fairness. Princeton, NJ
Evers, A., Lucassen, W., Meijer, R., & Sijtsma, K. (2010). COTAN beoordelingssysteem voor de
kwaliteit van tests. Amsterdam: NIP.
Joint Committee on Testing Practices. (2004). Code of fair testing practices in education.
Washington, DC: Joint Committee on Testing Practices.
Kane, M. T. (2004). Certification testing as an illustration of argument-based validation.
Measurement, 2, 135–170.

Saskia Wools
106
Kane, M. T. (2006). Validation. In R. Brennan (Ed.), Educational measurement (4th ed.) (pp. 17–
64). Westport, CT: American Council on Education and Praeger Publishers.
Keuning, J. (2004). De ontwikkeling van een beoordelingssysteem voor het beoordelen van
―Computer Based Tests.‖ POK Memorandum 2004-1. Arnhem: Citogroep.
Lindley, P., Bartram, D., & Kennedy, N. (2004). EFPA review model for the description and
evaluation of psychological tests. Retrieved from http://www.efpa.eu/professional-
development/tests-and-testing
Plomp, T. (2007). Educational design research: An introduction. In T. Plomp & N. Nieveen
(Eds.), An introduction to educational design research (pp. 9–35). Enschede, Nederland:
SLO.
Sanders, P. (2011). Beoordelingsinstrument voor de kwaliteit van examens. Enschede: RCEC.
Wools, S., Eggen, T., & Sanders, P. (2010). Evaluation of validity and validation by means of the
argument-based approach. CADMO, 8, 63–82.
Wools, S., Sanders, P., Eggen, T., Baartman, L., & Roelofs, E. (2011). Evaluatie van een
beoordelingssysteem voor de kwaliteit van competentie-assessments. Pedagogische
Studiën, 88, 23–40.
Wools, S., Sanders, P., & Roelofs, E. (2007). Beoordelingsinstrument: Kwaliteit van competentie
assessment. Arnhem: Cito.

107
Chapter 10
Influences on Classification Accuracy of Exam Sets: An Example
from Vocational Education and Training
Marianne Hubregtse and Theo J.H.M. Eggen
Abstract Classification accuracy of single exams is well studied in the educational measurement
literature. However, when making important decisions, such as certification decisions, one usually
uses several exams: an exam set. This chapter elaborates on classification accuracy of exam sets.
This is influenced by the shape of the ability distribution, the height of the standards, and the
possibility for compensation. This is studied using an example from vocational education and
training (VET). The classification accuracy for an exam set is computed using item response
theory (IRT) simulation. Classification accuracy is high when all exams from an exam set have
equal and standardized ability distributions. Furthermore, exams where few or no students pass or
fail increase classification accuracy. Finally, allowing compensation increases classification
accuracy.
Keywords: classification accuracy, misclassification, sets of exams, certification decisions
Introduction
Everyone agrees that high-stakes exams should be of sufficient quality. Quality of exams is
usually studied in terms of validity and reliability for traditional standardized tests. The quality of
exams that include performance assessments is generally studied in terms of authenticity (e.g.
Gulikers, 2006) and the validity of the assessment (e.g. Linn, Baker, & Dunbar, 1991). In contrast
to traditional forms of assessment, performance assessments are not standardized tests. This
implies that traditional reliability indices may not be suitable to apply to performance
assessments (Clauser, 2000; Dochy, 2009). Kane (1996) points out that the precision of
measurements is broader than just reliability. Classification accuracy provides an opportunity to
quantify the quality of exams in a universal way, for both standardized tests and performance
assessments. Especially in cases where reliability is difficult to compute, classification accuracy
may give a quantitative measure of the quality of a certain exam.

Marianne Hubregtse and Theo J.H.M. Eggen
108
Classification accuracy is a measure of precision that may be more appropriate for performance
assessments, yet also applicable to standardized tests. Classification accuracy is the degree of
overlap between a decision based on the scores of an exam and the decision that would have been
made on the basis of scores without any measurement error (Hambleton & Novick, 1973).
There is no measurement, and thus no exam, without measurement error. Therefore,
misclassifications occur wherever the decision based on the scores of an exam deviates from a
decision based on error-free scores. There are two types of misclassifications: false positives or
false negatives. False positives occur when students have a true classification below the set
standard, but they receive an exam score above the standard. The reverse is false negatives:
students that have a true classification above the set standard fail the exam. In all other cases—
true classification above the standard passes the exam and true classification below the standard
fails the exam—there is no misclassification. It must be noted that classification accuracy is not
the same as classification consistency. Where classification accuracy compares the true
classification of a student with the observed classification, classification consistency compares
the classification in two (parallel) exams (see also Lee, 2008). Here, the interest is solely in
classification accuracy.
In this chapter, the words standardized test, performance assessment, exam, and exam set
all have a distinct meaning. A standardized test is any test that includes only questions, though
they can be of any type: open-ended, multiple choice, and so on. A multiple choice test is a form
of a standardized test. A performance assessment is defined as a form of testing in which the
student is asked to perform a task that she could encounter in real life. Vocational education uses
performance assessments to allow a student to display competency in their prospective jobs. The
word exam is used whenever there is need for a general word for both performance assessments
and standardized tests. The term exam set is used for any combination and number of exams. For
instance, suppose a student must do three multiple choice tests and four performance assessments
in order to receive a diploma. The seven exams together would be considered one exam set.
In essence, certification decisions and other high stakes exams tend to be dichotomous
decisions. Either the student scores above or below the standard set for certification. One uses an
exam to classify students above or below a set threshold, in order to hand out diplomas. It is very
common to base diploma decisions on more than one exam.

10 Influences on Classification Accuracy of Exam Sets: An Example from Vocational Education and Training
109
Usually an exam set is used that measures, as far as possible, all competencies and abilities
involved. Generally, this seems like a good practice: more opportunities to observe a student give
a better idea of true ability or competence. Furthermore, more measurements increase the
reliability of the total measurement. Since the most important decision, the certification decision,
is based on an exam set, it seems appropriate to compute the classification accuracy of that exam
set instead of the classification accuracies of all separate exams.
Computing the classification accuracy of an exam set is not much different from
computing the classification accuracy for a single exam. This chapter will use a method of
computing classification accuracy for exam sets using simulation based on item response theory
(IRT). The focus will be on how to increase classification accuracy of exam sets. In order to
answer this question, three known influences on classification accuracy for single exams are
studied: the shape of the ability distribution of the target population, the standards set for the
exam set, and the compensation rules between the exams in the set.
Regarding the ability distribution of single exams, normalizing helps the simulation to
more accurately estimate classification accuracy (Van Rijn, Béguin, & Verstralen, 2009). An
increase in classification accuracy is related to more symmetrical misclassifications (Holden &
Kelley, 2008), which is exactly what occurs when ability distributions are normalized.
With respect to the influence of standards on single exams, the following observations are
made. Obviously, standards that are so extreme that they fall completely outside the population
distribution lead to a classification accuracy of 100% (Lee, 2008). Furthermore, it is more
difficult to correctly categorize students close to the standard than students far away from the
standard (Martineau, 2007). Therefore, a graph of classification accuracy should show a dip
around where the standard meets the average ability in the population (Lee, 2008).
Finally, the compensation rules are shown to have an effect on classification accuracy for
exam sets (Van Rijn et al., 2009; Verstralen, 2009a). Both Van Rijn et al. (2009) and Verstralen
(2009a) conclude that classification accuracy is increased when allowing some form of
compensation. It is expected that this result is found for all other varied influences. Intuitively
this makes sense, since allowing compensation essentially lengthens the separate exams into one
long exam (Gatti & Buckendahl, 2006).

Marianne Hubregtse and Theo J.H.M. Eggen
110
These three influences are studied in a simulation, using empirical data from a vocational
education and training (VET) exam set as a starting point. Outcomes are expected not to differ
from influences on single exams. In the next section of this chapter, the method of computing
classification accuracy for the exam set is shown in short. Furthermore, the influences varied in
the simulation study are discussed in more detail. The example section discusses the data source,
the specific setup of the simulation study, and the results of this specific simulation. The
following discussion section shows what the results imply for practitioners and discusses
limitations of the study and future research.
Method
There are a few different ways of computing classification accuracy. Hambleton and Novick
(1973) describe how to compute classification accuracy using two administrations of the same
test. Swaminathan, Hambleton, and Algina (1974) gave a correction to this coefficient. In 1990,
Huynh introduced a measure for class consistency for dichotomous items based on the Rasch
model. Livingston and Lewis (1995) further elaborated on this measure, allowing for different
scoring procedures. Schulz, Kolen, and Nicewander (1999) introduced the first real IRT model
for estimating classification accuracy, though still only for dichotomous items. Wang, Kolen, and
Harris (2000) extended this to a procedure for computing classification accuracy with
polytomous IRT models. Verstralen (2009b) developed this into a method for computing
classification accuracy for exam sets. This last method is used for the simulation and is explained
further in the following paragraph.
Simulation
To measure the classification accuracy of a certain exam set, data need to be collected. Item
parameters are estimated using an appropriate IRT model. This supposes that one exam measures
a certain ability or competency. Subsequently, the covariance matrix for the entire exam set can
be estimated. Given this covariance matrix and the item parameters, a latent ability distribution
for the population can be built. From either the given distribution or the estimated latent ability
distribution, 5,000 true latent abilities are drawn. This enables the researcher to know the true
ability and thus the true classification. In the case of an exam set, latent ability vectors are drawn,
from which the true classification of the exam set is determined.

10 Influences on Classification Accuracy of Exam Sets: An Example from Vocational Education and Training
111
Given the latent ability vectors and the item parameters, for each item the probability of a correct
answer is computed. Using these probabilities, 5,000 item answer vectors are randomly drawn.
From the answer vectors, the observed classification on the exam set is determined. Given the
5,000 observed and true classifications, the classification accuracy is simply determined by the
percentage of correctly classified students.
Varied Influences
The ability distribution is determined through the IRT model as estimated. This distribution is
supposed to approximate the population ability distribution. In the case of an exam set, the
distribution is always a multivariate one. Three variations of the ability distribution were used in
this chapter: the estimated empirical distribution, a centered distribution, and a standardized
distribution. The empirical distribution was solely estimated from the data sample, described in
the next section. Subsequently, the empirical distribution was centralized by subtracting the
means of each of the exams; furthermore, the observations were divided by the standard
deviation, giving a standard deviation of 1. This leaves the distribution with all means 0. Finally,
the distribution was normalized.
Standards are the pre-specified cutoff point for a certain exam. There are two types of
standards: norm-referenced and criterion referenced. Though these standards are set differently,
they are always a known transformation of each other, given a fixed population. Therefore, this
chapter varies norm-referenced standards. Bear in mind that if a norm-referenced criterion
requires 60% of the points to be obtained, this is no indication that 60% of the students pass said
exam. For each of the other varied influences, the standards are varied from 5% to 95% of the
students passing a certain exam. The standards are kept the same for each of the exams in the
exam set.
Compensation rules specify how the scores on separate exams should be combined into a
single decision on the exam set. These rules prescribe how much compensation is allowed
between the different exams. Compensation rules come in three different flavors: conjunctive,
complementary, and compensatory (see also Van Rijn et al., 2009). Conjunctive rules allow no
compensation; students should have a score higher than the standard on each exam.
Complementary rules state that the student should score above the standard for a set number of
exams.

Marianne Hubregtse and Theo J.H.M. Eggen
112
Compensatory rules allow complete compensation within an exam set, where the average score
of the four exams should exceed a certain pre-specified standard. Conjunctive and
complementary compensation rules are often used when there is a minimal level of ability or
competence required. Compensatory rules, on the other hand, are often used when it can be
justified that deficiencies in one competency are compensated with competency in other areas.
There are many compensatory rules possible, depending on the number of exams and the
leniency shown (Hambleton, Jaeger, Plake, & Mills, 2000). In the simulation all three types are
used, representing increasing leniency. The influence of allowing compensation between exams
within an exam set is shown this way.
Example
The data sample was taken from vocational education and training (VET) in the Netherlands. The
data used is described next in further detail, as well as the particulars of the simulation.
Vocational education and training (VET) in the Netherlands is focused on building and assessing
competencies (Gulikers, Bastiaens, & Kirschner, 2004). Therefore, it utilizes performance
assessments that find their base in a practical work-like setting. Usually, a few performance
assessments are grouped together in an exam set for a certification decision. The exam set may or
may not include standardized tests. Although the performance assessment is not the only type of
assessment used in certification decisions, it is generally an important one; the performance
assessment can constitute as much as 90% of an assessment program.
Data Source
Data were collected from a school for vocational education and training in the Netherlands. The
exam set used was from business education and leads to a diploma in Sales Clerk Training
(VET). In total, 188 students participated in the study (49% female). This was deemed sufficient,
since Martineau (2007) shows that around 200 observations are sufficient to use the computed
classification accuracy as a reasonable point estimate of the true classification accuracy. Not
every student had completed every exam yet. In VET, it is customary to hold the exam only with
students that feel they have a good chance of passing the exam. Therefore, a booklet design
where this could be incorporated was used.

10 Influences on Classification Accuracy of Exam Sets: An Example from Vocational Education and Training
113
The exam set used consists of four performance assessments. Each performance assessment
consists of a set of observations. These observations were taken as the items on which the IRT
model for the simulation was based. The empirical competence distributions of both data sets
were positively skewed and positively kurtosed, compared with the normal distribution (see also
Figure 2).
Setup of the Simulation
Since the standards were set differently for each simulation, a way of consistently changing the
grading system was devised. First, an estimation of the latent competence level was simulated.
Based on that, the grades were divided over percentiles equidistant on both sides of the specified
standard. For instance, where the normative standard was on 50% of the students passing, the
cutoff percentages were 90, 75, 50, 25 and 10% passing. The students falling in between two
given percentiles were given a grade. Some students scored exactly on the percentile. They got
the benefit of the doubt and received the higher grade. This conforms to current practice in actual
examinations.
The simulated observations were scored with six different grades from 0 to 5. The grade 3
was taken as the passing grade. To examine how the standards set influence the amount of
misclassification, a simulation was run for every standard between 5% passing and 95% passing,
with 12.5% increments, except for the first and last increment (7.5%). A simulation with these
standards was run for every variation of ability distribution and compensation rule.
The data consist of polytomous items, as described above. Therefore, they were analyzed
using a polytomous IRT model, the polytomous OPLM model (Verhelst, Glas, & Verstralen,
1993). This model gives the item category response function, describing the response to item , in
which the probability of observing as a function of the ability vector, is given by
(1)

Marianne Hubregtse and Theo J.H.M. Eggen
114
where are the item response parameters and is the discrimination parameter
for each item .
Using this model, the item parameters per exam were estimated, creating a latent ability
distribution under the assumption of a normally distributed ability for each exam. From the four
separate ability distributions, a covariance matrix of the latent abilities was estimated. This
multivariate normal latent ability distribution is the basis of the simulation. For each of the 5,000
replications, a true ability vector for replication , was randomly drawn from the multivariate
ability distribution. Given , the true pass-fail status of each replication was determined.
Subsequently, the response process was imitated by generating a response vector for
each replication . Four randomly drawn numbers from a uniform distribution form a vector ,
where for each element it holds that ( ). The generated response
vectors are used in equation (1) to estimate ability vector ̂ , from which again a pass-fail status
is gauged. Next, the vectors and ̂ can be compared to compute the total amount of
misclassification. Although the response vectors in the example each consist of four responses,
only the pass-fail status of the entire exam set was compared. The pass-fail status was always
subject to the compensation rule used in that set of replications.
Four different compensation rules were compared. One conjunctive rule, two
complementary rules, and one compensatory decision rule were studied. Although the exam set
should always average 3 or higher, there are many restrictions on the separate exams that can be
set to influence the diploma decision. Using the conjunctive rule, students will only receive a
diploma when they pass all their exams. Thus, every exam should be graded 3 or higher before a
student receives a diploma. On the other side of the spectrum is the completely compensatory
decision rule, where students obtain their diploma when they have an average on the exam set
that is above or equal to the passing grade 3. There are no additional restrictions for a pass on the
exam set.
In between are two complementary rules, where students are allowed to compensate one
or two deficiencies, respectively. A deficiency is defined as the number of points scored below
the specified passing grade. A 2 is one deficiency, a 1 counts as two deficiencies, and a 0 counts
as three deficiencies. With one deficiency allowed in the exam set, a 2 on one of the exams could
be compensated with a 4. Compensating a 1 with a 5 is not allowed.

10 Influences on Classification Accuracy of Exam Sets: An Example from Vocational Education and Training
115
When two compensations are allowed, both a 1 and a 2 can be compensated, given high enough
grades on the other exams. In this specific example, the complementary rule that allows three
deficiencies is equal to the compensatory rule.
Results
This section reviews the results of the simulations. Knowing what impacts classification accuracy
helps to make decisions regarding the examination process. It is important to remember that the
classification accuracy reflects the accuracy of the certification decision. First, the influence of
the distribution is discussed. Second, the impact of changing normative standards is introduced.
Finally, the results regarding different decision rules are discussed.
It has been shown that the shape of the ability distribution influences classification
accuracy of single exams (Holden & Kelley, 2008). The simulations demonstrate that a similar
influence is found for exam sets, as shown in Figure 1. When comparing the three rows of the
figure, it becomes apparent that the more the ability distribution of the population follows the
assumptions of the model used to compute the classification accuracy, the higher the accuracy
becomes. There is a small increase in average classification accuracy from the empirical ability
distribution (95%) to the normalized and standardized distributions (both on average 96%).
However, visually it is immediately apparent that this is a very consistent result over all the other
conditions. This implies both that the model is better in estimating the classification accuracy and
that when the model fits the ability distribution of the population, fewer misclassifications are
made. These results were expected.

Marianne Hubregtse and Theo J.H.M. Eggen
116
no compensation 1 compensation 2 compensations pass on average
empirical
distribution
normalization
standardization
Note: The height of the columns corresponds to the percentages correctly classified students. The scale of the
vertical axis is from 88% to 100% accuracy. Each bar plot contains all standards.
Figure 1 Classification accuracy per condition for all standards
A second part of the study looked at the influence of the standards of the exams on
classification accuracy of the exam set. In Figure 1, the effect of the standards is visible by
inspecting the 12 single graphs. From left to right, each graph shows the standards from 5%
obtaining a diploma to 95% obtaining a diploma. Within each graph, the bars show a line with a
dip. The dip consistently occurs around the point where the top of the ability distribution of the
target population is. This is as expected.

10 Influences on Classification Accuracy of Exam Sets: An Example from Vocational Education and Training
117
exam 1 exam 2 exam 3 exam 4
empirical
distribution
normalization
standardization
Note: This is a multivariate distribution. The four columns represent the four different exams that make up the exam
set used. Rows represent the different distributions. From top to bottom: empirical distribution, normalized
distribution, and standardized distribution.
Figure 2 Information on the ability distribution for all distributions
As can be seen in Figure 2, the empirical distribution shows an irregular pattern, resulting
in an irregular multivariate distribution. The normalized distribution shows more evenly spread,
but still slightly skewed, distributions. This translates into a flatter classification accuracy pattern
than for the empirical distribution. The larger dip in the classification accuracy pattern of the
standardized distribution coincides with the observed standardized distribution, which is more
kurtosed than the normalized distribution.
The highest accuracy is found nearer the extreme standards (where everyone fails every
exam or everyone passes every exam) and the lowest accuracy at the top of the ability
distribution. Extreme standards, where either nearly all students pass or nearly all fail, are usually
not desirable in educational settings. In certain settings, for instance when selecting a top-ten
group of students or candidates, extreme standards may apply.
There are two reasons for the coinciding of the dip and the ability distribution. Especially
in VET, it is well known what students should know or be able to do for each exam. This
undoubtedly leads to ―teaching to the test,‖ a phenomenon where students and teachers work
toward the level the test asks, the standards (Popham, 2001). Some might say that this is a
problem. However, when the standards are set at an adequate level, this is not necessarily true.
Exam 1
-4 -2 0 2 4
Exam 2
-4 -2 0 2 4
Exam 3
-4 -2 0 2 4
Exam 4
-4 -2 0 2 4
-4 -2 0 2 4 -4 -2 0 2 4 -4 -2 0 2 4 -4 -2 0 2 4
ability
-4 -2 0 2 4
ability
-4 -2 0 2 4
ability
-4 -2 0 2 4
ability
-4 -2 0 2 4
Exam 1
-4 -2 0 2 4
Exam 2
-4 -2 0 2 4
Exam 3
-4 -2 0 2 4
Exam 4
-4 -2 0 2 4
-4 -2 0 2 4 -4 -2 0 2 4 -4 -2 0 2 4 -4 -2 0 2 4
ability
-4 -2 0 2 4
ability
-4 -2 0 2 4
ability
-4 -2 0 2 4
ability
-4 -2 0 2 4
Exam 1
-4 -2 0 2 4
Exam 2
-4 -2 0 2 4
Exam 3
-4 -2 0 2 4
Exam 4
-4 -2 0 2 4
-4 -2 0 2 4 -4 -2 0 2 4 -4 -2 0 2 4 -4 -2 0 2 4
ability
-4 -2 0 2 4
ability
-4 -2 0 2 4
ability
-4 -2 0 2 4
ability
-4 -2 0 2 4
Exam 1
-4 -2 0 2 4
Exam 2
-4 -2 0 2 4
Exam 3
-4 -2 0 2 4
Exam 4
-4 -2 0 2 4
-4 -2 0 2 4 -4 -2 0 2 4 -4 -2 0 2 4 -4 -2 0 2 4
ability
-4 -2 0 2 4
ability
-4 -2 0 2 4
ability
-4 -2 0 2 4
ability
-4 -2 0 2 4
Exam 1
-4 -2 0 2 4
Exam 2
-4 -2 0 2 4
Exam 3
-4 -2 0 2 4
Exam 4
-4 -2 0 2 4
-4 -2 0 2 4 -4 -2 0 2 4 -4 -2 0 2 4 -4 -2 0 2 4
ability
-4 -2 0 2 4
ability
-4 -2 0 2 4
ability
-4 -2 0 2 4
ability
-4 -2 0 2 4
Exam 1
-4 -2 0 2 4
Exam 2
-4 -2 0 2 4
Exam 3
-4 -2 0 2 4
Exam 4
-4 -2 0 2 4
-4 -2 0 2 4 -4 -2 0 2 4 -4 -2 0 2 4 -4 -2 0 2 4
ability
-4 -2 0 2 4
ability
-4 -2 0 2 4
ability
-4 -2 0 2 4
ability
-4 -2 0 2 4
Exam 1
-4 -2 0 2 4
Exam 2
-4 -2 0 2 4
Exam 3
-4 -2 0 2 4
Exam 4
-4 -2 0 2 4
-4 -2 0 2 4 -4 -2 0 2 4 -4 -2 0 2 4 -4 -2 0 2 4
ability
-4 -2 0 2 4
ability
-4 -2 0 2 4
ability
-4 -2 0 2 4
ability
-4 -2 0 2 4
Exam 1
-4 -2 0 2 4
Exam 2
-4 -2 0 2 4
Exam 3
-4 -2 0 2 4
Exam 4
-4 -2 0 2 4
-4 -2 0 2 4 -4 -2 0 2 4 -4 -2 0 2 4 -4 -2 0 2 4
ability
-4 -2 0 2 4
ability
-4 -2 0 2 4
ability
-4 -2 0 2 4
ability
-4 -2 0 2 4
Exam 1
-4 -2 0 2 4
Exam 2
-4 -2 0 2 4
Exam 3
-4 -2 0 2 4
Exam 4
-4 -2 0 2 4
-4 -2 0 2 4 -4 -2 0 2 4 -4 -2 0 2 4 -4 -2 0 2 4
ability
-4 -2 0 2 4
ability
-4 -2 0 2 4
ability
-4 -2 0 2 4
ability
-4 -2 0 2 4
Exam 1
-4 -2 0 2 4
Exam 2
-4 -2 0 2 4
Exam 3
-4 -2 0 2 4
Exam 4
-4 -2 0 2 4
-4 -2 0 2 4 -4 -2 0 2 4 -4 -2 0 2 4 -4 -2 0 2 4
ability
-4 -2 0 2 4
ability
-4 -2 0 2 4
ability
-4 -2 0 2 4
ability
-4 -2 0 2 4
Exam 1
-4 -2 0 2 4
Exam 2
-4 -2 0 2 4
Exam 3
-4 -2 0 2 4
Exam 4
-4 -2 0 2 4
-4 -2 0 2 4 -4 -2 0 2 4 -4 -2 0 2 4 -4 -2 0 2 4
ability
-4 -2 0 2 4
ability
-4 -2 0 2 4
ability
-4 -2 0 2 4
ability
-4 -2 0 2 4
Exam 1
-4 -2 0 2 4
Exam 2
-4 -2 0 2 4
Exam 3
-4 -2 0 2 4
Exam 4
-4 -2 0 2 4
-4 -2 0 2 4 -4 -2 0 2 4 -4 -2 0 2 4 -4 -2 0 2 4
ability
-4 -2 0 2 4
ability
-4 -2 0 2 4
ability
-4 -2 0 2 4
ability
-4 -2 0 2 4

Marianne Hubregtse and Theo J.H.M. Eggen
118
The result should be adequately trained starters and if the standards of the exams are adequate for
that goal, it might even be desirable to teach to the test. Should institutes for learning or
examination desire a higher classification accuracy, they may consider setting a level of learning
higher than the level of examination.
The study also investigates the influence of compensation rules. Figure 1 shows that an
exam set in which compensation is allowed leads to higher classification accuracy. When looking
from left to right, all classification accuracies show increased classification accuracy, with the
increasing freedom of compensation. The third row shows this best. In the last graph, the
classification accuracy for each standard is comparable. For standards below 50% of students
passing, the compensation rules have a less pronounced effect. This seems due to the ability
distribution. The classification accuracy for different compensation rules converges on both sides
of the dip. Since a ceiling effect occurs, the classification accuracy does not converge on the
higher standards. It must be brought to mind that the compensation is between exams, not within
exams. The condition ―no compensation‖ means that each exam must have been finished with a
passing grade, not necessarily with a perfect score.
Table 1 Classification accuracy in percentage of correctly classified students
real standard average of all standards
empirical
distribution no compensation 88% 94%
1 compensation 91% 95%
2 compensations 92% 95%
pass on average 93% 96%
normalisation no compensation 97% 98%
1 compensation 96% 97%
2 compensations 96% 98%
pass on average 97% 97%
standardisation no compensation 96% 96%
1 compensation 96% 96%
2 compensations 96% 96%
pass on average 98% 96%
When just looking at the empirical distribution, set at the currently used standards (see
Table 1), the influence of compensation shows that each step of compensation adds some
accuracy. No compensation leads to a classification accuracy of 88%.

10 Influences on Classification Accuracy of Exam Sets: An Example from Vocational Education and Training
119
Obviously, this leaves 12% of the students to be misclassified. Allowing some compensation
increases classification accuracy for this exam set (1 compensation: 91%; 2 compensations:
92%).
However, the highest classification accuracy is achieved using full compensation (pass on
average: 93%). This implies that nearly half the misclassified students of the no compensation
scenario are correctly classified under full compensation. This could be a reason to implement a
higher level of compensation. It is interesting also to note that the biggest increase in
classification accuracy is found going from no compensation at all to at least some compensation
(difference of 91% - 88% = 3%). Depending on the amount of students partaking in the exams, it
may be worthwhile to consider at least partial compensation for the exam set. These results had
been anticipated as well, since allowing compensation essentially lengthens the exams within the
exam set and therefore it is expected that the exam set is better able to classify the students.
Discussion
Most research focuses on the quality of individual exams. However, the important decisions are
usually based on an exam set. Therefore, it seems more appropriate to focus on the quality of
exam sets. Much has been written about classification accuracy of single exams; there is literature
about several ways of computing classification accuracy and there is literature regarding the
influences on this classification accuracy.
A few well-known influences are the shape of the ability distribution of the measured
ability in the target population, the standard that has been set for the exam, and the allowance of
compensation within the exam. It was shown how the classification accuracy of exam sets is
influenced by ability distribution, standards, and compensation. This was done using an example
from vocational education and training (VET). The classification accuracy for an exam set is
computed using item response theory (IRT) simulation. The outcomes indicate that classification
accuracy for exam sets is influenced in a way similar to the classification accuracy for single
exams. Of course, this stays partially contingent on the quality and number of the exams that
together make up the exam set.

Marianne Hubregtse and Theo J.H.M. Eggen
120
Classification accuracy is high when all tests from an exam set have equal and standardized
ability distributions. To some extent, schools may exert some influence over the ability
distribution. However, researchers or test developers do not have this possibility. Nevertheless,
this does imply that concepts that are stable and normally distributed may be tested with higher
classification accuracy. Test developers may want to research the concepts they plan to test
beforehand, in order to assess whether they can accurately test them.
It is neither always possible nor always desirable to create exam sets that fit the ability
distribution of the target population. In some cases, the target population is unknown. Other
constraints may be time and money to obtain a distribution. Furthermore, ability distributions
may shift over time. Even when the target population and its ability distribution are known, it
may change in the time between measuring the distribution and taking the exams. Finally, it is
not expected that the ability distribution is completely normal, since most exams in VET are
designed with a ceiling effect in mind.
Furthermore, extreme standards (where few or no students pass or fail an exam) increase
classification accuracy. In practice, however, it is not common to test far below or above the
average ability of the target population. This is especially true in educational settings.
Furthermore, developing exam sets that are designed to test outside the ability distribution of the
target population do not yield much information. In certain situations, one may still decide to
develop such an exam set. For instance, one may want to ensure that all students have a certain
basic proficiency, where it is expected that all students easily surpass this proficiency.
Measurement is likely to be more accurate if the question of how proficient students are is
subordinate to the question of whether all students are proficient enough.
Finally, allowing compensation increases classification accuracy. Compensation, either
within a single exam or encompassing the entire exam set, is a property of the exam that
researchers or test developers nearly always have an influence on. There are various reasons why
one may want to allow or disallow compensation. This discussion limits itself to reasons for
allowing and disallowing compensation in exam sets. Reasons for allowing compensation include
increasing classification accuracy. Furthermore, when individual exams are short, and they tend
to be in VET, it seems reasonable to partially negate the effects of measurement error with the
allowance of compensation between exams. Moreover, intuitively it may feel unfair for a good
student to be denied a diploma should she fail just one exam.

10 Influences on Classification Accuracy of Exam Sets: An Example from Vocational Education and Training
121
Nevertheless, there are arguments in favor of conjunctive exam sets. In some vocations there are
at least certain parts of the examination that should be passed in any condition. A nurse that is
incapable of inserting an IV needle should not be allowed to practice. In addition, conjunctive
measurement may be the fastest, and thus cheapest, way of examination. Besides, it may be the
easiest rule to explain to the students, giving them the required insight in their assessment.
On the whole, it is advisable to compute classification accuracy for exam sets. It gives the
researcher or test developer insight into the quality of the exam set, rather than just the separate
exams. One especially gains insight into how many students are disadvantaged by the method of
examination. Moreover, when the quality of the separate exams is difficult to assess,
classification accuracy is an elegant measure for gauging the quality of the examination.
On the other hand, computing classification accuracy is rather expensive. It costs time and
requires a fair amount of skill on the part of the researcher or test developer, not to mention the
lack of easily accessible software. It may only be worth investing the resources when stakes are
high, for instance in the case of certification exam sets, or when the quality of the exam set is
highly disputed. Of course, when the resources are readily available, classification accuracy sure
seems a great measure to add to the findings on exam set quality.
References
Clauser, B. (2000). Recurrent Issues and Recent Advances in Scoring Performance Assessments.
Applied Psychological Measurement, 24(4), 310-324.
Dochy, F. (2009). The Edumetric Quality of New Modes of Assessment: Some Issues and
Prospects. In G. Joughin (Ed.), Assessment, Learning and Judgement in Higher Education
(pp. 85-114). Springer Science.
Gatti, G. G., & Buckendahl, C. W. (2006). On Correctly Classifying Examinees. In Annual
Meeting of the American Educational Research Association (San Francisco, CA).
Retrieved April 26, 2011 from http://www.unl.edu/buros/biaco/pdf/pres06gatti01.pdf.
Gulikers, J. T. M., Bastiaens, T. J., & Kirschner, P. A. (2004). A Five-Dimensional Framework
for Authentic Assessment. Educational Technology Research and Development, 52(3),
67-85.

Marianne Hubregtse and Theo J.H.M. Eggen
122
Hambleton, R. K., Jaeger, R. M., Plake, B. S., & Mills, C. (2000). Setting Performance Standards
on Complex Educational Assessments. Applied Psychological Measurement, 24(4), 355-
366.
Hambleton, R., & Novick, M. (1973). Toward an Integration of Theory and Method for
Criterion-Referenced Tests. Journal of Educational Measurement, 10(3), 159-170.
Holden, J. E., & Kelley, K. (2008). Effects of Misclassified Data on Two Methods of
Classification Analysis: A Monte Carlo Simulation Study. Paper presented at the Annual
Meeting of the American Educational Research Association, New York, NY.
Huynh, H. (1990). Computation and Statistical Inference for Decision Consistency Indexes Based
on the Rasch Model. Journal of Educational Statistics, 15, 353-368.
Kane, M. (1996). The Precision of Measurements. Applied Measurement in Education, 9(4), 355-
379.
Lee, W. C. (2008). Classification Consistency and Accuracy for Complex Assessments Using
Item Response Theory. Iowa City: Center for Advanced Studies in Measurement and
Assessment.
Linn, R. L., Baker, E. L., & Dunbar, S. B. (1991). Complex, Performance-Based Assessment:
Expectations and Validation Criteria. Educational Researcher, 20(8), 15-21.
Livingston, S. A., & Lewis, C. (1995). Estimating the Consistency and Accuracy of
Classifications Based on Test Scores. Journal of Educational Measurement, 32, 179-197.
Martineau, J. A. (2007). An Expansion and Practical Evaluation of Expected Classification
Accuracy. Applied Psychological Measurement, 31(3), 181-194.
Popham, W. J. (2001). Teaching to the test. Educational Leadership, 58(6), 16-20.
Schulz, E. M., Kolen, M. J., & Nicewander, W. A. (1999). A Rationale for Defining
Achievement Levels Using IRT-Estimated Domain Scores. Applied Psychological
Measurement, 23, 347-362.
Swaminathan, H., Hambleton, R. K., & Algina, J. (1974). Reliability of Criterion-Referenced
Tests: A Decision-Theoretic Formulation. Journal of Educational Measurement, 11,263-
268.
Van Rijn, P., Béguin, A., & Verstralen, H. (2009). Zakken of Slagen? De Nauwkeurigheid van
Examenuitslagen in het Voortgezet Onderwijs. (Pass or Fail? The Accuracy of Exam
Results in Secondary Education) Pedagogische Studiën, 86, 185-195.

10 Influences on Classification Accuracy of Exam Sets: An Example from Vocational Education and Training
123
Verhelst, N. D., Glas, C. A. W., & Verstralen, H. H. F. M. (1993). OPLM: One parameter
logistic model. Computer program and manual. Arnhem: Cito.
Verstralen, H. (2009a). Quality of Certification Decisions. Arnhem: Cito.
Verstralen, H. (2009b). Accuracy of Exams: CTT and IRT Compared. Arnhem: Cito

124

125
Chapter 11
Computerized Classification Testing and Its Relationship to the
Testing Goal
Maaike M. van Groen
Abstract Assessment can serve different goals. If the aim of testing is to classify respondents
into one of multiple levels instead of obtaining a precise estimate of the respondent‘s ability,
computerized classification testing can be used. This type of testing requires algorithms for item
selection and making the classification decision. The result of the test administration is provided
in a report about the decision with sometimes additional feedback. The design of all these
components of the test should be in line with the testing goal. Several goals have been defined for
assessment which make a judgment about: pupils, the learning process, groups of students and
schools, and the quality of education. The possibilities for use of computerized classification
testing for different testing goals are investigated in the current paper.
Keywords: computerized classification testing, testing goals, test design
Introduction
Assessment can have different goals. In some testing situations, the aim is to classify respondents
into one of multiple levels instead of making a precise estimate of the respondent‘s ability. This
should be achieved by administering as few items as possible while maximizing the number of
correct classifications. Computerized classification testing (CCT) is an approach that can be used
for finding a balance between the number of items and the level of confidence in the correctness
of the decision (Bartroff, Finkelman, & Lai, 2008). According to Thompson (2009),
computerized classification tests assign an examinee into one of two or more mutually exclusive
categories along the ability scale. In the current paper, this definition is further limited to tests
based on item pools that have been scaled using modern psychometric methods.
One part of the procedure determines which items have to be selected. Another part of the CCT
procedure determines whether testing can be stopped because enough confidence has been gained
in making the decision or that an additional item has to be administered.

Maaike M. van Groen
126
The classification method as well as the item selection method have to be in line with the testing
goal and the report and feedback that have to be provided after testing has been finished. This is
illustrated in Figure 1. Based on the testing goal, a method for reporting the classification and the
type of feedback can be determined. The testing goal also partly determines which classification
method can be used and how it should be implemented. The goal influences the selection of the
item as well. The way in which results can be reported and feedback can be provided is
determined by the classification method as well as the item selection method. Ideally, these
methods should be designed so the desired report and feedback can be provided afterwards. A
test developer should always keep in mind that the goals, methods, and report should be
synchronized with each other.
Figure 1 Testing goals and CCT components
Testing Goals and Computerized Classification Testing
In the previous section, attention was paid to testing goals. However, which goals testing can
have was not described. The implications for classification and item selection methods and report
and feedback have been mentioned only briefly. In this section, first, testing goals and
computerized classification testing are described. The possibility of using computerized
classification testing for specific testing goals is then described. In the last section, the
implications of testing goals for designing computerized classification tests are investigated.
Testing can serve different goals. One taxonomy of testing goals is provided by Sanders
(2011). He divides testing goals into:
Report & Feedback
Testing goalsClassification & Item
selection methods

11 Computerized Classification Testing and Its Relationship to the Testing Goal
127
Assessment for making a judgment about students
Assessment for making a judgment about the learning process
Assessment for making a judgment about groups of students and schools
Assessment for making a judgment about the quality of education.
A second distinction can be made regarding the importance of the consequences of testing
because the importance of the test has a major influence on test design. Stobart (2008) defines a
high-stakes test as having substantial consequences for some or all of the parties involved. A
third distinction can be made regarding the type of assessment: assessment for learning or
assessment of learning. Assessment for learning is used as a tool for supporting the learning of
pupils by providing guidance for the instructional process. Assessment of learning includes all
tests that measure knowledge after a period of instruction to assess whether the required
knowledge level has been reached or not. Since the testing goal, the importance of testing, and
the type of assessment are closely related to each other, they are described together.
Assessment for Making a Judgment about Pupils
Assessment for making a judgment about students can be subdivided into four subgoals:
Selection
Classification
Placement
Certification
Sanders (2011) explains that selection takes place if not all the students who want to enroll in a
program or study can be admitted. Based on the selection decision, a fixed number of students are
admitted to an educational program. A selection decision can be made based on a specially
designed test, for example, the Law School Admission Test for admission to law school in the
United States or based on a test with a more general goal. An example of the latter are the final
examinations for secondary education in the Netherlands used for selecting students for
admittance to medical school.

Maaike M. van Groen
128
Based on the classification decision in a classification test, a different educational program is
offered to the student that will lead to a different diploma (Sanders, 2011). The final test for
Dutch primary education (Cito, 2012) is one of the instruments that can be used for deciding the
level of secondary education a child will attend in addition to the teacher‘s advice and the
parents‘ ideas. If placement is the testing goal, the student will be placed in a different
educational program, but the final diploma will be the same. An example is an entrance driving
test that is used for selecting students for a short driving course who will be able to pass the
driving examination after only a limited number of driving lessons. Those who are expected to
need more lessons will be selected for a longer driving course. The last testing goal is
certification. Certification tests are used in situations in which a final judgment has to be made
regarding the student‘s level in order to receive a certificate or a diploma. Well-known examples
of such tests are the final examinations in secondary education in the Netherlands. These testing
goals have in common that they are a form of assessment of learning and that they can all be seen
as a form of high-stakes testing. The goal is to make a summative judgment of the student‘s
knowledge.
Assessment for Making a Judgment about the Learning Process
In assessments in which a judgment is made regarding the student‘s learning process, the goal is
to obtain information that can be used in the instructional process (Sanders, 2011). This can be
seen as assessment for learning. Using such a test, the teacher will be able to adapt his or her
instruction to increase the students‘ knowledge and skills. Diagnostic tests also serve this goal of
testing. If diagnostic testing is the goal of testing, the interested reader is referred to Rupp,
Templin, and Henson (2010). Also tests like the Mathgarden (www.mathsgarden.com), a serious
game for primary education arithmetic, and simulation-based learning in aviation can be seen as
making judgments about the learning process of the student. Sanders (2011) points out that the
distinctions between testing and instruction will become blurred in these tests. Tests that serve
this goal have a major impact on the teaching methodology but usually have only indirect impact
on the pupils themselves.

11 Computerized Classification Testing and Its Relationship to the Testing Goal
129
Assessment for Making a Judgment about Groups of Students and Schools
Assessments for making a judgment about groups of students and schools take place if the test
results of individual students are aggregated to get information about the group or the school
(Sanders, 2011). Assessment for making a judgment about groups of students and school can
serve different purposes. If the focus is on improvement of the learning of the group of students,
it can be seen as an assessment for learning. If the focus is on accountability for the results of the
group or the school, it can be seen as assessment of learning. An example of the former is the
situation in which small groups within the class are arranged based on their achievements on a
test in order to provide different instruction to each group. An example of the latter is the use of
test scores for giving the Inspectorate insight into the quality of the school. The consequences in
this situation are highest for the school instead of for the individual pupil (Stobart, 2008).
Assessment for Making a Judgment about the Quality of Education
The last goal of testing is assessment for making a judgment about the quality of education. In
these studies, the goal is to measure the quality of the education in a nation or to compare
educational systems in different nations (Sanders, 2011). Such studies, such as PPON and PISA,
provide policymakers, the Inspectorate, developers of instructional and assessment material, and
so on, insight into the current level of pupils in the nation. Based on the findings, adjustments in
policy and materials can be made. Since test results are not used for improvement of education on
the individual level, these tests can be seen as assessment of learning. The stakes in these tests are
primarily on the national level.
Computerized Classification Testing for Different Testing Goals
Computerized classification testing can be used in many different situations. In this section the
use of CCT is explored for the testing goals as defined by Sanders (2011). The efficiency and
effectiveness of CCT is compared to linear testing and computerized adaptive testing for those
goals. In computerized adaptive testing the goal is to obtain a precise estimate of the respondent‘s
ability level on a continuous scale instead of making a classification decision into one of multiple
mutually exclusive categories. But first, some additional information is provided about
computerized classification testing.

Maaike M. van Groen
130
Computerized Classification Testing
CCT requires two algorithms. The first determines when a classification decision can be made.
The second determines which item has to be administered next. Several methods exist for making
a classification, such as the sequential probability ratio test (Wald, 1947/1973; Reckase, 1983;
Eggen, 1999) and the ability confidence interval method (Weiss & Kingsbury, 1984). The
majority of these methods can classify respondents into two levels, but some can also classify
respondents into multiple groups. Commonly used item selection methods such as maximization
of information at the cutting point and maximization at the current ability estimate can be used if
classification into two groups is desired (Eggen, 1999), but some methods can also be used if a
classification into multiple levels is required (Eggen & Straetmans, 2000; Van Groen, Eggen, &
Veldkamp, 2012).
Assessment for Making a Judgment about Pupils
Computerized classification testing was originally designed for dividing respondents into
different groups. If the assessment is used for making a judgment about pupils, computerized
classification testing is one of the most efficient methods. Because decisions about pupils have a
major impact on students, a high level of accuracy is desired. In CCT, accuracy is maximized
while test length is minimized. Depending on the precise testing goal, more or less accuracy is
required. If the goal is classification or certification, accuracy is extremely important because of
the stakes for the student. CCT cannot be used if selection of students is the goal of the
assessment because CCT requires a fixed cutting point instead of a flexible cutting point. When
selection takes place, the cutting point is set at the value that results in the specified number of
students who pass.
Linear testing can be used for making classification decisions, but many more items are
required to make the classification decision as accurate as in CCT. Computerized adaptive testing
(CAT) also requires more items than necessary because in CAT precise estimates have to be
acquired at all points on the ability scale. In CCT, however, precision is required only on one or
more points on the ability scale if a classification decision has to be made. CAT is well suited for
making selection decisions because the cutting point can be set at every point on the scale after
all tests have been administered.

11 Computerized Classification Testing and Its Relationship to the Testing Goal
131
Assessment for Making a Judgment about the Learning Process
If assessment for making a judgment about the learning process is the goal, computerized
classification testing can be used if a precise ability estimate is not required. If a classification
decision on subdomains, such as multiplication, division, and so on, is sufficient, CCT can be
used; otherwise, CAT or linear testing has to be used. If CAT or linear testing is used, more items
will be required for obtaining information about the student‘s level. Different models can be used
in CAT and linear testing that have been designed for diagnostic testing especially (Rupp,
Templin, & Henson, 2010).
In assessment for making a judgment about the learning process, the idea is to gather
information within a rather short time and use the test results to adapt the instruction to the
students. This implies that only a limited number of items will be available for making the
classification decision and accuracy is not the most important goal. If diagnostic information has
to be gathered on several subdomains, a limited number of items will be available per subdomain,
and per subdomain a classification decision has to be made.
Assessment for Making a Judgment about Groups of Students and Schools
If a judgment has to be made about groups of students or schools in the context of assessment for
learning, the same conditions apply as for making judgments about the learning process for
individual students. In both situations, the ultimate goal is to adapt the instruction the teacher
provides to the students‘ knowledge level. The difference is in the focus on the judgment groups
and schools instead of individual students.
If a judgment has to be made about groups of students or schools in the context of
assessment of learning, computerized classification testing can be used if a classification decision
suffices. If different cutting points have been set for schools due to different student
characteristics, this is also possible. If more information is required than CCT can provide, CAT
or linear testing has to be used.
Assessment for Making a Judgment about the Quality of Education
If assessment for making a judgment about the quality of education is the goal of testing, whether
CCT can be used depends on the specific results policymakers want to be measured. If the goal is
to investigate whether the required subjects are mastered by pupils, CCT can be used.

Maaike M. van Groen
132
In situations in which the effect of a reform has to be investigated, the policymakers are
interested in differences in ability before and after the reform. CAT and linear testing are better
suited for evaluation of reforms. In the first situation, the stakes are at the national level instead of
at the student level.
Designing Computerized Classification Tests for Different Testing Goals
The relationship between testing goals and components of a computerized classification test were
described in Figure 1. The classification method, item selection method, report, and feedback
should all be designed so that they are in line with the testing goal. In this section, the four design
components are investigated for the different testing goals.
Assessment for Making a Judgment about Pupils
In a computerized classification test for making a judgment about pupils, traditional CCT
classification methods can be used for making the decision whether to classify into a certain level
or to continue testing. An algorithm can be selected based on the number of cutting points needed
for the test. The focus of the item selection method should be on obtaining the most information
as quickly as possible to be able to stop testing after as few items as possible. If one cutting point
is used, information can be maximized at the cutting point (Eggen, 1999). If multiple cutting
points are used, an algorithm that takes this into account has to be used (Eggen & Straetmans,
2000; Van Groen, Eggen, & Velkamp, 2012). Using simulations, optimal settings for the
classification method and item selection method can be determined. The report in a CCT for
making a judgment about pupils can be simple. Reporting the actual decision often suffices.
Specific feedback is not needed in these situations because the decision is all that matters.
Assessment for Making a Judgment about the Learning Process
If a computerized classification test is used for making a judgment about the learning process, the
classification method has to include one decision per subdomain. This implies that per subdomain
a classification has to be made about mastering the subdomain or not. It is also possible to
include multiple levels in the classification method per subdomain. The number of items that
have to be administered before stopping the test is strongly related to the number of subdomains
and the number of cutting points per subdomain.

11 Computerized Classification Testing and Its Relationship to the Testing Goal
133
The design of the classification method should be in line with the specific theories behind the
topic and should conform to the level of specificity a teacher needs to adapt the instruction to the
student‘s level.
The item selection method should select items for the subdomain for which a classification
decision has to be made. This implies that some kind of content control is required within the
item selection method. To make decisions with as much information as possible, items should be
selected that maximize information at the cutting point that is of interest. If items provide
information regarding several subdomains, developing a special item selection method for the test
can be more efficient. Simulation studies provide insight into the efficiency and side effects of
different item selection methods.
The report should provide the information a teacher needs to adapt the instruction. Per
subdomain the classification decision has to be provided. If available, specific feedback for
improving the instruction can be given such as references to relevant exercises and instruction
material. In a second screen, information could be provided per domain regarding the items that
the student answered correctly or incorrectly. Additional feedback can be provided about the
types of mistakes a student makes when answering the item. The report and the feedback should
be well structured and easy to comprehend; if not, the teacher will look only at the classifications.
Assessment for Making a Judgment about Groups of Students and Schools
If a computerized classification test is used for judging groups of students and schools in the
context of assessment for learning, the basic guidelines for CCT for judging the learning process
can be followed. Differences should appear in the way the report is presented after the test is
administered. The focus should be on groups of students or on the school. Aggregated results can
be presented per subdomain with feedback on how instruction could be improved. Instead of
providing information about individual students, the number of students that have gathered not
enough knowledge about a subdomain could be presented. In addition, clusters of students with
similar profiles based on the classifications can be provided. The teacher can provide instruction
to the groups of students based on the profiles. If a computerized classification test is used for
judging groups of students and schools in the context of assessment of learning, the classification
method should be directed toward making a classification after as few items as possible.

Maaike M. van Groen
134
The item selection method should also be directed toward gathering evidence for making the
classification decision as quickly as possible. The report can be very basic. The percentage or
number of students who pass the test should be reported. Feedback is not needed in this situation
because the goal is to provide information for accountability purposes only.
Assessment for Making a Judgment about the Quality of Education
If a CCT is used for judgment the quality of education, the design of the components of the CCT
can be comparable to the design for accountability. The difference between the two goals is
primarily visible in the report. Instead of aggregation to the group or school level, aggregation
should be at the national level. Specific feedback is not necessary.
Discussion
Computerized classification testing can be used in many testing situations in which students have
to be classified into groups who have gathered knowledge at a certain level. By including
subdomains in the classification method, it becomes possible to use CCT in more situations than
often realized. The main reasons for not using CCT include requirements for giving scores at a
continuous scale and possible objections against computerized testing.
Test developers should always keep the goal of their test in mind when designing the test. This is
not different from traditional paper-and-pencil tests or computerized adaptive tests, but only
limited theoretical work has been done for computerized classification testing. During the
construction phase, the test developer should always keep Figure 1 in mind: the testing goals
define the requirements for the classification method, item selection method, report, and
feedback. The classification and item selection methods restrict the information and feedback that
can be reported, which implies that these four components have to be designed concurrently.

11 Computerized Classification Testing and Its Relationship to the Testing Goal
135
References
Bartroff, J., Finkelman, M. D., & Lai, T. L. (2008). Modern sequential analysis and its
applications to computerized adaptive testing. Psychometrika, 73, 473-486. doi:
10.1007/s11336-007-9053-9
Cito. (2012). Eindtoets Basisonderwijs [Final test primary education]. Arnhem: Cito BV.
Eggen, T. J. H. M. (1999). Item selection in adaptive testing with the sequential probability ratio
test. Applied Psychological Measurement, 23, 249-261. doi:
10.1177/01466219922031365
Eggen, T. J. H. M. & Straetmans, G. J. J. M. (2000). Computerized adaptive testing for
classifying examinees into three categories. Educational and Psychological Measurement,
60, 713-734. doi: 10.1177/00131640021970862
Groen, M. M. van, Eggen, T. J. H M., & Veldkamp, B. P. (Unpublished). Item Selection Methods
Based on Multiple Objective Approaches for Classification of Respondents into Multiple
Levels.
Reckase, M. D. (1983). A procedure for decision making using tailored testing. In Weiss, D. J.
(Ed.), New horizons in testing: latent trait theory and computerized adaptive testing (pp.
237-254). New York, NY: Academic Press.
Rupp, A. A., Templin, J., & Henson, R. A. (2010). Diagnostic measurement: Theory, methods,
and applications. New York, NY: The Guilford Press.
Sanders, P. (2011). Het doel van toetsen [The goal of testing] In Sanders, P. (Ed.), Toetsen op
school [Testing in schools] (pp. 9-20). Arnhem: Stichting Cito Instituut voor
Toetsontwikkeling.
Stobart, G. (2008) Testing Times: The uses and abuses of assessment. London: Routledge.
Thompson, N. A. (2009). Item selection in computerized classification testing. Educational and
Psychological Measurement, 69, 778-793. doi: 10.1177/0013164408324460
Wald, A. (1947/1973). Sequential analysis. New York, NY: Dover Publications, Inc.
Weiss, D. J. & Kingsbury, G. G. (1984). Application of computerized adaptive testing to
educational problems. Journal of Educational Measurement, 21, 4, 361-375.
doi: 10.1111/j.1745-3984.1984.tb01040.x

136

137
Chapter 12
An Overview of Innovative Computer-Based Testing
Sebastiaan de Klerk
Abstract Driven by the technological revolution, computer-based testing (CBT) has witnessed an
explosive rise the last decades, in both psychological and educational assessment. Many paper-
and-pencil tests now have a computer-based equivalent. Innovations in CBT are almost
innumerable, and innovative and new CBTs continue to emerge on a very regular basis.
Innovations in CBT may best be described along a continuum of several dimensions. Parshall,
Spray, Kalohn, and Davey (2002) describe five innovation dimensions in which CBTs can differ
in their level of innovativeness: item format, response action, media inclusion, level of
interactivity, and scoring method. This chapter provides a detailed description of the five
innovation dimensions, including case examples. Furthermore, an overview of opportunities, risks,
and future research will be given.
Keywords: computer-based testing, dimensions of innovation, opportunities and risks, future
research
Introduction
The availability and utilization of personal computers has been growing explosively since the
1980s, and will continue to do so in the coming decades. The educational system has not been
oblivious to the explosive rise of PCs and technology in general. For example, the development
of high-speed scanners, or Optical Mark Recognition (OMR), halfway through the 1930s of the
20th
century introduced the possibility of automatically scoring multiple-choice tests. More
recently, during the late 1970s, the first computer-delivered multiple-choice tests emerged, and
computer-based testing (CBT) was born. Further improvements and cost reductions in technology
made the application of large-scale, high-stake CBTs during the 1990s possible. Present advances
in technology continue to drive innovations in CBT, and new CBTs are being designed on a
regular basis by a whole range of educational institutions.

Sebastiaan de Klerk
138
Nowadays, test developers can incorporate multimedia elements into their CBTs, and they can
develop innovative item types, all under the continuing influence of technology improvements.
This chapter provides an overview of innovations in CBT.
Because innovations in CBT are (almost) innumerable, and continue to emerge in many
different forms, a dichotomous categorization of CBTs as innovative versus non-innovative is not
possible. More specifically, however, innovation in CBTs may be seen as a continuum along
several dimensions. For instance, some CBTs may be highly innovative (scoring innovativeness
on multiple dimensions), while other CBTs are less innovative (scoring innovativeness on only
one dimension). Inclusion of media (e.g., video, animation, or pictures), test format (e.g.,
adaptive), item format (e.g., drag- and drop-, matrix-, or ranking and sequencing questions), and
construct measurement (e.g., skills or competencies) are all attributes upon which the
innovativeness of a CBT can be determined. In general, using PCs or technology to develop
creative ways of assessing test takers or to measure constructs that were previously impossible to
measure is the most important dimension for innovations in computerized testing. Parshall et al.
(2002) introduced five innovation dimensions of CBTs: item format, response action, media
inclusion, level of interactivity, and scoring method. Each of the five innovation dimensions will
be discussed below.
Dimensions of Innovation
Item Format
The first dimension is the item format, and this dimension makes reference to the response
possibilities of the test taker. The multiple-choice item format probably is the most well-known
item type, and can also be used in paper-and-pencil tests. Multiple-choice items fall into the
category of so-called selected response formats. The characterizing feature of these formats is
that the test taker is required to select one or multiple answers from a list of alternatives. In
contrast, constructed response formats require test takers to formulate their own answers, rather
than select an answer from a list of alternatives (Drasgow & Mattern, 2006). A fill-in-the-blank
item type is an example of constructed response format, but essay questions and short answers
are also constructed response items. All of the selected- and constructed-response item types can
be administered by computer and, even more importantly, a growing amount of innovative item
types are uniquely being designed for CBTs.

12 An Overview of Innovative Computer-Based Testing
139
Scalise and Gifford (2006) present a categorization or taxonomy of innovative item types for
technology platforms. The researchers have identified seven different item formats, and 28
corresponding item examples (four per category) after a profound literature search, and reported
these item examples in their paper. Most of the 28 item types are deliverable via a PC; however,
some item types have specific advantages when computerized. For example, categorization,
matching, ranking and sequencing, and hot-spot items are item types that are most efficiently
administered by computer, compared to paper-and-pencil administration. Innovations in item
format demonstrate that innovation is actually twofold. On the one hand, we can create new item
types to measure constructs differently (improved measurement). On the other hand, we can also
create new item types to measure completely different constructs that were difficult to measure
before. This will also hold for the other dimensions of innovation, as will become clear in the
following sections.
Response Action
The second innovation dimension is response action, and this dimension represents the physical
action(s) a test taker has to perform in order to answer a question. The most common response
action is of course filling in an answer sheet of a multiple-choice test in a paper-and-pencil test,
or mouse clicking in a CBT. However, computerized testing software and computer hardware
offer some interesting features for response actions. For example, test takers can also report their
answers by typing on the keyboard, or speak them into a microphone (possibly integrated with
voice recognition software). These types of response actions can hardly be called innovative
nowadays, because they have been available for quite some time now. However, they show the
constant progress in educational testing, influenced by the technological revolution.
Response actions in CBTs of skill assessment have been studied for the last two decades,
with researchers looking for possibilities to assess skill in a way such that the response action
corresponds with the actual skill under investigation. For example, joysticks, light pens, touch
screens, and trackballs were used by the test takers as tools for the response actions. This resulted
in another stream of innovations in assessment. The current innovations in assessment show that
a whole new movement of response actions is emerging.

Sebastiaan de Klerk
140
Researchers are trying to unite response action and skill assessment, for example, through virtual
environments, serious gaming, camera movement recognition, simulation software, and other
innovative technologies that require test takers to physically perform a range of actions (e.g., a
flight simulator). Van Gelooven and Veldkamp (2006) developed a virtual reality assessment for
road inspectors. Because traffic density keeps on rising, road inspectors have taken over some
tasks that used to be the duty of the traffic police, for instance, signaling to drivers, towing cars,
and helping to fill in insurance documents after accidents. The test takers (road inspectors) are
confronted with a virtual reality projected on a white screen. The director starts a specific case,
and test takers can walk through the virtual environment with a joystick. During the assessment,
all sorts of situations or problems develop, and the test takers are required to carry out actions
with their joystick in the virtual environment. This example shows how assessments can be
designed with innovative use of the response actions (controlling a joystick) a test taker has to
perform.
Future innovations in CBT will repeatedly use more of these types of response actions, all
the more because they unveil the possibility of measuring constructs that were difficult to
measure before, or to measure constructs more accurately than we (as assessment experts) were
able to in the past.
Media Inclusion
The third dimension is media inclusion, and indicates to what extent innovative CBTs incorporate
(multi)media elements. Addition of media elements to CBTs can enhance the tests‘ coverage of
the content area and may require test takers to use specific (cognitive) skills. Moreover, another
key advantage of media inclusion is improved validity. Yet another advantage is that reading
skills cannot be considered a confounding variable anymore. Media that are regularly found in
CBTs are, among others, video, graphics, sound, and animations. The simplest form is providing
a picture with an item stem, as is sometimes the case in paper-and-pencil tests. Ackerman, Evans,
Park, Tamassia, and Turner (1999) have developed such a test of dermatological disorders that
provides test takers with a picture of the skin disorder. Following presentation of the picture, the
test taker is asked to select the disorder from a list on the right side of his screen.

12 An Overview of Innovative Computer-Based Testing
141
The assessment remains rather ―static‖; however, it would be a more complex assessment form if
test takers had to manipulate the picture provided with the item, for example, by turning it around
or fitting it into another picture. Still more difficult are items in which test takers have to
assemble a whole structure with provided figures or icons, for example, when they have to
construct a model and the variables are provided.
Audio is most often used in foreign language tests, and usually requires test takers to put
on headphones. However, other fields have also used audio in (computerized) testing. For
example, the assessment of car mechanics sometimes relies upon sound. Test takers have to listen
to recorded car engines and indicate which cars have engine problems. In addition, medical
personnel are presented with stethoscope sounds during assessment, and they are asked which
sounds are unusual. Another innovative application of sound in assessment is to present questions
in sound for people who are dyslexic or visually-impaired.
Video and animations are other media elements that may be incorporated into CBTs.
These media elements are highly dynamic, and are highly congruent with authentic situations that
test takers will face outside of the assessment situation. Several researchers have carried out case
studies in which assessment included video. Schoech (2001) presents a video-based assessment
of child protection supervisor skills. His assessment is innovative because it incorporates video in
the assessment, but it is not highly interactive. The test takers watch a video, and then answer
(multiple-choice) questions about the video that they have just watched. Drasgow, Olson-
Buchanan, and Moberg (1999) present a case study of the development of an interactive video
assessment (IVA) of conflict resolution skills. Because they introduce an innovative idea for
making a CBT relatively interactive, their study is described below, in the section about the level
of interactivity (the fourth innovation dimension) of a CBT.
Level of Interactivity
Interactivity, the fourth dimension of innovation, indicates the amount of interaction between test
taker and test. As such, paper-and-pencil tests have no interaction at all. All test takers are
presented with the same set of items, and those do not change during the administration of the
test. In contrast, CBTs may also be highly interactive because of an adaptive element.
Computerized adaptive tests (CATs) compute which item should be presented to a test taker
based upon the answers given to all previous items.

Sebastiaan de Klerk
142
In that way, the CAT is tailored to the proficiency level of the test taker (Eggen, 2008, 2011).
CATs are now widely used in assessment (both psychological and educational), but were initially
a huge innovation made possible by the explosive growth of PCs and technology, and the
introduction of Item Response Theory (IRT).
Another form of interactivity, also based on the concept of adaptive testing, is the
incorporation of a two- or multistep branching function, possibly accompanied by video.
Drasgow et al. (1999) present such a case study of an innovative form of a CBT. The CBT is
structured upon two or more branches, and the answer(s) of the test taker form the route that is
followed through the branches. The IVA of conflict resolution skills presented by Drasgow et al.
required test takers to first watch a video of work conflict. Test takers then had to answer a
multiple-choice question about the video. Following their answers, and depending upon their
answers, a second video was started, and the cycle was completed once more. In essence, the
more branches you create, the higher the assessment scores on interactivity, because it is highly
unlikely that two test takers will follow exactly the same path.
Developing assessments that score high on the interactivity dimension is rather difficult,
especially compared to some of the other innovation dimensions. Test developers are required to
develop enough content to fill the branches in the adaptive interactive assessment. Another
difficulty is the scoring of interactive CBTs. As test takers proceed along the branches of the
interactive assessment, it becomes more difficult to use objective scoring rules, because many
factors play a role, including weighing the various components of the assessment, and the
dependency among the responses of the test taker. However, innovation in the level of
interactivity has the potential to open up a wide spectrum of previously immeasurable constructs
that now become available for measurement.
Scoring Method
The fifth and final innovation dimension is the scoring method. High-speed scanners were one of
the first innovations in automatic scoring of paper-and-pencil multiple-choice tests. Automatic
scoring possibilities have been developing rapidly, especially in the last two decades. Innovative
items that score relatively low on interactivity and produce a dichotomous score are not too
difficult to subject to automatic scoring.

12 An Overview of Innovative Computer-Based Testing
143
Other innovative CBTs, for example, complex performance-based CBTs, may require scoring on
multiple dimensions, and are much more difficult to subject to automatic scoring. In performance
assessment, the process that leads to the product is sometimes equal to or even more important
than the product itself; however, it is a complicated task to design an automatic scoring procedure
for process responses as well as product responses in complex performance-based CBTs.
Consider, for example, the above-mentioned branching of CBTs that incorporate video as
well. Response dependency can be an obstructive factor for the scoring of these types of CBTs.
This means that test takers‘ responses on previous items may release hints or clues for subsequent
items. An incorrect answer on an item, after a test taker has seen the first video in the IAV,
releases another video that may give the test taker a hint to his mistake on the previous item.
Another issue is the weighing of items in a multistep CBT. Do test takers score equal points for
all items, or do they score fewer points for easier items that manifest themselves after a few
incorrect answers by the test taker?
Automated scoring systems also demonstrate some key advantages for the grading process
of test takers‘ responses. The number of graders can be reduced, or graders can be completely
removed from the grading process, which will also eliminate interrater disagreement in grading.
Researchers have found that automated scoring systems produced scores that were not
significantly different from the scores provided by human graders. Moreover, performance
assessment of complex tasks is especially costly; molding these assessments into a CBT is
extremely cost and time efficient. Thus, computers offer many innovative possibilities for scoring
test takers‘ responses. For example, the use of text mining in assessment or classification is
possible because of innovations in computer-based scoring methods. Text mining refers to
extracting interesting and useful patterns or knowledge from text documents. This technique
provides a solution to classification errors, because it reduces the effects of irregularities and
ambiguities in text documents (He, Veldkamp, & Westerhof, this volume). Yet another stream of
innovation in scoring lies in test takers‘ behavior, and results in the scoring or logging of mouse
movements, response times, speed-accuracy relationships, or eye-tracking. The key point that
flows forth from the five innovation dimensions described above is twofold: not only do test
developers become more capable of measuring constructs better, they also find themselves in a
position to measure new constructs that were difficult to measure before.

Sebastiaan de Klerk
144
Opportunities of Innovations in CBT
Performance Assessment and CBTs
One of the main objections to multiple-choice tests is that, although extremely accurate in
measuring declarative knowledge, they are difficult to design to measure test takers‘ skills and
abilities. Thus, integrating performance assessment with CBT is an interesting opportunity for
innovative CBTs. Several research and educational institutions have started research programs to
explore the possibilities of measuring test takers‘ skills in complex performance-based tasks.
Clyman, Melnick, and Clauser (1999) found that the correlation between computer-based case
simulations and declarative knowledge assessment was only 0.5. Traditional tests and interactive
case simulations presented via the PC therefore measure different domains of knowledge, and
even make it possible to measure completely different constructs. The challenge lies in using a
PC‘s capability to provide assessment exercises that revolve around the core of the actual
performance of a task. In that way, the link between CBT and performance assessment becomes
stronger, and the construct under investigation corresponds in both assessment types. In other
words, both assessments are measuring the same construct, although in different ways.
Media in CBTs
Another opportunity in innovative CBTs is the inclusion of media within the CBT. Above, media
inclusion is briefly discussed as one of the five innovation dimensions. Media inclusion in itself
does not make a CBT innovative. However—and this is really the starting point of adding media
into a CBT—being innovative should improve measurement. As mentioned above, it should
either enhance the measurement of constructs that are now measured by other assessment types,
or it should enable us to measure constructs that we were previously unable to measure.
Consider, for example, the CBT designed by Ackermann et al. (1999), which is briefly
described in the section about media inclusion, as one of the five innovation dimensions. The
addition of pictures of dermatological disorders in their multiple-choice test made it possible to
more effectively measure test takers‘ knowledge about the skin disorders under investigation.
This example represents how media inclusion can enhance or improve the measurement of
constructs that were previously measured only by a multiple-choice test. In this case, it is the test
takers‘ ability to recognize and identify different types of skin disorders that can be more
accurately measured, but the possibilities that media offers are almost infinite.

12 An Overview of Innovative Computer-Based Testing
145
Novel Item Types in CBTs
A third opportunity that CBTs offer is the modification of item types, and the creation of novel
item types. Again, the central idea is that they should improve the quality of measurement, or
introduce new measurement possibilities. Paper-and-pencil tests impose restrictions on item
construction. For example, it is almost impossible to administer drag-and-drop questions in a
paper-and-pencil test, while computers offer great opportunities to integrate these questions
within a CBT. Zenisky and Sireci (2002) describe 21 new types of item formats in their paper.
Describing all item types is beyond the extent of this chapter; however, important to note here is
that innumerable innovative item types have emerged in the literature on CBT item types in
recent decades. Also, adaptations of these item types already exist, which shows that innovations
and opportunities are almost countless. Computers offer opportunities such that new item types
make it possible to access measurement to constructs that were very difficult or cost- and time-
consuming to measure in the past.
Scoring of CBTs
Improved scoring is a fourth and final opportunity that flows forth from computerized tests. The
emphasis in this section will be on automated scoring of CBTs that aims to measure performance-
based constructs or score performance-based tasks. Typically, these types of assessments require
human graders, and sometimes actors or even walk-ons. Cost and time constraints are some
serious disadvantages that go hand in hand with performance assessment. Automated scoring
systems are being developed, and some are already operational, that make it possible to remove
human graders from the scoring process, or at least minimize human intervention in the scoring
process. One opportunity is, of course, to design automated scoring systems that make it possible
to score test takers‘ attributes or behaviors in a way that we were not able to do before. Another
opportunity is that automated scoring systems are more consistent and are able to extract more
information than human graders (for example, text mining: He and Veldkamp (2012).
Moreover, Williamson, Bejar, and Hone (1997, cited in Dodd & Fitzpatrick, 2002) found
that human graders mostly let the automated score stand when provided with the analyses that
resulted from the automated scoring.

Sebastiaan de Klerk
146
The automated scoring of essays, for example, becomes more and more incorporated as a regular
and common method for scoring essays. Burstein et al. (1998) found that there was an 87% to
94% agreement between the scores on essays that resulted from automated scoring systems and
the scores awarded by the human graders. Above that, and equally important, this is not different
from having two human graders score an essay independently. These findings support the idea
that automated scoring systems are also applicable in the scoring of rather complex performance-
based tasks. One concern that results from applying automated scoring systems in performance-
based assessments is that it gives test takers the opportunity to actually lure the system into
assigning a higher grade, for example, by using specific words that are scored by the system, but
not properly used in the context of the essay. This is one risk that originates from the utilization
of automated scoring systems, and innovations in CBTs in general. In the following section, other
risks that might affect CBTs are discussed.
Risks of Innovations in CBT
CBTs offer a lot of opportunities, and the educational field can greatly benefit from these
opportunities. However, every medal has two sides, and the other side of CBTs is that they are
also subjected to several (potential) risks. For example, CBTs can be very costly and difficult to
develop. Moreover, it may take a substantial amount of time to validate a CBT and, even if
validated, questions about the efficiency of the CBT still remain. Finally, another threat to proper
functioning of a CBT is test security and test disclosure.
Development
Guidelines on the development of classical multiple-choice tests are widely available in
innumerable textbooks and publications. In contrast, such guidelines on the development of
innovative CBTs did not exist up till now. Although many different guidelines exist that regulate
the development of multiple-choice tests, it still takes a lot of time to develop a valid and reliable
multiple-choice test. Consider the development of an innovative CBT without a frame of
reference or any strong guidelines on these types of CBTs. It should now be possible to imagine
that the development of a valid and reliable innovative CBT will require a lot of creativity,
educational assessment expertise, and hard work. Such a process may endure multiple years and,
by the time the assessment is completely developed, it may be outdated.

12 An Overview of Innovative Computer-Based Testing
147
Or as Schoech (2001) subtly notes: Walk the fine line between current limitations and potentials.
Exam development is often a multi-year process, yet technology changes rapidly in several years.
Thus, a technology-based exam has the potential to look outdated when it is initially completed.
Validity of Scoring
Another risk imposed on innovations in CBTs is validity. Most concerns raised about the validity
of CBTs are related to the scoring procedure. If test developers create CBTs that automatically
score constructed responses (e.g., scoring of essays by a computer), they have to be cautious
about some pitfalls. For example, Powers et al. (2002) invited several parties in their study to
―challenge‖ (i.e., try to trick) e-rater, which is an automated essay scorer. Participants‘ essays
were also graded by humans, and the difference between the two types of scoring served as a
dependent variable. The researchers found that the challengers were more successful in tricking
the e-rater to award them higher scores than they deserved, based upon the human graders, than
tricking the e-rater to award them lower scores than they deserved based upon the human
graders. This short example stresses the importance of further research on automated scoring of
(complex) tasks in CBTs.
Test Security
One of the most significant risks that stems from CBTs is test security. First of all, the ICT
structure needs to be sufficient, thereby making it impossible for potential cheaters to hack a
computer or network to get access to the questions in an item bank. Also, Internet-based CBTs
make it possible to have test takers take tests at their own convenience, independent of time and
place. This may expose the test to other test takers, and thereby impose a serious threat to test
security. Another possible threat to the security of a test is test or item disclosure. Disclosure of a
whole test or even several items may result in higher scores for subsequent test takers (Drasgow,
2002).
Finally, remaining in the same item bank for extended periods of time may result in
diminished security of the test, because test takers are able to write down items, and may
distribute them via the Internet, for example.

Sebastiaan de Klerk
148
Future Research
The focus of future research in CBT will be on improving the measurement of skills and
performance abilities. Computers enable test developers to create high-fidelity computer
simulations that incorporate innovations on all of the dimensions discussed above. Those types of
CBTs are designed with the goal of measuring skill and demonstrating performance.
Additionally, they correspond to actual task performance to a great extent, which is defined as the
authenticity of an assessment. Therefore, these CBTs rely more upon the concept of authenticity
than multiple-choice tests do, for example. Integration of multimedia, constructed response item
types, highly interactive designs, and new (automatic) scoring methods will lead to an assessment
form that closely approximates performance assessment in its physical form. Future research
should determine to what extent it is possible to have computers adopt tasks that were usually
part of performance assessment.
Furthermore, the psychometric performance of innovative CBTs that integrate many of
the innovation dimensions should be determined. For example, studies on the validity of CBTs
that are based on the innovation dimensions are all but absent in the current literature. Other
studies should try to make innovative CBTs equivalent with performance assessment. Reliability
has always been an important issue in performance assessment, which usually relies upon human
graders. Innovative CBTs may be able to integrate high reliability with authentic assessment
forms. Therefore, researchers should also focus on the concept of reliability in innovative CBTs.
Automated scoring systems that rely upon IRT algorithms, or the integration of computerized
adaptive testing (CAT), are other interesting future research directions within CBT.
The research on innovations in CBTs that has been reported in the scientific literature
mainly focuses on cognitive performance tasks, usually in higher education. Some case studies
exist that have tried to measure particular constructs in skill-based professions, for example, in
the medical professions or ICT. However, future research should also focus on measuring skill
constructs in vocational professions that rely upon physical skills rather than cognitive or
intellectual skills.
The continuing technological revolution makes it possible for test developers to further
innovate, create, and revolutionize CBTs. The coming decade will be very interesting for the
educational measurement field, and there is a whole new range of CBTs to look forward to.

12 An Overview of Innovative Computer-Based Testing
149
References
Ackerman, T.A., Evans, J., Park, K.S., Tamassia, C., & Turner, R. (1999). Computer assessment
using visual stimuli: A test of dermatological skin disorders. In F. Drasgow & J.B. Olson-
Buchanan (Eds.), Innovations in computerized assessment (pp. 137-150). Mahwah, NJ:
Erlbaum.
Burstein, J., Braden-Harder, L., Chodrow, M., Hua, S., Kaplan, B., Kukich, K., et al. (1998).
Computer analysis of essay content for automated score prediction (ETS Research Report
RR-98-15). Princeton, NJ: Educational Testing Service.
Clyman, S.G., Melnick, D.E., & Clauser, B.E. (1999). Computer-based case simulations from
medicine: Assessing skills in patient management. In A. Tekian, C.H. McGuire, & W.C.
McGahie (Eds.), Innovative simulations for assessing professional competence (pp. 29-
41). Chicago, IL: University of Illinois, Department of Medical Education.
Dodd, B.G., & Fitzpatrick, S.J. (2002). Alternatives for scoring CBTs. In C.N. Mills, M.T.
Potenza,
Drasgow, F. (2002). The work ahead: A psychometric infrastructure for computerized adaptive
tests. In C.N. Mills, M.T. Potenza, J.J. Fremer, & W.C. Ward (Eds.), Computer-based
testing: Building the foundation for future assessments (pp. 1-35). Mahwah, NJ: Erlbaum.
Drasgow, F., & Mattern, K. (2006). New tests and new items: Opportunities and issues. In D.
Bartram & R.K. Hambleton (Eds.), Computer-based testing and the internet: Issues and
Advances (pp. 59-75). Chichester: Wiley.
Drasgow, F., Olson-Buchanan, J.B., & Moberg, P.J. (1999). Development of an interactive
videoassessment: Trials and tribulations. In F. Drasgow & J.B. Olson-Buchanan (Eds.),
Innovations in computerized assessment (pp. 177-196). Mahwah, NJ: Erlbaum.
Eggen, T.J.H.M. (2008). Adaptive testing and item banking. In J. Hartig, E. Klieme, & D.
Leutner (Eds.), Assessment of competencies in educational contexts (pp. 215-234).
Götting en: Hogrefe.
Eggen, T.J.H.M. (2011, October). What is the purpose of CAT? Presidential address at the 2011
Meeting of the International Association for Computerized Adaptive Testing, Monterey,
CA.
Fremer, J.J. & W.C. Ward (Eds.), Computer-based testing: Building the foundation for future
assessments (pp. 215-236). Mahwah, NJ: Erlbaum.

Sebastiaan de Klerk
150
Gelooven, D. van, & Veldkamp, B. (2006). Beroepsbekwaamheid van weginspecteurs: een
virtual reality toets. In E. Roelofs & G. Straetmans (Eds.), Assessment in
actie:Competentiebeoordeling in opleiding en beroep (pp. 93-122). Arnhem, the
Netherlands: Cito.
He, Q & Veldkamp, B.P.(2012). Classifying unstructured textual data using the Product Score
Model: an alternative text mining algorithm. In T.J.H.M. Eggen & B.P. Veldkamp (Eds.),
Psychometrics in Practice at RCEC: (pp. 47-63). Enschede, Netherlands: RCEC.
Parshall, C.G., Spray, J.A., Kalohn, J.C., & Davey, T. (2002). Practical considerations in
computer-based testing. New York, NY: Springer.
Powers, D.E., Burnstein, J.C., Chodorow, M., Fowles, M.E., & Kukich, K. (2002). Stumping e-
rater: Challenging the validity of automated essay scoring. Computers in Human
Behavior, 18, 103-134.
Scalise, K., & Gifford, B. (2006). Computer-based assessment in e-learning: A framework for
constructing ―intermediate constraint‖ questions and tasks for technology platforms.
Journal of Technology, Learning, and Assessment, 4(6). Retrieved [March 20, 2012] from
http://www.jtla.org.
Schoech, D. (2001). Using video clips as test questions: The development and use of a
multimedia exam. Journal of Technology in Human Services, 18(3-4), 117-131.
Zenisky, A.L., & Sireci, S.G. (2002). Technological innovations in large-scale assessment.
Applied Measurement in Education, 15, 337-362.

151
Chapter 13
Towards an Integrative Formative Approach of Data-Driven
Decision Making, Assessment for Learning, and Diagnostic
Testing
Jorine A. Vermeulen and Fabienne M. van der Kleij
Abstract This study concerns the comparison of three approaches to assessment: Data-Driven
Decision Making, Assessment for Learning, and Diagnostic Testing. Although the three
approaches claim to be beneficial with regard to student learning, no clear study into the
relationships and distinctions between these approaches exists to date. The goal of this study was
to investigate the extent to which the three approaches can be shaped into an integrative formative
approach towards assessment. The three approaches were compared on nine characteristics of
assessment. The results suggest that although the approaches seem to be contradictory with respect
to some characteristics, it is argued that they could complement each other despite these
differences. The researchers discuss how the three approaches can be shaped into an integrative
formative approach towards assessment.
Keywords: Formative Assessment, Data-Driven Decision Making, Assessment for Learning,
Diagnostic Testing
Introduction
Within the various approaches to assessment, the importance of increasing student learning by
acting on students‘ educational needs is emphasized. However, the meaning ascribed to
student learning is one of the factors that separates these approaches to assessment: a
distinction is made between learning outcomes and the process of learning. This means that
some assessment approaches focus on what has to be learned, while other approaches focus
on how students learn what has to be learned (best) and the quality of the learning process.
Furthermore, assessment approaches differ in the aggregation levels in the educational system
(e.g., student, classroom, school) at which the assessment is aimed. Due to these differences,
the approach to assessment that is chosen affects the strategies that are used to assess and
promote student learning outcomes.

Jorine A. Vermeulen and Fabienne M. van der Kleij
152
This chapter addresses the differences and similarities of the three approaches to assessment
that are currently most frequently discussed in educational research literature. The first
approach is Data-Driven Decision Making (DDDM), which originated in the United States of
America as a direct consequence of the No Child Left Behind (NCLB) Act in which
improving students‘ learning outcomes is defined in terms of results and attaining specified
targets. Secondly, Assessment for Learning (AfL), originally introduced by scholars from the
United Kingdom, is an approach to assessment that focuses on the quality of the learning
process, rather than merely on students‘ (final) learning outcomes (Stobart, 2008). Finally, in
Diagnostic Testing (DT), also referred to as diagnostic measurement, students‘ learning
outcomes are described as students‘ learning processes and factors that resulted in students‘
success or failure to do particular tasks (Leighton & Gierl, 2007a, 2007b; Rupp, Templin, &
Henson, 2010).
Although all three approaches claim to provide information that can be used to
increase students‘ learning outcomes, there appears to be no clear study into the relations and
distinctions between these approaches. More specifically, these terms are often used
interchangeably. Interestingly, the literature on DDDM tends to cite literature concerning
AfL, but not vice versa (e.g., Swan & Mazur, 2011). The aim of this study is to investigate the
extent to which DDDM, AfL, and DT can be integrated into an approach that can be used for
maximizing student learning. By maximizing student learning we aim at both the process and
outcomes of learning as optimized at all levels of education. The following research question
will be answered: To what extent can DDDM, AfL, and DT be shaped into an integrative
formative approach towards assessment?
The Formative Function
Tests are a crucial part of education, namely, it would not be possible to check whether a
certain instructional activity led to the realization of the intended learning outcomes without
testing (Wiliam, 2011). Paper-and-pencil tests are often used within the classroom to gather
information about student learning. Besides paper-and-pencil tests, there are various other
methods for measuring pupils‘ knowledge and abilities. For example, homework, projects,
discussions, and observations can provide valuable information about student learning.
Whenever such a broad spectrum of instruments is used for gathering information about
student learning one speaks of assessment (Stobart, 2008). Traditionally, in education, a
distinction is made between summative and formative assessment.

13 Integrative Approach of Data-Driven Decision Making, Assessment for Learning, and Diagnostic Testing
153
Summative assessments can be used to judge or compare the learning outcomes of students,
based on which a decision is made with regard to, for example, selection, classification,
placement, or certification. There are also tests that have the purpose of directing the learning
process.
These tests are called formative tests (Sanders, 2011). However, a test is not in itself
formative or summative by definition (Stobart, 2008). Whether a test is used formatively does
not depend on the characteristics of the test itself, but on the way the test results are being
used, in other words, the function of the test results (Harlen & James, 1997; Stobart, 2008).
Whenever a test result plays a role in making (part of the) pass/fail decision, it fulfills a
summative function. The same test, however, can also fulfill a formative function, for
example, when feedback is provided to students that can be used in future learning. Another
example of a formative use is a teacher using test results to evaluate the effectiveness of the
instruction. Subsequently, the teacher might make amendments to the educational program in
order to meet the needs of the learners.
Formative assessment is a broad concept that has many definitions (e.g., AfL, and
diagnostic assessment; Bennett, 2011; Johnson & Burdett, 2010). Initially, the formative
concept was introduced by Scriven (1967) to indicate interim evaluation of intervention
programs. In 1968, the formative concept was first used in the context of instruction by
Bloom. In the years that followed, various meanings have been ascribed to formative
assessment. Recently, researchers have come to the insight that a distinction between
formative and summative assessment based on time-related characteristics is not a useful one.
After all, it is the way that test results are eventually used that determines the purpose the test
serves (Stobart, 2008).
Subsequently, for comparison of assessment approaches it is useful to distinguish
between formative program evaluations and formative assessments (Shepard, 2005; Harlen,
2007). Formative program evaluations are meant to make decisions at a higher aggregation
level than the level of the learner (e.g., classroom or a school) about the educational needs of
pupils. Formative assessment, on the contrary, concerns decisions at the level of the learner.
Results from formative assessments are used to accommodate the individual educational
needs of pupils. In this study, we refer to formative evaluation as the evaluation of the quality
of education. We will use the term formative assessment to indicate assessment that takes
place within the classroom and is focused on improving instruction in the classroom and for
individual pupils. In the following sections, we elaborate on the characteristics of the three
views on assessment, after which the three approaches are compared.

Jorine A. Vermeulen and Fabienne M. van der Kleij
154
Data-Driven Decision Making
Teachers make most of their decisions based on their intuition and instincts (Slavin, 2002,
2003). However, educational policies such as NCLB have caused an increase in
accountability requirements, which has stimulated the use of data for informing school
practice in the United States of America. The main idea behind NCLB is that by setting
standards and measurable goals the learning outcomes of pupils can be raised. Namely,
research has pointed out that by setting specific learning goals an increase in student
achievement can be obtained (Locke & Latham, 2002). The idea of using data for informing
instruction is not new, namely, in the 1980s there was an approach that attempted to make
instruction more measurement-driven (Popham, Cruse, Rankin, Sandifer, & Williams, 1985).
Furthermore, recent studies draw attention to the importance of using data, such as assessment
results and student surveys, in making decisions (Wayman, Cho, & Johnston, 2007;
Wohlstetter, Datnow, & Park, 2008). When data about students are used to inform decisions
in the school it is referred to as DDDM (Ledoux, Blok, Boogaard, & Krüger, 2009).
Recently, DDDM has gained popularity in the Netherlands (the Dutch term that is
often used is opbrengstgericht werken), which is seen as a promising method for increasing
pupils' learning outcomes (Ledoux et al., 2009). Schildkamp and Kuiper (2010) have defined
DDDM as "systematically analyzing existing data sources within the school, applying
outcomes of analyses to innovate teaching, curricula, and school performance, and,
implementing (e.g., genuine improvement actions) and evaluating these innovations" (p. 482).
The data sources that can be used to inform decisions are not only results from tests. Other
usable data sources are school self-evaluations, characteristics of the pupils in the school,
results from questionnaires taken by parents or pupils, and various assessments sources, such
as an external national test or internal school assessments. In this study, for the sake of
comparing the three approaches, we will focus on the use of student achievement results for
informing the decision-making process. Data about student achievement will be referred to as
data-feedback.
Many schools already possess data-feedback, for example from a student monitoring
system. These data are often systematically collected via standardized tests and can therefore
be valued as objective. Besides these objective data, teachers possess data-feedback from
daily practice that has been gathered using various assessment methods. When data-feedback
is used in the right way, meaning that its use will lead to education that is more adequately
adapted to the needs of the learner, this will eventually lead to better learning results.

13 Integrative Approach of Data-Driven Decision Making, Assessment for Learning, and Diagnostic Testing
155
At the student and classroom level, data-driven decision making can be a valuable instrument
for using assessment results in a formative way. Assessment results are an important source of
information about how learning processes could be improved for both students and teachers.
Students need feedback to choose the most suitable learning strategies in order to achieve the
intended learning outcomes, while teachers need data-feedback in order to act on the pupils'
current points of struggle and to reflect on their own teaching practices. However, knowledge
about how teachers use assessment results for instructional improvement is limited (Young &
Kim, 2010).
According to Wayman (2005), the NCLB policy carries the assumption that whenever
data is available it will lead to changes in teaching practice. A general definition of
educational measurement comprises four activities that are part of a cyclic process of
evaluation: "…designing opportunities to gather evidence, collecting evidence, interpreting it,
and acting on interpretations" (Bennett, 2011, p. 16). However, it is not always self-evident
for practitioners how (accountability) data should be translated into information that can be
readily used to make decisions in the school. Therefore, it is not surprising that recent studies
suggest that data-feedback is underused in the majority of Dutch schools (Ledoux et al., 2009;
Schildkamp & Kuiper, 2010). These studies have found that the implementation of the
evaluative cycle is incomplete in many schools. The results of these studies imply that
students are frequently assessed and that the results of the assessments are registered, but that
there is no subsequent use of the data-feedback. Moreover, research has also pointed out that
many teachers indeed get stuck in the interpretation phase of the evaluative cycle (Meijer,
Ledoux, & Elshof, 2011). Thus, educators need to know how to translate raw assessment data
into knowledge about student learning outcomes that indicates in what way students‘ learning
outcomes can be optimized.
The literature makes a distinction between data and information (Davenport & Prusak,
1998; Light, Wexler, & Heinze, 2004; Mandinach, Honey, & Light, 2006). Data are
characterized as objective facts, which have no meaning. By interpreting data, they can be
transformed into information, for example by summarizing, contextualizing and calculating
(Davenport & Prusak, 1998). Subsequently, information can be transformed into actionable
knowledge by synthesizing and prioritizing. This actionable knowledge is the basis for a
decision about which action to undertake (Light et al., 2004).
The impact of the action is evaluated by gathering new data, in this way a feedback loop is
created (Mandinach et al., 2006). However, this is not an easy process because teachers are
used to making decisions intuitively (Slavin, 2002, 2003).

Jorine A. Vermeulen and Fabienne M. van der Kleij
156
"As many educators say, they are data rich, but information poor. By this they mean that there
is far too much information with which they must deal, but those data are not easily
translatable into information and actionable knowledge" (Mandinach et al., 2006, p. 12).
Within the school, many feedback loops can exist. The frequency in which the
feedback loops are completed depends, among other things, on the type of data-feedback that
is used. Data-feedback from formal and objective tests, for example from a student
monitoring system, are less frequently available than data from informal assessment
situations, such as homework assignments. Ledoux et al. (2009) stated that the quality of the
evaluative cycle is dependent upon the quality of the data-feedback. This implies that
unreliable data can lead to making unjustified decisions. Moreover, wrongly interpreting data
can also lead to making unjustified decisions. Being data-literate is thus a necessary
prerequisite for successfully implementing DDDM.
Assessment for Learning
AfL focuses specifically on the quality of the process of learning instead of the outcomes of
the learning process. Moreover, "it puts the focus on what is being learned and on the quality
of classroom interactions and relationships" (Stobart, 2008, p. 145). The theory of AfL has no
strict boundaries; it is part of a bigger entity in which curriculum, school culture, and
instruction approaches intervene. It is noteworthy that AfL is viewed as a divarication of
formative assessment (Johnson & Burdett, 2010; Stobart, 2008).
The Assessment Reform Group (2002) defined AfL as follows: "Assessment for
Learning is the process of seeking and interpreting evidence for use by learners and their
teachers to decide where the learners are in their learning, where they need to go and how best
to get there".
Klenowski (2009) reported on, what she named a 'second-generation definition' of
AfL, which was generated at the Third Assessment for Learning Conference (2009): "AfL is
part of everyday practice by students, teachers and peers that seeks, reflects upon and
responds to information from dialogue, demonstration and observation in ways that enhance
ongoing learning" (p. 264). This 'second-generation definition' was needed because
definitions, or parts of them, are often misinterpreted (Johnson & Burdett, 2010; Klenowski,
2009).

13 Integrative Approach of Data-Driven Decision Making, Assessment for Learning, and Diagnostic Testing
157
AfL takes place in everyday practice, which means the process is characterized by dialogues
between learners and the teacher. This also means that assessments are integrated into the
learning process, which is contrary to the traditional approach where assessments are a
separate activity that stands apart from instruction. Furthermore, Klenowski‘s (2009)
definition emphasizes the role of the learners in the learning process and their autonomy. It
also emphasizes the nature of AfL in terms of making decisions about which steps to take in
the learning process. The information that is used to inform decisions can come from various
assessment sources, such as dialogues and observations. These events can be both planned
and unplanned. This implies that the evidence that is gathered about the learning process of
the learners can be both qualitative and quantitative in nature. The last part of the definition
stresses the formative function of assessments. One can only say an assessment serves a
formative function when students and teachers use the information for informing and
enhancing learning. Therefore, a crucial aspect of AfL is feedback, which is used to direct
future learning (Stobart, 2008).The AfL approach encompasses more than the use of
assessments and their results. The Assessment Reform Group (1999) described AfL using five
core features:
1. Learners are actively engaged in their learning process;
2. effective feedback is provided to learners;
3. instructional activities are being adapted based on assessment results;
4. learners are able to perform self-assessment;
5. the influence of assessment on motivation and confidence of learners is
acknowledged.
Stobart (2008) argued that AfL is a social activity that influences both learner identity and the
type of learning that will take place.
Whenever the primary goal of testing is to measure a result this can lead to a
misleading image of what the level of the learner is, because one cannot measure the full
scope of a curriculum. Moreover, Stobart states that on some standardized tests results can
improve without students actually learning more. Also, when too much emphasis is placed on
achieving specific goals, by frequently using these types of standardized tests, the learning
process is narrowed and teaching to the test is promoted (Stobart, 2008), which elicits surface
learning (Harlen & James, 1997).

Jorine A. Vermeulen and Fabienne M. van der Kleij
158
Therefore, multiple methods for gathering evidence about student learning will lead to a more
complete picture of students‘ knowledge and abilities (Harlen & Gardner, 2010), and are
needed in order to achieve deep learning (Harlen & James, 1997).
Hargreaves (2005) compared various definitions of AfL in the literature and
interpreted definitions as formulated by teachers and head teachers in a survey. She concluded
that there are two approaches within AfL; a measurement and an inquiry approach. In the
measurement approach, AfL is viewed as an activity that includes marking, monitoring, and
showing a level. In this view, (quantitative) data are used to formulate feedback and to inform
decisions. Assessment is seen as a separate activity to show that a predetermined level has
been achieved. On the contrary, in the inquiry approach, AfL is a process of discovering,
reflecting, understanding and reviewing. It is very much focused on the process and
assessments are integrated into the learning process. Qualitative sources of information play
an important role. In both approaches, feedback is used to steer future learning. However, in
the first approach, feedback might be less immediate and less suited to meet the needs of the
learners because of the more formal character of the assessments.
In our opinion, the measurement approach towards AfL can easily turn into a
misinterpretation. To illustrate our point of view we will take the example of monitoring
(personal communication, M. Johnson, January 3, 2012). Monitoring in itself does not have to
be bad in the light of AfL. Teachers can keep accurate track of students‘ learning progress and
this can help them to make more informed decisions about their students. This way,
quantitative data can be used to inform qualitative actions, such as providing elaborated
feedback. However, as soon as the monitoring takes place at a level higher than the class
level, the measures used to monitor student learning lack a contextual link to the particular
performances to which they relate. In other words, the distance between the monitoring action
and the learner is too large, which makes it lose its qualitative potential. At this level,
monitoring is reduced to ticking boxes, which is at odds with the spirit of AfL (Johnson &
Burdett, 2010).
Diagnostic Testing
Making diagnoses originates from the field of physical and mental health care in which the
aim is to diagnose a disease or disorder and to advise on the treatment (De Bruyn,
Ruijssenaars, Pameijer, & Van Aarle, 2003; Kievit, Tak & Bosch, 2002).

13 Integrative Approach of Data-Driven Decision Making, Assessment for Learning, and Diagnostic Testing
159
In education, DT was initially used for identifying students who were unable to participate in
mainstream education because of their special educational needs. Currently, DT is still used
for the identification of students with learning deficiencies and/or behavioral problems.
However, it is currently also believed that for instruction to be effective educators need to
take into account all students‘ learning needs (Wiliam, 2011).
Before addressing the process of diagnosing the educational needs of students, the
distinction between formative assessment and DT will be explained, as well as the difference
between DT and diagnostic assessment. Articles on formative assessment sometimes use the
concept of diagnosing when explaining the purpose of formative assessment (e.g., Black &
Wiliam, 1998). Similarly, in the literature on DT (or assessment), DT has been defined as
equal to formative assessment (e.g., Turner, VanderHeide, & Fynewever, 2011). However,
not every diagnostic test fulfills a formative function because, as we explained in the sections
above, whether or not a test serves a formative purpose depends on how the results of that test
are used. According to Keeley and Tobey (2011), DT is mainly concerned with measuring
students‘ preconceptions and reasoning styles. This includes the identification of the use of
inadequate reasoning styles, and skipped or wrongly executed procedural steps as a result of,
among other things, misconceptions. Formative tests, on the other hand, take into account any
information about students‘ learning outcomes that can be used for adapting instruction and
providing feedback. In our view, a diagnostic test fulfills a formative function when the
diagnosis is used to optimize students‘ learning processes.
Moreover, we make a distinction between DT and diagnostic assessment. DT refers to the
use of computerized (adaptive) diagnostic tests, whereas diagnostic assessment refers to the
use of various assessment methods, such as diagnostic interviews (Moyer & Milewicz, 2002).
Diagnostic assessment is very time-consuming and labor-intensive, and mainly uses
qualitative methods. On the other hand, DT is less time-consuming and labor-intensive for
teachers, because students can work independently and the test results are delivered
automatically in a format that can readily be used to support decision making.
From a diagnostic testing point of view, the development of diagnostic tests requires
(statistical) measurement models that fulfill the role of the diagnostician. It also means that
data gathered with these tests are likely to be more objective and reliable than alternative
assessment methods.

Jorine A. Vermeulen and Fabienne M. van der Kleij
160
And also, even though data obtained with a diagnostic test have a quantitative nature, the
reportage of that test can be the qualitative interpretation of those data. It goes beyond the
scope of this chapter to elaborate on these measurement models, therefore we refer the
interested reader to Leighton and Gierl (2007b) and Rupp, Templin, and Henson (2010).
The utility of DT stems from its potential to inform instructional decisions by
providing information about students‘ learning needs. Stobart (2008, p. 55) described
diagnosing learning needs as: "…[identifying] how much progress can be made with adult
help…". This statement is in accordance with Vygotsky‘s criticism on the test culture of the
1930s.
He believed that in order to promote student learning, tests should focus on what
students are able to learn, rather than what they have learned so far (Verhofstadt-Denève, Van
Geert, & Vyt, 2003). In other words, tests should assess a student‘s zone of proximal
development (ZPD); which is defined as what a student can do with the minimal help of
adults or peers (Verhofstadt-Denève et al.).
There are multiple ways of assessing the ZPD, for example, a diagnostic test may
include tasks in which the student is offered help in terms of feedback when an incorrect
answer is given (e.g., a number line in an arithmetic test). This kind of help is also known as
scaffolding (Verhofstadt-Denève et al., 2003). Note that a diagnostic test will become more
similar to what can be described as learning material when students receive rich feedback
about their mistakes.
Another method to assess the ZPD is to diagnose students‘ line of reasoning when
solving the tasks within the diagnostic test. From a cognitive psychological point of view,
student ability is more than being able to solve specific tasks; how students derive the answers
to the items is viewed as an important indicator of students‘ ability levels. For this method of
DT a cognitive diagnostic model is necessary, meaning a theory about how students with
different ability levels solve the tasks that are the object of assessment (Leighton & Gierl,
2007a, 2007b). Such a theory includes commonly developed misconceptions and errors that
are frequently observed, and their relation to different ability levels. Because students within
similar cultural and educational contexts are likely to follow comparable learning processes, it
is more efficient to focus on frequently observed errors than on identifying students‘ errors
that are uncommon or the result of ‗slips‘ (Bennett, 2011). Additionally, Bennett explained
that the identification of ‗slips‘ has less diagnostic value because they cannot inform teachers
about how to change their practice.

13 Integrative Approach of Data-Driven Decision Making, Assessment for Learning, and Diagnostic Testing
161
Whatever method for developing a diagnostic test is used, it is the process of developing
"…items (i.e., tasks, problems) that can be used to efficiently elicit student conceptions that
these conceptions can be related back to a hypothesized learning progression" (Briggs &
Alonzo, 2009, p. 1). A similar cyclic process of formulating and testing hypotheses about the
nature of students‘ achievements is followed within child health care services. Although
variations might exist, the diagnostic cycle consists of the following four phases (De Bruyn et
al., 2003; Kievit et al., 2002):
1. Identifying the problem (complaint analysis);
2. clarifying the problem (problem analysis);
3. explaining the problem (diagnosing); and
4. indication of treatment possibilities (advising and deciding).
An example of diagnosing mathematics difficulties following phases similar to the four
phases of the diagnostic cycle is described by Rupp et al. (2010, p. 14).
Table 1 illustrates how each phase of the diagnostic cycle could be used in educational
contexts. The first three phases result in rich descriptions of the student‘s knowledge and
skills, whereas the fourth phase will result in a diagnosis that prescribes which decision
concerning the learning environment will have the highest probability of successful outcomes
for the student. As explained in the second paragraph of this section, a diagnostic test can only
have a formative function when it is used to improve students‘ learning processes. As shown
in Table 1, this is the case when Phase 4 is completed. Furthermore, we consider DT an
approach to assessment that primarily focuses on the learning processes of individual
students. For that reason, we frequently refer to the student. However, from a practical point
of view, it might be more feasible for teachers to address the needs of (small) groups of
students. This could be done by classifying students into, for example, instruction groups
based on the similarity of their diagnosis. However, caution is needed with this approach
because (depending on the measurement model used) DT is not meant for comparing
students. Also, because of the degree of detailed information, it might be difficult to group
students with a similar diagnosis who would benefit from the same adaptations to the learning
environment.

Jorine A. Vermeulen and Fabienne M. van der Kleij
162
Table 1 Objectives and Outcomes of the Four Phases of the Diagnostic Cycle
Diagnosis Type
Objective Outcome(s)
Descriptive
Acknowledging
(Phase 1)
Assessing whether the student‘s learning
process is optimized given the student‘s
characteristics and the characteristics of
the learning environment.
With this diagnosis it can only be
decided whether a student might benefit
from adaptations to the learning
environment.
The probability of the student reaching
learning goals given his/her current test
performance on tasks that are associated
with knowledge and abilities necessary
for achieving those goals.
Exploratory
(Phase 2)
Describing student‘s current
achievement on the test in terms of
strengths and weaknesses.
A list of strengths (i.e., things he can do
or knows that are improbable based on
his overall performance on other
domains) and a list of weaknesses (i.e.,
things he cannot do or does not know
that are improbable based on his overall
performance on other domains).
Explanatory
(Phase 3)
Investigating which hypotheses about
the nature of the student‘s achievements
on the test are most probable.
A description concerning which errors
the student has made and why these
errors occurred. The student report might
describe the relation between the
student‘s errors, misconceptions, as well
as his wrongly applied or skipped
procedural steps.
Prescriptive
(Phase 4)
a. Indication
b. Selection
c. Classification
a. Determining which intervention or
changes to the learning environment
are most likely to be effective in
optimizing the student‘s learning
process.
b. Determining whether the student
should be selected.
c. Determining to which group the
student belongs.
Advice about the actions that are most
likely to result in optimization of the
student‘s learning process.
Comparing the Three Approaches to Assessment
Rupp, Templin, and Henson (2010, p. 12) organized various uses of diagnostic assessment
into seven categories:
1. The object of the assessment;
2. the object of the decision;
3. the time point in which decisions need to be made;

13 Integrative Approach of Data-Driven Decision Making, Assessment for Learning, and Diagnostic Testing
163
4. the objective of the assessment;
5. the assessment methods;
6. the types of intervention; and
7. the power differentials between agents.
In order to compare DDDM, AfL, and DT we applied these characteristics of
assessment to all three approaches. This method enables us to systematically identify
differences and similarities between the approaches. Additionally, we added ‗characteristics
of the assessment process‘ and ‗learning theory‘. Also, we broke down some of the features to
smaller aspects. The explanation of the assessment features and their aspects are described in
Table 2.
Table 2 Characteristics of Assessment Used to Compare the Three Assessment Approaches
Assessment Characteristic Explanation
1. The object of the assessment. Level at which the data is collected (i.e., individual
student(s) or groups of students).
2. The object of the decision. Level at which the decision is aimed, which should be
equal to the level at which data are aggregated.
3. The time point in which
decisions need to be made.
a. Timing of the decision
b. Frequency of the decision
c. Timing of the feedback
The timing of assessment, decision and actions that
follow the decision.
4. The objective of the assessment. - Who should benefit from the decision?
- What behavioral and cognitive aspects are most
important?
5. The assessment method. - Degree of standardization.
- The resulting data (qualitative vs. quantitative).
6. Characteristics of the assessment
process. - Cyclic vs. non-cyclic.
- Systematic vs. non-systematic.
7. The power differentials between
agents.
a. Who makes the decision.
b. Who has to take actions
(e.g., providing feedback,
deciding what has to be
learned).
Discrepancies between the agents who make the decision
and the agents who are expected to follow-up on the
decisions by taking action. The higher the differential, the
higher the stakes.
8. The types of intervention.
The type of intervention that follows assessment.
Formative interventions can be:
a. proactive;
b. retroactive; or
c. interactive (Stobart, 2008, pp. 146-147).
9. (Learning) theory. On which learning theories the assessment approach is
based.

Jorine A. Vermeulen and Fabienne M. van der Kleij
164
First, we investigated how the object of assessment (e.g., students, teachers, or schools) as
well as the object of the decision making varies across assessment approaches. The reportage
of the results should equal the level at which the decision is aimed because it is, for example,
more difficult to base decisions about students on data reported at classroom level. Next, we
compared the three approaches on the timing of the assessment, which is affected by the time
in which the decision has to be made. With this third feature the frequency of assessment was
investigated as well. The timing of feedback is included to compare the approaches on the
timing of actions taken after the decision.
The fourth assessment characteristic is the objective of assessment, by which it was
analyzed who should benefit from the decision, as well as which behavioral and cognitive
aspects are essential to complete the assessment task. The behavioral and cognitive aspects
that are the primary objective of the assessment affect the assessment method that is most
likely to be used. We compared the assessment methods used in each approach on the degree
of standardization and the type of data that are collected. Sixth, the assessment process
consists of collecting data, interpreting data, making a decision, and taking actions. The
assessment approaches differ in the extent to which the assessment process is cyclic and
systematic. When the assessment process is very systematic and follows a strict cycle the
procedure becomes more formal, whereas a non-systematic and non-cyclic assessment
process will be perceived as informal and more integral to the learning process. This degree of
formality, in combination with the degree of standardization of the assessment method, affects
how students will perceive the stakes of the assessment.
Another assessment feature that affects the stakes of assessment is the power
differentials between agents. Power differentials might exist between the object of
assessment, the assessor, the decision maker, and the person who follows through with the
decision by implementing the intervention. The eighth characteristic is the type of
intervention that follows the decision. Because the aim of this comparison is to composite an
integrative formative approach to assessment, we studied which formative interventions could
follow each assessment approach. Assessment data can also be used for the sake of
remediating learning difficulties, which is called retroactive formative assessment (Stobart,
2008). On the contrary, proactive formative assessment leads to the implementation of
interventions that should prevent the development of learning difficulties by addressing
commonly developed misconceptions. This type of formative assessment is also known as
pre-emptive formative assessment (Carless, 2007).

13 Integrative Approach of Data-Driven Decision Making, Assessment for Learning, and Diagnostic Testing
165
With interactive formative assessment the intervention is the result of the interaction of the
learner with the learning environment (e.g., learning materials, teachers, and students),
meaning that the line between assessment and intervention is blurred (Stobart, 2008).
Finally, a parallel was drawn between the approaches regarding the learning theories
that are used to define what is meant by students‘ learning outcomes. Among these theories
are behaviorism, (social) constructivism (which is based on the cultural historical theory of
Vygotsky), cognitive developmental psychology of Piaget, and information processing
theories (Verhofstadt-Denève et al., 2003).
Results
The results of the comparison between the assessment approaches are shown in Table 3. The
numbers of the headings of the following sections correspond with the numbers of the
characteristics of assessment in Table 3.
1. The Object of the Assessment
DDDM comprises all educational levels, which means that it considers both assessment and
evaluation. AfL comprises classroom and individuals and DT concerns individuals. Since the
three approaches comprise different levels at which data are gathered, this suggests they could
complement each other.
2. The Object of Decision Making
The objects of the decisions differ across the three approaches. In DDDM, the decisions can
concern all levels of education, whereas AfL only concerns decisions within the classroom.
DT is merely aimed at decisions about individual students. The three approaches comprise
different levels at which decisions are made, which suggests that these approaches could be
present simultaneously. Figure 1 shows the objects of the decisions in the three approaches.
Figure 1 Objects of the Decisions in the Three Approaches

Jorine A. Vermeulen and Fabienne M. van der Kleij
166
3. The Time Point in Which Decisions Need to be Made
a. Timing of the decision
In DDDM, the timing of the decision can vary from immediately to a couple of years after
data collection. In AfL, the decisions are almost always made immediately during the learning
process. In DT, the time between the measurement and decision depends on the needs of the
learner(s), but it is desirable to keep this time limited.
b. Frequency of the decision
Depending on the stakes of the decision, in DDDM the frequency of the decisions varies
from daily to once in a couple of years. High-stakes decisions require careful consideration, as
well as reliable and objective data. These types of decisions are generally made less
frequently compared to low-stakes decisions. In AfL, teachers continuously make decisions
based on the assessment information at hand. Thus, decisions are made very frequently. For
DT, the frequency of the decisions will depend on the needs of the learner(s).
c. Timing of the feedback
In DDDM, feedback is usually delivered with a delay; this is especially the case when
feedback from a standardized measurement is delivered by an external party. In AfL,
feedback is provided continuously according to the needs of the learners. When using DT, it
is preferable to inform the learners about the diagnosis as soon as possible after the
measurement.
4. The Objective of the Assessment
The objective of DDDM is assessing and/or evaluating whether or not learning goals are met,
and thereby investigating whether changes to the learning environment are necessary. This
approach is retroactive, because it aims to resolve problems after a period of teaching. On the
other hand, the objective of AfL is improving the quality of the learning process and thereby
establishing higher learner autonomy, and higher learning outcomes. This process is
characterized as interactive and proactive, and sometimes also as retroactive (Stobart, 2008).
The objective of assessment within DT is measuring the student‘s processing activities, and
identifying their preconceptions, misconceptions, bugs, and problem solving strategies.
The process of DT is mostly retroactive, but it can also be used proactively. Furthermore,
when the instrument used for DT provides feedback during the test, the process becomes
interactive.

13 Integrative Approach of Data-Driven Decision Making, Assessment for Learning, and Diagnostic Testing
167
5. The Assessment Methods (Instruments)
The assessment methods used in DDDM are primarily standardized tests that result in
quantitatively reported data-feedback, which has to be interpreted by the user. Standardized,
in this context, indicates that all students take the same test. Also, the design of the instrument
is determined by the learning goals that are being assessed, meaning that emphasis is placed
on what has to be learned.
Usually, highly reliable tests are used that can be scored automatically, so they are easy to
administer on a large scale. Assessment methods used for AfL are usually non-standardized
and therefore students' learning outcomes are described qualitatively in most situations.
Because AfL focuses on the quality of the learning process, the form of the assessment is as
important as the content of the assessment. For the assessment of deep learning, the use of
various assessment methods is essential (Harlen & Gardner, 2010). Instruments used in DT
can be either standardized or adaptive, with the latter referring to computerized tests in which
the selection and sequencing of items depends on the responses given by the student. The
testing procedure of the instrument and the method of scoring should be based on
measurement theories designed for DT (e.g., Leighton & Gierl, 2007b; Rupp et al., 2010).
Additionally, theories about students' cognitive processes are required to formulate
hypotheses about the nature of students' learning outcomes. Because of the complexity of
diagnostic measurement models, it is preferred that quantitative results of DT are reported in a
readily usable format that contains an easy to understand qualitative description of the
student's learning needs.
Furthermore, for each approach the requirements with regard to the quality of the data
depend on the stakes of the decision: the need for objective and reliable data increases when
the stakes become higher (Harlen, 2010). An example of a high-stakes decision is a pass/fail
decision that is used to decide which students receive a diploma and which students will not.
Even though it is desirable to use objective and reliable data for daily decisions, this is not
always feasible because those data are often gathered with standardized (national) tests.
The time between the test moment and receiving reportage on the results of those tests
often exceeds the time in which those decisions have to be made. Therefore, if the feedback
loops are small, and the stakes are low, using various in-class assessment methods will
usually suffice (Harlen & James, 1997). Additionally, standardized tests are likely to be more
focused on specific learning goals than other assessment methods, and for that reason are
unable to fully cover the diverse meanings of students‘ learning outcomes within school
curricula.

Jorine A. Vermeulen and Fabienne M. van der Kleij
168
6. Characteristics of the Assessment Process
The processes of both DDDM and DT are cyclic, systematic, and formal. However, the stakes
that are associated with DDDM are usually higher than those associated with DT. The process
of AfL is non-cyclic and non-systematic, because the gathering of data is as a result of
student-teacher interactions in daily practice rather than of a planned and separate
measurement moment. Therefore, students will be likely to perceive the process of AfL as
informal.
7. The Power Differentials between Agents
a. Who provides feedback?
For DDDM, the feedback can be provided by an external party that develops standardized
tests. When this is the case, the decision most likely has a high-stakes character. Additionally,
in DDDM, feedback might also be provided by agents within the school. In both situations,
the teacher is responsible for using this feedback within the classroom and for feeding these
results back to the students. For AfL, feedback is only provided by agents within the school,
such as a teacher, a peer, or a computer. In DT, the feedback is provided by the computer,
either directly to the student, or indirectly via the teacher.
b. Who determines what has to be learned?
The learning outcomes assessed in DDDM are the learning objectives that are mandated by
external parties like the government. In AfL, national learning objectives serve as a broader
framework of learning goals, but do not determine what has to be learned on a day-to-day
basis. Instead, the students and their teacher(s) decide upon the daily learning intentions.
Although DT is concerned with the learning needs of individual students, what has to be
learned is determined by the agents outside the school who developed the diagnostic test.
Specifically, the theories about students' cognitive processes, common errors, and
misconceptions determine what has to be learned in DT.
8. Types of Intervention
In the section about Characteristic 6, the process of DDDM is described as retroactive,
meaning that the interventions that follow aim to remediate signaled learning difficulties.
Feedback in DDDM has a quantitative nature and can be used to inform decisions on all
educational levels. AfL is primarily interactive because interventions implemented in AfL,
such as qualitative feedback, are part of the daily classroom discourse (Stobart, 2008).

13 Integrative Approach of Data-Driven Decision Making, Assessment for Learning, and Diagnostic Testing
169
Specifically, the interventions in AfL are the result of the interaction between the learner and
the learning environment (e.g., teacher, peers, and materials). When the quality of the
interactions between the learner and the learning environment is optimal, AfL is also
characterized as proactive because in that case the development of learning difficulties is
highly improbable. DT is primarily retroactive; interventions are mostly used for the
remediation of learning problems. For example, this is the case when students are classified
and/or selected. However, as described above, DT becomes interactive when the diagnostic
tests provide feedback to the student during the measurement moment. Additionally, DT can
result in proactive interventions when it is used at the beginning of a teaching period to, for
example, measure students‘ preconceptions so that the development of learning difficulties
can be prevented.
9. Learning Theory
Initially, the improvement of learning outcomes was based on neo-behaviorist ideas, which
encompass student learning in terms of learning sub-skills spread out over fixed periods of
time within each school year (e.g., six weeks). After that period students‘ abilities are
assessed, usually with a paper-and-pencil test (Stobart, 2008). As a consequence of this cyclic
process, the formative function of those assessments is purely retroactive. As is implied by
previously described characteristics, DDDM is based on these theoretical principles.
However, critics of the neo-behaviorist principles argued that students‘ reasoning styles
should be recognized as an indicator of their ability, which is known as the constructivist
learning theory. In this theory, it is stated that learners actively construct their knowledge.
This theory prescribes that assessments should not only focus on behavioral aspects of
learning, but also on students‘ reasoning (Verhofstadt-Denève, 2003).
The theory on which AfL is based takes constructivism a step further by stating that
knowledge is constructed through interactions with others (Stobart, 2008). This is called
social constructivism. As described in the section about DT, DT is concerned with measuring
the student‘s ZPD. The ZPD is an element within social constructivism; learning through
interactions with others means learning with the minimal help of others. Thus, both AfL and
DT are based on principles of social constructivism.

Jorine A. Vermeulen and Fabienne M. van der Kleij
170
Table 3 Results of the Comparison of the Three Assessment Approaches Described by Characteristics
Assessment Characteristic Data-Driven Decision Making Assessment for Learning Diagnostic Testing
1. The object of the
assessment.
Individuals, classrooms, schools Individuals and classrooms Individuals.
2. The object of decision
making.
Individuals, subgroups within a
classroom, whole classrooms, multiple
classrooms, within a school, and across
schools.
Individuals, subgroups within a
classroom, and whole classrooms.
Individuals.
3. The time point in which
decisions need to be
made.
a. Timing of the
decision.
b. Frequency of the
decision.
c. Timing of the
feedback.
a. Depending on the level at which a
decision has to be made this can
vary from immediately to a couple
of years.
b. Varies from daily to once every
couple of years, depending on the
stakes of the decision.
c. Data-feedback at the school and
classroom level, usually delayed.
a. During the learning process.
b. When teaching, teachers
continuously need to decide upon
their next step. For these decisions
they use assessment information
that is available at that moment.
c. Continuously provided according
to the needs of the learners.
a. Depending on the needs of the
learner(s).
b. Depending on the needs of the
learner(s).
c. Preferably right after the diagnosis
and advice on the intervention is
given.
4. The objective of the
assessment.
Determining and monitoring whether
learning goals have been achieved, and
investigating whether changes to the
learning environment are necessary.
Improving the quality of the learning
process and thereby establishing
higher learner autonomy, and higher
learning outcomes.
Assessment of processing activities,
and identifying preconceptions,
misconceptions, bugs, and problem-
solving strategies.
5. The assessment methods
(instruments). - Standardized tests;
- quantitative results; and
- form follows content; larger focus on
what has to be learned than how it is
learned.
- Non-standardized;
- mainly qualitative results; and
- the content and form of assessment
that are chosen are directly related to
how successful learning is
operationalized in terms of subject
knowledge and understanding, as
well as in terms of self-regulation
skills (Stobart, 2008).
- Standardized or adaptive tests;
- quantitative results explained in
qualitative student reports; and
- the content and form are theory-
driven, because based on the
outcomes inferences have to be made
about why a student has achieved
those learning outcomes.

13 Integrative Approach of Data-Driven Decision Making, Assessment for Learning, and Diagnostic Testing
171
Table 3 (continued) Results of the Comparison of the Three Assessment Approaches Described by Characteristics
Assessment Characteristic Data-Driven Decision Making Assessment for Learning Diagnostic Testing
6. Characteristics of the
assessment process. - Cyclic;
- systematic; and
- formal.
- Non-cyclic (continuous);
- non-systematic; and
- informal.
- Cyclic;
- systematic; and
- formal.
7. The power differentials
between agents.
a. Who provides
feedback.
b. Who determines
what has to be
learned.
a. Depending on the stakes of the
test, feedback on student results is
provided by external or internal
parties. The teacher is responsible
for feeding back these results into
the classroom.
b. External party (i.e., the
government).
a. Peer, teacher, student(s), or
computer.
b. The teacher and the student decide
upon learning intentions, based on
students‘ learning needs, within a
framework of broader learning
goals.
a. Depending on the assessment
method used, feedback is provided
by the teacher or the computer.
b. The teacher and/or the student
decide upon the student‘s personal
learning goals.
8. Types of intervention.
- Retroactive;
- can inform decisions at all
educational levels (the level at
which the decision is taken affects
the type of intervention); and
- quantitative feedback.
- Interactive;
- adaptations to teaching;
- adaptations to the learning
environment on single classroom
and on student level; and
- qualitative feedback.
- Proactive (prevention);
- retroactive (remediation);
- classification (also for
differentiated teaching);
- selection; and
- quantitative and qualitative
feedback.
9. Learning theory. - Neo-behaviorism (Stobart, 2008) - Social constructivism (Stobart,
2008).
- Social constructivism;
- cognitive developmental
psychology; and
- information processing theories.

172
Discussion
The goal of this study was to investigate the extent to which DDDM, AfL, and DT can be shaped
into an integrative formative approach towards assessment. The three approaches to assessment
claim to be beneficial with regard to student learning. However, the literature has pointed out that
different meanings are ascribed to student learning within these approaches; on the one hand
student learning is defined as achieving learning goals, and on the other hand it is referred to as
the quality of the learning process (see James & Brown, 2005, for more possible meanings of
learning outcomes). If the three approaches can be combined into an integrative formative
approach towards assessment, this could maximize student learning, in terms of both the process
and the outcomes of learning at all levels of education. The three approaches were compared on
nine characteristics of assessment.
The results suggest that the approaches could complement each other with respect to the
objects of assessments, the objects of the decisions, the time point in which decisions need to be
made, the assessment methods, and characteristics of the assessment process. With respect to the
objects of assessments and the objects of the decisions, DDDM comprises all educational levels,
whereas AfL comprises the classroom level and individuals. DT only concerns individuals. If
these approaches are to be integrated, this would mean that DDDM would serve as a more
overarching approach concerning evaluation and monitoring. Furthermore, in our view, DDDM
should be concerned with high-stakes decisions, whereas AfL should concern the daily practice
where decisions are made on a continuous basis. DT should be used when needed to gather in-
depth information about student learning. The assessment methods differ widely between the
three approaches; however, we believe that they should be present simultaneously. Namely, when
all three approaches are combined this will lead to a complete picture of both students' learning
processes and learning outcomes. Also, the characteristics of the assessment process differ, but
can be complementary. Since DDDM is highly systematic and cyclic, it can be used to maintain
and improve the quality of education. Useful tools for this purpose for example are student
monitoring systems, in which students‘ learning outcomes are assessed using standardized tests
once or twice a year. When the results of these monitoring actions suggest that learning goals are
not being met, it has to be decided how the learning environment could be changed to improve
students' learning outcomes.

13 Integrative Approach of Data-Driven Decision Making, Assessment for Learning, and Diagnostic Testing
173
On a day-to-day basis in the classroom, however, AfL can be a very powerful approach. Because
of its flexible and responsive character, the learning needs of students can best be attended to. DT
can be used in a flexible way, when there is a need for more in-depth information about student
learning or particular learning needs.
The objectives of the assessments and the interventions in the three approaches were
found to be somewhat contradictory. More specifically, DDDM has a retroactive character,
whereas AfL and DT are more proactive, interactive, as well as retroactive. We believe that when
the three approaches are implemented simultaneously, the need for retroactive measurers will
decline, because learning difficulties will be resolved immediately. Therefore, we argue that
when sufficient autonomy is granted to the students and teachers, the three approaches could
actually support each other. The power differentials between agents appeared to differ between
the three approaches as well. The results suggest that high power differentials between agents, as
is the case in DDDM, will give students and teachers less opportunities to take responsibility for
the quality of the learning process, a necessary condition for AfL. DDDM is more distant from
teachers and students, because it mainly takes place outside the classroom, and therefore the
power differentials are high. Thus, power differentials between agents in AfL, and to a lesser
extent in DT, are much smaller than in DDDM because teachers decide on the learning activities
that take place in their classroom. We believe that when the power differentials at the classroom
level are low, this will offer the most optimal learning climate in which feedback can be used to
its full potential. However, low power differentials in AfL require that teachers receive autonomy
from school principles to design their practice. Moreover, the learning theory on which DDDM is
based, known as neo-behaviorism, has in most educational reforms been replaced with the
(social) constructivist view of learning (Stobart, 2008). Because our comparison shows that both
AfL and DT are based on social constructivism and this appears to be the theory that currently
dominates education, we believe it would be best if this theory was also used for DDDM. Social-
constructivism can be used in DDDM because it does not exclude neo-behaviorist principles.
Moreover, it supplements those principles by addressing the cognitive and social components of
learning. Pedagogical-didactical principles in neo-behaviorism focus on conditioning, meaning
students internalize how to solve tasks by repeatedly performing the same tasks (Verhofstadt-
Denève, et al., 2003).

Jorine A. Vermeulen and Fabienne M. van der Kleij
174
A DDDM approach that is more social-constructivist oriented includes learning activities that are
active (not merely reproducing and repeating the same tasks) and include frequent interactions
with peers and the teacher. Furthermore, concerning the ecological validity of assessment
methods used within the three approaches it is important to use methods that are similar to the
wide variety of learning tasks used in social-constructivist learning environments. However,
assessment methods often used in DDDM are standardized tests with a fixed question format.
Thus, a DDDM approach based on a social-constructivist view of learning acknowledges the
complexity of learning by including various assessment methods.
Furthermore, DT complements DDDM and AfL because it offers teachers a non-labor-
intensive way of systematically collecting detailed data on a student's learning needs. Moreover,
DT has a lower risk of misinterpretation of data than DDDM, because the quantitative data are
described in wording that is easy to understand and can be directly used in practice. This is in
contrast to DDDM, where the data has to be interpreted. For AfL, there is a low risk of making
unjustified decisions as a result of misinterpretations, because misinterpretations will be directly
revealed through teacher-student interactions, and can be contingently restored.
Nevertheless, the three approaches have some characteristics that might limit their formative
potentials. In DDDM, for example, monitoring students could easily transform into frequent
administration of mini summative tests (Harlen & James. 1997; Stobart, 2008), which would
unnecessarily raise the stakes for both students and teachers. Even more important, data-feedback
from monitoring activities is most likely aggregated quantitative data that cannot easily be used
to enhance the learning of individual students, because those data do provide sufficient detail
about individual students. A possible pitfall of AfL is that teachers require extensive knowledge
of the assessment domain to be able to, for example, ask questions that will promote students‘
learning during classroom discourse (Bennett, 2011; Moyer & Milewicz, 2002). In the section
about DT, it was explained that for the development of diagnostic tests, theories are required to
make inferences about students‘ reasoning during the tests. In AfL, teachers need to develop
similar theories to make distinctions between students‘ ‗slips‘ and errors (Bennett, 2011). Besides
formal teacher training programs, the use of DT might enhance teachers‘ knowledge about
students‘ thinking with regard to a specific domain. Subsequently, the necessity of theories about
how students construct knowledge and about their thinking within both AfL and DT becomes
clear from our comparison of the theoretical underpinnings of both approaches.

13 Integrative Approach of Data-Driven Decision Making, Assessment for Learning, and Diagnostic Testing
175
Finally, a pitfall of DT is that is only advises on the intervention, selection, and classification of
students and therefore a formative use is not guaranteed.
A limitation of the current study is that the three approaches were only compared on their
theoretical principles as described in educational literature. However, the definitions of the
approaches are not uniformly described in the literature. For the sake of comparing the three
approaches, interpretation of the meaning of these approaches was unavoidable. Further research
should investigate how this integrative formative approach could be implemented in practice.
Currently, in schools in British Columbia, Canada DDDM and AfL are the focus of their
accountability framework (Ministry of Education, British Columbia, Canada, 2002). They define
accountability in terms of the achievements of each student, and take into account the diversity of
students within different school districts by adapting expectations based on DDDM and AfL. In
addition to our comparison of DDDM, AfL, and DT, it would be interesting to further study
initiatives such as these.
References
Assessment Reform Group (1999). Assessment for Learning: Beyond the black box. Cambridge
University.
Assessment Reform Group (2002). Assessment is for Learning: 10 principles. Research-based
principles to guide classroom practice. Retrieved on April 13th 2012 from
http://assessmentreformgroup.files.wordpress.com/2012/01/10principles_english.pdf
Bennett, R. E. (2011). Formative assessment: A critical review. Assessment in Education:
Principles, Policy & Practice, 18, 5-25. doi:10.1080/0969594X.2010.513678
Black, P. & Wiliam, D. (1998). Inside the black box. Raising standards through classroom
assessment. Phi Delta Kappan, 80(2), 139-148.
Briggs, D. C. & Alonzo, A. C. (2009). The psychometric modeling of ordered multiple choice
item responses for diagnostic assessment with a learning progression. Learning
Progressions in Science (LeaPS). Iowa City, IA. Retrieved on November 10th, 2011 from
http://education.msu.edu/projects/leaps/proceedings/Briggs.pdf
Carless, D. (2007). Conceptualizing pre-emptive formative assessment. Assessment in Education,
14(2), 171-184. doi:10.1080/09695940701478412
Davenport, T. H. & Prusak, L. (1998). Working knowledge: How organizations manage what
they know. Boston: Harvard Business School Press.

Jorine A. Vermeulen and Fabienne M. van der Kleij
176
De Bruyn, E. E. J., Ruijssenaars, A. J. J. M., Pameijer, N. K., & Van Aarle, E. J. M. (2003). De
diagnostische cyclus. Een praktijkleer [The diagnostic cycle. Practical guidelines].
Leuven, Begium: Acco.
Hargreaves, E. (2005). Assessment for Learning? Thinking outside the (black) box. Cambridge
Journal of Education, 35(2), 213-224. doi:10.1080/03057640500146880
Harlen, W. (2007). The quality of learning: Assessment alternatives for primary education.
Interim Reports. Cambridge: University of Cambridge. Retrieved on August 10th, 2011
from www.primaryreview.org.uk
Harlen, W. (2010). What is quality teacher assessment? In J. Gardner, W. Harlen, L. Hayward,
and G. Stobart (Eds.), Developing teacher assessment (pp. 29-52). Maidenhead, England:
Open University Press.
Harlen, W. & Gardner, J. (2010). Assessment to support learning. In J. Gardner, W. Harlen, L.
Hayward, and G. Stobart (Eds.), Developing teacher assessment (pp. 15-28). Maidenhead,
England: Open University Press.
Harlen, W. & James, M. (1997). Assessment and learning: Differences between formative and
summative assessment. Assessment in Education: Principles, Policy, & Practice, 4, 365-
379. doi:10.1080/0969594970040304
James, M. & Brown, S. (2005). Grasping the TLRP nettle: preliminary analysis and some
enduring issues surrounding the improvement of learning outcomes. The Curriculum
Journal, 16, 7-30. doi:10.1080/0958517042000336782
Johnson, M. & Burdett, N. (2010). Intention, interpretation and implementation: Some paradoxes
of assessment for learning across educational contexts. Research in Comparative and
International Education, 5, 122-130. doi:10.2304/rcie.2010.5.2.122
Keeley, P. & Tobey, C. R. (2011). Mathematics formative assessment. Thousand Oaks, CA:
Corwin.
Kievit, Th., Tak, J. A., & Bosch, J. D. (Eds.), (2002). Handboek psychodiagnostiek voor de
hulpverlening aan kinderen (6th
ed.) [Handbook psychodiagnostics in healthcare for
children]. Utrecht, The Netherlands: De Tijdstroom.
Klenowski, V. (2009). Assessment for Learning revisited: An Asia-Pacific perspective.
Assessment in Education: Principles, Policy, & Practice, 16, 263-268.
doi:10.1080/09695940903319646

13 Integrative Approach of Data-Driven Decision Making, Assessment for Learning, and Diagnostic Testing
177
Ledoux, G., Blok, H., Boogaard, M., & Krüger, M. (2009). Opbrengstgericht werken. Over
waarde van meetgestuurd onderwijs [Data-driven decision making. About the value of
measurement oriented education]. SCO-Rapport 812. Amsterdam: SCO-Kohnstamm
Instituut.
Leighton, J. P. & Gierl, M. J. (2007a). Defining and evaluating models of cognition used in
educational measurement to make inferences about examinees‘ thinking processes.
Educational Measurement: Issues and Practice, 26, 3-16. doi:10.1111/j.1745-
3992.2007.00090.x
Leighton, J. P. & Gierl, M. J. (Eds.) (2007b). Cognitive diagnostic assessment for education.
Theory and applications. New York: Cambridge University Press.
Light, D., Wexler, D., & Heinze, J. (2004). How practitioners interpret and link data to
instruction: Research findings on New York City schools’ implementation of the grow
network. Paper presented at the annual meeting of the American Educational Research
Association, San Diego, CA.
Locke, E.A., & G. Latham (2002). Building a practically useful theory of goal setting and task
motivation. The American Psychologist, 57(9), 705-717. doi:10.1037/0003-066X.57.9.705
Mandinach, E. B., Honey, M., & Light, D. (April, 2006). A theoretical framework for data-driven
decision making. Paper presented at the annual meeting of the American Educational
Research Association, San Francisco.
Meijer, J., Ledoux, G., & Elshof, D. P. (2011). Gebruikersvriendelijke leerlingvolgsystemen in
het primair onderwijs [User friendly student monitoring systems in primary education].
Rapport 849, ISBN 90-6813-914-3. Amsterdam: Kohnstamm Instituut.
Ministry of Education, British Columbia, Canada (2002). Accountability Framework. Retrieved
on April 13th
, 2012 from
http://www.bced.gov.bc.ca/policy/policies/accountability_framework.htm
Moyer, P. S. & Milewicz, E. (2002). Learning to question: Categories of questioning used by
preservice teachers during diagnostic mathematics interviews. Journal of Mathematics
Teacher Education, 5, 293-315. doi:10.1023/A:1021251912775
Popham, W. J., Cruse, K. L., Rankin, S. C., Sandifer, P. D., & Williams, R. L. (1985).
Measurement-driven instruction. Phi Delta Kappan, 66, 628-634.
Jorine A. Vermeulen and Fabienne M. van der Kleij
178
Rupp, A. A., Templin, J., & Henson, R. A. (2010). Diagnostic measurement. Theory, methods,
and applications. New York: The Guilford Press.
Sanders, P. (2011). Het doel van toetsen [The purpose of tests]. In P. Sanders (Ed.), Toetsen op
school [Testing at school] (pp. 9-20). Arnhem: Cito.
Schildkamp, K. & Kuiper, W. (2010). Data-informed curriculum reform: Which data, what
purposes, and promoting and hindering factors. Teaching and Teacher Education, 26,
482-496. doi:10.1016/j.tate.2009.06.007
Scriven, M. (1967). The Methodology of Evaluation. Washington, DC: American Educational
Research Association.
Shepard, L. A. (2005, October). Formative assessment: Caveat emptor. Paper presented at the
ETS Invitational Conference, The Future of Assessment: Shaping Teaching and Learning,
New York.
Slavin, R. E. (2002). Evidence-based education policies: Transforming educational practice and
research. Educational Researcher, 21(7), 15-21. doi:10.3102/0013189X031007015
Slavin, R. E. (2003). A reader‘s guide to scientifically based research. Educational
Leadership, 60(5), 12-16.
Stobart, G. (2008). Testing times: The uses and abuses of assessment. London: Routledge.
Swan, G. & Mazur, J. (2011). Examining data driven decision making via formative assessment:
A confluence of technology, data interpretation heuristics and curricular policy.
Contemporary Issues in Technology and Teacher Education, 11(2), 205-222.
Third Assessment for Learning Conference. (2009). Third International Conference on
Assessment for for Learning, March 15-20 in Dunedin, New Zealand.
Turner, M., VanderHeide, K., & Fynewever, H. (2011). Motivations for and barriers to the
implementation of diagnostic assessment practices – a case study. Chemistry Education
Research and Practice, 12, 142-157. doi:10.1039/C1RP90019F
Verhofstadt-Denève, L., Van Geert, P., & Vyt, A. (2003). Handboek ontwikkelingspsychologie.
Grondslagen en theorieën [Handbook developmental psychology. Principles and
theories]. Houten: Bohn Stafleu Van Loghum.
Wayman, J. C. (2005). Involving teachers in data-driven decision making: Using computer data
systems to support teacher inquiry and reflection. Journal of Education for Students
Placed at Risk, 10, 295-308. doi:10.1207/s15327671espr1003_5

13 Integrative Approach of Data-Driven Decision Making, Assessment for Learning, and Diagnostic Testing
179
Wayman, J. C., Cho, V., & Johnston, M. T. (2007). The data-informed district: A district-wide
evaluation of data use in the Natrona Country School District. Austin: The University of
Texas.
Wiliam, D. (2011). What is Assessment for Learning? Studies in Educational Evaluation, 37, 3-
14. doi:10.106/j.stueduc.2011.03.001
Wohlstetter, P., Datnow, A., & Park, V. (2008). Creating a system for data-driven decision-
making: applying the principal-agent framework. School Effectiveness and School
Improvement, 19(3), 239-259. doi:10.1080/09243450802246376
Young, V. M., & Kim, D. H. (2010). Using assessments for instructional improvement: A
literature review. Educational Policy Analysis Archives, 18(19)

180