Embed Size (px)
Citation preview

Journal of
Actuator NetworksSensor and
Article
Prototyping and Validation of MEMS Accelerometersfor Structural Health Monitoring—The Case Study ofthe Pietratagliata Cable-Stayed Bridge
Chiara Bedon * ID , Enrico Bergamo ID , Matteo Izzi ID and Salvatore Noè
Department of Engineering and Architecture, University of Trieste, Piazzale Europa 1, 34127 Trieste, Italy;[email protected] (E.B.); [email protected] (M.I.); [email protected] (S.N.)* Correspondence: [email protected]; Tel.: +39-040-558-3837
Received: 23 June 2018; Accepted: 24 July 2018; Published: 27 July 2018�����������������
Abstract: In recent years, thanks to the simple and yet efficient design, Micro Electro-MechanicalSystems (MEMS) accelerometers have proven to offer a suitable solution for Structural HealthMonitoring (SHM) in civil engineering applications. Such devices are typically characterised by highportability and durability, as well as limited cost, hence resulting in ideal tools for applications inbuildings and infrastructure. In this paper, original self-made MEMS sensor prototypes are presentedand validated on the basis of preliminary laboratory tests (shaking table experiments and noise levelmeasurements). Based on the well promising preliminary outcomes, their possible application for thedynamic identification of existing, full-scale structural assemblies is then discussed, giving evidenceof their potential via comparative calculations towards past literature results, inclusive of bothon-site, Experimental Modal Analysis (EMA) and Finite Element Analytical estimations (FEA).The full-scale experimental validation of MEMS accelerometers, in particular, is performed using,as a case study, the cable-stayed bridge in Pietratagliata (Italy). Dynamic results summarised in thepaper demonstrate the high capability of MEMS accelerometers, with evidence of rather stable andreliable predictions, and suggest their feasibility and potential for SHM purposes.
Keywords: Micro Electro-Mechanical Systems (MEMS) accelerometers; Structural Health Monitoring(SHM); prototyping and validation; dynamic identification; cable-stayed bridge; Experimental ModalAnalysis (EMA); Finite Element Analytical (FEA) modelling
1. Introduction, State-of-the-Art and Objectives
Nowadays, buildings and infrastructure are designed to sustain ordinary or extreme dynamicloads (such as wind, traffic, earthquakes, impacts, etc.), whose magnitude is determined fromprobabilistic approaches (i.e., EN 1991 [1]). In most of the cases, simplified design methods andsimulation techniques are conventionally used, to describe the mechanical features of differentstructural typologies. However, their actual structural behaviour (i.e., fundamental period, vibrationshapes, etc.) is properly assessed for a limited number of cases only, i.e., for critical buildings andinfrastructures whose integrity and serviceability is of high importance for public safety and civilprotection. Only a few of these strategic constructional facilities are then equipped with continuousmonitoring systems.
The information that is typically obtained from structural monitoring tools, in this regard, is offundamental importance in view of the consequences associated to possible collapse phenomena.Those systems provide in fact the authorities with a careful evaluation of the damage evolution,supporting the planning of the restoration interventions (e.g., [2–5], etc.). Structural Health Monitoring(SHM) and non-destructive testing have key roles for structural systems in operational conditions,
J. Sens. Actuator Netw. 2018, 7, 30; doi:10.3390/jsan7030030 www.mdpi.com/journal/jsan
J. Sens. Actuator Netw. 2018, 7, 30 2 of 18
for monumental buildings ([6–8], etc.), industrial facilities, or aerospace components [9–13], tunnels,and underground environments [14,15].
Several research efforts have been devoted in the last decade to the development of reliableand cost-effective monitoring devices equipped with Micro Electro-Mechanical Systems (MEMS).MEMS technology has evolved considerably, leading to a general improvement of the sensorsperformance, as well as to a price minimization [16,17]. Comparative experimental studies ofliterature report a 1-to-10 cost ratio of MEMS, with respect to traditional piezoelectric accelerometers(i.e., [18,19], etc.). MEMS-based systems, in addition, proved to be efficient for several types of dynamicapplications. Dynamic measurements of human body movements, for example, were carried out viaMEMS accelerometers by Benevicius et al. [20]. Hand-arm and whole-body MEMS-based vibrationrecords were critically discussed, aiming at investigating the reliability of MEMS techniques forbiomedical applications. The so-called bioMEMS gave evidence of their potential for the medical fieldespecially, in the last five years [21]. At the same time, MEMS accelerometers proved to be efficientalso for vibration monitoring in industrial machines and rotors (e.g., [22–25], etc.).
Since the 1990s, major efforts and well-promising results were reported in the literature fromthe application of MEMS accelerometers in the SHM of civil engineering facilities, as well as in theearly-bird monitoring of seismological hazards. In the first case, MEMS systems have been efficientlyused for the monitoring of strong-motion events in rigid structures, but positive efforts have been alsoachieved from continuous MEMS measurements of flexible structures (such as vehicular and pedestrianbridges), as deeply discussed in several research papers. Bassoli et al. [26] reported on the dynamicidentification of an ancient masonry bell tower in Italy, seriously damaged after the Emilia earthquakeof 2012 and subjected to experimental tests after the retrofitting interventions. Dynamic tests werecarried out based on a MEMS acquisition system, including comparative measurements and acritical discussion of experimental results, as derived from the installed MEMS-based system orfrom traditional analogue instruments. This study is in line with the investigation presented in [27],where numerical model updating is carried out for ancient masonry bell towers, based on continuousSHM via a wired piezoelectric sensor network (commercially available, mono-axial accelerometers).
Feng et al. [28] explored the potential use of smartphone accelerometers for measuringthe structural vibrations in buildings, hence as active instruments for SHM and post-eventdamage diagnostics. The shake table tests discussed in [28] gave evidence of well promisingMEMS performances and results, both for low-amplitude ambient vibrations and high-amplitudeseismic responses. Wargantiwar et al. [29] gave further evidence of the high potential of MEMSaccelerometers, when working as earthquake alarm tools for buildings and civil engineeringinfrastructures. Major benefits were found in their typical low cost, limited power consumptionand relatively small size. Kok et al. [30] experimentally assessed the accuracy of MEMS accelerometersfor modal analysis purposes, giving evidence of maximum expected frequency errors up to 5%,within their working range. In [31,32], experimental shaking table tests are discussed for tri-axisMEMS accelerometers. The collected vibration data showed close agreement with the experimentalmeasurements derived from commercial devices for SHM purposes. Beskhyroun and Ma [33] alsopresented an application of MEMS accelerometers for the experimental modal analysis of a high rise,reinforced concrete building subjected to strong aftershocks. The experimental study highlighted thehigh accuracy of MEMS accelerometers for the prediction of the modal parameters of the monitoredbuilding, compared to traditional testing instruments. A list of additional positive MEMS applicationsfor the SHM and dynamic identification of civil engineering constructions, including wireless options,can be found in the literature (see for example [30,34–37]). In [38], the use of MEMS devices isproposed for the SHM of a suspension bridge in Istanbul. Domaneschi et al. [39] also explored theseismic performance of the Shimotsui-Seto suspension bridge in Japan. In [39], two MEMS sensorfamilies (with low- and high-density noise levels) were taken into account, giving evidence of therelated effects and sensitivity of measurements for localised damage detection purposes. The samesuspension bridge was further numerically investigated in [40] under wind excitation, exploring the
J. Sens. Actuator Netw. 2018, 7, 30 3 of 18
MEMS noise effects on the damage detection, for different scenarios of technical interest (i.e., damagelocation and severity).
A number of research projects aimed to assess the feasibility of MEMS applications in the formof seismological alarm systems can then be found in the literature. Dashti et al. [41], for example,explored the use of cellular phones as ground motion instruments, giving evidence of their accuracyas seismic monitoring devices via comparative shake table tests. Similar results are also reportedin [42,43], etc.
In this context, the paper presents original self-made MEMS accelerometers, as a possible suitabletool for SHM of engineering systems and constructed facilities. Major features of the prototyped devicesare first described in Section 2, including a preliminary experimental validation of the assembledsensors via shacking table tests and noise level measurements (see Section 3). The collected testmeasurements are compared with commercially available devices. The feasibility and potential of theproposed self-made MEMS sensors are then emphasized via a full-scale Experimental Modal Analysis(EMA) investigation, carried out on the cable-stayed bridge of Pietratagliata (Italy). Compared toexisting literature efforts, the current study aims at further assessing the reliability of SHM via low-cost,portable MEMS sensors that could be used for the continuous, on-site monitoring of constructedfacilities. The selected bridge was opened to traffic in 2008, and is of particular interest for SHM anddiagnostic purposes, due to its intrinsic dynamic behaviour. In addition, the bridge is representative ofa strategic infrastructure located in a high seismic region. During 2010 and 2012, moreover, the bridgewas affected by localised damage in two of the cables-to-deck connections, hence resulting in partialmodification of its actual boundary conditions and suggesting detailed investigations with continuousdata acquisition. In Section 4, for comparative purposes, MEMS experimental results are hencepost-processed and assessed towards past EMA predictions and Finite Element Analytical (FEA) dataavailable in the literature for the same structural system [44].
2. Measuring Devices
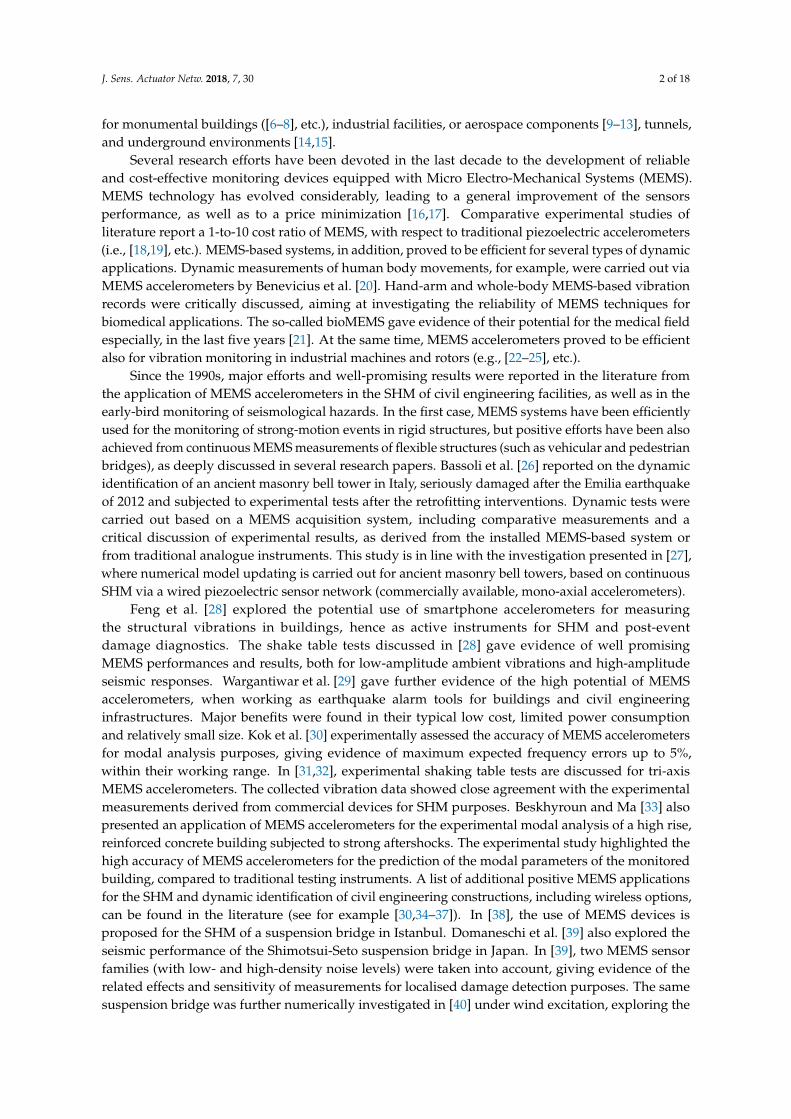
The typical measuring device considered in this study is composed of a printed circuit (PC) boardwith two RJ45 connectors for in-and-out connections (see Figure 1a). The main components of the PCboard are:
(i) a logic unit, programmed with the synchronisation and recording routines;(ii) an accelerometer;(iii) an Analogue-to-Digital Converter (ADC);(iv) a micro SD memory card, to store the recorded data;(v) a real-time clock, to keep the synchronisation between the devices consistent.
Figure 1. (a) PC board and (b) assembled system.
J. Sens. Actuator Netw. 2018, 7, 30 4 of 18
Each measuring device uses two CAT6 24AWG Ethernet cables with four couples of twisted wires:two couples of wires carry the power supply and the other two are used for the data transmission andthe synchronisation signal.
The synchronisation of the devices is provided—prior to starting each registration—by a personalcomputer (Figure 1b), which sends data packets with the current date and time. Each data packet hasa trigger, which activates the oscillators simultaneously. Furthermore, to ensure the consistence of themeasurements when recording, a check square wave with 1 Hz frequency is sent from the personalcomputer and is recorded by each device. The sensors generate a square wave (1024 Hz), which allowscollecting the input data at the sampling frequencies of 256 Hz, 128 Hz, and 64 Hz. The precision ofthe sensors strictly depends on the quality of the installed crystal, typically in the order of 20 ppm.Finally, in the post-processing phase, each synchronisation trace is compared with the reference traceand any small delay is corrected. Consequently, the alignment of the square wave recorded by eachsensor with respect to the original signal is verified.
At the time of the prototyping, the accelerometer was chosen based on the most convenienttrade-off between price and self-noise level. Several sensors were analysed before choosing the KionixKXR94-2050 (Kionix, Inc.®, Ithaca, NY, USA), a tri-axis silicon micromachined accelerometer with afull-scale output range of ±2 g. The acceleration sensing is based on the principle of a differentialcapacitance arising from the acceleration-induced motion of the sensor. Furthermore, each board isequipped with an ADC Texas Instrument device, ADS1220 type (Texas Instruments, Dallas, TX, USA),which has a resolution of 24 bits and features two differential or four single-ended inputs through aninput multiplexer. Table 1 lists the electrical properties of the chosen accelerometer and ADC.
Table 1. Electrical properties for the chosen accelerometer and ADC.
Accelerometer: Kionix KXR94-2050 ADC: Texas Instrument ADS1220
Measurement axes 3 Type Sigma-DeltaMeasurement range ±2 g Resolution 24 bit
Sensitivity 0.66 V/g Channels 2 diff./4 single endedNoise density 45 µg/
√Hz Data rate 2000 SPS
Supply voltage 3.3 V (typical) Supply voltage 3.3 V (typical)Temperature range from −40 ◦C to 85 ◦C Temperature range from −40 ◦C to 125 ◦C
The resolution R of the prototyped MEMS accelerometer is rationally calculated as follows:
R =3.3 V
223 counts·0.66 V/g= 0.596 µg/count (1)
where 0.66 V/g and 223 counts are the sensitivity and the quantisation levels available in eachaccelerometer, respectively, and 3.3 V is the operating voltage of the ADC. The electro-mechanical noiseof the accelerometer, conversely, is evaluated using the nominal specifications declared by the supplierin the product datasheet. The theoretical root-mean-square (rms) noise is evaluated by filtering thenoise density with a first-order low-pass 20 Hz filter leading to:
rms = 45µg√Hz·√
20 Hz·1.57 = 0.252 mg (2)
In this context, the result of Equation (2) is a theoretical value; the actual electro-mechanical noisemight be even higher, being influenced by the final layout of the PC board, the production techniques,the frequency of the power supply, and the temperature.

J. Sens. Actuator Netw. 2018, 7, 30 5 of 18
3. Laboratory Testing and Validation
3.1. Shaking Table Testing
Preliminary hardware tests were carried out at the University of Trieste (Italy), Department ofEngineering and Architecture, aimed at assessing the accuracy of the measuring devices with respectto commercial products available on the market. Tests compared the output response of the PC boards(Figure 2a) with a reference accelerometer used for laboratory measurements, the PCB 356A16 type ofFigure 2b. To this aim, three boards were randomly selected from the full set of instruments (S#1, S#2and S#3 in Table 2) and were simultaneously mounted on a vertical shaking table, together with thePCB 356A16 accelerometer. The shaking table operates at a frequency range of 5–50 Hz, while thePCB 356A16 has a sensitivity of 100 mV/g, an acceleration range of ±50 g and a frequency range of0.5–5000 Hz.
Figure 2. Laboratory shaking table tests: (a) MEMS and (b) comparative PCM sensors; (c,d) examplesof test measurements in terms of acceleration-time plots and pseudo-spectral density (PSD).
The experimental tests investigated the response of three randomly-selected PC boards(see Table 2), at the frequency of 5 Hz, 8 Hz, and 11 Hz. Such an interval of tested frequencies was takeninto account to assess the reliability of MEMS measurements, in a sufficiently wide frequency range ofinterest for the SHM and dynamic identification of buildings and civil engineering infrastructures.
For each one of these frequencies, a two-minute recording was carried out at a sampling rate of128 Hz. The shaking table was activated at the desired frequency and a recording window of 45 s wasselected for comparative purposes, 60 s after the activation of the shaking to avoid the occurrence oftransient starting frequencies. To optimise the experimental output and to assess the response of the
J. Sens. Actuator Netw. 2018, 7, 30 6 of 18
accelerometers, three test setups were considered (i.e., one for each axis), resulting in 27 measurements(three axes multiplied by three sensors, multiplied by three frequencies).
Comparative test calculations and a correlation assessment between the recorded signals from allsensors were carried out using the Pearson’s correlation coefficients ρX,Y and the ratio between theroot-mean-squares rmsX,Y of the prototypes (X) and the reference (Y) sensors, respectively. The ρX,Ycoefficient, defined in Equation (3), measures the correlation between two variables X and Y, givinga value in the range from 1 to −1 and allowing to quantify the linearity and phase distortion of thetested sensors. The rmsX,Y (Equation (4)), conversely, is a statistical measure for the magnitude of avarying quantity and was used to quantify the difference in the amplitude response. In both the cases,a ρX,Y or rmsX,Y value equal to 1 means that two signals are identical (i.e., perfect match), while −1denotes two opposite signals.
ρX,Y =∑i (xi − x)(yi − y)√
∑i(xi − x)2∑k(xk − y)2=
COV(X, Y)σxσy
(3)
rmsX,Y =
√√√√ 1n ∑i x2
i1n ∑i y2
i=
rms(X)
rms(Y)(4)
Table 2 lists the statistical coefficients derived from the measurements. A rather close correlationis observed for the Z-axis, while a major scatter is progressively perceived for the X- and Y-axesas far as the reference frequency f is increased. Such an effect could be partly justified by differentinternal production processes for the X- and Y-axes; however, most probably, it is due to alignmentissues during the setup of the tests. Nevertheless, Table 2 suggests a rather good stability of the testedinstruments for all the recorded frequencies, and a sufficient reliability of the test measurements undera repeated input.
Table 2. Statistical coefficients derived from laboratory test measurements (Equations (3) and (4)).
ReferenceAxis f (Hz)
ρX,Y rmsX,Y
S#1 S#2 S#3 S#1 S#2 S#3
Z5 0.9960 0.9950 0.9951 0.9942 0.9983 0.99168 0.9980 0.9971 0.9976 0.9938 0.9971 0.9920
11 0.9989 0.9971 0.9987 0.9930 0.9960 0.9906
X5 0.9797 0.9795 0.9799 0.9652 0.9737 0.97898 0.9607 0.9609 0.9608 0.9615 0.9701 0.9755
11 0.9515 0.9510 0.9519 0.9631 0.9714 0.9714
Y5 0.9809 0.9809 0.9806 0.9955 0.9959 0.99748 0.9628 0.9621 0.9625 0.9918 0.9924 0.9937
11 0.9535 0.9533 0.9531 0.9888 0.9892 0.9905
3.2. Noise Level Assessment
The noise level of the prototyped devices was also preliminary assessed, due to its effects on thequality of measurements (see for example [39,40]). To this aim, all the MEMS sensors were installed ona rigid foundation block and additional records were collected (steady-state regime, Z-axis componentonly), at the sampling frequencies of 256 Hz, 128 Hz, and 64 Hz. The actual noise level was, hence,evaluated by filtering the noise density with a first-order low-pass 20 Hz filter.
Compared to the theoretical noise value expected from the sensors (0.252 mg, see Table 1 andEquation (1)), the experimentally-derived noise level was generally found to lie in the order of 0.317 mg(+25% the nominal value), suggesting a rather stable performance for the full set of prototypedsensors. Additional calculations were carried out by taking into account further MEMS sensors
J. Sens. Actuator Netw. 2018, 7, 30 7 of 18
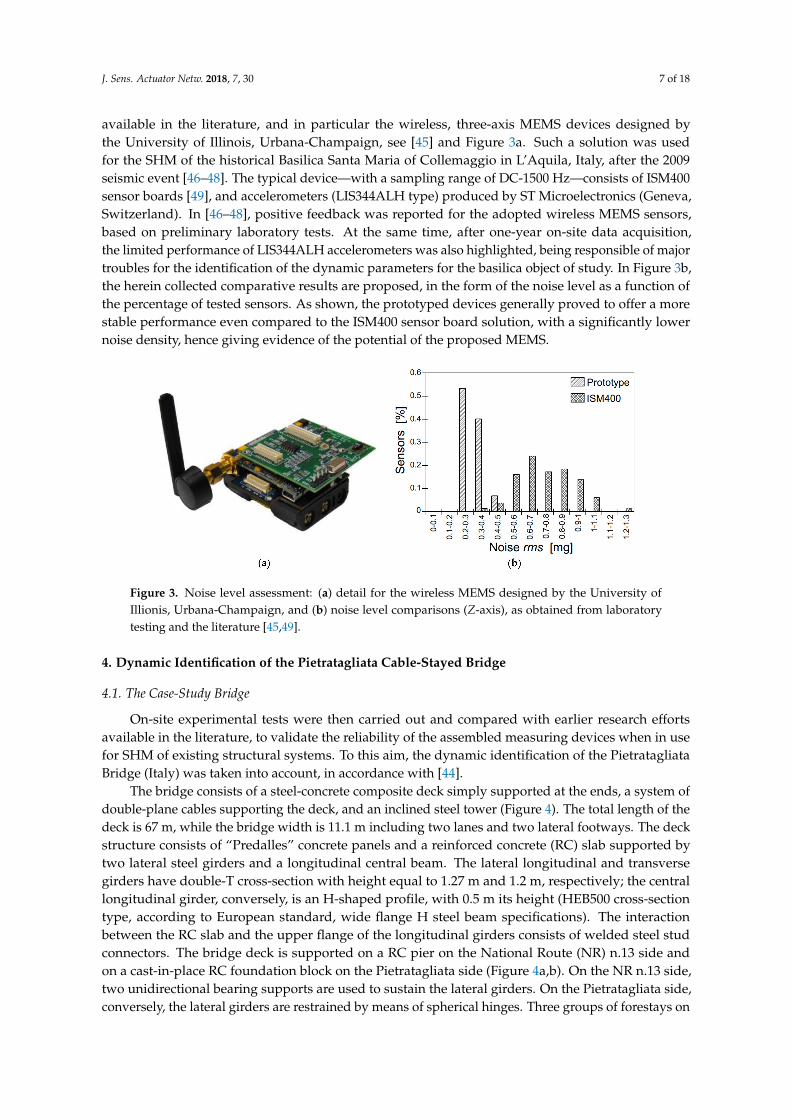
available in the literature, and in particular the wireless, three-axis MEMS devices designed bythe University of Illinois, Urbana-Champaign, see [45] and Figure 3a. Such a solution was usedfor the SHM of the historical Basilica Santa Maria of Collemaggio in L’Aquila, Italy, after the 2009seismic event [46–48]. The typical device—with a sampling range of DC-1500 Hz—consists of ISM400sensor boards [49], and accelerometers (LIS344ALH type) produced by ST Microelectronics (Geneva,Switzerland). In [46–48], positive feedback was reported for the adopted wireless MEMS sensors,based on preliminary laboratory tests. At the same time, after one-year on-site data acquisition,the limited performance of LIS344ALH accelerometers was also highlighted, being responsible of majortroubles for the identification of the dynamic parameters for the basilica object of study. In Figure 3b,the herein collected comparative results are proposed, in the form of the noise level as a function ofthe percentage of tested sensors. As shown, the prototyped devices generally proved to offer a morestable performance even compared to the ISM400 sensor board solution, with a significantly lowernoise density, hence giving evidence of the potential of the proposed MEMS.
Figure 3. Noise level assessment: (a) detail for the wireless MEMS designed by the University ofIllionis, Urbana-Champaign, and (b) noise level comparisons (Z-axis), as obtained from laboratorytesting and the literature [45,49].
4. Dynamic Identification of the Pietratagliata Cable-Stayed Bridge
4.1. The Case-Study Bridge
On-site experimental tests were then carried out and compared with earlier research effortsavailable in the literature, to validate the reliability of the assembled measuring devices when in usefor SHM of existing structural systems. To this aim, the dynamic identification of the PietratagliataBridge (Italy) was taken into account, in accordance with [44].
The bridge consists of a steel-concrete composite deck simply supported at the ends, a system ofdouble-plane cables supporting the deck, and an inclined steel tower (Figure 4). The total length of thedeck is 67 m, while the bridge width is 11.1 m including two lanes and two lateral footways. The deckstructure consists of “Predalles” concrete panels and a reinforced concrete (RC) slab supported bytwo lateral steel girders and a longitudinal central beam. The lateral longitudinal and transversegirders have double-T cross-section with height equal to 1.27 m and 1.2 m, respectively; the centrallongitudinal girder, conversely, is an H-shaped profile, with 0.5 m its height (HEB500 cross-sectiontype, according to European standard, wide flange H steel beam specifications). The interactionbetween the RC slab and the upper flange of the longitudinal girders consists of welded steel studconnectors. The bridge deck is supported on a RC pier on the National Route (NR) n.13 side andon a cast-in-place RC foundation block on the Pietratagliata side (Figure 4a,b). On the NR n.13 side,two unidirectional bearing supports are used to sustain the lateral girders. On the Pietratagliata side,conversely, the lateral girders are restrained by means of spherical hinges. Three groups of forestays on
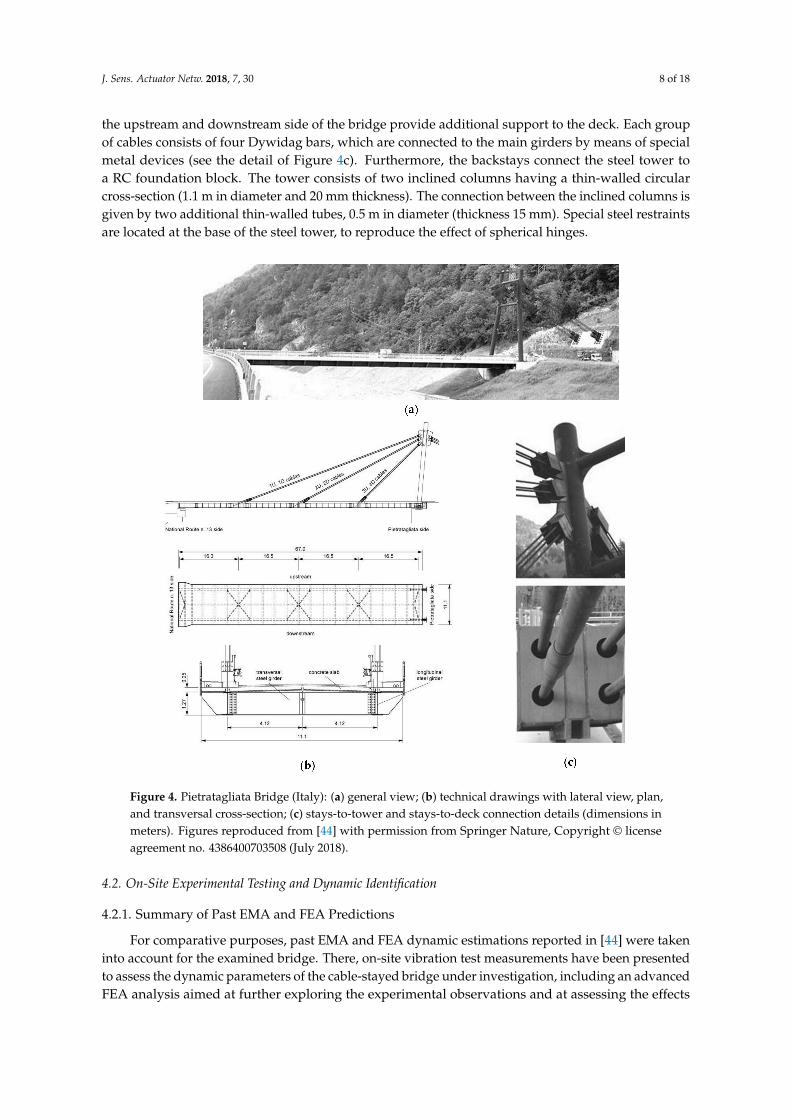
J. Sens. Actuator Netw. 2018, 7, 30 8 of 18
the upstream and downstream side of the bridge provide additional support to the deck. Each groupof cables consists of four Dywidag bars, which are connected to the main girders by means of specialmetal devices (see the detail of Figure 4c). Furthermore, the backstays connect the steel tower toa RC foundation block. The tower consists of two inclined columns having a thin-walled circularcross-section (1.1 m in diameter and 20 mm thickness). The connection between the inclined columns isgiven by two additional thin-walled tubes, 0.5 m in diameter (thickness 15 mm). Special steel restraintsare located at the base of the steel tower, to reproduce the effect of spherical hinges.
Figure 4. Pietratagliata Bridge (Italy): (a) general view; (b) technical drawings with lateral view, plan,and transversal cross-section; (c) stays-to-tower and stays-to-deck connection details (dimensions inmeters). Figures reproduced from [44] with permission from Springer Nature, Copyright © licenseagreement no. 4386400703508 (July 2018).
4.2. On-Site Experimental Testing and Dynamic Identification
4.2.1. Summary of Past EMA and FEA Predictions
For comparative purposes, past EMA and FEA dynamic estimations reported in [44] were takeninto account for the examined bridge. There, on-site vibration test measurements have been presentedto assess the dynamic parameters of the cable-stayed bridge under investigation, including an advancedFEA analysis aimed at further exploring the experimental observations and at assessing the effects

J. Sens. Actuator Netw. 2018, 7, 30 9 of 18
of some key input parameters on the overall performance of the bridge (i.e., boundaries, structuraldetailing, pre-stressing force in the stays, etc.).
More in detail, in terms of EMA measurements (herein referred as “TEST0”), an ambient vibrationdynamic test has been carried out with the aim of identifying the low vibration modes of the bridge(see [44]). At the time of past experiments, no additional excitation due to traffic was accountedfor, due to strict requirement of the Pietratagliata Municipal Authority. The instrumentation chainconsisted of a 16-channel data acquisition system, connected to a remote personal computer, and 11Sprengnether mono-axial servo-accelerometers sensors, operating in the frequency range of 0–25 Hz.Each sensor was provided with a pre-amplifier having variable gain controlled by the remote computer.The instruments were located at 20 selected points (16 on the deck and four on the tower), to capturethe deformed shapes of both the deck and the tower. Regarding the numerical simulations, the herereferred FEA model was implemented by means of the ABAQUS/Standard computer package [50],see Figure 5 and [44]. The geometrical description of the bridge components (deck, pylon, cables,and pier, see the A-to-E key details in Figure 5a), and the definition of their reciprocal mechanicalinteraction was, hence, carried out based on technical drawings and preliminary sensitivity studies.To this aim, additional FEA models representative of structural details were presented for a furtherassessment of boundary conditions effects on the dynamic parameters of the bridge. Refined calibrationof major input features was, hence, carried out, by including fine-tuning towards available on-sitemeasurements (see [44]).
Figure 5. Refined FEA model for the dynamic identification of the Pietratagliata Bridge (ABAQUS),(a) global assembly and bottom/pier detailing, in accordance with [44], and (b) selected details. Figuresreproduced from [44] with permission from Springer Nature, Copyright © license agreement no.4386400703508 (July 2018).
J. Sens. Actuator Netw. 2018, 7, 30 10 of 18
Additional local EMA measurements for the natural frequencies of the stay cables were alsoreported in [44] from ambient vibration tests, and used to identify the axial force on the supportingcables. Based on combined parametric FEA simulations, it was shown that the vibration frequencies ofthe bridge are not particularly sensitive to these structural modifications, with an average reduction upto 0.5–1% the fundamental frequencies of the reference, undamaged configuration. A maximum scatterup to −5% was estimated for some torsional shapes only, when damage was imposed in the stays withthe closest connection to the tower (i.e., with a key role for restraining the bridge deck for the modalshapes of interest). On the contrary, possible variation in the axial force amount, and/or damage inthe cables-to-deck restraints was found to induce even important changes in the shape of the lowervibration modes (i.e., loss of symmetry of restraints for the deck and, hence, of the correspondingdeformations, with respect to the longitudinal axis of the bridge), suggesting a potential use of such akind of information for diagnostic purposes.
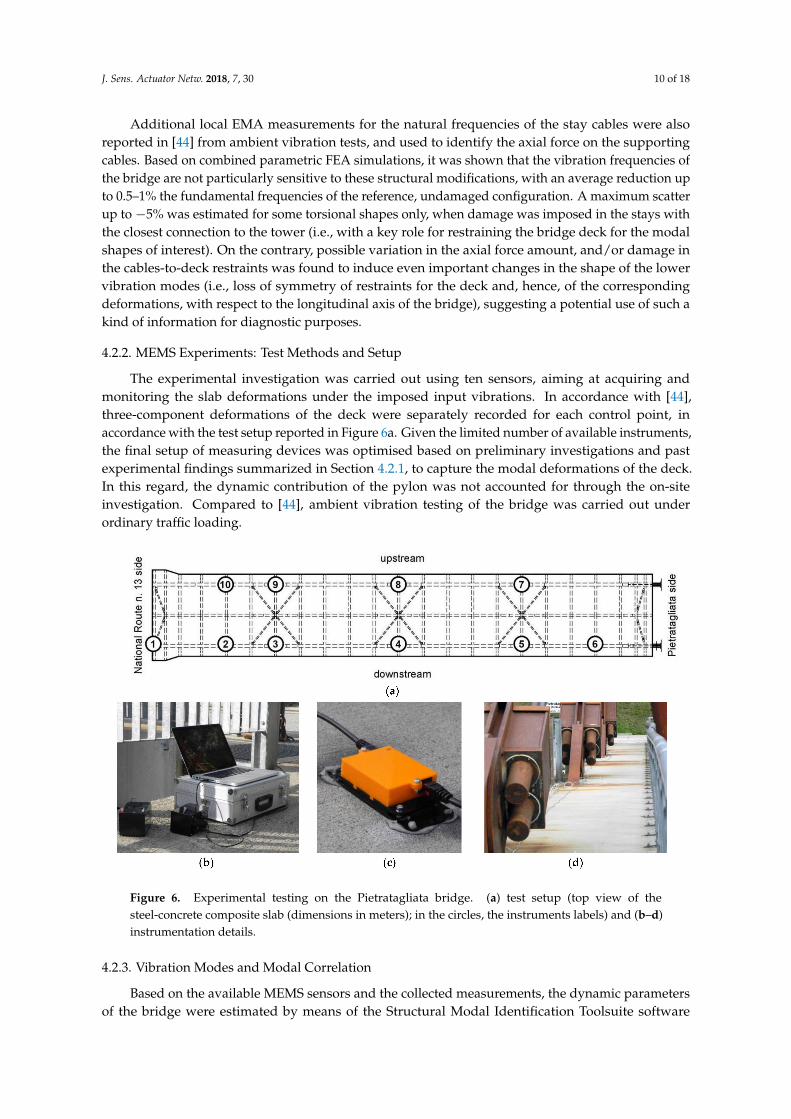
4.2.2. MEMS Experiments: Test Methods and Setup
The experimental investigation was carried out using ten sensors, aiming at acquiring andmonitoring the slab deformations under the imposed input vibrations. In accordance with [44],three-component deformations of the deck were separately recorded for each control point, inaccordance with the test setup reported in Figure 6a. Given the limited number of available instruments,the final setup of measuring devices was optimised based on preliminary investigations and pastexperimental findings summarized in Section 4.2.1, to capture the modal deformations of the deck.In this regard, the dynamic contribution of the pylon was not accounted for through the on-siteinvestigation. Compared to [44], ambient vibration testing of the bridge was carried out underordinary traffic loading.
Figure 6. Experimental testing on the Pietratagliata bridge. (a) test setup (top view of thesteel-concrete composite slab (dimensions in meters); in the circles, the instruments labels) and (b–d)instrumentation details.
4.2.3. Vibration Modes and Modal Correlation
Based on the available MEMS sensors and the collected measurements, the dynamic parametersof the bridge were estimated by means of the Structural Modal Identification Toolsuite software

J. Sens. Actuator Netw. 2018, 7, 30 11 of 18
(SMIT [51]). The ERA-OKID-OO approach [52,53], being representative of the extension of the simpleERA technique to vibrating systems whose initial conditions and dynamic external excitation areunknown, was used for natural frequencies, damping ratios, vibration shapes (see Figures 7 and 8,and Table 3). In general, the ERA-OKIDO-OO technique offers more stable identification results,compared to other approaches (see [52,53]).
In this regard, Figure 7a shows the typical test measurements for the examined bridge underambient vibration, while Figure 7b gives evidence of six vibration modes—i.e., PSD peaks—emergingfrom the noise level.
Due to the test setup configuration and input vibrations, the post-processing of the collectedexperimental data proved to allow a clear detection of the first six modes of the bridge, especially theflexural ones (i.e., major peaks in Figure 7b, where the EMA modes #1, #3, and #5 are emphasized),but also giving evidence of the fundamental torsional modes for the deck (EMA #2, #4, and #6 inFigure 7b).
Figure 7. Dynamic identification of the Pietratagliata bridge via MEMS sensors: (a) example oftest measurements (three sensors only are shown) and (b) pseudo spectral density with evidence offundamental modes.
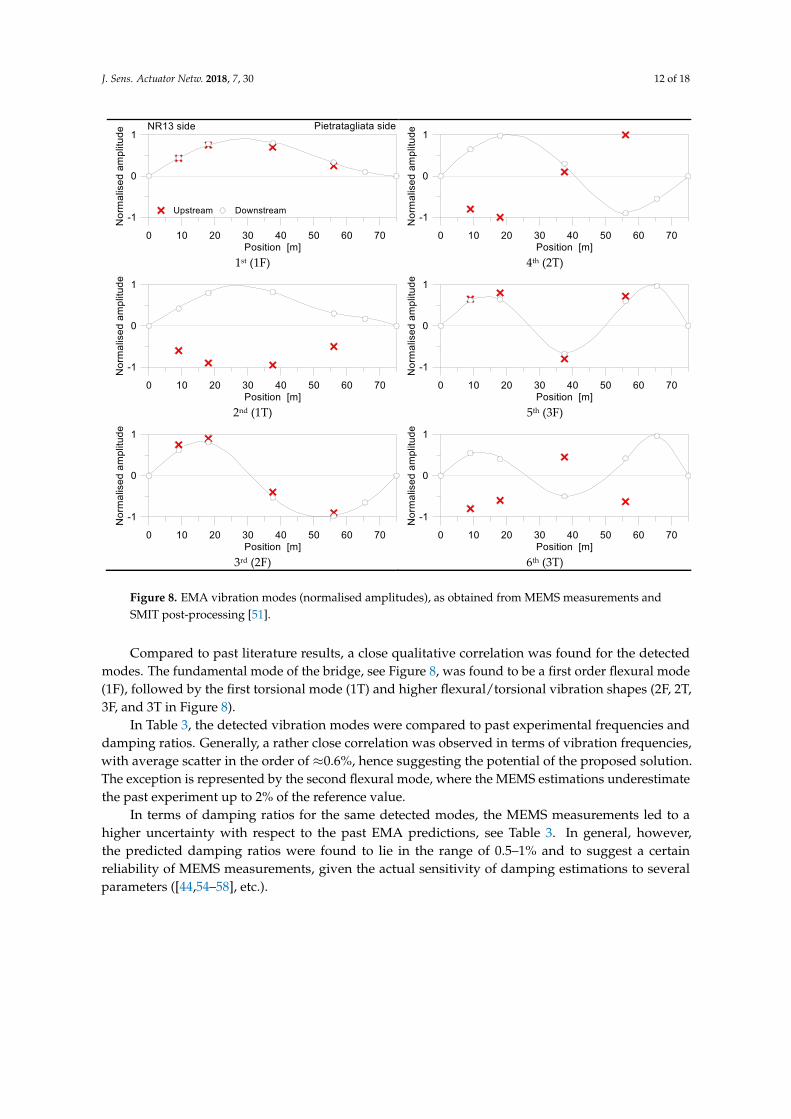
The experimentally-predicted vibration shapes are, in fact, reported in Figure 8 (lateral viewof the bridge deck), while the corresponding vibration frequencies and damping ratios are listed inTables 3 and 4.
J. Sens. Actuator Netw. 2018, 7, 30 12 of 18
J. Sens. Actuator Netw. 2018, 7, x FOR PEER REVIEW 12 of 18
1st (1F) 4th (2T)
2nd (1T) 5th (3F)
3rd (2F) 6th (3T)
Figure 8. EMA vibration modes (normalised amplitudes), as obtained from MEMS measurements and
SMIT post-processing [46].
Compared to past literature results, a close qualitative correlation was found for the detected
modes. The fundamental mode of the bridge, see Figure 8, was found to be a first order flexural mode
(1F), followed by the first torsional mode (1T) and higher flexural/torsional vibration shapes (2F, 2T,
3F, and 3T in Figure 8).
In Table 3, the detected vibration modes were compared to past experimental frequencies and
damping ratios. Generally, a rather close correlation was observed in terms of vibration frequencies,
with average scatter in the order of ≈0.6%, hence suggesting the potential of the proposed solution.
The exception is represented by the second flexural mode, where the MEMS estimations
underestimate the past experiment up to 2% of the reference value.
In terms of damping ratios for the same detected modes, the MEMS measurements led to a
higher uncertainty with respect to the past EMA predictions, see Table 3. In general, however, the
predicted damping ratios were found to lie in the range of 0.5–1% and to suggest a certain reliability
of MEMS measurements, given the actual sensitivity of damping estimations to several parameters
([44,54–58], etc.). Careful consideration, based on the available test measurements, was indeed spent
for the correlation of the flexural and torsional vibration shapes of the bridge with past literature
measurements. Given the limited number of control points, modal correlation was carried out by
considering the FEA vibration shapes reported in [44], where the accuracy of such an advanced
numerical model was emphasised.
Figure 8. EMA vibration modes (normalised amplitudes), as obtained from MEMS measurements andSMIT post-processing [51].
Compared to past literature results, a close qualitative correlation was found for the detectedmodes. The fundamental mode of the bridge, see Figure 8, was found to be a first order flexural mode(1F), followed by the first torsional mode (1T) and higher flexural/torsional vibration shapes (2F, 2T,3F, and 3T in Figure 8).
In Table 3, the detected vibration modes were compared to past experimental frequencies anddamping ratios. Generally, a rather close correlation was observed in terms of vibration frequencies,with average scatter in the order of ≈0.6%, hence suggesting the potential of the proposed solution.The exception is represented by the second flexural mode, where the MEMS estimations underestimatethe past experiment up to 2% of the reference value.
In terms of damping ratios for the same detected modes, the MEMS measurements led to ahigher uncertainty with respect to the past EMA predictions, see Table 3. In general, however,the predicted damping ratios were found to lie in the range of 0.5–1% and to suggest a certainreliability of MEMS measurements, given the actual sensitivity of damping estimations to severalparameters ([44,54–58], etc.).
J. Sens. Actuator Netw. 2018, 7, 30 13 of 18
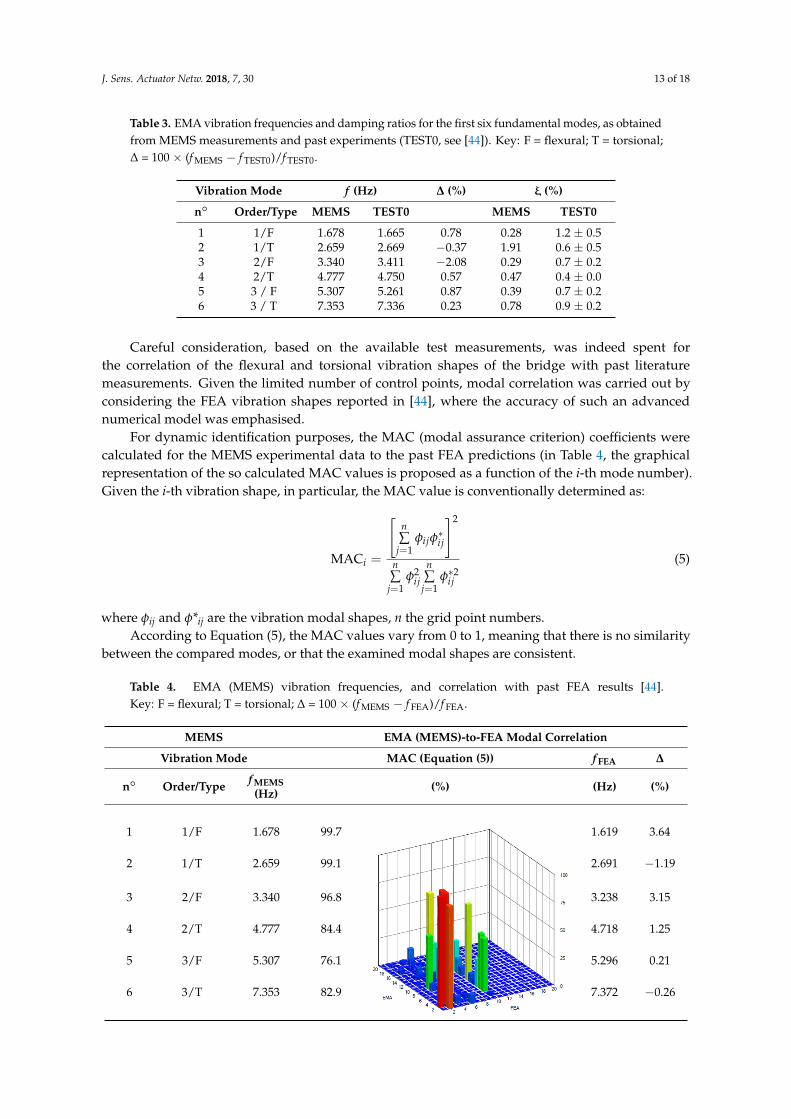
Table 3. EMA vibration frequencies and damping ratios for the first six fundamental modes, as obtainedfrom MEMS measurements and past experiments (TEST0, see [44]). Key: F = flexural; T = torsional;∆ = 100 × (f MEMS − f TEST0)/f TEST0.
Vibration Mode f (Hz) ∆ (%) ξ (%)
n◦ Order/Type MEMS TEST0 MEMS TEST0
1 1/F 1.678 1.665 0.78 0.28 1.2 ± 0.52 1/T 2.659 2.669 −0.37 1.91 0.6 ± 0.53 2/F 3.340 3.411 −2.08 0.29 0.7 ± 0.24 2/T 4.777 4.750 0.57 0.47 0.4 ± 0.05 3 / F 5.307 5.261 0.87 0.39 0.7 ± 0.26 3 / T 7.353 7.336 0.23 0.78 0.9 ± 0.2
Careful consideration, based on the available test measurements, was indeed spent forthe correlation of the flexural and torsional vibration shapes of the bridge with past literaturemeasurements. Given the limited number of control points, modal correlation was carried out byconsidering the FEA vibration shapes reported in [44], where the accuracy of such an advancednumerical model was emphasised.
For dynamic identification purposes, the MAC (modal assurance criterion) coefficients werecalculated for the MEMS experimental data to the past FEA predictions (in Table 4, the graphicalrepresentation of the so calculated MAC values is proposed as a function of the i-th mode number).Given the i-th vibration shape, in particular, the MAC value is conventionally determined as:
MACi =
[n∑
j=1φijφ
∗ij
]2
n∑
j=1φ2
ij
n∑
j=1φ∗2ij
(5)
where φij and φ*ij are the vibration modal shapes, n the grid point numbers.According to Equation (5), the MAC values vary from 0 to 1, meaning that there is no similarity
between the compared modes, or that the examined modal shapes are consistent.
Table 4. EMA (MEMS) vibration frequencies, and correlation with past FEA results [44].Key: F = flexural; T = torsional; ∆ = 100 × (f MEMS − f FEA)/f FEA.
MEMS EMA (MEMS)-to-FEA Modal Correlation
Vibration Mode MAC (Equation (5)) f FEA ∆
n◦ Order/Type f MEMS(Hz) (%) (Hz) (%)
1 1/F 1.678 99.7
J. Sens. Actuator Netw. 2018, 7, x FOR PEER REVIEW 13 of 18
For dynamic identification purposes, the MAC (modal assurance criterion) coefficients were
calculated for the MEMS experimental data to the past FEA predictions (in Table 4, the graphical
representation of the so calculated MAC values is proposed as a function of the i-th mode number).
Given the i-th vibration shape, in particular, the MAC value is conventionally determined as:
n
j
ij
n
j
ij
n
j
ijij
i
1
2*
1
2
2
1
*
MAC
(5)
where ϕij and ϕ*ij are the vibration modal shapes, n the grid point numbers.
According to Equation (5), the MAC values vary from 0 to 1, meaning that there is no similarity
between the compared modes, or that the examined modal shapes are consistent.
Table 4. EMA (MEMS) vibration frequencies, and correlation with past FEA results [44]. Key: F =
flexural; T = torsional; = 100 × (fMEMS − fFEA)/fFEA.
MEMS EMA (MEMS)-to-FEA Modal Correlation
Vibration Mode MAC (Equation (5)) fFEA
n° Order/Type fMEMS
(Hz) (%) (Hz) (%)
1 1/F 1.678 99.7
1.619 3.64
2 1/T 2.659 99.1 2.691 −1.19
3 2/F 3.340 96.8 3.238 3.15
4 2/T 4.777 84.4 4.718 1.25
5 3/F 5.307 76.1 5.296 0.21
6 3/T 7.353 82.9 7.372 −0.26
As shown in Table 4, a rather close correlation was generally observed for the experimentally-
detected vibration modes, for both flexural and torsional shape types, and especially for the lowest
ones. MAC values proved the reliability of test measurements, even with major scatter for higher and
complex vibration shapes, with MAC > 96.8 for the first fundamental modes. Given the actual goals
and limitations of MAC estimations (see for example [59,60]), the collected results can be considered
as well-representative of the potential of MEMS sensors.
Frequency results were also found to have close correlation with FEA calculations, being
experimentally estimated with mostly a limited scatter (in the order of 1–3%) and with major
discrepancies (3.5%) in the case of the first and third modes only. The scatter for these vibration
modes (corresponding to the 1F and 2F flexural shapes) could be affected by local effects of the pier,
since resulting in a flexible end support for the FEA deck. Based on the limited number of control
points, however, a reasonable accuracy of the prototyped instrumentation can, again, be deducted,
even if additional testing and assessment are required.
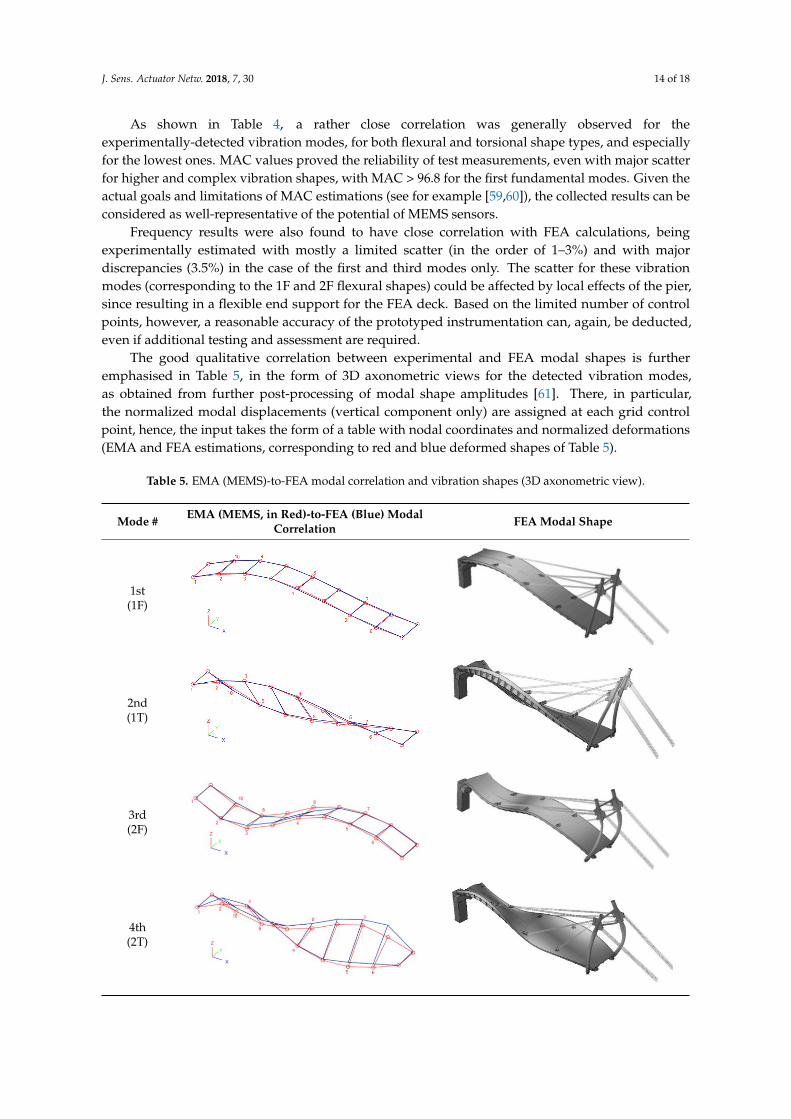
The good qualitative correlation between experimental and FEA modal shapes is further
emphasised in Table 5, in the form of 3D axonometric views for the detected vibration modes, as
obtained from further post-processing of modal shape amplitudes [61]. There, in particular, the
normalized modal displacements (vertical component only) are assigned at each grid control point,
hence, the input takes the form of a table with nodal coordinates and normalized deformations (EMA
and FEA estimations, corresponding to red and blue deformed shapes of Table 5).
1.619 3.64
2 1/T 2.659 99.1 2.691 −1.19
3 2/F 3.340 96.8 3.238 3.15
4 2/T 4.777 84.4 4.718 1.25
5 3/F 5.307 76.1 5.296 0.21
6 3/T 7.353 82.9 7.372 −0.26
J. Sens. Actuator Netw. 2018, 7, 30 14 of 18
As shown in Table 4, a rather close correlation was generally observed for theexperimentally-detected vibration modes, for both flexural and torsional shape types, and especiallyfor the lowest ones. MAC values proved the reliability of test measurements, even with major scatterfor higher and complex vibration shapes, with MAC > 96.8 for the first fundamental modes. Given theactual goals and limitations of MAC estimations (see for example [59,60]), the collected results can beconsidered as well-representative of the potential of MEMS sensors.
Frequency results were also found to have close correlation with FEA calculations, beingexperimentally estimated with mostly a limited scatter (in the order of 1–3%) and with majordiscrepancies (3.5%) in the case of the first and third modes only. The scatter for these vibrationmodes (corresponding to the 1F and 2F flexural shapes) could be affected by local effects of the pier,since resulting in a flexible end support for the FEA deck. Based on the limited number of controlpoints, however, a reasonable accuracy of the prototyped instrumentation can, again, be deducted,even if additional testing and assessment are required.
The good qualitative correlation between experimental and FEA modal shapes is furtheremphasised in Table 5, in the form of 3D axonometric views for the detected vibration modes,as obtained from further post-processing of modal shape amplitudes [61]. There, in particular,the normalized modal displacements (vertical component only) are assigned at each grid controlpoint, hence, the input takes the form of a table with nodal coordinates and normalized deformations(EMA and FEA estimations, corresponding to red and blue deformed shapes of Table 5).
Table 5. EMA (MEMS)-to-FEA modal correlation and vibration shapes (3D axonometric view).
Mode # EMA (MEMS, in Red)-to-FEA (Blue) ModalCorrelation FEA Modal Shape
1st(1F)
J. Sens. Actuator Netw. 2018, 7, x FOR PEER REVIEW 14 of 18
Table 5. EMA (MEMS)-to-FEA modal correlation and vibration shapes (3D axonometric view).
Mode # EMA (MEMS, in Red)-to-FEA (Blue) Modal
Correlation FEA Modal Shape
1st
(1F)
2nd
(1T)
3rd
(2F)
4th
(2T)
5th
(3F)
6th
(3T)
5. Conclusions
In this paper, original self-made Micro Electro-Mechanical System-based (MEMS)
accelerometers have been prototyped and validated via laboratory and on-site experimental tests. To
this aim, laboratory experimental comparisons have been first reported, so to assess the expected
accuracy of MEMS-based measurements towards traditional accelerometers commercially available
on the market, including noise level assessment. Based on the observed close correlation between the
tested instruments, a full-scale application has been then reported. As a case study, the cable-stayed
bridge in Pietratagliata (Italy) has been taken into account. The capability and potential of MEMS
2nd(1T)
J. Sens. Actuator Netw. 2018, 7, x FOR PEER REVIEW 14 of 18
Table 5. EMA (MEMS)-to-FEA modal correlation and vibration shapes (3D axonometric view).
Mode # EMA (MEMS, in Red)-to-FEA (Blue) Modal
Correlation FEA Modal Shape
1st
(1F)
2nd
(1T)
3rd
(2F)
4th
(2T)
5th
(3F)
6th
(3T)
5. Conclusions
In this paper, original self-made Micro Electro-Mechanical System-based (MEMS)
accelerometers have been prototyped and validated via laboratory and on-site experimental tests. To
this aim, laboratory experimental comparisons have been first reported, so to assess the expected
accuracy of MEMS-based measurements towards traditional accelerometers commercially available
on the market, including noise level assessment. Based on the observed close correlation between the
tested instruments, a full-scale application has been then reported. As a case study, the cable-stayed
bridge in Pietratagliata (Italy) has been taken into account. The capability and potential of MEMS
3rd(2F)
J. Sens. Actuator Netw. 2018, 7, x FOR PEER REVIEW 14 of 18
Table 5. EMA (MEMS)-to-FEA modal correlation and vibration shapes (3D axonometric view).
Mode # EMA (MEMS, in Red)-to-FEA (Blue) Modal
Correlation FEA Modal Shape
1st
(1F)
2nd
(1T)
3rd
(2F)
4th
(2T)
5th
(3F)
6th
(3T)
5. Conclusions
In this paper, original self-made Micro Electro-Mechanical System-based (MEMS)
accelerometers have been prototyped and validated via laboratory and on-site experimental tests. To
this aim, laboratory experimental comparisons have been first reported, so to assess the expected
accuracy of MEMS-based measurements towards traditional accelerometers commercially available
on the market, including noise level assessment. Based on the observed close correlation between the
tested instruments, a full-scale application has been then reported. As a case study, the cable-stayed
bridge in Pietratagliata (Italy) has been taken into account. The capability and potential of MEMS
4th(2T)
J. Sens. Actuator Netw. 2018, 7, x FOR PEER REVIEW 14 of 18
Table 5. EMA (MEMS)-to-FEA modal correlation and vibration shapes (3D axonometric view).
Mode # EMA (MEMS, in Red)-to-FEA (Blue) Modal
Correlation FEA Modal Shape
1st
(1F)
2nd
(1T)
3rd
(2F)
4th
(2T)
5th
(3F)
6th
(3T)
5. Conclusions
In this paper, original self-made Micro Electro-Mechanical System-based (MEMS)
accelerometers have been prototyped and validated via laboratory and on-site experimental tests. To
this aim, laboratory experimental comparisons have been first reported, so to assess the expected
accuracy of MEMS-based measurements towards traditional accelerometers commercially available
on the market, including noise level assessment. Based on the observed close correlation between the
tested instruments, a full-scale application has been then reported. As a case study, the cable-stayed
bridge in Pietratagliata (Italy) has been taken into account. The capability and potential of MEMS
J. Sens. Actuator Netw. 2018, 7, 30 15 of 18
Table 5. Cont.
Mode # EMA (MEMS, in Red)-to-FEA (Blue) ModalCorrelation FEA Modal Shape
5th(3F)
J. Sens. Actuator Netw. 2018, 7, x FOR PEER REVIEW 14 of 18
Table 5. EMA (MEMS)-to-FEA modal correlation and vibration shapes (3D axonometric view).
Mode # EMA (MEMS, in Red)-to-FEA (Blue) Modal
Correlation FEA Modal Shape
1st
(1F)
2nd
(1T)
3rd
(2F)
4th
(2T)
5th
(3F)
6th
(3T)
5. Conclusions
In this paper, original self-made Micro Electro-Mechanical System-based (MEMS)
accelerometers have been prototyped and validated via laboratory and on-site experimental tests. To
this aim, laboratory experimental comparisons have been first reported, so to assess the expected
accuracy of MEMS-based measurements towards traditional accelerometers commercially available
on the market, including noise level assessment. Based on the observed close correlation between the
tested instruments, a full-scale application has been then reported. As a case study, the cable-stayed
bridge in Pietratagliata (Italy) has been taken into account. The capability and potential of MEMS
6th(3T)
J. Sens. Actuator Netw. 2018, 7, x FOR PEER REVIEW 14 of 18
Table 5. EMA (MEMS)-to-FEA modal correlation and vibration shapes (3D axonometric view).
Mode # EMA (MEMS, in Red)-to-FEA (Blue) Modal
Correlation FEA Modal Shape
1st
(1F)
2nd
(1T)
3rd
(2F)
4th
(2T)
5th
(3F)
6th
(3T)
5. Conclusions
In this paper, original self-made Micro Electro-Mechanical System-based (MEMS)
accelerometers have been prototyped and validated via laboratory and on-site experimental tests. To
this aim, laboratory experimental comparisons have been first reported, so to assess the expected
accuracy of MEMS-based measurements towards traditional accelerometers commercially available
on the market, including noise level assessment. Based on the observed close correlation between the
tested instruments, a full-scale application has been then reported. As a case study, the cable-stayed
bridge in Pietratagliata (Italy) has been taken into account. The capability and potential of MEMS
5. Conclusions
In this paper, original self-made Micro Electro-Mechanical System-based (MEMS) accelerometershave been prototyped and validated via laboratory and on-site experimental tests. To this aim,laboratory experimental comparisons have been first reported, so to assess the expected accuracyof MEMS-based measurements towards traditional accelerometers commercially available on themarket, including noise level assessment. Based on the observed close correlation between thetested instruments, a full-scale application has been then reported. As a case study, the cable-stayedbridge in Pietratagliata (Italy) has been taken into account. The capability and potential of MEMSaccelerometers has been assessed on the basis of Experimental Modal Analysis (EMA) testing and FiniteElement Analytical (EMA) estimations derived from past literature efforts. As shown, the prototypedMEMS accelerometers proved to offer reliable estimations for the dynamic features of the bridge,hence confirming their potential use for structural monitoring in the form of low-cost, but practical,instruments. In this regard, further investigations are also expected to verify the reliability of MEMSestimations for different structural typologies.
Author Contributions: All the authors wrote and revised the paper collaboratively. The presented self-madeMEMS accelerometers are the extended result of E.B. Master Thesis project. For the paper drafting, C.B. and M.I.conceived of and pursued the literature survey on MEMS-based sensors. E.B. managed the laboratory and on-siteMEMS measurements. C.B. carried out the past FEA studies, while S.N. supervised the overall project.
Funding: This research project received no external funding. The APC was funded by MDPI (voucher discountsfor the first author acting as a reviewer for MDPI journals).
Acknowledgments: The research results discussed in this paper have been orally presented at the GNGTSNational Conference (November 2017, Trieste, Italy). In this regard, Dr. Luigi Bregant (Assistant Professor inApplied Mechanics for Machinery at University of Trieste, Department of Engineering and Architecture, Italy),is acknowledged for his technical support during the laboratory tests.
Conflicts of Interest: The authors declare no conflict of interest.
References
1. EN 1991. Eurocode 1: Actions on Structures. European Standard. European Committee for Standardization(CEN): Brussels, Belgium, 2010. Available online: http://www.phd.eng.br/wp-content/uploads/2015/12/en.1991.1.4.2005.pdf (accessed on 27 July 2018).
2. Nakano, Y.; Maeda, M.; Kuramoto, H.; Murakami, M. Guideline for post-earthquake damage evaluation andrehabilitation of RC buildings in Japan. In Proceedings of the 13th WCEE World Conference on EarthquakeEngineering, Vancouver, BC, Canada, 1–6 August 2004.

J. Sens. Actuator Netw. 2018, 7, 30 16 of 18
3. Xue, Q.; Chen, C.C.; Chen, K.C. Damage loss assessment for the basic earthquake insurance claim ofresidential RC buildings in Taiwan. J. Build. Apprais. 2011, 6, 213–226. [CrossRef]
4. Pozzi, M.; Zonta, D.; Trapani, D.; Athanasopoulos, N.; Amditis, A.J.; Bimpas, M.; Garetsos, A.; Stratakos, Y.E.;Ulieru, D. MEMS-based sensors for post-earthquake damage assessment. J. Phys. Conf. Ser. 2011, 305, 012100.[CrossRef]
5. Menderes, A.; Erener, A.; Sarp, G. Automatic Detection of Damaged Buildings after Earthquake Hazard byUsing Remote Sensing and Information Technologies. Procedia Earth Planet. Sci. 2015, 15, 257–262. [CrossRef]
6. Ubertini, F.; Comanducci, G.; Cavalagli, N. Vibration-based structural health monitoring of a historicbell-tower using output-only measurements and multivariate statistical analysis. Struct. Health Environ 2016,15, 438–457. [CrossRef]
7. Di Tommaso, A.; Gentilini, C.; Castellazzi, G. Structural Interpretation of Data from Static and DynamicStructural Health Monitoring of Monumental Buildings. Key Eng. Mater. 2017, 747, 431–439.
8. Ramos, L.; Marques, L.; Lourenço, P.; De Roeck, G.; Campos-Costa, A.; Roque, J. Monitoring historicalmasonry structures with operational modal analysis: Two case studies. Mech. Syst. Sig. Process. 2010, 24,1291–1305. [CrossRef]
9. Jouan, B.; Rudolph, J.; Bergholz, S. Structural Health Monitoring Solutions for Power Plants. In Proceedingsof the EWSHM—7th European Workshop on Structural Health Monitoring, Nantes, France, 8–11 July 2014;pp. 623–630.
10. Lemu, H.G. Assessment and analysis of structural health monitoring techniques for rotating machines.In Proceedings of the 27th International Ocean and Polar Engineering Conference, San Francisco, CA, USA,25–30 June 2017.
11. Schubert, F.; Frankenstein, B.; Fröhlich, K.J.; Kuttner, M.; Lamek, B.; Schwenkkros, J.; Kerkhof, K.; Petricevic, R.Structural Health Monitoring of Industrial Piping Systems Based on Guided Elastic Waves. DGZfP 2007, 32,14–16. Available online: https://pdfs.semanticscholar.org/05e1/ed16583d17c76793c3a65bec592b91ffad15.pdf (accessed on 26 July 2018).
12. Giglio, M.; Manes, A.; Sbarufatti, C. MEMS for structural health monitoring in aircraft. In MEMSfor Automotive and Aerospace Applications; Woodhead Publishing: Sawston, UK; Cambridge, UK, 2013;pp. 220–244. ISBN 978-0-85709-118-5.
13. Giurgiutiu, V. Structural Health Monitoring (SHM) of aerospace components. In Polymer Compositesin the Aerospace Industry; Woodhead Publishing: Sawston, UK; Cambridge, UK, 2015; pp. 449–507,ISBN 978-0-85709-523-7.
14. Mecocci, A.; Peruzzi, G.; Pozzebon, A.; Vaccarella, P. Architecture of a hydroelectrically powered wirelesssensor node for underground environmental monitoring. IET Wirel. Sens. Syst. 2017, 7, 123–129. [CrossRef]
15. Bennet, P.; Soga, K.; Wassel, I.; Fidler, P.; Abe, K.; Kobayashi, Y.; Vanicek, M. Wireless sensor network forunderground railway applications: Case studies in Prague and London. Smart Struct. Syst. 2010, 6, 619–639.[CrossRef]
16. Cochran, E.S.; Lawrence, J.F.; Kaiser, A.; Fry, B.; Chung, A.; Christensen, C. Comparison between low-costand traditional MEMS accelerometers: A case study from the M7.1 Darfield, New Zealand, aftershockdeployment. Ann. Geophys. 2011, 54, 728–737.
17. Evans, J.R.; Allen, R.M.; Chung, A.I.; Cochran, E.S.; Guy, R.; Hellweg, M.; Lawrence, J.F. Performance ofSeveral Low-Cost Accelerometers. Seismol. Res. Lett. 2014, 85, 147–158. [CrossRef]
18. Cigada, A.; Lurati, M.; Redaelli, M.; Vanali, M. Mechanical performance and metrological characterization ofMEMS accelerometers and application in modal analysis. In Proceedings of the IMAC XXV InternationalModal Analysis Conference, Orlando, FL, USA, 19–22 February 2007; pp. 236–244.
19. Sun, Z.; Chen, D.; Chen, J.; Deng, T.; Li, G.; Xu, C.; Wang, J. A MEMS based electrochemical seismometerwith low cost and wide working bandwidth. Procedia Eng. 2016, 168, 806–809. [CrossRef]
20. Benevicius, V.; Ostasevicius, V.; Gaidys, R. Identification of capacitive MEMS accelerometer structureparameters for human body dynamics measurements. Sensors 2013, 13, 11184–11195. [CrossRef] [PubMed]
21. Ciuti, G.; Ricotti, L.; Menciassi, A.; Dario, P. MEMS Sensor Technologies for Human Centred Applications inHealthcare Physical Activities, Safety and Environmental Sensing: A Review on Research Activities in Italy.Sensors 2015, 153, 6441–6468. [CrossRef] [PubMed]
22. Chaudhury, S.B.; Sengupta, M.; Mukherjee, K. Vibration Monitoring of Rotating Machines Using MEMSAccelerometer. Int. J. Sci. Eng. Res. 2014, 2, J2013358.
J. Sens. Actuator Netw. 2018, 7, 30 17 of 18
23. Jimenez, S.; Cole, M.O.T.; Keogh, P.S. Vibration sensing in smart machine rotors using internal MEMSaccelerometers. J. Sound Vib. 2016, 377, 68–75. [CrossRef]
24. Pedotti, L.A.S.; Zago, R.M.; Fruett, F. Instrument based on MEMS accelerometer for vibration andunbalance analysis in rotating machines. In Proceedings of the 1st INSCIT—International Symposiumon Instrumentation Systems, Circuits and Transducers, Belo Horizonte, Brazil, 29 August–3 September 2016;pp. 25–30. [CrossRef]
25. Son, J.-D.; Ahn, B.-H.; Ha, J.-M.; Choi, B.-K. An availability of MEMS-based accelerometers and currentsensors in machinery fault diagnosis. Measurement 2016, 94, 680–691. [CrossRef]
26. Bassoli, E.; Vincenzi, L.; Bovo, M.; Mazzotti, C. Dynamic identification of an ancient masonry bell towerusing MEMS-based acquisition system. In Proceedings of the 2015 EESMS Workshop on Environmental,Energy and Structural Monitoring Systems, Trento, Italy, 9–10 July 2015; Paper number 15347414. [CrossRef]
27. Clementi, F.; Pierdicca, A.; Milani, G.; Gazzani, V.; Poiani, M.; Lenci, S. Numerical model upgrading ofancient bell towers monitored with a wired sensor network. In Proceedings of the 10th International MasonryConference (IMC), Milan, Italy, 9–11 July 2018.
28. Feng, M.; Fukuda, Y.; Mizuta, M.; Ozer, E. Citizen Sensors for SHM: Use of Accelerometer Data fromSmartphones. Sensors 2015, 15, 2980–2998. [CrossRef] [PubMed]
29. Wargantiwar, N.K.; Barbade, A.S.; Shingade, A.P.; Shire, A.N. Wireless Earthquake Alarm Design based onMEMS Accelerometer. Int. Adv. Res. J. Sci. Eng. Technol. 2017, 4, 128–132.
30. Kok, R.; Furlong, C.; Putniewicz, R.J. Development of a Wireless MEMS Inertial System for Health Monitoringof Structures. In Materials Research Society Symposium Proceedings; Cambridge University Press: Cambridge,UK, 2003; Volume 785. [CrossRef]
31. Jung, J.W.; Moon, D.J.; Jung, J.W.; Lee, B.L.; Lee, S.J. A performance test of a 3-axis accelerometer and modalanalysis. In Proceedings of the FIG Congress 2014—Engaging the Challenges, Enhancing the Relevance,Kuala Lumpur, Malaysia, 16–21 June 2014.
32. Rajashri, P.P.; Chaudhari, V.D.; Rane, K.P. ARM based 3-axis seismic data acquisition system usingAccelerometer sensor and Graphical User Interface. Int. J. Eng. Res. Gen. Sci. 2015, 3, 833–838.
33. Beskhyroun, S.; Ma, Q. Low-Cost Accelerometers for Experimental Modal Analysis. In Proceedings ofthe 15th WCEE—World Conference in Earthquake Engineering, Lisbon, Portugal, 24–28 September 2012;Available online: http://www.iitk.ac.in/nicee/wcee/article/WCEE2012_0771.pdf (accessed on 26 July 2018).
34. Spencer, B.F.; Ruiz-Sandoval, M.; Kurata, N. Smart sensing technology for structural health monitoring.In Proceedings of the 13th WCEE—World Conference on Earthquake Engineering, Vancouver, BC, Canada,1–6 August 2004.
35. Torfs, T.; Sterken, T.; Brebels, S.; Santana, J.; van den Hoven, R.; Spiering, V.; Bertsch, N.; Trapani, D.; Zonta, D.Low Power Wireless Sensor Network for Building Monitoring. IEEE Sensors J. 2013, 13, 909–915. [CrossRef]
36. Renjan Raj, V.C. Wireless Sensor Network for Building Monitoring. Int. J. Eng. Sci. 2014, 3, 13–18.37. Pradeepkumar, N.J.; Ramesh, R.M.; Shalini, K.S.; Sujatha, H.R.; Hemanth Kumar, C.S. Smart System Sensor
Network for Building Monitoring. SSRG IJECE 2015, 2, 116–121.38. Picozzi, M.C.; Milkereit, C.; Zulfikar, C.; Fleming, K.; Ditommaso, R.; Erdik, M.; Zschau, J.; Fischer, J.;
Safak, E.; Ozel, O.; et al. Wireless technologies for the monitoring of strategic infrastructures: An ambientvibration test on the Fatih Sultan Mehmet suspension bridge in Istanbul, Turkey. Bull. Earthq. Eng. 2009, 8,671–691. [CrossRef]
39. Domaneschi, M.; Limongelli, M.P.; Martinelli, L. Structural damage localization in a suspension bridgeunder seismic excitation. In Proceedings of the 15th WCEE Conference—World Conference on EarthquakeEngineering, Lisbon, Portugal, 24–28 September 2012.
40. Domaneschi, M.; Limongelli, M.P.; Martinelli, L. Interpolation damage detection method on a suspensionbridge model: influence of sensors disturbances. Key Eng. Mater. 2013, 569–570, 734–741. [CrossRef]
41. Dashti, S.; Bray, J.D.; Reilly, J.; Glaser, S.; Bayen, A. iShake: The Reliability of Phones as Seismic Sensors.In Proceedings of the World Conference Earthquake Engineering, Lisbon, Portugal, 24–28 September 2012.
42. D’Alessandro, A.; D’Anna, G. Suitability of Low-Cost Three-Axis MEMS Accelerometers in Strong-MotionSeismology: Tests on the LIS331DLH (iPhone) Accelerometer. Bull. Seismol. Soc. Am. 2013, 103, 2906–2913.[CrossRef]
43. Kong, Q.; Allen, R.M.; Schreier, L.; Kwon, Y.-W. MyShake: A smartphone seismic network for earthquakeearly warning and beyond. Sci. Adv. 2016, 2. [CrossRef] [PubMed]

J. Sens. Actuator Netw. 2018, 7, 30 18 of 18
44. Bedon, C.; Dilena, M.; Morassi, A. Ambient vibration testing and structural identification of a cable-stayedbridge. Meccanica 2016, 51, 2777–2796. [CrossRef]
45. Rice, J.A.; Spencer, B.F. Flexible Smart Sensor Framework for Autonomous Full-Scale Structural HealthMonitoring. NSEL Report Series, Report n. NSEL-018, August 2009. Available online: https://core.ac.uk/download/pdf/4822684.pdf (accessed on 1 July 2018).
46. Federici, F.; Alesii, R.; Colarieti, A.; Faccio, M.; Graziosi, F.; Gattulli, V.; Potenza, F. Design of Wireless SensorNodes for Structural Health Monitoring Applications. Procedia Eng. 2014, 87, 1298–1301. [CrossRef]
47. Gattulli, V.; Graziosi, F.; Federici, F.; Potenza, F.; Colarieti, A. Structural Health Monitoring of the BasilicaS. Maria di Collemaggio. In Proceedings of the 5th International Conference on Structural Engineering,Cape Town, South Africa, 2–4 September 2013.
48. Antonacci, E.; Ceci, A.; Colarieti, V.; Gattulli, V.; Graziosi, F.; Lepidi, M.; Potenza, F. Dynamic testing andhealth monitoring via wireless sensor networks in the post-earthquake assessment of structural condition atL’Aquila. In Proceedings of the Eurodyn 2011—8th European Conference on Structural Dynamics, Leuven,Belgium, 4–6 July 2011; pp. 2440–2447.
49. ISM400—Multimetric Imote2 Sensor Board—Datasheet and User’s Guide. Available online: http://shm.cs.uiuc.edu (accessed on 1 July 2018).
50. ABAQUS Computer Software; Simulia: Johnston, RI, USA, 2018.51. SMIT. Available online: http://smit.atlss.lehigh.edu/?page_id=23 (accessed on 1 March 2018).52. Chang, M.; Leonard, R.L.; Pakzad, S.N. SMIT User’s Guide. Release 1.0, 2012. Available online: http:
//smit.atlss.lehigh.edu/wp-content/uploads/2012/07/SMIT-Users-Guide.pdf (accessed on 26 July 2018).53. Chang, M.; Pakzad, S.N. Observer Kalman Filter Identification for Output-Only Systems Using Interactive
Structural Modal Identification Toolsuite. J. Bridge Eng. 2014, 19, 04014002. [CrossRef]54. Frizzarin, M.; Feng, M.Q.; Franchetti, P.; Soyoz, S.; Modena, C. Damage detection based on damping analysis
of ambient vibration data. Struct. Control Health Monit. 2010, 17, 368–385. [CrossRef]55. Turek, M.E.; Bentura, C.E.; Shawwaf, K. Vibration testing of bridge stay cables to obtain damping values.
Struct. Dyn. 2011, 3, 331–340.56. Gonzalez, A.; Obrien, E.J.; McGetrick, P.J. Identification of damping in a bridge using a moving instrumented
vehicle. J. Sound Vib. 2012, 331, 4115–4131. [CrossRef]57. Liu, Y.; Ge, Y.; Cao, F.; Zhou, Y.; Wang, S. Statistics and identification of mode-dependent structural damping
of cable-supported bridges. In Proceedings of the APCWE-VIII—The 8th Asia-Pacific Conference on WindEngineering, Chennai, India, 10–13 December 2013.
58. Bedon, C.; Morassi, A. Dynamic testing and parameter identification of a base-isolated bridge. Eng. Struct.2014, 60, 85–99. [CrossRef]
59. Allemang, R.J.; Brown, D.L. A correlation Coefficient for Modal Vector Analysis. In Proceedings of the 1stInternational Modal Analysis (IMAC) Conference, Orlando, FL, USA, 8–10 November 1982; pp. 110–116.
60. Allemang, R.J. The Modal Assurance Criterion—Twenty Years of Use and Abuse. Sound Vib. 2003, 37, 14–23.61. DDS. FEMtools Computer Software. Customer Support Documentations. Available online: www.femtools.
com (accessed on 26 July 2018).
© 2018 by the authors. Licensee MDPI, Basel, Switzerland. This article is an open accessarticle distributed under the terms and conditions of the Creative Commons Attribution(CC BY) license (http://creativecommons.org/licenses/by/4.0/).


![[Rapid prototyping: a very promising method]](https://img.dokumen.tips/doc/110x75/635e704e6bc330780007e201/rapid-prototyping-a-very-promising-method.jpg)


![Prototyping Model [ bagus ]](https://img.dokumen.tips/doc/110x75/631b0b6b68e6f36d03045394/prototyping-model-bagus-.jpg)


