Embed Size (px)
Citation preview

1 Proton-Promoted Iron Dissolution from Nanoparticles and the2 Influence by the Local Iron Environment3 Jesper T. N. Knijnenburg,†,‡ Eleni Seristatidou,§ Florentine M. Hilty,† Frank Krumeich,‡
4 and Yiannis Deligiannakis*,‡,§
5†Department of Health Sciences and Technology, Human Nutrition Laboratory, Institute of Food, Nutrition and Health, ETH
6 Zurich, Schmelzbergstrasse 7, CH-8092 Zurich, Switzerland
7‡Department of Mechanical and Process Engineering, Particle Technology Laboratory, Institute of Process Engineering, ETH Zurich,
8 Sonneggstrasse 3, CH-8092 Zurich, Switzerland
9§Department of Physics, Laboratory of Physical Chemistry of Materials & Environment, University of Ioannina, Panepistimioupoli,
10 G-45110 Ioannina, Greece
11 *S Supporting Information
12 ABSTRACT: Nanostructured iron-containing compounds are promising for food13 fortification and supplementation to alleviate iron deficiency due to their fast dissolution14 in dilute acid and high dietary iron bioavailability. Furthermore, when such compounds15 are encapsulated in a nano-CaO matrix, their dissolution rate is increased. Here the16 relation between that rate and iron structure (amorphous/crystalline Fe2O3, crystalline17 Ca2Fe2O5, or monomeric Fe3+ inside CaO) is investigated. We used X-ray diffraction18 (XRD) and electron paramagnetic resonance (EPR) spectroscopy as complementary19 techniques to study the local iron environment in Ca/Fe oxides as a function of20 nanoparticle composition. Nanostructured mixed Ca/Fe oxide-containing powders were21 prepared by flame spray pyrolysis, and their dissolution over time in acidic solutions (pH22 1 and 3) was monitored by EPR spectroscopy. Three types of Fe were distinguished in23 these as-prepared powders: monomeric Fe3+ and crystalline Ca2Fe2O5 at low Fe content24 powders (Ca:Fe ≥ 3.6) and amorphous/crystalline Fe2O3 at Ca:Fe ≤ 0.7. During25 dissolution, monomeric Fe3+ and crystalline Ca2Fe2O5 dissolved rapidly (<1 min), while26 crystalline Fe2O3 was more stable and only slowly released Fe3+ even at pH 1. The Fe release is discussed within a27 thermodynamic model based on the nanoparticle lattice energy for each of the nanocrystalline phases, revealing that Fe28 coordination and lattice dynamics play a more dominant role than particle size. Thus, we demonstrate that control of crystalline29 structure rather than “nanosizing” may be a prerequisite for rapid dissolution of ferric iron from nanoparticles.
1. INTRODUCTION
30 Recently, interest in nanostructured iron compounds emerged31 for applications in nutrition thanks to their high dietary32 bioavailability.1,2 Micron-size ferric phosphate (FePO4) is only33 poorly bioabsorbed;3 however, when decreased to the nano-34 scale (mean particle size ∼11 nm), it is as bioavailable in rats as35 water-soluble ferrous sulfate (FeSO4), the “gold standard” for36 iron bioavailability.4 For low-solubility compounds, such as37 FePO4 and Fe2O3, the specific surface area (SSA) is a major38 determinant of dissolution kinetics4−6 since it defines the39 interface between powder and solution. Therefore, by40 decreasing the particle size (i.e., increasing the SSA), the41 dissolution kinetics and thus dietary bioavailability can be42 greatly improved. However, apart from particle size, chemical43 composition is still important for iron dissolution, even at the44 nanoscale. Addition of small amounts of either Ca or Mg to45 nanostructured Fe/Zn oxides increased iron bioavailability in46 rats to a level comparable to iron from FeSO4.
7 Also, addition47 of Ca or Mg to γ-Fe2O3 increased the proton-promoted48 dissolution rate in dilute acid after 30 min (in dilute acid, 0.1 M
49HCl, pH 1, a good in vitro predictor for in vivo dietary iron50bioavailability5) from <80% for γ-Fe2O3 to about 90%, despite a51strong decrease in SSA.8 Encapsulation of iron in a nano-CaO52matrix results in rapid iron dissolution in dilute acid,53irrespective of SSA and phase composition down to Ca:Fe54mass ratio 3.6 (≤17 at. % Fe).9
55The addition of Ca or Mg to Fe2O3 results in solid solutions56and mixed oxides (e.g., Ca2Fe2O5 and MgFe2O4) as confirmed57by X-ray diffraction (XRD).8 Such mixed oxides decrease the58overall crystal lattice energy per mole of cation10 compared to59γ-Fe2O3, and our hypothesis7−9 is that this promotes iron60dissolution. However, so far we had no experimental proof for61this hypothesis. A major challenge to address this is direct62monitoring of the release of monomeric Fe3+ from the63particulate phase into solution. To this front herein we have64used electron paramagnetic resonance (EPR) spectroscopy
Received: June 17, 2014Revised: August 24, 2014
Article
pubs.acs.org/JPCC
© XXXX American Chemical Society A dx.doi.org/10.1021/jp506024g | J. Phys. Chem. C XXXX, XXX, XXX−XXX
cxs00 | ACSJCA | JCA10.0.1465/W Unicode | research.3f (R3.6.i5 HF03:4230 | 2.0 alpha 39) 2014/07/15 09:23:00 | PROD-JCA1 | rq_2859125 | 9/26/2014 11:24:28 | 9 | JCA-DEFAULT
65 which enabled us to detect and quantify monomeric Fe3+
66 released from the nanoparticles into solution. An additional67 issue was that the structural details of the particle in the case of68 low crystallinity or low phase content in a nanoparticle cannot69 be probed by XRD as shown previously.9 XRD only has a70 detection limit of several wt %, and for low amounts of iron71 (Ca:Fe ≥ 3.6) no information about the local iron environment72 can be obtained.9 Yet this is the compositional range where the73 iron dissolves fastest, and the composition is most relevant for74 multimineral supplements.9
75 Here, we use XRD combined with EPR spectroscopy to76 unravel the different iron structures in nanostructured Ca/Fe77 compounds. Compared to XRD, EPR spectroscopy has a lower78 detection limit and allows detecting monomeric Fe3+ species in79 solids as well as in liquids down to parts per million80 concentrations.11 Naturally occurring iron oxide particles12 as81 well as the formation of engineered iron oxide nano-82 particles13−15 have been studied with EPR spectroscopy. Kliava83 and Berger provide a detailed review of iron particles in84 glasses.16 Unconventional effects occurring as the nanoparticle85 size approaches that of a molecular supercluster have recently86 been highlighted by Gatteschi et al.17 Thus, the characteristics87 of the EPR spectra of Fe3+ ions in solid oxides are well88 understood (see also Brodbeck and Bukrey18 and references89 therein). EPR spectroscopy has also been used to monitor Fe3+
90 speciation in nutrition-related media containing O2 and91 ascorbate19 and iron release from food materials.20 We apply92 EPR spectroscopy to monitoring H+-promoted dissolution of93 the different iron nanostructures in acidic aqueous solutions94 (pH 1−3), following the dynamic transition from solid-crystal95 to monomeric Fe3+ ions. The release of monomeric Fe3+ from96 nanoparticles in aqueous media is of interest not only for97 nutrition2,7 but also for (bio)environmental21−24 or medical98 purposes.25,26 Herein, we demonstrate that in Ca/Fe oxide-99 containing nanoparticles, apart from crystalline γ-Fe2O3 and100 crystalline Ca2Fe2O5, monomeric Fe3+ ions trapped inside the101 CaO lattice are also present. Both monomeric Fe3+ and102 crystalline Ca2Fe2O5 dissolve rapidly and completely up to pH103 3 to form monomeric Fe3+ species. In contrast, even at pH 1104 crystalline γ-Fe2O3 provides only low percentages of mono-105 meric Fe3+ species that interact magnetically with the106 undissolved γ-Fe2O3 nanoparticle. Optimization of nano-107 structured iron compounds for nutrition should thus avoid108 the formation of (nano)crystalline iron oxides, which is here109 below the iron percolation limit in CaO. Aging under ambient110 conditions converts Ca-rich powders to CaCO3 while the111 Ca2Fe2O5 phase disappears, and XRD does not provide any112 information on the iron structure.9 We have studied such aged113 powders by EPR spectroscopy, demonstrating that there was a114 strong conformational change in iron structure, which however115 did not strongly affect dissolution, despite the strong decrease116 in SSA.
2. MATERIALS AND METHODS117 2.1. Powder Synthesis and Characterization. Nano-118 structured compounds were produced by flame spray pyrolysis119 (FSP)27 as described previously.9 Briefly, mixtures of Ca(II)-120 nitrate tetrahydrate (puriss. p.a., ≥99%, Fluka) and Fe(III)-121 nitrate nonahydrate (puriss., ≥97%, Riedel-de-Haen) were122 dissolved in a 1:1 mixture by volume of ethanol (abs denat 2%123 2-butanone, Alcosuisse A15-A) and 2-ethylhexanoic acid (2-124 EHA, purum >99%, Riedel-de-Haen) at total metal concen-125 tration of 0.5 M. The precursor solution was fed into the
126reactor nozzle at 5 mL/min (unless stated otherwise) and127dispersed by 5 L/min O2 (purity 99.95%, PanGas) maintaining128a pressure drop of 1.8 bar over the nozzle. The spray was129ignited by a premixed CH4/O2 (1/2 L/min) ring-shaped130flame.9 Particles were collected on a water-cooled glass fiber131filter (257 mm diameter, GF/D Whatman) placed 50 cm above132the burner.133Powder compositions are identified by their Ca:Fe mass134ratios.9 The SSA was measured by nitrogen adsorption at 77 K135in the relative pressure range p/p0 = 0.05−0.25 (Micromeritics136Tristar 3000, Micromeritics Instruments Corporation). XRD137was performed on a Bruker AXS D8 Advance diffractometer. In138vitro solubility in dilute acid (0.1 M HCl, pH 1) and total metal139content of the powders were measured in triplicate28 by flame140atomic absorption spectroscopy (AAS, SpectrAA-240FS,141Agilent Technologies). For analysis by transmission electron142microscopy (TEM), the product powders were deposited onto143a holey carbon foil supported on a copper grid. The144investigation was performed on a Tecnai F30 microscope145(FEI) with field emission cathode operated at 300 kV.146EPR spectra were recorded at room temperature (298 K) or14777 K, using a Bruker ER200D X-band spectrometer equipped148with an Agilent 5310A frequency counter. The spectrometer149was running under a homemade software based on LabVIEW.29
150All EPR samples were prepared in N2-purged quartz tubes of 5151mm internal diameter. EPR spectra were recorded using a152modulation frequency of 100 kHz and modulation amplitude of15310 Gpp, for microwave powers between 200 mW (0 dB) and 12154mW.1552.2. Monitoring of Fe3+ Release by EPR Spectroscopy.156Aqueous suspensions were prepared by dispersing nano-157particles in ultrapure water (18 MΩ·cm, Milli-Q, Millipore).158In a typical experiment, 5 mg of powder was dispersed using a159Sonic 500 W sonicator (2 kJ energy) in 50 mL of H2O with pH160adjusted to 1 or 3 by HCl (from a 0.5 M stock of HCl, Aldrich),161resulting in a particle concentration of 100 mg/L. The solution162was stirred at room temperature using an overhead Teflon163stirrer (100 rpm, IKA RW 16). Aliquots of 300 μL were164sampled periodically and frozen (77 K in liquid N2) in the EPR165tube. In high Ca content powders (Ca:Fe = 125 and 71.8) we166verified that higher particle concentrations up to 2 g/L provide167rapid and complete release of monomeric Fe3+ ions.168Furthermore, the pH was carefully readjusted to the initial169pH since dissolution of these nanoparticles resulted in170alkalization of the solution.171Monomeric Fe3+ (S = 5/2) was quantified by the well-known172characteristic EPR signal (g-factor) of Fe3+−EDTA at g = 4.3.11
173According to protocol,11 standard solutions were prepared by174dissolving Fe3+−EDTA (Sigma-Aldrich, Fe content was175determined to be 14.8% Fe by GF-AAS PerkinElmer AA700,176PerkinElmer Inc.) in 1:3 (volumetric ratio) glycerol:water177adjusted to pH 2 by HNO3 (from a 1 M stock of HNO3,178Aldrich). The double integral of the g = 4.3 EPR signal of Fe3+
179(S = 5/2) recorded at 77 K provides an excellent standard for180frozen solutions or powders.11
181The EPR spectra of the nanoparticles in acid medium182contain contributions from both the particulate/clustered phase183as well as from monomeric Fe3+ centers. To reliably quantify184the monomeric Fe3+ (S = 5/2) after treatment of the185nanoparticles in acidic solution, the powder was separated by186centrifugation (8000 rpm, 20 min, Hettich Rotina), and187glycerol was added at 1:3 volumetric ratio to the supernatant188to eliminate random line-broadening effects in the EPR
The Journal of Physical Chemistry C Article
dx.doi.org/10.1021/jp506024g | J. Phys. Chem. C XXXX, XXX, XXX−XXXB

189 signals.11,30 This liquid sample was analyzed by EPR spectros-190 copy at 77 K for monomeric Fe3+ (S = 5/2) concentration. In191 the presence of undissolved Fe2O3, monomeric Fe3+ ions192 released during acid treatment were strongly interacting with193 the undissolved Fe2O3 nanoparticle, evidenced by broadening194 of their EPR signal intensity due to magnetic interactions of the195 Fe3+ ions with the Fe2O3 phase.
11,30 Therefore, we emphasize196 that for reliable quantitative analysis of the monomeric Fe3+ (S197 = 5/2) species by EPR spectroscopy the separation of the198 solution from the solid is crucial.
3. RESULTS AND DISCUSSION199 3.1. Iron Structures in Ca/Fe Oxide Nanoparticles.
f1 200 3.1.1. Crystallinity and Morphology of Ca/Fe Oxides. Figure 1
201 shows the XRD patterns of as-prepared Ca/Fe-containing202 powders with varying Ca:Fe mass ratio. For Ca:Fe = 125 the203 XRD pattern consists of crystalline CaO (ICDD Card No. 82-204 1690).9 No information about the iron structure is obtained at205 this composition9 because the iron content in this powder is206 below the XRD detection limit; however, the iron is readily207 detected by EPR (as shown below in Figure 3). Crystalline208 CaO is still present at Ca:Fe = 10.8−0.7 where it coexists with a209 mixed calcium−iron oxide (Ca2Fe2O5, ICDD Card No. 71-210 2264) phase8,9 as indicated by its main peaks around 2θ =211 33.5°. Increasing the iron content to Ca:Fe = 0.3 results in a212 decrease in CaO XRD peak intensity while the baseline213 becomes a broad hump indicative of amorphous particles,214 superimposed by peaks of crystalline Ca2Fe2O5. Pure iron oxide215 consists of nanocrystalline γ-Fe2O3 (ICDD Card No. 39-1346)216 particles as previously observed for FSP synthesis from Fe(III)217 nitrate.8 Since the FSP reactor was operated under oxygen-rich218 conditions, it is unlikely that any Fe2+ is present in the219 powders.31 From the XRD patterns two iron structures can be220 distinguished: crystalline γ-Fe2O3 (type I) and crystalline221 Ca2Fe2O5 (type II).
222 f2Figure 2 shows typical TEM images of the mixed Ca/Fe223oxides as well as γ-Fe2O3. A gradual decrease in primary particle
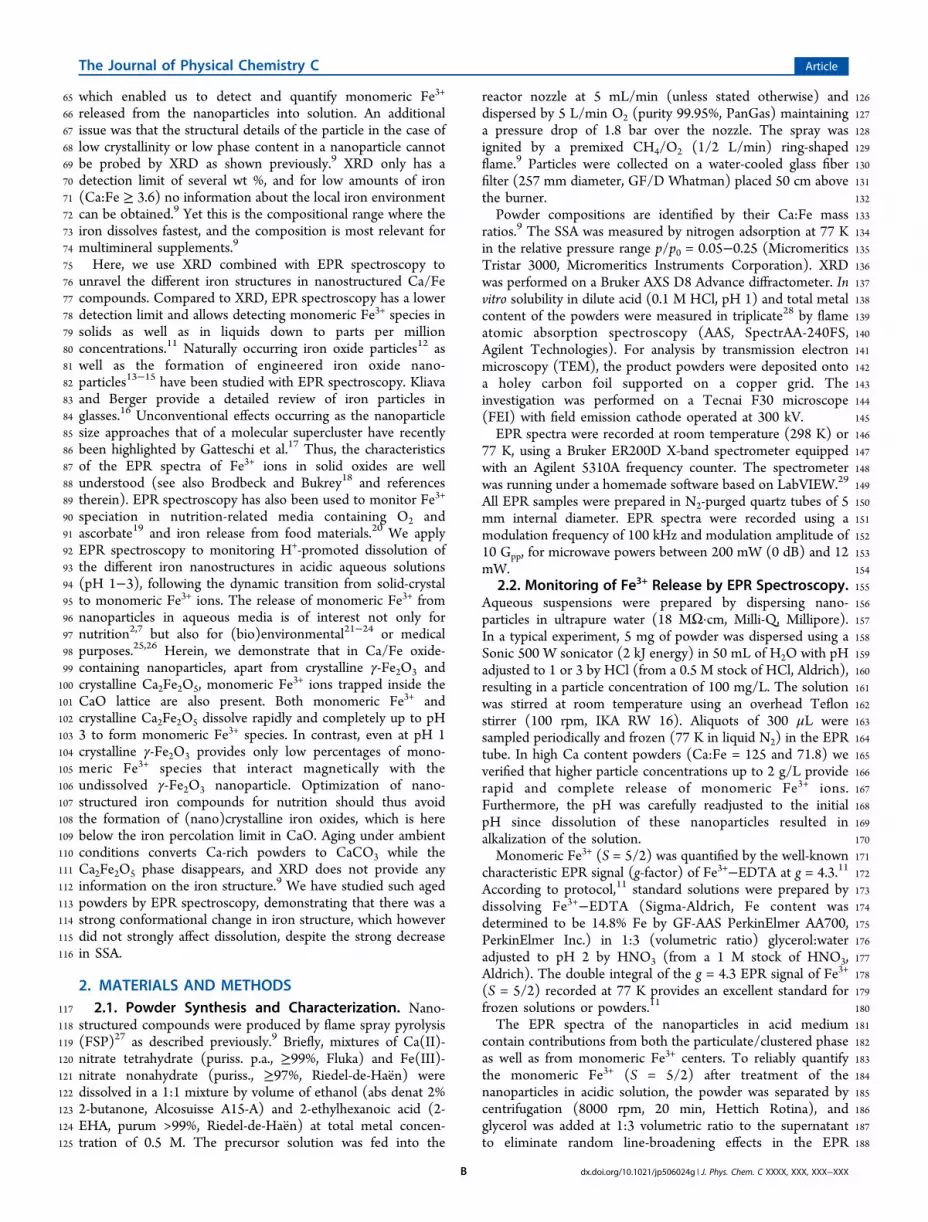
224size was observed by increasing the Fe content. The powder225with low Fe content (Ca:Fe = 125, Figure 2A) shows large226particles that are aggregated (bound by sinter necks).227Increasing the Fe content to Ca:Fe = 3.6 (Figure 2B) still228shows the high aggregation, but the primary particle size is229smaller. Pure γ-Fe2O3 (Figure 2C) shows a further decrease in230particle size. This powder consists of spherical and hexagonally231shaped primary particles32 that are more agglomerated232(physically bound primary particles) rather than aggregated.233When produced by a lower precursor flow rate, the γ-Fe2O3234primary particle size decreases (Figure 2C) due to the shorter235residence time in the high temperature zone of the flame.2363.1.2. EPR Spectra of Solid Nanoparticles at Low Fe237Contents (Ca:Fe ≥ 10.8). Low temperature (77 K) EPR spectra238of nanostructured Ca/Fe powders at low Fe content (Ca:Fe =239 f310.8−125) are shown in Figure 3A. All these powders show the240same EPR spectral characteristics, while a change in Ca:Fe ratio241only affects their relative intensities.242In Figure 3B the signal at g = ∼4.3 is typical for monomeric243Fe3+ (S = 5/2) ions in a rhombic environment,33 and it244increases monotonically with Fe content. The signals at g =245∼5.2 and g = ∼15 show a maximum at Ca:Fe = 71.8−17.9.246These signals are different than the g = 4.3 signal and resemble247those previously observed in Fe-doped marbles34 and Fe3+
248centers in calcite35 and can be attributed to monomeric Fe3+ (S249= 5/2) ions located in sites with weak crystal field; i.e., the zero250field splitting parameter D is considerably smaller than the251microwave energy of the X-band EPR (that is, D ≪ 0.3252cm−1).33 The g = 5.2 and g = 15 signals do not originate from253the same Fe center since the g = 15 signal is absent for Ca:Fe =254125 while the g = 5.2 is present. Thus, the g = 15 signal is a255more unstable form of monomeric Fe3+ (S = 5/2), occupying256sites closely approximating those of the Ca2+ ions.35
257Using Fe3+−EDTA as spin standard,11 we estimate that in258the solid nanoparticles the g = 4.3 monomeric Fe3+ ions259account for 5% of the total Fe atoms in Ca:Fe = 125, 0.5% in260Ca:Fe = 10.8, and 0.1% in Ca:Fe = 3.6 powders. This shows
Figure 1. XRD patterns of as-prepared FSP-made Ca/Fe oxides.Crystalline CaO is visible at low iron contents (Ca:Fe ≥ 0.3), whilepure iron oxide consists of γ-Fe2O3 (type I iron structure). Forintermediate iron contents, a mixed iron−calcium oxide Ca2Fe2O5(type II iron structure) coexists with CaO. The XRD patterns for thefull range 2θ = 20°−70° can be found in Figure S1 of the SupportingInformation.
Figure 2. TEM images of Ca/Fe oxides with (A) Ca:Fe = 125 and (B)Ca:Fe = 3.6 and (C, D) pure γ-Fe2O3. Sample D was produced using alower precursor flow rate of 1 mL/min.
The Journal of Physical Chemistry C Article
dx.doi.org/10.1021/jp506024g | J. Phys. Chem. C XXXX, XXX, XXX−XXXC
261 that at increased iron content fewer Fe3+ ions reside in262 monomeric form; i.e., a higher percentage of Fe3+ ions are263 incorporated in a crystalline phase.264 All Ca/Fe oxides show a narrow EPR signal centered at g =265 ∼2 (Figure 3C) with peak-to-peak line width ΔH = 24 ± 1 G,266 flanked by two bumps split by ΔH = 250 ± 4 G. At room267 temperature (data not shown) the sharp signal broadens,268 attaining a Lorentzian line shape, while the split bumps are not269 resolved. These are typical for magnetically coupled spins with270 dipolar and exchange interactions,30 as previously observed in271 EPR spectra of Ca2Fe2O5.
36 These features are detected only in272 the mixed Ca/Fe oxides, not in pure γ-Fe2O3 (as discussed273 below). In Figure 3C, this g = 2 signal increases in intensity at274 increasing Fe content and is attributed to magnetically coupled275 Fe3+ ions located in periodic lattice sites in the Ca/Fe oxide.276 3.1.3. EPR Spectra of Solid Nanoparticles at High Fe277 Contents (Ca:Fe ≤ 3.6). At increasing Fe concentration (i.e.,278 decreasing Ca:Fe ratio) we observe several characteristic
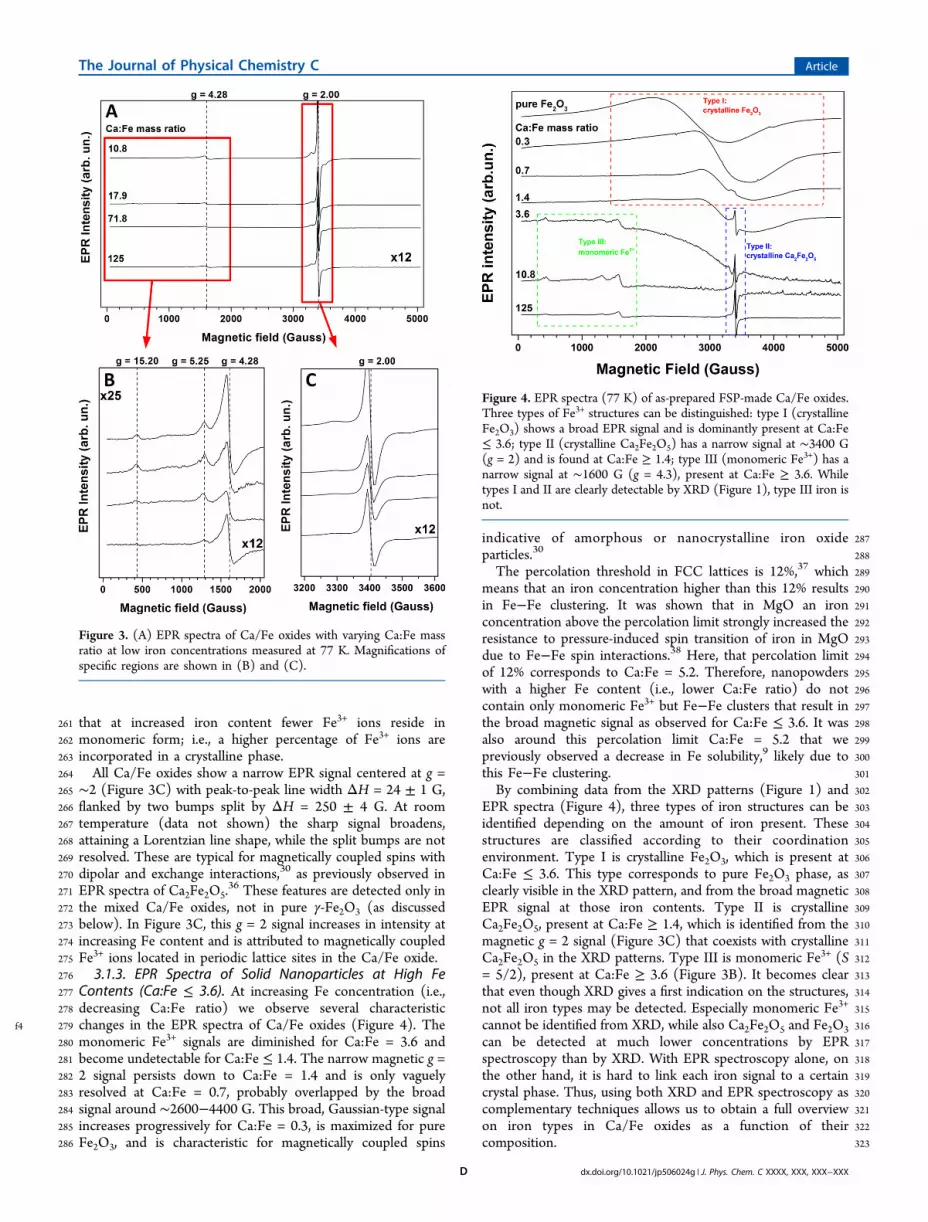
f4 279 changes in the EPR spectra of Ca/Fe oxides (Figure 4). The280 monomeric Fe3+ signals are diminished for Ca:Fe = 3.6 and281 become undetectable for Ca:Fe ≤ 1.4. The narrow magnetic g =282 2 signal persists down to Ca:Fe = 1.4 and is only vaguely283 resolved at Ca:Fe = 0.7, probably overlapped by the broad284 signal around ∼2600−4400 G. This broad, Gaussian-type signal285 increases progressively for Ca:Fe = 0.3, is maximized for pure286 Fe2O3, and is characteristic for magnetically coupled spins
287indicative of amorphous or nanocrystalline iron oxide288particles.30
289The percolation threshold in FCC lattices is 12%,37 which290means that an iron concentration higher than this 12% results291in Fe−Fe clustering. It was shown that in MgO an iron292concentration above the percolation limit strongly increased the293resistance to pressure-induced spin transition of iron in MgO294due to Fe−Fe spin interactions.38 Here, that percolation limit295of 12% corresponds to Ca:Fe = 5.2. Therefore, nanopowders296with a higher Fe content (i.e., lower Ca:Fe ratio) do not297contain only monomeric Fe3+ but Fe−Fe clusters that result in298the broad magnetic signal as observed for Ca:Fe ≤ 3.6. It was299also around this percolation limit Ca:Fe = 5.2 that we300previously observed a decrease in Fe solubility,9 likely due to301this Fe−Fe clustering.302By combining data from the XRD patterns (Figure 1) and303EPR spectra (Figure 4), three types of iron structures can be304identified depending on the amount of iron present. These305structures are classified according to their coordination306environment. Type I is crystalline Fe2O3, which is present at307Ca:Fe ≤ 3.6. This type corresponds to pure Fe2O3 phase, as308clearly visible in the XRD pattern, and from the broad magnetic309EPR signal at those iron contents. Type II is crystalline310Ca2Fe2O5, present at Ca:Fe ≥ 1.4, which is identified from the311magnetic g = 2 signal (Figure 3C) that coexists with crystalline312Ca2Fe2O5 in the XRD patterns. Type III is monomeric Fe3+ (S313= 5/2), present at Ca:Fe ≥ 3.6 (Figure 3B). It becomes clear314that even though XRD gives a first indication on the structures,315not all iron types may be detected. Especially monomeric Fe3+
316cannot be identified from XRD, while also Ca2Fe2O5 and Fe2O3317can be detected at much lower concentrations by EPR318spectroscopy than by XRD. With EPR spectroscopy alone, on319the other hand, it is hard to link each iron signal to a certain320crystal phase. Thus, using both XRD and EPR spectroscopy as321complementary techniques allows us to obtain a full overview322on iron types in Ca/Fe oxides as a function of their323composition.
Figure 3. (A) EPR spectra of Ca/Fe oxides with varying Ca:Fe massratio at low iron concentrations measured at 77 K. Magnifications ofspecific regions are shown in (B) and (C).
Figure 4. EPR spectra (77 K) of as-prepared FSP-made Ca/Fe oxides.Three types of Fe3+ structures can be distinguished: type I (crystallineFe2O3) shows a broad EPR signal and is dominantly present at Ca:Fe≤ 3.6; type II (crystalline Ca2Fe2O5) has a narrow signal at ∼3400 G(g = 2) and is found at Ca:Fe ≥ 1.4; type III (monomeric Fe3+) has anarrow signal at ∼1600 G (g = 4.3), present at Ca:Fe ≥ 3.6. Whiletypes I and II are clearly detectable by XRD (Figure 1), type III iron isnot.
The Journal of Physical Chemistry C Article
dx.doi.org/10.1021/jp506024g | J. Phys. Chem. C XXXX, XXX, XXX−XXXD

324 3.2. Iron Dissolution from Ca/Fe Oxides. 3.2.1. Dis-325 solution of Mixed Ca/Fe Oxides. The EPR spectra of Ca/Fe326 oxide containing Ca:Fe = 125 (2 g/L) during dissolution in
f5 327 HCl at pH 1 and 3 are shown in Figure 5A,B. At pH 1 (Figure328 5A) the nanoparticles dissolve very rapidly, as the magnetic329 component (g = 2) centered at ∼3400 G disappears within 1330 min. The Fe is fully converted to monomeric Fe3+ (S = 5/2)331 ions within 5 min, giving rise to a sharp g = 4.3 signal (centered332 at ∼1600 G) with no evidence for line broadening resulting333 from potential clustering between the Fe ions. This indicates334 formation of homogeneously dispersed Fe3+ ions at pH 1. This335 rapid release of monomeric Fe3+ was observed for powder336 concentrations of 100 mg/L up to 2 g/L. Quantitative analysis337 of the Fe3+ species, using Fe3+−EDTA as standard, shows that338 the Ca:Fe = 125 nanoparticles at pH = 1 release 63 ± 3 μmol of339 Fe/g of powder. Compared with the total Fe content measured340 by AAS (65 μmol of Fe/g of powder), this shows that 100% of341 the iron is released in monomeric form at pH 1.342 At pH 3 (Figure 5B) the particles still dissolve rapidly;343 however, a fraction of the monomeric Fe3+ ions show a344 broadening in their signal at 800−1600 G due to Fe−Fe345 proximity.30 This shows that at pH 3 a significant fraction346 (∼25−30%) of the monomeric Fe3+ ions is in close proximity347 but still in solution. This can be attributed to formation of348 Fe(OH)n species; e.g., Fe(OH) has a pKa value of 2.7.39
349Powders with a higher Fe content of Ca:Fe = 3.6 (100 mg/350L) dissolve readily but with a progressively slower rate. As seen351in Figure 5C, at pH 1 the monomeric Fe3+ (g = 4.3) signal is352maximized within 30 min, accounting for ∼80% of the Fe353content; the rest can be attributed to Fe−Fe aggregates as354evidenced by the broad hump at ∼2600−4400 G. At pH 3355(Figure 5D), however, the dissolution trend is different: at early356times (≤1 min) a monomeric g = 4.3 signal starts to develop,357which diminishes over time and is not detected any more after35860 min. This decrease coexists with a progressive increase of the359broad hump corresponding to Fe−Fe aggregates. The360conversion of monomeric Fe3+ in solution to Fe−Fe aggregates361can be attributed to precipitation of polynuclear Fe(OH)n iron362hydroxide12,16 that takes place above pH around 2.7.39
363For high Fe content nanoparticles (Ca:Fe = 0.3), only a very364small amount of monomeric Fe3+ was released after 60 min at365pH 1. Even after 960 min (see Figure S2 in Supporting366Information) a large amount of crystalline/amorphous Fe2O3
367was still undissolved. The supernatant contains some368monomeric Fe3+ with some Fe−Fe in proximity, while the369broad hump at ∼2600−4400 G shows the presence of370remaining crystalline/amorphous Fe2O3.371The particles containing Ca:Fe = 125 and 3.6 were aged9 for372225 days at ambient conditions, transforming them into calcite373CaCO3 (ICDD Card No. 85-1108) and a fraction of metastable374aragonite CaCO3 (ICDD Card No. 76-0606), while crystalline
Figure 5. EPR spectra (77 K) of Ca/Fe oxide containing 2 g/L Ca:Fe = 125 (A, B) and 100 mg/L Ca:Fe = 3.6 (C, D) during dissolution in dilutedHCl at pH 1 (A, C) and pH 3 (B, D). For Ca:Fe = 125 the magnetic Ca2Fe2O5 phase (g = 2) disappears within 1 min at both pH 1 and 3 and istransformed to monomeric Fe3+ in solution (g = 4.3). At pH 3, however, some Fe−Fe in proximity is visible apparent from the line broadening at800−1600 G. For Ca:Fe = 3.6, rapid dissolution takes place at pH 1. At pH 3, initially (≤1 min) monomeric Fe3+ is formed which decreases overtime until after 60 min, while progressively a broad hump at ∼2600−4000 G is formed indicative of polymeric Fe(OH)n species.
The Journal of Physical Chemistry C Article
dx.doi.org/10.1021/jp506024g | J. Phys. Chem. C XXXX, XXX, XXX−XXXE

375 Ca2Fe2O5 disappears.9 So the XRD patterns do not contain any
376 information about the iron structure in aged powders. We377 studied here the EPR spectra of aged powders to understand378 how the local Fe3+ environment was changed by aging and the379 effect on iron release.380 After aging there is a strong distortion of the crystal field of381 the monomeric Fe3+ centers (see Figure S3 in Supporting382 Information) resembling those of Fe in marbles.34 Upon aging,383 the magnetic phase at g = 2 disappears completely at Ca:Fe =384 125 but persists at Ca:Fe = 3.6. The severe modification of the385 Fe3+ EPR spectra observed for the aged particles Ca:Fe = 125386 indicates a weakening of the zero field splitting parameter D.34
387 As analyzed by Marshall and Reinberg,35 the multiple peaks in388 the EPR spectrum originate from transitions between389 neighboring magnetic spin levels that become allowed for D390 ≪ 0.31 cm−1. From numerical simulations of the EPR spectrum391 of Ca:Fe = 125 in Figure S3, we estimate that D = 0.08−0.11392 cm−1 (data not shown). Such a low D value indicates393 weakening of Fe3+ coordination within the calcite matrix, i.e.,394 as in the case of marbles.34 This might be due to lattice395 distortion and/or removal of coordinating atoms around Fe3+
396 upon aging. Despite the strong changes in powder EPR spectra,397 the aged particles at both compositions still dissolve rapidly9 at398 pH 1; however, the released Fe ions are more aggregated than399 the fresh ones (see Figure S4 in Supporting Information).400 3.2.2. Dissolution of Pure γ-Fe2O3. The pure iron oxide401 nanoparticles show remarkably slow dissolution at pH 1. For γ-402 Fe2O3 with SSA = 133 m2/g and dXRD = 8 nm,7 the crystalline403 phase dominates in the EPR spectrum at pH 1 even after 60
f6 404 min (Figure 6A), with no signal from monomeric (g = 4.3) Fe3+
405 species. However, when the liquid phase was separated from406 the undissolved particles by centrifugation, the EPR spectrum407 reveals the existence of monomeric Fe3+ ions (see Figure 6A).408 This shows that pure Fe2O3 releases some Fe3+ ions; however,409 when in contact with the undissolved Fe2O3 nanoparticles, the410 Fe3+ ions are strongly interacting magnetically with the Fe2O3
411 particle magnetic moments, and this results in magnetic412 broadening of the g = 4.3 signal beyond detection. Previous413 Mossbauer data40 revealed that Fe3+ ions can readsorb on α-414 Fe2O3 even at acidic pH 2.5. However, the data in Figure 6A415 show that in our system the released Fe3+ atoms sense strong416 magnetic interaction by the nanoparticle phase. Since these Fe417 atoms can be easily separated by simple centrifugation, this
418association between the Fe atoms and the undissolved particle419does not involve a strong chemical interaction, but is rather a420magnetic/dipolar interaction. This means that the released Fe421atoms are not absorbed on the particle surface, but rather422remain at close proximity to the Fe-oxide structure.40 The423monomeric Fe3+ ions resolved in the liquid phase account for42420 ± 5% of the total Fe of the Fe2O3 nanoparticles. Smaller γ-425Fe2O3 nanoparticles (SSA = 224 m2/g, dXRD = 3 nm, Figure4262D) show zero monomeric Fe3+ ions release after 60 min at pH4271 (Figure 6B). After 960 min under stirring at room428temperature only partial Fe3+ release was observed. This429demonstrates that pure Fe2O3 nanoparticles, even at small430particle diameter, cannot be dissolved by acid treatment even at431pH 1.432 f73.2.3. Iron Dissolution and Particle Size. Figure 7 shows the433Fe solubility (i.e., released monomeric Fe3+ (g = 4.3)) in dilute434acid after 30 min from EPR spectroscopy (blue). The Fe435released under these conditions is a good in vitro predictor for
Figure 6. EPR spectra (77 K) of pure γ-Fe2O3 with dXRD 8 nm (A) and 3 nm (B) dissolving in HCl pH 1. After 60 min at pH 1, the 8 nm crystals didnot show any release of monomeric Fe3+. After removal of the solid phase, the EPR spectrum of the supernatant shows the presence of somemonomeric Fe3+. For the 3 nm crystals some monomeric Fe3+ is detectable after 960 min.
Figure 7. Iron solubility in dilute acid (0.1 M HCl, pH 1) after 30 minas measured by AAS (red) and EPR spectroscopy (blue) and specificsurface area (SSA, black) as a function of nominal Ca:Fe mass ratio.Decreasing the Fe content results in an increase in Fe solubility,despite a strong decrease in SSA. Some of the SSA and AAS solubilitydata are adopted from Hilty et al.7,8 and Knijnenburg et al.9
The Journal of Physical Chemistry C Article
dx.doi.org/10.1021/jp506024g | J. Phys. Chem. C XXXX, XXX, XXX−XXXF

436 in vivo dietary iron bioavailability.5 Pure Fe2O3 has a Fe437 solubility of 20% that gradually increases to around 100%438 (indicating high dietary iron bioavailability9) by an increase in439 Ca:Fe mass ratio. The Fe solubility measured by AAS (red)440 follows qualitatively the same trend as the EPR spectroscopy441 values; however, there are distinct differences. For Ca:Fe ≥ 10.8442 the solubility values are approximately equal, while these values443 deviate for lower Ca:Fe ratios: for pure Fe2O3 the released Fe3+
444 species detected by EPR are only half of the Fe found by AAS445 spectroscopy. So the dissolved Fe3+ is either underestimated by446 EPR spectroscopy (e.g., part of the monomeric Fe3+ associated447 with the particle surface is removed from the system by448 centrifugation) or overestimated by AAS (e.g., there is more449 iron present but not as monomeric Fe3+). Although the former450 takes place (as discussed above), the latter phenomenon also451 plays a role: some of the Fe that is not in the form of452 monomeric Fe3+ is still present in the supernatant after453 centrifugation. Indeed, a fraction of the Fe oxide nanoparticles454 are still visible in solution as indicated by the broad magnetic455 phase in the EPR spectrum of the supernatant (Figure 6A). So456 likely these Fe-containing particles result in an overestimation457 of the dissolved monomeric Fe3+ with AAS spectroscopy.458 Similarly, separation of Ag/SiO2 nanoparticles from aqueous459 suspension by centrifugation resulted in slight UV−vis460 absorbance from remaining plasmonic Ag nanoparticles in the461 supernatant.41 So the difficulty of separating nanoparticles from462 aqueous solution is not unique for our Fe oxide nanoparticles463 but also applies to other particle compositions.464 The increase in iron solubility in dilute acid after 30 min with465 increasing calcium content is correlated with a decrease in SSA466 (black) and thus an increase in particle size; while iron467 solubility measured by AAS increases from 38 to 100%, powder468 SSA decreases from 133 to 60 m2/g (as also seen in the469 increase in primary particle size by TEM, Figure 2).8 Thus, our470 data show that both the chemical and phase composition471 determine dissolution kinetics.7,8 For very low iron contents472 (Ca:Fe = 125) the rapid dissolution is not affected by SSA473 (30−67 m2/g).9
474 3.3. Energetic Considerations. The present data show475 that monomeric Fe3+ release in acidic solutions may be476 controlled by two mechanisms: the crystalline matrix and the477 interfacial interactions of Fe3+ ions with the particulate phase.478 Iron oxides typically contain a number of kinetically labile iron479 atoms on the surface42 which are easily removed upon exposure480 to acid (e.g., HNO3 pH 1).43 Because of their high SSA, the481 nanostructured γ-Fe2O3 particles used in the current study may482 contain a large fraction of such labile surface iron. The present483 EPR data show that in pure nanostructured γ-Fe2O3 during484 dissolution at pH 1 the Fe3+ ions release is significantly slower485 than in the high Ca content particles.486 Incorporation of small amounts of Ca into Fe2O3 may be of487 interest for use as iron food fortificants to improve iron488 solubility and powder color8 while Ca-rich powders have489 potential as multimineral supplements:9 the powder with Ca:Fe490 = 125 contains Ca and Fe according to the mass ratio of their491 recommended dietary allowance (RDA) values (1000 mg for492 Ca and 8 mg for Fe, for males aged 19−50 years).44 The493 increased Ca content here not only accelerates the dissolution494 of Fe3+ ions but also results in their complete detachment from495 the solid matrix and minimizes Fe−Fe agglomeration. This496 finding is of relevance for the observed dissolution and497 bioavailability trend7−9 and on the fate of the Fe atoms after498 dissolution from the nanoparticles. The EPR spectra here show
499that in pure Fe2O3 or high-Fe content nanoparticles Fe3+ ion500dissolution is significantly retarded compared to the high Ca-501containing nanoparticles. After dissociation from the crystal502matrix the Fe3+ ions can undergo complex interactions with the503Fe2O3 phase that ultimately would determine their overall fate.504Thus, the present data reveal that mainly the crystal phase505and composition determine the fate of Fe in these nano-506particles. Mixed Ca/Fe oxide nanoparticles with high Ca:Fe507mass ratio rapidly release Fe3+ ions even at pH 3, while the Fe508release is disfavored for decreasing Ca:Fe ratio because of the509presence of stable Fe2O3 nanocrystals above the percolation510limit (12 at. % Fe or Ca:Fe = 5.2).37
511The differences in dissolution rate observed herein for the512three iron types can be related to their lattice energy, which513expresses the bond strength in a crystal and determines514dissolution together with energy of solvation.45 Type I is the515most stable crystal structure with the highest lattice energy516(bulk value 7155 kJ/mol cation for α-Fe2O3)
46 and lowest517proton-promoted dissolution rate (10−7.56 g/(m2 s) for γ-Fe2O3518in 0.5 M HCl).47 Since type III iron is monomeric Fe3+ ions in519a rhombic Ca-rich environment, the properties of the CaO520lattice can provide an approximation of its dissolution behavior.521The CaO lattice energy is significantly lower (bulk value 3414522kJ/mol cation),46 and also its proton-promoted dissolution rate523is more than 6 orders of magnitude larger (10−1.17 g/(m2 s) at524pH 1)48 than that of γ-Fe2O3. The log(rate) of CaO dissolution525is linearly proportional48 to pH with slope of −0.5, while α-526Fe2O3 dissolution has a slope of −1 to −1.2.49 So at higher pH527the difference between CaO and Fe2O3 dissolution rates528becomes even more prominent.529The particle size plays a strong role in the dissolution of iron530(hydr)oxides,24,49−51 while dissolution of Ca/Fe oxide powders531(Ca:Fe = 125) has no measurable particle size effect.9 Thus, the532increase in Fe dissolution here with increasing Ca:Fe mass ratio533but decreasing SSA (Figure 7) emphasizes more that for these534particles Fe-coordination properties and lattice dynamics play a535more dominant role than particle size. A decrease in lattice536energy from type I to III therefore may explain the strong537increase in Fe release. The properties of type II iron are in538between that of I and III, and the bulk lattice energy of539Ca2Fe2O5 is estimated (via the “simple salt approxima-540tion”10,52) to be 21 137 kJ/mol (so 5284 kJ/mol cation),541while to our knowledge no data on its dissolution rate have542been reported so far. While the dissolution rate, for a543(nano)particle of given chemistry, is only linearly proportional544to SSA,53 varying the particle chemistry may have a much545stronger impact (orders of magnitude), as shown for γ-Fe2O3546and CaO.547The cohesive energy of a material decreases with particle size548(especially below 10 nm)54 and surface free energy increases,55
549both effects destabilizing a nanoparticle upon size decrease. So,550decreasing particle size would lower the lattice energy and thus551improve nanoparticle dissolution. Although the absolute values552of the lattice energies given here for bulk solids may not be553directly valid for nanomaterials, the relative trend in lattice554stability between Fe2O3 and CaO lattices likely still exists on555the nanoscale (i.e., the lattice energy of a Fe2O3 crystal with a556given size is higher than that of CaO with the same size,557irrespective of crystal size). However, as revealed herein by the558present data for Ca/Fe-containing nanoparticles, this size effect559on particle stability alone is not strong enough to overwhelm560the destabilizing effect induced by changes in crystal phase561composition.
The Journal of Physical Chemistry C Article
dx.doi.org/10.1021/jp506024g | J. Phys. Chem. C XXXX, XXX, XXX−XXXG

562 Other dopants such as Mn,56 Zn,57 and Pb57 increase iron563 dissolution from iron (hydr)oxides, while dopants such as564 Al,56,58 Cr,56 and Cd57 decrease the iron dissolution rate. An565 explanation for these effects was related to the strength of the566 metal−oxygen−iron bonds: metal ions that increase the567 oxygen−iron bond strength (so increase the lattice energy)568 make it more resistant to protonation.45
569 Aging of the nanoparticles with low Fe content resulted in570 strong modifications of the EPR spectrum of the Fe3+ ions571 (Figure S3 in Supporting Information). EPR spectroscopy572 indicates a severe change in the local symmetry and weakening573 of the zero-field splitting.34,35 However, when brought at pH 1,574 the iron dissolution rate was not strongly affected by particle575 aging.9 The iron atoms are likely present inside the CaCO3
576 (calcite) with lattice energy of 2804 kJ/mol cation.46 This value577 is slightly lower than that of CaO, so a transformation from578 CaO to CaCO3 may therefore result in a slight improvement in579 dissolution, provided that no Fe−Fe agglomeration takes place,580 as evidenced by EPR spectroscopy.
4. CONCLUSIONS
581 Nanostructured Ca/Fe oxide-containing compounds were582 prepared by scalable, one-step flame synthesis, and their583 dissolution over time in dilute acid (pH 1 and 3) was584 monitored by EPR spectroscopy. By XRD and EPR spectros-585 copy three types of iron structures were distinguished in the586 powders: amorphous/crystalline Fe2O3 (type I), crystalline587 Ca2Fe2O5 (type II), and monomeric Fe3+ (type III). While type588 I is present at Ca:Fe ≤ 3.6 (above the percolation limit of iron),589 type II is present at Ca:Fe ≥ 1.4 and type III only exists at590 Ca:Fe ≥ 3.6. We were able to show that type II and III iron591 structures are responsible for immediate (<1 min) iron592 dissolution at pH up to 3. Pure γ-Fe2O3 (type I) released593 only a small amount of monomeric Fe3+ at pH 1, even for very594 small 3 nm crystals, and a significant fraction of the Fe3+
595 released from the crystal matrix was strongly associated with the596 particle surface. The dissolution rates can be related to the Fe597 coordination and lattice energies of the crystals. So high598 amounts of Ca preclude formation of slow dissolving crystalline599 γ-Fe2O3, and the crystal chemistry has a much stronger effect600 on iron dissolution than particle size. Thus, we demonstrate601 that “nanosizing” may not be a prerequisite for rapid dissolution602 of ferric iron. Optimization of nanostructured iron compounds603 for nutrition should avoid the formation of crystalline iron604 oxides, e.g., below the iron percolation limit in CaO.
605 ■ ASSOCIATED CONTENT
606 *S Supporting Information607 XRD patterns of as-prepared Ca/Fe oxides at 2θ = 20°−70°;608 EPR spectra of Ca:Fe = 0.3 during dissolution at pH 1 and EPR609 spectra of Ca:Fe = 125 and 3.6 after aging and during610 dissolution at pH 1. This material is available free of charge via611 the Internet at http://pubs.acs.org.
612 ■ AUTHOR INFORMATION
613 Corresponding Author614 *E-mail: [email protected] (Y.D.).
615 Notes616 The authors declare no competing financial interest.
617■ ACKNOWLEDGMENTS618We thank Prof. Sotiris E. Pratsinis for generously allowing use619of the Particle Technology Laboratory and for the valuable620discussions. TEM investigations were carried out at the EMEZ621(Electron Microscopy ETH Zurich). This work was supported622by ETH Research Grant ETH-06 10-1.
623■ REFERENCES(1) 624Miller, D. D. Food Nanotechnology - New Leverage against Iron
625Deficiency. Nat. Nanotechnol. 2010, 5, 318−319.(2) 626Zimmermann, M. B.; Hilty, F. M. Nanocompounds of Iron and
627Zinc: Their Potential in Nutrition. Nanoscale 2011, 3, 2390−2398.(3) 628Hurrell, R. F. Fortification: Overcoming Technical and Practical
629Barriers. J. Nutr. 2002, 132, 806S−812S.(4) 630Rohner, F.; Ernst, F. O.; Arnold, M.; Hilbe, M.; Biebinger, R.;
631Ehrensperger, F.; Pratsinis, S. E.; Langhans, W.; Hurrell, R. F.;632Zimmermann, M. B. Synthesis, Characterization, and Bioavailability in633Rats of Ferric Phosphate Nanoparticles. J. Nutr. 2007, 137, 614−619.
(5) 634Swain, J. H.; Newman, S. M.; Hunt, J. R. Bioavailability of635Elemental Iron Powders to Rats is Less Than Bakery-Grade Ferrous636Sulfate and Predicted by Iron Solubility and Particle Surface Area. J.637Nutr. 2003, 133, 3546−3552.
(6) 638Motzok, I.; Pennell, M. D.; Davies, M. I.; Ross, H. U. Effect of639Particle Size on Biological Availability of Reduced Iron. J. Assoc. Off.640Anal. Chem. 1975, 58, 99−103.
(7) 641Hilty, F. M.; Arnold, M.; Hilbe, M.; Teleki, A.; Knijnenburg, J. T.642N.; Ehrensperger, F.; Hurrell, R. F.; Pratsinis, S. E.; Langhans, W.;643Zimmermann, M. B. Iron from Nanocompounds Containing Iron and644Zinc is Highly Bioavailable in Rats without Tissue Accumulation. Nat.645Nanotechnol. 2010, 5, 374−380.
(8) 646Hilty, F. M.; Knijnenburg, J. T. N.; Teleki, A.; Krumeich, F.;647Hurrell, R. F.; Pratsinis, S. E.; Zimmermann, M. B. Incorporation of648Mg and Ca into Nanostructured Fe2O3 Improves Fe Solubility in649Dilute Acid and Sensory Characteristics in Foods. J. Food Sci. 2011, 76,650N2−N10.
(9) 651Knijnenburg, J. T. N.; Hilty, F. M.; Krumeich, F.; Zimmermann,652M. B.; Pratsinis, S. E. Multimineral Nutritional Supplements in a653Nano-CaO Matrix. J. Mater. Res. 2013, 28, 1129−1138.
(10) 654Yoder, C. H.; Flora, N. J. Geochemical Applications of the655Simple Salt Approximation to the Lattice Energies of Complex656Materials. Am. Mineral. 2005, 90, 488−496.
(11) 657Bou-Abdallah, F.; Chasteen, N. D. Spin Concentration658Measurements of High-Spin (g’ = 4.3) Rhombic Iron(III) Ions in659Biological Samples: Theory and Application. J. Biol. Inorg. Chem. 2008,66013, 15−24.
(12) 661Carbone, C.; Di Benedetto, F.; Marescotti, P.; Sangregorio, C.;662Sorace, L.; Lima, N.; Romanelli, M.; Lucchetti, G.; Cipriani, C. Natural663Fe-Oxide and -Oxyhydroxide Nanoparticles: An EPR and SQUID664Investigation. Mineral. Petrol. 2005, 85, 19−32.
(13) 665Cannas, C.; Gatteschi, D.; Musinu, A.; Piccaluga, G.;666Sangregorio, C. Structural and Magnetic Properties of Fe2O3667Nanoparticles Dispersed over a Silica Matrix. J. Phys. Chem. B 1998,668102, 7721−7726.
(14) 669Jitianu, A.; Crisan, M.; Meghea, A.; Rau, I.; Zaharescu, M.670Influence of the Silica Based Matrix on the Formation of Iron Oxide671Nanoparticles in the Fe2O3-SiO2 System, Obtained by Sol-Gel672Method. J. Mater. Chem. 2002, 12, 1401−1407.
(15) 673Gervasini, A.; Messi, C.; Ponti, A.; Cenedese, S.; Ravasio, N.674Nanodispersed Fe Oxide Supported Catalysts with Tuned Properties.675J. Phys. Chem. C 2008, 112, 4635−4642.
(16) 676Kliava, J.; Berger, R.; Franse, J.; Eremenko, V.; Sirenko, V. Smart677Mater. Ranging Syst. 2006, 226, 27−48.
(17) 678Gatteschi, D.; Fittipaldi, M.; Sangregorio, C.; Sorace, L.679Exploring the No-Man’s Land between Molecular Nanomagnets and680Magnetic Nanoparticles. Angew. Chem., Int. Ed. 2012, 51, 4792−4800.
(18) 681Brodbeck, C. M.; Bukrey, R. R. Model Calculations for the682Coordination of Fe3+ and Mn2+ Ions in Oxide Glasses. Phys. Rev. B6831981, 24, 2334−2342.
The Journal of Physical Chemistry C Article
dx.doi.org/10.1021/jp506024g | J. Phys. Chem. C XXXX, XXX, XXX−XXXH
(19)684 Dorey, C.; Cooper, C.; Dickson, D. P. E.; Gibson, J. F.;685 Simpson, R. J.; Peters, T. J. Iron Speciation at Physiological pH in686 Media Containing Ascorbate and Oxygen. Br. J. Nutr. 1993, 70, 157−687 169.
(20)688 Reddy, M. B.; Bates, G. W. Use of Transferrin and EPR to689 Probe the in Vitro Digestive Chemistry of Iron. J. Nutr. Biochem. 1993,690 4, 27−32.
(21)691 Kraemer, S. M. Iron Oxide Dissolution and Solubility in the692 Presence of Siderophores. Aquat. Sci. 2004, 66, 3−18.
(22)693 Pan, B.; Xing, B. S. Applications and Implications of694 Manufactured Nanoparticles in Soils: A Review. Eur. J. Soil Sci.695 2012, 63, 437−456.
(23)696 Wang, B.; Yin, J.-J.; Zhou, X.; Kurash, I.; Chai, Z.; Zhao, Y.;697 Feng, W. Physicochemical Origin for Free Radical Generation of Iron698 Oxide Nanoparticles in Biomicroenvironment: Catalytic Activities699 Mediated by Surface Chemical States. J. Phys. Chem. C 2013, 117,700 383−392.
(24)701 Cwiertny, D. M.; Hunter, G. J.; Pettibone, J. M.; Scherer, M. M.;702 Grassian, V. H. Surface Chemistry and Dissolution of Alpha-Feooh703 Nanorods and Microrods: Environmental Implications of Size-704 Dependent Interactions with Oxalate. J. Phys. Chem. C 2009, 113,705 2175−2186.
(25)706 Levy, M.; Lagarde, F.; Maraloiu, V.-A.; Blanchin, M.-G.;707 Gendron, F.; Wilhelm, C.; Gazeau, F. Degradability of Super-708 paramagnetic Nanoparticles in a Model of Intracellular Environment:709 Follow-up of Magnetic, Structural and Chemical Properties. Nano-710 technology 2010, 21, 395103.
(26)711 Arbab, A. S.; Wilson, L. B.; Ashari, P.; Jordan, E. K.; Lewis, B.712 K.; Frank, J. A. A Model of Lysosomal Metabolism of Dextran Coated713 Superparamagnetic Iron Oxide (SPIO) Nanoparticles: Implications for714 Cellular Magnetic Resonance Imaging. NMR Biomed. 2005, 18, 383−715 389.
(27)716 Madler, L.; Kammler, H. K.; Mueller, R.; Pratsinis, S. E.717 Controlled Synthesis of Nanostructured Particles by Flame Spray718 Pyrolysis. J. Aerosol Sci. 2002, 33, 369−389.
(28)719 Hilty, F. M.; Teleki, A.; Krumeich, F.; Buchel, R.; Hurrell, R. F.;720 Pratsinis, S. E.; Zimmermann, M. B. Development and Optimization721 of Iron- and Zinc-Containing Nanostructured Powders for Nutritional722 Applications. Nanotechnology 2009, 20, 475101.
(29)723 Grigoropoulou, G.; Christoforidis, K. C.; Louloudi, M.;724 Deligiannakis, Y. Structure-Catalytic Function Relationship of SiO2-725 Immobilized Mononuclear Cu Complexes: An EPR Study. Langmuir726 2007, 23, 10407−10418.
(30)727 Bencini, A.; Gatteschi, D. Electron Paramagnetic Resonance of728 Exchange Coupled Systems; Springer: Berlin, 1990.
(31)729 Strobel, R.; Pratsinis, S. E. Direct Synthesis of Maghemite,730 Magnetite and Wustite Nanoparticles by Flame Spray Pyrolysis. Adv.731 Powder Technol. 2009, 20, 190−194.
(32)732 Li, D.; Teoh, W. Y.; Selomulya, C.; Woodward, R. C.; Munroe,733 P.; Amal, R. Insight into Microstructural and Magnetic Properties of734 Flame-Made γ-Fe2O3 Nanoparticles. J. Mater. Chem. 2007, 17, 4876−735 4884.
(33)736 Gaffney, B. J.; Silverstone, H. J. In EMR of Paramagnetic737 Molecules, Berliner, L. J., Reuben, J., Eds.; Plenum Press: New York,738 1993; Vol. 13, pp 1−57.
(34)739 Polikreti, K.; Maniatis, Y. Distribution Changes of Mn2+ and740 Fe3+ on Weathered Marble Surfaces Measured by EPR Spectroscopy.741 Atmos. Environ. 2004, 38, 3617−3624.
(35)742 Marshall, S. A.; Reinberg, A. R. Paramagnetic Resonance743 Absorption Spectrum of Trivalent Iron in Single-Crystal Calcite. Phys.744 Rev. 1963, 132, 134−142.
(36)745 Azzoni, C. B.; Mozzati, M. C.; Massarotti, V.; Capsoni, D.; Bini,746 M. New Insights into the Magnetic Properties of the Ca2Fe2O5 Ferrite.747 Solid State Sci. 2007, 9, 515−520.
(37)748 Lorenz, C. D.; Ziff, R. M. Precise Determination of the Bond749 Percolation Thresholds and Finite-Size Scaling Corrections for the sc,750 fcc, and bcc Lattices. Phys. Rev. E 1998, 57, 230−236.
(38)751 Lin, J. F.; Gavriliuk, A. G.; Struzhkin, V. V.; Jacobsen, S. D.;752 Sturhahn, W.; Hu, M. Y.; Chow, P.; Yoo, C. S. Pressure-Induced
753Electronic Spin Transition of Iron in Magnesiowustite-(Mg,Fe)O.754Phys. Rev. B 2006, 73, 131107.
(39) 755Baes Jr., C. F.; Mesmer, R. E. The Hydrolysis of Cations; John756Wiley & Sons: New York, 1976.
(40) 757Ambe, S.; Ambe, F. Mossbauer Study of Ferric Ions Adsorbed at758α-Ferric Oxide/Aqueous Solution Interface. Langmuir 1990, 6, 644−759649.
(41) 760Sotiriou, G. A.; Pratsinis, S. E. Antibacterial Activity of761Nanosilver Ions and Particles. Environ. Sci. Technol. 2010, 44, 5649−7625654.
(42) 763Samson, S. D.; Stillings, L. L.; Eggleston, C. M. The Depletion764and Regeneration of Dissolution-Active Sites at the Mineral-Water765Interface: I. Fe, Al, and in Sesquioxides. Geochim. Cosmochim. Acta7662000, 64, 3471−3484.
(43) 767Eggleston, C. M.; Stack, A. G.; Rosso, K. M.; Bice, A. M.768Adatom Fe(III) on the Hematite Surface: Observation of a Key769Reactive Surface Species. Geochem. Trans. 2004, 5, 33−40.
(44) 770Otten, J. J.; Hellwig, J. P.; Mayers, L. D. Dietary Reference771Intakes: The Essential Guide to Nutrient Requirements; Institute of772Medicine of the National Academies: N.W. Washington DC, 2006.
(45) 773Cornell, R. M.; Schwertmann, U. The Iron Oxides: Structure,774Properties, Reactions, Occurences and Uses, 2nd ed.; Wiley-VHC:775Weinheim, 2003.
(46) 776Haynes, W. M. CRC Handbook of Chemistry and Physics, 92nd777ed.; CRC Press/Taylor and Francis: Boca Raton, FL, 2012.
(47) 778Sidhu, P. S.; Gilkes, R. J.; Cornell, R. M.; Posner, A. M.; Quirk, J.779P. Dissolution of Iron Oxides and Oxyhydroxides in Hydrochloric and780Perchloric Acids. Clays Clay Miner. 1981, 29, 269−276.
(48) 781Segall, R. L.; Smart, R. S. C.; Turner, P. S. In Surface and near-782Surface Chemistry of Oxide Materials, Nowotny, J., Dufour, L-C, Eds.;783Elsevier: Amsterdam, 1988; pp 527−576.
(49) 784Lanzl, C. A.; Baltrusaitis, J.; Cwiertny, D. M. Dissolution of785Hematite Nanoparticle Aggregates: Influence of Primary Particle Size,786Dissolution Mechanism, and Solution pH. Langmuir 2012, 28, 15797−78715808.
(50) 788Cornell, R. M.; Posner, A. M.; Quirk, J. P. Crystal Morphology789and Dissolution of Goethite. J. Inorg. Nucl. Chem. 1974, 36, 1937−7901946.
(51) 791Erbs, J. J.; Gilbert, B.; Penn, R. L. Influence of Size on Reductive792Dissolution of Six-Line Ferrihydrite. J. Phys. Chem. C 2008, 112,79312127−12133.
(52) 794Yoder, C. H.; Rowand, J. P. Application of the Simple Salt795Lattice Energy Approximation to the Solubility of Minerals. Am.796Mineral. 2006, 91, 747−752.
(53) 797Blesa, M. A.; Maroto, A. J. G. Dissolution of Metal Oxides. J.798Chim. Phys. 1986, 83, 757−764.
(54) 799Qi, W. H.; Wang, M. P. Size Effect on the Cohesive Energy of800Nanoparticle. J. Mater. Sci. Lett. 2002, 21, 1743−1745.
(55) 801Nanda, K. K.; Maisels, A.; Kruis, F. E.; Fissan, H.; Stappert, S.802Higher Surface Energy of Free Nanoparticles. Phys. Rev. Lett. 2003, 91,803106102.
(56) 804Schwertmann, U. Solubility and Dissolution of Iron Oxides.805Plant Soil 1991, 130, 1−25.
(57) 806Kaur, N.; Singh, B.; Kennedy, B. J. Dissolution of Cr, Zn, Cd807and Pb Single- and Multi-Metal-Substituted Goethite: Relationship to808Structural, Morphological, and Dehydroxylation Properties. Clays Clay809Miner. 2010, 58, 415−430.
(58) 810Batista, M. A.; da Costa, A. C. S.; Bigham, J. M.; Souza, I. G.;811Jones, F. S. Acid Dissolution Kinetics of Synthetic Aluminum-812Substituted Maghemites (γ-Fe2‑xAlxO3). Soil Sci. Soc. Am. J. 2011, 75,813855−861.
The Journal of Physical Chemistry C Article
dx.doi.org/10.1021/jp506024g | J. Phys. Chem. C XXXX, XXX, XXX−XXXI


