Embed Size (px)
Citation preview

PROSODIC PROMINENCE PERCEPTION, REGIONAL BACKGROUND,
ETHNICITY AND EXPERIENCE: NAIVE PERCEPTION OF AFRICAN AMERICAN
ENGLISH AND
EUROPEAN AMERICAN ENGLISH
by
JASON ALAN MCLARTY
A DISSERTATION
Presented to the Department of Linguistics and the Graduate School of the University of Oregon
in partial fulfillment of the requirements for the degree of
Doctor of Philosophy
September 2019

ii
DISSERTATION APPROVAL PAGE Student: Jason Alan McLarty
Title: Prosodic Prominence Perception, Ethnicity and Experience: Naive Listener Perception of African American English and European American English
This dissertation has been accepted and approved in partial fulfillment of the requirements for the Doctor of Philosophy degree in the Department of Linguistics by:
Tyler Kendall Chairperson Melissa Redford Core Member Charlotte Vaughn Core Member Spike Gildea Core Member Erik R. Thomas Core Member Kaori Idemaru Institutional Representative
and
Janet Woodruff-Borden Vice Provost and Dean of the Graduate School Original approval signatures are on file with the University of Oregon Graduate School.
Degree awarded September 2019.

iii
© 2019 Jason Alan McLarty
This work is licensed under a Creative Commons
Attribution-NonCommercial-ShareAlike (United States) License.

iv
DISSERTATION ABSTRACT
Jason Alan McLarty
Doctor of Philosophy
Department of Linguistics
September 2019
Title: Prosodic Prominence Perception, Regional Background, Ethnicity and
Experience: Naive Listener Perception of African American English and
European American English
Although much work has investigated various aspects of African American
English (AAE), prosodic features of AAE have remained relatively underexamined (e.g.
McLarty 2018; Thomas 2015). Studies have, however, identified prosodic differences
between AAE and European American English (EAE) varieties, with AAE speakers
found to have generally more dynamic prosody than EAE speakers. Despite these
findings, the extent to which listeners perceive these differences remains unclear, as well
as which specific phonetic features, alone or in concert, contribute to the differences.
To address this gap in knowledge, this dissertation project utilized the Rapid
Prosodic Transcription (RPT) task developed by Cole et al. (2010, 2017) to determine
how much sensitivity listeners have to prominence variation in conversational speech
excerpts from male and female African Americans and European Americans from North
Carolina. Crucially, participants are drawn from three different listener groups, who
represent a range of experience with AAE and EAE speech: African American listeners
from North Carolina, European American listeners from North Carolina, and European
American listeners from Oregon. In addition to examining listeners in terms of their

v
regional background and ethnicity, listeners’ own self-reports about their experience with
AAE are used to further explore the role of experience in prominence perception.
Results indicate that African American voices are heard as having significantly
more prominences in their speech than the European American speakers, a finding in line
with prior literature on production-based differences. Further, findings identify some
differences between the listener groups, but also show that the listeners generally attend
to linguistic factors in similar ways for these voices despite different regional
backgrounds, ethnicities and self-reported experiences with AAE. The methodological
approach and findings in this dissertation provide a a new avenue for sociolinguistic
research on prosody, while also providing insights on the relationship between production
and perception.

vi
CURRICULUM VITAE NAME OF AUTHOR: Jason Alan McLarty
GRADUATE AND UNDERGRADUATE SCHOOLS ATTENDED:
University of Oregon, Eugene North Carolina State University, Raleigh Appalachian State University, Boone, North Carolina
DEGREES AWARDED:
Doctor of Philosophy, Linguistics, 2019, University of Oregon Master of Arts, English, 2011, North Carolina State University Bachelor of Arts, Philosophy, 2007, Appalachian State University
AREAS OF SPECIAL INTEREST:
Sociolinguistics Sociophonetics African American English Language Variation and Change
PROFESSIONAL EXPERIENCE:
Graduate Teaching Fellow, University of Oregon, September 2012 – June 2019
GRANTS, AWARDS, AND HONORS:
NSF Award BCS-1627042, Doctoral Dissertation Research Improvement Grant, 2016 to 2019
Graduate Teaching Fellowship, Linguistics, 2012 to 2018
PUBLICATIONS:
McLarty, Jason. 2018. African American Language and European American English Intonation Variation over time in the American South. American Speech.

vii
McLarty, Jason, Taylor Jones, and Christopher Hall. 2019. Corpus-based Sociophonetic Approaches to Postvocalic R-Lessness in African American Language. American Speech 94 (1): 91-109.
McLarty, Jason, Tyler Kendall, and Charlie Farrington. 2016. Investigating the
Development of the Contemporary Oregonian English Vowel System. In Speech in the Western States, Vol. 1: The Pacific Coast. Publication of the American Dialect Society, edited by Valerie Fridland, Betsy Evans, Tyler Kendall, and Alicia Wassink, 135-157. Durham, NC: Duke University Press.
McLarty, Jason, Charlie Farrington, and Tyler Kendall. 2014. Perhaps We Used To, But
We Don’t Anymore: The Habitual Past in Oregonian English. University of Pennsylvania Working Papers in Linguistics: Vol. 20: Iss. 2. Article 13.
viii
ACKNOWLEDGMENTS
First and foremost, I wish to express my sincere appreciation and gratitude to the
participants in this study; without your willingness to be a part of this project, none of
this would be possible. I would also like to thank my Research Assistant at North
Carolina Central University, Hanny Kishawi. I cannot say enough how much your
support wherever you felt it was needed, meant to me during this whole process—thank
you! I must also thank the National Science Foundation (BCS-1627042) for funding that
supported this project.
This entire dissertation project would not have been possible without the
incredible support and guidance of my mentor and adviser, Tyler Kendall. Tyler, your
support, guidance and patience has made me a better scholar, writer and teacher. You
have taught me how to think differently and more deeply about the questions I ask in my
research. You have also taught me that there are ways our research can reach and affect
the communities we study in a positive way, and sometimes in ways we aren’t aware.
Most importantly, you have taught me what it means to be a good mentor; I can only
hope as my career moves forward, I will be able to reflect your devotion to your students.
Thank you, Tyler. I would also like to express my immense gratitude to Charlotte
Vaughn. Thank you for always being there. Your guidance, support and encouragement
throughout this project has made me a better scholar, teacher and human. You’re the best!
If I can be half the scholar, mentor and friend that y’all are, I will have been a massive
success in the field, but more importantly in life.
To the rest of committee members, Lisa Redford, Spike Gildea, Kaori Idemaru
and Erik Thomas, thank y’all so much for always challenging me to think of the bigger

ix
picture and larger implications of my work, why my research matters, and how to further
inform what we know about language. Aside from helping me grow as an academic, y’all
have always been there to support me as a human being.
Shelby Arnson and Kaylynn Gunter, I’m really gonna miss y’all—a lot. I don’t
really know what to say other than I am so thankful to have gotten to know y’all over the
last, what four or five years? Thanks for giving me advice and encouragement; really, just
thanks for being such a kick-ass friends. The world needs more Shelbys and Kaylynns.
Charlie Farrington, you’re getting your own damn paragraph. Sitting next to you
over the last ten years or so has been my favorite thing about graduate school. You have
been more much more than a colleague to me, and even more than a friend. You have
been the best sounding board, lab companion, dog sitter, child wrangler/uncle, and
generally the best friend/surrogate brother anyone could ask for. The hardest part of
leaving graduate school for me, is knowing you won’t be around the corner. I am going to
miss that, and you. Thanks for everything. You complete me.
Finally, I would like to thank my family. To my sister Jaime, for always
encouraging me to keep going. To my parents, Jim and Nancy McLarty, I am unsure
what to even say here, or if it could be put into words. I love you two more than you’ll
ever know. Your unwavering support, encouragement, and love for me has meant the
world to me. To my wife Molly and son Joah, this dissertation is as much yours as it is
mine. Thank you both for your patience, open ears, hugs, laughter and support for me in
this whole endeavor. I honestly wouldn’t be here if it wasn’t for y’all. I love you two.

x
For my wife, Molly, and my son, Joah—We did it!! I love you both to the moon and
back!!

xi
TABLE OF CONTENTS Chapter Page
I. INTRODUCTION, BACKGROUND AND MOTIVATION ......................................... 1
1.1. Introduction ............................................................................................................. 1
1.2. Chapter Outline ....................................................................................................... 5
1.3. Background on AAE and Prosody .......................................................................... 6
1.3.2. Perception-Based Studies and Ethnic Identification of AAE ....................... 20
1.4. Prosodic Prominence, Perception and the Sociolinguistic Endeavor .................... 24
1.5. The Role of Experience and Listener Dialect in Perception ................................. 30
1.6. Summary ............................................................................................................... 34
1.7. Dissertation Outline .............................................................................................. 36
II. METHODS AND DATA ............................................................................................. 38
2.1. Introduction ........................................................................................................... 38
2.2. Experimental Approach ........................................................................................ 38
2.3. Speaker and Stimulus Description and Selection ................................................. 44
2.4. Experiment Design ................................................................................................ 48
2.5. Participants, Recruitment and Field Sites ............................................................. 50
2.6. Probing Participants’ Identification of Speaker Ethnicity and Self-Reported
Experience with AAE ........................................................................................... 54
xii
Chapter Page
2.6.1. Ethnic identification task .............................................................................. 55
2.6.2. Self-Reported Experience Measures ............................................................. 57
2.7. Data Processing and Linguistic Factors ................................................................ 68
2.7.1. Part of Speech and Word Frequency ............................................................. 68
2.7.2. Acoustic Cues and Analysis .......................................................................... 71
2.8. Going Forward ...................................................................................................... 75
III. REGIONAL BACKGROUND, ETHNICITY, EXPERIENCE AND THE
PERCEPTION OF PROMINENCE ................................................................................. 77
3.1. Introduction ........................................................................................................... 77
3.1.1. Production, Perception and the Rapid Prosodic Transcription Task ............. 78
3.1.2. Ethnicity, Regional Background, and Listener Experience as Factors in
Prosodic Perception ................................................................................................... 81
3.1.3. Research Questions and Predictions ............................................................. 86
3.2. Quantitative and Statistical Analysis .................................................................... 90
3.2.1. Statistical Approach ...................................................................................... 90
3.2.2. Do Listeners Perceive Different Amounts of Prominences for AAE
Voices than EAE Voices? ......................................................................................... 95
3.2.3. Do African American Listeners Perceive Different Amounts of
Prominences for AAE Voices than EAE Voices? ..................................................... 98
3.2.4. To What Extent Does Listeners’ Regional Background and Ethnicity
Affect Their Perception of Prominence for AAE and EAE Voices?....................... 101

xiii
Chapter Page
3.2.5. Interim Summary ........................................................................................ 106
3.3. A Closer Examination of the Role of Self-Reported Experience on Listeners’
Perception of Prosodic Prominence in AAE ....................................................... 107
3.4. Summary and Going Forward ............................................................................. 116
IV. REGIONAL BACKGROUND, ETHNICITY, EXPERIENCE AND THE
PERCEPTION OF PROMINENCE: LINGUISTIC FACTORS .................................... 119
4.1. Introduction ......................................................................................................... 119
4.1.1. Linguistic Factors, Prominence Perception and the Rapid Prosodic
Transcription Task ................................................................................................... 123
4.1.2. Research Questions and Predictions ........................................................... 129
4.2. Quantitative and Statistical Analysis .................................................................. 135
4.3. Prominence Perception, Listener Groups and Linguistic Factors ....................... 140
4.3.1. Do the Acoustic Cues and Linguistic Factors Found to Influence
Perception of Prominence in Prior RPT Studies also Apply Here? ......................... 141
4.3.2. Do Listeners use Acoustic Cues Differently in their Perceptions of
Prominence for AAE and EAE Voices? .................................................................. 146
4.3.3. Do Listener Groups (NCAA, NCEA, OREA) Attend to Acoustic Cues
Differently?.............................................................................................................. 153
4.3.4. Interim Summary ........................................................................................ 158
4.3.5. What Cues are the NCAA Listeners Using for Judging Prosodic
Prominence in AAE and EAE Voices? Are these AAE-Specific Cues? ................. 159

xiv
Chapter Page
4.3.6. How does Listeners’ (Self-Reported) Experience with AAE Relate to
their use of Acoustic Cues? ..................................................................................... 164
4.4. Summary and Conclusions ................................................................................. 169
V. CONCLUSION .......................................................................................................... 174
5.1. Introduction ......................................................................................................... 174
5.2. Summary of Dissertation .................................................................................... 175
5.3. Considering the Influence of Regional Background, Ethnicity, and Experience
on Perceptions of Prosody .................................................................................. 183
5.3.1. The Perception of AAE Prosody ................................................................. 184
5.3.2. RPT and the Study of AAE Prosody ........................................................... 184
5.3.3. Acoustic Factors and AAE Prosody ........................................................... 186
5.3.4. Regional Background and AAE Prosody.................................................... 188
5.3.5. African American Listeners and the Perception of AAE Prosody .............. 189
5.3.6. Self-Reported Experience and AAE Prosody ............................................. 191
5.3.7. Future Directions ........................................................................................ 193
5.4. Applications of Prominence Perception .............................................................. 195
REFERENCES CITED ................................................................................................... 201

xv
LIST OF FIGURES Figure Page
2.1. LMEDS Stimulus Example ........................................................................................ 41
2.2. LMEDS Stimulus Example ........................................................................................ 42
2.3. Overall output for sample stimulus ............................................................................ 43
2.4. Correlations for experience measures: OREA listeners ............................................. 63
2.5. Correlations for experience measures: NCEA listeners ............................................. 64
2.6. Correlations for experience measures: NCAA listeners ............................................ 65
3.1. Predicted probabilities for prominence by ethnicity of voice: All listeners ............... 96
3.2. Predicted probabilities for prominence by ethnicity of voice and whether AAE
voices were heard first: All listeners ........................................................................ 97
3.3. Predicted probabilities for prominence by ethnicity of voice: NCAA listeners ...... 100
3.4. Predicted probabilities for prominence for all voices: Regional background and
ethnicity .................................................................................................................. 102
3.5. Predicted probabilities for prominence by ethnicity of voice: Regional
background and ethnicity ....................................................................................... 103
3.6. Fleiss’ Kappa values for listeners and voices by listener groups: All listeners ....... 104 3.7. Predicted probabilities for prominence by ethnicity of voice: Experience with
AAE ....................................................................................................................... 111
3.8. Predicted probabilities for prominence by ethnicity of voice and whether AAE
voices were heard first: OREA listeners ................................................................ 112
3.9. Fleiss’ Kappa values for OREA listeners by low vs. high experience with AAE:
OREA listeners ...................................................................................................... 115

xvi
Figure Page
4.1. Predicted probabilities for prominence for all voices: Pitch Max ............................ 142
4.2. Predicted probabilities for prominence for all voices: Intensity Max ...................... 143
4.3. Predicted probabilities for prominence for all voices: Word duration ..................... 143
4.4. Predicted probabilities for prominence for all voices: Part of Speech ..................... 144
4.5. Predicted probabilities for prominence for all voices: Word Frequency ................. 145
4.6. Predicted probabilities for prominence for ethnicity of voice: Pitch Change to
Following Word ..................................................................................................... 147
4.7. Predicted probabilities for prominence for ethnicity of voice: Intensity Max ......... 149
4.8. Predicted probabilities for prominence for ethnicity of voice: AAE first ................ 149
4.9. Predicted probabilities for prominence for ethnicity of voice and intensity: AAE
first ......................................................................................................................... 150
4.10. Predicted probabilities for prominence for ethnicity of voice and AAE first:
pitch change max ................................................................................................... 151
4.11. Predicted probabilities for prominence for listener group: pitch change max ....... 154
4.12. Predicted probabilities for prominence for listener group: pitch change from
previous word ......................................................................................................... 155
4.13. Predicted probabilities for prominence for listener group: Intensity max ............. 156
4.14. Predicted probabilities for prominence for NCAA listeners and voice group:
Pitch change to the following word ....................................................................... 163
4.15. Predicted probabilities for prominence by ethnicity of voice: Experience with
AAE ....................................................................................................................... 167

xvii
Figure Page
4.16. Predicted probabilities for prominence by ethnicity of voice and whether AAE
voices were heard first: OREA listeners ................................................................ 168
xviii
LIST OF TABLES Table Page
2.1. Characteristics of Conversational Speech Samples ................................................... 47
2.2. Listener location and ethnicity ................................................................................... 52
2.3. Experiment conditions and number of listeners ......................................................... 53
2.4. Ethnic identification results: African American voices ............................................. 56
2.5. Ethnic identification results: European American voices .......................................... 56
2.6. Questions related to self-reported experience with AAE, possible responses and
scoring ...................................................................................................................... 58
2.7. Listener groups reported experience with AAE ......................................................... 60 2.8. Listener groups reported how much speech in last two weeks is AAE ..................... 61
2.9. Listener groups reported how much music is rap/hip-hop ......................................... 61
2.10. Correlations for OREA listener group and experience measures ............................ 62
2.11. Correlations for NCEA listener group and experience measure .............................. 64
2.12. Correlations for NCAA listener group and experience measures ............................ 65
2.13. Composite scores for listener groups: means and standard deviations .................... 67
2.14. Word types in stimuli ............................................................................................... 69
2.15. Part of Speech types in stimuli: Content words ....................................................... 70
2.16. Acoustic measures extracted in analysis and calculation methodology ................... 73
2.17. Results for acoustic measures .................................................................................. 73
3.1. Prominence perception regression results .................................................................. 93
3.2. Fleiss' Kappa for agreement among prominence ratings ........................................... 94
3.3. Prominence Perception by North Carolina African American listeners .................. 100
xix
Table Page
3.4. AAE experience questions and possible responses .................................................. 109
3.5. Prominence perception and experience by Oregon European American
Listeners ................................................................................................................. 111
3.6. Fleiss' Kappa values for OREA listeners by Low vs. High Experience .................. 114
4.1. Acoustic Measures and Variance Inflation Factor ................................................... 136
4.2. Trimmed Acoustic Measures and Variance Inflation Factor ................................... 137
4.3. Prominence Perception and Acoustic and Linguistic Factors Regression Results:
Main Effects ........................................................................................................... 139
4.4. Prominence Perception and Linguistic Factors Regression Results: Interaction
Effects .................................................................................................................... 140
4.5. Prominence Perception and Acoustic and Linguistic Factors Regression Results:
NCAA Listeners ..................................................................................................... 161
4.6. Prominence Perception, Acoustic Factors and Experience with AAE Regression
Results: Main Effects ............................................................................................. 166
4.7. Prominence Perception, Acoustic Factors and Experience with AAE Regression
Results: Interaction Effects .................................................................................... 166

1
CHAPTER I
INTRODUCTION, BACKGROUND AND MOTIVATION 1.1 Introduction
African American English1 (AAE) is the most studied language variety in the
United States and one of the most studied varieties by sociolinguists world-wide
(Wolfram 1969; Labov 1972, 1998; Schneider 1996). As is the case with many varieties,
work in sociolinguistics describing AAE has focused on morphosyntactic and segmental
features more than prosodic features (see Thomas 2015 for a full discussion). From the
existing work on prosody, evidence suggests that some varieties of AAE exhibit prosodic
patterns that differ from those of other varieties of English (Hawkins 1992; Foreman
2000; Thomas and Reaser 2004; Thomas, Lass and Carpenter 2010). For example, AAE
speakers have been shown to use more pitch accents per syllable (McLarty 2011, 2018),
and utilize more primary stresses (Loman 1975; Wolfram and Thomas 2002), than their
European American English (EAE) counterparts. Prior approaches to prosodic variation
in AAE have yielded important insights. At the same time, they have relied on analyst-
driven annotations of the speech signal whose relevance to the perceptions of everyday
listeners is largely unknown.
A major open question regarding prosodic dialect variation is the extent to which
variation observed in the acoustics is also perceptually salient. The project reported on in
this dissertation investigates whether everyday listeners are sensitive to some kinds of
prosodic differences between AAE and EAE. To do this, I make use of the Rapid
1 Following Thomas and Bailey (2015: 403), this dissertation uses the term African American English (AAE) to refer to “any kind of speech that can be audibly distinguished as African American, including both middle-class and working-class varieties.”
2
Prosodic Transcription technique (Cole, Mo and Hasegawa-Johnson 2010; Cole, Mahrt
and Roy 2015), which asks participants—non-experts, or “everyday” listeners—to listen
to samples of speech and to mark the lexical items that they hear as prominent. This
approach allows researchers to investigate the perceptual salience of prosodic
prominence, or the strength of a word relative to other words, for each lexical item, and
the potential social and linguistic correlates of the perception of prominence, and to do so
for everyday listeners, who do not need to be trained for the task and can simply supply
their naïve, everyday judgments.
I focus on listeners’ perceptions of speech in excerpts of conversational speech
extracted from sociolinguistic interview recordings from male and female African
Americans and European Americans from North Carolina, in the Southeastern U.S. In
addition to investigating everyday listeners’ perception of prominence, I also examine the
acoustic patterns in the stimuli, to confirm that these AAE and EAE voices indeed show
production-based prosodic differences. The acoustic data then allow me to consider
whether listeners are attending to these production differences in perception.
Along with an attention to differences in how the prosody of speakers from
different ethnic dialects, i.e. ethnolects, are perceived, I also consider the role of the
dialects of the listeners in this study. This is an important consideration for sociolinguists,
given that both production and perception are components of having a dialect (Sumner
and Samuel 2009). But, thus far, work in cross-dialect perception has largely focused on
contrastive categories like vowels (e.g. Evans and Iverson 2007; Sumner and Samuel
2009; Clopper 2012; Kendall and Fridland 2012). An exception is a study by Cole et al.
(2017), who investigated the perception of prosodic prominence in American English

3
speakers by listeners of varying familiarity with those dialects (I return to discuss this
study in Section 1.4). Cross-dialect perception can be, and often is, associated with
notions of experience, or the amount of exposure listeners have had with relevant forms.
Experience can be considered from several different perspectives. For instance, one’s
own regional background provides exposure to certain regional dialects and not others.
Experience can also be viewed along the lines of one’s own ethnicity. Individuals may
come from the same regional background, but within their home region come from
different ethnic communities, and thus have different amounts and types of experience
with different regionally situated ethnolects. Despite Cole et al.’s inquiry, little is known
about the role of regional background and experience in the perception of prosody across
varieties.
Better understanding cross-dialect perception is important, and I believe this is
especially true for the study of AAE. African American listeners’ perceptions of AAE
prosody, and AAE more generally, has been massively understudied. In fact, as I discuss
further below, many of the approaches that are used to examine AAE prosody were not
designed for AAE specifically, nor do these prior approaches incorporate the judgements
of African Americans. Practically speaking, AAE is highly stigmatized and considerable
evidence exists that AAE-speakers face discrimination based on their use of AAE and
even on their speech when not using AAE features (e.g. Purnell et al. 1999; Rickford and
King 2016; Jones et al. 2019). To address these issues, the present study includes
listeners with a range of experience with AAE and European American English (EAE)
speech: African American listeners from North Carolina, European American listeners
from North Carolina, and European American listeners from Oregon. In addition to
4
having listeners from two disparate regions in the United States (Oregon in the Northwest
and North Carolina in the Southeast) with different ethnic backgrounds, I also asked
listeners to provide their self-reported experience with AAE and EAE. This approach
allows for me to investigate factors that may influence the perception of prosodic
prominence in three main ways: listeners’ regional background, ethnicity and experience.
Altogether, this dissertation investigates production and perception in prosody
alongside one another, rather than focusing on each individually, as has often been the
case. More generally than the contributions I hope to be making to the study of AAE, the
approaches in this dissertation provide sociolinguists another tool to address questions
related to what it means to have a dialect, both for production and perception. Production
and perception each contribute to a nuanced picture of how dialects pattern prosodically,
and, together, these can provide a more complete view of AAE prosody.
In order to address these open questions regarding the relationship between
production and perception in AAE prosody, I focus my attention around two broad
research questions:
1. What differences do listeners perceive between AAE and EAE voices when they are asked to rate prosodic prominence? And, how do listener groups, who differ in regional background, ethnicity, and self-reported experience, compare to one another?
2. How do linguistic cues (i.e. acoustic and structural factors) to prosodic prominence differ for AAE and EAE voices? And how do listener groups, who differ in regional background, ethnicity, and self-reported experience, compare to one another in their use of these cues?
These questions provide the broad framing that organizes the two major empirical
chapters of this dissertation, Chapters III and IV. But, first, in the remainder of this

5
chapter I provide further background and in Chapter II, I describe the experiment and the
data in depth.
1.2 Chapter Outline
In the rest of this chapter, I first present background on production-based studies
of prosody in AAE, in Section 1.3.1, followed by a discussion of perception-based
studies in AAE, in Section 1.3.2. This latter consideration includes a review of work on
ethnic identification studies that have focused on AAE, since a good deal of interest in
perception of AAE has, in fact, been centered around a goal of understanding whether
and how American listeners differentiate African American and European American
voices. I attempt to provide extensive background information about prior work on
production and perception of AAE, in order to situate my central foci—understanding
prosodic prominence in AAE and EAE, how listeners’ regional background, ethnicity and
experience with these varieties influence their prominence perception, and how linguistic
factors are used in the production and perception of prominence by these speakers and
listeners—in terms of the broader field of work. In Section 1.4, I move away from a focus
on AAE to discuss prior approaches that have examined prosodic prominence both in
terms of production and perception. In Section 1.5, I discuss the role of listener’s dialects
in perception from a sociolinguistic perspective. In Section 1.6, I provide a brief
summary of this chapter. Finally, in Section 1.6, I return to further introduce the current
study and its potential implications both in the field of sociolinguistics as well as its
broader impacts outside of academia, and in Section 1.7, I outline the rest of the
dissertation.
6
1.3 Background on AAE and Prosody 1.3.1 Production-based Studies of AAE and Prosody
Prosodic prominence is just one aspect of the very large domain of prosody. In
order to situate this dissertation in the field, a much broader review of prior work on a
range of aspects in prosody is needed. Since research on prosody is less common than
other work in the sociolinguistic tradition, this section presents a thorough survey of
previous research in the domain of prosody. Much of the research on AAE prosody has
focused on speakers’ fundamental frequency (F0) characteristics and intonation, with
some studies examining speech rate and rhythm. Two acoustic properties that are related
to prosody, and prominence specifically, intensity and vowel duration, haven’t been as
well studied in AAE, though vowel duration is often examined alongside vowel quality
and also as a factor used to calculate prosodic rhythm. In this section, I first discuss early
sociolinguistic work examining F0 characteristics in AAE in Section 1.3.1.1. In Section
1.3.1.2, I briefly introduce some conventions of the Mainstream American English Tones
and Break Indices paradigm (MAE_ToBI; Beckman et al. 2005), which are helpful for
discussing more recent literature on AAE intonation. Then, in Section 1.3.1.3, I turn to
more recent sociolinguistic studies examining intonation, rhythm and speech rate.
1.3.1.1 Early Sociolinguistic Studies of AAE Prosody
The earliest studies examining AAE fundamental frequency (F0) characteristics
and intonation (Loman 1967, 1975; Tarone 1973; Hudson and Holbrook 1981, 1982)
focused on the distribution of F0 values, alongside F0 contours, and often utilized an

7
older, now outdated, transcription system (Trager and Smith 1951). These studies found
that African Americans use a wider pitch range, including more falsetto, and more level
and final rising contours than European Americans. Tarone (1973) examined the
intonation of European American and African American adolescent speakers in Seattle,
Washington, as a first look at possible differences between these two ethnolects. The
primary focus of this analysis was on utterance final contours. She found that AAE
speakers had more falling final contours in yes/no questions. Further, African American
speakers in her data exhibited a wider pitch range relative to their European American
cohorts, with these differences explained as potentially being a result of “the competitive
nature of the black speech events” (Tarone 1973: 32). Focusing on non-final contours,
Loman (1975) conducted an impressionistic study of AAE in Washington, DC, and found
a “high frequency of primary stresses” with AAE showing a “constant and marked shift
between pitch levels /3/ and /2/ [on Trager and Smith’s scale from 1 to 4] which basically
is correlated with the shift between syllables with primary stress and with weaker stress”,
while also observing the use of falsetto in “excited speech” (Loman 1975: 242).
Hudson and Holbrook (1981, 1982) investigated F0 range and variation
instrumentally in the read and spontaneous speech of African American students at a
Florida university. They also found a wider pitch range for AAE, especially in
spontaneous speech, compared to other studies that examined EAE F0 range (cf. Fitch
and Holbrook 1970). Hudson and Holbrook (1981, 1982) also demonstrated that AAE
speakers exhibited wider F0 range above the mean for modal fundamental frequency,
which is simply the F0 value accounting for the greatest proportion of time during a
sample of speech across all utterances. Lastly, Hudson and Holbrook (1981, 1982) was

8
also one of the first studies to examine sex-based differences in F0 for AAE speakers,
with their results demonstrating that African American males showed greater variation in
F0 range overall compared to African American females, which was not the case for the
EAE speakers.
Taken together, a number of consistent findings emerged in these early studies.
They highlight that AAE speakers may use a wider pitch range as a resource in certain
registers (Thomas 2015). However, the conclusions from both Tarone (1973) and Loman
(1975) should be regarded tentatively, as their explanations for F0 variation as related to
competitive or excited speech in AAE is problematic. What both authors noted is a result
of stylistic differences in the speech event, and to be clear, it is not the fact that AAE
itself is “competitive” or “excited” speech. Both studies observed the use of falsetto in
certain discourse contexts, which, rather than uncovering general differences between
AAE and EAE, perhaps highlights a possible distinctive pragmatic/semantic function for
falsetto use. Both studies examined young African American men conversing with each
other, so the observation of competitive or excited speech may be a function of these
particular interaction types, not a characteristic of most utterances in the variety (cf.
Smitherman 1977; Alim 2004). Though not examining AAE, Podesva (2007)
demonstrated ways in which falsetto, and F0 movement more generally, are linked to
expressiveness and act as a resource for indexing identity.
In sum, Tarone (1973), Loman (1975) and Hudson and Holbrook (1981, 1982) all
complement one another with respect to their findings. Tarone (1973) dealt with final
contours for the most part, whereas the work of Loman (1975) dealt primarily with non-
final contours. Tarone (1973) found that AAE speakers exhibit different patterns than

9
their EAE counterparts in final contours, with Loman (1975) showing a higher
occurrence of stressed syllables for AAE speakers as well as a continual shift between the
low and high-end of a speakers’ pitch range. An important implication in the findings in
Loman (1975) is that AAE speakers may have a higher occurrence of pitch accents,
relative to EAE speakers, as pitch accents fall predominantly on stressed syllables.
Further, in Loman (1975) there is a marked shift in AAE speakers’ pitch on stressed
syllables. Hudson and Holbrook (1981, 1982) provided insight into the general
characteristics of F0 instrumentally that were first observed in impressionistic coding by
Tarone (1973) and Loman (1975). They also examined possible sex-based differences in
pitch characteristics for AAE speakers. These papers helped lay a groundwork for initial
understandings of AAE intonation, while also acting as a springboard for future research.
1.3.1.2 MAE_ToBI Conventions
More recent work on AAE prosody has expanded away from a focus on overall
F0 characteristics, such as pitch range and boundary tones, to look more broadly at
intonation in AAE. In terms of general approaches to analyzing intonation, the
MAE_ToBI paradigm (Beckman et al. 2005), or ToBI more generally, has become the
predominant intonation annotation and transcription system and serves as a system
through which researchers can compare and contrast research findings with similar
terminology and assumptions. While the approach to prosodic prominence used in my
study does not make use of MAE_ToBI, I briefly describe two relevant components of
that system so that my discussions of prior prosodic studies, and my own findings, can be
better related to work in the MAE_ToBI tradition.

10
Within MAE_ToBI, there are two main phrase types described for varieties of
English. The first, an intonational phrase (IP), is characterized by an obvious boundary
tone and the lengthening of the final syllable or foot; these phrases are often, though not
always, followed by a pause, and seem to be found in all languages. Boundary tones are
generally defined by either the rise or fall in pitch at the end of an utterance, and mark the
end of an utterance. The second phrase type is an intermediate phrase (ip), and is
characterized by a less obvious boundary tone (often referred to as a phrasal accent) and
some final lengthening, but not followed by a pause (in which case the phrase would be
an IP). The most important distinction between these two phrase types is that
intermediate phrases are contained within intonational phrases. Only certain languages,
including English, have this phrase type (Beckman, Hirschberg, and Shattuck-Hufnagel
2005). One component of MAE_ToBI that has been central to many studies of intonation
is pitch accents. Pitch accents are defined as distinctive pitch peaks or pitch events, which
stand out both perceptually and in the F0 track. In English, pitch accents are annotated as
a combination of low and high tones (e.g. L+H*, L*+H) or as monotonal with either tone
by itself (e.g. H*, L*) (Beckman et al. 2005).
1.3.1.3 Recent Sociolinguistic Studies of AAE Prosody
One of the first studies utilizing the MAE_ToBI for AAE intonation, Jun and
Foreman (1996) compared boundary tones and focus realizations for information
structure in different utterance types for AAE and Mainstream American English (MAE)
speakers in Los Angeles, California. Focus realizations in prosody literature are typically
discussed in terms of narrow versus broad focus. In English, narrow focus is when one

11
part of an utterance is highlighted prosodically by a speaker, while broad focus indicates
the entire utterance is highlighted by the speaker. Intonation has been shown to indicate
information structure (old, new or contrasting information) in English, which is often
achieved through the marking of focus on lexical items. In English, often there is an
expanded pitch range on lexical items in focus (new/contrastive information), often
referred to as the nuclear accent, and a compressed pitch range for lexical items not in
focus (old information). Jun and Foreman (1996) used the MAE_ToBI annotation
paradigm, examining four male and four female AAE speakers and comparing them to
two male and two female MAE speakers. They found several differences between these
two ethnolects: First, African Americans showed a considerable amount of variation in
boundary tone realizations in IPs compared to their European American counterparts. For
example, AAE speakers show both rising and falling boundary tones for yes/no
questions, whereas EAE speakers show only rising boundary tones for yes/no questions.
Secondly, in the event of a high boundary tone, European Americans placed these high
tones on the final syllable, whereas AAE speakers placed this tone at the beginning of the
final word in an utterance, with the pitch then slightly falling. Third, AAE speakers tend
to have a pitch accent after the focal pitch accent, or a pitch accent following the lexical
item in (narrow) focus. English varieties typically exhibit post-focal de-accenting
following a focal pitch accent (Jun and Foreman 1996), and this pattern is unusual in
most varieties of English. In fact, as noted in Cole et al. (2005), the occurrence of post-
focal pitch accents should align with the greater number of primary stresses found in
Loman (1975), with the findings in these studies being potentially explained by the same
phenomenon. Additionally, Jun and Foreman (1996) found that AAE speakers in their
12
data are more likely to have a high tone at the beginning of an utterance. And, lastly, they
found that the AAE speakers in their study had a wider pitch range than the MAE
speakers. Jun and Foreman (1996) also confirm earlier results from Loman (1975),
Tarone (1973) and Hudson and Holbrook (1981, 1982) with respect to overall pitch range
for AAE speakers. Additionally, the incidence of post-focal pitch accents in these data
seem to confirm the observation of Loman (1975) that AAE speakers have a greater
number of (primary) stressed syllables, which implies more pitch accents, than their
European American counterparts (see also Thomas 2011, 2015 for more in depth
discussions).
Wolfram and Thomas (2002) examined intonation in AAE and EAE in Hyde
County, North Carolina, focusing on changes over time, drawing data from
sociolinguistic interviews with 32 speakers (16 African Americans and 16 European
Americans) over two generations (speakers born before 1920 and born after 1960). They
examined whether or not pitch would rise or fall in a sequence of stressed syllables. The
authors found robust differences in the frequency of high pitch accents among the
African Americans and European Americans, and this difference appears to be long-
standing, across both generations of their speakers (Wolfram and Thomas 2002).
Cole et al. (2005) built upon the findings of these prior studies by employing
acoustic analysis alongside a simplified MAE_ToBI-based analysis, by investigating if
there is a phonetic basis for phonological differences between AAE and EAE. To do this,
the authors analyzed the slope of pitch contours of AAE and EAE. In other words, if
there does seem to be persistent phonetic differences in the slope of pitch contours on
accented syllables (i.e. pitch accents), then there could possibly be a difference in the

13
phonological inventory (i.e., a different set of pitch accents) for AAE and EAE
intonation. Ultimately, Cole et al. (2005) found no statistically significant differences
between AAE and EAE in terms of the slope of pitch contours on accented syllables,
suggesting, at least in this phonetic domain, that there appears to be a shared inventory of
phonological pitch accents between African Americans and European Americans. On the
other hand, they also found a continued rise and fall of the F0 track over the course of an
intonational phrase (IP) for African American speakers, which suggests another possible
phonetic distinction between African American and European American intonation,
which may have phonological implications with respect to pitch accent inventories.
Additionally, the Cole et al. (2005) study explicitly aimed to disentangle ethnicity
and sex-based differences, which up until this point had been understudied. Cole et al.
found that sex effects were in general larger for the European Americans than for the
African Americans, and that for African Americans, both males and females exhibited
more prominent falls in F0 contours over the course of a pitch accent domain. These
findings suggest that investigations of prosodic differences by ethnicity should not ignore
potential sex-based variation.
The observed low falling contours found in AAE speech, which are absent in
EAE speech, may be indicative of a pitch accent type for AAE intonation (H*+L) not
present in the MAE_ToBI inventory: a bitonal contour where a low tone immediately
follows a high tone. Though unattested in other American English varieties, this tone has
been described in Trinidadian English Creole and Jamaican English (cf. Gooden, Drayton
and Beckman 2009). On the other hand, the low falling contours in pitch accents often
occur phrase medially, possibly indicating that falling F0 contours may arise from a low
14
tone (L- in MAE_ToBI analysis) assigned to an intermediate intonational phrase (ip) not
anchored to the previous tonal event, and could be indicative of a difference in prosodic
phrasing and structure rather than a difference in pitch accent inventory. Alternatively,
falling F0 contours could also be a byproduct of a greater pitch range for AAE speakers,
such that if a pitch accent is at the upper end of an AAE speaker’s range (which exceeds
that of EAE speakers), then pitch may reset to an easier to produce frequency within that
speaker’s range (Cole et al. 2005). Essentially, there remains open questions about how
the phenomena of “more pitch accents”, “higher pitch range” and the pronounced “rise
and fall of the F0 track” interact. The take-away of primary importance for this
dissertation is that a pronounced rise and fall of the pitch (F0) track appears to be
indicative of differences between AAE and EAE prosody. Further, the differences
described by Cole et al. (2005) may play a role in listeners’ perceptions of prosodic
prominence. Meaning, the rise and fall of the pitch track in AAE speech could lead
listeners to hear more prominences in AAE voices compared to EAE voices.
McLarty (2011) set out to investigate some of the findings and suggestions for
avenues of future research in Cole et al. (2005), focusing on the extent, if any, that F0
excursion (the difference from the peak value of F0 to the following trough) accounts for
the differences between AAE and EAE, especially with respect to the rise and fall of the
F0 track, as this would shed light on the possibility suggested by Cole et al. (2005) that
AAE has a pitch accent (H*+L), not found in other varieties of American English. F0
excursion in McLarty’s data did not show statistically significant differences between
African Americans and European Americans. However, the rates of occurrence of the
L+H* per syllable compared to the H* was significant for AAE voices; that is, AAE

15
speakers in McLarty’s data used this pitch accent more than the EAE voices. This was
interpreted as a possible preference for L+H* in AAE relative to EAE. But, McLarty
(2011) overall provided support for Cole et al.’s (2005) suggestion that there appears to
be shared pitch accent inventory between these two ethnolects, even if there are more
occurrences of a pitch accent type (e.g. L+H*). Essentially, these studies suggest that the
primary differences between AAE and EAE prosodically appear to be phonetic and not
phonological.
Holliday (2016) examined AAE intonation in 20 biracial individuals to better
understand the intersection of ethnicity, identity and style. Much of her work focused on
how intonation can act as an index of ethnicity for these individuals. Holliday (2016)
used a framework of ethnic identity proposed by Rockquemore and Brunsma (2008), and
conducted sociolinguistic interviews that included questions on race, social networks,
language, and self-identification. Based on responses, she then classified her participants
into three different identity types: Border, Singularly Black and Protean. Border identity
includes individuals who self-identified as biracial. Singularly Black individuals
identified as African American, and Protean individuals shifted between black and white
identities “based on social situation and motivation” (Holliday 2016: 21). Confirming and
expanding upon prior work on AAE intonation relevant for this dissertation, Holliday
(2016) found that individuals who identified as Singularly Black, when compared to
those identifying as Border and Protean, showed higher incidence and an overall
preference for the L+H* pitch accent, highlighting the indexical role that this pitch accent
may have in AAE speech.

16
Finally, using a modified version of MAE_ToBI, McLarty (2018) set out to
investigate the findings in McLarty (2011), in a way that explores potential differences in
overall pitch accent rates, pitch accent type and preference and frequency between AAE
and EAE varieties over time. Speakers in this study were males and females from
Raleigh, North Carolina born between 1918-1955 and were compared to speakers born
prior to the Civil War. Overall this study found pronounced and persistent differences
between AAE and EAE pitch accent preferences and rates of use for these speakers
across generations. Both in the past and in older speakers today, the AAE speakers
showed a preference for the L+H* pitch accent, regardless of sex or time period,
compared to their European American cohorts. Moreover, the significantly higher rates of
use of the L+H* pitch accent contributed to a difference in total pitch accent use (L+H*
and H*), where the African American speakers produced more pitch accents overall in
comparison to the European American speakers. These differences were not based solely
on ethnicity, but also sex, in that the AAE-speaking females and EAE-speaking males
exhibited change over time, but not in ways that aligned just with ethnicity and sex. Both
the AAE-speaking females and the EAE-speaking males increased their overall rates of
pitch accents, while the AAE-speaking males and EAE-speaking females showed a good
bit of stability between generations.
This more recent work has provided insights into some of the phonetic
distinctions that comprise differences between AAE and EAE intonation. First, both Jun
and Foreman (1996) and Cole et al. (2005) confirm prior work demonstrating that AAE
speakers have a wider pitch range than their EAE counterparts. Both Jun and Foreman
(1996) and Wolfram and Thomas (2002) confirmed instrumentally the findings of Loman

17
(1975), showing that AAE speakers have a higher frequency of pitch accents in a
sequence of stressed syllables than their European American counterparts. Cole et al.
(2005) shed light on several underexamined aspects of AAE intonation. Based on the
slope of pitch contours, they do not find evidence for AAE speakers having a unique
pitch accent. However, their study did not address F0 excursion or whether all the pitch
accent types are available for all speaker groups or whether there are differences in
frequency or distribution in these pitch accent types, only that that there did not appear to
be a pitch accent present in AAE not found in EAE. Further, their study was not able to
explain the continual rise and fall of the F0 track over the course of an utterance for AAE
speakers. McLarty (2011) found no difference in excursion for AAE and EAE intonation,
further confirming a shared pitch accent inventory in these two ethnolects. Holliday
(2016) is crucial for unpacking how intonational differences relate to ethnic identity. By
incorporating identity into the study of AAE intonation, she demonstrated in a nuanced
way that patterns for the L+H* pitch accent found in prior work (e.g. McLarty 2011) may
be indicative of a pattern of usage that is unique to AAE speakers and indexes African
American identity. This highlights the functionality of intonation in the ethnolinguistic
repertoire of African American English speakers (cf. Becker 2014; Benor 2010). McLarty
(2018) found that in terms of intonation, there are long-standing, persistent differences
between AAE and EAE, with AAE speakers showing significantly more pitch accents per
syllable and a preference for the bitonal pitch accent (L+H*). An important point to
reiterate about work utilizing the MAE_ToBI paradigm in the study of AAE intonation is
that MAE_ToBI was not designed for AAE, which I will come back to in both Section
1.6 and Chapter V.

18
1.3.1.4 Sociolinguistic Studies of other Aspects of AAE Prosody
While AAE intonation has not been as widely studied as aspects of morphosyntax
and segmental phonology, other aspects of prosody within AAE, such as speech rate and
prosodic rhythm, have seen even less research focus. Thomas and Carter (2006)
examined whether or not AAE and EAE varieties in the American South are converging
or diverging over time. The authors compared conversational speech of contemporary
African Americans and European Americans to African Americans and European
Americans born before the Civil War, as well as other varieties/languages that exhibit a
range of values on the continuum between syllable-timing (e.g. languages such as
Spanish) and stress-timing (e.g. English). Using the Pairwise Variability Index (PVI)
measure (Low, Grabe, and Nolan 2000), Thomas and Carter demonstrated that while
AAE in the past was more syllable-timed, it has now become more stress-timed and more
similar to EAE.
Considering other areas of prosody, Kendall (2013) examined pause and
articulation rate variability in American English using corpus-based approaches. In this
specific analysis, Kendall (2013) compared AAE to other ethnic varieties, finding
significant differences between the ethnolects under investigation. The AAE speakers in
this study pattern with Latino speakers and not EAE speakers with respect to pause
durations and articulation rates. Kendall (2013) provided some caution in the
interpretation of results, due to the fact that these differences are quite nuanced and could
be a result of other social factors (such as age, region and sex) and may not be simply a
result of ethnicity.

19
With respect to intensity (the relative amplitude or loudness of speech), there is
virtually no sociolinguistic or sociophonetic work examining this feature in AAE, and its
relationship to other prosodic phenomena. This may be due to the fact that intensity itself
is somewhat ambiguous acoustically and intertwined with in other segmental and
suprasegmental factors of more interest for sociophoneticians. Intensity is also relative,
and not absolute. Often, in sociolinguistic recordings collected in the field, its differences
are attributable to the recording setting and context rather than to properties of the
speaker. In sociophonetic approaches, intensity is subsumed within features that have
been of greater interest, such as lexical stress, nasality, phonation, shimmer, etc. (see
Thomas 2011 for a full discussion), and is often not examined alone. For the variable of
interest for this dissertation, prosodic prominence, intensity is a strong predictor for
prominence (see Section 1.3) and potentially plays an important role in prosodic
differences across varieties.
Despite these findings described here, it remains unclear as to the extent to which
prosodic differences in AAE and EAE varieties, as coded by MAE_ToBI or measured
through various rhythm metrics, are perceptible by non-phonetically-trained listeners.
That is, what this prior work has left unaddressed is whether the described differences
between AAE and EAE are perceptually salient for everyday listeners. More simply put,
do the differences described in production-based prosodic research in AAE matter to
everyday African American and European American language users? In the following
section, I discuss previous research on perception of AAE and studies of ethnic
identification. Ethnic identification literature, especially over the last twenty-five years or
so, has increasingly focused on the acoustic cues listeners attend to in the differentiation

20
of AAE and EAE voices. The purpose of reviewing the ethnic identification literature and
AAE is to better understand what the potential role of prosodic cues are in this process.
Some of the cues that listeners utilize in ethnic identification may also be some of the
same cues listeners utilize in prominence perception.
1.3.2 Perception-Based Studies and Ethnic Identification of AAE
In order to understand some of the production-based differences between AAE
and EAE varieties, sociolinguists have conducted perception-based experiments to
determine if and how speakers or listeners differentiate AAE from EAE, how production-
based differences between varieties affect auditory differentiation, and what listeners are
capable of accessing to make these identifications (Thomas and Reaser 2004; Thomas,
Lass, and Carpenter 2010). These experiments have demonstrated that American English
speakers are remarkably accurate in ethnic identification tasks, in which participants
correctly identify African American and European American voices with a great deal of
accuracy, from 70-90% on average (Shuy, Baratz and Wolfram 1969; Abrams 1973;
Irwin 1977; Bailey and Maynor 1989; Maynor 1992; Wolfram 2001; Mallinson 2002;
Thomas and Reaser 2004; Thomas, Lass, and Carpenter 2010). The first studies of ethnic
identification began in the 1950s with work by Dickens and Sawyer (1952) and the use of
ethnic identification tasks in the sociolinguistic tradition began in the late 1960s, with the
work of Shuy, Bratz and Wolfram (1969) in Detroit, MI.
Of the ethnic identification studies testing listeners’ ability to correctly identify
African American and European American voices, there are several that are important for
this dissertation. Irwin (1977) had mostly European American listeners from Ohio
21
identify the ethnicity of voices from North Carolina, with 90% listeners accurately
distinguishing these two ethnicities. The fact that these listeners, who are from a different
location and not African American, and thus presumably have a different dialect
background than the voices, still performed at such high accuracy, speaks to how salient
AAE is to American English speakers. In fact, Spears (1988) argued that even in absence
of stigmatized morphosyntactic and lexical items that are strongly associated with
African Americans there are voice characteristics that American listeners can access to
correctly distinguish AAE voices from EAE voices. Spears (1988) goes on to note that
prosodic cues may be at the core of these voice characteristics.
Perrachione et al. (2010) is particularly relevant for this dissertation. In this study,
the authors examined ethnic identification in AAE and EAE voices, while taking into
account listeners’ relative experience with these varieties and effect of this experience on
the potential acoustic cues listeners use in distinguishing AAE voices from EAE voices,
with the authors explicitly considering how listeners’ own dialect shapes their perception
system. The stimuli in this study consisted of twelve African American and twelve
European males reading phonetically balanced sentences, which did not contain AAE-
specific morphosyntactic features. The participants were African Americans from African
American households, and European American participants from European American
households. The participants were presented the stimuli and asked to indicate whether the
voices were African American or European American.
The authors found that participants correctly identified African American voices
where there were numerous phonetic and phonological features associated with AAE.
They also found that for African American voices that did not possess many of these

22
features, or had a mix of AAE and EAE features, some listeners would identify these
voices as European American. The authors found that listeners were more adept at
identifying voices of their own ethnicity, and that this is especially true for the African
American listeners, who were more accurate at identifying the voices that did not have
many AAE features than the European American listeners.
Perrachione et al. explained that this outcome is a result of “asymmetric cultural
experiences with speech” from different dialects (2010: 12). Asymmetric cultural
experience leads to differential quality and quantity of some experiences compared to
others. They go on to explain that, “since individuals predominately associate with others
with whom they share (or, for children, will come to share) a linguistic background, their
auditory system becomes primarily tuned to the meaningful variation within that
language or dialect” (Perrachione et al. 2010: 12). These results are especially relevant to
the potential outcomes for the analyses in this dissertation, since they suggest that African
American listeners may be more sensitive to features in African American speech than
less familiar European Americans.
Purnell, Idsardi, and Baugh (1999) considered the real-world implications of
listeners’ accuracy in identifying the ethnicity of speakers from their voices. They
showed that this ability can have serious ramifications in the lives of African Americans,
in areas such has housing, education and the legal system. In this study, the authors found
that listeners were able to correctly identify the ethnicity of the voice they are hearing in
as little two syllables (i.e. the word “Hello”) and demonstrated that speakers of AAE can
be denied housing and employment based on the perceived ethnicity of their voice.

23
Much of the work that has investigated ethnic identification has found that there
are several cues that listeners access in distinguishing AAE voice from EAE voices. Cues
such as vowel quality and syllable structure play a role in ethnic identification. Most
importantly for this dissertation, a few of these studies have shown that prosodic patterns,
specifically F0 characteristics and intonation, are cues that participants use for auditory
differentiation (Hawkins 1992; Walton and Orlikoff 1994; Thomas and Reaser 2004;
Thomas et al. 2010). What is less understood is the relationship between intonation and
other aspects of prosody, such as rhythm, as each domain relates to ethnic identification.
Hawkins (1992) showed that lower F0 values were associated with African Americans,
and that accuracy rates for ethnic identification differed for European American and
African American listeners. Thomas and Reaser (2004) conducted two experiments
testing ethnic identification using five-second excerpts of continuous, spontaneous speech
from sociolinguistic interviews of AAE speakers from Hyde County, North Carolina.
Their results suggested that vowel quality and intonation are cues that listeners accessed.
For the ethnic identification task, the first procedure looked at vowels, namely /o/, which
is emblematic of the African American Vowel System (AAVS; see Thomas 2007), as
North Carolina European American speakers centralize /o/ in the vowel space, whereas
North Carolina AAE speakers for the most part do not, or at least not to the degree that
North Carolina EAE speakers do (Thomas 2007). The second procedure excised vowels,
but kept subject pronouns, as they were helpful in emphasizing pitch accents. The
inclusion of these subject pronouns emphasized intonational variation, as subject
pronouns tend to co-occur with pitch accents and/or stress more often in AAE than in
EAE (Thomas and Reaser 2004).

24
In a follow up study, Thomas et al. (2010) expanded upon the findings of Thomas
and Reaser (2004), with a goal to disentangle the relationship of vowel quality and
prosody by examining the role that F0 plays in these tasks. The researchers paired AAE
and EAE speakers, and then manipulated the acoustic signal, switching F0 contours and
swapping segmental duration for each paired utterance, syllable by syllable. The results
showed that for all conditions, ethnicity was accurately identified over 80% of the time,
and at 84% for the prosody swapped condition. The similarity in the results highlights
that listeners use multiple cues in ethnic identification tasks, with F0 being a major
contributor to these percepts, while also highlighting how the perception system is
opportunistic, using different cues depending on their availability and reliability.
Though this dissertation is not about ethnic identification per se, it is about
perception. There has not been much work on the perception of prosody in AAE, with
much of what we know about how listeners attend to prosody in AAE and EAE voices
coming from the ethnic identification studies just discussed. The fact that there are
prosodic cues that listeners attend to in ethnic identification tasks (among others) can
help inform expectations for this study. That is, it may be the case that the listeners in this
dissertation are utilizing some the same cues utilized in ethnic identification in
prominence perception.
1.4 Prosodic Prominence, Perception and the Sociolinguistic Endeavor
Prosodic prominence presents a unique lens through which sociolinguists can
investigate prosodic variation in both production and perception in conversational speech.
Basing much of our work on acoustic measurements or analyst coding, sociolinguists

25
rarely examine or have a good way to know whether our measures of prosody are
relevant to everyday listeners or even how well they correlate with features that are
perceptually salient. Recent work in laboratory phonology has developed approaches that
provide a new way to examine prosody that taps into the perceptions of everyday
listeners. This work has begun investigating prominence, defined as “the strength of a
spoken word relative to the words surrounding it in an utterance” (Cole et al. 2010: 425),
as a domain of interest. While prosodic prominence is just one aspect of prosody and its
study cannot speak to the wide range of proposed prosodic differences between AAE and
EAE, prominence relates to several prosodic characteristics that have been highlighted in
prior work on AAE prosody. These include primary stresses, vowel duration differences,
and intonation. Differences between AAE and EAE in terms of intonation and more
general F0 characteristics (i.e. pitch range and pitch max) are particularly relevant for this
dissertation. AAE has been described has having more dynamic pitch realizations, more
primary stresses and potentially differences that can (in part) be attributed to vowel
duration (i.e. studies of rhythm and vowel quality). These factors can be examined
through the lens of prosodic prominence. In fact, approaching the study of AAE prosody
through a focus on prosodic prominence allows researchers to consider a range of
prosodic features, without the need to rely on a single theoretical construct such as
MAE_ToBI.
Though prominence can be examined on a more micro-level, such as the syllable
(and foot) (Beckman 1996; Ladd 1996), in this dissertation, I focus on prosodic
prominence at the phrasal level. At the level of the phonological phrase, one or more
words can exhibit greater prominence than others and prominence is often tied to focus,
26
especially in English varieties (Beckman 1996; Ladd 1996; Calhoun 2006; Cole et al.
2010). Phrasal prominence is often phonetic, and not necessarily phonological.
Prominence is strongest in the stressed syllable of words (relative to non-prominent
words) and includes a range of acoustic features, such as increased duration and intensity,
hyper-articulation, and rhythmic differences, as well as F0 movement (often defined as a
pitch accent in MAE_ToBI) (Pierrehumbert 1980; Beckman 1986; Beckman and
Edwards 1994; Ladd 1996; Cole et al. 2007). Simply put, speakers who indicate
prominence in production do so through prominent pitch events, greater intensity and
longer duration.
The Rapid Prosodic Transcription (RPT) task, a methodology created by Jennifer
Cole and her colleagues, provides a means to examine prosodic prominence and to
investigate how naïve/everyday listeners attend to prominence. It provides data that can
speak to questions like how much listeners agree in their ratings of prominence, while
also facilitating the investigation of what linguistic features correlate with perceived
prominence (Mo 2008, 2009; Mo et al. 2009a; Mo and Cole 2011; Cole, Mo, and
Hasegawa-Johnson 2010; Cole, Mahrt, and Hualde 2014; Hualde, et al. 2016; Cole,
Mahrt and Roy 2017). Of particular interest for sociolinguists is the fact that this
approach emphasizes the importance of conversational speech in ascertaining the
interactive communication of everyday speech and how it relates to prosodic variation,
rather than a focus on controlled, read speech which has often been the case in laboratory
approaches to prosody. Conversational speech is subject to reduction and reflects a range
of expression types and foci. It is also, of course, generally the preferred data for
sociolinguistic research. In the RPT experimental paradigm, listeners are simply

27
presented with short excerpts of conversational speech ranging from 11-23 seconds in
length (e.g. Cole et al. 2010), along with simple transcripts of the audio. Listeners are
then told that some people highlight words more than others in speech, and to mark all
words that they hear as highlighted (Cole et al. 2010). The output of the task for
researchers is simply a series of 1s and 0s corresponding to the words in the stimuli, a “1”
if the word is marked as prominent, and a “0” if it is not.
Using speakers from Buckeye corpus (Pitt et al. 2007), Cole et al. (2010)
demonstrated that listeners (native American English speakers from the Midwestern U.S.)
agree in their ratings of prosodic prominence well above the level of chance.
Additionally, they found that duration, intensity, and F0 are statistically significant
acoustic correlates of prominence perception. They also show that word frequency and
part of speech are significant predictors of prominence ratings. For word frequency, the
less frequent a word is, the more likely it is to be marked as prominent. For part of
speech, they found that nouns are more likely to marked as prominent than other words.
Cole et al. (2014) presented native Mainstream American English speaking
listeners with conversational speech excerpts, again from the Buckeye Corpus. In this
study, the authors asked some listeners to attend to prominence when only focusing on
acoustic cues, and others to focus on semantic/structural cues. The authors demonstrated
that when listeners rate prominence, they are able to “weigh acoustic and meaning based
cues differently when specifically instructed, but that in the absence of instructions
calling for attention to meaning-based criteria, transcribers rely more on acoustic cues in
marking prominences” (Cole et al. 2014). Cole et al. (2017) and Hualde et al. (2016) both
demonstrated that prosodic prominence ratings by everyday listeners is highly correlated
28
with MAE_ToBI transcriptions by expert analysts. This is to say, that that the RPT
approach can align well with prior analyst-driven approaches with less cost (in terms of
money, time and training) in addition to allow researchers to probe what listeners attend
to in prosody.
Of particular importance to prior work on AAE, Hualde et al. (2016) used 15
excerpts from 15 different speakers in the Buckeye Corpus (whose ethnicity was not
identified, but is presumed to be European American), and had 30 native speakers of
English rate prominence for these excerpts using RPT, while also having those same
excerpts coded in MAE_ToBI by expert analysts. The authors found that in English, the
bitonal pitch accent (which is favored by AAE speakers) is more likely to be rated as
prominent by naïve listeners. As a reminder, AAE speakers utilize this bitonal pitch
accent more than their EAE cohorts, so this may lead listeners to rate more prominences
in AAE voices than in EAE voices. Relevant for this dissertation, it could be the case that
since AAE speech includes more of these bitonal pitch accents, listeners potentially hear
more prominences for AAE voices, than EAE voices.
With respect to MAE_ToBI, Cole et al. (2017), also using conversational speech
excerpts from the Buckeye Corpus, addressed what it means to be a “good rater” in
prominence perception. To do this they compared naïve listeners from different language
backgrounds (American English and Indian English) to MAE_ToBI annotators, to better
understand how many raters are needed in an RPT task to facilitate acceptable levels of
agreement, and if listeners who differ their linguistic background attend to different
linguistic factors (both acoustic and structural) when rating prominence. That is, they
assessed how many listeners are needed to rate a conversational speech excerpt to

29
achieve optimum inter-rater reliability agreement, finding that 10-12 raters are needed to
achieve reliability. They also found that listeners, despite differences in their linguistic
backgrounds, generally attend to the same acoustic cues in prominence perception.
Additionally, they found that there are some raters who are just better at the task than
others, approaching the level of agreement for MAE_ToBI-trained annotators. Especially
important for this dissertation is that the most reliable raters are listeners who “have
strong familiarity with the language variety represented in the materials” to be rated for
prominence (Cole et al. 2017: 322).
For sociophoneticians and sociolinguists, the RPT approach provides two main
benefits. First, this approach gives sociophoneticians another tool for the study of
prosody by marrying sociophonetic and laboratory phonology approaches, helping to
enrich and augment what researchers have already uncovered with respect to prosodic
variation. That is, this approach allows sociophoneticians to probe the everyday listeners’
(i.e. non-linguists’) perception of prosodic phenomena while also providing researchers a
glimpse into what factors matter to listeners. A second benefit for this approach is its
practicality. Traditional approaches to prosodic analysis, like MAE_ToBI, require an
immense amount of training and are incredibly time consuming. MAE_ToBI analysis is a
slow process (10-100 times the duration of the speech recording; Cole and Hasegawa-
Johnson 2012), and does not lend itself easily to conversational recordings (Thomas
2011). By using the RPT methodology, sociolinguists can crowd-source prosodic
annotation much more quickly, again with some raters showing agreement levels as high
as those found in MAE_ToBI transcriptions by trained analysts (Cole et al. 2017). This
approach allows sociophoneticians without access to training in MAE_ToBI to be able to

30
investigate prosodic variation, and ask questions related to prosody in AAE that have not
been addressable in prior work.
Although prior MAE_ToBI-based approaches have yielded important insights
into prosody in AAE, these studies are always based on the perceptions of a relatively
small set of researchers who are trained to listen to prosody in a specific and similar way.
The RPT task allows researchers to ask everyday listeners, who can themselves be
speakers of the variety in question, what they attend to in samples of speech, while also
facilitating studies of prosody that are more cost-effective and potentially have more
ecological validity for non-linguists.
To summarize, RPT yields prosodic annotations that have been shown to align
with annotations by expert analysts (Hualde et al. 2016; Cole et al. 2017). As just
discussed, MAE_ToBI is time-consuming and requires an immense amount of training.
The RPT approach allows sociophoneticians who do not have access to ToBI training to
examine prosody. A further benefit of RPT is that this approach also provides researchers
a relatively straightforward way to the evaluate acoustic and structural cues that everyday
naïve listeners utilize in rating prominence, something I turn to in Section 1.5.
1.5 The Role of Experience and Listener Dialect in Perception
A central question in this dissertation is the role of the listeners’ experience with
AAE. Linguists have long known that there is a complex relationship between speech
production and speech perception, where these two aspects of knowing a language—of
“having a dialect” (in the terms of Sumner and Samuel 2009)—are related but not in a
straightforward way. Increasingly within sociophonetics, there is an interest in how

31
socially meaningful experiences with dialects influence perception, with several studies
that are particularly relevant for this dissertation having recently investigated these
questions.
Evans and Iverson (2007) examined how listeners adjust their vowel categories in
perception when hearing speech from two different dialects. Their listeners resided in
London, England, a multicultural and multidialectal city, but the participants came from
two different regions in England with distinct vocalic patterns, southern England and
northern England. They found that the listeners were able to adjust vowel categories in
perception for some vowel classes that they were familiar with but not for others that they
were less familiar with. This pattern was reflective of listeners’ linguistic experience,
where listeners who were not able to adjust their vowel categories in perception did not
have enough experience perceptually with the variety they heard.
Sumner and Samuel (2009) examined the relationship between production and
perception of rhoticity for three different listener groups: New York City listeners who
were r-less in their production, New York City listeners who were r-ful in their
production, and General American listeners (GA) who were also r-ful in production. New
York City English (NYCE) generally exhibits variability in rhoticity, where some
speakers of NYCE are r-less and some are not (e.g. Labov 1969; Labov 1972). Especially
relevant for this dissertation, Sumner and Samuel (2009) were interested in what it means
to have a dialect; that is, is having a dialect a component of production (which is often
how it is discussed in sociolinguistic literature), perception, representation or a
combination of the three? Specifically, they investigated how dialect variants are encoded
32
and represented by speakers of different dialects, and the effects of experience with a
dialect in processing and representation.
The authors found that experience is crucial for the processing and representation
of dialects, where “the most obvious influence of experience (or, the lack of it) is the
inability of General American participants to process out-of-dialect forms. There is a
clear and consistent processing cost for speakers new to a non-native dialect region”
(Sumner and Samuel 2009: 499). Essentially, since the General American listeners had
little exposure to the r-less variant, they showed significant processing costs when
presented with this form. The most interesting findings, however, were related to the two
NYCE listener groups. The r-less NYCE listeners showed fewer costs associated with
processing both variants, compared to the r-ful NYCE listeners. This finding
demonstrated that “language use and language representation are not equivalent, at least
for listeners exposed to two dialects” (Sumner and Samuel 2009: 499).
A possible explanation provided by Sumner and Samuel (2009) was that, while
both listener groups were life-long New York City residents and exposed regularly to
both r-ful and r-less forms, the kind and amount of experience they had with these
variants are different. The r-ful NYC listeners were exposed to the r-ful variant at home
and at a young age, and their exposure to the r-less variant is likely found in their peer
groups, whereas the r-less NYCE listeners were exposed to the r-less variant at home
from young age, and their exposure to the r-ful form was likely in more formal contexts
(e.g. school) and through their peers and media. Returning to the original question of
what it means to have a dialect, Sumner and Samuel (2009) suggest that dialects are

33
defined not just by production, but by a combination of production, perception and
representation.
Kendall and Fridland (2012) considered how listeners from three different dialect
regions in the United States (the South, the (Inland) North and the West) performed on a
vowel identification task in which listeners were presented with a synthesized continuum
between /e/ and /ɛ/, and then asked to select which token they heard based on two
potential options (i.e., did the listeners hear either bait or bet). All three listener groups
came from distinct dialect regions that show differences in the mid-front vowels. In the
South, there is a reversal of /e/ and /ɛ/ in the vowel space (and thus spectral overlap),
which is a component of the Southern Vowel Shift (SVS). In the Inland North, /e/ and /ɛ/
are maximally distant, which is a feature of the Northern Cities Shift (NCS). Whereas in
the West, /e/ and /ɛ/ are somewhere between these two extremes. Additionally, in this
study the authors also collected speech production data from a subset of listeners. The
authors were interested in understanding how these listeners’ own dialect, influences their
perception of these vowel categories, finding that listeners with vowel productions that
were representative of the SVS selected tokens that were more SVS-like. The findings in
this study provided important insights related to how perception and production are
shaped by regional background and thus experience.
The three studies discussed here presented findings that are directly applicable for
the interpretation of the analyses throughout this dissertation. With respect to prosody in
AAE, we do not know which acoustic cues listeners attend to when they listen to AAE
voices and how acoustic differences between AAE and EAE are noticed or perceived by
listeners. Studies such as Evans and Iverson (2007), Sumner and Samuel (2009), and

34
Kendall and Fridland (2012) in particular provide insightful explanations for patterns
seen in their data that inform the predictions and interpretation of the data for the present
study. The listeners in Sumner and Samuel (2009) reflect a similar sociolectal situation as
the listeners in this dissertation. They examine three sets of listeners, two of which are
from the same location but differ in terms of a feature of NYCE, but both have varying
levels and different types of experience with this feature. They compare these listeners to
listeners who are not from New York City and who do not have experience with this
variety. In this dissertation, the situation is similar, where I examine how listeners from
North Carolina and Oregon attend to prominence in voices from North Carolina. A key
sociolectal difference between this study and Sumner and Samuel (2009) is that I also,
and centrally, examine the role of ethnicity.
1.6 Summary
Prosody in AAE has been understudied in sociolinguistic research on speech
production, but even more so in perception. Our knowledge of prosodic variation in AAE
has utilized a range of methodologies and approaches that have provided important
insights for scholars regarding differences between AAE and EAE varieties. The limited
studies on these questions have indicated persistent, long-standing differences between
these varieties. As of yet, we still do not know how relevant these differences are to
perceptually salient to everyday listeners.
ToBI, though deeply valuable for describing intonational patterns for languages,
is limited when it comes to capturing the psychological reality of intonational contours,
as well as its ability to describe fine-grained differences between varieties of any given
35
language. Specifically, for sociophoneticians ToBI-based approaches present a few
problems. As discussed in Section 1.2.1.3, MAE_ToBI was not developed to address the
type of data and questions sociophoneticians are often interested in outside of MAE, and
thus must be augmented for sociolinguistic research. As such, sociolinguists who use
MAE_ToBI-based annotations and methods in the study of AAE (or any non-standard
variety for that matter) must also modify certain components to facilitate analysis.
Additionally, rhythm metrics (which have been used to show differences between
AAE and EAE) generally capture one aspect of rhythm, i.e. timing, but do not account
for patterns of prominence group, which are likely to be just as important for rhythm (see
Arvaniti 2009 for a full review). These facts raise concerns about prior work describing
differences between AAE and EAE, in that, if we as scholars are describing AAE through
a set of conventions that were not designed for AAE, or do not capture potentially
meaningful differences, there is a very real possibility that we are potentially missing
crucial differences that could be perceptually salient to listeners.
With respect to ethnic identification tasks, though prosody has been named as a
cue, we know very little about whether subdomains in prosody (e.g. rhythm, intonation,
speech rate, etc.) individually contribute to what listeners potentially attend to in auditory
differentiation, or if it is the case that the constellation of these features, the way they are
used in concert, matter for everyday listeners. Though this dissertation does not address
this question specifically, its findings provide potential avenues for future research, as
well as possible outcomes outside of academia, which will be discussed in Chapter V.
In the majority of work by Cole and colleagues examining prominence perception
in American English stimuli come from the Buckeye Corpus (Pitt et al. 2007), and

36
existing work has not examined regional or ethnic variation in the perception of prosodic
prominence in conversational speech. Yet their results are striking and demonstrate that
utilizing everyday listeners in examining prosodic prominence yields new insights for
researchers who seek to understand the production and perception of prosodic variation.
What has not been examined, as of yet, is how listeners perceive prominence in voices of
different ethnicities (e.g. AAE and EAE) and how these perceptions correspond to more
traditional approaches to prosody. By combining these methodologies with prior
sociolinguistic research, we can better understand how prosody and prominence are
attended to by everyday listeners as well as the acoustic cues that correlate with perceived
prominence. And we can do this for European American and African American speakers
and listeners.
Listeners’ experience with varieties plays an important role in their processing of
speech. Work related to these concepts has shown that the amount and type of experience
listeners have with dialects inform how different varieties and features are encoded and
represented cognitively by listeners. It has also demonstrated the complex relationship
between social and linguistic factors that individuals utilize in shaping their own
production and perception systems. This dissertation seeks to add to this body of
knowledge by examining how listeners attend to prosodic prominence and the role that
ethnicity may play alongside location and experience.
1.7 Dissertation Outline
This dissertation is organized as follows: Chapter II presents the methods used in
this dissertation, with a discussion of the experimental methodology and design, as well
37
as stimuli and listener descriptions. Additionally, this chapter also presents analyses of
the stimuli themselves and details about how listener experience was calculated from the
information collected from participants.
Chapter III and Chapter IV represent the core empirical treatments for this
dissertation. Chapter III responses to a set of questions designed to probe the first broad
research question, asking: What differences do listeners perceive between AAE and EAE
voices when they are asked to rate prosodic prominence? And, how do listener groups,
who differ in regional background, ethnicity, and self-reported experience, compare to
one another? To do this, it examines the overall patterns of perception of prosodic
prominence from the RPT-based experiment. Chapter IV then builds on the findings of
Chapter III to investigate a set of questions around the second broad research question:
How do linguistic cues (i.e. acoustic and structural factors) to prosodic prominence differ
for AAE and EAE voices? And how do listener groups, who differ in regional
background, ethnicity, and self-reported experience, compare to one another in their use
of these cues? For this, I consider the relationship between linguistic factors and
perceived prosodic prominence for these voices, asking how perceptually salient certain
linguistic factors are and how sensitive listeners are to prosodic variation in AAE and
EAE. Finally, in Chapter V, I return to the overarching questions laid out here and how
the findings in this dissertation connect to these questions, with a focus on the overall
impact of this dissertation in sociolinguistics as well as how these results also can be
applied to other, non-academic settings.

38
CHAPTER II
METHODS AND DATA
2.1 Introduction
This chapter describes the experimental framework used throughout this project,
Rapid Prosodic Transcription (RPT) and in particular the Language Markup and Design
Software (LMEDS), which provides a web-based platform for collecting everyday
listeners’ judgments of prosodic prominence. This chapter describes the experimental
approach, stimuli, listener groups, experimental design and data processing. Section 2.1
describes the experimental approach for this dissertation. To address the gap in
sociolinguistic literature related to the production and perception of prosody in AAE, the
experiments designed for this dissertation obtain prosodic judgments from listeners for
excerpts of conversational speech from sociolinguistic interviews. Section 2.3 discusses
the speakers and the selection of conversational speech excerpts used as stimuli. In
Section 2.4, I explain the experimental design for this dissertation. Section 2.5 describes
participants, recruitment and the research sites. In Section 2.5, I discuss some of the data
I collected from the listeners, including their performance in an ethnic identification task
for the stimuli and the responses they provided to questions about their experience with
AAE and Southern EAE. In Section 2.5, I discuss data processing and the linguistic
factors of interest, with brief analyses of differences in realization of factors of interest.
Finally, in Section 2.7 I provide a discussion of the application of this methodology for
the research questions addressed in the subsequent Chapters III and IV.
2.2 Experimental Approach

39
This dissertation project uses the RPT methodology implemented through
LMEDS. The method and software were developed by Jennifer Cole and colleagues to
address issues related to prosodic transcription (Cole et al. 2010; Cole et al. 2017), i.e. to
determine which prosodic label applies to which word in speech. As opposed to most
prior approaches to analyzing prosody which have used a complex set of criteria, such as
the MAE_ToBI paradigm (Beckman et al. 2005), applied by highly trained analysts, RPT
methodology allows researchers to crowd-source prosodic annotations. Through the
LMEDS implementation of RPT, I ask untrained listeners (i.e. non-linguists, or
“everyday listeners”) to assign simple prosodic labels (prominent versus non-prominent)
to lexical items heard in samples of speech, based on their auditory impressions alone.
This approach provides insight into what prosodic factors everyday listeners attend to in
the speech signal, thus reflecting the perceptual salience of these factors for the speech
samples in this study on the one hand, and allowing us to probe properties of the listeners
on the other hand. In addition to basing prosodic annotations on the perceptions of
everyday listeners rather than trained experts, RPT also differs from prior approaches,
like MAE_ToBI, by relying on the auditory signal alone. Annotators do not have access
to additional information such as the pitch track or spectrographic, visual representations,
which are often central in the annotation process when conducted by trained experts,
despite obviously not being a part of normal speech listening.
Prosodic phenomena, like many linguistic features, can be complex to describe
and linguists develop highly specialized terminology to make fine distinctions between
different prosodic forms (e.g. the differences between monotonal and bitonal pitch
contours). However, for the RPT task, especially as used here, I want listeners’

40
judgments based on their “everyday” notions about language. That is, rather than training
everyday listeners to understand and make fine-grained distinctions about prosodic
forms, they are given simple explanations about the phenomena. Listeners in the RPT
experiment used here are given these simple, initial instructions:
In everyday speech, speakers pronounce some word or words in a
sentence with more prominence than others. The prominent words are in a
sense highlighted for the listener, and stand out from other non-prominent
words.
Then, listeners hear short samples of speech along with simple transcriptions, with no
punctuation or capitalization, and they simply “click” on each word they think is
“highlighted for the listener” by the speaker. The lack of punctuation and capitalization is
meant to avoid priming listeners for prominence based on orthographic conventions—i.e.
I don’t want periods to prime listeners to pauses, or capitalized nouns to emphasize
importance, etc. A speech sample in the LMEDS interface is demonstrated in Figure 2.1.
Following the initial instructions, there are abbreviated instructions posted with each
speech sample, which can also be seen in Figure 2.1.

41
Figure 2.1 LMEDS Stimulus Example
The task itself yields a binary output for each word, where a lexical item that is
clicked on is given a “1” in the output, demonstrating that the listener heard the word as
prominent. If a lexical item isn’t clicked, the output gives that word a “0”. Visually, if a
participant hears a word as “highlighted” by the speaker and clicks on the word, then that
word then changes color from black to red, demonstrated by Figure 2.2, which shows the
same stimulus from Figure 2.1 after a participant has made determinations about which
words were prominent.

42
Figure 2.2 LMEDS Stimulus Example
While individual listeners provide their individual judgments, the power of the
RPT task comes through the use of many listeners, whose judgments are then combined
to provide an aggregate picture of how the speech sample was heard by the group of
listeners. Figure 2.3 provides a summary bar plot for the overall output for the stimulus
from Figures 2.1 and 2.2 across all listeners. In this summary view, each lexical item in
this stimulus is given a score, which is the overall proportion of listeners who voted the
word as prominent. In this particular example, we can see that the word being is
perceived as prominent by ~90% of listeners, dorm is heard as prominent by ~80% of
listeners, and so on.

43
Figure 2.3 Overall output for sample stimulus
From this output, these data can be analyzed in multiple ways. Some published
analyses of RPT data analyze aggregated ratings for each word (such as illustrated in
Figure 2.3), which are referred to in studies using this approach as a word’s p-score (Cole
et al. 2010, 2017), or the proportion of prominence for each word across all listeners who
heard that word. This is a useful approach for gaining understanding of the properties of
the speech sample and the speaker, but it loses information about the individual listeners.
Thus, the raw output (the individual ratings of 1s and 0s for words by individual listeners)
can also be examined for individual listeners, to understand the social and linguistic
factors that predict these ratings. I analyze the data in this second way. These individual
ratings can be statistically analyzed using logistic regression and also in terms inter-rater
agreement measures. Both of these techniques are used in Chapters III and IV.

44
2.3 Speaker and Stimulus Description and Selection
The goal of the experiment is to obtain listeners’ judgments about prosodic
prominence across speech by African American and European American speakers, so a
critical aspect of the experimental design is the selection and even distribution of
stimulus voices. The conversational speech excerpts come from two sources: (1) the
Raleigh Corpus developed by Dr. Robin Dodsworth at North Carolina State University
(Dodsworth and Kohn 2012), and (2) The post-high school interviews of participants in
the Frank Porter Graham study (FPG, Wolfram and Van Hofwegen 2010; Van Hofwegen
and Wolfram 2017). The Raleigh, NC recordings are sociolinguistic interviews that were
mostly conducted by a field-worker of the same ethnicity as the interviewee. These
recordings were made by using a Marantz PMD 660 model digital recorder and a lapel
microphone, either in a quiet office or a quiet room in the home of the speaker. Much of
the focus of these interviews were on how Raleigh has changed as a city, interviewees’
families, and what interviewees remember about growing up in Raleigh. These
recordings were then uploaded into the Sociolinguistic Analysis and Archive Project
(SLAAP, Kendall 2007). For this study, the male speakers (both AAE and EAE) as well
as the female EAE speakers are all from the Raleigh corpus (see Table 2.1). Due to a
paucity of African American females in the Raleigh Corpus, the stimuli from the AAE-
speaking females were selected from the Frank Porter Graham (FPG) data from the
Raleigh-Durham area in North Carolina. Speakers in the FPG study were mostly
interviewed by an African American field-worker, with the topics ranging from
experiences in high school and college, and other everyday experiences. These recordings
were also made using a Marantz PMD 660 model digital recorder with a lapel
45
microphone.
Initial selection criteria for speakers were based on age and social class. All
speakers used in the stimuli were between the ages of 18-24 years old. I selected this
range to account for potential variability related to age-grading and/or changes across
generations, where listeners in this project may be attending to phenomena that may be
age-graded or a result of aging in general (Wolfram and Van Hofwegen 2010; Sankoff
and Blondeau 2007); therefore, I selected speech samples for stimuli from speakers that
are roughly of the same age as listeners in this project.
I also targeted stimuli from generally middle-class speakers, with social class
determinations largely based on metadata available for the Raleigh Corpus and the FPG
study. Traditionally in sociolinguistics and the study of AAE varieties, the “vernacular
speaker,” not the middle-class speaker, has been the object of study, with vernacular
speakers showing more “prototypically” vernacular AAE features than middle-class
speakers, especially with respect to grammatical structures (see Labov 1966; Britt and
Weldon 2015). If there are persistent differences in the perception of speech samples
from middle-class AAE and EAE speakers, the results in this study should be able to add
nuance to discussions of levels of variation within AAL, and what everyday listeners may
be attending to, at least with respect to prosody (Fasold et al. 1987).
After initial speaker selection, excerpts were selected that exhibit no “vernacular”
AAE features, that are often associated with African Americans. This was done to
mitigate the potential influence of non-prosodic features in listeners’ judgments. Such
features are often stigmatized in popular media discourse (such as habitual be, unstressed
completive done, copula absence, stressed BIN, etc.), and some of which have well-

46
attested prosodic components related to their realization (e.g. stressed BIN and unstressed
done). More generally, I wanted to be sure that listeners in this project were attending to
prosodic prominence and not grammatical features. I also followed the same criteria for
the European American speech samples, though in this case it was overt Southern
American English features that were avoided (such as completive done, which is stressed
in Southern American English). The European American speakers, though from the
South, exhibit almost no vernacular Southern European American English features
(Dodsworth and Kohn 2012; Forrest and Dodsworth 2015); in fact, there was little
evidence of the Southern Vowel Shift (SVS) in the voices in these data, let alone
grammatical features such as completive done, auxiliary absence, and negative concord.
In fact, prior work examining the SVS in Raleigh, NC has shown that this vowel
configuration has largely disappeared from younger speakers in the area, and
impressionistically these voices do not sound “prototypically” Southern (Dodsworth and
Kohn 2012). Table 2.1 below shows the breakdown of the speakers used for speech
stimuli. Throughout the later parts of this dissertation I often refer to the speakers as
“voices”, since I, and listeners, attend to prosodic characteristics of the speakers’ voices
and not other characteristics of the speakers.
Once speakers were selected, I then went through the recordings and extracted
speech sample excerpts that were between 8-23 seconds in length, following the stimulus
lengths in work by Jennifer Cole and colleagues utilizing this paradigm (Cole et al. 2010,
2012, 2016, 2017). This prior work, especially Cole et al. (2010), has demonstrated that
excerpts longer than 23 seconds are generally more difficult for listeners to deal with, and
thus yield results that are less reliable and more variable. Once selected, all stimuli were
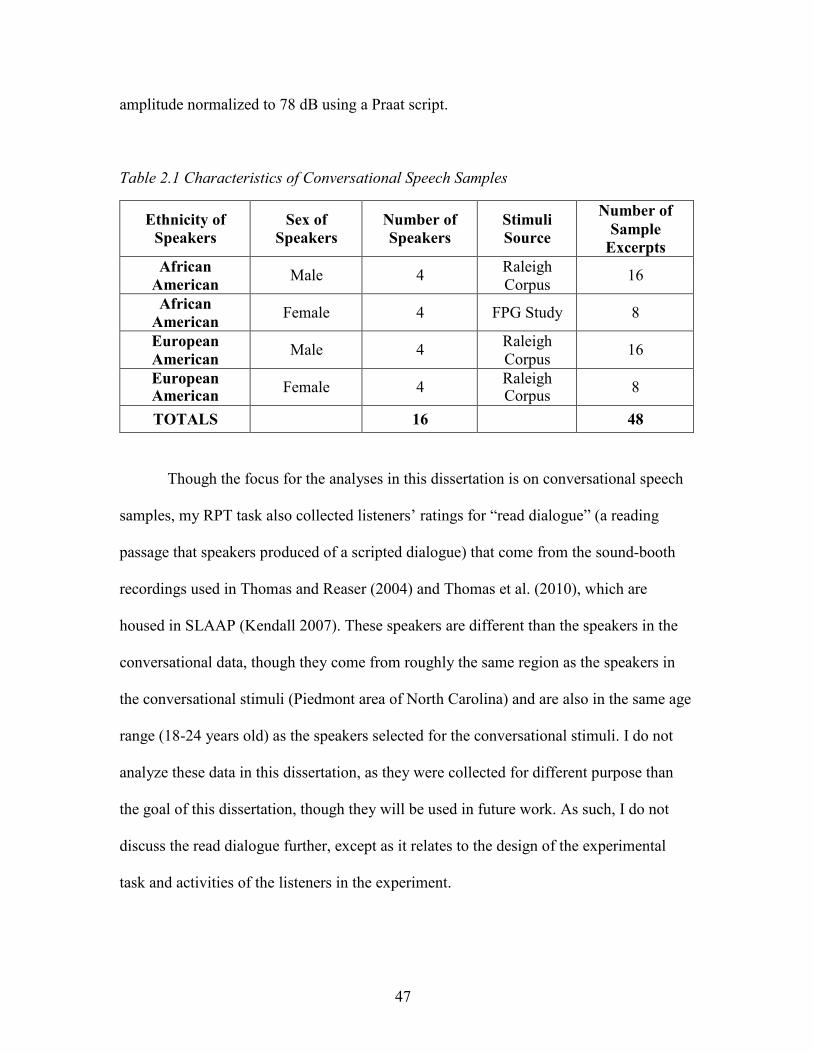
47
amplitude normalized to 78 dB using a Praat script.
Table 2.1 Characteristics of Conversational Speech Samples
Ethnicity of Speakers
Sex of Speakers
Number of Speakers
Stimuli Source
Number of Sample
Excerpts African
American Male 4 Raleigh Corpus 16
African American Female 4 FPG Study 8
European American Male 4 Raleigh
Corpus 16
European American Female 4 Raleigh
Corpus 8
TOTALS 16 48
Though the focus for the analyses in this dissertation is on conversational speech
samples, my RPT task also collected listeners’ ratings for “read dialogue” (a reading
passage that speakers produced of a scripted dialogue) that come from the sound-booth
recordings used in Thomas and Reaser (2004) and Thomas et al. (2010), which are
housed in SLAAP (Kendall 2007). These speakers are different than the speakers in the
conversational data, though they come from roughly the same region as the speakers in
the conversational stimuli (Piedmont area of North Carolina) and are also in the same age
range (18-24 years old) as the speakers selected for the conversational stimuli. I do not
analyze these data in this dissertation, as they were collected for different purpose than
the goal of this dissertation, though they will be used in future work. As such, I do not
discuss the read dialogue further, except as it relates to the design of the experimental
task and activities of the listeners in the experiment.

48
2.4 Experiment Design
The experiment itself had three main tasks, which all participants performed in
the following order: 1) marking prominence for the conversational speech samples2; 2)
marking prominence for the read dialogue speech samples; and 3) an ethnic identification
task based on the stimuli each listener heard. Finally, each listener filled out a post-task
survey which collected demographic information. There are several conditions in this
experiment based on speech task (conversational data versus read dialogue), speaker sex,
and speaker ethnicity. All conditions described here were counter-balanced and
individual speech stimuli were pseudo-randomized to mitigate possible order (item) and
voice effects.
Each listener heard only speakers of a single sex – i.e. all males or all females. This was largely due to delays in acquiring female speakers early in the experiment
design and subject running. Once I was able to acquire female speakers, I had already
begun running participants, so in order to make all experiment conditions similar, I chose
to block conditions by sex. For this same reason, more speech stimuli were used for male
voices than for female voices. (As I explain in Chapter III, no sex-based differences
emerge in the results for the experiment, so in the end I do not focus on speaker sex in the
analyses of Chapters III and IV.) In total, 8 experimental conditions were designed and
run for male voices. For each of these conditions, the task included 4 speakers per
ethnicity (African American and European American) with 2 excerpts per speaker,
yielding a total of 16 excerpts rated in each condition by each listener. The male voice
conditions were set up following a 2x2x2 experiment design. First, conditions were
2 All listeners also completed a boundary marking task for the conversational speech, prior to the prominence marking task, but the boundary marking data are not examined as a part of this dissertation.
49
blocked by ethnicity, and these were counter-balanced so one listener group heard
African American voices first and the second group heard European American voices
first. Second, there were two pseudo-randomized orders of the individual speakers within
the ethnicity blocks, which was meant to combat potential order effects. Finally, there
were two different lists of excerpts from each speaker, so while each listener heard only 2
excerpts from each speaker, a total of 4 excerpts were used for each speaker, with
different listeners receiving different pairs of excerpts.
For the female voices, 4 experimental conditions were set up and run, following a
2x2 design, where again conditions were blocked by ethnicity, and there were two orders
of speakers within the ethnicity blocks. The difference between the male and female
voice conditions is that only 2 speech samples were used for each of the female speakers.
Thus, combining the versions for the male and female voices, a total of 48 conversational
speech samples were rated (32 for male voices and 16 for female voices) across a total of
12 experimental conditions. The read dialogue task was also counterbalanced and
pseudo-randomized, but since the read dialogue data is not part of the analyses in this
project, for the sake of space I do not describe the presentation of the read dialogue data.
The final part of the experiment involved an ethnic identification task where the
participants were tested as to whether they identified the ethnicity of each of the speakers
in the experiment. The general design of this task follows prior approaches testing
listeners’ identification of the ethnicity of a speaker (Shuy et al. 1969; Bailey and Maynor
1989; Purnell et al. 1999; Wolfram 2001; Mallinson 2002; Thomas and Reaser 2004). In
this part of the experiment, listeners are simply asked, “Is this voice Caucasian or African
American” and presented with a forced-choice box where they indicate what ethnicity

50
they believe the voice to be, from these two options. The stimuli for the ethnic
identification task come from both the conversational and read dialogue, and were
presented to listeners in the exact same order as they were presented in the earlier tasks.
Stimuli for the ethnic identification task were, however, trimmed to be between 1.5 and
2.3 seconds. This range was chosen for practical reasons. The conversational recordings
are substantially longer in terms of time than the read dialogue excerpts. In order to make
sure these excerpts were roughly of the same time and length for this task, I trimmed the
conversational recordings in this range, while also in some cases needing to trim some
(but not all) of the read dialogue recordings. Thus, listeners heard roughly the same
amount of speech for both stimuli types. The decision of what trimmed had two main
criteria: 1) I chose the first 1.5-2.3 seconds, so that listeners were hearing the beginning
of each excerpt; 2) I also made sure that no excerpt ended with an incomplete
constituency (e.g. in a noun phrase, the phrase was read to completion, “We had a dog”
and not “We had a”). I report the results of the ethnic identification task in Section 2.5.1.
Following these three major tasks in the experiment, listeners also completed two
post-surveys, which asked basic demographic information (self-reported gender, self-
reported ethnicity, age, place of birth, etc.) and then asked questions related to listeners’
experience with AAE. This last part in the post-survey task is important for the
dissertation research and I discuss the self-reported experience and results in depth in
Section 2.6.2.
2.5 Participants, Recruitment and Field Sites
Listeners were recruited from two populations: students at the University of
Oregon, located in Eugene, OR (a Primarily White Institution; PWI), and students at

51
North Carolina Central University, located in Durham, NC (a Historically Black
College/University; HBCU). The listeners from both groups are between 18-24 years old,
matching the age range of voices used in the stimuli. Since the key points of interest for
this dissertation project are listeners’ regional background and ethnicity, and their
experience with different English varieties, the two broad participant groups are broken
down further. Since North Carolina Central University (NCCU) is an HBCU, there is a
large population of African American students (72.9%), but NCCU also has a substantial
non-African American population as well (27.1%)3. The University of Oregon is 78.2%
European American and 21.8% students of color, with African Americans making up
2.2% of the student population.
Listeners from the University of Oregon were recruited through the university’s
Psychology and Linguistics Human Subjects Pool. Participants received course credit for
taking part in the study, and no limits were put on who was able to participate (i.e. there
were no demographic or other criteria or pre-filters). A total of 146 participants enrolled
in the study from this group. For the North Carolina Central University group, listeners
were recruited by local fieldworkers and paid to participate in the study. The local
fieldworkers were students in the university’s Communication Disorders department. The
fieldworkers were given some flexibility about who they recruited but were asked to
target primarily African American and European American participants. A total of 114
participants took part from this group, with African Americans comprising the largest
number of participants. A sizeable number of European Americans also participated from
this university. In addition to the 260 participants just described, an additional 42
3 http://www.nccu.edu/discover/quickfacts.cfm

52
participants had also been recruited for the experiment but were excluded from the study
for four main reasons: Listeners were excluded if they were not native American English
speakers, if they had taken any linguistics courses, such as syntax, phonology or
phonetics, if they had any self-reported hearing, vision or speech related issues, or if they
did not complete all parts of the experiment.
In order to focus in on questions about regional background and African
American and European American ethnicity specifically, I limit the analyses of Chapters
III and IV to just a subset of the remaining participants, those who self-reported as
European American from the University of Oregon and those who self-reported as either
European American or African American at North Carolina Central University. Though
participants were recruited at both the University of Oregon and North Carolina Central
University who were of various other ethnic backgrounds (i.e. Latinx and Asian
American), I chose to focus solely on African American and European American
listeners. While it would have been illuminating to examine African American listeners
in Oregon, only 4 African Americans were recruited from the University of Oregon, and
this was determined to be too few to make a meaningful group for analysis. In total, 218
participants are used in the analyses, as indicated in Table 2.2.
Table 2.2 Listener location and ethnicity
Research Site Location of Listeners
Ethnicity of Listeners
Number of Listeners
University of Oregon
Eugene, Oregon
European American 108
North Carolina Central
University
Durham, North
Carolina
African American 84
Total: 110 European
American 26
Overall Total 218
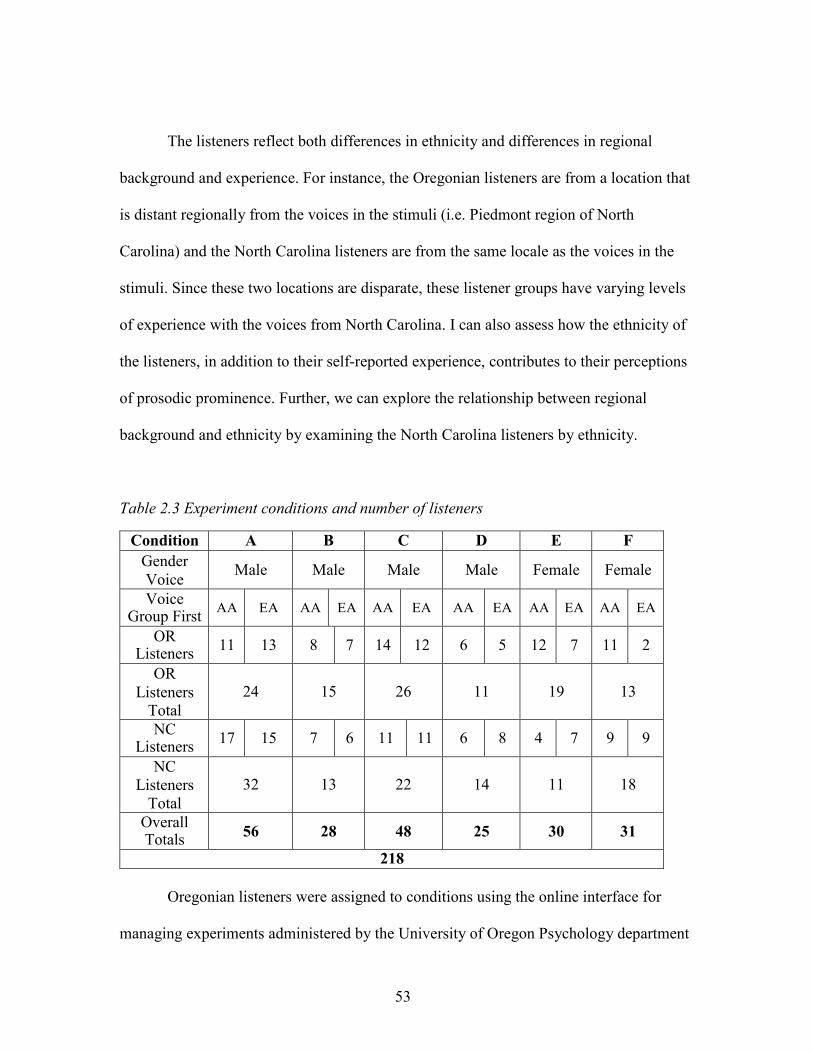
53
The listeners reflect both differences in ethnicity and differences in regional
background and experience. For instance, the Oregonian listeners are from a location that
is distant regionally from the voices in the stimuli (i.e. Piedmont region of North
Carolina) and the North Carolina listeners are from the same locale as the voices in the
stimuli. Since these two locations are disparate, these listener groups have varying levels
of experience with the voices from North Carolina. I can also assess how the ethnicity of
the listeners, in addition to their self-reported experience, contributes to their perceptions
of prosodic prominence. Further, we can explore the relationship between regional
background and ethnicity by examining the North Carolina listeners by ethnicity.
Table 2.3 Experiment conditions and number of listeners
Condition A B C D E F
Gender Voice Male Male Male Male Female Female
Voice Group First AA EA AA EA AA EA AA EA AA EA AA EA
OR Listeners 11 13 8 7 14 12 6 5 12 7 11 2
OR Listeners
Total
24
15
26
11
19
13
NC Listeners 17 15 7 6 11 11 6 8 4 7 9 9
NC Listeners
Total
32
13
22
14
11
18
Overall Totals 56 28 48 25 30 31
218
Oregonian listeners were assigned to conditions using the online interface for
managing experiments administered by the University of Oregon Psychology department
54
(the university’s Psychology and Linguistics Human Subjects Pool). North Carolinian
listeners were assigned to different conditions automatically, with the experimental
website designed to automatically route each participant to a condition based on how
many participants were sought for each condition. Table 2.3 presents the breakdown of
total listener numbers in each condition and listener group by each research site, i.e.
Oregon and North Carolina.
The overall numbers of participants that were targeted per condition were driven
largely by findings of Cole et al. (2017), who found that in the RPT paradigm for crowd-
sourcing annotation, the number of ideal raters is between 10-12 listeners for each
stimulus/excerpt presented. Though the numbers are variable across conditions, in most
conditions I exceed those target numbers; additionally, these conditions are pooled
together in analysis so potential differences are controlled for statistically.
2.6 Probing Participants’ Identification of Speaker Ethnicity and Self-Reported Experience with AAE
Having described the selection of the speech samples used as stimuli, the design
of the experiment, and the recruitment of participants, I turn now to present examinations
of two aspects of the data collected from participants, their identification of the ethnicity
of the speakers of the stimuli and their self-reported experience with AAE. The ethnic
identification data provides good evidence that listeners are aware of ethnic differences
between the speaker groups while participating in the main RPT task, and the self-
reported experience data are used in Chapters III and IV for probing that important aspect
of this dissertation.

55
2.6.1 Ethnic identification task
As mentioned above, as a part of the experiment design, all listeners completed an
ethnic identification task. As discussed in Chapter I, speakers of American English show
high rates of accuracy (> 70%) for the identification of African American and European
American voices, which suggests that there is some sort of schema that speakers of
varieties of American English access in determining the ethnicity of the voice (Shuy et al.
1969; Bailey and Maynor 1989; Purnell et al. 1999; Wolfram 2001; Mallinson 2002;
Thomas and Reaser 2004). This result still holds even without unique AAE
morphosyntactic features (Thomas and Reaser 2004). This highlights the fact that even in
utterances where these features do not occur, other characteristics in speakers’ voices
allow listeners to determine the speakers’ ethnic background. Spears (1988) notes that
these characteristics are strongly associated with AAE, and are most likely found in the
prosodic system (though Thomas and Reaser (2004) note that there are other acoustic
factors involved). In this section, I report the results of the ethnic identification task, in
order to simply demonstrate that these listeners are aware of the ethnicity of the voices
they are attending to, as well as to see how the results here align with prior work
incorporating ethnic identification.
Since regional background and ethnicity are central factors throughout the
analyses in this dissertation, I first present each listener group’s results for the ethnic
identification task for the AAE voices (Table 2.4) followed by the results for EAE voices
(Table 2.5). In Table 2.4, all three listener groups show high rates of accuracy for these
voices (> 90%).

56
For the European American voices, we also see a similar trend, where these
voices were also correctly identified at > 90%. Though there is slightly more accuracy for
AAE voices, there is a bit more similarity across the three listener groups for the EAE
voices. Table 2.5 below show these results.
Table 2.4 Ethnic identification results: African American voices
Region and Ethnicity of
Listener
Number of
Listeners
Response: African
American
Response: European American
Percent Correct
Oregon European American
108
697
51
93.2%
North Carolina European American
26
171
5
97.2%
North Carolina African
American
84
537
40
93.1%
Table 2.5 Ethnic identification results: European American voices
Region and Ethnicity of
Listener
Number of Listeners
Response: African
American
Response: European American
Percent Correct
Oregon European American 108 59 705 92.3%
North Carolina European American 26 11 177 94.1%
North Carolina African American 84 51 547 91.5%
The ethnic identification task highlights that the listeners in these data accurately identify
the ethnicity of voices above 90% in all cases. Though, I cannot assume outright (nor do
these data address this question directly) that listeners are using their knowledge of
57
speakers’ ethnicity in completing the RPT tasks, these listeners do have a good sense of
what the ethnicity of the voice they are listening to, and the results here align with prior
work investigating ethnic identification.
2.6.2 Self-Reported Experience Measures
The post-survey part of the experimental task asked participants to provide self-
reports about their experience with American English varieties. In particular, it asked
three questions about their experience with each of the two varieties relevant to the
speech stimuli, African American English and European American English. In this
section, I describe in depth the questions and the way self-reported experience was
calculated and used in analyses in Chapter III and Chapter IV.
In the post-survey questionnaire, listeners were presented questions in a forced-
choice format, with 4 or 5 possible options for selection for each question. This was done
to facilitate analysis without the wide range of responses that may have been collected
with free-response questions or with a numerical scale (1-100). Though I collected data
for listeners’ experience with both AAE and Southern EAE, the goal of this dissertation
is to assess the role of listeners’ self-reported experience with AAE and I focus on those
questions here. I do not examine the self-report data on experience with EAE, here or in
the analyses of Chapter III and IV, but leave that for future work.
Table 2.6 presents the questions related to experience as well as the range of
answers that listeners could select. These questions cover three main ways that self-
reported experience can be thought of for these listeners: how much experience listeners
believe they have with AAE; how much speech in the last two weeks they consider to be

58
AAE; how much music they listen to that is either rap or hip-hop. The self-reported
experience question is meant to gauge listeners’ own general sense of their experience
with AAE. The amount of speech question helps me better estimate how much AAE
speech they interact with in their recent everyday lives (rather than in a general sense).
The music question allows better understand the role of popular music in their view of
their own experience with AAE. By asking questions related to media, we can assess
whether listeners report higher levels of experience, or elevate their experience, due to an
interest in popular culture (such as TV, film, or music). In other words, these three
questions were designed and chosen to determine what proportion of listeners’ self-
reported experience comes from particular sources. Each potential response for the
questions have numeric score associated with them, as indicated by Table 2.6 below.
From these numbers, we can these assess differences among the groups for each question. Table 2.6 Questions related to self-reported experience with AAE, possible responses and scoring
Questions Responses How much experience would you say you have had with African American English?
No experience = 0 Little experience = 1 Some experience = 2 Lots of experience = 3
Of all the speech (not including music, television and film) you have heard in the last two weeks, what percentage of it would you say is African American English?
Less than 2% = 0 Less than 10% = 1 Less than 20% = 2 Less than 50% = 3 More than 50% = 4
Of all the music you listen to, what percentage of it would you say is Rap or Hip-Hop?
Less than 2% = 0 Less than 10% = 1 Less than 20% = 2 Less than 50% = 3 More than 50% = 4

59
Self-reports about experience with AAE could mean different things to different
listeners. Importantly, the three different listener groups, Oregon European Americans
(OREA), North Carolina European Americans (NCEA), and North Carolina African
Americans (NCAA), are expected to have different types and amount of experience with
AAE, based on their own ethnic and regional backgrounds. Per 2010 census data
(census.gov), Eugene, Oregon (where Oregon participants were recruited), was 85.8%
European American, with only 1.4% of the population African American. Durham, NC
(where North Carolina participants were recruited) was 42.5% European American and
41.0% African American. Though Durham, NC shows relatively equivalent numbers of
African American and European Americans in the city itself, the neighborhood
demographic differences tell a different story. Durham neighborhoods are highly
segregated, where African Americans tend to live in primarily African American
neighborhoods (see Kohn 2018 for an in depth discussion). The point being, these two
regions have very different levels of exposure to and experience with AAE, that
potentially could be reflected in the self-reported experience measures. Further, these
listeners are students at the University of Oregon (a Primarily White Institution; PWI),
and students at North Carolina Central University, located in Durham, NC (a Historically
Black College/University; HBCU). In sum, the two broad listener groups (Oregon vs
North Carolina) come from cities and universities that have very different ethnic make-
ups and these differences are likely reflected in the listeners’ self-reported experience
measures. Partly, we expect that Oregonians, due to the demographic make-up of the
state, will report less experience in general than North Carolinians. But, also, we should
interpret Oregonians reporting that they have “lots of experience” with AAE as
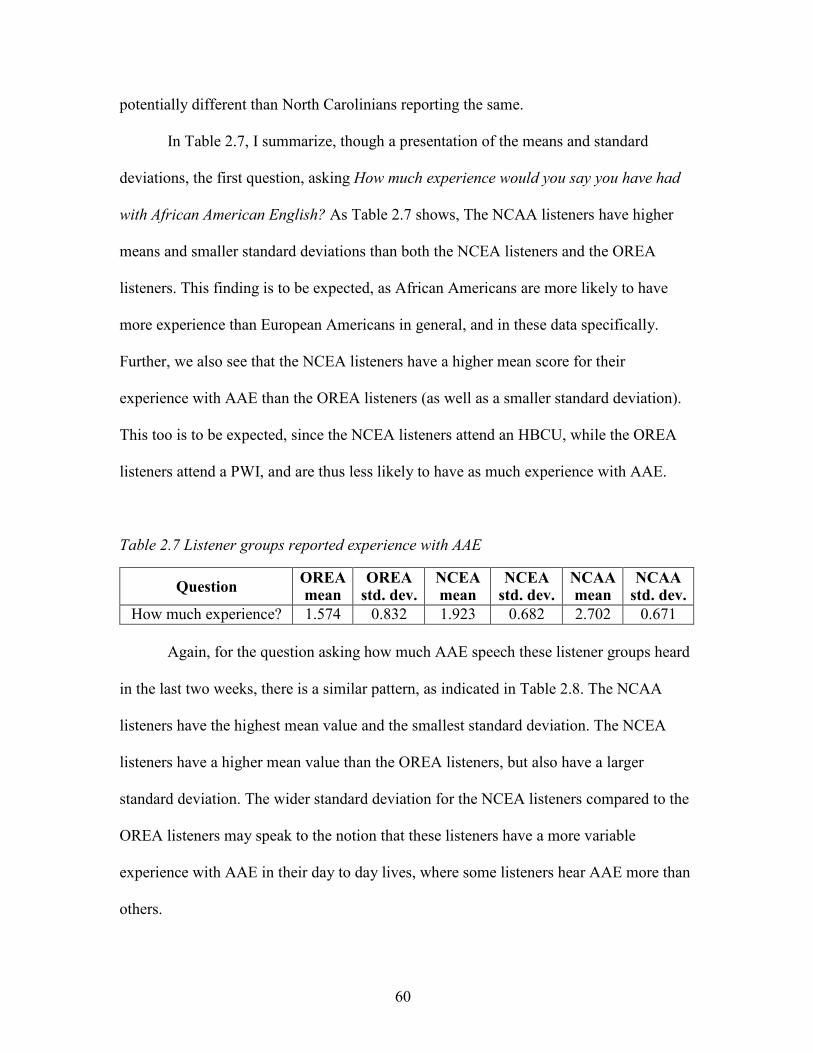
60
potentially different than North Carolinians reporting the same.
In Table 2.7, I summarize, though a presentation of the means and standard
deviations, the first question, asking How much experience would you say you have had
with African American English? As Table 2.7 shows, The NCAA listeners have higher
means and smaller standard deviations than both the NCEA listeners and the OREA
listeners. This finding is to be expected, as African Americans are more likely to have
more experience than European Americans in general, and in these data specifically.
Further, we also see that the NCEA listeners have a higher mean score for their
experience with AAE than the OREA listeners (as well as a smaller standard deviation).
This too is to be expected, since the NCEA listeners attend an HBCU, while the OREA
listeners attend a PWI, and are thus less likely to have as much experience with AAE.
Table 2.7 Listener groups reported experience with AAE
Question OREA mean
OREA std. dev.
NCEA mean
NCEA std. dev.
NCAA mean
NCAA std. dev.
How much experience? 1.574 0.832 1.923 0.682 2.702 0.671
Again, for the question asking how much AAE speech these listener groups heard
in the last two weeks, there is a similar pattern, as indicated in Table 2.8. The NCAA
listeners have the highest mean value and the smallest standard deviation. The NCEA
listeners have a higher mean value than the OREA listeners, but also have a larger
standard deviation. The wider standard deviation for the NCEA listeners compared to the
OREA listeners may speak to the notion that these listeners have a more variable
experience with AAE in their day to day lives, where some listeners hear AAE more than
others.

61
Table 2.8 Listener groups reported how much speech in last two weeks is AAE
Question OREA mean
OREA std. dev.
NCEA mean
NCEA std. dev.
NCAA mean
NCAA std. dev.
How much speech (2 weeks)? 1.564 1.159 1.731 1.238 3.381 0.977
As can be seen in Table 2.9, in the last measure asking how much music the
listener groups listen to is rap or hip-hop, we see a slightly different outcome than for the
first two questions. The NCAA listeners again have the highest mean and smallest
standard deviation. For this question, the OREA listeners have a higher mean and smaller
standard deviation than the NCEA listeners. This result is not terribly surprising, as rap
and hip-hop are extremely popular forms of music in the United States in general, and the
differences between these two European American listener groups may simply be a result
of having NCEA listeners who do not listen to as much rap or hip-hop as the Oregon
listeners.
Table 2.9 Listener groups reported how much music is rap/hip-hop
Question OREA mean
OREA std. dev.
NCEA mean
NCEA std. dev.
NCAA mean
NCAA std. dev.
How much rap/hip- hop? 2.546 1.433 2.000 1.608 3.535 0.921
For the analyses in Chapters III and IV, I chose to address all three measures
through a composite score, rather than focusing on just one of the questions or examining
each as an individual predictor. By creating a composite score for all three questions, I
am able test these experience-related measures together as a single predictor for
prominence perception in AAE and EAE. Prior to discussing how the composite score

62
was created for use in analyses in Chapter III and Chapter IV, it is important to consider
to what extent the responses to the three questions are correlated among the listeners in
each listener group. In the tables below I present the correlations for the self-reported
experience measures for listener groups individually.
For the OREA listeners, all the self-reported experience measures are
significantly correlated (p < 0.001), with the actual r values indicated in Table 2.10.
Figure 2.4 below presents pie charts of the correlations between the experience measures.
The highest correlation occurs between responses to how much rap or hip-hop
participants listen to and how much AAE speech they believe they have encountered in
the last two weeks. The second highest correlation is for listeners’ self-reported
experience with AAE and how much rap or hip-hop they listen to. Rather surprisingly, the
lowest correlation is for self-reported experience with AAE and how much AAE speech
they believe they have encountered in the last two weeks.
Table 2.10 Correlations for OREA listener group and experience measures
Self-Reported Experience with
AAE
How Much Speech
How Much Music
Self-Reported Experience with AAE 1.0 0.318 0.376
How Much Speech 0.318 1.0 0.384 How Much Music 0.376 0.384 1.0

63
Figure 2.4 Correlations for experience measures: OREA listeners
Turning to examine the correlations for the self-reported experience measures for
the NCEA listeners, which is also significant (p < 0.001), Table 2.11 and Figure 2.5
display the correlations for the NCEA group. The three measures are more highly
correlated for the NCEA listeners than for the OREA listeners, but, interestingly, the
correlations pattern in almost identical ways. The strongest correlation occurs between
the rap or hip-hop music question and the amount of AAE speech in the last two weeks
question, with those two questions showing lower correlations with the self-report about
overall experience. Higher correlations than were found for the OREA group makes
sense, given that the NCEA group are European Americans attending an HBCU. These
participants encounter more AAE speech on a regular basis, regardless of whether they
have had lots of experience with AAE earlier in their lives, compared to the OREA
listeners. Due to this, it makes sense that the correlations for these listeners are much
higher than for the OREA listeners.

64
Table 2.11 Correlations for NCEA listener group and experience measure
Self-Reported Experience with
AAE
How Much Speech
How Much Music
Self-Reported Experience with AAE 1.0 0.579 0.608
How Much Speech 0.579 1.0 0.787 How Much Music 0.601 0.787 1.0
Figure 2.5 Correlations for experience measures: NCEA listeners
Lastly, Table 2.12 and Figure 2.6 show the correlations for the self-reported
experience measures for the NCAA participants. The responses from these listeners show
much lower correlations. Of the experience measures for these listeners, the only
statistically significant correlation was for experience with AAE and how much AAE
they have heard in the last two weeks (p < 0.001). For these listeners, who themselves are
African Americans at an HBCU, the amount of AAE speech they report having heard in
the last two weeks is somewhat correlated with their overall experience with AAE, but

65
their exposure to rap and hip hop music bears almost no relationship to the responses to
these other two questions. This makes sense, given that the listeners report having lots of
experience with AAE and also encounter AAE speech regularly compared to the other
two listener groups, as evidenced in Tables 2.12 and Figure 2.6.
Table 2.12 Correlations for NCAA listener group and experience measures
Self-Reported Experience with
AAE
How Much Speech
How Much Music
Self-Reported Experience with AAE 1.0 0.283 0.066
How Much Speech 0.283 1.0 0.104 How Much Music 0.066 0.104 1.0
Figure 2.6 Correlations for experience measures: NCAA listeners
These experience measures indicate how different the types of experience these
listener groups have with AAE. For the NCAA listeners have the highest raw mean
66
values and the lowest standard deviations for all individual measures, as shown in Tables
2.7-2.9. Interestingly, the NCAA group shows the lowest correlations among the listener
groups (Table 2.12). This result can be interpreted as being related to the type and
amount of experience with AAE. The fact that these measures are not as well correlated
as they are for the European American listeners, may stem from the fact that these
listeners presumably grew up in African American households, and were surrounded by
AAE from a young age.
Conversely, the two European American listener groups showed lower means and
higher standard deviations for all experience measures compared to the NCAA listeners.
For the measures probing how much experience these listeners say they have with AAE
and how much speech in the last two weeks they would say is AAE, the NCEA listeners
have higher means and lower standard deviations than the OREA listeners. For the
question related to rap/hip-hop, the OREA listeners have higher means and lower
standard deviations than the NCEA listeners. Additionally, the two European American
listener groups show higher correlations and the relationship between the measures are
identical. The European American listeners did not have the same type or amount of
experience as the NCAA listeners, and as such these measures are more meaningful for
them than they are for the NCAA listeners. Moreover, the NCEA listeners are attending
an HBCU, and though they have more experience with AAE than the OREA listeners,
that experience is of a different quality than the NCAA listeners.
As discussed at the beginning of this section, to address these individual
questions, rather than just focusing on one question specifically or the questions
individually, I created a composite score for experience for each listener. Each potential
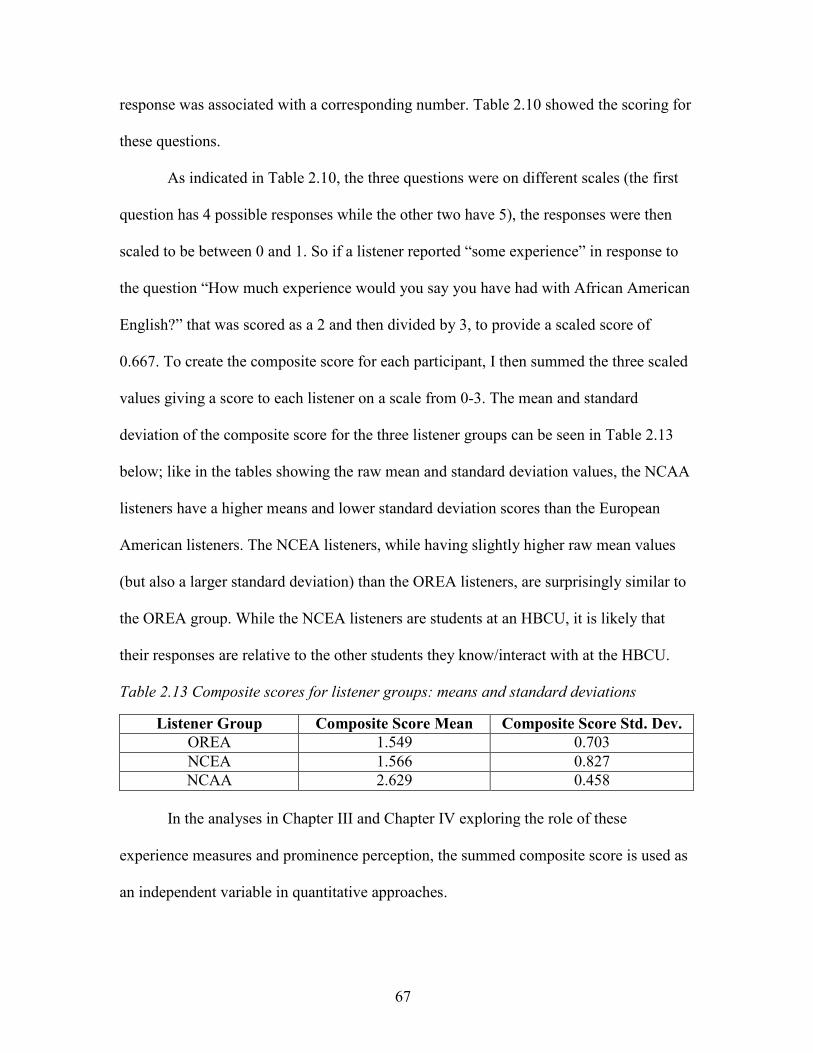
67
response was associated with a corresponding number. Table 2.10 showed the scoring for
these questions.
As indicated in Table 2.10, the three questions were on different scales (the first
question has 4 possible responses while the other two have 5), the responses were then
scaled to be between 0 and 1. So if a listener reported “some experience” in response to
the question “How much experience would you say you have had with African American
English?” that was scored as a 2 and then divided by 3, to provide a scaled score of
0.667. To create the composite score for each participant, I then summed the three scaled
values giving a score to each listener on a scale from 0-3. The mean and standard
deviation of the composite score for the three listener groups can be seen in Table 2.13
below; like in the tables showing the raw mean and standard deviation values, the NCAA
listeners have a higher means and lower standard deviation scores than the European
American listeners. The NCEA listeners, while having slightly higher raw mean values
(but also a larger standard deviation) than the OREA listeners, are surprisingly similar to
the OREA group. While the NCEA listeners are students at an HBCU, it is likely that
their responses are relative to the other students they know/interact with at the HBCU.
Table 2.13 Composite scores for listener groups: means and standard deviations
In the analyses in Chapter III and Chapter IV exploring the role of these
experience measures and prominence perception, the summed composite score is used as
an independent variable in quantitative approaches.
Listener Group Composite Score Mean Composite Score Std. Dev. OREA 1.549 0.703 NCEA 1.566 0.827 NCAA 2.629 0.458

68
2.7 Data Processing and Linguistic Factors
In order to understand how prominence ratings relate to linguistic factors, I
extracted a number of acoustic factors from the stimuli audio files and I annotated the
transcripts for relevant linguistic factors. To do this, first, the stimuli were forced-aligned
using the Montreal Forced Aligner (McAuliffe et al. 2016), with the phone-level
alignments subsequently hand-checked/corrected. Following this, various acoustic
measures were extracted using custom scripts developed in Praat (Boersma and Weenik
2016), and part of speech tags and word frequencies were assigned to each of the words
in each stimuli. In this section, I explain part of speech and word frequency and the
acoustic measures, describing both the rationale for their use and the methods I used to
determine them.
2.7.1 Part of Speech and Word Frequency
Part of speech and acoustic measures were extracted and analyzed for this
dissertation project were largely based on prior findings in production-based work on
AAE as well as prior work using the RPT paradigm (Cole et 2010, 2017; Baumann and
Winter 2018), which will be discussed in-depth in this section and 2.7.2 below.
For part of speech, I used the CLAWS Part of Speech Tagger (Garside 1987;
Brysbaert and New 2009; Brysbaert et al. 2012). For word frequency, I used the
SUBTLEXus Corpus. Once the stimuli were tagged for Part of Speech, I first hand-
corrected the tags themselves. For the most part the tagger was accurate, but there were
instances were certain lexical items can be found in multiple classes and the tagger
selected the wrong class. For example, so as a lexical item can be a “conjunction”,
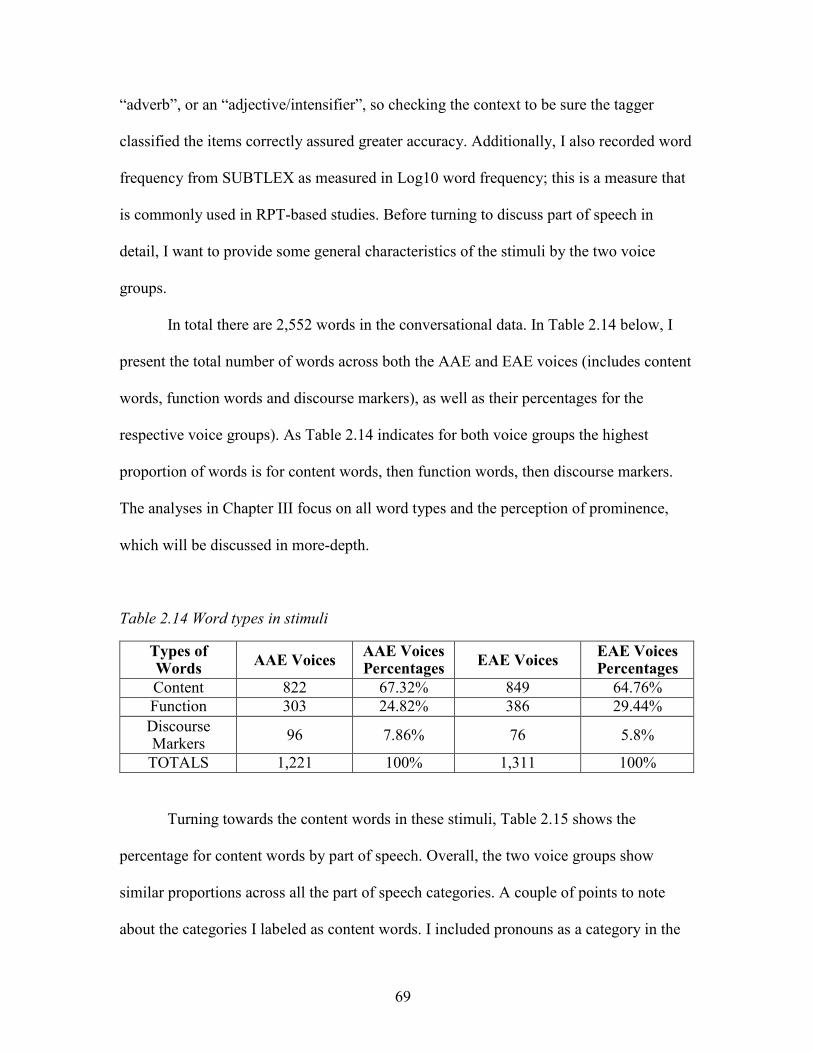
69
“adverb”, or an “adjective/intensifier”, so checking the context to be sure the tagger
classified the items correctly assured greater accuracy. Additionally, I also recorded word
frequency from SUBTLEX as measured in Log10 word frequency; this is a measure that
is commonly used in RPT-based studies. Before turning to discuss part of speech in
detail, I want to provide some general characteristics of the stimuli by the two voice
groups.
In total there are 2,552 words in the conversational data. In Table 2.14 below, I
present the total number of words across both the AAE and EAE voices (includes content
words, function words and discourse markers), as well as their percentages for the
respective voice groups). As Table 2.14 indicates for both voice groups the highest
proportion of words is for content words, then function words, then discourse markers.
The analyses in Chapter III focus on all word types and the perception of prominence,
which will be discussed in more-depth.
Table 2.14 Word types in stimuli
Types of Words AAE Voices AAE Voices
Percentages EAE Voices EAE Voices Percentages
Content 822 67.32% 849 64.76% Function 303 24.82% 386 29.44% Discourse Markers 96 7.86% 76 5.8%
TOTALS 1,221 100% 1,311 100%
Turning towards the content words in these stimuli, Table 2.15 shows the
percentage for content words by part of speech. Overall, the two voice groups show
similar proportions across all the part of speech categories. A couple of points to note
about the categories I labeled as content words. I included pronouns as a category in the
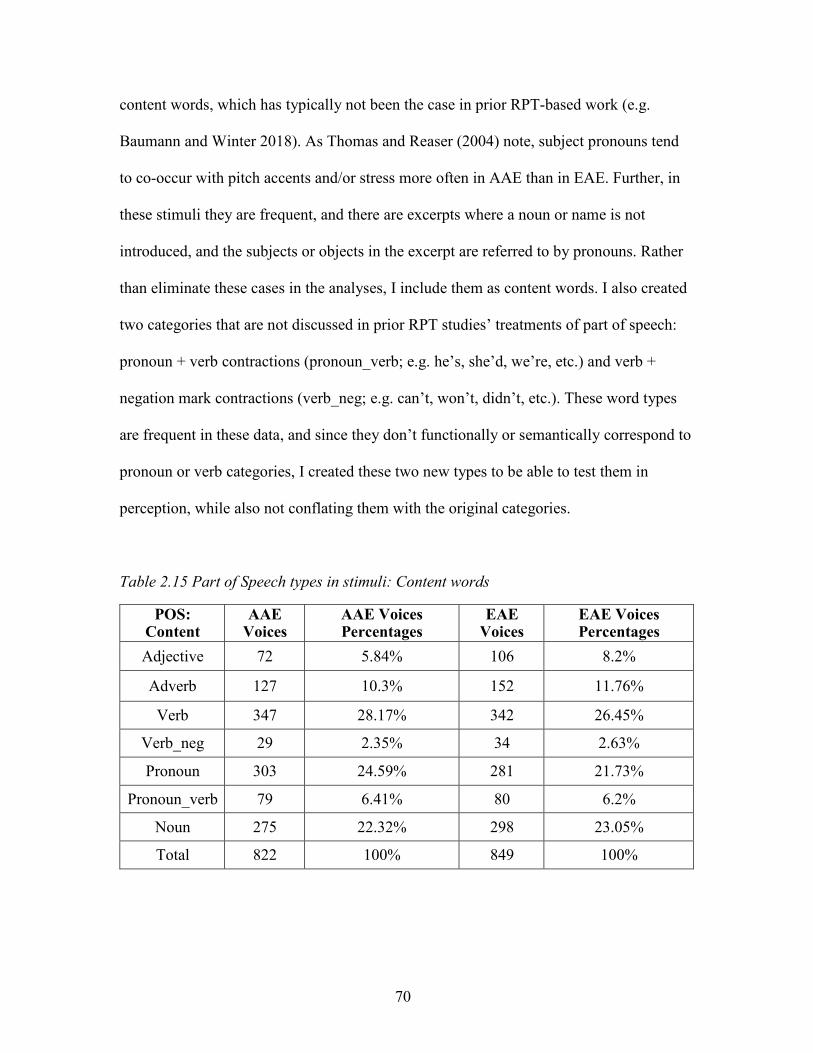
70
content words, which has typically not been the case in prior RPT-based work (e.g.
Baumann and Winter 2018). As Thomas and Reaser (2004) note, subject pronouns tend
to co-occur with pitch accents and/or stress more often in AAE than in EAE. Further, in
these stimuli they are frequent, and there are excerpts where a noun or name is not
introduced, and the subjects or objects in the excerpt are referred to by pronouns. Rather
than eliminate these cases in the analyses, I include them as content words. I also created
two categories that are not discussed in prior RPT studies’ treatments of part of speech:
pronoun + verb contractions (pronoun_verb; e.g. he’s, she’d, we’re, etc.) and verb +
negation mark contractions (verb_neg; e.g. can’t, won’t, didn’t, etc.). These word types
are frequent in these data, and since they don’t functionally or semantically correspond to
pronoun or verb categories, I created these two new types to be able to test them in
perception, while also not conflating them with the original categories.
Table 2.15 Part of Speech types in stimuli: Content words
POS:
Content AAE
Voices AAE Voices Percentages
EAE Voices
EAE Voices Percentages
Adjective 72 5.84% 106 8.2%
Adverb 127 10.3% 152 11.76%
Verb 347 28.17% 342 26.45%
Verb_neg 29 2.35% 34 2.63%
Pronoun 303 24.59% 281 21.73%
Pronoun_verb 79 6.41% 80 6.2%
Noun 275 22.32% 298 23.05%
Total 822 100% 849 100%
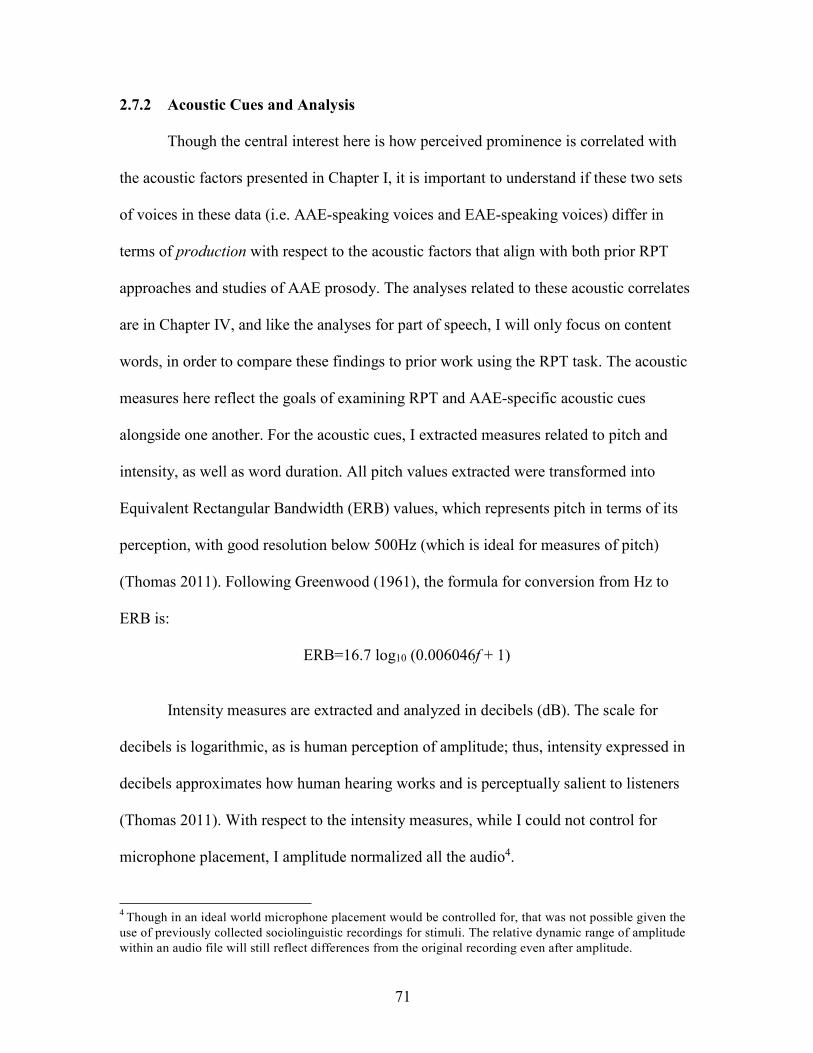
71
2.7.2 Acoustic Cues and Analysis
Though the central interest here is how perceived prominence is correlated with
the acoustic factors presented in Chapter I, it is important to understand if these two sets
of voices in these data (i.e. AAE-speaking voices and EAE-speaking voices) differ in
terms of production with respect to the acoustic factors that align with both prior RPT
approaches and studies of AAE prosody. The analyses related to these acoustic correlates
are in Chapter IV, and like the analyses for part of speech, I will only focus on content
words, in order to compare these findings to prior work using the RPT task. The acoustic
measures here reflect the goals of examining RPT and AAE-specific acoustic cues
alongside one another. For the acoustic cues, I extracted measures related to pitch and
intensity, as well as word duration. All pitch values extracted were transformed into
Equivalent Rectangular Bandwidth (ERB) values, which represents pitch in terms of its
perception, with good resolution below 500Hz (which is ideal for measures of pitch)
(Thomas 2011). Following Greenwood (1961), the formula for conversion from Hz to
ERB is:
ERB=16.7 log10 (0.006046f + 1)
Intensity measures are extracted and analyzed in decibels (dB). The scale for
decibels is logarithmic, as is human perception of amplitude; thus, intensity expressed in
decibels approximates how human hearing works and is perceptually salient to listeners
(Thomas 2011). With respect to the intensity measures, while I could not control for
microphone placement, I amplitude normalized all the audio4.
4 Though in an ideal world microphone placement would be controlled for, that was not possible given the use of previously collected sociolinguistic recordings for stimuli. The relative dynamic range of amplitude within an audio file will still reflect differences from the original recording even after amplitude.

72
Importantly for the analyses in Chapter III and Chapter IV, after pitch and
intensity values were extracted and calculated, they were centered around their mean, but
not scaled. The reason for centering and not scaling rests on the fact that pitch and
intensity values are already on a perceptually meaningful scale. By centering these
values, we can interpret findings based on the grand mean. I turn describe the actual
measures themselves and potential differences among the AAE and EAE voices in the
stimuli.
I examine the differences in AAE and EAE in terms of pitch max, intensity max
and word duration as these have been found to correlate well with perceived prosodic
prominence (Baumann and Winter 2018; Cole et al. 2010; Cole et al. 2017), so I want to
understand if these voices are different across these measures. I also examine differences
that are reflective of the more dynamic nature of AAE prosody, pitch change within
word, pitch change from the stimulus mean, pitch change from previous word and pitch
change to following word. Along these same lines, I also examined intensity change from
stimulus mean, to see if there is a potential difference for voices being “louder” than the
mean amplitude in the stimulus. Table 2.16 below shows the measures I collected and
how they were calculated for analysis.
In order to analyze potential differences between the two stimulus voice groups, I
ran Welch two sample t-tests on each of the acoustic measures of interest. Since I am
running multiple t-tests, I use a Bonferroni-corrected lower p-value, with a cut-off of
0.007 for the determination of significant differences. Table 2.17 below shows the results
for the differences between these voice groups. I present mean values and standard
normalizing; though I normalized the amplitude across files I cannot fully control for all possible intensity differences across the stimuli.
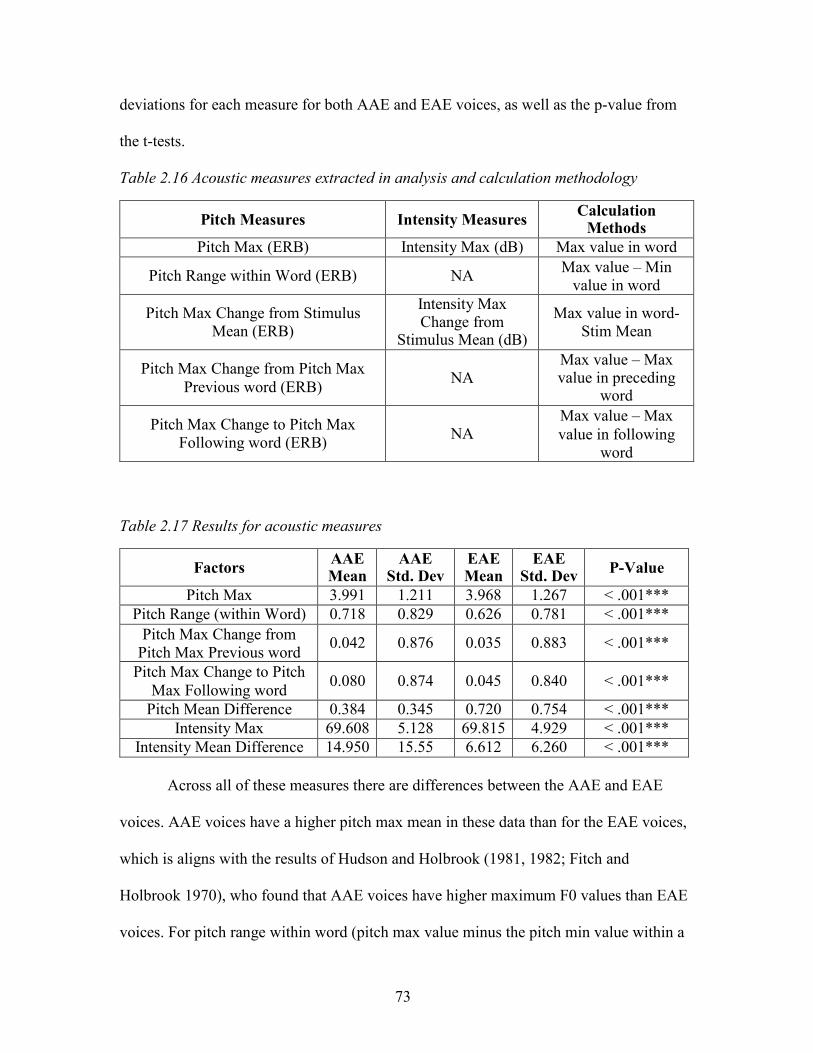
73
deviations for each measure for both AAE and EAE voices, as well as the p-value from
the t-tests.
Table 2.16 Acoustic measures extracted in analysis and calculation methodology
Pitch Measures Intensity Measures Calculation Methods
Pitch Max (ERB) Intensity Max (dB) Max value in word
Pitch Range within Word (ERB) NA Max value – Min value in word
Pitch Max Change from Stimulus Mean (ERB)
Intensity Max Change from
Stimulus Mean (dB)
Max value in word- Stim Mean
Pitch Max Change from Pitch Max Previous word (ERB)
NA
Max value – Max value in preceding
word
Pitch Max Change to Pitch Max Following word (ERB)
NA
Max value – Max value in following
word
Table 2.17 Results for acoustic measures
Factors AAE Mean
AAE Std. Dev
EAE Mean
EAE Std. Dev P-Value
Pitch Max 3.991 1.211 3.968 1.267 < .001*** Pitch Range (within Word) 0.718 0.829 0.626 0.781 < .001***
Pitch Max Change from Pitch Max Previous word 0.042 0.876 0.035 0.883 < .001***
Pitch Max Change to Pitch Max Following word 0.080 0.874 0.045 0.840 < .001***
Pitch Mean Difference 0.384 0.345 0.720 0.754 < .001*** Intensity Max 69.608 5.128 69.815 4.929 < .001***
Intensity Mean Difference 14.950 15.55 6.612 6.260 < .001***
Across all of these measures there are differences between the AAE and EAE
voices. AAE voices have a higher pitch max mean in these data than for the EAE voices,
which is aligns with the results of Hudson and Holbrook (1981, 1982; Fitch and
Holbrook 1970), who found that AAE voices have higher maximum F0 values than EAE
voices. For pitch range within word (pitch max value minus the pitch min value within a

74
word), AAE voices have a larger pitch range within a word. Holliday (2016) finds a
difference in peak delay for AAE voices, where there is a longer distance from the onset
of the syllable to the maximum F0 value. The two measures that examine the change
from the previous word and change to the next word, which are meant to capture the rise
and fall of the F0 track that is characteristic of AAE prosody (e.g. Cole et al. 2005;
Thomas 2015; McLarty 2011, 2018), also show significant differences, with AAE voices
showing a greater change across words than the EAE voices. Though these measures do
not necessarily provide a direct analog to prior acoustic analyses of AAE intonation (e.g.
the measurements used in Cole et al. 2005 and McLarty 2011), they confirm that the
AAE voices show a pronounced rise and fall of the F0 track compared to the EAE voices.
The last pitch measure, pitch mean difference, measured the difference between the max
pitch value of a word from the overall stimulus mean. Though this measure is not one
that has been used in prior work on AAE this measure is included to better understand the
relative relationship between pitch realizations and the mean pitch for any given stimulus.
For the African American voices, the words on average are higher than the stimulus
mean, and for the European American voices, the words on average are lower than the
mean, with the AAE voices showing a lower standard deviation.
In addition to the pitch measures, as discussed above and in Chapter I, maximum
intensity has been used in prior work utilizing RPT. Though there is not prior work
examining intensity differences between AAE and EAE explicitly, it is important to see if
there are differences for these measures between these AAE and EAE voices. As Table
2.17 demonstrates, AAE voices have lower intensity max values than the EAE voices. This indicates that overall, AAE voices are not as “loud” as the EAE voices. Intensity

75
difference from the mean values show a different pattern than for the pitch difference
from the mean measure. That is, AAE voices show a lower mean than the EAE voices,
while also showing a larger standard deviation.
Taken together, the differences in pitch measures for these voice groups
underscore findings in prior work that point to AAE having “more dynamic” prosody
compared to EAE (Cole et al. 2005; Thomas and Wolfram 2002; McLarty 2011, 2018;
Thomas 2015; Holliday 2016). As just discussed, though there is not prior research that
investigates intensity differences between AAE and EAE, the patterns here highlight that
in fact there are intensity differences between the ethnolects in the speech samples
presented to the listeners in the study. Though not the focus of this dissertation, the
patterns uncovered for the acoustic measurements here are important for the
sociolinguistic study of AAE prosody in general. These results indicate that at least along
these intensity measures, there appears to be sociolinguistic patterning for intensity in
AAE and EAE. Future work could usefully explore this result in detail, and thus add to
the growing body of literature on AAE prosody. In terms of looking ahead to Chapter III
and Chapter IV, these acoustic measures may influence how listeners rate prominence in
these voices. The production based results demonstrate differences acoustically for these
two voice groups, but we still do not know if these are measures that listeners attend to in
perception.
2.8 Going Forward
In Chapters III and IV, I take the data collected through the experiment described
here and apply them to the research questions presented in Chapter I. In Chapter III, I
76
address the first broad research question: What differences do listeners perceive between
AAE and EAE voices when they are asked to rate prosodic prominence? And, how do
listener groups, who differ in regional background, ethnicity, and self-reported
experience, compare to one another? That is, I begin, in Chapter III, by exploring how
these listener groups attend to prominence in these voices without considering the role of
linguistic factors. Following this, in Chapter IV, I consider the second broad research
question: How do linguistic cues (i.e. acoustic and structural factors) to prosodic
prominence differ for AAE and EAE voices? And how do listener groups, who differ in
regional background, ethnicity, and self-reported experience, compare to one another in
their use of these cues? In the analyses in Chapter IV, I focus on the set of acoustic
factors described above, as well as part of speech, word frequency, and word duration.
This seeks to lead to better understanding of the role of acoustic cues as well as the types
of words listeners are attending to in these voices, which may underpin differences in
perception among listener groups, and thus enrich what we know about the role of
experience and the interplay of production and perception in AAE and EAE.

77
CHAPTER III
REGIONAL BACKGROUND, ETHNICITY, EXPERIENCE AND THE
PERCEPTION OF PROMINENCE
3.1 Introduction
This chapter addresses two of the major interests of this dissertation: patterns of
prosodic prominence in the speech of AAE and EAE speakers from the Southeastern
U.S., and the role of listeners’ regional background, ethnicity and self-reported
experience with AAE in the perception of prosodic prominence. I begin by considering
whether everyday listeners show differences in their prominence ratings of words in
excerpts of AAE and EAE speech, as might be expected based on previous descriptions
of prosodic differences in production-based studies. Following this, I turn to assess the
role of listeners’ regional background and ethnicity as they relate to experience in the
perception of prominence. Lastly, to probe the role of experience more deeply, I
investigate whether listeners’ self-reported experience with AAE affects their perception
of prosodic prominence. As a part of this inquiry, I consider the perception of prosodic
prominence in AAE by native speakers of the variety, the North Carolina African
American (NCAA) listeners, and ask how the perceptions of those native speakers
compare to perceptions by other listener groups, the North Carolina European American
(NCEA) and the Oregon European American (OREA) listeners. This chapter primarily
examines its questions through a focus on the rates of prosodic prominences that are
marked by the listeners and agreement patterns among the listeners groups. Chapter IV
expands on the findings of this chapter to look at how acoustic cues, such as pitch and
intensity, and linguistic factors, like a word’s grammatical category (part of speech),
78
influence which words are heard as prominent, and how such factors interact with the
properties of the speakers and listeners.
3.1.1 Production, Perception and the Rapid Prosodic Transcription Task
As discussed in Chapter I, prior production-based research on AAE and EAE
varieties has identified differences in the phonetic realization of pitch-related properties
(Tarone 1973; Loman 1975; Wolfram and Thomas 2002; McLarty 2018). These studies,
drawing on a combination of acoustic phonetic and phonological (e.g. MAE_ToBI-based)
methods, have generally found that AAE has what I have described as “more dynamic
prosody” (e.g. more primary stresses, more pitch accents, etc.) compared to EAE
varieties (Loman 1975; Wolfram and Thomas 2002; Holliday 2016; McLarty 2018). The
acoustic analyses of the stimuli used for the present study, presented in Section 2.7.2,
confirm such differences. The AAE stimuli have, for instance, higher maximum F0
values (pitch max) and greater change in terms of minimum and maximum F0 values
across a word (pitch range within word), in comparison to the EAE stimuli. What is not
yet known is whether or not differences between the varieties, as found by expert analyst
studies in production, are perceptible by everyday listeners, and, in particular, whether
everyday listeners who themselves are African American perceive differences between
AAE and EAE in terms of prominence.
Additionally, prosodic differences between the varieties have been implicated in
perception-related studies where listeners use prosodic cues to correctly distinguish AAE
voices from EAE voices (Purnell et al. 1999; Thomas and Reaser 2004; Thomas et al.
2010). Speakers of American English show high rates of accuracy (> 70%) for the

79
identification of African American and European American voices, even without the
presence of AAE morphosyntactic features (Thomas and Reaser 2004). This highlights
the fact that even in utterances where these features do not occur, there are characteristics
of AAE that are “prototypical” voice characteristics in AAE. Spears (1988) notes that
these characteristics are strongly associated with AAE, and are most likely found in the
prosodic system (though Thomas and Reaser (2004) and Perrachione et al. (2010) point
out that there are other acoustic factors involved as well). This prior work would suggest
that prosodic differences between AAE and EAE are noticed by listeners, at least when
doing an ethnic identification task. However, this dissertation is the first study to ask
directly whether listeners notice prosodic differences between AAE and EAE.
As described in detail in the previous chapters, the analyses in this dissertation use
the Rapid Prosodic Transcription (RPT) task to probe listeners’ perceptions of
prominence in AAE- and EAE-speaking voices. As a reminder, RPT asks everyday
listeners to mark words they think speakers are “highlighting” as they listen to excerpts of
conversational speech. This approach allows researchers to determine everyday listeners’
judgments of prominent prosodic events as well as to examine the acoustic and structural
factors that correlate with listeners’ perceptions. Prior work using RPT has shown that
prosodic prominence marking is highly correlated with pitch accents (Hualde et al. 2016;
Turnbull et al. 2017), and thus the RPT task and its use for examining prominence is
especially relevant for examining prosodic differences between AAE and EAE speakers,
who are thought to differ in their use of pitch accents (McLarty 2011, 2018; Thomas
2015; Holliday 2016).
80
Using the RPT task, I ask everyday listeners to rate prominence in excerpts of
speech from AAE and EAE speakers from North Carolina. In this chapter, I first examine
whether the AAE voices are heard by listeners as having more prominences than the EAE
voices, which would be in line with expectations from the prior production-based
research and would provide supporting evidence that AAE and EAE varieties are
perceptibly different in terms of prosodic prominence according to everyday listeners.
Three listener groups are examined, African American and European American listeners
from North Carolina (NCAA and NCEA, respectively) and European American listeners
from Oregon (OREA). These three groups present an opportunity to explore the role of
listeners’ regional background and ethnicity in the perception of prominence when
listening to African American and European American voices, and how these listener
groups may differ in terms of the agreement patterns among their individual perceivers, a
common consideration used in prior research with the RPT task (e.g. Mo 2010; Cole et al.
2017). I also explore listeners’ self-reported experience with AAE as a factor in the
perception of prominence in these voices. In Section 3.1.2 below, I discuss the three
major listener factors – regional background, ethnicity, and self-reported experience –
further, and how these factors shape the analyses that follow.
While my primary interest is in the ways that properties of the speakers and, in particular,
of the listeners influence the perception of prominence, it is also the case that properties
of the RPT task, and the implementation of the task in the LMEDS software, may
influence the patterns uncovered. Thus, included in my analyses are an attention to one of
the major aspects of the experimental design, whether listeners were presented with AAE
voices first or second. As described in Chapter II, the experimental conditions blocked

81
the speech stimuli by ethnicity, and two versions were created for each condition, so that,
for each condition, listeners were either presented with the AAE voices first and the EAE
voices second, or vice-versa. This manipulation was done in order to directly assess the
role that ethnicity order effects might have on prominence perception; if long-term
experience may matter for prominence perception, short-term (task-based) experience
may matter as well. That is, the fact that some listeners heard AAE voices first and others
heard EAE voices first may affect prominence perception and interact with the overall
patterns uncovered for the primary factors of interest in this chapter, those relating the
ethnicity of the speakers and the regional background and ethnicity of the listeners, as
well as the listeners’ self-reported experience with AAE. (Other manipulations that were
made in the conditions (such as the order of the individual voices within the ethnicity
blocks and the individual stimuli presented to listeners) were not of theoretical interest
and are not examined here.)
3.1.2 Ethnicity, Regional Background, and Listener Experience as Factors in Prosodic Perception
It is well known that one’s experience with a language, and with a variety, affects
the way it is treated in various perception tasks. Several studies that provide important
interpretive perspectives for this dissertation address this. For instance, Evans and
Iverson (2007) examined how listeners adjust their vowel categories in perception when
hearing speech from two different dialects. The researchers found that the less
exposure/experience that listeners’ have with a variety, the less the listeners are able to
perceive unfamiliar vocalic variants. Kendall and Fridland (2012) investigated the
perception of vowel categories in terms of participants’ regional backgrounds. They
82
considered how listeners from three different dialect regions in the United States (the
South, the Inland North, and the West) performed on a vowel identification task, and
found that listeners who come from the same regional background share linguistic norms
that influence their perception. Though Evans and Iverson (2007) and Kendall and
Fridland (2012) examined the relationship between experience and the perception of
vowels (and not prosody), the findings in these studies highlight the importance of
regional experience in the perception of dialect variants.
With respect to prominence perception in particular, Cole et al. (2017) found that
RPT participants who have the same language background as the voices they are
perceiving (American English) show more agreement in prominence perception than
listeners who have a different language background (Indian English). Though the purpose
of their study was to determine what makes a participant a good annotator in the RPT
paradigm, a different goal than that of the current project, their findings present an
important analogy for this study. While their Indian annotators come from a multilingual
and non-U.S. setting, their primary interest in that group is their lessened exposure to
American English, which, indeed, led them to show less agreement as annotators for
American English prominence patterns. This suggests that exposure to different varieties
of American English may play a role in the perception of prominences for those varieties.
Finally, Perrachione et al. (2010) examined the role of one’s own dialect in the
perception of different talker groups in an ethnic identification task. In this study, the
authors presented European American and African American listeners with European
American and African American voices and asked them to label the voice’s ethnicity.
The authors found that listeners have a bias to their own dialect in the perception of
83
talkers. This bias is argued to be a result of “asymmetric cultural experiences”, and for
listeners, the “quantity or quality of some experiences exceeds that of others”
(Perrachione et al. 2010: 12). Essentially, listeners’ perception system becomes attuned to
the language or dialect of speakers they primarily associate and share a linguistic
background with.
Indeed, one’s perception system is influenced by its input, and how much and
what kind of experiences with languages or varieties affect perception are major
questions in the field. In this study, I am interested in AAE speech, especially as
compared with EAE speech. Thus, there are several aspects of experience that may be
relevant for the listeners in this study. First, one’s own ethnicity may matter, as it is
plausible that in the context of the U.S., a person may have the most experience with
people who share their ethnicity; thus, participants identifying as African American may
have more experience with speech from African American individuals. Second, because
the stimuli in this study are from a particular region, participants who come from that
same region likely have more exposure to that region’s local varieties, which could affect
perception. Third, I consider the composite score of self-reported experience and its
potential influence on prominence perception and this provides a more individualized
way to examine listeners’ experience. I now discuss each of these three factors in more
detail.
As explained in Chapter II, the listener groups examined here come from Oregon
(in the Northwestern U.S.) and North Carolina (in the Southeastern U.S.), while the
speech samples are all taken from speakers from North Carolina. The selection of stimuli
avoided strongly Southern-accented speakers and excerpts with grammatical features

84
associated with AAE or Southern EAE (again, see Chapter II), but the North Carolina
listeners are expected to have more experience with the North Carolina voices than the
Oregon listeners have, and this is expected across both groups of ethnicities in the
stimuli.
Further, the North Carolina listeners are separated into two groups, African
American (NCAA) listeners and European American (NCEA) listeners, while the Oregon
listeners are all European Americans (OREA). Thus, the difference between the NCAA
group and the two European American listener groups, NCEA and OREA, allow us to
consider the role of ethnicity, while also attending to whether the regional differences
between the OREA and NCEA groups matter for the perception of prominence. Since the
NCAA listener group share both regional and ethnic background with the AAE speaker
samples, this group is especially useful for examining how everyday listeners attend to
prosodic differences between AAE and EAE. The NCAA group allow us to examine how
African American listeners perceive prominence in AAE.
Finally, experience can also be examined more directly, on an individual-by-
individual basis. That is, rather than using participants’ general backgrounds as proxies
for their experience, experience can also be probed by examining individual participants’
life histories. While a range of approaches could be used to address participants’
individual experiences as a factor in their perceptions of prosodic prominence, for the
present project, this perspective on experience is captured through listeners’ self-reports
about their experience along several social dimensions (specifically: how much
experience they think they have with a variety, how much they hear a variety in their
recent daily lives, and how much they engage with it through media). As discussed in
85
Chapter II, participants were asked three questions about their experience with AAE in
the post-experiment questionnaire following the experiment and their responses to these
three questions were then combined into a composite score.
Importantly, although self-reports are in a sense more direct and more
individualized than the group-level associations of ethnicity and regional background,
they also may be subject to the types of biases introduced when asking for self-reflection
regarding language varieties. Further, these self-reports about experience with a language
variety cannot be considered the same across all regions or communities, nor are they the
same within an ethnic group. We cannot, for instance, expect that the OREA listeners
mean the same thing when they report “some experience with AAE” that the NCAA
listeners mean when they report that level of experience. Further, both North Carolina
listener groups, NCAA and NCEA, were drawn from the student population at a Historic
Black College/University (HBCU) and so have relatively extensive experience with
AAE. Thus, I focus primarily on the OREA listeners’ self-reports about experience with
AAE, since this group’s self-reports are expected to represent the widest range of
experience.
The point here is not to suggest that one view of experience is “better” than
another, or to test whether one “version” of experience is more influential than another;
rather, it is to recognize that experience is made up of a confluence of factors, with the
three perspectives probed here meant to advance the general understanding of how
listeners’ regional backgrounds affect their perception of prosodic prominence.
Throughout this chapter and Chapter IV, this dissertation aims to assess the role these
factors (regional background, ethnicity and self-reported experience) play in prominence

86
perception by asking a series of questions. In Section 3.1.3 below, I present the specific
research questions addressed in this chapter, and the potential outcomes of the ensuing
analyses.
3.1.3 Research Questions and Predictions
In this chapter, I explore four main research questions to better understand how
the stimulus speakers realize prosodic prominence and how the listeners in these data,
similarly or differently, attend to prominence in the stimuli:
1. Do all listener groups perceive different amounts of prominences for AAE voices than EAE voices? 2. Do African American listeners (i.e., NCAA) perceive different amounts of prominences for AAE voices than EAE voices? 3. To what extent does listeners’ regional background and ethnicity (i.e, NCAA, NCEA, and OREA) affect their perception of prominence for AAE and EAE voices? 4. To what extent does listeners’ (self-reported) experience with AAE affect their perception of prominence for the AAE voices?
These research questions are primarily about the speakers (research question 1)
and the listeners (research questions 2-4), but, as mentioned above, I also take into
consideration how the task-related factor of which speaker group (AAE or EAE) the
listeners heard first as I pursue these questions. This is particularly relevant to the first
research question. If AAE and EAE voices are heard as having different amounts of
prominence, it may be the case that hearing one set of voices first influences listeners’
perceptions of the second set of voices. This will be addressed as a part of the inquiries
into the individual research questions, although the primary organization here is based
around the four main research questions introduced above.
87
The first research question, do all listener groups perceive different amounts of
prominences for AAE voices than EAE voices?, investigates a core issue in the
sociolinguistic study of AAE prosody. As described in Chapter I, prior work has
demonstrated persistent differences between AAE and EAE varieties in prosodic
production (Tarone 1973; Loman 1975; Wolfram and Thomas 2002; Holliday 2016;
McLarty 2018). What this work has yet to uncover is how salient these differences are to
everyday listeners. Though not investigating prosodic differences explicitly, prior work
has also implicated prosody in ethnic identification tasks for AAE and EAE voices. This
work has indicated that prosodic differences may be salient to American English
speakers, and are used in differentiating AAE and EAE voices (e.g. Purnell et al. 1999;
Thomas and Reaser 2004; Thomas et al. 2010). As such, I expect that listeners will hear
the AAE voices as having more prominences than the EAE voices, due to differences in
prosodic production for these varieties, that at least on some level, listeners are aware of
(e.g. Thomas 2010). Essentially, no matter the regional or ethnic background or the level
of experience with AAE these listeners have, the production differences between AAE
and EAE varieties (e.g. more pitch accents, more stresses) could lead all listeners to
perceive more prominences in these AAE voices compared to the EAE voices. This result
would align with claims by Spears (1988) and discussions in Thomas and Reaser (2004).
These studies suggest that there are voice characteristics associated with AAE (above and
beyond canonical AAE morphosyntactic features), which as Spears (1988) suggests lies
(mainly) in the prosodic domain, and are generally perceptible by speakers of American
English varieties in distinguishing AAE and EAE voices.

88
The second research question, do African American listeners perceive different
amounts of prominences for AAE voices than EAE voices?, attempts to provide
sociolinguists an important insight into AAE. As previously discussed in Chapter II,
many of the studies that examine AAE prosody have utilized paradigms, like
MAE_ToBI, that were not designed for AAE specifically, nor do they (generally)
incorporate the judgments of African Americans. This dissertation acts as an initial step
in understanding how African Americans attend to prosody in AAE, and, as I return to in
Chapter V, how these perceptions may inform a more complete model of AAE prosody.
A potential outcome of the second research question could be that the NCAA listeners
hear prominence differently in the AAE voices than the European American listeners,
due to their shared cultural and linguistic background with the AAE voices (Perrachione
et al. 2010; Sumner and Samuel 2009). It is harder to predict, however, whether the
NCAA listeners would hear more or less prominences for AAE voices compared to EAE
voices, so I do not offer a prediction about the direction of this difference. Whatever the
finding, understanding how African American listeners perceive prominences in AAE
speech will provide important stepping stones for future work on AAE prosody.
The third research question, to what extent does listeners’ regional background
and ethnicity affect their perception of prominence for AAE and EAE voices?, adds to the
growing literature on the role of regional background and perception (e.g. Evans and
Iverson 2007; Sumner and Samuel 2009; Kendall and Fridland 2012), as well as the
interaction between regional and ethnic background. Though this literature does not
examine prosody or AAE specifically, it has provided important insights into how social
variation affects perception. Based on the findings from this prior work, we could expect

89
an outcome where the North Carolina African Americans (NCAA) and European
Americans (NCEA) perceive prominence in these voices in similar ways compared to the
Oregon (OREA) listeners, due to the fact that the North Carolina listeners and speakers
are drawn from regionally similar groups. For instance, we could expect that prominence
perception for both AAE and EAE speaking voices would be perceived similarly by both
North Carolina listener groups, since we expect these groups to have relatively similar
exposure to the voices, which would also be in line with the findings of Cole et al.
(2017), who found that listeners with more familiarity with voices show more agreement
in words they rate has prominent. On the other hand, the NCAA listeners, who are
African American themselves, may show persistent differences from both European
American groups, despite sharing a regional background with the NCEA listeners.
The fourth research question in this analysis, to what extent does listeners’ (self-
reported) experience with AAE affect their perception of prominence for the AAE
voices?, focuses on the Oregon European Americans (OREA), the listener group that
does not have the same ethnic or regional background as the NCAA listeners. This
question seeks to provide insights into how listeners’ own views of their experience
potentially affect prominence perception. These listeners reported a range of prior
experience with AAE (see Section 2.7.1), which allows me to examine how different
levels of experience with AAE affect the listeners’ perceptions of prosodic prominence. I
expect that the OREA listeners with less self-reported experience with AAE would attend
to the differences between AAE and EAE prosody in different ways than listeners who
report more experience. More specifically, Oregonians with more (self-reported)
experience with AAE might perform in the RPT task more similar to the NCEA or

90
NCAA listener groups than Oregonians with less experience with AAE. I do not have
more specific a priori predictions than this, but address this question last, so as to use it to
build upon the findings of the first three questions.
3.2 Quantitative and Statistical Analysis
As previously discussed, prior production-based research has found differences
between AAE-speaking voices and EAE-speaking voices, where AAE speakers generally
show “more dynamic prosody” compared to their EAE-speaking counterparts. This has
been addressed, for instance, in terms of stress patterns, where AAE speakers produce
“more stresses” than EAE speakers (Loman 1975; Wolfram and Thomas 2002). By
examining how the listener groups attend to prominence we can better understand how
prior findings of prosodic differences between AAE- and EAE-speaking voices align
with the perception of everyday listeners. We turn now to examine the patterns of
prosodic prominence and the perception patterns obtained through the RPT task. I begin
by describing the quantitative approaches taken and the main statistical model of the
prominences, which allow me to address the first three research questions. (The fourth
research question is taken up in Section 3.3.)
3.2.1 Statistical Approach
This section describes the quantitative analyses used to examine the data collected
in the prominence perception task. It explains the statistical model used to examine the
overall prominence ratings provided by the three listener groups and presents the
outcome from this model. It also describes the use of Fleiss’ Kappa statistics (Fleiss

91
1971), which are a common inter-rater agreement measure used for RPT tasks (e.g. Cole
et al. 2017). In the statistical modeling, I focus on a few key independent variables: the
ethnicity of the speakers, the listener groups, whether listeners were presented with AAE
voices or EAE voices first, and several interactions among these factors (more detail
below). This statistical analysis and a series of Fleiss’ Kappa agreement measures
provide the basis for addressing the first three research questions, which are then
presented, one at a time, in Sections 3.2.2-3.2.4. The fourth research question will utilize
a second statistical model, described later.
To analyze the results of the RPT data, I primarily utilize mixed-effect logistic
regression, following statistical procedures described in Sonderegger et al. (2018). The
regressions were run using the lme4 package (Bates, Maechler, Bolker and Walker 2015)
in R (R Core Development Team 2018). (All models use the ‘bobyqa’ optimizer, which
facilitates model convergence (Bates et al. 2015).) The statistical model tests prominence
as the dependent variable, whether each word in the stimuli was heard as prominent (1) or
not (0) by each listener. (Some RPT-based studies limit their analyses to content words;
the grammatical category (i.e. part of speech) of the words will be addressed as a factor in
Chapter IV, but for the purposes of the analyses here it should be noted that the analysis
includes all words in the stimuli, including function words and discourse markers.) The
model includes random intercepts for word, speaker, and participant nested by
experimental condition. As mentioned above, three main effects are included for fixed
effects. The ethnicity of the speakers (AAE vs. EAE, also referred to as the ethnicity of
voice) and the role of the listener groups (NCAA vs. NCEA vs. OREA) are each main
effects and of primary interest. AAE voices are the reference level for the ethnicity of

92
voice factor and the NCAA listeners are the reference level for the listener group factor.
The model also includes as a main effect the factor “was AAE first”, which captures
whether listeners heard AAE voices first or not, with false (i.e. EAE voices were first) as
the reference level. In addition to these three main effects, the model also includes a two-
way interaction between the ethnicity of voices and the listener group, which was a
planned comparison. Other interactions were tested and only included if they improved
the model, as assessed using likelihood ratio tests via the anova function in R. The
interaction between the ethnicity of voices and “was AAE first” significantly improved
the model and is included. I also investigated the role of the sex of the voice, as way to
check findings related to McLarty (2018) where African American female voices were
found to produce more pitch accents than African American males, but I find no
statistically significant results for sex as a main effect or an interaction in any of the
models I have evaluated. Thus, despite an original interest in examining sex as a factor in
prosodic prominence perception, I do not discuss speaker or listener sex further.
All independent variables were centered so that the intercept is interpretable as the
grand mean of the dependent variable (in this case prominences). Table 3.1 presents the
outcome of the statistical model and provides the basis for addressing the first three
research questions. The components of the model’s outcome are discussed in depth as
relevant in the following sections, which take up each of the three research questions in
turn. Each section provides figures to help unpack the model results.

93
Table 3.1 Prominence perception regression results
Random Effects: Word (sd= 1.212); Speaker (sd= 0.811); Participant nested by Condition (sd= 0.115)
Factor Estimate Std. Error P-Value
Intercept -1.374 0.125 < 0.001 *** Ethnicity of voices (EAE)
(Reference level: AAE) -0.226 0.066 < 0.001 ***
Listener Group (OREA) (Reference level: NCAA)
0.108 0.119 0.365
Listener Group (NCEA) (Reference level: NCAA)
0.102 0.183 0.578
AAE First (TRUE) (Reference level: FALSE)
0.201 0.113 0.075
Ethnicity of Voice (EAE) X Listener Group (OREA)
0.002 0.031 0.950
Ethnicity of Voice (EAE) X Listener Group (NCEA)
-0.036 0.049 0.463
Ethnicity of Voice (EAE) X AAE First
0.124 0.029 < 0.001***
In addition to the main mixed-effect logistic regression model, I also run
additional statistical tests where relevant. In particular, I draw on Fleiss’ Kappa statistics
to assess patterns of agreement among the listeners, both in terms of listener groups and
in terms of the ethnicity of the voices in the stimuli. As mentioned above, Fleiss’ Kappa
is a common statistic for assessing inter-rater reliability for cases where there are more
than two raters. This statistic is commonly used for assessing the results of RPT tasks
(e.g. Cole et al. 2010, 2017; Mo 2010). Fleiss’ Kappa provides a measure of how much a
set of “raters”, in this case listener participants in the RPT task, agree in which words
they select and do not select as prominent. Fleiss’ Kappa values were generated using the
kappam.fleiss function in the irr package (Gamer, Lemon, and Singh 2012) in R. This
function was run on each listener and voice group pairing, as well as for all listeners
together and both sets of voices together. Since agreement needs to be assessed over (the
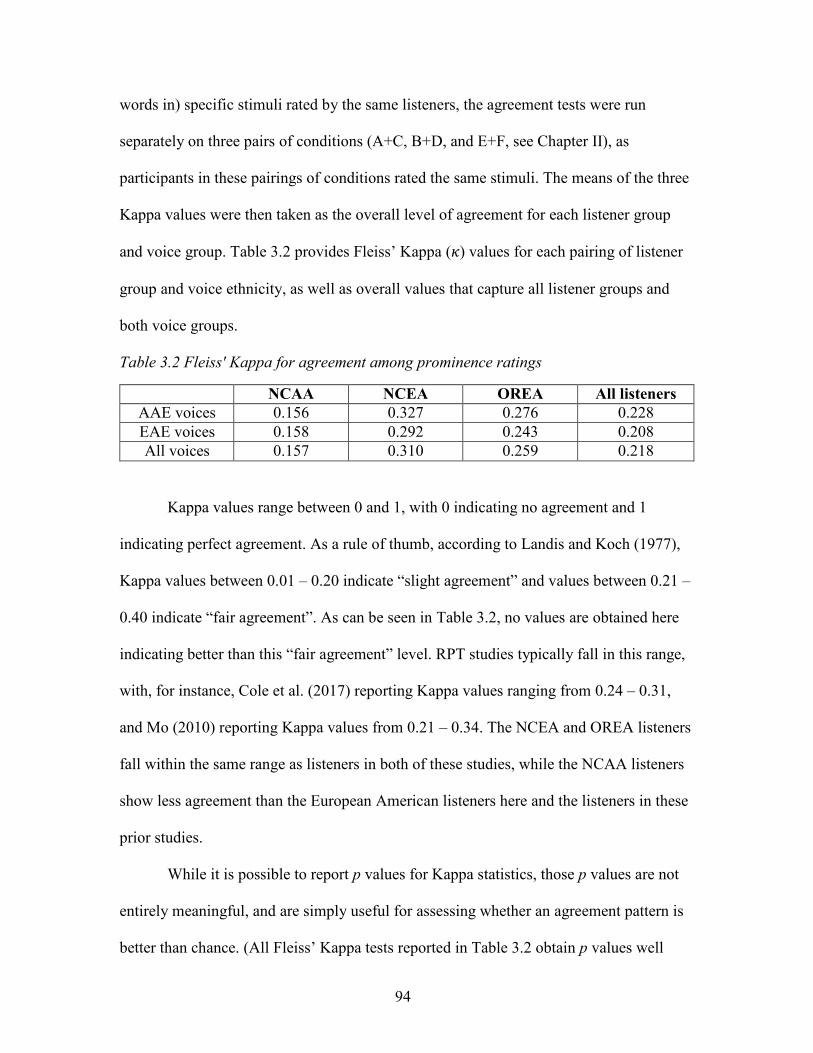
94
words in) specific stimuli rated by the same listeners, the agreement tests were run
separately on three pairs of conditions (A+C, B+D, and E+F, see Chapter II), as
participants in these pairings of conditions rated the same stimuli. The means of the three
Kappa values were then taken as the overall level of agreement for each listener group
and voice group. Table 3.2 provides Fleiss’ Kappa (𝜅𝜅) values for each pairing of listener
group and voice ethnicity, as well as overall values that capture all listener groups and
both voice groups.
Table 3.2 Fleiss' Kappa for agreement among prominence ratings
NCAA NCEA OREA All listeners AAE voices 0.156 0.327 0.276 0.228 EAE voices 0.158 0.292 0.243 0.208 All voices 0.157 0.310 0.259 0.218
Kappa values range between 0 and 1, with 0 indicating no agreement and 1
indicating perfect agreement. As a rule of thumb, according to Landis and Koch (1977),
Kappa values between 0.01 – 0.20 indicate “slight agreement” and values between 0.21 –
0.40 indicate “fair agreement”. As can be seen in Table 3.2, no values are obtained here
indicating better than this “fair agreement” level. RPT studies typically fall in this range,
with, for instance, Cole et al. (2017) reporting Kappa values ranging from 0.24 – 0.31,
and Mo (2010) reporting Kappa values from 0.21 – 0.34. The NCEA and OREA listeners
fall within the same range as listeners in both of these studies, while the NCAA listeners
show less agreement than the European American listeners here and the listeners in these
prior studies.
While it is possible to report p values for Kappa statistics, those p values are not
entirely meaningful, and are simply useful for assessing whether an agreement pattern is
better than chance. (All Fleiss’ Kappa tests reported in Table 3.2 obtain p values well

95
below 0.05.) It is also not straightforward how to assess whether two Kappa values are
significantly different from one another, and thus for the Kappa statistics, I generally only
consider the Kappa values as providing insight into which listener groups and voice
groups have relatively better or worse agreement, without making claims about the
statistical significance of the differences between Kappa values. I return to consider the
agreement statistics as they are relevant in the following sections. We now turn to address
how these analyses speak to the first three research questions.
3.2.2 Do Listeners Perceive Different Amounts of Prominences for AAE Voices than EAE Voices?
I begin by investigating the first research question: Do listeners perceive different
amounts of prominences for AAE voices than EAE voices? Table 3.1, above, presents the
statistical output for the mixed-effect logistic regression and Figure 3.1, below, shows the
model prediction for the main effect5 of ethnicity of voice. This speaks directly to the first
research question. The effect (β = -0.226, p < 0.001) indicates that AAE voices are heard
as having more prominences than EAE voices, underscoring that the patterns uncovered
in prior work examining production-based differences in prosody between AAE and EAE
varieties are indeed perceptible by everyday listeners. That is, the finding here is in line
with the suggestion that AAE has “more dynamic prosody” than EAE varieties.
5 More accurately, this should be referred to as a conditional effect since the effect is also included in an interaction in the model, but I generally follow common practice and refer to this as a “main effect” for simplicity throughout Chapter III and Chapter IV.

96
Figure 3.1 Predicted probabilities for prominence by ethnicity of voice: All listeners
In addition to the significant effect of the ethnicity of the voice, the model in
Table 3.1 also identifies that the order listeners heard the different voice groups mattered.
Listeners who were presented with the AAE voices first trended toward hearing more
prominences than those who heard AAE voices after EAE voices (overall: β = 0.201, p =
0.075) and this significantly interacted with the ethnicity of the voice, so that listeners
who heard AAE voices before EAE voices rated the EAE voices as having significantly
more prominences (interaction: β = 0.124, p < 0.001). This interaction is shown in Figure
3.2. In line with how I introduced this factor, this is best interpreted as a task-based
effect. Listeners hearing voices with more prominences first in the RPT task (AAE
voices) are led to continue to hear more prominences later in the task (EAE voices). This
is an interesting finding and valuable for future RPT-based research. Prior research using
RPT to investigate English (e.g. Cole et al. 2010, 2017) has not explicitly investigated
ethnicity (or compared how listeners attend to prominence in two different English

97
dialects in the same experiment) and thus has not examined the effect of blocked speaker
groups within an experiment. Future work utilizing RPT to investigate potential
dialect/ethnolect differences in perception should take this finding into account; dialects
and ethnolects with known production differences may affect how everyday listeners rate
prominence in tasks where stimuli are blocked by those dialects/ethnolects. In addition to
this methodological point, this result raises an interesting theoretical suggestion that
prosodic prominence perception should not be treated as free of contextual effects; since
prominence perception is affected here by previously heard speech, or short-term
experience, the idea that prominence perception is conducted relative to other speech
samples should be explored in future work. This task-based finding does not minimize a
main take-away for the first research question: African American voices are heard has
having more prominences than European American voices across the board.
Figure 3.2 Predicted probabilities for prominence by ethnicity of voice and whether AAE voices were heard first: All listeners
98
Before proceeding, it is worth pointing out that the significant difference between
the rates of prominences detected for these two voice groups is only a few percentage
points apart. As well, prominence rates are between about 18% and 25% (as seen in
Figures 3.1 and 3.2). This may appear low, and the difference between the two voice
groups is clearly small, but it is important to keep in mind that this is the percentage of
total words that are perceived as prominent, and the dependent variable examined here
includes all words in the stimulus passages, including function words. Thus, a rate of
20% prominent marking means that one in every five words is marked as prominent.
Finally, turning to the agreement patterns, the Kappa statistics indicate that there
is generally greater agreement across all the listeners for the AAE voices (𝜅𝜅 = 0.228) than
for the EAE voices (𝜅𝜅 = 0.208). Thus, not only are listeners hearing significantly more
prominent words in the speech of African Americans than European Americans, they are
also agreeing more in which words they hear as prominent for AAE speech in
comparison to EAE speech.
3.2.3 Do African American Listeners Perceive Different Amounts of Prominences for AAE Voices than EAE Voices?
The second research question for this chapter asks: Do African American listeners
perceive different amounts of prominences for AAE voices than EAE voices? This
question is meant to bring to the forefront the fact that much research on AAE prosody,
and AAE more generally, is based on the analyses and interpretations of listeners,
whether expert analysis or research participants, who are not themselves native speakers
of AAE varieties. Better understanding how everyday African American listeners

99
perceive aspects of AAE will lead to a better understanding of AAE varieties themselves.
I turn now to consider the patterns of perception for just the NCAA listeners.
The main analysis, in Table 3.1, above, indicates that there are not significant
differences between the listener groups (something I return to with research question
three, below), either in terms of the main effect for listener group or for the interaction
between listener group and ethnicity of voice. This non-significant interaction between
speaker ethnicity and listener group directly speaks to the question of whether African
American listeners differently perceive prominence across AAE and EAE speakers,
indicating that they do not do so differently than the European American listener groups.
Given the major a priori interest of examining native listeners of AAE, however, I
also ran a new model to more deeply examine how African American listeners perceive
prominence. That is, I ran a logistic mixed-effect model on just the subset of the data for
the NCAA listener group. Modeling here started with just the ethnicity of voices (listener
group is not a factor, since this analysis focuses on just one listener group). I also
considered the “was AAE first” factor as a main effect and in interaction with ethnicity of
voices, but these did not improve the model (again, as tested through likelihood ratio tests
using the anova function in R) so are not included in the final model (as was true in the
model for all listener voices in Table 3.1). The outcome for the model for NCAA
listeners is shown in Table 3.3, below. As the model demonstrates, these listeners indeed
heard the AAE voices as having more prominence than the EAE voices (β = -0.116, p =
0.015). Figure 3.2 below presents the effect visually. This result is, not surprisingly, quite
similar to the patterns uncovered in Table 3.1 and Figure 3.1. The overarching take away

100
is that the NCAA listener group largely replicates the main pattern for the voices that
emerged from all listeners together.
Interestingly, the effect of the order of the voices (“was AAE first”) did not arise
as significantly improving the model for just the NCAA listeners. That is, for the NCAA
listeners, the model did not fit the data better when taking into account whether listeners
heard AAE voices. This may be suggestive of a more substantial difference between the
perceptions of African American and European American listeners. However, it may also
just be a function of the lower statistical power due to examining a smaller amount of
data. Investigating this putative difference will need to remain for future work.
Table 3.3 Prominence Perception by North Carolina African American listeners
Random Effects: Word (sd= 1.058); Speaker (sd= 0.071); Participant nested by Condition (sd= 1.039) Factor Estimate Std. Error P-Value Intercept -1.291 0.126 < 0.001 *** Ethnicity of voices (EAE) (Reference level: AAE) -0.116 0.048 0.015 *
Figure 3.3 Predicted probabilities for prominence by ethnicity of voice: NCAA listeners
101
While the rates of prominence perception are similar between just the NCAA
listeners and the larger analysis of all listeners, the Fleiss’ Kappa agreement patterns from
Table 3.2 indicate something different. We saw above that all listeners together had
higher rates of agreement for AAE voices (𝜅𝜅 = 0.228) than EAE voices (𝜅𝜅 = 0.208). The
NCAA listeners, however, have almost identical, and lower, agreement rates for the two
voice groups (𝜅𝜅 = 0.156 for AAE voices and 𝜅𝜅 = 0.158 for EAE voices). Thus, the
African American listeners do not have higher agreement rates for the AAE voices. This
is contrary to what I had expected. Following the discussion in Perrachione et al. (2010),
due to the greater quality and quantity of experience with AAE that the NCAA listeners’
have, I expected these listeners to show higher agreement rates for AAE voices than the
NCEA and OREA listeners (which would also align with the findings of Cole et al.
2017). However, this is not the case. Rather, the lower overall Kappa values suggest that
the NCAA listeners’ strategies in the task may be less consistent across listeners than
other listener groups. Given the greater number of prominences realized by AAE
speakers, this might indicate that African American listeners have a wider range of
strategies for the RPT task than other listener groups. That different listeners use different
strategies in the RPT task has been suggested before (Mo 2010; Cole et al. 2010) and is
something that I will return to in the next section, and in Chapter IV.
3.2.4 To What Extent Does Listeners’ Regional Background and Ethnicity Affect Their Perception of Prominence for AAE and EAE Voices?
I now turn to the third research question, to ask: To what extent does listeners’
regional background and ethnicity affect their perception of prominence for AAE and
EAE voices? The statistical model presented in Table 3.1, above, provides much insight
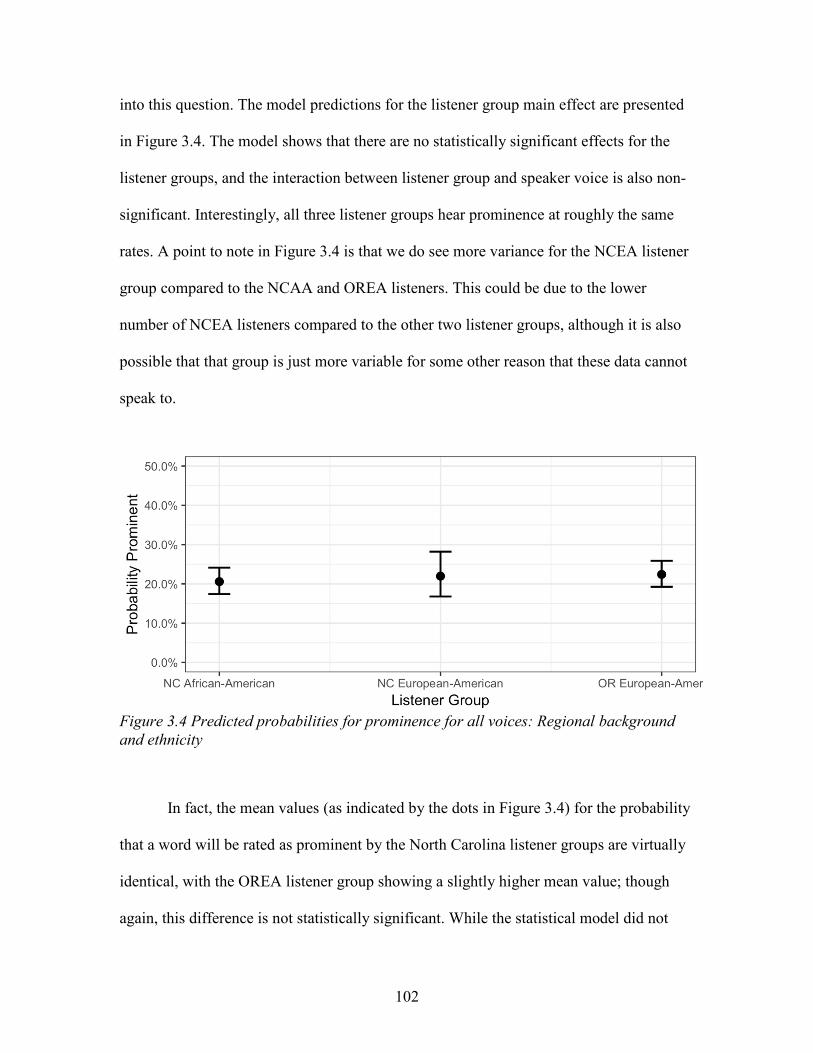
102
into this question. The model predictions for the listener group main effect are presented
in Figure 3.4. The model shows that there are no statistically significant effects for the
listener groups, and the interaction between listener group and speaker voice is also non-
significant. Interestingly, all three listener groups hear prominence at roughly the same
rates. A point to note in Figure 3.4 is that we do see more variance for the NCEA listener
group compared to the NCAA and OREA listeners. This could be due to the lower
number of NCEA listeners compared to the other two listener groups, although it is also
possible that that group is just more variable for some other reason that these data cannot
speak to.
Figure 3.4 Predicted probabilities for prominence for all voices: Regional background and ethnicity
In fact, the mean values (as indicated by the dots in Figure 3.4) for the probability
that a word will be rated as prominent by the North Carolina listener groups are virtually
identical, with the OREA listener group showing a slightly higher mean value; though
again, this difference is not statistically significant. While the statistical model did not

103
directly test the difference between the NCEA and OREA groups, it is clear from Figure 3.4 that there is also not a significant difference between these two listener groups.
More important to the present interests than the effect of listener group is the
question of whether the different listener groups perceive prominences differently than
one another for the different speaker groups. The interaction between listener group and
the ethnicity of voice tests this directly. The model results, in Table 3.1, indicate that the
interaction does not obtain significance. Figure 3.5 displays the (non-significant) effects
for the interaction.
Figure 3.5 Predicted probabilities for prominence by ethnicity of voice: Regional background and ethnicity
As noted in Section 3.2.3, the agreement levels obtained through the Fleiss’
Kappa analysis show that the NCAA listeners have similar agreement for both groups of
voices. They also had lower agreement than all of the listeners did when combined (in
Section 3.2.2). As Table 3.2 makes clear, the NCAA listeners in fact have the lowest
agreement rates. Figure 3.6 displays the Kappa values for the three listener groups and for
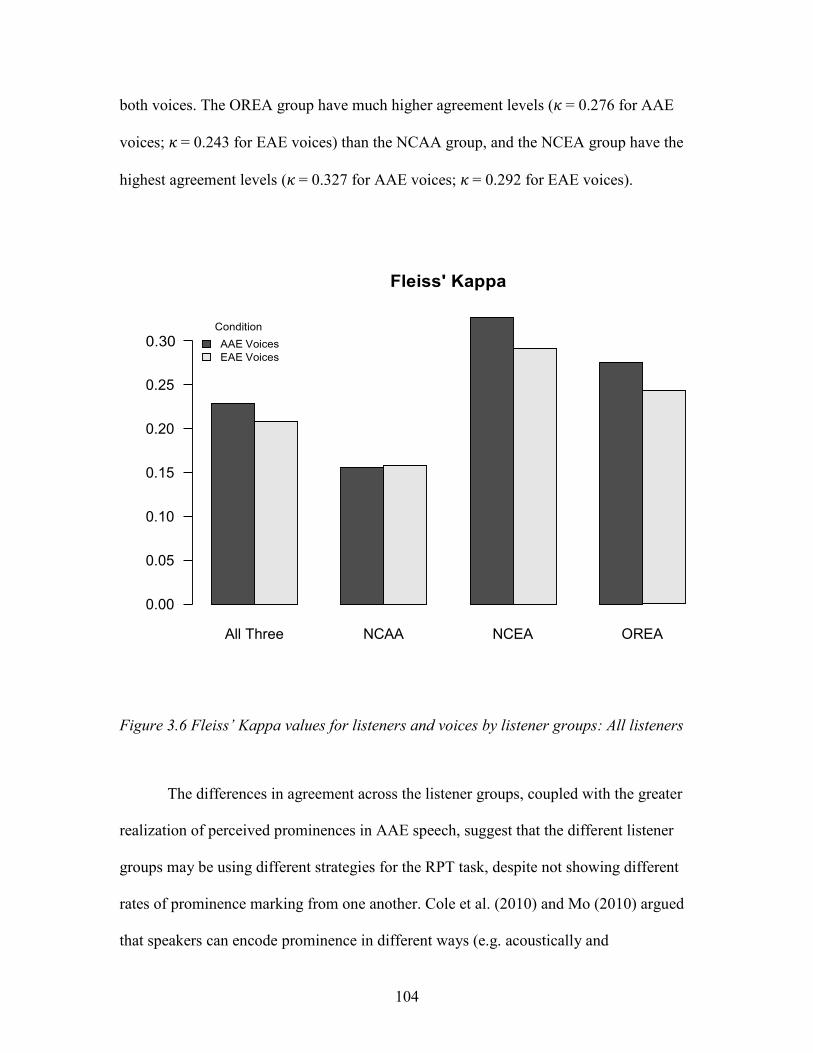
104
both voices. The OREA group have much higher agreement levels (𝜅𝜅 = 0.276 for AAE
voices; 𝜅𝜅 = 0.243 for EAE voices) than the NCAA group, and the NCEA group have the
highest agreement levels (𝜅𝜅 = 0.327 for AAE voices; 𝜅𝜅 = 0.292 for EAE voices).
Fleiss' Kappa
Condition 0.30 AAE Voices
EAE Voices
0.25
0.20
0.15
0.10
0.05
0.00
All Three NCAA NCEA OREA Figure 3.6 Fleiss’ Kappa values for listeners and voices by listener groups: All listeners
The differences in agreement across the listener groups, coupled with the greater
realization of perceived prominences in AAE speech, suggest that the different listener
groups may be using different strategies for the RPT task, despite not showing different
rates of prominence marking from one another. Cole et al. (2010) and Mo (2010) argued
that speakers can encode prominence in different ways (e.g. acoustically and
105
structurally), and that listeners are sensitive to those differences; thus, listeners can attend
to prominence in different ways and differently for different voices. Bauman and Winter
(2018) explored in more depth what listeners pay attention to in prominence perception.
Interestingly, the authors found that some listeners attend more to acoustic variables in
prominence perception and less so to structural and semantic variables, while other
listeners attend more to structural and semantic variables, paying less attention to
acoustic-related variables. The low, and similar, agreement for both voice groups for the
NCAA listeners is potentially indicative that they are attending to a wider range of cues,
and, generally, make use of more varied strategies for the task. And, further, that they are
doing so for both ethnic voice groups. The fact that the NCEA and OREA groups have
relatively similar increases in agreement for AAE voices over EAE suggests that these
groups are doing something both less varied across the individual participants, and that
they may be making use of similar linguistic cues. These are just speculations at this
point, but they lead to direct questions that will be examined in Chapter IV, where I turn
to assess how the listener groups use acoustic cues and linguistic information, such as
words’ part of speech and word frequency, in marking prosodic prominence.
The greatest amount of agreement was found among the NCEA listeners. This
may make sense if greater experience with AAE speech leads non-AAE speakers to be
more consistent in their perceptions of prominence. The NCEA group, recall, share
regional background with the voices in the stimuli and they are also drawn from the
population of students at an HBCU. Thus, their experiences with both groups of voices
are surely, on average at least, greater than those for the OREA group. In Section 3.3, I

106
make use of the self-reported experience data to probe the role of experience more
deeply. But, first, I summarize the findings thus far.
3.2.5 Interim Summary
The findings in these analyses provide valuable insights for the first three research
questions. The analyses show that all listeners hear AAE voices as having more
prominences than the EAE voices, and that this pattern is equivalent for all three listener
groups. No significant differences emerge in prominence marking for the different
listener groups, either as an interaction with the ethnicity of the voices or as a main effect
in the RPT task. While my primary interest was in the perception patterns of the NCAA
group, that group did not perceive prominence for either voice ethnicity group at different
rates than the other two listener groups. The only identifiable difference between the
listener groups emerged in the analysis of how much participants within each group
agreed with one another (as measured through the Fleiss’ Kappa statistic). There, the
NCAA group was found to have lower agreement than the other two listener groups and,
unlike the other two listener groups, realized similar agreement rates for both voice
groups.
Essentially, the ethnicity of the voices matters to all listeners in terms of how
many words they rate as prominent, regardless of listeners’ ethnicity or regional
background. This is in alignment with a hypothesis that listeners are rating prominence in
an ethnicity-contingent manner. Further, this result highlights that differences described
in prior production-based work, that AAE appears to have more dynamic prosody (e.g.
more pitch accents and more primary stresses; Loman 1975; Wolfram and Thomas 2002;
107
McLarty 2018) are perceptible by everyday listeners. This result provides support for the
suggestion that there are indeed “prototypical” AAE voice characteristics, even in the
absence of AAE morphosyntactic features, that are perceptible by speakers of American
English varieties, again regardless of the ethnicity or regional background of listeners.
The role of listener background is less clear. An effect for listener group did not
emerge, such that the regional background of the listener did not affect how they rated all
voices regardless of ethnicity in a statistically significant way. Additionally, the
difference between ethnicity of voices was not different across listener groups (as
indicated by a non-significant interaction between speaker group and listener group), as
initially expected. This lack of difference was unexpected, and will be explored further in
Chapter IV. Though these listeners mark prominence at similar rates, the agreement
patterns suggest that these listeners are using different strategies to mark prominence. A
possibility along those lines is that the listener groups may be attending to acoustic and
linguistic factors associated with prominence in different ways. This will be taken up at
length in the analyses of acoustic and linguistic factors in Chapter IV. First, we turn in
Section 3.3 to examine self-reported experience as a factor in prominence perception
more deeply.
3.3 A Closer Examination of the Role of Self-Reported Experience on Listeners’ Perception of Prosodic Prominence in AAE
As I discuss in several places in the dissertation, a large part of my interest in the
listener groups is based around a goal of better understanding the role that experience
with AAE plays in listeners’ perceptions of prosodic prominence in AAE. The regional
background and ethnicities of the listeners lead to different relationships with AAE, in
108
general, and the specific variety of AAE presented in the speech stimuli used in my RPT
tasks, specifically. The self-report data that listeners provided about their experiences
with AAE provide an opportunity to look more closely at the role of experience in
prosodic prominence perception, at an individual level.
To this end, I turn now to the fourth and final research question for this chapter,
which asks: To what extent does listeners’ (self-reported) experience with AAE affect
their perception of prominence for the AAE voices? To address this question, I focus in
on a subset of the listeners, the OREA listener group, and examine the data about their
self-reported experience with AAE. I focus on this group for a few reasons. First, the
OREA listeners have a different regional background than the NC listeners and overall
are expected to have less experience with the North Carolina-based voices in the stimuli.
Secondly, both North Carolina listener groups were recruited from the student population
from an HBCU, so the NCEA listeners have considerable experience with AAE, even if
they did not grow up directly in AAE-speaking communities. As mentioned earlier, what
it means to have “little” or “a lot” of experience with AAE has to be interpreted within
the context of the participants’ life experiences. Lastly, in the analysis for the composite
score in Chapter II, the NCEA listeners and the OREA listeners report similar mean
values (with the NCEA listeners having a larger standard deviation). I chose to focus on
the OREA listeners, rather than NCEA listeners, because they have a different regional
background than the voices in the stimuli, but it should be noted that these listener groups
do report have similar self-reported experience scores. Further, the OREA listeners are
expected to have a wider range of personal experiences with AAE and this would suggest

109
that this group provides the most potentially informative window into the role of a
listener’s self-reported experience with AAE on their perception of AAE voices.
To reorient readers to how self-reported experience was calculated for this
analysis, I created a composite score based on the questions presented in the post-
experiment questionnaire. The questions asked and potential responses are repeated from
Chapter II in Table 3.4 below. Chapter II considered the ways that these questions tap
into different aspects of experience with AAE, but, as described there, for analysis the
three questions are weighted equivalently and combined to form a single, numerical score
to capture each listener’s general “self-reported experience”. Each potential response was
associated with a corresponding number, e.g. No experience = 0, Little experience =1,
Some experience =2, etc. From these numbers, I then created a proportion from 0-1 for
each question, and then summed the proportions giving a score to each listener on a scale
from 0-3, with 0 representing the least amount of experience and 3 the most.
Table 3.4 AAE experience questions and possible responses
Questions Responses How much experience would you say you have had with African American English?
No experience, little experience, some experience, lots of experience
Of all the speech (not including music, television and film) you have heard in the last two weeks, what percentage of it would you say is African American English?
Less than 2%, less than 10%, less than 20%, less than 50%, more than 50%
Of all the music you listen to, what percentage of it would you say is Rap or Hip-Hop?
Less than 2%, less than 10%, less than 20%, less than 50%, more than 50%
To investigate whether the OREA listeners differ in the perceptions of
prominence by their experience, I applied logistic mixed-effect regression modeling. The
110
statistical modeling began with the same fixed and random effects from the main model
in Table 3.1, although, since I am examining the data from only one listener group,
listener group was not included in the model. I then added the experience with AAE
factor and tested interactions. Interactions were included in the model if they significantly
improved the model, as assessed via likelihood ratio tests using the anova function in R.
Thus, the fixed main effects were ethnicity of voice (AAE and EAE), the “was AAE
first” task-based factor, and the experience with AAE score. Two interactions improved
the model and are included: ethnicity of voice and experience with AAE, and ethnicity of
voice and was AAE first. I also tested for an interaction between experience with AAE
and was AAE first, as well as a three-way interaction between ethnicity of voice,
experience with AAE, and was AAE first, but neither improved the model.
The results of the statistical model are presented in Table 3.5 below. As the model
output shows, the effect for ethnicity of voice only approaches significance in this model
(β = -0.171, p = 0.074), though the coefficient indicates a trend in the same direction as
was found in the earlier analyses, i.e. AAE voices are heard as (marginally) more
prominent. There are not significant main effects for either experience with AAE or was
AAE first, but there are significant interactions for both interactions, ethnicity of voice
and experience with AAE and ethnicity of voice and was AAE first.
Figure 3.7 shows the model predictions for the interaction between ethnicity of
voice and self-reported experience with AAE. As Figure 3.7 indicates, as Oregonian
listeners’ experience with AAE increases, they are less likely to rate EAE voices as
prominent. Interestingly, self-reported experience with AAE has virtually no effect on the
perception of AAE voices; that is, as OREA listeners’ experience with AAE increases,

111
their likelihood to rate a word spoken by an AAE voices as prominent remains relatively
flat. This is a surprising finding and is something I will come back to momentarily.
Table 3.5 Prominence perception and experience by Oregon European American Listeners
Random Effects: Word (sd= 1.329); Speaker (sd= 0.145); Participant nested by Condition (sd= 0.680)
Factor Estimate Std. Error P-Value Intercept -1.242 0.197 < 0.001 ***
Ethnicity of voices (EAE) (Reference level: AAE) -0.171 0.096 0.074
Experience with AAE 0.013 0.096 0.888 AAE First (TRUE)
(Reference level: FALSE) 0.089 0.136 0.515
Ethnicity of voices (EAE) X Experience with AAE -0.092 0.029 0.002 **
Ethnicity of Voice (EAE) X AAE First 0.242 0.043 < 0.001 ***
Figure 3.7 Predicted probabilities for prominence by ethnicity of voice: Experience with AAE
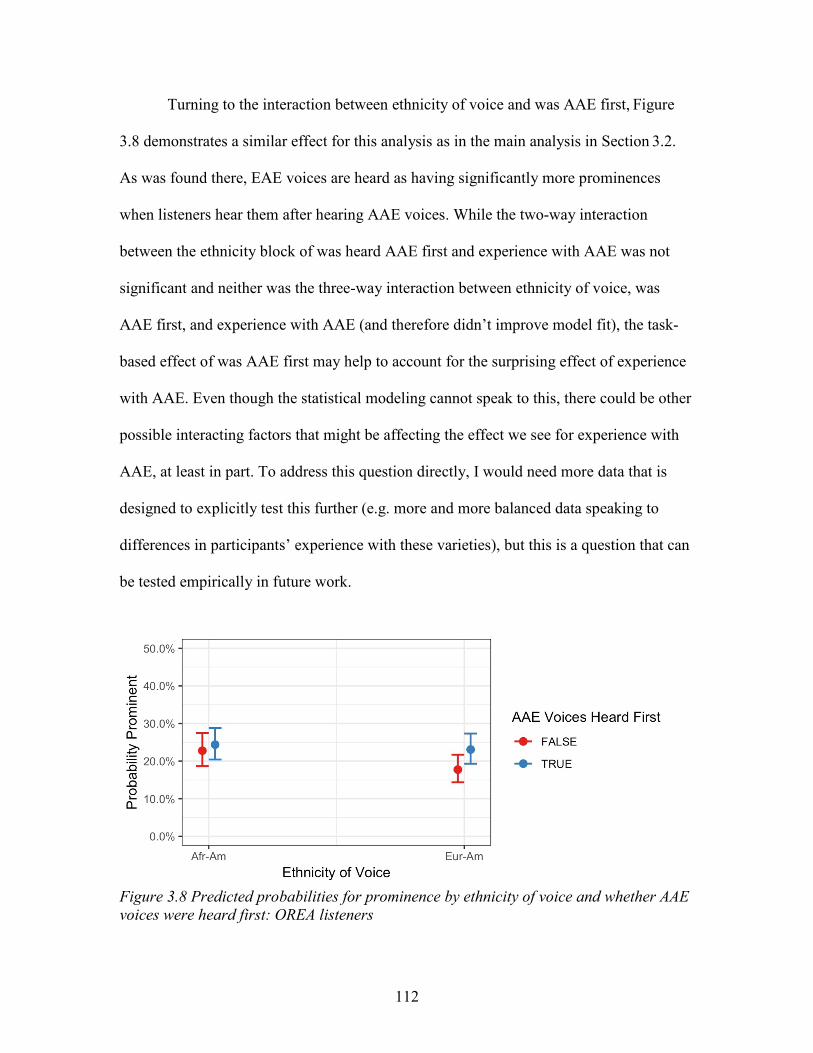
112
Turning to the interaction between ethnicity of voice and was AAE first, Figure 3.8 demonstrates a similar effect for this analysis as in the main analysis in Section 3.2.
As was found there, EAE voices are heard as having significantly more prominences
when listeners hear them after hearing AAE voices. While the two-way interaction
between the ethnicity block of was heard AAE first and experience with AAE was not
significant and neither was the three-way interaction between ethnicity of voice, was
AAE first, and experience with AAE (and therefore didn’t improve model fit), the task-
based effect of was AAE first may help to account for the surprising effect of experience
with AAE. Even though the statistical modeling cannot speak to this, there could be other
possible interacting factors that might be affecting the effect we see for experience with
AAE, at least in part. To address this question directly, I would need more data that is
designed to explicitly test this further (e.g. more and more balanced data speaking to
differences in participants’ experience with these varieties), but this is a question that can
be tested empirically in future work.
Figure 3.8 Predicted probabilities for prominence by ethnicity of voice and whether AAE voices were heard first: OREA listeners

113
The results from the statistical modeling show that the influence of the OREA
listeners’ self-reported experience with AAE on their perception of prominence is not
straightforward. As the statistical results indicate, self-reported experience with AAE
affects how the OREA listeners attend to prominence but, surprisingly, the effect is for
the EAE voices, and not for the AAE voices. While the effect’s direction is surprising,
the result is that as the OREA listeners experience increases, there is a larger
differentiation between AAE and EAE voices. As just discussed, some of the influence of
listeners’ experience may be obscured by the stronger task-based effect of whether they
heard AAE voices first. It is also possible that the compound numerical factor for
experience, tested only as a linear predictor, is just too simplifying to capture experience-
related differences among the OREA listeners. And, of course, it also possible that the
participants’ self-reports about their experience with AAE are just too unreliable to
provide accurate insight here.
An attention to agreement patterns among the listeners, as measured through
Fleiss’ Kappa statistics, helped to shed light on the analyses for the first three research
questions and I now turn to assess whether listeners’ agreement with one another is
influenced by their self-reported experience with AAE. Recall that the NCEA listeners
had the highest levels of agreement, for both AAE and EAE voices (see Table 3.2).
Further, I expect that the NCEA listeners have more experience with the stimuli voices
(due to the regional proximity to the stimuli speakers and the fact that they are drawn
from the student populations of an HBCU, where they encounter AAE more than the
OREA students who are from a Predominately White Institution (PWI)). Thus, we might
expect the OREA listeners with more (self-reported) experience with AAE to show

114
higher rates of agreement than the OREA listeners who report less experience with AAE.
On the other hand, since the NCAA listeners showed the least amount of agreement (see
Table 3.2), it is possible that greater experience could lead to less agreement. However, I
expect that the NCEA group are a more likely relevant comparator to OREA listeners
with more experience with AAE than the NCAA group, who are themselves African
American and likely come from AAE-speaking communities, and therefore have a
different quantity and quality of experience with AAE than the NCEA listeners.
To examine agreement patterns for the OREA listeners, based on their experience,
I split the OREA listeners into two groups, those whose numerical score for experience
with AAE was in the lower half of the range (“low”, <1.5) and those whose numerical
score was in the upper half of the range (“high”, ≥1.5). (Conveniently, roughly equal
numbers of participants fall in each experience group (low N = 53, high N = 55).) As
before, Fleiss’ Kappa statistics were generated on the three sets of experimental
conditions separately and then these three Kappa values were averaged to generate
overall agreement values for both experience levels (low and high) and for both sets of
voices (AAE and EAE), as well as for all voices. These values are presented in Table 3.6,
which also contains the overall OREA and NCEA Kappa values from Table 3.2 for
comparison. The Kappa values are also displayed visually in Figure 3.9.
Table 3.6 Fleiss' Kappa values for OREA listeners by Low vs. High Experience
OREA low experience with AAE
OREA high experience with AAE
All OREA (from Table
3.2)
All NCEA (from Table
3.2) AAE voices 0.260 0.281 0.276 0.327 EAE voices 0.226 0.257 0.243 0.292 All voices 0.243 0.269 0.259 0.310

115
Fleiss' Kappa
0.30
AAE Voices EAE Voices
0.25
0.20
0.15
0.10
0.05
0.00 Low
(0-1.5)
High
(1.5-3) Figure 3.9 Fleiss’ Kappa values for OREA listeners by low vs. high experience with AAE: OREA listeners
The Fleiss’ Kappa statistics indicate that the OREA listeners with higher self-
reported levels of experience with AAE perceive prominence with higher levels of
agreement than OREA listeners with lower self-reported experience. These results are in
line with the findings of Cole et al. (2017), who found that listeners with more experience
with a language variety show higher levels of agreement than listeners with less
experience. Interestingly, the high experienced OREA listeners do this for both AAE and
EAE voices. While it is hard to explain why increased experience with AAE would lead
to greater agreement for both the AAE and EAE voices for these listeners, it is notable
that this trend is in line with the patterns of agreement for the NCEA listeners, who show
116
higher levels of agreement for both AAE and EAE voices, as was discussed in Section 3.2.4. There this pattern was interpreted as having to do with the greater experience the
NCEA group must have with both voice groups (not just the AAE voices). The patterns
uncovered here, for the OREA listeners who report more experience with AAE, may
point instead to increased experience with AAE leading to different strategies for the
RPT task for all voices. It also may be that the order of voices plays a role in these
agreement patterns. A Fleiss’ Kappa test on the different experience groups broken down
by which listeners heard AAE voices first vs. second might be illuminating, but
ultimately this is left for future work.
Though I am unable to make strong conclusions about the influence of self-
reported experience based on the analyses here, I believe this factor warrants further
investigation. One potential possibility is that as the OREA listeners’ self-reported
experience with AAE increases, they may begin attending to acoustic and structural
factors for both AAE and EAE voices in ways that are similar to the NCAA listeners.
This possibility will be explored in Chapter IV.
3.4 Summary and Going Forward
The results of this chapter have provided important insights into the perception of
prominence in AAE and EAE voices. The analyses presented in Section 3.2 highlight that
the production-based differences described between AAE and EAE prosody are in fact
attended to by everyday listeners, regardless of regional background or ethnicity. This
finding also underscores claims by Spears (1988) and others, who argue that there is
something prototypical about AAE voices and that prosody seems to be a central
component of this fact. Surprisingly, there were not significant differences for the rates of
117
prominence perception for the three listener groups; meaning that the NCAA, NCEA and
OREA perceive prominence at roughly the same rates. However, the results from the
Fleiss’ Kappa analysis identifies some differences in how the listener groups perform in
the RPT task, finding that the NCEA listeners show the highest amount of agreement,
followed by the OREA listeners and then the NCAA listeners. This result, coupled with
the lack of significant differences for prominence rates across the listener groups,
suggests that these listeners, despite identifying similar amounts of prominences, may be
attending to acoustic and structural factors in these voices differently. That is, it may be
the case that the NCAA listeners are utilizing a wider range of acoustic cues than the
European American listeners, who, in turn, may be using a narrower set of cues (e.g.
Bauman and Winter 2018). Further, as discussed in Chapter II, there are production
differences for the AAE and EAE voices in these data, with some of these differences
relating to prior findings about prosodic differences between AAE and EAE in speech
production, such as pitch range within word, pitch change from the previous word and
pitch change to the next word. Potentially, the NCAA listeners may be attending to a
range of more AAE-specific cues (perhaps in addition to general markers of prominence),
whereas the European American listeners are only attending to more general cues
associated with prominence in the RPT task, such as pitch max, intensity max and word
duration. Greater experience with AAE for the European American listeners, leads to
higher agreement rates, but whether this leads the listeners to attend to acoustic and
structural cues differently is an open question. In Chapter IV, I will examine these
potential outcomes in a direct way, probing the role of acoustic cues and linguistic factors

118
in the listeners’ perceptions of prosodic prominence, to further elucidate upon what
Chapter III has uncovered.

119
CHAPTER IV
REGIONAL BACKGROUND, ETHNICITY, EXPERIENCE AND THE
PERCEPTION OF PROMINENCE: LINGUISTIC FACTORS
4.1 Introduction
This chapter builds on the findings, and questions, of Chapter III, and addresses
the second broad research question of this dissertation: How do linguistic cues (i.e.
acoustic and structural factors) to prosodic prominence differ for AAE and EAE voices?
And how do listener groups, who differ in regional background, ethnicity, and self-
reported experience, compare to one another in their use of these cues?
I seek to better understand if differences in acoustic cues between African
American English (AAE) and European American English (EAE), as described for the
stimuli in Chapter II and more generally in prior literature (e.g. Hudson and Holbrook
1981, 1982; Cole et al. 2005; McLarty 2011, 2018; Holliday 2016), are utilized by
everyday listeners in the rating of prominence. As Chapter III indicates, while the overall
perception data indicate that listeners hear more prominences in the AAE speech samples
than in the EAE speech samples, the listener groups do not perceive prominence at
different rates from one another. The three listener groups did, however, vary in terms of
their patterns of inter-rater agreement, where the North Carolina European American
(NCEA) listeners showed the highest levels of agreement, followed by the Oregon
European American (OREA) listeners. The North Carolina African American (NCAA)
listeners showed the least amount of agreement. Additionally, both European American

120
listener groups showed higher levels of agreement for AAE voices than the EAE voices,
while the NCAA listeners showed less agreement and similar agreement rates for both
groups of voices. Another interesting outcome from Chapter III was an effect for the
order in which listeners heard the two groups of voices. In the main analysis, listeners
who heard AAE voices first then heard EAE voices as having significantly more
prominences. This was not found for the analysis of the NCAA listeners alone, but the
effect appeared generally robust. Lastly, in the examination of the OREA listeners’ self-
reported experience, the data indicated that as listeners’ experience with AAE increased
they were less likely to rate a word spoken by EAE voices as prominent, with almost no
effect for AAE voices. This is surprising, but one aspect of this finding was that the
listeners with more experience with AAE differentiated EAE and AAE voices more in
terms of prominence perception.
I now examine a series of additional questions that turn our attention to the
properties of the speech stimuli themselves and to how the different listener groups make
use of those properties. The analyses in this chapter focus solely on the content words in
the speech samples. This is a departure from the treatment in Chapter III, which focused
on all words in the stimuli (content words as well as function words and discourse
markers). In order to verify that the results from Chapter III do not change when focusing
only on content words, I re-ran the statistical model in Chapter III with just content
words, and the model shows the same effects as it does for the model examining all
words6.
6 Prominence Perception Regression Results: Content Words Only Random Effects: Word (sd =1.17 ); Speaker (sd = 0.123 ); Participant nested by Condition (sd = 0.843 )
Factor Estimate Std. Error P-Value Intercept -1.153 0.116 <0.001 ***
Ethnicity of voices (EAE) (Reference level: AAE) -0.177 0.073 0.015 *
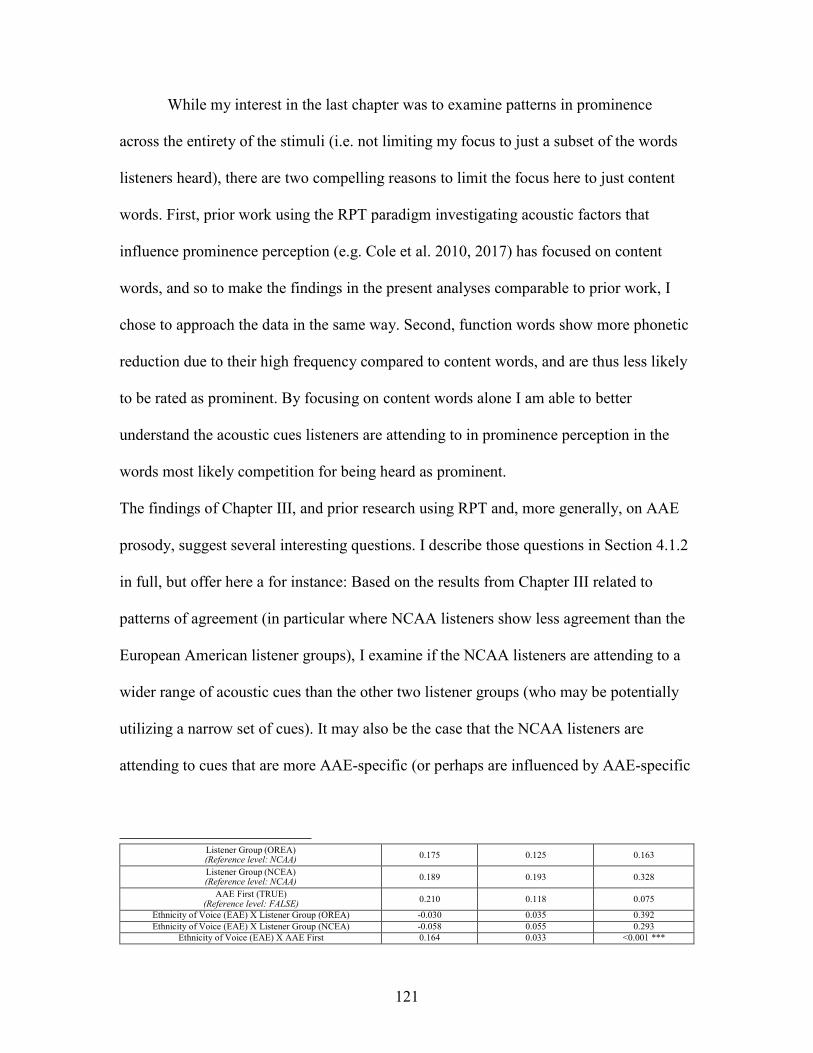
121
While my interest in the last chapter was to examine patterns in prominence
across the entirety of the stimuli (i.e. not limiting my focus to just a subset of the words
listeners heard), there are two compelling reasons to limit the focus here to just content
words. First, prior work using the RPT paradigm investigating acoustic factors that
influence prominence perception (e.g. Cole et al. 2010, 2017) has focused on content
words, and so to make the findings in the present analyses comparable to prior work, I
chose to approach the data in the same way. Second, function words show more phonetic
reduction due to their high frequency compared to content words, and are thus less likely
to be rated as prominent. By focusing on content words alone I am able to better
understand the acoustic cues listeners are attending to in prominence perception in the
words most likely competition for being heard as prominent.
The findings of Chapter III, and prior research using RPT and, more generally, on AAE
prosody, suggest several interesting questions. I describe those questions in Section 4.1.2
in full, but offer here a for instance: Based on the results from Chapter III related to
patterns of agreement (in particular where NCAA listeners show less agreement than the
European American listener groups), I examine if the NCAA listeners are attending to a
wider range of acoustic cues than the other two listener groups (who may be potentially
utilizing a narrow set of cues). It may also be the case that the NCAA listeners are
attending to cues that are more AAE-specific (or perhaps are influenced by AAE-specific
Listener Group (OREA) (Reference level: NCAA) 0.175 0.125 0.163
Listener Group (NCEA) (Reference level: NCAA) 0.189 0.193 0.328
AAE First (TRUE) (Reference level: FALSE) 0.210 0.118 0.075
Ethnicity of Voice (EAE) X Listener Group (OREA) -0.030 0.035 0.392 Ethnicity of Voice (EAE) X Listener Group (NCEA) -0.058 0.055 0.293
Ethnicity of Voice (EAE) X AAE First 0.164 0.033 <0.001 ***
122
cues in addition to or instead of the cues found in previous research to be important in
RPT prominence rating tasks, such as pitch maximum values and intensity maximum
values), whereas the European American listener groups could be attending to cues that
are more generally associated with prominence perception and RPT.
Further, as detailed in Chapter II, acoustic differences between the two voice
groups (AAE and EAE) exist in the stimuli. Some of these differences are directly
relatable to those described in prior work on AAE and EAE, such as the measures of
pitch range within word, pitch change from previous word and pitch change to next word.
Since several of these differences are in features known to be used by listeners in RPT
tasks, we might further expect these to play a role in the overall perception differences
between the two voice groups. Thus, we might wonder whether the greater number of
prominences heard for the AAE voices comes simply from their greater use of the
acoustic cues that listeners most attend to or whether listeners are attending to cues
differently for the two voice groups. I consider a range of questions along these lines.
Lastly, since prior work with RPT has noted robust differences for which words
are heard as prominent as a function of those words’ grammatical categories, I also
consider the grammatical category, or part of speech, for content words, i.e. nouns vs.
adjectives vs. adverbs, etc. Simply put, I assess if the listeners are rating different types of
words as prominent in AAE and EAE voices. Since the distributions of part of speech
categories were largely similar across the two voice groups, I do not expect that
differences among the stimuli are influential for listeners, but it could still be the case that
different types of words are produced with more prominence by the speakers in the
different groups, or are heard as more prominent by the different listener groups. I also
123
consider word frequency, which has been shown to play a role in prominence perception
in prior work, as a factor for these listeners. Much like in Chapter III, since prior work
examining AAE prosody has not (in general) investigated African Americans’ percepts of
AAE, I pay particular attention to African Americans’ use of these linguistic factors in
prominence perception.
In the rest of Section 4.1, Section 4.1.1, I continue to review findings related to
production studies of AAE prosody from Chapter I, and then turn to discuss how the
measures discussed in Chapter II and used in analyses here relate to prior work, while
also presenting the research questions and potential outcomes. Following this, in Section
4.1.2, I present five research questions and the potential outcomes for analyses in this
chapter. Like in Chapter III, the rest of the chapter is organized around the research
questions, with Sections 4.2 presenting a primary statistical model for the data, and 4.3.1-
4.3.3 addressing the first three research questions. In Section 4.3.4, I provide an interim
summary. Sections 4.3.5 and 4.3.6 address the final two research questions. Lastly,
Section 4.4 provides a summary of the chapter and concluding thoughts, which pave the
way for the larger interpretive work of Chapter V.
4.1.1 Linguistic Factors, Prominence Perception and the Rapid Prosodic Transcription Task
As discussed throughout the previous chapters, there are known production
differences between AAE and EAE varieties, and these differences are known to include
prosodic elements. As a reminder, acoustic differences described between AAE and EAE
include patterns like higher pitch realizations in AAE than EAE (Hudson and Holbrook
1981; 1982). Prior work on AAE prosody has also highlighted its dynamic nature, where

124
there are differences in the phonetic/acoustic realization of pitch compared to EAE
voices, such as the pronounced continual rise and fall of the pitch track over the course of
an utterance in AAE, which is not found in EAE varieties (Cole et al. 2005; Holliday
2016). Since these prosodic differences between AAE and EAE are central to the
analyses in this chapter, I review some of the most relevant work from Chapter I before
describing the main research questions for this chapter in the next section.
Hudson and Holbrook (1981; 1982) found a wider pitch range for AAE,
especially in spontaneous speech, compared to other studies that examined EAE pitch
range (cf. Fitch and Holbrook 1970). Cole et al. (2005) found a continued rise and fall of
the pitch track over the course of an intonational phrase (IP) for African American
speakers. That is, the authors find that African Americans exhibit more pronounced falls
in pitch contours over the course of a pitch accent domain than European Americans. The
authors also suggest that this could also be a byproduct of a greater pitch range for AAE
speakers, such that if a pitch accent is at the upper end of an AAE speaker’s range (which
typically exceeds that of EAE speakers), then pitch may reset to an easier to produce
range. Holliday (2016) found a complex pattern related to peak delay (i.e. the length of
time between the vowel onset and maximum pitch in a pitch accented syllable) and
speakers’ ethnic identity. Of her participants, the speakers who identified as African
American, and were speaking with other African American friends, were more likely to
exhibit a longer interval from vowel onset to maximum zero than those who were not.
The findings of Hudson and Holbrook (1981, 1982), Cole et al. (2005) and
Holliday (2016) are relatable to specific measures used in these analyses. The pitch max
measure can help us better understand if listeners are attending to the differences in pitch

125
max values in AAE and EAE described in Hudson and Holbrook (1918, 1982). Chapter II
showed that AAE speech samples have a higher mean pitch max, while also having a
smaller standard deviation compared to the EAE voices, which aligns with prior work.
Additionally, as also discussed in Chapter II, I created two measures that attempt to
capture the rise and fall of the pitch track described by Cole et al. (2005): pitch change
from previous word and pitch change to following word. For these measures, the AAE
samples show a greater change from the previous word, as well as a greater change to the
following word. Thus, the acoustic analysis for the stimuli supports the expectation that
the AAE stimuli voices have more rise and fall of the pitch track compared to the EAE
voices. I also measured pitch change within word, which is meant to relate to peak delay
and the findings in Holliday (2016). Pitch change within word, as discussed in Chapter II,
also shows differences across these voices groups, where the AAE voices have a larger
mean value, i.e. a wider range within words, and also a larger standard deviation, than the
EAE voices. Thus, the pitch-related differences described previously between AAE and
EAE are in the stimuli presented to listeners. The questions for this chapter consider if
listeners attend to and utilize these phonetic differences between AAE and EAE in
prominence perception.
Numerous RPT-based studies have demonstrated that there are acoustic correlates
to prominence perception, and that acoustic cues vary in their level of importance for
listeners (e.g. Cole et al. 2010, 2017; Baumann and Winter 2018). Cole et al. (2010,
2017) find that acoustic correlates such as maximum pitch values, RMS intensity and
vowel duration contribute to prominence perception7.
7 Though prior RPT studies also examine other factors such as word-phone rate and pause duration, which have been shown to be important, I am not examining these factors because they are less well motivated by

126
An important finding in studies by Mo (2008) and Cole et al. (2010, 2017) is that
pitch max values show a less consistent influence on prominence perception in various
experiments in comparison to the contribution of duration measures or intensity. Further,
Baumann and Winter (2018), using a random forest methodology to assess each of their
measures’ importance in prominence perception for their listeners, found that intensity
values are the strongest acoustic variable in prominence perception, with pitch and
duration measures showing less importance. This has potential ramifications on the data
and analyses here. Prosodic differences between AAE and EAE have primarily been
studied in terms of pitch patterns and prior work does not provide insights into how
intensity patterns across ethnolects of English.
Interestingly, Chapter II showed that there are differences across the intensity
measures for the AAE and EAE voices in these data. For intensity max, the EAE voices
have higher intensity maximum values than the AAE voices. For the intensity difference
from the mean measure, there is a greater difference in words from the stimulus mean in
AAE voices compared to EAE voices. Compared to the pitch-based differences, while the
AAE voices have higher pitch max values, they show lower intensity max values
compared to the EAE voices. The differences related to pitch and intensity differences
from the mean show that AAE voices (in both pitch and intensity) have a higher
difference from the mean.
The differences in pitch and intensity between the AAE and EAE voices in the
stimuli, alongside prior RPT work suggesting that intensity matters more for listeners in
prominence perception, raise some important questions. As I discuss in Section 4.1.2
prior studies of AAE prosody (and my own interests in AAE). I leave considerations of these other potential measures for future work.

127
below, it could be the case that the persistent pitch-related differences described between
AAE and EAE may not matter for listeners; rather, the intensity measures (and their
differences) may be more important for listeners’ perception of prominence.
While my principal interests are in the phonetics and phonology of AAE and EAE
prosody, it is also the case that more structural and semantic factors influence listeners’
perceptions of prominence. In prior work using the RPT paradigm (e.g. Cole et al. 2017;
Baumann and Winter 2018), words’ grammatical categories, i.e. parts of speech, have
been shown to be an important component of prominence perception. In Cole et al.
(2017), the authors found a rank order for part of speech categories for content words,
where noun > adjective > adverb > verb in terms of words’ likelihood to be heard as
prominent. As mentioned earlier, the authors focused on content words alone. Baumann
and Winter (2018), though they examined German, found a rank order in part of speech
categories, such that name > adjective > noun > adverb > verb. Baumann and Winter
(2018) also examined function words, for which they found particle > modal >
conjunction > pronoun > article > auxiliaries > prepositions in terms of these words’
likelihood to be marked as prominent. Not surprisingly, however, they found that content
words were overall more likely to be rated as prominent than function words.
In addition to part of speech, word frequency has also been found to play a role in
prominence marking. Cole et al (2010; 2017) and Baumann and Winter (2018) find that
less frequent words are more likely to be rated as prominent. This pattern in prominence
perception is in line with what we might expect, as highly frequent words are generally
less surprising and less informative (Cole et al. 2017; Roy et al. 2017). Further, function
words, which for both phonetic and structural reasons are not likely to be perceived as

128
prominent (e.g. Cole and Shattuck-Hufnagel 2016; Cole et al. 2017; Baumann and Winter
2018), also tend to be highly frequent. These findings may prove to be important in this
dissertation, as it could be the case that the different listener groups may be rating
different types of words as prominent. Thus, I also examine the role of word frequency
and part of speech, although these factors take a back seat to my primary interest in the
role of the acoustic cues for the perception of prominence in AAE and EAE voices, and
on the listeners. (As was described in Chapter II, there are many acoustic differences in
potentially relevant factors in the AAE and EAE stimuli, but the distributions of part of
speech types are generally similar in the stimuli, so I do not expect that differences in
perceptions of the AAE and EAE stimuli are related to part of speech distributions in the
stimuli.)
The final interest in this chapter is the role of self-reported experience for the
OREA listeners, and how increased levels of experience potentially affect the acoustic
cues these listeners attend to in prominence perception. As a reminder, in Chapter III,
listeners who have more experience with AAE are able to differentiate AAE from EAE in
terms of overall rates of prominence perception, though the relationship between self-
reported experience with AAE is not straightforward. Some of the influence of these
listeners’ self-reported experience could be obscured by the stronger task-based effect of
whether they heard AAE voices first. On the other hand, the OREA listeners who report
more experience with AAE, may just use different strategies for the RPT task for all
voices. Therefore, whether increased self-reported experience with AAE leads the
listeners to attend to acoustic and structural cues differently is a question investigated in
this chapter. It could be the case that as the OREA listeners’ experience with AAE

129
increases, they may begin attending to cues that are known to be specific to AAE;
conversely, it also may be the case that the cues that these listeners use in prominence
perception is fairly consistent, and that it is simply the case that listeners with more
experience are aware that there are just more prominences in AAE speech than in EAE
speech. In Section 4.1.2 below, I present the research questions and potential outcomes
for the following analyses.
4.1.2 Research Questions and Predictions
Building upon the general review just presented, I now turn to describe the
specific questions I take up in this chapter. Here, as I did in Chapter III, I enumerate the
series of main research questions that organize the rest of the chapter. The questions build
from those that engage with the prior literature, on both AAE prosody and RPT tasks, and
which ask whether prominence perception for AAE follows the same general patterns
found for the EAE voices and for prior studies of other English speech, to those that
interrogate the specific questions that arose in Chapter III, based on the listener groups of
particular interest here.
1. Do the acoustic cues and linguistic factors found to influence perception of prominence in prior RPT studies also apply here?
2. Do listeners use acoustic cues differently in their perceptions of prominence for AAE and EAE voices? Further, 2a. Do the pitch patterns associated with AAE play a role in listeners’ perceptions of prominence for AAE?
3. Do listener groups (NCAA, NCEA, OREA) attend to acoustic cues differently? 4. What cues do the NCAA listeners use for judging prosodic prominence in AAE
and EAE voices? Are these AAE-specific cues? Further, 4a. Are the NCAA listeners using a wider range of strategies, as suggested by their lower agreement levels?
5. How does listeners’ (self-reported) experience with AAE relate to their use of acoustic cues?
130
As discussed in Chapter II and briefly above, there are acoustic differences
between the AAE and EAE voices, but it is unclear if the listeners attend to those
differences in prominence perception. Since it played an important role in the analyses of
Chapter III, I also take into consideration the task-related factor of which speaker group
(AAE or EAE) the listeners heard first, and whether this factor plays a role in how the
listeners utilize the different cues as they rate prominence.
The first research question, do the acoustic cues and linguistic factors found to
influence perception of prominence in prior RPT studies also apply here?, starts with the
relatively simple question of whether factors like pitch max, intensity max, word
duration, part of speech and word frequency show results that are similar to their patterns
as reported in prior RPT studies. As a reminder, these factors are expected to influence
prominence perception from prior research. For pitch max and intensity max, words that
have higher pitch and intensity values have been found to be more likely to be rated as
prominent by listeners. Additionally, words that are longer in duration as well as less
frequent are also more likely to be rated as prominent. It is reasonable to expect that the
patterns found in prior studies would also be found here. Additionally, as discussed in
Chapter II and in Section 4.1.1, certain part of speech categories have been found to be
correlated with prominence perception in English, such that nouns are more likely be
prominent than adjectives or adverbs. Though there is not research that has examined
these kinds of prosodic lexical patterns for AAE specifically, it could be the case that
AAE speakers mark different kinds of lexical items with prominence at different rates
than EAE speakers and that listeners perceive these differences. But, without prior work
suggesting differences along these lines, and without obvious differences in the

131
distributions of part of speech type between the AAE and EAE stimuli (Section 2.7.1),
expectations here are that all listeners will mark similar types of words as prominent and
do so at similar rates for the AAE and EAE voices (with findings that align with Cole et
al. 2017). This might be especially true since the stimuli selection avoided canonical
AAE morphosyntactic features for the AAE samples.
The second research question has two primary parts. First, do listeners use
acoustic cues differently in their perceptions of prominence for AAE and EAE voices?
And, further, do the pitch patterns associated with AAE play a role in listeners’
perceptions of prominence for AAE? These questions seek to better understand if the
production differences between the groups of voices, as reported on Chapter II, play a
role in the way the listeners rate prominence. To address these questions I focus on the
influence of the speakers’ ethnicity (as a main effect) and its interaction with the different
acoustic and linguistic factors considered. AAE voices are known to show
phonetic/phonological differences from EAE voices in production, but it remains an open
question if these differences are utilized in perception. For instance, intensity max has
been found to be more important than pitch max in prior RPT studies, so it could be the
case that although there are pervasive differences between AAE and EAE in terms of
pitch, those measures are not important for what listeners hear as prominent relative to
the intensity patterns in the stimuli. On the other hand, since it does appear to be the case
that listeners are aware of ethnic differences between speaker groups and that listeners
seem to be sensitive to those differences (e.g. Spears 1988; Thomas and Reaser 2004),
listeners may make use of different cues for different voice groups. The second
component of this research question (2a) asks directly whether the prosodic features

132
associated with AAE (in prior studies and in the differences described in Chapter II) are
among the important cues listeners use in rating prominence for AAE voices. That is,
while cues found in prior RPT studies are likely important here, more AAE-specific cues
may hold more importance to these listeners.
The third research question, do listener groups (NCAA, NCEA, OREA) attend to
acoustic cues differently?, builds upon the findings from research question two and
focuses on how the different listener groups utilize acoustic cues in prominence
perception. As discussed in Chapter III, there are not significant differences among the
listener groups in terms of the rates of prominence perception. But it remains possible
that the listener groups make differential use of acoustic cues for the voices. That is,
listeners may perceive prominence at similar overall rates but may be using different cues
and picking different words as prominent. A potential outcome from this analysis is that
the European American (NCEA and OREA) listeners are attending to similar acoustic
cues as one another but different cues than the African American (NCAA) listeners. A
second potential outcome could be that the North Carolina listeners (NCAA and NCEA)
attend to similar cues in similar ways, as they have the same regional background as the
voices in the stimuli and the NCEA listeners also attend the same HBCU as the NCAA
listeners. Another potential outcome is that all three listener groups utilize different cues
than one another, due to the fact that they all have varying levels of experience with the
varieties based on regional background and ethnicity. That is, the NCAA and NCEA
listeners, though they have the same regional background, come from different ethnic
backgrounds (and thus have different cultural and linguistic experiences; Perrachione et
al. 2010; Sumner and Samuel 2009), which may affect the way in which they utilize
133
acoustic cues in prominence perception. The OREA listeners do not share the same
regional background as the North Carolina listeners (and thus the voices in the stimuli),
while also not sharing the same ethnic background as the NCAA listeners. Finally, it also
could be that all three groups simply use the same cues when judging which words are
prominent in the stimuli.
The fourth research question also asks a multipart question. What cues do the
NCAA listeners use for judging prosodic prominence in AAE and EAE voices? Are these
AAE-specific cues? On the one hand, as the question states, this seeks to understand
whether the NCAA listeners are using AAE-specific cues in their perceptions of
prominence. But, further, and on the other hand, the second part of this (4a) also asks, are
the NCAA listeners using a wider range of strategies, as suggested by their lower
agreement levels? These questions take a step back to focus on just how the NCAA
listeners attend to prominence in these voices. As discussed throughout this dissertation,
how everyday African American listeners attend to prosody in AAE (compared to EAE)
is largely unknown, as prior work has largely used expert analysts, and many of these
analysts, myself included, are not from AAE-speaking communities. By examining how
the NCAA listeners attend to acoustic cues in prominence perception, I can potentially
illuminate the reason behind the low agreement found for the NCAA listeners, as well as
add further insight to prosodic prominence perception and AAE prosody more generally.
Prior research and the findings from Chapter III set up somewhat conflicting predictions
for what might emerge here. One potential outcome from the low agreement in Chapter
III could be that the NCAA listeners are attending to a wider range of cues or that
individual NCAA listeners are using different cues, and this might lead to lower levels of
134
statistical significance for the effects of the acoustic cues. On the other hand, the NCAA
listeners could be focusing more on cues that are known to be specific to AAE prosody
more generally (i.e. pitch range within word, pitch change from previous word, pitch
change to following word, etc.), rather than the cues that have been found to be most
important in prior work on prominence perception.
Research question five returns to the interest of how (self-reported) experience
with AAE affects listeners’ perceptions of prominence. It asks, how does listeners’ (self-
reported) experience with AAE relate to their use of acoustic cues? To reorient readers
from the discussion in Section 4.1 and the findings from Chapter III, as the OREA
listeners’ self-reported experience with AAE increases, they differentiate AAE and EAE
voices more, but the effect is a decrease in the likelihood that a word will be rated as
prominent in EAE voices (and no effect for the AAE voices). For this research question, I
return to the data from this subset of listeners to identify how the acoustic and linguistic
factors relate to differences in (self-reported) experience. One expected outcome could be
that as these listeners’ experience with AAE increases, the acoustic cues they utilize may
become more similar to that of the NCAA listeners or that they start attending to more
AAE-specific features for AAE voices. But, given that Chapter III’s findings suggested
that OREA listeners with more experience with AAE patterned more like NCEA
listeners, we might rather expect to find greater similarities between those groups,
regardless of what findings emerge for the NCAA listeners.
As I did for Chapter III, in Section 4.2 below, I describe the quantitative
approaches for the following analyses and present the outcome of the major statistical

135
modeling before proceeding to sections that take up each of these major research
questions, one at a time.
4.2 Quantitative and Statistical Analysis
Before presenting the quantitative and statistical approaches in this chapter, I first
consider issues of collinearity among the acoustic measures described in Chapter II, and
how I address them. Unsurprisingly, several of the various pitch and intensity measures
show collinearity and this is known to be a problem for statistical analysis. After all,
many of the measures are related. For instance, a word that has a high maximum pitch
value will also have a larger pitch change from the mean than lower pitch values. Due to
this fact, it is important to assess how collinear these factors are before examining
potential statistical differences.
To address this potential issue, I use the Variance Inflation Factor (VIF) measure
to assess the degree of multicollinearity in these data. VIF is a widely-used measure that
yields an index of how much variance of a regression coefficient increases due to
collinearity, through a least squares regression analysis. Essentially, VIF computes the
variance in a model with multiple independent variables by the variance of a model with
just one independent variable (O’Brien 2007). VIF indicates how much potential variance
of a regression coefficient increases above what that regression would be if the R2 value
is zero (see O’Brien 2007 for a full review). Generally, as a rule of thumb, if the VIF
score is less than 5, collinearity is not an issue for a model. If the VIF is between 5-10
then it may be a problem, and if it is greater than 10, collinearity among the factors
should be viewed as a severe problem and the model should be reworked. A stricter

136
suggested cut-off for collinearity has been suggest as a VIF score of 4; meaning if the
VIF score is above 4 then collinearity is an issue and the model should address this fact
(O’Brien 2007). I proceed with the strict cut-off value of 4.
In order to test for collinearity in these data, I ran a mixed-effect logistic
regression using the lme4 package (Bates, Maechler, Bolker and Walker 2015) in R (R
Core Development Team 2018). This model included the same random effects structure
as the models in Chapter III: word, speaker and participant nested by experimental
condition as random intercepts. As in Chapter III, the model also used the ‘bobyqa’
optimizer, which facilitates model convergence (Bates et al. 2015). In this model,
prominence is the dependent variable (prominent (1) or not (0) by each listener), and the
independent variables were all the acoustic factors (with no interactions). From the model
output, I then use the VIF function in the car package (Fox and Weisberg 2019) in R to
test for collinearity. Table 4.1 show the VIF scores from the initial model.
Table 4.1 Acoustic Measures and Variance Inflation Factor
Acoustic Measure Variance Inflation Factor Score Pitch Max 13.323 Pitch Range Within Word 2.000 Pitch Change from Previous Word 1.405 Pitch Change to Following word 1.500 Pitch Mean Difference 15.222 Intensity Max 9.627 Intensity Mean Difference 9.569 Word Duration 1.176
Based on the VIF results, I then proceeded through a series of model tests. I
removed the factors that have high VIF scores (pitch max, pitch mean difference,
intensity max and intensity mean difference) individually and tested which of those
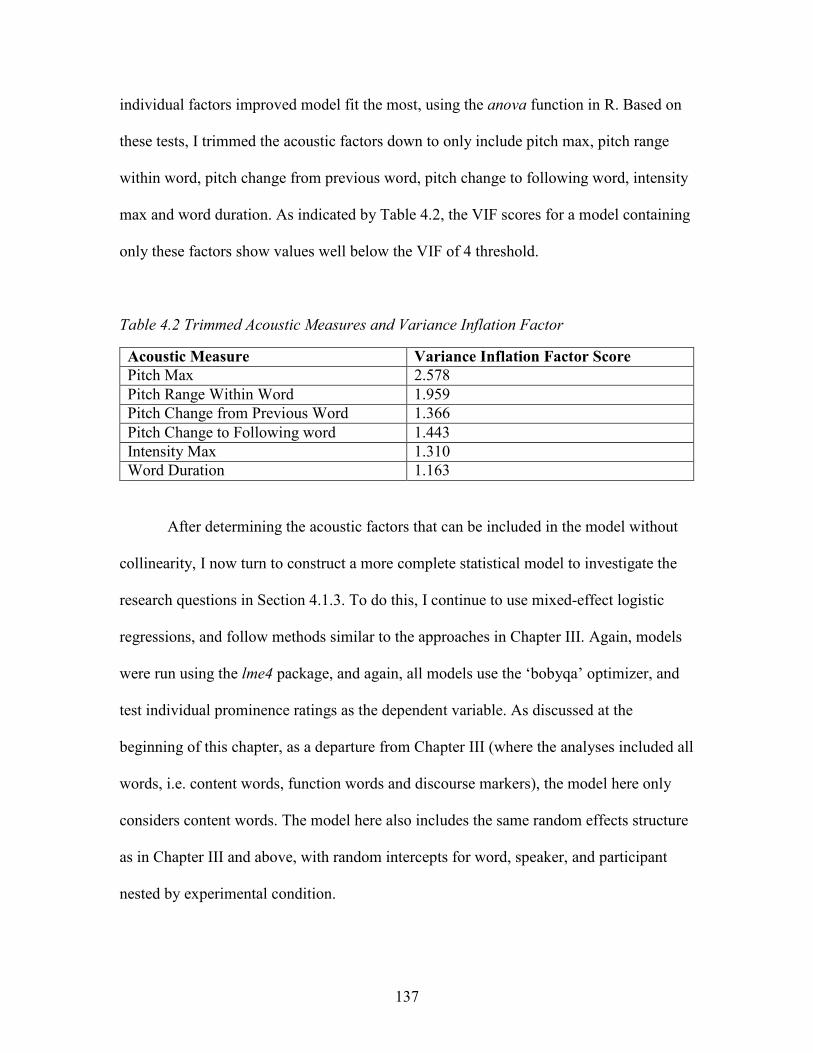
137
individual factors improved model fit the most, using the anova function in R. Based on
these tests, I trimmed the acoustic factors down to only include pitch max, pitch range
within word, pitch change from previous word, pitch change to following word, intensity
max and word duration. As indicated by Table 4.2, the VIF scores for a model containing
only these factors show values well below the VIF of 4 threshold.
Table 4.2 Trimmed Acoustic Measures and Variance Inflation Factor
Acoustic Measure Variance Inflation Factor Score Pitch Max 2.578 Pitch Range Within Word 1.959 Pitch Change from Previous Word 1.366 Pitch Change to Following word 1.443 Intensity Max 1.310 Word Duration 1.163
After determining the acoustic factors that can be included in the model without
collinearity, I now turn to construct a more complete statistical model to investigate the
research questions in Section 4.1.3. To do this, I continue to use mixed-effect logistic
regressions, and follow methods similar to the approaches in Chapter III. Again, models
were run using the lme4 package, and again, all models use the ‘bobyqa’ optimizer, and
test individual prominence ratings as the dependent variable. As discussed at the
beginning of this chapter, as a departure from Chapter III (where the analyses included all
words, i.e. content words, function words and discourse markers), the model here only
considers content words. The model here also includes the same random effects structure
as in Chapter III and above, with random intercepts for word, speaker, and participant
nested by experimental condition.
138
The main effects included in the model are the ethnicity of voice (AAE vs EAE),
listener groups (NCAA vs. NCEA vs. OREA), as well as the acoustic and linguistic
factors (pitch max, pitch range within word, pitch change from previous word, pitch
change to following word, intensity max, word duration, word frequency and part of
speech). The AAE voices are the reference level for the ethnicity of voice factor and the
NCAA listeners are the reference level for the listener group factor; additionally, nouns
are the reference level for part of speech. Based on the findings from Chapter III, I also
include the “AAE first” factor, with the EAE voices being heard first as the reference
level. The model also tested all two-way interactions involving acoustic measures,
ethnicity of voices and listener groups. I also tested the interaction between the ethnicity
of voices and “was AAE first” since that was found to be important in Chapter III. Lastly,
I tested relevant three-way interactions of interest based on the research questions. The
three way-interactions that were tested included AAE first, acoustic factors and ethnicity
of voice. Two- and three-way interactions were tested but only included in the final
model if they improved the model fit, as assessed using likelihood ratio tests via the
anova function in R. The best model includes three-way interactions between AAE first,
intensity max, and ethnicity of voice, as well as AAE first, pitch change to following
word and ethnicity of voice.
All independent acoustic variables were centered so that the intercept is
interpretable as the grand mean of the dependent variable (in this case prominences). Part
of speech was simple contrast coded, and as just mentioned, the reference level was set to
noun, since that part of speech category has been found to be most rated as prominent in
prior studies (e.g. Roy et al. 2017). Table 4.3 (main effects) and Table 4.4 (interactions)

139
present the outcome of the statistical model and provide the basis for addressing the first
three research questions. The components of the model’s outcome are discussed in depth
as relevant in the following sections, which take up each of the research questions in turn.
Each section provides figures for relevant model predictions to help unpack the model
results.
Table 4.3 Prominence Perception and Acoustic and Linguistic Factors Regression Results: Main Effects
Random Effects: Word (sd = 0.808); Speaker (sd = 0.112); Participant nested by Condition (sd = 0.864)
Factor Estimate Std. Error P-Value Intercept -1.275 0.151 < 0.001 *** Ethnicity of voices (EAE) (Reference level: AAE) -0.108 0.066 0.102
Listener Group (OREA) (Reference level: NCAA) 0.089 0.127 0.482
Listener Group (NCEA) (Reference level: NCAA) 0.043 0.198 0.829
Pitch Max 0.101 0.031 < 0.001 *** Pitch Change from Previous Word -0.010 0.027 0.709
Pitch Change to Following Word 0.116 0.032 < 0.001 *** Intensity Max 0.048 0.005 < 0.001 *** Word Duration 0.591 0.036 < 0.001 *** Part of Speech (Adjective) (Reference level: Noun) -0.058 0.156 0.706
Part of Speech (Adverb) (Reference level: Noun) -0.693 0.139331 < 0.001 ***
Part of Speech (Pronoun) (Reference level: Noun) -0.912 0.166 < 0.001 ***
Part of Speech (Pronoun + Verb) (Reference level: Noun) -1.080 0.589 < 0.001 ***
Part of Speech (Verb) (Reference level: Noun) -0.823 0.111 < 0.001 ***
Part of Speech (Verb + Negative) (Reference level: Noun) -4.864 2.390308 < 0.001 ***
Word Frequency -0.523 0.171 0.002 ** AAE First (Reference level: FALSE) 0.196 0.122 0.108

140
Table 4.4 Prominence Perception and Linguistic Factors Regression Results: Interaction Effects
Factor Estimate Std. Error P-Value Listener Group (OREA) X Pitch Max 0.061 0.0301 0.042 *
Listener Group (NCEA) X Pitch Max 0.029 0.0467 0.529
Listener Group (OREA) X Pitch Change from Previous Word 0.069 0.025 0.005 **
Listener Group (NCEA) X Pitch Change from Previous Word 0.132 0.039 < 0.001 ***
Listener Group (OREA) X Pitch Change to Following Word -0.045 0.026 0.077
Listener Group (NCEA) X Pitch Change to Following Word -0.066 0.041 0.108
Listener Group (OREA) X Intensity Max -0.046 0.026 < 0.001 ***
Listener Group (NCEA) X Intensity Max 0.065 0.007 < 0.001 ***
Ethnicity of Voice (EAE) X Pitch Change from Previous Word 0.027 0.029 0.342
Ethnicity of Voice (EAE) X Pitch Change to Following Word -0.217 0.0383 < 0.001 ***
Ethnicity of Voice (EAE) X Intensity Max -0.007 0.007 0.033 *
Ethnicity of Voice (EAE) X AAE First 0.200 0.0382 < 0.001 ***
AAE First X Intensity Max -0.001 0.005 0.804 AAE First X Pitch Change to Following Word -0.051 0.029 0.080
AAE First X Ethnicity of Voice (EAE) X Pitch Change to Following Word
-0.018
0.007
0.023 *
AAE First X Ethnicity of Voice (EAE) X Intensity Max 0.083 0.041 0.45 *
4.3 Prominence Perception, Listener Groups and Linguistic Factors
The statistical model presented in Table 4.3 and Table 4.4 allow me to address the
first three research questions. In Sections 4.3.1-4.3.3 I take up each of these research

141
questions in turn. The model results above show that there are effects8 that align with
prior RPT research (Cole et al. 2010, 2017), and interactions for acoustic cues and
ethnicity of voice effects that speak to the differences between AAE and EAE voices.
Finally, there are also results that show that the listener groups appear to differ in some of
the ways that they attend to different linguistic cues in prominence perception. Following
a discussion of the results for the first three research questions in Section 4.3.4, I turn to
examine the NCAA listeners specifically and their attention to acoustic cues, to better
understand what African American listeners utilize in prominence perception in AAE in
Section 4.3.5. Lastly, in Section 4.3.6, I consider the role of OREA listeners self-reported
experience with AAE and its role in the perception of prominence for these voice groups.
4.3.1 Do the Acoustic Cues and Linguistic Factors Found to Influence Perception of Prominence in Prior RPT Studies also Apply Here?
I begin by investigating the first research question: Do the acoustic cues and
linguistic factors found to influence perception of prominence in prior RPT studies also
apply here? The goal for this section is to better understand if these listeners do in fact
attend to the same linguistic cues as described in prior RPT analyses (Mo 2008; Cole et
al. 2010, 2017; Baumann and Winter 2018). Table 4.3, above, which presents the results
of the main effects, speaks to this question. To unpack its results, I present a series of
figures. Figure 4.1, below, shows the model prediction for the main effect of pitch max,
which demonstrates that as a maximum pitch values increases, so does the probability
that a word will be rated as prominent (β = 0.101, p < 0.001). This finding aligns with
8 As a reminder, like in Chapter III, this should be referred to as a conditional effect since the effect is also included in an interaction in the model, but I generally follow common practice and refer to this as a “main effect” for simplicity throughout this chapter.

142
prior work utilizing the RPT task, where listeners attend to this cue in prominence rating
(Mo 2008; Cole et al. 2010, 2017; Baumann and Winter 2018).
Figure 4.1 Predicted probabilities for prominence for all voices: Pitch Max
Turning to the role of intensity max on prominence perception, there is a significant
effect for intensity. As shown in Figure 4.2, as intensity values increase, so does the
likelihood that a word will be rated as prominent (β = 0.048, p < 0.001). An important
note to be made here, which I will come back to shortly, is that the effect for intensity
max is stronger in these data than that of pitch max.

143
Figure 4.2 Predicted probabilities for prominence for all voices: Intensity Max
For word duration, shown in Figure 4.3, there is an expected outcome that also
aligns with prior work; namely the longer the word is, the higher the probability that it
will be rated as prominent (β = 0.591, p < 0.001). This is in line with patterns uncovered
in Cole et al. (2010; 2017).
Figure 4.3 Predicted probabilities for prominence for all voices: Word duration

144
Part of speech also shows patterns that align with prior work (Cole et al. 2017;
Roy et al. 2017; Baumann and Winter 2018), as indicated by Figure 4.4. In these data,
both nouns and adjectives are most likely to be rated as prominent (with no statistical
differences between the two). Following nouns and adjectives, adverbs, pronouns and
verbs are then most likely to be rated as prominent, with these three categories showing
roughly the same probabilities. Lastly, the two additional categories I included not used
in prior studies, pronoun + verb and verb + negative contractions, are the least likely
categories to have words rated as prominent, not surprising given the phonetically
reduced status of most of these contractions. Roy et al. (2017) found a strong preference
for nouns to be rated as prominent compared to the other part of speech categories and
explain this tendency by pointing out that words that are more likely to be rated as
prominent in English, generally, introduce new information or new referents to the
discourse situation (i.e. nouns and adjectives), compared to words that that are less likely
to do so. Further, there is a close relationship between part of speech and word frequency,
which is discussed below.
Figure 4.4 Predicted probabilities for prominence for all voices: Part of Speech
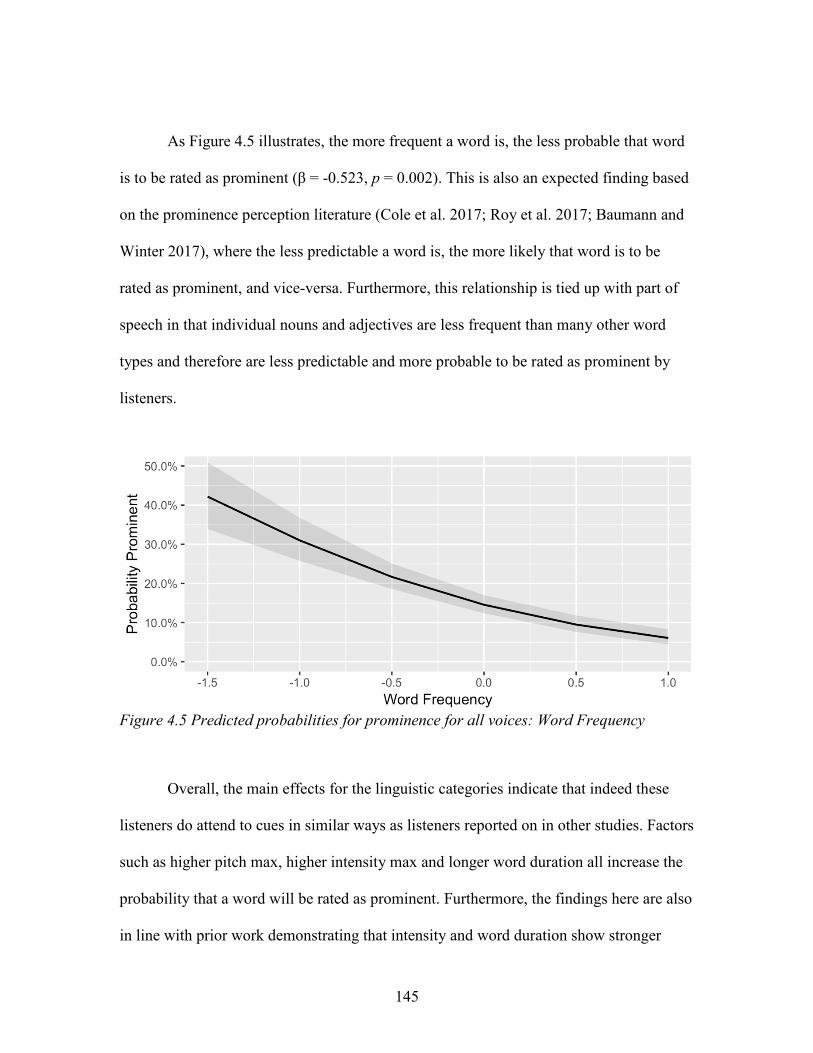
145
As Figure 4.5 illustrates, the more frequent a word is, the less probable that word
is to be rated as prominent (β = -0.523, p = 0.002). This is also an expected finding based
on the prominence perception literature (Cole et al. 2017; Roy et al. 2017; Baumann and
Winter 2017), where the less predictable a word is, the more likely that word is to be
rated as prominent, and vice-versa. Furthermore, this relationship is tied up with part of
speech in that individual nouns and adjectives are less frequent than many other word
types and therefore are less predictable and more probable to be rated as prominent by
listeners.
Figure 4.5 Predicted probabilities for prominence for all voices: Word Frequency
Overall, the main effects for the linguistic categories indicate that indeed these
listeners do attend to cues in similar ways as listeners reported on in other studies. Factors
such as higher pitch max, higher intensity max and longer word duration all increase the
probability that a word will be rated as prominent. Furthermore, the findings here are also
in line with prior work demonstrating that intensity and word duration show stronger

146
influences on the likelihood a word will be rated as prominent than pitch (e.g. Mo 2008;
Cole et al. 2010). Lastly, part of speech and word frequency also pattern similarly to prior
studies where nouns and adjectives (e.g. Roy et al. 2017; Baumann and Winter 2018) are
more likely to be heard as prominent. Additionally, we also see the effect that the less
frequent a word is, the more probable that word is to be rated as prominent.
4.3.2 Do Listeners use Acoustic cues Differently in their Perceptions of Prominence for AAE and EAE voices?
In this section I consider the how listeners utilize acoustic cues in AAE and EAE
voices in prominence perception, as well as whether or not the pitch patterns associated
with AAE play a role in these listeners’ perceptions of prominence for AAE. The
interactions in the main statistical model were presented above in Table 4.4, and these
interactions allow me to address the questions for this section. As a reminder, AAE
varieties have been described as having more dynamic prosody than EAE varieties, and
as the analysis in Chapter II illustrates, this is the case for these stimuli as well.
The non-significant main effect for the ethnicity of the voice in the model (Table
4.3) indicates that the voices are not heard as having different prominences when all of
these other factors are considered. While this continues to suggest, from Chapter III, that
there are not huge differences in prominence marking between AAE and EAE, a primary
interest here is in the potential interactions between the ethnicity of the voice and the
acoustic factors. As Table 4.4 indicates, there are two significant interactions between the
voice groups and acoustic factors in the best model: pitch change to following word and
intensity max. Both of these acoustic cues showed significant differences between the
AAE and EAE voices in Chapter II, where AAE voices showed a greater change in pitch

147
to the following word, as well as a lower intensity max value compared to the EAE
voices. The pitch change to following word measure, meant to act as a proxy for the
continual rise and fall of the pitch track described by Cole et al. (2005), shows
statistically significant effects as a main effect in Table 4.3 in addition to showing
interaction effects. Figure 4.6 shows the interaction effect for pitch change to following
word and ethnicity of voice.
Figure 4.6 Predicted probabilities for prominence for ethnicity of voice: Pitch Change to Following Word
As the figure indicates, for AAE voices, the greater the pitch change to the
following word the more probable a word is to be rated as prominent (β = -0.217, p <
0.001). On the other hand, there is an inverse effect for the EAE voices, where the greater
the pitch change to the following word the less likely that word is to be rated as
prominent. This negative effect for the EAE voices is, admittedly, hard to explain. At this
point, I can do no more than offer the suggestion that perhaps as the pitch change
increases for EAE voices, listeners are influenced to not hear a word as prominence, as

148
this does not align with their expectations acoustically for EAE voices. Importantly for
this research question though, listeners are attending to this AAE-specific cue for AAE
voices and appear to use it in their ratings for prominence, even though the opposing
effect for the EAE voices is harder to explain.
Listeners also attend to prominence in these AAE and EAE voices differentially
with respect to intensity max. As Table 4.3 and Figure 4.2 indicated above, as intensity
max increases (as a main effect) so does the probability that a word will be rated as
prominent for all voices. Further Table 4.4 and Figure 4.7 add to this a significant
interaction with ethnicity of voice, where the main effect is stronger for AAE voices than
for EAE voices (β = -0.007, p = 0.033). Interestingly, based on the results in Chapter II,
AAE voices showed lower intensity max values than the EAE voices. For perception,
listeners use intensity max more in their perception of prominent words for the AAE
voices compared to the EAE voices. This could indicate that listeners upweight smaller
intensity changes for the AAE voices since they have lower overall max intensities. I note
that this pattern is unlike the way that pitch-related factors appear to influence listeners’
perceptions of prominence, but such a finding is ultimately in line with prior work using
RPT, where intensity appears to be a stronger cue to prominence than pitch.

149
Figure 4.7 Predicted probabilities for prominence for ethnicity of voice: Intensity Max
In line with the findings in Chapter III, there was also a significant interaction
between ethnicity of voice and whether AAE voices were heard first (β = 0.200, p <
0.001). This finding illustrated in Figure 4.8, indicates that when listeners heard AAE
voices first, they heard more significantly more prominences overall.
Figure 4.8 Predicted probabilities for prominence for ethnicity of voice: AAE first

150
As shown in Figure 4.9 there was also a significant three-way interaction for
intensity max, AAE first, and ethnicity of voice (β = -0.018, p < 0.023). The effect for
this complex interaction is somewhat hard to describe but is best characterized as a
steeper slope for the effect of intensity max for the AAE voices, relative to higher overall
ratings of prominence for the EAE voices, when the AAE voices are heard first.
Figure 4.9 Predicted probabilities for prominence for ethnicity of voice and intensity: AAE first
Lastly, there is also a significant three-way interaction for pitch change to the
following word, AAE first, and ethnicity of voice (β = 0.083, p = 0.045). This nuances
the two-way interaction between pitch change to following word and ethnicity of voices
which was discussed above and shown in Figure 4.6. Figure 4.10 displays the patterns for
this interaction. The effect for hearing AAE voices first dampens the effect of this pitch
change measure for AAE voices. The negative effect for EAE voices remains mostly the
same (with the higher overall ratings of prominence being due to the two-way interaction
between AAE first and the ethnicity of voice) and remains hard to explain. However,

151
listeners appear to be more influenced by the pitch change measure for AAE voices when
they heard those voices after the EAE voices. This could be evidence that AAE-specific
pitch patterns are used more by listeners when they have the contrast provided by hearing
the AAE voices after the EAE voices.
Figure 4.10 Predicted probabilities for prominence for ethnicity of voice and AAE first: pitch change max
Taken together, the results indicate that listeners are indeed attending to an AAE-
specific cue, the pitch change to following word, which was the second component to this
research question (i.e., do the pitch patterns associated with AAE play a role in listeners’
perceptions of prominence for AAE?), where for AAE voices the greater the change to
the following word, the more likely that word is to be rated as prominent. Additionally,
there is an effect for intensity max and ethnicity of voice, such that the higher the
intensity value the more probable a word is to be rated as prominent, with this effect
being stronger in the AAE voices. As was found in Chapter III, once again whether
listeners heard AAE voices first or second played a role in the patterns of prominence
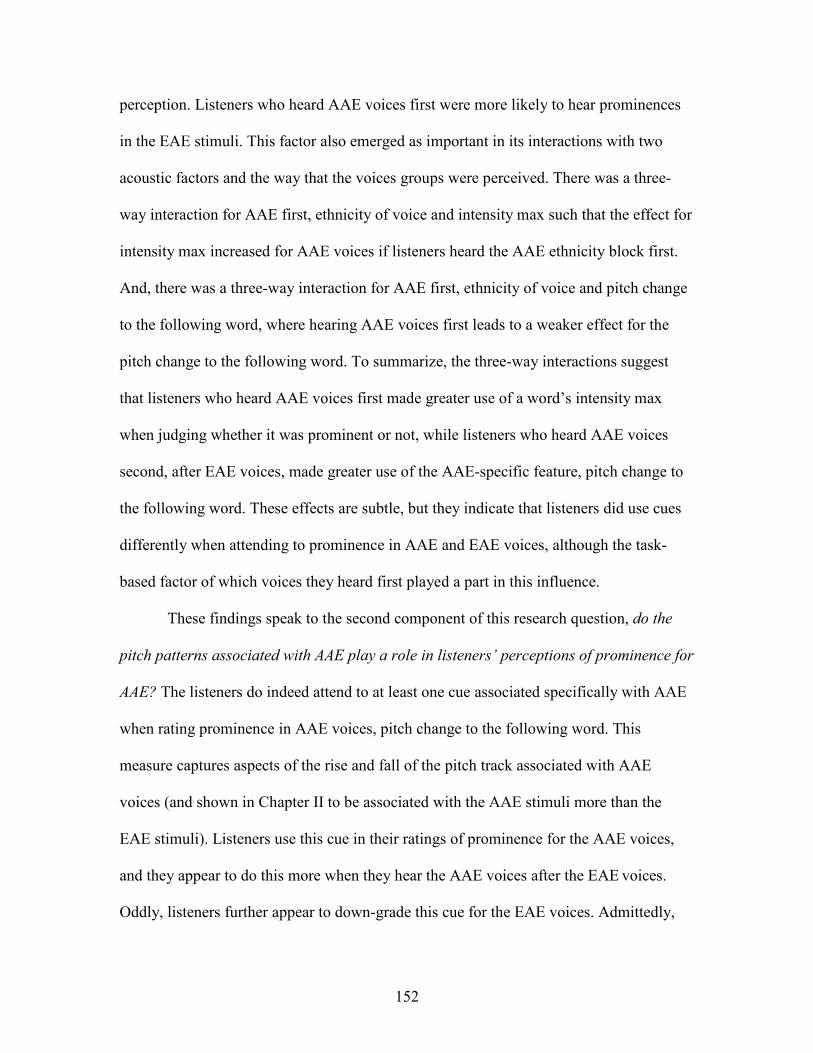
152
perception. Listeners who heard AAE voices first were more likely to hear prominences
in the EAE stimuli. This factor also emerged as important in its interactions with two
acoustic factors and the way that the voices groups were perceived. There was a three-
way interaction for AAE first, ethnicity of voice and intensity max such that the effect for
intensity max increased for AAE voices if listeners heard the AAE ethnicity block first.
And, there was a three-way interaction for AAE first, ethnicity of voice and pitch change
to the following word, where hearing AAE voices first leads to a weaker effect for the
pitch change to the following word. To summarize, the three-way interactions suggest
that listeners who heard AAE voices first made greater use of a word’s intensity max
when judging whether it was prominent or not, while listeners who heard AAE voices
second, after EAE voices, made greater use of the AAE-specific feature, pitch change to
the following word. These effects are subtle, but they indicate that listeners did use cues
differently when attending to prominence in AAE and EAE voices, although the task-
based factor of which voices they heard first played a part in this influence.
These findings speak to the second component of this research question, do the
pitch patterns associated with AAE play a role in listeners’ perceptions of prominence for
AAE? The listeners do indeed attend to at least one cue associated specifically with AAE
when rating prominence in AAE voices, pitch change to the following word. This
measure captures aspects of the rise and fall of the pitch track associated with AAE
voices (and shown in Chapter II to be associated with the AAE stimuli more than the
EAE stimuli). Listeners use this cue in their ratings of prominence for the AAE voices,
and they appear to do this more when they hear the AAE voices after the EAE voices.
Oddly, listeners further appear to down-grade this cue for the EAE voices. Admittedly,
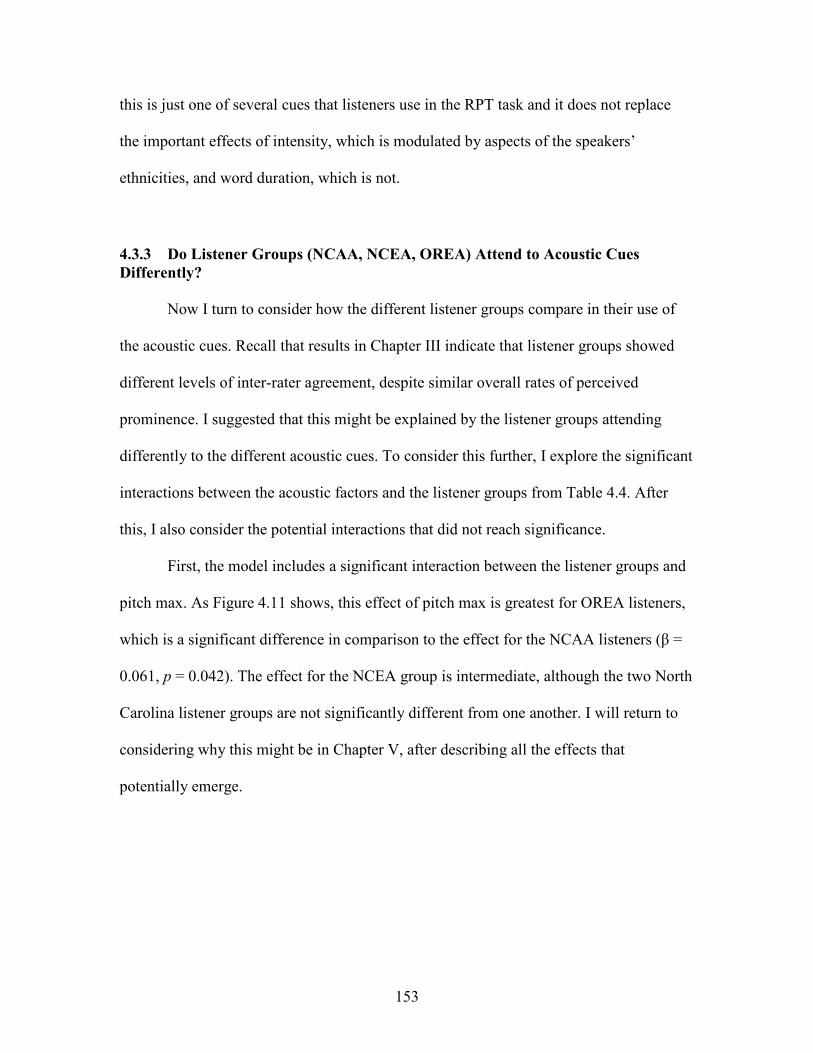
153
this is just one of several cues that listeners use in the RPT task and it does not replace
the important effects of intensity, which is modulated by aspects of the speakers’
ethnicities, and word duration, which is not.
4.3.3 Do Listener Groups (NCAA, NCEA, OREA) Attend to Acoustic Cues Differently?
Now I turn to consider how the different listener groups compare in their use of
the acoustic cues. Recall that results in Chapter III indicate that listener groups showed
different levels of inter-rater agreement, despite similar overall rates of perceived
prominence. I suggested that this might be explained by the listener groups attending
differently to the different acoustic cues. To consider this further, I explore the significant
interactions between the acoustic factors and the listener groups from Table 4.4. After
this, I also consider the potential interactions that did not reach significance.
First, the model includes a significant interaction between the listener groups and
pitch max. As Figure 4.11 shows, this effect of pitch max is greatest for OREA listeners,
which is a significant difference in comparison to the effect for the NCAA listeners (β =
0.061, p = 0.042). The effect for the NCEA group is intermediate, although the two North
Carolina listener groups are not significantly different from one another. I will return to
considering why this might be in Chapter V, after describing all the effects that
potentially emerge.
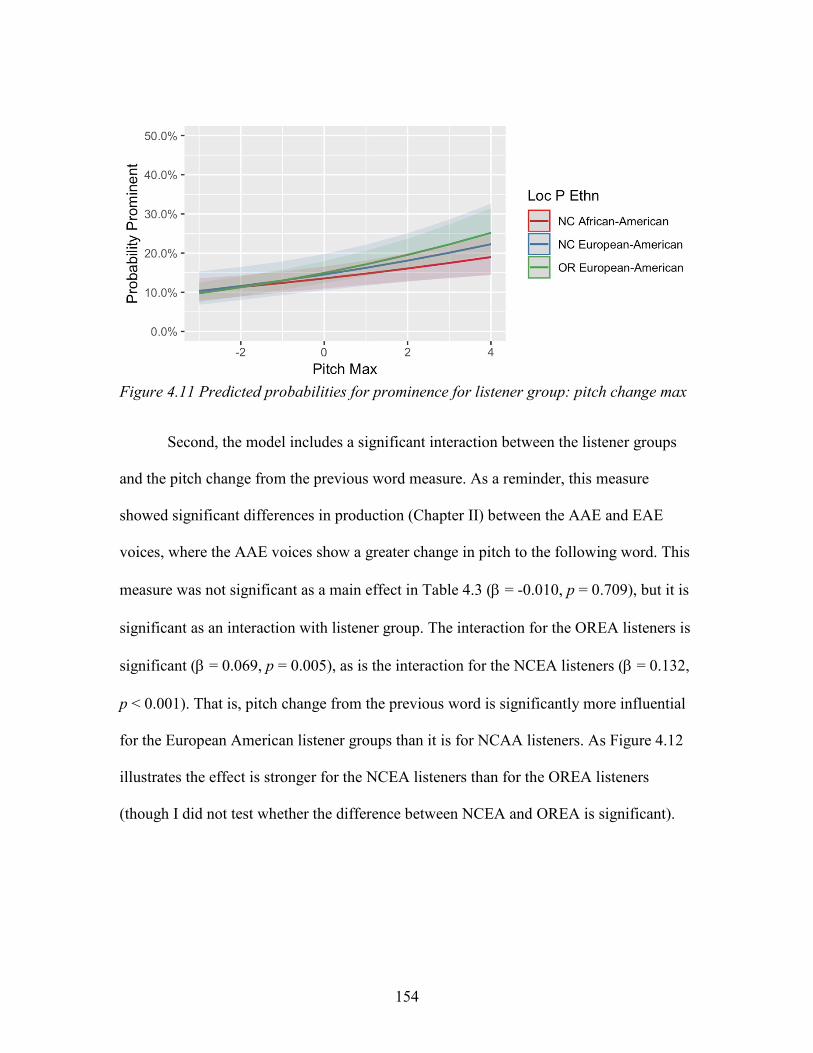
154
Figure 4.11 Predicted probabilities for prominence for listener group: pitch change max
Second, the model includes a significant interaction between the listener groups
and the pitch change from the previous word measure. As a reminder, this measure
showed significant differences in production (Chapter II) between the AAE and EAE
voices, where the AAE voices show a greater change in pitch to the following word. This
measure was not significant as a main effect in Table 4.3 (β = -0.010, p = 0.709), but it is
significant as an interaction with listener group. The interaction for the OREA listeners is
significant (β = 0.069, p = 0.005), as is the interaction for the NCEA listeners (β = 0.132,
p < 0.001). That is, pitch change from the previous word is significantly more influential
for the European American listener groups than it is for NCAA listeners. As Figure 4.12
illustrates the effect is stronger for the NCEA listeners than for the OREA listeners
(though I did not test whether the difference between NCEA and OREA is significant).
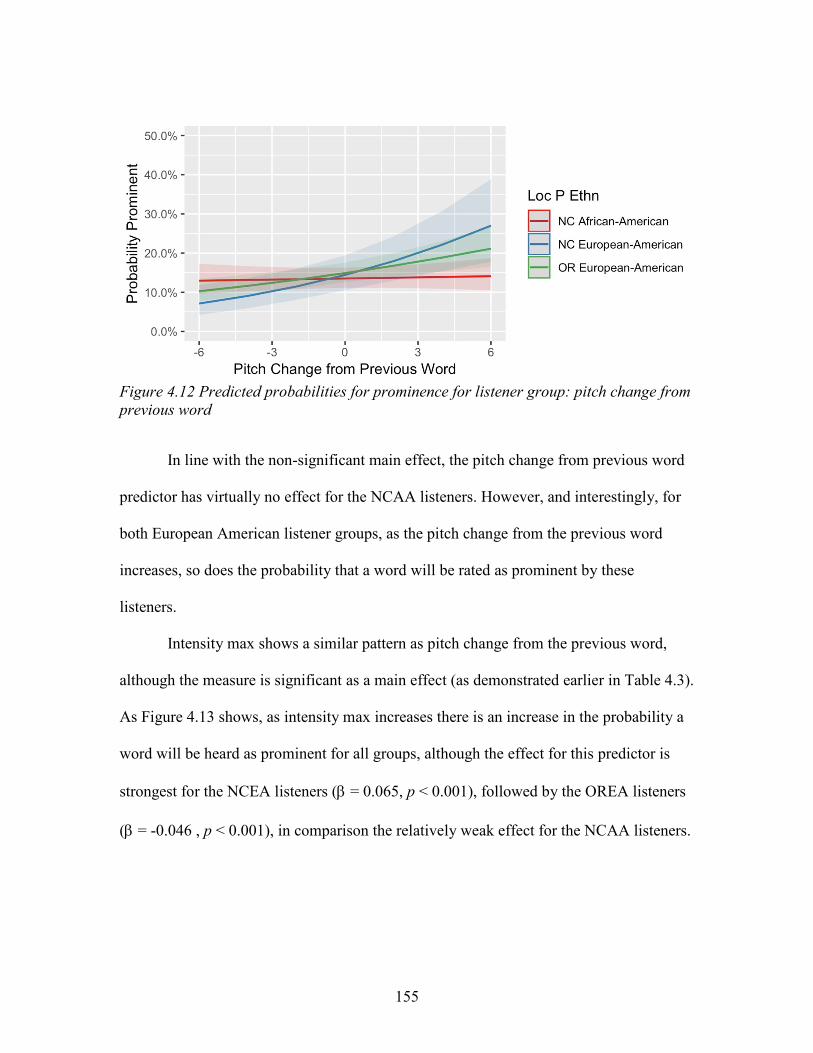
155
Figure 4.12 Predicted probabilities for prominence for listener group: pitch change from previous word
In line with the non-significant main effect, the pitch change from previous word
predictor has virtually no effect for the NCAA listeners. However, and interestingly, for
both European American listener groups, as the pitch change from the previous word
increases, so does the probability that a word will be rated as prominent by these
listeners.
Intensity max shows a similar pattern as pitch change from the previous word,
although the measure is significant as a main effect (as demonstrated earlier in Table 4.3).
As Figure 4.13 shows, as intensity max increases there is an increase in the probability a
word will be heard as prominent for all groups, although the effect for this predictor is
strongest for the NCEA listeners (β = 0.065, p < 0.001), followed by the OREA listeners
(β = -0.046 , p < 0.001), in comparison the relatively weak effect for the NCAA listeners.

156
Figure 4.13 Predicted probabilities for prominence for listener group: Intensity max
These results for the differences among the acoustic predictors for the different
regional background and ethnicity groups indicate that the NCAA group are least
influenced by the acoustic factors. This could be due to some other, untested acoustic
factor playing an important role for these listeners, but as it stands here this appears to be
congruent with the overall lower inter-rater agreement shown by the NCAA listeners.
That is, since it appears that the cues examined here are used less by the NCAA listeners
compared to the European American listeners, it may be the case that the NCAA listeners
are indeed using a wider variety of task strategies. It would appear that either individual
NCAA listeners are using different task strategies from one another (i.e. relying on
different cues to make decisions about what is prominent) or they are perhaps using a
wider range of cues where individual acoustic cues show less statistically significant
influences on the perceptions of this group relative to the other listener groups. I return to
investigate these possibilities explicitly in Section 4.3.5.

157
The non-significant results in these data also provide important insights. First, the
fact that all listeners do not show significant differences for the ethnicity of voices (as a
main effect), which is counter to the findings in Chapter III, underscores the fact that
these listeners do not hear prominence differently in these two voice groups when the
linguistic factors are considered in analysis. Additionally, a factor that was significant in
Section 4.3.2 when we examined differences for the voices, pitch change to the following
word, is not used differentially for these listeners; rather, pitch change from the previous
word showed differential use, where the NCEA and OREA listeners use this cue when
rating prominence and the NCAA listeners show little to no effect for this cue in
prominence perception. The fact that a greater difference in the pitch between a word and
its preceding word increases the likelihood that the word will be heard as prominent by
the European American listener groups but not the NCAA listener group indicates that
these listeners groups are attending to differences in pitch changes from word to word.
Conversely, listener groups do not appear to pay differential attention to the relative pitch
changes between a word and its following word, despite that measure showing
differences in how it affects the perceptions of the two voice groups. The relationship
between these two measures may mean that the pitch change from the previous word is a
more meaningful cue for the European American listeners (due to the fact that it is
different than their own dialect), whereas for the NCAA listeners, their own experience
with this feature leads for it to be not as influential on their perceptions of prominence.
Above and beyond the subtle differences, the biggest take-away here appears to be that
none of the acoustic cues predict prominence for the NCAA listeners as strongly as they
do for the European American listeners.

158
4.3.4 Interim Summary
The analyses in Sections 4.3.1-4.3.3 point to a few major findings. First, for the
first research question, listeners in the present task attended to the tested acoustic and
linguistic factors in similar ways to what has been found in period RPT-based work (Cole
et al. 2010, 2017; Roy et al. 2017; Baumann and Winter 2018). Pitch max, intensity max,
word duration, part of speech and word frequency all show significant influences on
prominence perception in these data and generally align with the findings in prior
research. For the second research question, whether listeners attend to prominence in
AAE and EAE voices differently, there are some notable patterns. First, all listener
groups are more likely to rate a word as prominent if there is a greater change in pitch to
the following word. Additionally, as intensity max values increase in AAE voices words
are more likely to be rated as prominent compared to EAE voices. For the third research
question, whether the listener groups attend to prominence differently, there are some
noteworthy patterns. With respect to the interaction effects for pitch change from the
previous word and intensity max are utilized differently in prominence perception by the
listener groups. Intensity max also showed differences in how the listener groups attend
to this cue. For both of these acoustic measures, the European American listeners utilize
these cue more than the NCAA listeners (for pitch change from the previous word, the
NCAA listeners do not attend to this cue at all in prominence perception).
Interestingly, there is not a significant interaction between the listener groups and
the ethnicity voices. Despite this, European American listeners pattern more like one
another than the NCAA listeners (who pattern differently) in terms of the perception of

159
prominence and the acoustic cues. The NCAA listeners show almost no effect for the
pitch change from the previous word measure, and though they are influenced by a
word’s intensity max, that effect is much less than for the NCEA and OREA listeners.
Thus, overall, the model examined indicates that the NCAA listeners are using the tested
cues less. This is in line with my hypothesis from Chapter III’s examination of the
agreement data, which showed low levels of agreement among the NCAA listeners.
There I suggested that one possibility is that the NCAA listeners are using different task
strategies and the general low level of statistically significant acoustic predictors here is
congruent with that line of thinking. If different individuals are attending to different cues
and selecting different words as prominent, this leads to overall fewer patterns. Of course,
there are other possibilities. One, for instance, is that the acoustic measurements I
collected and tested simply fail to capture the cues that the NCAA listeners are most
attending to (but this would still leave unanswered why their agreement rates are low).
With a major goal to better understand what the NCAA listeners are attending to, in
Section 4.3.5, I turn to investigate these listeners separately from the European American
listeners.
4.3.5 What cues are the NCAA listeners using for judging prosodic prominence in AAE and EAE voices? Are these AAE-specific cues?
In this section, I investigate the fourth research question, asking what cues the
NCAA listeners are attending to, specifically, when rating prosodic prominence in these
two voice groups. While the analyses in Sections 4.3.1-4.3.3 (and 4.3.3 especially)
largely address this question, I nonetheless dive deeper into the data for the African
American listeners. This section has two goals: first, to help better understand the
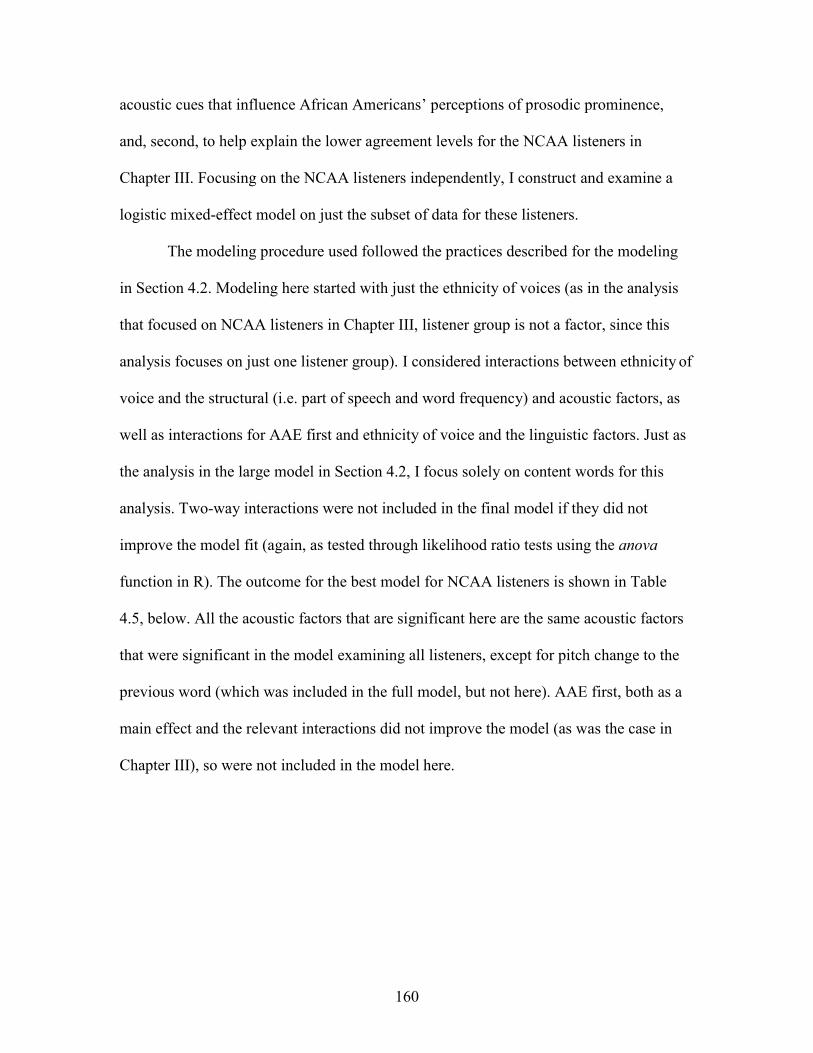
160
acoustic cues that influence African Americans’ perceptions of prosodic prominence,
and, second, to help explain the lower agreement levels for the NCAA listeners in
Chapter III. Focusing on the NCAA listeners independently, I construct and examine a
logistic mixed-effect model on just the subset of data for these listeners.
The modeling procedure used followed the practices described for the modeling
in Section 4.2. Modeling here started with just the ethnicity of voices (as in the analysis
that focused on NCAA listeners in Chapter III, listener group is not a factor, since this
analysis focuses on just one listener group). I considered interactions between ethnicity of
voice and the structural (i.e. part of speech and word frequency) and acoustic factors, as
well as interactions for AAE first and ethnicity of voice and the linguistic factors. Just as
the analysis in the large model in Section 4.2, I focus solely on content words for this
analysis. Two-way interactions were not included in the final model if they did not
improve the model fit (again, as tested through likelihood ratio tests using the anova
function in R). The outcome for the best model for NCAA listeners is shown in Table
4.5, below. All the acoustic factors that are significant here are the same acoustic factors
that were significant in the model examining all listeners, except for pitch change to the
previous word (which was included in the full model, but not here). AAE first, both as a
main effect and the relevant interactions did not improve the model (as was the case in
Chapter III), so were not included in the model here.

161
Table 4.5 Prominence Perception and Acoustic and Linguistic Factors Regression Results: NCAA Listeners
Random Effects: Word (sd = 0.682); Speaker (sd = 0.078); Participant nested by Condition (sd = 1.074) Factor Estimate Std. Error P-Value Intercept -1.435 0.143 < 0.001 *** Ethnicity of voices (EAE) (Reference level: AAE) 0.034 0.057 0.550 Pitch Max 0.072 0.033 0.029 * Pitch Range (within Word) -0.020 0.039 0.596 Pitch Change to Following Word 0.047 0.033 0.153 Intensity Max 0.053 0.006 < 0.001 *** Word Duration 0.416 0.044 < 0.001 *** Part of Speech (Adjective) (Reference level: Noun) 0.118 0.119 0.320
Part of Speech (Adverb) (Reference level: Noun) -0.421 0.123 < 0.001 ***
Part of Speech (Pronoun) (Reference level: Noun) -0.826 0.152 < 0.001 ***
Part of Speech (Pronoun + Verb) (Reference level: Noun) -2.177 0.201 < 0.001 ***
Part of Speech (Verb) (Reference level: Noun) -0.499 0.088 < 0.001 ***
Part of Speech (Verb + Negative) (Reference level: Noun) -1.606 0.263 < 0.001 *** Word Frequency -0.882 0.099 < 0.001 *** Ethnicity of Voice (EAE) X Pitch Change to Following Word -0.092 0.045 0.040 *
Ethnicity of Voice (EAE) X Pitch Range (within Word) 0.087 0.050 0.080
Ethnicity of Voice (EAE) X Intensity Max -0.014 0.008 0.077
With respect to the main effects, there is a significant effect for pitch max (β =
0.072, p = 0.029). As indicated by the coefficient, as the pitch max value increases for all
voices, the more likely that word is to be rated as prominent by listeners. This result is in
line with the findings for the model examining all listener groups, though the effect is not
quite as strong in this model as it is in the model examining all listeners. There is also a
significant effect for intensity max (β = 0.053, p < 0.001); similar to pitch max, as

162
intensity values increase so does the probability that a word will be rated as prominent.
For word duration, we see the same effect that we saw for all listeners, as a word
becomes longer in duration, the more probable that word is to be rated as prominent (β =
0.416, p < 0.001). In this case, we still see a strong effect. The findings for the main
effects indicate that the NCAA listeners attend to the acoustic features described in prior
RPT work known to correlate for prominence perception in both AAE and EAE voices
(Cole et al. 2010; Cole et al. 2017). With respect to both part of speech and word
frequency, the effects here also align with the findings in Table 4.3. Altogether, the
patterns for the NCAA listeners alone largely parallel the effects in the model considering
all listeners.
Turning now to the model’s interactions, only one of the interactions between
ethnicity of voice and acoustic factors yielded statistical significance in the best model:
pitch change to the following word (β = -0.092, p = 0.040). Figure 4.14 shows that the
NCAA listeners hear more prominences as pitch change to the following word increases
for AAE voices and less when it does for EAE voices. This is congruent what was found
for all the listeners (since the full model did not identify interactions between listener
groups and this measure). This feature indicates that the NCAA listeners do indeed attend
to an AAE-specific cue in differentiating prominence in AAE and EAE voices, but it is
the same cue utilized by the European American listener groups.

163
Figure 4.14 Predicted probabilities for prominence for NCAA listeners and voice group: Pitch change to the following word
While the other two factors (pitch range within word, intensity max) in the best
model for this analysis did not obtain statistical significance, I nonetheless note that some
non-significant factors were still found to improve the model in model comparisons and
are included in the model. Both interactions, pitch change within word and ethnicity of
voice (β = 0.087, p = 0.080) and intensity max and ethnicity of voices (β = -0.014, p =
0.077) trend towards significance.
The main take-away for the African American listeners is that they are not very
different from the European America listeners. This finding (and the lower p-values for
intensity max and pitch change within word) underscore that as it remains, and uncovered
in Chapter III, that the NCAA group shows less inter-rater agreement than the other
listener groups and the results in this chapter appear to support the suggestion that this is
related to the NCAA listeners using a wider range of task strategies than the OREA and
NCEA listener groups. As Baumann and Winter (2018) showed, different listeners can

164
attend to different cues for different individual voices, and this seems like at least a part
of what is happening here. One additional plausible explanation is that since the NCAA
listeners have more experience with AAE they are more aware of different cues that AAE
speakers can employ to signal prominent words, and due to this fact can draw on a larger
suite of cues when asked to mark which words speakers are highlighting.
4.3.6 How does listeners’ (self-reported) experience with AAE relate to their use of acoustic cues?
I turn now to consider the last major question of interest, how listeners’
experience with AAE influences their use of acoustic cues when judging prosodic
prominence in this experiment. As I did in Chapter III, I address this through a
consideration of the OREA listeners specifically and their self-reported experience with
AAE.
To do this I apply similar statistical model as I have used throughout (logistic
mixed-effect regression with the same random effects structure as used earlier), but limit
the data to the subset of data from the OREA listeners, and I include the composite AAE
experience score used in Chapter III (Section 3.3) and described in Chapter II (Section
2.6.2). The main difference here is that I tested for interactions between experience with
AAE and the acoustic factors, along with interactions between ethnicity of voice and the
acoustic factors, as well as AAE first and acoustic factors. Like in the analyses in Table
4.3 and Table 4.4, I included AAE first, as it was shown to be an important factor for the
OREA listener group. I also tested for relevant three-way interactions. Again, as with the
modeling in analyses above, interactions were only included in the final model if they

165
significantly improved the model based on model comparisons, as tested through
likelihood tests.
Table 4.6 presents the main effects for this analysis. An important beginning
observation is that the model shows similar results for the non-acoustic factors as were
found in the analysis for the OREA listeners’ self-reported experience in Chapter III.
First, there is not a statistically significant effect for the ethnicity of voice, which was
also the case in the analysis in Section 3.3 (β = -0.171, p = 0.074). Again, as in Chapter
III, there were also not significant main for experience with AAE or AAE first. For the
acoustic factors, statistically significant effects are uncovered for pitch max, pitch change
from previous word, pitch change to the following word, intensity max and word
duration. Generally, these results are the same (and in the same direction) as they are in
the main model for all listeners, presented earlier in Table 4.3, with one difference. In this
analysis, there is also a significant effect for pitch change from previous word. This did
not emerge as a significant effect in the main analysis, but did occur as a significant
interaction with listener group. The European American listener groups were found to use
this cue. The main effect here, since it is just for the OREA listeners, is congruent with
that overall pattern.
Turning to consider the interaction effects in Table 4.7, it is immediately notable
that there are not significant interactions for experience with AAE and any of the acoustic
measures. On the other hand we do see significant effects for the ethnicity of voice and
pitch change to the following word, and intensity max. While the primary interest here
was in the potential interactions between experience with AAE and the acoustic factors, it
is helpful to review the other interactions which emerged as significant in the model.

166
Table 4.6 Prominence Perception, Acoustic Factors and Experience with AAE Regression Results: Main Effects
Random Effects: Word (sd = 1.0510); Speaker (sd = 0.1504); Participant nested by Condition (sd = 0.7368) Factor Estimate Std. Error P-Value Intercept -1.520 0.213 < 0.001*** Ethnicity of voices (EAE) (Reference level: AAE)
0.045 0.109 0.679
Pitch Max 0.153 0.034 < 0.001*** Pitch Range (within Word) 0.016 0.030 0.588 Pitch Change from Previous Word 0.082 0.023 < 0.001*** Pitch Change to Following Word 0.103 0.046 0.026 * Intensity Max 0.092 0.008 < 0.001*** Word Duration 0.823 0.049 < 0.001*** AAE First (Reference level: FALSE)
0.047 0.149 0.752
Experience with AAE 0.0148 0.105 0.895 Table 4.7 Prominence Perception, Acoustic Factors and Experience with AAE Regression Results: Interaction Effects
Experience with AAE X Pitch Change to Following Word -0.022 0.021 0.299
Experience with AAE X Intensity Max -0.001 0.004 0.909 Ethnicity of Voice (EAE) X Pitch Change to Following Word -0.186 0.041 < 0.001***
Ethnicity of Voice (EAE) X Intensity Max -0.034 0.008 < 0.001***
Experience with AAE X Ethnicity of Voice (EAE) -0.124 0.036 < 0.001***
AAE First X Ethnicity of Voice (EAE) 0.317 0.052 < 0.001***
There are interactions for both ethnicity of voice and pitch change to the
following word (β = -0.186, p < 0.001) and ethnicity of voice and intensity max (β = -
0.034, p < 0.001). Both of these effects are almost identical to the effects in Table 4.5. If
the pitch of a word is higher than the following word, the probability that a word will be
rated as prominent for AAE voices increases. Like in the analysis in Table 4.5, there is an
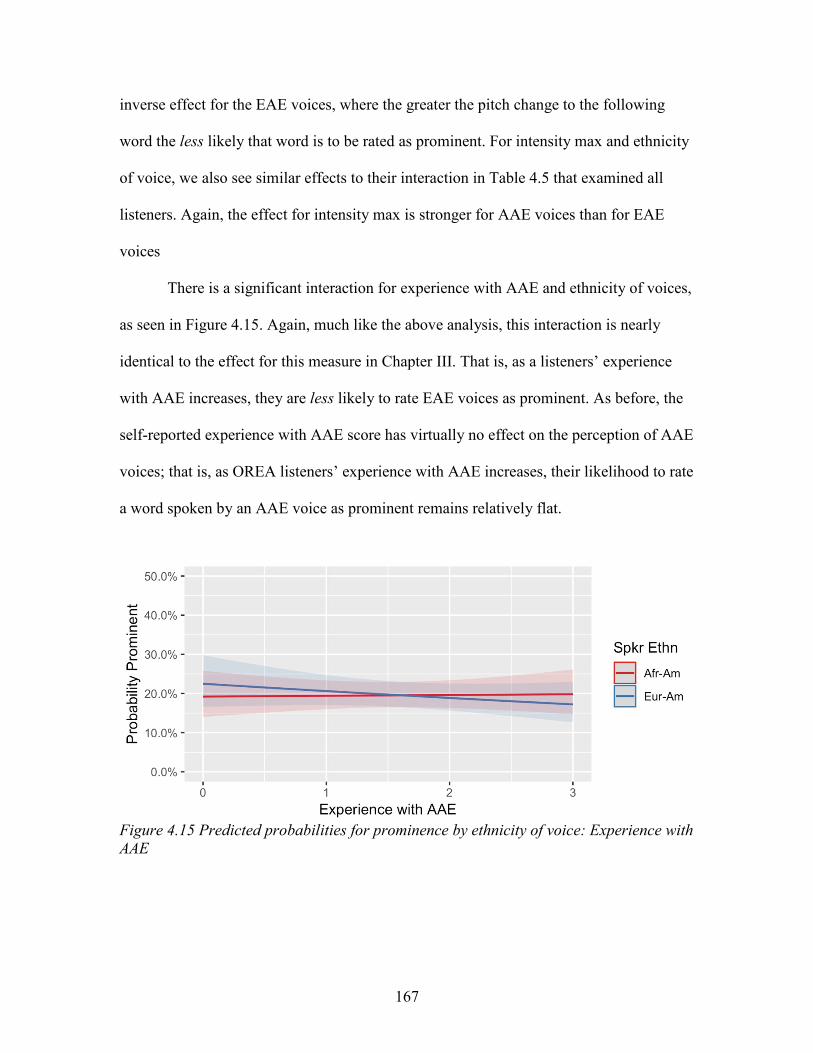
167
inverse effect for the EAE voices, where the greater the pitch change to the following
word the less likely that word is to be rated as prominent. For intensity max and ethnicity
of voice, we also see similar effects to their interaction in Table 4.5 that examined all
listeners. Again, the effect for intensity max is stronger for AAE voices than for EAE
voices
There is a significant interaction for experience with AAE and ethnicity of voices,
as seen in Figure 4.15. Again, much like the above analysis, this interaction is nearly
identical to the effect for this measure in Chapter III. That is, as a listeners’ experience
with AAE increases, they are less likely to rate EAE voices as prominent. As before, the
self-reported experience with AAE score has virtually no effect on the perception of AAE
voices; that is, as OREA listeners’ experience with AAE increases, their likelihood to rate
a word spoken by an AAE voice as prominent remains relatively flat.
Figure 4.15 Predicted probabilities for prominence by ethnicity of voice: Experience with AAE
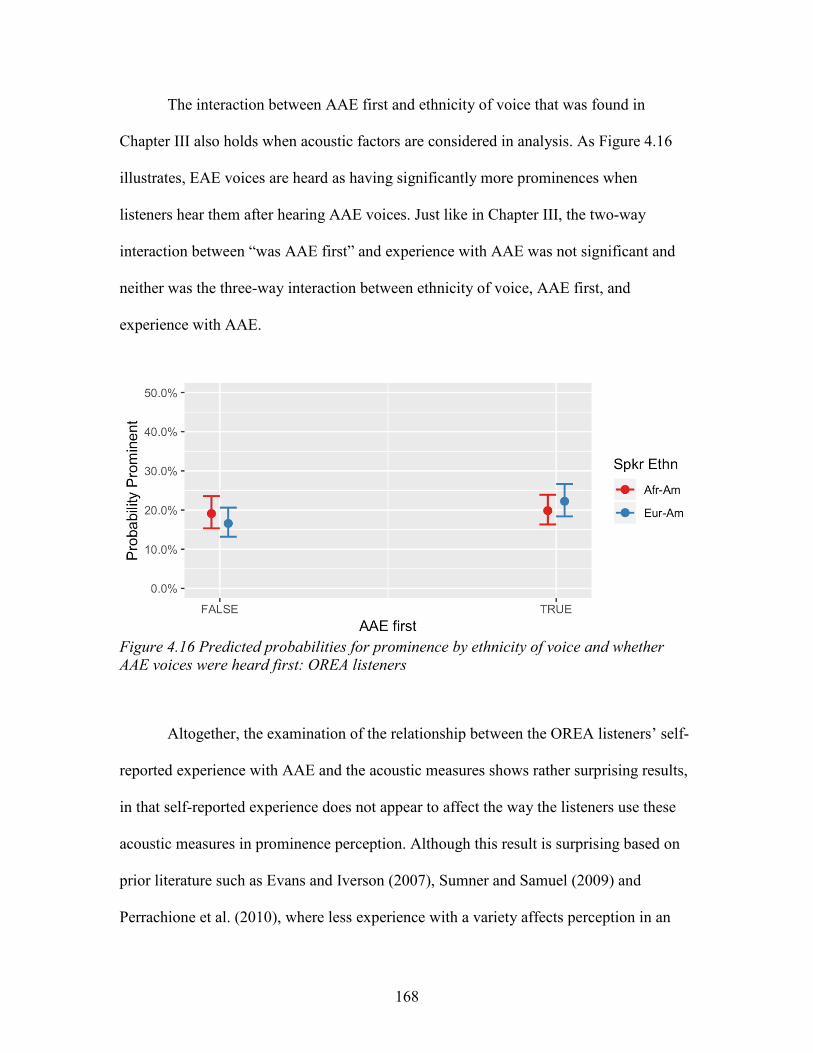
168
The interaction between AAE first and ethnicity of voice that was found in
Chapter III also holds when acoustic factors are considered in analysis. As Figure 4.16
illustrates, EAE voices are heard as having significantly more prominences when
listeners hear them after hearing AAE voices. Just like in Chapter III, the two-way
interaction between “was AAE first” and experience with AAE was not significant and
neither was the three-way interaction between ethnicity of voice, AAE first, and
experience with AAE.
Figure 4.16 Predicted probabilities for prominence by ethnicity of voice and whether AAE voices were heard first: OREA listeners
Altogether, the examination of the relationship between the OREA listeners’ self-
reported experience with AAE and the acoustic measures shows rather surprising results,
in that self-reported experience does not appear to affect the way the listeners use these
acoustic measures in prominence perception. Although this result is surprising based on
prior literature such as Evans and Iverson (2007), Sumner and Samuel (2009) and
Perrachione et al. (2010), where less experience with a variety affects perception in an

169
adverse way, I note that the results here do align with the findings of Cole et al. (2017).
In that study, the authors found that even though there are differences among the listener
groups (i.e. American listeners versus Indian listeners) in their ratings of prominence for
the speech stimuli, there is a remarkable amount of consistency for the acoustic cues
listeners attend to. The findings here appear to support this. It may be the case for the
RPT task, there are some (perhaps secondary) acoustic cues that listeners disagree about,
but for the most part listeners generally use the same type of acoustic cues in prominence
perception. This point will be discussed in more depth in Chapter V.
4.4 Summary and Conclusions
Overall the findings in this chapter have shed light on the questions raised at the
end of Chapter III, while also informing the second broad research question for this
dissertation: How do linguistic cues (i.e. acoustic and structural factors) to prosodic
prominence differ for AAE and EAE voices? And how do listener groups, who differ in
regional background, ethnicity, and self-reported experience, compare to one another in
their use of these cues? In order to answer this broad research question, I asked a series of
five interrelated, more focused research questions.
These questions shed light on how the listener groups in this study utilize
linguistic factors in prominence perception. The first main finding of this chapter showed
that that the factors examined in prior RPT studies do indeed matter for these listeners
and in much of the same way. That is, intensity and word duration as acoustic cues all
listeners utilize in prominence perception is more important than the max pitch measure,
which has also been found in prior work (Cole et al. 2010, 2017). Part of speech and

170
word frequency are also cues utilized by these listeners and again, in much the same way
as in prior RPT studies. For part of speech there is a preference for nouns and adjectives
(which are the most likely to be rated as prominent) followed by the other part of speech
categories. This generally aligns with the findings in Cole et al. (2017), Roy et al. (2017)
and Baumann and Winter (2018). The main take-away from these results is that the
acoustic measures described in prior RPT are also important for these listeners, and in
much of the same way.
The analysis here also indicated that there are indeed cues that listeners use
differently for AAE and EAE voices, as well as cues associated with AAE specifically
for AAE voices. The listeners in the study attend to two cues differently for AAE and
EAE voices: pitch change to the following word, and intensity max. Further, these cues
were also present in three-way interactions. Pitch change to the following word, which is
an AAE-specific cue, plays in important role in the rating of prominence for AAE voices.
As the pitch change increases, listeners are more likely to rate a word as prominent in
AAE voices; interestingly, there is an inverse pattern for EAE voices, such that, as the
pitch change to the following word increases for EAE voices, listeners are less likely to
rate a word as prominent. For intensity max, there is an interaction effect where as
intensity max increases AAE voices are more likely to be rated as prominent compared to
EAE voices (past a certain threshold). These two findings indicate that these cues are
important for rating prominence in AAE voices for these listeners, with pitch change to
the next word being an AAE-specific cue that listeners use to differentiate prominence in
these voice groups. Additionally, the three-way interactions present somewhat complex
results, that can be explained in a couple of different ways. For the three-way interaction

171
between AAE first, ethnicity of voice and pitch change to the following word, the inverse
effect for EAE voices described for the two-way interaction is dampened somewhat by
hearing AAE first. Meaning, if listeners hear AAE first, the interaction between ethnicity
of voice and pitch change to the following word is not as strong. Relatedly, the
interaction for AAE first, ethnicity of voice and intensity max, the effect is in the
opposite direction compared to the three-way interaction involving pitch change to the
following word, such that the effect for intensity max for these listeners is stronger if
listeners hear AAE voices first. A potential interpretation of these findings is related to
the two-way interaction for AAE first and ethnicity of voice that was present in this
analysis and in the analysis in Chapter III. As a reminder, if listeners heard AAE voices
first, then they heard more prominences in EAE voices. So a potential way to interpret
the three-way interaction effects is to think of them as an extension of the AAE first and
ethnicity of voice interaction, such that there could be some specific cues that are
responsible for this effect. Hearing AAE first makes listeners use some cues more (pitch
change to the following word) and others less (intensity max), when they rate EAE
voices.
The different listener groups indeed attend to cues differently, with pitch max,
pitch change from the previous word and pitch change and intensity max utilized
differently among the three listener groups. With respect to pitch max, the OREA
listeners attend to this cue more compared to the two North Carolina listener groups. For
the pitch change from the previous word and intensity max, the European American
listeners patterned similarly to one another with these two effects mattering most for the
NCEA listeners. An interesting outcome from this analysis as well is the fact that these

172
measures had much less of an effect for prominence perception for the NCAA listeners,
and for pitch change from the previous word, this effect was virtually flat, i.e. the NCAA
listeners do not seem to use this cue in prominence perception.
The findings here also suggest a complicated relationship between the two
acoustic measures I used as proxies for the rise and fall of the pitch track described in
prior production-based work on AAE prosody. Pitch change to the following word is
used by all listeners differently for the AAE and EAE voices, while pitch change from the
previous word is not. On the other hand, pitch change to the following word is used to
differentiate prominence in AAE voices from EAE voices by all listeners, whereas pitch
change from the previous word is only used by the European American listeners. This
pattern for these listeners could be explained by the experience that the NCAA listeners
have with AAE. This is to say, pitch change to the following word is important to all
listeners, but since the NCAA listeners presumably have more experience with AAE and
with the kinds of voices in the stimuli, they do not appear to use pitch change from the
previous word as a cue to prosodic prominence.
The NCAA listeners are attending to pitch change to the following word in
differentiating AAE and EAE voices (which is unsurprising, as this was the finding in the
large model in Table 4.4) in prominence perception, whereas pitch change within word
and intensity max trend towards significance. This analysis was meant to give closer
focus to the perceptions of the African American listeners in the experiment. It’s
findings, however, were largely in line with the results from the main analyses for the
first three research questions, especially for main effects. African American listeners
largely pattern like the other listener groups, although, as was uncovered in Chapter III,

173
they appear to be less influenced by the tested acoustic cues than the other listener
groups. This was largely taken as congruent with the lower inter-rater agreement patterns
noted in Chapter III. This finding aligns with the suggestion that the individuals in the
NCAA listener group are using a more diverse set of strategies for the task.
For the OREA listeners and their experience with AAE, the results build on, but
largely replicate, the findings from Chapter III. While self-reported experience affects
how much prominence these listeners hear in the voice groups, it does not influence the
way listeners attend to acoustic cues in these voices. Essentially, this result shows that in
terms of acoustic cues that the OREA listeners use in prominence ratings, are not affected
by experience with AAE.
In Chapter V, I summarize the entire dissertation and return to address the
importance of the findings and implications of this study in depth. An important take-
away from the analyses in this chapter is that all listeners respond to (some) of the
differences between the AAE and EAE voices. The fact that there are subtle differences
between these listener groups and how they use linguistic factors in prominence
perception, i.e. the NCAA listeners are not attending to prominence in fundamentally
different ways than the European American listeners, has important implications within
the field of sociolinguistics, but also more broadly, how these findings inform the broad
research questions from Chapter I.
174
CHAPTER V
CONCLUSION
5.1 Introduction
In this dissertation, I investigated relationships between regional background,
ethnicity and experience and the perception of prosodic prominence in African American
English (AAE) and European American English (EAE). Prior work on AAE prosody has
shown that some varieties of AAE exhibit patterns that differ from those of other varieties
of English (Tarone 1973; Loman 1975; Wolfram and Thomas 2002; Holliday 2016;
McLarty 2018). Focusing in on prosodic prominence, how speakers prosodically
“highlight” certain words for listeners while speaking (Mo 2008; Cole et al. 2010; Cole et
al. 2017), I investigated how AAE and EAE compare in terms of prominence. Further,
since prior research has largely focused on analyst-driven approaches to the study of
prosodic variation in AAE, scholars know very little about how naïve, i.e. everyday,
listeners attend to prosodic differences. This presents important gaps in our knowledge:
are everyday listeners sensitive to prosodic variation in AAE and EAE?
To begin to address these gaps, I analyzed how everyday listeners perceive
prominence in conversational speech excerpts of sociolinguistic recordings from male
and female African Americans and European Americans from North Carolina using the
Rapid Prosodic Transcription (RPT) task (e.g. Cole et al. 2010). Participants were drawn
from three listener groups: African American listeners from North Carolina (NCAA),
European American listeners from North Carolina (NCEA) and European American
listeners from Oregon (OREA). These listener groups represent two different geographic
regions, Oregon and North Carolina, with different ethnic backgrounds and a range of
175
experience with the AAE and EAE voices in this dissertation. Focusing on listeners’
regional background, ethnicity and experience, I focused on two broad research
questions:
1. What differences do listeners perceive between AAE and EAE voices when they are asked to rate prosodic prominence? And, how do listener groups, who differ in regional background, ethnicity, and self-reported experience, compare to one another?
2. How do linguistic cues (i.e. acoustic and structural factors) to prosodic prominence differ for AAE and EAE voices? And how do listener groups, who differ in regional background, ethnicity, and self-reported experience, compare to one another in their use of these cues?
Throughout this dissertation, I investigated several aspects of listeners’
perceptions of prosodic prominence and the ways that listeners use various linguistic cues
in these perceptions. In this chapter, I start, in Section 5.2, by briefly reviewing each
chapter in the dissertation. Section 5.3 then discusses the implications for the findings in
this study. Finally, in Section 5.4, I address how the results of this study can be applied
more broadly, both in the context of sociolinguistics, but also outside of academia.
5.2 Summary of Dissertation
Chapter I laid the groundwork for the empirical work of the dissertation, by
describing the dissertations framework and reviewing prior research on AAE prosody.
Prior work has established that there are production differences for prosody between
AAE and EAE varieties and that these differences are persistent and longstanding
(Loman 1975; Wolfram and Thomas 2002; Holliday 2016; McLarty 2018). Even though
this work has yielded important insights for prosodic variation in AAE, scholars do not
know how/if these differences are attended to by non-linguists. Relatedly, ethnic
176
identification tasks have shown that prosodic features act as a cue for listeners in
identifying speakers as African American or European American. Further, this work also
demonstrated that American English listeners, regardless of regional background or
ethnicity, are able to distinguish African American and European American voices at
rates higher than 70% (and often much higher) (Thomas and Reaser 2004). I then turned
to discuss the utility of examining prosodic variation in terms of prosodic prominence,
with a discussion of methodologies and work by Jennifer Cole and colleagues and how
this work can add to our understanding of AAE prosody (e.g. Cole et al. 2017; Roy et al.
2017). By using the Rapid Prosodic Transcription (RPT) paradigm, sociolinguists can
directly probe everyday listeners’ perceptions of prosodic prominence, and thus better
understand prosodic variation more holistically (i.e., in terms of both production and
perception differences). I also discussed the importance of recent work that investigates
the relationship between production, perception and social variation more generally
(Sumner and Samuel 2009; Kendall and Fridland 2012; Evans and Iverson 2007), which
laid some groundwork that will be relevant as I consider the implications of the empirical
findings in this chapter. Ultimately, this work highlighted the complex relationship
between social and linguistic factors that listeners utilize in shaping their own production
and perception systems.
In Chapter II, I described the experimental framework, the overall structure of the
experiment, participant recruitment and characteristics, as well as my data processing
procedures. The experiment for this dissertation used the RPT paradigm and implemented
that paradigm using the Language Markup and Experimental Design Software (LMEDS).
To address the gap in sociolinguistic literature related to the production and perception of

177
prosody in AAE, the experiments designed for this dissertation obtained prosodic
judgments in conversational speech from sociolinguistic interviews by listeners. The
three listener groups, NCAA, NCEA, and OREA, were asked to rate prominence in two
sets of voices, AAE and EAE voices from North Carolina. Chapter II provided the results
from an ethnic identification task within the experiment, finding that that all listeners,
regardless of reginal background or location, were above 90% accurate in correctly
identifying the ethnicity of the voice presented in these data. This analysis showed that
listeners, on some level, are aware of the ethnicity of the voice they are hearing. In
Chapter II, I also discussed measures I collected of participants’ (self-reported)
experience with AAE through a post-survey questionnaire. From participants’ responses
about their experience with AAE in three different contexts, I created a composite score
for each listener representing their relative self-reported experience with AAE.
Lastly, I described the linguistic factors, a series of acoustic measures, word
duration, words’ part of speech categories and word frequency, that were used in the
analyses to determine the linguistic correlates of perceived prominence for the voices
used in this dissertation project. After the description of the linguistic factors, I provided
(brief) analyses for the linguistic factors (part of speech, word frequency and acoustic
cues). For part of speech, I summarized the total number of words and part of speech
categories across both the AAE and EAE voices, as well as their percentages for the
respective voice groups), showing very little differences across the AAE and EAE voices
in these data. For the analysis of the acoustic cues, I sought to understand if the AAE and
EAE stimuli differed in terms of their production patterns with respect to the acoustic
factors that align with both prior RPT approaches and studies of AAE prosody. Results

178
from this analysis showed that there are robust differences between the two voice groups,
confirming that the AAE speech samples have “more dynamic” prosody compared to the
EAE samples, which is in line with general findings across a range of prior work
(Thomas and Wolfram 2002; Cole et al. 2005; McLarty 2011, 2018; Thomas 2015;
Holliday 2016).
Chapter III and Chapter IV represented the core empirical treatments for this
dissertation. Chapter III centered around the first broad research question: What
differences do listeners perceive between AAE and EAE voices when they are asked to
rate prosodic prominence? And, how do listener groups, who differ in regional
background, ethnicity, and self-reported experience, compare to one another? The results
in Chapter III demonstrated that production-based differences described between AAE
and EAE prosody (e.g. more stresses, more pitch accents in AAE) are in fact attended to
by everyday listeners, regardless of regional background or ethnicity. That is, all listener
groups heard AAE voices has having more prominences. Somewhat surprisingly, the
analysis in this chapter found no significant differences for the rates of prominence
perception for the three listener groups; that is, the NCAA, NCEA and OREA groups
perceived prominence at roughly the same rates in these voices. Chapter III also
investigated inter-rater agreement levels for the three listener groups through Fleiss’
Kappa statistics (Fleiss 1971), which is a common measure used in RPT tasks (e.g. Cole
et al. 2010; Cole et al. 2017). The results from the Fleiss’ Kappa analyses showed
differences among the three listener groups. The NCEA listeners showed the highest
amount of agreement, followed by the OREA listeners. The NCAA listeners,
surprisingly, showed the lowest amount of agreement. This result, coupled with the lack
179
of significant differences for prominence rates across the listener groups, suggested that
the NCAA listeners, despite identifying similar amounts of prominences, may be
attending to acoustic and structural factors in these voices differently. Additionally, this
chapter also indicated a task-related effect for the ethnicity block in the experiment,
where listeners who heard AAE voices first heard more prominences in general.
Lastly, Chapter III also examined the role of self-reported experience with AAE
in prominence perception, focusing on the data from the OREA listeners. Results
demonstrated that self-reported experience with AAE affects how the OREA listeners
attend to prominence but, surprisingly, the statistical analysis identified the effect
impacting their perceptions of the EAE voices, and not the AAE voices. That is, the
OREA listeners were less likely to rate EAE voices as prominent as their self-reported
experience with AAE increases, with self-reported experience with AAE having virtually
no effect on their perception of AAE voices. Despite this, the results were taken as
indication that the OREA listeners with more self-reported experience with AAE did
differentiate AAE and EAE more than listeners with less self-reported experience. The
analysis of the OREA listeners’ self-reported experience also considered agreement
through Fleiss’ Kappa statistics, and this indicated that the OREA listeners with higher
self-reported levels of experience with AAE perceived prominence with higher levels of
agreement than OREA listeners with lower self-reported experience. This finding is in
line with results from Cole et al. (2017), who found that listeners with more experience
with a language variety show higher levels of agreement than listeners with less
experience.
180
While the findings in Chapter III provided important insights into the perception
of prominence in AAE and EAE voices, the findings also raised important questions. The
lack of significant differences between listener groups in prominence perception for AAE
and EAE voices, coupled with lower levels of agreement for the NCAA listeners
compared to the European American listeners, suggested that the three listener groups
may be attending to acoustic and structural factors in these voices differently. These
questions pointed to areas of particular interest for follow up in Chapter IV.
Chapter IV built on the findings, and questions, of Chapter III, while also
addressing the second broad research question of this dissertation: How do linguistic cues
(i.e. acoustic and structural factors) to prosodic prominence differ for AAE and EAE
voices? And how do listener groups, who differ in regional background, ethnicity, and
self-reported experience, compare to one another in their use of these cues? A central
interest in this chapter was to understand if differences in acoustic and structural
linguistic factors in African American English (AAE) and European American English
(EAE), as described for the stimuli in Chapter II and more generally in prior literature
(e.g. Hudson and Holbrook 1981, 1982; Cole et al. 2005; McLarty 2011, 2018; Holliday
2016), are utilized by everyday listeners in the rating of prominence. Additionally, I
wanted to understand whether these listeners utilize acoustic cues (factors like pitch max,
intensity max, word duration) and linguistic factors (part of speech and word frequency)
in ways that are similar to prior work in the RPT paradigm (Cole et al. 2010, 2017; Roy
et al. 2017; Baumann and Winter 2018). Through a series of interrelated questions, I
examined the properties of the speech stimuli themselves and how the different listener
groups make use of those properties. This examination was also meant to address the

181
questions related to different levels of agreement for prominence rating among the three
listener groups in Chapter III. That is, were the three listener groups utilizing different
strategies in prominence perception for AAE and EAE voices?
Results in Chapter IV indicated that the listeners did indeed attend to the factors
examined in prior RPT studies. All listeners used pitch max, intensity max and word
duration in prominence perception, with intensity and word duration showing a stronger
effect than pitch max. Part of speech and word frequency were also attended to in
prominence perception for these listeners. For all listeners, with respect to part of speech,
nouns and adjectives were most likely to be rated as prominent followed by the other part
of speech categories; for word frequency, the less frequent a word is the more likely it
was to be rated as prominent.
Chapter IV also showed that there are acoustic cues that all listeners utilized
differently in their perceptions of prominence for AAE and EAE voices. The listeners in
the study responded to two cues differently for the AAE and EAE voices: pitch change to
the following word, and intensity max. Pitch change to the following word, the pitch in a
word relative to the pitch in the following word, is interpreted as an AAE-specific cue.
Results indicated that increased pitch change to the following word increases the
likelihood that a word will be rated as prominent if spoken by an AAE voice, while it
decreases the likelihood it will be rated as prominent in EAE voices. For intensity max, a
cue more associated with prominence in other RPT-based studies, but not one previously
investigated in studies of AAE prosody, as intensity max values increase, listeners were
more likely to rate a word as prominent for AAE voices compared to EAE voices. There
was also a three-way interaction for the ethnicity block of hearing AAE first, ethnicity of
182
voice and pitch change to the following word, showed that the effect of pitch change to
the following word for the EAE voices was lessened if listeners heard the AAE voices
first. Additionally, there was also a three-way interaction for AAE first, ethnicity of voice
and intensity max, where the interaction effect was stronger if listeners hear AAE voices
first.
The listener groups also showed differences from one another in how they
responded to acoustic cues in prominence perception for these voices. Three acoustic
factors, pitch max, pitch change from the previous word and intensity max, were utilized
differently among the listener groups. The OREA listeners attended to pitch max more
compared to the two North Carolina listener groups. For the other two cues, pitch change
from the previous word and intensity max, important patterns emerged, where, overall,
the African American listeners, the NCAA group, used these cues less (for intensity max)
or not at all (pitch change from the previous word) in perceiving prosodic prominence. At
the same time, both European American listener groups, NCEA and OREA, did use these
cues in their perceptions of prominence.
I also considered the NCAA listeners separately, to give closer focus to the
perceptions of the African American listeners in the experiment. The findings for the
analysis of the NCAA listeners demonstrated that these listeners were not very different
from the European American listeners in terms of the acoustic cues they attend to in
prominence perception. For the NCAA listeners examined on their own, only one
acoustic cue was identified as used for differentiating prominence perception in AAE and
EAE voices: pitch change to the following word (though pitch change within word and
intensity max trend towards significance). This finding is congruent with the findings for
183
the ethnicity of voice when all voices are considered together. Another important
outcome was that the NCAA listeners utilized a more limited set of acoustic cues in
prominence perception compared to the European American listeners. This result was
seen as in-line with the lower agreement levels for these listeners described in Chapter
III. Altogether, it appears that the African American listeners in this study used a wider-
range of task-strategies than the European American listeners.
Lastly, in Chapter IV, I returned to the investigation of OREA listeners’ self-
reported experience with AAE and the role it may play in prominence perception for
these voice groups. Here, I examined self-reported experience with AAE alongside
acoustic factors known to influence prominence perception, to see if the OREA listeners
who reported more experience with AAE used different strategies for the RPT task than
those who reported less experience. The results showed that OREA listeners’ experience
with AAE did not affect the way they attend to the acoustic cues that they use in
prominence ratings.
Taken all together, this dissertation raises important implications for the study of
prosodic variation in AAE and EAE, and the role of regional background, ethnicity and
self-reported experience in the perception of prosodic phenomena. In Section 5.3, I turn
to discuss the ramifications for the core findings from Chapter III and Chapter IV.
5.3 Considering the Influence of Regional Background, Ethnicity, and Experience on Perceptions of Prosody
The data and analyses presented in the previous chapters provided important
insights into how listeners who have different regional backgrounds, are of different
ethnicities and have different levels of experience with AAE attend to prominence in
AAE- and EAE-speaking voices. The findings also raise several important implications

184
for the study of both the production and the perception of AAE prosody, and the RPT
task itself.
5.3.1 The Perception of AAE Prosody
The most important finding in this dissertation was that all listeners heard AAE
voices as exhibiting more prominence than the EAE voices, regardless of listeners’
regional background, ethnicity or self-reported experience. This result showed that
production differences described for AAE voices (i.e. more stresses, more pitch accents)
are indeed perceptually salient to everyday listeners, at least when they are asked to
attend to prominence in AAE and EAE varieties. The patterns uncovered align with prior
findings using analyst-driven approaches (e.g. Loman 1975; Wolfram and Thomas 2002;
McLarty 2018). While I did not focus on this aspect of the study (because there was
nothing to focus on), the lack of any statistically significant differences for speaker sex
showed that these listeners did not rate prominence differently for male and female
voices. This finding indicates that at least in the RPT task, listeners rate prominence in
for both male and female voices in similar ways, underscoring that ethnicity of voice
matters more in prominence perception than potential sex-based differences.
5.3.2 RPT and the Study of AAE Prosody
The findings raise important implications for the use of RPT-like tasks, and the
broader investigation of prosodic variation in perception. The present experiments
focused on ethnolectal differences and blocked stimuli by ethnicity. To my knowledge,
this is the first RPT-based study to examine more than one language variety in a single

185
task. In this experiment, voices were blocked by ethnolect with half of the conditions
putting the AAE voices first and half putting the EAE voices first. The order of the voices
was found to play an important role in overall prominence perception and also influenced
how listeners attended to acoustic cues. This finding, as well as some related outcomes,
suggest that RPT tasks that examine dialect differences need to carefully consider the
order that participants receive the stimuli. Future work should keep this in mind when
designing future studies that examine prosodic prominence in an ethnicity-contingent
manner, or in any situation that asks listeners to rate different kinds of voices.
Further, while I adopted the use of the RPT task because it provides novel ways to
probe the perceptions of everyday listeners and offers important new insights into
prosodic variation, I also have to acknowledge that it could be that this task is less ideal
than I hoped to study nuanced prosodic differences across ethnolects. For this study,
where I was interested in the relationship between AAE-specific prosodic features, the
RPT paradigm presents a task that may be too simplifying to capture nuanced acoustic
differences that may matter for listeners. A potential reason why there are not many
differences between the listener groups may be due to the fact that these listeners are
indeed attending to prominence, but the AAE-specific acoustic cues measured here are
simply not meaningful to listeners when they are asked to pick words that are
“highlighted for them by the speaker”. I will return to discuss this outcome and how it
relates to future work in Section 5.3.6.
186
5.3.3 Acoustic Factors and AAE Prosody
The findings from Chapter IV that investigate the role of acoustic factors provide
some important insights. Although there were significant differences between the two
voice groups across all acoustic measures, listeners did not utilize all measures in
prominence perception. This highlights that for the listeners in the RPT task, certain cues
matter more than others in rating prominence for AAE and EAE voices, and that (some)
significant differences in production do not always matter for listeners in perception. In
line with prior work using RPT (e.g. Cole et al. 2010; Cole et al. 2017), word duration
and intensity were more influential on listener perceptions of prominence than most of
the pervasive pitch-based differences in the stimuli. To some degree, this must be
interpreted as related to the task and to the notion of prosodic prominence itself, but it
also highlights that not all differences will be meaningful for listeners in all situations.
The patterns that emerged here can suggest future directions for considering how
meaningful different variants are for everyday listeners, while also raising new questions
that can be probed in future work. As noted by Sumner and Samuel (2009), much
sociolinguistic research considers dialect differences in terms of production, but not
necessarily in terms of perception. The findings here highlight that not all variation is
meaningful for listeners, and certain acoustic differences may lead listeners to respond to
or weight cues differently for different voices.
With respect to the specific acoustic cues examined in this dissertation, I found
that overall, the acoustic cues described in prior RPT work known to correlate with
prominence perception (i.e. pitch max, intensity max and word duration) are meaningful
for these listeners, with all listeners using these three cues for both sets of voices in

187
perception. The relationship that these cues have to the more AAE-specific cues (pitch
change from the previous word, pitch change to the following word and pitch range
within word) is complex. All listeners used pitch change to the following word in their
prominence perception for AAE voices, but not for EAE voices. Further, all listeners did
not attend to the other cues that were measured to represent AAE-specific prosodic
features. This raises questions about the measures themselves and how listeners attend to
them. For pitch change within word, which was intended to capture peak delay
differences between these varieties, this factor was not significant in the model where all
listeners were examined together as a main effect or as an interaction. This seems to
suggest that listeners are not sensitive to pitch changes within a domain as small as a
word. That is, pitch perturbations within words simply may not be meaningful to
listeners, so that listeners ignore or do not utilize the production differences for this cue in
prominence perception.
The pitch measures examining differences between a word and the words
immediately preceding and following it were complex, and difficult to explain. All
listeners attended to the pitch change between a word and the following word for the
AAE voices, but not the change from the previous word. As I note in both Chapter II and
Chapter IV, these measures were meant to encapsulate the rise and fall of the pitch track
that has been described for AAE (e.g. Cole et al. 2005). In terms of the actual acoustics,
these two measures captured related phenomena (i.e. the relationship in pitch values
between adjacent words), so the fact that listeners respond to one measure and not the
other is puzzling. The measures implemented here were more coarse-grained, capturing
the differences between adjacent words, not syllables (which is often the case in more
188
fine-grained sociophonetic approaches), and were meant to address the rise and fall of the
pitch track. In terms of perception, it is the case that pitch changes to the following word
matter more for listeners in prominence perception than the change from the previous
word. This may be due to the RPT task itself; meaning, as listeners hear a speech excerpt
and attend to words that they hear as “highlighted”, once they determine that a word is
prominent, they use the relationship that word has to the next word in speech to confirm
their judgment. Since listeners cannot rewind or replay the immediate previous word, it
makes sense that the next word matters more in the RPT task than the previous word.
This is all to say, that the finding for pitch change to the following word could be a result
of the task itself, not some inherent property of the signal or how meaningful this
measure actually is for listeners.
5.3.4 Regional Background and AAE Prosody
The role of regional background and ethnicity in these data provided important
insights about the role of these factors in prominence perception. First, fand perhaps most
noteworthy, is that the findings from Perrachione et al. (2010), as well as Sumner and
Samuel (2009), Evans and Iverson (2007), and Kendall and Fridland (2007) seem to run
counter to the results here. That is, all of these studies showed that listeners with more
exposure or experience with the varieties they hear in perception, based on regional
background, attend to cues differently than listeners who do not. Though Evans and
Iverson (2007) and Kendall and Fridland (2012) examined the relationship between
experience and the perception of vowels (and not prosody), the findings in these studies
highlight the importance of regional experience in the perception of dialect variants. The
189
researchers found that the less exposure/experience that listeners’ have with a variety, the
less the listeners are able to perceive unfamiliar vocalic variants.
With respect to ethnicity in particular, Perrachione et al. (2010) presented
European American and African American listeners with European American and
African American voices and asked them to label the voice’s ethnicity. The authors found
that listeners have a bias to their own dialect in the perception of talkers. This bias is
argued to be a result of “asymmetric cultural experiences”, and for listeners, the “quantity
or quality of some experiences exceeds that of others” (Perrachione et al. 2010: 12).
Essentially, listeners’ perception system becomes attuned to the language or dialect of
speakers they primarily associate and share a linguistic background with.
The findings in these data do not align with the findings in this dissertation. The
fact that all listener groups, despite regional background and ethnicity, hear AAE voices
as exhibiting prominence at roughly the same rates, while also attending to similar cues
may speak to the ubiquity of AAE to American English speakers. That is, the findings in
this dissertation related to regional background and ethnicity may be result of how salient
AAE is to American English speakers, and that this study is unable to capture potential
subtle differences in how these listeners attend to prosodic variation in AAE.
5.3.5 African American Listeners and the Perception of AAE Prosody
Another main interest in this dissertation is how African American listeners attend
to prominence in AAE voices. The findings in this dissertation showed that the NCAA
listeners do not attend to prominence at different rates than the European American
listeners. However, an intriguing outcome remains that despite these similarities in rates

190
between the listener groups the African American listeners have lower levels of inter-
rater agreement than the European American listener groups. Along these lines, the most
interesting result for the NCAA listeners is not about a specific cue or suite of cues
utilized in prominence perception. Rather, the finding that these listeners use a smaller
(or more limited) set of cues than the other listeners groups is of most interest. This
pattern is congruent with their lower agreement rates and was taken as support for the
interpretation that the NCAA listeners use a broader range of strategies than the other
listener groups in completing the RPT task.
In terms of the acoustic cues used by the NCAA listeners, these listeners were
found to attend to the pitch change to the following word measure in differentiating
prominence perception in AAE voices compared to EAE voices, which was also the case
for the European American listeners, but they did not use other measures (at least in a
statistically significant way). This interpretation is in line with the findings of Baumann
and Winter (2018) who found that different listeners attend to different cues for different
voices. Additionally, the results also align with the findings of Cole et al. (2017), where
familiarity with a variety was found not to affect the way that listeners attend to the
acoustic cues that influence prominence perception. This is further reinforced by the
finding that all listeners here more prominence in AAE voices (compared to EAE voices).
The cues used by all listeners in prominence perception for AAE, and that the NCAA
listeners are not different from the other listener groups, also supports claims by Spears
(1988) and Thomas and Reaser (2004). American English speakers are adept at
distinguishing AAE and EAE voices, and as such, the listener groups are ultimately more

191
similar to one another in their prominence perception than they are different because of
how salient AAE is to American English speakers.
5.3.6 Self-Reported Experience and AAE Prosody
A central interest for this dissertation project was investigating the role of
listeners’ experience with a variety on their perceptions for that variety. Experience can
be viewed in numerous ways, such as listeners’ regional background and how much
(potential) exposure they have had with varieties, their ethnicity (i.e. how their own
ethnic background influences perception in ethnolects that are not their own), and
listeners’ own self-reported experience about their exposure to varieties. The listeners I
examined do not differ in their perception of prominence based on their regional
background. Two groups of participants, NCAA and NCEA, were drawn from effectively
the same population as the speakers of the stimuli, while one group, OREA, come from a
quite distant locale, in a different dialect region. But this difference did not matter in the
RPT task as much as I had expected.
As mentioned above, all listeners heard AAE voices as exhibiting more
prominences than EAE voices, while also attending to the same acoustic cues, no matter
where they were from. On the other hand, when I investigated self-reported experience
for the OREA listeners, I found that self-reported experience did indeed matter for these
listeners in prominence perception. As these listeners’ self-reported experience increases,
they differentiated prominence in these voices more, with prominence in EAE voices
decreasing as experience increases.

192
Since the OREA listeners have less exposure to AAE, both based on regional
background and ethnicity, and showed the lower amounts of self-reported experience
with AAE (compared to the NCAA listeners) in the composite score presented in Chapter
II, so it makes sense that experience (or a lack thereof) would play a role in prominence
perception. On the other hand, the analyses suggest that self-reported experience did not
affect which acoustic cues these listeners attend to in prominence perception. That is, no
matter the level of self-reported experience these listeners have with AAE, they attend to
acoustic cues in the same way. This is somewhat surprising and it raises a number of
questions for future work. Complicating the findings for experience is the task-based
effect for the ethnicity block discussed in 5.3.2 where listeners who heard AAE voices
first heard more prominences in general. It seems to be the case in these data that if
listeners heard AAE voices first, the effect was more about influencing their perceptions
for the EAE voices than for the AAE voices. It could be the case that the OREA listeners
register maximum amounts of prominences for the AAE voices and then in turn apply
that to EAE voices, and thus boost the overall rate of prominence. Essentially all the
effects for experience are related to the EAE voices and not the AAE voices (which
remain relatively consistent) in terms of perception.
The outcomes related to self-reported experience, of course, could be an artifact
of the particulars of my study. For instance, it could be due to the composite score I
created itself. By creating a composite score, I was able to examine listener’s responses to
the three experience-related questions about AAE together as a single factor, but in doing
so I potentially may have obscured the influence of one of the factors individually.
Alternatively, the questions I asked to better understand self-reported experience may not

193
accurately capture the actual, most relevant aspects of listeners’ experience with AAE.
Though there are effects for experience in the investigation of the data from the OREA
group, I am unable to speak to what experience with AAE actually means for these
listeners. That is, a study investigating the influence of listeners’ subjective attitudes
and/or orientations to AAE may provide important insights in how they attend to
prominence. The approach I have taken here, focusing on experience as it relates to
exposure to a variety, may simply not capture what most influences listeners’ behavior in
the RPT task.
As discussed in Chapter II, the three listener groups have very different types and
amounts of experience with AAE, and likely experience with AAE has a different
meaning for each of these listener groups. This fact led me to focus my analysis on the
OREA listener group since I determined that the measures I collected might be most
meaningful for this group. Future work could usefully apply the findings in this
dissertation to investigate experience with AAE in more fine-grained ways, while also
constructing questions/measures that probe listeners’ subjective views of AAE and what
experience with AAE means for everyday language users.
5.3.7 Future Directions
Though this dissertation provided important insights and first steps in
understanding how everyday listeners attend to prosodic variation in AAE and EAE,
future work can apply these findings to more controlled studies. As discussed in Section
5.3.1, the RPT task may not be the tool best-suited for studying nuanced prosodic
differences across ethnolects and how they are perceived by everyday listeners. In order
to understand the influence of the acoustic cues individually in perception, future work

194
could use experimental paradigms to examine other aspects of prosody beyond
prominence. As described in Section 5.3.3, it may be that everyday listeners can provide
deeper insights into differences in prosody between AAE and EAE if asked to attend to
more nuanced prosodic elements in different ways than I have done here. The fact that
African American listeners may be using different strategies than the European American
listeners raises important ramifications for RPT itself. The nature of the RPT task is that
listeners can take a holistic approach to their prominence judgments, and this does not
capture the finest-grained cues that a listener is capable of using to make prosodic
judgments, only what they choose to use when presented with uncontrolled, naturalistic
stimuli. Alternatively, a task like AXB discrimination (where listeners are presented with
three speech excerpts and indicate whether the second excerpt is more like the first or the
third) could be used to determine which precise acoustic correlates of various prosodic
phenomena listeners are capable of attending to. Future work can apply the findings from
this dissertation, both the acoustic cues that listeners attend to and the findings related to
experience, and test these cues in a more controlled setting to further elucidate what we
know about production and perception in AAE.
Another point to be made about the approach in this dissertation (which is not
necessarily about RPT itself) is that information structure and focus are known to
influence prosodic prominence in both production and perception. Since my focus was on
acoustic prominence and not the relationship between acoustic and structural
prominence,I did not code for information structure in these data. Doing so, may have
been more illuminating for these data than just focusing on acoustic cues and part of
speech as I did. As Chapter II and IV demonstrated, these voices have similar rates of
195
part of speech categories, and the listeners attend to prominence in these categories in
expected ways (i.e., nouns and adjectives are favored compared to the other categories).
That being said, the analyses in this dissertation did not examine different types of nouns
and adjectives and their role in information structure and focus. Further, the way focus in
AAE is signaled by speakers is massively understudied and there indeed may be a
relationship between AAE voices in these data being heard as exhibiting more
prominences and information structure and focus. That is, AAE may mark focus and
information structure in ways that are different from EAE, and the amount of
prominences heard by listeners for AAE voices stem from this fact.
Relatedly, Arvaniti (2009) argues that rhythm, at least in part, is a byproduct of
prosodic prominence. The regular spacing or intervals of prominence is achieved in
language-specific ways. The point being, that for these data, listeners may be attending to
prominence grouping differences between these varieties primarily, with the acoustic
cues measured here playing a secondary role. An analysis of the relationship between
boundary marking9 and prominence rating in these data could help address the claims by
Arvaniti (2009). Overall, future work should explore other known factors in prominence
perception, such as the role of information structure, focus and potential grouping
differences in prominence perception to further inform what we know about AAE
prosody.
5.4 Applications of Prominence Perception
9 I chose to focus on prominence, rather than boundaries and prominence together, as production differences described for AAE and EAE are largely encompassed by prominence, rather than boundaries. Though I did collect boundary marking data.

196
The work of this dissertation is meant to lead to applications both within the field
of linguistics and outside of academia. Prior research has demonstrated that prosody
plays an important role in listeners’ judgments of the ethnicity of speakers, but how
speakers use prosody and the acoustic parameters that lead to these assessments has been
largely unknown. Prior research, and findings in this dissertation, have demonstrated that
listeners hear more prominence in AAE and can discern the ethnicity of speakers based
on relatively short speech samples, and that prosody plays a major role in this
discernment (Purnell et al. 1999; Thomas and Reaser 2004; Thomas et al. 2010). This has
very real consequences for speakers of AAE in their everyday lives. For example, Baugh
(2003) shows that speakers of AAE can be denied housing and employment based on the
perceived ethnicity of the voices listeners hear. Recent work by Jones et al. (2019) has
shown that speakers of AAE face very serious issues in the courtroom. Jones et al.
investigated the accuracy with which court stenographers transcribe speakers of AAE in
Philadelphia. While court stenographers are required to show 95% accuracy in
transcription for certification, their study showed that stenographers were accurate in
their transcriptions for AAE speakers roughly 60% of the time. This has can have dire
consequences for AAE speakers, as the authors note:
Since what the court reporter writes is taken to be what is said, if there is
an error in transcription of a deposition, for instance, an entirely honest
witness can be accused of perjury for contradicting a prior statement. And
should an AAE-speaking defendant make it to trial, the transcript may
play an essential role not just in the initial court proceedings but in any
subsequent appeals as well (Jones et al. 2019: 223).

197
In their study, many of the incorrect transcriptions of AAE features have a prosodic
component. Features such as remote time been and unstressed done are categorized in
part based on their prosodic realization. Jones et al. (2019) suggest that one way to
alleviate the biases and obstacles that AAE-speakers face in the courtroom is to have
court stenographers undergo training and certifications for non-standard dialects like
AAE, and the findings here can help in that endeavor. For instance, AAE is heard by
listeners as exhibiting more prominence, and since many of the unique aspectual features
of AAE have components related to prominence, the relationship between these two facts
may contribute to stenographers inaccuracy in transcription. By making stenographers
aware of these differences, these features of AAE may, in part, be less confusable. It is
my hope that the work in this dissertation can represent some groundwork that might
undergird future steps to help alleviate some of the discrimination AAE speakers face
based on their voices alone.
With respect to education, no other variety of American English has been as
controversial as African American English nor as well-recognized. Throughout the last
fifty years, AAE has been the subject of national controversies, from the difference-
deficit debates in the 1960s (Labov 1969) and the Ann Arbor Decision in the 1970s
(Whiteman 1980) to the Oakland Ebonics Controversy in the 1990s (Wolfram 1998;
Baugh 1999; Rickford 1999; see the ORAAL website (oraal.uoregon.edu; McLarty et al.
2018) for more on these topics). Further, there has been work highlighting how children
who speak AAE are treated in the classroom. Tarone (1973) discussed that prosodic
variation needs to be better understood by linguists because of its effect in the classroom,
specifically regarding interactions of AAE speaking children and their Mainstream

198
American English speaking teachers. An insufficient amount of work, however, has
followed up on her suggestions despite the passage of almost 50 years.
Alim and Smitherman (2012) demonstrate that often children who speak AAE are
thought of as rude or disrespectful by teachers who speak another variety of American
English, when teachers are unfamiliar with AAE, with prosody being one of the main
factors in the determination of a child’s attitude. Rickford and Wolfram (2009) note that
teachers should be able to facilitate and incorporate dialect awareness in the classroom,
but to accomplish this, instructors should also be aware of what features are integral
components of varying dialects in the U.S. For AAE, research over the last half-century
has clearly demonstrated that prosody is a central component. The findings in this
dissertation could be included in resources used for training teachers about features of
AAE specifically and dialect awareness in general. The knowledge that AAE produces
more pitch accents and is perceived as more exhibiting more prominences may help
teachers understand AAE better more generally, and thus limit misunderstandings in the
classroom. With respect to prosodic differences and how they may be perceived, this
knowledge could support the improvement in the quality of education for AAE-speaking
children in the classroom.
Sociolinguistically, this dissertation helped us better understand what everyday
listeners attend to in prosodic prominence perception as well as the acoustic cues that
influence these perceptions. It is my hope that this work can help chart a path forward for
better understanding the relationship between perception and production of prosodic
differences between AAE and EAE varieties and how prosodic features are represented
cognitively for listeners.

199
Moreover, as discussed in Chapter I, approaches examining prosody in
sociolinguistics have increasingly been using the MAE_ToBI system. While MAE_ToBI
has benefits, such as allowing researchers to compare and contrast research findings
through similar terminology and assumptions, it also provides some substantial obstacles.
Learning MAE_ToBI requires being taught the system and its assumptions by another
trained analyst. In sociolinguistics, those analysts are few and far between, limiting the
number of researchers who can study prosody. Further MAE_ToBI transcription is
incredibly time-consuming, and usually requires at least two (preferably 3-5) analysts
transcribing the same speech and then coming to a consensus on labels. Additionally,
MAE_ToBI was not designed with the sociolinguistic endeavor in mind, and generally
has to be modified or adjusted to be used in sociolinguistic recordings. The RPT
paradigm used in this dissertation can alleviate those obstacles while also giving
researchers insights into what listeners may or may not be attending to in the acoustic
signal. Further, MAE_ToBI was not designed for AAE. It is still unsettled as to whether
or not pitch accents and phrasal accents described in MAE_ToBI apply to AAE varieties.
Researchers who use MAE_ToBI in the study of AAE prosody (or any other non-
standard variety such as Appalachian English, Jewish English, etc.) are essentially trying
to fit a square peg into a round hole. The RPT paradigm allows sociolinguists to begin to
create a prosodic profile for AAE that can be based on native AAE speakers’ assessments
of their own dialect, not European American linguists describing what they believe to be
the case about AAE prosody based on its similarities and differences to MAE. Most
importantly, this approach can increase the ability of African Americans, whether
linguists or not, to begin to participate in the description of AAE prosody, without the
200
need for extensive training in a paradigm that is often difficult to come by.
Sociolinguistics needs more African American scholars to study AAE, and even more so
in the study of prosody; the approaches in this dissertation may serve as one step in
addressing this need.
In conclusion, this dissertation provided an important first step in understanding
how everyday listeners attend to prominence in AAE. The findings discussed throughout
this chapter can act as a guide for future, more controlled studies examining listeners’
perceptions of fine-grained acoustic features in AAE. This dissertation has shown that
listeners, from a range of regional backgrounds, ethnicities and self-reported experiences
with AAE, do perceive AAE voices as having more prosodic prominences than EAE
voices, which confirms prior work that has examined production differences between
these varieties, and also underscores that prosodic features of AAE are salient to
American English speakers. The approaches in this dissertation give sociophoneticians
another methodological approach to the study of AAE prosody, by marrying
sociophonetic and laboratory phonology approaches, helping to enrich and augment what
researchers have already uncovered. The methods and findings in this dissertation can
usefully be applied to other sociolects and ethnolects to examine how everyday listeners
attend to prosodic variation across language varieties. And this work can have
implications within linguistics and outside academia. In sum, this dissertation has shown
that tapping into how everyday listeners attend to prosodic variation in different
ethnolects provides insights into prosodic features that matter to everyday listeners and
can provide further avenues for advancing the study of prosodic variation and the
relationship between speech production and speech perception.
201
REFERENCES CITED Abrams, Albert S. 1973. Minimal Auditory Cues for Distinguishing Black from White
Talkers. Unpublished PhD dissertation. NewYork: City University of New York. Alim, H. Samy and Geneva Smitherman. 2012. Articulate While Black: Barack Obama,
Language, and Race in the U.S. Oxford, UK: Oxford University Press. Arvaniti, Amalia. 2009. Rhythm, Timing, and the Timing of Rhythm. Phonetica 66(1-2):
46–63. Baayen, R. Harald, Douglass J. Davidson, and Douglas M. Bates. 2008. Mixed-effects
Modeling with Crossed Random Effects for Subjects and Items. Journal of Memory and Language 59.4: 390-412.
Bailey, Guy and Natalie Maynor. 1989. The Divergence Controversy. American Speech,
64: 12-39.
Bates, Douglas, Martin Mächler, Ben Bolker, and Steve Walker. 2015. Fitting Linear Mixed-Effects Models Using lme4. Journal of Statistical Software 67.1: 1-48.
Baugh, John. 2003. Linguistic Profiling. In Sinfree Makoni, Geneva Smitherman,
Arnetha F.Ball and Arthur K. Spears (eds.), Black Linguistics: Language Society and Politics inAfrica and the Americas. London, UK: Routledge Press.
Baumann, Stefan and Bodo Winter. 2018. What Makes a Word Prominent? Predicting
Untrained Germans Perceptual Judgments. Journal of Phonetics 70. Beckman, Mary E., Julia Hirschberg, and Stefanie Shattuck-Hufnagel, S. 2005. The
original ToBI system and the evolution of the ToBI framework. In S-A. Jun (ed.), Prosodic Typology. Oxford: Oxford University Press.
Becker, Kara. 2014. Linguistic Repertoire and Ethnic Identity in New York City. In
Lauren Hall-Lew and Malcah Yaeger-Dror (eds.) New Perspectives on Linguistic Variation and Ethnic Identity in North America. Special issue of Language and Communication 35: 43-54.
Benor, Sarah Bunin. 2010. Ethnolinguistic Repertoire: Shifting the Analytic Focus in
Language and Ethnicity. Journal of Sociolinguistics 14(2): 159-183. Boersma, Paul, and David Weenink. 2016. PRAAT: Doing Phonetics by Computer.
Version 6.0.21. http://www.fon.hum.uva.nl/praat/.

202
Britt, Erica and Tracey L. Weldon. 2015. African American English in the Middle Class. In Sonja Lanehart (ed). The Oxford Handbook of African American Language. New York: Oxford University Press. 800-816.
Brysbaert, Marc, and Boris New. 2009. Moving Beyond Kucera and Francis: A Critical Evaluation of Current Word Frequency Norms and the Introduction of a New and Improved Word Frequency Measure for American English. Behavior Research Methods 41: 977-990.
Bybee, Joan. 2002. Word Frequency and Context of Use in the Lexical Diffusion of
Phonetically Conditioned Sound Change. Language Variation and Change 14.3: 261-290.
Clopper, Cynthia G.2012. Effects of Dialect Variation on the Semantic Predictability
Benefit. Language and Cognitive Processes, 27, 1002-1020. Cole, Jennifer, Tim Mahrt,, Joseph Roy. 2017. Crowd-Sourcing Prosodic Annotation.
Computer Speech Language, 45: 300–325 Cole, Jennifer and Stefanie Shattuck-Hufnagel. 2016. New Methods for Prosodic
Transcription : Capturing Variability as a Source of Information. Journal of Laboratory Phonology. 7 (1), 1–29.
Cole, Jennifer, Tim Mahrt, and Joseph Roy. 2015. New Methods of Crowd-Sourcing for
Prosodic Annotation: Inter-Annotator Agreement, Individual Differences, and Sources of Variation. Paper presented at Experimental and Theoretical Advances in Prosody 3, Urbana-Champaign, IL, May 2015.
Cole, Jennifer and Mark Hasegawa-Johnson. 2012. Corpus Phonology with Speech
Resources. In A. Cohn, C. Fougeron, and M. Huffman (eds.), Handbook of Laboratory Phonology. Oxford, UK: Oxford University Press, pp. 431-440.
Cole, Jennifer, Yoonsook Mo, and Soondo Baek. 2010. The Role of Syntactic Structure
in Guiding Prosody Perception with Ordinary Listeners and Everyday Speech. Language and Cognitive Processes, 25: 7: 1141–1177.
Cole, Jennifer, Yoonsook Mo, and Mark Hasegawa-Johnson. 2010. Signal-Based and
Expectation-Based Factors in the Perception of Prosodic Prominence. Laboratory Phonology, 1.1: 425–452.
Cole, Jennifer, Heejin Kim, Hansook Choi, and Mark Hasegawa-Johnson. 2007. Prosodic
Effects on Acoustic Cues to Stop Voicing and Place of Articulation: Evidence from Radio News Speech. Journal of Phonetics, 35: 180 –209.
Cole, Jennifer, Erik R. Thomas, Erica Britt, and Elizabeth L. Coggshall. 2005.
Intonational Distinctiveness of African American English. Paper presented at New Ways of Analyzing Variation 34, New York, NY, October.

203
Dickens, Milton and Granville M. Sawyer. 1952. An Experimental Comparison of Vocal Quality among Mixed Groups of Whites and Negroes. Southern Speech Journal 17: 178-185.
Dodsworth, Robin and Mary Kohn. 2012. Urban Rejection of the Vernacular: The SVS
Undone. Language Variation and Change, 24.2: 221-245. Evans, Bronwen G. and Paul Iverson. 2007. Vowel Normalization for Accent: An
Investigation of Best Exemplar Locations in Northern and Southern British English Sentences. The Journal of the Acoustical Society of America, 115, 352.
Fasold, Ralph W., William Labov, Fay Boyd Vaughn-Cooke, Guy Bailey, Walt Wolfram,
Arthur K. Spears, and John R. Rickford. 1987. Are black and white vernacular varieties
Fitch, James L., and Anthony Holbrook. 1970. Modal Vocal Fundamental Frequency of
Young Adults. Archives of Otolaryngology 92.4: 379–82 Foreman, Christina. 2000. Identification of African-American English from Prosodic
Cues. Texas Linguistic Forum, 43:57-66. Forrest, Jon and Robin Dodsworth. 2016. “Towards a Sociologically-Grounded View of
Occupation in Sociolinguistics”. University of Pennsylvania Working Papers in Linguistics. 22(2).
Gooden, Shelome. Kath-Ann Drayton and Mary Beckman. 2009. Tone Inventories and
Tune Text Alignments: Prosodic Variation in ‘hybrid’ prosodic systems. Studies in Language 33:2, 354–394
Green, Lisa J. 2002. African American English: A Linguistic Introduction. New York:
Cambridge University Press. Green, Lisa J. 2011. Language and the African American Child. Cambridge: Cambridge
University Press. Hawkins, Francine Dove. 1993. Speaker Ethnic Identification: The Roles of Speech
Sample, Fundamental Frequency, Speaker and Listener Variations. PhD. diss., University of Maryland
Holliday, Nicole. 2019. Variation in Question Intonation in the Corpus of Regional
African American Language. In Kendall and Farrington 2019, 110-130. Holliday, Nicole Reannon. 2016. Intonational Variation, Linguistic Style and the
Black/Biracial Experience. PhD. Diss., New York University.
204
Hualde, Josè.I., Jennifer Cole, Caroline L. Smith, Christopher D. Eager, Timothy Mahrt, Ricardo Napoleão de Souza. 2016. The Perception of Phrasal Prominence in English, Spanish and French Conversational Speech. Proceedings of Speech Prosody 8, 459-463
Hudson, Amelia I., and Anthony Holbrook. 1981. A Study of the Reading Fundamental
Vocal Frequency of Young Black Adults. Journal of Speech and Hearing Research 24.2: 197–201.
Hudson, Amelia I., and Anthony Holbrook. 1982. Fundamental Frequency
Characteristics of Young Black Adults: Spontaneous Speaking and Oral Reading. Journal of Speech and Hearing Research 25.1: 25–28.
Irwin, .1977. Ruth Beckey. 1977. Judgments of vocal quality, speech fluency, and confidence of Southern Black and White speakers. Language and Speech 20: 261- -266.
Jones, Taylor, Jessica Kalbfeld, Robin Clark, and Ryan Hancock. 2019. Testifying While
Black: An Experimental Study of Court Reporter Accuracy in Transcription of African American English. Language 95.2.
Jun, Sun-Ah, and Christina Foreman. 1996. Boundary Tones and Focus Realization in
African American Intonation. Paper presented at the 3rd Joint Meeting of the Acoustical Society of America and the Acoustical Society of Japan, Honolulu, Hawaii, Dec. 2–6.
Kendall, Tyler. 2007. Enhancing Sociolinguistic Data Collections: The North Carolina
Sociolinguistic Archive and Analysis Project. University of Pennsylvania Working Papers in Linguistics 13.2.
Kendall, Tyler. 2013. Speech Rate, Pause, and Sociolinguistic Variation: Studies in
Corpus Sociophonetics. Basingstoke, UK: Palgrave Macmillan. Kendall, Tyler and Valerie Fridland. 2012. Variation in perception and production of mid
front vowels in the U.S. Southern Vowel Shift. Journal of Phonetics. Kohn, Mary. 2018. (De)Segregation: The Impact of De-facto and De-jure Segregation on
African American English in the New South.” Proceedings from LAVIS IV: Language Variety in the South. Chapel Hill: University of North Carolina Press.
Labov, William. 1966. The Logic of Non-Standard English. In J. Alatis (ed.),
Georgetown Monograph on Languages and Linguistics, 22: 1-44 Labov, William. 1972. Language in the Inner City: Studies in the Black English
Vernacular. Philadelphia: University of Pennsylvania Press. Labov, William. 1998. Co-Existent Systems in African-American Vernacular English.
African-American English: Structure, History, and Use. 110-153.

205
Labov, William, Paul Cohen, Clarence Robbins, and John Lewis. 1968. A Study of the Non-Standard English of Negro and Puerto Rican Speakers in New York City. Philadelphia: U.S. Regional Survey.
Lanehart, Sonja (ed.). 2015.Oxford Handbook of African American Language.
Oxford/New York: Oxford University Press. Loman, Bengt. 1975. Prosodic Patterns in a Negro American Dialect. In Style and Text:
StudiesPresented to Nils Erik Enkvist, edited by Håkan Ringbom, Alfhild Ingberg, Ralf Norrman, Kurt Nyholm, Rolf Westman, and Kay Wikberg, 219–42. Stockholm: Språkförlaget Skriptor.
Low, Ee Ling, Esther Grabe, and Francis Nolan. 2000. Quantitative Characterizations of
Speech Rhythm: Syllable-Timing in Singapore English. Language and Speech 43.4: 377–401
Lüdecke, Daniel. 2018. sjPlot: Data Visualization for Statistics in Social Science. doi: 10.5281/zenodo.1308157, R package version 2.6.3, https://CRAN.R- project.org/package=sjPlot.
Mallinson, Christine. 2002. The Regional Accommodation of African American English:
Evidence from a Bi-Ethnic Mountain Enclave Community. Unpublished MA thesis. North Carolina State University
McAuliffe, Michael, Michaela Socolof, Sarah Mihuc, Michael Wagner, and Morgan
Sonderegger 2017. Montreal Forced Aligner. Version 0.9.0. Computer program. http://montrealcorpustools.github.io/Montreal-Forced-Aligner/.
McLarty, Jason. 2011. AAE and EAE Pitch Accent Types and Frequencies: An Apparent
Time Perspective. Unpublished MA Capstone Project. North Carolina State University.
McLarty, Jason. 2018. African American Language and European American English
Intonation Variation over time in the American South. American Speech. Mo, Yoonsook. 2008. Acoustic Correlates of Prosodic Prominence for Naïve Listeners of
American English. In Proceedings of the 34th Meeting of the Berkeley Linguistic Society.
Mo, Yoonsook, Jennifer Cole and Mark Hasegawa-Johnson. 2009. Prosodic effects on
vowel production: Evidence from formant structure. Interspeech 2009, Brighton, UK
O’Brien, Robert M. 2007. A Caution Regarding Rules of Thumb for Variance Inflation
Factors. Quality and Quantity 41: 673-690

206
Niedzielski, Nancy. 1999.The Effect of Social Information on the Perception of Sociolinguistic Variables. In Milroy, L. and D. R. Preston, eds. JLSP special edition.
Perrachione, Tyler K., Joan Y. Chiao, and Patrick C.M. Wong. 2009. Asymmetrical
Cultural Effects on Perceptual Expertise Underlie an Own Race-Bias for Voices. Cognition 114(1): 42-55.
Pitt M.A., Dilley, L., Johnson, K., Kiesling, S., Raymond, W., Hume, E. and Fosler-
Lussier, E. (2007) Buckeye Corpus of Conversational Speech (2nd release) [www.buckeyecorpus.osu.edu] Columbus, OH: Department of Psychology, Ohio State University (Distributor).
Podesva, Robert J. 2007. Phonation Type as a Stylistic Variable: The Use of Falsetto in
Constructing a Persona. Journal of Sociolinguistics 11 (4): 478–504 Purnell, Thomas, William Idsardi, and John Baugh.1999. Perceptual and phonetic
experiments on American English dialect identification. Journal of Language and Social Psychology 18.1: 10-30.
R Core Team. 2016. R: A Language and Environment for Statistical Computing. R
Foundation for Statistical Computing, Vienna, Austria. URL http://www.R- project.org/.
Rickford, John R. 1999. African American Vernacular English: Features, Evolution and
Educational Implications. Oxford: Blackwell. Rickford, John R., and Sharese King. 2016. Language and Linguistics on Trial: Hearing
Rachel Jeantel (and Other Vernacular Speakers) in the Courtroom and Beyond. Language 92.4: 948-988.
Rickford, John R., and Faye McNair-Knox. 1994. Addressee- and Topic-Influenced Style
Shift: A Quantitative Sociolinguistic Study. In Perspectives on Register: Situating Register Variation within Sociolinguistics, edited by Douglas Biber and Edward Finegan, 235-276. Oxford: Oxford University Press.
Rockquemore, Kerry, David L. Brunsma, and Joe R. Feagin. 2008. Beyond Black:
Biracial Identity in America. Rowman and Littlefield. Roy, Joseph, Jennifer Cole and Timothy Mahrt. 2017. Individual Differences and
Patterns of Convergence in Prosody Perception. Laboratory Phonology. Sankoff, Gillian and Héléne Blondeau. 2007. Language Change Across the Lifespan: /r/
in Montreal English 83(3): 560-588 Schneider, Edgar (ed.). 1996. Focus on the USA. Amsterdam, The Netherlands: John
Benjamins.

207
Sonderegger, Morgan, Michael Wagner, and Francisco Torreira. 2018. Quantitative Methods for Linguistic Data. Version 1.0. http://people.linguistics.mcgill.ca/~morgan/book/index.html
Spears, Arthur K. 1988. Black American English. In Johnnetta B. Cole (ed.) Anthropology for the Nineties: Introductory Readings. New York: Free Press; and London: Collier Macmillan. 96-113.
Sumner, Megan and Arthur G. Samuel, A. G. 2009. The Role of Experience in the
Processing of Cross Dialectal Variation. Journal of Memory and Language, 60, 487 – 50
Tarone, Elaine E. 1973. Aspects of Intonation in Black English. American Speech, 48:
29-36. Thomas, Erik R. 2015. Prosodic Features of African American English. In Sonja
Lanehart (ed.), The Oxford Handbook of African American Language. Oxford, UK: Oxford University Press.
Thomas, Erik R. 2011. Sociophonetics: An Introduction. Basingstoke, UK: Palgrave
Macmillan.
Thomas, Erik R. 2007. Phonological and Phonetic Characteristics of African American Vernacular English. Language and Linguistics Compass 1.5: 450–75.
Thomas, Erik R., and Guy Bailey. 2015. Segmental Phonology of African American
Language. In The Oxford Handbook of African American Language, edited by Sonja Lanehart, 403-419. Oxford, UK: Oxford University Press.
Thomas, Erik R., Norman J. Lass, and Jeannine Carpenter. 2010. Identification of
African American Speech. In Dennis R. Preston and Nancy Niedzielski (eds.), A Reader in Sociophonetics. New York, NY: De Gruyter Mouton.
Thomas, Erik R. and Phillip M. Carter. 2006. Prosodic Rhythm and African American English. English World-Wide, 27:3: 331–355.
Thomas, Erik R. and Jeffery Reaser. 2004. Delimiting Perceptual Cues Used for the
Ethnic Labeling of African American and European American Voices. Journal of Sociolinguistics, 8.1: 54-87.
Trager, George L. and Henry Lee Smith. 1951. An Outline of English Structure. Norman,
OK: Battenburg Press. Van Hofwegen, Janneke, and Walt Wolfram. 2010. Coming of Age in African American
English.Journal of Sociolinguistics 14.4: 427-455.
208
Walton, Julie H. and Robert F. Orlikoff. 1994. Speaker Race Identification from Acoustic Cues in the Vocal Signal. Journal of Speech and Hearing Research 37: 738-745.
Wolfram, Walter A. 1969. A Sociolinguistic Description of Detroit Negro Speech.
Washington, D.C.: Center for Applied Linguistics. Wolfram, Walt. 1974. The Relationship of White Southern Speech to Vernacular Black
English. Language 50: 498-527. Wolfram, Walt. 1984. A Dialectologist’s Guide to Washington, DC. Newsletter of the
American Dialect Society (NADS) 16.3: 21-23. Wolfram, Walt. 1991. The Linguistic Variable: Fact and Fantasy. American Speech 66.1:
22-32. Wolfram, Walt. 1994. On the Sociolinguistic Significance of Obscure Dialect Structures:
The [NP i Call NP i V-Ing] Construction in African-American Vernacular English. American Speech 69.4: 339-360.
Wolfram, Walt. 2004. The Grammar of Urban African American Vernacular English.
Handbook of Varieties of English 2: 111-32. Wolfram, Walt. 2007. Sociolinguistic Folklore in the Study of African American English.
Language and Linguistics Compass 1.4: 292-313. Wolfram, Walt, and Erik R. Thomas. 2002. The Development of African American
English. Malden/Oxford: Blackwell. Wolfram, Walt, and Natalie Schilling. 2016. American English: Dialects and Variation,
3rd Ed. Malden/Oxford: Wiley/Blackwell.
Wolfram, Walt and Janneke Van Hofwegen. 2017. On the Utility of Composite Indices in Longitudinal Language Studies. In Suzanne Evans Wagner and Isabella Buchstaller (eds.), Panel Studies of Variation and Change. New York: Taylor & Francis Group.


