Embed Size (px)
Citation preview
PROJECT FEASIBILITY REPORT
NOVIEMBRE DE 2020
Document identifier: DB5.1 Version: v1.2 Author: inèdit Dissemination status:
2
Grant Agreement nº:
LIFE15 ENV/ES/000437
Project acronym:
reWINE
Project title: Glass bottles reuse in southern Europe wine sector
Funding Scheme:
LIFE Environment and Resource Efficiency
Annex II reference version:
13/06/2016
Project Duration:
2016/09/01 – 2020/12/31 (52 months)
Coordinator: Fundació Parc de Recerca UAB
Associated Beneficiaries:
Agrícola Falset Marçà I S.C (AFALMA)
Agència de Residus de Catalunya (ARC)
Fundació Privada Catalana de Prevenció de Residus i el Consum Responsable (FPRC)
Inèdit Innovació SL (INEDIT)
Instalaciones de Gas del Mediterráneo, Todogas S.L (INFINITY)
Miguel Torres S.A. (TORRES)
3
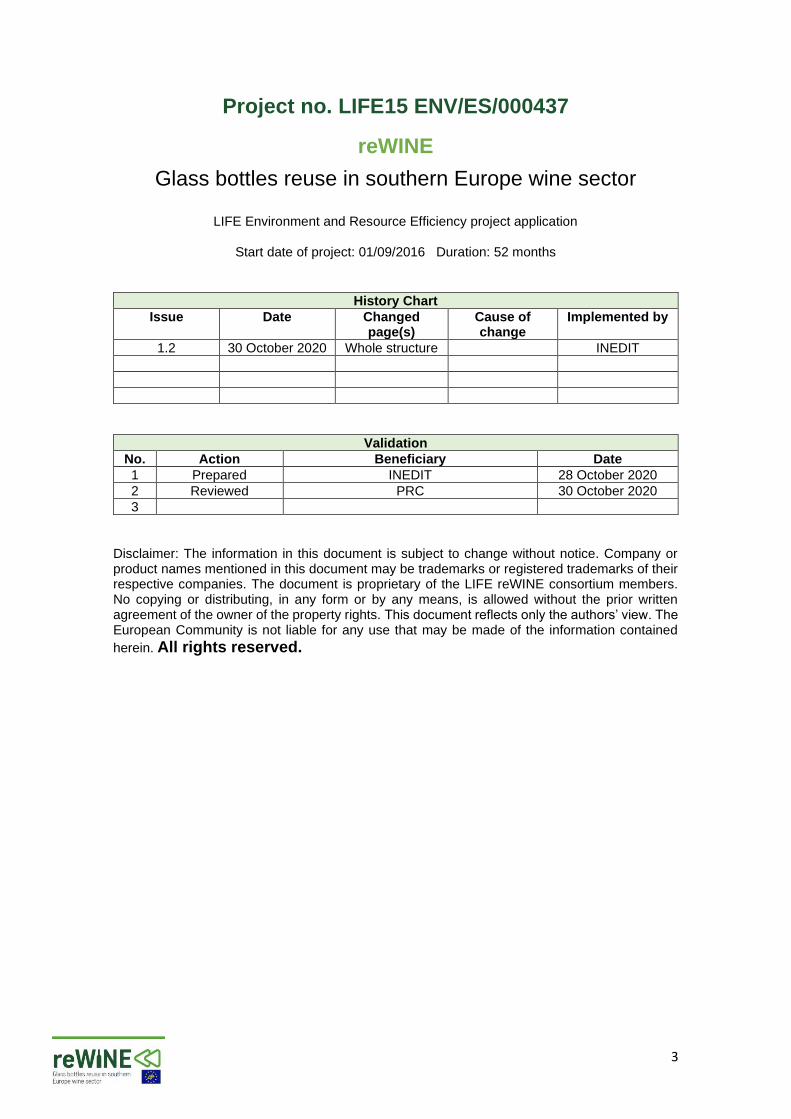
Project no. LIFE15 ENV/ES/000437
reWINE
Glass bottles reuse in southern Europe wine sector
LIFE Environment and Resource Efficiency project application
Start date of project: 01/09/2016 Duration: 52 months
History Chart
Issue Date Changed page(s)
Cause of change
Implemented by
1.2 30 October 2020 Whole structure INEDIT
Validation
No. Action Beneficiary Date
1 Prepared INEDIT 28 October 2020
2 Reviewed PRC 30 October 2020
3
Disclaimer: The information in this document is subject to change without notice. Company or product names mentioned in this document may be trademarks or registered trademarks of their respective companies. The document is proprietary of the LIFE reWINE consortium members. No copying or distributing, in any form or by any means, is allowed without the prior written agreement of the owner of the property rights. This document reflects only the authors’ view. The European Community is not liable for any use that may be made of the information contained
herein. All rights reserved.
4
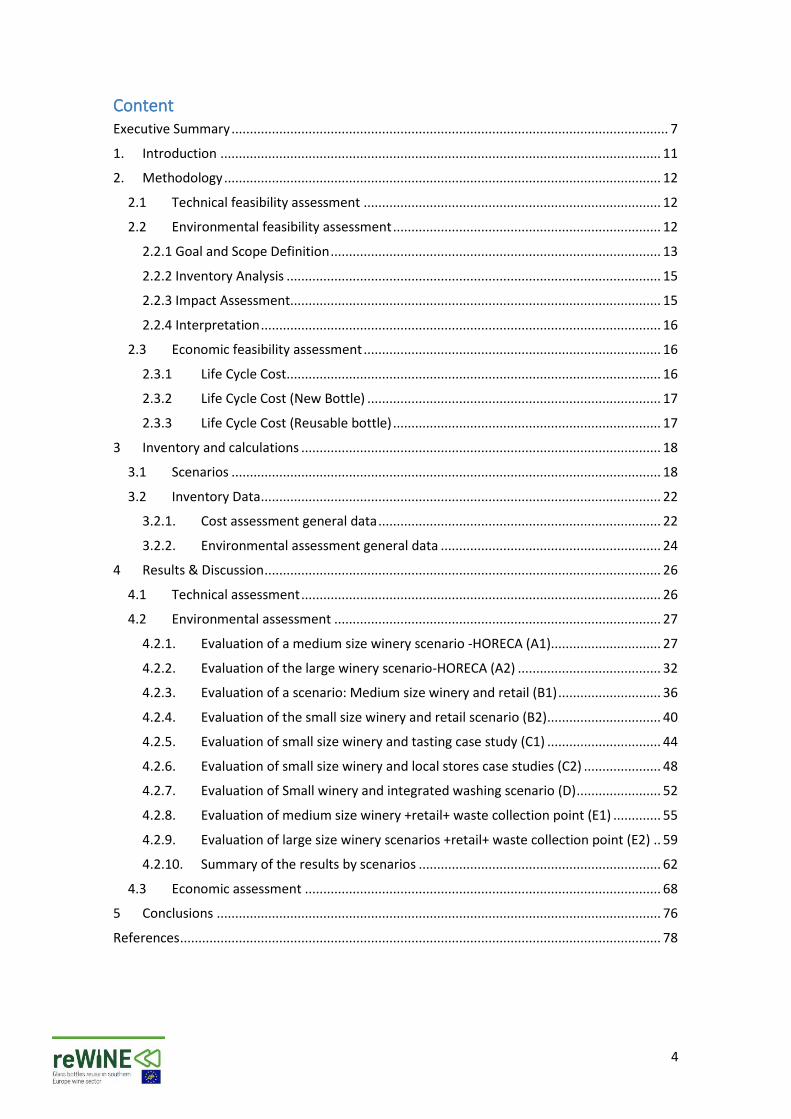
Content Executive Summary ....................................................................................................................... 7
1. Introduction ........................................................................................................................ 11
2. Methodology ....................................................................................................................... 12
2.1 Technical feasibility assessment ................................................................................. 12
2.2 Environmental feasibility assessment ......................................................................... 12
2.2.1 Goal and Scope Definition .......................................................................................... 13
2.2.2 Inventory Analysis ...................................................................................................... 15
2.2.3 Impact Assessment..................................................................................................... 15
2.2.4 Interpretation ............................................................................................................. 16
2.3 Economic feasibility assessment ................................................................................. 16
2.3.1 Life Cycle Cost ...................................................................................................... 16
2.3.2 Life Cycle Cost (New Bottle) ................................................................................ 17
2.3.3 Life Cycle Cost (Reusable bottle) ......................................................................... 17
3 Inventory and calculations .................................................................................................. 18
3.1 Scenarios ..................................................................................................................... 18
3.2 Inventory Data ............................................................................................................. 22
3.2.1. Cost assessment general data ............................................................................. 22
3.2.2. Environmental assessment general data ............................................................ 24
4 Results & Discussion ............................................................................................................ 26
4.1 Technical assessment .................................................................................................. 26
4.2 Environmental assessment ......................................................................................... 27
4.2.1. Evaluation of a medium size winery scenario -HORECA (A1).............................. 27
4.2.2. Evaluation of the large winery scenario-HORECA (A2) ....................................... 32
4.2.3. Evaluation of a scenario: Medium size winery and retail (B1) ............................ 36
4.2.4. Evaluation of the small size winery and retail scenario (B2) ............................... 40
4.2.5. Evaluation of small size winery and tasting case study (C1) ............................... 44
4.2.6. Evaluation of small size winery and local stores case studies (C2) ..................... 48
4.2.7. Evaluation of Small winery and integrated washing scenario (D) ....................... 52
4.2.8. Evaluation of medium size winery +retail+ waste collection point (E1) ............. 55
4.2.9. Evaluation of large size winery scenarios +retail+ waste collection point (E2) .. 59
4.2.10. Summary of the results by scenarios .................................................................. 62
4.3 Economic assessment ................................................................................................. 68
5 Conclusions ......................................................................................................................... 76
References ................................................................................................................................... 78
5
Index of Figure Figure 1 LCA structure defined by ISO 14040 ............................................................................. 13 Figure 2 System boundaries for a single-use bottle .................................................................... 14 Figure 3 System boundadaries for a reusable bottle .................................................................. 14 Figure 4 Life cycle stages included in a reusable wine bottle ..................................................... 15 Figure 5 Large and medium size case study scheme.................................................................. 18 Figure 6 Large retail case study scheme ..................................................................................... 19 Figure 7 Small retail and small wineries case study scheme ...................................................... 20 Figure 8 Small size winery and integrated washing case study scheme ..................................... 20 Figure 9 Large and medium size wineries for Retail and waste collection point case study scheme ..................................................................................................................................................... 21 Figure 10 GWP savings evolution for medium size winery- Horeca ........................................... 30 Figure 11 GWP savings evolution for large winery ..................................................................... 34 Figure 12 GWP savings evolution for medium size winery and retail ......................................... 38 Figure 13 GWP savings evolution for small size winery and retail .............................................. 42 Figure 14 GWP savings evolution for small size winery ............................................................. 46 Figure 15 GWP savings evolution for small size winery and local stores .................................... 50 Figure 16 GWP savings evolution for small winery and integrated washing .............................. 54 Figure 17 GWP savings evolution for medium size winery and retail ........................................ 57 Figure 18 GWP savings evolution for a large size winery and retail .......................................... 61 Figure 19 GWP savings range for 2 reuses for each scenario ..................................................... 64 Figure 20 Map of the Catalan Certification of Origin zones for wine and virtual areas of influence of washing facilities ..................................................................................................................... 66 Figure 21: Reusable plastic box considered for the collection and storage of the wine bottles 68 Figure 22: Plastic container considered for the collection and storage of the wine bottles ...... 68 Figure 23 Green dot tax cost evolution (source: https://www.ecoembes.com/es/empresas/ingresos-punto-verde/tarifa-punto-verde-por-material) ...................................................................................................................................... 71 Figure 24 Comparison and variation ranges between single use (NEW) and reusable (REUSE) bottles for each scenario ............................................................................................................. 75
Index of Tables Table 1 Case studies and scenarios included in the assessment ................................................ 18 Table 2 Economic general data for the cost assessment. ........................................................... 22 Table 3 Consumptions during the washing ................................................................................. 24 Table 4 Distances for the bottles collection and between the winery and washing facility ...... 25 Table 5 LCA results for 500 wine bottles and 8 reuses for medium size winery-Horeca ............ 28 Table 6 Difference in the LCA results for a single use and a reusable bottle for the medium size winery .......................................................................................................................................... 29 Table 7 GWP savings considering distance and number of washings per cycle for medium size Horeca ......................................................................................................................................... 31 Table 7 LCA results for 500 wine bottles and 8 reuses for large winery-HORECA ...................... 32 Table 8 Difference in the LCA results for a single use and a reusable bottle for large winery ... 33 Table 9 GWP savings considering distance and number of washings per cycle for large winery Horeca ......................................................................................................................................... 35 Table 10 LCA results for 500 wine bottles and 8 reuses for medium size winery and retail ...... 36 Table 11 Difference in the LCA results for a single use and a reusable bottle for the medium size winery and retail ......................................................................................................................... 37
6
Table 12 GWP savings considering distance and number of washings per cycle for a medium size winery and retail ......................................................................................................................... 39 Table 13 LCA results for 500 wine bottles and 8 reuses for small size winery and retail .......... 40 Table 14 Difference in the LCA results for a single use and a reusable bottle for small size winery and retail ..................................................................................................................................... 41 Table 15 GWP savings considering distance and number of washings per cycle for small size winery and retail ......................................................................................................................... 43 Table 16 LCA results for 500 wine bottles and 8 reuses for small size winery .......................... 44 Table 17 Difference in the LCA results for a single use and a reusable bottle for small size winery ..................................................................................................................................................... 45 Table 18 GWP savings considering distance and number of washings per cycle for small size winery .......................................................................................................................................... 47 Table 19 LCA results for 500 wine bottles and 8 reuses for small size winery and local stores . 48 Table 20 Difference in the LCA results for a single use and a reusable bottle for for small size winery and local stores ............................................................................................................... 49 Table 21 GWP savings considering distance and number of washings per cycle for small size winery and local stores ............................................................................................................... 51 Table 22 LCA results for 500 wine bottles and 8 reuses for the small winery and integrated washing ....................................................................................................................................... 52 Table 23 Difference in the LCA results for a single use and a reusable bottle for small winery and integrated washing ...................................................................................................................... 53 Table 24 LCA results for 500 wine bottles and 8 reuses for medium size winery and retail ...... 55 Table 25 Difference in the LCA results for a single use and a reusable bottle for medium size winery and retail ......................................................................................................................... 56 Table 26 GWP savings considering distance and number of washings per cycle for medium size winery and retail ......................................................................................................................... 58 Table 27 LCA results for 500 wine bottles and 8 reuses for large size winery and retail ........... 59 Table 28 Difference in the LCA results for a single use and a reusable bottle for large size winery and retail ..................................................................................................................................... 60 Table 29 GWP savings considering distance and number of washings per cycle for the large size winery and retail ......................................................................................................................... 62 Table 31 Summary of the GWP savings for 2 reuses .................................................................. 63 Table 32 Summary of the GWP savings for 8 reuses .................................................................. 65 Table 33 Maximum distances to obtain CO2 eq savings ............................................................. 67 Table 34 General economic data for the cost assessment ......................................................... 70 Table 35 Data for the alternatives in each case study ................................................................ 72 Table 36 Cost assessment results................................................................................................ 73 Table 37 summary of the cost assessment compared to the cost of a single use bottle ........... 74
7
Executive Summary
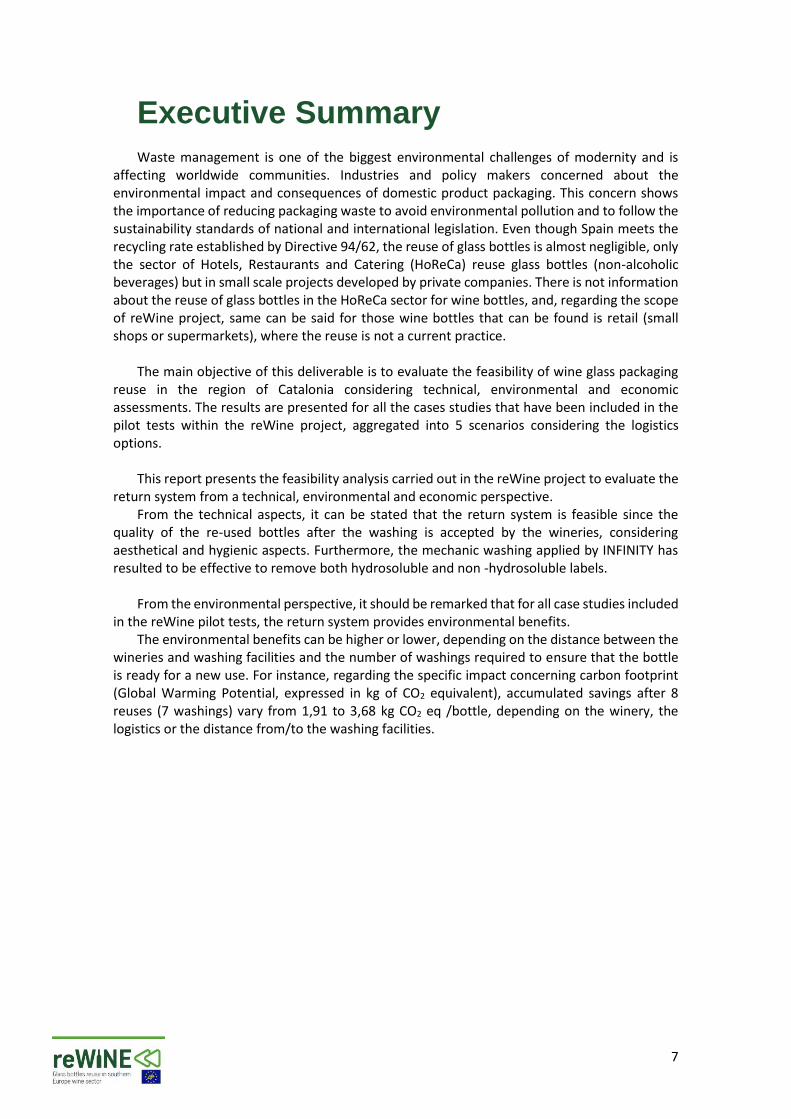
Waste management is one of the biggest environmental challenges of modernity and is affecting worldwide communities. Industries and policy makers concerned about the environmental impact and consequences of domestic product packaging. This concern shows the importance of reducing packaging waste to avoid environmental pollution and to follow the sustainability standards of national and international legislation. Even though Spain meets the recycling rate established by Directive 94/62, the reuse of glass bottles is almost negligible, only the sector of Hotels, Restaurants and Catering (HoReCa) reuse glass bottles (non-alcoholic beverages) but in small scale projects developed by private companies. There is not information about the reuse of glass bottles in the HoReCa sector for wine bottles, and, regarding the scope of reWine project, same can be said for those wine bottles that can be found is retail (small shops or supermarkets), where the reuse is not a current practice.
The main objective of this deliverable is to evaluate the feasibility of wine glass packaging
reuse in the region of Catalonia considering technical, environmental and economic assessments. The results are presented for all the cases studies that have been included in the pilot tests within the reWine project, aggregated into 5 scenarios considering the logistics options.
This report presents the feasibility analysis carried out in the reWine project to evaluate the
return system from a technical, environmental and economic perspective. From the technical aspects, it can be stated that the return system is feasible since the
quality of the re-used bottles after the washing is accepted by the wineries, considering aesthetical and hygienic aspects. Furthermore, the mechanic washing applied by INFINITY has resulted to be effective to remove both hydrosoluble and non -hydrosoluble labels.
From the environmental perspective, it should be remarked that for all case studies included
in the reWine pilot tests, the return system provides environmental benefits. The environmental benefits can be higher or lower, depending on the distance between the
wineries and washing facilities and the number of washings required to ensure that the bottle is ready for a new use. For instance, regarding the specific impact concerning carbon footprint (Global Warming Potential, expressed in kg of CO2 equivalent), accumulated savings after 8 reuses (7 washings) vary from 1,91 to 3,68 kg CO2 eq /bottle, depending on the winery, the logistics or the distance from/to the washing facilities.
8
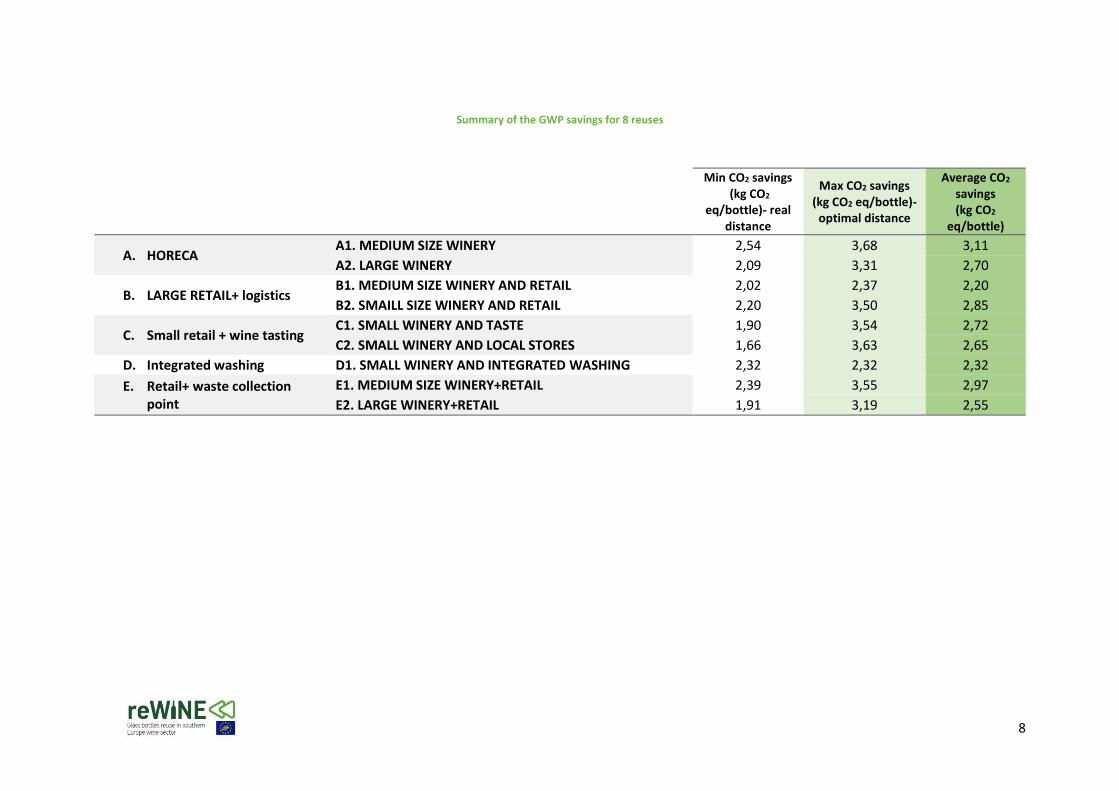
Summary of the GWP savings for 8 reuses
Min CO2 savings (kg CO2
eq/bottle)- real distance
Max CO2 savings (kg CO2 eq/bottle)-
optimal distance
Average CO2 savings (kg CO2
eq/bottle)
A. HORECA A1. MEDIUM SIZE WINERY 2,54 3,68 3,11
A2. LARGE WINERY 2,09 3,31 2,70
B. LARGE RETAIL+ logistics B1. MEDIUM SIZE WINERY AND RETAIL 2,02 2,37 2,20
B2. SMAILL SIZE WINERY AND RETAIL 2,20 3,50 2,85
C. Small retail + wine tasting C1. SMALL WINERY AND TASTE 1,90 3,54 2,72
C2. SMALL WINERY AND LOCAL STORES 1,66 3,63 2,65
D. Integrated washing D1. SMALL WINERY AND INTEGRATED WASHING 2,32 2,32 2,32
E. Retail+ waste collection point
E1. MEDIUM SIZE WINERY+RETAIL 2,39 3,55 2,97
E2. LARGE WINERY+RETAIL 1,91 3,19 2,55
9
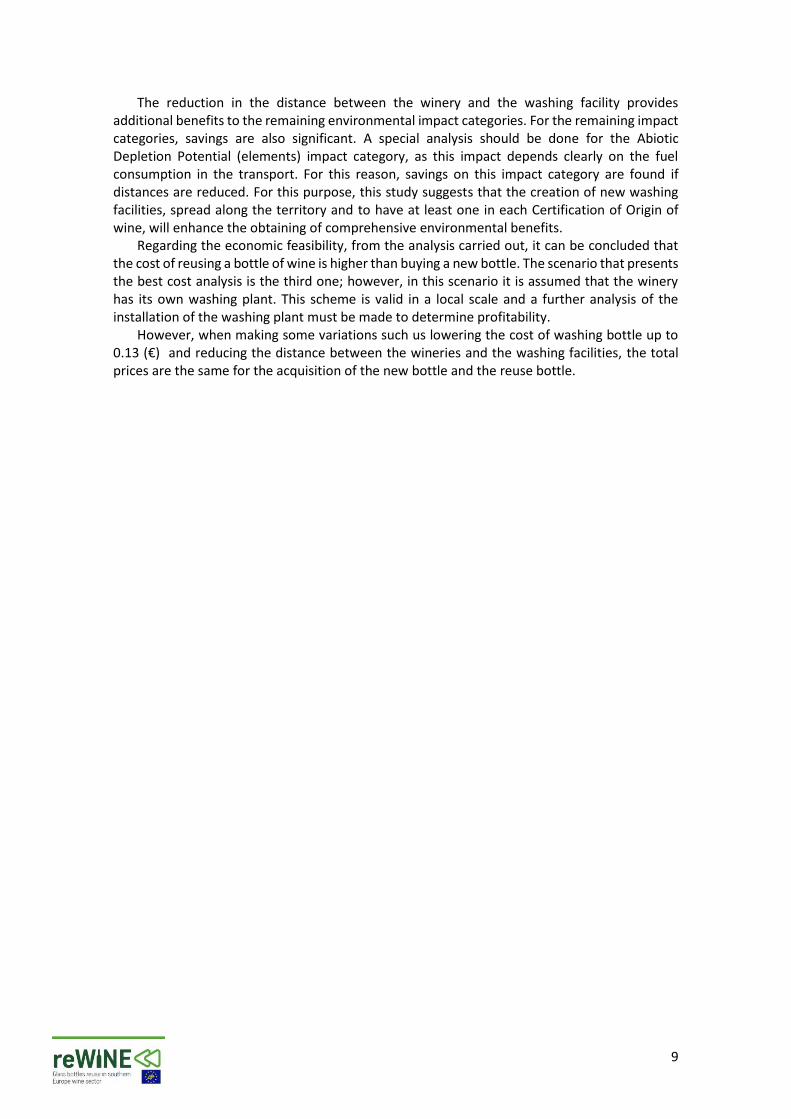
The reduction in the distance between the winery and the washing facility provides additional benefits to the remaining environmental impact categories. For the remaining impact categories, savings are also significant. A special analysis should be done for the Abiotic Depletion Potential (elements) impact category, as this impact depends clearly on the fuel consumption in the transport. For this reason, savings on this impact category are found if distances are reduced. For this purpose, this study suggests that the creation of new washing facilities, spread along the territory and to have at least one in each Certification of Origin of wine, will enhance the obtaining of comprehensive environmental benefits.
Regarding the economic feasibility, from the analysis carried out, it can be concluded that the cost of reusing a bottle of wine is higher than buying a new bottle. The scenario that presents the best cost analysis is the third one; however, in this scenario it is assumed that the winery has its own washing plant. This scheme is valid in a local scale and a further analysis of the installation of the washing plant must be made to determine profitability.
However, when making some variations such us lowering the cost of washing bottle up to 0.13 (€) and reducing the distance between the wineries and the washing facilities, the total prices are the same for the acquisition of the new bottle and the reuse bottle.
10
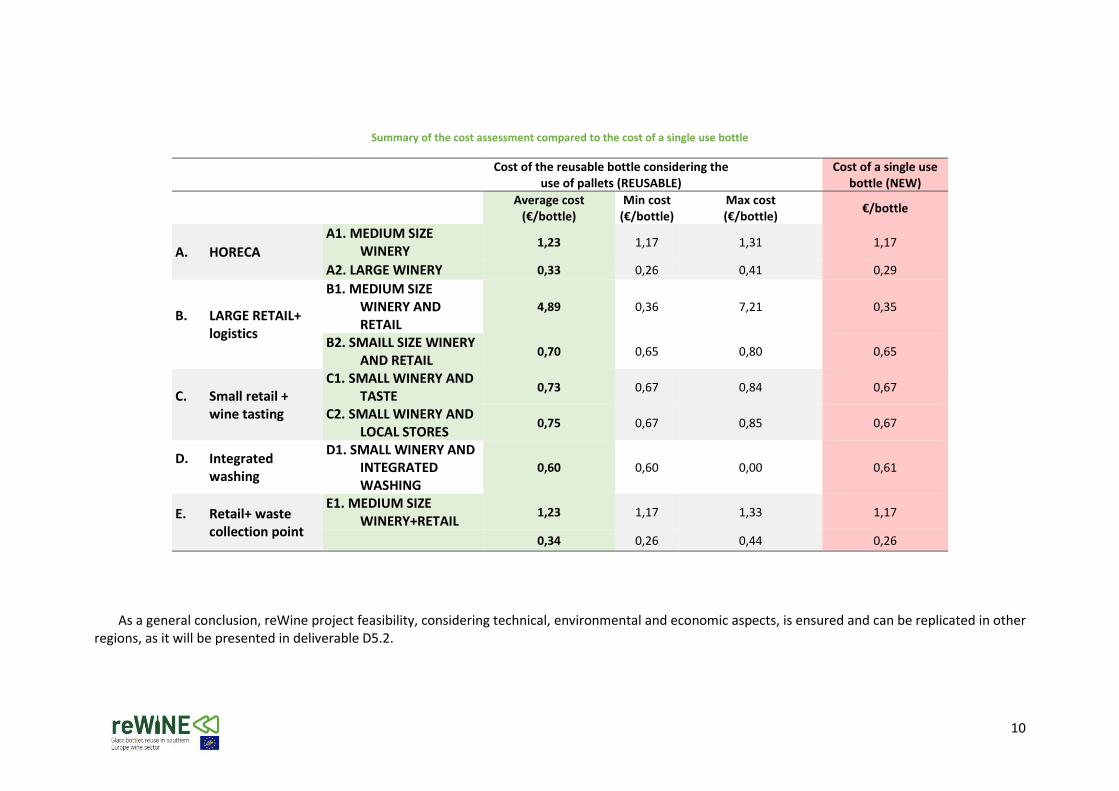
Summary of the cost assessment compared to the cost of a single use bottle
Cost of the reusable bottle considering the use of pallets (REUSABLE)
Cost of a single use bottle (NEW)
Average cost (€/bottle)
Min cost (€/bottle)
Max cost (€/bottle)
€/bottle
A. HORECA
A1. MEDIUM SIZE WINERY
1,23 1,17 1,31 1,17
A2. LARGE WINERY 0,33 0,26 0,41 0,29
B. LARGE RETAIL+ logistics
B1. MEDIUM SIZE WINERY AND RETAIL
4,89 0,36 7,21 0,35
B2. SMAILL SIZE WINERY AND RETAIL
0,70 0,65 0,80 0,65
C. Small retail + wine tasting
C1. SMALL WINERY AND TASTE
0,73 0,67 0,84 0,67
C2. SMALL WINERY AND LOCAL STORES
0,75 0,67 0,85 0,67
D. Integrated washing
D1. SMALL WINERY AND INTEGRATED WASHING
0,60 0,60 0,00 0,61
E. Retail+ waste collection point
E1. MEDIUM SIZE WINERY+RETAIL
1,23 1,17 1,33 1,17
0,34 0,26 0,44 0,26
As a general conclusion, reWine project feasibility, considering technical, environmental and economic aspects, is ensured and can be replicated in other
regions, as it will be presented in deliverable D5.2.
11
1. Introduction
Waste management is one of the biggest environmental challenges of modernity and is affecting worldwide communities. In Spain, packaging waste represents approximately 30% of municipal solid waste by weight and from that percentage the 68% is recycled (Eurostat, 2015). In the region of Catalonia glass packaging represent 5% of municipal solid waste by weight (Agencia de Residuos de Catalunya, 2019). As a result of these statistics, industries and policy makers are concern about the environmental impact and consequences of domestic product packaging, therefore best practices related to the protection of resources and minimizing the ecological impact arising from production and consumption as well as from the disposal of products are becoming important in order to implement improvements that promote sustainability.
The 94/62/EC (European Parliament and Council Directive, 2005) directive on packaging
and packaging waste puts as first priority preventing the production of packaging waste and, as additional fundamental principles, reusing packaging, recycling and other forms of recovering packaging waste before the final disposal. In Spain the glass recycling rate is 68%, which meets the target of recycling established by Directive 94/62 / EC, before December 31, 2008. The European Strategy for Plastics in a Circular Economy is a recent initiative whose proposal is to initiate work on harmonized rules to ensure that by 2030 all plastics packaging placed on the EU market can be reused or recycled in a cost-effective manner (European Commission, 2018); this new initiative will affect specially to the private sector because packaging must be reinvented and new opportunities for investment and generation of jobs will be created. Also, this strategy on plastics can also broader the use of glass packing and at the same time increase the reuse of glass packaging by making it cost-effective lying on the new frame of circular economy.
This study is focused on the reuse of glass bottles which are used to pack a variety of
beverages, but our interest stands in the wine industry. Catalonia consumes 9 million bottle beverages where 6% correspond to wine bottles. The industry of wine in Spain represents the 14% of land for cultivation in a global scale and is the third country in wine production after France and Italy (International Organisation of Vine and Wine, 2017). In 2017 sales in Spain were 643,102 thousand of liters and 89,597 thousand of liters were sold in the region of Catalonia (Generalitat de Catalunya, 2017).
The main objective of this deliverable is to evaluate the feasibility of wine glass
packaging reuse in the region of Catalonia considering the technical, environmental and economic perspective.
This research study is structured as follows. Section 2 mentions the material and
methodology use to evaluate the economic feasibility of reuse glass bottles in the wine sector in the region of Catalonia. Section 3 presents the information collected from the companies involved in the project showing the assumptions and calculations that had to be done to get the information organized and ready for the economical assessment. This is followed by Section 4 that contains results and discussions, while Section 5 summarizes and concludes the study while also offering suggestions for future research based on the evidence presented in Section 4.
12
2. Methodology
2.1 Technical feasibility assessment The methodology applied to analyse the technical feasibility has pivoted in 3 main aspects that have revealed to be relevant to accept the reuse of wine bottles:
1- Visual inspection: indicate if the aesthetics of the bottle accomplishes with the wineries criteria.
2- Microbiological inspection: ensure the suitability of the washed bottle to contain wine for further consumers.
3- Other aspects related to logistics:
a. It is necessary to communicate to both the final consumer and the retailer that the bottle is reusable and the instructions to facilitate the collection by the consumers. For this purpose, specific communication material for retail (banners, rollouts, flags) were prepared and stickers were added to the bottles to identify that there were reusable bottles.
b. Retail need to ensure that they have a proper place to store the bottles before they are sent to washing. This can be done either in the retail storing room or, in a small scale, in specific containers.
c. To ensure an efficient logistic, it is preferable to avoid the use of third parts in the bottles transport, as it can lead to a cost increase.
Other aspects that determine the feasibility of the reusability deal with the time of storage of the empty bottles. The results of the evaluation of these aspects are provided in section 4.
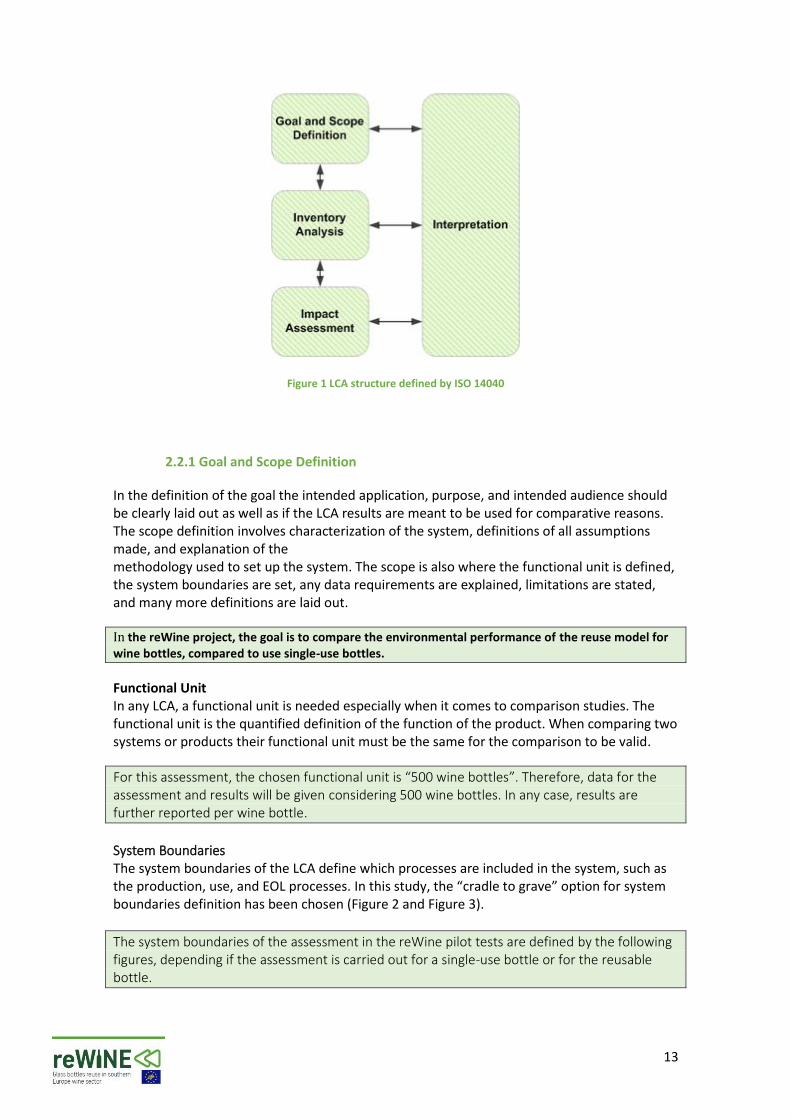
2.2 Environmental feasibility assessment The environmental feasibility study has been carried out using the Life Cycle Assessment methodology. Life Cycle Assessment (LCA) is an analysis of the environmental impact of a product, process, or activity over the course of its lifetime by identifying and quantifying the energy and materials used and wastes released to the environment. There are two standards for LCA created by the International Organisation for Standardisation (ISO): ISO 14040 (Environmental management - Life cycle assessment - Principles and framework) and ISO 14044 (Environmental management - Life cycle assessment - Requirements and guidelines). LCAs have four distinct steps, shown in Figure 1 below.
13
Figure 1 LCA structure defined by ISO 14040
2.2.1 Goal and Scope Definition
In the definition of the goal the intended application, purpose, and intended audience should be clearly laid out as well as if the LCA results are meant to be used for comparative reasons. The scope definition involves characterization of the system, definitions of all assumptions made, and explanation of the methodology used to set up the system. The scope is also where the functional unit is defined, the system boundaries are set, any data requirements are explained, limitations are stated, and many more definitions are laid out.
In the reWine project, the goal is to compare the environmental performance of the reuse model for wine bottles, compared to use single-use bottles.
Functional Unit In any LCA, a functional unit is needed especially when it comes to comparison studies. The functional unit is the quantified definition of the function of the product. When comparing two systems or products their functional unit must be the same for the comparison to be valid.
For this assessment, the chosen functional unit is “500 wine bottles”. Therefore, data for the assessment and results will be given considering 500 wine bottles. In any case, results are further reported per wine bottle.
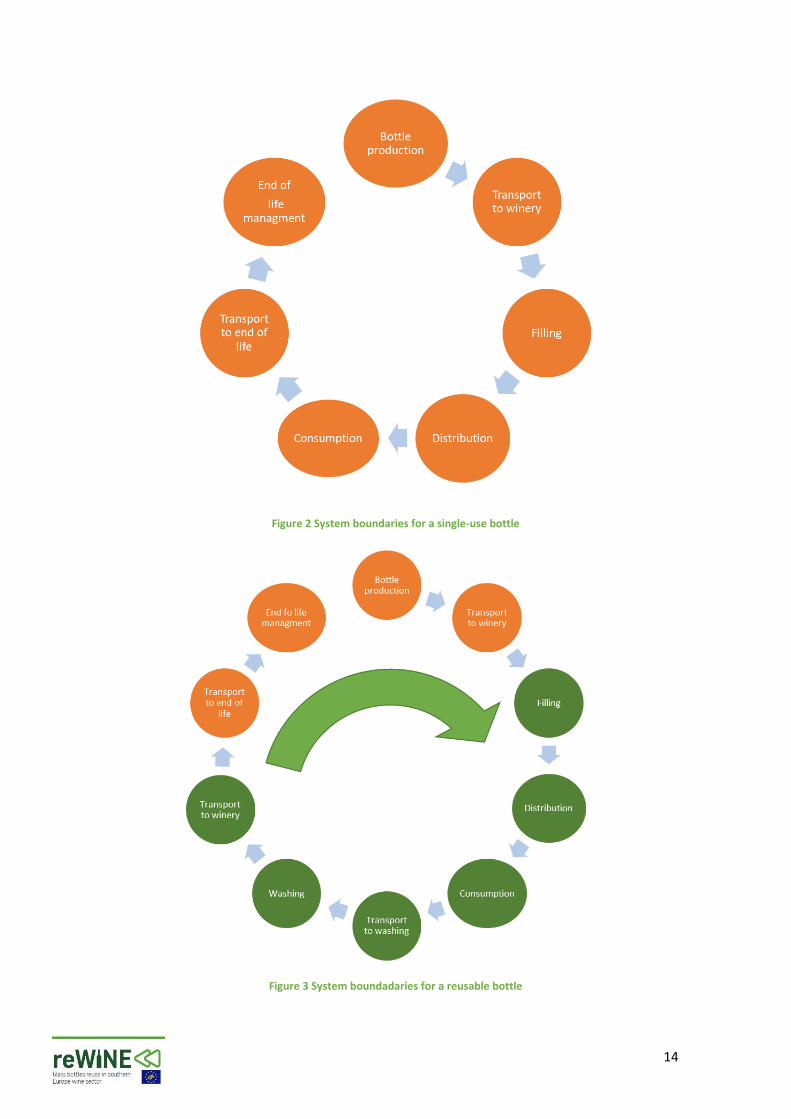
System Boundaries The system boundaries of the LCA define which processes are included in the system, such as the production, use, and EOL processes. In this study, the “cradle to grave” option for system boundaries definition has been chosen (Figure 2 and Figure 3).
The system boundaries of the assessment in the reWine pilot tests are defined by the following figures, depending if the assessment is carried out for a single-use bottle or for the reusable bottle.
14
Figure 2 System boundaries for a single-use bottle
Figure 3 System boundadaries for a reusable bottle
15
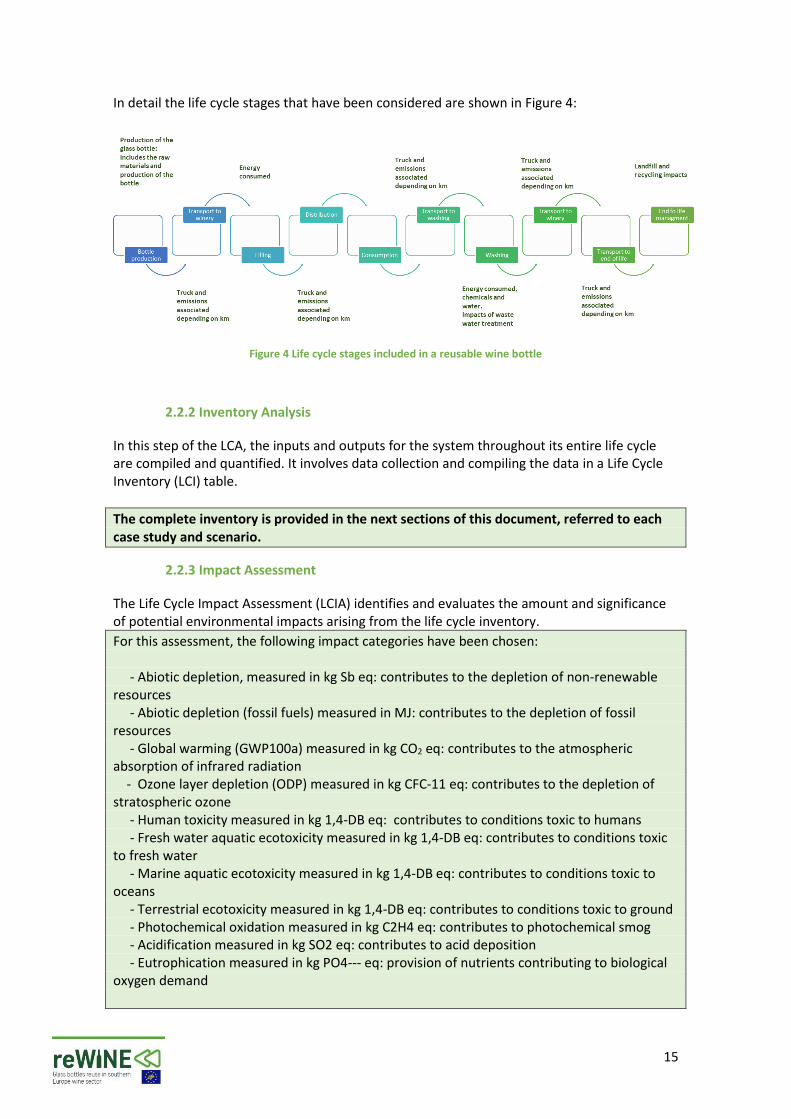
In detail the life cycle stages that have been considered are shown in Figure 4:
Figure 4 Life cycle stages included in a reusable wine bottle
2.2.2 Inventory Analysis
In this step of the LCA, the inputs and outputs for the system throughout its entire life cycle are compiled and quantified. It involves data collection and compiling the data in a Life Cycle Inventory (LCI) table.
The complete inventory is provided in the next sections of this document, referred to each case study and scenario.
2.2.3 Impact Assessment
The Life Cycle Impact Assessment (LCIA) identifies and evaluates the amount and significance of potential environmental impacts arising from the life cycle inventory.
For this assessment, the following impact categories have been chosen: - Abiotic depletion, measured in kg Sb eq: contributes to the depletion of non-renewable resources - Abiotic depletion (fossil fuels) measured in MJ: contributes to the depletion of fossil resources - Global warming (GWP100a) measured in kg CO2 eq: contributes to the atmospheric absorption of infrared radiation - Ozone layer depletion (ODP) measured in kg CFC-11 eq: contributes to the depletion of stratospheric ozone - Human toxicity measured in kg 1,4-DB eq: contributes to conditions toxic to humans - Fresh water aquatic ecotoxicity measured in kg 1,4-DB eq: contributes to conditions toxic to fresh water - Marine aquatic ecotoxicity measured in kg 1,4-DB eq: contributes to conditions toxic to oceans - Terrestrial ecotoxicity measured in kg 1,4-DB eq: contributes to conditions toxic to ground - Photochemical oxidation measured in kg C2H4 eq: contributes to photochemical smog - Acidification measured in kg SO2 eq: contributes to acid deposition - Eutrophication measured in kg PO4--- eq: provision of nutrients contributing to biological oxygen demand
16
2.2.4 Interpretation
After the LCIA is performed, the results are evaluated to assure that they are consistent with the goal and scope definition and to ensure that the study has been completed. This interpretation phase encompasses two parts: identification of significant issues and evaluation.
In the reWine assessment, specific indicators have been further analysed, to understand the influence of the different life stages and elements to the results. Furthermore, sensitivity analysis has been performed to check the consistency of the obtained results and how they may change if the original data is varied. Specifically, results have been calculated considering more than 1 washing per cycle of reuse and varying the distance between the washing plant and the winery.
2.3 Economic feasibility assessment The economic feasibility study has been developed using unitary cost per reuse bottle to
compare to the cost of the acquisition of a new bottle. In this study different actors existing on the territory are involved: a washing facility, two
wineries and a distributor of the product. With the aim to develop this study four scenarios were created considering the actors involved in the reuse of wine bottles with special attention in the logistic system.
The importance of developing these four scenarios concerns in the logistic and operational
costs resulting in a significant field of study, since key information about reusability can be obtained through these scenarios. In addition, comparisons between local and regional distribution will be useful to determine if an optimal distance can be achieved to align costs of reusable bottles with one-way bottles. The economic study has been divided in several specific objectives:
• Determine the different scenarios related with the reuse system.
• Identify the unitary costs related to the information gathered.
• Identify the environmental impacts associated with the reuse system and compare them to a conventional scenario
2.3.1 Life Cycle Cost
Life-cycle cost (LCC) is a tool to evaluate the cost of a product over its entire life cycle and can be seen as an economic assessment of the LCA (Nakamura and Kondo, 206 2006). In previous studies (Roch Navarro, 2017) an LCA was conducted for the Environmental feasibility assessment of wine glass packaging reuse scenarios in Catalonia and as a complement for the process of decision making an LCC will be developed in order to assess the sustainability of wine packaging reuse in the economical aspect.
The LCC methodology is a way to evaluate the most cost-effective solution; however, it does
not guarantee a particular result. The LCC allows the project manager to make a comparison between alternate solutions within the limits of the available data (Hydraulic Institute,
17
Europump, 2001). The LCC of the reuse bottle will evaluate the economic benefits with respect to the costs of acquiring a new bottle. The LCC considers all the cost associated to the reuse and to the acquisition of a bottle. For this study, the LCC of the new bottle a reuse bottle will be divided into five (5) parameters as follows in next section.
2.3.2 Life Cycle Cost (New Bottle)
𝐿𝑖𝑓𝑒 𝐶𝑦𝑐𝑙𝑒 𝐶𝑜𝑠𝑡 (𝑁𝑒𝑤 𝐵𝑜𝑡𝑡𝑙𝑒) = 𝐶𝑛𝑏 + 𝐶𝑡𝑎𝑥 + 𝐶𝑙𝑎𝑏𝑒𝑙 + 𝐶𝑙𝑎𝑏𝑒𝑙𝑙𝑖𝑛𝑔 + 𝐶𝑏𝑜𝑡𝑡𝑙𝑖𝑛𝑔 (𝐸𝑞. 1)
New bottle acquisition cost (𝐶𝑛𝑏): The cost presented here considers the glass production, operating and administrative cost of the manufacturer as well as economic profits.
Green dot tax cost (𝐶𝑡𝑎𝑥): When the Law 11/97 on Packaging and Waste Packaging enter into force, all packaging companies have the obligation to recover the waste packaging from the products they place in the market, so that they can be recycled and their value recovered. The green dot is the distinguishing mark that shows that the packaging company is complying with the legislation and financing the recycling of the glass packaging through the Extended Producer Responsibility EPR (Ecovidrio, n.d.)
Label costs (𝐶𝑙𝑎𝑏𝑒𝑙): Wine bottles have labels in the front and back of the bottle. In the case of one-way use bottles the label is non-hydrosoluble.
Labelling costs (𝐶𝑙𝑎𝑏𝑒𝑙𝑙𝑖𝑛𝑔): Labor and operating cost of labelling are estimated apart from
the label. Labelling cost vary for each type of bottle.
Bottling costs (𝐶𝑏𝑜𝑡𝑡𝑙𝑖𝑛𝑔): Costs of the operation and labor of fulfilling the wine bottles.
Bottling cost vary for each type of bottle.
2.3.3 Life Cycle Cost (Reusable bottle)
𝐿𝑖𝑓𝑒 𝐶𝑦𝑐𝑙𝑒 𝐶𝑜𝑠𝑡 (𝑅𝑒𝑢𝑠𝑒 𝐵𝑜𝑡𝑡𝑙𝑒) = 𝐶𝑤𝑏 + 𝐶𝑙𝑠𝑦𝑠 + 𝐶𝑙𝑎𝑏𝑒𝑙 + 𝐶𝑙𝑎𝑏𝑒𝑙𝑙𝑖𝑛𝑔 + 𝐶𝑏𝑜𝑡𝑡𝑙𝑖𝑛𝑔 (𝐸𝑞. 2)
Bottle washing cost (𝐶𝑤𝑏): the cost of this parameter includes acquisition of the washing
plant, installation, labor, resource consumptions, amortization of the washing facility, economic profits, operation and maintenance, and wastewater treatment.
Logistics cost (𝐶𝑙𝑠𝑦𝑠): this cost will be analysed in several parts because four different
scenarios will be developed. The logistic costs may vary depending the transportation distances and actor involved in the logistics, the type of packaging use for the collection and stock of the bottle and the labour and transport of the palletized of the bottles.
Label costs (𝐶𝑙𝑎𝑏𝑒𝑙): Wine bottles have labels in the front and back of the bottle. In the
case of reuse bottles the label is water soluble. Labelling costs (𝐶𝑙𝑎𝑏𝑒𝑙𝑙𝑖𝑛𝑔): Labor and operating cost of labelling are estimated apart
from 250 the label. Labelling cost vary for each type of bottle. Bottling costs (𝐶𝑏𝑜𝑡𝑡𝑙𝑖𝑛𝑔): Costs of the operation and labor of fulfilling the wine bottles.
Bottling cost vary for each type of bottle.
18
3 Inventory and calculations
In this section the four scenarios will be explained as well as the inventory and assumptions made for this study.
3.1 Scenarios The following case studies have been analysed and grouped in 5 scenarios Table 1:
Table 1 Case studies and scenarios included in the assessment
SCENARIO CASE STUDIES
A. HORECA A1. MEDIUM SIZE WINERY
A2. LARGE WINERY
B. Large retail+ logistics B1. MEDIUM SIZE WINERY AND RETAIL
B2. SMAILL SIZE WINERY AND RETAIL
C. Small retail + wine tasting C1. SMALL WINERY AND TASTE
C2. SMALL WINERY AND LOCAL STORES
D. Integrated washing D1. SMALL WINERY AND INTEGRATED WASHING
E. Retail+ waste collection point E1. MEDIUM SIZE WINERY+RETAIL
E2. LARGE WINERY+RETAIL
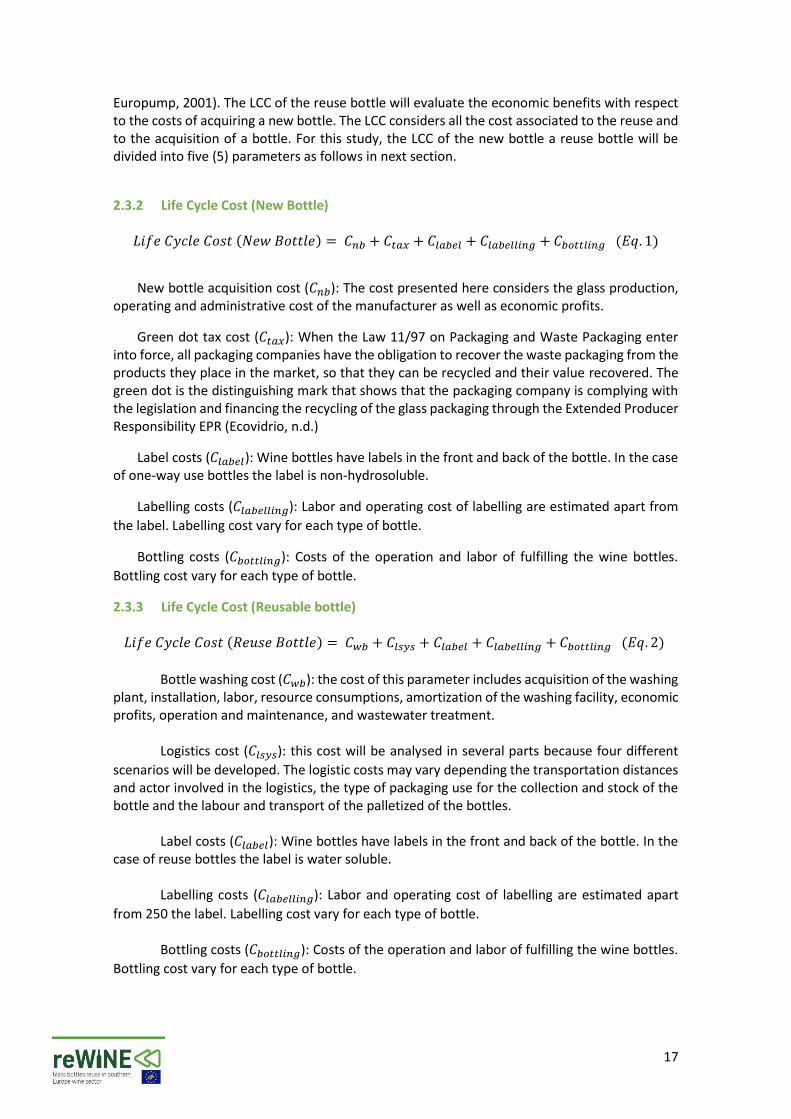
Scenario A: HORECA and local retail: large and medium size wineries This scenario includes two case studies for the medium size (A1) and large size (A2) wineries for bottles that are commercialized in local small stores, restaurants or during wine tastings. In both case studies, inverse logistics is employed and trucks that are employed to carry the products to the stores from the winery is also used to collect the returned empty bottles and bring them back to the winery. Figure 5 summarises this scenario.
Figure 5 Large and medium size case study scheme
19
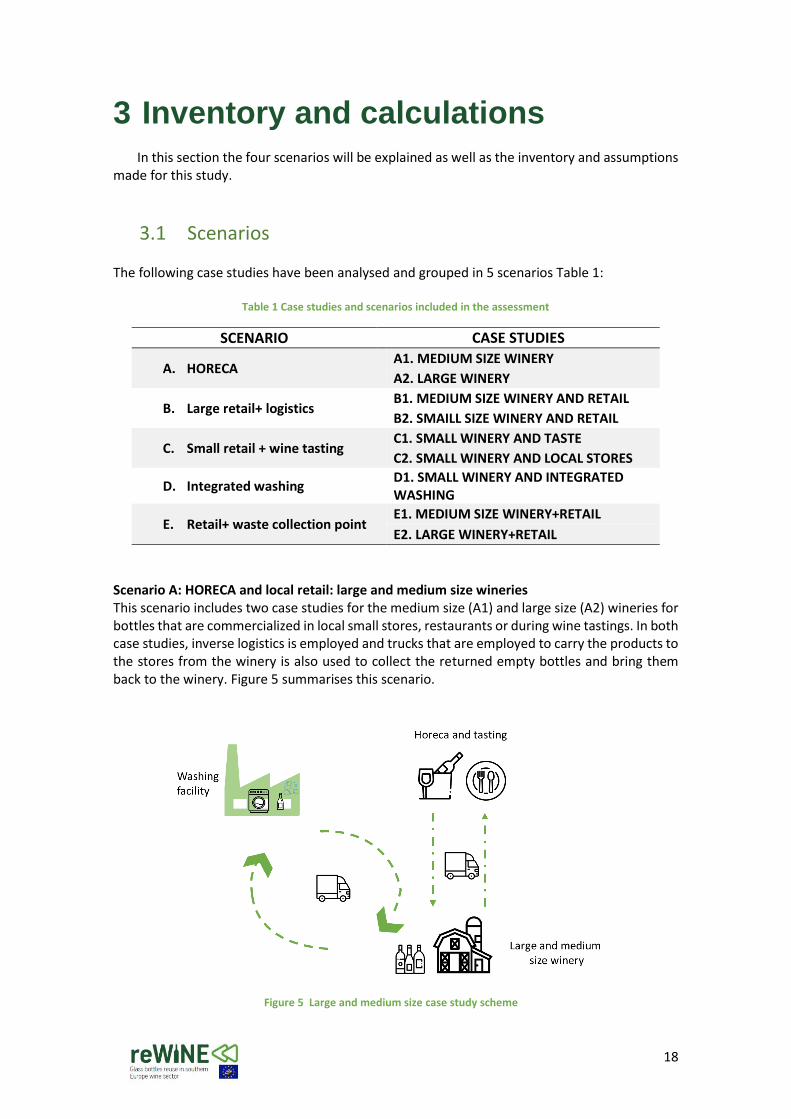
Scenario B: Large retail: Small and medium size wineries This scenario includes two case studies for a small (B2) and a medium size (B1) wineries wine bottles that are commercialized in large retail stores. In both case studies, there is a warehouse where bottles are stored after and before being washed. For the medium size winery, the logistics includes the employment of a social cooperative to collect wine bottles from the stores and transport them to the warehouse, using electric scooters. In the small size winery case study, inverse logistics is employed and trucks that are employed to carry the products to the stores from the warehouse is also used to collect the returned empty bottles and bring them back to the warehouse. Figure 6 summarises this scenario.
Figure 6 Large retail case study scheme
Scenario C: Small retail and tasting: small size wineries This scenario includes two case studies for 2 small size wineries wine bottles that are commercialized in local small stores or during wine. In both case studies, inverse logistics is employed and trucks that are employed to carry the products to the stores from the winery is also used to collect the returned empty bottles and bring them back to the winery. Figure 7 summarises this scenario.
20
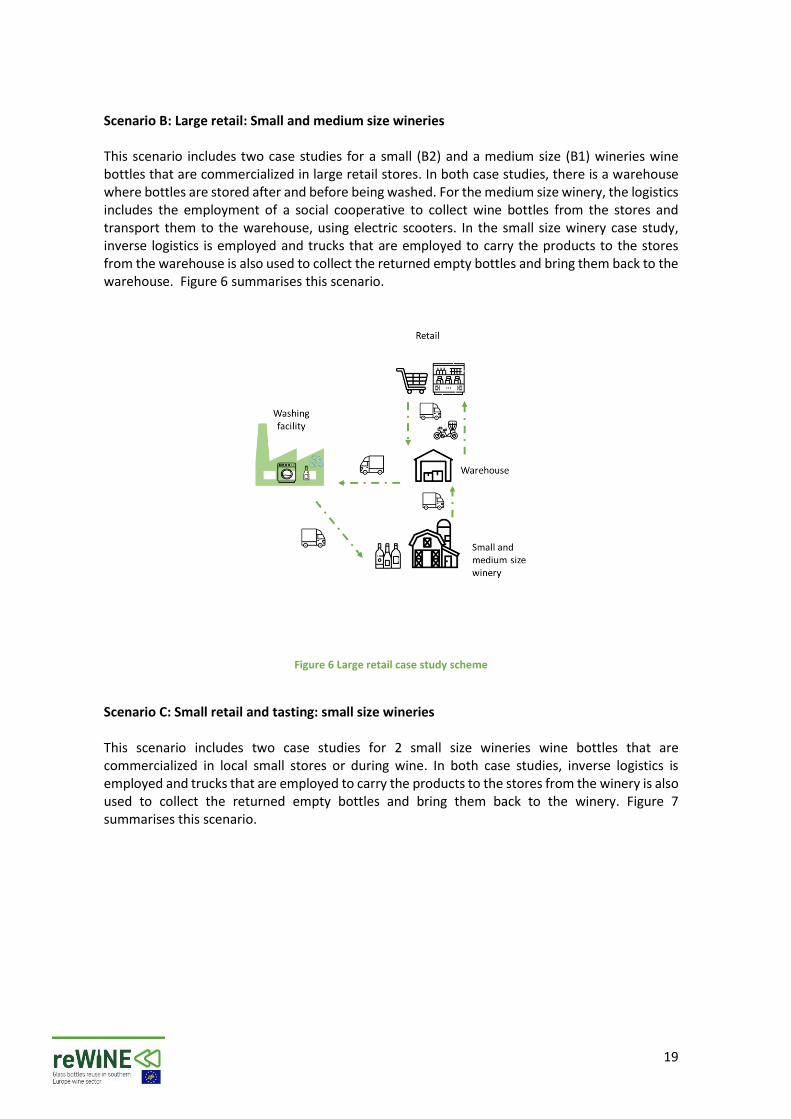
Figure 7 Small retail and small wineries case study scheme
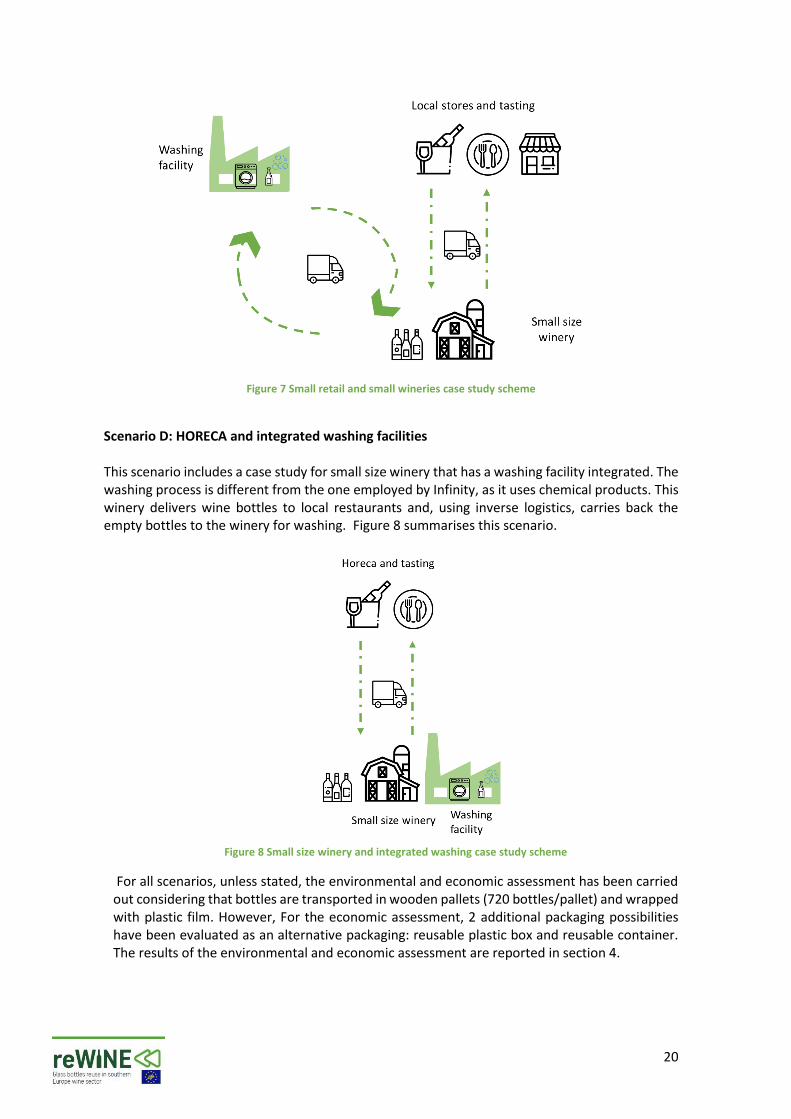
Scenario D: HORECA and integrated washing facilities This scenario includes a case study for small size winery that has a washing facility integrated. The washing process is different from the one employed by Infinity, as it uses chemical products. This winery delivers wine bottles to local restaurants and, using inverse logistics, carries back the empty bottles to the winery for washing. Figure 8 summarises this scenario.
Figure 8 Small size winery and integrated washing case study scheme
For all scenarios, unless stated, the environmental and economic assessment has been carried out considering that bottles are transported in wooden pallets (720 bottles/pallet) and wrapped with plastic film. However, For the economic assessment, 2 additional packaging possibilities have been evaluated as an alternative packaging: reusable plastic box and reusable container. The results of the environmental and economic assessment are reported in section 4.
21
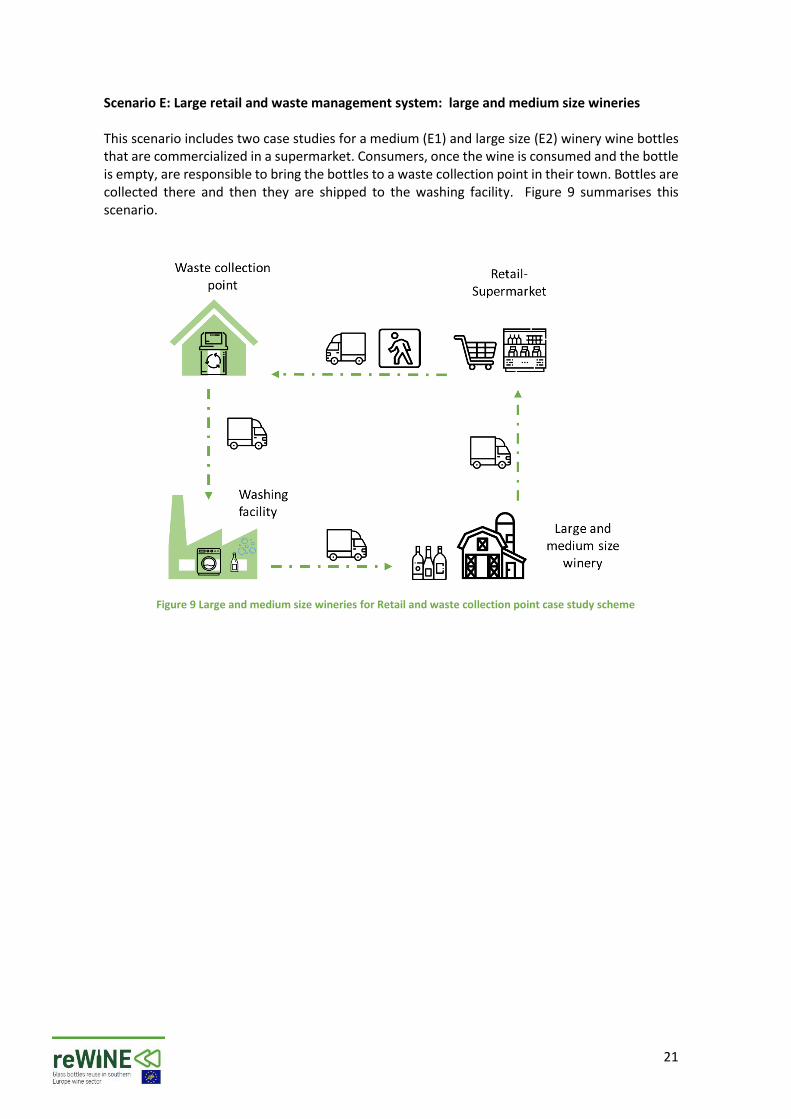
Scenario E: Large retail and waste management system: large and medium size wineries This scenario includes two case studies for a medium (E1) and large size (E2) winery wine bottles that are commercialized in a supermarket. Consumers, once the wine is consumed and the bottle is empty, are responsible to bring the bottles to a waste collection point in their town. Bottles are collected there and then they are shipped to the washing facility. Figure 9 summarises this scenario.
Figure 9 Large and medium size wineries for Retail and waste collection point case study scheme
22
3.2 Inventory Data
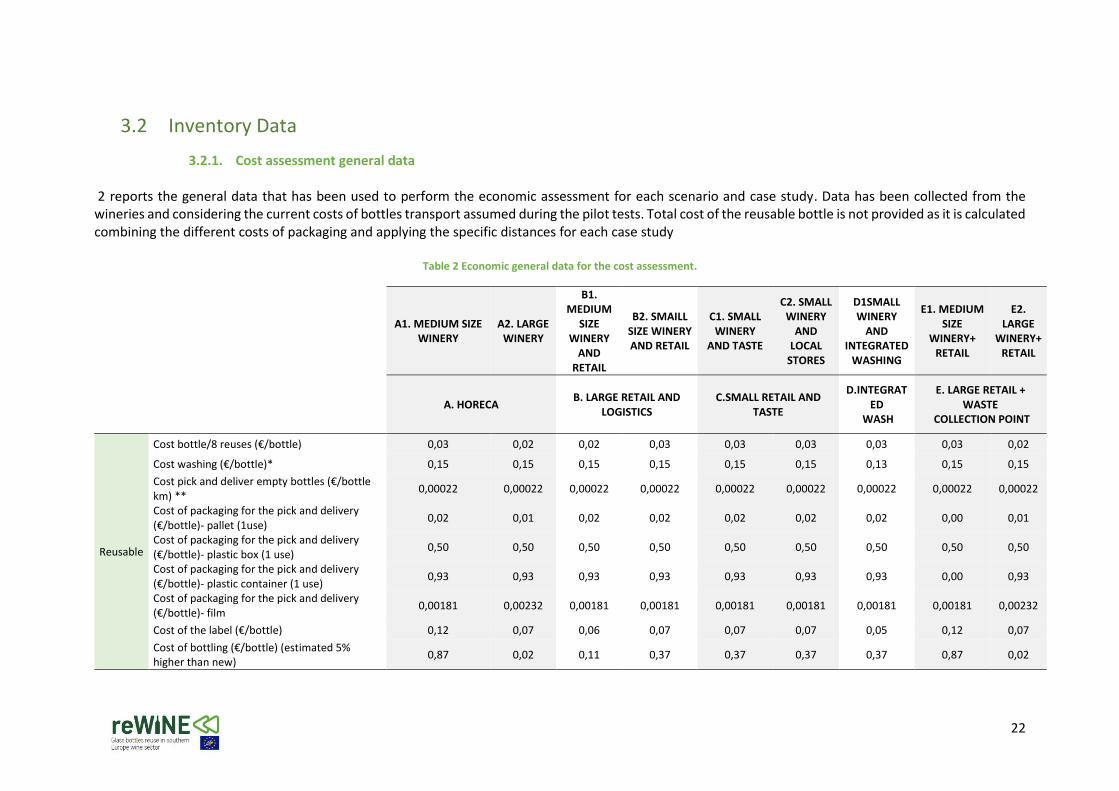
3.2.1. Cost assessment general data 2 reports the general data that has been used to perform the economic assessment for each scenario and case study. Data has been collected from the wineries and considering the current costs of bottles transport assumed during the pilot tests. Total cost of the reusable bottle is not provided as it is calculated combining the different costs of packaging and applying the specific distances for each case study
Table 2 Economic general data for the cost assessment.
A1. MEDIUM SIZE WINERY
A2. LARGE WINERY
B1. MEDIUM
SIZE WINERY
AND RETAIL
B2. SMAILL SIZE WINERY AND RETAIL
C1. SMALL WINERY
AND TASTE
C2. SMALL WINERY
AND LOCAL
STORES
D1SMALL WINERY
AND INTEGRATED
WASHING
E1. MEDIUM SIZE
WINERY+ RETAIL
E2. LARGE
WINERY+RETAIL
A. HORECA B. LARGE RETAIL AND
LOGISTICS C.SMALL RETAIL AND
TASTE
D.INTEGRATED
WASH
E. LARGE RETAIL + WASTE
COLLECTION POINT
Reusable
Cost bottle/8 reuses (€/bottle) 0,03 0,02 0,02 0,03 0,03 0,03 0,03 0,03 0,02
Cost washing (€/bottle)* 0,15 0,15 0,15 0,15 0,15 0,15 0,13 0,15 0,15
Cost pick and deliver empty bottles (€/bottle km) **
0,00022 0,00022 0,00022 0,00022 0,00022 0,00022 0,00022 0,00022 0,00022
Cost of packaging for the pick and delivery (€/bottle)- pallet (1use)
0,02 0,01 0,02 0,02 0,02 0,02 0,02 0,00 0,01
Cost of packaging for the pick and delivery (€/bottle)- plastic box (1 use)
0,50 0,50 0,50 0,50 0,50 0,50 0,50 0,50 0,50
Cost of packaging for the pick and delivery (€/bottle)- plastic container (1 use)
0,93 0,93 0,93 0,93 0,93 0,93 0,93 0,00 0,93
Cost of packaging for the pick and delivery (€/bottle)- film
0,00181 0,00232 0,00181 0,00181 0,00181 0,00181 0,00181 0,00181 0,00232
Cost of the label (€/bottle) 0,12 0,07 0,06 0,07 0,07 0,07 0,05 0,12 0,07
Cost of bottling (€/bottle) (estimated 5% higher than new)
0,87 0,02 0,11 0,37 0,37 0,37 0,37 0,87 0,02
23
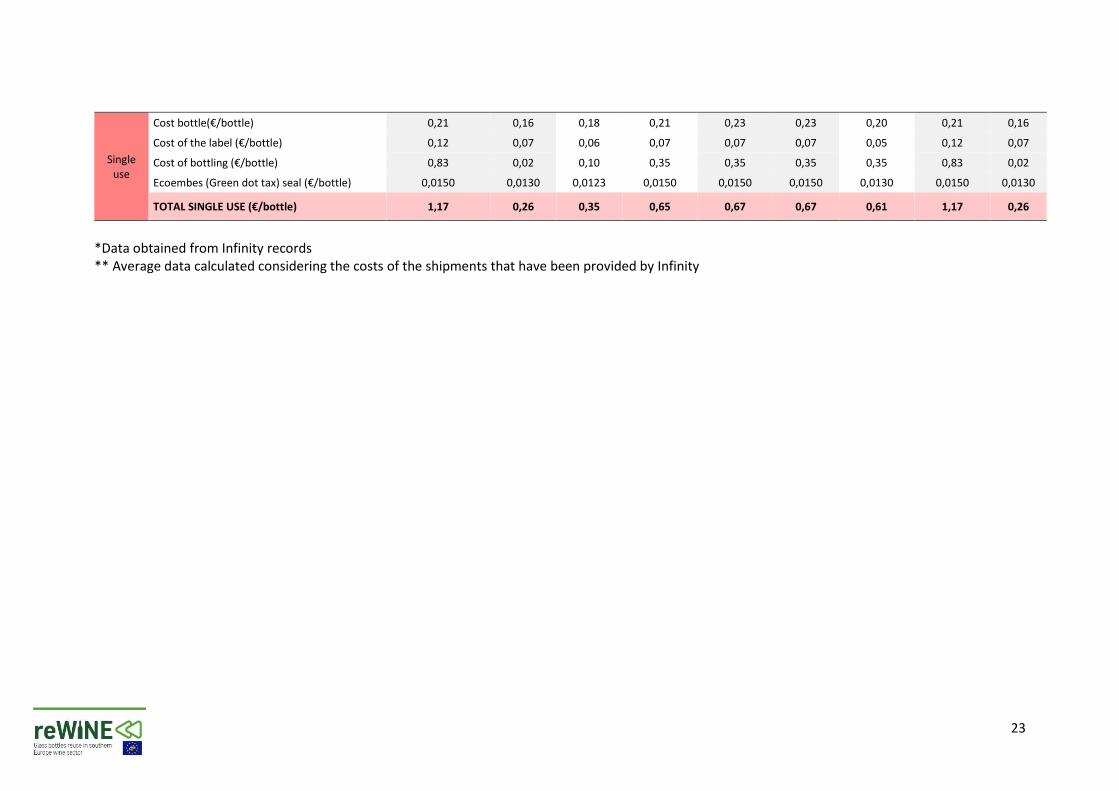
Single use
Cost bottle(€/bottle) 0,21 0,16 0,18 0,21 0,23 0,23 0,20 0,21 0,16
Cost of the label (€/bottle) 0,12 0,07 0,06 0,07 0,07 0,07 0,05 0,12 0,07
Cost of bottling (€/bottle) 0,83 0,02 0,10 0,35 0,35 0,35 0,35 0,83 0,02
Ecoembes (Green dot tax) seal (€/bottle) 0,0150 0,0130 0,0123 0,0150 0,0150 0,0150 0,0130 0,0150 0,0130
TOTAL SINGLE USE (€/bottle) 1,17 0,26 0,35 0,65 0,67 0,67 0,61 1,17 0,26
*Data obtained from Infinity records ** Average data calculated considering the costs of the shipments that have been provided by Infinity
24
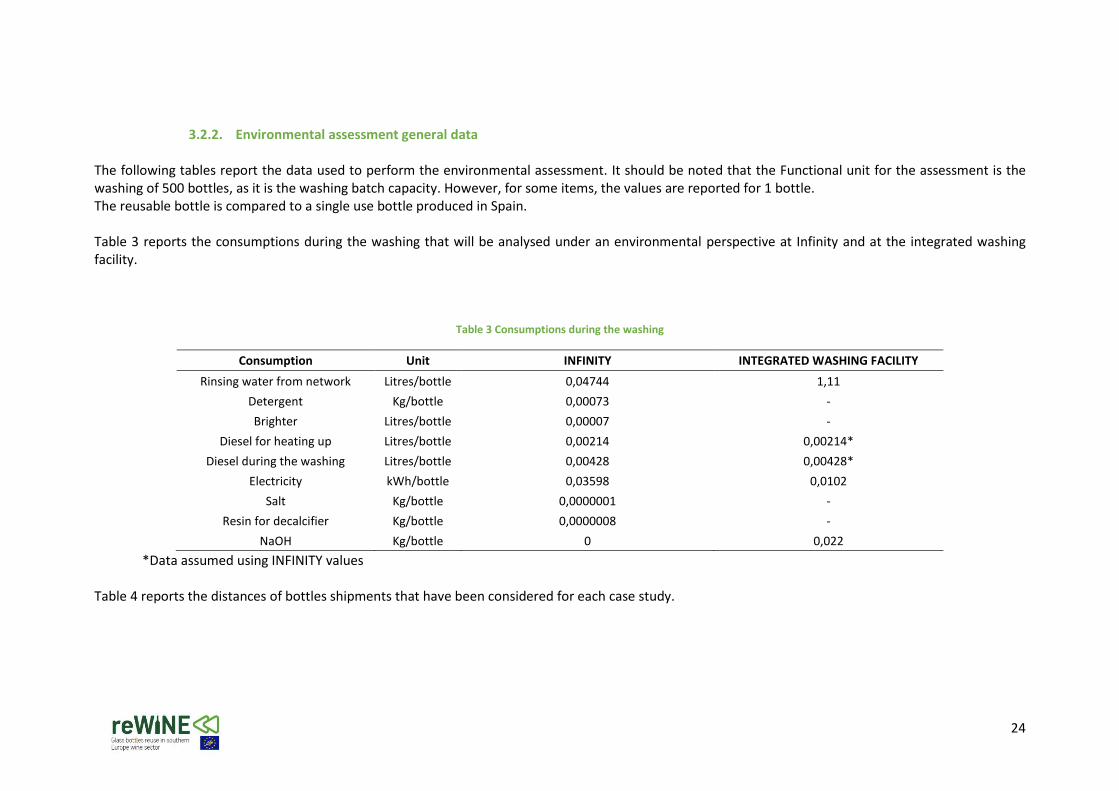
3.2.2. Environmental assessment general data The following tables report the data used to perform the environmental assessment. It should be noted that the Functional unit for the assessment is the washing of 500 bottles, as it is the washing batch capacity. However, for some items, the values are reported for 1 bottle. The reusable bottle is compared to a single use bottle produced in Spain. Table 3 reports the consumptions during the washing that will be analysed under an environmental perspective at Infinity and at the integrated washing facility.
Table 3 Consumptions during the washing
Consumption Unit INFINITY INTEGRATED WASHING FACILITY
Rinsing water from network Litres/bottle 0,04744 1,11
Detergent Kg/bottle 0,00073 -
Brighter Litres/bottle 0,00007 -
Diesel for heating up Litres/bottle 0,00214 0,00214*
Diesel during the washing Litres/bottle 0,00428 0,00428*
Electricity kWh/bottle 0,03598 0,0102
Salt Kg/bottle 0,0000001 -
Resin for decalcifier Kg/bottle 0,0000008 -
NaOH Kg/bottle 0 0,022
*Data assumed using INFINITY values Table 4 reports the distances of bottles shipments that have been considered for each case study.
25
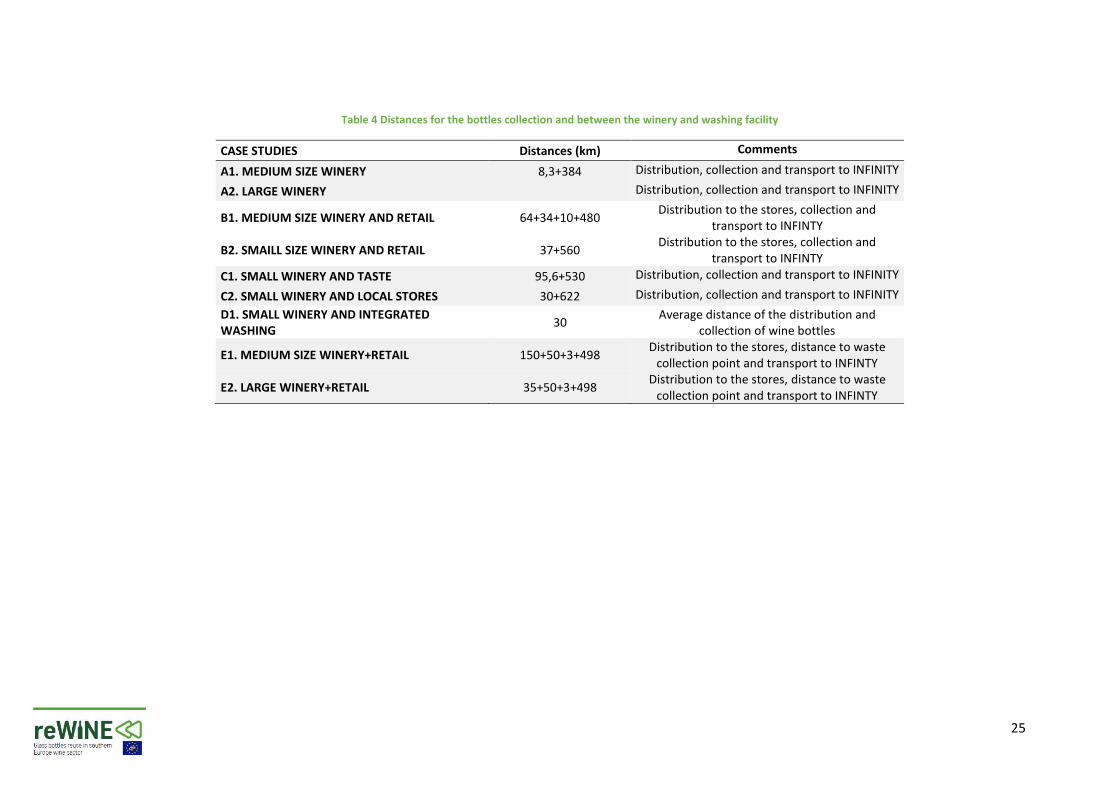
Table 4 Distances for the bottles collection and between the winery and washing facility
CASE STUDIES Distances (km) Comments
A1. MEDIUM SIZE WINERY 8,3+384 Distribution, collection and transport to INFINITY
A2. LARGE WINERY Distribution, collection and transport to INFINITY
B1. MEDIUM SIZE WINERY AND RETAIL 64+34+10+480 Distribution to the stores, collection and
transport to INFINTY
B2. SMAILL SIZE WINERY AND RETAIL 37+560 Distribution to the stores, collection and
transport to INFINTY
C1. SMALL WINERY AND TASTE 95,6+530 Distribution, collection and transport to INFINITY
C2. SMALL WINERY AND LOCAL STORES 30+622 Distribution, collection and transport to INFINITY
D1. SMALL WINERY AND INTEGRATED WASHING
30 Average distance of the distribution and
collection of wine bottles
E1. MEDIUM SIZE WINERY+RETAIL 150+50+3+498 Distribution to the stores, distance to waste
collection point and transport to INFINTY
E2. LARGE WINERY+RETAIL 35+50+3+498 Distribution to the stores, distance to waste
collection point and transport to INFINTY
26
The environmental assessment has been carried out considering different alternatives:
• Only 1 washing is required, thus 8 reuses of the wine bottle are possible
• 2 washings are required per cycle of reuse, thus 3 reuses of the wine bottle are possible
• 3 washings are required per cycle of reuse, thus 2 reuses of the wine bottle are possible These alternatives respond to the fact that during the pilot test more than one washing was required since empty wine bottles were stored for a long time before being washed. Additionally, the environmental assessment includes the evaluation in the current case, using the current distances between the wineries and the washing facilities, and an optimized scenario where the distances is reduced up to 60 km.
As it can be seen from the different scenarios there are variables that have an important role when calculating the economic sustainability in the reuse bottle process. The information gathered for this study is collaboration from the actors involved in the Life+ reWINE Project.
4 Results & Discussion
4.1 Technical assessment The results of the technical assessment
1- Visual inspection: Considering these criteria, wineries accepted that bottles could be washed 7 times (8 reuses) and the aesthetics of the bottle after all these washings was acceptable.
2- Use of a hydrosoluble label: the use of an hydrosoluble label is not a restriction since the washing procedures applied by INFINUTY are capable to remove any type of label, hydrosoluble and non-hydrosoluble.
3- Microbiological inspection: after the washing, microbiological tests have been conducted and
the content of bacteria (enterobacteria’s and aerobic bacteria) resulted to be lower than 1
fc/cm2, which is a value that is admissible.
4- Other aspects related to logistics:
a. It is necessary to communicate to both the final consumer and the retailer that the bottle is reusable and the instructions to facilitate the collection by the consumers. For this purpose, specific communication material for retail (banners, rollouts, flags) were prepared and stickers were added to the bottles to identify that there were reusable bottles.
b. Retail need to ensure that they have a proper place to store the bottles before they are sent to washing. This can be done either in the retail storing room or, in a small scale, in specific containers.
27
c. To ensure an efficient logistic, it is preferable to avoid the use of third parts in the bottles transport, as it can lead to a cost increase.
Other aspects that determine the feasibility of the reusability deal with the time of the empty bottle’s storage. During the pilot test, some bottles were stored for a long time (more than 4 weeks) before they were washed. This delayed has dealt to difficulty in removing all wine rests from the bottle in just one washed, so bottles required or more than 1 washing. As a general conclusion of the technical assessment, the pilot test and the results of the tests performed on the bottles has demonstrated the technical feasibility of the wine bottle return system proposed in reWine.
4.2 Environmental assessment This section includes the environmental assessment for each case study and a summary for each scenario. The environmental assessment includes a sensitivity analysis where different alternatives are studied to understand the contribution of the distance of the wineries to the washing facilities and the contribution of the number of washings required per cycle of reuse.
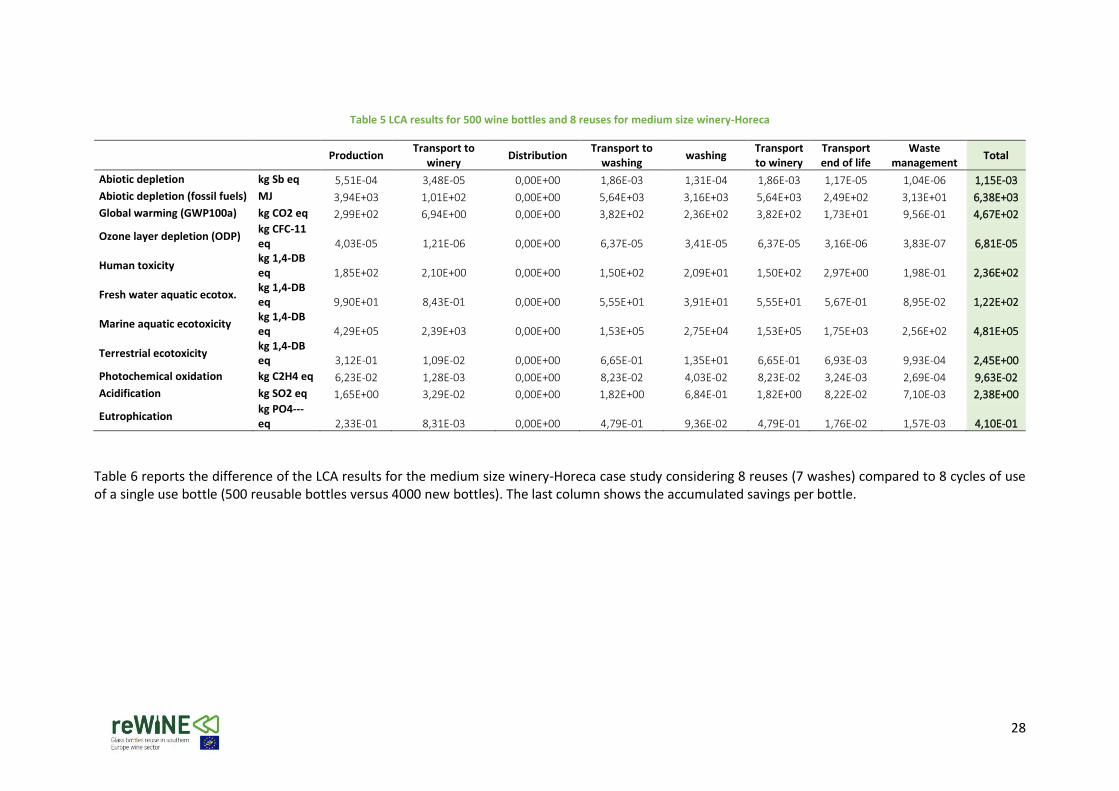
4.2.1. Evaluation of MEDIUM SIZE WINERY -HORECA (A1) Table 5 reports the LCA results for the medium size winery -Horeca case study considering 8 reuses (7 washes) for 500 wine bottles.
28
Table 5 LCA results for 500 wine bottles and 8 reuses for medium size winery-Horeca
Production Transport to
winery Distribution
Transport to washing
washing Transport to winery
Transport end of life
Waste management
Total
Abiotic depletion kg Sb eq 5,51E-04 3,48E-05 0,00E+00 1,86E-03 1,31E-04 1,86E-03 1,17E-05 1,04E-06 1,15E-03
Abiotic depletion (fossil fuels) MJ 3,94E+03 1,01E+02 0,00E+00 5,64E+03 3,16E+03 5,64E+03 2,49E+02 3,13E+01 6,38E+03
Global warming (GWP100a) kg CO2 eq 2,99E+02 6,94E+00 0,00E+00 3,82E+02 2,36E+02 3,82E+02 1,73E+01 9,56E-01 4,67E+02
Ozone layer depletion (ODP) kg CFC-11 eq 4,03E-05 1,21E-06 0,00E+00 6,37E-05 3,41E-05 6,37E-05 3,16E-06 3,83E-07 6,81E-05
Human toxicity kg 1,4-DB eq 1,85E+02 2,10E+00 0,00E+00 1,50E+02 2,09E+01 1,50E+02 2,97E+00 1,98E-01 2,36E+02
Fresh water aquatic ecotox. kg 1,4-DB eq 9,90E+01 8,43E-01 0,00E+00 5,55E+01 3,91E+01 5,55E+01 5,67E-01 8,95E-02 1,22E+02
Marine aquatic ecotoxicity kg 1,4-DB eq 4,29E+05 2,39E+03 0,00E+00 1,53E+05 2,75E+04 1,53E+05 1,75E+03 2,56E+02 4,81E+05
Terrestrial ecotoxicity kg 1,4-DB eq 3,12E-01 1,09E-02 0,00E+00 6,65E-01 1,35E+01 6,65E-01 6,93E-03 9,93E-04 2,45E+00
Photochemical oxidation kg C2H4 eq 6,23E-02 1,28E-03 0,00E+00 8,23E-02 4,03E-02 8,23E-02 3,24E-03 2,69E-04 9,63E-02
Acidification kg SO2 eq 1,65E+00 3,29E-02 0,00E+00 1,82E+00 6,84E-01 1,82E+00 8,22E-02 7,10E-03 2,38E+00
Eutrophication kg PO4--- eq 2,33E-01 8,31E-03 0,00E+00 4,79E-01 9,36E-02 4,79E-01 1,76E-02 1,57E-03 4,10E-01
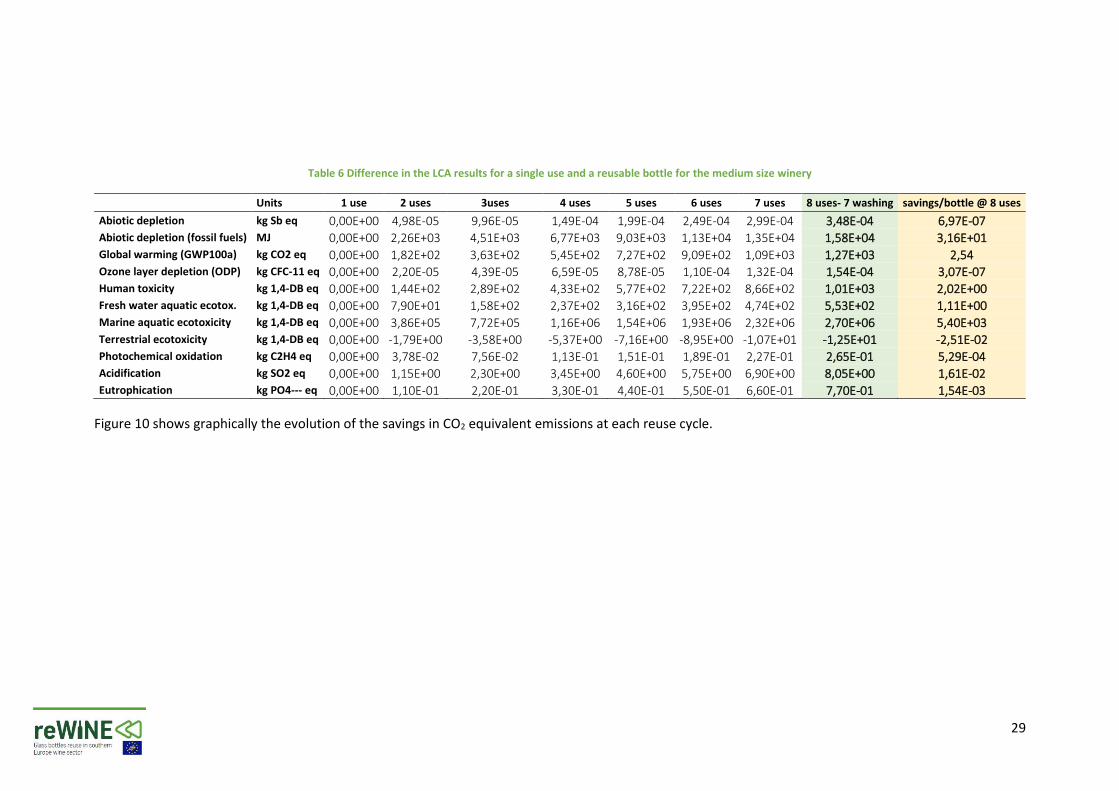
Table 6 reports the difference of the LCA results for the medium size winery-Horeca case study considering 8 reuses (7 washes) compared to 8 cycles of use of a single use bottle (500 reusable bottles versus 4000 new bottles). The last column shows the accumulated savings per bottle.
29
Table 6 Difference in the LCA results for a single use and a reusable bottle for the medium size winery
Units 1 use 2 uses 3uses 4 uses 5 uses 6 uses 7 uses 8 uses- 7 washing savings/bottle @ 8 uses
Abiotic depletion kg Sb eq 0,00E+00 4,98E-05 9,96E-05 1,49E-04 1,99E-04 2,49E-04 2,99E-04 3,48E-04 6,97E-07
Abiotic depletion (fossil fuels) MJ 0,00E+00 2,26E+03 4,51E+03 6,77E+03 9,03E+03 1,13E+04 1,35E+04 1,58E+04 3,16E+01
Global warming (GWP100a) kg CO2 eq 0,00E+00 1,82E+02 3,63E+02 5,45E+02 7,27E+02 9,09E+02 1,09E+03 1,27E+03 2,54
Ozone layer depletion (ODP) kg CFC-11 eq 0,00E+00 2,20E-05 4,39E-05 6,59E-05 8,78E-05 1,10E-04 1,32E-04 1,54E-04 3,07E-07
Human toxicity kg 1,4-DB eq 0,00E+00 1,44E+02 2,89E+02 4,33E+02 5,77E+02 7,22E+02 8,66E+02 1,01E+03 2,02E+00
Fresh water aquatic ecotox. kg 1,4-DB eq 0,00E+00 7,90E+01 1,58E+02 2,37E+02 3,16E+02 3,95E+02 4,74E+02 5,53E+02 1,11E+00
Marine aquatic ecotoxicity kg 1,4-DB eq 0,00E+00 3,86E+05 7,72E+05 1,16E+06 1,54E+06 1,93E+06 2,32E+06 2,70E+06 5,40E+03
Terrestrial ecotoxicity kg 1,4-DB eq 0,00E+00 -1,79E+00 -3,58E+00 -5,37E+00 -7,16E+00 -8,95E+00 -1,07E+01 -1,25E+01 -2,51E-02
Photochemical oxidation kg C2H4 eq 0,00E+00 3,78E-02 7,56E-02 1,13E-01 1,51E-01 1,89E-01 2,27E-01 2,65E-01 5,29E-04
Acidification kg SO2 eq 0,00E+00 1,15E+00 2,30E+00 3,45E+00 4,60E+00 5,75E+00 6,90E+00 8,05E+00 1,61E-02
Eutrophication kg PO4--- eq 0,00E+00 1,10E-01 2,20E-01 3,30E-01 4,40E-01 5,50E-01 6,60E-01 7,70E-01 1,54E-03
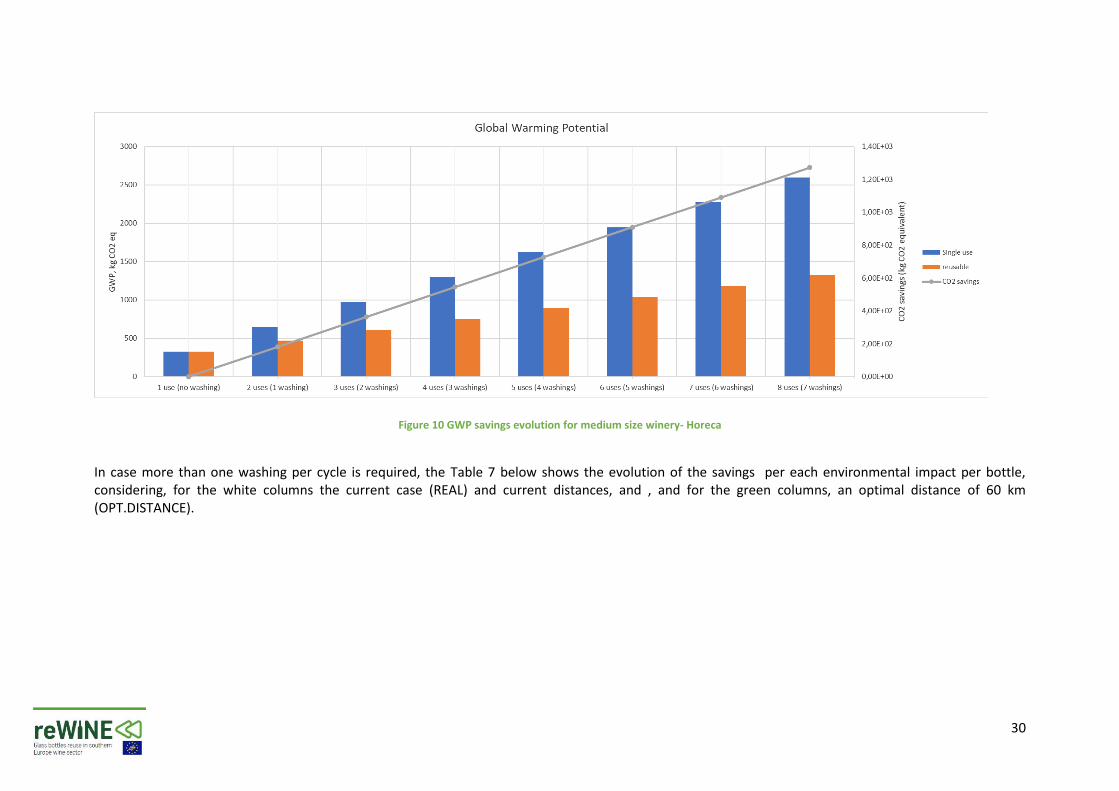
Figure 10 shows graphically the evolution of the savings in CO2 equivalent emissions at each reuse cycle.
30
Figure 10 GWP savings evolution for medium size winery- Horeca
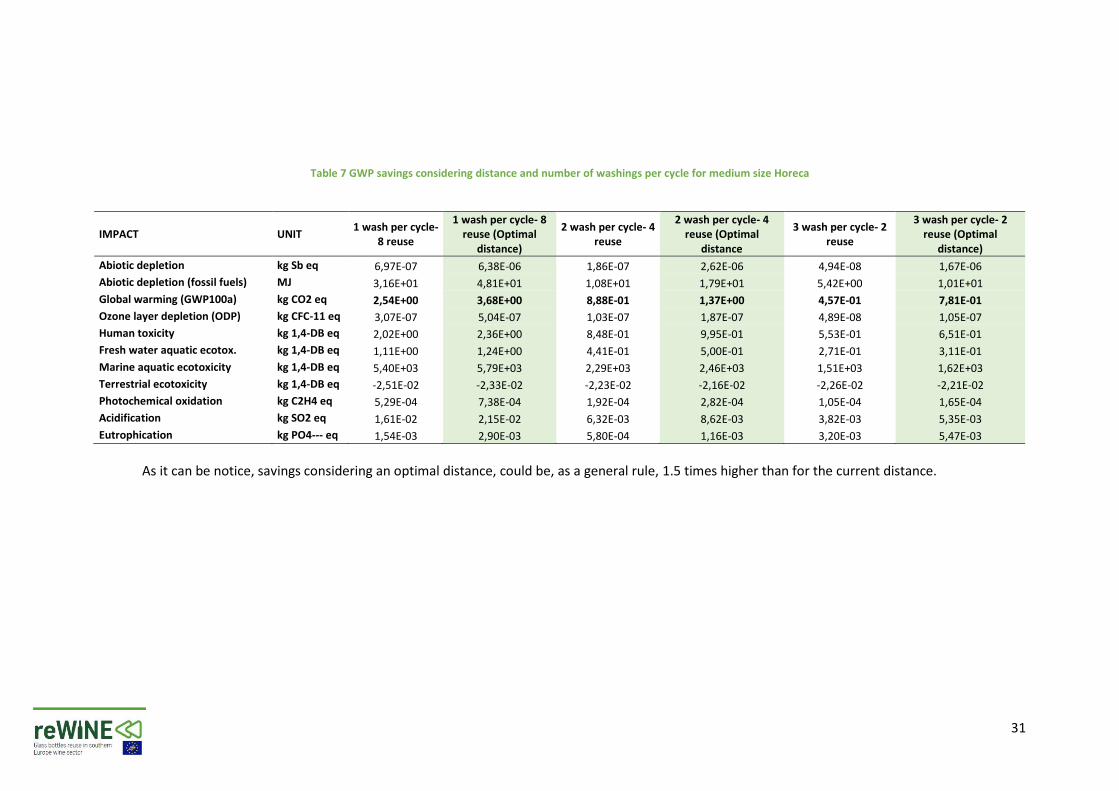
In case more than one washing per cycle is required, the Table 7 below shows the evolution of the savings per each environmental impact per bottle, considering, for the white columns the current case (REAL) and current distances, and , and for the green columns, an optimal distance of 60 km (OPT.DISTANCE).
31
Table 7 GWP savings considering distance and number of washings per cycle for medium size Horeca
IMPACT UNIT 1 wash per cycle-
8 reuse
1 wash per cycle- 8 reuse (Optimal
distance)
2 wash per cycle- 4 reuse
2 wash per cycle- 4 reuse (Optimal
distance
3 wash per cycle- 2 reuse
3 wash per cycle- 2 reuse (Optimal
distance)
Abiotic depletion kg Sb eq 6,97E-07 6,38E-06 1,86E-07 2,62E-06 4,94E-08 1,67E-06
Abiotic depletion (fossil fuels) MJ 3,16E+01 4,81E+01 1,08E+01 1,79E+01 5,42E+00 1,01E+01
Global warming (GWP100a) kg CO2 eq 2,54E+00 3,68E+00 8,88E-01 1,37E+00 4,57E-01 7,81E-01
Ozone layer depletion (ODP) kg CFC-11 eq 3,07E-07 5,04E-07 1,03E-07 1,87E-07 4,89E-08 1,05E-07
Human toxicity kg 1,4-DB eq 2,02E+00 2,36E+00 8,48E-01 9,95E-01 5,53E-01 6,51E-01
Fresh water aquatic ecotox. kg 1,4-DB eq 1,11E+00 1,24E+00 4,41E-01 5,00E-01 2,71E-01 3,11E-01
Marine aquatic ecotoxicity kg 1,4-DB eq 5,40E+03 5,79E+03 2,29E+03 2,46E+03 1,51E+03 1,62E+03
Terrestrial ecotoxicity kg 1,4-DB eq -2,51E-02 -2,33E-02 -2,23E-02 -2,16E-02 -2,26E-02 -2,21E-02
Photochemical oxidation kg C2H4 eq 5,29E-04 7,38E-04 1,92E-04 2,82E-04 1,05E-04 1,65E-04
Acidification kg SO2 eq 1,61E-02 2,15E-02 6,32E-03 8,62E-03 3,82E-03 5,35E-03
Eutrophication kg PO4--- eq 1,54E-03 2,90E-03 5,80E-04 1,16E-03 3,20E-03 5,47E-03
As it can be notice, savings considering an optimal distance, could be, as a general rule, 1.5 times higher than for the current distance.
32
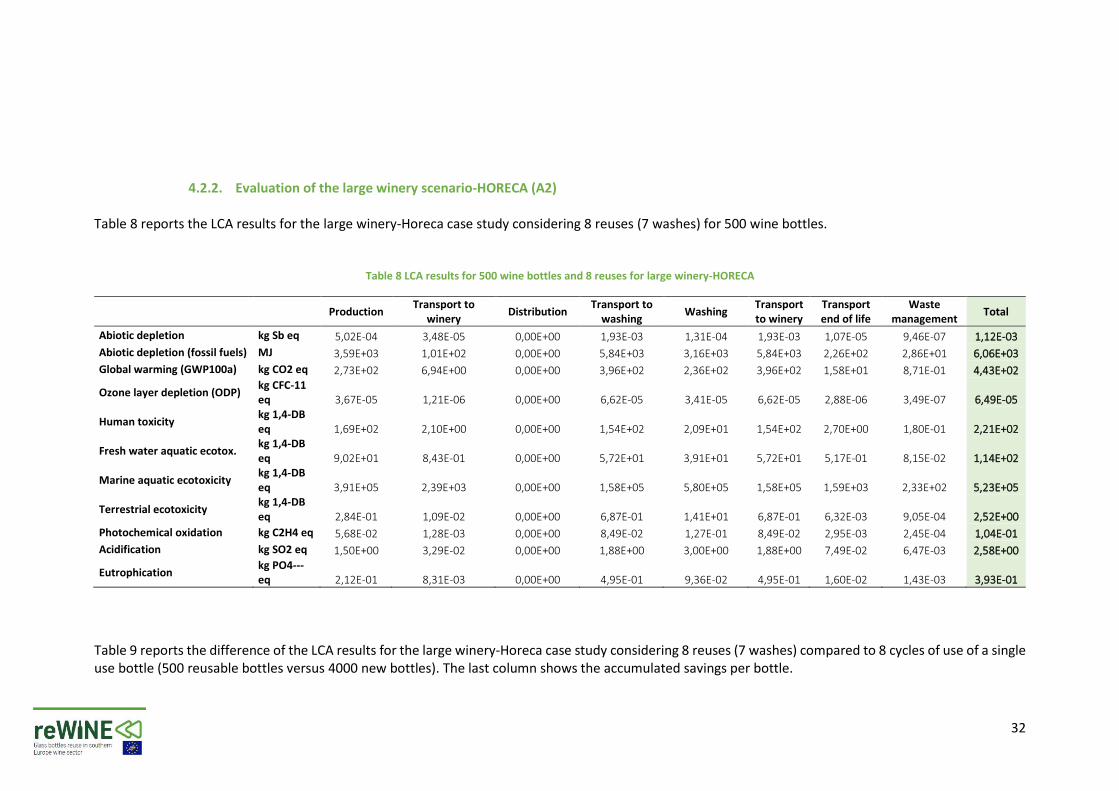
4.2.2. Evaluation of the large winery scenario-HORECA (A2)
Table 8 reports the LCA results for the large winery-Horeca case study considering 8 reuses (7 washes) for 500 wine bottles.
Table 8 LCA results for 500 wine bottles and 8 reuses for large winery-HORECA
Production Transport to
winery Distribution
Transport to washing
Washing Transport to winery
Transport end of life
Waste management
Total
Abiotic depletion kg Sb eq 5,02E-04 3,48E-05 0,00E+00 1,93E-03 1,31E-04 1,93E-03 1,07E-05 9,46E-07 1,12E-03
Abiotic depletion (fossil fuels) MJ 3,59E+03 1,01E+02 0,00E+00 5,84E+03 3,16E+03 5,84E+03 2,26E+02 2,86E+01 6,06E+03
Global warming (GWP100a) kg CO2 eq 2,73E+02 6,94E+00 0,00E+00 3,96E+02 2,36E+02 3,96E+02 1,58E+01 8,71E-01 4,43E+02
Ozone layer depletion (ODP) kg CFC-11 eq 3,67E-05 1,21E-06 0,00E+00 6,62E-05 3,41E-05 6,62E-05 2,88E-06 3,49E-07 6,49E-05
Human toxicity kg 1,4-DB eq 1,69E+02 2,10E+00 0,00E+00 1,54E+02 2,09E+01 1,54E+02 2,70E+00 1,80E-01 2,21E+02
Fresh water aquatic ecotox. kg 1,4-DB eq 9,02E+01 8,43E-01 0,00E+00 5,72E+01 3,91E+01 5,72E+01 5,17E-01 8,15E-02 1,14E+02
Marine aquatic ecotoxicity kg 1,4-DB eq 3,91E+05 2,39E+03 0,00E+00 1,58E+05 5,80E+05 1,58E+05 1,59E+03 2,33E+02 5,23E+05
Terrestrial ecotoxicity kg 1,4-DB eq 2,84E-01 1,09E-02 0,00E+00 6,87E-01 1,41E+01 6,87E-01 6,32E-03 9,05E-04 2,52E+00
Photochemical oxidation kg C2H4 eq 5,68E-02 1,28E-03 0,00E+00 8,49E-02 1,27E-01 8,49E-02 2,95E-03 2,45E-04 1,04E-01
Acidification kg SO2 eq 1,50E+00 3,29E-02 0,00E+00 1,88E+00 3,00E+00 1,88E+00 7,49E-02 6,47E-03 2,58E+00
Eutrophication kg PO4--- eq 2,12E-01 8,31E-03 0,00E+00 4,95E-01 9,36E-02 4,95E-01 1,60E-02 1,43E-03 3,93E-01
Table 9 reports the difference of the LCA results for the large winery-Horeca case study considering 8 reuses (7 washes) compared to 8 cycles of use of a single use bottle (500 reusable bottles versus 4000 new bottles). The last column shows the accumulated savings per bottle.
33
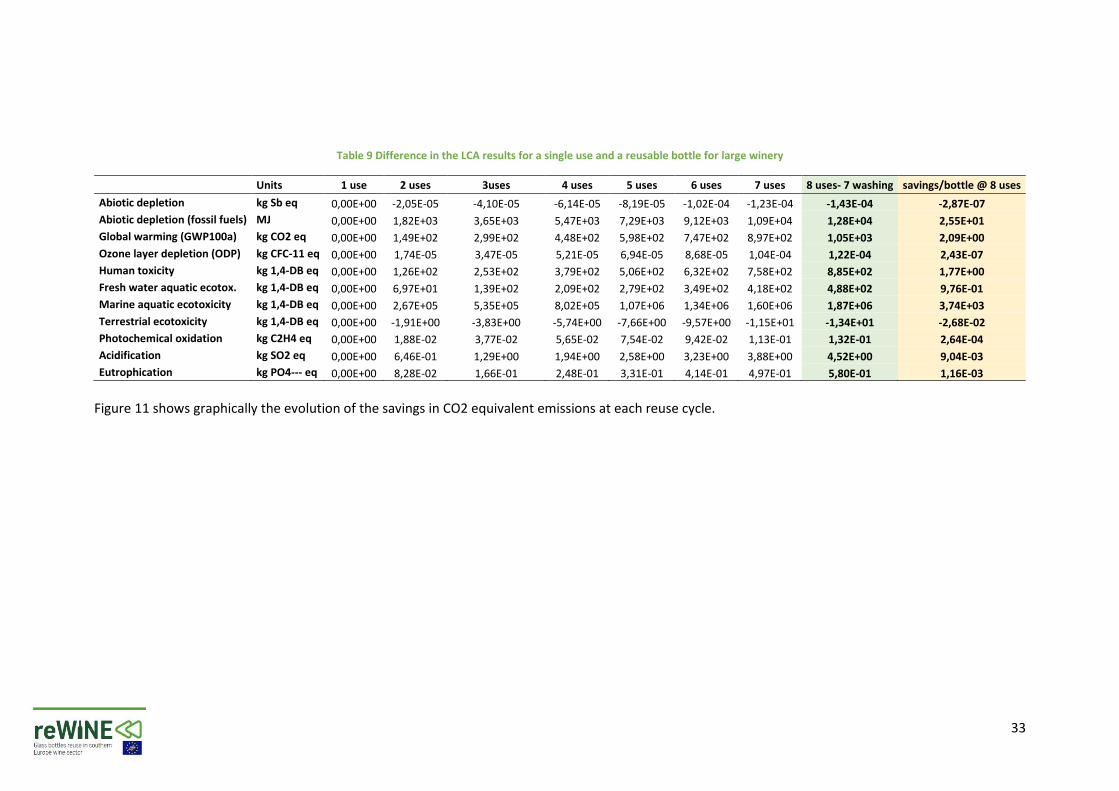
Table 9 Difference in the LCA results for a single use and a reusable bottle for large winery
Units 1 use 2 uses 3uses 4 uses 5 uses 6 uses 7 uses 8 uses- 7 washing savings/bottle @ 8 uses
Abiotic depletion kg Sb eq 0,00E+00 -2,05E-05 -4,10E-05 -6,14E-05 -8,19E-05 -1,02E-04 -1,23E-04 -1,43E-04 -2,87E-07
Abiotic depletion (fossil fuels) MJ 0,00E+00 1,82E+03 3,65E+03 5,47E+03 7,29E+03 9,12E+03 1,09E+04 1,28E+04 2,55E+01
Global warming (GWP100a) kg CO2 eq 0,00E+00 1,49E+02 2,99E+02 4,48E+02 5,98E+02 7,47E+02 8,97E+02 1,05E+03 2,09E+00
Ozone layer depletion (ODP) kg CFC-11 eq 0,00E+00 1,74E-05 3,47E-05 5,21E-05 6,94E-05 8,68E-05 1,04E-04 1,22E-04 2,43E-07
Human toxicity kg 1,4-DB eq 0,00E+00 1,26E+02 2,53E+02 3,79E+02 5,06E+02 6,32E+02 7,58E+02 8,85E+02 1,77E+00
Fresh water aquatic ecotox. kg 1,4-DB eq 0,00E+00 6,97E+01 1,39E+02 2,09E+02 2,79E+02 3,49E+02 4,18E+02 4,88E+02 9,76E-01
Marine aquatic ecotoxicity kg 1,4-DB eq 0,00E+00 2,67E+05 5,35E+05 8,02E+05 1,07E+06 1,34E+06 1,60E+06 1,87E+06 3,74E+03
Terrestrial ecotoxicity kg 1,4-DB eq 0,00E+00 -1,91E+00 -3,83E+00 -5,74E+00 -7,66E+00 -9,57E+00 -1,15E+01 -1,34E+01 -2,68E-02
Photochemical oxidation kg C2H4 eq 0,00E+00 1,88E-02 3,77E-02 5,65E-02 7,54E-02 9,42E-02 1,13E-01 1,32E-01 2,64E-04
Acidification kg SO2 eq 0,00E+00 6,46E-01 1,29E+00 1,94E+00 2,58E+00 3,23E+00 3,88E+00 4,52E+00 9,04E-03
Eutrophication kg PO4--- eq 0,00E+00 8,28E-02 1,66E-01 2,48E-01 3,31E-01 4,14E-01 4,97E-01 5,80E-01 1,16E-03
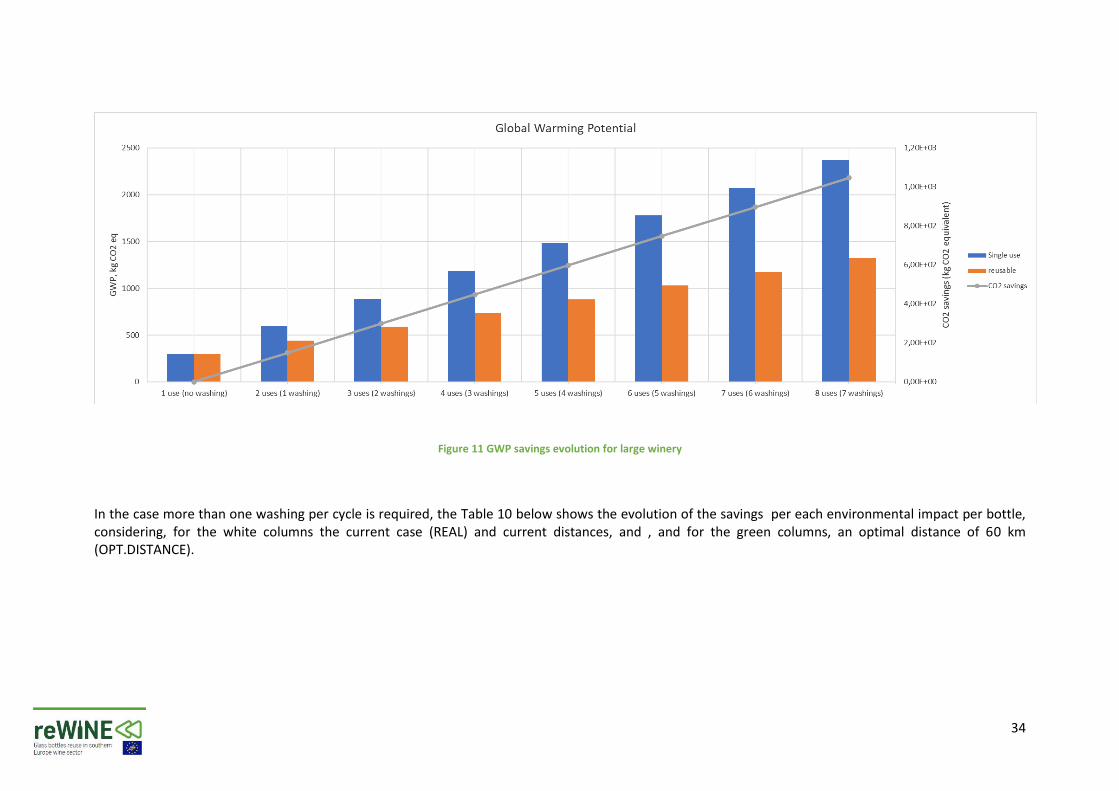
Figure 11 shows graphically the evolution of the savings in CO2 equivalent emissions at each reuse cycle.
34
Figure 11 GWP savings evolution for large winery
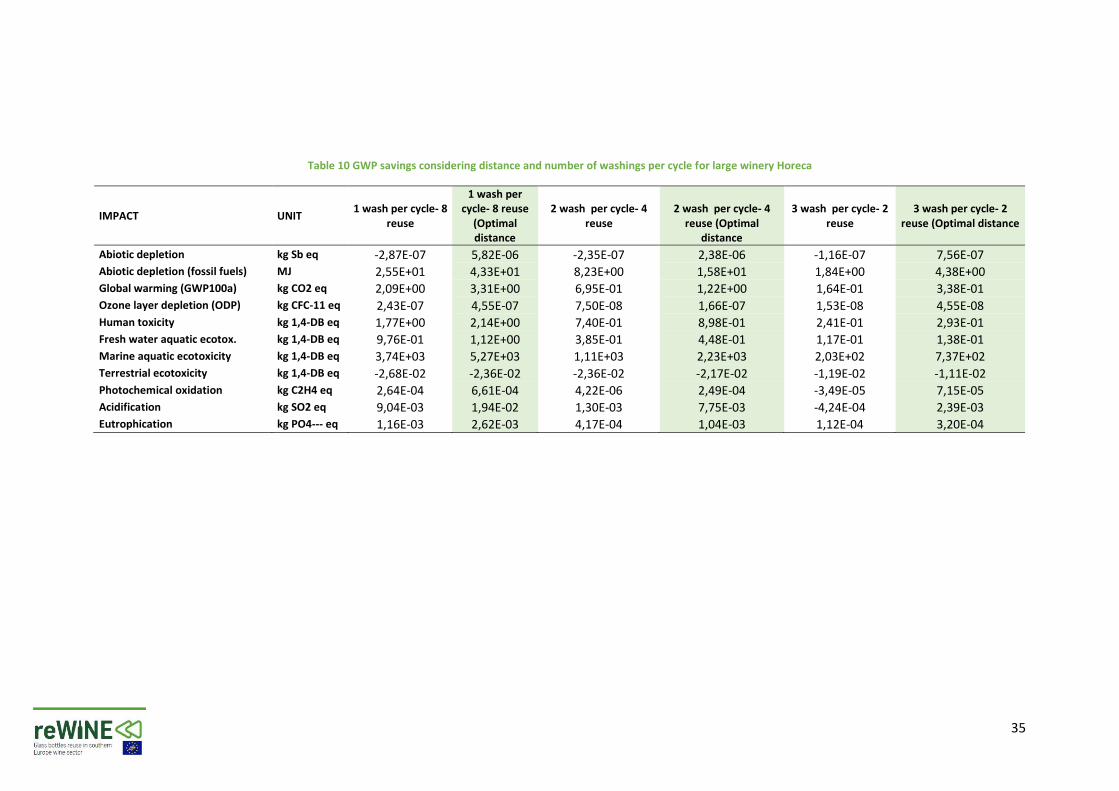
In the case more than one washing per cycle is required, the Table 10 below shows the evolution of the savings per each environmental impact per bottle, considering, for the white columns the current case (REAL) and current distances, and , and for the green columns, an optimal distance of 60 km (OPT.DISTANCE).
35
Table 10 GWP savings considering distance and number of washings per cycle for large winery Horeca
IMPACT UNIT 1 wash per cycle- 8
reuse
1 wash per cycle- 8 reuse
(Optimal distance
2 wash per cycle- 4 reuse
2 wash per cycle- 4 reuse (Optimal
distance
3 wash per cycle- 2 reuse
3 wash per cycle- 2 reuse (Optimal distance
Abiotic depletion kg Sb eq -2,87E-07 5,82E-06 -2,35E-07 2,38E-06 -1,16E-07 7,56E-07
Abiotic depletion (fossil fuels) MJ 2,55E+01 4,33E+01 8,23E+00 1,58E+01 1,84E+00 4,38E+00
Global warming (GWP100a) kg CO2 eq 2,09E+00 3,31E+00 6,95E-01 1,22E+00 1,64E-01 3,38E-01
Ozone layer depletion (ODP) kg CFC-11 eq 2,43E-07 4,55E-07 7,50E-08 1,66E-07 1,53E-08 4,55E-08
Human toxicity kg 1,4-DB eq 1,77E+00 2,14E+00 7,40E-01 8,98E-01 2,41E-01 2,93E-01
Fresh water aquatic ecotox. kg 1,4-DB eq 9,76E-01 1,12E+00 3,85E-01 4,48E-01 1,17E-01 1,38E-01
Marine aquatic ecotoxicity kg 1,4-DB eq 3,74E+03 5,27E+03 1,11E+03 2,23E+03 2,03E+02 7,37E+02
Terrestrial ecotoxicity kg 1,4-DB eq -2,68E-02 -2,36E-02 -2,36E-02 -2,17E-02 -1,19E-02 -1,11E-02
Photochemical oxidation kg C2H4 eq 2,64E-04 6,61E-04 4,22E-06 2,49E-04 -3,49E-05 7,15E-05
Acidification kg SO2 eq 9,04E-03 1,94E-02 1,30E-03 7,75E-03 -4,24E-04 2,39E-03
Eutrophication kg PO4--- eq 1,16E-03 2,62E-03 4,17E-04 1,04E-03 1,12E-04 3,20E-04
36
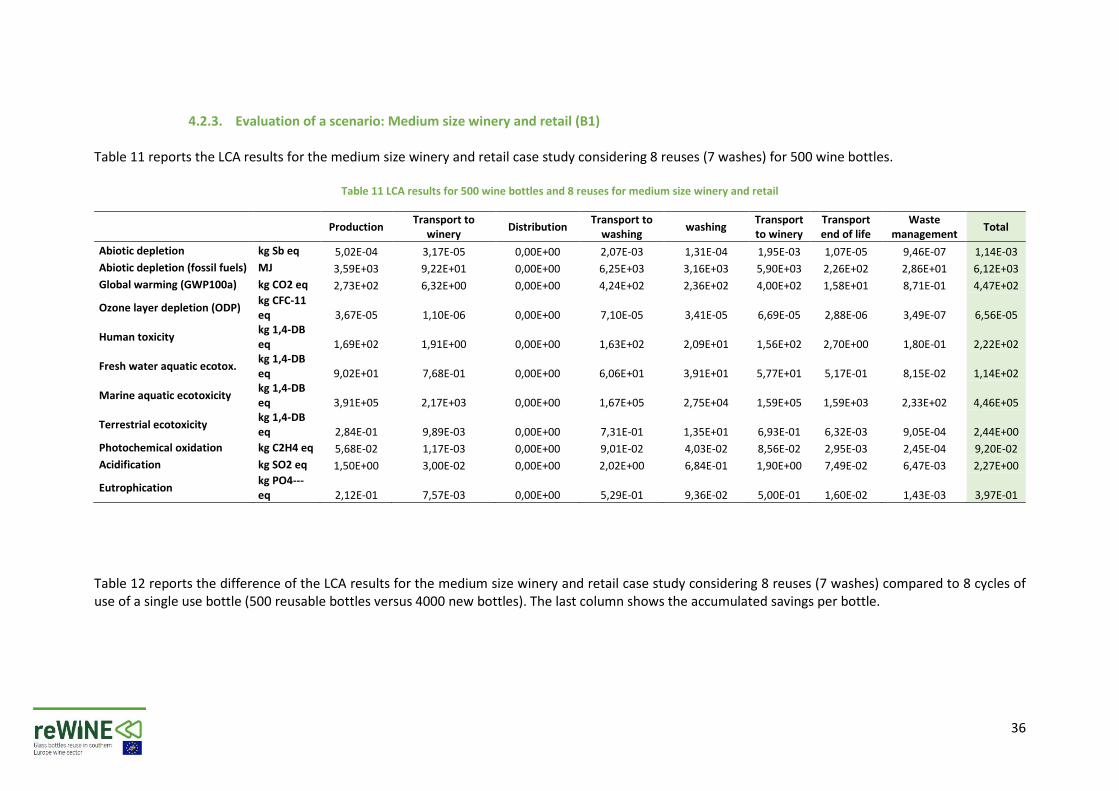
4.2.3. Evaluation of a scenario: Medium size winery and retail (B1) Table 11 reports the LCA results for the medium size winery and retail case study considering 8 reuses (7 washes) for 500 wine bottles.
Table 11 LCA results for 500 wine bottles and 8 reuses for medium size winery and retail
Production Transport to
winery Distribution
Transport to washing
washing Transport to winery
Transport end of life
Waste management
Total
Abiotic depletion kg Sb eq 5,02E-04 3,17E-05 0,00E+00 2,07E-03 1,31E-04 1,95E-03 1,07E-05 9,46E-07 1,14E-03
Abiotic depletion (fossil fuels) MJ 3,59E+03 9,22E+01 0,00E+00 6,25E+03 3,16E+03 5,90E+03 2,26E+02 2,86E+01 6,12E+03
Global warming (GWP100a) kg CO2 eq 2,73E+02 6,32E+00 0,00E+00 4,24E+02 2,36E+02 4,00E+02 1,58E+01 8,71E-01 4,47E+02
Ozone layer depletion (ODP) kg CFC-11 eq 3,67E-05 1,10E-06 0,00E+00 7,10E-05 3,41E-05 6,69E-05 2,88E-06 3,49E-07 6,56E-05
Human toxicity kg 1,4-DB eq 1,69E+02 1,91E+00 0,00E+00 1,63E+02 2,09E+01 1,56E+02 2,70E+00 1,80E-01 2,22E+02
Fresh water aquatic ecotox. kg 1,4-DB eq 9,02E+01 7,68E-01 0,00E+00 6,06E+01 3,91E+01 5,77E+01 5,17E-01 8,15E-02 1,14E+02
Marine aquatic ecotoxicity kg 1,4-DB eq 3,91E+05 2,17E+03 0,00E+00 1,67E+05 2,75E+04 1,59E+05 1,59E+03 2,33E+02 4,46E+05
Terrestrial ecotoxicity kg 1,4-DB eq 2,84E-01 9,89E-03 0,00E+00 7,31E-01 1,35E+01 6,93E-01 6,32E-03 9,05E-04 2,44E+00
Photochemical oxidation kg C2H4 eq 5,68E-02 1,17E-03 0,00E+00 9,01E-02 4,03E-02 8,56E-02 2,95E-03 2,45E-04 9,20E-02
Acidification kg SO2 eq 1,50E+00 3,00E-02 0,00E+00 2,02E+00 6,84E-01 1,90E+00 7,49E-02 6,47E-03 2,27E+00
Eutrophication kg PO4--- eq 2,12E-01 7,57E-03 0,00E+00 5,29E-01 9,36E-02 5,00E-01 1,60E-02 1,43E-03 3,97E-01
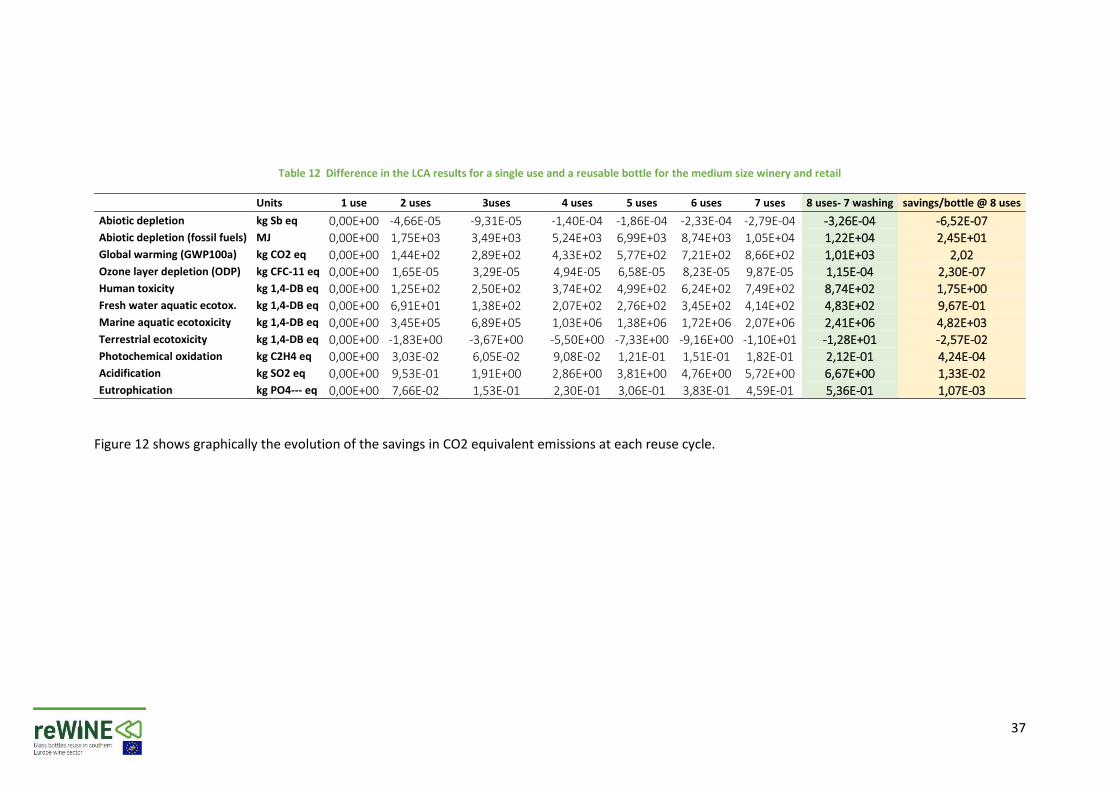
Table 12 reports the difference of the LCA results for the medium size winery and retail case study considering 8 reuses (7 washes) compared to 8 cycles of use of a single use bottle (500 reusable bottles versus 4000 new bottles). The last column shows the accumulated savings per bottle.
37
Table 12 Difference in the LCA results for a single use and a reusable bottle for the medium size winery and retail
Units 1 use 2 uses 3uses 4 uses 5 uses 6 uses 7 uses 8 uses- 7 washing savings/bottle @ 8 uses
Abiotic depletion kg Sb eq 0,00E+00 -4,66E-05 -9,31E-05 -1,40E-04 -1,86E-04 -2,33E-04 -2,79E-04 -3,26E-04 -6,52E-07
Abiotic depletion (fossil fuels) MJ 0,00E+00 1,75E+03 3,49E+03 5,24E+03 6,99E+03 8,74E+03 1,05E+04 1,22E+04 2,45E+01
Global warming (GWP100a) kg CO2 eq 0,00E+00 1,44E+02 2,89E+02 4,33E+02 5,77E+02 7,21E+02 8,66E+02 1,01E+03 2,02
Ozone layer depletion (ODP) kg CFC-11 eq 0,00E+00 1,65E-05 3,29E-05 4,94E-05 6,58E-05 8,23E-05 9,87E-05 1,15E-04 2,30E-07
Human toxicity kg 1,4-DB eq 0,00E+00 1,25E+02 2,50E+02 3,74E+02 4,99E+02 6,24E+02 7,49E+02 8,74E+02 1,75E+00
Fresh water aquatic ecotox. kg 1,4-DB eq 0,00E+00 6,91E+01 1,38E+02 2,07E+02 2,76E+02 3,45E+02 4,14E+02 4,83E+02 9,67E-01
Marine aquatic ecotoxicity kg 1,4-DB eq 0,00E+00 3,45E+05 6,89E+05 1,03E+06 1,38E+06 1,72E+06 2,07E+06 2,41E+06 4,82E+03
Terrestrial ecotoxicity kg 1,4-DB eq 0,00E+00 -1,83E+00 -3,67E+00 -5,50E+00 -7,33E+00 -9,16E+00 -1,10E+01 -1,28E+01 -2,57E-02
Photochemical oxidation kg C2H4 eq 0,00E+00 3,03E-02 6,05E-02 9,08E-02 1,21E-01 1,51E-01 1,82E-01 2,12E-01 4,24E-04
Acidification kg SO2 eq 0,00E+00 9,53E-01 1,91E+00 2,86E+00 3,81E+00 4,76E+00 5,72E+00 6,67E+00 1,33E-02
Eutrophication kg PO4--- eq 0,00E+00 7,66E-02 1,53E-01 2,30E-01 3,06E-01 3,83E-01 4,59E-01 5,36E-01 1,07E-03
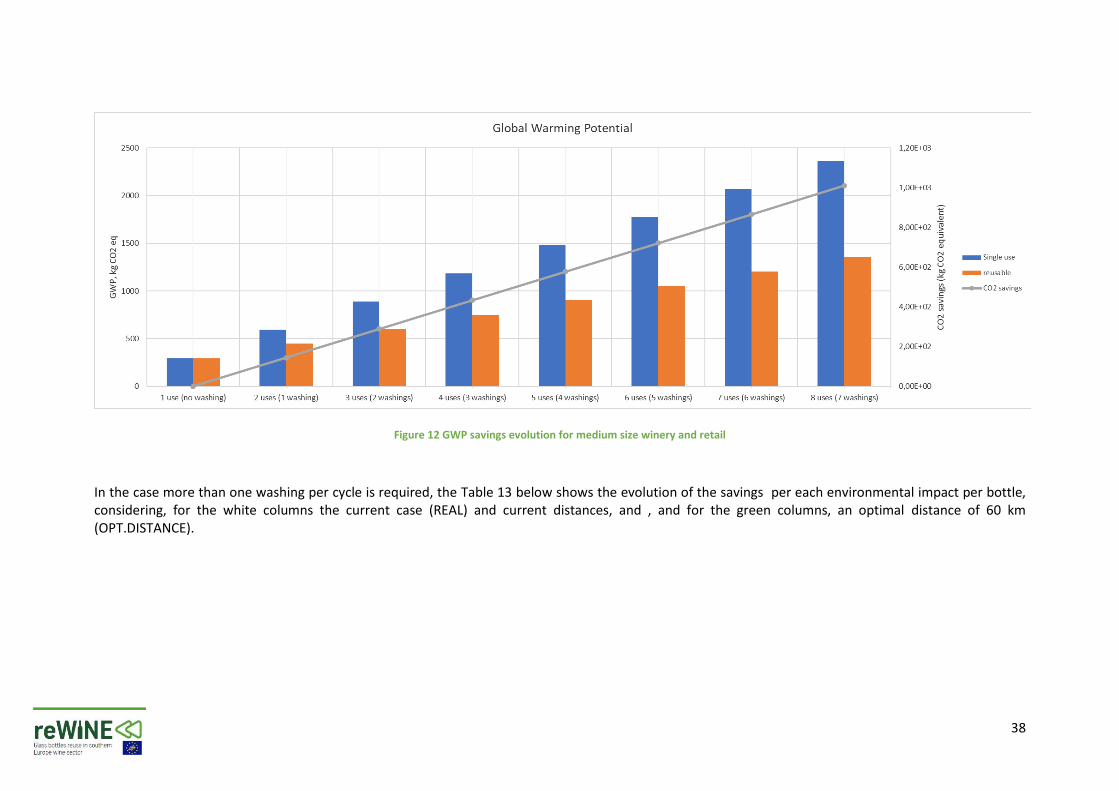
Figure 12 shows graphically the evolution of the savings in CO2 equivalent emissions at each reuse cycle.
38
Figure 12 GWP savings evolution for medium size winery and retail
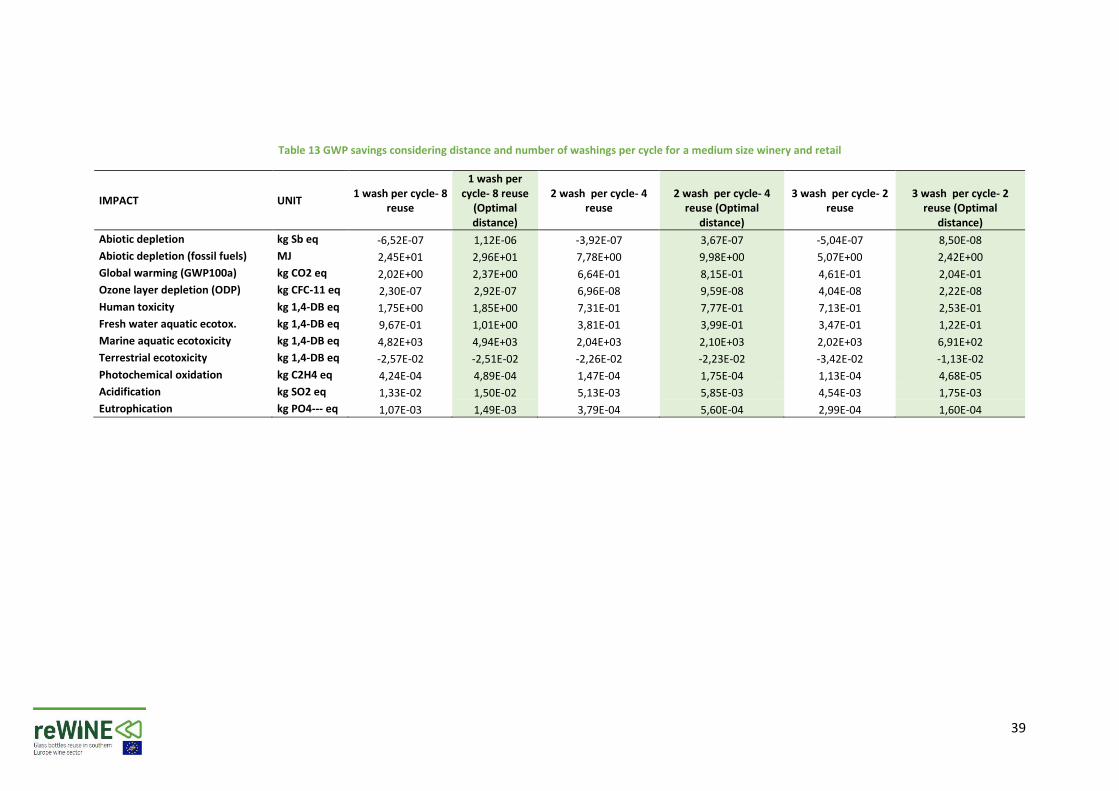
In the case more than one washing per cycle is required, the Table 13 below shows the evolution of the savings per each environmental impact per bottle, considering, for the white columns the current case (REAL) and current distances, and , and for the green columns, an optimal distance of 60 km (OPT.DISTANCE).
39
Table 13 GWP savings considering distance and number of washings per cycle for a medium size winery and retail
IMPACT UNIT 1 wash per cycle- 8
reuse
1 wash per cycle- 8 reuse
(Optimal distance)
2 wash per cycle- 4 reuse
2 wash per cycle- 4 reuse (Optimal
distance)
3 wash per cycle- 2 reuse
3 wash per cycle- 2 reuse (Optimal
distance)
Abiotic depletion kg Sb eq -6,52E-07 1,12E-06 -3,92E-07 3,67E-07 -5,04E-07 8,50E-08
Abiotic depletion (fossil fuels) MJ 2,45E+01 2,96E+01 7,78E+00 9,98E+00 5,07E+00 2,42E+00
Global warming (GWP100a) kg CO2 eq 2,02E+00 2,37E+00 6,64E-01 8,15E-01 4,61E-01 2,04E-01
Ozone layer depletion (ODP) kg CFC-11 eq 2,30E-07 2,92E-07 6,96E-08 9,59E-08 4,04E-08 2,22E-08
Human toxicity kg 1,4-DB eq 1,75E+00 1,85E+00 7,31E-01 7,77E-01 7,13E-01 2,53E-01
Fresh water aquatic ecotox. kg 1,4-DB eq 9,67E-01 1,01E+00 3,81E-01 3,99E-01 3,47E-01 1,22E-01
Marine aquatic ecotoxicity kg 1,4-DB eq 4,82E+03 4,94E+03 2,04E+03 2,10E+03 2,02E+03 6,91E+02
Terrestrial ecotoxicity kg 1,4-DB eq -2,57E-02 -2,51E-02 -2,26E-02 -2,23E-02 -3,42E-02 -1,13E-02
Photochemical oxidation kg C2H4 eq 4,24E-04 4,89E-04 1,47E-04 1,75E-04 1,13E-04 4,68E-05
Acidification kg SO2 eq 1,33E-02 1,50E-02 5,13E-03 5,85E-03 4,54E-03 1,75E-03
Eutrophication kg PO4--- eq 1,07E-03 1,49E-03 3,79E-04 5,60E-04 2,99E-04 1,60E-04
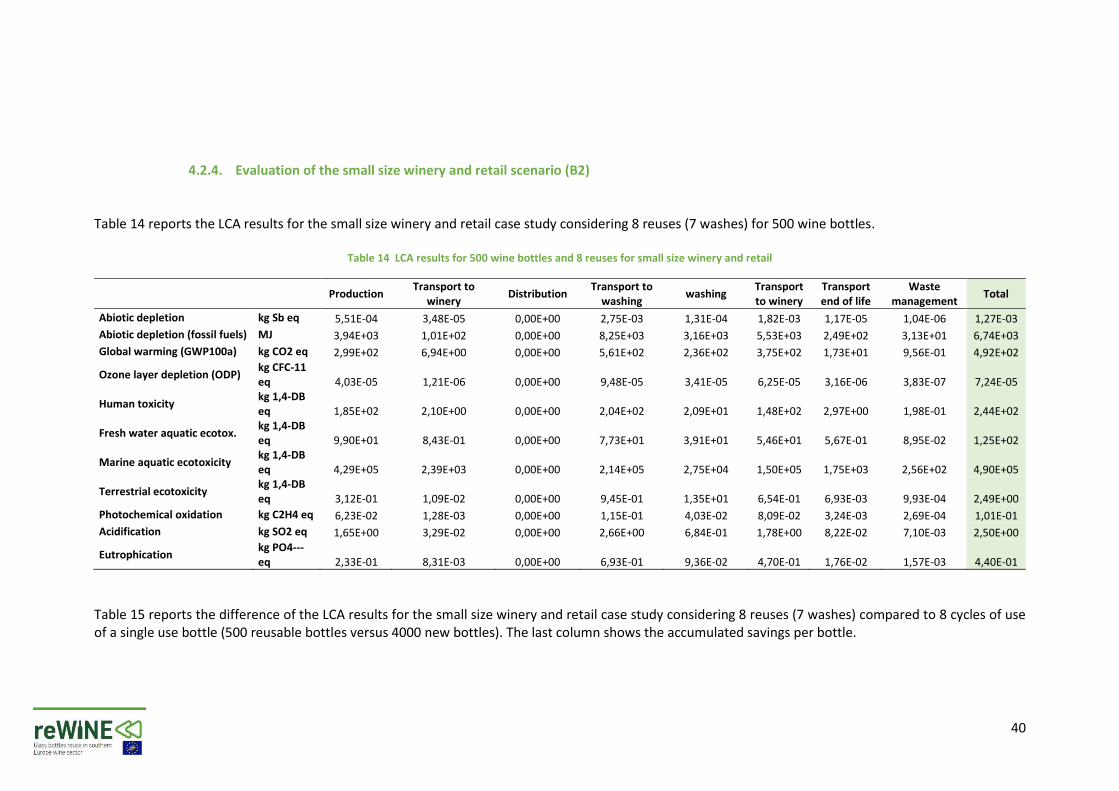
40
4.2.4. Evaluation of the small size winery and retail scenario (B2) Table 14 reports the LCA results for the small size winery and retail case study considering 8 reuses (7 washes) for 500 wine bottles.
Table 14 LCA results for 500 wine bottles and 8 reuses for small size winery and retail
Production Transport to
winery Distribution
Transport to washing
washing Transport to winery
Transport end of life
Waste management
Total
Abiotic depletion kg Sb eq 5,51E-04 3,48E-05 0,00E+00 2,75E-03 1,31E-04 1,82E-03 1,17E-05 1,04E-06 1,27E-03
Abiotic depletion (fossil fuels) MJ 3,94E+03 1,01E+02 0,00E+00 8,25E+03 3,16E+03 5,53E+03 2,49E+02 3,13E+01 6,74E+03
Global warming (GWP100a) kg CO2 eq 2,99E+02 6,94E+00 0,00E+00 5,61E+02 2,36E+02 3,75E+02 1,73E+01 9,56E-01 4,92E+02
Ozone layer depletion (ODP) kg CFC-11 eq 4,03E-05 1,21E-06 0,00E+00 9,48E-05 3,41E-05 6,25E-05 3,16E-06 3,83E-07 7,24E-05
Human toxicity kg 1,4-DB eq 1,85E+02 2,10E+00 0,00E+00 2,04E+02 2,09E+01 1,48E+02 2,97E+00 1,98E-01 2,44E+02
Fresh water aquatic ecotox. kg 1,4-DB eq 9,90E+01 8,43E-01 0,00E+00 7,73E+01 3,91E+01 5,46E+01 5,67E-01 8,95E-02 1,25E+02
Marine aquatic ecotoxicity kg 1,4-DB eq 4,29E+05 2,39E+03 0,00E+00 2,14E+05 2,75E+04 1,50E+05 1,75E+03 2,56E+02 4,90E+05
Terrestrial ecotoxicity kg 1,4-DB eq 3,12E-01 1,09E-02 0,00E+00 9,45E-01 1,35E+01 6,54E-01 6,93E-03 9,93E-04 2,49E+00
Photochemical oxidation kg C2H4 eq 6,23E-02 1,28E-03 0,00E+00 1,15E-01 4,03E-02 8,09E-02 3,24E-03 2,69E-04 1,01E-01
Acidification kg SO2 eq 1,65E+00 3,29E-02 0,00E+00 2,66E+00 6,84E-01 1,78E+00 8,22E-02 7,10E-03 2,50E+00
Eutrophication kg PO4--- eq 2,33E-01 8,31E-03 0,00E+00 6,93E-01 9,36E-02 4,70E-01 1,76E-02 1,57E-03 4,40E-01
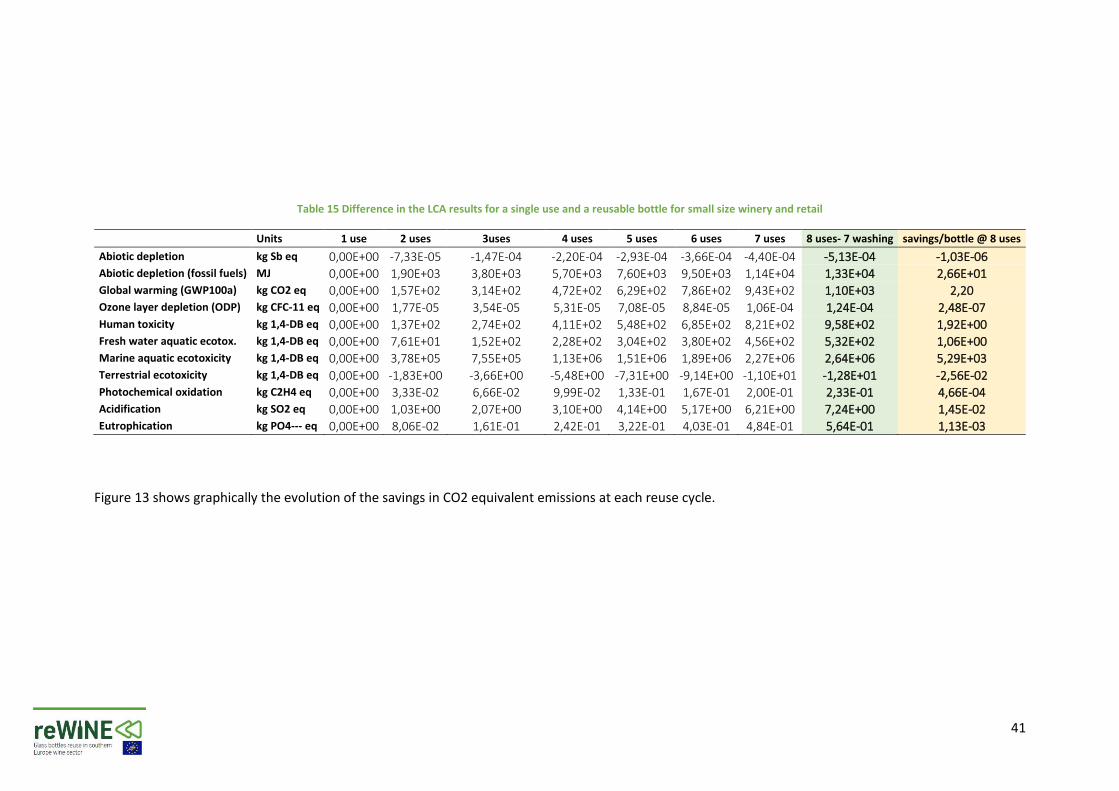
Table 15 reports the difference of the LCA results for the small size winery and retail case study considering 8 reuses (7 washes) compared to 8 cycles of use of a single use bottle (500 reusable bottles versus 4000 new bottles). The last column shows the accumulated savings per bottle.
41
Table 15 Difference in the LCA results for a single use and a reusable bottle for small size winery and retail
Units 1 use 2 uses 3uses 4 uses 5 uses 6 uses 7 uses 8 uses- 7 washing savings/bottle @ 8 uses
Abiotic depletion kg Sb eq 0,00E+00 -7,33E-05 -1,47E-04 -2,20E-04 -2,93E-04 -3,66E-04 -4,40E-04 -5,13E-04 -1,03E-06
Abiotic depletion (fossil fuels) MJ 0,00E+00 1,90E+03 3,80E+03 5,70E+03 7,60E+03 9,50E+03 1,14E+04 1,33E+04 2,66E+01
Global warming (GWP100a) kg CO2 eq 0,00E+00 1,57E+02 3,14E+02 4,72E+02 6,29E+02 7,86E+02 9,43E+02 1,10E+03 2,20
Ozone layer depletion (ODP) kg CFC-11 eq 0,00E+00 1,77E-05 3,54E-05 5,31E-05 7,08E-05 8,84E-05 1,06E-04 1,24E-04 2,48E-07
Human toxicity kg 1,4-DB eq 0,00E+00 1,37E+02 2,74E+02 4,11E+02 5,48E+02 6,85E+02 8,21E+02 9,58E+02 1,92E+00
Fresh water aquatic ecotox. kg 1,4-DB eq 0,00E+00 7,61E+01 1,52E+02 2,28E+02 3,04E+02 3,80E+02 4,56E+02 5,32E+02 1,06E+00
Marine aquatic ecotoxicity kg 1,4-DB eq 0,00E+00 3,78E+05 7,55E+05 1,13E+06 1,51E+06 1,89E+06 2,27E+06 2,64E+06 5,29E+03
Terrestrial ecotoxicity kg 1,4-DB eq 0,00E+00 -1,83E+00 -3,66E+00 -5,48E+00 -7,31E+00 -9,14E+00 -1,10E+01 -1,28E+01 -2,56E-02
Photochemical oxidation kg C2H4 eq 0,00E+00 3,33E-02 6,66E-02 9,99E-02 1,33E-01 1,67E-01 2,00E-01 2,33E-01 4,66E-04
Acidification kg SO2 eq 0,00E+00 1,03E+00 2,07E+00 3,10E+00 4,14E+00 5,17E+00 6,21E+00 7,24E+00 1,45E-02
Eutrophication kg PO4--- eq 0,00E+00 8,06E-02 1,61E-01 2,42E-01 3,22E-01 4,03E-01 4,84E-01 5,64E-01 1,13E-03
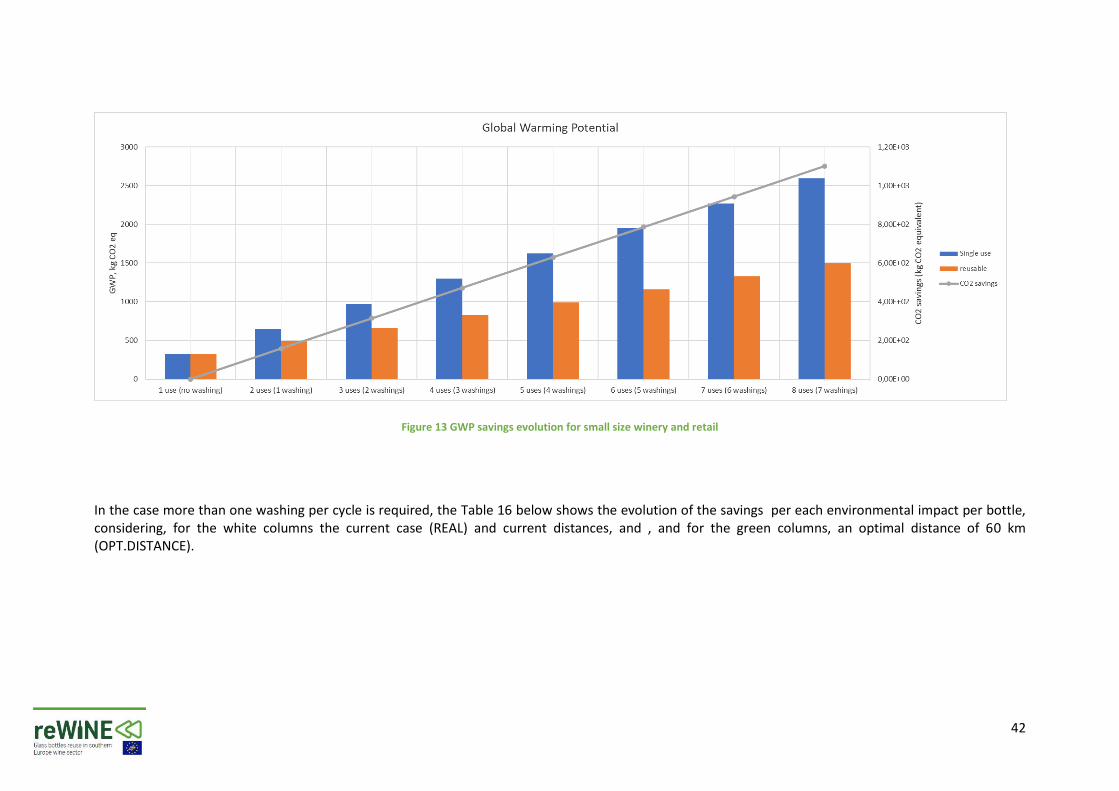
Figure 13 shows graphically the evolution of the savings in CO2 equivalent emissions at each reuse cycle.
42
Figure 13 GWP savings evolution for small size winery and retail
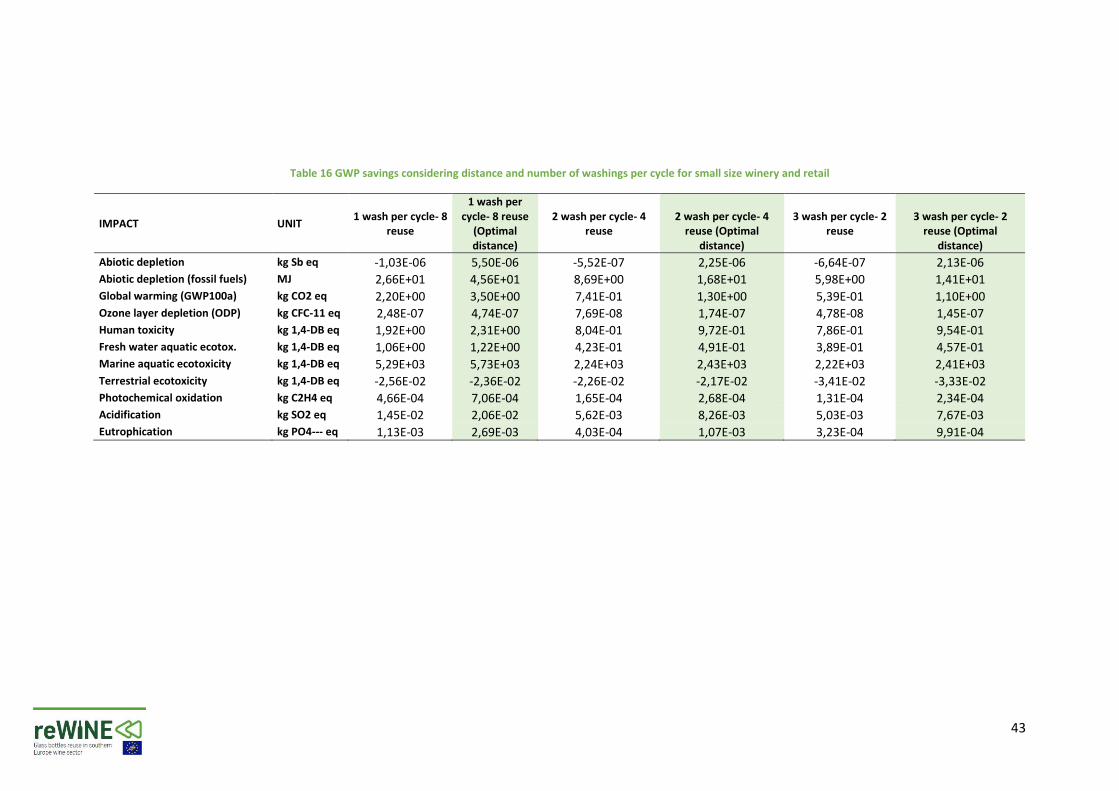
In the case more than one washing per cycle is required, the Table 16 below shows the evolution of the savings per each environmental impact per bottle, considering, for the white columns the current case (REAL) and current distances, and , and for the green columns, an optimal distance of 60 km (OPT.DISTANCE).
43
Table 16 GWP savings considering distance and number of washings per cycle for small size winery and retail
IMPACT UNIT 1 wash per cycle- 8
reuse
1 wash per cycle- 8 reuse
(Optimal distance)
2 wash per cycle- 4 reuse
2 wash per cycle- 4 reuse (Optimal
distance)
3 wash per cycle- 2 reuse
3 wash per cycle- 2 reuse (Optimal
distance)
Abiotic depletion kg Sb eq -1,03E-06 5,50E-06 -5,52E-07 2,25E-06 -6,64E-07 2,13E-06
Abiotic depletion (fossil fuels) MJ 2,66E+01 4,56E+01 8,69E+00 1,68E+01 5,98E+00 1,41E+01
Global warming (GWP100a) kg CO2 eq 2,20E+00 3,50E+00 7,41E-01 1,30E+00 5,39E-01 1,10E+00
Ozone layer depletion (ODP) kg CFC-11 eq 2,48E-07 4,74E-07 7,69E-08 1,74E-07 4,78E-08 1,45E-07
Human toxicity kg 1,4-DB eq 1,92E+00 2,31E+00 8,04E-01 9,72E-01 7,86E-01 9,54E-01
Fresh water aquatic ecotox. kg 1,4-DB eq 1,06E+00 1,22E+00 4,23E-01 4,91E-01 3,89E-01 4,57E-01
Marine aquatic ecotoxicity kg 1,4-DB eq 5,29E+03 5,73E+03 2,24E+03 2,43E+03 2,22E+03 2,41E+03
Terrestrial ecotoxicity kg 1,4-DB eq -2,56E-02 -2,36E-02 -2,26E-02 -2,17E-02 -3,41E-02 -3,33E-02
Photochemical oxidation kg C2H4 eq 4,66E-04 7,06E-04 1,65E-04 2,68E-04 1,31E-04 2,34E-04
Acidification kg SO2 eq 1,45E-02 2,06E-02 5,62E-03 8,26E-03 5,03E-03 7,67E-03
Eutrophication kg PO4--- eq 1,13E-03 2,69E-03 4,03E-04 1,07E-03 3,23E-04 9,91E-04
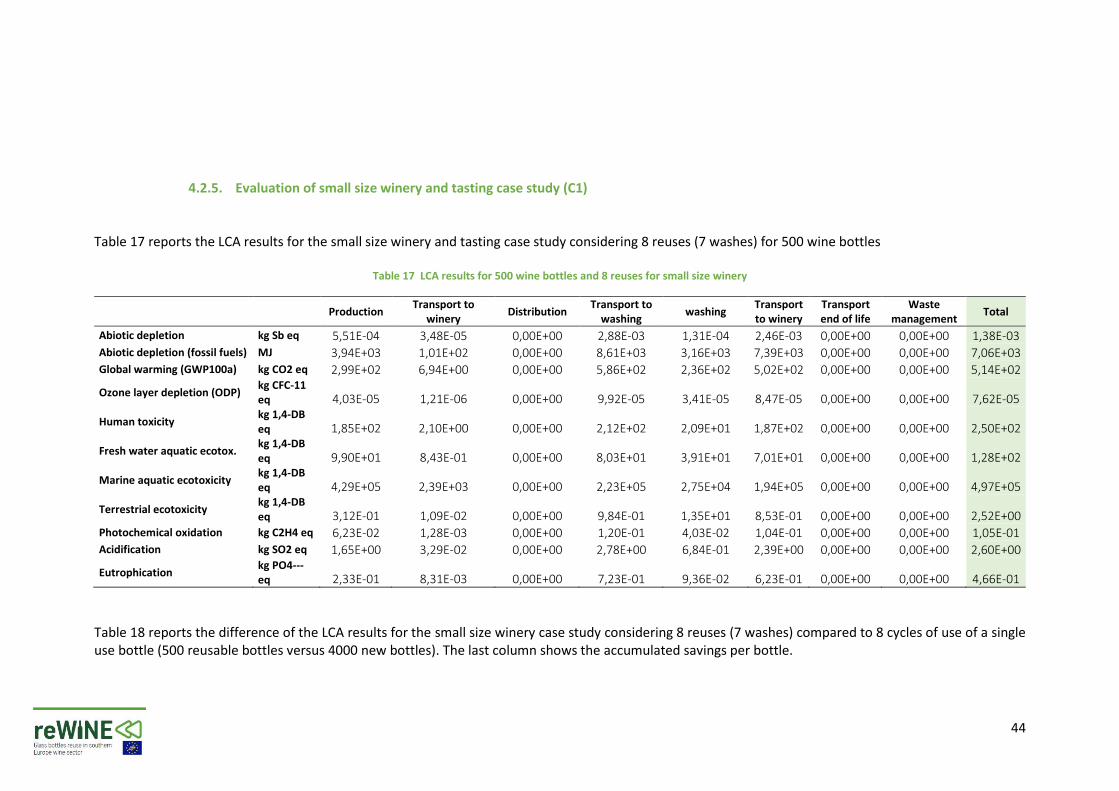
44
4.2.5. Evaluation of small size winery and tasting case study (C1) Table 17 reports the LCA results for the small size winery and tasting case study considering 8 reuses (7 washes) for 500 wine bottles
Table 17 LCA results for 500 wine bottles and 8 reuses for small size winery
Production Transport to
winery Distribution
Transport to washing
washing Transport to winery
Transport end of life
Waste management
Total
Abiotic depletion kg Sb eq 5,51E-04 3,48E-05 0,00E+00 2,88E-03 1,31E-04 2,46E-03 0,00E+00 0,00E+00 1,38E-03
Abiotic depletion (fossil fuels) MJ 3,94E+03 1,01E+02 0,00E+00 8,61E+03 3,16E+03 7,39E+03 0,00E+00 0,00E+00 7,06E+03
Global warming (GWP100a) kg CO2 eq 2,99E+02 6,94E+00 0,00E+00 5,86E+02 2,36E+02 5,02E+02 0,00E+00 0,00E+00 5,14E+02
Ozone layer depletion (ODP) kg CFC-11 eq 4,03E-05 1,21E-06 0,00E+00 9,92E-05 3,41E-05 8,47E-05 0,00E+00 0,00E+00 7,62E-05
Human toxicity kg 1,4-DB eq 1,85E+02 2,10E+00 0,00E+00 2,12E+02 2,09E+01 1,87E+02 0,00E+00 0,00E+00 2,50E+02
Fresh water aquatic ecotox. kg 1,4-DB eq 9,90E+01 8,43E-01 0,00E+00 8,03E+01 3,91E+01 7,01E+01 0,00E+00 0,00E+00 1,28E+02
Marine aquatic ecotoxicity kg 1,4-DB eq 4,29E+05 2,39E+03 0,00E+00 2,23E+05 2,75E+04 1,94E+05 0,00E+00 0,00E+00 4,97E+05
Terrestrial ecotoxicity kg 1,4-DB eq 3,12E-01 1,09E-02 0,00E+00 9,84E-01 1,35E+01 8,53E-01 0,00E+00 0,00E+00 2,52E+00
Photochemical oxidation kg C2H4 eq 6,23E-02 1,28E-03 0,00E+00 1,20E-01 4,03E-02 1,04E-01 0,00E+00 0,00E+00 1,05E-01
Acidification kg SO2 eq 1,65E+00 3,29E-02 0,00E+00 2,78E+00 6,84E-01 2,39E+00 0,00E+00 0,00E+00 2,60E+00
Eutrophication kg PO4--- eq 2,33E-01 8,31E-03 0,00E+00 7,23E-01 9,36E-02 6,23E-01 0,00E+00 0,00E+00 4,66E-01
Table 18 reports the difference of the LCA results for the small size winery case study considering 8 reuses (7 washes) compared to 8 cycles of use of a single use bottle (500 reusable bottles versus 4000 new bottles). The last column shows the accumulated savings per bottle.
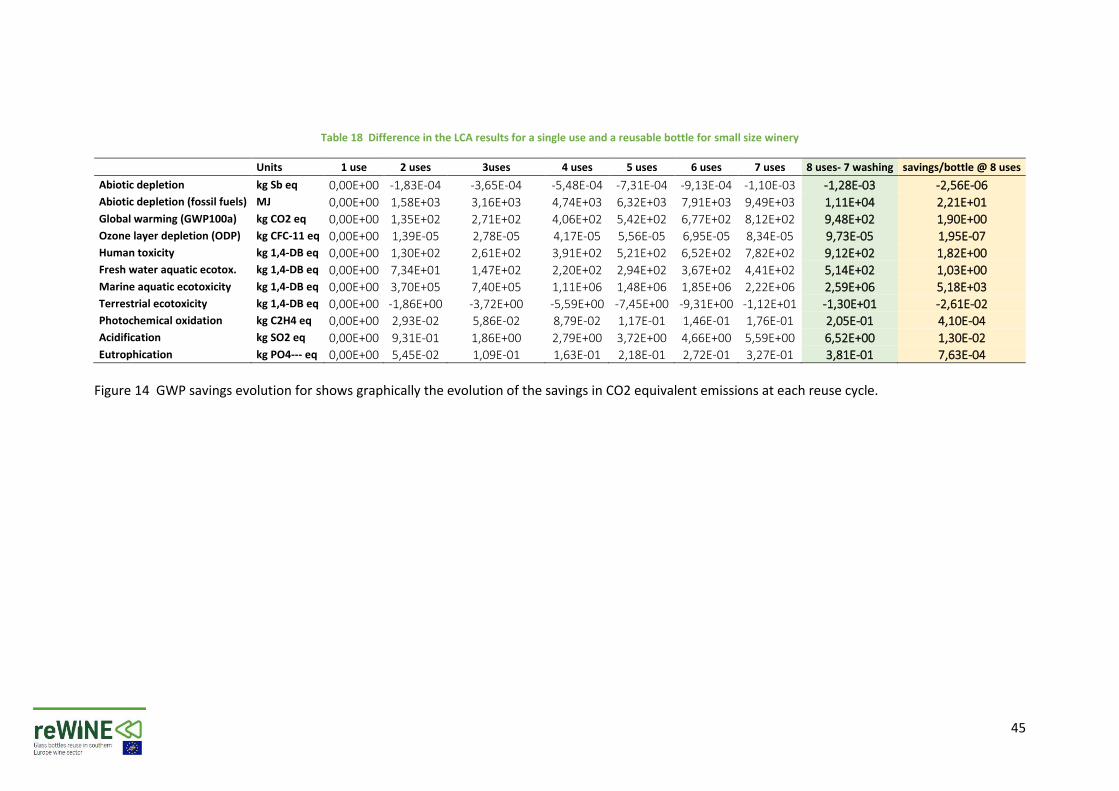
45
Table 18 Difference in the LCA results for a single use and a reusable bottle for small size winery
Units 1 use 2 uses 3uses 4 uses 5 uses 6 uses 7 uses 8 uses- 7 washing savings/bottle @ 8 uses
Abiotic depletion kg Sb eq 0,00E+00 -1,83E-04 -3,65E-04 -5,48E-04 -7,31E-04 -9,13E-04 -1,10E-03 -1,28E-03 -2,56E-06
Abiotic depletion (fossil fuels) MJ 0,00E+00 1,58E+03 3,16E+03 4,74E+03 6,32E+03 7,91E+03 9,49E+03 1,11E+04 2,21E+01
Global warming (GWP100a) kg CO2 eq 0,00E+00 1,35E+02 2,71E+02 4,06E+02 5,42E+02 6,77E+02 8,12E+02 9,48E+02 1,90E+00
Ozone layer depletion (ODP) kg CFC-11 eq 0,00E+00 1,39E-05 2,78E-05 4,17E-05 5,56E-05 6,95E-05 8,34E-05 9,73E-05 1,95E-07
Human toxicity kg 1,4-DB eq 0,00E+00 1,30E+02 2,61E+02 3,91E+02 5,21E+02 6,52E+02 7,82E+02 9,12E+02 1,82E+00
Fresh water aquatic ecotox. kg 1,4-DB eq 0,00E+00 7,34E+01 1,47E+02 2,20E+02 2,94E+02 3,67E+02 4,41E+02 5,14E+02 1,03E+00
Marine aquatic ecotoxicity kg 1,4-DB eq 0,00E+00 3,70E+05 7,40E+05 1,11E+06 1,48E+06 1,85E+06 2,22E+06 2,59E+06 5,18E+03
Terrestrial ecotoxicity kg 1,4-DB eq 0,00E+00 -1,86E+00 -3,72E+00 -5,59E+00 -7,45E+00 -9,31E+00 -1,12E+01 -1,30E+01 -2,61E-02
Photochemical oxidation kg C2H4 eq 0,00E+00 2,93E-02 5,86E-02 8,79E-02 1,17E-01 1,46E-01 1,76E-01 2,05E-01 4,10E-04
Acidification kg SO2 eq 0,00E+00 9,31E-01 1,86E+00 2,79E+00 3,72E+00 4,66E+00 5,59E+00 6,52E+00 1,30E-02
Eutrophication kg PO4--- eq 0,00E+00 5,45E-02 1,09E-01 1,63E-01 2,18E-01 2,72E-01 3,27E-01 3,81E-01 7,63E-04
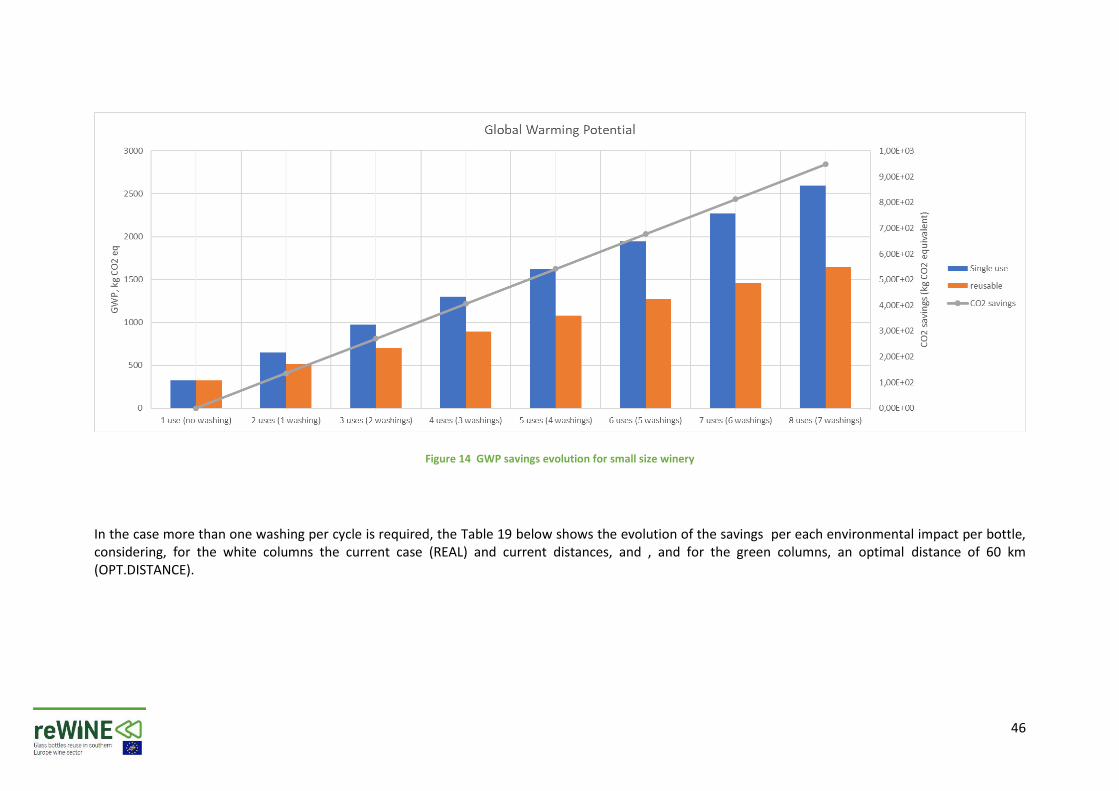
Figure 14 GWP savings evolution for shows graphically the evolution of the savings in CO2 equivalent emissions at each reuse cycle.
46
Figure 14 GWP savings evolution for small size winery
In the case more than one washing per cycle is required, the Table 19 below shows the evolution of the savings per each environmental impact per bottle, considering, for the white columns the current case (REAL) and current distances, and , and for the green columns, an optimal distance of 60 km (OPT.DISTANCE).

47
Table 19 GWP savings considering distance and number of washings per cycle for small size winery
IMPACT UNIT 1 wash per cycle- 8
reuse
1 wash per cycle- 8 reuse
(Optimal distance)
2 wash per cycle- 4 euse
2 wash per cycle- 4 reuse (Optimal
distance)
3 wash per cycle- 2 reuse
3 wash per cycle- 2 reuse (Optimal
distance)
Abiotic depletion kg Sb eq -2,56E-06 5,69E-06 -1,21E-06 2,33E-06 -8,80E-07 1,48E-06
Abiotic depletion (fossil fuels) MJ 2,21E+01 4,61E+01 6,78E+00 1,71E+01 2,71E+00 9,56E+00
Global warming (GWP100a) kg CO2 eq 1,90E+00 3,54E+00 6,10E-01 1,31E+00 2,72E-01 7,41E-01
Ozone layer depletion (ODP) kg CFC-11 eq 1,95E-07 4,80E-07 5,42E-08 1,77E-07 1,67E-08 9,83E-08
Human toxicity kg 1,4-DB eq 1,82E+00 2,32E+00 7,64E-01 9,77E-01 4,97E-01 6,39E-01
Fresh water aquatic ecotox. kg 1,4-DB eq 1,03E+00 1,23E+00 4,07E-01 4,93E-01 2,49E-01 3,06E-01
Marine aquatic ecotoxicity kg 1,4-DB eq 5,18E+03 5,75E+03 2,20E+03 2,44E+03 1,45E+03 1,61E+03
Terrestrial ecotoxicity kg 1,4-DB eq -2,61E-02 -2,35E-02 -2,28E-02 -2,17E-02 -2,29E-02 -2,22E-02
Photochemical oxidation kg C2H4 eq 4,10E-04 7,13E-04 1,41E-04 2,71E-04 7,11E-05 1,58E-04
Acidification kg SO2 eq 1,30E-02 2,08E-02 5,00E-03 8,34E-03 2,94E-03 5,17E-03
Eutrophication kg PO4--- eq 7,63E-04 2,73E-03 2,47E-04 1,09E-03 1,11E-04 6,73E-04
48
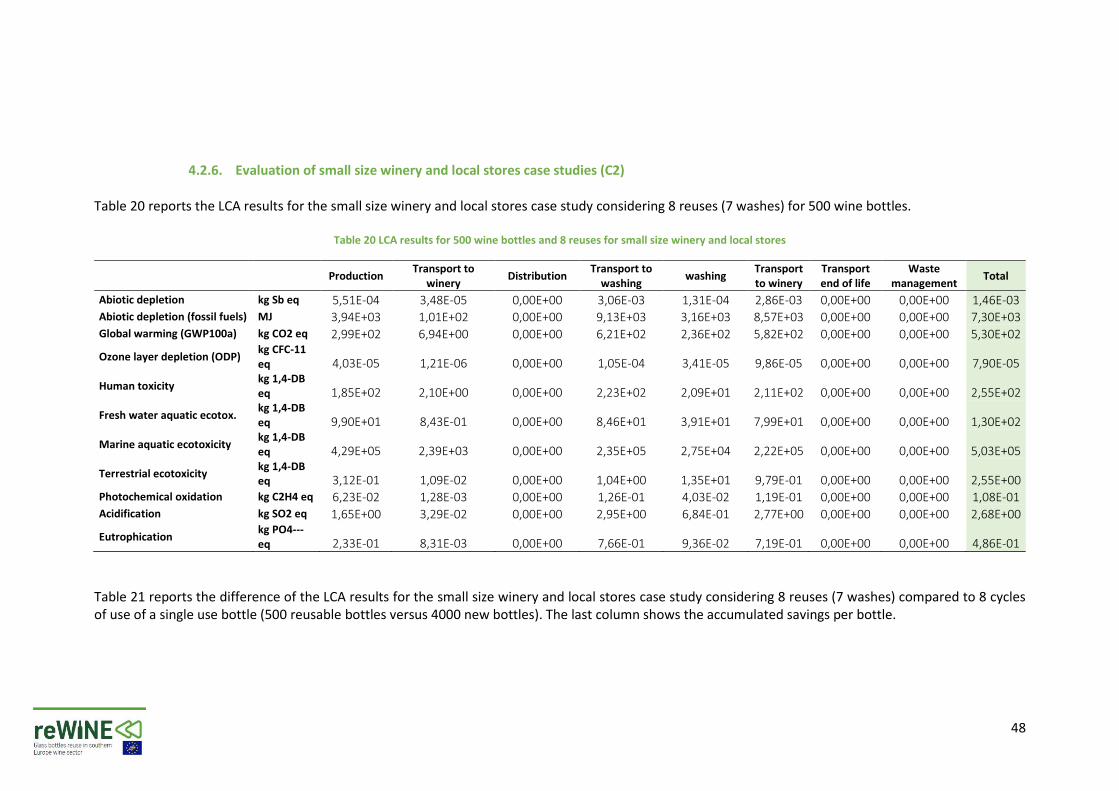
4.2.6. Evaluation of small size winery and local stores case studies (C2)
Table 20 reports the LCA results for the small size winery and local stores case study considering 8 reuses (7 washes) for 500 wine bottles.
Table 20 LCA results for 500 wine bottles and 8 reuses for small size winery and local stores
Production Transport to
winery Distribution
Transport to washing
washing Transport to winery
Transport end of life
Waste management
Total
Abiotic depletion kg Sb eq 5,51E-04 3,48E-05 0,00E+00 3,06E-03 1,31E-04 2,86E-03 0,00E+00 0,00E+00 1,46E-03
Abiotic depletion (fossil fuels) MJ 3,94E+03 1,01E+02 0,00E+00 9,13E+03 3,16E+03 8,57E+03 0,00E+00 0,00E+00 7,30E+03
Global warming (GWP100a) kg CO2 eq 2,99E+02 6,94E+00 0,00E+00 6,21E+02 2,36E+02 5,82E+02 0,00E+00 0,00E+00 5,30E+02
Ozone layer depletion (ODP) kg CFC-11 eq 4,03E-05 1,21E-06 0,00E+00 1,05E-04 3,41E-05 9,86E-05 0,00E+00 0,00E+00 7,90E-05
Human toxicity kg 1,4-DB eq 1,85E+02 2,10E+00 0,00E+00 2,23E+02 2,09E+01 2,11E+02 0,00E+00 0,00E+00 2,55E+02
Fresh water aquatic ecotox. kg 1,4-DB eq 9,90E+01 8,43E-01 0,00E+00 8,46E+01 3,91E+01 7,99E+01 0,00E+00 0,00E+00 1,30E+02
Marine aquatic ecotoxicity kg 1,4-DB eq 4,29E+05 2,39E+03 0,00E+00 2,35E+05 2,75E+04 2,22E+05 0,00E+00 0,00E+00 5,03E+05
Terrestrial ecotoxicity kg 1,4-DB eq 3,12E-01 1,09E-02 0,00E+00 1,04E+00 1,35E+01 9,79E-01 0,00E+00 0,00E+00 2,55E+00
Photochemical oxidation kg C2H4 eq 6,23E-02 1,28E-03 0,00E+00 1,26E-01 4,03E-02 1,19E-01 0,00E+00 0,00E+00 1,08E-01
Acidification kg SO2 eq 1,65E+00 3,29E-02 0,00E+00 2,95E+00 6,84E-01 2,77E+00 0,00E+00 0,00E+00 2,68E+00
Eutrophication kg PO4--- eq 2,33E-01 8,31E-03 0,00E+00 7,66E-01 9,36E-02 7,19E-01 0,00E+00 0,00E+00 4,86E-01
Table 21 reports the difference of the LCA results for the small size winery and local stores case study considering 8 reuses (7 washes) compared to 8 cycles of use of a single use bottle (500 reusable bottles versus 4000 new bottles). The last column shows the accumulated savings per bottle.
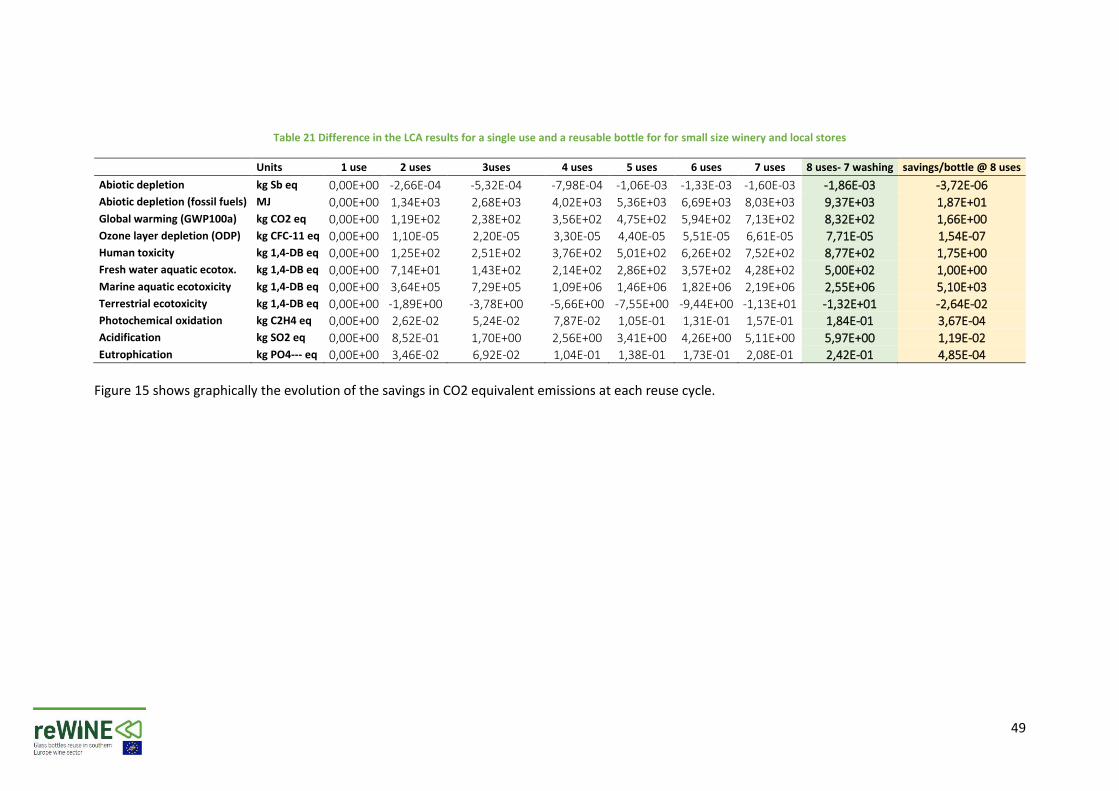
49
Table 21 Difference in the LCA results for a single use and a reusable bottle for for small size winery and local stores
Units 1 use 2 uses 3uses 4 uses 5 uses 6 uses 7 uses 8 uses- 7 washing savings/bottle @ 8 uses
Abiotic depletion kg Sb eq 0,00E+00 -2,66E-04 -5,32E-04 -7,98E-04 -1,06E-03 -1,33E-03 -1,60E-03 -1,86E-03 -3,72E-06
Abiotic depletion (fossil fuels) MJ 0,00E+00 1,34E+03 2,68E+03 4,02E+03 5,36E+03 6,69E+03 8,03E+03 9,37E+03 1,87E+01
Global warming (GWP100a) kg CO2 eq 0,00E+00 1,19E+02 2,38E+02 3,56E+02 4,75E+02 5,94E+02 7,13E+02 8,32E+02 1,66E+00
Ozone layer depletion (ODP) kg CFC-11 eq 0,00E+00 1,10E-05 2,20E-05 3,30E-05 4,40E-05 5,51E-05 6,61E-05 7,71E-05 1,54E-07
Human toxicity kg 1,4-DB eq 0,00E+00 1,25E+02 2,51E+02 3,76E+02 5,01E+02 6,26E+02 7,52E+02 8,77E+02 1,75E+00
Fresh water aquatic ecotox. kg 1,4-DB eq 0,00E+00 7,14E+01 1,43E+02 2,14E+02 2,86E+02 3,57E+02 4,28E+02 5,00E+02 1,00E+00
Marine aquatic ecotoxicity kg 1,4-DB eq 0,00E+00 3,64E+05 7,29E+05 1,09E+06 1,46E+06 1,82E+06 2,19E+06 2,55E+06 5,10E+03
Terrestrial ecotoxicity kg 1,4-DB eq 0,00E+00 -1,89E+00 -3,78E+00 -5,66E+00 -7,55E+00 -9,44E+00 -1,13E+01 -1,32E+01 -2,64E-02
Photochemical oxidation kg C2H4 eq 0,00E+00 2,62E-02 5,24E-02 7,87E-02 1,05E-01 1,31E-01 1,57E-01 1,84E-01 3,67E-04
Acidification kg SO2 eq 0,00E+00 8,52E-01 1,70E+00 2,56E+00 3,41E+00 4,26E+00 5,11E+00 5,97E+00 1,19E-02
Eutrophication kg PO4--- eq 0,00E+00 3,46E-02 6,92E-02 1,04E-01 1,38E-01 1,73E-01 2,08E-01 2,42E-01 4,85E-04
Figure 15 shows graphically the evolution of the savings in CO2 equivalent emissions at each reuse cycle.
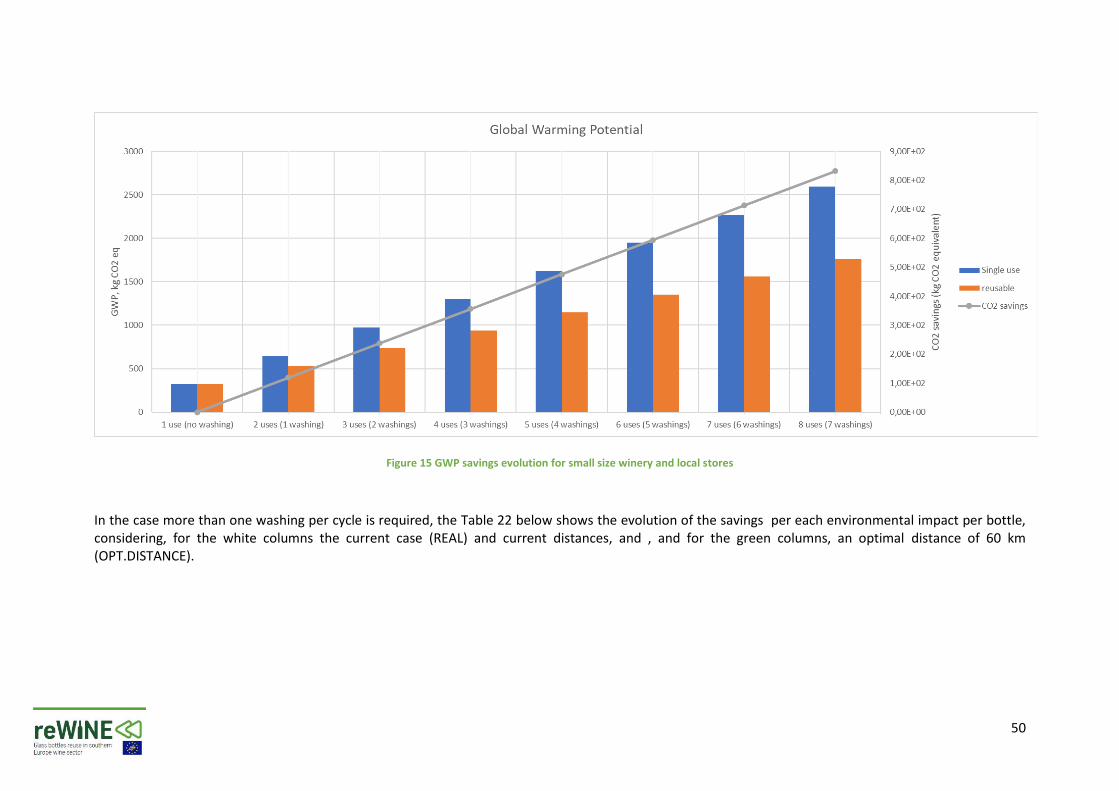
50
Figure 15 GWP savings evolution for small size winery and local stores
In the case more than one washing per cycle is required, the Table 22 below shows the evolution of the savings per each environmental impact per bottle, considering, for the white columns the current case (REAL) and current distances, and , and for the green columns, an optimal distance of 60 km (OPT.DISTANCE).
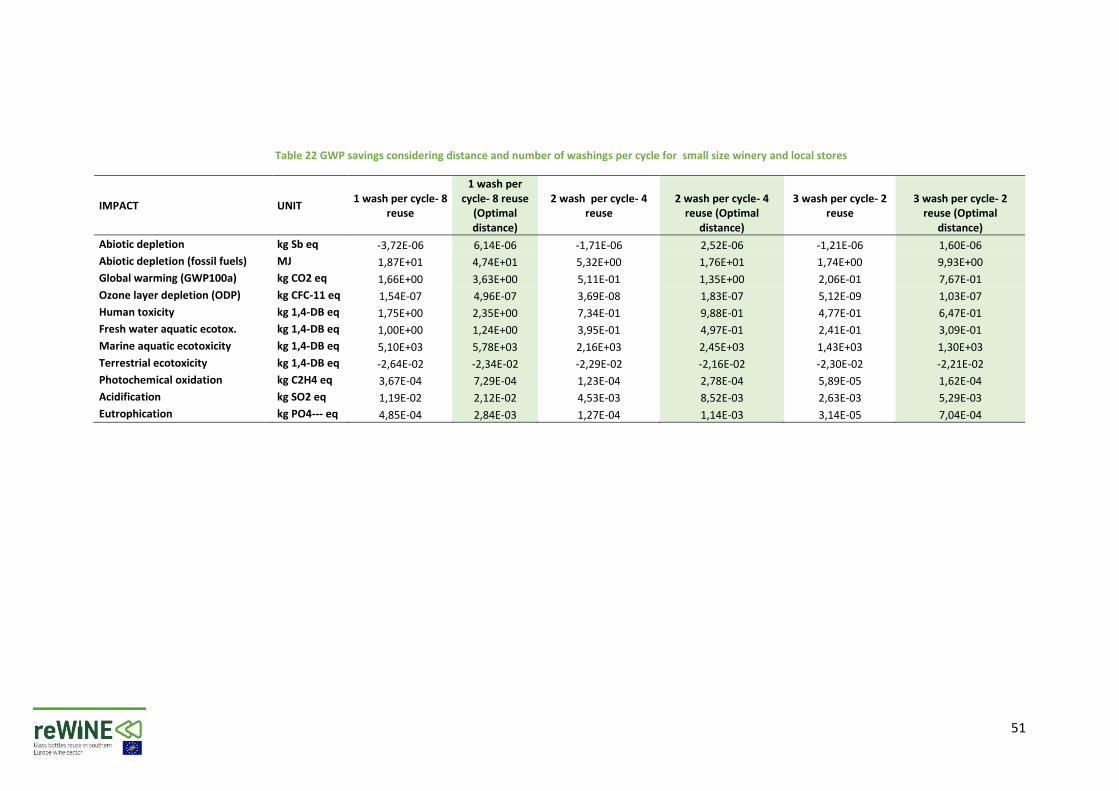
51
Table 22 GWP savings considering distance and number of washings per cycle for small size winery and local stores
IMPACT UNIT 1 wash per cycle- 8
reuse
1 wash per cycle- 8 reuse
(Optimal distance)
2 wash per cycle- 4 reuse
2 wash per cycle- 4 reuse (Optimal
distance)
3 wash per cycle- 2 reuse
3 wash per cycle- 2 reuse (Optimal
distance)
Abiotic depletion kg Sb eq -3,72E-06 6,14E-06 -1,71E-06 2,52E-06 -1,21E-06 1,60E-06
Abiotic depletion (fossil fuels) MJ 1,87E+01 4,74E+01 5,32E+00 1,76E+01 1,74E+00 9,93E+00
Global warming (GWP100a) kg CO2 eq 1,66E+00 3,63E+00 5,11E-01 1,35E+00 2,06E-01 7,67E-01
Ozone layer depletion (ODP) kg CFC-11 eq 1,54E-07 4,96E-07 3,69E-08 1,83E-07 5,12E-09 1,03E-07
Human toxicity kg 1,4-DB eq 1,75E+00 2,35E+00 7,34E-01 9,88E-01 4,77E-01 6,47E-01
Fresh water aquatic ecotox. kg 1,4-DB eq 1,00E+00 1,24E+00 3,95E-01 4,97E-01 2,41E-01 3,09E-01
Marine aquatic ecotoxicity kg 1,4-DB eq 5,10E+03 5,78E+03 2,16E+03 2,45E+03 1,43E+03 1,30E+03
Terrestrial ecotoxicity kg 1,4-DB eq -2,64E-02 -2,34E-02 -2,29E-02 -2,16E-02 -2,30E-02 -2,21E-02
Photochemical oxidation kg C2H4 eq 3,67E-04 7,29E-04 1,23E-04 2,78E-04 5,89E-05 1,62E-04
Acidification kg SO2 eq 1,19E-02 2,12E-02 4,53E-03 8,52E-03 2,63E-03 5,29E-03
Eutrophication kg PO4--- eq 4,85E-04 2,84E-03 1,27E-04 1,14E-03 3,14E-05 7,04E-04
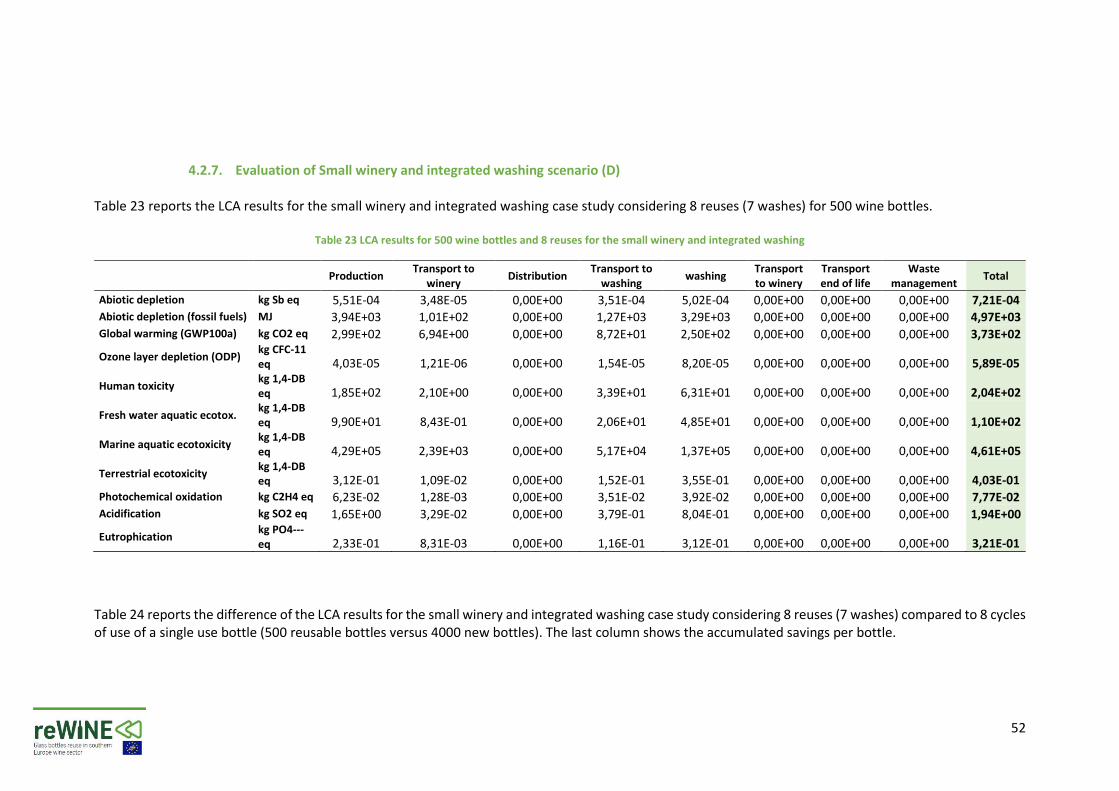
52
4.2.7. Evaluation of Small winery and integrated washing scenario (D) Table 23 reports the LCA results for the small winery and integrated washing case study considering 8 reuses (7 washes) for 500 wine bottles.
Table 23 LCA results for 500 wine bottles and 8 reuses for the small winery and integrated washing
Production Transport to
winery Distribution
Transport to washing
washing Transport to winery
Transport end of life
Waste management
Total
Abiotic depletion kg Sb eq 5,51E-04 3,48E-05 0,00E+00 3,51E-04 5,02E-04 0,00E+00 0,00E+00 0,00E+00 7,21E-04
Abiotic depletion (fossil fuels) MJ 3,94E+03 1,01E+02 0,00E+00 1,27E+03 3,29E+03 0,00E+00 0,00E+00 0,00E+00 4,97E+03
Global warming (GWP100a) kg CO2 eq 2,99E+02 6,94E+00 0,00E+00 8,72E+01 2,50E+02 0,00E+00 0,00E+00 0,00E+00 3,73E+02
Ozone layer depletion (ODP) kg CFC-11 eq 4,03E-05 1,21E-06 0,00E+00 1,54E-05 8,20E-05 0,00E+00 0,00E+00 0,00E+00 5,89E-05
Human toxicity kg 1,4-DB eq 1,85E+02 2,10E+00 0,00E+00 3,39E+01 6,31E+01 0,00E+00 0,00E+00 0,00E+00 2,04E+02
Fresh water aquatic ecotox. kg 1,4-DB eq 9,90E+01 8,43E-01 0,00E+00 2,06E+01 4,85E+01 0,00E+00 0,00E+00 0,00E+00 1,10E+02
Marine aquatic ecotoxicity kg 1,4-DB eq 4,29E+05 2,39E+03 0,00E+00 5,17E+04 1,37E+05 0,00E+00 0,00E+00 0,00E+00 4,61E+05
Terrestrial ecotoxicity kg 1,4-DB eq 3,12E-01 1,09E-02 0,00E+00 1,52E-01 3,55E-01 0,00E+00 0,00E+00 0,00E+00 4,03E-01
Photochemical oxidation kg C2H4 eq 6,23E-02 1,28E-03 0,00E+00 3,51E-02 3,92E-02 0,00E+00 0,00E+00 0,00E+00 7,77E-02
Acidification kg SO2 eq 1,65E+00 3,29E-02 0,00E+00 3,79E-01 8,04E-01 0,00E+00 0,00E+00 0,00E+00 1,94E+00
Eutrophication kg PO4--- eq 2,33E-01 8,31E-03 0,00E+00 1,16E-01 3,12E-01 0,00E+00 0,00E+00 0,00E+00 3,21E-01
Table 24 reports the difference of the LCA results for the small winery and integrated washing case study considering 8 reuses (7 washes) compared to 8 cycles of use of a single use bottle (500 reusable bottles versus 4000 new bottles). The last column shows the accumulated savings per bottle.
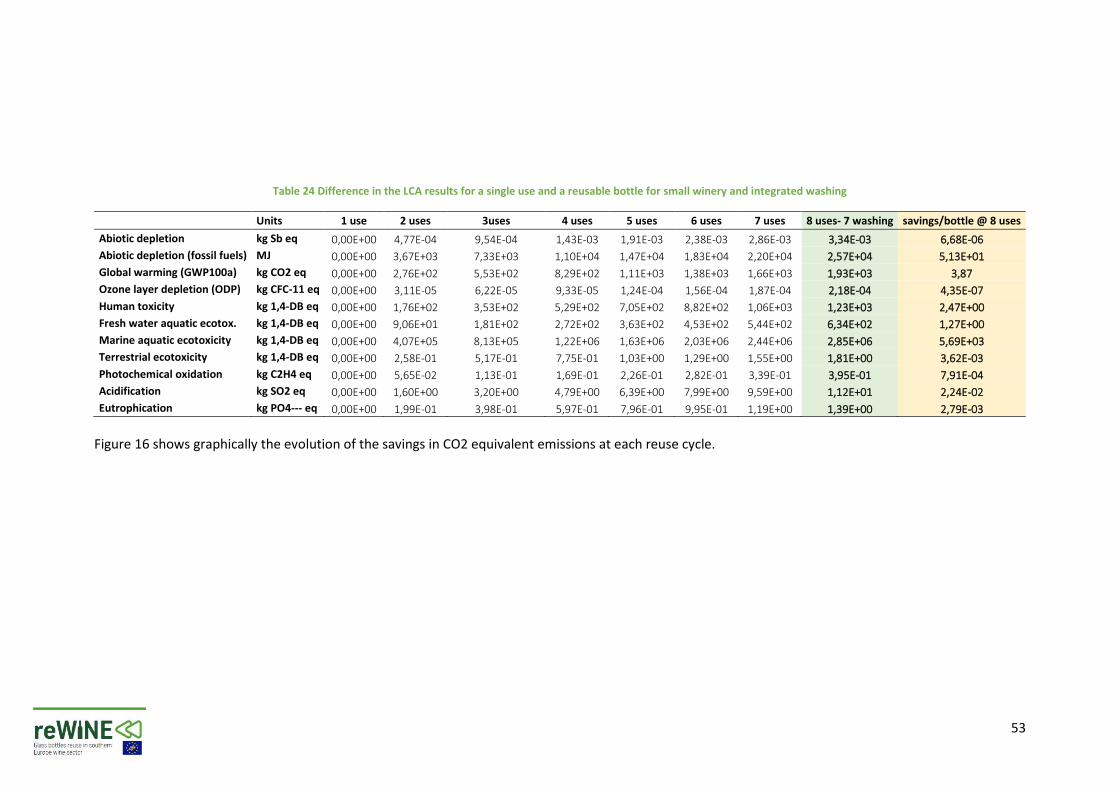
53
Table 24 Difference in the LCA results for a single use and a reusable bottle for small winery and integrated washing
Units 1 use 2 uses 3uses 4 uses 5 uses 6 uses 7 uses 8 uses- 7 washing savings/bottle @ 8 uses
Abiotic depletion kg Sb eq 0,00E+00 4,77E-04 9,54E-04 1,43E-03 1,91E-03 2,38E-03 2,86E-03 3,34E-03 6,68E-06
Abiotic depletion (fossil fuels) MJ 0,00E+00 3,67E+03 7,33E+03 1,10E+04 1,47E+04 1,83E+04 2,20E+04 2,57E+04 5,13E+01
Global warming (GWP100a) kg CO2 eq 0,00E+00 2,76E+02 5,53E+02 8,29E+02 1,11E+03 1,38E+03 1,66E+03 1,93E+03 3,87
Ozone layer depletion (ODP) kg CFC-11 eq 0,00E+00 3,11E-05 6,22E-05 9,33E-05 1,24E-04 1,56E-04 1,87E-04 2,18E-04 4,35E-07
Human toxicity kg 1,4-DB eq 0,00E+00 1,76E+02 3,53E+02 5,29E+02 7,05E+02 8,82E+02 1,06E+03 1,23E+03 2,47E+00
Fresh water aquatic ecotox. kg 1,4-DB eq 0,00E+00 9,06E+01 1,81E+02 2,72E+02 3,63E+02 4,53E+02 5,44E+02 6,34E+02 1,27E+00
Marine aquatic ecotoxicity kg 1,4-DB eq 0,00E+00 4,07E+05 8,13E+05 1,22E+06 1,63E+06 2,03E+06 2,44E+06 2,85E+06 5,69E+03
Terrestrial ecotoxicity kg 1,4-DB eq 0,00E+00 2,58E-01 5,17E-01 7,75E-01 1,03E+00 1,29E+00 1,55E+00 1,81E+00 3,62E-03
Photochemical oxidation kg C2H4 eq 0,00E+00 5,65E-02 1,13E-01 1,69E-01 2,26E-01 2,82E-01 3,39E-01 3,95E-01 7,91E-04
Acidification kg SO2 eq 0,00E+00 1,60E+00 3,20E+00 4,79E+00 6,39E+00 7,99E+00 9,59E+00 1,12E+01 2,24E-02
Eutrophication kg PO4--- eq 0,00E+00 1,99E-01 3,98E-01 5,97E-01 7,96E-01 9,95E-01 1,19E+00 1,39E+00 2,79E-03
Figure 16 shows graphically the evolution of the savings in CO2 equivalent emissions at each reuse cycle.
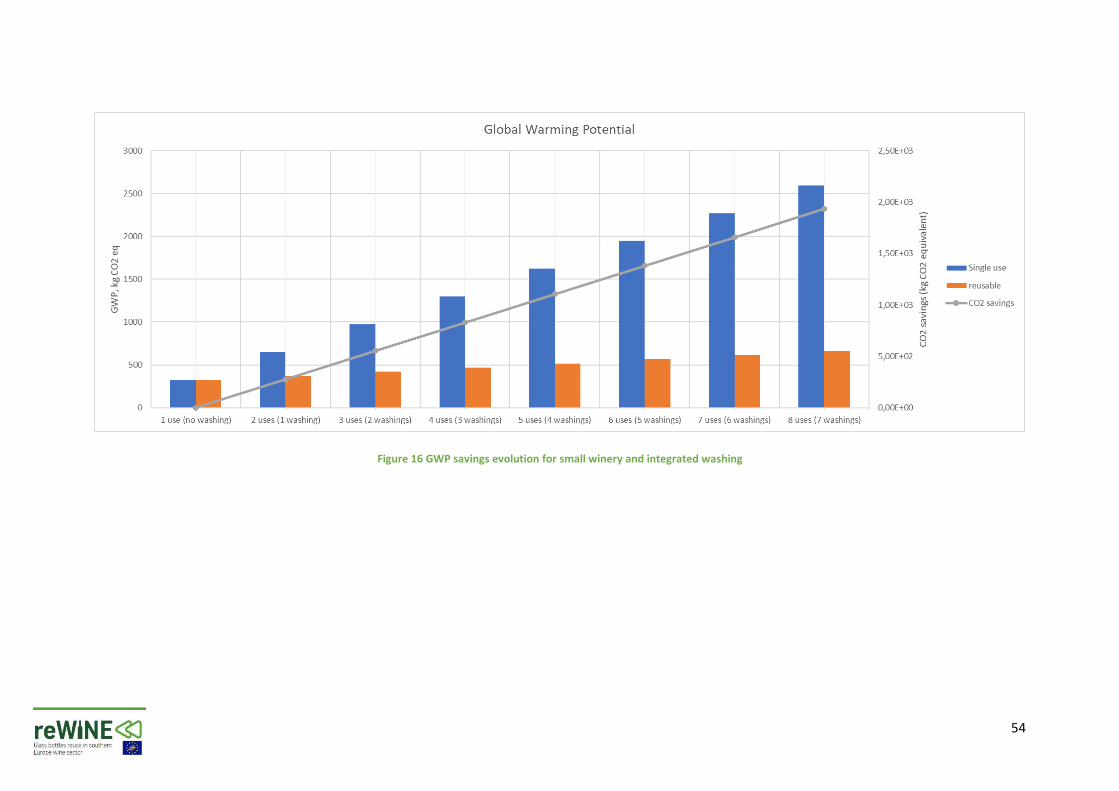
54
Figure 16 GWP savings evolution for small winery and integrated washing
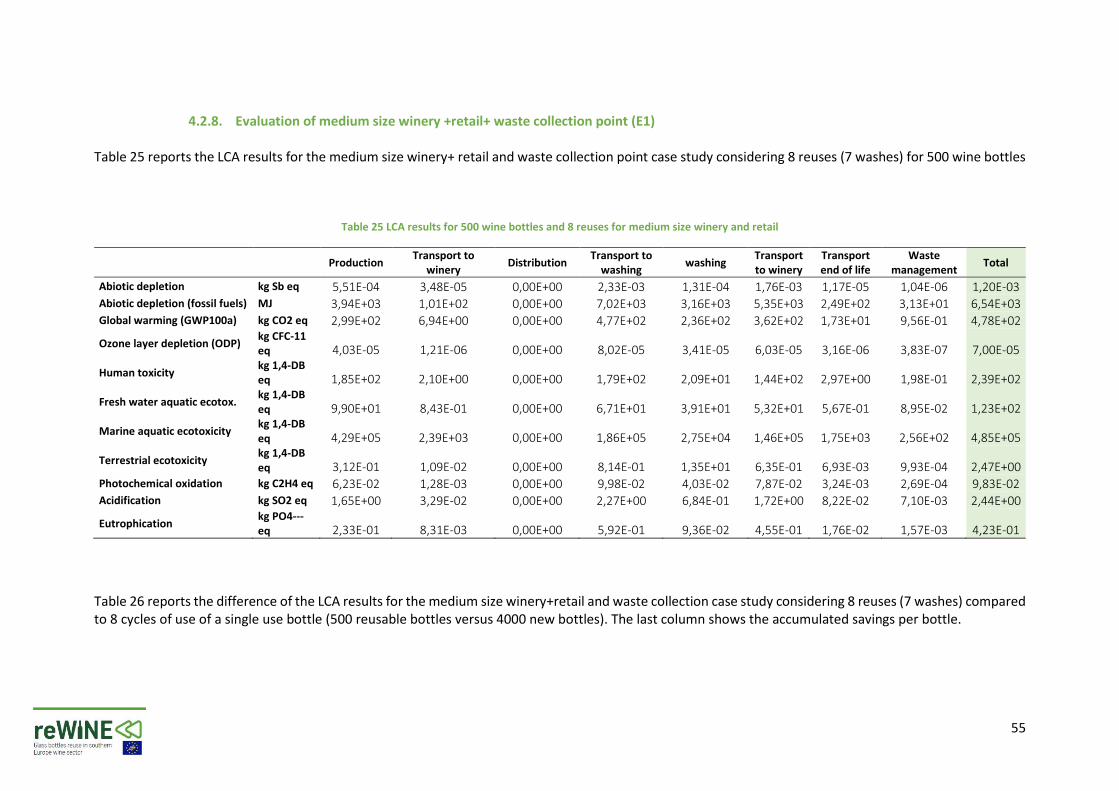
55
4.2.8. Evaluation of medium size winery +retail+ waste collection point (E1) Table 25 reports the LCA results for the medium size winery+ retail and waste collection point case study considering 8 reuses (7 washes) for 500 wine bottles
Table 25 LCA results for 500 wine bottles and 8 reuses for medium size winery and retail
Production Transport to
winery Distribution
Transport to washing
washing Transport to winery
Transport end of life
Waste management
Total
Abiotic depletion kg Sb eq 5,51E-04 3,48E-05 0,00E+00 2,33E-03 1,31E-04 1,76E-03 1,17E-05 1,04E-06 1,20E-03
Abiotic depletion (fossil fuels) MJ 3,94E+03 1,01E+02 0,00E+00 7,02E+03 3,16E+03 5,35E+03 2,49E+02 3,13E+01 6,54E+03
Global warming (GWP100a) kg CO2 eq 2,99E+02 6,94E+00 0,00E+00 4,77E+02 2,36E+02 3,62E+02 1,73E+01 9,56E-01 4,78E+02
Ozone layer depletion (ODP) kg CFC-11 eq 4,03E-05 1,21E-06 0,00E+00 8,02E-05 3,41E-05 6,03E-05 3,16E-06 3,83E-07 7,00E-05
Human toxicity kg 1,4-DB eq 1,85E+02 2,10E+00 0,00E+00 1,79E+02 2,09E+01 1,44E+02 2,97E+00 1,98E-01 2,39E+02
Fresh water aquatic ecotox. kg 1,4-DB eq 9,90E+01 8,43E-01 0,00E+00 6,71E+01 3,91E+01 5,32E+01 5,67E-01 8,95E-02 1,23E+02
Marine aquatic ecotoxicity kg 1,4-DB eq 4,29E+05 2,39E+03 0,00E+00 1,86E+05 2,75E+04 1,46E+05 1,75E+03 2,56E+02 4,85E+05
Terrestrial ecotoxicity kg 1,4-DB eq 3,12E-01 1,09E-02 0,00E+00 8,14E-01 1,35E+01 6,35E-01 6,93E-03 9,93E-04 2,47E+00
Photochemical oxidation kg C2H4 eq 6,23E-02 1,28E-03 0,00E+00 9,98E-02 4,03E-02 7,87E-02 3,24E-03 2,69E-04 9,83E-02
Acidification kg SO2 eq 1,65E+00 3,29E-02 0,00E+00 2,27E+00 6,84E-01 1,72E+00 8,22E-02 7,10E-03 2,44E+00
Eutrophication kg PO4--- eq 2,33E-01 8,31E-03 0,00E+00 5,92E-01 9,36E-02 4,55E-01 1,76E-02 1,57E-03 4,23E-01
Table 26 reports the difference of the LCA results for the medium size winery+retail and waste collection case study considering 8 reuses (7 washes) compared to 8 cycles of use of a single use bottle (500 reusable bottles versus 4000 new bottles). The last column shows the accumulated savings per bottle.
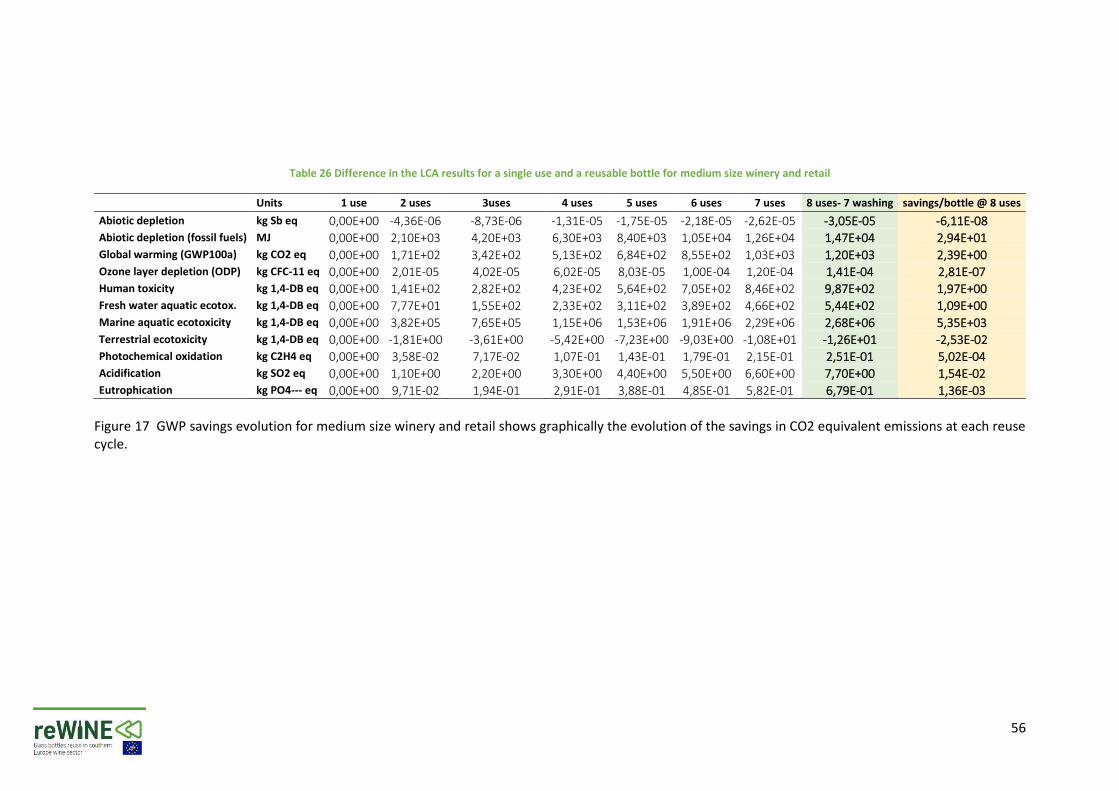
56
Table 26 Difference in the LCA results for a single use and a reusable bottle for medium size winery and retail
Units 1 use 2 uses 3uses 4 uses 5 uses 6 uses 7 uses 8 uses- 7 washing savings/bottle @ 8 uses
Abiotic depletion kg Sb eq 0,00E+00 -4,36E-06 -8,73E-06 -1,31E-05 -1,75E-05 -2,18E-05 -2,62E-05 -3,05E-05 -6,11E-08
Abiotic depletion (fossil fuels) MJ 0,00E+00 2,10E+03 4,20E+03 6,30E+03 8,40E+03 1,05E+04 1,26E+04 1,47E+04 2,94E+01
Global warming (GWP100a) kg CO2 eq 0,00E+00 1,71E+02 3,42E+02 5,13E+02 6,84E+02 8,55E+02 1,03E+03 1,20E+03 2,39E+00
Ozone layer depletion (ODP) kg CFC-11 eq 0,00E+00 2,01E-05 4,02E-05 6,02E-05 8,03E-05 1,00E-04 1,20E-04 1,41E-04 2,81E-07
Human toxicity kg 1,4-DB eq 0,00E+00 1,41E+02 2,82E+02 4,23E+02 5,64E+02 7,05E+02 8,46E+02 9,87E+02 1,97E+00
Fresh water aquatic ecotox. kg 1,4-DB eq 0,00E+00 7,77E+01 1,55E+02 2,33E+02 3,11E+02 3,89E+02 4,66E+02 5,44E+02 1,09E+00
Marine aquatic ecotoxicity kg 1,4-DB eq 0,00E+00 3,82E+05 7,65E+05 1,15E+06 1,53E+06 1,91E+06 2,29E+06 2,68E+06 5,35E+03
Terrestrial ecotoxicity kg 1,4-DB eq 0,00E+00 -1,81E+00 -3,61E+00 -5,42E+00 -7,23E+00 -9,03E+00 -1,08E+01 -1,26E+01 -2,53E-02
Photochemical oxidation kg C2H4 eq 0,00E+00 3,58E-02 7,17E-02 1,07E-01 1,43E-01 1,79E-01 2,15E-01 2,51E-01 5,02E-04
Acidification kg SO2 eq 0,00E+00 1,10E+00 2,20E+00 3,30E+00 4,40E+00 5,50E+00 6,60E+00 7,70E+00 1,54E-02
Eutrophication kg PO4--- eq 0,00E+00 9,71E-02 1,94E-01 2,91E-01 3,88E-01 4,85E-01 5,82E-01 6,79E-01 1,36E-03
Figure 17 GWP savings evolution for medium size winery and retail shows graphically the evolution of the savings in CO2 equivalent emissions at each reuse cycle.
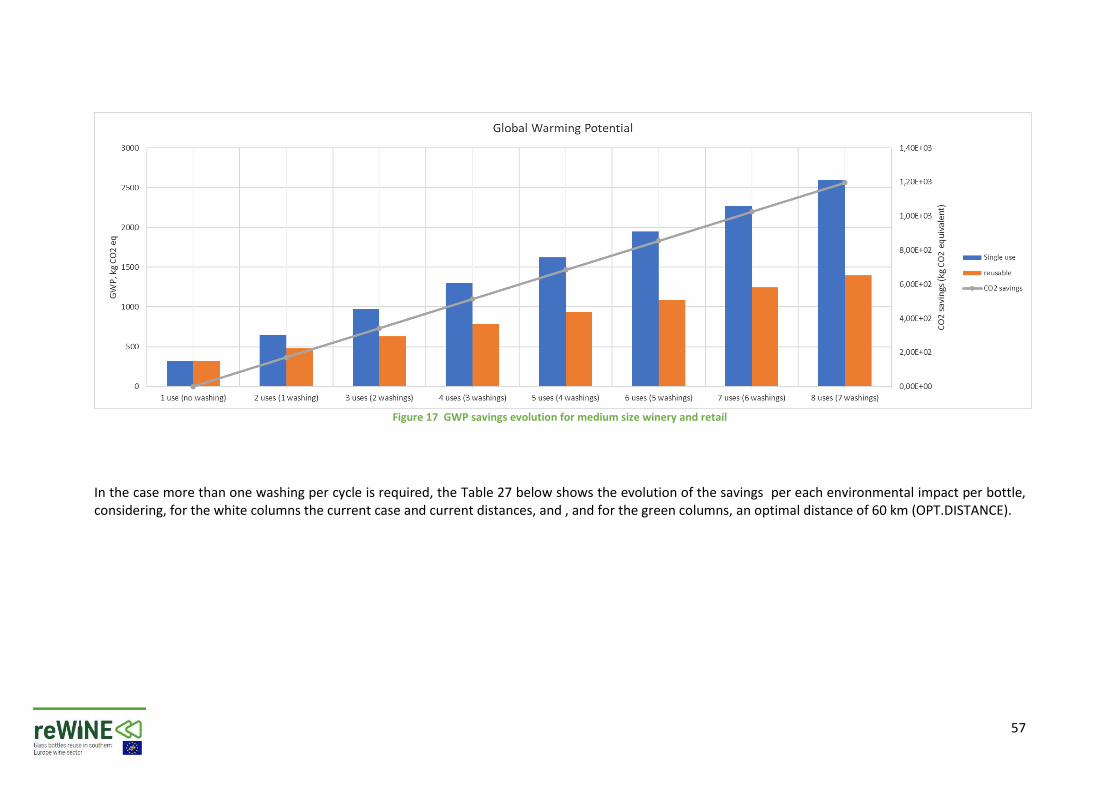
57
Figure 17 GWP savings evolution for medium size winery and retail
In the case more than one washing per cycle is required, the Table 27 below shows the evolution of the savings per each environmental impact per bottle, considering, for the white columns the current case and current distances, and , and for the green columns, an optimal distance of 60 km (OPT.DISTANCE).
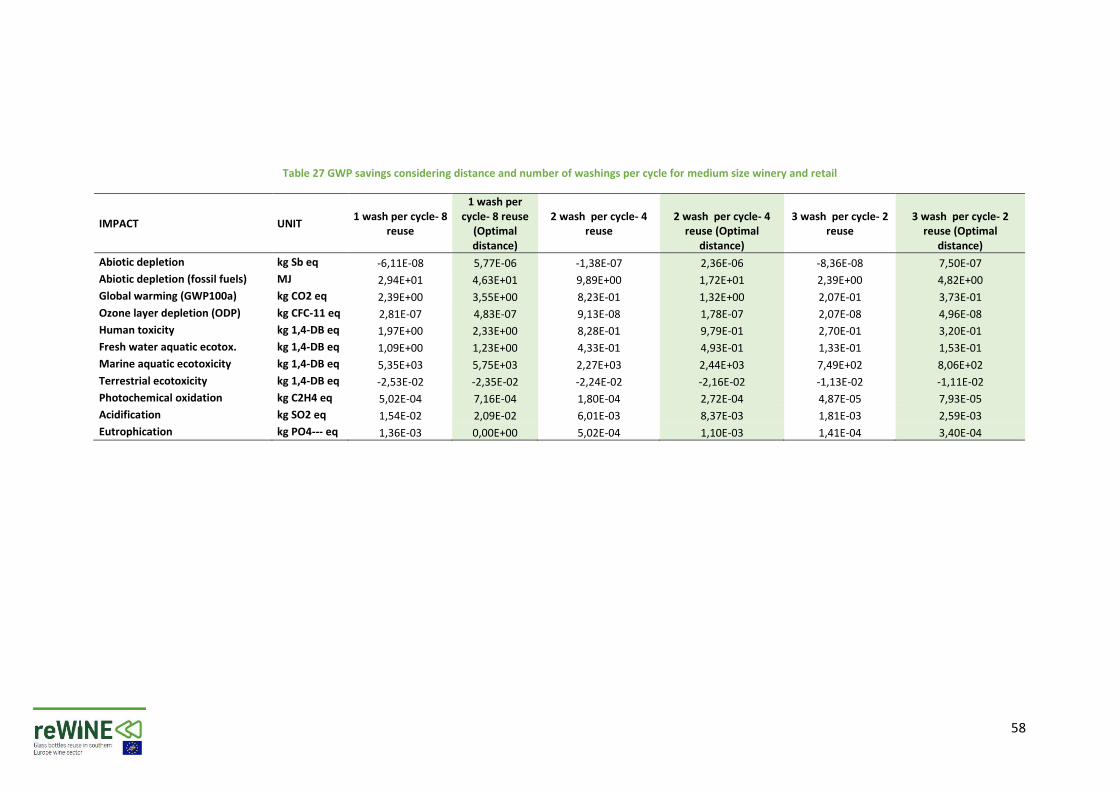
58
Table 27 GWP savings considering distance and number of washings per cycle for medium size winery and retail
IMPACT UNIT 1 wash per cycle- 8
reuse
1 wash per cycle- 8 reuse
(Optimal distance)
2 wash per cycle- 4 reuse
2 wash per cycle- 4 reuse (Optimal
distance)
3 wash per cycle- 2 reuse
3 wash per cycle- 2 reuse (Optimal
distance)
Abiotic depletion kg Sb eq -6,11E-08 5,77E-06 -1,38E-07 2,36E-06 -8,36E-08 7,50E-07
Abiotic depletion (fossil fuels) MJ 2,94E+01 4,63E+01 9,89E+00 1,72E+01 2,39E+00 4,82E+00
Global warming (GWP100a) kg CO2 eq 2,39E+00 3,55E+00 8,23E-01 1,32E+00 2,07E-01 3,73E-01
Ozone layer depletion (ODP) kg CFC-11 eq 2,81E-07 4,83E-07 9,13E-08 1,78E-07 2,07E-08 4,96E-08
Human toxicity kg 1,4-DB eq 1,97E+00 2,33E+00 8,28E-01 9,79E-01 2,70E-01 3,20E-01
Fresh water aquatic ecotox. kg 1,4-DB eq 1,09E+00 1,23E+00 4,33E-01 4,93E-01 1,33E-01 1,53E-01
Marine aquatic ecotoxicity kg 1,4-DB eq 5,35E+03 5,75E+03 2,27E+03 2,44E+03 7,49E+02 8,06E+02
Terrestrial ecotoxicity kg 1,4-DB eq -2,53E-02 -2,35E-02 -2,24E-02 -2,16E-02 -1,13E-02 -1,11E-02
Photochemical oxidation kg C2H4 eq 5,02E-04 7,16E-04 1,80E-04 2,72E-04 4,87E-05 7,93E-05
Acidification kg SO2 eq 1,54E-02 2,09E-02 6,01E-03 8,37E-03 1,81E-03 2,59E-03
Eutrophication kg PO4--- eq 1,36E-03 0,00E+00 5,02E-04 1,10E-03 1,41E-04 3,40E-04
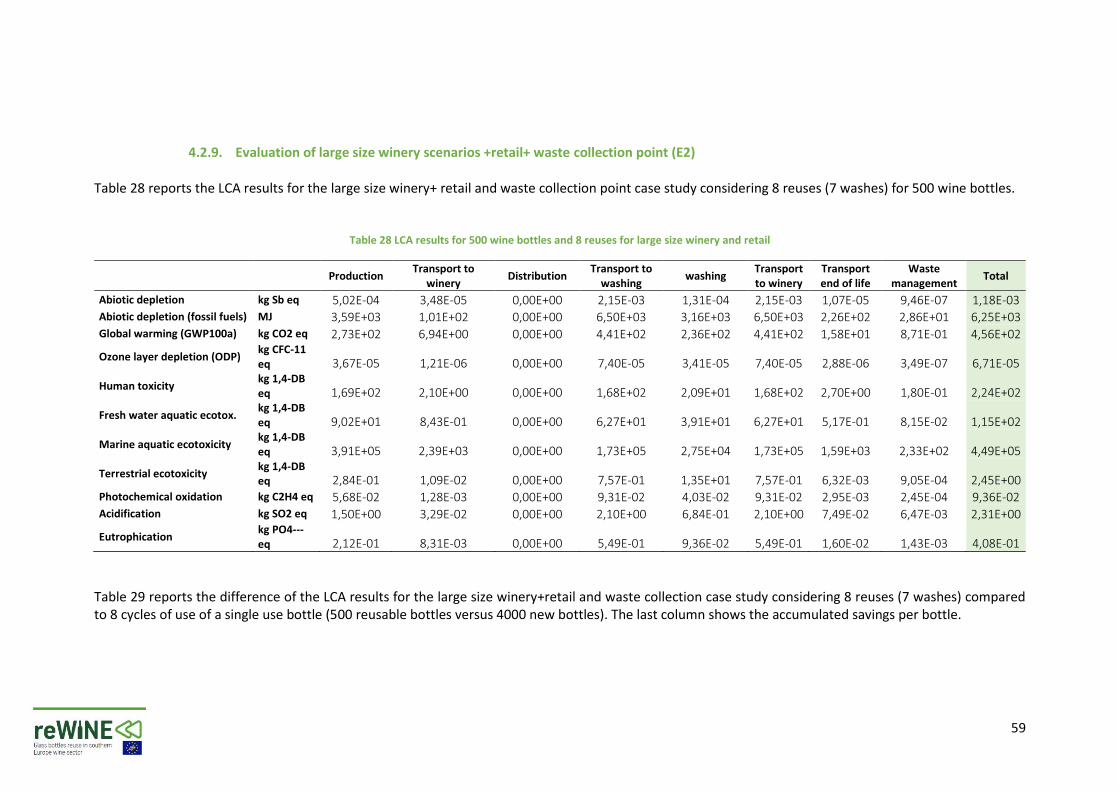
59
4.2.9. Evaluation of large size winery scenarios +retail+ waste collection point (E2) Table 28 reports the LCA results for the large size winery+ retail and waste collection point case study considering 8 reuses (7 washes) for 500 wine bottles.
Table 28 LCA results for 500 wine bottles and 8 reuses for large size winery and retail
Production Transport to
winery Distribution
Transport to washing
washing Transport to winery
Transport end of life
Waste management
Total
Abiotic depletion kg Sb eq 5,02E-04 3,48E-05 0,00E+00 2,15E-03 1,31E-04 2,15E-03 1,07E-05 9,46E-07 1,18E-03
Abiotic depletion (fossil fuels) MJ 3,59E+03 1,01E+02 0,00E+00 6,50E+03 3,16E+03 6,50E+03 2,26E+02 2,86E+01 6,25E+03
Global warming (GWP100a) kg CO2 eq 2,73E+02 6,94E+00 0,00E+00 4,41E+02 2,36E+02 4,41E+02 1,58E+01 8,71E-01 4,56E+02
Ozone layer depletion (ODP) kg CFC-11 eq 3,67E-05 1,21E-06 0,00E+00 7,40E-05 3,41E-05 7,40E-05 2,88E-06 3,49E-07 6,71E-05
Human toxicity kg 1,4-DB eq 1,69E+02 2,10E+00 0,00E+00 1,68E+02 2,09E+01 1,68E+02 2,70E+00 1,80E-01 2,24E+02
Fresh water aquatic ecotox. kg 1,4-DB eq 9,02E+01 8,43E-01 0,00E+00 6,27E+01 3,91E+01 6,27E+01 5,17E-01 8,15E-02 1,15E+02
Marine aquatic ecotoxicity kg 1,4-DB eq 3,91E+05 2,39E+03 0,00E+00 1,73E+05 2,75E+04 1,73E+05 1,59E+03 2,33E+02 4,49E+05
Terrestrial ecotoxicity kg 1,4-DB eq 2,84E-01 1,09E-02 0,00E+00 7,57E-01 1,35E+01 7,57E-01 6,32E-03 9,05E-04 2,45E+00
Photochemical oxidation kg C2H4 eq 5,68E-02 1,28E-03 0,00E+00 9,31E-02 4,03E-02 9,31E-02 2,95E-03 2,45E-04 9,36E-02
Acidification kg SO2 eq 1,50E+00 3,29E-02 0,00E+00 2,10E+00 6,84E-01 2,10E+00 7,49E-02 6,47E-03 2,31E+00
Eutrophication kg PO4--- eq 2,12E-01 8,31E-03 0,00E+00 5,49E-01 9,36E-02 5,49E-01 1,60E-02 1,43E-03 4,08E-01
Table 29 reports the difference of the LCA results for the large size winery+retail and waste collection case study considering 8 reuses (7 washes) compared to 8 cycles of use of a single use bottle (500 reusable bottles versus 4000 new bottles). The last column shows the accumulated savings per bottle.
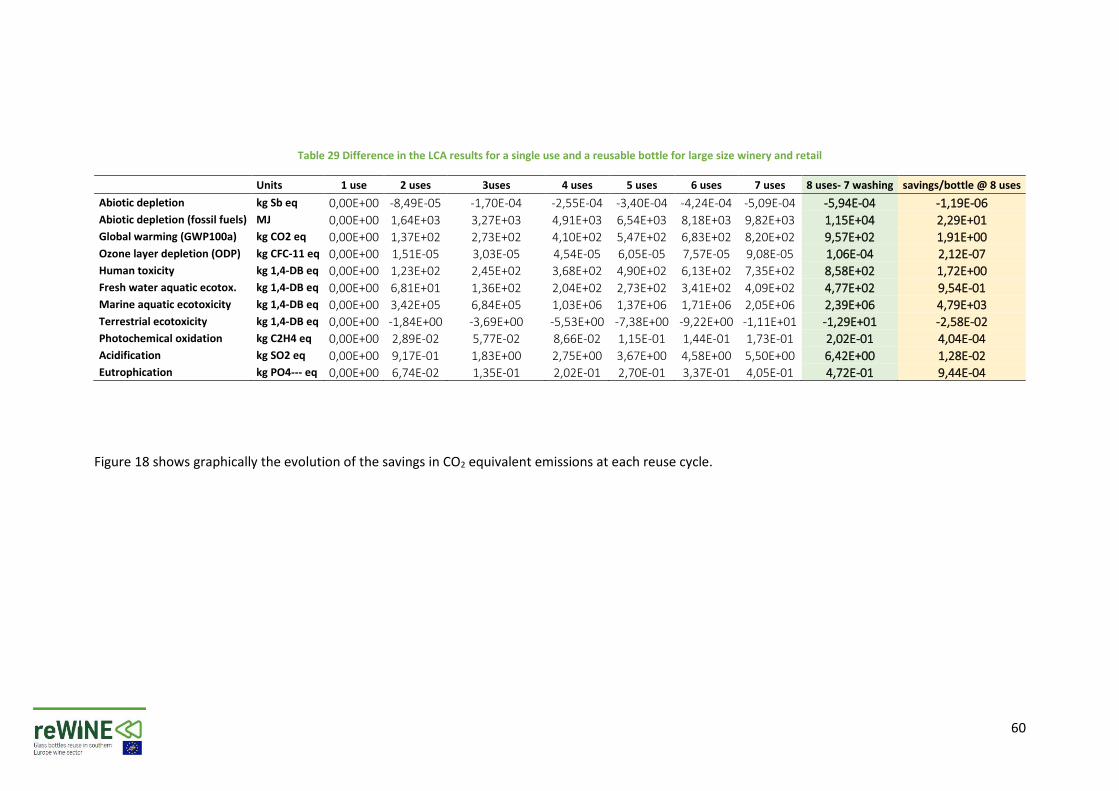
60
Table 29 Difference in the LCA results for a single use and a reusable bottle for large size winery and retail
Units 1 use 2 uses 3uses 4 uses 5 uses 6 uses 7 uses 8 uses- 7 washing savings/bottle @ 8 uses
Abiotic depletion kg Sb eq 0,00E+00 -8,49E-05 -1,70E-04 -2,55E-04 -3,40E-04 -4,24E-04 -5,09E-04 -5,94E-04 -1,19E-06
Abiotic depletion (fossil fuels) MJ 0,00E+00 1,64E+03 3,27E+03 4,91E+03 6,54E+03 8,18E+03 9,82E+03 1,15E+04 2,29E+01
Global warming (GWP100a) kg CO2 eq 0,00E+00 1,37E+02 2,73E+02 4,10E+02 5,47E+02 6,83E+02 8,20E+02 9,57E+02 1,91E+00
Ozone layer depletion (ODP) kg CFC-11 eq 0,00E+00 1,51E-05 3,03E-05 4,54E-05 6,05E-05 7,57E-05 9,08E-05 1,06E-04 2,12E-07
Human toxicity kg 1,4-DB eq 0,00E+00 1,23E+02 2,45E+02 3,68E+02 4,90E+02 6,13E+02 7,35E+02 8,58E+02 1,72E+00
Fresh water aquatic ecotox. kg 1,4-DB eq 0,00E+00 6,81E+01 1,36E+02 2,04E+02 2,73E+02 3,41E+02 4,09E+02 4,77E+02 9,54E-01
Marine aquatic ecotoxicity kg 1,4-DB eq 0,00E+00 3,42E+05 6,84E+05 1,03E+06 1,37E+06 1,71E+06 2,05E+06 2,39E+06 4,79E+03
Terrestrial ecotoxicity kg 1,4-DB eq 0,00E+00 -1,84E+00 -3,69E+00 -5,53E+00 -7,38E+00 -9,22E+00 -1,11E+01 -1,29E+01 -2,58E-02
Photochemical oxidation kg C2H4 eq 0,00E+00 2,89E-02 5,77E-02 8,66E-02 1,15E-01 1,44E-01 1,73E-01 2,02E-01 4,04E-04
Acidification kg SO2 eq 0,00E+00 9,17E-01 1,83E+00 2,75E+00 3,67E+00 4,58E+00 5,50E+00 6,42E+00 1,28E-02
Eutrophication kg PO4--- eq 0,00E+00 6,74E-02 1,35E-01 2,02E-01 2,70E-01 3,37E-01 4,05E-01 4,72E-01 9,44E-04
Figure 18 shows graphically the evolution of the savings in CO2 equivalent emissions at each reuse cycle.
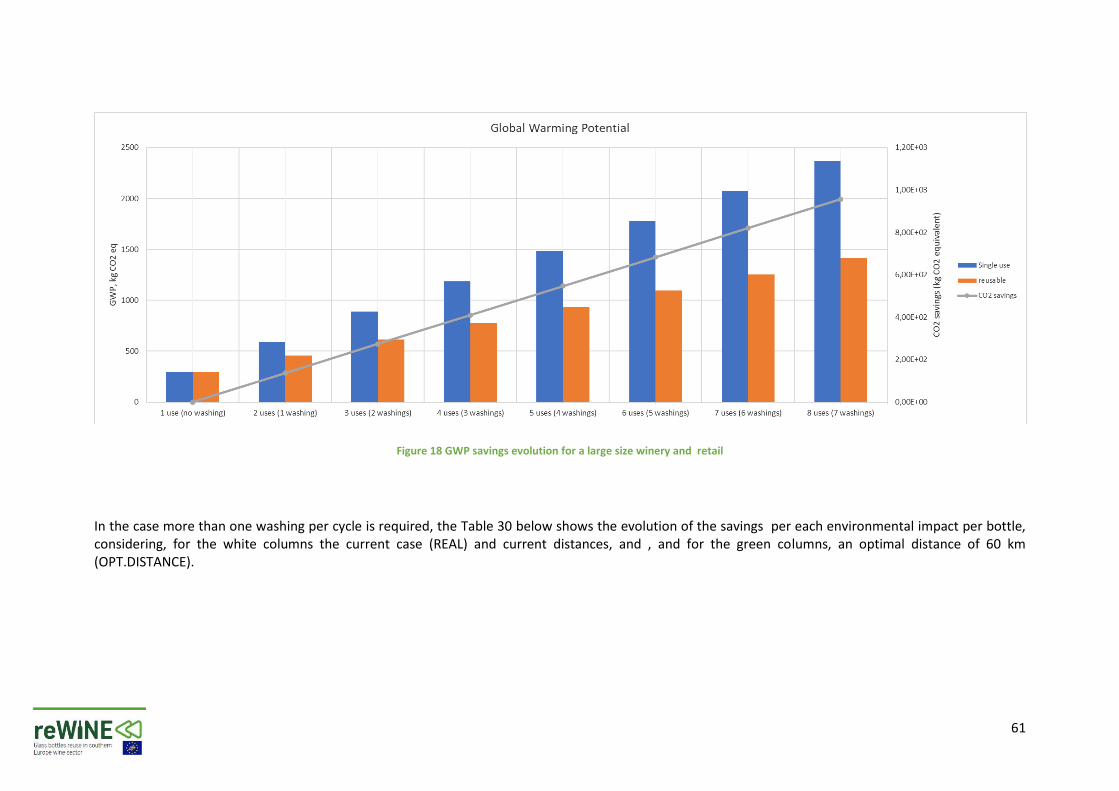
61
Figure 18 GWP savings evolution for a large size winery and retail
In the case more than one washing per cycle is required, the Table 30 below shows the evolution of the savings per each environmental impact per bottle, considering, for the white columns the current case (REAL) and current distances, and , and for the green columns, an optimal distance of 60 km (OPT.DISTANCE).
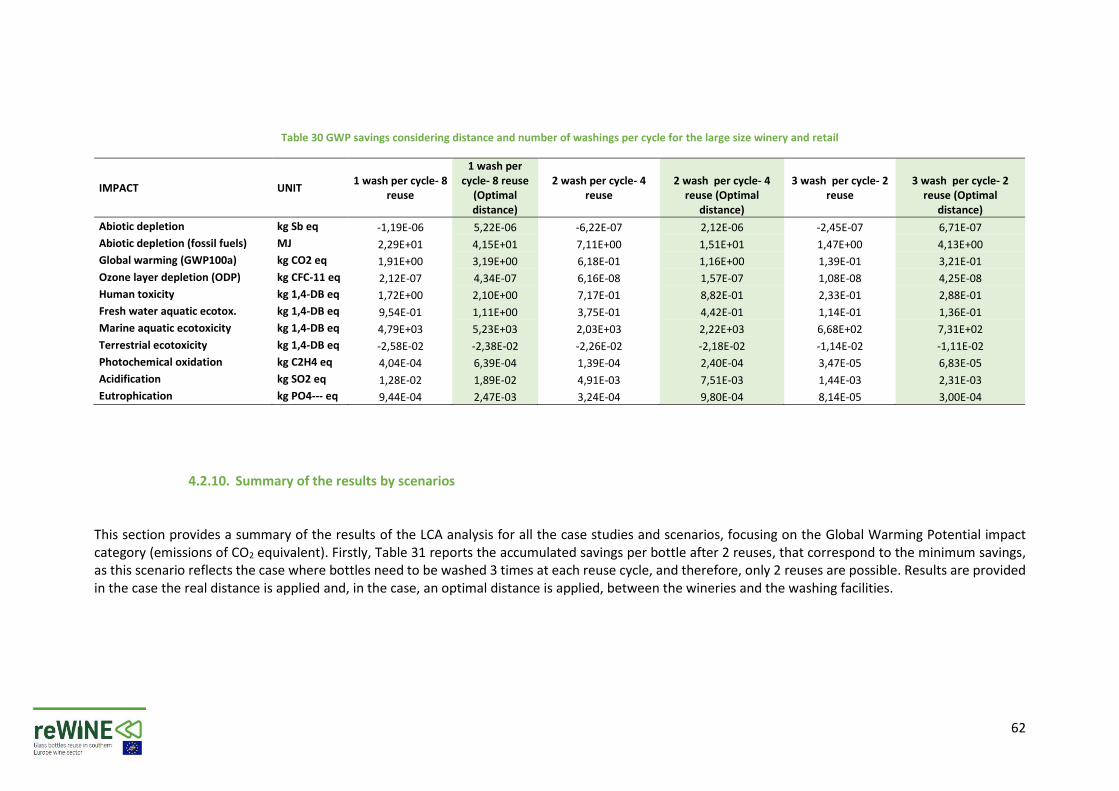
62
Table 30 GWP savings considering distance and number of washings per cycle for the large size winery and retail
IMPACT UNIT 1 wash per cycle- 8
reuse
1 wash per cycle- 8 reuse
(Optimal distance)
2 wash per cycle- 4 reuse
2 wash per cycle- 4 reuse (Optimal
distance)
3 wash per cycle- 2 reuse
3 wash per cycle- 2 reuse (Optimal
distance)
Abiotic depletion kg Sb eq -1,19E-06 5,22E-06 -6,22E-07 2,12E-06 -2,45E-07 6,71E-07
Abiotic depletion (fossil fuels) MJ 2,29E+01 4,15E+01 7,11E+00 1,51E+01 1,47E+00 4,13E+00
Global warming (GWP100a) kg CO2 eq 1,91E+00 3,19E+00 6,18E-01 1,16E+00 1,39E-01 3,21E-01
Ozone layer depletion (ODP) kg CFC-11 eq 2,12E-07 4,34E-07 6,16E-08 1,57E-07 1,08E-08 4,25E-08
Human toxicity kg 1,4-DB eq 1,72E+00 2,10E+00 7,17E-01 8,82E-01 2,33E-01 2,88E-01
Fresh water aquatic ecotox. kg 1,4-DB eq 9,54E-01 1,11E+00 3,75E-01 4,42E-01 1,14E-01 1,36E-01
Marine aquatic ecotoxicity kg 1,4-DB eq 4,79E+03 5,23E+03 2,03E+03 2,22E+03 6,68E+02 7,31E+02
Terrestrial ecotoxicity kg 1,4-DB eq -2,58E-02 -2,38E-02 -2,26E-02 -2,18E-02 -1,14E-02 -1,11E-02
Photochemical oxidation kg C2H4 eq 4,04E-04 6,39E-04 1,39E-04 2,40E-04 3,47E-05 6,83E-05
Acidification kg SO2 eq 1,28E-02 1,89E-02 4,91E-03 7,51E-03 1,44E-03 2,31E-03
Eutrophication kg PO4--- eq 9,44E-04 2,47E-03 3,24E-04 9,80E-04 8,14E-05 3,00E-04
4.2.10. Summary of the results by scenarios This section provides a summary of the results of the LCA analysis for all the case studies and scenarios, focusing on the Global Warming Potential impact category (emissions of CO2 equivalent). Firstly, Table 31 reports the accumulated savings per bottle after 2 reuses, that correspond to the minimum savings, as this scenario reflects the case where bottles need to be washed 3 times at each reuse cycle, and therefore, only 2 reuses are possible. Results are provided in the case the real distance is applied and, in the case, an optimal distance is applied, between the wineries and the washing facilities.
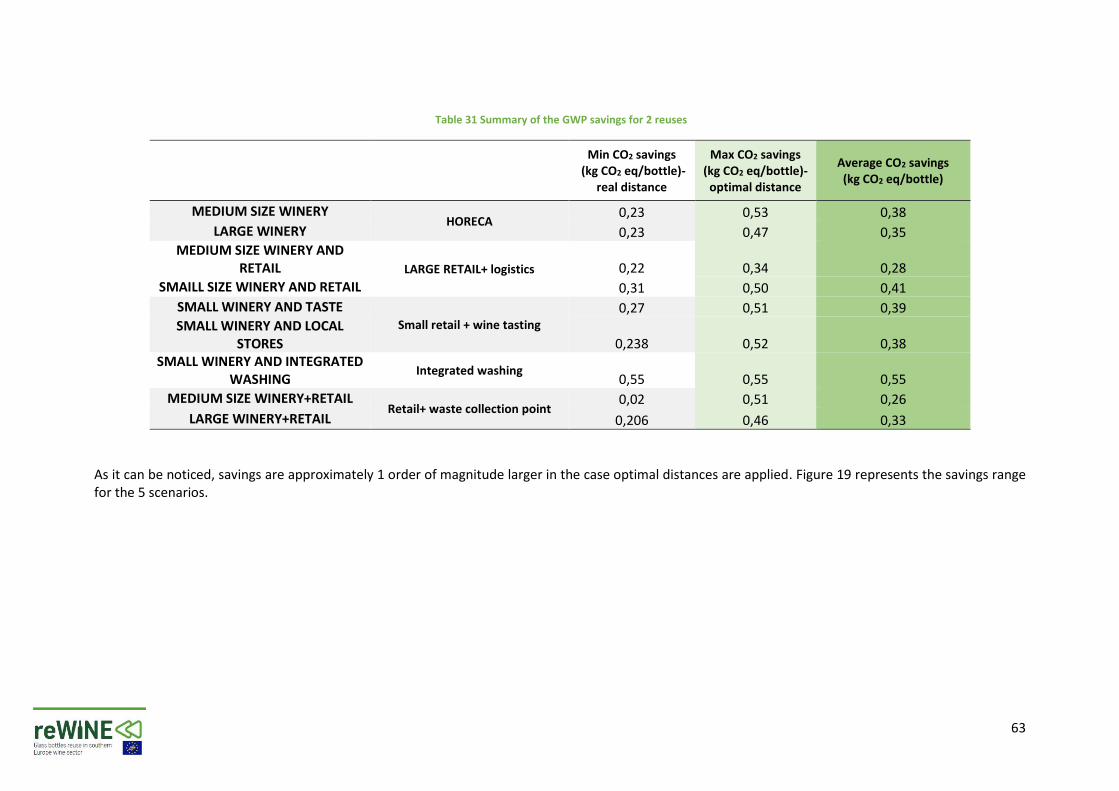
63
Table 31 Summary of the GWP savings for 2 reuses
Min CO2 savings (kg CO2 eq/bottle)-
real distance
Max CO2 savings (kg CO2 eq/bottle)-
optimal distance
Average CO2 savings (kg CO2 eq/bottle)
MEDIUM SIZE WINERY HORECA
0,23 0,53 0,38
LARGE WINERY 0,23 0,47 0,35
MEDIUM SIZE WINERY AND RETAIL LARGE RETAIL+ logistics 0,22 0,34 0,28
SMAILL SIZE WINERY AND RETAIL 0,31 0,50 0,41
SMALL WINERY AND TASTE
Small retail + wine tasting 0,27 0,51 0,39
SMALL WINERY AND LOCAL STORES 0,238 0,52 0,38
SMALL WINERY AND INTEGRATED WASHING
Integrated washing 0,55 0,55 0,55
MEDIUM SIZE WINERY+RETAIL Retail+ waste collection point
0,02 0,51 0,26
LARGE WINERY+RETAIL 0,206 0,46 0,33
As it can be noticed, savings are approximately 1 order of magnitude larger in the case optimal distances are applied. Figure 19 represents the savings range for the 5 scenarios.
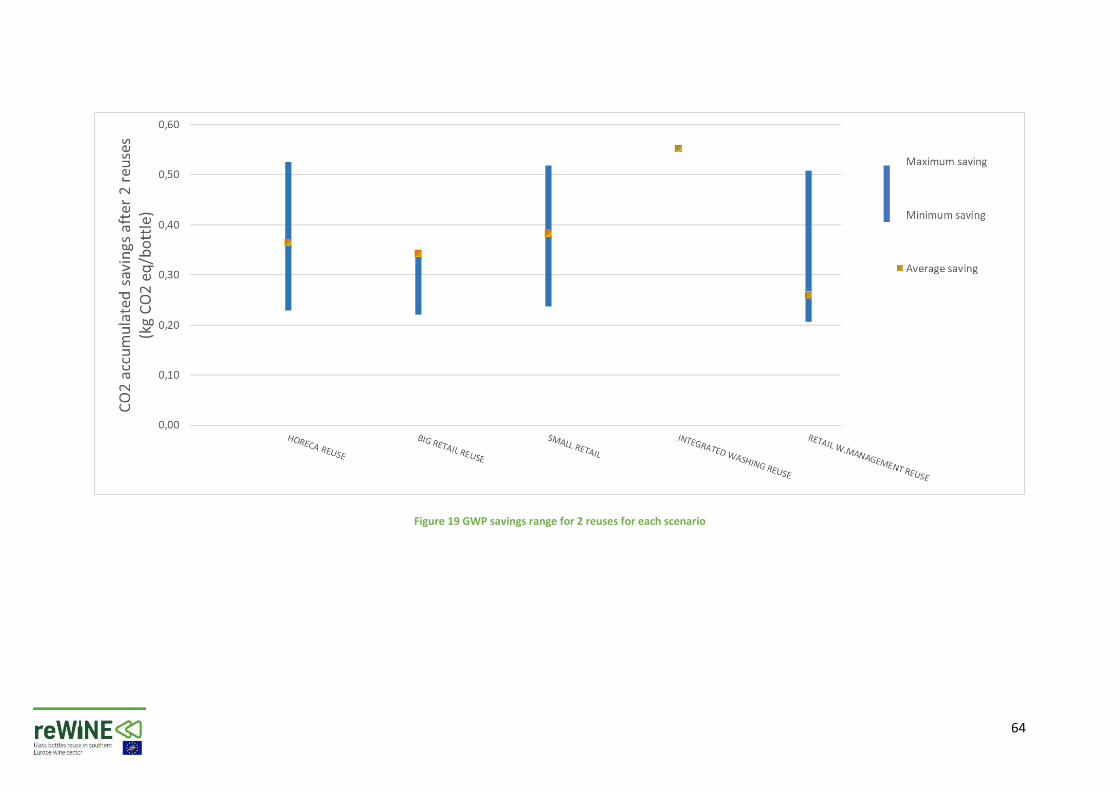
64
Figure 19 GWP savings range for 2 reuses for each scenario
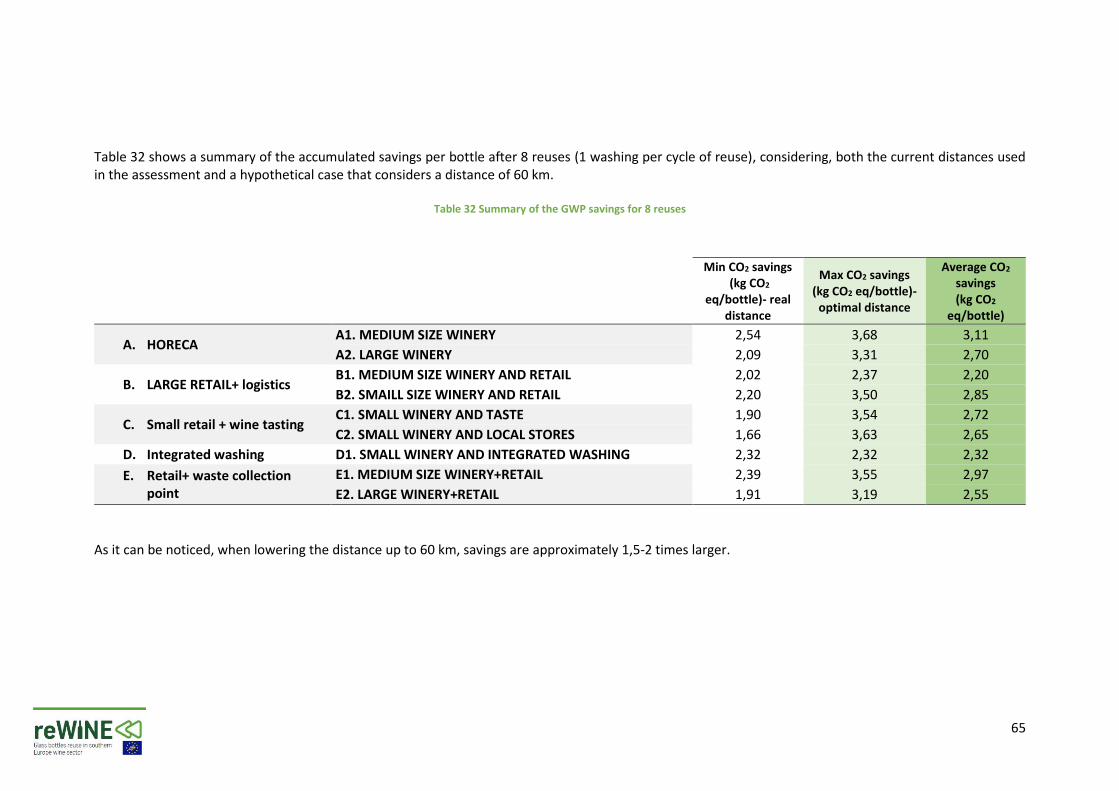
65
Table 32 shows a summary of the accumulated savings per bottle after 8 reuses (1 washing per cycle of reuse), considering, both the current distances used in the assessment and a hypothetical case that considers a distance of 60 km.
Table 32 Summary of the GWP savings for 8 reuses
Min CO2 savings (kg CO2
eq/bottle)- real distance
Max CO2 savings (kg CO2 eq/bottle)-
optimal distance
Average CO2 savings (kg CO2
eq/bottle)
A. HORECA A1. MEDIUM SIZE WINERY 2,54 3,68 3,11
A2. LARGE WINERY 2,09 3,31 2,70
B. LARGE RETAIL+ logistics B1. MEDIUM SIZE WINERY AND RETAIL 2,02 2,37 2,20
B2. SMAILL SIZE WINERY AND RETAIL 2,20 3,50 2,85
C. Small retail + wine tasting C1. SMALL WINERY AND TASTE 1,90 3,54 2,72
C2. SMALL WINERY AND LOCAL STORES 1,66 3,63 2,65
D. Integrated washing D1. SMALL WINERY AND INTEGRATED WASHING 2,32 2,32 2,32
E. Retail+ waste collection point
E1. MEDIUM SIZE WINERY+RETAIL 2,39 3,55 2,97
E2. LARGE WINERY+RETAIL 1,91 3,19 2,55
As it can be noticed, when lowering the distance up to 60 km, savings are approximately 1,5-2 times larger.
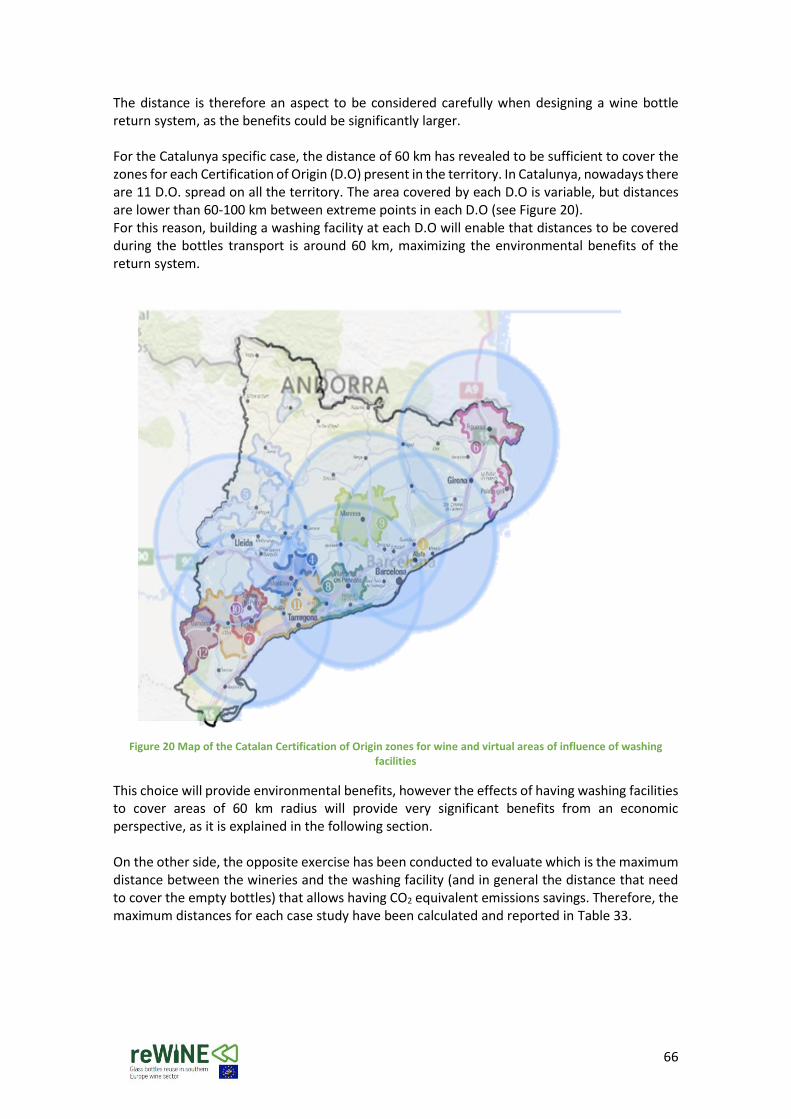
66
The distance is therefore an aspect to be considered carefully when designing a wine bottle return system, as the benefits could be significantly larger. For the Catalunya specific case, the distance of 60 km has revealed to be sufficient to cover the zones for each Certification of Origin (D.O) present in the territory. In Catalunya, nowadays there are 11 D.O. spread on all the territory. The area covered by each D.O is variable, but distances are lower than 60-100 km between extreme points in each D.O (see Figure 20). For this reason, building a washing facility at each D.O will enable that distances to be covered during the bottles transport is around 60 km, maximizing the environmental benefits of the return system.
Figure 20 Map of the Catalan Certification of Origin zones for wine and virtual areas of influence of washing
facilities
This choice will provide environmental benefits, however the effects of having washing facilities to cover areas of 60 km radius will provide very significant benefits from an economic perspective, as it is explained in the following section. On the other side, the opposite exercise has been conducted to evaluate which is the maximum distance between the wineries and the washing facility (and in general the distance that need to cover the empty bottles) that allows having CO2 equivalent emissions savings. Therefore, the maximum distances for each case study have been calculated and reported in Table 33.
67
Table 33 Maximum distances to obtain CO2 eq savings
CASE STUDIES Distances (km) Comments
A1. MEDIUM SIZE WINERY 1100 Distribution, collection and
transport to INFINITY
A2. LARGE WINERY 1050 Distribution, collection and
transport to INFINITY
B1. MEDIUM SIZE WINERY AND RETAIL 1150 Distribution to the stores, collection and transport to
INFINTY
B2. SMAILL SIZE WINERY AND RETAIL 1100 Distribution to the stores, collection and transport to
INFINTY
C1. SMALL WINERY AND TASTE 1050 Distribution to the stores, collection and transport to
INFINTY
C2. SMALL WINERY AND LOCAL STORES 1100 Distribution to the stores, collection and transport to
INFINTY
D1. SMALL WINERY AND INTEGRATED WASHING 1100 Average distance of the
distribution and collection of wine bottles
E1. MEDIUM SIZE WINERY+RETAIL 1200 Distribution to the stores, distance
to waste collection point and transport to INFINTY
E2. LARGE WINERY+RETAIL 1100 Distribution to the stores, distance
to waste collection point and transport to INFINTY
As it can be noticed from the table above, the maximum distances are large enough and they will mean that the location of the washing facilities as it has been during the pilot tests, enables the achievement of CO2 eq savings.
Therefore, it can be concluded that the distance is not a limiting factor to have CO2 eq savings, though, as stated previously, reducing the distance would provide larger environmental benefits.
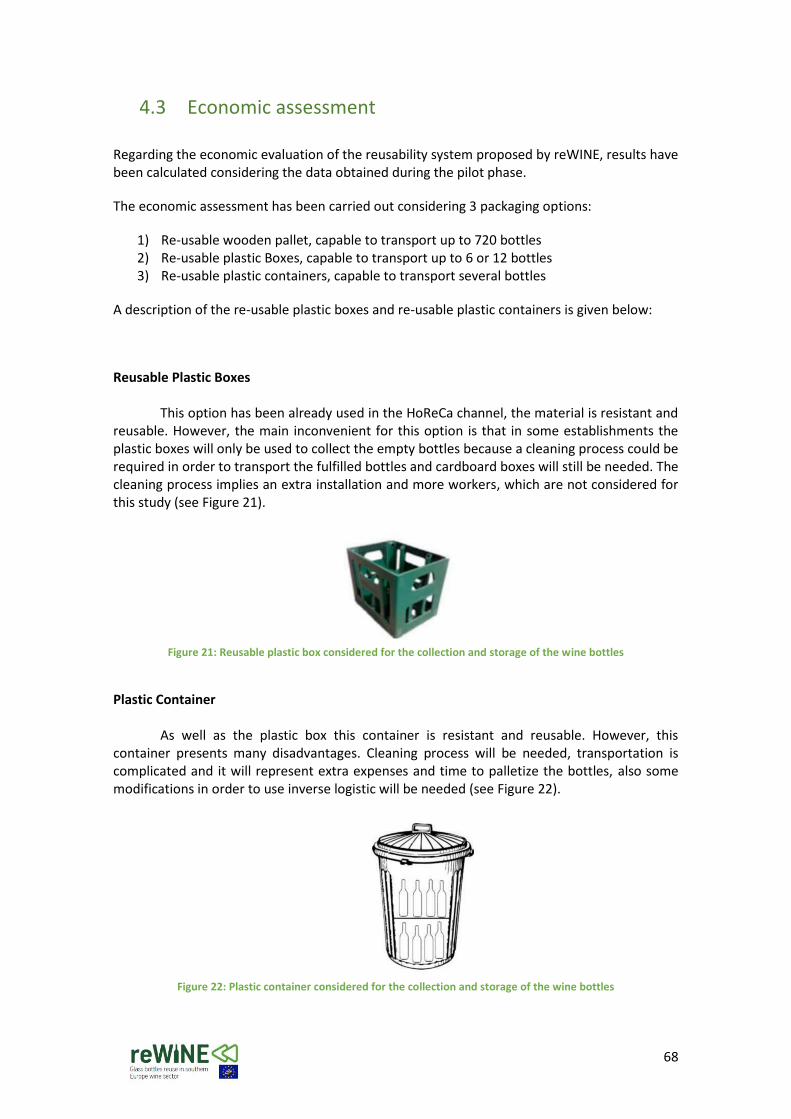
68
4.3 Economic assessment
Regarding the economic evaluation of the reusability system proposed by reWINE, results have been calculated considering the data obtained during the pilot phase.
The economic assessment has been carried out considering 3 packaging options:
1) Re-usable wooden pallet, capable to transport up to 720 bottles 2) Re-usable plastic Boxes, capable to transport up to 6 or 12 bottles 3) Re-usable plastic containers, capable to transport several bottles
A description of the re-usable plastic boxes and re-usable plastic containers is given below:
Reusable Plastic Boxes This option has been already used in the HoReCa channel, the material is resistant and
reusable. However, the main inconvenient for this option is that in some establishments the plastic boxes will only be used to collect the empty bottles because a cleaning process could be required in order to transport the fulfilled bottles and cardboard boxes will still be needed. The cleaning process implies an extra installation and more workers, which are not considered for this study (see Figure 21).
Figure 21: Reusable plastic box considered for the collection and storage of the wine bottles
Plastic Container
As well as the plastic box this container is resistant and reusable. However, this container presents many disadvantages. Cleaning process will be needed, transportation is complicated and it will represent extra expenses and time to palletize the bottles, also some modifications in order to use inverse logistic will be needed (see Figure 22).
Figure 22: Plastic container considered for the collection and storage of the wine bottles
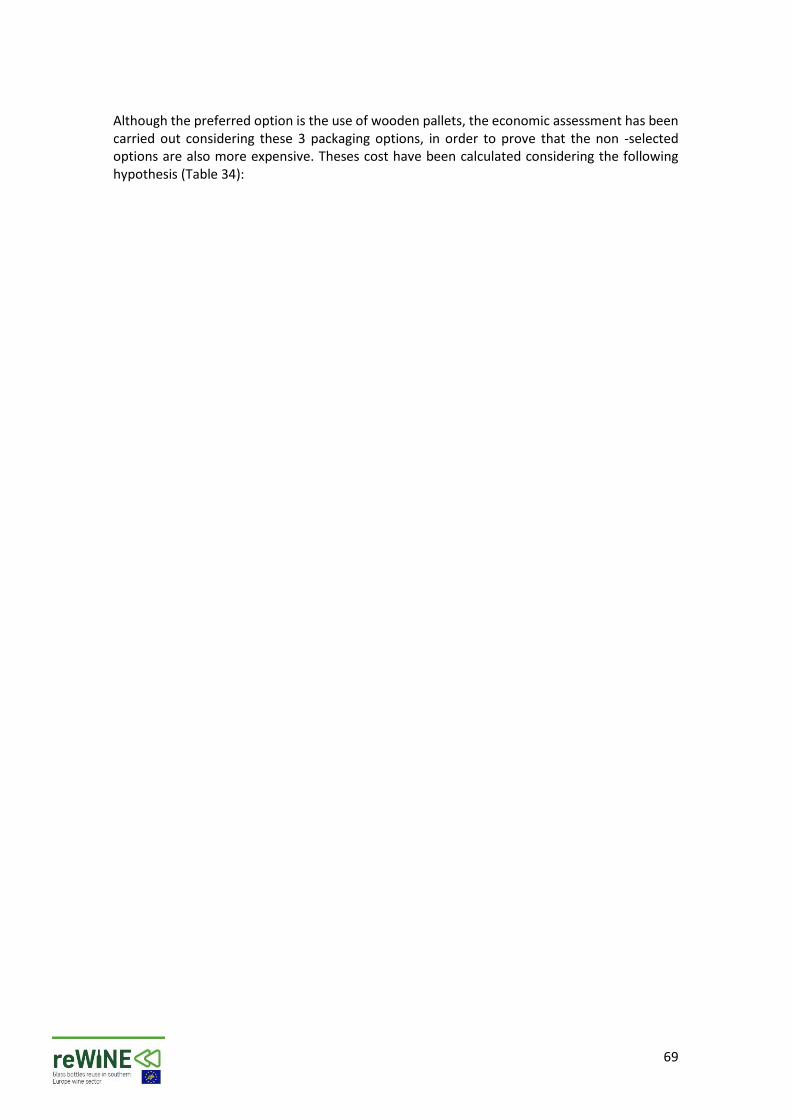
69
Although the preferred option is the use of wooden pallets, the economic assessment has been carried out considering these 3 packaging options, in order to prove that the non -selected options are also more expensive. Theses cost have been calculated considering the following hypothesis (Table 34):
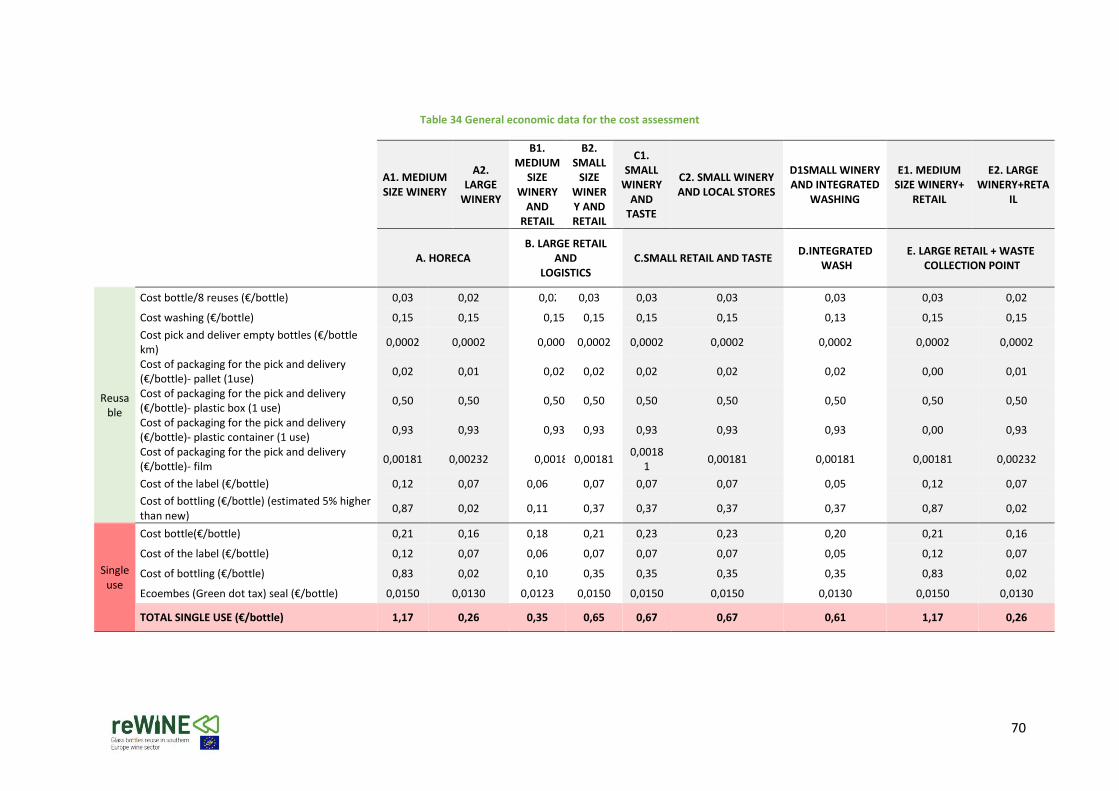
70
Table 34 General economic data for the cost assessment
A1. MEDIUM SIZE WINERY
A2. LARGE
WINERY
B1. MEDIUM
SIZE WINERY
AND RETAIL
B2. SMALL
SIZE WINERY AND RETAIL
C1. SMALL
WINERY AND
TASTE
C2. SMALL WINERY AND LOCAL STORES
D1SMALL WINERY AND INTEGRATED
WASHING
E1. MEDIUM SIZE WINERY+
RETAIL
E2. LARGE WINERY+RETA
IL
A. HORECA B. LARGE RETAIL
AND LOGISTICS
C.SMALL RETAIL AND TASTE D.INTEGRATED
WASH E. LARGE RETAIL + WASTE
COLLECTION POINT
Reusable
Cost bottle/8 reuses (€/bottle) 0,03 0,02 0,02 0,03 0,03 0,03 0,03 0,03 0,02
Cost washing (€/bottle) 0,15 0,15 0,15 0,15 0,15 0,15 0,13 0,15 0,15
Cost pick and deliver empty bottles (€/bottle km)
0,0002 0,0002 0,0002 0,0002 0,0002 0,0002 0,0002 0,0002 0,0002
Cost of packaging for the pick and delivery (€/bottle)- pallet (1use)
0,02 0,01 0,02 0,02 0,02 0,02 0,02 0,00 0,01
Cost of packaging for the pick and delivery (€/bottle)- plastic box (1 use)
0,50 0,50 0,50 0,50 0,50 0,50 0,50 0,50 0,50
Cost of packaging for the pick and delivery (€/bottle)- plastic container (1 use)
0,93 0,93 0,93 0,93 0,93 0,93 0,93 0,00 0,93
Cost of packaging for the pick and delivery (€/bottle)- film
0,00181 0,00232 0,00181 0,00181 0,0018
1 0,00181 0,00181 0,00181 0,00232
Cost of the label (€/bottle) 0,12 0,07 0,06 0,07 0,07 0,07 0,05 0,12 0,07
Cost of bottling (€/bottle) (estimated 5% higher than new)
0,87 0,02 0,11 0,37 0,37 0,37 0,37 0,87 0,02
Single use
Cost bottle(€/bottle) 0,21 0,16 0,18 0,21 0,23 0,23 0,20 0,21 0,16
Cost of the label (€/bottle) 0,12 0,07 0,06 0,07 0,07 0,07 0,05 0,12 0,07
Cost of bottling (€/bottle) 0,83 0,02 0,10 0,35 0,35 0,35 0,35 0,83 0,02
Ecoembes (Green dot tax) seal (€/bottle) 0,0150 0,0130 0,0123 0,0150 0,0150 0,0150 0,0130 0,0150 0,0130
TOTAL SINGLE USE (€/bottle) 1,17 0,26 0,35 0,65 0,67 0,67 0,61 1,17 0,26
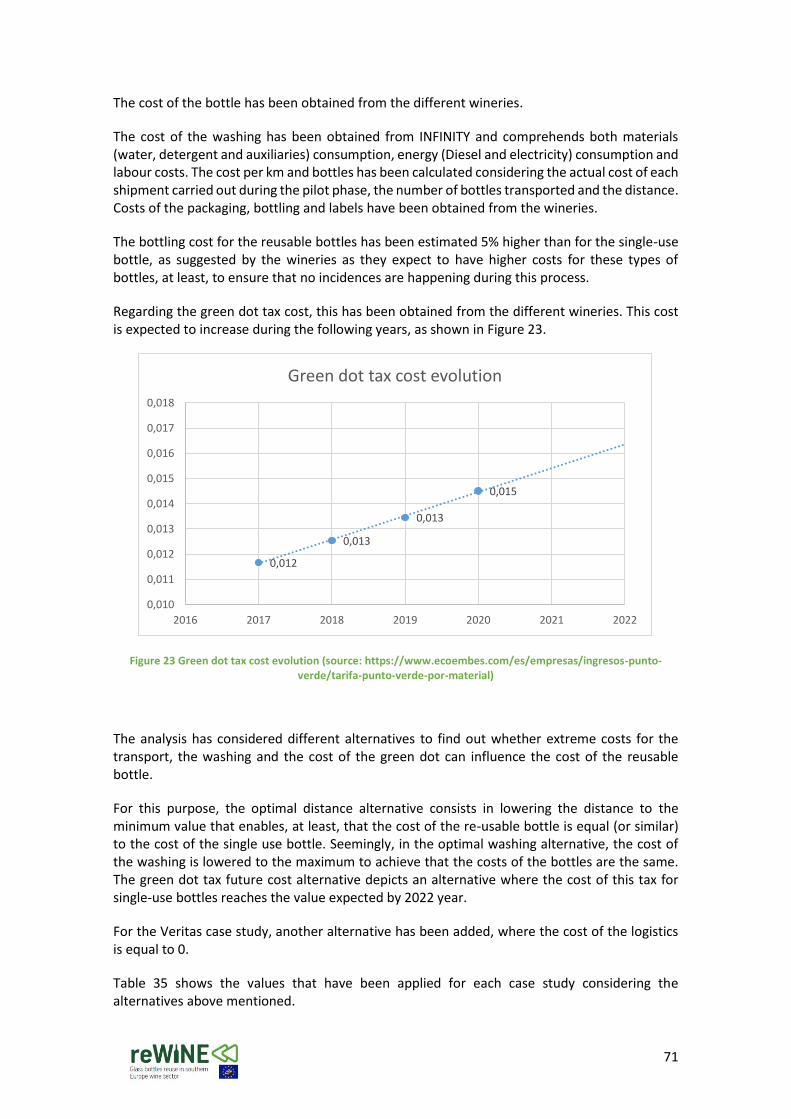
71
The cost of the bottle has been obtained from the different wineries.
The cost of the washing has been obtained from INFINITY and comprehends both materials (water, detergent and auxiliaries) consumption, energy (Diesel and electricity) consumption and labour costs. The cost per km and bottles has been calculated considering the actual cost of each shipment carried out during the pilot phase, the number of bottles transported and the distance. Costs of the packaging, bottling and labels have been obtained from the wineries.
The bottling cost for the reusable bottles has been estimated 5% higher than for the single-use bottle, as suggested by the wineries as they expect to have higher costs for these types of bottles, at least, to ensure that no incidences are happening during this process.
Regarding the green dot tax cost, this has been obtained from the different wineries. This cost is expected to increase during the following years, as shown in Figure 23.
Figure 23 Green dot tax cost evolution (source: https://www.ecoembes.com/es/empresas/ingresos-punto-verde/tarifa-punto-verde-por-material)
The analysis has considered different alternatives to find out whether extreme costs for the transport, the washing and the cost of the green dot can influence the cost of the reusable bottle.
For this purpose, the optimal distance alternative consists in lowering the distance to the minimum value that enables, at least, that the cost of the re-usable bottle is equal (or similar) to the cost of the single use bottle. Seemingly, in the optimal washing alternative, the cost of the washing is lowered to the maximum to achieve that the costs of the bottles are the same. The green dot tax future cost alternative depicts an alternative where the cost of this tax for single-use bottles reaches the value expected by 2022 year.
For the Veritas case study, another alternative has been added, where the cost of the logistics is equal to 0.
Table 35 shows the values that have been applied for each case study considering the alternatives above mentioned.
0,012
0,013
0,013
0,015
0,010
0,011
0,012
0,013
0,014
0,015
0,016
0,017
0,018
2016 2017 2018 2019 2020 2021 2022
Green dot tax cost evolution
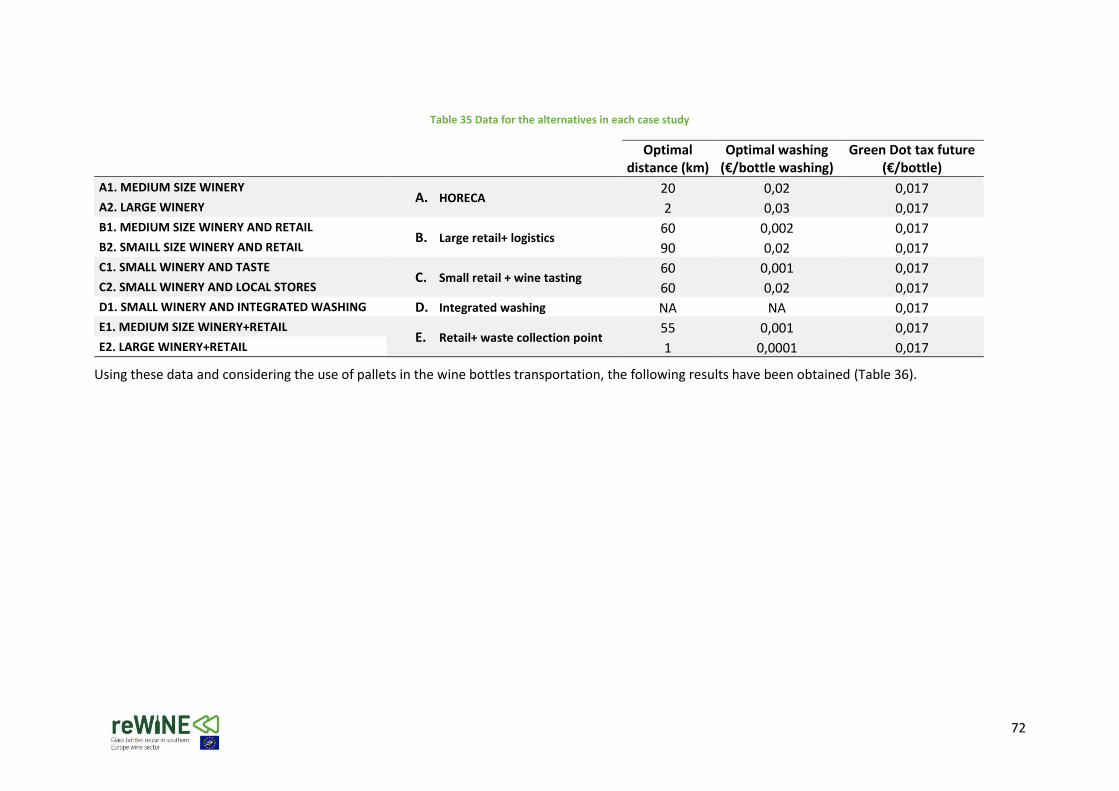
72
Table 35 Data for the alternatives in each case study
Optimal distance (km)
Optimal washing (€/bottle washing)
Green Dot tax future (€/bottle)
A1. MEDIUM SIZE WINERY A. HORECA
20 0,02 0,017
A2. LARGE WINERY 2 0,03 0,017
B1. MEDIUM SIZE WINERY AND RETAIL B. Large retail+ logistics
60 0,002 0,017
B2. SMAILL SIZE WINERY AND RETAIL 90 0,02 0,017
C1. SMALL WINERY AND TASTE C. Small retail + wine tasting
60 0,001 0,017
C2. SMALL WINERY AND LOCAL STORES 60 0,02 0,017
D1. SMALL WINERY AND INTEGRATED WASHING D. Integrated washing NA NA 0,017
E1. MEDIUM SIZE WINERY+RETAIL E. Retail+ waste collection point
55 0,001 0,017
E2. LARGE WINERY+RETAIL 1 0,0001 0,017
Using these data and considering the use of pallets in the wine bottles transportation, the following results have been obtained (Table 36).
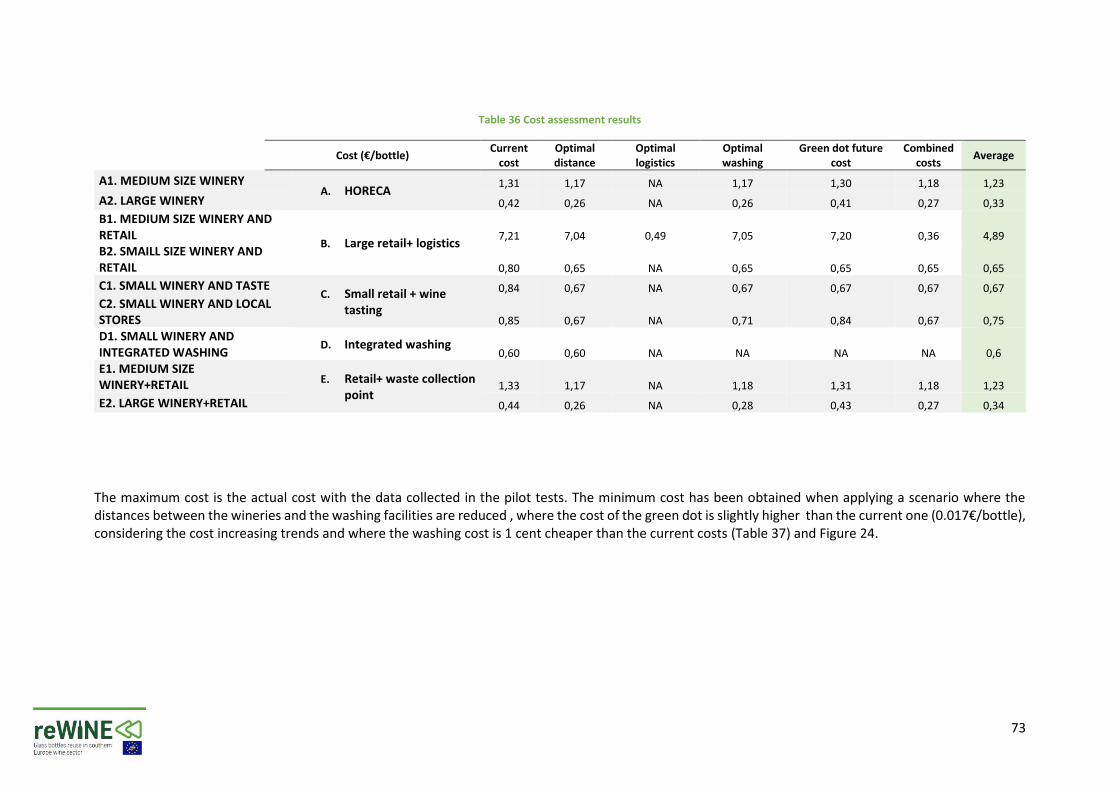
73
Table 36 Cost assessment results
Cost (€/bottle)
Current cost
Optimal distance
Optimal logistics
Optimal washing
Green dot future cost
Combined costs
Average
A1. MEDIUM SIZE WINERY A. HORECA
1,31 1,17 NA 1,17 1,30 1,18 1,23
A2. LARGE WINERY 0,42 0,26 NA 0,26 0,41 0,27 0,33
B1. MEDIUM SIZE WINERY AND RETAIL
B. Large retail+ logistics 7,21 7,04 0,49 7,05 7,20 0,36 4,89
B2. SMAILL SIZE WINERY AND RETAIL 0,80 0,65 NA 0,65 0,65 0,65 0,65
C1. SMALL WINERY AND TASTE C. Small retail + wine
tasting
0,84 0,67 NA 0,67 0,67 0,67 0,67
C2. SMALL WINERY AND LOCAL STORES 0,85 0,67 NA 0,71 0,84 0,67 0,75
D1. SMALL WINERY AND INTEGRATED WASHING
D. Integrated washing 0,60 0,60 NA NA NA NA 0,6
E1. MEDIUM SIZE WINERY+RETAIL
E. Retail+ waste collection point
1,33 1,17 NA 1,18 1,31 1,18 1,23
E2. LARGE WINERY+RETAIL 0,44 0,26 NA 0,28 0,43 0,27 0,34
The maximum cost is the actual cost with the data collected in the pilot tests. The minimum cost has been obtained when applying a scenario where the distances between the wineries and the washing facilities are reduced , where the cost of the green dot is slightly higher than the current one (0.017€/bottle), considering the cost increasing trends and where the washing cost is 1 cent cheaper than the current costs (Table 37) and Figure 24.
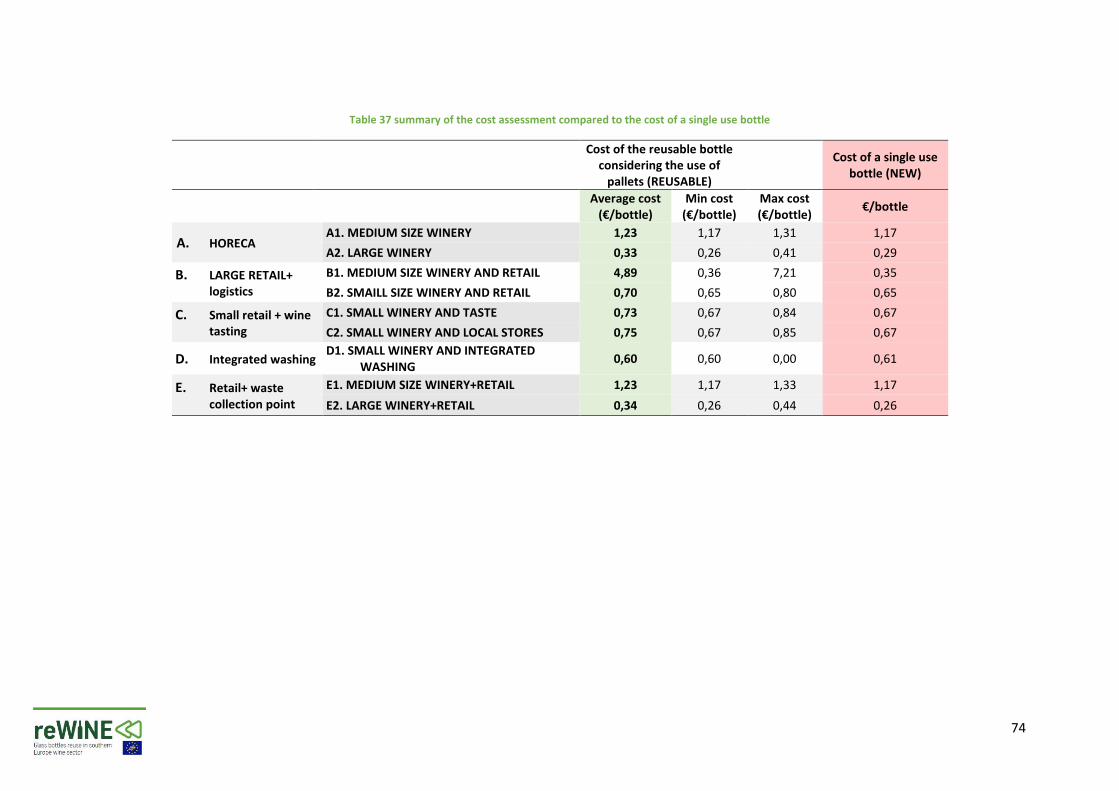
74
Table 37 summary of the cost assessment compared to the cost of a single use bottle
Cost of the reusable bottle considering the use of
pallets (REUSABLE)
Cost of a single use bottle (NEW)
Average cost (€/bottle)
Min cost (€/bottle)
Max cost (€/bottle)
€/bottle
A. HORECA A1. MEDIUM SIZE WINERY 1,23 1,17 1,31 1,17
A2. LARGE WINERY 0,33 0,26 0,41 0,29
B. LARGE RETAIL+ logistics
B1. MEDIUM SIZE WINERY AND RETAIL 4,89 0,36 7,21 0,35
B2. SMAILL SIZE WINERY AND RETAIL 0,70 0,65 0,80 0,65
C. Small retail + wine tasting
C1. SMALL WINERY AND TASTE 0,73 0,67 0,84 0,67
C2. SMALL WINERY AND LOCAL STORES 0,75 0,67 0,85 0,67
D. Integrated washing D1. SMALL WINERY AND INTEGRATED
WASHING 0,60 0,60 0,00 0,61
E. Retail+ waste collection point
E1. MEDIUM SIZE WINERY+RETAIL 1,23 1,17 1,33 1,17
E2. LARGE WINERY+RETAIL 0,34 0,26 0,44 0,26
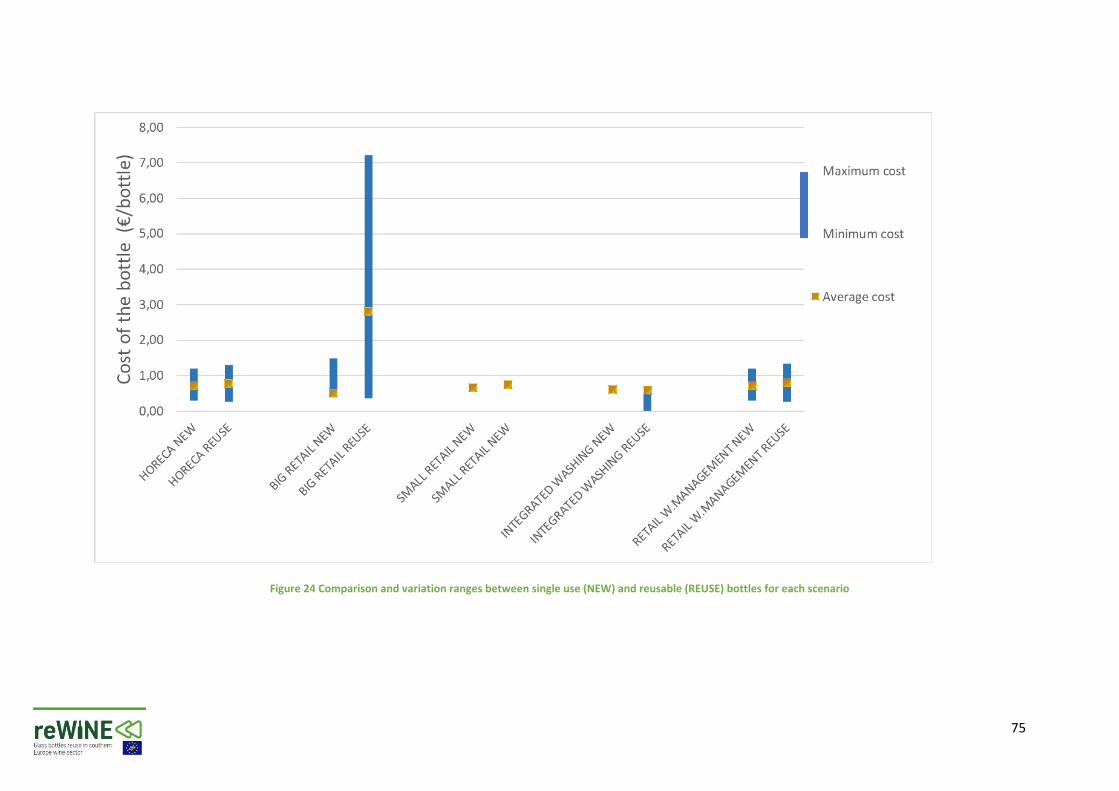
75
Figure 24 Comparison and variation ranges between single use (NEW) and reusable (REUSE) bottles for each scenario
76
As a general conclusion, the reuse of wine bottles at the moment is slightly higher than the use of new bottles. The cost of the reuse is directly influenced by the cost of the transport, the cost of the washing and the associated costs of the logistics and third parties involved in the bottles collection. The latest two seem to be difficult to happen as the washing cost cannot be reduced infinitely. Seemingly, the logistic cost, for medium size winery and big retail case study, cannot be reduced so easily with the means and the volume of bottles transported during the pilot test. Nevertheless, the cost of the transport can be easily reduced if distances from the wineries to the washing point are reduced, as depicted by the results in the column “optimal distance” in table 35. For instance, 60 km, will provide significant cost savings and will make that the cost of the reuse is the same as the cost of a new bottle.
Having washing facilities closer to the wineries, as it was defined in figure 20, is a scenario that should be envisage with the aim of making this project fully feasible from an economic perspective.
It is also important that now, the Spanish glass packaging producers, are considered as industries with a high consumption of electricity. For this reason, their competitiveness is highly determined by the cost of electricity. To ensure their competitiveness and support this sector, this industry is beneficiary of special and reduced electricity fees, supported by the administrations. Therefore, the cost of a single use bottle can be kept low enough to allow to have market in the region. This economic support clearly affects the cost comparison between single use and reusable bottles. In the case these benefits are eliminated, cost a single use bottle will certainly be increased and the alternative of having reusable bottles will be more attractive also from an economic perspective.
5 Conclusions
This report presents the feasibility analysis carried out in the reWine project to evaluate the return system from a technical, environmental and economic perspective.
From the technical aspects, it can be stated that the return system is feasible since the quality of the re-used bottles after the washing is accepted by the wineries, considering aesthetical and hygienic aspects. Furthermore, the mechanic washing applied by INFINITY has resulted to be effective to remove both hydrosoluble and non -hydrosoluble labels.
From the environmental perspective, it should be remarked that for all case studies included
in the reWine pilot tests, the return system provides environmental benefits. The environmental benefits can be higher or lower, depending on the distance between the
wineries and washing facilities and the number of washings required to ensure that the bottle is ready for a new use. For instance, regarding the specific impact concerning carbon footprint (Global Warming Potential, expressed in kg of CO2 equivalent), accumulated savings after 8 reuses (7 washings) vary from 1,9 to 3,7 kg CO2 eq /bottle, depending on the logistics and the distances.
The reduction in the distance between the winery and the washing facility provides additional benefits to the remaining environmental impact categories. For the remaining impact categories, savings are also significant. A special analysis should be done for the Abiotic Depletion Potential (elements) impact category, as this impact depends clearly on the fuel consumption in the transport. For this reason, savings on this impact category are found as long as distances are reduced.
77
For this purpose, this study suggests that the creation of new washing facilities, spread along the territory and in order to have at least one in each Certification of Origin of wine, will enhance the obtaining of comprehensive environmental benefits.
Regarding the economic feasibility, from the analysis carried out, it can be concluded that
the cost of reusing a bottle of wine is higher than buying a new bottle. The scenario that presents the best cost analysis is the third one; however, in this scenario it is assumed that the winery has its own washing plant. This scheme is valid in a local scale and a further analysis of the installation of the washing plant must be made to determine profitability.
However, when making some variations such us lowering the cost of washing bottle up to
0.13 (€) and reducing the distance from and to the washing facility, the total costs are the same for the acquisition of the new bottle and the reuse bottle.
As a general conclusion, reWine project feasibility, considering technical, environmental,
and economic aspects, is ensured and can be replicated in other regions, as it will be presented in deliverable D5.2.
78
References
Agència de Residus de Catalunya (2019). [ONLINE] Catalunya, Departament de Territori i Sostenibilitat. Available at: http://estadistiques.arc.cat/ARC/# [access October 2020] Directive 94/62/EC of the European Parliament and of the Council of 20th November 1994 on packaging and packaging waste. European Parliament and European Council (1994). ELI: http://data.europa.eu/eli/dir/1994/62/oj Directive 2008/98/EC of the European Parliament and of the Council of 19th November 2008 on waste and repealing certain. (Text with EEA relevance). ELI: http://data.europa.eu/eli/dir/2008/98/oj Eurostat (2015). Environment on the EU - Each person in the EU generated 475kg of municipal waste in 2014. European Commission. Press release Nº 56. Available at: http://ec.europa.eu/eurostat/documents/2995521/7214320/8-22032016-AP-EN.pdf/eea3c8df-ce89-41e0-a958-5cc7290825c3 [Accessed 30 August 2017].


