Embed Size (px)
Citation preview
Project COMPASS
September 2019 Final Evaluation Report
September 30, 2019
5900 Summit Ave. #201
Browns Summit, NC 27214 www.serve.org
ii
PROJECT COMPASS FINAL EVALUATION REPORT
Prepared by: Dr. Julie Edmunds
Ms. Beth Thrift SERVE Center at UNCG
Dr. Dora Gicheva
Dr. Marie Hull Bryan School of Business and Economics, UNCG
Contact:
Dr. Julie Edmunds, Program Director 336-315-7415
Submitted to: Bryan Ryan, Wake Technical Community College
iii
Copyright © Notice
Copyright © 2019. The material within this report may not be reproduced or replicated without written permission from SERVE Center at the University of North Carolina at Greensboro.
For permission, contact: Julie Edmunds at [email protected]; 336-315-7415
Suggested citation:
Edmunds, J. A., Gicheva, D., Thrift, B., & Hull, M. (2019). Project COMPASS: Final Evaluation Report. Greensboro, NC: The SERVE Center, University of North Carolina at Greensboro.
Funding Acknowledgment and Disclaimer:
This work has been supported by the U.S. Department of Education’s First in the World program, through Grant #P116F150082. The opinions expressed are those of the authors and do not represent views of the U.S. Department of Education or other individuals within the SERVE Center, the University of North Carolina at Greensboro, or Wake Technical Community College.
iv
BACKGROUND INFORMATION ABOUT THE SERVE CENTER
The SERVE Center at the University of North Carolina at Greensboro (UNCG) is a university-based research, development, dissemination, evaluation, and technical assistance center. Its mission is to support and promote teaching and learning excellence in the education community.
Since its inception in 1990, SERVE has been awarded over $200 million in contracts and grants. It has successfully managed 14 major awards including four consecutive contracts for the Regional Educational Laboratory for the Southeast (REL-SE) funded by the Institute of Education Sciences (IES) at the US Department of Education (USED) and five awards from USED for the National Center for Homeless Education (NCHE). In addition, past SERVE awards include a five-year Technology Grant for Coordinating Teaching and Learning in Migrant Communities, three consecutive contracts as the Eisenhower Consortium for Mathematics and Science Education for the Southeast, and two consecutive Regional Technology in Education Consortium grants.
At the national level, SERVE operates the National Center for Homeless Education (NCHE), USED’s technical assistance and information dissemination center in the area of homeless education. NCHE uses state-of-the-art technology for web communication and online professional development and for supporting state coordinators of homeless education, local program coordinators, educators, parents, and advocates in all 50 states and in 15,000 school districts.
In addition to national-level NCHE activities, SERVE currently conducts research studies and evaluations under grants and contracts with federal, state, and local education agencies. Examples of SERVE’s grant-funded research work include three federally funded studies of the impact of Early College High Schools and an evaluation of North Carolina’s Career and College Promise. Contract work includes evaluations of four Investing in Innovation (i3) projects, the Winston-Salem/Forsyth County Magnet Program in North Carolina, the Guilford County Schools teacher incentive program (Mission Possible), the USED-funded Bridges to Early Learning Project in South Carolina, and North Carolina’s Race to the Top Initiative. The Guiding Principles for Evaluators (American Evaluation Association, 2004) and the What Works Clearinghouse Standards (Institute of Education Sciences, March, 2014) guide the evaluation work performed at the SERVE Center.
v
Acknowledgements
We greatly appreciate the work of the Wake Technical Community College staff. Throughout this project, they have been committed to ensuring a high-quality, rigorous study. We also appreciate the insight and input of Dr. Jeremy Bray from the UNCG Department of Economics.
vi
TABLE OF CONTENTS Section I: Introduction ........................................................................................................ 1
Section II: Project COMPASS Design ................................................................................... 3
Section III: Evaluation Methods .......................................................................................... 6
Section IV: Implementation Supports ............................................................................... 18
Section V: Implementation of the Strategies ................................................................... 28
Section VI: Program Impacts ............................................................................................. 45
Section VII: Institutional Impacts ...................................................................................... 54
Section VIII: Conclusions and Lessons Learned ................................................................ 59
References ........................................................................................................................ 62
Appendix A: Project COMPASS Consort Flow Diagram—All Courses ............................... 63
Appendix B: Supplementary COI Survey Tables ............................................................... 64
Appendix C: Supplementary Tables for Impact Analyses ................................................. 67
Appendix D: Impact Estimates for Summer 2018 ............................................................. 69
Appendix E: Data Collection Protocols ............................................................................. 71
Appendix F: Fidelity of Implementation Tables ................................................................ 79
Appendix G: Project COMPASS Presentations and Publications ...................................... 87
1
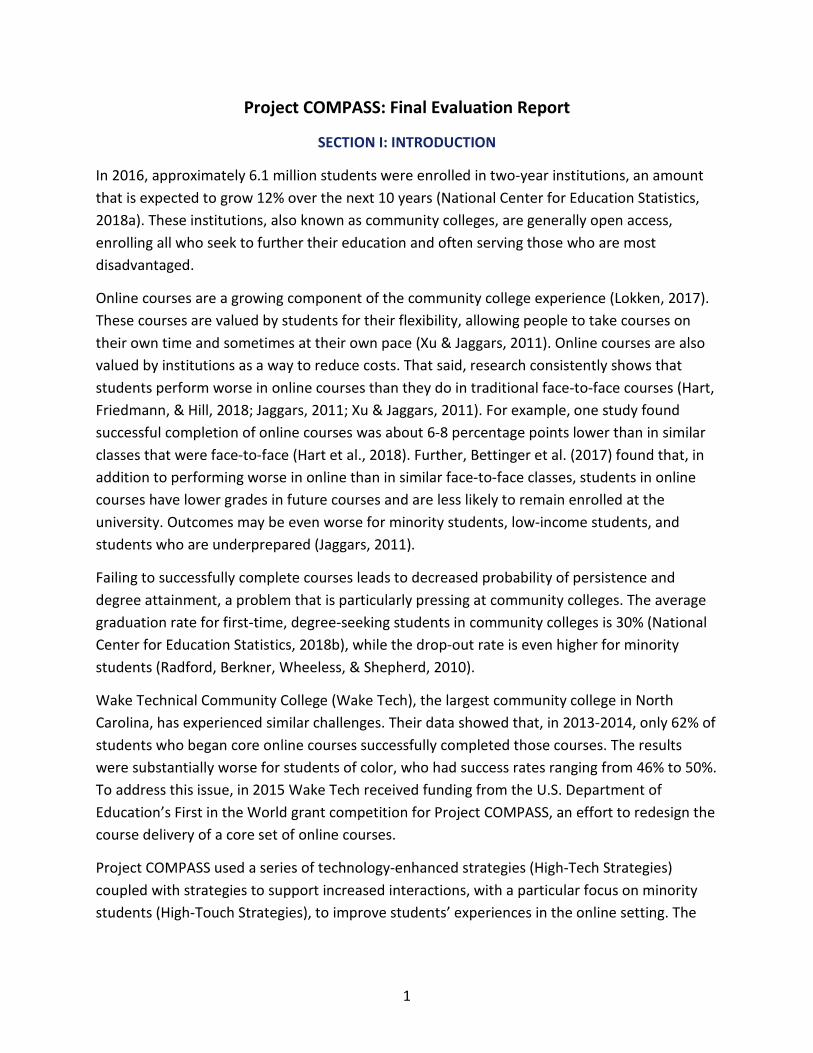
Project COMPASS: Final Evaluation Report
SECTION I: INTRODUCTION
In 2016, approximately 6.1 million students were enrolled in two-year institutions, an amount that is expected to grow 12% over the next 10 years (National Center for Education Statistics, 2018a). These institutions, also known as community colleges, are generally open access, enrolling all who seek to further their education and often serving those who are most disadvantaged.
Online courses are a growing component of the community college experience (Lokken, 2017). These courses are valued by students for their flexibility, allowing people to take courses on their own time and sometimes at their own pace (Xu & Jaggars, 2011). Online courses are also valued by institutions as a way to reduce costs. That said, research consistently shows that students perform worse in online courses than they do in traditional face-to-face courses (Hart, Friedmann, & Hill, 2018; Jaggars, 2011; Xu & Jaggars, 2011). For example, one study found successful completion of online courses was about 6-8 percentage points lower than in similar classes that were face-to-face (Hart et al., 2018). Further, Bettinger et al. (2017) found that, in addition to performing worse in online than in similar face-to-face classes, students in online courses have lower grades in future courses and are less likely to remain enrolled at the university. Outcomes may be even worse for minority students, low-income students, and students who are underprepared (Jaggars, 2011).
Failing to successfully complete courses leads to decreased probability of persistence and degree attainment, a problem that is particularly pressing at community colleges. The average graduation rate for first-time, degree-seeking students in community colleges is 30% (National Center for Education Statistics, 2018b), while the drop-out rate is even higher for minority students (Radford, Berkner, Wheeless, & Shepherd, 2010).
Wake Technical Community College (Wake Tech), the largest community college in North Carolina, has experienced similar challenges. Their data showed that, in 2013-2014, only 62% of students who began core online courses successfully completed those courses. The results were substantially worse for students of color, who had success rates ranging from 46% to 50%. To address this issue, in 2015 Wake Tech received funding from the U.S. Department of Education’s First in the World grant competition for Project COMPASS, an effort to redesign the course delivery of a core set of online courses.
Project COMPASS used a series of technology-enhanced strategies (High-Tech Strategies) coupled with strategies to support increased interactions, with a particular focus on minority students (High-Touch Strategies), to improve students’ experiences in the online setting. The
2
model was implemented in three popular introductory gateway courses that historically had lower-than-desired outcomes. More detail is provided on the model in Section II.
This report presents results from an evaluation of this model. The impact of the model was evaluated using a randomized controlled trial in which students were randomly assigned to online course sections, some of which were taught by teachers trained in the Project COMPASS protocol and some of which were taught by control teachers who had not been exposed to the protocol. The study then compared treatment and control students on a set of core outcomes related to success in the classes and persistence in college. The evaluation also collected data around program implementation. The study design is described in more depth in Section III of this report. Section IV describes the activities Wake Tech used to support the project. Section V presents findings relative to the implementation of the instructional strategies in the classroom, and Section VI presents the impacts on students. Section VII describes the institutional impacts on Wake Tech as a result of this project. The report concludes with a discussion of lessons learned and implications for both Wake Tech and the broader field of online learning.
3
SECTION II: PROJECT COMPASS DESIGN
Project COMPASS was a development project funded under the U.S. Department of Education’s First in the World competition. The goals of the project were to 1) increase the number of students, particularly students of color, completing online courses; 2) improve the academic performance of those students; and 3) increase the percentage of students who persist in postsecondary education. The project planned to achieve these outcomes by redesigning the delivery of a core set of online courses so that they incorporated a variety of technologies and strategies that increased the quality of the online learning experience. The grant proposal set targets for 1) reducing the withdrawal rates of students of color by 10 percentage points in each class and 2) increasing the success rates of students of color by 10 percentage points in each class.
Conceptual Framework
Created by staff at Wake Tech, Project COMPASS was structured around the Community of Inquiry conceptual framework, which identifies three core components of the online experience: 1) social presence, 2) cognitive presence, and 3) teaching presence (Arbaugh, 2007; Garrison, Anderson, & Archer, 2001).
Social Presence
Social presence is defined as “the degree to which participants in computer-mediated communication feel affectively connected one to another” (Swan et al., 2008, p. 2) and is seen as critical in supporting students’ online learning (Diaz, Swan, Ice, & Kupczynksi, 2010). Regarding Project COMPASS, social presence refers to the way in which students interacted and were effectively connected with each other and with the instructors.
Cognitive Presence
Cognitive presence is defined as the extent to which learners are able to “construct and confirm meaning through sustained reflection and discourse” (Arbaugh, 2007, p. 74). It emphasizes the engagement of students in critical thinking and is seen as challenging to implement in an online environment (Arbaugh, 2007). For Project COMPASS, cognitive presence was expected to be enhanced by the type of questions instructors asked and the type of activities in which students were expected to engage.
Teaching Presence
Teaching presence is the extent to which the learning environment is designed and facilitated to support the other presences. It is also the extent to which there is direct instruction focused on the content of the course (Arbaugh et al., 2008). As articulated by Project COMPASS staff, teaching presence was the kind of presence an instructor projects in an online community. For
4
example, instructors with strong teaching presence are those who post frequently, actively remind students of deadlines, invite questions, respond quickly to students, and solicit and incorporate feedback.
Intervention
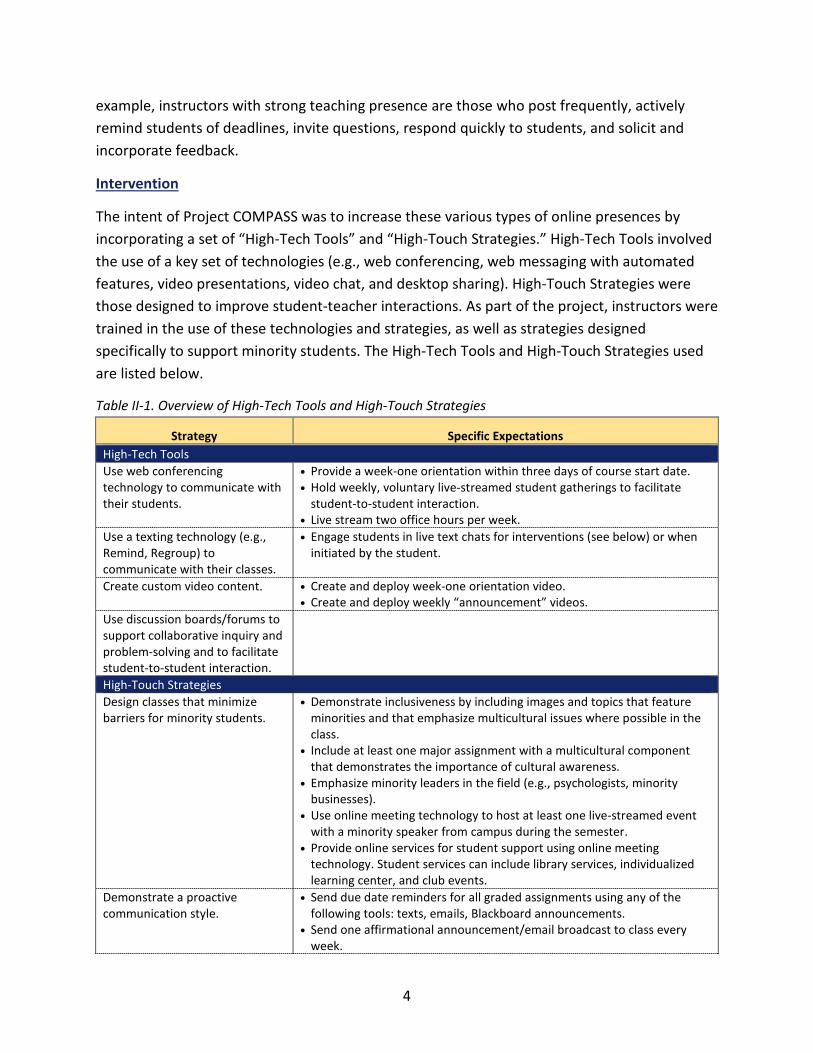
The intent of Project COMPASS was to increase these various types of online presences by incorporating a set of “High-Tech Tools” and “High-Touch Strategies.” High-Tech Tools involved the use of a key set of technologies (e.g., web conferencing, web messaging with automated features, video presentations, video chat, and desktop sharing). High-Touch Strategies were those designed to improve student-teacher interactions. As part of the project, instructors were trained in the use of these technologies and strategies, as well as strategies designed specifically to support minority students. The High-Tech Tools and High-Touch Strategies used are listed below.
Table II-1. Overview of High-Tech Tools and High-Touch Strategies
Strategy Specific Expectations High-Tech Tools Use web conferencing technology to communicate with their students.
• Provide a week-one orientation within three days of course start date. • Hold weekly, voluntary live-streamed student gatherings to facilitate
student-to-student interaction. • Live stream two office hours per week.
Use a texting technology (e.g., Remind, Regroup) to communicate with their classes.
• Engage students in live text chats for interventions (see below) or when initiated by the student.
Create custom video content. • Create and deploy week-one orientation video. • Create and deploy weekly “announcement” videos.
Use discussion boards/forums to support collaborative inquiry and problem-solving and to facilitate student-to-student interaction.
High-Touch Strategies Design classes that minimize barriers for minority students.
• Demonstrate inclusiveness by including images and topics that feature minorities and that emphasize multicultural issues where possible in the class.
• Include at least one major assignment with a multicultural component that demonstrates the importance of cultural awareness.
• Emphasize minority leaders in the field (e.g., psychologists, minority businesses).
• Use online meeting technology to host at least one live-streamed event with a minority speaker from campus during the semester.
• Provide online services for student support using online meeting technology. Student services can include library services, individualized learning center, and club events.
Demonstrate a proactive communication style.
• Send due date reminders for all graded assignments using any of the following tools: texts, emails, Blackboard announcements.
• Send one affirmational announcement/email broadcast to class every week.
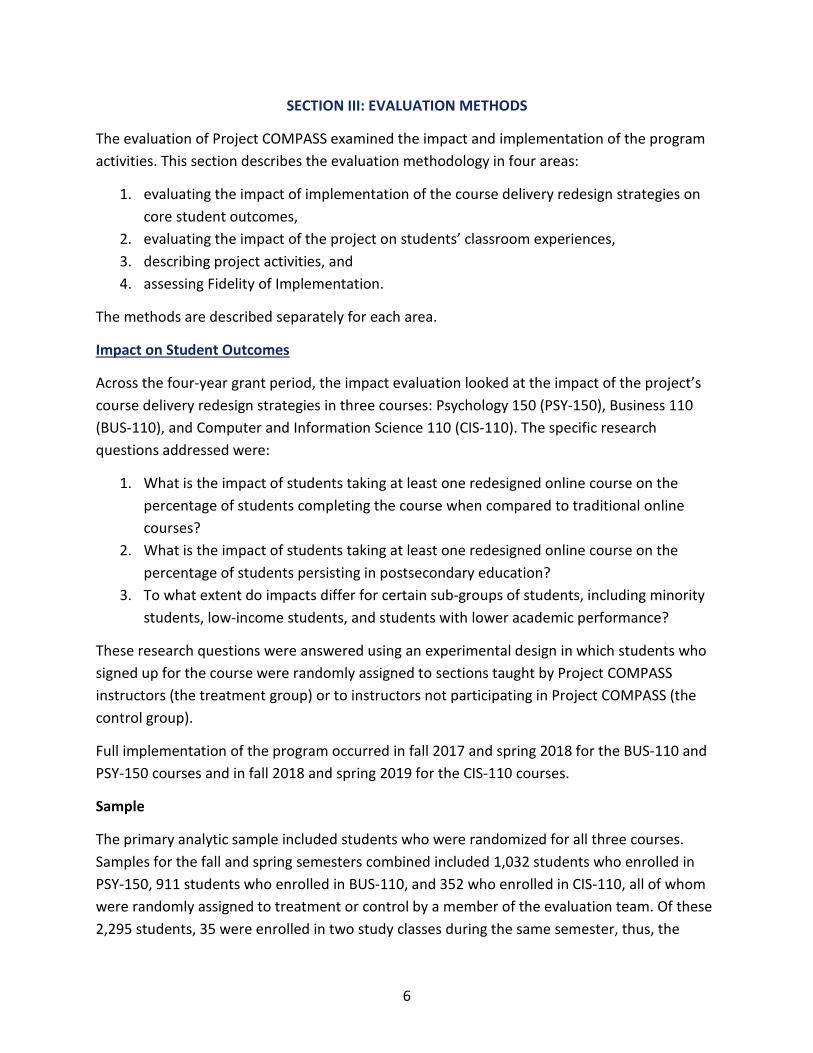
5
Strategy Specific Expectations • Demonstrate high responsiveness by responding to all email/texts within
six hours (during the hours of 8am-8pm), six days a week. • Offer multiple low-stakes opportunities for students to demonstrate
mastery of content, providing both automated and personalized feedback.
Engage in proactive intervention strategies designed to identify and mentor students before they get in trouble.
• Contact students who are taking the class for the second time during the first week of class. The goal of this contact is to provide information regarding support services available to the student.
• Send weekly email/text follow-up to students who miss work during the previous week.
• Attempt to contact students who do not log into Blackboard for seven days to offer help (using the student’s email or listed phone number).
These strategies were implemented in a core set of online courses, taken as introductory courses by many students, including Psychology 150 (PSY-150), Business 110 (BUS-110), and Computer and Information Science 110 (CIS-110).
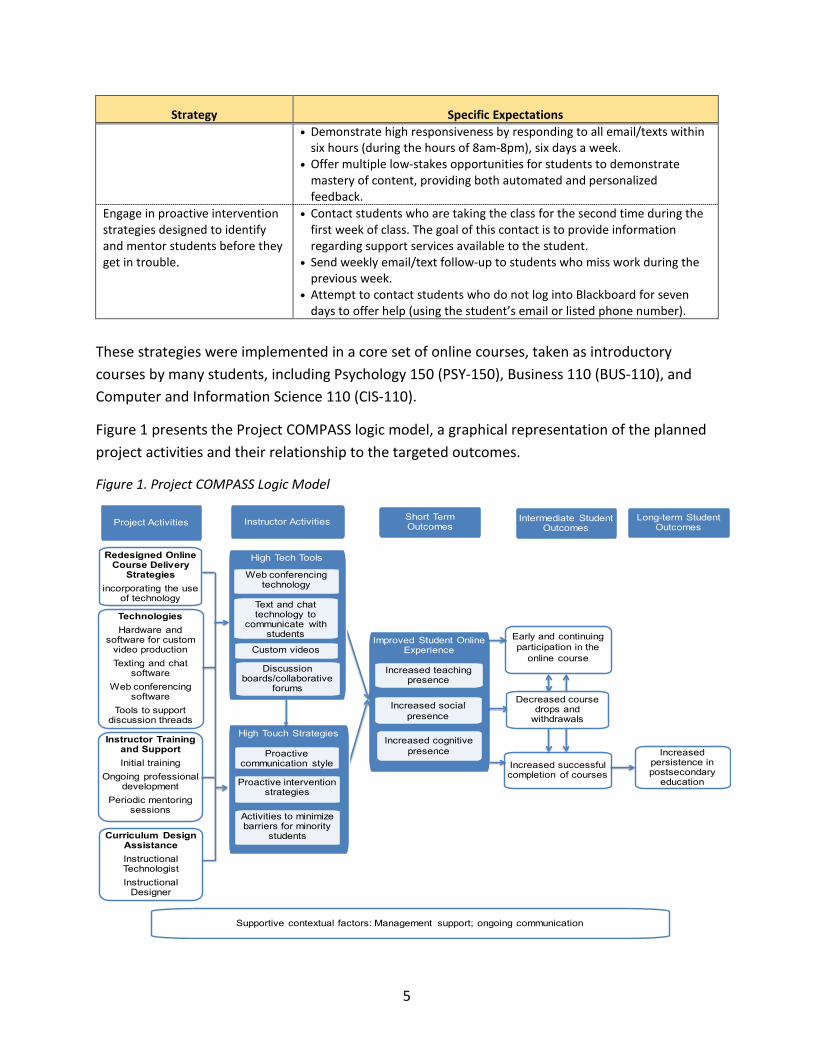
Figure 1 presents the Project COMPASS logic model, a graphical representation of the planned project activities and their relationship to the targeted outcomes.
Figure 1. Project COMPASS Logic Model
Early and continuing participation in the
online course
Short Term Outcomes
Improved Student Online Experience
Increased social presence
Increased teaching presence
Increased cognitive presence
Long-term Student Outcomes
Increased successful completion of courses
Increased persistence in postsecondary
education
Intermediate Student Outcomes
Instructor Training and SupportInitial training
Ongoing professional development
Periodic mentoring sessions
Redesigned Online Course Delivery
Strategiesincorporating the use
of technology
Project Activities
High Tech Tools
Discussion boards/collaborative
forums
Text and chat technology to
communicate with students
Web conferencing technology
Custom videos
Instructor Activities
TechnologiesHardware and
software for custom video productionTexting and chat
softwareWeb conferencing
softwareTools to support
discussion threadsHigh Touch Strategies
Proactive communication style
Proactive intervention strategies
Activities to minimize barriers for minority
studentsCurriculum Design AssistanceInstructional TechnologistInstructional
Designer
Supportive contextual factors: Management support; ongoing communication
Decreased course drops and
withdrawals
6
SECTION III: EVALUATION METHODS
The evaluation of Project COMPASS examined the impact and implementation of the program activities. This section describes the evaluation methodology in four areas:
1. evaluating the impact of implementation of the course delivery redesign strategies on core student outcomes,
2. evaluating the impact of the project on students’ classroom experiences, 3. describing project activities, and 4. assessing Fidelity of Implementation.
The methods are described separately for each area.
Impact on Student Outcomes
Across the four-year grant period, the impact evaluation looked at the impact of the project’s course delivery redesign strategies in three courses: Psychology 150 (PSY-150), Business 110 (BUS-110), and Computer and Information Science 110 (CIS-110). The specific research questions addressed were:
1. What is the impact of students taking at least one redesigned online course on the percentage of students completing the course when compared to traditional online courses?
2. What is the impact of students taking at least one redesigned online course on the percentage of students persisting in postsecondary education?
3. To what extent do impacts differ for certain sub-groups of students, including minority students, low-income students, and students with lower academic performance?
These research questions were answered using an experimental design in which students who signed up for the course were randomly assigned to sections taught by Project COMPASS instructors (the treatment group) or to instructors not participating in Project COMPASS (the control group).
Full implementation of the program occurred in fall 2017 and spring 2018 for the BUS-110 and PSY-150 courses and in fall 2018 and spring 2019 for the CIS-110 courses.
Sample
The primary analytic sample included students who were randomized for all three courses. Samples for the fall and spring semesters combined included 1,032 students who enrolled in PSY-150, 911 students who enrolled in BUS-110, and 352 who enrolled in CIS-110, all of whom were randomly assigned to treatment or control by a member of the evaluation team. Of these 2,295 students, 35 were enrolled in two study classes during the same semester, thus, the
7
number of unique students included in the study was 2,260. All cross-enrolled students had the same assignment in all classes. Such students were first assigned randomly to the treatment and control group for BUS-110, and their treatment/control status was used in the assignment for PSY-150. There were no cross-enrolled students in fall 2017 nor spring 2018 semesters because only Computer Science 110 students participated in the study.
All students who were originally randomly assigned were kept in the analytic sample, even if they ended up dropping or being dropped from the course prior to the start of the course. There were 135 students who enrolled in study courses in two different semesters. These students were randomized, and their data from the initial assignment were included in the analysis but excluded in subsequent classes. We excluded data from their subsequent classes because of concerns that, if the intervention was successful at encouraging more students to persist in school, these students may have been more marginal students and would negatively affect impact estimates.
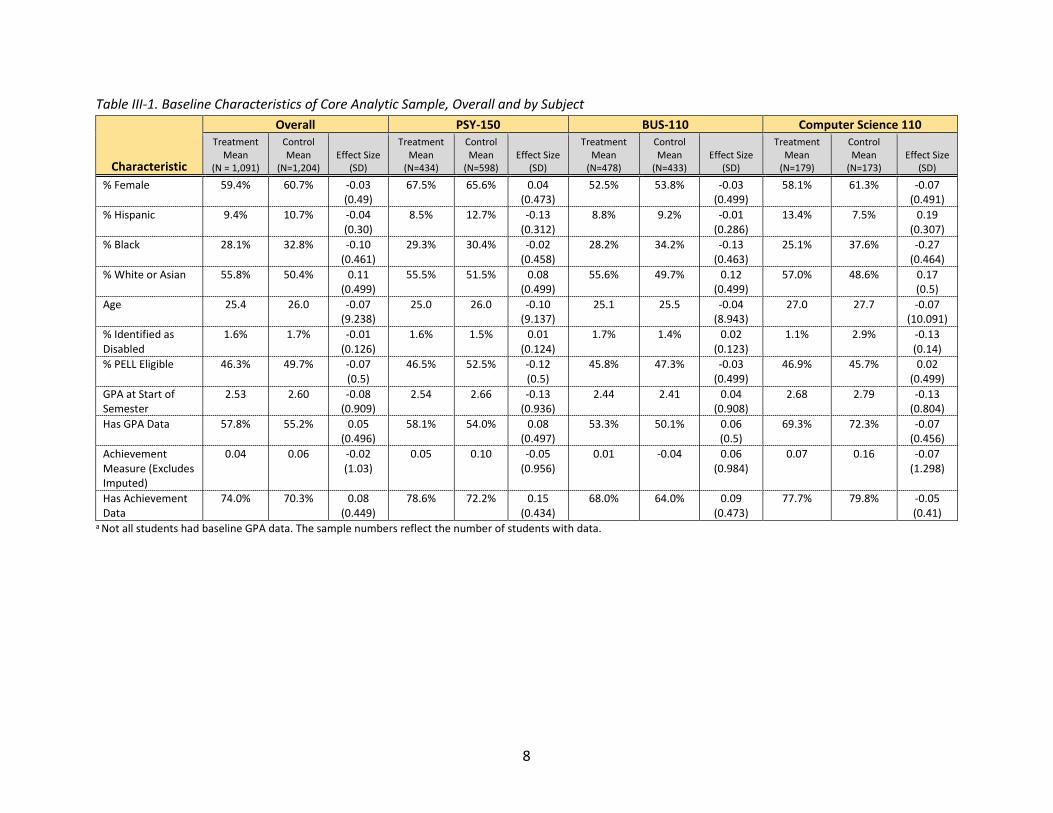
The PSY-150 sample included 434 students in 16 treatment sections and 598 in 20 control sections across the two semesters. The BUS-110 sample included 478 students in eight treatment sections and 433 students in nine control sections. The CIS-110 sample included 179 students in six treatment sections and 173 students in eight control sections. Table III-1 on the following page shows the characteristics of the students in the analytic samples for the three courses. The characteristics of minority and white or Asian students in the sample are shown separately in Appendix B, Table B-1. Appendix A provides a CONSORT diagram documenting the creation of the analytic samples for the impact analyses.
The sample for the persistence measure included only the students from PSY-150 and BUS-110, a total of 1,943 students.
Measures and Data Collection
This impact study used administrative data collected by Wake Tech as part of their regular course administration; these data were then shared with the evaluation team. The specific outcomes examined in the impact study are described below.
8
Table III-1. Baseline Characteristics of Core Analytic Sample, Overall and by Subject
Characteristic
Overall PSY-150 BUS-110 Computer Science 110 Treatment
Mean (N = 1,091)
Control Mean
(N=1,204) Effect Size
(SD)
Treatment Mean
(N=434)
Control Mean
(N=598) Effect Size
(SD)
Treatment Mean
(N=478)
Control Mean
(N=433) Effect Size
(SD)
Treatment Mean
(N=179)
Control Mean
(N=173) Effect Size
(SD)
% Female 59.4% 60.7% -0.03 (0.49)
67.5% 65.6% 0.04 (0.473)
52.5% 53.8% -0.03 (0.499)
58.1% 61.3% -0.07 (0.491)
% Hispanic 9.4% 10.7% -0.04 (0.30)
8.5% 12.7% -0.13 (0.312)
8.8% 9.2% -0.01 (0.286)
13.4% 7.5% 0.19 (0.307)
% Black 28.1% 32.8% -0.10 (0.461)
29.3% 30.4% -0.02 (0.458)
28.2% 34.2% -0.13 (0.463)
25.1% 37.6% -0.27 (0.464)
% White or Asian 55.8% 50.4% 0.11 (0.499)
55.5% 51.5% 0.08 (0.499)
55.6% 49.7% 0.12 (0.499)
57.0% 48.6% 0.17 (0.5)
Age 25.4 26.0 -0.07 (9.238)
25.0 26.0 -0.10 (9.137)
25.1 25.5 -0.04 (8.943)
27.0 27.7 -0.07 (10.091)
% Identified as Disabled
1.6% 1.7% -0.01 (0.126)
1.6% 1.5% 0.01 (0.124)
1.7% 1.4% 0.02 (0.123)
1.1% 2.9% -0.13 (0.14)
% PELL Eligible 46.3% 49.7% -0.07 (0.5)
46.5% 52.5% -0.12 (0.5)
45.8% 47.3% -0.03 (0.499)
46.9% 45.7% 0.02 (0.499)
GPA at Start of Semester
2.53 2.60 -0.08 (0.909)
2.54 2.66 -0.13 (0.936)
2.44 2.41 0.04 (0.908)
2.68 2.79 -0.13 (0.804)
Has GPA Data 57.8% 55.2% 0.05 (0.496)
58.1% 54.0% 0.08 (0.497)
53.3% 50.1% 0.06 (0.5)
69.3% 72.3% -0.07 (0.456)
Achievement Measure (Excludes Imputed)
0.04 0.06 -0.02 (1.03)
0.05 0.10 -0.05 (0.956)
0.01 -0.04 0.06 (0.984)
0.07 0.16 -0.07 (1.298)
Has Achievement Data
74.0% 70.3% 0.08 (0.449)
78.6% 72.2% 0.15 (0.434)
68.0% 64.0% 0.09 (0.473)
77.7% 79.8% -0.05 (0.41)
a Not all students had baseline GPA data. The sample numbers reflect the number of students with data.

9
Successful Completion of the Targeted Course. We used two different definitions of successful completion. The first one was completion of the course with a grade of an A, B, or C; this measure captured the percentage of students who received a grade that would allow the course to transfer to a four-year institution. The second definition was completion of the course with a grade of D or higher; we also calculated this outcome because students could still earn credit for a D, and the course could count towards graduation at the community college. Students who completed the course with failing grades or who withdrew or dropped the course after enrolling were considered as not successfully completing the course. These data were collected by Wake Tech as part of their normal program administration.
Withdrawal from the Course. This measure captured students not completing the course at all and is defined as students never attending, withdrawing, or dropping the course after enrollment. The measure also included students who were randomly assigned but were then dropped for non-payment of tuition or fees. These data were collected by Wake Tech.
Persistence in Postsecondary Education. We defined persistence in two different ways. The primary outcome was enrollment in, and/or graduation from, any postsecondary institution within one year after the intervention. For students enrolled in fall 2017, the one-year persistence point was defined as enrollment with a start date from December 1, 2017 through November 30, 2018. For students enrolled in spring 2018, the one-year persistence point was defined as any enrollment with a start date between May 1, 2018 and April 30, 2019. This broad definition allowed for the varying structures of terms and semesters (trimesters, summer school, etc.). Students who enrolled in the semester but subsequently withdrew were still considered as persisting. Graduating in the same time period was also counted as persisting, with any sort of credential being accepted.
The second definition of persistence was enrollment in, and/or graduation from, any postsecondary institution one semester following the Project COMPASS intervention and considered enrollment as occurring in the semester immediately subsequent to the original semester.
The persistence sample included only students from both semesters for PSY-150 and BUS-110; CIS-110 students were not included because their follow-up period was not sufficiently long. Data for both persistence outcomes came from the National Student Clearinghouse (NSC) and were linked to Wake Tech identifiers by Wake Tech staff. The data were then sent to the evaluation team for analyses. A student who did not have a record in the NSC was considered to be not enrolled.
There was no missing outcome data and no attrition because we used administrative data from Wake Tech and because most of the outcomes were defined such that a student who did not have a value for the outcome was still able to be included in the analyses. For example, a
10
student who dropped out of the course and did not have a final grade was still included in the successful completion outcome as a non-completer.
Student Covariates. Wake Tech also provided data for the following student-level characteristics that were used as covariates in our models.
• Gender. Students self-identified as male or female. An indicator of gender was available for all students but one.
• Race/ethnicity. Students self-identified as members of one racial category, including Asian, American Indian, Black/African American, White, Multiracial. Regardless of their racial selection, they could also choose to identify as Hispanic/Latino under ethnicity. Students who identified as African American, Hispanic/Latino, Native American, or Multiracial were counted as minority students in our analyses. Ten percent (10%) of students did not disclose their race, ethnicity, or both.
• Age. This was the student’s age in years as of enrollment in the course. This variable was available for all students.
• Disability status. Students were flagged if they self-reported a disability to the college. Students not flagged were considered as not possessing a disability; as such, there were no missing data.
• PELL Eligibility. For students who submitted a Free Application for Federal Student Aid (FAFSA), this variable indicated whether they qualified for PELL grants. This variable was considered a measure of student financial need. Students who were not identified as PELL eligible (whether or not they submitted the FAFSA) were considered as not eligible; there were no missing data.
• Placement test scores. This variable included the score on any placement test that a student has taken. We standardized the test scores to make the scales comparable and used the following approach to identify an appropriate achievement measure to include as a covariate in the analyses. Twelve percent (12%) of students had taken the COMPASS1 Pre-Algebra test, and we used this score. For students who did not take this test, we used the Accuplacer Arithmetic score, if available (5% of students). If neither score was available, we used the student’s SAT Math score (8%). We continued this process with ACT Math (7%), Accuplacer Reading & Writing (4%), and COMPASS1 Reading and Writing (1%). If none of these test scores were available, we used high school GPA (14% of students), which was also standardized so its scale was comparable to all other scores. For students who were still missing an achievement measure, we used the student’s cumulative GPA for all courses taken at Wake Tech prior to the
1 Note that, despite the same name, this is the COMPASS college placement exam, not an exam specifically designed for Project COMPASS.
11
semester in which they enrolled in one of the study courses (23%). The remaining 26% of students had missing values on the achievement measure.
Because race, ethnicity, and gender were missing only if students elected to not provide that information, missing values for these variables were recoded to a “not provided” category and these students were retained in the analysis. Missing baseline achievement scores were imputed using linear regression and the student characteristics from the main impact estimation model: treatment group indicator, age and age squared, gender, race, ethnicity, PELL eligibility, and disability status.
Instructor Covariates. Wake Tech also provided data at the instructor level on the withdrawal rate and grade distribution for students in previous semesters. For instructors who taught online versions of BUS-110, PSY-150, or CIS-110, in at least one of the two semesters prior to the beginning of the study period, we constructed a measure of prior successful completion rates, which we used as a covariate in the analysis. This measure was set to “0” for instructors who had not taught these classes previously, and we also included an indicator for new instructors. These two instructor-level variables accounted for baseline differences among those teaching the targeted classes and were necessary because instructors were not randomly assigned to the treatment or control condition.
Analyses
The analyses were conducted as Intent-to-Treat (ITT) analyses whereby students remained in their originally assigned groups (treatment or control) and were included in the analysis regardless of whether they ended up participating in the intervention or not. ITT is the standard for most experimental impact studies as it keeps the original random assignment intact (Institute of Education Sciences, 2005) and ensures that results are not driven by attrition or students leaving the intervention. However, because ITT includes results for students who did not participate in the intervention, it has the potential to underestimate the impact (Hollis & Campbell, 1999). To account for this situation, in addition to the impact analyses described below, we also repeated the analyses excluding students who were removed for non-payment prior to the start of the course or who dropped the course before seeing their section assignment (no-shows). Three percent of our population were considered no-shows.
The impact analyses were conducted using a multi-level model with students clustered by section. At the student level, we incorporated the following covariates: 1) indicators for gender, race, and ethnicity; 2) age and age squared; 3) indicator for disability; 4) an indicator for PELL eligibility; 5) the achievement measure we constructed, including its imputed values; 6) an indicator for concurrent enrollment in PSY-150 and BUS-110; and 7) an indicator for having taken the same course in a previous semester. We also included indicators for subject (PSY-150, BUS-110, CIS-110) and semester when analyzing pooled samples. At the instructor level, we
12
included successful completion rates for fall 2015 and spring 2016 (for PSY-150), spring and fall 2016 (for BUS-110), or fall 2016 and spring 2017 (for CIS-110). We also included an indicator for whether a given instructor had taught online sections of these courses in the two semesters prior to the pilot implementation.
We incorporated random effects at the section level to account for the joint variation in the error terms at the section level. Students had different probabilities of being randomly assigned to a treatment section depending on the time they registered and, in the case of cross-enrolled students, the course they registered for first. We used stabilized inverse probability weights in the impact analyses equal to the inverse of each student’s individual probability of being assigned to their treatment condition multiplied by the overall probability, by course and semester, of being in the respective treatment or control group (Imbens & Rubin, 2015).
The experimental analyses were supplemented by descriptive analyses of the progress towards Wake Tech’s goals. For these descriptive analyses, we compared performance in the 2017-18 year for PSY-150 and BUS-110 and in the 2018-19 year for CIS-110. Performance in the baseline year was defined as the year before the Wake Tech started received the grant, 2014-15 for PSY-150 and BUS-110 and the year prior to CIS-110 starting the intervention (2016-17). We identified the success and withdrawal rates of all students and students of color in PSY-150 and BUS-110 sections that were receiving the treatment using an approach that was consistent with the way Wake Tech staff identified baseline levels for the Project COMPASS proposal. Specifically, the numerator for the success rates was the number of students who received an A, B, or C in the class. The numerator for withdrawal rates was the number of students who dropped or withdrew from the course. The denominator for both outcomes was the number of students who were enrolled in the course at the start of the semester, excluding students dropped for non-payment and students who never attended. Note that these definitions are slightly different from the definitions used in the experimental study, so the frequencies reported here are different from those reported in the impact study results. In addition, the impact study estimates took into account students’ background characteristics, while the descriptive findings did not.
Impact on Students’ Experiences
In addition to looking at the impact of the pilot implementation on core student outcomes, the evaluation examined the extent to which desired changes were happening in the way that students experience the courses (third column in the logic model). The specific research questions were:
1. Do the redesigned courses have an increased teaching, social, and cognitive presence for students when compared to the traditional online courses?
2. Do Project COMPASS students log into Blackboard more frequently than control
13
students?
Sample
The first research question was answered using a survey (described in more depth below) that was administered to both treatment and control students.
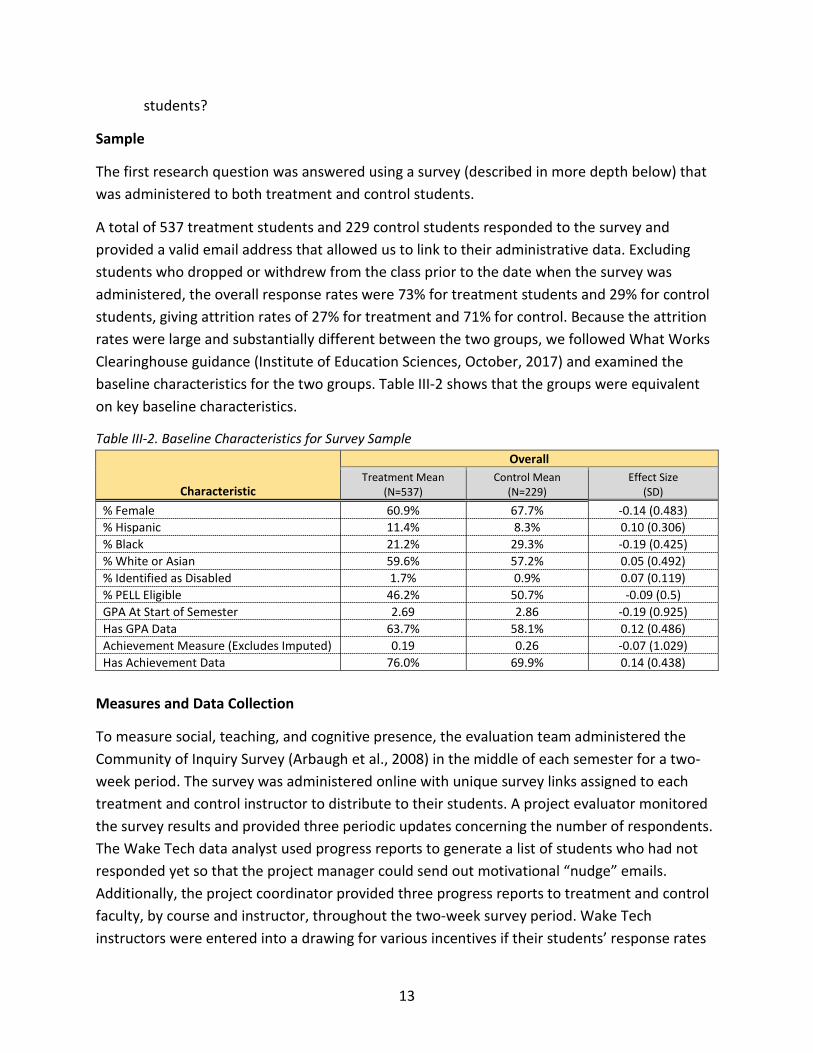
A total of 537 treatment students and 229 control students responded to the survey and provided a valid email address that allowed us to link to their administrative data. Excluding students who dropped or withdrew from the class prior to the date when the survey was administered, the overall response rates were 73% for treatment students and 29% for control students, giving attrition rates of 27% for treatment and 71% for control. Because the attrition rates were large and substantially different between the two groups, we followed What Works Clearinghouse guidance (Institute of Education Sciences, October, 2017) and examined the baseline characteristics for the two groups. Table III-2 shows that the groups were equivalent on key baseline characteristics.
Table III-2. Baseline Characteristics for Survey Sample
Characteristic
Overall Treatment Mean
(N=537) Control Mean
(N=229) Effect Size
(SD)
% Female 60.9% 67.7% -0.14 (0.483) % Hispanic 11.4% 8.3% 0.10 (0.306) % Black 21.2% 29.3% -0.19 (0.425) % White or Asian 59.6% 57.2% 0.05 (0.492) % Identified as Disabled 1.7% 0.9% 0.07 (0.119) % PELL Eligible 46.2% 50.7% -0.09 (0.5) GPA At Start of Semester 2.69 2.86 -0.19 (0.925) Has GPA Data 63.7% 58.1% 0.12 (0.486) Achievement Measure (Excludes Imputed) 0.19 0.26 -0.07 (1.029) Has Achievement Data 76.0% 69.9% 0.14 (0.438)
Measures and Data Collection
To measure social, teaching, and cognitive presence, the evaluation team administered the Community of Inquiry Survey (Arbaugh et al., 2008) in the middle of each semester for a two-week period. The survey was administered online with unique survey links assigned to each treatment and control instructor to distribute to their students. A project evaluator monitored the survey results and provided three periodic updates concerning the number of respondents. The Wake Tech data analyst used progress reports to generate a list of students who had not responded yet so that the project manager could send out motivational “nudge” emails. Additionally, the project coordinator provided three progress reports to treatment and control faculty, by course and instructor, throughout the two-week survey period. Wake Tech instructors were entered into a drawing for various incentives if their students’ response rates
14
were 65% or higher. Instructor incentives included opportunities to have lunch at the campus restaurant with college leadership, services offered by college departments (i.e., facials by cosmetology instructors), and Wake Tech-branded products (i.e., mug, bumper sticker). All students who completed the survey and provided their Wake Tech email address were entered into a drawing for $25 Amazon gift cards. Some instructors provided additional student incentives, such as giving extra points for the week’s assignment.
The survey included three scales:
• Social presence, which measured the extent to which the online course provided a supportive learning community.
• Cognitive presence, or the extent to which course activities supported inquiry and collaborative problem-solving.
• Teaching presence, a measure of the extent to which the instructor in the course facilitated learning.
A mean score was created for each scale. The reliability coefficient for each of the scales was 0.94 or higher, indicating that the questions within each category consistently measured the same underlying concept.
Analysis
The analysis approach was identical to the analyses described under the Impact on Student Outcomes methodology section above. The primary impact estimates used a multi-level model, with students at the first level and sections at the second level. The covariates included at the student, section, and instructor level are the same ones used in the main impact analysis. The models included section-level random effects.
Describing Project Activities
This portion of the evaluation was designed to describe project implementation and collect feedback from project staff and teachers relative to the quality and usability of the various activities. Throughout the life of the project, the evaluation team conducted a series of interviews and observations.
Interviews
The evaluation team used a semi-structured interview protocol to conduct interviews with key project staff and instructors. The questions varied depending on the stage of the project. At the beginning of the project, the questions were more formative in nature and captured intended plans and preliminary feedback. At the midpoint of the project, the questions were intended to get at the supports that were being provided, the extent to which strategies were being implemented in the classroom, and any barriers to implementation. At the end of the project,
15
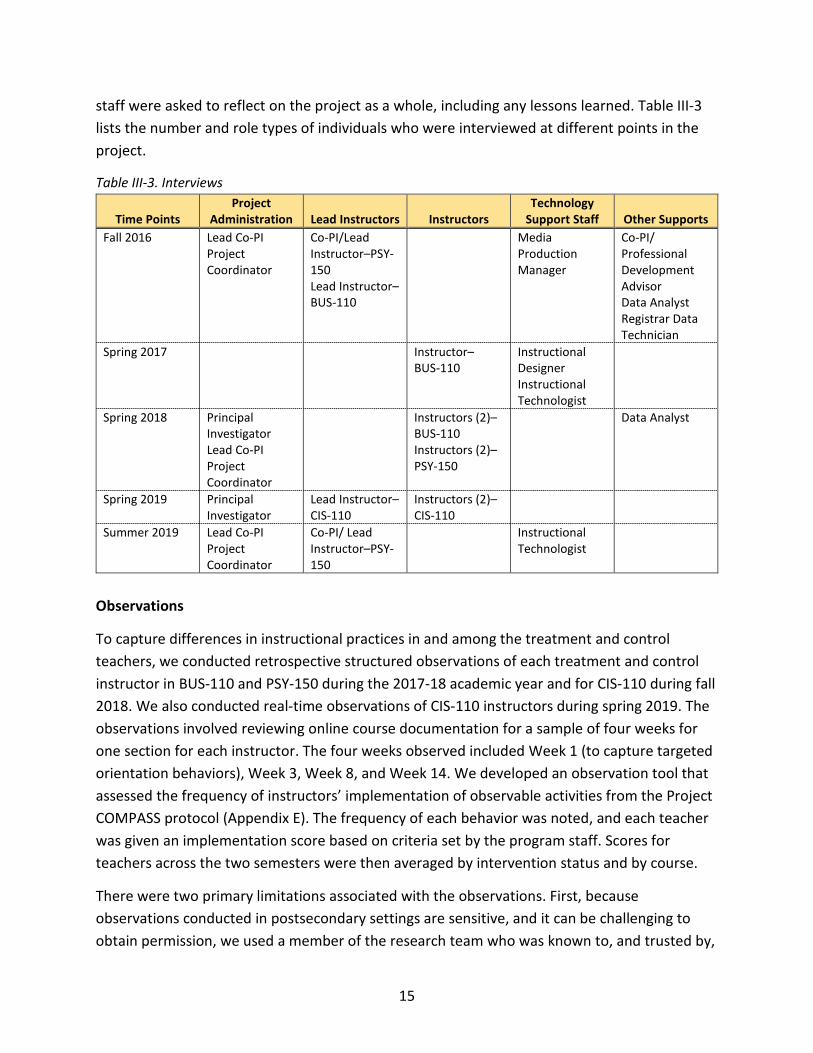
staff were asked to reflect on the project as a whole, including any lessons learned. Table III-3 lists the number and role types of individuals who were interviewed at different points in the project.
Table III-3. Interviews
Time Points Project
Administration Lead Instructors Instructors Technology
Support Staff Other Supports Fall 2016 Lead Co-PI
Project Coordinator
Co-PI/Lead Instructor–PSY-150 Lead Instructor–BUS-110
Media Production Manager
Co-PI/ Professional Development Advisor Data Analyst Registrar Data Technician
Spring 2017 Instructor– BUS-110
Instructional Designer Instructional Technologist
Spring 2018 Principal Investigator Lead Co-PI Project Coordinator
Instructors (2)– BUS-110 Instructors (2)–PSY-150
Data Analyst
Spring 2019 Principal Investigator
Lead Instructor–CIS-110
Instructors (2)–CIS-110
Summer 2019 Lead Co-PI Project Coordinator
Co-PI/ Lead Instructor–PSY-150
Instructional Technologist
Observations
To capture differences in instructional practices in and among the treatment and control teachers, we conducted retrospective structured observations of each treatment and control instructor in BUS-110 and PSY-150 during the 2017-18 academic year and for CIS-110 during fall 2018. We also conducted real-time observations of CIS-110 instructors during spring 2019. The observations involved reviewing online course documentation for a sample of four weeks for one section for each instructor. The four weeks observed included Week 1 (to capture targeted orientation behaviors), Week 3, Week 8, and Week 14. We developed an observation tool that assessed the frequency of instructors’ implementation of observable activities from the Project COMPASS protocol (Appendix E). The frequency of each behavior was noted, and each teacher was given an implementation score based on criteria set by the program staff. Scores for teachers across the two semesters were then averaged by intervention status and by course.
There were two primary limitations associated with the observations. First, because observations conducted in postsecondary settings are sensitive, and it can be challenging to obtain permission, we used a member of the research team who was known to, and trusted by,
16
the Wake Tech staff. As a result, the observer was aware of the treatment or control status of the members; however, we attempted to mitigate this concern by focusing on project activities whose presence or absence was easily defined and not subject to interpretation. Second, because most of the observations were done retrospectively, we experienced situations where the instructors may have removed specific announcements that we sought to capture. Instructors were not required to use Blackboard as the means for making announcements, and in some cases, instructors may have chosen to use email or texting for sending announcements in addition to, or in place of, posting announcements in Blackboard. In these cases, the observer would not have access to such communications, thus, there may be instances in which announcements for the weeks observed could not be documented. We have no reason to believe that this activity differed by groups or by course, but it did influence our ability to record the frequency of some actions.
Coding Open-Ended Questions
On the Community of Inquiry Survey there were three open-ended questions that were administered to students starting in spring 2018. These open-ended questions asked students to describe specific activities that were related to each of the three presences (teaching, social, and cognitive). The open-ended questions were coded and synthesized.
Reviewing Project Records
The evaluation team reviewed program meeting minutes for planning meetings and obtained data relative to attendance at professional development sessions.
Assessment of Fidelity of Implementation
Fidelity of Implementation (FOI) is the extent to which an intervention is happening the way it is intended to happen. For Project COMPASS, we conceptualized FOI as relevant to two different aspects of the program: 1) the implementation of the strategies in the online classroom environment (second column of the logic model, Figure 1) and 2) the supports that Wake Tech needs to have in place to prepare instructors to implement the strategies and support instructors in that implementation (first column of logic model). As a development grant, the expectation was that the project would develop clearly defined threshold levels of implementation by the end of the grant.
Implementation of Strategies
Over the past two years, the Wake Tech project staff have created a detailed matrix for assessing FOI within the online classroom environment (Appendix D). Most of the strategies have clearly developed indicators and initial threshold levels that were designed to indicate the
17
minimum required level of intervention. The evaluation team worked with project staff to develop and refine these indicators.
After reviewing FOI data collected during the pilot phase of the study and obtaining feedback about the data collection process from BUS-110 and PSY-150 treatment instructors, the lead project instructors revised the data collection requirements for tracking and measuring FOI. In an effort to collect more accurate implementation data and to ease the data collection burden on treatment instructors, the lead instructors developed an Excel workbook template for treatment instructors to use to collect uniform data from Blackboard logs, Adobe Connect user logs, and other self-reports. The Excel workbook template was added to instructors’ Blackboard sites. The FOI data collection process was discussed during the orientation kick-off meetings each semester, and instructions for FOI data collection were included in the First in the World Project COMPASS Treatment Instructor Guide. Additionally, lead instructors checked in with treatment instructors periodically throughout the semester.
The FOI data collected included:
• the use of Adobe Connect to host orientation, meetings, and office hours; • instructors’ use of texting and other varying communication strategies to contact
students; • the use of custom videos in the classroom; • the use of discussion boards and multiple low-stakes quizzes; • incorporation of minority images, inclusive assessments, and the use or promotion of
live-streamed events featuring minority role models; and • presence of support services and clubs.
Implementation Supports
FOI should also be considered relative to the implementation supports provided to instructors. The evaluation team worked with Wake Tech staff to develop an FOI matrix that would indicate the expected level of implementation supports. An initial matrix was developed during Year 2. At the end of the final project year, the evaluation team and the project team met to identify the key supports that needed to be in place if the project were to be implemented in other subjects or at a different institution. This resulted in a final FOI matrix, which is included in Appendix F.
18
SECTION IV: IMPLEMENTATION SUPPORTS
Across the two years of full project implementation, the Project COMPASS staff implemented a series of activities (what we call “implementation supports”) designed to help instructors implement the treatment protocol in their courses. This section summarizes the way Wake Tech staff managed the project and the type of implementation supports they established as part of Project COMPASS. Key findings included the following:
• Wake Tech had a well-developed project management approach, utilizing three different teams: a Management Team, a Support Staff Team, and an Advisory Council composed of deans and department heads. All teams met regularly.
• All technology tools were in place and support staff provided assistance with how to integrate these tools into the courses.
• Two lead instructors undertook significant additional redesign efforts in their courses. The PSY-150 instructor introduced gamification into his course, a redesign that was recognized by Blackboard, Inc. as an Exemplary Course. The BUS-110 instructor worked with the support staff to develop an online business textbook.
Project Management
Over the course of the project, the work of Project COMPASS was facilitated via three different teams.
The Project COMPASS Management Team was in place from the beginning of the project and met twice monthly. The team was composed of the project’s principal investigator (senior vice president of effectiveness and innovation), the lead co-PI (senior dean of strategic innovations and the chief campus officer for the Wake Tech Online College), three co-PIs (professional development advisor, director of media production and learning support services, and associate professor in the department of social sciences [who was also the lead instructor for PSY-150]), the project coordinator, the director of grant performance, the data analyst, and the lead instructors for BUS-110 and Computer Information Science 110. The purpose of the meetings was to discuss and make relevant decisions affecting project implementation and funding.
In January 2017, the project formed a Support Staff team, which was composed of the lead co-PI, project coordinator, instructional designer, instructional technologist, video production specialist, and the data analyst. Meetings were established during the pilot phase and continued to be held twice monthly on alternating weeks of the Project COMPASS Management Team meetings. The purpose of the meetings was to share project implementation updates, understand the needs of the treatment instructors, plan support resources and activities related to enhancing or redesigning course content for online delivery (e.g., technology
19
integration in the course syllabi, instructional strategies, student assessments, and student management), as well as other needs.
The Project COMPASS Management Team also identified the need to keep the academic departments more aware of the decisions being made that may affect both the academic departments as well as the project implementation. Thus, in early 2017, deans and department heads from the Business, Psychology, and Computer Science departments were invited to serve on an Advisory Committee for the remainder of the project. The Advisory Committee meetings were initially held quarterly and then moved to bi-monthly (13 meetings between March 2017 and June 2019), with a core membership that included the PI, lead co-PI, project coordinator, and the academic deans and department heads. The purpose of the meetings was to ensure that academic department deans and department heads who were not directly involved with the day-to-day implementation of the project were kept abreast of the project purpose, implementation progress, decisions affecting the academic departments, and support needs.
A review of meeting minutes across all three meeting groups (i.e., Management Team, Support Staff, and Advisory Committee) reflected that the standard practice was to send agendas to group members in advance of the meeting. Minutes, which included topics of discussion, decisions points, and action items, were sent to committee members following the meetings. Action items with assigned responsibilities were also highlighted in the body of the minutes-distribution email. The project coordinator was the common link across the three groups who met regularly and was typically the person who sent out the meeting minutes and highlighted identified action steps.
Additionally, the evaluation team met monthly with individuals from the Project COMPASS Management Team to share information about project implementation and evaluation study details as well as address and resolve any issues that may have had implications for the project or the study.
Implementation Supports
To support integration of the strategies in the online classroom, Project COMPASS staff identified implementation support activities in four overarching categories:
1. redesigning online course delivery strategies to implement the High-Tech Tools and High-Touch Strategies,
2. providing access to High-Tech Tools, 3. providing instructor training and support, and 4. assistance with curriculum design.
The description of the specific implementation supports is organized by the four categories, and feedback from instructors is embedded throughout the discussion of the various supports.
20
Redesigning Online Course Delivery Strategies
A central focus of project activity was the redesign of online course delivery strategies, a process guided by a theoretical framework and instructional strategies. With the support of Wake Tech staff, the expectation was that instructors merge the theoretical framework, High-Tech Tools, High-Touch strategies, and specific course content to create a redesigned online course.
As previously noted, Project COMPASS was structured around the Community of Inquiry conceptual framework that identifies three core components of the online experience: 1) teaching presence, 2) social presence, and 3) cognitive presence (Arbaugh, 2007; Garrison et al., 2001).
Instructors in PSY-150 and BUS-110 completed much of their initial course delivery redesign efforts during the pilot phase of the project (fall 2016-spring 2017). They continued to refine course content and delivery efforts during fall 2017-spring 2018.
To help address questions raised during the pilot phase from instructors about the Project COMPASS High-Tech and High-Touch protocol, the lead instructors for each of the study courses collaborated to develop the First in the World Project COMPASS Treatment Instructor Guide. The guide served as a resource for helping instructors to better understand the project goals, implementation priorities and timelines, as well as provide examples of implementation strategies and tips for managing the implementation of the Project COMPASS High-Tech and High-Touch protocol. The guide, which also reflected adjustments to the implementation targets, was introduced to treatment instructors and support staff during the fall 2017 project orientation kick-off meeting. Two instructors who were interviewed reported a sense of being able to better manage their implementation of the model during the fall 2017 semester with: 1) the additional guidance of the First in the World Project COMPASS Treatment Instructor Guide, and 2) the increased flexibility afforded instructors in selecting tools that best suited their instructional purposes and students’ needs. One instructor noted,
I feel like they’ve added a lot more flexibility with the protocol, allowing instructors to kind of do what they see is best for their students.... ‘These are the tools you have, you need to choose a couple of things that work for you.’
Building on the Project COMPASS work, the lead PSY-150 and BUS-110 instructors each undertook additional, significant redesign projects during the 2017-18 academic year. The PSY-150 instructor developed a semester-long gamification element, “Graduating Gilbert,” which featured multiethnic characters to engage students in content designed to promote a growth mindset, familiarize students with campus resources, and identify success strategies. Developed
21
in collaboration with the instructional designer and the instructional technologist, this course design was recognized in 2018 as a Blackboard Exemplary Course.
The BUS-110 instructor, in collaboration with the instructional designer and instructional technologist, developed an open-source-based textbook that replaced the previously used online textbook, including subject information and interactive features such as study guides and quizzes. The new text, which was first implemented in the summer of 2018, was free to students, replacing the previous national publisher’s textbook, which was believed to be prohibitively priced for some students and thus, a potential contributing factor to student drop or fail rates. A basic course shell was developed to align with the new online text content.
The CIS-110 redesigned online course delivery was planned for implementation in fall 2018 to spring 2019, the year following the implementation of PSY-150 and BUS-110. Collaboration between the instructional design team and the CIS-110 instructors was less evident than with PSY-150 and BUS-110. Prior to the semesters in which CIS began implementing the protocol (when instructional designers might still have been working heavily with PSY-150 and BUS-110), the CIS-110 lead instructor took advantage of already scheduled upgrades to Microsoft Office to redesign the course shell (to be used by all CIS-110 instructors), adding the Microsoft Teams feature to include activities for student interaction, real-time feedback and evaluation, as well as adding Microsoft Office environment simulations. The lead instructor reported having a background in instructional design, and other CIS instructors felt that having someone with instructional design expertise within the department lessened the need to seek out additional support. The lead instructor reported,
So, by the time the instructional designers turned their attention towards me, I had a stable, functional class. I actually have an academic background in instructional design. So, I applied all of that and the class itself was healthy, functional, and stable.
Providing Access to High-Tech Tools
In order to implement the Project COMPASS strategies as part of the course redesign, Wake Tech identified specific technologies or technology functions that needed to be put into place. The key technologies identified included: 1) a video production studio, 2) Blackboard learning management system, 3) Adobe Connect online meeting space, 4) texting technology, and 5) instructor laptops. As of the 2017-18 school year, the year in which the project was officially rolled out in PSY-150 and BUS-110, all technologies were in place.
Video Production. Wake Tech opened a One Button Studio to provide an efficient method by which instructors could produce a high number of high-quality videos. The One Button Studio is a special production studio that provides video recording equipment, a green screen, editing software, and media production support. There were some delays in the installation of the One
22
Button Studio, which meant that it was not initially available for instructors to begin creating their video content during the pilot implementation of the model. As a work-around for the delays, treatment instructors were provided with laptops and tri-pods/clamps to record and edit video content, so they could begin practicing skills during the pilot phase and have video content ready for the implementation phase in fall 2017. The One Button Studio was fully installed in late spring 2017, and instructors were provided training by the end of May.
One instructor reported that using the Studio, specifically the green screen, enhanced the quality of the videos. However, there was also concern from the treatment instructors about the time required to produce videos. One instructor reported, “We are supposed to do a video each week...[which] is time consuming…and there’s also a learning curve.” As a result of the level of concern over the time involved in producing videos, the project reduced the expected number of videos from 10 to eight. Since all videos were required to be captioned to be fully accessible, the project contracted with an external company to do the captioning for the video, thus reducing the instructors’ time in completing that task. The lead instructors reported that some videos were posted to individual instructors’ YouTube channels, while other videos were posted to a COMPASS account. One lead instructor reported that he used the YouTube channel for posting weekly updates and recaps in which the content would be specific to his section and/or vary each semester. However, videos that were more operational in nature (i.e., how to use Blackboard, how to purchase and navigate the online textbook) and/or could be used across course sections and semesters were posted on the Project COMPASS server.
With studios on two of Wake Tech’s campuses, as of the writing of this report, the One Button Studio is now available to all Wake Tech faculty, who can reserve the facilities through an online system. Also, a production assistant is available to assist with recording, editing, and publishing videos.
Blackboard. Blackboard is the learning management system used by Wake Tech for online courses. Course syllabi, resources, and learning activities are housed in Blackboard. A key activity for online courses is the use of discussion forums, which allows students to respond to prompts related to course readings or assignments and to engage with each other. While discussion forums are typically text-based discussions, in 2016-17, two instructors began testing the use of FlipGrid, which allows students to easily record and upload a video response.
Adobe Connect. Adobe Connect is a cloud-based conferencing platform that allows for synchronous content streaming. While most of the other technology components of the Project COMPASS model are asynchronous (e.g., Blackboard, email), the use of Adobe Connect allowed instructors the opportunity to interact with their students in real time. Wake Tech invested in Adobe Connect licenses for all treatment instructors. Instructors used Adobe Connect for holding live office hours and conducting webinars and seminars.
23
Texting Technology. The Regroup/Remind web messaging system was the text messaging system that the college provided for instructors to use in texting/instant messaging students, an added vehicle for staying in touch with students. Text messaging was primarily used to send reminders to all students of upcoming due dates for assignments and tests/quizzes. Some instructors used texting to reach out to students individually who may have missed assignments or had not logged into to Blackboard for several days. In addition, one BUS-110 instructor encouraged group chats through Remind. In addition to Remind, CIS-110 instructors utilized Microsoft Teams to chat directly with students and to encourage student-to-student interaction.
Instructor Laptops. Instructors had desktop systems at the college; however, because some of their lesson development and instructional time occurred during hours when they were at home, concerns were expressed about the hardware quality and software consistency of instructors’ personal home systems and whether these systems could adequately support the development of interactive learning components. Thus, while laptops were initially included as purchases for the lead instructors only, the Project COMPASS Management Team sought a budget change in order to purchase laptops for all treatment instructors. Treatment instructors also received headsets and USB drives.
Providing Instructor Training
Throughout the project, Wake Tech provided training at three levels: 1) formal professional development events sponsored by the project, 2) informal professional learning sessions, and 3) other identified professional learning opportunities. Each of these is described in more depth below.
Formal Professional Development. Formal professional development is characterized as those events (i.e., workshops, seminars) identified as part of the Project COMPASS professional development (PD) plan. The original proposal specified that all treatment faculty and instructional staff were to complete the EPIC 30 training (described below) prior to the start of the project. In addition, treatment instructors participated in 12 hours of PD, which was identified by the project, annually.
All treatment instructors were required to complete EPIC 30, a 30-hour training program prior to the implementation phase. As part of Wake Tech’s Quality Enhancement Plan, the training includes best practices for online teaching, including online course design, instruction, accessibility and communication. All PSY-150, BUS-110 and CIS-110 instructors completed this requirement prior to the pilot phase in spring 2017. There were also a series of PD activities that were offered to the instructors as shown in the table below.
24
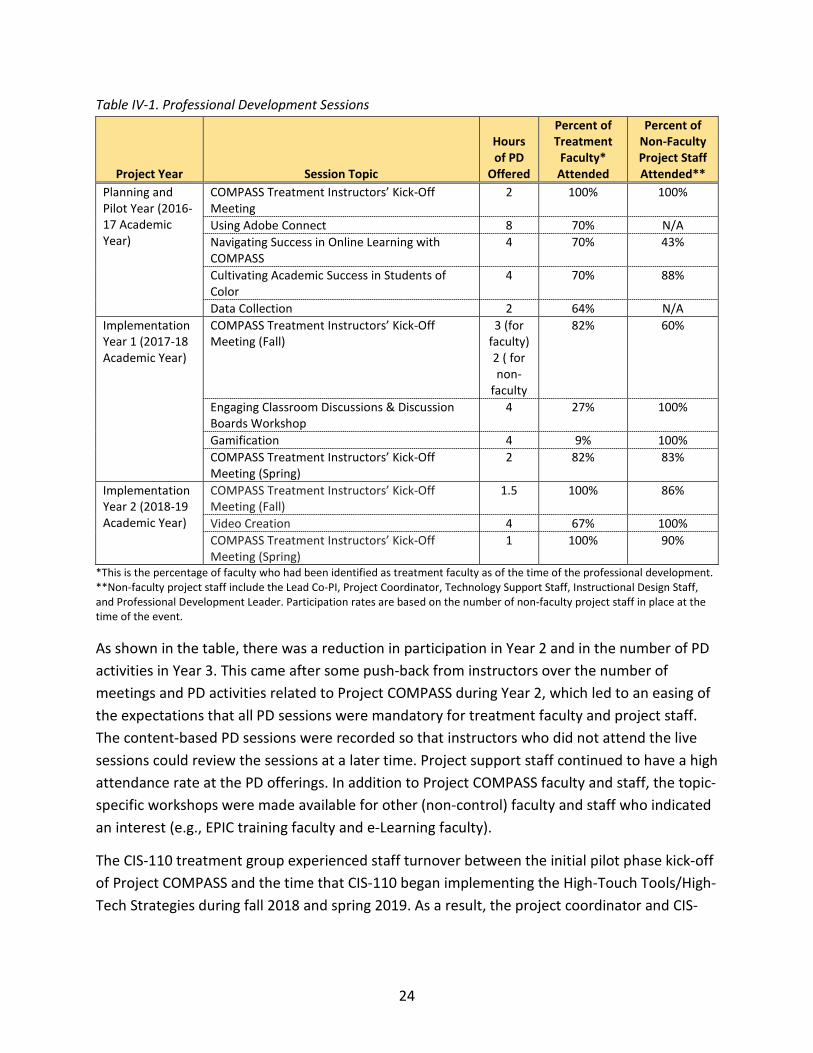
Table IV-1. Professional Development Sessions
Project Year Session Topic
Hours of PD
Offered
Percent of Treatment
Faculty* Attended
Percent of Non-Faculty Project Staff Attended**
Planning and Pilot Year (2016-17 Academic Year)
COMPASS Treatment Instructors’ Kick-Off Meeting
2 100% 100%
Using Adobe Connect 8 70% N/A Navigating Success in Online Learning with COMPASS
4 70% 43%
Cultivating Academic Success in Students of Color
4 70% 88%
Data Collection 2 64% N/A Implementation Year 1 (2017-18 Academic Year)
COMPASS Treatment Instructors’ Kick-Off Meeting (Fall)
3 (for faculty) 2 ( for non-
faculty
82% 60%
Engaging Classroom Discussions & Discussion Boards Workshop
4 27% 100%
Gamification 4 9% 100% COMPASS Treatment Instructors’ Kick-Off Meeting (Spring)
2 82% 83%
Implementation Year 2 (2018-19 Academic Year)
COMPASS Treatment Instructors’ Kick-Off Meeting (Fall)
1.5 100% 86%
Video Creation 4 67% 100% COMPASS Treatment Instructors’ Kick-Off Meeting (Spring)
1 100% 90%
*This is the percentage of faculty who had been identified as treatment faculty as of the time of the professional development. **Non-faculty project staff include the Lead Co-PI, Project Coordinator, Technology Support Staff, Instructional Design Staff, and Professional Development Leader. Participation rates are based on the number of non-faculty project staff in place at the time of the event. As shown in the table, there was a reduction in participation in Year 2 and in the number of PD activities in Year 3. This came after some push-back from instructors over the number of meetings and PD activities related to Project COMPASS during Year 2, which led to an easing of the expectations that all PD sessions were mandatory for treatment faculty and project staff. The content-based PD sessions were recorded so that instructors who did not attend the live sessions could review the sessions at a later time. Project support staff continued to have a high attendance rate at the PD offerings. In addition to Project COMPASS faculty and staff, the topic-specific workshops were made available for other (non-control) faculty and staff who indicated an interest (e.g., EPIC training faculty and e-Learning faculty).
The CIS-110 treatment group experienced staff turnover between the initial pilot phase kick-off of Project COMPASS and the time that CIS-110 began implementing the High-Touch Tools/High-Tech Strategies during fall 2018 and spring 2019. As a result, the project coordinator and CIS-
25
110 lead instructor met separately with one treatment instructor to review the framework and protocol, as this individual did not have the opportunity to attend the initial PD.
One CIS-110 instructor who was initially identified as a treatment group instructor, and who did receive some of the preliminary PD during the pilot phase (FA16 and SP17) relative to the framework and protocol, decided not to participate as a treatment instructor and was reassigned to the control group. The instructor did not receive further PD beyond spring 2017.
Informal Professional Learning Sessions. Informal professional learning sessions were those that tended to arise out of a common interest in learning or practicing a new skill or sharing pertinent information. Opportunities may have been planned, but attendance was based on interest or need, not necessarily as a requirement. Typically, these sharing sessions were led by faculty or instructional staff who gained new skills or knowledge that may be relevant for colleagues. In 2016-17, there were two instances of informal learning sessions in Project COMPASS:
• Brown Bag lunches among treatment faculty and instructional staff in which technology skills were demonstrated, instructional strategies shared, and pedagogical discussions occurred; and
• on-the-fly technology-use demonstration or instruction occurring among fellow faculty members or between support staff and faculty. Examples mentioned included webinars, seminars, and peer observations.
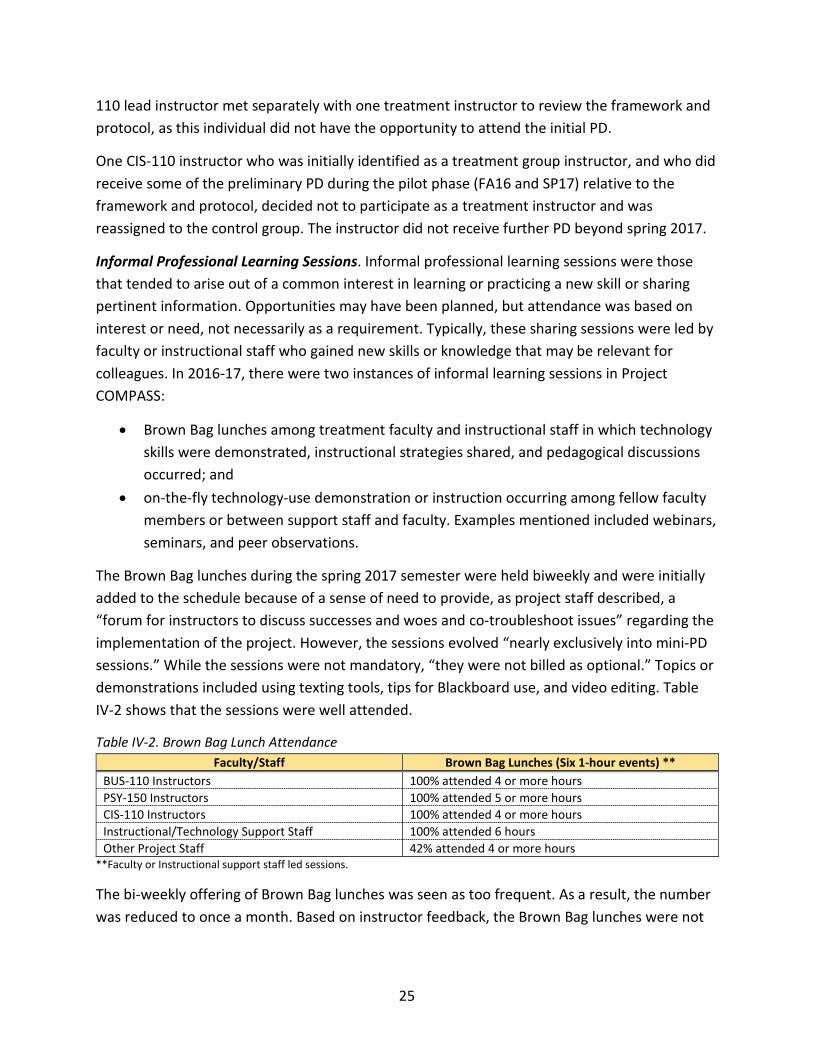
The Brown Bag lunches during the spring 2017 semester were held biweekly and were initially added to the schedule because of a sense of need to provide, as project staff described, a “forum for instructors to discuss successes and woes and co-troubleshoot issues” regarding the implementation of the project. However, the sessions evolved “nearly exclusively into mini-PD sessions.” While the sessions were not mandatory, “they were not billed as optional.” Topics or demonstrations included using texting tools, tips for Blackboard use, and video editing. Table IV-2 shows that the sessions were well attended.
Table IV-2. Brown Bag Lunch Attendance Faculty/Staff Brown Bag Lunches (Six 1-hour events) **
BUS-110 Instructors 100% attended 4 or more hours PSY-150 Instructors 100% attended 5 or more hours CIS-110 Instructors 100% attended 4 or more hours Instructional/Technology Support Staff 100% attended 6 hours Other Project Staff 42% attended 4 or more hours
**Faculty or Instructional support staff led sessions.
The bi-weekly offering of Brown Bag lunches was seen as too frequent. As a result, the number was reduced to once a month. Based on instructor feedback, the Brown Bag lunches were not
26
continued after spring 2017; instead, instructors opted to meet, as needed, within their department to discuss implementation progress, needs, and concerns.
CIS-110 instructors reported meeting informally, but regularly, within their treatment group to discuss implementation progress and concerns. As mentioned previously, the CIS-110 lead instructor’s background in instructional technology served as additional support for other CIS-110 instructors on redesign issues. Additionally, one CIS-110 instructor reported viewing some web-based video sessions when needing assistance with creating more engaging videos for the class.
Other Professional Learning. Other professional learning opportunities included faculty and instructional staff self-identifying relevant topics which were supported by the college and/or Project COMPASS. Co-PIs have attended one or more conferences related to innovative learning strategies and environments. For example, Project COMPASS instructional staff attended the Distance Teaching & Learning Conference at the University of Wisconsin-Madison as a group for two consecutive years. Pre-planning for conference session attendance and post-conference follow-up sharing helped project staff to maximize their collective learning. The Project COMPASS PI, co-PI, and co-PI/lead instructor(s), and instructional designer presented (collaboratively or individually) at several conferences (e.g., poster sessions, panel discussions, white papers, or joint presentation). See Appendix G for a list of Project COMPASS presentations and publications.
Instructors also reported that attendance at other distance learning conferences–at both the national and regional level–contributed to their professional learning.
Support for Curriculum Design
As part of Project COMPASS, Wake Tech hired an instructional designer, instructional technologist, and a media production assistant to assist instructors with the redesign of the online courses to increase and improve content effectiveness and efficiency. The instructional designer and instructional technologist assisted instructors by providing resources, training, video captioning, course formatting, and support in the use of new technology tools. They also developed a repository of resources from which instructors could select, such as suitable images and existing videos, including those featuring minorities, and additional instructional guides, activities, and assessments, such as those created in Softchalk for PSY-150 instructors.
Based on a review of support staff meeting minutes and interviews collected during the project period, the instructional designer and instructional technologist worked most closely with the PSY-150 and BUS-110 COMPASS project leads. The most frequently mentioned instances of assistance were those provided to PSY-150 around the development of the Graduating Gilbert game content and to BUS-110 around the development of the open-source course shell
27
content. Additionally, the instructional designer and instructional technologist assisted in the development of papers for conference proceedings, journal articles, and the entry form for the Blackboard Exemplary Course program, for which the PSY-150 Graduating Gilbert was a 2018 winner.
One instructor noted,
The only thing somebody can't get you is more time, but [the instructional support staff] have managed to give us time. They have just created some wonderful resources for us that are ready to just get and then put right into our online courses, so that has been really helpful.
Another individual indicated that, because the protocol is “pretty robust,” if they had “to choose that one staff member who's necessary,” they would choose “the instructional designer because there's just so much to do.”
While the CIS-110 instructors reported meeting with the instructional design support staff to get an overview of their services, both instructors and the instructional design staff reported that CIS-110 instructors opted to utilize the instructional guidance of the CIS-110 lead instructor with the background in instructional design. When asked to reflect on the process of redesigning the CIS-110 course to incorporate the High-Touch/High-Tech strategies, one instructor noted that
CIS-110, it’s pretty regimented…it’s created for us and most of that is already checked before it gets to us. It’s kind of pushed out to us…but if we need it, we have an instructional designer right around the corner from us…and we are encouraged to run it by the instructional designer.
The Media Assistant also helped by filming and editing the Eagle Stream campus-wide video segments posted to the Eagle Stream YouTube channel.
28
SECTION V: IMPLEMENTATION OF THE STRATEGIES
The supports described in Section IV were provided to help the instructors implement the targeted course delivery strategies. This section explores implementation in three different ways. First, we report on findings relative to implementation of Project COMPASS strategies from course observations and interviews with faculty. We then present results relative to the FOI of course strategies. We conclude with findings about implementation coming from the Community of Inquiry Survey administered to students.
Key findings included:
• Project COMPASS treatment instructors implemented the targeted strategies at higher levels than did control instructors, as measured through observations.
• FOI data collection showed that instructors implemented many of the targeted strategies at the appropriate level; however, it was challenging to collect data on implementation of some of the strategies.
• Treatment students reported higher levels of cognitive and social presence than did control students.
• More treatment students would recommend the course than would control students.
Strategy Implementation
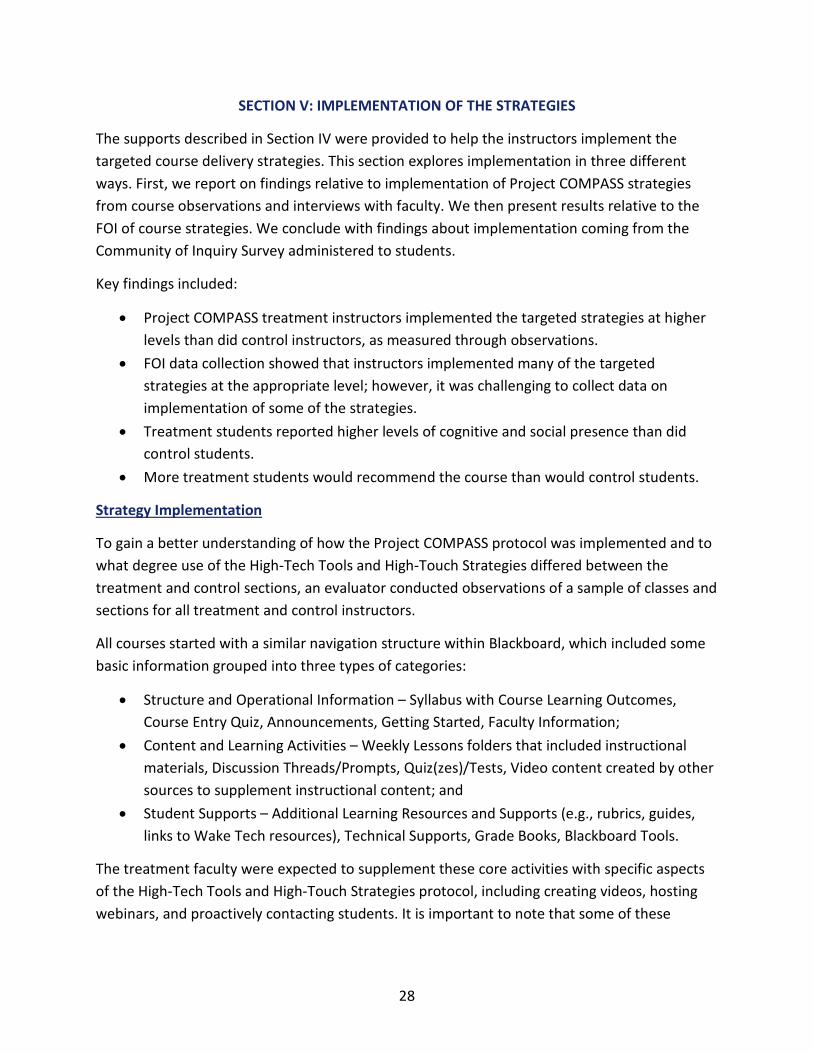
To gain a better understanding of how the Project COMPASS protocol was implemented and to what degree use of the High-Tech Tools and High-Touch Strategies differed between the treatment and control sections, an evaluator conducted observations of a sample of classes and sections for all treatment and control instructors.
All courses started with a similar navigation structure within Blackboard, which included some basic information grouped into three types of categories:
• Structure and Operational Information – Syllabus with Course Learning Outcomes, Course Entry Quiz, Announcements, Getting Started, Faculty Information;
• Content and Learning Activities – Weekly Lessons folders that included instructional materials, Discussion Threads/Prompts, Quiz(zes)/Tests, Video content created by other sources to supplement instructional content; and
• Student Supports – Additional Learning Resources and Supports (e.g., rubrics, guides, links to Wake Tech resources), Technical Supports, Grade Books, Blackboard Tools.
The treatment faculty were expected to supplement these core activities with specific aspects of the High-Tech Tools and High-Touch Strategies protocol, including creating videos, hosting webinars, and proactively contacting students. It is important to note that some of these

29
activities (such as contacting students through text or email) could not be observed because they occurred outside of the Blackboard course setting.
Additionally, BUS-110 used a vendor textbook and CIS-110 used a vendor-based textbook/simulation platform, both of which were accessible from a link in Blackboard, but which required additional access rights, which the observer did not have. For the courses noted, many learning activities and supports (e.g., study guides, assignments, and quizzes/tests) were embedded in the vendor-based textbook/simulation.
The observation protocol (Appendix E) was used to identify instances of implementation of activities aligned across the five clusters of strategies in the High-Touch/High-Tech protocol as listed in the Treatment Instructor Guide:
1. synchronous events (e.g., seminars, lectures, webinars); 2. announcements (e.g., reminders, affirmations, Remind texting app sign-up); 3. instructor personalized videos (e.g., orientation video, announcements, instructional
summary, feedback); 4. reducing barriers for minorities (e.g., minority images, announcements of campus
events related to cultural diversity/inclusiveness); 5. threaded discussions (e.g., text-based Blackboard forums, FlipGrid).
Frequency of observed examples of implementation was tracked for treatment and control instructors across the two semesters in which the intervention was being implemented, and an implementation score was assigned based on the degree to which targets were reached for the strategies identified in the Treatment Instructor Guide. A four-point score (0=no evidence of implementation, 1=little evidence of implementation, 2=some evidence of implementation, and 3=evidence of full implementation) was assigned for each cluster of strategies for each instructor, for each semester. An average implementation score was calculated for each instructor and for each course in the treatment and control group.
Table V-1 shows the frequency of use of observed Project COMPASS strategies by course and by treatment/control status. As the table shows, the treatment instructors implemented the targeted strategies at a higher rate than did the control instructors, particularly with regard to texting and personalized videos.
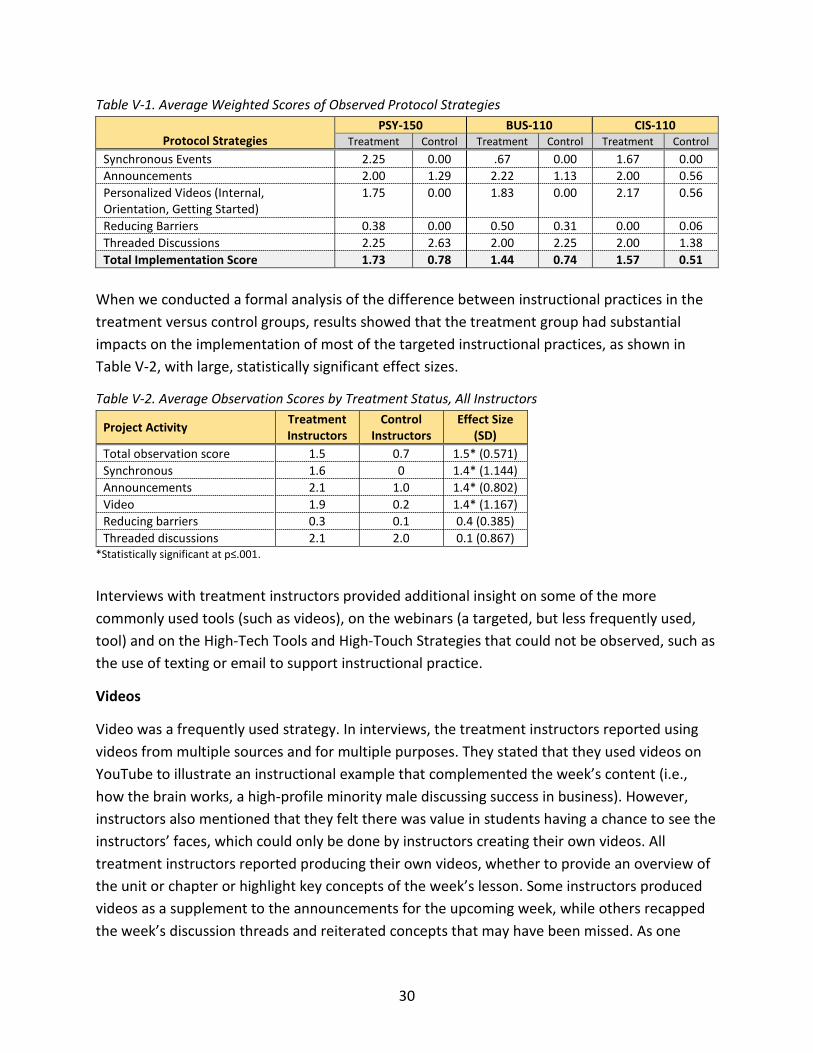
30
Table V-1. Average Weighted Scores of Observed Protocol Strategies
Protocol Strategies PSY-150 BUS-110 CIS-110
Treatment Control Treatment Control Treatment Control Synchronous Events 2.25 0.00 .67 0.00 1.67 0.00 Announcements 2.00 1.29 2.22 1.13 2.00 0.56 Personalized Videos (Internal, Orientation, Getting Started)
1.75 0.00 1.83 0.00 2.17 0.56
Reducing Barriers 0.38 0.00 0.50 0.31 0.00 0.06 Threaded Discussions 2.25 2.63 2.00 2.25 2.00 1.38 Total Implementation Score 1.73 0.78 1.44 0.74 1.57 0.51
When we conducted a formal analysis of the difference between instructional practices in the treatment versus control groups, results showed that the treatment group had substantial impacts on the implementation of most of the targeted instructional practices, as shown in Table V-2, with large, statistically significant effect sizes.
Table V-2. Average Observation Scores by Treatment Status, All Instructors
Project Activity Treatment Instructors
Control Instructors
Effect Size (SD)
Total observation score 1.5 0.7 1.5* (0.571) Synchronous 1.6 0 1.4* (1.144) Announcements 2.1 1.0 1.4* (0.802) Video 1.9 0.2 1.4* (1.167) Reducing barriers 0.3 0.1 0.4 (0.385) Threaded discussions 2.1 2.0 0.1 (0.867)
*Statistically significant at p≤.001.
Interviews with treatment instructors provided additional insight on some of the more commonly used tools (such as videos), on the webinars (a targeted, but less frequently used, tool) and on the High-Tech Tools and High-Touch Strategies that could not be observed, such as the use of texting or email to support instructional practice.
Videos
Video was a frequently used strategy. In interviews, the treatment instructors reported using videos from multiple sources and for multiple purposes. They stated that they used videos on YouTube to illustrate an instructional example that complemented the week’s content (i.e., how the brain works, a high-profile minority male discussing success in business). However, instructors also mentioned that they felt there was value in students having a chance to see the instructors’ faces, which could only be done by instructors creating their own videos. All treatment instructors reported producing their own videos, whether to provide an overview of the unit or chapter or highlight key concepts of the week’s lesson. Some instructors produced videos as a supplement to the announcements for the upcoming week, while others recapped the week’s discussion threads and reiterated concepts that may have been missed. As one
31
instructor noted, “[students] see my face, they hear my voice…they’re able to have the classroom experience without being in the classroom.” Another instructor described how students appreciated the videos, “I see students who will email me and say, ‘Thank you for that video. Because of your video, I really feel like you care.’"
Instructors reported that there was a learning curve associated with creating their own videos and that finding time was, at first, an effort. One instructor reported that it took “one full semester to really get the hang of it,” because “in the beginning, it was hard to find time to create these videos.” This same instructor reported that they intend to continue producing videos and conducting synchronous web cast events (if not as many) after the study concludes. “By the second semester, I felt better about it; I was excited about it; I could see a value in it.”
One Button Studio was a significant investment for Project COMPASS; however, it has not been utilized as anticipated, perhaps because of initial construction delays and periodic closings of the studio for maintenance. Some instructors noted that, unless they were creating videos that could be used across multiple semesters, they created their videos using a mobile device (e.g., phone, or iPad) or their computer, as it was more convenient and easier to do so. Instructors creating videos for the purpose of developing a course shell or a game component were more likely to use the One Button Studio.
Video production seemed to fall into two categories: 1) those videos that had a potentially long life (i.e., could be used more than one semester) and that were typically longer in duration, such as course orientation, unit overviews, success strategies, gamification/simulation, and instructional in nature (i.e., how-to support resources); and 2) those videos that had a limited window of relevancy, such as weekly announcements, check-ins/class-wide feedback. Instructors tended to utilize the One Button Studio to film those videos for which there was a longer life and for which production quality was deemed important. Instructors who wanted to be more spontaneous and provide more frequent and shorter videos, opted to use their personal devices (i.e., smart phones, tablets, laptops, or mini-cams) for recording video. Some instructors chose both means of production, based on the intended purpose of the video.
In addition to instructor videos, the co-PI/lead instructor-initiated Eagle Stream, which broadcasts two 30-minute live video segments monthly. The segments were then posted on the Wake Tech YouTube channel of the same name. The Michael Eure Show was hosted by a Wake Tech student success coach who interviewed minorities in leadership roles who provided student success and career advice. The Lunch with Liza segment typically featured enrollment advisors from North Carolina four-year colleges or universities who would provide information about their institution and tips that can lead to successful enrollment. Eighty-six percent (86%) of these segments featured minorities. While Eagle Stream was an output of Project COMPASS, it was a resource accessible to all Wake Tech students. Treatment instructors reported being
32
aware of the segments and were encouraged to post announcements in Blackboard to inform students of these success resources.
Adobe Connect (e.g., Webinars, Seminars, Roundtables, Virtual Classrooms)
Instructors in PSY-150 have utilized Adobe Connect more consistently and reported better student response to these synchronous web cast events than did instructors in BUS-110. PSY-150 instructors who were interviewed reported using Adobe Connect to host weekly synchronous web cast events in which students participated in a live lesson that allowed them to chat or talk with their classmates. One psychology instructor commented,
I have seen more and more students come into that virtual classroom ready to talk about the chapter. They're not just asking questions about the research paper or about ‘Hey, I missed an assignment. Can I make it up?’ The questions that they're asking are questions about the chapter, about the material. So, I have seen an increase in content-related questions from students.
BUS-110 instructors, on the other hand, reported having very low student attendance during synchronous web cast events conducted during the pilot phase, and thus, chose to use Adobe Connect more sparingly, such as for a first week orientation synchronous event. One BUS-110 instructor reported using Adobe Connect for virtual office hours, leaving the “office” open for an extended period of time, and if students showed up, they had time with the instructor. However, if no one showed up, the instructor did not feel time had been wasted, as he or she was able to use that time for normal instructional planning or assignment grading tasks. This is how a BUS-110 instructor explained how they used Adobe Connect, saying, “There originally was an idea that we needed to do regular webinars, like actual online classes, and the way that I adapted that for my class was changing it to a virtual office, where you could stop in any time and do a pop-in. I think that, for my business class, in particular, it probably works better.”
As the project unfolded, discussions among treatment faculty shifted the focus from prescribed technologies in some cases (such as Adobe Connect) to the intended functions of a technology type for supporting the instructors’ ability to provide engaging and cognitively rich learning experiences for students. This allowed instructors greater latitude in purposefully selecting technologies to support instructional strategies while also fitting with their teaching preferences/styles. For example, some CIS-110 instructors utilized Adobe Connect, particularly for their virtual office hours, but reported also using other platforms (i.e., Zoom, Skype, and/or Microsoft Teams) for class meetings because they were more user-friendly.
Remind/Text Messaging
The Remind software/platform was identified by all instructors interviewed as a tool used frequently in communicating with students. While some instructors mentioned using Remind to
33
text with students about upcoming due dates, some instructors mentioned also sending out other messages on occasion. For example, one instructor reported using Remind to send out memes, humorous comments, and motivational quotes, in addition to reminders, as a way to connect with students. One instructor reported using Remind’s group chat feature with students to allow students to pose questions and engage in extended conversations with their peers. This instructor also reported using the voice messaging feature of Remind to engage with students who may have visual disabilities. By leaving the voice or text messaging system open, they could have an ongoing “conversation” with the student(s) over an extended period of time. One instructor believed that students were more willing to share personal information via text compared to email, which allowed him to gain more information about the student.
All instructors reported using email as a mode of communication with students. As part of the Project COMPASS protocol, instructors were expected to respond to student emails within a specific time frame and, although instructors had mixed responses to that requirement, all instructors reported that they responded more promptly than in the past. One instructor said,
I was a little hesitant to contact students so frequently because I was afraid that it would make students lose accountability for their own actions. It really does work where I have students who will email me back and say, ‘I didn’t know that you noticed I missed an assignment. Thank you for emailing me. I will not miss another assignment this semester.’
Another instructor similarly reported the importance of contacting students, noting, “I think it helps them realize that somebody’s watching.”
Instructors reported contacting, via email, students who were repeating the course, students who had been absent for a week, and students who had missed assignments or quizzes. One instructor noted that their emails were now more content-based; whereas, in the past, emails were primarily used to convey course management information (i.e., due dates, upcoming tests).
Fidelity of Implementation
Another source of implementation data came from the treatment instructors. To examine whether all treatment instructors were implementing the High-Tech/High-Touch protocol as intended, Wake Tech project staff asked participants to document their level of implementation of the project activities as described in the methodology section.
FOI data show that instructors were able to document high level usage of a variety of strategies for reaching out to students at the beginning of each semester, including live orientation web
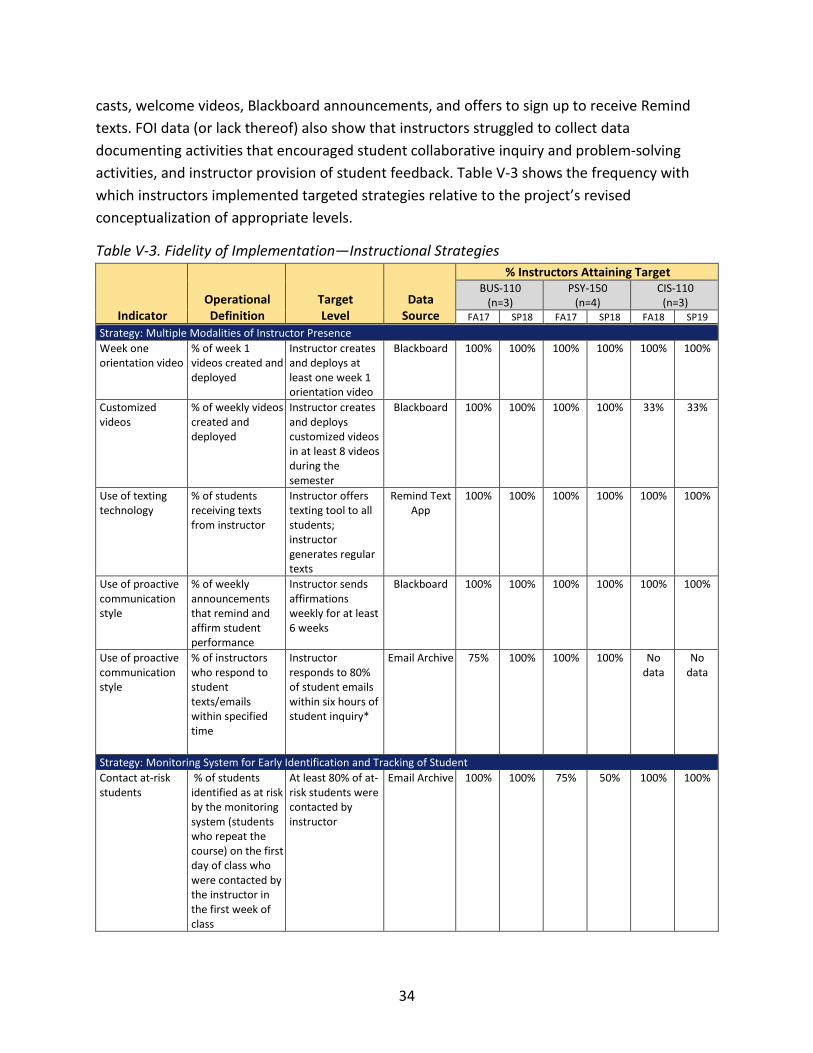
34
casts, welcome videos, Blackboard announcements, and offers to sign up to receive Remind texts. FOI data (or lack thereof) also show that instructors struggled to collect data documenting activities that encouraged student collaborative inquiry and problem-solving activities, and instructor provision of student feedback. Table V-3 shows the frequency with which instructors implemented targeted strategies relative to the project’s revised conceptualization of appropriate levels.
Table V-3. Fidelity of Implementation—Instructional Strategies
Indicator Operational Definition
Target Level
Data
Source
% Instructors Attaining Target BUS-110
(n=3) PSY-150
(n=4) CIS-110
(n=3) FA17 SP18 FA17 SP18 FA18 SP19
Strategy: Multiple Modalities of Instructor Presence Week one orientation video
% of week 1 videos created and deployed
Instructor creates and deploys at least one week 1 orientation video
Blackboard 100% 100% 100% 100% 100% 100%
Customized videos
% of weekly videos created and deployed
Instructor creates and deploys customized videos in at least 8 videos during the semester
Blackboard 100% 100% 100% 100% 33% 33%
Use of texting technology
% of students receiving texts from instructor
Instructor offers texting tool to all students; instructor generates regular texts
Remind Text App
100% 100% 100% 100% 100% 100%
Use of proactive communication style
% of weekly announcements that remind and affirm student performance
Instructor sends affirmations weekly for at least 6 weeks
Blackboard 100% 100% 100% 100% 100% 100%
Use of proactive communication style
% of instructors who respond to student texts/emails within specified time
Instructor responds to 80% of student emails within six hours of student inquiry*
Email Archive 75% 100% 100% 100% No data
No data
Strategy: Monitoring System for Early Identification and Tracking of Student Contact at-risk students
% of students identified as at risk by the monitoring system (students who repeat the course) on the first day of class who were contacted by the instructor in the first week of class
At least 80% of at-risk students were contacted by instructor
Email Archive 100% 100% 75% 50% 100% 100%
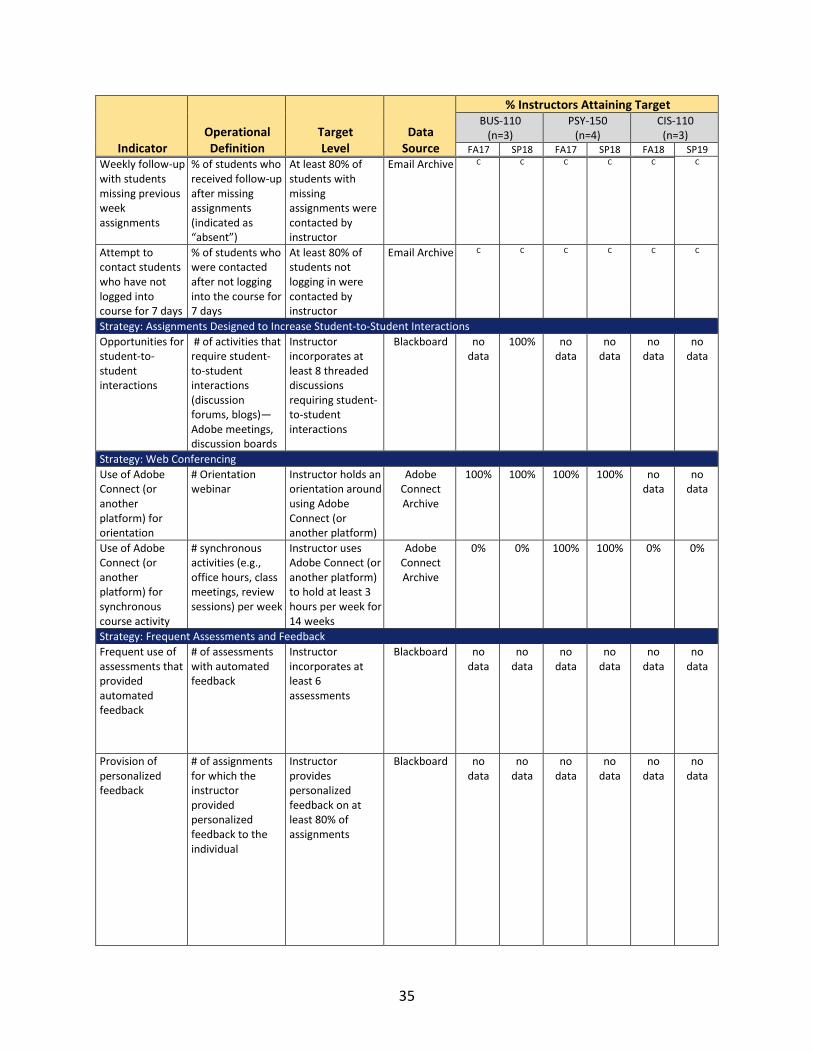
35
Indicator Operational Definition
Target Level
Data
Source
% Instructors Attaining Target BUS-110
(n=3) PSY-150
(n=4) CIS-110
(n=3) FA17 SP18 FA17 SP18 FA18 SP19
Weekly follow-up with students missing previous week assignments
% of students who received follow-up after missing assignments (indicated as “absent”)
At least 80% of students with missing assignments were contacted by instructor
Email Archive C C C C C C
Attempt to contact students who have not logged into course for 7 days
% of students who were contacted after not logging into the course for 7 days
At least 80% of students not logging in were contacted by instructor
Email Archive C C C C C C
Strategy: Assignments Designed to Increase Student-to-Student Interactions Opportunities for student-to-student interactions
# of activities that require student-to-student interactions (discussion forums, blogs)—Adobe meetings, discussion boards
Instructor incorporates at least 8 threaded discussions requiring student-to-student interactions
Blackboard no data
100% no data
no data
no data
no data
Strategy: Web Conferencing Use of Adobe Connect (or another platform) for orientation
# Orientation webinar
Instructor holds an orientation around using Adobe Connect (or another platform)
Adobe Connect Archive
100% 100% 100% 100% no data
no data
Use of Adobe Connect (or another platform) for synchronous course activity
# synchronous activities (e.g., office hours, class meetings, review sessions) per week
Instructor uses Adobe Connect (or another platform) to hold at least 3 hours per week for 14 weeks
Adobe Connect Archive
0% 0% 100% 100% 0% 0%
Strategy: Frequent Assessments and Feedback Frequent use of assessments that provided automated feedback
# of assessments with automated feedback
Instructor incorporates at least 6 assessments
Blackboard no data
no data
no data
no data
no data
no data
Provision of personalized feedback
# of assignments for which the instructor provided personalized feedback to the individual
Instructor provides personalized feedback on at least 80% of assignments
Blackboard no data
no data
no data
no data
no data
no data
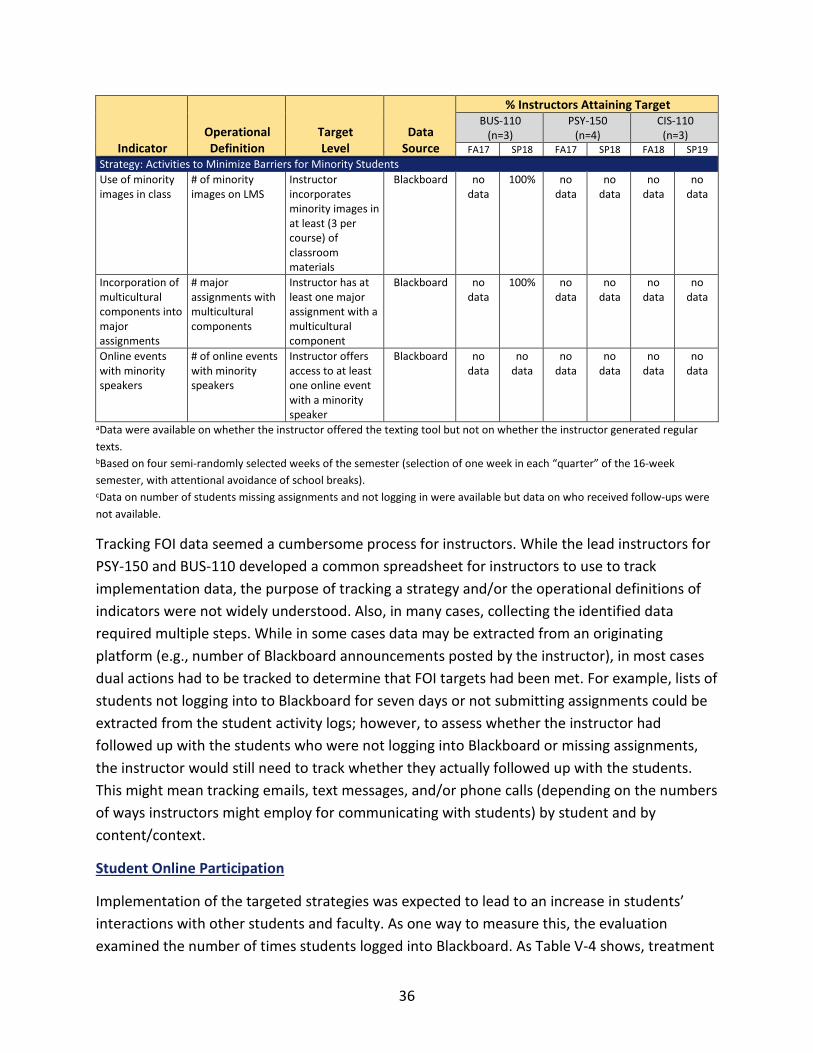
36
Indicator Operational Definition
Target Level
Data
Source
% Instructors Attaining Target BUS-110
(n=3) PSY-150
(n=4) CIS-110
(n=3) FA17 SP18 FA17 SP18 FA18 SP19
Strategy: Activities to Minimize Barriers for Minority Students Use of minority images in class
# of minority images on LMS
Instructor incorporates minority images in at least (3 per course) of classroom materials
Blackboard no data
100% no data
no data
no data
no data
Incorporation of multicultural components into major assignments
# major assignments with multicultural components
Instructor has at least one major assignment with a multicultural component
Blackboard no data
100% no data
no data
no data
no data
Online events with minority speakers
# of online events with minority speakers
Instructor offers access to at least one online event with a minority speaker
Blackboard no data
no data
no data
no data
no data
no data
aData were available on whether the instructor offered the texting tool but not on whether the instructor generated regular texts. bBased on four semi-randomly selected weeks of the semester (selection of one week in each “quarter” of the 16-week semester, with attentional avoidance of school breaks). cData on number of students missing assignments and not logging in were available but data on who received follow-ups were not available.
Tracking FOI data seemed a cumbersome process for instructors. While the lead instructors for PSY-150 and BUS-110 developed a common spreadsheet for instructors to use to track implementation data, the purpose of tracking a strategy and/or the operational definitions of indicators were not widely understood. Also, in many cases, collecting the identified data required multiple steps. While in some cases data may be extracted from an originating platform (e.g., number of Blackboard announcements posted by the instructor), in most cases dual actions had to be tracked to determine that FOI targets had been met. For example, lists of students not logging into to Blackboard for seven days or not submitting assignments could be extracted from the student activity logs; however, to assess whether the instructor had followed up with the students who were not logging into Blackboard or missing assignments, the instructor would still need to track whether they actually followed up with the students. This might mean tracking emails, text messages, and/or phone calls (depending on the numbers of ways instructors might employ for communicating with students) by student and by content/context.
Student Online Participation
Implementation of the targeted strategies was expected to lead to an increase in students’ interactions with other students and faculty. As one way to measure this, the evaluation examined the number of times students logged into Blackboard. As Table V-4 shows, treatment
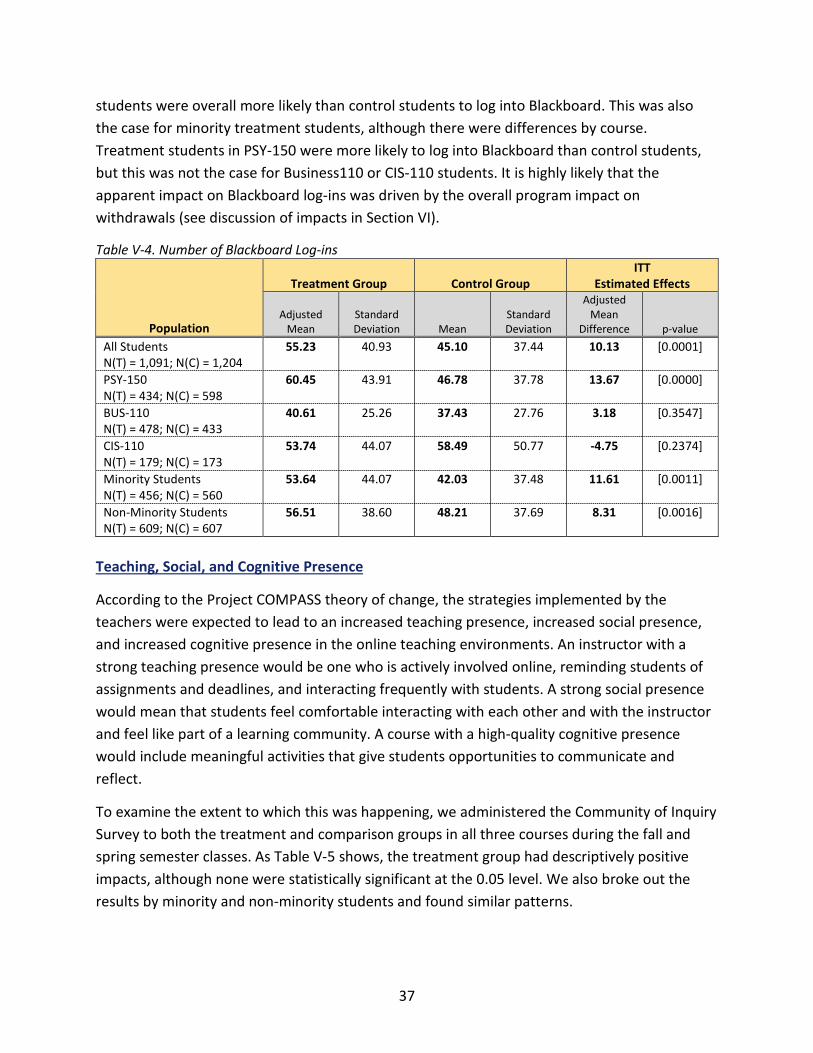
37
students were overall more likely than control students to log into Blackboard. This was also the case for minority treatment students, although there were differences by course. Treatment students in PSY-150 were more likely to log into Blackboard than control students, but this was not the case for Business110 or CIS-110 students. It is highly likely that the apparent impact on Blackboard log-ins was driven by the overall program impact on withdrawals (see discussion of impacts in Section VI).
Table V-4. Number of Blackboard Log-ins
Population
Treatment Group Control Group ITT
Estimated Effects
Adjusted Mean
Standard Deviation Mean
Standard Deviation
Adjusted Mean
Difference p-value All Students N(T) = 1,091; N(C) = 1,204
55.23 40.93 45.10 37.44 10.13 [0.0001]
PSY-150 N(T) = 434; N(C) = 598
60.45 43.91 46.78 37.78 13.67 [0.0000]
BUS-110 N(T) = 478; N(C) = 433
40.61 25.26 37.43 27.76 3.18 [0.3547]
CIS-110 N(T) = 179; N(C) = 173
53.74 44.07 58.49 50.77 -4.75 [0.2374]
Minority Students N(T) = 456; N(C) = 560
53.64 44.07 42.03 37.48 11.61 [0.0011]
Non-Minority Students N(T) = 609; N(C) = 607
56.51 38.60 48.21 37.69 8.31 [0.0016]
Teaching, Social, and Cognitive Presence
According to the Project COMPASS theory of change, the strategies implemented by the teachers were expected to lead to an increased teaching presence, increased social presence, and increased cognitive presence in the online teaching environments. An instructor with a strong teaching presence would be one who is actively involved online, reminding students of assignments and deadlines, and interacting frequently with students. A strong social presence would mean that students feel comfortable interacting with each other and with the instructor and feel like part of a learning community. A course with a high-quality cognitive presence would include meaningful activities that give students opportunities to communicate and reflect.
To examine the extent to which this was happening, we administered the Community of Inquiry Survey to both the treatment and comparison groups in all three courses during the fall and spring semester classes. As Table V-5 shows, the treatment group had descriptively positive impacts, although none were statistically significant at the 0.05 level. We also broke out the results by minority and non-minority students and found similar patterns.
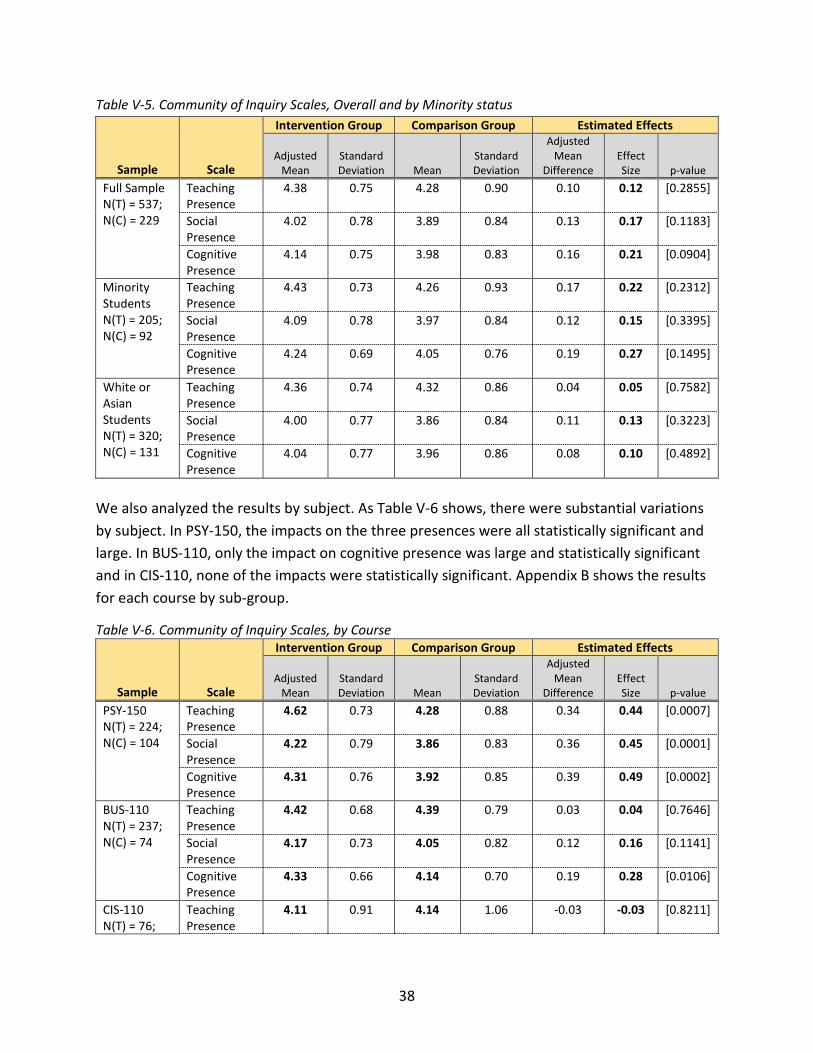
38
Table V-5. Community of Inquiry Scales, Overall and by Minority status
Sample Scale
Intervention Group Comparison Group Estimated Effects
Adjusted Mean
Standard Deviation Mean
Standard Deviation
Adjusted Mean
Difference Effect Size p-value
Full Sample N(T) = 537; N(C) = 229
Teaching Presence
4.38 0.75 4.28 0.90 0.10 0.12 [0.2855]
Social Presence
4.02 0.78 3.89 0.84 0.13 0.17 [0.1183]
Cognitive Presence
4.14 0.75 3.98 0.83 0.16 0.21 [0.0904]
Minority Students N(T) = 205; N(C) = 92
Teaching Presence
4.43 0.73 4.26 0.93 0.17 0.22 [0.2312]
Social Presence
4.09 0.78 3.97 0.84 0.12 0.15 [0.3395]
Cognitive Presence
4.24 0.69 4.05 0.76 0.19 0.27 [0.1495]
White or Asian Students N(T) = 320; N(C) = 131
Teaching Presence
4.36 0.74 4.32 0.86 0.04 0.05 [0.7582]
Social Presence
4.00 0.77 3.86 0.84 0.11 0.13 [0.3223]
Cognitive Presence
4.04 0.77 3.96 0.86 0.08 0.10 [0.4892]
We also analyzed the results by subject. As Table V-6 shows, there were substantial variations by subject. In PSY-150, the impacts on the three presences were all statistically significant and large. In BUS-110, only the impact on cognitive presence was large and statistically significant and in CIS-110, none of the impacts were statistically significant. Appendix B shows the results for each course by sub-group.
Table V-6. Community of Inquiry Scales, by Course
Sample Scale
Intervention Group Comparison Group Estimated Effects
Adjusted Mean
Standard Deviation Mean
Standard Deviation
Adjusted Mean
Difference Effect Size p-value
PSY-150 N(T) = 224; N(C) = 104
Teaching Presence
4.62 0.73 4.28 0.88 0.34 0.44 [0.0007]
Social Presence
4.22 0.79 3.86 0.83 0.36 0.45 [0.0001]
Cognitive Presence
4.31 0.76 3.92 0.85 0.39 0.49 [0.0002]
BUS-110 N(T) = 237; N(C) = 74
Teaching Presence
4.42 0.68 4.39 0.79 0.03 0.04 [0.7646]
Social Presence
4.17 0.73 4.05 0.82 0.12 0.16 [0.1141]
Cognitive Presence
4.33 0.66 4.14 0.70 0.19 0.28 [0.0106]
CIS-110 N(T) = 76;
Teaching Presence
4.11 0.91 4.14 1.06 -0.03 -0.03 [0.8211]
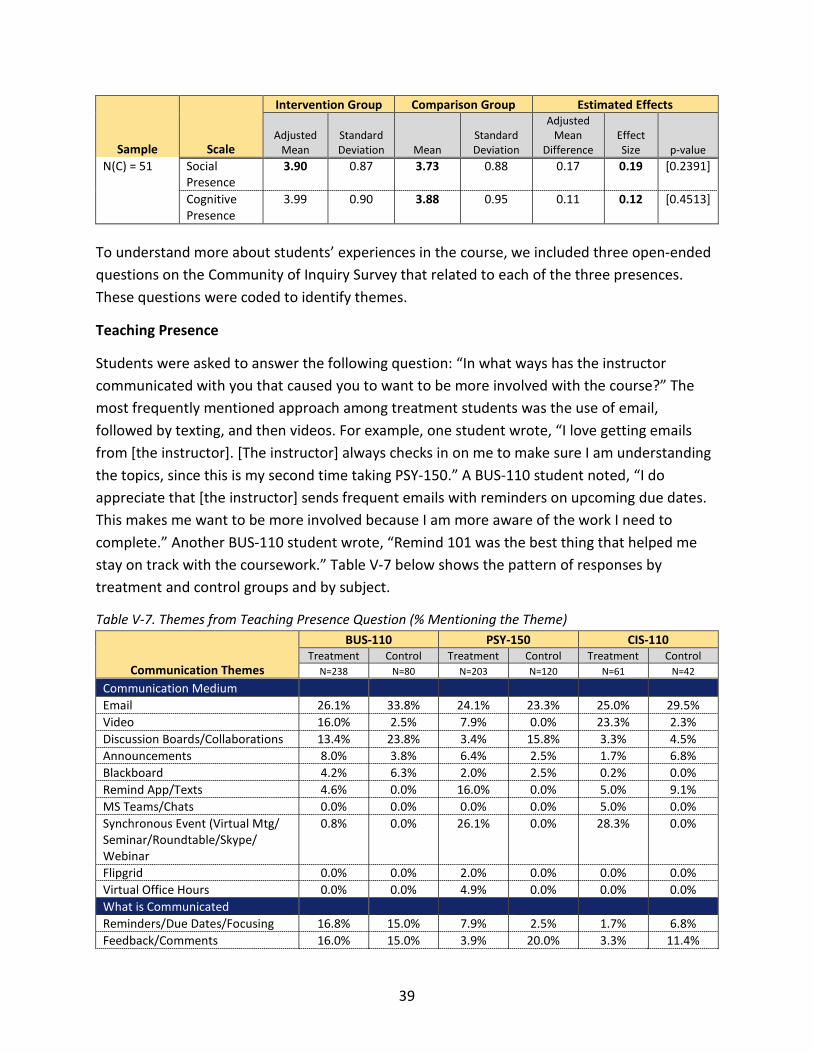
39
Sample Scale
Intervention Group Comparison Group Estimated Effects
Adjusted Mean
Standard Deviation Mean
Standard Deviation
Adjusted Mean
Difference Effect Size p-value
N(C) = 51 Social Presence
3.90 0.87 3.73 0.88 0.17 0.19 [0.2391]
Cognitive Presence
3.99 0.90 3.88 0.95 0.11 0.12 [0.4513]
To understand more about students’ experiences in the course, we included three open-ended questions on the Community of Inquiry Survey that related to each of the three presences. These questions were coded to identify themes.
Teaching Presence
Students were asked to answer the following question: “In what ways has the instructor communicated with you that caused you to want to be more involved with the course?” The most frequently mentioned approach among treatment students was the use of email, followed by texting, and then videos. For example, one student wrote, “I love getting emails from [the instructor]. [The instructor] always checks in on me to make sure I am understanding the topics, since this is my second time taking PSY-150.” A BUS-110 student noted, “I do appreciate that [the instructor] sends frequent emails with reminders on upcoming due dates. This makes me want to be more involved because I am more aware of the work I need to complete.” Another BUS-110 student wrote, “Remind 101 was the best thing that helped me stay on track with the coursework.” Table V-7 below shows the pattern of responses by treatment and control groups and by subject.
Table V-7. Themes from Teaching Presence Question (% Mentioning the Theme)
Communication Themes
BUS-110 PSY-150 CIS-110 Treatment Control Treatment Control Treatment Control
N=238 N=80 N=203 N=120 N=61 N=42
Communication Medium Email 26.1% 33.8% 24.1% 23.3% 25.0% 29.5% Video 16.0% 2.5% 7.9% 0.0% 23.3% 2.3% Discussion Boards/Collaborations 13.4% 23.8% 3.4% 15.8% 3.3% 4.5% Announcements 8.0% 3.8% 6.4% 2.5% 1.7% 6.8% Blackboard 4.2% 6.3% 2.0% 2.5% 0.2% 0.0% Remind App/Texts 4.6% 0.0% 16.0% 0.0% 5.0% 9.1% MS Teams/Chats 0.0% 0.0% 0.0% 0.0% 5.0% 0.0% Synchronous Event (Virtual Mtg/ Seminar/Roundtable/Skype/ Webinar
0.8% 0.0% 26.1% 0.0% 28.3% 0.0%
Flipgrid 0.0% 0.0% 2.0% 0.0% 0.0% 0.0% Virtual Office Hours 0.0% 0.0% 4.9% 0.0% 0.0% 0.0% What is Communicated Reminders/Due Dates/Focusing 16.8% 15.0% 7.9% 2.5% 1.7% 6.8% Feedback/Comments 16.0% 15.0% 3.9% 20.0% 3.3% 11.4%
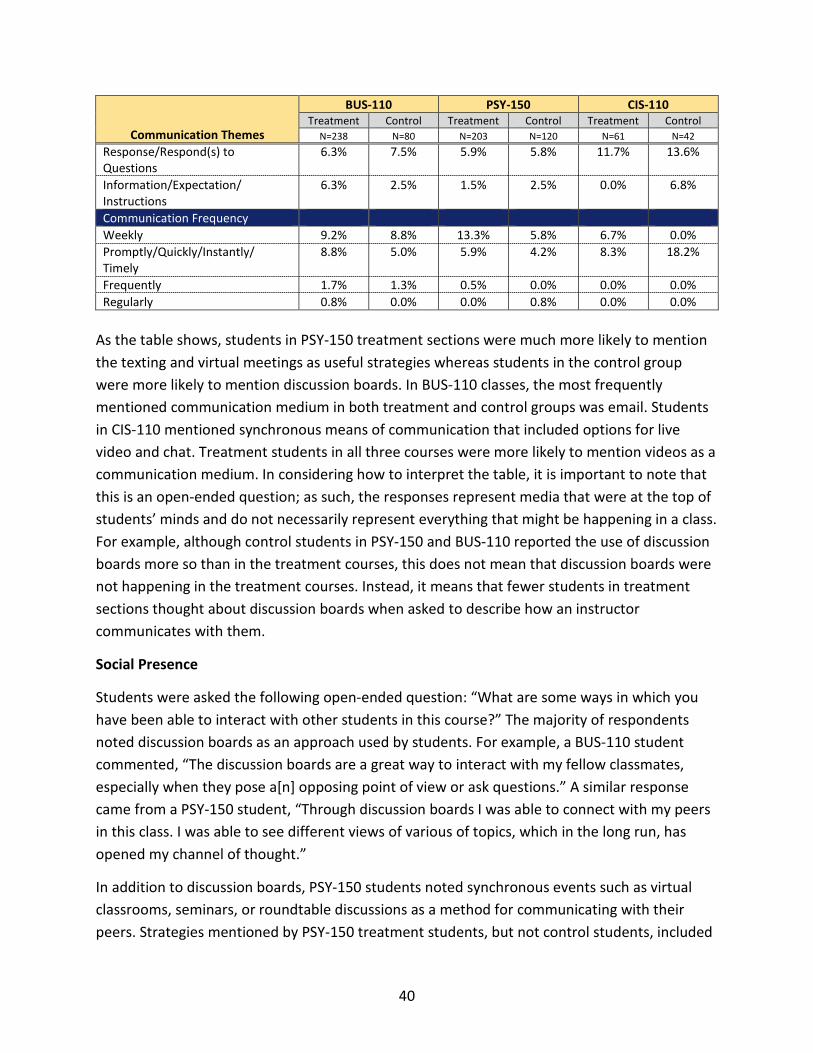
40
Communication Themes
BUS-110 PSY-150 CIS-110 Treatment Control Treatment Control Treatment Control
N=238 N=80 N=203 N=120 N=61 N=42 Response/Respond(s) to Questions
6.3% 7.5% 5.9% 5.8% 11.7% 13.6%
Information/Expectation/ Instructions
6.3% 2.5% 1.5% 2.5% 0.0% 6.8%
Communication Frequency Weekly 9.2% 8.8% 13.3% 5.8% 6.7% 0.0% Promptly/Quickly/Instantly/ Timely
8.8% 5.0% 5.9% 4.2% 8.3% 18.2%
Frequently 1.7% 1.3% 0.5% 0.0% 0.0% 0.0% Regularly 0.8% 0.0% 0.0% 0.8% 0.0% 0.0%
As the table shows, students in PSY-150 treatment sections were much more likely to mention the texting and virtual meetings as useful strategies whereas students in the control group were more likely to mention discussion boards. In BUS-110 classes, the most frequently mentioned communication medium in both treatment and control groups was email. Students in CIS-110 mentioned synchronous means of communication that included options for live video and chat. Treatment students in all three courses were more likely to mention videos as a communication medium. In considering how to interpret the table, it is important to note that this is an open-ended question; as such, the responses represent media that were at the top of students’ minds and do not necessarily represent everything that might be happening in a class. For example, although control students in PSY-150 and BUS-110 reported the use of discussion boards more so than in the treatment courses, this does not mean that discussion boards were not happening in the treatment courses. Instead, it means that fewer students in treatment sections thought about discussion boards when asked to describe how an instructor communicates with them.
Social Presence
Students were asked the following open-ended question: “What are some ways in which you have been able to interact with other students in this course?” The majority of respondents noted discussion boards as an approach used by students. For example, a BUS-110 student commented, “The discussion boards are a great way to interact with my fellow classmates, especially when they pose a[n] opposing point of view or ask questions.” A similar response came from a PSY-150 student, “Through discussion boards I was able to connect with my peers in this class. I was able to see different views of various of topics, which in the long run, has opened my channel of thought.”
In addition to discussion boards, PSY-150 students noted synchronous events such as virtual classrooms, seminars, or roundtable discussions as a method for communicating with their peers. Strategies mentioned by PSY-150 treatment students, but not control students, included
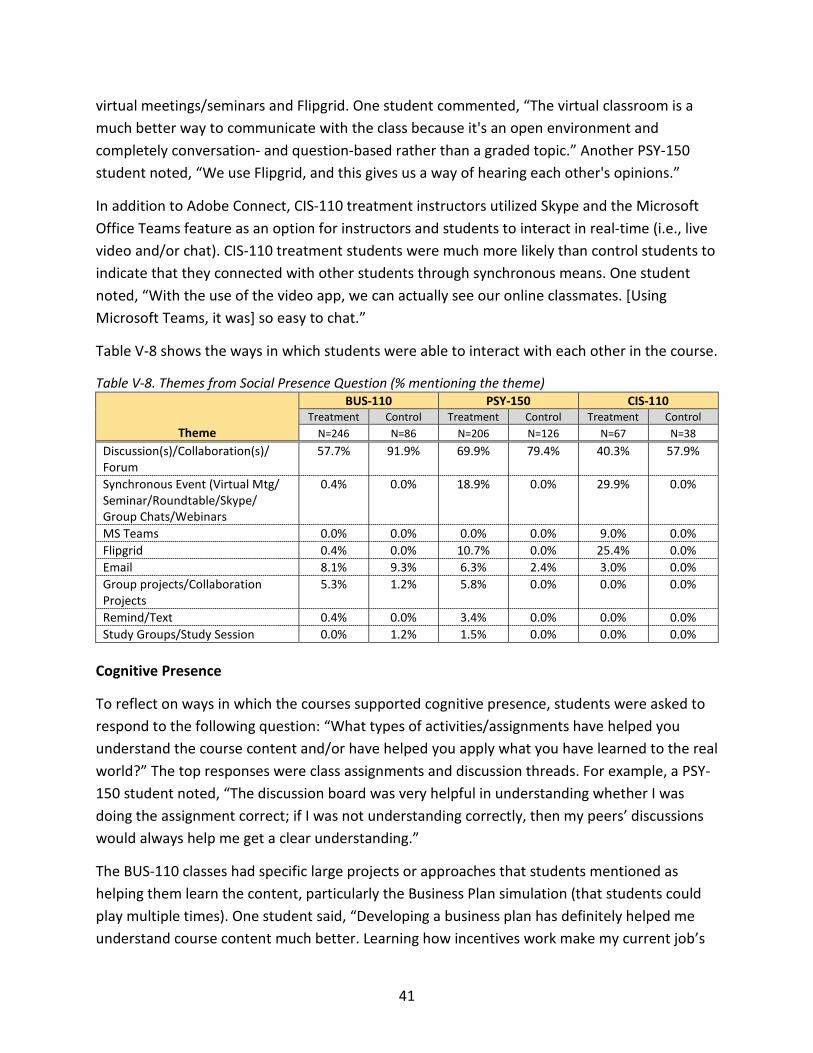
41
virtual meetings/seminars and Flipgrid. One student commented, “The virtual classroom is a much better way to communicate with the class because it's an open environment and completely conversation- and question-based rather than a graded topic.” Another PSY-150 student noted, “We use Flipgrid, and this gives us a way of hearing each other's opinions.”
In addition to Adobe Connect, CIS-110 treatment instructors utilized Skype and the Microsoft Office Teams feature as an option for instructors and students to interact in real-time (i.e., live video and/or chat). CIS-110 treatment students were much more likely than control students to indicate that they connected with other students through synchronous means. One student noted, “With the use of the video app, we can actually see our online classmates. [Using Microsoft Teams, it was] so easy to chat.”
Table V-8 shows the ways in which students were able to interact with each other in the course.
Table V-8. Themes from Social Presence Question (% mentioning the theme)
Cognitive Presence
To reflect on ways in which the courses supported cognitive presence, students were asked to respond to the following question: “What types of activities/assignments have helped you understand the course content and/or have helped you apply what you have learned to the real world?” The top responses were class assignments and discussion threads. For example, a PSY-150 student noted, “The discussion board was very helpful in understanding whether I was doing the assignment correct; if I was not understanding correctly, then my peers’ discussions would always help me get a clear understanding.”
The BUS-110 classes had specific large projects or approaches that students mentioned as helping them learn the content, particularly the Business Plan simulation (that students could play multiple times). One student said, “Developing a business plan has definitely helped me understand course content much better. Learning how incentives work make my current job’s
Theme
BUS-110 PSY-150 CIS-110 Treatment Control Treatment Control Treatment Control
N=246 N=86 N=206 N=126 N=67 N=38 Discussion(s)/Collaboration(s)/ Forum
57.7% 91.9% 69.9% 79.4% 40.3% 57.9%
Synchronous Event (Virtual Mtg/ Seminar/Roundtable/Skype/ Group Chats/Webinars
0.4% 0.0% 18.9% 0.0% 29.9% 0.0%
MS Teams 0.0% 0.0% 0.0% 0.0% 9.0% 0.0% Flipgrid 0.4% 0.0% 10.7% 0.0% 25.4% 0.0% Email 8.1% 9.3% 6.3% 2.4% 3.0% 0.0% Group projects/Collaboration Projects
5.3% 1.2% 5.8% 0.0% 0.0% 0.0%
Remind/Text 0.4% 0.0% 3.4% 0.0% 0.0% 0.0% Study Groups/Study Session 0.0% 1.2% 1.5% 0.0% 0.0% 0.0%
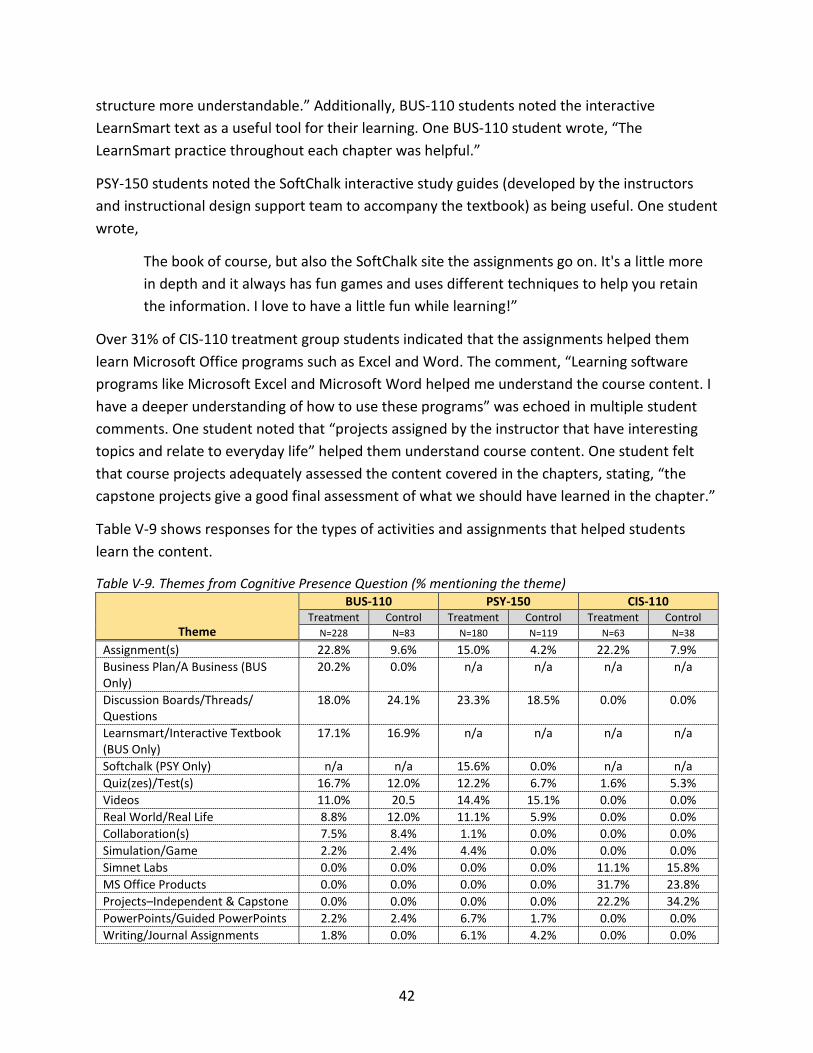
42
structure more understandable.” Additionally, BUS-110 students noted the interactive LearnSmart text as a useful tool for their learning. One BUS-110 student wrote, “The LearnSmart practice throughout each chapter was helpful.”
PSY-150 students noted the SoftChalk interactive study guides (developed by the instructors and instructional design support team to accompany the textbook) as being useful. One student wrote,
The book of course, but also the SoftChalk site the assignments go on. It's a little more in depth and it always has fun games and uses different techniques to help you retain the information. I love to have a little fun while learning!”
Over 31% of CIS-110 treatment group students indicated that the assignments helped them learn Microsoft Office programs such as Excel and Word. The comment, “Learning software programs like Microsoft Excel and Microsoft Word helped me understand the course content. I have a deeper understanding of how to use these programs” was echoed in multiple student comments. One student noted that “projects assigned by the instructor that have interesting topics and relate to everyday life” helped them understand course content. One student felt that course projects adequately assessed the content covered in the chapters, stating, “the capstone projects give a good final assessment of what we should have learned in the chapter.”
Table V-9 shows responses for the types of activities and assignments that helped students learn the content.
Table V-9. Themes from Cognitive Presence Question (% mentioning the theme)
Theme
BUS-110 PSY-150 CIS-110 Treatment Control Treatment Control Treatment Control
N=228 N=83 N=180 N=119 N=63 N=38
Assignment(s) 22.8% 9.6% 15.0% 4.2% 22.2% 7.9% Business Plan/A Business (BUS Only)
20.2% 0.0% n/a n/a n/a n/a
Discussion Boards/Threads/ Questions
18.0% 24.1% 23.3% 18.5% 0.0% 0.0%
Learnsmart/Interactive Textbook (BUS Only)
17.1% 16.9% n/a n/a n/a n/a
Softchalk (PSY Only) n/a n/a 15.6% 0.0% n/a n/a Quiz(zes)/Test(s) 16.7% 12.0% 12.2% 6.7% 1.6% 5.3% Videos 11.0% 20.5 14.4% 15.1% 0.0% 0.0% Real World/Real Life 8.8% 12.0% 11.1% 5.9% 0.0% 0.0% Collaboration(s) 7.5% 8.4% 1.1% 0.0% 0.0% 0.0% Simulation/Game 2.2% 2.4% 4.4% 0.0% 0.0% 0.0% Simnet Labs 0.0% 0.0% 0.0% 0.0% 11.1% 15.8% MS Office Products 0.0% 0.0% 0.0% 0.0% 31.7% 23.8% Projects–Independent & Capstone 0.0% 0.0% 0.0% 0.0% 22.2% 34.2% PowerPoints/Guided PowerPoints 2.2% 2.4% 6.7% 1.7% 0.0% 0.0% Writing/Journal Assignments 1.8% 0.0% 6.1% 4.2% 0.0% 0.0%
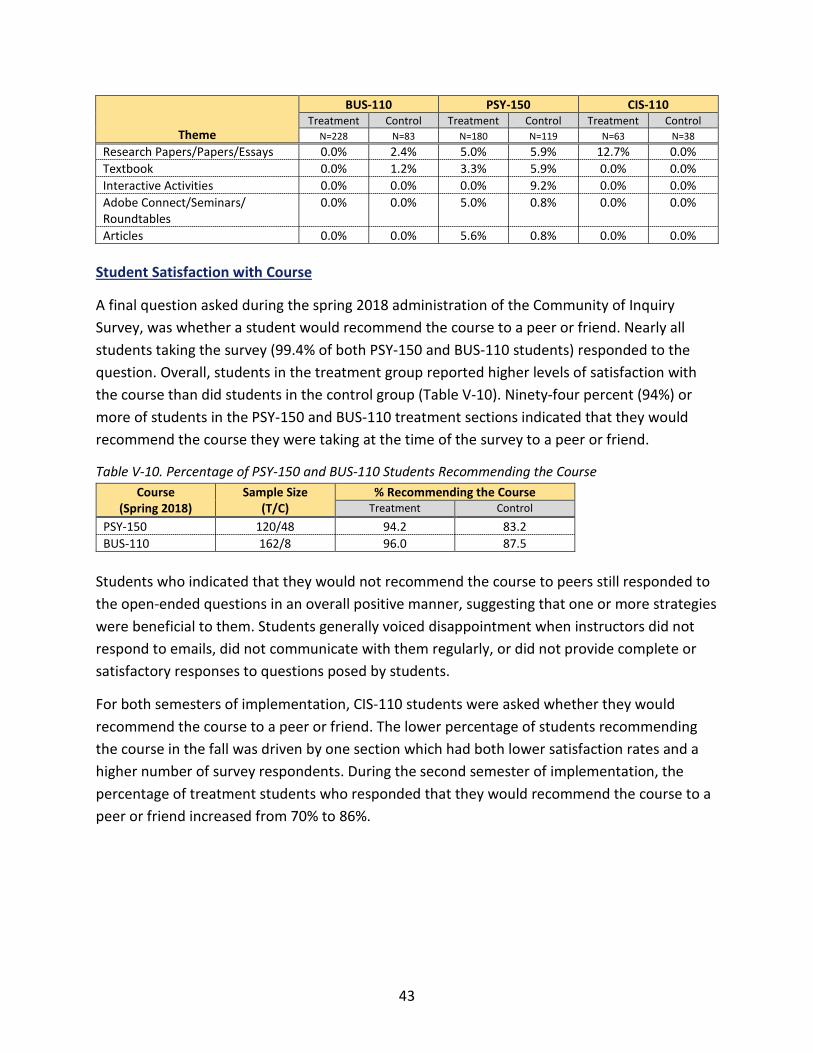
43
Theme
BUS-110 PSY-150 CIS-110 Treatment Control Treatment Control Treatment Control
N=228 N=83 N=180 N=119 N=63 N=38 Research Papers/Papers/Essays 0.0% 2.4% 5.0% 5.9% 12.7% 0.0% Textbook 0.0% 1.2% 3.3% 5.9% 0.0% 0.0% Interactive Activities 0.0% 0.0% 0.0% 9.2% 0.0% 0.0% Adobe Connect/Seminars/ Roundtables
0.0% 0.0% 5.0% 0.8% 0.0% 0.0%
Articles 0.0% 0.0% 5.6% 0.8% 0.0% 0.0% Student Satisfaction with Course
A final question asked during the spring 2018 administration of the Community of Inquiry Survey, was whether a student would recommend the course to a peer or friend. Nearly all students taking the survey (99.4% of both PSY-150 and BUS-110 students) responded to the question. Overall, students in the treatment group reported higher levels of satisfaction with the course than did students in the control group (Table V-10). Ninety-four percent (94%) or more of students in the PSY-150 and BUS-110 treatment sections indicated that they would recommend the course they were taking at the time of the survey to a peer or friend.
Table V-10. Percentage of PSY-150 and BUS-110 Students Recommending the Course Course
(Spring 2018) Sample Size
(T/C) % Recommending the Course
Treatment Control
PSY-150 120/48 94.2 83.2 BUS-110 162/8 96.0 87.5
Students who indicated that they would not recommend the course to peers still responded to the open-ended questions in an overall positive manner, suggesting that one or more strategies were beneficial to them. Students generally voiced disappointment when instructors did not respond to emails, did not communicate with them regularly, or did not provide complete or satisfactory responses to questions posed by students.
For both semesters of implementation, CIS-110 students were asked whether they would recommend the course to a peer or friend. The lower percentage of students recommending the course in the fall was driven by one section which had both lower satisfaction rates and a higher number of survey respondents. During the second semester of implementation, the percentage of treatment students who responded that they would recommend the course to a peer or friend increased from 70% to 86%.
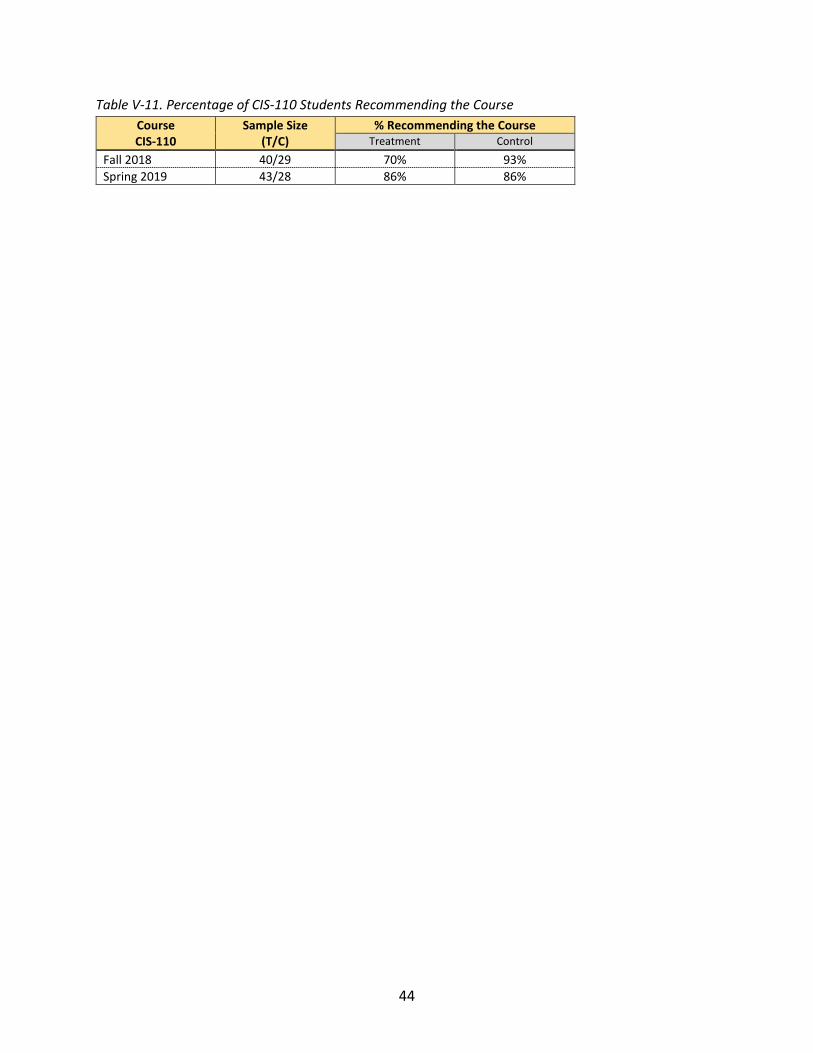
44
Table V-11. Percentage of CIS-110 Students Recommending the Course Course CIS-110
Sample Size (T/C)
% Recommending the Course Treatment Control
Fall 2018 40/29 70% 93% Spring 2019 43/28 86% 86%
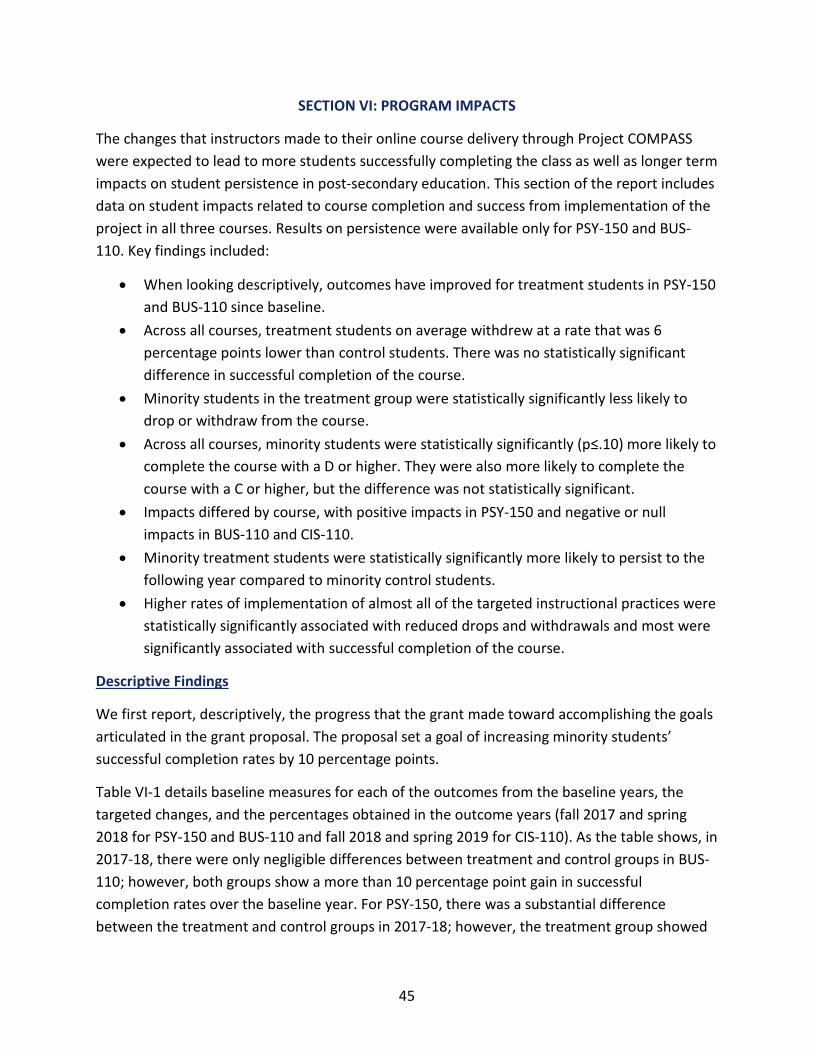
45
SECTION VI: PROGRAM IMPACTS
The changes that instructors made to their online course delivery through Project COMPASS were expected to lead to more students successfully completing the class as well as longer term impacts on student persistence in post-secondary education. This section of the report includes data on student impacts related to course completion and success from implementation of the project in all three courses. Results on persistence were available only for PSY-150 and BUS-110. Key findings included:
• When looking descriptively, outcomes have improved for treatment students in PSY-150 and BUS-110 since baseline.
• Across all courses, treatment students on average withdrew at a rate that was 6 percentage points lower than control students. There was no statistically significant difference in successful completion of the course.
• Minority students in the treatment group were statistically significantly less likely to drop or withdraw from the course.
• Across all courses, minority students were statistically significantly (p≤.10) more likely to complete the course with a D or higher. They were also more likely to complete the course with a C or higher, but the difference was not statistically significant.
• Impacts differed by course, with positive impacts in PSY-150 and negative or null impacts in BUS-110 and CIS-110.
• Minority treatment students were statistically significantly more likely to persist to the following year compared to minority control students.
• Higher rates of implementation of almost all of the targeted instructional practices were statistically significantly associated with reduced drops and withdrawals and most were significantly associated with successful completion of the course.
Descriptive Findings
We first report, descriptively, the progress that the grant made toward accomplishing the goals articulated in the grant proposal. The proposal set a goal of increasing minority students’ successful completion rates by 10 percentage points.
Table VI-1 details baseline measures for each of the outcomes from the baseline years, the targeted changes, and the percentages obtained in the outcome years (fall 2017 and spring 2018 for PSY-150 and BUS-110 and fall 2018 and spring 2019 for CIS-110). As the table shows, in 2017-18, there were only negligible differences between treatment and control groups in BUS-110; however, both groups show a more than 10 percentage point gain in successful completion rates over the baseline year. For PSY-150, there was a substantial difference between the treatment and control groups in 2017-18; however, the treatment group showed
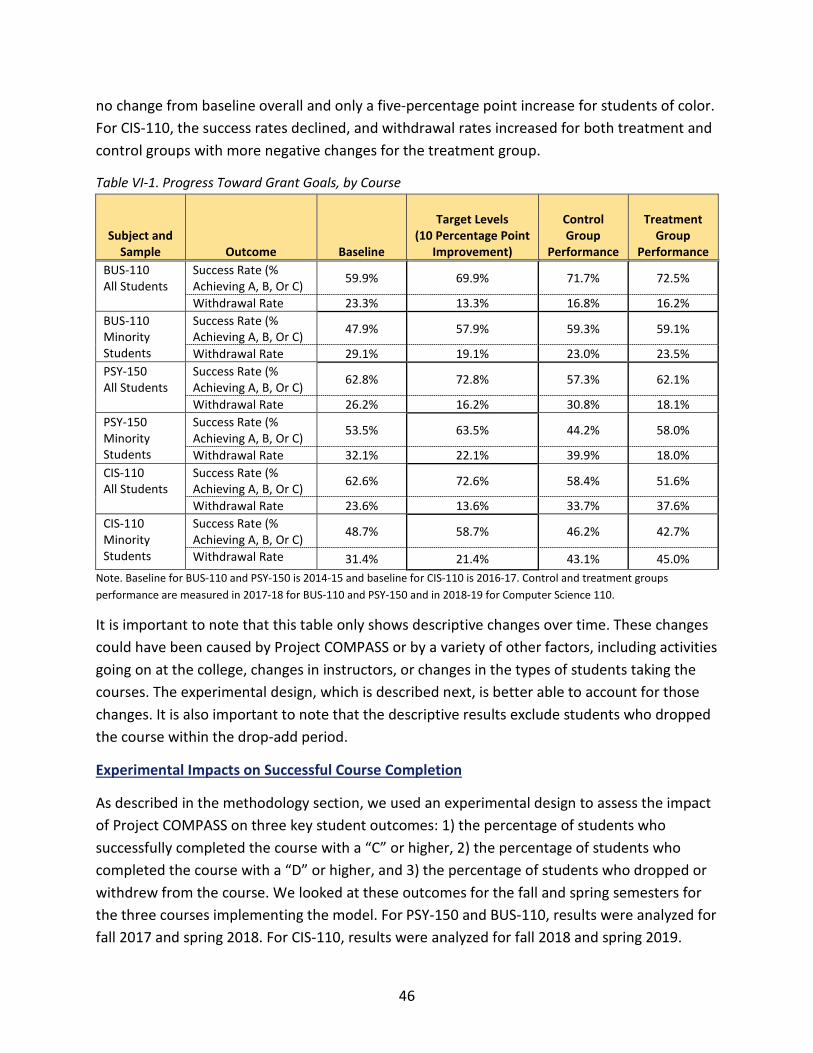
46
no change from baseline overall and only a five-percentage point increase for students of color. For CIS-110, the success rates declined, and withdrawal rates increased for both treatment and control groups with more negative changes for the treatment group.
Table VI-1. Progress Toward Grant Goals, by Course
Subject and Sample Outcome Baseline
Target Levels (10 Percentage Point
Improvement)
Control Group
Performance
Treatment Group
Performance BUS-110 All Students
Success Rate (% Achieving A, B, Or C) 59.9% 69.9% 71.7% 72.5%
Withdrawal Rate 23.3% 13.3% 16.8% 16.2% BUS-110 Minority Students
Success Rate (% Achieving A, B, Or C) 47.9% 57.9% 59.3% 59.1%
Withdrawal Rate 29.1% 19.1% 23.0% 23.5% PSY-150 All Students
Success Rate (% Achieving A, B, Or C) 62.8% 72.8% 57.3% 62.1%
Withdrawal Rate 26.2% 16.2% 30.8% 18.1% PSY-150 Minority Students
Success Rate (% Achieving A, B, Or C) 53.5% 63.5% 44.2% 58.0%
Withdrawal Rate 32.1% 22.1% 39.9% 18.0% CIS-110 All Students
Success Rate (% Achieving A, B, Or C) 62.6% 72.6% 58.4% 51.6%
Withdrawal Rate 23.6% 13.6% 33.7% 37.6% CIS-110 Minority Students
Success Rate (% Achieving A, B, Or C) 48.7% 58.7% 46.2% 42.7%
Withdrawal Rate 31.4% 21.4% 43.1% 45.0% Note. Baseline for BUS-110 and PSY-150 is 2014-15 and baseline for CIS-110 is 2016-17. Control and treatment groups performance are measured in 2017-18 for BUS-110 and PSY-150 and in 2018-19 for Computer Science 110.
It is important to note that this table only shows descriptive changes over time. These changes could have been caused by Project COMPASS or by a variety of other factors, including activities going on at the college, changes in instructors, or changes in the types of students taking the courses. The experimental design, which is described next, is better able to account for those changes. It is also important to note that the descriptive results exclude students who dropped the course within the drop-add period.
Experimental Impacts on Successful Course Completion
As described in the methodology section, we used an experimental design to assess the impact of Project COMPASS on three key student outcomes: 1) the percentage of students who successfully completed the course with a “C” or higher, 2) the percentage of students who completed the course with a “D” or higher, and 3) the percentage of students who dropped or withdrew from the course. We looked at these outcomes for the fall and spring semesters for the three courses implementing the model. For PSY-150 and BUS-110, results were analyzed for fall 2017 and spring 2018. For CIS-110, results were analyzed for fall 2018 and spring 2019.
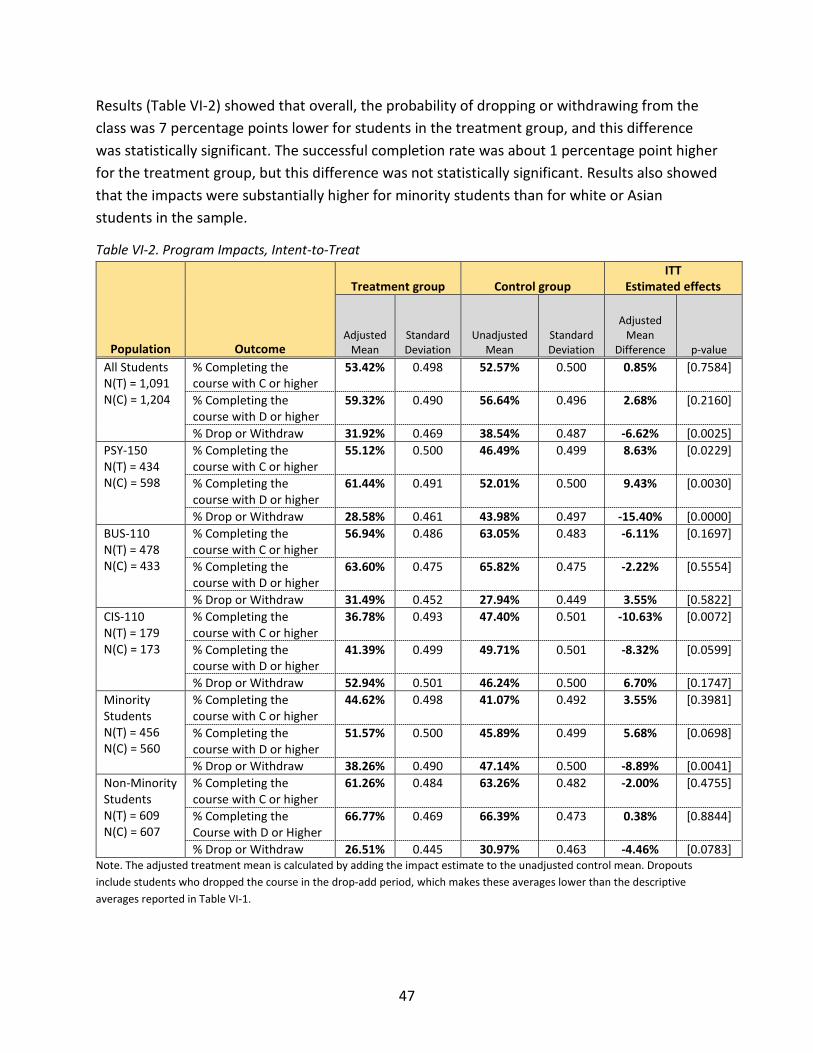
47
Results (Table VI-2) showed that overall, the probability of dropping or withdrawing from the class was 7 percentage points lower for students in the treatment group, and this difference was statistically significant. The successful completion rate was about 1 percentage point higher for the treatment group, but this difference was not statistically significant. Results also showed that the impacts were substantially higher for minority students than for white or Asian students in the sample.
Table VI-2. Program Impacts, Intent-to-Treat
Population Outcome
Treatment group Control group ITT
Estimated effects
Adjusted Mean
Standard Deviation
Unadjusted Mean
Standard Deviation
Adjusted Mean
Difference p-value All Students N(T) = 1,091 N(C) = 1,204
% Completing the course with C or higher
53.42% 0.498 52.57% 0.500 0.85% [0.7584]
% Completing the course with D or higher
59.32% 0.490 56.64% 0.496 2.68% [0.2160]
% Drop or Withdraw 31.92% 0.469 38.54% 0.487 -6.62% [0.0025] PSY-150 N(T) = 434 N(C) = 598
% Completing the course with C or higher
55.12% 0.500 46.49% 0.499 8.63% [0.0229]
% Completing the course with D or higher
61.44% 0.491 52.01% 0.500 9.43% [0.0030]
% Drop or Withdraw 28.58% 0.461 43.98% 0.497 -15.40% [0.0000] BUS-110 N(T) = 478 N(C) = 433
% Completing the course with C or higher
56.94% 0.486 63.05% 0.483 -6.11% [0.1697]
% Completing the course with D or higher
63.60% 0.475 65.82% 0.475 -2.22% [0.5554]
% Drop or Withdraw 31.49% 0.452 27.94% 0.449 3.55% [0.5822] CIS-110 N(T) = 179 N(C) = 173
% Completing the course with C or higher
36.78% 0.493 47.40% 0.501 -10.63% [0.0072]
% Completing the course with D or higher
41.39% 0.499 49.71% 0.501 -8.32% [0.0599]
% Drop or Withdraw 52.94% 0.501 46.24% 0.500 6.70% [0.1747] Minority Students N(T) = 456 N(C) = 560
% Completing the course with C or higher
44.62% 0.498 41.07% 0.492 3.55% [0.3981]
% Completing the course with D or higher
51.57% 0.500 45.89% 0.499 5.68% [0.0698]
% Drop or Withdraw 38.26% 0.490 47.14% 0.500 -8.89% [0.0041] Non-Minority Students N(T) = 609 N(C) = 607
% Completing the course with C or higher
61.26% 0.484 63.26% 0.482 -2.00% [0.4755]
% Completing the Course with D or Higher
66.77% 0.469 66.39% 0.473 0.38% [0.8844]
% Drop or Withdraw 26.51% 0.445 30.97% 0.463 -4.46% [0.0783] Note. The adjusted treatment mean is calculated by adding the impact estimate to the unadjusted control mean. Dropouts include students who dropped the course in the drop-add period, which makes these averages lower than the descriptive averages reported in Table VI-1.
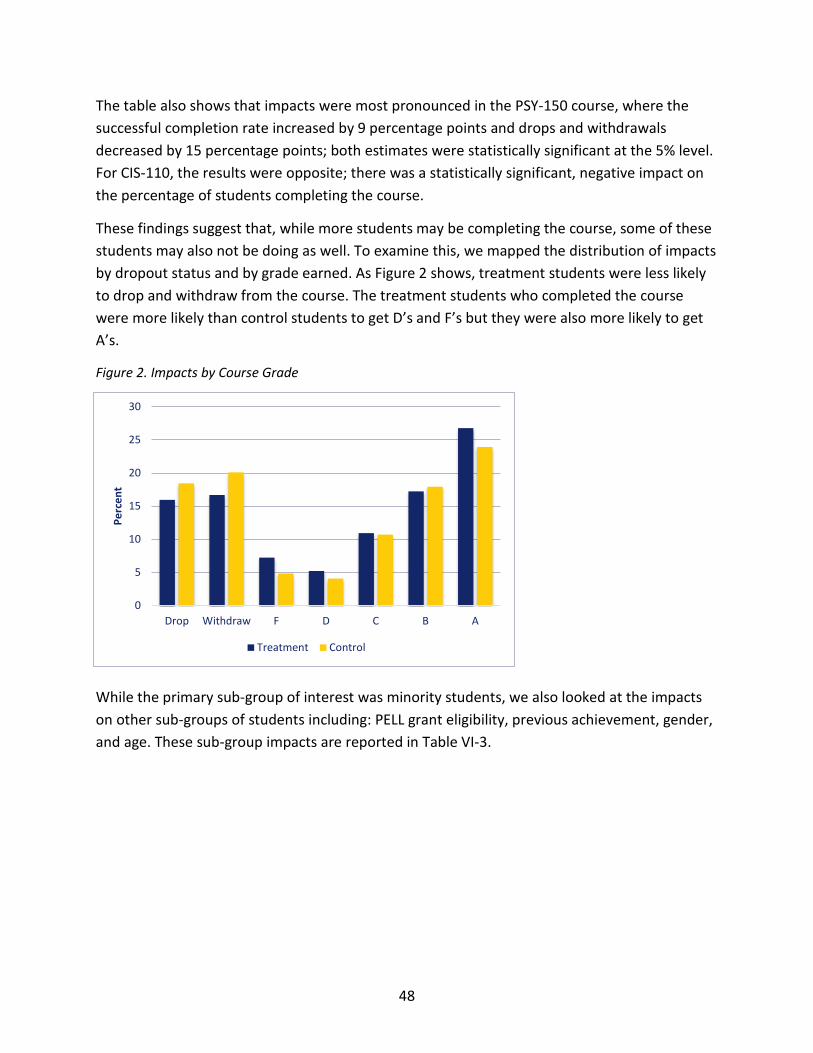
48
The table also shows that impacts were most pronounced in the PSY-150 course, where the successful completion rate increased by 9 percentage points and drops and withdrawals decreased by 15 percentage points; both estimates were statistically significant at the 5% level. For CIS-110, the results were opposite; there was a statistically significant, negative impact on the percentage of students completing the course.
These findings suggest that, while more students may be completing the course, some of these students may also not be doing as well. To examine this, we mapped the distribution of impacts by dropout status and by grade earned. As Figure 2 shows, treatment students were less likely to drop and withdraw from the course. The treatment students who completed the course were more likely than control students to get D’s and F’s but they were also more likely to get A’s.
Figure 2. Impacts by Course Grade
While the primary sub-group of interest was minority students, we also looked at the impacts on other sub-groups of students including: PELL grant eligibility, previous achievement, gender, and age. These sub-group impacts are reported in Table VI-3.
0
5
10
15
20
25
30
Drop Withdraw F D C B A
Perc
ent
Treatment Control
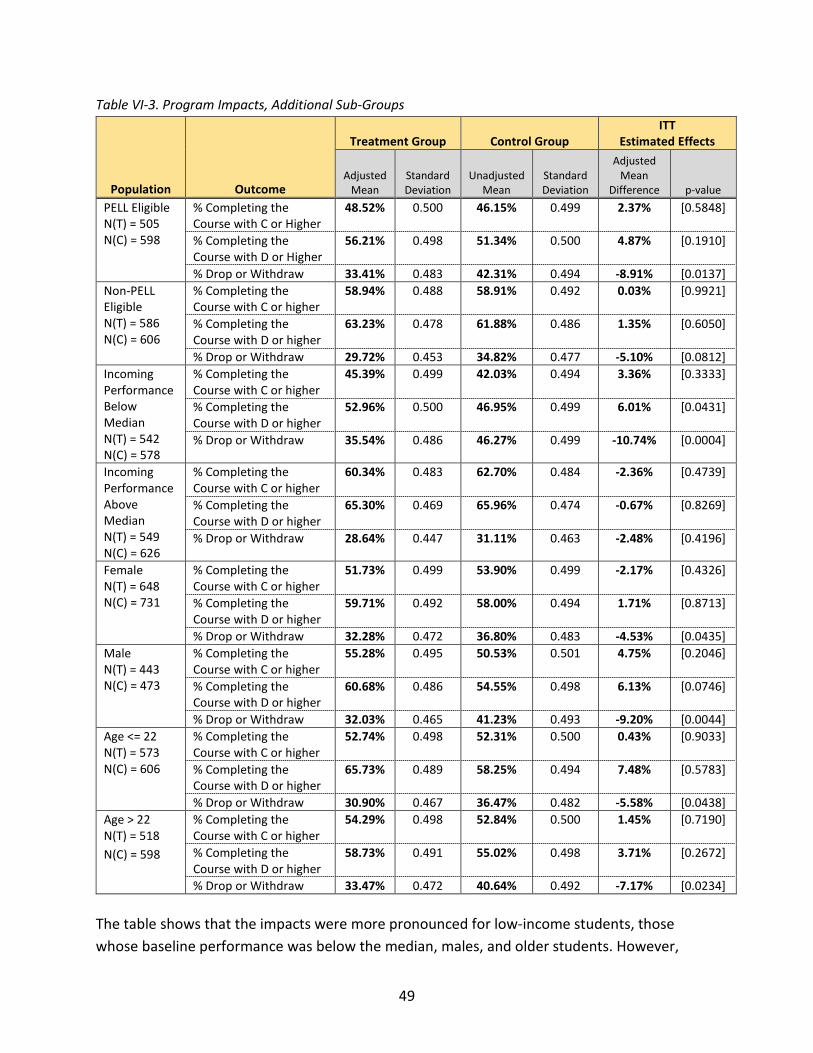
49
Table VI-3. Program Impacts, Additional Sub-Groups
Population Outcome
Treatment Group Control Group ITT
Estimated Effects
Adjusted Mean
Standard Deviation
Unadjusted Mean
Standard Deviation
Adjusted Mean
Difference p-value PELL Eligible N(T) = 505 N(C) = 598
% Completing the Course with C or Higher
48.52% 0.500 46.15% 0.499 2.37% [0.5848]
% Completing the Course with D or Higher
56.21% 0.498 51.34% 0.500 4.87% [0.1910]
% Drop or Withdraw 33.41% 0.483 42.31% 0.494 -8.91% [0.0137] Non-PELL Eligible N(T) = 586 N(C) = 606
% Completing the Course with C or higher
58.94% 0.488 58.91% 0.492 0.03% [0.9921]
% Completing the Course with D or higher
63.23% 0.478 61.88% 0.486 1.35% [0.6050]
% Drop or Withdraw 29.72% 0.453 34.82% 0.477 -5.10% [0.0812] Incoming Performance Below Median N(T) = 542 N(C) = 578
% Completing the Course with C or higher
45.39% 0.499 42.03% 0.494 3.36% [0.3333]
% Completing the Course with D or higher
52.96% 0.500 46.95% 0.499 6.01% [0.0431]
% Drop or Withdraw 35.54% 0.486 46.27% 0.499 -10.74% [0.0004]
Incoming Performance Above Median N(T) = 549 N(C) = 626
% Completing the Course with C or higher
60.34% 0.483 62.70% 0.484 -2.36% [0.4739]
% Completing the Course with D or higher
65.30% 0.469 65.96% 0.474 -0.67% [0.8269]
% Drop or Withdraw 28.64% 0.447 31.11% 0.463 -2.48% [0.4196]
Female N(T) = 648 N(C) = 731
% Completing the Course with C or higher
51.73% 0.499 53.90% 0.499 -2.17% [0.4326]
% Completing the Course with D or higher
59.71% 0.492 58.00% 0.494 1.71% [0.8713]
% Drop or Withdraw 32.28% 0.472 36.80% 0.483 -4.53% [0.0435] Male N(T) = 443 N(C) = 473
% Completing the Course with C or higher
55.28% 0.495 50.53% 0.501 4.75% [0.2046]
% Completing the Course with D or higher
60.68% 0.486 54.55% 0.498 6.13% [0.0746]
% Drop or Withdraw 32.03% 0.465 41.23% 0.493 -9.20% [0.0044] Age <= 22 N(T) = 573 N(C) = 606
% Completing the Course with C or higher
52.74% 0.498 52.31% 0.500 0.43% [0.9033]
% Completing the Course with D or higher
65.73% 0.489 58.25% 0.494 7.48% [0.5783]
% Drop or Withdraw 30.90% 0.467 36.47% 0.482 -5.58% [0.0438] Age > 22 N(T) = 518 N(C) = 598
% Completing the Course with C or higher
54.29% 0.498 52.84% 0.500 1.45% [0.7190]
% Completing the Course with D or higher
58.73% 0.491 55.02% 0.498 3.71% [0.2672]
% Drop or Withdraw 33.47% 0.472 40.64% 0.492 -7.17% [0.0234] The table shows that the impacts were more pronounced for low-income students, those whose baseline performance was below the median, males, and older students. However,
50
when comparing the different groups (for example, male vs. female or lower-performing vs. higher performing) only the difference in impacts estimates for drops and withdrawals between lower- and higher-performing students is statistically significant.
Because students were randomly assigned to instructors but instructors were not randomly assigned to the intervention (Weiss, 2010) and because there were a relatively small number of instructors overall, we attempted to explore the influence instructors might have had on the findings. First, we noticed that, although the treatment instructors remained consistent across semesters, the control instructors changed across semesters, and some of these control instructors were very high-performing. We tried to control for pre-existing instructor characteristics by including previous success rates for the instructors in the analysis, but it is possible that this process did not successfully absorb all of the possible impacts.
We also examined the possibility that outcomes for the lead instructors could be driving some of the results, both because these were strong instructors and because they were involved in developing the intervention. To test whether the intervention could be rolled out to other instructors who were not involved in developing it, we excluded the lead instructors’ classes from the analyses. When the lead instructors’ classes were excluded from the analyses, the impact estimates for the pooled sample, for minority students, and for students in PSY-150 were attenuated, but the estimated effects for drops and withdrawals remained statistically significant in all three cases. The full table showing these results is included in Appendix C.
We also conducted additional sensitivity analyses. First, because our ITT design required the inclusion of students who were assigned to the course, but never attended (NAs), we conducted a sensitivity analysis that excluded the NAs. In addition, we also conducted sensitivity analyses that included the students who had previously taken a targeted course. The findings (shown in Appendix C) were very similar to the main analyses. Finally, results were also analyzed for the students who attended in the summer of 2018. We did not originally propose to look at data from the summer for a variety of reasons including the small sample size and the difference in the type of students who choose to attend summer school, however, we did conduct a lottery for that sample and results are available. Findings from the summer are included in Appendix D.
Experimental Impacts on Persistence
When students successfully complete a course, particularly a gateway course like the ones targeted in Project COMPASS, the hope is that students will continue to persist. The evaluation therefore examined the impact of the model on students’ persistence in college. The primary outcome was students’ persistence at any point over the next year, but we also examined persistence in the semester immediately following the one in which they took the Project COMPASS course. As shown in Table VI-4, there was a positive impact on year-long persistence
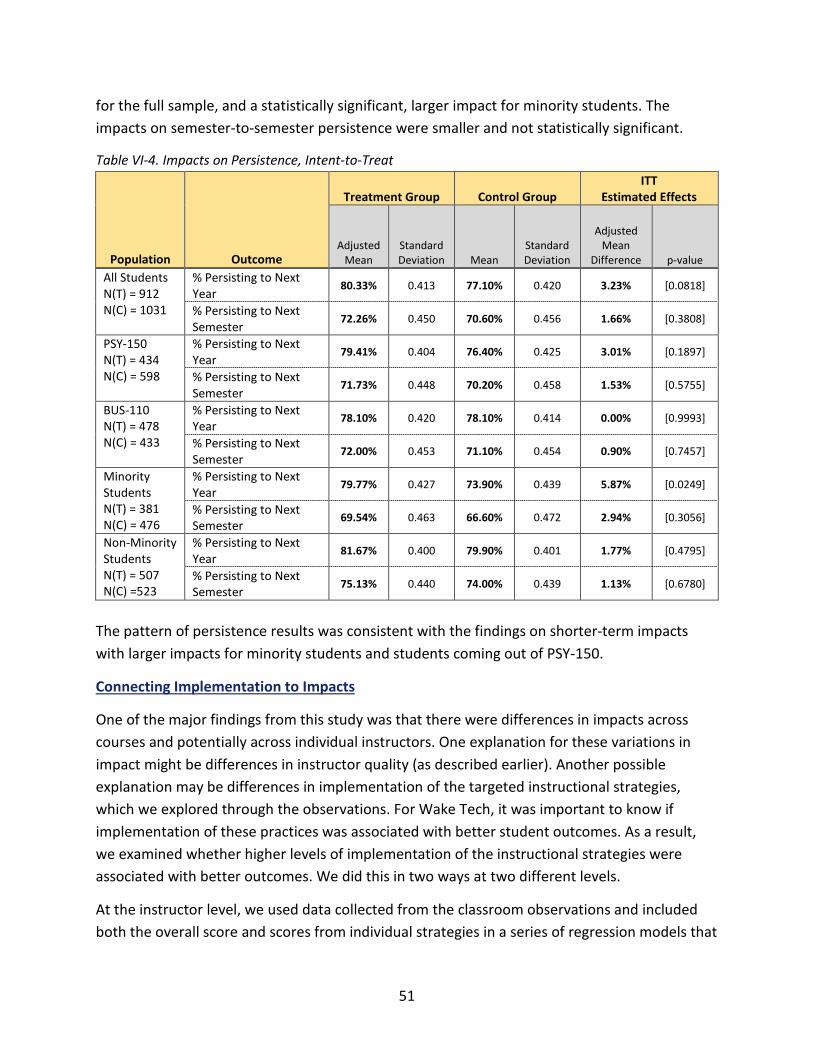
51
for the full sample, and a statistically significant, larger impact for minority students. The impacts on semester-to-semester persistence were smaller and not statistically significant.
Table VI-4. Impacts on Persistence, Intent-to-Treat
Population Outcome
Treatment Group Control Group ITT
Estimated Effects
Adjusted Mean
Standard Deviation Mean
Standard Deviation
Adjusted Mean
Difference p-value All Students N(T) = 912 N(C) = 1031
% Persisting to Next Year
80.33% 0.413 77.10% 0.420 3.23% [0.0818]
% Persisting to Next Semester
72.26% 0.450 70.60% 0.456 1.66% [0.3808]
PSY-150 N(T) = 434 N(C) = 598
% Persisting to Next Year
79.41% 0.404 76.40% 0.425 3.01% [0.1897]
% Persisting to Next Semester
71.73% 0.448 70.20% 0.458 1.53% [0.5755]
BUS-110 N(T) = 478 N(C) = 433
% Persisting to Next Year
78.10% 0.420 78.10% 0.414 0.00% [0.9993]
% Persisting to Next Semester
72.00% 0.453 71.10% 0.454 0.90% [0.7457]
Minority Students N(T) = 381 N(C) = 476
% Persisting to Next Year
79.77% 0.427 73.90% 0.439 5.87% [0.0249]
% Persisting to Next Semester
69.54% 0.463 66.60% 0.472 2.94% [0.3056]
Non-Minority Students N(T) = 507 N(C) =523
% Persisting to Next Year
81.67% 0.400 79.90% 0.401 1.77% [0.4795]
% Persisting to Next Semester
75.13% 0.440 74.00% 0.439 1.13% [0.6780]
The pattern of persistence results was consistent with the findings on shorter-term impacts with larger impacts for minority students and students coming out of PSY-150.
Connecting Implementation to Impacts
One of the major findings from this study was that there were differences in impacts across courses and potentially across individual instructors. One explanation for these variations in impact might be differences in instructor quality (as described earlier). Another possible explanation may be differences in implementation of the targeted instructional strategies, which we explored through the observations. For Wake Tech, it was important to know if implementation of these practices was associated with better student outcomes. As a result, we examined whether higher levels of implementation of the instructional strategies were associated with better outcomes. We did this in two ways at two different levels.
At the instructor level, we used data collected from the classroom observations and included both the overall score and scores from individual strategies in a series of regression models that
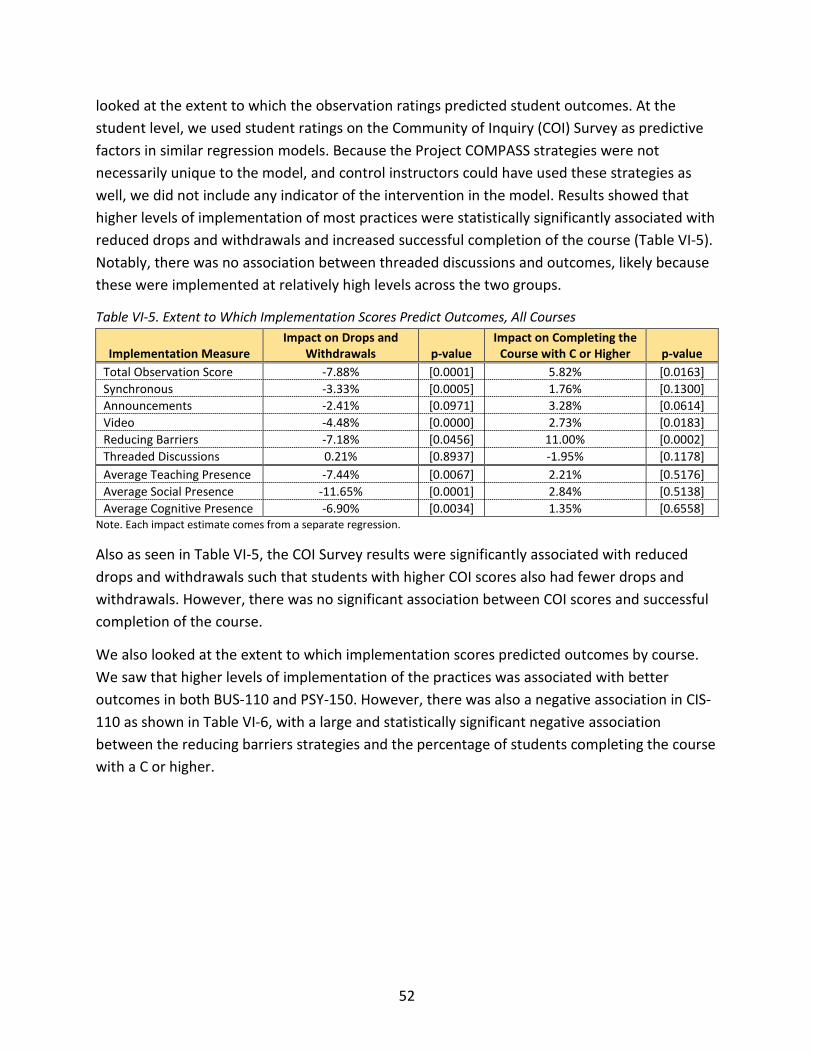
52
looked at the extent to which the observation ratings predicted student outcomes. At the student level, we used student ratings on the Community of Inquiry (COI) Survey as predictive factors in similar regression models. Because the Project COMPASS strategies were not necessarily unique to the model, and control instructors could have used these strategies as well, we did not include any indicator of the intervention in the model. Results showed that higher levels of implementation of most practices were statistically significantly associated with reduced drops and withdrawals and increased successful completion of the course (Table VI-5). Notably, there was no association between threaded discussions and outcomes, likely because these were implemented at relatively high levels across the two groups.
Table VI-5. Extent to Which Implementation Scores Predict Outcomes, All Courses
Implementation Measure Impact on Drops and
Withdrawals p-value Impact on Completing the
Course with C or Higher p-value Total Observation Score -7.88% [0.0001] 5.82% [0.0163] Synchronous -3.33% [0.0005] 1.76% [0.1300] Announcements -2.41% [0.0971] 3.28% [0.0614] Video -4.48% [0.0000] 2.73% [0.0183] Reducing Barriers -7.18% [0.0456] 11.00% [0.0002] Threaded Discussions 0.21% [0.8937] -1.95% [0.1178] Average Teaching Presence -7.44% [0.0067] 2.21% [0.5176] Average Social Presence -11.65% [0.0001] 2.84% [0.5138] Average Cognitive Presence -6.90% [0.0034] 1.35% [0.6558]
Note. Each impact estimate comes from a separate regression.
Also as seen in Table VI-5, the COI Survey results were significantly associated with reduced drops and withdrawals such that students with higher COI scores also had fewer drops and withdrawals. However, there was no significant association between COI scores and successful completion of the course.
We also looked at the extent to which implementation scores predicted outcomes by course. We saw that higher levels of implementation of the practices was associated with better outcomes in both BUS-110 and PSY-150. However, there was also a negative association in CIS-110 as shown in Table VI-6, with a large and statistically significant negative association between the reducing barriers strategies and the percentage of students completing the course with a C or higher.
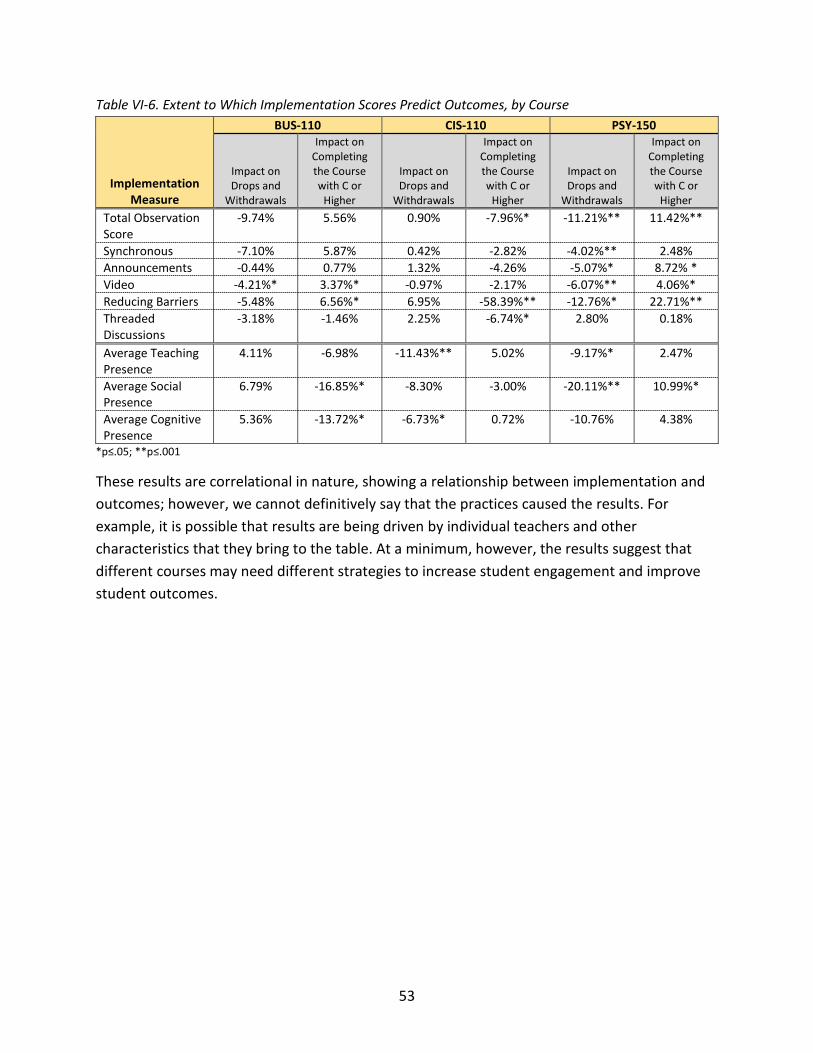
53
Table VI-6. Extent to Which Implementation Scores Predict Outcomes, by Course
Implementation Measure
BUS-110 CIS-110 PSY-150
Impact on Drops and
Withdrawals
Impact on Completing the Course with C or
Higher
Impact on Drops and
Withdrawals
Impact on Completing the Course with C or
Higher
Impact on Drops and
Withdrawals
Impact on Completing the Course with C or
Higher Total Observation Score
-9.74% 5.56% 0.90% -7.96%* -11.21%** 11.42%**
Synchronous -7.10% 5.87% 0.42% -2.82% -4.02%** 2.48% Announcements -0.44% 0.77% 1.32% -4.26% -5.07%* 8.72% * Video -4.21%* 3.37%* -0.97% -2.17% -6.07%** 4.06%* Reducing Barriers -5.48% 6.56%* 6.95% -58.39%** -12.76%* 22.71%** Threaded Discussions
-3.18% -1.46% 2.25% -6.74%* 2.80% 0.18%
Average Teaching Presence
4.11% -6.98% -11.43%** 5.02% -9.17%* 2.47%
Average Social Presence
6.79% -16.85%* -8.30% -3.00% -20.11%** 10.99%*
Average Cognitive Presence
5.36% -13.72%* -6.73%* 0.72% -10.76% 4.38%
*p≤.05; **p≤.001
These results are correlational in nature, showing a relationship between implementation and outcomes; however, we cannot definitively say that the practices caused the results. For example, it is possible that results are being driven by individual teachers and other characteristics that they bring to the table. At a minimum, however, the results suggest that different courses may need different strategies to increase student engagement and improve student outcomes.
54
SECTION VII: INSTITUTIONAL IMPACTS
As described in the previous section, Project COMPASS had positive impacts on student outcomes, particularly for minority students. In interviews, meetings, and papers, the project staff all agreed that the project has also had a substantial impact on Wake Tech as an institution. This section summarizes those impacts. Key findings include:
• Wake Tech is actively seeking to incorporate lessons learned about effective strategies into their other online courses.
• Wake Tech staff have both published and presented findings from Project COMPASS in the broader research and practitioner community. Project staff have also received state and global recognition for their work.
• Project staff believe that Project COMPASS has increased Wake Tech’s research expertise. They are exploring ways to institutionalize examination of the effectiveness of their different initiatives.
Project COMPASS represented a shift in how Wake Tech was thinking about their grants and improvement efforts. Senior staff acknowledged that Wake Tech had begun seeking grants starting in 2010 and had been successful at getting a number of grants. However, as one staff member said,
One of the challenges that I've seen as we've done more and more of these projects…at the end of the project, I can't point to whether or not these interventions have had an impact on the student success outcomes. Just because, in some cases, the grant didn't require us to have an independent experimental design or it didn't even, in some cases, it didn't require us to do fidelity of implementation.... As we're doing these projects more and more, what I've seen is that moving the needle is very difficult. So, [it is not fair] to keep going back to your talented, creative people who want to make a difference, asking them to do something and you can't really point to if it has made a difference. So, what appealed to me about the First in the World grant was that they were going require us to kick it up a notch and do a better experimental design.
Wake Tech staff reported that they were ready to more rigorously examine the impact of one of their efforts. For senior staff, Project COMPASS thus represented an opportunity to increase the rigor and effectiveness of their work.
When discussing the institutional impact of the project, three primary themes emerged: 1) internal program improvement, 2) increased public awareness and recognition of Wake Tech’s work, and 3) an increased emphasis on research and evidence. Each is discussed separately.
55
Internal Program Improvement
Although Wake Tech staff were always mindful of the need to keep the experimental design intact by minimizing control group instructors’ exposure to the content of the Project COMPASS model, now that the project is over, they are eager to take the lessons they are learning and apply them to other online courses.
Wake Tech’s Online College Team has approached the project developer about including elements of the Project COMPASS protocol into materials that they will be developing in the future, and the project team is currently contemplating how to incorporate lessons learned in a standardized way across the institution. A senior staff member described how the project has encouraged them to consider ways to embed effective practices into the design of online courses such that they can work regardless of the quality of the teacher. These approaches might include the creation of course shells in which effective instructional practices can be embedded or the creation of a gamified course that an online instructor can use as a base. As the staff member said,
So, a course shell's an example of that, a gamified course is an example of that; you take the elements that you really think are important for students to learn, like the subject matter, and you bake it into a framework that captures those engaging elements we were trying to get at with this project, and you just use all that to facilitate. The instructor, I would assume, is then in a better position to try to just create a personal relationship with the students, and to help the students learn beyond what the subject matter is.
Additionally, Project COMPASS staff collaborated with another Department of Education grant project at Wake Tech, the High School Equivalency Program (HEP)—a national initiative that helps migrant workers obtain high school equivalency diplomas. This collaboration derived from the HEP project’s growing challenge of students’ inability to physically attend class for a variety of reasons. The Project COMPASS intervention proved helpful to minority students in this population. Project staff shared techniques and lessons learned from the Project COMPASS protocol and supported the HEP project’s move to an online platform with 100% retention of their students.
Additionally, the Project COMPASS lead instructors for PSY-150 and BUS-110 will be developing tools to help Wake Tech scale the High-Tech/High-Touch protocol, such as the instructor training modules and implementation guide, which can then serve as a regular e-learning support training tool for Wake Tech online instructors interested in implementing the model. Implementation of the teaching model will be on a voluntary basis.
56
Increased Public Awareness and Recognition of Wake Tech
Wake Tech staff have increased their visibility within the community college community and in the broader research and policy community as well. The Wake Tech Project COMPASS staff have delivered 36 conference presentations, had 10 articles published in conference proceedings, and published eight journal articles. A full list of conferences and presentations completed by Wake Tech and the UNCG evaluation team can be found in Appendix F.
Project staff have also earned recognition for their work. In 2018, Kai Wang was named North Carolina Community College System’s Staff Person of the Year due to his innovative work, which included Project COMPASS. Another Co-PI, Carlos McCormick was named Wake Tech Staff Member of the Year, due in part to his efforts on the COMPASS project. Additionally, three other Project COMPASS team members (instructor Christopher Roddenberry, Instructional Designer Shelley Evans, and Instructional Technologist Cynthia Bowers) were awarded the Exemplary Course Award by Blackboard, Inc. for their work on a gamified version of PSY-150. The course was one of only 11 courses in the world to receive this distinction in 2018.
In 2019, Wake Tech was one of six organizations worldwide to receive a Blackboard Catalyst Award for Leading Change for Project COMPASS’ impact on student learning and performance. In the same year, Wake Tech was one of three winners worldwide to receive the Ellucian Impact Award for Project COMPASS’ improving the student learning experience through technology.
Increased Emphasis on Research and Evidence
Project staff report that they have increased their awareness of, and capacity to engage in educational research as a result of Project COMPASS. The principal investigator noted that his division, which supports innovative projects throughout the college, now requires that programs conduct a formal evaluation of the impact of their work. Additionally, the college has started paying more attention to engaging in formative assessment and tracking FOI so that they can implement any necessary mid-course corrections along the way. As he noted, “the whole fidelity of the implementation thing has really been huge for us too from this. Because part of our concern is whether something's working or not, whether it's actually being implemented.”
Wake Tech Project COMPASS staff have also increased their internal capacity around evaluation and research. One of the project developers has expanded his research expertise and will be taking on more of a research role within the college. For example, he was included as the researcher on a proposal the college submitted to the National Science Foundation. A senior staff member believed that the college has generally become more skilled in conducting research and data analyses:
57
The other benefit of the work that we're doing [from] this project and others, we're now a lot savvier and honestly, there are a lot of educational technology and other sorts of agencies out there that are selling you resources and services, and I think we're in a much better position to evaluate whether we need that kind of help now that we've done some of those things [ourselves].
The implementation and dissemination of Project COMPASS has helped increase the interest in research at Wake Tech more broadly. To support this interest, the college has formed the Wake Tech Research Colloquium, which aims to create a collaborative, cross-disciplinary learning community that effectively supports the growth of a research culture and can assist in identifying research resources and opportunities across the college.
Any faculty, staff, and students involved in research in any capacity or who is interested in becoming involved may voluntarily become members of the Wake Tech Research Colloquium. Through this research colloquium, the college hopes to achieve the following objectives:
• Provide support in conducting academic research/educational research to improve student success.
• Provide guidance in designing research and research methodology. • Create avenues for research collaboration across the college. • Assist in building research capacity to increase research volume and quality. • Assist in the dissemination of research through publications, conference presentations,
and other avenues. • Provide support to expand undergraduate research.
The project staff have also become more connected to the broader research community. For example, project staff and the evaluation team presented at the 2018 and 2019 Annual Meetings for the Society for Research on Educational Effectiveness (SREE) in Washington, DC. In 2018, the team held a symposium that included four papers. In 2019, the team presented two individual papers that were embedded in other sessions. Wake Tech has joined SREE as an institutional member. In 2019, Wake Tech project staff also participated with the evaluation team in presentations conducted at the Association for Education Finance and Policy, held in Kansas City, Missouri.
Finally, the project staff are also now looking for more opportunities to develop and test interventions. The quote below is the final paragraph from the paper developed by the project staff for SREE:
Now that Wake Tech has experience with the design and processes required of rigorous experimental studies, has developed people who can use experimental design strategies, and has tools and partners who can help manage the needed processes, the

58
college has a greater pool of possible initiatives and funding sources. Even before they have proven the effectiveness of the Project COMPASS interventions, and even if these interventions do not work, the Project COMPASS veterans are already looking for other research opportunities.
59
SECTION VIII: CONCLUSIONS AND LESSONS LEARNED
Project COMPASS is a development project that, at the end of four years, was expected to have a model for online course delivery redesign that increased the number of students successfully completing core academic courses. The model included a set of High-Tech Tools and High-Touch Strategies designed to improve teaching presence, social presence, and cognitive presence within online courses. This section summarizes the results from the project, as well as lessons learned that may be useful to the broader online learning community.
Summary of Results
Over the four-year grant period, Wake Tech developed and formally tested the Project COMPASS online course delivery protocol in three different foundational online courses. During the development and piloting phase of the work, Wake Tech purchased, and made available, key technology tools, including a video production studio, texting technology, online webinar software, and laptops. They also hired an instructional designer, an instructional technologist, and a media production assistant to work with the teachers on effectively embedding technology into their online classes. The lead instructors created a handbook that delineated the project strategies and expectations for their implementation. All treatment instructors were required to complete a 30-hour training on teaching in the online environment (specifically utilizing Blackboard) prior to the pilot phase of the project. Additionally, treatment instructors attended a variety of PD activities that were more intense during the pilot period and that became less frequent as the project matured. PD was more consistently attended by the project leadership and support staff than by the instructional staff when not required.
An examination of FOI showed that instructors in the three courses generally implemented the targeted strategies at the expected levels; however, there were quite a few strategies for which it was challenging to collect implementation data. Observations generally supported the FOI data, showing that treatment instructors implemented the strategies at higher levels than control instructors.
The impact study showed that, overall, treatment students were less likely to drop or withdraw than control students and minority students were more likely to persist in postsecondary education, although the results differed by course. The impact was positive in PSY-150, null in BUS-110, and negative in CIS-110. This difference in impact appeared to be driven at times by individual instructors who were either more or less effective than other instructors.
Nevertheless, when we looked at the connection between implementation and impacts, results showed that higher levels of implementation of the targeted strategies (regardless of whether someone was a treatment instructor or not) were associated with increased numbers of students successfully completing the course. This suggests that, overall, these strategies are
60
worth implementing. As a result, Wake Tech is moving forward to embed these strategies in their online learning environments.
One of the most substantial impacts from the program has been the change in culture at Wake Tech. Project COMPASS has served as an impetus for an increased focus on research and evaluation. For example, Wake Tech has participated in more research-oriented conferences and has established its own in-house research colloquium. The project PI noted that new projects at the college are expected to more formally track their implementation and impacts so that the college community can learn from all efforts, those that are successful and those that are not.
Lessons Learned
Project COMPASS has also led to three primary lessons learned that may be useful for others seeking to improve online learning, particularly in the community college setting. These lessons include:
1. Instructors can implement strategies that increase student engagement in online courses.
The study showed that when instructors used the High-Tech Tools and High-Touch Strategies implemented in Project COMPASS, they were more likely to keep students enrolled.
There was evidence to suggest, however, that these practices may need to look different in different courses. As described earlier, Project COMPASS had differential impacts across courses. Some of this may have been due to the efficacy of individual instructors but some of this may have been due to certain practices being more effective in some subject areas than in others. Exploring what high engagement strategies should look like in different courses is a natural next step for this work.
2. Instructors need supports to implement strategies effectively.
The project staff identified a series of supports that were helpful for instructors. These included an instructor guide that delineated expectations relative to strategy implementation, PD opportunities in which instructors could learn the strategies and the rationale behind them, and ongoing support from individuals such as instructional designers. When individuals such as instructional designers are involved, staff believed it would be useful to be clear about their role and how they can help so that instructors know how to best utilize their skills.
An additional support was providing the instructors with course shells in which high-quality instructional strategies were embedded; this was seen as allowing instructors to spend less time with lesson planning and more time with interacting with and supporting students.
61
3. Effective project implementation requires selecting the right people, communicating regularly, and monitoring implementation and outcomes.
As with most projects, having the right people involved was critical. Implementation required project staff who were collaborative and committed to improving student outcomes. Characteristics of the types of instructors who would benefit from this included those who were interested in making changes and had some level of technical expertise.
One of the most important lessons learned was around the importance of regular communication within the college and among the partners. Having regular meetings with different groups—including project staff, department heads and deans, and the evaluation team—was seen as critical for building trust, communicating priorities, and problem-solving.
The project staff also recognized the importance of engaging in ongoing monitoring and assessment. This allowed them to track whether the project was being implemented as intended and whether it was having the intended impact.
These three lessons learned can be applied across multiple online settings. They are also lessons that Wake Tech has already begun applying throughout their work.
62
REFERENCES
Arbaugh, J. B. (2007). An empirical verification of the Community of Inquiry framework. Journal of Asynchronous Learning Networks, 11(1), 73-85.
Arbaugh, J. B., Cleveland-Innes, M., Diaz, S. R., Garrison, D. R., Ice, P., Richardson, J. C., & Swan, K. P. (2008). Developing a community of inquiry instrument: Testing a measure of the Community of Inquiry framework using a multi-institutional sample. Internet and Higher Education, 11, 133-136.
Bettinger, E. B., Fox, L., Loeb, S., & Taylor, E. S. (2017). Virtual classrooms: how online college courses affect student success. American Economic Review, 107(9), 2855-2875.
Diaz, S. R., Swan, K. P., Ice, P., & Kupczynksi, L. (2010). Student ratings of the importance of survey items, multiplicative factor analysis, and the validity of the community of inquiry survey. The Internet and Higher Education, 13, 22-30.
Garrison, D. R., Anderson, T., & Archer, W. (2001). Critical thinking, cognitive presence and computer conferencing in distance education. American Journal of Distance Education, 15(1), 7-23.
Hart, C. M. D., Friedmann, E., & Hill, M. (2018). Online course-taking and student outcomes in California community colleges. Education Finance and Policy, 13(1), 42-71.
Hollis, S., & Campbell, F. (1999). What is meant by intention to treat analyses? Survey of published randomised controlled trials. British Medical Journal, 319, 670-674.
Institute of Education Sciences. (2005, December). Key Items to Get Right When Conducting a Randomized Controlled Trial in Education. Retrieved from http://ies.ed.gov/ncee/wwc/pdf/guide_RCT.pdf
Institute of Education Sciences. (October, 2017). What Works Clearinghouse, Procedures and Standards Handbook, version 4.0. Retrieved from Washington, DC: https://ies.ed.gov/ncee/wwc/Docs/referenceresources/wwc_standards_handbook_v4.pdf
Jaggars, S. S. (2011). Online learning: Does it help low-income and underprepared students? Retrieved from New York: https://ccrc.tc.columbia.edu/media/k2/attachments/online-learning-help-students.pdf
Lokken, F. (2017). 2016 ITC National eLearning report and survey results. Retrieved from Columbus, OH: https://www.itcnetwork.org/sites/default/files/content-files/itc_2016_annual_survey_results.pdf
National Center for Education Statistics. (2018a). The Condition of Education: Undergraduate enrollment. Retrieved from https://nces.ed.gov/programs/coe/indicator_cha.asp
National Center for Education Statistics. (2018b). The Condition of Education: Undergraduate retention and graduation rates. Retrieved from https://nces.ed.gov/programs/coe/indicator_ctr.asp
Radford, A. W., Berkner, L., Wheeless, S. C., & Shepherd, B. (2010). Persistence and Attainment of 2003-04 Beginning Postsecondary Students: After 6 Years. First Look. Technical Report NCES 2011-151. Retrieved from Washington, DC: https://files.eric.ed.gov/fulltext/ED513453.pdf
Swan, K. P., Richardson, J. C., Ice, P., Garrison, D. R., Cleveland-Innes, M., & Arbaugh, J. B. (2008). Validating a measurement tool of presence in online communities of inquiry. e-mentor, 2(24).
Weiss, M. J. (2010). The implications of teacher selection and the teacher effect in individually randomized group treatment trials. Journal of Research on Educational Effectiveness, 3(381-405).
Xu, D., & Jaggars, S. S. (2011). Online and hybrid course enrollment and performance in Washington State community and technical colleges. Retrieved from New York: https://ccrc.tc.columbia.edu/media/k2/attachments/online-hybrid-performance-washington.pdf
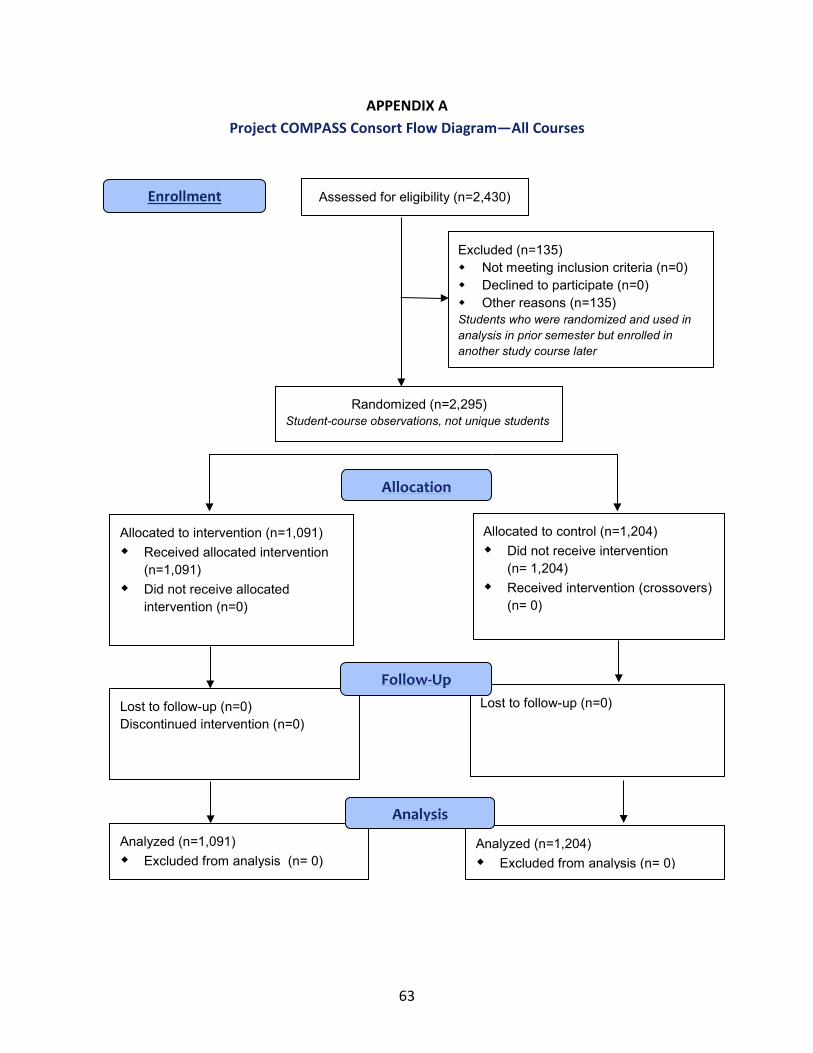
63
APPENDIX A Project COMPASS Consort Flow Diagram—All Courses
Assessed for eligibility (n=2,430)
Excluded (n=135) Not meeting inclusion criteria (n=0) Declined to participate (n=0) Other reasons (n=135) Students who were randomized and used in analysis in prior semester but enrolled in another study course later
Analyzed (n=1,091) Excluded from analysis (n= 0)
Lost to follow-up (n=0) Discontinued intervention (n=0)
Allocated to intervention (n=1,091) Received allocated intervention
(n=1,091) Did not receive allocated
intervention (n=0)
Lost to follow-up (n=0)
Allocated to control (n=1,204) Did not receive intervention
(n= 1,204) Received intervention (crossovers)
(n= 0)
Analyzed (n=1,204) Excluded from analysis (n= 0)
Allocation
Analysis
Follow-Up
Randomized (n=2,295) Student-course observations, not unique students
Enrollment
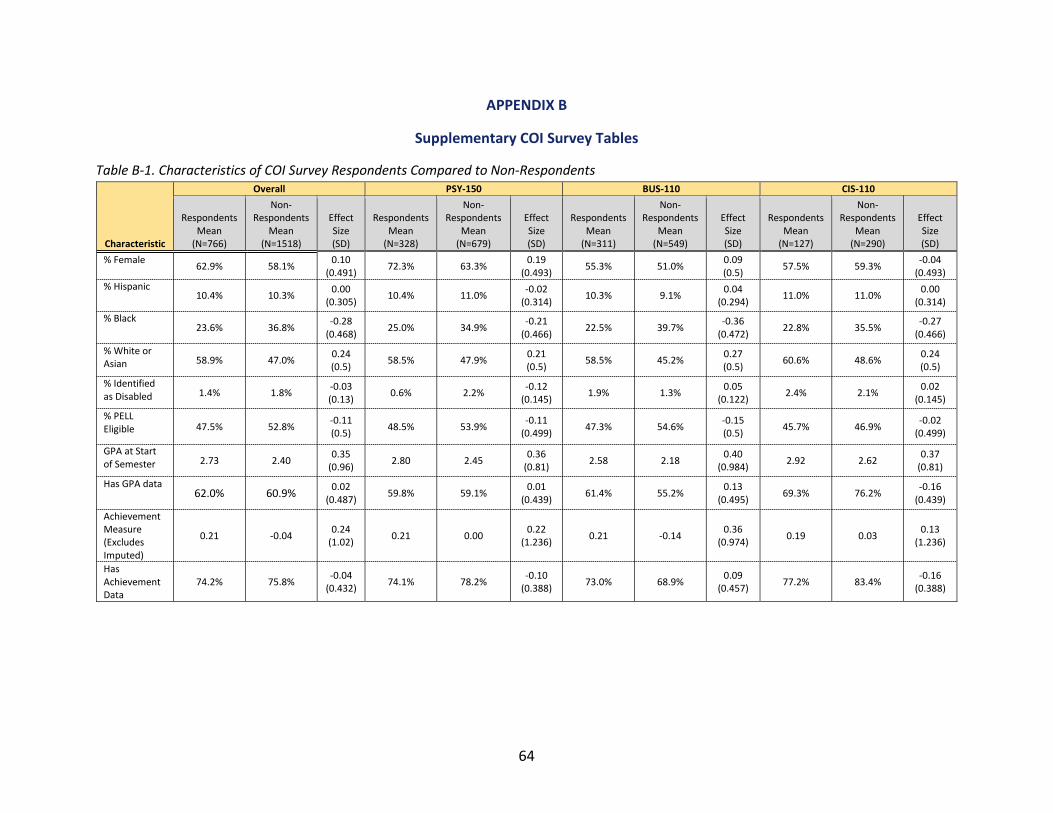
64
APPENDIX B
Supplementary COI Survey Tables
Table B-1. Characteristics of COI Survey Respondents Compared to Non-Respondents
Characteristic
Overall PSY-150 BUS-110 CIS-110
Respondents Mean
(N=766)
Non-Respondents
Mean (N=1518)
Effect Size (SD)
Respondents Mean
(N=328)
Non-Respondents
Mean (N=679)
Effect Size (SD)
Respondents Mean
(N=311)
Non-Respondents
Mean (N=549)
Effect Size (SD)
Respondents Mean
(N=127)
Non-Respondents
Mean (N=290)
Effect Size (SD)
% Female 62.9% 58.1% 0.10 (0.491) 72.3% 63.3% 0.19
(0.493) 55.3% 51.0% 0.09 (0.5) 57.5% 59.3% -0.04
(0.493) % Hispanic
10.4% 10.3% 0.00 (0.305) 10.4% 11.0% -0.02
(0.314) 10.3% 9.1% 0.04 (0.294) 11.0% 11.0% 0.00
(0.314) % Black
23.6% 36.8% -0.28 (0.468) 25.0% 34.9% -0.21
(0.466) 22.5% 39.7% -0.36 (0.472) 22.8% 35.5% -0.27
(0.466) % White or Asian 58.9% 47.0% 0.24
(0.5) 58.5% 47.9% 0.21 (0.5) 58.5% 45.2% 0.27
(0.5) 60.6% 48.6% 0.24 (0.5)
% Identified as Disabled 1.4% 1.8% -0.03
(0.13) 0.6% 2.2% -0.12 (0.145) 1.9% 1.3% 0.05
(0.122) 2.4% 2.1% 0.02 (0.145)
% PELL Eligible 47.5% 52.8% -0.11
(0.5) 48.5% 53.9% -0.11 (0.499) 47.3% 54.6% -0.15
(0.5) 45.7% 46.9% -0.02 (0.499)
GPA at Start of Semester 2.73 2.40 0.35
(0.96) 2.80 2.45 0.36 (0.81) 2.58 2.18 0.40
(0.984) 2.92 2.62 0.37 (0.81)
Has GPA data 62.0% 60.9%
0.02 (0.487) 59.8% 59.1% 0.01
(0.439) 61.4% 55.2% 0.13 (0.495) 69.3% 76.2% -0.16
(0.439) Achievement Measure (Excludes Imputed)
0.21 -0.04 0.24 (1.02) 0.21 0.00 0.22
(1.236) 0.21 -0.14 0.36 (0.974) 0.19 0.03 0.13
(1.236)
Has Achievement Data
74.2% 75.8% -0.04 (0.432) 74.1% 78.2% -0.10
(0.388) 73.0% 68.9% 0.09 (0.457) 77.2% 83.4% -0.16
(0.388)
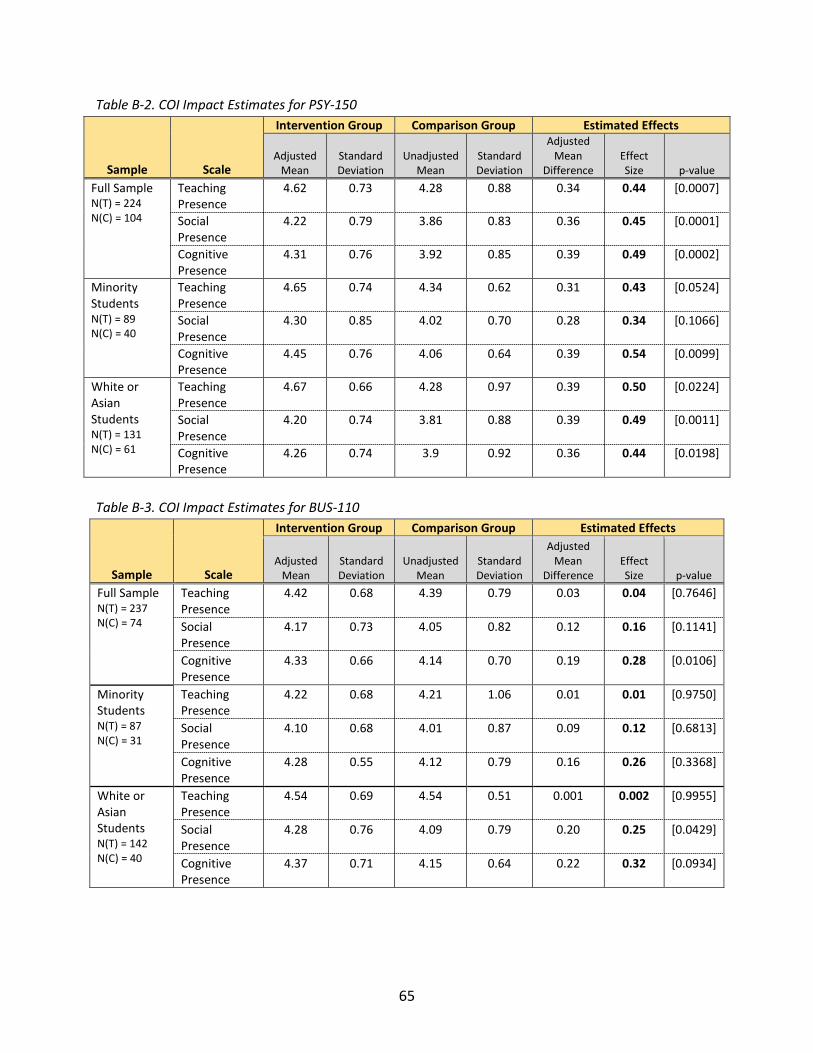
65
Table B-2. COI Impact Estimates for PSY-150
Sample Scale
Intervention Group Comparison Group Estimated Effects
Adjusted Mean
Standard Deviation
Unadjusted Mean
Standard Deviation
Adjusted Mean
Difference Effect Size p-value
Full Sample N(T) = 224 N(C) = 104
Teaching Presence
4.62 0.73 4.28 0.88 0.34 0.44 [0.0007]
Social Presence
4.22 0.79 3.86 0.83 0.36 0.45 [0.0001]
Cognitive Presence
4.31 0.76 3.92 0.85 0.39 0.49 [0.0002]
Minority Students N(T) = 89 N(C) = 40
Teaching Presence
4.65 0.74 4.34 0.62 0.31 0.43 [0.0524]
Social Presence
4.30 0.85 4.02 0.70 0.28 0.34 [0.1066]
Cognitive Presence
4.45 0.76 4.06 0.64 0.39 0.54 [0.0099]
White or Asian Students N(T) = 131 N(C) = 61
Teaching Presence
4.67 0.66 4.28 0.97 0.39 0.50 [0.0224]
Social Presence
4.20 0.74 3.81 0.88 0.39 0.49 [0.0011]
Cognitive Presence
4.26 0.74 3.9 0.92 0.36 0.44 [0.0198]
Table B-3. COI Impact Estimates for BUS-110
Sample Scale
Intervention Group Comparison Group Estimated Effects
Adjusted Mean
Standard Deviation
Unadjusted Mean
Standard Deviation
Adjusted Mean
Difference Effect Size p-value
Full Sample N(T) = 237 N(C) = 74
Teaching Presence
4.42 0.68 4.39 0.79 0.03 0.04 [0.7646]
Social Presence
4.17 0.73 4.05 0.82 0.12 0.16 [0.1141]
Cognitive Presence
4.33 0.66 4.14 0.70 0.19 0.28 [0.0106]
Minority Students N(T) = 87 N(C) = 31
Teaching Presence
4.22 0.68 4.21 1.06 0.01 0.01 [0.9750]
Social Presence
4.10 0.68 4.01 0.87 0.09 0.12 [0.6813]
Cognitive Presence
4.28 0.55 4.12 0.79 0.16 0.26 [0.3368]
White or Asian Students N(T) = 142 N(C) = 40
Teaching Presence
4.54 0.69 4.54 0.51 0.001 0.002 [0.9955]
Social Presence
4.28 0.76 4.09 0.79 0.20 0.25 [0.0429]
Cognitive Presence
4.37 0.71 4.15 0.64 0.22 0.32 [0.0934]
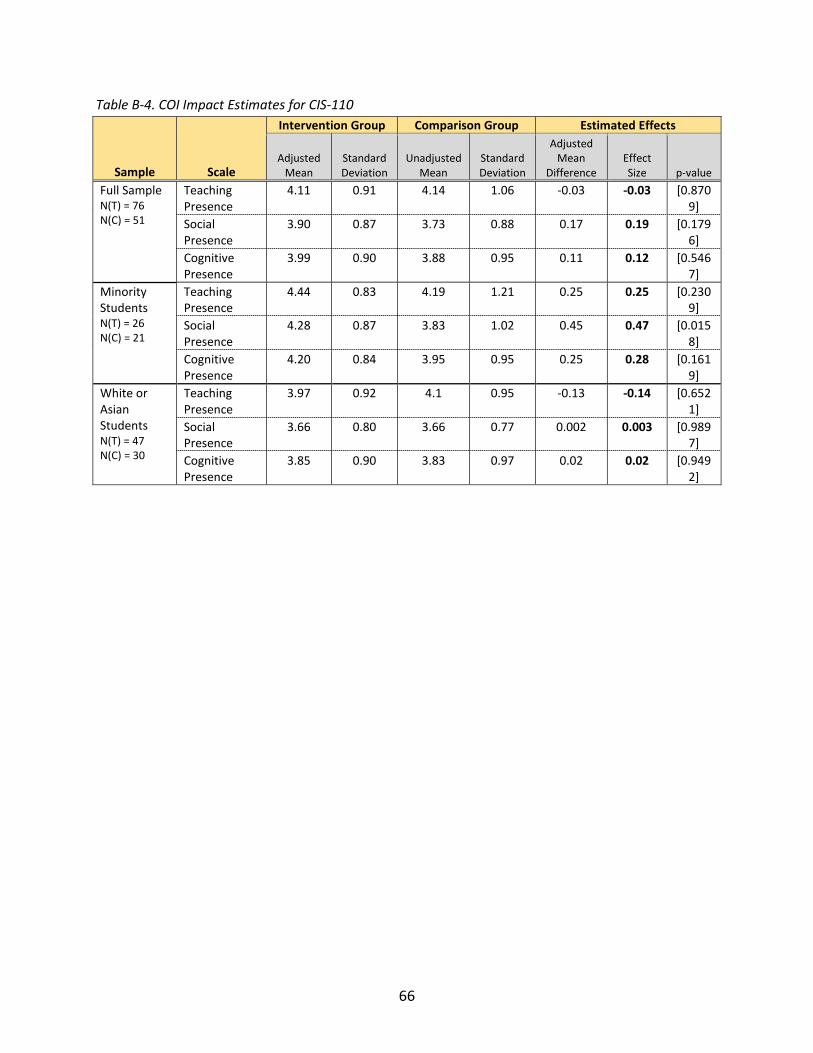
66
Table B-4. COI Impact Estimates for CIS-110
Sample Scale
Intervention Group Comparison Group Estimated Effects
Adjusted Mean
Standard Deviation
Unadjusted Mean
Standard Deviation
Adjusted Mean
Difference Effect Size p-value
Full Sample N(T) = 76 N(C) = 51
Teaching Presence
4.11 0.91 4.14 1.06 -0.03 -0.03 [0.8709]
Social Presence
3.90 0.87 3.73 0.88 0.17 0.19 [0.1796]
Cognitive Presence
3.99 0.90 3.88 0.95 0.11 0.12 [0.5467]
Minority Students N(T) = 26 N(C) = 21
Teaching Presence
4.44 0.83 4.19 1.21 0.25 0.25 [0.2309]
Social Presence
4.28 0.87 3.83 1.02 0.45 0.47 [0.0158]
Cognitive Presence
4.20 0.84 3.95 0.95 0.25 0.28 [0.1619]
White or Asian Students N(T) = 47 N(C) = 30
Teaching Presence
3.97 0.92 4.1 0.95 -0.13 -0.14 [0.6521]
Social Presence
3.66 0.80 3.66 0.77 0.002 0.003 [0.9897]
Cognitive Presence
3.85 0.90 3.83 0.97 0.02 0.02 [0.9492]

67
APPENDIX C
Supplementary Tables for Impact Analyses
Table C-1: Baseline Characteristics of Core Analytic Sample, by Minority and White/Asian
Characteristic
Minority White or Asian Treatment
Mean (N = 456)
Control Mean
(N=560) Effect Size (SD)
Treatment Mean
(N=609)
Control Mean
(N=607) Effect Size (SD)
% Female 69.3% 65.9% 0.07 (0.469) 52.5% 55.0% -0.05 (0.499) % Hispanic 22.6% 23.0% -0.01 (0.42) 0.0% 0.0% % Black 67.3% 70.5% -0.07 (0.462) 0.0% 0.0% % White or Asian 0.0% 0.0% 100.0% 100.0% Age 26.8 27.4 -0.06 (10.001) 24.3 24.8 -0.05 (8.338) % Identified as Disabled 1.3% 1.3% 0.00 (0.112) 1.8% 2.1% -0.02 (0.139) % PELL Eligible 66.2% 65.9% 0.01 (0.474) 30.9% 34.9% -0.09 (0.47) GPA at Start of Semester 2.31 2.45 -0.15 (0.887) 2.68 2.76 -0.09 (0.904)
Table C-2: Impact Estimates Excluding Lead Instructors
Population Outcome
Treatment Group Control Group ITT
Estimated Effects
Adjusted Mean
Standard Deviation
Unadjusted Mean
Standard Deviation
Adjusted Mean
Difference p-value
All Students N(T) = 804 N(C) = 1204
% Completing the Course with C or Higher
51.12% 0.500 52.57% 0.500 -1.45% [0.5739]
% Drop or Withdraw 34.23% 0.479 38.54% 0.487 -4.31% [0.0312] PSY-150 N(T) = 323 N(C) = 598
% Completing the Course with C or Higher
51.99% 0.500 46.49% 0.499 5.50% [0.3132]
% Drop or Withdraw 32.76% 0.466 43.98% 0.497 -11.22% [0.0015] BUS-110 N(T) = 350 N(C) = 433
% Completing the Course with C or Higher
58.03% 0.494 63.05% 0.483 -5.02% [0.2011]
% Drop or Withdraw 29.66% 0.471 27.94% 0.449 1.72% [0.6194] CIS-110 N(T) = 131 N(C) = 173
% Completing the Course with C or Higher
31.40% 0.489 47.40% 0.501 -16.00% [0.0000]
% Drop or Withdraw 58.10% 0.501 46.24% 0.500 11.86% [0.0318] Minority Students N(T) = 341 N(C) = 560
% Completing the Course with C or Higher
42.59% 0.494 41.07% 0.492 1.52% [0.7054]
% Drop or Withdraw 40.24% 0.494 47.14% 0.500 -6.90% [0.0249]
Non-Minority Students N(T) = 442 N(C) = 607
% Completing the Course with C or Higher
59.06% 0.494 63.26% 0.482 -4.20% [0.0974]
% Drop or Withdraw 28.77% 0.461 30.97% 0.463 -2.20% [0.3548]
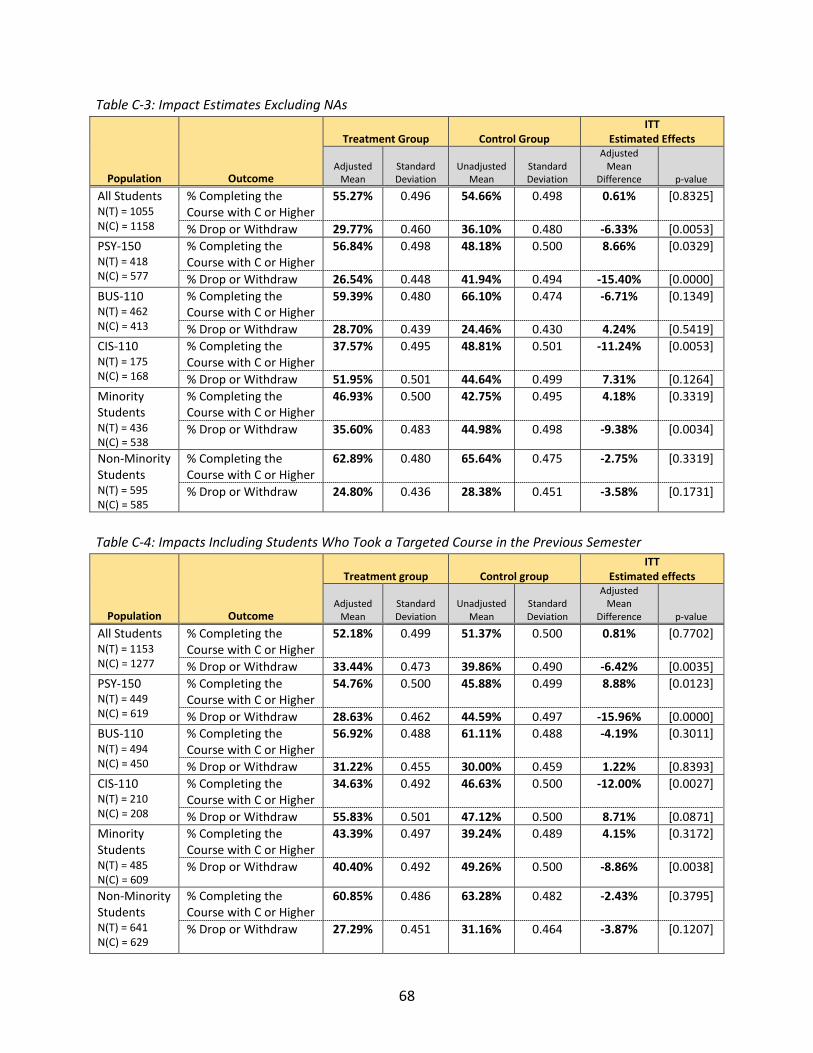
68
Table C-3: Impact Estimates Excluding NAs
Population Outcome
Treatment Group Control Group ITT
Estimated Effects
Adjusted Mean
Standard Deviation
Unadjusted Mean
Standard Deviation
Adjusted Mean
Difference p-value
All Students N(T) = 1055 N(C) = 1158
% Completing the Course with C or Higher
55.27% 0.496 54.66% 0.498 0.61% [0.8325]
% Drop or Withdraw 29.77% 0.460 36.10% 0.480 -6.33% [0.0053] PSY-150 N(T) = 418 N(C) = 577
% Completing the Course with C or Higher
56.84% 0.498 48.18% 0.500 8.66% [0.0329]
% Drop or Withdraw 26.54% 0.448 41.94% 0.494 -15.40% [0.0000] BUS-110 N(T) = 462 N(C) = 413
% Completing the Course with C or Higher
59.39% 0.480 66.10% 0.474 -6.71% [0.1349]
% Drop or Withdraw 28.70% 0.439 24.46% 0.430 4.24% [0.5419] CIS-110 N(T) = 175 N(C) = 168
% Completing the Course with C or Higher
37.57% 0.495 48.81% 0.501 -11.24% [0.0053]
% Drop or Withdraw 51.95% 0.501 44.64% 0.499 7.31% [0.1264] Minority Students N(T) = 436 N(C) = 538
% Completing the Course with C or Higher
46.93% 0.500 42.75% 0.495 4.18% [0.3319]
% Drop or Withdraw 35.60% 0.483 44.98% 0.498 -9.38% [0.0034]
Non-Minority Students N(T) = 595 N(C) = 585
% Completing the Course with C or Higher
62.89% 0.480 65.64% 0.475 -2.75% [0.3319]
% Drop or Withdraw 24.80% 0.436 28.38% 0.451 -3.58% [0.1731]
Table C-4: Impacts Including Students Who Took a Targeted Course in the Previous Semester
Population Outcome
Treatment group Control group ITT
Estimated effects
Adjusted Mean
Standard Deviation
Unadjusted Mean
Standard Deviation
Adjusted Mean
Difference p-value
All Students N(T) = 1153 N(C) = 1277
% Completing the Course with C or Higher
52.18% 0.499 51.37% 0.500 0.81% [0.7702]
% Drop or Withdraw 33.44% 0.473 39.86% 0.490 -6.42% [0.0035] PSY-150 N(T) = 449 N(C) = 619
% Completing the Course with C or Higher
54.76% 0.500 45.88% 0.499 8.88% [0.0123]
% Drop or Withdraw 28.63% 0.462 44.59% 0.497 -15.96% [0.0000] BUS-110 N(T) = 494 N(C) = 450
% Completing the Course with C or Higher
56.92% 0.488 61.11% 0.488 -4.19% [0.3011]
% Drop or Withdraw 31.22% 0.455 30.00% 0.459 1.22% [0.8393] CIS-110 N(T) = 210 N(C) = 208
% Completing the Course with C or Higher
34.63% 0.492 46.63% 0.500 -12.00% [0.0027]
% Drop or Withdraw 55.83% 0.501 47.12% 0.500 8.71% [0.0871] Minority Students N(T) = 485 N(C) = 609
% Completing the Course with C or Higher
43.39% 0.497 39.24% 0.489 4.15% [0.3172]
% Drop or Withdraw 40.40% 0.492 49.26% 0.500 -8.86% [0.0038]
Non-Minority Students N(T) = 641 N(C) = 629
% Completing the Course with C or Higher
60.85% 0.486 63.28% 0.482 -2.43% [0.3795]
% Drop or Withdraw 27.29% 0.451 31.16% 0.464 -3.87% [0.1207]
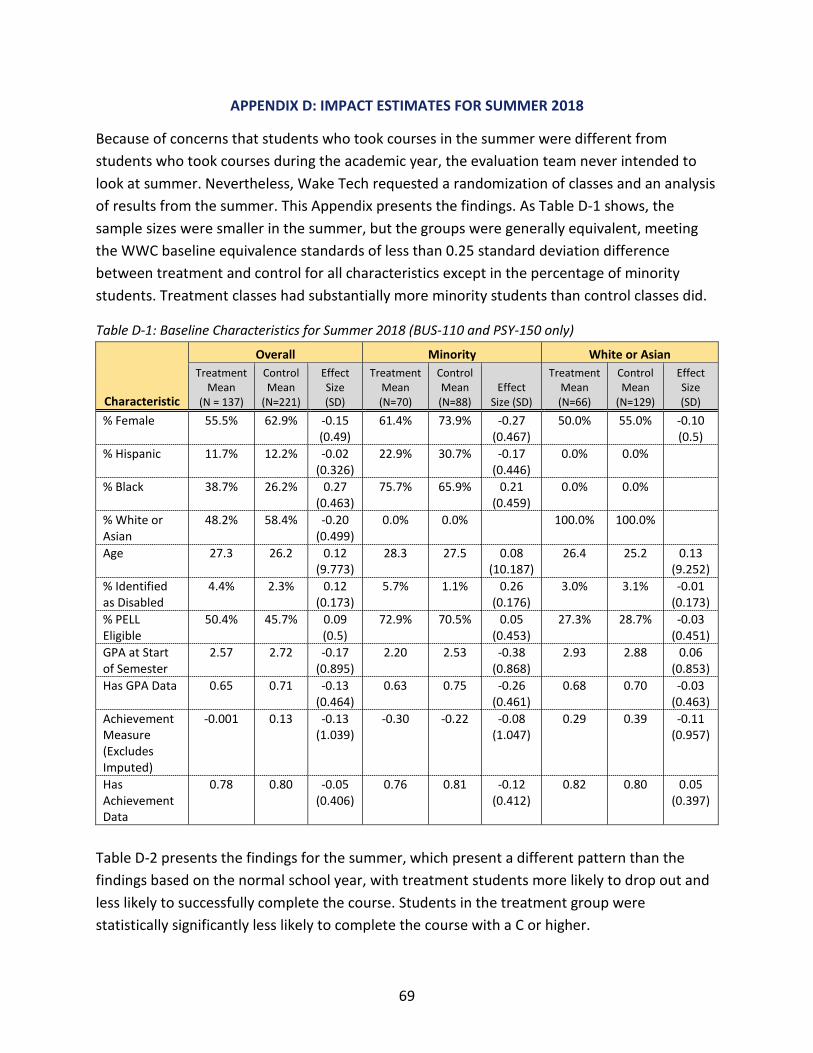
69
APPENDIX D: IMPACT ESTIMATES FOR SUMMER 2018
Because of concerns that students who took courses in the summer were different from students who took courses during the academic year, the evaluation team never intended to look at summer. Nevertheless, Wake Tech requested a randomization of classes and an analysis of results from the summer. This Appendix presents the findings. As Table D-1 shows, the sample sizes were smaller in the summer, but the groups were generally equivalent, meeting the WWC baseline equivalence standards of less than 0.25 standard deviation difference between treatment and control for all characteristics except in the percentage of minority students. Treatment classes had substantially more minority students than control classes did.
Table D-1: Baseline Characteristics for Summer 2018 (BUS-110 and PSY-150 only)
Characteristic
Overall Minority White or Asian Treatment
Mean (N = 137)
Control Mean
(N=221)
Effect Size (SD)
Treatment Mean (N=70)
Control Mean (N=88)
Effect Size (SD)
Treatment Mean (N=66)
Control Mean
(N=129)
Effect Size (SD)
% Female 55.5% 62.9% -0.15 (0.49)
61.4% 73.9% -0.27 (0.467)
50.0% 55.0% -0.10 (0.5)
% Hispanic 11.7% 12.2% -0.02 (0.326)
22.9% 30.7% -0.17 (0.446)
0.0% 0.0%
% Black 38.7% 26.2% 0.27 (0.463)
75.7% 65.9% 0.21 (0.459)
0.0% 0.0%
% White or Asian
48.2% 58.4% -0.20 (0.499)
0.0% 0.0%
100.0% 100.0%
Age 27.3 26.2 0.12 (9.773)
28.3 27.5 0.08 (10.187)
26.4 25.2 0.13 (9.252)
% Identified as Disabled
4.4% 2.3% 0.12 (0.173)
5.7% 1.1% 0.26 (0.176)
3.0% 3.1% -0.01 (0.173)
% PELL Eligible
50.4% 45.7% 0.09 (0.5)
72.9% 70.5% 0.05 (0.453)
27.3% 28.7% -0.03 (0.451)
GPA at Start of Semester
2.57 2.72 -0.17 (0.895)
2.20 2.53 -0.38 (0.868)
2.93 2.88 0.06 (0.853)
Has GPA Data 0.65 0.71 -0.13 (0.464)
0.63 0.75 -0.26 (0.461)
0.68 0.70 -0.03 (0.463)
Achievement Measure (Excludes Imputed)
-0.001 0.13 -0.13 (1.039)
-0.30 -0.22 -0.08 (1.047)
0.29 0.39 -0.11 (0.957)
Has Achievement Data
0.78 0.80 -0.05 (0.406)
0.76 0.81 -0.12 (0.412)
0.82 0.80 0.05 (0.397)
Table D-2 presents the findings for the summer, which present a different pattern than the findings based on the normal school year, with treatment students more likely to drop out and less likely to successfully complete the course. Students in the treatment group were statistically significantly less likely to complete the course with a C or higher.
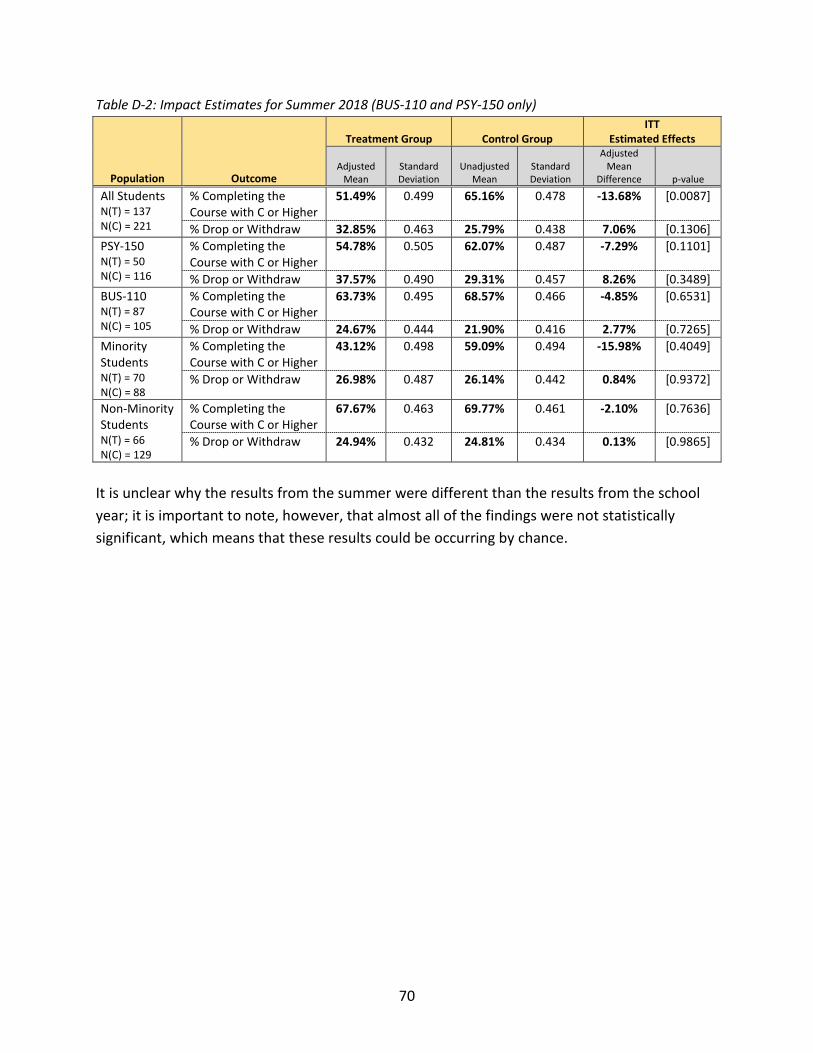
70
Table D-2: Impact Estimates for Summer 2018 (BUS-110 and PSY-150 only)
Population Outcome
Treatment Group Control Group ITT
Estimated Effects
Adjusted Mean
Standard Deviation
Unadjusted Mean
Standard Deviation
Adjusted Mean
Difference p-value
All Students N(T) = 137 N(C) = 221
% Completing the Course with C or Higher
51.49% 0.499 65.16% 0.478 -13.68% [0.0087]
% Drop or Withdraw 32.85% 0.463 25.79% 0.438 7.06% [0.1306] PSY-150 N(T) = 50 N(C) = 116
% Completing the Course with C or Higher
54.78% 0.505 62.07% 0.487 -7.29% [0.1101]
% Drop or Withdraw 37.57% 0.490 29.31% 0.457 8.26% [0.3489] BUS-110 N(T) = 87 N(C) = 105
% Completing the Course with C or Higher
63.73% 0.495 68.57% 0.466 -4.85% [0.6531]
% Drop or Withdraw 24.67% 0.444 21.90% 0.416 2.77% [0.7265] Minority Students N(T) = 70 N(C) = 88
% Completing the Course with C or Higher
43.12% 0.498 59.09% 0.494 -15.98% [0.4049]
% Drop or Withdraw 26.98% 0.487 26.14% 0.442 0.84% [0.9372]
Non-Minority Students N(T) = 66 N(C) = 129
% Completing the Course with C or Higher
67.67% 0.463 69.77% 0.461 -2.10% [0.7636]
% Drop or Withdraw 24.94% 0.432 24.81% 0.434 0.13% [0.9865]
It is unclear why the results from the summer were different than the results from the school year; it is important to note, however, that almost all of the findings were not statistically significant, which means that these results could be occurring by chance.
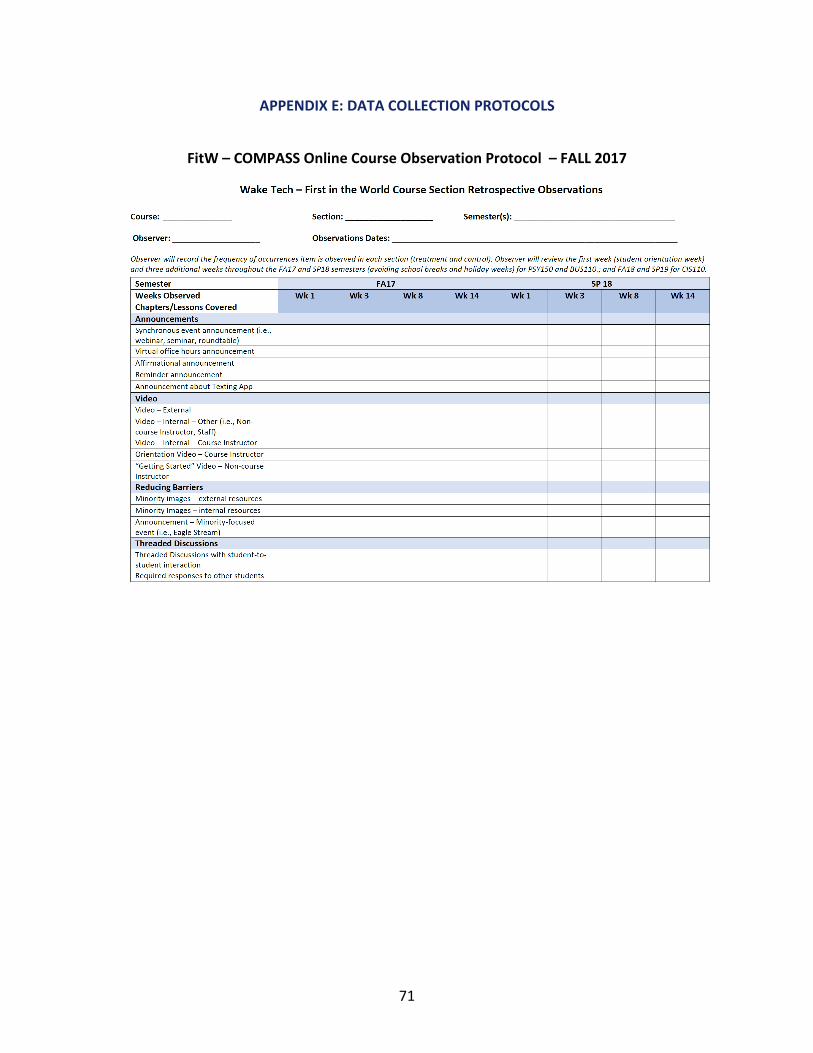
71
APPENDIX E: DATA COLLECTION PROTOCOLS
FitW – COMPASS Online Course Observation Protocol – FALL 2017
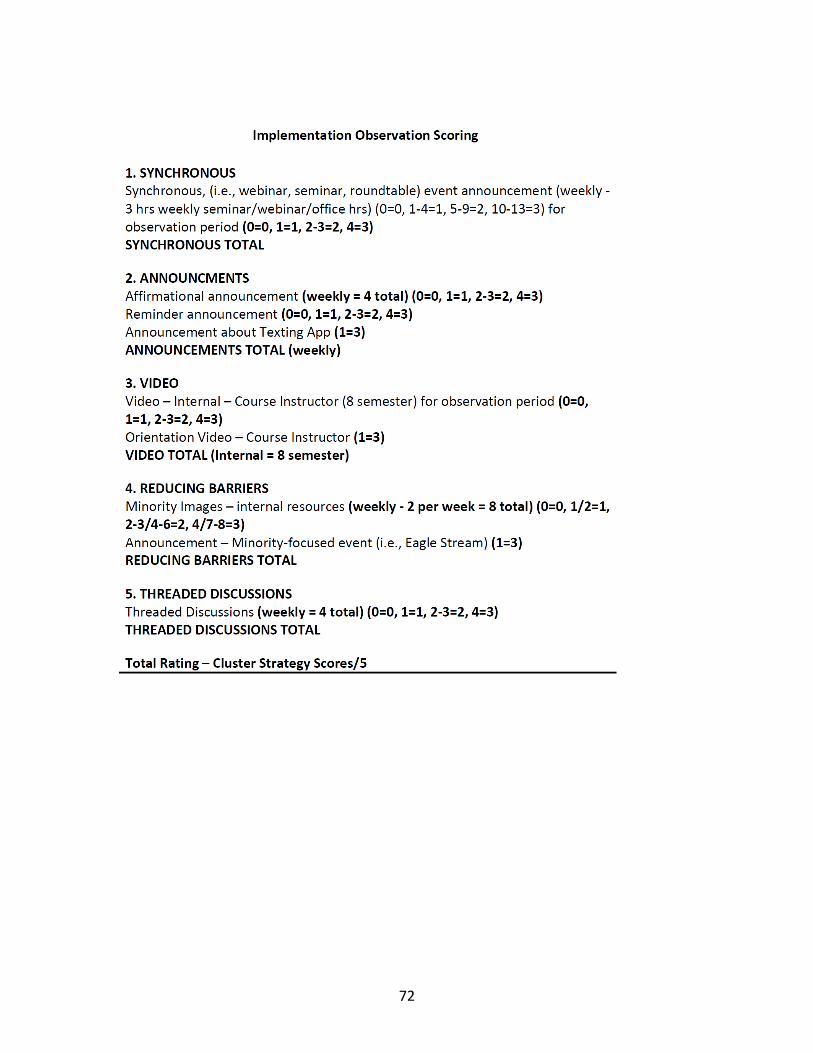
72
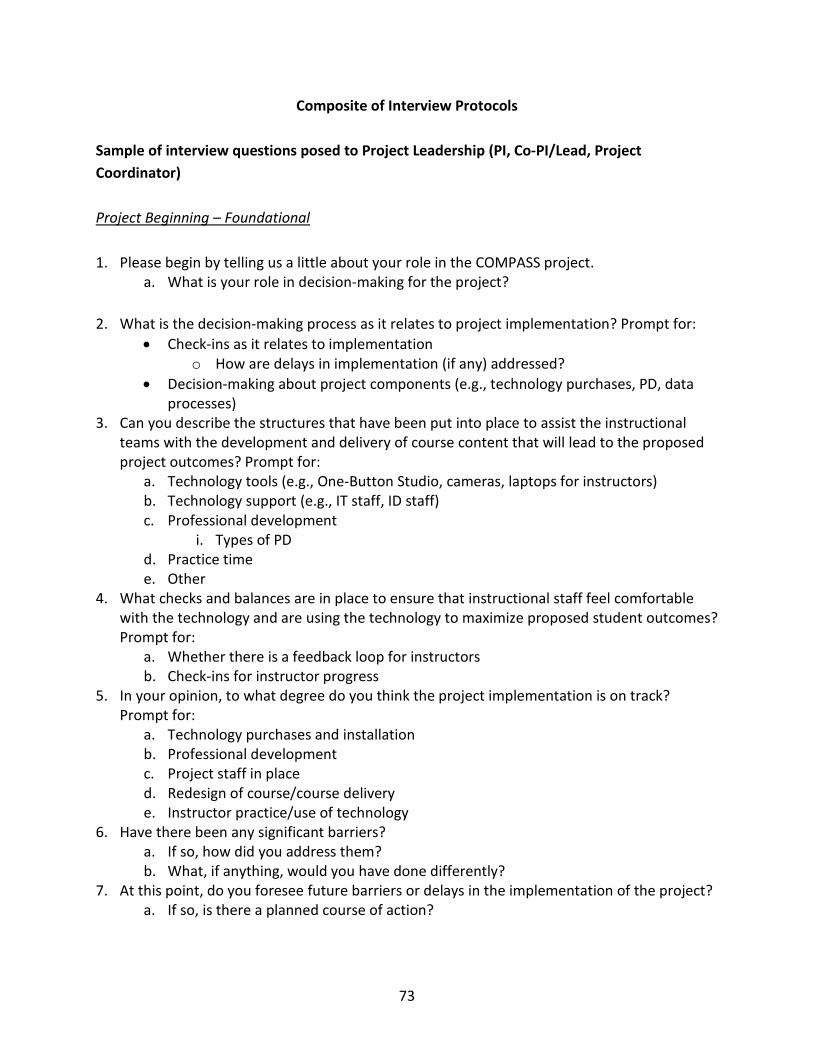
73
Composite of Interview Protocols
Sample of interview questions posed to Project Leadership (PI, Co-PI/Lead, Project Coordinator) Project Beginning – Foundational 1. Please begin by telling us a little about your role in the COMPASS project.
a. What is your role in decision-making for the project? 2. What is the decision-making process as it relates to project implementation? Prompt for:
• Check-ins as it relates to implementation o How are delays in implementation (if any) addressed?
• Decision-making about project components (e.g., technology purchases, PD, data processes)
3. Can you describe the structures that have been put into place to assist the instructional teams with the development and delivery of course content that will lead to the proposed project outcomes? Prompt for:
a. Technology tools (e.g., One-Button Studio, cameras, laptops for instructors) b. Technology support (e.g., IT staff, ID staff) c. Professional development
i. Types of PD d. Practice time e. Other
4. What checks and balances are in place to ensure that instructional staff feel comfortable with the technology and are using the technology to maximize proposed student outcomes? Prompt for:
a. Whether there is a feedback loop for instructors b. Check-ins for instructor progress
5. In your opinion, to what degree do you think the project implementation is on track? Prompt for:
a. Technology purchases and installation b. Professional development c. Project staff in place d. Redesign of course/course delivery e. Instructor practice/use of technology
6. Have there been any significant barriers? a. If so, how did you address them? b. What, if anything, would you have done differently?
7. At this point, do you foresee future barriers or delays in the implementation of the project? a. If so, is there a planned course of action?
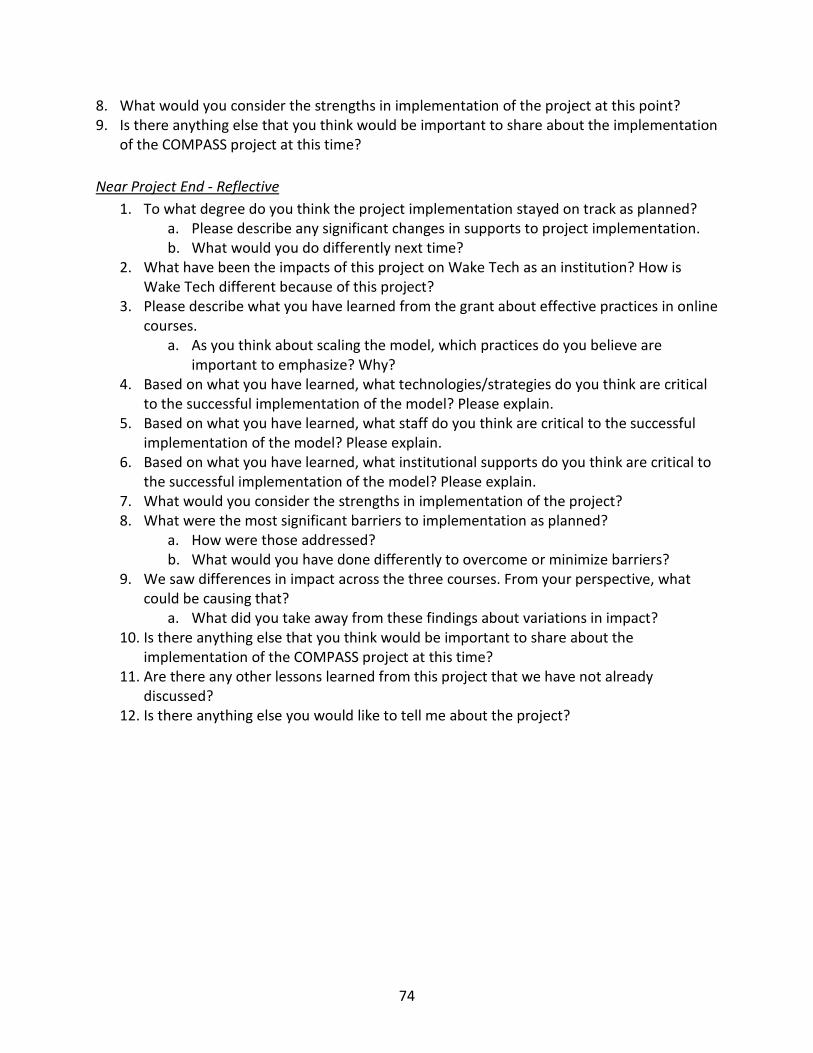
74
8. What would you consider the strengths in implementation of the project at this point? 9. Is there anything else that you think would be important to share about the implementation
of the COMPASS project at this time? Near Project End - Reflective
1. To what degree do you think the project implementation stayed on track as planned? a. Please describe any significant changes in supports to project implementation. b. What would you do differently next time?
2. What have been the impacts of this project on Wake Tech as an institution? How is Wake Tech different because of this project?
3. Please describe what you have learned from the grant about effective practices in online courses.
a. As you think about scaling the model, which practices do you believe are important to emphasize? Why?
4. Based on what you have learned, what technologies/strategies do you think are critical to the successful implementation of the model? Please explain.
5. Based on what you have learned, what staff do you think are critical to the successful implementation of the model? Please explain.
6. Based on what you have learned, what institutional supports do you think are critical to the successful implementation of the model? Please explain.
7. What would you consider the strengths in implementation of the project? 8. What were the most significant barriers to implementation as planned?
a. How were those addressed? b. What would you have done differently to overcome or minimize barriers?
9. We saw differences in impact across the three courses. From your perspective, what could be causing that?
a. What did you take away from these findings about variations in impact? 10. Is there anything else that you think would be important to share about the
implementation of the COMPASS project at this time? 11. Are there any other lessons learned from this project that we have not already
discussed? 12. Is there anything else you would like to tell me about the project?
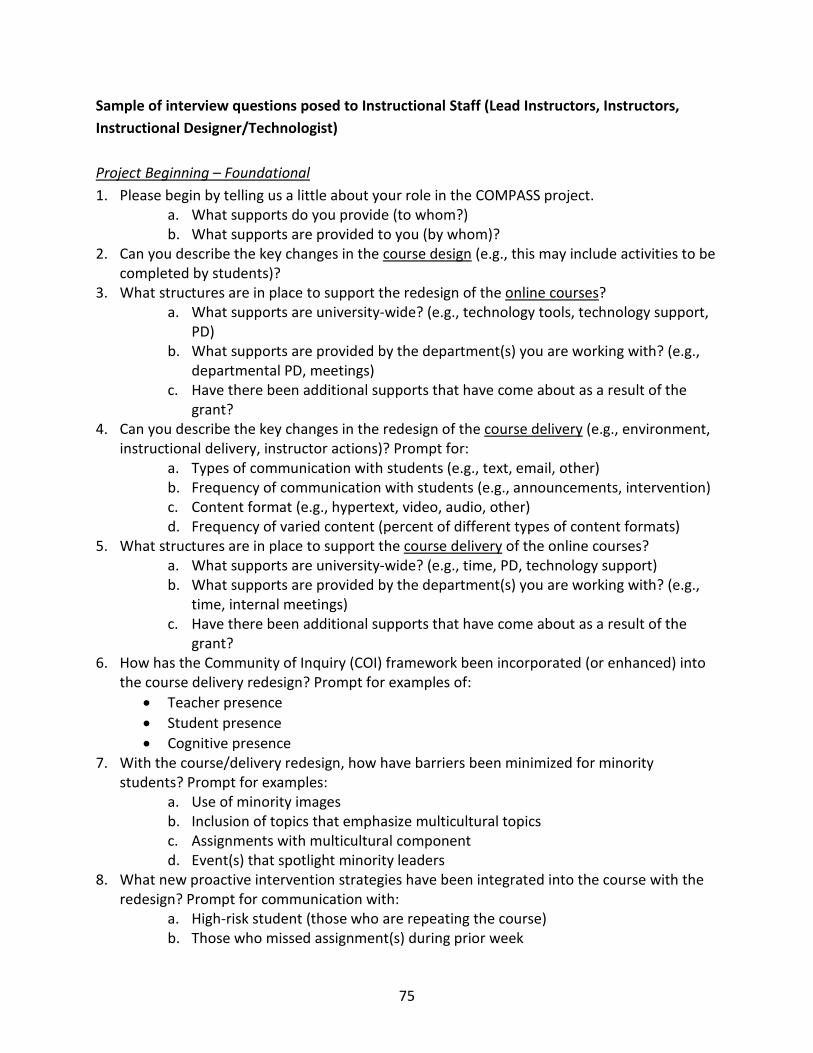
75
Sample of interview questions posed to Instructional Staff (Lead Instructors, Instructors, Instructional Designer/Technologist) Project Beginning – Foundational 1. Please begin by telling us a little about your role in the COMPASS project.
a. What supports do you provide (to whom?) b. What supports are provided to you (by whom)?
2. Can you describe the key changes in the course design (e.g., this may include activities to be completed by students)?
3. What structures are in place to support the redesign of the online courses? a. What supports are university-wide? (e.g., technology tools, technology support,
PD) b. What supports are provided by the department(s) you are working with? (e.g.,
departmental PD, meetings) c. Have there been additional supports that have come about as a result of the
grant? 4. Can you describe the key changes in the redesign of the course delivery (e.g., environment,
instructional delivery, instructor actions)? Prompt for: a. Types of communication with students (e.g., text, email, other) b. Frequency of communication with students (e.g., announcements, intervention) c. Content format (e.g., hypertext, video, audio, other) d. Frequency of varied content (percent of different types of content formats)
5. What structures are in place to support the course delivery of the online courses? a. What supports are university-wide? (e.g., time, PD, technology support) b. What supports are provided by the department(s) you are working with? (e.g.,
time, internal meetings) c. Have there been additional supports that have come about as a result of the
grant? 6. How has the Community of Inquiry (COI) framework been incorporated (or enhanced) into
the course delivery redesign? Prompt for examples of: • Teacher presence • Student presence • Cognitive presence
7. With the course/delivery redesign, how have barriers been minimized for minority students? Prompt for examples:
a. Use of minority images b. Inclusion of topics that emphasize multicultural topics c. Assignments with multicultural component d. Event(s) that spotlight minority leaders
8. What new proactive intervention strategies have been integrated into the course with the redesign? Prompt for communication with:
a. High-risk student (those who are repeating the course) b. Those who missed assignment(s) during prior week
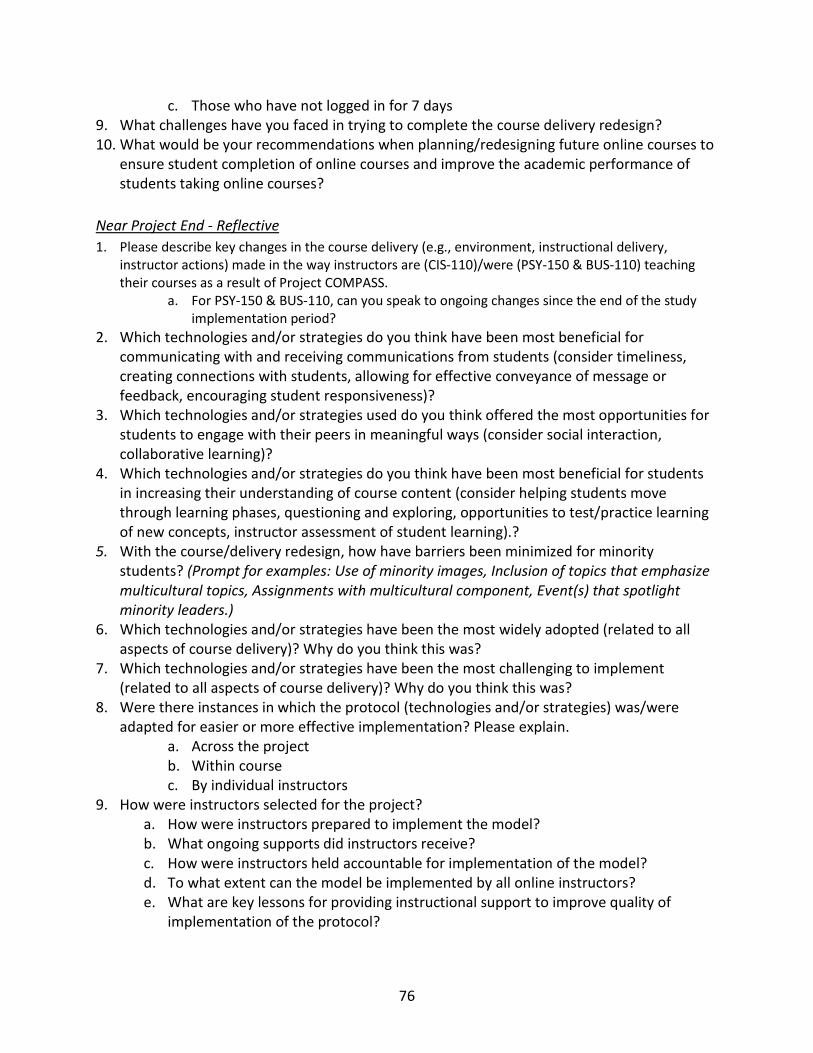
76
c. Those who have not logged in for 7 days 9. What challenges have you faced in trying to complete the course delivery redesign? 10. What would be your recommendations when planning/redesigning future online courses to
ensure student completion of online courses and improve the academic performance of students taking online courses?
Near Project End - Reflective 1. Please describe key changes in the course delivery (e.g., environment, instructional delivery,
instructor actions) made in the way instructors are (CIS-110)/were (PSY-150 & BUS-110) teaching their courses as a result of Project COMPASS.
a. For PSY-150 & BUS-110, can you speak to ongoing changes since the end of the study implementation period?
2. Which technologies and/or strategies do you think have been most beneficial for communicating with and receiving communications from students (consider timeliness, creating connections with students, allowing for effective conveyance of message or feedback, encouraging student responsiveness)?
3. Which technologies and/or strategies used do you think offered the most opportunities for students to engage with their peers in meaningful ways (consider social interaction, collaborative learning)?
4. Which technologies and/or strategies do you think have been most beneficial for students in increasing their understanding of course content (consider helping students move through learning phases, questioning and exploring, opportunities to test/practice learning of new concepts, instructor assessment of student learning).?
5. With the course/delivery redesign, how have barriers been minimized for minority students? (Prompt for examples: Use of minority images, Inclusion of topics that emphasize multicultural topics, Assignments with multicultural component, Event(s) that spotlight minority leaders.)
6. Which technologies and/or strategies have been the most widely adopted (related to all aspects of course delivery)? Why do you think this was?
7. Which technologies and/or strategies have been the most challenging to implement (related to all aspects of course delivery)? Why do you think this was?
8. Were there instances in which the protocol (technologies and/or strategies) was/were adapted for easier or more effective implementation? Please explain.
a. Across the project b. Within course c. By individual instructors
9. How were instructors selected for the project? a. How were instructors prepared to implement the model? b. What ongoing supports did instructors receive? c. How were instructors held accountable for implementation of the model? d. To what extent can the model be implemented by all online instructors? e. What are key lessons for providing instructional support to improve quality of
implementation of the protocol?
77
10. Please describe what you have learned from the grant about effective practices in online courses.
a. Which practices do believe are important to emphasize? Why? 11. What recommendations might you have for other community colleges planning to
implement a project similar to the COMPASS project to increase effectiveness in implementation and maximize student impact?
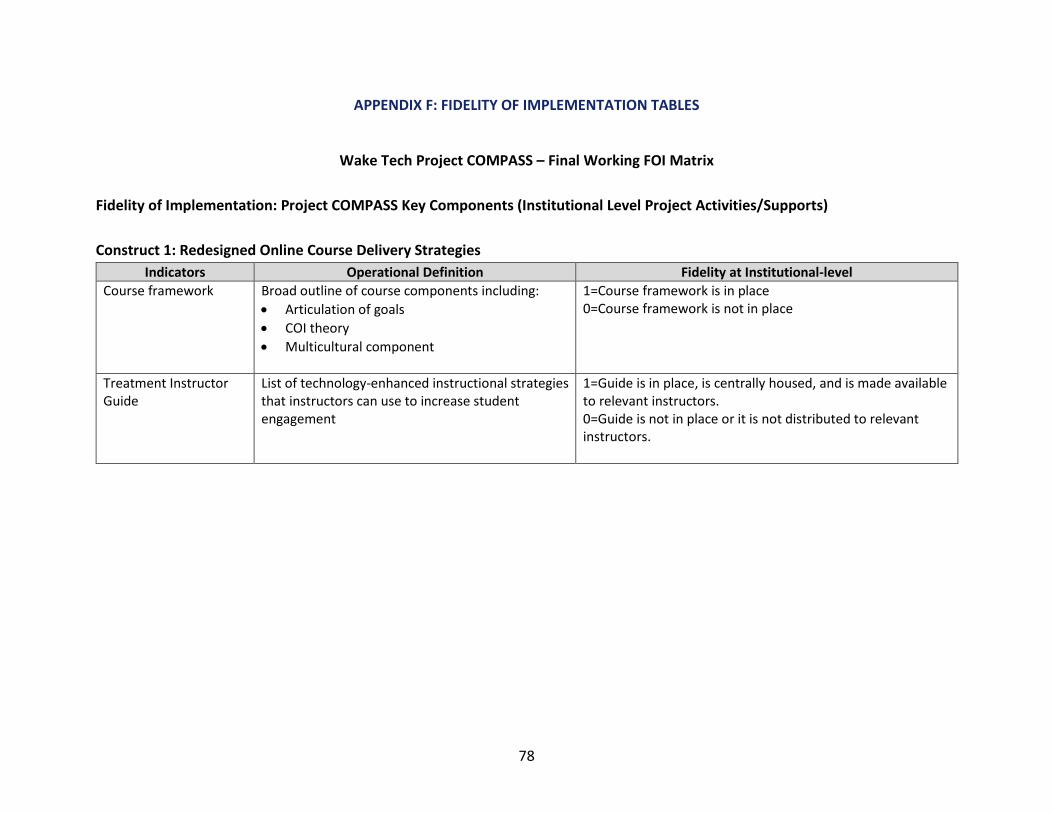
78
APPENDIX F: FIDELITY OF IMPLEMENTATION TABLES
Wake Tech Project COMPASS – Final Working FOI Matrix
Fidelity of Implementation: Project COMPASS Key Components (Institutional Level Project Activities/Supports) Construct 1: Redesigned Online Course Delivery Strategies
Indicators Operational Definition Fidelity at Institutional-level Course framework Broad outline of course components including:
• Articulation of goals • COI theory • Multicultural component
1=Course framework is in place 0=Course framework is not in place
Treatment Instructor Guide
List of technology-enhanced instructional strategies that instructors can use to increase student engagement
1=Guide is in place, is centrally housed, and is made available to relevant instructors. 0=Guide is not in place or it is not distributed to relevant instructors.
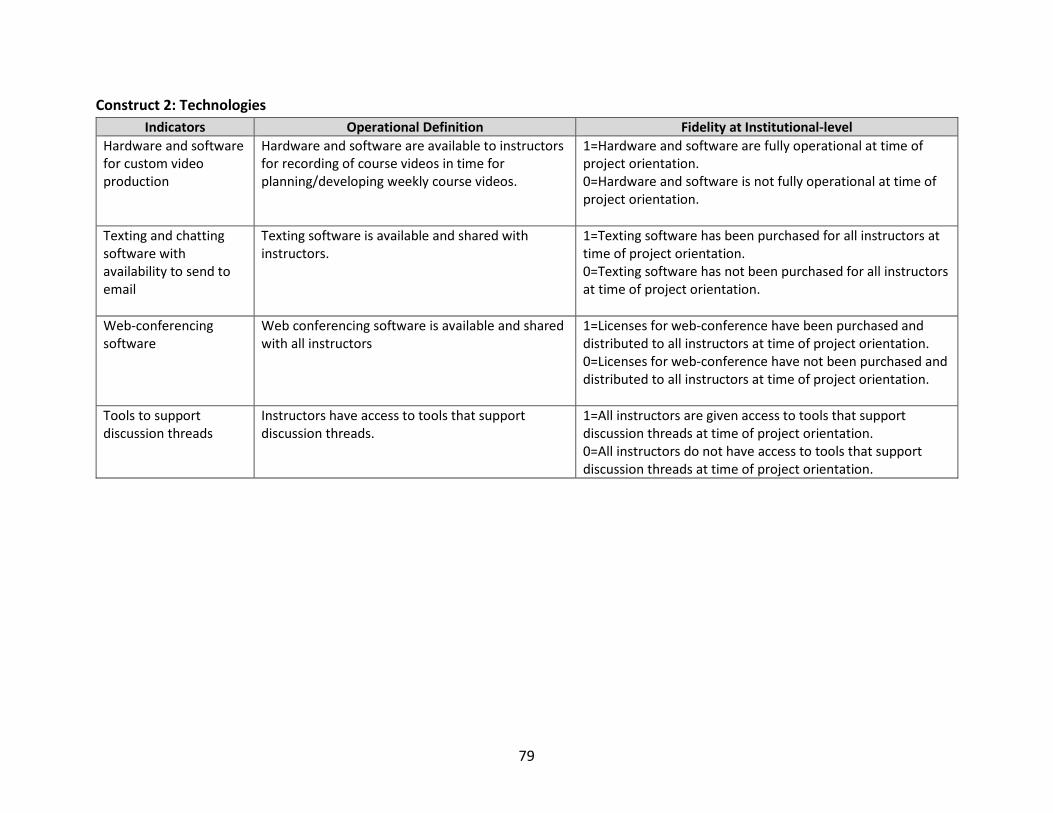
79
Construct 2: Technologies Indicators Operational Definition Fidelity at Institutional-level
Hardware and software for custom video production
Hardware and software are available to instructors for recording of course videos in time for planning/developing weekly course videos.
1=Hardware and software are fully operational at time of project orientation. 0=Hardware and software is not fully operational at time of project orientation.
Texting and chatting software with availability to send to email
Texting software is available and shared with instructors.
1=Texting software has been purchased for all instructors at time of project orientation. 0=Texting software has not been purchased for all instructors at time of project orientation.
Web-conferencing software
Web conferencing software is available and shared with all instructors
1=Licenses for web-conference have been purchased and distributed to all instructors at time of project orientation. 0=Licenses for web-conference have not been purchased and distributed to all instructors at time of project orientation.
Tools to support discussion threads
Instructors have access to tools that support discussion threads.
1=All instructors are given access to tools that support discussion threads at time of project orientation. 0=All instructors do not have access to tools that support discussion threads at time of project orientation.
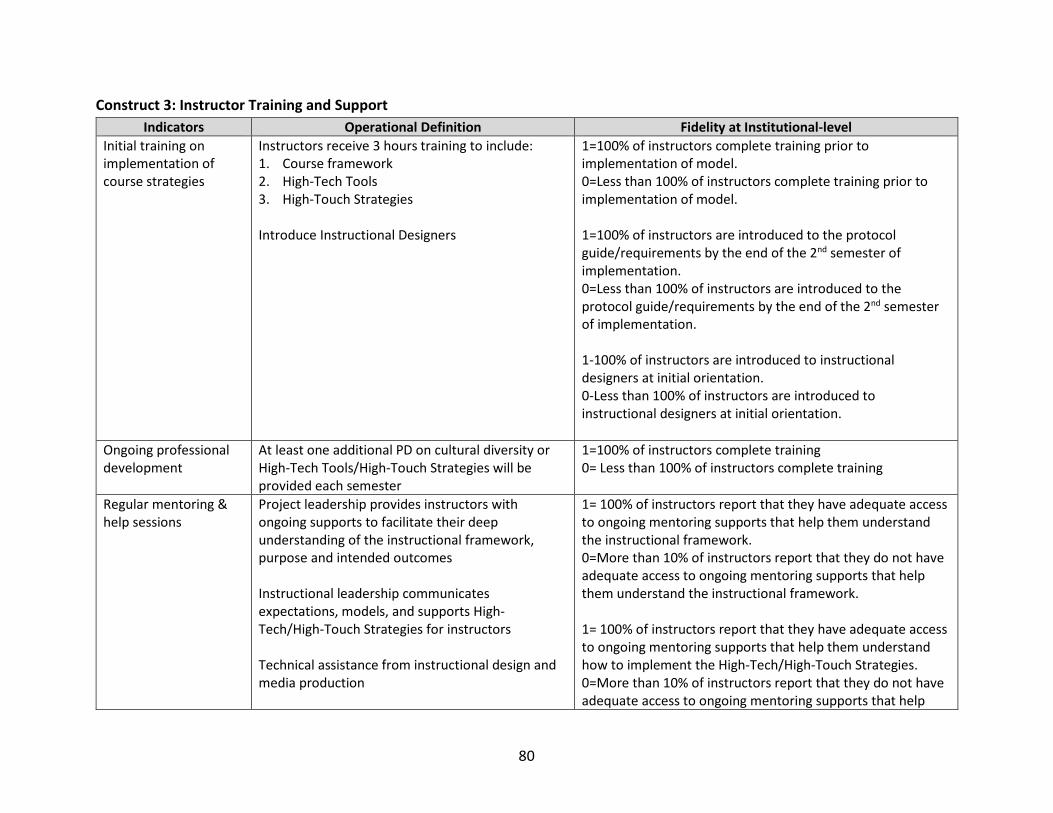
80
Construct 3: Instructor Training and Support Indicators Operational Definition Fidelity at Institutional-level
Initial training on implementation of course strategies
Instructors receive 3 hours training to include: 1. Course framework 2. High-Tech Tools 3. High-Touch Strategies Introduce Instructional Designers
1=100% of instructors complete training prior to implementation of model. 0=Less than 100% of instructors complete training prior to implementation of model. 1=100% of instructors are introduced to the protocol guide/requirements by the end of the 2nd semester of implementation. 0=Less than 100% of instructors are introduced to the protocol guide/requirements by the end of the 2nd semester of implementation. 1-100% of instructors are introduced to instructional designers at initial orientation. 0-Less than 100% of instructors are introduced to instructional designers at initial orientation.
Ongoing professional development
At least one additional PD on cultural diversity or High-Tech Tools/High-Touch Strategies will be provided each semester
1=100% of instructors complete training 0= Less than 100% of instructors complete training
Regular mentoring & help sessions
Project leadership provides instructors with ongoing supports to facilitate their deep understanding of the instructional framework, purpose and intended outcomes Instructional leadership communicates expectations, models, and supports High-Tech/High-Touch Strategies for instructors Technical assistance from instructional design and media production
1= 100% of instructors report that they have adequate access to ongoing mentoring supports that help them understand the instructional framework. 0=More than 10% of instructors report that they do not have adequate access to ongoing mentoring supports that help them understand the instructional framework. 1= 100% of instructors report that they have adequate access to ongoing mentoring supports that help them understand how to implement the High-Tech/High-Touch Strategies. 0=More than 10% of instructors report that they do not have adequate access to ongoing mentoring supports that help
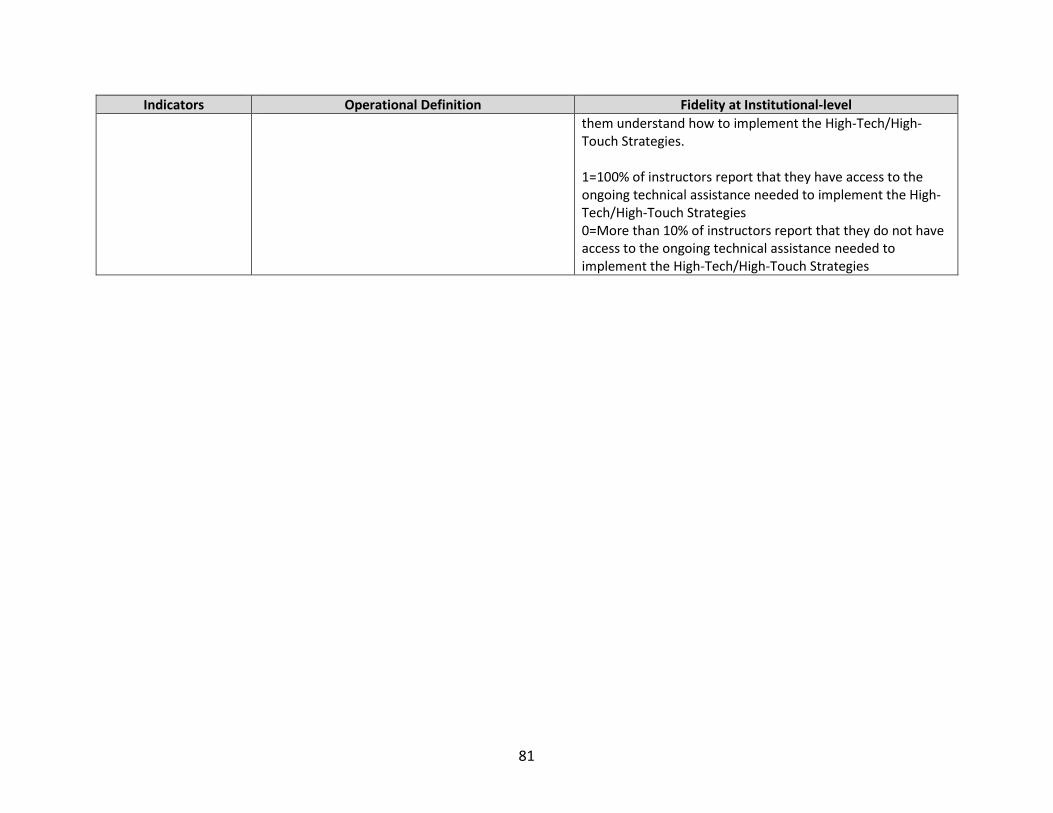
81
Indicators Operational Definition Fidelity at Institutional-level them understand how to implement the High-Tech/High-Touch Strategies. 1=100% of instructors report that they have access to the ongoing technical assistance needed to implement the High-Tech/High-Touch Strategies 0=More than 10% of instructors report that they do not have access to the ongoing technical assistance needed to implement the High-Tech/High-Touch Strategies
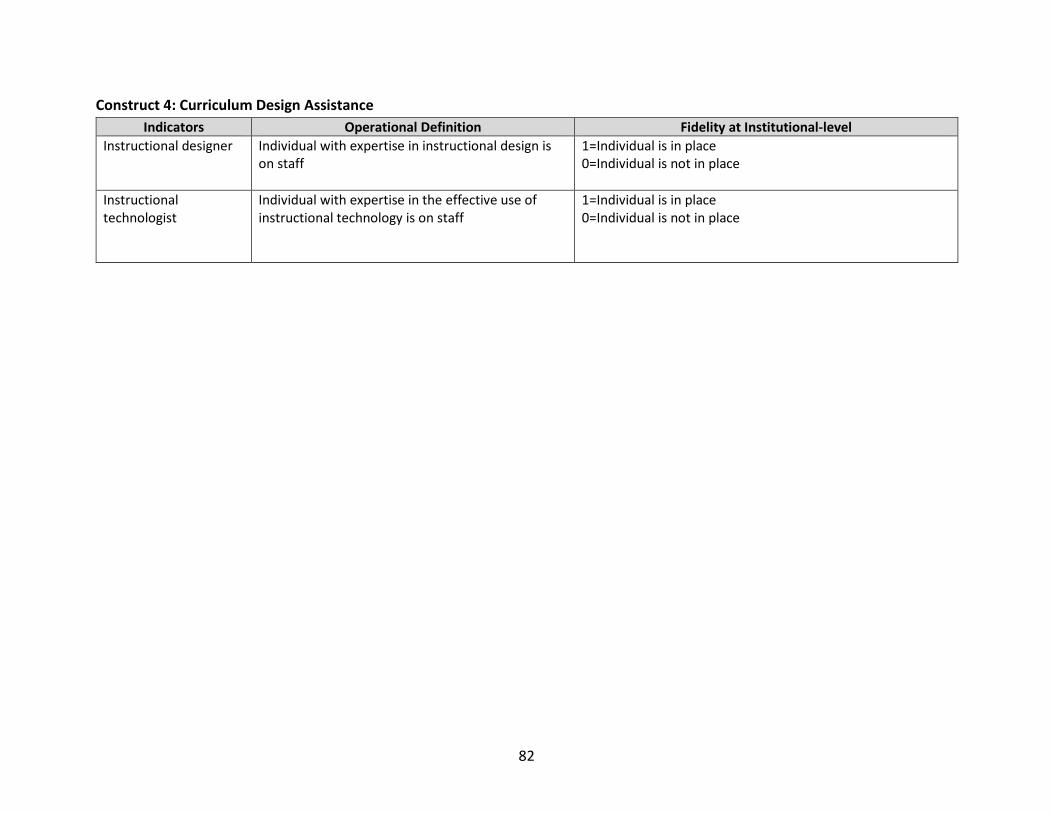
82
Construct 4: Curriculum Design Assistance Indicators Operational Definition Fidelity at Institutional-level
Instructional designer
Individual with expertise in instructional design is on staff
1=Individual is in place 0=Individual is not in place
Instructional technologist
Individual with expertise in the effective use of instructional technology is on staff
1=Individual is in place 0=Individual is not in place
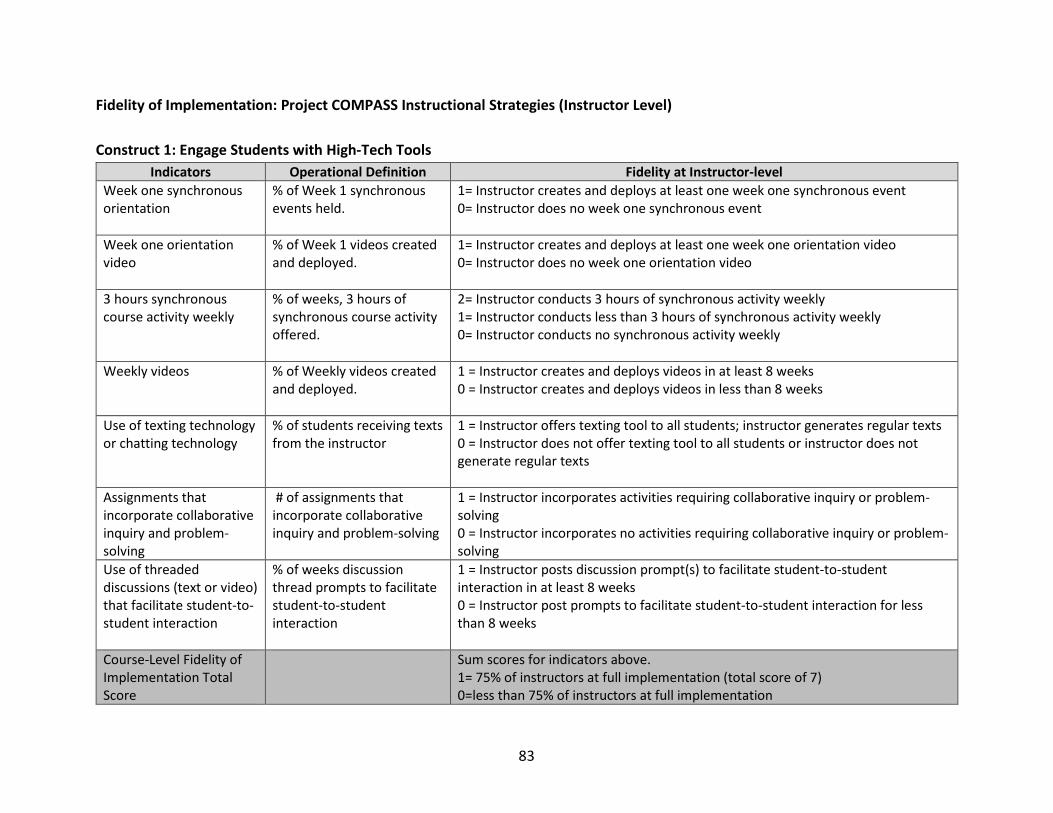
83
Fidelity of Implementation: Project COMPASS Instructional Strategies (Instructor Level) Construct 1: Engage Students with High-Tech Tools
Indicators Operational Definition Fidelity at Instructor-level Week one synchronous orientation
% of Week 1 synchronous events held.
1= Instructor creates and deploys at least one week one synchronous event 0= Instructor does no week one synchronous event
Week one orientation video
% of Week 1 videos created and deployed.
1= Instructor creates and deploys at least one week one orientation video 0= Instructor does no week one orientation video
3 hours synchronous course activity weekly
% of weeks, 3 hours of synchronous course activity offered.
2= Instructor conducts 3 hours of synchronous activity weekly 1= Instructor conducts less than 3 hours of synchronous activity weekly 0= Instructor conducts no synchronous activity weekly
Weekly videos % of Weekly videos created and deployed.
1 = Instructor creates and deploys videos in at least 8 weeks 0 = Instructor creates and deploys videos in less than 8 weeks
Use of texting technology or chatting technology
% of students receiving texts from the instructor
1 = Instructor offers texting tool to all students; instructor generates regular texts 0 = Instructor does not offer texting tool to all students or instructor does not generate regular texts
Assignments that incorporate collaborative inquiry and problem-solving
# of assignments that incorporate collaborative inquiry and problem-solving
1 = Instructor incorporates activities requiring collaborative inquiry or problem-solving 0 = Instructor incorporates no activities requiring collaborative inquiry or problem-solving
Use of threaded discussions (text or video) that facilitate student-to-student interaction
% of weeks discussion thread prompts to facilitate student-to-student interaction
1 = Instructor posts discussion prompt(s) to facilitate student-to-student interaction in at least 8 weeks 0 = Instructor post prompts to facilitate student-to-student interaction for less than 8 weeks
Course-Level Fidelity of Implementation Total Score
Sum scores for indicators above. 1= 75% of instructors at full implementation (total score of 7) 0=less than 75% of instructors at full implementation
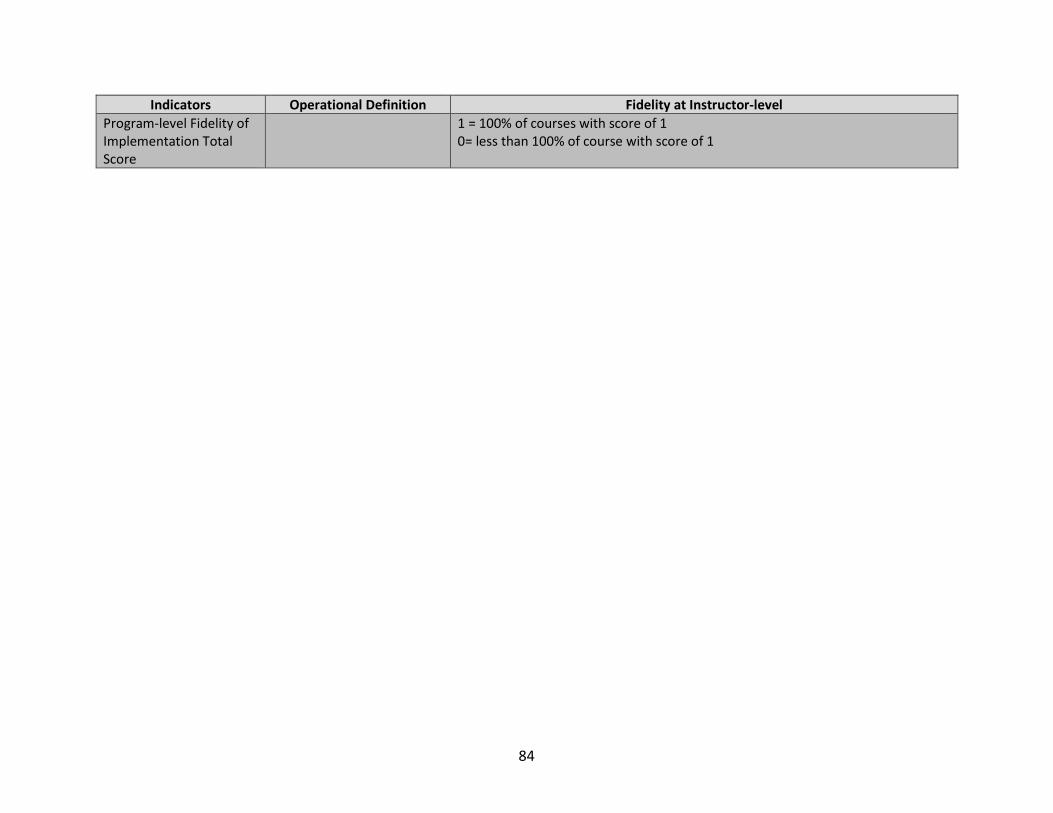
84
Indicators Operational Definition Fidelity at Instructor-level Program-level Fidelity of Implementation Total Score
1 = 100% of courses with score of 1 0= less than 100% of course with score of 1
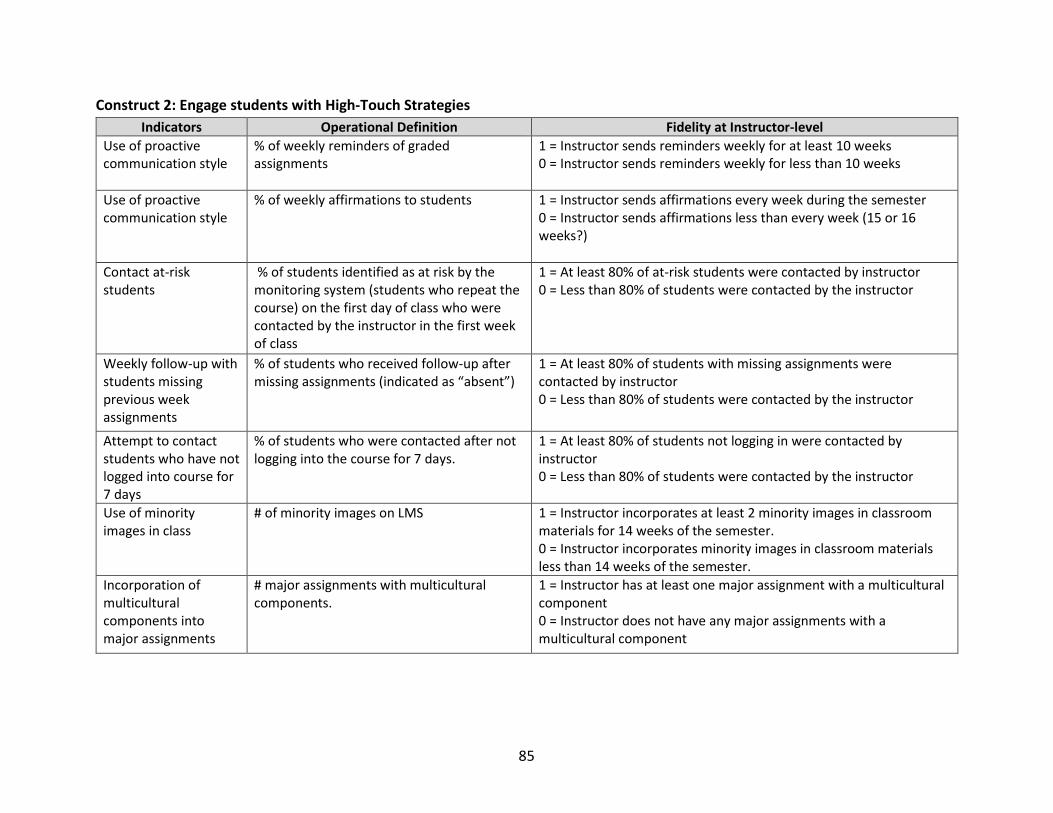
85
Construct 2: Engage students with High-Touch Strategies Indicators Operational Definition Fidelity at Instructor-level
Use of proactive communication style
% of weekly reminders of graded assignments
1 = Instructor sends reminders weekly for at least 10 weeks 0 = Instructor sends reminders weekly for less than 10 weeks
Use of proactive communication style
% of weekly affirmations to students 1 = Instructor sends affirmations every week during the semester 0 = Instructor sends affirmations less than every week (15 or 16 weeks?)
Contact at-risk students
% of students identified as at risk by the monitoring system (students who repeat the course) on the first day of class who were contacted by the instructor in the first week of class
1 = At least 80% of at-risk students were contacted by instructor 0 = Less than 80% of students were contacted by the instructor
Weekly follow-up with students missing previous week assignments
% of students who received follow-up after missing assignments (indicated as “absent”)
1 = At least 80% of students with missing assignments were contacted by instructor 0 = Less than 80% of students were contacted by the instructor
Attempt to contact students who have not logged into course for 7 days
% of students who were contacted after not logging into the course for 7 days.
1 = At least 80% of students not logging in were contacted by instructor 0 = Less than 80% of students were contacted by the instructor
Use of minority images in class
# of minority images on LMS 1 = Instructor incorporates at least 2 minority images in classroom materials for 14 weeks of the semester. 0 = Instructor incorporates minority images in classroom materials less than 14 weeks of the semester.
Incorporation of multicultural components into major assignments
# major assignments with multicultural components.
1 = Instructor has at least one major assignment with a multicultural component 0 = Instructor does not have any major assignments with a multicultural component
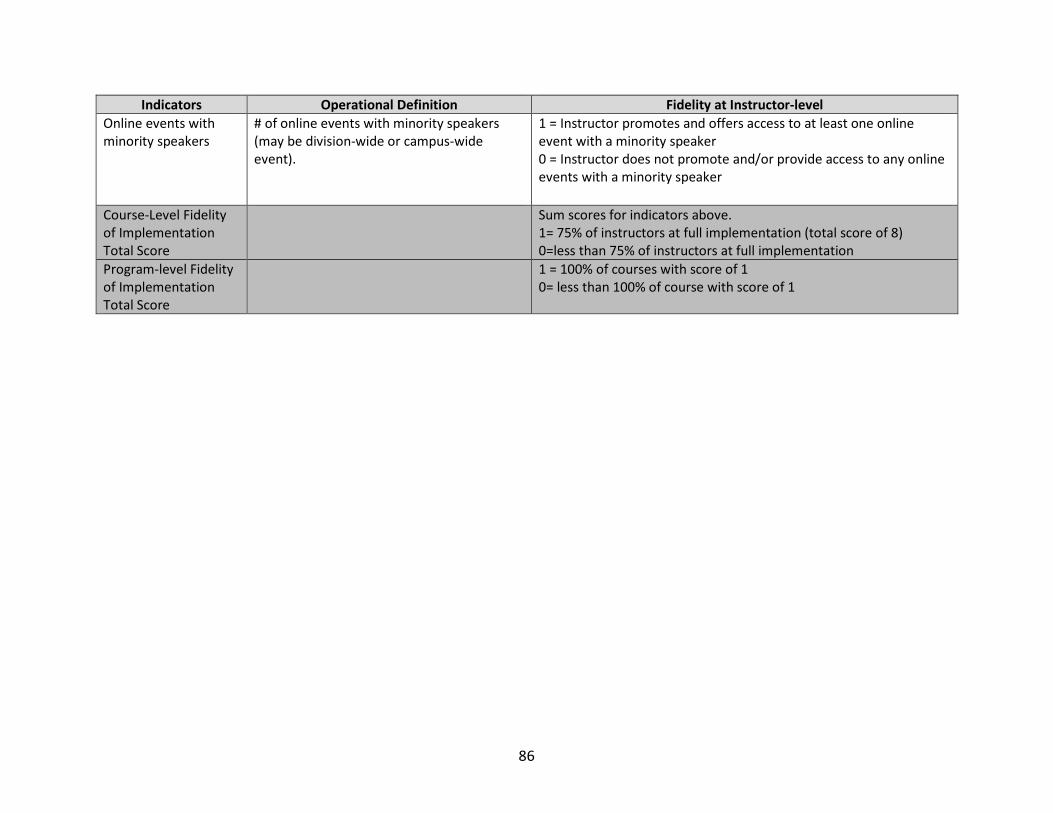
86
Indicators Operational Definition Fidelity at Instructor-level Online events with minority speakers
# of online events with minority speakers (may be division-wide or campus-wide event).
1 = Instructor promotes and offers access to at least one online event with a minority speaker 0 = Instructor does not promote and/or provide access to any online events with a minority speaker
Course-Level Fidelity of Implementation Total Score
Sum scores for indicators above. 1= 75% of instructors at full implementation (total score of 8) 0=less than 75% of instructors at full implementation
Program-level Fidelity of Implementation Total Score
1 = 100% of courses with score of 1 0= less than 100% of course with score of 1
87
APPENDIX G: PROJECT COMPASS PRESENTATIONS AND PUBLICATIONS Conference Presentations
1. Roddenberry, C.A. (November 2016). Using Online meeting Technology to Create Non-Instructional Activities. Association for the Advancement of Computing in Education, ELearn Conference (Arlington, VA).
2. Roddenberry, C.A. (November 2016). Achieving High-Touch through High-Tech: A Strategic Deployment of Online Technology to Improve the Educational Experience of Performance of Minority Students. Association for the Advancement of Computing in Education, ELearn Conference (Arlington, VA).
3. Roddenberry, C.A., McElvaney, C., Minor, A., Arnette, R. (February 2017). Breaking Down the Walls: Using “Presence Building” Technologies to Improve Student Engagement and Performance in Online Introductory Psychology. North Carolina State University, Scholar-Practitioner Summit (Raleigh, NC).
4. Roddenberry, C.A. (February 2017). Breaking Down the Walls: Using “Presence Building” Technologies to Improve Student Engagement and Performance in Online Introductory Psychology. Instructional Technology Council eLearning Conference (St. Petersburg, FL).
5. Rankin T., & Roddenberry, C. (March 2017). Coordinating Interaction-Facilitating Software to Improve Student Engagement and Outcomes. League for Innovation in the Community College (San Francisco, CA).
6. Roddenberry, C.A. (May 2017). Operation Graduating Gilbert: A Multi-Episode Spy Adventure. Association for Psychological Science Annual Convention (Boston, MA).
7. Roddenberry, C. (June 2017). Full Stream Ahead: Creating Interactive Live Stream Educational Programming. League for Innovation in the Community College, Learning Summit (Phoenix, AZ).
8. Roddenberry, C. (June 2017). The value and challenges of using web conferencing technology to integrate online students into campus activities. Association for the Advancement of Computing in Education, EdMedia Conference 2017 (Washington, DC).
9. Rankin T., & Roddenberry, C. (July 2017). Full Stream Ahead: Connecting Online Learners to Campus Using Synchronous Interaction Tools. Distance Teaching & Learning Conference (Madison, WI).
88
10. Roddenberry, C. (July 2017). Operation Graduating Gilbert: A Multi-Episode Spy Adventure. Distance Teaching & Learning Conference (Madison, WI).
11. Minor, A., Rankin T., & Roddenberry, C. (October 2017). Engaging the Online Student: Support for a Semi-intrusive Course Management Model. NC Community College Association of Distance Learning Conference 2017 (Cary, NC).
12. Evans, S. & Roddenberry, C. (October 2017). Engaging the Learner: Operation Graduating Gilbert. NC Community College Association of Distance Learning Conference 2017 (Cary, NC).
13. Roddenberry, C.A., & Rankin, T.E. (February 2018). Engaging the Online Student: Support for a Semi-Intrusive Course Management Model. Instructional Technology Council eLearning Conference (Tucson, AZ).
14. Roddenberry, C.A., & Rankin, T.E. (February 2018). Maximizing Fusion: Integrating Instructional Design Teams to Build More Engaging Online Courses. Instructional Technology Council eLearning Conference (Tucson, AZ).
15. Roddenberry, C.A., Rankin, T.E., Edmunds, J., Gicheva, D., Thrift, B., Bray, J, Hull, M., Wang, K., & Ryan, B. (February 2018). Project COMPASS: Using Rigorous Evaluation to Change How a Community College Looks at Their Programs. Society for Research on Educational Effectiveness Conference (Washington, DC).
16. Roddenberry, C.A. & Rankin, T.E. (February 2018). The Implementation of Project COMPASS. Society for Research on Educational Effectiveness Conference (Washington, DC).
17. Evans, S., Roddenberry, C. & Bowers, C. (March 2018). Operation Graduating Gilbert: Comparing the Impact of Several Engagement-Related Enhancements on Student Course Perceptions. Association for the Advancement of Computing in Education, Society for Information Technology & Teacher Education International Conference (Washington, DC).
18. Rankin, T.E. & Tribble, P. (March 2018). Open for Business: Introduction to OER and One Business Instructors Open Source Journey. Wake Technical Community College Faculty Professional Development Conference. (Raleigh, NC).
19. Roddenberry, C.A., Rankin, T.E., & Minor, A. (March 2018). The High-Tech/High-Touch teaching model helps students succeed. League for Innovation in the Community College, Innovations Conference (National Harbor, MD).
89
20. Roddenberry, C.A. (May 2018). Course Design as a Means of Improving Student Engagement in Online Classes. Association for Psychological Science Annual Convention (San Francisco, CA).
21. Edmunds, J., Wang, K., & Ryan, B. (October 2018). Project COMPASS: Developing the Capacity for Educational Effectiveness Research while Improving Minority Student Performance in Online Courses. North Carolina Community College System Conference (Raleigh, NC).
22. Roddenberry, C.A. & Rankin, T.E. (October 2018). High-Tech/High-Touch Teaching Method: Creating an Engagement-Enhanced Online Class. North Carolina Community College System Conference (Raleigh, NC).
23. Roddenberry, C. & Chi, M., Harris, G. (October 2018). Using Web Conferencing to Build a Persistent Virtual Campus Experience for Student Use. Association for the Advancement of Computing in Education, E-Learn World Conference on E-Learning (Las Vegas, NV).
24. Henry, M. (October 2018). Leveraging Online Learning Student Success with Soft and
Hard Deadlines. Association for the Advancement of Computing in Education, E-Learn World Conference on E-Learning (Las Vegas, NV).
25. Evans, S., & Bowers, C. (November 2018). The Storyline Course: Using Narrative Structure to Create an Inclusive Online Introductory Psychology Design. Online Learning Consortium, Accelerate Conference (Orlando, FL).
26. Henry, M., Anderton, A. & Bouknight-Lyons, C.A. (January 2019). Using a Tiered Technology Approve to Improve Student Success in Online Learning. Lilly Evidence-Based Teaching and Learning Conference (Austin, TX).
27. Henry, M., Anderton, A. & Bouknight-Lyons, C.A. (February 2019). Using a Tiered Technology Approve to Improve Student Success in Online Learning. Instructional Technology Council, eLearning Conference (Las Vegas, NV).
28. Henry, M., Anderton, A. & Bouknight-Lyons, C.A. (February 2019). Using a Tiered Technology Approve to Improve Student Success in Online Learning. Instructional Technology Council, eLearning Conference (Las Vegas, NV).
29. Edmunds, J., Wang, K., Roddenberry, C., Ryan, B., Gicheva, D., & Thrift, B. (March 2019). Identifying Factors Influencing Impact Estimates in Project COMPASS. Society for Research Effectiveness in Education Symposium (Washington, DC).
90
30. Edmunds, J., Wang, K., Roddenberry, C., Bray, J., Ryan, B., Gicheva, D., & Thrift, B. (March 2019). Improving College Outcomes: Evidence from New Interventions, The Impact of Project COMPASS. Association for Education Finance and Policy Conference (Kansas City, MO).
31. Evans, S., & Bowers, C. (March 2019). How to Submit a Course to the Blackboard Exemplary Program. Wake Technical Community College Spring 2019 Faculty Professional Development Conference (Raleigh, NC).
32. Roddenberry, C., & Bowers, C. (July 2019). Student Engagement in Online Courses (Roundtable). Blackboard World Conference (Austin, TX).
33. Henry, M. (August 2019). Influence of Course Design and Enhanced Instruction on Retention and Success in High-Attrition Online Classes. Distance Teaching & Learning Conference (Madison, WI).
34. Roddenberry, C. (October 2019). Using Web Conferencing to Build a Persistent Virtual Campus Experience. Instructional Technology Council eLearning Conference (Las Vegas, NV).
35. Roddenberry, C. (May 2019). High-Tech/High-Touch Teaching Method: Creating an Engagement-Enhanced Online Class. National Institute for Staff and Organizational Development (Austin, TX).
36. Henry, M. (June 2019). Using a Tiered Technology Approve to Improve Student Success in Online Learning. Innovation Education Colorado Conference (Keystone, Colorado).
Published Conference Proceedings
1. Roddenberry, C. (2016). Achieving high touch through high tech: A strategic deployment of online technology to improve educational experience and performance of minority students. In Proceedings of Association for the Advancement of Computing in Education (AACE) E-Learn: World Conference on E-Learning. Washington, DC. November 2016.
2. Roddenberry, C. (2016). Using online meeting technology to create non-instructional opportunities for online students. In Proceedings of Association for the Advancement of Computing in Education (AACE) E-Learn: World Conference on E-Learning. Washington, DC. November 2016.
3. Roddenberry, C. (2017). The value and challenges of using web conferencing technology to integrate online students into campus activities. In J. Johnston (Ed.), Proceedings of
91
Association for the Advancement of Computing in Education (AACE) EdMedia 2017. Washington, DC. June 2017.
4. Roddenberry, C. (2017). Operation Graduating Gilbert and Whole Student Success. In Proceedings of Distance Teaching & Learning Conference 2017. Madison, WI. July 2017.
5. Rankin, T.E., & Roddenberry, C. (2017). Synchronous Interaction Tools and Blended Learning. In Proceedings of Distance Teaching & Learning Conference 2017. Madison, WI. July 2017.
6. Rankin, T.E., & Roddenberry, C. (2018). Measure Thyself: A case study involving a self-observational method for assessing the fidelity of implementation of an educational intervention. In Proceedings of Society for Research on Educational Effectiveness 2018. Washington, DC. February 2018.
7. Ryan, B., & Wang, K. (2018). Project COMPASS: Lessons Learned about and from Implementing an Experimental Study. In Proceedings of Society for Research on Educational Effectiveness 2018. Washington, DC. February 2018.
8. Evans, S., Roddenberry, C. & Bowers, C. (2018). Operation Graduating Gilbert: Student Perceptions of a Unique Course Design. In E. Langran & J. Borup (Eds.), Proceedings of Association for the Advancement of Computing in Education (AACE) Society for Information Technology & Teacher Education International Conference. Washington, DC. March 2018.
9. Roddenberry, C.A., Chi, M. & Harris, G. (2018). Using Web Conferencing to Build a Persistent Virtual Campus Experience for Student Use. In Proceedings of Association for the Advancement of Computing in Education (AACE) ELearn Conference. Las Vegas, NV. October 2018.
10. Henry, M., Anderton, A. & Bouknight-Lyons, C.A. (2019). Using a Tiered Technology Approve to Improve Student Success in Online Learning. In Proceedings of Lilly Evidence-Based Teaching and Learning Conference. Austin, TX. January 2019.
92
Published Articles
1. Cook, L. (2016). How Wake Technical is Taking a High-Tech, High-Touch Approach to Supporting At-Risk Students. Academic Impressions. February 2016. Retrieved from https://www.academicimpressions.com/blog/how-wake-technical-is-taking-a-high-tech-high-touch-approach-to-supporting-at-risk-students.
2. Rankin, T.E., & Roddenberry, C. (2017). Six High-Touch Processes for Improving Student Learning. Online Classroom. October 2017.
3. Evans, S., & Roddenberry, C. (2018). Web Conferencing Creates Highly Engaged Online Students in Introductory Psychology. E-Learn Magazine. March 2018.
4. Roddenberry, C., Evans, S., & Bowers, C. (2018). A simple way to gamify your courses for better student engagement. Online Classroom. April 2018. Retrieved from https://www.magnapubs.com/newsletter/online-classroom.
5. Evans, S., Bowers, C., & Roddenberry, C.A. (2018). A Professional Profile of an Award Winning Instructional Team. Journal of Scholarly Engagement. November 2018. Retrieved from https://scholarlyengagement.com/home/currentissue/volume1issue2/evansbowersroddenberry.
6. Evans, S., Rhodes, M., & Anderton, A. (2018). Using Texting Tools to Reinforce Communication in the Online Classroom. E-learn Magazine Special Issue: Instructional Technology to Impact eLearning. December 2018. Retrieved from https://elearnmag.acm.org/archive.cfm?aid=3236711.
7. Roddenberry, C.A. & Fister, M. (2018). Web Conferencing Supports the Wake Tech High School Equivalency Program. E-learn Magazine. December 2018. Retrieved from https://elearnmag.acm.org/archive.cfm?aid=3236699.
8. Roddenberry, C.A. (2019). Best Practices for Using Webinars in Online Teaching. Online
Classroom. August 2019. Retrieved from https://www.teachingprofessor.com/topics/online-learning/best-practices-for-using-webinars-in-teaching.
9. Gicheva, D., Edmunds, J.A., Thrift, B., Hull, M., & Bray, J. (in press). Conducting a
randomized controlled trial in education: Experiences from an online postsecondary setting. SAGE Research Methods Cases.


