Embed Size (px)
Citation preview
Cropping System
s
450 Agronomy Journa l • Volume 102 , I s sue 2 • 2010
Published in Agron. J. 102:450–456 (2010)Published online 5 Jan. 2010doi:10.2134/agronj2009.0327Copyright © 2010 by the American Society of Agronomy, 5585 Guilford Road, Madison, WI 53711. All rights re-served. No part of this periodical may be reproduced or transmitted in any form or by any means, electronic or mechanical, including photocopying, recording, or any information storage and retrieval system, without permission in writing from the publisher.
Agronomists often perpetuate ineffi cient produc-tion systems by presenting data that supports the goal of
maximizing production instead of maximizing profi ts. Few agronomic studies examine both the productivity and profi t-ability of cropping systems. If production costs continue to increase and profi t margins become smaller, crop producers will increasingly scrutinize their crop production costs. Con-sequently, agronomic research should include some measure of system or treatment profi tability. Singer et al. (2003) compared the profi tability of grain and forage crop rotations using chisel plow or no-tillage practices. Th ey reported rotations includ-ing alfalfa (Medicago sativa L.) increased returns to land and management compared solely to grain or seed crop rotations, mainly by lowering N inputs. In the absence of forage markets, grain and oilseed cropping systems that include organic amend-ments and green manures can off set fertilizer inputs, among other benefi ts, by enhancing nutrient cycling.
Singer and Cox (1998a) compared corn production in continuous corn, corn–soybean, and a 3-yr rotation of corn–soybean–wheat/red clover (Trifolium pratense L.). Nitrogen fertilizer input was reduced 25% in the 2- and 3-yr rotation
compared with continuous corn and corn yielded 10% higher than continuous corn with greater fertilizer N. Th e corn–soybean rotation had higher returns than the 3-yr rotation because wheat yields averaged 3696 kg ha–1 and the wheat price averaged $0.14 kg–1 during the period from 1994 to 1996 compared with corn, which averaged 9343 kg ha–1 with a price of $0.13 kg–1 (Singer and Cox, 1998b). Th e red clover green manure was only credited with 45 kg N ha–1, which was similar to the soybean credit. Meyer-Aurich et al. (2006) reported rotations that included wheat had yearly net returns that were greater than the rotation that only included corn and soybean and the full economic benefi t of including wheat in the rota-tion was only fully realized when wheat was interseeded with red clover. In their economic analysis, production costs were 1% lower for chisel plow compared with moldboard plow in corn, soybean, and wheat (Meyer-Aurich et al., 2006).
Archer et al. (2007) compared economic returns for conven-tional and organic crop rotations using conventional and strip tillage. Th e conventional system used commercial fertilizer while the organic rotations used manure to supply nutrients. Total production costs for the corn–soybean–wheat/alfalfa–alfalfa rotation in the conventional system using conventional tillage was $454 ha–1 compared with $459 ha–1 in the same rotation and tillage in the organic system (Archer et al., 2007). Seventy-fi ve percent of the higher costs for seed, chemical, and fertilizer in the conventional system compared with the organic system were off set by the costs for manure hauling and load-ing. In their analysis they assumed no cost for purchasing the manure and a cost of $6.61 Mg–1 for solid manure for mixing, loading, and transporting within 1.6 km of the fi eld.
Singer et al. (2004 and 2007) reported a tillage × amend-ment interaction for no-tillage with and without compost amendment for corn and soybean. Quantifying the economic benefi t of reduced tillage and compost amendment will assist
ABSTRACTProductivity rather than profi tability is oft en used to compare agronomic systems. Th e objective of this study was to compare profi tability of moldboard plow, chisel plow, and no-tillage with or without composted animal manure in a corn (Zea mays L.)–soybean [Glycine max (L.) Merr.]–wheat (Triticum aestivum L.)/clover (Trifolium spp.) rotation during three rotation cycles. Corn and soybean grain and seed yield exhibited a tillage × compost amendment interaction. Yield in moldboard and chisel plow with or without compost was similar, but yield in no-tillage with compost was 8 and 5% greater than without compost for corn and soybean. Wheat yielded 5% higher in moldboard and chisel plow than no-tillage and 4% higher in compost than no-compost amendment. Wheat returns were similar among tillage and 7% higher when compost was amended. Corn production with or without compost amendment had similar returns in moldboard plow. Corn in chisel plow with compost had 8% greater returns than the no-compost treatment. Corn in no-tillage with compost had 15% greater returns with compost amendment than without. Similar corn returns were generated for all tillage systems if compost was applied. Soybean production using no-tillage had 9% greater returns than without compost and greater returns than moldboard and chisel plow with or without compost. Summing returns across the three-crop rotation indicated cycling nutrients through compost application exhibits a functional synergy in no-tillage and chisel plow but not moldboard plow for these crops, which enhances their profi tability.
J.W. Singer, USDA-ARS, and K.A. Kohler, 2110 University Blvd., Ames, IA 50011; C.A. Chase, Iowa State Univ., 720 7th Ave. SW, Tripoli, IA 50696.Received 27 Aug. 2009. *Corresponding author ([email protected]).
Profi tability of Cropping Systems Featuring Tillage and Compost
Jeremy W. Singer,* Craig A. Chase, and Keith A. Kohler
Agronomy Journa l • Volume 102, Issue 2 • 2010 451
producers in optimizing their production systems. Conse-quently, the objective of this work was to compare returns to land and management for moldboard plow, chisel plow, and no-tillage with or without composted animal manure in a corn–soybean–wheat/clover rotation during three rotation cycles from 1999 to 2007.
MATERIALS AND METHODSField research was conducted at the Iowa State University
Agronomy and Agricultural Engineering Research Farm near Boone, IA (42°01́ N, 93°45́ W, 341 m above sea level) from 1999 through 2007 on Canisteo silty clay loam (fi ne-loamy, mixed, superactive, calcareous, mesic Typic Endoaquolls) and Clarion loam (fi ne-loamy, mixed, superactive, mesic Typic Hapludolls) soils. Th e experimental site had been in continu-ous corn production from 1987 to 1996, with tillage main plots consisting of moldboard plow, chisel plow, and no-tillage since 1988. In 1997 the entire site was planted to soybean. Soil sam-ples collected from the top 18 cm in 1997 indicated that tillage had not aff ected soil pH (6.7), OM (63 g kg–1), P (Bray-1, 54 mg kg–1), or K (ammonium acetate extraction, 210 mg kg–1) levels. Organic matter concentrations were determined by dry combustion using a LECO CHN-2000 (LECO Corp., St. Joseph, MI).1 In 1998, a corn–soybean–wheat/clover rotation was initiated with all phases represented each year (Table 1) in each tillage system.
Th e experimental design was a randomized complete block in a split-plot treatment arrangement with four replicates. Tillage main plots, 22.8 m wide by 27.4. m long, were fall moldboard plow, fall chisel plow, and no-tillage before corn and soybean rotational phases. Moldboard plow depth was approximately 20 cm. Chisel plow depth was 25 cm using twisted shanks. Spring secondary tillage operations included an early spring disking and a preplant fi eld cultivation in moldboard and chisel plow systems. Aft er soybean harvest and before wheat seeding, moldboard plow plots had one pass with a tandem disk and one pass with a fi eld cultivator, chisel plow plots had one pass with a fi eld cultivator, and no tillage was performed in the no-tillage plots. A no-till planter with 76 cm wide rows and row cleaners was used to plant all corn plots. Th e same planter was used to plant soybean plots from 1999 to 2004 and a grain drill with 15 cm wide rows was used from 2004 to 2006. Wheat was drilled in 19 cm wide rows from 1998 to 2003 and in 15 cm wide rows from 2004 to 2006.
Subplots, 7.6 m (10 rows with a 76 cm row spacing) wide by 13.1 m long, consisted of the application of compost (amended) or no-compost. Bedded swine manure compost was applied from 1998 to 2003 and beef cattle compost was applied from
2004 to 2006. Both swine and cattle manure was mixed with corn stalks or grain straw bedding and was approximately 6 to 9 mo old before land application. Th e compost process was facilitated by using a manure spreader to homogenize the material via repiling. Composition of compost used during the study period is presented in Table 2. Th e compost application rate during the fi rst crop rotation cycle (1998–2000) was set at 8000 kg C ha–1 per application, reduced to 4000 kg C ha–1 during the second cycle (2001–2003), and changed to a P removal basis from 2004 to 2006 (Table 2). Compost was applied aft er corn and wheat/clover from 1998 to 2003 and only aft er wheat/clover from 2004 to 2006. Th e P removal rate was based on the P removal of corn, soybean, and wheat grain or seed during the 3-yr rotation (35, 22, and 16 kg P ha–1, respectively). In 1998, 1999, 2000, and 2001, the straw residue aft er wheat harvest was allowed to remain on the compost plots, but was removed from the no-compost plots. In subse-quent years, all wheat straw was baled. Straw yields were not determined in this study. For the economic analysis, a harvest index of 0.3 was used to estimate wheat straw yield with the assumption that 90% of the wheat straw was harvestable.
Compost was applied mechanically and by hand during the study period. Th e fall moldboard plow and chisel plow opera-tions were conducted within 3 d aft er compost application. Compost moisture content was determined by drying at 70°C for 48 h. Compost total C and N were determined aft er acidi-fi cation with 0.5N HCl (1:2 sample/solution ratio), air drying, grinding, and dry combustion in a Carlo-Erba NA1500 NCS elemental analyzer (Haake Buchler Instruments, Paterson, NJ). Compost P and K were determined on dried ground samples aft er digestion with 10 mL DI water, 5 mL HNO3, and 1 mL HCl. Compost samples from 2004 to 2006 were acidifi ed with 0.44 M tartaric acid instead of HCl. Potassium was analyzed using atomic absorption in emission mode, while P was deter-mined colorimetrically using ascorbic acid and ammonium molybdate. Eight soil cores to a depth of 18 cm were collected in the spring in each subplot to monitor changes in P, K, and organic matter concentrations. Potassium was surface applied to all no-compost plots in April of 2004 at a rate of 101 kg ha–1 based on soil test results. All no-compost plots had optimal or higher levels of P throughout the study period and only required one application of K. Consequently, we assume these elements were not limiting in the no amendment treatment and did not confound amendment treatment response.
Corn hybrid ‘Pioneer Brand 3563’ was planted from 1999 to 2001, ‘Pioneer Brand 35P12’ was planted from 2002 to 2004, and ‘Dekalb DKC59–08’ was planted from 2005 to 2007 in mid to late April from 1999 to 2006 and on 11 May 2007 at a seeding rate of 81,510 seeds ha–1. Starter fertilizer was not applied. Late spring soil NO3–N concentrations were used to determine sidedress N application rates in compost and no-compost treatments. In 1999, 2001, and 2002, rates were
Table 1. Sequence of corn (C), soybean (S), and wheat/clover (W/Cl) and frequency of compost application for the period from 1996 to 2007 near Ames, IA. The site had been managed in continuous corn (CC) from 1988 to 1996.
1996 1997 1998 1999 2000 2001 2002 2003 2004 2005 2006 2007CC S W/Cl† C† S W/Cl† C† S W/Cl† C S W/ClCC S S W/Cl† C† S W/Cl† C† S W/Cl† C SCC S C† S W/Cl† C† S W/Cl† C S W/Cl† C
† Fall compost application.
1 Mention of trade names or commercial products is solely for the purpose of providing specifi c information and does not imply recommendation or endorsement by the U.S. Department of Agriculture.
452 Agronomy Journa l • Volume 102, Issue 2 • 2010
averaged across tillage systems. In 2000, six rates were applied for each tillage × amendment combination. In 1999, 2001, and 2002, 151, 174, and 123 kg N ha–1 was applied to no-compost plots, and 118, 151, and 67 kg N ha–1 was applied to compost plots. In 2000, 162, 106, and 106 kg N ha–1 was applied to the no-compost plots in no-tillage, chisel plow, and moldboard plow systems, respectively, while the compost plots received 146, 84, and 62 kg N ha–1 for the three tillage systems. In 2003, all compost plots received 101 kg N ha–1, while no-com-post plots in no-tillage, chisel, and moldboard plow received 162, 157, and 112 kg ha–1. In 2004 and 2005, compost plots received 101 and 67 kg N ha–1, while no-compost plots received 168 and 146 kg N ha–1. In 2006, compost plots received 67 kg N ha–1 and no-compost plots in no-tillage, chisel, and moldboard plow received 134, 95, and 95 kg ha–1. In 2007, compost plots received 101 kg ha–1 while no-compost plots received 168 kg ha–1. Starting in 2002, the compost history was considered similar to a manure history, which signifi cantly lowered N inputs on compost plots. All sidedress N was 32% urea ammonium nitrate applied using a point-injector applica-tor and was applied between V4 and V5 (Hanway, 1963).
Soybean variety ‘Pioneer Brand 9294’ was planted from 1999 to 2001, ‘Pioneer Brand 92B84’ from 2002 to 2004, and ‘Asgrow Brand 2203’ from 2005 to 2007 was planted in early to mid-May all years at a rate of 444,600 seeds ha–1. No fertilizer was applied during the soybean phase of the rota-tion except for the K application in the spring of 2004. Wheat variety ‘Arapahoe’ was planted from 1998 to 2003 and ‘Karl 92’ was planted from 2004 to 2006 in October at a rate of 3.2 million seeds ha–1. ‘Jerry’ oat was planted in the spring of 2001 because wheat winterkilled. ‘Bigbee’ berseem clover (Trifolium
alexandrinum L.) was frost seeded in March of 1998 and 1999 while ‘Cherokee’ red clover was frost seeded in March of 2000 to 2006 at 20 kg seed ha–1 using a drop spreader. ‘Southern Belle’ red clover replaced ‘Cherokee’ in 2007 using the same seeding rate. Ammonium nitrate fertilizer was topdressed in wheat annually in early April at a rate of 45 kg N ha–1. Clover was chemically killed each fall. Typical management practices were used for corn and soybean weed control. No herbicide was applied to wheat. All crops were harvested with a plot combine. Th ree interior 76 cm corn and soybean rows were harvested aft er end-trimming, while the entire subplot was harvested for drilled soybean and wheat. Reported grain yields were adjusted to a moisture content of 155, 130, and 130 g kg–1 for corn, soybean, and wheat, respectively.
Machinery costs were determined by applying estimates to the cultural practices for each tillage and amendment treat-ment using Duff y and Smith (2007 and previous years). Th e standardization of costs per operation eliminated diff erences from machinery repairs and depreciation and allowed the focus to be on the fi eld practice. Seed, chemical, and fertilizer expenses were the actual expenses paid by the research project (Table 3). Other crop expense was estimated using Duff y and Smith (2007 and previous years) and included crop insurance, miscellaneous expenses, and interest on preharvest expenses. Miscellaneous expenses could include cost items such as crop enterprise record-keeping fees, magazine subscriptions, organi-zational member fees and other crop-related expenses that do not fi t neatly into one of the other cost categories.
Th e analysis of returns focuses on the returns to land and management using the higher of average crop prices or govern-ment support price (Table 4). Prices listed are marketing year
Table 2. Composition and application rate of fall 1998 to 2006 compost amendment.
Year H2O P K C N C:N Compost N P Kg kg–1 dry Mg ha–1 kg ha–1
1998 340 – – 114 10.6 10.8 61.6 653 – –1999 318 5.0 11.2 105 7.6 13.8 74.7 568 374 8372000 311 7.2 16.1 147 13.0 11.3 54.1 703 390 8712001 415 6.2 13.7 227 13.9 16.3 22.3 310 138 3062002 433 3.1 13.2 175 11.0 15.9 15.7 172 49 2072003 523 9.0 15.5 216 16.4 13.2 15.2 241 137 2362004 374 5.7 16.6 218 16.7 13.1 13.2 220 75 2192005 348 4.5 14.6 164 11.0 14.9 6.9 76 31 1012006 505 6.3 12.8 220 13.7 16.1 9.4 129 59 120
Table 3. Input prices during the study period.
Input 1999 2000 2001 2002 2003 2004 2005 2006 2007$
Seed Corn, 80,000 kernel unit 93.90 93.90 93.90 113.96 113.96 113.96 82.25 82.25 82.25 Soybean, 22.6 kg unit 24.55 24.55 24.55 26.95 26.95 26.95 27.36 27.36 27.36 Wheat, kg 0.37 0.37 0.37 0.37 0.37 0.37 1.10 1.10 1.10 Clover, kg 3.46 3.75 3.75 3.75 3.75 3.75 3.75 3.75 3.75Fertilizer UAN 32%, kg 0.37 0.44 0.62 0.46 0.44 0.51 0.60 0.84 0.97 NH4NO3, kg 0.44 0.62 0.79 0.66 0.64 0.71 0.75 1.23 1.26 K, kg 0.26Herbicide Dual II†, L 15.05 17.01 21.69 21.69 27.51 19.63 18.61 Roundup‡, L 8.99 8.60 8.47 11.77 11.85 11.85 12.40 3.44 2.79† Dual II Magnum was used in 2001, 2003, 2004, 2006, and 2007.
‡ Roundup Ultra, UltraMAX, or WeatherMAX were used from 1999 to 2005 and Roundup original in 2006 and 2007.
Agronomy Journa l • Volume 102, Issue 2 • 2010 453
average price received by farmers in Iowa (USDA-NASS, 2007). For 1999, 2000, and 2001 (soybean only), the aver-age price received was lower than the estimated average Iowa county loan rate over the study period. Aft er 2001, all average prices received were above the estimated county loan rate. Th e higher of the average price or county loan rate takes into account the price support off ered by loan defi ciency pay-ments. Th e other two payments received by farmers (direct and counter-cyclical) are not considered in this paper. Direct and counter-cyclical payments are not based on actual production and are not aff ected by what is actually produced on the land. Th erefore, they would be the same regardless of tillage and amendment treatment. Wheat straw price was assumed to be $45 Mg–1.
Gross revenues were determined by multiplying price by yield. Production costs were subtracted from gross revenues to determine economic returns to land, labor, and manage-ment. To calculate economic returns to land and manage-ment, labor costs were subtracted. Th e wage rates used varied by year (Duff y and Smith, 2007 and previous years) and were estimated by the number of hours of fi eldwork (Table 5). Estimated hours for fi eldwork for the moldboard and chisel plow treatments diff ered only slightly (0.10–0.12 h ha–1). Land charges are not considered in this study. Consequently, this study assumes debt charges, equity charges, real estate taxes, and other land ownership costs are not aff ected by tillage and amendment.
Analysis of variance was conducted using the PROC MIXED routine of SAS v9.2 to test for main and interaction eff ects. Block and year and their interactions were considered random eff ects, while tillage and amendment were considered fi xed eff ects. Least squares means are presented for main and interaction eff ects and are compared using the PDIFF routine
in SAS, which produces a probability value for each pairwise comparison. All results were considered signifi cant if P values were ≤ 0.05.
RESULTS AND DISCUSSIONGrain and Seed Yield
Wheat yield during the study period was highly infl uenced by tillage and compost amendment, but did not exhibit an interaction to these factors (Table 6). Wheat growing on compost-amended soil had 4% greater grain yield than the no-compost treatment. Wheat yield was similar between moldboard plow and chisel tillage (4484 and 4507 kg ha–1) (P = 0.73), both of which were greater than no-tillage (4294 kg ha–1) (P < 0.01). Cavigelli et al. (2008) reported simi-lar wheat yield between chisel tillage (4.26 Mg ha–1) and no-till
Table 5. Estimated fi eldwork by crop, tillage, and amendment, 1999 to 2007.†
Tillage/amendment Fieldworkh ha–1
Moldboard plow/no-compostWheat 2.87Corn 2.84Soybean 2.54Chisel plow/no-compostWheat 2.67Corn 2.77Soybean 2.47No-tillage/no-compostWheat 2.54Corn 2.12Soybean 1.70Moldboard plow/compostWheat 2.84Corn 4.69Soybean 3.61Chisel plow/compostWheat 2.64Corn 4.62Soybean 3.53No-tillage/compostWheat 2.52Corn 4.03Soybean 2.77† Estimates are for fi eldwork activities from Hanna (2001) and include travel time to and from the fi eld for a 1.6 km roundtrip for compost application and harvesting.
Table 6. Corn and soybean grain and seed yield for moldboard plow (MP), chisel plow (CT), and no-tillage (NT) main effect and compost amendment subplot analyzed across years (1999–2007) using year as a random effect. Wheat grain yield is presented from 2000 to 2007. In the spring of 2001, oat was planted because wheat winterkilled.
Treatment Wheat yield Corn yield Soybean yieldkg ha–1
MP no 4457 12648 4022MP yes 4511 12456 4117CT no 4391 12131 3905CT yes 4624 12504 4010NT no 4200 11266 3823NT yes 4389 12216 4115
ANOVA P > FTillage <0.01 <0.01 0.12Amendment <0.01 <0.01 <0.01Tillage × amendment 0.23 <0.01 0.05
P > tMP no vs. MP yes – 0.37 0.14CT no vs. CT yes – 0.08 0.10NT no vs. NT yes – <0.01 <0.01MP no vs. CT no – 0.05 0.12MP no vs. CT yes – 0.57 0.87MP no vs. NT no – <0.01 <0.01MP no vs. NT yes – 0.09 0.21CT no vs. NT no – <0.01 0.27CT no vs. NT yes – 0.74 <0.01
Table 4. Prices received by Iowa farmers, 1999 to 2007.†
Year Wheat Corn Soybean$ kg–1
1999 0.088/0.092 0.068/0.071 0.167/0.1912000 0.079/0.092 0.069/0.071 0.165/0.1912001‡ 0.057 0.075 0.160/0.1912002 0.105 0.087 0.2042003 0.105 0.093 0.2832004 0.112 0.078 0.2122005 0.114 0.076 0.2042006 0.123 0.119 0.2422007 0.193 0.169 0.386
† USDA, National Agricultural Statistics Service, Iowa Agricultural Statistics Bulletin. Marketing year average wheat, corn, and soybean prices received by Iowa farmers were less than the estimated loan rate in 1999 and 2000. The fi rst price listed is the actual price received by farmers. The second price is the estimated loan rate. Average soybean price received by Iowa farmers also was below the loan rate in 2001.
‡ Wheat winterkilled during the winter 2000/2001 and was replanted to oat in the spring of 2001. The 2001 price represents the marketing year average oat price received by Iowa farmers.
454 Agronomy Journa l • Volume 102, Issue 2 • 2010
(3.98 Mg ha–1) under mid-Atlantic growing conditions aver-aged across four growing seasons in a corn–soybean–wheat/double crop soybean rotation.
Corn yield exhibited a tillage × amendment interaction during the 9-yr study period. Yield in moldboard plow with or without compost was similar. Likewise, corn yield in chisel plow with or without compost was similar. But yield in no-till-age with compost was 8% greater than without compost. Mold-board plow without compost yielded 4% greater than chisel plow without compost. Chisel plow without compost yielded 8% greater than no-tillage without compost. However, all till-age systems had equal corn yield in the compost amendment
treatment. Cavigelli et al. (2008) reported similar corn yield between chisel tillage (8.03 Mg ha–1) and no-till (7.81 Mg ha–1) averaged across six growing seasons that received 165 kg N ha–1 each year, including starter. No starter fertilizer was used in this study and may have contributed to early season N defi ciency in no-till without compost. Averaged across amendment in 2003 at 47 d aft er planting, N uptake in moldboard plow and chisel plow was 8 kg ha–1 compared with 3 kg ha–1 in no-till, although no diff erences were detected in 2004 among tillage at the fi rst sampling date at 63 d aft er planting (Singer et al., 2007).
Soybean yield also exhibited a tillage × amendment inter-action. Yield in moldboard and chisel plow with or without compost was similar. But yield in no-tillage with compost was 8% greater than without compost. Moldboard plow without compost yielded 5% greater than no-tillage without compost, while chisel plow and no-tillage without compost amendment produced similar yields. Similar soybean yield in chisel tillage and no-till without compost is similar to Cavigelli et al. (2008). No-tillage with compost produced similar or greater seed yield than moldboard and chisel plow with or without compost amendment.
Previous results from this experiment reported a tillage × amendment interaction for corn and soybean in 2 of 4 yr during the fi rst 4 yr of this study (Singer et al., 2004). Wheat yield did not exhibit a tillage × amendment interaction, similar to the response reported herein. Additional experi-mentation in this study from 2003 to 2005 attempted to explain the mechanisms responsible for the tillage × amend-ment interaction in corn and soybean. In 2003 and 2004, an interaction was detected for corn (Singer et al., 2007), but possible reasons for this response were not identifi ed and not related to total N, P, or K uptake, soil water use, and dry matter partitioning. Additional soybean experimentation from 2003 to 2005 failed to identify an interaction, which eliminated the possibility of identifying causal relationships (Singer et al., 2008).
Production Costs
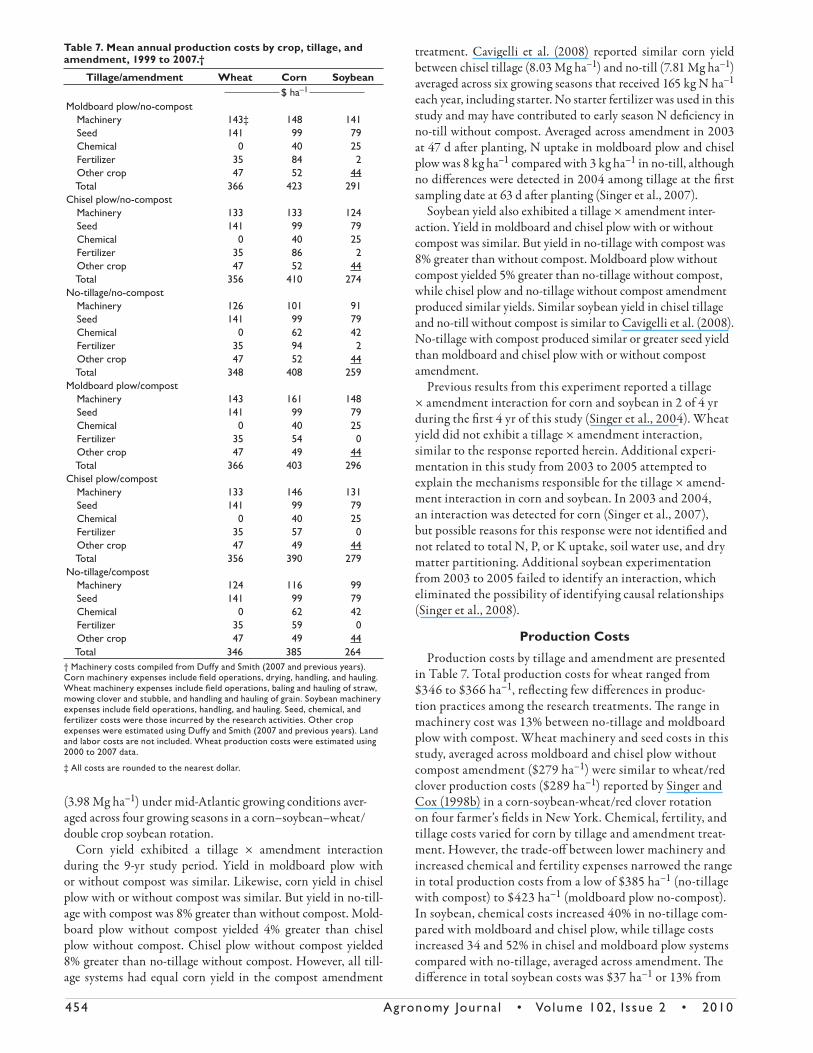
Production costs by tillage and amendment are presented in Table 7. Total production costs for wheat ranged from $346 to $366 ha–1, refl ecting few diff erences in produc-tion practices among the research treatments. Th e range in machinery cost was 13% between no-tillage and moldboard plow with compost. Wheat machinery and seed costs in this study, averaged across moldboard and chisel plow without compost amendment ($279 ha–1) were similar to wheat/red clover production costs ($289 ha–1) reported by Singer and Cox (1998b) in a corn-soybean-wheat/red clover rotation on four farmer’s fi elds in New York. Chemical, fertility, and tillage costs varied for corn by tillage and amendment treat-ment. However, the trade-off between lower machinery and increased chemical and fertility expenses narrowed the range in total production costs from a low of $385 ha–1 (no-tillage with compost) to $423 ha–1 (moldboard plow no-compost). In soybean, chemical costs increased 40% in no-tillage com-pared with moldboard and chisel plow, while tillage costs increased 34 and 52% in chisel and moldboard plow systems compared with no-tillage, averaged across amendment. Th e diff erence in total soybean costs was $37 ha–1 or 13% from
Table 7. Mean annual production costs by crop, tillage, and amendment, 1999 to 2007.†
Tillage/amendment Wheat Corn Soybean$ ha–1
Moldboard plow/no-compost Machinery 143‡ 148 141 Seed 141 99 79 Chemical 0 40 25 Fertilizer 35 84 2 Other crop 47 52 44 Total 366 423 291Chisel plow/no-compost Machinery 133 133 124 Seed 141 99 79 Chemical 0 40 25 Fertilizer 35 86 2 Other crop 47 52 44 Total 356 410 274No-tillage/no-compost Machinery 126 101 91 Seed 141 99 79 Chemical 0 62 42 Fertilizer 35 94 2 Other crop 47 52 44 Total 348 408 259Moldboard plow/compost Machinery 143 161 148 Seed 141 99 79 Chemical 0 40 25 Fertilizer 35 54 0 Other crop 47 49 44 Total 366 403 296Chisel plow/compost Machinery 133 146 131 Seed 141 99 79 Chemical 0 40 25 Fertilizer 35 57 0 Other crop 47 49 44 Total 356 390 279No-tillage/compost Machinery 124 116 99 Seed 141 99 79 Chemical 0 62 42 Fertilizer 35 59 0 Other crop 47 49 44 Total 346 385 264† Machinery costs compiled from Duffy and Smith (2007 and previous years). Corn machinery expenses include fi eld operations, drying, handling, and hauling. Wheat machinery expenses include fi eld operations, baling and hauling of straw, mowing clover and stubble, and handling and hauling of grain. Soybean machinery expenses include fi eld operations, handling, and hauling. Seed, chemical, and fertilizer costs were those incurred by the research activities. Other crop expenses were estimated using Duffy and Smith (2007 and previous years). Land and labor costs are not included. Wheat production costs were estimated using 2000 to 2007 data.
‡ All costs are rounded to the nearest dollar.
Agronomy Journa l • Volume 102, Issue 2 • 2010 455
a low of $259 ha–1 (no-tillage no-compost) to a high of $296 ha–1 (moldboard plow with compost).
Returns to Land and Management
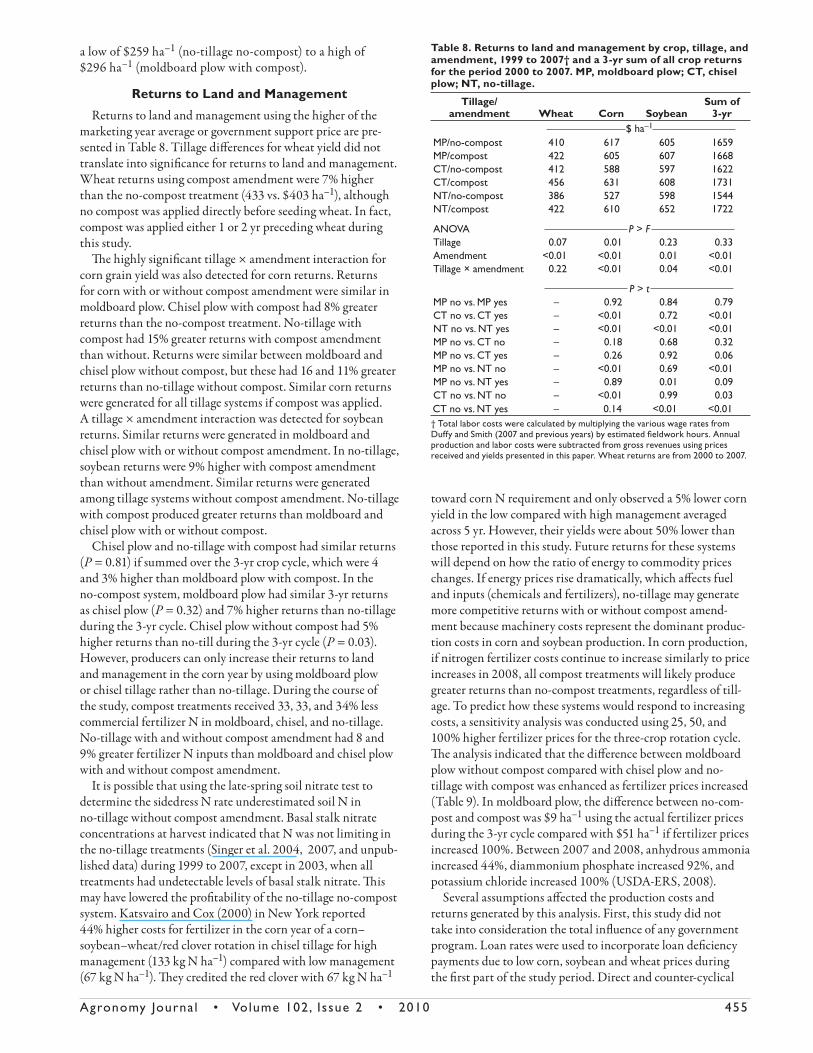
Returns to land and management using the higher of the marketing year average or government support price are pre-sented in Table 8. Tillage diff erences for wheat yield did not translate into signifi cance for returns to land and management. Wheat returns using compost amendment were 7% higher than the no-compost treatment (433 vs. $403 ha–1), although no compost was applied directly before seeding wheat. In fact, compost was applied either 1 or 2 yr preceding wheat during this study.
Th e highly signifi cant tillage × amendment interaction for corn grain yield was also detected for corn returns. Returns for corn with or without compost amendment were similar in moldboard plow. Chisel plow with compost had 8% greater returns than the no-compost treatment. No-tillage with compost had 15% greater returns with compost amendment than without. Returns were similar between moldboard and chisel plow without compost, but these had 16 and 11% greater returns than no-tillage without compost. Similar corn returns were generated for all tillage systems if compost was applied. A tillage × amendment interaction was detected for soybean returns. Similar returns were generated in moldboard and chisel plow with or without compost amendment. In no-tillage, soybean returns were 9% higher with compost amendment than without amendment. Similar returns were generated among tillage systems without compost amendment. No-tillage with compost produced greater returns than moldboard and chisel plow with or without compost.
Chisel plow and no-tillage with compost had similar returns (P = 0.81) if summed over the 3-yr crop cycle, which were 4 and 3% higher than moldboard plow with compost. In the no-compost system, moldboard plow had similar 3-yr returns as chisel plow (P = 0.32) and 7% higher returns than no-tillage during the 3-yr cycle. Chisel plow without compost had 5% higher returns than no-till during the 3-yr cycle (P = 0.03). However, producers can only increase their returns to land and management in the corn year by using moldboard plow or chisel tillage rather than no-tillage. During the course of the study, compost treatments received 33, 33, and 34% less commercial fertilizer N in moldboard, chisel, and no-tillage. No-tillage with and without compost amendment had 8 and 9% greater fertilizer N inputs than moldboard and chisel plow with and without compost amendment.
It is possible that using the late-spring soil nitrate test to determine the sidedress N rate underestimated soil N in no-tillage without compost amendment. Basal stalk nitrate concentrations at harvest indicated that N was not limiting in the no-tillage treatments (Singer et al. 2004, 2007, and unpub-lished data) during 1999 to 2007, except in 2003, when all treatments had undetectable levels of basal stalk nitrate. Th is may have lowered the profi tability of the no-tillage no-compost system. Katsvairo and Cox (2000) in New York reported 44% higher costs for fertilizer in the corn year of a corn–soybean–wheat/red clover rotation in chisel tillage for high management (133 kg N ha–1) compared with low management (67 kg N ha–1). Th ey credited the red clover with 67 kg N ha–1
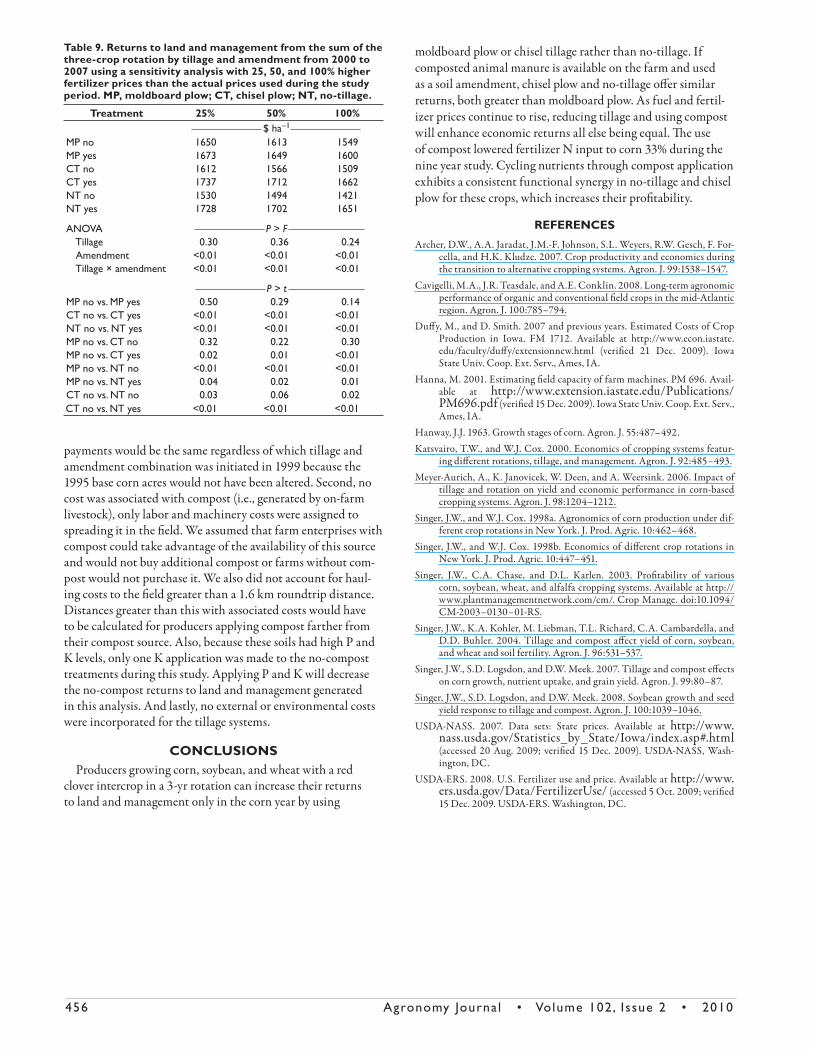
toward corn N requirement and only observed a 5% lower corn yield in the low compared with high management averaged across 5 yr. However, their yields were about 50% lower than those reported in this study. Future returns for these systems will depend on how the ratio of energy to commodity prices changes. If energy prices rise dramatically, which aff ects fuel and inputs (chemicals and fertilizers), no-tillage may generate more competitive returns with or without compost amend-ment because machinery costs represent the dominant produc-tion costs in corn and soybean production. In corn production, if nitrogen fertilizer costs continue to increase similarly to price increases in 2008, all compost treatments will likely produce greater returns than no-compost treatments, regardless of till-age. To predict how these systems would respond to increasing costs, a sensitivity analysis was conducted using 25, 50, and 100% higher fertilizer prices for the three-crop rotation cycle. Th e analysis indicated that the diff erence between moldboard plow without compost compared with chisel plow and no-tillage with compost was enhanced as fertilizer prices increased (Table 9). In moldboard plow, the diff erence between no-com-post and compost was $9 ha–1 using the actual fertilizer prices during the 3-yr cycle compared with $51 ha–1 if fertilizer prices increased 100%. Between 2007 and 2008, anhydrous ammonia increased 44%, diammonium phosphate increased 92%, and potassium chloride increased 100% (USDA-ERS, 2008).
Several assumptions aff ected the production costs and returns generated by this analysis. First, this study did not take into consideration the total infl uence of any government program. Loan rates were used to incorporate loan defi ciency payments due to low corn, soybean and wheat prices during the fi rst part of the study period. Direct and counter-cyclical
Table 8. Returns to land and management by crop, tillage, and amendment, 1999 to 2007† and a 3-yr sum of all crop returns for the period 2000 to 2007. MP, moldboard plow; CT, chisel plow; NT, no-tillage.
Tillage/amendment Wheat Corn Soybean
Sum of 3-yr
$ ha–1
MP/no-compost 410 617 605 1659MP/compost 422 605 607 1668CT/no-compost 412 588 597 1622CT/compost 456 631 608 1731NT/no-compost 386 527 598 1544NT/compost 422 610 652 1722
ANOVA P > FTillage 0.07 0.01 0.23 0.33Amendment <0.01 <0.01 0.01 <0.01Tillage × amendment 0.22 <0.01 0.04 <0.01
P > tMP no vs. MP yes – 0.92 0.84 0.79CT no vs. CT yes – <0.01 0.72 <0.01NT no vs. NT yes – <0.01 <0.01 <0.01MP no vs. CT no – 0.18 0.68 0.32MP no vs. CT yes – 0.26 0.92 0.06MP no vs. NT no – <0.01 0.69 <0.01MP no vs. NT yes – 0.89 0.01 0.09CT no vs. NT no – <0.01 0.99 0.03CT no vs. NT yes – 0.14 <0.01 <0.01† Total labor costs were calculated by multiplying the various wage rates from Duffy and Smith (2007 and previous years) by estimated fi eldwork hours. Annual production and labor costs were subtracted from gross revenues using prices received and yields presented in this paper. Wheat returns are from 2000 to 2007.
456 Agronomy Journa l • Volume 102, Issue 2 • 2010
payments would be the same regardless of which tillage and amendment combination was initiated in 1999 because the 1995 base corn acres would not have been altered. Second, no cost was associated with compost (i.e., generated by on-farm livestock), only labor and machinery costs were assigned to spreading it in the fi eld. We assumed that farm enterprises with compost could take advantage of the availability of this source and would not buy additional compost or farms without com-post would not purchase it. We also did not account for haul-ing costs to the fi eld greater than a 1.6 km roundtrip distance. Distances greater than this with associated costs would have to be calculated for producers applying compost farther from their compost source. Also, because these soils had high P and K levels, only one K application was made to the no-compost treatments during this study. Applying P and K will decrease the no-compost returns to land and management generated in this analysis. And lastly, no external or environmental costs were incorporated for the tillage systems.
CONCLUSIONSProducers growing corn, soybean, and wheat with a red
clover intercrop in a 3-yr rotation can increase their returns to land and management only in the corn year by using
moldboard plow or chisel tillage rather than no-tillage. If composted animal manure is available on the farm and used as a soil amendment, chisel plow and no-tillage off er similar returns, both greater than moldboard plow. As fuel and fertil-izer prices continue to rise, reducing tillage and using compost will enhance economic returns all else being equal. Th e use of compost lowered fertilizer N input to corn 33% during the nine year study. Cycling nutrients through compost application exhibits a consistent functional synergy in no-tillage and chisel plow for these crops, which increases their profi tability.
REFERENCES
Archer, D.W., A.A. Jaradat, J.M.-F. Johnson, S.L. Weyers, R.W. Gesch, F. For-cella, and H.K. Kludze. 2007. Crop productivity and economics during the transition to alternative cropping systems. Agron. J. 99:1538–1547.
Cavigelli, M.A., J.R. Teasdale, and A.E. Conklin. 2008. Long-term agronomic performance of organic and conventional fi eld crops in the mid-Atlantic region. Agron. J. 100:785–794.
Duff y, M., and D. Smith. 2007 and previous years. Estimated Costs of Crop Production in Iowa. FM 1712. Available at http://www.econ.iastate.edu/faculty/duff y/extensionnew.html (verifi ed 21 Dec. 2009). Iowa State Univ. Coop. Ext. Serv., Ames, IA.
Hanna, M. 2001. Estimating fi eld capacity of farm machines. PM 696. Avail-able at http://www.extension.iastate.edu/Publications/PM696.pdf (verifi ed 15 Dec. 2009). Iowa State Univ. Coop. Ext. Serv., Ames, IA.
Hanway, J.J. 1963. Growth stages of corn. Agron. J. 55:487–492.Katsvairo, T.W., and W.J. Cox. 2000. Economics of cropping systems featur-
ing diff erent rotations, tillage, and management. Agron. J. 92:485–493.Meyer-Aurich, A., K. Janovicek, W. Deen, and A. Weersink. 2006. Impact of
tillage and rotation on yield and economic performance in corn-based cropping systems. Agron. J. 98:1204–1212.
Singer, J.W., and W.J. Cox. 1998a. Agronomics of corn production under dif-ferent crop rotations in New York. J. Prod. Agric. 10:462–468.
Singer, J.W., and W.J. Cox. 1998b. Economics of diff erent crop rotations in New York. J. Prod. Agric. 10:447–451.
Singer, J.W., C.A. Chase, and D.L. Karlen. 2003. Profi tability of various corn, soybean, wheat, and alfalfa cropping systems. Available at http://www.plantmanagementnetwork.com/cm/. Crop Manage. doi:10.1094/CM-2003–0130–01-RS.
Singer, J.W., K.A. Kohler, M. Liebman, T.L. Richard, C.A. Cambardella, and D.D. Buhler. 2004. Tillage and compost aff ect yield of corn, soybean, and wheat and soil fertility. Agron. J. 96:531–537.
Singer, J.W., S.D. Logsdon, and D.W. Meek. 2007. Tillage and compost eff ects on corn growth, nutrient uptake, and grain yield. Agron. J. 99:80–87.
Singer, J.W., S.D. Logsdon, and D.W. Meek. 2008. Soybean growth and seed yield response to tillage and compost. Agron. J. 100:1039–1046.
USDA-NASS. 2007. Data sets: State prices. Available at http://www.nass.usda.gov/Statistics_by_State/Iowa/index.asp#.html (accessed 20 Aug. 2009; verifi ed 15 Dec. 2009). USDA-NASS, Wash-ington, DC.
USDA-ERS. 2008. U.S. Fertilizer use and price. Available at http://www.ers.usda.gov/Data/FertilizerUse/ (accessed 5 Oct. 2009; verifi ed 15 Dec. 2009. USDA-ERS. Washington, DC.
Table 9. Returns to land and management from the sum of the three-crop rotation by tillage and amendment from 2000 to 2007 using a sensitivity analysis with 25, 50, and 100% higher fertilizer prices than the actual prices used during the study period. MP, moldboard plow; CT, chisel plow; NT, no-tillage.
Treatment 25% 50% 100%$ ha–1
MP no 1650 1613 1549MP yes 1673 1649 1600CT no 1612 1566 1509CT yes 1737 1712 1662NT no 1530 1494 1421NT yes 1728 1702 1651
ANOVA P > F Tillage 0.30 0.36 0.24 Amendment <0.01 <0.01 <0.01 Tillage × amendment <0.01 <0.01 <0.01
P > tMP no vs. MP yes 0.50 0.29 0.14CT no vs. CT yes <0.01 <0.01 <0.01NT no vs. NT yes <0.01 <0.01 <0.01MP no vs. CT no 0.32 0.22 0.30MP no vs. CT yes 0.02 0.01 <0.01MP no vs. NT no <0.01 <0.01 <0.01MP no vs. NT yes 0.04 0.02 0.01CT no vs. NT no 0.03 0.06 0.02CT no vs. NT yes <0.01 <0.01 <0.01


