Embed Size (px)
Citation preview
Vol. 45 ı No. 1 ı 2008 www.biotechniques.com ı BioTechniques ı 81
Research Reports
INTRODUCTION
Numerous methods exist to charac-terize transcriptomes and to measure gene expression at both the transcript and exon level (1–5), and recent work (6–8) indicates that much more of the genome is transcribed than previously thought. Techniques to map transcrip-tional start sites (9–11), quantitatively measure splicing events (12,13), and discover mutations in the transcriptome (14) have been described. Analysis of full-length cDNA data generated from capillary sequencing generally assists in gene discovery and refinement of gene annotations (15), but this approach is limited by the high costs and throughput challenges associated with capillary sequencers. Next-generation sequencing-by-synthesis approaches now provide an effective way to inexpensively and rapidly produce billions of bases of sequence data (16–19). As a result, these approaches have the potential to characterize the transcriptome in a genome-wide and therefore comprehensive manner.
Here we used short (31 nt) sequence reads from an Illumina Genome Analyzer 1 (Illumina, San Diego, CA, USA) to characterize the transcriptome of the human cervical carcinoma-derived cell line, HeLa S3 (National Cell Culture Centre, Minneapolis, MN, USA). Using these data, we assessed: (i) transcript abundance at the exon level and transcript level; (ii) transcriptional start and termi-nation sites; (iii) exon-exon linkages in mature transcripts; (iv) the spectrum of base changes (both known and novel variants); and (v) the potential to identify novel exons belonging to known genes.
MATERIALS AND METHODS
Construction of HeLa Whole Transcriptome Libraries
We constructed a total of four libraries for whole transcriptome shotgun sequencing (WTSS). For the first two libraries, a 75 μg aliquot of HeLa S3 total RNA (Ambion, Applied Biosystems, Foster City, CA, USA) was separated
into polyA+ and polyA- fractions using + and polyA- fractions using +the MACS mRNA Isolation kit (Miltenyi Biotec, Bergisch Gladbach, Germany). The nonribosomal polyA- RNA was enriched in the latter fraction using two iterations of the RiboMinus Human/Mouse Transcriptome Isolation kit (Invitrogen, Carlsbad, CA, USA). Double-stranded cDNAs were made from 200 ng of each of the polyA+ and ribosomal + and ribosomal +RNA-depleted polyA- fractions (4 μM; Stratagene cDNA Synthesis kit, Agilent, Santa Clara CA, USA) and random hexamer primers (8 μM; Invitrogen). For μM; Invitrogen). For μthe second two libraries, 25 ng of HeLa S3 total RNA was used to synthesize full-length single-stranded cDNAs using the SMART PCR cDNA Synthesis kit (Clontech, Mountain View, CA, USA). Here, a modified oligo(dT) primer primes the first strand synthesis reaction, and a template-switching mechanism generates full-length single-stranded cDNAs containing the complete 5′ end of the mRNA and universal priming sequences for end-to-end PCR amplification. Four 50 μL PCR amplifications were performed each from 1/10 of a single first
Profiling the HeLa S3 transcriptome using randomly primed cDNA and massively parallel
short-read sequencing
Ryan D. Morin, Matthew Bainbridge, Anthony Fejes, Martin Hirst, Martin Krzywinski, Trevor J. Pugh, Helen McDonald, Richard Varhol, Steven J.M. Jones, and Marco A. Marra
BioTechniques 45:81-94 (July 2008)doi 10.2144/000112900
Sequence-based methods for transcriptome characterization have typically relied on generation of either serial analysis of gene expression tags or expressed sequence tags. Although such approaches have the potential to enumerate transcripts by counting sequence tags derived from them, they typically do not robustly survey the majority of transcripts along their entire length. Here we show that massively parallel sequencing of randomly primed cDNAs, using a next-generation sequencing-by-synthesis technology, offers the potential to generate relative measures of mRNA and individual exon abundance while simultaneously profiling the preva-lence of both annotated and novel exons and exon-splicing events. This technique identifies known single nucleotide polymorphisms (SNPs) as well as novel single-base variants. Analysis of these variants, and previously unannotated splicing events in the HeLa S3 cell line, reveals an overrepresentation of gene categories including those previously implicated in cancer.
Genome Sciences Centre, BC Cancer Agency, Vancouver, British Columbia, Canada
82 ı BioTechniques ı www.biotechniques.com Vol. 45 ı No. 1 ı 2008
Research Reports
strand synthesis reaction using 18 cycles of 95°C for 5 s, 65°C for 5 s, and 68°C for 6 min. The products were pooled, purified on a QIAquick PCR Purification kit (Qiagen, Valencia, CA, USA), and eluted in 30 μL of Tris-EDTA buffer (10:0.1). The quality and quantity of the resulting double-stranded cDNAs were assessed using an Agilent DNA 7500 Series II assay (Agilent, Mississauga, Ontario, Canada) and NanoDrop ND-1000 spectrophotometer (NanoDrop, Wilmington, DE, USA). Two 14 μL aliquots containing ∼200 ng amplified cDNA were each diluted with water to 100 μL and sonicated, one aliquot for 5 min and the other for 20 min. Sonication was performed in an ice-water bath using a Sonic Dismembrator 550 (Fisher, Ottawa, Ontario, Canada) with a power setting of “7” in pulses of 30 s interspersed with 30
s of cooling. Total sonication times refer to active sonication time only and do not include the rest periods in between each pulse.
The resultant cDNAs from all four libraries were size-fractionated on 8%polyacrylamide gels, and the 100 to 300 bp fractions excised. Gel-purified cDNA products were modified for Illumina sequencing using the Illumina Genomic DNA Sample Prep kit as follows: size-selected cDNAs were end-repaired by T4 DNA polymerase and phosphory-lated by T4 DNA polymerase and T4 polynucleotide kinase. The cDNA products were incubated with Klenow DNA Polymerase (Illumina) to generate 3′ adenine overhangs followed by ligation ′ adenine overhangs followed by ligation ′to Illumina adapters, which contain 5′thymine overhangs. The adapter-ligated products were purified on QIAquick spin
columns (Qiagen), then PCR-amplified with Phusion DNA Polymerase (Illumina) in 10 cycles using Illumina’s genomic DNA primer set. PCR products were purified on QIAquick MinElute columns (Qiagen) and the DNA quality-assessed and quantified using an Agilent DNA 1000 Series II assay and NanoDrop ND-1000 spectrophotometer and diluted to 10 nM. Cluster generation and sequencing was performed using the Standard Cluster Generation kit and the 36 Cycle Solexa Sequencing kit on the Illumina Cluster Station and Illumina Genome Analyzer I following manufacturer’s instructions. Six lanes of the flow cell were applied to the first polyA+ library and two lanes + library and two lanes +were used to sequence the polyA- library. A single lane from a subsequent flow cell was used to sequence each of the latter two full-length libraries. Sequences were extracted from the resulting image files using the Firecrest and Bustard applications (Illumina) run with default parameters. A per-read error rate for each position in our reads was computed and showed a median error of less than 1% and a maximal error (at 31, the final position) of ∼1.6%.
Defining “Mappability” of Exonic Sequences
Due to the presence of repetitive sequences in the human genome, in many cases, the short reads produced by Illumina sequencing cannot be unambigu-ously mapped to a single locus. We deter-mined the expected “mappability” of all annotated exons to aid us in interpreting the significance of regions with lower (or no) representation in our libraries. This computation, described in detail in the Supplementary Material (available online at www.BioTechniques.com), first assigns a mappability score to each nucleotide in the genome. This value represents the fraction of all possible Illumina reads derived from that position that could theoretically be mapped unambiguously back to that position. For latter calcula-tions, exons with average mappability (over all their nucleotides) of <0.5 were considered low-mappability exons and were ignored in some calculations (see next section).
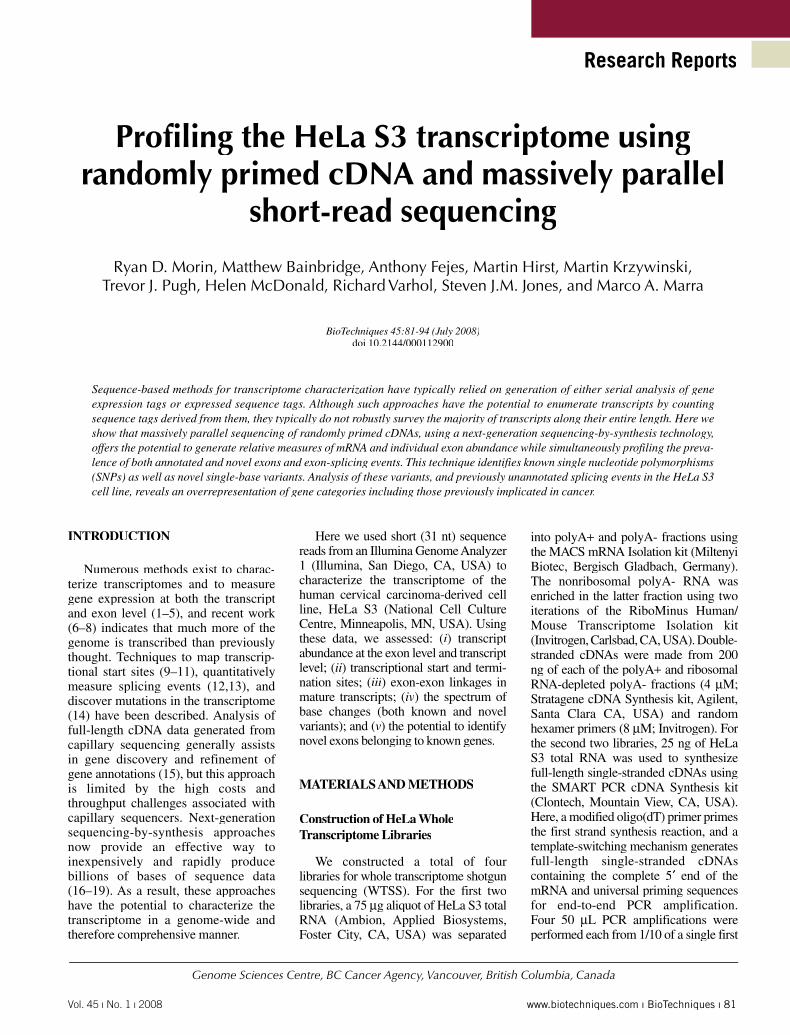
Figure 1. Average coverage depth of all Ensembl exons and genes. (A) The number of exons with coverage depth ranging from 0 to over 2000×, considering either all exons (blue), scaled exon coverage based on mappability of exons (green), or ignoring exons with average mappability <0.5 (yellow). (B) The number of genes with various coverage depths considering the average coverage of all their exons (blue), including scaled coverage based on mappability of each individual exon (green), or ignoring genes with average mappability <0.5 (yellow).
Table 1. Summary of Gene and Exon Coverage
Number of Exons Number of Genes
Raw Coveragea
Corrected Coverageb
Raw Coverage
Corrected Coverage
1× or better 143,749 145,343 10,864 11,246
5× or better 65,701 67,071 5684 5881
10× or better 36,445 37,457 3432 3590aRaw coverage refers to the unadjusted depth of coverage for the exon or average of all exons for a gene.bCorrected coverage refers to the adjusted depth when mappability is taken into consideration.
A
B
0
0.5
1
2
3
4
5
10
20
30
50
100
200
500
1000
2000
0
0.5
1
2
3
4
5
10
20
30
50
100
200
500
1000
2000
10,000 20,000 30,000 40,000
0 2250 4500 6750 9000

84 ı BioTechniques ı www.biotechniques.com Vol. 45 ı No. 1 ı 2008
Research Reports
Alignment, Peak Discovery, and Exon and Transcript Abundance Calculation
We aligned the Illumina WTSS sequences to the human reference genome (NCBI Build 36.1) using the Eland aligner (Illumina), which produced a summary and alignment position for each unambiguously mapped sequence (allowing up to two mismatches). This process flagged both the sequences where the best alignments mapped to multiple locations and sequences that failed to align to the reference genome. Only sequences with unambiguous alignments to a single genomic site were retained for this analysis. Reads that aligned fully within the boundaries of an annotated exon (Ensembl, version 48; www.ensembl.org) were considered for coverage calcu-lations. The average coverage of an exon was computed as the sum of the read
depth aligned across each individual base divided by its length (Supplementary Table S1). Corrected exon coverage was calculated by dividing average coverage by the average mappability value for that exon. A summary value for each gene was calculated using the mean coverage for all exons comprising a representative gene model (the one with the most unambigu-ously mapped reads). Notably, short reads do not provide enough information for us to discern individual transcripts; hence these numbers represent a summary of the net transcriptional activity of each gene locus (Supplementary Table S2). All genomic regions in which more than one aligned read overlapped was considered a peak, with peak height defined by the maximum number of overlapping reads at any position in that peak. For known exons, height (or depth) was considered a metric for exon abundance, while for nonexonic peaks, height was considered
stronger evidence for its potential to represent a novel exon. Cap analysis of gene expression (CAGE) data was treated in the same way, producing CAGE peaks.The CAGE dataset used in this work consisted of 24 libraries from 14 tissue types (http://fantom31p.gsc.riken.jp/cage/hg17/). A UCSC wig-formatted file for visualization of the HeLa peaks is available for download (ftp://ftp03.bcgsc.ca/public/HeLa/).
Discerning Exon-Exon Splicing Events
A database of exon-exon junction sequences was constructed by combining, for each gene, the last 30 nt of an exon with the first 30 nt of each of its downstream exons. Those exon-exon junctions present in at least one annotated Ensembl transcript were considered “known” events whereas the remainder were considered “putative” events. These ∼3.5 M junction sequences were then queried with all reads that failed to align to the human genome, enforcing perfect alignments with no mismatches. We retained the reads aligning with at least 6 nt on either side of the junction and excluded those mapping to multiple junctions. A junction was considered present if at least two distinct reads mapped uniquely across it.
Novel cryptic exons were identified by first creating a database representing the most likely possible exon-intron splicing events. These were identified by searching
Figure 2. Measuring transcript abundance and confirming transcript ends. Shown (A) is a sum of transcript coverage (relative to transcript ends) based on all Ensembl transcripts. The x-axis represents strand-corrected posi-tion scaled to transcript length (0%–100%), with up- and downstream regions also shown (+/-20%). The y-axis shows the number of reads that overlap any given portion of the transcribed region (including introns). A clear overrepre-sentation of reads at transcript ends is apparent. Comparison of CAGE tag–de-rived peaks to peaks identified from HeLa transcriptome shotgun reads (HeLa peaks) showed a strong correspondence (B and C). Increased confidence (peak height) CAGE peaks showed a stronger correspondence with HeLa peaks (B, blue). HeLa peaks of all heights overlapped with CAGE peaks as a function of increasing HeLa peak height (C).
Table 2. Results of Enumeration of Observed Exon-Exon Splicing Events between either Two Known Exons or a Single Known Exon and a Nonannotated Exon
Total (Unique)
Aligning reads (known exon junctions) 306,562 (137,707)
Aligning reads (putative exon junctions) 3339 (2114)
Known exon junctions with at least one read 57,854
Putative exon junctions with at least one read 1599
Known exon junctions with strong support 31,618
Putative exon junctions with strong support 379
Cryptic novel exons spliced to a known exon 37
A 700,000
525,000
350,000
175,000
-20 0 100 120
CC
2
3
4
5
6
7
8
9
10
20
30
40
50
100
500
1000
5000+
2
3
4
5
6
7
8
9
10
20
30
40
50
100
500
1000
5000+
0 2.5 5.0 7.5 10.0
0 2.5 5.0 7.5 10.0
B

Research Reports
Reach over
125,000Life Science
Professionals Life science marketing lists with more life.For more information, call (212) 520-2729
�������������������������������������������������������������������������������������������������������������������������������������������������������������������������������������������������������������������������������������
������������������������������������������������������������������������������������������������������������ �������������������������������������������������
��������������������������������������� ����������������������
� ���������������������������������������
� �������������������������������
� ���������������������������������������������������������������
� ���������������
��������������������������������������������������������������������
������������������������������������
the downstream introns for each exon (to a maximum distance of 50 kb) for all canonical splice acceptor sequences (AG), and creating a putative exon junction with the latter 30 bases of this exon and the first 30 bases following the acceptor sequence. The same procedure was done using the 5′end of each exon and its upstream introns, but involved searching for the canonical splice acceptor sequence (GT). These junctions were created using the preceding 30 nucleotides from that intron and the first 30 nucleotides of that exon. Reads were mapped to a database of these junctions (as described in the previous paragraph)to identify evidence for splicing of cryptic exons to known exons.
Identification of Single-base Changes
All reads were aligned to the human genome using the MAQ multiple alignment software (http://maq.source-forge.net/maq-man.shtml), which considers the phred-like Illumina read quality scores (produced by Bustard)
for building consensus sequences and robustly identifying high quality discrep-ancies. Candidate single-base changes identified by MAQ were filtered for those with consensus quality scores >20 and coverage depth of at least 6 reads. These parameters were chosen to minimize the number of false positive mutations discovered in an in silico simulation of WTSS sequences. To determine the effect of candidate mutations on gene products, we replaced the discrepant nucleotide in all corresponding Ensembl transcripts and compared the resulting amino acid sequence to that produced by the reference transcript.
RESULTS
Transcript Identification and Quantitation
A total of 28.6 million 31 nt reads were generated using eight flow-cell lanes to sequence randomly primed
cDNA libraries prepared from polyA+and polyA- fractions of HeLa S3 RNA (see Construction of HeLa Whole Transciptome Libraries section above). Of these sequences, 18.9 million reads were unambiguously aligned to yield 3 million peaks representing more than 125 Mbp (4.1%) of the reference human genome sequence, and 15.6 million of these reads mapped to regions of the genome annotated as exons (20). Using only the reads mapping within these exons, we calculated the average coverage depth and total reads mapped to every exon. A total of 143,749 exons had an average of one read covering each nucleotide (1×coverage) while 36,445 of these showed an average coverage of at least 10× (Table × (Table ×1). Many exons in the genome contained low-mappability bases (see Defining “Mappability” of Exonic Sequences section and Supplementary Material). These numbers were re-examined ignoring all exons with mappable fractions <0.5 to determine the effect of mappa-bility on exon coverage—we identified

86 ı BioTechniques ı www.biotechniques.com Vol. 45 ı No. 1 ı 2008
Research Reports
a small number of exons (6527) showing <1× coverage that could be explained by × coverage that could be explained by ×such mapping issues, while the remainder were likely expressed at low levels. For those exons with imperfect mappability, we computed a corrected coverage depth to better gauge their abundance. A summary of exon coverage depth is shown, indicating coverage depth for all exons with their unadjusted and adjusted coverage values as well as the subset of exons with mappable fractions of at least 0.5 (Figure 1A).
To assess the extent to which entire genes were sequenced, we considered the coverage of all exons for a gene, choosing the gene model with the most mapped reads (Figure 1B). It is apparent that a large fraction of the reads produced in this study corresponded to a few extremely abundant genes (>2000× coverage), mainly those encoding ribosomal proteins. As indicated in Table 1, 5684 genes demonstrated coverage of at least 5× for × for ×every exon. This number increased to 5881when exons with low (<0.5) mappa-bility were ignored. Our analysis revealed an overrepresentation of sequence reads aligning to transcript termini compared with internal regions. We also noted that the 5′ ends of transcripts were overrepresented 2:1 compared with 3′ends (Figure 2). Comparison of our four HeLa-derived libraries reveals that the library preparation procedure affects the extent of this bias and that is likely a technical artifact that can be addressed with improvements to library preparation. In support of this notion, the two libraries produced using the SMART cDNA synthesis method (see Construction of HeLa Whole Transciptome Libraries
section) have offered much more uniform coverage of transcripts (Supplementary Figure S1). We have since found that a 5 min sonication of random-primed cDNA fragments reduces the end-bias observed in the first two libraries; this procedure is now included in our standard protocol.
As the number of reads should corre-spond to the abundance of transcripts, these data should allow us to individually quantify the abundance of each exon in the transcriptome, providing a digital alternative to tiling arrays. As part of the ENCODE project, the HeLa transcriptome was profiled using custom tiling arrays produced by Affymetrix (Santa Clara, CA, USA), providing means for direct comparison between these methods (7). The 4633 Ensembl exons in the ENCODE regions showed a strong rank correlation between these platforms (R2
= 0.693) (Figure 3). To exclude the effect = 0.693) (Figure 3). To exclude the effect =of the overrepresented reads deriving from transcript ends, we compared the abundance of the 3908 internal exons in these regions (Figure 3A). This resulted in an enhanced Spearman correlation (R2 =0.713). This level of significance is similar to comparisons of different array platforms (21) and is striking when we consider that these two experiments were performed on HeLa RNA purified in separate laboratories. A plot of the array-based and sequence-based measures of exon levels is shown (Figure 3A) along with an example demonstrating the correspon-dence between all exons for a represen-tative gene (Figure 3B). We demonstrated method reproducibility by comparing the two libraries produced with different sonication times (see Construction of HeLa Whole Transciptome Libraries
section). This comparison revealed a strong correlation of exon coverage and quantitation between replicates (R2 =0.976) (Supplementary Figure S2).
Discerning Exon-Exon Splicing Events
We assessed the ability of this method to identify exon-exon junctions to infer the presence of alternative transcript isoforms. As discussed, we first searched all reads that could not be mapped directly to the genome against the theoretical junctions of all possible combinations of exons within and between neighboring genes (see Discerning Exon-Exon Splicing Events section in Materials and Methods). Using this approach, 31,618 of the 284,873 known exon-exon junctions and 379 unannotated exon-skipping events were supported by multiple unambigu-ously mapped reads. Another 26,232 and 1220 annotated and novel within-gene junctions (respectively) were supported either by a single read or by ambiguously mapped reads. The novel exon-skipping events (e.g., Figure 4A) occurred within 1355 different genes (Supplementary Table S3) with a slight enrichment among highly abundant genes (mean read depth = 29). Finally, we found a single = 29). Finally, we found a single =example of distinct reads spanning a pair of exons from neighboring genes, which suggests some transcripts result from co-transcription (22) of FAM24b along with its downstream neighbor CUZD1.
Following this fairly conservative approach for identifying reads spanning splice junctions, many reads (∼9.7 million) still remained unmapped. We expected that some of the unmapped reads likely corresponded to the exonic or junction
Figure 3. Measurement of exon abundance using sequence data and exon tiling arrays. (A) A scatter plot comparing the abundance of exons within all ENCODE regions as measured by Affymetrix tiling array (x-axis) and WTSS sequence coverage (y-axis). This comparison of 4633 exons resulted in a Spearman correlation of 0.693. An example is shown (B) to illustrate the correspondence between exon signal from array (black) and sequence data (blue). Affy, Affymetrix. Plier, probe logarithmic intensity error.
AA B
88 ı BioTechniques ı www.biotechniques.com Vol. 45 ı No. 1 ı 2008
Research Reports
sequence belonging to exons not currently annotated. We extended our attempt to use these sequences by including candidate splicing events represented in the trome transcript database, a much larger resource where automated annota-tions are driven by cDNA sequence (23). Another 156,563 reads could be mapped to 34,895 junctions described in trome, providing additional empirical evidence that these should be added to gene models (see Figure 4A for an example). A further 32,829 unique reads could be mapped to 7195 transcripts within the trome transcript database, indicating the presence of novel exons. These included both known structures, which are present in other databases such as RefSeq but missing from Ensembl, as well as novel events, some of which are supported by EST evidence only. This highlights the still underappreciated diversity of the transcriptome as reflected in current annotations and promises a means for rapid and robust advancements of annota-tions in the near future.
Identification of Transcriptional Start and Termination Sites
In addition to our current limited understanding of alternative splicing, correct definition of the boundaries of a gene or transcription unit is still inher-ently difficult. We assessed the utility of our approach for refining the transcrip-tional start (TSS) and termination sites (TTS) of annotated genes. A TSS or TTS was considered confirmed if one of our WTSS peaks started (or ended) within 30 bp of the annotated TSS/TTS. Using these criteria, we confirmed the TSS of 12,177 and TTS of 11,906 transcripts by this approach. We further investigated our ability to refine or identify a TSS by comparing our results to CAGE data. As CAGE tags are derived from the first 20 nt from the 5′ end of an mRNA transcript ′ end of an mRNA transcript ′(9,10), we would only expect the HeLa peaks corresponding to initial exons to overlap CAGE peaks. However we would expect most CAGE peaks to overlap HeLa peaks as long as they derive from a
gene expressed in HeLa. CAGE tags were realigned to the latest human genome build (see Alignment, Peak Discovery, and Exon and Transcript Abundance Calculation section) yielding 102,823 distinct CAGE alignment peaks. Due to the reported presence of alternate promoters for many genes (11), we checked for the overlap of a CAGE peak at any position within HeLa exons. A total of 37,054 (36.1%) of these overlapped with HeLa peaks. Of the weakest CAGE alignment sites (supported by only two CAGE tags), 13,081 (27.8%) overlapped with one of our HeLa peaks (regardless of peak strength) while 9140 (59.6%) of alignment sites with ≥10 CAGE tags corresponded to a HeLa peak (Figure 2B and Supplemental Table 4).
A strong relationship between HeLa peak height and CAGE overlap was also observed (Figure 2C). Nearly all (27,495) of the sites matched by CAGE tags and HeLa peaks corresponded to known exons, supporting the notion that these regions are likely to represent real transcriptional start sites. The remaining CAGE sites that lacked supporting reads in this library may have been due to either inactive or low expression of genes in HeLa. Conversely, the 9559 sites co-occupied by both HeLa peaks and CAGE peaks but not overlapping annotated exons likely represent unannotated exons. As expected, some of these sites (1927, 20%) corresponded to exons in the UCSC “known genes” while a larger proportion (6722, 70%) also overlapped with an exon from an AceView EST-based gene model (24).
Discovery of Novel Expressed Elements
Although the majority (54.6%) of the reads that mapped to the genome were localized to exons, only 1% of the 3 million peaks were exonic. Following our previous observation of the correspon-dence between HeLa transcription peaks and potential novel transcription start sites, we considered the possibility that the large number of nonexonic genomic loci highlighted by HeLa peaks might represent novel transcribed elements. To assess this possibility, we again leveraged the Affymetrix tiling array generated from HeLa RNA spanning all the ENCODE regions. The ENCODE data includes 4377 transfrags, or contiguous regions
A
B
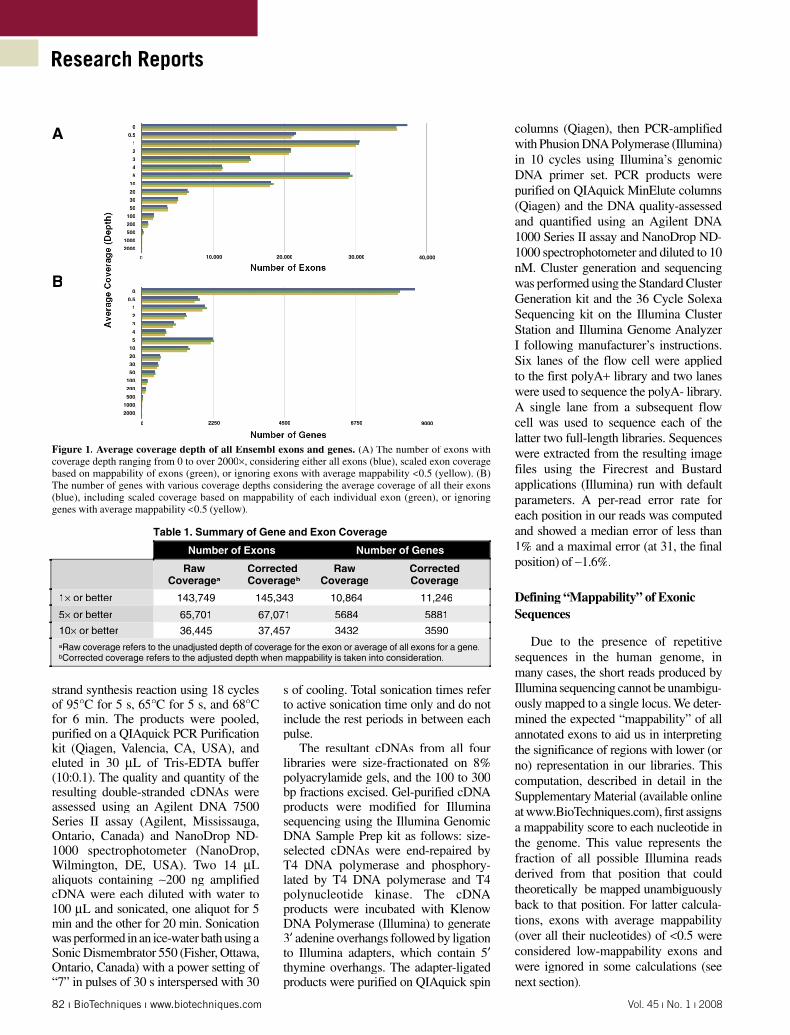
Figure 4. Novel alternative events supported by exon junction-spanning reads. Shown are two ex-amples of unannotated splicing events supported in our library. The first example (A) involves an exon skip in which the middle exon is not included (shown in black in the top track). The second example shows a known exon joined to a putative novel cryptic exon (B). The linkage of this exon to the intronic peak (upper right, blue) is supported by multiple exon junction-spanning reads (shown in black below the peaks). The later event involves a known tumor suppressor gene (Bin1), which is known to produce many distinct isoforms. This event is supported by ESTs from tumors and embryonic stem cells, sug-gesting this event is restricted to cells with unique properties.
Vol. 45 ı No. 1 ı 2008 www.biotechniques.com ı BioTechniques ı 89
Research Reports
of the genome believed to be transcrip-tionally active, based on these arrays (25), and only 2584 (59.0%) of these overlap known UCSC genes. A total of 14,906 HeLa peaks resided within the ENCODE regions, and comparison to the set of HeLa transfrags revealed that 3523 (23.8%) of these sites overlapped with 2311 (52.7%) of the transfrags. Of the 1736 highest confidence ENCODE-situated HeLa peaks that did not corre-spond to exons, 1285 (74.0%) overlapped with 1060 (24.2%) transfrags.
To further assess the relationship between transfrags and peaks, we compared the median signal strength of all probes of a transfrag that overlap with a peak to the median signal strength of all probes not overlapping the peak. This analysis revealed that, even for peaks comprising single reads, the median signal strength was increased on average from 0.26 to 2.22 (8.5×). Focusing on the highest confidence HeLa peaks (with height of at least 10) revealed a median increase of probe signal strength from 0.29 to 15.67 (54×). These results indicate that the sequences derive from transcribed regions of the genome and that even mapped singleton reads may be derived from bona fide transcripts.
Considering the number of reads mapping to introns, we sought evidence that some intronic peaks corresponded to novel cryptic exons. This was accom-plished by searching for reads derived from the junction between an intronic peak and a known exon within the same gene. Using the 2846 genes with prominent intronic peaks (height 10 or greater), we created a database of sequences repre-senting all possible junctions between known exons and intronic canonical splice sites (see Discerning Exon-Exon Splicing Events section). Searching all unmapped reads against this database identified 37 putative novel exons (in 32 genes) with redundant support. Many additional events were unannotated in Ensembl but were present in either RefSeq or UCSC gene annotations. An example of a partic-ularly interesting event is shown in Figure 4, which demonstrates a novel exon in the MYC-interacting tumor suppressor gene Bin1 (26). This putative exon showed greater coverage than many of the other exons in this gene, suggesting it may be included in most of the transcripts deriving from this locus. The known cancer genes
(27) with evidence for novel alternative isoforms are included in Table 4.
Identification of Single-base Changes
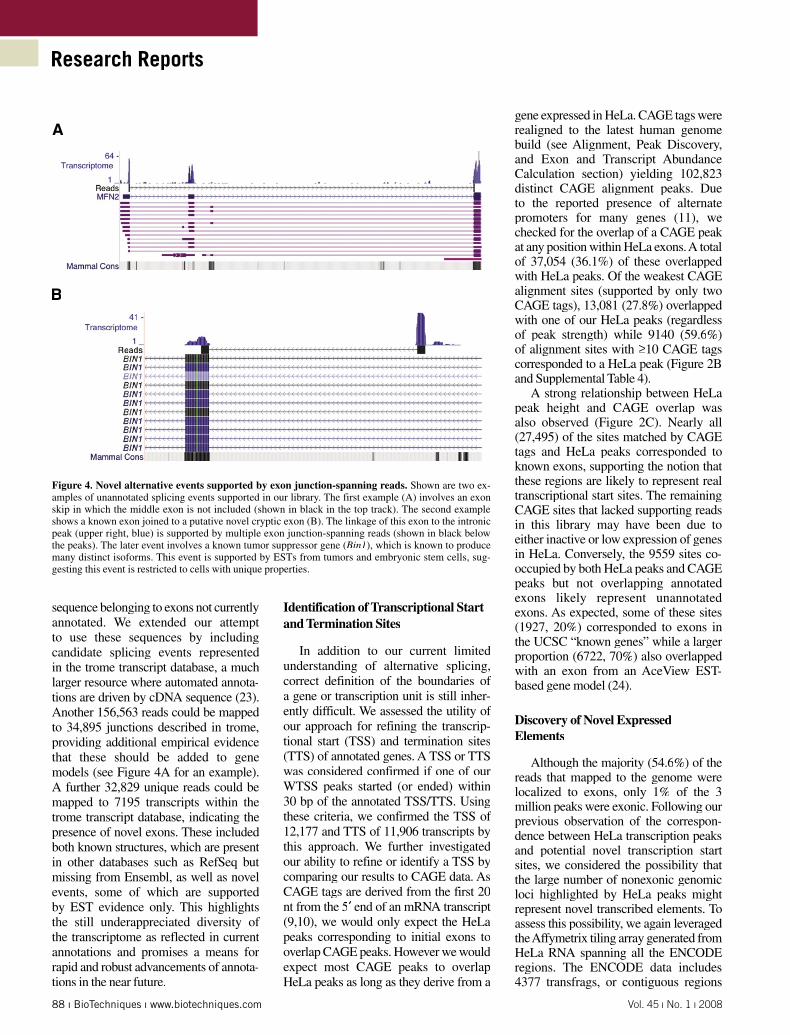
A deep sampling of expressed sequences offers the attractive possi-bility of identifying single-base variation in coding elements. This variation could correspond to inherited polymorphisms as well as mutations. To determine the extent of this type of variation in HeLa, we used publicly available short-read alignment software (see Identification of Single-base Changes section in Materials and Methods) to identify and assign confidence scores to nucleotides discrepant from the reference genome. Using our empiri-cally derived thresholds, a variant must be covered by at least six reads of suffi-cient quality and at least two of them must represent the nonreference allele. After this filtering, 2230 putative novel single-base mutations (1474 genes) and 3895 known variants remained (Table 3). The profile of MAQ consensus scores for these sites was signifi-cantly distinct from that of the known SNPs, suggesting that these candidate
mutations likely comprise some degree of false positives (Kolmogorov-Smirnov test). Applying more stringent filtering criteria reduced the representation of novel mutations but did not remedy the disparity between confidence scores, which suggests that all false positives cannot be eliminated based solely on their confidence score. Considering the heterozygous mutations and known SNPs, the ratio reads representing each allele was generally different than 1:1, suggesting the potential to detect allelic expression differences. The mean ratio of less abundant to more abundant alleles was 0.68 for known SNPs and 0.63 for novel mutations (Supplementary Figure S3). Of the genes containing candidate mutations, approximately 3/4 (1123) contained a single variant, with a small number (34) containing more than 4 candidate mutations. As one might expect, many of the latter are annotated as pseudogenes, which are subject to neutral selection. One hundred genes had at least one nonsynonymous novel mutation, including nine genes with apparent truncating mutations. Using the GeneTrail software (genetrail.bioinf.uni-sb.de) (28), we found an enrichment of genes involved in the
Table 3. Known SNPs and Novel Single-base Mutations Detected by WTSS Reads
Chromosome Total Single-base Changes
Known SNPs
Novel Mutations
Novel Nonsynonymous
1 648 420 228 192 390 229 161 33 320 196 124 84 166 90 76 25 338 187 151 46 306 183 123 37 282 178 104 88 223 128 95 29 227 141 86 710 242 164 78 211 280 169 111 612 354 246 108 513 113 70 43 414 221 144 77 315 222 153 69 416 363 226 137 417 368 248 120 818 82 59 23 219 382 301 81 520 182 115 67 721 75 52 23 022 121 82 39 3X 197 102 95 2Y 23 12 11 0
Total 5928 3895 2230 111
Nonsynonymous mutations include 102 amino acid substitutions as well as 9 truncating mutations.

90 ı BioTechniques ı www.biotechniques.com Vol. 45 ı No. 1 ı 2008
Research Reports
cell cycle (P = 6.47 × 10⁻⁵) as well as those involved in the E2F transcriptional module (P = 0.0286) in this list (29). Among these were 17 genes that reside in the COSMIC database (www.sanger.ac.uk/genetics/cgp/cosmic), hence are known to acquire somatic mutations in some types of cancer. These genes, their observed alterations, and genes
containing novel exon skipping events are included in Table 4.
DISCUSSION
Here we describe a new approach for sequence analysis of transcriptomes, which involves generating multiple
random-primed cDNA libraries, followed by sequencing using the Illumina 1G sequencer. Analysis of those <20 million randomly derived sequence reads aligned to the human genome revealed that the approach can be used to study gene expression and to identify novel gene structures as well as to genotype polymorphisms and discover novel
Table 4. Genes of Interest with Nonsynonymous Mutations or Novel Alternative Splicing Events
Gene Symbol
Novel Splicing Events
Novel Synonymous Mutations
Novel Nonsynonymous Mutations
E2F Module
Cell Cycle Gene
COSMIC Database
ANAPC7 0 0 1 yes yes
ASPM 0 2 1 yes yes
CDC2L2 0 2 1 yes
CENPF 0 0 1 yes
BRD3 0 0 1 yes
CDK5RAP1 0 0 1 yes
EIF2AK1 0 0 1 yes
GPI 0 1 1 yes
GSPT2 0 0 1 yes
INPPL1 0 0 1* yes
MARK3 0 1 1 yes
NUP210 0 0 1 yes
PER1 0 0 1 yes
PKN3 0 0 1 yes
RB1 0 2 1 yes yes yes
SMC3 0 1 1 yes
SMC4 0 1 1 yes yes
STAG2 0 4 1 yes yes
ULK1 0 0 1 yes
YWHAE 0 1 2* yes yes
CDC25C 1 0 0 yes yes
CDKN3 1 0 0 yes yes
CHEK2 1 0 0 yes yes
EIF4A2 1 0 0 yes
FANCD2 1 0 0 yes
PCSK7 1 0 0 yes
SDHC 1 0 0 yes
SUFU 1 0 0 yes
TAF15 1 0 0 yes
YWHAZ 1 0 0 yes
CDK4 1 0 0 yes yes
GNAS 1 0 0 yes
PLK1 1 1 0 yes
PSMD4 1 0 0 yes
RAF1 1 0 0 yes yes
RAP1D 1 0 0
BTRC 1 0 0 yes yes
MLLT3 1 0 0 yes
*One of these mutations results in a truncated protein.
92 ı BioTechniques ı www.biotechniques.com Vol. 45 ı No. 1 ı 2008
Research Reports
single-base mutations in a transcriptome-wide fashion.
The results presented here derive mainly from analysis of data produced from a single flow cell. A strong advantage of this approach, and of digital gene expression profiling in general, is that the sensitivity of detection is limited in principle only by the methods used to prepare the sample for analysis and by the depth of sequencing used. If a single unambiguously mapped read is considered equivalent to a SAGE tag for measuring the transcriptional activity of a gene, we identified 28,613 genes in the largest of the four libraries, suggesting the potential for detecting changes in their expression across libraries of equivalent depth. Though the bulk of these (23,460) were sequenced to less than 5× coverage, × coverage, ×on average (Figure 1), additional “deeper” sequencing from the same library would allow a larger proportion of these to be fully sequenced for genotyping and improved detection of mutations and alternative splicing. Alternatively, sequencing libraries produced from normalized cDNA, in which the relative representation of abundant transcripts is reduced, may provide a more cost-effective option for expanded coverage of low-abundance genes. Production of paired end reads, deriving from both ends of fragments with defined lengths, is also currently in development and should assist in placing reads in low-mappability regions, providing improvements in mutation detection and quantitation.
In our description here of some of the first transcriptome shotgun libraries sequenced by this method, we identified a strong bias in representation of 5′ and 3′ and 3′ ′ends relative to internal transcript regions. Though these biased regions account for approximately 55% of the reads aligned to a transcript, we have shown with subsequent libraries that this bias is a direct result of the library construction method (Supplementary Figure S2) and is remedied by a 5 min sonication step (see Construction of HeLa Whole Transciptome Libraries section above). Future development of the approach will focus on further reduction of this bias, in effect seeking to distribute reads randomly across transcripts. This should improve the proportional coverage of internal exons and improve the overall efficiency and reproducibility of this approach, improving quantitation of each exon within
a given transcriptome. More powerful analyses will likely be possible once this level of uniformity has been achieved. For example, short informative regions of different transcript isoforms (either junctions or portions of exons unique to a given transcript) should enable quanti-tative discrimination of these isoforms. We have also shown that selection for polyad-enylated transcripts significantly depletes noncoding RNA transcripts, which can be recovered from eluate (Supplementary Figure S4), and may be of interest for investigation into the noncoding RNA component of the transcriptome. We show that this fraction contains evidence for some novel noncoding RNA (ncRNA) genes as well as transcriptional activity induced by the integrated HPV18 genome (Supplementary Material).
We have demonstrated that the exons from a large number of genes can be sequenced to considerable depth (Figure 1, Table 1), allowing us to identify distinct exon junctions that can differentiate alter-native transcript isoforms (Table 2, Figure 4). Not all splicing events identified here corresponded to annotated transcripts (Table 2), and may include exons and alternative events unique to HeLa S3 cells or certain cell types (Figure 4). That such events were detected here suggests the possibility of a digital approach for quantifying differences in alternative splicing between tissues and samples, previously only feasible using arrays (12,13). Differences in alternative splicing have been shown to be useful as prognostic markers in various cancers (30,31) and may relate to chemotherapy resistance (13).
Another potential application of this technique is the concurrent detection of mutation and aberrant gene expression events in cancers. Several studies (32,33) have described efforts in which directed exon sequencing has been used to identify cancer-associated mutations. Appropriate statistical techniques may allow differ-entiation of passenger mutations from driver mutations, or those responsible for transformation. Due to the use of the Illumina system, which involves sequencing molecules clonally derived from single DNA molecules, we suspect that transcriptome shotgun sequencing has the potential to facilitate detection of rare, but possibly critical, mutations in sub-populations of cells (34).
While primarily sequencing the most prevalent, or highly expressed, transcripts
in this study, we have revealed 100 genes with apparent changes to their proteins caused by single-base changes as well as potentially many more, due to novel alternative splicing events (Table 4). In the context of cancer, it is noteworthy that we observed a significant enrichment of genes involved in the cell cycle and the E2F signal transduction pathway. The latter has been linked to many cancers (35), particularly in the formation of cervical cancer and the transformation of primary cells to immortal cell lines (36–38). From this analysis we suggest that further profiling of other cell lines and primary tumor samples will likely reveal single-base mutations as well as alternative splicing events involving both known and potentially undiscovered exons, which will aid us in better under-standing the underlying mechanisms of cancer biology and could lead to improved methods to combat the disease.
ACKNOWLEDGEMENTS
R.M. and M.B. contributed equally to this work. The authors are grateful for the expert technical assistance provided by the library construction core of the BC Genome Sciences Centre at the BC Cancer Agency. Funding for this work was provid-ed in part by the BC Cancer Foundation, Genome British Columbia and Western Diversification. M.M. is a senior scholar and S.J. is a scholar at the Michael Smith Foundation for Health Research.
COMPETING INTERESTS STATEMENT
The authors declare no competing interests.
REFERENCES:
1. DeRisi, J., L. Penland, P.O. Brown, M.L.Bittner, P.S. Meltzer, M. Ray, Y. Chen, Y.A.Su, et al. 1996. Use of a cDNA microarray to analyse gene expression patterns in human can-cer. Nat. Genet. 14:457-460.
2. Shoemaker, D.D., E.E. Schadt, C.D. Armour,Y.D. He, P. Garrett-Engele, P.D. McDonagh,P.M. Loerch, A. Leonardson, et al. 2001. Experimental annotation of the human genome using microarray technology. Nature 409:922-927.
3. Saha, S., A.B. Sparks, C. Rago, V. Akmaev,C.J. Wang, B. Vogelstein, K.W. Kinzler, andV.E. Velculescu. 2002. Using the transcrip-
Research Reports
tome to annotate the genome. Nat. Biotechnol. 20:508-512.
4. Velculescu, V.E., S.L. Madden, L. Zhang, A.E.Lash, J. Yu, C. Rago, A. Lal, C.J. Wang, et al.1999. Analysis of human transcriptomes. Nat. Genet. 23:387-388.
5. Larsson, M., S. Graslund, L. Yuan, E.Brundell, M. Uhlen, C. Hoog, and S. Stahl.2000. High-throughput protein expression of cDNA products as a tool in functional genomics. J. Biotechnol. 80:143-157.
6. Bertone, P., V. Stolc, T.E. Royce, J.S.Rozowsky, A.E. Urban, X. Zhu, J.L. Rinn, W.Tongprasit, et al. 2004. Global identification of human transcribed sequences with genome tiling arrays. Science 306:2242-2246.
7. Birney, E., J.A. Stamatoyannopoulos,A. Dutta, R. Guigo, T.R. Gingeras, E.H.Margulies, Z. Weng, M. Snyder, et al. 2007. Identification and analysis of functional elements in 1% of the human genome by the ENCODE pilot project. Nature 447:799-816.
8. Kapranov, P., J. Cheng, S. Dike, D.A. Nix, R.Duttagupta, A.T. Willingham, P.F. Stadler, J.Hertel, et al. 2007. RNA maps reveal new RNA classes and a possible function for pervasive transcription. Science 316:1484-1488.
9. Carninci, P. 2006. Tagging mammalian tran-scription complexity. Trends Genet. 22:501-510.
10. Shiraki, T., S. Kondo, S. Katayama, K. Waki,T. Kasukawa, H. Kawaji, R. Kodzius, A.Watahiki, et al. 2003. Cap analysis gene ex-
pression for high-throughput analysis of tran-scriptional starting point and identification of promoter usage. Proc. Natl. Acad. Sci. USA 100:15776-15781.
11. Wakaguri, H., R. Yamashita, Y. Suzuki, S.Sugano, and K. Nakai. 2008. DBTSS: Database of transcription start sites, progress report 2008. Nucleic Acids Res. 36:D97-D101.
12. Johnson, J.M., J. Castle, P. Garrett-Engele, Z.Kan, P.M. Loerch, C.D. Armour, R. Santos,E.E. Schadt, et al. 2003. Genome-wide survey of human alternative pre-mRNA splicing with exon junction microarrays. Science 302:2141-2144.
13. Griffith, M., M.J. Tang, O.L. Griffith, R.D.Morin, S.Y. Chan, J.K. Asano, T. Zeng, S.Flibotte, et al. 2008. ALEXA: A microarray de-sign platform for alternative expression analysis. Nat. Methods 5:118.
14. Cargill, M., D. Altshuler, J. Ireland, P. Sklar,K. Ardlie, N. Patil, N. Shaw, C.R. Lane, et al. 1999. Characterization of single-nucleotide polymorphisms in coding regions of human genes. Nat. Genet. 22:231-238.
15. Ota, T., Y. Suzuki, T. Nishikawa, T. Otsuki,T. Sugiyama, R. Irie, A. Wakamatsu, K.Hayashi, et al. 2004. Complete sequencing and characterization of 21,243 full-length human cDNAs. Nat. Genet. 36:40-45.
16. Barski, A., S. Cuddapah, K. Cui, T.Y. Roh,D.E. Schones, Z. Wang, G. Wei, I. Chepelev,et al. 2007. High-resolution profiling of his-
tone methylations in the human genome. Cell 129:823-837.
17. Robertson, G., M. Hirst, M. Bainbridge, M. Bilenky, Y. Zhao, T. Zeng, G. Euskirchen, B. Bernier, et al. 2007. Genome-wide profiles of STAT1 DNA association using chromatin im-munoprecipitation and massively parallel se-quencing. Nat. Methods 4:651-657.
18. Chen W, V. Kalscheu, A. Tzschach, C. Menzel,R. Ullmann, M. Schulz, F. Erdogan, N. Li, et al. 2008. Mapping translocation breakpoints by next-generation sequencing. Genome Res. [Epub 21 May 2008].
19. Morin, R.D., M.D. O’Connor, M. Griffith,F. Kuchenbauer, A. Delaney, A. Prabhu, Y.Zhao, H. McDonald, et al. 2008. Application of massively parallel sequencing to microRNA profiling and discovery in human embryonic stem cells. Genome Res. 18:610-621.
20. Hubbard, T.J., B.L. Aken, K. Beal, B.Ballester, M. Caccamo, Y. Chen, L. Clarke,G. Coates, et al. 2007. Ensembl 2007. Nucleic Acids Res. 35:D610-D617.
21. Yauk, C.L. and M.L. Berndt. 2007. Review of the literature examining the correlation among DNA microarray technologies. Environ. Mol. Mutagen. 48:380-394.
22. Akiva, P., A. Toporik, S. Edelheit, Y. Peretz,A. Diber, R. Shemesh, A. Novik, and R. Sorek.2006. Transcription-mediated gene fusion in the human genome. Genome Res. 16:30-36.
23. Sperisen, P., C. Iseli, M. Pagni, B.J. Stevenson,P. Bucher, and C.V. Jongeneel. 2004. Trome,
NEW MICROCALORIMETRY PRODUCTSFROM
TA INSTRUMENTS...The World Leader in
Thermal Analysis, Rheology, and Microcalorimetry
w w w. ta i n s t r u m e n t s . c o m
NANO DSC-High Sensitivity Scanning Calorimeter-Protein Denaturation, Stability
NANO ITC-High Sensitivity Titration Calorimeter-Protein Binding, Interactions, Kinetics
TAM III-High Sensitivity Isothermal Calorimeter-Stability, Compatibility, Morphology
Research Reports
trEST and trGEN: databases of predicted protein sequences. Nucleic Acids Res. 32:D509-D511.
24. Thierry-Mieg, D. and J. Thierry-Mieg. 2006.AceView: A comprehensive cDNA-supported gene and transcripts annotation. Genome Bio. 7:S12 1-14 [Epub 7 August 2007].
25. Cheng, J., P. Kapranov, J. Drenkow, S. Dike,S. Brubaker, S. Patel, J. Long, D. Stern, et al.2005. Transcriptional maps of 10 human chro-mosomes at 5-nucleotide resolution. Science 308:1149-1154.
26. Pineda-Lucena, A., C.S. Ho, D.Y. Mao, Y.Sheng, R.C. Laister, R. Muhandiram, Y. Lu,B.T. Seet, et al. 2005. A structure-based model of the c-Myc/Bin1 protein interaction shows al-ternative splicing of Bin1 and c-Myc phosphory-lation are key binding determinants. J. Mol. Biol. 351:182-194.
27. Futreal, P.A., L. Coin, M. Marshall, T. Down,T. Hubbard, R. Wooster, N. Rahman, andM.R. Stratton. 2004. A census of human cancer genes. Nat. Rev. Cancer 4:177-183.
28. Backes, C., A. Keller, J. Kuentzer, B. Kneissl,N. Comtesse, Y.A. Elnakady, R. Muller, E.Meese, et al. 2007. GeneTrail—advanced gene set enrichment analysis. Nucleic Acids Res. 35:W186-W192.
29. Krull, M., S. Pistor, N. Voss, A. Kel, I. Reuter,D. Kronenberg, H. Michael, K. Schwarzer,et al. 2006. TRANSPATH: An information resource for storing and visualizing signalling
pathways and their pathological aberrations. Nucleic Acids Res. 34:D546-D551.
30. Pampalakis, G., A. Scorilas, and G.Sotiropoulou. 2008. Novel splice variants of prostate-specific antigen and applications in di-agnosis of prostate cancer. Clin. Biochem. [Epub 11 January 2008].
31. Yousef, G.M., N.M. White, I.P. Michael, J.C.Cho, J.D. Robb, L. Kurlender, S. Khan, andE.P. Diamandis. 2005. Identification of new splice variants and differential expression of the human kallikrein 10 gene, a candidate cancer biomarker. Tumour Biol. 26:227-235.
32. Greenman, C., P. Stephens, R. Smith, G.L.Dalgliesh, C. Hunter, G. Bignell, H. Davies, J.Teague, et al. 2007. Patterns of somatic mutation in human cancer genomes. Nature 446:153-158.
33. Sjoblom, T., S. Jones, L.D. Wood, D.W.Parsons, J. Lin, T.D. Barber, D. Mandelker,R.J. Leary, et al. 2006. The consensus coding sequences of human breast and colorectal can-cers. Science 314:268-274.
34. Thomas, R.K., E. Nickerson, J.F. Simons, P.A.Janne, T. Tengs, Y. Yuza, L.A. Garraway, T.LaFramboise, et al. 2006. Sensitive mutation detection in heterogeneous cancer specimens by massively parallel picoliter reactor sequencing. Nat. Med. 12:852-855.
35. Gabellini, C., D. Del Bufalo, and G. Zupi.2006. Involvement of RB gene family in tumor angiogenesis. Oncogene 25:5326-5332.
36. Kim, H., J. Farris, S.A. Christman, B.W.Kong, L.K. Foster, S.M. O’Grady, and D.N.Foster. 2002. Events in the immortalizing pro-cess of primary human mammary epithelial cells by the catalytic subunit of human telomerase. Biochem. J. 365:765-772.
37. Crowe, D.L., D.C. Nguyen, K.J. Tsang, andS. Kyo. 2001. E2F-1 represses transcription of the human telomerase reverse transcriptase gene. Nucleic Acids Res. 29:2789-2794.
38. Giacinti, C. and A. Giordano. 2006. RB and cell cycle progression. Oncogene 25:5220-5227.
Received 22 March 2008; accepted 12 May 2008.
Address correspondence to Marco A. Marra, Genome Sciences Centre, BC Cancer Agency, Suite 100, 570 West 7th Avenue, Vancouver, British Columbia, V5Z 4S6, Canada. e-mail: [email protected]
To purchase reprints of this article, contact: [email protected]


