Embed Size (px)
Citation preview
STRUCTURAL CHANGE AND
ECONOMIC DYNAMICS
ELSEVIER St~cturalChan~ andEconomicDynamics8(1997)279-295
Productivity convergence in OECD service industries
Claud ine G o u y e t t e , Sergio P e r e l m a n *
CREPP - UniversitO de LiOge, Bd du Rectorat 7 (B31), 4000 Liege, Belgium
Abstract
The objective of this paper is threefold. First, to estimate the productivity performances realized in service and manufacturing industries by 13 OECD countries over the period 1970-1987. Secondly, to compare the productivity indicators computed under the alternative frontier analysis and Divisia index approaches. Thirdly, to test the convergence phenomenon in both industries, focusing on the catching-up process and on the interaction between productivity changes and capital intensity variations. The main results show that, contrary to the manufacturing sector and in spite of very low growth rates, productivity levels converge in services. Moreover, new investments in capital appear to exert an unexpected depressive effect on total factor productivity growth in service activities, while having a positive influence in manufacturing industries. © 1997 Elsevier Science B.V.
J E L classification: Code; Code
Keywords: Productivity; Catching up; Convergence; Service industries; Frontier analysis
1. Introduction
In past decades, service industries experienced substantial changes in their pro- duction environment and market conditions. Rapid progress in information and communicat ion technologies as well as progressive deregulations were usually assumed to have a positive influence on productivity growth and convergence. Furthermore, the relative share of services in total G D P has been increasing for many years, and this rise is likely to continue in the future. However, productivity within the service sector has not received much attention in international studies when compared to the impressive literature on manufacturing or global economic performances.1 The papers by Wolff ( 1991, 1992) and Fecher and Pestieau (1993), which analyse some specific service sectors in OECD countries, are two notable
* Corresponding author. 1 See Fagerberg (1994).
0954-349X/97/$17.00 © 1997 Elsevier Science B.V. All rights reserved. PII S0954-349X (97) 00008-8
280 C. Gouyette, S. Perelman / Structural Change and Economic Dynamics 8 (1997) 279~95
exceptions. If the poor growth scores computed by those authors were to be con- firmed at an aggregate level, this would clearly suggest that economic growth projections for the next century should be considered with caution.
The objective of this paper is threefold. Firstly, to estimate the performances of 13 OECD countries in two specific sectors (services and manufacturing) over the 1970-1987 period. Secondly, to analyse and compare the productivity indicators computed under two alternative approaches: frontier analysis and index numbers. Thirdly, to test the convergence hypothesis in both industries, and to give particular attention to the catching-up process and to the interaction between productivity growth rates and capital intensity changes.
Data on output, labour and capital come from the International Sectoral Data Base (ISDB) which contains aggregate information for most OECD countries (OECD, 1991). Productivity performances are derived using two alternative approaches: a traditional Divisia index method previously applied by Wolff (1991) and Wolff (1992) to the same database, and a frontier analysis.
As mentioned by F~ire et al. (1994), frontier analysis can be considered as an appropriate framework to study the convergence process. For each activity, the computed production frontier represents the 'best practice' to which each unit (either a firm or a country) is compared. The gap between the observed output and the corresponding benchmark (best practice) output results from technical inefficiency. As a consequence, the only way for efficient units to improve their productivity is through technological innovations (i.e. by pushing the production frontier up), while inefficient units can realize productivity gains either through technological progress or by adopting existing technologies. If those units grow faster than the leaders, this generates a catching-up process leading to convergence.
Among the set of available production frontier approaches, we opt for the non- parametric data envelopment analysis (DEA) which consists of deriving a convex envelope from the solution of a linear programming optimization process. 2 Following F~ire et al. (1992), we then derive a Malmquist index of total factor productivity growth and decompose it into two distinct factors: technological changes and efficiency changes (i.e. individual catching-up).
Our results can be summarized as follows. Firstly, the conclusions derived from the frontier analysis are very similar to those derived from Divisia indices. Secondly, service industries within OECD countries have been characterized by very small productivity gains. This finding largely confirms those of previous studies and can probably be considered an illustration of the 'cost disease' hypothesis set out by Baumol (1991). Thirdly, the Malmquist decomposition shows that total factor productivity growth results exclusively from efficiency improvements in services and from technological progress in manufacturing. Finally, the convergence pattern differs among the two sectors. To be more precise, we identify a clear catching-up process and a path towards productivity convergence in service activities, but some signs of stagnation in manufacturing industries. Regarding the dynamics of physical
2 Alternatively, best practice frontiers can be estimated using parametric approaches, either deterministic or stochastic. For a survey of these approaches, see Lovell (1993).
C Gouyette, S. Perelman / Structural Change and Economic Dynamics 8 (1997) 279-295 281
investments, it appears that an increase in capital intensity has a depressive impact on total factor productivity changes in services and a positive one in manufacturing.
This paper is organized as follows. Section 2 focuses on the methodological issues related to the measurement of productivity growth and convergence. The data and main results are presented in Section 3. Section 4 is devoted to concluding remarks.
2. Measuring productivity growth and convergence
2.1. Frontier analysis and TFP decomposition
The frontier analysis assumes the existence of an unobservable function, the production frontier, corresponding to the maximum attainable output level for any combination of inputs at a given point in t ime) This so-called 'best practice' function, f[.], can be represented as follows:
yF(h,t) =f[x(h , t ) , t], ( 1 )
where yF(h,t) is the maximum potential output level (i.e. on the frontier) for country h at time t and x(h,t) is a vector of inputs. Note that f[.] directly depends on time, indicating that some of the shifts in the production frontier may occur independently of changes in inputs, n In the terminology of Solow (1957), the time variable t is assumed to catch neutral technological progress in production.
Thus, for any observed output y(h,t) , using x(h,t) as inputs, we can estimate the corresponding level of output-oriented technical efficiency. This is given by the distance function: 5
y(h,t) Oto[x(h,t),y(h,t )] =-u(h,t) = (2)
yF(h,t) '
with D~o[x(h,t),y(h,t)]= 1 for technically efficient units, located on the reference frontier, and Dto[x(h,t), y(h,t)] < 1 for inefficient ones, located below the reference frontier.
The derivative of the logarithm of Eq. (1) with respect to time generates a convenient expression of output growth:
f:(h,t) i¢(h,t) ft(h,t) - - = e x - - + e t + - - , (3) y(h,t) x(h,t) u(h,t)
where cx and ct denote, respectively, the partial elasticity of yl~(h,t) with respect to the inputs (in vector form) and t, and dotted variables refer to time derivatives.
Eq. (3) indicates that output changes can be broken down into three components.
3 The notion of production frontier is essentially due to Farrell (1957) who first gave the scope of its applicability in empirical studies. 4 In addition, f[.] is assumed to satisfy the axioms listed in F~ire (1988). s See F/ire et al. (1985).
282 C. Gouyette, S. Perelman / Structural Change and Economic Dynamics 8 (1997) 279~95
The first corresponds to input changes weighted by output elasticities. The second represents the rate of technological progress of the 'best practice' frontier. The last corresponds to the efficiency gain which can be interpreted as an individual catching-up effect.
Following Nishimizu and Page (1982), we define the rate of total factor produc- tivity change (or TFP change) as the variation in output not explained by input variations:
u(h,t) TFe(h,t) = e, + - TC(h,t)+ TEC(h,t), (4)
u(h,t)
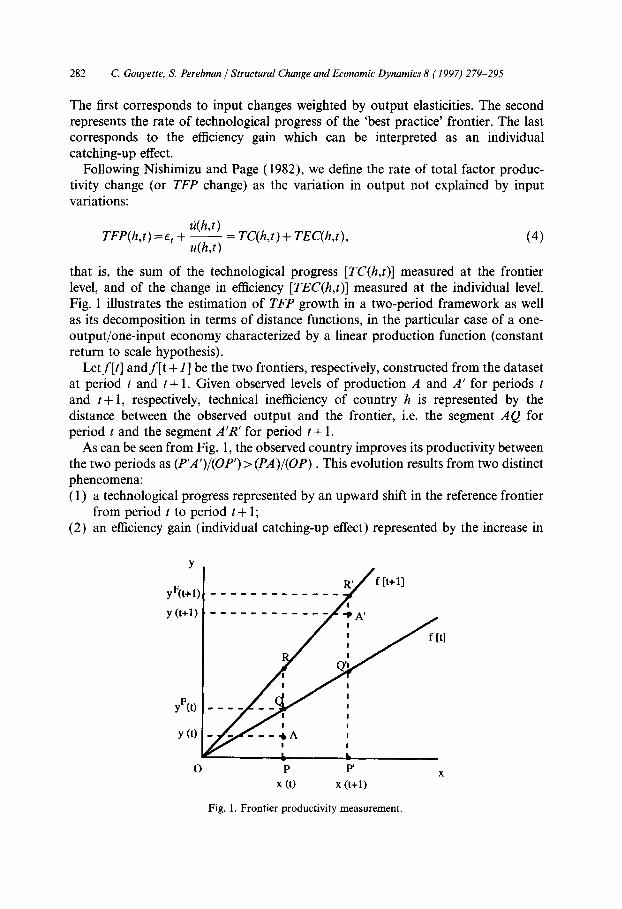
that is, the sum of the technological progress [TC(h,t)] measured at the frontier level, and of the change in efficiency [TEC(h,t)] measured at the individual level. Fig. 1 illustrates the estimation of TFP growth in a two-period framework as well as its decomposition in terms of distance functions, in the particular case of a one- output/one-input economy characterized by a linear production function (constant return to scale hypothesis).
Letf[t] andf[ t + 1] be the two frontiers, respectively, constructed from the dataset at period t and t + 1. Given observed levels of production A and A' for periods t and t+ 1, respectively, technical inefficiency of country h is represented by the distance between the observed output and the frontier, i.e. the segment A Q for period t and the segment A'R' for period t + 1.
As can be seen from Fig. 1, the observed country improves its productivity between the two periods as (P',4')/(OP')> (PA)/(OP). This evolution results from two distinct pheneomena: (1) a technological progress represented by an upward shift in the reference frontier
from period t to period t + 1; (2) an efficiency gain (individual catching-up effect) represented by the increase in
Y
yF(t+l)
y (t+l)
yF(0
y (0
0
. . . . . . . . . . . . R ~ f It+l]
A'
/lJ---tA IL b p P' x
× (t) × (t+l)
Fig. 1. Frontier productivity measurement.
C. Gouyette, S. Perelman / Structural Change and Economic Dynamics 8 (1997) 2 79-295 283
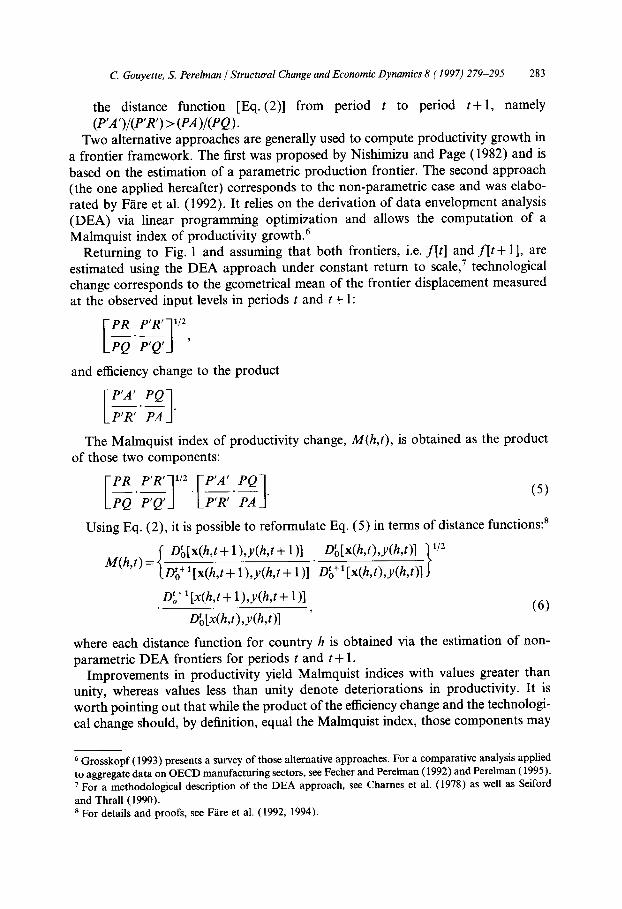
the distance function [Eq.(2)] from period t to period t + l , namely (P'A')/(P'R') > (PA )/(PQ ).
Two alternative approaches are generally used to compute productivity growth in a frontier framework. The first was proposed by Nishimizu and Page (1982) and is based on the estimation of a parametric production frontier. The second approach (the one applied hereafter) corresponds to the non-parametric case and was elabo- rated by F/~re et al. (1992). It relies on the derivation of data envelopment analysis (DEA) via linear programming optimization and allows the computation of a Malmquist index of productivity growth. 6
Returning to Fig. 1 and assuming that both frontiers, i.e. f[t] and f[t + 1 ], are estimated using the DEA approach under constant return to scale, 7 technological change corresponds to the geometrical mean of the frontier displacement measured at the observed input levels in periods t and t + 1:
and efficiency change to the product
P'R' The Malmquist index of productivity change, M(h,t), is obtained as the product
of those two components:
~_~ P'Q'] LP,R-~, ~-~ . (5)
Using Eq. (2), it is possible to reformulate Eq. (5) in terms of distance functions: 8
=~ Dto[x(h,t+ !),y(h,t+ 1)]_ Dtotx(h,t),y(h,t)] ~,/z M(h,t) tD~o+l[x(h,t + 1),y(h,t+ 1)] D ~ ) ] )
Oto + l[x(h,t + 1),y(h,t + 1 )] (6)
Dto[x(h,t),y(h,t)]
where each distance function for country h is obtained via the estimation of non- parametric DEA frontiers for periods t and t + 1.
Improvements in productivity yield Malmquist indices with values greater than unity, whereas values less than unity denote deteriorations in productivity. It is worth pointing out that while the product of the efficiency change and the technologi- cal change should, by definition, equal the Malmquist index, those components may
6 Grosskopf (1993) presents a survey of those alternative approaches. For a comparative analysis applied to aggregate data on O E C D manufactur ing sectors, see Fecher and Perelman (1992) and Perelman (1995). 7 For a methodological description o f the D E A approach, see Charnes et al. (1978) as well as Seiford
and Thrall (1990). s For details and proofs, see Fare et al. (1992, 1994).
284 (2 Gouyette, S. Perelman / Structural Change and Economic Dynamics 8 (1997) 279-295
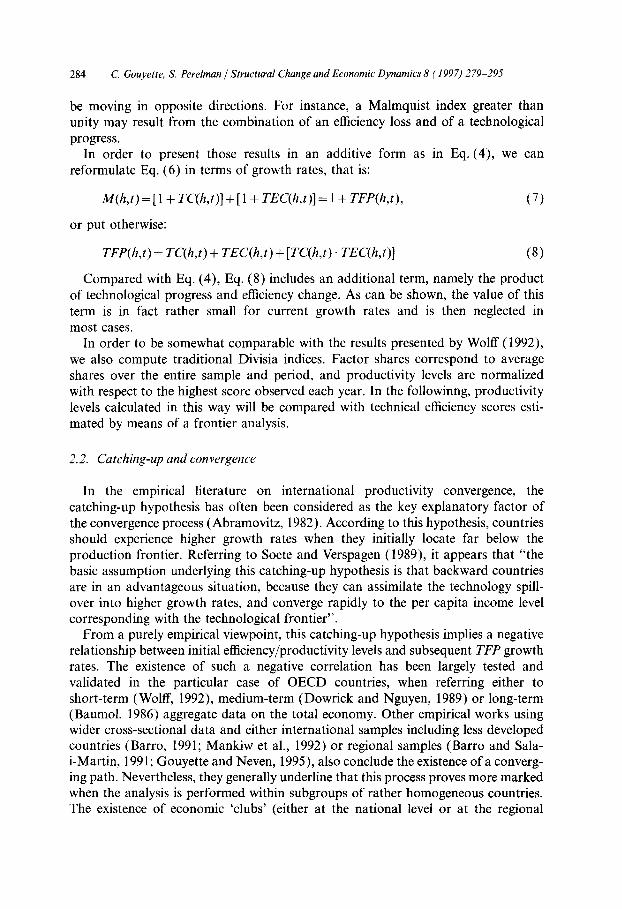
be moving in opposite directions. For instance, a Malmquist index greater than unity may result from the combination of an efficiency loss and of a technological progress.
In order to present those results in an additive form as in Eq. (4), we can reformulate Eq. (6) in terms of growth rates, that is:
m(h , t ) = [1 + TC(h,t)] + [1 + TEC(h,t)] = 1 + TFP(h,t) , (7)
or put otherwise:
TFP(h, t ) = TC(h,t) + TEC(h, t ) + [TC(h,t) . TEC(h,t)] (8)
Compared with Eq. (4), Eq. (8) includes an additional term, namely the product of technological progress and efficiency change. As can be shown, the value of this term is in fact rather small for current growth rates and is then neglected in most cases.
In order to be somewhat comparable with the results presented by Wolff (1992), we also compute traditional Divisia indices. Factor shares correspond to average shares over the entire sample and period, and productivity levels are normalized with respect to the highest score observed each year. In the followinng, productivity levels calculated in this way will be compared with technical efficiency scores esti- mated by means of a frontier analysis.
2.2. Catching-up and convergence
In the empirical literature on international productivity convergence, the catching-up hypothesis has often been considered as the key explanatory factor of the convergence process (Abramovitz, 1982). According to this hypothesis, countries should experience higher growth rates when they initially locate far below the production frontier. Referring to Soete and Verspagen (1989), it appears that "the basic assumption underlying this catching-up hypothesis is that backward countries are in an advantageous situation, because they can assimilate the technology spill- over into higher growth rates, and converge rapidly to the per capita income level corresponding with the technological frontier".
From a purely empirical viewpoint, this catching-up hypothesis implies a negative relationship between initial efficiency/productivity levels and subsequent TFP growth rates. The existence of such a negative correlation has been largely tested and validated in the particular case of OECD countries, when referring either to short-term (Wolff, 1992), medium-term (Dowrick and Nguyen, 1989) or long-term (Baumol, 1986) aggregate data on the total economy. Other empirical works using wider cross-sectional data and either international samples including less developed countries (Barro, 1991; Mankiw et al., 1992) or regional samples (Barro and Sala- i-Martin, 1991; Gouyette and Neven, 1995), also conclude the existence of a converg- ing path. Nevertheless, they generally underline that this process proves more marked when the analysis is performed within subgroups of rather homogeneous countries. The existence of economic 'clubs' (either at the national level or at the regional
C. Gouyette, S. Perelman / Structural Change and Economic Dynamics 8 (1997) 279-295 285
level) has been stressed and discussed within new growth theories. Those 'clubs' are generally characterized by an internal convergence while clearly diverging among each others.
In order to test the catching-up hypothesis, we perform various analyses for both the service and the manufacturing sectors. We first compute the evolution of the gap between the countries experiencing the extreme efficiency/productivity levels as well as the evolution of those economic performances in average. However, as noted by Lichtenberg (1994), most of those traditional tests establish necessary, but not sufficient, conditions for convergence. In order to strengthen our conclusions about the convergence process among OECD countries, it is then interesting to test the homogenization hypothesis that refers to the reduction in the dispersion of produc- tivity levels. 9 For this purpose, we perform an additional test which consists in estimating the time path of technical efficiency dispersion among OECD countries.
Finally, we test the mean reversion hypothesis by estimating the correlation coefficient between initial efficiency/productivity levels and subsequent changes. This preliminary result is then refined within a regression framework, as in Wolff (1992). The dependent variable is TFP change and the independent variables are initial efficiency levels and the capital intensity variations.
3. Data and results
The major objective of this section is to derive efficiency/productivity scores as well as their evolutions in two aggregate sectors, manufacturing and services, within a sample of 13 OECD countries observed over the 1970-1987 period. Our data source is the 1991 version of the International Sectoral Data Base (OECD, 1991) which is described in Meyer-zu-Schlochterm (1988). l° The key countries and vari- ables are shown in Table 1.11 Services and manufacturing are respectively defined as the aggregation of six 'private' service sectors and nine manufacturing sectors (see Appendix A). Our measure of aggregate output is real GDP (expressed in 1980 US dollar equivalents, on the basis of OECD purchasing power parities). Total employ- ment (the sum of employees plus self-employed workers) and gross capital stock (measured in 1980 US dollars equivalents) are our input proxies for labour and capital respectively.
In Table 1, we present a brief overview of the average output and input evolutions over the selected period. The picture differs somewhat among the two sectors, in the sense that growth scores are better in services (there is notably no contraction in employment). Note that in service activities, Australia, Canada, the US and Japan
9 In a clarifying paper, Baumol et al. (1994) describe some of the pertinent convergence concepts generally used in the literature. lo The data set covers the 1960-1989 period but the period of greatest data availability is from 1980 to 1987. A new version of the ISDB is now available, but we choose to work with the old version to be somewhat comparable with existing studies (e.g. Wolff, 1992). Nevertheless, following our referees' advice, we perform the same analysis using the new ISDB version and come to similar conclusions.
1 One of the countries, Italy, was excluded from our computat ions because of some anomalies.
286 C. Gouyette, S. Perelman / Structural Change and Economic Dynamics 8 (1997) 279-295
Table 1
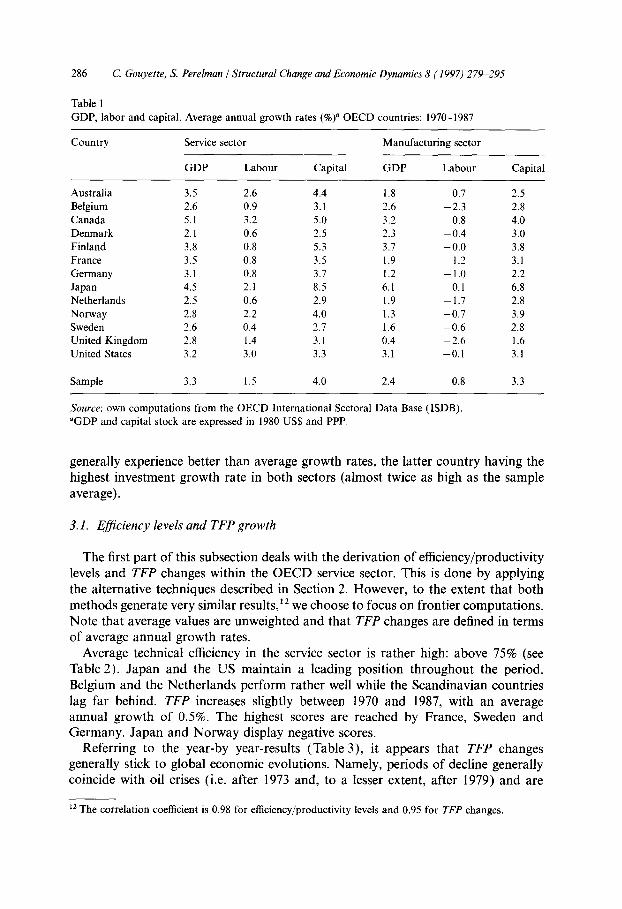
GDP, labor and capital. Average annual growth rates (%)" OECD countries: 1970-1987
Country Service sector Manufacturing sector
GDP Labour Capital GDP Labour Capital
Australia 3.5 2.6 4.4 1.8 - 0.7 2.5 Belgium 2.6 0.9 3.1 2.6 - 2.3 2.8 Canada 5.1 3.2 5.0 3.2 0.8 4.0 Denmark 2.1 0.6 2.5 2.3 - 0.4 3.0 Finland 3.8 0.8 5.3 3.7 - 0 . 0 3.8 France 3.5 0.8 3.5 1.9 - 1.2 3.1 Germany 3.1 0.8 3.7 1.2 - 1.0 2.2 Japan 4.5 2.1 8.5 6.1 0.1 6.8 Netherlands 2.5 0.6 2.9 1.9 - 1.7 2.8 Norway 2.8 2.2 4.0 1.3 -0 .7 3.9 Sweden 2.6 0.4 2.7 1.6 - 0 . 6 2.8 United Kingdom 2.8 1.4 3.1 0.4 - 2.6 1.6 United States 3.2 3.0 3.3 3.1 -0 .1 3.1
Sample 3.3 1.5 4.0 2.4 - 0.8 3.3
Source: own computations from the OECD International Sectoral Data Base (ISDB). aGDP and capital stock are expressed in 1980 US$ and PPP.
generally experience better than average growth rates, the latter country having the highest investment growth rate in both sectors (almost twice as high as the sample average).
3.1. Efficiency levels and TFP growth
The first part of this subsection deals with the derivation of efficiency/productivity levels and TFP changes within the OECD service sector. This is done by applying the alternative techniques described in Section 2. However, to the extent that both methods generate very similar results,12 we choose to focus on frontier computations. Note that average values are unweighted and that TFP changes are defined in terms of average annual growth rates.
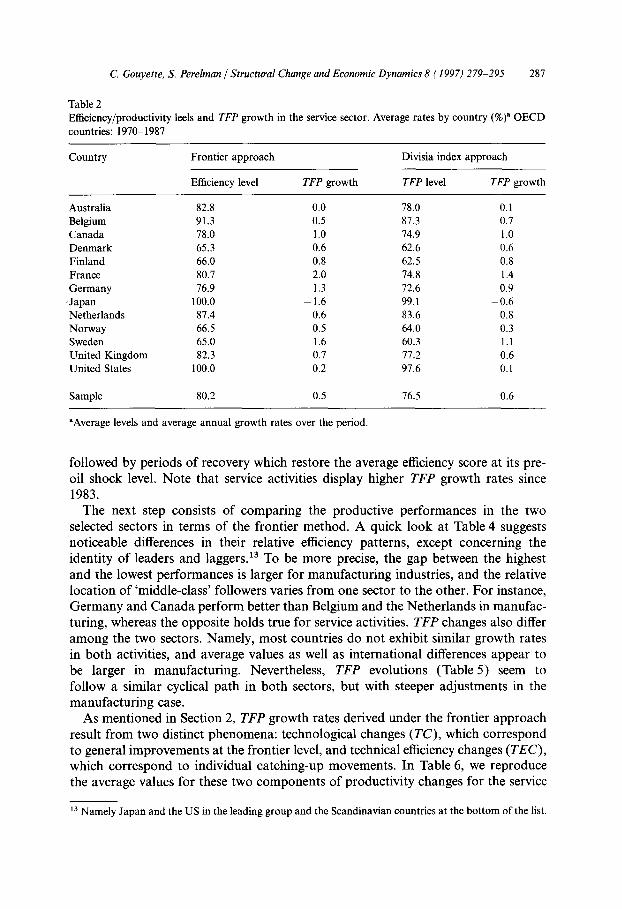
Average technical efficiency in the service sector is rather high: above 75% (see Table 2). Japan and the US maintain a leading position throughout the period. Belgium and the Netherlands perform rather well while the Scandinavian countries lag far behind. TFP increases slightly between 1970 and 1987, with an average annual growth of 0.5%. The highest scores are reached by France, Sweden and Germany. Japan and Norway display negative scores.
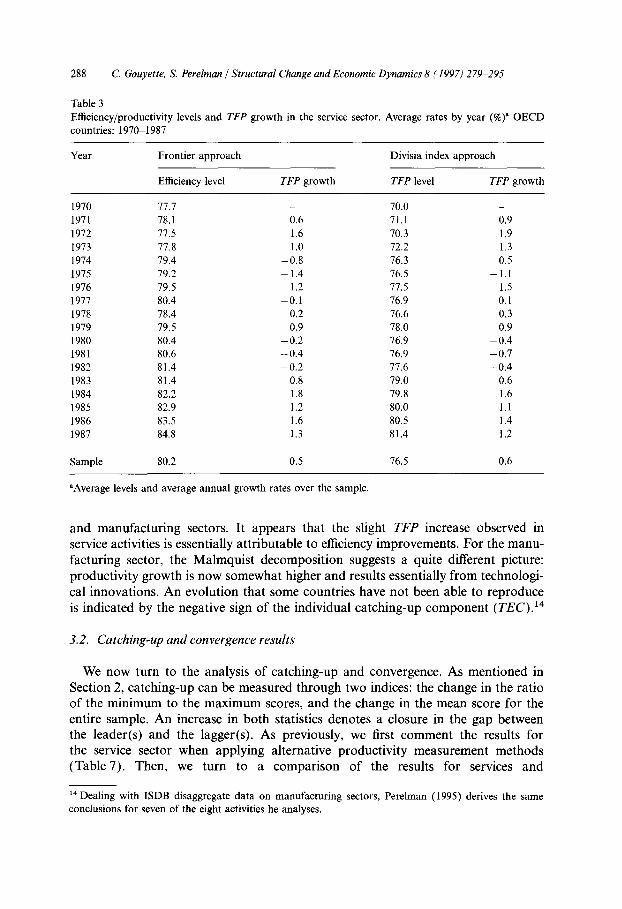
Referring to the year-by year-results (Table 3), it appears that TFP changes generally stick to global economic evolutions. Namely, periods of decline generally coincide with oil crises (i.e. after 1973 and, to a lesser extent, after 1979) and are
~2 The correlation coefficient is 0.98 for efficiency/productivity levels and 0.95 for TFP changes.
C Gouyette, S. Perelman / Structural Change and Economic Dynamics 8 (1997) 279-295 287
Table 2 Efficiency/productivity leels and TFP growth in the service sector. Average rates by country (%)a OECD countries: 1970-1987
Country Frontier approach Divisia index approach
Efficiency level TFP growth TFP level TFP growth
Australia 82.8 0.0 78.0 0.1 Belgium 91.3 0.5 87.3 0.7 Canada 78.0 1.0 74.9 1.0 Denmark 65.3 0.6 62.6 0.6 Finland 66.0 0.8 62.5 0.8 France 80.7 2.0 74.8 1.4 Germany 76.9 1.3 72.6 0.9 • Japan 100.0 - 1.6 99.1 - 0.6 Netherlands 87.4 0.6 83.6 0.8 Norway 66.5 - 0.5 64.0 - 0.3 Sweden 65.0 1.6 60.3 1.1 United Kingdom 82.3 0.7 77.2 0.6 United States 100.0 0.2 97.6 0.1
Sample 80.2 0.5 76.5 0.6
aAverage levels and average annual growth rates over the period.
followed by periods of recovery which restore the average efficiency score at its pre- oil shock level. Note that service activities display higher TFP growth rates since 1983.
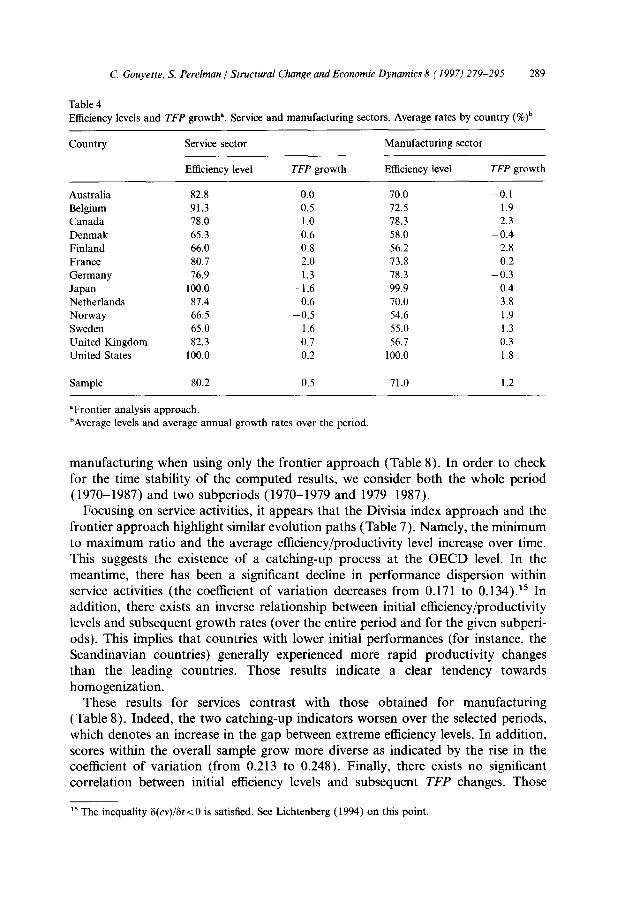
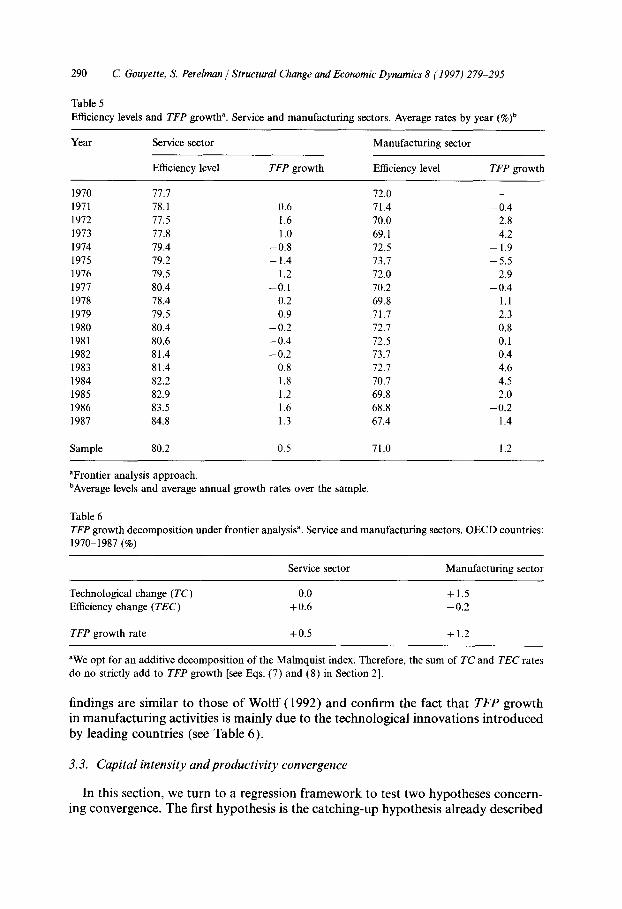
The next step consists of comparing the productive performances in the two selected sectors in terms of the frontier method. A quick look at Table 4 suggests noticeable differences in their relative efficiency patterns, except concerning the identity of leaders and laggers. 13 To be more precise, the gap between the highest and the lowest performances is larger for manufacturing industries, and the relative location of 'middle-class' followers varies from one sector to the other. For instance, Germany and Canada perform better than Belgium and the Netherlands in manufac- turing, whereas the opposite holds true for service activities. T F P changes also differ among the two sectors. Namely, most countries do not exhibit similar growth rates in both activities, and average values as well as international differences appear to be larger in manufacturing. Nevertheless, TFP evolutions (Table5) seem to follow a similar cyclical path in both sectors, but with steeper adjustments in the manufacturing case.
As mentioned in Section 2, TFP growth rates derived under the frontier approach result from two distinct phenomena: technological changes (TC) , which correspond to general improvements at the frontier level, and technical efficiency changes (TEC) , which correspond to individual catching-up movements. In Table 6, we reproduce the average values for these two components of productivity changes for the service
13 Namely Japan and the US in the leading group and the Scandinavian countries at the bottom of the list.
288 C. Gouyette, S. Perelman / Structural Change and Economic Dynamics 8 (1997) 279~95
Table 3 Efficiency/productivity levels and TFP growth in the service sector. Average rates by year (%)" OECD countries: 1970-1987
Year Frontier approach Divisia index approach
Efficiency level TFP growth TFP level TFP growth
1970 77.7 - 70.0 - 1971 78.1 0.6 71.1 0.9 1972 77.5 1.6 70.3 1.9 1973 77.8 1.0 72.2 1.3 1974 79.4 -0.8 76.3 -0.5 1975 79.2 - 1.4 76.5 - 1.1 1976 79.5 1.2 77.5 1.5 1977 80.4 0.1 76.9 0.1 1978 78.4 0.2 76.6 0.3 1979 79.5 0.9 78.0 0.9 1980 80.4 -0.2 76.9 -0.4 1981 80.6 -0.4 76.9 -0.7 1982 81.4 -0.2 77.6 -0.4 1983 81.4 0.8 79.0 0.6 1984 82.2 1.8 79.8 1.6 1985 82.9 1.2 80.0 1.1 1986 83.5 1.6 80.5 1.4 1987 84.8 1.3 81.4 1.2
Sample 80.2 0.5 76.5 0.6
"Average levels and average annual growth rates over the sample.
and manufac tu r ing sectors. It appears that the slight TFP increase observed in service activities is essentially a t t r ibutable to efficiency improvements . For the ma nu - facturing sector, the Malmquis t decomposi t ion suggests a quite different picture: productivi ty growth is now somewhat higher and results essentially f rom technologi- cal innovat ions . A n evolut ion that some countries have not been able to reproduce is indicated by the negative sign of the individual catching-up componen t (TEC). 14
3.2. Catching-up and convergence results
We now turn to the analysis of catching-up and convergence. As ment ioned in Section 2, catching-up can be measured through two indices: the change in the ratio of the m i n i m u m to the m a x i m u m scores, and the change in the mean score for the entire sample. A n increase in bo th statistics denotes a closure in the gap between the leader(s) and the lagger(s). As previously, we first comment the results for the service sector when applying alternative product ivi ty measurement methods (Tab le7 ) . Then, we turn to a compar ison of the results for services and
14Dealing with ISDB disaggregate data on manufacturing sectors, Perelman (1995) derives the same conclusions for seven of the eight activities he analyses.
C. Gouyette, S. Perelman / Structural Change and Economic Dynamics 8 (1997) 279-295 289
Table 4 Efficiency levels and TFP growth a. Service and manufacturing sectors. Average rates by country (%)b
Country Service sector Manufacturing sector
Efficiency level TFP growth Efficiency level TFP growth
Australia 82.8 0.0 70.0 - 0.1 Belgium 91.3 0.5 72.5 1.9 Canada 78.0 1.0 78.3 2.3 Denmak 65.3 0.6 58.0 - 0.4 Finland 66.0 0.8 56.2 2.8 France 80.7 2.0 73.8 - 0.2 Germany 76.9 1.3 78.3 - 0.3 Japan 100.0 - 1.6 99.9 0.4 Netherlands 87.4 0.6 70.0 3.8 Norway 66.5 - 0.5 54.6 1.9 Sweden 65.0 1.6 55.0 1.3 United Kingdom 82.3 0.7 56.7 0.3 United States 100.0 0.2 100.0 1.8
Sample 80.2 0.5 71.0 1.2
aFrontier analysis approach. bAverage levels and average annual growth rates over the period.
manufacturing when using only the frontier approach (Table 8). In order to check for the time stability of the computed results, we consider both the whole period (1970-1987) and two subperiods (1970-1979 and 1979-1987).
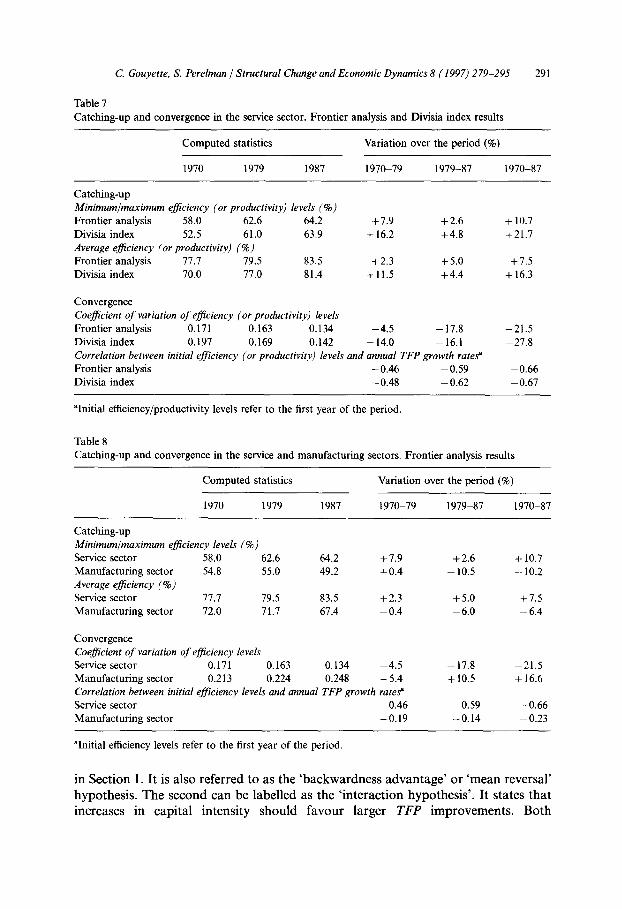
Focusing on service activities, it appears that the Divisia index approach and the frontier approach highlight similar evolution paths (Table 7). Namely, the minimum to maximum ratio and the average efficiency/productivity level increase over time. This suggests the existence of a catching-up process at the OECD level. In the meantime, there has been a significant decline in performance dispersion within service activities (the coefficient of variation decreases from 0.171 to 0.134). 15 In addition, there exists an inverse relationship between initial efficiency/productivity levels and subsequent growth rates (over the entire period and for the given subperi- ods). This implies that countries with lower initial performances (for instance, the Scandinavian countries) generally experienced more rapid productivity changes than the leading countries. Those results indicate a clear tendency towards homogenization.
These results for services contrast with those obtained for manufacturing (Table 8). Indeed, the two catching-up indicators worsen over the selected periods, which denotes an increase in the gap between extreme efficiency levels. In addition, scores within the overall sample grow more diverse as indicated by the rise in the coefficient of variation (from 0.213 to 0.248). Finally, there exists no significant correlation between initial efficiency levels and subsequent T F P changes. Those
15 The inequality ~(cv)/6t< 0 is satisfied. See Lichtenberg (1994) on this point.
290 C. Gouyette, S. Perelman / Structural Change and Economic Dynamics 8 (1997) 279-295
Table 5 Efficiency levels and TFP growth a. Service and manufacturing sectors. Average rates by year (%)b
Year Service sector Manufacturing sector
Efficiency level TFP growth Efficiency level TFP growth
1970 77.7 72.0 - 1971 78.1 0.6 71.4 -0 .4 1972 77.5 1.6 70,0 2.8 1973 77.8 1.0 69.1 4.2 1974 79.4 -0 .8 72.5 - 1.9 1975 79.2 - 1.4 73.7 -5 .5 1976 79.5 1.2 72.0 2.9 1977 80.4 -0.1 70.2 -0 .4 1978 78.4 0.2 69.8 1.1 1979 79.5 0,9 71.7 2.3 1980 80.4 -0 .2 72.7 0.8 1981 80.6 -0 .4 72.5 0.1 1982 81.4 -0 .2 73.7 0.4 1983 81.4 0.8 72.7 4,6 1984 82.2 1.8 70.7 4.5 1985 82.9 1.2 69.8 2.0 1986 83.5 1.6 68.8 -0 .2 1987 84.8 1.3 67.4 1.4
Sample 80.2 0.5 71.0 1.2
aFrontier analysis approach. bAverage levels and average annual growth rates over the sample.
Table 6 TFP growth decomposition under frontier analysis a. Service and manufacturing sectors. OECD countries: 1970-1987 (%)
Service sector Manufacturing sector
Technological change (TC) 0.0 + 1.5 Efficiency change (TEC) + 0.6 - 0.2
TFP growth rate +0.5 + 1.2
aWe opt for an additive decomposition of the Malmquist index. Therefore, the sum of TC and TEC rates do no strictly add to TFP growth [see Eqs. (7) and (8) in Section 2].
f i n d i n g s a r e s i m i l a r to t h o s e o f W o l f f ( 1 9 9 2 ) a n d c o n f i r m the f ac t t h a t TFP g r o w t h
in m a n u f a c t u r i n g ac t iv i t i e s is m a i n l y d u e to t h e t e c h n o l o g i c a l i n n o v a t i o n s i n t r o d u c e d
b y l e a d i n g c o u n t r i e s (see T a b l e 6) .
3.3. Capital intensity and productivity convergence
In th i s sec t ion , we t u r n to a r e g r e s s i o n f r a m e w o r k to tes t t w o h y p o t h e s e s c o n c e r n -
ing c o n v e r g e n c e . T h e f i rs t h y p o t h e s i s is t h e c a t c h i n g - u p h y p o t h e s i s a l r e a d y d e s c r i b e d
C. Gouyette, S. Perelman / Structural Change and Economic Dynamics 8 (1997) 279-295
Table 7 Catching-up and convergence in the service sector. Frontier analysis and Divisia index results
291
Computed statistics Variation over the period (%)
1970 1979 1987 1970-79 1979-87 1971)-87
Catching-up Minimum/maximum efficiency (or productivity) levels (%) Frontier analysis 58.0 62.6 64.2 +7.9 +2.6 + 10.7 Divisia index 52.5 61.0 63.9 + 16.2 +4.8 +21.7 Average efficiency (or productivity) (%) Frontier analysis 77.7 79.5 83.5 +2.3 +5.0 +7.5 Divisia index 70.0 77.0 81.4 + 11.5 + 4.4 + 16.3
Convergence Coefficient of variation of efficiency (or productivity) levels Frontier analysis 0.171 0.163 0.134 - 4.5 - 17.8 - 21.5 Divisia index 0.197 0.169 0.142 - 14.0 - 16.1 -27.8 Correlation between initial efficiency (or productivity) levels and annual TFP growth rated ~ Frontier analysis -0.46 -0.59 -0.66 Divisia index -0.48 -0.62 -0.67
alnitial efficiency/productivity levels refer to the first year of the period.
Table 8 Catching-up and convergence in the service and manufacturing sectors. Frontier analysis results
Computed statistics Variation over the period (%)
1970 1979 1987 1970 79 1979-87 1970-87
Catching-up Minimum~maximum efficiency levels (%) Service sector 58.0 62.6 64.2 + 7.9 + 2.6 + 10.7 Manufacturing sector 54.8 55.0 49.2 +0.4 - 10.5 -- 10.2 Average efficiency (%) Service sector 77.7 79.5 83.5 + 2.3 + 5.0 + 7.5 Manufacturing sector 72.0 71.7 67.4 -0 .4 -6 .0 -6 .4
Convergence Coefficient of variation of efficiency levels Service sector 0.171 0.163 0.134 -4 .5 - 17.8 --21.5 Manufacturing sector 0.213 0.224 0.248 + 5.4 + 10.5 + 16.6 Correlation between initial efficiency levels and annual TFP growth rates ~ Service sector -0.46 -0.59 -0.66 Manufacturing sector - 0.19 - 0.14 - 0.23
alnitial efficiency levels refer to the first year of the period.
in S e c t i o n 1. I t is a l so r e f e r r e d to as the ' b a c k w a r d n e s s a d v a n t a g e ' o r ' m e a n r eve r sa l '
h y p o t h e s i s , T h e s e c o n d c a n be l abe l l ed as t he ' i n t e r a c t i o n h y p o t h e s i s ' . I t s t a t e s t h a t
i nc reases in c ap i t a l i n t ens i t y s h o u l d f a v o u r l a rge r T F P i m p r o v e m e n t s . B o t h
292 C. Gouyette, S. Perelman / Structural Change and Economic Dynamics 8 (1997) 279 295
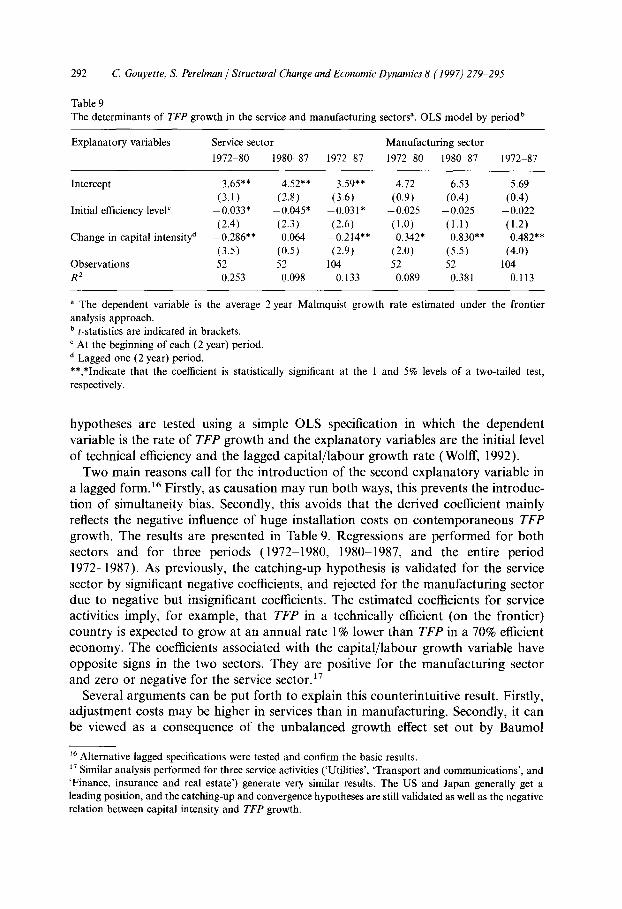
Table 9 The determinants of TFP growth in the service and manufacturing sectors a. OLS model by period b
Explanatory variables Service sector Manufacturing sector 1972-80 1980-87 1972 87 1972 80 1980 87 1972-87
Intercept 3.65"* 4.52** 3.59** 4.72 6.53 5.69 (3.1) (2.8) (3.6) (0.9) (0.4) (0.4)
Initial efficiency level c -0.033* -0.045* -0.031" -0.025 -0.025 -0.022 (2.4) (2.3) (2.6) (1.0) (1.1) (1.2)
Change in capital intensity a -0.286** 0.064 -0.214"* 0.342* 0.830** 0.482** (3.5) (0.5) (2.9) (2.0) (5.5) (4.0)
Observations 52 52 104 52 52 104 R 2 0.253 0.098 0.133 0.089 0.381 0.113
a The dependent variable is the average 2 year Malmquist growth rate estimated under the frontier analysis approach. b t-statistics are indicated in brackets. c At the beginning of each (2 year) period. d Lagged one (2 year) period. **,*Indicate that the coefficient is statistically significant at the 1 and 5% levels of a two-tailed test, respectively.
hypotheses are tested using a simple OLS specification in which the dependent variable is the rate o f T F P growth and the explanatory variables are the initial level o f technical efficiency and the lagged capi tal / labour growth rate (Wolff, 1992).
Two main reasons call for the introduct ion o f the second explanatory variable in a lagged form. 16 Firstly, as causat ion may run both ways, this prevents the introduc- tion o f simultaneity bias. Secondly, this avoids that the derived coefficient mainly reflects the negative influence o f huge installation costs on contemporaneous T F P
growth. The results are presented in Table 9. Regressions are performed for both sectors and for three periods (1972-1980, 1980-1987, and the entire period 1972-1987). As previously, the catching-up hypothesis is validated for the service sector by significant negative coefficients, and rejected for the manufac tur ing sector due to negative but insignificant coefficients. The estimated coefficients for service activities imply, for example, that T F P in a technically efficient (on the frontier) country is expected to grow at an annual rate 1% lower than T F P in a 70% efficient economy. The coefficients associated with the capi tal / labour growth variable have opposite signs in the two sectors. They are positive for the manufactur ing sector and zero or negative for the service sector. 17
Several arguments can be put forth to explain this counterintuitive result. Firstly, adjustment costs may be higher in services than in manufactur ing. Secondly, it can be viewed as a consequence o f the unbalanced growth effect set out by Baumol
~6 Alternative lagged specifications were tested and confirm the basic results. 17 Similar analysis performed for three service activities ('Utilities', 'Transport and communications', and 'Finance, insurance and real estate') generate very similar results. The US and Japan generally get a leading position, and the catching-up and convergence hypotheses are still validated as well as the negative relation between capital intensity and TFP growth.
c. Gouyette, S. Perelman / Structural Change and Economic Dynamics 8 (1997) 279-295 293
(1991). This effect, also referred to as the 'cost disease' hypothesis, is associated with the highly labouristic nature of the production process in service activities which prevents the introduction of new technologies. Thirdly, there is an important measurement problem associated with service outputs in the sense that price changes do not fully incorporate quality improvements. This implies that true output growth is probably underestimated. 18
4. Concluding remarks
In this paper, we estimate the productive performance of service activities using a representative set of OECD countries over the last two decades. Our conclusions can be summarized as follows. Productivity growth rates in the service sector appear rather poor when compared to those experienced by manufacturing industries. In addition, we find some evidence of convergence in service activities, such a process failing to materialize in manufacturing. Unfortunately, the small size of the sample does not allow the performing of additional convergence tests, as suggested in Quah (1996).
Considering that services represent an increasing share in the total economy, those findings seem quite puzzling. The recent evolution towards market deregulations combined with the progress in information technologies should radically modify the production conditions, and especially favour the introduction of new generations of services. We think that measuring productivity and catching-up in this sector, as well as the specific interaction between technological innovation and productivity improvement, should become a key concern for future studies applying similar frontier analysis techniques to panel data.
Acknowledgements
The authors thank Michel Beine, Tim Coelli, Alain Jousten, Jacques Mairesse, Pierre Pestieau and Jean-Philippe Stijns for helpful comments and suggestions. Financial support from the Belgian Science Foundation and the Belgian Ministry of Scientific Policy is acknowledged.
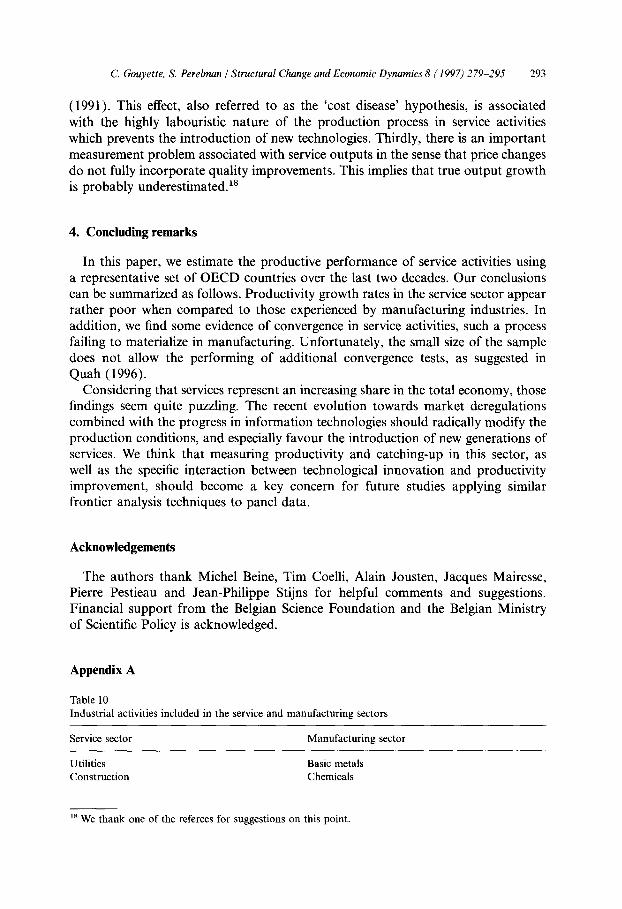
Appendix A
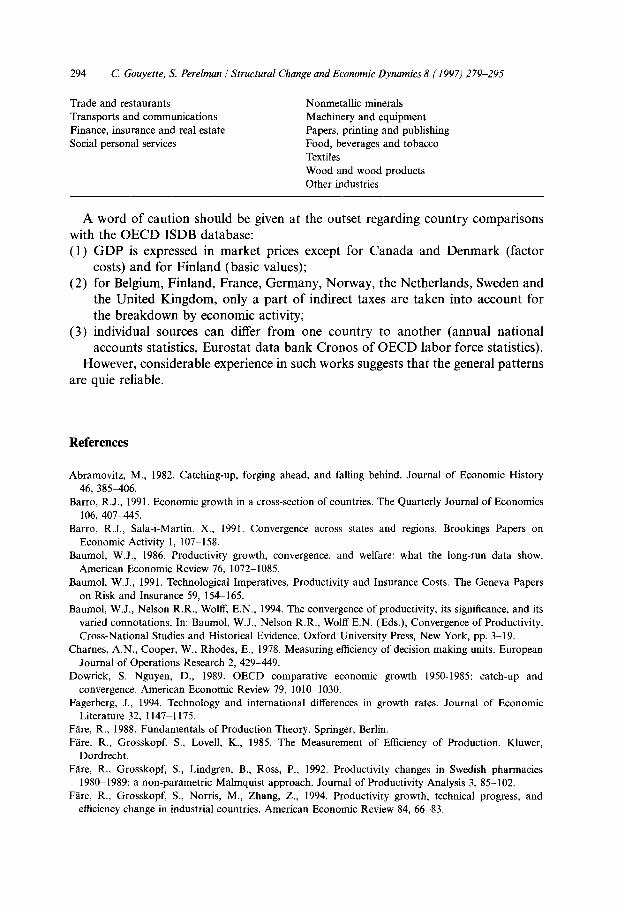
Table 10 Industrial activities included in the service and manufacturing sectors
Service sector Manufacturing sector
Utilities Basic metals Construction Chemicals
~8 We thank one of the referees for suggestions on this point.
294 C. Gouyette, S. Perelman / Structural Change and Economic Dynamics 8 (1997) 279-295
Trade and restaurants Transports and communications Finance, insurance and real estate Social personal services
Nonmetallic minerals Machinery and equipment Papers, printing and publishing Food, beverages and tobacco Textiles Wood and wood products Other industries
A word of caution should be given at the outset regarding country comparisons with the OECD ISDB database: (1) GDP is expressed in market prices except for Canada and Denmark (factor
costs) and for Finland (basic values); (2) for Belgium, Finland, France, Germany, Norway, the Netherlands, Sweden and
the United Kingdom, only a part of indirect taxes are taken into account for the breakdown by economic activity;
(3) individual sources can differ from one country to another (annual national accounts statistics, Eurostat data bank Cronos of OECD labor force statistics).
However, considerable experience in such works suggests that the general patterns are quie reliable.
References
Abramovitz, M., 1982. Catching-up, forging ahead, and falling behind. Journal of Economic History 46, 385-406.
Barro, R.J., 1991. Economic growth in a cross-section of countries. The Quarterly Journal of Economics 106, 407-445.
Barro, R.J., Sala-i-Martin, X., 1991. Convergence across states and regions. Brookings Papers on Economic Activity 1, 107-158.
Baumol, W.J., 1986. Productivity growth, convergence, and welfare: what the long-run data show. American Economic Review 76, 1072 1085.
Baumol, W.J., 1991. Technological Imperatives, Productivity and Insurance Costs. The Geneva Papers on Risk and Insurance 59, 154-165.
Baumol, W.J., Nelson R.R., Wolff, E.N., 1994. The convergence of productivity, its significance, and its varied connotations. In: Baumol, W.J., Nelson R.R., Wolff E.N. (Eds.), Convergence of Productivity. Cross-National Studies and Historical Evidence. Oxford University Press, New York, pp. 3-19.
Charnes, A.N., Cooper, W., Rhodes, E., 1978. Measuring efficiency of decision making units. European Journal of Operations Research 2, 429-449.
Dowrick, S. Nguyen, D., 1989. OECD comparative economic growth 1950-1985: catch-up and convergence. American Economic Review 79, 1010-1030.
Fagerberg, J., 1994. Technology and international differences in growth rates. Journal of Economic Literature 32, 1147-1175.
Fare, R., 1988. Fundamentals of Production Theory. Springer, Berlin. Fare, R., Grosskopf, S., Lovell, K., 1985. The Measurement of Efficiency of Production. Kluwer,
Dordrecht. Fares R., Grosskopf, S., Lindgren, B., Ross, P., 1992. Productivity changes in Swedish pharmacies
1980-1989: a non-parametric Malmquist approach. Journal of Productivity Analysis 3, 85-102. F/are, R., Grosskopf, S., Norris, M., Zhang, Z., 1994. Productivity growth, technical progress, and
efficiency change in industrial countries. American Economic Review 84, 66-83.
C. Gouyette, S. Perelman / Structural Change and Economic Dynamics 8 (1997) 279-295 295
Farrell, M.J., 1957. The measurement of productivity efficiency. Journal of the Royal Statistical Society A 120, 253-290.
Fecher, F., Perelman, S., 1992. Productivity growth and technical efficiency in OECD industrial activities. In: Caves, R. (Ed.), Industrial Efficiency in Six Nations. MIT Press, Cambridge, MA, pp. 459-488.
Fecher, F., Pestieau, P., 1993. Efficiency and competition in OECD financial services. In: Fried, H., Lovell, K., Schmidt, S. (Eds.), The Measurement of Productive Efficiency: Techniques and Applications. Oxford University Press, New York, pp. 374-385.
Grosskopf, S., 1993. Efficiency and Productivity. In: Fried, H., Lovell, K., Schmidt, S. (Eds.), The Measurement of Productive Efficiency: Techniques and Applications. Oxford University Press, New York, pp. 160-194.
Gouyette, C., Neven, D., 1995. Regional convergence in the European Community. Journal of Common Market Studies 33, 47-65.
Lichtenberg, F.R., 1994. Testing the convergence hypothesis. The Review of Economics and Statistics 76, 576-579.
Lovell, K., 1993. Production frontiers and productivity efficiency. In: Fried, H., Lovell K , Schmidt S., (Eds.), The Measurement of Productive Efficiency: Techniques and Applications. Oxford University Press, New York, pp. 3 67.
Mankiw, N.G., Romer, D., Weil, D.N., 1992. A contribution to the empirics of economic growth. The Quarterly Journal of Economics 107, 407 437.
Meyer-zu-Schlochterm, F.J.M., 1988. An international sectoral database for 13 OECD countries. Working Paper no. 57, Department of Economics and Statistics, OECD, Paris.
Nishimizu, M., Page, J.M., 1982. Total factor productivity growth, technological progress and technical efficiency change: dimensions of productivity change in Yugoslavia, 1965-78. The Economic Journal 92, 920-936.
OECD, 1991. International Sectoral Database. OECD, Paris. Perelman, S., 1995. R and D, technological progress and efficiency change in industrial activities. Review
of Income and Wealth 41,349-366. Quah, D.T., 1996. Empirics for economic growth and convergence. European Economic Review 40,
1353-1375. Seiford, L.M., Thrall, R.M., 1990. Recent developments in DEA: the mathematical programming
approach to frontier analysis. Journal of Econometrics 46, 7 38. Soete, L., Verspagen, B., 1989. Technology and growth: the complex dynamics of catching-up, falling
behind and take over. In: Szimari, A., van Ark, B., Pilat D. (Eds.), Explaining Economic Growth. North-Holland, Amsterdam, pp. 101-127.
Solow, R., 1957. Technical change and the aggregate production function. Review of Economics and Statistics 39, 312-320.
Wolff, E.N., 1991. Productivity growth, capital intensity, and skill levels, in the US Insurance Industry, 1948-86. The Geneva Paper on Risk and Insurance 59, 173 190.
Wolff, E.N., 1992. Productivity growth and capital intensity on the sector and industry level: specialization among OECD countries, 1970-1988. In: Silverberger, G., Soete L. (Eds.), The Economics of Growth and Technical Change. Edward Elgar, Aldershot, 185-211.