Embed Size (px)
Citation preview
OECD DEVELOPMENT CENTRE
Working Paper No. 234
THE IMPACT OF SOCIAL INSTITUTIONSON THE ECONOMIC ROLE OF WOMEN
IN DEVELOPING COUNTRIES
by
Christian Morrisson and Johannes Jütting
Research programme on:Social Institutions and Dialogue
May 2004DEV/DOC(2004)03
The Impact of Social Institutions on the Economic Role of Women in Developing Countries DEV/DOC(2004)03
© OECD 2004 2
DEVELOPMENT CENTRE WORKING PAPERS
This series of working papers is intended to disseminate the Development Centre’s research findings rapidly among specialists in the field concerned. These papers are generally available in the original English or French, with a summary in the other language.
Comments on this paper would be welcome and should be sent to the OECD Development Centre, Le Seine Saint-Germain, 12 boulevard des Îles, 92130 Issy-les-Moulineaux, France.
THE OPINIONS EXPRESSED AND ARGUMENTS EMPLOYED IN THIS DOCUMENT ARE THE SOLE RESPONSIBILITY OF THE AUTHOR
AND DO NOT NECESSARILY REFLECT THOSE OF THE OECD OR OF THE GOVERNMENTS OF ITS MEMBER COUNTRIES
CENTRE DE DÉVELOPPEMENT DOCUMENTS DE TRAVAIL
Cette série de documents de travail a pour but de diffuser rapidement auprès des spécialistes dans les domaines concernés les résultats des travaux de recherche du Centre de Développement. Ces documents ne sont disponibles que dans leur langue originale, anglais ou français ; un résumé du document est rédigé dans l’autre langue.
Tout commentaire relatif à ce document peut être adressé au Centre de Développement de l’OCDE, Le Seine Saint-Germain, 12 boulevard des Îles, 92130 Issy-les-Moulineaux, France.
LES IDÉES EXPRIMÉES ET LES ARGUMENTS AVANCÉS DANS CE DOCUMENT SONT CEUX DE L’AUTEUR ET NE REFLÈTENT PAS NÉCESSAIREMENT CEUX DE L’OCDE OU DES GOUVERNEMENTS DE SES PAYS MEMBRES
Applications for permission to reproduce or translate all or part of this material should be made to:
Head of Publications Service, OECD 2, rue André-Pascal, 75775 PARIS CEDEX 16, France
© OECD 2004
OECD Development Centre Working Paper No. 234 DEV/DOC(2004)03
© OECD 2004 3
TABLE OF CONTENTS
ACKNOWLEDGEMENTS.......................................................................................................................... 4
PREFACE ...................................................................................................................................................... 5
RÉSUMÉ........................................................................................................................................................ 6
SUMMARY ................................................................................................................................................... 7
I. INTRODUCTION..................................................................................................................................... 8
II. DONOR POLICIES AND GENDER INEQUALITIES ..................................................................... 11
III. A FRAMEWORK FOR ANALYSIS OF THE ECONOMIC ROLE OF WOMEN ........................ 13
IV. THE ECONOMIC ROLE OF WOMEN IN DEVELOPING COUNTRIES: A NEW DATABASE........................................................................................................................... 19
V. THE IMPORTANCE OF SOCIAL INSTITUTIONS FOR THE ECONOMIC ROLE OF WOMEN IN DEVELOPING COUNTRIES................................................................................ 24
VI. CONCLUSIONS .................................................................................................................................. 29
BIBLIOGRAPHY........................................................................................................................................ 30
ANNEXES................................................................................................................................................... 32
OTHER TITLES IN THE SERIES/ AUTRES TITRES DANS LA SÉRIE.............................................. 53
The Impact of Social Institutions on the Economic Role of Women in Developing Countries DEV/DOC(2004)03
© OECD 2004 4
ACKNOWLEDGEMENTS
The Development Centre would like to express its gratitude to the Swiss Authorities for the financial support given to the project which gave rise to this study.
This paper has benefited from excellent research assistance provided by Silke Friedrich, Jennifer Davies and Lucie Senftova, and from comments made at an internal Development Centre seminar, especially those provided by Marcelo Soto.
OECD Development Centre Working Paper No. 234 DEV/DOC(2004)03
© OECD 2004 5
PREFACE
The improvement of the socio-economic situation of women is a major objective of OECD countries’ policies. The international community has included promoting gender equality in developing countries and empowering women in the Millennium Development Goals. By improving women’s access to education, health care, micro-credit, justice and employment considerable progress in reducing gender disparities can be achieved. However, millions of women are still denied basic rights.
A major element in the Development Centre’s work on social institutions and development is persisting gender inequality. In an innovative approach, this paper measures the impact of social institutions such as laws, codes of conduct, social norms and traditions on the possibilities of women to participate in economic activities. The authors find evidence that established institutional frameworks outweigh the importance of commonly assumed factors and are the most important determinants of women’s participation in economic activities.
Three policy conclusions emerge from this work: First, standard gender equality policies are likely to fail in countries with an unfavourable institutional environment. Secondly, donors can assist policy makers in developing countries to address the underlying causes of gender discrimination within the local culture; otherwise, women’s effective participation in labour markets can be thwarted. This change will help to unlock potential for more sustainable growth. Third, although changing social institutions takes time, such changes are, in fact, possible. The current modification of the family law in Morocco, within the framework of Islamic law, is a promising example.
Prof. Louka T. Katseli Director
OECD Development Centre 4 May 2004
The Impact of Social Institutions on the Economic Role of Women in Developing Countries DEV/DOC(2004)03
© OECD 2004 6
RÉSUMÉ
Les agences d’aide et les responsables politiques s’accordent en général sur l’idée suivante : un accès accru des femmes à l’éducation, à la santé, au crédit, aux droits reconnus par la loi et aux possibilités d’emploi, en conjonction avec la croissance économique, améliorera significativement le rôle des femmes dans la société et l’économie des pays en développement. Ce document conteste cette idée pour la raison suivante : ces mesures risquent de ne pas suffire aussi longtemps que le cadre institutionnel limite dans un pays la participation des femmes aux activités économiques. Il montre que les institutions sociales, c’est-à-dire les lois, les normes, les traditions et les codes de comportement dans une société représentent le facteur le plus important qui détermine la liberté de choix des femmes en matière d’activité économique. Les institutions sociales n’ont pas seulement un impact direct sur le rôle économique des femmes, mais elles ont aussi un impact indirect à cause de leur incidence sur l’accès des femmes à des ressources telles que l’éducation et les soins de santé. Les résultats de l’étude laissent penser qu’un cadre institutionnel qui désavantage la moitié de la population adulte freine le développement. La conclusion suggérée par ces résultats est que les responsables politiques et les agences d’aide, pour agir efficacement sur les inégalités en fonction du sexe, doivent se demander s’il faut intervenir et comment pour modifier un cadre institutionnel qui discrimine les femmes. C’est à l’évidence une tâche encore plus ardue qu’augmenter les taux de scolarisation des filles ou introduire des formules durables de micro-crédit, deux objectifs déjà difficiles à atteindre.
OECD Development Centre Working Paper No. 234 DEV/DOC(2004)03
© OECD 2004 7
SUMMARY
Donor agencies and policy makers tend to agree that increased access of women to education, health, credit, formal legal rights and employment opportunities, in conjunction with economic growth, will substantially improve the socio-economic role of women in developing countries. This paper challenges that view. It argues that these measures might not be sufficient if the institutional framework within a country constrains women from participating in economic activities. It finds that social institutions — laws, norms, traditions and codes of conduct — constitute the most important single factor determining women’s freedom of choice in economic activities. They have not only a direct impact on the economic role of women but also an indirect one through women’s access to resources like education and health care. The findings suggest that an institutional framework that disadvantages half of the adult population hinders development. To address gender inequalities effectively, policy makers and donors must think about and address institutional frameworks that discriminate against women, a task even more difficult than the tough exercises of increasing female enrolment rates or introducing sustainable micro-credit schemes.
The Impact of Social Institutions on the Economic Role of Women in Developing Countries DEV/DOC(2004)03
© OECD 2004 8
I. INTRODUCTION
“Preventing women from contributing to the sustenance and improvement of others by means of their efforts infringes the basic rules of public co-operation to such a degree that our national society is stricken like a human body that is paralysed on one side. Yet women are not inferior to men in their intellectual and physical capacities.”
Namil Kemal (a leader of the Young Turks), 1867
A steadily growing literature has examined the relationship between gender and economic development since the early 1970s. This study contributes to the debate by identifying the basic determinants of the economic role of women. Based on a newly developed data set including various kinds of variables measuring gender inequalities, two new indicators measure discrimination against women related to constraints imposed by social institutions — laws, social norms, codes of conduct and traditions. Using these indicators, three important results emerge. First, the study finds a clear gap between countries in East Asia and Latin America on the one hand and those in Sub-Saharan-Africa, South Asia and the Middle East and North African region (MENA) on the other. In the former, even in poor countries, women have economic roles nearly comparable to those in the developed countries, while in the latter strong gender inequalities exist even in some countries with high per capita incomes. Second, important disparities in gender inequality exist across countries with the same levels of development and the same dominant religions. This means that a country could develop while gender inequalities persist, and religion per se does not prevent improvement in the economic role of women. Third, an unfavourable institutional environment that disadvantages women hinders development, because through various channels it excludes the participation of half of the population in economic activities.
Most current work on gender and development reflects three stylised schools of thought concerning the impact of development and growth on gender inequalities (Forsythe et al., 2000):
— The modernisation-neoclassical approach holds that gender inequalities likely will decline as a country develops. Economic growth entails an increase in employment opportunities and competition, which gradually eliminates gender inequalities in education, finance, training and so forth.
— The Boserup (1970) approach views the relationship between gender inequalities and economic growth in terms of a U-shaped pattern. Where no market economy exists, such inequalities remain negligible. With growth and development, discrimination against women initially increases as a consequence of the specialisation of roles, with women
OECD Development Centre Working Paper No. 234 DEV/DOC(2004)03
© OECD 2004 9
having the principal responsibility for childcare and men for earning income. Later, however, and with the overall transformation of society, this trend can reverse owing to increasing opportunities and demand for women in the workforce.
— Feminist studies (e.g. Tinker and Bramsen, 1976; Semyonov, 1986) emphasise the major role played by institutions such as patriarchal family structures in perpetuating gender inequality. Economic growth is regarded as a factor that increases the vulnerability of women.
In a comprehensive and detailed cross-sectional and longitudinal analysis using data from more than 100 developed and developing countries, Forsythe et al. (2000) find support for the neoclassical approach. They measure gender inequality mainly with the UNDP’s Gender Development Index (GDI), which includes inequalities in access to health, education and income-earning opportunities. As an independent variable they use a proxy for the prevalence of patriarchal institutional arrangements, a dummy variable that takes the value of one for countries with more than 50 per cent Muslim populations or are located in Latin America. They also include the Gender Empowerment Measure (GEM), which tries to capture discrimination against women in political and economic opportunities. These choices of independent variables present two main problems. First, it is not clear and not backed up by the existing literature that patriarchal institutions exist only in mainly Muslim or Latin American countries. In North Indian states, for example, patriarchal institutions remain very strong and discriminate against women. Second, one can question the hypothesised directions of causality and the treatment of endogeneity. It is reasonable to assume that women’s levels of education determine their chances of becoming parliamentarians as well as their ability to acquire managerial positions. Ordinary Least-Squares estimators as used in the article thus might lead to biased results.
In addition to studies of how growth or economic development affects gender, an emerging debate concerns the reverse causality, i.e. whether gender inequalities can explain different country growth rates (Lagerlöf, 2003). The empirical evidence so far is inconclusive. Klasen (1999) for instance, using cross-country regressions, shows that gender inequality reduces growth. He uses two variables for educational inequality: the ratio of women’s to men’s total years of schooling within populations aged 15 and older in 1960, and the ratio of annual growth rates over 1960-90 in years of schooling for women and men within populations defined the same way. A comparison between South and East Asia shows that 0.7 percentage point of the annual growth difference of 2.5 per cent in GDP per capita in 1960-92 can be attributed to gender inequality in education. In contrast, however, Seguino (2000) finds that for open developing countries gender inequalities stimulate growth. Seguino’s cross-country analysis of semi-industrialised, export-oriented economies finds a lower female wage rate correlated positively with growth across countries and over time. It detects two channels of influence, namely the quantity and quality of investment. Countries with relatively lower wages attract more investment, and it is used more productively.
This brief review of the empirical research on the relationship between gender inequalities and economic development stresses the importance of finding valid indicators of gender inequality. Cross-national and individual country studies usually draw on data in the UNDP Human Development Report, the UN World’s Women surveys and the World Bank’s gender
The Impact of Social Institutions on the Economic Role of Women in Developing Countries DEV/DOC(2004)03
© OECD 2004 10
statistics database, GenderStats. In general, these indicators measure discrimination against women in terms of access to education, health care, political representation, earnings or income and so forth. The aggregate indices that have received the most attention recently are the UNDP’s well known GDI and GEM. The GDI is the unweighted average of three indices that measure gender differences in terms of life expectancy at birth, gross enrolment and literacy rates and earned income. The GEM is also an unweighted average of three variables reflecting the importance of women in society. They include the percentage of women in parliament, the male/female ratio among administrators and managers and professional and technical workers, and the female/male GDP per capita ratio calculated from female and male shares of earned income.
The validity of these aggregate indices has been widely debated and questioned (Dijkstra, 2000; Bardhan and Klasen, 1999; Dijkstra and Hanmer, 2000; White, 1997). The criticisms raised are pertinent and straightforward, but this paper argues that the more fundamental problem with the use of GDI and GEM lies in their failure to pay attention to the institutional frameworks that constrain the economic role of women in many countries. It demonstrates that this framework is key to our understanding of the role of women in developing countries and that ignoring traditions, customs and explicit or implicit laws can limit the usefulness of policy actions aimed at improving the situation of women. The paper’s original feature is its inclusion of exogenous variables in the analysis of women’s socio-economic conditions. These variables reflect laws, customs and traditions that have prevailed for centuries. The paper’s main argument holds that these traditional social institutions have a long-lasting impact on the role of women and on their access to resources such as land, credit, health care and education. To support it, a comprehensive database includes variables not taken into account elsewhere, such as age of marriage, women’s freedom of movement, parental authority over children, inheritance law and so forth. They are used to construct two indices for the institutional framework. In a ranking of 66 developing countries according to these two indices, a distinct gap appears between the situation of women in East Asia and Latin America on one hand and in Sub-Saharan-Africa, South Asia and the Middle East-North Africa (MENA) region on the other.
This paper is divided into six sections. This introduction (section I) is followed by a short description on the way donor policies address gender inequalities (section II). In section III an analytical framework is presented, while in section IV a new data base on the economic role of women is developed. Section V discusses the relative importance of the various determinants of the economic role of women: social institutions, access to resources and policy. Lastly, section VI concludes.
OECD Development Centre Working Paper No. 234 DEV/DOC(2004)03
© OECD 2004 11
II. DONOR POLICIES AND GENDER INEQUALITIES
The approach to women in development policies changed significantly over the last sixty years. In the 1950s and 1960s, policies viewed women mainly as mothers and passive beneficiaries of development aid. The main focus was on food aid and family planning. The “Women in Development” (WID) approach developed in the 1970s and influenced by the seminal work of Boserup (1970) acknowledged the various contributions of women to development and sought equity for them in the form of political and economic autonomy. It called for reducing women’s inequality vis à vis men. Since the beginning of the 1990s the “Gender and Development” (GAD) approach has dominated the debate, and governments and aid agencies have widely adopted it. It emerged from the Fourth World Conference on Women in Beijing in 1995. The Beijing Declaration calls for a fundamental restructuring of society and the removal of remaining sources of inequality between men and women. It introduces gender equality as a human right and it contains the method of “gender mainstreaming” that requires inclusion of a gender dimension throughout institutions, policies, planning and decision-making. Gender mainstreaming involves women’s political, economic and social empowerment. The Beijing Platform of Action specifies the 12 critical areas of action that represent the main obstacles to women’s advancement:
— Women and poverty; — Women and education and training; — Women and health; — Violence against women; — Women and armed conflict; — Women and the economy; — Women in power and decision-making; — Institutional mechanisms for the advancement of women; — Human rights of women; — Women and the media; — Women and the environment; and — The girl child.
In the gender debate today, achieving the Millennium Development Goals (MDGs) is a major concern. The promotion of gender equality and women’s empowerment is Goal Three of the MDGs agreed at the Millennium Summit of the United Nations in September 2000. Goal Three is unique because it underpins all the others, which, as is widely recognised, cannot be
The Impact of Social Institutions on the Economic Role of Women in Developing Countries DEV/DOC(2004)03
© OECD 2004 12
reached without achieving it. Increased interest in gender equality has also contributed to the creation of several databases and regular reporting on gender inequalities and the role of women in the world. Examples include the UNDP Human Development Reports (which began in 1990) together with the GDI and GEM, both introduced in 1995, World’s Women (UN, first issue in 1991) and GenderStats (World Bank, first issue 1999).
Despite an overall consensus among donors about the need for the advancement of women, the actions of individual donors often fail technically. They have a conceptual confusion about what gender mainstreaming means and how to do it in practice. The recently released Transforming the Mainstream, Gender in UNDP (UNDP, 2003) indicates this. It notes that most development agencies do not use “social relations analysis”, a concept that addresses the power structure of a society in a broad sense, including its processes and relations. The report concludes that to end women’s subordination, men will have to transfer some of their economic, political and social power to women. Development agencies tend to use the “gender roles” framework that focuses only on the household unit and on allocating resources among family members (Razavi and Miller, 1995). The first, more challenging approach attacks the status quo in a society, but the second is more politically acceptable for developing countries and carries less threat that donors will be accused of “cultural neo-colonialism”.
A critical look at donors’ conceptual documents reveals two important points. First, donors generally acknowledge the roles in gender inequality of informal institutions, social norms and traditions of conduct, but often not prominently and rather as side remarks (e.g. OECD-DAC 1998 and 1999; UNDP, 2003; World Bank, 2001). Second, they often lack concrete targets to empower women economically and politically within in a given time. The OECD-DAC network on gender equality, for instance, criticises the absence of formulated, quantitative targets to measure progress of women’s participation in paid work outside the agricultural sector (Rodenberg, 2003).
Donor agencies do cover a wide range of issues related to the 12 agreed areas of action from the Beijing Platform. A main focus lies on women’s access to resources like education, health and nutrition as well as micro-finance. More recently issues related to governance, trafficking in human beings and information and communication technologies have attracted attention. Yet they address only at the margins, if at all, the role of social institutions in determining the status of women.
OECD Development Centre Working Paper No. 234 DEV/DOC(2004)03
© OECD 2004 13
III. A FRAMEWORK FOR ANALYSIS OF THE ECONOMIC ROLE OF WOMEN
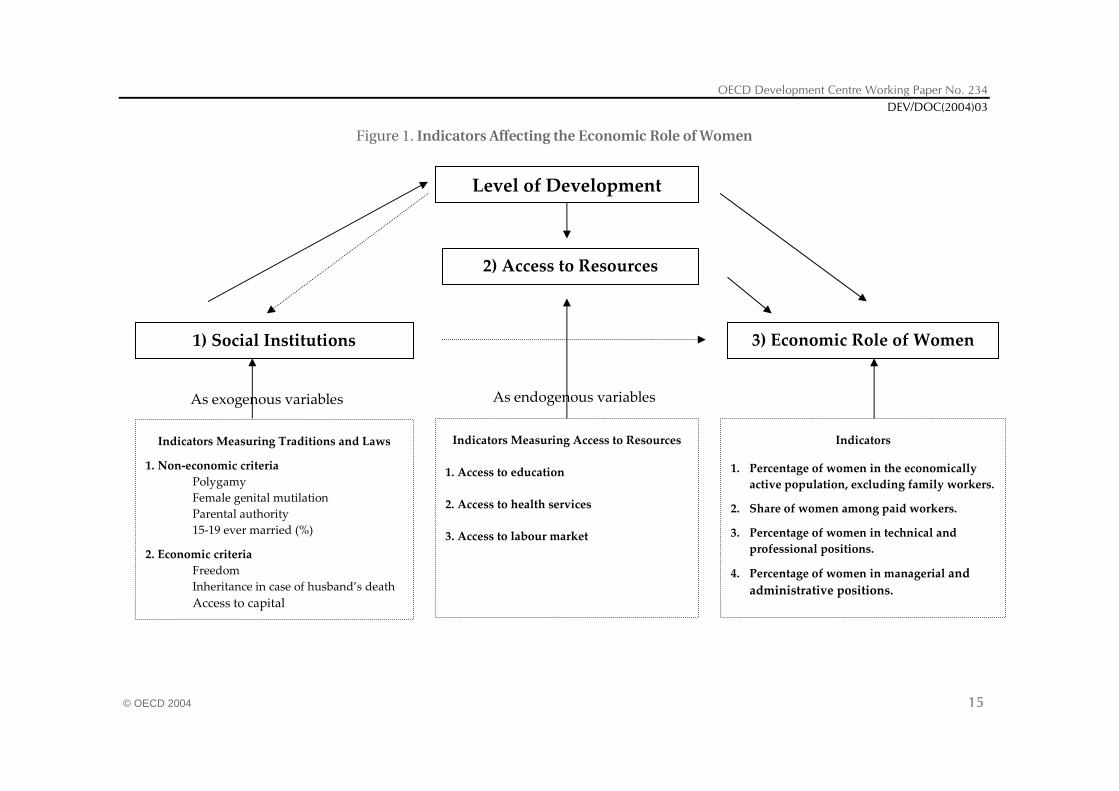
The framework used here assumes that three major factors influence the economic role of women: social institutions, women’s access to resources and the level of development (Figure 1 on the following page). A recently published World Bank study (2001) follows a somewhat similar approach, highlighting the key importance of norms and customs for gender inequality. Its index of gender equality incorporates various aspects of women’s rights: political, legal, social, economic and in marriage and divorce. It shows that inequalities in rights lie at the heart of those in education, access to health care and political representation. It also points out that religion in general influences gender relations and outcomes, but the effects of specific religious affiliations are mixed, due to different interpretations of obligations and codes of conduct in different cultural settings. Given the objectives of the present study, however, this World Bank study has two major shortcomings. It addresses only partly the determinants of the economic role of women and provides no figures or estimates for individual countries.
The core idea behind the framework presented in Figure 1 is that sets of laws, norms, codes of conduct and traditions heavily influence the economic roles of women in developing countries. Social institutions1 may impose direct constraints on women’s activities — by not allowing them to start their own businesses, for instance — and influence women’s access to resources such as land, credit and other productive inputs and assets. In societies where girls are married at between 12 and 15 years of age, parents may be unwilling to send their daughters to school. The direct and indirect costs of schooling can be quite high for the household, and the return on this investment is uncertain or zero. Social institutions may also influence policy; it would be very difficult, for example, for a state to enact and enforce a law that prohibits marriage below the age of 18 years.
An important assumption — tested later in the empirical section — is that social institutions are exogenous while the other variables — access to resources and level of development — are endogenous with respect to the economic role of women. Many social norms, codes of conduct, formal and informal laws and traditions may have existed for a century, a millennium or more and have changed only marginally if at all. Thus better access to education may increase women’s participation in the labour force and a significant increase of women in the labour force might reduce gender inequalities in access to health care, but neither would affect the custom of polygamy or increase freedom of dressing.
1. The concept of exogenous versus endogenous institutions and their impact on development outcomes is
discussed in Jütting (2003).
The Impact of Social Institutions on the Economic Role of Women in Developing Countries DEV/DOC(2004)03
© OECD 2004 14
The individual indicators in the analytical framework are explained in more detail below. The quantitative data for the countries studied are presented in Annex 1 and discussed in a later section.
The Dependent Variable: The Economic Role of Women
The economic role of women is very difficult to measure. A commonly used proxy is the percentage of economically active women or (in a different form) the ratio of that percentage to that of economically active men. It can mislead, because it aggregates employment situations that may differ considerably across countries, regions or ethnic groups. In most of Africa and South Asia, most economically active women are family workers. The proxy considers them as full-time workers, although some work only part-time. It also fails to account for even more important differences in women’s autonomy to choose activities. It makes a considerable difference whether a woman owns her own crop and sells part of her harvest for her own benefit or works instead under the authority of her husband. The former has an individual income that in principle is at her disposal, while in the latter case the income-earner is the husband. That such an individual income is important for women, is shown in a recent study by Kabeer and Mahmud (2004). They report findings of interviews with female workers in the garment manufacturing in Bangladesh. These women stress that having an independent income increased their self reliance, reduced their dependency on household income and helped them to stand on their feet. Yet statistics on women in the agricultural sector that reflect these differences are not available.
To counter these problems, the analysis uses a new general measure and supplements it with three more specific ones. The general measure is the percentage of working women, excluding family workers. It captures salaried or self-employed women with personal incomes that ensure their financial independence2. The three other variables are the percentage of women among wage earners, the percentage of women in professional and technical positions and the percentage of women among administrative workers and managers. The first of these is a good indicator if within a given society women have access to salaried employment that procures them regular and stable incomes, but this is not the case for most women working in the informal sector. The two other variables measure the proportion of women in relatively highly skilled positions that give them access to high salaries and power.
2. It subtracts from the percentage of economic active women the percentage of women working as family
workers. Data sources: ILO (2001) and UN (2000).
OECD Development Centre Working Paper No. 234 DEV/DOC(2004)03
© OECD 2004 15
Level of Development
Figure 1. Indicators Affecting the Economic Role of Women
2) Access to Resources
1) Social Institutions 3) Economic Role of Women
As endogenous variables As exogenous variables
Indicators Measuring Traditions and Laws
1. Non-economic criteria Polygamy Female genital mutilation Parental authority 15-19 ever married (%)
2. Economic criteria Freedom Inheritance in case of husband’s death Access to capital
Indicators
1. Percentage of women in the economically active population, excluding family workers.
2. Share of women among paid workers.
3. Percentage of women in technical and professional positions.
4. Percentage of women in managerial and administrative positions.
Indicators Measuring Access to Resources
1. Access to education
2. Access to health services
3. Access to labour market
The Impact of Social Institutions on the Economic Role of Women in Developing Countries DEV/DOC(2004)03
© OECD 2004 16
The Independent Variables
Social Institutions. Two indicators, NON-ECO and ECO, were constructed to estimate the importance of social institutions. Both are aggregates composed of variables considered exogenous, i.e. not dependent on current economic and social conditions. They reflect longstanding norms, customs and traditions that have long prevailed3. NON-ECO and ECO aggregate seven different variables in all. NON-ECO includes four that have no economic character — genital mutilation4, marriage before the age of 20, polygamy and authority over children — all selected on the assumption that these customs constrain women’s freedom to choose the economic activities they wish to pursue. The first two are continuous variables for which data are available. The other two are dichotomous; the coding of polygamy does not refer to the frequency of polygamy but to its legality. Countrywide estimates of how many women live in polygamous households are not available, but one can safely assume that the percentage of polygamous couples remains relatively low because only a small minority can support several wives. When polygamy is permitted it is coded as one, when it is forbidden as zero. Polygamy entails inequality between men and women because usually there is a difference of 20 to 30 years between the second (or third) wife and her husband. For the woman it is a marriage in some respect under compulsion by her family, often with no free consent between the spouses. Authority over children is coded as one when the father has the whole parental authority and as zero when he shares the authority with the mother. Full authority of the father means that only he can seek passports for his children or take educational decisions for them. After a divorce he will always be given custody, except in some cases for babies and very young children.
The combination of the four variables can indicate strong domination of men over women. The maximum value of NON-ECO can reach about 0.86 after dividing the individual components by four and summing the results. (That is, 0.95/4 if excision is practised on 95 per cent of girls, as in Mali, plus 0.50/4 when half the girls marry before the age of 20, as in Bangladesh, plus 1/4 for polygamy, plus 1/4 when the father monopolises parental authority.) OECD countries have NON-ECO values of less than 0.05.
The ECO indicator incorporates three variables: the right to inherit from the husband, the right of ownership and freedom of movement and dress. All three have an economic impact. If women are partially or totally barred from inheritance, cannot borrow or own property in their own names and cannot move around or dress freely, they cannot gain economic independence. When women are disadvantaged in inheritance, the relevant variable is assigned a value of one. This occurs, for example, when a father has a son and a daughter and the latter receives half of
3. The data set includes a few countries where social institutions changed due to major cultural
revolutions, such as Turkey after 1924, Tunisia in 1956 and Iran in 1979. 4. Genital mutilation exists in most but not all Sub-Saharan African countries as well as in a few others
like Yemen, Oman, Bahrain and Egypt. The weight of genital mutilation in the NON-Eco indicator is 0.25. It has the shortcoming of not fully grasping the various forms of violence that women confront, but better data on violence are not available. In any case, excision is a very severe form of violence against women and a strong sign of their subordination.
OECD Development Centre Working Paper No. 234 DEV/DOC(2004)03
© OECD 2004 17
what the son gets from the father’s estate, or when a husband dies childless and the estate goes only to his family, not to his widow. A value of zero is assigned in situations of equality of rights between siblings of different sexes and when the rules on inheritance in the absence of children are identical for women and men. Women’s right of ownership is weighted as follows: 30 per cent for access to bank loans, 30 per cent for the right to ownership of property other than land and 40 per cent for access to land ownership. Thus if women can borrow freely from banks and own property but not land, the variable takes a value of 0.4. If women have none of these rights, it is coded as one. For freedom of movement and dress, each component is coded as 0.5 for prohibitions. Usually (but not always) the two freedoms relate closely. Veiled women cannot leave their homes without permission of their husbands, for example, in the North Indian custom of purdah. When women have freedom of movement but must wear the veil, they have no access to some occupations and consequently fewer economic opportunities. Such cases are coded as 0.5; if this obligation applies to only half the population, the value becomes 0.25. Having coded these three variables from zero to one, the value of the ECO indicator emerges after dividing their sum by three.
Variables Measuring Access to Resources. Women’s access to resources also influences their economic role. Women with better education and access to health care as well as to the labour market will be more likely to get wage employment or highly qualified jobs than those excluded from these resources. The following variables make up the data set:
— Education: the school enrolment ratio, literacy ratio, female school enrolment rate and literacy rate for women. The first indicator measures disparities in access to primary, secondary and higher education, with one being the value for female-male parity. The second indicator shows disparities in ability to read and write5. The last two variables provide additional information, but are not significant per se. A low enrolment rate for girls means nothing by itself, as the rate for boys may be equally low.
— Health: the life expectancy gap, sex ratio and maternal mortality rate all are indicators to measure gender disparities related to access to health care. The newly developed life-expectancy gap measures differences in access to health services over the entire lifetimes of individuals. In most developed countries, the life expectancy of women is on average 5.9 years greater than that of men. The variable used here is calculated as the observed difference in life expectancy between men and women in the country under consideration, less 5.9. Its value thus is approximately zero in a country where women are supposed to have equal access to health care (as in the OECD countries) and is negative when women’s access is constrained. In Bangladesh, for example, the observed male/female difference in life expectancy is only 0.1 year, so the life expectancy gap value is –5.8, indicating that women suffer discrimination in access to health services. The sex ratio (female/male) is inferior to one when sex-specific abortions and infanticides are practised and when girls receive less food or less health care than boys do.
5. The ratio is calculated by dividing the female literacy rate by the male literacy rate.
The Impact of Social Institutions on the Economic Role of Women in Developing Countries DEV/DOC(2004)03
© OECD 2004 18
— Access to the labour market: the percentage of women having access to birth control and the total fertility rate both proxy for labour-market entrance barriers faced by women. It goes without saying that women denied such access and having six children on average will find it practically impossible to have independent activities. Chad provides a good example; only 4 per cent of women have access to birth control, and the average number of children per woman is 6.4. In such situations, women can work only in family agriculture, with often little or no independence. Therefore, these two demographic variables act as key prerequisites for freedom of labour market participation.
Level of Development
One may suppose that the economic role of women improves with higher levels of development. This could occur when women’s access to resources becomes easier with higher per capita incomes. That in turn allows women to participate more in paid economic activities outside the agricultural sector. With the creation of a more formalised, rules-based system, informal institutions might lose importance. This would allow positive changes in the institutional constraints imposed on women.
OECD Development Centre Working Paper No. 234 DEV/DOC(2004)03
© OECD 2004 19
IV. THE ECONOMIC ROLE OF WOMEN IN DEVELOPING COUNTRIES: A NEW DATABASE
Social Institutions
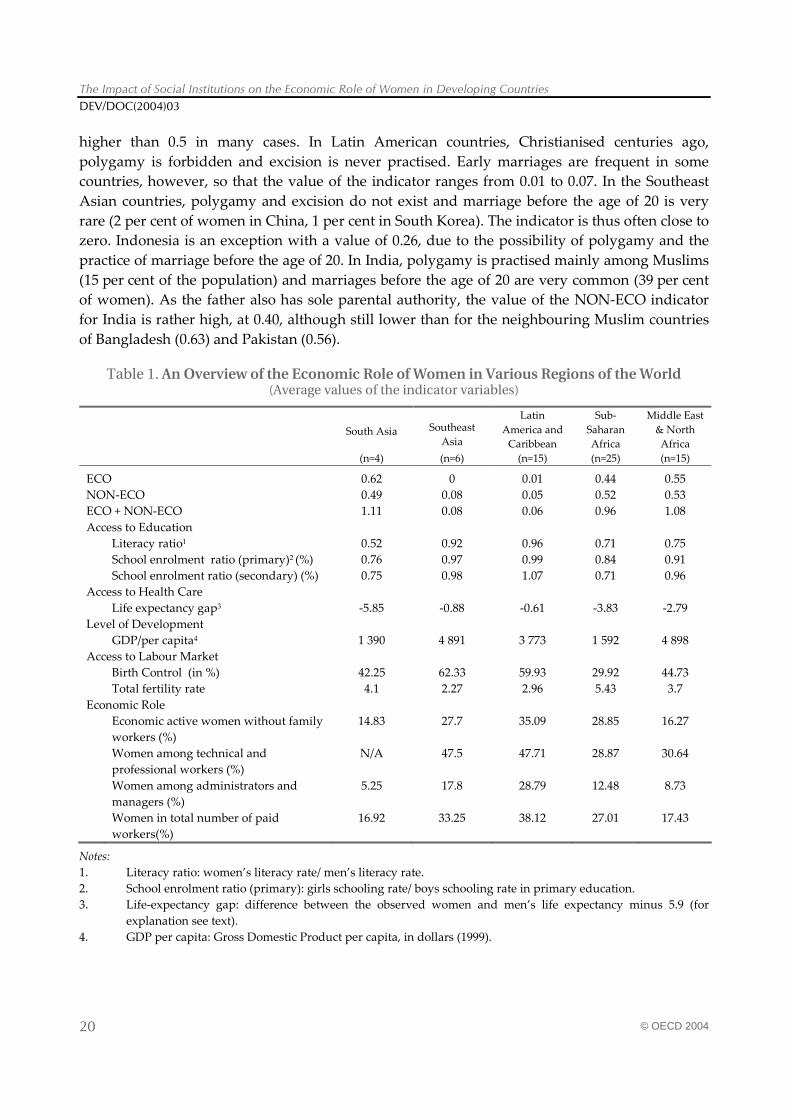
Table 1 provides an overview of the economic role of women in low-income countries of different world regions. Table A-1 in Annex 1 covers the 66 countries from which this regional survey is drawn. From a global perspective one can observe important differences between two large multi-regional groupings — Southeast Asia and Latin America, on the one hand, and Sub-Saharan Africa, the Indian Sub-continent and the MENA region, on the other. The values of ECO and NON-ECO, at less than 0.08, are consistently very low in the first group and comparable to those that one would get for OECD countries. In this group polygamy is forbidden, early marriages are not frequent, inheritance laws are egalitarian and women have access to property and can circulate and dress freely.
In the second group, the values of ECO and NON-ECO amount to approximately 0.6, with several instances like Pakistan or the Sahelian countries where they are above 0.7 (Table A-1). The explanation of these results for Sub-Saharan Africa lies in the conjunction of excision, early marriage, polygamy and the absence of access to land holding. Excision is not usual in the MENA region, but in many countries polygamy is legal, women are disadvantaged in inheritance and authority over children and, in some cases, they cannot move and dress freely. In South Asia, the Islamic code is enforced in Bangladesh and Pakistan, whereas in India, except in the South, women are disadvantaged for inheritance, parental authority and access to capital, and they have no freedom of movement. The NON-ECO indicator is greater than or equal to 0.6 in many Sub-Saharan African countries (Benin, Chad, Eritrea, Guinea, Mali, Niger, Senegal and Sudan) and in Egypt. These are countries where female genital mutilation is widely practised, over 40 per cent of girls are married before 20 and polygamy is legal (Table A-1).
Excision is not usual in Arab and Muslim countries, and values for the NON-ECO indicator are lower in these countries than in Sub-Saharan-Africa when polygamy is forbidden. For example, in Tunisia the value is 0.26, less than half of that for many countries in Sub-Saharan Africa. In Turkey, a Muslim country where neither excision nor polygamy is practised and where civil law does not invest parental authority in the father alone, the value is very low, at 0.046. In most Arab and Muslim countries, however, polygamy remains legal, early marriages are frequent and the father holds sole parental authority. As a result, the NON-ECO indicator is
6. The value does not reach the developed-country benchmark of 0 because 14 per cent of girls are
married under the age of 20.
The Impact of Social Institutions on the Economic Role of Women in Developing Countries DEV/DOC(2004)03
© OECD 2004 20
higher than 0.5 in many cases. In Latin American countries, Christianised centuries ago, polygamy is forbidden and excision is never practised. Early marriages are frequent in some countries, however, so that the value of the indicator ranges from 0.01 to 0.07. In the Southeast Asian countries, polygamy and excision do not exist and marriage before the age of 20 is very rare (2 per cent of women in China, 1 per cent in South Korea). The indicator is thus often close to zero. Indonesia is an exception with a value of 0.26, due to the possibility of polygamy and the practice of marriage before the age of 20. In India, polygamy is practised mainly among Muslims (15 per cent of the population) and marriages before the age of 20 are very common (39 per cent of women). As the father also has sole parental authority, the value of the NON-ECO indicator for India is rather high, at 0.40, although still lower than for the neighbouring Muslim countries of Bangladesh (0.63) and Pakistan (0.56).
Table 1. An Overview of the Economic Role of Women in Various Regions of the World (Average values of the indicator variables)
South Asia Southeast
Asia
Latin America and
Caribbean
Sub-Saharan Africa
Middle East & North Africa
(n=4) (n=6) (n=15) (n=25) (n=15)
ECO 0.62 0 0.01 0.44 0.55 NON-ECO 0.49 0.08 0.05 0.52 0.53 ECO + NON-ECO 1.11 0.08 0.06 0.96 1.08 Access to Education Literacy ratio1 0.52 0.92 0.96 0.71 0.75 School enrolment ratio (primary)2 (%) 0.76 0.97 0.99 0.84 0.91 School enrolment ratio (secondary) (%) 0.75 0.98 1.07 0.71 0.96 Access to Health Care Life expectancy gap3 -5.85 -0.88 -0.61 -3.83 -2.79 Level of Development GDP/per capita4 1 390 4 891 3 773 1 592 4 898 Access to Labour Market Birth Control (in %) 42.25 62.33 59.93 29.92 44.73 Total fertility rate 4.1 2.27 2.96 5.43 3.7 Economic Role Economic active women without family
workers (%) 14.83 27.7 35.09 28.85 16.27
Women among technical and professional workers (%)
N/A 47.5 47.71 28.87 30.64
Women among administrators and managers (%)
5.25 17.8 28.79 12.48 8.73
Women in total number of paid workers(%)
16.92 33.25 38.12 27.01 17.43
Notes: 1. Literacy ratio: women’s literacy rate/ men’s literacy rate. 2. School enrolment ratio (primary): girls schooling rate/ boys schooling rate in primary education. 3. Life-expectancy gap: difference between the observed women and men’s life expectancy minus 5.9 (for
explanation see text). 4. GDP per capita: Gross Domestic Product per capita, in dollars (1999).
OECD Development Centre Working Paper No. 234 DEV/DOC(2004)03
© OECD 2004 21
The values of the ECO indicator correlate partially with those of NON-ECO (R2 = 0.58), but significant differences appear in individual countries. In Tunisia, for example, the results show a higher value for ECO than NON-ECO. Polygamy is forbidden in Tunisia, but the law on inheritance discriminates against women.
To sum up so far, inter-regional comparison of the magnitude of these indicators of social institutions reveals a dichotomy. In Southeast Asian and Latin American countries, authority over children is always shared, inheritance laws are egalitarian and women have access to property and enjoy freedom of movement and dress. As a consequence the indicators are quite low. By contrast, in Sub-Saharan Africa, South Asia and the MENA region women often face disadvantage in terms of inheritance and parental authority and have access neither to land nor to other property. Unsurprisingly, the sums of the NON-ECO and ECO indicators for these countries very often exceed unity. There is thus a distinct gap in the condition of women between Southeast Asian, Latin American, European and North American countries on one side and Sub-Saharan Africa, the Indian sub-continent and countries in the MENA region on the other. Some exceptions appear in the second group, such as Mauritius, Togo, Tunisia and Turkey.
One might argue that religion and economic development drive or govern the economic role of women. As Annex 2 shows, there is a tendency in Muslim countries for gender inequalities higher than in Christian and Buddhist ones if one compares the average value of NON-ECO + ECO. One can also show, however, that this must not hold per se, as in Muslim countries the NON-ECO value might drop to 0.04 while in a Christian country it might be 0.72. This hints that religion cannot fully explain the economic situation of women in developing countries. The same holds true for the level of development. Gender inequalities are quite high in some high-income countries and low in some low-income countries. All this reinforces the strong role of social institutions in shaping women’s opportunities for active participation in economic activity.
Access to Education, Health Care and the Labour Market
In the regions characterised by high values of ECO and NON ECO, women generally suffer discrimination in education, health and their access to the labour market, whereas in Latin America and Southeast Asia such discrimination does not exist. Such results show clearly a relation between the institutional framework or social institutions and the access of women to human capital and economic activity. The regional comparison reveals strong disparities in the indicators (Tables 1 and A-1). The literacy ratio is highest in Latin America and Southeast Asia (about 0.95), followed by the MENA region and Sub-Saharan Africa. South Asia has the lowest literacy ratio (about 0.50). These disparities reflect differences in primary school enrolment rates. In Latin America and East Asia, the ratio between the rates for boys and girls is nearly equal to unity, whereas it is only 0.76 in South Asia. The literacy ratio is less than 0.7 in the three countries of the Indian sub-continent and in many African countries. The disparity is less marked in Arab countries, with values of 0.66 for Morocco and Egypt and 0.68 for Syria. Yemen, at 0.37, is an exception. The contrast with Latin America, East Asia and Southeast Asia is striking. In all but one Latin American country, the value is higher than 0.9 and often equal to one. In Southeast Asia, it is also equal to one, except in China (0.83) and Indonesia (0.89), where it nevertheless remains much higher than for the countries in the remaining regions (Table A-1).
The Impact of Social Institutions on the Economic Role of Women in Developing Countries DEV/DOC(2004)03
© OECD 2004 22
The proxies measuring access to and use of health care confirm the disparities between regions. Latin America and Southeast Asia show a life-expectancy gap between 0 and –1, indicating that women’s life expectancy is five years greater than men’s, nearly the same as in the developed countries. The MENA region, Sub-Saharan Africa and finally South Asia follow in descending order. In the last case, women have nearly the same life expectancy as men, indicating a strong bias against them in access to health care. The life expectancy gap shows a particular discrimination in access to health services in countries such as Bangladesh, Pakistan, Nepal, Botswana, Zambia and Zimbabwe. Here the variable has a value of minus six. In Mauritius and Korea the gap is positive, which means that, as in the developed countries, women have the same access to health services as men (Table A-1).
Finally, one can observe important differences in access to the labour market. On average, about two-thirds of women in Latin America and Southeast Asia have access to birth control, compared with one-third in Sub-Saharan Africa. Hence it comes as no surprise that fertility rates also differ remarkably, between less than three and over five in the respective regions. At the country level the situation becomes even more pronounced. The average rate of women having access to birth control in Benin, Burkina-Faso, Central African Republic, Ivory Coast, Eritrea, Guinea, Mali, Mauritania, Mozambique, Niger and Chad is less than 10 per cent, and the average birth rate amounts to 5.7. Having more than five children makes it nearly impossible to enter the labour market.
The Economic Role of Women: A New Database
As pointed out above, the percentage of economically active women can be quite misleading as a measure of women’s economic role. It would indicate that Africa has the highest rate of economically active women among all the regions studied (75 per cent) owing to a high rate of female participation in agriculture and household work. Yet these are not necessarily forms of employment in which women have autonomy. The measure of economically active women excluding family workers proves to be a more precise indicator. It is 32 per cent in Latin America and East Asia, seven per cent in South Asia, 16 per cent in the MENA region and 29 per cent in Africa. Note that most women in South Asia are indeed family workers; the rate of activity increases from seven per cent to 59 per cent when family workers are included.
Of the three regions where women are disadvantaged, Africa has the highest rate of female economic activity. This arises from the importance of small commerce, often controlled by women. Although in terms of the institutional background the condition of women looks particularly bad in Sub-Saharan Africa, women in this region enjoy liberties that women in the MENA region do not. A comparison of the average values for freedom of movement and for the percentage of women who wear the veil reveals why. Sub-Saharan women can conduct economic activity in petty trading or the craft industry, whereas customs in the MENA region generally allow women to have such activities only if they pursue the business at home. The low rate of economically active women in the MENA region arises primarily from the institutional framework rather than backwardness in education, because female/male ratios in primary, secondary and higher education as well as literacy rates are higher in the MENA region than in Sub-Saharan Africa.
OECD Development Centre Working Paper No. 234 DEV/DOC(2004)03
© OECD 2004 23
Similar results emerge from a regional comparison of the percentages of women among wage earners. Some 35 per cent of wage earners are women in Latin America and East Asia, 19 per cent in South Asia, 27 per cent in Sub-Saharan Africa and 17 per cent in the MENA region. The low scores for South Asia and the MENA region reflect mainly the influence of the institutional framework. A comparison with figures for China and South Korea — where women account for 38 per cent and 40 per cent of the total number of salaried workers respectively, proportions twice as high as in South Asia and MENA — shows how these low rates curb the development of manufactured goods exports.
The percentage of technicians who are women goes up to 50 per cent in many Latin American countries as well as China, Thailand and the Philippines. It is far lower, around 20 per cent, in a number of African countries, such as Central African Republic, Mali, Mauritania, Mozambique, Togo and Niger (the lowest value, at eight per cent). The figure for the MENA region is 30 per cent, quite low compared to Latin America and East Asia but far higher than in Sub-Saharan Africa and South Asia. Women represent around 20 per cent of managers in Latin America and East Asia but under 10 per cent in South Asia and the MENA region and 13 per cent in Africa. The higher result for Africa seems paradoxical because women in the MENA region and South Asia have greater access to secondary education — a vital prerequisite for managerial jobs — than do women in Sub-Saharan Africa. Yet this just underlines the importance of the institutional factors. More women may have access to secondary education in South Asian and MENA societies, but tradition makes it unacceptable for them to hold responsibilities and possibly give orders to men. The percentage of women technicians is higher in Arab than in African countries, but technicians’ jobs are somewhat different; usually these women are not in a position to give orders.
The Impact of Social Institutions on the Economic Role of Women in Developing Countries DEV/DOC(2004)03
© OECD 2004 24
V. THE IMPORTANCE OF SOCIAL INSTITUTIONS FOR THE ECONOMIC ROLE OF WOMEN IN DEVELOPING COUNTRIES
This part analyses the determinants of the economic role of women. Following the framework developed above, assume that the variable of interest, the economic role of women, depends on social institutions, the level of development and access to resources, and that access to resources depends on social institutions and the level of development.
Based on this framework, the following equations are estimated:
1) (access to resources) = f (ECO/NON-ECO) + (log Y) + et
2) (economic role of women) = f (access to resources) + et
3) (economic role of women) = f (ECO/NON-ECO) + (log Y) + et
A core assumption of the model is that the variables used to build the ECO and NON-ECO indicators are exogenous. The conditions that they measure have existed for more than a century and have not changed with very few exceptions (e.g. Turkey, Tunisia, Iran). Nevertheless, one might argue that religious affiliation or some other country-specific variable might simultaneously influence the economic role of women, ECO and NON-ECO. This would mean that ECO and NON-ECO are in fact endogenous. One can test for this with an endogeneity test computationally equivalent to the Hausman test. It uses the predicted values from the reduced-form equation, regressing religious affiliations on ECO and NON-ECO, and inserts these values on the right-hand side of the primary equation7. The test examines whether the unobservable values in the reduced-form equation help to explain the variation in the economic role of women after controlling for the observable explanatory variables (Waters, 1999). The results are displayed in Annex 5, where a two-stage least-squares model instrumenting ECO and NON-ECO is estimated. They show that with the exception of women among administrators and managers the hypothesis that ECO and NON-ECO are exogenous cannot be rejected. In Table 3 for the percentage of women among managers and administrators a two stage least square model instrumenting Eco and Non-Eco is estimated, otherwise OLS estimates are reported.
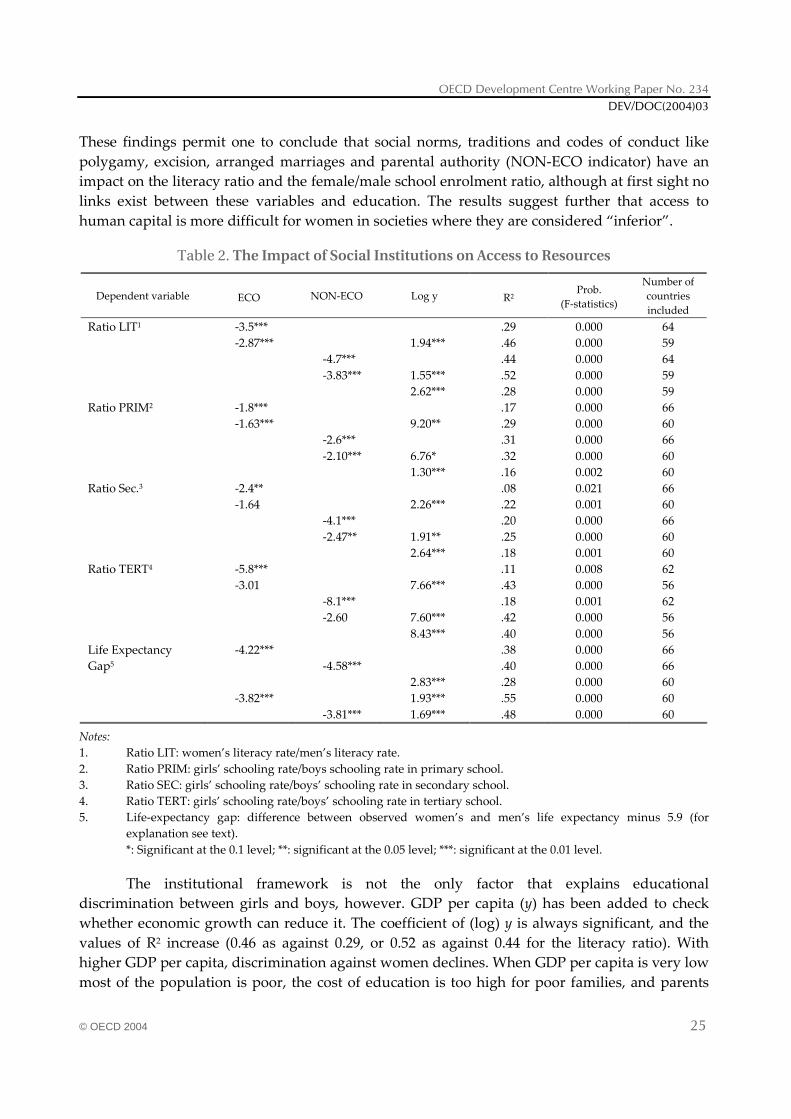
The hypothesis that access to education and health care are influenced by social institutions is confirmed (Table 2). All coefficients have the expected negative sign and nearly all of them are highly significant. To use the equation explaining the literacy ratio as an example, the explanatory power of the models including ECO and NON-ECO indicators is quite satisfactory, with R2 values of 0.29 and 0.44. The R2 values are not as high for enrolment rates in primary and secondary education, at 0.31 and 0.20 (NON-ECO indicator) and 0.17 and 0.08 (ECO indicator). 7. Dummies for religious affiliations included are: Muslim, Christian, Hindu, Buddhist and Other.
OECD Development Centre Working Paper No. 234 DEV/DOC(2004)03
© OECD 2004 25
These findings permit one to conclude that social norms, traditions and codes of conduct like polygamy, excision, arranged marriages and parental authority (NON-ECO indicator) have an impact on the literacy ratio and the female/male school enrolment ratio, although at first sight no links exist between these variables and education. The results suggest further that access to human capital is more difficult for women in societies where they are considered “inferior”.
Table 2. The Impact of Social Institutions on Access to Resources
Dependent variable ECO NON-ECO Log y R2 Prob.
(F-statistics)
Number of countries included
Ratio LIT1 -3.5*** .29 0.000 64 -2.87*** 1.94*** .46 0.000 59 -4.7*** .44 0.000 64 -3.83*** 1.55*** .52 0.000 59 2.62*** .28 0.000 59 Ratio PRIM2 -1.8*** .17 0.000 66 -1.63*** 9.20** .29 0.000 60 -2.6*** .31 0.000 66 -2.10*** 6.76* .32 0.000 60 1.30*** .16 0.002 60 Ratio Sec.3 -2.4** .08 0.021 66 -1.64 2.26*** .22 0.001 60 -4.1*** .20 0.000 66 -2.47** 1.91** .25 0.000 60 2.64*** .18 0.001 60 Ratio TERT4 -5.8*** .11 0.008 62 -3.01 7.66*** .43 0.000 56 -8.1*** .18 0.001 62 -2.60 7.60*** .42 0.000 56 8.43*** .40 0.000 56 Life Expectancy -4.22*** .38 0.000 66 Gap5 -4.58*** .40 0.000 66 2.83*** .28 0.000 60 -3.82*** 1.93*** .55 0.000 60 -3.81*** 1.69*** .48 0.000 60
Notes: 1. Ratio LIT: women’s literacy rate/men’s literacy rate. 2. Ratio PRIM: girls’ schooling rate/boys schooling rate in primary school. 3. Ratio SEC: girls’ schooling rate/boys’ schooling rate in secondary school. 4. Ratio TERT: girls’ schooling rate/boys’ schooling rate in tertiary school. 5. Life-expectancy gap: difference between observed women’s and men’s life expectancy minus 5.9 (for
explanation see text). *: Significant at the 0.1 level; **: significant at the 0.05 level; ***: significant at the 0.01 level.
The institutional framework is not the only factor that explains educational discrimination between girls and boys, however. GDP per capita (y) has been added to check whether economic growth can reduce it. The coefficient of (log) y is always significant, and the values of R2 increase (0.46 as against 0.29, or 0.52 as against 0.44 for the literacy ratio). With higher GDP per capita, discrimination against women declines. When GDP per capita is very low most of the population is poor, the cost of education is too high for poor families, and parents
The Impact of Social Institutions on the Economic Role of Women in Developing Countries DEV/DOC(2004)03
© OECD 2004 26
choose which children they will send to school. In an institutional framework unfavourable to girls, the preference always goes to boys. In contrast, when only a small minority of the population is poor and even if the institutional framework is the same, parents can usually send all their children to school.
The regressions for the life-expectancy gap suggest that women have less access to health services when the institutional framework is hostile to them. The coefficients of ECO and NON-ECO are highly significant and the value of R2 reaches 0.40. The relatively high coefficients (4.2 and 4.6) mean that ECO or NON-ECO values of 0.7 reduce women’s life expectancy by three years. Income has less influence on the life-expectancy gap (R2 = 0.26). As income rises, more and more people have access to health services, which previously disadvantaged women. Using both variables (y and institutions) very satisfactory results appear (R2 equal to 0.51 or 0.59 with significant coefficients).
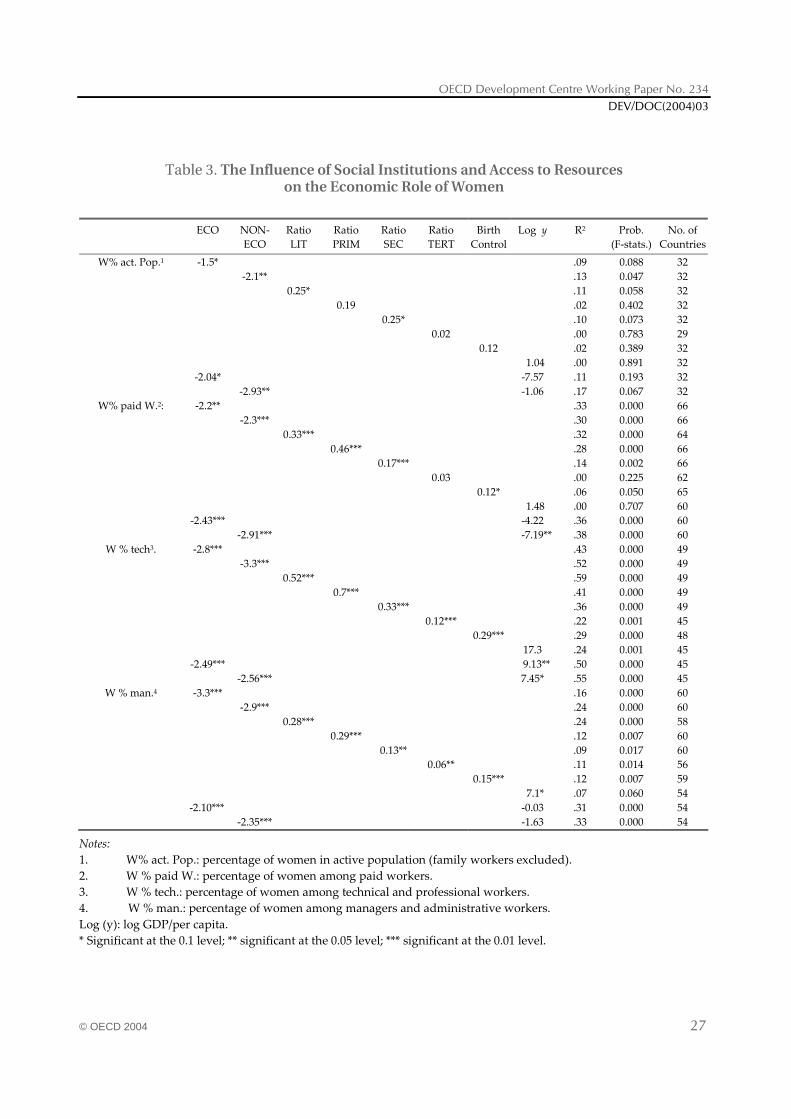
Table 3 presents the results of regression analyses using the proxies for the institutional framework — the ECO and NON-ECO indicators — and those for women’s access to resources as independent variables to explain gender inequalities in the economic role of women. For all four dependent variables chosen, both the NON-ECO and ECO indicators have significant, often highly significant impact, and the coefficients have the expected negative sign. Thus a clear link appears between an unfavourable institutional environment and a low rate of female participation in economic life. The impact of social institutions has more importance for women’s entry into the labour market as wage earners than for their having independent economic activity.
The impact of social institutions is straightforward, but that of income is not. Contrary to the finding of Forsythe et al. (2000) of a positive relationship between economic growth and the role of women, quite mixed effects appear here. The income variable is not significant for women’s participation in the labour force, with one exception. Regressing women’s percentage among paid workers on NON-ECO + income, the income variable even becomes negatively significant. Thus women can remain excluded from participating in the labour force even if the level of development increases. Income does become (positively) significant for women’s participation in technical and managerial positions. This is an indication that women find it easier to get highly skilled or specialised jobs in more developed countries than in low-income countries.
The regressions also confirm the importance of basic education for women’s chances to enter the labour force, although education alone is not sufficient. As Table 1 showed, the percentage of women in wage employment is twice as high in Latin American countries as in the MENA region. This disparity does not arise simply from a difference in access to education. The two regions have nearly identical school enrolment rates for women, yet the difference in female salaried employment is very large. Comparing instead the sum of the NON-ECO and ECO indicators, the MENA region has a high value of 1.08 as against 0.06 in Latin America, signalling much stronger discrimination against women in MENA.
OECD Development Centre Working Paper No. 234 DEV/DOC(2004)03
© OECD 2004 27
Table 3. The Influence of Social Institutions and Access to Resources on the Economic Role of Women
ECO NON-ECO
Ratio LIT
Ratio PRIM
Ratio SEC
Ratio TERT
Birth Control
Log y R2 Prob. (F-stats.)
No. of Countries
W% act. Pop.1 -1.5* .09 0.088 32 -2.1** .13 0.047 32 0.25* .11 0.058 32 0.19 .02 0.402 32 0.25* .10 0.073 32 0.02 .00 0.783 29 0.12 .02 0.389 32 1.04 .00 0.891 32 -2.04* -7.57 .11 0.193 32 -2.93** -1.06 .17 0.067 32
W% paid W.2: -2.2** .33 0.000 66 -2.3*** .30 0.000 66 0.33*** .32 0.000 64 0.46*** .28 0.000 66 0.17*** .14 0.002 66 0.03 .00 0.225 62 0.12* .06 0.050 65 1.48 .00 0.707 60 -2.43*** -4.22 .36 0.000 60 -2.91*** -7.19** .38 0.000 60
W % tech3. -2.8*** .43 0.000 49 -3.3*** .52 0.000 49 0.52*** .59 0.000 49 0.7*** .41 0.000 49 0.33*** .36 0.000 49 0.12*** .22 0.001 45 0.29*** .29 0.000 48 17.3 .24 0.001 45 -2.49*** 9.13** .50 0.000 45 -2.56*** 7.45* .55 0.000 45
W % man.4 -3.3*** .16 0.000 60 -2.9*** .24 0.000 60 0.28*** .24 0.000 58 0.29*** .12 0.007 60 0.13** .09 0.017 60 0.06** .11 0.014 56 0.15*** .12 0.007 59 7.1* .07 0.060 54 -2.10*** -0.03 .31 0.000 54 -2.35*** -1.63 .33 0.000 54
Notes: 1. W% act. Pop.: percentage of women in active population (family workers excluded). 2. W % paid W.: percentage of women among paid workers. 3. W % tech.: percentage of women among technical and professional workers. 4. W % man.: percentage of women among managers and administrative workers. Log (y): log GDP/per capita. * Significant at the 0.1 level; ** significant at the 0.05 level; *** significant at the 0.01 level.
The Impact of Social Institutions on the Economic Role of Women in Developing Countries DEV/DOC(2004)03
© OECD 2004 28
Finally, as expected, access to birth control has a strong influence on the probability that women will get higher-paid jobs. It is significant for women among paid workers and non-significant for women in the economically active population. This observation has an explanation. Women belonging to large families can have economic activities of their own such as petty trade, but they cannot enter the formal labour market due to family obligations and the associated time constraints.
Both the institutional framework and access to education have important impacts as determinants of women joining the skilled labour force as technicians. The coefficients of these variables are always very significant and the values of R2 are high: 0.43 and 0.52 for ECO and NON-ECO and 0.59, 0.41 and 0.36 for the literacy, primary education and secondary education ratios. The lower value of R2 for the higher education ratio is not surprising because most technicians do not attend institutions of higher education. Income alone, in contrast, does not have a significant impact and the value of R2 is very low.
The percentage of women managers presents an interesting case. First, the analysis again shows social institutions as important for having access to these jobs, with relatively high R2 values (0.30 and 0.24). Second, women’s access to literacy training or primary education has an impact on the percentage of managers who are women. Surprisingly, however, the R2 values for secondary and higher education are quite low (0.09 and 0.11), suggesting that the institutional framework acts as a greater barrier to women’s access to these jobs than discrimination in education. An institutional framework that strongly hinders women’s participation in economic activity raises obstacles to their access to the kinds of employment that would offer them higher social roles in terms of power and income.
In sum, if social institutions in developing countries discriminate against women, policy measures aiming to improve their situation via improved access to education and health will have only a limited impact. While there is evidence that in countries where women have less education than men do they participate less in economic activity, it can also be shown that women’s access to education depends on the institutional framework. This calls for a more pro-active donor approach to address these fundamental roots of gender inequality.
OECD Development Centre Working Paper No. 234 DEV/DOC(2004)03
© OECD 2004 29
VI. CONCLUSIONS
This paper aims to identify the basic determinants of gender inequalities in participation in economic activity. While the debate in the literature touches mainly on the causality between gender inequalities and levels of development, this study emphasises the important role of social institutions. Three important results emerge:
— First, using a newly developed data set the study detects strong regional disparities. It finds a clear gap between countries in East Asia and Latin America and countries from Sub-Saharan-Africa, South Asia and the MENA region. There are certainly many poor countries in the second group, but the relationship between GDP per capita and the indicators for the institutional framework is not always confirmed. As an example, South Korea and the United Arab Emirates have the same GDP per capita, but the NON-ECO indicator is much higher in the latter. In poor Latin American countries such as Haiti and Nicaragua, the value of this indicator is never higher than 0.08, while in African countries with the same average income such as Ivory Coast, Mozambique and Senegal it can reach 0.60.
— Second, while there is evidence that gender inequalities in participation in economic activities generally are higher in Muslim and Hindu-dominated countries compared with Christian and Buddhist ones, there are important exceptions. This suggests that within the dominant religion various interpretations and applications regarding the economic role of women are possible. It is of utmost importance for future research to identify the main determinants of these differences.
— Third, an institutional framework that disadvantages women hinders development because it governs the possibilities of half of the population for participation in economic activities. It also reduces human capital formation, a major factor explaining growth.
From all this it follows that the current approaches by donors to improve women’s access to education, health, credit and so forth is important but fails to address the underlying causes of gender discrimination in countries with strong social institutions discriminating against women. If custom forbids outside work for women, the enrolment rate of girls in primary school can double without entailing an increase in female participation in the labour market. If custom goes against accepting that women can be in a position to exercise authority, the enrolment rate in universities can double without increasing the number of women managers. These examples show that to increase the effectiveness of country and donor policies, measures to address the institutional framework have to be undertaken. The encouraging finding is that even in different settings influenced by culture, religion or economic roles, changes in favour of women are possible. Yet tackling the deep roots of gender inequality still has a long way to go and demands much political will.
The Impact of Social Institutions on the Economic Role of Women in Developing Countries DEV/DOC(2004)03
© OECD 2004 30
BIBLIOGRAPHY
BARDHAN, K. and S. KLASEN (1999), “UNDP’s Gender-Related Indices: A Critical Review”, World Development, Vol. 27, No. 6.
BOSERUP, E. (1970), Women’s Role in Economic Development, St. Martin’s Press, New York.
DIJKSTRA, A.G. (2000), “A Larger Pie through a Fair Share? Gender Equality and Economic Performance”, Institute of Social Studies, Working Paper No. 15, mimeo, The Hague, The Netherlands.
DIJKSTRA, A.G. and L. C. HANMER (2000), “Measuring Socio-Economic Gender Equality, Towards an Alternative to UNDP’s GDI”, Institute of Social Studies, Working Paper No. 251, The Hague, The Netherlands.
FORSYTHE, N., R. P. KORZENIEWICZ and V. DURRANT (2000), “Gender Inequalities and Economic Growth: A Longitudinal Evaluation”, Economic Development and Cultural Change, Vol. 48, No. 3, pp. 573-617.
ILO (2001), Key Indicators of the Labor Market 2001 –2002, ILO, Geneva.
JÜTTING, J. (2003), Institutions and Development: A Critical Review, Technical Paper No. 210, OECD Development Centre, Paris.
KABEER, N. and S. MAHMUD (2004). Globalization, Gender and Poverty: Bangladesh Women Workers in Export and Local Market, Journal of International Development, 16, pp. 93 – 109.
KLASEN, S. (1999), “Does Gender Inequality Reduce Growth and Development? Evidence from Cross-Country Regressions”, Policy Research Report on Gender and Development, Working Paper Series No. 7, World Bank, Washington, D. C.
LAGERLÖF, N.-P. (2003), “Gender Equality and Long-Run Growth”, Journal of Economic Growth, 8, pp. 403 – 426.
OECD-DAC (1998), DAC Source Book on Concepts and Approaches Linked to Gender Equality, OECD, Paris.
OECD-DAC (1999), DAC Guidelines for Gender Equality and Women’s Empowerment in Development Co-operation”, OECD, Paris.
RAZAVI, S. and C. MILLER (1995), Conceptual Shift in the Women and Development Discourse, UNRISD and UNDP, Geneva.
RODENBERG, B. (2003), Gender und Armutsbekämpfung, Deutsches Institut für Entwicklungspolitik, Berichte und Gutachten, Bonn.
SEGUINO, S. (2000), “Gender Inequality and Economic Growth: A Cross-Country Analysis”, World Development, Vol. 28, No. 7.
SEMYONOV, M. (1986), “The Social Context of Women’s Labor Force Participation: A Comparative Analysis”, American Journal of Sociology, 86.
OECD Development Centre Working Paper No. 234 DEV/DOC(2004)03
© OECD 2004 31
TINKER, I. and M. BRAMSEN (1976), Women and World Development, Overseas Development Council, Washington, D. C.
UN (2000), World’s Women Survey 2000, New York.
UNDP (1998), Human Development Report, New York.
UNDP (2003), Transforming the Mainstream, Gender in UNDP, New York.
WATERS, H. (1999), “Measuring the Impact of Health Insurance with a Correction for Selection Bias: A Case Study of Ecuador”, Health Economics and Econometrics, 8.
WHITE, H. (1997), Patterns of Gender Discrimination: An Examination of the UNDP’s Gender Development Index, Institute of Social Studies, The Hague, The Netherlands.
WORLD BANK (2001), Engendering Development: Through Gender Equality in Rights, Resources and Voice, Washington, D. C.
Resources used for the Database:
AMNESTY INTERNATIONAL (1997), Female Genital Mutilation in Africa: Information by Country, Amnesty International Index, ACT 77/07/97, London.
CLÉVENOT, M. (1987), “L’État des Religions dans le Monde”, Eds. La Découverte, Paris.
ILO (2002), Key Indicators of the Labor Market, Geneva.
MADDISON, A. (2001), The World Economy: A Millennial Perspective, Development Centre Studies, OECD, Paris.
RÉPUBLIQUE FRANÇAISE (1998), Enquête sur la Situation des Femmes dans le Monde, Assemblée Nationale, Paris.
UN (2000), World’s Women, New York.
UN (2002), Millennium Indicator Database, Statistics Division, New York.
UNDP (2002), Human Development Report: Deepening Democracy in a Fragmented World, New York.
WORLD BANK (2002), GenderStats: Database of Gender Statistics, Washington, D. C.
The Impact of Social Institutions on the Economic Role of Women in Developing Countries DEV/DOC(2004)03
© OECD 2004 32
ANNEXES
Page A-1. Data by Country 33 A-2. Data by Region 46 A-3. Data by Religious Affiliation 47 A-4. Data by Level of Economic Development 48 A-5. Test of Endogeneity 49
OECD Development Centre Working Paper No. 234 DEV/DOC(2004)03
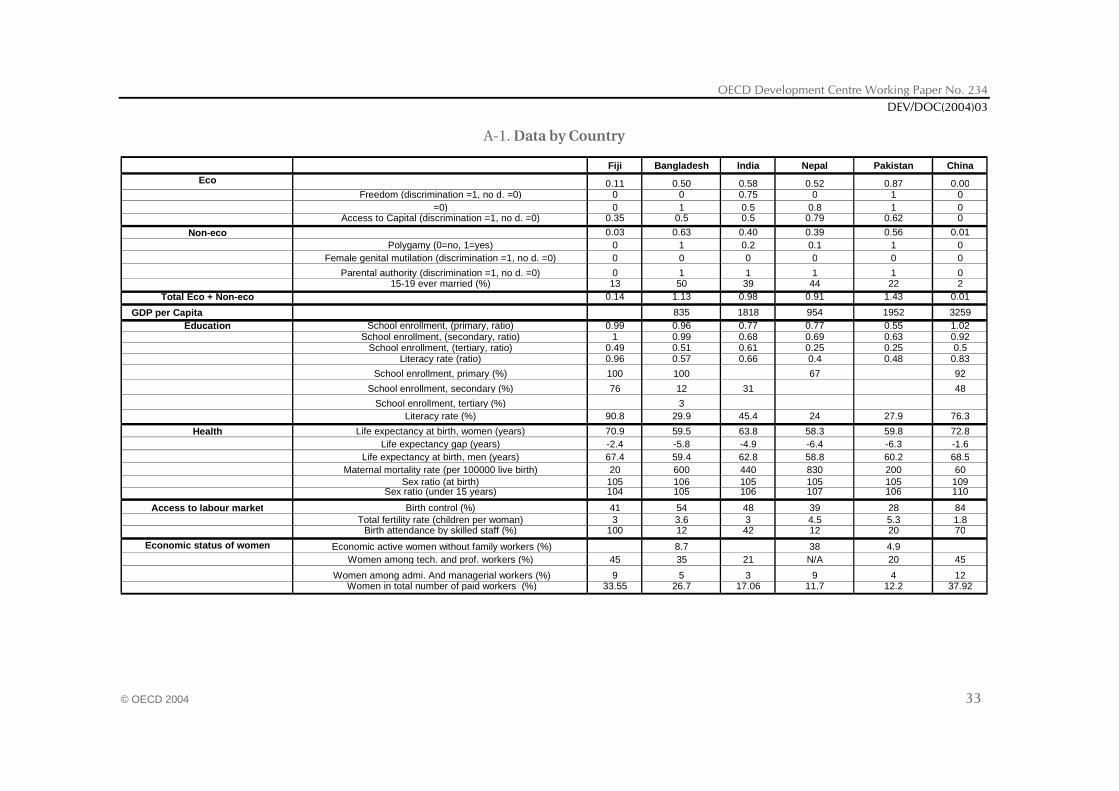
© OECD 2004 33
A-1. Data by Country
Fiji Bangladesh India Nepal Pakistan China
Eco 0.11 0.50 0.58 0.52 0.87 0.00Freedom (discrimination =1, no d. =0) 0 0 0.75 0 1 0
=0) 0 1 0.5 0.8 1 0Access to Capital (discrimination =1, no d. =0) 0.35 0.5 0.5 0.79 0.62 0
Non-eco 0.03 0.63 0.40 0.39 0.56 0.01Polygamy (0=no, 1=yes) 0 1 0.2 0.1 1 0
Female genital mutilation (discrimination =1, no d. =0) 0 0 0 0 0 0
Parental authority (discrimination =1, no d. =0) 0 1 1 1 1 015-19 ever married (%) 13 50 39 44 22 2
Total Eco + Non-eco 0.14 1.13 0.98 0.91 1.43 0.01
GDP per Capita 835 1818 954 1952 3259Education School enrollment, (primary, ratio) 0.99 0.96 0.77 0.77 0.55 1.02
School enrollment, (secondary, ratio) 1 0.99 0.68 0.69 0.63 0.92School enrollment, (tertiary, ratio) 0.49 0.51 0.61 0.25 0.25 0.5
Literacy rate (ratio) 0.96 0.57 0.66 0.4 0.48 0.83
School enrollment, primary (%) 100 100 67 92
School enrollment, secondary (%) 76 12 31 48
School enrollment, tertiary (%) 3Literacy rate (%) 90.8 29.9 45.4 24 27.9 76.3
Health Life expectancy at birth, women (years) 70.9 59.5 63.8 58.3 59.8 72.8Life expectancy gap (years) -2.4 -5.8 -4.9 -6.4 -6.3 -1.6
Life expectancy at birth, men (years) 67.4 59.4 62.8 58.8 60.2 68.5Maternal mortality rate (per 100000 live birth) 20 600 440 830 200 60
Sex ratio (at birth) 105 106 105 105 105 109Sex ratio (under 15 years) 104 105 106 107 106 110
Access to labour market Birth control (%) 41 54 48 39 28 84Total fertility rate (children per woman) 3 3.6 3 4.5 5.3 1.8
Birth attendance by skilled staff (%) 100 12 42 12 20 70
Economic status of women Economic active women without family workers (%) 8.7 38 4.9Women among tech. and prof. workers (%) 45 35 21 N/A 20 45
Women among admi. And managerial workers (%) 9 5 3 9 4 12 Women in total number of paid workers (%) 33.55 26.7 17.06 11.7 12.2 37.92
The Impact of Social Institutions on the Economic Role of Women in Developing Countries DEV/DOC(2004)03
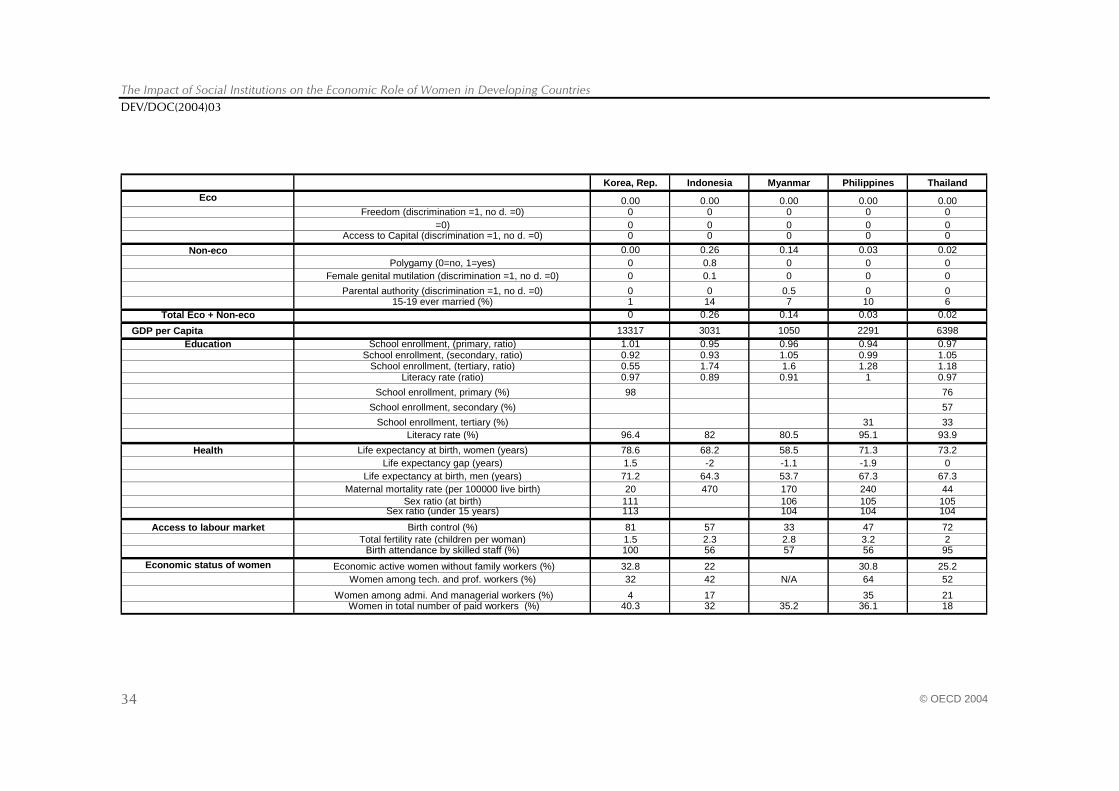
© OECD 2004 34
Korea, Rep. Indonesia Myanmar Philippines Thailand
Eco 0.00 0.00 0.00 0.00 0.00Freedom (discrimination =1, no d. =0) 0 0 0 0 0
=0) 0 0 0 0 0Access to Capital (discrimination =1, no d. =0) 0 0 0 0 0
Non-eco 0.00 0.26 0.14 0.03 0.02Polygamy (0=no, 1=yes) 0 0.8 0 0 0
Female genital mutilation (discrimination =1, no d. =0) 0 0.1 0 0 0
Parental authority (discrimination =1, no d. =0) 0 0 0.5 0 015-19 ever married (%) 1 14 7 10 6
Total Eco + Non-eco 0 0.26 0.14 0.03 0.02
GDP per Capita 13317 3031 1050 2291 6398Education School enrollment, (primary, ratio) 1.01 0.95 0.96 0.94 0.97
School enrollment, (secondary, ratio) 0.92 0.93 1.05 0.99 1.05School enrollment, (tertiary, ratio) 0.55 1.74 1.6 1.28 1.18
Literacy rate (ratio) 0.97 0.89 0.91 1 0.97
School enrollment, primary (%) 98 76
School enrollment, secondary (%) 57
School enrollment, tertiary (%) 31 33Literacy rate (%) 96.4 82 80.5 95.1 93.9
Health Life expectancy at birth, women (years) 78.6 68.2 58.5 71.3 73.2Life expectancy gap (years) 1.5 -2 -1.1 -1.9 0
Life expectancy at birth, men (years) 71.2 64.3 53.7 67.3 67.3Maternal mortality rate (per 100000 live birth) 20 470 170 240 44
Sex ratio (at birth) 111 106 105 105Sex ratio (under 15 years) 113 104 104 104
Access to labour market Birth control (%) 81 57 33 47 72Total fertility rate (children per woman) 1.5 2.3 2.8 3.2 2
Birth attendance by skilled staff (%) 100 56 57 56 95
Economic status of women Economic active women without family workers (%) 32.8 22 30.8 25.2Women among tech. and prof. workers (%) 32 42 N/A 64 52
Women among admi. And managerial workers (%) 4 17 35 21 Women in total number of paid workers (%) 40.3 32 35.2 36.1 18
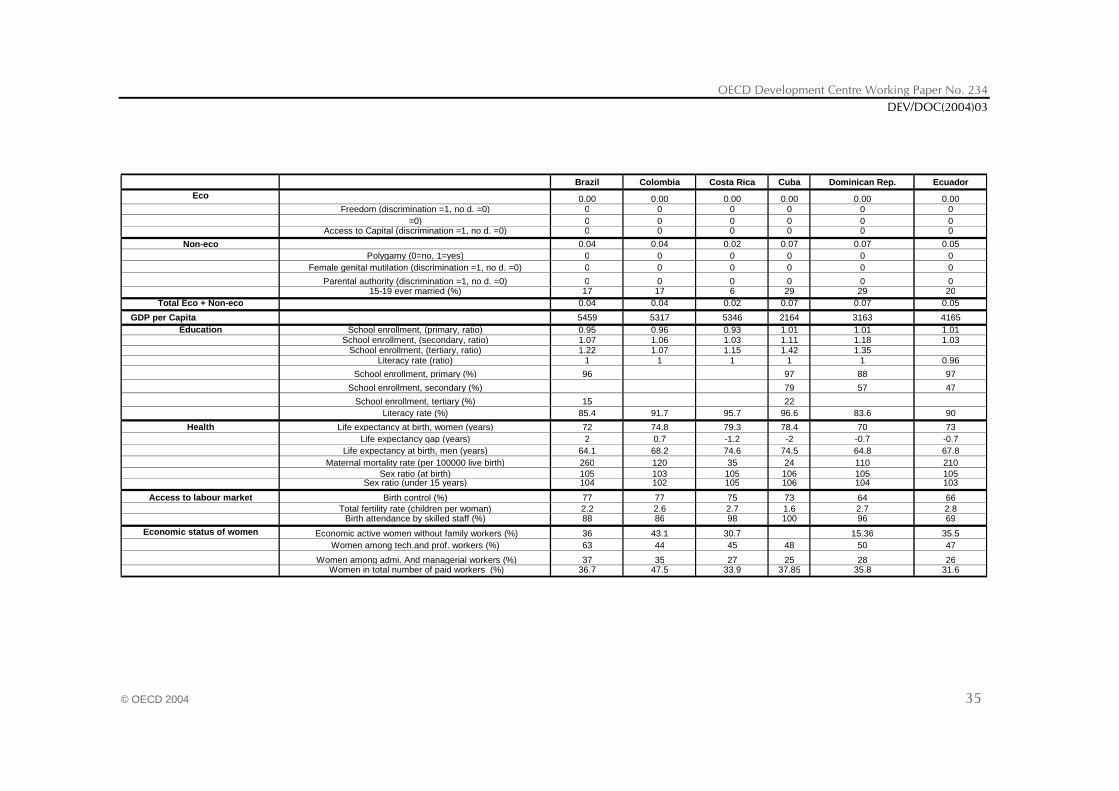
OECD Development Centre Working Paper No. 234 DEV/DOC(2004)03
© OECD 2004 35
Brazil Colombia Costa Rica Cuba Dominican Rep. Ecuador
Eco 0.00 0.00 0.00 0.00 0.00 0.00Freedom (discrimination =1, no d. =0) 0 0 0 0 0 0
=0) 0 0 0 0 0 0Access to Capital (discrimination =1, no d. =0) 0 0 0 0 0 0
Non-eco 0.04 0.04 0.02 0.07 0.07 0.05Polygamy (0=no, 1=yes) 0 0 0 0 0 0
Female genital mutilation (discrimination =1, no d. =0) 0 0 0 0 0 0
Parental authority (discrimination =1, no d. =0) 0 0 0 0 0 015-19 ever married (%) 17 17 6 29 29 20
Total Eco + Non-eco 0.04 0.04 0.02 0.07 0.07 0.05
GDP per Capita 5459 5317 5346 2164 3163 4165Education School enrollment, (primary, ratio) 0.95 0.96 0.93 1.01 1.01 1.01
School enrollment, (secondary, ratio) 1.07 1.06 1.03 1.11 1.18 1.03School enrollment, (tertiary, ratio) 1.22 1.07 1.15 1.42 1.35
Literacy rate (ratio) 1 1 1 1 1 0.96
School enrollment, primary (%) 96 97 88 97
School enrollment, secondary (%) 79 57 47
School enrollment, tertiary (%) 15 22Literacy rate (%) 85.4 91.7 95.7 96.6 83.6 90
Health Life expectancy at birth, women (years) 72 74.8 79.3 78.4 70 73Life expectancy gap (years) 2 0.7 -1.2 -2 -0.7 -0.7
Life expectancy at birth, men (years) 64.1 68.2 74.6 74.5 64.8 67.8Maternal mortality rate (per 100000 live birth) 260 120 35 24 110 210
Sex ratio (at birth) 105 103 105 106 105 105Sex ratio (under 15 years) 104 102 105 106 104 103
Access to labour market Birth control (%) 77 77 75 73 64 66Total fertility rate (children per woman) 2.2 2.6 2.7 1.6 2.7 2.8
Birth attendance by skilled staff (%) 88 86 98 100 96 69
Economic status of women Economic active women without family workers (%) 36 43.1 30.7 15.36 35.5Women among tech.and prof. workers (%) 63 44 45 48 50 47
Women among admi. And managerial workers (%) 37 35 27 25 28 26 Women in total number of paid workers (%) 36.7 47.5 33.9 37.85 35.8 31.6
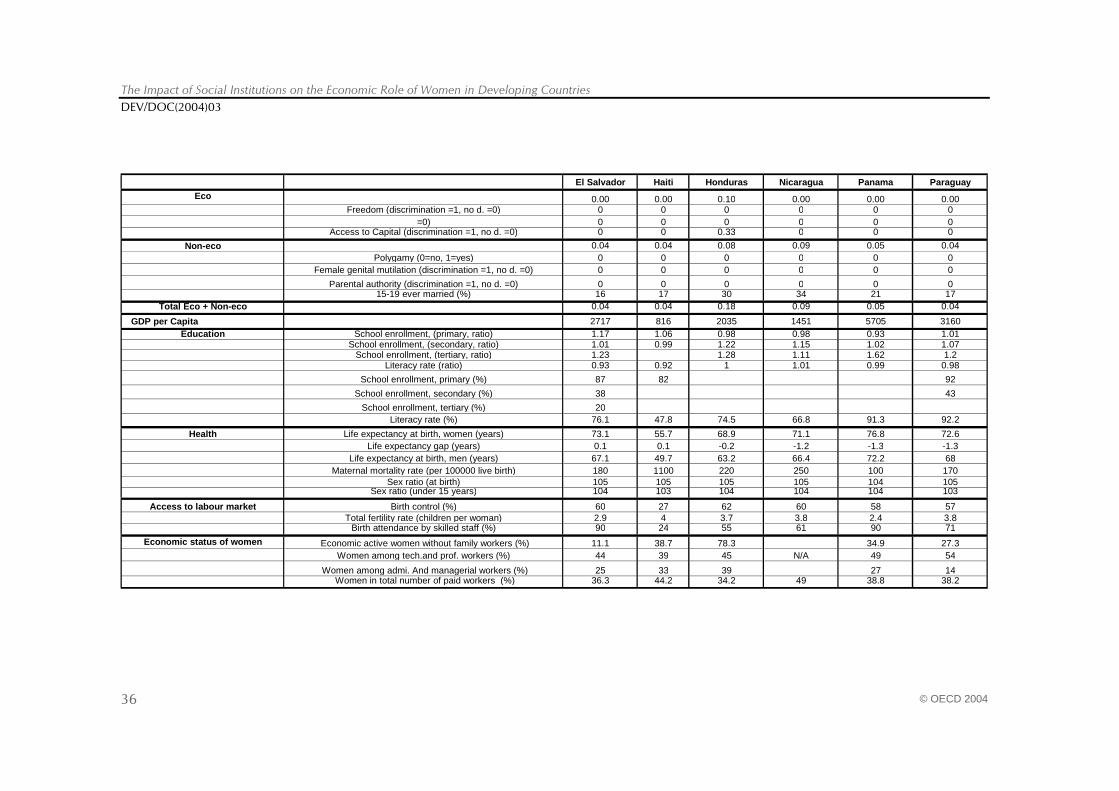
The Impact of Social Institutions on the Economic Role of Women in Developing Countries DEV/DOC(2004)03
© OECD 2004 36
El Salvador Haiti Honduras Nicaragua Panama Paraguay
Eco 0.00 0.00 0.10 0.00 0.00 0.00Freedom (discrimination =1, no d. =0) 0 0 0 0 0 0
=0) 0 0 0 0 0 0Access to Capital (discrimination =1, no d. =0) 0 0 0.33 0 0 0
Non-eco 0.04 0.04 0.08 0.09 0.05 0.04Polygamy (0=no, 1=yes) 0 0 0 0 0 0
Female genital mutilation (discrimination =1, no d. =0) 0 0 0 0 0 0
Parental authority (discrimination =1, no d. =0) 0 0 0 0 0 015-19 ever married (%) 16 17 30 34 21 17
Total Eco + Non-eco 0.04 0.04 0.18 0.09 0.05 0.04
GDP per Capita 2717 816 2035 1451 5705 3160Education School enrollment, (primary, ratio) 1.17 1.06 0.98 0.98 0.93 1.01
School enrollment, (secondary, ratio) 1.01 0.99 1.22 1.15 1.02 1.07School enrollment, (tertiary, ratio) 1.23 1.28 1.11 1.62 1.2
Literacy rate (ratio) 0.93 0.92 1 1.01 0.99 0.98
School enrollment, primary (%) 87 82 92
School enrollment, secondary (%) 38 43
School enrollment, tertiary (%) 20Literacy rate (%) 76.1 47.8 74.5 66.8 91.3 92.2
Health Life expectancy at birth, women (years) 73.1 55.7 68.9 71.1 76.8 72.6Life expectancy gap (years) 0.1 0.1 -0.2 -1.2 -1.3 -1.3
Life expectancy at birth, men (years) 67.1 49.7 63.2 66.4 72.2 68Maternal mortality rate (per 100000 live birth) 180 1100 220 250 100 170
Sex ratio (at birth) 105 105 105 105 104 105Sex ratio (under 15 years) 104 103 104 104 104 103
Access to labour market Birth control (%) 60 27 62 60 58 57Total fertility rate (children per woman) 2.9 4 3.7 3.8 2.4 3.8
Birth attendance by skilled staff (%) 90 24 55 61 90 71
Economic status of women Economic active women without family workers (%) 11.1 38.7 78.3 34.9 27.3Women among tech.and prof. workers (%) 44 39 45 N/A 49 54
Women among admi. And managerial workers (%) 25 33 39 27 14 Women in total number of paid workers (%) 36.3 44.2 34.2 49 38.8 38.2
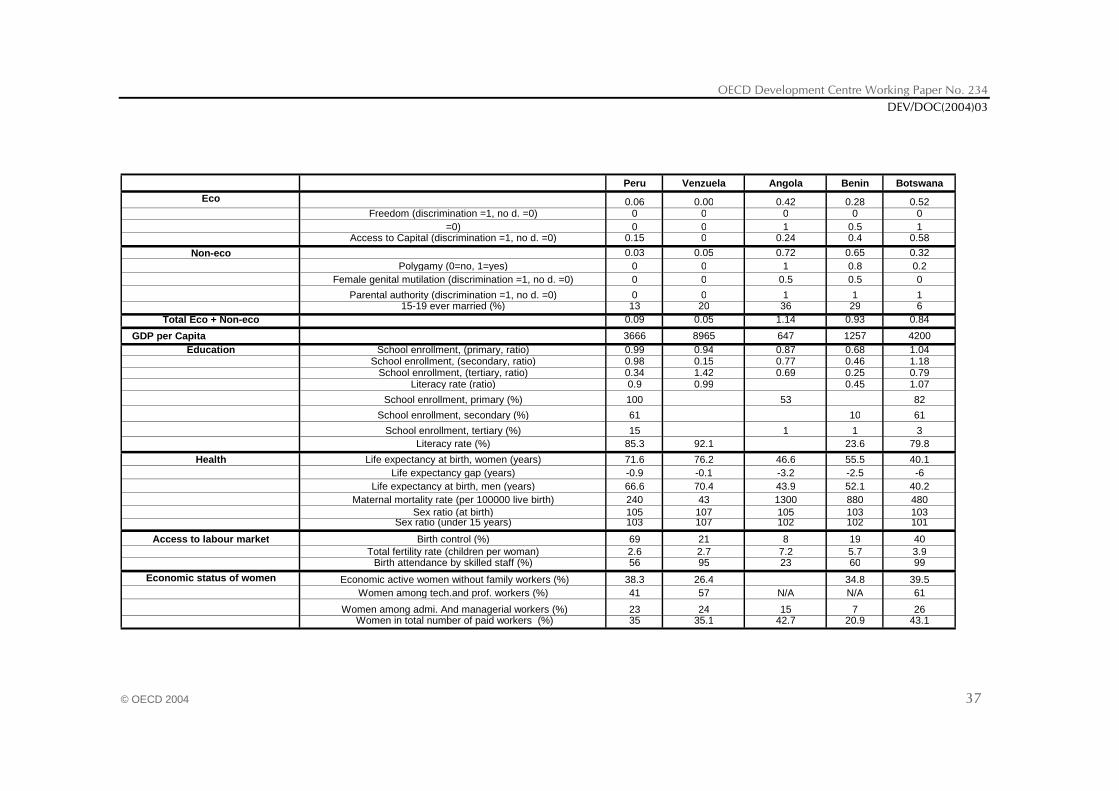
OECD Development Centre Working Paper No. 234 DEV/DOC(2004)03
© OECD 2004 37
Peru Venzuela Angola Benin Botswana
Eco 0.06 0.00 0.42 0.28 0.52Freedom (discrimination =1, no d. =0) 0 0 0 0 0
=0) 0 0 1 0.5 1Access to Capital (discrimination =1, no d. =0) 0.15 0 0.24 0.4 0.58
Non-eco 0.03 0.05 0.72 0.65 0.32Polygamy (0=no, 1=yes) 0 0 1 0.8 0.2
Female genital mutilation (discrimination =1, no d. =0) 0 0 0.5 0.5 0
Parental authority (discrimination =1, no d. =0) 0 0 1 1 115-19 ever married (%) 13 20 36 29 6
Total Eco + Non-eco 0.09 0.05 1.14 0.93 0.84
GDP per Capita 3666 8965 647 1257 4200Education School enrollment, (primary, ratio) 0.99 0.94 0.87 0.68 1.04
School enrollment, (secondary, ratio) 0.98 0.15 0.77 0.46 1.18School enrollment, (tertiary, ratio) 0.34 1.42 0.69 0.25 0.79
Literacy rate (ratio) 0.9 0.99 0.45 1.07
School enrollment, primary (%) 100 53 82
School enrollment, secondary (%) 61 10 61
School enrollment, tertiary (%) 15 1 1 3Literacy rate (%) 85.3 92.1 23.6 79.8
Health Life expectancy at birth, women (years) 71.6 76.2 46.6 55.5 40.1Life expectancy gap (years) -0.9 -0.1 -3.2 -2.5 -6
Life expectancy at birth, men (years) 66.6 70.4 43.9 52.1 40.2Maternal mortality rate (per 100000 live birth) 240 43 1300 880 480
Sex ratio (at birth) 105 107 105 103 103Sex ratio (under 15 years) 103 107 102 102 101
Access to labour market Birth control (%) 69 21 8 19 40Total fertility rate (children per woman) 2.6 2.7 7.2 5.7 3.9
Birth attendance by skilled staff (%) 56 95 23 60 99
Economic status of women Economic active women without family workers (%) 38.3 26.4 34.8 39.5Women among tech.and prof. workers (%) 41 57 N/A N/A 61
Women among admi. And managerial workers (%) 23 24 15 7 26 Women in total number of paid workers (%) 35 35.1 42.7 20.9 43.1
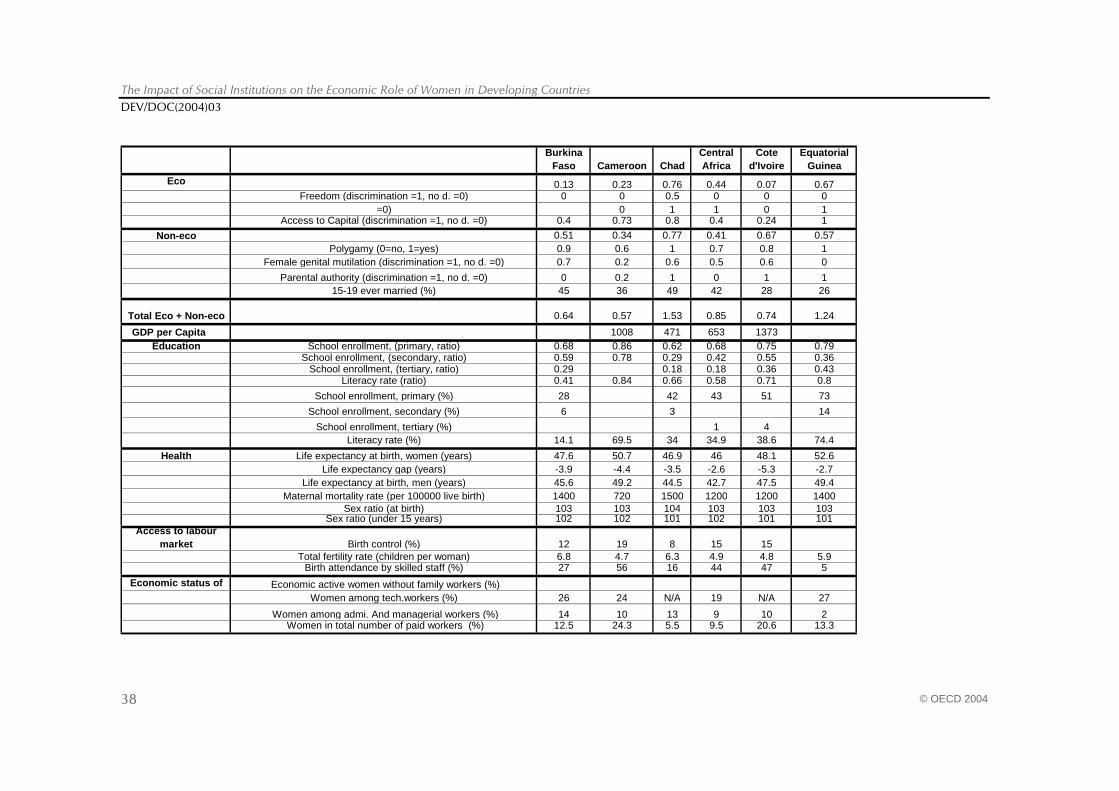
The Impact of Social Institutions on the Economic Role of Women in Developing Countries DEV/DOC(2004)03
© OECD 2004 38
Burkina
Faso Cameroon ChadCentral Africa
Cote d'Ivoire
Equatorial Guinea
Eco 0.13 0.23 0.76 0.44 0.07 0.67Freedom (discrimination =1, no d. =0) 0 0 0.5 0 0 0
=0) 0 1 1 0 1Access to Capital (discrimination =1, no d. =0) 0.4 0.73 0.8 0.4 0.24 1
Non-eco 0.51 0.34 0.77 0.41 0.67 0.57Polygamy (0=no, 1=yes) 0.9 0.6 1 0.7 0.8 1
Female genital mutilation (discrimination =1, no d. =0) 0.7 0.2 0.6 0.5 0.6 0
Parental authority (discrimination =1, no d. =0) 0 0.2 1 0 1 115-19 ever married (%) 45 36 49 42 28 26
Total Eco + Non-eco 0.64 0.57 1.53 0.85 0.74 1.24
GDP per Capita 1008 471 653 1373Education School enrollment, (primary, ratio) 0.68 0.86 0.62 0.68 0.75 0.79
School enrollment, (secondary, ratio) 0.59 0.78 0.29 0.42 0.55 0.36School enrollment, (tertiary, ratio) 0.29 0.18 0.18 0.36 0.43
Literacy rate (ratio) 0.41 0.84 0.66 0.58 0.71 0.8
School enrollment, primary (%) 28 42 43 51 73
School enrollment, secondary (%) 6 3 14
School enrollment, tertiary (%) 1 4Literacy rate (%) 14.1 69.5 34 34.9 38.6 74.4
Health Life expectancy at birth, women (years) 47.6 50.7 46.9 46 48.1 52.6Life expectancy gap (years) -3.9 -4.4 -3.5 -2.6 -5.3 -2.7
Life expectancy at birth, men (years) 45.6 49.2 44.5 42.7 47.5 49.4Maternal mortality rate (per 100000 live birth) 1400 720 1500 1200 1200 1400
Sex ratio (at birth) 103 103 104 103 103 103Sex ratio (under 15 years) 102 102 101 102 101 101
Access to labour market Birth control (%) 12 19 8 15 15
Total fertility rate (children per woman) 6.8 4.7 6.3 4.9 4.8 5.9Birth attendance by skilled staff (%) 27 56 16 44 47 5
Economic status of Economic active women without family workers (%)Women among tech.workers (%) 26 24 N/A 19 N/A 27
Women among admi. And managerial workers (%) 14 10 13 9 10 2 Women in total number of paid workers (%) 12.5 24.3 5.5 9.5 20.6 13.3
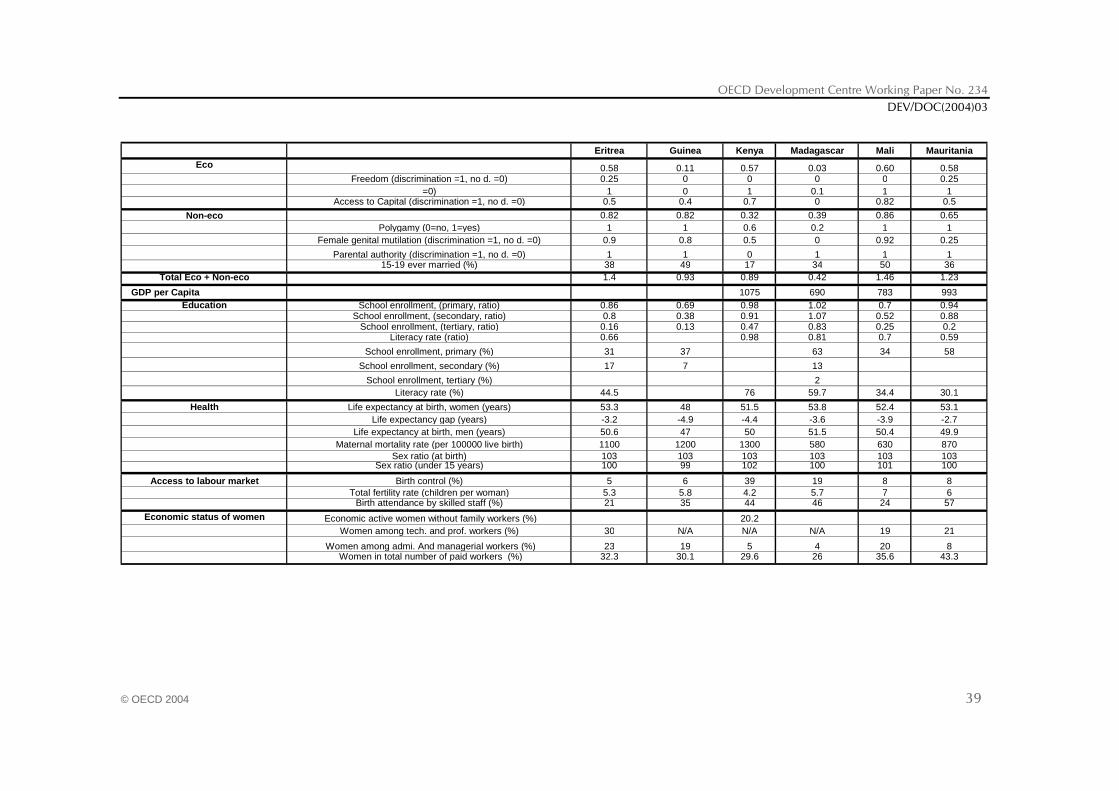
OECD Development Centre Working Paper No. 234 DEV/DOC(2004)03
© OECD 2004 39
Eritrea Guinea Kenya Madagascar Mali Mauritania
Eco 0.58 0.11 0.57 0.03 0.60 0.58Freedom (discrimination =1, no d. =0) 0.25 0 0 0 0 0.25
=0) 1 0 1 0.1 1 1Access to Capital (discrimination =1, no d. =0) 0.5 0.4 0.7 0 0.82 0.5
Non-eco 0.82 0.82 0.32 0.39 0.86 0.65Polygamy (0=no, 1=yes) 1 1 0.6 0.2 1 1
Female genital mutilation (discrimination =1, no d. =0) 0.9 0.8 0.5 0 0.92 0.25
Parental authority (discrimination =1, no d. =0) 1 1 0 1 1 115-19 ever married (%) 38 49 17 34 50 36
Total Eco + Non-eco 1.4 0.93 0.89 0.42 1.46 1.23
GDP per Capita 1075 690 783 993Education School enrollment, (primary, ratio) 0.86 0.69 0.98 1.02 0.7 0.94
School enrollment, (secondary, ratio) 0.8 0.38 0.91 1.07 0.52 0.88School enrollment, (tertiary, ratio) 0.16 0.13 0.47 0.83 0.25 0.2
Literacy rate (ratio) 0.66 0.98 0.81 0.7 0.59
School enrollment, primary (%) 31 37 63 34 58
School enrollment, secondary (%) 17 7 13
School enrollment, tertiary (%) 2Literacy rate (%) 44.5 76 59.7 34.4 30.1
Health Life expectancy at birth, women (years) 53.3 48 51.5 53.8 52.4 53.1Life expectancy gap (years) -3.2 -4.9 -4.4 -3.6 -3.9 -2.7
Life expectancy at birth, men (years) 50.6 47 50 51.5 50.4 49.9Maternal mortality rate (per 100000 live birth) 1100 1200 1300 580 630 870
Sex ratio (at birth) 103 103 103 103 103 103Sex ratio (under 15 years) 100 99 102 100 101 100
Access to labour market Birth control (%) 5 6 39 19 8 8Total fertility rate (children per woman) 5.3 5.8 4.2 5.7 7 6
Birth attendance by skilled staff (%) 21 35 44 46 24 57
Economic status of women Economic active women without family workers (%) 20.2Women among tech. and prof. workers (%) 30 N/A N/A N/A 19 21
Women among admi. And managerial workers (%) 23 19 5 4 20 8 Women in total number of paid workers (%) 32.3 30.1 29.6 26 35.6 43.3
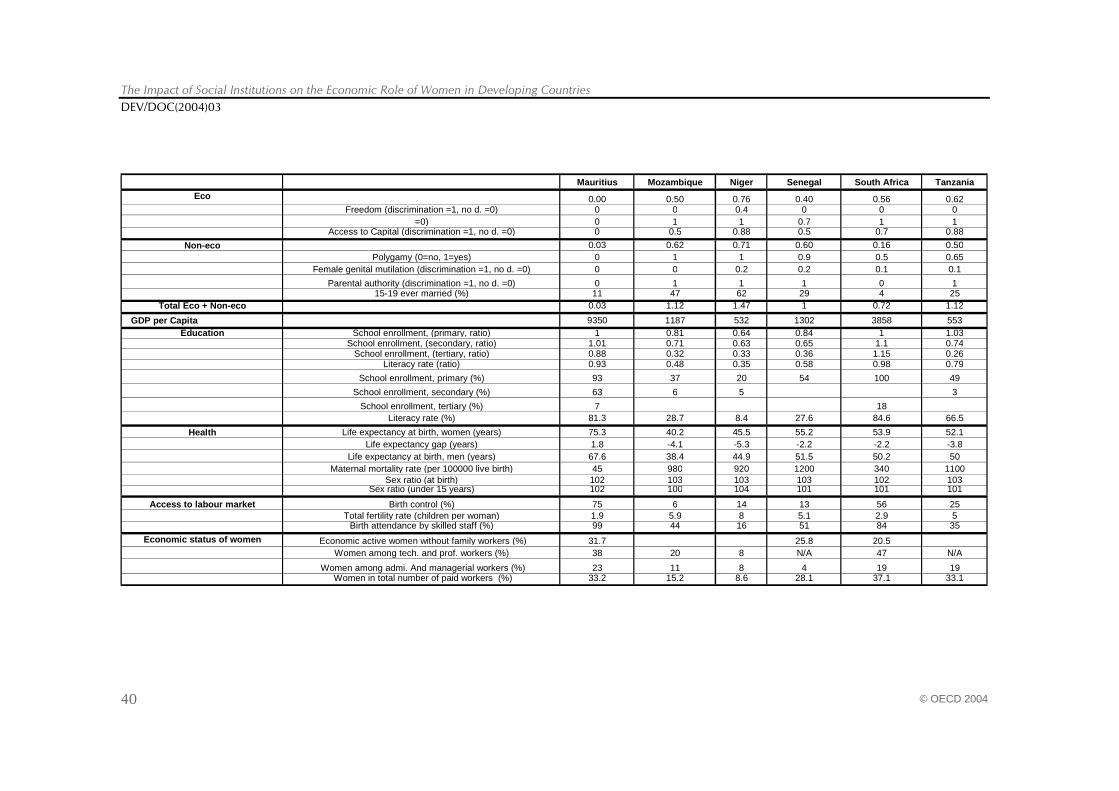
The Impact of Social Institutions on the Economic Role of Women in Developing Countries DEV/DOC(2004)03
© OECD 2004 40
Mauritius Mozambique Niger Senegal South Africa Tanzania
Eco 0.00 0.50 0.76 0.40 0.56 0.62Freedom (discrimination =1, no d. =0) 0 0 0.4 0 0 0
=0) 0 1 1 0.7 1 1Access to Capital (discrimination =1, no d. =0) 0 0.5 0.88 0.5 0.7 0.88
Non-eco 0.03 0.62 0.71 0.60 0.16 0.50Polygamy (0=no, 1=yes) 0 1 1 0.9 0.5 0.65
Female genital mutilation (discrimination =1, no d. =0) 0 0 0.2 0.2 0.1 0.1
Parental authority (discrimination =1, no d. =0) 0 1 1 1 0 115-19 ever married (%) 11 47 62 29 4 25
Total Eco + Non-eco 0.03 1.12 1.47 1 0.72 1.12
GDP per Capita 9350 1187 532 1302 3858 553Education School enrollment, (primary, ratio) 1 0.81 0.64 0.84 1 1.03
School enrollment, (secondary, ratio) 1.01 0.71 0.63 0.65 1.1 0.74School enrollment, (tertiary, ratio) 0.88 0.32 0.33 0.36 1.15 0.26
Literacy rate (ratio) 0.93 0.48 0.35 0.58 0.98 0.79
School enrollment, primary (%) 93 37 20 54 100 49
School enrollment, secondary (%) 63 6 5 3
School enrollment, tertiary (%) 7 18Literacy rate (%) 81.3 28.7 8.4 27.6 84.6 66.5
Health Life expectancy at birth, women (years) 75.3 40.2 45.5 55.2 53.9 52.1Life expectancy gap (years) 1.8 -4.1 -5.3 -2.2 -2.2 -3.8
Life expectancy at birth, men (years) 67.6 38.4 44.9 51.5 50.2 50Maternal mortality rate (per 100000 live birth) 45 980 920 1200 340 1100
Sex ratio (at birth) 102 103 103 103 102 103Sex ratio (under 15 years) 102 100 104 101 101 101
Access to labour market Birth control (%) 75 6 14 13 56 25Total fertility rate (children per woman) 1.9 5.9 8 5.1 2.9 5
Birth attendance by skilled staff (%) 99 44 16 51 84 35
Economic status of women Economic active women without family workers (%) 31.7 25.8 20.5Women among tech. and prof. workers (%) 38 20 8 N/A 47 N/A
Women among admi. And managerial workers (%) 23 11 8 4 19 19 Women in total number of paid workers (%) 33.2 15.2 8.6 28.1 37.1 33.1
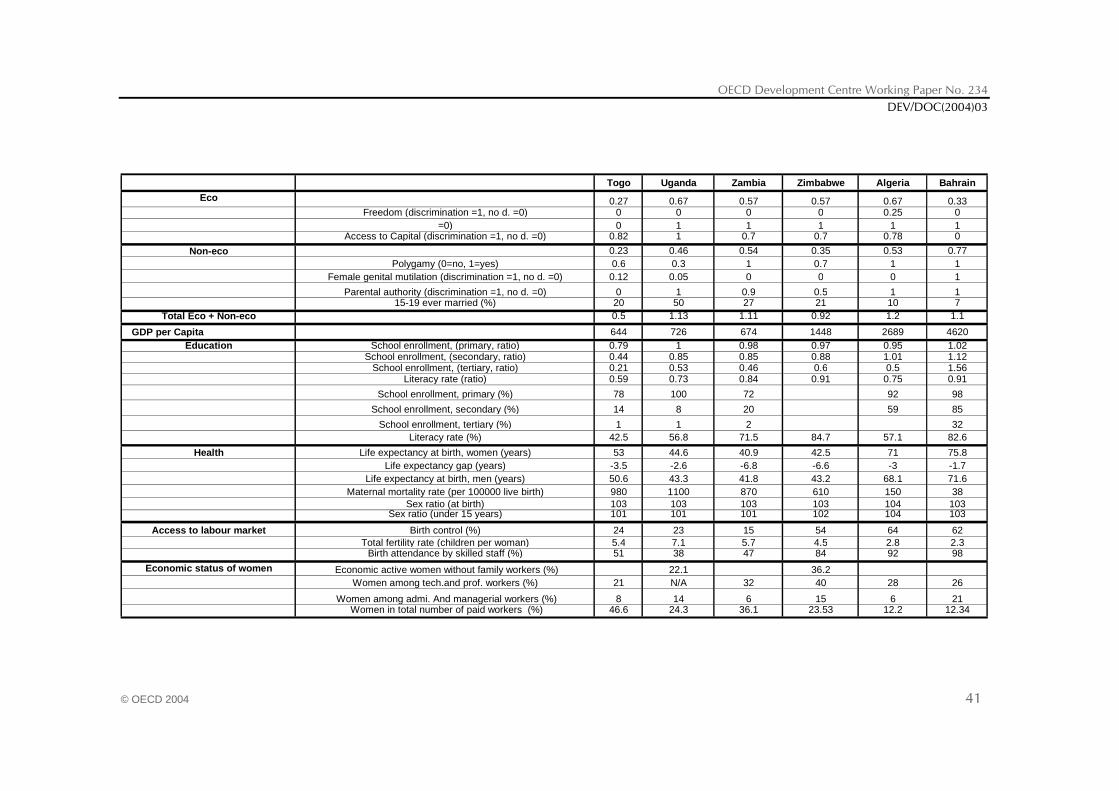
OECD Development Centre Working Paper No. 234 DEV/DOC(2004)03
© OECD 2004 41
Togo Uganda Zambia Zimbabwe Algeria Bahrain
Eco 0.27 0.67 0.57 0.57 0.67 0.33Freedom (discrimination =1, no d. =0) 0 0 0 0 0.25 0
=0) 0 1 1 1 1 1Access to Capital (discrimination =1, no d. =0) 0.82 1 0.7 0.7 0.78 0
Non-eco 0.23 0.46 0.54 0.35 0.53 0.77Polygamy (0=no, 1=yes) 0.6 0.3 1 0.7 1 1
Female genital mutilation (discrimination =1, no d. =0) 0.12 0.05 0 0 0 1
Parental authority (discrimination =1, no d. =0) 0 1 0.9 0.5 1 115-19 ever married (%) 20 50 27 21 10 7
Total Eco + Non-eco 0.5 1.13 1.11 0.92 1.2 1.1
GDP per Capita 644 726 674 1448 2689 4620Education School enrollment, (primary, ratio) 0.79 1 0.98 0.97 0.95 1.02
School enrollment, (secondary, ratio) 0.44 0.85 0.85 0.88 1.01 1.12School enrollment, (tertiary, ratio) 0.21 0.53 0.46 0.6 0.5 1.56
Literacy rate (ratio) 0.59 0.73 0.84 0.91 0.75 0.91
School enrollment, primary (%) 78 100 72 92 98
School enrollment, secondary (%) 14 8 20 59 85
School enrollment, tertiary (%) 1 1 2 32Literacy rate (%) 42.5 56.8 71.5 84.7 57.1 82.6
Health Life expectancy at birth, women (years) 53 44.6 40.9 42.5 71 75.8Life expectancy gap (years) -3.5 -2.6 -6.8 -6.6 -3 -1.7
Life expectancy at birth, men (years) 50.6 43.3 41.8 43.2 68.1 71.6Maternal mortality rate (per 100000 live birth) 980 1100 870 610 150 38
Sex ratio (at birth) 103 103 103 103 104 103Sex ratio (under 15 years) 101 101 101 102 104 103
Access to labour market Birth control (%) 24 23 15 54 64 62Total fertility rate (children per woman) 5.4 7.1 5.7 4.5 2.8 2.3
Birth attendance by skilled staff (%) 51 38 47 84 92 98
Economic status of women Economic active women without family workers (%) 22.1 36.2Women among tech.and prof. workers (%) 21 N/A 32 40 28 26
Women among admi. And managerial workers (%) 8 14 6 15 6 21 Women in total number of paid workers (%) 46.6 24.3 36.1 23.53 12.2 12.34
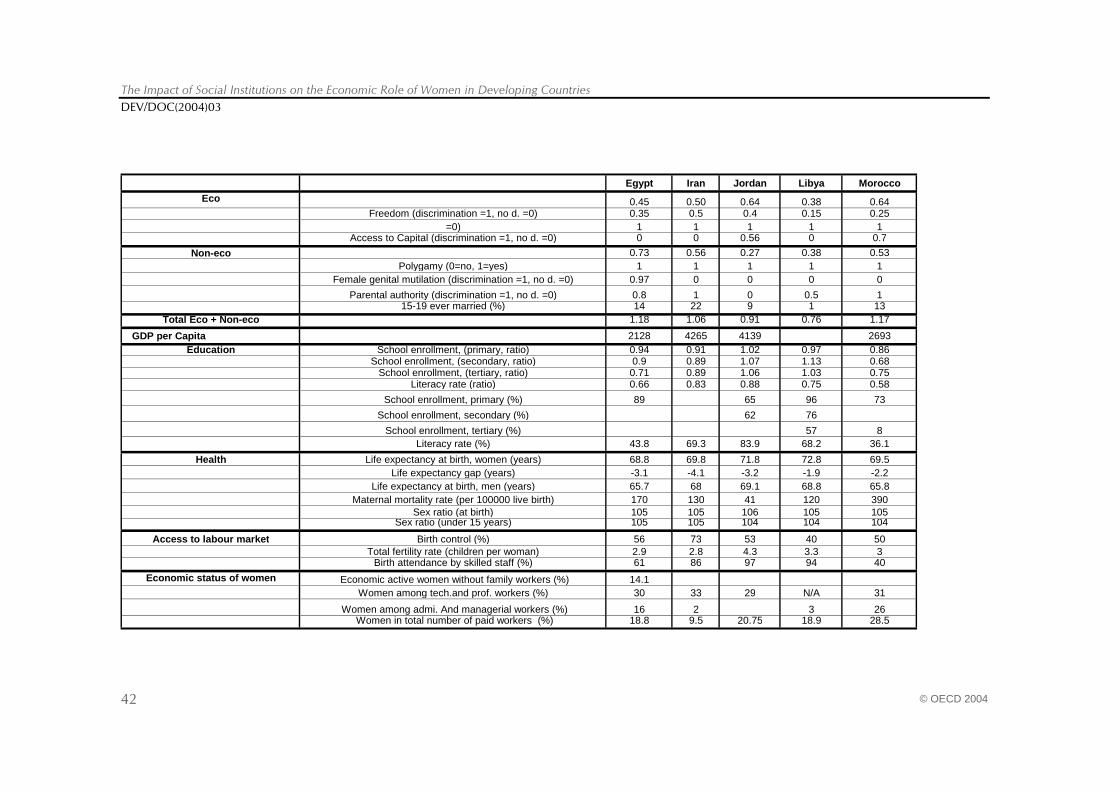
The Impact of Social Institutions on the Economic Role of Women in Developing Countries DEV/DOC(2004)03
© OECD 2004 42
Egypt Iran Jordan Libya Morocco
Eco 0.45 0.50 0.64 0.38 0.64Freedom (discrimination =1, no d. =0) 0.35 0.5 0.4 0.15 0.25
=0) 1 1 1 1 1Access to Capital (discrimination =1, no d. =0) 0 0 0.56 0 0.7
Non-eco 0.73 0.56 0.27 0.38 0.53Polygamy (0=no, 1=yes) 1 1 1 1 1
Female genital mutilation (discrimination =1, no d. =0) 0.97 0 0 0 0
Parental authority (discrimination =1, no d. =0) 0.8 1 0 0.5 115-19 ever married (%) 14 22 9 1 13
Total Eco + Non-eco 1.18 1.06 0.91 0.76 1.17
GDP per Capita 2128 4265 4139 2693Education School enrollment, (primary, ratio) 0.94 0.91 1.02 0.97 0.86
School enrollment, (secondary, ratio) 0.9 0.89 1.07 1.13 0.68School enrollment, (tertiary, ratio) 0.71 0.89 1.06 1.03 0.75
Literacy rate (ratio) 0.66 0.83 0.88 0.75 0.58
School enrollment, primary (%) 89 65 96 73
School enrollment, secondary (%) 62 76
School enrollment, tertiary (%) 57 8Literacy rate (%) 43.8 69.3 83.9 68.2 36.1
Health Life expectancy at birth, women (years) 68.8 69.8 71.8 72.8 69.5Life expectancy gap (years) -3.1 -4.1 -3.2 -1.9 -2.2
Life expectancy at birth, men (years) 65.7 68 69.1 68.8 65.8Maternal mortality rate (per 100000 live birth) 170 130 41 120 390
Sex ratio (at birth) 105 105 106 105 105Sex ratio (under 15 years) 105 105 104 104 104
Access to labour market Birth control (%) 56 73 53 40 50Total fertility rate (children per woman) 2.9 2.8 4.3 3.3 3
Birth attendance by skilled staff (%) 61 86 97 94 40
Economic status of women Economic active women without family workers (%) 14.1Women among tech.and prof. workers (%) 30 33 29 N/A 31
Women among admi. And managerial workers (%) 16 2 3 26 Women in total number of paid workers (%) 18.8 9.5 20.75 18.9 28.5
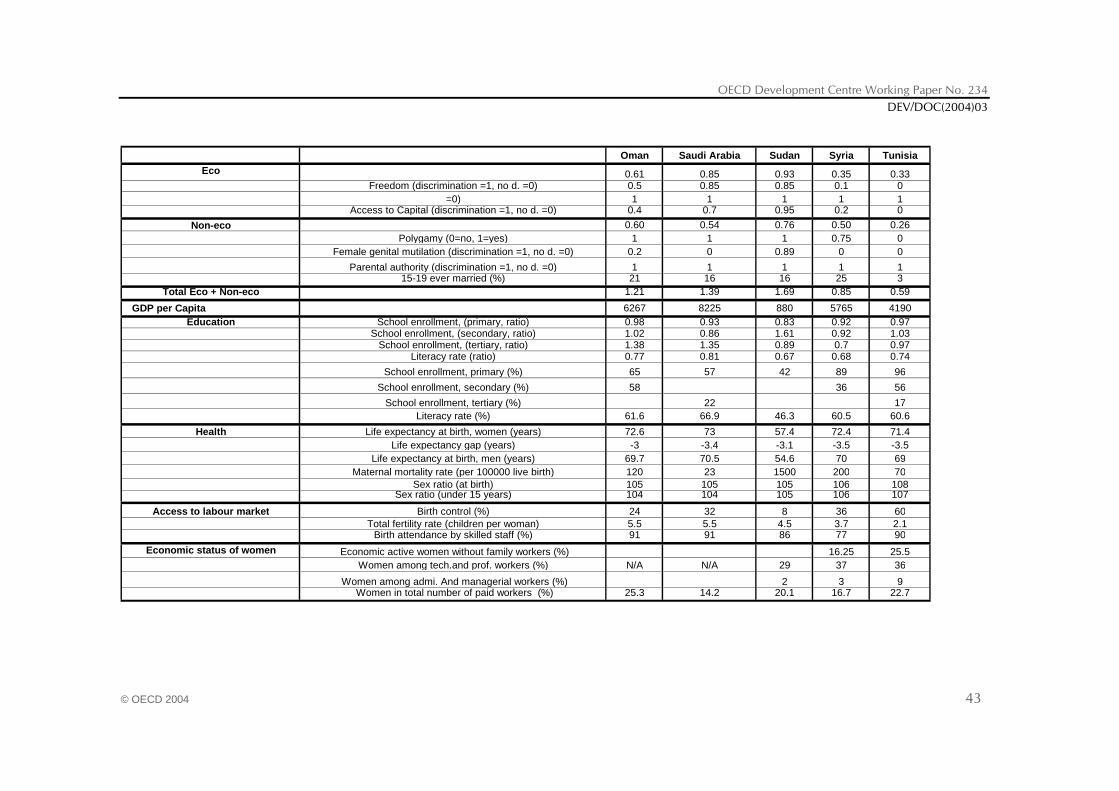
OECD Development Centre Working Paper No. 234 DEV/DOC(2004)03
© OECD 2004 43
Oman Saudi Arabia Sudan Syria Tunisia
Eco 0.61 0.85 0.93 0.35 0.33Freedom (discrimination =1, no d. =0) 0.5 0.85 0.85 0.1 0
=0) 1 1 1 1 1Access to Capital (discrimination =1, no d. =0) 0.4 0.7 0.95 0.2 0
Non-eco 0.60 0.54 0.76 0.50 0.26Polygamy (0=no, 1=yes) 1 1 1 0.75 0
Female genital mutilation (discrimination =1, no d. =0) 0.2 0 0.89 0 0
Parental authority (discrimination =1, no d. =0) 1 1 1 1 115-19 ever married (%) 21 16 16 25 3
Total Eco + Non-eco 1.21 1.39 1.69 0.85 0.59
GDP per Capita 6267 8225 880 5765 4190Education School enrollment, (primary, ratio) 0.98 0.93 0.83 0.92 0.97
School enrollment, (secondary, ratio) 1.02 0.86 1.61 0.92 1.03School enrollment, (tertiary, ratio) 1.38 1.35 0.89 0.7 0.97
Literacy rate (ratio) 0.77 0.81 0.67 0.68 0.74
School enrollment, primary (%) 65 57 42 89 96
School enrollment, secondary (%) 58 36 56
School enrollment, tertiary (%) 22 17Literacy rate (%) 61.6 66.9 46.3 60.5 60.6
Health Life expectancy at birth, women (years) 72.6 73 57.4 72.4 71.4Life expectancy gap (years) -3 -3.4 -3.1 -3.5 -3.5
Life expectancy at birth, men (years) 69.7 70.5 54.6 70 69Maternal mortality rate (per 100000 live birth) 120 23 1500 200 70
Sex ratio (at birth) 105 105 105 106 108Sex ratio (under 15 years) 104 104 105 106 107
Access to labour market Birth control (%) 24 32 8 36 60Total fertility rate (children per woman) 5.5 5.5 4.5 3.7 2.1
Birth attendance by skilled staff (%) 91 91 86 77 90
Economic status of women Economic active women without family workers (%) 16.25 25.5Women among tech.and prof. workers (%) N/A N/A 29 37 36
Women among admi. And managerial workers (%) 2 3 9 Women in total number of paid workers (%) 25.3 14.2 20.1 16.7 22.7
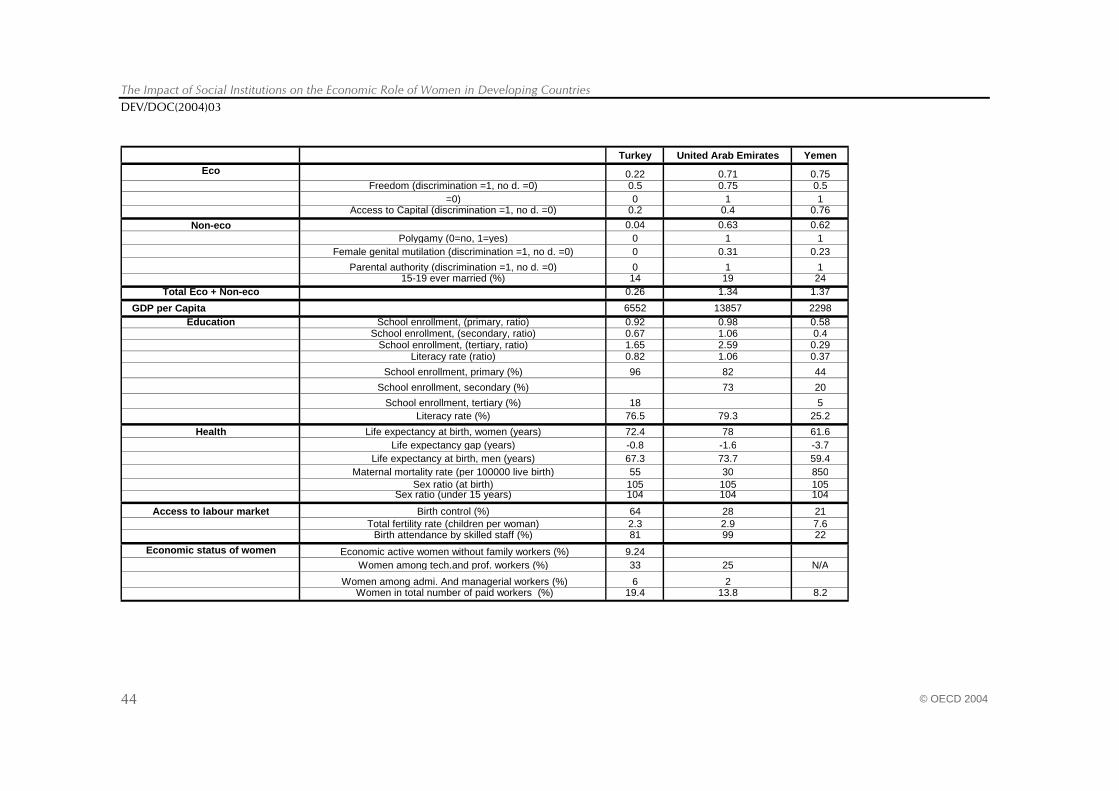
The Impact of Social Institutions on the Economic Role of Women in Developing Countries DEV/DOC(2004)03
© OECD 2004 44
Turkey United Arab Emirates Yemen
Eco 0.22 0.71 0.75Freedom (discrimination =1, no d. =0) 0.5 0.75 0.5
=0) 0 1 1Access to Capital (discrimination =1, no d. =0) 0.2 0.4 0.76
Non-eco 0.04 0.63 0.62Polygamy (0=no, 1=yes) 0 1 1
Female genital mutilation (discrimination =1, no d. =0) 0 0.31 0.23
Parental authority (discrimination =1, no d. =0) 0 1 115-19 ever married (%) 14 19 24
Total Eco + Non-eco 0.26 1.34 1.37
GDP per Capita 6552 13857 2298Education School enrollment, (primary, ratio) 0.92 0.98 0.58
School enrollment, (secondary, ratio) 0.67 1.06 0.4School enrollment, (tertiary, ratio) 1.65 2.59 0.29
Literacy rate (ratio) 0.82 1.06 0.37
School enrollment, primary (%) 96 82 44
School enrollment, secondary (%) 73 20
School enrollment, tertiary (%) 18 5Literacy rate (%) 76.5 79.3 25.2
Health Life expectancy at birth, women (years) 72.4 78 61.6Life expectancy gap (years) -0.8 -1.6 -3.7
Life expectancy at birth, men (years) 67.3 73.7 59.4Maternal mortality rate (per 100000 live birth) 55 30 850
Sex ratio (at birth) 105 105 105Sex ratio (under 15 years) 104 104 104
Access to labour market Birth control (%) 64 28 21Total fertility rate (children per woman) 2.3 2.9 7.6
Birth attendance by skilled staff (%) 81 99 22
Economic status of women Economic active women without family workers (%) 9.24Women among tech.and prof. workers (%) 33 25 N/A
Women among admi. And managerial workers (%) 6 2 Women in total number of paid workers (%) 19.4 13.8 8.2
OECD Development Centre Working Paper No. 234 DEV/DOC(2004)03
© OECD 2004 45
Notes:
ECO: Freedoms: arithmetic average of two variables:
— Freedom to dress — Freedom to circulate Each component is coded 0.5 for prohibitions. Inheritance in case of the husband’s death: if women cannot inherit without any discrimination, the value
assigned for the variable is one. The opposite situation is coded zero. — Access to capital: this variable is a weighted average of — Access to bank loans (30 per cent) — Right to ownership of property other than land (30 per cent) — Access to land ownership (40 per cent) If women have none of the aforementioned rights, the value attributed is one. If women have the first two
rights but cannot own land, the value is 0.4. NON-ECO: “Polygamy”: This variable is coded as one or zero, depending on whether polygamy is legal or not. If half of the
country’s population is Muslim, the code is 0.5. “Genital mutilation”: per cent of girls who undergo excision. “Parental authority”: If the father holds sole parental authority over children, the code attributed is one, whereas
it is zero if the authority is shared. “15-19 ever married”: per cent of women who are married before the age of 20.
Education: “School enrolment ratio, primary/secondary/tertiary”: Girls schooling rate/boys schooling rate. Measures the
disparities in terms of access to primary, secondary and higher education, with one as the value for a situation of parity.
“Literacy ratio”: This is ratio between the female and male literacy rates. It reveals disparities in being able to read to write.
“School enrolment, primary/secondary/tertiary”: rate of women enrolled in primary, secondary and tertiary education.
“Literacy rate”: rate of literate women. Health role: “Life expectancy at birth women/men”: Number of years a girl can expect to live when born, divided by the same
measure for boys at birth. “Life expectancy gap”: newly developed measure describing gender disparities in access to health services over
the entire lifetime of an individual. For developed countries, women live 5.9 years longer than men do. This variable is thus the difference between men and women’s life expectancies less 5.9. Hence, in a country where women have the same access to health services than men, the value is supposedly zero, and it is negative when women’s access is constrained.
“Maternal mortality rate”: Number of maternal deaths per 100 000 women. “Sex ratio at birth/under 15 years”: This is the number of females relative to males at a given age.
Access to labour market: “Birth control”: per cent of women using effective contraception measures. “Total fertility rate”: number of children born alive per 1 000 women aged 15-49. Birth attendance by skilled staff”: per cent of births realised with skilled and competent staff.
Economic role of women: “Economically active women without family workers”: refers to salaried or self-employed women, with personal
incomes that ensure their financial independence “Women among technical and professional workers”: per cent of women working as professional or technical
workers in the whole “technical and professional workers” population. “Women among administrators and managerial workers”: per cent of women employed as managers or involved
in administrative positions in the whole “administrative” and “managers” population. “Women in total number of paid workers”: percentage of women within the whole population of paid workers.
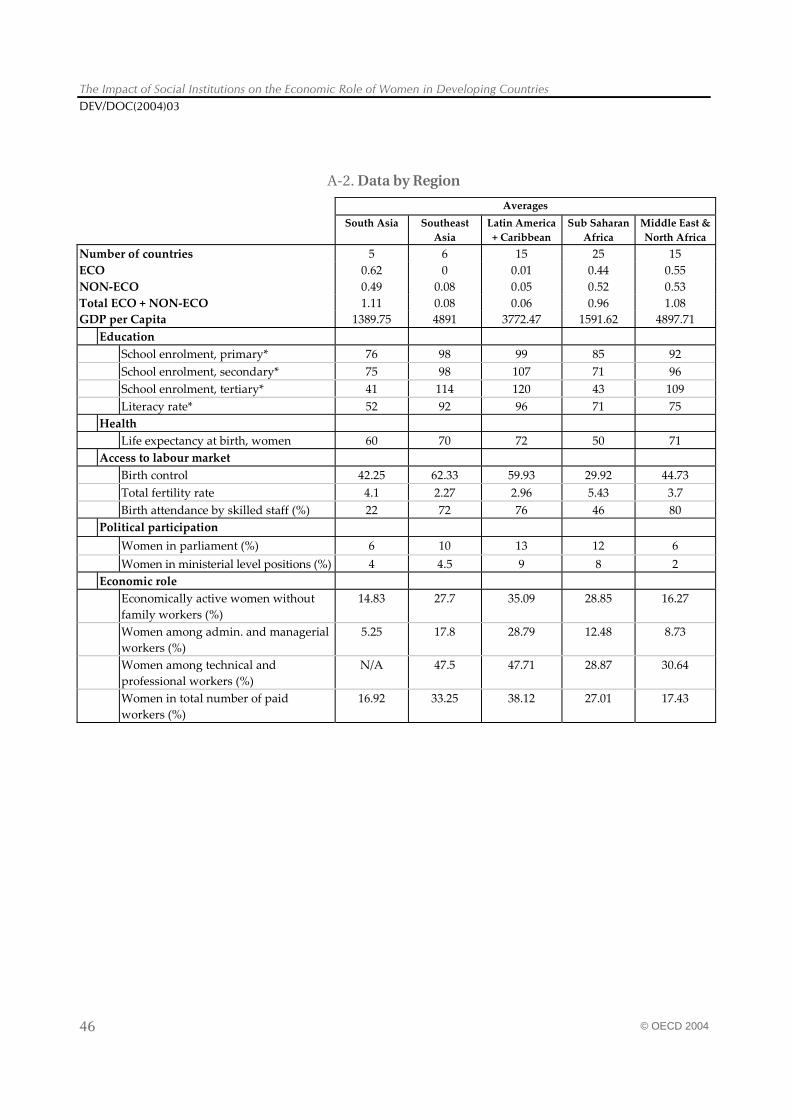
The Impact of Social Institutions on the Economic Role of Women in Developing Countries DEV/DOC(2004)03
© OECD 2004 46
A-2. Data by Region
Averages South Asia Southeast
Asia Latin America + Caribbean
Sub Saharan Africa
Middle East & North Africa
Number of countries 5 6 15 25 15 ECO 0.62 0 0.01 0.44 0.55 NON-ECO 0.49 0.08 0.05 0.52 0.53 Total ECO + NON-ECO 1.11 0.08 0.06 0.96 1.08 GDP per Capita 1389.75 4891 3772.47 1591.62 4897.71 Education
School enrolment, primary* 76 98 99 85 92 School enrolment, secondary* 75 98 107 71 96 School enrolment, tertiary* 41 114 120 43 109 Literacy rate* 52 92 96 71 75
Health Life expectancy at birth, women 60 70 72 50 71
Access to labour market Birth control 42.25 62.33 59.93 29.92 44.73 Total fertility rate 4.1 2.27 2.96 5.43 3.7 Birth attendance by skilled staff (%) 22 72 76 46 80
Political participation Women in parliament (%) 6 10 13 12 6 Women in ministerial level positions (%) 4 4.5 9 8 2
Economic role Economically active women without
family workers (%) 14.83 27.7 35.09 28.85 16.27
Women among admin. and managerial workers (%)
5.25 17.8 28.79 12.48 8.73
Women among technical and professional workers (%)
N/A 47.5 47.71 28.87 30.64
Women in total number of paid workers (%)
16.92 33.25 38.12 27.01 17.43
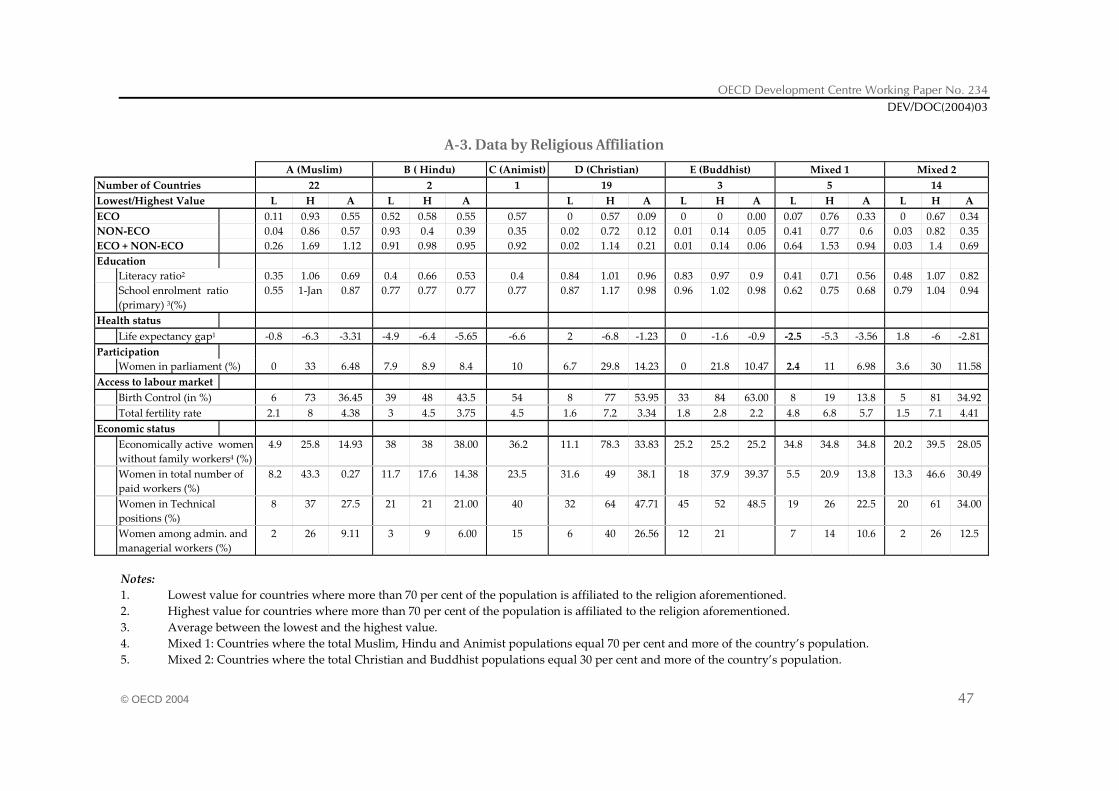
OECD Development Centre Working Paper No. 234 DEV/DOC(2004)03
© OECD 2004 47
A-3. Data by Religious Affiliation
A (Muslim) B ( Hindu) C (Animist) D (Christian) E (Buddhist) Mixed 1 Mixed 2 Number of Countries 22 2 1 19 3 5 14 Lowest/Highest Value L H A L H A L H A L H A L H A L H A ECO 0.11 0.93 0.55 0.52 0.58 0.55 0.57 0 0.57 0.09 0 0 0.00 0.07 0.76 0.33 0 0.67 0.34 NON-ECO 0.04 0.86 0.57 0.93 0.4 0.39 0.35 0.02 0.72 0.12 0.01 0.14 0.05 0.41 0.77 0.6 0.03 0.82 0.35 ECO + NON-ECO 0.26 1.69 1.12 0.91 0.98 0.95 0.92 0.02 1.14 0.21 0.01 0.14 0.06 0.64 1.53 0.94 0.03 1.4 0.69 Education
Literacy ratio2 0.35 1.06 0.69 0.4 0.66 0.53 0.4 0.84 1.01 0.96 0.83 0.97 0.9 0.41 0.71 0.56 0.48 1.07 0.82 School enrolment ratio
(primary) 3(%) 0.55 1-Jan 0.87 0.77 0.77 0.77 0.77 0.87 1.17 0.98 0.96 1.02 0.98 0.62 0.75 0.68 0.79 1.04 0.94
Health status Life expectancy gap1 -0.8 -6.3 -3.31 -4.9 -6.4 -5.65 -6.6 2 -6.8 -1.23 0 -1.6 -0.9 -2.5 -5.3 -3.56 1.8 -6 -2.81
Participation Women in parliament (%) 0 33 6.48 7.9 8.9 8.4 10 6.7 29.8 14.23 0 21.8 10.47 2.4 11 6.98 3.6 30 11.58
Access to labour market Birth Control (in %) 6 73 36.45 39 48 43.5 54 8 77 53.95 33 84 63.00 8 19 13.8 5 81 34.92 Total fertility rate 2.1 8 4.38 3 4.5 3.75 4.5 1.6 7.2 3.34 1.8 2.8 2.2 4.8 6.8 5.7 1.5 7.1 4.41
Economic status Economically active women
without family workers4 (%) 4.9 25.8 14.93 38 38 38.00 36.2 11.1 78.3 33.83 25.2 25.2 25.2 34.8 34.8 34.8 20.2 39.5 28.05
Women in total number of paid workers (%)
8.2 43.3 0.27 11.7 17.6 14.38 23.5 31.6 49 38.1 18 37.9 39.37 5.5 20.9 13.8 13.3 46.6 30.49
Women in Technical positions (%)
8 37 27.5 21 21 21.00 40 32 64 47.71 45 52 48.5 19 26 22.5 20 61 34.00
Women among admin. and managerial workers (%)
2 26 9.11 3 9 6.00 15 6 40 26.56 12 21 7 14 10.6 2 26 12.5
Notes: 1. Lowest value for countries where more than 70 per cent of the population is affiliated to the religion aforementioned. 2. Highest value for countries where more than 70 per cent of the population is affiliated to the religion aforementioned. 3. Average between the lowest and the highest value. 4. Mixed 1: Countries where the total Muslim, Hindu and Animist populations equal 70 per cent and more of the country’s population. 5. Mixed 2: Countries where the total Christian and Buddhist populations equal 30 per cent and more of the country’s population.
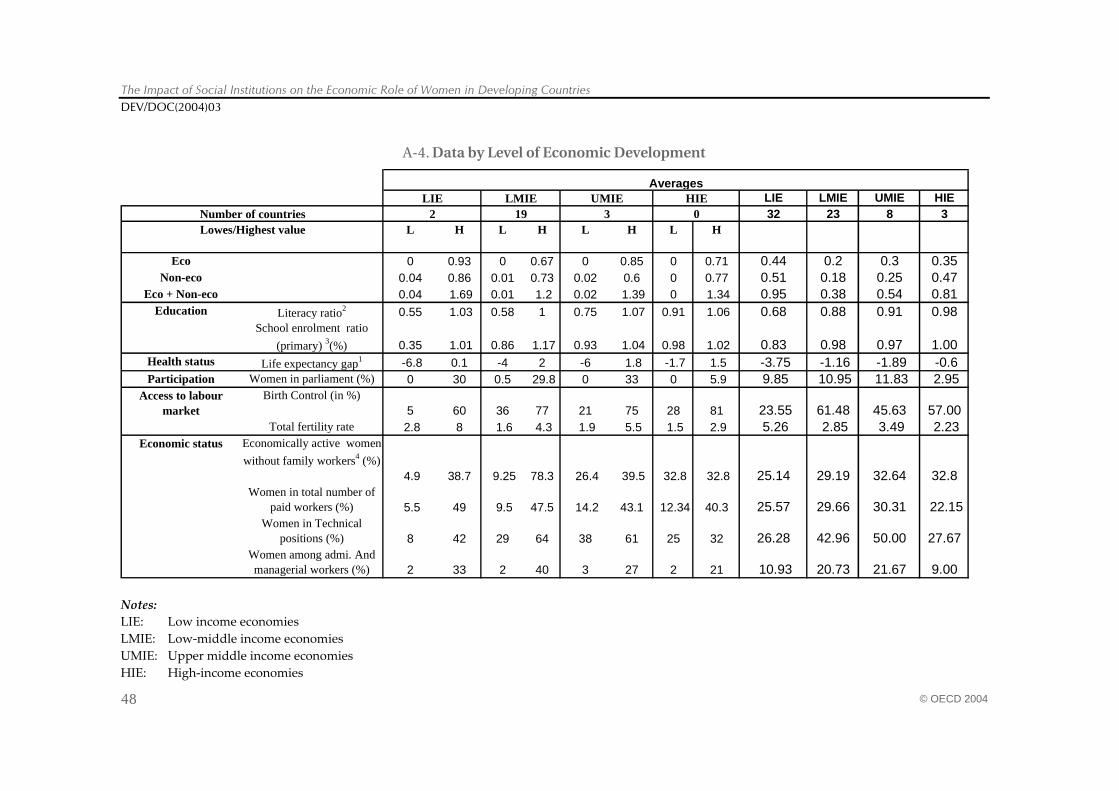
The Impact of Social Institutions on the Economic Role of Women in Developing Countries DEV/DOC(2004)03
© OECD 2004 48
A-4. Data by Level of Economic Development
LIE LMIE UMIE HIE32 23 8 3
L H L H L H L H
Eco 0 0.93 0 0.67 0 0.85 0 0.71 0.44 0.2 0.3 0.35Non-eco 0.04 0.86 0.01 0.73 0.02 0.6 0 0.77 0.51 0.18 0.25 0.47
Eco + Non-eco 0.04 1.69 0.01 1.2 0.02 1.39 0 1.34 0.95 0.38 0.54 0.81Education Literacy ratio2 0.55 1.03 0.58 1 0.75 1.07 0.91 1.06 0.68 0.88 0.91 0.98
School enrolment ratio
(primary) 3(%) 0.35 1.01 0.86 1.17 0.93 1.04 0.98 1.02 0.83 0.98 0.97 1.00Health status Life expectancy gap1 -6.8 0.1 -4 2 -6 1.8 -1.7 1.5 -3.75 -1.16 -1.89 -0.6Participation Women in parliament (%) 0 30 0.5 29.8 0 33 0 5.9 9.85 10.95 11.83 2.95
Access to labour market
Birth Control (in %)5 60 36 77 21 75 28 81 23.55 61.48 45.63 57.00
Total fertility rate 2.8 8 1.6 4.3 1.9 5.5 1.5 2.9 5.26 2.85 3.49 2.23Economic status Economically active women
without family workers4 (%) 4.9 38.7 9.25 78.3 26.4 39.5 32.8 32.8 25.14 29.19 32.64 32.8
Women in total number of paid workers (%) 5.5 49 9.5 47.5 14.2 43.1 12.34 40.3 25.57 29.66 30.31 22.15
Women in Technical positions (%) 8 42 29 64 38 61 25 32 26.28 42.96 50.00 27.67
Women among admi. And managerial workers (%) 2 33 2 40 3 27 2 21 10.93 20.73 21.67 9.00
Lowes/Highest value
AveragesLIE LMIE UMIE HIE
Number of countries 3 02 19
Notes: LIE: Low income economies LMIE: Low-middle income economies UMIE: Upper middle income economies HIE: High-income economies
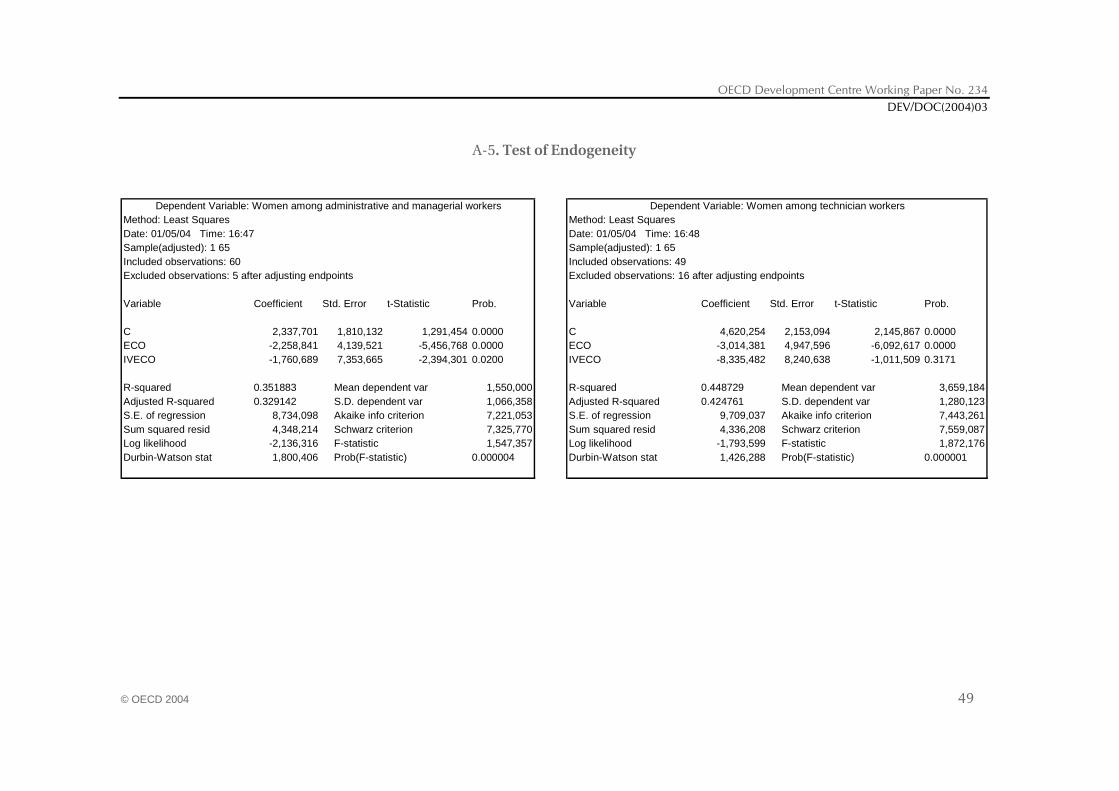
OECD Development Centre Working Paper No. 234 DEV/DOC(2004)03
© OECD 2004 49
A-5. Test of Endogeneity
Method: Least Squares Method: Least SquaresDate: 01/05/04 Time: 16:47 Date: 01/05/04 Time: 16:48Sample(adjusted): 1 65 Sample(adjusted): 1 65Included observations: 60 Included observations: 49Excluded observations: 5 after adjusting endpoints Excluded observations: 16 after adjusting endpoints
Variable Coefficient Std. Error t-Statistic Prob. Variable Coefficient Std. Error t-Statistic Prob.
C 2,337,701 1,810,132 1,291,454 0.0000 C 4,620,254 2,153,094 2,145,867 0.0000ECO -2,258,841 4,139,521 -5,456,768 0.0000 ECO -3,014,381 4,947,596 -6,092,617 0.0000IVECO -1,760,689 7,353,665 -2,394,301 0.0200 IVECO -8,335,482 8,240,638 -1,011,509 0.3171
R-squared 0.351883 Mean dependent var 1,550,000 R-squared 0.448729 Mean dependent var 3,659,184Adjusted R-squared 0.329142 S.D. dependent var 1,066,358 Adjusted R-squared 0.424761 S.D. dependent var 1,280,123S.E. of regression 8,734,098 Akaike info criterion 7,221,053 S.E. of regression 9,709,037 Akaike info criterion 7,443,261Sum squared resid 4,348,214 Schwarz criterion 7,325,770 Sum squared resid 4,336,208 Schwarz criterion 7,559,087Log likelihood -2,136,316 F-statistic 1,547,357 Log likelihood -1,793,599 F-statistic 1,872,176Durbin-Watson stat 1,800,406 Prob(F-statistic) 0.000004 Durbin-Watson stat 1,426,288 Prob(F-statistic) 0.000001
Dependent Variable: Women among administrative and managerial workers Dependent Variable: Women among technician workers
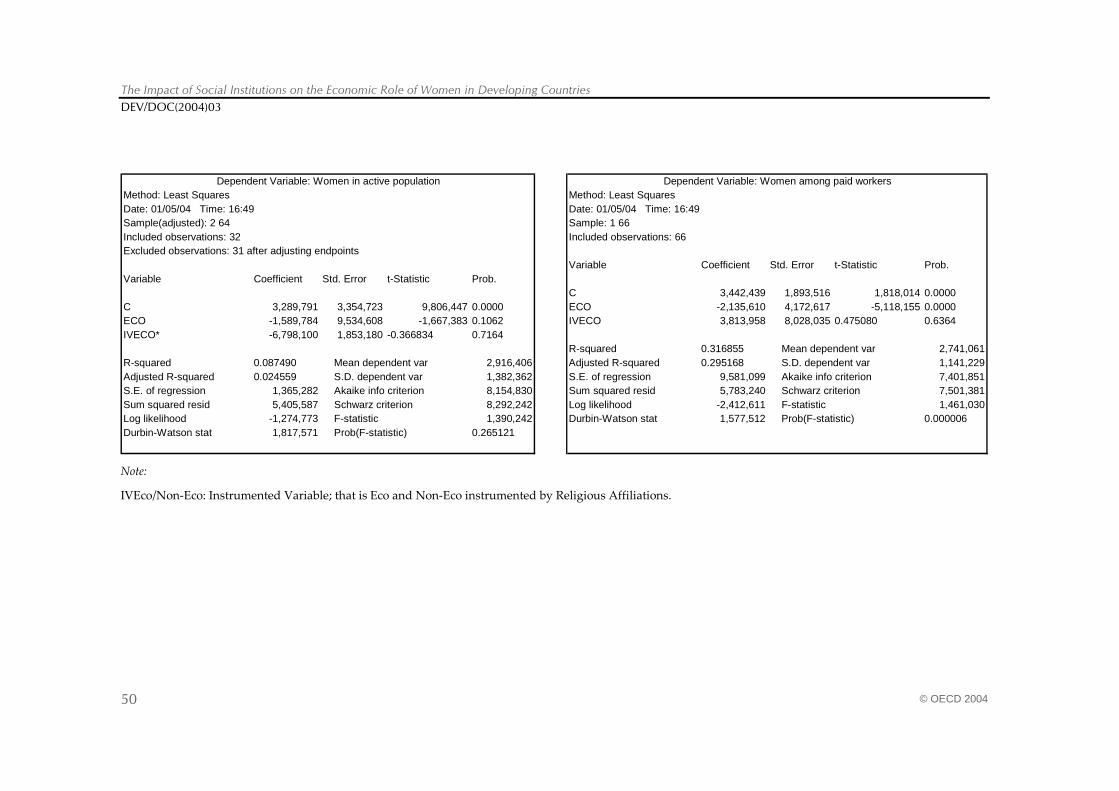
The Impact of Social Institutions on the Economic Role of Women in Developing Countries DEV/DOC(2004)03
© OECD 2004 50
Method: Least Squares Method: Least SquaresDate: 01/05/04 Time: 16:49 Date: 01/05/04 Time: 16:49Sample(adjusted): 2 64 Sample: 1 66Included observations: 32 Included observations: 66Excluded observations: 31 after adjusting endpoints
Variable Coefficient Std. Error t-Statistic Prob. Variable Coefficient Std. Error t-Statistic Prob.
C 3,442,439 1,893,516 1,818,014 0.0000C 3,289,791 3,354,723 9,806,447 0.0000 ECO -2,135,610 4,172,617 -5,118,155 0.0000ECO -1,589,784 9,534,608 -1,667,383 0.1062 IVECO 3,813,958 8,028,035 0.475080 0.6364IVECO* -6,798,100 1,853,180 -0.366834 0.7164
R-squared 0.316855 Mean dependent var 2,741,061R-squared 0.087490 Mean dependent var 2,916,406 Adjusted R-squared 0.295168 S.D. dependent var 1,141,229Adjusted R-squared 0.024559 S.D. dependent var 1,382,362 S.E. of regression 9,581,099 Akaike info criterion 7,401,851S.E. of regression 1,365,282 Akaike info criterion 8,154,830 Sum squared resid 5,783,240 Schwarz criterion 7,501,381Sum squared resid 5,405,587 Schwarz criterion 8,292,242 Log likelihood -2,412,611 F-statistic 1,461,030Log likelihood -1,274,773 F-statistic 1,390,242 Durbin-Watson stat 1,577,512 Prob(F-statistic) 0.000006Durbin-Watson stat 1,817,571 Prob(F-statistic) 0.265121
Dependent Variable: Women in active population Dependent Variable: Women among paid workers
Note:
IVEco/Non-Eco: Instrumented Variable; that is Eco and Non-Eco instrumented by Religious Affiliations.
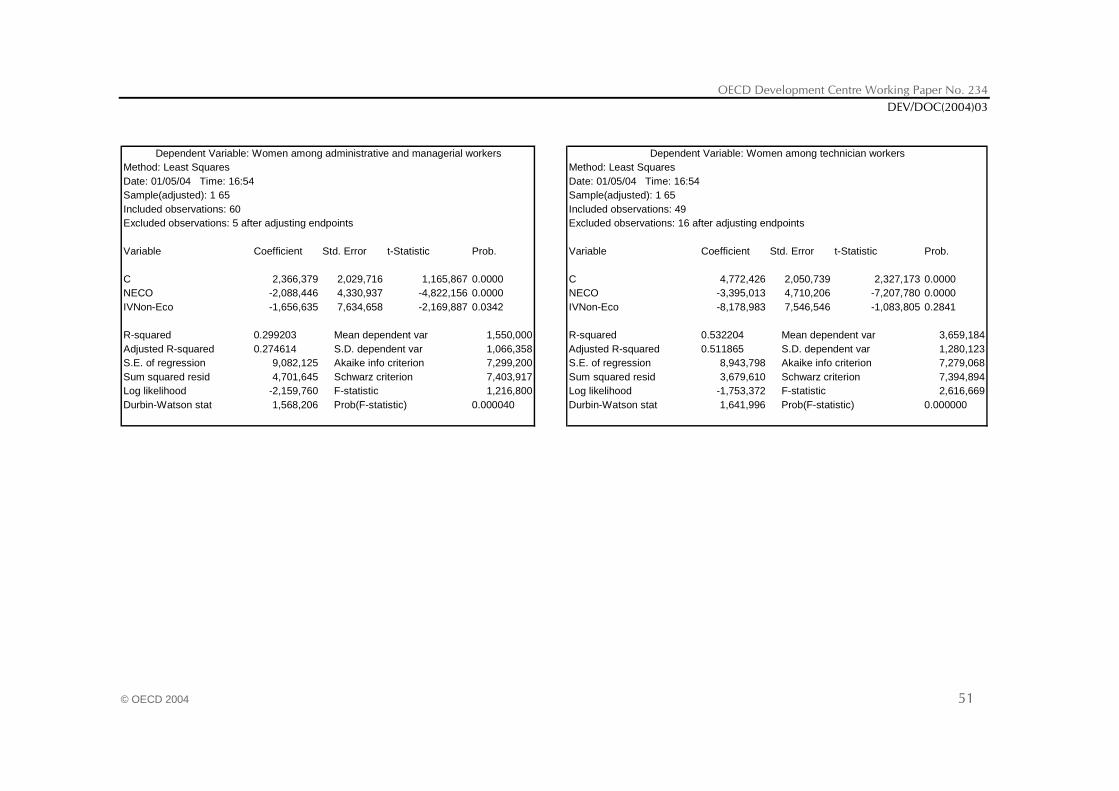
OECD Development Centre Working Paper No. 234 DEV/DOC(2004)03
© OECD 2004 51
Method: Least Squares Method: Least SquaresDate: 01/05/04 Time: 16:54 Date: 01/05/04 Time: 16:54Sample(adjusted): 1 65 Sample(adjusted): 1 65Included observations: 60 Included observations: 49Excluded observations: 5 after adjusting endpoints Excluded observations: 16 after adjusting endpoints
Variable Coefficient Std. Error t-Statistic Prob. Variable Coefficient Std. Error t-Statistic Prob.
C 2,366,379 2,029,716 1,165,867 0.0000 C 4,772,426 2,050,739 2,327,173 0.0000NECO -2,088,446 4,330,937 -4,822,156 0.0000 NECO -3,395,013 4,710,206 -7,207,780 0.0000IVNon-Eco -1,656,635 7,634,658 -2,169,887 0.0342 IVNon-Eco -8,178,983 7,546,546 -1,083,805 0.2841
R-squared 0.299203 Mean dependent var 1,550,000 R-squared 0.532204 Mean dependent var 3,659,184Adjusted R-squared 0.274614 S.D. dependent var 1,066,358 Adjusted R-squared 0.511865 S.D. dependent var 1,280,123S.E. of regression 9,082,125 Akaike info criterion 7,299,200 S.E. of regression 8,943,798 Akaike info criterion 7,279,068Sum squared resid 4,701,645 Schwarz criterion 7,403,917 Sum squared resid 3,679,610 Schwarz criterion 7,394,894Log likelihood -2,159,760 F-statistic 1,216,800 Log likelihood -1,753,372 F-statistic 2,616,669Durbin-Watson stat 1,568,206 Prob(F-statistic) 0.000040 Durbin-Watson stat 1,641,996 Prob(F-statistic) 0.000000
Dependent Variable: Women among administrative and managerial workers Dependent Variable: Women among technician workers
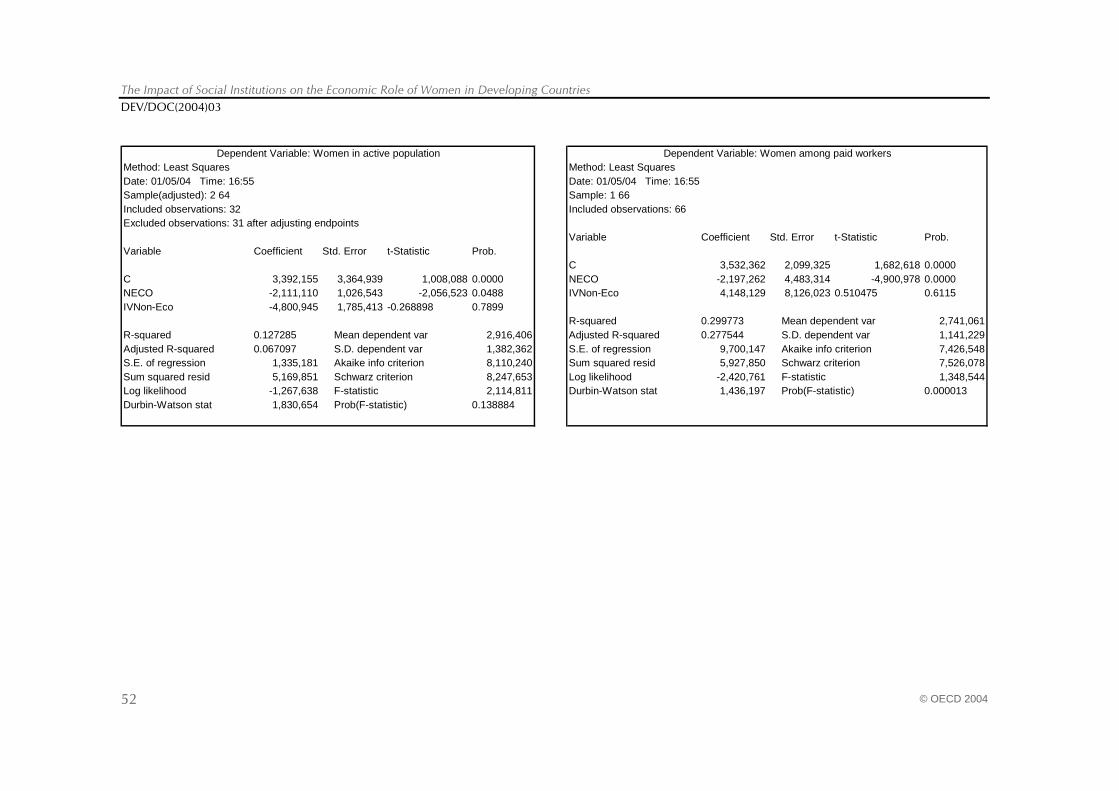
The Impact of Social Institutions on the Economic Role of Women in Developing Countries DEV/DOC(2004)03
© OECD 2004 52
Method: Least Squares Method: Least SquaresDate: 01/05/04 Time: 16:55 Date: 01/05/04 Time: 16:55Sample(adjusted): 2 64 Sample: 1 66Included observations: 32 Included observations: 66Excluded observations: 31 after adjusting endpoints
Variable Coefficient Std. Error t-Statistic Prob. Variable Coefficient Std. Error t-Statistic Prob.
C 3,532,362 2,099,325 1,682,618 0.0000C 3,392,155 3,364,939 1,008,088 0.0000 NECO -2,197,262 4,483,314 -4,900,978 0.0000NECO -2,111,110 1,026,543 -2,056,523 0.0488 IVNon-Eco 4,148,129 8,126,023 0.510475 0.6115IVNon-Eco -4,800,945 1,785,413 -0.268898 0.7899
R-squared 0.299773 Mean dependent var 2,741,061R-squared 0.127285 Mean dependent var 2,916,406 Adjusted R-squared 0.277544 S.D. dependent var 1,141,229Adjusted R-squared 0.067097 S.D. dependent var 1,382,362 S.E. of regression 9,700,147 Akaike info criterion 7,426,548S.E. of regression 1,335,181 Akaike info criterion 8,110,240 Sum squared resid 5,927,850 Schwarz criterion 7,526,078Sum squared resid 5,169,851 Schwarz criterion 8,247,653 Log likelihood -2,420,761 F-statistic 1,348,544Log likelihood -1,267,638 F-statistic 2,114,811 Durbin-Watson stat 1,436,197 Prob(F-statistic) 0.000013Durbin-Watson stat 1,830,654 Prob(F-statistic) 0.138884
Dependent Variable: Women in active population Dependent Variable: Women among paid workers
OECD Development Centre Working Paper No. 234 DEV/DOC(2004)03
© OECD 2004 53
OTHER TITLES IN THE SERIES/ AUTRES TITRES DANS LA SÉRIE
The former series known as “Technical Papers” and “Webdocs” merged in November 2003 into “Development Centre Working Papers”. In the new series, former Webdocs 1-17 follow
former Technical Papers 1-212 as Working Papers 213-229.
All these documents may be downloaded from: http://www.oecd.org/dev/wp or obtained via e-mail ([email protected])
Working Paper No.1, Macroeconomic Adjustment and Income Distribution: A Macro-Micro Simulation Model, by François Bourguignon, William H. Branson and Jaime de Melo, March 1989. Working Paper No. 2, International Interactions in Food and Agricultural Policies: The Effect of Alternative Policies, by Joachim Zietz and Alberto Valdés, April, 1989. Working Paper No. 3, The Impact of Budget Retrenchment on Income Distribution in Indonesia: A Social Accounting Matrix Application, by Steven Keuning and Erik Thorbecke, June 1989. Working Paper No. 3a, Statistical Annex: The Impact of Budget Retrenchment, June 1989. Document de travail No. 4, Le Rééquilibrage entre le secteur public et le secteur privé : le cas du Mexique, par C.-A. Michalet, juin 1989. Working Paper No. 5, Rebalancing the Public and Private Sectors: The Case of Malaysia, by R. Leeds, July 1989. Working Paper No. 6, Efficiency, Welfare Effects, and Political Feasibility of Alternative Antipoverty and Adjustment Programs, by Alain de Janvry and Elisabeth Sadoulet, January 1990. Document de travail No. 7, Ajustement et distribution des revenus : application d’un modèle macro-micro au Maroc, par Christian Morrisson, avec la collaboration de Sylvie Lambert et Akiko Suwa, décembre 1989. Working Paper No. 8, Emerging Maize Biotechnologies and their Potential Impact, by W. Burt Sundquist, October 1989. Document de travail No. 9, Analyse des variables socio-culturelles et de l’ajustement en Côte d’Ivoire, par W. Weekes-Vagliani, janvier 1990. Working Paper No. 10, A Financial Computable General Equilibrium Model for the Analysis of Ecuador’s Stabilization Programs, by André Fargeix and Elisabeth Sadoulet, February 1990. Working Paper No. 11, Macroeconomic Aspects, Foreign Flows and Domestic Savings Performance in Developing Countries: A ”State of The Art” Report, by Anand Chandavarkar, February 1990. Working Paper No. 12, Tax Revenue Implications of the Real Exchange Rate: Econometric Evidence from Korea and Mexico, by Viriginia Fierro and Helmut Reisen, February 1990. Working Paper No. 13, Agricultural Growth and Economic Development: The Case of Pakistan, by Naved Hamid and Wouter Tims, April 1990. Working Paper No. 14, Rebalancing the Public and Private Sectors in Developing Countries: The Case of Ghana, by H. Akuoko-Frimpong, June 1990. Working Paper No. 15, Agriculture and the Economic Cycle: An Economic and Econometric Analysis with Special Reference to Brazil, by Florence Contré and Ian Goldin, June 1990. Working Paper No. 16, Comparative Advantage: Theory and Application to Developing Country Agriculture, by Ian Goldin, June 1990. Working Paper No. 17, Biotechnology and Developing Country Agriculture: Maize in Brazil, by Bernardo Sorj and John Wilkinson, June 1990. Working Paper No. 18, Economic Policies and Sectoral Growth: Argentina 1913-1984, by Yair Mundlak, Domingo Cavallo, Roberto Domenech, June 1990. Working Paper No. 19, Biotechnology and Developing Country Agriculture: Maize In Mexico, by Jaime A. Matus Gardea, Arturo Puente Gonzalez and Cristina Lopez Peralta, June 1990. Working Paper No. 20, Biotechnology and Developing Country Agriculture: Maize in Thailand, by Suthad Setboonsarng, July 1990.
The Impact of Social Institutions on the Economic Role of Women in Developing Countries DEV/DOC(2004)03
© OECD 2004 54
Working Paper No. 21, International Comparisons of Efficiency in Agricultural Production, by Guillermo Flichmann, July 1990. Working Paper No. 22, Unemployment in Developing Countries: New Light on an Old Problem, by David Turnham and Denizhan Eröcal, July 1990. Working Paper No. 23, Optimal Currency Composition of Foreign Debt: the Case of Five Developing Countries, by Pier Giorgio Gawronski, August 1990. Working Paper No. 24, From Globalization to Regionalization: the Mexican Case, by Wilson Peres Núñez, August 1990. Working Paper No. 25, Electronics and Development in Venezuela: A User-Oriented Strategy and its Policy Implications, by Carlota Perez, October 1990. Working Paper No. 26, The Legal Protection of Software: Implications for Latecomer Strategies in Newly Industrialising Economies (NIEs) and Middle-Income Economies (MIEs), by Carlos Maria Correa, October 1990. Working Paper No. 27, Specialization, Technical Change and Competitiveness in the Brazilian Electronics Industry, by Claudio R. Frischtak, October 1990. Working Paper No. 28, Internationalization Strategies of Japanese Electronics Companies: Implications for Asian Newly Industrializing Economies (NIEs), by Bundo Yamada, October 1990. Working Paper No. 29, The Status and an Evaluation of the Electronics Industry in Taiwan, by Gee San, October 1990. Working Paper No. 30, The Indian Electronics Industry: Current Status, Perspectives and Policy Options, by Ghayur Alam, October 1990. Working Paper No. 31, Comparative Advantage in Agriculture in Ghana, by James Pickett and E. Shaeeldin, October 1990. Working Paper No. 32, Debt Overhang, Liquidity Constraints and Adjustment Incentives, by Bert Hofman and Helmut Reisen, October 1990. Working Paper No. 34, Biotechnology and Developing Country Agriculture: Maize in Indonesia, by Hidjat Nataatmadja et al., January 1991. Working Paper No. 35, Changing Comparative Advantage in Thai Agriculture, by Ammar Siamwalla, Suthad Setboonsarng and Prasong Werakarnjanapongs, March 1991. Working Paper No. 36, Capital Flows and the External Financing of Turkey’s Imports, by Ziya Önis and Süleyman Özmucur, July 1991. Working Paper No. 37, The External Financing of Indonesia’s Imports, by Glenn P. Jenkins and Henry B.F. Lim, July 1991. Working Paper No. 38, Long-term Capital Reflow under Macroeconomic Stabilization in Latin America, by Beatriz Armendariz de Aghion, April 1991. Working Paper No. 39, Buybacks of LDC Debt and the Scope for Forgiveness, by Beatriz Armendariz de Aghion, April 1991. Working Paper No. 40, Measuring and Modelling Non-Tariff Distortions with Special Reference to Trade in Agricultural Commodities, by Peter J. Lloyd, July 1991. Working Paper No. 41, The Changing Nature of IMF Conditionality, by Jacques J. Polak, August 1991. Working Paper No. 42, Time-Varying Estimates on the Openness of the Capital Account in Korea and Taiwan, by Helmut Reisen and Hélène Yèches, August 1991. Working Paper No. 43, Toward a Concept of Development Agreements, by F. Gerard Adams, August 1991. Document de travail No. 44, Le Partage du fardeau entre les créanciers de pays débiteurs défaillants, par Jean-Claude Berthélemy et Ann Vourc’h, septembre 1991. Working Paper No. 45, The External Financing of Thailand’s Imports, by Supote Chunanunthathum, October 1991. Working Paper No. 46, The External Financing of Brazilian Imports, by Enrico Colombatto, with Elisa Luciano, Luca Gargiulo, Pietro Garibaldi and Giuseppe Russo, October 1991. Working Paper No. 47, Scenarios for the World Trading System and their Implications for Developing Countries, by Robert Z. Lawrence, November 1991. Working Paper No. 48, Trade Policies in a Global Context: Technical Specifications of the Rural/Urban-North/South (RUNS) Applied General Equilibrium Model, by Jean-Marc Burniaux and Dominique van der Mensbrugghe, November 1991. Working Paper No. 49, Macro-Micro Linkages: Structural Adjustment and Fertilizer Policy in Sub-Saharan Africa, by Jean-Marc Fontaine with the collaboration of Alice Sindzingre, December 1991. Working Paper No. 50, Aggregation by Industry in General Equilibrium Models with International Trade, by Peter J. Lloyd, December 1991. Working Paper No. 51, Policy and Entrepreneurial Responses to the Montreal Protocol: Some Evidence from the Dynamic Asian Economies, by David C. O’Connor, December 1991. Working Paper No. 52, On the Pricing of LDC Debt: an Analysis Based on Historical Evidence from Latin America, by Beatriz Armendariz de Aghion, February 1992. Working Paper No. 53, Economic Regionalisation and Intra-Industry Trade: Pacific-Asian Perspectives, by Kiichiro Fukasaku, February 1992. Working Paper No. 54, Debt Conversions in Yugoslavia, by Mojmir Mrak, February 1992. Working Paper No. 55, Evaluation of Nigeria’s Debt-Relief Experience (1985-1990), by N.E. Ogbe, March 1992. Document de travail No. 56, L’Expérience de l’allégement de la dette du Mali, par Jean-Claude Berthélemy, février 1992. Working Paper No. 57, Conflict or Indifference: US Multinationals in a World of Regional Trading Blocs, by Louis T. Wells, Jr., March 1992. Working Paper No. 58, Japan’s Rapidly Emerging Strategy Toward Asia, by Edward J. Lincoln, April 1992. Working Paper No. 59, The Political Economy of Stabilization Programmes in Developing Countries, by Bruno S. Frey and Reiner Eichenberger, April 1992.
OECD Development Centre Working Paper No. 234 DEV/DOC(2004)03
© OECD 2004 55
Working Paper No. 60, Some Implications of Europe 1992 for Developing Countries, by Sheila Page, April 1992. Working Paper No. 61, Taiwanese Corporations in Globalisation and Regionalisation, by Gee San, April 1992. Working Paper No. 62, Lessons from the Family Planning Experience for Community-Based Environmental Education, by Winifred Weekes-Vagliani, April 1992. Working Paper No. 63, Mexican Agriculture in the Free Trade Agreement: Transition Problems in Economic Reform, by Santiago Levy and Sweder van Wijnbergen, May 1992. Working Paper No. 64, Offensive and Defensive Responses by European Multinationals to a World of Trade Blocs, by John M. Stopford, May 1992. Working Paper No. 65, Economic Integration in the Pacific Region, by Richard Drobnick, May 1992. Working Paper No. 66, Latin America in a Changing Global Environment, by Winston Fritsch, May 1992. Working Paper No. 67, An Assessment of the Brady Plan Agreements, by Jean-Claude Berthélemy and Robert Lensink, May 1992. Working Paper No. 68, The Impact of Economic Reform on the Performance of the Seed Sector in Eastern and Southern Africa, by Elizabeth Cromwell, June 1992. Working Paper No. 69, Impact of Structural Adjustment and Adoption of Technology on Competitiveness of Major Cocoa Producing Countries, by Emily M. Bloomfield and R. Antony Lass, June 1992. Working Paper No. 70, Structural Adjustment and Moroccan Agriculture: an Assessment of the Reforms in the Sugar and Cereal Sectors, by Jonathan Kydd and Sophie Thoyer, June 1992. Document de travail No. 71, L’Allégement de la dette au Club de Paris : les évolutions récentes en perspective, par Ann Vourc’h, juin 1992. Working Paper No. 72, Biotechnology and the Changing Public/Private Sector Balance: Developments in Rice and Cocoa, by Carliene Brenner, July 1992. Working Paper No. 73, Namibian Agriculture: Policies and Prospects, by Walter Elkan, Peter Amutenya, Jochbeth Andima, Robin Sherbourne and Eline van der Linden, July 1992. Working Paper No. 74, Agriculture and the Policy Environment: Zambia and Zimbabwe, by Doris J. Jansen and Andrew Rukovo, July 1992. Working Paper No. 75, Agricultural Productivity and Economic Policies: Concepts and Measurements, by Yair Mundlak, August 1992. Working Paper No. 76, Structural Adjustment and the Institutional Dimensions of Agricultural Research and Development in Brazil: Soybeans, Wheat and Sugar Cane, by John Wilkinson and Bernardo Sorj, August 1992. Working Paper No. 77, The Impact of Laws and Regulations on Micro and Small Enterprises in Niger and Swaziland, by Isabelle Joumard, Carl Liedholm and Donald Mead, September 1992. Working Paper No. 78, Co-Financing Transactions between Multilateral Institutions and International Banks, by Michel Bouchet and Amit Ghose, October 1992. Document de travail No. 79, Allégement de la dette et croissance : le cas mexicain, par Jean-Claude Berthélemy et Ann Vourc’h, octobre 1992. Document de travail No. 80, Le Secteur informel en Tunisie : cadre réglementaire et pratique courante, par Abderrahman Ben Zakour et Farouk Kria, novembre 1992. Working Paper No. 81, Small-Scale Industries and Institutional Framework in Thailand, by Naruemol Bunjongjit and Xavier Oudin, November 1992. Working Paper No. 81a, Statistical Annex: Small-Scale Industries and Institutional Framework in Thailand, by Naruemol Bunjongjit and Xavier Oudin, November 1992. Document de travail No. 82, L’Expérience de l’allégement de la dette du Niger, par Ann Vourc’h et Maina Boukar Moussa, novembre 1992. Working Paper No. 83, Stabilization and Structural Adjustment in Indonesia: an Intertemporal General Equilibrium Analysis, by David Roland-Holst, November 1992. Working Paper No. 84, Striving for International Competitiveness: Lessons from Electronics for Developing Countries, by Jan Maarten de Vet, March 1993. Document de travail No. 85, Micro-entreprises et cadre institutionnel en Algérie, par Hocine Benissad, mars 1993. Working Paper No. 86, Informal Sector and Regulations in Ecuador and Jamaica, by Emilio Klein and Victor E. Tokman, August 1993. Working Paper No. 87, Alternative Explanations of the Trade-Output Correlation in the East Asian Economies, by Colin I. Bradford Jr. and Naomi Chakwin, August 1993. Document de travail No. 88, La Faisabilité politique de l’ajustement dans les pays africains, par Christian Morrisson, Jean-Dominique Lafay et Sébastien Dessus, novembre 1993. Working Paper No. 89, China as a Leading Pacific Economy, by Kiichiro Fukasaku and Mingyuan Wu, November 1993. Working Paper No. 90, A Detailed Input-Output Table for Morocco, 1990, by Maurizio Bussolo and David Roland-Holst November 1993. Working Paper No. 91, International Trade and the Transfer of Environmental Costs and Benefits, by Hiro Lee and David Roland-Holst, December 1993. Working Paper No. 92, Economic Instruments in Environmental Policy: Lessons from the OECD Experience and their Relevance to Developing Economies, by Jean-Philippe Barde, January 1994. Working Paper No. 93, What Can Developing Countries Learn from OECD Labour Market Programmes and Policies?, by Åsa Sohlman with David Turnham, January 1994.
The Impact of Social Institutions on the Economic Role of Women in Developing Countries DEV/DOC(2004)03
© OECD 2004 56
Working Paper No. 94, Trade Liberalization and Employment Linkages in the Pacific Basin, by Hiro Lee and David Roland-Holst, February 1994. Working Paper No. 95, Participatory Development and Gender: Articulating Concepts and Cases, by Winifred Weekes-Vagliani, February 1994. Document de travail No. 96, Promouvoir la maîtrise locale et régionale du développement : une démarche participative à Madagascar, par Philippe de Rham et Bernard Lecomte, juin 1994. Working Paper No. 97, The OECD Green Model: an Updated Overview, by Hiro Lee, Joaquim Oliveira-Martins and Dominique van der Mensbrugghe, August 1994. Working Paper No. 98, Pension Funds, Capital Controls and Macroeconomic Stability, by Helmut Reisen and John Williamson, August 1994. Working Paper No. 99, Trade and Pollution Linkages: Piecemeal Reform and Optimal Intervention, by John Beghin, David Roland-Holst and Dominique van der Mensbrugghe, October 1994. Working Paper No. 100, International Initiatives in Biotechnology for Developing Country Agriculture: Promises and Problems, by Carliene Brenner and John Komen, October 1994. Working Paper No. 101, Input-based Pollution Estimates for Environmental Assessment in Developing Countries, by Sébastien Dessus, David Roland-Holst and Dominique van der Mensbrugghe, October 1994. Working Paper No. 102, Transitional Problems from Reform to Growth: Safety Nets and Financial Efficiency in the Adjusting Egyptian Economy, by Mahmoud Abdel-Fadil, December 1994. Working Paper No. 103, Biotechnology and Sustainable Agriculture: Lessons from India, by Ghayur Alam, December 1994. Working Paper No. 104, Crop Biotechnology and Sustainability: a Case Study of Colombia, by Luis R. Sanint, January 1995. Working Paper No. 105, Biotechnology and Sustainable Agriculture: the Case of Mexico, by José Luis Solleiro Rebolledo, January 1995. Working Paper No. 106, Empirical Specifications for a General Equilibrium Analysis of Labor Market Policies and Adjustments, by Andréa Maechler and David Roland-Holst, May 1995. Document de travail No. 107, Les Migrants, partenaires de la coopération internationale : le cas des Maliens de France, par Christophe Daum, juillet 1995. Document de travail No. 108, Ouverture et croissance industrielle en Chine : étude empirique sur un échantillon de villes, par Sylvie Démurger, septembre 1995. Working Paper No. 109, Biotechnology and Sustainable Crop Production in Zimbabwe, by John J. Woodend, December 1995. Document de travail No. 110, Politiques de l’environnement et libéralisation des échanges au Costa Rica : une vue d’ensemble, par Sébastien Dessus et Maurizio Bussolo, février 1996. Working Paper No. 111, Grow Now/Clean Later, or the Pursuit of Sustainable Development?, by David O’Connor, March 1996. Working Paper No. 112, Economic Transition and Trade-Policy Reform: Lessons from China, by Kiichiro Fukasaku and Henri-Bernard Solignac Lecomte, July 1996. Working Paper No. 113, Chinese Outward Investment in Hong Kong: Trends, Prospects and Policy Implications, by Yun-Wing Sung, July 1996. Working Paper No. 114, Vertical Intra-industry Trade between China and OECD Countries, by Lisbeth Hellvin, July 1996. Document de travail No. 115, Le Rôle du capital public dans la croissance des pays en développement au cours des années 80, par Sébastien Dessus et Rémy Herrera, juillet 1996. Working Paper No. 116, General Equilibrium Modelling of Trade and the Environment, by John Beghin, Sébastien Dessus, David Roland-Holst and Dominique van der Mensbrugghe, September 1996. Working Paper No. 117, Labour Market Aspects of State Enterprise Reform in Viet Nam, by David O’Connor, September 1996. Document de travail No. 118, Croissance et compétitivité de l’industrie manufacturière au Sénégal, par Thierry Latreille et Aristomène Varoudakis, octobre 1996. Working Paper No. 119, Evidence on Trade and Wages in the Developing World, by Donald J. Robbins, December 1996. Working Paper No. 120, Liberalising Foreign Investments by Pension Funds: Positive and Normative Aspects, by Helmut Reisen, January 1997. Document de travail No. 121, Capital Humain, ouverture extérieure et croissance : estimation sur données de panel d’un modèle à coefficients variables, par Jean-Claude Berthélemy, Sébastien Dessus et Aristomène Varoudakis, janvier 1997. Working Paper No. 122, Corruption: The Issues, by Andrew W. Goudie and David Stasavage, January 1997. Working Paper No. 123, Outflows of Capital from China, by David Wall, March 1997. Working Paper No. 124, Emerging Market Risk and Sovereign Credit Ratings, by Guillermo Larraín, Helmut Reisen and Julia von Maltzan, April 1997. Working Paper No. 125, Urban Credit Co-operatives in China, by Eric Girardin and Xie Ping, August 1997. Working Paper No. 126, Fiscal Alternatives of Moving from Unfunded to Funded Pensions, by Robert Holzmann, August 1997. Working Paper No. 127, Trade Strategies for the Southern Mediterranean, by Peter A. Petri, December 1997. Working Paper No. 128, The Case of Missing Foreign Investment in the Southern Mediterranean, by Peter A. Petri, December 1997. Working Paper No. 129, Economic Reform in Egypt in a Changing Global Economy, by Joseph Licari, December 1997.
OECD Development Centre Working Paper No. 234 DEV/DOC(2004)03
© OECD 2004 57
Working Paper No. 130, Do Funded Pensions Contribute to Higher Aggregate Savings? A Cross-Country Analysis, by Jeanine Bailliu and Helmut Reisen, December 1997. Working Paper No. 131, Long-run Growth Trends and Convergence Across Indian States, by Rayaprolu Nagaraj, Aristomène Varoudakis and Marie-Ange Véganzonès, January 1998. Working Paper No. 132, Sustainable and Excessive Current Account Deficits, by Helmut Reisen, February 1998. Working Paper No. 133, Intellectual Property Rights and Technology Transfer in Developing Country Agriculture: Rhetoric and Reality, by Carliene Brenner, March 1998. Working Paper No. 134, Exchange-rate Management and Manufactured Exports in Sub-Saharan Africa, by Khalid Sekkat and Aristomène Varoudakis, March 1998. Working Paper No. 135, Trade Integration with Europe, Export Diversification and Economic Growth in Egypt, by Sébastien Dessus and Akiko Suwa-Eisenmann, June 1998. Working Paper No. 136, Domestic Causes of Currency Crises: Policy Lessons for Crisis Avoidance, by Helmut Reisen, June 1998. Working Paper No. 137, A Simulation Model of Global Pension Investment, by Landis MacKellar and Helmut Reisen, August 1998. Working Paper No. 138, Determinants of Customs Fraud and Corruption: Evidence from Two African Countries, by David Stasavage and Cécile Daubrée, August 1998. Working Paper No. 139, State Infrastructure and Productive Performance in Indian Manufacturing, by Arup Mitra, Aristomène Varoudakis and Marie-Ange Véganzonès, August 1998. Working Paper No. 140, Rural Industrial Development in Viet Nam and China: A Study in Contrasts, by David O’Connor, September 1998. Working Paper No. 141,Labour Market Aspects of State Enterprise Reform in China, by Fan Gang,Maria Rosa Lunati and David O’Connor, October 1998. Working Paper No. 142, Fighting Extreme Poverty in Brazil: The Influence of Citizens’ Action on Government Policies, by Fernanda Lopes de Carvalho, November 1998. Working Paper No. 143, How Bad Governance Impedes Poverty Alleviation in Bangladesh, by Rehman Sobhan, November 1998. Document de travail No. 144, La libéralisation de l’agriculture tunisienne et l’Union européenne: une vue prospective, par Mohamed Abdelbasset Chemingui et Sébastien Dessus, février 1999. Working Paper No. 145, Economic Policy Reform and Growth Prospects in Emerging African Economies, by Patrick Guillaumont, Sylviane Guillaumont Jeanneney and Aristomène Varoudakis, March 1999. Working Paper No. 146, Structural Policies for International Competitiveness in Manufacturing: The Case of Cameroon, by Ludvig Söderling, March 1999. Working Paper No. 147, China’s Unfinished Open-Economy Reforms: Liberalisation of Services, by Kiichiro Fukasaku, Yu Ma and Qiumei Yang, April 1999. Working Paper No. 148, Boom and Bust and Sovereign Ratings, by Helmut Reisen and Julia von Maltzan, June 1999. Working Paper No. 149, Economic Opening and the Demand for Skills in Developing Countries: A Review of Theory and Evidence, by David O’Connor and Maria Rosa Lunati, June 1999. Working Paper No. 150, The Role of Capital Accumulation, Adjustment and Structural Change for Economic Take-off: Empirical Evidence from African Growth Episodes, by Jean-Claude Berthélemy and Ludvig Söderling, July 1999. Working Paper No. 151, Gender, Human Capital and Growth: Evidence from Six Latin American Countries, by Donald J. Robbins, September 1999. Working Paper No. 152, The Politics and Economics of Transition to an Open Market Economy in Viet Nam, by James Riedel and William S. Turley, September 1999. Working Paper No. 153, The Economics and Politics of Transition to an Open Market Economy: China, by Wing Thye Woo, October 1999. Working Paper No. 154, Infrastructure Development and Regulatory Reform in Sub-Saharan Africa: The Case of Air Transport, by Andrea E. Goldstein, October 1999. Working Paper No. 155, The Economics and Politics of Transition to an Open Market Economy: India, by Ashok V. Desai, October 1999. Working Paper No. 156, Climate Policy Without Tears: CGE-Based Ancillary Benefits Estimates for Chile, by Sébastien Dessus and David O’Connor, November 1999. Document de travail No. 157, Dépenses d’éducation, qualité de l’éducation et pauvreté : l’exemple de cinq pays d’Afrique francophone, par Katharina Michaelowa, avril 2000. Document de travail No. 158, Une estimation de la pauvreté en Afrique subsaharienne d’après les données anthropométriques, par Christian Morrisson, Hélène Guilmeau et Charles Linskens, mai 2000. Working Paper No. 159, Converging European Transitions, by Jorge Braga de Macedo, July 2000. Working Paper No. 160, Capital Flows and Growth in Developing Countries: Recent Empirical Evidence, by Marcelo Soto, July 2000. Working Paper No. 161, Global Capital Flows and the Environment in the 21st Century, by David O’Connor, July 2000. Working Paper No. 162, Financial Crises and International Architecture: A “Eurocentric” Perspective, by Jorge Braga de Macedo, August 2000. Document de travail No. 163, Résoudre le problème de la dette : de l’initiative PPTE à Cologne, par Anne Joseph, août 2000. Working Paper No. 164, E-Commerce for Development: Prospects and Policy Issues, by Andrea Goldstein and David O’Connor, September 2000.
The Impact of Social Institutions on the Economic Role of Women in Developing Countries DEV/DOC(2004)03
© OECD 2004 58
Working Paper No. 165, Negative Alchemy? Corruption and Composition of Capital Flows, by Shang-Jin Wei, October 2000. Working Paper No. 166, The HIPC Initiative: True and False Promises, by Daniel Cohen, October 2000. Document de travail No. 167, Les facteurs explicatifs de la malnutrition en Afrique subsaharienne, par Christian Morrisson et Charles Linskens, octobre 2000. Working Paper No. 168, Human Capital and Growth: A Synthesis Report, by Christopher A. Pissarides, November 2000. Working Paper No. 169, Obstacles to Expanding Intra-African Trade, by Roberto Longo and Khalid Sekkat, March 2001. Working Paper No. 170, Regional Integration In West Africa, by Ernest Aryeetey, March 2001. Working Paper No. 171, Regional Integration Experience in the Eastern African Region, by Andrea Goldstein and Njuguna S. Ndung’u, March 2001. Working Paper No. 172, Integration and Co-operation in Southern Africa, by Carolyn Jenkins, March 2001. Working Paper No. 173, FDI in Sub-Saharan Africa, by Ludger Odenthal, March 2001 Document de travail No. 174, La réforme des télécommunications en Afrique subsaharienne, par Patrick Plane, mars 2001. Working Paper No. 175, Fighting Corruption in Customs Administration: What Can We Learn from Recent Experiences?, by Irène Hors; April 2001. Working Paper No. 176, Globalisation and Transformation: Illusions and Reality, by Grzegorz W. Kolodko, May 2001. Working Paper No. 177, External Solvency, Dollarisation and Investment Grade: Towards a Virtuous Circle?, by Martin Grandes, June 2001. Document de travail No. 178, Congo 1965-1999: Les espoirs déçus du « Brésil africain », par Joseph Maton avec Henri-Bernard Solignac Lecomte, septembre 2001. Working Paper No. 179, Growth and Human Capital: Good Data, Good Results, by Daniel Cohen and Marcelo Soto, September 2001. Working Paper No. 180, Corporate Governance and National Development, by Charles P. Oman, October 2001. Working Paper No. 181, How Globalisation Improves Governance, by Federico Bonaglia, Jorge Braga de Macedo and Maurizio Bussolo, November 2001. Working Paper No. 182, Clearing the Air in India: The Economics of Climate Policy with Ancillary Benefits, by Maurizio Bussolo and David O’Connor, November 2001. Working Paper No. 183, Globalisation, Poverty and Inequality in sub-Saharan Africa: A Political Economy Appraisal, by Yvonne M. Tsikata, December 2001. Working Paper No. 184, Distribution and Growth in Latin America in an Era of Structural Reform: The Impact of Globalisation, by Samuel A. Morley, December 2001. Working Paper No. 185, Globalisation, Liberalisation, Poverty and Income Inequality in Southeast Asia, by K.S. Jomo, December 2001. Working Paper No. 186, Globalisation, Growth and Income Inequality: The African Experience, by Steve Kayizzi-Mugerwa, December 2001. Working Paper No. 187, The Social Impact of Globalisation in Southeast Asia, by Mari Pangestu, December 2001. Working Paper No. 188, Where Does Inequality Come From? Ideas and Implications for Latin America, by James A. Robinson, December 2001. Working Paper No. 189, Policies and Institutions for E-Commerce Readiness: What Can Developing Countries Learn from OECD Experience?, by Paulo Bastos Tigre and David O’Connor, April 2002. Document de travail No. 190, La réforme du secteur financier en Afrique, par Anne Joseph, juillet 2002. Working Paper No. 191, Virtuous Circles? Human Capital Formation, Economic Development and the Multinational Enterprise, by Ethan B. Kapstein, August 2002. Working Paper No. 192, Skill Upgrading in Developing Countries: Has Inward Foreign Direct Investment Played a Role?, by Matthew J. Slaughter, August 2002. Working Paper No. 193, Government Policies for Inward Foreign Direct Investment in Developing Countries: Implications for Human Capital Formation and Income Inequality, by Dirk Willem te Velde, August 2002. Working Paper No. 194, Foreign Direct Investment and Intellectual Capital Formation in Southeast Asia, by Bryan K. Ritchie, August 2002. Working Paper No. 195, FDI and Human Capital: A Research Agenda, by Magnus Blomström and Ari Kokko, August 2002. Working Paper No. 196, Knowledge Diffusion from Multinational Enterprises: The Role of Domestic and Foreign Knowledge-Enhancing Activities, by Yasuyuki Todo and Koji Miyamoto, August 2002. Working Paper No. 197, Why Are Some Countries So Poor? Another Look at the Evidence and a Message of Hope, by Daniel Cohen and Marcelo Soto, October 2002. Working Paper No. 198, Choice of an Exchange-Rate Arrangement, Institutional Setting and Inflation: Empirical Evidence from Latin America, by Andreas Freytag, October 2002. Working Paper No. 199, Will Basel II Affect International Capital Flows to Emerging Markets?, by Beatrice Weder and Michael Wedow, October 2002. Working Paper No. 200, Convergence and Divergence of Sovereign Bond Spreads: Lessons from Latin America, by Martin Grandes, October 2002. Working Paper No. 201, Prospects for Emerging-Market Flows amid Investor Concerns about Corporate Governance, by Helmut Reisen, November 2002. Working Paper No. 202, Rediscovering Education in Growth Regressions, by Marcelo Soto, November 2002.
OECD Development Centre Working Paper No. 234 DEV/DOC(2004)03
© OECD 2004 59
Working Paper No. 203, Incentive Bidding for Mobile Investment: Economic Consequences and Potential Responses, by Andrew Charlton, January 2003. Working Paper No. 204, Health Insurance for the Poor? Determinants of participation Community-Based Health Insurance Schemes in Rural Senegal, by Johannes Jütting, January 2003. Working Paper No. 205, China’s Software Industry and its Implications for India, by Ted Tschang, February 2003. Working Paper No. 206, Agricultural and Human Health Impacts of Climate Policy in China: A General Equilibrium Analysis with Special Reference to Guangdong, by David O’Connor, Fan Zhai, Kristin Aunan, Terje Berntsen and Haakon Vennemo, March 2003. Working Paper No. 207, India’s Information Technology Sector: What Contribution to Broader Economic Development?, by Nirvikar Singh, March 2003. Working Paper No. 208, Public Procurement: Lessons from Kenya, Tanzania and Uganda, by Walter Odhiambo and Paul Kamau, March 2003. Working Paper No. 209, Export Diversification in Low-Income Countries: An International Challenge after Doha, by Federico Bonaglia and Kiichiro Fukasaku, June 2003. Working Paper No. 210, Institutions and Development: A Critical Review, by Johannes Jütting, July 2003. Working Paper No. 211, Human Capital Formation and Foreign Direct Investment in Developing Countries, by Koji Miyamoto, July 2003. Working Paper No. 212, Central Asia since 1991: The Experience of the New Independent States, by Richard Pomfret, July 2003. Working Paper No. 213, A Multi-Region Social Accounting Matrix (1995) and Regional Environmental General Equilibrium Model for India (REGEMI), by Maurizio Bussolo, Mohamed Chemingui and David O’Connor, November 2003. Working Paper No. 214, Ratings Since the Asian Crisis, by Helmut Reisen, November 2003. Working Paper No. 215, Development Redux: Reflactions for a New Paradigm, by Jorge Braga de Macedo, November 2003. Working Paper No. 216, The Political Economy of Regulatory Reform: Telecoms in the Southern Mediterranean, by Andrea Goldstein, November 2003. Working Paper No. 217, The Impact of Education on Fertility and Child Mortality: Do Fathers Really Matter Less than Mothers?, by Lucia Breierova and Esther Duflo, November 2003. Working Paper No. 218, Float in Order to Fix? Lessons from Emerging Markets for EU Accession Countries, by Jorge Braga de Macedo and Helmut Reisen, November 2003. Working Paper No. 219, Globalisation in Developing Countries: The Role of Transaction Costs in Explaining Economic Performance in India, by Maurizio Bussolo and John Whalley, November 2003. Working Paper No. 220, Poverty Reduction Strategies in a Budget-Constrained Economy: The Case of Ghana, by Maurizio Bussolo and Jeffery I. Round, November 2003. Working Paper No. 221, Public-Private Partnerships in Development: Three Applications in Timor Leste, by José Braz, November 2003. Working Paper No. 222, Public Opinion Research, Global Education and Development Co-operation Reform: In Search of a Virtuous Circle, by Ida McDonnell, Henri-Bernard Solignac Lecomte and Liam Wegimont, November 2003. Working Paper No. 223, Building Capacity to Trade: What Are the Priorities?, by Henry-Bernard Solignac Lecomte, November 2003. Working Paper No. 224, Of Flying Geeks and O-Rings: Locating Software and IT Services in India’s Economic Development, by David O’Connor, November 2003. Document de travail No. 225, Cap Vert: Gouvernance et Développement, by Jaime Lourenço and Colm Foy, November 2003. Working Paper No. 226, Globalisation and Poverty Changes in Colombia, by Maurizio Bussolo and Jann Lay, November 2003. Working Paper No. 227, The Composite Indicator of Economic Activity in Mozambique (ICAE): Filling in the Knowledge Gaps to Enhance Public-Private Partnership (PPP), by Roberto J. Tibana, November 2003. Working Paper No. 228, Economic-Reconstruction in Post-Conflict Transitions: Lessons for the Democratic Republic of Congo (DRC), by Graciana del Castillo, November 2003. Working Paper No. 229, Providing Low-Cost Information Technology Access to Rural Communities in Developing Countries: What Works? What Pays? by Georg Caspary and David O’Connor, November 2003. Working Paper No. 230, The Currency Premium and Local-Currency Denominated Debt Costs in South Africa, by Martin Grandes, Marcel Peter and Nicolas Pinaud, December 2003. Working Paper No. 231, Macroeconomic Convergence in Southern Africa: The Rand Zone Experience, by Martin Grandes, December 2003. Working Paper No. 232, Financing Global and Regional Public Goods through ODA: Analysis and Evidence from the OECD Creditor Reporting System, by Helmut Reisen, Marcelo Soto and Thomas Weithöner, January 2004. Working Paper No. 233, Land, Violent Conflict and Development, by Nicolas Pons-Vignon and Henri-Bernard Solignac Lecomte, February 2004.