Embed Size (px)
Citation preview
HUSKY WHITE ROSE DEVELOPMENT PROJECT: NEW DRILL CENTRE CONSTRUCTION
AND OPERATIONS PROGRAM ENVIRONMENTAL ASSESSMENT ADDENDUM
Prepared by
for
LGL Report SA883a
January 2007

HUSKY WHITE ROSE DEVELOPMENT PROJECT: NEW DRILL CENTRE CONSTRUCTION
AND OPERATIONS PROGRAM ENVIRONMENTAL ASSESSMENT ADDENDUM
by
LGL Ltd. environmental research associates
388 Kenmount Rd., P.O. Box 13248, Stn. A. St. John’s, NL A1B 4A5
(709) 754-1992
for
Husky Energy Inc. 707-8th Avenue SW
Box 6525, Stn. D Calgary, AB T2P 3G7
LGL Report SA883a
January 2007

Suggested format for citation: LGL Limited. 2007. Husky White Rose Development Project: New Drill Centre Construction &
Operations Program Environmental Assessment Addendum. LGL Rep. SA883a. Rep. by LGL Limited, St. John’s, NL, for Husky Energy Inc., Calgary, AB. 126 p. + App.
Table of Contents Page Table of Contents............................................................................................................................ ii 1.0 Introduction..........................................................................................................................1 2.0 The Proponent......................................................................................................................5 3.0 Project Description...............................................................................................................6 4.0 Physical Environment ........................................................................................................29 5.0 Biological Environment .....................................................................................................46 6.0 Effects Assessment Methodology......................................................................................61 7.0 Routine Project Activities ..................................................................................................64 8.0 Accidental Events ..............................................................................................................97 9.0 Summary and Conclusions ..............................................................................................122 10.0 Literature Cited ................................................................................................................124 Appendix 1: Comments and Responses for the Husky White Rose Development Project: New Drill Centre Construction and Operations Program Environmental Assessment..................................................................................127 Appendix 2. List of People Consulted......................................................................................159 Appendix 3: Climate of the Husky New Drill Centre ..............................................................161
Husky White Rose Development Project: New Drill Centre Construction & Operations Program EA Addendum Page ii

1.0 Introduction This is a follow-up document to the Husky White Rose Development Project: New Drill Centre Construction and Operations Program Environmental Assessment. It includes a revised Project Description, other revised text relevant to changes in the Project Description and reviewer comments on the EA, and a Table of Concordance in Appendix 1 which contains reviewer comments and their respective responses. References to the reviewer comments in the Table of Concordance are inserted throughout the body of the document to provide context to the reader as to which areas of the EA the comments applied. Numbered comments are inserted after the revised text (or response). Husky Oil Operations Limited (Husky) is proposing the development of up to five new drill centres. The new drill centres would be located in three areas adjacent to the Northern, Central and Southern Drill Centres (NDC, CDC, and SDC, respectively) currently active in the White Rose Field (Figures 1.1 and 1.2) which is located on the Grand Banks offshore Newfoundland approximately 350 km east-southeast of St. John’s. The most southerly of the areas proposed for new drill centres has been designated South White Rose Extension (SWRX) and North Amethyst, each potentially requiring a new drill centre (Figures 1.1 and 1.2). The area adjacent (1.3 to 3 km northwest) to the current Central drill centre and designated as West White Rose Extension (WWRX) could potentially support up to two new drill centres. The most northerly area, located one to three km northeast of the current Northern drill centre, has been designated North White Rose Extension (NWR). NWRX would support one new drill centre. Current planning calls for the SWRX drill centre to be constructed in the summer of 2007. Pending approval, a second glory hole for North Amethyst may also be constructed in summer 2007. The viability of any or all of the other proposed new drill centres is contingent on successful delineation drilling results during the next three to seven years. The Project will require authorizations pursuant to Section 138 (1) (b) of the Canada-Newfoundland Atlantic Accord Implementation Act and Section 134 (1) (a) of the Canada-Newfoundland and Labrador Atlantic Accord Implementation Newfoundland and Labrador Act. Subject to Section 5 (1) (d) of the Canadian Environmental Assessment Act (CEA Act), the Canada-Newfoundland and Labrador Offshore Petroleum Board (C-NLOPB, also referred to as “the Board”) is a responsible authority (RA) and federal environmental assessment coordinator (FEAC) and must undertake a screening level environmental assessment (EA) of the Project. Also required are habitat alteration, disruption or destruction (HADD) authorization(s) and ocean disposal permit(s) from Fisheries and Oceans and Environment Canada, respectively.
Husky White Rose Development Project: New Drill Centre Construction & Operations Program EA Addendum Page 1
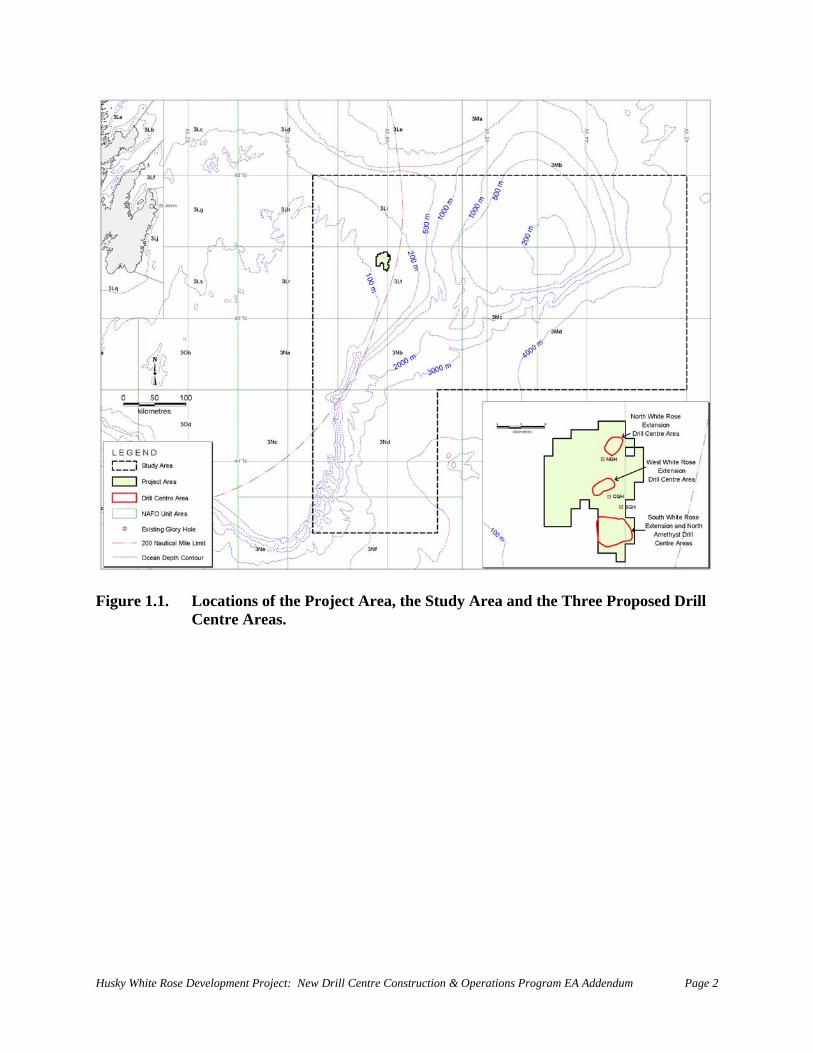
Figure 1.1. Locations of the Project Area, the Study Area and the Three Proposed Drill
Centre Areas.
Husky White Rose Development Project: New Drill Centre Construction & Operations Program EA Addendum Page 2
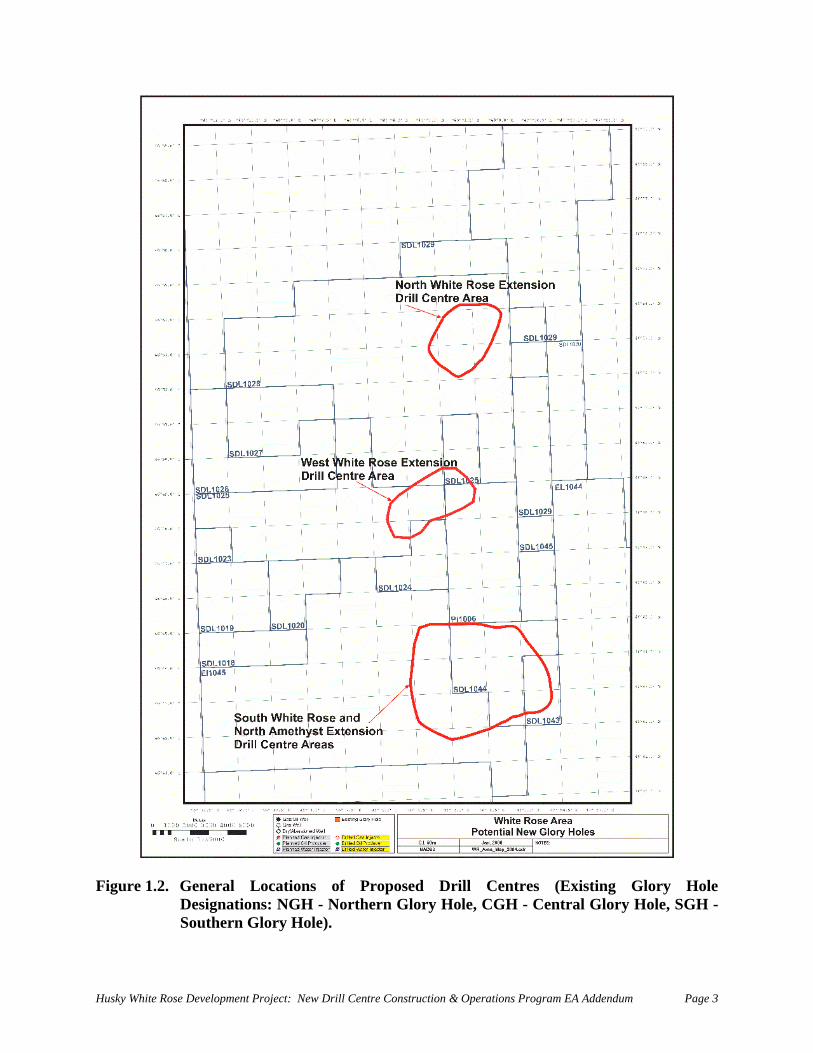
Figure 1.2. General Locations of Proposed Drill Centres (Existing Glory Hole
Designations: NGH - Northern Glory Hole, CGH - Central Glory Hole, SGH - Southern Glory Hole).
Husky White Rose Development Project: New Drill Centre Construction & Operations Program EA Addendum Page 3
Legislation that is relevant to the environmental aspects of this Project include
• Navigable Waters Protection Act
•
coping and technical advice received from the C-NLOPB, other federal agencies, and ho ky will guide the preparation of this assessment. The Project
15: Timing of commencement of glory hole construction
• Canada-Newfoundland Atlantic Accord Implementation Acts • Canadian Environmental Assessment Act • Oceans Act • Fisheries Act
• Canada Shipping Act • Species at Risk Act
Migratory Birds Convention Act • Canadian Environmental Protection Act
There is no federal funding for this Project. Federal lands are involved and they are administered by the C-NLOPB, a federal-provincial agency operating under the Canada-Newfoundland & Labrador Atlantic Accord acts. Sstake lders consulted by HusDescription is an accurate reflection of the Proponent’s current level of knowledge. Comment No.
Husky White Rose Development Project: New Drill Centre Construction & Operations Program EA Addendum Page 4
2.0 The Proponent Headquartered in Calgary, Alberta, Husky Oil Operations Limited (the Operator) is a Canadian-based integrated energy company serving global customers, committed to maximizing returns to its shareholders in an ethical and socially responsible way, through the dedicated effort of its people. It is involved in:
• Exploration and development of crude oil and natural gas, • Production, purchase, transportation, refining and marketing of crude oil, natural gas
for the Operator’s seven Significant
rovided below.
709) 724-3993 [email protected]
and natural gas liquids and sulfur, and • Transportation and marketing of refined products.
The Operator is the management and operating companyDiscovery Areas (SDA) and ten Exploration Licenses, offshore Newfoundland. The White Rose field, the largest of the Operator’s SDA’s, is estimated to contain 200-250 million barrels of recoverable reserves. 2.1 Operator Contacts
Operator contacts concerning this application are p Don Williams HSEQ Manager Husky Oil Operations Limited Suite 901, Scotia Center 235 Water Street St. John’s, NL A1C 1B6 Phone: (709) 724-3900 Fax: (D Chris Laing Development Manager, East Coast Operations Husky Oil Operations Limited Suite 901, Scotia Centre 235 Water Street
A1C 1B6 St. John’s, Newfoundland
Phone: (709) 724-4760 Fax: (709) 724-3980 [email protected]
Husky White Rose Development Project: New Drill Centre Construction & Operations Program EA Addendum Page 5
3.0 Project Description
During the period 2007 to 2015, Husky plans to develop up to five new drill centres in three areas adjacent to the three drill centres currently active in the White Rose Field; the Southern Glory Hole (SGH), the Central Glory Hole (CGH) and the Northern Glory Hole (NGH) (Figures 1.1 and 1.2). Production operations associated with these five new drill centres would occur between 2009 and 2020. Comment No. 17: Current active drill centres in Figures 1.1 and 1.2 Comment No. 21: Stated duration of period of drilling 3.1
The official name of the Project is the Husky White Rose Development Project: New Drill
Name and Location of Proposed Project
Cen tre Construction & Operations Program. It is located on the northeastern Grand Ban 1.1). All proposed activities will occur within the defined Project Area (Figure 1.2). T is defined as the North, West and South White Rose Extension Drill Centres and thmethyst Drill Centre including all related subsea structures (Figure 1.2).
Alternative Means within Project
ly all floating production systems on the Grand Banks are designed similarly to the Te
ks (Figure he Project e North A 3.2
urrent rra ov a
Wh d placem ) on the s o
e sea . There are no alternative means to glory hole construction to produce the
d and Labrador Benefits
ten anada Newfoundland Atlantic Accord
CN a nd White Rose systems (i.e., construction of glory holes and installation of drill centres).
ile individual field analysis of iceberg risk is performed, the results to date have supporteent of the trees, manifold, and subsea controls equipment in recessed areas (glory holeseabed. This approach provides protection against icebergs large enough to be a danger t
bed equipmentthoil out of the ancillary pools. Alternatives to dredge a new glory hole included the use of a suction hopper versus a clamshell dredging system. For technical reasons, the suction hopper dredge technique for excavating the new glory holes was selected. Husky has also considered long range directional drilling but this
ethod was determined to be inappropriate. m
.3 Canada-Newfoundlan3
CIm
onsis t with the legislative requirements of the Cplementation acts, Husky Oil Operations Limited is committed to enhancing the business
opportunities for Canada and Newfoundland and Labrador as outlined in the Company’s Canada-Newfoundland and Labrador Benefits G/L outlined in the Benefits Plan. Consequently, Husky will utilize the services of Newfoundland and Labrador and other Canadian companies and personnel wherever possible.
Husky White Rose Development Project: New Drill Centre Construction & Operations Program EA Addendum Page 6
3.4 Personnel
The work associated with this Project Description will be managed by Husky’s East Coast Operations Development Manager located in St. John’s. The onshore management team that supports the Development Manager includes the Drilling and Completions Manager, Sub-Surface Manager, Production Operations Manager, Logistics Manager, HSEQ Manager and the Regulatory Affairs and Administration Manager. Offshore, the Management teams will vary by project phase and requirements but will generally onsist of the following:
• Subsea Construction and Installation Team led by the Subsea Manager and the Subsea Installation Manager onshore will manage the design and construction of the glory holes and the design construction and installation of the subsea drilling
l be managed through Husky’s Logistics Team, made up of a Logistics ead and supporting Coordinators. The Logistics Coordinator manages supply vessels,
r Husky’s East Coast operations. The transport f personnel to and from St. John’s and the Operating Area will be conducted mainly by
e used.
sky 2000), is seafloor excavation work generally to lower the “profile of subsea production equipment relative to t s device for cutting, scraping and ing it to another location.
c • Drilling Operations Team led by the Drill Rig (s) Offshore Installation Manager (s)
(OIM) and Offshore Senior Drilling Supervisor reporting to Drilling Superintendent and the Drilling and Completions Manager onshore.
templates, well head appurtenances and flow lines connecting the new drill centres to the existing White Rose Development subsea and production infrastructure. The work involved in the construction of the glory holes and the installation of the incremental subsea infrastructure will be carried out by sub-contractors managed by Husky.
• Production Operations Team led by the Production Operations Manager will
manage production operations once the Project described herein is completed and the operation is fully integrated with the White Rose Production Operation’s organization.
Logistical support wilLhelicopters, and materials movement activities foohelicopter but, in isolated situations, supply vessels may b 3.5 Offshore Equipment 3.5.1 Glory Hole Construction/TGB Installation Dredging, as described in the White Rose Oilfield Comprehensive Study (Hu
he urrounding seafloor.” A dredge is a vessel equipped with a/or suctioning the seafloor material and displac
Husky White Rose Development Project: New Drill Centre Construction & Operations Program EA Addendum Page 7
Glo h e dredged using a trailing suction hopper dredging (TSHD) ves . led ship which fills its hold or hopper during dredging whi f pped with either single or twin (one on each side) trailing suction pipes. Material is lifted through the trailing pipes by one or more pum e dredge. When the hoppers are full the TSHD sails to a disposal area and either dumps the material through doors in the hull
he Temporary Guide Base (TGB) is, in principle, a standard drilling technology used for
comes the new well entry point.
eters, housing the living nd workshops. The GSF Grand Banks or a comparable
wi proposed Project. Note that no jack up drilling platforms will ot operate over glory
oles due to the nature of their anchoring process and all wells drilled for this project will be
ry oles in this Project will bsel This type of dredge is a self-propelle ollowing a pre-set track. Such dredges are equi
ps and discharged into a hopper contained within the hull of th
or pumps the material out of the hoppers. The largest hopper dredges in the world (subject to revision) are Jan De Nul’s Vasco Da Gama (33,000 m3 hopper, 37,060 kW total installed power) and Boskalis WD FAIRWAY 35,000 m3 hopper. Tindividual wells and in multi-well template configurations for the purpose of providing a precise location to begin a well and re-enter a well. TGBs are generally utilized only for the spudding and surface casing portion of the well. As the wellhead system is “built up”, a permanent guide base (PGB) is located above the TGB and be 3.5.2 Drilling Drilling will be conducted by a mobile offshore drilling unit (MODU). The GSF Grand Banks, is an example of a typical MODU that has been used on the East Coast. The GSF Grand Banks is a rectangular, twin hull, column stabilized, MODU, constructed to an Aker #3.2 design. There are two 29.5 ft. (9.0 m) diameter corner stability columns plus two 24.3 ft. (7.4 m) diameter intermediate stability columns rising from each hull to support the main deck. The deck is rranged with the drilling mast in the centre and modules on the perima
quarters, equipment, storage area aODU ll be used to execute the M
be used to execute development of the new drill centres. Jack up rigs cannhplaced in glory holes. Comment No. 18: Use of jack-up drilling rigs 3.5.3 Production Subsea Equipment Installation Subsea facilities to support the new drill centres will include all equipment necessary for the safe
fici d control of the subsea wells and transportation of production and
• Wellheads and xmas trees (production and water injection); • Production and water injection manifolds;
and ef ent operation aninjection fluids. Procedures for installation of subsea facilities and subsequent operations are anticipated to be the same as those currently employed for the existing White Rose Development. The following equipment will be installed in the new drill centres:
Husky White Rose Development Project: New Drill Centre Construction & Operations Program EA Addendum Page 8
• Subsea distribution un its; • Subsea umbilical termination unit;
Flo , water injection);
xmas trees and manifolds in hole equipment a minimum of two to three metres below the seabed nd u nk technology.
V rather than diving operations and may volve several structures such as foundations, piles, manifolds. The flowlines and umbilicals
SV. The lines will be transported on large reels on a heavy lift (HL he DSV or in a carousel (on the DSV while at the factory). The
t to shuttle tankers. The SeaRose FPSO has been operational on
.5.5 Abandonment
• wlines (gas lift, production• Jumpers (control, gas lift); and • Rigid spools (to production and water injection xmas trees.
Iceberg protection measures applied to the current White Rose Project will also be applied to the WRX, and other drill centers, including placement of wellheads, S
glory s, with the top of the evel a se of flowline weak lil
Subsea equipment for the White Rose Project, while standard in design, must be installed quite accurately relative to the seabed and other equipment components. Two types of specialty vessels are required for installation of the subsea equipment; a subsea construction vessel (SCV) and a subsea diving support vessel (DSV). The SCV work will generally consist of large equipment lifts that require precise placement on the seabed. This work is generally supported by ROinare planned to be installed by a D
essel V) and handled onto tvlines are precisely laid on the seabed, inspected and mapped by ROV. The lines are then connected by divers, displaced to water, pigged and tested. 3.5.4 Production Operations 3.5.4.1 Floating Production, Storage and Offloading Vessel (FPSO) The FPSO proposed for use at White Rose was described in detail in Section 2.4.1 of the Project Description of the White Rose Oilfield Comprehensive Study (Husky 2000). It is a floating system that contains the necessary equipment to retrieve, produce and store crude petroleum and
moor and transfer oil productothe Grand Banks since November 2005. All production from the new drill centres will be processed through the SeaRose FPSO currently operating at White Rose. 3 The decommissioning and abandonment of all Project facilities will be in accordance with C-NLOPB requirements and Newfoundland Offshore Petroleum Production and Conservation Regulations and any other applicable laws (see Section 3.8.6 for further detail).
Husky White Rose Development Project: New Drill Centre Construction & Operations Program EA Addendum Page 9
3.6 Logistic Support
3.6.1 Marine Support Vessels Husky’s existing fleet of Anchor Handling Tug Supply (AHTS) and Supply/Standby vessels will be used to support the offshore construction and installation operations associated with the Project. These vessels are and will be Canadian-flagged and crewed and will be managed from the Contractor’s office in St. John’s, Newfoundland and Labrador. 3.6.2 Helicopter Support Cougar Helicopters Inc. (CHI) have been contracted to provide helicopter support for the Project nd will have access to a Sikorsky S61, AS-332L Super Puma or other equivalent rated aircraft,
t nd technicians, alternate landing site at Long Pond complete with weather station, aviation fuel,
and helicopter passenger transportation suits and an aircraft maintenance and passenger handling facility located at the St. John’s Ai rs Inc. will utilise their internal flight foll i 3.6
he Project will be managed and operational decisions will continue to be made from Husky Oil
. Harvey and Company Ltd. will continue to provide marine base facilities to support Project acti nticipated that Pier 17 will provide the appropriate wha ssel. Existing port facilities are capable of servicing multiple operations with the existing infrastructure including office space, crane support, bulk storage and consum ater) storage and delivery capability. The existing infrastructure and activity at t H the utilisation of supply vessels and other log c Wa o by Husky’s contracted warehouse provider (AS will consist primarily of storage for tubular goo , longing to the rig contractor which can be stored onshore.
apooled with all operators in St. John’s to service the Company’s requirements. Cougar Helicopter Inc. will also provide all auxiliary flight services including First Response Equipmena
rport. Cougar Helicopteow ng service using the Blue Sky tracking system.
.3 Shorebase Facilities TOperations Limited’s existing Regional Office in St. John’s at Suite 901, 235 Water Street. A
vity and, to the extent necessary, it is arfage for the dredge ve
able (fuel, whe arvey’s facility enables the industry to optimise isti assets.
reh use facilities will continue to be providedCO) and Project contractors as required andds and the equipment be
Operation and co-ordination service of voice and data communication services from offshore installations and vessels will continue to be provided from the central facility Stratos Wireless Communications in St. John’s. The primary communications link between the offshore installation(s) and the Project Operations office in St. John’s will be via a dedicated C-Band satellite service. Details on communications systems are outlined in the Husky East Coast Emergency Response Plan currently on file with the C-NLOPB.
Husky White Rose Development Project: New Drill Centre Construction & Operations Program EA Addendum Page 10
3.7 Information on Consultations
As part of the White Rose Development Plan Application, that included an assessment of development activities such as glory hole construction and well drilling, Husky conducted extensive consultations with numerous organizations (see Appendix 2). These included federal agencies, particularly Fisheries and Oceans and Environment Canada; provincial departments
ch as Environment and Labour, and Fisheries and Aquaculture; municipal governments in St. ups including the Natural History
ty etailed list of over 100 meetings is tion Report”
e Rose Development Plan pplication also went through a series of Commission hearings that were open to the public.
In add in explora description of proposed activities, locations and timing.
• •
•
or econ t
• sheries and Oceans
• Groundfish Enterprise Allocation Council
Env n eetings on the White Rose Project that ould be of relevance to the development of new drill centres included those associated with the
suJohn’s, Clarenville and Marystown; special interest gro
ocie ; and the general public at various locations. A dScontained in the report entitled “White Rose Oilfield Development Public Consultaand summarized in the Comprehensive Study Report. The WhitA
ition, Husky briefed the following parties on the nature of the Jeanne d’Arc Bastory drilling project, including a
• Transport Canada (23 April 2002) C-NOPB (12 April 2002) Transport Canada, C-NOPB, Det Norse Veritas (7 May 2002)
• Environment Canada (May 2002) Fisheries & Oceans Canada (May 2002)
F th proposed new drill centre development program, the following organizations have been
sul ed by Husky during the preparation of the environmental assessment:
Department of Fi• Environment Canada • Natural History Society • One Ocean • Fish, Food and Allied Workers Union (FFAW) • Association of Seafood Producers • Fishery Products International
• Clearwater Seafoods Limited Partnership • Icewater Harvesting iro mental concerns expressed during some of the m
cdischarge of waste including drilling muds and cuttings (more so synthetic based muds as opposed to water based muds), produced water, any oily discharges (particularly accidental oil spills), fishery exclusions, and attraction of several species of seabirds to the rig. The general consensus of the meetings was that offshore oil could be developed on the Grand Banks in an
Husky White Rose Development Project: New Drill Centre Construction & Operations Program EA Addendum Page 11
environmentally responsible manner and in coexistence with the fishing industry. These issues were also addressed during the White Rose Development Application review process and have
een considered in the environmental assessment together with issues that arose from the c c for the new drill centre development program. Husky will
aintain ongoing consultations with the above groups and is available to discuss issues at all
• South White Rose Extension (SWRX) (one glory hole with drill centre) imately five kilometres due south of the current Southern Drill Centre in
ately 120 m of water.
North Amethyst (one glory hole with drill ce ly five kilometers hwest of the current Southern Drill Centre in 0 m of water.
n (WWRX) (one or two glory holes with one or two drill ately 1.5 to 3.0 km northwest of the current Central Drill Centre in
ly 120 m of water.
• North White Rose Extension (NWRX) (one glory hole with drill centre) ap ern Drill Centre in approximately 125 m
• South White Rose Extension: maximum 16 wells.
• •
It is ro X (and po ea constru these two drill centres to the SeaRose FPSO occurring
bspecifi onsultations conducted mtimes. 3.8 Project Components/Structures/Activities
ive new drill centres are being proposed at the following locations: F
approxapproxim
• ntre), approximate
sout approximately 12
• West White Rose Extensiocentres) approximapproximate
proximately 3.0 km northeast of the current North of water.
Figure 1.1 depicts the general locations of the new drill centres within the Project Area. The number of wells that will be drilled in each glory hole has yet to be determined and will depend on the results of delineation drilling. However, for planning purposes it will be assumed that each of the five drill centres could potentially support the following distribution of wells if all the drill centres are constructed over the next eight years:
• North Amethyst: maximum 16 wells. West White Rose Extension: maximum 18 wells. North White Rose Extension: maximum 4 wells.
p posed that initial construction operations will start with glory hole excavation at SWRssibly North Amethyst) during the 2007 construction season with drilling and subsction operations and tie-ins from
Husky White Rose Development Project: New Drill Centre Construction & Operations Program EA Addendum Page 12
ove h lls and two
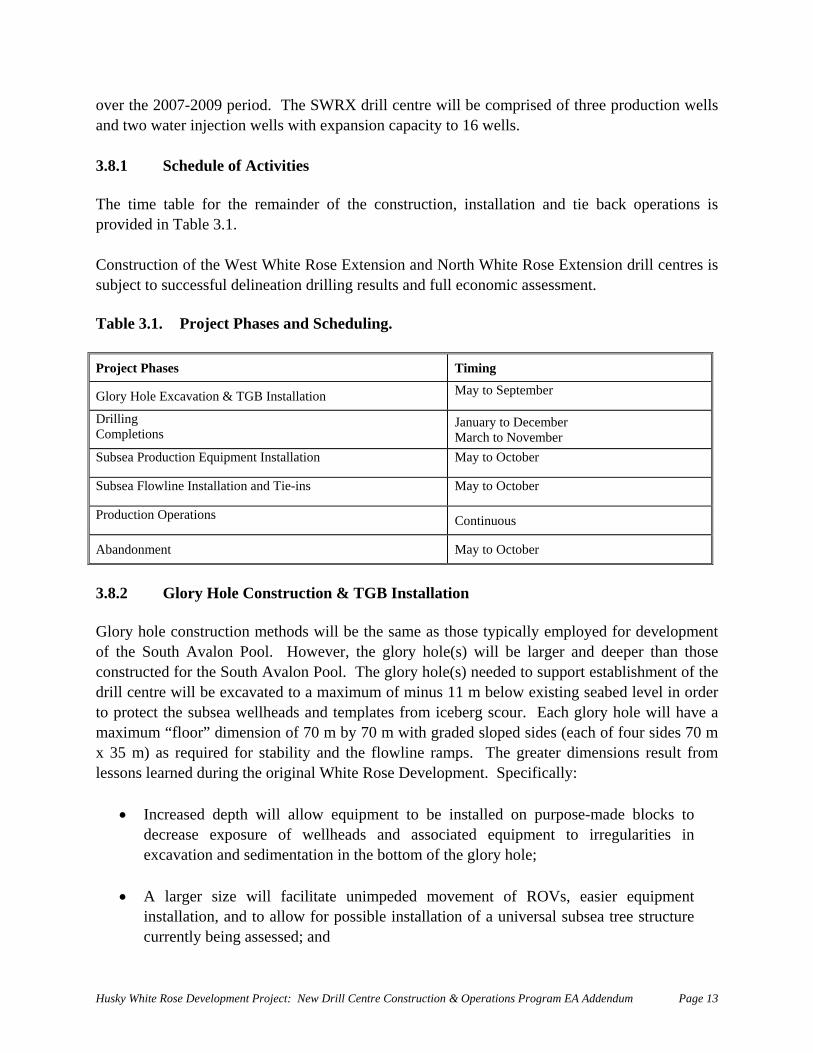
he time table for the remainder of the construction, installation and tie back operations is
Project Phases and Scheduling.
r t e 2007-2009 period. The SWRX drill centre will be comprised of three production we water injection wells with expansion capacity to 16 wells.
3.8.1 Schedule of Activities Tprovided in Table 3.1. Construction of the West White Rose Extension and North White Rose Extension drill centres is subject to successful delineation drilling results and full economic assessment. Table 3.1. Project Phases Timing
Glory Hole Excavation & TGB Installation May to September
DC
rilling ompletions
January to December March to November
Subsea Production Equipment Installation
May to October
Subsea Flowline Installation and Tie-ins
May to October
Production Operations Continuous
Abandonment May to October
3.8.2 Glory Hole Construction & TGB Installation
ed sides (each of four sides 70 m 35 m) as required for stability and the flowline ramps. The greater dimensions result from
larities in excavation and sedimentation in the bottom of the glory hole;
• A larger size will facilitate unimpeded movement of ROVs, easier equipment
installation, and to allow for possible installation of a universal subsea tree structure currently being assessed; and
Glory hole construction methods will be the same as those typically employed for development of the South Avalon Pool. However, the glory hole(s) will be larger and deeper than those constructed for the South Avalon Pool. The glory hole(s) needed to support establishment of the drill centre will be excavated to a maximum of minus 11 m below existing seabed level in order to protect the subsea wellheads and templates from iceberg scour. Each glory hole will have a maximum “floor” dimension of 70 m by 70 m with graded slopxlessons learned during the original White Rose Development. Specifically:
• Increased depth will allow equipment to be installed on purpose-made blocks to decrease exposure of wellheads and associated equipment to irregu
Husky White Rose Development Project: New Drill Centre Construction & Operations Program EA Addendum Page 13
• aded slope ramps will facilitate placement of fGr low lines and may enhance removal or movement of sediment out of the glory hole through less obstructed current flow.
onstruction of glory holes will engender a HADD, pursuant to the federal Fisheries Act. To
rill the ells associated with this project.
have been constructed to an appropriate design for the operating area nd physical environment. The drilling unit will have the necessary capability for drilling in the
sport Canada Marine Safety Inspection will be conducted as part of the quirements for a Letter of Compliance issued by that agency.
umentation. Any foreign orker’s Permits will be sought as the overall Project crew complement is finalized.
As noted previously, glory hole construction will be accomplished by use of a trailing suction hopper dredge operation. Approximately 155,540 m3 of seabed sediment per glory hole will be moved and dumped at a previously used dumpsite located approximately three kilometres south-southeast of the current southern glory hole. Husky will submit an application for an Ocean Dumping Permit for the South White Rose Extension Glory Hole early in 2007. A second Ocean Dumping Permit application will be submitted should construction of the North Amethyst glory hole be approved for 2007. Concrete mattresses or impact resistant plastic sleeves at flow exits from the glory holes will protect the flow lines from drill rig anchor chains. It is not planned to bury flow lines in the seabed. Ccompensate for the loss of fish habitat and its attendant fish productivity, Husky will be required to construct fish habitat in an area of Newfoundland. 3.8.3 Drilling Husky’s current drill rig contractor or a separate contractor will operate a MODU to dw The drill rig employed will awater depths required and the functional specifications of the well design. The rig will have a valid Certificate of Fitness for Canadian waters issued by the rig contractor’s Certifying Authority; a Tranre The rig contractor(s) will have an operations office located in St. John’s, Newfoundland. The strategy concerning drilling unit crewing plans will be presented in the associated Canada-Newfoundland Benefits Plan and/or components of the Safety Program update docW
Husky White Rose Development Project: New Drill Centre Construction & Operations Program EA Addendum Page 14
3.8.4 Production Subsea Equipment Installation The production subsea equipment installation will be done in a similar fashion to the same work previously carried out for the other White Rose drill centers in recent years (i.e., flowlines, umbilicals, and subsea manifolds with control system components).
m he new drill centres may entail tying back to the FPSO through existing drill entres via new production flowlines or the new drill centres may be tied back directly to the
and all production fluids (i.e., oil nd gas) will be flushed from the manifold and flowline system using a pig train driven by water
icals used during the process will be screened through the ffshore Chemical Management System.
espite the flushing operations, small amounts of oil may remain trapped in the flowline carcass
f oily residue may be released to the environment. The pipework will be open for a pipe spools are connected to the exposed
n ns learned will be incorporated into glory hole design for the new glory
nd ions hite Rose. Subsea tie-in work in the new drill centres
new drill centres are tied back to existing ones) will be
usky Oil manages the production and maintenance operations of the White Rose oilfield on ehalf of itself and Petro-Canada from the Husky Oil office in St. John's, where the management
Develop ent of tcSeaRose FPSO. In the event that new drill centres are tied back through existing drill centres, it will be necessary to disconnect valves and sections of pipework from the subsurface manifolds in the existing drill centres. Prior to disconnecting the existing manifold pipework, the complete drill centre production flowline system will be depressurized afrom the FPSO. To assist in the removal of oil emulsions from the surface of the flowline and manifold pipework, if necessary, a dilute surfactant may be added to the water during the flushing operation. Any chemO Dand manifold piping cavities due to the nature of the flexible flowlines and the intricacies of the manifold pipework. As a result, once the pipework section is removed by divers, a small amount oapproxim tely two to four hours until the replacement manifold flanges. The amount of oily residue released is not anticipated to exceed 0.3 m³. Once tie-in is complete, the system will be brought back into service through the existing infrastructure at the FPSO. As already oted, lessoholes. Specifically, glory holes will be larger and deeper to reduce the interface of equipment with the seabed. The umbilical and flowlines utilized for the new drill centres will be of the same design aspecificat as those currently used by Wand the existing drill centres (ifaccomplished using ROV technology as well as divers, when required. 3.8.5 Production Operations 3.8.5.1 Organization Hb
Husky White Rose Development Project: New Drill Centre Construction & Operations Program EA Addendum Page 15
team is located. The day-to-day management and control of all offshore operations is the sponsibility of the Offshore Installation Manager (OIM) who is located on the FPSO. Each
he offshore operation will be provided with engineering support by the Technical Services
ach drilling vessel will require approximately 85-110 support staff during drilling operations. irement of some 170 to 210 personnel per drilling unit.
th the manuals and procedures.
ents.
nfo uipment and each system and subsystem are an information is drawn from vendor sources,
reMODU operating in the field will also be managed and controlled by an Installation Manager. The OIM on the FPSO will, however, take responsibility for routine coordination of all concurrent offshore operations. 3.8.5.2 FPSO The crew complement for the FPSO is approximately between 80-90 personnel on board (POB). The maximum allowed POB offshore during production is 90. The crew complement on the FPSO is not anticipated to change as result of the development of the new drill centres. Major maintenance will be conducted during production shutdowns. TGroup. This support will be for specific tasks, or investigation and solution of process problems, and will be on an ad hoc basis. 3.8.5.3 MODU ETo provide for rotation, this means a requ 3.8.5.4 Operations and Maintenance Procedures Operations and maintenance procedures and manuals have been prepared specifically for the White Rose development. They make provision for compliance with all regulatory requirements, and personnel are trained to operate in accordance wi 3.8.5.4.1 Systems Systems manuals provide descriptions and drawings of the primary process, ancillary systems, and associated equipment and subsystems. The rationale behind the design is presented.
perating parameters are set out. Operator training manuals are based upon these documO 3.8.5.4.2 Equipment Detailed i rmation on each individual piece of eqssembled d incorporated into data books. Sucha
design specifications and operational record. It includes drawings, specifications, descriptions, materials, installation guidelines, operation and maintenance guidelines, and recommendations on spare parts inventory.
Husky White Rose Development Project: New Drill Centre Construction & Operations Program EA Addendum Page 16
3.8 and Procedures Rol lines of reporting and accountabilities in production operations are set out r re applicable bridging manuals. For the current White Rose operations, these clearly identify reporting relationships throughout the organization as well as wit x The reporting procedures will be applied to activities related to the
evelopment of the new drill centres.
ocedures for record-keeping are set out in the manuals, together with quirements for report generation and distribution and data acquisition. Operating and
quired by Husky Oil and governing regulations. equisite reports are produced routinely. The same record-keeping procedures will be applied to
vironmental protection lans that govern day to day work define the necessary environmental protection, compliance
manuals will be prepared for all equipment installed for the new drill entres. These procedures will be based on design data, recommendations by vendors, operating
ill be based on the effect of failure of the item of equipment on personnel safety, environmental
stem.
itoring, inspection, and maintenance and repair, will be cognized in the program.
e production and marine procedures manual deals with the safe and efficient operation of the FPSO for all facets of production and marine-related activities. It describes in detail how the following activities are carried out or managed:
.5.4.3 Reporting Relationships
es, limits of authority, in eporting procedures and whe
h e ternal agencies. d Similarly, the prremaintenance records are documented as reRactivities related to the development of the new drill centres. Production operating procedures and drilling and production operations enpmonitoring and internal/external reporting processes required to ensure environmental protection. These procedures will also apply to the activities related to the construction and operation of the new drill centres. 3.8.5.4.4 Maintenance Procedures Maintenance procedurescconditions, and the importance of the equipment to operation of the facility. This latter aspect wconsequences, operational efficiency, and revenues. As with existing White Rose operations, the maintenance program for new equipment will be extensively supported by computerized systems, providing detailed information on each item of equipment, including its criticality, maintenance history, and spares to be kept in inventory. The system will also be linked to an inventory control sy The basic significant features of monre 3.8.5.4.5 Production and Marine Procedures Th
Husky White Rose Development Project: New Drill Centre Construction & Operations Program EA Addendum Page 17
process start-up and shutdown; routine production;
adverse weather conditions; ent; and
es. The o ill apply to all activities related to the construction and operation of the new r 3.8 es
a cedures currently set out clearly the steps and responsibilities for ice rveil ance, monitoring and reporting. The procedures are structured to include cooperation
oncurrent ice surveillance and anagement operations on the Grand Banks. All available ice intelligence information sources
y and Environment (HSE) Management System
l h ty and environment management system for the White Rose evelopment that meets or exceeds all statutory requirements, and facilitates continued employee
ted to construction and operation of the new drill centres.
ocumented procedures are available to address the various tiers of emergencies that might arise
ergencies
operations limits;
crude storage and shipm marine activiti
pr cedures manual w d ill centres.
.5.4.6 Ice Management Procedur Husky Oil already has an Ice Management Plan in place for its operations on the Grand Banks. Husky Oil will review and update, or modify, this plan as appropriate for application to the proposed development of additional drill centres at the White Rose field. Ice man gement pro
lsuwith other operators and government agencies in their cmare used to ensure the well-being of the facilities offshore. The ice management procedures in place for the current White Rose development will be employed for construction and operation of the new drill centres. 3.8.5.4.7 Health, Safet Husky Oi as a health, safedsafety and health as well as environmental protection. Environmental protection and compliance monitoring plans and the environmental effects monitoring program also comprise part of the HSE Management System. The HSE Management System will apply to all activities rela
3.8.5.4.8 Emergency Procedures Don the FPSO or other offshore facilities. As well, there are contingency documents that address specific risks that have been identified as potential em
Husky White Rose Development Project: New Drill Centre Construction & Operations Program EA Addendum Page 18
3.8.5.5 Operational Limits Environmental factors impose limitations on the following operations:
ta ; • deck loading;
e expected to have a system efficiency comparable to that of the existing h R ll be subject to equipment,
reservo s environmental factors. 3.8.5.6 3.8 and Storage Yard The ma utilize the same facilities as the current Wh le to accommodate the add o additional warehousing and storage yard space will be
hite R ment.
.2 sels
on ort vessels will be fully trained in emergency duties. There will be
s with the current White Rose Project, personnel movements between St. John's and the field will normally be carried out by helicopter. During construction of the new drill centres, some
• s tion-keeping ability
• bulk storage; • crane operation; • helicopter movement; • ice management; and • crude storage and tanker loading.
he new facilities arT
W ite ose operation. Similar to White Rose, operating efficiency wiir and well performance as well a
Logistics
.5.6.1 Marine Base, Warehousing,
rine base will be located in St. John's and willnt marine base is anticipated to be abite Rose Project. The curre
itional equipment required for construction of the new drill centres. During operations, n required above that used for the current
ose developW .8.5.6 Support Ves3
Support vessel requirements for the operation of the new drill centres will not change from the current requirements for the White Rose Project. During construction of the new drill centres, additional support vessels will be required to service drilling rigs and installation vessels.
Vessels will be continuously available in the field for standby duty in accordance with regulatory requirements. Supply vessels will convey materials, consumables and equipment to and from the
ffshore facilities. o
ll pers nel staffing the suppAroutinely scheduled emergency drills and exercises. 3.8.5.6.3 Personnel Movements A
Husky White Rose Development Project: New Drill Centre Construction & Operations Program EA Addendum Page 19
additional helicopter flights may be required to transfer personnel from drilling rigs. During operations, the current helicopter requirements will remain the same since it is anticipated that no dditional personnel will be required on the FPSO.
.8.5.7 Communications
ommunication requirements related to the construction and operation of the new drill centres t. This system
cludes communications linkages between all of Husky’s facilities both onshore and offshore. Primary an to ensure continuous communications capability ental conditions. The system comprises the following elem
• FPS
• Ship Radio System; r/G ir VHF Base Station;
o e of the White Rose oilfield, Husky Oil will decommission and he -NLOPB requirements and Newfoundland Offshore Petroleum
a 3 Cwill be integrated into the system currently used for the White Rose Projecin
d back-up systems will continue to be used amongst all facilities in all environm
ents:
O and MODU/Shore Link; • Telephone System; • Local Area Network (LAN);
• Ai round/A• Air/Ground/Air VHF Hand-held Radios; • Non-directional Beacon for Aircraft Approach; • VHF Radio System; and • Shore Base Radio Station Services (including marine vessel tracking and flight
following). 3.8.6 Abandonment At the end f the production lifbandon t site according to Ca
Production and Conservation Regulations and any other applicable legislation. Floating production facilities will be removed from the field. Subsea infrastructure will be removed or bandoned as outlined in the White Rose Comprehensive Study and the Decision Report a
2001.01. The site will be restored to a condition that minimizes environmental impact and that will not impede fishing activities. 3.8.6.1 Approval Process At the completion of oil production from the White Rose field, Husky Oil will seek approval to decommission the facilities and abandon the field in accordance with the requirements of the Newfoundland Offshore Petroleum Production and Conservation Regulations.
Husky White Rose Development Project: New Drill Centre Construction & Operations Program EA Addendum Page 20
The approval request will include all relevant data required to demonstrate that all practical and conomic extraction of oil from the field has been achieved.
follow the following procedure for abandonment of wells:
ost perforations; t exceeding 150 m below the mudline;
eable formations; and
• displace hydrocarbons in production wells with a kill fluid and abandon.
d from the risers. The topsides equipment will be ecommissioned offshore, and any residual hazardous waste arising from this will be taken to
FPSO will depend upon its condition at of the end of the roduction life of the White Rose field, and upon the options available for further use.
lds, riser base e purged and
The final abandonment and decommissioning plan has to meet C-NLOPB requirements and Newfoundland Offshore Petroleum Production and Conservation Regulations and any other applicable laws or regulations and will be subject to final approval by the C-NLOPB.
e 3.8.6.2 Abandonment Methods 3.8.6.2.1 Production and Injection Wells
usky Oil intends toH
• install cement plugs and mechanical bridge plugs as follows: at the bottom of the deepest casing string; above the upperm at depths no to seal off porous, perm to seal off formations with abnormal pressures;
• remove wellheads and cut casings; and,
3.8.6.2.2 FPSO At abandonment, the FPSO will be disconnectedshore and treated at appropriate approved waste treatment facilities. All anchors, lines and chains will be recovered. The ultimate disposition of thep 3.8.6.2.3 Subsea Facilities All equipment located in glory holes will be removed and the glory holes will be left as they are. Christmas trees and manifolds will be purged, rendered safe, and recovered. All other subsea facilities above the seafloor, including production manifo
anifolds, loading riser manifolds, flowlines, and export lines, will bmdecommissioned in accordance with regulations prevailing at the time. Risers and umbilicals will be decommissioned, rendered safe, and recovered.
Husky White Rose Development Project: New Drill Centre Construction & Operations Program EA Addendum Page 21
3.9 Description of Waste Discharges and Treatments
lopment will include drill muds and cuttings, produced water,
te associated with the FPSO and drill rigs are itemized in the respective
ased l well hole for the surface
rt nductor) is drilled without the riser in lace and thus the wa based drilling mud and associated cuttings
marine environment. Approximately 230 m3 of water based c rged per well during this stage of the drilling. During the drilling o e hole for the intermediate casing, the riser ssociated BOP are in place and mud is tran rted back to the rig. Cuttings are then removed from the drilling mud in successive separation stages through shakers, hydrocyclones, and ifuges. After passing through the solids control system, the cleaned cuttings are then discharged overboard through a cuttings chute. Recoverable mud is then reconditioned and reused. Up to 175 m3 of cleaned cuttings could be discharged during the installation of the intermedi casing. SBM will be recycled and reused where possible, or brought to shore for disposal when spent.
ll drilling cuttings and fluid discharges will be in accordance with the C-NLOPB OWTG –
Waste discharges during the devegrey and black water, ballast water, bilge water, deck drainage, discharges from machinery spaces, cement, blowout preventer (BOP) fluid, and air emissions. All discharges will be in compliance with the Offshore Waste Treatment Guidelines (OWTG). Details are provided in the following sections. All was s discharges EPPs. Waste discharges of the dredger and supply vessels would include air emissions, grey and black water, and bilge water. 3.9.1 Drilling Muds Water-based muds (WBM) will be used where possible, usually during the first sections of each well. Synthetic-based muds (SBM) will be used to drill the majority of each well. Components and additives typically differ somewhat by well, the specific conditions encountered in drilling, and by the depth and purpose for drilling. Typical formulations for water bdrilling mud and the quantities likely to be used when drilling a verticaand the conductor are provided in Section 7.0. Tp
he first pa of the hole (i.e., the surface casing and coter are discharged directly to the
uttings dischawill be
f th and aspo
centr
ate
AAugust 2002 Revision and subject to approval by C-NLOPB.
Husky White Rose Development Project: New Drill Centre Construction & Operations Program EA Addendum Page 22
3.9.2 Produced Water 3.9.2.1 Well Testing If hydrocarbons are present and testing is conducted then small amounts of produced water may be discharged by atomizing with hydrocarbons and flared. If the flare capacity is at risk of being exceeded, then small amounts of treated produced water will be brought ashore for disposal. 3.9.2.2 Production
roduced water discharge for the core White Rose Project is 22,000 /day. While the specific volumes of produced water that will be generated by each of the
ced water will not exceed this amount.
mp d water is provided in Table 3.2.
The current estimate of p
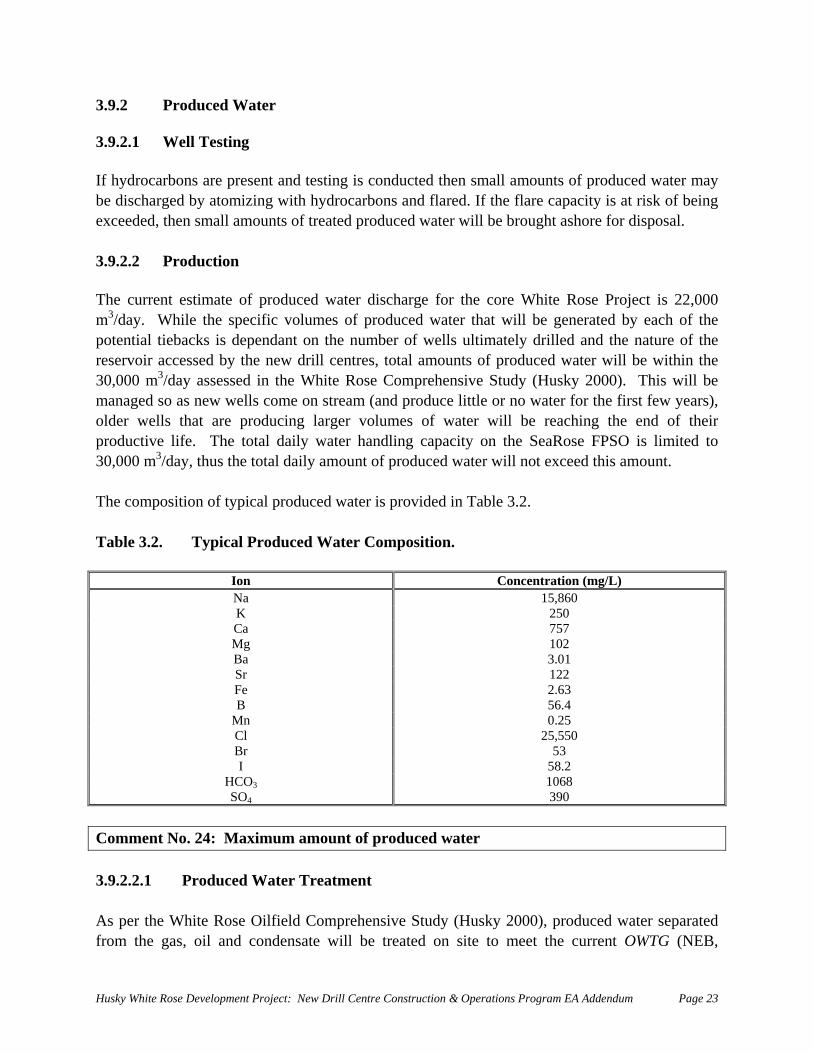
3mpotential tiebacks is dependant on the number of wells ultimately drilled and the nature of the reservoir accessed by the new drill centres, total amounts of produced water will be within the 30,000 m3/day assessed in the White Rose Comprehensive Study (Husky 2000). This will be managed so as new wells come on stream (and produce little or no water for the first few years), older wells that are producing larger volumes of water will be reaching the end of their productive life. The total daily water handling capacity on the SeaRose FPSO is limited to 30,000 m3/day, thus the total daily amount of produ The co osition of typical produce Table 3.2. Typical Produced Water Composition.
Ion Concentration (mg/L) Na 15,860 K 250 Ca 757 Mg 102 Ba 3.01 Sr 122 Fe 2.63 B 56.4
Mn 0.25 Cl 25,550 Br 53 I 58.2
HCO3 1068 SO4 390
Comment No. 24: Maximum amount of produced water 3.9.2.2.1 Produced Water Treatment As per the White Rose Oilfield Comprehensive Study (Husky 2000), produced water separated from the gas, oil and condensate will be treated on site to meet the current OWTG (NEB,
Husky White Rose Development Project: New Drill Centre Construction & Operations Program EA Addendum Page 23
C-NOPB and C-NSOPB 1996, revised 2002). Produced water will be treated to reduce the oil veraged over a 30-d period and subsequently discharged. Minimal, if
du er will be discharged during development drilling.
ions
operations by iso it small amount of greenhouse gas emissions. The o ose Project is calculated and sent to the C-NLOPB
ompliance Monitoring Plan (EPCMP). Black water or sewage will ated amounts
content to 30 mg/L or less aany, pro ced wat Once produced water is realized, compliance monitoring of produced water will be conducted as per the FPSO Environmental Protection Compliance Monitoring Plan (EPCMP). A water quality specific component of the overall Environmental Effects Monitoring (EEM) program that will primarily address produced water is under development and will be implemented with
-NLOPB approval C .9.3 Air Emiss3
The SeaRose FPSO was designed to minimize greenhouse gas emissions (GHG) and volatile organic compounds (VOC’s). These design modifications are addressed in the document eferencing Condition 35 of Approval for the White Rose Project. Drilling r
compar n to production operations emuantity f emissions from the White Rq
annually as per the OWTG (2002) and also sent to Statistics Canada. The VOC’s are reported to the National Pollutant Release Inventory annually. 3.9.4 Grey and Black Water Grey and black water produced on the drilling rig and FPSO is treated as per the relevant
nvironmental Protection CEbe macerated to 6 mm particle size or less and discharged as per the OWTG. Estimof black water are up to 19 m3 per day. 3.9.5 Bilge Water Bilge water for both the drill rig and FPSO will be treated to OWTG standards (15 mg/L or less). 3.9.6 Deck Drainage Any deck drainage for both the drill rig and FPSO for both the drill rig and FPSO will be treated to OWTG Standards (15 mg/L of oil or less). 3.9.7 Ballast Water
Water used for stability purposes in both supply boats, FPSO’s and drilling rigs is stored in dedicated closed system tanks and does not contain any oil under normal operations. If oil is suspected in the ballast water it will be tested and if necessary treated to OWTG standards (15 mg/L or less).
Husky White Rose Development Project: New Drill Centre Construction & Operations Program EA Addendum Page 24
3.9.8 Cooling Water
s p t ater) return is treated with chlorine to prevent biof li is 0.5 ppm y prop a r consideration prior to use. .9.9
substances not discussed above or covered in ut prior notification and approval of the C-NLOPB.
o d treatment is contained in the environmental assessment
ployed by 2-D or 3-D seismic surveys but is r a shorter time period (12 to 36 hours). mall array and sonar. They are used to
eotechnical survey information may be gathered in the field for locating bottom-supported
3.9.8.1 FPSO A er he FPSO EPCMP, cooling water (i.e., seaw
ou ng and is monitored pursuant to the OWTG. Husky’s target discharge concentration . Water from closed systems will be tested daily and will comply with the OWTG. An
os ls for alternate biocides will be submitted to C-NLOPB fo
3 Garbage All trash and garbage, including organic waste from galleys, will be containerized and transported to shore for disposal in approved landfills. Combustible waste such as oil rags and paint cans will be placed in hazardous materials containers for transport to shore. 3.9.10 Glycol and Other Chemicals When drilling with semi-submersibles, blowout preventer (BOP) test fluid (glycol/water) is released at intervals (typically three pressure and three function tests per 40-day drilling). About
.0 m31 is released per test (Husky 2000). No other the OWTG will be discharged witho
dditi nal information on discharges anAsections of this document. 3.10 Seismic Survey Equipment (Geohazard and VSP Surveys) Geohazard/well site surveys and vertical seismic profiling (VSP) using an airgun array may be conducted as part of the drilling activities. The VSP is used to assist in further defining a
etroleum resource. The array is similar to that emptypically smaller and deployed in a smaller area ove
ell site or geohazard surveys may also deploy a sWidentify and avoid geotechnically unstable areas (e.g., shallow gas deposits) or hazards (e.g., shipwrecks) prior to drilling. The proposed geohazard surveys associated with the drilling program have been assessed under separate cover (LGL and Canning & Pitt 2005). 3.11 Geotechnical Surveys
The purpose of geotechnical surveys is to assure, to the degree possible, that there are no "false starts" and multiple tries for piling and excavation. It is also to assure the safety of the flowlines
om damage related to unsupported sections because of protuberances on the seafloor.frG
Husky White Rose Development Project: New Drill Centre Construction & Operations Program EA Addendum Page 25
facilities, glory hole excavation, flowline path, and mooring, foundation or riser base pile locations.
The types of geotechnical survey methods that could be employed include:
• core drilling of the seabed (to 10 to 35 m); • vane shear strength of soil at seabed and at points to approximately three metres below
l to installation sites; and vi
.12 Waste Management Plan
he waste streams related to development of the new drill centres will be managed according to
n. As with current operations, herever possible, waste streams will be segregated so as not to create the additional problem of
nvironmental/Ice-Observers, called weather observers are present on the MODU at all times.
rt of these duties these ersonnel will also assist in vessel monitoring under the Project Collision Avoidance Procedures
seabed; • acoustic signal reflections loca• sual surveys
In all geotechnical survey types, no equipment is left on the seabed. For electromagnetic wave sensing and acoustic surveys, emitted signals are short duration and very local (i.e., the emitter and the sensor are in very close proximity). For core drilling and vane shear strength surveys, the seabed is left disturbed in a small area of a few square meters. For the proposed new drill centres, Husky is considering eliminating the geotechnical survey and instead building flexibility into the design of pipelines, well trajectories, etc. to allow relocating a glory hole up to approximately 50 m in any horizontal direction, should an obstacle too difficult to remove be encountered. 3 Tthe Husky Waste Management Plan currently implemented for the White Rose Project. The purpose of the Husky Waste Management Plan is to provide guidance on effectively dealing with waste from the facility and avoiding environmental pollutiowexpensive decontamination or separation onshore. 3.13 Onsite Environmental/Ice Observers EAn onsite Environmental Observer will also be on board the MODU to record and report 24-hour weather, oceanographic and ice parameters. During any year that has been assessed as a particularly bad ice year, two Environmental/Ice Observers may be stationed on the MODU to assist the Drilling Operations personnel in strategic and tactical planning along with the recording and reporting the weather and oceanographic duties. As papoutlined in the East Coast Incident Coordination Plan.
Husky White Rose Development Project: New Drill Centre Construction & Operations Program EA Addendum Page 26
The environmental observers will also conduct seabird and marine mammal observations on a daily basis in accordance with established protocols. In addition, an Oceanographic Monitoring Program will again be conducted in accordance with
e C-NLOPB Guidelines Respecting Physical Environment Programs. The program will be the meters and a wave-sensing device.
Environmental Features
h and fish habitat, fisheries, marine irds, marine mammals, and sea turtles through emissions and discharges, both routine and
as in the Project Area. A description of the hysical and biological environment of the northeastern Grand Banks and potential Project
EA. A valued ecosystem component (VEC) proach is used in the EA. VECs in the area include fish, fish habitat, commercial fisheries, abirds, marine mammals, sea turtles, and Species at Risk Act (SARA) species (including
COSEWIC-listed species). Effects on VECs including cumulative effects (within the Project and with existing and planned projects) are assessed in the EA to follow. Focus is on sensitive species, areas and times, including SARA species. 3.14.2 Other Users Current and past uses of the area include marine shipping, oil and gas exploration, defence-related ship traffic, and commercial fisheries. Hunting of murres, waterfowl, and seals has occurred for many years farther inshore from the Project Area. There is a continuing problem on the Grand Banks and the approaches to the Gulf of St. Lawrence with oily discharges (i.e., mystery spills) from marine vessels in international shipping lanes. Previous disturbance of the seabed may have occurred from bottom trawling activity associated with commercial fisheries. The closest protected bird areas are Cape St. Mary’s and Witless Bay which are located about 350 and 310 km, respectively, to the west of the Study Area. In addition, the offshore region of the Grand Bank is heavily used by migratory seabirds. The “Bonavista Cod Box,” a fisheries protected area, is located approximately 200 km northwest of the Study Area. The closest urban centre is St. John’s, located about 300 km to the west of the Study Area. The physical presence of the rig and supply boats affects navigable waters on the Grand Banks to a small degree. The Study Area is close to major North Atlantic shipping lanes and may receive
thsame as previous ones and include the installation of current 3.14 Project Site Information 3.14.1 The Project has the potential to affect air, water, plankton, fisbaccidental. There are no known special or unique arepinteractions and effects are included in this apse
Husky White Rose Development Project: New Drill Centre Construction & Operations Program EA Addendum Page 27
ship t ffic from fishing vessels, tankersil
ra , freighters, naval vessels, private yachts and others. The eta ed physical characteristics of the waterway are provided in Section 4.0.
omment No. 16: Rig anchorage
d C Comment No. 19: Misnaming of provincial department Comment No. 20: Well number discrepancy between EA and Development Plan
Amendment Comment No. 22: Oily residue discharge during tie-back Comment No. 23: Pollution prevention measures Comment No. 25: Chlorine in cooling water
Husky White Rose Development Project: New Drill Centre Construction & Operations Program EA Addendum Page 28
4.0 Physical Environment Effects of the Environment on the Project Effects of the physical environment on the Project include those caused by geohazards, wind,
iled project planning, by esign in accordance with recognized and appropriate national and international standards, by
ibuting factor to accidents. Accidental effects are discussed in detail in Section 8.0 of e EA.
ice, waves, currents and biofouling, particularly extreme events. The physical variables have been described in detail in Section 4.0 of the EA (see also Appendix 3 of this document). Weather, ice and icing and wave conditions affect every project on the East Coast to some degree. It is anticipated that these effects will be mitigated by using rigs, vessels and equipment that are all certified by the appropriate authorities (e.g., DNV, Transport Canada, Coast Guard, and the C-NLOPB, and others) for use on the Grand Banks, by detadoperational scheduling, and by state-of-the-art forecasting. The residual effects of physical environmental factors are predicted to be adverse (i.e., in the form of delays) because they can cause delays to the Project, damage to equipment and thus economic losses, or because they can be a contrth The effects of ice on the Project will be minimal because most of the Project Area is often free of sea ice and subject to relatively few icebergs most of the year. Given careful timing selection and good forecasting, there is expected to be little effect on the Project from sea ice. Any potential effects on the Project from icebergs can be mitigated by timing selection and by the Ice Management Plan described below such that residual effects will be minimal. Ice accumulations (superstructure icing) may cause delays while operations are slowed or suspended and ice accumulation is avoided or removed. Any delays are anticipated to be relatively short-lived compared to the Project’s timeline. There is some risk of seismic activity on the east coast (assessed in the White Rose Comprehensive Study). However, the risk is not abnormally high and is unlikely to significantly affect surface activities if a floating drill rig and FPSO are used and the emergency systems disconnect as designed. Other geohazards, e.g., steep slopes, slumping, shallow gas, etc., will be evaluated prior to drilling either through dedicated geohazard surveys or further analyses of 3-D eismic data. s
Effects of the physical environment on the Project include those caused by wind, ice, waves, and currents. These effects may differ somewhat by equipment type. For example, bottom-founded equipment is stable under all conditions whereas floating systems are subject to heaving due to wave action. A semi-submersible may be more affected by surface currents and not by bottom type whereas bottom equipment may be more affected by bottom currents and bottom substrate type.
Husky White Rose Development Project: New Drill Centre Construction & Operations Program EA Addendum Page 29
Aside from the obvious concerns associated with extreme wind and wave events, sea ice and
hing itself on exposed may also affect a similar effect on the interior of pipes as well as nkage used for waste water storage and treatment, and possibly
ment will be mitigated by state-of-the-art weather and ice prediction, itable rigs, vessels, equipment and personnel, and by adherence to Husky’s f the environment on the Project are assessed further in the following
ctions.
hysical Environment
The physical environ il in Section 4.0. Effects of the physical nvironment on the Project include those caused by geohazards, wind, ice, waves, currents,
d currents. These effects may differ somewhat by activity or equipment type. or example, bottom-founded infrastructure is stable under all conditions whereas floating
hips) are subject to heaving due to wave action, although DP rigs robably less so than anchored rigs. All surface vessels are constrained by ice but most can
using different procedures and different environmental criteria. floating rig may be more affected by surface currents and not by bottom type currents whereas
y be more affected by bottom currents and bottom substrate type.
bvious concerns associated with extreme wind and wave events, ice poses some ng oil and gas operations on the Grand Banks.
rning system, and by towing. In addition, move off site relatively
n can affect personnel and structural safety. ice may create slippery decks and cause falls and in extreme cases can affect
ipitation in the Newfoundland and Labrador area is most likely to tro-Canada 1996). Accumulations of ice on structures may be due
precipitation, condensation or sea spray and are highly related to air temperature, wind speed, diameter of surfaces, and other factors. Husky will manage risk through forecasting, close monitoring of conditions, and adherence to documented and proven safety procedures.
icebergs are probably the greatest physical environmental and safety concerns affecting oil and gas operations on the Grand Banks. Refer to Section 4.5 for further discussion on ice and icebergs. Effects of the biological environment on the Project are primarily those related to biofouling. Biofouling may affect rig stability and encourage corrosion by establissupport structures or hulls and water intakes and outlets and tadrill mud tankage. Apart from corrosion and stability concerns, establishment of sulphur reducing bacteria in closed tankage where low oxygen tensions in water occur can result in hydrogen sulphide gas evolution that has the potential for safety risks.
ffects of the environEtiming, selection of suHSE Plan. Effects ose P
ment is described in detaetemperatures anFsystems (e.g., semi-subs, drillspdisconnect and move away albeitAbottom-founded equipment ma Aside from the onvironmental and safety concerns affectie
Icebergs will be managed by surveillance, an early wae proposed rig type and FPSO will be able to safely disconnect andth
quickly, if required. Freezi g precipitation is of concern because it Accumulations of vessel stability. Freezing precoccur from March to April (Peto
Husky White Rose Development Project: New Drill Centre Construction & Operations Program EA Addendum Page 30
Biological Environment
The biological environment carough biofouling of water i
n also affect the Project’s efficiency, vessel stability, and safety ntakes, and vessel and rig undersides, and waste water treatment
also become contaminated with bacteria. These effects ill be minimized through regular inspections and cleaning and where necessary treatment with
es, usually a chlorine or gluteraldehyde based product.
ontaminated environments may also create effects on worker health and safety (e.g., evolution r phide from bacterial contamination of tankage where conditions exist to support
is phenomenon). There are no known contaminated sites or munitions dump sites in the
sive documentation of sediments.
: Iceberg scour environment, seabed sediments and character of
thand storage tankage. Mud systems canwappropriate biocid Anthropogenic Environment
Cof hyd ogen sulthProject Area. 4.1 Geochemical See Husky EEM reports for exten Comment No. 28
sediments to be dredged. 4.1.1 eology
G
p update and additional material.
tmospheric circulation patterns
Text in EA remains the same. 4.1.2 Chemical Environment Text in EA remains the same. 4.2 Climate See A pendix 3 for an Comment No. 27: Current a 4.2.1 Overview Text in EA remains the same.
Husky White Rose Development Project: New Drill Centre Construction & Operations Program EA Addendum Page 31
4.2.2 Seasonal D ifferences
mate Data Sources
m ses for derivation of marine climate statistics
Text in EA remains the same. 4.2.3 Marine Cli See Appendix 3. Com ent No. 30: Databa 4.2.4 Winds See Appendix 3. Comment No. 31: Winds 4.2.4.1 Wind-generated Waves
e Appendix 3. Se
omment No. 32C : Wind-generated waves 4.2.5 Air and Sea Surface Temperatures Text in EA remains the same.
s the same.
s
4.2.6 Visibility and Causes of Restricted Visibility Text in EA remain 4.3 Physical Oceanography 4.3.1 Water Masses Text in EA remains the same. 4.3.2 Current Text in EA remains the same but see also Appendix 3. Comment No. 29: Ocean current models
Husky White Rose Development Project: New Drill Centre Construction & Operations Program EA Addendum Page 32
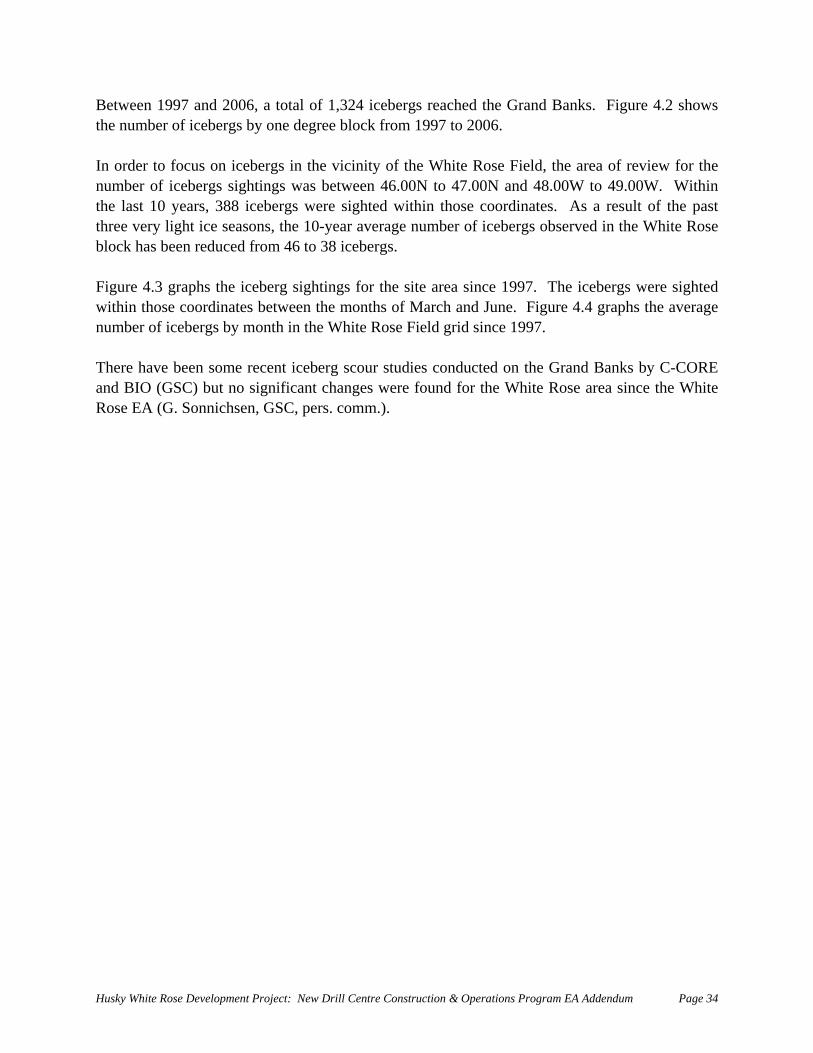
4.4 Extremes 4.4.1 Wind and Wave Extreme Analysis See Appendix 3. Comment No. 33: Wind and wave extreme analysis 4.5 Ice and Icebergs 4.5.1 General The following is an updated ice distribution analysis of the ice environment surrounding the White Rose Field drilling and exploration site over the last 10 years. Two different forms of floating ice, sea ice and icebergs, are present in this marine environment.
his updated ice distribution analysis begins with a description of the databases used, followed y a summary of the sea ice cover and of the icebergs sighted on the White Rose Field.
4.5.2 Databases The data used to report the thickness of sea ice on the Grand Banks was extracted from a digital database of (approximately) weekly composite ice charts produced by the Canadian Ice Services (CIS) with the past three years extracted from the CIS weekly regional ice charts. Data on icebergs are compiled from 10 years of iceberg sightings and detections from the PAL Ice Reconnaissance flights. The data is extracted from the PAL Ice flight digital database. 4.5.3 Sea Ice Between 1997 and 2006, sea ice was present only during three of those ten years. Sea ice was approximately 15 km from the White Rose field in 1997, 2002 and 2003. During those three years, sea ice occurred between March 12th and April 30th and the duration of coverage ranged from one to five weeks. The mean concentration of the sea ice was 4.3 (on a scale of 10). Figure 4.1 shows the results of all sea ice coverage. 4.5.4 Icebergs Iceberg sightings made within a grid constrained by the coordinates 46.00N to 48.00N and 48.00W to 50.00W were extracted from the PAL database. For the purpose of this document, that constrained grid will be referred to as the Grand Banks.
Tb
Husky White Rose Development Project: New Drill Centre Construction & Operations Program EA Addendum Page 33
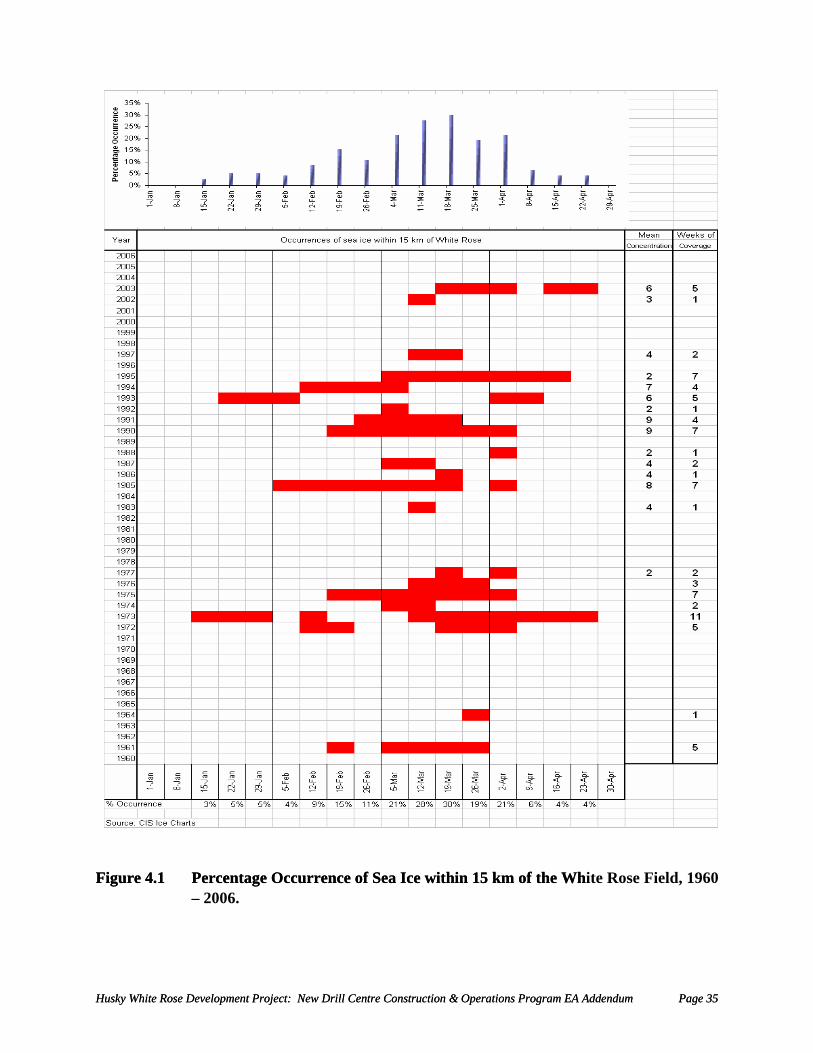
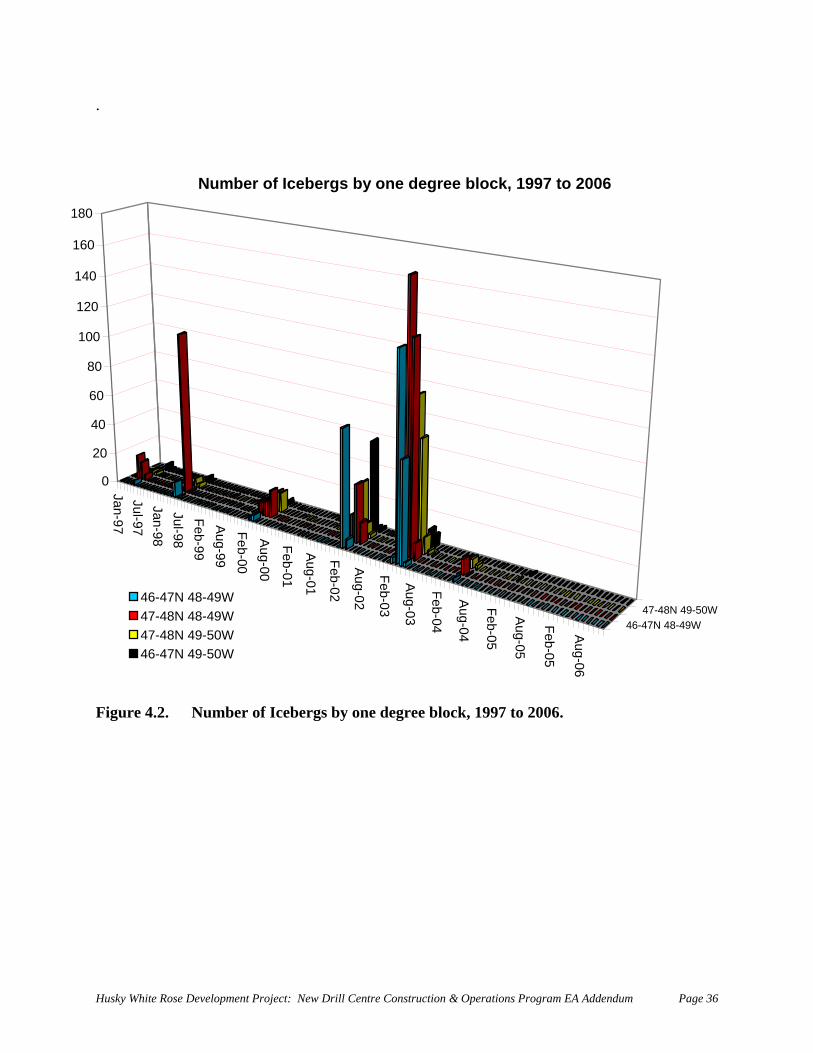
Between 1997 and 2006, a total of 1,324 icebergs reached the Grand Banks. Figure 4.2 shows the number of icebergs by one degree block from 1997 to 2006. In order to focus on icebergs in the vicinity of the White Rose Field, the area of review for the number of icebergs sightings was between 46.00N to 47.00N and 48.00W to 49.00W. Within the last 10 years, 388 icebergs were sighted within those coordinates. As a result of the past three very light ice seasons, the 10-year average number of icebergs observed in the White Rose block has been reduced from 46 to 38 icebergs. Figure 4.3 graphs the iceberg sightings for the site area since 1997. The icebergs were sighted within those coordinates between the months of March and June. Figure 4.4 graphs the average number of icebergs by month in the White Rose Field grid since 1997. There have been some recent iceberg scour studies conducted on the Grand Banks by C-CORE and BIO (GSC) but no significant changes were found for the White Rose area since the White Rose EA (G. Sonnichsen, GSC, pers. comm.).
Husky White Rose Development Project: New Drill Centre Construction & Operations Program EA Addendum Page 34
Husky White Rose Development Project: New Drill Centre Construction & Operations Program EA Addendum Page 35
Figure 4.1 Percentage Occurrence of Sea Ice within 15 km of the Wh
Husky White Rose Development Project: New Drill Centre Construction & Operations Program EA Addendum Page 35
Figure 4.1 Percentage Occurrence of Sea Ice within 15 km of the White Rose Field, 1960
– 2006.
.
Figure 4.2. Number of Icebergs by one degree block, 1997 to 2006.
Jan-97Jul-97Jan-98Jul-98Feb-99Aug-99Feb-00
Aug-00
Feb-01
Aug-01
Feb-02
Aug-02
Feb-03
Aug-03
Feb-04 04
eb-05
Aug-
Feb
Aug-
F
05 -05
Aug-06
46-47N 48-49W47-48N 49-50W
0
20
40
60
80
100
120
140
160
180
Number of Icebergs by one degree block, 1997 to 2006
46-47N 48-49W47-48N 48-49W47-48N 49-50W46-47N 49-50W
Husky White Rose Development Project: New Drill Centre Construction & Operations Program EA Addendum Page 36
Figure 4.3. Iceberg Sightings for the White Rose Site, 1997-2006.
Iceberg Sightings for Site Area
0
20
40
60
80
100
120
140
Jan-
97
Jun-
97
Nov
-97
Apr
-98
Sep
-98
Mar
-99
Aug
-99
Jan-
00
Jun-
00
Nov
-00
Apr
-01
Sep
-01
Feb-
02
Jul-0
2
Dec
-02
May
-03
Oct
-03
Mar
-04
Aug
-04
Jan-
05
Jun-
05
Nov
-05
Apr
-06
Sep
-06
Husky White Rose Development Project: New Drill Centre Construction & Operations Program EA Addendum Page 37
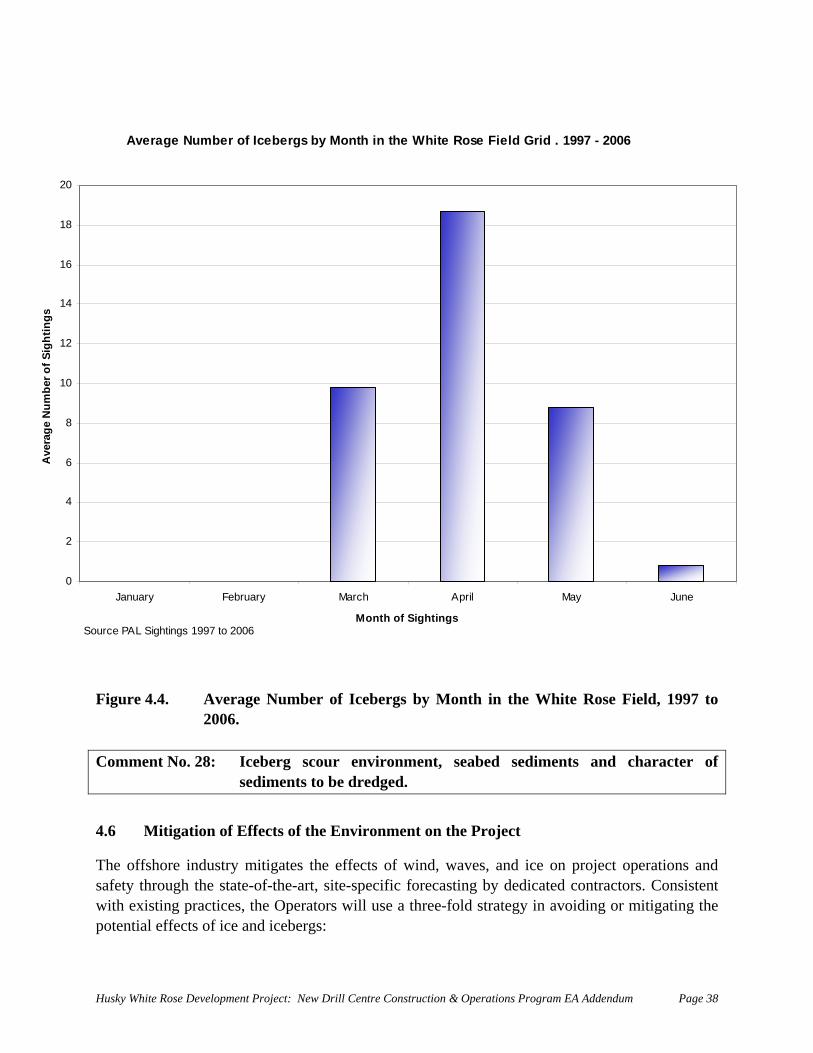
Average Number of Icebergs by Month in the White Rose Field Grid . 1997 - 2006
0
2
4
6
8
10
12
14
16
18
20
February April June
Sightings
Ave
rage
Num
ber o
f Sig
htin
gs
So 2006
January March May
Month ofurce PAL Sightings 1997 to
Figure 4.4. Average Number of Icebergs by Month in the White Rose Field, 1997 to 2006.
Comment No. 28: Iceberg scour environment, seabed sediments and character of
sediments to be dredged.
.6 Mitigation of Effects of the Environment on the Project 4
The f on project operations and safe twith ex ractices, the Operators will use a three-fold strategy in avoiding or mitigating the pot i
o fshore industry mitigates the effects of wind, waves, and icety hrough the state-of-the-art, site-specific forecasting by dedicated contractors. Consistent
isting pent al effects of ice and icebergs:
Husky White Rose Development Project: New Drill Centre Construction & Operations Program EA Addendum Page 38
1. Project scheduling, 2. Onboard environmental observer (s), and
. Ice management protocols (ice mitigations as defined in the Ice Management Plan).
arine Meteorological Observation Program
e appropriate software to facilitate logging, primary level error hecking, coding, and data transmittal of meteorological, oceanographic, and rig response data
s Other Observations
3 M During drilling, marine observations will be conducted as required by the Physical Environmental Guidelines (PEG’s) and the Drilling Regulations. A qualified observer will record and report both aviation and marine weather observations. Using WMO/MSC-approved, standard meteorological sensors, the observers will provide synoptic weather observations every three hours over the synoptic periods 00:00Z through to 21:00Z and either, hourly aviation observations between 10:00Z to 21:00Z or whenever aviation operations are planned. All meteorological, oceanographic, and vessel response measurements and observations will be recorded on a computer running thc(Table 4.1). Table 4.1. Environmental Parameters to be Measured or Observed. Measured Parameters Observed ParameterWind Speed and Direction Present Weather Ocean Currents Station Barometric Pressure Past Weather Passing Vessel Traffic Sea Level Barometric Pressure Visibility Heave, Pitch and Roll
Pressure Trend Wind Wave required) Wildlife Numbers and Behaviour (if
Altimeter Primary Swell Anchor Tensions Air Temperature Secondary Swell Well Offset (if required) Wet-bulb Temperature Sky Condition Dew Point Temperature Cloud Type Sea Surface Temperature Sea Ice/Icebergs Ice Accretion Mar e ic hou nd the i a Storm the n ed equ s issued whenever:
ubles to 25 knots (46.3 km/hr) or more; gale warning in
•
in weather observations will be taken every three hours (main and intermediate synoptrs) according to procedures outlined in the MANMAR manual (including amendments) agu delines published by the C-NLOPB. If necessary, a Special Weather Report and/or
Report will be filed whenever the criteria for such reports are met, regardless of whether co ditions were forecast or not. A Storm Report will be filed whenever the wind spe
or exceeds 48 knots. Special Weaal ther Reports will be
• Mean wind speed do• Mean wind speed increases to 34 knots (62.9 km/hr) or more with no
effect; Visibility decreases to one-half mile or less;
Husky White Rose Development Project: New Drill Centre Construction & Operations Program EA Addendum Page 39

• rom the value reported at the last main synoptic; • rstructure.
Aviatio Aviation weather observations will be taken hourly from 06:30L to 17:30L, and/or whenever helicop e as outlined in the MANOBS manual and as s en changing weather con i to the Com a e consistent with weather reports from shore-based stations, aviation observations from the rig will be e er observa hould cod h nd the We Enviro Instrumthe N be insp t
t i forecasts will consist of:
site-specific forecasts prepared and issued on a st updates on a 6-hour basis.
rt-term forecasts out to 54 hours followed by a long-range forecast in 12-hour or an additional three days.
briefings. • Site-specific forecasts, which will include at a minimum the following:
Wave height increases by 1.5 m fIce forms on the supe
n Meteorological Program
ter operations are planned. The observations will bpre cribed by the C-NLOPB. Special observations will be taken wh
dit ons meet the criteria for “specials”. These specials will be reported immediately p ny’s helicopter contractor and the Husky contractor’s Weather Forecasting Office. To b
cod d and transmitted in METAR format. The onboard observer will take aviation weathtions at the MODU and will record those observations using suitable software that s
e t e observation into a METAR format and forward it to both the Helicopter contractor aather Forecasting Office.
nmental and Meteorological Instrumentation
entation for environmental and weather observations that meet the stated requirements of C- LOPB and MSC will be available onboard the MODU. The instrumentation will ec ed and calibrated by qualified personnel.
Meteorological Forecast Services Meteorological forecasts tailored to meet the operational requirements of the program and satisfy all C-NLOPB guidelines will be in place for the duration of the drilling programs. The forecasts will be verified against the synoptic weather observations collected on the MODU. A a m nimum, the
• A 24-hour weather watch with 12-hour basis and foreca
• Shotime steps f
• Updated forecasts issued on a three-hour basis or more frequent, if required, during emergency or storm conditions.
• Issuances of weather warnings when appropriate. • Weather
Synopsis of present weather patterns; Mean and maximum wind speed and direction; Precipitation;
Husky White Rose Development Project: New Drill Centre Construction & Operations Program EA Addendum Page 40
Visibility and sky condition; Air temperature; Mean sea level pressure; Potential for freezing spray/icing conditions; Significant and maximum wave height and direction; Wave period; Significant height and direction of swells; and
t and maximum wave height and direction. • An overview of weather and sea state forecast procedures and information sources.
ta archiving, processing, and preparation of all the required reports as outlined in
METAR and MANMAR observations d to the MSC network. ollected on the MODU and any other
cumented process. echnological advances in the preceding two decades have improved ice detection capabilities to
a p t large area with gre c Ice t nd monitor ice distribution. Between government (both Canadian and US) and private industry there are over 5,000 hours of airborne reconnaissance conducted annually over the Canadian East
Combined significan
• QA/QC processes as well as forecast verification procedures to ensure ongoing accuracy of forecasts.
• Forecasts prepared by qualified personnel who have experience in the geographical region and familiar with MSC and C-NLOPB requirements and guidance material.
• An effective data communications system to ensure timely receipt and issuance of environmental data and forecasts.
• Dathe C-NLOPB Guidelines including the preparation of a forecast verification report.
• Quality control of weather observations. TheMANMAR coded observations will be forwarde
• s c Sea state will be verified against observationobservations available.
Ice Management and Mitigation Program This section provides an overview of ice management practices that will be employed on this project to provide a safe environment and minimize operational disruptions caused by ice. Currently ice management is comprised of:
• Detection; • Monitoring and Assessment; and • Physical Management.
Detection Detecting small floating targets in open seas is a well-understood and doT
oin where both sea ice and icebergs can be detected and positioned over aat a curacy.
de ection will use a combination of radar technologies and procedures to quantify a
Husky White Rose Development Project: New Drill Centre Construction & Operations Program EA Addendum Page 41
coast. In addition to these radar-equipped aircraft, the areas off Canada’s East Coast are swept daily by an assortment of satellite-based sensors and long-range, shore-based radars. Data from all these sources are integrated into a daily summary of ice distribution. The sequential ice
istribution data is then used to monitor growth and movement. Using these procedures, the detect and monitor ice conditions, allowing for long-term resource and
perational ice management planning.
establish the speed and direction of its movement (drift) nd, when enough information has been obtained, assess its potential threat to the Project.
e components of detailed ice assessment data are:
• Depth measurements of icebergs (draft); and drift (direction and speed).
. These methods are described in detail in usky’s Ice Management Plan that applies to its operations in the Newfoundland Offshore Area.
Obt i he widesp now provides very accurate positions,
ermitting accurate tracks, even over short distances and time spans.
ata have been collected, a reasonable assessment of the risk posed by the e will be made. Typical risk assessment considers the following questions:
• rift of the ice likely to pose a collision risk or disrupt operations?
• ?
doperator will be able to o Monitoring and Assessment Once detected, ice will be monitored toaTypically this is accomplished in stages. The initial detection is usually accompanied by a general classification of the type of ice or iceberg. As successive detections are made over an area, a general drift track is established. At this stage the available data will allow for general assumptions to be made. As ice closes on the Project Area, more detailed information will be acquired. Th
• Physical dimensions of sea ice and/or icebergs;
• Accurate The standard methodology for obtaining physical dimensions comprises a mix of measurement, calculation and in some cases estimation, depending on the operational significance of the ice in question. Smaller icebergs and ice floes are usually estimated, because their masses are well within the capabilities of ice management vesselsH
ain ng accurate drift information is a simple process of measuring distance over time. Tread use of the Global Positioning Systems (GPS)
p Once these baseline dic
Is the d• Is the ice in excess of the design criteria of the facility?
Is the ice/iceberg within manageable parameters• Is the drift acceptable within the time frame required to move the MODU if required?
Husky White Rose Development Project: New Drill Centre Construction & Operations Program EA Addendum Page 42
If the answer to these simple questions is, ‘no’ then the ice need only be monitored for any drift changes. If however, the answer is ‘yes’ then either a physical ice management procedure will be initiated or the facility will be secured and prepared for a possible move. Physical Management In general terms, most physical iceberg management consists of towing or deflecting the iceberg off its free drifting track or braking ice floes to a size acceptable to design of the facility. Iceberg
wing strategies employed over this project will be the same as those used on the Grand Banks
ement of drilling.
e Mitigations
sting by dedicated ontractors. Husky Oil Operations Limited will use a three-fold strategy in avoiding or
mitigating the potential effects of ice and icebergs:
1. Onboard environmental observer (s); and 2. Protocols that deal specifically with ice mitigations for a semi-submersible have
been included in the Husky Ice Management Plan. In summary, the Ice Management Plan involves describing three zones around the rig, in order of farthest from the rig:
1. Zone 3: Monitor--track and manage (potentially “tow”). There is no set size for this zone.
2. Zone 2: React--prepare for departure to designated safe area. The size of Zone 2 is partially defined by the “T-Time” (see below).
3. Zone 1: Alert—depart to designated safe area. The size of Zone 1 (one nmi or one hour drift) is the same for both rig types.
toand off Labrador for the past 30 years. Sea ice management procedures are well documented; breaking up sea ice to assist shipping is a commonplace occurrence in Canadian waters. Because of the loose nature of the pack in the area, sea ice management primarily consists of using support vessels to break up any large ice floes that meet or exceed the design limits of the facility. The exact procedures for detection, monitoring and mitigation will be described in the project’s ice management plan, which will be submitted for regulatory approval prior to the commenc Effects of the biological environment will be mitigated through regular inspections and cleaning and the use of C-NLOPB approved anti-fouling coatings, chemicals and techniques. Ic The offshore industry, including Husky, mitigates the effects of wind, waves, and ice on project operations and safety through the state-of-the-art, site-specific forecac
Husky White Rose Development Project: New Drill Centre Construction & Operations Program EA Addendum Page 43
The size o the zones may vary depending upon the capabilitief s of individual rigs, perceived reats, weather conditions, and the drift and speed of the ice. The “T-Time” is the total time
operations wel re ove to a safe updated by senior offshore management personnel.
made on the “ice threat” based on calculation of size and type of ice and “closest ch.” The semi-subm rsible has to retrieve anchors in orde o move; they also
are ab to shear links and drop chains in an es to evacuate personnel, if necessary.
ts on the roject
ts of the env onment on the Project is contained in Tables 4.2 and 4.3. azards will be mitigated by pre-project surveys. W her and wave co itions affect every
d Banks to some egree. It is anticipated that these effe s will be mitigated ect by operational scheduling for dredging within the May – September period and by
g. The res al effects of wind, waves and weathe are predicte o be not significant.
ny potential effects on the Proje rom icebergs ca be mitigated by timing of specific erations outside of the iceberg season and by the Ice Management Plan described above such
hysical effects of biofouling on infrastructure are monitored during annual or more frequent
ROV facility integrity inspections. Biofouling is reduced to non-significance through the use of inspections, chlorination and bioc rocedures.
threquired to suspend , secure the l/work site and prepa the rig to marea. This T-Time is continually beingEvaluations arepoint of approa
ave emergency shear links on anchor chains and e r t
h leemergency. There are also procedur
4.7 Summary of Effec
A summary of the effec
P
irGeoh eat ndproject on the Gran d ctfor the Projstate-of-the-art forecastin idu r d tadverse (i.e., in the form of delays) but A ct f nopthat residual effects will be not significant.
P
ides as per standard operating p
Husky White Rose Development Project: New Drill Centre Construction & Operations Program EA Addendum Page 44
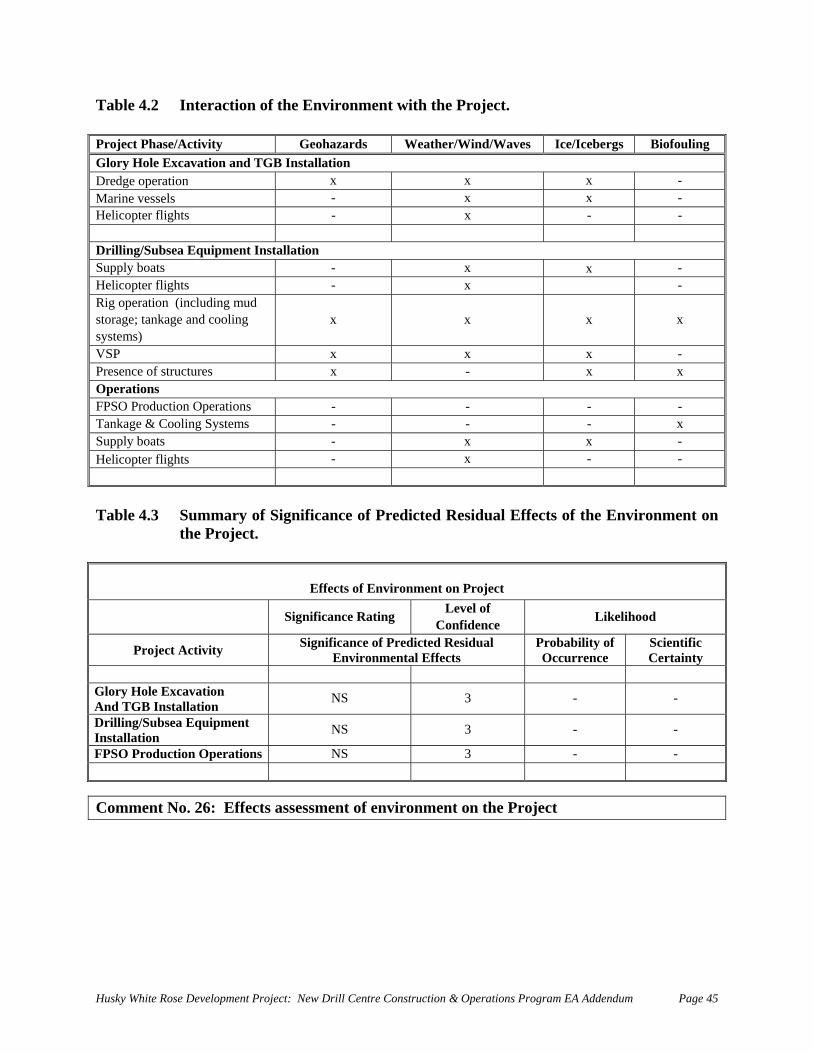
Table 4.2 Interaction of the Environment with the Project.
Geohazards Weather/Wind/Waves Ice/Icebergs Biofouling Project Phase/ActivityGlory Hole Excavation and TGB Installation Dredge operation x x x - Marine vessels - x x - Helicopter flights - x - - Drilling/Subsea Equipment Installation Supply boats - x x - Helicopter flights - x - Rig operation (including mud
orage; tankage and cooling x x x
x stsystems) VSP x x x - Presence of structures x - x x Operations FPSO Production Operations - - - - Tankage & Cooling Systems - - - x Supply boats - x x - Helicopter flights - x - -
mm ance of esidua the Environment on Pr
cts of Environment on Pr ject
Table 4.3 Su ary of Signific Predicted R l Effects ofthe
oject.
Effe o Significance Rating Level of
Confidence Likelihood
Project Activity SignificaEnvironmental Effects
nce of Predicted Residual Probability of Occurrence
Scientific Certainty
Glory Hole Excavation NS 3 - And TGB Installation -
Drilling/Subsea Equipment NS 3 - - Installation FPSO Production Operations NS 3 - -
Comment No. 26: Effects assessment of environment on the Project
Husky White Rose Development Project: New Drill Centre Construction & Operations Program EA Addendum Page 45
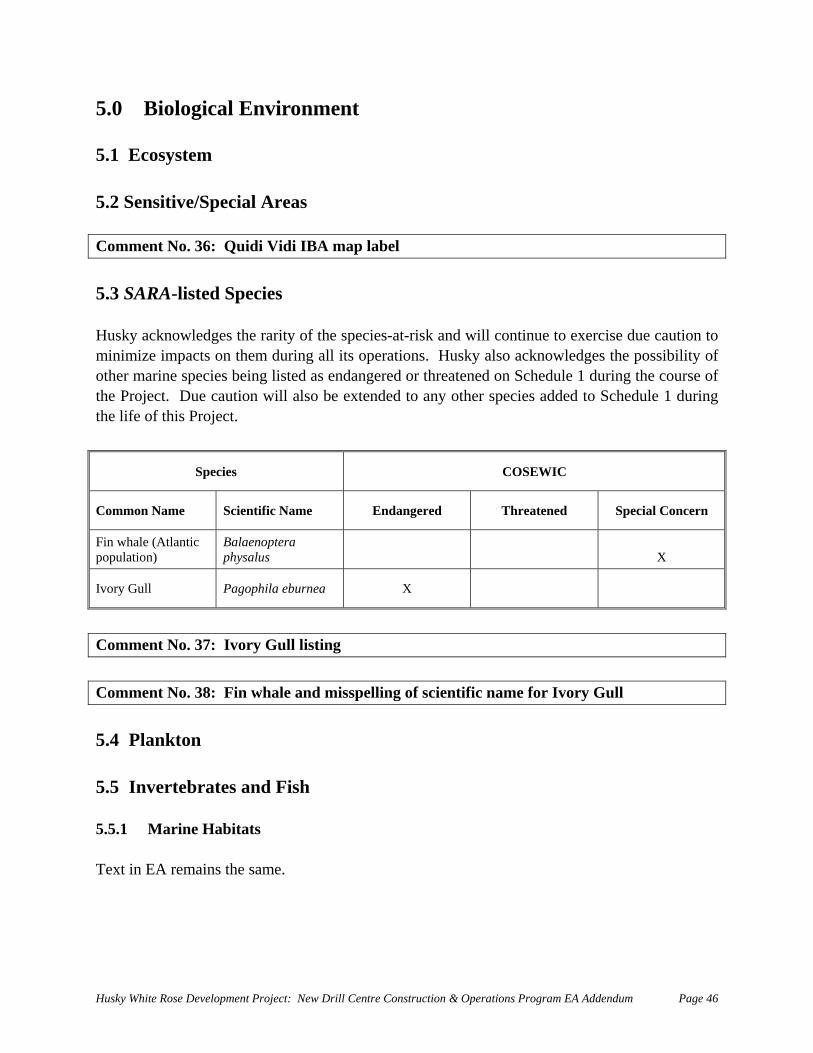
5.0 Biological Environment 5.1 Ecosystem 5.2 Sensitive/Special Areas Comment No. 36: Quidi Vidi IBA map label 5.3 SARA-listed Species Husky acknowledges the rarity of the species-at-risk and will continue to exercise due caution to minimize impacts on them during all its operations. Husky also acknowledges the possibility of other marine species being listed as endangered or threatened on Schedule 1 during the course of
e Project. Due caution will also be extended to any other species added to Schedule 1 during
Species COSEWIC
ththe life of this Project.
Common Name Scientific Name Endangered Threatened Special Concern
Fin whale (Atlantic population)
Balaenoptera physalus
X
Ivory Gull Pagophila eburnea X
Comment No. 37: Ivory Gull listing Comment No. 38: Fin whale and misspelling of scientific name for Ivory Gull 5.4 Plankton 5.5 Invertebrates and Fish 5.5.1 Marine Habitats Text in EA remains the same.
Husky White Rose Development Project: New Drill Centre Construction & Operations Program EA Addendum Page 46
5.5.2 Profiles of Commercially Important Species 5.5.2.2.4 Large Pelagics Swordfish (Xiphias gladius) may feed in the Study Area during the summer months. Adults are opportunistic feeders, known to forage for their food from the surface to the bottom over a wide depth range. Its diet consists predominantly of fishes, supplemented by crustaceans and squid.. Swordfish do not spawn in the Study Area (FishBase 2006). The various tuna species (Thunnus spp.) that may feed in the Study Area are also oceanic fish. Bluefin, yellowfin, albacore and skipjack tunas often occur in mixed schools during their feeding migrations. As with swordfish, tunas also feed predominantly on fishes and supplement this prey type with crustaceans and squid. None of these tuna species spawn within the Study Area (FishBase 2006). Comment No. 39: Inconsistent level of detail re: large pelagics 5.5.3 Profiles of SARA- and COSEWIC-listed Fish 5.5.3.1 Wolffishes Of the three wolffish species, northern wolffish is the deepest residing species and Atlantic wolffish is the shallowest residing species. Based on DFO trawl surveys in Newfoundland and Labrador waters between 1971 and 2003 (Kulka et al. 2004), northern wolffish were most concentrated during December to May in areas where depths ranged from 500 to 1,000 m, shifting to slightly shallower areas from June to November. Spotted wolffish concentrations were highest in areas with water depths ranging from 200 to 750 m at all times of the year, peaking in 300 m areas from June to November. Atlantic wolffish were most concentrated in
ating 250 m at all times of the year. areas with depths approxim Comment No. 40: Wolffish depth distributions 5.5.3.2 Atlantic Cod In March 2003, the Fisheries Resources Conservation Council (FRCC) released somrecommendations for the Northern Cod. For the bank sub-stocks, the Council rec
e ommended a
igher level of protection than has been in place since commencement of the moratorium. In g and juvenile cod, the FRCC
commended the establishment of experimental ‘cod boxes’ in both the Hawke Channel and the Bonavista Corridor (Figure 5.1). The Hawke Channel is located approximately 120 nm northwest of the Bonavista Cod Box, just off the coast of Labrador. The FRCC recommended that these areas be protected from all forms of commercial fishery (except snow crab trapping)
horder to reduce by-catch mortality and disturbance to spawninre
Husky White Rose Development Project: New Drill Centre Construction & Operations Program EA Addendum Page 47
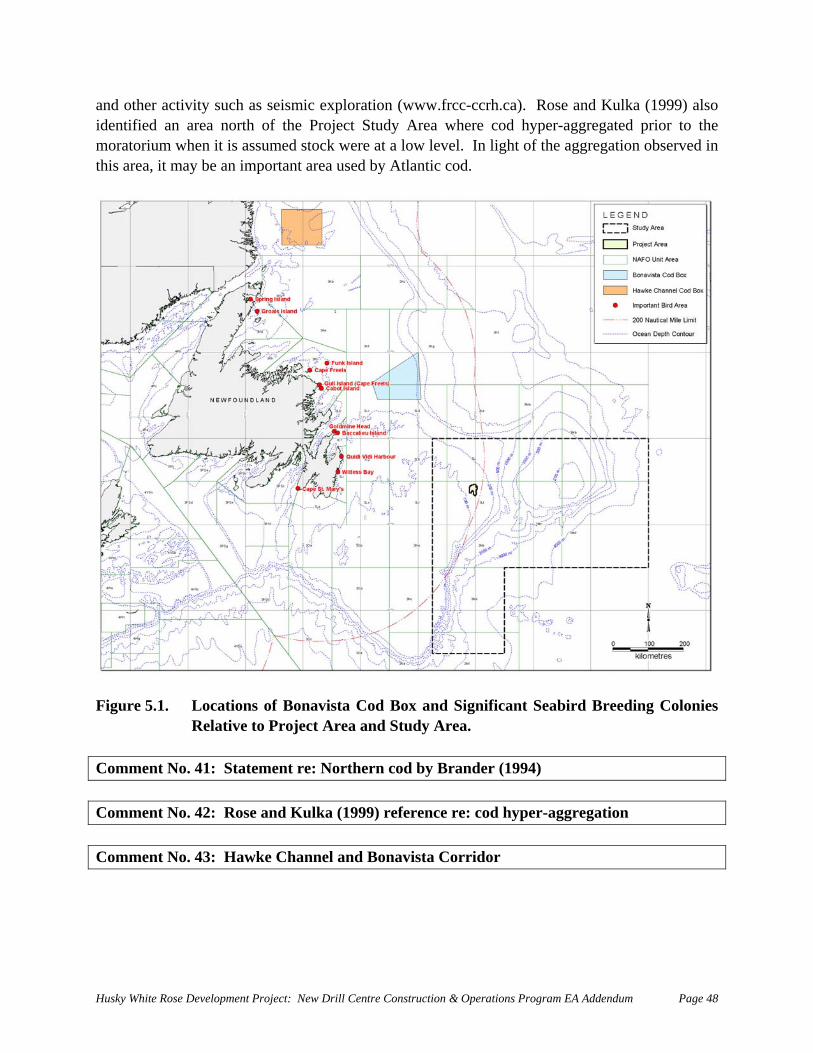
and other activity such as seismic exploration (www.frcc-ccrh.ca). Rose and Kulka (1999) also entified an area north of the Project Study Area where cod hyper-aggregated prior to the id
moratorium when it is assumed stock were at a low level. In light of the aggregation observed in this area, it may be an important area used by Atlantic cod.
Figure 5.1. Locations of Bonavista Cod Box and Significant Seabird Breeding Colonies
omment No. 41: Statement re: Northern cod by Brander (1994)
Relative to Project Area and Study Area. C Comment No. 42: Rose and Kulka (1999) reference re: cod hyper-aggregation Comment No. 43: Hawke Channel and Bonavista Corridor
Husky White Rose Development Project: New Drill Centre Construction & Operations Program EA Addendum Page 48
5.5.3.3 Porbeagle Shark Between March and July 2005, three DFO RAP meetings were held to assess the recovery potential of NAFO Subarea 3-6 porbeagle shark (O’Boyle 2005). DFO (2005) indicates that the porbeagle in the Northwest Atlantic can recover if human-induced mortality is sufficiently low. The only sources of human-induced mortality identified in DFO (2005) for incidental harm permitting are fisheries that capture this shark as bycatch. Comment No. 44: Porbeagle shark 5.5.3.4 White Shark
hite sharks are rare in Canadian waters and are recorded mostly in the Bay of Fundy area. WThey are extremely rare as far north as the White Rose area. Comment No. 45: White shark 5.5 Sho i monly observed on the Grand Banks and in bays around New u 5.5 Blu h Banks and in bays around Newfoundland. Co ks
.3.5 Shortfin Mako Shark
rtf n mako sharks are comfo ndland.
.3.6 Blue Shark
e s arks are commonly observed on the Grand
mment No. 46: Shortfin mako and blue shar 5.5.3.7 Cusk Cusk are at the extreme northern fringe of their range on the southern Grand Bank and would only occasionally occur in the White Rose area. Comment No. 47: Cusk range 5.5.4 Invertebrate and Fish Spawning Text in EA remains the same.
Husky White Rose Development Project: New Drill Centre Construction & Operations Program EA Addendum Page 49
5.6 Commercial Fisheries In this discussion of commercial fishing activities, a number of assessment and fisheries
omestic harvesters.
Fisheries-related information provided during the consultations is reported under the discussions of the commercial fisheries below, and any issues raised during the consultations are discussed in Section 6.0. The following fisheries agencies and industry stakeholders were consulted:
• Department of Fisheries and Oceans • Environment Canada • Natural History Society • One Ocean • FFAW • Association of Seafood Producers • Fishery Products International • Clearwater Seafoods Limited Partnership • Icewater Harvesting • Groundfish Enterprise Allocation Council
5.6.2 Historical Overview Figures 5.2 and 5.3 illustrate these changes in harvesting on the eastern Grand Banks since 1982. These graphs show catches for NAFO-regulated species by foreign and domestic harvesters, based on NAFO-supplied data. Figure 5.2 shows groundfish harvests (largely Atlantic cod, American plaice, capelin and redfish) over this 20-year period, and Figure 5.3 indicates shrimp catches. (Snow crab, presently another principal species harvested on the eastern Grand Banks and its slopes, is not managed by NAFO.). NAFO Unit Areas are indicated in Figure 5.1. Comment No. 48: Mapping of NAFO Unit Areas
management areas are referenced. The Drill Centre Areas (the North, West, and South White Rose Extensions and North Amethyst) are the areas of proposed development, the Project Area is the area which contains the three new Drill Centre Areas and the current White Rose Project (Figure 1.2), and the Study Area contains all of the Northwest Atlantic Fisheries Organization (NAFO) Unit Areas (UAs) 3Li, 3Lt (Project Area within this UA), 3Mc, 3Md, 3Nb, 3Nf and portions of UAs 3Lh, 3Lr, 3Ma, 3Mb, 3Na and 3Nf (Figure 1.1). The Study Area is used to characterize regional historical fisheries for both foreign and d 5.6.1 Information Sources
Husky White Rose Development Project: New Drill Centre Construction & Operations Program EA Addendum Page 50
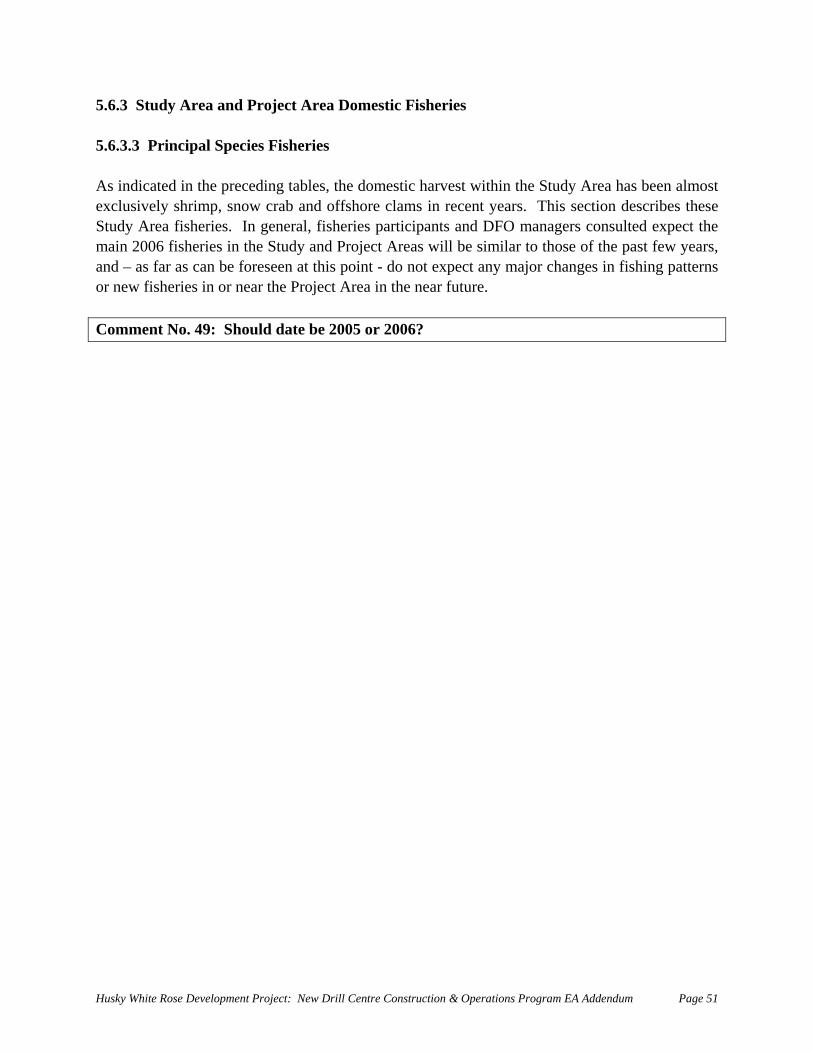
5.6.3 Study Area and Project Area Domestic Fisheries 5.6.3.3 Principal Species Fisheries
s indicated in the preceding tables, the domestic harvest within the Study Area has been almost hese
tudy Area fisheries. In general, fisheries participants and DFO managers consulted expect the main 2006 fisheries in the Study and Project Areas will be similar to those of the past few years, and – as far as can be foreseen at this point - do not expect any major changes in fishing patterns or new fisheries in or near the Project Area in the near future. Comment No. 49: Should date be 2005 or 2006?
Aexclusively shrimp, snow crab and offshore clams in recent years. This section describes tS
Husky White Rose Development Project: New Drill Centre Construction & Operations Program EA Addendum Page 51
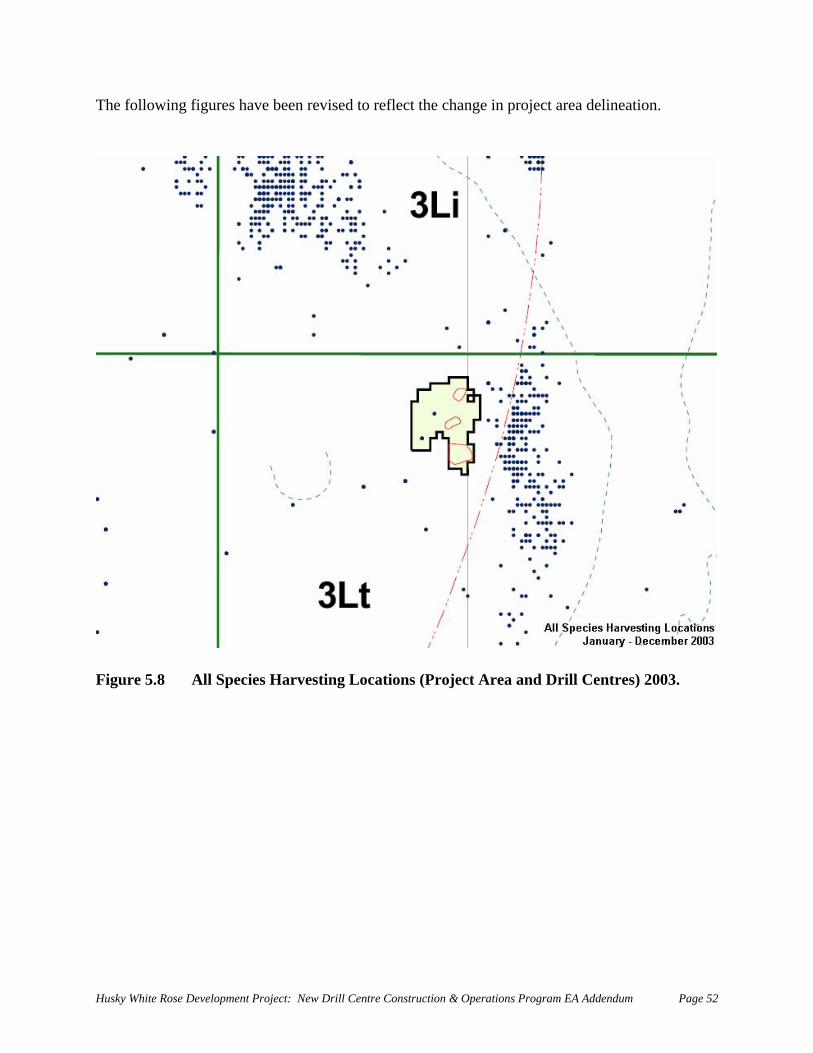
Husky White Rose Development Project: New Drill Centre Construction & Operations Program EA Addendum Page 52
he following figures have been revised to reflect the change in project area delineation.
03. Figure 5.8 All Species Harvesting Locations (Project Area and Drill Centres) 20
T
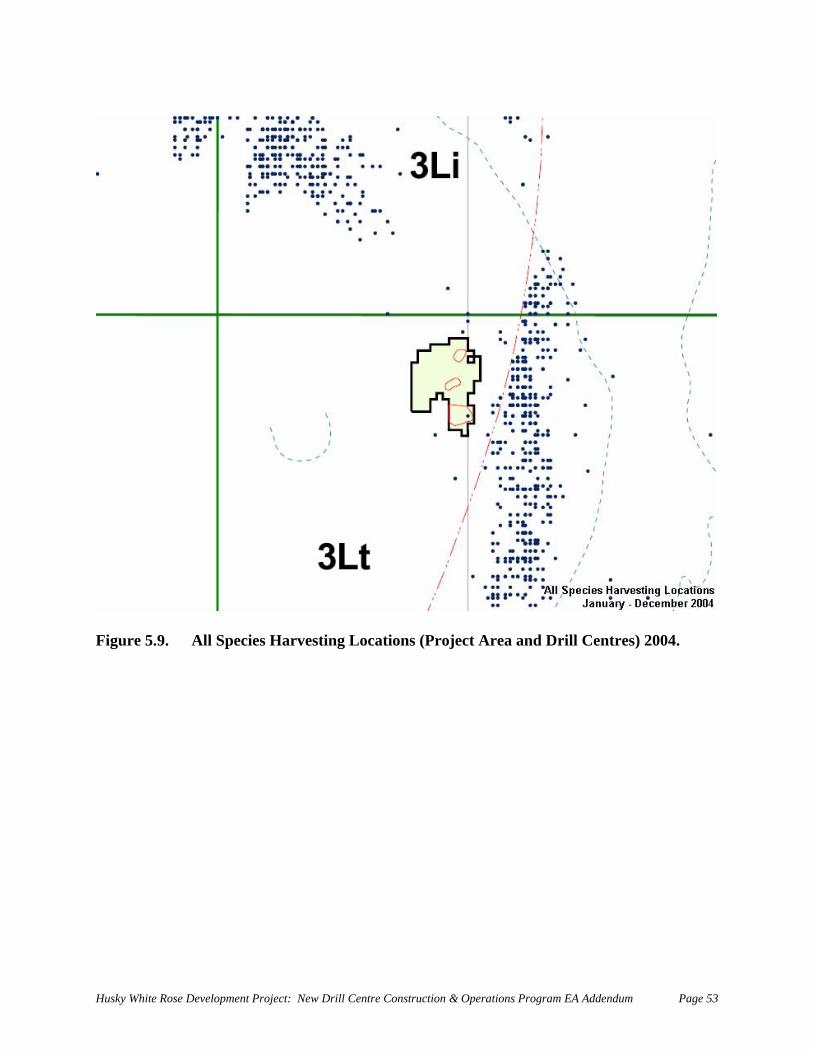
Fig
ure 5.9. All Species Harvesting Locations (Project Area and Drill Centres) 2004.
Husky White Rose Development Project: New Drill Centre Construction & Operations Program EA Addendum Page 53
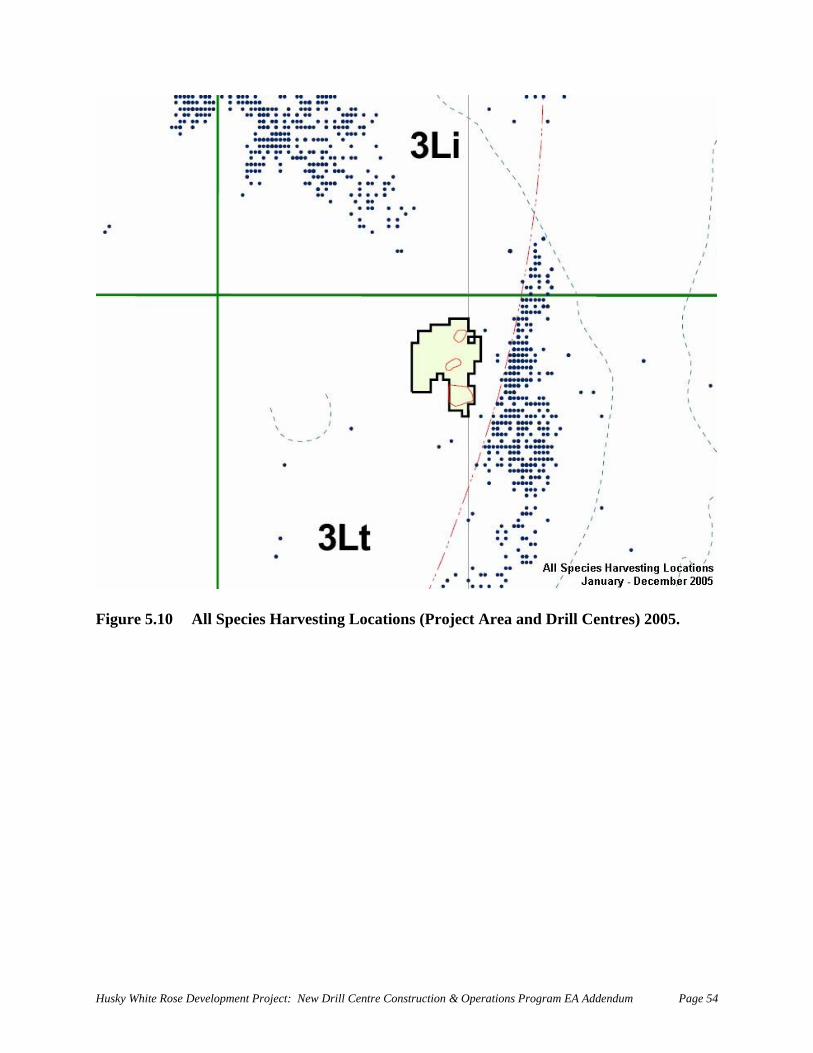
Figure 5.10 All Species Harvesting Locations (Project Area and Drill Centres) 2005.
Husky White Rose Development Project: New Drill Centre Construction & Operations Program EA Addendum Page 54
5.6.4 DFO Science Surveys
ext in EA remains the same.
.7 Marine Birds Comm
T 5
ent No. 50: PIROP spelled out Comment No. 52: Reference for Figure 5.33 There i rn and or ober to December period (Brown 198 ge is p The en he Grand ay Islands on
airs ne cludes the largest breeding olo
Atl ic Puffin he nesting he
rand f these rd
Comm
s a pattern of increased bird numbers along the Continental Shelf edge on the northetheastern Grand Banks in the July to September and Oct n
6; Lock et al. 1994) (Figure 5.33). Data from other seasons are incomplete but the shelf edrobably important during all seasons.
ormous numbers of nesting seabirds on the Avalon Peninsula illustrate the richness of tBanks for seabirds. The seabird breeding colonies on Baccalieu Island, the Witless B and Cape St. Mary’s are among the largest in Atlantic Canada. More than 4.6 millist at these three locations (Table 5.9 and Figure 5.1). This inp
c ny of Leach’s Storm-Petrel in the world (3,336,000 pair on Baccalieu Island), and the largest antic Canada colonies of Thick-billed Murre (1,000 pair at Cape St. Mary’s) and Atlant
(216,000 pair Witless Bay Islands). All these birds feed on the Grand Banks during t season May to September. In addition, Funk Island located 150 km northwest of tBanks supports the largest colony of Common Murre in Atlantic Canada. Many oG
bi s would reach the northern Grand Banks during the breeding season.
ent No. 53: Interpretation of Figure 5.33 and Baccalieu Island Comment No. 54: Incorrect table reference
An Important Bird Area (IBA) is a site thareeding or non-breeding birds. There ar
t provides essential habitat for one or more species of e nine seabird nesting sites on the southeast coast of
ewfoundland from Cape Freels to the Burin Peninsula meeting the criteria for an IBA. (Figure 5.1 and Table 5.10). A grand total of 5.2 million pairs of birds breed at these sites. The Study Area is well beyond the foraging range of breeding birds during the breeding season, approximately May to August. At Witless Bay, Common Murres forage up to 200 km from the breeding site but usually only 50-100 km (Cairns et al. 1990, in Gaston and Jones 1998). However, during post-breeding dispersal the Study Area is within range of all seabirds breeding in eastern Newfoundland and Labrador. In addition, Grates Point, Mistaken Point and Placentia Bay qualify as IBAs because of significant wintering populations of Common Eider. Comment No. 55: Suggested paragraph restructuring
bN
Husky White Rose Development Project: New Drill Centre Construction & Operations Program EA Addendum Page 55
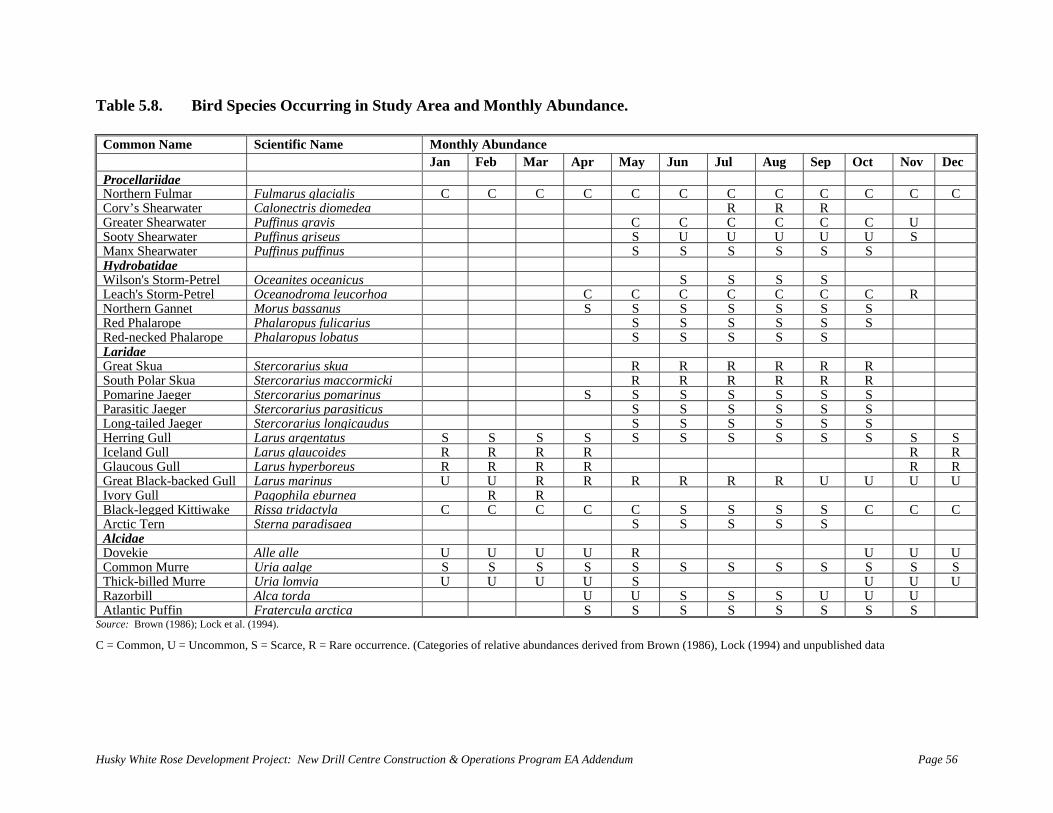
e Rose Development Project: New Drill Centre Construction & Operations Program EA Addendum Page 56
abl rea a
Commo m Scientific Name Mon
e 5.8.
n Na
Bir
e
d Species Occurring in Study A nd
thly
M
Ab
on
un
th
da
ly Ab
nce
undance.
Jan a y u Sep v Feb M r Apr Ma J n Jul Aug Oct No DecProcella e riida Norther lman Fu r Ful us mar glacialis C C CC C C C C C C C CCory’s S wahear ter Ca ctri medea R R Rlone s dioGreater rwShea ater Puffinus gravis C C C C C C USooty S atehearw r Puffinus griseus S U U U U U SManx Shearwater Puffinus puffinus S S S S S SHydrob e atidaWilson's Storm-Petrel Oceanites nic ocea us S S S SLeach's Storm-Petrel Oceanodr euc Roma l orhoa C C C C C C CNorthern Gannet Morus bassanus S S S S S S SRed Phalarope Phalaropus fulicarius S S S S S SRed-necked Phalarope Phalaropu atuss lob S S S S SLaridae Great Skua Stercorari ua R R R Rus sk R RSouth Polar Skua Stercorarius maccormicki R R R R RRPomarine Jaeger Stercorarius pomarinus S S S S S SSParasitic Jaeger Stercorarius parasiticus S S S S S SLong-tailed Jaeger Stercorari nus lo gicaudus S S S S S SHerring Gull Larus argentatus S SS S S S S S S S S SIceland Gull Larus glaucoides R RR R R R Glaucous Gull Larus hyperboreus R RR R R R Great Black-backed Gull Larus marinus U U UU U R R R R R R UIvory Gull Pagophila eburnea R R Black-legged Kittiwake Rissa tridactyla C C C C S S C C CC S SArctic Tern Sterna paradisaea S S SS SAlcidae Dovekie Alle alle U U U R U U UUCommon Murre Uria aalge S S S S S S S S S S SSThick-billed Murre Uria lomvia U U U U S U U URazorbill Alca torda S S S U UU U UAtlantic Puffin Fratercula arctica S S S S SS S S
Source: Brown (1986); Lock et al. (1994).
C = Common, U = Uncommon, S = Scarce, R = Rare (Categori un m Lo npubl ta
occurrence. es of relative ab dances derived fro Brown (1986), ck (1994) and u ished da
Husky Whit
T
Comment No. 51: Missing scientific names in Table 5.8 5.7.1 Seasonal Abundance of Seabirds in the Study Area
spelling
5.7.1.2 Hydrobatidae (storm-petrels) Comment No. 56: Incorrect 5.7.1.6.1 Dovekie Dovekies breed in the North Atlantic, primarily in Greenland and east Novaya Zemlya, Jan Mayen and Franz Josef Land in northern Russia. Comment No. 57: Incorrect spelling 5.7.1.6.3 Thick-billed Murre Thick-billed Murre is common in the Study Area between October and May. Comment No. 58: Incorrect information for Thick-billed Murre 5.7.2 Prey and Foraging Habits 5.7.2.2 Hydrobatidae (storm-petrels) Leach’s and Wilson’s Storm-Petrels feed on a variety small fish <100 mm long especially myctophids and various small crustaceans and gelatinous zooplankton. These storm-petrels usually feed while on the wing, picking small food items from the surface. Comment No. 59: Additional information for Storm-Petrels 5.7.3 Ivory Gull Comment No. 60: Reference to Species-at-Risk section for more information on Ivory
Gull
Husky White Rose Development Project: New Drill Centre Construction & Operations Program EA Addendum Page 57
5.8 Marine Mammals The listing of the monitoring programs in Section 5.8 should read as follows:
ogram in Jeanne d’Arc Basin (Lang et al. 2006) where marine mammal observers (MMOs) conducted ~371 hours of observation along 2,859-km
e M/V Western Neptune from 1 October to 8 November 2005. Most ade north of the Project Area (see Husky Seismic Area 2005 in
Dartmouth, NS along the Scotian Shelf and the southern Grand Banks to the Orphan here were 61.7 h of observations along 485
were 20 sightings of 116
y.
ource’s 3D seismic program in Orphan Basin where MMOs on along 10,541 km from the SR/V Veritas Vantage
tember 2004 (Moulton et al. 2005). In total, there were 151 ematic watches from the Vantage.
4. Chevron Canada Limited’s 3D seismic program in Orphan Basin where MMOs of observation along 22,664 km from two seismic vessels (M/V
Geco Diamond and Western Patriot) from 12 May to 10 October 2005 (Moulton et al. re were 409 sightings of 3,554 marine mammals during
systematic watches.
d sentence
1. Husky’s 3D seismic pr
trackline from thobservations were mFigure 5.34) as the seismic ship conducted its surveys primarily in EL1067, with the vessel making turns in EL1066 and 1089 (Figure 5.34). A total of 170 marine mammal sightings were made, totaling 530 individuals.
2. Observations conducted by a biologist aboard the CCGS Hudson as it sailed from
Basin (Lang and Moulton 2004). In total tkm during 24 June to 7 July 2004. Of this effort, 25.5 h and 36.2 h occurred when theship was stationary and moving, respectively. In total, theremarine mammals during systematic watches and incidentall
3. Chevron Canada Res
conducted 1,198 h of observatifrom 26 June to 18 Sepsightings of 1,397 marine mammals during syst
conducted 2,656 h
2006b). In total, the
Comment No. 61: Unfinishe
Husky White Rose Development Project: New Drill Centre Construction & Operations Program EA Addendum Page 58
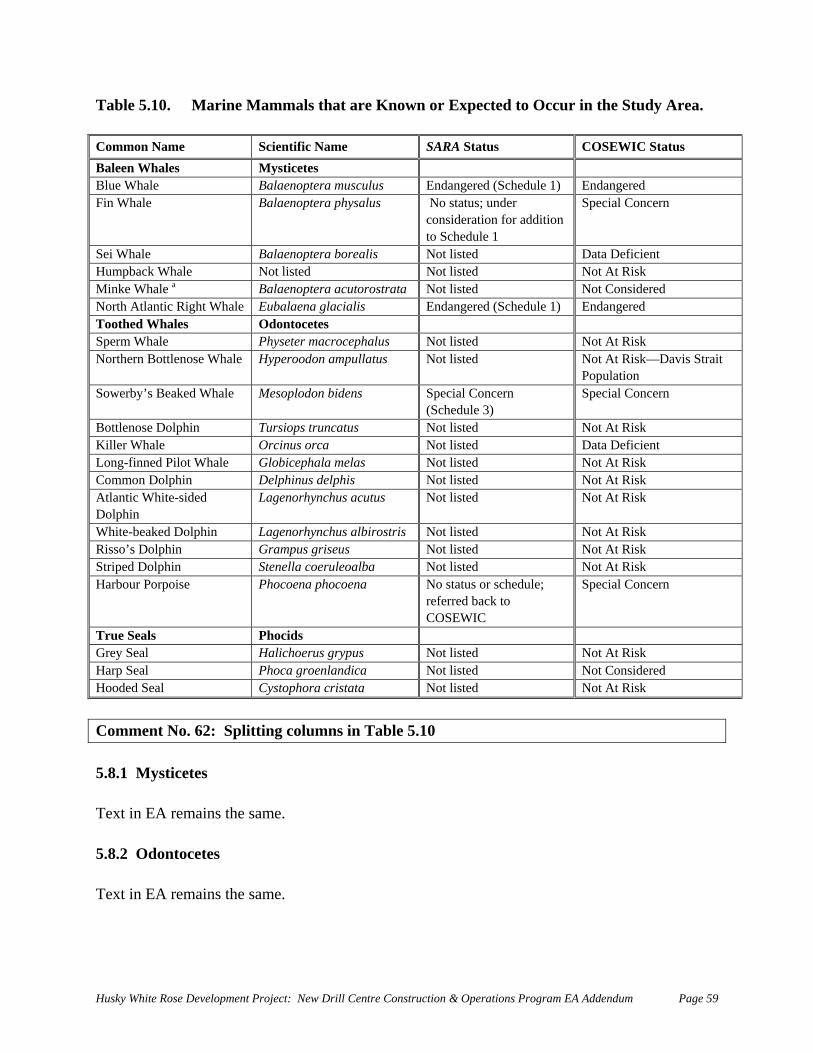
Table 5.10. Marine Mammals that are Known or Expected to Occur in the Study Area.
ific Name SARA Status COSEWIC Status
Common Name ScientBaleen Whales Mysticetes Blue Whale Balaenoptera musculus Endangered (Schedule 1) Endangered Fin Whale Balaenoptera physalus No status; under
consideration for addition to Schedule 1
Special Concern
Sei Whale Balaenoptera borealis Not listed Data Deficient Humpback Whale Not listed Not listed Not At Risk Minke Whale a Balaenoptera acutorostrata Not listed Not Considered North Atlantic Right Whale Eubalaena glacialis Endangered (Schedule 1) Endangered Toothed Whales Odontocetes Sperm Whale Physeter macrocephalus Not listed Not At Risk Northern Bottlenose Whale Hyperoodon ampullatus Not listed Not At Risk—Davis Strait
Population Sowerby’s Beaked Whale Mesoplodon bidens Special Concern
(Schedule 3) Special Concern
Bottlenose Dolphin Tursiops truncatus Not listed Not At Risk Killer Whale Orcinus orca Not listed Data Deficient Long-finned Pilot Whale Globicephala melas Not listed Not At Risk Commo Dolphin n Delphinus delphis Not listed Not At Risk Atlantic White-sided Lagenorhynchus acutus Not listed Not At Risk Dolphin White-beaked Dolphin Lagenorhynchus albirostris Not listed Not At Risk Risso’s Dolphin Grampus griseus Not listed Not At Risk Striped Dolphin Stenella coeruleoalba Not listed Not At Risk Harbour Porpoise Phocoena phocoena No status or schedule;
referred back to Special Concern
COSEWIC True Seals Phocids Grey Seal Halichoerus grypus Not listed Not At Risk Harp Seal Phoca groenlandica Not listed Not Considered Hooded Seal Cystophora cristata Not listed Not At Risk Comment No. 62: Splitting columns in Table 5.10 5.8.1 Mysticetes Text in EA remains the same. 5.8.2 Odontocetes
ext in EA remains the same. T
Husky White Rose Development Project: New Drill Centre Construction & Operations Program EA Addendum Page 59

5.8.3 Phocids Text in EA remains the same. 5.8.4 Profiles of SARA- and COSEWIC-listed Marine Mammals Text in EA remains the same.
Husky White Rose Development Project: New Drill Centre Construction & Operations Program EA Addendum Page 60
6.0 Effects Assessment Methodology
e.
n meeting, H ovided maps showing available at the time posed development of new drill centres. The in cluded the ential
r disturbance area related sed drill cen as the location of the opos mp the sediment removed during excavation of the glory
contained in Appendix 2.
Appendix 2 ed to but not in docume
6.1 Scoping Text in EA remains the sam 6.2 Consultations At each consultatio usky pr informationon the pro formation in potseafloo to the five propo tres as well spoils area where Husky pr es to duholes. The list of attendees is Comment No. 63: referr nt 6.2.1 Issues and Concerns
EA remains the same.
Ecosystem Co
.
mains the same.
Fishery VE
ains the same. 6.3.4 Marine Bird VEC Text in EA remains the same.
Text in 6.3 Valued
mponents (VECs)
6.3.1 Fish Habitat VEC Text in EA remains the same 6.3.2 Fish VEC Text in EA re 6.3.3 Commercial C Text in EA rem
Husky White Rose Development Project: New Drill Centre Construction & Operations Program EA Addendum Page 61
6.3.5 Marine Mammal VEC Text in EA remains the same.
the same.
s
he same.
oundaries
ties ith the development of as many as five new drill roduction) have been assessed ‘year-round’ for the period 2007-2016. Effects
d with prod sing the new drill centres have been assessed ‘year-round’ for the period 2009-2020. Effects of routine activities related to abandonment have
or after 2020. The potential effect of accidental .e., blowouts batch o been considered
oject Area
roje ur in any given year (Figure 1.1).
ose onal Area
6.3.6 Sea Turtle VEC Text in EA remains 6.3.7 Species-at-Risk VEC Text in EA remains the same. 6.4 Other Issue Text in EA remains t 6.5 B 6.5.1 Temporal Effects of the routine activi associated wcentres (i.e., pre-pof activities associate uction operations u
been assessed f s events (i andspills) have als . 6.5.2 Spatial 6.5.2.1 Pr The Project Area is where P
ct activities will occ
Comment No. 64: White R Operati 6.6 Effects Assessment Pr es ocedur 6.6.1 Identification and Evaluation of Effects Text in EA remains the same.
Husky White Rose Development Project: New Drill Centre Construction & Operations Program EA Addendum Page 62
6.6.2 Classifying Anticipated Environmental Effects
ext in EA remains the same.
.6.4 Application of Evaluation Criteria for Assessing Environmental Effects
ext in EA remains the same.
.6.5 Cumulative Effects
omment No. 65: Inclusion of aboriginal fisheries in cumulative effects
Text in EA remains the same. 6.6.3 Mitigation T 6 T 6 C 6.6.6 Integrated Residual Environmental Effects
ext in EA remains the same.
.6.7 Significance Rating
.7 Monitoring/Follow-Up
ex in EA remains the same.
omment No. 66: More details on effect of environment on Project
T 6
ext in EA remains the same. T 6
tT 6.8 Effects of the Environment on the Project Refer to response to Comment No. 26 – see Chapter 4.0. C
Husky White Rose Development Project: New Drill Centre Construction & Operations Program EA Addendum Page 63
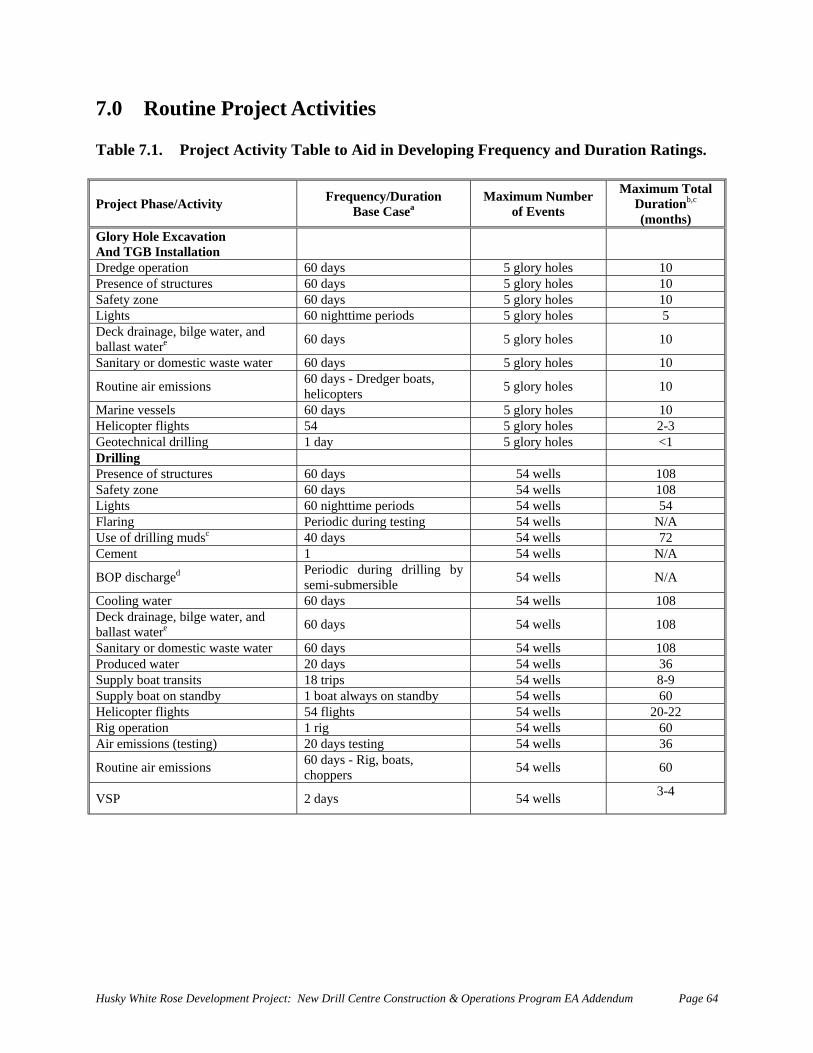
7.0 Routine Project Activities Table 7.1. Project Activity Table to Aid in Developing Frequency and Duration Ratings.
Project Phase/Activity Frequency/Duration Base Casea
Maximum Number of Events
Maximum Total Durationb,c (months)
Glory Hole Excavation And TGB Installation
Dredge operation 60 days 5 glory holes 10 Presence of structures 60 days 5 glory holes 10 Safety zone 60 days 5 glory holes 10 Lights 60 nighttime periods 5 glory holes 5 Deck drainage, bilge water, and ballast wa 60 days 5 glory holes 10 tere
Sanitary or domestic waste water 60 days 5 glory holes 10
Routine air emissions 60 days - Dredger boats, helicopters 5 glory holes 10
Marine vessels 60 days 5 glory holes 10 Helicopter flights 54 5 glory holes 2-3 Geotechnical drilling 1 day 5 glory holes <1 Drilling Presence of structures 60 days 54 wells 108 Safety zone 60 days 54 wells 108 Lights 60 nighttime periods 54 wells 54 Flaring Periodic during testing 54 wells N/A Use of drilling mudsc 40 days 54 wells 72 Cement 1 54 wells N/A
BOP discharged Periodic during drilling by semi-submersible 54 wells N/A
Cooling water 60 days 54 wells 108 Deck drainage, bilge water, and ballast watere 60 days 54 wells 108
Sanitary or domestic waste water 60 days 54 wells 108 Produced water 20 days 54 wells 36 Supply boat transits 18 trips 54 wells 8-9
Supply boat on standby 1 boat always on standby 54 wells 60 Helicopter flights 54 flights 54 wells 20-22 Rig operation 1 rig 54 wells 60 Air emissions (testing) 20 days testing 54 wells 36
Routine air emissions choppers 54 wells 60 60 days - Rig, boats,
VSP 2 days 54 wells 3-4
Husky White Rose Development Project: New Drill Centre Construction & Operations Program EA Addendum Page 64
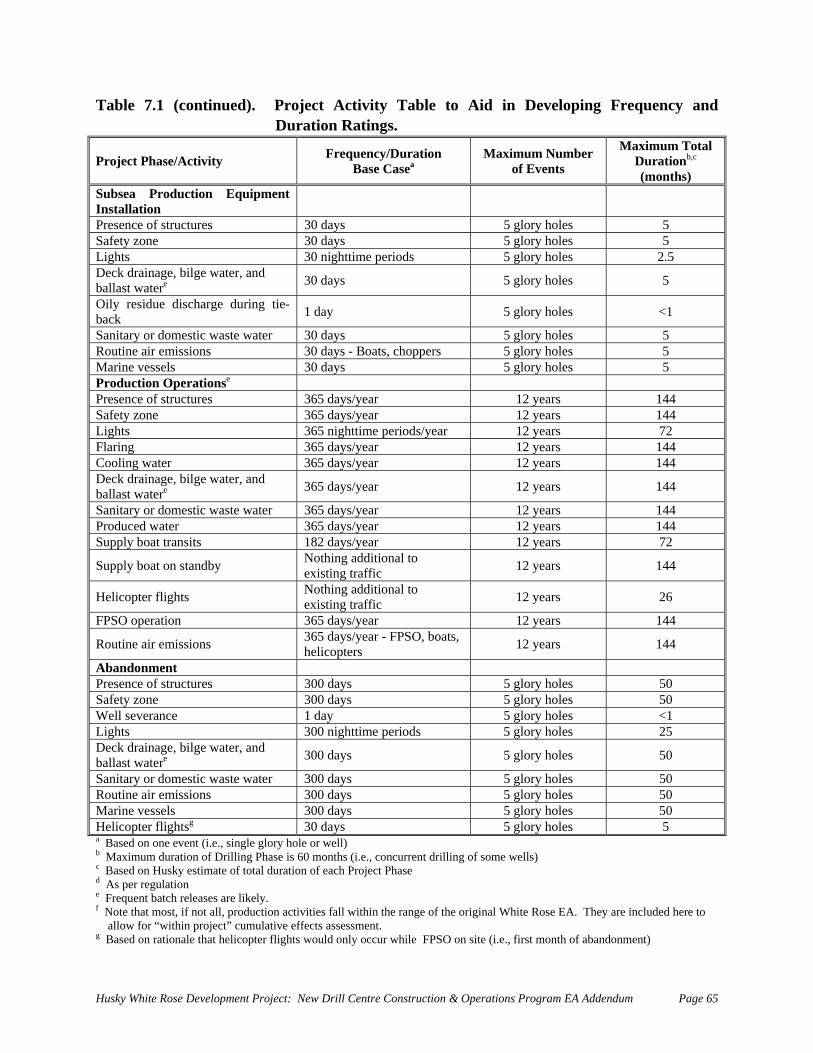
Table 7.1 (continued). Project Activity Table to Aid in Developing Frequency and Duration Ratings.
Project Phase/Activity Frequency/Duration Base Casea
Maximum Number of Events
Maximum Total Durationb,c (months)
Subsea Production Equipment Installation
Presence of structures 30 days 5 glory holes 5 Safety zone 30 days 5 glory holes 5 Lights 30 nighttime periods 5 glory holes 2.5 Deck drainage, bilge water, and ballast watere 30 days 5 glory holes 5
Oily residue discharge during tie-back 1 day 5 glory holes <1
Sanitary or domestic waste water 30 days 5 glory holes 5 Routine air emissions 30 days - Boats, choppers 5 glory holes 5 Mari 30 days 5 glory holes 5 ne vessels Production Operations e
Presence 144 of structures 365 days/year 12 years Safety zo 144 ne 365 days/year 12 years Lights 365 nighttime periods/year 12 years 72 Flaring 365 days/year 12 years 144 Cooling wate 365 days/year 12 years 144 r Deck drainage, bilge ballast w
water, and atere 365 days/year 12 years 144
Sanitary or domestic waste water 365 days/year 12 years 144 Produced water 365 days/year 12 years 144 Supply boat transits 182 days/year 12 years 72
Supply boat on standby Nothing additional to existing traffic 12 years 144
Helicopter fl existing traffic 12 years 26 ights Nothing additional to
FPSO operation 365 days/year 12 years 144
Rou 365 days/year - FPSO, boats, helicopters 12 years 144 tine air emissions
Abando nment Presence of st ory holes 50 ructures 300 days 5 glSafety zone 300 days 5 glory holes 50 Well severance 1 day 5 glory holes <1 Lights 300 nighttime periods 5 glory holes 25 Deck drainagballast watere
e, bilge water, and 300 days 5 glory holes 50
Sanitary or domestic waste water 300 days 5 glory holes 50 Routine air e 300 days 5 glory holes 50 missions Marine vessels 300 days 5 glory holes 50 Helicopt ier fl ghtsg 30 days 5 glory holes 5 a Based on ob Maximum d Phase is 60 months (i.e., concurrent drilling of some wells) c Based on Huskd As per e Frequent batf Note that mo vities fall within the range of the original White Rose EA. They are included here to
., first month of abandonment)
ne event (i.e., single glory hole or well) uration of Drilling
y estimate of total duration of each Project Phase regulation
ch releases are likely. st, if not all, production acti
allow for “within project” cumulative effects assessment. g Based on rationale that helicopter flights would only occur while FPSO on site (i.e
Husky White Rose Development Project: New Drill Centre Construction & Operations Program EA Addendum Page 65
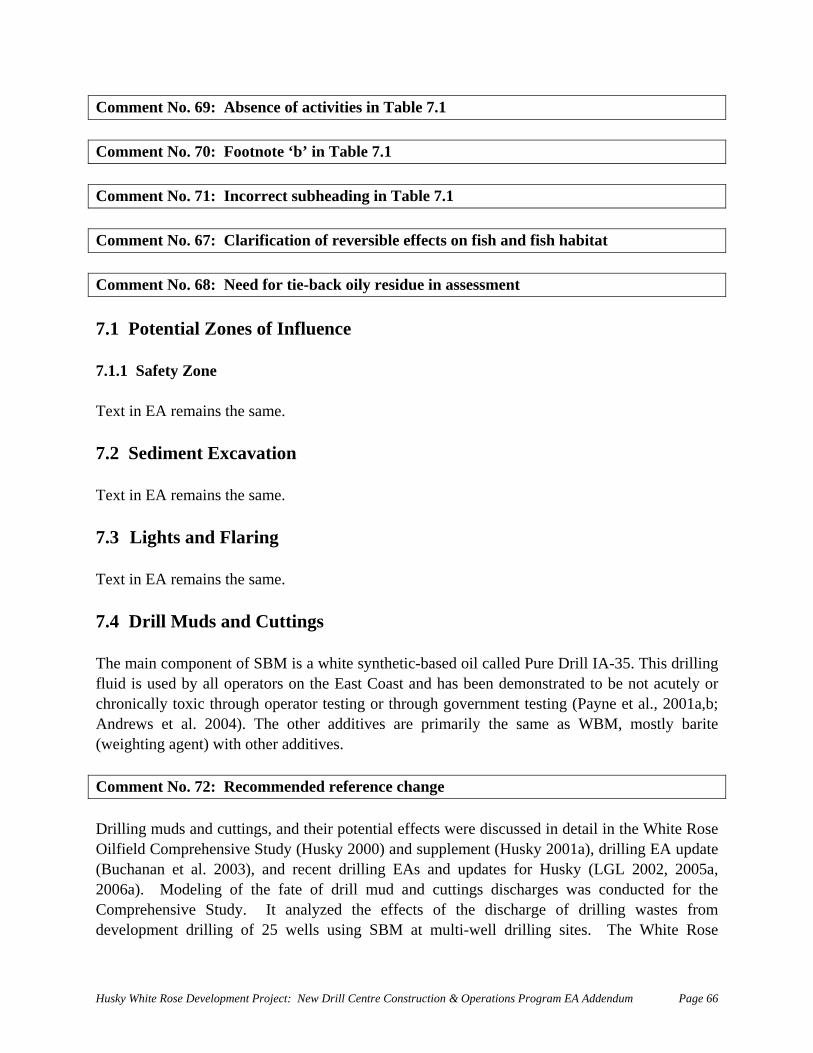
Comment No. 69: Absence of activities in Table 7.1 Comment No. 70: Footnote ‘b’ in Table 7.1 Comment No. 71: Incorrect subheading in Table 7.1 Comment No. 67: Clarification of reversible effects on fish and fish habitat Comment No. 68: Need for tie-back oily residue in assessment 7.1 Potential Zones of Influence
7.1.1 Safety Zone Text in EA remains the same. 7.2 Sediment Excavation Text in EA remains the same. 7.3 Lights and Flaring Text in EA remains the same. 7.4 Drill Muds and Cuttings The main component of SBM is a white synthetic-based oil called Pure Drill IA-35. This drilling fluid is used by all operators on the East Coast and has been demonstrated to be not acutely or chronically toxic through operator testing or through government testing (Payne et al., 2001a,b; Andrews et al. 2004). The other additives are primarily the same as WBM, mostly barite (weighting agent) with other additives. Comment No. 72: Recommended reference change Drilling muds and cuttings, and their potential effects were discussed in detail in the White Rose Oilfield Comprehensive Study (Husky 2000) and supplement (Husky 2001a), drilling EA update (Buchanan et al. 2003), and recent drilling EAs and updates for Husky (LGL 2002, 2005a, 2006a). Modeling of the fate of drill mud and cuttings discharges was conducted for the Comprehensive Study. It analyzed the effects of the discharge of drilling wastes from
evelopment drilling of 25 wells using SBM at multi-well drilling sites. The White Rose d
Husky White Rose Development Project: New Drill Centre Construction & Operations Program EA Addendum Page 66
development drilling was deemed to create no significant effect on fish and fish habitat, the shery, seabirds, marine mammals, or sea turtles. Additional relevant documents not available
hite Rose Comprehensive Study include MMS (2000); CAPP 001a,b), NEB et al. (2002), the White Rose baseline studies (Husky 2001b, 2003), Husky
fiduring the preparation of the W(2exploratory drilling EAs and updates (LGL 2002, 2003, 2005a, 2006a), the reviews of Buchanan et al. (2003), Hurley and Ellis (2004) and Neff (2005), and the Husky EEM reports (Husky 2005, 2006). All of these documents discuss the discharge of mud and cuttings and associated effects. These recent reports have further confirmed the conclusions of the White Rose work that routine drilling, particularly small scale drilling, has no significant effect on the marine environment of the Grand Banks. This conclusion is also supported by the studies carried out on fish health and fish habitat over a three year period at the Terra Nova site where six wells were drilled using a combination of water–based and synthetic based muds (Mathieu et al., 2005; Deblois et al., 2005). Comment No. 73: Recommended additional references 7.4.1 Water-Based Muds Text in EA remains the same. 7.4.2 Synthetic-Based Muds Synthetic based muds or (SBM) include those whose base fluids are composed of synthetic
ydrocarbons (olefins, paraffins, and esters) (OGP 2003). Their persistence is related to the ear the sea floor (e.g., re-suspension and transport, current velocity,
diment characteristics), re-working of sediments by burrowing biota and biodegradation of the
se fewer effects on the benthos (Jensen et al. 999 in OGP 2003).
conducted that assessed the degradation [reviewed in Jensen et al. 1999 (Norwegian
hphysical conditions on and nsebase fluids. The specific rates of biodegradation of all the different formulations of SBM are mostly unknown under all environmental conditions but are known to be related to the type of base fluid, temperature, oxygen levels, the type of bacteria present (aerobic or anaerobic), the species of bacteria present, the history of the area viz a viz hydrocarbons, and the form, mass and topography of the material (OGP 2003; Roberts and Nguyen 2006). In general, biodegradation is expected to occur faster under aerobic conditions than anaerobic ones (OGP 2003). Effects on benthic organisms may result from physical smothering or from the anoxic conditions created by the biodegradation which increases the oxygen demand in the sediments. Effects on benthic communities are not simply related to the rate of biodegradation. For example, esters have been found to biodegrade rapidly under laboratory conditions but to cause anoxia in the field whereas olefins which degrade slower may cau1
number of field and monitoring studies have beenArates of SBMs and the recovery rates of benthos
Husky White Rose Development Project: New Drill Centre Construction & Operations Program EA Addendum Page 67
North Sea); Neff et al. 2000 (UK North Sea); OGP 2003; Roberts and Nguyen 2006). Ester-ased fluids generally biodegrade rapidly and the benthos is mostly recovered within 11 months.
• Physical Conditions
bStudies on olefin-based fluids have been conducted under a wide variety of conditions with varying results but degradation and benthic recovery may take from several months to several years depending upon a wide variety of factors. In general, as many as three to five years could be required for benthos to recover fully after discharge of SBM (Neff et al. 2000). Results with paraffin-based fluids have been highly variable. Researching the biodegradation rates of SBM in the field is a complex process because of the different formulations and mixtures used in addition to the wide variety of environmental conditions encountered. According to the above-mentioned reviews of information, simplified ideal conditions for biodegradation could be defined as:
t is reasonable to assume higher rates of biodegradation at higher temperatures. Note,
Small cuttings piles, thus increasing exposure to aerobic bacteria,
High energy seabed, thus creating dispersion and increased exposure to aerobic conditions, and
High temperature [Bacterial activity is often related to temperature and thus i
however, that biodegradation of at least certain types of SBM appears to occur relatively rapidly in the deepwater of the Gulf of Mexico which is on the order of 4ºC. Also, very rapid biodegradation can cause anoxia which could slow down degradation. Pressure appears to have no effect on degradation rates—Roberts and Nguyen 2006.].
• Biological Conditions
High rate of bioturbation (e.g., by burrowing species),
Presence of hydrocarbon-degrading bacteria (e.g., Pseudomanoas spp., and others), and
Comment No. 74: Biodegradation of synthetic-based muds
Aerobic conditions (i.e., oxygenated sediments) [Aerobic degradation is usually faster than anaerobic. Aerobic biodegradation requires oxygen as an electron acceptor whereas anaerobic biodegradation mostly uses sulphate, or carbon dioxide in the absence of sulfate—Roberts and Nguyen 2006. Both types of biodegradation probably occur in the typical situation involving SBM and cuttings piles.],
Previous exposure of the area to similar types of hydrocarbons which appears to reduce the lag time.
Husky White Rose Development Project: New Drill Centre Construction & Operations Program EA Addendum Page 68
7.5 Noise Comment No. 75: Supply boat sound levels in Table 7.4 Comment No. 76: Dynamic positioning thruster sound levels in Table 7.4 7.6 Potential Effects of Routine Activities 7.6.1 Fish Habitat 7.6.1.1 Presence of Structures Text in EA remains the same. 7.6.1.2 Sediment Excavation Considering the relatively small area of each glory hole (maximum 70 m x 70 m floor dimension equivalent to <0.0002 % of Project Area), the reuse of the original spoil area for sediment
and the sandy nature of the sediment minimizing the amount and duration of spension in the water column, the magnitude, geographic extent and duration of the
ation on the fish habitat VEC are low, <1 km2, and 1-12 le; 10 months maximum), respectively (Table 7.6). Based on
ese criteria evaluations, the potential residual effects of sediment excavation on the fish habitat
dominance of polychaetes g activity at the Southern drill centre. Both parameters
ncreasing distance from the drill centre. Amphipod abundance was
deposition, sediment supotential effects of sediment excavmonths (2 months per glory hothVEC are not significant (Table 7.7). 7.6.1.5 Drill Muds and Cuttings Benthic community analyses were performed during the Husky EEM Program in 2004 and 2005 (Husky 2005, 2006). In 2004, there were indications of lower abundance of amphipods near the Southern and Northern drill centres. In 2005, total abundance andappeared to be affected by drillinincreased significantly with ireduced near all drill centres in 2005. All of these abundance and dominance differences appear to be associated with hydrocarbon concentrations in the sediment. However, the significance of these benthic community observations does not imply that effects of the White Rose development are greater than at other development sites. In fact, many effects on benthic communities observed at other development areas have not been observed at White Rose. Examples include decreases in benthos diversity in the North Sea (Kingston 1992), and reduction in benthos richness in the Gulf of Mexico (Peterson et al. 1996). Other examples are discussed in Husky (2006).
Husky White Rose Development Project: New Drill Centre Construction & Operations Program EA Addendum Page 69
Comment No. 77: Development project effects on benthic communities 7.6.1.5.5 Cumulative Effects
all within the constructed lory holes. If all 54 wells are drilled during the 60 month period, there would likely be the
s. Assuming 500 m as the radius of each ell’s biological zone of influence (ZOI) (i.e., potential smothering due to a minimum of one
lory hole will accumulate vertically (i.e., overlap of individual well iological ZOIs). Given the almost complete overlap of well ZOIs in each glory hole, the
A maximum of 54 wells would be drilled during the Drilling Phase,goccurrence of concurrent drilling in different glory holewcentimetre thickness of deposited cuttings and mud) and given that the floor dimension of each glory hole will be 70 m x 70 m, there would be essentially 100% overlap of the ZOIs of adjacent wells within a single glory hole. Therefore, the ZOI associated with each glory hole would have an area of approximately 0.78 km2. The total area of ZOI for all five proposed glory holes will be approximately 3.9 km2, equivalent to <1% of the area of the Project Area. Including the ZOIs of the 19 wells in the existing three glory holes increases the total ZOI area to 6.24 km2, equivalent to <1.6% of the area of the Project Area. Since the wells will be drilled on the floor portion of each glory hole which is approximately 11 m below the surface of the ocean substrate, it is likely that much of the mud and cuttings deposition will occur within the glory holes (136 m x 136 m including sloped ramps), areas already subjected to HADD. Deposition from adjacent wells in any single gboccasional occurrence of concurrent drilling is insignificant in terms of cumulative effects. Comment No. 78: Cumulative effects 7.6.1.6.9 Produced Water While produced water is infrequently an issue during drilling activities, it is a primary waste
ater utfalls. As indicated in Section 3.9.2.2.1, produced water will be treated to reduce the oil
od and subsequently discharged. ydrocarbon concentrations in produced waters are typically less than the 96-h LC50 levels for
in Husky 2000). Most ischarge will occur during production activities with minimal discharge during development
effects of exposure to produced water n marine organisms is presented in Husky (2000).
associated with production activities. As stated in Husky (2000), the most toxic components of produced water are the volatile hydrocarbon aromatics: benzene, toluene, ethlybenzene, xylene and polyaromatic hydrocarbons (PAHs). All but the PAHs evaporate quickly. Therefore, the more persistent PAHs would likely be responsible for any biological effects near produced wocontent to 30 mg/L or less averaged over a 30-d periHmost species and are not of ecotoxicological concern (GESAMP 1993ddrilling. More information relating to acute and chronic o
omment No. 8: Produced water C
Husky White Rose Development Project: New Drill Centre Construction & Operations Program EA Addendum Page 70
7.6.1.6.11 Oily Residue Discharge During Tie-back
the new drill centres may entail tying back to the FPSO through existing drill entres via new production flowlines or the new drill centres may be tied back directly to the
ng drill centres. Prior to disconnection of the existing manifold pipework, the complete rill centre production flowline system will be depressurized and all production fluids (i.e., oil
he manifold and flowline system using a pig train driven by water om the FPSO. To assist in the removal of oil emulsions from the surface of the flowline and
ctant if necessary may be added to the water during the flushing peration. Any chemicals used during the process will be screened through the Offshore
espite the flushing operations, small amounts of oil may remain trapped in the flowline carcass e to the nature of the flexible flowlines and the intricacies of the
anifold pipework. As a result, once the pipework section is removed by divers, a small amount
onsidering the relatively small amount of oily residue discharged (approximately two barrels) e on fish habitat would be in duration. This results
ual effects of oily residue discharge on fish habitat of not significant.
: Oily residue discharge during tie-back
Development ofcSeaRose FPSO. In the event that new drill centres are tied back through existing drill centres, it will be necessary to disconnect valves and sections of pipework from the subsurface manifolds in the existidand gas) will be flushed from tfrmanifold pipework, a dilute surfaoChemical Screening System. Dand manifold piping cavities dumof oily residue may be released to the environment. The pipework will be open for approximately two to four hours until the replacement pipe spools are connected to the exposed manifold flanges. The amount of oily residue released is not anticipated to exceed 0.3 m³. Cand the infrequency of discharge, the effects of oily residue discharg
egligible in magnitude, <1 km2 in geographic extent and >72 monthsnin a rating of the resid Comment No. 22 7.6.1.7 Atmospheric Emissions The air emissions of offshore drilling activities are within range of those from fishing vessels, tanker traffic, and military vessels that routinely transit eastern Canadian waters. Worldwide, offshore drilling probably accounts for a very small portion of photochemical pollutants, reactive hydrocarbons, NOx emissions, inert pollutants or volatile organic compounds (VOC’s) (e.g., CO, NO2, SO2, particulates), greenhouse gases (carbon dioxide, methane, nitrogen dioxide), ozone, water vapour, and halocarbons compared to other industries and particularly personal automobile use. The offshore environment is windy and air emissions disp
hich alleviates safety concerns. Equipment will be similar in emerse quickly from the installations,
issions to other industrial ent in routine use, will be within the range of what is occurring now offshore, and
wequipm
Husky White Rose Development Project: New Drill Centre Construction & Operations Program EA Addendum Page 71
mitigations will be employed. State of the art safety equipment and procedures, including reathing apparatus will be available to offshore workers, as appropriate.
ent. Given the rapid dispersal offshore, there will be no cumulative effects associated ith other projects. The effects of the Project, including cumulative effects on air quality will be
b In summary, the proposed Project will not unduly add to air emissions; VOC’s or greenhouse gases, and will not endanger the health and safety of offshore workers or the marine environmwnot significant. Comment No. 79: Greenhouse gas emissions Comment No. 80: Air emissions 7.6.1.12 Geotechnical Surveying Geotechnical surveying could potentially result in the disruption of small aIt is likely that these disrupted areas would occur within the area desig
reas of the substrate. nated for glory hole
2).
the potential effects of sediment excavation on ish are low, <1 km2, and 1-12 months (2 months per glory hole; 10 months maximum),
riteria evaluations, the potential residual effects of diment excavation on the fish VEC is not significant (Table 7.10).
.6.2.6.9 Produced Water
hile produced water is rare during drilling activities, it is a primary waste associated with
bons (PAHs). All but the PAHs evaporate quickly. Therefore, the more persistent AHs would likely be responsible for any biological effects near produced water outfalls. As
g/L r less averaged over a 30-d period and subsequently discharged. Hydrocarbon concentrations in
the 96-h LC50 levels for most species and are not of cotoxicological concern (GESAMP 1993 in Husky 2000). Most discharge will occur during
excavation (Section 7.6.1. 7.6.2 Fish 7.6.2.2 Sediment Excavation Considering the relatively small area of each glory hole (maximum 70 m x 70 m floor dimension equivalent to < 0.0002 % of Project Area) and the spoils site, as well as the sandy nature of the sediment which minimizes the amount and duration of sediment suspension in the water column, the magnitude, geographic extent and duration of frespectively (Table 7.9). Based on these cse 7 Wproduction activities. As stated in Husky (2000), the most toxic components of produced water are the volatile organic compounds: benzene, toluene, ethlybenzene, xylene and polyaromatic hydrocarPindicated in Section 3.9.2.2.1, produced water will be treated to reduce the oil content to 30 moproduced waters are typically less thane
Husky White Rose Development Project: New Drill Centre Construction & Operations Program EA Addendum Page 72
production activities with minimal discharge during development drilling. More information lating to acute and chronic effects of exposure to produced water on marine organisms is
(2000). represented in Husky Comment No. 8: Produced water 7.6.2.6.11 Oily Residue Discharge During Tie-back
FPSO. In the event that new drill centres are tied back through existing drill centres, it ill be necessary to disconnect valves and sections of pipework from the subsurface manifolds in
is Prior to disconnection of the existing manifold pipework, the complete rill centre production flowline system will be depressurized and all production fluids (i.e., oil
d to the water during the flushing operation. ny chemicals used during the process will be screened through the Offshore Chemical
Ma . Despite the flushing operations, small amounts of oil may remain trapped in the flowline carcass and ma ue to the nature of the flexible flowlines and the intricacies of the manifold pipework. As a result, once the pipework section is removed by divers, a small amount
f oily residue may be released to the environment. The pipework will be open for
flanges. The amount of oily residue released is not anticipated to exceed 0.3 m³.
Considering the relatively small amount of oily residue discharged (approximately two barrels) and the infrequency of discharge, the effects of oily residue discharge on the fish VEC would be
egligible in magnitude, <1 km2 in geographic extent and >72 months in duration. This results
omment No. 22: Oily residue discharge during tie-back
Development of the new drill centres may entail tying back to the FPSO through existing drill centres via new production flowlines or the new drill centres may be tied back directly to the SeaRose wthe ex ting drill centres.dand gas) will be flushed from the manifold and flowline system using a pig train driven by water from the FPSO. To assist in the removal of oil emulsions from the surface of the flowline and manifold pipework, a mild detergent may be addeA
nagement System
nifold piping cavities d
oapproximately 2 to 4 hours until the replacement pipe spools are connected to the exposed manifold
nin a rating of the residual effects of oily residue discharge on the fish VEC of not significant. C Comment No. 81: Small transfer spills and BOP fluids in Table 7.9 Comment No. 82: Safety zones as safe havens for fish Comment No. 83: Frequency of small spills and associated negligible effect Comment No. 84: Flaring of produced water from production
Husky White Rose Development Project: New Drill Centre Construction & Operations Program EA Addendum Page 73
Comment No. 85: Frequency of ROV work
.6.2.10 Noise A l sour s gPhase of the Project. Surveys would be brief relative to other noi ssociated with the Pr 7.6.3 Commercial Fisheries 7.6.3.1 Presence of Structures The potential size of the safety zone should all fiv drill centre be developed will be approximately 114 km2. 7. avatio Thus the magnitude of the potential effects of sediment negligible. T ent will b <1 km2; the ration 1-12 months (2 months per glory hole; 10 m um) (Table 7-12). Based on these criteria, the potential effects of sediment ex ommerci heries VEC re not significant (Table 7-13). C : Pot on spe es under moratorium
7
nother potentia ce of noise i eotechnical surveying during the Glory Hole excavation se sources a
oject.
e s
6.3.2 Sediment Exc n
excavation on harvesting is he geographic ext e duonths maximcavation on the c al fis a
omment No. 86 ential effects ci 7.6.4 Marine Birds 7. T for f ract w marine birds during the Drilling and Production Operations Phases of the Projec able 7.14). While this activity is relatively infrequent and short duration on a per event basis during the Drilling Phase, flaring during the Production O is cont of this activity during the Production Operations Phase, th arine birds are expected to be low in m 2 in geographic extent and >72 mont rating of the residual effects of flaring on marine birds of not significant (Table 7.16). C ts associated with other p jects/activ s on the Gr d Banks are likely not la e a ch he signif nce rating Comment No. 89: Flaring during drilling vs. production
6.4.4 Flaring
here is potential laring to inte i htt (T
perations Phase inuous. Based on the worst-case scenarioe effects of flaring on m
agnitude, 1-10 km hs in duration (Table 7.15), resulting in a
umulative effec ro itie anrge enough to caus ange in t ica .
Husky White Rose Development Project: New Drill Centre Construction & Operations Program EA Addendum Page 74
Husky White Rose Development Project: New Drill Centre Construction & Operations Program EA Addendum Page 75
-up
Handling and release of any str in accordance with Husky pr on fi and r ve will obtain the appropriate bird handling permits for new vessels or f ssocia the Project. C Suggested wording change
7.6.4.14 Monitoring and Follow
anded Leach’s Storm-Petrels will be otocols that are le with CWS are simila to those de l
acilities aoped by Petro-Canada. Husky
ted with
omment No. 91: C 7: Storm-petrels vs. Storm-Petrels omment No. 8 Comment No. 88: Attraction of birds to lights C seabird monitoring protocol omment No. 90: CWS pelagic C abird and marine mammal observation program o ment No. 9m 2: Se 7.
.6.5.2 Sediment Excavation
he magnitude, geographic extent and duration of the potential effects of sediment excavation on
6.5 Marine Mammals 7 Tthe marine mammal VEC are negligible to low, <1 km2, and 1-12 months (2 months per glory hole; 10 months maximum total), respectively (Table 7-17). Based on these criteria evaluations, the potential effects of sediment excavation on the marine mammal VEC is not significant (Table 7-18). Comment No. 93: Ship strikes and noise Comment No. 94: BOP frequency in Table 7.17 7.6.5.8 Noise
Comment No. 95: Noise and mitigation measures for marine mammals and sea turtles
Another potential source of noise is geotechnical surveying during the Glory Hole excavation Phase of the Project. Surveys would be brief relative to other noise sources associated with the Project.
Comment No. 96: Reference needed
Husky White Rose Development Project: New Drill Centre Construction & Operations Program EA Addendum Page 76
Comment No. 97: Suggested reference 7.6.6 Sea Turtles Com
ment . 93: ip stri eNo Sh kes and nois 7.6.6.1 Hearing Abilities of Sea Turtles AnoPhase of the Project. Surveys wProject. 7.6.7 As indicated in Section 5.3, five are lisaccord
Two mfollows:
• •
Potential inspecies presently listed on Schedule 1 of
ther po tial source of noise is te ing ould be brief relative to other noise sources associated with the
Species-at-Risk
al species that potentially occur in the Study Area ted as either endangered or threatened on Schedule 1 of SARA .e., officially ‘ating to Canadian law). They are as follows:
• Blue whale; • North Atlantic right whale; • Leatherback sea turtle; • Northern wolfish; and • Spotted wolfish.
a ted
Ivory Gull; and Atlantic wolf
teractions of the routine activities associated with the Project and the seven marine a
ten geo chnical survey during the Glory Hole excavation
marine anim (i risk’
rine species are also lis as special concern on Schedule 1 of SARA. They are as
ish.
SARA re indicated in Table 7.21.
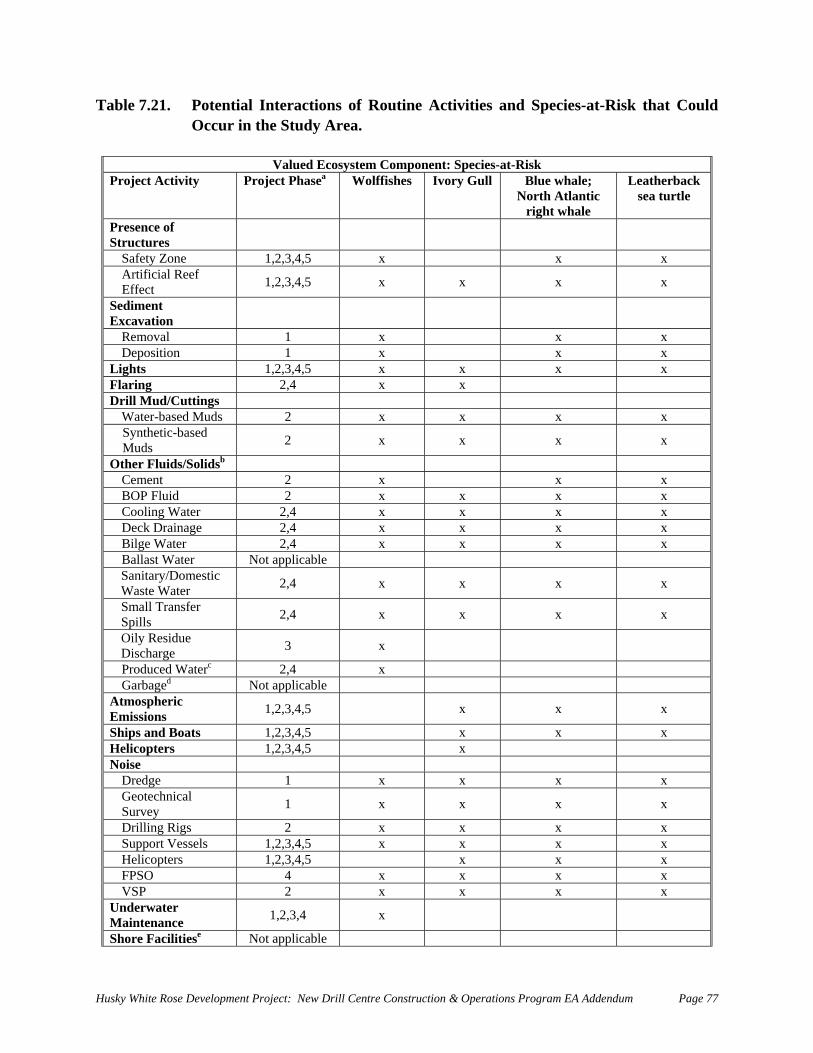
Table 7.21. Potential Interactions of Routine Activities and Species-at-Risk that Could r A .
Valued Ecosystem Component: Species-at-Risk
Occu in the Study rea
Projec a lffishes Blue whale; North Atlantic
right whale
Leatherback sea turtle
t Activity Project Phase Wo Ivory Gull
Presence of Struct
ures
Safety Zone 1,2,3,4,5 x x x Artificial Effect x x Reef 1,2,3,4,5 x x
Sediment Ex cavation
Removal x x x 1 Deposition 1 x x x Lig x x x hts 1,2,3,4,5 x Flaring 2,4 x x Drill Mud/Cuttings Water-ba Muds 2 x x sed x x Syn ic ed 2 x x thet
s -bas
Mud x x
O ther Fluids/Solidsb 2 x x Cement x P Flui 2 x x x BO d x Cooling Water 2,4 x x x x Deck Drainage 2,4 x x x x Bilge Water 2,4 x x x x Ballast Water Not applicable / Waste x x Sanitary
WDomater
e
stic 2,4 x x
x x Sma
Spilll Tls
ransfer 2,4 x x
si g Oily
Disc Rehar
duee
3 x
Produced Waterc 2,4 x Garbaged Not applicable Atmospheric Emissions 1,2,3,4,5 x x x
Ships and Boats 1, x x 2,3,4,5 x Helico 1, xpters 2,3,4,5 Noise Dredge x 1 x x x Geotechnical
Survey 1 x x x x Drilling Rigs 2 x x x x Support Vessels 1,2,3,4,5 x x x x Helicopte 1, 4,5 x rs 2,3, x x FPSO 4 x x x x VSP 2 x x x x UM
nderaint
waen
tean
r ce 1,2,3,4 x
Shore Facilitiese Not applicable
Husky White Rose Development Project: New Drill Centre Construction & Operations Program EA Addendum Page 77
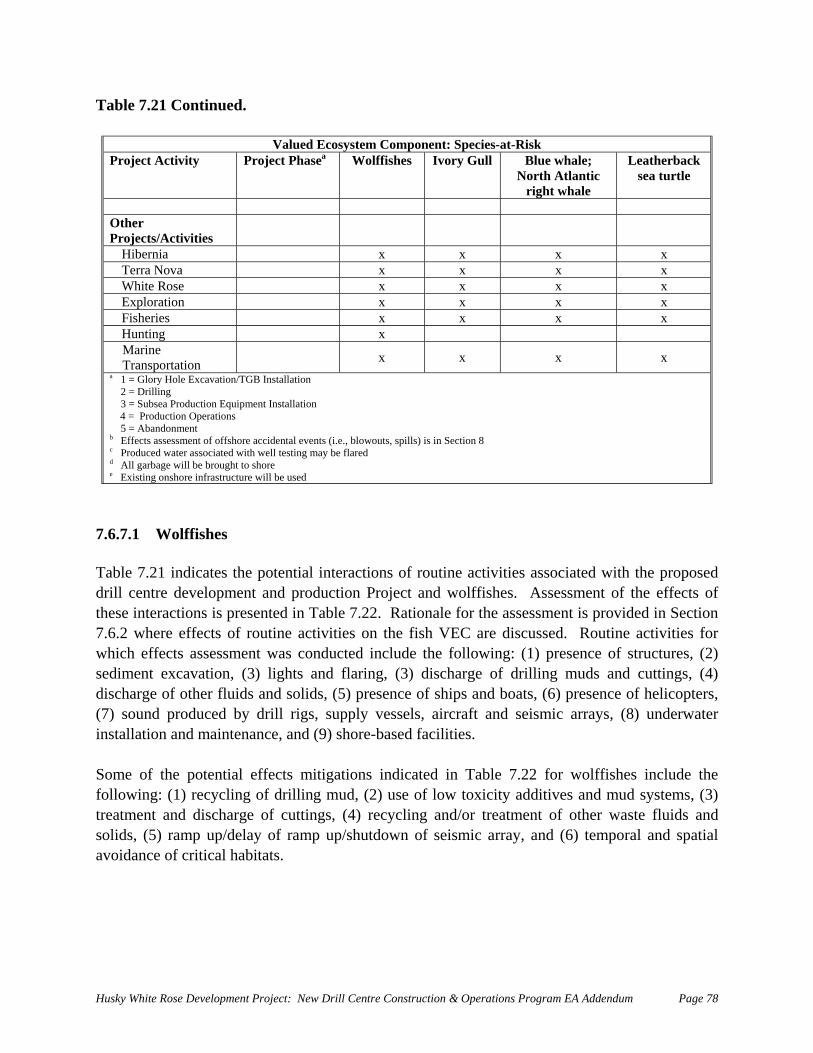
Table 7.21 Continued.
Valued Ecosystem Component: Species-at-Risk Project Activity Project Phasea Wolffishes Ivory Gull Blue whale;
North Atlantic right whale
Leatherback sea turtle
Other Projects/Activities
x Hibernia x x x x xTerra Nova x x White Rose x x x x Exploration x x x x Fisheries x x x x Hunting x Marine Transportation x x x x a 1 = Glory Hole Excavation/TGB Installation
roduction Equipment oduction Operations
Abandonment f offshore accidental events (i.e., blowouts, spills) is in Section 8
ated with well testing may be flared e
ture will be used
2 = Drilling = Subsea P 3
4 = PrInstallation
5 = b Effects assessment oc Produced water associd All garbage will be brought to shore Existing onshore infrastruc
7.6.7.1 Wolffishes
ates the pote interactions of routine activities associated with the proposed velopment and production Project and wolffishes. Assessment of the effects of
s presente able 7.22. Rationale for the assessment is provided in Section s of routine activities on the fish VEC are discussed. Routine activities for
which effects assessment was conducted include the following: (1) presence of structures, (2) vation, (3) lights and flaring, (3) discharge of drilling mud nd cuttings (4)
f other fluids and s ts, (6) presence of helicopters, uced by drill , supply v ls, aircraft and seismic arrays, (8) underwater
tenanc ) shore-b facilities.
the potential eff gations i ated in Tabl 7.22 for wolffishes include the ing: (1) recycling of drilling mud, (2) use of low toxicity additives and ud systems, (3)
and discharge of cuttings, (4) recycling and/or treatment of other waste fluids and delay of r p up/shutdown of seismic a y, and (6) te poral and spatial
tical habitat
Table 7.21 indic ntialdrill centre dethese interactions i7.6.2 where effect
d in T
sediment excadischarge o
s a , olids, (5) presence of ships and boa
(7) sound prod rigs esseinstallation and main e, and (9 ased Some of ects miti ndic e follow mtreatmentsolids, (5) ramp up/ am rra mavoidance of cri s.
Husky White Rose Development Project: New Drill Centre Construction & Operations Program EA Addendum Page 78
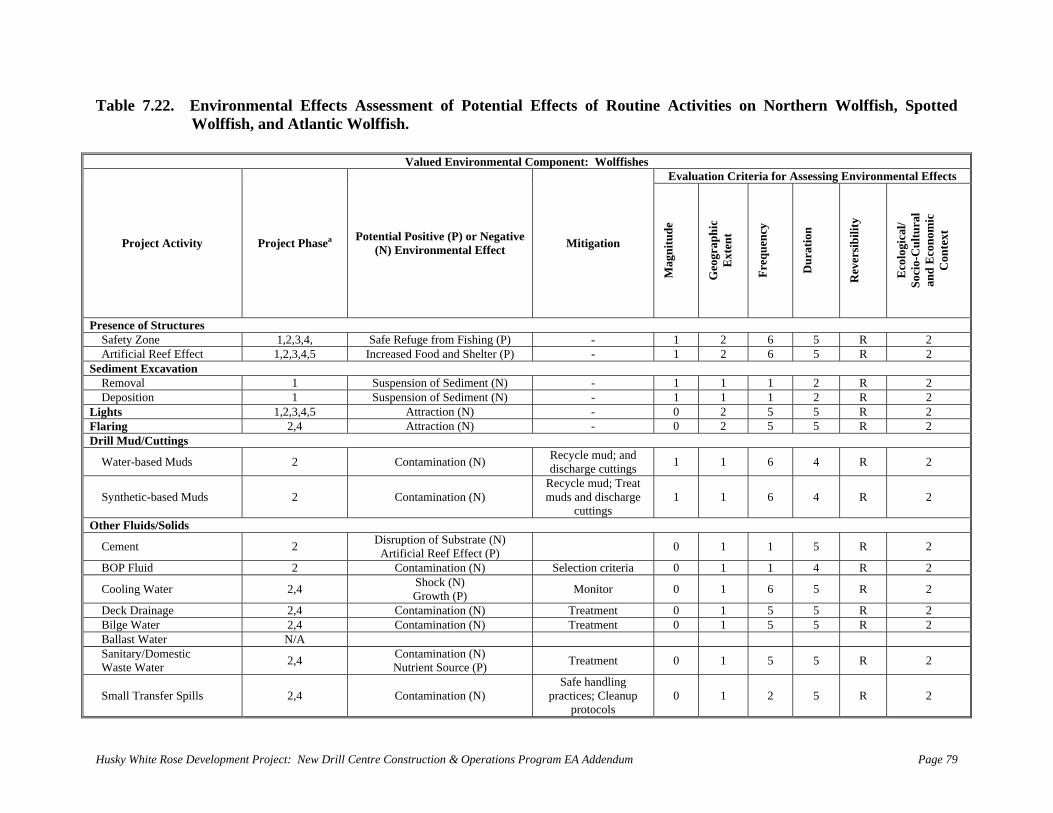
Table 7.22. Environmental Effects AssessmenWolffish, and Atlantic Wolf
t of Potential Effects of
ta
R
Wol
o
ffi
ut
sh
in
es
e Activities on Northern Wolffish, Spot fi
lued
tedsh.
Va Environmen l Component: Evaluation C vir ntal Efriteria for Assessing En onme fects
Project Activit tial Positive N) Environm g
Mag
nitu
de
Ext
ent
Rev
ersi
bilit
y
Eco
logi
cal/
Con
text
(P) enta
or l E
Neffe
gact
tive Miti ation
Geo
grap
hic
Freq
uenc
y
Dur
atio
n
Soci
o-C
ultu
ral
and
Eco
nom
ic
y Project Phasea Poten(
Presence of Structures Safety Zone fe Refuge from Fishin - 1 2 1,2,3,4, Sa g (P) 6 5 R 2 Artificial Reef Effe reased Food and Shelter - 1 2 R ct 1,2,3,4,5 Inc (P) 6 5 2 Sediment Excavation Removal uspension of Sediment (N) - 1 1 S 1 1 2 R 2 Deposition uspension of Sediment (N) - 1 1 1 S 1 2 R 2 Lights Attraction (N) - 5 1,2,3,4,5 0 2 5 R 2Flaring Attraction (N) - 5 2,4 0 2 5 R 2Drill Mud/Cuttings
Water-based Muds Contamination (N) Recycle mud; and discharge cuttings 6 R 2 1 1 4 2
Synthetic-based M Contamination (N) Recycle mud; Treatmuds and discharg
cuttings 6
e 1 1 4 R 2uds 2
Other Fluids/Solids
Cement isruption of Substrate (N) Artificial Reef Effect (P) 0 1 2 D 1 5 R 2
BOP Fluid Contamination (N) Selection criteria 0 1 1 2 2 4 R
Cooling Water Shock (N) Growth (P) Monitor 0 6 2 2,4 1 5 R
Deck Drainage Contamination (N) Treatment 0 5 2 2,4 1 5 R Bilge Water Contamination (N) Treatment 0 1 5 2 2,4 5 R Ballast Water N/A Sanitary/Domestic Waste Water
Contamination (N) Nutrient Source (P) Treatment 0 1 5 R 2 2,4 5
Small Transfer Spills Contamination (N) Safe handling
practices; Cleanup protocols
0 1 2 2 2,4 5 R
Husky White Rose Development Project: New Drill Centre Construction & Operations Program EA Addendum Page 79
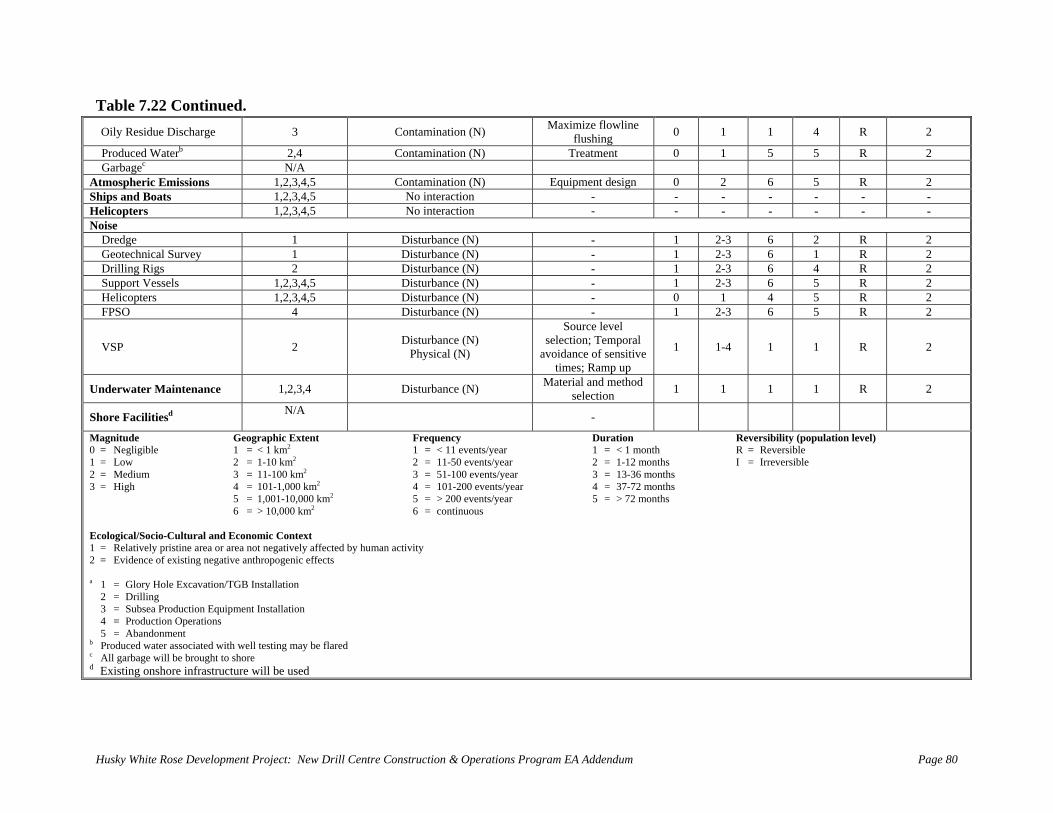
Table 7.22 Continued. Maximize flowline Oily Residue Discharge 3 Contamination (N) 0 1 1 4 R 2 flushing
Produced Waterb 2,4 0 1 5 5 R 2 Contamination (N) Treatment Garbagec N/A Atmospheric Emissions 1,2,3,4,5 Contamination (N) Equipment design 0 2 6 5 R 2 Ships and Boats 1,2,3,4,5 No interaction - - - - - - - Helicopters 1,2,3,4,5 No interaction - - - - - - - Noise Dredge 1 2-3 6 2 R 2 1 Disturbance (N) - Geotechnical Survey 1 Disturbance (N) - 1 1 R 2 2-3 6 Drilling Rigs 2 Disturbance (N) - R 21 2-3 6 4 Support Vessels 1,2,3,4,5 Disturbance (N) - 6 1 2-3 5 R 2 Helicopters 1,2,3,4,5 Disturbance (N) - 4 0 1 5 R 2 FPSO 4 Disturbance (N) - 3 6 5 1 2- R 2
VSP 2 Disturbance (N) Physical (N)
Source level selection; Temporal
avoidance of sensitive tim p up
1 1 R 2
es; Ram
1 1-4
Underwater Maintenance Material and method 1 1 1 1 R 2 1,2,3,4 Disturbance (N) selection
Shore Facilitiesd N/A -
Magnitude Geographic nt Reversibility (population level) 1 = < 1 km2 < 1 month R = Reversible
2 = 1-10 km2 2 = 11-50 events/year onths I = Irreversible 3 = 11-100 2 s/year onth4 = 101-1,00 km2 events/year onths 5 = 1,001-1 00 km2 /year onths6 = > 10, m2
ral and Economic Co xt istine area or area not negatively affected by human
ting negative anthro fects
cavation/TGB Installat
ction Equipment Instalons
sociated with well testing y be flared c ht to shore
tructure will be
Exte Frequency 1 = < 11 events/year
Duration 1 = 0 = Negligible
1 = Low 2 = 1-12 m3 = 13-36 m4 = 37-72 m
2 = Medium 3 = High
km 3 = 51-100 event4 = 101-200
s 0
0,0000 k
5 = > 200 events6 = continuous
5 = > 72 m
cio-CultuEcological/So nte
1 = Relatively pr2 = Evidence of
activity exis
pogenic ef
a 1 = Glory Hole Ex ion 2 = Drilling 3 = Subsea Produ lation 4 = Production Operati 5 = Abandonment b Produced water as ma
All garbage will be brougd Existing onshore infras used
Husky White Rose Development Project: New Drill Centre Construction & Operations Program EA Addendum Page 80
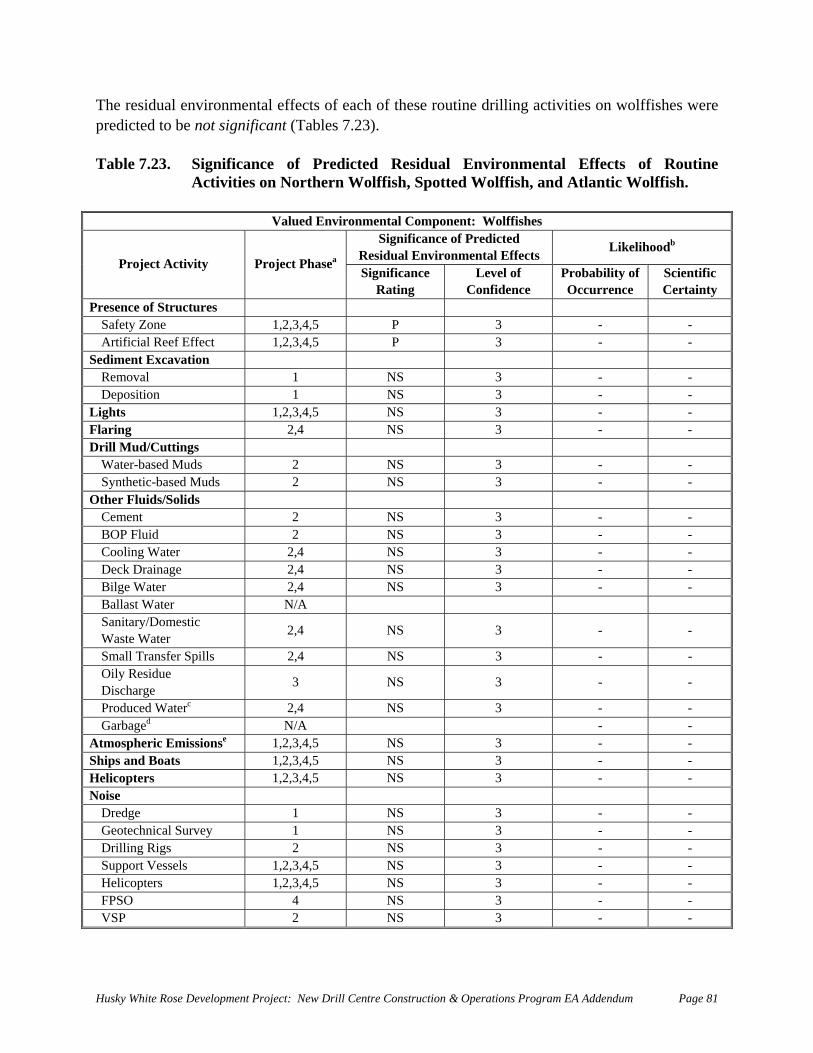
The residual environmental effects of each of these routine drilling activities on wolffishes were pre b ot si T s 3). Table 7.23. Significance of Predicted Residual Environmental Effects of Routine
tted Wolffish, and Atlantic Wolffish.
Valued Environmental Compon Wolffishes
dicted to e n gnificant ( able 7.2
Activities on Northern Wolffish, Spo
ent:Significa r ted
Residual Environ Effects Likelihoodbnce of Pm
edictal enProject Activity Project Phasea
Significance Rating
l of dence
Probability of Occurrence
Scientific Certainty
Lo
evenfiC
Presence of Structures Safet 3,4 3 - - y Zone 1,2, ,5 P Art ial Reef Effect 1,2,3,4,5 P 3 - - ificSediment Excavation Remo 1 - - val NS 3 Depo 1 NS - - sition 3 Lights 3, - - 1,2, 4,5 NS 3 Flaring - - 2,4 NS 3 Drill M ud/Cuttings Wate 3 - - r-based Muds 2 NS Synth 3 - - etic-based Muds 2 NS Other Fluids/S olids
Cement 2 3 - - NS BOP Fluid 2 NS - - 3 Cooling Wate 2,4 NS - - r 3 Deck ge 4 - - Draina 2, NS 3 Bilge ,4 - - Water 2 NS 3 Balla er /A st Wat N Sanitary/Dom Wast r ,4 - - estic
e Wate 2 NS 3
Small Transfe ills 2,4 NS 3 - - r Sp Oily Residue Discharge 3 NS 3 - -
Produced Waterc 2,4 NS 3 - - Garbaged N/A - - Atmo e 3,4 NS - - spheric Emissions 1,2, ,5 3 Ship ats 3,4 - - s and Bo 1,2, ,5 NS 3 Helicop 3,4 NS -ters 1,2, ,5 3 - Noise Dredge 1 NS -3 - Geotechnical Survey 1 NS 3 - - Drill s 2 NS 3 -ing Rig - Support Vessels 3,4,5 NS 3 -1,2, - Helic 3,4, NS 3 -opters 1,2, 5 - FPSO 4 NS - 3 - VSP 2 -NS 3 -
Husky White Rose Development Project: New Drill Centre Construction & Operations Program EA Addendum Page 81
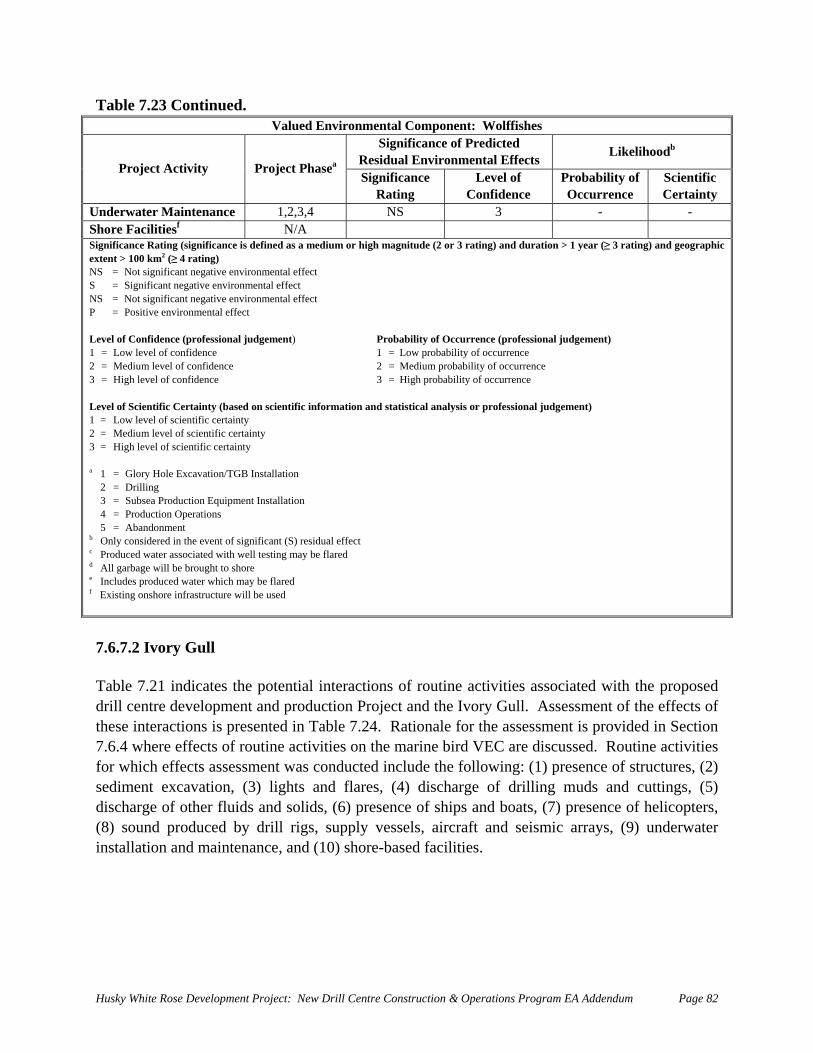
Table 7.23 Continued. Valued Environmental Component: Wolffishes
Significance of Predicted Residual Environmental Effects Likelihoodb
Project Activity Project Phasea
Significance Rating
Level of Confidence
Probability of Occurrence
Scientific Certainty
U tenance 1,2,3,4 NS 3 - - nderwater MainShore Facilitiesf N/A SeNS = Significant negative environmental effect NP Level of Confidence (professional judgement) Probability of Occurrence (professional judgement) 1 = Low level of confidence 2 = Medium level of confidence 3 = High level of confidence e Level atio nalysis o al judg1 = Low level of scientific certainty
certainty rtainty
GB Insta
quipment Installation Operations
sidered in the event of signific al effect water associated with well testing be flared
ht to shore ich may be flare
will be used
ignificance Rating (significance is defined as a medium or high magnitude (2 or 3 rating) and duration > 1 year (≥ 3 rating) and geographic xtent > 100 km2 (≥ 4 rating) S = Not significant negative environmental effect
S = Not significant negative environmental effect = Positive environmental effect
1 = Low probability of occurrence 2 = Medium probability of occurrence 3 = High probability of occurrenc
of Scientific Certainty (based on scientific inform n and statistical a r profession ement)
2 = Medium level of scientific3 = High level of scientific ce
a 1 = Glory Hole Excavation/T llation 2 = Drilling
roduction E 3 = Subsea P 4 = Production
bandonment 5 = Ab Only con ant (S) residuc Produced may d All garbage will be brouge Includes produced water wh d f Existing onshore infrastructure
7.6.7.2 Ivory Gull
ates the pote interactions of routine activities associated with the proposed elopment and production Project and the Ivory Gull. Assessment of the effects of
s presented Table 7.24. tionale for the assessment is provided in Section fects of routine ivities on the m rine bird VEC are discussed. Routine activities
sessment was conducted include the following: (1) presence of structures, (2) ) ligh and flares, (4) discharge of drilling muds and cuttings, )
er fluids and s, (6) pres of ships and oats, (7) presence of helicopters, by drill rigs, supply vess aircraft and seismic arrays, (9) underwater tenanc 0) shore- d facilities.
Table 7.21 indic ntialdrill centre devthese interactions i7.6.4 where ef
in act
Raa
for which effesediment excavation, (3
cts asts (5
discharge of oth solid ence b(8) sound produced
d mainels,
installation an e, and (1 base
Husky White Rose Development Project: New Drill Centre Construction & Operations Program EA Addendum Page 82
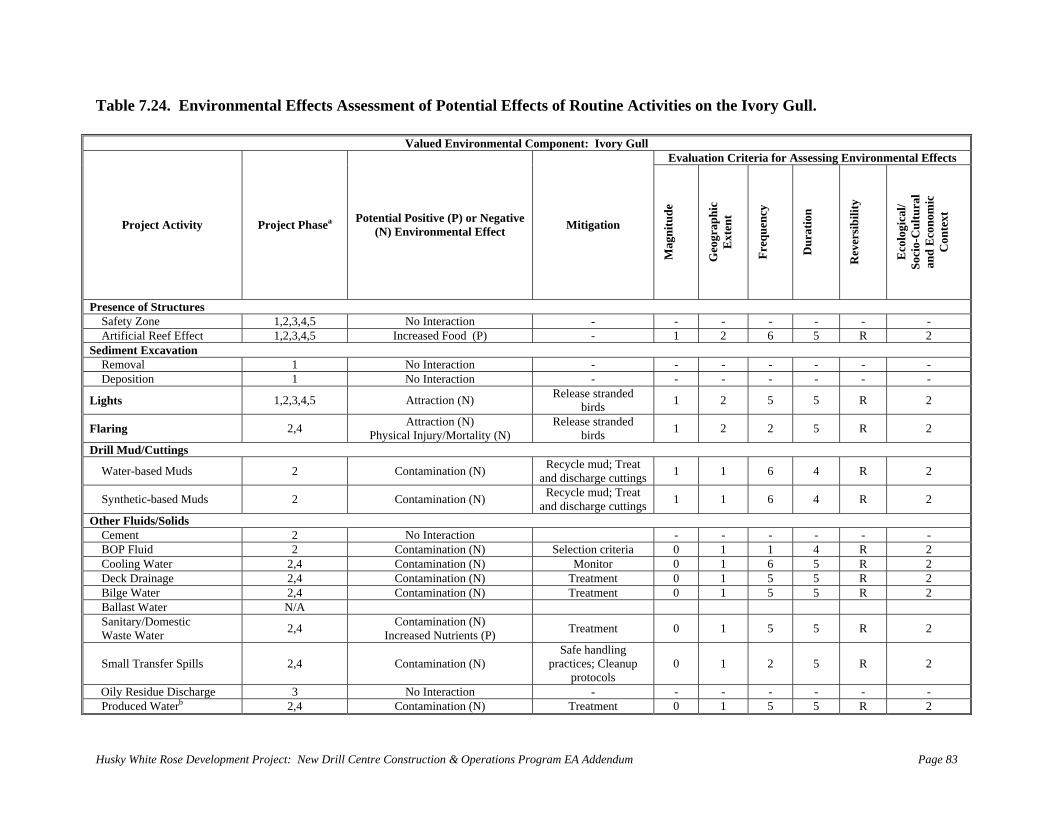
Table 7.2
Valu o y
4. Environmental Effects Assessment of P
ed
ot
En
en
vi
t
ro
ia
nm
l
en
Ef
ta
fe
l C
ct
o
s o
mp
f R
nen
o
t:
ut
Iv
in
or
e A
Gu
ct
ll
ivities on the Ivory Gull.
Evaluation Criteria for Assess iro tal Efing Env nmen fects
Projec ot Posi gnviro c
Dur
atio
n
Rev
ersi
bilit
y lSo
cio-
Cul
tura
l an
d E
cono
mic
tivenm
(Pen
) ota
r l E
Neffe
ativt
e Mitigation
Mag
nitu
de
Geo
grap
hic
Ext
ent
Freq
uenc
y
Eco
logi
ca/
Con
text
t Activity Project Phasea P ential(N) E
Presence of Structures Safety Zon No - - e 1,2,3,4,5 Interaction - - - - - Artificial R creased Food - 1 6 5 R eef Effect 1,2,3,4,5 In (P) 2 2 Sediment Excavation Removal No Interaction - - 1 - - - - - Deposition No Interaction - - - - - 1 - -
Lights Attraction (N) Release s debird 2 tran
s d 1 5 5 R 21,2,3,4,5
Flaring Attraction (N) P al Injury/Mortality (N)
Release s dbird 2 2 5 tran
s ed 1 R 22,4 hysic
Drill Mud/Cuttings
Water-bas Contamination (N) Recycle m Tand discha t 1 6 4 ud;
rge cureatting
s 1 R 2ed Muds 2
Synthetic-b Contamination (N) Recycle m Tand discha t 1 6 ud;
rge cureatting
s 1 4 R 2ased Muds 2
Other Fluids/Solids Cement No Interaction - - - 2 - - - BOP Fluid Contamination (N) Selection eria 1 1 4 R 2 crit 0 2 Cooling Water Contamination (N) Moni 1 6 5 R 2 2,4 tor 0 Deck Drainage Contamination (N) 1 5 5 2 2,4 Treatment 0 R Bilge Water Contamination (N) Treatment 1 5 5 2 2,4 0 R Ballast Water N/A Sanitary/Dome Waste Water
Contamination (N) Increased Nutrients (P) Treatment 0 1 5 5 2 stic 2,4 R
Small Transfer Contamination (N) Safe handling
practices; Cleanup protocols
0 1 2 5 R 2 Spills 2,4
Oily Residue D No Interaction - - - - - - ischarge 3 - Produced Wate Contamination (N) Treatment 0 1 5 5 2 rb 2,4 R
Husky White Rose Development Project: New Drill Centre Construction & Operations Program EA Addendum Page 83
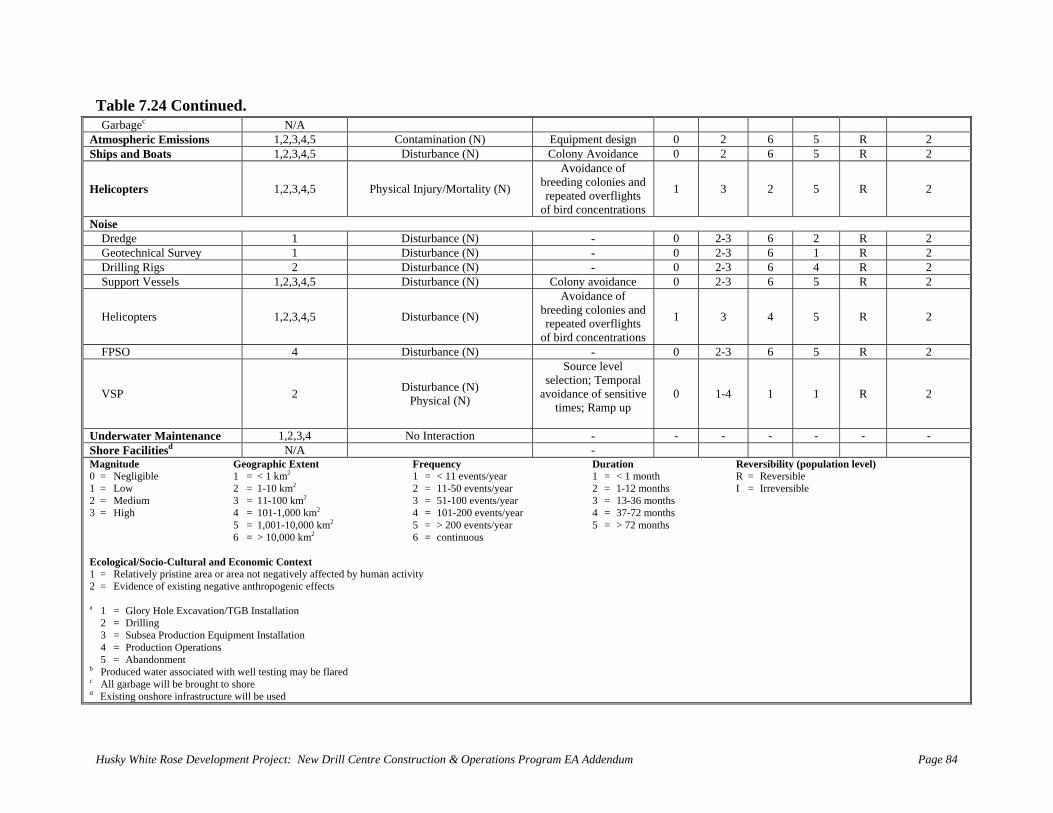
Table 7.24 Continued. Garbagec N/A Atmospheric Emiss ,4,5 Contamination (N) Equipment design 0 2 6 5 R 2 ions 1,2,3Ships and Boats 1,2,3,4,5 Disturbance (N) Colony Avoidance 0 2 6 5 R 2
Helicopters 1,2,3,4,5 Physical Injury/Mortality (N) breeding colonies and repeated overflights
of bird concentrations
Avoidance of
1 3 2 5 R 2
Noise Dre 0 2-3 6 2 2 dge 1 Disturbance (N) - R 0 2-3 6 1 R 2 Geotechnical Survey 1 Disturbance (N) - Drilling Rigs 2 - 0 2-3 4 R 2 Disturbance (N) 6 Support Vessels 1,2,3,4,5 Disturbance (N) Colony avoidance 0 R 2 2-3 6 5
Helicopters 1,2,3,4,5 Disturbance (N)
Avoidance of breeding colonies and repeated overflights
of bird ations
4
concentr
1 3 5 R 2
FPSO 4 Disturbance (N) - 0 2-3 6 5 R 2
VSP 2 Disturbance (N) Physical (N)
Source level selection; Temporal
avoidance sensitive times; Ramp up
of
0 1-4 1 1 R 2
Underwater Maintenance - - - - - - 1,2,3,4 No Interaction - Shore Facilitiesd N/A -Magnitud0 =
e Geograp uration Reversibility (population level) Negligible 1 = < 1 km ear = < 1 month R = sible
2 = 1-10 km2 2 = 11-50 events/year 2 = 1-12 months I = Irreversible 3 = 11-100 2 /year months4 = 101-1, km2 ear onths
5 = 1,001-10,000 km2 5 = > 200 events/year onths 6 = > 10,00 m2
ral and Economic Context y pristine area or area not negatively affected by hu
idence of existing negative anthro fects
cavation/TGB Installat
tion Equipment Installperations t
b Produced water associated with well testing may be flared c All garbage will be brought to shore d Existing onshore infrastructure will be used
hic Extent Frequency D2 1 = < 11 events/y 1 Rever
1 = Low 2 = Medium 3 = High
km 3 = 51-100 events4 = 101-200 events/y
3 = 13-36 4 = 37-72 m
000
5 = > 72 m 0 k 6 = continuous Ecological/Socio-Cultu1 = Relativel2 = Ev
man activity pogenic ef
a 1 = Glory Hole Ex ion 2 = Drilling
duc 3 = Subsea Pro 4 = Production
ation O
5 = Abandonmen
Husky White Rose Development Project: New Drill Centre Construction & Operations Program EA Addendum Page 84
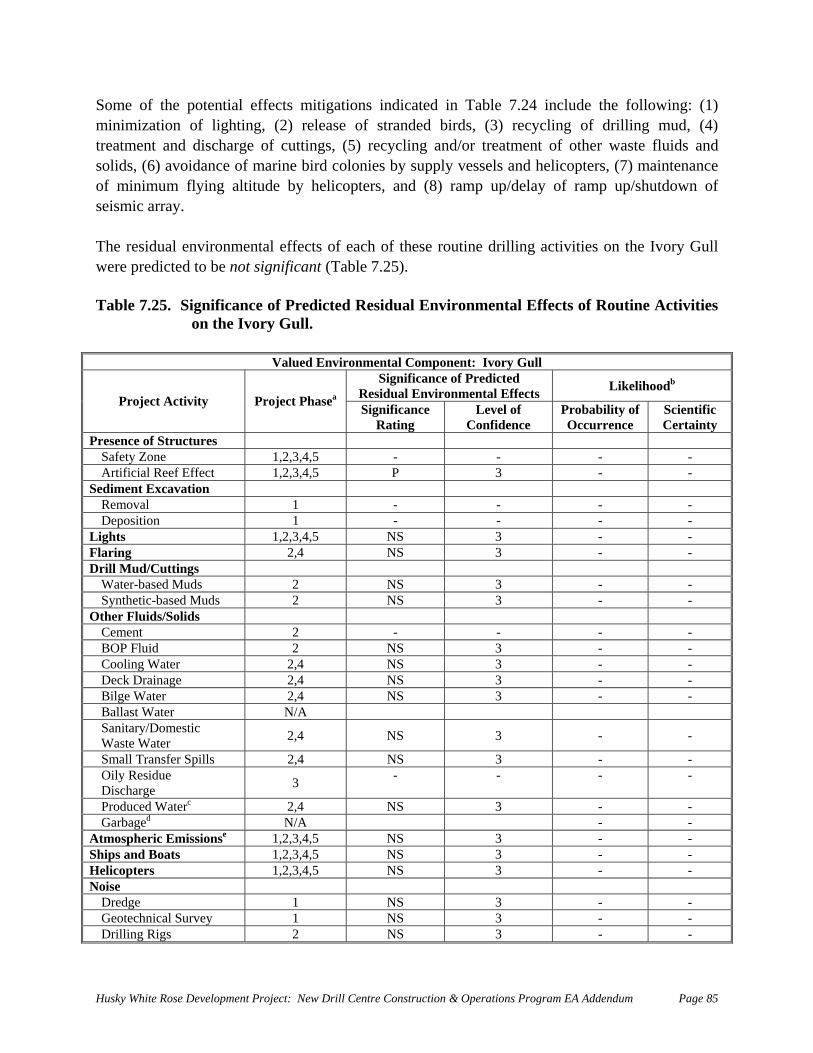
Husky Whit
Som
e Rose Development Project: New Drill Centre Construction & Operations Program EA Addendum Page 85
e mitigations indicated in Table 7.24 include the following: (1) minim (3) recycling of ud, (4) treatm t and schar , (5) recycling and/or treatment of other waste fluids and solids, (6) avoidance of marine bird colonies by supply vessels and helicopters, (7) maintenance of m um flying altitude by helicop sseism The res dual environm fects of each of these routine drilling activities on the Ivory Gull were predicted to be not significant (Table 7.25). Tabl 25. Significance of Predicted Residual Environmental Effects of Routine Activities
on th G l.
Valued Environmental Component: Ivory Gull
of the potential effects ization of lighting, en
inimic array.
i
e 7.
(2) release of stranded birds, drilling mdi ge of cuttings
ter , and (8) ramp up/delay of ramp up/shutdown of
ental ef
e Ivory ul
Significance of Residual Environmental Effects Li lihoodbPredicted ke
Project Activity Project Phasea
nificance Rating
Level of Confidence
r ility of nce
Scientific Certainty
Sig PO
obabccurre
Presence of Structures Safet Zone 1, - y 2,3,4,5 - - - Art ial Reef Effect 1, 3 - ific 2,3,4,5 P - Sediment Excavation Rem 1 - - - - oval Depo 1 - - - - sitionLigh 1,2,3,4,5 NS 3 - - ts Flari 2,4 NS 3 - - ng Drill Mud/Cutting s Wat based Muds - er- 2 NS 3 - Sy ic-based S - nthet Muds 2 N 3 - Other Solids Fluids/ Cem - ent 2 - - - BO uid - P Fl 2 NS 3 - Cool g Water 3 - - in 2,4 NS Deck rainage 2,4 NS 3 - - D Bi ater 2,4 NS 3 - - lge W Ballast Water N/A San mesti Waste Water 2,4 NS 3 - itary/Do c -
Small Transfer Sp - ills 2,4 NS 3 - Oily Residue Discharge 3 - - - -
Produced Waterc 2,4 NS 3 - - Garbaged N/A - - Atmospheric Emissionse 1,2,3,4,5 NS 3 - - Ships and Boats 1, 4,5 NS 3 - - 2,3,Helicopters 1, ,4,5 3 - - 2,3 NSNoise Dredge - 1 NS 3 - Geotechnical Sur - vey 1 NS 3 - Drilling Rigs - 2 NS 3 -
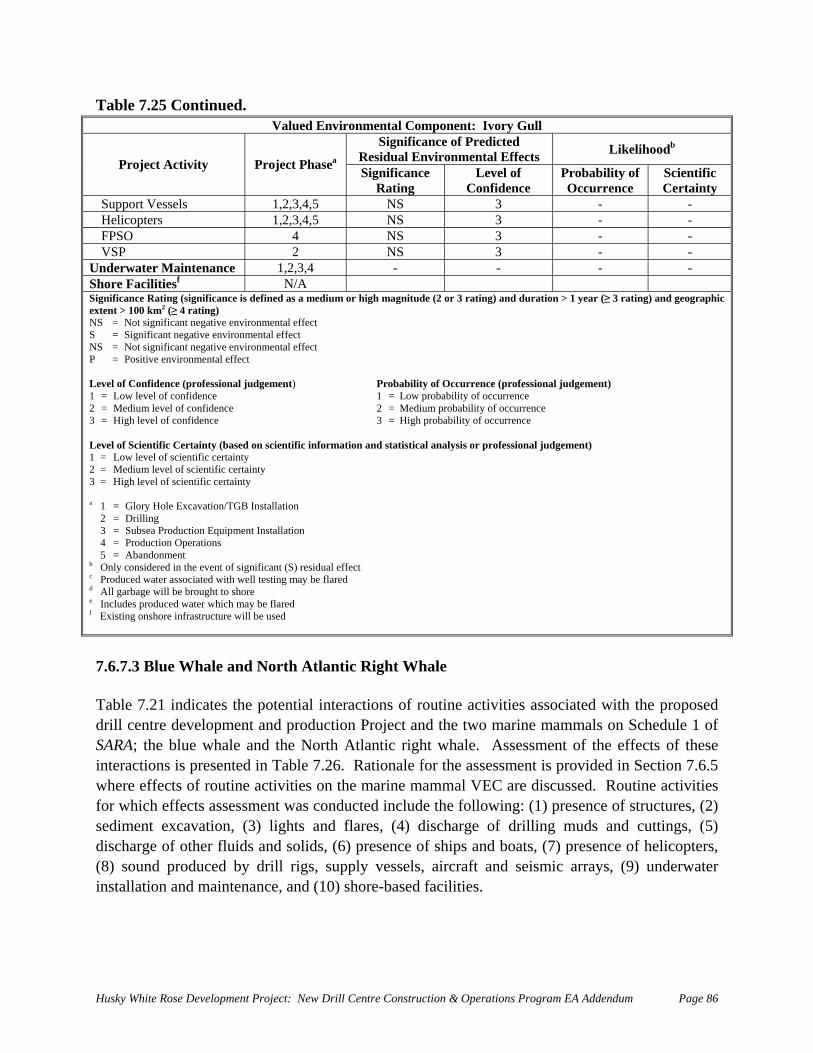
Tabl 25 Continuenmenta onent: Ivory Gull
e 7. d. Valued Enviro l Comp
Significance of Predicted Residual Environmental Effects Likelihoodb
Project Activity Project Phasea
Significance Rating
Level of Confidence
Probability of Occurrence
Scientific Certainty
Supp els 4,5 NS 3 - - ort Vess 1,2,3, Helic rs 1,2,3,4,5 NS 3 - - opte FPSO 4 N 3 - - S VSP 2 NS 3 - - Underw r Maintenance 1,2,3,4 - - - - ateShore F litiesf N/A aciSignificance Rating (significance is defined as a medium or high magnitude ting) and duration > 1 year (≥ 3 rating) and geographic extent > 100 km2 (≥ 4 rating) NS gnificant negative ental effect S icant negative env NS gnificant negative env P e environmental effect Level idence (professiona Probability of Oc ofessional judgement) 1 = level of confidence 1 = Low proba nce 2 = um level of confidence 2 edium p urrence 3 = level of confidence 3 gh pr ence Level of Scientific Cert (based on sci nd s l ional judgement) 1 = level of scientific certainty 2 = um level of scientific certainty 3 = level of scien ertainty
a 1 ory Hole Excavation/TGB Install 2 illing 3 bsea Produc quipment Installation 4 oduction Op 5 andonment b Only considered in the event of significant (S) residual effect c Produced water associated with well testing may bed All age will be b o shore e Includes produced w ch may be flared f Existing onshore infrastructure will be used
(2
oba
ana
or
bilrobbil
lys
3 ra
curityabiity
is
= N= S= N= P
of CLow MediHigh
Low MediHigh
= Gl= Dr= Su= Pr= Ab
garb
ot siignifot siositiv
onf
environmironment
al effect
ironmental effect
l judgement) ren of lity of
or
ceocc of
oc
pro
(prurre occcurr
fess
= M= Hi
tatisticaainty
tific c
entific information a
ation
tion Eerations
rought tater whi
flared
7.6.7.3 Blue W and North Atlantic Right Wha Table 7.21 indicates the potential interactions of routine activities associated with the proposed drill centre development and production Project and e two rine mals on Schedule 1 of SARA; the blue ale and the North Atlantic al of the effects of these interactions is p ented in Table 7.26. Ration n e n S 7.6.5 where effects of routine activities on the marine mam uti a vities
which effects assessment was conducted include ) iment excavation, (3) lights and flares, (4) discharge of drilling muds and cuttings, (5) harge of oth fluids and solids, (6) presence of ships and boats, (7) presence of helicopters, sound prod d by drill rigs, supply ves , raft and se water allation and intenance, and (10) shore-based facilities.
hale le
thwh
r tm
the following: (1) presence of structures, (2
airc
AesEC
mas
sm
maens sc
i
mt
prouss
c a
whres
rigale
ht fo
e. ssV
sese
are
smt idi
ism
hea al
vided.
rray
d i Ro
s,
ectne
u
ion cti
er
for seddisc(8) inst
er uce ma
sels (9) nd
Husky White Rose Development Project: New Drill Centre Construction & Operations Program EA Addendum Page 86
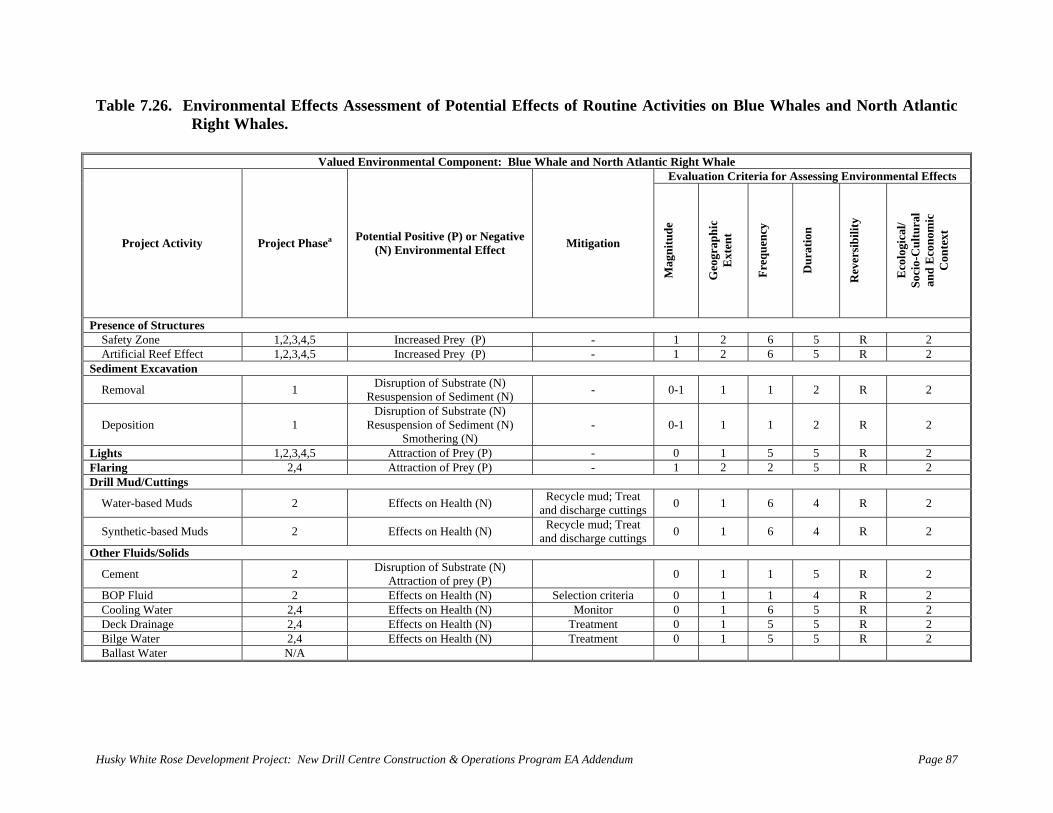
e Rose Development Project: New Drill Centre Construction & Operations Program EA Addendum Page 87
Activities on Blu
lue W ant ght Whale
Ta
ble 7.26. EnviRig
roht
n W
meh
ntale
al Efs.
fe
V
cts A
alued
sse
En
ss
vir
m
on
ent
men
o
tal
f P
Co
ot
mp
en
on
tia
ent
l
: B
Effects
hal
of
e a
R
nd
ou
Nor
tin
th
e
Atl
e Whales and North Atlantic
ic RiEvaluation Crite r A Enria fo ssessing vironmental Effects
Project Activity Project Phasea Potential Positive (P) or Negative (N) Environmental Effect Mitigation
Ext
ent
Mag
nitu
de
Geo
grap
hic
Freq
uenc
y
Dur
atio
n
Rev
ersi
bilit
y
Eco
logi
cal/
Soci
o-C
ultu
ral
and
Eco
nom
ic
Con
text
Presence of Structures Safety Zone 1,2,3,4,5 Increased Prey (P) - 1 2 6 5 R 2 Artificial Reef Effect 1,2,3,4,5 Increased Prey (P) - 1 2 6 5 R 2 Sediment Excavation
Removal 1 Disruption of Substrate (N) e N - Resuspension of S diment ( ) 0-1 1 1 2 R 2
Deposition 1 Resuspension of Sediment (N) Smothering (N)
- R Disruption of Substrate (N)
0-1 1 1 2 2
Lights 1,2,3,4,5 Attraction of Prey (P) - 1 R 0 5 5 2 Flaring 2,4 Attraction of Prey (P) - 2 R 1 2 5 2 Drill Mud/Cuttings
Recycle mud; Treatn RWater-based Muds 2 Effects on Health (N)
gs and discharge cutti 0 1 6 4 2
Synthetic-based Muds 2 Effects on Health (N) Recycle mud; Treatand discharge cuttings R 0 1 6 4 2
Other Fluids/Solids
Cement 2 Disruption of Substrate (N) Attraction of prey (P) R0 1 1 5 2
BOP Fluid 2 Effects on Health (N) Selection criteria R 0 1 1 4 2 1 R Cooling Water 2,4 Effects on Health (N) Monitor 0 6 5 2 Deck Drainage 2,4 Effects on Health (N) Treatment 1 R 0 5 5 2 Bilge Water 2,4 Effects on Health (N) Treatment 1 R 2 0 5 5 Ballast Water N/A
Husky Whit
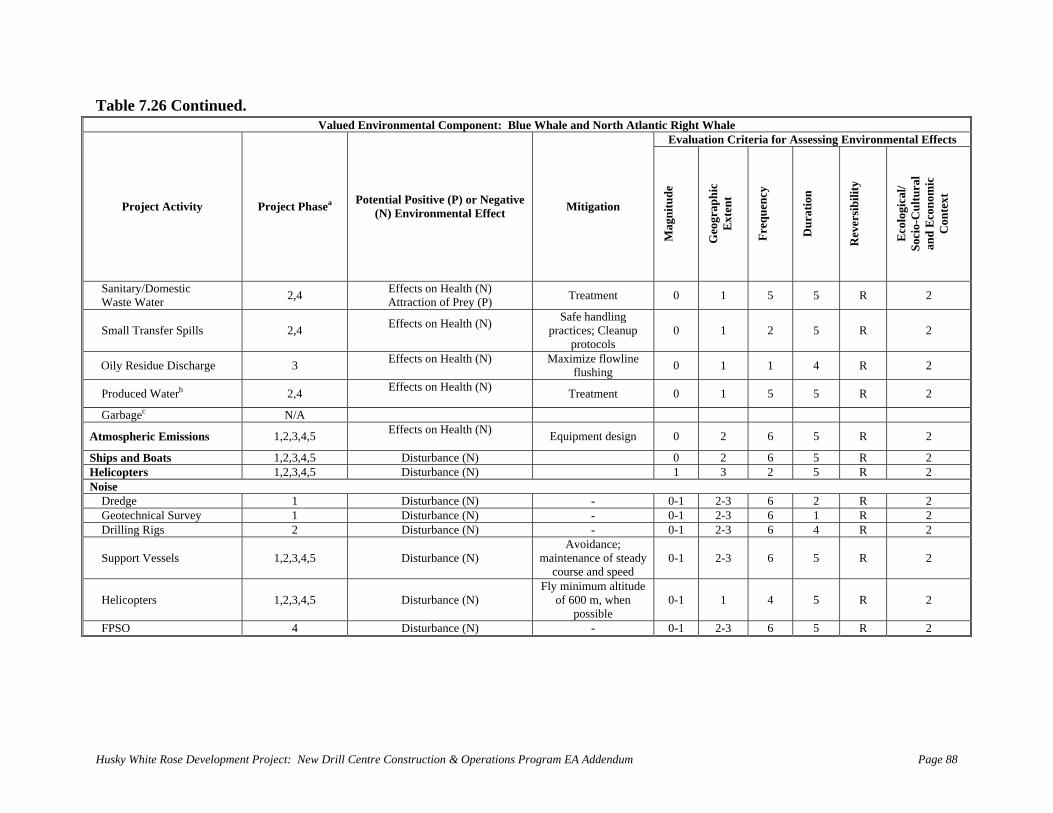
Tnm Com n
able 7.26 Continued. Valued Enviro ental ponent: Blue Whale and North Atla tic Right Whale
Evaluatio iro tal Efn Criteria for Assessing Env nmen fects
Project Activity al ve (PE men g
M Geo
grap
hic
Rev
ersi
bilit
y
Eco
logi
cal/
Soci
o-C
ultu
ral
and
Eco
nom
ic
Con
text
Project Phasea Potenti(N)
Positinviron
) ortal
NEff
egec
atit
ve Miti ation
agni
tude
Ext
ent
Freq
uenc
y
Dur
atio
n
Sanitary/Domestic Waste Water
ff n Hea ttr of Pre Treatment 0 1 2,4 E
Aects oaction
lth (N)y (P) 5 5 R 2
Small Transfer Spills ffects on Health (N)
Safe handling practices; Cleanu
protocols 5 2,4 E p 0 1 2 R 2
Oily Residue Dischar ffects on Health (N)
Maximize flowliflushing 4 R ge 3 E ne 0 1 1 2
Produced Waterb ffects on Health (N) Treatment 1 5 2,4 E 0 5 R 2
Garbagec N/A
Atmospheric Emission ffects on Health (N) Equipment desig 2 6 5 R s 1,2,3,4,5 E n 0 2
Ships and Boats Disturbance (N) 2 6 5 R 1,2,3,4,5 0 2Helicopters Disturbance (N) 3 2 5 1,2,3,4,5 1 R 2Noise Dredge Disturbance (N) - 2-3 6 1 0-1 2 R 2 Geotechnical Survey Disturbance (N) - 2-3 1 1 0-1 6 R 2 Drilling Rigs Disturbance (N) - 2-3 4 2 0-1 6 R 2
Support Vessels Disturbance (N) Avoidance;
maintenance of stecourse and spee
0-1 2-3 5 R 1,2,3,4,5 ady d
6 2
Helicopters Disturbance (N) Fly minimum altit
of 600 m, when possible
0-1 1 5 1,2,3,4,5 ude
4 R 2
FPSO Disturbance (N) - 0-1 2-3 6 5 4 R 2
Husky White Rose Development Project: New Drill Centre Construction & Operations Program EA Addendum Page 88
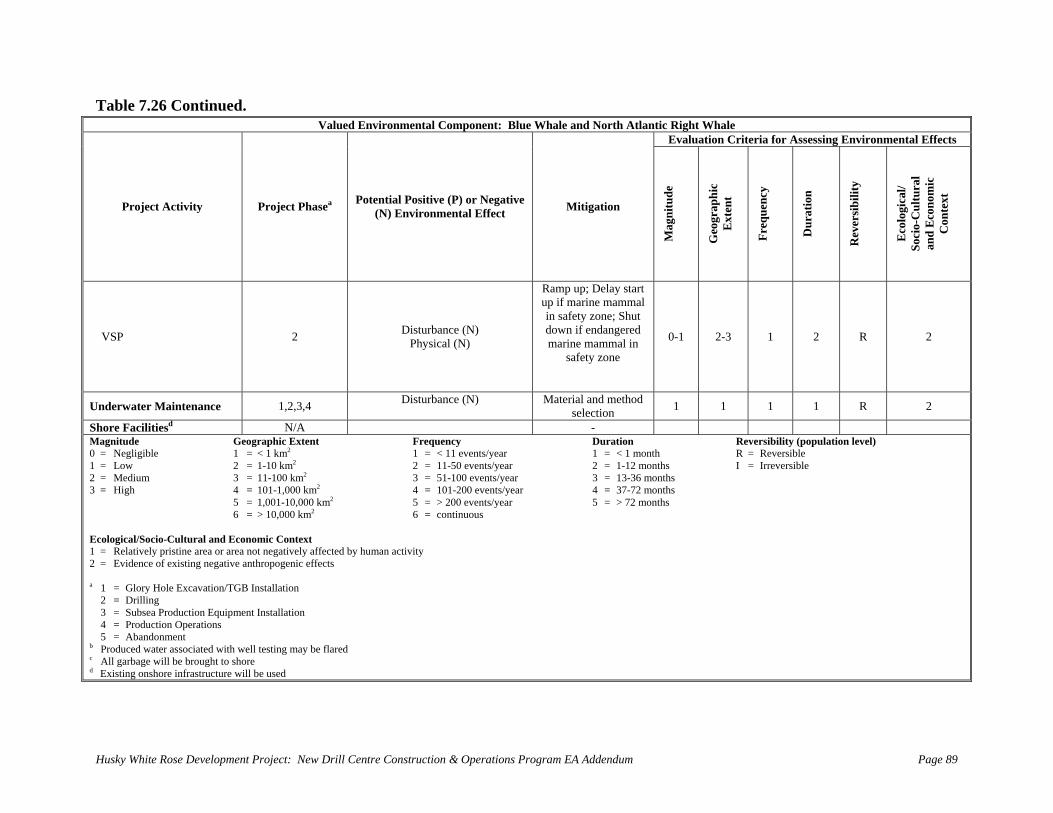
Table 7.26 Continued. Valued Environmental Component: Blue Whale and North Atlantic Right Whale
Evaluation Criteria for Assessing Environmental Effects
Project Activity Project Phasea Potential Positive (P) or Negative Mitigation
Mag
nitu
de
Geo
grap
hic
Ext
ent nc
y
Dur
atio
n
Rev
ersi
bilit
y
Eco
logi
cal/
Soci
o-C
ultu
ral
and
Eco
nom
ic
Con
text
(N) Environmental Effect
Freq
ue
VSP 2 Disturbance (N) Physical (N)
Ramp up; Delay start up if marine mammal in safety zone; Shut down if endangered marine mmal in
safety zone
0-1 2-3 ma
1 2 R 2
Underwater Maintenance 1, 4 Material and method sele on 2,3, Disturbance (N)
cti 1 1 1 1 R 2
Shore Facilitiesd N/A - Magnitude Geograp uration Reversibility (population level)
igible 1 = < 1 km ear = < 1 month R = sible
2 = 1-10 k ts/year = 1-12 months I = Irreversible 3 = 11-100 km2 3 = 51-100 events/year months 4 = 101-1,0 km2 s/year onth
5 = 1,001-10,000 km2 5 = > 200 events/year onths 6 = > 10,00 m2
ral and Economic Context area or area not negatively affected by hu
of existing negative anthro fects
xcavation/TGB Installati
tion Equipment In Operations
t b Produced water associated with well testing be flared c All garbage will be brought to shore d Existing onshore infrastructure will be used
hic Extent Frequency D0 = Negl 2
m2 1 = < 11 events/y2 = 11-50 even
1 2
Rever1 = Low 2 = Medium 3 = 13-36
4 = 37-72 m5 = > 72 m
3 = High 00 4 = 101-200 event s
0 k 6 = continuous
Ecological/Socio-Cultu1 = Relatively pristine man activity 2 = Evidence pogenic ef a 1 = Glory Hole E 2 = Drilling
on
3 = Subsea Produc stallation 4 = Production 5 = Abandonmen
may
Husky White Rose Development Project: New Drill Centre Construction & Operations Program EA Addendum Page 89
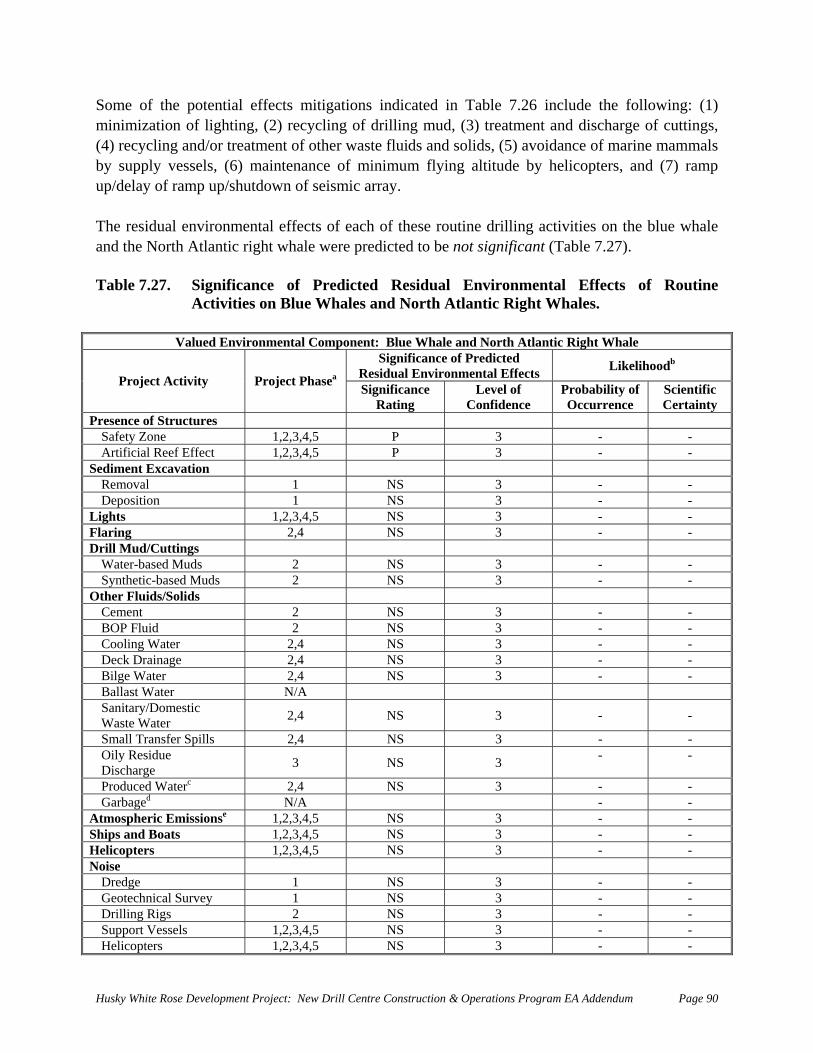
Husky Whit
Som
e Rose Development Project: New Drill Centre Construction & Operations Program EA Addendum Page 90
e mitigations indicated in Table 7.26 include the following: (1) minim n of lighting, (2) recycling of drillin(4) recycling and/or treatm ds and solids, (5) avoidance of marine mammals by supply vessels, (6) maintenance of minimum flying altitude by helicopters, and (7) ramp up/delay of ramp up/shutdow c array. The residual environmental effects of each of these routine drilling activities on the blue whale and the North Atlantic right hale were predicted to be not significant (Table 7.27). Table 7.27. nce icted
Activities on Blue Whales and North Atlantic Right Whales.
Valued Env Com ent: Blue Whale and North Atlantic Right Whale
of the potential effects izatio g mud, (3) treatment and discharge of cuttings,
ent of other waste flui
n of seismi
w
Significa of Pred Residual Environmental Effects of Routine
ironmental ponSignificance of Predicted
Residual Environme Likelihoodbntal Effects Project Activity h Significance
Rating Level of
Confidence Probability of
rrence Scientific Certainty
Project P asea
OccuPresence of Structures Safet Zone 1, , P - y 2,3,4 5 3 - Art ial Reef Effect 1, P - ific 2,3,4,5 3 - Sediment Excavation Re NS - moval 1 3 - Depo NS - sition 1 3 - Ligh 1,2,3,4,5 NS 3 - - ts Flari 2,4 NS 3 - - ng Drill Mud/Cutting s Wat based Muds NS 3 - - er- 2 Sy ic-based - - nthet Muds 2 NS 3 Other Solids Fluids/ Ce - - ment 2 NS 3 BO uid - - P Fl 2 NS 3 Cool g Water - - in 2,4 NS 3 Deck rainage NS 3 - - D 2,4 Bi ater 2,4 NS 3 - - lge W Ballast Water N/A Sanitary/Domestic Waste Water 2,4 NS 3 - -
Small Transfer Spills 2,4 - - NS 3 Oily Residue Discharge 3 NS - - 3
Produced Waterc 2,4 NS 3 - - Garbaged N/A - - Atmospheric Emissionse 1, 4,5 NS 3 - - 2,3,Ships and Boats 1, 4,5 NS 3 - - 2,3,Helicopters 1, 4,5 NS 3 - - 2,3,Noise Dredge - - 1 NS 3 Geotechnical Survey - - 1 NS 3 Drilling Rigs - - 2 NS 3 Support Vessels 1, 4,5 - - 2,3, NS 3 Helicopters 1, 4,5 - - 2,3, NS 3
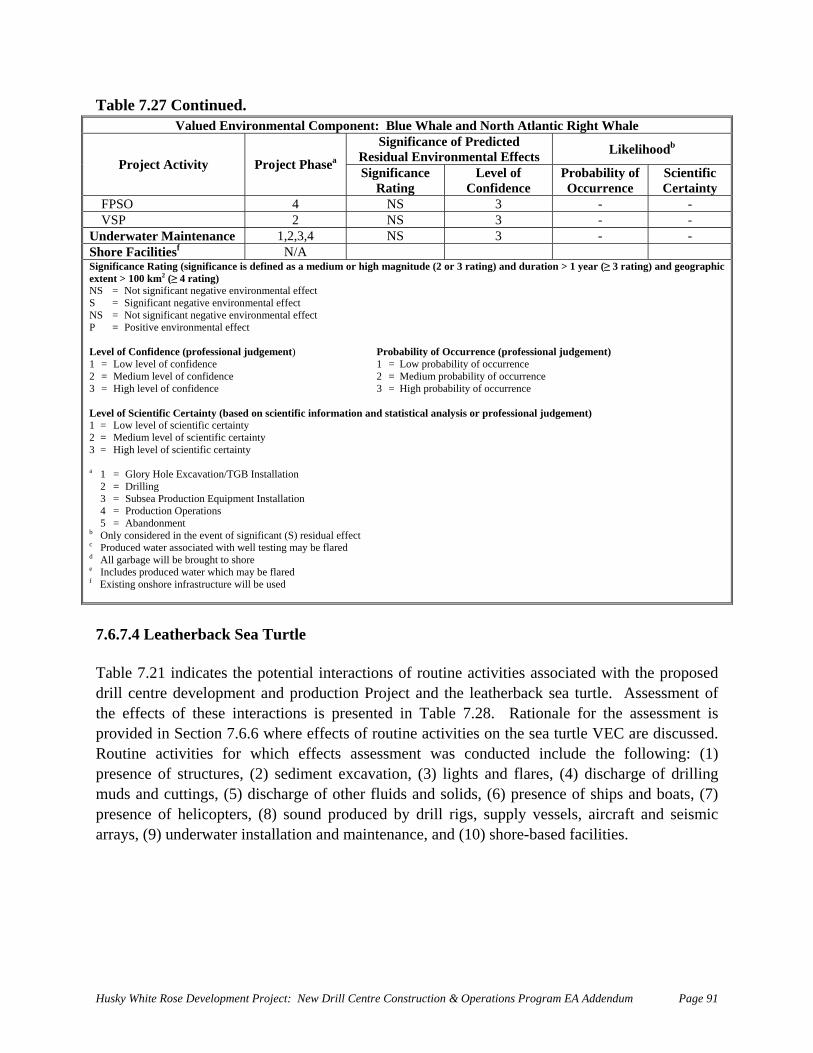
Tabl 27 ContinueValued Environme ponent: Blue Whale and North Atlantic Right Whale
e 7. d. ntal Com
Significance of Predicted Residual Environmental Effects Likelihoodb
Project Activity Project Phasea
Significance Rating
Level of Confidence
Probability of Occurrence
Scientific Certainty
FPSO NS 3 - - 4 VSP 2 NS 3 - - Underw r Maintenance NS 3 - - ate 1,2,3,4 Shore F litiesf aci N/A Significance Rating (significance is defined as a medium or high magnitude (2 or 3 rating) and duration > 1 year (≥ 3 rating) and geographic extent > 100 km2 (≥ 4 rating) NS = N gnificant nmental effect S = S icant negative environmental effect NS = N gnificant negative environmental effect P = Positive environmental e Level of Confidence (professional judgem Probability of Occurrence (professional judgement) 1 = Low level of confidence 1 = Low probability of occurrence 2 = level of confidence 2 = Medium probability of occurrence 3 = level of confidence 3 = High probability of occurrence Level of Scientific Certainty (based on scientific information and statistical analysis or professional judgement) 1 = level of scientific certainty 2 = um level of scientific certainty 3 = level of scien ertainty
a 1 ory Hole Exca n/TGB Install 2 illing 3 bsea Production Equipment Installation 4 oduction Operations 5 andonment b Only considered in the event of significant (S) residual effect c Produced water associated with well testing may be flared d All age will be b o shore e Includes produced w ch may be flf Existing onshore infrastructure will be us
ot siignifot si
ium
negative enviro
ffect
ent)
MedHigh
Low MediHigh
= Gl= Dr= Su= Pr= Ab
garb
tific c
vatio ation
rought tater whi ared
ed
7.6.7.4 Leatherback Sea Turtle Table 7.21 indicates the potential interactions of routine activities associated with the proposed drill centre development and production Project an e leatherback sea turtle. Assessment of the effects of these interactions is presented in Table 7.28. Rationale for the assessment is provided in Section 7.6.6 where effects of routine activities on the sea turtle VEC are discussed. Routine activities for which effects assessment was conducted include the following: (1) presence of structures, (2) sediment excavation, (3) lights a flares, (4) discharge of drilling muds and cuttings, (5) discharge of other fluids a ds, ( presence of ships and boats, (7)
ence of helicopters, (8) sound produced by d s, s ly vessels, aircraft and seismic ys, (9) underwater installation and maintenance, and (10) shore-based facilities.
d th
sll
nd 6) upp
ndri
olirigpres
arra
Husky White Rose Development Project: New Drill Centre Construction & Operations Program EA Addendum Page 91
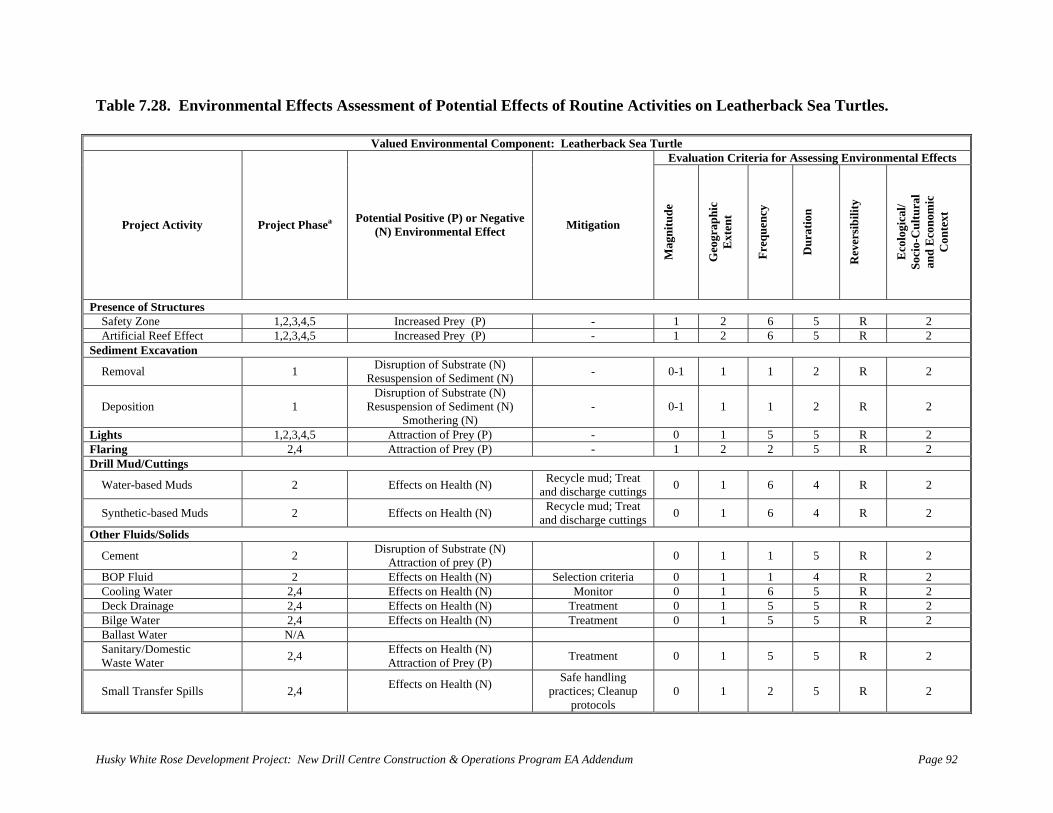
e Rose Development Project: New Drill Centre Construction & Operations Program EA Addendum Page 92
able 7.2 En menta R tivities on Leath
e e a Turtle
8. viron l Effects Assessm
Va
e
lue
nt
d E
of
nvi
Po
ron
te
me
nti
nta
al
l C
Ef
om
fe
pon
cts of
nt: L
ou
athe
ti
rb
ne
ack
Ac
Se
erback Sea Turtles.
Evaluation Crite r A Enria fo ssessing vironmental Effects
Project Activity Project a Potential Positive (P) ative (N) Environmental Effect Miti n
Mag
nitu
de
Ext
ent
Phase or Neg gatio
Geo
grap
hic
Freq
uenc
y
Dur
atio
n
Rev
ersi
bilit
y
Eco
logi
cal/
Soci
o-C
ultu
ral
and
Eco
nom
ic
Con
text
Presence of Structures Safety Zone 1,2,3,4,5 Increased Prey (P) 1 - 2 6 5 R 2 Artificial Reef Effect 1,2,3,4,5 Increased Prey (P) - 1 2 6 5 R 2 Sediment Excavation
Removal 1 Disruption of Substrate (N) Resuspension of Sediment (N) - 1 0- 1 1 2 R 2
Deposition Smothering (N)
1 1Di
Ressruusp
ptioensi
n oon
f Suof
bstrate (N) imeSed nt (N) - 0- 1 1 2 R 2
Lights 1,2,3,4,5 Attraction of Prey (P) - 0 1 R 5 5 2 Flaring 2,4 Attraction of Prey (P) - 1 2 R 2 5 2 Drill Mud/Cuttings
Water-based Muds 2 Effects on Health (N) Recycle mud; Treatand discharge cuttin 0 1 6 R
gs 4 2
Synthetic-based Muds yc eatand discharge cuttin 0 1 6 R2 Effects on Health (N) Rec le mud; Tr
gs 4 2
Other Fluids/Solids
Cement 2 Disruption of Substrate (N) Attraction of prey (P) 0 1 1 R5 2
BOP Fluid 2 Effects on Health (N) Selection criteria 0 1 1 R 4 2 Cooling Water 2,4 Effects on Health (N) Monitor 0 1 R 6 5 2 Deck Drain ect 0 1 R age 2,4 Eff s on Health (N) Treatment 5 5 2 Bilge Water 2,4 Effects on Health (N) Treatment 0 1 R 5 5 2 Ballast Water N/A Sanitary/Domestic Waste Water 2,4 Effects on Health (N)
Attraction of Prey (P) Treatment 0 1 5 R 2 5
Small Transfer Spills 2,4 Effects on Health (N) Safe handling practices; Cleanup 0 1 2 R5 protocols
Husky Whit
T
2
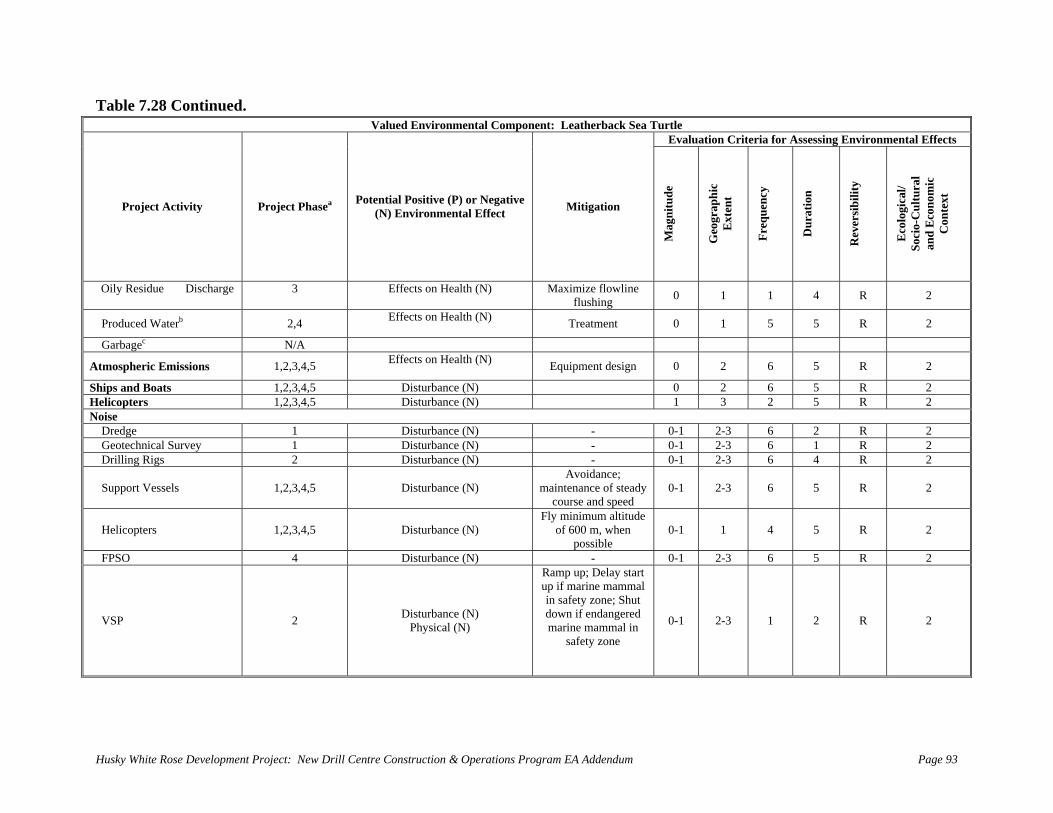
e Rose Development Project: New Drill Centre Construction & Operations Program EA Addendum Page 93
CoValued Environmen ponen h l
able 7.28 ntinued. tal Com t: Leat erback Sea Turt e
Evaluation Criteria for Assessing Environmental Effects
Project Acti Pro ha Potential Positive (P)(N) Environmental Effect
Geo
grap
hic
Ext
ent
Dur
atio
n
Rev Eco
logi
cal/
vity ject P sea or Negative Mitigation
Mag
nitu
de
Freq
uenc
y
ersi
bilit
y
Soci
o-C
ultu
ral
and
Eco
nom
ic
Con
text
Oily Residue Effects on Health (
lowlishing 0 1 1 R Discharge 3 N) Maximize f
flune 4 2
Produced Waterb Effects on Health (N) atment 0 1 5 R 2,4 Tre 5 2
Garbagec N/A
Atmospheric Emis 4,5 Effects on Health (N) Equipment design 0 2 6 5 sions 1,2,3, R 2
Ships and Boats 4,5 Disturbance (N) 0 2 6 5 1,2,3, R 2Helicopters 4,5 Disturbance (N) 1 3 1,2,3, 2 5 R 2Noise Dredge Disturbance (N) 0-1 2-3 6 2 1 - R 2 Geotechnical Sur Disturbance (N) 0-1 2-3 6 1 R vey 1 - 2 Drilling Rigs Disturbance (N) 0-1 2-3 6 4 R 2 - 2
Support Vessels 4,5 Disturbance (N) i
ma cou a
0-1 2-3 6 5 1,2,3,Avo
intenanrse
dance ond s
ce;f spe
teaed
dy
R 2
Helicopters 4,5 Disturbance (N) Fly m m
of ss
0-1 1 4 5 1,2,3,ini
600po
um m, ib
altwhle
ituen
de R 2
FPSO Disturbance (N) - 0-1 2-3 6 5 R 24
Husky Whit
T
VSP 2 Disturbance (N) Physical (N)
Ra Delay stup if ne mamin safety zone; Sdown if endangermarine mammal in
safety zone
0-1 2-3 1 2 2
mp up;mari
art mal hut ed R
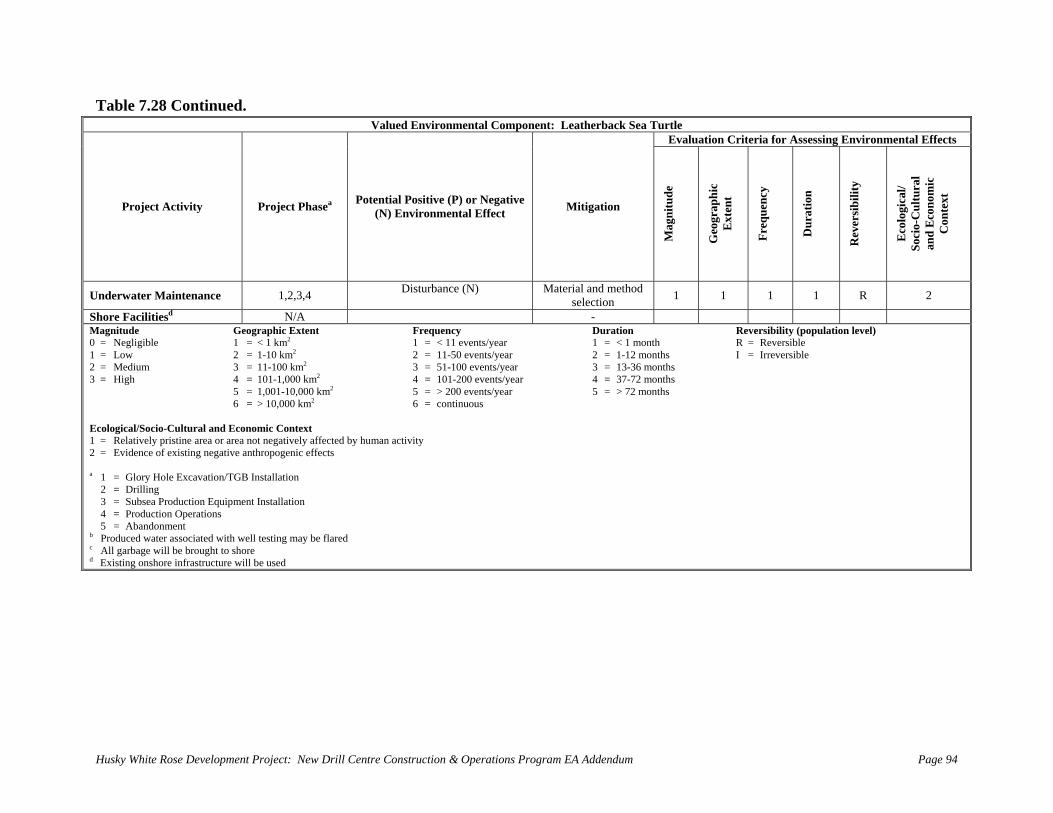
e Rose Development Project: New Drill Centre Construction & Operations Program EA Addendum Page 94
lu vir en er Se rtle
Table 7.28 Continued. Va ed En onm tal Component: Leath back a Tu
Evaluation Criteri Ass E Effects a for essing nvironmental
Project Activity Project Phasea ia tiv) on l E ga
Mag
nitu
de
Geo
grap
hic
Ext
ent
Dur
atio
n Potent(N
l PosiEnvir
e (P)menta
or Negative ffect Miti tion
Freq
uenc
y
Rev
ersi
bilit
y
Eco
logi
cal/
Soci
o-C
ultu
ral
and
Eco
nom
ic
Con
text
U ce 1,2,3,4 rb N) Ma an hot 1 1 nderwater Maintenan Distu ance (
terial
selecd metion
d 1 1 R 2
S N/A hore Facilitiesd - M Geographic Extent equenc Duration Rever (p ion0 1 = < 1 km2 = < 11 even 1 = < 1 m R = ible
1 2 = 1-10 km2 = 11-50 eve r 2 = 1-12 I = I ible2 3 = 11-100 km2 = 51-100 ev ear 3 = 13-36 hs 3 4 = 101-1,000 km2 = 101-200 ear 4 = 37-72 hs 5 = 1,001-10,000 km2 = > 200 events/year 5 = > 72 6 = > 10,000 km2 = continuous E and Economic Context 1 a or area not negatively affected by a2 egative anthropogenic effects a ation/TGB Installation Equipment Installation ons b d with well testing may be flared c ht to shore d ucture will be used
level) opulat
sibilityReversrrevers
onth months mont mont
months
y ts/yearnts/yeaents/y
events/y
human
Fr1 2 3 4 5
Husky Whit
agnitude = Negligible = Low = Medium = High
cological/Socio-Cultural = Relatively pristine are= Evidence of existing n
1 = Glory Hole Excav2 = Drilling 3 = Subsea Production4 = Production Operati5 = Abandonment Produced water associateAll garbage will be brougExisting onshore infrastr
6
ctivity
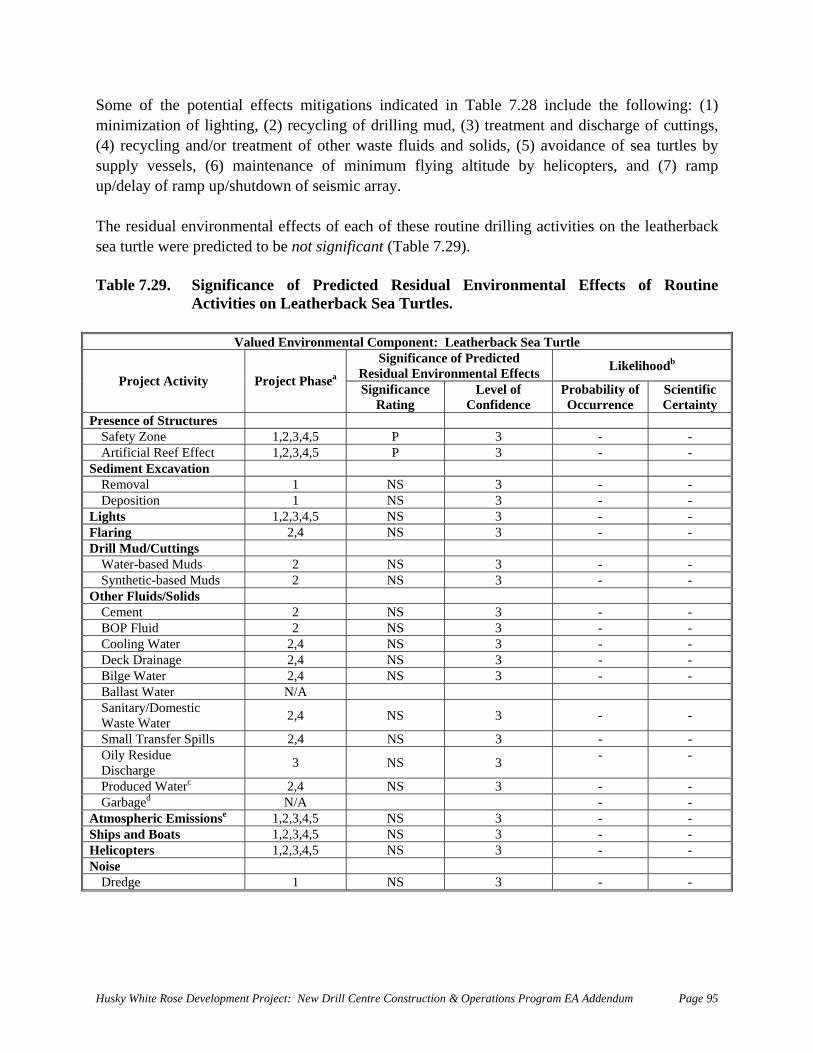
Some of the potential effects mitigations indicated in Table 7.28 include the following: (1) minimization of lighting, (2) recycling of drilling mud, (3) treatment and discharge of cuttings, (4) recycling and/or treatment of other waste fluids and solids, (5) avoidance of sea turtles by supply vessels, (6) maintenance of minimum flying altitude by helicopters, and (7) ramp up/delay of ramp up/shutdown of seismic array. The residual environmental effects of each of these routine drilling activities on the leatherback sea turtle were predicted to be not significant (Table 7.29). Table 7.29. Significance of Predicted Residual Environmental Effects of Routine
Activities on Leatherback Sea Turtles.
Valued Environmental Component: Leatherback Sea Turtle Significance of Predicted Likelihoodb
Residual Environmental Effects Project Activity Project Phasea
Significance Level of Probability of Scientific Rating Confidence Occurrence Certainty
Presence of Structures Safety Zone 1,2,3,4,5 3 - - P Artificial Reef Effe 1,2,3,4,5 ct P 3 - - Sediment Excavation 1 N - Removal S 3 - 1 N - Deposition S 3 - L 1,2,3,4,5 NS - ights 3 - F 2,4 NS - laring 3 - Drill Mud/Cuttings Water-based Muds 2 N - S 3 - uds 2 3 - Synthetic-based M NS - O ids/Solids ther Flu ent 2 N - Cem S 3 - 2 NS - BOP Fluid 3 - Cool er 2,4 N - ing Wat S 3 - rainage 2,4 N - Deck D S 3 - Bilge Water 2,4 N - S 3 - N/A Ballast Water Sanitary/Domestic Waste Water 2,4 NS 3 - -
- Small Transfer Spills 2,4 NS 3 - Oily Discharge 3 NS 3 Residue - -
Produced Waterc 2,4 NS 3 - - Garbaged N/A - - Atmospheric Emissionse 1,2,3,4,5 NS 3 - - Ships and Boats 1,2,3,4,5 NS 3 - - Helicopters 1,2,3,4,5 NS 3 - - Noise Dredge 1 NS 3 - -
Husky White Rose Development Project: New Drill Centre Construction & Operations Program EA Addendum Page 95
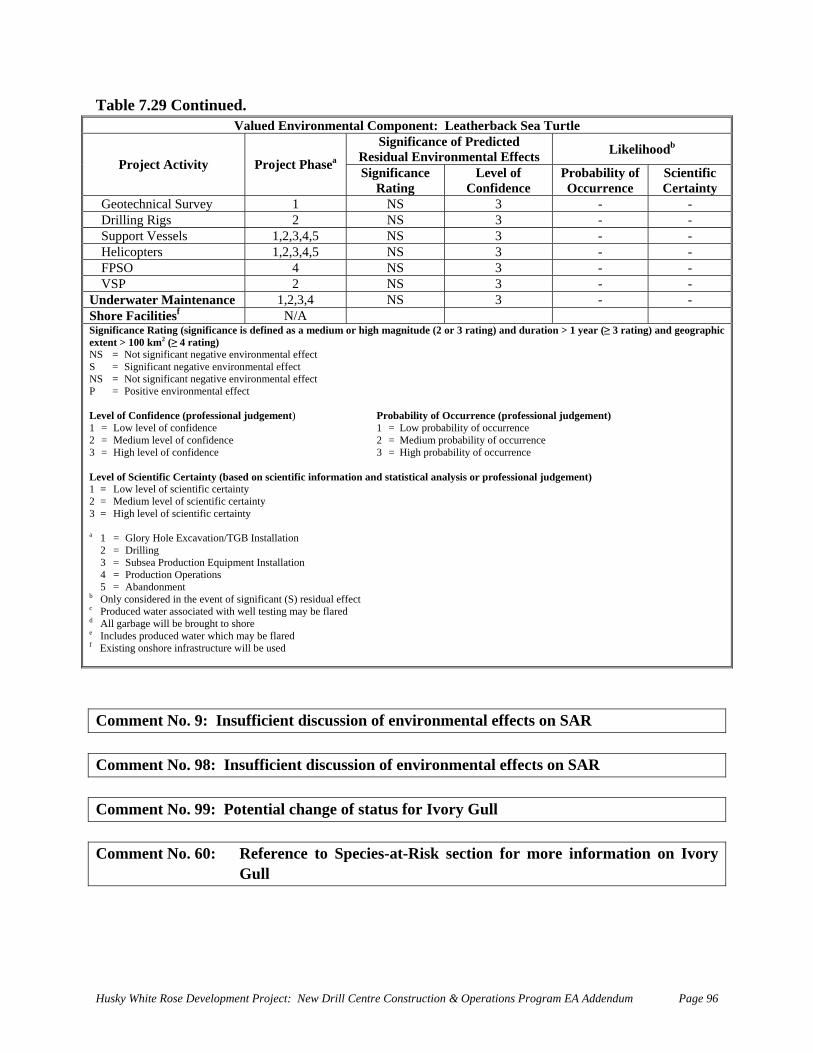
Table 7.29 Continued. Valued Environmental Component: Leatherback Sea Turtle
Significance of Predicted Residual Environmental Effects Likelihoodb
Project Activity Project Phasea
Significance Rating
Level of Confidence
Probability of Occurrence
Scientific Certainty
Geotechnical Survey 1 NS 3 - - Drilling Rigs 2 NS 3 - - Support Vessels 1,2,3,4,5 NS 3 - - Helicopters 1,2,3,4,5 NS 3 - - FPSO 4 NS 3 - - - - VSP 2 NS 3 Underw - - ater Maintenance 1,2,3,4 NS 3 Shore Facilitiesf N/A SeNSNP L Probability of Occurrence (professional judgement) 1 = Low level of confidence 1 = Low probability of occurrence 23 L123
a 1 = Glory Hole Excavation/TGB Installation 2 = Drilling 3 = Subsea Production Equipment Installation 4 = Production Operations 5 = Abandonment b Only considered in the event of significant (S) residual effect c Produced water associated with well testing may be flared d All garbage will be brought to shore e Includes produced water which may be flared f Existing onshore infrastructure will be used
ignificance Rating (significance is defined as a medium or high magnitude (2 or 3 rating) and duration > 1 year (≥ 3 rating) and geographic xtent > 100 km2 (≥ 4 rating) S = Not significant negative environmental effect = Significant negative environmental effect S = Not significant negative environmental effect = Positive environmental effect
evel of Confidence (professional judgement)
= Medium level of confidence 2 = Medium probability of occurrence = High level of confidence 3 = High probability of occurrence
evel of Scientific Certainty (based on scientific information and statistical analysis or professional judgement) = Low level of scientific certainty = Medium level of scientific certainty = High level of scientific certainty
Comment No. 9: Insufficient discussion of environmental effects on SAR Comment No. 98: Insufficient discussion of environmental effects on SAR Comment No. 99: Potential change of status for Ivory Gull Comment No. 60: Reference to Species-at-Risk section for more information on Ivory
Gull
Husky White Rose Development Project: New Drill Centre Construction & Operations Program EA Addendum Page 96
Husky White Rose Development Project: New Drill Centre Construction & Operations Program EA Addendum Page 97
omment No. 100: Consider effects of accidental events for each Phase
8.0 Accidental Events Accidental events could potentially occur during any of the five Project Phases. This section considers a range of accident spill size scenarios which adequately represents any accidental event that might occur during any of the Project Phases. C 8.1 Probability of Accidental Events Husky is proposing the development of five new drill centres and subsequent production operations using these drill centres. A maximum of 54 development wells are proposed for the Project Area during the period between 2007 and 2016. 8.1.1 General Oil Pollution Record of the Offshore Exploration and Production Industry Text in the EA remains the same. 8.1.2 Sources of Information Text in t. 8.1.3 Categories of Accidental Event Size Text in the EA remains the same.
E s
the US, only two moderate-size oil-well blowouts involving oil spills greater in size than 50,000
h occurred during production or work-over activities. The fifth was from ely the 1979 Ixtoc 1 oil-well blowout in the Bay of Campeche, Mexico.
rgest oil spill in history was caused by drilling procedures (used by PEMEX, Mexico’s
8.1.4 xtremely Large, Very Large and Large Accidental Event 8.1.4.1 Historical Statistics for Extremely Large and Very Large Spills The main concern from a safety, environmental and economic perspective, is the possibility of a well blowout occurring and discharging large quantities of oil into the marine environment. In
barrels have occurred since offshore drilling began in the mid-fifties. One must therefore look beyond the US to find a reasonable database on very large and extremely large oil-well blowouts. Table 8.2 lists all worldwide blowouts involving spillage of more than 10,000 barrels as of 2005. With respect to “extremely large” spills (i.e., oil spills ≥ 150,000 barrels in size), there have been five such spills in the history of offshore drilling, two of which occurred during development drilling and two of whicexploration drilling, namThis la
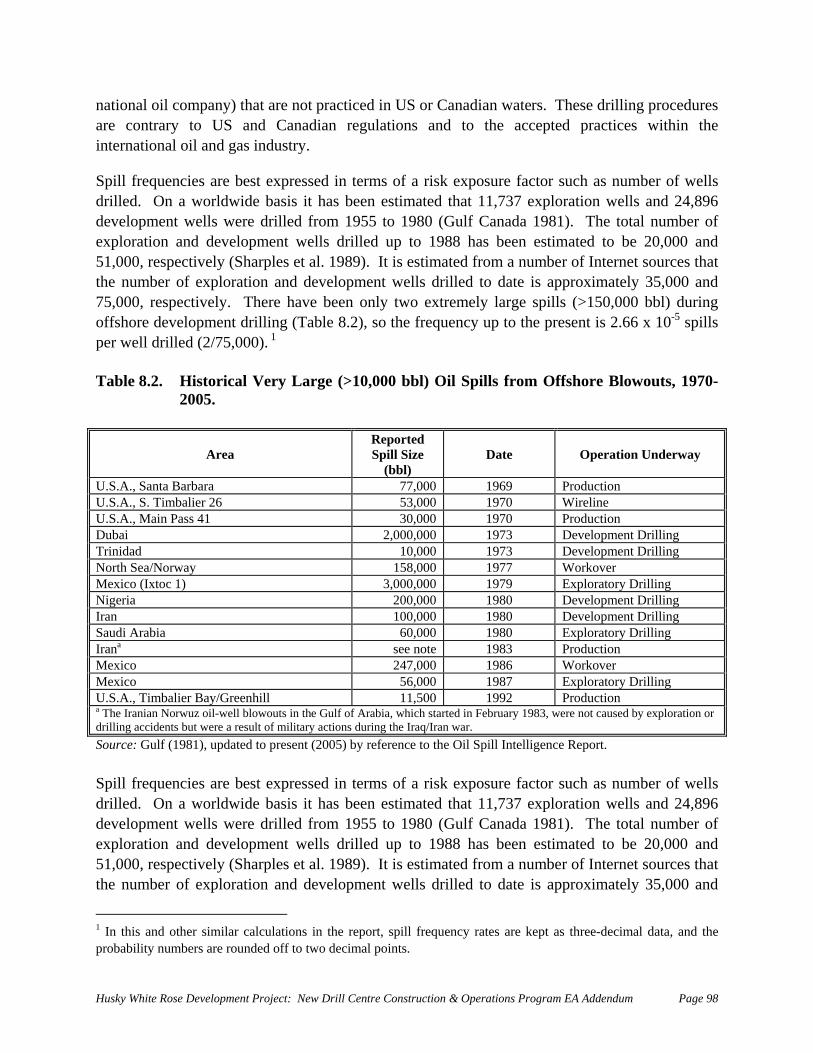
national oil com n US or Canadian waters. These drilling procedures are contrary to US and Canadian regulations and to the accepted practices within the international oil and gas industry. Spill frequencies a res s of a risk exposure factor such as number of wells
led n a worldwide basis it has been estimated that 11,737 exploration wells and 24,896 elo ent wells were drilled from 1955 to 1980 (Gulf Canada 1981). The total number of lor n and ll il up to 1988 has been estimated to be 20,000 and 00 espectively et al. 1989). It is estimated from a number of Internet sources that nu er of exploration and development wells drilled to date is approximately 35,000 and 0 s ti two extremely large spills (>150,000 bbl) during ho e opment drilling (Table 8.2), so the frequency up to the present is 2.66 x 10⁻⁵ spills we r (2/75,000). 1
le . Historical Very Large (>10,000 bbl) Oil Spills from Offshore Blowouts, 1970-05.
Aeported ill Size (bbl)
Date Operation Underway
pany) that are not practiced i
re best exp sed in termdrildevexp51,0the 75,0offsper Tab
. Opmatio, rmb
0, rere dll d
8.2
develo(Sh
pmar
enples
t we s dr led
pecvelilled
vely. There have been only
20
rea RSp
U.S.A., Santa Barbara 77,000 1969 Production U.S.A., S. Ti lie 53,000 1970 Wireline mba r 26 U.S.A., Main Pass 41 30,000 1970 Production Dubai 2,000,000 1973 Development Drilling Trinidad 10,000 1973 Development Drilling North Sea/Norway 158,000 1977 Workover Mexico (Ixtoc 1) 3,000,000 1979 Exploratory Drilling Nigeria 200,000 1980 Development Drilling Iran 100,000 1980 Development Drilling Saudi Arabia 60,000 1980 Exploratory Drilling Irana see note 1983 Production Mexico 247,000 1986 Workover Mexico 56,000 1987 Exploratory Drilling U.S.A. balier B G 11,500 1992 Production , Tim ay/ reenhill a Thedrilli
Ir N uz oil-well blowouts in the Gulf of Ar hich started in February 1983, were not caused by exploration or ng e ut were a result of military actions during the Iraq/Iran war.
anianaccid
orwnts b
abia, w
Sour Spidrildevexp51,0the
ce f 1), updated to present (2005) by reference to the Oil Spill Intelligence Report.
ll f encies a essed s of a risk exposure factor such as number of wells led. O worldwide basis it has been estimated that 11,737 exploration wells and 24,896 elopment wells were drilled from 1955 to 1980 (Gulf Canada 1981). The total number of loration and d up to 1988 has been estimated to be 20,000 and 00, respectively (Sharples et al. 1989). It is estimated from a number of Internet sources that number of exploration and development wells drilled to date is approximately 35,000 and
: Gul
requ
(198
re best expr in termn a
evelopment wells drilled
this an her s , spill frequency rates are kept as three-decimal data, and the ability n ber t oints.
1 In prob
d otum
sims ar
ilae r
r coun
alcde
ulad o
tionff to
in wo
thedec
reim
portal p
Husky White Rose Development Project: New Drill Centre Construction & Operations Program EA Addendum Page 98
75,000, respectively. There have been only two extremely large spills (>150,000 bbl) during ffshore development drilling (Table 8.2), so the frequency up to the present is 2.66 x 10⁻⁵ spills
per well drilled (2/75,000). 2 A similar analysis can be done for so-called “very large” spills (i.e., those larger than 10,000 barrels). Table 8.2 indicates that four development drilling blowouts have produced spills in the “very large” spill category (including Ixtoc 1), resulting in a spill frequency for “very large” spills of 5.33 x 10⁻⁵ spills per well drilled (4/75,000). 8.1.4.2 Historical Statistics for Large Spills (>1,000 bbl) from Blowouts Almost no historical information is available on blowout-related spills in the size range of 1,000 bbl to 10,000 bbl. These likely have occurred with greater regularity than very large spills (>10,000 bbl), but historical information is lacking. Certainly no large spills (>1,000 bbl) from blowouts have occurred in US GOM OCS operations since 1972. However, it seems likely that several have occurred elsewhere.
port (OSIR) utter Information Corp., Arlington, MA) were analyzed. OSIR publishes annual lists detailing
n the above-calculated value for very large (>10,000) bbl spills, which is 5.33 x 10⁻⁵. The lower value can be explained by a number of factors including incompleteness of data. It is certainly possible that better blowout prevention methods were developed and used in the 1990s compared to the 1970s and 1980s when most offshore blowout occurred (Table 8.2). For the purposes of this EA, spills in this size category are not discussed further because of uncertainties associated with the database.
o
To check this possibility, spill statistics published by the Oil Spill Intelligence Re(Call worldwide spills larger in size than 10,000 gallons (238 bbl). Annual reports from 1994 to 1999 were available and surveyed. Only one large spill (>1,000 bbl) from a blowout occurred during this six-year period. It happened on March 15, 1998 off India, and involved 100,000 gallons (2,380 bbl) of crude. It can be estimated that during this six-year period, approximately 20,000 exploration and development wells were drilled offshore on a worldwide basis. This translates to a frequency of 5.0 x 10⁻⁵ large spills (>1,000 bbl) per well drilled. This frequency is smaller tha
2 In this and other similar calculations in the report, spill frequency rates are kept as three-decimal data, and the probability numbers are rounded off to two decimal points.
Husky White Rose Development Project: New Drill Centre Construction & Operations Program EA Addendum Page 99

8.1.4.3 Large Spills in the Newfoundland and Labrador Offshore Area (NLOA) A spill of approximately 1,038 bbl (165,000 l) of crude oil occurred in November 2004 at Petro-Canada’s Ter ro te a ith produced wat ep ti process. is th n ‘l ’ sp rec d to d Newfoundland offshore area. Comment No. 101: Terra Nova spill in 2004 needs to be included
ra Nova p duction si (Table 8.3). The spill was ssociated w the FPSO’ser s ara on Th is e o ly arge oil ill orde ate in the
8.1.4.4 Calculated Prob ’ Drill Centres Project Based on 54 development wells being drilled over a five year period, the spill frequencies e te r the Drillin the development of new drill centres Project would be as f s Predicted frequency of extrem y lar o sp s ( 50 00 bbl) from blowouts during the Drilling Phase based on an exposure of thirty wells drilled is 54 x 2.66 x 10-5 1.44 x 1 ills. T q to a probabi ring the Drilling Phase of one in 696. Predicted frequency of very la e oil pil (> ,00 bb fro blowouts during the Drilling Phase based on an exposure of wells drilled is 54 x 5.33 x 10-5 = 2.88 x 10⁻³ ills. This equates to a probability during the Drilling Phase of one in 347. Predicted frequency of large o spill >1 00 bl) rom blow uts ring he Drilli ase based on an exposure of wells drilled is 54 x 5.0 x 10-5 = 2.70 x 10 spills. This equates to a probability during th Dr ng P se of one in 370. 8.1.5 Blowouts Involving Gas Only or Small Disch rges of Oil Gas blowouts from that do not involve a disc are generally believed to be relatively innocuous to the marine environment. Such blowouts do, however, represent a threat to human life and property because of the possibility of explosion and fire. Two sources are used for historical statistics on blowouts i all oil discharges. A particularly good source for US low uts th MMS web te becau MS keeps track of ills ow to on barre in e. This is not the case in other parts of the world. A d c for w ts i the rt ea n U Oalthough no reference is given as to whether or not oil spills were involved in the reported b
ability for Husky s Development of New
stima d fo g Phase ofollow :
el ge il ill >1 ,0 = 0-3 sp
his e uates lity du
rg s ls 10 0 l) m sp
il s ( ,0 b f o du t ng Ph-3
e illi ha
a
offshore wells harge of liquid petroleum
nvolving only gas or sm b o is e si se M
sp d n e l siz goo sour e blo ou n No h S a d in the S G M is Scandpower (2000),
lowouts.
Husky White Rose Development Project: New Drill Centre Construction & Operations Program EA Addendum Page 100
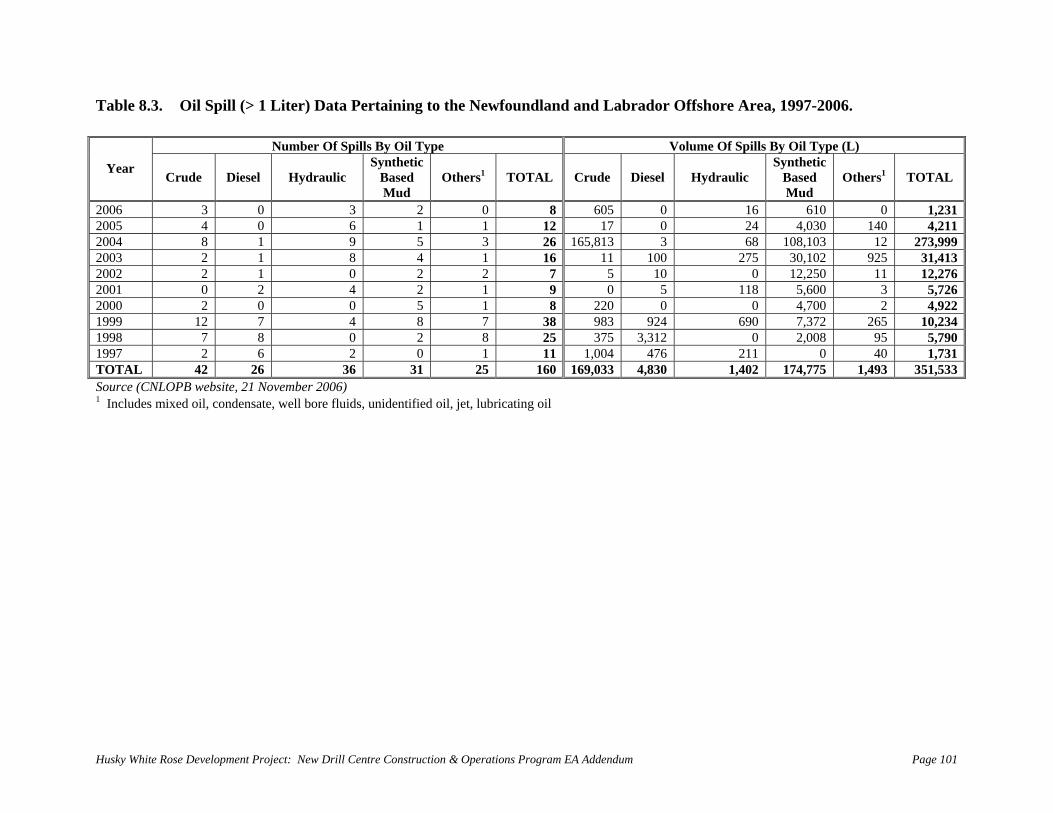
e Rose Development Project: New Drill Centre Construction & Operations Program EA Addendum Page 101
Oil Spill (> 1 Liter) Data Pert oundland and Labrad Offshore Ar 19
Number Of Spills By O Volume Of Spills By O
aining to the Ne
il Type
wf or ea, 97-2006.
il Type (L)
Year Crude Diesel Hydraulic
SynthBasMu
TOTAL Crude Di aulic ynBaM
1 Tetic ed d
Others1 esel HydrS thetic
sed ud
Others TO AL
2006 3 0 3 8 605 1,2 0 0 16 610 0 2312005 4 0 6 12 17 4,1 1 0 24 4,030 140 2112004 8 1 9 26 165,813 108,1 2 73,5 3 3 68 03 1 2 9992003 2 1 8 16 11 30,1 5 314 1 100 275 02 92 ,4132002 2 1 0 7 12,2 1 122 2 5 10 0 50 1 ,2762001 0 2 4 9 5,60 3 5,2 1 0 5 118 0 7262000 2 0 0 8 22 4,70 2 4,5 1 0 0 0 0 9221999 12 7 4 38 983 7,37 5 108 7 924 690 2 26 ,2341998 7 8 0 25 375 3, 2,00 5 5,2 8 312 0 8 9 7901997 2 6 2 11 1,004 476 0 1,7310 1 211 0 4TOTAL 42 26 36 31 160 169,033 4,830 1, 174,7 3 351,53375 1,49402 25Source (CNLOPB website, 21 November 2006) 1 Includes mixed oil, condensate, well bore fluids, unidentifi bricating oil
ed oil, jet, lu
Husky Whit
Table 8.3.
8.1.5.1 MMS US GOM OCS Statistics Data representing the 34-year period from 1972 to 2005 are contained in Table 8.4. Note that there are no large spills (>1,000 bbl) in the entire database. However, if the database had started in 1970, two very large blowout spills would have been included of 30,000 barrels and 53,000 barrels respectively (Table 8.2). The total number of exploration and development wells drilled in the US OCS from 1972 to 2005 is not shown in Table 8.4, but it is derived from other sections of MMS (1997), the E&P Forum (1996), and from current Internet sources. The approximate numbers of development wells drilled in the US during the thirty four-year period are 20,000. The number of blowouts from development well drilling is shown to be 91. Therefore, the blowout frequency is 91/20,000 or 4.55 x 10⁻³ blowouts per development well drilled or one blowout for every 220 development wells drilled. Only one of the blowouts involved any oil spill and that involved only 1 bbl. The statistics suggest that most blowouts occurred in gas-prone fields or were shallow-gas blowouts. 8.1.5.2 Calculated Probability for Husky’s Development of New Drill Centres There are a maximum of 54 development wells to be drilled during the five year Drilling Phase
etween fall 2007 and summer 2012. The calculated blowout frequency is 54 x 4.55 x 10-3 =
Drilling Phas d with the blowout are xtremely low, actually 1.1% (one oil spills from 91 development well blowouts) according to
the statistics in Table 8.4. This means blo x 4.55 x 10⁻³ or 5.0 x 10⁻⁵ per well drilled ell Drilling Ph = 2.7 x 10⁻³, or a probability of one-in-370 during the 54-well Drilling Phase).
b2.46 x 10-1 or an approximate one-in-four chance of a blowout occurring over the 54-well
e. However, the chances of having an oil discharge associatee
the chance of having a(for the 54-w
wout involving any oil is 0.011ase, 54 x 5.0 x 10-5
Husky White Rose Development Project: New Drill Centre Construction & Operations Program EA Addendum Page 102
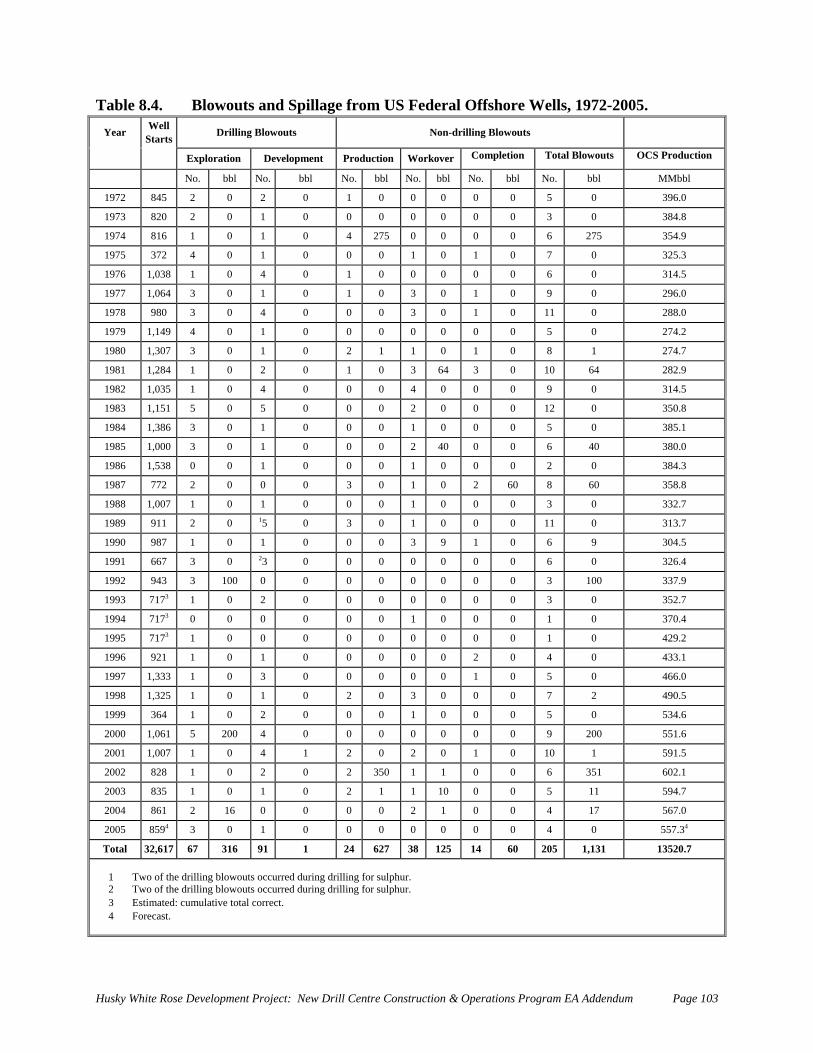
Table 8.4. Blowouts and Spillage from US Federal Offshore Wells, 1972-2005. Year Well
Starts Drilling Blowouts Non-drilling Blowouts
Explorat Completion Total Blowouts OCS Producion Development Production Workover tion
No. bbl No. bbl No. bbl No. bbl No. bbl No. bbl MMbbl
1972 845 2 0 2 0 1 0 0 0 0 0 5 0 396.0
1973 820 2 0 1 0 0 0 0 0 0 0 3 0 384.8
1974 816 1 0 1 0 4 275 0 0 0 0 6 275 354.9
1975 372 4 0 1 0 0 0 1 0 1 0 7 0 325.3
1976 1,038 1 0 4 0 1 0 0 0 0 0 6 0 314.5
1977 1,064 3 0 1 0 1 0 3 0 1 0 9 0 296.0
1978 980 3 0 4 0 0 0 3 0 1 0 11 0 288.0
1979 1,149 4 0 1 0 0 0 0 0 0 0 5 0 274.2
1980 1,307 3 0 1 0 2 1 1 0 1 0 8 1 274.7
1981 1,284 1 0 2 0 1 0 3 64 3 0 10 64 282.9
1982 1,035 1 0 4 0 0 0 4 0 0 0 9 0 314.5
1983 1,151 5 0 5 0 0 0 2 0 0 0 12 0 350.8
1984 1,386 3 0 1 0 0 0 1 0 0 0 5 0 385.1
1985 1,000 3 0 1 0 0 0 2 40 0 0 6 40 380.0
1986 1,538 0 0 1 0 0 0 1 0 0 0 2 0 384.3
1987 772 2 0 0 0 3 0 1 0 2 60 8 60 358.8
1988 1,007 1 0 1 0 0 0 1 0 0 0 3 0 332.7
1989 911 2 0 15 0 3 0 1 0 0 0 11 0 313.7
1990 987 1 0 1 0 0 0 3 9 1 0 6 9 304.5
1991 667 3 0 23 0 0 0 0 0 0 0 6 0 326.4
1992 943 3 100 0 0 0 0 0 0 0 0 3 100 337.9
1 3 71799 3 1 0 2 0 0 0 0 0 0 0 3 0 352.7
1994 7173 0 0 0 0 0 0 1 0 0 0 1 0 370.4
1995 7173 1 0 0 0 0 0 0 0 0 0 1 0 429.2
1996 921 1 0 1 0 0 0 0 0 2 0 4 0 433.1
1997 1,333 1 0 3 0 0 0 0 0 1 0 5 0 466.0
1998 1,325 1 0 1 0 2 0 3 0 0 0 7 2 490.5
1999 364 1 0 2 0 0 0 1 0 0 0 5 0 534.6
2000 1,061 5 200 4 0 0 0 0 0 0 0 9 200 551.6
2001 1,007 1 0 4 1 2 0 2 0 1 0 10 1 591.5
2002 828 1 0 2 0 2 350 1 1 0 0 6 351 602.1
2003 835 1 0 1 0 2 1 1 10 0 0 5 11 594.7
2004 861 2 16 0 0 0 0 2 1 0 0 4 17 567.0
2005 8594 3 0 1 0 0 0 0 0 0 0 4 0 557.34
Total 32,617 67 316 91 1 24 627 38 125 14 60 205 1,131 13520.7
1 T o of the drilling blowouts occurred during drilling for sulphur. w2 Two of the drilling blowouts occurred during drilling for sulphur. 3 Estimated: cumulative total correct. 4 Forecast.
Husky White Rose Development Project: New Drill Centre Construction & Operations Program EA Addendum Page 103
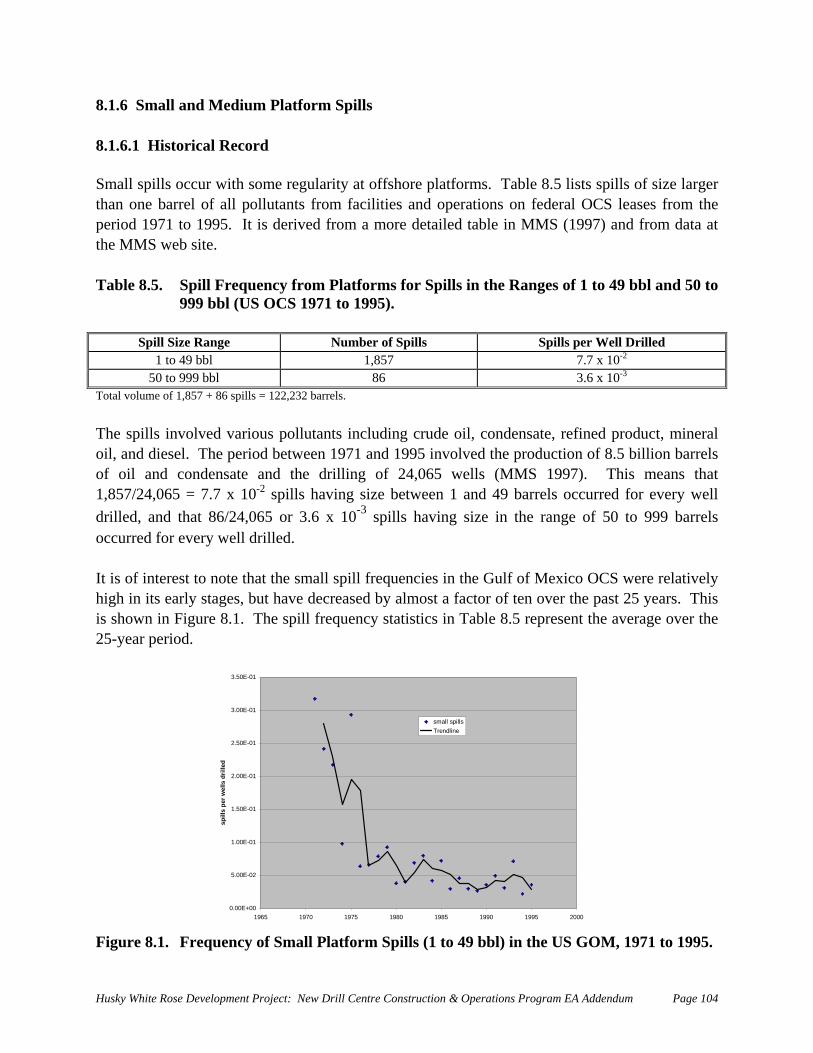
8.1.6 Small and Medium Platform Spills 8.1.6.1 Historical Record
Spill Size Range Number of Spills Spills per Well Drilled
Small spills occur with some regularity at offshore platforms. Table 8.5 lists spills of size larger than one barrel of all pollutants from facilities and operations on federal OCS leases from the period 1971 to 1995. It is derived from a more detailed table in MMS (1997) and from data at the MMS web site. Table 8.5. Spill Frequency from Platforms for Spills in the Ranges of 1 to 49 bbl and 50 to
999 bbl (US OCS 1971 to 1995).
1 to 49 bbl 1,857 7.7 x 10⁻²
50 to 999 bbl 86 3.6 x 10⁻³
Total volume of 1,857 + 86 spills = 122,232 barrels.
he spills involved various pollutants including crude oil, condensate, refined product, mineral oil, and diesel. The period between 1971 and 1995 involved the production of 8.5 billion barrels
f oil and condensate and the drilling of 24,065 wells (MMS 1997). This means that 1,857/24,065 = 7.7 x 10⁻² spills having size between 1 and 49 barrels occurred for every well drilled, and that 86/24,065 or 3.6 x 10⁻³ spills having size in the range of 50 to 999 barrels occurred for every well drilled.
all spill frequencies in the Gulf of Mexico OCS were relatively igh in its early stages, but have decreased by almost a factor of ten over the past 25 years. This
ill frequency statistics in Table 8.5 represent the average over the 5-year period.
T
o
It is of interest to note that the smhis shown in Figure 8.1. The sp2
0.00E+00
5.00E-02
1.00E-01
3.00E-01
3.50E-01
1965 1970 1975 1980 1985 1990 1995 2000
r we
d
2.50E-01
2.00E-01
lls d
rille
1.50E-01
spill
s pe
small spillsTrendline
Figure 8.1. Frequency of Small Platform Spills (1 to 49 bbl) in the US GOM, 1971 to 1995.
Husky White Rose Development Project: New Drill Centre Construction & Operations Program EA Addendum Page 104
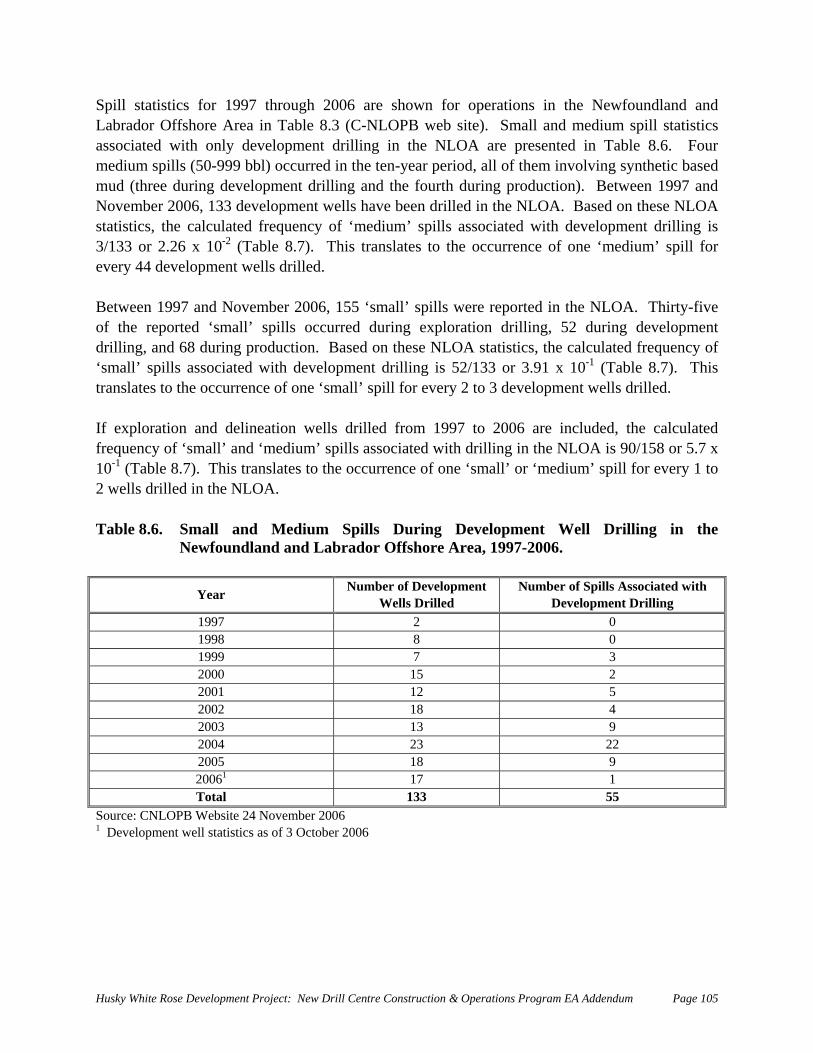
Spill statistics for 1997 through 2006 are shown for operations in the Newfoundland and abrador Offshore Area in Table 8.3 (C-NLOPB web site). Small and medium spill statistics
ment drilling in the NLOA are presented in Table 8.6. Four edium spills (50-999 bbl) occurred in the ten-year period, all of them involving synthetic based
and the fourth during production). Between 1997 and ovember 2006, 133 development wells have been drilled in the NLOA. Based on these NLOA
opment rilling, and 68 during production. Based on these NLOA statistics, the calculated frequency of
0-1 (Table 8.7). This anslates to the occurrence of one ‘small’ spill for every 2 to 3 development wells drilled.
um’ spills associated with drilling in the NLOA is 90/158 or 5.7 x ce of one ‘small’ or ‘medium’ spill for every 1 to
8.6. Small and Medium Spills During Development Well Drilling in the Newfoundland and Labrador Offshore Area, 1997-2006.
Number of Development Wells Drilled
Number of Spills Associated with Development Drilling
Lassociated with only developmmud (three during development drilling Nstatistics, the calculated frequency of ‘medium’ spills associated with development drilling is 3/133 or 2.26 x 10⁻² (Table 8.7). This translates to the occurrence of one ‘medium’ spill for every 44 development wells drilled. Between 1997 and November 2006, 155 ‘small’ spills were reported in the NLOA. Thirty-five of the reported ‘small’ spills occurred during exploration drilling, 52 during develd‘small’ spills associated with development drilling is 52/133 or 3.91 x 1tr
exploration and delineation wells drilled from 1997 to 2006 are included, the calculated Iffrequency of ‘small’ and ‘medi0-1 (Table 8.7). This translates to the occurren1
2 wells drilled in the NLOA. Table
Year
1997 2 0 1998 8 0 1999 7 3 2000 15 2 2001 12 5 2002 18 4 2003 13 9 2004 23 22 2005 18 9 20061 17 1 Total 133 55
Source: CNLOPB Website 24 N1 Development well statistics a
ovember 2006 s of 3 October 2006
Husky White Rose Development Project: New Drill Centre Construction & Operations Program EA Addendum Page 105
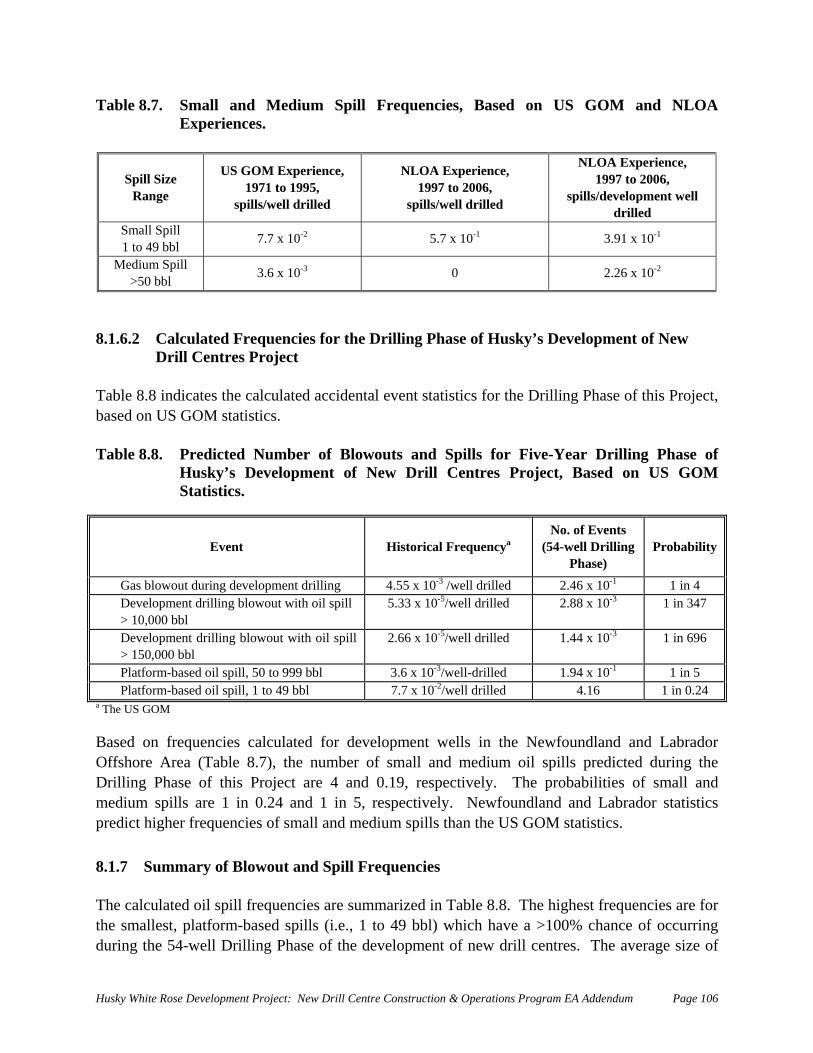
Table 8.7. Small and Medium Spill Frequencies, Based on US GOM and NLOA Experiences.
US GOM Experience, NLOA Experience, NLOA Experience,
Spill Size Range 1971 to 1995,
spills/well drilled 1997 to 2006,
spills/well drilled
1997 to 2006, spills/development well
drilled Small Spill 1 to 49 bbl 7.7 x 10⁻² 5.7 x 10⁻¹ 3.91 x 10⁻¹
Medium Spill 3.6 x 10⁻³ 0 2.26 x 10⁻²
>50 bbl 8.1.6.2 Calculated Frequencies for the Drilling Phase of Husky’s Development of New
Drill Centres Project
on US GOM Statistics.
Event Historical FrequencyaNo. of Events
(54-well Drilling Probability
Table 8.8 indicates the calculated accidental event statistics for the Drilling Phase of this Project, based on US GOM statistics. Table 8.8. Predicted Number of Blowouts and Spills for Five-Year Drilling Phase of
Husky’s Development of New Drill Centres Project, Based
Phase) Gas blowout during dev 0-3 /well drilled 2.46 x 10⁻¹ 1 in 4 elopment drilling 4.55 x 1
Development drilling blowout with oil spill 5.33 x 10⁻⁵/well drilled 2.88 x 10⁻³ 1 in 347 > 10,000 bbl
Development drilling blowout with oil spill 2.66 x 10⁻⁵/well drilled 1.44 x 10⁻³ 1 in 696 > 150,000 bbl Platform-based oil spill, 50 to 999 bbl 3.6 x 10⁻³/well-drilled 1.94 x 10⁻¹ 1 in 5 Platform-based oil spill, 1 to 49 bbl 7.7 x 10⁻²/well drilled 4.16 1 in 0.24 a The US GOM Based on frequencies calculated for development wells in the Newfoundland and Labrador Offshore Area (Table 8.7), the number of small and medium oil spills predicted during the Drilling Phase of this Project are 4 and 0.19, respectively. The probabilities of small and
edium spills are 1 in 0.24 and 1 in 5, respectively. Newfoundland and Labrador statistics s.
cies
lated oil spill frequencies are summarized in Table 8.8. The highest frequencies are for the smallest, platform-based spills (i.e., 1 to 49 bbl) which have a >100% chance of occurring during the 54-well Drilling Phase of the development of new drill centres. The average size of
mpredict higher frequencies of small and medium spills than the US GOM statistic 8.1.7 Summary of Blowout and Spill Frequen The calcu
Husky White Rose Development Project: New Drill Centre Construction & Operations Program EA Addendum Page 106
this small spill type can be expected to be less than 10 barrels. There is a 20% chance that a latform-based spill larger than 50 barrels (<999 bbl) might occur over the course of the entire
Drilling Phase.
ell blowouts om development drilling are very small: 0.14% and 0.29%, respectively. These predictions are
d are strongly influenced by blowouts that have occurred in Mexico, Africa and the Middle East, where drilling and production regulations may be less
d/or practice over the past 15 years. There could be about a 25% chance of having blowout involving gas only.
.2 Oil Spill Behaviour and Fate from Hypothetical Blowouts and Spills
.2.1 Oil Characteristics
e.
Text in EA remains the same. 8.2.3 Blowout/Spill Scenarios Text in EA remains the same. 8.2.4 Modeling and Description of Selected Blowout/Spill Scenarios Text in EA remains the same.
.3 Spill Trajectories
Text in EA remains the same.
p
The chances of an extremely large (>150,000 bbl) and very large (>10,000 bbl) oil wfrbased on worldwide blowout data an
rigorous than in North America. It might be reasonable to expect even lower frequencies for the Drilling Phase of this Project in the Jeanne d’Arc Basin given the significant improvement of technology ana 8 8
ext in EA remains the samT 8.2.2 Selection of Blowout/Spill Scenarios
8
.3.1 Hibernia and Terra Nova Analyses 8 Text in EA remains the same. 8.3.2 White Rose Spill Trajectories
Husky White Rose Development Project: New Drill Centre Construction & Operations Program EA Addendum Page 107
8.3.3 White Rose Spill Areas and Concentrations of Dispersed Oil Text in EA remains the same. 8.3.4 Effects of Pack Ice on Oil Spills The White Rose site lies close to the extreme southern limit of the regional pack ice (see Section 4.5 for a discussion of pack ice distribution). Pack ice incursions within 15 km of White Rose occur about half the data years (1960 to 2006), centered on mid-March, with durations varying from one to 11 weeks. Mean sea ice concentrations on the Grand Banks south of 49 degrees latitude are fairly consistent at 6/10ths coverage. Coverages greater that 5/10ths occur by early February and continue through mid-April, at which time they slowly decrease to 2/10ths. Comment No. 103: Reference in text to Appendix 1 – NO Appendix 1
.4 Estimation of Potential Cleanup Effectiveness
ext in EA remains the same.
.5 Alternatives to Containment and Recovery
Text in EA remains the same. 8.6 Spill Response Text in EA remains the same. 8.7 Potential Effects of Accidental Events Comment No, 104: References to ‘exploratory drilling’ are incorrect
8 T 8
.7.1 Fish Habitat
omment No. 105: ‘Fish Habitat’ should be renumbered to 8.7.1, and all subsequent
8 C
sections at this level
Husky White Rose Development Project: New Drill Centre Construction & Operations Program EA Addendum Page 108
8.7 F 8.7.2.2 The i dy of literature regarding the effects of exposure to oil on juvenile and dult fish. Although some of the literature describes field observations, most refers to laboratory
. (1996), Payne et al. (2003) and numerous other authors.
Comment No. 106: Suggested additional reference
.2 ish
Juveniles and Adults
re s an extensive boastudies. Reviews of the effects of oil on fish have been prepared by Armstrong et al. (1995), Rice et al
8.7.3 Commercial Fishery
ith respect to commercial fish harvesting, the present assessment concursW with the White Rose
ill or blow-o nt effects on fish and fish habitat or result in tainting f fish flesh. Thus, effects on com
the Husky White Rose developm
Comment No. 4: References to ‘exploratory drilling’ rather than present Project
Comprehensive Study (Husky 2000) that effects on fish populations due to an oil spill or blow-out would be not significant (see Section 8). That study concluded that a large (>10,000 bbl) oil
ut would not cause significaspo mercial fisheries as a result of physical effects on fish during
ent Project are considered to be not significant.
Comment No. 107: Harm to f ure fishery should be considered rather than just ut
immediate compensation 8.7.4 Marine Birds
ccording to the CWS report, an estimated 10,000 to 16,000 alcids were put at risk by the Terra et al. 2006). Estimated numbers of birds at risk were derived using two
ethods: (1) estimate based on the densities of seabirds observed during helicopter and vessel-
ANova spill (Wilhelmmbased surveys following the spill and the total area covered by the slick (three scenarios), and (2) a mortality estimate based on a published empirical relationship between the volume of oil released during an incident and the number of seabirds killed. Estimates derived from each method shared the same order of magnitude. Comment No. 102: CWS report of Terra Nova spill needs to be referenced Comment No. 108: Measures to prevent spills
Husky White Rose Development Project: New Drill Centre Construction & Operations Program EA Addendum Page 109
Husky White Rose Development Project: New Drill Centre Construction & Operations Program EA Addendum Page 110
dult alcids are also flightless during moulting which increases their vulnerability to oil spills.
Comment No. 109: Adult alcids being flightless during moult should be noted
8.7.4.4 Sensitive Species A
8.7.4.7 Enhancement Techniques Effects interactions, assessment and significance predictions of accidental events associated with
e proposed Husky White Rose Development Project on marine birds are presented in Tables th8.26 to 8.28. Comment No. 4: References to ‘exploratory drilling’ rather than present Project
omment No. 110: Incorrect reference to ‘exploratoC ry drilling’ 8.7.5 Marine Mammals 8.7.5.1.5 Summary of Effects on Cetaceans
in the affected area,
effects on cetaceans will likely occur over a much smaller area. For all spill scenarios
omment No. 4: References to ‘exploratory drilling’ rather than present Project
epending on the time of year, location of toothed and baleen whales withD
and type of oil spill or blowout, the effects of an offshore oil release on the health of cetaceans is predicted to range from a negligible to low magnitude over varying geographic extents. A geographic extent of >10,000 km2 is predicted for all subsea and above-surface blowout scenarios which were modelled. A geographic extent of 1001-10,000 km2 is predicted for all modelled batch spill releases. As indicated above, this estimate is quite conservative and any
considered, the duration is predicted to be 1-12 months and effects are considered reversible (Table 8.30). It is predicted that there will be no significant negative effect on cetaceans from an accidental release of oil during the proposed Husky White Rose Development Project (Table 8.31). C Comment No. 111: Incorrect reference to ‘exploratory drilling’ Comment No. 112: Rationale behind level of confidence rating
8.7.5.2.5 mmary o ts on Seals Depending on the time of year and type of oil spill or blowout, the effects of an offshore oil release on seals could range from a negligible to low magnitude over varying geographic extents. For sub a abov >10,000 km2. A geographic extent of 1001-10,000 km2 is predicted for all modelled batch spill scenarios. As indicated previously ate is quite conservative and any effects on seals will likely occur over a much smaller area. It is unlikely that oil from a blowout or spill will
h th ont were harp seals congregate to pup and breed given that oil spill trajectories are to east northeast. For all spill scenarios c ide , th uration is predicted to be 1-12 ths effects are considered reversible (Table 8.30). It is predicted that there will be no ifica negative e m c t elea oil during the proposed Husky ite R Development Project (Table 8.31). Similar predictions were made in the Hibernia, ra N EIS and W e E regarding ills blo uts at those sites (Mobil 1985; o-C da 1996a,b; Husky 2000).
m t No. Refere o l ry drilling’ ra than present Project
Su
sea
f Effec
nd e-surface blowouts, it is estimated that the geographic extent is
, this estim
reacthe monsignWhTerPetr Com
e Fr andandnt oseovaana
ons red e d
ffect aon se ls fro an a ciden al r se of
hite Ros A sp or wo
en 4: nces t ‘exp orato ther 8.7. 8.7. Depreleexte>10scenturtocc1-12no sHus Com
6 Tur
6. umm of Effe
en g on the time of year and type of oil spill or blowout, the effects of an offshore oil as n sea turtles could range from a gli le t w gnitude over varying geographic nt or su and above-su e b ou it i stim d that the geographi xtent is ,0 m2. graphic ten 10 10 km s p icted for all modelled batch spill a . As indicated previous this tim is e c ervative and any e n sea
les will likely occur over a much smaller area. Also, it is unlikely that many sea turtles will ur in Jean c Basin. For all spill scenarios considered, the duration is d to be months cts are nsid d r rsib (Ta 8.3 It is predicted th ignificant e effec n se rtl rom ac ent elease of oil durin h posed ky White evelop t ( le 8 ).
ment No ferences to ‘exploratory drilling’ rather than present Project
Sea
1 S
dine os. F00 krios
tles
ary cts on Sea Turtles
nelow01- es
gibts,
,000ate
o los e
maate
redons
bsea A geo
rfact ofly,
c e
ct
ict
e p
2 iquit eff
preat there will beg t
s o
ed
ro
ex
ne d’Arand effe negativRose D
. 4: Re
cot o
men
erea tu
Tab
evees f.31
le an
ble cid
0). al r
8.7. As are acco
7 Species-a isk
indicated in tion 5.3, e m ne imal species that potentially occur in the Study Area listed as ei endangered or re ed on Schedule 1 of SARA (i.e., offi risk’ rding to Canadian law). They are as follows:
t-R
Secther
fiv ari th
anaten cially ‘at
Husky White Rose Development Project: New Drill Centre Construction & Operations Program EA Addendum Page 111
Husky Whit
T
e Rose Development Project: New Drill Centre Construction & Operations Program EA Addendum Page 112
• Blue whale; • North Atlantic right whale; • Leatherback sea turtle; • Northern wolfish; and • Spotted wolfish.
wo marine species are also list hedule 1 of . They are as f
• Atlantic wolfish. Potential interactions of accidental e ts associated with the Project and the seven marine species presently listed on Schedule 1 of SARA are indicated in Table 8.32. T idental Events and Species-at-Risk that Could
e Study Area.
Valued Ecosystem C
ed as special concern on Sc SARAollows:
• Ivory Gull; and
ven
able 8.32. Potential Interactions of AccOccur in th
omponent: Species-at-Risk
A cidental Event Scenario Wolffishes Ivory Gull le;
North Atlantic Leatherback sea turtle c
Blue wha
right whale Su x x x x bsea Blowout 7 Day Subsea Blowout 45 Day x x x x Above-surface Blowout 7 Day x x x x Batch Spill 800 m3 x x x x Batch Spill 10,000 m3 x x x x Batch Spill 30,000 m3 x x x x 8.7.8.1 Wolffishes Table 8.32 indicates the potential interactions of accidental events associated with the proposed
ent and production Project and the three species of wolffish currently listed SARA. Assessment of the effects of these interactions is presented in Table
ent is provided in Section 8.7.3 where effects of accidental events
l events is the primary mitigative measure. However, in the case of an tal event, appropriate response measures are required. Husky’s plans for spill response
are discussed in detail in two documents currently on file with the C-NLOPB. They are (1) East Coast Oil Spill Response Plan WR-ERP-PR-0001, and (2) East Coast Offshore Operations – Stage 1 Spill Response Procedures WR-ERP-PR-0002.
drill centre developmon Schedule 1 of 8.33. Rationale for the assessmon the fish VEC are discussed. Prevention of accidentaacciden
The residual environmental effects of each of these accidental event scenarios on wolffishes were predicted to be t (Table 8.34). 8.7.8.2 Ivory Gull Table 8.32 indicates the potential interactions of accidental events associated with the proposed drill centre development and production Project and the Ivory Gull. Assessment of the effects of these interactions is presented in Table 8.35. Rationale for the assessment is provided in Section 8.7.5 where effects of accidental events on the marine bird VEC are discussed. Prevention of accidental events is the primary mitigative measure. However, in the case of an accid al event, appropriate response measures are required. Husky’s plans for spill response are discussed in detail in two documents currently t Coast Oil Spill Response Plan WR-ERP-PR-0001, and (2) East Coast Offshore Operations – Stage 1 Spill Response Procedures WR-ERP-PR-000 The residual environm ese accidental event scenarios on the Ivory Gull were predicted to be s c . T gnificant negative effect is deem irreversible at the individual level bu r a p tion level. 8.7 Blu ales a Ta 8.32 indicates th ents associated with the proposed drill centre development and production Project and two marine mammal species currently listed on Schedule 1 of SARA, the blue whale and the North Atlantic right whale. Assessment of the effects of these interactions is presented in Table 8.37. Rationale for the assessment is provided in tion 8 here effects o cid l e ts o he m ammal VEC are discussed. Prevention of accidental events is the primary mitigative measure. However, in the case of an accidental event, appropriate response measures are required. Husky’s plans for spill response are discussed in detail in two documents currently on file with the C-NLOPB. They are (1) East Coast Oil espons lan R-E -PR 001 nd East Coast Offs per ns – Stage 1 Spill Response Procedures WR-ERP-PR-0002. The residual environmental effects of each of these accidental event scenar and North Atlantic right whales were predicted to be not significant (Table 8.3
not significan
ent on file with the C-NLOPB. They are (1) Eas
2.
ental effects of each of thignifi
nd No
e poten
ant (T
rth At
tial in
able 8t reve
lantic
teracti
36). sible
Right
ons of
he sit the
Whale
accide
ed to be
atio
opula
s
ntal ev
.8.3
ble
Sec
e Wh
.7.6 w f ac enta ven n t arine m
Spill R e P W RP -0 , a (2) h
io8
or
s ).
e O
on blue whales
Husky White Rose Development Project: New Drill Centre Construction & Operations Program EA Addendum Page 113
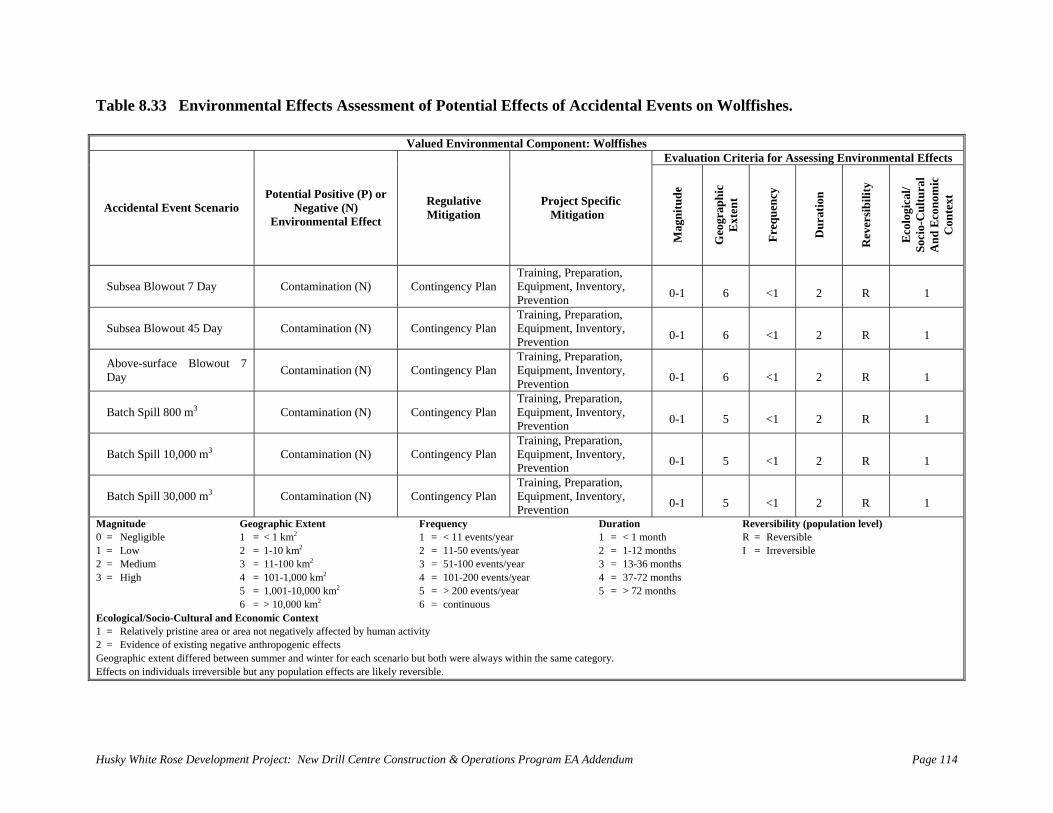
Table 8.33 Environmental Effects Assessment of Potential E ts ts on Wolffishe
Valued Environmen omp f
ff
ta
ec
l C
of
one
Ac
nt
ci
: W
de
olf
ntal
ishe
E
s
ven s.
Evaluation Criteria for Assessing Environmental Effects
Accidental Event Scenario Potential Positive (P) or
Negative (N) Environmental Effect
Regulative Mitigation
Pro c M
Geo
grap
hic
Ext
ent
Freq
uenc
y
Dur
atio
n
Rev
ersi
bilit
y
Eco
logi
cal/
Soci
o-C
ultu
ral
And
Eco
nom
ic
Con
text
jeciti
t Sgat
peion
cifi
Mag
nitu
de
Subsea Blowout 7 Day Contamination (N) Contingency Plan raining, Prepar ,
Equipment, Inve y, Prevention
6
<1
2
R
1
T ationntor
0-1
Subsea Blowout 45 Day Contamination (N) Contingency Plan Training, Prepar , Equipment, Inventory, Prevention
6
<1
2
R
1
ation 0-1
Above-surface Blowout 7 Day Contamination (N) Contingency Plan
Training, Preparation, Equipment, Inventory, Prevention 6 <1
R
1
0-1
2
Batch Spill 800 m3 Contamination (N) Contingency Plan Training, , Equipme y, Preventi
0-1
5
<1
2
R
1
Prnt,
on
epIn
araven
tiontor
Batch Spill 10,000 m3 Contamination (N) Contingency Plan Training, , Equipm y, Preventi
0-1
R
1
Prent, on
epIn
araven
tiontor 5 <1
2
Batch Spill 30,000 m3 Contamination (N) Contingency Plan Training, , Equipm y, Preventi
0-1
5
<1
R
1
Prent, on
epIn
araven
tiontor
2
Magnitude Geographic Extent Frequency ation Reversibility (population level0 = Negligible 1 = < 1 km2 1 = < 11 events/year < 1 month R = Reversible1 = Low 2 = 1-10 km2 2 = 11-50 events/year 1-12 months I = Irreversibl2 = Medium 3 = 11-100 km2 3 = 51-100 events/year 13-36 months 3 = High 4 = 101-1,000 km2 4 = 101-200 events/year 37-72 months 5 = 1,001-10,000 km2 5 = > 200 events/year > 72 months 6 = > 10,000 km2 6 = continuous Ecological/Socio-Cultural and Economic Context 1 = Relatively pristine area or area not negatively affected by human activity 2 = Evidence of existing negative anthropogenic effects Geographic extent differed between summer and winter for each scenario but both were always within the same category. Effects on individuals irreversible but any population effects are likely reversible.
Dur1 = 2 =3 =4 =5 =
)
e
Husky White Rose Development Project: New Drill Centre Construction & Operations Program EA Addendum Page 114
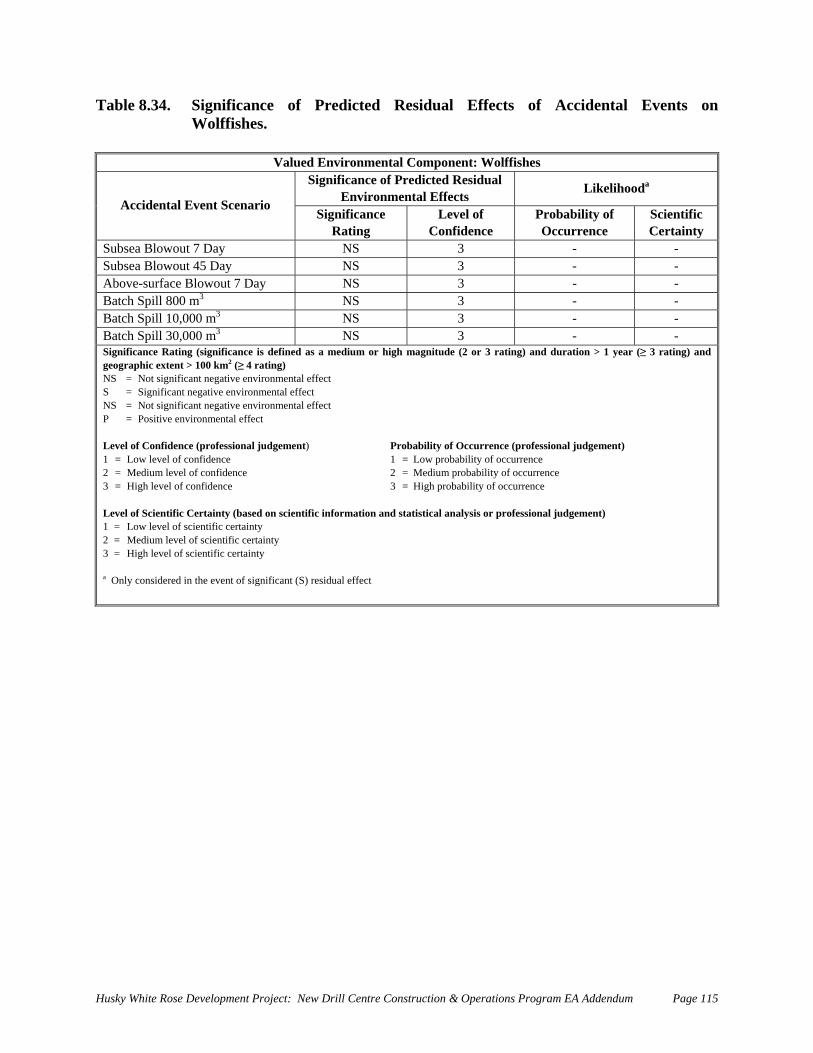
Table 8.34 Significan Predicted Residual Effects of Accidental Events on Wolffishes.
Valued Environmental Component: Wolffishes
. ce of
Significa o e d sidual Environmental Effects odance f Pr dicte Re Likeliho
Accidental E ent Scenario Sig ificance
Rating Lev l of
ConfidencProbability of Occurrence
Scientific Certainty
vn e
e Subsea Blowou ay NS 3 - - t 7 DSubsea Blowout 45 D N - - ay S 3Above-surface Blowout 7 Day NS 3 - - Batch Spill m3 NS 3 - - 800Batch Spill 00 m3 NS 3 - - 10,0Batch Spill 00 m3 NS 3 - - 30,0Significance g (significance is r h m ud or 3 rating) ation > 1 year (≥ 3 rating) and geographic extent > 100 km2 (≥ 4 ratiNS = Not significant negative environm ef S = Significant negative e nmenta ct NS = Not significant negativ vironm ef P = Positive environmental effect Level of Confidence (profess l judge rrence (professional judgement) 1 = Low level of confidence y of occurrence 2 = Medium level of confide bility of occurrence 3 = High level of confidence ty of occurrence Level of Scientific Certainty (based on s s or prof na ment) 1 = Low level of scientific certainty 2 = Medium level3 = High level of scientific certainty
a Only considered in the even ignificant
Ratin define s ang)
d a medium o igh agnit e (2 and dur
ental l effeental
ment)
cientific
fect fect
inform
ation
Prob1 = 2 = 3 =
and sta
nviroe en
iona
nce
abilityLow pMediuHigh p
tistical
of Occurobabilitm probarobabili
analysi essio l judge
of scientific certainty
t of s (S) residual effect
Husky White Rose Development Project: New Drill Centre Construction & Operations Program EA Addendum Page 115
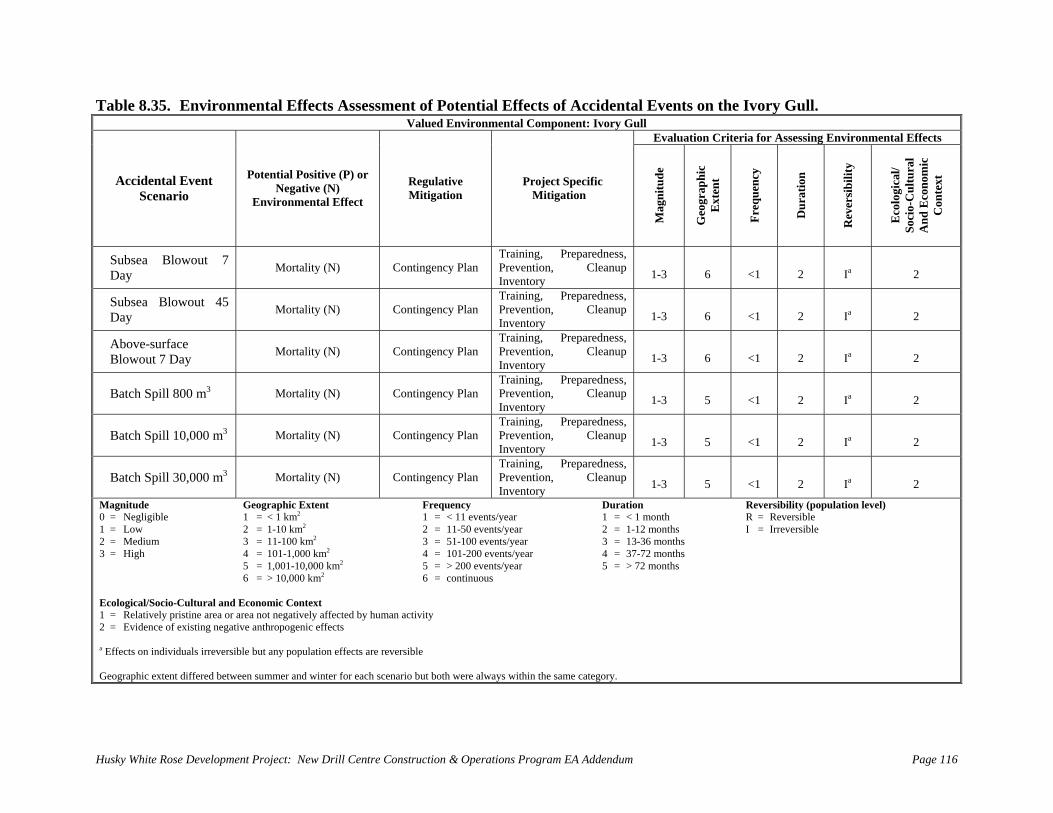
ntia al ts on the Ivory Gull. ed Environmen p Gul
Table 8.35. Environmental Effects Assessment oValu
f Pote l Effeta
cl C
tsom
of one
Acnt
ci: Iv
deory
nt El
ven
Evaluation Criteria for Assessing Environmental Effects
Accidental EScena
vent o
PotentialNe
Environri
Pgatm
ulative gation
cig
Geo
grap
hic
Ext
ent
Freq
uenc
y l/ So
cio-
Cul
tura
l A
nd E
cono
mic
C
onte
xt
ProjeMit
t Spati
ecion
fic
Mag
nitu
de
Dur
atio
n
Rev
ersi
bilit
y
Eco
logi
caositive (P) or ive (N) ental Effect
RegMiti
Su lo D rta Plan
T Prepare s, , Cl p
I t
6
<1
2
2
rai
nven
ninPrevention
g,
ory
dneseanu 1
-3
Ia
bsea Bay
wout 7 Mo lity (N) Contingency
Su ow D rta Plan
Traini Prepare s, Prevention, Cl pInvent
6
<1
2
Ia
2
ng,
ory
dneseanu 1
-3
bsea Blay
out 45 Mo lity (N) Contingency
A ac Bl Da rta Contingency Plan
Traini Preparedness, Prevention, CleanupInvent
2
2
ng,
ory 1
-3 6 <1
Ia
bove-surfowout 7
e y Mo lity (N)
Ba 80 rta Contingency Plan Traini Preparedness, Prevention,Invent 1-3
5
<1
2
2
ng,
ory Cleanup
Ia0 m3 Motch Spill lity (N)
Ba 10 rta Contingency Plan TrainiPrevention,Invent
1-3
5
<1
2
Ia
2
ng, Preparedness, Cleanup
ory ,000 m3 Motch Spill lity (N)
Batch 30,00 rta Contingency Plan TrainiPrevention,Invent
1-3 5 <1 2
Ia
2
ng, Preparedness, Cleanup
ory
0 m3 Mo Spill lity (N)
Magnitud c E Frequency ration Reversibility (population leve0 = m2 1 = < 11 events/year < 1 month R = Reversible
1 = Low km 2 = 11-50 events/year = 1-12 months I = Irreversible 2 = Med 0 k 3 = 51-100 events/year 13-36 months 3 = High 00 4 = 101-200 events/yea 37-72 months -10, 5 = > 200 events/year > 72 months 000 6 = continuous Ecological/Socio-Cultu on1 = tiv n activity 2 = Evid f existin gen a E duals ir op versible
fer and nario but both were always within the same category.
eNegligible
ium
Relatively pristineence o
ffects on indivi
Geographic extent dif
Geographi1 = < 1 k2 = 1-10 3 = 11-104 = 101-1,5 = 1,0016 = > 10,
ral and Economic Carea or area not negag negative anthropo
reversible but any p
ed between summer
xtent
2
m
Du1 = 2 3 =4 =5 =
l)
2 0 km
r 2
000 km2 km2
text ely affected by humaic effects
ulation effects are re
winter for each sce
Husky White Rose Development Project: New Drill Centre Construction & Operations Program EA Addendum Page 116
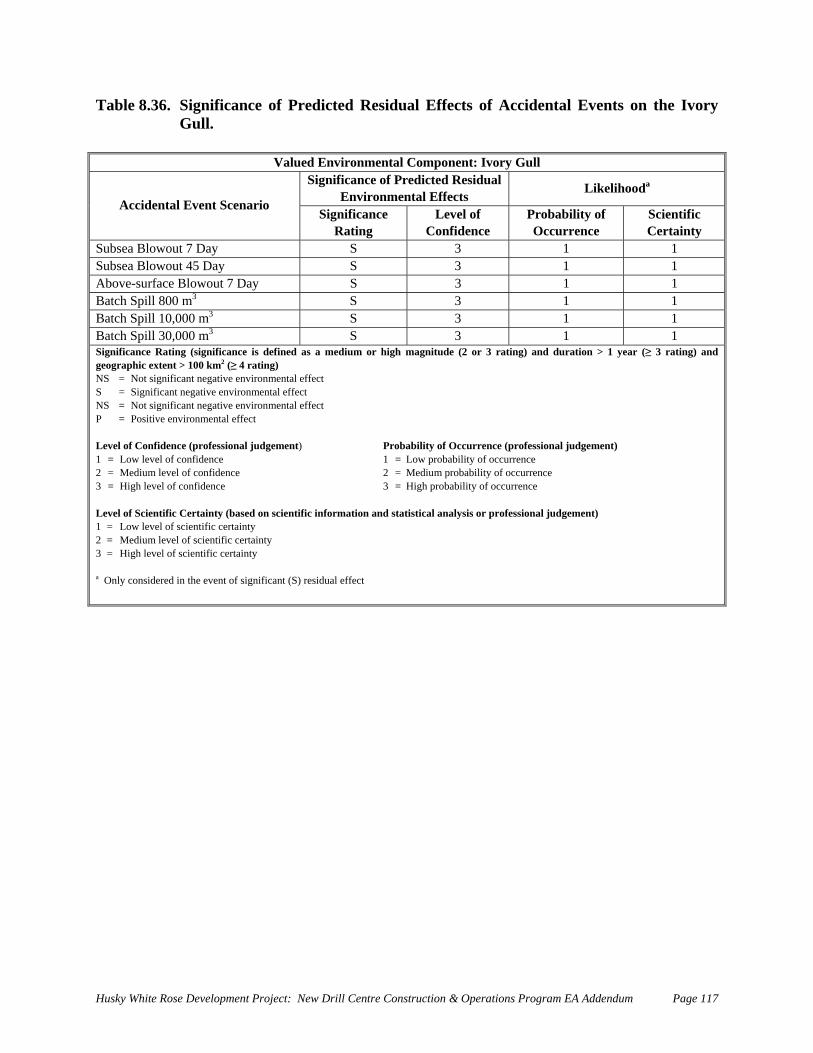
Table 8.36. Significan redicted Residual Effects of Accidental Events on the Ivory Gull.
Valued Environmental Component: Ivory Gull
ce of P
Significan P ic ReEnvironmental Effects Likelihoodace of red ted sid
ual
Accidental Event Scenario
Rating el
ConfidProbability of Occurrence
Scientific Certainty
Significance Lev of ence
Subsea Blowout 7 Day S 3 1 1 Subsea Blowout 45 S 3 1 1 Day Above-su e Blowout 7 Day S 3 1 1 rfacBatch Sp 0 m3 S 3 1 1 ill 80Batch Sp ,000 m3 S 3 1 1 ill 10Batch Sp ,000 m3 S 3 1 1 ill 30Significance Rating (significance me g gn e (2 or 3 rat uration > 1 year (≥ 3 rating) and geographic extent > 100 km2 (≥ 4 raNS = Not significant negative environ tal t S = Significant negative environmen ffect NS = Not significant negative environ tal t P = Positive environmental effect Level of Confidence (professional jud ccurrence (professional judgement) 1 = Low level of confidence ility of occurrence 2 = Medium level of confidence bability of occurrence 3 = High level of confidence ility of occurrence Level of Scientific Certainty (based on ysis or pr ) 1 = Low level of scientific certainty 2 = Medium level of scientific certainty 3 = High level of scientific certainty
a Only considered in the event of significant (S) a
is defined ating)
s a dium or hi h ma itud ing) and d
mental emen
gement
scienti
effec
effec
)
fic info
rmatio
Pr1 2 3
n and
obabil= Low= Med= Hig
statistic
ity of O probabium pro
h probab
al anal ofessional judgement
residu l effect
Husky White Rose Development Project: New Drill Centre Construction & Operations Program EA Addendum Page 117
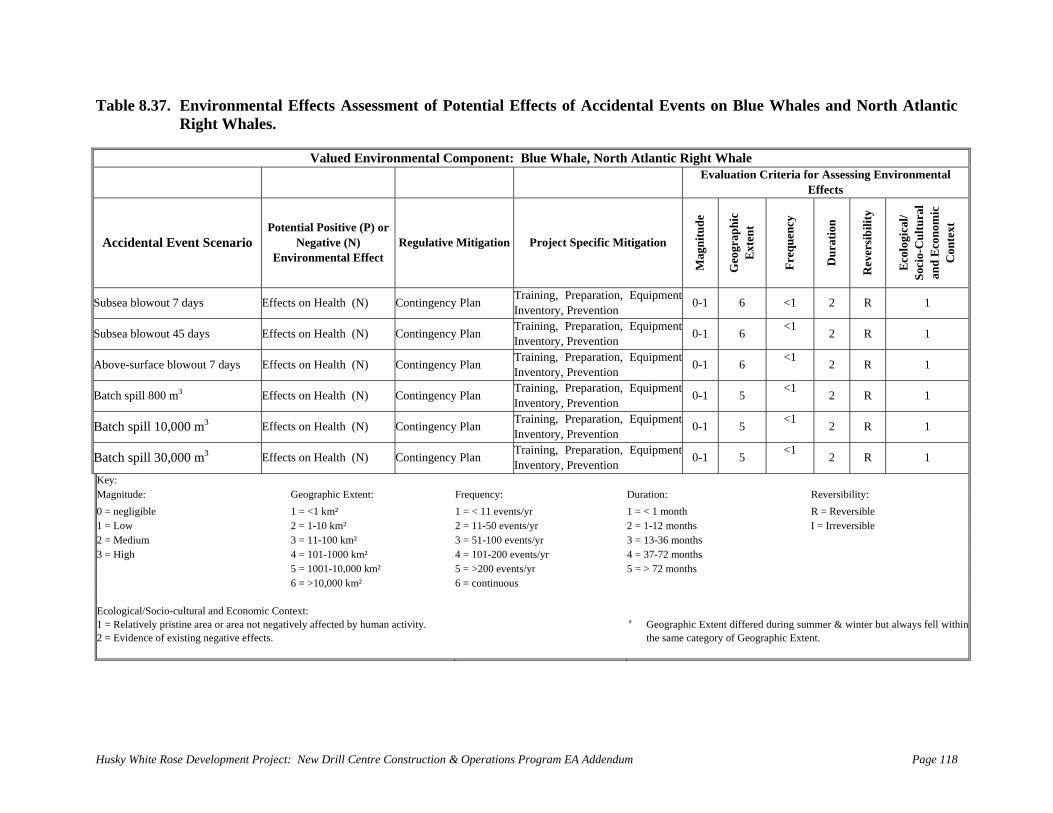
e Rose Development Project: New Drill Centre Construction & Operations Program EA Addendum Page 118
Table 8.37. Environmental Effects
Valu
Assess
Envi
ment
men
of Potential Effects of Accidental Events
ha
on Blue Whales and North Atlantic Right Whales.
ed ron tal Componen W h ight Whale t: Blue le, Nort Atlantic R
Evaluation As ng Environmental
ffect Criteria for
Esessis
Accidental Event Scenario Potential ive r
EnvironMitigation ect ci
Mag
nitu
de
Geo
grap
hic
Ext
ent
Freq
uenc
Dur
atio
n
Rev
ersi
bilit
y
Eco
logi
cal/
Soci
o-C
ultu
ral
and
Eco
nom
ic
Con
text
PositNegative (N)
men
(P) o
tal Effect Regulative Proj Spe fic Mitigation
y
Subsea blowout 7 days Effects on h ( Plan Tra g, Prepar , Ey, Prevention 0-1 6 <1 2 R 1 Healt N) Contingency inin
Inventoration quipment
Subsea blowout 45 days Effects on h ( Plan Tra g, Preparation, Ey, Prevention 0-1 6 <1 R 1 Healt N) Contingency inin
Inventorquipment 2
Above-surface blowout 7 days Effects on h ( Plan Tra g, Preparation, Ey, Prevention 0-1 6 R 1 Healt N) Contingency inin
Inventorquipment <1 2
Batch spill 800 m3 Effects on h ( Plan Tra g, n, 0-1 5 <1 R 1 Healt N) Contingency inin
Inventor P
y, Preprev
araen
tiotion
Equipment 2
Batch spill 10,000 m3 Effects on h ( Plan Tra g, , Equipment 0-1 5 <1 2 R 1 Healt N) Contingency inin
Inventor Pr
y, Peprev
araen
tiontion
Batch spill 30,000 m3 Effects on h ( Plan Tra g, , Equipment 0-1 5 <1 R 1 Healt N) Contingency inin
Inventor Pr
y, Peprev
araen
tiontion 2
Key: Magnitude: Geographic Extent: Frequency: Duration: Reversibility: 0 = negligible 1 = < 1 = < 11 events/y 1 = < 1 month R = Reversible 1 km² r 1 = Low 2 = 1- ² 2 = 11-50 events/ 2 = 1-12 months I = Irreversible 10 km yr 2 = Medium 3 = 1 km² 3 = 51-100 event 3 = 13-36 months 1-100 s/yr 3 = High 4 = 1 0 km² 4 = 101-200 event 4 = 37-72 months 01-100 s/yr 5 = 1 ,000 km² 5 = >200 events/y 5 = > 72 months 001-10 r 6 = > km² 6 = continuous 10,000
Husky Whit
Ecological/Socio-cultural and Economic Context: 1 = Relatively pristine area or area not negatively human activity. 2 = Evidence of existing negative effects.
a Geographic Extent differed during summer & winter but always fell within the same category of Geographic Extent.
affected by
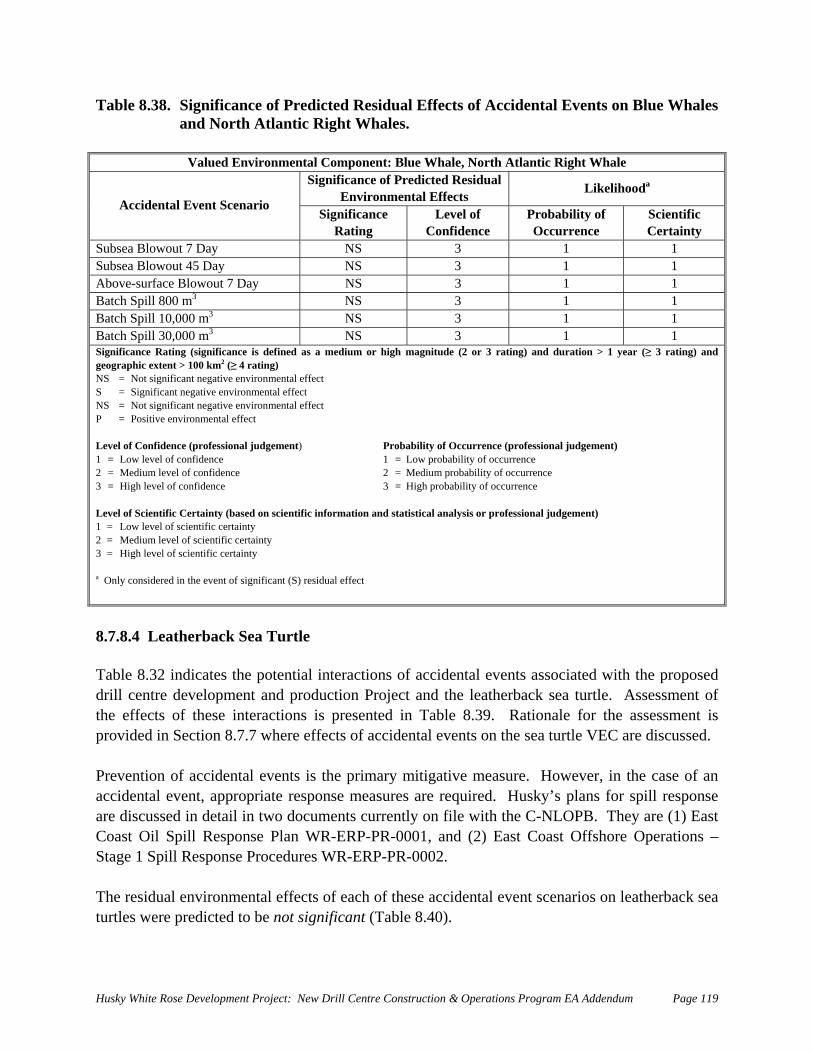
al Effects of Accidental Events on Blue Whales
Blue Whale, North Atlantic Right Whale
Table 8.38. Significance of Predicted Residuand North Atlantic Right Whales.
Valued Environmental Component:Significance of Predicted Residual
Environmental Effects Likelihooda
Accidental Event Scenario Significance Level of Probability of Scientific
Rating Confidence Occurrence Certainty Subsea Blowout 7 Day NS 3 1 1 Subsea Blowout 45 Day NS 3 1 1 Above-surface Blowout 7 Day NS 3 1 1 Batch Spill 800 m3 NS 3 1 1 Batch ill 10,000 m Sp 3 1 1 3 NS Batch ill 30,000 m Sp 3 1 1 3 NS Significance Rating (significance is defined as a medium or high magnitude (2 or 3 rating) and duration > 1 year (≥ 3 rating) and
= Significant negative environmental effect NS P o Level of C rrence (professional judgement) 1 = w 2 = 3 = Level of S1 = Low 2 = Med3 = High
a On n S) residual effect
geographic extent > 100 km2 (≥ 4 rating) S = Not significant negative environmental effect N
S = Not significant negative environmental effect = P sitive environmental effect
onfidence (professional judgement) Probability of Occulevel of confidence 1 = Low probabilityLo of occurrence
Medium level of confidence 2 = Medium probability of occurrence High level of confidence 3 = High probability of occurrence
cientific Certainty (based on scientific information and statistical analysis or professional judgement) level of scientific certainty ium level of scientific certainty level of scientific certainty
ly co sidered in the event of significant (
8.7
Plan WR-ERP-PR-0001, and (2) East Coast Offshore Operations – tage 1 Spill Response Procedures WR-ERP-PR-0002.
.8.4 Leatherback Sea Turtle Table 8.32 indicates the potential interactions of accidental events associated with the proposed drill centre development and production Project and the leatherback sea turtle. Assessment of the effects of these interactions is presented in Table 8.39. Rationale for the assessment is provided in Section 8.7.7 where effects of accidental events on the sea turtle VEC are discussed. Prevention of accidental events is the primary mitigative measure. However, in the case of an accidental event, appropriate response measures are required. Husky’s plans for spill response are discussed in detail in two documents currently on file with the C-NLOPB. They are (1) East Coast Oil Spill ResponseS The residual environmental effects of each of these accidental event scenarios on leatherback sea turtles were predicted to be not significant (Table 8.40).
Husky White Rose Development Project: New Drill Centre Construction & Operations Program EA Addendum Page 119
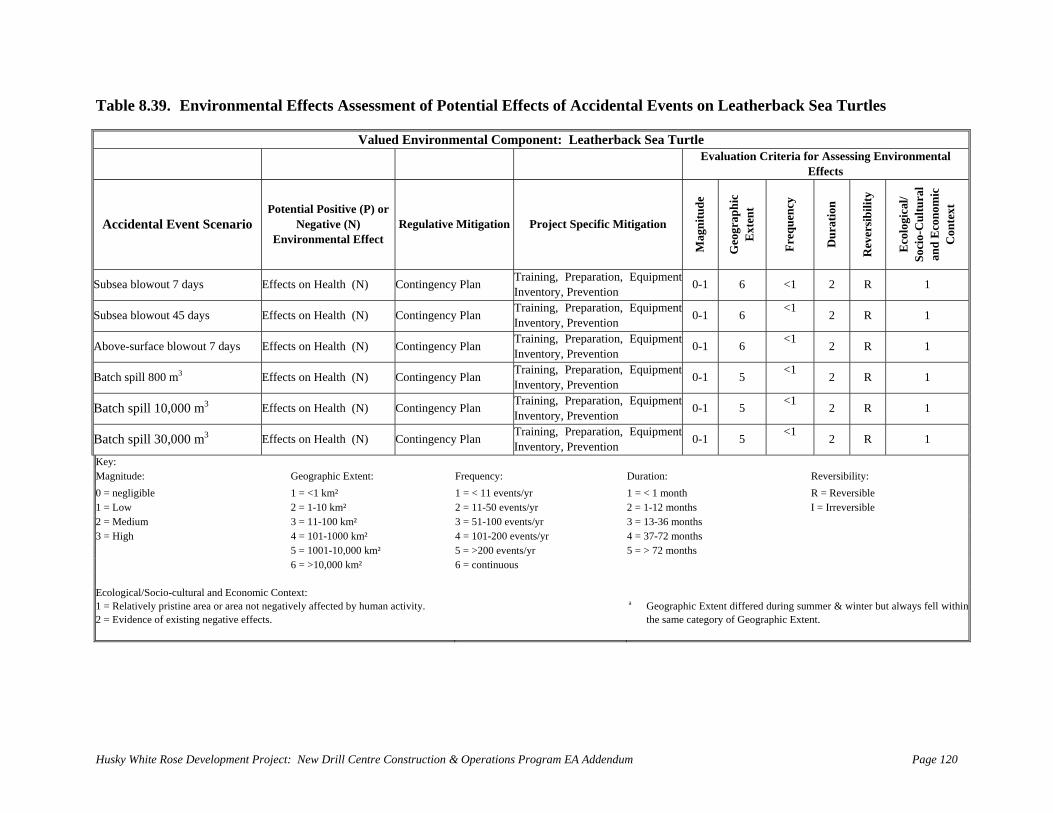
e Rose Development Project: New Drill Centre Construction & Operations Program EA Addendum Page 120
Environmental Effects Assessmen Events on Leatherback Sea Turtles
Valued Enviro nta ponen eatherback Sea Turtle
t of Potential Effects of Accidental
nme l Com t: L
Evaluation Criteria for Assessing Env
Effects ironmental
Accidental Event Scenario Potential Positive (P) or
Negative (N) Environmental Effect
Regulat itig Project Specific Mitigation
Mag
nitu
de
Geo
grap
hic
Ext
ent
Freq
uenc
y
Dur
atio
n
Rev
ersi
bilit
y
ive M ation
Eco
logi
cal/
Soci
o-C
ultu
ral
and
Eco
nom
ic
Con
text
Subsea blowout 7 days Effects on Health (N) Continge lan Tr eparation, EquipmentInv evention 0-1 6 <1 2 R ncy P aining, Pr
entory, Pr 1
Subsea blowout 45 days Effects on Health (N) Continge lan Tr eparation, EquipmentInv evention 0-1 6 <1 2 R ncy P aining, Pr
entory, Pr 1
Above-surface blowout 7 days Effects on Health (N) Continge lan Tr eparation, Equipment Inv evention 0-1 6 <1 2 R ncy P aining, Pr
entory, Pr 1
Batch spill 800 m3 Effects on Health (N) Contingency Plan Tr eparation, EquipmentInv evention 0-1 5 <1 2 R aining, Pr
entory, Pr 1
Batch spill 10,000 m3 Effects on Health (N) Contingency Plan Tr eparation, Equipment Inv revention 0-1 5 <1 2 R aining, Pr
entory, P 1
Batch spill 30,000 m3 Effects on Health (N) Contingency Plan Tr eparation, EquipmentInv evention 0-1 5 <1 2 R aining, Pr
entory, Pr 1
Key: Magnitude: Geographic Extent: Frequency: Duration: Reversibility: 0 = negligible 1 = <1 km² 1 = < 11 events/yr 1 = < 1 month R = Reversible 1 = Low 2 = 1-10 km² 2 = 11-50 events/yr 2 = 1-12 months I = Irreversible 2 = Medium 3 = 11-100 km² 3 = 51-100 events/yr 3 = 13-36 months 3 = High 4 = 101-1000 km² 4 = 101-200 events/yr 4 = 37-72 months 5 = 1001-10,000 km² 5 = >200 events/yr 5 = > 72 months
Husky Whit
Table 8.39.
6 = >10,000 km² 6 = continuous Ecological/Socio-cultural and Economic Context: 1 = Relatively pristine area or area not negatively affected by human activity. 2 = Evidence of existing negative effects.
a Geographic Extent differed during summer & winter but alway n the same category of Geographic Extent.
s fell withi
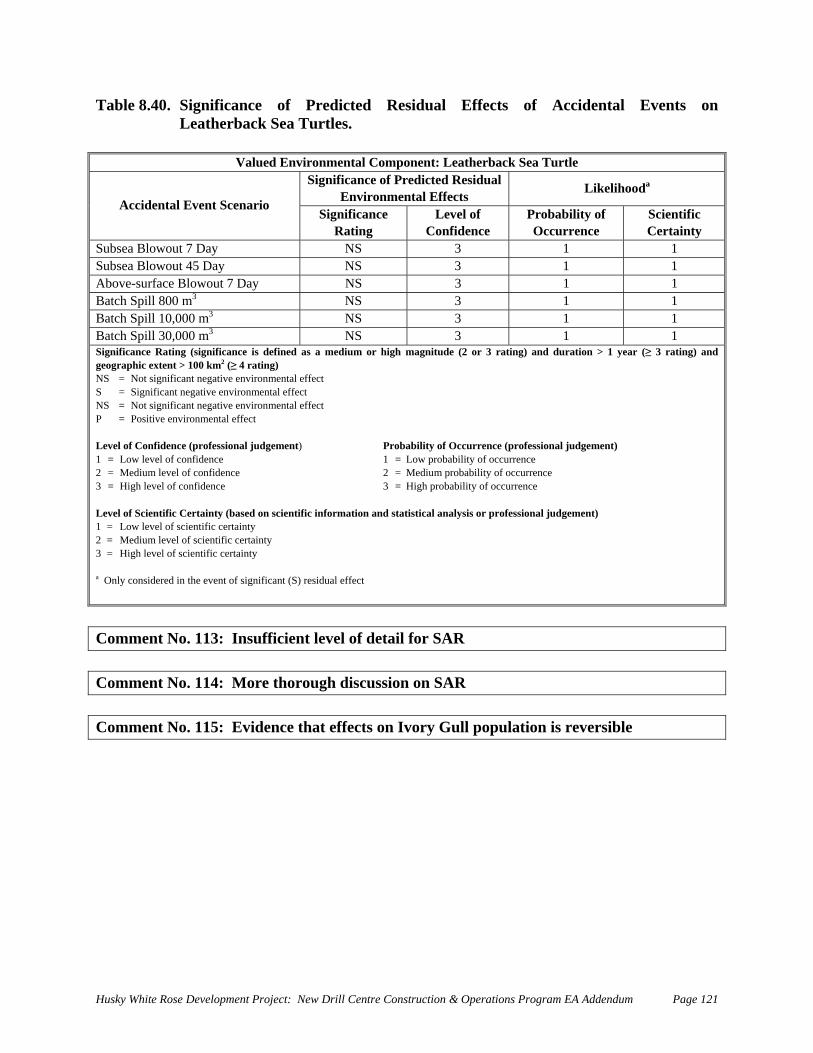
Predicted Residual Effects of Accidental Events on
Table 8.40. Significance of Leatherback Sea Turtles.
Valued Environmental Component: Leatherback Sea Turtle Significance of Predicted Residual
Environmental Effects Likelihooda
Accility of Scientific
idental Event Scenario Significance Level of Probab
Rating Confidence Occurrence Certainty Subsea Blowout 7 Day NS 3 1 1 Subsea Blowout 45 Day NS 3 1 1 Above-surface Blowout 7 Day NS 3 1 1 Batch Spill 800 m3 NS 3 1 1 Batch Sp 3 1 1 ill 10,000 m3 NS Batch Spill 30,000 m3 NS 3 1 1 SignificangeographiNS = No
P = Po Level of C1 = Low 2 = Medi m probability of occurrence
Level of S )
3 = High
ce Rating (significance is defined as a medium or high magnitude (2 or 3 rating) and duration > 1 year (≥ 3 rating) and c extent > 100 km2 (≥ 4 rating) t significant negative environmental effect
S = Significant negative environmental effect NS = Not significant negative environmental effect
sitive environmental effect
onfidence (professional judgement) Probability of Occurrence (professional judgement) level of confidence 1 = Low probability of occurrence um level of confidence 2 = Mediu
3 = High level of confidence 3 = High probability of occurrence
cientific Certainty (based on scientific information and statistical analysis or professional judgement1 = Low level of scientific certainty 2 = Medium level of scientific certainty
level of scientific certainty
a Only considered in the event of significant (S) residual effect
Comment No. 113: Insufficient level of detail for SAR Comment No. 114: More thorough discussion on SAR Comment No. 115: Evidence that effects on Ivory Gull population is reversible
Husky White Rose Development Project: New Drill Centre Construction & Operations Program EA Addendum Page 121
as nega
9.0 Summary and Conclusions
9.1 Residual Effects of the Project The predicted residual effects of the Husky White Rose Development Project: New Drill Centre Construction & Operations Program including accidental events on Species-at-Risk are assessed
tive but not significant.
Comment No. 116: Species-at-Risk not discussed 9.2
•
• surveys and
•
CAPP
Banks two ex
will nospills o
A potemateriaeffects This scenario is subject to numerous variables such as type of mud, weather conditions, water depth and velocity, discharge depth, species involved, biological
Cumulative Effects of the Project
Projects and activities considered in the cumulative effects assessment included:
New Drill Centre Construction & Operations Program within-Project cumulative impacts. For the most part, and unless otherwise indicated, within-Project cumulative effects are fully integrated within this assessment;
• Hibernia, Terra Nova, and White Rose (existing offshore oil developments); Other offshore oil exploration activity (seismic surveys and exploratory drilling). In 2007, Grand Banks activity could include multiple seismic delineation/exploration drilling. The Labrador Shelf may also see some exploration activity because there has been recent seismic survey activity there. Commercial fisheries;
• Marine transportation (tankers, cargo ships, supply vessels, naval vessels, fishing vessel transits, etc.); and Hunting activities (marine birds and• seals).
had predicted that there would be between one and four drill rigs per year operating on the
Grand Banks between 2000 and 2010 (CAPP 1999). CAPP’s scenario for a moderate level of activity predicts two rigs drilling exploration, delineation and production wells on the Grand
each year over the ten-year period. It is reasonable to assume that there will be at least ploratory drilling programs on the Grand Banks in 2007. Any cumulative effects on the
Grand Banks ecosystem from drilling outside the proposed drilling area will probably not overlap in time and space and thus, will be additive but not multiplicative. This level of activity
t change the effects predictions when viewed on a cumulative basis unless significant oil r blowouts occur.
ntial scenario for cumulative effects from drill mud and cuttings discharge would be if the l settles on the ocean floor, smothers benthic communities partially or completely, and
are persistent over time.
Husky White Rose Development Project: New Drill Centre Construction & Operations Program EA Addendum Page 122
Husky Whit
e Rose Development Project: New Drill Centre Construction & Operations Program EA Addendum Page 123
and biodegradation activity. In order to obtain some order of magnitude of the area of seabed ally affected by the Husky development drilling during the 2007-201potenti 2 period, one can
A max rilled during the Drilling Phase, all within the constructed
(i.e., po ud)
essentiZOI as an area of approximately 0.78 km2. The total
of the area of the Project Area. Including the Zincreas Area.
m below the surface of the ocean substrate, it isdeposition will occur within thalready adjacent wells in any single glory hole will accumulate vertically (i.e., overlap of individual well biological ZOIs). Comment No. 117: Uncertainty associated with cumulative effects estimations and
quickly calculate a very rough approximation of the total affected area.
imum of 54 wells would be dglory holes. Assuming 500 m as the radius of each well’s biological zone of influence (ZOI)
tential smothering due to a minimum of 1 cm thickness of deposited cuttings and mand given that the floor dimension of each glory hole will be 70 m x 70 m, there would be
ally 100% overlap of the ZOIs of adjacent wells within a single glory hole. Therefore, the sociated with each glory hole would have
area of ZOI for all five proposed glory holes will be approximately 3.90 km2, equivalent to <1% OIs of the 19 wells in the existing 3 glory holes
es the total ZOI area to 6.24 km2, equivalent to <1.6% of the area of the Project Since the wells will be drilled on the floor portion of each glory hole which is approximately 11
likely that much of the mud and cuttings e glory holes (136 m x 136 m including sloped ramps), areas
subjected to HADD. Deposition from
potential for future data collection 9.3 Monitoring and Follow-up
Spill specific EEMComment No. 118:
Husky Whit
10.0 Literature Cited
snowcrab exposed to drilling fluid being us roc. 31st orkshop: Oc arlottetown, Prince
nd, H. Grynberg, D. Gwyther, mmond, S. Mourtikas, B.J. rdrop. 1994. In: J.M. Swan,
.M e nd P.C. Young (eds.), Environmental i ons of offshore oil and gas findi scientific review. Australian
n Society, Sydney. Phoca
) to im
M., C. Leeder, K.C. Penney, M. Mu ower, and U.P. Williams. ental effects m nitoring program: from environmental
pact statem pp. 475-491. ental Effects onitor proaches and Tec rmsworthy, P.J. Cranford
nd K. L mba unities
reas 3-6 porbeagle shark. DFO Can. Sci.
platforms in the northwestern of S. Fish and Wildlife Service, Office of
OBS-82/27. Bureau of Land Management,
wbel, L.R. Martin, F.J. Margrave and R.L. Ecological Investigations of
xico. LGL Report (Contract ent, Washington, D.C. 108 p. +
., L.R. Martin, R.L. nd and G.D. Dennis. 1981. Effects on In:
oduction. Plenum Publishing
Hernandez, F.J. Jr., R.F. Shaw, J.S. Cope, J.G. blages collected at offshore oil and
r Delta. American Fisheries Society posiumsearch Ltd. 2006. Vancouver Island Transmission Reinforcement Project:
ospheric and underwater acoustics assessment report. Prepared for British Columbia ra ission Corporation. 49 p.
Andrews, C., B. French, L. Fancey, J. Guine
Annual Aquatic Toxicity WEdward Island. Can. Tech. Rep. Fish. Aquat. Sci.: 2562. 138 p.
Black, K.P., G.W. Richardson and J.A. WaJdevelopment in Australia - the Petroleum Exploratio
Blackwell, S.B., J.WhispidaJournal of the Acoustical Society of
Deblois, E.2005. Terra Nova environmimMa
Dernie, K.M., M.J. Kaiser, and R.following physical disturbance. J. A
DFO. 2005. Stock assessmAdvis. Sec. Sci. Advis. Rep. 2005/044.
Gallaway, B.J. and G.S. Lewbel. 1982. The ecolGulfBiological SGulf of Mexico OCS Re
Gallaway, BHoward. 1979. A Final Report thPetroleumNo. AA551-App.
Gallaway, B.Jartificial reeMiddleditch (ed.), EnvirCorp., NY.
across-shelf larval, postlarval, gas platformSym
JASCO ReatmT
e Ro Project: New Drill Cen ruction & Operations Program EA Addendum Page 124
y, and J.F. Payne. 2004. Chronic toxicity study on ed on the Grand Banks (abstract) Ptober 24-27, 2004, Ch
Production facilities.
ngs of an i
illiams. 2004. Tolerance by ringed seals (tion sounds at an oil production island.
America, 115 (5, Pt. 1): 2346-2357. rdoch, M.D.
oIn: Offshore Oil and Gas Environm
hnologies. E
Bra
. Lawson, and M.T. Wpact pipe-driving and construc
ent onward. Ap
L.S. Ha pp. 209-407.
mplicatindependent
Paine, F. P
ited by S.L.
. N ff a
ing: d Aee. Batelle Press, Colu
M. W
ent report on NAFO Suba
Mexico: a community profervices, Washington, D
gional Offi
Production Platforms in the CentraCT8-17) for U.S. Bureau of Land
Howarf and demersal fish and
onmental Effects of
and juvenile fish assems west of the Mississippi Ri
36: 39-72.
us, Ohio. rwick. 2003. Recovery rates of benthic comm
nim. Ecol. 72: 1043-1056.
ogy of petroleumile. U.
C. FWS/ce, Open File Report 82-03. 92 p.
e Artificial Reef Studies. l Gulf of Memanagem
d, G.S. Bolamacrocrustacean communities. pp. 237-299.
Offshore Oil Pr
Ditty, T. Farooqi, and M.C. Benfield. 2003. The
ve
.J., M.F. Johnson, G.S. Boland, G.S. Le
nsm
se Development tre Const
Husky White Rose Development Project: New Drill Centre Construction & Operations Program E Addendum Page 125 A
Jensen, T., R. Palerud, F. Olsgard, S.M. Bakke. 1999. Dispersion and effects of synthetic drilling fluids in the environm3507. 49 p.
Lavigne, D.M. and K.M. Kovacs. 1988. Harps Atlantic. University of Waterl
Lawson, J.W. and I. McQuinn. 2004. Review of Canada, risks to marine ma itigation strategies for seismic activities. DFO Canadian Science DocumON, Department of Fisheries and Oceans: AS web site).
Lawson, J.W. 2006. Preliminary infor(Balaenoptera physalus) in Newfoundland and Labrador, Canada. SC/14/FW/21-SC/M06/FW21. Joint NAMMCO/IWC Scientif orkshop On The Catch History, Stock Structure And Abundance Of North Atla in Whales. Reykjavík, Iceland, 23-26 March, 2006. 12 p.
Mathieu, A., W. Melvin, B. French, M. Dawe, E. s. 2005. Health effects indicators in Am Terra Nova development site, Grand Banks, NL, Canada. pp. 297-317. In: and Gas Environmental Effects Monitoring: S.L. Armsworthy, P.J. Cranford and K. Lee. Batelle Press, Columbus, Ohio.
Neff, J.M., S. McKelvie, and R.C. Ayers. 2000. Environmental impacts of synthetic based drilling fluids. U.S. Dept. of the Interior, Minerals Management Service. Gulf of Mexico OCS Region, New Orleans, LA. OCS Study MMS 2006-064. 145 p.
O’Boyle, R. 2005. Recovery potential assessment of Atlantic porbeagle Maritimes Regional Advisory Process; 22 March, 28 June and 14 July 2005. DFO Can. Sci. Advis. Sec. Proceed. Ser. 2005/019.
OGP. 2003. Environmental aspects of the use and disposal of non aqueous drilling fluids associated with offshore oil and gas operations. International AssoProducers R
Payne, J.F., A. Mathieu, and T.K. Collier. 2003. Ecotoxicological studi arine and freshwater fish. pp. 191-224. In: PAHs: an Ecotoxicological Perspective. P.E.T. Douben, John Wiley and Sons, London.
Payne, J.F., C. Andrews, S. Whiteway, and K. Lee. 2001a. Definition zones around oil development sites: dose response relationships for the msurrogates Microtox® and amphipods, exposed to Hibernia source cusynthetic base oil. Can. Man. Rep. Fish. Aquat. Sci. No. 2577, 10p + vi.
Payne, J.F., L. Fancey, C. Andrews, J. Meade, F. Power, K. Lee, G. 2001b. Laboratory exposures of invertebrate and vertebrate species to concentrations of IA-35 (Petro-Canada) drill mud fluid, production water and Hibernia drill mCan. Man. Rep. Fish. Aquat. Sci. No. 2560, 27p +iv.
Roberts, D.J. and A.H. Nguyen. 2006. Degradation of synthetic-based drby Gulf of o sediments: Final report. U.S. Dept. Management Service. Gulf of Mexico OCS Region, New Orleans, LA. OCS Study MMS 2006-028. 122 p.
ent. Minist
oo Press, W
mmals, and m
m
erican plaice (
ry of Oil and Energy Technical Report No. 99-
and hoods, ice-breeding seals of the Northwest aterloo, Ontario. 174 p.
the potential hydrophysical-related issues in onitoring and m
Advisory Secretariat Research53p + iv. (available on the CS
ation on distribution and abundance of fin whales
ic Wntic F
M. Deblois, F. Power, U.P. WilliamHippoglossoides platessoides
Approaches and Technologies. Edited by
ent. Ottawa,
) from theOffshore Oil
shark: Meeting of the
ciation of Oil & Gas
es focusing on m
of sedim
ttings containing a
Veinott, and A. Cook.
illing mof the Int
eport No. 342. 112 p.
Mexic
Edited by
ent toxicity onitoring
ud cuttings.
ud base fluids ior, Mineer rals
Rose, G. A. and D. W. Kulka. 1999. Hyper-aggregation of fish and fisheries: how CPUE increased as the northern cod declined. Can. J. Fish. Aquat. Sci. 56p.
Stanley, D.R. and C.A. Wilson. 1990. A fishery-dependen ed study of fish species composition and associated catch rate around oi Bull. (U.S.), 88 (4): 719-730.
Stanley, D.R. and C.A. Wilson. 1991. Factors affecting oil and gas platforms in the northern Gulf of Mexico. Fish. U.S.), 89(1):
Stanley, D.R. and C.A. Wilson. 1997. Seasonal and spatial e distribution of fishes associated with a petroleum platf u Mexico. Can. J. Fish. Aquat. Sci., 54: 1166-1176.
Wiese, F.K. and W.A. Montevecchi. 1999. Marine bird and mNewfoundland Grand Bank from offshore supplof Newfoundland, St. John's, NL for Husky Oil, St. John'
Wilhelm, S.I., G.J. Robertson, P.C. Ryan, and D.C. of the number of seabirds at risk during the NovemberGrand Banks. Canadian Wildlife Service TeRegion. vii + 25 pp.
. Miller, Y.C. Allen, K.M. Boswell, and D.depth, location, and habitat type on relative abu com associated with petroleum platforms and Sonnier Bank in the northern Gulf of Me U.S. Dept. of the Interior, Minerals ManagemeNew Orleans, LA. OCS Study MMS 2006-037. 85 p.
, B., Senior Science Coordinator/Advisor, NAFO
S
., CWS s, U., Petro-Canada
FishBase. 2006. Website www.fishbase.org.
t basl and gas structures off Louisiana. Fish.
the abundanceBull. (
variation in the abundaorm in the northern G
y vessels. Rep. by Memorial University s, NL. 28 p. + appendices.
Schneider. 2006. An 2004 Terra Nova
chnical Report Series No. 461. Atlantic
L. Nieland. 2006. Effects of
of selected fishes near
ammal surveys on the
FPSO oil
149-159.
asse
nce and sizlf of
ssmentspill on the
Wilson, C.A., M.Wndance and species
nt Service. Gulf of Mexico OCS Region,
position of fishesxico.
Personal Communication Belore, R., SL Ross BrodieCoady, K., C-NLOPB Johnson, S.R., LGL Ltd. Lang, T., LGL Ltd. Lawson, J., DFO Lilly, G., DFO Robertson G., CWSimms, J., DFO Biologist Sonnichsen, G., GSC Turpin, WWilliam Website Accessed
Husky White Rose Development Project: New Drill Centre Construction tions Program EA Add Page 126 & Opera endum
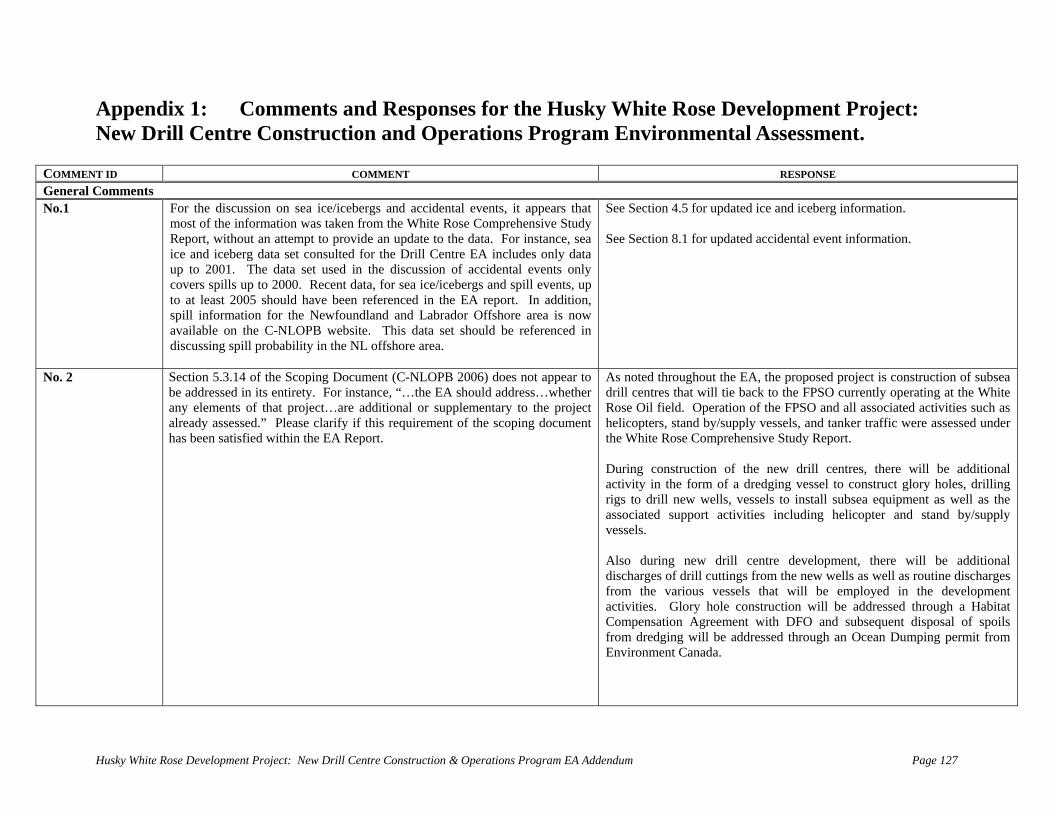
Append y White Rose Development Project: New Dr m Environmental Assessment.
COMMENT ID RESPONSE
ix 1: Comments and Responses for the Huskill Centre Construction and Operations Progra
COMMENT General Comments No.1
ferenced in the EA report. In addition,
See Section 4.5 for updated ice and iceberg information. See Section 8.1 for updated accidental event information.
For the discussion on sea ice/icebergs and accidental events, it appears that most of the information was taken from the White Rose Comprehensive Study Report, without an attempt to provide an update to the data. For instance, sea ice and iceberg data set consulted for the Drill Centre EA includes only data up to 2001. The data set used in the discussion of accidental events only covers spills up to 2000. Recent data, for sea ice/icebergs and spill events, up to at least 2005 should have been respill information for the Newfoundland and Labrador Offshore area is now available on the C-NLOPB website. This data set should be referenced in discussing spill probability in the NL offshore area.
No. 2
ementary to the project already assessed.” Please clarify if this requirement of the scoping document has been satisfied within the EA Report.
As noted throughout the EA, the proposed project is construction of subsea drill centres that will tie back to the FPSO currently operating at the White Rose Oil field. Operation of the FPSO and all associated activities such as h
Also during new drill centre development, there will be additional
the various vessels that will be employed in the development activities. Glory hole construction will be addressed through a Habitat
nd subsequent disposal of spoils from dredging will be addressed through an Ocean Dumping permit from Environment Canada.
Section 5.3.14 of the Scoping Document (C-NLOPB 2006) does not appear to be addressed in its entirety. For instance, “…the EA should address…whether any elements of that project…are additional or suppl
elicopters, stand by/supply vessels, and tanker traffic were assessed under the White Rose Comprehensive Study Report. During construction of the new drill centres, there will be additional activity in the form of a dredging vessel to construct glory holes, drilling rigs to drill new wells, vessels to install subsea equipment as well as the associated support activities including helicopter and stand by/supply vessels.
discharges of drill cuttings from the new wells as well as routine discharges from
Compensation Agreement with DFO a
Husky White Rose Development Project: New Drill Centre Construction & Operations Program EA Addendum Page 127
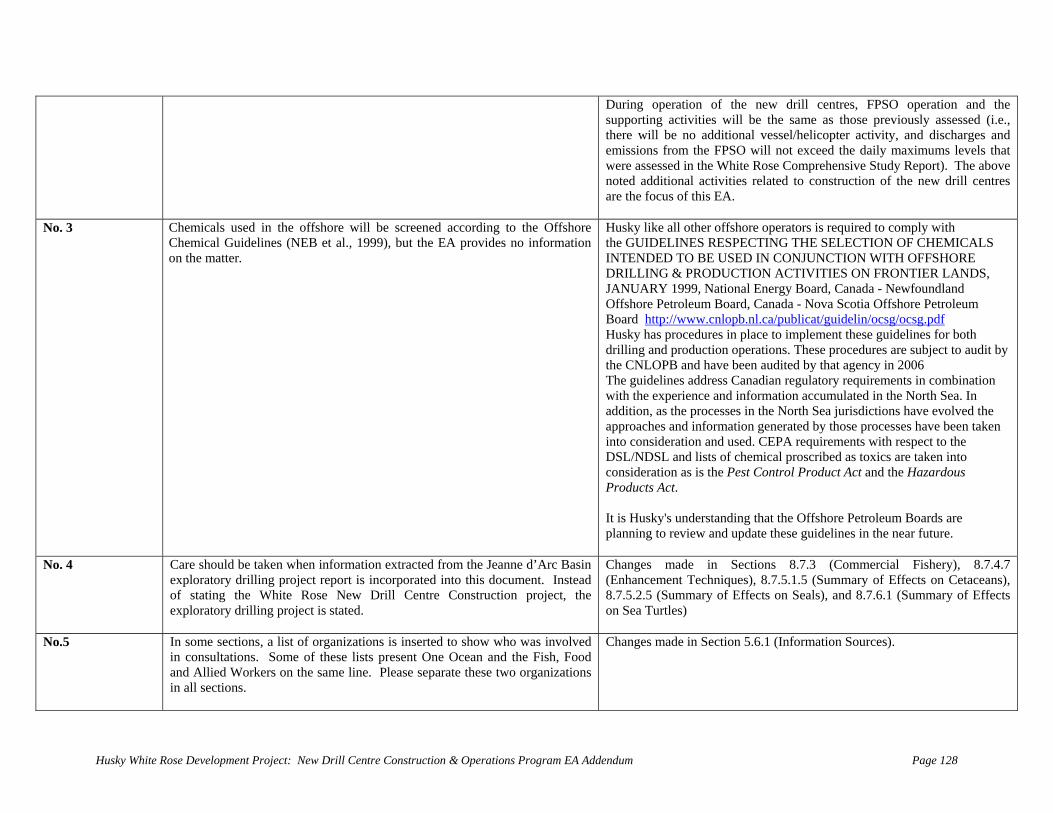
During operation of the new drill centres, FPSO operation and the supporting activities will be the same as those previously assessed (i.e., there will be no additional vessel/helicopter activity, and discharges and
rehensive Study Report). The above noted additional activities related to construction of the new drill centres are the focus of this EA.
emissions from the FPSO will not exceed the daily maximums levels that were assessed in the White Rose Comp
No. 3 NEB et al., 1999), but the EA provides no information
n the matter.
Husky like all other offshore operators is required to comply with the GUIDELINES RESPECTING THE SELECTION OF CHEMICALS INTENDED TO BE USED IN CONJUNCTION WITH OFFSHORE DRILLING & PRODUCTION ACTIVITIES ON FRONTIER LANDS, JANUARY 1999, National Energy Board, Canada - Newfoundland Offshore Petroleum Board, Canada - Nova Scotia Offshore Petroleum Board http://www.cnlopb.nl.ca/publicat/guidelin/ocsg/ocsg.pdf
Chemicals used in the offshore will be screened according to the Offshore Chemical Guidelines (o
Husky has procedures in place to implement these guidelines for both
address Canadian regulatory requirements in combination
he processes in the North Sea jurisdictions have evolved the approaches and information generated by those processes have been taken into consideration and used. CEPA requirements with respect to the
l proscribed as toxics are taken into consideration as is the Pest Control Product Act and the Hazardous Products Act.
drilling and production operations. These procedures are subject to audit by the CNLOPB and have been audited by that agency in 2006 The guidelineswith the experience and information accumulated in the North Sea. In addition, as t
DSL/NDSL and lists of chemica
It is Husky's understanding that the Offshore Petroleum Boards are planning to review and update these guidelines in the near future.
No. 4 Care should be taken when information extracted from the Jeanne d’Arc Basin exploratory drilling project report is incorporated into this document. Instead of stating the White Rose New Drill Centre Construction project, the exploratory drilling project is stated.
ry), 8.7.4.7 Enhancement Techniques), 8.7.5.1.5 (Summary of Effects on Cetaceans),
8.7.5.2.5 (Summary of Effects on Seals), and 8.7.6.1 (Summary of Effects on Sea Turtles)
Changes made in Sections 8.7.3 (Commercial Fishe(
No.5 n some sections, a list of organizations is inserted to show who was involved Changes made in Section 5.6.1 (Information Sources). Iin consultations. Some of these lists present One Ocean and the Fish, Food and Allied Workers on the same line. Please separate these two organizations in all sections.
Husky White Rose Development Project: New Drill Centre Construction & Operations Program EA Addendum Page 128
No. 6 So noted. Figures are used quite often in the document, but they are usually hard to read or interpret. These figures should be larger to be much more effective.
No. 7
sediment will occur. In light of bottom currents, the zone of nfluence has the potential to be greater than 70m X 70m. Has the actual zone
of influence been modeled or assessed to this point?
The technology that will be used to dredge the new glory holes will be a suction hopper dredge. Material is lifted through the trailing pipes by one or more pumps and discharged into a hopper contained within the hull of
se Field. It is not expected that the area affected will be any greater than that area already affected by previous disposal activities
ities associated with glory hole
Sediment excavation will remove 155,540 m3 of sediment in a zone of 70 X 70 meters for each glory hole. In addition to direct habitat/sediment removal, uspension ofs
i the dredge, thus minimizing sediment suspension in the water column. As well, the sediments in the White Rose area are predominantly sand (> 95%) rather than silt or clay, thus sediment suspension is less of a concern. The zone of influence of sediment suspension as a result of glory hole construction has not been modeled. It should be noted however that any sediment suspension will be primarily associated with the deposition of dredge spoils at the existing sediment disposal site in the south-west of the White Ro
especially as any new spoils will be deposited on the already affected areas at the disposal site. In addition, the extent of any dispersal of the kinds of sediment to be excavated can be reasonably considered as significantly less in terms of physical area that was modeled for drill cuttings in the White Rose comprehensive study. Activconstruction are regulated through the Habitat Compensation Agreement with DFO and the Ocean Dumping permit issued by Environment Canada.
No. 8
ion activ tiass s VECs, the discussion of produced water an In additio m other pr
Durations Ratings) and in all VEC assessment tables for routine activities (Tables 7.5 to 7.20). Produced water from both delineation drilling and production operations is discussed in text accompanying the assessment tables. See additional text in Sections 7.6.1.6.9 and 7.6.2.6.9.
Produced water discussion. Throughout the document, the discussion of produced water appears to focus on the discharge associated with drilling activities. Produced water is typically not encountered during drilling act ties.
Produced water is indicated as a potential product for both drilling and production in Table 7.1 (Project Activity Table to Aid in Developing Frequency and
ivi It is, however, a primary waste associated with producti es. This is not evident in the EA report. In addition, in the effects ment sections, for each of thees
d the potential effects associated with its discharge is insufficient. n, cumulative effects discussion does not address the discharges frooduction installations.
No. 9 The c e. Ev a escription of the various listed species wi u to ensure the protection of those sp s nt. While addresses legal aspects of SARA by considering listed species,
is a minimum requirement and DFO recommends that the report fully acknowledge the rarity of all species at risk and that due caution will
Text added to Section 5.3 (SARA-listed Species) New text in Sections 7.6.7 and 8.7.8.
overage of Species at Risk is dismissive and thus, inadequattion of SAR is basically a dalu
tho t the benefit of any added measuresecie – something that should be the main component of the docume
the reportit
Husky White Rose Development Project: New Drill Centre Construction & Operations Program EA Addendum Page 129
necessarily need to be exercised. Finally, the report, in assessing effects of
be presented. The SAR assessment should clearly identify adverse effects and significant adverse effects on listed
both routine and accidental events, avoids directly assessing effects on SAR by stating: “The details of potential effects…on relevant marine animals species…have been discussed in previous sections…”. For SARA listed species with low estimated populations, a detrimental effect on individuals may translate into a significant effect at the population level. Given their importance, these sections are not adequate and a better effects analysis and specific mitigations for SAR should
SAR, and propose and describe mitigation and monitoring to address the adverse effects. Where applicable, the proponent should refer to listed SAR recovery strategies/action plans to ensure that proposed mitigation is consistent with the applicable strategies/plans.
No. 10
nt a summary the information and original references to support it.
This document often refers the reader to the White Rose Oilfield Comprehensive Study Report and other previous EA reports for details on effects assessment. DFO reiterates that it is inefficient to expect reviewers to refer to other EA documents for detailed information on the biophysical environment and on effects assessment. The report should preseof
The document does summarize relevant information presented in other documents. Revised summary text regarding the physical environment has been included in Section 4.0.
No. 11 It is anticipated that the monitoring and mitigation strategies for seismic activities outlined in the referenced document (Lawson and McQuinn 2004) will be incorporated into the forthcoming Mitigation of Seismic Noise in the Marine Environment – Statement of Canadian Practice. Once referenced in regulation the relevant mitigation measures in the Statement of Practice will be implemented. Currently, the relevant mitigations in the Statement of Practice are considered and incorporated into our seismic
ropriate.
DFO has produced a review of the potential hydrophysical-related issues in Canada, risks to marine mammals, and monitoring and mitigation strategies for seismic activities (Lawson and McQuinn, 2004) that it recommends for referral as it is relevant to both this assessment and to other places in Canada. This reference, as well as others is attached to this document.
operations as app
No.12 Corrections of spelling and typographical errors are included in the revised text.
There are spelling and typographical errors throughout the document.
No. 13 Personal Communication now included. Table of Contents: A “Personal Communication” section has not been included in the document.
No. 14 ted) has not been Appendix 2 now included. Table of Contents: Appendix 2 (List of People Consulincluded in the document.
Husky White Rose Development Project: New Drill Centre Construction & Operations Program EA Addendum Page 130
Specific Comments No. 15 Despite searches of the document, examples of statements that construction
will begin the fall could not be found. Section 1.0, page 1, 3rd paragraph, line 1: Summer is identified for construction to begin. Fall is identified later in the document.
No. 16 The MODUs that will be used to drill the new wells will have 8-point or 12-point mooring systems. For example, the GSF Grand Banks has an 8-point mooring system using Stevin MK3 anchors with two flukes angled at 32 degrees. The anchors are typically located 1200 to 1300 m from the drilling platform, radiating out in an approximate 45 degree pattern. For a 12-point system, the anchors would be placed in groups of three
anchoring systems are computer controlled to maintain station keeping.
Section 3.0, page 6: Anchorage of a rig is not discussed, demonstrating the size, type and number of anchors typically used. This would be interesting to know to add to the disturbance or dredging of the sea floor from certain styles of anchors and chains.
(approximately 15 degrees apart) with an approximate 60 degree angle between each grouping. The
No. 17 Abbreviations for the three currently active drill centres have been added to the first paragraphs of Section 1.0 (Introduction) and Section 3.0 (Project Description).
Section 3.0, page 6, 1st paragraph: It is stated that the currently active drill centres are shown on Figures 1.1 and 1.2. It is not obvious on these figures.
No. 18 Section 3.5.2 explicitly states that jack-up drilling rigs will not be used for the Project.
Page 8: The use of jack-up drilling rigs is not discussed in this section. If there is a possibility that jack-up rigs could be used throughout the life of the project, then they should be included in the EA report.
No. 19 Section 3.7, page 11: It should be the “Department of Fisheries and Change is made in Section 3.7. Aquaculture” not the “Department of Fisheries, Food and Aquaculture”.
No. 20 The EA has been modified to include a revised project description and an assessment of the environmental effects associated with the addition of 8 wells in the SWRX drill centre and the addition of another glory hole with 16 wells in the North Amethyst drill centre. The Project Area has also been revised to include the area of the North Amethyst drill centre.
Section 3.8, page 12. In the discussion of the number of well per drill centre, it is stated that the SWR drill centre will have up to 8 wells. However, in the “White Rose Development Plan Amendment – South White Rose Extension Tie-back” (Husky 2006) a maximum of 16 wells in the SWR Drill Centre is contemplated. The information presented in the EA report should be consistent with that presented in the Development Plan Amendment. As such it is required that the EA be modified to include an assessment of environmental effects associated with a maximum of 16 wells in the SWR drill centre.
No. 21 al scope of the EA for the drilling activities is indicated as a
four-year period, to end in 2011. Husky is proposing to drill 30 wells in
The revised Project Description (Section 3.0) has addressed this discrepancy. The maximum number of wells has been revised to 54 and the period of drilling has been extended to 2016. Concurrent drilling may occur if the maximum number of wells is realized.
Table 3.1, page 13. A potential schedule of activities is presented in Table 3.1, and the tempor
approximately 48 months. However, the effects assessment indicates a drill
Husky White Rose Development Project: New Drill Centre Construction & Operations Program EA Addendum Page 131
will require an additional environmental assessment.
time of 60 days per well. Therefore, for 30 wells, it will take approximately 60 months, a full year beyond project estimates. If drilling is required to be undertaken beyond 2011, these activities will be outside the scope of
roject/scope of assessment andp
No. 22 Section 3.8.4, page 15. The 3rd paragraph in this section indicates that a discharge of approximately 0.330 m3 of oily residue will be discharged during subsea equipment installation. In the discussion of environmental effects with respect to production activities, the effects associated with tie-back to the FPSO, including the above, and mitigations to reduce or eliminate effects, are not included. The EA report should include a discussion of environmental effects for all phases of the project, including tie-back/hook-up to the existing FPSO.
The oily discharge associated with tie-back has potential to interact with primarily fish habitat and fish. See new sections 7.6.1.6.11 discussing effects of oily discharge on fish habitat, and 7.6.2.6.11 discussing effects of oily discharge on fish VEC. This activity is considered in Section 7.6.7 (Species-at-Risk) in relation to the wolffishes. The primary mitigation is to maximize efficiency of flowline flushing in order to minimize the oily discharge.
No. 23 Section 3.9, page 23: The Offshore Waste Treatment Guidelines (NEB et al., 2002) place an onus on operators to review and implement pollution prevention measures that minimize waste generation and discharge. Consideration of pollution prevention measures has important implications for
rtunities to recover water-based mud as opposed to a bulk
• options related to the length and/or diameter of the surface-hole
Although a discussion of alternative means of carrying out the project is not required for a Screening under CEAA, the environmental assessment did note where alternative means of carrying out the project (i.e., well type, drilling rig and dredger) were considered. Husky has in place a Compliance Monitoring Plan for drilling activities that addresses and monitors the management of drill fluids to minimize their discharge to the environment. Husky utilizes low toxicity SBM fluids and selects drilling and utility chemicals that minimize toxicity to the environment. In the past year, Husky has employed reconditioning of drill muds onshore
base oil that is then re-used offshore to minimize SBM . Husky also employs a Duster Cutting Dryer on its
development drilling rig. This equipment is advanced technology for optimal drying of synthetic, mineral-oil and diesel-base drilled cuttings and is recognized by the CNLOPB as BAT for this type of activity. Husky has also experimented with RVD (rotary vacuum drier) technology on its exploration drilling rig. This technology is a secondary processing unit for treatment of SOC (synthetics on cuttings) and is applied following treatment by the shakers in order to recover more drilling mud from cuttings prior to disposal.
the nature and extent of environmental impacts from offshore activities. Nonetheless, the discussion of pollution prevention opportunities is limited in the EA. Similarly, consideration of alternative means of carrying out the project is essentially restricted to a brief paragraph on rig type and a sentence on the use of vertical wells (p. 10). Examples of pollution prevention opportunities which could be considered in revisions to the EA include the following:
• opporelease at the end of the well;
• alternative means of managing synthetic-based muds such as measures that reduce drilling mud volumes, reduce or substitute the toxic constituents of drilling muds, and other means of managing the resulting waste (e.g., re-injection of cuttings, transport to shore) recognizing that technology is being developed to remove oil from cuttings);
• substitute drilling additives; and
section.
and recovery of base oil discharges
Husky White Rose Development Project: New Drill Centre Construction & Operations Program EA Addendum Page 132
No. 24 See revised Section 3.9.2. Section 3.9.2.2, page 23: The maximum amount of produced water associated
with increased production from the new drill centres, and that already estimated from existing production should be stated. If this amount is anticipated to exceed that assessed in the White Rose Comprehensive Study, the Drill Centre EA report should include an assessment of effects associated with the additional produced water.
No. 25
ial for the dechlorination of cooling ater prior to discharge. The Pest Management Regulatory Agency should be
Husky has complied with the White Rose Decision Report Condition #36 which required Husky to document the rationale for the chosen system for biofouling control. This report titled Condition 36: Cooling Water Discharge (WR-HSE-RP-0063) was provided to the C-NOPB in 2003. Husky’s current chlorine discharge level (0.5 ppm) has been approved by the C-NLOPB pursuant to the OWTG. As well, the Canadian Council of Environment Ministers has called for a level of hypochlorous acid of 0.5 ppm and Husky is meeting this target. In fact, discharge records for the SeaRose show that the facility is routinely below the 0.5 ppm target for chlorine discharge.
Section 3.9.8.1, page 24: The EA states that the target discharge concentration for chlorine in cooling water is 0.5 ppm. Chlorinated wastewater effluent through once-use coolant systems is listed as a toxic substance under CEPA. It is recommended that the EA include a discussion of alternatives to chlorine use and whether these are feasible for the proposed project. If chlorine is to be employed, the proponent should indicate which chlorine product has been selected for use and consider the potentwcontacted with respect to the applicability of the Pest Control Products Act and use of chlorine in any non-closed-loop cooling water systems.
No. 26 s no effects assessment of the environment on the roject, as stated later in the document. Section 5.3.4 of the Scoping document
See response to Comment No. 26 in Chapter 4.0. Section 4.0, page 28: There ipstates that the EA report is to include effects of the environment on the Project. However, no such assessment is provided in the EA report. The effects of the project on the environment assessment piece should be consistent, in terms of information presented and analysis undertaken as is provided for the VECs, and include all project activities.
No. 27 port by Oceans Ltd 005) provided in Appendix 1. Sections 1 and 2, and Appendices A and B of
this Oceans Ltd report, are nearly identical to the wind and wave information presented in Section 4.2, Climate, and Appendices A & B, in LGL (2005a). It would be clearer to refer to LGL (2005a) in the EA report rather than Oceans Ltd (2005), since the wind and wave information in LGL (2005a) has been more widely distributed and reviewed. Response to the EC review comments on the wind and wave climate and its effects on the project, are contained in LGL (2005a), should be incorporated into this document. The EA did not include any mention of long-term or decadal climate variation or change as it relates to the marine climate in this area, even though this project includes a production program scheduled out to 2020. Most climate
See Appendix 3. Section 4.0, page 28: The EA references a detailed re(2
Husky White Rose Development Project: New Drill Centre Construction & Operations Program EA Addendum Page 133
studies to date have not yet definitely shown an increasing trend in winds and waves over the Grand Banks or the Scotian Shelf. In fact, some studies have shown a flat or slightly decreasing trend. However, projections from coupled atmosphere-ocean climate models show that an increasing trend is expected in the future. While the effects of long-term climate change may or may not impact the area by that date, the time period is long enough to include ariations due to inter-annual or decadal variability. It is recommended that
current atmospheric circulation patterns, such as the North Atlantic Oscillation or the Pacific-North America pattern, how they vary over a decadal scale, and how they relate to marine climate over the Grand Banks, be discussed.
v
No. 28 See Husky EEM reports for extensive documentation of sediments and
Section 4.5 Ice and Icebergs.. Section 4.0, page 28: There is no discussion of the iceberg scour environment, seabed sediments, or the character of the sediments that will be dredged.
No. 29
y used for spill trajectory tracking in the NL Region are
See Appendix 3. Section 4.0, page 28: Physical Environment - In general, the material as it relates to the physical environment is acceptable. However, the ocean current
odels commonlminadequate. In this report, the International Ice Patrol map of mean currents is used; but these do not contain any fluctuations about the mean and miss much of the horizontal and temporal variability present in real currents. At some point, a future trajectory exercise should be conducted with a modern model hat simulates the real ocean more closely. t
No. 30 Section 4.2.3, page 31: This section lists the databases used to derive the marine climate statistics in recent assessments of the Project Area. In addition to the AES40 hindcast database, it lists the marine weather and sea state observations by ships and platforms archived by ICOADS; marine weather observations from Husky programs on the Grand Banks during the 1980s and 1990s; and wind observations, waverider buoy data, and ocean current data, from a number of drilling programs on the Grand Banks from 1980-1989. It does not appear that any of the databases of observations or measurements were used in the derivation of the wind and wave climate, despite what is suggested in this section. The EA report itself contains almost no specific information on climatological wind and wave statistics for the area. Instead it refers to Oceans Ltd. (2005), contained in the Appendix. The wind and wave information in Oceans Ltd. (2005) is based entirely on the AES40 dataset of hindcast values. The assessment of the physical environment would be much enhanced by the analysis of the observations mentioned in this section. ICOADS observations
See Appendix 3.
Husky White Rose Development Project: New Drill Centre Construction & Operations Program EA Addendum Page 134
on reports and other instrument
Os have not sent marine reports, hey would have aviation observation programs in support of helicopter
operations to each ship, and this data would be available in industry archives. It is recommended that recent aviation and marine observations of winds and waves from platforms and waverider buoys operating in the area in recent years also be analyzed and results presented and compared to the AES40 hindcast results. This would be of particular value as there have been a number of very extreme storms in the last 10 years, and given that the AES40 hindcast wind is a somewhat different quantity than what is observed by platforms.
are available directly from the ICOADS website, which allows downloading of subsets of data defined by specific areas. Waverider data are available directly from the MEDS website. The wind sources listed in this section come from marine reports, which include a 10-minute mean wind. However, aviation observations include a 2-minute mean wind, which is of more use for design (platform selection) and
perational considerations. Aviatiomeasurements, including waverider data, would be available from industry archives. Specifically, the Hibernia platform has been in place and transmitting 3-hourly marine reports, since November 1997. The Henry Goodrich and the GSF Grand Banks semi-submersible platforms have been operating in the area for the past several years, and have sent marine reports on a 3-hourly basis. As mentioned in this section, a waverider has usually been located near a drilling platform. The Terra Nova FPSO has been operating in the area since January 2002 and the Sea Rose FPSO has been on site at White Rose since August 2005. While these FPSt
No. 31 Section 4.2.4, page 33: This section requires elaboration. Even if the physical environment is described in a separate report, pertinent details should be summarized in the EA report. As it stands, the EA does not provide specific
alues, other than that maximum monthly wind speeds exceed 30 m/s in
es from the 10-minute means in marine
See Appendix 3.
vFebruary. This value represents the maximum one-hour mean wind speed at 10 m, but this was not stated. The kind of wind speed should be defined in terms of averaging period and equivalent anemometer height as it makes a significant difference, as noted below. The anemometer height affects the mean wind speed value, and higher peak values are expected for shorter averaging periods. The AES40 hindcast winds represent a one-hour mean wind speed. Peak values from one-hour mean winds will be lower than peak valu
Husky White Rose Development Project: New Drill Centre Construction & Operations Program EA Addendum Page 135
reports and lower than the peak values from the one to two-minute means used for aviation. Anemometers are generally well above 10 m, around 80 m for drilling platforms, as indicated in Section 4.2.3, or as high as 139 m at Hibernia. The 2005 reports gives 10-minute and 1-minute mean equivalents to the 1-hour mean, for the extremal analysis winds. These are determined by increasing the one-hour maximum values by 1.06 and 1.22, respectively. A maximum one-hour mean wind speed of 30 m/s (58 kt) would correspond to a maximum 10-minute mean wind of (31.8 m/s) 61 kt, for example. References o the adjustmet nt factors should be given. There are also methods to adjust the
ated, and hat it is highly probable that some of the peaks in the wind speed have been
missed by the hindcasting methodology. It would be prudent to analyze winds that have been measured for marine eports and for aviation, by platforms located near the area of interest for more
alysis should be
e frequency distribution of the
and monthly basis, are provided in Appendix 1 of the EA report. These are useful ways of describing typical climate conditions. However, the wind roses, frequency distribution plots, and joint frequency distribution tables are not usually adequate to describe the top 10 percent or so of the wind speed distribution. The extreme values occur too infrequently to appear on diagrams or in tables giving percent frequency of occurrence to the hundredths decimal place. These will not show the most extreme values.
winds for height. The accuracy of these statistical or empirical adjustment methods is uncertain and dependent on actual conditions in the marine surface layer. The 2005 Oceans Ltd. report indicates that the wind speeds are based
n gridded data at 6-hourly intervals, and may be slightly underestimot
rthan 2 decades, in some cases. These results, including description of peak events, should be presented. There does not appear to be any consideration of extreme winds and waves that might be experienced during passage of a tropical, transitioning, or post-ropical cyclone during the summer and fall. This ant
conducted or previous studies applicable to this area should be referenced and summarized. Although the passage of tropical, transitioning, or post-tropical cyclones over this area is relatively rare, the EA should include some consideration of the possible conditions should one occur. Description of the climate typically includes descriptions of the means, maximum values, and some indication of thfield of interest. Wind roses, frequency distribution (percent exceedance) plots, and joint frequency distribution tables of wind speed and direction, on an annual
Husky White Rose Development Project: New Drill Centre Construction & Operations Program EA Addendum Page 136
y wind direction.
For any additional analyses of wind climate that may be undertaken for this EA, such as for observed data, it is recommended that additional means of showing the frequencies of the more extreme values be explored. For example, this could include box plots showing the 75th, 90th, and 99th percentile values, and peak values, of wind speed, b
No. 32 Section 4.2.4.1, page 33: There is no quantitative information presented in the main body of the EA. The relevant information should either be presented in this section or summarized from the appendix or other sources.
The EA should include an analysis of hourly significant wave height and peak
As recommended for the section on wind, any additional analyses of wave climate that may be undertaken for this EA, such as for measured waves, should explore methods of showing the frequencies of the more extreme values of the wave height and period distributions.
period measurements made by waverider buoys in the area. This should include presentation of means, peak values, and frequency distributions. This may show useful wave information for the local area that cannot be obtained from the AES40.
See Appendix 3.
No. 33
al analysis results for one-hour mean wind speeds, and gives those values adjusted to 10-minute mean and 1-minute mean
torms in recent years have exceeded these values. Examination of storm summaries for the
inds to 10 m (assuming eutral stability and a logarithmic profile), that corresponds to a wind at 10 m
of 58kt. This is more than the AES40 10-yr return period value. A sustained
See Appendix 3. Section 4.4.1, page 36: This section should be retitled as either Wind and Wave Extremal Analysis or Wind and Wave Extreme Value Analysis. The EA only refers to the analysis in LGL (2005a), but does not include a summary. Pertinent results should be summarized. There is no reference to the extremal analysis presented in the appendix (as noted, it is the same as in LGL 2005a). The appendix gives extrem
equivalent extreme values. For 10-minute mean winds, at 10-m, the 1-yr, 10-yr, 25-yr, and 100-yr return period wind speeds are 50kt, 57kt, 60kt, and 64kt, respectively. However, observed wind speeds during extreme s
North Atlantic in the Mariners Weather Log, produced by NOAA (US National Oceanic and Atmospheric Administration) shows that the Hibernia platform winds have reached or exceeded 75kt in each of the last 5 autumn/winter seasons, when the anemometer height was 139 m. If an adjustment factor of .77 is used to reduce these wn
Husky White Rose Development Project: New Drill Centre Construction & Operations Program EA Addendum Page 137
southwest wind of 97kt was measured at the Hibernia platform on 11 February
treme values. As indicated in the Mariners Weather Log, these very high wind speeds are also sometimes confirmed by QuikScat satellite-sensed wind speeds. Summary values from the extreme value analysis of AES40 hindcast data
mpared to the extreme wind speeds measured by platforms in recent severe storms over the Grand Banks. The wind comparison should include adjustment of values to a standard reference height, using air and sea temperature observations if possible. Peak one-hour mean hindcast wind values should be adjusted to be equivalent to the shorter averaging periods corresponding to observed peak
btained and archived by the offshore industry at various heights from various platforms under extreme conditions might result in
e latforms on the Grand Banks. In addition, analysis of continuously measured
winds speeds would allow assessment of the frequency of rapid wind direction changes at high wind speeds, a particular concern for FPSOs (the kind of vessel planned for use in the production phase of this project). This kind of analysis of rapid wind changes is not possible from 3 or 6-hourly values. Both of these types of research would make valuable contributions to improved understanding of the severe climate in the area and its effects on offshore structures.
he area easured a significant wave height of 14.66 m. This is close to the AES40
50-yr return period wave height of 14.5 m. Peak significant wave heights from other recent extreme storms have been measured between 7 and 13 m, which were in the same ball park as the AES40 hindcast values. It is recommended that the EA present peak significant wave heights measured by waverider buoys, and compare them to AES40 hindcast waves, and to the extreme value analysis wave heights.
2003. Reduced by 0.77, this would correspond to a 10 m wind of 75kt. This exceeds the AES40 100-yr return period value. Reports from the Henry Goodrich semi-submersible platform or other platforms, when available, tend to confirm the validity of these ex
should be given in the body of the EA report and co
values, using the best methods available. Standard adjustment methods for wind, to account for height and averaging period, are empirical and/or statistical. Research and analysis of continuous wind measurements o
improved adjustment methods that could be tailored to the conditions and thp
During the 11 February 2003 storm mentioned above, a waverider in tm
Husky White Rose Development Project: New Drill Centre Construction & Operations Program EA Addendum Page 138
No. 34 Section 4.5, page 36: The information on ice and icebergs is a succinct summary of what was used in previous reports on Jeanne-d’Arc Basin. In ection 4.5.1, its is stated that sea ice cover occurs for an average of four weeks
once every three years. Based on the Canadian Ice Service (CIS) report, “Sea Ice Climatic Atlas East Coast of Canada 1971-2000”, there have been occurrences of ice in the area 1-15% of the years from the end of January to the end of April, and 16-33% of the years between the end of February and the nd of March.
In section 4.5.2, the first sentence mentions that in the “last ten years” an average of 900 icebergs reached the Grand Banks each year. It should be specified what period is implied by “the last ten years” (not 1997-2006).
erg information.
e
See Section 4.5 for updated ice and iceb
No. 35 Section 4.5.1, page 36: The following sentence requires clarification and/or rewording: “The thickness of most of the sea ice that occurs on the Grand
anks ranges from 30 to 100 B cm, based on CIS ice chart data for periods of ice coverage (1985-2001) that exceeded four weeks duration”.
See Section 4.5 for updated ice and iceberg information.
No. 36 Section 5.2, Figure 5.1, page 38: The Important Bird Area at Quidi Vidi is Quidi Vidi Lake, not Quidi Vidi Harbour as stated in the document.
The IBA label on Figure 5.1 should be ‘Quidi Vidi Lake’, not ‘Quidi Vidi Harbour’.
No. 37 ection 5.3, page 37: Although the Ivory Gull is still legally listed as Special The COSEWIC status of the Ivory Gull was redesignated to endangered in SConcern, it has been upgraded by COSEWIC to Endangered.
April 2006.
No. 38 n Whale is COSEWIC-listed as Special Concern and should be included in the table. Please refer to Lawson, 2006, for preliminary information on distribution and abundance and
opulation estimates of fin whales in waters off Newfoundland and Labrador. Also, the scientific name for the Ivory Gull is Pagophila eburnea, the `n` should be removed from eburnean in the table.
See additional row to Table 5.1 in Section 5.3 for fin whale.
Gull is noted.
Section 5.3, Table 5.1, page 40”: The Fi
p
Misspelling of scientific name for Ivory
No. 39 Section 5.5.2.2.3, page 50: The level of detail is not consistent with the rest of the report.
See additional text in Section 5.5.2.2.4
Husky White Rose Development Project: New Drill Centre Construction & Operations Program EA Addendum Page 139
No. 40 ee additional text in Section 5.5.3.1. Section 5.5.3, page 50: In terms of depth distribution of the 3 wolffish species,
it appears that there might be some confusion between spotted and northern wolffish. Northern wolffish is the deepest residing species, based on Kulka et al., 2004. Otherwise the descriptions are accurate.
S
No. 41 ection 5.5.3.2, page 52: “The Northern Cod has been called one of the least Remove the statement attributed to Brander (1994) from Section 5.5.3.2. Sproductive of the major cod stocks (Brander 1994)”. This statement seems to downplay the importance of Northern Cod. Updated information on cod should be used here.
No. 42 hyper-aggregated
st north of the project study area, meaning it is possible that it is an area
The reference Rose and Kulka (1999) is noted. Section 5.5.3.2, page 52: An additional recommended reference is Rose and Kulka, 1999 who showed that just before final collapse, codjucritical for recovery. This important aspect should be noted in this report.
No. 43 See revised Figure 5.1 Section 5.5.3.2, page 54: Cod boxes should be illustrated on figures/maps, i.e. Hawke Channel & Bonavista Corridor. A map is needed on page 54, or at least make reference to one.
No. 44 e under publications/
Proceedings/2005). A key point missed with regard to the Grand Banks is that
See additional text in Section 5.5.3.3. Section 5.5.3.3, page 54: The authors should make note of the Porbeagle Recovery Potential Proceedings (on the CSAS websit
the area, including White Rose is the pupping ground for this species at risk and therefore a very ecologically important area. As well, the Grand Banks was once a major fishing ground for porbeagle. These are important details that should be mentioned.
No. 45
s should be noted.
So noted. Section 5.5.3.4, page 55: White sharks are very rare in Canadian waters and sightings are recorded mostly in the Bay of Fundy area. They are extremely rare as far north as the White Rose area. Thi
No. 46
oned.
Section 5.5.3.5 & 5.5.3.6, page 55: Shortfin Mako and blue shark are common in the area and used to be taken in both the porbeagle and the swordfish fishery. Blue is the most common shark species in the world although both have shown decline. Both mako and blue are commonly seen on the banks and even in the bays, a point which should be menti
See additional text in Sections 5.5.3.5 and 5.5.3.6.
Husky White Rose Development Project: New Drill Centre Construction & Operations Program EA Addendum Page 140
No. 47 Section 5.5.3.7, page 55: It should be noted that cusk are at the extreme
northern fringe of their range on the southern Grand Bank and would only be itinerant in the White Rose area.
So noted.
No. 48 he Unit Areas should be included on a figure in this ection even though they are identified on Figure 5.1.
Added reference to Figure 5.1 in Section 5.6.2. Section 5.6.2, page 58: Ts
No. 49 ee revised text in Section 5.6.3.3. Section 5.6.3.3, page 74, line 4. Should 2005 be 2006?
S
No. 50 r les Oiseaux Pélagiques Section 5.7, 2nd paragraph, page 87: The first letter of each word should be capitalized when spelling Programme Intégré de Recherches sur les Oiseaux Pélagiques out in full.
Programme Integer de Recherches su
No. 51 Section 5.7, Table 5.8, page 88: Some of the scientific names are missing from the table: Sooty Shearwater – Puffinus griseus and Red-necked Phalarope – Phalaropus lobatus. It is not clear how the categories Common, Uncommon, Scarce and Rare occurrence are designated. These categories hould be quantified. s
See revised Table 5.8 in Section 5.7.
No. 52 Lock et al. (1994) Section 5.7, Figure 5.33, page 89: Please provide a reference for this figure.
No. 53 ection 5.7, 1st paragraph, page 90: It is stated that there are increased bird numbers along the continental shelf edge from July to September, however, Figure 5.33 (page 89) does not support this conclusion. There is an increasing pattern of effort from July to September but comparisons between blocks for
hich there is both summer and winter data, for example, show similar patterns of abundance along the shelf edge. It should be noted that Baccalieu Island is not only the largest Leach’s Storm-Petrel colony in Atlantic Canada (p. 90), but is the largest in the world.
See revised text in Section 5.7. S
w
No. 54 ection 5.7, page 90, 3rd paragraph, line 2: Table 5.10 lists marine mammals Reference to Table 5.10 should be to Table 5.9. Snot seabirds.
No. 55 page 90, 4 paragraph: The last sentence describing what an IBA should be moved up to follow the first sentence in that paragraph where the
term IBA is introduced.
See revised text in Section 5.7. Section 5.7, th
is
Husky White Rose Development Project: New Drill Centre Construction & Operations Program EA Addendum Page 141
No. 56 Section 5.7.1.2, page 94: The correct spelling for the title of this section should be Hydrobatidae.
See revised caption for Section 5.7.1.2.
No. 57 Section 5.7.1.6.1, page 97: The Dovekie breeding area listed as “Nova Zemlya” is spelled incorrectly. The correct spelling is Novaya Zemlya. Other
reeding sites that could be added to the list include Severnaya Zemlya and
n 5.7.1.6.1.
bSvalbard.
See revised text in Sectio
No. 58
n in the Study Area between October and
Section 5.7.1.6.3, page 97, 2nd paragraph, line 6 & last sentence: It states that “Thick-billed Murre is common from October to May” and it also states “Thick-billed Murre is uncommoApril”.
See revised text in Section 5.7.1.6.3.
No. 59 See revised text in Section 5.7.2.2. Section 5.7.2.2, page 99: Storm-Petrels also feed on fish (myctophids, cod, rockfish), squid and octopus.
No. 60 e Ivory Gull can be found in the Species at Risk section”.
Remove the sentence in question from Section 5.7.3.1. Section 5.7.3.1, page 100, 1st paragraph, line 4: It states that “More information on thInformation on the Ivory Gull is not presented in the SAR section. However, the SAR section should be updated to include a discussion of all SAR (Schedule 1 and COSEWIC listed, as per the Scoping Document).
No. 61 Section 5.8, page 100: The sentence “Husky’s 3D seismicprogram…observation along” is not finished.
See revised text in Section 5.8.
No. 62 See revised Table 5.10 in Section 5.8. Section 5.8, page 101, Table 5.10: The last column should be split into two columns (COSEWIC and SARA).
No. 63 Section 6.2, page 115, 1st paragraph: There is no “Appendix 2” in the document.
Appendix 2 now included.
No. 64 Section 6.5.2.1, page 119: The “White Rose Operational Area” is not identified on Figure 1.1.
See revised text in Section 6.5.2.1. Project Area is indicated in Figure 1.1.
No. 65 ection 6.6.5, page 123: The Scoping Document states that “Aboriginal Fisheries” should be considered in the cumulative effects assessment.
No aboriginal fisheries are persecuted in the immediate vicinity of the Study Area. The nearest location of aboriginal fisheries is likely off the central Labrador coast.
S
Husky White Rose Development Project: New Drill Centre Construction & Operations Program EA Addendum Page 142
No. 66 Section 6.8, page 125: This very short section states that wind, ice, waves, and currents, particularly extreme events, that have effects on the Project, are
escribed in detail in Section 4. This is an incomplete statement, since there is
no description of how the environment could impact on the project,
the Env o e in de lo n the hould nclude a very brief description of threshold and extreme values likely to
im act o his would ns would phase, since this would include the wi a so, FPSOs re wind and wave conditions than semi-
e The as of this factor should also include description of weather and w i rst case sc ct. For ex nter weather could hamp delay efforts to cap a well. Weather at the thresholds of normal
mpact on the ability of the atform to disconnect safely from the well.
See revised text in Section 4.0. d
very little information in Section 4 itself. The details are in the Appendix. As it stands, Section 4 of the EA does not even include a summary of specific significant values likely to affect the project.
here isTand there is no justification for the statement that effects of the environment on the Project are expected to be not significant. EC has prepared a short do mecu nt entitled, “Guidance on the Consideration of the Effects of
ir nment on a Drilling Project”, which could provide some guidancping the appropriate justification for EA conclusions. ve
EA, the assessment of effects of the environment on the project sIi
p perations, both in the drilling phase and in the production phase. T allow assessment of potential downtime. Environmental conditiohave more impact on the production
nd nd wave sensitive offloading from the FPSO to shuttle tankers. Al are more sensitive to seve
subm rsibles, so different thresholds would be required.
sessmentave mpacts and methods to mitigate against impacts, under various wo
enarios for the different platforms and vessels to be used for the projeample, in the rare event of a blow-out, severe wi
er or operating conditions could increase the risk of a collision between the shuttle tanker and the FPSO. Severe sea states could ipl
No. 67
nd for negatively affected fish species to rehabilitate?
e following physical disturbance compared to muddy sand habitats. No significant
etween disturbed and undisturbed sites 213 days after disturbance. They suggested that physical and biological recovery rates are mediated by a combination of physical, chemical and biological factors that differ in relative importance in different habitats.
Section 7.0 – For fish habitat and fish tables that summarize the environmental effects, the tables indicate negative effects that occur at a continuous frequency. More clarity is needed when you identify these effects as reversible. What is the time frame for disturbed habitat restoration a
In their large-scale marine field experiment, Dernie et al. (2003) found that clean sand communities showed the most rapid recovery rat
differences in total number of benthic species and total number of benthic individuals were found b
Husky White Rose Development Project: New Drill Centre Construction & Operations Program EA Addendum Page 143
No. 68 In the discussion of environmental effects with respect to production activities,
the effects associated with tie-back to the FPSO, and mitigations to reduce or eliminate effects, are not included. The EA report should include a discussion of environmental effects for all phases of the project, including tie-back/hook-
p to the existing FPSO. u
See response to Comment No. 22.
No. 69 Section 7.0, Table 7.1, page 127: This table does not include several activities which could have important effects, including well spudding and vertical profiling (during which airgun arrays or a single airgun would be used), and well severance during decommissioning (during which explosive charges might be used). These noise-producing activities should be included in the table especially as they are discussed later in Section 7.5.
VSP is included in Table 7.1. See revised Table 7.1 in Section 7.0 for inclusion of oily residue discharge during tie-back and well-severance.
No. 70 Table 7.1. Footnote ‘b’ states (i.e., concurrent drill of some wells). Is there a possibility that more than one drilling unit will be operating at the same time? If concurrent drilling is planned, then it must be addressed in the EA report, particularly in regards to potential cumulative effects.
r See Section 7.6.1.5.5 fo reference to concurrent drilling with respect to cumulative effects.
No. 71 Section 7.0, Table 7.1, page 128: The first subheading “Glory Hole Excavation and TGB Installation” should be “Subsea Production Equipment Installation”?
See revised Table 7.1 in Section 7.0
No. 72 Section 7.4, page 131, 1st paragraph: Change the reference list from Payne, et al., 2000 to Payne et al., 2001a, Payne et al., 2001b, Andrews et al., 2004. (See attached references).
See text revision to Section 7.4
No. 73 Section 7.4, page 131, 4th paragraph, last sentence: This conclusion is also supported by the studies carried out on fish health and fish habitat over a three year period at the Terra Nova site where 6 wells were drilled using a combination of water–based and synthetic based muds (Mathieu et al., 2005; Deblois et al., 2005).
See text revision to section 7.4
No. 74 Section 7.4.2, page 133: Synthetic Based Muds supposedly “biodegrade relatively rapidly in certain conditions.” Expand on this, outline ideal conditions.
See text revision to Section 7.4.2
Husky White Rose Development Project: New Drill Centre Construction & Operations Program EA Addendum Page 144
No. 75 Section 7.5, Table 7.4, page 135: Supply Boats sound levels are not included
for normal operation. This only shows the changes from the extra use of propeller nozzles and bow thrusters. There is no level presented to compare with other vessels and installations.
Broadband source levels for most small ships are ~170-180 dB re 1µPa (Richardson et al. 1995).
No. 76 Section 7.5, Table 7.4, page 135: The table does not include data on the use of vessels with large dynamic positioning thrusters (e.g., larger thrusters than on a typical supply vessel). If data are available on these sources, then they should be included here as applicable.
There are limited data available on DP thruster source levels. A recent report by JASCO Research Ltd. cited a nominal broadband acoustic source level of 177 dB re 1µPa @ 1 m for a rock dumping vessel (the Pompei) using DP thrusters (JASCO 2006).
No. 77 Section 7.6.1.5.1, last paragraph, last line, page 144: “In fact, many project effects on benthic communities observed at other development areas have not been observed at White Rose”. Please specify what development areas are being referred to – e.g. Offshore Newfoundland and Labrador, or development elsewhere. Also, please provide further explanation as to what effects are being referred to.
See revised text in Section 7.6.1.5.
No. 78 Section 7.6.1.5.5, page 145: The final paragraph downplays cumulative effects by comparing the affected area to the total area of the Grand Banks. This is not necessary to make cumulative effects deem/seem not significant.
So noted.
No. 79 Section 7.6.1.7, page 150: The project will result in the release of greenhouse gas (GHG) emissions, including emissions from blowdowns, maintenance activities, leaks, and accidents and malfunctions. The current federal government has committed to developing a plan to reduce GHGs and ensuring clean air, land, water and energy for Canadians. Several GHGs contribute to climate change. The main anthropogenic contributor is carbon dioxide (CO2) and the second major contributor is
ethane (CH4). Methane is also the primary component of natural gas. Although annual anthropogenic emissions of methane are less than (CO2) methane is a more effective heat-trapping gas. Each kilogram of methane warms the earth about 23 times more than the same mass of carbon dioxide.
It is generally easier to reduce emissions by implementing best ractice options at the project planning and design stage rather than after
project construction. Estimates of the quantity and composition of GHG emissions can provide a basis for comparing the project with industry profiles,
m
Minimizing GHG releases is important from an environmental and economic perspective. p
See additional text in Section 7.6.1.7.
Husky White Rose Development Project: New Drill Centre Construction & Operations Program EA Addendum Page 145
evaluating reduction opportunities and verifying the effectiveness of the
st practices in an effort to reduce GHGs.
oning, operation, maintenance) and sources; and • consider and implement best practices available for GHG
measures implemented. GHGs are a cumulative, global issue and reducing GHG emissions from all sources, both large and small, should be considered. Environment Canada continues to encourage consideration of be
The proponent is encouraged to take the following steps in planning the project:
• estimate GHG emissions from all project phases (e.g., installation, commissi
emissions reduction and verify the effectiveness of these efforts.
No. 80 6.1.7, page 150: For greater clarity and certainty, the proponent should include the following considerations in an assessment of impacts to air quality:
• emission estimates for SO2, NOx, H2S, PM, PM2.5, PM10, and VOCs according to source;
• potential local effects and contributions to atmospheric loadings as they pertain to ambient air quality objectives in the immediate area; and
• a demonstration of how every reasonable effort to adopt best available technologies and best management practices is being taken so as to minimize emissions of air pollutants.
ispersion modeling is the appropriate method for estimating local air
.6.1.7. • Section 7.
Dpollutant concentrations as a result of the project.
See additional text in Section 7
No. 81
ions be implemented to reduce their frequency? Please clarify.
Table 7.9, page 154. Small transfer spills have a frequency of 5 (more than 200), yet this is ranked negligible. BOP fluid is released at a frequency of 6 (continuous), and is also negligible. Why? Some clarification regarding these releases, in terms of rationale for their occurrence should be provided. Can mitigat
Frequencies given for small transfer spills and BOP fluid in EA were incorrect. Frequency ratings for small transfer spills and BOP fluids should be 2 (11-50 events/year) and 1 (<11 events/year), respectively. Mitigations for small transfer spills and BOP fluid discharges are indicated n the assessment tables. i
Husky White Rose Development Project: New Drill Centre Construction & Operations Program EA Addendum Page 146
No. 82 Section 7.6.2.1, page 157. What scientific evidence, or reference is available
to support the statement that safety zones are a ‘safe haven for fish’ and There is extensive scientific documentation that offshore oil and gas platforms attract large numbers of both young (Hernandez et al. 2003) and
to attraction from other areas or if they represent an actual production. Interestingly, the numbers recorded are higher at
operating platforms than at natural or artificial reefs and are higher at upper portions of the rig than the lower (Wilson et al. 2006). The following is excerpted a comment/response contained in the White Rose Comprehensive Study Supplement Report (Husky 2001): Regulator Comment 109 Considering the effect of the sub-sea structures on productivity (artificial reef effect) as positive is unreasonable. Attracting organisms or enhancing productivity at a contaminated site is a potential negative effect and may result in taint. Husky Response: The artificial reef effect and the associated fishery xclusion zone can be considered positive from the perspective of fish and
fish habitat. The artificial reef effect at petroleum platforms has been known for some time and is well documented (Gallaway et al. 1979; Gallaway et al. 1981; Stanley and Wilson 1990, 1991, 1997; Black et al. 1994, and others). In the northern Gulf of Mexico, there are over 4,000 petroleum platforms that add approximately 12 km2 of hard substrate to the 2,600 km2 of natural hard substrate (Stanley and Wilson 1997). Over 40 species of fish have been reported to be associated with platforms in the
nley and es to be
closely associated with a petroleum platform that they monitored for 15 months using stationary dual beam hydro acoustics. Seven species
near platforms in the Gulf of Mexico and consume their catches with no apparent complaints of ill effects (Gallaway and Lewbel 1992). In the case of White Rose, underwater structures are expected to attract fish to some extent because of the associated shelter and biofouling
therefore be a ‘positive effect’?
adult fish (Wilson et al. 2006). For example, Wilson et al. (2006) recorded 10,000 to 30,000 fish associated with individual platforms in the Gulf of Mexico. There is still scientific debate if the increased fish numbers are mainly duencrease ini
e
Gulf of Mexico (Stanley and Wilson 1990). A recent study by StaWilson (1997) found between 1,990 and 28,100 fish of 19 speci
accounted for the majority and included commercially and recreationally important species such as amberjack, red snapper and bluefish. Numbers of fish varied seasonally. Both anglers and commercial fishers routinely fish
Husky White Rose Development Project: New Drill Centre Construction & Operations Program EA Addendum Page 147
communities (a potential source of food) that may become established. In addition, the associated fishery exclusion zone will protect local resident fish. These effects were considered positive in the assessment for fish and fish habitat, albeit at a relatively small scale. Taint was considered to be a potential adverse effect in the assessment, but again not a significant effect because in the unlikely event that it did occur, it would only affect resident fish, only sedentary species, and only those individuals not subject to a commercial fishery. Furthermore, tainting is unlikely to occur at White Rose because of the use of synthetic and water-based drilling fluids, treatment of produced water, and strict concentration on eliminating spills. In the unlikely event of a blowout or large oil spill, the oil would go to the surface, where the interaction between the oil and fish would be minimal.” Admittedly, most of the research conducted on the fish attraction issue has been conducted in the Gulf of Mexico where there are over 5,000 operating oil and gas platforms in Gulf waters. The Gulf of Mexico also supports about 33% and 40% of the US recreational and commercial fisheries (see Hernandez et al. 2003). In the Gulf of Mexico, the platforms also attract fishers whereas on the Grand Banks, there is a fishery exclusion zone around each platform. Other key differences between the two areas are that there are many more reef-dependent and reef-associated fish in the Gulf than on the Grand Banks and reef habitat may limit production in the Gulf area where the bottom is mostly mud. Nonetheless, it is reasonable to predict that structures on the Grand Banks will attract fish and that this association will protect them from being killed by the fishery. Thus, this can be considered a positive effect, albeit a negligible one given the small geographic area involved.
No. 83 Section 7.6.2.4, page 158: Small spills occur quite frequently in flaring operations. According to Figure 7.9, the occurrence is over 200 times a year.
lease explain how this is considered negligible.
ing to C-NLOPB statistics, 268 oil spills have occurred in the Newfoundland and Labrador Offshore Area since 1997, an annual average of < 30 spills. This number includes spills of less than 1 litre. Therefore, the small transfer spill frequency indicated in all tables showing environmental effects assessment of routine activities on various VECs should be 2 (11-50 events/year), not 5 (>200 events/year).
P
Accord
No. 84 Section 7.6.2.6.9, page 163. It is implied that any produced water encountered during production operations is sent to the flare. This is incorrect and should be restated.
The reviewer has misinterpreted the section.
Husky White Rose Development Project: New Drill Centre Construction & Operations Program EA Addendum Page 148
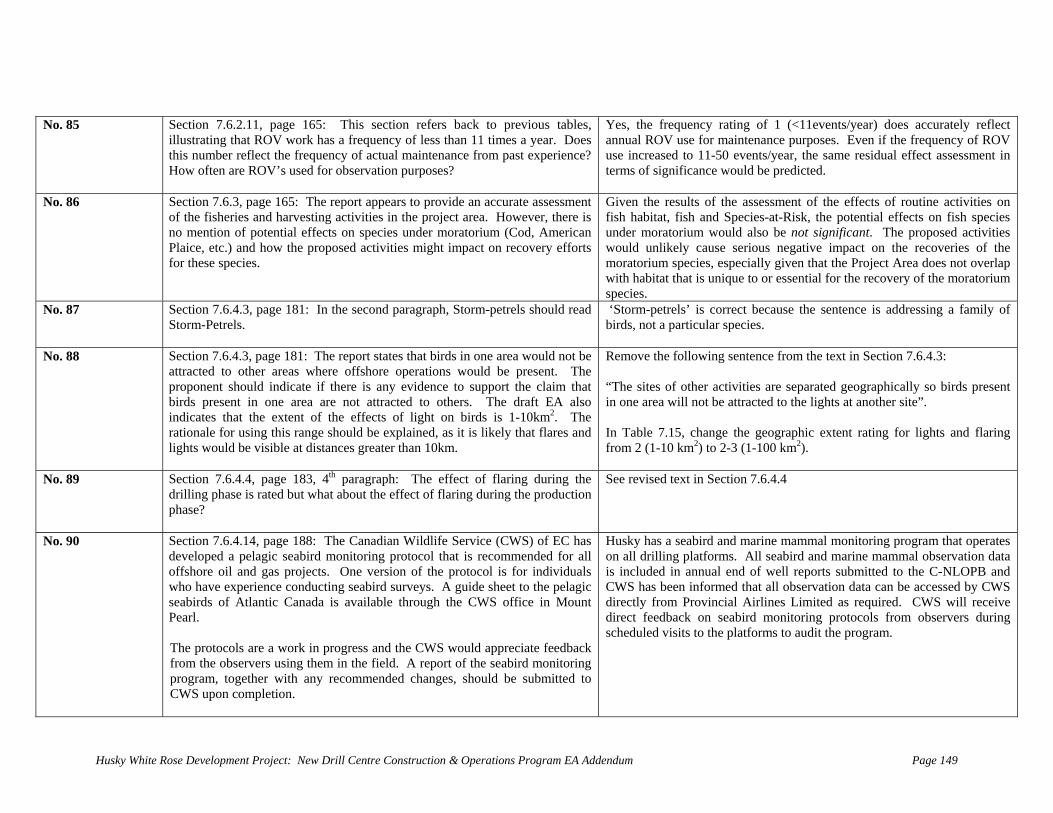
(<11events/year) does accurately reflect ce purposes. Even if the frequency of ROV
use increased to 11-50 events/year, the same residual effect assessment in terms of significance would be predicted.
No. 85 Section 7.6.2.11, page 165: This section refers back to previous tables,
illustrating that ROV work has a frequency of less than 11 times a year. Does this number reflect the frequency of actual maintenance from past experience? How often are ROV’s used for observation purposes?
Yes, the frequency rating of 1 annual ROV use for maintenan
No. 86 Section 7.6.3, page 165: The report appears to provide an accurate assessment of the fisheries and harvesting activities in the project area. However, there is no mention of potential effects on species under moratorium (Cod, American Plaice, etc.) and how the proposed activities might impact on recovery efforts for these species.
Given the results of the assessment of the fish habitat, fish and Species-at-Risk, the
effects of routine activities on potential effects on fish species
under moratorium would also be not significant. The proposed activities would unlikely cause serious negative impact on the recoveries of the moratorium species, especially given that the Project Area does not overlap with habitat that is unique to or essential for the recovery of the moratorium species.
No. 87 .3, page 181: In the second paragraph, Storm-petrels should read ‘Storm-petrels’ is correct because the sentence is addressing a family of Section 7.6.4Storm-Petrels.
birds, not a particular species.
No. 88
0km2. The rationale for using this range should be explained, as it is likely that flares and
r activities are separated geographically so birds present
r lights and flaring
Section 7.6.4.3, page 181: The report states that birds in one area would not be attracted to other areas where offshore operations would be present. The proponent should indicate if there is any evidence to support the claim that birds present in one area are not attracted to others. The draft EA also ndicates that the extent of the effects of light on birds is 1-1i
lights would be visible at distances greater than 10km.
Remove the following sentence from the text in Section 7.6.4.3: The sites of othe“
in one area will not be attracted to the lights at another site”. n Table 7.15, change the geographic extent rating foI
from 2 (1-10 km2) to 2-3 (1-100 km2).
No. 89 Section 7.6.4.4, page 183, 4th paragraph: The effect of flaring during the drilling phase is rated but what about the effect of flaring during the production
hase? p
See revised text in Section 7.6.4.4
No. 90 Section 7.6.4.14, page 188: The Canadian Wildlife Service (CWS) of EC has developed a pelagic seabird monitoring protocol that is recommended for all offshore oil and gas projects. One version of the protocol is for individuals
ho have exw perience conducting seabird surveys. A guide sheet to the pelagic
d to WS upon completion.
mmal monitoring program that operates ird and marine mammal observation data
is included in annual end of well reports submitted to the C-NLOPB and CWS has been informed that all observation data can be accessed by CWS
Limited as required. CWS will receive toring protocols from observers during
scheduled visits to the platforms to audit the program.
seabirds of Atlantic Canada is available through the CWS office in Mount Pearl. The protocols are a work in progress and the CWS would appreciate feedback from the observers using them in the field. A report of the seabird monitoring
rogram, together with any recommended changes, should be submittepC
Husky has a seabird and marine on all drilling platforms. All seab
ma
directly from Provincial Airlinesdirect feedback on seabird moni
Husky White Rose Development Project: New Drill Centre Construction & Operations Program EA Addendum Page 149
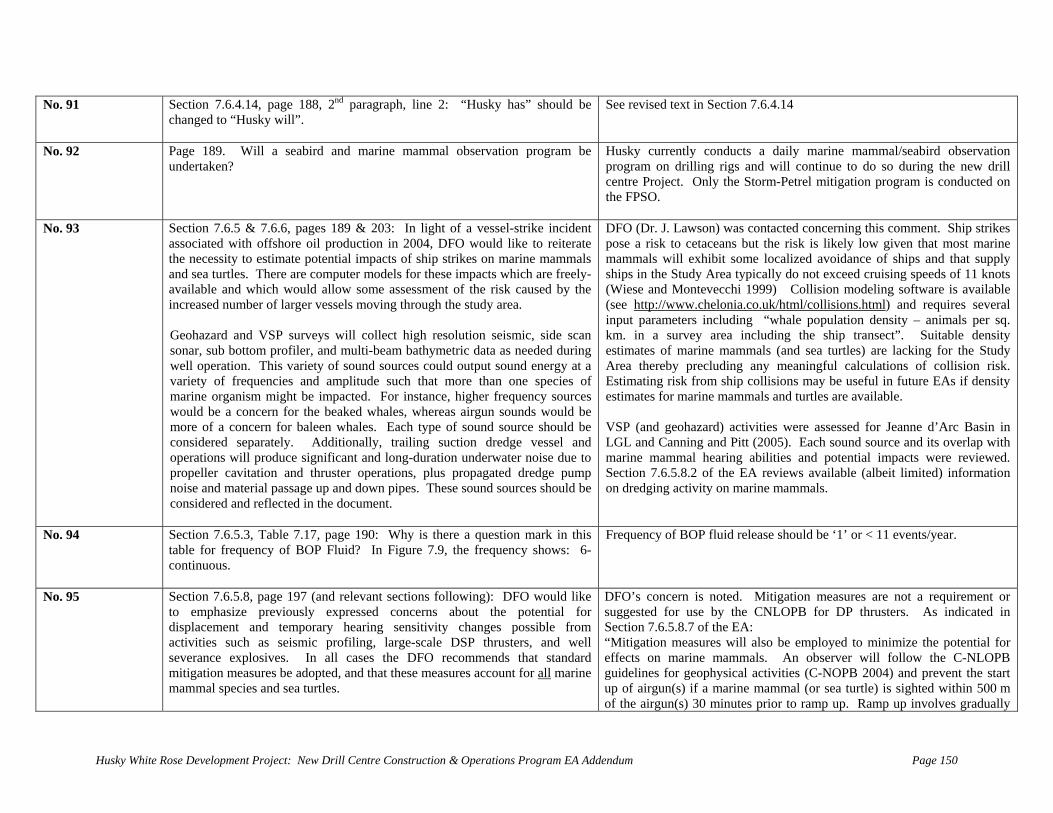
No. 91 Section 7.6.4.14, page 188, 2nd paragraph, line 2: “Husky has” should be See revised text in Section 7.6.4.14 changed to “Husky will”.
No. 92 Page 189. Will a seabird and marine mammal observation program be undertaken?
y currently conducts a daily marine mammal/seabird observation ntinue to do so during the new drill
centre Project. Only the Storm-Petrel mitigation program is conducted on the FPSO.
Huskprogram on drilling rigs and will co
No. 93 Section 7.6.5 & 7.6.6, pages 189 & 203: In light of a vessel-strike incident associated with offshore oil production in 2004, DFO would like to reiterate the necessity to estimate potential impacts of ship strikes on marine mammals and sea turtles. There are computer models for these impacts which are freely-available and which would allow some assessment of the risk caused by the
creased number of larger vessels moving through the study area. Geohazard and VSP surveys will collect high resolution seismic, side scan sonar, sub bottom profiler, and multi-beam bathymetric data as needed during well operation. This variety of sound sources could output sound energy at a variety of frequencies and amplitude such that more than one species of marine organism might be impacted. For instance, higher frequency sources would be a concern for the beaked whales, whereas airgun sounds would be more of a concern for baleen whales. Each type of sound source should be considered separately. Additionally, trailing suction dredge vessel and operations will produce significant and long-duration underwater noise due to propeller cavitation and thruster operations, plus propagated dredge pump noise and material passage up and down pipes. These sound sources should be considered and reflected in the document.
in
DFO (Dr. J. Lawson) was contacted concerning this comment. Ship strikes pose a risk to cetaceans but the risk is likely low given that most marine mammals will exhibit some localized avoidance of ships and that supply ships in the Study Area typically do not exceed cruising speeds of 11 knots (Wiese and Montevecchi 1999) Collision modeling software is available(see http://www.chelonia.co.uk/html/collisions.html) and requires several input parameters including “whale population density – animals per sq. km. in a survey area including the ship transect”. Suitable density estimates of marine mammals (and sea turtles) are lacking for the Study Area thereby precluding any meaningful calculations of collision risk. Estimating risk from ship collisions may be useful in future EAs if density estimates for marine mammals and turtles are available. VSP (and geohazard) activities were assessed for Jeanne d’Arc Basin in LGL and Canning and Pitt (2005). Each sound source and its overlap with marine mammal hearing abilities and potential impacts were reviewed. Section 7.6.5.8.2 of the EA reviews available (albeit limited) information on dredging activity on marine mammals.
No. 94 Section 7.6.5.3, Table 7.17, page 190: Why is there a question mark in this table for frequency of BOP Fluid? In Figure 7.9, the frequency shows: 6-continuous.
Frequency of BOP fluid release should be ‘1’ or < 11 events/year.
No. 95 Section 7.6.5.8, page 197 (and relevant sections following): DFO would like to emphasize previously expressed concerns about the potential for displacement and temporary hearing sensitivity changes possible from activities such as seismic profiling, large-scale DSP thrusters, and well severance explosives. In all cases the DFO recommends that standard mitigation measures be adopted, and that these measures account for all marine mammal species and sea turtles.
concern is noted. Mitigation measures are not a requirement or DFO’s suggested for use by the CNLOPB for DP thrusters. As indicated in Section 7.6.5.8.7 of the EA: “Mitigation measures will also be employed to minimize the potential for effects on marine mammals. An observer will follow the C-NLOPB guidelines for geophysical activities (C-NOPB 2004) and prevent the start up of airgun(s) if a marine mammal (or sea turtle) is sighted within 500 m of the airgun(s) 30 minutes prior to ramp up. Ramp up involves gradually
Husky White Rose Development Project: New Drill Centre Construction & Operations Program EA Addendum Page 150
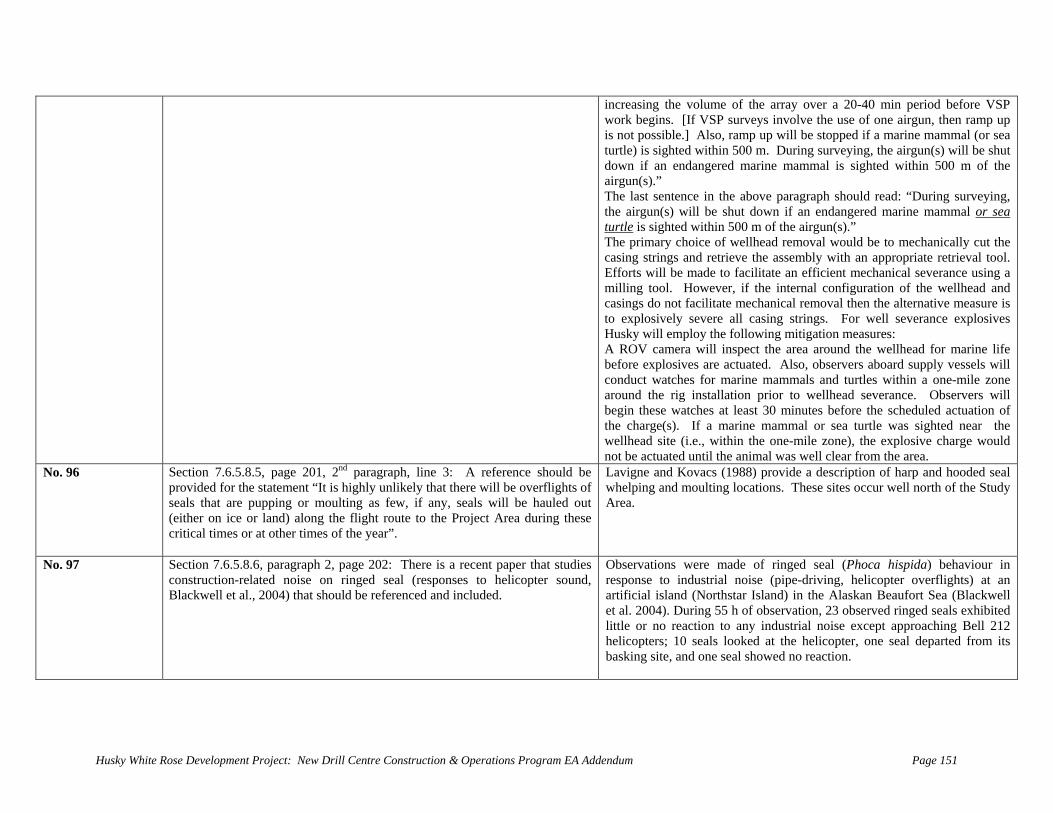
increasing the volume of the array over a 20-40 min period before VSP work begins. [If VSP surveys involve the use of one airgun, then ramp up is not possible.] Also, ramp up will be stopped if a marine mammal (or sea turtle) is sighted within 500 m. During surveying, the airgun(s) will be shut down if an endangered marine mammal is sighted within 500 m of the airgun(s).” The last sentence in the above paragraph should read: “During surveying, the airgun(s) will be shut down if an endangered marine mammal or sea turtle is sighted within 500 m of the airgun(s).” The primary choice of wellhead removal would be to mechanically cut the casing strings and retrieve the assembly with an appropriate retrieval tool. Efforts will be made to facilitate an efficient mechanical severance using a milling tool. However, if the internal configuration of the wellhead and asings do noc
tot facilitate mechanical removal then the alternative measure is
explosively severe all casing strings. For well severance explosives Husky will employ the following mitigation measures: A ROV camera will inspect the area around the wellhead for marine life
o, observers aboard supply vessels will mmals and turtles within a one-mile zone
around the rig installation prior to wellhead severance. Observers will nutes before the scheduled actuation of
mmal or sea turtle was sighted near the wellhead site (i.e., within the one-mile zone), the explosive charge would not be actuated until the animal was well clear from the area.
before explosives are actuated. Alsconduct watches for marine ma
begin these watches at least 30 mithe charge(s). If a marine ma
No. 96 Section 7.6.5.8.5, page 201, 2nd paragraph, line 3: A reference should be provided for the statement “It is highly unlikely that there will be overflights of eals that are pupping or moulting as few, if any, seals will be hauled out
a description of harp and hooded seal ese sites occur well north of the Study
Area. s(either on ice or land) along the flight route to the Project Area during these critical times or at other times of the year”.
Lavigne and Kovacs (1988) provide whelping and moulting locations. Th
No. 97
) in the Alaskan Beaufort Sea (Blackwell 4). During 55 h of observation, 23 observed ringed seals exhibited o reaction to any industrial noise except approaching Bell 212
Section 7.6.5.8.6, paragraph 2, page 202: There is a recent paper that studies construction-related noise on ringed seal (responses to helicopter sound, Blackwell et al., 2004) that should be referenced and included.
Observations were made of ringed seal (Phoca hispida) behaviour in response to industrial noise (pipe-driving, helicopter overflights) at an artificial island (Northstar Islandet al. 200little or nhelicopters; 10 seals looked at the helicopter, one seal departed from its basking site, and one seal showed no reaction.
Husky White Rose Development Project: New Drill Centre Construction & Operations Program EA Addendum Page 151
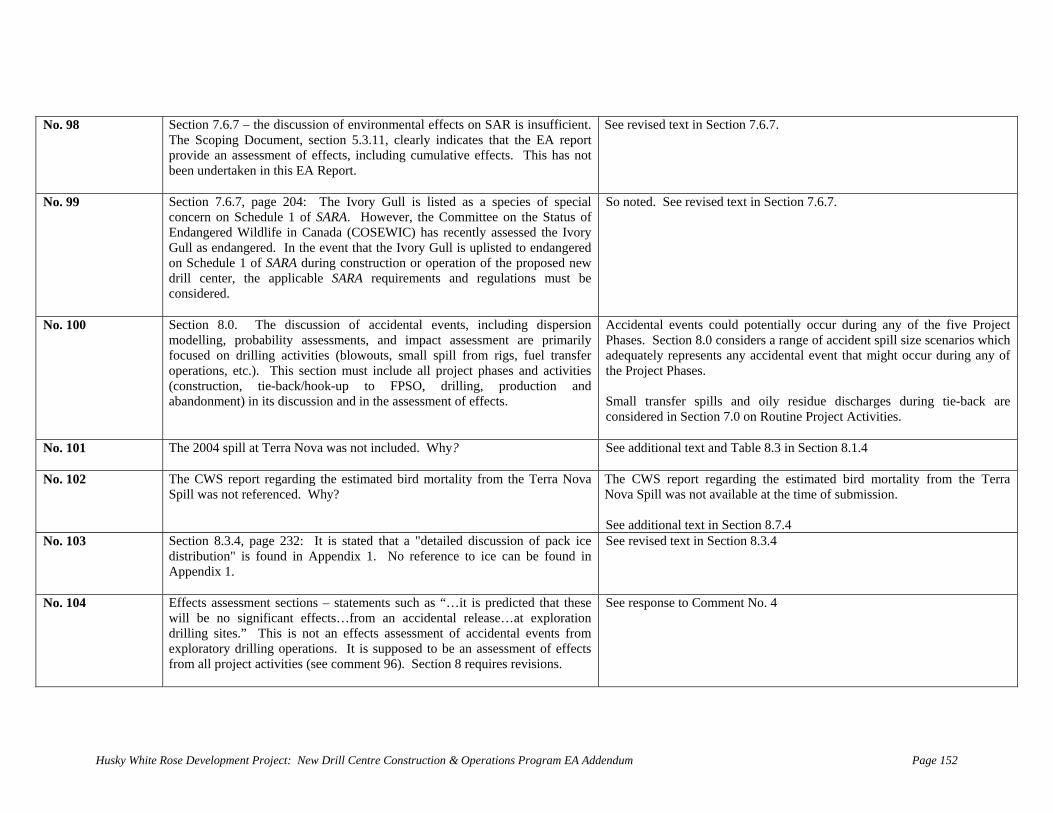
No. 98 Section 7.6.7 – the discussion of environmental effects on SAR is insufficient.
The Scoping Document, section 5.3.11, clearly indicates that the EA report provide an assessment of effects, including cumulative effects. This has not been undertaken in this EA Report.
See revised text in Section 7.6.7.
No. 99 Section 7.6.7, page 204: The Ivory Gull is listed as a species of special concern on Schedule 1 of SARA. However, the Committee on the Status of Endangered Wildlife in Canada (COSEWIC) has recently assessed the Ivory Gull as endangered. In the event that the Ivory Gull is uplisted to endangered on Schedule 1 of SARA during construction or operation of the proposed new drill center, the applicable SARA requirements and regulations must be considered.
So noted. See revised text in Section 7.6.7.
No. 100 Section 8.0. The discussion of accidental events, including dispersion modelling, probability assessments, and impact assessment are primarily focused on drilling activities (blowouts, small spill from rigs, fuel transfer operations, etc.). This section must include all project phases and activities (construction, tie-back/hook-up to FPSO, drilling, production and abandonment) in its discussion and in the assessment of effects.
Accidental events could potentially occur during any of the five Project Phases. Section 8.0 considers a range of accident spill size scenarios which adequately represents any accidental event that might occur during any of the Project Phases. Small transfer spills and oily residue discharges during tie-back are considered in Section 7.0 on Routine Project Activities.
No. 101 The 2004 spill at Terra Nova was not included. Why?
See additional text and Table 8.3 in Section 8.1.4
No. 102 The CWS report regarding the estimated bird mortality from the Terra Nova Spill was not referenced. Why?
eport regarding the estimated bird mortality from the Terra Nova Spill was not available at the time of submission. The CWS r
See additional text in Section 8.7.4
No. 103 Section 8.3.4, page 232: It is stated that a "detailed discussion of pack ice distribution" is found in Appendix 1. No reference to ice can be found in Appendix 1.
See revised text in Section 8.3.4
No. 104 Effects assessment sections – statements such as “…it is predicted that these will be no significant effects…from an accidental release…at exploration drilling sites.” This is not an effects assessment of accidental events from exploratory drilling operations. It is supposed to be an assessment of effects from all project activities (see comment 96). Section 8 requires revisions.
See response to Comment No. 4
Husky White Rose Development Project: New Drill Centre Construction & Operations Program EA Addendum Page 152
No. 105 Section 8.7.2, page 236: Should this be Section 8.7.1?
EA. Numbering in Section 8.7 has been
Section 8.7.1 was skipped in the revised.
No. 106 Section 8.7.3.2, paragraph 3, 3rd sentence, page 250: The effects of polycyclic aromatic hydrocarbons on fish have been reviewed more recently (Payne et al., 2003).
See revised text in Section 8.7.2.2
No. 107 Section 8.7.4, page 251: The section mentions mitigation of an oil spill only in the context of financial compensation for fishers. This is most certainly a short-term solution and does not include the potential harm of a major ccidental event to the future fishery in the area. Please revisit and revise
This comment needs to be considered in the context of the analysis contained in Section 8.7.4. That analysis clearly addresses the effects of an oil spill on all fish life stages and the benthic community. It also recognizes the potential responses of the market place to a spill in terms of
e fisher can chose to use an or seek direct recourse to the legal
f a spill in the area, recognizing that based on various odeling exercises that it is extremely unlikely oil will enter the near shore
or affect the shoreline, will be short term. The oil will disperse and be biodegraded and any fish that do ingest or absorb oil fractions to which they are exposed will depurate in a matter of days to weeks. The concern
aaccordingly.
perceived or real concerns over taint of fish flesh or shell fish meat. Direct mortality on the various life stages of fish is demonstrated to be not significant based on laboratory and population biology analyses and outcomes from large spills elsewhere in the world. This in the context that the concentration of the water soluble fraction of crude oil in the first 10 m of the water column is anticipated to be lower than levels that demonstrate taint effects in the laboratory. As noted in the assessment, Husky has a compensation plan on file with the Board that exceeds the terms of the C-NLOPB guidelines on this subject. It addresses direct effects (i.e., physical damage to fishers’ vessels and gear, loss of catch and income, and to a reasonable extent, the impact on fish plant workers directly affected by the loss of catch due to the incident. The compensation plan sets reasonable limits on the nature and extent of claim that can be handles by either negotiation between Husky and a fisher demonstrated to be affected by a spill or by an independent, mutually binding arbitration process that would be accessible during a significant spill. In this context, it is important to note that ththe processes provided by the plsystem. The concern expressed in the comment reflects on the idea of effects on the “future fishery in the area”. It is clear from the assessment that the direct
iophysical effects obm
Husky White Rose Development Project: New Drill Centre Construction & Operations Program EA Addendum Page 153
with respect to market perception of taint will be mitigated by the implementation of a spill environmental effects monitoring program, a procedure on file with the C-NLOPB. The data and information from this program will address the extent and intensity of effects from the spill on ish and f other receptors in the area. These data will contribute to the
process of deciding whether or not to close the fishery which is a decision that rests exclusively within the jurisdiction of Fisheries and Oceans Canada.
No. 108 Section 8.7.5, page 253: Even small spills of oil can have very serious effects on migratory birds. Therefore, every effort should be taken to ensure that no
that contractors are aware that Section 5.1 of the Migratory Birds Convention Act prohibits persons from depositing harmful substances in waters or areas frequented by migratory birds.
o ills occur in the area. The proponent should ensure that all precautions are taken by the contractors to prevent fuel leaks from equipment, and that a contingency plan in case of oil spills is prepared. Furthermore, the proponent should ensure
il sp
Husky has in place an Environmental Protection Plan (EPP) and an Oil Spill Response Plan (OSRP). All contractors working for Husky are required to adhere to Husky’s EPP and OSRP requirements. Vessels under contract by Husky are required to have an EPP and OSRP approved by Husky.
No. 109 Section 8.7.5.4, page 255: In the third paragraph, it should be noted that adult alcids are also flightless during moult.
See revised text in Section 8.7.4.4
No. 110 Section 8.7.5.7, page 258, 5th paragraph: Do you mean the “New Drill Centre Construction and Operations Program” instead of the “delineation/exploratory drilling program”?
See revised text in Section 8.7.4.7
No. 111 Section 8.7.6.1.5, page 265, 1st paragraph after Table 8.29, last line: Should it be “exploratory drilling sites”?
See revised text in Section 8.7.5.1.5
No. 112 Section 8.7.6.1.5, Table 8.31, page 267: Regardless of the intended interpretation of this table (i.e. the likelihood of occurrence of an event factored into the significance rating), the lack of data and uncertainty presented in the accompanying text does little to justify a rating of 3 (high level of confidence) to a significance rating of NS (Not Significant). This is particularly relevant for potential impacts to species at risk. A discussion regarding how this level of confidence is derived is warranted.
A detailed summary discussion of the potential effects of oil on marine mammals and sea turtles is contained in the 10 pages of text that surround Table 8.31. The prediction of no significant effect from an offshore oil spill at White Rose can be made with a high level of confidence for a number of reasons. These reasons include: General Most of these animals, particularly the SARA species, are scarce in the Project Area and thus the potential for encountering spilled oil is limited. In addition, many of them have at least some ability to detect and avoid oil on the surface.
Husky White Rose Development Project: New Drill Centre Construction & Operations Program EA Addendum Page 154
e Rose Development Project: New Drill Centre Construction & Operations Program EA Addendum Page 155
concern major
rs), it has ills.
avoid
ulation. igh.
g than
e able to s that
gh the from
oil spills hite Rose
owered igh.
anks is
elihood ition, no
any idence in
t effects
Husky Whit
No. 113
Cetaceans Of the three groups of animals, cetaceans are probably of least from an oil spill perspective. After extensive surveys associated withoil spills such as the ExxonValdez and Santa Barbara (and othebeen concluded that no direct mortalities can be attributed to these spAt least some species are known to have the ability to detect andsurface oil. Oil on their surfaces does not create thermoregulatory problems (as with seabirds) because cetaceans use blubber for insIngested oil can be depurated. Confidence in the prediction is clearly h Seals Seals, especially young seals, may be more sensitive to oilincetaceans but again hair seals do not lose thermoregulation due to oiling and they have shown depuration ability. Some individuals may bdetect and avoid oil but the key feature in terms of interaction ivirtually all Grand Banks oil spill modeling from Hibernia throuWhite Rose studies has shown the oil to move to the east away concentrations of seals inshore or at the Front. Studies of major such as the ExxonValdez (a much worse case than a spill at Wwould be because of contact with the shore and other factors) have linitial direct mortality estimates. Confidence in the prediction is h Sea Turtles Information on sea turtle abundance and distribution on the Grand Bscarce (largely, but not entirely, due to their scarcity) but they are likely rare and they are known to occur only seasonally. As such, the likof their encountering an oil spill is correspondingly low. In addone, to our knowledge, has ever attributed sea turtle mortalities insignificant numbers to an offshore oil spill. Thus, while the confthe prediction may be somewhat lower than for marine mammals because of the scarcity of data, it is still high that there will be no significanon sea turtle populations from an oil spill at White Rose.
Section 8.7.8, page 271: The level of detail is not consistent with the rest of the report.
See revised text in Section 8.7.7
e Rose Development Project: New Drill Centre Construction & Operations Program EA Addendum Page 156
SecticoncSignithan quest
throuimpathe p
on lusioficaoneiona
well, it alsoghocts ooten
8.7 ag 1: rt p us entioned,n e ts n al t ec t risk as nt, n i epi it efi h itude, gre ye d 1 m2 wi hi ve confidencbl si t nsi ha r o ese species.
ata h th ion ig ant Effect, as appu s a te h ent of potenn es sk O e orough discussiotia ha e t id ent p risk.
xt in Section 8.7..8, pof th (evear an
e con deb
t the repspecil for
e 27effecn keover
deringble wort i
at rirm du
Fu of ang w00 khe seether even
. DFo acc
her acci
hin t), gitivite depprorecoenta
to adenthe dven y tofinitpriamml ev
pointevennitionth a rm fo of Sfor t
nds a ms on s
revioon spof higgh lesomenific
e assessmore thecies at
ly mies amagnl of f th
the Not ater
e, is As lied tial
n of
See revised te 7.
No. 115 Section 8.7.8, page T oc ates that any effects of an accidental nt e G a nif b ill be reversible over e p at ve id a c this statement should ed.
I ta are scarce but t ra mbers el o be low a . They are known l si or in gr and to be h ated with sea ice. such t poten i tion with o White Rose is so hat li . No nificant e a large oil spill, si r to ot eabird s ed in the
ecautionary basis g a r a rio d just as ve p ted n ificant effect due
t al for lack of inte n. I e above, coupled the ve w likel o jor spill, i onable to predic t very (if an or ls would s ity, and thus the population d su of a few a would be well within the va y of al mortality rates. Non ess, with or without the loss of indiv s, the population coul l be declining. It is agreed with revie at in the light of the ent few and declining numbers, it may be ature to conclude that opulation will perpetuate. In the event o oiled Ivory Gull, Husk ll attempt to rehabilitate the individual.
272:Ivoryion le
he dull ml. Ev
umey beence
nt st sig or
spill time be pr
eveat thovid
on thopul
icant,referen
ut we for
vorynd dighlil spffect
EA o
o the
n ligt seeuffenim
Guecliy asille dun a
po
ht oms
r mals a
etheld stilapparthe py wi
ll daningsocid at e to pr
approach. One coultenti
f threas
ortals it
heir to t
As mewmila
usineasily haractio
witht tha
overave
ll nungly
heir mitedher seasonredic
ry lo few coul
riabilita few the
are bsmall
tial for nethels, wa
o sign
ihoody) Iv
stain thnaturidual
wer thpremf an
ieved toups
nteracess, a sig
predictble “worst case” scena
f a may Gul
e loss
Husky Whit
No. 114
No. 116 Section 9.1, page 273: SARA is not discussed.
See onal text in Section 9.1. additi
No. 117 Section 9.2, page 273: Cumulative effects estimations cannot be expressed with such certainty as we know very little about effects of industry on marine mammal distribution and abundance – or even basic information on marine mammal distribution and abundance itself. Given these two sources of uncertainty, DFO would like to see cooperation, in the future, on large-scale baseline surveys to assess abundance and distribution of marine megafauna over larger areas of the region.
So n Husky is interested in cooperating with O and other East Coast operators in joint efforts to assess abundan istribution of mari egafauna.
oted.
ne m
DFce and d
e Rose Development Project: New Drill Centre Construction & Operations Program EA Addendum Page 157
Section 9. This section indicates the proponent’s commitment to conduct a spill-specific EEM program to test specific hypothesis as part of the oil spill response plan (OSRP). However, the latest version of the OSRP on file at EC (dated 2004 05 20) contains the following elements:
• the use of aerial surveys (although these were found to be inadequate based on responses to recent actual spill events); and
• activation of the full EEM sampling program for spills >20 m3 (the annex, which describes that program, contains only a note that the emergency EEM is to be completed before production).
Therefore, if there is a more recent version of the OSRP, please provide a copy including the EEM annex for review and any revisions in light of recent experience.
Husky’s White Rose Sp rocedure (WR-HSE-PR-4021) is o e th NL a pa Husky’s overall suite of plans, po a ro res ad e ency and spill response. Husky recognizes that re x nc h err va response indicated that the placem f ird rv n d more useful data than aerial o ig T bo te ce does call for aerial over flights bu s r e g rve vessels. Notwithstanding this, H r t pill effects monitoring procedure and the OSRP ld vi o i po essons learned to date. Husky would be pl d e h dia ldlife Service to review and amend the p ns h ce th rectly address or affect seabirds and mi ry ds The R elf is currently undergoing revision for r mi t C- P
ill En fillicies
cent eent over flt doeusky
shoueaseortiogratoesub
nvironwithnd p
perieseabhts. not p
concu be reto m of t birssion
mentale C-cedu
e witobsehe a
ecluds thased t
et wite pro. o the
EffectOPB that
the Ters ove noplacinthe sncor
Canadure OSNLO
s Monind isdress
a Novesselsd proobse
rate ln Wiat diP itsB.
toring Prt ofmerg
spill providedure rs on
No. 119 Appendix 1, TOC: The appendices are not listed for this document.
The appendices were listed in T of te f the EA. The appendices are now included.
Conable the
Husky Whit
No. 118
nts o


Husky White Rose Development Project: New Drill Centre Construction & Operations Program EA Addendum Page 159
Appendix 2. List of People Consulted The following agencies and persons were consulted on Husky’s proposed development of new drill centres Project. Environment Canada (Environmental Protection Branch) Glenn Troke, EA Co-ordinator Fredricka Kirstein, EA Coordinator (Halifax Office) Rick Wadman, Manager, Ocean Disposal Fisheries and Oceans James Meade, Senior Regional Habitat Biologist Sigrid Kuehnemund, Senior Regional Habitat Biologist Fraser Davidson, Research Biologist, Biological and Physical Oceanographic Section Bill Brodie, Senior Science Coordinator/Advisor, NAFO Natural History Society Dr. Len Zedel, MUN One Ocean Maureen Murphy, Research Assistant Fish, Food and Allied Workers Union Sherry Glynn, Fisheries Biologist Keith Sullivan, Fisheries Biologist Association of Seafood Producers E. Derek Butler, Executive Director Fishery Products International Derek Fudge, Manager, Fleet Administration and Scheduling William Savory, FPI Offshore Captain

Husky White Rose Development Project: New Drill Centre Construction & Operations Program EA Addendum Page 160
Icewater Harvesting Michael O’Connor, Fish Harvesting Consultant Clearwater Seafoods Limited Partnership Christine Penney, Director of Corporate Affairs Groundfish Enterprise Allocation Council (Ottawa) Bruce Chapman, Executive Director
Husky White Rose Development Project: New Drill Centre Construction & Operations Program EA Addendum Page 161
Appendix 3: Climate of the Husky New Drill Centre
by
Oceans Ltd. December 2006
CLIMATE OF THE HUSKY NEW DRILL CENTRE
Submitted to
LGL Limited Environmental Research Associates
P.O. Box 13248, Stn. A 388 Kenmount Road,
St. John's, Newfoundland A1B 4A5
by
85 LeMarchant Rd.
St. John’s, NL A1C 2H1
Telephone: (709) 753-5788 Facsimile: (709) 753-3301
Email: [email protected]
December 2006
Climate of the Husky New Drill Centre
Doc Ref 11824 i
TABLE OF CONTENTS
1 INTRODUCTION................................................................................................................. 1
2 WIND CLIMATOLOGY..................................................................................................... 3
2.1 WIND ROSE PLOT............................................................................................................. 4 2.2 MONTHLY 10 METRE WIND SPEED PERCENTAGE EXCEEDANCE ...................................... 6 2.3 AES-40 VS. OBSERVED WIND SPEEDS ............................................................................. 9 2.4 TROPICAL SYSTEMS....................................................................................................... 10
3 WAVE CLIMATOLOGY.................................................................................................. 13
3.1 MONTHLY PERCENTAGE EXCEEDANCE OF SIGNIFICANT WAVE HEIGHT........................ 14 3.2 MONTHLY PERCENTAGE OCCURRENCE OF SPECTRAL PEAK PERIOD ............................. 18 3.3 PERCENT FREQUENCY OF SIGNIFICANT WAVE HEIGHT AND SPECTRAL PEAK PERIOD... 18 3.4 AES-40 VS. OBSERVED WAVE HEIGHTS........................................................................ 19
4 AIR AND SEA SURFACE TEMPERATURES............................................................... 21
5 VISIBILITY ........................................................................................................................ 22
6 WIND AND WAVE EXTREME VALUE ANALYSIS................................................... 24
6.1 EXTREME VALUE ESTIMATES FOR WINDS FROM A GUMBEL DISTRIBUTION .................. 24 6.2 EXTREME VALUE ESTIMATES FOR WAVES FROM A GUMBEL DISTRIBUTION ................. 27
7 INTERANNUAL VARIABILITY AND SHORT-TERM CLIMATE TRENDS ......... 31
7.1 THE NORTH ATLANTIC OSCILLATION AND WIND AND WAVE TRENDS OVER THE NORTHERN GRAND BANKS ........................................................................................................ 32
8 BIBLIOGRAPHY............................................................................................................... 37
APPENDIX A.............................................................................................................................. 38
Climate of the Husky New Drill Centre
Doc Ref 11824 ii
LIST OF FIGURES
Figure 1. General Location Map showing the position of AES-40 grid point 5622 and the ICOADS data area. .......... 2 Figure 2. Wind Rose for All Months and Years, July 1954 through June 2004. .................................................................. 5 Figure 3. Monthly Percentage Exceedances of 10 metre Wind Speed - January through July.......................................... 8 Figure 4. Monthly Percentage Exceedance of 10 metre Wind Speed – July through January........................................... 8 Figure 5. Historical tracks of Tropical Systems passing within 65 nm of 47 degrees N, 48 degrees W, 1956 to 2005............................................................................................................................................................................................................ 11 Figure 6. Monthly Percent Exceedance of Significant Wave Height - January to July..................................................... 17 Figure 7. Monthly Percent Exceedance of Significant Wave Height - July to January..................................................... 17 Figure 8. Monthly Average Air and Sea Surface Temperature. ............................................................................................ 21 Figure 9. Percent Occurrence of Visibility Ranges.................................................................................................................. 23 Figure 10. Correlation Coefficient for Significant Wave Height using a Gumbel Distribution...................................... 25 Figure 11. Distribution Fit for Wind Data Using 228 Storms................................................................................................ 27 Figure 12. Distribution Fit for Wave Data Using 228 Storms............................................................................................... 30 Figure 13. Winter and Summer Seasonal Variability of Mean Wind Speed and Mean Significant Wave Height at AES-40 Grid Point 5622............................................................................................................................................................... 31 Figure 14. NAO Index in Summer and Winter Season........................................................................................................... 33 Figure 15. Scatter Plot of Summer NAO Index and Seasonal Mean Wind Speed and Significant Wave Height ........ 34 Figure 16. Scatter Plot of Winter NAO Index and Seasonal Mean Wind Speed and Significant Wave Height........... 34 Figure 17. Summer Season Mean Wind Speed Time-Series ................................................................................................. 35 Figure 18. Summer Season Mean Significant Wave Height Time-Series ........................................................................... 35 Figure 19. Winter Season Mean Wind Speed Time-Series .................................................................................................... 36 Figure 20. Winter Season Mean Significant Wave Height Time -Series .............................................................................. 36 Figure 21. Wind Rose for January.............................................................................................................................................. 39 Figure 22. Wind Rose for February............................................................................................................................................ 40 Figure 23. Wind Rose for March. ............................................................................................................................................... 41 Figure 24. Wind Rose for April. ................................................................................................................................................. 42 Figure 25. Wind Rose for May.................................................................................................................................................... 43 Figure 26. Wind Rose for June.................................................................................................................................................... 44 Figure 27. Wind Rose for July. ................................................................................................................................................... 45 Figure 28. Wind Rose for August............................................................................................................................................... 46 Figure 29. Wind Rose for September. ........................................................................................................................................ 47 Figure 30. Wind Rose for October.............................................................................................................................................. 48 Figure 31. Wind Rose for November......................................................................................................................................... 49 Figure 32. Wind Rose for December.......................................................................................................................................... 50
Climate of the Husky New Drill Centre
Doc Ref 11824 iii
LIST OF TABLES
Table 1. Monthly 10 metre Wind Direction and Speed Statistics........................................................................................... 3 Table 2. Monthly Maximum 10 metre Wind Speed Statistics by Direction.......................................................................... 4 Table 3. Percentage Occurrence of Wind Speed by Direction for all Months and All Years. ........................................... 5 Table 4. Percentage Exceedances of 10 metre Wind Speeds................................................................................................... 6 Table 5. Exceedances of 10 metre Wind Speeds........................................................................................................................ 7 Table 6. Comparison of AES -40 hindcast winds and Husky Manmar winds....................................................................... 9 Table 7. Data for Tropical Systems passing within 65 nm of 47 degrees N, 48 degrees W, 1956 to 2005. .................. 12 Table 8. Monthly Statistics of Significant Wave Height. ....................................................................................................... 13 Table 9. Monthly Statistics of Spectral Peak Period. .............................................................................................................. 14 Table 10. Monthly Percentage Exceedance of Significant Wave Height. ........................................................................... 15 Table 11. Percentage Frequency of Occurrence of Sea Ice at Grid Point 5622 .................................................................. 15 Table 12. Monthly Exceedance of Significant Wave Height................................................................................................. 16 Table 13. Monthly Percent Frequency of Occurrence of Spectral Peak Periods................................................................ 18 Table 14. Percent Frequency of the Joint Occurrence of Significant Wave Height and Spectral Peak Period............. 19 Table 15. Comparison of AES-40 hindcast winds and Husky Manmar winds................................................................... 20 Table 16. Monthly Air and Sea Surface Temperature Statistics............................................................................................ 22 Table 17. Percentage Occurrence of Visibility Ranges........................................................................................................... 23 Table 18. Extreme Wind Estimates for Return Periods of 1, 10, 25, 50 and 100 Years for Winds Corresponding to Different Averaging Periods, at a 10 metre Height. ................................................................................................................ 26 Table 19. Extreme Wave Estimates for Return Periods of 1, 10, 25, 50, and 100 Years.................................................. 29 Table 20. Percentage Occurrence of Wind Speed by Direction for January. ...................................................................... 39 Table 21. Percentage Occurrence of Wind Speed by Direction for February. .................................................................... 40 Table 22. Percentage Occurrence of Wind Speed by Direction for March. ........................................................................ 41 Table 23. Percentage Occurrence of Wind Speed by Direction for April. ........................................................................... 42 Table 24. Percentage Occurrence of Wind Speed by Direction for May............................................................................. 43 Table 25. Percentage Occurrence of Wind Speed by Direction for June. ............................................................................ 44 Table 26. Percentage Occurrence of Wind Speed by Direction for July. ............................................................................ 45 Table 27. Percentage Occurrence of Wind Speed by Direction for August........................................................................ 46 Table 28. Percentage Occurrence of Wind Speed by Direction for September. ................................................................. 47 Table 29. Percentage Occurrence of Wind Speed by Direction for October....................................................................... 48 Table 30. Percentage Occurrence of Wind Speed by Direction for November. ................................................................. 49 Table 31. Percentage Occurrence of Wind Speed by Direction for December. .................................................................. 50
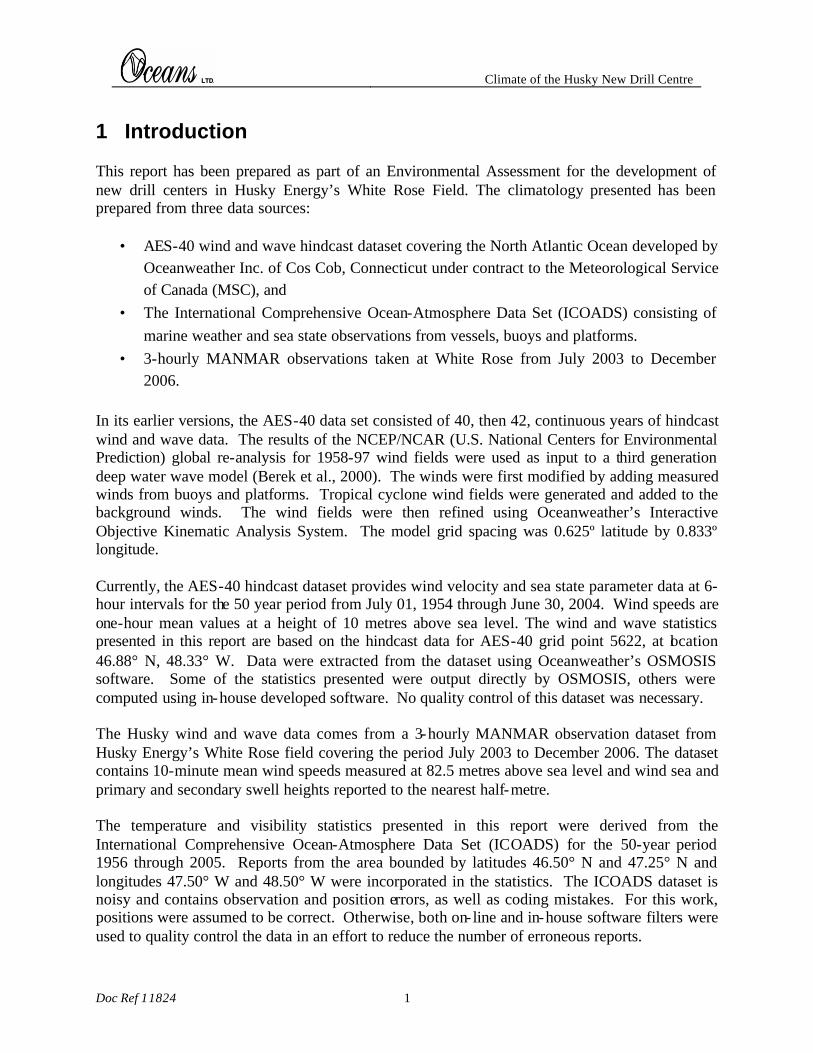
Climate of the Husky New Drill Centre
Doc Ref 11824 1
1 Introduction This report has been prepared as part of an Environmental Assessment for the development of new drill centers in Husky Energy’s White Rose Field. The climatology presented has been prepared from three data sources:
• AES-40 wind and wave hindcast dataset covering the North Atlantic Ocean developed by Oceanweather Inc. of Cos Cob, Connecticut under contract to the Meteorological Service of Canada (MSC), and
• The International Comprehensive Ocean-Atmosphere Data Set (ICOADS) consisting of marine weather and sea state observations from vessels, buoys and platforms.
• 3-hourly MANMAR observations taken at White Rose from July 2003 to December 2006.
In its earlier versions, the AES-40 data set consisted of 40, then 42, continuous years of hindcast wind and wave data. The results of the NCEP/NCAR (U.S. National Centers for Environmental Prediction) global re-analysis for 1958-97 wind fields were used as input to a third generation deep water wave model (Berek et al., 2000). The winds were first modified by adding measured winds from buoys and platforms. Tropical cyclone wind fields were generated and added to the background winds. The wind fields were then refined using Oceanweather’s Interactive Objective Kinematic Analysis System. The model grid spacing was 0.625º latitude by 0.833º longitude. Currently, the AES-40 hindcast dataset provides wind velocity and sea state parameter data at 6-hour intervals for the 50 year period from July 01, 1954 through June 30, 2004. Wind speeds are one-hour mean values at a height of 10 metres above sea level. The wind and wave statistics presented in this report are based on the hindcast data for AES-40 grid point 5622, at location 46.88° N, 48.33° W. Data were extracted from the dataset using Oceanweather’s OSMOSIS software. Some of the statistics presented were output directly by OSMOSIS, others were computed using in-house developed software. No quality control of this dataset was necessary. The Husky wind and wave data comes from a 3-hourly MANMAR observation dataset from Husky Energy’s White Rose field covering the period July 2003 to December 2006. The dataset contains 10-minute mean wind speeds measured at 82.5 metres above sea level and wind sea and primary and secondary swell heights reported to the nearest half-metre. The temperature and visibility statistics presented in this report were derived from the International Comprehensive Ocean-Atmosphere Data Set (ICOADS) for the 50-year period 1956 through 2005. Reports from the area bounded by latitudes 46.50° N and 47.25° N and longitudes 47.50° W and 48.50° W were incorporated in the statistics. The ICOADS dataset is noisy and contains observation and position errors, as well as coding mistakes. For this work, positions were assumed to be correct. Otherwise, both on- line and in-house software filters were used to quality control the data in an effort to reduce the number of erroneous reports.
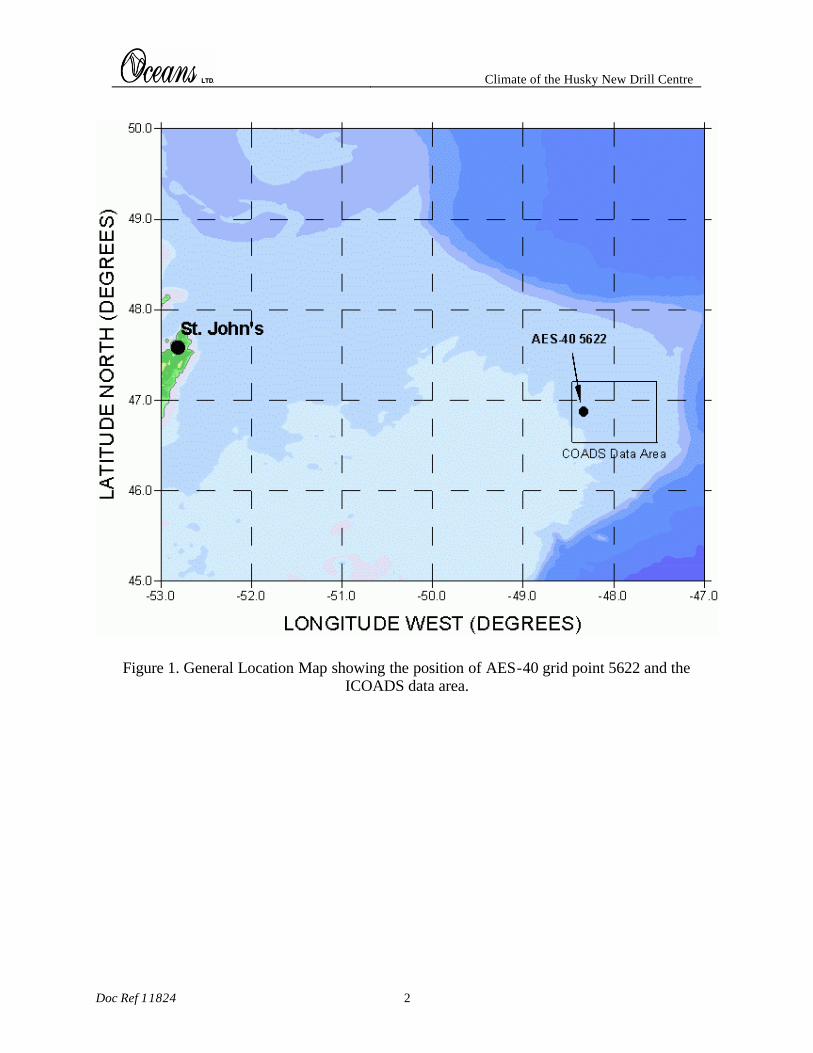
Climate of the Husky New Drill Centre
Doc Ref 11824 2
Figure 1. General Location Map showing the position of AES-40 grid point 5622 and the ICOADS data area.
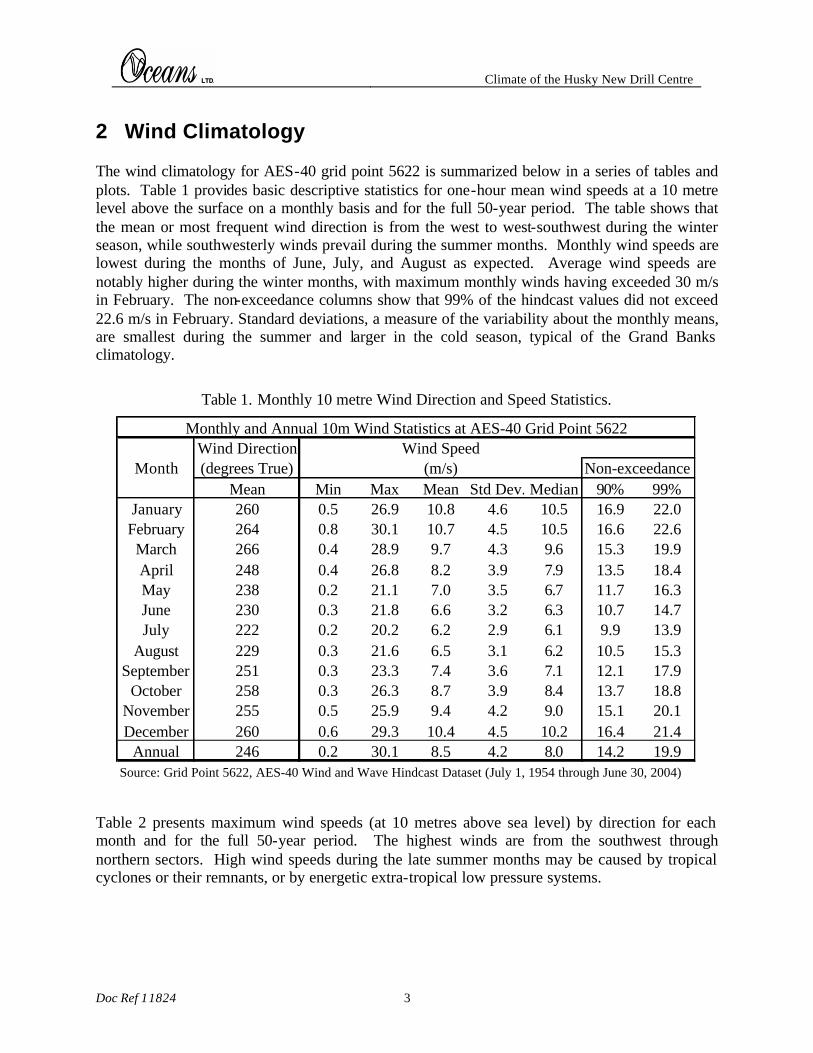
Climate of the Husky New Drill Centre
Doc Ref 11824 3
2 Wind Climatology The wind climatology for AES-40 grid point 5622 is summarized below in a series of tables and plots. Table 1 provides basic descriptive statistics for one-hour mean wind speeds at a 10 metre level above the surface on a monthly basis and for the full 50-year period. The table shows that the mean or most frequent wind direction is from the west to west-southwest during the winter season, while southwesterly winds prevail during the summer months. Monthly wind speeds are lowest during the months of June, July, and August as expected. Average wind speeds are notably higher during the winter months, with maximum monthly winds having exceeded 30 m/s in February. The non-exceedance columns show that 99% of the hindcast values did not exceed 22.6 m/s in February. Standard deviations, a measure of the variability about the monthly means, are smallest during the summer and larger in the cold season, typical of the Grand Banks climatology.
Table 1. Monthly 10 metre Wind Direction and Speed Statistics.
Wind Direction Wind SpeedMonth (degrees True) (m/s) Non-exceedance
Mean Min Max Mean Std Dev. Median 90% 99%January 260 0.5 26.9 10.8 4.6 10.5 16.9 22.0
February 264 0.8 30.1 10.7 4.5 10.5 16.6 22.6March 266 0.4 28.9 9.7 4.3 9.6 15.3 19.9April 248 0.4 26.8 8.2 3.9 7.9 13.5 18.4May 238 0.2 21.1 7.0 3.5 6.7 11.7 16.3June 230 0.3 21.8 6.6 3.2 6.3 10.7 14.7July 222 0.2 20.2 6.2 2.9 6.1 9.9 13.9
August 229 0.3 21.6 6.5 3.1 6.2 10.5 15.3September 251 0.3 23.3 7.4 3.6 7.1 12.1 17.9
October 258 0.3 26.3 8.7 3.9 8.4 13.7 18.8November 255 0.5 25.9 9.4 4.2 9.0 15.1 20.1December 260 0.6 29.3 10.4 4.5 10.2 16.4 21.4
Annual 246 0.2 30.1 8.5 4.2 8.0 14.2 19.9Source: Grid Point 5622, AES-40 Wind and Wave Hindcast Dataset (July 1, 1954 through June 30, 2004)
Monthly and Annual 10m Wind Statistics at AES-40 Grid Point 5622
Table 2 presents maximum wind speeds (at 10 metres above sea level) by direction for each month and for the full 50-year period. The highest winds are from the southwest through northern sectors. High wind speeds during the late summer months may be caused by tropical cyclones or their remnants, or by energetic extra-tropical low pressure systems.
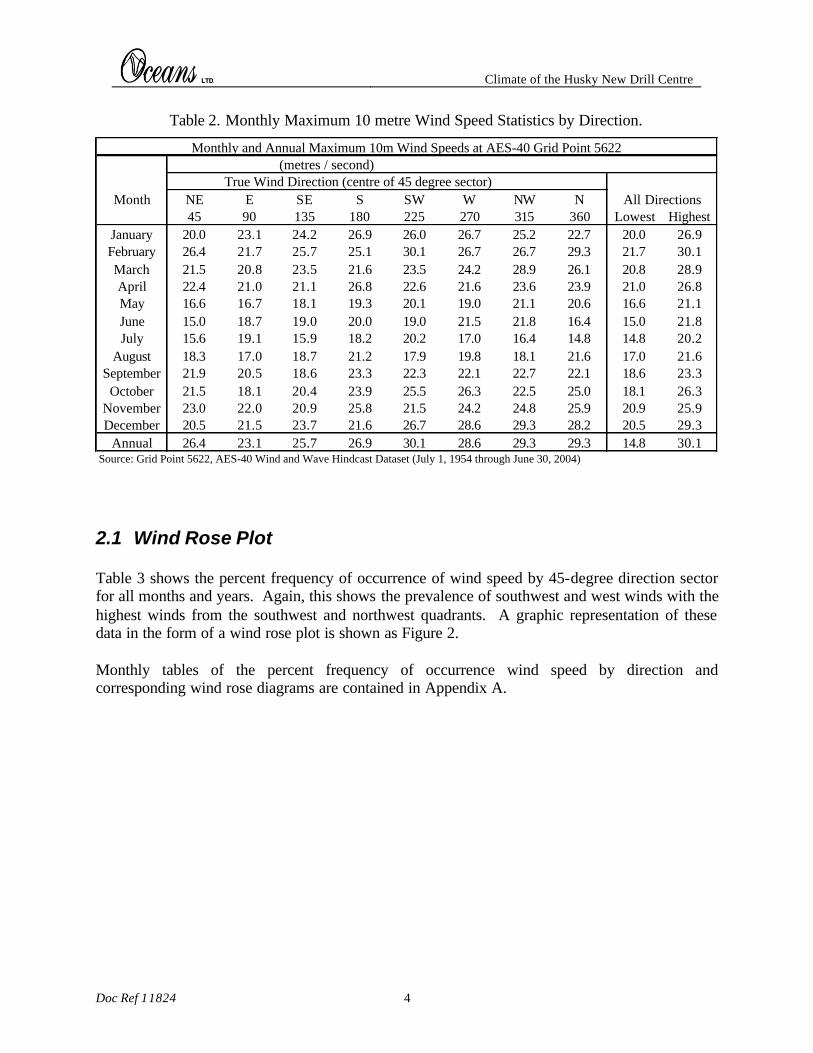
Climate of the Husky New Drill Centre
Doc Ref 11824 4
Table 2. Monthly Maximum 10 metre Wind Speed Statistics by Direction.
(metres / second)True Wind Direction (centre of 45 degree sector)
Month NE E SE S SW W NW N45 90 135 180 225 270 315 360 Lowest Highest
January 20.0 23.1 24.2 26.9 26.0 26.7 25.2 22.7 20.0 26.9February 26.4 21.7 25.7 25.1 30.1 26.7 26.7 29.3 21.7 30.1March 21.5 20.8 23.5 21.6 23.5 24.2 28.9 26.1 20.8 28.9April 22.4 21.0 21.1 26.8 22.6 21.6 23.6 23.9 21.0 26.8May 16.6 16.7 18.1 19.3 20.1 19.0 21.1 20.6 16.6 21.1June 15.0 18.7 19.0 20.0 19.0 21.5 21.8 16.4 15.0 21.8July 15.6 19.1 15.9 18.2 20.2 17.0 16.4 14.8 14.8 20.2
August 18.3 17.0 18.7 21.2 17.9 19.8 18.1 21.6 17.0 21.6September 21.9 20.5 18.6 23.3 22.3 22.1 22.7 22.1 18.6 23.3
October 21.5 18.1 20.4 23.9 25.5 26.3 22.5 25.0 18.1 26.3November 23.0 22.0 20.9 25.8 21.5 24.2 24.8 25.9 20.9 25.9December 20.5 21.5 23.7 21.6 26.7 28.6 29.3 28.2 20.5 29.3
Annual 26.4 23.1 25.7 26.9 30.1 28.6 29.3 29.3 14.8 30.1Source: Grid Point 5622, AES-40 Wind and Wave Hindcast Dataset (July 1, 1954 through June 30, 2004)
All Directions
Monthly and Annual Maximum 10m Wind Speeds at AES-40 Grid Point 5622
2.1 Wind Rose Plot Table 3 shows the percent frequency of occurrence of wind speed by 45-degree direction sector for all months and years. Again, this shows the prevalence of southwest and west winds with the highest winds from the southwest and northwest quadrants. A graphic representation of these data in the form of a wind rose plot is shown as Figure 2. Monthly tables of the percent frequency of occurrence wind speed by direction and corresponding wind rose diagrams are contained in Appendix A.
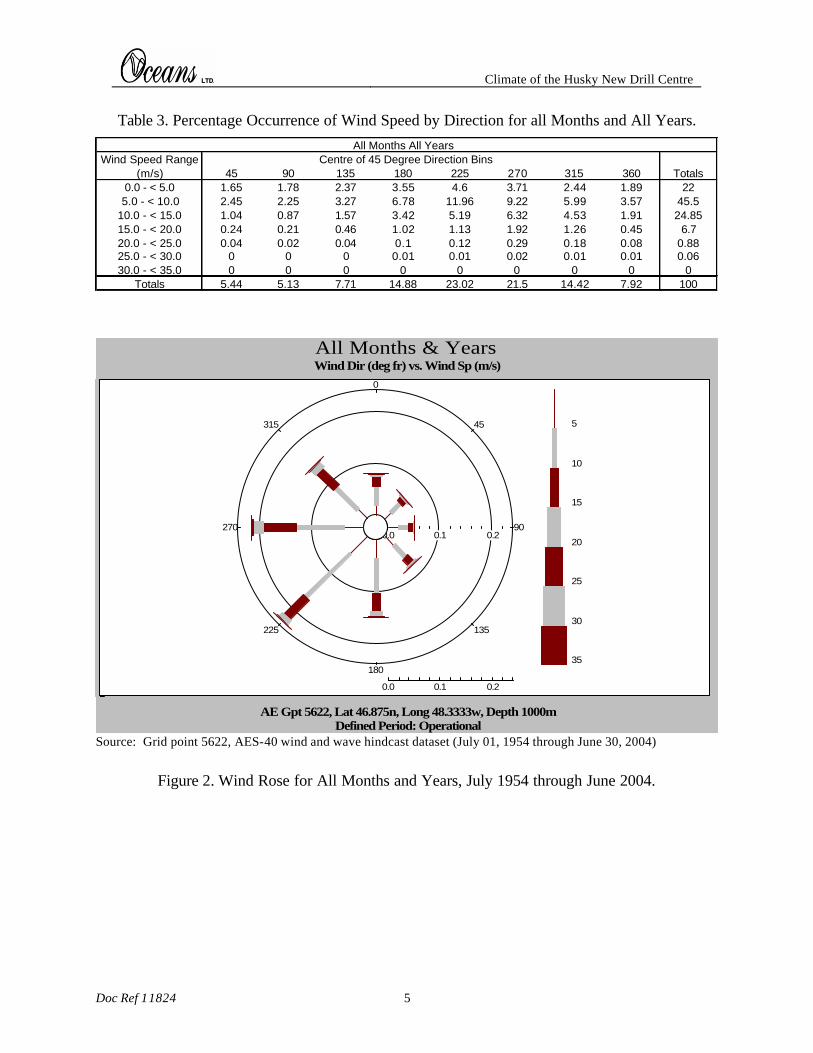
Climate of the Husky New Drill Centre
Doc Ref 11824 5
Table 3. Percentage Occurrence of Wind Speed by Direction for all Months and All Years. All Months All Years
Wind Speed Range Centre of 45 Degree Direction Bins(m/s) 45 90 135 180 225 270 315 360 Totals
0.0 - < 5.0 1.65 1.78 2.37 3.55 4.6 3.71 2.44 1.89 225.0 - < 10.0 2.45 2.25 3.27 6.78 11.96 9.22 5.99 3.57 45.5
10.0 - < 15.0 1.04 0.87 1.57 3.42 5.19 6.32 4.53 1.91 24.8515.0 - < 20.0 0.24 0.21 0.46 1.02 1.13 1.92 1.26 0.45 6.720.0 - < 25.0 0.04 0.02 0.04 0.1 0.12 0.29 0.18 0.08 0.8825.0 - < 30.0 0 0 0 0.01 0.01 0.02 0.01 0.01 0.0630.0 - < 35.0 0 0 0 0 0 0 0 0 0
Totals 5.44 5.13 7.71 14.88 23.02 21.5 14.42 7.92 100
90
45
0
315
270
225
180
135
0.0
0.0
0.1
0.1
0.2
0.2
5
10
15
20
25
30
35
All Months & YearsWind Dir (deg fr) vs. Wind Sp (m/s)
Defined Period: OperationalAE Gpt 5622, Lat 46.875n, Long 48.3333w, Depth 1000m
Source: Grid point 5622, AES-40 wind and wave hindcast dataset (July 01, 1954 through June 30, 2004)
Figure 2. Wind Rose for All Months and Years, July 1954 through June 2004.
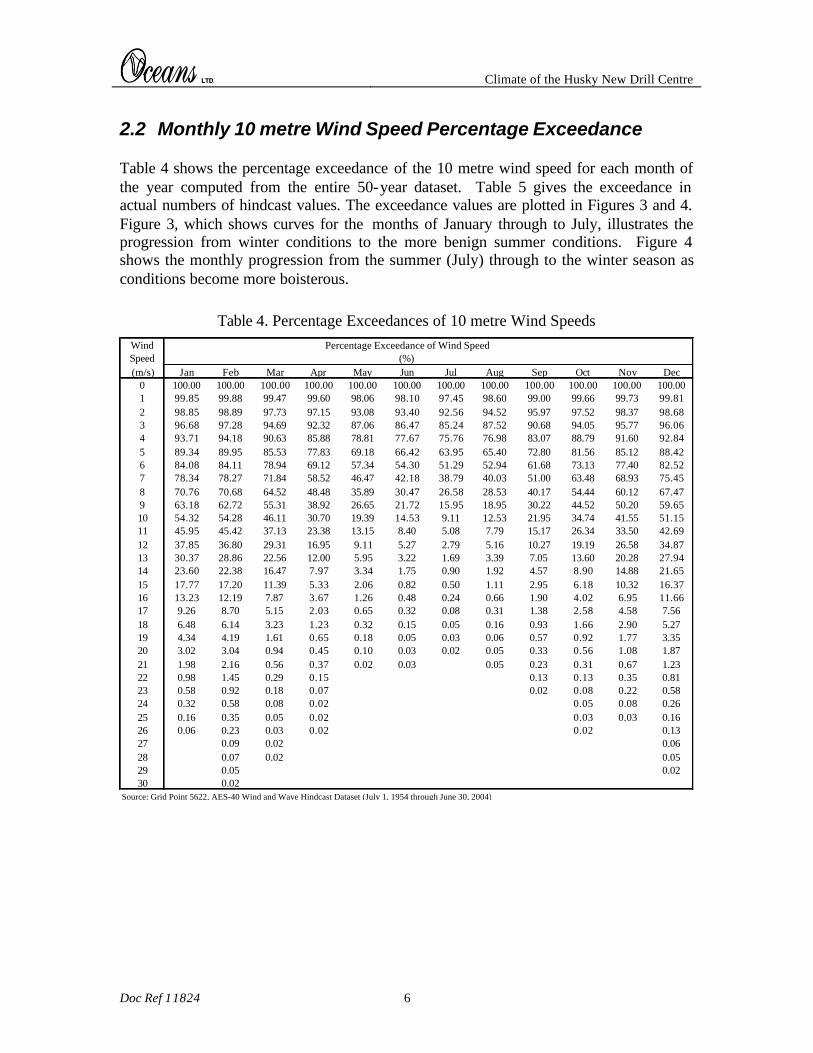
Climate of the Husky New Drill Centre
Doc Ref 11824 6
2.2 Monthly 10 metre Wind Speed Percentage Exceedance Table 4 shows the percentage exceedance of the 10 metre wind speed for each month of the year computed from the entire 50-year dataset. Table 5 gives the exceedance in actual numbers of hindcast values. The exceedance values are plotted in Figures 3 and 4. Figure 3, which shows curves for the months of January through to July, illustrates the progression from winter conditions to the more benign summer conditions. Figure 4 shows the monthly progression from the summer (July) through to the winter season as conditions become more boisterous.
Table 4. Percentage Exceedances of 10 metre Wind Speeds Wind Percentage Exceedance of Wind SpeedSpeed (%)(m/s) Jan Feb Mar Apr May Jun Jul Aug Sep Oct Nov Dec
0 100.00 100.00 100.00 100.00 100.00 100.00 100.00 100.00 100.00 100.00 100.00 100.001 99.85 99.88 99.47 99.60 98.06 98.10 97.45 98.60 99.00 99.66 99.73 99.812 98.85 98.89 97.73 97.15 93.08 93.40 92.56 94.52 95.97 97.52 98.37 98.683 96.68 97.28 94.69 92.32 87.06 86.47 85.24 87.52 90.68 94.05 95.77 96.064 93.71 94.18 90.63 85.88 78.81 77.67 75.76 76.98 83.07 88.79 91.60 92.845 89.34 89.95 85.53 77.83 69.18 66.42 63.95 65.40 72.80 81.56 85.12 88.426 84.08 84.11 78.94 69.12 57.34 54.30 51.29 52.94 61.68 73.13 77.40 82.527 78.34 78.27 71.84 58.52 46.47 42.18 38.79 40.03 51.00 63.48 68.93 75.458 70.76 70.68 64.52 48.48 35.89 30.47 26.58 28.53 40.17 54.44 60.12 67.479 63.18 62.72 55.31 38.92 26.65 21.72 15.95 18.95 30.22 44.52 50.20 59.6510 54.32 54.28 46.11 30.70 19.39 14.53 9.11 12.53 21.95 34.74 41.55 51.1511 45.95 45.42 37.13 23.38 13.15 8.40 5.08 7.79 15.17 26.34 33.50 42.6912 37.85 36.80 29.31 16.95 9.11 5.27 2.79 5.16 10.27 19.19 26.58 34.8713 30.37 28.86 22.56 12.00 5.95 3.22 1.69 3.39 7.05 13.60 20.28 27.9414 23.60 22.38 16.47 7.97 3.34 1.75 0.90 1.92 4.57 8.90 14.88 21.6515 17.77 17.20 11.39 5.33 2.06 0.82 0.50 1.11 2.95 6.18 10.32 16.3716 13.23 12.19 7.87 3.67 1.26 0.48 0.24 0.66 1.90 4.02 6.95 11.6617 9.26 8.70 5.15 2.03 0.65 0.32 0.08 0.31 1.38 2.58 4.58 7.5618 6.48 6.14 3.23 1.23 0.32 0.15 0.05 0.16 0.93 1.66 2.90 5.2719 4.34 4.19 1.61 0.65 0.18 0.05 0.03 0.06 0.57 0.92 1.77 3.3520 3.02 3.04 0.94 0.45 0.10 0.03 0.02 0.05 0.33 0.56 1.08 1.8721 1.98 2.16 0.56 0.37 0.02 0.03 0.05 0.23 0.31 0.67 1.2322 0.98 1.45 0.29 0.15 0.13 0.13 0.35 0.8123 0.58 0.92 0.18 0.07 0.02 0.08 0.22 0.5824 0.32 0.58 0.08 0.02 0.05 0.08 0.2625 0.16 0.35 0.05 0.02 0.03 0.03 0.1626 0.06 0.23 0.03 0.02 0.02 0.1327 0.09 0.02 0.0628 0.07 0.02 0.0529 0.05 0.0230 0.02
Source: Grid Point 5622, AES-40 Wind and Wave Hindcast Dataset (July 1, 1954 through June 30, 2004)
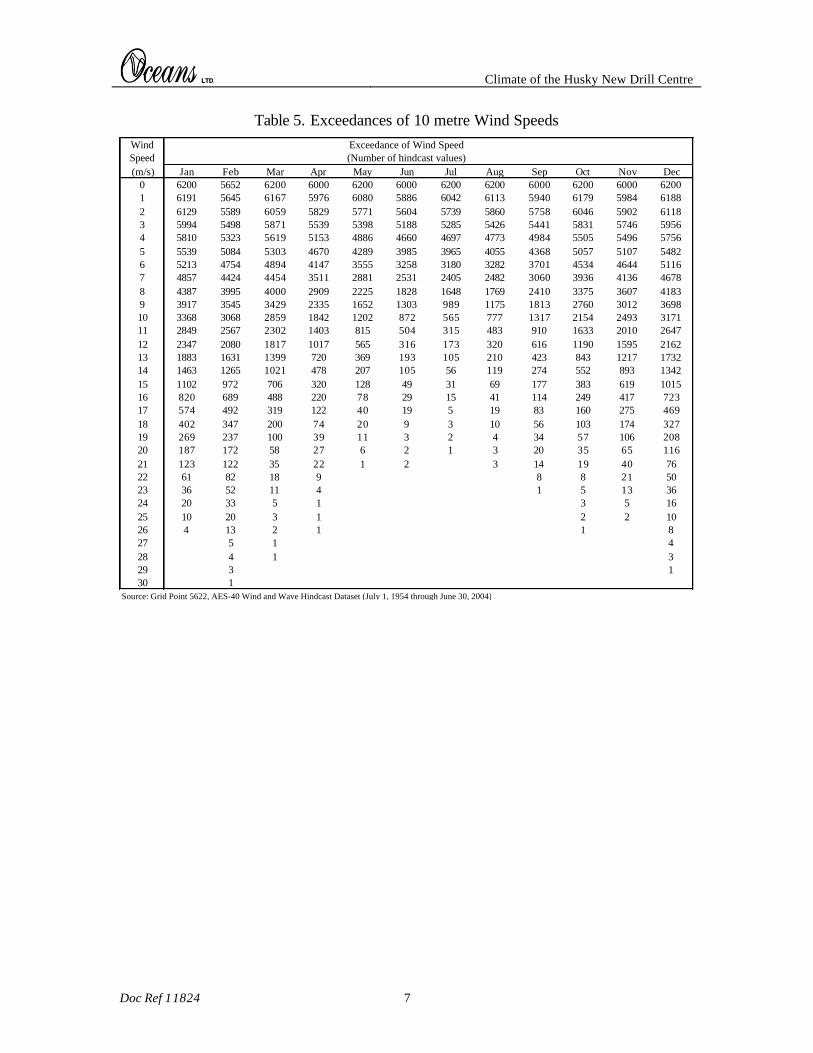
Climate of the Husky New Drill Centre
Doc Ref 11824 7
Table 5. Exceedances of 10 metre Wind Speeds Wind Exceedance of Wind SpeedSpeed (Number of hindcast values)(m/s) Jan Feb Mar Apr May Jun Jul Aug Sep Oct Nov Dec
0 6200 5652 6200 6000 6200 6000 6200 6200 6000 6200 6000 62001 6191 5645 6167 5976 6080 5886 6042 6113 5940 6179 5984 61882 6129 5589 6059 5829 5771 5604 5739 5860 5758 6046 5902 61183 5994 5498 5871 5539 5398 5188 5285 5426 5441 5831 5746 59564 5810 5323 5619 5153 4886 4660 4697 4773 4984 5505 5496 57565 5539 5084 5303 4670 4289 3985 3965 4055 4368 5057 5107 54826 5213 4754 4894 4147 3555 3258 3180 3282 3701 4534 4644 51167 4857 4424 4454 3511 2881 2531 2405 2482 3060 3936 4136 46788 4387 3995 4000 2909 2225 1828 1648 1769 2410 3375 3607 41839 3917 3545 3429 2335 1652 1303 989 1175 1813 2760 3012 369810 3368 3068 2859 1842 1202 872 565 777 1317 2154 2493 317111 2849 2567 2302 1403 815 504 315 483 910 1633 2010 264712 2347 2080 1817 1017 565 316 173 320 616 1190 1595 216213 1883 1631 1399 720 369 193 105 210 423 843 1217 173214 1463 1265 1021 478 207 105 56 119 274 552 893 134215 1102 972 706 320 128 49 31 69 177 383 619 101516 820 689 488 220 78 29 15 41 114 249 417 72317 574 492 319 122 40 19 5 19 83 160 275 46918 402 347 200 74 20 9 3 10 56 103 174 32719 269 237 100 39 11 3 2 4 34 57 106 20820 187 172 58 27 6 2 1 3 20 35 65 11621 123 122 35 22 1 2 3 14 19 40 7622 61 82 18 9 8 8 21 5023 36 52 11 4 1 5 13 3624 20 33 5 1 3 5 1625 10 20 3 1 2 2 1026 4 13 2 1 1 827 5 1 428 4 1 329 3 130 1
Source: Grid Point 5622, AES-40 Wind and Wave Hindcast Dataset (July 1, 1954 through June 30, 2004)
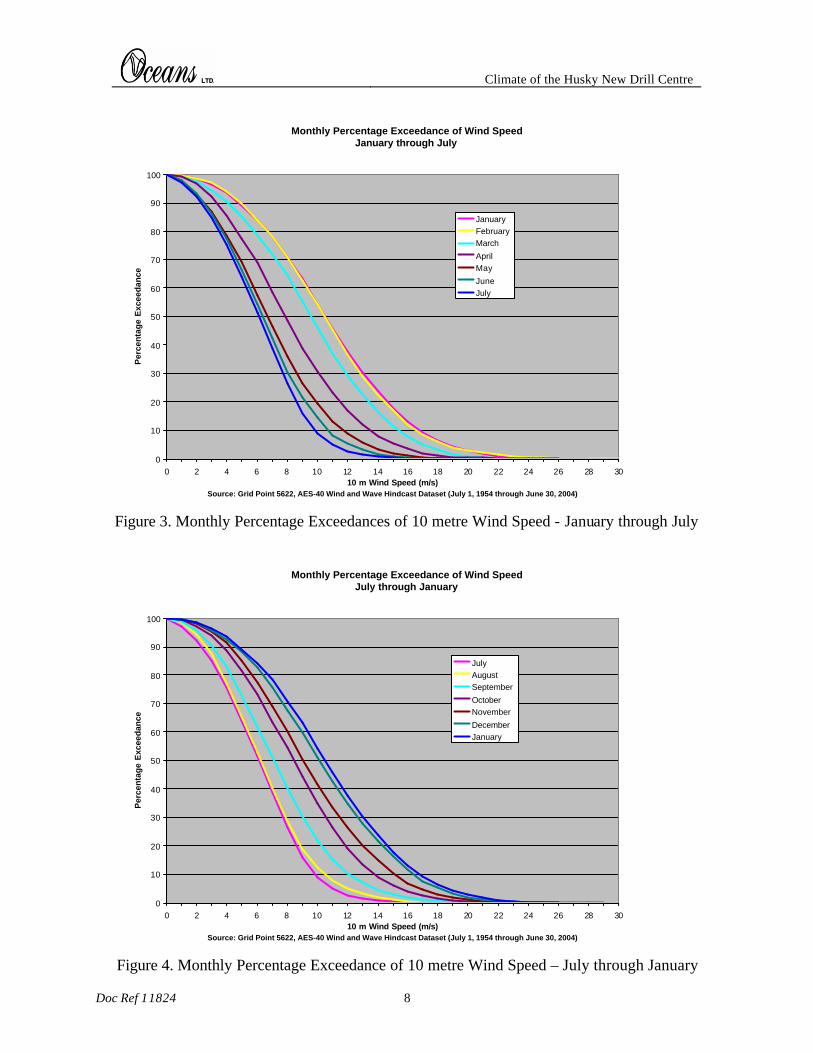
Climate of the Husky New Drill Centre
Doc Ref 11824 8
Monthly Percentage Exceedance of Wind SpeedJanuary through July
0
10
20
30
40
50
60
70
80
90
100
0 2 4 6 8 10 12 14 16 18 20 22 24 26 28 3010 m Wind Speed (m/s)
Source: Grid Point 5622, AES-40 Wind and Wave Hindcast Dataset (July 1, 1954 through June 30, 2004)
Per
cen
tag
e E
xcee
dan
ce
JanuaryFebruary March
AprilMay
JuneJuly
Figure 3. Monthly Percentage Exceedances of 10 metre Wind Speed - January through July
Monthly Percentage Exceedance of Wind SpeedJuly through January
0
10
20
30
40
50
60
70
80
90
100
0 2 4 6 8 10 12 14 16 18 20 22 24 26 28 3010 m Wind Speed (m/s)
Source: Grid Point 5622, AES-40 Wind and Wave Hindcast Dataset (July 1, 1954 through June 30, 2004)
Per
cen
tag
e E
xcee
dan
ce
JulyAugust September
OctoberNovember
DecemberJanuary
Figure 4. Monthly Percentage Exceedance of 10 metre Wind Speed – July through January
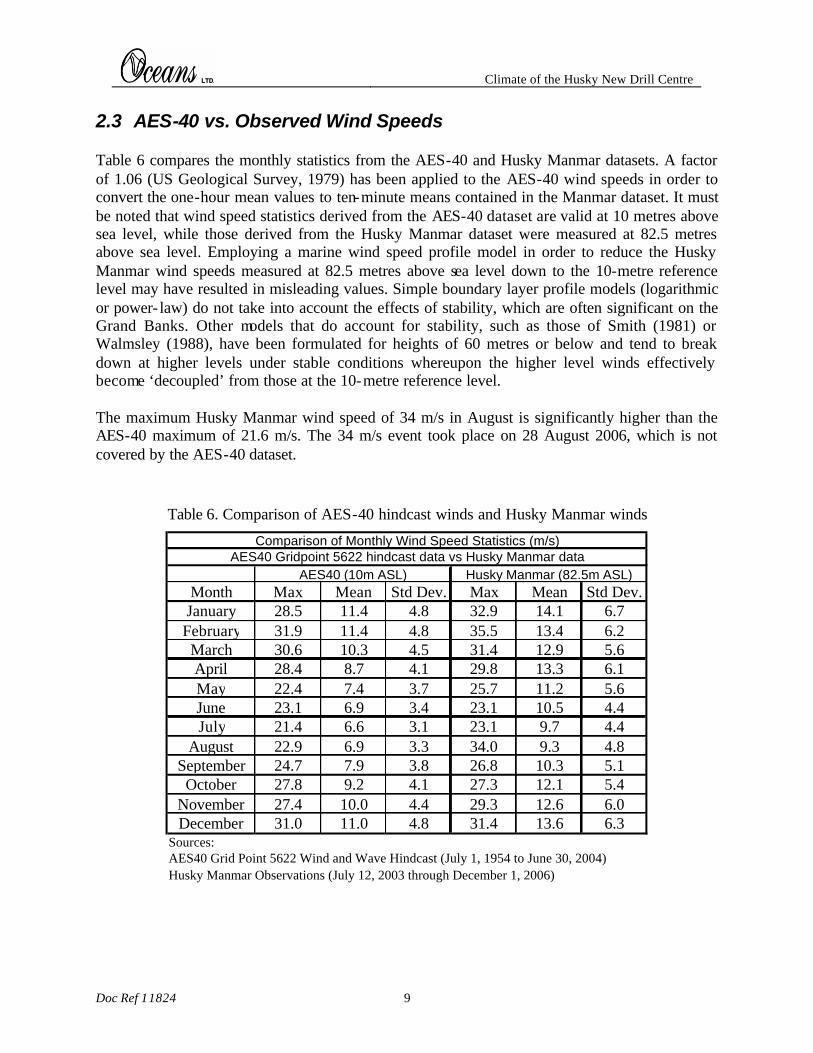
Climate of the Husky New Drill Centre
Doc Ref 11824 9
2.3 AES-40 vs. Observed Wind Speeds Table 6 compares the monthly statistics from the AES-40 and Husky Manmar datasets. A factor of 1.06 (US Geological Survey, 1979) has been applied to the AES-40 wind speeds in order to convert the one-hour mean values to ten-minute means contained in the Manmar dataset. It must be noted that wind speed statistics derived from the AES-40 dataset are valid at 10 metres above sea level, while those derived from the Husky Manmar dataset were measured at 82.5 metres above sea level. Employing a marine wind speed profile model in order to reduce the Husky Manmar wind speeds measured at 82.5 metres above sea level down to the 10-metre reference level may have resulted in misleading values. Simple boundary layer profile models (logarithmic or power- law) do not take into account the effects of stability, which are often significant on the Grand Banks. Other models that do account for stability, such as those of Smith (1981) or Walmsley (1988), have been formulated for heights of 60 metres or below and tend to break down at higher levels under stable conditions whereupon the higher level winds effectively become ‘decoupled’ from those at the 10-metre reference level. The maximum Husky Manmar wind speed of 34 m/s in August is significantly higher than the AES-40 maximum of 21.6 m/s. The 34 m/s event took place on 28 August 2006, which is not covered by the AES-40 dataset.
Table 6. Comparison of AES-40 hindcast winds and Husky Manmar winds
Month Max Mean Std Dev. Max Mean Std Dev.January 28.5 11.4 4.8 32.9 14.1 6.7
February 31.9 11.4 4.8 35.5 13.4 6.2March 30.6 10.3 4.5 31.4 12.9 5.6April 28.4 8.7 4.1 29.8 13.3 6.1May 22.4 7.4 3.7 25.7 11.2 5.6June 23.1 6.9 3.4 23.1 10.5 4.4July 21.4 6.6 3.1 23.1 9.7 4.4
August 22.9 6.9 3.3 34.0 9.3 4.8September 24.7 7.9 3.8 26.8 10.3 5.1
October 27.8 9.2 4.1 27.3 12.1 5.4November 27.4 10.0 4.4 29.3 12.6 6.0December 31.0 11.0 4.8 31.4 13.6 6.3
Sources:AES40 Grid Point 5622 Wind and Wave Hindcast (July 1, 1954 to June 30, 2004)Husky Manmar Observations (July 12, 2003 through December 1, 2006)
Husky Manmar (82.5m ASL)
Comparison of Monthly Wind Speed Statistics (m/s)AES40 Gridpoint 5622 hindcast data vs Husky Manmar data
AES40 (10m ASL)
Climate of the Husky New Drill Centre
Doc Ref 11824 10
2.4 Tropical Systems The hurricane season normally extends from June through November. While the incidence of tropical depressions, storms, hurricanes or the remnants of such systems is infrequent, the risk of occurrence is greatest between August and October. The frequency of occurrence from tropical systems that have originated in equatorial regions to affect the Northern Grand Banks region in any particular year is low, and varies from none to a few. These systems normally approach the region from the south or southwest. Once formed, a tropical storm or hurricane will maintain its energy as long as a sufficient supply of warm, moist air is available. Tropical storms and hurricanes obtain their energy from latent heat of vapourization that is released during the condensation process. Since the capacity of the air to hold water vapour is dependent on temperature, as the hurricanes move northward over the colder ocean waters, they begin to lose their tropical character, often transforming into vigorous, fast moving extra-tropical cyclones. Conditions on the Northern Grand Banks associated with tropical cyclones and their remnants vary widely from relatively minor events to major storms producing windy wet weather and high waves. Figure 5 shows the historical track of tropical systems that passed within 65 nautical miles of 47 degrees N, 48 degrees W from 1956 to 2005. Table 7 gives the statistical data on these systems. It must be noted a direct comparison should not be drawn between wind speeds given in Table 7 and those in Table 1. The values in Table 7 are the maximum 1-minute mean winds speeds occurring in any sector of the tropical system at the 10-metre reference level as it passes within 65nm of the site and therefore may not be representative of the actual winds that occurred at the site.
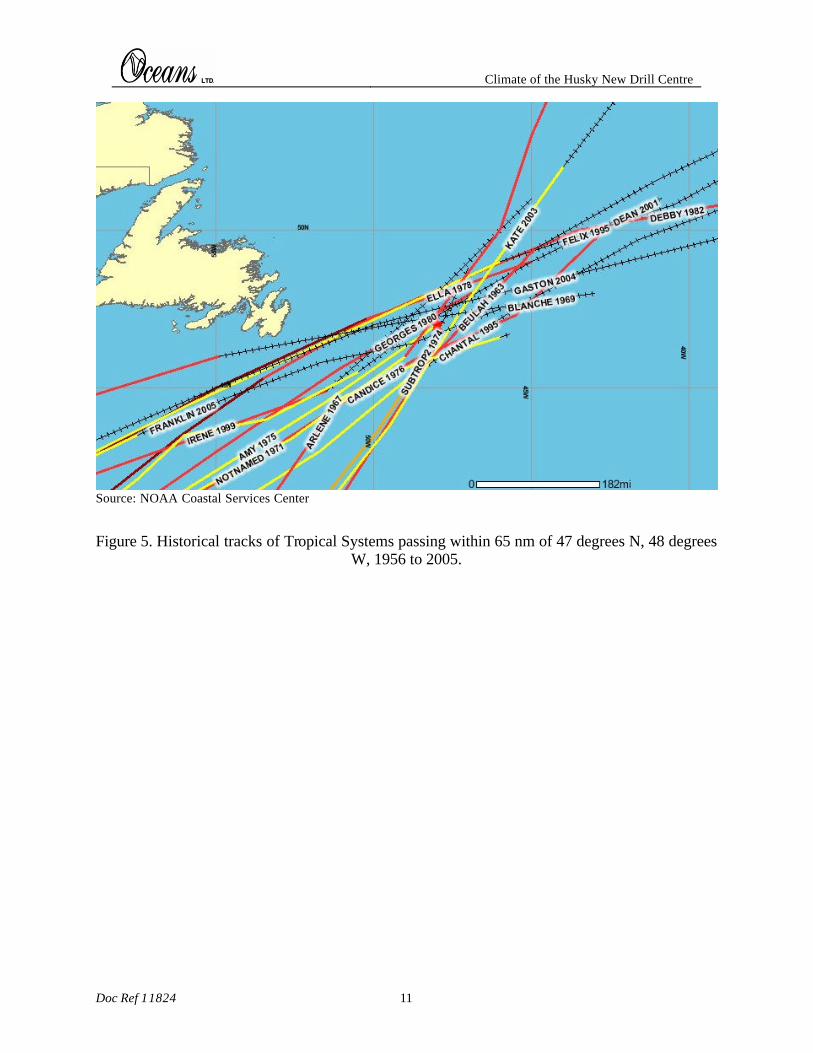
Climate of the Husky New Drill Centre
Doc Ref 11824 11
Source: NOAA Coastal Services Center
Figure 5. Historical tracks of Tropical Systems passing within 65 nm of 47 degrees N, 48 degrees W, 1956 to 2005.
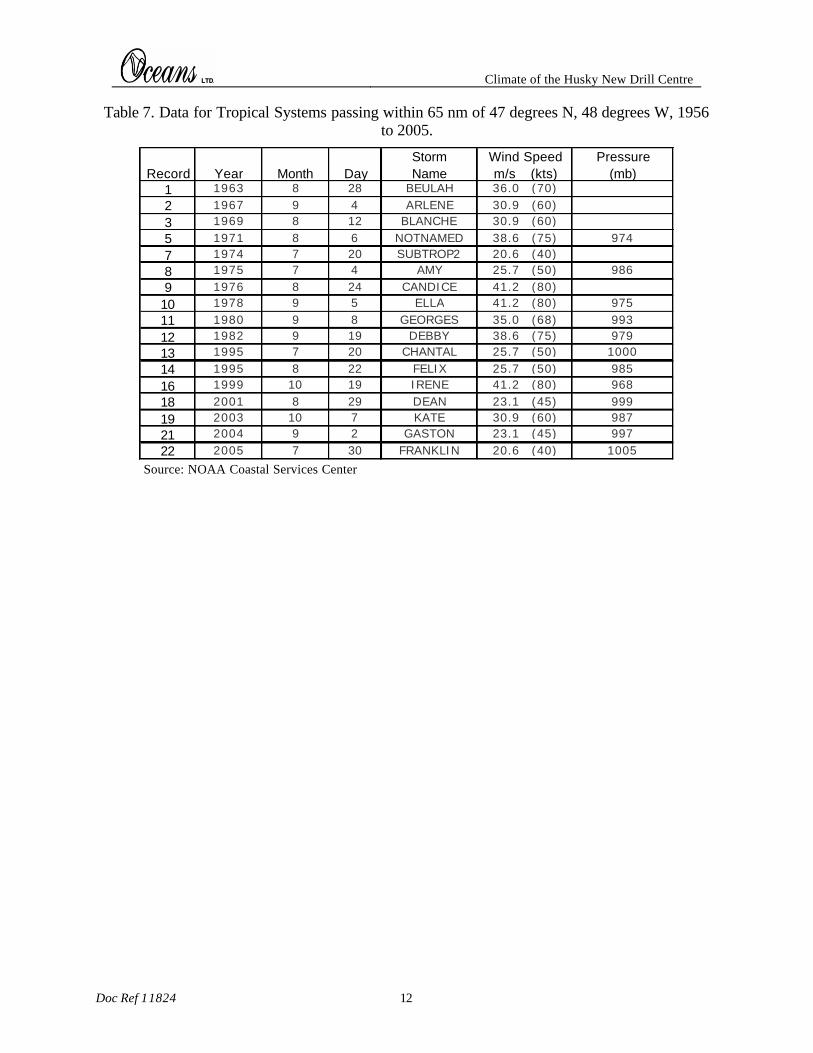
Climate of the Husky New Drill Centre
Doc Ref 11824 12
Table 7. Data for Tropical Systems passing within 65 nm of 47 degrees N, 48 degrees W, 1956 to 2005.
Storm Wind Speed PressureRecord Year Month Day Name m/s (kts) (mb)
1 1963 8 28 BEULAH 36.0 (70)2 1967 9 4 ARLENE 30.9 (60)3 1969 8 12 BLANCHE 30.9 (60)5 1971 8 6 NOTNAMED 38.6 (75) 9747 1974 7 20 SUBTROP2 20.6 (40)8 1975 7 4 AMY 25.7 (50) 9869 1976 8 24 CANDICE 41.2 (80)
10 1978 9 5 ELLA 41.2 (80) 97511 1980 9 8 GEORGES 35.0 (68) 99312 1982 9 19 DEBBY 38.6 (75) 97913 1995 7 20 CHANTAL 25.7 (50) 100014 1995 8 22 FELIX 25.7 (50) 98516 1999 10 19 IRENE 41.2 (80) 96818 2001 8 29 DEAN 23.1 (45) 99919 2003 10 7 KATE 30.9 (60) 98721 2004 9 2 GASTON 23.1 (45) 99722 2005 7 30 FRANKLIN 20.6 (40) 1005
Source: NOAA Coastal Services Center
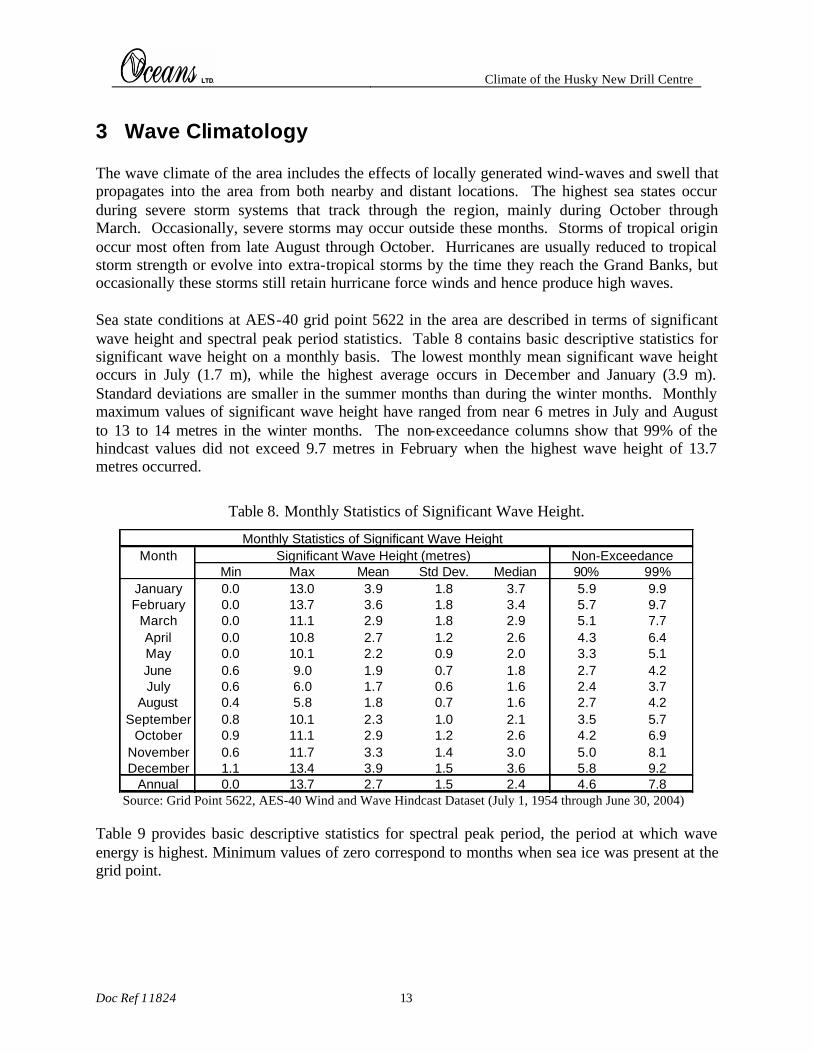
Climate of the Husky New Drill Centre
Doc Ref 11824 13
3 Wave Climatology The wave climate of the area includes the effects of locally generated wind-waves and swell that propagates into the area from both nearby and distant locations. The highest sea states occur during severe storm systems that track through the region, mainly during October through March. Occasionally, severe storms may occur outside these months. Storms of tropical origin occur most often from late August through October. Hurricanes are usually reduced to tropical storm strength or evolve into extra-tropical storms by the time they reach the Grand Banks, but occasionally these storms still retain hurricane force winds and hence produce high waves. Sea state conditions at AES-40 grid point 5622 in the area are described in terms of significant wave height and spectral peak period statistics. Table 8 contains basic descriptive statistics for significant wave height on a monthly basis. The lowest monthly mean significant wave height occurs in July (1.7 m), while the highest average occurs in December and January (3.9 m). Standard deviations are smaller in the summer months than during the winter months. Monthly maximum values of significant wave height have ranged from near 6 metres in July and August to 13 to 14 metres in the winter months. The non-exceedance columns show that 99% of the hindcast values did not exceed 9.7 metres in February when the highest wave height of 13.7 metres occurred.
Table 8. Monthly Statistics of Significant Wave Height.
Monthly Statistics of Significant Wave HeightMonth Significant Wave Height (metres)
Min Max Mean Std Dev. Median 90% 99%January 0.0 13.0 3.9 1.8 3.7 5.9 9.9February 0.0 13.7 3.6 1.8 3.4 5.7 9.7
March 0.0 11.1 2.9 1.8 2.9 5.1 7.7April 0.0 10.8 2.7 1.2 2.6 4.3 6.4May 0.0 10.1 2.2 0.9 2.0 3.3 5.1June 0.6 9.0 1.9 0.7 1.8 2.7 4.2July 0.6 6.0 1.7 0.6 1.6 2.4 3.7
August 0.4 5.8 1.8 0.7 1.6 2.7 4.2September 0.8 10.1 2.3 1.0 2.1 3.5 5.7
October 0.9 11.1 2.9 1.2 2.6 4.2 6.9November 0.6 11.7 3.3 1.4 3.0 5.0 8.1December 1.1 13.4 3.9 1.5 3.6 5.8 9.2
Annual 0.0 13.7 2.7 1.5 2.4 4.6 7.8Source: Grid Point 5622, AES-40 Wind and Wave Hindcast Dataset (July 1, 1954 through June 30, 2004)
Non-Exceedance
Table 9 provides basic descriptive statistics for spectral peak period, the period at which wave energy is highest. Minimum values of zero correspond to months when sea ice was present at the grid point.
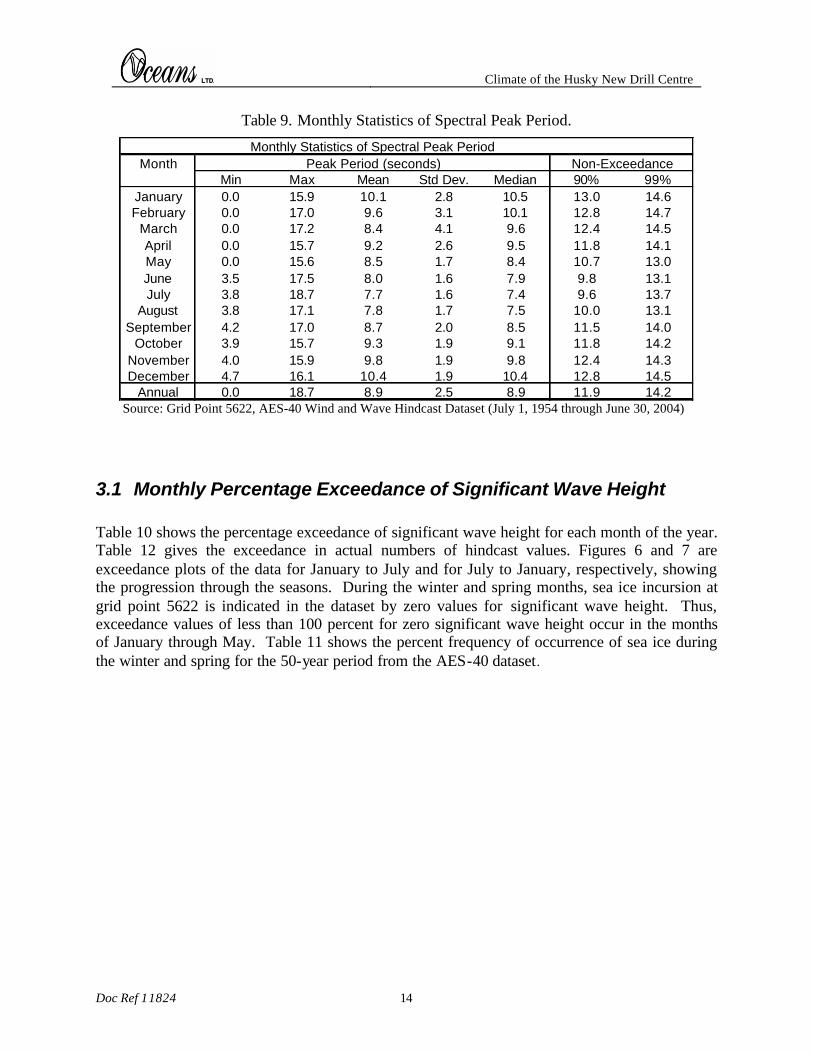
Climate of the Husky New Drill Centre
Doc Ref 11824 14
Table 9. Monthly Statistics of Spectral Peak Period.
Monthly Statistics of Spectral Peak PeriodMonth Peak Period (seconds)
Min Max Mean Std Dev. Median 90% 99%January 0.0 15.9 10.1 2.8 10.5 13.0 14.6February 0.0 17.0 9.6 3.1 10.1 12.8 14.7
March 0.0 17.2 8.4 4.1 9.6 12.4 14.5April 0.0 15.7 9.2 2.6 9.5 11.8 14.1May 0.0 15.6 8.5 1.7 8.4 10.7 13.0June 3.5 17.5 8.0 1.6 7.9 9.8 13.1July 3.8 18.7 7.7 1.6 7.4 9.6 13.7
August 3.8 17.1 7.8 1.7 7.5 10.0 13.1September 4.2 17.0 8.7 2.0 8.5 11.5 14.0
October 3.9 15.7 9.3 1.9 9.1 11.8 14.2November 4.0 15.9 9.8 1.9 9.8 12.4 14.3December 4.7 16.1 10.4 1.9 10.4 12.8 14.5
Annual 0.0 18.7 8.9 2.5 8.9 11.9 14.2Source: Grid Point 5622, AES-40 Wind and Wave Hindcast Dataset (July 1, 1954 through June 30, 2004)
Non-Exceedance
3.1 Monthly Percentage Exceedance of Significant Wave Height Table 10 shows the percentage exceedance of significant wave height for each month of the year. Table 12 gives the exceedance in actual numbers of hindcast values. Figures 6 and 7 are exceedance plots of the data for January to July and for July to January, respectively, showing the progression through the seasons. During the winter and spring months, sea ice incursion at grid point 5622 is indicated in the dataset by zero values for significant wave height. Thus, exceedance values of less than 100 percent for zero significant wave height occur in the months of January through May. Table 11 shows the percent frequency of occurrence of sea ice during the winter and spring for the 50-year period from the AES-40 dataset.
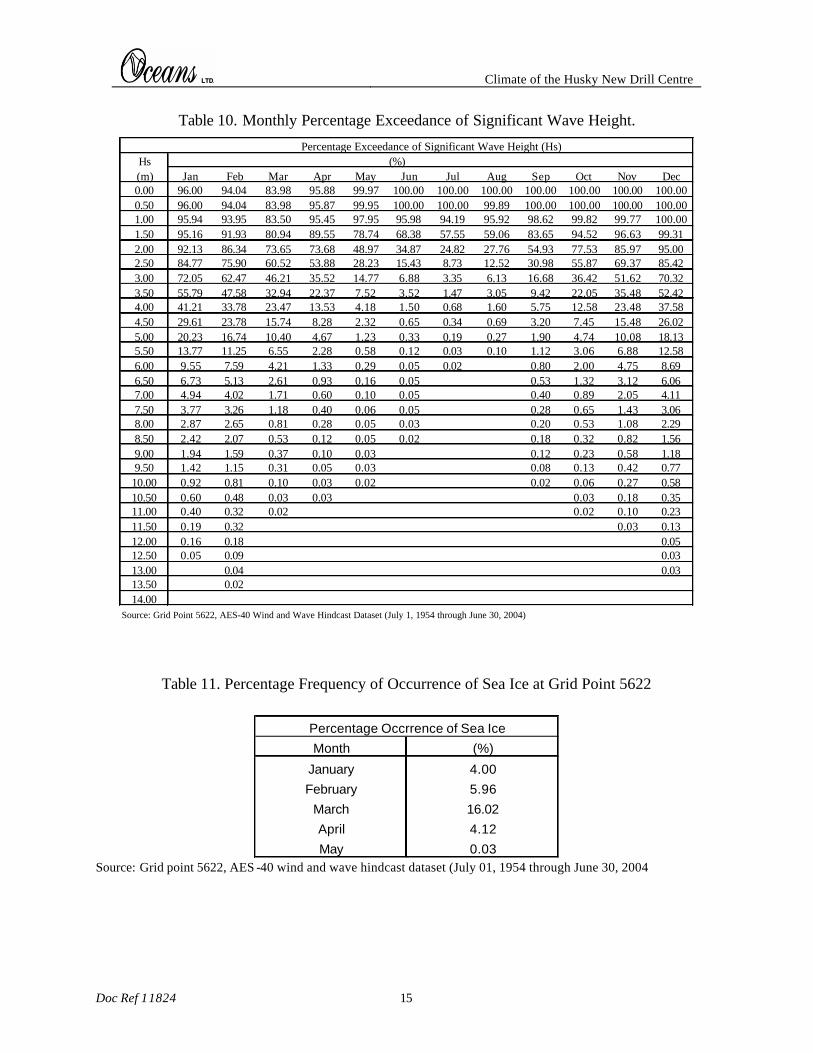
Climate of the Husky New Drill Centre
Doc Ref 11824 15
Table 10. Monthly Percentage Exceedance of Significant Wave Height.
Percentage Exceedance of Significant Wave Height (Hs)Hs (%)(m) Jan Feb Mar Apr May Jun Jul Aug Sep Oct Nov Dec0.00 96.00 94.04 83.98 95.88 99.97 100.00 100.00 100.00 100.00 100.00 100.00 100.000.50 96.00 94.04 83.98 95.87 99.95 100.00 100.00 99.89 100.00 100.00 100.00 100.001.00 95.94 93.95 83.50 95.45 97.95 95.98 94.19 95.92 98.62 99.82 99.77 100.001.50 95.16 91.93 80.94 89.55 78.74 68.38 57.55 59.06 83.65 94.52 96.63 99.312.00 92.13 86.34 73.65 73.68 48.97 34.87 24.82 27.76 54.93 77.53 85.97 95.002.50 84.77 75.90 60.52 53.88 28.23 15.43 8.73 12.52 30.98 55.87 69.37 85.423.00 72.05 62.47 46.21 35.52 14.77 6.88 3.35 6.13 16.68 36.42 51.62 70.323.50 55.79 47.58 32.94 22.37 7.52 3.52 1.47 3.05 9.42 22.05 35.48 52.424.00 41.21 33.78 23.47 13.53 4.18 1.50 0.68 1.60 5.75 12.58 23.48 37.584.50 29.61 23.78 15.74 8.28 2.32 0.65 0.34 0.69 3.20 7.45 15.48 26.025.00 20.23 16.74 10.40 4.67 1.23 0.33 0.19 0.27 1.90 4.74 10.08 18.135.50 13.77 11.25 6.55 2.28 0.58 0.12 0.03 0.10 1.12 3.06 6.88 12.586.00 9.55 7.59 4.21 1.33 0.29 0.05 0.02 0.80 2.00 4.75 8.696.50 6.73 5.13 2.61 0.93 0.16 0.05 0.53 1.32 3.12 6.067.00 4.94 4.02 1.71 0.60 0.10 0.05 0.40 0.89 2.05 4.117.50 3.77 3.26 1.18 0.40 0.06 0.05 0.28 0.65 1.43 3.068.00 2.87 2.65 0.81 0.28 0.05 0.03 0.20 0.53 1.08 2.298.50 2.42 2.07 0.53 0.12 0.05 0.02 0.18 0.32 0.82 1.569.00 1.94 1.59 0.37 0.10 0.03 0.12 0.23 0.58 1.189.50 1.42 1.15 0.31 0.05 0.03 0.08 0.13 0.42 0.77
10.00 0.92 0.81 0.10 0.03 0.02 0.02 0.06 0.27 0.5810.50 0.60 0.48 0.03 0.03 0.03 0.18 0.3511.00 0.40 0.32 0.02 0.02 0.10 0.2311.50 0.19 0.32 0.03 0.1312.00 0.16 0.18 0.0512.50 0.05 0.09 0.0313.00 0.04 0.0313.50 0.0214.00
Source: Grid Point 5622, AES-40 Wind and Wave Hindcast Dataset (July 1, 1954 through June 30, 2004)
Table 11. Percentage Frequency of Occurrence of Sea Ice at Grid Point 5622
Month (%)
January 4.00
February 5.96
March 16.02
April 4.12
May 0.03
Percentage Occrrence of Sea Ice
Source: Grid point 5622, AES -40 wind and wave hindcast dataset (July 01, 1954 through June 30, 2004
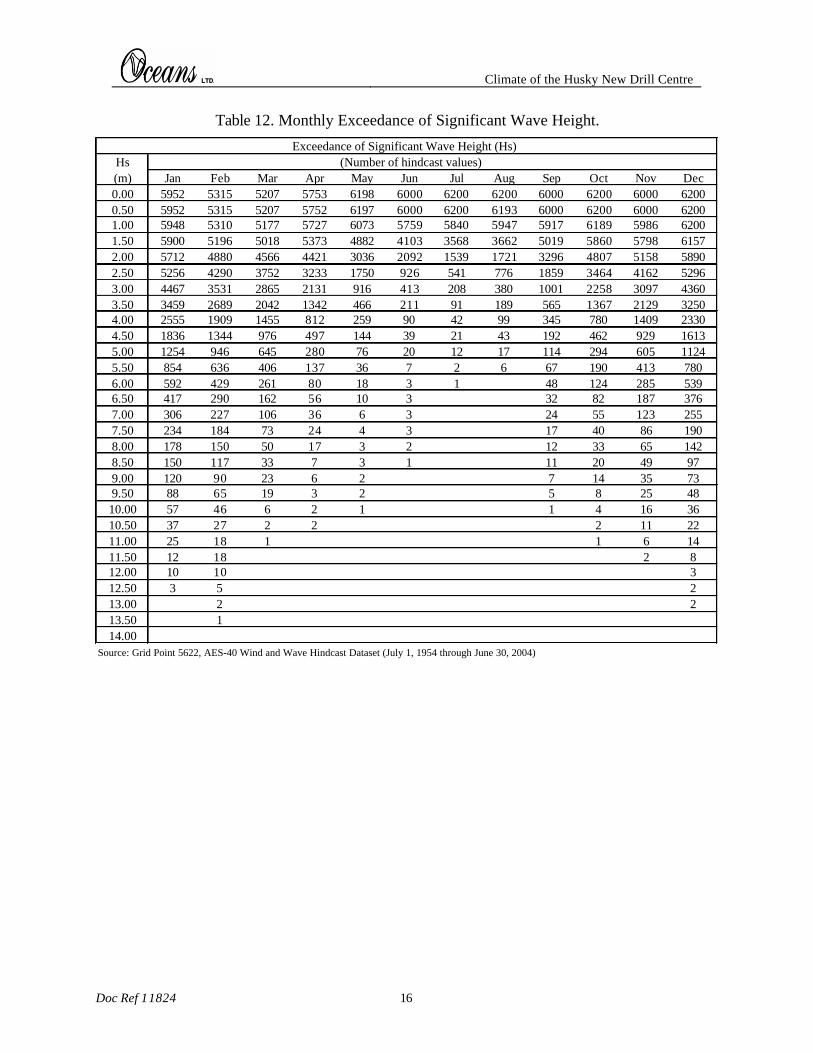
Climate of the Husky New Drill Centre
Doc Ref 11824 16
Table 12. Monthly Exceedance of Significant Wave Height.
Exceedance of Significant Wave Height (Hs)Hs (Number of hindcast values)(m) Jan Feb Mar Apr May Jun Jul Aug Sep Oct Nov Dec0.00 5952 5315 5207 5753 6198 6000 6200 6200 6000 6200 6000 62000.50 5952 5315 5207 5752 6197 6000 6200 6193 6000 6200 6000 62001.00 5948 5310 5177 5727 6073 5759 5840 5947 5917 6189 5986 62001.50 5900 5196 5018 5373 4882 4103 3568 3662 5019 5860 5798 61572.00 5712 4880 4566 4421 3036 2092 1539 1721 3296 4807 5158 58902.50 5256 4290 3752 3233 1750 926 541 776 1859 3464 4162 52963.00 4467 3531 2865 2131 916 413 208 380 1001 2258 3097 43603.50 3459 2689 2042 1342 466 211 91 189 565 1367 2129 32504.00 2555 1909 1455 812 259 90 42 99 345 780 1409 23304.50 1836 1344 976 497 144 39 21 43 192 462 929 16135.00 1254 946 645 280 76 20 12 17 114 294 605 11245.50 854 636 406 137 36 7 2 6 67 190 413 7806.00 592 429 261 80 18 3 1 48 124 285 5396.50 417 290 162 56 10 3 32 82 187 3767.00 306 227 106 36 6 3 24 55 123 2557.50 234 184 73 24 4 3 17 40 86 1908.00 178 150 50 17 3 2 12 33 65 1428.50 150 117 33 7 3 1 11 20 49 979.00 120 90 23 6 2 7 14 35 739.50 88 65 19 3 2 5 8 25 4810.00 57 46 6 2 1 1 4 16 3610.50 37 27 2 2 2 11 2211.00 25 18 1 1 6 1411.50 12 18 2 812.00 10 10 312.50 3 5 213.00 2 213.50 114.00
Source: Grid Point 5622, AES-40 Wind and Wave Hindcast Dataset (July 1, 1954 through June 30, 2004)
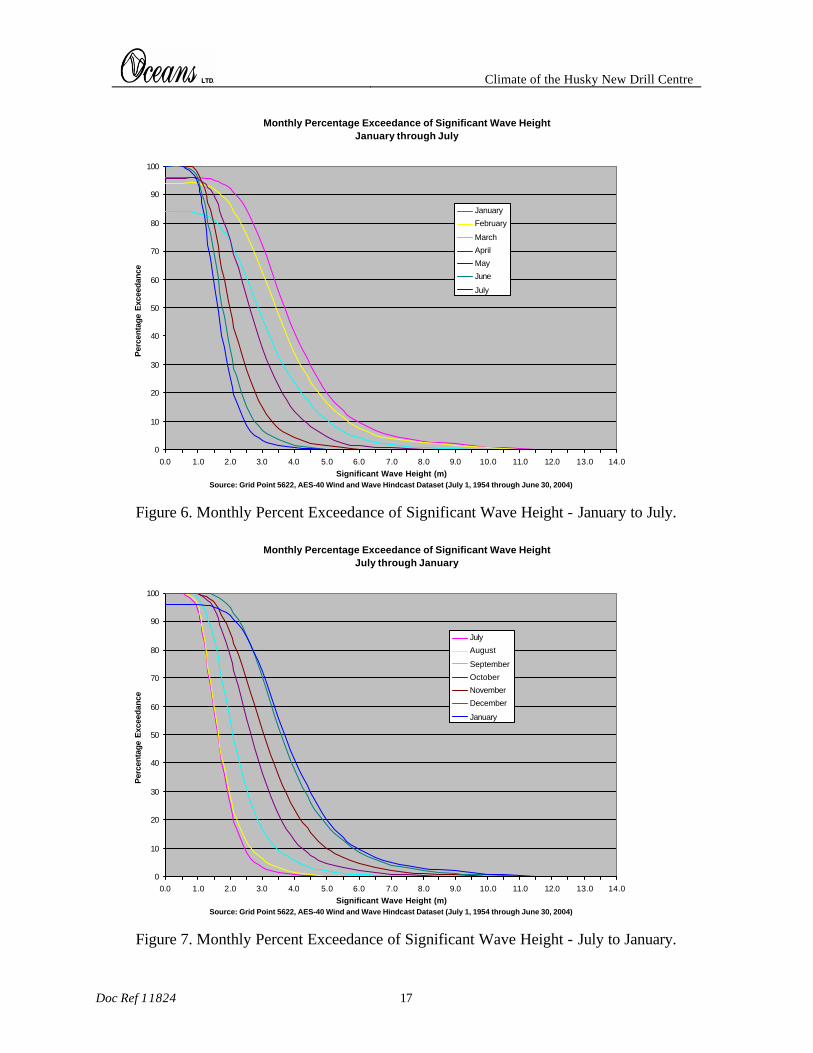
Climate of the Husky New Drill Centre
Doc Ref 11824 17
Monthly Percentage Exceedance of Significant Wave HeightJanuary through July
0
10
20
30
40
50
60
70
80
90
100
0.0 1.0 2.0 3.0 4.0 5.0 6.0 7.0 8.0 9.0 10.0 11.0 12.0 13.0 14.0Significant Wave Height (m)
Source: Grid Point 5622, AES-40 Wind and Wave Hindcast Dataset (July 1, 1954 through June 30, 2004)
Per
cent
age
Exc
eeda
nce
January
February
March
April
May
June
July
Figure 6. Monthly Percent Exceedance of Significant Wave Height - January to July.
Monthly Percentage Exceedance of Significant Wave HeightJuly through January
0
10
20
30
40
50
60
70
80
90
100
0.0 1.0 2.0 3.0 4.0 5.0 6.0 7.0 8.0 9.0 10.0 11.0 12.0 13.0 14.0Significant Wave Height (m)
Source: Grid Point 5622, AES-40 Wind and Wave Hindcast Dataset (July 1, 1954 through June 30, 2004)
Per
cent
age
Exc
eeda
nce
July
August
September
October
November
December
January
Figure 7. Monthly Percent Exceedance of Significant Wave Height - July to January.
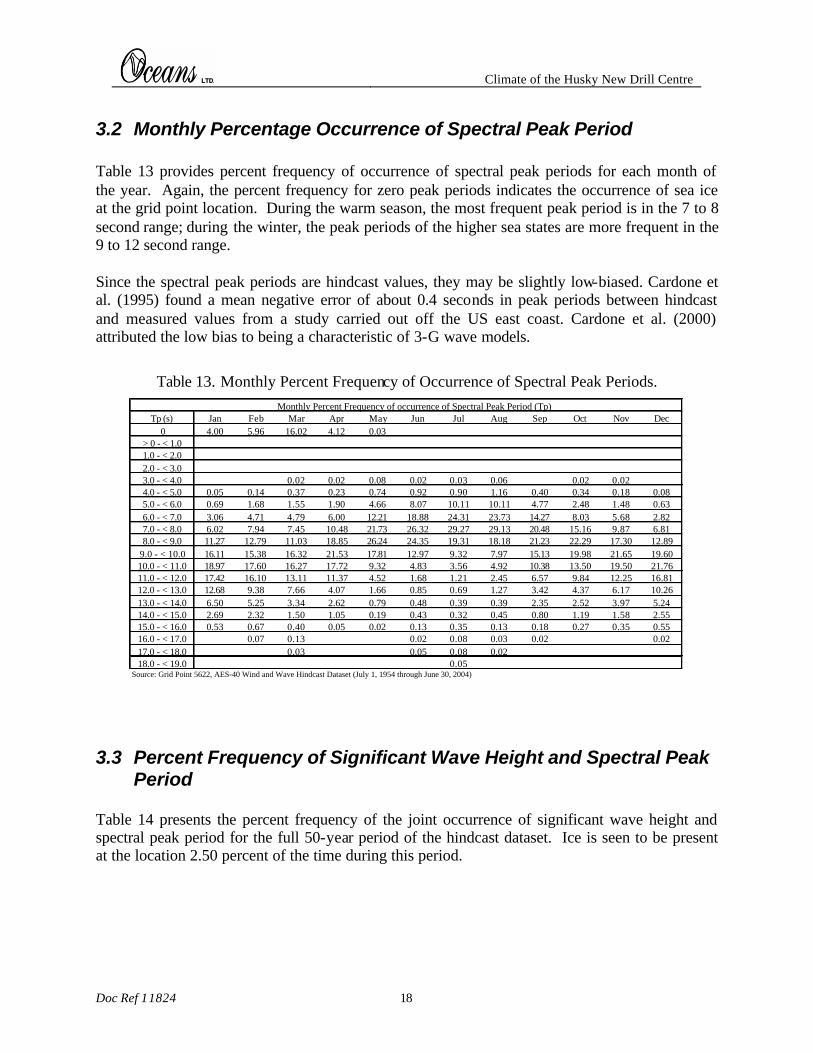
Climate of the Husky New Drill Centre
Doc Ref 11824 18
3.2 Monthly Percentage Occurrence of Spectral Peak Period Table 13 provides percent frequency of occurrence of spectral peak periods for each month of the year. Again, the percent frequency for zero peak periods indicates the occurrence of sea ice at the grid point location. During the warm season, the most frequent peak period is in the 7 to 8 second range; during the winter, the peak periods of the higher sea states are more frequent in the 9 to 12 second range. Since the spectral peak periods are hindcast values, they may be slightly low-biased. Cardone et al. (1995) found a mean negative error of about 0.4 seconds in peak periods between hindcast and measured values from a study carried out off the US east coast. Cardone et al. (2000) attributed the low bias to being a characteristic of 3-G wave models.
Table 13. Monthly Percent Frequency of Occurrence of Spectral Peak Periods. Monthly Percent Frequency of occurrence of Spectral Peak Period (Tp)
Tp (s) Jan Feb Mar Apr May Jun Jul Aug Sep Oct Nov Dec0 4.00 5.96 16.02 4.12 0.03
> 0 - < 1.01.0 - < 2.02.0 - < 3.03.0 - < 4.0 0.02 0.02 0.08 0.02 0.03 0.06 0.02 0.024.0 - < 5.0 0.05 0.14 0.37 0.23 0.74 0.92 0.90 1.16 0.40 0.34 0.18 0.085.0 - < 6.0 0.69 1.68 1.55 1.90 4.66 8.07 10.11 10.11 4.77 2.48 1.48 0.636.0 - < 7.0 3.06 4.71 4.79 6.00 12.21 18.88 24.31 23.73 14.27 8.03 5.68 2.827.0 - < 8.0 6.02 7.94 7.45 10.48 21.73 26.32 29.27 29.13 20.48 15.16 9.87 6.818.0 - < 9.0 11.27 12.79 11.03 18.85 26.24 24.35 19.31 18.18 21.23 22.29 17.30 12.89
9.0 - < 10.0 16.11 15.38 16.32 21.53 17.81 12.97 9.32 7.97 15.13 19.98 21.65 19.6010.0 - < 11.0 18.97 17.60 16.27 17.72 9.32 4.83 3.56 4.92 10.38 13.50 19.50 21.7611.0 - < 12.0 17.42 16.10 13.11 11.37 4.52 1.68 1.21 2.45 6.57 9.84 12.25 16.8112.0 - < 13.0 12.68 9.38 7.66 4.07 1.66 0.85 0.69 1.27 3.42 4.37 6.17 10.2613.0 - < 14.0 6.50 5.25 3.34 2.62 0.79 0.48 0.39 0.39 2.35 2.52 3.97 5.2414.0 - < 15.0 2.69 2.32 1.50 1.05 0.19 0.43 0.32 0.45 0.80 1.19 1.58 2.5515.0 - < 16.0 0.53 0.67 0.40 0.05 0.02 0.13 0.35 0.13 0.18 0.27 0.35 0.5516.0 - < 17.0 0.07 0.13 0.02 0.08 0.03 0.02 0.0217.0 - < 18.0 0.03 0.05 0.08 0.0218.0 - < 19.0 0.05
Source: Grid Point 5622, AES-40 Wind and Wave Hindcast Dataset (July 1, 1954 through June 30, 2004)
3.3 Percent Frequency of Significant Wave Height and Spectral Peak Period
Table 14 presents the percent frequency of the joint occurrence of significant wave height and spectral peak period for the full 50-year period of the hindcast dataset. Ice is seen to be present at the location 2.50 percent of the time during this period.
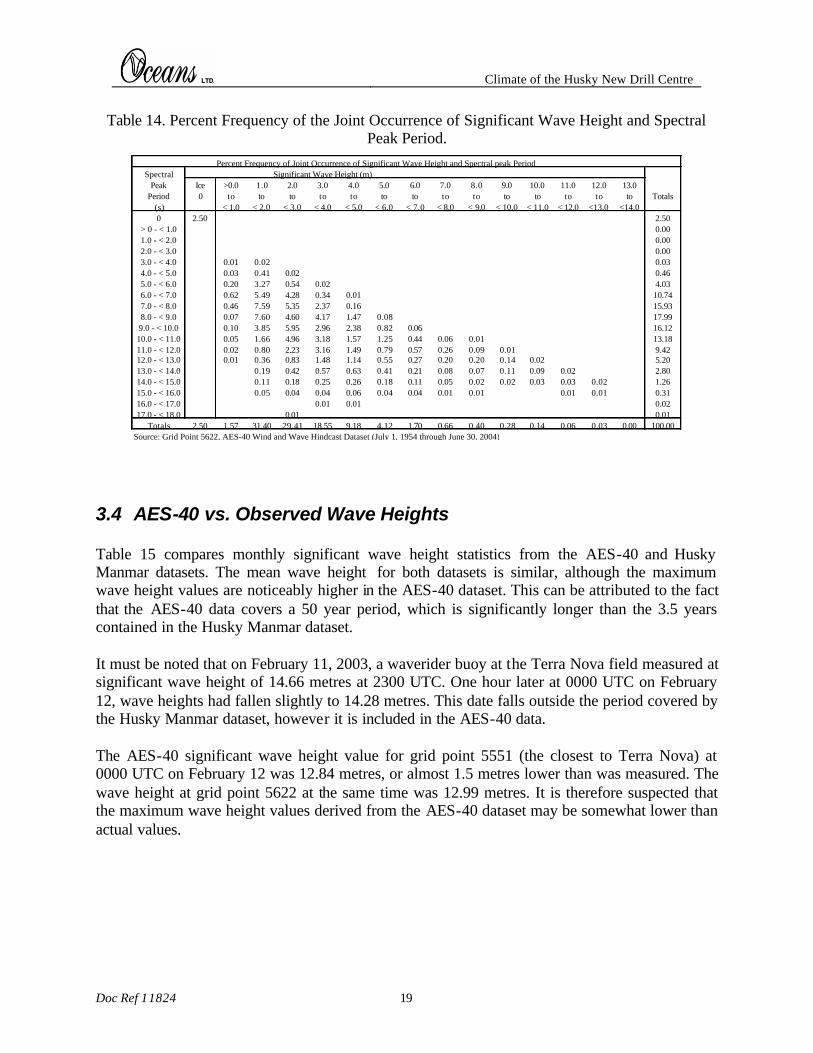
Climate of the Husky New Drill Centre
Doc Ref 11824 19
Table 14. Percent Frequency of the Joint Occurrence of Significant Wave Height and Spectral Peak Period.
Percent Frequency of Joint Occurrence of Significant Wave Height and Spectral peak PeriodSpectral Significant Wave Height (m)
Peak Ice >0.0 1.0 2.0 3.0 4.0 5.0 6.0 7.0 8.0 9.0 10.0 11.0 12.0 13.0Period 0 to to to to to to to to to to to to to to Totals
(s) < 1.0 < 2.0 < 3.0 < 4.0 < 5.0 < 6.0 < 7.0 < 8.0 < 9.0 < 10.0 < 11.0 < 12.0 <13.0 <14.00 2.50 2.50
> 0 - < 1.0 0.001.0 - < 2.0 0.002.0 - < 3.0 0.003.0 - < 4.0 0.01 0.02 0.034.0 - < 5.0 0.03 0.41 0.02 0.465.0 - < 6.0 0.20 3.27 0.54 0.02 4.036.0 - < 7.0 0.62 5.49 4.28 0.34 0.01 10.747.0 - < 8.0 0.46 7.59 5.35 2.37 0.16 15.938.0 - < 9.0 0.07 7.60 4.60 4.17 1.47 0.08 17.999.0 - < 10.0 0.10 3.85 5.95 2.96 2.38 0.82 0.06 16.1210.0 - < 11.0 0.05 1.66 4.96 3.18 1.57 1.25 0.44 0.06 0.01 13.1811.0 - < 12.0 0.02 0.80 2.23 3.16 1.49 0.79 0.57 0.26 0.09 0.01 9.4212.0 - < 13.0 0.01 0.36 0.83 1.48 1.14 0.55 0.27 0.20 0.20 0.14 0.02 5.2013.0 - < 14.0 0.19 0.42 0.57 0.63 0.41 0.21 0.08 0.07 0.11 0.09 0.02 2.8014.0 - < 15.0 0.11 0.18 0.25 0.26 0.18 0.11 0.05 0.02 0.02 0.03 0.03 0.02 1.2615.0 - < 16.0 0.05 0.04 0.04 0.06 0.04 0.04 0.01 0.01 0.01 0.01 0.3116.0 - < 17.0 0.01 0.01 0.0217.0 - < 18.0 0.01 0.01
Totals 2.50 1.57 31.40 29.41 18.55 9.18 4.12 1.70 0.66 0.40 0.28 0.14 0.06 0.03 0.00 100.00Source: Grid Point 5622, AES-40 Wind and Wave Hindcast Dataset (July 1, 1954 through June 30, 2004)
3.4 AES-40 vs. Observed Wave Heights Table 15 compares monthly significant wave height statistics from the AES-40 and Husky Manmar datasets. The mean wave height for both datasets is similar, although the maximum wave height values are noticeably higher in the AES-40 dataset. This can be attributed to the fact that the AES-40 data covers a 50 year period, which is significantly longer than the 3.5 years contained in the Husky Manmar dataset. It must be noted that on February 11, 2003, a waverider buoy at the Terra Nova field measured at significant wave height of 14.66 metres at 2300 UTC. One hour later at 0000 UTC on February 12, wave heights had fallen slightly to 14.28 metres. This date falls outside the period covered by the Husky Manmar dataset, however it is included in the AES-40 data. The AES-40 significant wave height value for grid point 5551 (the closest to Terra Nova) at 0000 UTC on February 12 was 12.84 metres, or almost 1.5 metres lower than was measured. The wave height at grid point 5622 at the same time was 12.99 metres. It is therefore suspected that the maximum wave height values derived from the AES-40 dataset may be somewhat lower than actual values.
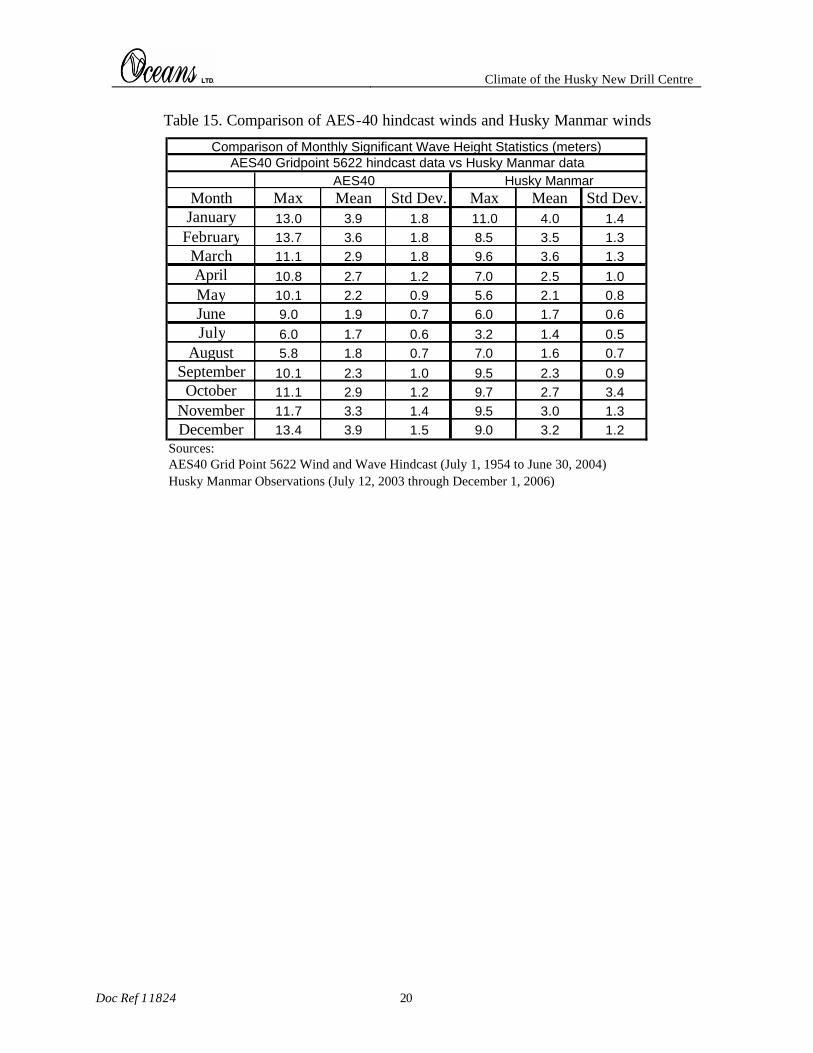
Climate of the Husky New Drill Centre
Doc Ref 11824 20
Table 15. Comparison of AES-40 hindcast winds and Husky Manmar winds
Month Max Mean Std Dev. Max Mean Std Dev.January 13.0 3.9 1.8 11.0 4.0 1.4
February 13.7 3.6 1.8 8.5 3.5 1.3March 11.1 2.9 1.8 9.6 3.6 1.3April 10.8 2.7 1.2 7.0 2.5 1.0May 10.1 2.2 0.9 5.6 2.1 0.8June 9.0 1.9 0.7 6.0 1.7 0.6July 6.0 1.7 0.6 3.2 1.4 0.5
August 5.8 1.8 0.7 7.0 1.6 0.7September 10.1 2.3 1.0 9.5 2.3 0.9
October 11.1 2.9 1.2 9.7 2.7 3.4November 11.7 3.3 1.4 9.5 3.0 1.3December 13.4 3.9 1.5 9.0 3.2 1.2
Sources:AES40 Grid Point 5622 Wind and Wave Hindcast (July 1, 1954 to June 30, 2004)Husky Manmar Observations (July 12, 2003 through December 1, 2006)
Husky Manmar
Comparison of Monthly Significant Wave Height Statistics (meters)AES40 Gridpoint 5622 hindcast data vs Husky Manmar data
AES40
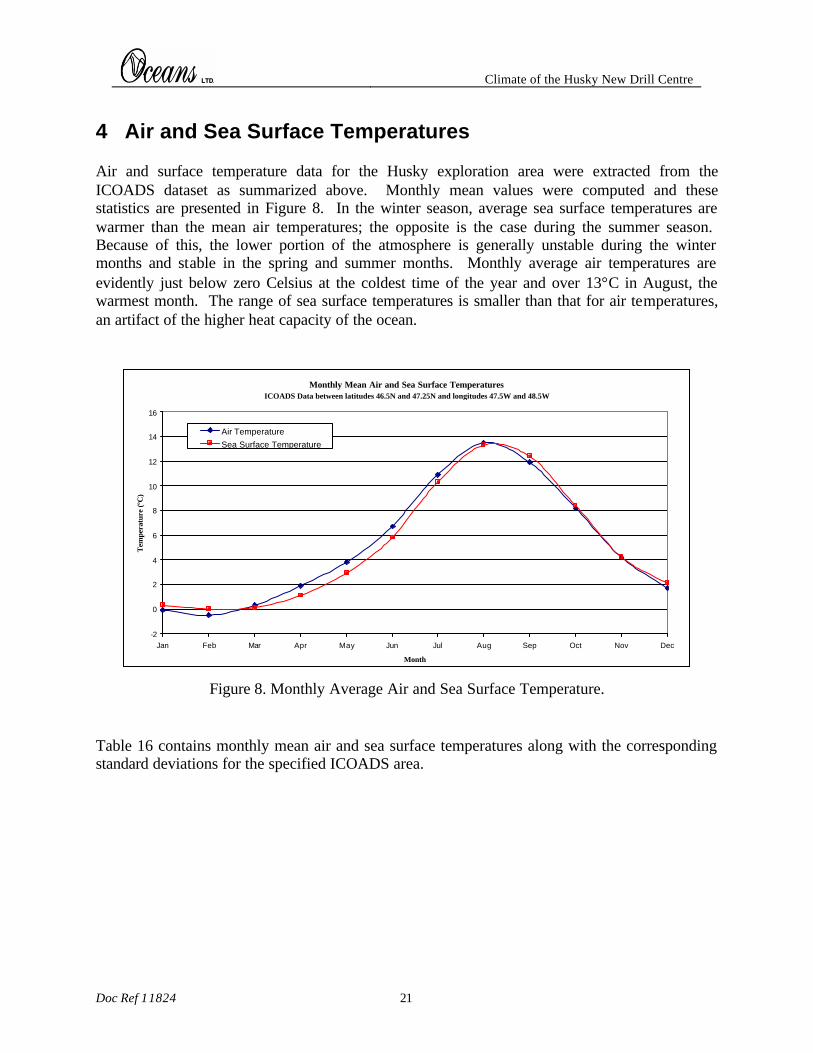
Climate of the Husky New Drill Centre
Doc Ref 11824 21
4 Air and Sea Surface Temperatures Air and surface temperature data for the Husky exploration area were extracted from the ICOADS dataset as summarized above. Monthly mean values were computed and these statistics are presented in Figure 8. In the winter season, average sea surface temperatures are warmer than the mean air temperatures; the opposite is the case during the summer season. Because of this, the lower portion of the atmosphere is generally unstable during the winter months and stable in the spring and summer months. Monthly average air temperatures are evidently just below zero Celsius at the coldest time of the year and over 13°C in August, the warmest month. The range of sea surface temperatures is smaller than that for air temperatures, an artifact of the higher heat capacity of the ocean.
Monthly Mean Air and Sea Surface TemperaturesICOADS Data between latitudes 46.5N and 47.25N and longitudes 47.5W and 48.5W
-2
0
2
4
6
8
10
12
14
16
Jan Feb Mar Apr May Jun Jul Aug Sep Oct Nov Dec
Month
Tem
pera
ture
(ºC
)
Air TemperatureSea Surface Temperature
Figure 8. Monthly Average Air and Sea Surface Temperature. Table 16 contains monthly mean air and sea surface temperatures along with the corresponding standard deviations for the specified ICOADS area.
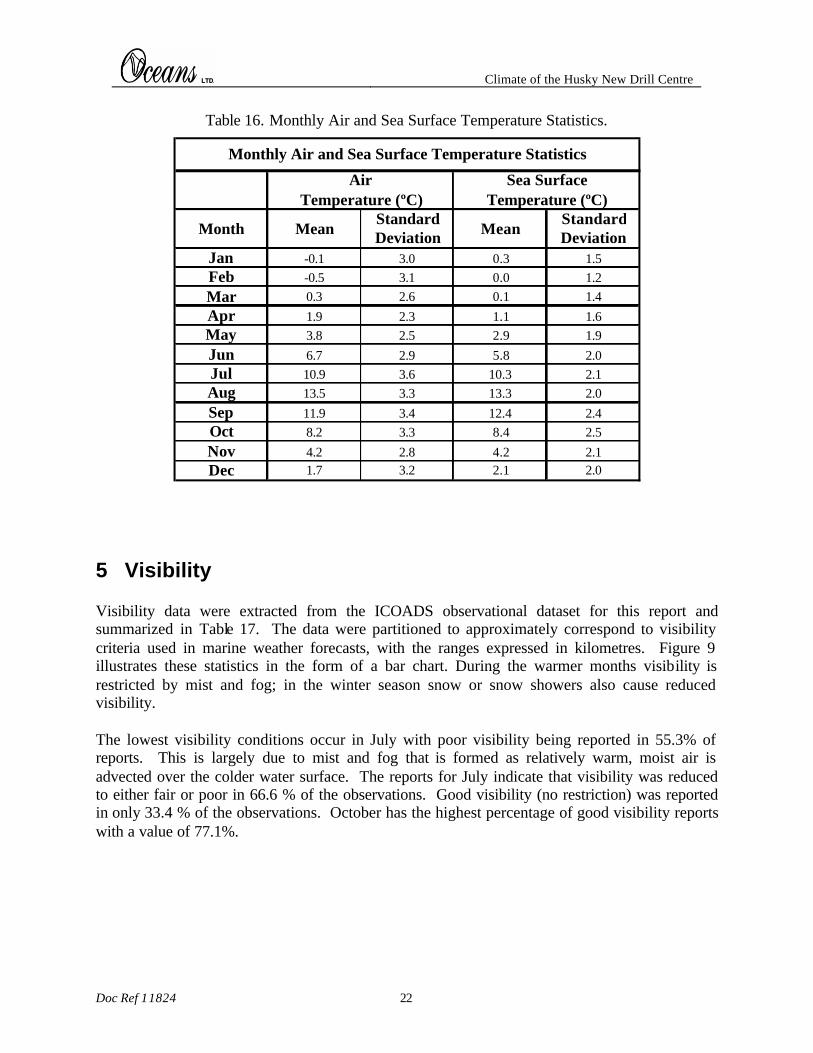
Climate of the Husky New Drill Centre
Doc Ref 11824 22
Table 16. Monthly Air and Sea Surface Temperature Statistics.
Standard StandardDeviation Deviation
Jan -0.1 3.0 0.3 1.5Feb -0.5 3.1 0.0 1.2Mar 0.3 2.6 0.1 1.4Apr 1.9 2.3 1.1 1.6May 3.8 2.5 2.9 1.9Jun 6.7 2.9 5.8 2.0Jul 10.9 3.6 10.3 2.1Aug 13.5 3.3 13.3 2.0Sep 11.9 3.4 12.4 2.4Oct 8.2 3.3 8.4 2.5Nov 4.2 2.8 4.2 2.1Dec 1.7 3.2 2.1 2.0
Mean Mean
Temperature (ºC)
Month
Temperature (ºC)
Monthly Air and Sea Surface Temperature Statistics
Air Sea Surface
5 Visibility Visibility data were extracted from the ICOADS observational dataset for this report and summarized in Table 17. The data were partitioned to approximately correspond to visibility criteria used in marine weather forecasts, with the ranges expressed in kilometres. Figure 9 illustrates these statistics in the form of a bar chart. During the warmer months visibility is restricted by mist and fog; in the winter season snow or snow showers also cause reduced visibility. The lowest visibility conditions occur in July with poor visibility being reported in 55.3% of reports. This is largely due to mist and fog that is formed as relatively warm, moist air is advected over the colder water surface. The reports for July indicate that visibility was reduced to either fair or poor in 66.6 % of the observations. Good visibility (no restriction) was reported in only 33.4 % of the observations. October has the highest percentage of good visibility reports with a value of 77.1%.
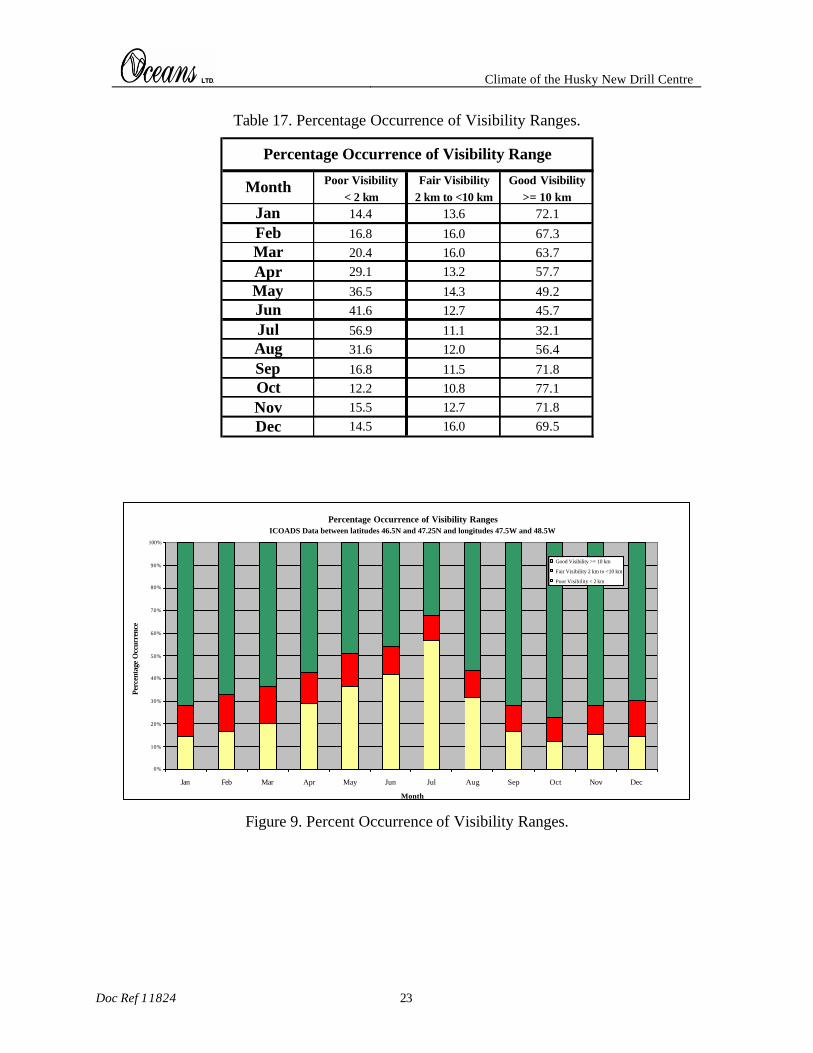
Climate of the Husky New Drill Centre
Doc Ref 11824 23
Table 17. Percentage Occurrence of Visibility Ranges.
Poor Visibility Fair Visibility Good Visibility< 2 km 2 km to <10 km >= 10 km
Jan 14.4 13.6 72.1Feb 16.8 16.0 67.3Mar 20.4 16.0 63.7Apr 29.1 13.2 57.7May 36.5 14.3 49.2Jun 41.6 12.7 45.7Jul 56.9 11.1 32.1Aug 31.6 12.0 56.4Sep 16.8 11.5 71.8Oct 12.2 10.8 77.1Nov 15.5 12.7 71.8Dec 14.5 16.0 69.5
Percentage Occurrence of Visibility Range
Month
Percentage Occurrence of Visibility RangesICOADS Data between latitudes 46.5N and 47.25N and longitudes 47.5W and 48.5W
0%
10%
20%
30%
40%
50%
60%
70%
80%
90%
100%
Jan Feb Mar Apr May Jun Jul Aug Sep Oct Nov Dec
Month
Perc
enta
ge O
ccur
renc
e
Good Visibility >= 10 km
Fair Visibility 2 km to <10 km
Poor Visibility < 2 km
Figure 9. Percent Occurrence of Visibility Ranges.
Climate of the Husky New Drill Centre
Doc Ref 11824 24
6 Wind and Wave Extremal Value Analysis The wind and wave extremal analysis was carried out from the AES-40 data set at grid point 5622 for 50 years of data between July 1, 1954 and June 30, 2004. Grid point 5622 is located at 46.88°N; 48.33°W, the closest grid point to the study area. The data has been generated using time steps of 6 hours. In some storms, particularly those of short duration, the peak winds may get missed due to the length of the sampling period. A shorter sampling period would be more desirable. However, the AES-40 data set has been a major improvement over previous data sets because of the many years of continuous data. The extreme values for wind and waves were calculated using the peak-over-threshold method; and after considering four different distributions, the Gumbel Distribution was chosen as the most appropriate because it gave the best fit to the data. A sensitivity analysis was carried out to determine how many storms to use in the analysis, because the extreme values can vary depending on how well the data fits the distribution function. The sensitivity analysis showed that the Gumbel Distribution had a good fit using 228 storms when all the data was considered in calculating the yearly extremes. For monthly extremes the top 55 storms were used in the analysis. This number of storms was chosen in order to give a consistent threshold value for waves during the winter months as compared to all months combined. This represents a significant wave height threshold value of 8.0 m. A plot of the correlation coefficient versus the number of storms is shown in Figure 10.
6.1 Extreme Value Estimates for Winds from a Gumbel Distribution The extreme value estimates for wind were calculated using Oceanweather’s software programs for return periods of 1-year, 10-years, 25-years, 50-years and 100-years. The values calculated for each month and all months combined are given in Table 18. The extreme value analysis used hourly wind values for the reference height of 10-metres above sea level. The 10-minute and 1-minute winds were calculated from the 1-hour mean values using a constant ratio of 1.06 and 1.22 respectively (U.S. Geological Survey 1979). The 100-year extreme wind speed was 31.2 m/s. The 1-year, 10-year, 25-year, and 50-year extreme wind speeds were 24.4 m/s, 27.8 m/s, 29.2 m/s, and 30.2 m/s, respectively. These values may be slightly underestimated due to the 6-hour time interval in the data. It is highly probable that some of the peaks in the wind speed have been missed by the hindcasting methodology. The distribution fits for the wind data values using the 228 storms for the Gumbel distribution are presented in Figure 11.
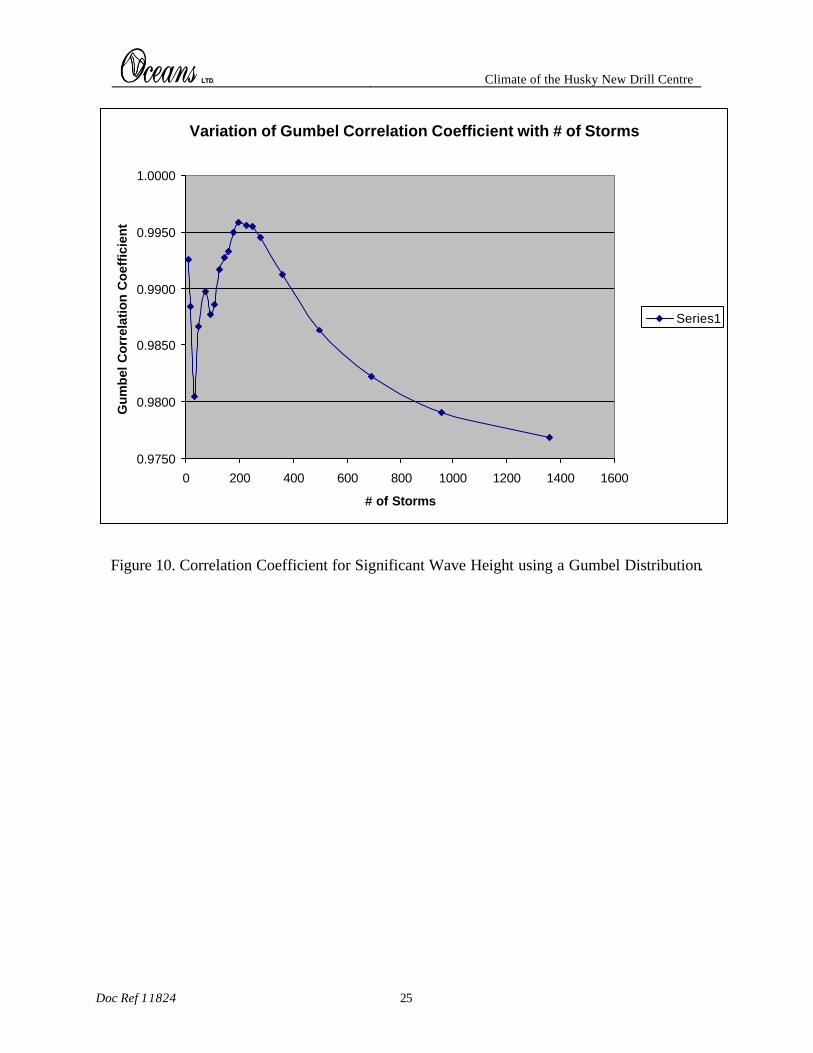
Climate of the Husky New Drill Centre
Doc Ref 11824 25
Variation of Gumbel Correlation Coefficient with # of Storms
0.9750
0.9800
0.9850
0.9900
0.9950
1.0000
0 200 400 600 800 1000 1200 1400 1600
# of Storms
Gu
mb
el C
orr
elat
ion
Co
effic
ien
t
Series1
Figure 10. Correlation Coefficient for Significant Wave Height using a Gumbel Distribution.
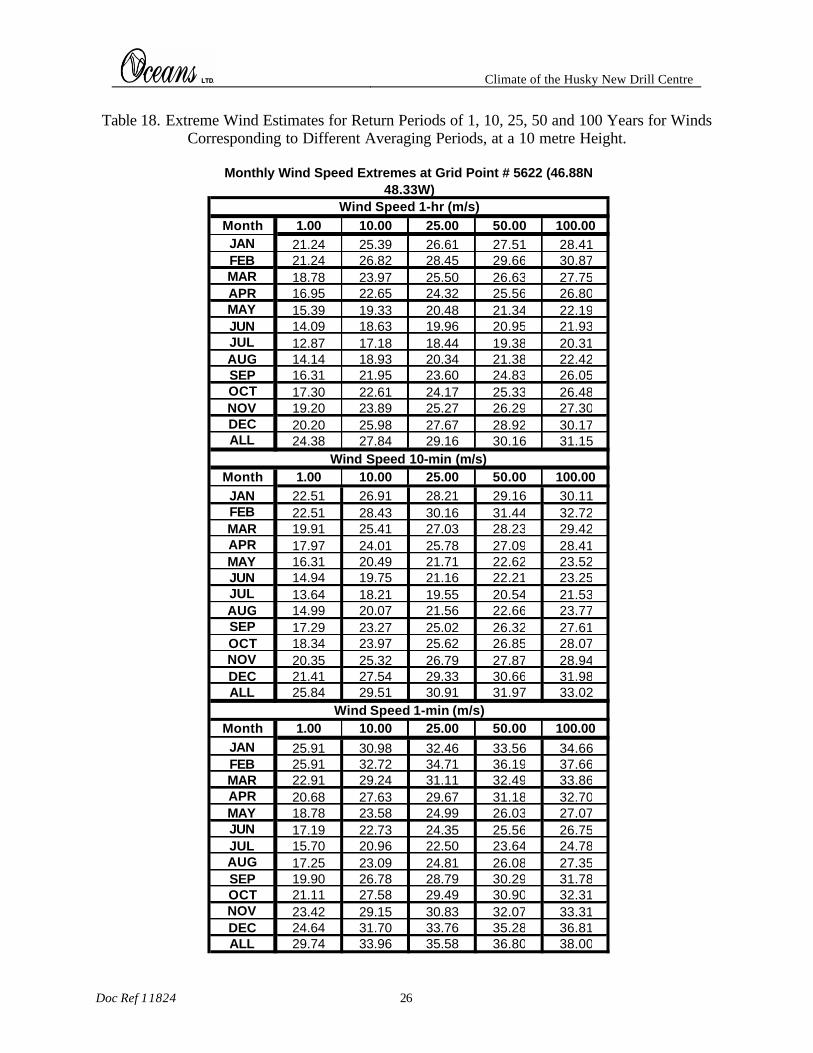
Climate of the Husky New Drill Centre
Doc Ref 11824 26
Table 18. Extreme Wind Estimates for Return Periods of 1, 10, 25, 50 and 100 Years for Winds Corresponding to Different Averaging Periods, at a 10 metre Height.
Month 1.00 10.00 25.00 50.00 100.00JAN 21.24 25.39 26.61 27.51 28.41FEB 21.24 26.82 28.45 29.66 30.87MAR 18.78 23.97 25.50 26.63 27.75APR 16.95 22.65 24.32 25.56 26.80MAY 15.39 19.33 20.48 21.34 22.19JUN 14.09 18.63 19.96 20.95 21.93JUL 12.87 17.18 18.44 19.38 20.31AUG 14.14 18.93 20.34 21.38 22.42SEP 16.31 21.95 23.60 24.83 26.05OCT 17.30 22.61 24.17 25.33 26.48NOV 19.20 23.89 25.27 26.29 27.30DEC 20.20 25.98 27.67 28.92 30.17ALL 24.38 27.84 29.16 30.16 31.15
Month 1.00 10.00 25.00 50.00 100.00JAN 22.51 26.91 28.21 29.16 30.11FEB 22.51 28.43 30.16 31.44 32.72MAR 19.91 25.41 27.03 28.23 29.42APR 17.97 24.01 25.78 27.09 28.41MAY 16.31 20.49 21.71 22.62 23.52JUN 14.94 19.75 21.16 22.21 23.25JUL 13.64 18.21 19.55 20.54 21.53AUG 14.99 20.07 21.56 22.66 23.77SEP 17.29 23.27 25.02 26.32 27.61OCT 18.34 23.97 25.62 26.85 28.07NOV 20.35 25.32 26.79 27.87 28.94DEC 21.41 27.54 29.33 30.66 31.98ALL 25.84 29.51 30.91 31.97 33.02
Month 1.00 10.00 25.00 50.00 100.00JAN 25.91 30.98 32.46 33.56 34.66FEB 25.91 32.72 34.71 36.19 37.66MAR 22.91 29.24 31.11 32.49 33.86APR 20.68 27.63 29.67 31.18 32.70MAY 18.78 23.58 24.99 26.03 27.07JUN 17.19 22.73 24.35 25.56 26.75JUL 15.70 20.96 22.50 23.64 24.78AUG 17.25 23.09 24.81 26.08 27.35SEP 19.90 26.78 28.79 30.29 31.78OCT 21.11 27.58 29.49 30.90 32.31NOV 23.42 29.15 30.83 32.07 33.31DEC 24.64 31.70 33.76 35.28 36.81ALL 29.74 33.96 35.58 36.80 38.00
Monthly Wind Speed Extremes at Grid Point # 5622 (46.88N 48.33W)
Wind Speed 1-min (m/s)
Wind Speed 10-min (m/s)
Wind Speed 1-hr (m/s)
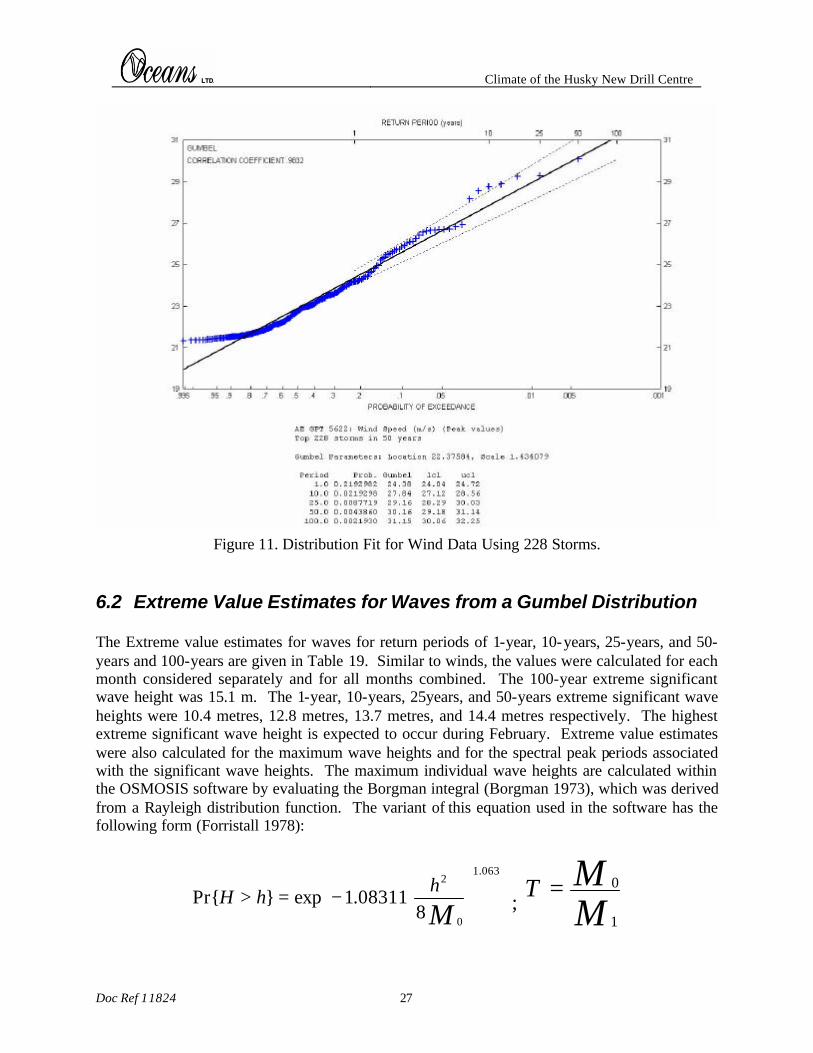
Climate of the Husky New Drill Centre
Doc Ref 11824 27
Figure 11. Distribution Fit for Wind Data Using 228 Storms.
6.2 Extreme Value Estimates for Waves from a Gumbel Distribution The Extreme value estimates for waves for return periods of 1-year, 10-years, 25-years, and 50-years and 100-years are given in Table 19. Similar to winds, the values were calculated for each month considered separately and for all months combined. The 100-year extreme significant wave height was 15.1 m. The 1-year, 10-years, 25years, and 50-years extreme significant wave heights were 10.4 metres, 12.8 metres, 13.7 metres, and 14.4 metres respectively. The highest extreme significant wave height is expected to occur during February. Extreme value estimates were also calculated for the maximum wave heights and for the spectral peak periods associated with the significant wave heights. The maximum individual wave heights are calculated within the OSMOSIS software by evaluating the Borgman integral (Borgman 1973), which was derived from a Rayleigh distribution function. The variant of this equation used in the software has the following form (Forristall 1978):
−=>
063.1
0
2
808311.1exp}Pr{
Mh
hH ; MMT
1
0=
Climate of the Husky New Drill Centre
Doc Ref 11824 28
where h is the significant wave height, T is the wave period, M0 and M1 are the first and second spectral moments of the total spectrum. The associated peak periods are calculated by plotting the peak periods of the chosen storm peak values versus the corresponding significant wave heights. This plot is fitted to a power function (y = axb), and the resulting equation is used to calculate the peak periods associated with the extreme values of significant wave height. The extreme significant wave heights, maximum wave heights, and associated peak periods are presented in Table 19. A graph showing how well the Gumbel Distribution fit the significant wave height data for selected 228 storms is presented in Figure 12. The calculated extreme values of significant wave height compare reasonably well to observed data. For example, the value of 14.4 metres for the 50-year extreme significant wave height was very close to the values observed during a recent extreme storm event. On February 11, 2003, a very intense storm moved across the Grand Banks. A waverider buoy in the area recorded a peak significant wave height of 14.66 metres. This is only slightly higher than 50-year return period derived from the Gumbel distribution in this report. A storm with a return period of 50 years means that the calculated significant wave height will occur once every 50 years, averaged over a long period of time. It is entirely possible that this event was a 50-year or even 100-year storm, as it was the highest recorded significant wave height in a near continuous waverider data set extending back to early 1999. The previous highest recorded va lue in this data set was 12.47 metres. If more occurrences of an event of this magnitude are observed, the calculated statistics would consequently begin to increase.
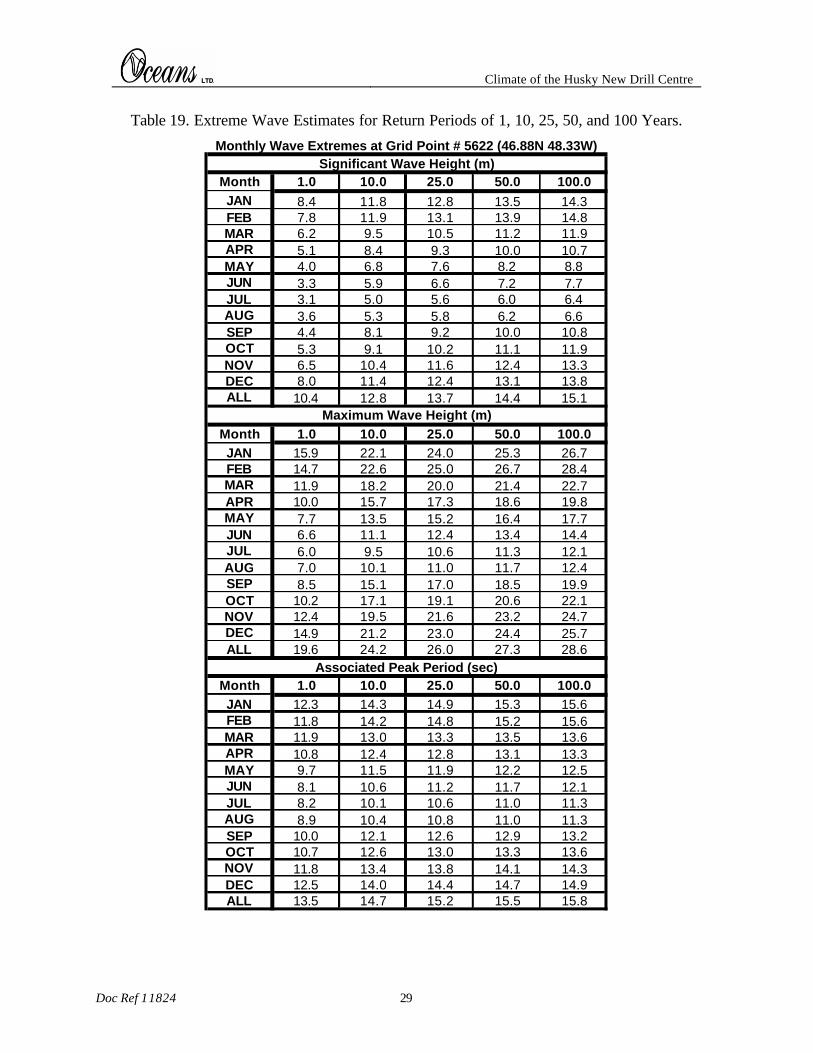
Climate of the Husky New Drill Centre
Doc Ref 11824 29
Table 19. Extreme Wave Estimates for Return Periods of 1, 10, 25, 50, and 100 Years.
Month 1.0 10.0 25.0 50.0 100.0JAN 8.4 11.8 12.8 13.5 14.3FEB 7.8 11.9 13.1 13.9 14.8MAR 6.2 9.5 10.5 11.2 11.9APR 5.1 8.4 9.3 10.0 10.7MAY 4.0 6.8 7.6 8.2 8.8JUN 3.3 5.9 6.6 7.2 7.7JUL 3.1 5.0 5.6 6.0 6.4AUG 3.6 5.3 5.8 6.2 6.6SEP 4.4 8.1 9.2 10.0 10.8OCT 5.3 9.1 10.2 11.1 11.9NOV 6.5 10.4 11.6 12.4 13.3DEC 8.0 11.4 12.4 13.1 13.8ALL 10.4 12.8 13.7 14.4 15.1
Month 1.0 10.0 25.0 50.0 100.0JAN 15.9 22.1 24.0 25.3 26.7FEB 14.7 22.6 25.0 26.7 28.4MAR 11.9 18.2 20.0 21.4 22.7APR 10.0 15.7 17.3 18.6 19.8MAY 7.7 13.5 15.2 16.4 17.7JUN 6.6 11.1 12.4 13.4 14.4JUL 6.0 9.5 10.6 11.3 12.1AUG 7.0 10.1 11.0 11.7 12.4SEP 8.5 15.1 17.0 18.5 19.9OCT 10.2 17.1 19.1 20.6 22.1NOV 12.4 19.5 21.6 23.2 24.7DEC 14.9 21.2 23.0 24.4 25.7ALL 19.6 24.2 26.0 27.3 28.6
Month 1.0 10.0 25.0 50.0 100.0JAN 12.3 14.3 14.9 15.3 15.6FEB 11.8 14.2 14.8 15.2 15.6MAR 11.9 13.0 13.3 13.5 13.6APR 10.8 12.4 12.8 13.1 13.3MAY 9.7 11.5 11.9 12.2 12.5JUN 8.1 10.6 11.2 11.7 12.1JUL 8.2 10.1 10.6 11.0 11.3AUG 8.9 10.4 10.8 11.0 11.3SEP 10.0 12.1 12.6 12.9 13.2OCT 10.7 12.6 13.0 13.3 13.6NOV 11.8 13.4 13.8 14.1 14.3DEC 12.5 14.0 14.4 14.7 14.9ALL 13.5 14.7 15.2 15.5 15.8
Monthly Wave Extremes at Grid Point # 5622 (46.88N 48.33W)
Maximum Wave Height (m)
Significant Wave Height (m)
Associated Peak Period (sec)
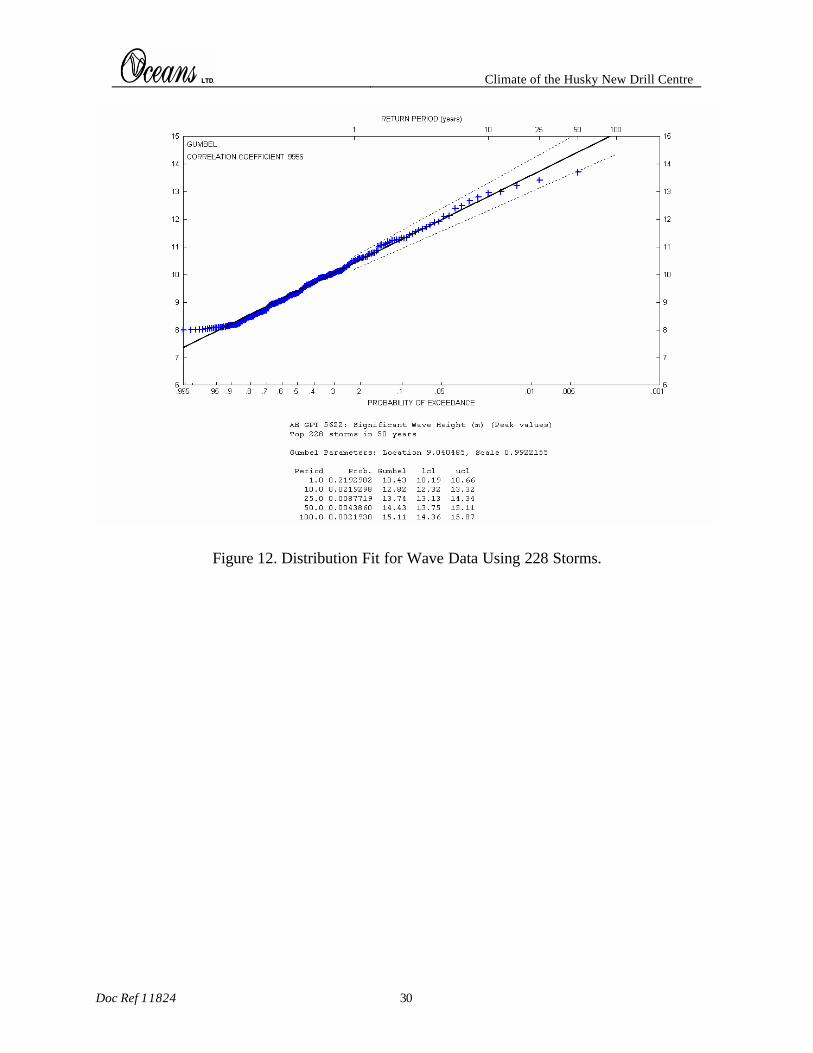
Climate of the Husky New Drill Centre
Doc Ref 11824 30
Figure 12. Distribution Fit for Wave Data Using 228 Storms.
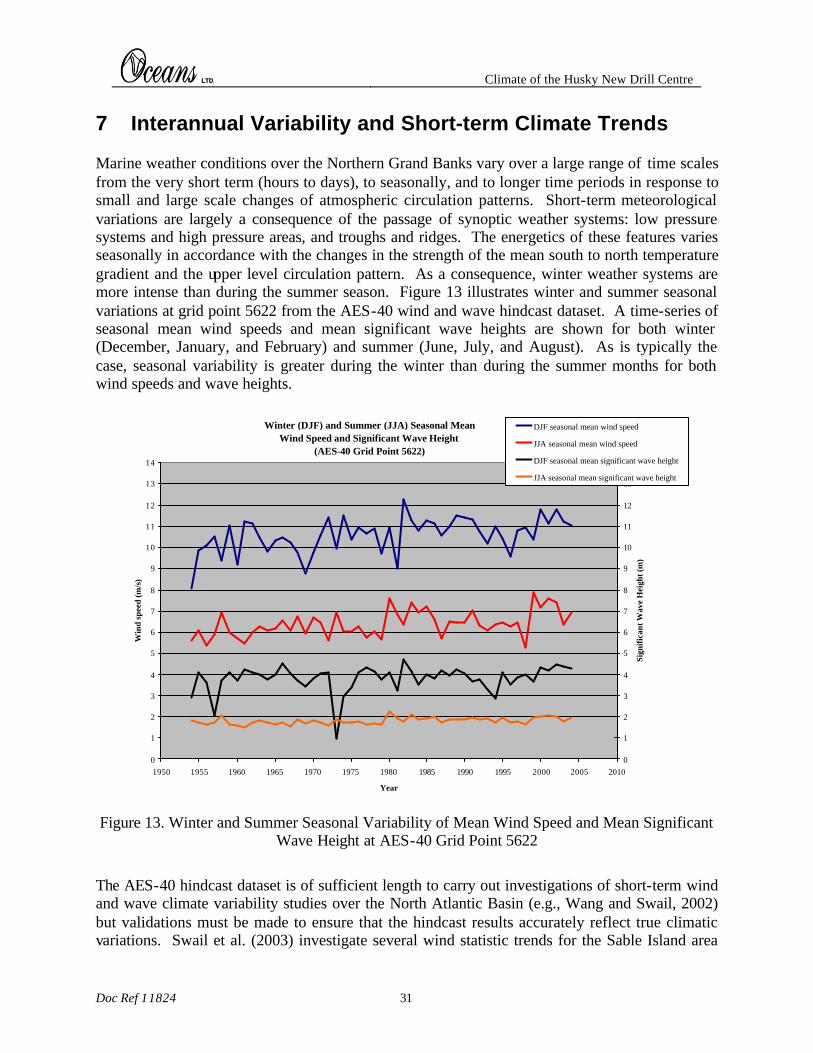
Climate of the Husky New Drill Centre
Doc Ref 11824 31
7 Interannual Variability and Short-term Climate Trends Marine weather conditions over the Northern Grand Banks vary over a large range of time scales from the very short term (hours to days), to seasonally, and to longer time periods in response to small and large scale changes of atmospheric circulation patterns. Short-term meteorological variations are largely a consequence of the passage of synoptic weather systems: low pressure systems and high pressure areas, and troughs and ridges. The energetics of these features varies seasonally in accordance with the changes in the strength of the mean south to north temperature gradient and the upper level circulation pattern. As a consequence, winter weather systems are more intense than during the summer season. Figure 13 illustrates winter and summer seasonal variations at grid point 5622 from the AES-40 wind and wave hindcast dataset. A time-series of seasonal mean wind speeds and mean significant wave heights are shown for both winter (December, January, and February) and summer (June, July, and August). As is typically the case, seasonal variability is greater during the winter than during the summer months for both wind speeds and wave heights.
Winter (DJF) and Summer (JJA) Seasonal Mean Wind Speed and Significant Wave Height
(AES-40 Grid Point 5622)
0
1
2
3
4
5
6
7
8
9
10
11
12
13
14
1950 1955 1960 1965 1970 1975 1980 1985 1990 1995 2000 2005 2010
Year
Win
d sp
eed
(m/s
)
0
1
2
3
4
5
6
7
8
9
10
11
12
13
14
Sign
ific
ant W
ave
Hei
ght (
m)
DJF seasonal mean wind speed
JJA seasonal mean wind speed
DJF seasonal mean significant wave height
JJA seasonal mean significant wave height
Figure 13. Winter and Summer Seasonal Variability of Mean Wind Speed and Mean Significant Wave Height at AES-40 Grid Point 5622
The AES-40 hindcast dataset is of sufficient length to carry out investigations of short-term wind and wave climate variability studies over the North Atlantic Basin (e.g., Wang and Swail, 2002) but validations must be made to ensure that the hindcast results accurately reflect true climatic variations. Swail et al. (2003) investigate several wind statistic trends for the Sable Island area
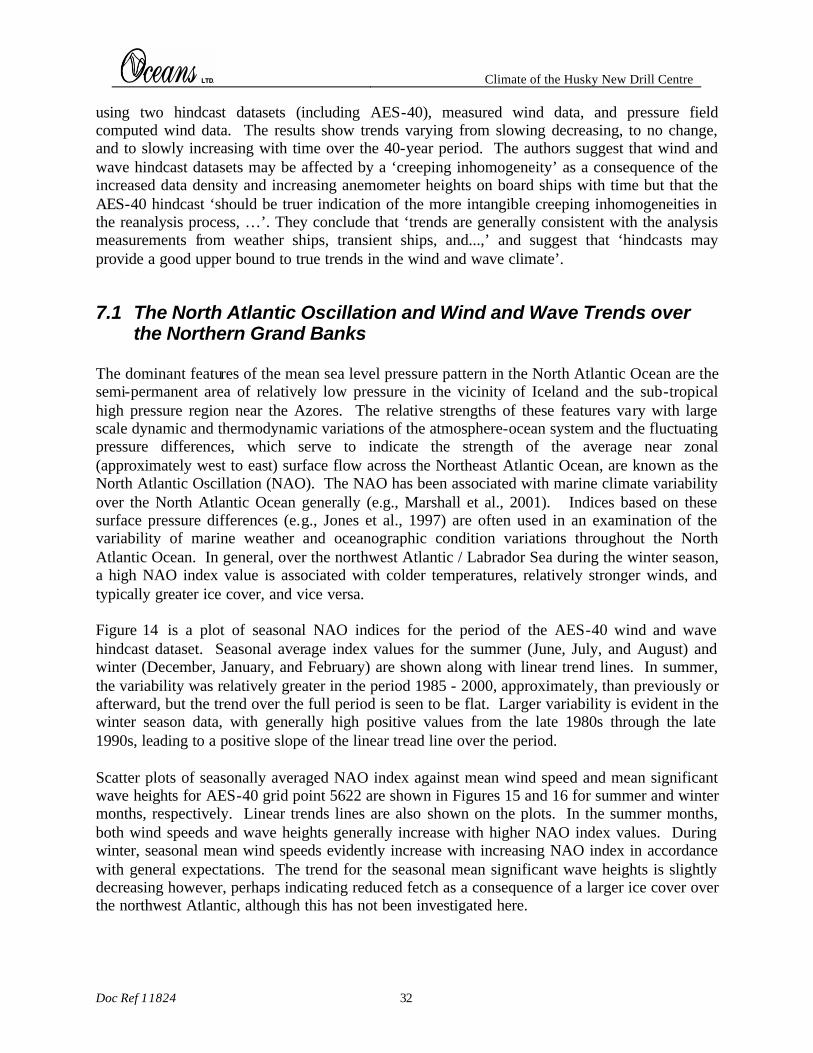
Climate of the Husky New Drill Centre
Doc Ref 11824 32
using two hindcast datasets (including AES-40), measured wind data, and pressure field computed wind data. The results show trends varying from slowing decreasing, to no change, and to slowly increasing with time over the 40-year period. The authors suggest that wind and wave hindcast datasets may be affected by a ‘creeping inhomogeneity’ as a consequence of the increased data density and increasing anemometer heights on board ships with time but that the AES-40 hindcast ‘should be truer indication of the more intangible creeping inhomogeneities in the reanalysis process, …’. They conclude that ‘trends are generally consistent with the analysis measurements from weather ships, transient ships, and...,’ and suggest that ‘hindcasts may provide a good upper bound to true trends in the wind and wave climate’.
7.1 The North Atlantic Oscillation and Wind and Wave Trends over the Northern Grand Banks
The dominant features of the mean sea level pressure pattern in the North Atlantic Ocean are the semi-permanent area of relatively low pressure in the vicinity of Iceland and the sub-tropical high pressure region near the Azores. The relative strengths of these features vary with large scale dynamic and thermodynamic variations of the atmosphere-ocean system and the fluctuating pressure differences, which serve to indicate the strength of the average near zonal (approximately west to east) surface flow across the Northeast Atlantic Ocean, are known as the North Atlantic Oscillation (NAO). The NAO has been associated with marine climate variability over the North Atlantic Ocean generally (e.g., Marshall et al., 2001). Indices based on these surface pressure differences (e.g., Jones et al., 1997) are often used in an examination of the variability of marine weather and oceanographic condition variations throughout the North Atlantic Ocean. In general, over the northwest Atlantic / Labrador Sea during the winter season, a high NAO index value is associated with colder temperatures, relatively stronger winds, and typically greater ice cover, and vice versa. Figure 14 is a plot of seasonal NAO indices for the period of the AES-40 wind and wave hindcast dataset. Seasonal average index values for the summer (June, July, and August) and winter (December, January, and February) are shown along with linear trend lines. In summer, the variability was relatively greater in the period 1985 - 2000, approximately, than previously or afterward, but the trend over the full period is seen to be flat. Larger variability is evident in the winter season data, with generally high positive values from the late 1980s through the late 1990s, leading to a positive slope of the linear tread line over the period. Scatter plots of seasonally averaged NAO index against mean wind speed and mean significant wave heights for AES-40 grid point 5622 are shown in Figures 15 and 16 for summer and winter months, respectively. Linear trends lines are also shown on the plots. In the summer months, both wind speeds and wave heights generally increase with higher NAO index values. During winter, seasonal mean wind speeds evidently increase with increasing NAO index in accordance with general expectations. The trend for the seasonal mean significant wave heights is slightly decreasing however, perhaps indicating reduced fetch as a consequence of a larger ice cover over the northwest Atlantic, although this has not been investigated here.
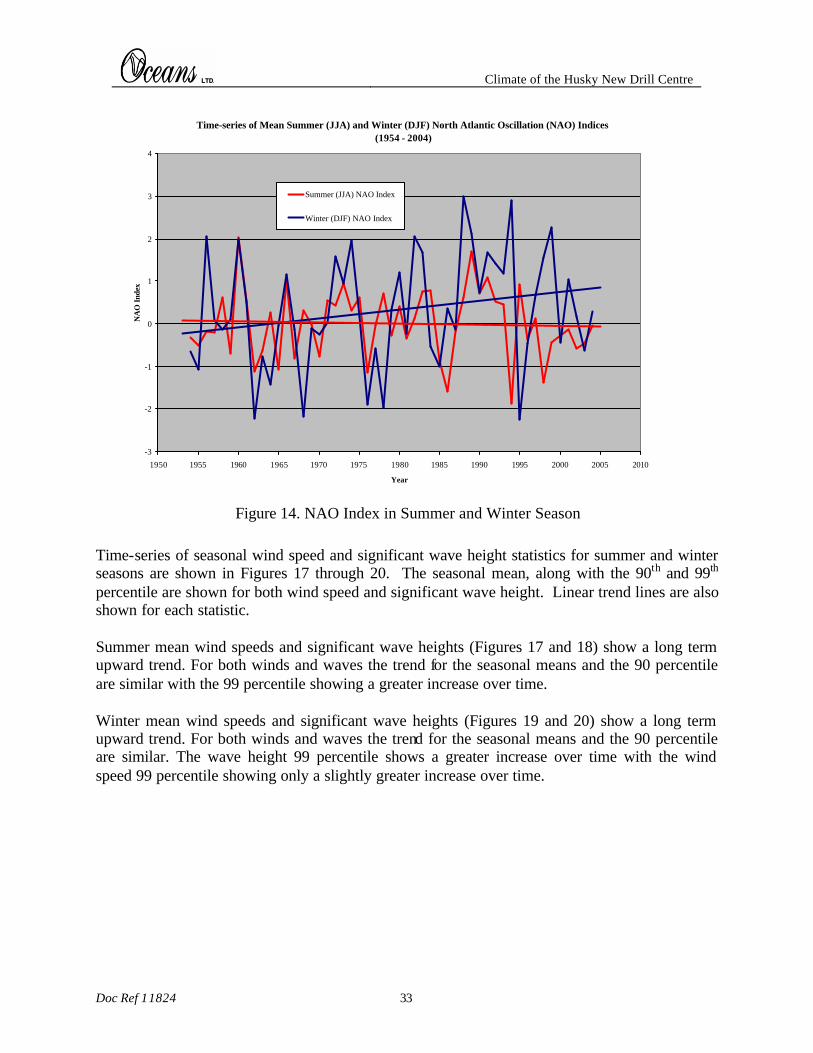
Climate of the Husky New Drill Centre
Doc Ref 11824 33
Time-series of Mean Summer (JJA) and Winter (DJF) North Atlantic Oscillation (NAO) Indices(1954 - 2004)
-3
-2
-1
0
1
2
3
4
1950 1955 1960 1965 1970 1975 1980 1985 1990 1995 2000 2005 2010
Year
NA
O I
ndex
Summer (JJA) NAO Index
Winter (DJF) NAO Index
Figure 14. NAO Index in Summer and Winter Season
Time-series of seasonal wind speed and significant wave height statistics for summer and winter seasons are shown in Figures 17 through 20. The seasonal mean, along with the 90th and 99th percentile are shown for both wind speed and significant wave height. Linear trend lines are also shown for each statistic. Summer mean wind speeds and significant wave heights (Figures 17 and 18) show a long term upward trend. For both winds and waves the trend for the seasonal means and the 90 percentile are similar with the 99 percentile showing a greater increase over time. Winter mean wind speeds and significant wave heights (Figures 19 and 20) show a long term upward trend. For both winds and waves the trend for the seasonal means and the 90 percentile are similar. The wave height 99 percentile shows a greater increase over time with the wind speed 99 percentile showing only a slightly greater increase over time.
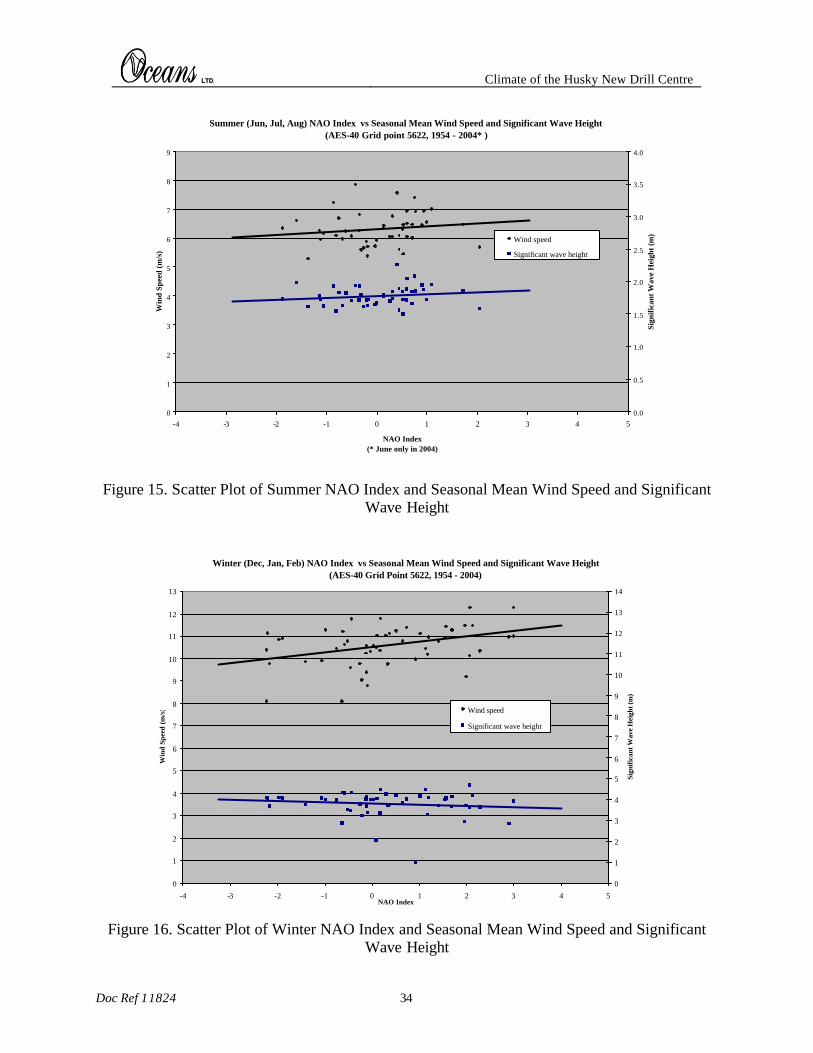
Climate of the Husky New Drill Centre
Doc Ref 11824 34
Summer (Jun, Jul, Aug) NAO Index vs Seasonal Mean Wind Speed and Significant Wave Height(AES-40 Grid point 5622, 1954 - 2004* )
0
1
2
3
4
5
6
7
8
9
-4 -3 -2 -1 0 1 2 3 4 5
NAO Index(* June only in 2004)
Win
d Sp
eed
(m/s
)
0.0
0.5
1.0
1.5
2.0
2.5
3.0
3.5
4.0
Sign
ifica
nt W
ave
Hei
ght (
m)
Wind speed
Significant wave height
Figure 15. Scatter Plot of Summer NAO Index and Seasonal Mean Wind Speed and Significant Wave Height
Winter (Dec, Jan, Feb) NAO Index vs Seasonal Mean Wind Speed and Significant Wave Height(AES-40 Grid Point 5622, 1954 - 2004)
0
1
2
3
4
5
6
7
8
9
10
11
12
13
-4 -3 -2 -1 0 1 2 3 4 5NAO Index
Win
d Sp
eed
(m/s
)
0
1
2
3
4
5
6
7
8
9
10
11
12
13
14
Sign
ifica
nt W
ave
Hei
ght (
m)
Wind speed
Significant wave height
Figure 16. Scatter Plot of Winter NAO Index and Seasonal Mean Wind Speed and Significant Wave Height
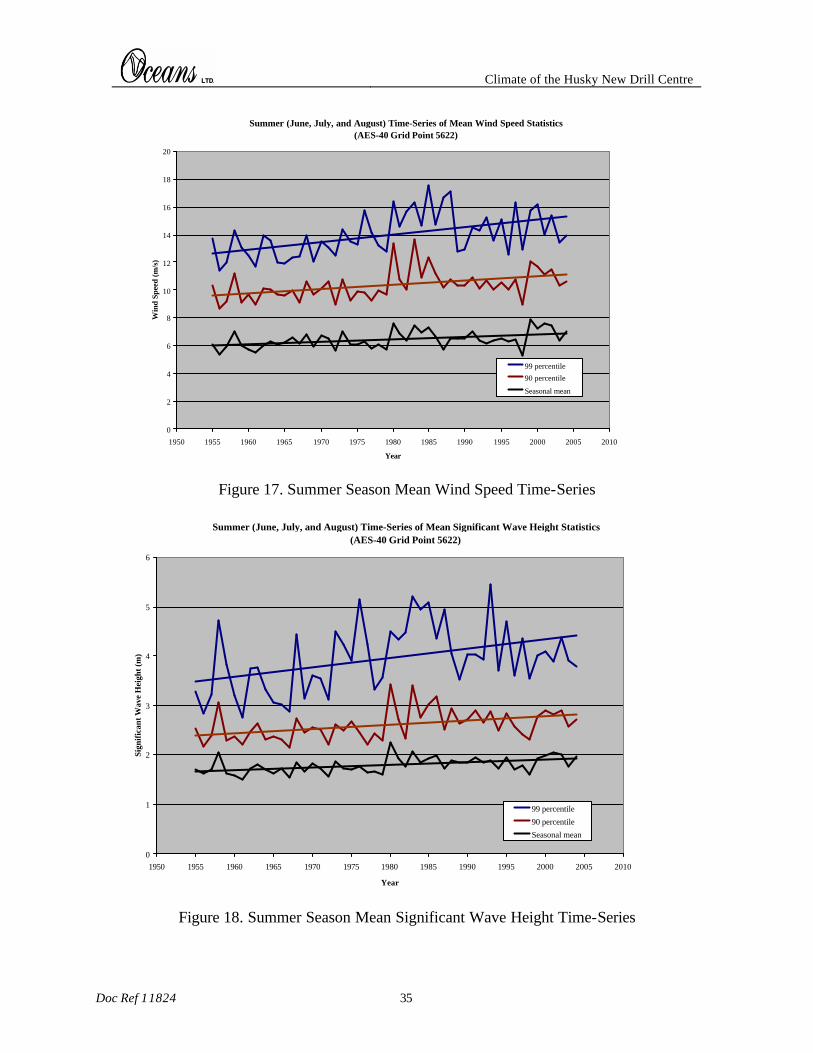
Climate of the Husky New Drill Centre
Doc Ref 11824 35
Summer (June, July, and August) Time-Series of Mean Wind Speed Statistics (AES-40 Grid Point 5622)
0
2
4
6
8
10
12
14
16
18
20
1950 1955 1960 1965 1970 1975 1980 1985 1990 1995 2000 2005 2010
Year
Win
d Sp
eed
(m/s
)
99 percentile
90 percentile
Seasonal mean
Figure 17. Summer Season Mean Wind Speed Time-Series
Summer (June, July, and August) Time-Series of Mean Significant Wave Height Statistics (AES-40 Grid Point 5622)
0
1
2
3
4
5
6
1950 1955 1960 1965 1970 1975 1980 1985 1990 1995 2000 2005 2010
Year
Sign
ific
ant W
ave
Hei
ght (
m)
99 percentile
90 percentile
Seasonal mean
Figure 18. Summer Season Mean Significant Wave Height Time-Series
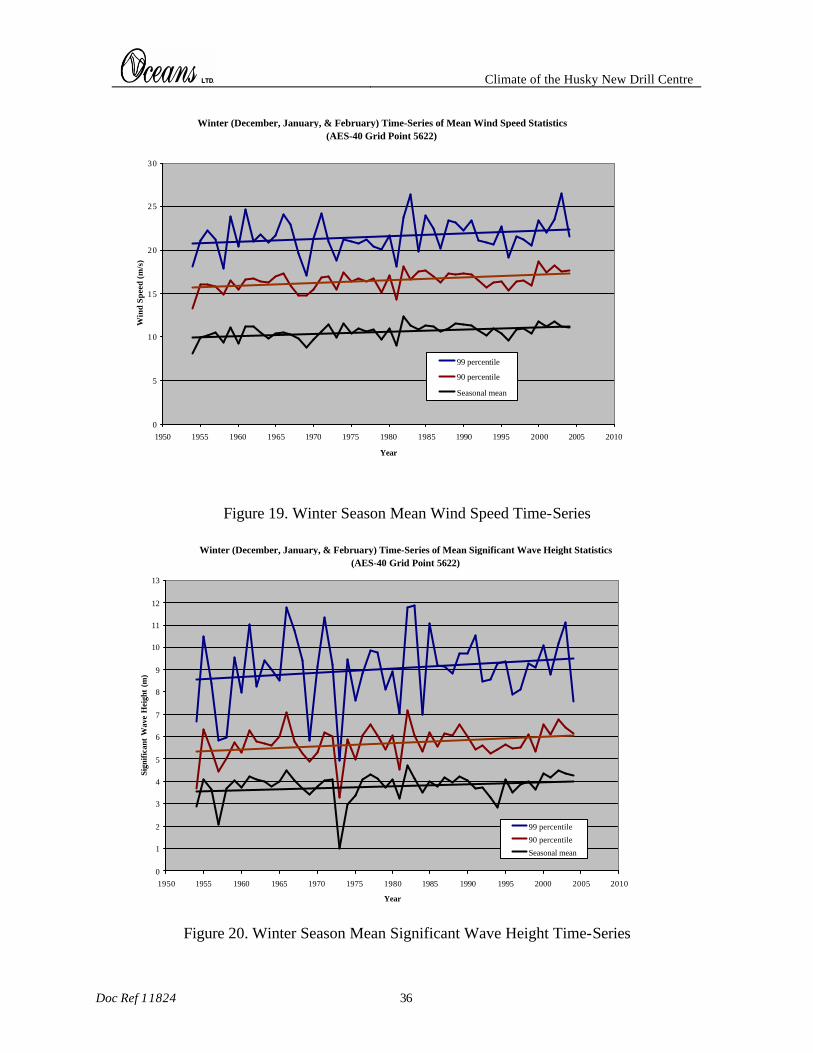
Climate of the Husky New Drill Centre
Doc Ref 11824 36
Winter (December, January, & February) Time-Series of Mean Wind Speed Statistics (AES-40 Grid Point 5622)
0
5
10
15
20
25
30
1950 1955 1960 1965 1970 1975 1980 1985 1990 1995 2000 2005 2010
Year
Win
d Sp
eed
(m/s
)
99 percentile
90 percentile
Seasonal mean
Figure 19. Winter Season Mean Wind Speed Time-Series
Winter (December, January, & February) Time-Series of Mean Significant Wave Height Statistics (AES-40 Grid Point 5622)
0
1
2
3
4
5
6
7
8
9
10
11
12
13
1950 1955 1960 1965 1970 1975 1980 1985 1990 1995 2000 2005 2010
Year
Sign
ifica
nt W
ave
Hei
ght
(m)
99 percentile
90 percentile
Seasonal mean
Figure 20. Winter Season Mean Significant Wave Height Time-Series
Climate of the Husky New Drill Centre
Doc Ref 11824 37
8 Bibliography Berek, E. P., V. J. Cardone, V. R. Swail, 2000. “Comparison of Hindcast Results and Extreme
Value Estimates for Wave Conditions in the Hibernia Area – Grand Banks of Newfoundland.” 6th International Workshop on Wave Hindcasting and Forecasting November 6-10, 2000, Monterey, California.
Borgman, L. E. 1973. Probabilities for the highest wave in a hurricane. J. Waterways, Harbors
and Coastal Engineering Div., ASCE, 185-207 Cardone, V. J., H. C. Graber, R. E. Jensen, S. Hasselmann, M. J. Caruso, 1995. “In search of the
true surface wind field in SWADE IOP-1: Ocean wave modelling perspective.” The Global Atmosphere and Ocean System, 3, 107-150.
Cardone, V.J., A.T. Cox and V.R. Swail, 2000. “Specification of the Global Wave Climate: Is
this the Final Answer?” 6th International Workshop on Wave Hindcasting and Forecasting November 6-10, 2000, Monterey, California.
Forristall, G. Z. 1978. “On the statistical distribution of wave heights in a storm.” J. Of Geophys.
Res., 83, 2353-2358 Jones, P.D., Jónsson, T. and Wheeler, D., 1997. Extension to the North Atlantic Oscillation using
early instrumental pressure observations from Gibraltar and South-West Iceland. Int. J. Climatol. 17, 1433-1450.
Marshall, J., Y. Kushnir, D. Battisti, P. Change, A. Czaja, R. Dickson, J. Hurrell, M. McCartney,
R. Saravanan, and M. Visbeck, 2001. North Atlantic Climate Varability: Phenomena, Impacts, and Mechanisms. International Journal of Climatology, Vol. 21, pp. 1863-1898.
Smith, S.D., 1981. “Factors for Adjustment of Wind Speed over Water to a 10-meter Height”.
Bedford Institute of Oceanography, Dartmouth, Nova Scotia, Canada. Swail, V.R., A. Cox, and V.J Cardone, 2003. Analysis of Wave Climate Trends and Variability.
In: Advances in the Applications of Marine Climatology, WMO/TD-No. 1081, 2003. (JCOMM Technical Report 13).
United States Geological Survey, Conservation Division, 1979. OCS Platform Verification
Program. Reston, Virginia. Walmsley, J.L., 1988. “On Theoretical Wind Speed and Temperature Profiles over the Sea with
Applications to Data from Sable Island, Nova Scotia”. Atmosphere-Ocean 26 (2), 203-233.
Wang, X.L., and V.R. Swail, 2002. Trends of Atlantic Wave Extremes as Simulated in a 40-Yr
Wave Hindcast Using Kinematically Reanalysed Wind Fields.

Climate of the Husky New Drill Centre
Doc Ref 11824 38
Appendix A
Monthly Wind Roses for AES-40 Grid Point 5622
Latitude 46.875 N, Longitude 48.333 W
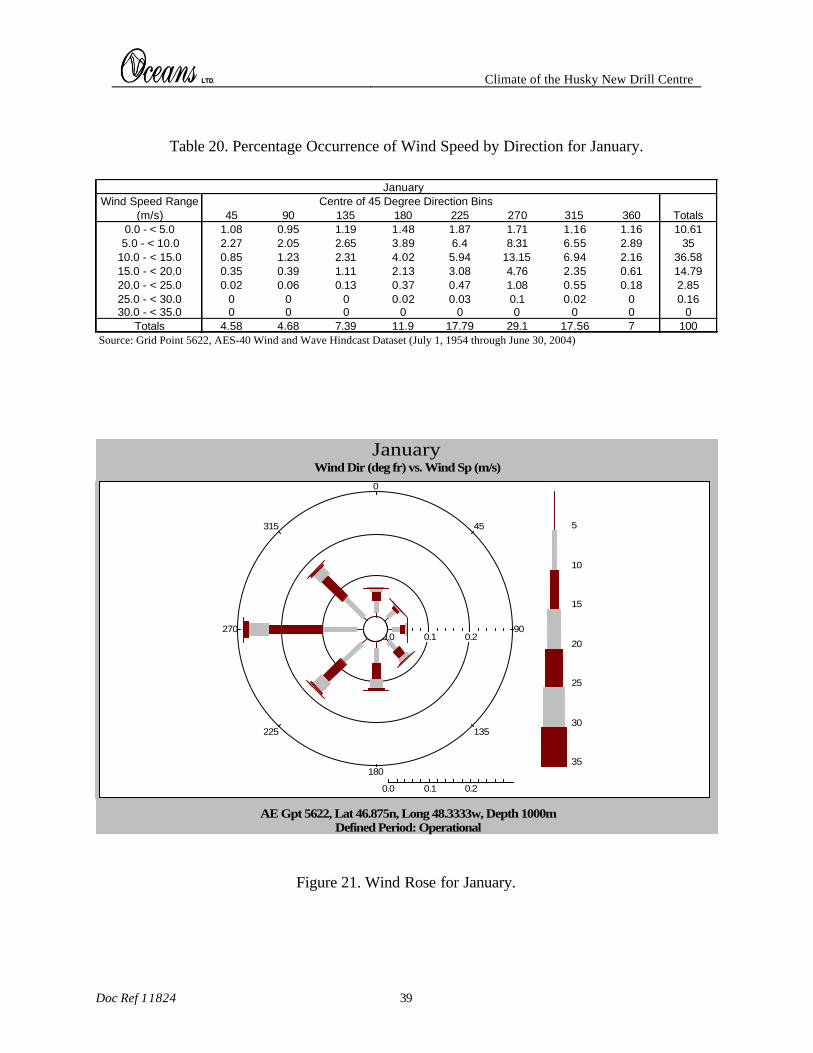
Climate of the Husky New Drill Centre
Doc Ref 11824 39
Table 20. Percentage Occurrence of Wind Speed by Direction for January.
JanuaryWind Speed Range Centre of 45 Degree Direction Bins
(m/s) 45 90 135 180 225 270 315 360 Totals0.0 - < 5.0 1.08 0.95 1.19 1.48 1.87 1.71 1.16 1.16 10.615.0 - < 10.0 2.27 2.05 2.65 3.89 6.4 8.31 6.55 2.89 35
10.0 - < 15.0 0.85 1.23 2.31 4.02 5.94 13.15 6.94 2.16 36.5815.0 - < 20.0 0.35 0.39 1.11 2.13 3.08 4.76 2.35 0.61 14.7920.0 - < 25.0 0.02 0.06 0.13 0.37 0.47 1.08 0.55 0.18 2.8525.0 - < 30.0 0 0 0 0.02 0.03 0.1 0.02 0 0.1630.0 - < 35.0 0 0 0 0 0 0 0 0 0
Totals 4.58 4.68 7.39 11.9 17.79 29.1 17.56 7 100Source: Grid Point 5622, AES-40 Wind and Wave Hindcast Dataset (July 1, 1954 through June 30, 2004)
90
45
0
315
270
225
180
135
0.0
0.0
0.1
0.1
0.2
0.2
5
10
15
20
25
30
35
JanuaryWind Dir (deg fr) vs. Wind Sp (m/s)
Defined Period: OperationalAE Gpt 5622, Lat 46.875n, Long 48.3333w, Depth 1000m
Figure 21. Wind Rose for January.
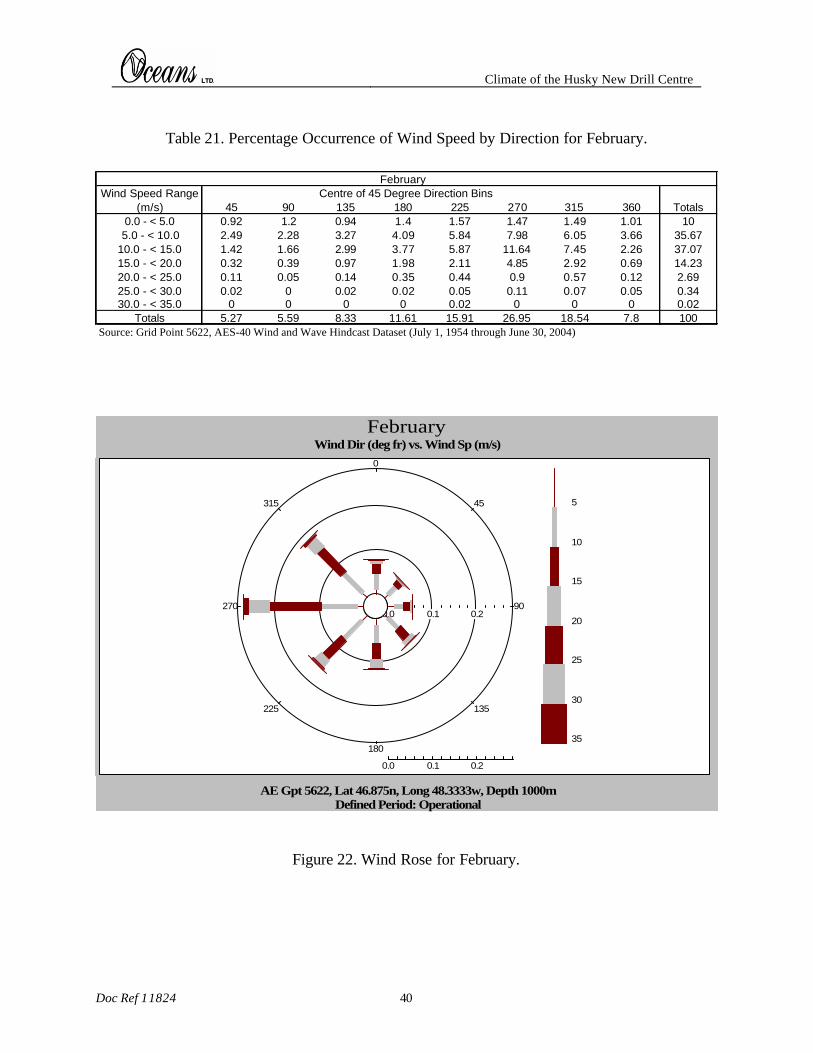
Climate of the Husky New Drill Centre
Doc Ref 11824 40
Table 21. Percentage Occurrence of Wind Speed by Direction for February.
FebruaryWind Speed Range Centre of 45 Degree Direction Bins
(m/s) 45 90 135 180 225 270 315 360 Totals0.0 - < 5.0 0.92 1.2 0.94 1.4 1.57 1.47 1.49 1.01 105.0 - < 10.0 2.49 2.28 3.27 4.09 5.84 7.98 6.05 3.66 35.67
10.0 - < 15.0 1.42 1.66 2.99 3.77 5.87 11.64 7.45 2.26 37.0715.0 - < 20.0 0.32 0.39 0.97 1.98 2.11 4.85 2.92 0.69 14.2320.0 - < 25.0 0.11 0.05 0.14 0.35 0.44 0.9 0.57 0.12 2.6925.0 - < 30.0 0.02 0 0.02 0.02 0.05 0.11 0.07 0.05 0.3430.0 - < 35.0 0 0 0 0 0.02 0 0 0 0.02
Totals 5.27 5.59 8.33 11.61 15.91 26.95 18.54 7.8 100Source: Grid Point 5622, AES-40 Wind and Wave Hindcast Dataset (July 1, 1954 through June 30, 2004)
90
45
0
315
270
225
180
135
0.0
0.0
0.1
0.1
0.2
0.2
5
10
15
20
25
30
35
FebruaryWind Dir (deg fr) vs. Wind Sp (m/s)
Defined Period: OperationalAE Gpt 5622, Lat 46.875n, Long 48.3333w, Depth 1000m
Figure 22. Wind Rose for February.
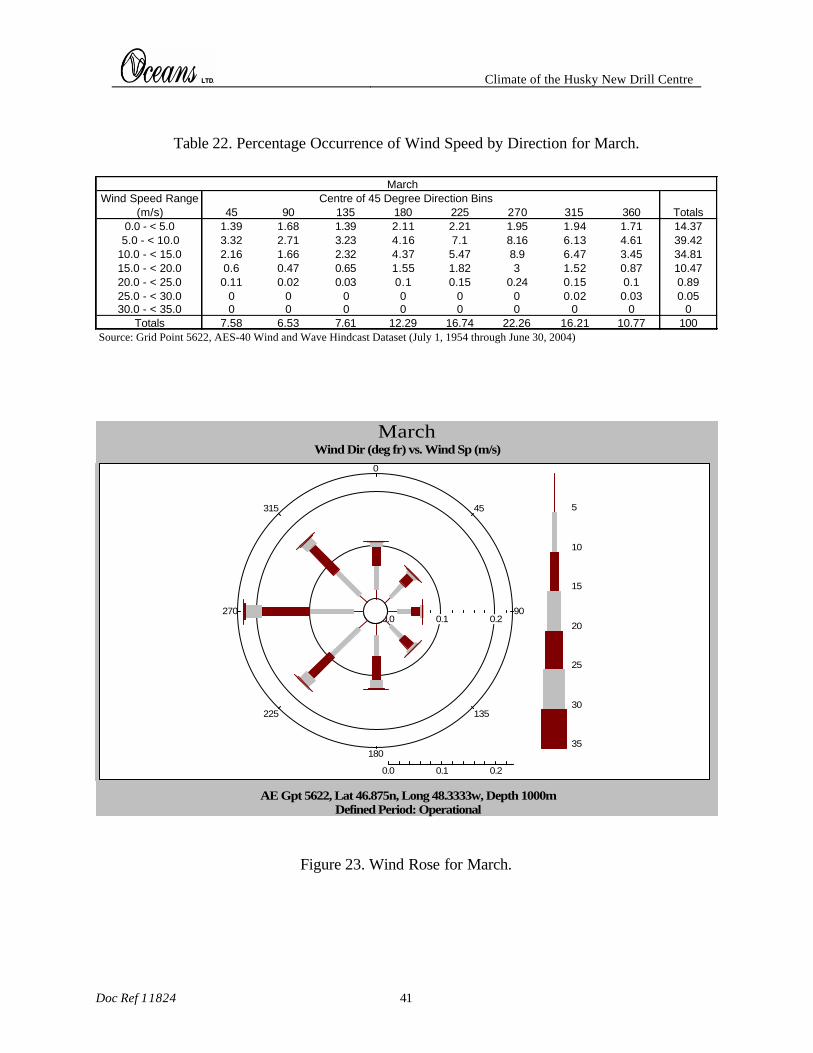
Climate of the Husky New Drill Centre
Doc Ref 11824 41
Table 22. Percentage Occurrence of Wind Speed by Direction for March.
MarchWind Speed Range Centre of 45 Degree Direction Bins
(m/s) 45 90 135 180 225 270 315 360 Totals0.0 - < 5.0 1.39 1.68 1.39 2.11 2.21 1.95 1.94 1.71 14.375.0 - < 10.0 3.32 2.71 3.23 4.16 7.1 8.16 6.13 4.61 39.42
10.0 - < 15.0 2.16 1.66 2.32 4.37 5.47 8.9 6.47 3.45 34.8115.0 - < 20.0 0.6 0.47 0.65 1.55 1.82 3 1.52 0.87 10.4720.0 - < 25.0 0.11 0.02 0.03 0.1 0.15 0.24 0.15 0.1 0.8925.0 - < 30.0 0 0 0 0 0 0 0.02 0.03 0.0530.0 - < 35.0 0 0 0 0 0 0 0 0 0
Totals 7.58 6.53 7.61 12.29 16.74 22.26 16.21 10.77 100Source: Grid Point 5622, AES-40 Wind and Wave Hindcast Dataset (July 1, 1954 through June 30, 2004)
90
45
0
315
270
225
180
135
0.0
0.0
0.1
0.1
0.2
0.2
5
10
15
20
25
30
35
MarchWind Dir (deg fr) vs. Wind Sp (m/s)
Defined Period: OperationalAE Gpt 5622, Lat 46.875n, Long 48.3333w, Depth 1000m
Figure 23. Wind Rose for March.
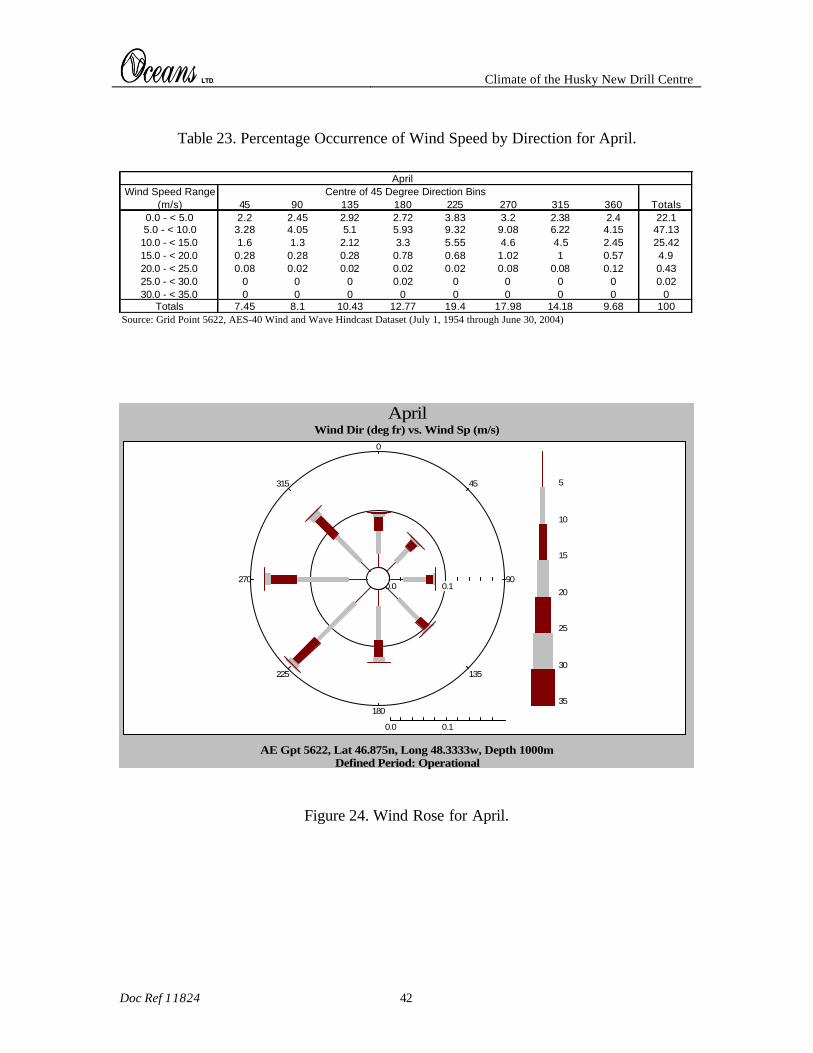
Climate of the Husky New Drill Centre
Doc Ref 11824 42
Table 23. Percentage Occurrence of Wind Speed by Direction for April.
AprilWind Speed Range Centre of 45 Degree Direction Bins
(m/s) 45 90 135 180 225 270 315 360 Totals0.0 - < 5.0 2.2 2.45 2.92 2.72 3.83 3.2 2.38 2.4 22.15.0 - < 10.0 3.28 4.05 5.1 5.93 9.32 9.08 6.22 4.15 47.13
10.0 - < 15.0 1.6 1.3 2.12 3.3 5.55 4.6 4.5 2.45 25.4215.0 - < 20.0 0.28 0.28 0.28 0.78 0.68 1.02 1 0.57 4.920.0 - < 25.0 0.08 0.02 0.02 0.02 0.02 0.08 0.08 0.12 0.4325.0 - < 30.0 0 0 0 0.02 0 0 0 0 0.0230.0 - < 35.0 0 0 0 0 0 0 0 0 0
Totals 7.45 8.1 10.43 12.77 19.4 17.98 14.18 9.68 100Source: Grid Point 5622, AES-40 Wind and Wave Hindcast Dataset (July 1, 1954 through June 30, 2004)
90
45
0
315
270
225
180
135
0.0
0.0
0.1
0.1
5
10
15
20
25
30
35
AprilWind Dir (deg fr) vs. Wind Sp (m/s)
Defined Period: OperationalAE Gpt 5622, Lat 46.875n, Long 48.3333w, Depth 1000m
Figure 24. Wind Rose for April.
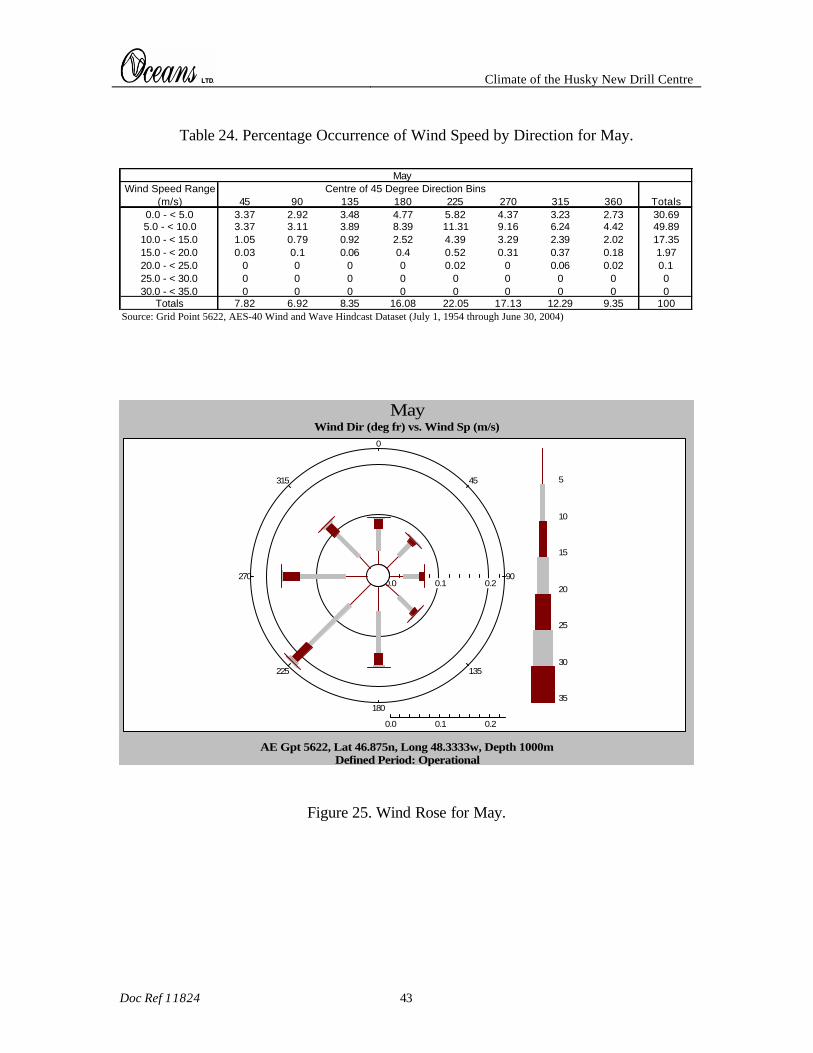
Climate of the Husky New Drill Centre
Doc Ref 11824 43
Table 24. Percentage Occurrence of Wind Speed by Direction for May.
MayWind Speed Range Centre of 45 Degree Direction Bins
(m/s) 45 90 135 180 225 270 315 360 Totals0.0 - < 5.0 3.37 2.92 3.48 4.77 5.82 4.37 3.23 2.73 30.695.0 - < 10.0 3.37 3.11 3.89 8.39 11.31 9.16 6.24 4.42 49.89
10.0 - < 15.0 1.05 0.79 0.92 2.52 4.39 3.29 2.39 2.02 17.3515.0 - < 20.0 0.03 0.1 0.06 0.4 0.52 0.31 0.37 0.18 1.9720.0 - < 25.0 0 0 0 0 0.02 0 0.06 0.02 0.125.0 - < 30.0 0 0 0 0 0 0 0 0 030.0 - < 35.0 0 0 0 0 0 0 0 0 0
Totals 7.82 6.92 8.35 16.08 22.05 17.13 12.29 9.35 100Source: Grid Point 5622, AES-40 Wind and Wave Hindcast Dataset (July 1, 1954 through June 30, 2004)
90
45
0
315
270
225
180
135
0.0
0.0
0.1
0.1
0.2
0.2
5
10
15
20
25
30
35
MayWind Dir (deg fr) vs. Wind Sp (m/s)
Defined Period: OperationalAE Gpt 5622, Lat 46.875n, Long 48.3333w, Depth 1000m
Figure 25. Wind Rose for May.
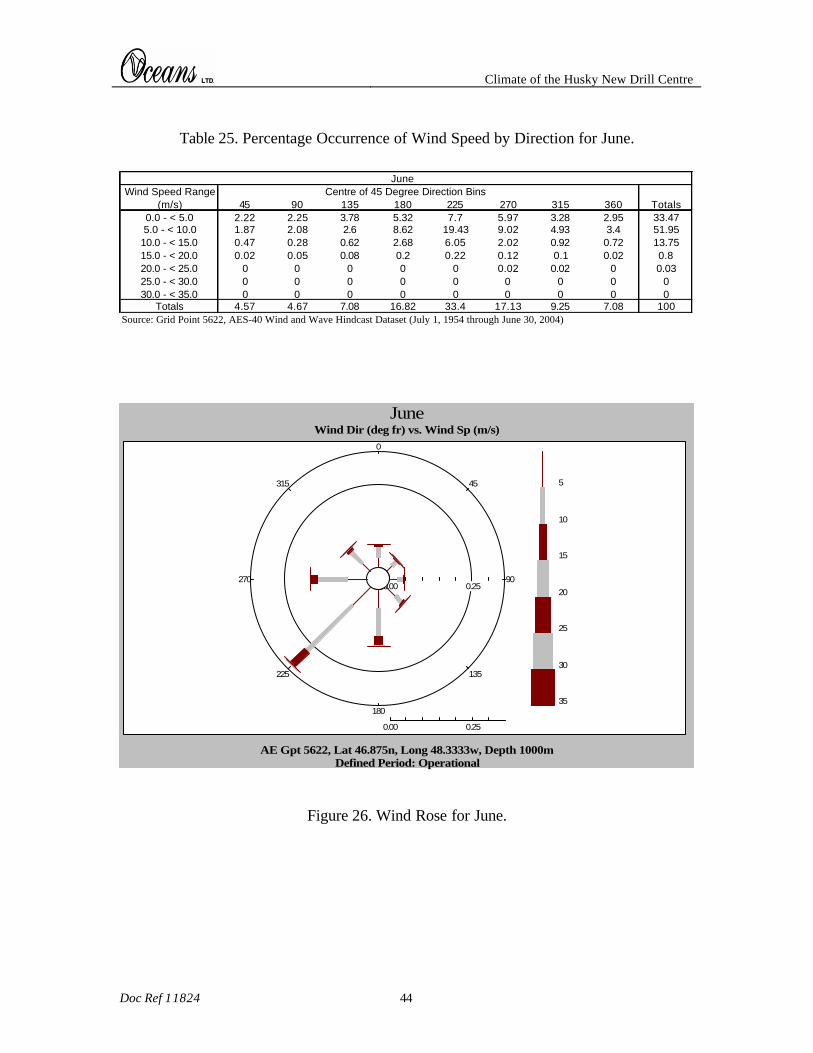
Climate of the Husky New Drill Centre
Doc Ref 11824 44
Table 25. Percentage Occurrence of Wind Speed by Direction for June.
JuneWind Speed Range Centre of 45 Degree Direction Bins
(m/s) 45 90 135 180 225 270 315 360 Totals0.0 - < 5.0 2.22 2.25 3.78 5.32 7.7 5.97 3.28 2.95 33.475.0 - < 10.0 1.87 2.08 2.6 8.62 19.43 9.02 4.93 3.4 51.95
10.0 - < 15.0 0.47 0.28 0.62 2.68 6.05 2.02 0.92 0.72 13.7515.0 - < 20.0 0.02 0.05 0.08 0.2 0.22 0.12 0.1 0.02 0.820.0 - < 25.0 0 0 0 0 0 0.02 0.02 0 0.0325.0 - < 30.0 0 0 0 0 0 0 0 0 030.0 - < 35.0 0 0 0 0 0 0 0 0 0
Totals 4.57 4.67 7.08 16.82 33.4 17.13 9.25 7.08 100Source: Grid Point 5622, AES-40 Wind and Wave Hindcast Dataset (July 1, 1954 through June 30, 2004)
90
45
0
315
270
225
180
135
0.00
0.00
0.25
0.25
5
10
15
20
25
30
35
JuneWind Dir (deg fr) vs. Wind Sp (m/s)
Defined Period: OperationalAE Gpt 5622, Lat 46.875n, Long 48.3333w, Depth 1000m
Figure 26. Wind Rose for June.
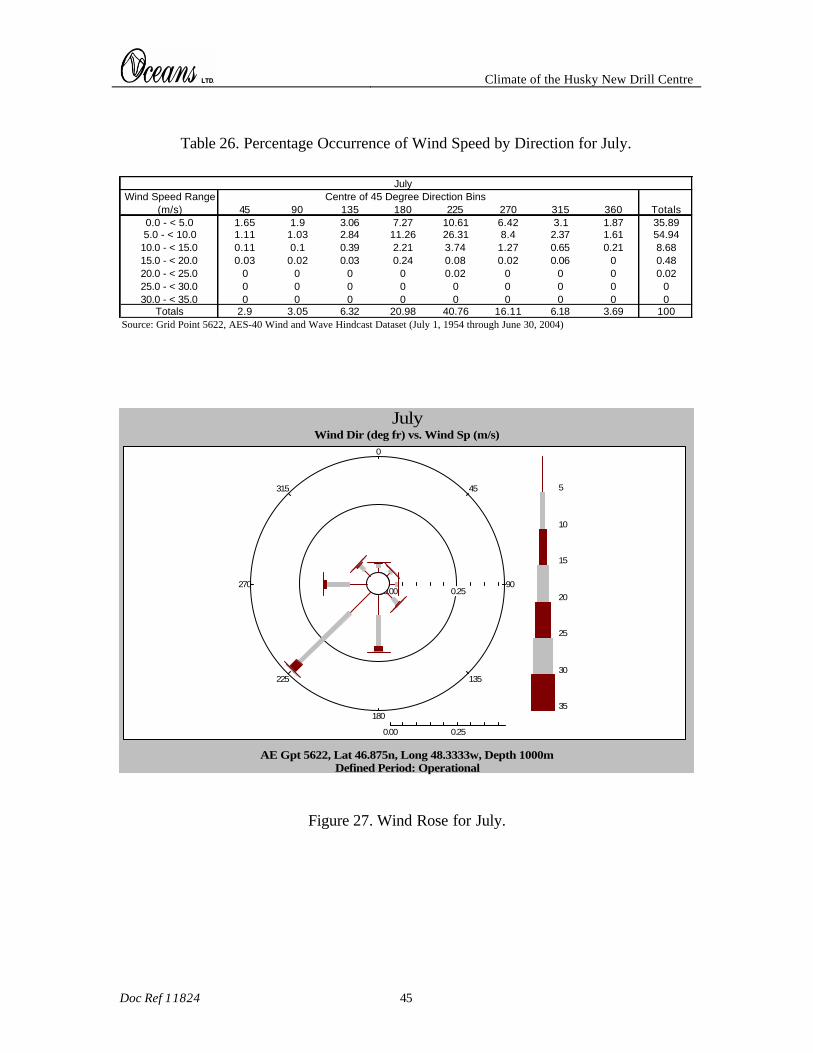
Climate of the Husky New Drill Centre
Doc Ref 11824 45
Table 26. Percentage Occurrence of Wind Speed by Direction for July.
JulyWind Speed Range Centre of 45 Degree Direction Bins
(m/s) 45 90 135 180 225 270 315 360 Totals0.0 - < 5.0 1.65 1.9 3.06 7.27 10.61 6.42 3.1 1.87 35.895.0 - < 10.0 1.11 1.03 2.84 11.26 26.31 8.4 2.37 1.61 54.94
10.0 - < 15.0 0.11 0.1 0.39 2.21 3.74 1.27 0.65 0.21 8.6815.0 - < 20.0 0.03 0.02 0.03 0.24 0.08 0.02 0.06 0 0.4820.0 - < 25.0 0 0 0 0 0.02 0 0 0 0.0225.0 - < 30.0 0 0 0 0 0 0 0 0 030.0 - < 35.0 0 0 0 0 0 0 0 0 0
Totals 2.9 3.05 6.32 20.98 40.76 16.11 6.18 3.69 100Source: Grid Point 5622, AES-40 Wind and Wave Hindcast Dataset (July 1, 1954 through June 30, 2004)
90
45
0
315
270
225
180
135
0.00
0.00
0.25
0.25
5
10
15
20
25
30
35
JulyWind Dir (deg fr) vs. Wind Sp (m/s)
Defined Period: OperationalAE Gpt 5622, Lat 46.875n, Long 48.3333w, Depth 1000m
Figure 27. Wind Rose for July.
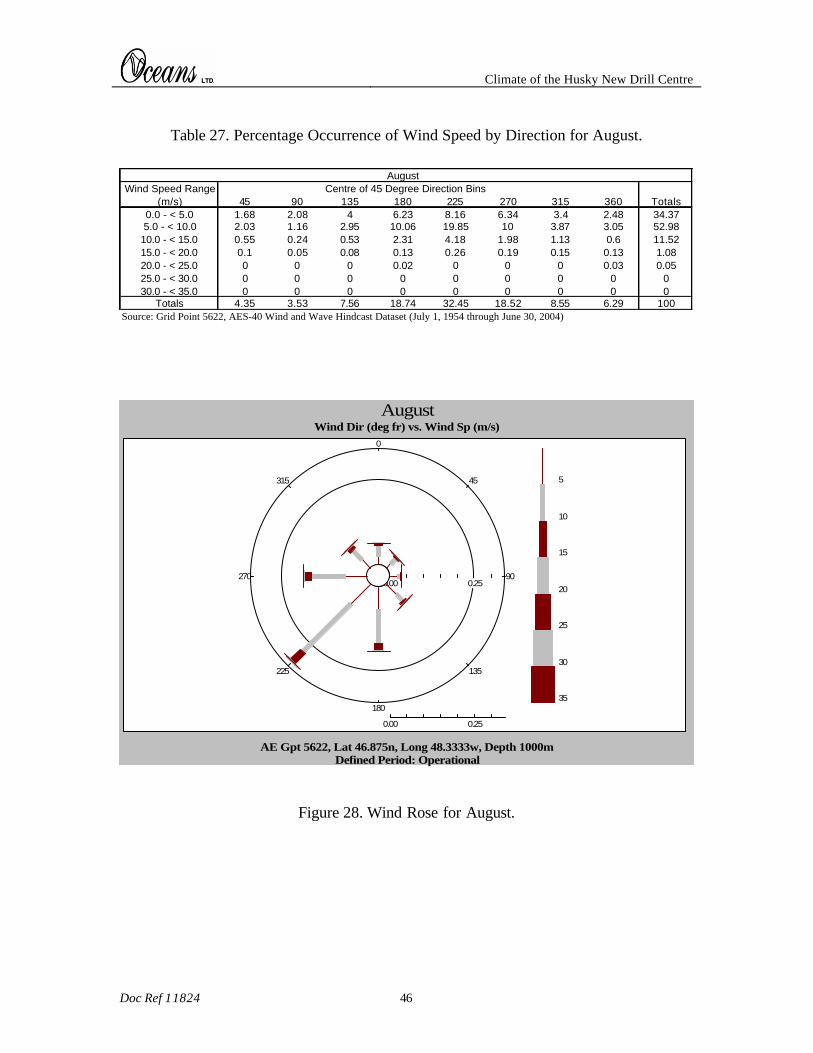
Climate of the Husky New Drill Centre
Doc Ref 11824 46
Table 27. Percentage Occurrence of Wind Speed by Direction for August.
AugustWind Speed Range Centre of 45 Degree Direction Bins
(m/s) 45 90 135 180 225 270 315 360 Totals0.0 - < 5.0 1.68 2.08 4 6.23 8.16 6.34 3.4 2.48 34.375.0 - < 10.0 2.03 1.16 2.95 10.06 19.85 10 3.87 3.05 52.98
10.0 - < 15.0 0.55 0.24 0.53 2.31 4.18 1.98 1.13 0.6 11.5215.0 - < 20.0 0.1 0.05 0.08 0.13 0.26 0.19 0.15 0.13 1.0820.0 - < 25.0 0 0 0 0.02 0 0 0 0.03 0.0525.0 - < 30.0 0 0 0 0 0 0 0 0 030.0 - < 35.0 0 0 0 0 0 0 0 0 0
Totals 4.35 3.53 7.56 18.74 32.45 18.52 8.55 6.29 100Source: Grid Point 5622, AES-40 Wind and Wave Hindcast Dataset (July 1, 1954 through June 30, 2004)
90
45
0
315
270
225
180
135
0.00
0.00
0.25
0.25
5
10
15
20
25
30
35
AugustWind Dir (deg fr) vs. Wind Sp (m/s)
Defined Period: OperationalAE Gpt 5622, Lat 46.875n, Long 48.3333w, Depth 1000m
Figure 28. Wind Rose for August.

Climate of the Husky New Drill Centre
Doc Ref 11824 47
Table 28. Percentage Occurrence of Wind Speed by Direction for September.
SeptemberWind Speed Range Centre of 45 Degree Direction Bins
(m/s) 45 90 135 180 225 270 315 360 Totals0.0 - < 5.0 1.93 1.95 2.5 3.97 5.32 5.3 3.53 2.53 27.035.0 - < 10.0 3.23 1.9 2.85 7.43 12.75 11.33 7.42 4.05 50.97
10.0 - < 15.0 0.83 0.52 0.82 2.83 4.48 4.18 3.5 1.88 19.0515.0 - < 20.0 0.18 0.13 0.15 0.48 0.48 0.47 0.55 0.17 2.6220.0 - < 25.0 0.02 0.02 0 0.07 0.07 0.12 0.03 0.02 0.3325.0 - < 30.0 0 0 0 0 0 0 0 0 030.0 - < 35.0 0 0 0 0 0 0 0 0 0
Totals 6.2 4.52 6.32 14.78 23.1 21.4 15.03 8.65 100Source: Grid Point 5622, AES-40 Wind and Wave Hindcast Dataset (July 1, 1954 through June 30, 2004)
90
45
0
315
270
225
180
135
0.0
0.0
0.1
0.1
0.2
0.2
5
10
15
20
25
30
35
SeptemberWind Dir (deg fr) vs. Wind Sp (m/s)
Defined Period: OperationalAE Gpt 5622, Lat 46.875n, Long 48.3333w, Depth 1000m
Figure 29. Wind Rose for September.
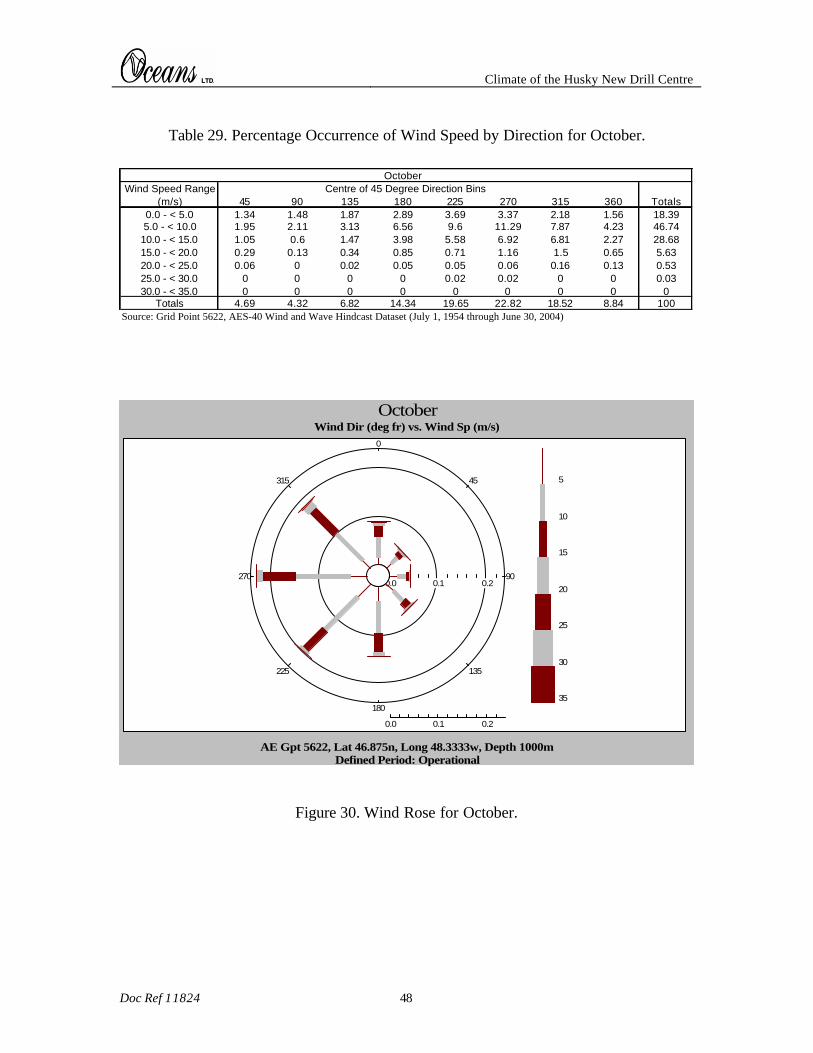
Climate of the Husky New Drill Centre
Doc Ref 11824 48
Table 29. Percentage Occurrence of Wind Speed by Direction for October.
OctoberWind Speed Range Centre of 45 Degree Direction Bins
(m/s) 45 90 135 180 225 270 315 360 Totals0.0 - < 5.0 1.34 1.48 1.87 2.89 3.69 3.37 2.18 1.56 18.395.0 - < 10.0 1.95 2.11 3.13 6.56 9.6 11.29 7.87 4.23 46.74
10.0 - < 15.0 1.05 0.6 1.47 3.98 5.58 6.92 6.81 2.27 28.6815.0 - < 20.0 0.29 0.13 0.34 0.85 0.71 1.16 1.5 0.65 5.6320.0 - < 25.0 0.06 0 0.02 0.05 0.05 0.06 0.16 0.13 0.5325.0 - < 30.0 0 0 0 0 0.02 0.02 0 0 0.0330.0 - < 35.0 0 0 0 0 0 0 0 0 0
Totals 4.69 4.32 6.82 14.34 19.65 22.82 18.52 8.84 100Source: Grid Point 5622, AES-40 Wind and Wave Hindcast Dataset (July 1, 1954 through June 30, 2004)
90
45
0
315
270
225
180
135
0.0
0.0
0.1
0.1
0.2
0.2
5
10
15
20
25
30
35
OctoberWind Dir (deg fr) vs. Wind Sp (m/s)
Defined Period: OperationalAE Gpt 5622, Lat 46.875n, Long 48.3333w, Depth 1000m
Figure 30. Wind Rose for October.
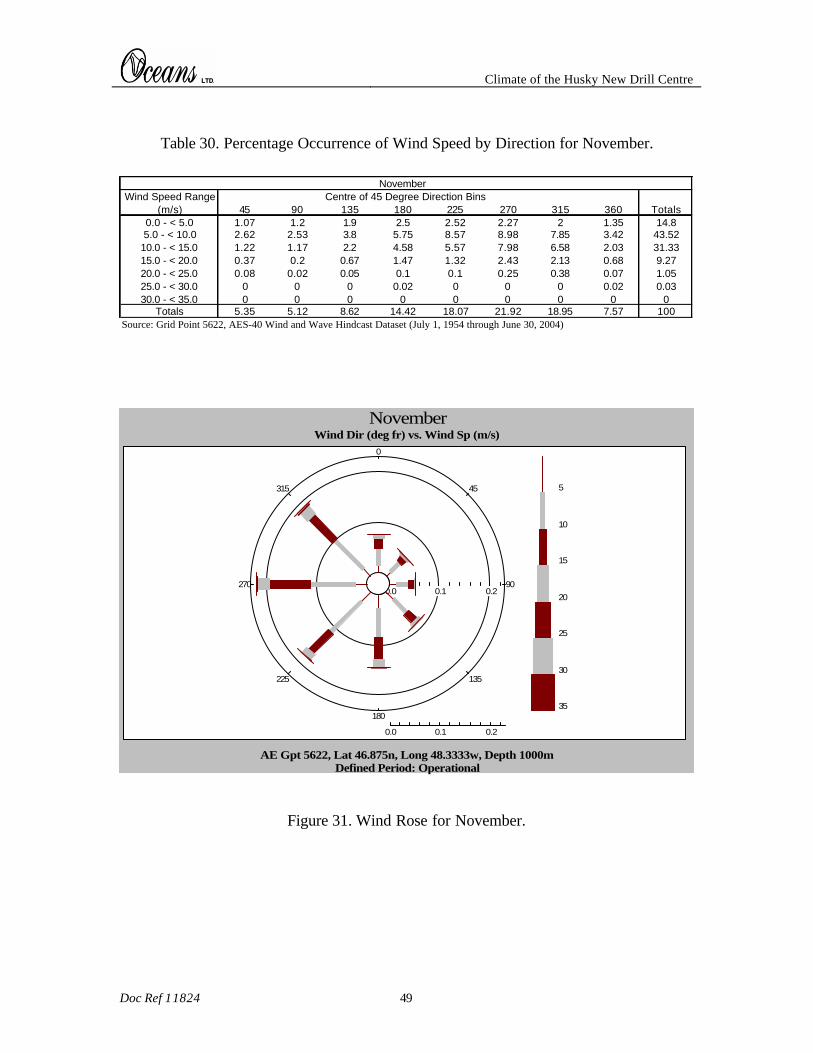
Climate of the Husky New Drill Centre
Doc Ref 11824 49
Table 30. Percentage Occurrence of Wind Speed by Direction for November.
NovemberWind Speed Range Centre of 45 Degree Direction Bins
(m/s) 45 90 135 180 225 270 315 360 Totals0.0 - < 5.0 1.07 1.2 1.9 2.5 2.52 2.27 2 1.35 14.85.0 - < 10.0 2.62 2.53 3.8 5.75 8.57 8.98 7.85 3.42 43.52
10.0 - < 15.0 1.22 1.17 2.2 4.58 5.57 7.98 6.58 2.03 31.3315.0 - < 20.0 0.37 0.2 0.67 1.47 1.32 2.43 2.13 0.68 9.2720.0 - < 25.0 0.08 0.02 0.05 0.1 0.1 0.25 0.38 0.07 1.0525.0 - < 30.0 0 0 0 0.02 0 0 0 0.02 0.0330.0 - < 35.0 0 0 0 0 0 0 0 0 0
Totals 5.35 5.12 8.62 14.42 18.07 21.92 18.95 7.57 100Source: Grid Point 5622, AES-40 Wind and Wave Hindcast Dataset (July 1, 1954 through June 30, 2004)
90
45
0
315
270
225
180
135
0.0
0.0
0.1
0.1
0.2
0.2
5
10
15
20
25
30
35
NovemberWind Dir (deg fr) vs. Wind Sp (m/s)
Defined Period: OperationalAE Gpt 5622, Lat 46.875n, Long 48.3333w, Depth 1000m
Figure 31. Wind Rose for November.

Climate of the Husky New Drill Centre
Doc Ref 11824 50
Table 31. Percentage Occurrence of Wind Speed by Direction for December.
DecemberWind Speed Range Centre of 45 Degree Direction Bins
(m/s) 45 90 135 180 225 270 315 360 Totals0.0 - < 5.0 0.95 1.24 1.37 1.73 1.71 2.06 1.52 0.95 11.535.0 - < 10.0 1.9 2.06 3 4.98 6.63 8.9 6.44 3.35 37.27
10.0 - < 15.0 1.26 0.92 2.26 4.52 5.53 10.19 7.19 2.9 34.7715.0 - < 20.0 0.35 0.34 1.06 2.06 2.29 4.92 2.63 0.89 14.5520.0 - < 25.0 0.03 0.03 0.1 0.18 0.19 0.77 0.24 0.16 1.7125.0 - < 30.0 0 0 0 0 0.02 0.05 0.06 0.03 0.1630.0 - < 35.0 0 0 0 0 0 0 0 0 0
Totals 4.5 4.6 7.79 13.47 16.37 26.9 18.08 8.29 100Source: Grid Point 5622, AES-40 Wind and Wave Hindcast Dataset (July 1, 1954 through June 30, 2004)
90
45
0
315
270
225
180
135
0.0
0.0
0.1
0.1
0.2
0.2
5
10
15
20
25
30
35
DecemberWind Dir (deg fr) vs. Wind Sp (m/s)
Defined Period: OperationalAE Gpt 5622, Lat 46.875n, Long 48.3333w, Depth 1000m
Figure 32. Wind Rose for December.