Embed Size (px)
Citation preview

Prioritisation and Network Analysis of Crohn’s DiseaseSusceptibility GenesDaniele Muraro1*, Douglas A. Lauffenburger2, Alison Simmons1
1 Weatherall Institute of Molecular Medicine, University of Oxford, Oxford, United Kingdom, 2 Department of Biological Engineering, Massachusetts Institute of
Technology, Cambridge, Massachusetts, United States of America
Abstract
Recent Genome-Wide Association Studies (GWAS) have revealed numerous Crohn’s disease susceptibility genes and a keychallenge now is in understanding how risk polymorphisms in associated genes might contribute to development of thisdisease. For a gene to contribute to disease phenotype, its risk variant will likely adversely communicate with a variety ofother gene products to result in dysregulation of common signaling pathways. A vital challenge is to elucidate pathways ofpotentially greatest influence on pathological behaviour, in a manner recognizing how multiple relevant genes may yieldintegrative effect. In this work we apply mathematical analysis of networks involving the list of recently described Crohn’ssusceptibility genes, to prioritise pathways in relation to their potential development of this disease. Prioritisation wasperformed by applying a text mining and a diffusion based method (GRAIL, GPEC). Prospective biological significance of theresulting prioritised list of proteins is highlighted by changes in their gene expression levels in Crohn’s patients intestinaltissue in comparison with healthy donors.
Citation: Muraro D, Lauffenburger DA, Simmons A (2014) Prioritisation and Network Analysis of Crohn’s Disease Susceptibility Genes. PLoS ONE 9(9): e108624.doi:10.1371/journal.pone.0108624
Editor: David L Boone, University of Chicago, United States of America
Received July 8, 2014; Accepted September 1, 2014; Published September 30, 2014
Copyright: ! 2014 Muraro et al. This is an open-access article distributed under the terms of the Creative Commons Attribution License, which permitsunrestricted use, distribution, and reproduction in any medium, provided the original author and source are credited.
Data Availability: The authors confirm that all data underlying the findings are fully available without restriction. All relevant data are within the paper and itsSupporting Information files.
Funding: DM and AS gratefully acknowledge the Sir Jules Thorn Charitable Trust for financial support through grant HBRWGDO. DL gratefully acknowledges theInstitute for Collaborative Biotechnologies through grant W911NF-09-0001 from the United States Army Research Office; the content of the information does notnecessarily reflect the position or the policy of the Government, and no official endorsement should be inferred. The funders had no role in study design, datacollection and analysis, decision to publish, or preparation of the manuscript.
Competing Interests: The authors have declared that no competing interests exist.
* Email: [email protected]
Introduction
Biological functions are rarely a consequence of the activity of asingle molecule and arise from the interactions between multiplecomponents of biological systems. Since the completion of thehuman genome project in 2003, high-throughput techniques havegenerated a large amount of molecular-interaction data in thehuman cells. The need to analyse the role of associated interactionnetworks at a system-wide level, rather than focusing on singleinteractions, led to a change in perspective in the investigation ofbiological systems and to the development of Systems Biologyapproaches [1]. During the past decade, significant contributionshave been made to curate databases of validated network maps atdifferent levels (protein-interaction, regulatory, metabolic andRNA networks), these often comprising thousands of nodes andlinks [2], [3]. Investigation of networks of such dimension cannotbe easily performed by intuitive reasoning and quantitativeapproaches are needed to explore their emerging properties moreobjectively. Recent progresses in network theory have encouragedthe application of network based approaches in the study ofmolecular interaction networks. Although incompleteness inknowledge should suggest caution as these networks are a proxyof the actual interactome, integration with independent functionaldata may support the biological viability of their topology [4].
When a network-based viewpoint is applied to disease, thedisease phenotype is associated with global perturbed networks
instead of single failing components [5], [6]. Starting from theunderlying assumption that a disease is rarely a consequence ofabnormality in single genes, but depends on the indirectperturbation of an interaction network, it should be clarifiedwhether genes and proteins associated with disease are placedrandomly in the interactome, or there are correlations betweentheir function and their network topology [7]. Understanding howdefects in such networks influence the progression of disease mayprovide useful information when selecting targets for drugdevelopment.
Genetic studies have revealed numerous susceptibility genevariants in common diseases such as Crohn’s, but the function ofindividual gene variants in disease induction remains unclear.Here we use a list of Crohn’s susceptibility genes to prioritise genesto serve as a seed to define a putative Crohn’s disease network. Wethen use graph theory to probe hypotheses about its topologicalstructure and to analyse how proteins implicated as being linked toCrohn’s disease by this network may relate with their neighboursin the rest of the proteome. Biological relevance of the prioritisedlist and of its associated interactions is supported by microarrayand functional classification data.
This article is organised as follows. First, we prioritise a list ofcandidate disease genes obtained from literature GWAS reports byapplying both a diffusion-based and a text-mining approach. Therelevance of our prioritised list is next examined by comparisonwith differentially expressed genes in biopsies from patients with
PLOS ONE | www.plosone.org 1 September 2014 | Volume 9 | Issue 9 | e108624
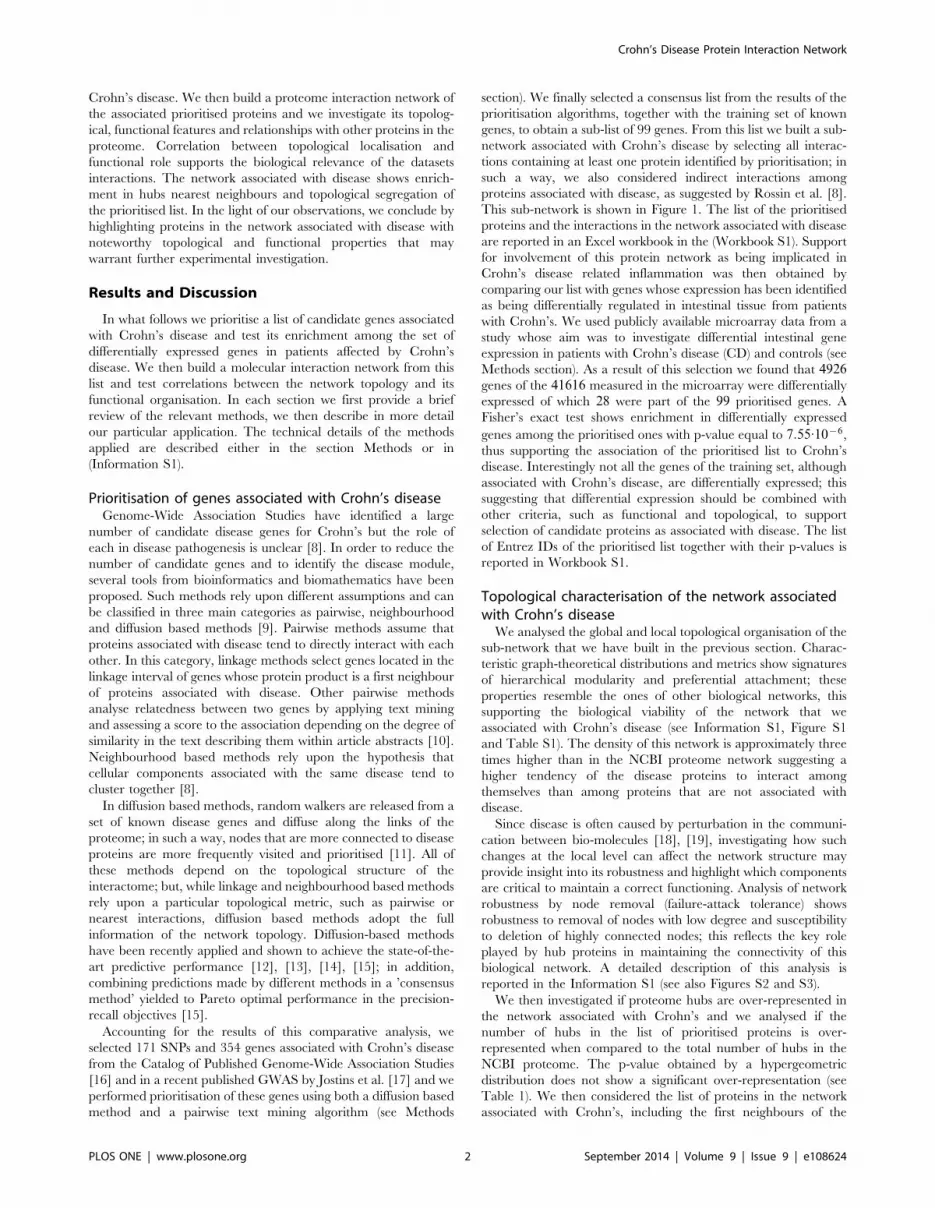
Crohn’s disease. We then build a proteome interaction network ofthe associated prioritised proteins and we investigate its topolog-ical, functional features and relationships with other proteins in theproteome. Correlation between topological localisation andfunctional role supports the biological relevance of the datasetsinteractions. The network associated with disease shows enrich-ment in hubs nearest neighbours and topological segregation ofthe prioritised list. In the light of our observations, we conclude byhighlighting proteins in the network associated with disease withnoteworthy topological and functional properties that maywarrant further experimental investigation.
Results and Discussion
In what follows we prioritise a list of candidate genes associatedwith Crohn’s disease and test its enrichment among the set ofdifferentially expressed genes in patients affected by Crohn’sdisease. We then build a molecular interaction network from thislist and test correlations between the network topology and itsfunctional organisation. In each section we first provide a briefreview of the relevant methods, we then describe in more detailour particular application. The technical details of the methodsapplied are described either in the section Methods or in(Information S1).
Prioritisation of genes associated with Crohn’s diseaseGenome-Wide Association Studies have identified a large
number of candidate disease genes for Crohn’s but the role ofeach in disease pathogenesis is unclear [8]. In order to reduce thenumber of candidate genes and to identify the disease module,several tools from bioinformatics and biomathematics have beenproposed. Such methods rely upon different assumptions and canbe classified in three main categories as pairwise, neighbourhoodand diffusion based methods [9]. Pairwise methods assume thatproteins associated with disease tend to directly interact with eachother. In this category, linkage methods select genes located in thelinkage interval of genes whose protein product is a first neighbourof proteins associated with disease. Other pairwise methodsanalyse relatedness between two genes by applying text miningand assessing a score to the association depending on the degree ofsimilarity in the text describing them within article abstracts [10].Neighbourhood based methods rely upon the hypothesis thatcellular components associated with the same disease tend tocluster together [8].
In diffusion based methods, random walkers are released from aset of known disease genes and diffuse along the links of theproteome; in such a way, nodes that are more connected to diseaseproteins are more frequently visited and prioritised [11]. All ofthese methods depend on the topological structure of theinteractome; but, while linkage and neighbourhood based methodsrely upon a particular topological metric, such as pairwise ornearest interactions, diffusion based methods adopt the fullinformation of the network topology. Diffusion-based methodshave been recently applied and shown to achieve the state-of-the-art predictive performance [12], [13], [14], [15]; in addition,combining predictions made by different methods in a ’consensusmethod’ yielded to Pareto optimal performance in the precision-recall objectives [15].
Accounting for the results of this comparative analysis, weselected 171 SNPs and 354 genes associated with Crohn’s diseasefrom the Catalog of Published Genome-Wide Association Studies[16] and in a recent published GWAS by Jostins et al. [17] and weperformed prioritisation of these genes using both a diffusion basedmethod and a pairwise text mining algorithm (see Methods
section). We finally selected a consensus list from the results of theprioritisation algorithms, together with the training set of knowngenes, to obtain a sub-list of 99 genes. From this list we built a sub-network associated with Crohn’s disease by selecting all interac-tions containing at least one protein identified by prioritisation; insuch a way, we also considered indirect interactions amongproteins associated with disease, as suggested by Rossin et al. [8].This sub-network is shown in Figure 1. The list of the prioritisedproteins and the interactions in the network associated with diseaseare reported in an Excel workbook in the (Workbook S1). Supportfor involvement of this protein network as being implicated inCrohn’s disease related inflammation was then obtained bycomparing our list with genes whose expression has been identifiedas being differentially regulated in intestinal tissue from patientswith Crohn’s. We used publicly available microarray data from astudy whose aim was to investigate differential intestinal geneexpression in patients with Crohn’s disease (CD) and controls (seeMethods section). As a result of this selection we found that 4926genes of the 41616 measured in the microarray were differentiallyexpressed of which 28 were part of the 99 prioritised genes. AFisher’s exact test shows enrichment in differentially expressed
genes among the prioritised ones with p-value equal to 7:55:10{6,thus supporting the association of the prioritised list to Crohn’sdisease. Interestingly not all the genes of the training set, althoughassociated with Crohn’s disease, are differentially expressed; thissuggesting that differential expression should be combined withother criteria, such as functional and topological, to supportselection of candidate proteins as associated with disease. The listof Entrez IDs of the prioritised list together with their p-values isreported in Workbook S1.
Topological characterisation of the network associatedwith Crohn’s disease
We analysed the global and local topological organisation of thesub-network that we have built in the previous section. Charac-teristic graph-theoretical distributions and metrics show signaturesof hierarchical modularity and preferential attachment; theseproperties resemble the ones of other biological networks, thissupporting the biological viability of the network that weassociated with Crohn’s disease (see Information S1, Figure S1and Table S1). The density of this network is approximately threetimes higher than in the NCBI proteome network suggesting ahigher tendency of the disease proteins to interact amongthemselves than among proteins that are not associated withdisease.
Since disease is often caused by perturbation in the communi-cation between bio-molecules [18], [19], investigating how suchchanges at the local level can affect the network structure mayprovide insight into its robustness and highlight which componentsare critical to maintain a correct functioning. Analysis of networkrobustness by node removal (failure-attack tolerance) showsrobustness to removal of nodes with low degree and susceptibilityto deletion of highly connected nodes; this reflects the key roleplayed by hub proteins in maintaining the connectivity of thisbiological network. A detailed description of this analysis isreported in the Information S1 (see also Figures S2 and S3).
We then investigated if proteome hubs are over-represented inthe network associated with Crohn’s and we analysed if thenumber of hubs in the list of prioritised proteins is over-represented when compared to the total number of hubs in theNCBI proteome. The p-value obtained by a hypergeometricdistribution does not show a significant over-representation (seeTable 1). We then considered the list of proteins in the networkassociated with Crohn’s, including the first neighbours of the
Crohn’s Disease Protein Interaction Network
PLOS ONE | www.plosone.org 2 September 2014 | Volume 9 | Issue 9 | e108624

prioritised list, and analysed their over-representation in a similarmanner; in this case, hub over-representation is significant,suggesting Crohn’s disease susceptibility genes tend to directlyinteract with proteome hubs.
The global features of preferential attachment and hierarchicalmodularity suggest the presence of sub-graphs characterising thenetwork at a local level. We now address the problem ofidentifying such topological modules and analysing their potentialcorrelation with proteins associated with disease. More specifically,we searched for over-represented subgraphs (motifs) whencompared to randomised versions of the same network. Algo-rithms for the search of network motifs explore the fullcombinatorial set of graphs of a given dimension. Since thecomputational time grows exponentially with graph dimension,small motifs comprising three or four nodes are usually analysed[20]. Several tools have been developed to identify network motifs,such as Mfinder [21], MAVisto [22], FANMOD [23]. A wellestablished tool developed for network motif search is Mfinder[21]. Beginning with a selected edge, Mfinder searches for all thesubgraphs of a given dimension comprising it. All the sets of visitednodes are then stored in a hash table, this reducing the searchingtime as the searching tree is stopped when a set of nodes has beenalready visited. Motif over-representation is then evaluated bycomparing the frequency of motifs in the real network with a set of
randomly generated networks. In the default mode randomnetworks preserve the degree distribution of the nodes and aregenerated using a switching method, namely edges are switchedwhile keeping the number of incoming edges, outgoing edges andmutual edges of each node of the input network. We investigatedthe presence of motifs and anti-motifs in the network associatedwith disease by applying Mfinder with the default conditions.Because of the computational time required, we analysed motifs ofthree or four nodes only and evaluated their over-representationover 1000 random networks. According to the default Z-scorethreshold (Z-score = 2), the network associated with Crohn’scontains 2 motifs (with motif ids id78 and id4382) and 5 anti-motifs (with motif ids id238, id4698, id4958, id13278, id31710),(Figure 1b). Interestingly, cliques composed of four nodes areunder-represented, suggesting that such a high level of connectivityis not likely in realistic biological networks. We then analysedwhich prioritised proteins were more frequently associated withmotifs and we found, in order of frequency, PRDM1, ATF4 andFASLG. Notwithstanding the degree distribution of the networkassociated with Crohn’s was preserved when generating randomnetworks, two of these proteins are highly connected, FASLGbeing the fourth most connected protein in the prioritised list andATF4 the thirteenth. ATF4 is also one of the known proteinsassociated with Crohn’s disease, see Table S2.
Figure 1. Network associated with Crohn’s disease and motifs. (a) Representation of the protein interaction network obtained byprioritisation. The network presents 28 connected components, each one being highlighted using a different colour. The giant component, namelythe connected subgraph that contains the majority of the entire graph’s nodes, is shown in red. (b) Sub-graphs frequency and z-scores in the networkassociated with Crohn’s. Considering the threshold DZ-scoreD w2, subgraphs id78 and id4382 are over-represented (motifs), whereas subgraphs id238,id4698, id4958, id13278, id31710 are under-represented (anti-motifs).doi:10.1371/journal.pone.0108624.g001
Table 1. Hubs distribution.
Proteins list N. proteins N. Hubs p-value
NCBI Human PPI network proteins 10486 2685 {
Prioritised proteins 99 31 1:18:10{1
Disease network proteins 807 563 v2:20:10{16
Table summarising the number of hub proteins in the NCBI proteome, in the list of prioritised proteins and in the same list together with their first neighbours (Diseasenetwork proteins). Over-representation of hubs is statistically significant when considering first neighbours of the prioritised list (Hypergeometric distribution p-values).doi:10.1371/journal.pone.0108624.t001
Crohn’s Disease Protein Interaction Network
PLOS ONE | www.plosone.org 3 September 2014 | Volume 9 | Issue 9 | e108624

Crohn’s Disease Protein Interaction Network
PLOS ONE | www.plosone.org 4 September 2014 | Volume 9 | Issue 9 | e108624

Functional classification and topological segregation ofenriched categories
Based on the assumption that proteins with similar functionalproperties interact with one another, protein interaction mapshave been frequently used to generate hypotheses on thefunctional role of proteins of unknown functional classification[24], [25]. A systematic graph-theoretical study built from thispremise was proposed in [4] on four datasets that approximate theprotein interaction network of yeast Saccharomyces cerevisiae. Inorder to determine how well such datasets characterise the proteininteraction network of Saccharomyces cerevisiae, the authorsinvestigated the relationship between the topology of the proteininteraction maps and the known functional properties of theprotein. In all four datasets strong correlations were foundbetween the network’s structure and the functional role and sub-cellular localisation of its protein constituents. By measuring thetendency of proteins to interact with other proteins of the samefunctional or localisation class they concluded that most functionalclasses appear as relatively segregated sub-networks of the fullprotein interaction network.
In the spirit of this analysis, we examined whether the proteinnetwork that we associated with Crohn’s disease leads to a similarcorrelation with the functional properties of the prioritisedproteins. We performed a functional classification by applyingthe PANTHER (Protein ANalysis THrough Evolutionary Rela-tionships) Classification System [26]. Here proteins have beenfunctionally classified according to molecular function (thefunction of the protein by itself or with directly interactingproteins at a biochemical level, e.g. a protein kinase); biologicalprocess (the function of the protein in the context of a largernetwork of proteins that interact to accomplish a process at thelevel of the cell or organism, e.g. mitosis) or pathway (similar tobiological process, but a pathway also explicitly specifies therelationships between the interacting molecules). We askedwhether enriched categories presented a correlation with networktopology being topologically segregated. Categories comprisingless than 10 proteins were not considered in this analysis as theyare too few to perform a statistical characterisation. Topologicalsegregation was evaluated by calculating the segregation function
!mml per functional class l in the enriched categories (see Methodssection). This function represents how many times it is more likelythat proteins in a particular functional category interact withneighbours belonging to the same category than with proteinsrandomly placed in the network. The evaluation of the topologicalsegregation is reported in Figure 2. Particularly interconnectedclasses are the ones related to inflammation (’Inflammationmediated by chemokine and cytokine signalling pathway’) and tothe immune system (’defense/immunity protein’). Correlationbetween topology and functional organisation further supports thebiological relevance of the network topology. Evaluation of thetopological segregation of the prioritised list by Eq. (1) in theMethods section returned a value of 3:21 showing tendency ofthese proteins to aggregate.
Conclusions
In this work we have prioritised a list of genes associated withCrohn’s disease and developed a graph-theoretical analysis of themolecular interaction network resulting from this list. Prioritisation
was performed by applying both a diffusion based method (GPEC)[11] and a pairwise text mining algorithm (GRAIL: GeneRelationships Across Implicated Loci) [10] with available software.The relevance of the prioritised list was supported by enrichmentin differentially expressed genes in microarray data betweenbiopsies taken from patients with Crohn’s disease and healthycontrols. By analysing the network associated with Crohn’s from agraph-theoretical perspective, we have shown that it presentshierarchical modularity and density higher than in the NCBIproteome network, this suggesting a higher tendency of the diseaseproteins to interact among themselves than among proteins thatare not associated with disease. Finally we have analysed therelationships among the topology of this network and thefunctional properties of its proteins. To test if prioritised proteinsassociated with the same functional class are more likely to interactamong each other than with other proteins we have calculatedtheir segregation function and we have highlighted a correlationbetween functional role and their topological location, this beingalso in agreement with the global modular organisation of thedisease network. A small number of the prioritised proteinsdemonstrated both noteworthy functional and topological prop-erties which are discussed below. STAT3 and JAK2 are present in11 and 15 over-represented and topologically segregated func-tional categories respectively; they interact in the same signalingpath ’JAK-STAT cascade’, they were both differentially expressedin Crohn’s tissue and they are highly interconnected with hubs asfirst neighbours, besides being highly interconnected proteinsthemselves in the network associated with disease, see Table 2.Vitamin D receptor (VDR) represents a strong positionalcandidate susceptibility gene for inflammatory bowel disease(IBD) [27] and is part of the training set (see Table S2); it ishighly interconnected in the network associated with disease andalso highly interconnected with hubs as a first neighbour (seeTable 2); in addition, it is present in 6 over-represented andtopologically segregated functional categories. PRDM1 is theprotein which is most frequently present in network motifs and theadjusted p-value associated to its differential expression, althoughnot being under the arbitrary statistical threshold of 0:05, is stillsignificant being 0:08; it is also highly interconnected with hubs asa first neighbour (see Table 2). FASLG is present in 22 over-represented and topologically segregated functional categories, it isone of the proteins that occur most frequently in network motifs, itis also highly interconnected in the network associated withCrohn’s and highly interconnected with hubs as a first neighbour(see Table 2). ATF4 is a protein of the training set and is part ofthe unfolded protein response (UPR) pathway which has beenrecently emerged in IBD pathophysiology [28], [29], [30]; it is oneof the proteins most frequently associated with network motifs andit is highly interconnected with hubs as a first neighbour (seeTable 2). A table listing the over-represented functional categoriesof the proteins just mentioned is reported in Table S3. Selectedproteins combining functional and topological information mayconstitute candidates to investigate novel interactions betweenproteins directly associated to a causal mutation and proteinswhose perturbation may be indirectly relevant in affecting thedisease phenotype.
Figure 2. Topological segregation. Series of plots representing the segregation functions of over-represented categories in the networkassociated with Crohn’s sorted from the most to the least segregated category. (a) categories within biological processes; (b) categories withinprotein classes; (c) categories within molecular functions and pathways.doi:10.1371/journal.pone.0108624.g002
Crohn’s Disease Protein Interaction Network
PLOS ONE | www.plosone.org 5 September 2014 | Volume 9 | Issue 9 | e108624

Methods
Prioritisation algorithms171 SNPs and 354 genes associated with Crohn’s disease were
downloaded from the Catalog of Published Genome-WideAssociation Studies [16] and from a recent published GWAS byJostins et al. [17]. Genes and SNPs association is given by the locuslist defined by the NHGRI GWAS catalogue [16], whoseannotation was applied by Jostins et al., and that reports thestrongest SNP and genes reported by the author(s) of thepublication per locus window. Prioritisation was derived by theconsensus of two algorithms, namely a diffusion based method(GPEC) [11] and a pairwise text mining algorithm (GRAIL: GeneRelationships Across Implicated Loci) [10] using as input SNPs rsnumbers and Entrez IDs respectively with available software.GRAIL has two input sets of disease regions in the form ofgenomic regions around associated SNPs: a collection of seedregions and a collection of query regions. Genes in query regionsare evaluated for relationships to genes in seed regions, and queryregions are then assigned a significance score. When examining aset of regions for relationships between implicated genes, as in thiscase, the query regions and the seed regions are identical. GRAILranks genes by text similarity calculating gene relatedness as thedegree of similarity in the text describing them within PubMedarticle abstracts; the algorithm then assigns a p-value to each geneby evaluating the number of other disease regions with relatedgenes. By querying all human genes within the database, GRAILassociated 156 of the 171 SNPs to 174 genes with a p-value lessthan 0.1. We then applied GPEC on the list of genes reportedfrom the collection of GWAS as follows. Prioritisation with GPECwas performed through a random walk with restart algorithmalong a gene or protein relationship network. Nodes in thenetwork were represented by Entrez Gene IDs, UniProt ACs, orofficial symbols for genes and proteins. A set of training genes,whose role in disease is verified in the literature, was specifiedtogether with a set of candidate genes which was defined as the listof genes associated with Crohn’s disease from GWAS. The list ofthe candidate genes is reported in Workbook S1, whereas the listof training genes, together with a list of literature references, islisted in Table S2. A human protein-protein interaction networkwas downloaded from the NCBI Entrez Gene FTP site (ftp://ftp.ncbi.nlm.nih.gov/gene/GeneRIF/interactions.gz) which inte-grates three databases: Biomolecular Interaction Network Data-base [31], Biological General Repository for Interaction Datasets[32], Human Protein Reference database [33]. As a result anetwork of 10,486 genes and 50,791 interactions was built and
employed to define the graph on which the random walk wasdefined. Random walkers were then initialised in the set of traininggenes and allowed to diffuse along the protein interaction networkuntil they reached a steady state, which is numerically approxi-mated by repeating the iterations until the difference between thevector of probabilities at time t and at time tz1, where the i-thelement represents the probability of the walker being at node i ata fixed time, is smaller than a threshold value (whose default value
is set to 10{6). As a result of the GPEC algorithm run a set of 212genes were identified at steady state. We finally selected aconsensus list from the results of the prioritisation algorithms,together with the training set of known genes, to obtain a sub-listof 99 genes.
Microarray datasetThe microarray dataset analysed is available at Gene Expres-
sion Omnibus (http://www.ncbi.nlm.nih.gov/geo/ accession num-ber GSE20881). 172 biopsies from CD and control subjects werestudied. Endoscopic biopsies were taken at ileocolonoscopy fromfour specific anatomical locations, these being terminal ileum,sigmoid colon, ascending colon, descending colon [34]. Thegroups of CD and healthy samples were compared in order toidentify genes that are differentially expressed across experimentalconditions using the interactive web tool GEO2R (http://www.ncbi.nlm.nih.gov/geo/geo2r). GEO2R performs comparisons onoriginal submitter-supplied processed data tables using theGEOquery and limma R packages from the Bioconductor project(http://www.bioconductor.org). The Benjamini and Hochbergfalse discovery rate method was selected by default to adjust p-values for multiple testing. We used these values as the primarystatistics by which to interpret results, selecting as differentiallyexpressed genes those whose p-value was less than 0:05.
Categories enrichmentEnrichment was performed by applying a statistical over-
representation test to the prioritised proteins using as a referencelist the set of all genes in the genome classified in the PANTHERdatabase. Each list is compared to the reference list using thebinomial test [35] for each molecular function, biological process,or pathway term in PANTHER; Bonferroni correction is appliedfor multiple testing. PANTHER mapped 97 of the 99 diseaseproteins into different categories and assigned a p-value to eachcategory. Categories with a p-value minor than 0:01 wereconsidered over-represented; their chart representations arereported in Figures S4–S7 and their lists in Workbook S1.
Table 2. Selected proteins.
Protein name N. neighbours N. hub neighbours p-value
STAT3 112 99 v2:2:10{16
JAK2 91 74 v2:2:10{16
VDR 53 50 v2:2:10{16
PRDM1 13 10 1:5:10{4
FASLG 41 38 v2:2:10{16
ATF4 25 18 1:5:10{6
Table summarising the number of hub first neighbours in the selected proteins listed in section ’Results and discussion’. P-values represent the probability that thenumber of neighbour hubs is due to random choice and are calculated using a Fisher’s exact test which compares the total number of hubs in the NCBI proteome withthe number of hubs in the neighbours of the selected proteins. Of the 10486 proteins listed in the NCBI protein interaction network 2685 have a number of firstneighbours which is strictly higher than the average; connectivity with these hubs is over-represented for the 6 proteins presented.doi:10.1371/journal.pone.0108624.t002
Crohn’s Disease Protein Interaction Network
PLOS ONE | www.plosone.org 6 September 2014 | Volume 9 | Issue 9 | e108624

Classification by cellular component returned a number ofclassified proteins that was too low for a statistical analysis, forcompleteness these are reported in Workbook S1.
Evaluation of the topological segregationThe presence of topological segregation was evaluated by
calculating its segregation function for each enriched category; thisis defined as follows. Given a protein i belonging to the functionalclass l the segregation function is given by
mli (d) : ~
Mli (d)
Mi(d)
where Mli (d) denotes the number of proteins at distance d from
protein i and belonging to the functional class l and Mi(d) denotesthe total number of proteins at distance d from protein i. We then
denote by ml(d) the average of all mli (d) belonging to the same
class l:
ml(d) : ~Smli (d)T
If proteins of a functional class l were randomly distributed, then(see [4])
ml(d)~mlrand : ~Nl=N,
for any d , where Nl denotes the total number of proteinsbelonging to the functional class l and N is the total number ofproteins in the protein network. Defining
!mml : ~Sml(d)=mlrandT, ð1Þ
where the average is taken over the distance, a random
distribution would return !mml~1.
Supporting Information
Figure S1 Topological distributions. Characteristic graph-theoretical distributions of the NCBI human protein-proteininteraction network and of the protein interaction networkobtained by prioritisation. (a), (b) average clustering coefficientdistributions; (c), (d) topological coefficient distributions. A formaldefinition of these distributions is reported in the Appendix.(TIFF)
Figure S2 Failure-attack tolerance to node removal.Series of plots representing how the number of interactions andthe number of secondary extinctions vary when removing nodesrandomly (black circles), from the highest to the lowest degree (redcircles) and from the lowest to the highest degree (green circles). (a)Number of interactions in the network associated with Crohn’sagainst percentage of removed nodes; (b) Number of secondaryextinctions in the network associated with Crohn’s againstpercentage of removed nodes; (c) Number of interactions in arandom network against percentage of removed nodes; (d)Number of secondary extinctions in a random network againstpercentage of removed nodes.(TIFF)
Figure S3 Failure-attack tolerance to SNP removal. Plotsrepresenting how the number of interactions varies whenremoving nodes associated with the SNPs locus windows (blue)and when removing the same number of nodes from the highest to
the lowest degree (red circles) and from the lowest to the highestdegree (green circles).(TIFF)
Figure S4 Enriched biological processes. Chart summa-rising the biological precesses that are enriched in the prioritisedlist of proteins. P-value threshold was set to 0:01.(TIFF)
Figure S5 Enriched protein classes. Chart summarising theprotein classes that are enriched in the prioritised list of proteins.P-value threshold was set to 0:01.(TIFF)
Figure S6 Enriched molecular functions. Chart summa-rising the molecular functions that are enriched in the prioritisedlist of proteins. P-value threshold was set to 0:01.(TIFF)
Figure S7 Enriched pathways. Chart summarising thepathways that are enriched in the prioritised list of proteins. P-value threshold was set to 0:01.(TIFF)
Table S1 Topological metrics. Table summarising thetopological properties of the disease network and of 30 Erdos-Renyi networks with the same number of nodes and edges. All thelisted properties in the disease network are significantly differentfrom random with p-values, calculated from z-scores, smaller than
2:10{4. m and s are respectively mean values and standarddeviations of the graph metrics.(PDF)
Table S2 Training set. Table listing the Entrez IDs includedin the training set with their literature references.(PDF)
Table S3 Segregated enriched categories. Table summa-rising the segregated enriched categories containing STAT3,JAK2, VDR, FASLG (see section ’Results and discussion’ in themain text). ATF4 and PRDM1 are not reported not being presentin such categories.(PDF)
Workbook S1 Network associated with Crohn’s diseaseand enrichment tables. Workbook containing the candidateSNPs and Entrez IDs (Sheet 1), the prioritised Entrez IDs (Sheet2), the network associated with Crohn’s disease (Sheet 3), theNCBI proteome network (Sheet 4), the interactions among theproteins associated with the 28 prioritised and differentiallyexpressed genes (Sheet 5) and the enrichment tables in biologicalprocesses (Sheet 6), protein classes (Sheet 7), molecular functions(Sheet 8), pathways (Sheet 9), cellular components (Sheet 10).(XLS)
Information S1 Supplementary Text and Supplementa-ry Tables.(PDF)
Acknowledgments
We thank Professor Charlotte Deane for helpful comments.
Author Contributions
Conceived and designed the experiments: DM DL AS. Performed theexperiments: DM. Analyzed the data: DM. Contributed reagents/materials/analysis tools: DM. Wrote the paper: DM DL AS.
Crohn’s Disease Protein Interaction Network
PLOS ONE | www.plosone.org 7 September 2014 | Volume 9 | Issue 9 | e108624
´

References
1. Ideker T, Galitski T, Hood L (2001) A new approach to decoding life: systemsbiology. Annu Rev Genomics Hum Genet 2: 343–72.
2. Ideker T, Krogan NJ (2012) Differential network biology. Mol Syst Biol 8: 565.3. Zhu X, Gerstein M, Snyder M (2007) Getting connected: analysis and principles
of biological networks. Genes Dev 21(9):1010–24.4. Yook SH, Oltvai ZN, Barabasi AL (2004) Functional and topological
characterization of protein interaction networks. Proteomics 4(4):928–42.5. Pawson T, Linding R (2008) Network medicine. FEBS Lett 582(8):1266–70.6. Kreeger PK, Lauffenburger DA (2010) Cancer systems biology: a network
modeling perspective. Carcinogenesis 31(1):2–8.7. Vidal M, Cusick ME, Barabasi AL (2011) Interactome networks and human
disease. Cell 144(6):986–98.8. Rossin EJ, Lage K, Raychaudhuri S, Xavier RJ, Tatar D, et al. (2011) Proteins
Encoded in Genomic Regions Associated with Immune-Mediated DiseasePhysically Interact and Suggest Underlying Biology. PLoS Genet 7(1): e1001273.
9. Barabasi AL, Gulbahce N, Loscalzo J (2011) Network medicine: a network-based approach to human disease. Nat Rev Genet 12: 56–68.
10. Raychaudhuri S, Plenge RM, Rossin EJ, Ng AC, International SchizophreniaConsortium, et al. (2009) Identifying Relationships among Genomic DiseaseRegions: Predicting Genes at Pathogenic SNP Associations and Rare Deletions.PLoS Genet 5(6): e1000534.
11. Le DH, Kwon YK (2012) GPEC: a Cytoscape plug-in for random walk-basedgene prioritization and biomedical evidence collection. Comput Biol Chem 37:17–23.
12. Zhang SW, Shao DD, Zhang SY, Wang YB (2014) Prioritization of candidatedisease genes by enlarging the seed set and fusing information of the networktopology and gene expression. Mol Biosyst 10(6):1400–8.
13. Valentini G, Paccanaro A, Caniza H, Romero AE, Re M (2014) An extensiveanalysis of disease-gene associations using network integration and fast kernel-based gene prioritization methods. Artif Intell Med 61(2): 63–78.
14. Zhu J, Qin Y, Liu T, Wang J, Zheng X (2013) Prioritization of candidate diseasegenes by topological similarity between disease and protein diffusion profiles.BMC Bioinformatics 14 Suppl 5:S5.
15. Navlakha S, Kingsford C (2010) The power of protein interaction networks forassociating genes with diseases. Bioinformatics 26, 1057–1063.
16. Hindorff LA, MacArthur J, Morales J, Junkins HA, Hall PN, et al. (2012) ACatalog of Published Genome-Wide Association Studies. Available: www.genome.gov/gwastudies. Accessed 2012 October.
17. Jostins L, Ripke S, Weersma RK, Duerr RH, McGovern DP, et al. (2012) Host-microbe interactions have shaped the genetic architecture of inflammatorybowel disease. Nature 491, 119–124.
18. Nussinov R, Panchenko AR, Przytycka T (2011) Physics approaches to proteininteractions and gene regulation. Phys Biol 8(3):030301.
19. Yadav G, Babu S (2012) NEXCADE: Perturbation Analysis for ComplexNetworks. PLoS ONE 7(8): e41827.
20. Mirzasoleiman B, Jalili M (2011) Failure Tolerance of Motif Structure inBiological Networks. PLoS ONE 6(5): e20512.
21. Kashtan N, Itzkovitz S, Milo R, Alon U (2004) Efficient sampling algorithm forestimating subgraph concentrations and detecting network motifs. Bioinfor-matics 20: 1758–1746.
22. Schreiber F, Schwbbermeyer H (2005) MAVisto: a tool for the exploration ofnetwork motifs. Bioinformatics 21: 3572–3574.
23. Wernicke S, Rasche F (2006) FANMOD: a tool for fast network motif detection.Bioinformatics 22: 1152–1153.
24. Tong AH, Drees B, Nardelli G, Bader GD, Brannetti B, et al. (2002) Acombined experimental and computational strategy to define protein interactionnetworks for peptide recognition modules. Science 295(5553):321–4.
25. Schwikowski B, Uetz P, Fields S, et al (2000) A network of protein-proteininteractions in yeast. Nat Biotechnol 18(12):1257–61.
26. Mi H, Muruganujan A, Thomas PD (2013) PANTHER in 2013: modeling theevolution of gene function, and other gene attributes, in the context ofphylogenetic trees. Nucleic Acids Res. 41(Database issue):D377-86. http://www.pantherdb.org
27. Simmons JD, Mullighan C, Welsh KI, Jewell DP (2000) Vitamin D receptorgene polymorphism: association with Crohn’s disease susceptibility. Gut47(2):211–4.
28. Fritz T1, Niederreiter L, Adolph T, Blumberg RS, Kaser A (2011) Crohn’sdisease: NOD2, autophagy and ER stress converge. Gut 60(11):1580–8.
29. Kaser A, Blumberg RS (2010) Endoplasmic reticulum stress and intestinalinflammation. Mucosal Immunol 3: 11–16.
30. Kaser A, Blumberg RS (2009) Endoplasmic reticulum stress in the intestinalepithelium and inflammatory bowel disease. Semin Immunol 21: 156–63.
31. Bader GD, Betel D, Hogue CWV (2003) BIND: the Biomolecular InteractionNetwork Database. Nucleic Acids Res, 31, pp. 248–250.
32. Breitkreutz BJ, Stark C, Reguly T, Boucher L, Breitkreutz A, et al. (2008) TheBioGRID interaction database: 2008 update. Nucleic Acids Res 36, pp. D637–D640.
33. Keshava Prasad TS, Goel R, Kandasamy K, Keerthikumar S, Kumar S, et al.(2009) Human protein reference database - 2009 update. Nucleic Acids Res 37,pp. D767–D772.
34. Noble CL, Abbas AR, Lees CW, Cornelius J, Toy K, et al. (2010)Characterization of intestinal gene expression profiles in Crohn’s disease bygenome-wide microarray analysis. Inflamm Bowel Dis 16(10):1717–28.
35. Cho RJ, Campbell MJ (2000) Transcription, genomes, function. TrendsGenetics 16: 409–415.
Crohn’s Disease Protein Interaction Network
PLOS ONE | www.plosone.org 8 September 2014 | Volume 9 | Issue 9 | e108624

1
Supporting Information
1 Large scale organisation of the network associated with dis-
ease
In this section we analyse the topological properties that characterise the large scale organisation of ournetwork associated with disease. In section 1.1 we review and apply topological distributions and metricsto delineate the network structure; in section 1.2 we analyse the network robustness to nodes removals.
1.1 Topological distributions and metrics
One of the major goals in network theory is the identification of few general principles that govern thearchitecture of complex networks as they evolve in natural systems. Recently, the concept of hierarchicaland modular organisation in complex networks was introduced in the context of metabolism in [1]. Theauthors analysed metabolic networks of 43 distinct organisms and found that they are organised into manysmall, highly connected topological modules that combine hierarchically into larger, less cohesive units.Important signatures of hierarchy and modularity are the scaling of the average clustering coe�cientdistribution and of the topological coe�cient distributions [1], [2]. A formal definition of the averageclustering coe�cient distribution, together with definitions of the other metrics used, is reported in theAppendix. A power law scaling of the average clustering coe�cient distribution indicates that proteinswith a low number of connections tend to be part of highly linked regions, these communicating throughfew, weakly clustered hubs. This property is typical of hierarchical networks whose structure is based onsuccessive layers of highly interconnected groups of nodes communicating through hubs. The topologicalcoe�cient distribution is defined similarly to the average clustering coe�cient distribution, see Appendix,and its decrease with the number of neighbours indicates that hubs do not have more common neighboursthan proteins with fewer links, this confirming a modular network organisation.
We analysed the topological properties of the disease network built from Crohn’s susceptibility genesto determine if they were in agreement with the ones just described. We investigated the associatedtopological distributions using the Cytoscape plugin Network Analyzer [3], [4]. Typical parameters thatcharacterised the network associated with disease, the NCBI human protein interaction network andaverage parameters of 30 randomised networks with the same size and number of edges as the networkassociated with disease are reported in Supplementary Table 1; characteristic graph theoretical distribu-tions are reported in Supplementary Figure 1. The network associated with disease is composed of 28connected components of which 1 is a giant component and presents a density value which is approx-imately three times higher than in the NCBI human protein interaction network, this indicating thatthe number of edges is high relatively to the network dimension, see Supplementary Table 1. Networkcentralisation and heterogeneity reflect the tendency of the network to contain hub nodes, these beingsignificantly higher than in randomised networks (see Supplementary Table 1). The clustering coe�cientdistribution follows a power law indicating a hierarchical organisation in the disease network whereas itis not significantly fitted by a power law in the NCBI human protein interaction network, see Supple-mentary Figures 1a, 1b. Preferential attachment together with a decrease of the topological coe�cientdistribution indicate a modular network organisation [1], [5], see Supplementary Figures 1c, 1d. Overallboth the NCBI human protein interaction network and the prioritised Crohn’s disease network presenttopological properties that resemble the ones of other biological networks, this supporting their biologicalviability.

2
1.2 Failure-attack tolerance
Disease is often caused by perturbation in the communication between bio-molecules [6], [7]. Investigatinghow such changes at the local level can a↵ect the network structure may provide insight on its robustnessand highlight which components are critical to maintain a correct functioning. A graph theoretical anal-ysis of how nodes removal a↵ect the overall connectedness of complex communication networks showedthat topology plays an important role in generating robustness [8]. When compared to an Erdos-Renyimodel, these networks were found to be robust to progressive removal of nodes, when they were randomlyselected (failures), but more vulnerable to deletion of nodes playing an important role in maintaining thenetwork’s connectivity (attacks). Such resilience can be quantified by analysing how a specific networkattribute is a↵ected when disabling nodes one after the other. In particular, to investigate the robustnessof the disease network that we prioritised, we monitored how the total number of interactions vary as afunction of the percentage of removed nodes; the curves obtained are called co-extinctions curves. Thecomputation was performed by applying the open source software for complex network analysis NEX-CADE [7]. In Supplementary Figure 2a we show a co-extinction curve representing how the numberof interactions in the disease network vary when nodes are removed randomly, from the highest degreeto the lowest and from the lowest to the highest degree. Random removal of nodes caused the totalnumber of interactions to decrease approximately linearly; in contrast, removal of nodes from the highestto the lowest degree resulted in a rapid decrease in the total number of interactions leading to networkfragmentation within deletion of the first 20% of nodes. The network also presents stronger resiliencewhen the co-extinction curve, calculated when removing nodes from the lowest to the highest degree,is compared to the co-extinction curves obtained when deleting nodes in reverse or random order. Wethen investigated the indirect influence of node removals to secondary extinctions, these being defined asfollows. By defining a node as extinct when either it is removed or it does not share any connection withanother node in the network, the number of extinctions is calculated when they are either directly orindirectly caused by the current perturbation; in the former case they are called primary whereas in thelatter secondary. In Supplementary Figure 2b we show a co-extinction curve representing how the numberof secondary extinctions vary when nodes are removed randomly, from the highest degree to the lowestand from the lowest to the highest degree. Similarly to the co-extinction curve evaluating the number ofinteractions, secondary extinctions present high susceptibility to hub removals; nevertheless, they appearto be more resilient when removing random nodes and nodes from lowest to highest degrees. In Supple-mentary Figures 2c, 2d we show the same co-extinction curves when applied to an Erdos-Renyi networkmodel with the same number of nodes and interactions as in the disease network. The co-extinction curveof the number of interactions (Supplementary Figure 2c) shows an approximately linear decrease which issimilar to the one observed in the corresponding curve of the disease network (Supplementary Figure 2a).Conversely, removal of nodes in sorted order highlighted higher resilience of the disease network whennodes were removed from the lowest degree to the highest, whereas higher susceptibility is shown whendeletion occurs in the reverse order. When comparing the secondary extinction cascade of the diseasenetwork (Supplementary Figure 2b) with the one evaluated on the Erdos-Renyi model (SupplementaryFigure 2d), the disease network presented higher resilience to random removal of nodes, this being incontrast with the similarity of the co-extinctions curves of the number of interactions when a↵ected by thesame perturbation (Supplementary Figures 2a, 2c). Similarly to the co-extinction curves associated withthe number of interactions, deletion of nodes in sorted order presents higher susceptibility in the diseasenetwork than in the Erdos-Renyi model when removals occur from the highest to the lowest node degree;instead, it shows higher resilience when nodes are removed in reverse order. Overall the robustness ofthe network associated with disease to removal of nodes with low degree and its susceptibility to deletionof highly connected nodes reflects the key role played by hub proteins in maintaining the connectivity ofthis biological network.
Since in some cases SNPs have been shown to be false positives and the removal of the genes asso-ciated with their windows loci would a↵ect the network connectivity, we tested the network robustness

3
when removing nodes associated with the SNPs loci windows. The results are shown in SupplementaryFigure 3 and are compared with removal of an equivalent number of nodes per SNP when selected fromthe lowest to the highest degree and from the highest to the lowest degree. Robustness is evaluated asnumber of remaining interactions and shows higher network susceptibility to removal of nodes associatedwith the SNPs loci windows than to removal of nodes selected from the lowest to the highest degree;conversely, the network is more robust to removal of nodes associated with the SNPs loci windows thanwhen removing nodes from the highest to the lowest degree.

4
2 Supplementary Tables
Graph metric NCBI Human PPI network Disease network Random networks (µ± �)Number of nodes 10486 807 807Number of edges 50791 1093 1093Network density 8.817 · 10�4 3.361 · 10�3 3.361 · 10�3
Clustering coe�cient 1.239 · 10�1 4.446 · 10�2 2.499 · 10�3 ± 1.811 · 10�3
Network diameter 14 10 15± 1.365Average path length 4.071 4.706 6.517± 8.503 · 10�2
Network centralization 3.107 · 10�2 1.360 · 10�1 8.074 · 10�3 ± 1.150 · 10�3
Network heterogeneity 1.842 2.520 6.098 · 10�1 ± 1.242 · 10�2
Table 1: Topological metrics. Table summarising the topological properties of the disease network andof 30 Erdos-Renyi networks with the same number of nodes and edges. All the listed properties in thedisease network are significantly di↵erent from random with p-values, calculated from z-scores, smallerthan 2 · 10�4. µ and � are respectively mean values and standard deviations of the graph metrics.
Entrez ID Gene name References64127 NOD2 [9], [10], [11]55054 ATG16L1 [10], [11], [12]4843 NOS2 [10], [11], [13]3458 IFNG [10], [11], [14]10125 RASGRP-1 [10], [11]5604 MAP2K1 [15], [16]7421 VDR [11], [17]1665 DBP1 [11], [18]8767 RIPK2 [11], [19]5605 MAP2K2 [15], [20],56848 SPHK2 [11], [21]468 ATF4 [22], [23], [24]2879 GPX4 [11], [25]
Table 2: Training set. Table listing the Entrez IDs included in the training set with their literaturereferences.

5
STAT3 JAK2 VDR FASLG
Biological Process Biological Process Biological Process Biological Process
immune response cellular defense response intracellular signaling cascade immune response
cellular defense response immune system process cell communication cytokine-mediated signaling pathway
immune system process response to stimulus signal transduction cellular defense response
response to stimulus intracellular signaling cascade cellular process immune system process
intracellular signaling cascade cell communication Molecular Function response to stimulus
cell communication signal transduction receptor activity intracellular signaling cascade
signal transduction cell-cell signaling Protein Class MAPKKK cascade
JAK-STAT cascade JAK-STAT cascade receptor cell communication
cellular process cell surface receptor signal transduction
linked signal transduction
apoptosis induction of apoptosis cell-cell signaling
Pathway cellular process I-kappaB kinase/NF-kappaB cascade
Inflammation mediated by chemokine apoptosis response to interferon-gamma
and cytokine signaling pathway
Molecular Function cell surface receptor
linked signal transduction
receptor activity induction of apoptosis
Pathway cellular process
Inflammation mediated by chemokine apoptosis
and cytokine signaling pathway
Protein Class Molecular Function
receptor cytokine activity
receptor binding
receptor activity
protein binding
Protein Class
cytokine
signaling molecule
Table 3: Segregated enriched categories. Table summarising the segregated enriched categoriescontaining STAT3, JAK2, VDR, FASLG (see section ‘Results and discussion’ in the main text). ATF4and PRDM1 are not reported not being present in such categories.

6
Appendix
In what follows we list the formal definitions of the graph theoretical metrics that we applied in ouranalysis.
Formal definitions of graph measures
Average clustering coe�cient distribution
The clustering coe�cient of a node is defined by
Ci =2ni
ki(ki � 1)(1)
where ki is the degree of node i and ni denotes the number of edges between neighbours of node i [4].The average clustering coe�cient distribution C(k) is evaluated by calculating the average of the clus-tering coe�cients for all nodes n with exactly k neighbours by varying k. A power law scaling of C(k)indicates that proteins with a low number of connections tend to be part of highly linked regions, thesecommunicating through few, weakly clustered hubs.
Topological coe�cient distribution
The topological coe�cient Ti of a node i with ki neighbours estimates the tendency of the node to haveshared neighbours with other nodes; this is defined as follows
Ti =< J(i, j) >
ki(2)
where J(i, j) is the number of neighbours shared between the nodes i and j, plus one if there is a directlink between i and j [4], [26]. The topological coe�cient distribution T (k) is defined similarly to theaverage clustering coe�cient distribution and its decrease with the number of neighbours indicates thathubs do not have more common neighbours than proteins with fewer links, this confirming a modularnetwork organisation.
Number of hubs
Following the definition suggested in [27], we define nodes as hubs if their nodal degree exceeds theaverage degree of the network, namely
N. Hubs =NX
i
hki > hki
i.
Average (or characteristic) path length
The average path length L is defined as the average distance between any two nodes in the network,where the distance between two particular nodes is the minimum number of edges needed to connectthem.
Network density
The density of a network D is given by the ratio of the number of its edges E to the number of all possibleedges, these being
�N2
�; it follows
D =2E
N(N � 1).
A network comprising isolated nodes only has a density of 0; conversely, the density of a clique is 1.
7
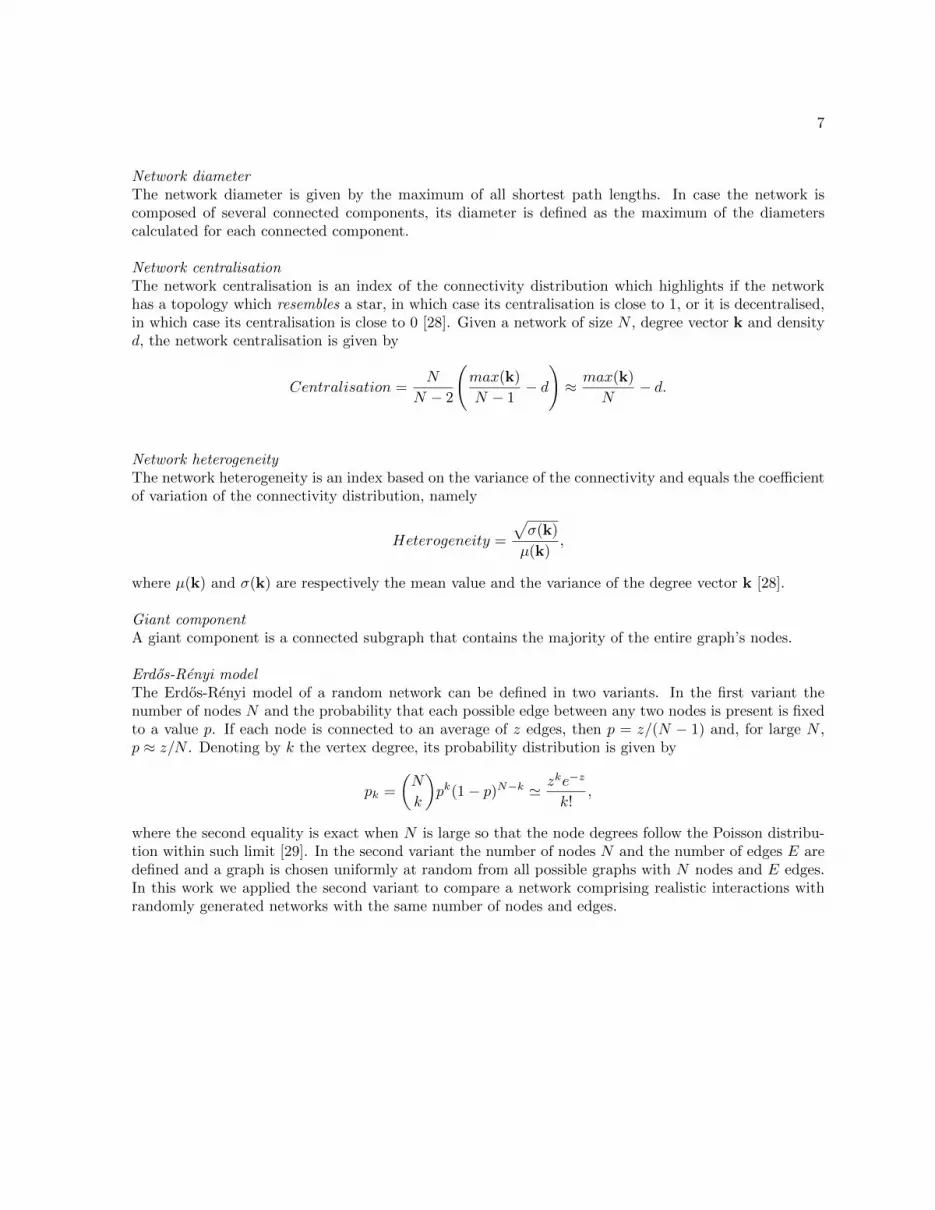
Network diameter
The network diameter is given by the maximum of all shortest path lengths. In case the network iscomposed of several connected components, its diameter is defined as the maximum of the diameterscalculated for each connected component.
Network centralisation
The network centralisation is an index of the connectivity distribution which highlights if the networkhas a topology which resembles a star, in which case its centralisation is close to 1, or it is decentralised,in which case its centralisation is close to 0 [28]. Given a network of size N , degree vector k and densityd, the network centralisation is given by
Centralisation =N
N � 2
max(k)
N � 1� d
!⇡ max(k)
N� d.
Network heterogeneity
The network heterogeneity is an index based on the variance of the connectivity and equals the coe�cientof variation of the connectivity distribution, namely
Heterogeneity =
p�(k)
µ(k),
where µ(k) and �(k) are respectively the mean value and the variance of the degree vector k [28].
Giant component
A giant component is a connected subgraph that contains the majority of the entire graph’s nodes.
Erdos-Renyi model
The Erdos-Renyi model of a random network can be defined in two variants. In the first variant thenumber of nodes N and the probability that each possible edge between any two nodes is present is fixedto a value p. If each node is connected to an average of z edges, then p = z/(N � 1) and, for large N ,p ⇡ z/N . Denoting by k the vertex degree, its probability distribution is given by
pk =
✓N
k
◆pk(1� p)N�k ' zke�z
k!,
where the second equality is exact when N is large so that the node degrees follow the Poisson distribu-tion within such limit [29]. In the second variant the number of nodes N and the number of edges E aredefined and a graph is chosen uniformly at random from all possible graphs with N nodes and E edges.In this work we applied the second variant to compare a network comprising realistic interactions withrandomly generated networks with the same number of nodes and edges.

8
References
1. Ravasz E, Somera AL, Mongru DA, Oltvai ZN, Barabasi AL (2002) Hierarchical organization ofmodularity in metabolic networks. Science. 2002 Aug 30;297(5586):1551-5.
2. Stelzl U, Worm U, Lalowski M, Haenig C, Brembeck FH, et al (2005) A human protein-proteininteraction network: a resource for annotating the proteome. Cell 122(6):957-68.
3. Assenov Y, Ramirez F, Schelhorn SE, Lengauer T, Albrecht M (2008) Computing topologicalparameters of biological networks. Bioinformatics 24, 2, 282-284.
4. Doncheva NT, Assenov Y, Domingues FS, Albrecht M (2012) Topological analysis and interactivevisualization of biological networks and protein structures. Nat Protoc 7(4):670-85.
5. Sengupta U, Ukil S, Dimitrova N, Agrawal S (2009) Expression-Based Network Biology IdentifiesAlteration in Key Regulatory Pathways of Type 2 Diabetes and Associated Risk/Complications.PLoS ONE 4(12): e8100.
6. Nussinov R, Panchenko AR, Przytycka T (2011) Physics approaches to protein interactions andgene regulation. Phys Biol 8(3):030301.
7. Yadav G, Babu S (2012) NEXCADE: Perturbation Analysis for Complex Networks. PLoS ONE7(8): e41827.
8. Albert R, Jeong H, Barabasi AL (2000) Error and attack tolerance of complex networks. Nature406, 378-382.
9. Cooney R, Baker J, Brain O, Danis B, Pichulik T, et al (2010) NOD2 stimulation induces autophagyin dendritic cells influencing bacterial handling and antigen presentation. Nat Med 16(1):90-7.
10. Marcuzzi A, Bianco AM, Girardelli M, Tommasini A, Martelossi S, et al (2013) Genetic and func-tional profiling of Crohn’s disease: autophagy mechanism and susceptibility to infectious diseases.Biomed Res Int. 2013;2013:297501.
11. Jostins L, Ripke S, Weersma RK, Duerr RH, McGovern DP, et al (2012) Host-microbe interactionshave shaped the genetic architecture of inflammatory bowel disease. Nature 491(7422):119-24.
12. Travassos LH, Carneiro LA, Ramjeet M, Hussey S, Kim YG, et al (2010) Nod1 and Nod2 directautophagy by recruiting ATG16L1 to the plasma membrane at the site of bacterial entry. NatImmunol 11(1):55-62.
13. Kraynack NC, Corey DA, Elmer HL, Kelley TJ (2002) Mechanisms of NOS2 regulation by RhoGTPase signaling in airway epithelial cells. Am J Physiol Lung Cell Mol Physiol 283(3):L604-11.
14. Sasaki T, Hiwatashi N, Yamazaki H, Noguchi M, Toyota T (1992) The role of interferon gammain the pathogenesis of Crohn’s disease. Gastroenterol Jpn 27(1):29-36.
15. Van Den Blink B, Ten Hove T, Van Den Brink GR, Peppelenbosch MP, Van Deventer SJ (2002)From Extracellular to Intracellular Targets, Inhibiting MAP Kinases in Treatment of Crohn’sDisease. Ann N Y Acad Sci 973:349-58.
16. Lee JC, Lyons PA, McKinney EF, Sowerby JM, Carr EJ (2011) Gene expression profiling ofCD8+ T cells predicts prognosis in patients with Crohn disease and ulcerative colitis. J Clin Invest121(10):4170-9.

9
17. Simmons JD, Mullighan C, Welsh KI, Jewell DP (2000) Vitamin D receptor gene polymorphism:association with Crohn’s disease susceptibility. Gut. 2000 Aug;47(2):211-4.
18. Lipinski S, Grabe N, Jacobs G, Billmann-Born S, Till A, et al (2012) RNAi screening identifiesmediators of NOD2 signaling: implications for spatial specificity of MDP recognition. Proc NatlAcad Sci U S A 109(52):21426-31.
19. Tigno-Aranjuez JT, Asara JM, Abbott DW (2010) Inhibition of RIP2’s tyrosine kinase activitylimits NOD2-driven cytokine responses. Genes Dev 24(23): 2666-2677
20. Zahn A, Moehle C, Langmann T, Ehehalt R, Autschbach F, et al (2007) Aquaporin-8 expressionis reduced in ileum and induced in colon of patients with ulcerative colitis. World J Gastroenterol13(11): 1687-1695.
21. Edmonds Y, Milstien S, Spiegel S (2011) Development of small-molecule inhibitors of sphingosine-1-phosphate signaling. Pharmacol Ther 132(3):352-60.
22. Fritz T, Niederreiter L, Adolph T, Blumberg RS, Kaser A (2011) Crohn’s disease: NOD2, au-tophagy and ER stress converge Gut 60:1580-1588.
23. Kaser A, Blumberg RS (2010) Endoplasmic reticulum stress and intestinal inflammation. MucosalImmunol 3, 11-16.
24. Kaser A, Blumberg RS (2009) Endoplasmic reticulum stress in the intestinal epithelium and in-flammatory bowel disease. Semin Immunol 21:156-63.
25. McGovern DP, Jones MR, Taylor KD, Marciante K, Yan X, et al (2010) Fucosyltransferase 2(FUT2) non-secretor status is associated with Crohn’s disease. Hum Mol Genet 19 (17): 3468-3476.
26. Assenov Y, Ramirez F, Schelhorn SE, Lengauer T, Albrecht M (2008) Computing topologicalparameters of biological networks. Bioinformatics 24, 2, 282-284.
27. van Wijk BC, Stam CJ, Da↵ertshofer A (2010) Comparing brain networks of di↵erent size andconnectivity density using graph theory. PLoS One 5(10):e13701.
28. Dong J, Horvath S (2007) Understanding Network Concepts in Modules. BMC Syst Biol 1:24.
29. Newman ME, Strogatz SH, Watts DJ (2001) Random graphs with arbitrary degree distributionsand their applications. Phys Rev E 64, 026118.

10
Supporting Information Legends
Information S1: Supplementary Text and Supplementary Tables.
Figure S1: Topological distributions. Characteristic graph-theoretical distributions of the NCBI hu-man protein-protein interaction network and of the protein interaction network obtained by prioritisation.(a), (b) average clustering coe�cient distributions; (c), (d) topological coe�cient distributions. A formaldefinition of these distributions is reported in the Appendix.
Figure S2: Failure-attack tolerance to node removal. Series of plots representing how the numberof interactions and the number of secondary extinctions vary when removing nodes randomly (black cir-cles), from the highest to the lowest degree (red circles) and from the lowest to the highest degree (greencircles). (a) Number of interactions in the network associated with Crohn’s against percentage of removednodes; (b) Number of secondary extinctions in the network associated with Crohn’s against percentageof removed nodes; (c) Number of interactions in a random network against percentage of removed nodes;(d) Number of secondary extinctions in a random network against percentage of removed nodes.
Figure S3: Failure-attack tolerance to SNP removal. Plots representing how the number of inter-actions varies when removing nodes associated with the SNPs locus windows (blue) and when removingthe same number of nodes from the highest to the lowest degree (red circles) and from the lowest to thehighest degree (green circles).
Figure S4: Enriched biological processes. Chart summarising the biological precesses that are en-riched in the prioritised list of proteins. P-value threshold was set to 0.01.
Figure S5: Enriched protein classes. Chart summarising the protein classes that are enriched in theprioritised list of proteins. P-value threshold was set to 0.01.
Figure S6: Enriched molecular functions. Chart summarising the molecular functions that are en-riched in the prioritised list of proteins. P-value threshold was set to 0.01.
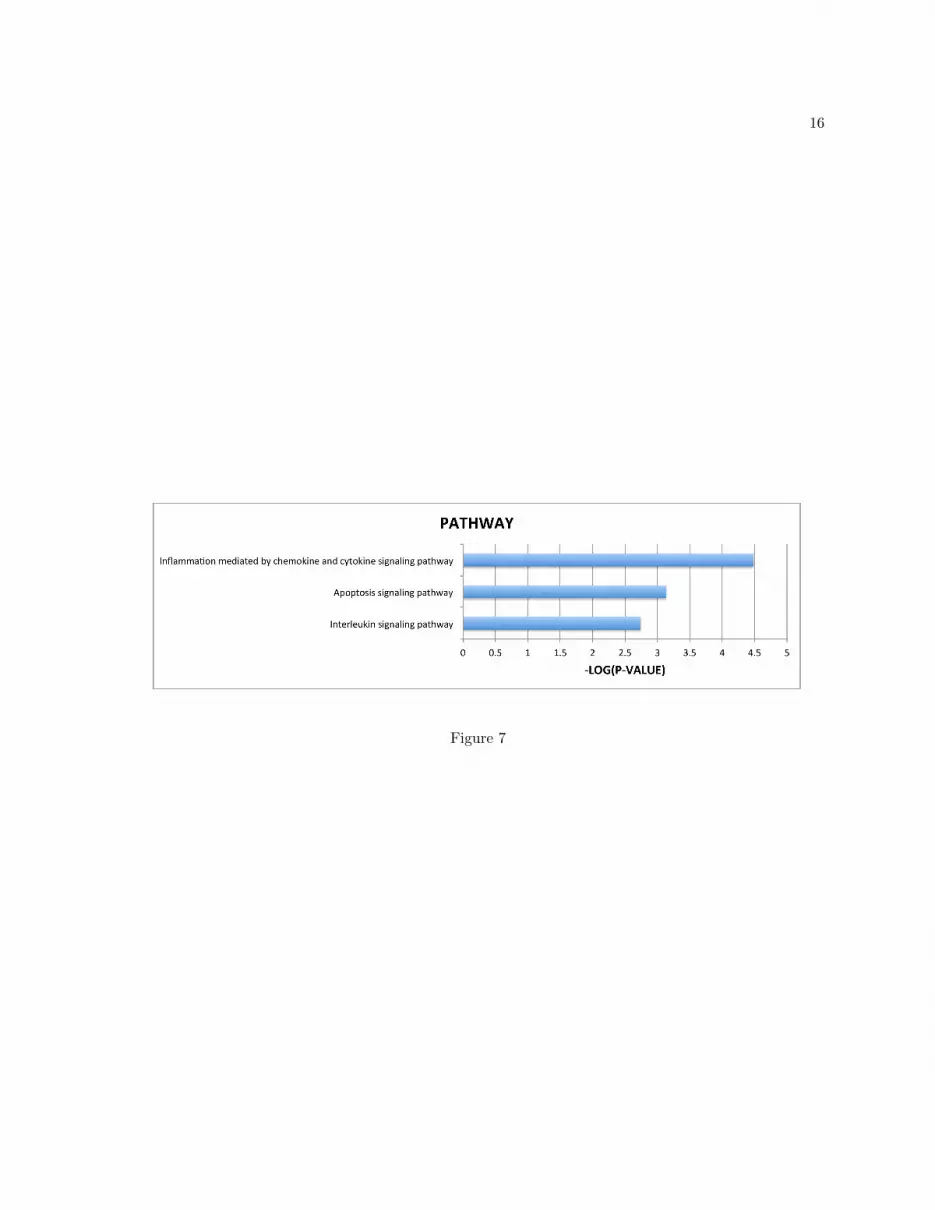
Figure S7: Enriched pathways. Chart summarising the pathways that are enriched in the prioritisedlist of proteins. P-value threshold was set to 0.01.
Table S1: Topological metrics. Table summarising the topological properties of the disease networkand of 30 Erdos-Renyi networks with the same number of nodes and edges. All the listed properties in thedisease network are significantly di↵erent from random with p-values, calculated from z-scores, smallerthan 2 · 10�4. µ and � are respectively mean values and standard deviations of the graph metrics.
Table S2: Training set. Table listing the Entrez IDs included in the training set with their literaturereferences.
Table S3: Segregated enriched categories. Table summarising the segregated enriched categoriescontaining STAT3, JAK2, VDR, FASLG (see section ‘Results and discussion’ in the main text). ATF4and PRDM1 are not reported not being present in such categories.
Workbook S1: Network associated with Crohn’s disease and enrichment tables. Workbookcontaining the candidate SNPs and Entrez IDs (Sheet 1), the prioritised Entrez IDs (Sheet 2), the net-work associated with Crohn’s disease (Sheet 3), the NCBI proteome network (Sheet 4), the interactionsamong the proteins associated with the 28 prioritised and di↵erentially expressed genes (Sheet 5) and the

11
enrichment tables in biological processes (Sheet 6), protein classes (Sheet 7), molecular functions (Sheet8), pathways (Sheet 9), cellular components (Sheet 10).
Figure 1

12
Figure 2

13
Figure 3

14
Figure 4

15
Figure 5
Figure 6
16
Figure 7


