Embed Size (px)
Citation preview

IN DEGREE PROJECT COMPUTER SCIENCE AND ENGINEERING,SECOND CYCLE, 30 CREDITS
, STOCKHOLM SWEDEN 2018
Presentation Slides Recommender System Design
YIMING FAN
KTH ROYAL INSTITUTE OF TECHNOLOGYSCHOOL OF ELECTRICAL ENGINEERING AND COMPUTER SCIENCE


Presentation SlidesRecommender SystemDesign
YIMING FAN
Master in Machine LearningDate: June 30, 2018Supervisor: Mario Romero VegaExaminer: Tino WeinkaufSwedish title: Design av ett rekommendationssystem förpresentationsbilderSchool of Electrical Engineering and Computer Science

iii
Abstract
Using presentation software such as PowerPoint or Keynote to sup-port lectures and presentations has become ubiquitous in both academiaand industry. However, designing the visuals of presentation slides isa time-consuming and laborious task; repetitive steps are required forselecting templates, organizing objects, and optimizing layouts. To al-leviate these laborious works and to allow users to focus on preparingthe contents of presentations, we present SmartPPT, a framework thatsupports the automatic generation of presentation slides from textualoutline. We built a Recommender System model inside the frameworkthat could pick up slide templates for input textual outline. To test itsfunctionality and efficiency, two sets of user study procedures wereconducted and shown that SmartPPT is time efficient in generatingslides and it outperforms in user satisfaction when compared to user-handcrafted slides and the baseline condition, which was PowerPointsuggested templates.
iv
Sammanfattning
Att använda presentationsprogram som PowerPoint eller Keynote föratt stödja föreläsningar och presentationer har blivit allestädes när-varande både i akademin och industrin. Att utforma visuella bilderav presentationsmaterial är emellertid en tidskrävande och mödosamuppgift; upprepade steg krävs för att välja mallar, organisera objektoch optimera layouter. För att underlätta dessa mödosamma arbetenoch låta användarna fokusera på att förbereda innehållet i presentatio-ner presenterar vi SmartPPT, ett ramverk som stöder den automatiskagenerationen av presentationsbilder från en textvy. Vi byggde en Re-commender System-modell inuti ramen som kunde plocka upp bild-mallar för inmatning av textrutor. För att testa dess funktionalitet ocheffektivitet genomfördes två uppsättningar av användarstudieproce-durer och visade att SmartPPT är tidseffektivt för att generera bilderoch användarna blev nöjdare jämfört med när man gjort handgjordabilder eller använt PowerPoint-föreslagna mallar.
Contents
1 Introduction 21.1 Research Question . . . . . . . . . . . . . . . . . . . . . . 3
2 Literature Review 42.1 Recommender Systems . . . . . . . . . . . . . . . . . . . . 42.2 Deep Learning in Recommender Systems . . . . . . . . . 52.3 Computer-aided Design . . . . . . . . . . . . . . . . . . . 52.4 Automatic presentation slide generation . . . . . . . . . . 62.5 Knowledge Base . . . . . . . . . . . . . . . . . . . . . . . . 7
3 Research Methods 83.1 Terminology . . . . . . . . . . . . . . . . . . . . . . . . . . 8
3.1.1 Presentation slide . . . . . . . . . . . . . . . . . . . 83.1.2 Input text . . . . . . . . . . . . . . . . . . . . . . . 103.1.3 The framework . . . . . . . . . . . . . . . . . . . . 11
3.2 Workflow of SmartPPT . . . . . . . . . . . . . . . . . . . . 113.2.1 Extracting features of input text and templates . . 123.2.2 Recommendation . . . . . . . . . . . . . . . . . . . 133.2.3 Compilation . . . . . . . . . . . . . . . . . . . . . . 16
3.3 User study . . . . . . . . . . . . . . . . . . . . . . . . . . . 173.3.1 Overview of participants . . . . . . . . . . . . . . 183.3.2 Design differences between user study 1 & 2 . . . 183.3.3 Explanation on variables related to elapsed time . 193.3.4 Explanation on variables related to user satisfac-
tion . . . . . . . . . . . . . . . . . . . . . . . . . . . 203.3.5 Detailed explanation on feedback . . . . . . . . . 21
4 Results and Discussion 234.1 Overview . . . . . . . . . . . . . . . . . . . . . . . . . . . . 234.2 Execution time analysis . . . . . . . . . . . . . . . . . . . . 23
v
vi CONTENTS
4.3 User satisfaction analysis . . . . . . . . . . . . . . . . . . . 244.4 Detailed feedback analysis . . . . . . . . . . . . . . . . . . 26
5 Conclusion 28
Bibliography 30
A List of input text features 35
B List of presentation template features 37
C User study design 39C.1 User study 1 design . . . . . . . . . . . . . . . . . . . . . . 39
C.1.1 Step 1 . . . . . . . . . . . . . . . . . . . . . . . . . . 39C.1.2 Step 2 . . . . . . . . . . . . . . . . . . . . . . . . . . 39C.1.3 Step 3 . . . . . . . . . . . . . . . . . . . . . . . . . . 40C.1.4 Step 4 . . . . . . . . . . . . . . . . . . . . . . . . . . 45
C.2 User study 2 design . . . . . . . . . . . . . . . . . . . . . . 46C.2.1 Step 1 . . . . . . . . . . . . . . . . . . . . . . . . . . 46C.2.2 Step 2 . . . . . . . . . . . . . . . . . . . . . . . . . . 46C.2.3 Step 3 . . . . . . . . . . . . . . . . . . . . . . . . . . 46C.2.4 Step 4 . . . . . . . . . . . . . . . . . . . . . . . . . . 47C.2.5 Step 5 . . . . . . . . . . . . . . . . . . . . . . . . . . 47C.2.6 Step 6 . . . . . . . . . . . . . . . . . . . . . . . . . . 48

Acknowledgement
Words cannot fully describe my gratitude towards people who pro-vided help while completing my thesis. First, I wish to express mysincere thanks to my thesis supervisor Prof. Mario Romero Vega. It isoften challenging to conduct a master’s thesis project outside Sweden.Without our smooth and inspiring remote communication, the thesiswork could not have been completed so successfully.
I would also like to thank my thesis examiner Prof. Tino Weinkaufand Prof. Ann Bengtsson, for their valuable suggestions on writing thethesis document.
I am also grateful to Prof. Nan Cao and my fellow labmates, forproviding me with all the necessary assistance for the thesis projectand sharing sincere and valuable guidance and encouragement to me.
I also thank my parents for the unceasing, long-term support andcare. Finally, I am grateful to have such a fiancée, Ms. Yanshan Ji, whoaccompanied me throughout this journey. Life might be cruel and hasno answer after all, but our shared experience will remain, and makeus stronger.
1
Chapter 1
Introduction
We make presentations every day and everywhere. It is essential to de-sign informative and aesthetically pleasing presentation slides to suc-ceed in communication. Currently, widely used software tools for de-signing slides include: Microsoft PowerPoint, Google Slides, Keynote,and WPS Office. In this thesis, I do not address the style of slides cre-ated through LATEX.
Usually, there are a number of steps between an idea and a goodslide. First, we must transform our ideas into text (or image, videoand charts if possible). Then, we must fit the text into suitable, well-selected slide templates. After that, we need to combine slides into acomplete presentation, which should:
• Tell a complete story (informative and logically coherent)
• Be perceptually satisfactory (no obvious bugs in design)
• Be aesthetically pleasing (e.g. coherent style / design language)
Generally speaking, the most time consuming task is to choose suit-able slide templates for all slides. How are the sentences (and words)related to each other? Do they follow chronological order (such that a“timeline” could suit them)? Is it likely that the sentences fit the sceneof a scientific report or an informal occasion? All of the above ques-tions are to be considered when choosing a template.
This has been a difficult task where people spend too much time onchoosing and fine-tuning templates for slides. Researchers and scien-tists typically have to edit their slides manually before presenting onworkshops and conferences.
2
CHAPTER 1. INTRODUCTION 3
So, what could it be, if a Computer-Aided Design framework couldautomatically pick up templates and output well-prepared slides fromthem? The framework could take structured text as input, extract thefeatures inside, and generate a set of most suitable templates via anembedded Recommender System model. Given a list of recommendedslides, users could select one or two slide styles with their favoredtemplate. As a result, the effort of choosing and fine-tuning propertemplates would be well reduced. This thesis formally and rigorouslyexplores these conjectures.
1.1 Research Question
If we employ a Recommender System in a Computer-Aided Design(CAD) framework for presentation slides, what are the costs and ben-efits measured by task completion time, user experience, and objec-tive and subjective quality of the using the recommender system forslide generation?
The main research question above introduces two subquestions.One, what are the visual features we need to extract from a slide tem-plate before employing the recommender system? And two, what arethe structural features we need to extract from the input text beforeinserting them into a slide template?
This thesis follows this structure: section 2 reviews the most rel-evant related work in order to contextualize this work; section 3 de-scribes the research methods employed to address the main researchquestions, including formal empirical studies; section 4 presents theresults of the empirical studies; section 5 summarizes the conclusionfrom the current work.
Chapter 2
Literature Review
We present the design of a CAD framework embedded with a recom-mender system model. Within this context, we will list the work thatrepresents the state-of-the-art of recommender systems in the follow-ing two sections. As for the field of CAD, we will list the work thatprovides useful criterias and guides for the implementation of ourframework. Since our framework focuses on automatic presentationslide generation, some milestone papers of that field are also listed asguidelines.
2.1 Recommender Systems
Recommender systems arise from the need of e-commerce. It seeks topredict a user’s potential “preference” or “rating” over an item basedon the history of preferences from that user. In recent years, recom-mender systems have gained increasing attention from academia andindustry [19]. Some well-designed recommender systems have broughtsignificant profits [9].
The techniques used in recommender systems are usually catego-rized into two groups: collaborative filtering (CF) [8] and content-based recommendations [4]. Collaborative filtering seeks to predictuser’s preference using previous preference information from manyusers. In content-based recommendations, items are described by somekeywords, and user’s preference is based on her profile indicatingwhich types of items she prefers. Among collaborative filtering tech-niques, matrix factorization (MF) is the most popular [1] and producesmore accurate recommendation results [14]. We will discuss the details
4

CHAPTER 2. LITERATURE REVIEW 5
of matrix factorization in the next section.Typical types of machine learning algorithms used in collabora-
tive filtering include Bayesian ([6], [7]), Decision Tree ([17]), Neighbor-based algorithms ([11]), Neural Networks ([2]) and so on. Some ofthe algorithms try to reduce the collaborative filtering problem into aclassification problem, and classifiers such as support vector machines(SVM) work in some cases [16]. However, traditional machine learn-ing algorithms for collaborative filtering are gradually being replacedby newly designed deep learning algorithms, which this report willintroduce at a later point.
2.2 Deep Learning in Recommender Systems
In recent years, deep learning (DL) has made breakthrough in manyfields [27], and has been applied to solve collaborative filtering in someresearches.
Deep learning models play the role of matrix factorization in col-laborative filtering. Users and items are mapped into latent factors viatransformations inside deep networks. Consequently, a deep networkshould be well-trained before being able to produce reasonable recom-mendations.
The most widely applied deep learning models include: convolu-tional neural networks (CNN) ([28], [10], [13]), recurrent neural net-works (RNN) ([12], [25]) and restricted Boltzmann machine (RBM)[20]. The recent uprising surge of generative adversarial networks(GAN) also floods into the field of recommender systems [24]. Somerecommender systems rely solely on deep learning models to makepredictions, while some researches integrate deep learning with tradi-tional recommender system models, such as tightly coupled models[24].
2.3 Computer-aided Design
In our CAD framework, input text will be filled into recommendedtemplates to form complete slides. Output slides should be aesthet-ically pleasing to meet user satisfaction. Yang et al. [26] have sum-marized style points on generating visual-textual presentation layouts(e.g. magazine covers, posters, PowerPoint slides, etc.):
6 CHAPTER 2. LITERATURE REVIEW
• Textual information completeness: elements should not exceedbackground boundaries or overlap each other.
• Visual information maximization: Images should have propersizes that preserve important visual information.
• Spatial layout reasonableness: Positions of textual elements shouldobey some aesthetic principles.
• Perception consistency: Texts should have distinctive text sizes,fonts, and have high contrast to the background color.
• Color harmonization: Similar to Perception Consistency, the com-bination of colors of elements should be harmonious.
• Textual information readability: Textual elements should haveproper sizes.
We apply recommender systems to mimic the process of interac-tive layout suggestions. O’Donovan et al. [18] present a system whichproduces two types of suggestions: refinement suggestions (small im-provement on the current layout) and brainstorming suggestions (lay-outs of various styles).
2.4 Automatic presentation slide generation
Our CAD framework will output presentation slides from structuredinput text. Below we will list those work that inspire us before imple-mentation.
Masao et al. [15] presented an approach to generate presentationslides from semantically annotated documents. In 2005, Shibata et al.[21] provided a way to generate slides from raw input text. Raw in-put text is separated into topic- and non-topic parts, and presentationslides are generated with respect to those parts. Sravanthi et al. [22]presented a framework to generate slides from LATEXdocuments. Intheir framework, documents are first parsed into XML format, then itsinformation is compressed and summarized through a summarizer.Presentation slides are eventually outputted using the summarizedcontent.
CHAPTER 2. LITERATURE REVIEW 7
Those papers mentioned above are good examples of workflowthat transforms input text into presentation slides. Since our frame-work will focus on matching slide templates with input text, we willpresume that input text is well summarized and structured before in-putting into the framework.
2.5 Knowledge Base
In this part we will list some other papers that inspired us during lit-erature review.
Our master thesis will serve as part of a PowerPoint slides project,which includes slides recommendation, layout generation, layout re-finement, etc. Some work might inspire us in the process of slidelayout generation: Cao et al. [5] provided a probabilistic model toautomatically generate stylistic manga layout. Qiang et al. [18] pre-sented an approach to generate scientific paper posters. Tokumaru etal. [23] provided a system to facilitate the design of harmonious colors.Beamer and Girju’s work [3] focuses on the process of slide to paperalignment.
Chapter 3
Research Methods
To address the research question, we implemented a CAD frameworkcalled SmartPPT. It takes structured text as input, and returns presen-tation slides as output. In this part, we will show the overall work-flow of SmartPPT and how our recommender system works inside theframework. Moreover, we will briefly illustrate the user study meth-ods that address our research question.
3.1 Terminology
Here we provide stipulative, detailed explanation on some terminolo-gies.
3.1.1 Presentation slide
A presentation slide (sometimes “slide” for short) is a single page con-taining text, shapes, images and/or charts used for presentation.
Slide template
A slide template (sometimes “template” for short) is a single page con-taining shapes, images and/or charts. A template may contain place-holder text for replacement.
Bullet component
A bullet component is defined as a piece of replicable component in aslide template.
8
CHAPTER 3. RESEARCH METHODS 9
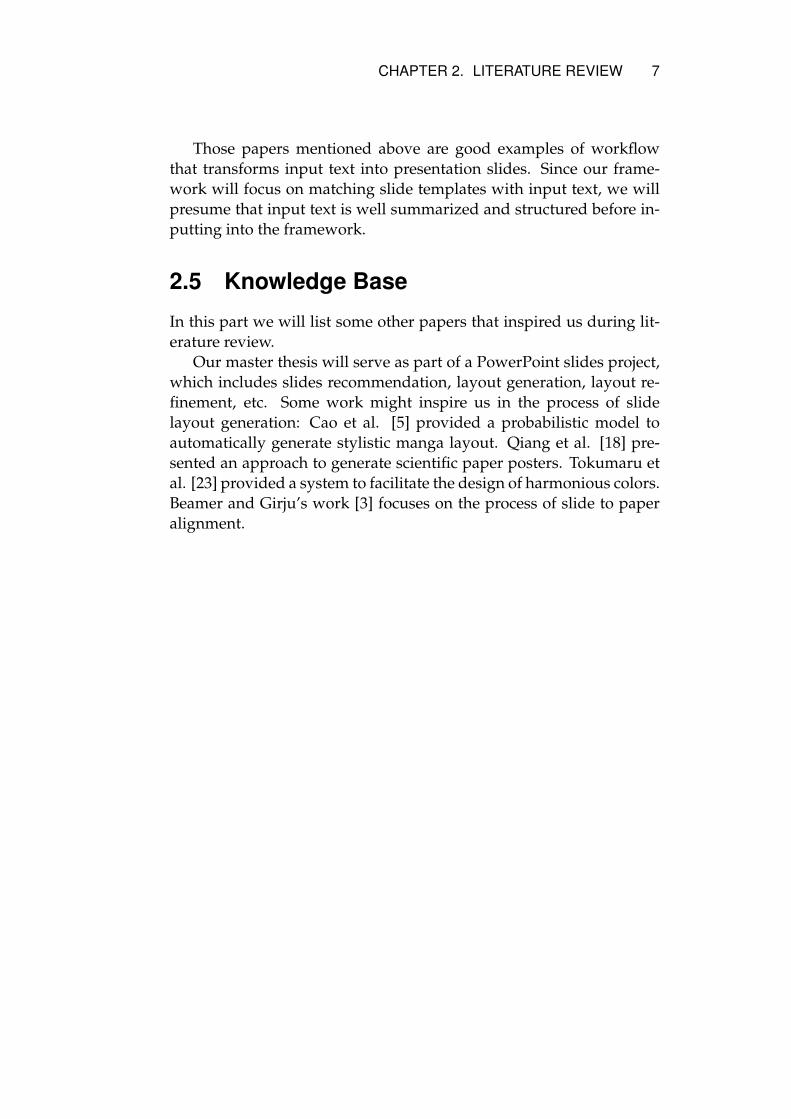
Figure 3.1: A slide template. There are 5 bullet components inside thetemplate.
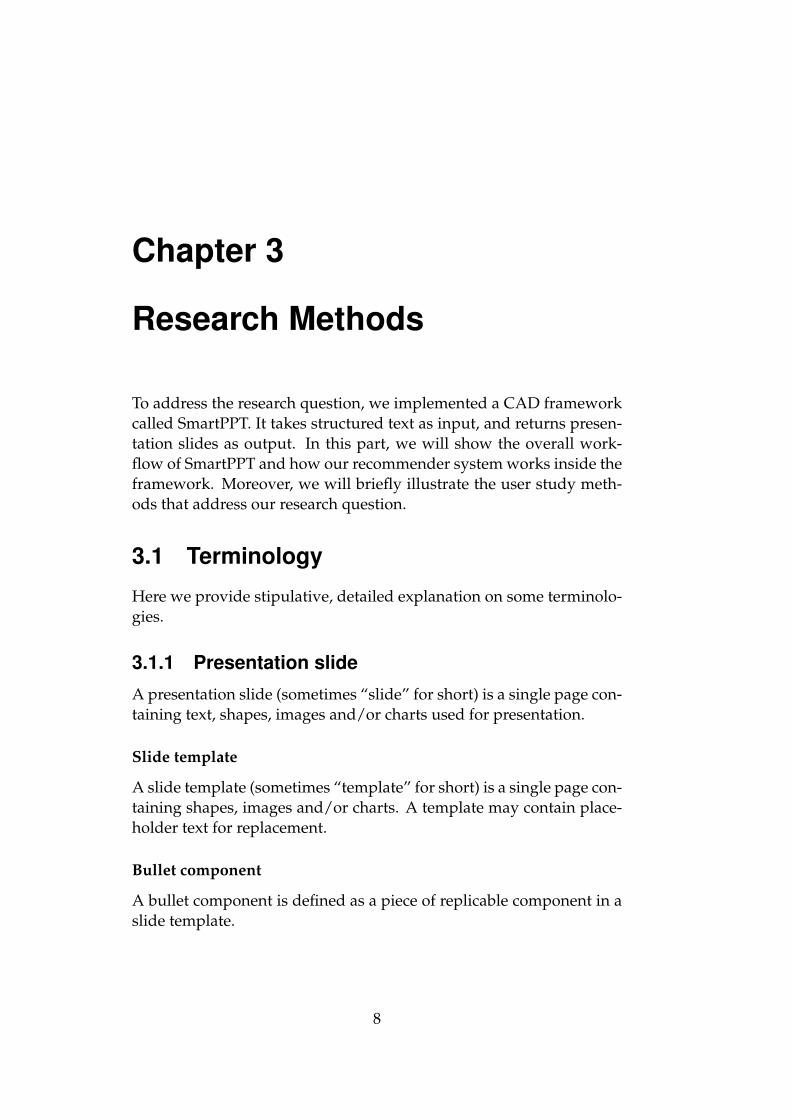
Figure 3.2: Baseline slides.
Recommended slide
A recommended slide is defined as a presentation slide generated throughthe CAD framework.
Recommended template
A set of recommended templates are templates which is the output ofrecommender system. Those templates need to be “compiled” withinput text to form recommended slides.
Baseline slide
A baseline slide is a slide generated using templates contained in Mi-crosoft PowerPoint, without or with slight modification.
10 CHAPTER 3. RESEARCH METHODS
3.1.2 Input text
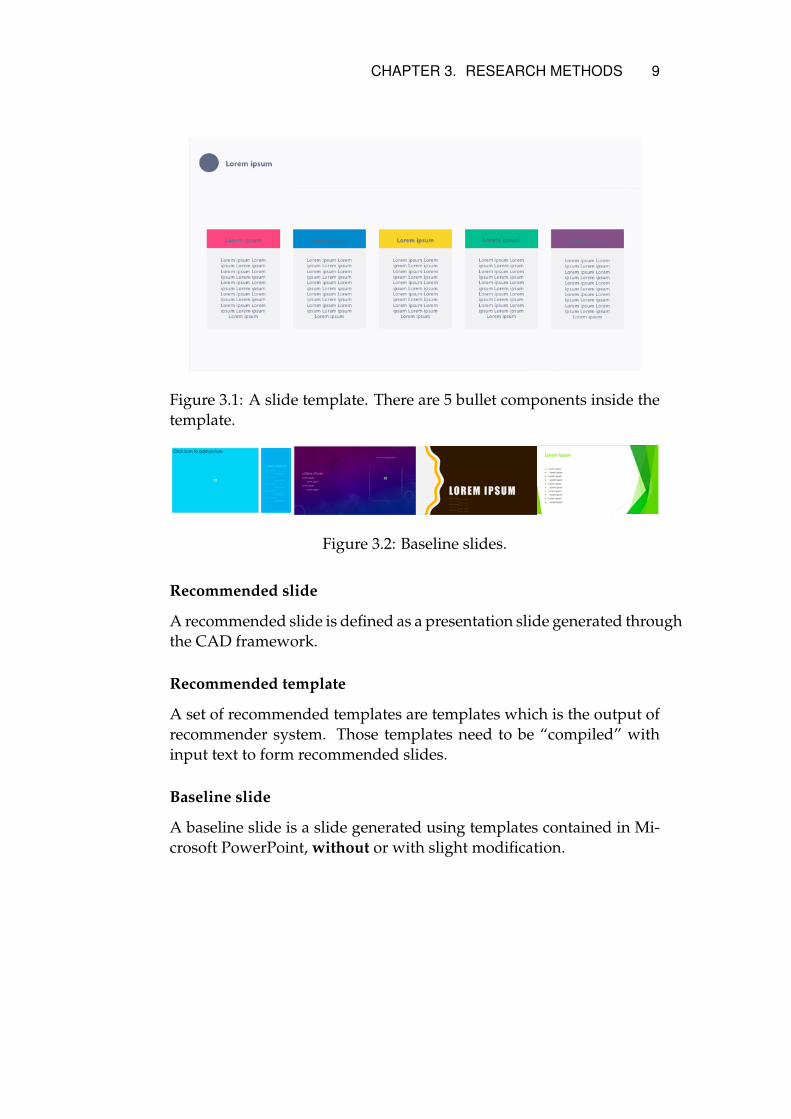
The input text of SmartPPT framework is structured with hierarchicalorder. Below shows an example of hierarchical input text.
- Page 1 title ... level 0 line- Level 1 content ... level 1 line
- Lorem ipsum ... level 2 line- Lorem ipsum ... level 2 line
- Another level 1 content ... level 1 line- Lorem ipsum ... level 2 line
- Page 2 title ... level 0 line- Level 1 content: Lorem ipsum, lorem ipsum, lo-rem ipsum ... level 1 line
Line
A line is the basic component of structured input text. It contains a fewtabs, a short dash and its content.
The “level” of a line is defined by the number of tabs before thedash of the line. Every line belongs to the first line above it that haslower level. Lines with level 0 do not belong to any lines; they are pagetitles.
Page
Each page of content is separated by level 0 lines. For example, thereare two sets of recommended slides generated with the above exampleinput.
If we consider input text as having forest-like structure, then eachpage could be treated as a tree, whose root is their respective level 0line.
Bullet
Each bullet content inside one page is separated by level 1 lines. In theprocess of compilation, each bullet corresponds to a piece of replicablecomponent in a template.
CHAPTER 3. RESEARCH METHODS 11
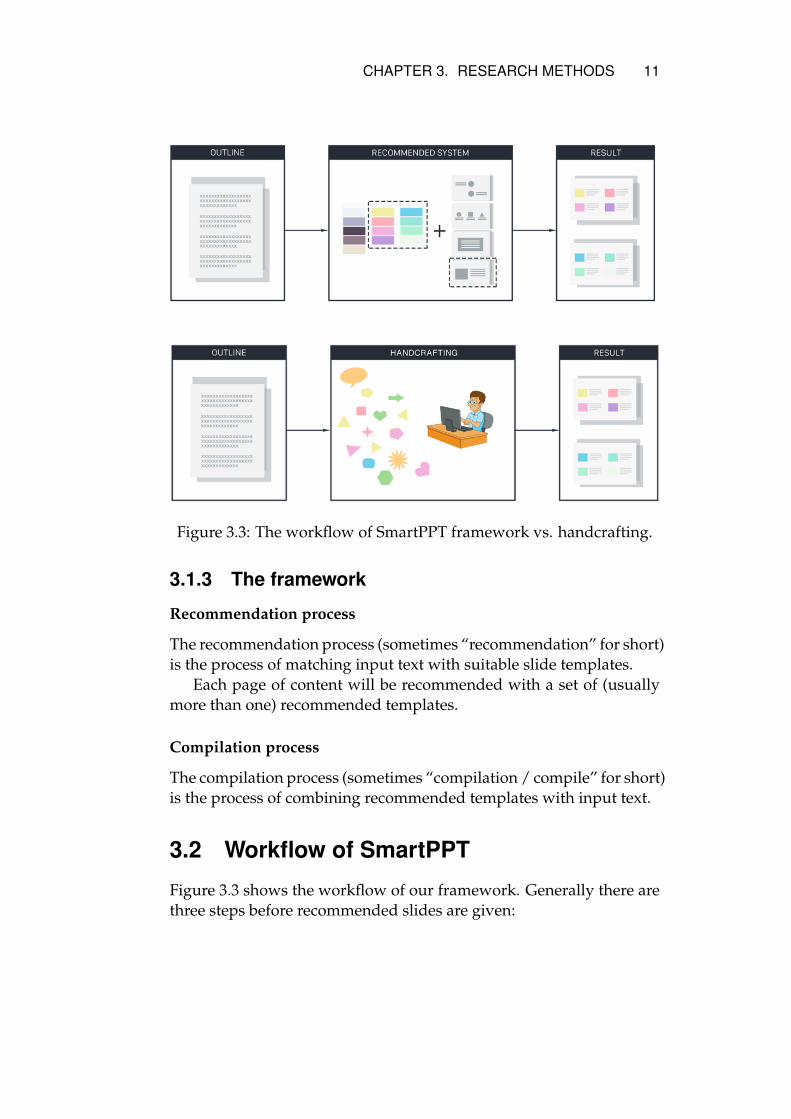
Figure 3.3: The workflow of SmartPPT framework vs. handcrafting.
3.1.3 The framework
Recommendation process
The recommendation process (sometimes “recommendation” for short)is the process of matching input text with suitable slide templates.
Each page of content will be recommended with a set of (usuallymore than one) recommended templates.
Compilation process
The compilation process (sometimes “compilation / compile” for short)is the process of combining recommended templates with input text.
3.2 Workflow of SmartPPT
Figure 3.3 shows the workflow of our framework. Generally there arethree steps before recommended slides are given:
12 CHAPTER 3. RESEARCH METHODS
• Step 1: Initialization. Input text are parsed, and key features ofinput text and templates are extracted.
• Step 2: Recommendation. Pre-trained Machine Learning modelis loaded. Given the feature of input text and templates, themodel provide recommended templates. The result of predictionis an array of presentation slide template(s).
• Step 3: Compilation. Slides are generated using recommendedtemplate(s).
In the following sections, we will illustrate those steps in detail.
3.2.1 Extracting features of input text and templates
Feature extraction and pruning is a crucial part in Machine Learn-ing. We need to manually expand features of input text and templatesinto multidimensional vector space, in order for models to understandthem.
Extracting features of input text
We extract structural features of input text, and align those featuresinto a vector. The feature vector of input text concerns about its struc-tural features only, meaning that we simply ignore the lexical and se-mantic features inside the context (that is, we have less to do with Nat-ural Language Processing).
Extracting features of templates
Features of templates that are within our care include:
• Position of shapes;
• Height, width, area and their ratio (divided by height and widthof slides);
• Number of shapes inside a replicable component (a “bullet”);
• If bullets are left aligned and/or right aligned;
• Colors of shapes.
Those features will be also aligned into vectors. We will providedetailed lists of features of input text and templates in appendix part.
CHAPTER 3. RESEARCH METHODS 13
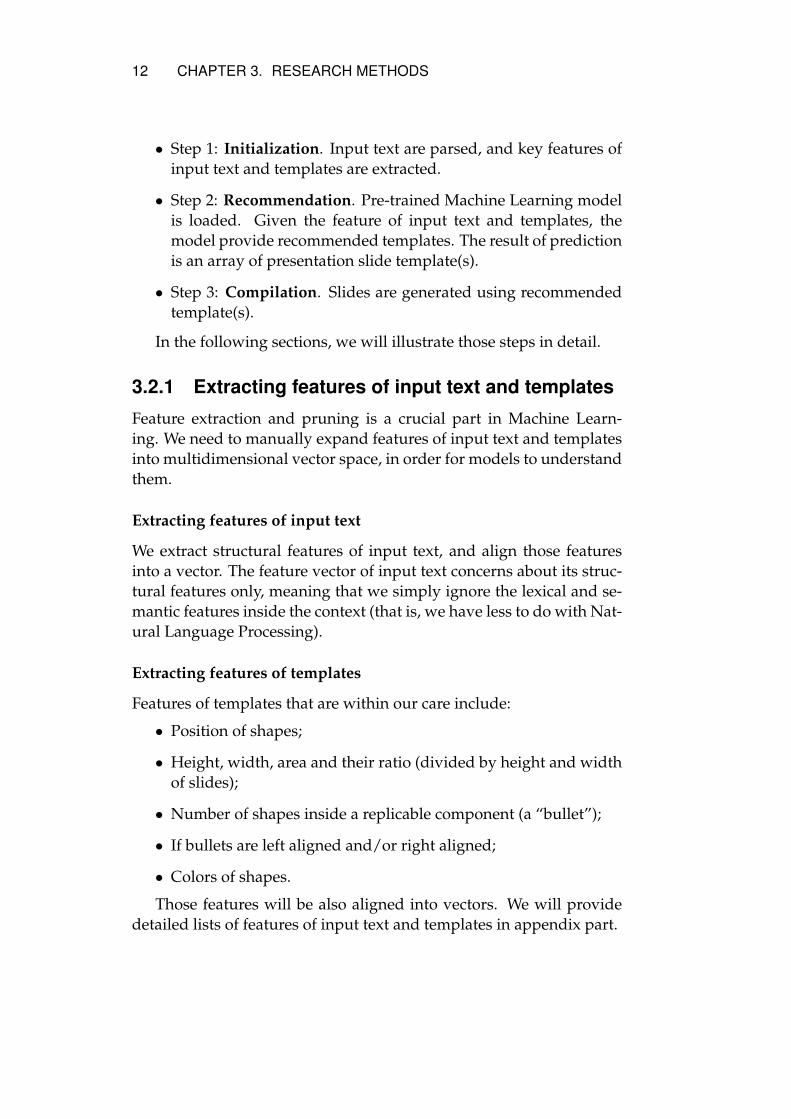
Figure 3.4: SVM training data format.
3.2.2 Recommendation
In this step, recommender system will compare features of input textwith features of various slide templates. The model returns a list ofslide templates that better match the input text. In the context of rec-ommender system, input text is seen as “user” and templates are con-sidered as “items”. Therefore, our task can be described as to selectsuitable items (slide templates) for a certain user (input text).
In order to deeper address our research question, two recommendersystem models are implemented using SVM and CNN respectively.In the following sections, we will introduce those models, how theyare trained and how they provide recommendations with different ap-proaches.
During runtime of the framework, user could manually select whichrecommender system model she wishes to use.
Training data
Recommender system models must be trained to predict suitable slidetemplates for a certain piece of input text. We have invited people withadequate design background to generate training data.
We utilize a set of 11 templates which covers basic layout configura-tions to generate training data. During training, we generate presenta-tion slides using input text with various structural properties withoutrecommender system. That is, every basic template that is structurallylegal with respect to the input text is selected for generating slides.After generating presentation slides, people are supposed to decidewhich templates better match the input text. Suitable template-textmatches are stored as positive data for training.

14 CHAPTER 3. RESEARCH METHODS
Figure 3.5: CNN training data format.
The structure of training dataset for SVM is slightly different thanwhat for CNN. We train CNN as a binary classifier that detects if a cer-tain template-text match is suitable. Therefore, all positive and nega-tive data are used for training. On the other hands, we divide positivetraining dataset into 11 categories which corresponds to each page ofbasic templates, so that SVM could be trained as a 11-class classifier.For example, if basic template 2 matches a certain piece of input text,that row of training data will be labeled as 2. Figure 3.5 briefly showshow training data are structured.
Support vector machine
Support vector machine (SVM) is a kind of supervised model. If trainedwith suitable kernels, SVM could well classify high-dimensional non-linear data with high robustness.
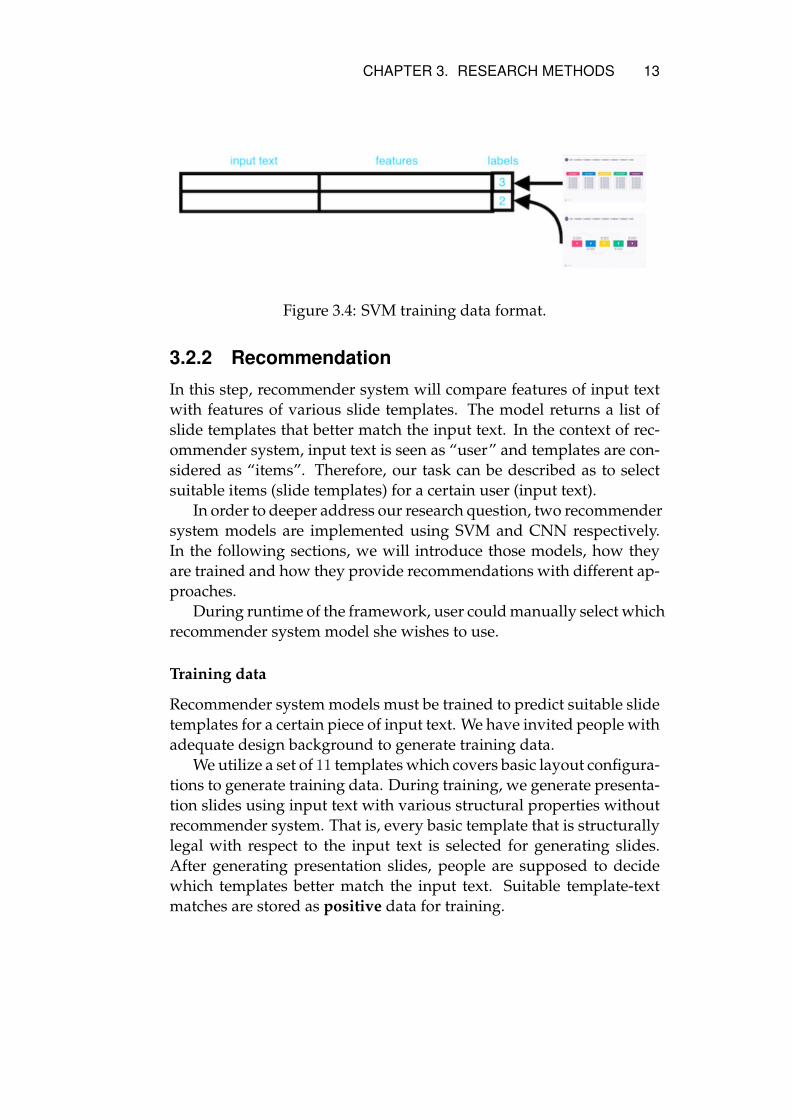
After training, the prediction procedure of SVM-based recommendersystem is shown below. A label indicating which category the inputtext belongs to is first predicted. Then we iterate all candidate tem-plates, and calculate their feature similarities with the basic templatethat label corresponds to. The recommender system will therefore re-turn a list of templates that are closest to the basic template.
CHAPTER 3. RESEARCH METHODS 15
Figure 3.6: Prediction of SVM-based recommender system.
Our SVM model is trained with the help of scikit-learn tool-box. The model uses radial basis function (RBF) kernel to achieve non-linear classification.
Convolutional neural network
Convolutional neural network (CNN) is a type of feed-forward artifi-cial neural network that has been applied into many fields includingcomputer vision, pattern recognition and recommender systems. Inaddressing this research question, we have trained a one-dimensionalCNN model for detecting whether the template-text match is applica-ble.
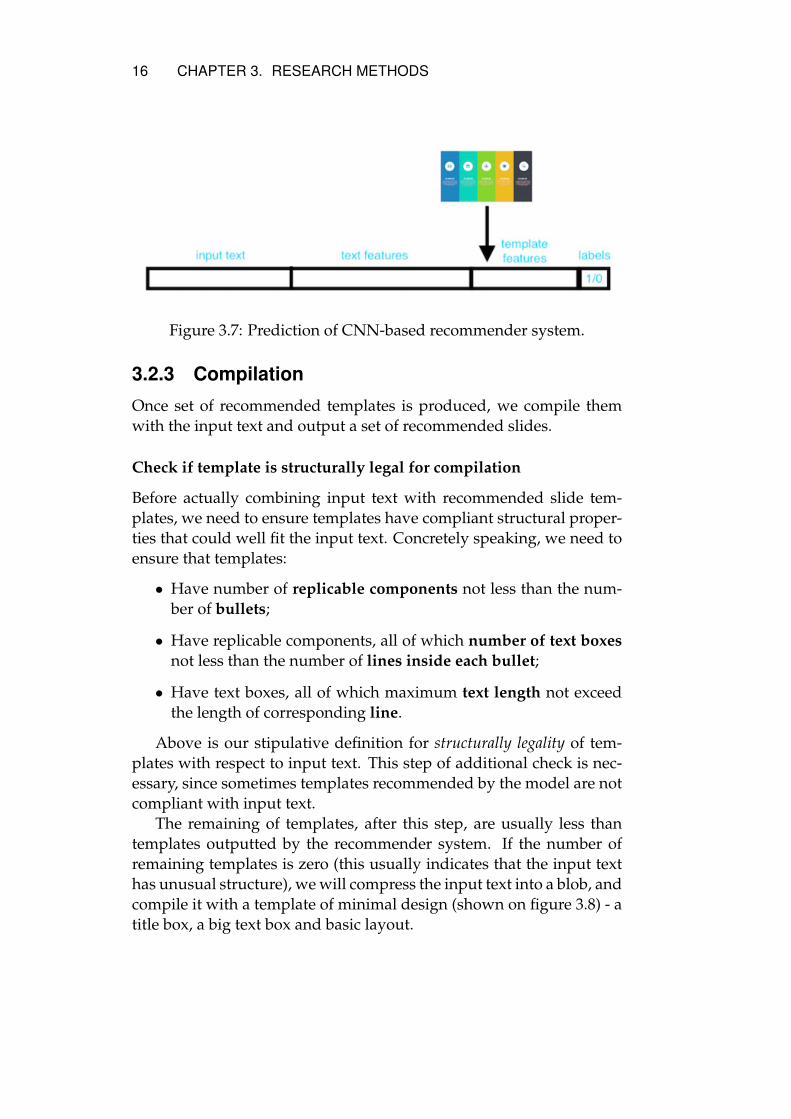
The prediction procedure of CNN-based recommender system isshown below. First we extract both the features of input text and slidetemplate, then feed the aligned data into the model. The model willreturn a boolean value indicating whether the template matches theinput text well. By iterating over all candidate templates, we will even-tually receive a list of recommended templates.
Our model is trained with the help of keras framework written inpython. Input data goes through one fully connected layer, then oneconvolutional layer (including convolution and max pooling), thentwo fully connected layers, then one dropout layer, finally one fullyconnected layer to complete the prediction process. The model is trainedwith stochastic gradient descent method and Adam optimizer. Af-ter training, the model achieves 78% prediction accuracy on cross-validated data.
16 CHAPTER 3. RESEARCH METHODS
Figure 3.7: Prediction of CNN-based recommender system.
3.2.3 Compilation
Once set of recommended templates is produced, we compile themwith the input text and output a set of recommended slides.
Check if template is structurally legal for compilation
Before actually combining input text with recommended slide tem-plates, we need to ensure templates have compliant structural proper-ties that could well fit the input text. Concretely speaking, we need toensure that templates:
• Have number of replicable components not less than the num-ber of bullets;
• Have replicable components, all of which number of text boxesnot less than the number of lines inside each bullet;
• Have text boxes, all of which maximum text length not exceedthe length of corresponding line.
Above is our stipulative definition for structurally legality of tem-plates with respect to input text. This step of additional check is nec-essary, since sometimes templates recommended by the model are notcompliant with input text.
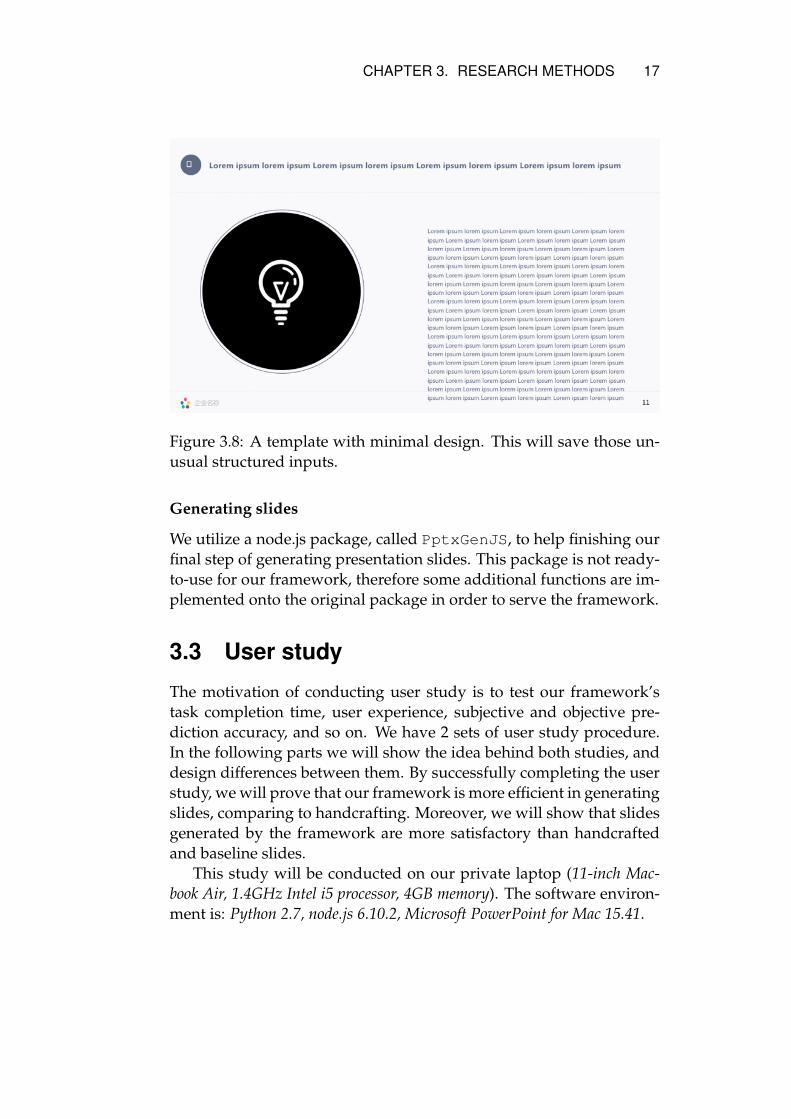
The remaining of templates, after this step, are usually less thantemplates outputted by the recommender system. If the number ofremaining templates is zero (this usually indicates that the input texthas unusual structure), we will compress the input text into a blob, andcompile it with a template of minimal design (shown on figure 3.8) - atitle box, a big text box and basic layout.
CHAPTER 3. RESEARCH METHODS 17
Figure 3.8: A template with minimal design. This will save those un-usual structured inputs.
Generating slides
We utilize a node.js package, called PptxGenJS, to help finishing ourfinal step of generating presentation slides. This package is not ready-to-use for our framework, therefore some additional functions are im-plemented onto the original package in order to serve the framework.
3.3 User study
The motivation of conducting user study is to test our framework’stask completion time, user experience, subjective and objective pre-diction accuracy, and so on. We have 2 sets of user study procedure.In the following parts we will show the idea behind both studies, anddesign differences between them. By successfully completing the userstudy, we will prove that our framework is more efficient in generatingslides, comparing to handcrafting. Moreover, we will show that slidesgenerated by the framework are more satisfactory than handcraftedand baseline slides.
This study will be conducted on our private laptop (11-inch Mac-book Air, 1.4GHz Intel i5 processor, 4GB memory). The software environ-ment is: Python 2.7, node.js 6.10.2, Microsoft PowerPoint for Mac 15.41.
18 CHAPTER 3. RESEARCH METHODS
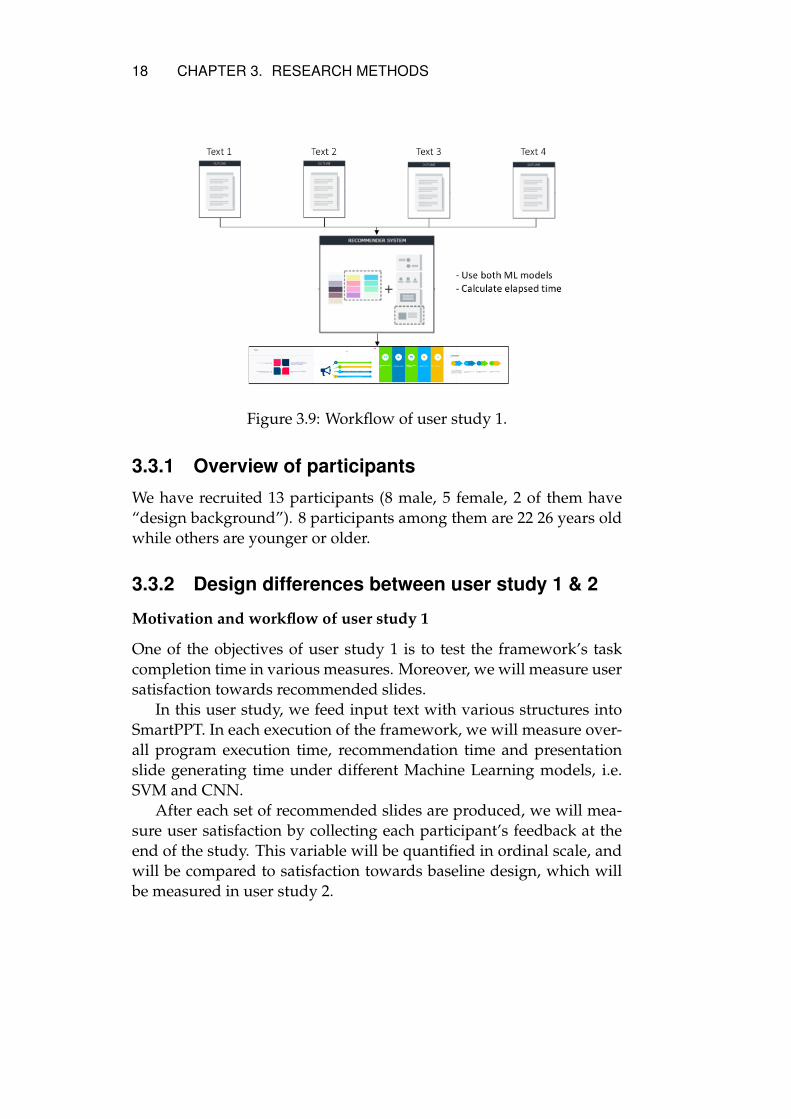
Figure 3.9: Workflow of user study 1.
3.3.1 Overview of participants
We have recruited 13 participants (8 male, 5 female, 2 of them have“design background”). 8 participants among them are 22 26 years oldwhile others are younger or older.
3.3.2 Design differences between user study 1 & 2
Motivation and workflow of user study 1
One of the objectives of user study 1 is to test the framework’s taskcompletion time in various measures. Moreover, we will measure usersatisfaction towards recommended slides.
In this user study, we feed input text with various structures intoSmartPPT. In each execution of the framework, we will measure over-all program execution time, recommendation time and presentationslide generating time under different Machine Learning models, i.e.SVM and CNN.
After each set of recommended slides are produced, we will mea-sure user satisfaction by collecting each participant’s feedback at theend of the study. This variable will be quantified in ordinal scale, andwill be compared to satisfaction towards baseline design, which willbe measured in user study 2.
CHAPTER 3. RESEARCH METHODS 19
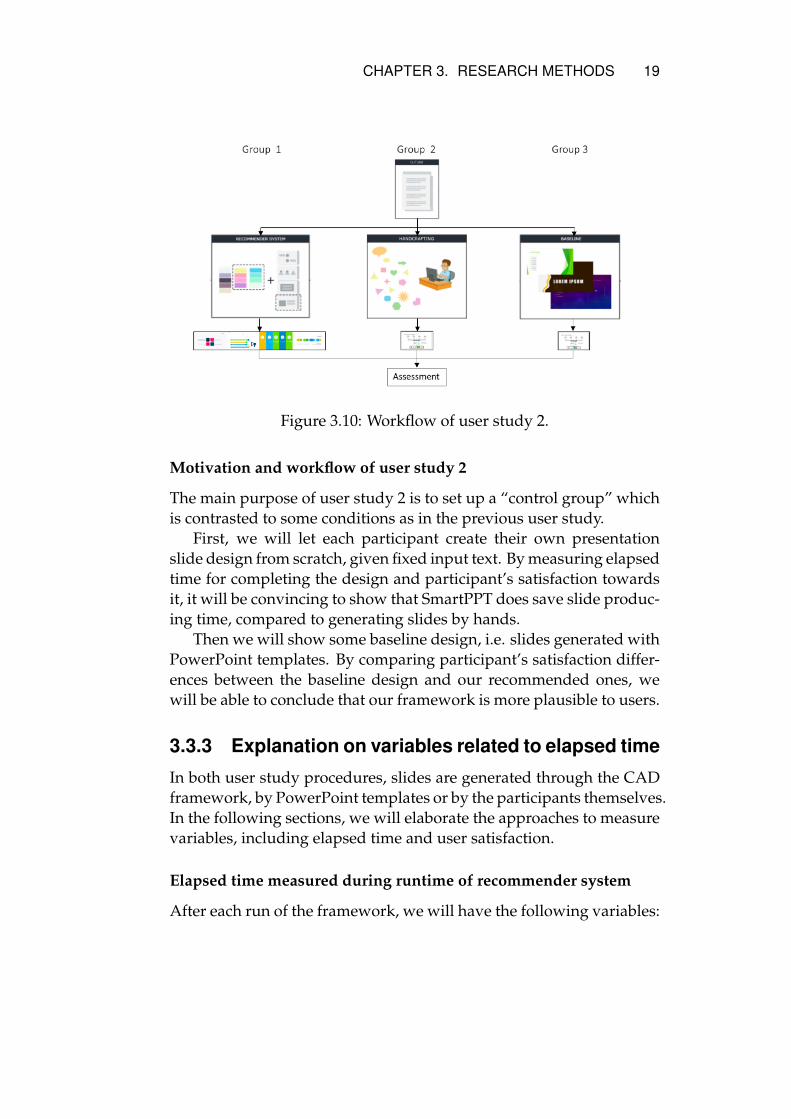
Figure 3.10: Workflow of user study 2.
Motivation and workflow of user study 2
The main purpose of user study 2 is to set up a “control group” whichis contrasted to some conditions as in the previous user study.
First, we will let each participant create their own presentationslide design from scratch, given fixed input text. By measuring elapsedtime for completing the design and participant’s satisfaction towardsit, it will be convincing to show that SmartPPT does save slide produc-ing time, compared to generating slides by hands.
Then we will show some baseline design, i.e. slides generated withPowerPoint templates. By comparing participant’s satisfaction differ-ences between the baseline design and our recommended ones, wewill be able to conclude that our framework is more plausible to users.
3.3.3 Explanation on variables related to elapsed time
In both user study procedures, slides are generated through the CADframework, by PowerPoint templates or by the participants themselves.In the following sections, we will elaborate the approaches to measurevariables, including elapsed time and user satisfaction.
Elapsed time measured during runtime of recommender system
After each run of the framework, we will have the following variables:
20 CHAPTER 3. RESEARCH METHODS
• t_exec: By calculating the time from beginning to end.
• t_rec: By calculating the time elapsed in Step 2 (see section 3.2).
• t_gen: By calculating the time elapsed in Step 3.
Elapsed time measured during handcraft
In user study 2, we let participant create a presentation slide fromscratch, and calculate the overall elapsed time.
Estimated elapsed time of handcrafting recommended slides
We will also ask participants to estimate how long it might take forthem to handcraft those recommended slides, given their knowledgeof presentation slides. The estimated time is recorded into the sameinterval above.
Every time when we conduct user study 1, we create 8 sets of rec-ommendation slides. Therefore, the participant will be asked the samequestion 8 times (and we get 8 data each time).
Every time when we conduct user study 2, the participant will beasked to estimate how long it might take for them to handcraft Mi-crosoft PowerPoint template-based (baseline) slides, based on their ex-perience with presentation slides.
The answers are just for reference, since participants might over-estimate or underestimate their experience with presentation slides.However, comparing estimated time with actual elapsed time of hand-crafting would be interesting.
3.3.4 Explanation on variables related to user satis-faction
In order to prove that users have better experience in creating slideswith SmartPPT, we need to give stipulative definition of “better userexperience” before conducting any meaningful study. Here we define“to have better user experience” as: If a user has better experience towardone slide production process than the other, in the user satisfaction survey,she gives higher point to that process. Notice that having obtained higheraverage point does not necessarily mean users have better user expe-rience to a certain slide production process.
CHAPTER 3. RESEARCH METHODS 21
In the following sections, we will also elaborate what “user sat-isfaction survey” is, how we collect feedbacks from participants andhow feedbacks are quantized.
User satisfaction towards recommended slides
In the end of user study 1, participant will be asked if she agree withthe sentence: “Overall speaking, I am satisfied with the output of SmartPPT.”The answer will be divided into 5 ordinal intervals: Strongly agree(worth 5 points), agree (4 points), so-so (3 points), disagree (2 points)and strongly disagree (1 point). To calculate their average is to dividethe sum of ordinal values by the size of data.
User satisfaction towards handcrafted slides
In user study 2, after handcrafted slides are completed, participant willbe asked if she agree with the sentence: “Overall speaking, I am satisfiedwith my own design.” The answer will be divided into the same inter-vals as above, and the way to calculate their average is the same.
User satisfaction towards baseline slides
In user study 2, participant will be asked if she agree with the sentence:“Overall speaking, I am satisfied with the slide provided by PowerPoint.”The answer will be divided into the same intervals as above, and theway to calculate their average is the same.
Miscellaneous Measures
Besides questions above, we collect participants’ feedback in other per-spectives. For example, the last question in user study 1 is “Do youagree with the sentence: I would like to use this framework to automaticallygenerate presentation slides, if there are any chance.” These answers areseen as reference or “side witness” of user satisfaction, and it wouldbe also interesting to analyze them.
3.3.5 Detailed explanation on feedback
In this section, we will illustrate how comments are collected duringuser study.
22 CHAPTER 3. RESEARCH METHODS
Feedback collection process
Every time we conduct user study 1, we show participant 8 sets ofrecommended slides. Each time after showing one set of slides, partic-ipant should answer the question: “How many slides among them do youthink might be useful in your presentation tasks?”
If the previous answer is not “None”, we let the participant pickup one slide she considers “useful in potential presentation tasks” anddescribe its advantages that pleases her.
If the previous answer is not “All of them”, we let the participantpick up one slide she considers “not to be selected in potential presen-tation tasks” and describe its disadvantages.
As a result, we will receive at most 16 comments after completingone user study.
Feedback selection process
Not all comments are valuable for us. We remove comments like “justgood” and “bad design”, since they lack detailed description of how“good/bad” a slide is. This is normal, since some participants mightbe less critical to presentation slide design or might say shorter sen-tences compared to other participants.
Chapter 4
Results and Discussion
4.1 Overview
We divide the results into quantitative and qualitative parts for clear il-lustration. The quantitative results are categorized into task completiontime and user satisfaction. The aim of the qualitative analysis is to obtaina thorough understanding of user study feedback. Besides of quanti-tative analysis of user experiences, we would like to see more detailed,more expressive comments from participants. We will first provide acomplete explanation on how we obtain comments from participants,and how those comments are arranged on the spreadsheet. Then wewill analyze user comments and reveal the most interesting findings.
4.2 Execution time analysis
In section 3.3.4, we have explained the measurement procedure, i.e.how we obtain the data and what they mean. In this section, we willthen proceed to conduct the analysis.
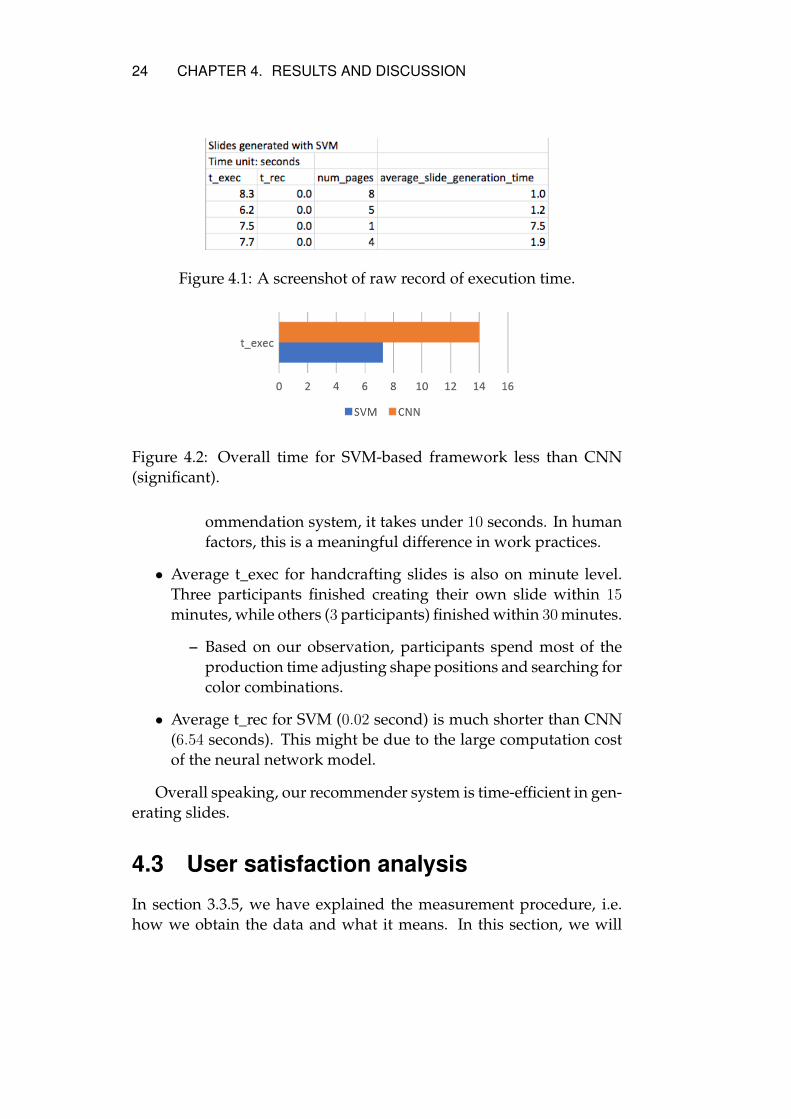
Raw results can be seen in the spreadsheet. Part of the spreadsheetis screenshot and shown below.
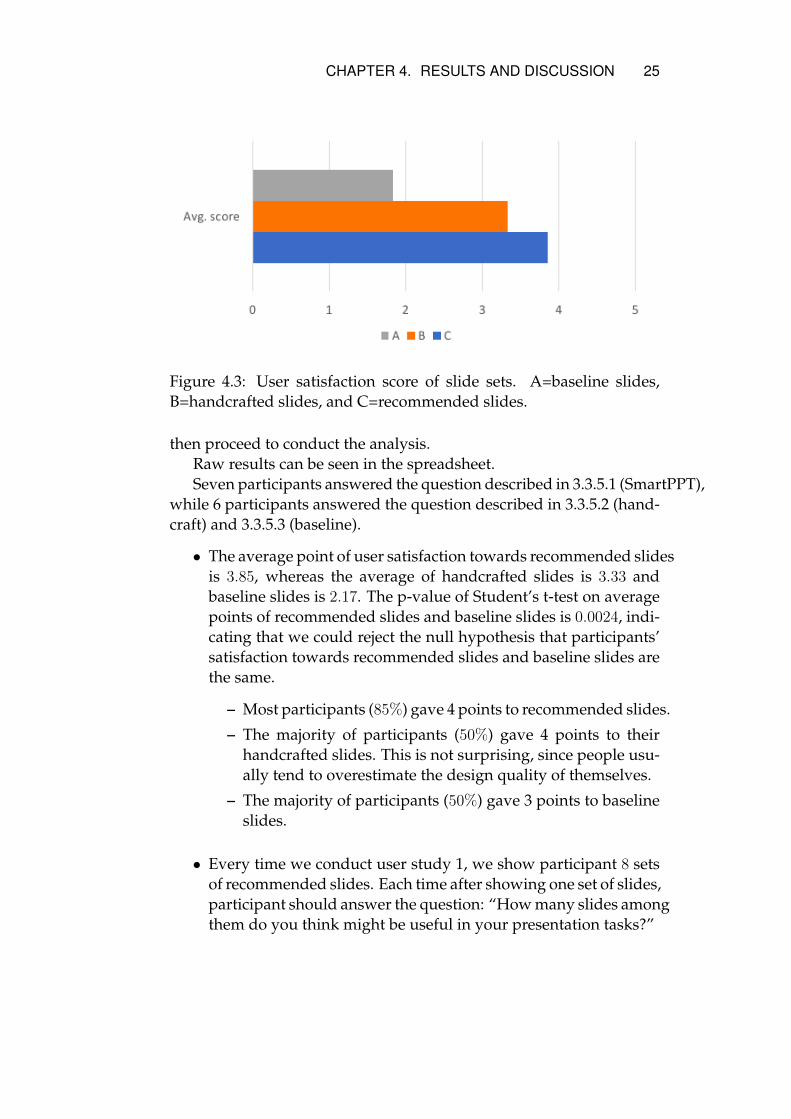
• Average t_exec (program execution time) is 7.26 seconds for SVM,and 14.01 seconds for CNN.
– Both times are on second level.
– Average measured time of handcrafting those recommendedslides is 10±3 minutes, whereas when done through the rec-
23
24 CHAPTER 4. RESULTS AND DISCUSSION
Figure 4.1: A screenshot of raw record of execution time.
Figure 4.2: Overall time for SVM-based framework less than CNN(significant).
ommendation system, it takes under 10 seconds. In humanfactors, this is a meaningful difference in work practices.
• Average t_exec for handcrafting slides is also on minute level.Three participants finished creating their own slide within 15
minutes, while others (3 participants) finished within 30 minutes.
– Based on our observation, participants spend most of theproduction time adjusting shape positions and searching forcolor combinations.
• Average t_rec for SVM (0.02 second) is much shorter than CNN(6.54 seconds). This might be due to the large computation costof the neural network model.
Overall speaking, our recommender system is time-efficient in gen-erating slides.
4.3 User satisfaction analysis
In section 3.3.5, we have explained the measurement procedure, i.e.how we obtain the data and what it means. In this section, we will
CHAPTER 4. RESULTS AND DISCUSSION 25
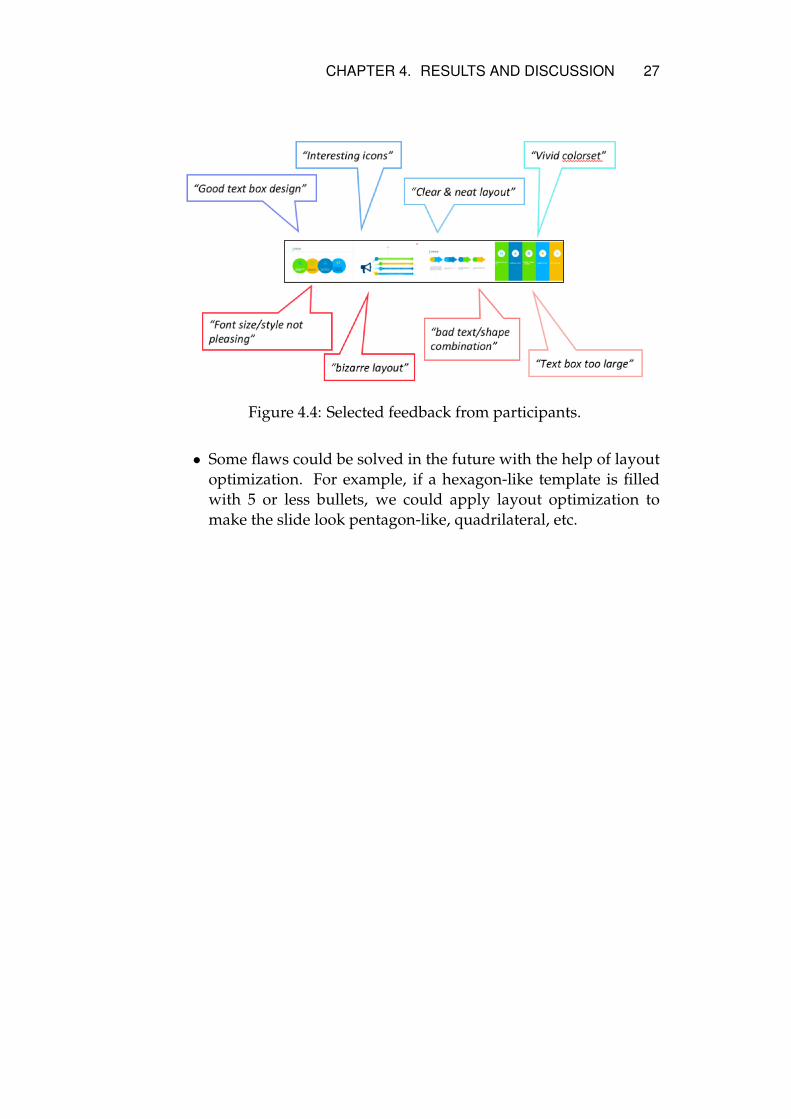
Figure 4.3: User satisfaction score of slide sets. A=baseline slides,B=handcrafted slides, and C=recommended slides.
then proceed to conduct the analysis.Raw results can be seen in the spreadsheet.Seven participants answered the question described in 3.3.5.1 (SmartPPT),
while 6 participants answered the question described in 3.3.5.2 (hand-craft) and 3.3.5.3 (baseline).
• The average point of user satisfaction towards recommended slidesis 3.85, whereas the average of handcrafted slides is 3.33 andbaseline slides is 2.17. The p-value of Student’s t-test on averagepoints of recommended slides and baseline slides is 0.0024, indi-cating that we could reject the null hypothesis that participants’satisfaction towards recommended slides and baseline slides arethe same.
– Most participants (85%) gave 4 points to recommended slides.
– The majority of participants (50%) gave 4 points to theirhandcrafted slides. This is not surprising, since people usu-ally tend to overestimate the design quality of themselves.
– The majority of participants (50%) gave 3 points to baselineslides.
• Every time we conduct user study 1, we show participant 8 setsof recommended slides. Each time after showing one set of slides,participant should answer the question: “How many slides amongthem do you think might be useful in your presentation tasks?”

26 CHAPTER 4. RESULTS AND DISCUSSION
– The answer is categorized into four intervals: None, one ortwo slides, three or four slides and all of them.
– The question is asked 8 times per user study. Since we haverecruited 7 participants in the study, we have finally col-lected 56 answers.
– Majority (78%) of the answers are “1 2 pages”.
– Very few answers are “3 4 pages”. Those answers actuallycome from two participants who are seemingly less criticalin judging designs.
As a result, we could conclude that the slides provided by ourframework is satisfactory, and “have better user experience” than thebaseline condition.
4.4 Detailed feedback analysis
In this section, we will analyze feedbacks collected through processdescribed in section 3.3.6 and reveal some interesting findings.
• Recommended slides could not fit all participants’ tastes. For ex-ample, some participants prefer “simple and neat” slides, whichis disgusted by others for “having too few components”.
• Features that participants appreciate most:
– Vivid color combination
– Good layout design
– Simple / neat / clear structure
• Features that participants disgust most:
– Too bizarre layout.
– Color combination. This is quite subjective, since variousparticipants might prefer different color combinations.
– Image / textbox discordance.
– Some slides have too big / too small fonts.
CHAPTER 4. RESULTS AND DISCUSSION 27
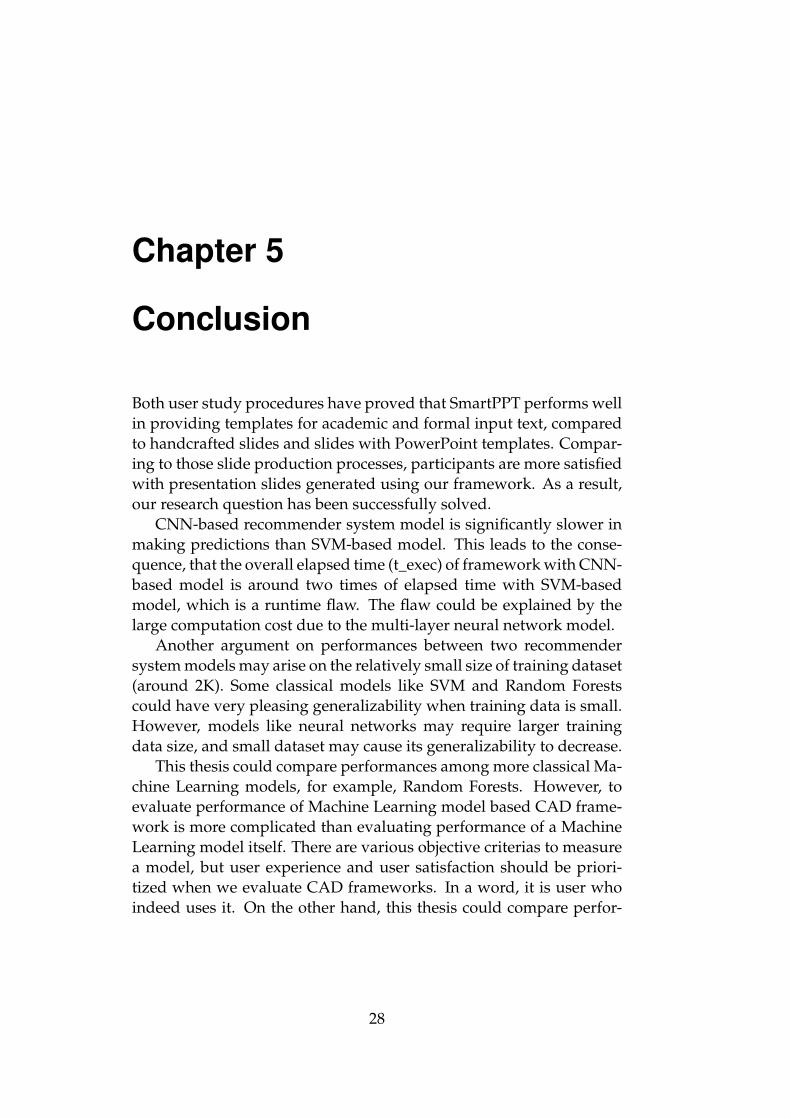
Figure 4.4: Selected feedback from participants.
• Some flaws could be solved in the future with the help of layoutoptimization. For example, if a hexagon-like template is filledwith 5 or less bullets, we could apply layout optimization tomake the slide look pentagon-like, quadrilateral, etc.
Chapter 5
Conclusion
Both user study procedures have proved that SmartPPT performs wellin providing templates for academic and formal input text, comparedto handcrafted slides and slides with PowerPoint templates. Compar-ing to those slide production processes, participants are more satisfiedwith presentation slides generated using our framework. As a result,our research question has been successfully solved.
CNN-based recommender system model is significantly slower inmaking predictions than SVM-based model. This leads to the conse-quence, that the overall elapsed time (t_exec) of framework with CNN-based model is around two times of elapsed time with SVM-basedmodel, which is a runtime flaw. The flaw could be explained by thelarge computation cost due to the multi-layer neural network model.
Another argument on performances between two recommendersystem models may arise on the relatively small size of training dataset(around 2K). Some classical models like SVM and Random Forestscould have very pleasing generalizability when training data is small.However, models like neural networks may require larger trainingdata size, and small dataset may cause its generalizability to decrease.
This thesis could compare performances among more classical Ma-chine Learning models, for example, Random Forests. However, toevaluate performance of Machine Learning model based CAD frame-work is more complicated than evaluating performance of a MachineLearning model itself. There are various objective criterias to measurea model, but user experience and user satisfaction should be priori-tized when we evaluate CAD frameworks. In a word, it is user whoindeed uses it. On the other hand, this thesis could compare perfor-
28

CHAPTER 5. CONCLUSION 29
mances of SmartPPT with automatic generated slides using LATEX.
Bibliography
[1] G. Adomavicius and A. Tuzhilin. “Toward the next generationof recommender systems: a survey of the state-of-the-art andpossible extensions”. In: IEEE Transactions on Knowledge and DataEngineering 17.6 (June 2005), pp. 734–749. ISSN: 1041-4347. DOI:10.1109/TKDE.2005.99.
[2] Sergio A. Alvarez et al. “Neural Expert Networks for Faster Com-bined Collaborative and Content-based Recommendation”. In:J. Comp. Methods in Sci. and Eng. 11.4 (Dec. 2011), pp. 161–172.ISSN: 1472-7978. DOI: 10.3233/JCM-2011-0360. URL: http://dx.doi.org/10.3233/JCM-2011-0360.
[3] Brandon Beamer and Roxana Girju. “Investigating AutomaticAlignment Methods for Slide Generation from Academic Papers”.In: Proceedings of the Thirteenth Conference on Computational Nat-ural Language Learning. CoNLL ’09. Boulder, Colorado: Associa-tion for Computational Linguistics, 2009, pp. 111–119. ISBN: 978-1-932432-29-9. URL: http://dl.acm.org/citation.cfm?id=1596374.1596395.
[4] Derek Bridge et al. “Case-based Recommender Systems”. In: Knowl.Eng. Rev. 20.3 (Sept. 2005), pp. 315–320. ISSN: 0269-8889. DOI:10.1017/S0269888906000567. URL: http://dx.doi.org/10.1017/S0269888906000567.
[5] Ying Cao, Antoni B. Chan, and Rynson W. H. Lau. “AutomaticStylistic Manga Layout”. In: ACM Trans. Graph. 31.6 (Nov. 2012),141:1–141:10. ISSN: 0730-0301. DOI: 10.1145/2366145.2366160.URL: http://doi.acm.org/10.1145/2366145.2366160.
[6] Kathleen Ericson and Shrideep Pallickara. “On the Performanceof High Dimensional Data Clustering and Classification Algo-rithms”. In: Future Gener. Comput. Syst. 29.4 (June 2013), pp. 1024–
30
BIBLIOGRAPHY 31
1034. ISSN: 0167-739X. DOI: 10.1016/j.future.2012.05.026. URL: http://dx.doi.org/10.1016/j.future.2012.05.026.
[7] C. Felden and P. Chamoni. “Recommender Systems Based on anActive Data Warehouse with Text Documents”. In: System Sci-ences, 2007. HICSS 2007. 40th Annual Hawaii International Confer-ence on. Jan. 2007, 168a–168a. DOI: 10.1109/HICSS.2007.460.
[8] David Goldberg et al. “Using Collaborative Filtering to Weavean Information Tapestry”. In: Commun. ACM 35.12 (Dec. 1992),pp. 61–70. ISSN: 0001-0782. DOI: 10.1145/138859.138867.URL: http://doi.acm.org/10.1145/138859.138867.
[9] Carlos A. Gomez-Uribe and Neil Hunt. “The Netflix RecommenderSystem: Algorithms, Business Value, and Innovation”. In: ACMTrans. Manage. Inf. Syst. 6.4 (Dec. 2015), 13:1–13:19. ISSN: 2158-656X. DOI: 10.1145/2843948. URL: http://doi.acm.org/10.1145/2843948.
[10] Yuyun Gong and Qi Zhang. “Hashtag Recommendation UsingAttention-based Convolutional Neural Network”. In: Proceedingsof the Twenty-Fifth International Joint Conference on Artificial Intel-ligence. IJCAI’16. New York, New York, USA: AAAI Press, 2016,pp. 2782–2788. ISBN: 978-1-57735-770-4. URL: http://dl.acm.org/citation.cfm?id=3060832.3061010.
[11] N. Hariri et al. “Supporting Domain Analysis through Miningand Recommending Features from Online Product Listings”. In:IEEE Transactions on Software Engineering 39.12 (Dec. 2013), pp. 1736–1752. ISSN: 0098-5589. DOI: 10.1109/TSE.2013.39.
[12] Balázs Hidasi et al. “Parallel Recurrent Neural Network Archi-tectures for Feature-rich Session-based Recommendations”. In:Proceedings of the 10th ACM Conference on Recommender Systems.RecSys ’16. Boston, Massachusetts, USA: ACM, 2016, pp. 241–248. ISBN: 978-1-4503-4035-9. DOI: 10.1145/2959100.2959167.URL: http://doi.acm.org/10.1145/2959100.2959167.
[13] Donghyun Kim et al. “Convolutional Matrix Factorization forDocument Context-Aware Recommendation”. In: Proceedings ofthe 10th ACM Conference on Recommender Systems. RecSys ’16.Boston, Massachusetts, USA: ACM, 2016, pp. 233–240. ISBN: 978-
32 BIBLIOGRAPHY
1-4503-4035-9. DOI: 10.1145/2959100.2959165. URL: http://doi.acm.org/10.1145/2959100.2959165.
[14] Yehuda Koren. “Factorization Meets the Neighborhood: A Mul-tifaceted Collaborative Filtering Model”. In: Proceedings of the14th ACM SIGKDD International Conference on Knowledge Discov-ery and Data Mining. KDD ’08. Las Vegas, Nevada, USA: ACM,2008, pp. 426–434. ISBN: 978-1-60558-193-4. DOI: 10.1145/1401890.1401944. URL: http://doi.acm.org/10.1145/1401890.1401944.
[15] Utiyama Masao and Hasida Kôiti. “Automatic Slide Presenta-tion from Semantically Annotated Documents”. In: Proceedingsof the Workshop on Coreference and Its Applications. CorefApp ’99.College Park, Maryland: Association for Computational Linguis-tics, 1999, pp. 25–30. URL: http://dl.acm.org/citation.cfm?id=1608810.1608816.
[16] Sung-Hwan Min and Ingoo Han. “Recommender Systems Us-ing Support Vector Machines”. In: Web Engineering. Ed. by DavidLowe and Martin Gaedke. Berlin, Heidelberg: Springer BerlinHeidelberg, 2005, pp. 387–393. ISBN: 978-3-540-31484-4.
[17] Joel Pinho Lucas, Saddys Segrera, and M. Moreno. “Making Useof Associative Classifiers in Order to Alleviate Typical Draw-backs in Recommender Systems”. In: Expert Syst. Appl. 39.1 (Jan.2012), pp. 1273–1283. ISSN: 0957-4174. DOI: 10.1016/j.eswa.2011.07.136. URL: http://dx.doi.org/10.1016/j.eswa.2011.07.136.
[18] Yuting Qiang et al. “Learning to Generate Posters of ScientificPapers by Probabilistic Graphical Models”. In: CoRR abs/1702.06228(2017). arXiv: 1702.06228. URL: http://arxiv.org/abs/1702.06228.
[19] Francesco Ricci et al. Recommender systems handbook. Springer US,2011. ISBN: 978-0-387-85820-3. DOI: 10.1007/978-0-387-85820-3.
[20] Ruslan Salakhutdinov, Andriy Mnih, and Geoffrey Hinton. “Re-stricted Boltzmann Machines for Collaborative Filtering”. In: Pro-ceedings of the 24th International Conference on Machine Learning.ICML ’07. Corvalis, Oregon, USA: ACM, 2007, pp. 791–798. ISBN:
BIBLIOGRAPHY 33
978-1-59593-793-3. DOI: 10.1145/1273496.1273596. URL:http://doi.acm.org/10.1145/1273496.1273596.
[21] Tomohide Shibata and Sadao Kurohashi. “Automatic Slide Gen-eration Based on Discourse Structure Analysis”. In: Natural Lan-guage Processing – IJCNLP 2005. Ed. by Robert Dale et al. Berlin,Heidelberg: Springer Berlin Heidelberg, 2005, pp. 754–766. ISBN:978-3-540-31724-1.
[22] M. Sravanthi, C. Chowdary, and P. Kumar. “SlidesGen: Auto-matic Generation of Presentation Slides for a Technical PaperUsing Summarization”. In: (2009). URL: https://aaai.org/ocs/index.php/FLAIRS/2009/paper/view/22.
[23] M. Tokumaru, N. Muranaka, and S. Imanishi. “Color design sup-port system considering color harmony”. In: Fuzzy Systems, 2002.FUZZ-IEEE’02. Proceedings of the 2002 IEEE International Confer-ence on. Vol. 1. 2002, pp. 378–383. DOI: 10.1109/FUZZ.2002.1005020.
[24] Jun Wang et al. “IRGAN: A Minimax Game for Unifying Gen-erative and Discriminative Information Retrieval Models”. In:CoRR abs/1705.10513 (2017). arXiv: 1705.10513. URL: http://arxiv.org/abs/1705.10513.
[25] S. Wu et al. “Personal recommendation using deep recurrentneural networks in NetEase”. In: 2016 IEEE 32nd InternationalConference on Data Engineering (ICDE). May 2016, pp. 1218–1229.DOI: 10.1109/ICDE.2016.7498326.
[26] Xuyong Yang et al. “Automatic Generation of Visual-Textual Pre-sentation Layout”. In: ACM Trans. Multimedia Comput. Commun.Appl. 12.2 (Feb. 2016), 33:1–33:22. ISSN: 1551-6857. DOI: 10.1145/2818709. URL: http://doi.acm.org/10.1145/2818709.
[27] Shuai Zhang, Lina Yao, and Aixin Sun. “Deep Learning basedRecommender System: A Survey and New Perspectives”. In: CoRRabs/1707.07435 (2017). arXiv: 1707.07435. URL: http://arxiv.org/abs/1707.07435.
[28] Lei Zheng, Vahid Noroozi, and Philip S. Yu. “Joint Deep Mod-eling of Users and Items Using Reviews for Recommendation”.In: Proceedings of the Tenth ACM International Conference on WebSearch and Data Mining. WSDM ’17. Cambridge, United King-dom: ACM, 2017, pp. 425–434. ISBN: 978-1-4503-4675-7. DOI: 10.

34 BIBLIOGRAPHY
1145/3018661.3018665. URL: http://doi.acm.org/10.1145/3018661.3018665.

35
36 APPENDIX A. LIST OF INPUT TEXT FEATURES
Appendix A
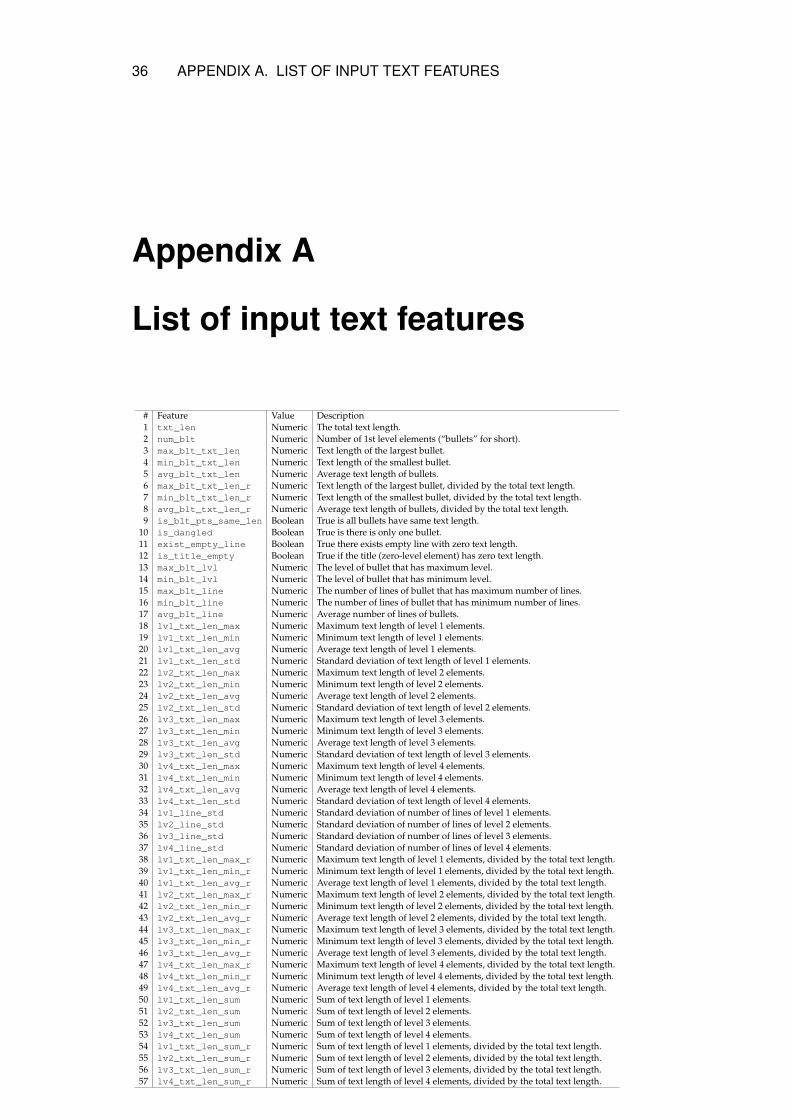
List of input text features
# Feature Value Description1 txt_len Numeric The total text length.2 num_blt Numeric Number of 1st level elements (“bullets” for short).3 max_blt_txt_len Numeric Text length of the largest bullet.4 min_blt_txt_len Numeric Text length of the smallest bullet.5 avg_blt_txt_len Numeric Average text length of bullets.6 max_blt_txt_len_r Numeric Text length of the largest bullet, divided by the total text length.7 min_blt_txt_len_r Numeric Text length of the smallest bullet, divided by the total text length.8 avg_blt_txt_len_r Numeric Average text length of bullets, divided by the total text length.9 is_blt_pts_same_len Boolean True is all bullets have same text length.
10 is_dangled Boolean True is there is only one bullet.11 exist_empty_line Boolean True there exists empty line with zero text length.12 is_title_empty Boolean True if the title (zero-level element) has zero text length.13 max_blt_lvl Numeric The level of bullet that has maximum level.14 min_blt_lvl Numeric The level of bullet that has minimum level.15 max_blt_line Numeric The number of lines of bullet that has maximum number of lines.16 min_blt_line Numeric The number of lines of bullet that has minimum number of lines.17 avg_blt_line Numeric Average number of lines of bullets.18 lv1_txt_len_max Numeric Maximum text length of level 1 elements.19 lv1_txt_len_min Numeric Minimum text length of level 1 elements.20 lv1_txt_len_avg Numeric Average text length of level 1 elements.21 lv1_txt_len_std Numeric Standard deviation of text length of level 1 elements.22 lv2_txt_len_max Numeric Maximum text length of level 2 elements.23 lv2_txt_len_min Numeric Minimum text length of level 2 elements.24 lv2_txt_len_avg Numeric Average text length of level 2 elements.25 lv2_txt_len_std Numeric Standard deviation of text length of level 2 elements.26 lv3_txt_len_max Numeric Maximum text length of level 3 elements.27 lv3_txt_len_min Numeric Minimum text length of level 3 elements.28 lv3_txt_len_avg Numeric Average text length of level 3 elements.29 lv3_txt_len_std Numeric Standard deviation of text length of level 3 elements.30 lv4_txt_len_max Numeric Maximum text length of level 4 elements.31 lv4_txt_len_min Numeric Minimum text length of level 4 elements.32 lv4_txt_len_avg Numeric Average text length of level 4 elements.33 lv4_txt_len_std Numeric Standard deviation of text length of level 4 elements.34 lv1_line_std Numeric Standard deviation of number of lines of level 1 elements.35 lv2_line_std Numeric Standard deviation of number of lines of level 2 elements.36 lv3_line_std Numeric Standard deviation of number of lines of level 3 elements.37 lv4_line_std Numeric Standard deviation of number of lines of level 4 elements.38 lv1_txt_len_max_r Numeric Maximum text length of level 1 elements, divided by the total text length.39 lv1_txt_len_min_r Numeric Minimum text length of level 1 elements, divided by the total text length.40 lv1_txt_len_avg_r Numeric Average text length of level 1 elements, divided by the total text length.41 lv2_txt_len_max_r Numeric Maximum text length of level 2 elements, divided by the total text length.42 lv2_txt_len_min_r Numeric Minimum text length of level 2 elements, divided by the total text length.43 lv2_txt_len_avg_r Numeric Average text length of level 2 elements, divided by the total text length.44 lv3_txt_len_max_r Numeric Maximum text length of level 3 elements, divided by the total text length.45 lv3_txt_len_min_r Numeric Minimum text length of level 3 elements, divided by the total text length.46 lv3_txt_len_avg_r Numeric Average text length of level 3 elements, divided by the total text length.47 lv4_txt_len_max_r Numeric Maximum text length of level 4 elements, divided by the total text length.48 lv4_txt_len_min_r Numeric Minimum text length of level 4 elements, divided by the total text length.49 lv4_txt_len_avg_r Numeric Average text length of level 4 elements, divided by the total text length.50 lv1_txt_len_sum Numeric Sum of text length of level 1 elements.51 lv2_txt_len_sum Numeric Sum of text length of level 2 elements.52 lv3_txt_len_sum Numeric Sum of text length of level 3 elements.53 lv4_txt_len_sum Numeric Sum of text length of level 4 elements.54 lv1_txt_len_sum_r Numeric Sum of text length of level 1 elements, divided by the total text length.55 lv2_txt_len_sum_r Numeric Sum of text length of level 2 elements, divided by the total text length.56 lv3_txt_len_sum_r Numeric Sum of text length of level 3 elements, divided by the total text length.57 lv4_txt_len_sum_r Numeric Sum of text length of level 4 elements, divided by the total text length.

37
38 APPENDIX B. LIST OF PRESENTATION TEMPLATE FEATURES
Appendix B
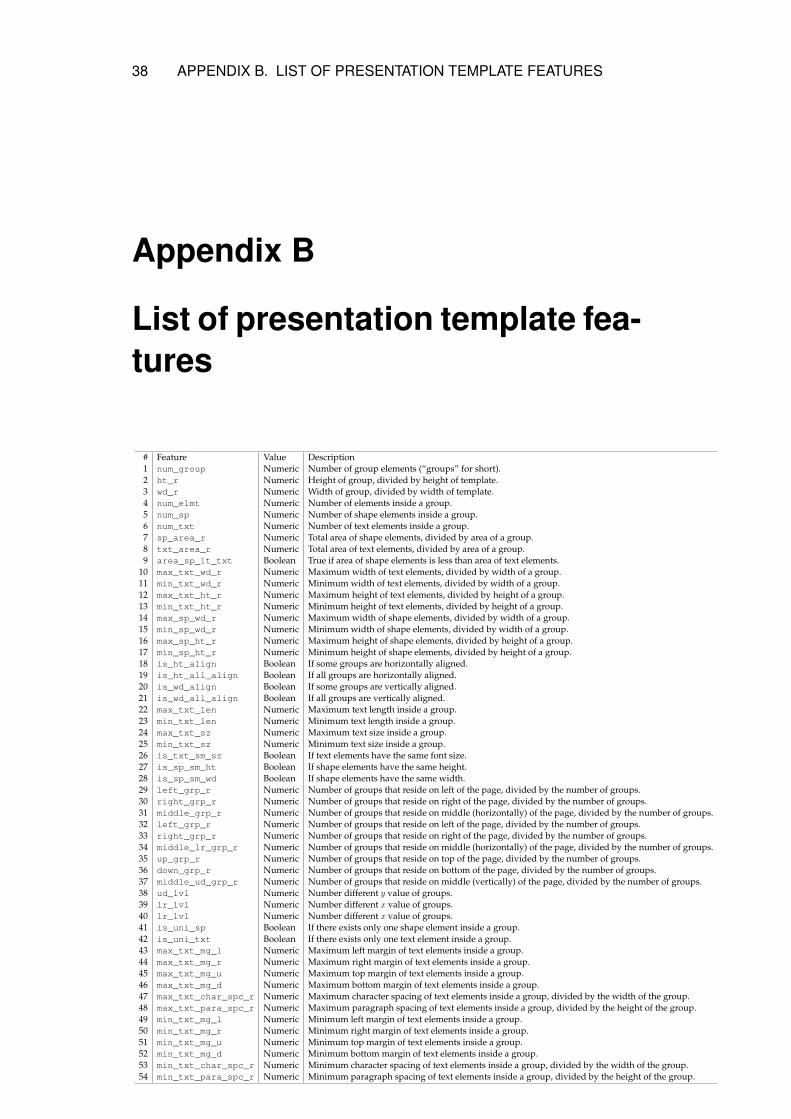
List of presentation template fea-tures
# Feature Value Description1 num_group Numeric Number of group elements (“groups” for short).2 ht_r Numeric Height of group, divided by height of template.3 wd_r Numeric Width of group, divided by width of template.4 num_elmt Numeric Number of elements inside a group.5 num_sp Numeric Number of shape elements inside a group.6 num_txt Numeric Number of text elements inside a group.7 sp_area_r Numeric Total area of shape elements, divided by area of a group.8 txt_area_r Numeric Total area of text elements, divided by area of a group.9 area_sp_lt_txt Boolean True if area of shape elements is less than area of text elements.
10 max_txt_wd_r Numeric Maximum width of text elements, divided by width of a group.11 min_txt_wd_r Numeric Minimum width of text elements, divided by width of a group.12 max_txt_ht_r Numeric Maximum height of text elements, divided by height of a group.13 min_txt_ht_r Numeric Minimum height of text elements, divided by height of a group.14 max_sp_wd_r Numeric Maximum width of shape elements, divided by width of a group.15 min_sp_wd_r Numeric Minimum width of shape elements, divided by width of a group.16 max_sp_ht_r Numeric Maximum height of shape elements, divided by height of a group.17 min_sp_ht_r Numeric Minimum height of shape elements, divided by height of a group.18 is_ht_align Boolean If some groups are horizontally aligned.19 is_ht_all_align Boolean If all groups are horizontally aligned.20 is_wd_align Boolean If some groups are vertically aligned.21 is_wd_all_align Boolean If all groups are vertically aligned.22 max_txt_len Numeric Maximum text length inside a group.23 min_txt_len Numeric Minimum text length inside a group.24 max_txt_sz Numeric Maximum text size inside a group.25 min_txt_sz Numeric Minimum text size inside a group.26 is_txt_sm_sz Boolean If text elements have the same font size.27 is_sp_sm_ht Boolean If shape elements have the same height.28 is_sp_sm_wd Boolean If shape elements have the same width.29 left_grp_r Numeric Number of groups that reside on left of the page, divided by the number of groups.30 right_grp_r Numeric Number of groups that reside on right of the page, divided by the number of groups.31 middle_grp_r Numeric Number of groups that reside on middle (horizontally) of the page, divided by the number of groups.32 left_grp_r Numeric Number of groups that reside on left of the page, divided by the number of groups.33 right_grp_r Numeric Number of groups that reside on right of the page, divided by the number of groups.34 middle_lr_grp_r Numeric Number of groups that reside on middle (horizontally) of the page, divided by the number of groups.35 up_grp_r Numeric Number of groups that reside on top of the page, divided by the number of groups.36 down_grp_r Numeric Number of groups that reside on bottom of the page, divided by the number of groups.37 middle_ud_grp_r Numeric Number of groups that reside on middle (vertically) of the page, divided by the number of groups.38 ud_lvl Numeric Number different y value of groups.39 lr_lvl Numeric Number different x value of groups.40 lr_lvl Numeric Number different x value of groups.41 is_uni_sp Boolean If there exists only one shape element inside a group.42 is_uni_txt Boolean If there exists only one text element inside a group.43 max_txt_mg_l Numeric Maximum left margin of text elements inside a group.44 max_txt_mg_r Numeric Maximum right margin of text elements inside a group.45 max_txt_mg_u Numeric Maximum top margin of text elements inside a group.46 max_txt_mg_d Numeric Maximum bottom margin of text elements inside a group.47 max_txt_char_spc_r Numeric Maximum character spacing of text elements inside a group, divided by the width of the group.48 max_txt_para_spc_r Numeric Maximum paragraph spacing of text elements inside a group, divided by the height of the group.49 min_txt_mg_l Numeric Minimum left margin of text elements inside a group.50 min_txt_mg_r Numeric Minimum right margin of text elements inside a group.51 min_txt_mg_u Numeric Minimum top margin of text elements inside a group.52 min_txt_mg_d Numeric Minimum bottom margin of text elements inside a group.53 min_txt_char_spc_r Numeric Minimum character spacing of text elements inside a group, divided by the width of the group.54 min_txt_para_spc_r Numeric Minimum paragraph spacing of text elements inside a group, divided by the height of the group.

Appendix C
User study design
C.1 User study 1 design
C.1.1 Step 1
Present the first 5 pages of User Study slide to warm up the participant.We will tell the participant about the background and workflow of theproject, and goal of this study.
If the participant confirms that she is well informed of the studyprocesses, we proceed to the next step.
C.1.2 Step 2
In this step, we will ask some basic information about the participantherself.
Step 2.1
Ask the age and sex of the participant.
Step 2.2
Ask if the participant have “design background”. Here we providestipulative definition of “to have design background” by “to have earneda design major degree, or be currently in a design degree program”.
39
40 APPENDIX C. USER STUDY DESIGN
C.1.3 Step 3
In this step, we will generate 8 sets of recommendation slides for inputoutline with varying properties:
• Much (100+ words) / less (less than 50 words) content,
• Many (6) / few (1 2) numbers of “bullet”,
• By SVM / CNN.
The participant may change the content of input outline based onher own interest.
Step 3.1
Generate slides with less content and few numbers of “bullet” withSVM. The result slides will be shown to the participant.
Step 3.1.1 During the execution of the program, we measure the over-all execution time by calculating the time from the beginning of theprogram to the end.
Step 3.1.2 Ask the participant the following questions: Are there anyrecommended slide(s), which design are likely to be adapted in your potentialpresentation tasks?
For those slide(s) that are selected in the first question:
• Pick up a slide and describe why you may choose it in your potentialpresentation tasks?
• Based on your familiarity with presentation slides, how long will it taketo design such a slide?
For those slide(s) that are not selected in the first question:
• Pick up a slide and describe why you may not choose it in your potentialpresentation tasks?
• Based on your familiarity with presentation slides, could you avoid de-signing such a slide?

APPENDIX C. USER STUDY DESIGN 41
Step 3.2
Generate slides with less content and few numbers of “bullet” withCNN. The result slides will be shown to the participant.
Step 3.2.1 During the execution of the program, we measure the over-all execution time by calculating the time from the beginning of theprogram to the end.
Step 3.2.2 Ask the participant the following questions: Are there anyrecommended slide(s), which design are likely to be adapted in your potentialpresentation tasks?
For those slide(s) that are selected in the first question:
• Pick up a slide and describe why you may choose it in your potentialpresentation tasks?
• Based on your familiarity with presentation slides, how long will it taketo design such a slide?
For those slide(s) that are not selected in the first question:
• Pick up a slide and describe why you may not choose it in your potentialpresentation tasks?
• Based on your familiarity with presentation slides, could you avoid de-signing such a slide?
Step 3.3
Generate slides with less content and many numbers of “bullet” withSVM. The result slides will be shown to the participant.
Step 3.3.1 During the execution of the program, we measure the over-all execution time by calculating the time from the beginning of theprogram to the end.
Step 3.3.2 Ask the participant the following questions: Are there anyrecommended slide(s), which design are likely to be adapted in your potentialpresentation tasks?
For those slide(s) that are selected in the first question:
42 APPENDIX C. USER STUDY DESIGN
• Pick up a slide and describe why you may choose it in your potentialpresentation tasks?
• Based on your familiarity with presentation slides, how long will it taketo design such a slide?
For those slide(s) that are not selected in the first question:
• Pick up a slide and describe why you may not choose it in your potentialpresentation tasks?
• Based on your familiarity with presentation slides, could you avoid de-signing such a slide?
Step 3.4
Generate slides with less content and many numbers of “bullet” withCNN. The result slides will be shown to the participant.
Step 3.4.1 During the execution of the program, we measure the over-all execution time by calculating the time from the beginning of theprogram to the end.
Step 3.4.2 Ask the participant the following questions: Are there anyrecommended slide(s), which design are likely to be adapted in your potentialpresentation tasks?
For those slide(s) that are selected in the first question:
• Pick up a slide and describe why you may choose it in your potentialpresentation tasks?
• Based on your familiarity with presentation slides, how long will it taketo design such a slide?
For those slide(s) that are not selected in the first question:
• Pick up a slide and describe why you may not choose it in your potentialpresentation tasks?
• Based on your familiarity with presentation slides, could you avoid de-signing such a slide?
APPENDIX C. USER STUDY DESIGN 43
Step 3.5
Generate slides with rich content and few numbers of “bullet” withSVM. The result slides will be shown to the participant.
Step 3.5.1 During the execution of the program, we measure the over-all execution time by calculating the time from the beginning of theprogram to the end.
Step 3.5.2 Ask the participant the following questions: Are there anyrecommended slide(s), which design are likely to be adapted in your potentialpresentation tasks?
For those slide(s) that are selected in the first question:
• Pick up a slide and describe why you may choose it in your potentialpresentation tasks?
• Based on your familiarity with presentation slides, how long will it taketo design such a slide?
For those slide(s) that are not selected in the first question:
• Pick up a slide and describe why you may not choose it in your potentialpresentation tasks?
• Based on your familiarity with presentation slides, could you avoid de-signing such a slide?
Step 3.6
Generate slides with rich content and few numbers of “bullet” withCNN. The result slides will be shown to the participant.
Step 3.6.1 During the execution of the program, we measure the over-all execution time by calculating the time from the beginning of theprogram to the end.
Step 3.6.2 Ask the participant the following questions: Are there anyrecommended slide(s), which design are likely to be adapted in your potentialpresentation tasks?
For those slide(s) that are selected in the first question:
44 APPENDIX C. USER STUDY DESIGN
• Pick up a slide and describe why you may choose it in your potentialpresentation tasks?
• Based on your familiarity with presentation slides, how long will it taketo design such a slide?
For those slide(s) that are not selected in the first question:
• Pick up a slide and describe why you may not choose it in your potentialpresentation tasks?
• Based on your familiarity with presentation slides, could you avoid de-signing such a slide?
Step 3.7
Generate slides with rich content and many numbers of “bullet” withSVM. The result slides will be shown to the participant.
Step 3.7.1 During the execution of the program, we measure the over-all execution time by calculating the time from the beginning of theprogram to the end.
Step 3.7.2 Ask the participant the following questions: Are there anyrecommended slide(s), which design are likely to be adapted in your potentialpresentation tasks?
For those slide(s) that are selected in the first question:
• Pick up a slide and describe why you may choose it in your potentialpresentation tasks?
• Based on your familiarity with presentation slides, how long will it taketo design such a slide?
For those slide(s) that are not selected in the first question:
• Pick up a slide and describe why you may not choose it in your potentialpresentation tasks?
• Based on your familiarity with presentation slides, could you avoid de-signing such a slide?
APPENDIX C. USER STUDY DESIGN 45
Step 3.8
Generate slides with rich content and many numbers of “bullet” withCNN. The result slides will be shown to the participant.
Step 3.8.1 During the execution of the program, we measure the over-all execution time by calculating the time from the beginning of theprogram to the end.
Step 3.8.2 Ask the participant the following questions: Are there anyrecommended slide(s), which design are likely to be adapted in your potentialpresentation tasks?
For those slide(s) that are selected in the first question:
• Pick up a slide and describe why you may choose it in your potentialpresentation tasks?
• Based on your familiarity with presentation slides, how long will it taketo design such a slide?
For those slide(s) that are not selected in the first question:
• Pick up a slide and describe why you may not choose it in your potentialpresentation tasks?
• Based on your familiarity with presentation slides, could you avoid de-signing such a slide?
C.1.4 Step 4
Ask the participant the following questions:
• Overall speaking, are you satisfied with the output of the recommendersystem?
• How would you like to use this framework to automatically generatepresentation slides, if there are any chance?
46 APPENDIX C. USER STUDY DESIGN
C.2 User study 2 design
C.2.1 Step 1
Present the first 5 pages of User Study slide to warm up the participant.We will tell the participant about the background and workflow of theproject, and goal of this study.
If the participant confirms that she is well informed of the studyprocesses, we proceed to the next step.
C.2.2 Step 2
In this step, we will ask some basic information about the participantherself.
Step 2.1
Ask the age and sex of the participant.
Step 2.2
Ask if the participant has “design background”. Here we provide stip-ulative definition of “to have design background” by “to have earneda design major degree, or be currently in a design degree program”.
C.2.3 Step 3
Step 3.1
Ask the participant to generate one page of presentation slide “fromscratch”, i.e. from blank slide in Microsoft PowerPoint.
Step 3.2
After the participant finishes creating the slide, calculate the elapsedtime.
Step 3.3
Ask the participant the following questions:
• How are you satisfied with your design?
APPENDIX C. USER STUDY DESIGN 47
• Which aspect(s) do you think this slide could be improved?
C.2.4 Step 4
Step 4.1
Show the participant the presentation slide generated from MicrosoftPowerPoint template.
Step 4.2
Ask the participant the following questions:
• How are you satisfied with this design, i.e. how would you be likely tochoose this slide design in your potential presentation tasks?
• Based on your familiarity with presentation slides, how long will it taketo design such a slide?
C.2.5 Step 5
In this step, we will generate one set of recommendation slides forinput outline with the following properties: Less (less than 50 words)content, and Many (6) numbers of “bullet”.
The participant may change the content of input outline based onher own interest.
Step 5.1
Generate slides with less content and many numbers of “bullet” withSVM. The result slides will be shown to the participant.
Step 5.2
During the execution of the program, we measure the overall execu-tion time by calculating the time from the beginning of the program tothe end.
48 APPENDIX C. USER STUDY DESIGN
Step 5.3
Ask the participant the following questions: Are there any recommendedslide(s), which design are likely to be adapted in your potential presentationtasks?
For those slide(s) that are selected in the first question:
• Pick up a slide and describe why you may choose it in your potentialpresentation tasks?
• Based on your familiarity with presentation slides, how long will it taketo design such a slide?
For those slide(s) that are not selected in the first question:
• Pick up a slide and describe why you may not choose it in your potentialpresentation tasks?
• Based on your familiarity with presentation slides, could you avoid de-signing such a slide?
C.2.6 Step 6
Ask the participant the following questions:
• Overall speaking, are you satisfied with the output of the recommendersystem?
• How would you like to use this framework to automatically generatepresentation slides, if there are any chance?

www.kth.se


