Embed Size (px)
Citation preview

Prediction of technological quality (cooking loss and Napole Yield)of pork based on fresh meat characteristics
Hanne Christine Bertrama,b, Henrik Jørgen Andersena,*, Anders Hans Karlssona,Per Hornc, Jakob Hedegaardc, Lars Nørgaardb, Søren Balling Engelsenb
aDepartment of Animal Product Quality, Danish Institute of Agricultural Sciences, Research Centre Foulum, PO Box 50, DK-8830 Tjele, DenmarkbCentre for Advanced Food Studies, Food Technology, The Royal Veterinary and Agricultural University, Rolighedsvej 30,
DK-1958 Frederiksberg, DenmarkcDepartment of Breeding and Genetics, Danish Institute of Agricultural Sciences, Research Centre Foulum, PO Box 50, DK-8830 Tjele, Denmark
Received 12 August 2002; received in revised form 27 September 2002; accepted 28 September 2002
Abstract
In order to investigate if cooking loss and Napole Yield can be predicted from various fresh meat characteristics, pH (1, 15, 30,60, 120 min and 24 h post mortem), temperature (1, 15, 30, 60, 120 min and 24 h post mortem), water-holding capacity (Honikel’s
drip loss method and centrifugation loss), and NMR T2 relaxation 24 h post mortem were measured in fresh porcineM. longissimusdorsi from 102 Hampshire crossbreeds of known RN� genotype. Subsequently, cooking loss and Napole Yield were determined oncooked and cured, cooked samples, respectively, and partial least squares regression (PLS) was carried out to investigate possible
intercorrelations between the physico-chemical measurements performed on the fresh meat and cooking loss/Napole Yield. Sig-nificant correlations were found between NMR T2 relaxation measured in fresh pork 24 h post mortem and the cooking loss(R=0.64) and Napole Yield (R=0.58), whereas no correlations were found between traditionally applied methods such as pHmeasurements, Honikel’s method and centrifugation, and the cooking loss/Napole Yield. Consequently, it is concluded that NMR
T2 relaxation characteristics of fresh pork in contrast to traditional fresh meat characteristics contain information about factors ofimportance for cooking loss/Napole Yield from cooked uncured/cured pork. The result implies that low-field (LF) NMR data fromfresh meat reflects information about water compartmentalisation and mobility that is partly decisive for subsequent heat-induced
changes of importance for the distribution of water within the cooked meat. In addition, the obtained results show that LF NMRdata measured on fresh meat also seems to contain information about the inherent water of importance for the technologicalcharacteristics of the meat even when the meat is cured before cooking.
# 2003 Elsevier Science Ltd. All rights reserved.
Keywords: NMR T2 relaxation; Water-holding capacity; Cooking loss; Napole Yield; Technological quality; RN-gene
1. Introduction
The technological quality of pork, especially thewater-holding capacity (WHC) of meat during storage,retail display and processing, is substantial for the meatindustry due to its economic consequences. Cookingloss and Napole Yield (the process yield after curing inbrine and subsequent cooking) are two important tech-nological quality attributes. In addition, these traits are
also substantial from a sensory point of view, as a highloss of water implies that the meat is perceived as lessjuicy (Martens, Stabursvik, & Martens, 1982). Tradi-tionally, the technological quality of pork is assessed bypH 45 min post mortem and/or pH 24 h post mortem.However, even though WHC of the fresh meat is pre-sumed to be of significance for product yield (Guignot,Vignon, & Monin, 1993; Hamm, 1972; Lawrie, 1979),only poor correlations between either pH or WHC infresh meat and product yield (Napole Yield or cookingloss) have to the authors’ knowledge been demonstrated(Fernandez, Lefaucheur, Gueblez, & Monin, 1991;Lundstrom, Andersson, & Hansson, 1996; Lundstrom,Enfalt, Tornberg, & Agerhem, 1998).
0309-1740/03/$ - see front matter # 2003 Elsevier Science Ltd. All rights reserved.
doi:10.1016/S0309-1740(02)00272-3
Meat Science 65 (2003) 707–712
www.elsevier.com/locate/meatsci
* Corresponding author. Tel.: +45-89-99-12-41; fax: +45-89-99-
15-64.
E-mail address: [email protected] (H. J. Andersen).
The use of low-field (LF) 1H NMR (nuclear magneticresonance) relaxation measurements for determinationof WHC in fresh meat has been suggested (Tornberg,Andersson, Goransson, & von Seth, 1993; Trout, 1988).Besides being fast and non-invasive, the NMR methodalso has the advantage of providing information aboutdistribution and mobility of water in the meat. Themethod can thus be expected to produce relevant infor-mation about the water-holding capacity of the meat.Several studies have also shown a high correlationbetween LF NMR relaxation measurements and WHCdetermined by the traditional gravimetric methods suchas Honikel’s bag method and centrifugation (Bertram,Andersen, & Karlsson, 2001; Brøndum, Munck,Henckel, Karlsson, Tornberg, & Engelsen, 2000; Ber-tram, Dønstrup, Karlsson, & Andersen, 2002; Brown,Capozzi, Cavani, Cremonini, Petracci, & Placucci, 2000;Tornberg et al., 1993). Despite the fact that LF NMRmeasurements should be expected to contain furtherinformation, e.g. the physical location of the water,which affects water loss during further processing, theuse of LF NMR relaxation measurements for predictionof the technological characteristics of the meat has onlybeen investigated in a relatively limited number ofstudies so far (Brown et al., 2000; Fjelkner-Modig &Tornberg, 1986; Renou, Monin, & Sellier, 1985).The objective of the present study was to investigate if
fresh meat attributes could be used to predict the techno-logical pork quality expressed as cooking loss andNapoleYield. For this purpose, pH (1, 15, 30, 60, 120 min and 24h post mortem), temperature (1, 15, 30, 60, 120 min and24 h post mortem), traditional WHC and LF NMRrelaxation measurements were carried out on fresh porksamples from Hampshire crossbreeds of known geno-type. The Hampshire crossbreed of both wildtype (rn+)and carriers of the RN� genotype was chosen, as thepresence of the RN-gene is known to influence processyield of cured and cooked products (Napole Yield)(Fernandez, Tornberg, Naveau, Talmant, & Monin,1992; Lundstrom et al., 1996, 1998; Naveau, 1986).
2. Methods and materials
2.1. Animals and slaughter
The experiment included a total of 102 animals of thebreed combination Hampshire/Duroc boars crossedwith Landrace/Yorkshire sows. Of the 102 animals, 49were carriers of the RN� genotype, while the remaining53 were of wildtype (rn+/rn+). RN� genotyping wasdetermined on DNA from muscle tissue. RN� geno-types were identified using amplification by PCR of a259 bp fragment of PRKAG3, including the RN-muta-tion using the primers described previously (Milan et al.,2000) and followed by a BsrBI digestion.
The pigs had a slaughter weight between 44.6 and85.2 kg and were slaughtered over 9 days at the experi-mental abattoir at Research Centre Foulum. The sameslaughter procedure was used for all animals. The animalswere anaesthetised with 80%CO2 for 3 min. After cuttingand exsanguination, the animals were scalded at 62 �Cfor 3 min. Cleaning and evisceration of the carcasseswere completed within 30 min post mortem. Thereafterthe carcasses were divided, and approx. 60 min postmortem they were placed at a room temperature of 4 �Cand stored until assessments at 24 h post mortem.
2.2. Sampling
A chop of approximately 5 cm was cut from M.longissimus dorsi next to the third lumbar vertebrae 24 hpost mortem and used for NMR relaxation measure-ments and determination of WHC by means of cen-trifugation (see later). The chop was dividedtransversely to the direction of the fibres and afterwardsa sample for relaxation measurement and for cen-trifugation was taken in the middle of the musclesample. The remaining two parts of the chop were fro-zen at �20 �C until further analysis of cooking loss andNapole Yield. Moreover, for determination of WHC bymeans of Honikel’s bag method (Honikel, 1998), a chopof approximately 1.5 cm was also cut from M. long-issimus dorsi next to the third lumbar vertebrae at 24 hpost mortem.
2.3. pH and temperature measurements
The pH and temperature at 1, 15, 30, 60, 120 min and24 hours post mortem were measured in M. longissimusdorsi next to the last rib. For pH measurements aninsertion electrode (Metrohm AG CH-9101 Herisau,Schwitzerland) was used. The electrode was calibratedat a temperature of 4 �C. A two-point calibration wasperformed, and the used calibration buffers had a pH of7.000 and 4.005 at 25 �C (Radiometer, Denmark). Fortemperature measurements a Testo 110 thermometer(Testo, Germany) was used.
2.4. Determination of water-holding capacity
Determination of WHC was performed using twodifferent methods, the Honikel method (Honikel, 1998)and a centrifugation method.Honikel’s method, which is a gravimetric method, was
performed as described by Honikel (1998). The sampletaken at 24 h post mortem (see earlier) and weighing 50–100 g was trimmed and weighed. The sample was thenplaced in a net surrounded by an inflated plastic bagand suspended for 48 h at 4 �C. After the 48 h thesample was re-weighed, and drip loss was expressed asthe weight change percentage.
708 H.C. Bertram et al. /Meat Science 65 (2003) 707–712

The centrifugation method is described by Bertram etal. (2001). From the chop cut 24 h post mortem, sam-ples were cut parallel with the fibre direction with ascalpel. These samples were 1.5 cm long, had a cross-section area of about 3�3 mm, and weighed approxi-mately 0.3–0.5 g. The samples were weighed and placedin tubes (Mobicols from MoBiTec, Gottingen) with afilter at the bottom (pore size 90 mm) thus separating themeat from the exudated meat juice. The samples werecentrifuged at 40 g for 1 h at 4 �C. After centrifugation,the samples were weighed again, and the drip loss cal-culated as the weight change percentage. Five replicateswere performed on each meat sample.
2.5. Determination of processing yield (cooking loss andNapole Yield)
Frozen samples (see above) were thawed at 4 �C for24 h, and determinations of cooking loss and NapoleYield were carried out as described below.For determination of cooking loss, a meat sample of
1 cm3 was cut from each animal. After weighing (weight1), the sample was stored for 24 h at 4 �C before heattreatment in a water bath at 85 �C for 10 min resultingin a core temperature of approximately 75 �C. Subse-quently the meat sample was lightly dabbed andweighed (weight 2). The cooking loss was calculatedaccording to Eq. (1):
Cooking Loss ¼ 100%Weight 1�Weight 2
Weight 1
� �ð1Þ
Napole Yield was determined as a modification ofthe method described by Naveau, Pommeret, andLechaux. (1985). From each animal a meat sample of1 cm3 was cut, weighed (weight 1) and placed for 24 h in2 ml of a 13.6% NaCl solution containing nitrite (0.6%nitrite in NaCl) at 4 �C. Subsequently the sample wasexposed to heat treatment in a water bath at 85 �C for10 min, equivalent to a core temperature of 75 �C.Finally the sample was lightly dabbed and weighed(weight 2). Napole Yield was determined according tothe Eq (2):
Napole Yield ¼ 100% 1�Weight 1�Weight 2
Weight 1
� �ð2Þ
2.6. LF NMR relaxation measurements
Relaxation measurements were performed on aMaran Benchtop Pulsed NMR analyser (ResonanceInstruments, Witney, UK) with a magnetic fieldstrength of 0.47 Tesla and with a corresponding reso-nance frequency for protons of 23.2 MHz. The NMRinstrument was equipped with a 18 mm variable tem-
perature probe. Transverse relaxation, T2, was mea-sured using the Carr–Purcell–Meiboom–Gill sequence(CPMG, Carr & Purcell, 1954; Meiboom & Gill, 1958).The T2 measurements were made with a t-value (timebetween 90� pulse and 180� pulse) of 150 ms. Data from4096 echoes were acquired as 16 scans repetitions. Therepetition time between 2 subsequent scans was 2 s. Therelaxation measurements were performed at 25 �C.Before measurement, the meat samples were thermo-stated to 25 �C for 20 min in a water bath.Bi-exponential fitting analysis of T2 relaxation data
was performed using the RIWinfit programme (softwarerelease 1.2.3) released from Resonance Instruments. Bi-exponential fiting is performed fitting the CPMG datato a linear combination of two exponentials:
M ¼ pT21exp �t=T21ð Þ þ pT22exp �t=T22ð Þ ð3Þ
where M is the magnetisation amplitude, T21 and T22
are the two characteristic relaxation time constants, andpT21 and pT22, also referred to as the T21 and T22
population, are the corresponding fractions of the mag-netisation amplitude that can be described by the twotime constants, respectively.
2.7. Data analyses
Statistical analysis was carried out with the StatisticalAnalysis System (SAS Institute, 1991), using linearregression analysis (Proc GLM). The statistical modelincluded the fixed effect of genotype and random effectof slaughter day.In addition, partial least square regression (PLSR)
(Martens & Næs, 1989) were carried out with theUnscrambler version 7.6 software (Camo AS, Oslo,Norway). PLSR is a multivariate calibration method, bywhich two sets of data, X (e.g. fresh meat measurements)and y (e.g. cooking loss, Napole Yield) are related bymeans of regression. The purpose of PLSR is to establisha linear model, which enables the prediction of y fromthe measured spectrum X. This is described by Eq. (4):
y ¼ Xb ð4Þ
in which vector b contains the regression coefficientsdetermined during the calibration procedure. PLSRseeks the systematic part of the matrix X that is relevantfor the description of y, and analysis of X and modelbetween X and y is performed simultaneously. Tem-perature, pH, drip loss, centrifugation loss, and T2
relaxation curves were included as X-data sets.During regression Martens’s uncertainty test (Mar-
tens & Martens, 2000) was used to eliminate noisy vari-ables, and all models were validated using full crossvalidation (‘‘leave one out’’), and only validated resultsare reported. As indicator of prediction ability, the root
H.C. Bertram et al. /Meat Science 65 (2003) 707–712 709
mean square error of cross validation (RMSECV), isgiven. RMSECV is calculated according to Eq. (5):
RMSECV ¼
ffiffiffiffiffiffiffiffiffiffiffiffiffiffiffiffiffiffiffiffiffiffiffiffiffiffiffiXni¼1
y_
i � yi� �2
n
vuut ð5Þ
in which y_
i is the predicted value of the y-variable forsample i, yi is the actual value of the y-variable forsample i, and n is the number of samples.
3. Results and discussion
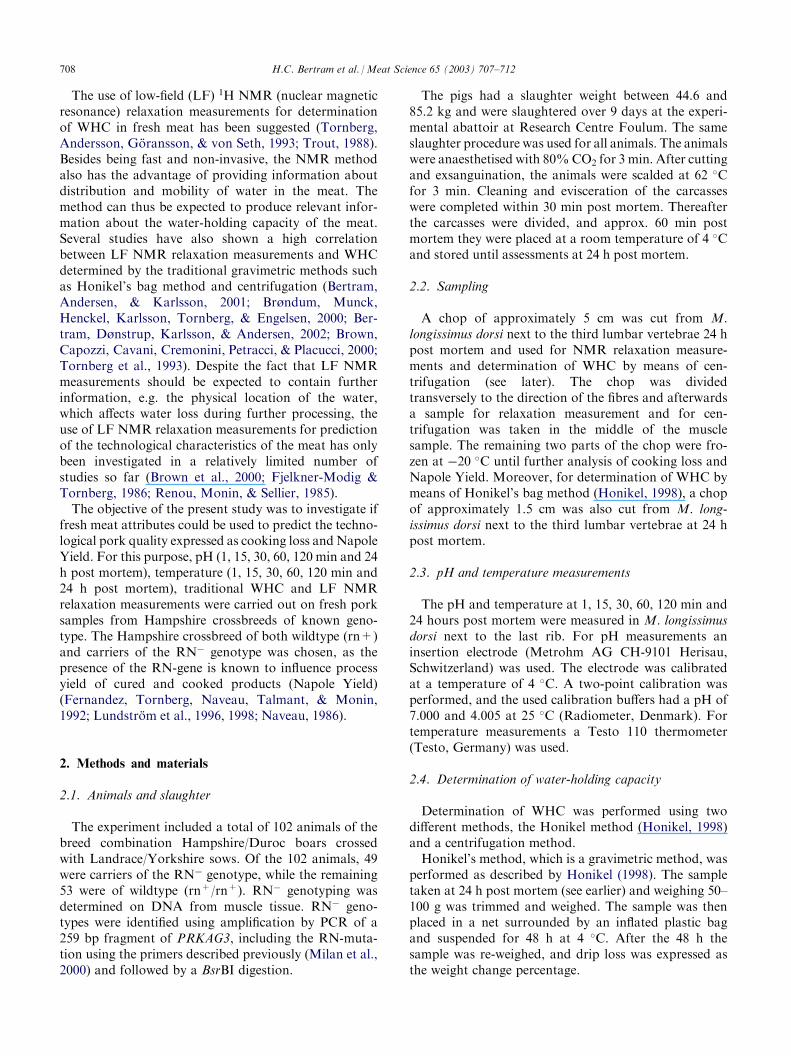
Table 1 shows the temperature and pH values mea-sured at various times post mortem, drip loss, cen-trifugation loss, T2 attributes, cooking loss, and NapoleYield for the two genotypes. pH measured at 24 h postmortem, WHC determined by Honikel’s method, cook-ing loss, and Napole Yield differed significantly betweenthe two genotypes. This is in agreement with previousstudies in which meat from pigs carrying the RN-genehas been shown to be associated with lower NapoleYield and ultimate pH plus higher drip loss and cookingloss (Enfalt, Lunstrom, Karlsson, & Hansson, 1997;Jonsall, Johannsson, & Lundstrom, 2001; Lundstrom etal., 1996, 1998). Even though not significantly different,meat from RN-carriers tended to have a larger T22
population, which is in agreement with earlier studies,
where positive correlation between the T22 populationand drip loss has been shown (Bertram et al., 2002).Table 2 shows the results obtained upon PLS calibra-
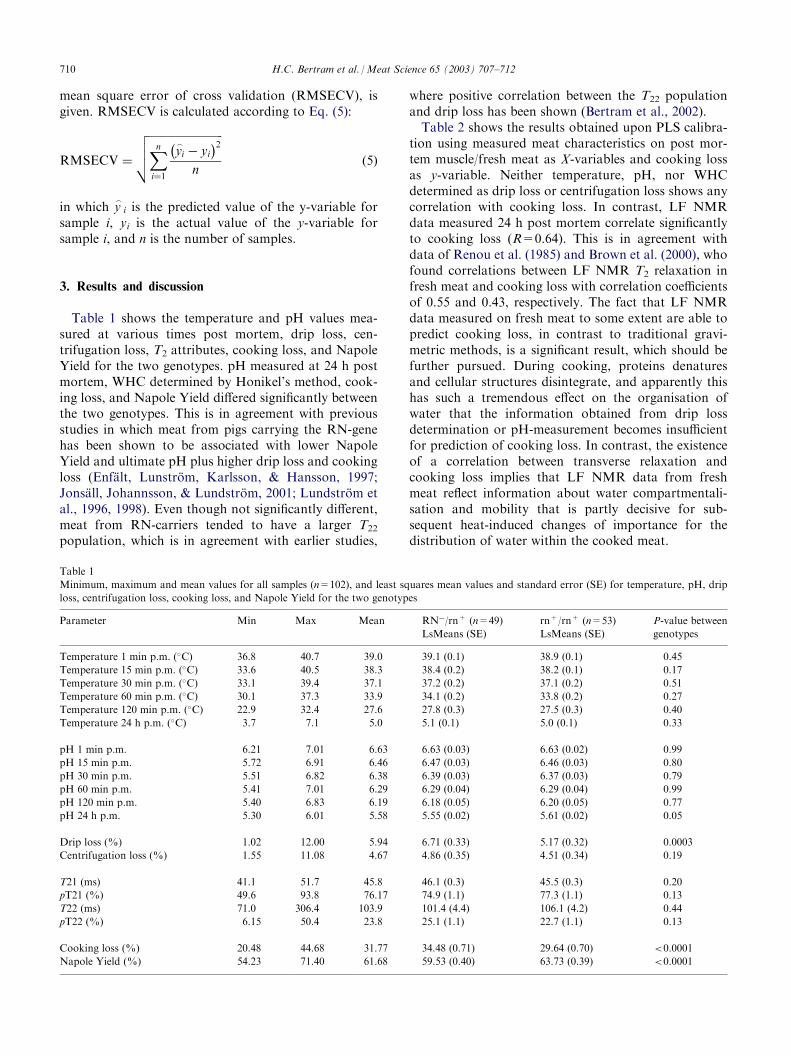
tion using measured meat characteristics on post mor-tem muscle/fresh meat as X-variables and cooking lossas y-variable. Neither temperature, pH, nor WHCdetermined as drip loss or centrifugation loss shows anycorrelation with cooking loss. In contrast, LF NMRdata measured 24 h post mortem correlate significantlyto cooking loss (R=0.64). This is in agreement withdata of Renou et al. (1985) and Brown et al. (2000), whofound correlations between LF NMR T2 relaxation infresh meat and cooking loss with correlation coefficientsof 0.55 and 0.43, respectively. The fact that LF NMRdata measured on fresh meat to some extent are able topredict cooking loss, in contrast to traditional gravi-metric methods, is a significant result, which should befurther pursued. During cooking, proteins denaturesand cellular structures disintegrate, and apparently thishas such a tremendous effect on the organisation ofwater that the information obtained from drip lossdetermination or pH-measurement becomes insufficientfor prediction of cooking loss. In contrast, the existenceof a correlation between transverse relaxation andcooking loss implies that LF NMR data from freshmeat reflect information about water compartmentali-sation and mobility that is partly decisive for sub-sequent heat-induced changes of importance for thedistribution of water within the cooked meat.
Table 1
Minimum, maximum and mean values for all samples (n=102), and least squares mean values and standard error (SE) for temperature, pH, drip
loss, centrifugation loss, cooking loss, and Napole Yield for the two genotypes
Parameter
Min Max Mean RN�/rn+ (n=49)LsMeans (SE)
rn+/rn+ (n=53)
LsMeans (SE)
P-value between
genotypes
Temperature 1 min p.m. (�C)
36.8 40.7 39.0 39.1 (0.1) 38.9 (0.1) 0.45Temperature 15 min p.m. (�C)
33.6 40.5 38.3 38.4 (0.2) 38.2 (0.1) 0.17Temperature 30 min p.m. (�C)
33.1 39.4 37.1 37.2 (0.2) 37.1 (0.2) 0.51Temperature 60 min p.m. (�C)
30.1 37.3 33.9 34.1 (0.2) 33.8 (0.2) 0.27Temperature 120 min p.m. (�C)
22.9 32.4 27.6 27.8 (0.3) 27.5 (0.3) 0.40Temperature 24 h p.m. (�C)
3.7 7.1 5.0 5.1 (0.1) 5.0 (0.1) 0.33pH 1 min p.m.
6.21 7.01 6.63 6.63 (0.03) 6.63 (0.02) 0.99pH 15 min p.m.
5.72 6.91 6.46 6.47 (0.03) 6.46 (0.03) 0.80pH 30 min p.m.
5.51 6.82 6.38 6.39 (0.03) 6.37 (0.03) 0.79pH 60 min p.m.
5.41 7.01 6.29 6.29 (0.04) 6.29 (0.04) 0.99pH 120 min p.m.
5.40 6.83 6.19 6.18 (0.05) 6.20 (0.05) 0.77pH 24 h p.m.
5.30 6.01 5.58 5.55 (0.02) 5.61 (0.02) 0.05Drip loss (%)
1.02 12.00 5.94 6.71 (0.33) 5.17 (0.32) 0.0003Centrifugation loss (%)
1.55 11.08 4.67 4.86 (0.35) 4.51 (0.34) 0.19T21 (ms)
41.1 51.7 45.8 46.1 (0.3) 45.5 (0.3) 0.20pT21 (%)
49.6 93.8 76.17 74.9 (1.1) 77.3 (1.1) 0.13T22 (ms)
71.0 306.4 103.9 101.4 (4.4) 106.1 (4.2) 0.44pT22 (%)
6.15 50.4 23.8 25.1 (1.1) 22.7 (1.1) 0.13Cooking loss (%)
20.48 44.68 31.77 34.48 (0.71) 29.64 (0.70) <0.0001Napole Yield (%)
54.23 71.40 61.68 59.53 (0.40) 63.73 (0.39) <0.0001710 H.C. Bertram et al. /Meat Science 65 (2003) 707–712
The results from PLSR calibration with measure-ments on fresh meat as X-variables and Napole Yield asy-variable are shown in Table 3. Like cooking loss, nocorrelation was found between Napole Yield and tem-perature, pH, WHC, determined either by Honikel’smethod (Honikel, 1998) or by centrifugation. However,a significant correlation between LF NMR data mea-sured on the fresh meat and Napole Yield (R=0.58)was evident. In order to investigate if the obtainedcorrelations between T2 relaxation and cooking loss/Napole Yield are caused simply by a qualitative differ-ence between the two genotypes, PLSR were also per-formed separately on the two genotypes, see Table 4.
Even though slightly lower correlations were obtainedin models based on single genotypes, prediction ofcooking loss/Napole Yield did not fail completely,which reveals that the correlations are probably causedby a qualitative difference. Consequently, LF NMRdata measured on fresh meat also seem to containinformation about the inherent water of importance forthe technological characteristics of the meat even whenthe meat is cured before cooking. This result impliesthat the water distribution of the fresh meat significantlyaffects or facilitates the curing process. However, morestudies and relaxation measurements on both fresh,cooked and cured, cooked meat in relation to productyield should be considered in the future. For example, itis of prime importance to investigate the influence offreeze-thaw process between the NMR measurementsand the measurements of the technological traits.
4. Conclusion
In conclusion, LF NMR relaxation measurementson fresh meat the day after slaughter correlate sig-nificantly with both cooking loss and Napole Yield ofcooked and cured, cooked meat, respectively. In con-trast, neither temperature, pH nor gravimetric meth-ods used to determine water-holding capacity in pork(Honikel’s method and a centrifugation method) cor-related with cooking loss and Napole Yield. Conse-quently, LF NMR relaxation measurements on freshmeat the day after slaughter provide information aboutproperties of importance for water holding and waterdistribution, which affect the technological quality ofthe pork.
Acknowledgements
The authors are grateful to the Danish Veterinary andAgricultural Research Council (SJVF # 9702805) and tothe Danish Directorates for Development (ProductQuality Project to H.J.A.) for financial support of thisproject.
Table 2
Performances of PLS regression models with fresh meat data as X-
variables and cooking loss as y-variable
Variable in X
Significanttime points
R
Y-var(%)
RMSECV
(%)
PCa
Temperature
120 min 0.16 5 4.26 1pH
none 0.05 3 4.38 1Drip loss
– 0.08 3 4.36 1Centrifugation loss
– 0.20 8 4.28 1T2 relaxation curve
0.64 50 3.41 4Correlation coefficients (R), explained Y-variance, root mean
squared error of cross validation (RMSECV) and number of principal
components (PC) are given.a The number of PCs resulting in the lowest RMSECV were chosen.
Table 3
Performances of PLS regression models with fresh meat data as X-
variables and Napole Yield as y-variable
Variable in X
Significanttime points
R
y-var(%)
RMSECV
(%)
PCa
Temperature
None 0.0 0 3.57 1pH
None 0.04 3 3.53 1Drip loss
– 0.06 4 3.49 1Centrifugation loss
– 0.0 0 3.52 1T2 relaxation curve
0.58 41 2.78 4Correlation coefficients (R), explained y-variance, root mean
squared error of cross validation (RMSECV) and number of principal
components (PC) are given.a The number of PCs resulting in the lowest RMSECV were chosen.
Table 4
Performances of PLS regression models separately on the two genotypes with NMR T2 data as X-variables and cooking loss/Napole Yield as
y-variable
RN�/rn+ (n=49)
rn+/rn+(n=53)Variable in y
R y-var(%)
RMSECV
(%)
PCa
R y-var(%)
RMSECV
(%)
PCa
Cooking loss
0.44 29 3.95 2 0.62 49 3.43 3Napole Yield
0.49 44 2.81 4 0.40 24 3.26 2Correlation coefficients (R), explained y-variance, root mean squared error of cross validation (RMSECV) and number of principal components
(PC) are given.a The number of PCs resulting in the lowest RMSECV were chosen.
H.C. Bertram et al. /Meat Science 65 (2003) 707–712 711

References
Bertram, H. C., Andersen, H. J., & Karlsson, A. H. (2001). Com-
parative study of low-field NMR relaxation measurements and two
traditional methods in the determination of water holding capacity
of pork. Meat Science, 57, 125–132.
Bertram, H. C., Dønstrup, S., Karlsson, A. H., & Andersen, H. J.
(2002). Continuous distribution analysis of T2 relaxation in meat—
an approach in the determination of water holding capacity. Meat
Science, 60, 279–285.
Brown, R. J. S., Capozzi, F., Cavani, C., Cremonini, M. A., Petracci,
M., & Placucci, G. (2000). Relationships between 1H NMR relaxa-
tion data and some technological parameters of meat: a chemo-
metric approach. Journal of Magnetic Resonance Imaging, 147, 89–
94.
Brøndum, J., Munck, L., Henckel, P., Karlsson, A., Tornberg, E., &
Engelsen, S. B. (2000). Prediction of water-holding capacity and
composition of porcine meat with comparative spectroscopy. Meat
Science, 55, 177–185.
Carr, H. Y., & Purcell, E. M. (1954). Effects of diffusion on free pre-
cession in nuclear magnetic resonance experiments. American Jour-
nal of Physics, 94, 630–638.
Enfalt, A. C., Lundstrom, K., Karlsson, A. H., & Hansson, I.
(1997). Estimated frequency of the RN� allele in Swedish Hamp-
shire pigs and comparison of glycolytic potential, carcass compo-
sition and technological meat quality among Swedish Hampshire,
Landrace, and Yorkshire pigs. Journal of Animal Science, 75,
2927–2935.
Fernandez, X., Lefauheur, L., Gueblez, R., & Monin, G. (1991). Paris
ham processing: technological yield as affected by residual glycogen
content of muscle. Meat Science, 29, 121–128.
Fernandez, X., Tornberg, E., Naveau, J., Talmant, A., & Monin, G.
(1992). Bimodal distribution of the muscle glycolytic potential in
French and Swedish populations of Hampshire crossbred pigs.
Journal of Science and Food Agriculture, 59, 307–311.
Fjelkner-Modig, S., & Tornberg, E. (1986). Water distribution in
porcine M. longissimus dorsi in relation to sensory properties. Meat
Science, 17, 213–231.
Guignot, F., Vignon, X., & Monin, G. (1993). Post mortem evolution
of myofilament spacing and extracellular space in veal muscle. Meat
Science, 33, 333–347.
Hamm, R. (1972). Kolloidchemie des Fleisches. Hamburg, Berlin:
Parey.
Honikel, K. O. (1998). Reference methods for the assessment of phy-
sical characteristics of meat. Meat Science, 49, 447–457.
Jonsall, A., Johannsson, L., & Lundstrom, K. (2001). Sensory quality
and cooking loss of ham muscle (M. biceps femoris) from pigs reared
indoors and outdoors. Meat Science, 57, 245–250.
Lawrie, R. A. (1979). Meat science (3rd ed.). Oxford: Pergamon
Press.
Lundstrom, K., Andersson, A., & Hansson, I. (1996). Effect of the RN
gene on technological and sensory meat quality in crossbred pigs
with Hampshire as terminal sire. Meat Science, 20, 145–153.
Lundstrom, K., Enfalt, A.-C., Tornberg, E., & Agerhem, H. (1998).
Sensory and technological meat quality in carrieres and non-car-
rieres of the RN allele in Hampshire Crosses and in purebred
Yorkshire pigs. Meat Science, 48, 115–124.
Martens, H., & Martens, M. (2000). Modified jack-knife estimation of
parameter uncertainty in bilinear modeling by partial least squares
regression (PLSR). Food Quality and Preference, 11, 5–16.
Martens, H., & Næs, T. (1989). Multivariate calibration. Chichester:
John Wiley & Sons.
Martens, H., Stabursvik, E., & Martens, M. (1982). Texture and col-
our changes in meat during cooking related to thermal denaturation
of muscle proteins. Journal of Texture Studies, 13, 291–309.
Meiboom, S., & Gill, D. (1958). Modified spin-echo method for mea-
suring nuclear times. Reviews of Scientific Instruments, 29, 688–691.
Milan, D., Jeon, J.-T., Looft, C., Amarger, V., Robic, A., Thelander,
M., Rogel-Gaillard, C., Paul, S., Iannuccelli, N., Rask, L., Ronne,
H., Lundstrom, K., Reinsch, N., Gellin, J., Kalm, E., Le Roy, P.,
Chardon, P., & andersson, L. (2000). A mutation in PRKAG3
associated with excess glycogen content in pig skeletal muscle.
Science, 288, 1248–1251.
Naveau, J. (1986). Contribution a l’etude du determinisme genetique
de la qualite de viande porcine Heritabilite du Rendement Techno-
logique Napole. Journees Rech. Porcine en France, 18, 265–276.
Naveau, J., Pommeret, P., & Lechaux, P. (1985). Proposition d’une
methode de mesure du rendement technologique: ‘‘la methode
Napole’’. Techni-Porc, 8, 7–11.
Renou, J. P., Monin, G., & Sellier, P. (1985). Nuclear magnetic reso-
nance measurements on pork of various qualities. Meat Science, 15,
225–233.
SAS Institute. (1991). SAS user’s guide: statistics (version 6, 4th ed.).
Cary NC: SAS Inst Inc.
Tornberg, E., Andersson, A., Goransson, A., & von Seth, G. (1993).
Water and fat distribution in pork in relation to sensory properties.
In E. Puolanne, & D.I. Demeyer (with M. Ruusunen, & S. Ellis)
(Eds.), Pork quality: genetic and metabolic factors (pp. 239–258).
Wallingford, Oxon: CAB International.
Trout, G. R. (1988). Techniques for measuring water-binding capacity
in muscle foods—a review of methodology. Meat Science, 23, 235–
252.
712 H.C. Bertram et al. /Meat Science 65 (2003) 707–712