Embed Size (px)
Citation preview

Predicting GPCR Promiscuity Using Binding Site FeaturesAnat Levit,†,‡ Thijs Beuming,§ Goran Krilov,§ Woody Sherman,§ and Masha Y. Niv*,†,‡
†Institute of Biochemistry, Food Science and Nutrition, Robert H. Smith Faculty of Agriculture Food and Environment, The HebrewUniversity, Rehovot 76100, Israel‡Fritz Haber Center for Molecular Dynamics, The Hebrew University, Jerusalem 91904, Israel§Schrodinger Inc., 120 West Forty-Fifth Street, 17th Floor, New York, New York 10036, United States
*S Supporting Information
ABSTRACT: G protein-coupled receptors (GPCRs) repre-sent a large family of signaling proteins that includes manytherapeutic targets. GPCR ligands include odorants, tastants,and neurotransmitters and vary in size and properties.Dramatic chemical diversity may occur even among ligandsof the same receptor. Our goal is to unravel the structural andchemical features that determine GPCRs’ promiscuity towardtheir ligands. We perform statistical analysis using more than30 descriptors related to the sequence, physicochemical,structural, and energetic properties of the GPCR bindingsiteswe find that the chemical variability of antagonists significantly correlates with the binding site hydrophobicity andanticorrelates with the number of hydrogen bond donors in the binding site. The number of disulfide bridges in the extracellularregion of a receptor anticorrelates with the range of molecular weights of its antagonists, highlighting the role of the entrancepathway in determining the size selectivity for GPCR antagonists. The predictive capability of the model is successfully validatedusing a separate set of GPCRs, using either X-ray structures or homology models.
■ INTRODUCTION
G protein-coupled receptors (GPCRs) form the largest familyof cell surface receptors in the human genome.1 They are keysignaling molecules and are the targets of over 30% of currentlyapproved and marketed drugs.2 Endogenous agonists ofGPCRs include bioamines, nucleotides, neurotransmitters,peptides, and many other chemical stimuli. Some GPCRs arenarrowly tuned toward their agonists, such as the pheromonereceptors3 and subsets of the olfactory receptor subfamily,4
while others have a broad receptive range. Striking examples ofbroadly tuned receptors include some olfactory receptors5,6 andseveral bitter taste receptors,7,8 in which a single receptorrecognizes a broad range of ligands.A recent systematic analysis of ligand-contacting residues in
the transmembrane (TM) ligand-binding pocket of GPCR X-ray structures has revealed that, except for the C−X−Cchemokine type 4 receptor (CXCR4) and the neurotensin 1receptor (NTSR1), all other X-ray structures of Family AGPCRs share similarity in ligand-contacting residues, withtopologically equivalent positions in TM3, TM6, and TM7typically contacting the ligand in nearly all receptors.9 Variationin the amino acids occupying these positions accounts forligand specificity in different receptors. Furthermore, individualGPCRs may accommodate diverse chemical matter by utilizingdifferent subsets of binding site residues,8,10 as well as differenttypes of interactions (i.e., polar vs nonpolar).8 Thesedifferences can be identified by crystallography11,12 or via acombination of modeling and mutagenesis studies8,10,13 on a
case-by-case basis. Here, we attempt to address whether thereceptive range of a receptor can be predicted based on thephysicochemical properties of the binding site.Recently developed methods, such as ligand’s eye-view of
protein similarity,14,15 as well as chemoproteometric16 orchemogenomic approaches,17,18 analyze and predict therelationship between proteins and the ligands they bind basedon either ligand similarities or both protein and ligand similarityinformation. For example, agonist-specific regions were shownto concentrate between TMs 2, 3, and the second extracellularloop (ECL2), while antagonist-specific regions are located atthe top of TMs 5 and 6.18 A ligand-based view of promiscuitycan suggest ligand properties that determine its polypharmacol-ogy (the number of targets with which the ligand interacts).Studies have found that the most promiscuous drugs tend to behighly hydrophobic (clog P ≥ 3). The relation between ligandsize (in terms of molecular weight (MW)) and its promiscuityhas also been studied, but no consensus was reached.19 In somecases, an inverse correlation between mean MW and ligandpromiscuity toward targets was found, while another studyshowed that within a given clog P range, promiscuity decreaseswith increasing ligand size. A recent study20 on a large set ofover 40 000 molecules for which at least three measuredaffinities (pXC50 ≥ 6) were available in ChEMBL did not find
Received: September 25, 2013
Article
pubs.acs.org/jcim
© XXXX American Chemical Society A dx.doi.org/10.1021/ci400552z | J. Chem. Inf. Model. XXXX, XXX, XXX−XXX

any significant correlation between MW and ligand promiscu-ity.Our goal is not to study what underlies the promiscuity of a
small molecule. Rather, we aim to understand which molecularand structural features of a receptor determine the chemicaldiversity of ligands that it is capable of binding. This ability mayalso be termed receptive range, multispecificity, or promiscuityof a receptor. Both binding site promiscuity and ligandpromiscuity are common in nature. A recent study indicatesthat more than 1/3 of pockets in a data set of 20 000 ligandbinding pockets, interact with multiple, chemically differentligands.21 While selectivity or promiscuity of GPCRs ingeneral,19,22 and of specific GPCR subtypes in particular,23,24
is often mentioned in the literature, a comprehensive metric forquantification of GPCR promiscuity toward their ligands ismissing. Here, GPCR promiscuity is assessed by determiningthe diversity of known antagonists. In turn, antagonist diversityis quantified using several descriptors, including the size of theknown ligand set, the number of unique scaffolds within this setand the ranges of physicochemical properties of ligands in theset. The abundance of chemical data for GPCR antagonists25
and the recent increase in the number of X-ray structures ofGPCRs,9,26,27 provide an unprecedented opportunity forunraveling molecular details of GPCR architecture, which canoffer insights into the fundamental features underlying GPCRselectivity. We use this information to develop an approach topredict GPCR selectivity based only on target information.
■ RESULTSGPCRs with Determined Structures and Their Corre-
sponding Ligand Sets. Our training set consisted of 10Family A GPCRs for which X-ray structures had been solvedexperimentally at the start of this study, and theircorresponding ligands sets, retrieved from ChEMBL, assummarized in Table 1.
Additional structures of GPCRs have been published duringthe course of this study, and their structures were used formodel validation. We excluded the S1P1 and the NTSR1receptors from both training and validation sets, as there areonly few recently (year 2000 and later) reported ligands in theChEMBL database, possibly reflecting the fact that theirchemical space has not yet been well studied. Family Breceptors were not included since preliminary tests showedsignificant differences from the Family A binding sites.
Variability of GPCRs Ligands Sets. First, we set to assessthe diversity of ligands in the different data sets and to explorethe relevance of the number of ligands or the number of uniquescaffolds in a set as measures of ligand set variability. To thisend, we calculated statistics (mean, median, range, standarddeviation, and variance) of a default set of physicochemicalligand descriptors for the antagonists sets in our training set(Table 1), all within 1 μM activity cutoff. The total number ofmolecules in a set, number of unique scaffolds (NUS), andnumber of clusters (using either radial or dendritic fingerprints)for each of the 10-ligand sets were also computed ((SupportingInformation Figure S1A). Differences in the distribution of MWand ALogP are observed between compounds belonging todifferent targets, reflecting differences in the nature of thebinding sites. The chemical space distribution of the entire 1μM activity cutoff set (n = 11 750), as defined by MW andALogP, is shown in Figure S1B. The compounds included inour data set cover a large chemical space and are notconcentrated, for example, only within the boundaries definedby Lipinski rules for drug-like molecules (as indicated by thedotted lines in Figure S1B), suggesting that the data set isdiverse and can be used to explore GPCR promiscuity.Statistical parameters of the ligand physicochemical
descriptors were included in a multivariate analysis, to quantifythe relationships among them (Figure 1). A correlation matrixincluding all calculated statistics for ligand properties for the 1μM ligand sets is shown in Supporting Information Figure S2Aand Table S1 lists the statistically significant pairwisecorrelations observed. The results are described below andare consistent when repeating the analysis for ligands with up to10 μM activity cutoff (data not shown) and when includingover 320 additional molecular descriptors of the compounds inthe analysis (Figure S2B).The correlation (r) between the number of molecules in the
set and NUS is very high (0.98; p-value < 0.0001). This means,that where there are more ligands, there are also more uniquescaffolds and suggests that there is no major overrepresentationof a few scaffolds within a particular ligand set. Furthermore,the ranges of almost all calculated physicochemical descriptors(Supporting Information Figure S2A and B) are in strikingpositive correlation with NUS and with number of molecules.Thus, the larger the number of unique scaffolds or the numberof known ligands, the higher the chemical variability, asmanifested in properties ranges of the ligands the receptor caninteract with.The medians (Figure 1) and means (Figure S2A) show much
lower levels of correlation with NUS, with a few exceptions: thehighest positive correlation (r) is observed between NUS andmedian value of chiral centers in the scaffold (0.65) and withring count median (0.57). The highest negative correlation isobserved between NUS and the rotatable bond median(−0.71), HB donors median (−0.52), and centralizationmedian (−0.515). This means that the more promiscuousreceptors tend to have antagonists with more chiral centers and
Table 1. GPCRs in the Training and the Validation Sets,along with X-Ray Structure PDB Codes and ChEMBLLigand Set Sizes (1 and 10 μM Activity Cutoff)
ChEMBL ligand set size
receptorPDBcode
IC50/Ki ≤ 1μM
IC50/Ki ≤ 10μM
training setμ-opioid receptor (OPRM) 4DKL 2300 3103κ-opioid receptor (OPRK) 4DJH 2273 3220adenosine 2A receptor (A2AR) 3EML 2084 3107dopamine D3 receptor (DRD3) 3PBL 1872 2335muscarinic M2 receptor (M2R) 3UON 786 1024muscarinic M3 receptor (M3R) 4DAJ 836 1010histamine H1 receptor (HRH1) 3RZE 669 881β1-adrenergic receptor (β1AR) 2VT4 366 652β2-adrenergic receptor (β2AR) 2RH1 434 661C−X−C chemokine receptor type 4(CXCR4)
3ODU 130 184
validation setδ-opioid receptor (OPRD) 4EJ4 1941N/OFQ opioid receptor (OPRX) 4EA3 1048serotonin receptor 1B (5HT1B) 4IAR 762serotonin receptor 2B (5HT2B) 4IB4 494protease-activated receptor 1(PAR1)
3VW7 393
smoothened receptor (SMO) 4JKV 289
Journal of Chemical Information and Modeling Article
dx.doi.org/10.1021/ci400552z | J. Chem. Inf. Model. XXXX, XXX, XXX−XXXB

rings (being bulky or “fat”) and do not tend to be flexible andpolar. This is in agreement with the “fat or flat” idea:28
aromaticity relates to “flatness”, while sp3-hybridized (tetrahe-dral) carbon atom fraction (Fsp3) relates to fatness or “three-dimensionality” of the molecule.The anticorrelation between fatness and flatness is also
apparent from the opposing positions of these properties alongthe second principle component obtained in principalcomponent analysis (PCA) of ligand sets molecular properties:The correlations between median values of ligand descriptors ofthe different targets in our 1 μM training set were subjected toPCA to obtain a global view of the relationship between thesedescriptors. The 10 GPCR ligand sets were then projected ontothe axes of the first two principle components (PCs) (Figure2). The first two PCs explain 74% of the variability in the data.PC1 is composed mostly of ligand flexibility and polaritydescriptors in the positive direction (i.e., number of rotatablebonds and number of HB donors) and of data set size-relateddescriptors in the negative direction (i.e., NUS, number ofclusters, and number of molecules). This means that ligandssets where ligands have more rotatable bonds and hydrogenbond donors typically decompose into fewer unique scaffoldsusing the Bemis−Murcko protocol. PC2 is composed mostly ofthe chirality descriptors and flexibility (Fsp3) in one directionand of aromatic ring count in the opposite direction. Thepromiscuous opioid receptors map in the region related to highchirality (or fatness). Interestingly, fatness of an individualcompound was shown to correlate with its selectivity towardtargets.29
The medians and, to a lesser degree, means of polaritydescriptors (HB donors, acceptors, etc.) are correlated amongthemselves and have modest anticorrelation with NUS.Interestingly, the MW median and mean values, which aredominant descriptors of ligand sets variability, are not correlated
Figure 1. Multivariate correlations between ligand set descriptors obtained from the 1 μM ligand sets. The degree of correlation ranges from red(+1) to blue (−1). Descriptors were clustered together based on correlation values. Median values of total charge, negative atom count, and positiveatom count were excluded from the analysis due to lack of variability between the different ligand sets.
Figure 2. Principal component analysis on median values of 20 liganddescriptors for the 1 μM training set. Biplot of loading and scoringshowing the variables (blue) composing the first two principalcomponents and projection of the 10 different ligand sets used (red).The first two principal components account for 74% of the variance inthe data. Ar ring−aromatic rings count; HBA−hydrogen bondacceptors; PSA−polar surface area; HBD−hydrogen bond donors;RB−rotatable bonds; Estate−electrotopological states; Cent−central-ization; Polar−molecular polarizability; MW−molecular weight; HA−heavy atom count; MR−molecular refractivity; Chiral−chiral centercount; Scaffold chiral−chiral center count in scaffolds; Ring−ringscount; # molecules−number of molecules; Fsp3−fraction of sp3-hybridized (tetrahedral) carbon atoms out of total carbon count;NUS−number of unique scaffolds; clusters (rad)−number of clustersusing radial FP; clusters (den)−number of clusters using dendritic FP.
Journal of Chemical Information and Modeling Article
dx.doi.org/10.1021/ci400552z | J. Chem. Inf. Model. XXXX, XXX, XXX−XXXC

with NUS. This finding is not trivial, since it might have beenassumed that if large ligands can bind to a receptor, the largebinding site may be accessible to many chemically dissimilarligands.Ranking the Targets According to Number of Unique
Scaffolds (NUS). NUS, which presented high positivecorrelation with ranges of molecular properties within theexamined GPCRs ligand sets, was chosen as a good indicationof the diversity of ligands binding to a given GPCR. Theranking of the training set GPCRs based on their NUS, as wellas ligand set size is shown in Supporting Information FigureS1A.It is clear that the GPCRs studied here vary in terms of
number and diversity of their ligands, with opioid receptorsdefined as the most promiscuous using this metric, and theCXCR4 receptor the least promiscuous. To determine receptorfeatures that may be responsible for these differences, bindingsite descriptors for the GPCRs in the training set (Table 1) arecalculated and analyzed next.Statistical Analysis of Relationships between Ligand
Set Diversity and Receptors Descriptors. Characterizingthe Receptor Structures. The location and features of theorthosteric binding site of GPCRs has long been establishedfrom mutagenesis studies30−32 and validated in the numerousX-ray structures currently available (analyzed, e.g. in refs 9 and33). The binding sites of the 10 training set X-ray structures(Table 1) were analyzed in terms of sequence, structure,solvation properties, and flexibility.For the sequence analysis, the relative percentage of
hydrophobic (M/L/I/V), aromatic (W/F/Y), polar (S/T/N/Q/H), basic (K/R), acidic (D/E), and small (A/C/G) bindingsite residue content was calculated for each of the receptors(binding site positions included in the analysis are listed inSupporting Information Table S2). Next, structural propertiesof the binding site were analyzed using SiteMap,34 whichcalculates the size, volume, exposure, and other properties, thatrelate to the ability of regions on the surface of proteins to bindmolecules (see Methods). SiteMap also calculates surfacesrepresenting the hydrophobic, donor, acceptor, and hydrophilicregions of the binding site. The areas of these surfaces wereused as descriptors as well.The ability of ligands to differentially displace and retain
specific water molecules solvating the protein binding sites mayoffer additional insights into the properties of the pocket. TheGPCR orthosteric sites were analyzed with the WaterMapalgorithm,35 which computes the locations and thermodynamicproperties of water molecules in protein binding sites.WaterMap has been used to reveal important aspects ofbinding sites relating to their ability to bind small molecules,both in globular proteins36 and GPCRs.37 In addition,WaterMap has been successfully used to assess bindingselectivity.38,39 More recently, WaterMap has been used tounderstand the role of water networks in the hydrophobic effectand molecular recognition, including validation using iso-thermal titration calorimetry (ITC) data to assess the entropicand enthalpic binding contributions from the solvent.40,41 Wehypothesized that thermodynamic parameters of watermolecules in the binding site may be related to the bindingsite promiscuity. Values of enthalpy (ΔH), entropy (−TΔS),and free energy (ΔG) were estimated using WaterMap for eachhydration site in the orthosteric binding site of each GPCR. Weused the average values for entropy, enthalpy, and free energy,
as well as the total free energy of all hydration sites as receptordescriptors.Flexibility of the binding site was estimated by the total
number of accessible rotamers from a conformational searchwithin either 5 or 10 kcal/mol of the native state usingmolecular mechanics with an implicit solvent model (seeMethods). Using the number of accessible rotamers is one ofmany possible ways to account for binding site flexibility andhas been used in other applications.42,43
Binding sites were characterized also in terms of intrinsicselectivity ratio (ISR),44 a dimensionless quantity that measuresthe degree to which native-like protein ligand interactions areenergetically stabilized relative to other possible protein−ligandbinding interactions (see Supporting Information Table S3 forISR results). A higher value of ISR indicates higher predictedselectivity.Due to the proximity of the second extracellular loop
(ECL2) to the ligand binding site, as evident from GPCRstructures, the length and secondary structure of ECL2 mayinfluence the properties of the binding site. Indeed, this loophas been shown to be important for ligand binding in manyGPCRs.9 The average secondary structure content based onbackbone hydrogen bonds, and the total length of the loopwere determined. In addition, a conserved Cys in ECL2 forms adisulfide bridge with TM3, which is found in all solved FamilyA X-ray structures, except for the S1P1 receptor. The totalnumber of disulfide bridges in the extracellular region variesbetween different receptors and was also included amongreceptor descriptors.In total, 32 different structural and sequence-related
descriptors were generated for each receptor. Principalcomponent analysis (PCA) suggests that no single descriptorcan account for the majority of the observed diversity of thereceptors (Supporting Information Figure S3A). This finding issupported by multivariate analysis (Supporting InformationFigure S3B and Table S4). Since no single receptor descriptoris highly correlated (either positively or negatively) with all, or amajority of, other descriptors, all 32 receptor descriptors wereincluded in the analysis that is described below.Next, we aimed to identify those receptor descriptors that are
most correlated with, and predictive of, receptor promiscuity(as represented, for example, by NUS). This was carried out intwo stages: First, the stepwise regression was applied in anautomated process of building a model by successively addingor removing variables based on the t-statistics of their estimatedcoefficients. Second, all variables (in our case, receptordescriptors) that significantly correlate with the analyzedmeasure of receptor promiscuity serve as input for thegeneration of a linear regression model for prediction ofreceptor promiscuity. This model is then applied to anindependent set of receptors for validation.
Stage One: Stepwise Regression. Stepwise regression is amethod for selecting a subset of predictive variables for aregression model, based on an automatic procedure ofsearching through different models with combinations ofvariables, and testing the predictive capabilities of the models.The result is a set of the most important variables (of the 32receptors’ variables used here) to predict the observable (in thiscase, the chemical diversity of the antagonists that bind to theGPCR, as represented by NUS or other diversity parameters).The outcome of this analysis is summarized in Table 2, showingthat the percent of hydrophobic residues (M/L/I/V) in thebinding site is the most influential factor on NUS p-value
Journal of Chemical Information and Modeling Article
dx.doi.org/10.1021/ci400552z | J. Chem. Inf. Model. XXXX, XXX, XXX−XXXD

0.0076), followed by the SiteMap descriptors for area of thedonor region (p-value 0.0277) and exposure (p-value 0.0048).To test the robustness of this unbiased analysis, we repeated
it for four other ligand set descriptors that are strongly
correlated with NUS, namely, the diversity-related descriptors“number of molecules in a set” and “number of clusters” (ascalculated using radial fingerprints, which have highercorrelation with NUS then dendritic fingerprints0.98compared with 0.83) and the molecular size-related descrip-torsranges of “molecular weight” and of “electrotopologicalstates”. The receptor descriptors that were found as mostinfluential and statistically significant differ somewhat, depend-ing on the analyzed ligand descriptor. In general, these includepercent of M/I/L/V residues in the binding site, number ofextracellular disulfide bridges, and several SiteMap descriptors(area donor, hydrophilic, balance, and exposure). Thus, thestructural descriptors found to be correlated with receptorpromiscuity are reasonably robust. Somewhat surprisingly, noneof the WaterMap, flexibility, and ISR descriptors were found tocorrelate with any of the ligand-based promiscuity measures. Itis possible that indeed there is no correlation between theproperties that these descriptors attempt to describe or that theapproximations used to develop these descriptors introduce toomuch noise for a signal to emerge.
Stage Two: Linear Regression Model of GPCR Promiscuity.On the basis of the stepwise regression results above, the fourmost influential factors (% M/L/I/V residues in the bindingsite, number of disulfide bridges, SiteMap area donor, andSiteMap exposure) were entered into a Standard Least Squaresfit analysis to develop a predictive model for receptorpromiscuity. Either NUS, number of molecules, number ofclusters (using radial fingerprints), electrotopological statesrange, or molecular weight range were used as descriptors of
Table 2. Results of Stepwise Regression Analysis Illustratingthe Receptor Descriptors Independently Associated withNUS and Various Additional Ligand Descriptors
diversity measurecorrelation with
NUS (r)receptorparameter P value
number of unique scaffolds(NUS)
% M/L/I/V 0.0076a
area donor 0.0277a
exposure 0.0048a
number of molecules 0.9762 % M/L/I/V 0.0009a
area donor 0.0474a
exposure 0.0319a
% W/F/Y 0.0683number of clustersb 0.9800 % M/L/I/V 0.0016a
area donor 0.0362a
disulfidebridges
0.0368a
MW range 0.9312 hydrophilic 0.0143a
% A/C/G 0.0786electrotopological staterange
0.9363 % M/L/I/V 0.0115a
disulfidebridges
0.0317a
balance 0.0230a
aStatistically significant at the 0.05 level (i.e., 95% confidence). bThenumber of clusters is based on hierarchical clustering of a Tanimotosimilarity matrix derived from radial fingerprints.
Table 3. Regression Coefficients of Receptor Descriptors Maximally Affecting NUS and Various Additional Ligand Descriptors,As Determined by the Standard Least Squares Fit Analysis
diversity measure receptor parameter estimate (b)b betac P value
number of unique scaffolds (NUS) intercept 1365.37 0.0965% M/L/I/V 3711.6365 0.641496 0.0008a
area donor −2.865893 −0.56276 0.0013a
exposure 3021.576 0.31258 0.0344a
disulfide bridges −143.78 −0.12995 0.2752number of molecules intercept 950.23611 0.2511
% M/L/I/V 4301.9155 0.784294 0.0006a
area donor −1.943108 −0.40248 0.0104a
exposure 1851.2282 0.202012 0.1678disulfide bridges −131.2362 −0. 12512 0.3545
number of clustersd intercept 656.68722 0.1170% M/L/I/V 1983.1373 0.765061 0.0007a
area donor −1.014765 −0.44478 0.0070a
exposure 740.34228 0.170952 0.2316disulfide bridges −88.90828 −0.17936 0.2045
MW range intercept 687.34705 0.0238a
%M/L/I/V 957.79607 0.507617 0.0022a
area donor −0.856493 −0.51573 0.0018a
exposure 1487.5971 0.471897 0.0068a
disulfide bridges −106.2566 −0.29449 0.0369a
electrotopological states range intercept 124.66511 0.0178a
%M/L/I/V 218.66809 0.663442 0.0005a
area donor −0.110723 −0.38167 0.0056a
exposure 209.79303 0.380985 0.0136a
disulfide bridges −18.83734 −0.29887 0.0306a
aStatistically significant. bEstimate (b) is the coefficient of the linear model found by least-squares. cBeta is the parameter estimates that would haveresulted from the regression had all the variables been standardized to a mean of 0 and a variance of 1. dNumber of clusters is based on hierarchicalclustering of a Tanimoto similarity matrix derived from radial fingerprints.
Journal of Chemical Information and Modeling Article
dx.doi.org/10.1021/ci400552z | J. Chem. Inf. Model. XXXX, XXX, XXX−XXXE
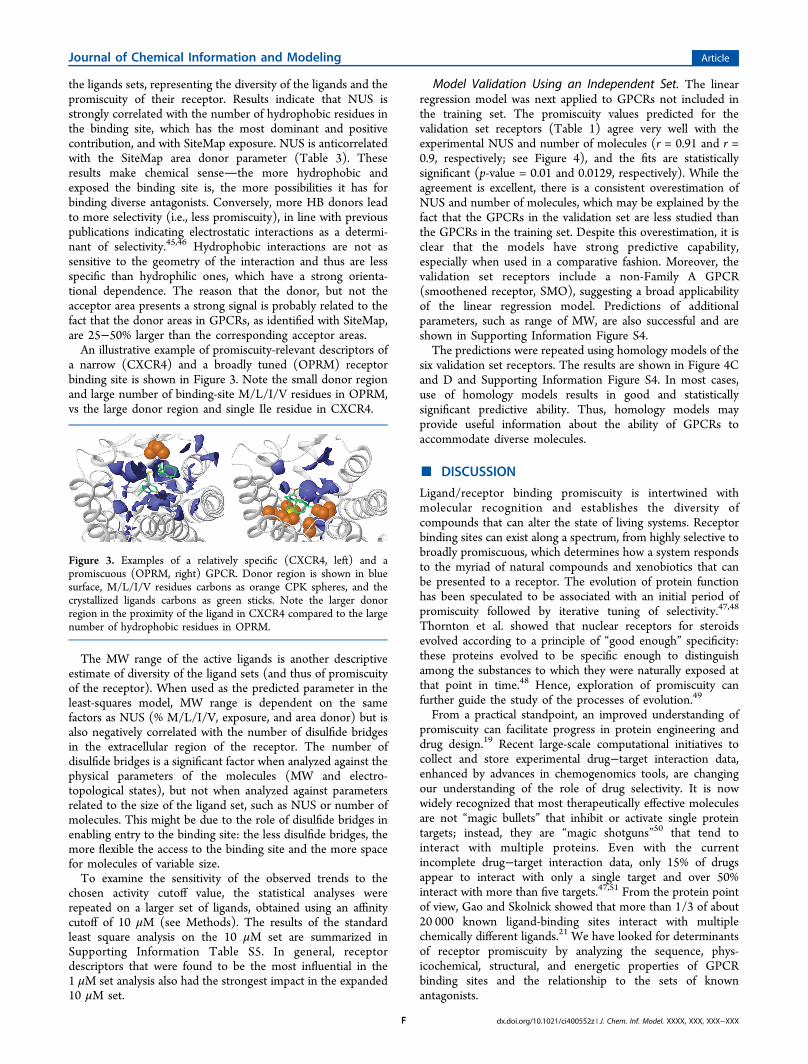
the ligands sets, representing the diversity of the ligands and thepromiscuity of their receptor. Results indicate that NUS isstrongly correlated with the number of hydrophobic residues inthe binding site, which has the most dominant and positivecontribution, and with SiteMap exposure. NUS is anticorrelatedwith the SiteMap area donor parameter (Table 3). Theseresults make chemical sensethe more hydrophobic andexposed the binding site is, the more possibilities it has forbinding diverse antagonists. Conversely, more HB donors leadto more selectivity (i.e., less promiscuity), in line with previouspublications indicating electrostatic interactions as a determi-nant of selectivity.45,46 Hydrophobic interactions are not assensitive to the geometry of the interaction and thus are lessspecific than hydrophilic ones, which have a strong orienta-tional dependence. The reason that the donor, but not theacceptor area presents a strong signal is probably related to thefact that the donor areas in GPCRs, as identified with SiteMap,are 25−50% larger than the corresponding acceptor areas.An illustrative example of promiscuity-relevant descriptors of
a narrow (CXCR4) and a broadly tuned (OPRM) receptorbinding site is shown in Figure 3. Note the small donor regionand large number of binding-site M/L/I/V residues in OPRM,vs the large donor region and single Ile residue in CXCR4.
The MW range of the active ligands is another descriptiveestimate of diversity of the ligand sets (and thus of promiscuityof the receptor). When used as the predicted parameter in theleast-squares model, MW range is dependent on the samefactors as NUS (% M/L/I/V, exposure, and area donor) but isalso negatively correlated with the number of disulfide bridgesin the extracellular region of the receptor. The number ofdisulfide bridges is a significant factor when analyzed against thephysical parameters of the molecules (MW and electro-topological states), but not when analyzed against parametersrelated to the size of the ligand set, such as NUS or number ofmolecules. This might be due to the role of disulfide bridges inenabling entry to the binding site: the less disulfide bridges, themore flexible the access to the binding site and the more spacefor molecules of variable size.To examine the sensitivity of the observed trends to the
chosen activity cutoff value, the statistical analyses wererepeated on a larger set of ligands, obtained using an affinitycutoff of 10 μM (see Methods). The results of the standardleast square analysis on the 10 μM set are summarized inSupporting Information Table S5. In general, receptordescriptors that were found to be the most influential in the1 μM set analysis also had the strongest impact in the expanded10 μM set.
Model Validation Using an Independent Set. The linearregression model was next applied to GPCRs not included inthe training set. The promiscuity values predicted for thevalidation set receptors (Table 1) agree very well with theexperimental NUS and number of molecules (r = 0.91 and r =0.9, respectively; see Figure 4), and the fits are statisticallysignificant (p-value = 0.01 and 0.0129, respectively). While theagreement is excellent, there is a consistent overestimation ofNUS and number of molecules, which may be explained by thefact that the GPCRs in the validation set are less studied thanthe GPCRs in the training set. Despite this overestimation, it isclear that the models have strong predictive capability,especially when used in a comparative fashion. Moreover, thevalidation set receptors include a non-Family A GPCR(smoothened receptor, SMO), suggesting a broad applicabilityof the linear regression model. Predictions of additionalparameters, such as range of MW, are also successful and areshown in Supporting Information Figure S4.The predictions were repeated using homology models of the
six validation set receptors. The results are shown in Figure 4Cand D and Supporting Information Figure S4. In most cases,use of homology models results in good and statisticallysignificant predictive ability. Thus, homology models mayprovide useful information about the ability of GPCRs toaccommodate diverse molecules.
■ DISCUSSION
Ligand/receptor binding promiscuity is intertwined withmolecular recognition and establishes the diversity ofcompounds that can alter the state of living systems. Receptorbinding sites can exist along a spectrum, from highly selective tobroadly promiscuous, which determines how a system respondsto the myriad of natural compounds and xenobiotics that canbe presented to a receptor. The evolution of protein functionhas been speculated to be associated with an initial period ofpromiscuity followed by iterative tuning of selectivity.47,48
Thornton et al. showed that nuclear receptors for steroidsevolved according to a principle of “good enough” specificity:these proteins evolved to be specific enough to distinguishamong the substances to which they were naturally exposed atthat point in time.48 Hence, exploration of promiscuity canfurther guide the study of the processes of evolution.49
From a practical standpoint, an improved understanding ofpromiscuity can facilitate progress in protein engineering anddrug design.19 Recent large-scale computational initiatives tocollect and store experimental drug−target interaction data,enhanced by advances in chemogenomics tools, are changingour understanding of the role of drug selectivity. It is nowwidely recognized that most therapeutically effective moleculesare not “magic bullets” that inhibit or activate single proteintargets; instead, they are “magic shotguns”50 that tend tointeract with multiple proteins. Even with the currentincomplete drug−target interaction data, only 15% of drugsappear to interact with only a single target and over 50%interact with more than five targets.47,51 From the protein pointof view, Gao and Skolnick showed that more than 1/3 of about20 000 known ligand-binding sites interact with multiplechemically different ligands.21 We have looked for determinantsof receptor promiscuity by analyzing the sequence, phys-icochemical, structural, and energetic properties of GPCRbinding sites and the relationship to the sets of knownantagonists.
Figure 3. Examples of a relatively specific (CXCR4, left) and apromiscuous (OPRM, right) GPCR. Donor region is shown in bluesurface, M/L/I/V residues carbons as orange CPK spheres, and thecrystallized ligands carbons as green sticks. Note the larger donorregion in the proximity of the ligand in CXCR4 compared to the largenumber of hydrophobic residues in OPRM.
Journal of Chemical Information and Modeling Article
dx.doi.org/10.1021/ci400552z | J. Chem. Inf. Model. XXXX, XXX, XXX−XXXF

To the best of our knowledge, no well-defined comparativemeasure of receptor promiscuity has previously beenestablished. We therefore evaluated a number of criteria toassess the diversity of ligands that bind to a given GPCR. Theseincluded simply the size of the ligands data set for each of thereceptors, the number of unique scaffolds in each of these sets,and the number of clusters derived from a Tanimoto similaritymatrix. In addition, we measured the range of propertiestypically associated with diversity, including MW and atomicstructural information. While no single metric is ideal for thetask of classifying receptors based on their promiscuity, we havefound that many of these properties are highly correlated,suggesting that together they provide an adequate measure ofreceptor promiscuity.The mean hydrophobicity of the antagonists of a receptor is
only moderately correlated with the chemical diversity ofGPCR antagonists, as represented by the ranges of molecularproperties. Thus, the gain obtained through removal ofhydrophobic compounds from the aqueous environment and
by forming multiple, weak interactions between a hydrophobicligand and hydrophobic amino acids, as was proposed formultidrug transporters,52,53 cannot solely explain the energeticgain in binding ligands to GPCRs. Nevertheless, hydro-phobicity of the binding site of the more promiscuousreceptors is higher and the content of HB donors is lowerthan for the less promiscuous ones.MW and other size-related properties contribute significantly
to the overall variability of the antagonists sets as they representthe main contributions to the principal axis (PC1) obtained inprinciple component analysis of sets of ligands studied in thiswork and are well-established dominant descriptors of ligandsvariability.54 However, these do not correlate with the chemicalvariability of the antagonists (i.e., the number of uniquescaffolds; NUS) or with the size of the antagonist sets.Specifically, the mean MW of ligands of the receptors classifiedas the most promiscuous ones does not differ significantly fromthe mean MW of ligands of the least promiscuous receptors. Itis the range of observed MW that correlates with the number of
Figure 4. Predictive power of the linear regression models. Predicted vs experimental values of (A and C) NUS and (B and D) number of molecules,as tested on the X-ray (left) and homology model (right) validation sets, respectively. The values of each property were predicted using the linearregression models and compared to the experimental data obtained from ChEMBL. Pairwise correlation (r) and p values are shown for each plot.
Journal of Chemical Information and Modeling Article
dx.doi.org/10.1021/ci400552z | J. Chem. Inf. Model. XXXX, XXX, XXX−XXXG

diverse ligands and which inversely correlates with the numberof disulfide bridges in the extracellular region of thecorresponding receptor. This may indicate that the higherdisulfide bridge content restricts the shape of the binding siteby rigidifying the loops. Conversely, the length of ECL2 andsecondary structure content did not appear to have a significantimpact on receptor promiscuity in our current data set ofGPCRs. Neither did we find significant contribution with acrude measure of binding site flexibility, assessed by theestimation of number of accessible binding site side-chainrotamers.The linear regression model is successful in predicting
selectivity of an independent set of GPCRs. This implies thatdifferent GPCR targets can be prioritized in terms of theexpected diversity of their antagonists using a simplistic modelthat relies solely on their structure. The successful predictionswe obtained using homology models are particularly encourag-ing, since thus far, X-ray structures are available for only ∼20members of the large GPCR superfamily.
■ CONCLUSIONS
Our work links structural and sequence characteristics ofGPCRs to the putative diversity of antagonists that they canbind. The number of GPCR antagonists correlates with ranges(but typically not with means or medians) of theirphysicochemical properties. GPCRs with wider ranges ofantagonists’ properties tend to have more hydrophobic aminoacids and less H-bond donors in their orthosteric binding sites.GPCRs with high number of disulfide bridges in theextracellular region typically have a limited range of antagonists’set size. Binding site properties derived from X-rays orhomology models of GPCRs that were not included in theoriginal data set successfully predict receptors promiscuity. Thisanalysis can be applied to GPCRs of unknown structure toestimate their expected promiscuity toward ligands, usingGPCR homology models, so that the expected range of ligandrepertoire can be evaluated even for orphan Family A GPCRs.Such valuable information may guide drug designers in targetchoice, since targeting promiscuous GPCRs provides room fordiscovery of multiple chemotypes, and opportunities formultiobjective optimization. On the protein engineering side,narrowing or expansion of the receptive range of a given GPCRby site-directed mutagenesis can be guided by computationallypredicting the promiscuity of multiple mutant receptorcandidates. The ideas introduced here provide insights intomolecular recognition of GPCRs and may be generalizedtoward assessment and prediction of promiscuity of otherprotein families.
■ METHODS
Data Preparation. For each of the receptors in the trainingand validation sets (see Table 1), chemical structures of itsantagonists and corresponding affinity data were retrieved fromChEMBL (version 15).25 For the structures that were solvedfor species other than human, e.g. the turkey β1AR, the ratM3R, and the mouse OPRM, the data for the correspondinghuman homologues were retrieved. Experimentally measuredIC50 and Ki values were filtered to produce two sets of ligandsfor each receptor: (1) ligands with affinity of at least 1 μM; (2)ligands with affinity of at least 10 μM. In total, 11 750 and16 177 receptor−ligand pairs were collected for the 1 and 10μM data sets, respectively.
Calculation of GPCR Structural Descriptors. StructurePreparation. Each X-ray structure in Table 1 was preparedusing the Protein Preparation Wizard55 implemented inMaestro (version 9.3, Schrodinger, LLC, New York, NY,2013). For structures with multiple chains in the crystallo-graphic unit chain “A” was selected, except for 2VT4, where wechose chain “B” instead (due to the anomalous kink in TM1 ofchain A).
SiteMap Calculations. All GPCR orthosteric TM bindingsites were subjected to SiteMap analysis34 (as implemented inMaestro version 9.3), which characterizes binding sites in termsof size (the total number of SiteMap site points); volume,exposure, and enclosure (determined by how buried the site is);hydrophobic and hydrophilic character and balance (measuresof the relative hydrophobic/hydrophilic nature of the site);contact (representing the strength of the van der Waalsinteraction of the site points with the protein); donor/acceptor(the degree to which a ligand might be expected to donate,rather than accept, hydrogen bonds); and SiteScore andDScore (weighted combinations of size, enclosure andhydrophilic character terms, which are found to distinguishdrug-binding from nondrug-binding sites). SiteMap alsocalculates various surfaces representing the hydrophobic,donor, acceptor, and hydrophilic (donor + acceptor) regionsof the binding site. The areas of these surfaces were used asdescriptors as well (named area hydrophobic, area donor, areaacceptor, and area hydrophilic). SiteMap was run in the defaultmode. All descriptors, including the size of the various surfacesgenerated by the algorithm, were extracted from the outputfiles. There is a significant degree of redundancy among theseparameters, but this can be adequately dealt with by thestatistical analyses described below.
WaterMap Calculations. WaterMap (version 1.4, Schro-dinger, LLC, New York, NY, 2012) is a method based onmolecular dynamics (MD) and statistical thermodynamics todescribe solvent energetics around protein surfaces.35 Water-Map calculations were run in the default mode, including agrand canonical Monte Carlo simulation to hydrate the buriedGPCR pocket prior to the MD stage. Average thermodynamicproperties of all hydration sites in the binding pockets werecalculated. In addition, we also calculated the number ofdistinct clusters of high-energy sites according to a previouslypublished algorithm.36
Flexibility Estimation. The flexibility of binding sites wasestimated by performing an analysis of the rotameric statesaccessible to residues in the protein binding site. All residueswithin 4 Å of the ligand were considered. Using the rotamerlibrary implemented in Prime (version 3.2, Schrodinger, LLC,New York, NY, 2013), all possible rotameric states for eachresidue were generated, and their energy was compared to thatof the native state. All rotamers within 5 and 10 kcal/mol of thenative state were kept. The sum of the total number of rotamersfor each binding site was normalized by dividing by the numberof residues in the binding site, or by the total number ofenumerated states in the rotamer libarary for the particularresidues in the binding site. The rank ordering of GPCR basedon predicted flexibility using the different energy cutoffs andnormalization schemes were highly similar, suggesting robust-ness of the predictions with respect to these rather arbitrarychoices.
Intrinsic Specificity Ratio. The intrinsic specificity ratio, ISR,is a dimensionless quantity computed as the ratio of (1) theenergy gap (δE) between the lowest (i.e., native) binding state
Journal of Chemical Information and Modeling Article
dx.doi.org/10.1021/ci400552z | J. Chem. Inf. Model. XXXX, XXX, XXX−XXXH

and the average of all other higher energy binding states and(2) the energy variance (ΔE) of the non-native states.44 In thiswork we utilize a variation of the original ISR definition inwhich we explore the distribution of binding energies using adiverse fragment library rather than an ensemble of poses fromthe same ligand. This approach provides additional informationabout native and non-native interactions in the binding site thatmight not be accessible by a single ligand. The native bindingstate of a given receptor is assumed to comprise a set offavorable specific interactions necessary for ligand binding. Thedegree to which these specific interactions are important forstabilizing the protein−ligand complex is probed by computingthe ISR for an ensemble of binding states generated by dockinga library of diverse fragments spanning a broad range ofpotential protein−ligand interactions. This fragment library isavailable on the Schrodinger Web site (http://schrodinger.com/productpage/14/5/78/) and consists of 441 unique smallfragments (6−37 atoms; molecular weight range 32−226)derived from molecules in the medicinal chemistry literature.The total set, after generating all energetically accessibleionization and tautomeric states, includes 667 fragments. TheISR values computed for the set of 10 GPCRs are given inSupporting Information Table S3. Higher values indicate moreselective binding sites.Ligand Set Descriptors. All chemical structures from
ChEMBL were processed to remove inconsistencies and salts,prior to molecular descriptor calculations. The mean, median,range, standard deviation, and variance of the followingmolecular descriptors of the ligands for each target in ourtraining set, were calculated using Canvas (version 1.5,Schrodinger, LLC, New York, NY, 2012):56 molecular weight(MW), lipophilicity (as ALogP, the atomic LogP), hydrogenbond (HB) donor count (HBD), hydrogen bond acceptorscount (HBA), rotatable bonds count (RB), polar surface area(PSA), electrotopological states (estate), molecular refractivity(MR), molecular polarizability (polar), centralization (cent),aromatic rings count (Ar ring), rings count (ring), chiral centerscount (chiral), heavy atoms count (HA), total charge, negativeatoms count, positive atoms count, and fraction of sp3-hybridized (tetrahedral) carbon atoms out of total carboncount (Fsp3). There are 18 default ligand descriptors in thePhysiochemical descriptor set of Canvas, which were chosenbased on surveying the literature to determine a small butdiverse set of descriptors that are fast to compute andcommonly used throughout the field. An extended analysisusing a total of 340 ligand descriptors was carried out as well,by calculating all Topological and Ligf ilter descriptor sets.The number of unique scaffolds (NUS) in each set was
computed using the Bemis−Murcko scaffold decompositionprotocol57 implemented in Canvas. In this process, the largestscaffold in a structure is first obtained by stripping off allterminal side chains with the exception of exocyclic andexolinker double bonds. The resulting scaffold is then split intoall possible smaller subscaffolds by breaking bonds andremoving linkers between rings, other than those in fusedrings. The resulting scaffolds were used to calculate the scaffoldchiral centers count. While the Bemis−Murcko strategyprovides a good measure of the diversity of molecularframeworks in a given data set, it should be noted that itincreases the NUS count for data sets containing fused aromaticrings (the majority of targets studied here) over data setscontaining mostly aliphatic compounds (i.e., the lipid S1P1receptor).
Hierarchical clustering on a Tanimoto similarity matrix usingeither radial or dendritic fingerprints (FP)58 was carried out inCanvas. A clustering level of 0.6 Tanimoto similarity waschosen, based on a preliminary convergence analysis of clustersnumber. The number of clusters (either for “radial” or“dendritic” FPs) was calculated for each ligand set. Keydescriptors found to be significantly related to receptorpromiscuity in our subsequent analysis were also calculatedfor the ligands of the six targets in the validation set.
Statistical Analysis. Principal component analysis (PCA)was performed using Matlab (version R2012b; Mathworks, Inc.,MA, USA) on receptor descriptors and on median values ofligand descriptors for the 10 sets in our training set. Prior toanalysis, factor scaling was applied to normalize the data.Statistical analyses were carried out in the JMP statisticalsoftware package (version 7.0.1; SAS Institute Inc., NC, USA).Correlations between ligand descriptors or between receptordescriptors were computed using the multivariate module.Stepwise regression analysis was used to determine the receptordescriptors that explain most of the variance of a specific liganddiversity measure. These receptor descriptors were then used togenerate a regression model for prediction of the diversitymeasure using standard least squares fit.
Homology Modeling. In order to make models for asubset of GPCRs in the validation set (OPRD, OPRX, 5HT1B,5HT2B, and PAR1), the closest template (in terms of sequenceidentity) available at the time was chosen. This resulted inOPRM as a template for OPRD and OPRX, OPRK for PAR1,and the DRD3 for 5HT1B and 5HT2B. Models were builtusing Prime (version 3.1, Schrodinger, LLC, New York, NY,2012). The alignment was created with the Multiple SequenceViewer in Maestro using the ClustalW algorithm, ensuringmanually the correct alignment of all the conserved motifs inthe 7 TM domains and the conserved Cys in ECL2. Gaps andinsertions were placed at the center of the loop when needed.No further loop refinement was performed. The model forSMO was obtained by submitting the N-terminus-truncatedsequence of smoothened receptor to I-TASSER server,59 aniterative threading assembly refinement (I-TASSER) server.Starting from an amino acid sequence, I-TASSER generatesthree-dimensional atomic models from multiple threadingalignments and iterative structural assembly simulations. TheX-ray SMO structure (4JKV) was excluded from the templates.Interestingly, the two top templates used in modeling wereboth Family B GPCRs, 4L6R (glucagon receptor) and 4K5Y(CRF1R).
■ ASSOCIATED CONTENT*S Supporting InformationFigure S1: Chemical characterization of analyzed ligand sets.Figure S2: Multivariate correlations between all statisticalproperties of the ligand set descriptors. Figure S3: Statisticalanalysis of receptor descriptors. Figure S4: Prediction power ofthe linear regression models. Table S1: Statistically significantpairwise correlations between ligand descriptors for the 1 μMligand sets. Table S2: Binding site residues for all GPCRsstudied. Table S3: ISR results. Table S4: Statistically significantpairwise correlations between receptor descriptors for the 1 μMligand sets. Table S5: Regression coefficients of receptordescriptors affecting NUS and various additional liganddescriptors, as determined by standard least-squares fit analysison the 10 μM ligand sets. This material is available free ofcharge via the Internet at http://pubs.acs.org.
Journal of Chemical Information and Modeling Article
dx.doi.org/10.1021/ci400552z | J. Chem. Inf. Model. XXXX, XXX, XXX−XXXI

■ AUTHOR INFORMATION
Corresponding Author*E-mail: [email protected]. Tel.: +972-(0)8-9489664.Fax: +972-(0)8-9476189.
NotesThe authors declare no competing financial interest.
■ ACKNOWLEDGMENTSWe thank Dr. Elite Levine for consultation on statisticalanalysis, Ayana Wiener for helpful discussions, and Prof. AmiravGordon for his kind encouragement. The Israel ScienceFoundation (No. 432/12) and the German ResearchFoundation DFG (ME 1024/8-1) grants to M.Y.N. aregratefully acknowledged. M.Y.N. participates in the EuropeanCOST Action CM1207 (GLISTEN).
■ REFERENCES(1) Fredriksson, R.; Lagerstrom, M. C.; Lundin, L. G.; Schioth, H. B.The G-protein-coupled receptors in the human genome form fivemain families. Phylogenetic analysis, paralogon groups, and finger-prints. Mol. Pharmacol. 2003, 63, 1256−72.(2) Rask-Andersen, M.; Almen, M. S.; Schioth, H. B. Trends in theexploitation of novel drug targets. Nat. Rev. Drug Discov. 2011, 10,579−90.(3) Leinders-Zufall, T.; Lane, A. P.; Puche, A. C.; Ma, W.; Novotny,M. V.; Shipley, M. T.; Zufall, F. Ultrasensitive pheromone detection bymammalian vomeronasal neurons. Nature 2000, 405, 792−6.(4) Hallem, E. A.; Carlson, J. R. Coding of odors by a receptorrepertoire. Cell 2006, 125, 143−60.(5) Li, J.; Haddad, R.; Chen, S.; Santos, V.; Luetje, C. W. A broadlytuned mouse odorant receptor that detects nitrotoluenes. J. Neuro-chem. 2012, 121, 881−90.(6) Baud, O.; Etter, S.; Spreafico, M.; Bordoli, L.; Schwede, T.; Vogel,H.; Pick, H. The mouse eugenol odorant receptor: structural andfunctional plasticity of a broadly tuned odorant binding pocket.Biochemistry 2011, 50, 843−53.(7) Meyerhof, W.; Batram, C.; Kuhn, C.; Brockhoff, A.; Chudoba, E.;Bufe, B.; Appendino, G.; Behrens, M. The molecular receptive rangesof human TAS2R bitter taste receptors. Chem. Senses 2010, 35, 157−70.(8) Born, S.; Levit, A.; Niv, M. Y.; Meyerhof, W.; Behrens, M. TheHuman Bitter Taste Receptor TAS2R10 Is Tailored to AccommodateNumerous Diverse Ligands. J. Neurosci. 2013, 33, 201−13.(9) Venkatakrishnan, A. J.; Deupi, X.; Lebon, G.; Tate, C. G.;Schertler, G. F.; Babu, M. M. Molecular signatures of G-protein-coupled receptors. Nature 2013, 494, 185−94.(10) Brockhoff, A.; Behrens, M.; Niv, M. Y.; Meyerhof, W. Structuralrequirements of bitter taste receptor activation. Proc. Natl. Acad. Sci.USA 2010, 107, 11110−5.(11) Warne, T.; Moukhametzianov, R.; Baker, J. G.; Nehme, R.;Edwards, P. C.; Leslie, A. G.; Schertler, G. F.; Tate, C. G. Thestructural basis for agonist and partial agonist action on a beta(1)-adrenergic receptor. Nature 2011, 469, 241−4.(12) Dore, A. S.; Robertson, N.; Errey, J. C.; Ng, I.; Hollenstein, K.;Tehan, B.; Hurrell, E.; Bennett, K.; Congreve, M.; Magnani, F.; Tate,C. G.; Weir, M.; Marshall, F. H. Structure of the Adenosine A2AReceptor in Complex with ZM241385 and the Xanthines XAC andCaffeine. Structure 2011, 19, 1283−1293.(13) Levit, A.; Barak, D.; Behrens, M.; Meyerhof, W.; Niv, M.Homology Model-Assisted Elucidation of Binding Sites in GPCRs. InMembrane Protein Structure and Dynamics; Vaidehi, N., Klein-Seetharaman, J., Eds.; Humana Press, 2012; Vol. 914, Chapter 11,pp 179−205.(14) Lin, H.; Sassano, M. F.; Roth, B. L.; Shoichet, B. K. Apharmacological organization of G protein-coupled receptors. Nat.Methods 2013, 10, 140−6.
(15) van Westen, G. J.; Overington, J. P. A ligand’s-eye view ofprotein similarity. Nat. Methods 2013, 10, 116−7.(16) van Westen, G. J. P.; Wegner, J. K.; IJzerman, A. P.; van Vlijmen,H. W. T.; Bender, A. Proteochemometric modeling as a tool to designselective compounds and for extrapolating to novel targets.MedChemComm 2011, 2, 16−30.(17) Weill, N.; Rognan, D. Development and validation of a novelprotein-ligand fingerprint to mine chemogenomic space: application toG protein-coupled receptors and their ligands. J. Chem. Inf. Model.2009, 49, 1049−62.(18) Wichard, J. D.; Ter Laak, A.; Krause, G.; Heinrich, N.; Kuhne,R.; Kleinau, G. Chemogenomic analysis of G-protein coupledreceptors and their ligands deciphers locks and keys governing diverseaspects of signalling. PLoS One 2011, 6, e16811.(19) Nobeli, I.; Favia, A. D.; Thornton, J. M. Protein promiscuity andits implications for biotechnology. Nat. Biotechnol. 2009, 27, 157−67.(20) Gleeson, M. P.; Hersey, A.; Montanari, D.; Overington, J.Probing the links between in vitro potency, ADMET andphysicochemical parameters. Nat. Rev. Drug Discov. 2011, 10, 197−208.(21) Gao, M.; Skolnick, J. A comprehensive survey of small-moleculebinding pockets in proteins. PLoS Comput. Biol. 2013, 9, e1003302.(22) Kooistra, A. J.; Kuhne, S.; de Esch, I. J. P.; Leurs, R.; de Graaf, C.A structural chemogenomics analysis of aminergic GPCRs: lessons forhistamine receptor ligand design. Br. J. Pharmacol. 2013, 170, 101−126.(23) Newman, A. H.; Beuming, T.; Banala, A. K.; Donthamsetti, P.;Pongetti, K.; LaBounty, A.; Levy, B.; Cao, J.; Michino, M.; Luedtke, R.R.; Javitch, J. A.; Shi, L. Molecular determinants of selectivity andefficacy at the dopamine D3 receptor. J. Med. Chem. 2012, 55, 6689−99.(24) Wu, H.; Wacker, D.; Mileni, M.; Katritch, V.; Han, G. W.;Vardy, E.; Liu, W.; Thompson, A. A.; Huang, X. P.; Carroll, F. I.;Mascarella, S. W.; Westkaemper, R. B.; Mosier, P. D.; Roth, B. L.;Cherezov, V.; Stevens, R. C. Structure of the human kappa-opioidreceptor in complex with JDTic. Nature 2012, 485, 327−32.(25) Gaulton, A.; Bellis, L. J.; Bento, A. P.; Chambers, J.; Davies, M.;Hersey, A.; Light, Y.; McGlinchey, S.; Michalovich, D.; Al-Lazikani, B.;Overington, J. P. ChEMBL: a large-scale bioactivity database for drugdiscovery. Nucleic Acids Res. 2012, 40, D1100−7.(26) Granier, S.; Kobilka, B. A new era of GPCR structural andchemical biology. Nat. Chem. Biol. 2012, 8, 670−3.(27) Wang, C.; Jiang, Y.; Ma, J.; Wu, H.; Wacker, D.; Katritch, V.;Han, G. W.; Liu, W.; Huang, X. P.; Vardy, E.; McCorvy, J. D.; Gao, X.;Zhou, E. X.; Melcher, K.; Zhang, C.; Bai, F.; Yang, H.; Yang, L.; Jiang,H.; Roth, B. L.; Cherezov, V.; Stevens, R. C.; Xu, H. E. Structural Basisfor Molecular Recognition at Serotonin Receptors. Science 2013, 340,610−614.(28) Walters, W. P.; Green, J.; Weiss, J. R.; Murcko, M. A. What domedicinal chemists actually make? A 50-year retrospective. J. Med.Chem. 2011, 54, 6405−16.(29) Leeson, P. D.; St-Gallay, S. A. The influence of the’organizational factor’ on compound quality in drug discovery. Nat.Rev. Drug Discov. 2011, 10, 749−65.(30) de Graaf, C.; Rognan, D. Customizing G Protein-coupledreceptor models for structure-based virtual screening. Curr. Pharm.Des. 2009, 15, 4026−48.(31) Levit, A.; Barak, D.; Behrens, M.; Meyerhof, W.; Niv, M. Y.Homology model-assisted elucidation of binding sites in GPCRs.Methods Mol. Biol. 2012, 914, 179−205.(32) Shi, L.; Javitch, J. A. The binding site of aminergic G protein-coupled receptors: the transmembrane segments and secondextracellular loop. Annu. Rev. Pharmacol. Toxicol. 2002, 42, 437−67.(33) Katritch, V.; Cherezov, V.; Stevens, R. C. Structure-function ofthe G protein-coupled receptor superfamily. Ann. Rev. Pharmacol.Toxicol. 2013, 53, 531−56.(34) Halgren, T. New method for fast and accurate binding-siteidentification and analysis. Chem. Biol. Drug Des. 2007, 69, 146−8.
Journal of Chemical Information and Modeling Article
dx.doi.org/10.1021/ci400552z | J. Chem. Inf. Model. XXXX, XXX, XXX−XXXJ
(35) Abel, R.; Young, T.; Farid, R.; Berne, B. J.; Friesner, R. A. Roleof the active-site solvent in the thermodynamics of factor Xa ligandbinding. J. Am. Chem. Soc. 2008, 130, 2817−31.(36) Beuming, T.; Che, Y.; Abel, R.; Kim, B.; Shanmugasundaram,V.; Sherman, W. Thermodynamic analysis of water molecules at thesurface of proteins and applications to binding site prediction andcharacterization. Proteins 2012, 80, 871−83.(37) Mason, J. S.; Bortolato, A.; Congreve, M.; Marshall, F. H. Newinsights from structural biology into the druggability of G protein-coupled receptors. Trends Pharmacol. Sci. 2012, 33, 249−60.(38) Beuming, T.; Farid, R.; Sherman, W. High-energy water sitesdetermine peptide binding affinity and specificity of PDZ domains.Protein Sci. 2009, 18, 1609−19.(39) Robinson, D. D.; Sherman, W.; Farid, R. Understanding kinaseselectivity through energetic analysis of binding site waters.ChemMedChem 2010, 5, 618−27.(40) Snyder, P. W.; Mecinovic, J.; Moustakas, D. T.; Thomas, S. W.,3rd; Harder, M.; Mack, E. T.; Lockett, M. R.; Heroux, A.; Sherman,W.; Whitesides, G. M. Mechanism of the hydrophobic effect in thebiomolecular recognition of arylsulfonamides by carbonic anhydrase.Proc. Natl. Acad. Sci. U.S.A. 2011, 108, 17889−94.(41) Breiten, B.; Lockett, M. R.; Sherman, W.; Fujita, S.; Al-Sayah,M.; Lange, H.; Bowers, C. M.; Heroux, A.; Krilov, G.; Whitesides, G.M. Water networks contribute to enthalpy/entropy compensation inprotein-ligand binding. J. Am. Chem. Soc. 2013, 135, 15579−84.(42) Carlson, H. A. Protein flexibility and drug design: how to hit amoving target. Curr. Opin. Chem. Biol. 2002, 6, 447−52.(43) Grove, L. E.; Hall, D. R.; Beglov, D.; Vajda, S.; Kozakov, D.FTFlex: accounting for binding site flexibility to improve fragment-based identification of druggable hot spots. Bioinformatics 2013, 29,1218−9.(44) Wang, J.; Zheng, X.; Yang, Y.; Drueckhammer, D.; Yang, W.;Verkhivker, G.; Wang, E. Quantifying intrinsic specificity: a potentialcomplement to affinity in drug screening. Phys. Rev. Lett. 2007, 99,198101.(45) Huggins, D. J.; Sherman, W.; Tidor, B. Rational approaches toimproving selectivity in drug design. J. Med. Chem. 2012, 55, 1424−44.(46) Watkins, R. E.; Wisely, G. B.; Moore, L. B.; Collins, J. L.;Lambert, M. H.; Williams, S. P.; Willson, T. M.; Kliewer, S. A.;Redinbo, M. R. The human nuclear xenobiotic receptor PXR:structural determinants of directed promiscuity. Science 2001, 292,2329−33.(47) Jalencas, X.; Mestres, J. On the origins of drug polypharmacol-ogy. MedChemComm 2013, 4, 80−87.(48) Eick, G. N.; Colucci, J. K.; Harms, M. J.; Ortlund, E. A.;Thornton, J. W. Evolution of minimal specificity and promiscuity insteroid hormone receptors. PLoS Genetics 2012, 8, e1003072.(49) Skolnick, J.; Gao, M. Interplay of physics and evolution in thelikely origin of protein biochemical function. Proc. Natl. Acad. Sci.U.S.A. 2013, 110, 9344−9.(50) Allen, J. A.; Roth, B. L. Strategies to discover unexpected targetsfor drugs active at g protein-coupled receptors. Annu. Rev. Pharmacol.Toxicol. 2011, 51, 117−44.(51) Perez-Nueno, V. I.; Ritchie, D. W. Identifying and characterizingpromiscuous targets: implications for virtual screening. Expert Opin.Drug Discov. 2012, 7, 1−17.(52) Higgins, C. F. Multiple molecular mechanisms for multidrugresistance transporters. Nature 2007, 446, 749−57.(53) Fluman, N.; Bibi, E. Bacterial multidrug transport through thelens of the major facilitator superfamily. Biochim. Biophys. Acta 2009,1794, 738−47.(54) Khan, R. M.; Luk, C. H.; Flinker, A.; Aggarwal, A.; Lapid, H.;Haddad, R.; Sobel, N. Predicting odor pleasantness from odorantstructure: pleasantness as a reflection of the physical world. J. Neurosci.2007, 27, 10015−23.(55) Sastry, G. M.; Adzhigirey, M.; Day, T.; Annabhimoju, R.;Sherman, W. Protein and ligand preparation: parameters, protocols,and influence on virtual screening enrichments. J. Comput.-Aided Mol.Des. 2013, 27, 221−34.
(56) Sastry, M.; Lowrie, J. F.; Dixon, S. L.; Sherman, W. Large-scalesystematic analysis of 2D fingerprint methods and parameters toimprove virtual screening enrichments. J. Chem. Inf. Model. 2010, 50,771−84.(57) Bemis, G. W.; Murcko, M. A. The properties of known drugs. 1.Molecular frameworks. J. Med. Chem. 1996, 39, 2887−93.(58) Duan, J.; Dixon, S. L.; Lowrie, J. F.; Sherman, W. Analysis andcomparison of 2D fingerprints: insights into database screeningperformance using eight fingerprint methods. J. Mol. Graphics Modell.2010, 29, 157−70.(59) Roy, A.; Kucukural, A.; Zhang, Y. I-TASSER: a unified platformfor automated protein structure and function prediction. Nat. Protoc.2010, 5, 725−38.
Journal of Chemical Information and Modeling Article
dx.doi.org/10.1021/ci400552z | J. Chem. Inf. Model. XXXX, XXX, XXX−XXXK


