Embed Size (px)
Citation preview

Practical Outcomes of Applying Ensemble Machine Learning Classifiers toHigh-Throughput Screening (HTS) Data Analysis and Screening
Kirk Simmons,*,† John Kinney,‡ Aaron Owens,§ Daniel A. Kleier,| Karen Bloch,§ Dave Argentar,⊥
Alicia Walsh,§ and Ganesh Vaidyanathan#
Simmons Consulting, 52 Windybush Way, Titusville, New Jersey 08560, DuPont Stine Haskell ResearchLaboratories, 1090 Elkton Road, Newark, Delaware 19711, DuPont Engineering Research and Technology,
POB 80249, Wilmington, Delaware 19880, Drexel University, 3141 Chestnut Street,Philadelphia, Pennsylvania 19104, Sun Edge, LLC, 147 Tuckahoe Lane, Bear, Delaware 19701, and Quantum
Leap Innovations, 3 Innovation Way, Suite 100, Newark, Delaware 19711
Received May 14, 2008
Over the years numerous papers have presented the effectiveness of various machine learning methods inanalyzing drug discovery biological screening data. The predictive performance of models developed usingthese methods has traditionally been evaluated by assessing performance of the developed models againsta portion of the data randomly selected for holdout. It has been our experience that such assessments, whilewidely practiced, result in an optimistic assessment. This paper describes the development of a series ofensemble-based decision tree models, shares our experience at various stages in the model developmentprocess, and presents the impact of such models when they are applied to vendor offerings and the forecastedcompounds are acquired and screened in the relevant assays. We have seen that well developed models cansignificantly increase the hit-rates observed in HTS campaigns.
INTRODUCTION
High-Throughput Screening (HTS) is an integral compo-nent of many pharmaceutical, animal health, and crop-protection discovery operations. However, the implementa-tion of HTS can differ significantly between these industriesin that crop-protection screening libraries can be evaluateddirectly against the pest species of interest at very early stagesin the discovery process. This is often accomplished using96-well plate-based assays evaluating the affect of a com-pound directly on the viability of the intact insect, weed, orfungal pathogen. A potentially significant value of in-vivoHTS is that completely unexpected or novel mechanisms ofaction may be discovered as a result of a screening campaign.However, HTS requires testing large numbers of compoundsin order to produce the required number of hit and leadcompounds for a discovery effort, a common theme in allof these industries. Therefore, historical HTS data are a richstarting point from which to learn rules for classifyingcandidate compounds into activity categories with theultimate goal of improving HTS by applying the resultingclassifiers to preselect compounds for screening in the nextHTS campaign.
Over the last few years ensemble modeling has becomewidely accepted as a significant advance in predictivemodeling and is being applied to a broad range of machinelearning methods.1-18 Significant improvements in predictive
performance can be realized when multiple models arecombined into one classifier by averaging or polling of theresults of the individual models. It is important that the in-dividual models are diverse in their predictive performancewith regards to the classes being forecast so that the weaknessof one model is offset by the strength of another model.Consistent with these observations, our earlier work19
demonstrated that significantly stronger predictive modelscould be achieved by developing a series of recursivepartitioning classifiers from a data set and averaging thepredictions from each classifier to form the final classifica-tion. Ensemble modeling has been applied to predict variousendpoints such as mutagenicity,1 docking scores,2 aqueoussolubility,3,16 drug likeness,8 aquatic toxicity,12 and numerousin-vitro biological activities.4-7,9-11,13-15,17,18 These pub-lished modeling efforts have utilized a number of differentchemical descriptor types and various machine learningmethods, such as Decision Trees, Nearest-Neighbor Analy-ses, Support Vector Machines, Artificial Neural Networks,Linear Discriminant Analyses, and Genetic Algorithms.Essentially all of the published models were developed onsmall data sets (typically a few hundred compounds) withthe largest reported data set being 15,000 compounds.13 Inevery example model development was performed by firstrandomly splitting the data set into training and testingportions, and the reported model performance was assessedsolely on the prediction quality for the testing set. In onlyone reference was the resulting classifier used to actuallyscore externally available chemistry and the success observedfor that scoring exercise reported.13
During the course of expanding the ensemble models fromour earlier studies19 we have noted that the traditional meansof evaluating classifier performance, namely randomly split-
* Corresponding author e-mail: [email protected].† Simmons Consulting.‡ DuPont Stine Haskell Research Laboratories.§ DuPont Engineering Research and Technology.| Drexel University.⊥ Sun Edge, LLC.# Quantum Leap Innovations.
J. Chem. Inf. Model. XXXX, xxx, 000 A
10.1021/ci800164u CCC: $40.75 XXXX American Chemical Society
Published on Web 11/05/2008

ting the data set into training and testing subsets, can leadto an optimistic assessment of classifier performance. Thisoccurs because corporate compound collections are oftenpopulated with families of chemistry that arise duringhistorical synthetic optimization efforts. Random splitting ofsuch collections into training and testing subsets results inchemical structures in the testing set that can be closelyrelated to those in the training set. We encountered thisphenomenon during the project outlined in this paper, andwe will present and discuss strategies designed to minimizethis historical bias.
This paper also provides an overview of this multiyearproject in which classifiers were researched and developedusing historical in-house in-vivo HTS data. The primary goalin developing predictive models from historical HTS datawas to use them to identify, acquire, and screen structuresmore likely to be active in our various agrochemical assays.Specifically, our desired outcome was to achieve at least a500% increase in HTS hit-rate. During the course of thisproject several machine learning methods were explored aswell as a number of different chemical descriptor typescommonly used in the cheminformatics community.20,21 Asoptimal classifiers were developed throughout this projectthey were used to score current offerings from chemistryvendors, and those structures scoring well were purchasedand evaluated in our biological assays as the basis for proofof concept experiments. The biological activity observed forthese chemical purchases was used to evaluate the predictiveperformance of the corresponding classifiers, a significantlymore rigorous and practical assessment of their performancethan the simple random split method. Key lessons learnedfrom these experiments were then incorporated into thedevelopment of the next generation of classifiers.
METHODS
Biology. In the agrochemical industry, early primarybiological screens are often based upon a few key speciesthat are especially sensitive to chemical control. Screeningfirst on these sensitive species essentially eliminates inactiveor weakly active compounds from advancing into more laborintensive biological assays which are comprised of a broadspectrum of species which represent major market areas forcrop protection products. In order to develop activityclassifiers with predictive capabilities that fit those marketareas, we utilized as many of the species endpoints aspossible for model development. For each of the cropprotection domains in Table 1, we trained two classifiers,each focused on a different but relevant major market area.The market focus was control of ascomycete and oomycetepathogens in fungicides, control of monocot (grass) and dicot(broadleaf) weeds in herbicides and control of homoptera(sucking) and lepidoptera (chewing) insects in insecticides.Compounds were initially screened in the primary bioassaysin each domain (fungicide, herbicide, and insecticide) at the
concentrations listed in Table 1. Compounds that were activein the primary bioassays were advanced into higher levelfoliar-based screens to further explore and define the biologi-cal activity that was initially observed. For our studiescompounds marked as “inactive” produced less than 10%inhibition or mortality in the corresponding primary bioassay,and compounds marked as “active” were confirmed activeagainst any relevant specie within a given market area inadvanced foliar-based screens at application rates listed inTable 1. The HTS results were subjected to a triage in whichduplicate structures and those of unknown or questionablestructure were removed.
It should be emphasized that the endpoint in each of theagrochemical assays represents death of the respectiveorganism, a process than can be induced by inhibiting orinterfering with a variety of differing biochemical mecha-nisms. As such, in-vivo HTS data become especially chal-lenging to successfully train useful classifiers given thediversity of potential biochemical targets that are representedby the biologically active examples in the data set. Typicallymechanisms of action studies are not initiated until muchlater in a project, so the mechanisms of action are unknownfor the biologically active compounds on which the classifiersare being trained.
Chemistry. All of the structures in the HTS data sets werepreprocessed using Pipeline Pilot22 to standardize structuralrepresentations (e.g. -[N+]()O)[O-] )> -N()O))O) andto remove counter ions for structures represented as salts.The standardized clean structures were output as MDLconnection tables.23 As needed, 2D structures were convertedto 3D using Concord, and the structures were output as Sybylmol2 connection tables.24 All calculated chemical descriptorswere generated from the standardized clean chemicalstructures.
Chemical Descriptors. A large number of widely avail-able descriptors can be computed from a connection table.We selected a subset of them for consideration in modeldevelopment. The chemical descriptor types that wereevaluated in model development are listed in Table 2. Ourchoices focused on exploring a diversity of descriptor typesthat could be computed efficiently since we envisionedultimately applying our final classifiers to score millions ofchemical structures each and every year.
The ISIS fingerprint descriptors were generated using theCheshire software package (version 3.0).25 We computedboth the “public” keys (166) whose definitions are availableas well as the full private 960 key set.
The atom pair descriptors26 which represent all of the<atom type - distance - atom type> combinations in thestructure were computed from the Sybyl mol2 connectiontable. Our implementation of the atom-pair descriptors, coded
Table 1. Bioassay Applied Doses and Activity Criteria
domain primary advanced active designation
fungicide 17 µM e200 ppm g80% controlherbicide 1000 g/Ha e500 g/Ha g80% controlinsecticide 1050 µM e250 ppm g80% control
Table 2. Chemical Descriptor Types Used To Train Classifiers
descriptor source size
ISIS 960 fingerprint Cheshire 960ISIS 166 fingerprint Cheshire 1662D AtomPairs in-house code 8253D AtomPairs in-house code 825AlogP Atom Types Cerius2 120MolconnZ MolconnZ 221Diverse Solutions BCUTS Diverse Solutions 8Cerius2 combichem Cerius2 44
B J. Chem. Inf. Model., Vol. xxx, No. xx, XXXX SIMMONS ET AL.
in the C programming language,27 collapses the ca. 25 Sybylmol2 atom types into 10 atom types and maps the Cartesiandistances between them into 1-Angstrom distance bins(distances ranging from 1 to 15 Angstroms) for the 3Dvariant. The 2D atom pair variant maps the bond spacingbetween the atom types (distances ranging from 1 to 15bonds). The final descriptors consisted of 825 numericalvalues representing 55 possible atom-type pairs mapped onto15 distance ranges. Concord was used to generate a reason-able 3D-geometry for the structure before computing the 3Datom pair descriptors.
The AlogP atom type descriptors (counts of the occur-rences of each atom type used in calculating AlogP) werecomputed using the Cerius2 software package28 (version ccO)and exported as a tab-delimited text file. Additionally, thesoftware allowed for calculating the “combichem” subset ofdescriptors which consisted of 44 descriptors often used asthe basis for diversity analysis of combinatorial chemistrylibraries within the software. The interested reader shouldreference Accelrys documentation.29
The MolconnZ software30 (version 3.5) was used toconvert structures into a set of 221 descriptors representingmolecular connectivity, shape, and charge distribution in theunderlying structure. The interested reader should referencethe MolconnZ manual31 for a more in depth discussion.
The BCUT descriptors32 were computed using Diverse-Solutions33 software (version 4). From the myriad of possibleBCUT descriptors an 8-member subset (‘Const_0.250_H’,‘Gast_0.031_H’,‘Gast_0.219_L’,‘Ha_0.500_H’,‘Hd_0.562_H’,‘Pol_0.208_L’, ‘Pol_1.250_H’, ‘MolVol’) was selected asproviding a significant dispersion of the chemical structuresin the DuPont corporate chemistry collection as well as rep-resenting features that made chemical sense with regards tosmall molecule-protein interactions.
Model Development/Assessment. Model developmentusing Neural Networks analysis34 and InfoEvolve35 wereconducted using software proprietary to DuPont. Obliquedecision tree-based analyses were completed using OC136
(Oblique Classifier). EnsembleFIRM modeling was imple-mented using a proprietary routine coded in FORTRANinterfacing to FIRM37 (formal inference-based recursivemodeling).
Initially data sets were randomly divided into training andtesting subsets for the purposes of model development.Models and the associated machine learning techniques wereevaluated on the performance of predicting the testing set,following model development on the training set. Predictiveperformance was assessed by developing ROC curves forthe predictions of the testing data sets by sorting the testsets descending on the prediction probabilities which runfrom zero to one. These ordered lists were then traversedfrom the top most ranked compound to the least, and thenumber of actives retrieved were counted as a function oflist depth. When classifiers were also used to score externallyavailable chemical structures for compound acquisitioncampaigns, the hit-rate from biological evaluation of theacquired chemistry was compared to our historical HTSbaseline as an additional factor to evaluate classifierperformances.
Neural Network Models. Neural network models weredeveloped stepwise by first randomly selecting 10% of thetraining data set as a validation set. During training of the
neural network the validation set was used to decide theoptimal number of hidden units and to determine an errorlimit for terminating training. Using these stopping conditionsthe neural network was then retrained using the entire trainingdata set.
Oblique Decision Tree Models. Oblique classifiers searchlinear combinations of descriptors for splitting the data setand so offer the advantage of potentially simpler yet moreaccurate decision trees than parallel axis methods such asCART, C4.5, and FIRM. However, they tend to be signifi-cantly more computationally intensive. The OC1 procedurewas used to induce a set of oblique decision trees using 10-fold cross-validation during training to select the final tree.
EnsembleFIRM Decision Tree Models. FIRM treatscontinuous descriptors by binning them initially into 10approximately equally populated intervals. The algorithmanalyzes the data set deciding which descriptor and whichsplit cardinality is optimal at each node in the tree bysystematically and recursively collapsing adjacent descriptorbins when they are not significantly different with respectto the predicted class. FIRM uses a chi-squared test (if classendpoint is categorical) or a T-test (if the class endpoint iscontinuous) to decide the cardinality of the optimal split.The user can specify the minimum significance requiredduring these tests as well as the overall significance of thevariable choice. In all runs the minimum significances wereset to a p-tail ) 0.05. Statistical test results are correctedusing the Bonferroni adjustment38 to reflect the number ofdescriptors considered at each split. In addition FIRM allowsthe user to specify the smallest size node that is allowed tobe further split. Tree induction ceases when statistical testsfor descriptor selection exceed statistical thresholds, whenthe node size is below the splitting threshold specified bythe user or when the node is too homogenous to split further.
Our approach to ensemble decision tree modeling involvedwrapping FIRM with a FORTRAN procedure which man-aged data set sampling and model averaging while basicallyinvoking FIRM for decision tree induction. Our samplingstrategy consistently included all of the actives from thetraining set and appended a number of inactive structuresrandomly selected from the training set. Across resamplingiterations the active structures are always reused while theinactive structures are not. For example, an HTS trainingset containing 1% actives would produce 100 smaller trainingdata sets consisting of a 1:1 inactive/active ratio, whenresampled using our strategy. The optimal ratio of inactiveto active structures in the training subsets was empiricallydetermined. FIRM models were developed for each of thesesmaller data sets, and the final classifier predictions werederived from averaging the individual classifier predictionsacross the models.
InfoEvolve Models. The InfoEvolve method uses thesame sampling strategy described for the ensemble decisiontree method. InfoEvolve first analyzes each of the datasubsets separately in order to identify the most informationrich combinations of possible input variables for that datasubset. All possible combinations of inputs are representedin a gene pool in which each bit in the gene represents eachpossible input. The global information content for the dataset is used to drive the genetic algorithm based optimization.Once the evolution is completed there exists a pool of genesthat represents optimal combinations of inputs which are
ENSEMBLE MACHINE LEARNING CLASSIFIERS J. Chem. Inf. Model., Vol. xxx, No. xx, XXXX C

most information rich for that data subset. Analysis of thefrequency of occurrence of the inputs across this gene poolis used to select the final inputs considered in modeling eachdata subset. Once the optimal inputs are selected a secondgenetic algorithm-based optimization step occurs in whichthe root mean square (RMS) error between predicted andactual is minimized for the training data set, while monitoringa small validation set RMS error in order to avoid overfitting.The single models are then combined into a single classifierby polling. The interested reader is referred to the work ofVaidyanathan35 for additional discussion.
RESULTS
During the course of this project, we assembled HTS datasets for each of two major market areas within the agro-chemical domains of herbicides, fungicides, and insecticides.Data mining models were developed for each of these HTSdata sets using eight different chemical descriptor types. Ourmodeling efforts initially focused on a fungicide HTS dataset since it was the first to be assembled and used the selectedmachine learning routines to develop ensemble-based clas-sifiers starting with the 3D Atom-Pair and MolconnZdescriptors. While models were being developed in thefungicide area, HTS data sets were assembled for the otherbiological areas. Each of the HTS data sets was randomlydivided into training (67%) and testing (33%) subsets. Thefinal classifiers developed on the training portion were thenapplied to the testing subset, and the forecasted probabilitieswere used to construct ROC curves in order to evaluate andcompare their performance. We were quite pleased with ourinitial fungicide results19 in which all four machine learningmethods produced classifiers with lifts significantly betterthan random (Figure 1) For example, only the top 6% of the
EnsembleFIRM ranked compounds need to be retrieved inorder to obtain over 80% of the active compounds. Thiscorresponds to an enrichment factor of thirteen. The otherclassifiers derived from MolconnZ descriptors were InfoE-volve (enrichment)11), Oblique Classifiers (enrichment)6),and Neural Networks (enrichment)5).
During further model development it quickly becameapparent that oblique decision tree classifiers, while offeringthe possibility of simpler tree models, were too computeintensive for on-going development and deployment. Withsome of the larger HTS data sets derived from the atom-pair descriptors we were encountering compute times fortraining measured in cpu-weeks. Neural networks can haveproblems converging with wide data sets as well (i.e., datasets with a large number of descriptors relative to the numberof data points), and our implementation is no exception. Weencountered problems developing Neural Network modelswith the atom-pair descriptors (825 inputs). We have priorexperience in engineering projects where InfoEvolve couldbe successfully used to perform variable selection prior toperforming Neural Network analysis (data not shown), butsince our previous studies19 indicated that models derivedusing Oblique Decision Tree and Neural Networks weregenerally weaker we narrowed the field for further study toInfoEvolve and EnsembleFIRM.
As work continued at building and evaluating classifiersfrom a variety of chemical descriptor types (Table 2), severalquestions arose.
1. Is the rank order of actives the same across differentdescriptor types using the same machine learning method?
2. Is the rank order of actives the same across differentmachine learning methods using the same descriptor type?
Figure 1. ROC curves for several early fungicide classifiers using MolconnZ descriptors. In order to better contrast performance of theactivity classifiers at the early stages of retrieval, the fraction of actives retrieved is plotted against the fraction of the data set tested on alog scale rather than the more typical linear scale. Note that the “random” curve corresponds to retrieving x% of the actives when x% ofthe data set has been tested.
D J. Chem. Inf. Model., Vol. xxx, No. xx, XXXX SIMMONS ET AL.
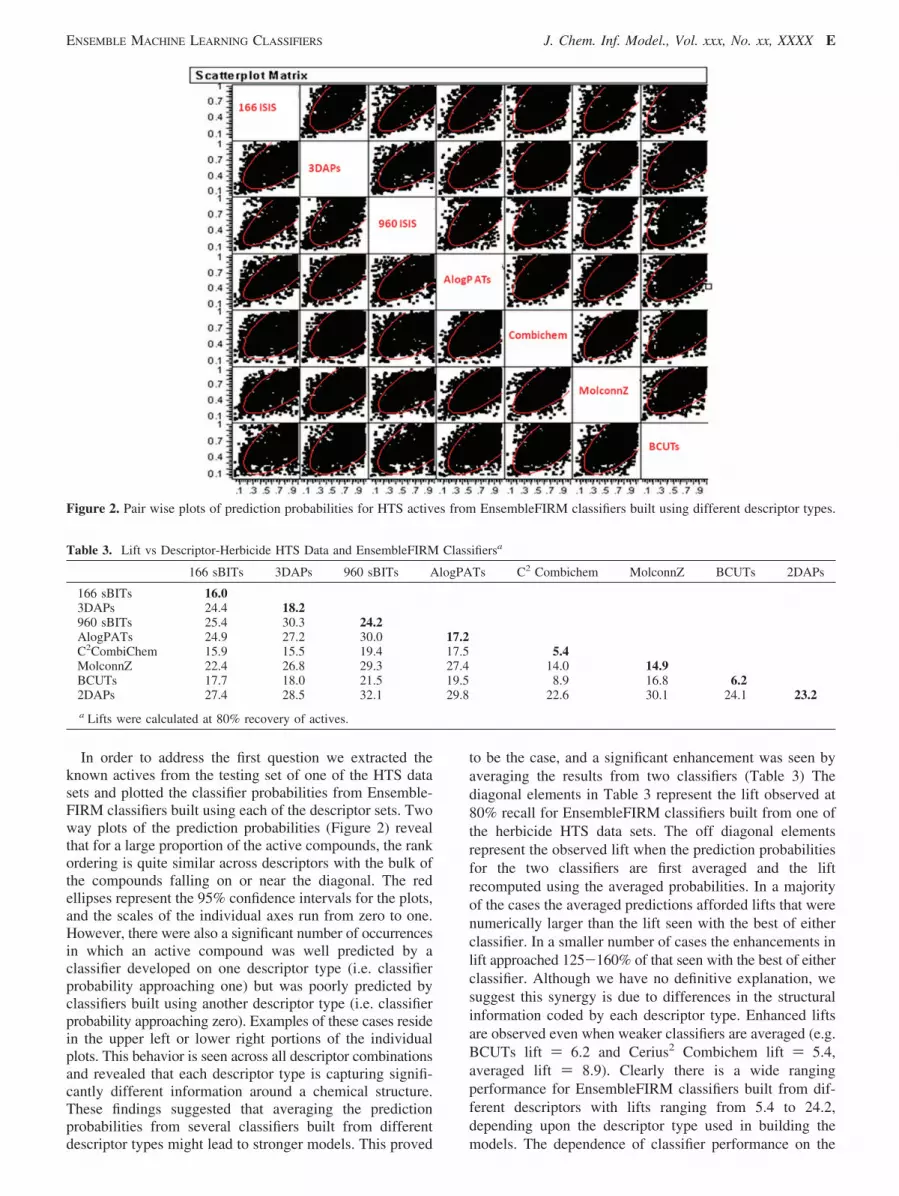
In order to address the first question we extracted theknown actives from the testing set of one of the HTS datasets and plotted the classifier probabilities from Ensemble-FIRM classifiers built using each of the descriptor sets. Twoway plots of the prediction probabilities (Figure 2) revealthat for a large proportion of the active compounds, the rankordering is quite similar across descriptors with the bulk ofthe compounds falling on or near the diagonal. The redellipses represent the 95% confidence intervals for the plots,and the scales of the individual axes run from zero to one.However, there were also a significant number of occurrencesin which an active compound was well predicted by aclassifier developed on one descriptor type (i.e. classifierprobability approaching one) but was poorly predicted byclassifiers built using another descriptor type (i.e. classifierprobability approaching zero). Examples of these cases residein the upper left or lower right portions of the individualplots. This behavior is seen across all descriptor combinationsand revealed that each descriptor type is capturing signifi-cantly different information around a chemical structure.These findings suggested that averaging the predictionprobabilities from several classifiers built from differentdescriptor types might lead to stronger models. This proved
to be the case, and a significant enhancement was seen byaveraging the results from two classifiers (Table 3) Thediagonal elements in Table 3 represent the lift observed at80% recall for EnsembleFIRM classifiers built from one ofthe herbicide HTS data sets. The off diagonal elementsrepresent the observed lift when the prediction probabilitiesfor the two classifiers are first averaged and the liftrecomputed using the averaged probabilities. In a majorityof the cases the averaged predictions afforded lifts that werenumerically larger than the lift seen with the best of eitherclassifier. In a smaller number of cases the enhancements inlift approached 125-160% of that seen with the best of eitherclassifier. Although we have no definitive explanation, wesuggest this synergy is due to differences in the structuralinformation coded by each descriptor type. Enhanced liftsare observed even when weaker classifiers are averaged (e.g.BCUTs lift ) 6.2 and Cerius2 Combichem lift ) 5.4,averaged lift ) 8.9). Clearly there is a wide rangingperformance for EnsembleFIRM classifiers built from dif-ferent descriptors with lifts ranging from 5.4 to 24.2,depending upon the descriptor type used in building themodels. The dependence of classifier performance on the
Figure 2. Pair wise plots of prediction probabilities for HTS actives from EnsembleFIRM classifiers built using different descriptor types.
Table 3. Lift vs Descriptor-Herbicide HTS Data and EnsembleFIRM Classifiersa
166 sBITs 3DAPs 960 sBITs AlogPATs C2 Combichem MolconnZ BCUTs 2DAPs
166 sBITs 16.03DAPs 24.4 18.2960 sBITs 25.4 30.3 24.2AlogPATs 24.9 27.2 30.0 17.2C2CombiChem 15.9 15.5 19.4 17.5 5.4MolconnZ 22.4 26.8 29.3 27.4 14.0 14.9BCUTs 17.7 18.0 21.5 19.5 8.9 16.8 6.22DAPs 27.4 28.5 32.1 29.8 22.6 30.1 24.1 23.2a Lifts were calculated at 80% recovery of actives.
ENSEMBLE MACHINE LEARNING CLASSIFIERS J. Chem. Inf. Model., Vol. xxx, No. xx, XXXX E
chosen descriptor was observed across all machine learningmethods and all HTS data sets (data not shown).
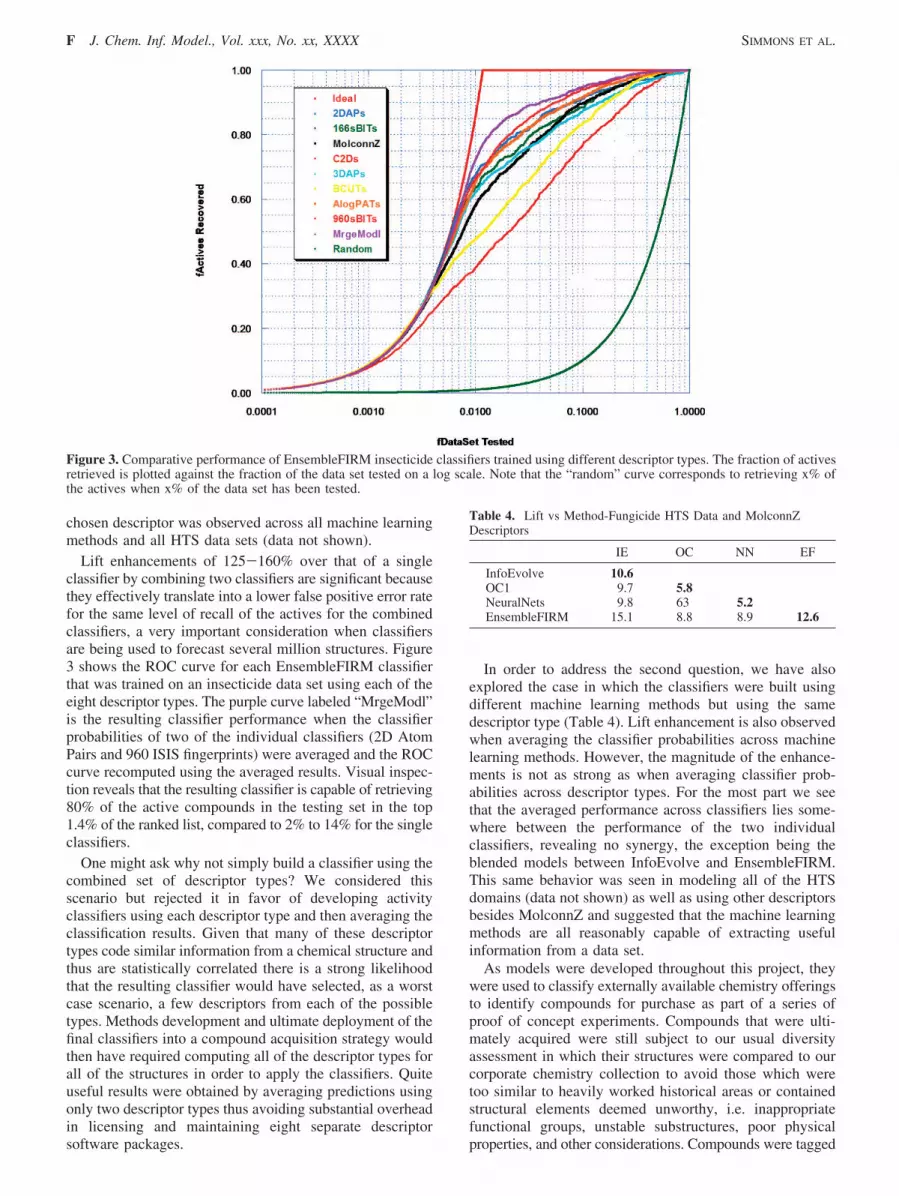
Lift enhancements of 125-160% over that of a singleclassifier by combining two classifiers are significant becausethey effectively translate into a lower false positive error ratefor the same level of recall of the actives for the combinedclassifiers, a very important consideration when classifiersare being used to forecast several million structures. Figure3 shows the ROC curve for each EnsembleFIRM classifierthat was trained on an insecticide data set using each of theeight descriptor types. The purple curve labeled “MrgeModl”is the resulting classifier performance when the classifierprobabilities of two of the individual classifiers (2D AtomPairs and 960 ISIS fingerprints) were averaged and the ROCcurve recomputed using the averaged results. Visual inspec-tion reveals that the resulting classifier is capable of retrieving80% of the active compounds in the testing set in the top1.4% of the ranked list, compared to 2% to 14% for the singleclassifiers.
One might ask why not simply build a classifier using thecombined set of descriptor types? We considered thisscenario but rejected it in favor of developing activityclassifiers using each descriptor type and then averaging theclassification results. Given that many of these descriptortypes code similar information from a chemical structure andthus are statistically correlated there is a strong likelihoodthat the resulting classifier would have selected, as a worstcase scenario, a few descriptors from each of the possibletypes. Methods development and ultimate deployment of thefinal classifiers into a compound acquisition strategy wouldthen have required computing all of the descriptor types forall of the structures in order to apply the classifiers. Quiteuseful results were obtained by averaging predictions usingonly two descriptor types thus avoiding substantial overheadin licensing and maintaining eight separate descriptorsoftware packages.
In order to address the second question, we have alsoexplored the case in which the classifiers were built usingdifferent machine learning methods but using the samedescriptor type (Table 4). Lift enhancement is also observedwhen averaging the classifier probabilities across machinelearning methods. However, the magnitude of the enhance-ments is not as strong as when averaging classifier prob-abilities across descriptor types. For the most part we seethat the averaged performance across classifiers lies some-where between the performance of the two individualclassifiers, revealing no synergy, the exception being theblended models between InfoEvolve and EnsembleFIRM.This same behavior was seen in modeling all of the HTSdomains (data not shown) as well as using other descriptorsbesides MolconnZ and suggested that the machine learningmethods are all reasonably capable of extracting usefulinformation from a data set.
As models were developed throughout this project, theywere used to classify externally available chemistry offeringsto identify compounds for purchase as part of a series ofproof of concept experiments. Compounds that were ulti-mately acquired were still subject to our usual diversityassessment in which their structures were compared to ourcorporate chemistry collection to avoid those which weretoo similar to heavily worked historical areas or containedstructural elements deemed unworthy, i.e. inappropriatefunctional groups, unstable substructures, poor physicalproperties, and other considerations. Compounds were tagged
Figure 3. Comparative performance of EnsembleFIRM insecticide classifiers trained using different descriptor types. The fraction of activesretrieved is plotted against the fraction of the data set tested on a log scale. Note that the “random” curve corresponds to retrieving x% ofthe actives when x% of the data set has been tested.
Table 4. Lift vs Method-Fungicide HTS Data and MolconnZDescriptors
IE OC NN EF
InfoEvolve 10.6OC1 9.7 5.8NeuralNets 9.8 63 5.2EnsembleFIRM 15.1 8.8 8.9 12.6
F J. Chem. Inf. Model., Vol. xxx, No. xx, XXXX SIMMONS ET AL.

upon arrival from the vendors to track them through thescreening process. Once all of the compounds were screenedthrough the various domain bioassays, the screening resultswere analyzed in order to compute a hit-rate within theselected sets. The hit-rates were compared to the baselinehit-rate for our HTS process which was computed based onscreening results several years just prior to these experiments.The proof of concept experiments was conducted over severalyears, and the results are summarized in Table 5.
During the course of these experiments a large number ofclassifiers were explored from a variety of machine learningmethods based upon eight commonly encountered chemicaldescriptor types. In all years the application of data miningmodels to identify compounds with an enhanced likelihoodof bioactivity proved to be successful. Even our earliestmodels, developed in 2001 and which represented only aportion of the agrochemical domains, afforded screening hit-rates that were nearly 300% over our HTS benchmark.Models developed later, which benefited from the key lessonslearned in the project, were providing hit-rates that were630% over benchmark. Ultimately the analysis of over 7million chemical structures identified less than 47,000 thatwere deemed worthy of purchase. This illustrates whyclassifiers are required to possess a low false positive rateas well as a high true positive rate if they are to be useful.Classifiers developed later in the project were sufficientlydiscriminating that typically less than 1% of the structuresbeing forecast would score above the required thresholds forpredicted activity. Screening externally available chemistrycompounds which were forecast as ‘active’ by our classifiersprovided hit-rates in the range of 0.6-1.8% (280-890% overthe HTS benchmark).
Our experiences revealed that external vendor compoundsmay only be available for a relatively short period of timefollowing the initial offering, and so speed in modeldevelopment and implementation become important factorsin an effective compound acquisition strategy. For example,in 2002 only about 40% of the compounds that scored wellin our models were still available when the order was placed.This reinforces the need to be able to build, retrain, and applymodels quickly, one nice attribute of decision tree modeling.For this same reason we also chose not to consider chemical
descriptors that required an optimal energy-minimized 3Dstructure (i.e. 3D pharmacophore feature-based descriptors)because their computation for several million candidatestructures would result in slower turnaround for forecasting.
At the time of their development, the activity classifiersdemonstrated lifts for predictions from the randomly selectedtesting subsets significantly higher than 5 to 6 with liftsaveraging 50-55 across all of the models. We explored theindividual HTS data sets and the corresponding training andtesting subsets more carefully so as to understand why themodels performed more poorly in compound acquisitionsthan the original validation results would have suggested.Sheridan39 has noted that the level of similarity between amolecule and those in the training set is a good discriminatoras to how well that molecule will be predicted by a modelbuilt on that training data. We analyzed the overall diversityof the chemistry comprising the actives in each our HTSdata sets. What we found (Table 6) were islands of similarcompounds clustered around molecular scaffolds that rep-resented synthetic efforts around tightly focused historicallead areas. Of course, there were diverse actives that hadarisen from effective compound acquisitions, but these weredominated by analogs derived from lead optimization efforts.Randomly dividing the HTS data into training and testingsubsets, a process widely practiced for model validation,would essentially place structurally related analogs into boththe training and testing subsets. Inspection of Table 6 revealsthe herbicide HTS data set actives were the least structurallydiverse, displaying the largest maximum cluster size, thelargest average cluster size, and the lowest proportion ofsingleton clusters at 90% similarity. The fungicide HTS dataset actives were the most structurally diverse, while theinsecticide HTS data set actives were in between these two.Clearly there is a bias within the HTS data sets toward activesderived from historical synthetic optimization efforts. Thisbias had to be mitigated if trained models were to be morerobust.
To understand and quantify the effect of including similarmolecular analogs on classifier performance we quantifiedthe similarity between molecules in the testing and trainingsubsets. Each active molecule in the testing subsets wascompared to the compounds in the respective training subset
Table 5. Proof of Concept Experiments
compounds biology results
strategy year analyzed ordered received screened active hit-rate improvement
HTS benchmark 212,730 421 0.20%data mining 2001 533,000 12,287 12,168 12,168 67 0.55% 2.8
2002 2,370,675 9,432 3,733 3,733 66 1.77% 8.92003 1,959,508 16,573 9,163 9,163 92 1.00% 5.12004 2,323,869 8,512 5,330 5,330 66 1.24% 6.3
totals 7,187,052 46,804 30,394 30,394 291
Table 6. Cluster Summary for HTS Data Set Actives at 90% Similarity Using the ISIS 960 Fingerprints
fungicide herbicide insecticide
ascomycete oomycete monocots dicots homopteran lepidopteran
NumCompds 9176 4114 17,823 15,659 6155 7999MaxClusterSize 336 214 1164 1358 376 618AveClusterSize 3.2 3.8 11.3 13.3 4.1 8.7NumClusters 4769 1853 4173 3265 2587 2262NumSingletons 3498 1299 2485 1826 1598 1278
ENSEMBLE MACHINE LEARNING CLASSIFIERS J. Chem. Inf. Model., Vol. xxx, No. xx, XXXX G
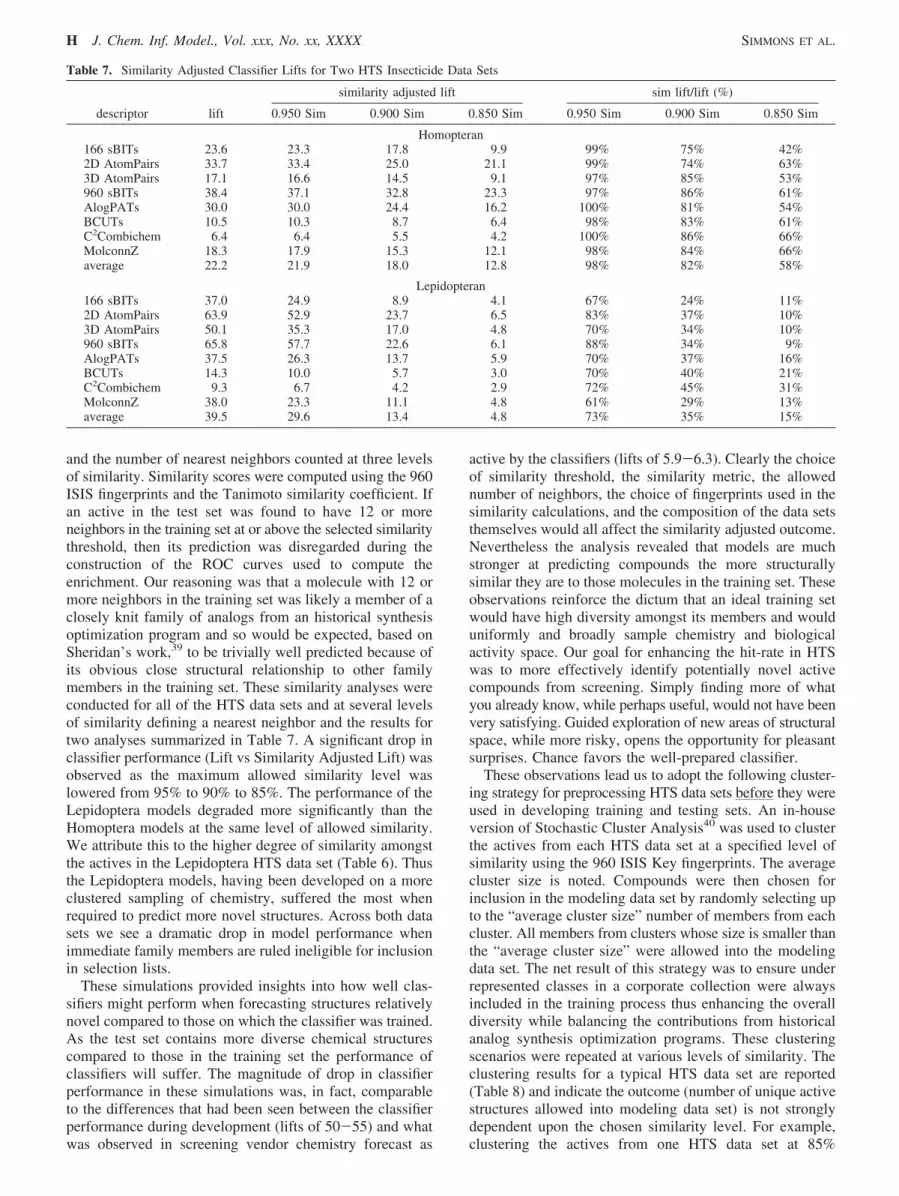
and the number of nearest neighbors counted at three levelsof similarity. Similarity scores were computed using the 960ISIS fingerprints and the Tanimoto similarity coefficient. Ifan active in the test set was found to have 12 or moreneighbors in the training set at or above the selected similaritythreshold, then its prediction was disregarded during theconstruction of the ROC curves used to compute theenrichment. Our reasoning was that a molecule with 12 ormore neighbors in the training set was likely a member of aclosely knit family of analogs from an historical synthesisoptimization program and so would be expected, based onSheridan’s work,39 to be trivially well predicted because ofits obvious close structural relationship to other familymembers in the training set. These similarity analyses wereconducted for all of the HTS data sets and at several levelsof similarity defining a nearest neighbor and the results fortwo analyses summarized in Table 7. A significant drop inclassifier performance (Lift vs Similarity Adjusted Lift) wasobserved as the maximum allowed similarity level waslowered from 95% to 90% to 85%. The performance of theLepidoptera models degraded more significantly than theHomoptera models at the same level of allowed similarity.We attribute this to the higher degree of similarity amongstthe actives in the Lepidoptera HTS data set (Table 6). Thusthe Lepidoptera models, having been developed on a moreclustered sampling of chemistry, suffered the most whenrequired to predict more novel structures. Across both datasets we see a dramatic drop in model performance whenimmediate family members are ruled ineligible for inclusionin selection lists.
These simulations provided insights into how well clas-sifiers might perform when forecasting structures relativelynovel compared to those on which the classifier was trained.As the test set contains more diverse chemical structurescompared to those in the training set the performance ofclassifiers will suffer. The magnitude of drop in classifierperformance in these simulations was, in fact, comparableto the differences that had been seen between the classifierperformance during development (lifts of 50-55) and whatwas observed in screening vendor chemistry forecast as
active by the classifiers (lifts of 5.9-6.3). Clearly the choiceof similarity threshold, the similarity metric, the allowednumber of neighbors, the choice of fingerprints used in thesimilarity calculations, and the composition of the data setsthemselves would all affect the similarity adjusted outcome.Nevertheless the analysis revealed that models are muchstronger at predicting compounds the more structurallysimilar they are to those molecules in the training set. Theseobservations reinforce the dictum that an ideal training setwould have high diversity amongst its members and woulduniformly and broadly sample chemistry and biologicalactivity space. Our goal for enhancing the hit-rate in HTSwas to more effectively identify potentially novel activecompounds from screening. Simply finding more of whatyou already know, while perhaps useful, would not have beenvery satisfying. Guided exploration of new areas of structuralspace, while more risky, opens the opportunity for pleasantsurprises. Chance favors the well-prepared classifier.
These observations lead us to adopt the following cluster-ing strategy for preprocessing HTS data sets before they wereused in developing training and testing sets. An in-houseversion of Stochastic Cluster Analysis40 was used to clusterthe actives from each HTS data set at a specified level ofsimilarity using the 960 ISIS Key fingerprints. The averagecluster size is noted. Compounds were then chosen forinclusion in the modeling data set by randomly selecting upto the “average cluster size” number of members from eachcluster. All members from clusters whose size is smaller thanthe “average cluster size” were allowed into the modelingdata set. The net result of this strategy was to ensure underrepresented classes in a corporate collection were alwaysincluded in the training process thus enhancing the overalldiversity while balancing the contributions from historicalanalog synthesis optimization programs. These clusteringscenarios were repeated at various levels of similarity. Theclustering results for a typical HTS data set are reported(Table 8) and indicate the outcome (number of unique activestructures allowed into modeling data set) is not stronglydependent upon the chosen similarity level. For example,clustering the actives from one HTS data set at 85%
Table 7. Similarity Adjusted Classifier Lifts for Two HTS Insecticide Data Sets
similarity adjusted lift sim lift/lift (%)
descriptor lift 0.950 Sim 0.900 Sim 0.850 Sim 0.950 Sim 0.900 Sim 0.850 Sim
Homopteran166 sBITs 23.6 23.3 17.8 9.9 99% 75% 42%2D AtomPairs 33.7 33.4 25.0 21.1 99% 74% 63%3D AtomPairs 17.1 16.6 14.5 9.1 97% 85% 53%960 sBITs 38.4 37.1 32.8 23.3 97% 86% 61%AlogPATs 30.0 30.0 24.4 16.2 100% 81% 54%BCUTs 10.5 10.3 8.7 6.4 98% 83% 61%C2Combichem 6.4 6.4 5.5 4.2 100% 86% 66%MolconnZ 18.3 17.9 15.3 12.1 98% 84% 66%average 22.2 21.9 18.0 12.8 98% 82% 58%
Lepidopteran166 sBITs 37.0 24.9 8.9 4.1 67% 24% 11%2D AtomPairs 63.9 52.9 23.7 6.5 83% 37% 10%3D AtomPairs 50.1 35.3 17.0 4.8 70% 34% 10%960 sBITs 65.8 57.7 22.6 6.1 88% 34% 9%AlogPATs 37.5 26.3 13.7 5.9 70% 37% 16%BCUTs 14.3 10.0 5.7 3.0 70% 40% 21%C2Combichem 9.3 6.7 4.2 2.9 72% 45% 31%MolconnZ 38.0 23.3 11.1 4.8 61% 29% 13%average 39.5 29.6 13.4 4.8 73% 35% 15%
H J. Chem. Inf. Model., Vol. xxx, No. xx, XXXX SIMMONS ET AL.

similarity produced 1012 singleton clusters and 502 non-singleton clusters. The largest cluster that formed contained591 compounds. The average cluster size was five. Randomlyselecting up to five members from each cluster provided adata set of 2505 unique active compounds for inclusion inthe modeling data set, 61% of the total actives. Afterclustering a number of HTS data sets using this strategy andcomparing the results we settled on a Tanimoto similaritythreshold of 85%. This clustering strategy assures that datasets on which models are developed are not dominated bylarge numbers of compounds from a few chemical classesbut contain a more uniform sampling of representatives fromall of the classes.
Our clustering strategy was now addressing the need fora uniform and unbiased sampling of locally availablecompounds for model development, but the chemistry spaceof active pest control compounds is broader than our localcollection. Our strategy did not yet address the issue ofbreadth of diversity of the chemistry on which a model isdeveloped nor did it address the issue that random splittingof a data set potentially places closely related analogs intoboth the training and testing subsets.
Up to this point all models had been developed using HTSresults from within the DuPont enterprise. It logicallyfollowed that training activity classifiers using screeningresults from the entire crop protection industry would providemore robust classifiers since they would be trained on a muchbroader sampling of active compounds. To this end a projectwas initiated41 to curate the published agrochemical patentsfor companies which comprised the crop protection industryfrom 1970 to 2005. Information collected from each patentconsisted of the structure of the chemical analogs that weredisclosed and the level of biological activity against variousagrochemically relevant species reported in that patent.Curation was limited to compounds for which some formof physical data was also reported. In order to prevent largepatents and their associated chemistry from dominating theresulting database no more than 30 representative structureswere abstracted from any one patent. If two patents weredeemed equivalent only one was curated. The resultingdatabase (AgPatentdb) contained over 93,000 chemicalstructures from over 7000 patents spanning nearly 35 yearsof reported discoveries. A nearest neighbor analysis wascompleted in which each AgPatentdb active was comparedto our in-house active structures using the 960 ISIS finger-print and a Tanimoto similarity threshold of 90% to definea near neighbor. The vast majority of patent actives (75 to90% depending upon market area) returned zero nearneighbors (at > 90% similarity), and a smaller proportion(10 to 20%) returned fewer than 10 near neighbors from ourcorporate chemistry collection. The appropriate active struc-
tures were used to augment our in-house HTS training datasets and the respective classifiers retrained. This strategyaddresses the breadth of diversity of chemistry for modeldevelopment by sampling examples from a much broadersource of crop protection actives.
One final strategy was employed that addressed the issuerelated to creating training and testing sets by randomsplitting of data sets. When classifiers are used to preselectstructures from a vendor’s chemistry collection, the underly-ing assumption is that models trained on yesterday’s screen-ing results can reliably predict tomorrow’s novel activechemistry. Our earlier similarity adjusted lift discussion shedssome light on how true this assumption might be and clearlyimplies that there is a limit to how distant an analog can befrom those in the training set and still be reliably forecast.However, our desire was to mitigate any excessive myopicbias in the training subsets that might ultimately impair aclassifier’s ability to extrapolate to novel structures. In orderto reduce the likelihood that analogs of the same chemistryend up in both the training and testing subsets, we chrono-logically split the HTS data to create the training and testingsubsets. Data used in training were selected from screeningresults up to a specific point in time, and screening resultsfor all years after this point were placed into the testing set.Chemistry projects, even successful ones, have a finitelifetime after which the synthesis teams are redeployed tothe optimization of more recently discovered leads. Onecomponent of our on-going compound acquisition strategywas to purchase compounds each year that were structurallydissimilar to compounds in our present collection, so thatleads arising from screening over time tend to be structurallyunrelated. For the purpose of testing the far-sightedness ofour models, a chronological split strategy offers a significantadvantage since classifiers can now be evaluated against testsets that are less likely to be comprised of or dominated bystructurally related analogs. The performance estimates basedupon forecasting the chronologically derived test sets shouldmore closely mirror how the classifiers are subsequently usedin the “real world”. The classifier’s inherent performanceduring training may not necessarily improve because of thisstrategy. However, the resulting assessment of that perfor-mance is likely to be a more realistic reflection of what willbe seen when classifiers are used to forecast structurallydissimilar vendor chemistry. We wanted to train our clas-sifiers to think out of the box.
Chronological splitting has another significant advantagewhen testing the real-world performance of our classifiers.When vendor chemistry was forecast using our classifiers,those compounds that scored well in the models werepurchased. Ideally one would like to assess a classifier’sperformance for predicting both the active and inactive
Table 8. Typical Clustering Results for one HTS Data Seta
Tanimoto AveSize MaxSize MinSize NumSingle TotalClusters NumUnique % of total0.800 5.6 758 1 784 1265 2312 56%0.825 5.7 648 1 890 1377 2370 58%0.850 5.0 591 1 1012 1514 2505 61%0.875 4.6 368 1 1135 1658 2650 64%0.900 3.8 214 1 1299 1853 2773 67%0.925 2.9 130 1 1546 2125 2859 69%0.950 2.1 90 1 1898 2456 2931 71%
a All actives: 4114.
ENSEMBLE MACHINE LEARNING CLASSIFIERS J. Chem. Inf. Model., Vol. xxx, No. xx, XXXX I
classes, but this would have required the purchase ofcompounds that the models forecast to be inactive. This wasnot seen as a wise use of resources. Chronological splittingactually has the advantage that one can now use the classifiersto predict a large collection of chemistry (potentially severalyears of screening and tens or hundreds of thousands ofcompounds) whose biological outcome is already known andwhich comprise both active and inactive structures. Compar-ing the actual biological activity of compounds forecast as“active” and those forecast as “inactive” by the classifierswould provide a measure of discrimination for the classifieracross both classes. We chose the time point for thechronological split such that nearly 30 months of screeningresults were placed into the testing subsets and more than20 years of screening results were placed into the trainingsubsets for each classifier domain.
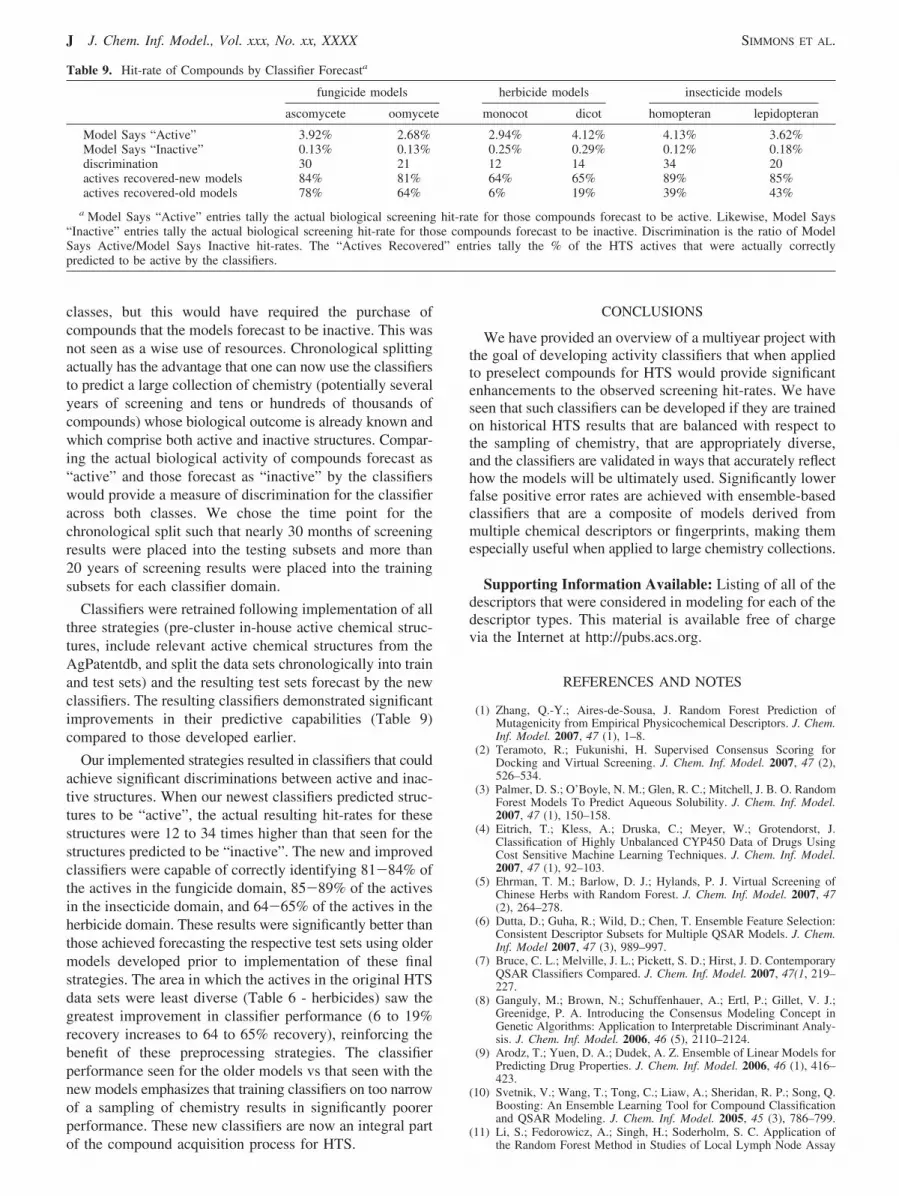
Classifiers were retrained following implementation of allthree strategies (pre-cluster in-house active chemical struc-tures, include relevant active chemical structures from theAgPatentdb, and split the data sets chronologically into trainand test sets) and the resulting test sets forecast by the newclassifiers. The resulting classifiers demonstrated significantimprovements in their predictive capabilities (Table 9)compared to those developed earlier.
Our implemented strategies resulted in classifiers that couldachieve significant discriminations between active and inac-tive structures. When our newest classifiers predicted struc-tures to be “active”, the actual resulting hit-rates for thesestructures were 12 to 34 times higher than that seen for thestructures predicted to be “inactive”. The new and improvedclassifiers were capable of correctly identifying 81-84% ofthe actives in the fungicide domain, 85-89% of the activesin the insecticide domain, and 64-65% of the actives in theherbicide domain. These results were significantly better thanthose achieved forecasting the respective test sets using oldermodels developed prior to implementation of these finalstrategies. The area in which the actives in the original HTSdata sets were least diverse (Table 6 - herbicides) saw thegreatest improvement in classifier performance (6 to 19%recovery increases to 64 to 65% recovery), reinforcing thebenefit of these preprocessing strategies. The classifierperformance seen for the older models vs that seen with thenew models emphasizes that training classifiers on too narrowof a sampling of chemistry results in significantly poorerperformance. These new classifiers are now an integral partof the compound acquisition process for HTS.
CONCLUSIONS
We have provided an overview of a multiyear project withthe goal of developing activity classifiers that when appliedto preselect compounds for HTS would provide significantenhancements to the observed screening hit-rates. We haveseen that such classifiers can be developed if they are trainedon historical HTS results that are balanced with respect tothe sampling of chemistry, that are appropriately diverse,and the classifiers are validated in ways that accurately reflecthow the models will be ultimately used. Significantly lowerfalse positive error rates are achieved with ensemble-basedclassifiers that are a composite of models derived frommultiple chemical descriptors or fingerprints, making themespecially useful when applied to large chemistry collections.
Supporting Information Available: Listing of all of thedescriptors that were considered in modeling for each of thedescriptor types. This material is available free of chargevia the Internet at http://pubs.acs.org.
REFERENCES AND NOTES
(1) Zhang, Q.-Y.; Aires-de-Sousa, J. Random Forest Prediction ofMutagenicity from Empirical Physicochemical Descriptors. J. Chem.Inf. Model. 2007, 47 (1), 1–8.
(2) Teramoto, R.; Fukunishi, H. Supervised Consensus Scoring forDocking and Virtual Screening. J. Chem. Inf. Model. 2007, 47 (2),526–534.
(3) Palmer, D. S.; O’Boyle, N. M.; Glen, R. C.; Mitchell, J. B. O. RandomForest Models To Predict Aqueous Solubility. J. Chem. Inf. Model.2007, 47 (1), 150–158.
(4) Eitrich, T.; Kless, A.; Druska, C.; Meyer, W.; Grotendorst, J.Classification of Highly Unbalanced CYP450 Data of Drugs UsingCost Sensitive Machine Learning Techniques. J. Chem. Inf. Model.2007, 47 (1), 92–103.
(5) Ehrman, T. M.; Barlow, D. J.; Hylands, P. J. Virtual Screening ofChinese Herbs with Random Forest. J. Chem. Inf. Model. 2007, 47(2), 264–278.
(6) Dutta, D.; Guha, R.; Wild, D.; Chen, T. Ensemble Feature Selection:Consistent Descriptor Subsets for Multiple QSAR Models. J. Chem.Inf. Model 2007, 47 (3), 989–997.
(7) Bruce, C. L.; Melville, J. L.; Pickett, S. D.; Hirst, J. D. ContemporaryQSAR Classifiers Compared. J. Chem. Inf. Model. 2007, 47(1, 219–227.
(8) Ganguly, M.; Brown, N.; Schuffenhauer, A.; Ertl, P.; Gillet, V. J.;Greenidge, P. A. Introducing the Consensus Modeling Concept inGenetic Algorithms: Application to Interpretable Discriminant Analy-sis. J. Chem. Inf. Model. 2006, 46 (5), 2110–2124.
(9) Arodz, T.; Yuen, D. A.; Dudek, A. Z. Ensemble of Linear Models forPredicting Drug Properties. J. Chem. Inf. Model. 2006, 46 (1), 416–423.
(10) Svetnik, V.; Wang, T.; Tong, C.; Liaw, A.; Sheridan, R. P.; Song, Q.Boosting: An Ensemble Learning Tool for Compound Classificationand QSAR Modeling. J. Chem. Inf. Model. 2005, 45 (3), 786–799.
(11) Li, S.; Fedorowicz, A.; Singh, H.; Soderholm, S. C. Application ofthe Random Forest Method in Studies of Local Lymph Node Assay
Table 9. Hit-rate of Compounds by Classifier Forecasta
fungicide models herbicide models insecticide models
ascomycete oomycete monocot dicot homopteran lepidopteran
Model Says “Active” 3.92% 2.68% 2.94% 4.12% 4.13% 3.62%Model Says “Inactive” 0.13% 0.13% 0.25% 0.29% 0.12% 0.18%discrimination 30 21 12 14 34 20actives recovered-new models 84% 81% 64% 65% 89% 85%actives recovered-old models 78% 64% 6% 19% 39% 43%
a Model Says “Active” entries tally the actual biological screening hit-rate for those compounds forecast to be active. Likewise, Model Says“Inactive” entries tally the actual biological screening hit-rate for those compounds forecast to be inactive. Discrimination is the ratio of ModelSays Active/Model Says Inactive hit-rates. The “Actives Recovered” entries tally the % of the HTS actives that were actually correctlypredicted to be active by the classifiers.
J J. Chem. Inf. Model., Vol. xxx, No. xx, XXXX SIMMONS ET AL.

Based Skin Sensitization Data. J. Chem. Inf. Model. 2005, 45 (4),952–964.
(12) Gini, G.; Craciun, M. V.; Konig, C. Combining Unsupervised andSupervised Artificial Neural Networks to Predict Aquatic Toxicity.J. Chem. Inf. Comput. Sci. 2004, 44 (6), 1897–1902.
(13) van Rhee, A. M. Use of Recursion Forests in the Sequential ScreeningProcess: Consensus Selection by Multiple Recursion Trees. J. Chem.Inf. Comput. Sci 2003, 43 (3), 941–948.
(14) Tong, W.; Hong, H.; Fang, H.; Xie, Q.; Perkins, R. Decision Forest:Combining the Predictions of Multiple Independent Decision TreeModels. J. Chem. Inf. Comput. Sci. 2003, 43 (2), 525–531.
(15) Svetnik, V.; Liaw, A.; Tong, C.; Culberson, J. C.; Sheridan, R. P.;Feuston, B. P. Random Forest A Classification and Regression Toolfor Compound Classification and QSAR Modeling. J. Chem. Inf.Comput. Sci. 2003, 43 (6), 1947–1958.
(16) Manallack, D. T.; Tehan, B. G.; Gancia, E.; Hudson, B. D.; Ford,M. G.; Livingstone, D. J.; Whitley, D. C.; Pitt, W. R. A ConsensusNeural Network-Based Technique for Discriminating Soluble andPoorly Soluble Compounds. J. Chem. Inf. Comput. Sci. 2003, 43 (2),674–679.
(17) Lanctot, J. K.; Putta, S.; Lemmen, C.; Greene, J. Using Ensembles toClassify Compounds for Drug Discovery. J. Chem. Inf. Comput. Sci2003, 43 (6), 2163–2169.
(18) Agrafiotis, D. K.; Cedeno, W.; Lobanov, V. S. On the Use of NeuralNetwork Ensembles in QSAR and QSPR. J. Chem. Inf. Comput. Sci2002, 42 (4), 903–911.
(19) Simmons, K.; Kinney, J.; Owens, A.; Kleier, D.; Bloch, K.; Argentar,D.; WalshA.; Vaidyanathan, G. A , Comparative Study of Machine-Learning and Chemometric Tools for Analysis of In-vivo High-Throughput Screening Data. J. Chem. Inf. Model. 2008, 48 (8), 1663–1668.
(20) Livingston, D. J. The characterization of chemical structures usingmolecular properties. A survey. J. Chem. Inf. Comput. Sci. 2000, 40,195–209.
(21) Bajorath, J. Selected concepts and investigations in compoundclassification, molecular descriptor analysis and virtual screening.J. Chem. Inf. Comput. Sci. 2001, 41, 233–245.
(22) Pipeline Pilot, version 5, Scitegic Inc., San Diego, CA. http://www.scitegic.com (accessed July 19, 2008).
(23) MDL connection table specifications available at Symyx, Inc., SanRamon, CA. http://www.mdli.com (accessed July 20, 2008).
(24) Concord is available from Tripos, Inc., St. Louis, MO. http://www.tripos.com/data/SYBYL/Concord_072505.pdf (accessed July 19,2008). For the specifications of the mol2 format, see: http://tripos.com/data/support/mol2.pdf (accessed July 19, 2008).
(25) Cheshire, version 3, distributed by Symyx, Inc., San Ramon, CA. http://www.mdl.com/products/pdfs/mdl_cheshire_ds.pdf (accessed July 20,2008).
(26) Carhart, R.; Smith, D. H.; Venkataraghavan, R. J. Atom pairs asmolecular features in structure-activity studies: definition and applica-tions. J. Chem. Inf. Comput. Sci. 1985, 25, 64–73.
(27) Many thanks to Prof. Alex Tropsha, University of North Carolina.(28) Cerius2, version ccO, Accelrys, Inc., San Diego, CA. http://accelry-
s.com/products/cerius2/ (accessed July 20, 2008).(29) Accelrys, Inc., San Diego, CA. http://accelrys.com/products/datasheets/
ds_qsar_0907.pdf (accessed July 23, 2008).(30) MolconnZ, version 3.50, EduSoft, Ashland, VA. http://www.edusoft-
lc.com/molconn (accessed July 19, 2008).(31) MolconnZmanual, version 4, EduSoft, Ashland, VA. http://www.edu-
soft-lc.com/molconn/manuals/400/ (accessed July 20, 2008).(32) Pearlman, R. S.; Smith, K. M. Novel Software Tools for Chemical
Diversity. In PerspectiVe in Drug DiscoVery and Design; Kubinyi,H., Folkers, G., Martin, Y. C., Eds.; KLUWER/ESCOM: Dordrecht,1998; Vols. 7/8, p 31.
(33) DiverseSolutions, version 4, University of Texas, Austin, distributedby Tripos, Inc., St. Louis, MO. http://www.tripos.com (accessed July20, 2008).
(34) Owens, A. J. D. L.; Filkin, D. L. Efficient training of the BackPropagation Network by solving a system of stiff ordinary differentialequations. International Joint Conference on Neural Networks, II,Washington, DC, 1989; pp 381-386.
(35) Vaidyanathan, G. InfoEvolve Moving from Data to Knowledge UsingInformation Theory and Genetic Algorithms. Ann. N.Y. Acad. Sci.2004, 1020, 227–238.
(36) Murphy, S. K.; Kasif, K.; Salzberg, S. A System for Induction ofOblique Decision Trees. J. Artif. Intell. Re. 1994, 2, 1–32.
(37) Hawkins, D. Formal Inference-Based Recursive Modeling, version 2.3,Univ. of Minnesota, Duluth, MN, 1999.
(38) For a discussion of the Bonferroni statistical correction, see: http://en.wikipedia.org/wiki/Bonferroni_correction (accessed Mar 31, 2008)and http://www.itl.nist.gov/div898/handbook/prc/section4/prc473.htm(accessed Mar 31, 2008).
(39) Sheridan, R. P.; Feuston, B. P.; Maiorov, V. N.; Kearsley, S. K.Similarity to Molecules in the Training Set Is a Good Discriminatorfor Prediction Accuracy in QSAR. J. Chem. Inf. Comput. Sci. 2004,44 (6), 1912–1928.
(40) Reynolds, C. H.; Druker, P.; Pfahler, L. B. Lead Discovery UsingStochastic Cluster Analysis (SCA): A New Method for ClusteringStructurally Similar Compounds. J. Chem. Inf. Comput. Sci. 1998,38, 305–312.
(41) GVK Biosciences, Hyderabad, India. http://www.gvkbio.com (accessedJuly 20, 2008).
CI800164U
ENSEMBLE MACHINE LEARNING CLASSIFIERS J. Chem. Inf. Model., Vol. xxx, No. xx, XXXX K


