Embed Size (px)
Citation preview

Potato metabolomics by GC–MS: what are the limiting factors?
Tom Shepherda,*, Gary Dobsona, Susan R. Verralla, Sean Connera, D. Wynne. Griffithsa, James W. McNicolb,Howard V. Daviesa, and Derek Stewarta
aSCRI, Dundee, DD2 5DA, UKbBiomathematics & Statistics Scotland, Dundee Unit, Dundee, DD2 5DA, UK
Received 21 December 2006; Accepted 30 March 2007
Metabolic profiling methods are not ideally suited to the simultaneous analysis of all metabolite classes within a biological
sample and must be optimized for maximum applicability. Several factors related to the optimization, validation and limitations of
a GC–MS-based metabolic profiling method for potato were examined. A key step is conversion of reducing sugars to
methyloximes, and optimum reaction conditions were 50 �C for 4 h. Shorter times or lower temperatures resulted in incomplete
oximation whereas longer times and higher temperatures caused hydrolysis of sucrose, the major tuber dissacharide. Metabolite
concentration gradients were observed in tuber sections. Glucose, fructose, alanine, methionine, threonine and tyrosine were more
concentrated in the interior, whereas asparagine, putrescine, and caffeic and chlorogenic acids were higher in the skin and citrate
was concentrated at the tuber�s bud end. These results impact upon choice of sampling strategy, consequently the use of freeze-dried
(FD) material from a sampling protocol developed to avoid gradient-induced bias was examined. Using FD material, the method
was highly linear and there was little qualitative or quantitative difference in the metabolite composition between fresh and FD
material. The short- and long-term repeatability of the method was studied, and the use of reference materials to monitor and to
improve data quality is discussed. Ascorbate is an important tuber metabolite that is readily measured by targeted approaches, but
can be a problem in metabolic profiling. It was shown for standards and FD potato that ascorbate was largely degraded during
oximation, although some survived in FD material.
KEY WORDS: GC–MS; Solanum tuberosum; tubers; metabolomics; method validation.
1. Introduction
Potato is the fourth most widely cultivated food crop(Scott et al., 2000; FAOSTAT, 2005) and much effort isbeing put into improvement of quality parametersincluding nutritional value and organoleptic propertiessuch as texture and flavour. To achieve these goals thereis a need to explore and utilise the range ofphytochemical diversity within Solanum germplasm.Many relevant metabolites, including amino acids,sugars, vitamin C and glycoalkaloids, have traditionallybeen quantified using well-established targeted methods.However, metabolomics is emerging as a broadspectrum analytical tool with which to dissect compo-sitional and functional variation. It uses establishedmethods of analytical chemistry (e.g., nuclear resonance,gas chromatography–mass spectrometry [GC–MS],liquid chromatography–mass spectrometry [see reviewby Cellini et al., 2004]) to measure as many compoundsas possible rather than analysing specific or single classesof compounds. Such measurements reflect a staticsnapshot of metabolite composition at a specificmoment in time. For example, a GC–MS approach hasbeen developed for analyzing potato tuber metabolites(Roessner et al., 2000) and has been used to phenotype
genetically and environmentally modified plants(Roessner et al., 2001).
As with any analytical technology, particularattention must be paid to the reliability and reproduc-ibility of the techniques and also to the preparation andsampling of biological materials to minimise variability.In this paper, we describe the validation of a GC–MSapproach for the analysis of polar and non-polarmetabolite profiles from freeze-dried (FD) potatopowder. The method is based on that of Roessner et al.(2000) but several facets of the method have beeninvestigated in detail. These include optimisation of theexperimental conditions, with particular attention tooximation conditions, investigation of the existence ofmetabolite gradients within tubers, and a comparison ofthe use of FD potato samples with the use of freshmaterial. The linearity of metabolite abundance inrelation to amount of sample, the repeatability of theoptimized method and metabolite activity, especially ofascorbic acid, during sample processing, were alsoinvestigated.
2. Materials and methods
2.1. Plant material
Potato tubers ofSolanum tuberosumL. cultivarDesireeand S. phureja genotype 333/16 were grown using
*To whom correspondence should be addressed.
E-mail: [email protected]
Metabolomics, Vol. 3, No. 4, December 2007 (� 2007)DOI: 10.1007/s11306-007-0058-2 475
1573-3882/07/1200-0475/0 � 2007 Springer ScienceþBusiness Media, LLC

standard agronomic practices and harvested from fieldplots at a trial site located at Mylnefield, Dundee, UK.Tubers were harvested 2 weeks following foliage burn-down, stored at ambient temperature (ca. 8–12 �C) for4 weeks to allow for skin set, then transferred to a 4 �Cstore. Additional tubers of S. tuberosum cultivar Desiree,used in the comparison of metabolites from fresh and FDmaterial, were purchased from a local supermarket.
2.2. Chemicals
Standards and reagents were purchased from Sigma-Aldrich Co. Ltd. (Poole, UK). Solvents were of Distolgrade and were supplied by Fischer Scientific UK(Loughborough, UK).
2.3. General preparation of freeze-dried samples
A random selection of potato tubers (6 or 7) of averagesize were taken from storage, washed, blotted dry withtissue paper, weighed and cut into eighths. Two oppositeeighths from each tuber were taken and immediatelyimmersed in liquid N2 and bulked by replicate forfreeze-drying (Griffiths and Dale, 2001). This samplingprocedure minimises variation due to internal metabolitegradients within the tuber. Samples were freeze-dried,ground in a laboratory mill fitted with a 1 mm screen andthe resulting powdered samples were stored in the dark at)20 �C until used for metabolite analysis.
2.4. Preparation of samples for metabolite gradientanalysis
Three tubers were washed and cut into ten radial slices,each approximately 1 cm thick, from the heel (stem) endof the tuber to the rose (bud) end. From each slice up tofour or five evenly distributed cores (7 mmdiameter) weretaken from within each of three physiologically distinctregions, namely the central pith (also known as themedulla), inner cortex and outer cortex (figure 1). Inaddition four short segments were taken tangential to theouter surface from evenly distributed points around eachslice, which incorporated skin and attached cortical
tissue. The fresh potato cores from an individual slicewere bulked according to anatomical location, and werethen frozen and freeze-dried as described above. Thuseach potato slice provided four samples corresponding todifferent positions from the centre (pith) out to the skinand in total each tuber provided 40 samples which wereused to measure any radial and longitudinal metabolitegradients within the tuber.
2.5. Preparation and extraction of samples forcomparison of fresh and freeze-dried material
A sliced tuber (Desiree) was immediately frozen inliquid nitrogen and ground to a powder while keptfrozen. A fresh sample was taken and the remainder ofthe frozen potato was freeze-dried and ground to apowder. Six sub-samples (�460 mg each) of freshmaterial and six sub-samples (�68 mg each, equivalentto 460 mg of fresh tubers using a measured dry mattercontent of 14.7%, w/w) of FD material were extractedas described below except that only 0.36 mL water(instead of 0.75 mL) was used during the extraction ofthe fresh samples to allow for their water content. Allsamples were derivatized and the metabolite profileswere determined as described below.
2.6. Extraction of polar and non-polar metabolites fromfreeze-dried powder
The following protocol describes the general methodused for extraction of metabolites from samples. Inter-nal standards for polar metabolites (100 lL aqueousribitol, 2 mg mL)1) and non-polar metabolites (100 lLmethanolic methyl nonadecanoate, 0.2 mg mL)1) wereadded to powdered FD potato tuber (100 mg) in a glassculture tube (125·16 mm). Methanol (3 mL) was addedand the mixture was shaken vigorously on a vortexshaker at 30 �C for 30 min. Water (0.75 mL) and chlo-roform (6 mL) were added sequentially, and after eachaddition the mixture was shaken at 30 �C for a further30 min. Finally more water (1.5 mL) was added and themixture was shaken by hand and then separated bycentrifugation into upper (polar) and lower (non-polar)fractions, each of which was isolated by pipette. Theseparated fractions were either subjected immediately tofurther processing, derivatisation and analysis, oralternatively were stored at )20 �C pending furtherprocessing. Polar fractions could be stored directlywhereas non-polar fractions were first evaporated todryness under nitrogen and then re-dissolved inisohexane containing 50 ppm 2,6-di-t-butyl-4-methyl-phenol (BHT).
2.7. Linearity experiments
To assess the linearity of the response ratios forindividual metabolites with increasing sample size
Pith Inner cortex Outer cortex Skin
tissue core
tangential slice through skin
Figure 1. Potato tuber slice showing different tissue types and loca-
tion of tissue samples taken to measure metabolite gradients.
T. Shepherd et al./Potato metabolomics by GC–MS476

different quantities of FD potato (5, 10, 30, 50, 100, 200,250 and 400 mg) were extracted, processed and analysedusing the optimized methodology as described for100 mg samples.
2.8. Derivatisation of polar extracts
All derivatizations were, unless stated differently inthe text, carried out as follows. An aliquot (250 lL) ofthe polar fraction was evaporated to dryness using acentrifugal evaporator and oximated with methoxyl-amine hydrochloride (20 mg mL)1) in anhydrous pyri-dine (80 lL) at 50 �C for 4 h. Anhydrous pyridine wasstored over molecular sieves (4 A) in a dessicator.Samples were then silylated at 37 �C for 30 min with80 lL of N-methyl-N-(trimethylsilyl)-trifluoroacetamide(MSTFA). A sub-sample (40 lL) was taken and addedto an autosampler vial containing a mixture of alkanesto serve as retention index (Rt) markers. The retentionstandards consisted of a mixture of the n-alkanesundecane, tridecane, hexadecane, eicosane, tetracosane,triacontane, tetratriacontane and octatriacontane, eachat a concentration of 0.2 mg mL)1 in isohexane. Thesample was diluted with pyridine (1:1) and analysed byGC–MS.
2.9. Derivatisation of non-polar extracts
The entire non-polar fraction was evaporated todryness and transesterified at 50 �C overnight with 1%(v/v) methanolic sulphuric acid (2 mL). Sodium chloride(5 mL, 5% w/v) and chloroform (3 mL) were added andthe mixture was shaken and left to separate into twolayers. The lower chloroform layer was separated off,shaken with 2% (w/v) potassium bicarbonate (3 mL)and the mixture was left to separate. The lower chlo-roform layer was removed, dried over anhydroussodium sulphate and then evaporated to dryness. Theconcentrate was solubilised in chloroform (50 lL),pyridine (10 lL) was added and silylation was achievedwith MSTFA (80 lL) at 37 �C for 30 min. A sub-sam-ple (40 lL) was prepared for analysis by GC–MS asdescribed for the polar fraction.
2.10. Analysis of tuber metabolites by GC–MS
2.10.1. Time-of-flight (TOF)–mass spectrometryThe polar and non-polar samples were analysed simi-larly using a Thermo Finnigan Tempus GC–(TOF)–MSsystem. Samples (1 lL) were injected into a program-mable temperature vaporising (PTV) injector with a splitof 167:1. The PTV conditions were injection tempera-ture 132 �C for 1 min, transfer rate 14.5 �C s)1, transfertemperature 320 �C for 1 min, clean rate 14.5 �C s)1
and clean temperature 400 �C for 2 min. Chromatog-raphy was effected on a DB5-MSTM column(15 m · 0.25 mm · 0.25 lm; J&W, Folsom, CA) using
helium at 1.5 mL min)1 (constant flow). The GC tem-peratures were 100 �C for 2.1 min, 25 �C min)1 to320 �C then isothermal for 3.5 min. The GC–MSinterface temperature was 250 �C. MS acquisition con-ditions were electron impact (EI) ionisation at 70 eV,solvent delay 1.3 min, source temperature 200 �C, massrange 35–900 a.m.u. at 4 spectra s)1. Acquisition rateswere set to give approximately 10 data points across achromatographic peak. Data were acquired using theXcaliburTM software package V. 1.2.
2.10.2. Quadrupole–mass spectrometryAlternatively, samples were analysed using a ThermoFinnigan Trace DSQ GC–MS system. Conditions usedfor sample injection and chromatographic separationwere identical to those described for the TOF system,except that a split of 80:1 was used on the PTV injector.The GC–MS interface temperature was 250 �C, and theMS source temperature was 200 �C. Mass spectra wereacquired over the mass range 35–900 a.m.u. at 6scans s)1 under EI ionisation conditions at 70 eV, aftera solvent delay of 1.25 min. Data were acquired usingthe XcaliburTM software package V. 1.4.
2.11. Data analysis
A number of XcaliburTM raw data files were selectedas being representative examples for both polar andnon-polar metabolites. These files were used with theAMDISTM software package to verify the presence ofindividual analytes and to deconvolute co-eluting peaks.Specific ions(s) characteristic of each metabolite wereselected to be used for compound detection in process-ing methods created using XcaliburTM. For each com-ponent, including the appropriate internal standard, atime window was defined relative to an adjacent Rt
standard and a selected ion chromatogram (SIC) wasgenerated for each metabolite within the appropriatetime window. An example of this for three co-elutingamino acids in the polar metabolite fraction can befound in Supplementary Material. Response ratios wereautomatically calculated for each analyte relative to theIS using the calculated SIC areas for both components.The main criteria for selection of suitable ions forcompound identification were that the ion should haveas high a relative abundance as possible and should beunique to the compound and/or be well resolved fromother ions with the same m/z in the defined time win-dow. Processed data were checked and corrected wherenecessary, for example for incorrect assignment of theposition of the selected ion within the time window,before being subject to further data analysis. Com-pounds were identified by analysis of standards, com-parison with MS libraries and literature data and byextrapolation from data for known compounds. Pro-cessed data were subject to appropriate statisticaltreatment including principal component analysis
T. Shepherd et al./Potato metabolomics by GC–MS 477

(PCA) or analysis of variance (ANOVA) as described byLehesranta et al. (2005). All statistical analyses werecarried out using GenstatTM for Windows, 6th Ed.
3. Results and discussion
Theprofilingmethodwas used to characterise a total ofabout 180 major and minor polar and non-polarmetabolites in potato tubers, and representative total ionchromatograms (TIC) for polar and non-polarmetabolites are shown in the Supplementary Material.Approximately 50%of themetabolites could be identifiedand these are listed in Tables 1 and 2 for polar andnon-polar metabolites, respectively. For each metabolitethe ion(s) used for metabolite identification andquantification are listed along with a relative retentionindex, RRi.
3.1. Effect of variation in oximation conditions
Aldose and ketose sugars such as fructose andglucose can adopt a variety of structural forms and inaqueous solution they exist predominantly in the cyclicfuranose and pyranose forms rather than in the openchain acyclic form. However, in non-aqueous solventsthe distribution of the different structural types of eachsugar can become more complex. To minimise forma-tion of multiple sugar structures during silylation ofpolar metabolites, methyloximes (MEOX) of aldose andketose reducing monosaccharides such as glucose andfructose are formed from the condensation reactionbetween the carbonyl group of the acyclic form of thesugar and methoxylamine hydrochloride, prior to sily-lation. This locks the sugar in the acyclic form to givetwo positional isomers per sugar and in principle avoidsthe formation of anomeric furanose and pyranoseforms. An illustration of this for fructose can be foundin the Supplementary Material. In addition, polysac-charides having a free reducing end are also oximatedwhereas those lacking a free reducing end, such assucrose, are unoximated. In practice, the extent ofoximation is both temperature- and time-dependent andoptimisation of conditions to maximise oxime formationis necessary since the presence of appreciable amounts ofunoximated derivatives further complicates both thechromatography and data analysis. A further compli-cation is that other metabolites may not be stable undersome reaction conditions. For example, in the earlystages of method development we observed that sucrosedegrades to glucose and fructose under more extremeoximation conditions.
The effects of reaction temperature and time of reac-tion on oximation were investigated to find optimal con-ditions. The polar fraction of a potato extract wasoximated at 30, 50, 70 and 100 �C for 45 min followed bystandard trimethylsilyl (TMS)derivatization. The relative
amounts of each analyte (oximated and unoximatedglucose and fructose, and sucrose) at the different tem-peratures were calculated from the area of a characteristicion relative to that of the internal standard (ribitol); asingle anomer was chosen for each type of analyte as therelative proportions of anomers was constant. At 30 �Cfructose and glucose were only partially oximated(figure 2A). The degree of oximation increased withincreasing temperature so that at 100 �C oximation wascomplete. However at 100 �C, the recovery of sucrosedecreased suggesting that it hadhydrolysed.Oximationofa standard sucrose sample at different temperaturesconfirmed that it was hydrolysing to glucose and fructoseat 100 �C for 45 min. A similar extract was oximated at50 �C for up to 21 h. Oximation was complete after 4 hbut prolonged reaction resulted in hydrolysis of sucrosewith a concomitant increase in oximated fructose andglucose (figure 2B). In summary, at lower temperatures(figure 2A) and shorter reaction times (figure 2B) oxi-mation was incomplete. At higher temperatures andlonger times oxime formation was essentially completebut sucrose degradation became significant. Ultimatelyunder the most extreme conditions, glucose and fructosealso degraded. For maximum formation of sugar oximesand minimum levels of sucrose breakdown, optimumconditions were found to be 50 �C for 4 h.
Various other reducing sugars (erythrose, xylose,lyxose, arabinose, ribose, rhamnose, fucose, sorbose,mannose, galactose, glucose-6-phosphate, fructose-6-phosphate, glucosamine, lactose, maltose and isomal-tose) were completely oximated under these conditions.In addition, there was no evidence of hydrolysis of di- ortri-saccharides (lactose, maltose, isomaltose and raffi-nose; data not shown). In some studies, oximation hasbeen carried out at either 30 or 37 �C for 90 min on avariety of materials (Schauer et al., 2005b; Urbanczyk-Wochniak and Fernie, 2005; Urbanczyk-Wochniaket al., 2005) including potato tubers (Roessner et al.,2000, 2001). Although oximation was considered to becomplete under these conditions (Roessner et al., 2000),our studies would suggest that oximation of glucose andfructose could be only about 50% complete.
3.2. Metabolite gradients in tubers
The response ratios of metabolites were measured atdifferent positions in fresh tubers, from four differenttissue types (pith, inner cortex, outer cortex and skin,figure 1) within each of 10 slices from the apical to thestolon end. The outer slices from each end of the potatowere excluded because they included a mixture of tissuetypes. A number of metabolites displayed significantdifferences either radially or between slices (Tables 3and 4), however, other metabolites did not exhibit suchvariations. Most of the metabolite gradients wereobserved between the different tissue types but notbetween the different slices. The levels of the amino acids
T. Shepherd et al./Potato metabolomics by GC–MS478

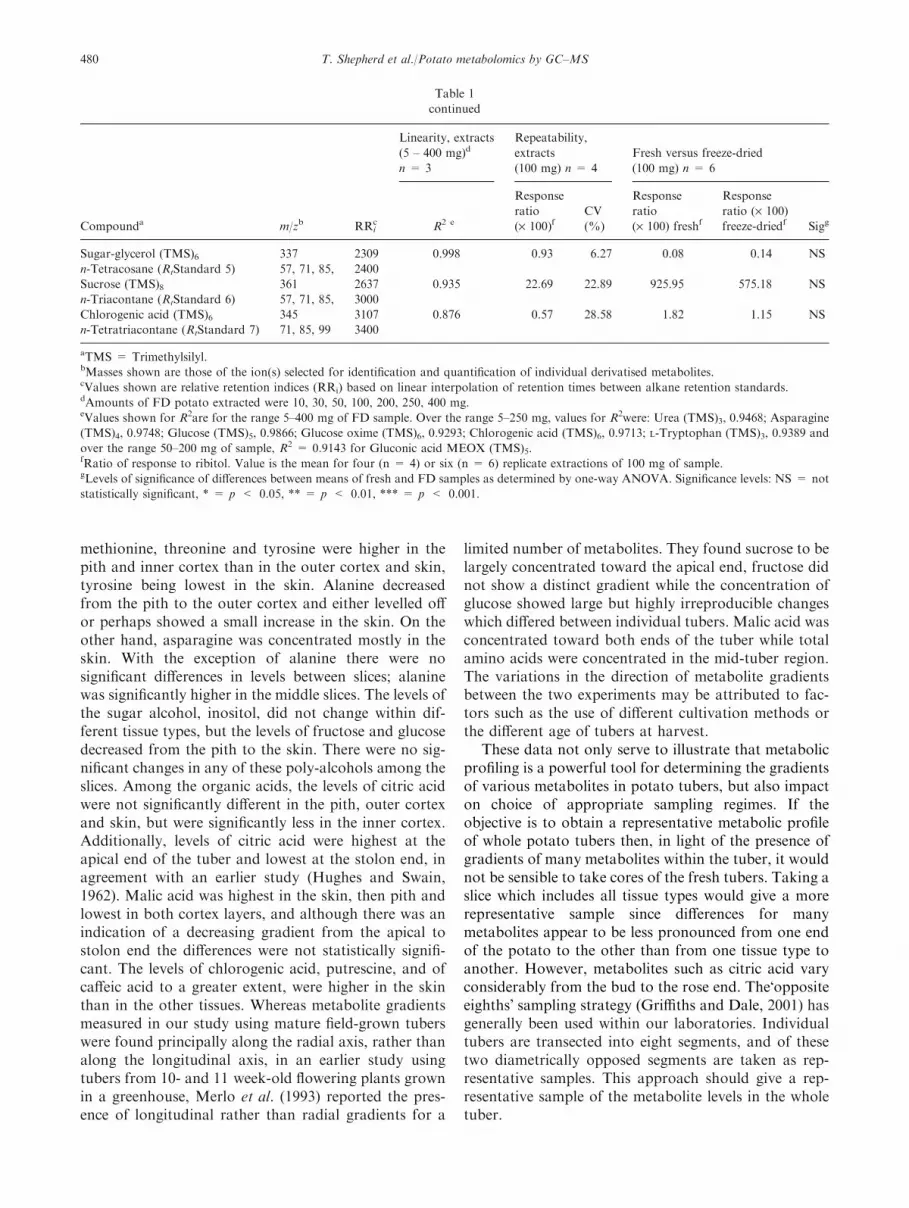
Table 1
Polar metabolites – linearity, repeatability and comparison of fresh and freeze-dried potato tubers
Compounda m/zb RRic
Linearity, extracts
(5 – 400 mg)d
n = 3
Repeatability,
extracts
(100 mg) n = 4
Fresh versus freeze-dried
(100 mg) n = 6
R2 e
Response
ratio
(· 100)fCV
(%)
Response
ratio
(· 100) freshf
Response
ratio (· 100)
freeze-driedf Sigg
L-Alanine (TMS)2 116 1095 0.981 16.61 16.61 133.19 135.21 NS
n-Undecane (RtStandard 1) 57, 71, 85 1100
2-Aminobutyric acid (TMS)2 130 1171 0.962 16.32 41.87 5.49 5.60 NS
Urea (TMS)3 261 1177 0.827 0.56 32.12 1.25 2.08 NS
L-Valine (TMS)2 144 1216 0.996 240.91 11.15 392.62 386.88 NS
Urea (TMS)2 189 1244 0.948 6.79 17.56 5.98 7.00 NS
Phosphate (TMS)3 299 1269 0.994 108.87 14.70 248.31 229.55 NS
L-Leucine (TMS)2 158 1270 0.998 32.68 12.04 113.39 111.49 NS
Glycerol (TMS)3 205 1274 0.983 11.76 12.67 5.14 6.78 **
L-Isoleucine-(TMS)2 158 1290 0.997 113.98 4.24 237.15 233.08 NS
L-Proline (TMS)2 142 1293 0.998 26.50 8.64 155.72 153.93 NS
n-Tridecane (RtStandard 2) 57, 71, 85 1300
Glycine (TMS)2 174 1300 0.976 18.09 13.67 13.21 15.52 NS
Succinic acid (TMS)2 247 1313 0.996 0.22 13.26 0.71 0.70 NS
2,3-Dihydroxypropanoic-acid (TMS)3 189 1331 0.990 0.92 10.61 2.07 1.97 NS
Fumaric acid (TMS)2 245 1356 0.994 0.45 7.39 2.01 2.36 *
L-Serine (TMS)3 204 1366 0.990 31.88 4.77 73.55 79.25 NS
2-Piperidinecarboxylic acid (TMS)2 156 1368 0.985 7.60 4.23 14.63 14.39 NS
Dihydroxydihydrofuranone (TMS)2 247 1378 0.990 0.77 3.70 0.08 0.10 NS
L-Threonine (TMS)3 218 1393 0.986 21.08 8.74 34.35 35.50 NS
b-Alanine (TMS)3 174 1438 0.969 2.56 6.41 3.13 3.34 NS
Oxaloacetic acid enol form (TMS)3 231, 279, 305, 333 1497 0.968 1.58 5.29 10.29 9.83 NS
Malic-acid (TMS)3 233 1497 0.996 25.92 9.24 196.05 176.56 ***
L-Methionine (TMS)2 176 1524 0.996 23.34 7.85 24.65 24.44 NS
Oxo-proline (TMS)2 156 1525 0.983 785.22 16.97 894.22 889.94 NS
L-Aspartic-acid (TMS)3 232 1527 0.990 89.19 15.41 288.81 281.60 NS
c-Aminobutyric acid (TMS)3 174 1534 0.986 300.09 6.64 101.78 127.23 NS
2,3,4-Trihydroxybutyric acid (TMS)4 292 1562 0.994 1.43 12.55 0.85 0.88 NS
n-Hexadecane (RtStandard 3) 57, 71, 85 1600
L-Glutamic acid (TMS)3 246 1618 0.979 91.30 11.69 61.40 52.36 NS
L-Phenylalanine (TMS)2 192 1623 0.995 25.01 5.33 42.31 40.29 NS
L-Asparagine (TMS)4 188 1625 0.901 20.96 25.46 81.96 93.28 NS
L-Asparagine (TMS)3 116 1670 0.985 170.45 6.41 276.23 253.95 NS
Ribitol (TMS)5(Internal standard) 307 1729
L-Glutamine (TMS)4 227 1736 0.917 0.14 48.33 3.71 2.68 NS
Putrescine (TMS)4 174 1742 0.974 4.19 19.95 1.85 2.09 NS
a-Glycerophosphate (TMS)4 299 1767 0.984 1.15 4.83 0.84 0.88 NS
L-Glutamine (TMS)3 156 1781 0.949 1.08 22.80 17.42 10.57 NS
Citric acid (TMS)4 273 1824 0.975 584.86 2.13 2324.57 1927.57 **
Quinic acid (TMS)5 345 1860 0.990 35.12 5.58 7.18 8.85 ***
D-Fructose MEOX (TMS)5 307 1873 0.973 195.65 6.73 2764.88 2958.49 NS
D-Fructose MEOX (TMS)5 307 1882 0.981 137.02 7.36 2091.04 2275.21 NS
Allantoin (TMS)4 331 1886 0.974 5.03 16.97 23.76 23.13 NS
D-Glucose MEOX (TMS)5 319 1896 0.959 823.85 6.70 2458.02 2739.62 NS
D-Glucose MEOX (TMS)5 319 1914 0.973 117.10 0.94 234.78 265.32 NS
L-Histidine (TMS)3 254 1919 0.984 1.18 32.91 4.34 4.04 NS
L-Lysine (TMS)4 174 1923 0.974 33.47 6.35 42.71 45.53 NS
Diketogulonic acid (MEOX)2(TMS)4 244 1932 0.792 1.46 5.33 0.97 0.37 ***
L-Tyrosine (TMS)3 218 1939 0.993 119.01 11.57 217.93 194.87 NS
D-Glucose (TMS)5 191, 204 1973 0.859 2.75 10.80 32.03 57.01 NS
n-Eicosane (RtStandard 4) 57, 71, 85 2000
Glucaric acid (TMS)4 292 2036 0.991 0.59 12.71 1.77 1.54 NS
Inositol (TMS)6 217 2086 0.999 37.43 3.93 182.28 169.07 NS
D-Glucose oxime (TMS)6 205 2105 0.876 1.39 15.20 1.84 1.77 NS
Caffeic acid (TMS)3 396 2138 0.937 1.35 15.98 1.07 0.70 ***
L-Tryptophan (TMS)3 202 2212 0.906 5.01 9.85 18.75 18.23 NS
T. Shepherd et al./Potato metabolomics by GC–MS 479
methionine, threonine and tyrosine were higher in thepith and inner cortex than in the outer cortex and skin,tyrosine being lowest in the skin. Alanine decreasedfrom the pith to the outer cortex and either levelled offor perhaps showed a small increase in the skin. On theother hand, asparagine was concentrated mostly in theskin. With the exception of alanine there were nosignificant differences in levels between slices; alaninewas significantly higher in the middle slices. The levels ofthe sugar alcohol, inositol, did not change within dif-ferent tissue types, but the levels of fructose and glucosedecreased from the pith to the skin. There were no sig-nificant changes in any of these poly-alcohols among theslices. Among the organic acids, the levels of citric acidwere not significantly different in the pith, outer cortexand skin, but were significantly less in the inner cortex.Additionally, levels of citric acid were highest at theapical end of the tuber and lowest at the stolon end, inagreement with an earlier study (Hughes and Swain,1962). Malic acid was highest in the skin, then pith andlowest in both cortex layers, and although there was anindication of a decreasing gradient from the apical tostolon end the differences were not statistically signifi-cant. The levels of chlorogenic acid, putrescine, and ofcaffeic acid to a greater extent, were higher in the skinthan in the other tissues. Whereas metabolite gradientsmeasured in our study using mature field-grown tuberswere found principally along the radial axis, rather thanalong the longitudinal axis, in an earlier study usingtubers from 10- and 11 week-old flowering plants grownin a greenhouse, Merlo et al. (1993) reported the pres-ence of longitudinal rather than radial gradients for a
limited number of metabolites. They found sucrose to belargely concentrated toward the apical end, fructose didnot show a distinct gradient while the concentration ofglucose showed large but highly irreproducible changeswhich differed between individual tubers. Malic acid wasconcentrated toward both ends of the tuber while totalamino acids were concentrated in the mid-tuber region.The variations in the direction of metabolite gradientsbetween the two experiments may be attributed to fac-tors such as the use of different cultivation methods orthe different age of tubers at harvest.
These data not only serve to illustrate that metabolicprofiling is a powerful tool for determining the gradientsof various metabolites in potato tubers, but also impacton choice of appropriate sampling regimes. If theobjective is to obtain a representative metabolic profileof whole potato tubers then, in light of the presence ofgradients of many metabolites within the tuber, it wouldnot be sensible to take cores of the fresh tubers. Taking aslice which includes all tissue types would give a morerepresentative sample since differences for manymetabolites appear to be less pronounced from one endof the potato to the other than from one tissue type toanother. However, metabolites such as citric acid varyconsiderably from the bud to the rose end. The�oppositeeighths� sampling strategy (Griffiths and Dale, 2001) hasgenerally been used within our laboratories. Individualtubers are transected into eight segments, and of thesetwo diametrically opposed segments are taken as rep-resentative samples. This approach should give a rep-resentative sample of the metabolite levels in the wholetuber.
Table 1
continued
Compounda m/zb RRic
Linearity, extracts
(5 – 400 mg)d
n = 3
Repeatability,
extracts
(100 mg) n = 4
Fresh versus freeze-dried
(100 mg) n = 6
R2 e
Response
ratio
(· 100)fCV
(%)
Response
ratio
(· 100) freshf
Response
ratio (· 100)
freeze-driedf Sigg
Sugar-glycerol (TMS)6 337 2309 0.998 0.93 6.27 0.08 0.14 NS
n-Tetracosane (RtStandard 5) 57, 71, 85, 2400
Sucrose (TMS)8 361 2637 0.935 22.69 22.89 925.95 575.18 NS
n-Triacontane (RtStandard 6) 57, 71, 85, 3000
Chlorogenic acid (TMS)6 345 3107 0.876 0.57 28.58 1.82 1.15 NS
n-Tetratriacontane (RtStandard 7) 71, 85, 99 3400
aTMS = Trimethylsilyl.bMasses shown are those of the ion(s) selected for identification and quantification of individual derivatised metabolites.cValues shown are relative retention indices (RRi) based on linear interpolation of retention times between alkane retention standards.dAmounts of FD potato extracted were 10, 30, 50, 100, 200, 250, 400 mg.eValues shown for R2are for the range 5–400 mg of FD sample. Over the range 5–250 mg, values for R2were: Urea (TMS)3, 0.9468; Asparagine
(TMS)4, 0.9748; Glucose (TMS)5, 0.9866; Glucose oxime (TMS)6, 0.9293; Chlorogenic acid (TMS)6, 0.9713; L-Tryptophan (TMS)3, 0.9389 and
over the range 50–200 mg of sample, R2 = 0.9143 for Gluconic acid MEOX (TMS)5.fRatio of response to ribitol. Value is the mean for four (n = 4) or six (n = 6) replicate extractions of 100 mg of sample.gLevels of significance of differences between means of fresh and FD samples as determined by one-way ANOVA. Significance levels: NS = not
statistically significant, * = p < 0.05, ** = p < 0.01, *** = p < 0.001.
T. Shepherd et al./Potato metabolomics by GC–MS480

Table 2
Non-polar metabolites – linearity, repeatability and comparison of fresh and freeze-dried potato tubers
Compound a m/zb RRic
Linearity,
extracts
(5 – 400 mg)d
n = 3
Repeatability,
extracts
(100 mg) n = 4
Fresh versus
freeze-dried
(100 mg) n = 6
R2 e
Response
ratio
(· 100)fCV
(%)
Response
ratio (· 100)
Freshf
Response
ratio (· 100)
Freeze-driedf Sigg
n-Hexadecane (RtStandard 3) 57,71,85 1600
n-Tetradecanoic acid methyl ester 242 1734 0.977 88.24 14.6 5.00 3.99 **
3- or 4-Methoxy-4- or 3-hydroxy
cinnamic acid methyl ester (TMS)
280 1832 0.976 95.16 19.1 10.81 6.48 NS
n-Pentadecanoic acid methyl ester 256 1836 0.970 46.56 6.4 7.07 5.03 ***
n-Hexadecenoic acid methyl ester 236 1909 0.971 9.67 5.6 5.08 4.93 NS
n-Hexadecanoic acid methyl ester 74 1932 0.981 3403.90 24.4 5765.36 4193.64 ***
3- or 4-Methoxy-4- or 3-hydroxy
cinnamic acid methyl ester (TMS)
250 1950 0.783 99.76 27.7 16.19 10.59 NS
15-Methylhexadecanoic acid 74 1989 0.998 48.06 8.3 29.02 21.85 ***
n-Eicosane (RtStandard 4) 57, 71, 85 2000
n-Heptadecanoic acid methyl ester 74 2028 0.992 49.63 6.8 38.53 29.30 ***
n-9,12-Octadecadienoic acid 294 2099 0.972 835.93 48.6 1191.83 795.68 ***
n-9,12,15-Octadecatrienoic acid methyl ester 292 2105 0.994 51.85 11.6 605.73 407.85 ***
n-Octadecenoic acid methyl ester 264 2105 0.993 40.95 8.6 40.46 29.92 *
n-Octadecenoic acid methyl ester 264 2110 0.999 28.83 12.1 _ _
2-Hydroxy-n-hexadecanoic acid methyl ester (TMS) 343–344 2127 0.996 42.89 8.4 33.05 25.28 **
n-Octadecanoic acid methyl ester 298 2132 0.966 293.09 39.2 296.96 224.22 ***
n-Nonadecenoic acid methyl ester 278 2168 0.963 0.62 82.3 0.96 0.73 **
n-Nonadecanoic acid methyl ester (internal standard) 269 2234
n-Tricosane 155 2306 0.997 6.55 9.2
n-Eicosanoic acid methyl ester 326 2331 0.999 41.92 9.6 45.46 35.08 ***
n-Tetracosane (RtStandard 5) 57, 71, 85, 2400
n-Heneicosanoic acid methyl ester 340 2427 0.976 13.12 10.6 4.07 3.50 **
n-Heneicosanol (TMS) 369 2450 0.925 92.30 17.4 20.09 19.98 NS
n-Docosanoic acid methyl ester 354 2537 0.982 26.50 23.0 15.98 12.82 ***
n-Docosanol (TMS) 383 2558 0.991 27.05 16.8 6.25 6.27 NS
n-Tricosanoic acid methyl ester 368 2641 0.992 27.63 5.6 16.61 12.99 ***
n-Tricosanol (TMS) 397 2658 0.990 13.74 22.5 2.30 2.45 NS
n-Heptacosane 380 2715 0.831
n-Tetracosanoic acid methyl ester 382 2742 0.994 51.71 7.7 14.45 11.67 ***
n-Tetracosanol (TMS) 411 2759 0.994 24.03 18.6 4.46 4.25 NS
n-Pentacosanoic acid methyl ester 396 2842 0.958 8.88 9.2 2.69 2.34 *
2-Hydroxy-n-tetracosanoic acid methyl ester (TMS) 411 2909 0.995 5.86 7.7 2.46 2.28 NS
n-Hexacosanoic acid methyl ester 410 2933 0.982 23.71 5.8 2.05 1.79 NS
n-Hexacosanol (TMS) 439 2943 0.995 56.82 15.4 9.07 8.37 NS
n-Triacontane (RtStandard 6) 57, 71, 75 3000
n-Heptacosanol (TMS) 453 3039 0.994 18.82 16.8 2.49 2.62 NS
n-Octacosanoic acid methyl ester 438 3136 0.992 82.01 3.8 6.74 6.23 NS
n-Octacosanol (TMS) 467 3140 0.934 942.36 20.9 65.61 60.59 NS
Solanid-5-en-ol (TMS) 469 3198 0.990 63.99 15.9 2.69 2.24 NS
n-Nonacosanoic acid methyl ester 452 3237 0.987 28.80 13.8 2.70 2.59 NS
Nonacosanol (TMS) 481 3237 0.990 75.15 13.1 13.33 12.92 NS
Stigmasterol (TMS) 484 3276 0.989 8.63 12.2 9.25 7.51 **
Fucosterol (TMS) 386 3330 0.986 11.04 13.3 9.04 7.22 **
b-Sitosterol (TMS) 357 3334 0.980 47.62 9.9 32.83 27.05 *
D5-Avenasterol (TMS) 386 3346 0.971 21.78 27.6 65.15 52.82 ***
5,24(25)-Stigmastadienol (TMS) 386 3369 0.985 10.14 21.4 7.49 5.80 **
n-Tetratriacontane (RtStandard 7) 71, 85, 99 3400
aTMS = Trimethylsilyl.bMasses shown are those of the ion(s) selected for identification and quantification of individual derivatised metabolites.cValues shown are relative retention indices (RRi) base on linear interpolation of retention times between alkane retention standards.dAmounts of FD potato extracted were 10, 30, 50, 100, 200, 250, 400 mg.eValues shown for R2are for the range 5–250 mg of FD sample. Over the range 50–200 mg of sample, R2 = 0.9772 for Methoxy cinnamic acid methyl ester (TMS).fRatio of response to nonadecanoic acid methyl ester. Value is the mean for four replicate extractions of 100 mg of sample.gLevels of significance of differences between means of fresh and FD samples as determined by one-way ANOVA. Significance levels: NS = not statistically
significant, *p 0.05, **p < 0.01, ***p < 0.001.
T. Shepherd et al./Potato metabolomics by GC–MS 481

3.3. Comparison of fresh and freeze-dried material
Homogenising fresh tubers to obtain representativesamples is an arduous and impractical task whenhandling large numbers of samples. This involvesgrinding the tubers in liquid nitrogen to minimizeenzymic and oxidative damage to the sample. A morepractical solution is to freeze-dry tubers and grind up toa fine powder. This enables representative samples to betaken and has the added advantage that material can beconveniently stored in a freezer until analysis orre-analysis.
A comparison of the polar and non-polar metaboliteswas made between fresh and FD potato tubers of S.tuberosum cultivar Desiree. There were no qualitativedifferences in metabolites and quantitatively, out of 128polar metabolites analysed, including those that wereidentified (Table 1), there were few significant differ-ences between fresh and FD material. The Desireetubers used in this comparison were obtained from asupermarket and were notable in containing high levelsof sugars (fructose, glucose and sucrose) compared toDesiree used in the linearity experiment which wasgrown under controlled conditions (Table 1). Presum-ably, this reflects prolonged cold storage, known toincrease sugar levels (Brown et al., 1990). There weresignificant differences (95% level) for only 11 metabo-lites (including seven that were identified) between freshand FD material. Glycerol, fumaric acid and quinic acidwere slightly higher in FD material, whereas malic,citric, diketogulonic and caffeic acids were higher infresh material. There was no separation of fresh and FDmaterial when the data was subjected to PCA.
The situation was different for the non-polar metab-olites. Between fresh and FD material, there were sig-nificant differences for 22 metabolites, about half thetotal number analysed (Table 2). These included mostfatty acids from C14 to C25 (not hexadecenoic acid or2-hydroxy tetracosanoic acid, but included 2-hydroxyhexadecanoic acid) and all the sterols, but not fatty acidsfrom C25 to C29, or straight chain alcohols. All the lowerchain fatty acids and sterols are membrane lipids, andthey were elevated (by approximately 30%) in freshmaterial. The reason for this is unclear but may reflect amore complete extraction for fresh material rather thandegradation of FD material. If membrane lipids hadbeen degraded, by the action of lipases, to a greaterdegree in FD material then the resultant free fatty acidswould also have been transesterified by the acid-cataly-sed procedure and therefore would have been includedin the analyses, i.e., similar total fatty acid methyl esterlevels to those in fresh material would have beenexpected. Fatty acid oxidation is unlikely since bothsaturated and unsaturated fatty acids were affected.When the data were analysed by PCA, the fresh and FDsamples were clearly separated in PC1. PC1 accountedfor 50% of the variation in the data and the metaboliteswith the highest loadings in this score were those thatwere significantly different according to ANOVA.However, the non-polar and polar results were asrepeatable for FD as for fresh material (on the basis ofcoefficients of variation, CV, for all compounds), andthe analytical method using FD material was linear (seefollowing section, Tables 1 and 2). Therefore, it followsthat, in spite of the lower levels of some non-polarmetabolites, the use of FD material is valid especiallywhen relative and not absolute levels of a particularmetabolite are to be compared between different treat-ments, as is usually the case.
3.4. Linearity and repeatability of the method
3.4.1. LinearityThe linearity of the profiling method was assessed byanalysis of polar and non-polar extracts made fromdifferent amounts of FD potato. The standard extrac-tion and derivatisation protocols were used withquantities of potato powder ranging from 5 to 400 mg.Measurements were made in triplicate relative to thefixed quantities of the respective internal standards usedin the standard method for sample sizes of 100 mg. Foreach metabolite, the best linear correlation betweenresponse ratio and sample size was determined and thelinear correlation coefficient R2 was calculated (Tables 1and 2). For the polar metabolites most R2 values weregreater than 0.97 over the full range of sample size(5–400 mg), indicating only small deviations from atruly linear response. For a few polar metabolites, theextent of linearity was improved if the data points forthe 400 mg sample were omitted. Similarly, the R2
0.0
0.5
1.0
1.5
2.0
2.5
3.0
30 40 50 60 70 80 90 100
Oximation temperature (°C)
oitaresnopse
R
(A)
0.0
0.5
1.0
1.5
2.0
2.5
0 1 2 3 4 5 6 7Oximation time (h)
oitaresnopse
R
(B)
Fructose Glucose Glucose MEOXSucrose Fructose MEOX
Figure 2. (A) Effects of reaction temperature on oximation of potato
tuber sugars for 45 min. (B) Effect of reaction time on oximation at
50 �C. Oximation is followed by silylation with MSTFA. Derivatives
shown are fructose MEOX (TMS)5; fructose (TMS)5; glucose MEOX
(TMS)5; glucose (TMS)5; sucrose (TMS)8. The arrow indicates optimum
conditions for oximation. Error bars represent lsd values (p < 0.05).
T. Shepherd et al./Potato metabolomics by GC–MS482

values for most non-polar metabolites were greater than0.97. However this linear response only held over therange 5–250 mg, linearity breaking down at the 400 mglevel; data points for the latter sample size were not usedfor calculation of the values shown in Table 2. Minordeviations from linearity were most pronounced at thelowest (5–30 mg) and highest (400 mg) sample sizes andprobably reflected the use of extraction conditionsoptimised for use with 100 mg samples. We also foundsimilarly linear behaviour when various metabolitestandards were analysed at a range of concentrations.The data presented in Tables 1 and 2 were acquired
using the TOF instrument, however the method wasfound to be similarly linear when the analysis wasconducted on the equivalent quadrupole instrument.
The use of autosamplers for sample injection onto aGC should minimise the effects of variation in injectiontechnique, however, it is possible that on occasion thevolume of sample injected may vary from the standard1 lL used, most likely due to the presence of air bubblesin the syringe. Consequently, we investigated the effectof changes in injection volume on the measured instru-mental response, and found that the response ratios fora selection of metabolites remained uniform except at
Table 3
Metabolite gradient within tuber – radial distribution
Compound
Response ratioa
Lsd (p < 0.05) Significance
Interaction
(with slice)Pith Inner cortex Outer cortex Skin
Amino acids
L-Alanine 0.76 0.38 0.22 0.37 0.155 <0.001 NS
L-Asparagine 1.02 0.63 0.69 3.07 0.510 <0.001 NS
L-Methionine 0.16 0.13 0.06 0.06 0.029 <0.001 NS
L-Threonine 0.17 0.16 0.10 0.11 0.034 <0.001 NS
L-Tyrosine 0.90 0.89 0.64 0.35 0.235 <0.001 NS
Poly-alcohols
Inositol 0.69 0.60 0.70 0.66 NS NS
Fructose 19.99 14.22 12.97 9.64 4.199 <0.001 NS
Glucose 18.63 13.96 14.07 8.8 5.093 <0.001 NS
Organic acids
Caffeic acid 0.0002 0.0005 0.0016 0.0247 0.0049 <0.001 NS
Chlorogenic acid 0.005 0.006 0.005 0.015 0.0054 <0.001 NS
Citric acid 8.08 5.45 7.7 9.02 2.07 0.008 NS
Malic acid 1.50 0.73 0.72 1.88 0.374 <0.001 NS
Putrescine 0.008 0.006 0.012 0.024 0.0034 <0.001 NS
a Response ratios, relative to internal standard, averaged over all slices; NS, not statistically significant.
Table 4
Metabolite gradient within tuber – from apical to stolon end
Compound
Response ratio of slicea
Lsd (p < 0.05) Significance
Apical Stolon
2 3 4 5 6 7 8 9
Amino acids
L–Alanine 0.33 0.53 0.51 0.52 0.57 0.45 0.29 0.26 0.220 0.026
L–Asparagine 1.11 1.16 1.43 1.15 1.45 1.88 1.41 1.24 NS
L–Methionine 0.11 0.12 0.11 0.12 0.12 0.10 0.09 0.07 NS
L–Threonine 0.14 0.16 0.13 0.14 0.15 0.13 0.12 0.11 NS
L–Tyrosine 0.72 0.79 0.63 0.74 0.80 0.65 0.68 0.56 NS
Poly-alcohols
Inositol 0.685 0.633 0.663 0.658 0.659 0.617 0.692 0.672 NS
Fructose 13.15 14.05 11.3 14.87 15.31 14.91 15.47 14.6 NS
Glucose 11.14 12.42 10.75 16.44 16.64 13.85 14.54 15.12 NS
Organic acids
Caffeic acid 0.009 0.006 0.008 0.007 0.008 0.004 0.005 0.006 2.928 NS
Chlorogenic acid 0.007 0.006 0.007 0.010 0.009 0.006 0.010 0.005 NS
Citric acid 10.81 8.87 9.23 7.13 7.28 6.14 6.11 4.92 0.003
Malic acid 1.457 1.335 1.518 1.214 1.212 0.999 0.911 1.005 NS
Putrescine 0.013 0.012 0.012 0.012 0.012 0.014 0.011 0.012 NS
a Response ratios, relative to internal standard, averaged over all tissue types; NS, not statistically significant.
T. Shepherd et al./Potato metabolomics by GC–MS 483

injection volumes below 0.25 lL when some evidence ofdifferential response was detected.
3.4.2. Short-term repeatability and control of small-scaleexperiments
The repeatability of the method has two major contrib-utory elements; sample preparation procedure andinstrumental analysis. The overall repeatability of themethodwas tested for polar andnon-polarmetabolites byanalysis of four replicate extracts of 100 mg of the samesample ofS. tuberosum cultivarDesiree on the TOF–GC–MS. Data were analysed by ANOVA and CV values forextracts are listed in Tables 1 and 2. For most polarmetabolites, CVs were in the range 5–15%, whereas thosefor most non-polar metabolites were slightly higher at 5–20%. These levels of variability are broadly in agreementwith previously reported values for potato tuber (Roess-ner et al. 2000) and rice (Frenzel et al. 2002).
Routinely, throughout a sequence of samples analysedwithin a 24-h period, GC–MS instrument performancewas monitored by including two reference samples [a S.tuberosum cultivar Desiree, and a S. phureja genotypeDB333(16)] each analysed in triplicate near the beginning,middle and endof the sequence (i.e., 18 injections in total).
3.4.3. Long-term repeatability and control of large orlong-term experiments
Experiments may often be conducted over long periodsof time or be otherwise designed such that analysis ofsamples from the study may require extended periodsvarying from a few days to several months and possiblyyears. Therefore, it was necessary to build into themethods used, mechanisms that will ensure that dataobtained over such periods remain valid. One way tomonitor performance was to include the same referencesamples (a Desiree and a Phureja genotype) within eachsequence of samples. The long-term repeatability of theresponse ratios for the polar (Table 5) and non-polar(Table 6) metabolites of the Desiree reference sample,analysed on 12 separate days (nine analyses each day,freshly extracted and derivatized each day) over a periodof 3 months on a quadrupole GC–MS, was considerablyworse than the repeatability on any one day. It seemsfeasible that day-to-day experimental error, for exampledue to variation in MS tune parameters, may affect theresponse ratios for the two reference samples in a similarway. In an attempt to eliminate some of the variabilitydue to experimental error, the response ratios of theDesiree references were expressed as a ratio to the rele-vant mean day response ratios of the Phureja references.Indeed, the repeatability was improved, particularly forthe non-polar metabolites, although they were stillinferior to the CV values for a single day.
It follows that the quality of the data obtained foractual samples may be considerably improved if theresponse ratios are expressed as a ratio to the mean dayresponse ratios of one of the reference samples. For
example, in one extreme case, in a study of the polar andnon-polar metabolites (112 in total) of a set of S.Phureja (30 samples) and S. tuberosum (30 samples)samples analysed over 2 days, there was separationaccording to day of analysis, when the response ratiodata was subjected to PCA (figure 3A); notably in score3. After expressing the data relative to the Desireereferences there was no obvious separation according today of analysis and separation of the two species, wasapparent in score 2 (figure 3B). It should be noted thatthe inclusion of a second reference material (S. phureja)is vital since it allows the effectiveness of the transfor-mation to be tested. Only if the variability of the secondreference shows an improvement after transformation,as is the case in this example, can it be assumed that thetransformation would be equally effective when appliedto the whole sample set.
3.5. Stability of ascorbic acid
Ascorbic acid is an important constituent of manyplant-derived materials, and in metabolite profilingstudies reported from other laboratories, both ascor-bate and dehydroascorbate have been listed asmetabolites identified and measured in potato tubers(Roessner et al., 2000, 2001) and leaves (Urbanczyk-Wochniak et al., 2005) and tomato fruit (Schaueret al., 2005b) and leaves (Schauer et al., 2005b; Ur-banczyk-Wochniak and Fernie, 2000). However, wefound that measurement of ascorbate in FD potatowas not reproducible. Ascorbate levels in FD potatohave previously been measured using more targetedmethods (Dale et al., 2003), therefore some factorwithin the metabolic profiling protocol may causeascorbate breakdown. Since the TMS derivative ofascorbate is formed readily by reaction with MSTFAin pyridine at 37 �C and is thermally stable, it wassuspected that ascorbate may degrade during oxima-tion. Solution phase degradation of ascorbate can becomplex and a simplified scheme is shown in figure 4.
When reference samples of pure ascorbate weresubjected to the derivatisation procedure, optimized forderivatization of sugars, with oximation times of up to4 h at 50 �C, ascorbate disappeared within half an hour(figure 5A) with formation of four major by-products(A1, B1, B2, C). Their mass spectra were consistent withidentification of A1 and a minor unquantified compo-nent (A2) as anomeric (TMS)2(MEOX)2 derivatives of2,3-dehydroascorbate, and B1 and B2 as anomeric(TMS)4(MEOX)2 derivatives of 2,3-diketogulonic acid,by analogy with the mass spectra of the closely related(TMS)4(MEOX)2 derivative of 3-ketoglucose. Compo-nent C remained unidentified. Similarly, with 2,3-dehy-droascorbate (as the dimer DHAsc2) in place ofascorbate (figure 5B), the same compounds (A1, B1, B2;
but not C) were formed along with a fourth unidentifiedcomponent D. If the oximation step were omitted and
T. Shepherd et al./Potato metabolomics by GC–MS484

ascorbate or dehydroascorbate was incubated at roomtemperature with pyridine only, for periods of up to 4 hprior to silylation, the major product (E) was the(TMS)4 derivative of 2,3-diketogulonic acid. Experi-ments with FD potato samples spiked with 0.2 mgascorbate showed that ascorbate was largely convertedto the by-products A1, B1 and B2. However, someascorbate did survive after 4 h and suggested that thepotato matrix partly inhibited ascorbate degradationunder the reaction conditions. These observations wereconsistent with oxidative degradation of ascorbate (fig-ure 4), and showed that ascorbic acid was unstableunder our derivatisation conditions, particularly in thepresence of pyridine, which due to its basicity mighthave been expected to promote the ring opening ofdehydroascorbate. Measurement of ascorbate based ondetection of known breakdown products such as dehy-droascorbate and diketogulonate may in theory beviable, but is complicated in that some possible
by-products, such as threonate and diketogulonate, arenatural metabolites of ascorbate. Under our standardoximation conditions neither threonate nor any otherrecognisable breakdown products of ascorbate anddehydroascorbate, other than those mentioned, weredetected during our investigations using standards.However, in our linearity studies using potato samples,only the diketogulonate derivative (B1) could bedetected and this gave a non-linear response withincreasing sample size, suggesting that measurement ofascorbate based on the presence of breakdown productsmay not be reliable.
4. Conclusions
When developing and validating a GC–MS basedmetabolite profiling method for use with potato, it was
Table 5
Repeatability of response ratios of polar metabolites
Compound
CV (%)
1 dayaCV (%)
long termb
CV (%)
long term
(ratio to
phureja)c
L–Alanine (TMS)2 7.4 21.7 10.6
L-Valine (TMS)2 6.1 14.6 9.2
Phosphate (TMS)3 5.9 20.1 15.9
Leucine (TMS)2 4.5 15.8 9.7
L-Isoleucine-(TMS)2 5.7 16.0 9.2
L-Proline (TMS)2 5.8 18.6 12.3
Glycine (TMS)2 8.0 10.8 8.9
2,3-Dihydroxypropanoic-acid
(TMS)3
8.7 23.5 22.7
L-Serine (TMS)3 8.9 12.4 10.7
2-Piperidinecarboxylic acid
(TMS)2
4.8 58.0 74.4
b-Alanine (TMS)3 4.2 13.8 16.2
Malic-acid (TMS)3 5.3 10.8 9.8
L-Methionine (TMS)2 4.8 65.5 23.7
Oxo-proline (TMS)2 5.0 58.0 52.4
L-Aspartic-acid (TMS)3 6.2 59.1 13.6
c-Aminobutyric acid (TMS)3 5.1 22.1 34.0
Glutamic acid (TMS)3 6.9 14.5 13.4
L-Phenylalanine (TMS)2 2.5 11.0 9.8
Asparagine (TMS)3 19.3 50.4 26.9
Citric acid (TMS)4 8.1 19.8 11.4
Quinic acid (TMS)5 7.0 22.8 9.1
Fructose MEOX (TMS)5 7.5 28.4 26.0
Glucose MEOX (TMS)5 7.9 28.1 26.2
L-Lysine (TMS)4 18.1 43.1 26.4
Inositol (TMS)6 5.6 11.5 8.5
Sucrose (TMS)8 7.7 14.1 9.1
aNine analyses of Desiree reference within a single sequence of samples
analysed over a 24 h period.bNine analyses of Desiree reference each day for 12 days over a period
of 3 months (new sample extracted and derivatized each day).cAs ‘‘CV long term’’ except CV values relate to response ratios ex-
pressed as a ratio to the relevant mean day response ratios of Phureja
references (nine analyses each day).
Table 6
Repeatability of response ratios of non-polar metabolites
Compound
CV (%)
1 dayaCV (%)
long termb
CV (%)
long term
(ratio to
phureja)c
n-Tetradecanoic acid methyl ester 4.6 59.9 14.0
n-Hexadecanoic acid methyl ester 6.0 13.9 9.5
Methoxycinnamic acid methyl ester
(TMS)
10.0 41.3 19.0
15-Methylhexadecanoic acid 7.9 55.9 12.5
n-Heptadecanoic acid methyl ester 7.4 55.9 10.7
n-9,12-Octadecadienoic acid 6.3 14.0 9.7
n-9,12,15-Octadecatrienoic acid
methyl ester
9.4 16.7 11.1
2-hydroxy-n-hexadecanoic acid
methyl ester
4.5 38.6 32.2
n-Octadecanoic acid methyl ester 5.8 11.8 8.9
n-Eicosanoic acid methyl ester 6.4 18.3 10.1
n-Heneicosanoic acid methyl ester 11.3 63.4 21.3
n-Heneicosanol (TMS) 8.0 28.5 12.8
n-Docosanoic acid methyl ester 11.8 31.4 14.1
n-Docosanol (TMS) 7.4 29.8 15.0
n-Tricosanoic acid methyl ester 7.8 66.9 14.7
n-Tetracosanoic acid methyl ester 10.5 29.0 14.4
n-Tetracosanol (TMS) 11.8 28.4 17.6
n-Pentacosanoic acid methyl ester 10.1 68.0 19.9
n-Hexacosanoic acid methyl ester 7.4 70.4 20.1
n-Hexacosanol (TMS) 4.7 31.7 18.1
n-Octacosanoic acid methyl ester 4.8 37.4 19.7
n-Octacosanol (TMS) 4.5 32.8 14.6
Solanid-5-en-ol (TMS) 5.7 88.8 32.1
Nonacosanol (TMS) 7.7 39.4 20.2
Fucosterol (TMS) 9.1 25.0 16.8
b-Sitosterol (TMS) 10.1 27.5 16.5
a Nine analyses of Desiree reference within a single sequence of sam-
ples analysed over a 24 h period.b Nine analyses of Desiree reference each day for 12 days over a period
of 3 months (new sample extracted and derivatized each day).c As ‘‘CV long term’’ except CV values relate to response ratios ex-
pressed as a ratio to the relevant mean day response ratios of Phureja
references (nine analyses each day).
T. Shepherd et al./Potato metabolomics by GC–MS 485

recognised that several factors have a significant effecton the outcome of the overall process.
Methods used to generate samples must be able totake into account the presence of metabolite gradientswithin the sample matrix. In the case of potato tubers,this can be achieved readily using the �opposite eighths�sampling procedure.
Reaction conditions used to prepare derivatives ofindividual metabolites suitable for analysis by GC–MSmust be carefully optimised to achieve specific objec-tives. For example, we chose to maximise formation ofmethyl oxime derivatives of reducing sugars and tominimise degradation of other metabolites such assucrose, prior to formation of silylated derivatives.However, ascorbic acid was found to be unstable undersuch conditions, undergoing oxidative degradation todiketogulonic acid. In attempting to include a broadrange of metabolites, it is not surprising that someaspect of the protocol will not be ideally suited to theanalysis of all metabolites, and degradation of ascorbate
is only one example. The analyst should be aware thatthere may be similar problems (e.g., degradation)with other metabolites. When examining standardcompounds to aid metabolite identification, it isimportant to utilise the same extraction/derivatizationconditions used for samples so that any problems can behighlighted, although, as observed for ascorbate, acompound in a sample matrix may, to some extent,behave differently to a standard.
We found that using either FD or fresh potatosamples is equally applicable when the metaboliteprofiling technique is used for cross-sample compari-sons. However, use of FD material provides severaladvantages over the use of fresh material, particularly inrelation to sample handling and storage and the abilityto accommodate the presence of metabolite gradientswithin the sample matrix.
Use of FD material gives highly linear and repeatableresults, particularly in the short-term. When analysinglarge numbers of samples over extended periods of time
(A) (B)T
P
R
D
P
D
T
D
T
D
T
D
T
D
T
D
T
DT
D
T
P
T
P
T
P
T
P
T
PT P
TP
R
P
R
P
R
P
R
R
DDP
DPD P
D
PT
P
T
PT
P
TP
T
P
T
P
TPR
P
RP
D
P
D
P
TP
T
P
T
PT
R
R
RDR
T
R
T
R
R
T
TD
RRR
5.7
5.2
5.2-
0.010.50.0
0.5
0.5-
0.5-
0.01
0.0
0.01-
scr[
3]
]2[rcs
scr[
3]
]2[rcs
T
P
R
P
P P
T
P
TP
T
P
T P
T
P
T
P
T
PT
P
T P
T
PT
P
T
P
T
P
T
R
P
PP
P
P
P
P
T
P
TP
T
R
T
RT
R
T
R
T
R
T
R
P
R
P
R
T
R
T
R
T
R
P
R
T
R
T
PT
T
RR
R
0.4-
0.6-
0.8-
0.6
0.2
0.2-
0.50.0
0.4
0.5-
0.0
0.01-
Figure 3. Score plots from principal component analysis of polar and non-polar metabolites (112 in total) in a study of S. Phureja (30 samples)
and S. tuberosum (30 samples) tuber samples A: Response ratio data relative to internal standards B: Ratio of response ratios of samples to
response ratios of Desiree reference. D, Desiree references; R, S. phureja references; P, S. phureja samples T; S. tuberosum samples. Samples
analysed on day 1 are black, and day 2 are grey.
cilcyciBlatekimeh remiD
etanoerhT
OC2 2
CynaM 2 C– 6
sdnuopmoc
e2- - H2-, +2A,1A 2B,1B
C
D
H[ 2 ]O
H[- 2 ]OH[- 2 ]O H[+ 2 ]O
-orhtyrE-LetabrocsA
etabrocsaordyheDetabrocsA
deifitnedinUtcudorp-yb
csA
csAHD 2
rehtrufnoitadixo
)O(H2O2 OC 2
ta,dipar(rolartuen)Hphgih
rolartuenHphgih
etanolugotekiD-3,2
Figure 4. Major breakdown products derived from ascorbic acid and dehydroascorbic acid. The principal reactions are oxidation of ascorbate to
2,3-dehydroascorbate followed by hydrolytic opening of the lactone ring to form 2,3-diketogulonic acid (Deutsch 1998a, b, c; Davey et al., 2000;
Goodpaster, 2004). 2,3-Dehydroascorbate can undergo reversible intramolecular or intermolecular ketal formation to form a bicyclic hemiketal
(Nishikawa and Kurata, 2000) or a dimer, respectively (Deutsch, 1998c). Subsequently, numerous compounds may arise by further oxidative
degradation of 2,3-diketogulonate, for example, threonic acid and L-erythroascorbate can be formed via oxidative decarboxylation, formation of
the latter being coupled with the reduction of 2,3-dehydroascorbate back to ascorbate (Jung and Wells, 1998).
T. Shepherd et al./Potato metabolomics by GC–MS486

it is useful to regularly include standard referencesamples in the analysis train to monitor medium andlong-term repeatability. Repeatability of results isimproved by reporting the abundance of individualmetabolites in an analytical sample relative to theabundance of the same metabolites in the referencesample.
From our experience of using two GC–MS platforms,which differed effectively only in the use of a TOF orquadrupole mass analyser, we were able to concludethat both were effective tools for use in metaboliteprofiling studies. This observation is in agreement withthe findings of Schauer et al. (2005a), who compared theperformance of TOF and quadrupole mass analysers.However, the enhanced sensitivity of the TOF instru-ment and its near continuous ion counting capabilitygave it some advantages over the fast-scanning quad-rupole. This was primarily manifest in a wider dynamicrange, better signal to noise and better peak shapes forSIC traces which was an advantage for automated dataanalysis. Thus using the TOF instrument it was possibleto identify more metabolites, particularly those of lowerabundance.
Acknowledgements
The authors acknowledge the support of the ScottishExecutive Environment and Rural Affairs department.
Electronic supplementary material
The online version of this article (doi: 10.1007/s11306-007-0058-2) contains supplementary material, which isavailable to authorized users.
References
Brown, J., Mackay, G.R., Bain, H., Griffiths, D.W. and Allison, M.J.
(1990). The processing potential of tubers of the cultivated
potato, Solanum tuberosum L., after storage at low tempera-
tures. 2. Sugar concentration. Potato Res. 33, 219–227.
Cellini, F., Chesson, A., Colquhoun, I., Constable, A., Davies, H.V.,
Engel, K.H., Gatehouse, A.M., Karenlampi, S., Kok, E.J.,
Leguay, J.J., Lehesranta, S., Noteborn, H.P., Pedersen, J. and
Smith, M. (2004). Unintended effects and their detection in
genetically modified crops. Food & Chem. Toxicol. 42, 1089–
1125.
Davey, M.W., Van Montagu, M., Inze, D., Sanmartin, M., Kanellis,
A., Smirnoff, N., Benzie, I.J.J., Strain, J.J., Favell, D. and
Fletcher, J. (2000). Plant L-ascorbic acid: chemistry, function,
metabolism, bioavailability and effects of processing. J. Sci.
Food Agric. 80, 825–860.
Dale, M.F.B., Griffiths, D.W. and Todd, D.T. (2003). Effects of
genotype, environment, and postharvest storage on the total
ascorbate content of potato (Solanum tuberosum) tubers. J.
Agric. Food Chem. 51, 244–248.
Deutsch, J.C. (1998a). Ascorbic acid oxidation by hydrogen peroxide.
Anal. Biochem. 255, 1–7.
Deutsch, J.C. (1998b). Spontaneous hydrolysis and dehydration of
dehydroascorbic acid in aqueous solution. Anal. Biochem. 260,
223–229.
Deutsch, J.C. (1998c). Oxygen-accepting antioxidants which arise
during ascorbate oxidation. Anal. Biochem. 265, 238–245.
FAOSTAT (2005). Food and agriculture organization of the United
Nations. FAO statistical databases. http://faostat.fao.org.
Frenzel, T., Miller, A. and Engel, K.H. (2002). Metabolite profiling – a
fractionation method for analysis of major and minor com-
pounds in rice grains. Cereal Chem. 79, 215–221.
Goodpaster, J.V. (2004). Identification of ascorbic acid and its deg-
radation products in black powder substitutes. J. Forensic Sci.
49, 1–6.
Griffiths, D.W. and Dale, M.F.B. (2001). Effect of light exposure on
the glycoalkaloid content of Solanum phureja tubers. J. Agric.
Food Chem. 49, 5223–5227.
Hughes, J.C. and Swain, T. (1962). After-cooking blackening in
potatoes. II.-Core experiments. J. Sci. Food Agric. 13, 229–236.
Jung, C.-H. and Wells, W.W. (1998). Spontaneous conversion of L-
dehydroascorbic acid to L-ascorbic acid and L-erythroascorbic
acid. Arch. Biochem. Biophys. 355, 9–14.
Lehesranta, S.J., Davies, H.V., Shepherd, L.V., Nunan, N., McNicol,
J.W., Auriola, S., Koistinen, K.M., Suomalainen, S., Kokko,
H.I. and Karenlampi, S.O. (2005). Comparison of tuber prote-
omes of potato varieties, landraces, and genetically modified
lines. Plant Physiol. 138, 1690–1699.
Merlo, L., Geigenberger, P., Hajirezaei, M. and Stitt, M. (1993).
Changes of carbohydrates, metabolites and enzyme activities in
potato tubers during development, and within a single tuber
along a stolon-apex gradient. J. Plant Physiol. 142, 392–402.
Nishikawa, Y. and Kurata, T. (2000). Interconversion between dehy-
dro-L-ascorbic acid and L-ascorbic acid. Biosci. Biotechnol.
Biochem. 64, 476–483.
Roessner, U., Wagner, C., Kopka, J., Trethewey, R.N. and Willmitzer,
L. (2000). Simultaneous analysis of metabolites in potato tuber by
gas chromatography–mass spectrometry. Plant J. 23, 131–142.
0.00
0.05
0.10
0.15
0.20
0.0 0.5 1.0 1.5 2.0 2.5 3.0 3.5 4.0
Oximation Time (h)
lotibiR/oita
R
A (316) B1 (244) B2 (244) C (217 )Asc (332)
(A)
0.00
0.03
0.06
0.09
0.15
0.0
Oximation Time (h)
lotibiR/oita
R
A (316,173) B1 (244)
0.12
0.5 1.0 1.5 2.0 2.5 3.0 3.5 4.0
(DHAsc)2 (147,302, 407)
B2 (244) D (245,360)
(B)
Figure 5. (A) Effect of oximation time at 50 �C on loss of ascorbic
acid and formation of degradation products A, B1, B2 and C. Values
in brackets are the m/z of the ions used to quantify each component
relative to ribitol. Error bars represent lsd values (p < 0.05). (B)
Effect of oximation time at 50 �C on loss of dehydroascorbic acid
dimer (DHAsc)2 and formation of degradation products A, B1, B2 and
D. Values in brackets are the m/z of the ions used to quantify each
component relative to ribitol. Error bars represent lsd values
(p < 0.05).
T. Shepherd et al./Potato metabolomics by GC–MS 487

Roessner, U., Luedemann, A., Brust, D., Fiehn, O., Linke, T.,
Willmitzer, L. and Fernie, A.R. (2001). Metabolic profiling
allows comprehensive phenotyping of genetically or environ-
mentally modified plant systems. Plant Cell 13, 11–29.
Schauer, N., Steinhauser, D., Strelkov, S., Schomburg, D., Allison, G.,
Moritz, T., Lundgren, K., Roessner-Tunali, U., Forbes, M.G.,
Willmitzer, L., Fernie, A.R. and Kopka, J. (2005a). GC–MS
libraries for the rapid identification of metabolites in complex
biological samples. FEBS Lett. 579, 1132–1137.
Schauer, N., Zamir, D. and Fernie, A.R. (2005b). Metabolic profiling
of leaves and fruit of wild species tomato: a survey of the
Solanum lycopersicum complex. J. Exp. Bot. 56, 297–307.
Scott, G.J., Rosegrant, M.W. and Ringler, C. (2000). Global projec-
tions for root and tuber crops to the year 2020. Food Policy 25,
561–597.
Urbanczyk-Wochniak, E. and Fernie, A.R. (2005). Metabolic profiling
reveals altered nitrogen nutrient regimes have diverse effects on
the metabolism of hydroponically-grown tomato (Solanum
lycopersicum). J. Exp. Bot. 56, 309–321.
Urbanczyk-Wochniak, E., Baxter, C., Kolbe, A., Kopka, J., Sweet-
love, L.J. and Fernie, A.R. (2005). Profiling of diurnal patterns
of metabolite and transcript abundance in potato (Solanum
tuberosum) leaves. Planta 221, 891–903.
T. Shepherd et al./Potato metabolomics by GC–MS488


