Embed Size (px)
Citation preview

Authors:Anthony Roelofs Michael Rasheed Ross Thomas Skye McKenna Helen Taylor
Project Coordinator: Simona Trimarchi
EcoPorts Monograph Series No. 23
Port of Weipa Long Term Seagrass Monitoring 2003 - 2005

Port of WeipaLong Term Seagrass Monitoring2003 - 2005
EcoPorts Monograph Series No. 23
Authors: Anthony Roelofs Michael RasheedRoss Thomas Skye McKenna Helen Taylor
Project Coordinator: Simona Trimarchi
Marine Ecology Group Northern Fisheries Centre
Department of Primary Industries& Fisheries
PO Box 5396 Cairns Qld 4870
Ports Corporation of Queensland ISSN 1326-4338 ISBN 1-876366-13-3 Published April 2006 by Ports Corporation of Queensland GPO Box 409 Brisbane Qld 4001
The opinions expressed in this document are not necessarily those of Ports Corporatiion of Queensland
The EcoPorts Monagraph Series is published by Ports Corporation of Queensland to disseminate information about, and results from, its corporate environment program

Disclaimer Information contained in this publication is provided as general advice only and supersedes data presented in previous interim reports. For application to specific circumstances, professional advice should be sought.
The Department of Primary Industries & Fisheries, Queensland has taken all reasonable steps to ensure the information contained in this publication is accurate at the time of the survey. Seagrass distribution and abundance can change seasonally and between years, and readers should ensure that they make appropriate enquiries to determine whether new information is available on the particular subject matter. Produced by the Marine Ecology Group Department of Primary Industries & Fisheries Northern Fisheries Centre, Cairns, 2006-04-20
Enquiries should be directed to: The authors Northern Fisheries Centre PO Box 5396 Cairns Qld 4870 Australia
Acknowledgements
This project was funded by Ports Corporation Queensland and the Queensland Department of Primary Industries and Fisheries.
We wish to thank the Traditional Owners at Napranum for granting us access to their sea country and helping us to achieve our work. It was our privilege to work with the Nanum Wungthim Land and Sea Centre to help support their sea country management aspirations and to develop their Seagrass-Watch monitoring program. We would particularly like to thank Richard Barkley, Jerry Wapau, Michael Morrison and Murray Penter for all their efforts at the monitoring site.
We also like to thank Bob Russell and his staff from Queensland Boating and Fisheries Patrol (QBFP) in Weipa for their invaluable assistance in fieldwork set up and the use of the QBFP vessels. The Marine Ecology Group is partially funded by CRC Reef Research Centre.
The correct citation of this document is:
Roelofs, A.J., Rasheed, M.A., Thomas, R., McKenna, S. and Taylor, H. (2006). Port of Weipa Long Term Seagrass Monitoring, 2003 - 2005. Ecoports Monograph Series No. 23 Ports Corporation of Queensland. 31pp.

TABLE OF CONTENTSEXECUTIVE SUMMARY ........................................................................................................ 1
BACKGROUND...................................................................................................................... 2
OBJECTIVES ......................................................................................................................... 2
METHODS .............................................................................................................................. 3Geographic Information System...................................................................................... 7
RESULTS ............................................................................................................................... 8Seagrass species, distribution and abundance............................................................... 8
Core Monitoring Meadows (A1 to A7) ................................................................... 10Intensive Monitoring Area ..................................................................................... 13Seagrass seed-bank distribution and abundance ................................................. 15Weipa seagrasses – entire port area .................................................................... 15Weipa climate data................................................................................................ 17Temperature loggers............................................................................................. 19Seagrass– Watch at Napranum ............................................................................ 20
DISCUSSION........................................................................................................................ 21
APPENDIX............................................................................................................................ 29
REFERENCES ..................................................................................................................... 31

1
EXECUTIVE SUMMARY
Seagrass meadows in the Port of Weipa have changed substantially during the six years of seagrass monitoring. Most of the changes appeared to be in response to regional and local climate and the physical and physiological characteristics of the seagrass meadows, rather than human activities that have occurred in the port. In general terms intertidal seagrass meadows throughout the port area had become more patchy (greater areas of open unvegetated substrate) with substantial reductions in biomass (density) for Enhalus acoroides dominated seagrass meadows. In addition complete Halodule/Halophila meadows were lost in the Pine River Bay area in 2002 and have yet to recover.
The most likely cause of changes to intertidal Enhalus meadows was desiccation of Enhalusplants when they were exposed at low tide (i.e. “burning”). Burning was likely to be caused by a combination of high air temperatures, low rainfall and higher solar radiation intensities. Climate data suggests there has been a trend for less rainfall and higher solar radiation over the last five years. Also maximum temperatures measured from intertidal temperature loggers during 2004/2005 have reached 41.5°C which is close to the limit where seagrass cell systems have been shown to be irreparably damaged.
Differing responses of subtidal meadows and intertidal meadows of different species such as Halodule and Halophila were likely to be due to the differing susceptibility to desiccation between species and locations. Physical differences in growth form allowed Halophila and Halodule to lie flat on the moist sediment surface during low tide exposure and deeper subtidal Enhalus meadows were protected from low tide exposure.
There had still been no recovery of Halodule and Halophila meadows in the Pine River Bay area since their loss in 2002. Seed sampling conducted in 2003 indicated that there were no seed reserves in the sediment which suggested that recruitment and recovery may be slow due to a limited local supply of propagules. Similar meadows in the southern Gulf of Carpentaria that had a seed bank had recovered from the 2002 losses in 2005 and 2006. There was some evidence of an increase in biomass for the remaining Halodule meadows in the Embley River. This may indicate a return to more favourable environmental conditions for Halodule growth.
The declines in the Embley River Enhalus meadows and Pine River Bay Halodule/Halophilameadows were likely to have some local fisheries implications. Analysis of fisheries commercial catch data for barramundi, mud crab and grey mackerel have shown declines that corresponded with the recent reductions in seagrass cover and biomass for Weipa.
The monitoring program indicates that despite some seagrass declines, the Weipa marine environment is relatively healthy with observed changes likely to be associated with regional and local climatic factors and the nature of the seagrass meadows rather than anthropogenic or port related impacts. The recent decline in the Evans Landing meadow is a concern however, and will be monitored closely in the upcoming 2006 survey. We have established a good understanding of the range of natural changes in seagrass meadows in Weipa through a period of “normal” and “drought” conditions. Through our state wide seagrass monitoring network we have been able to put these changes in a regional perspective and separate local versus regional drivers of seagrass change. This background has placed us in a good position to detect any anthropogenic causes of change to seagrasses beyond this natural background. Future monitoring will continue to enhance this ability and provide port and fisheries management with information on the status of the marine environment and fish habitats within the Weipa area and an early warning of changes to marine environmental health caused by port or other human activities.

2
BACKGROUND
Ports Corporation Queensland (PCQ) is the organisation responsible for managing and monitoring Weipa’s port environment. PCQ has recognised that seagrasses are ecologically important and environmentally sensitive habitats and established a long term seagrass monitoring program for the Port in 2000 (Roelofs et al. 2001; Roelofs et al. 2003). The goals of the program are to minimise impacts of port activities and development on these habitats and to assess the health of Weipa’s port environment.
The first three years (2000 to 2002) of the seagrass monitoring program provided important baseline information on the distribution, abundance and seasonality of seagrasses within the greater port limits. Due to the large area of the port, the approach for long term monitoring was to focus monitoring effort on seagrass meadows located near port and shipping infrastructure and activities (the Intensive Monitoring Area or IMA). Around August/September of each year, all seagrass meadows within the IMA are mapped and a selection of “core monitoring meadows”, representing the range of seagrass meadow types, is assessed for biomass and species composition. During the IMA survey, an aerial reconnaissance of seagrasses in the greater port limits is also conducted and re-mapping of the entire port limits occurs every 3 years (i.e. the full survey was completed in August 2005).
Seagrass meadows in the Port of Weipa were relatively stable from 2000 to 2002. However, significant decreases in seagrass distribution occurred in areas outside the immediate port influence but still within the port limits (outside the IMA). Investigations of factors that may have led to these declines indicated that changes were related to climate rather than port related activities and were similar to changes that occurred in other Queensland locations (Roelofs et al. 2004).
This report presents a summary of the results of the long term seagrass monitoring program conducted from 2003 to 2005 as well as comparisons with the 2000 to 2002 seagrass monitoring data.
OBJECTIVES
The objectives of the 2003 to 2005 long term seagrass monitoring of the Port of Weipa were to:
1. Map the distribution and abundance of selected seagrass monitoring meadows; 2. Map the distribution and confirm species composition of seagrass meadows in the
Intensive Monitoring Area (IMA); 3. Assess changes in seagrass meadows and compare results with previous monitoring
surveys; 4. Incorporate the results into the Geographic Information System (GIS) database for the
Port of Weipa.

3
METHODS
Methods for the 2003 to 2005 seagrass monitoring surveys were adapted from those developed by DPI&F for the 2000 to 2002 baseline monitoring program. The sampling approach for the 2000 to 2002 monitoring surveys was based on the need to establish interannual data on seagrass meadow distribution and seagrass characteristics such as above ground biomass, seagrass species composition, percent cover of algae, and sediment characteristics of the major seagrass meadows for the Port of Weipa (see Roelofs et al.2003). Since 2003, the long term monitoring survey design altered elements of the methodology to enable intensified sampling effort and the incorporation of additional sampling techniques such as Pulse Amplitude Modulated (PAM) fluorometry and seed sampling.
Three levels of sampling were used in the long term monitoring surveys:
1. Monitor seagrass distribution, species composition and abundance in five primary meadows (A2, A3, A5, A6, and A7) within the Intensive Monitoring Area (IMA) (Map 1).
2. Map seagrass distribution and confirm species composition in other seagrass meadows within the IMA (Map 1).
3. Confirm presence by helicopter reconnaissance at low tide of other seagrass meadows within the Weipa Port limits. No measurements of seagrass abundance and distribution were taken.
Monitoring was conducted in the dry season annually (Table 1), using a variety of sampling methods to survey the seagrass meadows within the Port of Weipa (Plate 1, Figure 1). A complete outline of these methods can be found in Roelofs et al. 2001 and Roelofs et al.2003.
Table 1 Long term seagrass habitat mapping project sampling timetable
Year Dates 2000 • 20 – 27 September
2001 • 14 – 20 September
2002 • 2 – 8 September
2003 • 8 – 9 September
2004 • 28 August – 2 September
2005 • 17 – 22 August
Seagrass community types were categorised according to the seagrass species, or combination of species, that dominated the overall composition of each meadow (Table 2). This was usually a visual estimate of composition as only the core monitoring meadows were assessed specifically for biomass and species composition.
We investigated the seed bank status of selected monitoring meadows in Pine River Bay in 2003. A PVC sediment corer (0.002 m-2) was used to collect samples at sites randomly scattered throughout the seed bank. The collected sediment samples were sorted in the field by passing the sample through a 1mm sieve. Any seeds collected were identified and counted.

4
Overall changes in core monitoring meadow seagrass above ground biomass between sampling events were analysed using ANOVA in Statistix®. Standard parametric tests were used for analysis of data or non-parametric tests when the assumptions of ANOVA were not met by the data (Sokal and Rohlf 1987).
Climate data were extracted from the Australian Bureau of Meteorology SILO database, exported into Microsoft Excel and graphed.
The water temperature experienced by intertidal seagrasses was investigated by placing temperature loggers in intertidal seagrass meadows at Munding near Napranum (Meadow A5) and at Evans Point in May 2004. These loggers recorded water temperature at one hour intervals and were retrieved and information downloaded approximately every 6 months.
A community based Seagrass-Watch program was started in May 2004 to provide the local Indigenous community at Napranum with year long seagrass health data and as a supplement to this PCQ monitoring program. It involves Indigenous rangers from the Nanum Wungthim Land & Sea Centre at Napranum and our DPI&F team. A description of Seagrass-Watch monitoring methods can be found at http://www.seagrasswatch.org/manuals.html(McKenzie et al. 2001). A Seagrass-Watch site was established in Monitoring Meadow A5 (known locally as Munding) and was monitored in May, July and August 2004 and in May and August 2005.
Table 2 Nomenclature for community types in the Port of Weipa, 2000 to 2005. Community type Species composition
Species A Species A is 100% of composition
Species A with Species B Species A is at least 60% of the composition. Species B comprises the rest.
Species A with Species B/Species C Species A is at least 50% of the
composition with equal % of Species B and C comprising the rest.
Species A/Species B Species A is 50% and Species B is 50% of the composition.

5
Plate 1 Seagrass monitoring techniques and equipment used at the Port of Weipa, 2000 to 2005: (a) underwater real-time video camera and frame (b) underwater video control panel and viewing screen (c) deploying underwater video camera from survey vessel (d) estimating above ground seagrass biomass from helicopter.
(a) (b)
(c) (d)

6
Isolated seagrass patches - The majority of area within the meadows consisted of unvegetated sediment interspersed with isolated patches of seagrass
Aggregated seagrass patches - Meadows were comprised of numerous seagrass patches but still featured substantial gaps of unvegetated sediment within the meadow boundaries
Continuous seagrass cover - The majority of area within the meadows was comprised of continuous seagrass cover interspersed with a few gaps of unvegetated sediment
Figure 1 Seagrass meadow landscape categories used in the Port of Weipa seagrass baseline and monitoring surveys, 2000 to 2005.

7
Geographic Information System All survey data were entered onto a Geographic Information System (GIS) for presentation of seagrass species distribution and abundance. The seagrass GIS was created in Mapinfoand ArcGIS using the survey information. Three GIS layers were created for each survey to describe Weipa seagrasses:
1. Site information: Point data containing all the information collected at seagrass characterisation sites.
2. Seagrass meadows and characteristics: Polygon or area data for the seagrass meadows with summary information on the meadow characteristics.
3. Seagrass meadow cover type: Polygon layer displaying the seagrass meadow cover categories.
A variety of methods were used to determine seagrass meadow boundaries. Rectified colour aerial photographs (June 1989, 1:25000) (courtesy Beach Protection Authority), Landsat TM satellite imagery, topographic maps, and aerial photography taken from the helicopter during the surveys assisted with mapping. Where possible, meadow boundaries were mapped in the field using a dGPS from low level helicopter flights. In subtidal areas where meadows could not be viewed from the air, boundaries were determined by underwater camera surveys. Other information including depth below MSL, substrate type, the shape of existing geographical features such as banks and embayments, and evidence of strong wave energy or tidal currents were also interpreted and used in determining meadow boundaries.
Each seagrass meadow was assigned a qualitative mapping reliability value (measured in ± metres) determined by the data sources and precision of mapping (Table 3). Estimates of reliability in mapping the boundaries of the seagrass meadows were based on the range of mapping information available for each meadow (Table 3). Other sources of mapping error associated with digitising and rectifying aerial photographs and topographic charts onto basemaps and with dGPS fixes for survey sites were assumed to be embedded within mapping reliability estimates. The mapping reliability value was used to calculate a range of meadow area for each meadow (R) in hectares.
Table 3 Ranks of mapping quality for seagrass meadows mapped in the Port of Weipa
Map Quality Data sets Comments Mapping precision
1Helicopter boundary mapping with high density of dGPS mapping sites & ground truthing (helicopter or camera)
Detailed mapping of meadow boundary during helicopter surveys. Meadows completely exposed or visible at low tide. High number of ground truthing sites.
0.5-5m
2Helicopter boundary mapping with low density of dGPS mapping sites & limited ground truthing (helicopter or camera)
Less detailed mapping of meadow boundaries during helicopter surveys. A lower density of dGPS mapping sites and limited ground truthing used.
10-15m
3 Helicopter reconnaissance with limited dGPS mapping sites
Meadow boundaries mapped with helicopter at higher altitude and limited ground truthing 20-50m
4 Underwater video survey only Meadow boundaries determined by camera ground truth surveys only. Reliability based on distance between camera survey sites.
50m
5 Helicopter reconnaissance only Meadow boundaries hand drawn on chart during helicopter reconnaissance. No dGPS mapping sites. 50-100m

8
RESULTS
Seagrass species, distribution and abundance
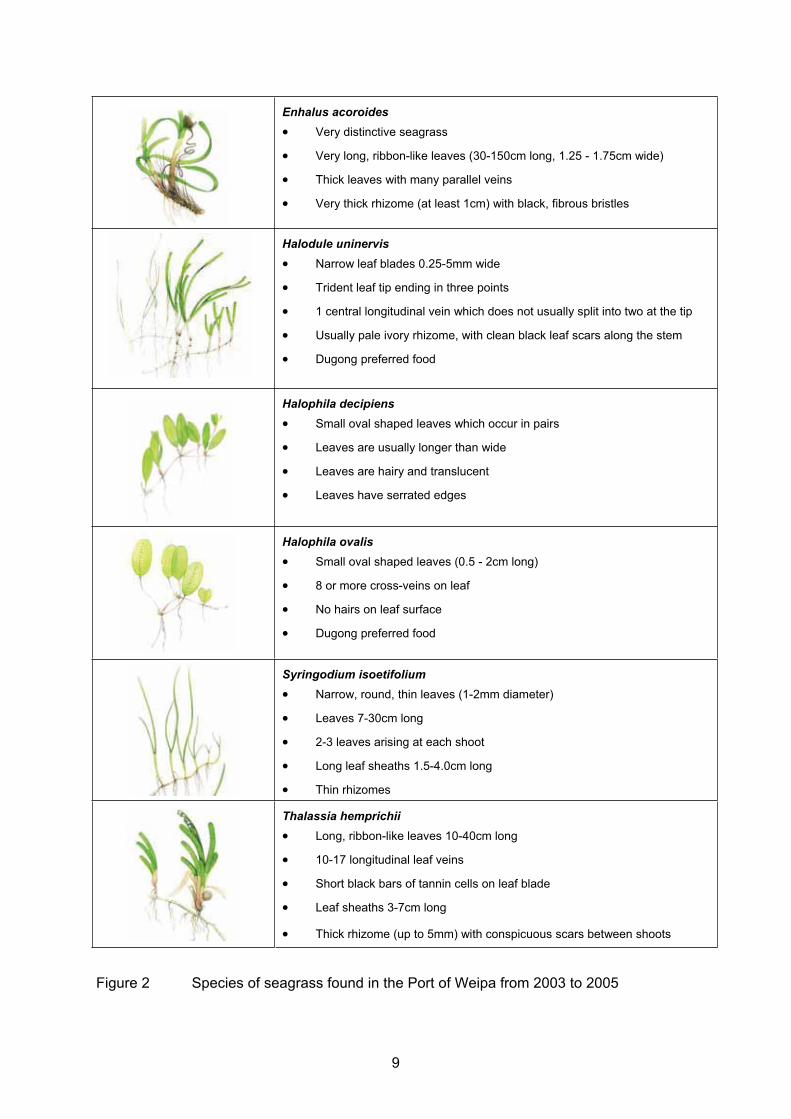
Six seagrass species (from 2 families) were identified in the 2003 to 2005 monitoring surveys (see Figure 2):
Family Cymodoceaceae Taylor
Halodule uninervis (narrow leaf morphology) (Forsk.) Aschers Syringodium isoetifolium (Aschers.) Dandy
Family Hydrocharitaceae Jussieu
Enhalus acoroides (L.f.) RoyleHalophila decipiens Ostenfield Halophila ovalis (Br.) D.J. Hook. Thalassia hemprichii (Ehrenb.) Aschers. in Petermann
We identified eight meadow community types within the Intensive Monitoring Area during the 2003 to 2005 monitoring program:
1. Enhalus acoroides 2. Enhalus acoroides with mixed species3. Halodule uninervis (narrow form)4. Halodule uninervis (narrow form)/Halophila ovalis with mixed species5. Halophila decipiens 6. Halophila ovalis 7. Halophila ovalis with mixed species8. Thalassia hemprichii with mixed species
The spatial distribution and presence/absence of these meadow community types has varied during the monitoring program (e.g. only seven of these meadow community types were present in August 2005) (Table 4). Since 2000, when seagrass surveying began in Weipa, we have identified a total of eleven meadow community types (Table 4). There has been an increase in the number and size of Enhalus acoroides meadows (although they have become patchier), a decrease in meadows dominated by Thalassia hemprichii, and a return of some of the more ephemeral species such as Halophila decipiens in subtidal areas (Mission River and Boyd Bay – see Maps 3 and 4) and Halodule uninervis (narrow form) in the intertidal zone (Table 4, Map 4).
9
Enhalus acoroides • Very distinctive seagrass
• Very long, ribbon-like leaves (30-150cm long, 1.25 - 1.75cm wide)
• Thick leaves with many parallel veins
• Very thick rhizome (at least 1cm) with black, fibrous bristles
Halodule uninervis • Narrow leaf blades 0.25-5mm wide
• Trident leaf tip ending in three points
• 1 central longitudinal vein which does not usually split into two at the tip
• Usually pale ivory rhizome, with clean black leaf scars along the stem
• Dugong preferred food
Halophila decipiens • Small oval shaped leaves which occur in pairs
• Leaves are usually longer than wide
• Leaves are hairy and translucent
• Leaves have serrated edges
Halophila ovalis • Small oval shaped leaves (0.5 - 2cm long)
• 8 or more cross-veins on leaf
• No hairs on leaf surface
• Dugong preferred food
Syringodium isoetifolium • Narrow, round, thin leaves (1-2mm diameter)
• Leaves 7-30cm long
• 2-3 leaves arising at each shoot
• Long leaf sheaths 1.5-4.0cm long
• Thin rhizomes
Thalassia hemprichii • Long, ribbon-like leaves 10-40cm long
• 10-17 longitudinal leaf veins
• Short black bars of tannin cells on leaf blade
• Leaf sheaths 3-7cm long
• Thick rhizome (up to 5mm) with conspicuous scars between shoots
Figure 2 Species of seagrass found in the Port of Weipa from 2003 to 2005

10
Core Monitoring Meadows (A1 to A7) Meadow biomass and species composition
All core monitoring meadows at Weipa had significant changes in biomass during the 2003 to 2005 monitoring program. There appears to be a general pattern of intertidal Enhalusmeadows declining and Halodule/Halophila meadows remaining relatively stable (Table 4, Maps 2 – 4, Figure 3).
Biomass of Enhalus meadows located adjacent to the Lorim Point Wharf (A6) and on the opposite bank (A2) in the Embley River (western shore) had declined significantly over the course of the monitoring program (Figure 3, Table 4, Map 2, see Appendix). The Lorim Point Wharf Enhalus meadow (A6) showed a significant drop in biomass in 2004 compared to 2001 and 2002 (see Appendix) although it had recovered slightly by 2005.
The large Embley River Enhalus meadow (A2) opposite the port facility had significantly lower biomass in 2003, 2004 and 2005 compared with previous surveys (see Appendix). This meadow has become increasingly patchy in recent years with bare spaces between Enhalus plants becoming greater, especially on the fringes of the meadows. The trend for increasing patchiness has been common to all Enhalus meadows in the Weipa monitoring area as well (see Intensive Monitoring Area section). This meadow (A2) has continued to trend downwards in biomass since surveying began in 2000 (Figure 3, Table 4). The declining trend was also observed in the deeper Enhalus monitoring meadow near Evans Landing (A7), which had a significant drop in biomass in 2005 and a downward trend that began in 2004 (Figure 3, Table 4, see Appendix). This meadow extends from intertidal to shallow subtidal depths.
The biomass of the two Halodule/Halophila monitoring meadows located in the Embley River (A5) and Hey River (A3) have fluctuated throughout the monitoring program (Figure 3, Table 4, Map 2). Meadow A3 declined significantly from 2001 to 2002 and from 2003 to 2004 (see Appendix). At the same time, similar Halodule/Halophila meadows also declined in Pine River Bay. There was a significant increase in biomass for the Embley River (A5) meadow between 2004 and 2005 (Figure 3, Table 4, Map 2).
Seagrass species composition in the core monitoring meadows was similar for all surveys (Maps 2 and 3). Desiccation or ‘burning’ of Enhalus plants was noted throughout the study area in 2005. This was the third year in a row that the condition had been recorded.
Meadow area
Total meadow area for all core monitoring meadows was similar to previous dry season surveys (Table 5, Map 2), although meadows A1, A2, A6 and A7 had become patchier. The patchiness appeared more evident at the edges of the meadow (Map 5). We would expect meadows to become smaller in area in the near future if this pattern continues and seagrass plants along the meadow edge are lost.

11
Table 4 Mean above-ground seagrass biomass and number of biomass sampling sites for each monitoring meadow within the Port of Weipa from 2000 to 2005.
Mean biomass ± SE in g DW m-2 (No. of sites) Monitoring
Meadow September 2000
September 2001
September 2002
September 2003
August 2004
August 2005
A2 Intertidal Enhalus
dominated
33.63 ± 5.82(17)
29.73 ± 2.88(51)
22.84 ± 2.99(50)
13.91 ± 1.96(54)
11.47 ± 1.77(51)
7.04 ± 0.72(51)
A3 Intertidal
Halodule/Halophiladominated
3.34 ± 0.87 (11)
2.04 ± 0.33(26)
0.37 ± 0.07(30)
1.63 ± 0.61(26)
0.31 ± 0.23(26)
1.08 ± 0.41(25)
A5 Intertidal
Halodule/Halophiladominated
6.45 ± 1.90(9)
3.11 ± 0.31(51)
2.49 ± 0.52(51)
2.29 ± 0.23(50)
4.18 ± 0.61(50)
4.11 ± 0.54(50)
A6 Intertidal Enhalus
dominated
9.63 ± 5.52(9)
10.4 ± 2.79(26)
9.5 ± 2.54(25)
8.31 ± 2.91(24)
1.14 ± 0.40(26)
3.37 ± 1.00(26)
A7 Shallow subtidal
Enhalusdominated
9.63 ± 4.12(14)
18.89 ± 3.88(30)
10.03 ± 2.34(33)
15.57 ± 3.39(31)
10.56 ± 2.82(30)
2.84 ± 0.58(30)
Table 5 Total meadow area for each monitoring meadow within the Port of Weipa from 2000 to 2005. (R is an estimate of reliability associated with mapping meadow boundaries)
Total meadow area ± R (ha) Monitoring Meadow
September 2000 September 2001 September 2002 September 2003 August 2004 August 2005
A1Intertidal Enhalus
dominated114 ± 7 110 ± 7 106 ± 8 107 ± 7 108 ± 7 112 ± 8
A2 Intertidal Enhalus
dominated253 ± 19 248 ± 19 255 ± 19 250 ± 20 255 ± 19 251 ± 20
A3 Intertidal
Halodule/Halophiladominated
30 ± 5 48 ± 5 34 ± 4 36 ± 4 41 ± 5 37 ± 5
A4 Intertidal
Halodule/Halophiladominated
192 ± 8 199 ± 8 180 ± 8 142 ± 9 148 ± 8 149 ± 8
A5 Intertidal
Halodule/Halophiladominated
95 ± 10 91 ± 10 102 ± 6 87 ± 9 93 ± 10 86 ± 10
A6Intertidal Enhalus
dominated5 ± 1 7 ± 1 7 ± 1 7 ± 1 7 ± 1 7 ± 1
A7Shallow subtidal
Enhalus dominated19 ± 2 23 ± 1 19 ± 1 19 ± 1 18 ± 1 17 ± 1
Total 709 ± 52 726 ± 52 703 ± 47 648 ± 51 671 ± 51 659 ± 53

12
Figure 3 Mean above ground biomass ± standard error (g DW m-2) for each core monitoring meadow monitored at Weipa from 2000 to 2005.
Enhalus dominated meadows A2 (Embley River - western shore) and A6 (Lorim Point Wharf)
0
5
10
15
20
25
30
35
40
45
Sep-2000 Sep-2001 Sep-2002 Sep-2003 Aug-2004 Aug-2005
Mea
n B
iom
ass
(g D
W m
-2)
A2 A6
Halodule dominated meadow s A3 (Hey River) and A5 (Embley River)
0
1
2
3
4
5
6
7
8
9
Sep-2000 Sep-2001 Sep-2002 Sep-2003 Aug-2004 Aug-2005
Mea
n Bi
omas
s (g
DW
m-2)
A3 A5
Enhalus dominated meadow A7 (Evans Landing)
0
5
10
15
20
25
Sep-2000 Sep-2001 Sep-2002 Sep-2003 Aug-2004 Aug-2005
Mea
n B
iom
ass
(g D
W m
-2)
A7

13
Intensive Monitoring Area
The total area of seagrass meadows in the IMA in August 2005 (1643 ± 136 ha) was the lowest recorded since the September 2000 survey (Figure 4, Table 6, Maps 2 & 3). There had been losses in seagrass area in Enhalus dominated and Halodule uninervis (narrow form)/Halophila ovalis meadows within the Mission River (Table 6, Map 3).
The number of monospecific Enhalus meadows had increased since 2002 (Table 6, Maps 2 & 3). This increase resulted from two factors. Firstly, a number of new, small meadows (some with only a few plants in each) were identified in 2003 and these persisted through to 2005. Secondly, the loss of Halodule and Halophila from some mixed species meadows in the Mission River had caused a shift in community structure to monospecific Enhalusmeadows. Gaps or bare areas in the meadows had also resulted from the losses of Haloduleand Halophila. These meadows were split into separate smaller meadows in our maps for 2005, thus increasing the overall meadow count.
We also recorded a change in the large sparse meadow located at Evans Point where the usually dominant Thalassia hemprichii had decreased in abundance to no longer be the major seagrass species in that meadow (Table 6, Maps 2).
A new Halophila decipiens meadow was mapped in the Mission River in August 2005 (Table 6, Map 3). A similar meadow was present at a much larger size in April 2002 when clear water conditions were ideal for growth of this ephemeral species.
Seagrass meadows throughout the IMA (and also the Port of Weipa limits) have become patchier during the monitoring program. The number and total area of meadows comprised of aggregated seagrass patches increased from 2003 to 2005 (Figure 4, Maps 2 & 3). Continuous seagrass cover type was lower in August 2004 and 2005 than all previous surveys. The most important change was in the Enhalus dominated meadow (A1) in the Embley River (opposite Evans Point) from continuous cover in all previous surveys to aggregated patches in 2004. This large meadow had become increasingly patchy along the inshore fringe since monitoring began in 2000. The adjacent Enhalus dominated meadow A2 also appeared to be following this trend. In this meadow, high seagrass biomass hotspots found in the north and south of the meadow had substantially decreased since 2001 (Map 5).

14
Figure 4 Total area of each seagrass cover type within the Port of Weipa IMA from 2000 to 2005.
Table 6 Total meadow area for each meadow community type within the Port of Weipa IMA from 2000 to 2005. (R is an estimate of reliability associated with mapping meadow boundaries)
Meadow area ± R (ha) (no. of meadows) Community type
Sep 2000 Sep 2001 Sep 2002 Sep 2003 Aug 2004 Aug 2005
Enhalus acoroides 76 ± 9(8)
45 ± 7(8)
43 ± 7(13)
173 ± 22(28)
225 ± 63(27)
203 ± 26(29)
Enhalus acoroides with mixed species
973 ± 63(12)
1092 ± 71(14)
962 ± 70(18)
866 ± 61(13)
886 ± 77(15)
841 ± 62(16)
Halodule uninervis (narrow form) 1.8 ± 1 (2) 0.3 ± 0.2
(2)Halodule uninervis (narrow form)/ Halophila ovalis
14 ± 3(1)
6 ± 2(1)
Halodule uninervis (narrow form)/ Halophila ovalis with mixed species
548 ± 36(5)
652 ± 42(5)
640 ± 35(5)
608 ± 39(5)
592 ± 43 (5)
547 ± 39 (5)
Halophila decipiens 0.1 ± 0.1(1)
0.1 ± 0.1(1) 15 ± 3
(1)
Halophila ovalis 0.002 ± 0.001 (2)
0.01 ± 0.005(5) 1.3 ± 0.7
(3)Halophila ovalis with mixed species
44 ± 4(2)
86 ± 5(2)
78 ± 5(3)
0.14 ± 0.03(1)
0.19 ± 0.07(4)
37 ± 6(1)
Syringodium isoetifolium 0.001 ± 0.001 (1)
0.001 ± 0.001 (1)
Thalassia hemprichii 0.001 ± 0.001 (1)
0.005 ± 0.002 (1)
Thalassia hemprichii with mixed species
55 ± 7(3)
65 ± 9(3)
62 ± 8(2)
37 ± 6(1)
37 ± 5(1)
Total 1712 ± 122 (38) 1945 ± 136 (41) 1785 ± 125 (41) 1684 ± 128 (48) 1742 ± 205 (52) 1643 ± 136 (57)
0200400600800
100012001400160018002000
Tota
l are
a (h
a)
Sep 2000 Sep 2001 Sep 2002 Sep 2003 Aug 2004 Aug 2005
Date
Weipa seagrass cover in the IMA
Isolated seagrass patches Aggregated seagrass patches Continuous seagrass cover

15
Seagrass seed-bank distribution and abundance Seed sampling was conducted at 13 sites on a sand bank in Pine River Bay in 2003. This area was previously covered with Halodule uninervis (narrow) and Halophila ovalis in September 2001 (Figure 5). No seeds or pieces of seed pericarp (outer casing of seeds) were found within the Pine River Bay survey area in September 2003, although a few very isolated Halodule uninervis (narrow form) rhizomes and leaves were found. There was no evidence of seagrass recovery in these areas by 2005.
Figure 5 Location of seed sampling sites within Pine River Bay, Weipa - September 2003.
Weipa seagrasses – entire port area In 2005 seagrass distribution and community type within the entire port limits (including areas outside the IMA) were mapped to enable a comparison with previous whole of port mapping conducted from 2000 to 2002 (Figure 6; Table 7). The total area of seagrass had decreased substantially in 2005 compared with the baseline surveys in 2000 and 2001 but was similar to the 2002 level (Table 7). There were also fewer community types in 2005 compared with all previous surveys, although the number of individual meadows had increased (Table 7). The higher number of meadows was likely a result of larger meadows becoming patchier and breaking into smaller individual meadows (Figure 6). The increase in the number of small meadows was most evident in the Mission River area (Map 3).
The large reductions in area recorded for meadows dominated by Halodule uninervis (narrow form), Halophila ovalis and Halophila decipiens in Pine River Bay and Mission River that were noted in 2003 (Roelofs et al. 2004) had shown little recovery by August 2005 (Maps 4). All of the seagrass meadows that had declined were patchy (isolated and aggregated seagrass patches). We did note recovery in a small Halodule uninervis (wide form) meadow in Nomenade Creek as well as some regrowth in meadows on the vast sand flats to the south of Pine River Bay (Map 4).
o0 0.1 0.2 0.30.05
Kilometres
Legend
!. Seed sampling sitesIntertidal ReefSand or Mud

16
Figure 6 Total area of each seagrass cover type within the port limits of Weipa in September 2000, 2001 and 2002 and August 2005.
Table 7 Total meadow area for each meadow community type within the port limits of the Port of Weipa in September 2000, 2001 and 2002 and August 2005. (R is an estimate of reliability associated with mapping meadow boundaries)
Total meadow area ± R (number of meadows) ha Meadow type
Sep 2000 Sep 2001 Sep 2002 Aug 2005
Enhalus acoroides 84 ± 12 (11) 47 ± 8 (10) 54 ± 9 (17) 212 ± 29 (32)
Enhalus acoroides with Halophila ovalis 13 ± 3 (1)
Enhalus acoroides with mixed species 1000 ± 71 (16) 1146 ± 92 (22) 1103 ± 93 (28) 1015 ± 108 (24)
Enhalus acoroides/Halodule uninervis (wide form) 261 ± 16 (1) 181 ± 17 (1) 207 ± 17 (1) 10 ± 3 (1)
Halodule uninervis (narrow form) 11 ± 7 (4) 9 ± 6 (1) 14 ± 12 (2) 17 ± 5 (5)
Halodule uninervis (narrow form) with mixed species 34 ± 4 (1)
Halodule uninervis (narrow form)/Halophila decipiens 118 ± 38 (1) 100 ± 35 (1) 177 ± 63 (2) 128 ± 62 (2)
Halodule uninervis (narrow form)/Halophila ovalis 20 ± 6 (4) 22 ± 6 (5) 0.001 ± 0.001 (2) 3 ± 0 (1)
Halodule uninervis (narrow form)/Halophilaovalis with mixed species 1168 ± 79 (10) 1309 ± 87 (10) 929 ± 54 (5) 876 ± 63 (6)
Halodule uninervis (wide form) 3 ± 2 (2) 2 ± 2 (2) 1 ± 1 (1) 1 ± 0.3 (1)
Halophila decipiens 1 ± 1 (2) 1 ± 1 (2) 1 ± 1 (1) 16 ± 3 (2)
Halophila ovalis 3 ± 1 (5) 23 ± 5 (9) 22 ± 10 (3) 15 ± 6 (8)
Halophila ovalis with mixed species 1911 ± 171 (8) 2001 ± 165 (7) 1161 ± 126 (10) 346 ± 57 (4)
Syringodium isoetifolium 0.001 ± 0.001 (1) 0.001 ± 0.001 (1)
Syringodium isoetifolium with mixed species 31 ± 3 (1) 55 ± 3 (1) 22 ± 3 (1) 15 ± 4 (1)
Thalassia hemprichii 0.001 ± 0.001 (1) 0.005 ± 0.002 (1)
Thalassia hemprichii with mixed species 77 ± 11 (7) 72 ± 10 (5) 70 ± 9 (3)
Total 4688 ± 418 (74) 4969 ± 436 (78) 3795 ± 403 (77) 3442 ± 442 (92)
0500
1000
15002000
25003000
350040004500
5000To
tal a
rea
(ha)
Sep-00 Sep-01 Sep-02 Aug-05
Date
Weipa seagrass cover in the Port of Weipa
Isolated seagrass patches Aggregated seagrass patches Continuous seagrass cover
17
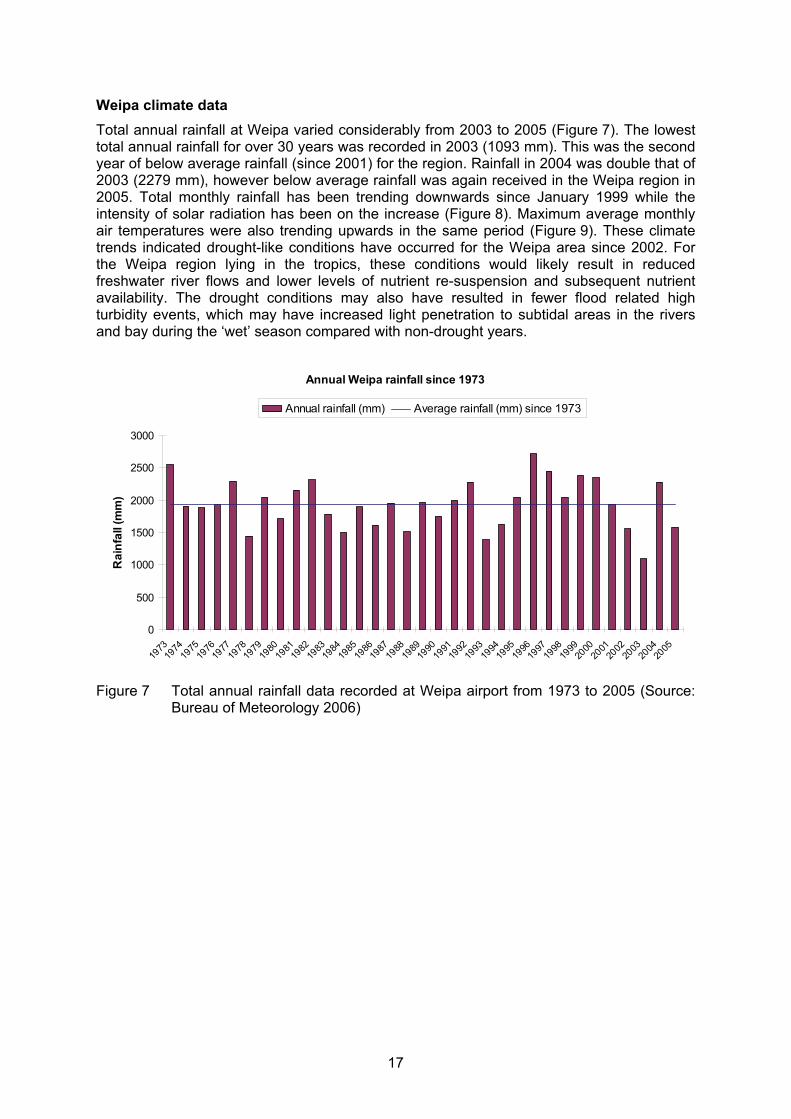
Weipa climate data Total annual rainfall at Weipa varied considerably from 2003 to 2005 (Figure 7). The lowest total annual rainfall for over 30 years was recorded in 2003 (1093 mm). This was the second year of below average rainfall (since 2001) for the region. Rainfall in 2004 was double that of 2003 (2279 mm), however below average rainfall was again received in the Weipa region in 2005. Total monthly rainfall has been trending downwards since January 1999 while the intensity of solar radiation has been on the increase (Figure 8). Maximum average monthly air temperatures were also trending upwards in the same period (Figure 9). These climate trends indicated drought-like conditions have occurred for the Weipa area since 2002. For the Weipa region lying in the tropics, these conditions would likely result in reduced freshwater river flows and lower levels of nutrient re-suspension and subsequent nutrient availability. The drought conditions may also have resulted in fewer flood related high turbidity events, which may have increased light penetration to subtidal areas in the rivers and bay during the ‘wet’ season compared with non-drought years.
Figure 7 Total annual rainfall data recorded at Weipa airport from 1973 to 2005 (Source: Bureau of Meteorology 2006)
Annual Weipa rainfall since 1973
0
500
1000
1500
2000
2500
3000
1973
1974
1975
1976
1977
1978
1979
1980
1981
1982
1983
1984
1985
1986
1987
1988
1989
1990
1991
1992
1993
1994
1995
1996
1997
1998
1999
2000
2001
2002
2003
2004
2005
Rai
nfal
l (m
m)
Annual rainfall (mm) Average rainfall (mm) since 1973

18
Figure 8 Average monthly rainfall (millimetres) and solar radiation (megajoules/metre2)recorded at Weipa airport from January 1999 to December 2005. Boxed data points indicate seagrass survey periods (Source: Bureau of Meteorology 2006).
Figure 9 Average monthly maximum air temperature (° Celsius) recorded at Weipa airport from January 1999 to December 2005. (Source: Bureau of Meteorology 2006).
Average maximum air temperature at Weipa (1999 to 2005)
24
26
28
30
32
34
36
38
40
Jan-9
9
Apr-99
Jul-9
9
Oct-99
Jan-0
0
Apr-00
Jul-0
0
Oct-00
Jan-0
1
Apr-01
Jul-0
1
Oct-01
Jan-0
2
Apr-02
Jul-0
2
Oct-02
Jan-0
3
Apr-03
Jul-0
3
Oct-03
Jan-0
4
Apr-04
Jul-0
4
Oct-04
Jan-0
5
Apr-05
Jul-0
5
Oct-05
Tem
pera
ture
(° C
elci
us)
Air temperature Linear trendline
Monthly Weipa rainfall and solar radiation
0
200
400
600
800
1000
1200
1400
1600
Jan-9
9
Apr-99
Jul-9
9
Oct-99
Jan-0
0
Apr-00
Jul-0
0
Oct-00
Jan-0
1
Apr-01
Jul-0
1
Oct-01
Jan-0
2
Apr-02
Jul-0
2
Oct-02
Jan-0
3
Apr-03
Jul-0
3
Oct-03
Jan-0
4
Apr-04
Jul-0
4
Oct-04
Jan-0
5
Apr-05
Jul-0
5
Oct-05
Rai
nfal
l (m
m)
0
2
4
6
8
10
12
14
16
18
20
22
24
26
28
30
Rad
iatio
n (m
j/m2 )
Monthly Rainfall (mm) Solar radiation Linear (Solar radiation) Linear (Monthly Rainfall)

19
Temperature loggers Temperature loggers were placed in intertidal seagrass meadows at Munding near Napranum (Meadow A5) and at Evans Point (Figure 10, Figure 11). A complete data set was retrieved from the Napranum loggers giving us a picture of the level of thermal stress experienced by intertidal seagrasses at Weipa. The temperature loggers at Evans Landing were unable to be retrieved in May 2005 leading to an incomplete data set (Figure 11). The highest recorded temperature at Napranum was 38°C while Evans Point recorded a maximum of 41.5°C. These temperatures are at the limit for effective seagrass plant cell function (Campbell et al. 2006).
Temperatures were more variable during dry season months (May to October) when the very low tides occur during daylight hours. There was less temperature fluctuation in the wet season (November to April). Daytime low tides were much higher (>1m above AHD) during these wet season months.
Figure 10 Average monthly temperature (° Celsius) recorded by intertidal temperature loggers in Meadow A5 near Napranum, Weipa from May 2004 to August 2005.
Figure 11 Average monthly temperature (° Celsius) recorded by intertidal temperature loggers at Evans Point, Weipa from May 2004 to August 2005.
0
10
20
30
40
50
May-04
Jun-0
4Ju
l-04
Aug-04
Sep-04
Oct-04
Nov-04
Dec-04
Jan-0
5
Feb-05
Mar-05
Apr-05
May-05
Jun-0
5Ju
l-05
Aug-05
Tem
pera
ture
(° C
elci
us)
Average Temp Max Min
0
10
20
30
40
50
May-04
Jun-0
4Ju
l-04
Aug-04
Sep-04
Oct-04
Nov-04
Dec-04
Jan-0
5
Feb-05
Mar-05
Apr-05
May-05
Jun-0
5Ju
l-05
Aug-05
Tem
pera
ture
(° C
elci
us)
Average Temp Max Min

20
Seagrass– Watch at Napranum The Seagrass-Watch site at Munding is dominated by Halodule uninervis (narrow form) (Figure 12, Figure 13). Growth of this species has driven the changes in % cover observed since May 2004. A pattern in annual changes of % cover is beginning to emerge with higher seagrass cover occurring just after the wet season months in May and lower cover late in the dry season in July through to August. This pattern, although only preliminary at this stage of the monitoring program, agrees with our baseline surveys for the port of Weipa from 2000 to 2002 (see Roelofs et al. 2003).
Figure 12 Changes in % seagrass cover at the Napranum Seagrass-Watch site at Munding (Monitoring Meadow A5) from May 2004 to August 2005.
Figure 13 Changes in % seagrass species composition and cover at the Napranum Seagrass-Watch site at Munding (Monitoring Meadow A5) from May 2004 to August 2005.
Napranum
05
10152025
303540
4550
Jan-
04
Mar
-04
May
-04
Jul-0
4
Sep
-04
Nov
-04
Jan-
05
Mar
-05
May
-05
Jul-0
5
Sep
-05
Nov
-05
% s
eagr
ass
cove
r
NP1
0
10
20
30
40
Jan-04 Mar-04 May-04 Jul-04 Sep-04 Nov-04 Jan-05 Mar-05 May-05 Jul-05 Sep-05 Nov-05
% s
eagr
ass
cove
r
Thalassia hemprichii
Halodule uninervis
Halophila ovalis
Zostera capricorni

21
Figure 14 Burnt Enhalus plants at Weipa, April 2002
DISCUSSION
Seagrass meadows in the Port of Weipa have changed substantially during the six years of seagrass monitoring. Most of the changes appeared to be in response to regional and local climate conditions and the physical and physiological characteristics of the seagrass meadows rather than human activities that have occurred in the port. In general terms intertidal seagrass meadows throughout the port area had become more patchy (greater areas of open unvegetated substrate) with substantial reductions in biomass (density) for Enhalus acoroides dominated seagrass meadows. In addition complete Halodule/Halophilameadows were lost in the Pine River Bay area in 2002 and have yet to recover.
Biomass has been measured throughout the monitoring program within the area of greatest port and urban activity (intensive monitoring area (IMA)). From 2003 to 2005 intertidal Enhalus meadows had become patchier with significant declines in biomass occurring within the IMA. These patterns of change did not seem to be occurring for deeper Enhalusmeadows or in intertidal Halodule/Halophila meadows within the IMA. It was likely that the observed changes were due to stress associated with desiccation of Enhalus plants when they were exposed at low tide. We have observed evidence of ‘browning’ or ‘burning’ of intertidal Enhalus plants in the Embley River each year from 2002, which caused the plants to appear stunted with the leaf blades rotted away. Recent regional climate conditions of increased solar irradiance, higher temperatures and a reduction in cloud cover were likely to have exacerbated thermal stress of intertidal seagrasses and increased the incidence of desiccation.
The deeper Enhalus meadow near Evans Landing was less likely to be affected by desiccation as it was rarely exposed and may explain why it did not suffer similar declines to the intertidal meadows in 2003 and 2004. Monitoring at nearby Thursday Island showed a similar pattern of change for Enhalus meadows with shallower meadows decreasing and deeper meadows increasing in biomass between 2002 and 2004 (Thomas and Rasheed 2004). A substantial decline in biomass for the Evans Landing meadow did occur however in the most recent survey (i.e. from 2004 to 2005). This meadow is located within the major infrastructure area for the port and while the recent decline may be due to climate, other human induced factors can not be ruled out, especially if the trend continues in the next monitoring survey. It was unlikely that port activity was the cause of the observed changes, however, as there were no identifiable changes to port operations, maintenance or infrastructure between 2004 and 2005.
Intertidal Halodule and Halophila monitoring meadows did not show the same declines as intertidal Enhalus within the IMA. This may be due to Halodule and Halophila species being less prone to desiccation by lying fully prostrate on the moist surface of the sediments at low tide. The more rigid Enhalushas the first section of the leaf base sitting proud above the sediments at low tide where it is exposed to the air. Observations of burn damaged Enhalus plants indicate it is in this area that the majority of damage occurs (Figure 14).

22
The damaging effects of desiccation may be exacerbated by thermal stress. We have been collecting temperature data for intertidal pools in Weipa to assist in understanding the thermal regime seagrasses are subjected to during tidal exposure periods. Recent experiments have shown that temperatures above 40° C start to negatively affect seagrass cellular systems with plant fatalities occurring above 45° C (Campbell et al. 2006). Initial analysis of Weipa intertidal temperature data indicates that daytime temperatures are occasionally reaching levels above 40° C placing these plants under thermal stress. Further analysis and continued temperature monitoring is required before stronger links between Weipa seagrass health and temperature can be established.
There had still been no recovery of Halodule and Halophila meadows in Pine River Bay since their complete loss in 2002. Seed sampling conducted in 2003 indicated that there was not a store of seeds in the sediment, suggesting that recruitment and recovery may be slow due to a limited local supply of propagules. There was some evidence of an increase in biomass for the remaining Halodule meadows in the Embley River (e.g., meadow A5). This may indicate a return to more favourable environmental conditions for Halodule growth. Intertidal Halodule meadows in Karumba have shown a marked increase in biomass between 2003 and 2006 associated with a return of favourable climate in the local Karumba area (Rasheed and McKenna 2005) that has not occurred in Weipa. The Karumba Halodulemeadows were also likely to be far more resilient and have an increased capacity for recovery than the Pine River Bay meadows. The meadows in Karumba were denser and although they declined significantly in 2002 they were not completely lost, providing a population of adult plants which could form the foundation of recovery (Rasheed and McKenna 2005; Rasheed et al. 2006). The Karumba seagrass meadow also had a seed bank from which recovery could occur (Rasheed et al. 2006).
The differing responses of the meadows to regional climate effects in Karumba and Weipa demonstrate the importance of understanding the individual nature of seagrass populations at a particular location. While meadows in both regions showed a similar negative response to the Gulf wide drought conditions in 2002, the different habitat characteristics of the Karumba and Weipa seagrass meadows combined with local differences in climate led to varied outcomes for the meadows in 2005.
Declines in the dense, high biomass Enhalus meadows are likely to have some local fisheries implications. These Embley River Enhalus communities are important fish habitats that have been shown to support many commercial and recreationally important fish and prawn species (Blaber et al. 1989). Increased patchiness and corresponding reduction in seagrass biomass is likely to have several impacts to the local ecosystem including:
• A loss of physical cover (habitat) for fish and crustaceans • A decrease in net primary production and carbon accumulation • A decrease in secondary production through loss of grazing animals relying on the
Enhalus meadow • A reduction in food resources for larger predatory fish such as barrumundi that feed
on the smaller animals inhabiting the seagrass meadows
Analysis of fisheries commercial catch data for barramundi, mud crab and grey mackerel have shown declines that correspond with the recent reductions in seagrass cover and biomass for Weipa (Gribble et al. 2005). This phenomenon is not isolated to the Weipa area with similar fisheries and seagrass declines also being recorded for the southern Gulf of Carpentaria (Rasheed and McKenna 2005). Further analysis of the fisheries data in relation to coastal habitat condition and climate is being conducted by DPI&F.

23
The monitoring program for Weipa indicates that despite some seagrass declines, the marine environment is relatively healthy with observed changes likely to be associated with regional and local climatic factors and the nature of the seagrass meadows rather than anthropogenic or port related impacts. The recent decline in the Evans Landing meadow is a concern however and will be monitored closely in the upcoming 2006 survey. We have established a good understanding of the range of natural changes in seagrass meadows in Weipa through a period of “normal” and “drought” conditions. Through our state wide seagrass monitoring network we have been able to put these changes in a regional perspective and separate local versus regional drivers of seagrass change. This background has placed us in a good position to detect any anthropogenic causes of change to seagrasses beyond this natural background. Future monitoring will continue to enhance this ability and provide port and fisheries management with information on the status of the marine environment and fish habitats within the Weipa area and an early warning of changes to marine environmental health caused by port or other human activities.

A2
A4
A1
A5
A3
A7A6
25
2
2
5
141°48'0"E
141°48'0"E
141°54'0"E
141°54'0"E
142°0'0"E
142°0'0"E
12°48'0"S 12°48'0"S
12°42'0"S 12°42'0"S
12°36'0"S 12°36'0"S
o
0 2 4 61
Kilometres
Map 1. Port of Weipa Intensive Monitoring Area showing seagrass meadows and sites monitored in August 2005
Source:Roelofs, A. J., Rasheed, M. A.,Thomas, R, McKenna, S. and Taylor, H. (2006).Port of Weipa Seagrass Monitoring, 2003 - 2005.Ecoports Monograph Series No. 23Ports Corporation of Queensland. 31 pp.
Funded by the Ports Corporation of Queensland and theDepartment of Primary Industries & Fisheries.
© Ports Corporation of Queensland and the State of Queenslandthrough the Department of Primary Industries & FisheriesLandsat Image Copyright Commonwealth of Australia - ACRES,Geoscience Australia
Produced by theMarine Ecology Group,
DPI&F, NFC, Cairns, 2006
Queensland
Weipa
Weipa
Weipa portfacility area
Mission
River
River
Hey
Embley
River
Weipa airport
LegendEnhalus acoroides
Enhalus acoroides with mixed species
Halodule uninervis (narrow form)
Halodule uninervis (narrow form)/Halophila ovalis with mixed species
Halophila decipiens
Halophila ovalis
Halophila ovalis with mixed species
Seagrass monitoring site
Intensive Monitoring Area
Lorim Point
EvansLanding
WallabyIsland

141°54'0"E
141°54'0"E
12°42'0"S
12°42'0"S
oLegend Isolatedseagrasspatches
Aggregatedseagrasspatches
Continuousseagrasscover
Enhalusacoroides
Enhalusacoroideswithmixedspecies
Haloduleuninervis(narrowform)
Haloduleuninervis(narrowform)/Halophilaovalis
Haloduleuninervis(narrowform)/Halophilaovaliswithmixedspecies
Halophiladecipiens
Halophilaovalis
Halophilaovaliswithmixedspecies
Thalassiahemprichiiwithmixedspecies
Map2.Meadowtypeandcoverforthe
coreseagrassmonitoringmeadows,
2000to2005
Source:
Roelofs,A.J.,Rasheed,M.A.,Thomas,R,McKenna,S.andTaylor,H.(2006).
PortofWeipaSeagrassMonitoring,2003-2005.
EcoportsMonographSeriesNo.23
PortsCorporationofQueensland.31pp.
FundedbythePortsCorporationofQueenslandandthe
DepartmentofPrimaryIndustries&Fisheries.
©PortsCorporationofQueenslandandtheStateofQueensland
throughtheDepartmentofPrimaryIndustries&Fisheries
LandsatImageCopyrightCommonwealthofAustralia-ACRES,
GeoscienceAustralia
ProducedbytheMarineEcologyGroup,
DepartmentofPrimaryIndustries&Fisheries,
NorthernFisheriesCentre,Cairns,2006.
Embley River
Hey River
01
23
0.5
Kilometres
September2000
September2001
September2002
September2003
August2004
Lorim
Point
Evans
Landing
August2005

25
2
141°48'0"E
141°48'0"E
141°54'0"E
141°54'0"E
12°36'0"S
12°36'0"S
25
2
141°48'0"E
141°48'0"E
141°54'0"E
141°54'0"E
12°36'0"S
12°36'0"S
25
2
141°48'0"E
141°48'0"E
141°54'0"E
141°54'0"E
12°36'0"S
12°36'0"S
25
2
141°48'0"E
141°48'0"E
141°54'0"E
141°54'0"E
12°36'0"S
12°36'0"S
oLegendIsolatedseagrasspatches
Aggregatedseagrasspatches
Continuousseagrasscover
Enhalusacoroides
Enhalusacoroideswithmixedspecies
Haloduleuninervis(narrowform)
Haloduleuninervis(narrowform)/Halophilaovaliswithmixedspecies
Halophiladecipiens
Halophilaovalis
Halophilaovaliswithmixedspecies
Syringodium
isoetifolium
Thalassiahemprichiiwithmixedspecies
Map3.Meadowtypeandcoverfor
seagrassmeadowsintheMissionRiver,
Weipa,September2000to2005
Source:
Roelofs,A.J.,Rasheed,M.A.,Thomas,R,McKenna,S.andTaylor,H.(2006).
PortofWeipaSeagrassMonitoring,2003-2005.
EcoportsMonographSeriesNo.23
PortsCorporationofQueensland.31pp.
FundedbythePortsCorporationofQueenslandandthe
DepartmentofPrimaryIndustries&Fisheries.
©PortsCorporationofQueenslandandtheStateofQueensland
throughtheDepartmentofPrimaryIndustries&Fisheries
LandsatImageCopyrightCommonwealthofAustralia-ACRES,
GeoscienceAustralia
ProducedbytheMarineEcologyGroup,
DepartmentofPrimaryIndustries&Fisheries,
NorthernFisheriesCentre,Cairns,2006
MissionRiver
02
46
1
Kilometres
September2000
September2001
September2002
September2003
025
5012.5 Metres
030
6015
Metres
030
6015 Metres
075
150
37.5 Metres
25
2
141°48'0"E
141°48'0"E
141°54'0"E
141°54'0"E
12°36'0"S
12°36'0"S
August2004
075
150
37.5 Metres
Wallaby
Island
25
2
141°48'0"E
141°48'0"E
141°54'0"E
141°54'0"E
12°36'0"S
12°36'0"S
August2005
0100
200
50
Metres

141°42'0"E
141°42'0"E
12°36'0"S 12°36'0"S
12°30'0"S 12°30'0"S
12°24'0"S 12°24'0"S
o
LegendEnhalus acoroides
Enhalus acoroides with Halophila ovalis
Enhalus acoroides with mixed species
Enhalus acoroides/Halodule uninervis (wide form)
Halodule uninervis (narrow form)
Halodule uninervis (narrow form)/Halophila decipiens
Halodule uninervis (narrow form)/Halophila ovalis
Halodule uninervis (narrow form)/Halophila ovalis with mixed species
Halodule uninervis (wide form)
Halophila decipiens
Halophila ovalis
Halophila ovalis with Enhalus acoroides
Halophila ovalis with mixed species
Syringodium isoetifolium with mixed species
Thalassia hemprichii with mixed species
Isolated seagrass patches
Aggregated seagrass patches
Continuous seagrass cover
Map 4. Meadow type and cover for seagrass meadows in Pine River Bay, Boyd Bay and Hey River, Weipa. September 2000 to August 2005
Source:Roelofs, A. J., Rasheed, M. A.,Thomas, R, McKenna, S. and Taylor, H. (2006).Port of Weipa Seagrass Monitoring, 2003 - 2005.Ecoports Monograph Series No. 23Ports Corporation of Queensland. 31 pp.
Funded by the Ports Corporation of Queensland and theDepartment of Primary Industries & Fisheries.
© Ports Corporation of Queensland and the State of Queenslandthrough the Department of Primary Industries & FisheriesLandsat Image Copyright Commonwealth of Australia - ACRES,Geoscience Australia
Produced by the Marine Ecology Group,Department of Primary Industries & Fisheries,Northern Fisheries Centre, Cairns, 2006.
NomenadeCreek
DuyfkenPoint
0 2 4 61
Kilometres
September 2000
September 2003
Pine River
PineRiverBay
141°42'0"E
141°42'0"E
12°54'0"S 12°54'0"S
September 2000 September 2002
LandfallPoint
BagleyChannel
Crawford
Creek
141°54'0"E
141°54'0"E
12°48'0"S 12°48'0"S
BoydBay
BoydPoint
HeyRiver
AlbatrossBay
September 2002 August 2005
September 2000 September 2002 August 2005
September 2000 September 2002 August 2005
0 1 2 3
Kilometres
0 1 2 30.5
Kilometres

Above-groundbiomass
(gDWm-²)
0.1
0.2-11
12-27
28-42
43-57
58-75
76-95
96-121
122-151
152-235
September2000
September2001
September2002
September2003
August2004
August2005
Map5.Changesinabove-groundbiomass
forMonitoringMeadowA2intheEmbleyRiver,
Weipa.2000to2005
o
Source:
Roelofs,A.J.,Rasheed,M.A.,Thomas,R,McKenna,S.
andTaylor,H.(2006).
PortofWeipaSeagrassMonitoring,2003-2005.
EcoportsMonographSeriesNo.23
PortsCorporationofQueensland.31pp.
FundedbythePortsCorporationofQueenslandand
theDepartmentofPrimaryIndustries&Fisheries.
©PortsCorporationofQueenslandandtheStateof
QueenslandthroughtheDepartmentofPrimary
Industries&Fisheries
LandsatImageCopyrightCommonwealthofAustralia
-ACRES,GeoscienceAustralia
ProducedbytheMarineEcologyGroup,
DepartmentofPrimaryIndustries&Fisheries,
NorthernFisheriesCentre,Cairns,2006.
00.5
11.5
0.25
Kilometres

29
APPENDIX
Results of one-way ANOVA for mean above ground biomass (log10 transformed) versus year for the Embley River intertidal Enhalus meadow (A2) at Weipa 2001 to 2005 (2000 baseline was omitted due to unequal sample sizes).
Meadow A2 DF SS MS F PBetween Years 4 10.3068 2.57719 9.02 <0.0001*
Within Years 252 71.9968 0.2857 Total 256 82.3055
Results of Least Significant Difference (LSD) pairwise comparisons of mean above ground biomass (g DW m-2) for the Embley River intertidal Enhalus meadow (A2) at Weipa 2001 to 2005. Means that share the same letter group are not significantly different (P <0.05).
Year Meanbiomass
2001 29.7 a 2002 22.8 a 2003 13.9 b 2004 11.5 b 2005 7.0 b
Results of one-way ANOVA for mean above ground biomass (log10 transformed) versus year for the Hey River intertidal Halophila/Halodule meadow (A3) at Weipa 2001 to 2005 (2000 baseline was omitted due to unequal sample sizes).
Meadow A3 Between Years 4 1.97342 0.49336 8.36 <0.0001*
Within Years 128 7.55508 0.05902 Total 132 9.5285
Results of Least Significant Difference (LSD) pairwise comparisons of mean above ground biomass (g DW m-2) for the Hey River intertidal Halophila/Halodule meadow (A3) at Weipa 2001 to 2005. Means that share the same letter group are not significantly different (P <0.05).
Results of one-way ANOVA for mean above ground biomass versus year for the Embley River intertidal Halophila/Halodule meadow (A5) at Weipa 2001 to 2005 (2000 baseline was omitted due to unequal sample sizes).
Meadow A5 Between Years 4 156.357 39.0891 3.62 0.0071
Within Years 247 2668.05 10.8018 Total 251 2824.41
Year Meanbiomass
2001 2.0 a 2002 0.4 c 2003 1.6 b 2004 0.1 c 2005 1.1 bc

30
Results of Least Significant Difference (LSD) pairwise comparisons of mean above ground biomass (g DW m-2) for the Embley River intertidal Halophila/Halodule meadow (A5) at Weipa 2001 to 2005. Means that share the same letter group are not significantly different (P <0.05).
Results of one-way ANOVA for mean above ground biomass (square root transformed) versus year for the Lorim Point intertidal Enhalus meadow (A6) at Weipa 2001 to 2005 (2000 baseline was omitted due to unequal sample sizes).
Meadow A6 Between Years 4 47.8782 11.9696 3.4 0.0113
Within Years 122 429.027 3.51661 Total 126 476.905
Results of Least Significant Difference (LSD) pairwise comparisons of mean above ground biomass (g DW m-2) for the Lorim Point intertidal Enhalus meadow (A6) at Weipa 2001 to 2005. Means that share the same letter group are not significantly different (P <0.05).
Year Meanbiomass
2001 10.4 a 2002 9.5 a 2003 8.3 a 2004 1.1 b 2005 3.4 ab
Results of one-way ANOVA for mean above ground biomass (square root transformed) versus year for the Evans Landing Intertidal/shallow subtidal Enhalus meadow (A7) at Weipa 2001 to 2005 (2000 baseline was omitted due to unequal sample sizes).
Meadow A7 Between Years 4 64.1054 16.0264 2.81 0.0275
Within Years 149 850.487 5.70797 Total 153 914.593
Results of Least Significant Difference (LSD) pairwise comparisons of mean above ground biomass (g DW m-2) for the Embley River intertidal Enhalus meadow (A6) at Weipa 2001 to 2005. Means that share the same letter group are not significantly different (P <0.05).
Year Meanbiomass
2001 18.9 a 2002 10.0 ab 2003 15.6 a 2004 10.6 ab 2005 2.8 b
Year Meanbiomass
2001 3.1 ab 2002 2.5 b 2003 2.3 b 2004 4.2 a 2005 4.1 a

31
REFERENCES
Blaber, S.J.M., Brewer, D.T. and Salini, J.P. (1989). "Species composition and biomasses of fishes in different habitats of a tropical northern Australian estuary: Their occurrence in the adjoining sea and estuarine dependence." Estuarine, Coastal and Shelf Science 29: 509-531.
Campbell, S.J., McKenzie, L.J. and Kerville, S.P. (2006). "Photosynthetic responses of seven tropical seagrasses to elevated seawater temperature." Journal of Experimental Marine Biology and Ecology330: 455-468.
McKenzie, L.J., Campbell, S.J. and Roder, C.A. (2001). Seagrass-Watch: Manual for Mapping & Monitoring Seagrass Resources by Community (citizen) volunteers. Cairns, Queensland Fisheries Service, Department of Primary Industries: 100pp.
Rasheed, M.A. and McKenna, S.A. (2005). Port of Karumba Long Term Seagrass Monitoring, Progress Report - October 2004. Report to the Ports Corporation of Queensland., Queensland Department of Primary Industries & Fisheries: Northern Fisheries Centre, Cairns: 12 pp.
Rasheed, M.A., Taylor, H.A. and Thomas, R. (2006). Port of Karumba Long Term Seagrass Monitoring, Progress Report - October 2005. DPI&F Information Series in press, Queensland Department of Primary Industries & Fisheries: Northern Fisheries Centre, Cairns: 15 pp.
Roelofs, A.J., Rasheed, M.A. and Thomas, R. (2001). Port of Weipa Seagrass Monitoring Baseline Surveys, April & September 2000. Brisbane, Ports Corporation of Queensland: 38 pp.
Roelofs, A.J., Rasheed, M.A. and Thomas, R. (2003). Port of Weipa Seagrass Monitoring, 2000 - 2002. Brisbane, Ports Corporation of Queensland: 32 pp.
Thomas, R. and Rasheed, M.A. (2004). Port of Thursday Island long-term seagrass monitoring - March 2004. QDPI&F Information Series QI04082, (Queensland Department of Primary Industries and Fisheries, Northern Fisheries Centre, Cairns): 22 pp.