Embed Size (px)
Citation preview

Long term seagrass monitoring in Port Curtis and Rodds Bay, Gladstone - November 2008 Kathryn Chartrand Michael Rasheed Richard Unsworth

PR09–4407 First Published 2009 This publication has been produced by: Marine Ecology Group Northern Fisheries Centre PO Box 5396 Cairns, QLD, 4870, Australia
The correct citation of this document is: Chartrand, K.M., Rasheed, M. A. and Unsworth, R.K.F. (2009). Long term seagrass monitoring in Port Curtis and Rodds Bay, November 2008.DEEDI Publication PR09-4407 (QPIF, Cairns), 34 pp. On 26 March 2009, the Department of Primary Industries and Fisheries was amalgamated with other government departments to form the Department of Employment, Economic Development and Innovation. © The State of Queensland, Department of Employment, Economic Development and Innovation, 2009. Except as permitted by the Copyright Act 1968, no part of the work may in any form or by any electronic, mechanical, photocopying, recording, or any other means be reproduced, stored in a retrieval system or be broadcast or transmitted without the prior written permission of the Department of Employment, Economic Development and Innovation. The information contained herein is subject to change without notice. The copyright owner shall not be liable for technical or other errors or omissions contained herein. The reader/user accepts all risks and responsibility for losses, damages, costs and other consequences resulting directly or indirectly from using this information. Seagrass and benthic macro invertebrate distribution and abundance can change seasonally and between years, and readers should ensure they make appropriate enquiries to determine whether new information is available. Enquiries about reproduction, including downloading or printing the web version, should be directed to [email protected] or telephone +61 7 3225 1398. Acknowledgements This project was funded by the Port Curtis Integrated Monitoring Program (PCIMP), Gladstone Ports Corporation Ltd and Queensland Primary Industries and Fisheries. We wish to thank the many QPIF staff for their invaluable assistance with this project including Helen Taylor, Skye McKenna, Tonia Sankey, Marcin Sladaniec and Melanie Commerford. Special thanks goes to PCIMP Coordinator Leonie Andersen (Vision Environment) for her invaluable assistance in securing additional funding and liaising with clients. We would also like to recognise Scott Wilson for his efforts in maintaining and downloading data loggers and Reid Heliworks for their helicopter support.

Port Curtis Long Term Seagrass Monitoring - November 2008
TABLE OF CONTENTS
EXECUTIVE SUMMARY .................................................................................................................1
INTRODUCTION .............................................................................................................................2
METHODS .......................................................................................................................................4 Habitat Mapping and Geographic Information System.........................................................5
RESULTS ........................................................................................................................................7 Seagrass Species, Distribution and Abundance for Monitoring Meadows in 2008 ..............7
Comparison with Previous Monitoring Surveys...................................................................14
Climate and Water Quality Data..........................................................................................23
DISCUSSION..................................................................................................................................27
REFERENCES ...............................................................................................................................30
APPENDIX......................................................................................................................................32

Port Curtis Long Term Seagrass Monitoring - November 2008 1
EXECUTIVE SUMMARY This report details findings of the 2008 annual seagrass monitoring survey for Port Curtis and Rodds Bay. The program was developed from a baseline survey conducted in 2002 and from recommendations of the Port Curtis Integrated Monitoring Program (PCIMP) review. In 2008 seagrasses in Port Curtis were in a relatively healthy condition compared with previous monitoring surveys. Most of the monitoring meadows had only slight changes in density and area from the previous year’s survey. However both the intertidal and subtidal meadows in the Fisherman’s Landing area and the Quoin Island meadow had some significant declines in biomass. The drivers of seagrass change in Port Curtis appear to be largely associated with local climate conditions, fine scale variability in the physical meadow environment and the natural resilience and capacity for recovery in individual seagrass meadows. Substantial rainfall and related turbid plumes that occurred in early 2008 within the port area appeared to have a negative effect on the seagrass meadows near the mouth of the Calliope River. The very healthy condition of seagrasses recorded in 2007 may have provided the meadows with a high resilience and potentially greater capacity to recover from flood related impacts in the longer term. The recent expansion of the seagrass monitoring program within PCIMP has led to a series of turbidity, light and temperature loggers and monitoring stations being established in the seagrass meadows late in 2007. Data loggers provided the first glimpse of in situ conditions to evaluate changes occurring at the meadow scale. The loggers, while valuable, have been in place under a year making comparative analyses difficult. Relationships between meadow dynamics and physical parameters will be better resolved as a larger dataset develops. The presence of seagrass meadows and dugong activity in intertidal areas adjacent to port facilities and infrastructure has implications for port management. Some of the most utilised seagrass meadows also appear to be those in closest proximity to major port infrastructure and proposed areas of expansion. Future port infrastructure developments would require careful management to ensure minimal impacts on these communities. The fact that “healthy” seagrass meadows and dugong activity have continued to exist within the port indicates that these important habitats can co-exist with well managed port activities and development. This was the fifth survey in the established annual monitoring program and some of the likely climate related drivers of seagrass change have been identified. Additional information on light and temperature being collected in the program will strengthen our ability to separate the natural and human induced causes of change to seagrass meadows that may arise in the future.

Port Curtis Long Term Seagrass Monitoring - November 2008 2
INTRODUCTION Seagrass meadows in Queensland are known to provide valuable nursery habitats for juvenile commercial and recreational fisheries species, as well as important food resources for endangered and threatened species such as dugong and turtles. The value of seagrasses in the Port of Gladstone area (Port Curtis) to dugong has been recognised by the declaration of the Rodds Bay Dugong Protection Area (DPA). Seagrasses also show measurable responses to changes in water quality making them ideal candidates for monitoring the “health” of port environments. Results from long term monitoring programs throughout other Queensland port locations have provided valuable information on the relationships between climatic changes, anthropogenic disturbance and seagrass abundance. They have also indicated that healthy and productive seagrass habitats can co-exist with appropriately managed port facilities. Long term seagrass monitoring programs have enabled port managers to make informed decisions regarding planning and development of port infrastructure that will have minimal impact on fisheries and the marine environment. Gladstone Ports Corporation Limited (GPCL) recognises that seagrass meadows comprise an important and sensitive component of the marine habitats within the port and as part of their commitment to maintaining the health of the marine environment within the port. GPCL commissioned the Queensland Primary Industries & Fisheries (QPIF; Department of Employment, Economic Development and Innovation (DEEDI)) Marine Ecology Group (MEG) to conduct a baseline, fine-scale survey of seagrass resources within the port limits and nearby Rodds Bay in 2002 (Rasheed et al. 2003). The baseline survey identified large areas of seagrass within the port limits with seagrass communities often occurring adjacent to port facilities and infrastructure. The baseline survey mapped 13,578 ha of seagrass habitat within Port Curtis and Rodds Bay finding that these habitats appeared to be healthy, however, detailed historical comparisons were not possible as the baseline survey was the first fine scale survey of the region. An annual long term seagrass monitoring program was considered valuable given the proximity of meadows to port and industrial infrastructure and possible impacts associated with future port and coastal developments. The ability of seagrasses to show measurable growth responses to changes in water quality and their extensive distribution through the port made them an ideal candidate for monitoring marine environmental health. At the request of GPCL and from recommendations from the Port Curtis Integrated Monitoring Program (PCIMP) review of monitoring in the Port Curtis region (SKM 2004) a long term seagrass monitoring strategy for the port was developed. From the results of the 2002 baseline survey and consultation with port users, thirteen seagrass meadows were selected to monitor. These monitoring meadows represent the range of seagrass communities within the port and include meadows that would most likely be impacted by port facilities and developments. Monitoring meadows include both intertidal and subtidal seagrasses as well as meadows preferred by dugong and those likely to support high fisheries productivity. Three meadows in Rodds Bay (outside of the port limits) were also selected to monitor in order to provide information on seagrasses unlikely to be impacted by port activity and to assist in separating out port related versus regional causes of seagrass change detected in the monitoring program (i.e. as a control). The annual monitoring program has been in place since 2004 (see Rasheed et al. 2005; 2006; Taylor et al. 2007). Some significant changes to seagrass monitoring meadows have occurred between the 2002 baseline and subsequent monitoring surveys from 2004 to 2007. Generally, regional and local climatic factors were the most likely causes of seagrass change rather than port related activities during this time. The last four years of monitoring has helped to better establish the range of natural changes for Port Curtis seagrasses and has placed us in a strong position to discern natural changes from human induced or port related change

Port Curtis Long Term Seagrass Monitoring - November 2008 3
Recognising the importance of seagrass meadows to a number of port users and the potential to add value to the program, it was decided to shift the seagrass monitoring program to PCIMP from 2007. Under PCIMP, the monitoring program provides information required to aid in planning of port development and maintenance programs that will have minimal effects on the marine environment in addition to ensuring the health of Port Curtis’ marine environment. The collaborative monitoring program between PCIMP and QPIF was further expanded in late 2007 to include in situ measurements of three key variables that are known to impact seagrass health: light, turbidity and temperature. The physicochemical data will be incorporated into monitoring assessments in order to resolve what impact they have on seagrass dynamics at the meadow scale. The objectives of the survey were to:
1. Conduct annual long term seagrass monitoring within the Gladstone port limits (Port Curtis) and Rodds Bay area based on information collected in the 2002 baseline survey
2. Monitor distribution, abundance and species composition of selected seagrass meadows
within the port limits and Rodds Bay
3. Analyse changes in seagrass meadows measured since the baseline during subsequent annual monitoring surveys
4. Document temporal physicochemical water quality parameters at selected seagrass
meadows within port limits (Central Queensland University separate report).
5. Interpret the affects of changes in temporal physicochemical water quality parameters on distribution, abundance and species composition of selected seagrass meadows within the port limits.
6. Place observed changes within a regional and state-wide context

Port Curtis Long Term Seagrass Monitoring - November 2008 4
METHODS
Seagrass surveys of the Gladstone port limits (Port Curtis) and Rodds Bay were conducted between the 12th and 16th of November 2008. The survey was conducted in mid November as seagrasses in the region were likely to be at their maximum density and distribution in late spring, and also to allow direct comparisons with previous surveys in the monitoring program which were all conducted in October/November. Thirteen meadows from the baseline survey (Rasheed et al. 2003) were previously selected for long term monitoring. These meadows were representative of the range of seagrass communities identified in the baseline survey and were also located in areas likely to be vulnerable to impacts from port operations and developments.
Seagrass habitat observations included species composition, above ground biomass, percent algal cover, depth below mean sea level (MSL; for subtidal sites), sediment type, time and position (Global Positioning System; GPS). Two sampling methods were used to survey the seagrass meadows; helicopter and divers. Methodology depended on the depth and size of area to be surveyed. A detailed description of the methods used to characterise the monitoring meadows is provided in Rasheed et al. (2003).
Seagrass above ground biomass was determined using a modified “visual estimates of biomass” technique described by Mellors (1991). This technique involves an observer ranking seagrass biomass in the field in three random placements of a 0.25m2 quadrat at each site. Ranks were made in reference to a series of quadrat photographs of similar seagrass habitat for which the above ground biomass had previously been measured. Two separate biomass ranges were used: low biomass and high biomass. The relative proportion of the above ground biomass (i.e. percentage) of each seagrass species within each survey quadrat was also recorded. Field biomass ranks were then converted into above ground biomass estimates in grams dry weight per square metre (g DW m-2). At the completion of sampling each observer ranked a series of calibration quadrats that represented the range of seagrass biomass observed during the survey. After ranking these quadrats, the seagrass was harvested and the actual biomass determined in the laboratory. A separate regression of ranks and biomass from these calibration quadrats was generated for each observer and applied to the field survey data to determine above ground biomass estimates.
In December 2007, PCIMP began collecting light, turbidity and temperature data in all ten of the seagrass monitoring meadows within Port Curtis (no data collected in Rodds Bay). A complete summary of the methods and data collected is provided in Wilson et al. (2008). Temperature data was collected at all ten meadows whilst light and turbidity were collected at Pelican Banks (meadow 43), North Fisherman’s (meadow 8), and Wiggins Island (meadow 4; see Map 2 & 3).

Port Curtis Long Term Seagrass Monitoring - November 2008 5
Habitat Mapping and Geographic Information System Spatial data from the field surveys were incorporated into the GPCL/QPI&F Geographic Information System (GIS) database. Three GIS layers were created:
Site information – site data containing above ground biomass (for each species), depth below mean sea level (MSL) (for subtidal sites), sediment type, time, differential Global Positioning System (GPS) fixes (±1.5m) and sampling technique.
Seagrass meadow biomass and community types – area data for seagrass meadows with summary information on meadow characteristics. Seagrass community types were determined according to species composition from nomenclature developed for seagrass meadows of the Queensland region (Table 1). Abundance categories (light, moderate, dense) were assigned to community types according to above ground biomass of the dominant species (Table 2).
Seagrass landscape category - area data showing the seagrass landscape category determined for each meadow:
Table 1 Nomenclature for community types in Port Curtis and Rodds Bay, November 2008
Community type Species composition
Species A Species A is 90-100% of composition
Species A with mixed species Species A is 50-90% of composition
Species A/Species B Species A is 40-60% of composition
Isolated seagrass patches The majority of area within the meadows consisted of unvegetated sediment interspersed with isolated patches of seagrass Aggregated seagrass patches Meadows are comprised of numerous seagrass patches but still feature substantial gaps of unvegetated sediment within the meadow boundaries Continuous seagrass cover The majority of area within the meadows comprised of continuous seagrass cover interspersed with a few gaps of unvegetated sediment.

Port Curtis Long Term Seagrass Monitoring - November 2008 6
Table 2 Density categories and mean above ground biomass ranges for each species used in determining seagrass community density in Port Curtis and Rodds Bay, November 2008
Mean above ground biomass (g DW m-2)
Density H. uninervis (narrow)
H. ovalis H.
decipiens
H. uninervis (wide) H. spinulosa Z. capricorni
Light < 1 < 1 < 5 < 15 < 20 Moderate 1 - 4 1 - 5 5 - 25 15 - 35 20 - 60
Dense > 4 > 5 > 25 > 35 > 60
Meadows were also assigned a mapping precision estimate (in metres) based on mapping methodology utilised for that meadow (Table 3). Mapping precision for coastal seagrass meadows ranged from ±5m to ±20m for the monitoring meadows (Table 3). The mapping precision estimate was used to calculate a range of meadow area for each meadow and was expressed as a meadow reliability estimate (R) in hectares. Additional sources of mapping error associated with digitising and rectifying aerial photographs onto base maps and with GPS fixes for survey sites were embedded within the meadow reliability estimates.
Table 3 Mapping precision and methodology for seagrass meadows in Port Curtis and Rodds Bay, November 2008
Mapping precision Mapping methodology
≤5m
Meadow boundaries mapped in detail by GPS from helicopter Intertidal meadows completely exposed or visible at low tide Relatively high density of mapping and survey sites Recent aerial photography aided in mapping
10m
Meadow boundaries determined from helicopter and diver surveys Inshore boundaries mapped from helicopter Offshore boundaries interpreted from survey sites and aerial photography Relatively high density of mapping and survey sites
20m
Meadow boundaries determined from helicopter and diver surveys Some boundaries mapped from helicopter Offshore boundaries interpreted from diver survey sites Lower density of survey sites for some sections of boundary

Port Curtis Long Term Seagrass Monitoring - November 2008 7
RESULTS
Seagrass Species, Distribution and Abundance for Monitoring Meadows in 2008 Five seagrass species (from three families) were identified in the thirteen seagrass monitoring meadows (Figure 1). For a complete list of species found within the port limits see Rasheed et al. (2003): Family CYMODOCEACEAE Taylor:
Halodule uninervis (wide and narrow leaf morphology) (Forsk.) Aschers. in Boissier Family HYDROCHARITACEAE Jussieu:
Halophila decipiens Ostenfeld Halophila ovalis (R. Br.) Hook. F. Halophila spinulosa (R. Br) Hook. F.
Family ZOSTERACEAE Drummortier:
Zostera capricorni Aschers.
Figure 1. Seagrass species present during 2008 Port of Gladstone monitoring surveys.
Zostera capricorni
Halophila decipiensHalophila ovalis
Halodule uninervis Halophila spinulosa
(wide) I t
(narrow)

Port Curtis Long Term Seagrass Monitoring - November 2008 8
A total of 2703.6 ± 96.3 ha of seagrass habitat was mapped in the thirteen seagrass monitoring meadows in November 2008 (Table 4). Meadow area ranged from 3.2 ha to 681.4 ha with the smallest meadow situated at Rodds Bay and largest meadow located at Pelican Banks (Table 5; Map 3). A total of 419 monitoring sites (excluding meadow boundary mapping sites) were surveyed, 83% (347 sites) of which had seagrass present (Map 1). Of these monitoring sites 306 intertidal sites were surveyed from helicopter and 113 subtidal sites were surveyed using boat based methods (diver). The thirteen monitoring meadows that were surveyed included seven different community types depending on species presence and dominance (Maps 2, 3 and 4; Table 4). Communities that were dominated by Zostera capricorni were the most common followed by communities dominated by Halophila decipiens and Halophila ovalis. In the north of the survey area, Zostera capricorni and Halophila ovalis communities dominated the intertidal sand and mud banks between Mud Island and Fishermans Landing wharves with Halophila decipiens dominating in subtidal areas. Further south, Zostera capricorni communities occurred between South Trees Inlet and Barney Point. A new seagrass meadow (meadow 49) was mapped in 2008 between the Quoin Island monitoring meadow (48) and the southern section of Quoin Island (Map 3). This relatively small and patchy intertidal meadow was dominated by Halophila ovalis. Mean above ground biomass for the monitoring meadows ranged from 0.30 ± 0.09 g DW m-2 in the light Halophila decipiens subtidal meadow north of Fisherman’s Landing (meadow 9) to 25.96 ± 3.03 g DW m-2 for the moderate Zostera capricorni meadow at Pelican Banks (meadow 43) (Table 6). Seagrass cover for intertidal meadows located on the mainland coast between South Trees and North Fishermans Landing was patchy with the majority of meadows consisting of isolated or aggregated patches of seagrass (Table 4; Maps 2 & 3). Cover of seagrasses in other areas including Pelican Banks, Quoin Island and Rodds Bay was more consistent with meadows having aggregated patches and some continuous cover of seagrass (Table 4; Maps 3 & 4). The majority of the monitoring meadows were located on sediments dominated by mud often combined with a smaller component of sand and/or shell. The exceptions were Pelican Banks (meadow 43) and Quoin Island meadows (meadow 48 & 49) which occurred on sediments dominated by sand. Dugong feeding activity was observed on the majority of intertidal seagrass meadows surveyed. The highest density of dugong feeding trails was observed at the light Zostera capricorni meadow at Wiggins Island west (meadow 5; Map 2) with dugong feeding trails recorded at 69% of sampling sites. Dugong feeding trails were also observed at Quoin Island meadows (meadow 48 & 49), Wiggins Island (meadow 4), Pelican Banks (meadow 43), South Trees (meadow 58) and across the intertidal meadows to the north and south of Fishermans Landing (meadows 6 & 8).

Port Curtis Long Term Seagrass Monitoring - November 2008 9
151°33'19"E151°19'59"E151°6'39"E
23°46'40"S
24°0'0"S
LegendCoastal seagrass from 2002 baseline
Deepwater seagrass from 2002 baseline
Sites without seagrass
Sites with seagrass
Port Curtis limits
Rodds Bay dugong protection areaSource: Chartrand, K.M., Rasheed, M.A. and Unsworth, R.K.F. 2009. Long term seagrass monitoring in Port Curtis and Rodds Bay, Gladstone - November 2008. QPI&F Publication PR09-4407 (QPI&F, Cairns) 32pp.
© Port Curtis Integrated Monitoring Program and The State of Queensland through Primary Industries and Fisheries.
Funded by the Port Curtis Integrated Monitoring Programand Queensland Primary Industries and Fisheries.
Produced by the Marine Ecology Group, Queensland Primary Industries and Fisheries, Northern Fisheries Centre, Cairns, 2009.
Map 1. Location of 2008 seagrass monitoring sites and seagrass meadows from the 2002 baseline survey in Ports Curtis and Rodds Bay
±0 3 6 9
Kilometers
Coral Sea
GLADSTONE
Calliope River
Boyne River
Turkey Beach
Rodds Bay
Rodds Peninsula
Curtis Island
Facing Island

Port Curtis Long Term Seagrass Monitoring - November 2008 10
Table 4 Community type, seagrass cover and species present in the thirteen Gladstone monitoring meadows, November 2008.
Monitoring Meadow Location No. of sites Community Type Cover Species Present
4 Wiggins Island 18 Light H. ovalis with
mixed species Isolated patches H. ovalis, Z. capricorni
5 Wiggins Island 32 Light Z. capricorni Aggregated
patches Z. capricorni, H. ovalis
6 South Fishermans 42 Light Z. capricorni
with mixed species Isolated patches Z. capricorni, H. ovalis, H. decipiens
7 South Fishermans 11
Moderate H. decipiens with mixed
species
Aggregated patches H. decipiens, H. ovalis
8 North Fishermans 38 Light Z. capricorni
with mixed species Isolated patches Z. capricorni, H. spinulosa, H. ovalis, H. decipiens
9 North Fishermans 29 Light H. decipiens Continuous cover H. decipiens, Z. capricorni
43 Pelican Banks 52 Moderate Z.
capricorni Continuous cover Z. capricorni, H. ovalis
48 Quoin Island 35 Light H. uninervis (wide) with mixed
species
Aggregated patches
H. uninervis (wide), H. uninervis (thin), H. spinulosa, H. decipiens,
H. ovalis
58 South Trees 28 Light Z. capricorni with mixed species
Aggregated patches Z. capricorni, H. ovalis,
60 South Trees 11 Light Z. capricorni Continuous cover Z. capricorni, H. ovalis
94 Rodds Bay 11 Light Z. capricorni Continuous cover Z. capricorni
96 Rodds Bay 32 Moderate Z. capricorni
Aggregated patches Z. capricorni
104 Rodds Bay 21 Light Z. capricorni Aggregated patches Z. capricorni

Port Curtis Long Term Seagrass Monitoring - November 2008 11
Map 2. Monitoring meadows in the Fishermans Landing region, 2008
k
k
k
k
k
k
151°13'0"E151°10'40"E
23°46'20"S
23°48'40"S
Legend
Light Halodule uninervis (wide) with mixed speciesLight Halophila ovalis with mixed speciesLight Halophila decipiensModerate Halophila decipiensModerate Halophila decipiens with mixed species
Light Zostera capricorniLight Zostera capricorni with mixed speciesModerate Zostera capricorniModerate H. ovalis/ Z. capricorni ±* This is not a complete seagrass distribution, only selected
seagrass monitoring meadows displayed
Background: Landsat ETM + Panchromatic 24 July 1994
0 1 2
Kilometers
Fishermans Landing Wharfs
Wiggins Island
Curtis Island
Friend Pt.
8
7
6
5
4
9
Calliope R
iver
Source: Chartrand, K.M., Rasheed, M.A. and Unsworth, R.K.F. 2009. Long term seagrass monitoring in Port Curtis and Rodds Bay, Gladstone - November 2008. QPI&F Publication PR09-4407 (QPI&F, Cairns) 32pp.
© Port Curtis Integrated Monitoring Program and The State of Queensland through Primary Industries and Fisheries.
Funded by the Port Curtis Integrated Monitoring Programand Queensland Primary Industries and Fisheries.
Produced by the Marine Ecology Group, Queensland Primary Industries and Fisheries, Northern Fisheries Centre, Cairns, 2009.
Isolated patches
Aggregated patches
Continuous cover
Data Loggers
k Light, Turbidity & Temp
k Temp Only

Port Curtis Long Term Seagrass Monitoring - November 2008 12
Map 3. Monitoring meadows in the Quoin Island and South Trees region, 2008
k
k
kk
151°18'0"E
23°48'0"S
23°51'0"S
0 1 2
Kilometres
±* This is not a complete seagrass distribution, only selected seagrass monitoring meadows displayed Background: Landsat ETM + Panchromatic 24 July 1994
43
48
58 60South Trees Point
Quoin Island
Facing Island
Curtis Island
Barney Point
LegendLight Halodule uninervis (wide) with mixed species
Light Halophila ovalis with mixed species
Light Zostera capricorni
Light Zostera capricorni with mixed species
Moderate Zostera capricorni
Source: Chartrand, K.M., Rasheed, M.A. and Unsworth, R.K.F. 2009. Long term seagrass monitoring in Port Curtis and Rodds Bay, Gladstone - November 2008. QPI&F Publication PR09-4407 (QPI&F, Cairns) 32pp.
© Port Curtis Integrated Monitoring Program and The State of Queensland through Primary Industries and Fisheries.
Funded by the Port Curtis Integrated Monitoring Programand Queensland Primary Industries and Fisheries.
Produced by the Marine Ecology Group, Queensland Primary Industries and Fisheries, Northern Fisheries Centre, Cairns, 2009.
49
Isolated patches
Aggregated patches
Continuous cover
Data Loggers
k Light, Turbidity & Temp
k Temp Only

Port Curtis Long Term Seagrass Monitoring - November 2008 13
Map 4. Monitoring meadows in the Rodds Bay region, 2008
151°41'0"E
24°5'0"S
0 0.5 1
Kilometres
±* This is not a complete seagrass distribution, only selected seagrass monitoring meadows displayed
Background: Landsat ETM + Panchromatic 24 July 1994
Rodds Peninsula
Turkey Point
Turkey Beach
96
94
104
Legend
Light Zostera capricorni
Moderate Zostera capricorni
Aggregated patches
Continuous cover
Source: Chartrand, K.M., Rasheed, M.A. and Unsworth, R.K.F. 2009. Long term seagrass monitoring in Port Curtis and Rodds Bay, Gladstone - November 2008. QPI&F Publication PR09-4407 (QPI&F, Cairns) 32pp.
© Port Curtis Integrated Monitoring Program and The State of Queensland through Primary Industries and Fisheries.
Funded by the Port Curtis Integrated Monitoring Programand Queensland Primary Industries and Fisheries.
Produced by the Marine Ecology Group, Queensland Primary Industries and Fisheries, Northern Fisheries Centre, Cairns, 2009.

Port Curtis Long Term Seagrass Monitoring - November 2008 14
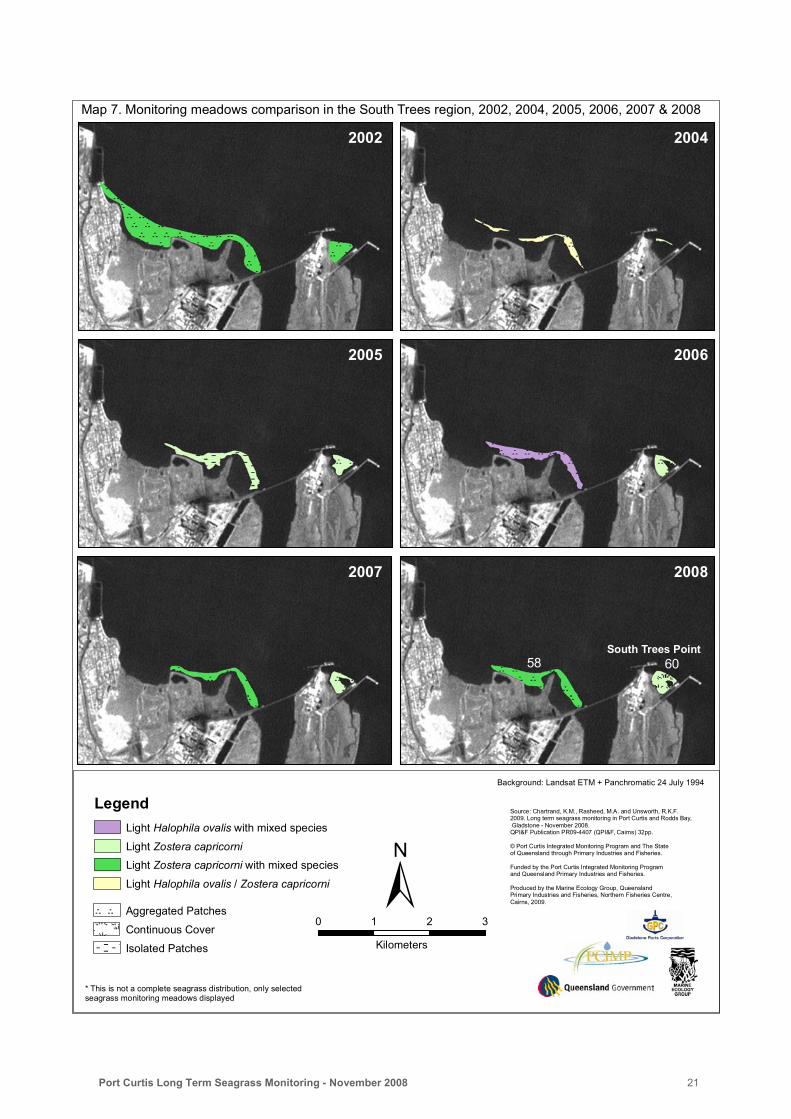
Comparison with Previous Monitoring Surveys In 2008, seagrass density and meadow area were similar to levels measured in past monitoring surveys in the Port of Gladstone. However, there were some significant declines from the previous year with 10 of the 13 meadows declining in biomass and only one meadow, the Pelican Banks Zostera meadow (meadow 43), showing a significant increase in biomass from 2007 (Table 6; Maps 6-9; see Appendix),. Both intertidal and subtidal seagrass monitoring meadows in the Fishermans Landing area (meadows 6, 7, 8 & 9) had significantly declined in biomass from the peak levels recorded in 2007 to near the lowest densities recorded in 2004 & 2005 (Figure 2). Species composition in these meadows shifted slightly with an increase in the proportion of biomass made up by the meadows’ dominant species (Figure 2). The meadow area of the two subtidal meadows (7 & 9) increased significantly from 2007 while the intertidal meadows (6 & 8) remained essentially unchanged in size. These results follow previous findings whereby the subtidal meadows appear highly dynamic compared to the neighbouring intertidal meadows. Seagrass biomass, area and cover on the two intertidal meadows closest to the mouth of the Calliope River (meadow 4 & 5) were not significantly different from 2007 values. Species composition only shifted slightly in meadow 5 to a monospecific stand of Zostera capricorni (Map 5). Filamentous green algae was again common on the banks adjacent to Wiggins Island (meadow 4) which has been observed during surveys since 2004 (Rasheed et al. 2005, 2007). Seagrass meadows adjacent to South Trees Point (meadows 58 & 60) had similar biomass to 2007 levels and was significantly higher than the previous three survey years (Figure 1; Table 6; see Appendix). The area of both meadows increased slightly from 2007 with no considerable changes to species composition (Figure 1; Table 5). These low biomass meadows appeared to be quite healthy overall in both 2007 and 2008 compared to previous years. The largely subtidal Halodule uninervis monitoring meadow at Quoin Island (meadow 48) declined further in biomass in 2008 following an initial decrease recode in the 2007 survey (Table 6; Figure 2; see Appendix). In the baseline survey in 2002, this meadow was dominated by the narrow leaf form of Halodule uninervis, however in each subsequent survey there had been a shift in species composition with the heavier wide leaf form of the species becoming dominant (Figure 2). In 2007 there was a reversal of this trend with an increase in the proportion of the lighter narrow leaf form explaining the corresponding reduction in biomass for this year (Figure 2). However, this relationship does not hold for the 2008 survey where a further reduction in biomass occurred in conjunction with a return to the larger wide leaf form of Halodule universis dominating the species composition (Figure 2). The Pelican Banks Zostera capricorni dominated meadow has been the most stable in the monitoring program in both biomass and area between years despite a significant rise in meadow biomass in 2008 to near its 2005 peak (Tables 5 & 6; Figure 2; see Appendix). The three intertidal Zostera capricorni monitoring meadows in Rodds Bay were at their highest recorded biomass in 2007. In 2008, there was some fluctuation in biomass however not at a significant level (Figure 2; see Appendix). Meadow size and species composition was unchanged from the previous year.

Port Curtis Long Term Seagrass Monitoring - November 2008 15
Table 5 Area (ha) for monitoring meadows in Port Curtis and Rodds Bay, November 2002, November 2004, October 2005, November 2006, October 2007 and November 2008.
Area ± R (ha) Meadow ID See map Location Meadow depth
2002 2004 2005 2006 2007 2008
4 5 Wiggins Island intertidal 35.8 ± 1.7 35.6 ± 1.7 32.5 ± 1.9 35.9 ± 2.1 40.2 ± 2.0 34.6 ± 1.8
5 5 Wiggins Island intertidal 149.8 ± 2.5 143.6 ± 2.5 140.11 ± 2.5 147.4 ± 2.5 147.5 ± 2.9 151.2 ± 2.7
6 5 South Fishermans intertidal 464.0 ± 12.9 373.5 ± 11.9 406.4 ± 12.7 428.8 ± 13.0 470.1 ± 12.9 453.1 ± 13.2
7 5 South Fishermans subtidal 72.6 ± 11.4 185.6 ± 8.7 112.1 ± 12.3 203.1 ± 8.2 20.6 ± 2.4 65.9 ± 5.1
8 5 North Fishermans intertidal 269.1 ± 11.3 268.3 ± 12.5 231.1 ± 12.3 275.2 ± 12.0 309.9 ± 12.0 294.9 ± 12.6
9 5 North Fishermans subtidal 268.3 ± 14.9 284.4 ± 7.1 7.0 ± 1.1 143.9 ± 8.0 153.0 ± 8.3 242.5 ± 8.2
43 6 Pelican Banks intertidal 624.8 ± 12.3 592.8 ± 12.4 614.6 ± 11.9 606.8 ± 14.5 662.0 ± 13.2 681.4 ± 12.8
48 6 Quoin Island intertidal/subtidal 421.4 ± 10.2 285.8 ± 21.8 316.6 ± 18.7 285.1 ± 19.9 301.7 ± 19.8 370.9 ± 19.4
58 7 South Trees intertidal 71.9 ± 3.9 11.2 ± 2.3 23.7 ± 2.4 24.0 ± 2.4 18.9 ± 2.1 27.4 ± 2.2
60 7 South Trees intertidal 11.1 ± 0.7 0.8 ± 0.4 7.7 ± 0.6 7.5 ± 0.8 7.9 ± 0.8 10.7 ± 0.9
94 8 Rodds Bay intertidal 3.1 ± 0.4 2.7 ± 0.8 3.1 ± 0.8 2.9 ± 0.8 3.2 ± 0.8 3.2 ± 0.8
96 8 Rodds Bay intertidal 321.9 ± 10.6 303.5 ± 10.3 314.8 ± 10.6 324.4 ± 11.9 327.0 ± 11.5 329.9 ± 11.6
104 8 Rodds Bay intertidal 47.7 ± 4.3 38.9 ± 3.8 41.94 ± 3.8 35.6 ± 4.5 36.7 ± 5.2 37.7 ± 5.0
Total 2755.3 ± 96.6 2526.7 ± 96.1 2251.6 ± 91.6 2520.6 ± 100.8 2498.7 ± 93.9 2703.4 ± 96.3

Port Curtis Long Term Seagrass Monitoring - November 2008 16
Table 6 Mean above ground biomass (g DW m-2) for monitoring meadows in Port Curtis and Rodds Bay, November 2002, November 2004, October 2005, November 2006, October 2007 and November 2008.
Mean biomass (g DW m-2) Meadow ID See map Location Meadow depth
2002 2004 2005 2006 2007 2008
4 5 Wiggins Island intertidal 0.8 ± 0.4 0.74 ± 0.36 0.33 ± 0.15 0.74 ± 0.26 1.20 ± 0.67 0.78 ± 0.47
5 5 Wiggins Island intertidal 1.4 ± 0.3 0.57 ± 0.19 0.86 ± 0.5 3.73 ± 0.77 8.78 ± 1.17 6.92 ± 1.03
6 5 South Fishermans intertidal 1.1 ± 0.1 0.24 ± 0.09 0.94 ± 0.61 2.65 ± 0.66 6.32 ± 0.86 1.42 ± 0.32
7 5 South Fishermans subtidal 0.9 ± 0.2 1.91 ± 0.36 0.03 ± 0.02 3.7 ± 0.95 4.16 ± 1.36 1.20 ± 0.53
8 5 North Fishermans intertidal 2.1 ± 0.3 0.14 ± 0.08 0.06 ± 0.04 1.28 ± 0.49 3.89 ± 0.77 0.69 ± 0.25
9 5 North Fishermans subtidal 0.9 ± 0.3 1.93 ± 0.27 0.001 ± 0.001 4.98 ± 0.72 4.64 ± 0.63 0.30 ± 0.09
43 6 Pelican Banks intertidal 20.8 ± 3.1 18.71 ± 2.13 28.3 ± 3.3 14.17 ± 1.07 13.87 ± 2.24 25.96 ± 3.03
48 6 Quoin Island intertidal/subtidal 1.8 ± 0.2 1.11 ± 0.2 2.12 ± 1.01 9.52 ± 1.85 6.21 ± 0.80 2.81 ± 0.60
58 7 South Trees intertidal 1.8 ± 0.5 0.47 ± 0.12 1.19 ± 0.35 0.44 ± 0.34 5.60 ± 1.24 4.89 ± 1.26
60 7 South Trees intertidal 9.4 ± 3.3 0.08 ± 0.01 0.09 ± 0.03 4.23 ± 0.58 9.04 ± 2.40 11.29 ± 3.65
94 8 Rodds Bay intertidal 15.1 ± 11.8 2.3 ± 0.51 17.11 ± 3.02 10.54 ± 1.38 28.11 ± 7.67 17.33 ± 8.70
96 8 Rodds Bay intertidal 6.4 ± 3.1 0.9 ± 0.5 3.62 ± 1.41 7.7 ± 1.58 21.56 ± 4.88 24.84 ± 5.01
104 8 Rodds Bay intertidal 8.4 ± 3.7 1.26 ± 0.43 10.73 ± 2.62 10.76 ± 1.81 25.20 ± 7.09 18.89 ± 4.84

Port Curtis Long Term Seagrass Monitoring - November 2008 17
Figure 2(A) Changes in biomass, area and species composition for monitoring meadows in
2002 & 2004 - 2008 (Biomass error bars = SE; Area error bars = “R” reliability estimate)
2002
2004
2006
2007
2008
2005
2002
2004
2006
2007
2008
2005
2002
2004
2006
2007
2008
2005
Biomass (g DW m-2) MeadowArea (Ha)
Species Composition (% of biomass)
Wiggins IslandMeadow 4
Wiggins IslandMeadow 5
Sth FishermansMeadow 6
Sth FishermansMeadow 7 *
Nth FishermansMeadow 8
Nth FishermansMeadow 9 *
Halophila spinulosa
Halophila decipiens
Halophila ovalis
Zostera capricorni
Halodule uninervis(narrow)
Halodule uninervis(wide)
0%
20%
40%
60%
80%
100%
2008
0%
20%
40%
60%
80%
100%
2008
0%
20%
40%
60%
80%
100%
2008
0%
20%
40%
60%
80%
100%
2008
0%
20%
40%
60%
80%
100%
0%
20%
40%
60%
80%
100%
0.05
0
0.5
1
1.5
2
1 2 3 4 5 6
0
2
4
6
8
10
12
1 2 3 4 5 6
0
2
4
6
8
1 2 3 4 5 6
0
1
2
3
4
5
6
1 2 3 4 5 6
0
1
2
3
4
5
1 2 3 4 5 6
0
1
2
3
4
5
6
1 2 3 4 5 6
0
10
20
30
40
50
1 2 3 4 5 6
0
50
100
150
200
1 2 3 4 5 6
0
100
200
300
400
500
600
1 2 3 4 5 6
0
50
100
150
200
250
1 2 3 4 5 6
0
50
100
150
200
250
300
350
1 2 3 4 5 6
0
50
100
150
200
250
300
350
1 2 3 4 5 6
0%
20%
40%
60%
80%
100%

Port Curtis Long Term Seagrass Monitoring - November 2008 18
Figure 2(B) Changes in biomass, area and species composition for monitoring meadows in
2002 & 2004 - 2008(Biomass error bars = SE; Area error bars = “R” reliability estimate)
2002
2004
2006
2007
2008
2005
2002
2004
2006
2007
2008
2005
2002
2004
2006
2007
2008
2005
Biomass (g DW m-2) MeadowArea (Ha)
Species Composition (% of biomass)
Halophila spinulosa
Halophila decipiens
Halophila ovalis
Zostera capricorni
Halodule uninervis(narrow)
Halodule uninervis(wide)
Pelican BanksMeadow 43
Quoin IslandMeadow 48*
South TreesMeadow 58
South TreesMeadow 60
Rodds BayMeadow 94
Rodds BayMeadow 96
Rodds BayMeadow 104
0
5
10
15
20
25
30
35
1 2 3 4 5 6
01.53
4.56
7.59
10.512
1 2 3 4 5 6
0
1
2
3
4
5
6
7
8
1 2 3 4 5 6
0
2
4
6
8
10
12
14
16
1 2 3 4 5 6
0
5
10
15
20
25
30
35
40
1 2 3 4 5 6
0
5
10
15
20
25
30
35
1 2 3 4 5 6
0
5
10
15
20
25
30
35
1 2 3 4 5 6
0100200300400500600700800
1 2 3 4 5 6
0
100
200
300
400
500
1 2 3 4 5 6
0
20
40
60
80
1 2 3 4 5 6
0
2
4
6
8
10
12
14
1 2 3 4 5 6
00.5
11.52
2.53
3.54
4.5
1 2 3 4 5 6
050
100150
200250300350400
1 2 3 4 5 6
0
10
20
30
40
50
1 2 3 4 5 6
0%
20%
40%
60%
80%
100%
100
0%
20%
40%
60%
80%
100%
2008
0%
20%
40%
60%
80%
100%
0
0%
20%
40%
60%
80%
100%
2008
0%
20%
40%
60%
80%
100%
2008
0%
20%
40%
60%
80%
100%
0
0%
20%
40%
60%
80%
100%
2008

Port Curtis Long Term Seagrass Monitoring - November 2008 19
Map 5. Monitoring meadows comparison, Fishermans Landing region, 2002, 2004, 2005, 2006, 2007 & 2008
* This is not a complete seagrass distribution, only selected seagrass monitoring meadows displayedBackground: Landsat ETM + Panchromatic 24 July 1994
20062005
9
4
9
5
6
8
7
4
±
LegendLight Halodule uninervis (wide)with mixed speciesModerate Halodule uninervis(wide) with mixed speciesLight Halophila ovalis with mixed speciesModerate Halophila ovalis withmixed speciesLight Halophila decipiensLight Halophila decipiens withmixed speciesModerate Halophila decipiensModerate Halophila decipienswith mixed speciesLight Zostera capricorniLight Zostera capricorni withmixed speciesModerate Zostera capricorniLight Halophila ovalis / Zostera capricorniModerate Halophila ovalis / Zostera capricorni
Isolated patchesAggregated patchesContinuous cover
0 2 4
Kilometers
Fishermans Landing Wharfs
2002 2004 2005
200820072006
5
4
7
6
9
8
Source: Chartrand, K.M., Rasheed, M.A. and Unsworth, R.K.F. 2009. Long term seagrass monitoring in Port Curtis and Rodds Bay, Gladstone - November 2008. QPI&F Publication PR09-4407 (QPI&F, Cairns) 32pp.
© Port Curtis Integrated Monitoring Program and The State of Queensland through Primary Industries and Fisheries.
Funded by the Port Curtis Integrated Monitoring Programand Queensland Primary Industries and Fisheries.
Produced by the Marine Ecology Group, Queensland Primary Industries and Fisheries, Northern Fisheries Centre, Cairns, 2009.

Port Curtis Long Term Seagrass Monitoring - November 2008 20
Map
6. M
onito
ring
mea
dow
s co
mpa
rison
in th
e Q
uoin
Isla
nd re
gion
, 200
2, 2
004,
200
5, 2
006,
200
7 &
2008
Back
grou
nd: L
ands
at E
TM +
Pan
chro
mat
ic 2
4 Ju
ly 1
994
2020
0220
04
2002
2006
5860
Sout
h Tr
ees
Poin
t
2007
Quo
in Is
land
2006
2002
2004
2005
2006
2007
2008
Cur
tis Is
land
Lege
nd
Mod
erat
e H
alod
ule
unin
ervi
s (th
in)
with
mix
ed s
peci
esLi
ght H
alod
ule
unin
ervi
s (w
ide)
Ligh
t Hal
odul
e un
iner
vis
(wid
e)w
ith m
ixed
spe
cies
Mod
erat
e H
alod
ule
unin
ervi
s (w
ide)
with
mix
ed s
peci
esLi
ght H
alop
hila
ova
lis w
ith m
ixed
spe
cies
Ligh
t Zos
tera
cap
ricor
niM
oder
ate
Zost
era
capr
icor
ni
±0
12
Kilo
met
ers
Sour
ce: C
hartr
and,
K.M
., R
ashe
ed, M
.A. a
nd U
nsw
orth
, R.K
.F.
200
9. L
ong
term
sea
gras
s m
onito
ring
in P
ort C
urtis
and
Rod
ds B
ay,
Gla
dsto
ne -
Nov
embe
r 200
8.
QP
I&F
Publ
icat
ion
PR09
-440
7 (Q
PI&F
, Cai
rns)
32p
p.
© P
ort C
urtis
Inte
grat
ed M
onito
ring
Pro
gram
and
The
Sta
te
of Q
ueen
slan
d th
roug
h Pr
imar
y In
dust
ries
and
Fish
erie
s.
Fund
ed b
y th
e P
ort C
urtis
Inte
grat
ed M
onito
ring
Prog
ram
and
Que
ensl
and
Prim
ary
Indu
strie
s an
d Fi
sher
ies.
Prod
uced
by
the
Mar
ine
Ecol
ogy
Gro
up, Q
ueen
slan
d Pr
imar
y In
dust
ries
and
Fish
erie
s, N
orth
ern
Fish
erie
s C
entre
, C
airn
s, 2
009.
Agg
rega
ted
patc
hes
Con
tinuo
us c
over
Isol
ated
pat
ches
4843
49
Port Curtis Long Term Seagrass Monitoring - November 2008 21
Map 7. Monitoring meadows comparison in the South Trees region, 2002, 2004, 2005, 2006, 2007 & 2008
* This is not a complete seagrass distribution, only selected seagrass monitoring meadows displayed
Background: Landsat ETM + Panchromatic 24 July 1994
20062002 2004 2005
Quoin Island
Curtis Island
2002
South Trees Point
58 60
Source: Chartrand, K.M., Rasheed, M.A. and Unsworth, R.K.F. 2009. Long term seagrass monitoring in Port Curtis and Rodds Bay, Gladstone - November 2008. QPI&F Publication PR09-4407 (QPI&F, Cairns) 32pp.
© Port Curtis Integrated Monitoring Program and The State of Queensland through Primary Industries and Fisheries.
Funded by the Port Curtis Integrated Monitoring Programand Queensland Primary Industries and Fisheries.
Produced by the Marine Ecology Group, Queensland Primary Industries and Fisheries, Northern Fisheries Centre, Cairns, 2009.
2002
2005 2006
2004
2007 2008
Aggregated Patches
Continuous Cover
Isolated Patches
LegendLight Halophila ovalis with mixed species
Light Zostera capricorni
Light Zostera capricorni with mixed species
Light Halophila ovalis / Zostera capricorni
South Trees Point
±0 1 2 3
Kilometers
58 60

Port Curtis Long Term Seagrass Monitoring - November 2008 22
Map 8. Comparison of monitoring meadows in the Rodds Bay region, 2002, 2004, 2005, 2006, 2007 & 2008
* This is not a complete seagrass distribution, only selected seagrass monitoring meadows displayed
Background: Landsat ETM + Panchromatic 24 July 1994
2002
2005
2004
2007
94
104
2006
LegendLight Zostera capricorni
Light Zostera capricorni with mixed species
Moderate Zostera capricorni
Isolated patches
Aggregated patches
Continuous cover
2004
2005 2006
2007 2008
Source: Chartrand, K.M., Rasheed, M.A. and Unsworth, R.K.F. 2009. Long term seagrass monitoring in Port Curtis and Rodds Bay, Gladstone - November 2008. QPI&F Publication PR09-4407 (QPI&F, Cairns) 32pp.
© Port Curtis Integrated Monitoring Program and The State of Queensland through Primary Industries and Fisheries.
Funded by the Port Curtis Integrated Monitoring Programand Queensland Primary Industries and Fisheries.
Produced by the Marine Ecology Group, Queensland Primary Industries and Fisheries, Northern Fisheries Centre, Cairns, 2009.
±0 1 2
Kilometers
Rodds Peninsula96
94
104

Port Curtis Long Term Seagrass Monitoring - November 2008 23
Climate and Water Quality Data Total annual rainfall for the Gladstone region was above average in 2008 (since 1995; Figure 3A) which coincided with high flows of the major catchment for the Gladstone area, the Calliope River (Figure 3B). The Calliope River catchment empties into Port Curtis directly adjacent to the Wiggins Island and Fisherman’s Landing meadows (meadows 4-9; Map 2). Total daytime tidal exposure in 2008 was down from the previous year yet similar to most previous years of the monitoring program (Figure 3C). Most notably, daytime tidal exposure was found to be positively correlated with above-ground biomass in all intertidal monitoring meadows over the last six years of surveys (see Appendix). The mean monthly maximum air temperature was below average for most months during 2008 prior to the November monitoring survey and did not rise above 30ºC with the exception of October (Figure 3C). Data loggers recorded variable physical conditions across Port Curtis monitoring meadows during the first ten months of their deployment. The monthly running mean temperature for Port Curtis meadows differed at times by up to 2 ºC for some meadows (Figure 4A). The deepest meadows had the lowest mean annual temperature (subtidal South Fisherman’s meadow (7) and mostly subtidal Quoin Island (48)) (Figure 4A). Mean annual temperature for the Pelican Banks (43) meadow was also lower than other meadows most likely due to its proximity to open ocean and greater flushing. There was a strong negative relationship between temperature and above-ground biomass for all intertidal meadows with data loggers (Map 2-3; see Appendix). This correlation controlled 56% of the variability in biomass among meadows. Overall, Pelican Banks and Wiggins Island (meadow 4 and 43) had a higher light environment than at North Fisherman’s (meadow 8; Figure 4B). The trend is consistent with expected higher turbidity in the Fisherman’s Landing area following high rainfall and flushing of the Calliope River in late 2007 and early 2008 (see above; Figure 3). Pelican Banks (43) is open to more oceanic flushing from tidal movement which maintains better light conditions. The Wiggins Island (4) meadow, despite being at the mouth of the Calliope River, is also more open to flushing than the Fisherman’s Landing meadows and likely returns to more favorable light conditions sooner than the Fisherman’s Landing meadows.

Port Curtis Long Term Seagrass Monitoring - November 2008 24
A B
0
200
400
600
800
1000
1200
1995 1996 1997 1998 1999 2000 2001 2002 2003 2004 2005 2006 2007 2008
Tota
l Ann
ual R
ainf
all (
mm
)
0
50000
100000
150000
200000
250000
300000
Jan-
00A
pr-0
0Ju
l-00
Oct
-00
Jan-
01A
pr-0
1Ju
l-01
Oct
-01
Jan-
02A
pr-0
2Ju
l-02
Oct
-02
Jan-
03A
pr-0
3Ju
l-03
Oct
-03
Jan-
04A
pr-0
4Ju
l-04
Oct
-04
Jan-
05A
pr-0
5Ju
l-05
Oct
-05
Jan-
06A
pr-0
6Ju
l-06
Oct
-06
Jan-
07A
pr-0
7Ju
l-07
Oct
-07
Jan-
08A
pr-0
8Ju
l-08
Oct
-08
Mon
thly
Riv
er F
low
(ML)
Mean anuual rainfall (mm) since 1995

Port Curtis Long Term Seagrass Monitoring - November 2008 25
C Figure 3 (A) Total annual rainfall for the Gladstone area from 2000 to 2008 (Bureau of Meteorology); (B) Total monthly river flow for the Calliope River between 2000 and 2008* (Queensland Department of Natural Resources and Mines); (C) The monthly total number of daylight hours that intertidal banks were exposed and mean monthly solar radiation (megajoules/metre2) recorded from 2002 to 2008 (red months indicate times of seagrass monitoring surveys) and inset is total annual hours of daytime exposure (Bureau of Meteorology and Maritime Safety Queensland). * November & December 2008 data unavailable
0
5
10
15
20
25
30
35
40
45
Jan-
02
Apr
-02
Jul-0
2
Oct
-02
Jan-
03
Apr
-03
Jul-0
3
Oct
-03
Jan-
04
Apr
-04
Jul-0
4
Oct
-04
Jan-
05
Apr
-05
Jul-0
5
Oct
-05
Jan-
06
Apr
-06
Jul-0
6
Oct
-06
Jan
07
Apr 0
7
Jul 0
7
Oct
07
Jan
08
Apr 0
8
Jul 0
8
Oct
08
Hou
rs E
xpos
ed
0
5
10
15
20
25
30
35
40
Max
. Tem
pera
ture
(C)
Annual Monitoring Survey
150
200
250
300
350
2002 2003 2004 2005 2006 2007 2008
Hou
rs E
xpos
ed

Port Curtis Long Term Seagrass Monitoring - November 2008 26
A
B Figure 4 (A) The monthly mean running temperature (ºC) recorded from December 2007 to November 2008 within 10 of the 13 monitoring meadows. Inset is the mean annual temperature of each meadow;. (B)Total daily photosynthetic active radiation (PAR) recorded from January to October 2008 within 3 of the13 monitoring meadows. Breaks in the data are due to technical difficulties with the loggers.
16
18
20
22
24
26
28
30
Nov 07 Jan 08 Mar 08 May 08 Jul 08 Sep 08 Nov 08
Mon
thly
Run
ning
Mea
n Te
mpe
ratu
re (°
C)
Wiggins Island (M4)West Wiggins (M5)South Fishermans (M6)South Fishermens (M7)North Fishermens (M8)North Fishermens (M9)Pelican Banks (M43)Quion Island (M48)South Trees (M58)South Trees (M60)
22.5
23.0
23.5
24.0
24.5
M4
M5
M6
M7
M8
M9
M43
M48
M58
M60
Tem
pera
ture
(°C
)
0
8000000
16000000
Jan 08 Feb 08 Apr 08 Jun 08 Jul 08 Sep 08 Oct 08
Tota
l Dai
ly P
AR
(µm
ol.m
-2.s
-1)
Pelican Banks (M43)Wiggins Island (M4)North Fishermens (M8)

Port Curtis Long Term Seagrass Monitoring - November 2008 27
DISCUSSION
The 2008 monitoring survey of Port Curtis and Rodds Bay found that seagrass in the region was reasonably healthy. Most of the monitoring meadows were only slightly down from their previously recorded peak abundance and area but were still at relatively high levels compared to earlier surveys. However, the four Fisherman’s Landing monitoring meadows (meadow 6-9) and the subtidal Quoin Island meadow (48) exhibited more substantial biomass declines. The drivers of seagrass change in Port Curtis appear to be largely associated with local climate conditions and fine scale variability in the physical meadow environments. The high rainfall for the Gladstone region and concurrent high flows of the Calliope River (Figure 3) were the likely significant drivers of seagrass decline in the Fisherman’s Landing meadows during 2008. High catchment rainfall can result in the inputs of sediment, nutrients, herbicides, and low salinity water and periods of high turbidity, strong currents and sediment burial that coincide with flood events. Such events typically have an initial negative impact on seagrasses (Campbell and McKenzie 2004, Waycott et al. 2007). In the longer term these effects may be reversed with associated nutrient inputs to the system enhancing seagrass growth as the sediments become enriched and light conditions improve post flooding (Waycott et al. 2007). The positive correlation between daytime tidal exposure and above-ground biomass in all intertidal meadows was somewhat unexpected since tidal exposure and biomass is often negatively correlated. Tidal exposure in tropical seagrass meadows typically leads to desiccation and extreme temperature conditions at the seagrass blade surface, which can both result in the condition known as burning and ultimately declines in above-ground biomass (Erftemeijer & Herman 1994, Chartrand et al 2008, Unsworth et al. 2008). The positive influence exhibited in Gladstone meadows suggests that a low light environment may be limiting seagrass growth. During periods of lower daytime low tides (and increased tidal exposure) more light would be available to seagrasses. Providing light and temperature do not reach threshold levels known to cause thermal stress (Campbell et al. 2006), this increase would provide a benefit to seagrasses growing in light limited environments. Fewer hours of daytime tidal exposure during 2008 (Figure 3C) may have therefore added to poor light conditions in some areas such as Fisherman’s Landing where low light was the likely cause of declines in seagrass biomass. Although regional-scale factors including rainfall, tidal exposure and river flow influence meadow dynamics, finer scale physical processes can lead to high inter-meadow variability. Data loggers introduced in December 2007 provided the first glimpse of in situ conditions to evaluate changes occurring at the meadow scale. The loggers, while valuable, have been in place under a year making comparative analyses difficult. Relationships between meadow dynamics and physical parameters will be better resolved as a larger dataset develops. However, preliminary analysis did demonstrate the value of the loggers and some of the general trends that were emerging. For example, there was a strong negative relationship between temperature and above-ground biomass for all intertidal meadows with data loggers, which controlled the majority of the variability in biomass among meadows (Map 2-3; see Appendix). Previous use of mean monthly maximum air temperature for the Gladstone region was indiscriminate and as such limited the interpretation of changing meadow dynamics whereas the resolution from the loggers now provides a clearer picture. The light and turbidity dataset does not comprise a complete record of conditions due to technical difficulties over the first year thus making interpretation of these parameters more difficult. In general, the light patterns that did emerge (Figure 4) correspond with the trends in high rainfall, flushing of the Calliope River and meadow location. While these initial patterns indicate strong correlations between the physical environment and seagrass meadow dynamics, a more detailed understanding of these relationships will emerge as the logger datasets expand alongside annual monitoring surveys.

Port Curtis Long Term Seagrass Monitoring - November 2008 28
Despite the decline in biomass in the Fisherman’s Landing subtidal meadows (meadow 7 & 9; Figure 2), meadow area increased in from 2007. There are two likely explanations for this trend. First, there may have been a dramatic improvement in light conditions mid-year allowing these meadows to expand quickly. Meadow area and biomass may have later declined when conditions deteriorated around the time of the annual monitoring survey. A second explanation for the observed trends may be that the light environment in the Fisherman’s Landing area over 2008 only reached levels promoting growth and expansion around the time of the annual survey. In this situation, the subtidal meadows may have first expanded in area via rhizome extension or seed germination prior to an increase in overall above-ground biomass (to have occurred in the ensuing post-survey months). The dominant species in these meadows is Halophila decipiens, a fast growing species that has large natural variations in density and distribution. Halophila decipiens is also capable of producing relatively long lived seeds that can lay dormant in the sediment for at least 2 years and can rapidly colonise when conditions are favourable (Hammerstrom et al. 2005; McMillan 1991). Conversely Halophila decipiens quickly declines when conditions are less favourable such as a reduction in available light. Thus, in either scenario, the dynamic nature of Halophila meadows is likely responsible for the disparate trends in biomass and meadow area for these subtidal meadows. In addition to the Fisherman’s Landing meadows, the Quoin Island meadow (48) also declined in biomass in 2008. The majority of this meadow was also subtidal and was likely impacted by reduced light from higher rainfall and flood runoff in the region during 2008. In previous surveys declines in biomass for this meadow tended to be accompanied by a shift from the larger, wide leaf growth form of the dominant species (Halodule uninervis) to the narrow leaf form of the species. In 2008 the seagrass became less dense but the wide leaf form remained dominant. An increase in leaf size is a common response of seagrass species to a reduction in available light (Abal et al. 1996; Gordon et al. 1994; Rasheed 2000) and may explain the trends observed for Quoin Island. The only intertidal meadow that exhibited a significant increase in density was the large Zostera capricorni meadow on Pelican Banks (43). This meadow has remained at a relatively consistent density between surveys with the exception of the two peak years of 2005 and 2008. The Pelican Banks meadow has far less exposure to estuarine influences than the other intertidal meadows in the study due to its location at the entrance between Curtis and Facing Islands. The regular tidal flushing of clean oceanic water over these banks is likely to have a buffering effect that would dilute the effects of runoff related turbidity and extreme temperatures (Figure 4) possibly explaining its relative stability throughout the monitoring program. The healthy Zostera capricorni communities identified throughout Port Curtis and Rodds Bay during the 2008 monitoring are likely to provide an important refuge for fish and crustacean species and are recognized as key nursery areas for many commercial species (Rasheed and Thomas 2002; McKenzie et al. 1996; Watson et al. 1993). Healthy Zostera capricorni meadows in Cairns Harbour have been demonstrated to be important habitat for juvenile tiger prawns and were estimated to be worth over AUD $3,687 per hectare per year in total landed value (1992 value; Watson et al. 1993). Evidence of dugong activity in the Port Curtis seagrass meadows has been consistently observed throughout the monitoring program. The seagrass meadows around Wiggins Island in particular appear to be heavily utilised by dugong, as feeding trails were found at a majority of sites sampled in 2008 and have been recorded in all previous surveys. Further evidence of feeding activity was observed in South Trees, Quoin Island and Fishermans Landing. Green sea turtles were regularly observed within the seagrass meadows particularly on Pelican Banks where they were often ‘stranded’ at low tide. The presence of seagrass meadows and dugong activity in intertidal areas adjacent to port facilities and infrastructure has implications for port management. Some of the most utilised seagrass meadows also appear to be those in closest proximity to major port infrastructure and proposed areas of expansion. Future port infrastructure developments such as wharves, breakwaters and

Port Curtis Long Term Seagrass Monitoring - November 2008 29
reclamations would require careful management to ensure minimal impacts on these communities. The fact that “healthy” seagrass meadows and dugong activity have continued to exist within the port indicates that these important habitats can co-exist with well managed port activities and development. This was the fifth survey in the established annual monitoring program and some of the likely climate related drivers of seagrass change have been identified. The expansion of the seagrass monitoring program within PCIMP and the Centre for Environmental Management at CQU to establish the turbidity, light and temperature loggers in the seagrass meadows in late 2007 will place us in a far stronger position to determine the major drivers of seagrass change in the years to come. The expanded program will also lead to a better ability to separate the natural and human induced causes of change to seagrass meadows that may arise in the future.

Port Curtis Long Term Seagrass Monitoring - November 2008 30
REFERENCES Abal, E.G., Dennison, W.C., (1996) Seagrass depth range and water quality in southern Moreton
Bay, Queensland, Australian Journal of Marine and. Freshwater Research 47: 763-771. Campbell, S.J. and McKenzie, L. J. (2004) Flood related loss and recovery of intertidal seagrass
meadows in southern Queensland, Australia. Estuarine, Coastal and Shelf Science 60 (3): 477-490.
Campbell, S.J., McKenzie, L.J., Kerville, S.P. and Bite, J.S. (2006) Photosynthetic response of
seven tropical seagrasses to elevated seawater temperature. Journal of Experimental Marine Biology and Ecology 330: 455-468.
Chartrand, K.M. and Rasheed, M.A. (2009) Port of Weipa Long term seagrass monitoring, 2000 –
2008. DPI&F Publication PR09-4201 (DPI&F Cairns), 26 pp. Gordon, D.M., Grey, K.A., Chase, S.C., Simpson, C.J., (1994) Changes to the structure and
productivity of a Posidonia sinuosa meadow during and after imposed shading. Aquatic Botany 47: 265-275.
Hammerstrom, K.K., Kenworthy, W.J., Fonseca, M.S. and Whitfield, P.E. (2005) Seed bank,
biomass and productivity of Halophila decipiens, a deep water seagrass on the west Florida continental shelf. Aquatic Botany 84:110-120.
Erftemeijer, P.L.A. and Herman, P.M.J. (1994) Seasonal changes in environmental variables,
biomass, production and nutrient contents in two contrasting tropical intertidal seagrass beds in South Sulawesi, Indonesia. Oecologia 99, 45–59.
McKenzie, L.J., Rasheed, M.A., Lee Long, W.J. and Coles, R.G. (1996) ‘Port of Mourilyan Seagrass
Monitoring, Baseline Surveys – Summer (December) 1993 and Winter (July) 1994. ’EcoPorts Monograph Series No 2. (Ports Corporation of Queensland, Brisbane), 52 pp.
McMillan, C. (1991) The longevity of seagrass seeds. Aquatic Botany 40: 195-198. Mellors, J.E. (1991) An evaluation of a rapid visual technique for estimating seagrass biomass.
Aquatic Botany 42:67-73. Rasheed, M.A. (1999) Recovery of experimentally created gaps within a tropical Zostera capricorni
(Aschers.) seagrass meadow, Queensland Australia. Journal of Experimental Marine Biology and Ecology 235:183-200.
Rasheed, M.A. (2004) Recovery and succession in a multi-species tropical seagrass meadow
following experimental disturbance: the role of sexual and asexual reproduction. Journal of Experimental Marine Biology and Ecology 310: 13 - 45.
Rasheed, M.A. and Thomas, R. (2002) Seagrass and marine resources of the Upstart Bay Dugong
Protection Area. In ‘Seagrass and the marine resources in the dugong protection areas of Upstart Bay, Newry Region, Sand Bay, Llewellyn Bay, Ince Bay and the Clareview Region: April/May 1999 and October 1999’. (Eds. Coles RG, Lee Long WJ, McKenzie LJ and Roder CA). Research Publication No. 72 (Great Barrier Reef Marine Park Authority, Townsville). pp 25-54.

Port Curtis Long Term Seagrass Monitoring - November 2008 31
Rasheed, M.A., Thomas, R., Roelofs, A.J. Neil, K.M. and Kerville, S.P. (2003) Port Curtis and Rodds Bay seagrass and benthic macro-invertebrate community baseline survey, November/December 2002. DPI Information Series QI03058 (DPI, Cairns), 47 pp. Rasheed, M.A., McKenna, S.A. and Thomas, R. (2005) Long-term seagrass monitoring in Port
Curtis and Rodds Bay, Gladstone - October/November 2004. DPI&F Information Series QI05032 (DPI&F, Cairns), 27 pp.
Rasheed, M.A., Taylor, H.A. and Thomas, R, (2006) Long-term seagrass monitoring in Port Curtis
and Rodds Bay, Gladstone – October 2006. DPI&F Information Series QI06030 (DPI&F, Cairns), 30pp.
Rasheed, M.A., McKenna, S.A., Sankey, T.L., Taylor, H.A. and Carter, A. (2008) Long term
seagrass monitoring in Cairns Harbour and Trinity Inlet - December 2007. DPI&F Publication PR07-3269 (DPI&F, Cairns), 24 pp.
Rasheed, M.A. and Taylor, H.A. (2008) Port of Karumba Long Term Seagrass Monitoring, October
2007. DPI&F Publication PR07-3267 (DPI&F, Northern Fisheries Centre, Cairns) 17 pp. SKM (2004). Port Curtis Integrated Monitoring Program: sampling design and statistical methods
package. Report to PCIMP, 128 pp. Taylor, H.A., Rasheed, M.A., Dew, K. and Sankey, T.L. (2007) Long term seagrass monitoring in
Port Curtis and Rodds Bay, Gladstone – November 2006. DPI&F Publication PR07- 2774 (DPI&F, Cairns), 30 pp.
Unsworth, R.KF., McKenna, S.A. and Rasheed, M.A. (2008) Long term seagrass monitoring in the
Port of Thursday Island, March 2008. DPI&F Publication PR08-4083 (DPI&F, Northern Fisheries Centre, Cairns), 29 pp.
Watson, R.A., Coles, R.G., and Lee Long, W.J. (1993) Simulation estimates of annual yield and landed value for commercial penaeid prawns from a tropical seagrass habitat, northern
Queensland, Australia. Australian Journal of Marine and Freshwater Research 44 (1): 211-220 Waycott, M., Collier, C., McMahon, K., Ralph, P., McKenzie, L., Udy, J., Grech, A. (2007) Vulnerability of seagrasses in the Great Barrier Reef to climate change. In Climate Change and the Great Barrier Reef: A Vulnerability Assessment (eds Johnson J, Marshall P), Great Barrier Reef Marine Park Authority, 191 – 235 pp. Wilson, S.P., Anderson, L.E., Melville, F. (2008) Port Curtis Seagrass Water Quality: Data Report December 2007-April 2008.

Port Curtis Long Term Seagrass Monitoring - November 2008 32
APPENDIX Results of one-way ANOVA for mean above ground biomass versus year for the thirteen seagrass monitoring meadows in Port Curtis and Rodds Bay (2002, 2004, 2005, 2006, 2007 & 2008) (* significant difference in biomass between years)
Meadow 4^ DF SS MS F P Between Years 5 4155.76 831.152 1.2 0.3136
Within Years 106 73372.2 692.191 Total 111 77528
Meadow 5# Between Years 5 118.584 23.7168 22.42 <0.0001*
Within Years 182 192.5 1.05769 Total 187 311.003
Meadow 6# Between Years 5 88.5723 17.7145 22.84 <0.0001*
Within Years 242 187.684 0.77555 Total 247 276.256
Meadow 7^ Between Years 5 29372 5874.4 11.92 <0.0001*
Within Years 91 44845 492.802 Total 96 74217
Meadow 8^ Between Years 5 220063 44012.5 14.48 <0.0001*
Within Years 217 659700 3040.13 Total 222 879771
Meadow 9^ Between Years 5 140380 28076.1 50.87 <0.0001*
Within Years 132 72851.5 551.905 Total 137 213232
Meadow 43# Between Years 5 134.494 26.8989 4.4 0.0007*
Within Years 343 2095.96 6.11068 Total 348 2230.46
Meadow 48# Between Years 5 104.572 20.9144 21.43 <0.0001*
Within Years 231 225.416 0.97583 Total 236 329.988
Meadow 58# Between Years 5 42.6977 8.53954 7.64 <0.0001*
Within Years 158 176.612 1.1178 Total 163 219.31
Meadow 60# Between Years 5 71.9655 14.3931 8.62 <0.0001*
Within Years 54 90.201 1.67039 Total 59 162.166
Meadow 94#(no 2002) Between Years 5 65.6728 16.4182 3.48 0.0142
Within Years 50 226.644 4.72175 Total 55 292.317
Meadow 96^ Between Years 5 97095.3 19419.1 8.72 <0.0001*
Within Years 176 392145 2228 Total 181 489240
Meadow 104# Between Years 5 136.713 27.3427 6.05 <0.0001*
Within Years 99 447.503 4.52023 Total 104 504.217
^ Kruskal-Wallis ANOVA # square- root transformed

Port Curtis Long Term Seagrass Monitoring - November 2008 33
Multiple linear regression modeling between seagrass above-ground biomass and daytime annual tidal exposure (<0.8m tide) in four intertidal meadows. Biomass data was gathered over the dry season (September-November) for 13 seagrass meadows within the Port Curtis and Rodds Bay region (Gladstone) from 2002 to 2008 (no data available in 2003)
Multiple regression model parameters and their significance.
Meadow Location
Meadow Number F P R2
Wiggins Island 4 21.7 0.01 84.4
Wiggins Island 5 8.1 0.05 66.9
South Fishermans 6 7.4 0.05 64.9
South Trees 58 8.3 0.04 67.5

Port Curtis Long Term Seagrass Monitoring - November 2008 34
Observed significant relationships (p<0.05, R2=0.61) between mean dry season (November) seagrass meadow biomass and mean annual water temperature across 7 intertidal seagrass meadows within the Port Curtis in 2008 (no temperature data for Rodds Bay, subtidal meadows excluded from analysis).