Embed Size (px)
Citation preview
Plants 2022, 11, 1555. https://doi.org/10.3390/plants11121555 www.mdpi.com/journal/plants
Article
Polyphenols and Flavonoids Composition, Anti-Inflammatory and Antioxidant Properties of Andean Baccharis Macrantha Extracts Santiago Rosero 1, Freddy Del Pozo 1, Walter Simbaña 1,3, Mario Álvarez 1, María Fernanda Quinteros 2, Wilman Carrillo 4,* and Dayana Morales 1*
1 Department of Research, Laboratory of Functional Foods, Department of Science and Engineering in Food and Biotechnology, Campus Huachi, Technical University of Ambato, Av. Los Chasquis y Río Payamino, EC Ambato 1801334, Ecuador; [email protected] (S.R.); [email protected] (F.D.P.); [email protected] (W.S.); [email protected] (M.Á.)
2 Departamento de Investigación, Universidad Estatal de Bolívar, Guaranda-Bolívar 020102, Ecuador; [email protected]
3 Instituto Nacional de Biodiversidad (INABIO), Pje. Rumipamba 341 y Av. De los Shyris, Quito170506, Ecuador
4 Departamento de Ingeniería Rural y Agroalimentaria, Universidad Politécnica de Valencia, 46022 Valencia, Spain
* Correspondence: [email protected] (W.C); [email protected] (D.M.)
Abstract: This study examined the leaves of Baccharis macrantha to obtain extracts of Baccharis macrantha (EBM) and to determine the total flavonoid content (TFC) and the total polyphenol con-tent (TPC). The main objective of this work was to quantify TPC and TFC of extracts of B. macrantha from Ecuador and evaluate its antioxidant and anti-inflammatory activities and inhibition of lipid peroxidation. The extraction method was optimized with solvents, ethanol, and methanol, at tem-peratures of 30–60 °C and extraction times of 5–20 min. The optimal TFC extraction conditions were at EtOH25% at 50 °C for 10 min. The optimal TPC extraction conditions were at EtOH50% at 50 °C for 10 min. EBM was characterized by TLC and HPLC with three standards: gallic acid, catechin, and quercetin. EBM-EtOH25% and EBM-EtOH50% obtained at 50 °C for 10 min were used to iden-tify quercetin and evaluate biologicals activities. Quercetin was detected in EBM (EtOH25% and EtOH50%). EBM anti-inflammatory activity was evaluated with the red blood cell stabilization (RBC) method. The RBC model showed values of 49.72% of protection lysis RBC to EBM-EtOH25% and 50.71% of protection lysis RBC to EBM-EtOH50%. The EBM in vitro inhibition of lipid peroxi-dation showed a protection of 77.00% (EtOH25%) and 73.11% (EtOH50%) when the TBARs method was used. EBM-EtOH25% and EtOH50% showed high antioxidant activity. EBM-EtOH25% pre-sented values of ABTS (1172 µmol TE/g EBM), DPPH (836 µmol TE/g, EBM), and FRAP (85.70 µmol TE/g, EBM).
Keywords: Baccharis macrantha; extracts; polyphenols; flavonoids; antioxidant activity; anti-inflam-matory activity; TBARS
1. Introduction Plants have been used as medicines for more than 5000 years by mankind to treat
different diseases. Ethnobotanical and ethnopharmacological science define medicinal plants as plant species used in traditional medicine that contain beneficial elements in the cure and treatment of diseases in humans and/or animals. Many medicinal plants are used in traditional medicine systems, such as the Indian Ayurvedic medicine system, tradi-tional Chinese medicine, and the West Indian and Latin American folk medicine system.
Citation: Rosero, S.; Del Pozo, F.;
Simbaña, W.; Álvarez, M.;
Quinteros, M.F.; Carrillo, W.;
Morales, D. Polyphenols and
Flavonoids Composition,
Anti-Inflammatory and Antioxidant
Properties of Andean Baccharis
Macrantha extracts. Plants 2022, 11,
1555. https://doi.org/10.3390/
plants11121555
Academic Editors: Angélica Román-
Guerrero and Maria Elena Estrada-
Zuñiga
Received: 16 May 2022
Accepted: 9 June 2022
Published: 12 June 2022
Publisher’s Note: MDPI stays neu-
tral with regard to jurisdictional
claims in published maps and institu-
tional affiliations.
Copyright: © 2022 by the authors. Li-
censee MDPI, Basel, Switzerland.
This article is an open access article
distributed under the terms and con-
ditions of the Creative Commons At-
tribution (CC BY) license
(https://creativecommons.org/licen-
ses/by/4.0/).
Plants 2022, 11, 1555 2 of 20
A large part of the population in developing countries continues to use ancestral medi-cines based on medicinal plant extracts [1–5].
The South America tropical Andes constitute the most species-rich biodiversity hotspot worldwide with around 15% of the world plant species, on just 1% of the world’s land area [6]. 17,548 vascular plant species are present in Ecuador, many of which play a major role in the development of Andean cultures. 5172 useful species have been reported by Ecuador, of which 60% are medicinal plants, 55% are a source of materials, 30% are edible, and 20% have social uses. With regard to the geographical location of the uses, 42% come from the eastern lowlands, 47% from the Andes, and 12% from the lowlands of the Coast and the Galapagos Islands [7,8]. Native Ecuador flora is used for ancestral medicinal purposes, where the genus Baccharis is included.
Baccharis is a dioecious, neotropical genus and the most diverse in the Asteraceae family [9–11]. It has between 354 to 500 species of shrubs, perennial herbaceous, sub-shrubs, aromatic, and native to the American continent [12–14]. The regions of the genus with the highest taxonomic richness are the tropical Andes and southeastern Brazil [15]. These plants have revealed medicinal properties used by the traditional medicine [16–18]. Over 150 compounds have been identified and isolated in the genus [14], including diter-penes [19], triterpenes [20–22], and flavonoids [23]. Different extracts of Baccharis plants have been used to evaluate the biological properties of their phytocomposition. Aqueous extracts from B. articulata, B. crispa, and B. trimera with anti-inflammatory properties have been described by Gené et al. [24,25]. Aqueous, methanol, and dichloromethane extracts from B. grisebachii, B. incarum, and B. latifolia were studied with activity on the respiratory burst and the inducible heat shock protein of 72 kDa (hsp72) synthesis. Dichloromethane extracts of B. grisebachii showed the higher activity in the assays [26]. Oliveira et al. [27] reported extracts from B. articulata with antioxidant activity. They identified the phenolic compound (4′-O-β-D-glucopyranosyl-3′,5′-dimethoxybenzyl-caffeate) with antioxidant activity similar to the Trolox standard used as positive control in antioxidants assays. Oliveira et al. [28] reported antioxidant activity of aqueous, dichloromethane, and ethanol extracts from B. spicata, B. trimera, and B. usterii, using the FRAP and TBARS methods.
Ecuador is home of 46 native Baccharis species, of which 11 are endemic. Tradition-ally, these species have been used for food, medicine, social, material, beekeeping, or fuel. One of the native species is B. macrantha Kunth, locally known as tigra, chilca, or pince; this species grows in the provinces of Azuay, Bolívar, Carchi, Chimborazo, Cotopaxi, Im-babura, Loja, Morona Santiago, Napo, Pichincha, Tungurahua [29].
The most studied characteristic of phenolic compounds is the ability to protect against oxidative damage in the human body. Protection against peroxidation of lipopro-teins could prevent heart diseases. Protection against oxidative DNA damage could pro-tect against certain types of cancer [30,31]. Epidemiological studies suggest that there is a correlation between the high consumption of phenolic compounds in the diet and the re-duction of cardiovascular disease risks [32,33]. The main antioxidant activity associated with polyphenols is the ability to scavenge free radicals. Antioxidant and anti-inflamma-tory activities of medicinal plants are related to a high content of polyphenols and flavo-noids in different parts of plants (fruits, seeds, leaves, and roots) [34,35]. Modern science is interested in verifying these properties by analyzing the medicinal plants for the pres-ence of valuable bioactive compounds, including antioxidants compounds and the result-ing interesting potential health properties. About 25% of current pharmaceuticals are de-rived directly or indirectly from plants, highlighting the strong foundation of plant-de-rived medicines [36].
B. macrantha is used in Ecuador as an ancestral medicinal plant with anti-inflamma-tory activity. However, there are no studies in the literature about its phytochemical com-position and the evaluation of its antioxidant and anti-inflammatory activity. A detailed description of the mineral composition when B. macrantha grows in volcanic areas is inex-
Plants 2022, 11, 1555 3 of 20
istent. This study quantifies secondary metabolites (polyphenols and flavonoids) of ex-tracts of B. macrantha and evaluates the effects on the inhibition of lipid peroxidation, an-tioxidant, and anti-inflammatory activities and determines its mineral composition.
2. Materials and Methods 2.1. Chemicals
Folin-Ciocalteu reactive, reference standard quercetin dihydrate (purity 99% w/w), catechin (98% w/w), quercetin (purity 99% w/w), gallic acid, and butylhydroxytoluene (BHT) standards were obtained from Sigma Chemical Co. (St Louis, MO, USA). Ethanol and methanol of grade HPLC were used.
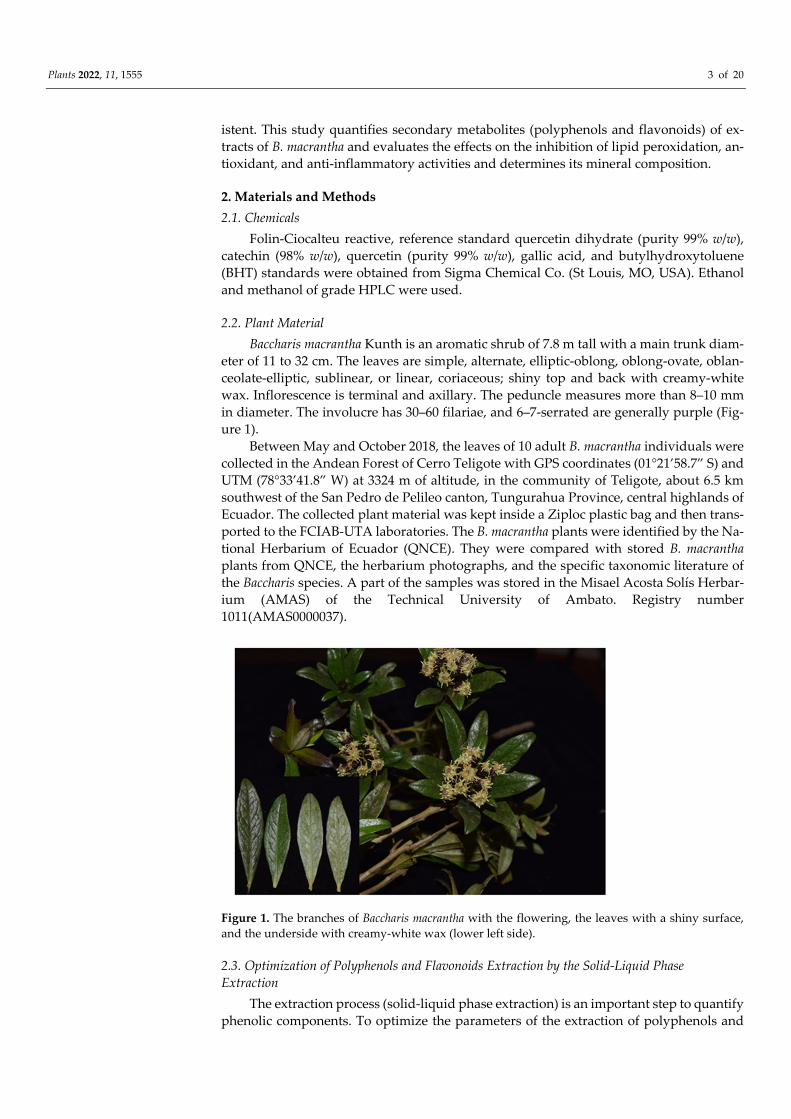
2.2. Plant Material Baccharis macrantha Kunth is an aromatic shrub of 7.8 m tall with a main trunk diam-
eter of 11 to 32 cm. The leaves are simple, alternate, elliptic-oblong, oblong-ovate, oblan-ceolate-elliptic, sublinear, or linear, coriaceous; shiny top and back with creamy-white wax. Inflorescence is terminal and axillary. The peduncle measures more than 8–10 mm in diameter. The involucre has 30–60 filariae, and 6–7-serrated are generally purple (Fig-ure 1).
Between May and October 2018, the leaves of 10 adult B. macrantha individuals were collected in the Andean Forest of Cerro Teligote with GPS coordinates (01°21’58.7” S) and UTM (78°33’41.8” W) at 3324 m of altitude, in the community of Teligote, about 6.5 km southwest of the San Pedro de Pelileo canton, Tungurahua Province, central highlands of Ecuador. The collected plant material was kept inside a Ziploc plastic bag and then trans-ported to the FCIAB-UTA laboratories. The B. macrantha plants were identified by the Na-tional Herbarium of Ecuador (QNCE). They were compared with stored B. macrantha plants from QNCE, the herbarium photographs, and the specific taxonomic literature of the Baccharis species. A part of the samples was stored in the Misael Acosta Solís Herbar-ium (AMAS) of the Technical University of Ambato. Registry number 1011(AMAS0000037).
Figure 1. The branches of Baccharis macrantha with the flowering, the leaves with a shiny surface, and the underside with creamy-white wax (lower left side).
2.3. Optimization of Polyphenols and Flavonoids Extraction by the Solid-Liquid Phase Extraction
The extraction process (solid-liquid phase extraction) is an important step to quantify phenolic components. To optimize the parameters of the extraction of polyphenols and

Plants 2022, 11, 1555 4 of 20
flavonoids from Baccharis macrantha leaves the effect of three independent variables (ex-traction solvent, extraction temperature and extraction time) was evaluated in two re-sponses named: total polyphenols content (TPC) and total flavonoids content (TFC). The extraction solvent variable was examined in nine levels [water, ethanol (25, 50, 75 and 96%) and methanol (25, 50, 75 and 98%)]. The extraction temperature variable was evalu-ated in two levels (50 °C and 60 °C) and the extraction time variable was evaluated in three levels (5, 10 y 20 min).
Extraction solvent: Two kinds of solvent systems were tested for their ability to extract secondary metabolites, polyphenols, and flavonoids. Unitary solvent systems (ethanol, methanol, and water) and binary solvent systems (hydroethanolic and hydro methanolic at concentrations of 25, 50, and, 75% w/v) were used.
The test began with 0.1 g of powder plant material being extracted with 1 mL of each solvent in an ultrasound bath (Branson 2800 Sonicator, Rochester, NY, USA) for 5 min at 50 °C. The mixtures were centrifuged at 12,000× g at 10 °C for 10 min. The supernatant was concentrated in an oven at 40 °C and increased to 5 mL with distilled deionized water. The extracts obtained were used to determine TPC and TFC contents.
Extraction temperature: Once the most effective solvent was selected, extractions were performed at different temperatures (30, 40, 50, and, 60 °C), following the same pro-cedure described above.
Extraction time: Finally, with the best conditions for solvent and temperature, three different periods were tested (5, 10, and, 20 min) in the extraction process.
Once the best conditions related to the solvent, temperature, and time were defined, the vegetal material was re-extracted four more times under the same conditions. Then, the extraction process was carried out with additional vegetal material maintaining the same solid-solvent ratio (1:10, w/v). Extraction was carried out five times under the same conditions. All assays were made in triplicate (n = 3).
2.4. Total Polyphenol Content (TPC) TPC was determined with the Folin-Ciocalteu method according to the description
by Vasco et al. [37]. In a 10 mL flask, 50 µL of EBM and 100 µL of Folin-Ciocalteu reagent were mixed. The solution was stirred for 3 min before adding 2 mL of NaCO3 (75 g/L). The volume was increased to 5 mL with distilled water. The solution was allowed to stand for 2 h at room temperature and in dark conditions. A blank was prepared in which the EBM was replaced with an equal volume of distilled water. The absorbance of the blue-colored complex was measured at 750 nm in a spectrophotometer (Evolution 201, Thermo Scientific, Waltham, MA, USA). TPC concentration was calculated with a calibration curve over the range of 50–200 ppm of gallic acid. The curve calibration obtained was (y = 0.0022x + 0.0268; R2 = 0.9979). The results obtained were expressed as mg of gallic acid equivalents (GAE)/g of EBM, dry weight (DW). All assays were made in triplicate (n = 3).
2.5. Total Flavonoid Content (TFC) TFC was determined using the colorimetric method described by Sakanaka et al. [38].
1.25 mL of water + 0.25 mL of EBM + 0.075 mL of (5% NaNO3) leaving the mixture for 6 min. Then, 0.15 mL of AlCl3 solution was added. The solution was standing up for 5 min. After, 0.5 mL of 1 M NaOH was added. The volume was increased to 5 mL with distilled water. The solution was mixed, and then the rosacea complex was measured at 510 nm. The calibration curve of the (+) catechin (CT) standard was made in the range of (5–100 ppm). The curve obtained was (y = 0.0289x + 0.0198; R2 = 0.9949). The results obtained were expressed as mg of catechin equivalents (mg CT/g of EBM, dry weight DW). All assays were carried out in triplicate (n = 3).
2.6. Thin-Layer Chromatography (TLC)

Plants 2022, 11, 1555 5 of 20
TLC analysis was made on a precoated silica gel 60 F254 TLC plate (Merck, Darm-stadt, Germany) according to the method described by Khatoon et al. [39] with some mod-ifications. Aliquots (6 µL) of ethanolic and methanolic EBM (15 mg/mL) and standards solutions (5 mg/mL of gallic acid, quercetin and (+) catechin) previously filtered (0.45 µm nylon membrane filters) were loaded on the activated plates as bands. The plates were developed in vertical glass chambers previously saturated with the mobile phase (toluene: ethyl acetate: formic acid) (40:40:2). After development, plates were dried at room tem-perature for 5 min and phenolic compounds were detected under UV light at 366 nm.
2.7. Reverse Phase-Ultra High-Performance Liquid Chromatography (RP-UHPLC) UHPLC analysis was performed using an UHPLC on Agilent 1200 infinity series
UHPLC System (Agilent Technologies, Waldron, Germany) with an XDB-C18 (Agilent Zorbax Eclipse 4.6 mm × 25 cm × 5.0 µm of particle size) column and water-methanol as mobile phase. Ten microliters of extracts were injected and eluted at 0.8 mL/min with a linear gradient from 5–80% of solvent B (methanol) in solvent A (Milli-Q water) for 30 min, then an isocratic mode (80% of solvent B) for 10 min, and then a return to the initial conditions in 5 min. The temperature of the column was 20 °C. UV-Vis spectra were rec-orded at wavelength of 366 nm. Gallic acid, quercetin, (+) catechin standards were used for identification of phenolic compounds in EBM-EtOH25% and EBM-EtOH50% with their retention time used as a reference [40].
2.8. Atomic Absorption Spectrometry Analysis of B. Macrantha Metal Content The concentration of 10 metals (Ca, Cu, Fe, Mg, Mn, Zn, Cd, Co, Ni, and Pb) in the
leaves of B. macrantha were measured: (a) Ashes: 5 empty crucibles were labeled with graphite pencil, taken to a flask at 550
°C for 4 h, until constant weight. They cooled down in a desiccator for 30 min and their weight was recorded. Then 0.6–0.7 g of flour from the leaves of B. macrantha spray was added to each sample. The crucibles with the sample were brought back to the flask at 550 °C for 24 h.
(b) Acid digestion: 1 mL of concentrated HNO3, free of trace metals, and 2 mL of fuming HCl, free of trace metals, were added to the ashes contained in the crucibles. The crucibles with the acids were heated to 75 °C for 2 h, to digest the remaining organic ma-terial. After, the digestion was completed, the residue from each crucible was filtered with a filter of 0.45 µm and graduated to 25 mL with 1% v/v HNO3. This content was transferred to 150 mL plastic bottles until use.
(c) The measurement of the concentration of metals with the atomic absorption spec-trophotometer AA550 (PG Instruments, Leicestershire, UK) and the data were collected through AAWin Pro software, from the same manufacturer. The measurement conditions for metals are shown in Table 1.
Table 1. Conditions of measure of metals in dry leaves of B. macrantha.
Metal Method Wavelength (nm)
Calibration Curve (ppm)
Lamp Current (mA)
Type of Flame
Copper Flame 324.79 0.1–1.75 5.0 Air/Acetylene Iron Flame 248.30 0.3–3.00 5.0 Air/Acetylene
Magnesium Flame 285.20 0.04–0.40 5.0 Air/Acetylene Manganese Flame 279.50 0.2–1.40 5.0 Air/Acetylene
Zinc Flame 213.90 0.1–2.00 5.0 Air/Acetylene Calcium Flame 422.70 0.5–3.50 5.0 N2O/Acetylene Cobalt Graphite furnace 240.70 0.015–0.10 7.0 10 Nickel Graphite furnace 232.0 0.0375–0.30 4.0 10 Lead Graphite furnace 283.30 0.05–0.60 3.0 10

Plants 2022, 11, 1555 6 of 20
Cadmium Graphite furnace 228.80 0.002–0.06 5.0 10
2.9. Biological Activities 2.9.1. Thiobarbituric Acid Reactive Substances (TBARs) In Vitro Assay
EBM’s capacity to inhibit lipid peroxidation was evaluated by mean of the TBARS assay according to the method described by Carrillo et al. [41] with some modifications. Ten milliliters of olive oil were mixed with EBM or BHT at different concentrations (100, 200, 500, and, 1000 µg/mL). The oil was oxidized by heat at 100 °C for 48 h under contin-uous agitation. Then oil was cooled and centrifuged at 10,000× g for 10 min.
Oxidized oil samples were mixed with TBA (1 mM of TBA in glacial acetic acid 50%) at ratio (1:1 v/v). Negative control was also prepared using only olive oil. The solution was incubated at 100 °C for 1 h, cooled down for 10 min, and centrifugated. The aqueous phase was measured at 532 nm with a spectrophotometer (Evolution 201, Thermo Scientific, Waltham, MA, USA). The capacity to inhibit lipid peroxidation was expressed as a per-centage of inhibition of lipid peroxidation, % Inhibition of lipid peroxidation = (Am-Ac)/(A0-Ac) × 100
Where Am is the absorbance of the sample, Ac is the absorbance of the negative con-trol, and A0 is the absorbance of the olive oil without oxidation.
2.9.2. . Red Blood Cell Membrane Stabilizing (RBC) Assay The evaluation of anti-inflammatory activity by the RBC method was carried out ac-
cording to the method described by Kota et al. [42] with slight modifications. Blood (5 mL) was collected from a healthy adult volunteer (who was not taking any NSAIDS for two weeks before the experiment) and mixed with an Alsever solution (2% dextrose, 0.8% so-dium citrate, 0.5% citric acid and, 0.42% NaCl) in equal quantities. The sample was centri-fuged at 2500× g for 5 min. The pellet was washed three times with a saline solution (0.85% w/v). A 10% v/v RBC solution was prepared in saline and stored at 4 °C, and 1 mL of EBM at different concentrations (25, 50, 100, 200, 500 and 1000 µg/mL) was mixed with 1 mL of phosphate buffer (0.15 M, pH 7.4), 2 mL of hyposaline solution (0.36%), and 0.5 mL of RBC suspension. The mixture was incubated at 37 °C for 30 min and centrifuged at 1000× g for 3 min. The absorbance of the hemoglobin content of the supernatant was measured at 540 nm. The anti-inflammatory drug diclofenac sodium was used as a positive control (25, 50, 100, 200, 500 and 1000 µg/mL) and Milli-Q water was used as a negative control. Each experiment was performed in triplicate. The results were expressed as a percentage of RBC with the following Equation:
% Protection RBC = 100-(As/Ac × 100) (1)
where As is the absorbance of the sample and Ac is the absorbance of the control.
2.9.3. Evaluation of Antioxidant Activity In Vitro
Ferric-Reducing Antioxidant Power (FRAP) Method The FRAP reagent was prepared by mixing (25 mL of 300 mM sodium acetate buffer
at pH 3.60 + 2.50 mL of 10 mM TPTZ diluted in 40 mM HCl + 2.50 mL of 20 mM ferric chloride hexahydrate). Next, 900 µL of FRAP reagent was mixed with 90 µL of distilled deionized water and 30 µL of EBM. The mixture was incubated in the dark at 37 °C for 30 min. It was then centrifuged at 500× g for 5 min. Finally, the absorbance of the samples was measured at 593 nm. The trolox standard was used to make a calibration curve (100–500 umol). The curve obtained was (y = 0.0011x + 0.46, R2 = 0.9972). The assay was done in triplicate (n = 3). The antioxidant activity data measured by FRAP were expressed as µmol trolox equivalents (TE)/g EBM, dry weight (DW) [43].
Azinobis (3-Ethyl-Benzothiazoline-6-Sulfonic Acid) Cation Bleaching ABTS Method
Plants 2022, 11, 1555 7 of 20
EBM (200 µL) were mixed with 3800 µL of ABTS solution (7 mM ABTS solution + 2.45 mM K2S2O8 in a 1:1, v/v ratio) and was incubated for 45 min in the darkness. Then, the mix was diluted adding a phosphate buffer (pH 7.0) until an absorbance of 1.10 ± 0.01 at 743 nm was obtained. The Trolox standard solution (0 µmol to 500 µmol) was used as the standard curve to determine the concentrations of antioxidants. The standard curve ob-tained was (y = 0.0011x + 0.46, R2 = 0.9972). The assay was done in triplicate (n = 3). The results of the antioxidant activity by ABTS assays were expressed as µmol of trolox equiv-alents (TE)/g EBM, dry weight (DW) [43].
2,2-Diphenyl-1-Picrylhydrazyl (DPPH) Radical Scavenging Assay The antioxidant activity of EBM was measured by the DPPH method described by
Boeri et al. [44]. The trolox standard was used as the reference standard curve (0–800 µmol Trolox/L) and the calibration curve was obtained (y = 0.0011x + 0.46, R2 = 0.9997). All assays were done three times (n = 3). The results obtained were represented as µmol trolox equiv-alents (TE)/g EBM, dry weight (DW).
2.10. Statistical Analysis The results obtained in this study were expressed as the means ± standard deviation
of the three experiments (n = 3). To determine the statistical differences, the data was eval-uated with one-way ANOVA analysis, followed by the Tuckey test. The significant differ-ences were considered at p < 0.05.
3. Results and Discussion 3.1. Effect of Solvent in the Extraction Process of TPC and TFC
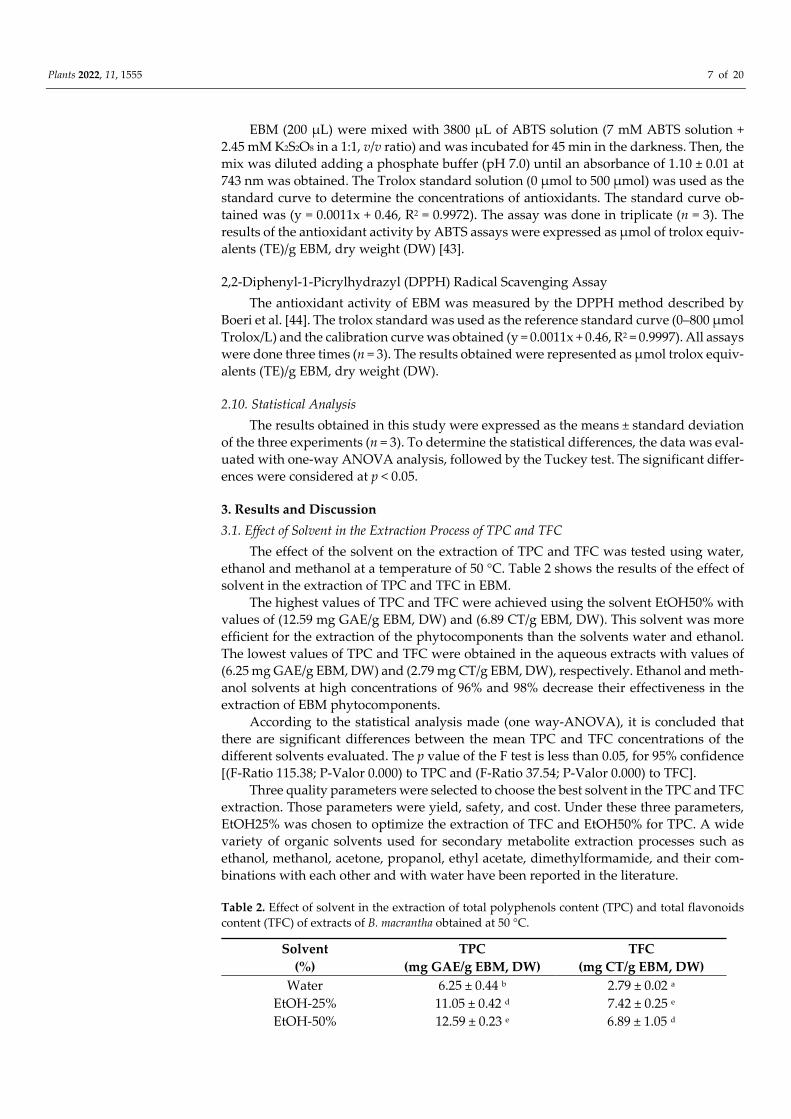
The effect of the solvent on the extraction of TPC and TFC was tested using water, ethanol and methanol at a temperature of 50 °C. Table 2 shows the results of the effect of solvent in the extraction of TPC and TFC in EBM.
The highest values of TPC and TFC were achieved using the solvent EtOH50% with values of (12.59 mg GAE/g EBM, DW) and (6.89 CT/g EBM, DW). This solvent was more efficient for the extraction of the phytocomponents than the solvents water and ethanol. The lowest values of TPC and TFC were obtained in the aqueous extracts with values of (6.25 mg GAE/g EBM, DW) and (2.79 mg CT/g EBM, DW), respectively. Ethanol and meth-anol solvents at high concentrations of 96% and 98% decrease their effectiveness in the extraction of EBM phytocomponents.
According to the statistical analysis made (one way-ANOVA), it is concluded that there are significant differences between the mean TPC and TFC concentrations of the different solvents evaluated. The p value of the F test is less than 0.05, for 95% confidence [(F-Ratio 115.38; P-Valor 0.000) to TPC and (F-Ratio 37.54; P-Valor 0.000) to TFC].
Three quality parameters were selected to choose the best solvent in the TPC and TFC extraction. Those parameters were yield, safety, and cost. Under these three parameters, EtOH25% was chosen to optimize the extraction of TFC and EtOH50% for TPC. A wide variety of organic solvents used for secondary metabolite extraction processes such as ethanol, methanol, acetone, propanol, ethyl acetate, dimethylformamide, and their com-binations with each other and with water have been reported in the literature.
Table 2. Effect of solvent in the extraction of total polyphenols content (TPC) and total flavonoids content (TFC) of extracts of B. macrantha obtained at 50 °C.
Solvent (%)
TPC (mg GAE/g EBM, DW)
TFC (mg CT/g EBM, DW)
Water 6.25 ± 0.44 b 2.79 ± 0.02 a
EtOH-25% 11.05 ± 0.42 d 7.42 ± 0.25 e
EtOH-50% 12.59 ± 0.23 e 6.89 ± 1.05 d

Plants 2022, 11, 1555 8 of 20
EtOH-75% 10.54 ± 0.70 d 6.29 ± 0.23 d
EtOH-96% 7.90 ± 0.38 c 2.98 ± 0.37 a
MetOH-25% 7.45 ± 0.16 c 6.48 ± 0.83 d
MetOH-50% 7.05 ± 0.34 c 5.51 ± 0.53 c
MetOH-75% 10.82 ± 0.76 d 7.37 ± 0.12 e
MetOH-98% 3.94 ± 0.14 a 4.11 ± 0.20 b
Results are presented as Mean ± SD (n = 3) and were evaluated by one-way Anova and Tukey test (p < 0.05). Statistical differences are indicated with different letters. DW (dry weight), GAE (gallic acid equivalents), EBM (extract of Baccharis macrantha), CT (catechin).
3.2. Effect of Temperature in the Extraction Process of TPC and TFC Table 3 shows the results of the effect of the temperature in the extraction of TPC and
TFC of EBM at 30, 40, 50, and 60 °C.
Table 3. Effect of the temperature in the extraction of total polyphenol content (TPC) and total fla-vonoids content (TFC) of EBM-EtOH50% and EBM-EtOH25%.
Temperature (°C)
TPC (mg GAE/g EBM-EtOH50%,
DW)
TFC (mg CT/g EBM-EtOH25%,
DW) 30 10.83 ± 0.16 a 5.01 ± 0.38 a
40 10.82 ± 0.31 a 7.18 ± 0.19 b
50 12.91 ± 0.77 b 7.22 ± 0.23 b
60 15.23 ± 0.49 c 9.24 ± 0.24 c
Results are presented as Mean ± SD (n = 3) and were evaluated by one-way Anova and Tukey test (p < 0.05). Statistical differences are indicated with different letters. DW (dry weight), GAE (gallic acid equivalents), EBM (extract of Baccharis macrantha), CT (catechin).
3.3. Effect of Time of Sonication in the Extraction Process of TPC and TFC Table 4 shows the results of the effect of sonication time on the extraction of TPC and
TFC from EBM-EtOH25% and EBM-EtOH50% at 50 °C and 60 °C for 5, 10, and 20 min. The TPC content increases with the sonication time tested. The highest value of TPC at 50 °C was obtained with 5 min of sonication (14.68 mg GAE/g EBM-EtOH50%, DW). The highest TFC value at 50 °C was obtained at 20 min of sonication with a value of (8.75 mg CT/g EBM-EtOH25%, DW). The highest value of TPC at 60 °C was obtained with 20 min of sonication (17.33 mg GAE/g EBM-EtOH50%, DW); the TFC presented a value of (9.84 mg CT/g EBM-EtOH25%, DW). One-way ANOVA analysis of variance showed that tem-peratures presented statistically significant differences for TPC and TFC. The analysis was evaluated with 95% confidence [(F-Ratio 55.42, p-Value 0.000) for TPC and (F-Ratio 124.01, p-Value 0.000) for TFC.
Soto et al. [45] have described the ethanolic extract of B. alnifolia from Chile (EtOH96%, 30 min of ultrasonic bath) with a content of TPC (4.42 mg GAE/g, DW) and TFC (1.24 mg quercetin equivalents (QE)/g, DW). The reported values of TPC and TFC for the different EBMs were higher than those reported for the ethanolic extract of B. alnifolia.
Brighente et al. [46] have described the TPC and TFC content of different extracts of B. illinita and B. platypoda from Brazil. The extracts were obtained with different solvents during a period of 15 days. The reported contents were (19.91–351.95 mg GAE/g, DW and 5.22 QE/g, DW) for B. illinita and (11.29–149.13 mg GAE/g, DW and 7.11–35.87 QE/g, DW) for B. platypoda. These TPC and TFC values were higher than those reported in this study for EBM. Differences may be due to the Baccharis species, the origin of the crop, the part of the plant used for the extract (leaves, flowers and stems), and the process used to obtain the extracts (solvents, temperatures, time, sonication, supercritical fluids, and number of extractions). Cavalaro et al. [47] have described different ethanolic extracts of B. dra-cunculifolia from Brazil with TPC contents between (11.33–120.52 mg GAE/g, DW). Gomez

Plants 2022, 11, 1555 9 of 20
et al. [48] have described decoction extract of B. grisebachii with a content of TPC (62.46 mg GAE/g, extract) and TFC (5.30 QE/g, extract). Sabir et al. [49] have described the TPC and TFC content of water extract of B. trimera from Brazil. The extract was concentrated with the help of a rotary evaporator. The values found were (101 mg GAE/g, DW) for TPC and (35.00 mg QE/g, DW) for TFC. Agudelo et al. [50] have reported content of TPC and TFC of methanolic extract of B. spicata with values of (66.30 mg tannic acid/g, DW) to TPC and (7.46 mg rutin/g, DW) to TFC.
Table 4. Effect of the time of extraction of total polyphenols content (TPC) and total flavonoids con-tent (TFC) of EBM-EtOH50% and EBM-EtOH25%.
Temperature (°C)
Time (min)
TPC (mg GAE/g EBM-EtOH50%, DW)
TFC (mg CT/g EBM-EtOH25%, DW)
50 5 12.91 ± 0.77 a 7.22 ± 0.23 a
10 14.68 ± 0.30 b 8.50 ± 0.49 b
20 14.91 ± 0.63 b 8.75 ± 0.25 b
60 5 15.23 ± 0.49 c 9.24 ± 0.24 c
10 15.41 ± 0.36 c 9.11 ± 0.13 c
20 17.33 ± 0.40 d 9.84 ± 0.23 c
Results are presented as Mean ± SD (n = 3) and were evaluated by one-way Anova and Tukey test (p < 0.05). Statistical differences are indicated with different letters. DW (dry weight), GAE (gallic acid equivalents), EBM (extract of Baccharis macrantha), CT (catechin).
Once the optimal parameters for the extraction of TPC and TFC in the extracts (sol-vent, temperature, and sonication time) were established, extractions of TPC and TFC were carried out until the plant material was totally used. TPC and TFC required four extraction cycles to obtain a value of (23.54 mg GAE/g EBM-EtOH50%, DW) and (19.32 mg CT/g EBM-EtOH25%, DW) equivalent to 100% and 98.56%, respectively. TFC needed five extraction cycles to obtain a value of (19.60 mg CT/g EBM-EtOH25%, DW), equivalent to 100%. Consecutive extractions enabled the improved performance of the content of the phytocomponents recovered in the plant material.
To determine the effect of the factors (temperature and time) on the response variable (concentration), a factorial design of (A × B) was applied, where factor A (temperature) has two levels (50 °C and 60 °C) and factor B (time) has three levels (5, 10, and 20 min). A multifactorial analysis of variance was performed, with the mean difference for each fac-tor. For the interaction between the different factors, a confidence level of 95% was ob-served. The correlation between the factors for each of the levels is shown in the interac-tion graph (Figure 2).
Figure 2. Relationship of temperature and time factors at different levels on (a) total flavonoids con-tent (TFC) and (b) total polyphenol content (TPC). (r = Pearson coefficient of correlation). (p < 0.005).
Plants 2022, 11, 1555 10 of 20
When the intervals for each cell overlap, the effect of the factors (temperature and time) is the same in that cell. The effect is observed in Figure 2a,b for TFC and TPC (50 and 60 °C for 10 min); both temperatures at that time produce the same effect in the poly-phenol extraction. Therefore, either of the two temperatures can be chosen as the best treatment. In both cases, it was decided to work with the lowest temperature, or 50 °C for an extraction time of 10 min, to preserve the quality of the extracted metabolites.
A Pearson correlation analysis was performed. It was found that the correlation co-efficients were higher when temperature was related to TPC and TFC. Values of r = 0.70 and r = 0.76, respectively, were found. When time was related to TPC and TFC, the coef-ficients were quite low with values of r = 0.63 and r = 0.52, respectively (Figure 2a,b). This indicates that there is a better correlation between the temperature variable and the con-centration variable.
The influence of the sonication time measured from 5 to 20 min on TPC concentration is shown in Table 4. Statistical evaluation (ANOVA) suggests that TPC extraction yields are time dependent. The study shows that the recoveries of phenolic compounds in-creased with sonication time, reaching the maximum at 10 min of sonication. Extraction efficiencies were low during the first 4 min of sonication, indicating that more sonication time is needed to break down cell walls and release phenolic compounds from cell con-stituents. The prolonged application of time did not benefit polyphenol yields to a large extent [51]. Since the particle sizes can affect the extraction process and its effectiveness, the experimental work was conducted with the fine powder of dried leaves of B. macrantha and the solid–solvent ratio was set to (1:10, w/v). The ultrasound assisted extraction was used to create optimal conditions, allowing a high diffusion of the solvent across the cell wall plants and the breaking down of the cell walls plants to facilitate the extraction of the compounds of interest present in the solution [52].
3.4. Anti-Inflammatory Activity of EBM The inflammation process is a tissue response to injury, infection or irritation caused
by an external agent. During this process, lysosomal enzymes are released that cause dam-age to macromolecules and cell membranes. The stabilization of lysosomal membranes is important in controlling the inflammation process. RBC is a method based on the stabili-zation of lysosomal membranes that have been subject to cell lysis due to hypotonicity. The ability of the extracts to stabilize erythrocyte membranes is evaluated with the RBC method [42].
The anti-inflammatory activity of EBM-EtOH25% and EBM-EtOH50% was evaluated with RBC assay. EBMs were tested at concentrations of 25, 50, 100, 200, and 500 µg/mL. The diclofenac sodium standard was used as positive control. Figure 3 shows results of EBM-EtOH25% and EBM-EtOH50% anti-inflammatory activity by the RBC assay. The positive control (diclofenac) presents a value between (91.42–97.12%) of protection lysis RBC. EBM-EtOH25% and EBM-EtOH50% at 100 and 200 µg/mL present higher values than the positive control. Moreover, 100 µg/mL of EBM-EtOH25% presents a value of 93.70% and EBM-EtOH50% presents a value of 92.26%. EBM-EtOH50% at 25 and 50 µg/mL presents a higher value than the positive control. Only EBM at 500 µg/mL presents statistical differences of the samples compared to the positive control after analysis of one-way ANOVA at p < 0.05. But EMB-EtOH25% and EBM-EtOH50% at 500 µg/mL were less active than the positive control.

Plants 2022, 11, 1555 11 of 20
Figure 3. Anti-inflammatory activity of EBM-EtOH25% and EBM-EtOH50% by red blood cell mem-brane stabilized (RBC) assay. The results for positive control (diclofenac) and negative control sol-vents (EtOH25% and EtOH50%) can be seen. Results are presented as Mean ± SD (n = 3) and were evaluated by one-way Anova and Tukey test (p < 0.05). Statistical differences are indicated with different letters.
De Oliveira et al. [53] have described six extracts of B. trimera with anti-inflammatory activity, using carrageenan-induced pleurisy in a rat model. The extracts were tested at concentrations of (25, 50, and 75 mg/kg). All the tested extracts showed anti-inflammatory activity. In addition, the extracts were enriched with phenolic compounds. Observing that the most active extract presented a 22.34% inhibition compared to the control carrageenan. Nogueira et al. [54] observed extracts and fractions of B. trimera with anti-inflammatory activity for carrageenan-induced mouse paw edema. Treatment with AFBt (aqueous frac-tion of B. trimera) reduced paw edema at 3 h by 44.70–54.20% and EFBt (ethanolic fraction of B. trimera) reduced edema by 49.30–58.20% compared to positive control (indomethacin 10 mg/kg), which reduced 64.60% of edema at 3 h. Zalewski et al. [55] described ethanolic extracts of B. uncinella with strong anti-inflammatory activity against inflammatory reac-tions induced by phospholipase A2 and rat paw edema induced by carrageenan model.
Different Baccharis species have shown anti-inflammatory activity in different in vivo and in vitro evaluation models. The anti-inflammatory activity of B. macrantha has not been reported in the scientific literature.
3.5. Inhibition of Lipid Peroxidation of EBM Figure 4 shows the results of EBM-EtOH25% and EBM-EtOH50% inhibition of lipid
peroxidation in vitro. The samples were tested at concentrations of 100, 200, 500, and 100 µg/mL of EBMs. BHT standard was used as positive control. When the samples were com-pared to the positive control, they showed less activity than the positive control at all con-centrations tested. At 500 µg/mL of BHT, the sample presented a value of 91.42%. The other samples showed a value of 77.00% in EBM-EtOH25% and 73.11% in EBM-EtOH50%. De las Heras et al. [56] have described ethanolic extracts of B. trinervis at a concentration of (100 µg/mL) with inhibition of microsomal lipid peroxidation of 74.80% of inhibition compared with control BHT (100 µM) with 100% of inhibition. Tapia et al. [57] reported extracts of B. grisebachii at a concentration of (500 µg/mL) with a capacity to inhibit lipid peroxidation in erythrocytes with values between 32–58% of inhibition. Our %TBARS in-hibition values were higher than those reported in the previous study. Sabir et al. [49] have described the aqueous extract of B. trimera able to inhibit TBARS molecules, induced by different prooxidants (iron and sodium nitroprusside) in rat liver, brain, and phospho-lipid homogenates from egg yolk. Guimarães et al. [58] described glycolic extracts from B. dracunculifolia (GEBd) with capacity to inhibit lipid peroxidation in rat liver mitochondria. GEBd 0.03% presented a value of 75% of inhibition of TBARS molecules. The percentage of inhibition of lipid peroxidation values of EBMs are consistent with those reported in the literature for extracts from other Baccharis species.

Plants 2022, 11, 1555 12 of 20
Figure 4. Inhibition of lipid peroxidation in vitro of EBM-EtOH25% and EBM-EtOH50%. Results for positive control butylhydroxytoluene (BHT) and negative control solvents (EtOH25% and EtOH50%) can be seen, as well as the results for EBM (extracts of Baccharis macrantha). Results are presented as Mean ± SD (n = 3) and were evaluated by one-way Anova and Tukey test (p < 0.05). Statistical differences are indicated with different letters.
3.6. Antioxidant Activity of EBM Table 5 shows the results of antioxidant activity of EBM-EtOH25% and EBM-
EtOH50% by ABTS, FRAP, and DPPH methods. EBM-EtOH25% and EBM-EtOH50% pre-sented similar antioxidant values when evaluated with the ABTS method (1172 µmol TE/g, EBM and 1168 µmol TE/g, EBM), respectively. Statistical analysis shows that there are no statistical differences between both values. The activity evaluated with the FRAP and DPPH methods present statistical differences. Gallic acid, quercetin, and catechin standards were used as positive controls. The antioxidant activity values evaluated with the three methods, and the results were higher than the two tested extracts (Table 5).
The antioxidant activity of EBM-EtOH25% evaluated by the DPPH method shows an activity 2.20 times higher than the activity of EBM-EtOH50% evaluated with the same method. Parejo et al. [59] described the antioxidant activity of extracts of B. pentlandiiand and B. platypoda, using the DPPH method. Obtaining values of (IC50 = 15.0 to 63.8 µg/mL) and (IC50 = 20.5 to 80.9 µg/mL), respectively. Saber et al. [49] have described the antioxi-dant activity by the DPPH method of the aqueous extract of B. trimera from Brazil. The water extract showed values between 30% and 80% DPPH. Soto et al. [45] examined the antioxidant activity of the ethanolic extract of B. alnifolia from Chile, and they identified the activity through the FRAP and TEAC methods. They found a value of (13.29 µmol TE/g, DW) through the FRAP method and (6.19 µmol TE/g, DW) through the TEAC method. The FRAP value of EBM was higher than that of the B. alnifolia extract.
Gomez et al. [48] have described B. grisebachii decoction extract with antioxidant ac-tivity evaluated by FRAP and TEAC methods. The extracts showed FRAP (700 µM TE/g extract) and TEAC (0.61 mg TE/g extract) values. The antioxidant values reported in this study for EBM with the FRAP method were higher than those reported in the previous study.
Table 5. Antioxidant activity of extract Baccharis macrantha (EBM) by ABTS, FRAP and DPPH meth-ods.
Sample ABTS
(µmol TE/g, EBM) FRAP
(µmol TE/g, EBM) DPPH
(µmol TE/g, EBM) EBM-EtOH25% 1172 ± 16.77 a 836 ± 37.10 a 85.70 ± 17.70 b
EBM-EtOH50% 1168 ± 16.70 a 930 ± 36.98 b 39.03 ± 17.17 a
a ai
i
cd
h f
be
gf
j j0
20
40
60
80
100
100 µg/mL 200 µg/mL 500 µg/mL 1000 µg/mL Solvents
% In
hibi
tion
TBAR
S
Positive controlEBM-EtOH50%EBM-EtOH25%
Plants 2022, 11, 1555 13 of 20
Gallic acid 40,000 ± 1790 d 4541 ± 51.48 e 7376 ± 360 e
Catechin 27,142 ± 645 b 1022 ± 40.44 c 4205 ± 111 c
Quercetin 37,628 ± 711 c 3471 ± 51.48 d 6419 ± 284 d
Results are presented as Mean ± SD (n = 3) and were evaluated by one-way Anova and Tukey test (p < 0.05). Statistical differences are indicated with different letters: GAE (gallic acid equivalents), EBM (extract of Baccharis macrantha), TE (trolox equivalents).
3.7. Characterization of EBM by TLC and UHPLC Analysis The components of EBM-EtOH25% and EBM-EtOH50% were analyzed by the TLC
technique (Figure 5). Gallic acid standard (GA), quercetin standard (QT), and catechin standard (CT) were used for the analysis. Figure 5 shows the EBM-EtOH25% and EBM-EtOH50% polyphenol components profile. The bands named 1, 2, and 3 correspond to the standards quercetin, gallic acid, and catechin, respectively. Five bands named 4, 5, 6, 7, and 8 were found in both samples. The bands 4, 5, and 6 were of blue color intensity. The bands 7 and 8 were of red color with low intensity. The intensity of the bands indicates the concentration of the component. The bands 4 and 5 may be associated with methylated or glycosylated phenolic compounds; the bands 7 and 8 would correspond to compounds with hydroxyl or methoxy substituents. The retention factor (Rf) of EBMs has been calcu-lated at this value to describe the polarity of the components. The bands with low Rf cor-respond to components with high polarity. High Rf is considered components of low po-larity. In terms of polarity, GA has the highest polarity with a value of Rf (0.38), followed by CT with a Rf value of (0.42). QT (band 1) was the standard with low polarity with a value of Rf (0.62).
The bands of blue color intensity band 6 (EBM-EtOH25% and EBM-EtOH50%) pre-sent values of Rf of 0.61, and the QT (band 1) standard presents an Rf of 0.62. Bands with the same color and the same Rf were identified as the same molecule (quercetin). Bands 2 and 3, which correspond to standard gallic acid and quercetin, respectively, were not de-tected in the two extracts tested. QT is a hydroxy flavone with 3 phenolic rings and 5 hydroxyl groups. The bands 4, 6, 7, and 8 observed in both EBM samples were not identi-fied.
Different Chinese medicinal plants are used to treat and prevent neurodegenerative diseases such as Alzheimer’s and Parkinson’s. Different flavonoid compounds have been identified from medicinal plant extracts such as apigenin (4′,5,7-trihydroxyflavone), lute-olin (7-O-β-glucoside), and quercetin. It has been described that flavonoids are com-pounds with the ability to prevent neurodegenerative diseases caused by dietary intake of advanced glycation end products from modern diets. Yang et al. [60] reported quercetin with preventive effects against cognitive damage of mice produced by advanced glycation end-products in the diet. Many food plants have quercetin flavonoids and are reported to have protective effects against Alzheimer disease in human patients and mouse models [61]. Oyedemi et al. [62] reported quercetin with the capacity to reduce hyperglycemia in a type 2 diabetes rat model.

Plants 2022, 11, 1555 14 of 20
Figure 5. Analysis TLC of EBM-EtOH25% and EBM-EtOH50%. GA (gallic acid standard), CT (+ catechin standard) and QT (quercetin standard). UV light at 366 nm.
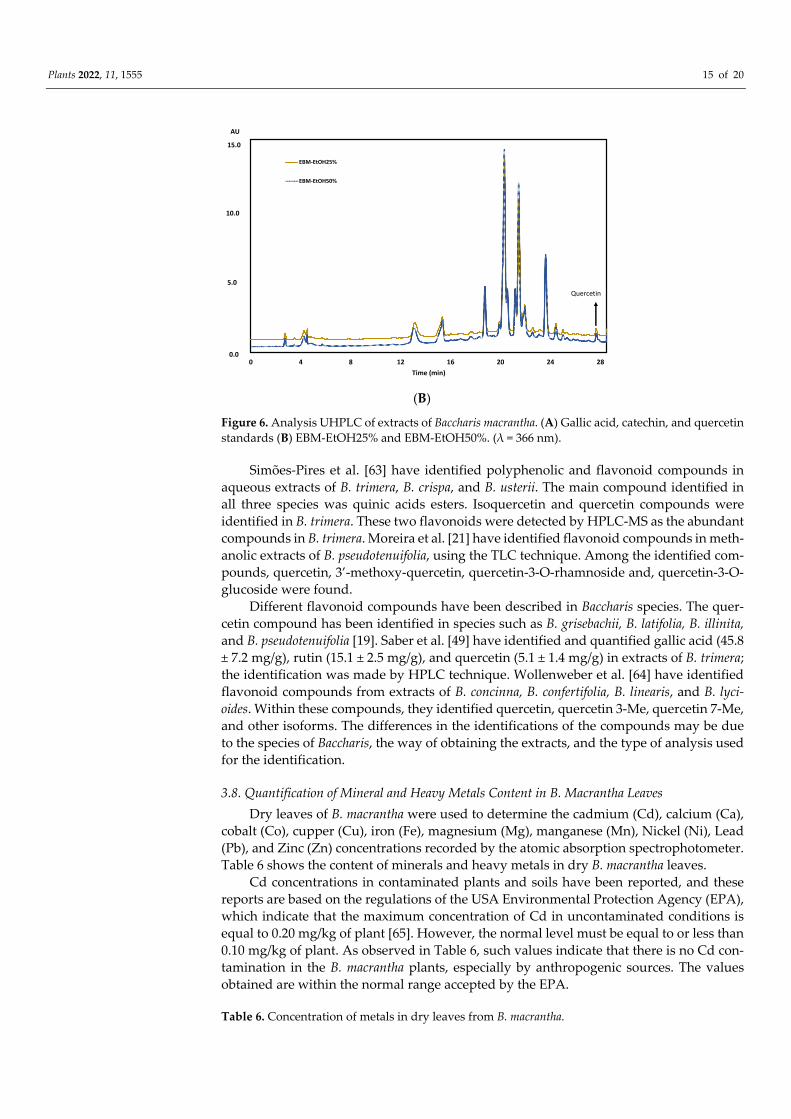
The components of EBM-EtOH25% and EBM-EtOH50% were also characterized with the UHPLC technique at a wavelength of 366 nm (Figure 6). GA, CT, and QT standards were used as reference in the analysis at concentration of 100 µg/mL (Figure 6a). Accord-ing to the retention times of the standards, only QT was identified in the chromatogram at wavelength of 366 nm of EBM-EtOH25% and EBM-EtOH50%) at retention time of 28.98 min (Figure 6b). This result is in accordance with the results obtained in the TLC analysis of EMB-EtOH25% and EBM-EtOH50%. The chromatogram presents a complex profile with compounds that were not identified by UHPLC between retention times of 2 to 26 min.
(A)
Plants 2022, 11, 1555 15 of 20
(B)
Figure 6. Analysis UHPLC of extracts of Baccharis macrantha. (A) Gallic acid, catechin, and quercetin standards (B) EBM-EtOH25% and EBM-EtOH50%. (λ = 366 nm).
Simões-Pires et al. [63] have identified polyphenolic and flavonoid compounds in aqueous extracts of B. trimera, B. crispa, and B. usterii. The main compound identified in all three species was quinic acids esters. Isoquercetin and quercetin compounds were identified in B. trimera. These two flavonoids were detected by HPLC-MS as the abundant compounds in B. trimera. Moreira et al. [21] have identified flavonoid compounds in meth-anolic extracts of B. pseudotenuifolia, using the TLC technique. Among the identified com-pounds, quercetin, 3’-methoxy-quercetin, quercetin-3-O-rhamnoside and, quercetin-3-O-glucoside were found.
Different flavonoid compounds have been described in Baccharis species. The quer-cetin compound has been identified in species such as B. grisebachii, B. latifolia, B. illinita, and B. pseudotenuifolia [19]. Saber et al. [49] have identified and quantified gallic acid (45.8 ± 7.2 mg/g), rutin (15.1 ± 2.5 mg/g), and quercetin (5.1 ± 1.4 mg/g) in extracts of B. trimera; the identification was made by HPLC technique. Wollenweber et al. [64] have identified flavonoid compounds from extracts of B. concinna, B. confertifolia, B. linearis, and B. lyci-oides. Within these compounds, they identified quercetin, quercetin 3-Me, quercetin 7-Me, and other isoforms. The differences in the identifications of the compounds may be due to the species of Baccharis, the way of obtaining the extracts, and the type of analysis used for the identification.
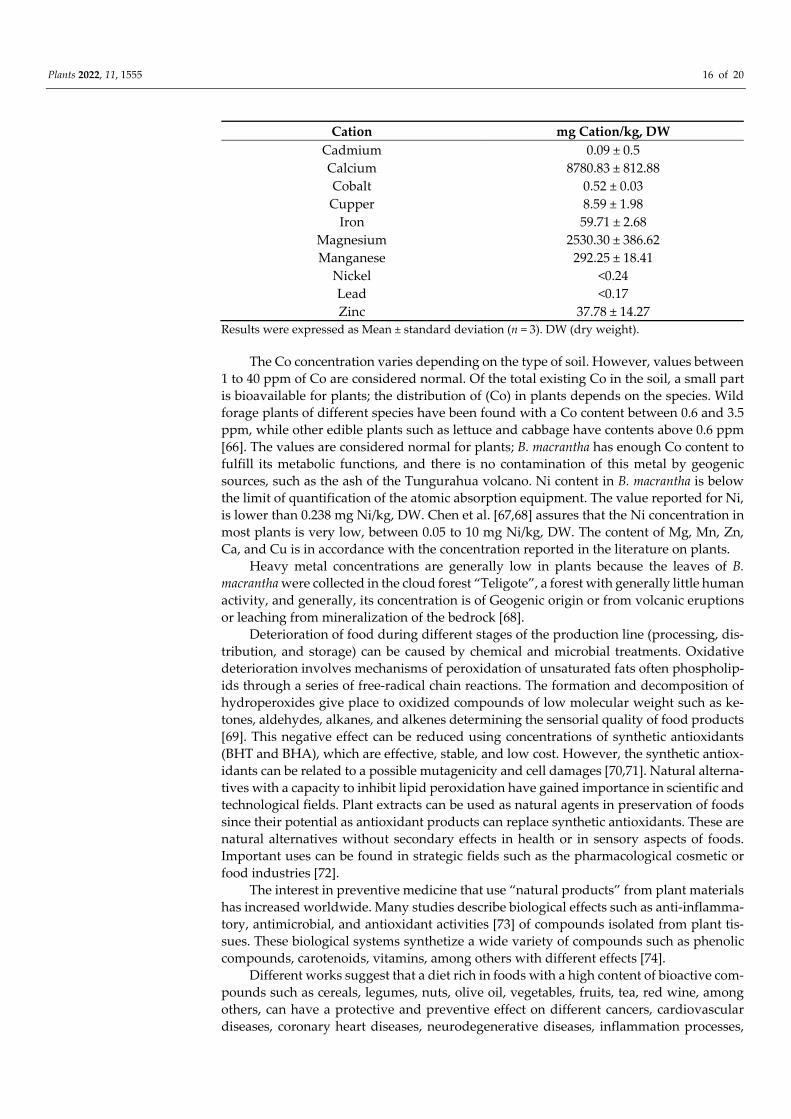
3.8. Quantification of Mineral and Heavy Metals Content in B. Macrantha Leaves Dry leaves of B. macrantha were used to determine the cadmium (Cd), calcium (Ca),
cobalt (Co), cupper (Cu), iron (Fe), magnesium (Mg), manganese (Mn), Nickel (Ni), Lead (Pb), and Zinc (Zn) concentrations recorded by the atomic absorption spectrophotometer. Table 6 shows the content of minerals and heavy metals in dry B. macrantha leaves.
Cd concentrations in contaminated plants and soils have been reported, and these reports are based on the regulations of the USA Environmental Protection Agency (EPA), which indicate that the maximum concentration of Cd in uncontaminated conditions is equal to 0.20 mg/kg of plant [65]. However, the normal level must be equal to or less than 0.10 mg/kg of plant. As observed in Table 6, such values indicate that there is no Cd con-tamination in the B. macrantha plants, especially by anthropogenic sources. The values obtained are within the normal range accepted by the EPA.
Table 6. Concentration of metals in dry leaves from B. macrantha.
0 4 8 12 16 20 24 28Time (min)
EBM-EtOH25%
EBM-EtOH50%
AU
15.0
10.0
5.0
0.0
Quercetin
Plants 2022, 11, 1555 16 of 20
Cation mg Cation/kg, DW Cadmium 0.09 ± 0.5
Calcium 8780.83 ± 812.88
Cobalt 0.52 ± 0.03
Cupper 8.59 ± 1.98
Iron 59.71 ± 2.68
Magnesium 2530.30 ± 386.62
Manganese 292.25 ± 18.41
Nickel <0.24
Lead <0.17
Zinc 37.78 ± 14.27
Results were expressed as Mean ± standard deviation (n = 3). DW (dry weight).
The Co concentration varies depending on the type of soil. However, values between 1 to 40 ppm of Co are considered normal. Of the total existing Co in the soil, a small part is bioavailable for plants; the distribution of (Co) in plants depends on the species. Wild forage plants of different species have been found with a Co content between 0.6 and 3.5 ppm, while other edible plants such as lettuce and cabbage have contents above 0.6 ppm [66]. The values are considered normal for plants; B. macrantha has enough Co content to fulfill its metabolic functions, and there is no contamination of this metal by geogenic sources, such as the ash of the Tungurahua volcano. Ni content in B. macrantha is below the limit of quantification of the atomic absorption equipment. The value reported for Ni, is lower than 0.238 mg Ni/kg, DW. Chen et al. [67,68] assures that the Ni concentration in most plants is very low, between 0.05 to 10 mg Ni/kg, DW. The content of Mg, Mn, Zn, Ca, and Cu is in accordance with the concentration reported in the literature on plants.
Heavy metal concentrations are generally low in plants because the leaves of B. macrantha were collected in the cloud forest “Teligote”, a forest with generally little human activity, and generally, its concentration is of Geogenic origin or from volcanic eruptions or leaching from mineralization of the bedrock [68].
Deterioration of food during different stages of the production line (processing, dis-tribution, and storage) can be caused by chemical and microbial treatments. Oxidative deterioration involves mechanisms of peroxidation of unsaturated fats often phospholip-ids through a series of free-radical chain reactions. The formation and decomposition of hydroperoxides give place to oxidized compounds of low molecular weight such as ke-tones, aldehydes, alkanes, and alkenes determining the sensorial quality of food products [69]. This negative effect can be reduced using concentrations of synthetic antioxidants (BHT and BHA), which are effective, stable, and low cost. However, the synthetic antiox-idants can be related to a possible mutagenicity and cell damages [70,71]. Natural alterna-tives with a capacity to inhibit lipid peroxidation have gained importance in scientific and technological fields. Plant extracts can be used as natural agents in preservation of foods since their potential as antioxidant products can replace synthetic antioxidants. These are natural alternatives without secondary effects in health or in sensory aspects of foods. Important uses can be found in strategic fields such as the pharmacological cosmetic or food industries [72].
The interest in preventive medicine that use “natural products” from plant materials has increased worldwide. Many studies describe biological effects such as anti-inflamma-tory, antimicrobial, and antioxidant activities [73] of compounds isolated from plant tis-sues. These biological systems synthetize a wide variety of compounds such as phenolic compounds, carotenoids, vitamins, among others with different effects [74].
Different works suggest that a diet rich in foods with a high content of bioactive com-pounds such as cereals, legumes, nuts, olive oil, vegetables, fruits, tea, red wine, among others, can have a protective and preventive effect on different cancers, cardiovascular diseases, coronary heart diseases, neurodegenerative diseases, inflammation processes,

Plants 2022, 11, 1555 17 of 20
and damage caused by cellular aging. Furthermore, the protective associations between phenolics compounds and these neurodegenerative diseases have also been described [75].
4. Conclusions B. macrantha is a plant with medicinal properties used to treat different inflammatory
diseases in Ecuador. Plant extracts were obtained from leaves of B. macrantha grown in volcanic areas of Ecuador. The extracts of B. macrantha presented high values of TPC and TFC. The most suitable solvent to obtain a high content of phenolic compounds was EtOH25% and EtOH50%.
EBM-EtOH25% and EBM-EtOH50% present in vitro high anti-inflammatory and an-tioxidant activities. EBM showed the ability to inhibit lipid peroxidation, and this ability was observed when the in vitro method was used. In both extracts, the quercetin flavonoid molecule was identified by TLC and UHPLC techniques. Future studies can focus on the identification of other phenol compounds present in EBM, using the mass spectrometry technique. The extracts can be subject to gastrointestinal digestion simulation to deter-mine the enzymatic hydrolysis of phenolic compounds. EBM has an interest for future studies for the medical and pharmaceutical industries for its biological properties.
Author Contributions: Conceptualization, D.M. and S.R.; methodology, F.D.P.; W.S.; D.M., M.F.Q.; software, S.R.; identification of vegetal material, W.S.; validation, S.R.; F.D.P., and D.M.; formal anal-ysis, S.R., M.Á., and M.F.Q.; investigation, S.R.; resources, D.M.; data curation, S.R.; writing—origi-nal draft preparation, D.M. and W.C.; writing—review and editing, W.C.; visualization, W.C.; su-pervision, W.C.; project administration, D.M.; funding acquisition, D.M. All authors have read and agreed to the published version of the manuscript.
Funding: This research received no external funding.
Data Availability Statement: Not applicable.
Institutional Review Board Statement: This study was approved by the University Technical of Ambato Ethics Research Board (Project 2383-CU-P-2017), May 2018.
Informed Consent Statement: RBC were obtained from the informed consent of all volunteer do-nors. FM-UTA-2018-0001. In addition, all project activities were approved by the Ministry of Envi-ronment, Water and Ecological Transition of Ecuador. Research permit N°01-2016-IC-FLO-DPAT-VS.
Acknowledgments: The authors thank the National Herbarium of Ecuador (QNCE) for the help provided for the identification and characterization of the plant material of this study (Baccharis macrantha Kunth). This work was supported by the research project 2383-CUP-2017: Study of the polyphenol profile and encapsulation of medicinal plant extracts used in Ecuador.
Conflicts of Interest: The authors declare no conflict of interest.
References 1. Biswas, P.; Anand, U.; Saha, S.C.; Kant, N.; Mishra, T.; Masih, H.; Bar, A.; Pandey, D.K.; Jha, N.K.; Majumder, M.; et al. Betelvine
(Piper betle L.): A comprehensive insight into its ethnopharmacology, phytochemistry, and pharmacological, biomedical and therapeutic attributes. J. Cell. Mol. Med. 2022, 26, 3083–3119. https://doi.org/10.1111/jcmm.17323.
2. Anand, U.; Jacobo-Herrera, N.; Altemimi, A.; Lakhssassi, N. A comprehensive review on medicinal plants as antimicrobial therapeutics: Potential avenues of biocompatible drug discovery. Metabolites 2019, 9, 258. https://doi.org/10.3390/metabo9110258.
3. Anand, U.; Nandy, S.; Mundhra, A.; Das, N.; Pandey, D.K.; Dey, A. A review on antimicrobial botanicals, phytochemicals and natural resistance modifying agents from Apocynaceae family: Possible therapeutic approaches against multidrug resistance in pathogenic microorganisms. Drug Resist. Updat. 2020, 51, 100695. https://doi.org/10.1016/j.drup.2020.100695.
4. Przeor, M. Some common medicinal plants with antidiabetic activity, known and available in Europe (A Mini-Review). Phar-maceuticals 2022, 15, 65. https://doi.org/10.3390/ph15010065.
5. Otari, S.S.; Patel, S.B.; Lekhak, M.M.; Ghane, S.G. Phytochemical studies on two unexplored endemic medicinal plants of India, Barleria terminalis and Calacanthus grandiflorus. Front. Pharmacol. 2022, 12, 817885. https://doi.org/10.3389/fphar.2021.817885.

Plants 2022, 11, 1555 18 of 20
6. Pérez-Escobar, O.P.; Chomicki, G.; Condamine, F.L.; Karremans, A.; Bogarín, D.; Matzke, N.J.; Silvestro, D.; Antonelli, A. Recent origin and rapid speciation of neotropical orchids in the world’s richest plant biodiversity hotspot. New Phytol. 2017, 215, 891–905.
7. Ulloa-Ulloa, C.; Acevedo-Rodríguez, P.; Beck, S.; Belgrano, M.J.; Bernal, R.; Berry, P.E.; Brako, L.; Celis, M.; Davidse, G.; Forzza, R.C.; et al. An integrated assessment of the vascular plant species of the Americas. Science 2017, 358, 1614–1617.
8. Heiden, G. Nomenclatural novelties in Baccharis subgen. Molina (Asteraceae, Astereae). Phytotaxa 2019, 423, 046–048. 9. Heiden, G. Baccharis: Diversity and Distribution. In Baccharis; Fernandes, G.W., Oki, Y., Barbosa, M., Eds.; Springer: Cham,
Switzerland, 2021; pp. 23–80. 10. Heiden, G.; Pirani, J.R. Novelties towards a phylogenetic infrageneric classification of Baccharis (Asteraceae, Astereae). Phyto-
taxa, 2016, 289, 285–290. 11. Müller, J. The Alate Species of Baccharis (Compositae-Astereae) of the North Andes. Syst. Bot. 2014, 39, 980–987. 12. Corrêa, E.J.A.; Alves, S.N.; Coimbra, M.C.; de Lima, L.H.F. The potential of the genus Baccharis spp. as an insecticide for mos-
quitoes and non-biting flies of veterinary importance. In New and Future Developments in Microbial Biotechnology and Bioengineer-ing; Singh, H.B., Vaishnav, A., Eds.; Elsevier: Amsterdam, The Netherlands, 2022; pp. 111–129.
13. Valtierra, M.V.; Marchesi, E.; Heiden, G.; Bonifacino, J.M. Baccharis rectialata (Compositae: Astereae): A new species of carqueja from Uruguay. Phytotaxa 2021, 478, 253–260.
14. Valarezo, E.; Rosillo, M.; Cartuche, L.; Malagón, O.; Meneses, M.; Morocho, V. Chemical composition, antifungal and antibac-terial activity of the essential oil from Baccharis latifolia (Ruiz & Pav.) Pers. (Asteraceae) from Loja, Ecuador. J. Essent. Oil Res. 2013, 25, 233–238.
15. Müller, J. A new subspecies of Baccharis L. (Compositae-Astereae) with winged stems from Argentina. Haussknechtia 2006, 11, 143–147.
16. Abad, M.J.; Bessa, A.L.; Ballarin, B.; Aragón, O.; Gonzales, E.; Bermejo, P. Anti-inflammatory activity of four Bolivian Baccharis species (Compositae). J. Ethnopharmacol. 2006, 103, 338–344.
17. Kurdelas, R.R.; López, S.; Lima, B.; Feresin, G.E.; Zygadlo, J.; Zacchino, S.; López, M.L.; Tapia, A.; Freile, M.L. Chemical compo-sition, anti-insect and antimicrobial activity of Baccharis darwinii essential oil from Argentina, Patagonia. Ind. Crops Prod. 2012, 40, 261–267.
18. Tene, V.; Malagón, O.; Finzi, P.V.; Vidari, G.; Armijos, C.; Zaragoza, T. An ethnobotanical survey of medicinal plants used in Loja and Zamora-Chinchipe, Ecuador. J. Ethnopharmacol. 2007, 111, 63–81.
19. Abad, M.; Bermejo, P. Baccharis (Compositae): A review update. Arkivoc 2007, 7, 76–96. 20. Fullas, F.; Hussain, R.A.; Chai, H.B.; Pezzuto, J.M.; Soejarto, D.D.; Kinghorn, A.D. Cytotoxic constituents of Baccharis gaudi-
chaudiana. J. Nat. Prod. 1994, 57, 801–807. 21. Moreira, F.P.M.; Voutinho, V.; Montanher, A.B.P.; Caro, M.S.B.; Brighente, I.M.C.; Pizzolatti, M.G.; Delle-Monache, F. Fla-
vonóides e triterpenos de Baccharis pseudotenuifolia–Bioatividade sobre Artemia Salina. Quim. Nova 2003, 26, 309–311. 22. Silva-Filho, A.A.; Resende, D.O.; Fukui, M.J.; Santos, F.F.; Pauletti, P.M.; Cunha, W.R.; Silva, M.L.; Gregório, L.E.; Bastos, J.K.;
Nanayakkara, N.P. In vitro antileishmanial, antiplasmodial and cytotoxic activities of phenolics and triterpenoids from Baccharis dracunculifolia D. C. (Asteraceae). Fitoterapia 2009, 80, 478–482.
23. Campos, F.R.; Bressan, J.; Jasinski, V.C.G.; Zuccolotto, T.; Silva, L.E.; Cerqueira, L.B. Baccharis (Asteraceae): Chemical constitu-ents and biological activities. Chem. Biodivers. 2016, 13, 1–17.
24. Gené, R.M.; Marín, E.; Adzet, T. Anti-inflammatory activity of aqueous extracts of three species of the genus Baccharis. Planta Med. 1992, 58, 565–566.
25. Gené, R.M.; Marín, E.; Adzet, T. Anti-inflammatory and analgesic activity of Baccharis trimera: Identification of the active con-stituents. Planta Med. 1996, 62, 232–235.
26. Pérez-García, F.; Marín, E.; Adzet, T.; Cañigueral, S. Activity of plant extracts on the respiratory burst and the stress protein synthesis. Phytomedicine 2001, 8, 31–38.
27. De Oliveira, S.Q.; Dal-Pizzol, F.; Gosmann, G.; Guillaume, D.; Moreira, J.C.F.; Schenkel, E.P. Antioxidant activity of Baccharis articulata extracts: Isolation of a new compound with antioxidant activity. Free Rad. Res. 2003, 37, 555–559.
28. De Oliveira, S.Q.; Dal-Pizzol, F.; Moreira, J.C.; Schenkel, E.P.; Gosmann, G. Antioxidant activity of Baccharis spicata, Baccharis trimera and Baccharis usterii. Acta Farm. Bonaer. 2004, 23, 365–368.
29. Jørgensen, P.M.; León-Yánez, S.; Eds. Catalogue of the vascular plants of Ecuador. Monogr. Syst. Bot. Mo. Bot. Gard. 1999, 75, 1–1182.
30. Tungmunnithum, D.; Thongboonyou, A.; Pholboon, A.; Yangsabai, A. Flavonoids and other phenolic compounds from medic-inal plants for pharmaceutical and medical aspects: An overview. Medicines 2018, 5, 93. https://doi.org/10.3390/medi-cines5030093.
31. Rahman, M.M.; Rahaman, M.S.; Islam, M.R.; Rahman, F.; Mithi, F.M.; Alqahtani, T.; Uddin, M.S. Role of phenolic compounds in human disease: Current knowledge and future prospects. Molecules 2021, 27, 233. https://doi.org/10.3390/molecules27010233.
32. Li, A.N.; Li, S.; Zhang, Y.J.; Xu, X.R.; Chen, Y.M.; Li, H.B. Resources and biological activities of natural polyphenols. Nutrients 2014, 6, 6020–6047.
33. Aguilera, Y.; Benítez, V. Phytochemicals: Dietary sources, innovative extraction, and health benefits. Foods 2021, 11, 72. https://doi.org/10.3390/foods11010072.
34. Stagos, D. Antioxidant activity of polyphenolic plant extracts. Antioxidants 2019, 9, 19. https://doi.org/10.3390/antiox9010019.
Plants 2022, 11, 1555 19 of 20
35. Tsao, R. Chemistry and biochemistry of dietary polyphenols. Nutrients 2010, 2, 1231–1246. 36. Anand, U.; Tudu, C.K.; Nandy, S.; Sunita, K.; Tripathi, V.; Loake, G.J.; Proćków, J. Ethnodermatological use of medicinal plants
in India: From ayurvedic formulations to clinical perspectives–A review. J. Ethnopharmacol. 2022, 284, 114744. https://doi.org/10.1016/j.jep.2021.114744.
37. Vasco, C.; Rúales, J.; Kamal-Eldin, A. Total phenolic compounds and antioxidant capacities of major fruits from Ecuador. Food Chem. 2008, 111, 816–823.
38. Sakanaka, S.; Tachibana, Y.; Okada, Y. Preparation and antioxidant properties of extracts of Japanese persimmon leaf tea (ka-kinoha-cha). Food Chem. 2005, 89, 569–575.
39. Khatoon, S.; Singh, N.; Srivastava, N.; Rawat, A.K.S.; Mehrotra, S. Chemical evaluation of seven Terminalia species and quanti-fication of important polyphenols by TLC. J. Planar Chromatogr. 2008, 21, 167–171.
40. Mena, P.; García-Viguera, C.; Navarro-Rico, J.; Moreno, D.A.; Bartual, J.; Saura, D.; Martí, N. Phytochemical characterization for industrial use of pomegranate (Punica granatum L.) cultivars grown in Spain. J. Sci. Food Agric. 2011, 91, 1893–1906.
41. Carrillo, W.; Gómez-Ruiz, J.A.; Miralles, B.; Ramos, M.; Barrio, D.; Recio, I. Identification of antioxidant peptides of hen egg-white lysozyme and evaluation of inhibition of lipid peroxidation and cytotoxicity in the Zebrafish model. Eur. Food Res. Technol. 2016, 242, 1777–1785.
42. Kota, K.; Sharma, S.; Tahashildar, J. A scientific validation of In vitro anti-inflammatory activity of Punica granatum L. by human red blood cell membrane stabilization. Int. J. Res. Med. Sci. 2018, 6, 2430–2433.
43. Samaniego, I.; Brito, B.; Viera, W.; Cabrera, A.; Llerena, W.; Kannangara, T.; Vilcacundo, R.; Angós, I.; Carrillo, W. Influence of the maturity stage on the phytochemical composition and the antioxidant activity of four Andean blackberry cultivars (Rubus glaucus Benth) from Ecuador. Plants 2020, 9, 1027. https://doi.org/10.3390/plants9081027.
44. Boeri, P.; Piñuel, L.; Dalzotto, D.; Monasterio, R.; Fontana, A.; Sharry, S.; Carrillo, W. Argentine Patagonia barberry chemical composition and evaluation of its antioxidant capacity. J. Food Biochem. 2020, 44, e13254. https://doi.org/10.1111/jfbc.13254.
45. Soto, E.; Bustos, L.; Simirgiotis, M.J.; Parra, C. Potential of Baccharis alnifolia Meyen & Walpan (Chilka) from northern Chile used as a medicinal infusion. Ciência Rural 2019, 49. e20190428, https://doi.org/10.1590/0103-8478cr20190428.
46. Brighente, I.M.C.; Dias, M.; Verdi, L.G.; Pizzolatti, M.G. Antioxidant activity and total phenolic content of some Brazilian spe-cies. Pharm. Biol. 2007, 45, 156–161.
47. Cavalaro, R.I.; Fabricio, L.F.D.F.; Vieira, T.M.F.D.S. Ultrasound-Assisted Extraction of Antioxidants from Baccharis dracunculifo-lia and Green Propolis. Processes 2020, 8, 1530. https://doi.org/10.3390/pr8121530.
48. Gómez, J.; Simirgiotis, M.J.; Lima, B.; Paredes, J.D.; Gabutti, C.M.V.; Gamarra-Luques, C.; Bórquez, J.; Luna, L.; Wendel, G.H.; Maria, A.O.; et al. Antioxidant, gastroprotective, cytotoxic activities and UHPLC PDA-Q orbitrap mass spectrometry identifi-cation of metabolites in Baccharis grisebachii decoction. Molecules 2019, 24, 1085. https://doi.org/10.3390/molecules24061085.
49. Sabir, S.M.; Athayde, M.L.; Boligon, A.A.; Rocha, J.B.T. Antioxidant activities and phenolic profile of Baccharis trimera, a com-monly used medicinal plant from Brazil. S. Afr. J. Bot. 2017, 113, 318–323.
50. Agudelo, I.J.; Isolabella, S.A.; Filip, R.; Wagner, M.L.; Ricco, R.A. Baccharis spicata (Lam) Baill: Polyphenol screening, determi-nation of their antioxidant activity and their main polyphenolic metabolites. J. Pharmacogn. Phytochem. 2016, 5, 278–285.
51. Jerman, T.; Trebše, P.; Mozetič Vodopivec, B. Ultrasound-assisted solid liquid extraction (USLE) of olive fruit (Olea europaea) phenolic compounds. Food Chem. 2010, 123, 175–182.
52. Yue, T.; Shao, D.; Yuan, Y.; Wang, Z.; Qiang, C. Ultrasound-assisted extraction. HPLC analysis. and antioxidant activity of polyphenols from unripe apple. J. Sep. Sci. 2012, 35, 2138–2145.
53. De Oliveira, C.B.; Comunello, L.N.; Lunardelli, A.; Amaral, R.H.; Pires, M.G.; Da Silva, G.L.; Gosmann, G. Phenolic enriched extract of Baccharis trimera presents anti-inflammatory and antioxidant activities. Molecules 2012, 17, 1113–1123.
54. Nogueira, N.P.A.; Reis, P.A.; Laranja, G.A.T.; Pinto, A.C.; Aiub, C.A.F.; Felzenszwalb, I.; Coelho, M.G.P. In vitro and in vivo toxicological evaluation of extract and fractions from Baccharis trimera with anti-inflammatory activity. J. Ethnopharmacol. 2011, 138, 513–522.
55. Zalewski, C.A.; Passero, L.F.D.; Melo, A.S.; Corbett, C.E.P.; Laurenti, M.D.; Toyama, M.H.; Toyama, D.O.; Romoff, P.; Fávero, O.A.; Lago, J.H.G. Evaluation of anti-inflammatory activity of derivatives from aerial parts of Baccharis uncinella. Pharm. Biol. 2011, 49, 602–607.
56. De las Heras, B.; Slowing, K.; Benedí, J.; Carretero, E.; Ortega, T.; Toledo, C.; Bermejo, P.; Iglesias, I.; Abad, M.J.; Gómez-Serranillos, P.; et al. Anti-inflammatory and antioxidant activity of plants used in traditional medicine in Ecuador. J. Ethnopharmacol. 1998, 61, 161–166.
57. Tapia, A.; Rodriguez, J.; Theoduloz, C.; Lopez, S.; Feresin, G.E.; Schmeda-Hirschmann, G. Free radical scavengers and antioxidants from Baccharis grisebachii. J. Ethnopharmacol. 2004, 95, 155–161.
58. Guimarães, N.S.; Mello, J.C.; Paiva, J.S.; Bueno, P.C.; Berretta, A.A.; Torquato, R.J.; Nantes-Cardoso, I.; Rodrigues, T. Baccharis dracunculifolia, the main source of green propolis, exhibits potent antioxidant activity and prevents oxidative mitochondrial damage. Food Chem. Toxicol. 2012, 50, 1091–1097.
59. Parejo, I.; Viladomat, F.; Bastida, J.; Rosas-Romero, A.; Saavedra, G.; Murcia, M.A.; Jiménez, A.M.; Codina, C. Investigation of Bolivian plant extracts for their radical scavenging activity and antioxidant activity. Life Sci. 2003, 73, 1667–1681.
60. Yang, S.; Zhou, H.; Wang, G.; Zhong, X.H.; Shen, Q.L.; Zhang, X.J.; Li, R.-Y.; Chen, L.-H.; Zhang, Y.-H.; Wan, Z. Quercetin is protective against short-term dietary advanced glycation end products intake induced cognitive dysfunction in aged ICR mice. J. Food Biochem. 2020, 44, e13164. https://doi.org/10.1111/jfbc.13164.
Plants 2022, 11, 1555 20 of 20
61. Nakagawa, T.; Itoh, M.; Ohta, K.; Hayashi, Y.; Hayakawa, M.; Yamada, Y.; Akanabe, H.; Chikaishi, T.; Nakagawa, K.; Itoh, Y.; et al. Improvement of memory recall by quercetin in rodent contextual fear conditioning and human early-stage Alzheimer’s disease patients. Neuro Report. 2016, 27, 671–676.
62. Oyedemi, S.O.; Nwaogu, G.; Chukwuma, C.I.; Adeyemi, O.T.; Matsabisa, M.G.; Swain, S.S.; Aiyegoro, O.A. Quercetin modulates hyperglycemia by improving the pancreatic antioxidant status and enzymes activities linked with glucose metabolism in type 2 diabetes model of rats: In silico studies of molecular interaction of quercetin with hexokinase and catalase. J. Food Biochem. 2020, 44, e13127. https://doi.org/10.1111/jfbc.13127.
63. Wollenweber, E.; Valant-Vetschera, K.M.; Fernandes, G.W. Chemodiversity of exudate flavonoids in Baccharis concinna and three further South-American Baccharis species. Nat. Prod. Commun. 2006, 1, 627–632.
64. Kirkham, M.B. Cadmium in plants on polluted soils: Effects of soil factors, hyperaccumulation, and amendments. Geoderma 2006, 137, 19–32.
65. Simões-Pires, C.A.; Queiroz, E.F.; Henriques, A.T.; Hostettmann, K. Isolation and on-line identification of antioxidant compounds from three Baccharis species by HPLC-UV-MS/MS with post column derivatisation. Phytochem. Anal. Int. J. Plant Chem. Biochem. Technol. 2005, 16, 307–314.
66. Palit, S.; Sharma, A.; Talukder, G. Effects of cobalt on plants. Bot. Rev. 1994, 60, 149–181. 67. Chen, C.; Huang, D.; Liu, J. Functions and toxicity of nickel in plants: Recent advances and future prospects. Clean Soil Air Water
2009, 37, 304–313. 68. Galán, E.; Romero, A. Contaminación de suelos por metales pesados. Macla 2008, 10, 48–60. 69. Rojano, B.; Gaviria, C.; Sáez, J. Determinación de la actividad antioxidante en un modelo de peroxidación lipídica de mantequilla
inhibida por el isoespintanol. Vitae. Revista De La Facultad De Química Farmacéutica 2008, 15, 212–218. 70. Malpur, P.P.; Shah, A.S.; Juvekar, A.R. Antioxidant and anti-inflammatory activity of extract obtained from Aspergillus candidus
MTCC 2202 broth filtrate. Indian J. Exp. Biol. 2006, 44, 468–473. 71. Wong, J.W.; Hashimoto, K.; Shibamoto, T. Antioxidant activities of rosemary and sage extracts and vitamin E in a model meat
system. J. Agric. Food Chem. 1995, 43, 2707–2712. 72. Simon, R.A. Adverse reactions to food and drug additives. Immunol. Allergy Clin. N. Am. 1996, 16, 137–176. 73. Esmaeili, A.; Mohabi, N. Experimental and theoretical determination of the antioxidant properties of aromatic monoterpenes
of thymol and 2.5.6-trifluorothymol. Int. J. Food Prop. 2014, 17, 1162–1168. 74. Kanner, J.; Frankel, E.; Granit, R.; German, B.; Kinsella, J.E. Natural Antioxidants in Grapes and Winess. J. Agric. Food Chem.
1994, 42, 64–69. 75. Kris-Etherton, P.M.; Hecker, K.D.; Bonanome, A.; Coval, S.M.; Binkoski, A.E.; Hilpert, K.F.; Griel Med, A.E.; Etherton, T.D.
Bioactive compounds in foods: Their role in the prevention of cardiovascular disease and cancer. Am. J. Med. 2002, 113, 71–88.


