Embed Size (px)
Citation preview

Seediscussions,stats,andauthorprofilesforthispublicationat:https://www.researchgate.net/publication/243338430
Polymerelectrolytesbasedonethyleneoxide–epichlorohydrincopolymers
ARTICLEinSOLIDSTATEIONICS·MAY2000
ImpactFactor:2.56·DOI:10.1016/S0167-2738(00)00550-6
CITATIONS
41
READS
59
4AUTHORS,INCLUDING:
MárciaA.S.Spinacé
UniversidadeFederaldoABC(UFABC)
31PUBLICATIONS471CITATIONS
SEEPROFILE
E.M.Girotto
UniversidadeEstadualdeMaringá
58PUBLICATIONS791CITATIONS
SEEPROFILE
MarcoAurelioDePaoli
UniversityofCampinas
278PUBLICATIONS6,687CITATIONS
SEEPROFILE
Availablefrom:MárciaA.S.Spinacé
Retrievedon:10February2016

Solid State Ionics 130 (2000) 281–291www.elsevier.com/ locate / ssi
Polymer electrolytes based on ethylene oxide–epichlorohydrincopolymers
*´W.A. Gazotti, M.A.S. Spinace, E.M. Girotto, M.-A. De Paoli´ ´ ´Laboratorio de Polımeros Condutores e Reciclagem, Instituto de Quımica, Universidade Estadual de Campinas, C. Postal 6154,
13081-970, Campinas-SP, Brazil
Received 30 August 1999; received in revised form 25 October 1999; accepted 1 February 2000
Abstract
In this work we studied the ionic conductivity for three copolymers of the title co-monomers as a function of LiClO4
content, temperature and ambient relative humidity. We also investigated the interactions between the salt and theco-monomer blocks in the copolymers and its effect on the morphology and thermal properties of the copolymer /salt
1complexes. Our data indicate that the Li ion predominantly interacts with the ethylene oxide repeating units of thecopolymers. The copolymer with the highest ionic conductivity was obtained with an ethylene oxide /epichlorohydrin ratio of
25 2184 /16 containing 5.5% (w/w) of LiClO . It showed a conductivity of 4.1 3 10 S cm (308C, humidity , 1 ppm) and424 212.6 3 10 S cm at 84% relative humidity (248C). The potential stability window of the copolymer /salt complex is 4.0 V,
as measured by cyclic voltammetry. For comparison, we also prepared a blend of the corresponding homopolymerscontaining LiClO ; it showed higher crystallinity and lower ionic conductivity. 2000 Elsevier Science B.V. All rights4
reserved.
Keywords: Polymeric electrolyte; Ionic conductivity; Ethylene oxide copolymers; Elastomers
PACS: 61.41; 68.45; 61.20Q
1. Introduction proposal of Armand and coworkers that these sys-tems could be used in secondary batteries [2]. Since
Since the 1970s great attention has been devoted that time, the research on solid polymeric elec-to the study of solid polymeric electrolytes, prepared trolytes has grown intensely and reviews with his-by dissolving inorganic salts in a polymeric matrix. toric surveys have been published [3,4]. The continu-This interest occurred mainly due to the pioneering ous and crescent interest on polymeric electrolytes ismeasurements of ionic conductivity in polymer–salt related to their use in different solid state electro-mixtures done by Wright and coworkers [1] and the chemical devices, such as: batteries [5–7], capacitors
[7], electrochromic displays [7,8], photoelectroch-emical cells [9], light emitting electrochemical cells*Corresponding author. Tel.: 155-19-788-3022; fax: 155-19-[10] and artificial muscles [11].788-3023.
E-mail address: [email protected] (M.-A. De Paoli) After Wright’s work [1], poly(ethylene oxide),
0167-2738/00/$ – see front matter 2000 Elsevier Science B.V. All rights reserved.PI I : S0167-2738( 00 )00550-6

282 W.A. Gazotti et al. / Solid State Ionics 130 (2000) 281 –291
PEO, mixed to alkali salts became the classical those obtained with a blend of the correspondingpolymeric electrolyte. In this material the ionic homopolymers.transport occurs in the amorphous phase [12] andionic conductivity is achieved only above its meltingtemperature (ca. 708C), precluding its use at room 2. Experimentaltemperature. Several strategies were used to decreasethe crystallinity of PEO and improve the conduc- Samples of the polymers supplied by Daiso Co.tivity of its complexes at room temperature, such as: Ltd. (Japan) were used as received. The ethylenethe addition of plasticizers, the use of PEO based oxide /epichlorohydrin ratio in the copolymers wereblends [13–15] or preparation of copolymers [16]. 84 /16, 60/40 and 50/50, and they were designatedAn alternative to plasticizers is the use of mixtures of P(EO–EPI)84–16, P(EO–EPI)60–40 and P(EO–PEO with acrylic polymers [13]. The blends–salt EPI)50–50, respectively. According to the supplier
6 21complexes show higher ionic conductivity in com- (Daiso Co.), M is 1.3 3 10 g mol for allw
parison to pure PEO–salt complexes. This effect was materials. Fig. 1 shows the basic structure of theassigned to lowering of PEO crystallinity in the copolymers.blends, to the presence of a highly flexible amor- A blend of poly(ethylene oxide) (PEO, Daiso Co.
6 21phous phase and to the cooperative effect of polar Ltd., M 5 1.3 3 10 g mol ) and polyepich-w5 21groups on ionic transport. The elastomeric copoly- lorohydrin (PEPI, Aldrich, M 5 9 3 10 g mol )w
mers of ethylene oxide and epichlorohydrin present (molar ratio: EO units 5 84%, EPI units 5 16%) waslow crystallinity. Kohjiya and coworkers [16] studied prepared by dissolving the homopolymers in drysome complexes of these copolymers with LiClO , tetrahydrofuran (THF). The blend was named BL4
26 21reporting a conductivity of 10 S cm at 308C. In 84–16.25 21another study a conductivity of 10 S cm was Solutions containing the copolymers or the blend
measured after mixing LiBF and poly(ethylene and anhydrous LiClO in different concentrations4 4
glycol) to this elastomer [17]. Recently, Ju and (0–25% (w/w)) were prepared by stirring in drycoworkers [18] reported the conductivity of a blend THF. Transparent films with thickness of ca. 100 mmof nitrilic rubber with the copolymer of ethylene were obtained by casting these solutions on TeflonE
oxide and epichlorohydrin swollen by a solution of plates at ambient pressure and under THF saturatedLiClO in propylene carbonate. For the blend con- atmosphere. After this, the films were dried under4
23 21taining 40% (w/w) of solution, s 5 10 S cm at dynamic vacuum for 144 h.room temperature. Conductivity measurements as a function of
In previous works we compared the thermal LiClO concentration and temperature were carried4
behavior and conductivity of LiClO complexes of out in a MBraun dry box (humidity , 1 ppm, under4
poly(epichlorohydrin), poly(ethylene oxide–co-epi- argon atmosphere). The films were fixed betweenchlorohydrin) (monomer ratio 5 1) and the ter- two mirror-polished stainless steel electrodes and thepolymer composed by ethylene oxide, epi- conductivity values were obtained by electrochemi-chlorohydrin and allyl-glycidyl-ether [19,20]. Resultsindicated that the copolymers present good electro-chemical stability and ionic conductivity in the range
24 25 21of 10 –10 S cm . In this work, we show asystematic study of the ionic conductivity and ther-mal properties of three copolymers of ethylene oxideand epichlorohydrin with different monomer ratios.These copolymers are produced by Daiso Co. Ltd.(Japan) under the trade name EpichlomerE. The Fig. 1. Basic structure for the copolymers; n and m are 0.84 andeffect of ambient humidity on the ionic conductivity 0.16; 0.60 and 0.40; 0.50 and 0.50, for P(EO–EPI)84–16, 60–40is also reported. We also compare these results with and 50–50, respectively.

W.A. Gazotti et al. / Solid State Ionics 130 (2000) 281 –291 283
cal impedance spectroscopy, using an Eco Chemie- DSC curves shown in this work correspond to step 3Autolab PGSTAT 10 with FRA module coupled to a and all of them were normalized with respect to the
6computer. Frequency range was 10 –10 Hz with mass. Glass transition temperatures and meltingamplitude of 5 mV. Conductivity measurements at temperatures were assumed as the half height of thedifferent humidity conditions were done in the same step and the maximum of the peak, respectively.way, but maintaining the samples under controlled Melting enthalpies were obtained by integrating thehumidity conditions (%RH 5 39, 53, 75, 84 and melting peak areas.97%) at 258C in a plastic glove-bag. The moisture inthe glove-bag was controlled by using saturatedaqueous solutions of different inorganic salts. Mea- 3. Resultssurements were done after conditioning the samplesfor 24 h. Fig. 2a shows the variation of the ionic con-
Electrochemical stability was evaluated by cyclic ductivity (s) for different copolymer /LiClO com-421voltammetry (0–7 V vs. Li, 5 mV s , 708C) plexes at 308C and dry atmosphere. The relative
sandwiching the films between a mirror polished LiClO content is represented by n (the molar4 TOT
stainless steel electrode and a Li electrode. Vol- ratio between oxygen atoms from both repeating1tammetric analysis was done placing the electro- units in the copolymers and Li from the salt). Fig.1chemical cell in the dry box. 2a shows that increasing the Li concentration in the
DSC curves for the copolymers /LiClO complex- copolymer complex increases the ionic conductivity4
es were obtained in a T.A. Instruments Thermal to a maximum with a subsequent decrease. ThisAnalyzer model 2100, coupled to a T.A. 2100 Data decrease in conductivity is assigned to reduction ofAnalysis System. Sample weights were maintained chain mobility and increase in viscosity of the ionicin the range of 8–10 mg and all experiments were environment caused by crosslinking sites produced
21 1performed under nitrogen flow of 100 ml min . The by the excess Li [19]. Reduction of chain mobilitymeasuring program was: 1- fast heating to 1008C is evidenced in the DSC measurements discussed
1with an isotherm for 5 min, 2- cooling to 2 1008C at below. The P(EO–EPI)84–16/Li complexes pres-21 21108C min and 3- heating to 1008C at 108C min . ent ionic conductivity about an order of magnitude
Fig. 2. Variation of the ionic conductivity of the copolymer /LiClO complexes as a function of (a) n (n 5h[O] 1[O] j / [Li]) and4 TOT TOT EO EPI
(b) n (n 5([O] / [Li]). (s) P(EO–EPI)84–16, (d) P(EO–EPI)60–40 and (h) P(EO–EPI)50–50.EO EO EO

284 W.A. Gazotti et al. / Solid State Ionics 130 (2000) 281 –291
higher than those complexes with the copolymerswith lower content of ethylene oxide units.
The ionic conductivity is assumed to occur by1Lewis acid–base interaction between the Li ions
and the oxygen atoms in the ether bonds. Bothrepeating units of the copolymer possess thesebonds, however, it seems that the epichlorohydrin
1units have weaker interaction with Li than theethylene oxide units. To test this hypothesis wecalculated the variation of conductivity as a functionof n (n is also the molar ratio between oxygenEO EO
and lithium, but was calculated considering only theoxygen atoms from the ethylene oxide repeatingunits), Fig. 2b. The curves for the different co-
Fig. 3. Variation of the ionic conductivity for P(EO–EPI)84–16/polymers show a coincident maximum, differently to LiClO complex (n530) at 258C, as a function of the relative4
what occurs when we use n . This confirms that humidity.TOT
the ethylene oxide units predominantly interact with1Li . In a previous work we also showed that
poly(epichlorohydrin) homopolymer containing the variation of the ionic conductivity of the P(EO–28 21LiClO presents ionic conductivity of 10 S cm EPI)84–16 (n 5 30) at 258C, as a function of4 EO
and this value has no dependence on the salt relative humidity. Considering the conductivity mea-concentration [19]. This can be explained taking into surement made inside the dry box as %RH 5 0 andaccount the electronic density presented by the the data in Fig. 3, the conductivity behavior can beoxygen atoms: those from epichlorohydrin units have fitted to the dotted curve representing an exponentialchlorine atoms in their neighborhood, thus are less equation which describes the ionic conductivityelectronegative than those from ethylene oxide units. increase with humidity. This is an interesting resultCation displacement in the cathode direction is because it is possible to predict the conductivity offollowed by anion displacement in the anode direc- the electrolyte used in an electrochemical cell work-tion. The anions may interact with the Lewis acidic ing at known relative humidity conditions. Measure-sites of the polymer, however, we have no ex- ments showed that, under very high relative humidi-perimental evidences for its transport mechanism. ty, the ionic conductivity does not follow the same
25 21The highest conductivity (4.1 3 10 S cm at behavior and increases abruptly, arriving to ca. 1 323 21308C) was obtained for P(EO–EPI)84–16 with n | 10 S cm for 97% of humidity, close to conduct-EO
30. It is important to emphasize that all these ance of LiClO aqueous solutions. In this case, the4
measurements were carried out under a strictly ionic transport occurs almost exclusively in the watercontrolled low-humidity ( , 1 ppm). All samples adsorbed into the polymer matrix.were dried for 144 h under dynamic vacuum, to Another important characteristic of an electrolyteensure complete THF evaporation because residual to use in technological applications is its electro-solvent could act as plasticizer and affect the con- chemical stability window. This is tested for theductivity [21]. system P(EO–EPI)84–16 (n 5 30) by measuringEO
Ambient humidity adsorbed in the polymer / the cyclic voltammetry, Fig. 4. This curve indicatesLiClO complex affects its ionic conductivity. As that this polymeric electrolyte has an electrochemical4
1discussed above, to measure the real ionic con- stability window between 1.0 and 5.0 V vs. Li /Li.ductivity of a polymeric electrolyte it is necessary to According to Scrosati [22], polymer–LiClO com-4
work in anhydrous conditions, however, knowledge plexes are cathodically limited by the reversibleabout the conductivity behavior under atmospheric lithium deposition–dissolution process and anodical-humidity is interesting because most of the practical ly limited by the irreversible oxidation of the per-devices work under these conditions. Fig. 3 presents chlorate anion to radicalar species. According to

W.A. Gazotti et al. / Solid State Ionics 130 (2000) 281 –291 285
Fig. 4. Cyclic voltammetry of the cell: stainless steel uu P(EO–21EPI)84–16/LiClO uu Li at 5 mV s and 708C.4 Fig. 5. Arrhenius plot for the copolymers / salt complexes with
n |30: (s) P(EO–EPI)84–16, (d) P(EO–EPI)60–40 and (h)EO
P(EO–EPI)50–50. Dotted lines correspond to the fitting of theAbraham [23], for lithium batteries the ideal po-experimental data by the VTF equation.tential window spans between 0.0 and 4.0 V, how-
ever, the potential window attained is sufficient topropose the use of this copolymer salt complex as which the free volume disappear if the free volumesolid electrolyte in a variety of other applications. theory is adopted. Fig. 5 shows the Arrhenius plots
The transport of ions occurs in the amorphous for the three copolymer–LiClO complexes (n |4 EO
phase of polymer /salt complexes producing their 30) and the dotted curves represent the fitting by theionic conductivity, this has been correlated to the VTF equation. We observe a good agreement be-segmental motion of the macromolecular strand tween the fitted curves and experimental data, in-above the glass transition temperature. There are dicating that the ionic conductivity in these complex-accurate theoretical models to evaluate and describe es is strongly coupled to the flow behavior of thethe conductivity behavior of polymeric electrolytes matrix.as a function of temperature [24]. In this work we Table 1 shows the VTF parameters obtained fromuse the empirical Vogel–Tamman–Fulcher equation the fitting. In the VTF equation the ionic conductivity(VTF, Eq. (1)) to describe the dependence of the is directly proportional to s and inversely propor-o
ionic conductivity with the temperature [2] tional to B and T . Fitting parameters in Table 1o
agree with these affirmations for s and B values.o21 / 2
s 5 s T exp[B /R(T 2 T )] (1) However, the T values do not follow the expectedo o o
trend: while P(EO–EPI)84–16 presents T close too
This equation has been used to explain the transport its T , P(EO–EPI)60–40 has T |0.9 T and P(EO–g o g
process into condensed media and, according to EPI)50–50 T |0.8 T (T for the polymer / salto g g
MacCallum and Vincent [25], its theoretical signifi- complexes were obtained from DSC curves dis-cance is expressed in terms of the free volume and cussed below). There is not a consensus in thethe entropy theory. In the VTF equation, s is a literature about the correlation between T and To o g
constant related to the number of carrier ions and B and it is possible to find works where this relationis proportional to the activation energy of the goes from T 50.8 T [26] to T 5T [27]. Resultso g o g
conduction process. Depending on the theory used to obtained in the present study show that the presenceexplain the VTF equation, T can be defined as the of epichlorohydrin units in the polymer matrixo
temperature at which the configurational entropy of affects T and suggest that this parameter not onlyo
the polymer becomes zero if the entropy theory is depends on the flow behavior of the material (relatedadopted or as the ideal glass transition temperature at to the T ) but also depend on other effects, such asg

286 W.A. Gazotti et al. / Solid State Ionics 130 (2000) 281 –291
Table 1Parameters obtained by fitting the experimental data to the VTF equation
21 21Electrolyte s /S cm B /KJ mol T / 8C ro o
P(EO–EPI)84–16, n |30 3.3 3.4 243 0.999EO
P(EO–EPI)60–40, n |28 2.8 7.5 268 0.994EO
P(EO–EPI)50–50, n |30 2.2 11.6 295 0.982EO
1the different interactions occurring between Li and Table 2Thermal transitions obtained from the DSC curves of the purethe oxygen atoms of the co-monomer units. Also,copolymersthere is no apparent correlation between T and theo
Electrolyte T / 8C T / 8Cionic conductivity because the polymer–salt with g m
highest ionic conductivity (P(EO–EPI)84–16 with P(EO–EPI)84–16 250 22an 530) present the highest T values. P(EO–EPI)60–40 244EO oaP(EO–EPI)50–50 243Temperature-dependence of the ionic conductivity
aof solid polymer electrolytes shows that this property No crystalline phase is observed.is strongly affected by their thermal behavior. Thus,the knowledge of their thermal transitions, like glass tures for the pure copolymers and for the copolymer /transition temperature, T , and melting temperature,g LiClO complexes, respectively. Samples with the4T , is particularly informative. Fig. 6 shows the DSCm highest conductivity are indicated by dotted lines incurves for the pure copolymers and the copolymers / Fig. 6. Initially we observe that the copolymer withLiClO complexes with different salt concentrations.4 the highest ethylene oxide content show the lowestTables 2 and 3 list the thermal transition tempera- T . Pure poly(ethylene oxide) and poly(epich-g
Fig. 6. DSC curves of copolymers /LiClO complexes with different salt contents: (a) P(EO–EPI)84–16, (b) P(EO–EPI)60–40 and (c)4
P(EO–EPI)50–50. The dotted curves correspond to the samples with the highest ionic conductivity.

W.A. Gazotti et al. / Solid State Ionics 130 (2000) 281 –291 287
Table 3Thermal transitions calculated from the DSC curves of the copolymers /LiClO complexes4
%LiClO P(EO–EPI)84–16 P(EO–EPI)60–40 P(EO–EPI)50–504
(w/w)T / 8C T / 8C T / 8C T / 8C T / 8C T / 8Cg m g m g m
b b0 250 22 245 243a a b b1 244 242
b b2 251 22 243 241a a b b3.5 239 239
b b b5 247 238 237b a a a a7.5 242b b b10 236 230 231b b b15 234 222 225b b20 230 223 230 71b25 234 244 64 232 79
a Measurements were not made at this LiClO concentration.4b No crystalline phase is observed.
lorohydrin) present T at 2508C and 2238C, respec-g
tively [28]. Increasing the ethylene oxide content inthe copolymer shifts its T to the value reported forg
pure PEO and T 5TgP(EO–EPI)84–16 gPEO.
The DSC curves in Fig. 6 and the data in Table 3show that, with the addition of the salt, a meltingpeak is first observed for the copolymer whichcontains the lower content of ethylene oxide units:P(EO–EPI)50–50 containing 20% (w/w) of LiClO4
presents T and P(EO–EPI)60–40 presents T onlym m
when the LiClO concentration is 25% (w/w). For4
these materials T is close to that observed for purem
PEO, suggesting that the crystalline phase is rich inethylene oxide units. This behavior is better ex-plained comparing the variation of T of the amor-g
phous phase of the complexes as a function of theirLiClO content, Fig. 7. For all copolymers T4 g
increases linearly with LiClO concentration, up to4
20% for P(EPI–EO)84–16 (n 56.9) and up toEO
15% for P(EPI–EO)60–40 (n 55.7) and P(EPI–EO
EO)50–50 (n 54.4). This behavior can be inter-EO
preted in terms of the formation of strong ion–dipoleinteractions similar to Lewis acid–base interaction
1between Li cations (Lewis acid site) and theoxygen atoms (Lewis base site). This was alsoreported for pure PEO with different salts [26],however, we observe that complexes containingmore than 15% of LiClO do not present linearity in4
this behavior. Taking into account that the Lewis Fig. 7. Variation of the T of the copolymers / salt complexes as aginteractions occurs predominantly with oxygen atoms function of LiClO concentration in the mixture: (a) P(EO–4
from the ethylene oxide units, the availability of EPI)84–16, (b) P(EO–EPI)60–40 and (c) P(EO–EPI)50–50.

288 W.A. Gazotti et al. / Solid State Ionics 130 (2000) 281 –291
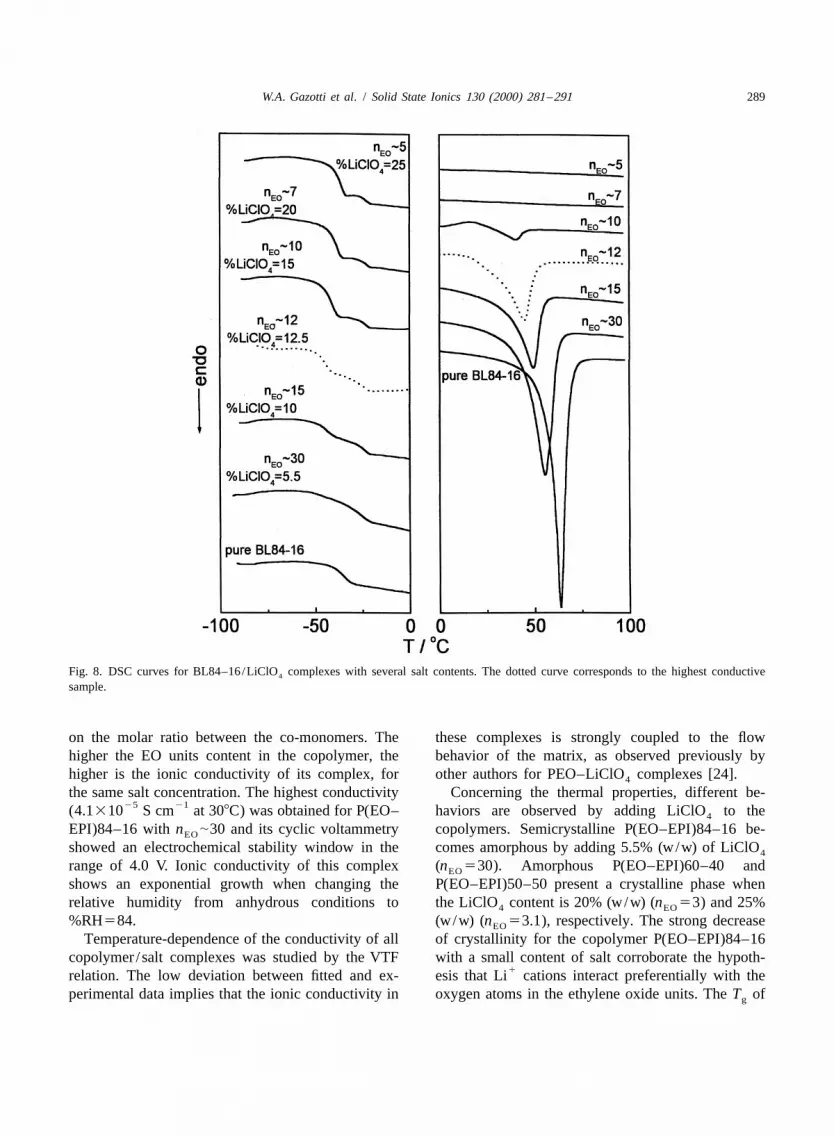
1oxygen atoms to interact with Li decreases from thalpies (DH ). For pure P(EO–EPI)84–16 (Fig. 6a)m21P(EO–EPI)84–16 to P(EO–EPI)60–40 and P(EO– and BL84–16 (Fig. 8) DH are 24.4 J g and 91.8 Jm
21EPI)50–50. g , respectively.Formation of a crystalline phase at high salt Fig. 9 shows the variation of T and T form g
concentrations is assigned to the formation of a BL84–16 with different concentrations of LiClO .4
polymer /salt complex with a defined stoichiometry T decreases linearly with the concentration ofm
and T is first observed for P(EO–EPI)50–50 be- LiClO and T remains constant up 7.5%. Thesem 4 g
cause this situation occurs at lower salt concentration results indicate that at low LiClO concentration the4
(20% of LiClO ). For P(EO–EPI)60–40, T is salt is exclusively dissolved in the crystalline phase.4 m
observed with 25% (w/w) of LiClO , when the same At higher LiClO contents two T ’s are observed:4 4 g
stoichiometry is attained. It is noteworthy that, for 2458C and 2228C. The first is an intermediateboth copolymers, the crystalline phase was observed value between the T ’s of pure PEO and PEPIg
when n |3. (T -PEO52508C, T -PEPI52238C), but is closerEO g g
The use of ethylene oxide based copolymers as to the T of pure PEO than the values observed atg
polymeric electrolyte was also confirmed by compar- lower LiClO concentrations; the second T is very4 g
ing with their parent blends. For this, solid elec- close to the T of pure PEPI. Another observation isg
trolytes were prepared by using a polymer matrix that the T closer to the T of PEPI does not changeg g
composed by a blend between poly(ethylene oxide) by adding LiClO , while the other transition tem-4
and polyepichlorohydrin with the same molar ratio of perature increases with the salt concentration, in-the repeating units of the copolymer P(EO–EPI)84– dicating that the salt interacts more strongly with the16. For all LiClO concentrations the blend com- PEO phase. The occurrence of two T ’s suggest that4 g
plexes present lower ionic conductivity than P(EO– a high salt concentration induces phase segregation.EPI)84–16/Li complexes containing the same salt For BL84–16 complexes, it was expected that smax
26content, Table 4. For the blend, s (s 51.6310 would be achieved when the blend is fully amor-max21S cm ) was achieved with n 512.1 (%LiClO 5 phous, but the highest conductive sampleEO 4
12.5, w/w). The lower conductivity values of the (%LiClO 512.5) still presents a crystalline domain.4
blend complexes in comparison to the copolymer This behavior is explained taking into account the Tg
complexes are caused by the higher crystallinity values obtained for the blend complexes. For thedegree of the blends, as confirmed by the DSC pure blend, the crystalline phase observed is assignedcurves in Fig. 8. They show that BL84–16 presents a to the PEO component and T is 2378C, which is ang
higher crystallinity degree than P(EO–EPI)84–16, as intermediate value between the T of the pureg
evidenced by the melting peaks and melting en- homopolymers. This indicates that BL84–16 presenta crystalline phase composed by PEO and an amor-phous phase composed by a miscible mixture be-
Table 4 tween PEO and PEPI. This explains why the highestIonic conductivity (308C) for P(EO–EPI)84–16 and BL84–16
conductive sample for BL84–16 complexes does notcomplexesoccur when the mixture is fully amorphous: although
6 21LiClO content s 310 /S cm4 the increase of the salt content induces a decrease of% (w/w) n P(EO–EPI)84–16 BL84–16EO the crystallinity degree, high salt content also in-
duces segregation of the amorphous phase.2.0 84.7 15 0.0415.0 32.8 24 0.0965.5 29.7 41 –6.0 27.1 28 – 4. Conclusions7.5 21.3 19 0.23
10.0 15.5 9.9 1.1Measurements of the ionic conductivity of co-12.5 12.1 – 1.6
15.0 9.8 8.5 0.94 polymers of ethylene oxide and epichlorohydrin20.0 6.9 7.3 0.90 containing LiClO showed that this parameter is not425.0 5.2 4.6 0.58 only dependent on the concentration of salt but also
W.A. Gazotti et al. / Solid State Ionics 130 (2000) 281 –291 289
Fig. 8. DSC curves for BL84–16/LiClO complexes with several salt contents. The dotted curve corresponds to the highest conductive4
sample.
on the molar ratio between the co-monomers. The these complexes is strongly coupled to the flowhigher the EO units content in the copolymer, the behavior of the matrix, as observed previously byhigher is the ionic conductivity of its complex, for other authors for PEO–LiClO complexes [24].4
the same salt concentration. The highest conductivity Concerning the thermal properties, different be-25 21(4.1310 S cm at 308C) was obtained for P(EO– haviors are observed by adding LiClO to the4
EPI)84–16 with n |30 and its cyclic voltammetry copolymers. Semicrystalline P(EO–EPI)84–16 be-EO
showed an electrochemical stability window in the comes amorphous by adding 5.5% (w/w) of LiClO4
range of 4.0 V. Ionic conductivity of this complex (n 530). Amorphous P(EO–EPI)60–40 andEO
shows an exponential growth when changing the P(EO–EPI)50–50 present a crystalline phase whenrelative humidity from anhydrous conditions to the LiClO content is 20% (w/w) (n 53) and 25%4 EO
%RH584. (w/w) (n 53.1), respectively. The strong decreaseEO
Temperature-dependence of the conductivity of all of crystallinity for the copolymer P(EO–EPI)84–16copolymer /salt complexes was studied by the VTF with a small content of salt corroborate the hypoth-
1relation. The low deviation between fitted and ex- esis that Li cations interact preferentially with theperimental data implies that the ionic conductivity in oxygen atoms in the ethylene oxide units. The T ofg

290 W.A. Gazotti et al. / Solid State Ionics 130 (2000) 281 –291
Acknowledgements
The authors are grateful to Daiso Co. Ltd. (Japan)for donation of the samples and the technical sup-port. WAG and EMG thank FAPESP (SP, Brazil) forpost-doctoral (97 /14132-1) and Ph.D. (97/02156-3)fellowships, respectively. The authors also thankFAPESP for financial support (96 /09983-0).
References
[1] D.E. Fenton, J.M. Parker, P.V. Wright, Polymer 14 (1973)589.
[2] M.B. Armand, J.M. Chabagno, M.J. Duclot, in: P. Vashisha,J.N. Mundy, G.K. Shenoy (Eds.), Fast Ion Transport inSolids, North Holland, New York, 1979, p. 131.
[3] M.B. Armand, Solid State Ionics 69 (1994) 309.[4] P.V. Wright, Electrochim. Acta 43 (1998) 1137.[5] W.H. Meyer, Adv. Mater. 10 (1998) 439.[6] B. Scrosati, R.J. Neat, in: B. Scrosati (Ed.), Applications of
Fig. 9. Variation of T and T for BL84–16/LiClO complexes Electroactive Polymers, Chapman & Hall, London, 1993, p.m g 4
as a function of the salt concentration. 182.[7] C. Arbizzani, M. Mastragostino, B. Scrosati, in: H.S. Nalwa
(Ed.), Organic Conductive Molecules and Polymers, JohnWiley & Sons, Chichester, 1997, p. 595.
[8] W.A. Gazotti, G. Casalbore-Miceli, A. Geri, M.-A. De Paoli,these systems increases linearly by adding LiClO up4 Adv. Mater. 10 (1998) 60.to 15%. This deviation and the formation of a ¨[9] O. Inganas, C. Carlberg, T. Yohannes, Electrochim. Acta 43crystalline phase at high salt concentrations were (1998) 1615.
[10] Q. Pei, G. Yu, C. Zhang, Y. Yange, A.J. Heeger, Science 269assigned to the formation of a polymer /salt complex(1995) 1086.with a defined stoichiometry. This is corroborated by
˜ ´[11] J.M. Sansinena, V. Olazabal, T.F. Otero, C.N. Polo dathe conductivity measurements and confirmed that Fonseca, M.-A. De Paoli, J. Chem. Soc. Chem. Commun.
1Li cations interact more strongly with the oxygen (1997) 2217.atoms from the ethylene oxide units than those from [12] C. Berthier, W. Gorecki, M. Minier, M.B. Armand, J.M.
Chabagno, P. Rigaud, Solid State Ionics 11 (1983) 91.the epichlorohydrin units.[13] W. Wieczorek, K. Such, Z. Florjanczyk, J. Przyluski, Electro-Comparison between thermal behavior and ionic
chim. Acta 37 (1992) 1565.conductivity of P(EO–EPI)84–16 with a parent [14] J. Li, I.M. Khan, Macromolecules 26 (1993) 1185.blend prepared with the homopolymers showed that [15] J.L. Acosta, E. Morales, J. Appl. Polym. Sci. 60 (1996)the copolymer presents better performance for using 1185.
[16] S. Kohjiya, S. Takesako, Y. Ikeda, S. Yamashita, Polym.as polymeric electrolyte. The performance of theBull. 23 (1990) 299.blend is affected by crystallization and phase segre-
[17] N. Munichandraiah, L.G. Scanlon, R.A. March, B. Kumar,gation. A.K. Sircar, J. Appl. Electrochem. 24 (1994) 1066.
The highest ionic conductivity attained in this [18] J. Ju, Q.-C. Gu, H.-S. Xu, C.-Z. Yang, J. Appl. Polym. Sci.25 21work (4.1310 S cm ) is sufficient to suggest 70 (1998) 353.
[19] G. Goulart Silva, N.H.T. Lemes, C.N. Polo da Fonseca,the use of the P(EO–EPI)84–16 complexes asM.-A. De Paoli, Solid State Ionics 93 (1997) 105.electrolyte in commercial applications, such as:
[20] A.P. de Almeida, G. Goulart Silva, M.-A. De Paoli, Polym.capacitors, electrochromic windows and photoelec- Eng. Sci. 39 (1999) 430.trochemical cells. Work is in progress to improve [21] A.E. Wolfenson, R.M. Torresi, T.J. Bonagamba, M.-A. Deconductivity and to test its use in lithium batteries. Paoli, H. Panepucci, J. Phys. Chem. B 101 (1997) 3469.

W.A. Gazotti et al. / Solid State Ionics 130 (2000) 281 –291 291
[22] B. Scrosati, in: J.R. MacCallum, C.A. Vincent (Eds.), Poly- [26] M. Armand, J.Y. Sanchez, M. Gauthies, Y. Choquette, in: J.mer Electrolyte Reviews, Vol. 1, Elsevier Applied Science, Lipkowski, P.N. Ross (Eds.), Electrochemistry of NovelLondon, 1987, p. 315. Materials, VCH Verlag, Weinheim, 1993, p. 65.
[23] K.M. Abraham, in: B. Scrosati (Ed.), Applications of Elec- [27] F.M. Gray, in: J.R. MacCallum, C.A. Vincent (Eds.), Poly-troactive Polymers, Chapman & Hall, London, 1993, p. 75. mer Electrolyte Reviews, Vol. 1, Elsevier Applied Science,
[24] M.A. Ratner, in: J.R. MacCallum, C.A. Vincent (Eds.), London, 1987, p. 139.Polymer Electrolyte Reviews, Vol. 1, Elsevier Applied Sci- [28] M.A. Silva, M.-A. De Paoli, M.I. Felisberti, Polymer 39ence, London, 1987, p. 173. (1998) 2551.
[25] J.R. MacCallum, C.A. Vincent, in: J.R. MacCallum, C.A.Vincent (Eds.), Polymer Electrolyte Reviews,Vol. 1, ElsevierApplied Science, London, 1987, p. 23.


![Hierarchically organized micellization of thermoresponsive rod-coil copolymers based on poly[oligo(ethylene glycol) methacrylate] and poly(ε-caprolactone)](https://img.dokumen.tips/doc/110x75/634c9ce0155e68b74b05d92d/hierarchically-organized-micellization-of-thermoresponsive-rod-coil-copolymers-based-1700092622.jpg)


