Embed Size (px)
Citation preview

This content has been downloaded from IOPscience. Please scroll down to see the full text.
Download details:
IP Address: 130.225.98.208
This content was downloaded on 28/11/2014 at 14:13
Please note that terms and conditions apply.
Policies for agricultural nitrogen management—trends, challenges and prospects for improved
efficiency in Denmark
View the table of contents for this issue, or go to the journal homepage for more
2014 Environ. Res. Lett. 9 115002
(http://iopscience.iop.org/1748-9326/9/11/115002)
Home Search Collections Journals About Contact us My IOPscience
Policies for agricultural nitrogenmanagement—trends, challenges andprospects for improved efficiency inDenmark
Tommy Dalgaard1, Birgitte Hansen2, Berit Hasler3, Ole Hertel3,Nicholas J Hutchings1, Brian H Jacobsen4, Lars Stoumann Jensen5,Brian Kronvang6, Jørgen E Olesen1, Jan K Schjørring5,Ib Sillebak Kristensen1, Morten Graversgaard1, Mette Termansen3 andHenrik Vejre7
1Aarhus University, Department of Agroecology. Blichers Allé 20, DK-8830 Tjele, Denmark2Geological Survey of Denmark & Greenland—GEUS. Lyseng Allé 1, DK-8270 Højbjerg, Denmark3Aarhus University, Department of Environmental Sciences, Frederiksborgvej 399, DK-4000 Roskilde,Denmark4University of Copenhagen, Department of Food and Resource Economics. Rolighedsvej 25, DK-1870Frederiksberg C, Denmark5University of Copenhagen, Department of Plant and Environmental Sciences. Thorvaldsensvej 40,DK-1871 Frederiksberg C, Denmark6Aarhus University, Department of Bioscience.Vejlsøvej 25, DK-8600 Silkeborg, Denmark7University of Copenhagen, Department of Geosciences and Natural Resource Management. Rolighedsvej23, DK-1858 Frederiksberg C, Denmark
E-mail: [email protected]
Received 31 July 2014, revised 8 September 2014Accepted for publication 24 September 2014Published 3 November 2014
AbstractWith more than 60% of the land farmed, with vulnerable freshwater and marine environments,and with one of the most intensive, export-oriented livestock sectors in the world, the nitrogen(N) pollution pressure from Danish agriculture is severe. Consequently, a series of policy actionplans have been implemented since the mid 1980s with significant effects on the surplus,efficiency and environmental loadings of N. This paper reviews the policies and actions takenand their ability to mitigate effects of reactive N (Nr) while maintaining agricultural production.In summary, the average N-surplus has been reduced from approximately 170 kg N ha−1 yr−1 tobelow 100 kg N ha−1 yr−1 during the past 30 yrs, while the overall N-efficiency for theagricultural sector (crop + livestock farming) has increased from around 20–30% to 40–45%, theN-leaching from the field root zone has been halved, and N losses to the aquatic and atmosphericenvironment have been significantly reduced. This has been achieved through a combination ofapproaches and measures (ranging from command and control legislation, over market-basedregulation and governmental expenditure to information and voluntary action), with specificmeasures addressing the whole N cascade, in order to improve the quality of ground- and surfacewaters, and to reduce the deposition to terrestrial natural ecosystems. However, there is still amajor challenge in complying with the EU Water Framework and Habitats Directives, calling for
Environmental Research Letters
Environ. Res. Lett. 9 (2014) 115002 (16pp) doi:10.1088/1748-9326/9/11/115002
Content from this work may be used under the terms of theCreative Commons Attribution 3.0 licence. Any further
distribution of this work must maintain attribution to the author(s) and thetitle of the work, journal citation and DOI.
1748-9326/14/115002+16$33.00 © 2014 IOP Publishing Ltd1
new approaches, measures and technologies to mitigate agricultural N losses and controlN flows.
Keywords: Denmark, nitrogen management, nitrogen policy development, nitrogen surplus,nitrogen use efficiency, reactive nitrogen, regulation
1. Introduction
In contemporary political debates it is often argued that thedevelopment of a green economy, with high levels of envir-onmental protection, and the promotion of low-emissionproduction chains, is an efficient pathway to sustainableeconomic growth (Carter 2007, The Commission on Natureand Agriculture 2013). In line with this it is argued thatenvironmental protection and pollution mitigation are com-patible with the benefits of economic growth, and that thecosts are less than the environmental and resource costs of notprotecting the environment resources (Stern 2007,OECD 2011, Jacobs 2013). This perspective implies thatgreen growth can be promoted through correcting for envir-onmental market failures, not only by market based incen-tives, but also by regulation that requires minimum efficiencystandards. This may be particularly relevant for agricultureand the related bio-based production sectors (Parajuliet al 2014), where OECD (2011) emphasizes that ‘anunderstanding of how growth occurs (production methods) isat least as important as how much growth takes place’.
Sustainable production methods imply a focus on allaspects of the agricultural production (Gu et al 2011). Thispaper deals with nitrogen (N) as a critical nutrient in agri-culture. With N being central both as an input factor affectingagricultural production and as a critical component for pol-lution of the aquatic, marine, terrestrial and atmosphericenvironments (Sutton et al 2011), N policy and regulation iscrucial for a sustainable production.
Denmark is here taken as an example of how concernsfor agricultural production can be balanced against environ-mental protection concerns. It is one of the most intensivelyfarmed regions in the world, where more than 60% of its landsurface is used for agriculture, it has a food export that ismore than twice the national consumption (FAO 2014), andhas one of the most well-developed environmental regulationsystems in the world (van Grinsven et al 2012).
For centuries, Denmark has been a major food supplier tothe neighbouring countries, first with live steers to Germanyand surplus cereals to Norway, and subsequently with butterand bacon to Britain and other overseas countries, followingthe introduction of cooperative dairy and slaughterhouses inthe late 1800s (Bjørn 191748-9326, Odgaard andRømer 2009). Initially the food production surplus was drivenby biologically fixed N inputs from grass-clover and pulses(Kjaergaard 1994, Dalgaard and Kyllingsbæk 2003) and asignificant expansion of the proportion of land ploughed(Dam and Jakobsen 2008). However, the largest expansion inthe food production took place after world war II, and wasdriven by synthetic N-fertilizer inputs, increasing from15 kg N ha−1 agricultural land in 1945 to 143 kg N ha−1 whenit peaked in 1983 (Dalgaard and Kyllingsbæk 2003, Dalgaard
et al 2009), and falling to the 74 kg N ha−1 it is today (Sta-tistics Denmark 2012).
The expansion of agricultural N inputs after world war IIgradually led to a parallel increase in agricultural N surpluses,and significantly increased N leaching to groundwater (Han-sen et al 2011). With more than 60% of the land farmed and a7500 km long coastline with shallow estuaries and coastalwaters, this has resulted in severe environmental problems,and according to the EU Nitrate Directive Denmark hasdesignated the whole territory as nitrate vulnerable. Increas-ing groundwater nitrate concentrations exacerbated the pro-blems since the drinking water supply in Denmark is almost100% groundwater based and, consequently, approximately15% of the land was designated as nitrate vulnerableabstraction areas in 2005 (Hansen and Thorling 2008).
From 1985 and onwards the following series of politicalaction plans to mitigate losses of N and other nutrients wereimplemented (updated from Dalgaard et al 2005, Kronvanget al 2008, Mikkelsen et al 2010):
A. 1985 Action Plan on nitrogen, phosphorus and organicmatter (NPo)
B. 1987 Action Plan for the Aquatic Environment I (AP-I)C. 1991 Action Plan for Sustainable AgricultureD. 1998, 2000 Action Plan for the Aquatic Environment II
(AP-II)E. 2001 Ammonia Action PlanF. 2004 Action Plan for the Aquatic Environment III
(AP-III)G. 2009 Green Growth PlanH. 2011 Draft Plans for River Basin Management Plans
(RBMPs), implementing the EU Water FrameworkDirective (WFD)
As a result of the early attention to marine pollution, the firstaction plans were based on both national and internationalpolitical initiatives. Already in 1972 Denmark, France,Iceland, Norway, Portugal, Spain, and Sweden signed theOslo Convention, prohibiting the direct dumping of harmfulsubstances at sea. After the inclusion of among others theUnited Kingdom, The Netherlands and Germany, this treatywas amended in 1981 and is today included in the OSPAR(1992) ‘Convention for the Protection of the MarineEnvironment of the North–East Atlantic’. The Danish actionplans have subsequently been used to implement the EUNitrates Directive of 1991 (The Council of the EuropeanCommunities 1991), and the WFD in year 2000 (TheEuropean Parliament and the Council of the EuropeanUnion 2000). Moreover, at an international level theambitions of reducing nutrient loads to the environment arealso important parts of treaties in relation to the HELCOMBaltic Marine Environment Protection Commission (TheHelsinki Commission 2008), The Marine Strategy Framework
2
Environ. Res. Lett. 9 (2014) 115002 T Dalgaard et al

Directive (The European Parliament and the Council 2008),and the from 1983 and onwards enforced UN Convention onLong-range Transboundary Air Pollution (CLRTAP 1979,Sutton et al 2014).
These initiatives and actions have led to significantreductions in N surplus from Danish agriculture (figure 1).The development in N surplus aligns well with the imple-mentation of action plans and also with nitrate concentrationin groundwater.
The objective of the present paper is to review and dis-cuss listed developments in N management and environ-mental impacts in Denmark and the different types of policyaction, pinpointing trends, challenges and prospects forimproved future actions. We present a typology of the policyactions and the related effects on N surplus and N efficiency.Moreover, we assess the effects on the specific N loadings tothe environment with special emphasis on loadings to theaquatic and atmospheric environments. Finally, we synthesizeand discuss the relevant N flows cascading from agriculture tothe environment, via stocks of N in soils, water, atmosphereand biomass, and through the various oxidation steps ofreactive nitrogen (Nr); i.e., in the form of nitrate (NO3
−),ammonia (NH4), nitrous oxide (N2O), nitrogen dioxide(NO2), etc, with their impacts on nature and environment,production, consumption, economic costs, benefits and publichealth.
2. Materials and methods
2.1. Nitrogen data
Information on agricultural N inputs and outputs were col-lected, with focus on the period from 1990 until today, but
also including longer time series back in time. In the analysesof N flows and balances, we delineated the system boundaryto comprise the entire primary production of the Danishagricultural sector, including cropland, livestock and grazinglands, but excluding processing industry (slaughter houses,flour mills etc). This means that inputs include chemicalfertilizers (all imported, since no national production), feed-stuff (mainly imported concentrates) and urban and industrialwaste products used as soil amendments, but not animalmanures, which are entirely produced and recycled within theagricultural sector, as no national export or import of animalmanures take place in Denmark (contrary to some otherEuropean countries, e.g. The Netherlands). Outputs accountedfor include cash crops (cereals, seeds etc sold), milk, eggs,meat and live animals exported, but not fodder crops pro-duced and fed to animals within the agricultural sector.National and regional data are collected from StatisticsDenmark (1968, 1969 and 1961–2012) and supplemented byfarm and field scale data available via the Danish ResearchRegister for Agriculture, FRJOR (2014), including geo-codedinformation about all Danish livestock, manure and housingsystems, fertilizer use, standard yields and the crops grown onall commercial farms.
Values for N fluxes into the environment are queriedfrom the National Monitoring and Assessment Programme forthe Aquatic and Terrestrial Environment (NOVANA),including the discharge at 178 near-coast gauging stationscovering 57% of the entire land area of Denmark. Totalnitrogen (TN) concentrations are measured at 118 monitoringstations based on discrete sampling at a frequency of 12–26times per year (mean: 18 samples per year) (Windolfet al 2011). The runoff and loading of TN from the ungaugedareas is then calculated utilizing a national model (DK-QN)(Windolf et al 2011), and annual loads of TN from pointsources are provided from national databases under theNOVANA programme (Jensen et al 2012).
Simultaneously, N depositions were monitored in theform of wet depositions (bulk samplers) and dry depositionsestimated from measured ambient air concentrations and drydeposition velocities determined on the basis of meteor-ological data derived by MM5 model calculations performedwithin the Danish THOR system (Ellermann et al 2010, 2012,Brandt et al 2000). Depositions to water systems were esti-mated as average values from the island based monitoringstations, and assumed representative for marine conditions,while terrestrial depositions are estimated as average valuesfrom the land based monitoring stations. In the DanishNOVANA programme, dry deposition of ammonia is fur-thermore computed using the Danish Ammonia ModellingSystem (DAMOS: Geels et al 2012, Hertel et al 2013) appliedon a routine basis to 129 selected nature areas around thecountry and verified by comparisons to results from campaignmeasurements (Sommer et al 2009). The DAMOS modelconsists of a combination of the long-range transport modelDanish Eulerian Hemispheric Model (DEHM: Chris-tensen 1997, Frohn et al 2001) and the local-scale plumemodel OML-DEP (Hertel et al 2006, Sommer et al 2009). Wedid not take account of bi-directional ammonia fluxes in the
Figure 1. Relation between the nitrogen (N) surplus from Danishagriculture and the 5 yr moving average nitrate (NO3
−) concentrationsin Danish oxic groundwater samples (updated from Hansenet al 2011). The vertical lines labelled A–H indicate the timing of theseries of major Danish action plans to reduce nitrogen pollution ofthe aquatic or atmospheric environment (for further details, see textand table 2).
3
Environ. Res. Lett. 9 (2014) 115002 T Dalgaard et al

calculations, because deposition of local ammonia representsless than a third of the nitrogen deposition on land (and less atsea) and including bi-directional fluxes would only changethe results a few per cent, but would require much moredetailed input data. The present ammonia emission inventoryfor Denmark is based on information at single farm level andaccounts for local agricultural practice that plays a significantrole for the temporal variation in emissions (Hertelet al 2012). The inventory is based on information from theabove national databases (Nielsen et al 2011). A standardisedammonia emission for each livestock farm and associatedfields is then estimated based on information on animal type/number and type of crops. The final inventory includes: thetotal annual ammonia emission from identified point sources(farms, storages etc) in Denmark, and from area sources, i.e.,field emissions from the growing of crops as well as emis-sions resulting from the application of manure and mineralfertilizer. The area sources are distributed in a 100 × 100 mgrid covering all of Denmark (Plejdrup and Gylden-kaerne 2011), and the temporal variation in emission isdescribed by 15 additive functions reflecting different agri-cultural activities and a 16th function describing the con-tribution from traffic (Skjøth et al 2004). Examples ofemission distributions are presented in Geels et al (2012).
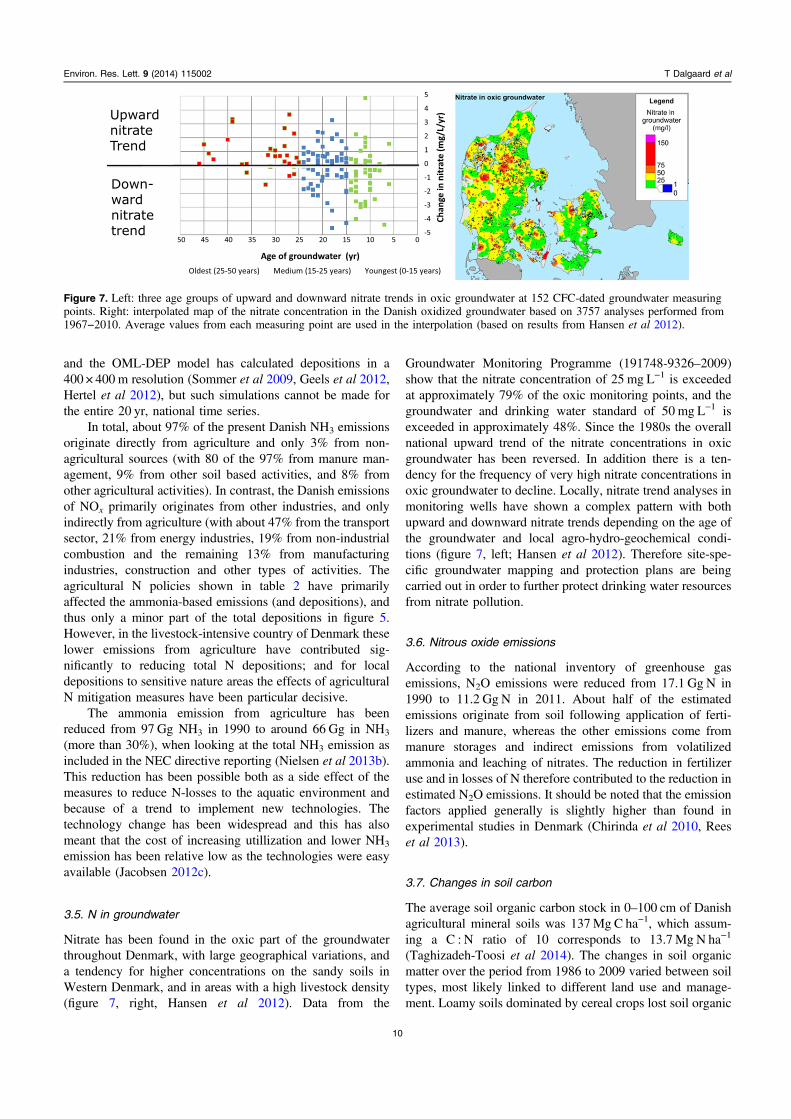
Data on nitrate concentrations in groundwater, fromcertified professional laboratories, was queried from thenational Danish geological and hydrological database JUPI-TER. A subgroup of 194 points in oxic groundwater, wherethe groundwater recharge age has moreover been determinedusing the chlorofluorocarbon (CFC) method, allows thecomparison of long-term changes in N surplus in agriculturewith changes in nitrate content of oxic groundwater (figure 1).In addition, nitrate trend analyses in 152 individual mon-itoring points were performed (figure 7, left), and 11 518samples from 3757 oxic monitoring points, sampled from1967−2011, were used to create a national overview (figure 7,right). The CFC analyses were performed according to theprocedure of Laier (2005) and Hinsby et al (2008) asdescribed in Hansen et al (2011).
The national emissions of nitrous oxide were calculatedusing the standard IPCC emission factor approach (Nielsenet al 2013). These calculations use national inventories of Nin fertilizers and manures applied as well as N in varioustypes of manure storages and estimates of ammonia volatili-zation and nitrate leaching.
Changes in soil organic matter content of agriculturalmineral soils was monitored by sampling in 1986, 1997 and2009 in a Danish nationwide square grid net (7 × 7 km) andanalysed for soil organic carbon content (Taghizadeh-Toosiet al 2014). Soils were sampled in three layers, 0–25 cm,25–50 cm and 50–100 cm. The measured changes in soilcarbon content were converted to changes in soil N byassuming a carbon to N ratio of 10 for the labile soil organicmatter (Thomsen et al 2008).
The costs of the measures implemented in previousaction plans are based on ex-post and ex-ante analyses madefrom 2003 until today looking at the cost-efficiency of the
measures both before and after implementation (Jacobsen2004, 2012b, Jacobsen et al 2004, Børgesen et al 2009).
2.2. A typology for nitrogen management policies
To analyse the trend in N management policies over years, themajor measures implemented in Denmark 1985–2014 arelisted and classified according to the following matrix(table 1).
The first category, command and control (C&C), is theclassic regulation type, where a certain action or pollutionpractice is forbidden by law, controlled by the authorities, andfined if the law is violated. In contrast, the second categorymarked-based regulation (MBR) includes all types of MBRand governmental expenditure that directly affect the marketand thereby the economic optimum for production and hencepollution. This category covers both: (i) market-basedinstruments where the management and pollution behaviourare regulated via market incentives, typically via a green tax(for example N-taxation) under the polluter pays principle(Carter 2007), (ii) other types of MBR (for example N quotascombined with manure trading possibilities), and (iii) gov-ernmental expenditure, that in the form of subsidies affectsthe market in a similar way to taxes, but by encouragementrather than inhibition. Governmental expenditure is notnecessarily under the polluter pays principle (for example,most of the EU agri-environmental policy measures are underthis category, as they are designed to promote environmen-tally friendly production practices, but financed by the EUmember states budgets and not via a specific farm tax; Bulleret al 2000). Finally, the remaining types of policy measuresare classified as information and voluntary action (IVA). Thisincludes knowledge production and communication ofinformation about more sustainable N-management practicesand technologies via research and extension services (whichmay be subsidized), and actions by ‘individuals or organiza-tions doing things to protect the environment that are neitherrequired by law nor encouraged by financial incentive’, andwhich ‘the government can encourage through a range ofcommunicative strategies’ (Carter 2007).
The typology further distinguishes between general ver-sus geographically targeted regulation, which is especiallyrelevant for N management policies, because both the risk ofN losses, the pressure of N load to the environment, and thesensitivity of the environment depend strongly on localgeology, soil, climate and recipient ecosystems (Blicher-Mathiesen et al 2014). ‘General regulation’ measures areimplemented equally in all parts of Denmark, whereas ‘geo-graphically targeted regulation’ measures are implementeddifferently (i.e. localized) depending on specific geographicalconditions (for instance, with different N regulations for dif-ferent watersheds, and different regulations depending on thesensitivity of the receiving environment to N losses, seeJacobsen et al 2007).
Finally, the regulation type can be either N input based(for example, regulation of fertilizer inputs) or N output based(for example, maximum ammonia emissions to a definedhabitat area).
4
Environ. Res. Lett. 9 (2014) 115002 T Dalgaard et al

2.3. Nitrogen surplus and efficiency
In line with OECD (2000), the main indicators used in thepresent paper comprise N surplus and N use efficiency (NUE,or just N-efficiency). As mentioned above, system boundarycomprises the entire primary production of the Danish agri-cultural sector, including cropland, livestock and grazinglands, and the N surplus and NUE. The agricultural N surplusis defined as N input minus N output in agricultural productsfrom the agricultural sector (equation (1)), while N efficiencyis defined as N output in agricultural products per unit N input(equation (2))
= −≅ +
+ −
N surplus N input N outputN leaching NH emission
denitrification soil N change, (1)3
− =N efficiency (N output) (N input). (2)
Annual values for N inputs and N outputs are derivedfrom national agricultural statistics (1968, 1969 and1961–2012) according to Vinther and Olsen (2013) andKyllingsbæk (2000). N inputs include N in commercial fer-tilizers and urban and industrial waste materials spread to thefields, N in imported concentrate feedstuffs like soybean cake,meat and bone meal (banned from year 2000), fodder urea,fish products, etc, and N derived from the atmosphere. Thelatter includes estimated values for net N deposition andbiological N fixation via legumes and free-living micro-organisms. N outputs include N in: (i) animal products,embracing eggs, milk, meat, live animals or livestockreceived by offal destruction plants, and (ii) plant products inthe form of cereals for food products, straw for energy pur-poses etc, seeds for manufacturing and sowing, beets forsugar production, potatoes, and other fruits and vegetableproducts.
N surplus can be used as a proxy for N losses fromfarming, assuming no change in the soil N pool, and covers anumber of N loss components (see equation (1)). In general,the largest N loss component is the leaching of nitrates(Dalgaard et al 2011a). N leaching is of special importance inrelation to ground and surface water pollution. Other N losscomponents are gaseous N (ammonia, di-nitrogen, nitrousoxides etc) and particulate N (mainly organic matter). Someof the surpluses may temporarily accumulate in farm productstocks, as biomass or in soil organic matter, but over time andas the soil system approaches steady state, N surplus and N
loss will converge, although this may take many decades oreven centuries. It must be noted that in the present paper Nsurpluses and N efficiencies are calculated for the wholeDanish agricultural system and cannot be directly comparedwith results calculated at other scales.
3. Results
3.1. Trends in nitrogen policies and management
The major N policy measures implemented in Denmark arepresented in table 2. C&C regulation was implemented first,followed by a mix with MBRs including increased govern-mental expenditures along with the more IVA basedmeasures.
From the beginning, all measures were implemented as‘general regulation’, i.e., with equal norms and standards forall parts of the country. The first exception to this was in 1990with the implementation of environmentally sensitive areas(ESAs) which was designated with the major aim to reduce Npollution (MAFF 2004), and with EU co-financed subsidiesto reduce N-fertilization of grasslands (Buller et al 2000).Originally, regional authorities were responsible for the des-ignation of these areas. In this way they were geographicallytargeted (but with the same fixed subsidy classes for thewhole country, and with subvention opportunities for farmersliving inside the designations), and for farmers it wasvoluntary whether they signed up to the scheme or not.Further geographical targeting was implemented in 1998 withthe AP-II agri-environmental subsidy schemes for (voluntary)construction of wetlands and afforestation in designated areas.Another initiative in 1998 was the initiation of the detailedDanish groundwater mapping programme on approximately40% of the land surface aiming at establishing site-specificgroundwater protections zones based on assessments of thenitrate vulnerability of the aquifers (Thomsen et al 2004,Hansen and Thorling 2008).
Until the AP-III in 2004 all regulation was carried out onthe input side. The first exception to this was the designationof buffer zones set around ammonia sensitive habitats, fol-lowed by special restrictions for emissions from new live-stock buildings to designated nature areas. Even though the1991 Nitrates Directive aimed to reduce the ‘end of pipe’NO3
− concentration in leached water to below 50 mg L−1, theregulation was implemented on the input side in the form of
Table 1. Typology for the classification of N policy measures. Each of the combinations could be either N input based (for exampleregulation of mineral fertilizer inputs) or N output based (for example maximum ammonia emissions to a defined habitat area).
General regulation Geographically targeted regulation
Input based Output based Input based Output based
Command and control (C&C) X X X XMarket-based regulation and governmentalexpenditure (MBR)
X X X X
Information and voluntary action (IVA) X X X X
5
Environ. Res. Lett. 9 (2014) 115002 T Dalgaard et al

Table 2. The major N policy measures, implemented over the past 30 years with the Danish action plans (AP) in 1985 (NPo), 1987 (AP-I), 1991 (AP for a more sustainable agriculture), 1998 (AP-II), 2001 (ammonia AP), 2004 (AP-III) and 2009 (Green Growth AP), classified into the table 1 policy typology. Localized measures represent the geographically targeted types of table 1, andbrackets indicate that the measures fit only partly to the typology class. Until more recently, nearly all regulations focused on the N input side, but from 2004 and onwards output-based regulationalso appears.
Year N measures imposed:C&C: command and
controlMBR: market-based regulation and gov-
ernmental expenditureIVA: information and volun-
tary action
1985 Max. stock density. X — —
Mandatory slurry tank floating barriers. X — —
No runoff from silage clamps and manure heaps. X — —
Min. slurry capacity and ban on winter spreading of slurry for spring crops(including subsidies to invest in slurry tanks etc).
X (X) —
1987 Mandatory fertilizer and crop rotation plans. X — —
Min. proportion of area with winter crops. X — —
Mandatory manure application within 12 h. X — —
1991 Statutory norms for manure N utilization. X — —
Max N applied to crops equalling economic optimum. X (X) —
Subsidies to low-N grasslands in environmentally sensitive areas. — (X) (localized) (X)1998 Max. N applied 10% below economic optimum. X (X) —
6% obligatory catch crops. X — —
Subsidies to more organic farming, wetlands, extensification andafforestation.
— X (localized) (X)
2001 Promotion of low excretion livestock feeding. — — X2004 More catch crops. X — —
Tightened ammonia restriction (e.g. broadcasting banned), and specialrestrictions near sensitive nature areas.
X (localized) (output-based)
— X
Subsidies to promote better manure handling and animal housing (BAT). — X X2009 Buffer zones around streams, lakes and NH4 sensitive habitats. localized (output-based) — —
Tax on mineral P in feed. — X —
Max. N applied ≈15% below economic optimum. X (X) —
Optimized feed practice promotion. — — X
6
Environ.
Res.
Lett.9(2014)
115002TDalgaard
etal
restrictions on the livestock density and manure applied to thefields (van Grinsven et al 2012). It was found that the directN-effect of reduced livestock density was low, but it hashelped to avoid very high livestock intensity resulting innational or regional nutrient surplus, as found in The Neth-erlands, Belgium (Flanders) and parts of France (Brittany).The key measures in Action Plan II were a higher requiredfertilizer equivalency of animal manure N, and reduced stat-utory fertilization N-norms (Jacobsen 2004).
In the future, and in particular with the further imple-mentation of the EU WFD, this regime is expected to changedramatically, requiring both new types of regulation sup-ported by considerable research and development to make themeasures more geographically specific (The Commission onNature and Agriculture 2013).
3.2. Trends in nitrogen surplus and efficiency
In this study, we analyse the overall N use efficiency of theentire agricultural sector per se, and have not intended toanalyse NUE of agricultural subsystems, like crop or live-stock production, separately. Overall agricultural N balanceswill be a key determinant for environmental impacts, and inthat sense, temporal trends and dynamics in N surplus andNUE for the agricultural sector will be better linked to theenvironmental N indicators, like aquatic environment Nlevels, which we compare against in the paper. The drawbackis, that the NUE becomes dependent on the specific Danishratio of livestock to crop production, which makes it difficultto compare against other countries with a different ratio, buthas the advantage that national registry data can be utilized toa much larger extent for the inventory.
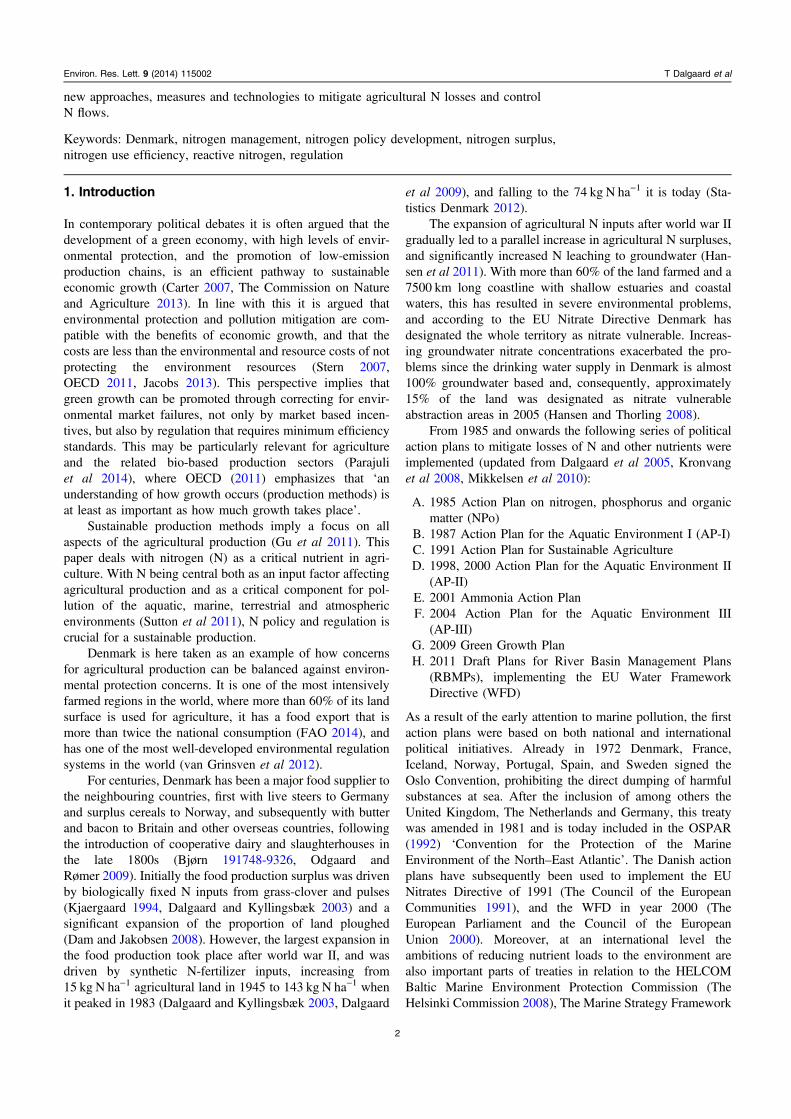
When the development in total agricultural N inputs andN outputs in products is calculated (figure 2) it is clear thatespecially the input of N to the agricultural sector has beenreduced since the implementation of the action plans (from662 Gg N when it peaked in 1983 to 448 Gg N in 2012). Seenover the period from 1990 to 2010, the N input was reducedby 34%, mainly through reduction in the application of syn-thetic fertilizer N, while the N output in products was onlyreduced by 15% in the same period and, consequently, thetotal N surplus was reduced by 45%, from 437 Gg to 241 Gg.
This means that over the past 25 years the average Nsurplus has been reduced from approximately170 kg N ha−1 yr−1 to below 100 kg N ha−1 yr−1 for agri-cultural, while the overall NUE for the agricultural sector hasincreased from around 20–30% to 43% (figure 2). However, itis worth noting that this increase in NUE appeared after aperiod where the NUE was reduced from 30% in 1950 tobelow 20% in 1983—its lowest ever level. However, it is fairto say that the present NUE of more than 40% is high, con-sidering the high level of animal production in Danish agri-culture (Denmark is one of the world’s largest exporters ofanimal products, and the export of animal products grew by39% from 33 kg N ha−1 in 1990 to 46 kg N ha−1 agriculturalland in 2010). It is true that during the two world wars theNUE was even higher (peaking at around 60% during WW1from 1914 to 1918, and 40% during WW2 from 1939 to1945), but this represents an unsustainable situation caused bya severe shortage of fertilizer inputs (represented by the dropin N-inputs on figure 2, left), and a similar drop in the pro-duction of plant products (Dalgaard and Kyllingsbæk 2003).
N input to crop production in the form of imported fer-tilizers and atmospheric N from biological N-fixation anddeposition has been reduced from the mid 1980s (figure 3),with an important turning point when the import of syntheticfertilizers peaked in 1983 with 143 kg N ha−1 and a total Ninput from fertilizers and the atmosphere of 162 kg N ha−1
agricultural land. However, the total N input from fertilizersand atmosphere did not peak until 1989 with 169 kg N ha−1
(142 kg N ha−1 from fertilizers and 27 kg N ha−1 from atmo-spheric fixation and deposition), but was reduced by 50%over the period 1990–2010. Over the same period the importof feed was sustained (equal figures of 71 kg N ha−1 in both1990 and 2010), whereas the N output in the form of plantproducts was halved from 48 kg N ha−1 to 24 kg N ha−1, andthe animal production as mentioned above increased by 39%.It must be noted that there are a large annual variation,especially in the plant production figures, but overall it mustbe assumed that the decreased output of grain cereals andother plant products was primarily caused by an increased useof domestically harvested plant products for livestock feed, sothat these do not appear as product outputs in the inventory.Simultaneously, a smaller decrease in domestically harvested
Figure 2. (a) Total sum of N inputs to and sum of N output in products from Danish agriculture, and (b) overall nitrogen use efficiency(N-efficiency) for Danish agriculture over the period 1900–2012. For definitions, see equations (1) and (2).
7
Environ. Res. Lett. 9 (2014) 115002 T Dalgaard et al

N was observed by Blicher-Mathiesen et al (2013), from128 kg N ha−1 harvested in 1990 to 107 kg N ha−1 harvestedin 2010, among other things because of a changedcropping pattern, crop use and the overall reduced N-fertili-zation level.
3.3. Nitrate leaching and emissions to the aquatic environment
The dominant source of TN loadings to coastal waters inDenmark is agriculture, which based on calculations for theperiod 2007–11 contributed 70% of the TN loadings, fol-lowed by background losses (21%), and emissions from pointsources (9%) (Nielsen et al 2011, Windolf et al 2011).
The water runoff from Denmark to coastal waters showedlarge inter-annual variations during the period 1990–2012,with the driest year being 1996 and the wettest 1994 (figure 4,top). A similar pattern can be seen for the TN loadings toDanish coastal waters showing the lowest and highest valuesin the same two years (figure 4, bottom). The TN loadingfrom all sources to coastal waters has decreased from anaverage of ca. 100 Gg N in the period 1990–94 to ca. 59 Gg Nin 2012 (figure 4, centre). The export coefficient of TN fromthe entire Danish terrestrial area thus decreased from23.3 kg N ha−1 to 13.7 kg N ha−1 during these two periods(41%). The point source contribution to TN loadings inDenmark has decreased significantly due to improved treat-ment of especially urban wastewater during the period1990–2012 (figure 4, mid). The emission from all pointsources amounted to an average of 19.6 Gg N during theperiod 1990–4 and had in 2012 been reduced to 5.7 Gg N,corresponding to a reduction of 71% (Wiberg-Larsenet al 2013). The flow weighted concentration of TN shows adecline from an average of 7.1 mg N L−1 in 1990–4 to3.9 mg N L−1 in 2012 (46%). Most of the reduction in TNloadings to coastal waters shown in figure 4 is derived from areduction of TN emissions from diffuse sources, mainlyagricultural sources.
3.4. Atmospheric ammonia volatilisation and deposition
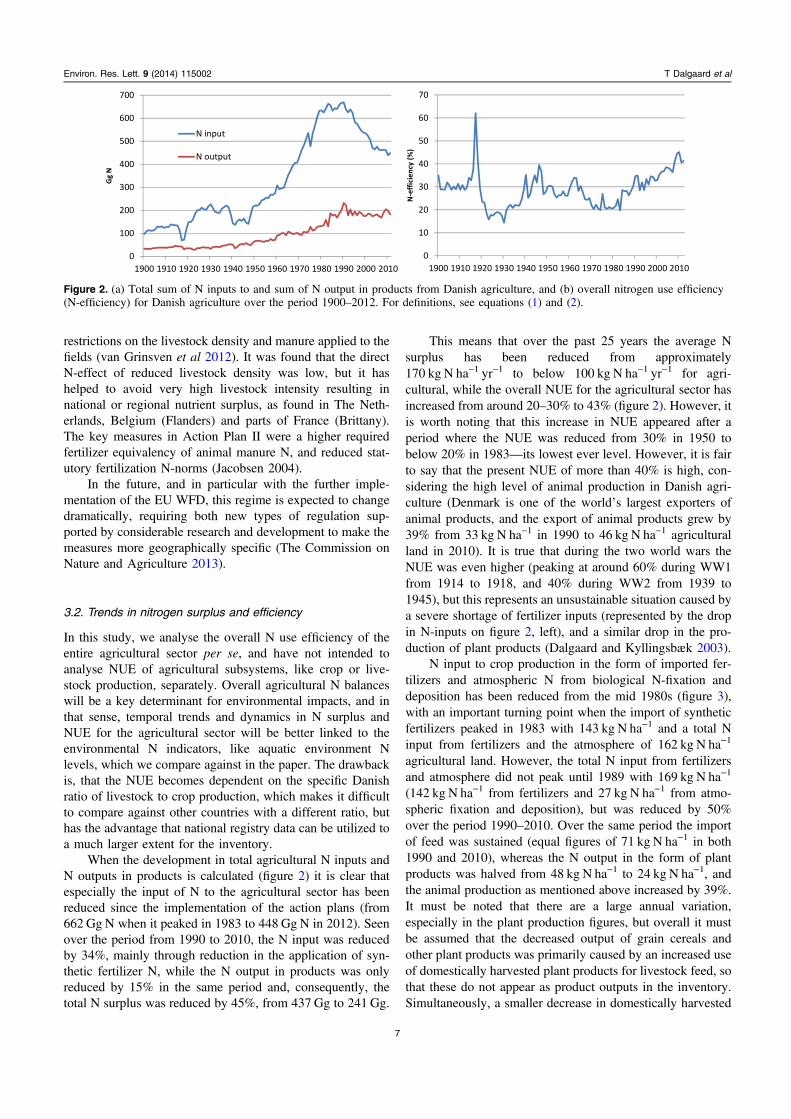
Deposition of atmospheric N to Danish terrestrial areas variessignificantly between different parts of the country (figure 5)but also very locally due to differences in local agriculturalproduction and the type and roughness of the surface.
Figure 3. Developments in the form of net N inputs to and net product N outputs from Danish Agriculture, average per hectare agriculturalland. Inputs include livestock feed (i.e. imported concentrates), plant fertilizers (imported since no Danish fertilizer production) andatmospheric N inputs (deposited + biologically fixed), and N outputs include animal products (i.e. milk, egg, meat) and cash crop products(sold from the agricultural sector, so not including fodder products utilized for livestock feed).
Figure 4. Annual total volume of runoff (top), annual total N loading(centre), and annual flow-weighted total N concentration in Danishsurface water outflow to the sea (bottom). (Based on Wiberg-Larsenet al 2013).
8
Environ. Res. Lett. 9 (2014) 115002 T Dalgaard et al
For 2012, the atmospheric deposition of ammonia wasfound to vary from 0.5 to 15 kg N ha−1 yr−1 (figure 5, left),and total N deposition from 8 to 23 kg N ha−1 yr−1 (figure 5,right). Total atmospheric N deposition to Danish terrestrialareas has been calculated at 60 Gg for 2012 (Ellermannet al 2013). This gives an average annual deposition of14 kg N ha−1 yr−1, which is an N input above the critical loadsfor many of the sensitive ecosystems in Denmark (Hertelet al 2013). The deposition varies over the country due to ageneral South–North gradient in concentration contributionsfrom long-range transport from source areas in Central Eur-ope, but also due to local differences in ammonia emissionsover Denmark and to differences in precipitation. The largestdepositions are thus found in Southwestern Denmark wherethe livestock production is high and so is precipitation.Uncertainties on the model calculations are estimated to be upto ±40% for the averages in the grid cells. This uncertaintyhas been derived from comparisons with measurements fromthe routine monitoring stations in Denmark. Generally anintegrated monitoring approach is applied where models andmeasurements are used in combination (Hertel et al 2006).
In comparison, the total annual atmospheric N depositionto Danish marine waters has been calculated at 81 Gg N,which gives an average deposition of 7.7 kg N ha−1 yr−1 in2012 (the area of Danish marine waters measures105 000 km2) (Ellermann et al 2013).
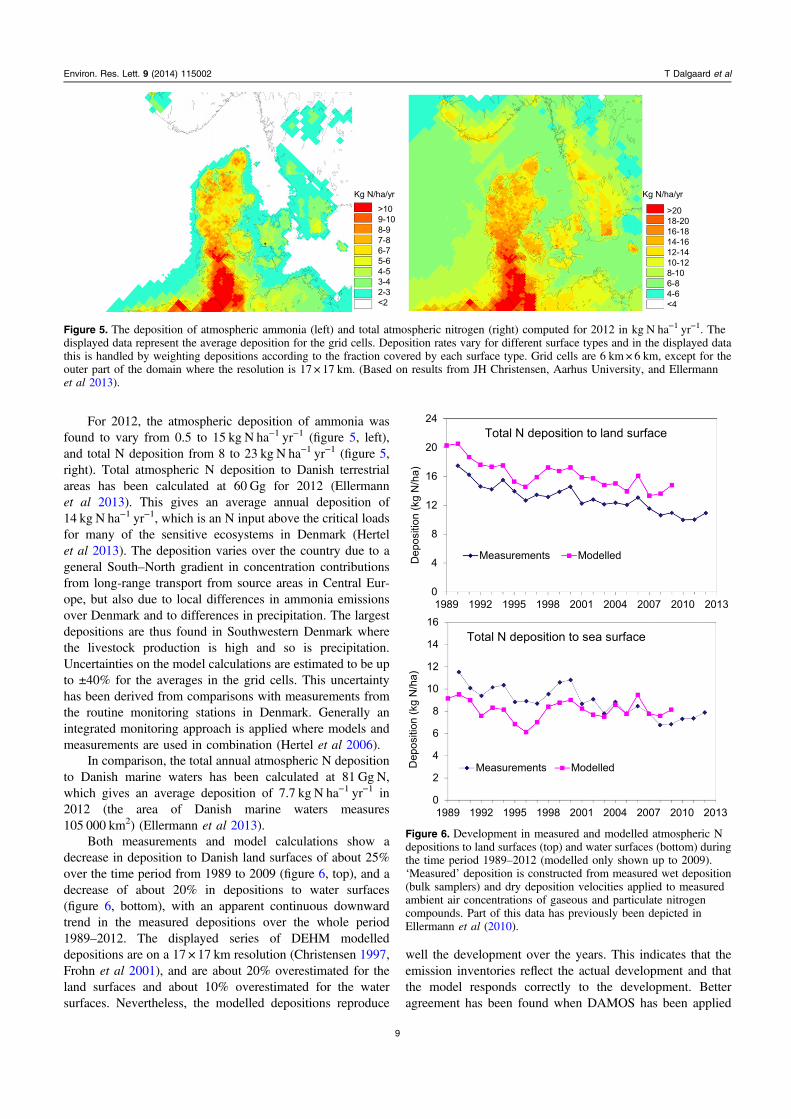
Both measurements and model calculations show adecrease in deposition to Danish land surfaces of about 25%over the time period from 1989 to 2009 (figure 6, top), and adecrease of about 20% in depositions to water surfaces(figure 6, bottom), with an apparent continuous downwardtrend in the measured depositions over the whole period1989–2012. The displayed series of DEHM modelleddepositions are on a 17 × 17 km resolution (Christensen 1997,Frohn et al 2001), and are about 20% overestimated for theland surfaces and about 10% overestimated for the watersurfaces. Nevertheless, the modelled depositions reproduce
well the development over the years. This indicates that theemission inventories reflect the actual development and thatthe model responds correctly to the development. Betteragreement has been found when DAMOS has been applied
Figure 5. The deposition of atmospheric ammonia (left) and total atmospheric nitrogen (right) computed for 2012 in kg N ha−1 yr−1. Thedisplayed data represent the average deposition for the grid cells. Deposition rates vary for different surface types and in the displayed datathis is handled by weighting depositions according to the fraction covered by each surface type. Grid cells are 6 km× 6 km, except for theouter part of the domain where the resolution is 17 × 17 km. (Based on results from JH Christensen, Aarhus University, and Ellermannet al 2013).
Figure 6. Development in measured and modelled atmospheric Ndepositions to land surfaces (top) and water surfaces (bottom) duringthe time period 1989–2012 (modelled only shown up to 2009).‘Measured’ deposition is constructed from measured wet deposition(bulk samplers) and dry deposition velocities applied to measuredambient air concentrations of gaseous and particulate nitrogencompounds. Part of this data has previously been depicted inEllermann et al (2010).
9
Environ. Res. Lett. 9 (2014) 115002 T Dalgaard et al
and the OML-DEP model has calculated depositions in a400 × 400 m resolution (Sommer et al 2009, Geels et al 2012,Hertel et al 2012), but such simulations cannot be made forthe entire 20 yr, national time series.
In total, about 97% of the present Danish NH3 emissionsoriginate directly from agriculture and only 3% from non-agricultural sources (with 80 of the 97% from manure man-agement, 9% from other soil based activities, and 8% fromother agricultural activities). In contrast, the Danish emissionsof NOx primarily originates from other industries, and onlyindirectly from agriculture (with about 47% from the transportsector, 21% from energy industries, 19% from non-industrialcombustion and the remaining 13% from manufacturingindustries, construction and other types of activities. Theagricultural N policies shown in table 2 have primarilyaffected the ammonia-based emissions (and depositions), andthus only a minor part of the total depositions in figure 5.However, in the livestock-intensive country of Denmark theselower emissions from agriculture have contributed sig-nificantly to reducing total N depositions; and for localdepositions to sensitive nature areas the effects of agriculturalN mitigation measures have been particular decisive.
The ammonia emission from agriculture has beenreduced from 97 Gg NH3 in 1990 to around 66 Gg in NH3
(more than 30%), when looking at the total NH3 emission asincluded in the NEC directive reporting (Nielsen et al 2013b).This reduction has been possible both as a side effect of themeasures to reduce N-losses to the aquatic environment andbecause of a trend to implement new technologies. Thetechnology change has been widespread and this has alsomeant that the cost of increasing utillization and lower NH3
emission has been relative low as the technologies were easyavailable (Jacobsen 2012c).
3.5. N in groundwater
Nitrate has been found in the oxic part of the groundwaterthroughout Denmark, with large geographical variations, anda tendency for higher concentrations on the sandy soils inWestern Denmark, and in areas with a high livestock density(figure 7, right, Hansen et al 2012). Data from the
Groundwater Monitoring Programme (191748-9326–2009)show that the nitrate concentration of 25 mg L−1 is exceededat approximately 79% of the oxic monitoring points, and thegroundwater and drinking water standard of 50 mg L−1 isexceeded in approximately 48%. Since the 1980s the overallnational upward trend of the nitrate concentrations in oxicgroundwater has been reversed. In addition there is a ten-dency for the frequency of very high nitrate concentrations inoxic groundwater to decline. Locally, nitrate trend analyses inmonitoring wells have shown a complex pattern with bothupward and downward nitrate trends depending on the age ofthe groundwater and local agro-hydro-geochemical condi-tions (figure 7, left; Hansen et al 2012). Therefore site-spe-cific groundwater mapping and protection plans are beingcarried out in order to further protect drinking water resourcesfrom nitrate pollution.
3.6. Nitrous oxide emissions
According to the national inventory of greenhouse gasemissions, N2O emissions were reduced from 17.1 Gg N in1990 to 11.2 Gg N in 2011. About half of the estimatedemissions originate from soil following application of ferti-lizers and manure, whereas the other emissions come frommanure storages and indirect emissions from volatilizedammonia and leaching of nitrates. The reduction in fertilizeruse and in losses of N therefore contributed to the reduction inestimated N2O emissions. It should be noted that the emissionfactors applied generally is slightly higher than found inexperimental studies in Denmark (Chirinda et al 2010, Reeset al 2013).
3.7. Changes in soil carbon
The average soil organic carbon stock in 0–100 cm of Danishagricultural mineral soils was 137Mg C ha−1, which assum-ing a C : N ratio of 10 corresponds to 13.7Mg N ha−1
(Taghizadeh-Toosi et al 2014). The changes in soil organicmatter over the period from 1986 to 2009 varied between soiltypes, most likely linked to different land use and manage-ment. Loamy soils dominated by cereal crops lost soil organic
Figure 7. Left: three age groups of upward and downward nitrate trends in oxic groundwater at 152 CFC-dated groundwater measuringpoints. Right: interpolated map of the nitrate concentration in the Danish oxidized groundwater based on 3757 analyses performed from1967−2010. Average values from each measuring point are used in the interpolation (based on results from Hansen et al 2012).
10
Environ. Res. Lett. 9 (2014) 115002 T Dalgaard et al
matter from the entire soil profile to 100 cm depth corre-sponding to annual N loss of 124 kg N ha−1, whereas sandysoils gained N at an average rate of 51 kg N ha−1. As anaverage of all agricultural mineral soils, there was a small andnon-significant annual reduction of 20 kg N ha−1.
4. Discussion and conclusions
4.1. The development in N-measures and their effect
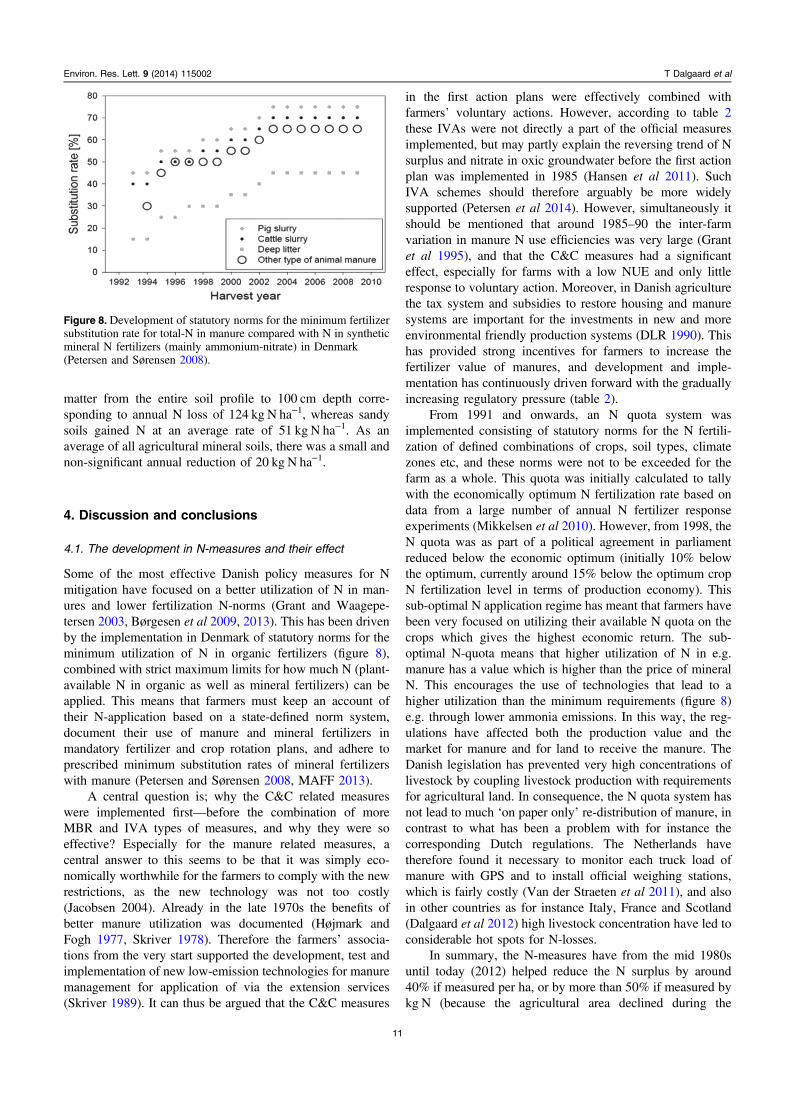
Some of the most effective Danish policy measures for Nmitigation have focused on a better utilization of N in man-ures and lower fertilization N-norms (Grant and Waagepe-tersen 2003, Børgesen et al 2009, 2013). This has been drivenby the implementation in Denmark of statutory norms for theminimum utilization of N in organic fertilizers (figure 8),combined with strict maximum limits for how much N (plant-available N in organic as well as mineral fertilizers) can beapplied. This means that farmers must keep an account oftheir N-application based on a state-defined norm system,document their use of manure and mineral fertilizers inmandatory fertilizer and crop rotation plans, and adhere toprescribed minimum substitution rates of mineral fertilizerswith manure (Petersen and Sørensen 2008, MAFF 2013).
A central question is; why the C&C related measureswere implemented first—before the combination of moreMBR and IVA types of measures, and why they were soeffective? Especially for the manure related measures, acentral answer to this seems to be that it was simply eco-nomically worthwhile for the farmers to comply with the newrestrictions, as the new technology was not too costly(Jacobsen 2004). Already in the late 1970s the benefits ofbetter manure utilization was documented (Højmark andFogh 1977, Skriver 1978). Therefore the farmers’ associa-tions from the very start supported the development, test andimplementation of new low-emission technologies for manuremanagement for application of via the extension services(Skriver 1989). It can thus be argued that the C&C measures
in the first action plans were effectively combined withfarmers’ voluntary actions. However, according to table 2these IVAs were not directly a part of the official measuresimplemented, but may partly explain the reversing trend of Nsurplus and nitrate in oxic groundwater before the first actionplan was implemented in 1985 (Hansen et al 2011). SuchIVA schemes should therefore arguably be more widelysupported (Petersen et al 2014). However, simultaneously itshould be mentioned that around 1985–90 the inter-farmvariation in manure N use efficiencies was very large (Grantet al 1995), and that the C&C measures had a significanteffect, especially for farms with a low NUE and only littleresponse to voluntary action. Moreover, in Danish agriculturethe tax system and subsidies to restore housing and manuresystems are important for the investments in new and moreenvironmental friendly production systems (DLR 1990). Thishas provided strong incentives for farmers to increase thefertilizer value of manures, and development and imple-mentation has continuously driven forward with the graduallyincreasing regulatory pressure (table 2).
From 1991 and onwards, an N quota system wasimplemented consisting of statutory norms for the N fertili-zation of defined combinations of crops, soil types, climatezones etc, and these norms were not to be exceeded for thefarm as a whole. This quota was initially calculated to tallywith the economically optimum N fertilization rate based ondata from a large number of annual N fertilizer responseexperiments (Mikkelsen et al 2010). However, from 1998, theN quota was as part of a political agreement in parliamentreduced below the economic optimum (initially 10% belowthe optimum, currently around 15% below the optimum cropN fertilization level in terms of production economy). Thissub-optimal N application regime has meant that farmers havebeen very focused on utilizing their available N quota on thecrops which gives the highest economic return. The sub-optimal N-quota means that higher utilization of N in e.g.manure has a value which is higher than the price of mineralN. This encourages the use of technologies that lead to ahigher utilization than the minimum requirements (figure 8)e.g. through lower ammonia emissions. In this way, the reg-ulations have affected both the production value and themarket for manure and for land to receive the manure. TheDanish legislation has prevented very high concentrations oflivestock by coupling livestock production with requirementsfor agricultural land. In consequence, the N quota system hasnot lead to much ‘on paper only’ re-distribution of manure, incontrast to what has been a problem with for instance thecorresponding Dutch regulations. The Netherlands havetherefore found it necessary to monitor each truck load ofmanure with GPS and to install official weighing stations,which is fairly costly (Van der Straeten et al 2011), and alsoin other countries as for instance Italy, France and Scotland(Dalgaard et al 2012) high livestock concentration have led toconsiderable hot spots for N-losses.
In summary, the N-measures have from the mid 1980suntil today (2012) helped reduce the N surplus by around40% if measured per ha, or by more than 50% if measured bykg N (because the agricultural area declined during the
Figure 8. Development of statutory norms for the minimum fertilizersubstitution rate for total-N in manure compared with N in syntheticmineral N fertilizers (mainly ammonium-nitrate) in Denmark(Petersen and Sørensen 2008).
11
Environ. Res. Lett. 9 (2014) 115002 T Dalgaard et al

period). Over the same period, N-leaching from the root zonehas also been approximately halved (Grant and Waagepe-tersen 2003, Dalgaard et al 2005, Børgesen et al 2009, 2013).Although the N surplus was reduced by more than 50% from1990 to 2011, the total N loadings to the aquatic environmentand the N-deposition from ammonia were reduced by less(roughly 42% and 25%, respectively). This shows the need tounderstand the relationships between the different N poolsand flows, including the denitrification of N, and the buffersof N in biotic N pools (soils and biomass) as well as theretention in ground- and surface water aquifers before it entersthe aquatic environment and the atmosphere. Modelling sucheffects is outside the scope of the present paper but is anintegral part of the further work in the DNMARK (2014)research alliance, where time-series for all relevant N flowsand stocks will be calculated for the period 1990–2010(Hutchings et al 2014), and scenarios for selected N mitiga-tions options will be modelled and demonstrated (Dalgaardet al 2014).
4.2. Socio-economy and public health
According to Jacobsen (2009, 2012a, 2012b) total annualcosts of the major Danish N action plans to date are roughly€600 million. About €340 million of these annual costs relateto the agricultural measures from AP-I onwards (table 3). Therest primarily covers costs related to industry and sewagetreatment plants outside agriculture.
In general, measures were chosen partly on their Nmitigation cost-effectiveness, partly on other benefits whichpoliticians wanted to promote. A significant reason for thesuccess of the Danish policies is that, when designing thepolicies, efforts have been taken to reduce the costs tofarmers. In summary, the most cost-effective measures in AP-II have been the requirements for catch crops (obligatory % ofcropped area to be undersown by grass or other species, toreduce N-leaching after main crop) and constructed wetlands,increased utilization-efficiency for N in animal manures, andimproved feeding practices (lowering excretion of N inmanure). The least cost effective measures have been land set-aside and increased area under grass, as well as the require-ment for reduced animal density (Jacobsen 2009). Otherbenefits besides N mitigation (such as biodiversity and
climate protection) are not included in the calculation, andthis is the main reason why area-related measures generallyhave the lowest cost efficiency.
In recent assessments of the costs and benefits of Nregulation in agriculture, Andersen et al (2013) found thatlarge economic benefits are related to drinking water healthimpacts, rather than to improvements in surface water qualityas such. Nitrate in drinking water has been suspected ofnegatively affecting human health, for example by causingcancer (Schullehner and Hansen 2014) although no clearevidence has as yet been found (Jensen 1982, De Rooset al 2003, Ward et al 2005). An assessment of social costs ofthe health effect (in this case colon cancer) due to nitrate indrinking water in 11 EU member states, estimated that Den-mark had the largest percentage of the population (16.2%)exposed to elevated nitrate concentrations (>25 mg L−1) (vanGrinsven et al 2010). The social costs associated with the lossof healthy life years were at 6.6 euro per capita—more thantwice the average of the 11 EU member states assessed.However, a new assessment by Schullehner and Hansen(2014) reveals that only approximately 5.1% of the Danishpopulation was exposed to nitrate concentrations >25 mg L−1
in 2012, and further investigations on the actual health effectsare needed.
As expected, the N measures related to agriculture have,over time, become gradually more expensive per kg reducedN loss. The current costs are around €3–4 per kg N lost to theenvironment, and the lower crop yields caused by N fertili-zation below the economic optimum has over time led tohigher costs than estimated in 2004. New solutions to meetthe requirements in the EU Habitats Directive, the MarineStrategy Framework Directive and the WFD are thereforecalled for. The vision for future regulation is to be able toimplement measures where the N mitigation benefit is thehighest, and allow for increased production elsewhere, i.e. onarable land with higher N retention capacity. The Danish N-policies have so far been national and input based. However,the WFD requires local and output-based approaches withmanagement at the river basin scale, analyses of cost-effec-tiveness, and measures targeted where the effect is the high-est, calling for a new regulation regime. However, moretargeted regulation requires more detailed data, there will bemore uncertainty in the effects estimated, and some measures
Table 3. Estimated costs of agricultural measures in the different N action plans (APs) and the first version of the River Basin ManagementPlans (RBMP) of the EU Water Framework Directive to reduce N losses from agriculture (Jacobsen et al 2004,Jacobsen 2009, 2012a, 2012b). The administrative costs are not included.
Ex-ante costs (mill. € yr−1) Ex-post costs (mill. € yr−1)
AP-I for the aquatic environment (1987) 84 Not calculatedAP for a more sustainable agriculture (1991) 134 Not calculatedAP-II (1998–2003) 92 70AP-III (2004–2015) 22 21Green Growth AP and RBMP 1.0 (2011) 41 48a
Total 340 NA
a
Of the €48 million total costs the agricultural sector pays €18 million and the public sector including EU €30 millionannually. The plan has been altered in 2014 and so a re-estimation of the costs has not been carried out yet. The costs forthe agricultural sector of RBMP 1.0 are likely to be lower as some measures are dropped (e.g. targeted catch crops).
12
Environ. Res. Lett. 9 (2014) 115002 T Dalgaard et al
might be placed in the wrong place. Therefore, knowledgeabout the uncertainty related to the estimates is important(Refsgaard et al 2014), and the choice of modelling andmonitoring framework will be critical for the identification ofsensitive (high risk of N loss) and robust (high capacity for Nretention) areas in regard to nitrate vulnerability of surfacewaters. Regardless of whether empirical or mechanisticmodels are applied for estimating the effect of specific mea-sures, combination with output monitoring (e.g. drainagewater monitoring of N concentrations) are likely to producethe most reliable guidance Furthermore, experiences on howto better integrate the different types of regulation in table 2,with a more localized and output based approach, will also beimportant.
Over the coming years (2014–7) pilot studies of theimplementation of new, local RBMPs will be carried out inselected pilot areas in connection to the DNMARK (2014)research alliance. It is expected that these studies can helpdrive N-regulation towards more output based and localizedregulation, facilitate better N-management, and overallimprove the cost-effectiveness and mitigation effect. Over thepast 30 yrs the table 2 mix of policy measures has helped toincrease the overall NUE from 20–30% to around 40–45%.According to Dalgaard et al (2011b), it should be possible tocontinue this development in the coming decades, but thiswill require a continuous implementation of new technologiesand management practices. The pilot areas can be used todemonstrate this and facilitate the locally-adapted actionsneeded for farmers to comply with policy requirementswithout incurring excessive costs. In this way we hope todevelop a greener economy and develop solution scenariosfor the further sustainable management of N.
4.3. Overall conclusion
Losses of N from Danish agriculture have been reducedsignificantly over the last three decades through regulationthat obliges all farmers to consider manure and fertilizer as avaluable resource. However, further reductions are required,especially to comply with the EU WFD. Applications of N tocrops are now well below the economic optimum and a fur-ther general reduction of N supply to crops would be veryexpensive. A change of paradigm is therefore planned, withsevere restrictions placed on applications to land vulnerable tonitrate leaching to the aquatic environment and a potentialeasing of restrictions in other areas. The lesson for othercountries is that general regulation can be usefully applied tocontrol widespread excessive applications of N but that oncethis has been achieved, and if further reductions are neces-sary, a switch to more spatially targeted measures is required.
Acknowledgements
This work was supported by the www.dnmark.org StrategicResearch Alliance (DNMARK: Danish Nitrogen MitigationAssessment: Research and Know‐how for a sustainable, low‐Nitrogen food production (2013–2017) funded by The Danish
Council for Strategic Research (Ref. 12‐132421)/Innova-tionsfonden and the Aarhus University Research Foundation,and the Platform for Research in Biobased Production (BIO-BASE) funded by the Danish Centre for Food and Agriculture.
References
Andersen M S, Nielsen H Ø, Pedersen A B, Thodsen H, Pizzol M,Wulff A F, Hansen L B and Senante M M 2013Macroeconomic perspective on water quality and quantityissues of relevance to the System of Environmental-EconomicAccounting for Water (SEEAW) PART A—Water Quality(Odense River Basin, Denmark) EPI-Water Deliverable no: D4.5 available at (www.feem-project.net/epiwater/pages/download-public-deliv.html), accessed 1 September 2014
Bjørn C 191748-9326 Det danske landbrugs historie 1810–1914(The history of Danish agriculture 1810–1914) vol 3 (Odense,Denmark: Landbohistorisk Selskab) p 431
Blicher-Mathiesen G, Andersen H E, Carstensen J, Børgesen C D,Hasler B and Windolf J 2014 Mapping of nitrogen risk areasAgric. Ecosyst. Environ. 195 149–60
Blicher-Mathiesen G, Rasmussen A, Grant R, Jensen P G,Hansen B and Thorling L 2013 Landovervågningsoplande2012 (Environmental Land Monitoring Program 2012)NOVANA. Aarhus Universitet, DCE—Nationalt Center forMiljø og Energi, p 150—Videnskabelig rapport fra DCE nr 74p 153 available at (http://dce2.au.dk/pub/SR74.pdf), accessed 1September 2014
Børgesen C D, Nordemann Jensen P, Blicher-Mathiesen G andSchelde K (ed) 2013 Udviklingen i kvælstofudvaskning ognæringsstofoverskud fra dansk landbrug for perioden2007–2011 (Development of Nitrogen leaching and nutrientsurplus in Danish agriculture for the period 2007–2011) DCAReport no 31 p 153, available at (http://pure.au.dk/portal/files/68362856/dcarapporten31.pdf), accessed 1 September 2014
Børgesen C D, Waagepetersen J, Iversen T M, Grant R,Jacobsen B and Elmholt S 2009 Midt-vejsevaluering afvandmiljøplan III—hoved og baggrundsnotater (mid-termevaluation of aquatic action plan III) DetJordbrugsvidenskabelige Fakultet og DanmarksMiljøundersøgelser DJF Report Markbrug 142 233 availableat(http://pure.agrsci.dk:8080/fbspretrieve/2841678/djfma142.pdf.pdf) accessed 1 September 2014
Brandt J, Christensen J, Frohn L, Berkowicz R and Palmgren F 2000The DMU-ATMI THOR Air Pollution Forecast System SystemDescription NERI Technical Report no 321 Ministry ofEnvironment and Energy National Environmental ResearchInstitute, Roskilde, Denmark available at (www2.dmu.dk/1_viden/2_Publikationer/3_fagrapporter/rapporter/FR321.PDF) accessed 1 September 2014
Buller H, Wilson G and Höll A 2000 Agri-Environmental Policy inthe European Union (Famham: Ashgate) p 291
Carter N 2007 The Politics of the Environment. Ideas, Activism,Policies 2nd edn (Cambridge: Cambridge UniversityPress) p 410
Chirinda N, Carter M S, Albert K R, Ambus P, Olesen J E,Porter J R and Petersen S O 2010 Emissions of nitrous oxidefrom arable organic and conventional cropping systems on twosoil types Agric. Ecosyst. Environ. 136 199–208
Christensen J H 1997 The Danish Eulerian hemispheric model—athree-dimensional air pollution model used for the ArcticAtmos. Environ. 31 4169–91
CLRTAP 1979 1979 Convention on Long-range TransboundaryAir Pollution (Geneva: United Nations Economic Commissionfor Europe) p 7 available at (www.unece.org/env/lrtap/),accessed 1 September 2014
13
Environ. Res. Lett. 9 (2014) 115002 T Dalgaard et al
Dalgaard T et al 2012 Farm nitrogen balances in EuropeanLandscapes Biogeosciences 9 5303–21
Dalgaard T et al 2014 DNMARK: Danish nitrogen mitigationassessment: research and know-how for a sustainable, low-nitrogen food production Chapter Submitted to the BookPublication after the N2013 Conference (Berlin:Springer) p 12
Dalgaard T, Børgesen C D, Hansen J F, Hutchings N J,Jørgensen U and Kyllingsbæk A 2005 How to half N-losses,improve N-efficiencies and maintain yields? The Danish Case3rd Int. Nitrogen Conf. Contributed Papers ed Z Zhu,K Minami and G Xing (Monmouth Junction, NJ: SciencePress) pp 291–6
Dalgaard T, Guul-Simonsen F, Kjeldsen C and Liboriussen T 2009Det moderne landbrug (Modern agriculture) ed O Høiris andT Ledet Modernitetens Verden. Natur, Menneske, Samfund,Kunst og Kultur (Aarhus, Denmark: Aarhus University Press)pp 423–42
Dalgaard T, Hutchings N, Dragosits U, Olesen J E, Kjeldsen C,Drouet J L and Cellier P 2011a Effects of farm heterogeneityand methods for upscaling on modelled nitrogen losses inagricultural landscapes Environ. Pollut. 159 3183–92
Dalgaard T and Kyllingsbæk A 2003 Developments in the nitrogensurplus and the fossil energy use in Danish agriculture duringthe 20th century ed J L Usó, B C Patten and C A BrebbiaAdvances in Ecological Sciences vol 18 (Southampton: WITPress) pp 669–78
Dalgaard T, Olesen J E, Petersen S O, Petersen B M, Jørgensen U,Kristensen T, Hutchings N J, Gyldenkærne S andHermansen J E 2011b Developments in greenhouse gasemissions and net energy use in Danish agriculture—How toachieve substantial CO2 reductions? Environ. Pollut. 1593193–203
Dam P and Jakobsen J G G 2008 Historisk-Geografisk Atlas edJ Brandt, R Guttesen, P Korsgaard, B Hermansen,T Dalgaard and A og Reenberg Atlas over Danmark odense:Det Kongelige Danske Geografiske Selskab ogGeografforlaget p 179
De Roos A J, Ward M H, Lynch C F and Cantor K P 2003 Nitrate inpublic water supplies and the risk of colon and rectum cancersEpidemiology 14 640–9
DLR 1990 Landbrugshåndbog 1990 (Copenhagen: DanskLandbrugs Realkreditfond) p 216
DNMARK 2014 Danish Nitrogen Assessment, Strategic ResearchAlliance Innovative Solutions for a Sustainable Management ofNitrogen in Agriculture available at (http://dnmark.org/wp-content/uploads/2013/12/DNMARK_UK_tryk.pdf) and(www.dNmark.org) (Aarhus: Aarhus University) p 8
Ellermann T, Andersen H V, Bossi T, Christensen J H, Løfstrøm P,Monies C, Grundahl L and Geels C 2010 AtmosfæriskDeposition 2009, NOVANA Scientific Report no 801 fromNational Environmental Research Institute Aarhus Universityp 95 available at (www2.dmu.dk/Pub/FR801.pdf), accessed 1September 2014
Ellermann T, Andersen H V, Bossi R, Christensen J, Løfstrøm P,Monies C, Grundahl L and Geels C 2012 Atmosfæriskdeposition 2011 (Atmospheric Deposition 2011) NOVANAScientific Report no 30 from DCE National Center forEnvironment and Energy Aarhus University p 82 available at(www2.dmu.dk/pub/sr30.pdf), accessed 1 September 2014
Ellermann T, Andersen H V, Bossi R, Christensen J H, Løfstrøm P,Monies C, Grundahl L and Geels C 2013 Atmosfæriskdeposition 2012 (atmospheric deposition 2012) NOVANAScientific Report no 73 from DCE National Center forEnvironment and Energy Aarhus University p 85 available at(http://dce2.au.dk/pub/SR73.pdf), accessed 1 September 2014
FAO 2014 FAOSTAT, Food and Agriculture Organization of theUnited Nations Statistics Country Profile for Denmark (Rome:
FAO) available at (www.fao.org/countryprofiles/index/en/?iso3=DNK), accessed 21 September 2014
FRJOR 2014 Research Register for Agriculture (DetForskningsrelaterede Jordbrugsregister, FRJOR) AarhusUniversity, Department of Agroecology
Frohn L M, Christensen J H, Brandt J and Hertel O 2001Development of a high resolution integrated nested model forstudying air pollution in Denmark Phys. Chem. Earth B—Hydrol. Oceans Atmos. 26 769–74
Geels C et al 2012 A coupled model system (DAMOS) improves theaccuracy of simulated atmospheric ammonia levels overDenmark Biogeosciences 9 2625–47
Grant R, Blicher Mathiesen G, Andersen H E, Berg P,Jensen P G and Laubel A R 1995 Landovervågningsoplande1994 (Environmental Land Monitoring Program 1994)Vandmiljøplanens Overvågningsprogram, Faglig rapport fraDMU. No 141 p 140 available at (www2.dmu.dk/1_viden/2_Publikationer/3_fagrapporter/rapporter/FR141.pdf),accessed 1 September 2014
Grant R and Waagepetersen J 2003 Vandmiljøplan II—slutevaluering (aquatic action plan II—final evaluation)Report National Environmental Research Institute, SilkeborgDecember 2003 p 32 available at (www.vmp3.dk/Files/Filer/Slutrapporter/VMPII_Slutevaluering_web.pdf), accessed 1September 2014
Gu B, Zhu Y, Chang J, Peng C, Liu D, Min Y, Luo W,Howarth R W and Ge Y 2011 The role of technology andpolicy in mitigating regional nitrogen pollution Environ. Res.Lett. 6 014011
Hansen B, Dalgaard T, Thorling L, Sørensen B and Erlandsen M2012 Regional analysis of groundwater nitrate concentrationsand trends in Denmark in regard to agricultural influenceBiogeosciences 9 3277–86
Hansen B and Thorling L 2008 Use of geochemistry in groundwatervulnerability mapping in Denmark Geol. Surv. DenmarkGreenland Bull. 15 45–8
Hansen B, Thorling L, Dalgaard T and Erlandsen M 2011 Trendreversal of nitrate in Danish groundwater—a reflection ofagricultural practices and nitrogen surpluses since 1950Environ. Sci. Technol. 45 228–34
Hertel O et al 2012 Governing processes for reactive nitrogencompounds in the European atmosphere Biogeosciences 94921–54
Hertel O, Geels C, Frohn L M, Ellermann T, Skjøth C A,Løfstrøm P, Christensen J H, Andersen H V and Peel R G2013 Assessing atmospheric nitrogen deposition to natural andsemi-natural ecosystems—experience from Danish studiesusing the DAMOS Atmos. Environ. 66 151–60
Hertel O, Skjøth C A, Løfstrøm P, Geels C, Frohn L M,Ellermann T and Madsen P V 2006 Modelling nitrogendeposition on a local scale—a review of the current state of theart Environ. Chem. 3 317–37
Hinsby K, Purtschert R and Edmunds W M 2008 Groundwater ageand quality ed P Quevauviller Groundwater Science andPolicy—An International Overview (Cambridge: RSCPublishing) pp 217–39
Højmark J V and Fogh H T 1977 Nedvaskning af kvælstof ogeftergødskning af byg på sandjord 1977 StatensPlanteavlsforsøg, Medd. 1382 2
Hutchings N J, Nielsen O K, Dalgaard T, Mikkelsen M H,Børgesen C D, Thomsen M, Ellermann T, Højberg A L,Mogensen L and Winther M 2 014 A nitrogen budget forDenmark; developments between 1990 and 2010, andprospects for the future Environ. Res. Lett. (submitted to thepresent focus issue)
Jacobs M 2013 Green growth: economic theory and politicaldiscourse Handbook of Global Climate and EnvironmentalPolicy ed R Falkner (Chichester: Wiley Blackwell) p 546
14
Environ. Res. Lett. 9 (2014) 115002 T Dalgaard et al
Jacobsen B H 2004 Økonomisk slutevaluering of vandmiljøplan II(final economic evaluation of the Action Plan for the AquaticEnvironment II) Report no. 169 (Copenhagen: Danish Instituteof Food Economics)
Jacobsen B H 2009 Farm economic consequences of the waterframework directive in Europe J. Farm Manage. 13 687–96
Jacobsen B H 2012a Analyse af Omkostningerne Ved En YderligereReduktion Af N-Tabet Fra Landbruget Med 10.000 tons N.Notat Til N-Udvalget (Analyses of Further Reduction Cost forReducing N Loss From Danish Agriculture by 10 000 ton)FOI Udredning nr 2012/26 (Copenhagen: Department of Foodand Resource Economics) p 91 available at (http://curis.ku.dk/ws/files/45184163/FOI_Udredning_2012_26.pdf), accessed 1September 2014
Jacobsen B H 2012b Analyse Af Landbruget Omkostninger VedImplementering Af Kvælstofreduktionen I Vandplanerne Fra2011 (Analysis of Agricultural Costs of Implementing NReduction in Danish Aquatic Action Plans 2011) FOIUdredningsnotat 2012/6 (Copenhagen: Department of Foodand Resource Economics) p 91 available at (http://curis.ku.dk/ws/files/40739929/FOI_udredning_2012_6.pdf accessed 1September 2014)
Jacobsen B H 2012c Reducing ammonia emission in Europe—cost,regulation and targets with focus on Denmark J. Agric. Sci.Technol. A 2 285–93
Jacobsen B H, Abildtrup J, Andersen J M, Christensen T, Hasler B,Hussain Z B, Huusom H, Jensen J D, Schou J S and Ørum J E2004 Omkostninger ved reduktion af landbrugetsnæringsstoftab til vandmiljøet (Costs of reducing nutrient lossfrom agriculture to the aquatic environment) Report no 167,(Copenhagen: Department of Food and Resource Economics)299 available at (www.vmp3.dk/Files/Filer/Rap_fra_t_grupper/Ny_rapport_167.pdf), accessed 1September 2014
Jacobsen T, Refsgaard A, Jacobsen B H and Ørum J E 2007Integrated modelling of nitrate loads to coastal waters and landrent applied to catchment scale water management Water Sci.Technol. 56 39–47
Jensen O M 1982 Nitrate in drinking water and cancer in NorthernJutland, Denmark, with special reference to stomach cancerEcotox. Environ. Saf. 6 258–67
Jensen P N et al 2012 Vandmiljø og Natur 2011 NOVANA Tilstandog udvikling—faglig sammenfatning (Aquatic environmentand nature: 2011 Status and development—summary) DCEReport no 36 Danish Center for Environment and Energy,Aarhus University, Denmark available at (www2.dmu.dk/pub/sr36.pdf), accessed 1 September 2014
Kjaergaard T 1994 The Danish Revolution, 1500-1800 AnEcohistorical Interpretation (Cambridge: CambridgeUniversity Press) p 314
Kronvang B, Andersen HE, Børgesen CD, Dalgaard T, Larsen SE,Bøgestrand J and Blicher-Mathiasen G 2008 Effects of policymeasures implemented in Denmark on nitrogen pollution ofthe aquatic environment Environ. Sci. Policy 11 144–52
Kyllingsbæk 2000 Kvælstofbalancer og kvælstofoverskud i dansklandbrug 1979–1999 (Nitrogen balances and surplus in Danishagriculture 1979–1999) DJF Markbrug Report nr 36 DanishInstitute of Agricultural Sciences, Foulum, Denmark availableat (http://pure.agrsci.dk:8080/fbspretrieve/458542/djfm36.pdf),accessed 1 September 2014
Laier T 2005 Nitrate monitoring and CFC-age dating of shallowgroundwaters—an attempt to check the effect of restricted use offertilizers Nitrates in Groundwater, International Associations ofhydrogeologists selected papers ed L Razowska-Jaworek andA Sadurski (London: A. A. Balkema Publishers) chapter 24
MAFF 2004 Vejledning Om Særligt Følsomme Landbrugsområder(SFL-områder)—Udpegning Samt Registrering i MVJ-TAS(Guide on environmentally vulnerable agricultural areas)
(Copenhagen, Denmark: Ministry of Food, Agriculture andFisheries)
MAFF 2013 Vejledning Om gødnings- Og Harmoniregler (Guideon F and Harmonisation Regulations) (Copenhagen,Denmark: The Danish Agrifish Agency, Ministry of Food,Agriculture and Fisheries) p 150
Mikkelsen S, Iversen T M, Jacobsen B H and Kjær S S 2010Danmark—Europe Reducing nutrient losses from intensivelivestock operations ed P Gerber, H Mooney and J DijkmanLivestock in a Changing Landscape vol 2: Experiences andRegional Perspectives Chapter 8 pp 140–53 (Washington, DC:Island Press) p 208
Nielsen O K et al 2011 Annual Danish informative inventory reportto UNECE emission inventories from the base year of theprotocols to year 2009 Scientific Report no 821 from NERI,Roskilde, Denmark: Aarhus University p 601 available at(www2.dmu.dk/pub/fr821.pdf), accessed 1 September 2014
Nielsen O K et al 2013 Denmark’s National Inventory Report2013 Emission Inventories 1990–2011—Submitted under theUnited Nations Framework Convention on Climate Changeand the Kyoto Protocol Aarhus University, DCE—DanishCentre for Environment and Energy p 1202 Scientific Reportno 56 from DCE—Danish Centre for Environment andEnergy available at (www2.dmu.dk/pub/sr56.pdf), accessed1 September 2014
Nielsen O K, Plejdrup M, Hjelgaard K, Nielsen M, Winther M,Mikkelsen M H, Albrektsen R, Fauser P, Hoffmann L andGyldenkærne S 2013b Projection of SO2, NOx, NMVOC, NH3
and particle emissions—2012–2035 Aarhus University, DCE—Danish Centre for Environment and Energy, 151 ppTechnical Report from DCE—Danish Centre for Environmentand Energy No 81 Available at (www.dce2.au.dk/pub/SR81.pdf), accessed September 2014
Odgaard B V and Rømer J R (ed) 2009 DanskeLandbrugslandskaber Gennem 2000 år. Fra Digevoldinger TilStøtteordninger pp 253–81 (Aarhus: Aarhus UniversityPress) p 301
OECD 2000 Environmental Indicators for Agriculture: Methods andResults, Executive Summary (OECD) p 22
OECD 2011 A Green Growth Strategy for Food and AgriculturePreliminary Report OECD p 82 available at (www.oecd.org/greengrowth/sustainable-agriculture/48224529.pdf), accessed1 September 2014
OSPAR 1992 Convention for the Protection of the MarineEnvironment of the North–East Atlantic (London: OSPARSecretariat) available at (www.ospar.org) p 33
Parajuli R, Dalgaard T, Knudsen M T, Birkved M, Hermansen J E,Jørgensen U, Adamsen A P, Gylling M and Schjørring J K2014 Biorefining in the prevailing energy and material crisis: areview on sustainable pathways for biorefinery value chainsand sustainability assessment methodologies Renew. Sust.Energy Rev. (in press)
Petersen C A, Hansen B, Thorling L and Dalgaard T 2014 Hvorforstoppede stigningen i nitrat i det nydannede grundvand førvandmiljøplanerne? Vand og Jord 4 (in press)
Petersen J and Sørensen P 2008 Fertilizer value of nitrogen in animalmanures—basis for determination of a legal substitution rateReport DJF Markbrug 138
Plejdrup MS and Gyldenkaerne S 2011 Spatial distribution ofemissions to air—the SPREAD model NERITechnical Reportno 823, National Environmental Research Institute, Denmark:Aarhus University p 72 available at (www2.dmu.dk/Pub/FR823.pdf), accessed 1 September 2014
Rees R M et al 2013 Nitrous oxide emissions from Europeanagriculture; an analysis of variability and drivers of emissionsfrom field experiments Biogeosciences 10 2671–82
Refsgaard J C et al 2014 Nitrate reduction in geologicallyheterogeneous catchments—a framework for assessing the
15
Environ. Res. Lett. 9 (2014) 115002 T Dalgaard et al
scale of predictive capability of hydrological models Sci. TotalEnviron. 468–469 1278–88
Schullehner J and Hansen B 2014 Nitrate exposure from drinking waterin Denmark over the last 35 years Environ. Res. Lett. 9 095001
Skjøth C A, Hertel O, Gyldenkærne S and Ellermann T 2004Implementing a dynamical ammonia emissionparameterization in the large-scale air pollution model ACDEPJ. Geophys. Res.—Atmos. 109 D06306
Skriver K 1978 Gødskning og kalkning (Fertilisatio and liming)Oversigt over forsøg og undersøgelser i Landbo- ogHusmandsforeningerne ed J Olesen (Aarhus: Landskontoretfor Planteavl) pp 100–24
Skriver K 1989 Aktion for bedre udnyttelse af husdyrgødninggennem en forstærket og koordineret rådgivningsindsats. Brevper 16/1 1989, KS/LL/4251P (Aarhus: Landskontoret forPlanteavl)N. 3
Sommer S G, Østergård H S, Løfstrøm P, Andersen H V andJensen L S 2009 Validation of model calculation of ammoniadeposition in the neighbourhood of a poultry farm usingmeasured NH3 concentrations and N deposition Atmos.Environ. 43 915–20
Statistics Denmark 1968 Agricultural Statistics 1900–1965 vol I,Agricultural Area and Harvest and Utilization of FertilizersStatistiske Undersøgelser no 22 (Copenhagen: Statistics Denmark)
Statistics Denmark 1969 Agricutural Statistics 1900–1965 vol IILivestock and Livestock Products and Consumption of FeedingStuffs Statistiske Undersøgelser no 25 (Copenhagen: StatisticsDenmark)
Statistics Denmark 1961–2012 Agricultural Statistics. Statistics onAgriculture, Gardening and Forestry (Copenhagen: Annualpublication publications from Statistics Denmark)
Stern N 2007 The Economics of Climate Change: The Stern Review(Cambridge: Cambridge University Press ) p 712
Sutton M A, Oenema O and Dalgaard T 2014 Preface: Nitrogen onthe table: the influence of food choices on nitrogen emissionsand the European environment ENA Special Report onNitrogen and Food The Food Climate Research Network edH Westhoek, J P Lesschen, T Rood, S Wagner, A Leip,A De Marco, D Murphy-Bokern, M A Sutton and O Oenema(Oxford: University of Oxford)
Sutton M, Howard C M, Erisman J W, Billen G, Bleeker A,Grennfelt P, van Grinsven H and Grizetti B (ed) 2011 TheEuropean Nitrogen Assessment Sources, Effects and PolicyPerpectives (Cambridge: Cambridge University Press) p 664available at (www.nine-esf.org/ENA-Book), accessed 1September 2014
Taghizadeh-Toosi A, Olesen J E, Kristensen K, Elsgaard L,Østergaard H S, Lægdsmand M, Greve M H andChristensen B T 2014 Changes in carbon stocks of Danishagricultural mineral soils during 1986–2009: effects ofmanagement Eur. J. Soil Sci. in press doi:10.1111/ejss.12169
The Commission on Nature and Agriculture 2013 Richer nature,new environmental regulation and new growth opportunitiesfor agriculture Executive summary The Danish Commission onNature and Agriculture, Copenhagen available at (www.naturoglandbrug.dk)
The Council of the European Communities 1991 Council Directiveof 12 December 1991 Concerning the protection of watersagainst pollution caused by nitrates from agricultural sources(91 /676/EEC) Off. J. Eur. Comm. No L 375/1
The European Parliament and the Council of the European Union2000 Directive 2000/60/EC of the European Parliament and ofthe Council of 23 October 2000 establishing a framework forCommunity action in the field of water policy Off. J. Eur.Comm. L 327/1
The European Parliament and the Council 2008 Directive 2008/56/EC of the European Parliament and the council establishing aframework for community action on the field of marineenvironmental policy (Marine Strategy Framework Directive)Off. J. Eur. Comm. L 164/19
The Helsinki Commission 2008 Convention on the Protection of theMarine Environment of the Baltic Sea Area, 1992 Markets ofconcentration permits: the case of manure policy (Helsinki,Finland: HELCOM Secretariat) p 43
Thomsen R, Søndergaard V H and Sørensen K I 2004Hydrogeological mapping as a basis for establishing site-specific groundwater protection zones in DenmarkHydrogeology J. 12 550–62
Thomsen I K, Petersen B M, Bruun S, Jensen L S andChristensen B T 2008 Estimating soil C loss potentials fromthe C to N ratio Soil Biol. Biochem. 40 849–52
Van der Straeten B, Buysse J, Nolte S, Lauwers L, Claeys D andHuylenbroeck G van 2011 Markets of concentration permits:the case of manure policy Ecol. Econ. 70 2098–104
van Grinsven H J M et al 2012 Management, regulation andenvironmental impacts of nitrogen fertilization in northwesternEurope under the Nitrates Directive; a benchmark studyBiogeosciences 9 5143–60
van Grinsven H J M, Rabl A and de Kok TM 2010 Estimation ofincidence and social cost of colon cancer due to nitrate indrinking water in the EU: a tentative cost-benefit assessmentEnviron. Health 9 58
Vinther F P and Olsen P 2013 Næringsstofbalancer ognæringsstofoverskud i landbruget 1991/92–2011/12 (Nutrientbalances and surplus in Danish agriculture 1991/92–2011/12)DCA—Report 06/2013; Foulum: Aarhus University p 25available at (http://pure.au.dk/portal/files/56329476/NPK_1991_92_2011_netfil.pdf), accessed 1 September 2014
Ward M J, de Kok T M Levallois P, Brender J, Gulis G,Nolan B T and VanDerslice J 2005 Workgroup report:drinking-water nitrate and health—recent findings and researchneeds Environ. Health Perspect. 113 1607–14
Wiberg-Larsen P et al 2013 Vandløb 2012 NOVANA AarhusUniversitet, DCE—Nationalt Center for Miljø og Energi, 84 s—Videnskabelig rapport fra DCE—Nationalt Center for Miljøog Energi nr 75 (http://dce2.au.dk/pub/SR75.pdf), accessed 8September 2014
Windolf J, Thodsen H, Troldborg L, Larsen S E, Bøgestrand J,Ovesen N B and Kronvang B 2011 A distributed modellingsystem for simulation of monthly runoff and nitrogen sources,loads and sinks for ungauged catchments in DenmarkJ. Environ. Monit. 13 2645–58
16
Environ. Res. Lett. 9 (2014) 115002 T Dalgaard et al


