Embed Size (px)
Citation preview

1
Long Range Coupling between Metallic Nanocavities
Adi Salomon1,2 and Yehiam Prior1
1Department of chemical physics, Weizmann Institute of Science, Rehovot, Israel 2Department of Chemistry, Institute of Nanotechnology and Advanced Materials,
Bar Ilan University, Raman Gan, Israel
Michael Fedoruk3 and Jochen Feldmann3
3Department of Physics, Ludwig‐Maximilians‐Universtität München,
Munich, Germany
Radoslaw Kolkowski4,5 and Joseph Zyss5
4Laboratoire de Photonique Quantique et Moleculaire, Institut d’Alembert, Ecole Normale Supérieure de Cachan, France
5Institute of Physical and Theoretical Chemistry, Faculty of Chemistry, Wroclaw University of
Technology, Poland
When two or more metallic nanoparticles are in close proximity, their plasmonic modes
may interact through the near field, leading to additional resonances of the coupled
system or to shifts of their resonant frequencies. [1‐10] This process is analogous to
atom‐hybridization, as had been proposed by Gersten and Nitzan[11] and modeled by
Nordlander et al.[9]. The coupling between plasmonic modes can be in‐phase
(symmetric) or out‐of‐phase (anti‐symmetric), reflecting correspondingly, the ‘bonding’
and ‘anti‐bonding’ nature of such configurations[12‐14]. Since the incoming light
redistributes the charge distribution around the metallic nanoparticles, its polarization
features play a major role in the nonlinear optical probing of the energy‐level landscape
upon hybridization [1, 15]. Thus, controlling the nature of coupling between metallic
nanostructures is of a great importance as it enables tuning their spectral responses
leading to novel devices which may surpass the diffraction limit.

2
Nanocavities (nanoholes carved in a thin metal film) can be viewed as complementary
to nanoparticles and their respective linear optical responses are related by Babinet’s
principle[16]. However, when the interaction between neighboring structures is
discussed, a fundamental difference exists between nanocavities and nanoparticles. The
interaction between individual nanoparticles decays rapidly (typically within tens of
nanometers). However, in the case of nanocavities, propagating surface plasmons
polaritons (SPP), which are supported by the metallic film between the nanocavities,
provide a channel for long‐range coupling between the nanocavities, and therefore,
fundamentally changing the interaction picture. This additional coupling mechanism
offers a way to modulate the linear and nonlinear responses of such nanostructures and
may lead to a strong amplification of the observed signal.
The coupling between metallic nanostructures (nanocavities or nanoparticles), in
particular its polarization properties, can be ideally probed by nonlinear optical
measurements. In particular, , second harmonic generation (SHG) [17, 18] offers two
benefits: it is the lowest order nonlinear optical mechanism and it is highly sensitive to
symmetry disruption as opposed to linear or cubic processes, which are less prone to
reflect symmetry changes. More specifically, the dependence of SHG responses on the
polarization of the incident beam provides a direct information about the properties of
the second order susceptibility tensor ijk(2) which critically depends on the structure
symmetry and the charge distribution at the metallic nanostructure surface. [19‐21]
Being a coherent process, SHG, can provide important information about the nature of
interaction between participating oscillating dipoles. More explicitly, if all the dipoles
emanating from the metallic nanostructures are in phase, we expect high directionality
of the SH emission. In addition, the SH intensity scales with N2, where N is the number
of the metallic nanostructures and therefore when all are coherently emitting, the signal
is highly amplified. An incoherent process, on the other hand, scales linearly with the
number of participating entities. However, generation of a coherent SH response from
an ensemble of metallic nanostructures (particles or holes) is a challenging task. One of
the reasons is that the SH responses arising from surface defects or the host material

3
may overwhelm the intrinsic signal of the metallic nanostructures, eventually resulting
in phase randomization of the emitted dipoles and relatively low signals. Thus, the
overall SH emission from an ensemble of metallic nano structures usually refers to the
incoherent process rather than to the coherent one.
Herein we report on the coherent coupling between plasmonic modes of triangular
cavities, which are arranged in a line and are separated by hundreds of nm. We compare
their nonlinear response to that of a complementary row of triangular nanoparticles of
identical shape, size and structure. The interaction is characterized by measuring the
SHG response at different polarizations of the input beam. This NLO based approach is
further complemented by additional linear dark field measurements. We show that
while coupling between the nanocavities induces a strong anisotropy in the SHG
emission, such is not the case for nanoparticles. For identical geometrical parameters,
no coupling is observed in the case of nanoparticles, thus breaking the often postulated
complementary between cavities and particles.
We chose to concentrate on equilateral triangular nanostructures, cavities or particles.
[22] This choice leads to a striking difference between the SHG responses of an
individual triangle which has a threefold symmetry, as compared to a chain of three
triangular structures, abiding to a lower symmetry only when coupled. Without
coupling, their behavior mimics that of an individual triangular structure.
The samples consist of equilateral triangular nanocavities drilled in a thin silver film and
their complementary structures, triangular silver nanoparticles, all of a typical side
length of 200nm (see figures 1a,b). The triangular cavities/particles are arranged in a
linear configuration separated by a distance of about 400 nm (figures 2a,e).
We first study the nonlinear (SHG) response of individual triangular nanostructures
(particle and cavity) as a function of the polarization of the incoming beam. The results
are presented in Figure 1. The total SHG emission intensity patterns for both individual
triangular nanoparticle and nanocavity structures are barely dependent on the input

beam
com
Figu
nano
with
(c‐d)
pola
Next
thes
the
and
distr
com
distr
nan
almo
two
m polarizat
mplementary
re 1: SEM
ostructures a
side length
) are the cor
rization of th
t we study
se nanostru
assembly g
its emissio
ribution of
mplementary
ribution of
oparticles i
ost uniform
orthogona
tions. Thus
y structures
M images o
and their co
of ~200nm.
rresponding
he incoming
the SHG re
ctures are c
governing th
on pattern
f the SHG
y nanostruc
the SHG i
is shown in
mly spread,
l incoming
no directio
s display a si
of triangula
rresponding
(b) A triang
polar plots o
beam.
sponse of a
coupled and
heir overall
s should c
responses
ctures, trian
intensity un
n Figures.2b
and there i
polarization
onality of t
imilar quasi
ar nanopart
g SHG emissi
ular nanocav
of the SHG to
a linear cha
d behave as
response i
change acco
s at two o
gular cavitie
nder those
b & 2c. In
s very little
ns. Howeve
the SHG em
‐isotropic b
icle and na
on patterns.
vity with the
otal emissio
in of three
s a single en
is then red
ordingly. F
orthogonal
es and parti
two ortho
both cases
e difference
er, for nano
mission is o
behavior [23
anocavity a
. (a) A trian
same geom
n patterns a
triangular n
ntity, the glo
uced and t
igure 2 de
polarizatio
icles respec
ogonal pola
s the inten
between e
ocavities (Fi
observed an
3] .
as complem
ngular nanop
etrical dimen
s a function
nanostructu
obal symme
he SHG res
epicts the s
ons for the
tively. The s
arizations fo
sity seems
excitations b
gures 2f &
4
nd the
mentary
particle
nsions.
of the
ures. If
etry of
sponse
spatial
e two
spatial
or the
to be
by the
2g), a

dram
pola
axis)
inte
evid
Figu
trian
nano
nano
pola
emis
pola
show
for b
To
thei
The
inte
cavit
matic chang
arization is
). When th
nsity much
dencing a dif
re 2: SHG re
ngular nano
oparticles wi
ocavities stru
rization alo
ssion(d). Co
rization alon
wing a highly
both cases.
further cha
r complete
nanoparti
nsities for
ty. Howev
ge in the S
pointing alo
he input po
higher, but
fferent beha
esponses as a
oparticles an
ith side lengt
uctures (e).
ng the X‐ax
rresponding
ng the X an
y anisotropic
aracterize t
dependenc
cles (figure
all input po
ver, the nan
HG respons
ong the co
olarization i
t also it is s
avior for the
a function o
nd nanocav
th of 200nm
Scanned ima
xis (b), and
scanned im
d Y axes (f
c emission pa
he polariza
cies on the
e 2d) disp
olarization d
nocavities (f
ses is obse
mmon two
s along the
spatially co
e system.
f the polariz
vities. (a)
m and separa
age of the SH
d along the
age of the S
and g) and
attern. The f
ation prope
input beam
play an alm
directions a
figure 2h) d
rved depen
‐fold (Y‐axi
eir common
ncentrated
zation of the
) SEM imag
ation of ~400
HG emission
Y‐axis(c) a
SHG emission
d their cor
fundamental
rties of suc
m polarizati
most unifo
as for an is
display a ve
nding on w
s) or perpe
n axis, not
at the mid
e incoming b
ge of a tri
0nm, and the
of nanopart
and their co
n of nanocav
responding
beam wave
ch structure
on angles (
rm signatu
olated trian
ery differen
whether the
endicular to
only is the
dle triangle
beam for trip
plet of tria
eir complem
ticles with in
orresponding
vities with in
total emissio
elength was 9
es, we mea
from 0° to
ure, with s
ngular parti
t behavior
5
input
o it (X‐
e SHG
e, thus
plets of
angular
mentary
ncident
g total
ncident
on (h),
940nm
asured
360°).
similar
icle or
and a

clea
plas
4‐5)
com
In ad
resp
Figu
beam
(ang
betw
Figu
inco
200n
of SH
clear
bar i
rly anisotro
monic mod
is observe
mmon Y‐axis
ddition, the
ponse of ‘c
ure 3 shows
m is set al
gle) of the ‘
ween the th
re 3: SHG re
ming beam.
nm and sepa
HG emission
rly observed
is 5 micron.
opic dipolar
des localized
ed when th
as compare
e anisotropy
oupled’ cav
s the change
ong the X‐
‘coupled’ ca
hree cavities
esponses of
. (a) SEM
ration of ~40
with incide
. The funda
emission is
d on cavities
e triangular
ed to the X‐
y is demons
vities arran
e in the SHG
axis. The S
avities with
s when prop
the triangu
image of a
00nm arrang
nt polarizatio
mental beam
s observed,
s. Moreove
r cavities a
‐ axis.
strated in a
ged along
G response
SHG respon
respect to
perly aligned
lar nanocav
triplet of tr
ged in a rainb
on along the
m wavelengt
revealing s
r, a higher e
re excited
nice pictor
a circle, po
when the
se clearly d
the x‐axis,
d.
ities triplets
iangular nan
bow like conf
e X‐axi with
h was 940nm
strong coup
emission lev
by light po
rial way by s
ointing tow
polarization
depends on
indicating s
s for x‐axis p
noparticles w
figuration (b)
the suppress
m for both c
pling betwee
vel (by a fac
larized alon
scanning th
wards the c
n of the inc
n the orien
stronger co
polarization
with side len
). A scanned
sed/enhance
ases, and th
6
en the
ctor of
ng the
e SHG
center.
oming
ntation
oupling
of the
ngth of
d image
ed SHG
e scale

In o
of lu
show
peak
spec
spec
pola
with
high
the
Figu
of a
– inc
blue
Y axi
The
diffe
resp
nano
emis
resu
phas
Counts/sec
rder to con
uminescenc
wn in Figur
king exactly
ctra, a clear
ctrum obs
arizations. I
h Figure 2. I
her by facto
X‐axis, in ag
re 4: SHG em
triplet of tria
coming beam
curve, incom
is. See text fo
observed
erent physic
pond as in
ocavities re
ssion. The
ulting in an
se and resp
firm that a
e or fluores
e 4. For bo
y at the seco
r and unam
erved from
n this case
n the case o
or ~5 when
greement w
mission spec
angular nano
m polarized a
ming beam p
or a discussio
SHG respo
cal mechani
dividual pa
spond as a
original th
anisotropic
pond at unis
pure SHG s
scence [24],
oth nanopar
ond‐harmon
mbiguous sp
m triangul
e, both pola
of the nano
excited alo
with the resu
ctra when ex
oparticles; bl
along the Y a
polarized alo
on of the res
onse of th
isms are inv
articles whe
single entity
hree‐fold sy
c dipolar SH
son as a sing
signal was o
, the spectr
rticles and
nic frequenc
pectral signa
lar nanopa
arizations e
ocavities, ho
ong the com
ults already
xcited at 940
ue curve, inc
axis. (b) Spec
ng the X axis
ults.
e two com
volved in ea
ere no inte
y with a mu
ymmetry of
HG emission
gle dipole.
Counts/sec
observed ra
ra of the em
nanocavitie
cy is the on
ature of SH
articles ex
exhibit simi
owever, the
mmon axis (
shown.
0nm fundam
coming beam
ctrum of a tri
s, red – inco
mplementar
ach case. W
eraction is
uch stronger
f the triang
n pattern, w
ther than a
mitted light
es, a narrow
ly compone
G. Figure 4
cited by
lar intensiti
SHG intens
(Y‐axis) com
ental wavele
m polarized a
iplet of trian
ming beam p
ry structure
While the th
coupling
r, spatially c
ular cavity
where all th
any contrib
was measu
w linewidth
ent present
a shows th
two ortho
ies in agree
sity (Figure.
mpared to t
ength (a) Spe
long the X ax
gular nanoca
polarized alo
es indicates
ree nanopa
them, the
concentrate
is then low
he cavities a
7
utions
red as
signal
in the
e SHG
ogonal
ement
4b) is
that of
ectrum
xis, red
avities;
ong the
s that
articles
three
ed SHG
wered,
are in‐

To f
wer
indiv
inse
is m
Whe
obse
refle
shift
shift
the
prob
shift
mod
Figu
(blac
blue
blue
wave
pola
further conf
e performe
vidual trian
nsitive to th
measured, th
en the incid
erved, one
ect the σ a
ted mode c
ted mode m
hybridizatio
bed by light
ted peak at
de is not res
re 5: Scatte
ck line), and
line depicts
line is for a
elength used
rizations is id
firm couplin
d by dark f
ngular cavit
he polarizat
he spectrum
dent light is
at about 9
nd σ* state
can be iden
may be ident
on model bo
t that is po
t about 875
solved in the
ring spectra
d a triplet of
s the measur
n input pola
d in our nonl
dentical.
ng between
ield microsc
ties the pl
tion of the
m is very se
polarized a
05nm and
es in the h
ntified as th
tified as the
oth modes
olarized per
5nm, which
ese measur
a obtained b
f triangular
rement for a
arization perp
inear experim
n the nanoc
copy. Figure
lasmonic m
incoming lig
ensitive to t
along the co
the other a
ybridization
he in‐phase
e σ* out‐of‐
are observe
rpendicular
h is probab
ements.
by dark field
nanocavities
an input pola
pendicular to
ments, the s
avities, line
e 5 depicts
mode appea
ght. Howev
the polariza
ommon trip
at about 77
n model, w
e σ mode, w
phase mod
ed.[1, 25] W
to the trip
ly the out‐
d microscopy
s (solid and
arization alo
o the triplet
cattering fro
ear scatterin
the main o
ars around
ver, when a
ation of the
plet axis, tw
75nm. These
here the m
while the le
e. Note tha
When the tr
plet axis we
of‐phase π
y for isolate
dashed blue
ong the triple
axis. Note t
om the triple
ng measure
bservations
d 800nm, a
triplet of ca
e incoming
o main pea
e two peak
more intens
ess intense
at as describ
iplet of cav
e observed
mode . T
ed triangular
e lines). Th
et axis, the d
hat at 940 n
t intensity fo
8
ments
s. For
and is
avities
beam.
aks are
ks may
e red‐
e blue‐
bed by
ities is
a red‐
The π*
r holes
e solid
dashed
nm, the
or both

9
The measured linear spectra confirm previously reported measurements on
nanoparticles, whereby strong coupling leads to splitting and shifts of the spectral lines.
It supports our conclusion of strong coupling between the plasmonic modes of these
triangular cavities. Furthermore, it reaffirm our observation of the long range coupling
for nanocavities as opposed to the known short range plasmonic coupling of metallic
nanoparticles. Unlike the case of nanoparticles, we are able to probe here also the so‐
called dark modes (σ*), which is slightly blue shifted with respect to individual modes.
The single peak which is observed for the orthogonal polarization is red shifted rather
than blue shifted as already observed for nanoparticles.
When it comes to coupling between neighboring metallic nanostructures, a
fundamental difference exists between nanocavities and nanoparticles and they cannot
be considered as complementary. Unlike nanoparticles, nanocavities may couple
through excitation of SPP propagating at the metallic film. [26] These propagating SPP
modes connect the localized surface plasmons (LSP) at neighboring nanocavities, thus
inducing strong mutual interactions. The degree of coupling depends on the SPP
excitation wavelength and its propagation length and therefore on the distance
between the cavities. The intrinsic parameters of the metallic film itself play a major
role as well. For example, poor coupling was observed (not shown here) when the
metallic surface between the cavities was rough leading to scattering of the SPP modes,
phase randomization of the dipoles, and therefore reduced coupling efficiency between
the LSP modes. A high fabrication quality of the silver film in terms of roughness and
grain size, as well as of the structures themselves, proved to be essential for our current
observations.
Estimation of the coupling degree The coupling degree between the cavities and their mutual interaction is subjected to
several parameters as already mentioned above. The amount of coupling can be
quantitatively inferred from the SHG emission analyzed along two orthogonal angles (X
and Y) for a range of input beam linear polarizations spanning by rotation all directions
within the plane of the sample.

10
In what follows we perform an analysis of the symmetry properties of such structures
as measured by the SHG, and introduce a tensor‐symmetry‐based model to analyze the
degree of coupling between the nanostructures in connection with their symmetry
lowering when going from uncoupled to coupled nano‐cavities.
To a good approximation, our samples can be viewed as two‐dimensional, and
contributions from the Z component (perpendicular to the plane of the thin film) of the
electric fields can be neglected. The dominant contributions to the susceptibility tensor
ijk(2) then span only the Y and X directions, leaving YYY(2), YXX(2) , XXX(2) and XYY(2) as the
only four independent coefficients. The presence of an additional mirror plane normal
to the X axis further leads to the cancellation of tensor elements which are anti‐
symmetric with respect to this mirror symmetry. Thus, terms where the X index makes
an odd number of occurrences vanish, namely XXX(2) = XYY(2) = 0. For a higher symmetry
corresponding to three‐fold rotational invariance around Z, such as for equilateral
triangular structures, the two remaining coefficients are further linked by a tensor
relation which expresses the cancellation of all dipolar‐like physical entities [27],
namely:
YYY(2) +YXX(2)=0 (1)
which leaves only one independent coefficient .
Such is the case for individual nano‐cavities, or a non‐interacting set of these (likewise for nano‐
particles).
However, when coupling is coming into play, the overall symmetry is reduced to a lower
level, relation (1) no longer holds, and the YYY(2) and YXX(2) terms become then
independent.
According to these general symmetry considerations, the level of coupling between the
nanocavities can be monitored via the dependence of the emitted SHG signal on the
input beam polarization. As can be seen in Figure 2, for a significant level of coupling,
when the input polarization is along the Y‐axis, the three cavities respond collectively

11
(Figure 2g) and the polarization signature of the emitted light (figure 2h) changes from a
four‐fold octupolar shape, characteristic of three‐fold symmetry, [28] [22, 29] to an
elongated dipolar signature characteristic of a reduced, two‐fold reflection symmetry.
Thus, we define a nonlinear anisotropy coefficient ρ, which reflects the departure from
three‐fold symmetry due to the coupling between the nanocavities, according to:
=YXX(2)/YYY
(2) (2)
The ρ parameter accounts for nonlinear anisotropy and enables to quantitatively
monitor the transition from three independent objects to a single, internally coupled
entity of lower symmetry. As the level of coupling between individual nanostructures
increases, YYY(2) tends to dominate over YXX(2) and ultimately approaches 0. On the
other hand, in the absence of coupling between the individual nano‐structures, the
system maintains its original three fold symmetry, relation (1) holds and . These
two extreme cases of individual contributions ( 1) and the fully coupled one ( 0
), calculated under realistic experimental conditions, are shown and fully discussed in
the supplementary material.
To investigate the degree of coupling between the triangular nanocavities, we
performed detailed polarization analysis of the individual X‐ and Y components of the
emitted SHG radiation as shown in figure 6. A dipolar‐like pattern is observed for the
polarization along the Y‐axis (blue curve); while an octupolar pattern of weaker intensity
is observed along the X‐axis (red curve exhibiting a butterfly‐like shape). The dipolar
pattern results from the reduced symmetry due to the strong coupling between the
triangular cavities. However, the coupling is not fully accomplished and the X
component emission pattern features a residual octupolar pattern [22, 29]. Within the
model described above, the data was best fitted (other than intensity scaling, is the
only fitting parameter) to 0.5 . This value indicates a strong, but less than full
level of coupling between the nanocavities. We note that under identical conditions,
the
octu
Figu
red d
triple
0.5,
supp
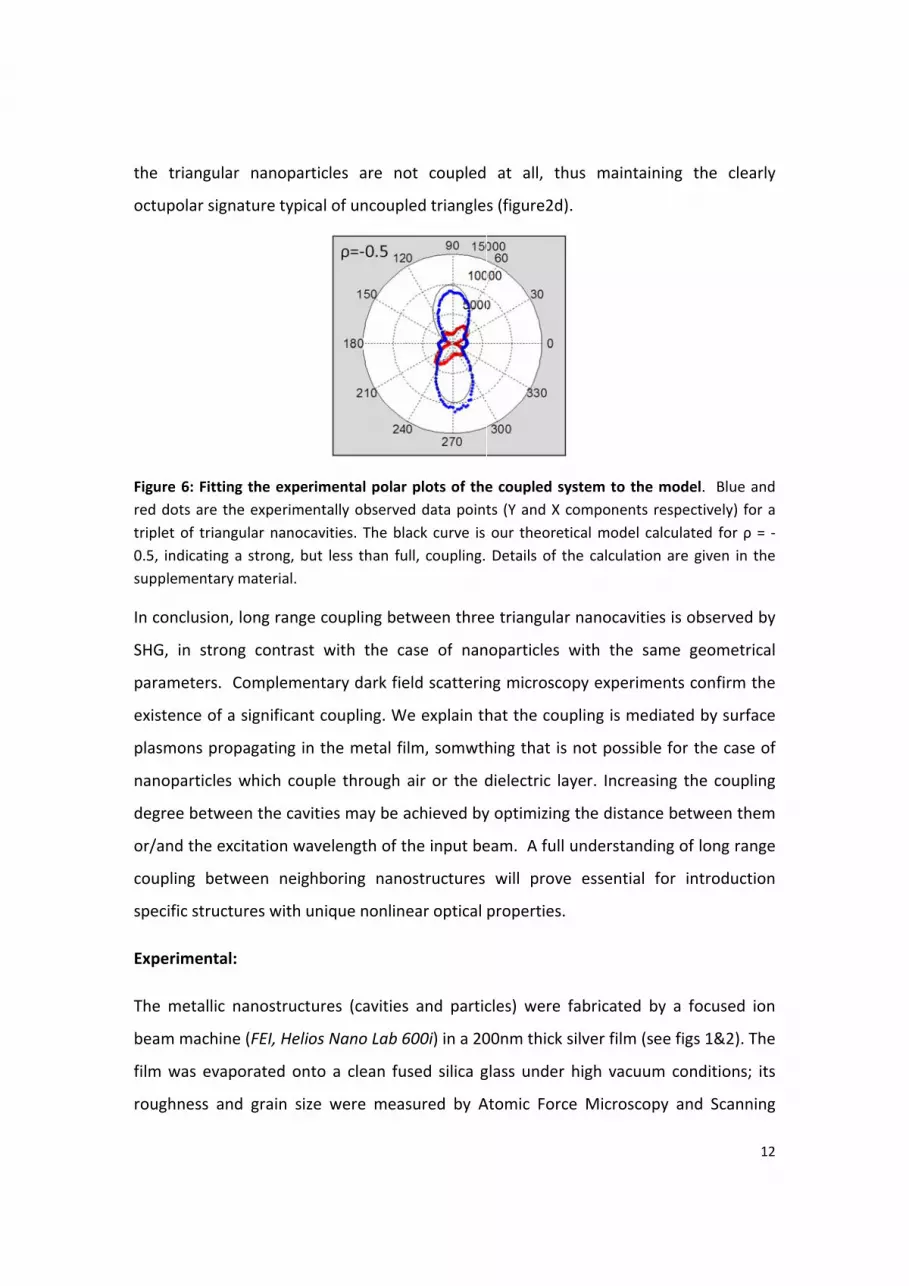
In co
SHG
para
exist
plas
nano
degr
or/a
coup
spec
Expe
The
beam
film
roug
triangular
upolar signa
re 6: Fitting
dots are the
et of triangu
indicating a
plementary m
onclusion, l
G, in strong
ameters. Co
tence of a s
mons propa
oparticles w
ree betwee
and the exci
pling betwe
cific structu
erimental:
metallic na
m machine
was evapo
ghness and
nanopartic
ature typical
the experim
e experiment
ular nanocav
strong, but
material.
ong range c
g contrast w
omplement
significant c
agating in t
which coup
n the caviti
itation wave
een neighb
res with un
anostructur
(FEI, Helios
orated onto
grain size
cles are no
l of uncoup
mental polar
tally observe
vities. The bl
less than fu
coupling bet
with the ca
tary dark fie
coupling. W
the metal fi
le through
es may be a
elength of t
boring nano
ique nonlin
res (cavities
Nano Lab 6
o a clean fu
were mea
ot coupled
led triangle
r plots of the
ed data point
ack curve is
ull, coupling.
tween three
ase of nan
eld scatterin
We explain th
lm, somwth
air or the d
achieved by
the input be
ostructures
ear optical
s and partic
600i) in a 20
used silica g
sured by A
at all, th
s (figure2d)
e coupled sy
ts (Y and X c
our theoret
Details of t
e triangular
noparticles
ng microsco
hat the cou
hing that is
dielectric la
y optimizing
eam. A full
will prove
properties.
cles) were
00nm thick s
glass under
Atomic Forc
hus maintai
.
ystem to the
components
tical model c
he calculatio
r nanocaviti
with the s
opy experim
pling is me
not possib
ayer. Increa
g the distanc
understand
e essential
fabricated
silver film (s
high vacuu
ce Microsco
ining the c
e model. Blu
respectively
calculated fo
on are given
es is observ
ame geom
ments confir
diated by s
le for the c
sing the co
ce between
ding of long
for introd
by a focuse
see figs 1&2
um conditio
opy and Sca
12
clearly
ue and
y) for a
or ρ = ‐
in the
ved by
etrical
rm the
urface
case of
upling
n them
range
uction
ed ion
2). The
ons; its
anning

13
Electron Microscopy to be smaller than 1nm and 50nm respectively. In order to have
similar indices of refraction on both sides of the nanocavities or around the
nanoparticles, the silver surfaces were covered by a 150 nm layer of polyvinyl alcohol
(PVA), with an average refractive index similar to that of glass (~ 1.5) in the relevant
wavelength range of the visible to near infrared. The sample was mounted on a piezo
stage and was scanned with a resolution of 40nm at the focal plane of a focused beam
from a Ti:Sapphire laser (Spectra‐Physics Mai‐Tai HP, 100 fsec, 80MHz), 2‐6 mWatt at
the entrance lens, with a fundamental incoming beam tunable between 750nm‐980nm.
Most of the experiments reported here were performed at an input laser wavelength of
940 nm. The main reason for selecting this wavelength is the fact that the silver film
supports plasmon propagation at both the fundamental and at the second harmonic
frequency of 470 nm. The laser was focused through the glass substrate using a 0.7 NA
objective (60), resulting in a spot size of about 0.9 µm. The SH signal was collected in
reflection mode through the same objective, and directed to two avalanche
photodiodes (APD, PerkinElmer) that measure the SH intensity along the X and Y
perpendicular polarization directions. A dichroic mirror was used to block the reflected
fundamental beam, and appropriate band‐pass filters (Semrock) were used to further
isolate the SH radiation. The SHG polarization dependence measurements have been
performed by rotating the linear input beam polarization using a half wave plate and a
polarizer (see figure s1 in supplementary materilas for set‐up details).
Acknowledgements: We acknowledge the support of the Weizmann‐CNRS NaBi LEA
laboratory. This work was funded, in part, by the Israel Science Foundation, grant no.
1242/12 and by the Leona M. and Harry B. Helmsley Charitable Trust. RK acknowledges
the government for the Polish‐French “co‐tutelle” PhD program. JZ acknowledges
support of the Humboldt Foundation for visits to LMU.

14
References
[1] S. Sheikholeslami et al., Nano Lett 10, 2655, (2010). [2] J. Aizpurua et al., Phys Rev B 71, (2005). [3] Y. Alaverdyan et al., Nature Physics 3, 884, (2007). [4] M. Abb et al., ACS Nano 6, 6462, (2012). [5] A. O. Pinchuk, and G. C. Schatz, Materials Science and Engineering B‐Advanced
Functional Solid‐State Materials 149, 251, (2008). [6] M. Rahmani et al., Nano Lett 12, 2101, (2012). [7] M. Hentschel et al., Nano Lett 10, 2721, (2010). [8] J. P. Kottmann, and O. J. F. Martin, Optics Letters 26, 1096, (2001). [9] P. Nordlander et al., Nano Lett 4, 899, (2004). [10] T. Klar et al., Physical Review Letters 80, 4249, (1998). [11] J. Gersten, and A. Nitzan, Journal of Chemical Physics 73, 3023, (1980). [12] N. Liu, and H. Giessen, Angew Chem Int Edit 49, 9838, (2010). [13] B. Ogut et al., ACS Nano 5, 6701, (2011). [14] P. K. Jain, and M. A. El‐Sayed, Chem Phys Lett 487, 153, (2010). [15] A. M. Funston et al., Nano Lett 9, 1651, (2009). [16] F. J. G. de Abajo, Rev Mod Phys 79, 1267, (2007). [17] V. Le Floc'h et al., Journal of Physical Chemistry B 107, 12403, (2003). [18] S. Brasselet et al., Physical Review Letters 92, (2004). [19] B. K. Canfield et al., Nano Lett 7, 1251, (2007). [20] M. Mascheck et al., Nature Photonics 6, 293, (2012). [21] M. I. Stockman et al., Chem Phys Lett 433, 130, (2006). [22] A. Salomon et al., J. Phys. Chem. C 117, 22377, (2013). [23] R. Piron et al., J Opt Soc Am B 22, 1276, (2005). [24] J. A. H. van Nieuwstadt et al., Phys Rev Lett 97, (2006). [25] E. Prodan et al., Science 302, 419, (2003). [26] J. Parsons et al., Phys Rev B 79, (2009). [27] J. Zyss, Journal of Chemical Physics 98, 6583, (1993). [28] M. Zielinski et al., Small 5, 2835, (2009). [29] P. Schon et al., Opt Lett 35, 4063, (2010).

5In
The
Figu
alon
Lo
1Departme2Departmen
3Dep
4(Laboratoi
nstitute of Ph
experiment
ure S1. Exp
ng both X an
ong Range
ent of chemint of Chemi
B
Mi
partment of
Ra
re de PhotoN
hysical and T
tal optical se
perimental s
nd Y axes. T
e Coupling
Adi Salom
ical physics,istry, InstituBar Ilan Univ
ichael Fedo
Physics, LudM
adoslaw Kol
onique QuanNormale SupTheoretical Ch
Te
Supplem
et-up is sho
set- up. The
The epi-refl
g between
mon1,2 and Ye
Weizmannute of Nanotversity, Ram
ruk3 and Joc
dwig‐Maximunich, Germ
lkowski4,5 an
ntique et Mopérieure de Chemistry, Facchnology, Po
mentary Inf
wn in Fig. S
e sample is
flected SH s
n Metallic
ehiam Prior
Institute oftechnology man Gan, Isr
chen Feldm
milians‐Univmany
nd Joseph Z
oleculaire, InCachan, Fraculty of Chemoland
formation
S1
mounted o
ignal is coll
Nanocavi
r1
f Science, Reand advancrael
ann3
verstität Mü
Zyss5
nstitut d’Aleance mistry, Wrocl
on a piezo s
lected by th
ties
ehovot, Israced materia
ünchen,
embert, Eco
law Universit
stage and sc
he same obje
ael ls,
ole
ty of
canned
ective,

and its two perpendicular polarization components are detected by two calibrated
avalanche photodiodes (APD).
Symmetry consideration for the second order susceptibility
Assuming a quasi-plane wave behavior at the focus of the confocal microscope with its
beam-waist in the (X,Y) plane, one can define the fundamental electric field by its two
in-plane components,E (EX ,EY ) (E cos,E sin ), where the field is taken as linearly
polarized, with an angle � defined with respect to the X axis and amplitude E. The
sample is illuminated at the fundamental frequency, and the Second Harmonic Generated
signal is collected through the same optical path, and its dependence on input field
polarization is measured. Let us examine the polarization plots for two extreme cases: an
object with threefold symmetry and an object with twofold symmetry.
i) A planar object with a threefold rotational symmetry
As discussed in the paper, for such an object the (2) tensor is composed of two
coefficients, (2) (2)andYYY YXX which are linked by relation (1), namely corresponding to =-1
where is the nonlinear anisotropy parameter as defined in the paper. Under these
conditions, define (2) (2) (2)/ / YYY YXX the single remaining independent coefficient of
the (2) tensor. The X and Y components of the induced SHG polarization vector can be
expressed as a function of the incoming fundamental field by:
2 (2) 2 2 (2) 2/ / / /sin(2 ) and cos(2 )X YP E P E
Approximating the far field intensities along X and Y as proportional to the squared
components of the induced polarization along the corresponding axis leads to the
following expressions:
2 22 (2) 2 2 2 (2) 2 2/ / / /sin (2 )( ) and cos (2 )( )X YI I I I

These expressions account for the four-lobed cross-shaped pattern of the SHG
polarization plot for a planar object abiding to three-fold symmetry. This possibly
surprising four-lobed pattern emanating from a threefold symmetric object is the result of
the symmetry breaking projection of the induced polarizations, and hence of the
generated harmonic fields, along the X and Y polarization analysis direction. The more
intuitive three-fold symmetry would appear if the object of interest were rotated while the
polarizations of the input fundamental and generated harmonic would remain fixed and
set parallel to each other. object
ii) A planar object with a twofold symmetry along its Y axis
Assuming the validity of Kleinman permutation symmetry The (2) tensor under this
symmetry is then composed of two independent coefficients
YYY(2) and YXX
(2) ( XYX(2) XXY
(2) ) . The two independent coefficients are no more linked by
relation (1), leading us to introduce the nonlinear anisotropy parameter (2) (2)/YXX YYY .
This anisotropy parameter reflects the deviation from three-fold symmetry, as would be
the case if the individual equilateral triangles depicts in figure 2 in the paper were to
couple to each other. For non-coupled entities, the threefold symmetry is maintained and
ρ=-1 , while for a fully coupled system, the (2)YYY completely dominates, and ρ=0. Thus,
the stronger the coupling the closer is ρ to zero.
In the following derivations, we make use of only two parameters, namely
(2) (2)/ / andYYY , with YXX
(2) //(2)
The expressions for the induced polarizations are then
2 (2) 2 2 (2) 2 2// / /sin(2 ) and cos(2 ) (1 )cosX YP E P E
Following a similar line of derivation as for the previous case, the harmonic intensities
detected along X and Y are then respectively given by

IX2 2 //
(2) 2(I )2 sin2 (2 )
IY2 //
(2) 2(I )2 cos2 (2 ) (1 ) ( 3)cos2 ( ) 2 cos2( )
For a three-fold symmetric object (ρ=-1) these general expressions reduce to those of the
previous case. In the limit of very strong coupling with ρ=0 the expressions take the
following form
IX2 0 and IY
2 //(2) 2
(I )2 sin4
It is interesting to note that the expression of IX2 maintains the same shape as in the
three fold case as derived above (subject to a ρ2 scaling factor). In particular, whatever
the value of , in the X analysis direction, the four-lobed shape that is characteristic of
octupolar systems is maintained, although the three-fold symmetry is lost. Its amplitude
decreases with 2 down to the strong coupling case of =0 where the ‘memory’ of the
three-fold symmetry vanishes. This is in agreement with our experimental observations as
in Fig. 6 in the paper.
Figure S2 depicts different harmonic polarization plots which display a progressive
alteration when the apparent SHG response changes from a perfect four lobed shape for
both X and Y polarizations in the non-interacting case (ρ =-1) onto a more dipolar shape
for ρ =-0.5.
As shown in Figure S3, In the strong coupling limit, the polar plot takes a characteristic
sin4 ”eight”-like shape along the Y interaction axis, consistently with our experimental
results.
Thus, by fitting the experimental polar plot data to this model, and extracting the value
for that best describes the data, we can discuss the degree of coupling between
individual objects that is responsible for lowering of symmetry as expressed by the
departure of the factor from -1.

Figure S2: Calculated polar plots of the SHG emission pattern from a triplet of objects
with three fold symmetry aligned along the Y axis as a function of the input beam
polarization. The coupling between objects is expressed by the ρ coupling parameter.
When strong coupling occurs ρ =0 and all the all dipoles are emitting in phase. When the
objects do not interact, ρ =-1, and the emission is similar to that of an individual object.
Blue curves: the Y-axis component of the generated SHG, red curves: the X-axis
component and black curves is the total emission. Polarization plots are shown for
different ρ values ranging here from -1 to -0.5 (i.e.) from non interacting nano-objects
with equilateral symmetry to a significant interaction level which lowers the three fold
symmetry in the independent case. The simulations shown in this Figure do not include
corrections for the not fully achromatic dichroic mirror and reproduce expressions in this
part.
1 0.9 0.8
0.7 0.6 0.5

Figu
obje
corr
ure S3: Sam
ects) and ρ
rections for t
me as above
ρ =0 (stron
the not fully
e for two ex
ngly interac
y achromati
xtreme case
cting nan-o
c dichroic m
es, namely ρ
bjects), now
mirror.
ρ =-1 (non
w includin
interacting
g in both
nano-
case


