Embed Size (px)
Citation preview
RangelandEcology & Management
Plant Establishment in Masticated Utah Juniper Woodlands
Kert R. Young,1 Bruce A. Roundy,2 and Dennis L. Eggett3
Authors are 1Research Associate and 2Professor, Department of Plant and Wildlife Sciences, Brigham Young University, Provo, UT 84602, USA; and3Associate Professor, Department of Statistics, Brigham Young University, Provo, UT 84602, USA.


Rangeland Ecol Manage 66:597–607 | September 2013 | DOI: 10.2111/REM-D-12-00094.1
Plant Establishment in Masticated Utah Juniper Woodlands
Kert R. Young,1 Bruce A. Roundy,2 and Dennis L. Eggett3
Authors are 1Research Associate and 2Professor, Department of Plant and Wildlife Sciences, Brigham Young University, Provo, UT 84602, USA; and3Associate Professor, Department of Statistics, Brigham Young University, Provo, UT 84602, USA.
Abstract
Juniper (Juniperus spp.) encroachment into sagebrush (Artemisia spp.)-bunchgrass communities has reduced understory coveron millions of hectares of semiarid rangelands. Mechanical masticators shred trees to restore desirable vegetation and reduce thepotential for catastrophic wildfire. Mechanical mastication where juniper density is high and perennial grass cover is low bringsa risk of invasive weed dominance unless perennial species are established. To determine whether juniper mastication favorsannual- or perennial-grass establishment, we compared seedling emergence, tillers, and aboveground biomass of cheatgrass(Bromus tectorum L.) and Anatone bluebunch wheatgrass (Pseudoroegneria spicata [Pursh] A. Love). Comparisons were madeamong hand-planted rows between and under juniper canopies of masticated and adjacent untreated control areas at threelocations in Utah. Bluebunch wheatgrass had 16% (95% CI: 11–21) and cheatgrass had 10% (95% CI: 5–15) fewer seedlingsemerge per row in masticated than untreated areas (P , 0.001). However, bluebunch wheatgrass had 3.2 (95% CI: 2.0–5.2)times more tillers and 1.9 (95% CI: 1.6–2.2) times more aboveground biomass per row in masticated than untreated areas(P , 0.001). Similarly, cheatgrass had 2.3 (95% CI: 1.5–3.8) times more tillers, 2.0 (95% CI: 1.7–2.4) times more abovegroundbiomass, and 11.4 (95% CI: 6.3–20.7) times more spikelets per row in masticated than untreated areas (P , 0.001). Thisincreased seedling growth in masticated areas was associated with increased inorganic nitrogen and soil water compared tountreated areas. Because mastication improves the growth of both cheatgrass and bluebunch wheatgrass seedlings, it couldsupport dominance by either annual- or perennial-life forms. To avoid cheatgrass dominance where perennial understory coveris limited and cheatgrass propagule pressure is high, mastication should be accompanied by seeding desirable perennial speciessuch as Anatone bluebunch wheatgrass.
Key Words: grass emergence, invasive weeds, mulch, resilience, resistance, resource availability
INTRODUCTION
Juniper (Juniperus spp.) encroachment into sagebrush (Artemi-
sia spp.) and bunchgrass communities has reduced understory
plant cover and resulted in juniper domination on millions of
hectares of semiarid rangelands (Miller et al. 2005). Juniper
encroachment is mainly attributed to reduced fire frequency
and a mild wet climate in the late 1800s and early 1900s
(Miller and Rose 1999). Reduced fire resulted from heavy
livestock grazing during the late 1800s and early 1900s that
reduced fine fuels needed to carry fire (Burkhardt and Tisdale
1976). The reduction of herbaceous vegetation also reduced
resource competition and allowed shrubs to increase in size and
provide safe sites for juniper establishment (Miller and Rose
1999). Juniper encroachment into and domination of these
communities is associated with formation of resources islands
as trees transfer soil nutrients and water away from plants in
interspaces to subcanopy litter mounds through roots and
canopy dropped leaf scales, fruits, and twigs (Schlesinger and
Pilmanis 1998; Newman et al. 2010).
Juniper-encroached lands are treated to return the plant
community back to sagebrush-bunchgrass dominated systems
and to reduce the potential for crown fire by reducing canopy
fuel loads (Miller and Tausch 2001). A recent method of tree
control is mechanical mastication that shreds canopies,
branches, and trunks into surface debris. Little is known about
the influence of juniper mastication on resource availability and
plant community dynamics. In general, juniper control reduces
competition for soil water and nutrients and thereby increases
understory plant productivity (Bates et al. 2000).
Plant community response to tree reduction can vary among
locations. For example, juniper control treatments have
resulted in increased annual-plant cover at some locations but
not at others (Barney and Frischknecht 1974; Koniak 1985;
Tausch and Tueller 1997). It is not always clear why invasive
annuals sometimes dominate after woody species control, but
increased resource availability is thought to increase the
invasibility of plant communities and reduce community
resistance to invasion (Vasquez et al. 2008a). For example,
increased soil inorganic nitrogen (N) has enabled greater
competitiveness and growth of invasive annual grasses over
perennial grasses (Vasquez et al. 2008b). In turn, rapid annual
grass growth reduces resources available to slower growing
perennial grasses and reduces perennial grass vigor (Melgoza et
al. 1990; Monaco et al. 2003). However, traits that endow
plants with the ability to grow rapidly under high resources
may reduce their ability to thrive under low resources (Grime
and Hunt 1975).
This is contribution number 95 of the Sagebrush Steppe Treatment Evaluation Project
(SageSTEP) funded by the US Joint Fire Science Program, the Bureau of Land
Management, the National Interagency Fire Center, and Brigham Young University.
Correspondence: Kert R. Young, Dept of Plant and Wildlife Sciences, 275 WIDB,
Brigham Young University, Provo, UT 84602, USA. Email: [email protected]
Manuscript received 26 July 2012; manuscript accepted 13 May 2013.
ª 2013 The Society for Range Management
RANGELAND ECOLOGY & MANAGEMENT 66(5) September 2013 597

As soil inorganic N is usually the most limiting mineralresource to plant growth (Sylvia et al. 2005), reducing soilinorganic N with carbon (C) additions in the form of sucrosehas reduced the biomass and density of invasive annual grasseslike cheatgrass (Bromus tectorum L.; Paschke et al. 2000;Beckstead and Augspurger 2004). Additions of C to the soil inthe form of masticated trees have also reduced soil inorganic Nin subalpine and montane forests (Rhoades et al. 2012) buthave increased both native and nonnative plant cover anddensity (Kane et al. 2010). Organic C additions reduce soilinorganic N through soil microorganism use when their organicC energy sources do not contain sufficient N for metabolismand growth (Brady and Weil 1999). It is uncertain how longmasticated trees might reduce soil inorganic N or influenceplant community dynamics, but if tree mastication maintainslow soil inorganic N levels long-term, perennial grassdominance may be favored over invasive annual grasses(Monaco et al. 2003).
The control of juniper trees not only influences inorganic Nlevels but also increases soil water availability during spring (Bateset al. 2000), a critical time for seedling establishment (Hardegreeet al. 2003; Roundy et al. 2007). The availability of soil water inspring may benefit perennials more than invasive annuals becauseperennial grass roots like those of bluebunch wheatgrass(Pseudoroegneria spicata [Pursh] A. Love) grow slower thaninvasive annuals like cheatgrass, especially during cool seasons(Harris 1967). The increased soil water availability and presumedlower inorganic N following tree chipping in Nevada increasedperennial and decreased annual grass density and cover underwoody debris (Benson 2006). However, such outcomes aredependent on pretreatment plant community composition, whichmay be limited where trees have dominated for several years onshallow soils (Koniak 1985; Miller et al. 2005).
Land managers need to know if mastication will favordesirable plant recovery and if they need to plant perennialgrasses in combination with juniper mastication whereincreased tree density has reduced desirable grasses. To addressthese questions, our main objective was to determine if junipermastication favors cheatgrass or bluebunch wheatgrass seedlingestablishment and growth. Our second objective was to isolatethe effects of soil inorganic N on seedling establishment andgrowth from other mastication-altered environmental condi-tions using ammonium sulfate (N-S) and sucrose (C) amend-ments. We hypothesized that: 1) juniper tree mastication willincrease bluebunch wheatgrass and cheatgrass establishmentand growth by increasing resource availability; 2) litter moundsin masticated areas as resource islands and N fertilization willfavor cheatgrass over bluebunch wheatgrass because of greatercheatgrass response to increased soil inorganic N; 3) high C:Nratio woody debris and C amendments will favor bluebunchwheatgrass over cheatgrass by reducing inorganic N; and 4)interspaces between litter mounds will not favor cheatgrass orbluebunch wheatgrass establishment.
MATERIALS AND METHODS
Study LocationsOur study locations included Greenville (lat 388120N, long1128480W), Onaqui (lat 408130N, long 1128280W), and Stans-
bury (lat 408350N, long 1128390W) in western Utah. Theselocations were part of the Sagebrush Steppe TreatmentEvaluation Project (SageSTEP) evaluating sagebrush stepperestoration methods in the Great Basin region (www.sagestep.org). Study locations contained a range of Utah juniper(Juniperus osteosperma [Torr.] Little) encroachment typical ofthe Great Basin in Utah. This encroachment varied from a fewtrees scattered among sagebrush and bunchgrass in Phase I toabundant trees with little remaining understory cover in PhaseIII (sensu Miller et al. 2005). The maximum tree density ( . 0.5m tall) prior to mastication was 586 trees � ha�1 at Greenville,444 trees � ha�1 at Onaqui, and 1 030 trees � ha�1 at Stansbury.We measured response variables in Phase III areas wherepretreatment shrub cover was , 5% and perennial grass coverwas , 10% at Greenville and Onaqui and , 20% at Stansburyas determined from SageSTEP measurements collected within100 m of our study.
Greenville vegetation included Utah juniper (Juniperusosteosperma [Torr.] Little), two-needle pinon (Pinus edulisEngelm.), Wyoming big sagebrush (Artemisia tridentata Nutt.ssp. wyomingensis Beetle & Young), rabbitbrush (Chrysotham-nus viscidiflorus [Hook.] Nutt.), bluebunch wheatgrass (Pseu-doroegneria spicata [Pursh] A. Love), needle-and-thread(Hesperostipa comata [Trin. & Rupr.] Barkworth), and Indianricegrass (Achnatherum hymenoides [Roem. & Schult.] Bark-worth). Onaqui vegetation included Utah juniper, Wyoming bigsagebrush, bluebunch wheatgrass, Sandberg bluegrass (Poasecunda J. Presl), and Indian ricegrass. Stansbury vegetationincluded Utah juniper, Wyoming big sagebrush, antelopebitterbrush (Purshia tridentata [Pursh] DC.), bluebunch wheat-grass, Sandberg bluegrass, and cheatgrass.
Soils at the three locations are loamy skeletal. Greenvillesoils are carbonatic, mesic Typic Calcixerepts (Rau et al. 2011).Onaqui soils are carbonatic, mesic, shallow Petrocalcic Palexe-rolls (Rau et al. 2011). Stansbury soils are mixed, active, frigidPachic Haploxerolls (Rau et al. 2011). We conducted ourresearch at 1 700–1 900 m in elevation across all threelocations. Annual precipitation totals during 1970–2007averaged 334 mm at Greenville, 311 mm at Onaqui, and 389mm at Stansbury (PRISM 2008). A more complete descriptionof the SageSTEP locations can be found in McIver et al. (2010).
Treatment Implementation and Study DesignA Tigercat M726E Mulcher (Tigercat Industries, Inc, Brant-ford, Ontario) with Fecon Bull Hog (Fecon, Inc, Lebanon, OH)masticated trees in fall 2006 at Onaqui and in fall 2007 atStansbury. A skid steer loader with Fecon Bull Hog masticatedtrees in fall 2007 at Greenville.
We implemented a randomized complete block design usingpaired masticated and untreated control plots with similar soiland vegetation at each of the three locations. A masticated plotwas 6–50 ha depending on space available for research wherejuniper trees taller than 0.5 m were masticated. The differencesin plot size would not be expected to alter response variables,which were measured at the microsite scale. Each plotcontained four replicate blocks with two trees in untreatedblocks and four trees in masticated blocks (Fig. 1). We usedjuniper trees with litter mounds at least 2 m in diameter toallow room for seeding. We divided the area around trees into
598 Rangeland Ecology & Management
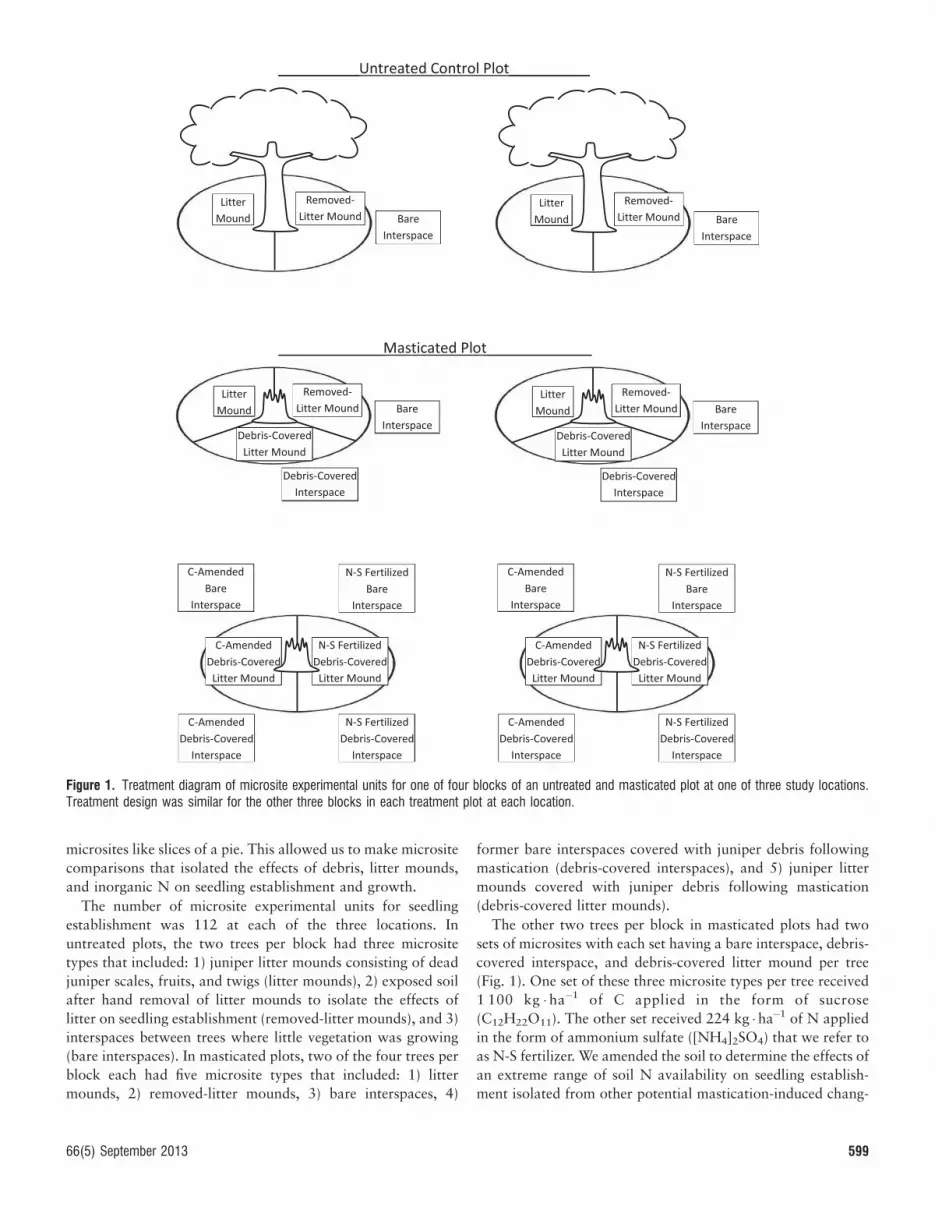
microsites like slices of a pie. This allowed us to make microsite
comparisons that isolated the effects of debris, litter mounds,
and inorganic N on seedling establishment and growth.
The number of microsite experimental units for seedling
establishment was 112 at each of the three locations. In
untreated plots, the two trees per block had three microsite
types that included: 1) juniper litter mounds consisting of dead
juniper scales, fruits, and twigs (litter mounds), 2) exposed soil
after hand removal of litter mounds to isolate the effects of
litter on seedling establishment (removed-litter mounds), and 3)
interspaces between trees where little vegetation was growing
(bare interspaces). In masticated plots, two of the four trees per
block each had five microsite types that included: 1) litter
mounds, 2) removed-litter mounds, 3) bare interspaces, 4)
former bare interspaces covered with juniper debris following
mastication (debris-covered interspaces), and 5) juniper litter
mounds covered with juniper debris following mastication
(debris-covered litter mounds).
The other two trees per block in masticated plots had two
sets of microsites with each set having a bare interspace, debris-
covered interspace, and debris-covered litter mound per tree
(Fig. 1). One set of these three microsite types per tree received
1 100 kg � ha�1 of C applied in the form of sucrose
(C12H22O11). The other set received 224 kg � ha�1 of N applied
in the form of ammonium sulfate ([NH4]2SO4) that we refer to
as N-S fertilizer. We amended the soil to determine the effects of
an extreme range of soil N availability on seedling establish-
ment isolated from other potential mastication-induced chang-
Figure 1. Treatment diagram of microsite experimental units for one of four blocks of an untreated and masticated plot at one of three study locations.Treatment design was similar for the other three blocks in each treatment plot at each location.
66(5) September 2013 599
es in environmental conditions. Amendments of N-S and Cwere applied once each fall at Greenville in October 2008 andNovember 2009, Onaqui in October 2007 and October 2008,and Stansbury in October 2008.
In every microsite, 40 seeds of Anatone bluebunch wheat-grass and cheatgrass were seeded by hand in separate 0.5-mrows during October through November, the fall precedingfield measurements. We measured plants for one growingseason and planted more seeds the following fall. Anatonebluebunch wheatgrass seed was purchased from the GraniteSeed Company in Lehi, Utah. The cheatgrass seed planted atOnaqui and Stansbury was hand collected from Skull Valley,Utah, in June 2007, and the cheatgrass seed planted atGreenville was collected from the same area in June 2008. Wehand selected individual seeds to ensure that all seeds werefilled and likely to germinate. Petri-dish germinability testsresulted in 97% cheatgrass germination and 100% bluebunchwheatgrass germination, but in an associated field study usingthe same seedlots, many of the retrieved seedbags for bothspecies had 100% germination using 40 seeds per seedbag.Based on this information, we treated the 40 seeds per row aspure live seed. Wire netting with 2.5-cm openings was placedaround rows with emerged seedlings at Greenville in 2010because of higher than usual wildlife browsing.
We measured soil water matric potential in one unamendedtree per block in masticated and untreated plots at each studylocation. The microsites included litter mounds, removed-littermounds, and bare interspaces in both treatment types plusdebris-covered interspaces and debris-covered litter mounds inmasticated plots resulting in 32 microsite experimental unitsper study location.
Field MeasurementsAfter seeding, we measured the depth of the replaced juniperlitter mounds and juniper debris to the nearest 0.5 cm using aruler. Seedling emergence, tillers, aboveground biomass, andcheatgrass spikelets were measured at Greenville in 2009 and2010 and at Onaqui in 2008 and 2009, except tillers were notcounted at Onaqui in 2008. Seedling emergence was measuredat Stansbury in 2009 and not 2010 because a wildfire inAugust 2009 ended our study at this location. We countedseedling emergence at approximately 3-wk intervals during thefirst spring and early summer following fall seeding. Wecounted tillers per row during summer before August harvestbecause many plants became intermingled and indistinguish-able as individual plants. Cheatgrass tillers were collected astheir seed heads became ripe, but bluebunch wheatgrass didnot produce seed the first growing season. We harvested allremaining aboveground biomass within 0.5 cm of the soil inAugust and oven dried it at 608C for at least 72 h. Whenpreparing hand-collected cheatgrass seed for fall seeding, wefound that the first floret in each spikelet was usually the onlyfilled seed. So, after harvesting planted rows, we counted thenumber of spikelets per row to represent cheatgrass seedproduction. To quantify the effects of debris on seedlingemergence from the soil, we moved the debris on half of thedebris-covered microsites long enough to count seedlingsemerged from the soil under the debris. The exception wasat Onaqui in 2008 when debris was moved on all debris-
covered microsites to count seedling emergence. On the otherhalf of the debris-covered microsites, we counted the numberof seedlings that emerged through the debris far enough to bevisible without moving the debris.
We measured inorganic N using plant root simulator (PRS)probes (Western Ag Innovations, Inc, Saskatoon, SK) buriedvertically in the top 12 cm of soil in each microsite. Wecombined inorganic N samples from similar microsites ofreplicated trees within blocks resulting in 56 samples persampling date at each location. PRS probes were installed andexchanged in March, July, and October through Novemberwith probes remaining in the field for 4 mo. Inorganic N resultswere summarized across seasons. We measured inorganic N atGreenville (2009, 2010), Onaqui (2008, 2009), and Stansbury(2009). After collecting PRS probes, we cleaned them withdeionized water and returned them to Western Ag Innovationsfor nitrate and ammonium analysis.
Soil water matric potential was measured with gypsumblocks (Delmhorst Instrument Co, Towaco, NJ) buried at 1–3,13–15, and 28–30-cm soil depths. We measured soil waterpotential during spring (1 March–30 June), summer (1 July–31August), fall (1 September–30 November), and winter (1December–28 February) at Greenville (2009, 2010), Onaqui(2008–2010), and Stansbury (early 2009). We presented soilwater results at 1- to 3-cm soil depths for spring only becausespring is a critical season for seedling establishment. Dataloggers (CR10X, Campbell Scientific, Inc, Logan, UT) recordedhourly average electrical resistance from gypsum blocksmeasured at 1-min intervals. Electrical resistance was convertedto soil water potential using a standard calibration curve(Campbell Scientific, Inc, 1983).
Data AnalysisWe analyzed all response variables using mixed-model analysisof variance in Proc Mixed or Glimmix (SAS version 9.2, SASInstitute, Inc, Cary, NC). The maximum likelihood estimationmethod used for mixed-model analysis of variance resulted inan F-test for testing the significance of fixed effects. Treatmentswere implemented on different years in a stagger-start design(Loughlin 2006). This design and analysis of all locations andyears together extended our inferences beyond an individuallocation and year. We nested microsites in trees, trees in blocks,blocks in years, and years in locations in the random statementto account for variability associated with treatments beingapplied and measurements taken on different years at differentlocations. This nested structure also accounted for potentialspatial correlation among microsites.
Masticated plots had more microsite types than untreatedplots because of the debris-covered microsites and N-S and C-amended microsites in masticated plots. This uneven number ofmicrosite types between treatment plots prevented a fullfactorial analysis. Instead, we used linear contrasts to compareresponses among microsite types within and across treatmentplots and between the five masticated and three untreatedmicrosites to quantify the overall treatment effect. To preparethe data for the overall treatment comparison using linearcontrasts, we assigned each treatment (trt) by microsite (micro)by amendment (amend) combination to 1 of 20 levels foremergence; 1 of 11 levels for tillers, aboveground biomass, and
600 Rangeland Ecology & Management

cheatgrass spikelets; and 1 of 14 levels for inorganic N. Anexample of a level is unamended bare interspace microsites inmasticated plots, and another example is N-S fertilized debris-covered interspaces in masticated plots. The number of levelsamong seedling establishment response variables differedbecause the repeated moving and replacing debris on half ofthe debris-covered microsites to count seedlings emerged fromthe soil did not allow seedlings to grow through the debris andproduce enough tillers, aboveground biomass, or spikelets toanalyze. We assigned each treatment by microsite combinationfor soil water potential to one of eight levels of the trt-micromain effect. We adjusted for multiple comparison false-positives using pseudo-Bonferroni with a critical alpha levelof 0.01 for 60 or fewer comparisons and 0.001 for more than60 comparisons.
The number of observations for seedling emergence, tillercounts, aboveground biomass, and cheatgrass spikelets were1 120, 456, 584, and 292, respectively. Seedling establishmentfixed effects included trt-micro-amend and species, and randomeffects included location, year, block, and tree. Interactionbetween trt-micro-amend and species allowed us to compareAnatone bluebunch wheatgrass and cheatgrass seedling estab-lishment among microsites. Seedling emergence values did notneed to be transformed to meet residuals distribution require-ments for analysis of variance based on review of residualsplots. Tiller counts, aboveground biomass, and cheatgrassspikelets were log-transformed prior to analysis and back-transformed by exponentiation for presentation. Soil waterpotential was summarized as the number of wet days ( . �1.5MPa) per season. Wet days did not need to be transformed tomeet distribution requirements for analysis of variance. Fixedeffects for wet days included trt-micro, season, and sensordepth, and random effects included years, locations, blocks,and trees. Inorganic N was log-transformed prior to analysis.Fixed effects for inorganic N included trt-micro-amend andseason, and random effects included location, year, block, andtree. For wet days and inorganic N, we accounted for potentialtemporal correlation using repeated measures in SAS.
RESULTS
The combined trt-micro-amend main effect was significant forseedling emergence, tillers, aboveground biomass, and spikelets(P , 0.001; Table 1). The species effect was significant foremergence and tillers (P , 0.001). The trt-micro-amend byspecies interaction was significant for emergence (P , 0.001;Table 1).
Juniper Tree Mastication EffectUnamended masticated plots had fewer but more productiveseedlings than untreated plots. For example, bluebunchwheatgrass had 16% (95% CI: 11–21) fewer and cheatgrasshad 10% (95% CI: 5–15) fewer seedlings emerge per row inunamended masticated plots than untreated plots (P , 0.001;Table 2). However, bluebunch wheatgrass seedlings had 3.2(95% CI: 2.0–5.2) times more tillers and 1.9 (95% CI: 1.6–2.2)times more aboveground biomass per row in unamendedmasticated plots than untreated plots (P , 0.001; Figs. 2 and3). Similarly, cheatgrass had 2.3 (95% CI: 1.5–3.8) times moretillers, 2.0 (95% CI: 1.7–2.4) times more abovegroundbiomass, and 11.4 (95% CI: 6.3–20.7) times more spikeletsper row in unamended masticated plots than untreated plots(P , 0.001; Figs. 2–4). Unamended masticated plots had 4.2(95% CI: 3.3–5.3) times more inorganic N than untreated plots(P , 0.001; Table 3). Masticated plots had 25.5 (95% CI:19.3–31.7) more wet days than untreated plots during spring atthe 1- to 3-cm soil depth (P , 0.001; Table 4).
Litter Mound EffectLitter mounds had fewer and less productive seedlings thanuncovered untreated microsites (Table 2; Figs. 2–4). Theaverage depth for litter mounds was 4.8 cm (range 0.5–11cm; Fig. 5). Bluebunch wheatgrass had 17% (95% CI: 8–25)more and cheatgrass had 23% (95% CI: 14–31) more seedlingsemerge per row in bare interspaces than litter mounds inuntreated plots (P , 0.001; Table 2). Bluebunch wheatgrasshad 3.2 (95% CI: 1.5–7.2) times more and cheatgrass had 4.7
Table 1. Seedling establishment mixed-model analysis of variance with type III F-tests from maximum likelihood estimation. Anatone bluebunchwheatgrass and cheatgrass seedling emergence, tillers, aboveground biomass, and cheatgrass spikelets measured at Greenville in 2009 and 2010 andOnaqui in 2008 and 2009 (Onaqui tillers not counted in 2008). Seedling emergence measured at Stansbury in 2009. Treatment (trt) by microsite (micro)by amendment (amend) combinations assigned to 1 of 20 levels for emergence and 1 of 11 levels for tillers, aboveground biomass, and cheatgrassspikelets.
Response variable Effect Num DF1 Den DF2 F value P value
Emergence (%) Trt-micro-amend 19 286 21.92 , 0.001
Species 1 727 55.26 , 0.001
Trt-micro-amend * Species 19 727 2.91 , 0.001
Tillers (No.) Trt-micro-amend 10 109 6.71 , 0.001
Species 1 281 18.61 , 0.001
Trt-micro-amend * Species 10 281 1.07 0.389
Aboveground biomass (g) Trt-micro-amend 10 122 12.65 , 0.001
Species 1 415 0.11 0.741
Trt-micro-amend * Species 10 415 0.28 0.985
Cheatgrass Spikelets (No.) Trt-micro-amend 10 138 10.00 , 0.0011Numerator degrees of freedom.2Denominator degrees of freedom.
66(5) September 2013 601

(95% CI: 2.1–10.3) times more tillers per row, and cheatgrasshad 4.4 (95% CI: 1.6–12.3) times more spikelets per row inbare interspaces than litter mounds (P , 0.01; Figs. 2 and 4).Following the same pattern, removed-litter mounds had moreseedlings and tillers per row than litter mounds in untreatedplots (Table 2; Fig. 2). However, in masticated plots, littermounds had little effect on seedling establishment in unamend-ed microsites (Table 2; Figs. 2–4). Bluebunch wheatgrass andcheatgrass emergence, tiller counts, and aboveground biomassand cheatgrass spikelets were not different among littermounds, removed-litter mounds, or bare interspaces exceptthat bluebunch wheatgrass had 1.4 (95% CI: 1.1–1.9) timesmore aboveground biomass per row in litter mounds than bareinterspaces in masticated plots (P , 0.01; Table 2; Figs. 2–4).Bare interspaces had 1.9 (95% CI: 1.3–3.0) times moreinorganic N than litter mounds in untreated plots, but inunamended masticated microsites, litter mounds had 1.9 (95%CI: 1.2–2.9) times more inorganic N than bare interspacesacross seasons (P , 0.01; Table 3). Also in masticated plots,litter mounds had 28.5 (95% CI: 17.3–39.7) more wet daysthan bare interspaces during spring at the 1- to 3-cm soil depth(P , 0.001), but in untreated plots, litter mounds and bareinterspaces had a similar number of wet days (P . 0.001; Table4).
Debris EffectUnamended debris increased seedling emergence from the soilbut decreased seedling emergence through the debris (Table 2).The average debris depth for debris-covered interspaces was
6.3 cm (range 1.5–13.5 cm; Fig. 5), and the average combineddebris and litter mound depth for debris-covered litter mounds
was 10.7 cm (range 5–19 cm). In debris-covered interspaces
where the debris was repeatedly moved during spring to count
emerged seedlings, bluebunch wheatgrass had 19% (95% CI:9–29) more seedlings emerge than in bare interspaces even
though cheatgrass emergence was not significantly different
across these microsites (P . 0.001; Table 2). However, indebris-covered interspaces where the debris was not moved and
seedlings had to emerge through the debris to be counted,
bluebunch wheatgrass had 25% (95% CI: 14–37) fewer and
cheatgrass had 27% (95% CI: 15–38) fewer seedlings emergethan in bare interspaces (P . 0.001; Table 2). The movement of
debris to count seedling emergence in moved debris-covered
microsites and the combined layers of debris and litter indebris-covered litter mounds prevented sufficient seedling
survival for collection and analysis of aboveground biomass,
tillers, and spikelets. Debris in unmoved debris-covered
microsites did not change bluebunch wheatgrass or cheatgrasstillers, aboveground biomass, or spikelets compared to the
other masticated microsites (adjusted P . 0.01; Figs. 2–4).
Seedling establishment patterns among N-S and C-amended
microsites were similar to unamended microsites. Unamendedbare interspaces had 2.2 (95% CI: 1.4–3.4) times more
inorganic N than debris-covered interspaces (P , 0.01; Table
3). Debris-covered interspaces had 31.4 (95% CI: 20.1–42.7)more and debris-covered litter mounds had 35.0 (95% CI:
23.8–46.2) more wet days than bare interspaces during spring
at the 1- to 3-cm soil depth (P , 0.001; Table 4).
Table 2. Seedling emergence linear-contrast comparisons. Forty seeds of Anatone bluebunch wheatgrass and cheatgrass seeded in separate 0.5-m rowseach fall. Applied ammonium sulfate ([NH4]2SO4) at 224 kg � ha�1 N and sucrose (C12H22O11) at 1 100 kg � ha�1 C each fall. Data collected at Greenville in2009 and 2010, Onaqui in 2008 and 2009, and Stansbury in 2009.
Microsite
Unamended treatment effect Amendment effect in masticated plots
Untreated Masticated Unamended (NH4)2SO4 C12H22O11
Bluebunch wheatgrass ---------------------- %---------------------- ------------------------------------% -----------------------------------
Litter mound 331 b2 36 b — — —
Removed-litter mound 533 a 37 b — — —
Bare interspace 503 a 37 b 37 34 a 31 b
Moved debris-covered litter mound — 22 bc 22 17 b 14 bc
Unmoved debris-covered litter mound — 4 c 4 3 b 3 c
Moved debris-covered interspaces — 56 a 56 424 a 57 a
Unmoved debris-covered interspaces — 12 c 12 13 b 23 bc
455 29 26 22 26
Cheatgrass
Litter mound 16 b 22 ab — — —
Removed-litter mound 46 a 43 a — — —
Bare interspace 39 a 33 a 33 36 a 28 ab
Moved debris-covered litter mound — 12 bc 12 9 c 6 c
Unmoved debris-covered litter mound — 3 c 3 1 c 1 c
Moved debris-covered interspaces — 42 a 42 274 ab 42 a
Unmoved debris-covered interspaces — 7 bc 7 9 bc 14 bc
335 23 19 16 18
1Species differences within columns are italicized (P , 0.01).2Microsite differences within columns and species have different letters (P , 0.01).3Removed-litter mounds and bare interspaces for bluebunch wheatgrass, untreated . unamended masticated (P , 0.01).4Moved debris-covered interspaces for bluebunch wheatgrass and cheatgrass, sucrose . ammonium sulfate; cheatgrass, unamended . ammonium sulfate (P , 0.01).5Bluebunch wheatgrass and cheatgrass collectively, untreated . unamended masticated (P , 0.01).
602 Rangeland Ecology & Management
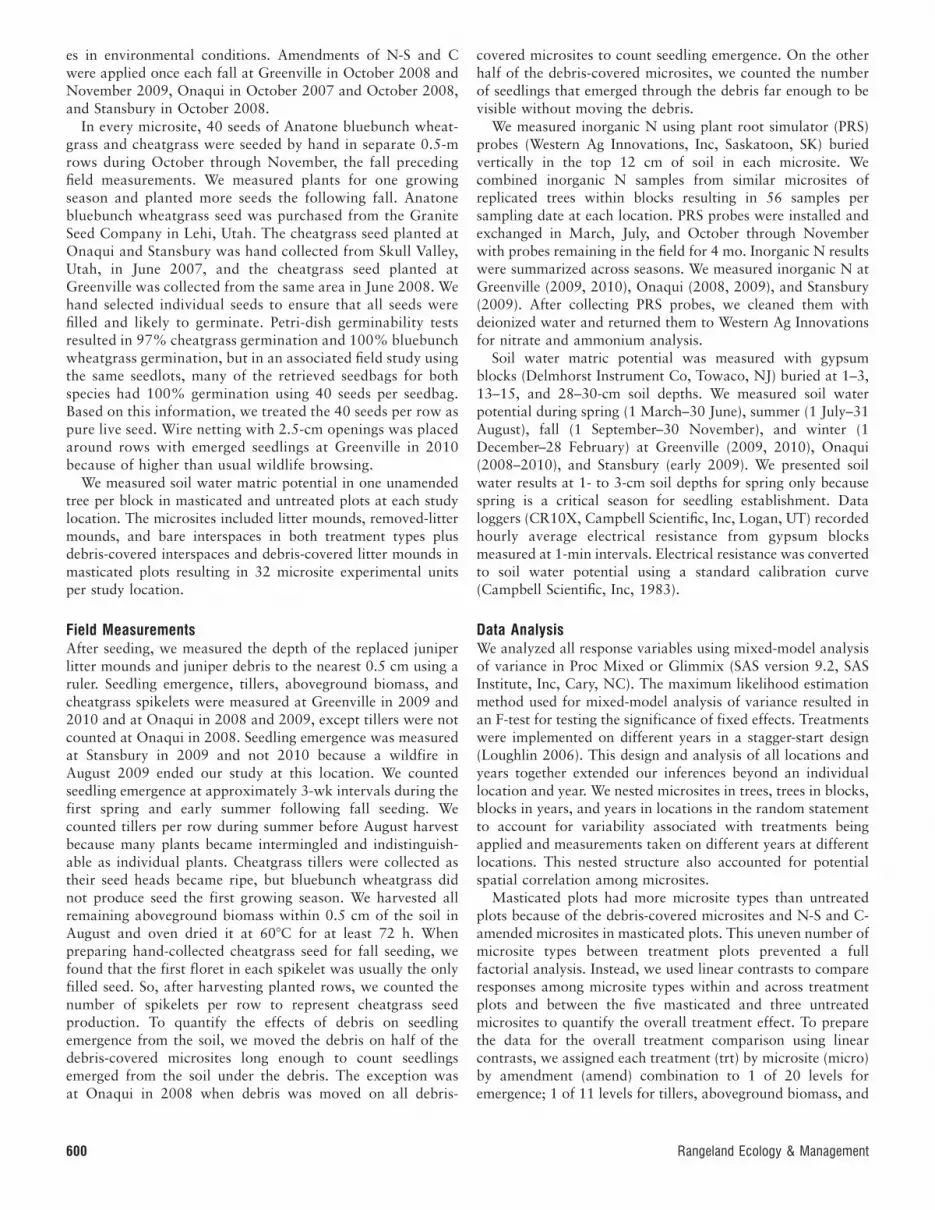
Species EffectBluebunch wheatgrass had 12% (95% CI: 8–16) moreseedlings emerge per row than cheatgrass across all untreatedmicrosites (P , 0.01; Table 2). Likewise, bluebunch wheatgrasshad 6% (95% CI: 3–9) more seedlings emerge per row thancheatgrass across all microsites in unamended masticated plotswith a similar pattern among N-S and C-amended microsites(P , 0.01; Table 2). Bluebunch wheatgrass seedling emergencewas notably higher than cheatgrass in litter mounds of bothuntreated and unamended masticated plots. Consistent withthese results, bluebunch wheatgrass had 1.9 (95% CI: 1.3–2.6)times more tillers per row across microsites and 2.4 (95% CI:1.3–4.3) times more tillers per row in litter mounds thancheatgrass in unamended masticated plots (P , 0.01; Fig. 2).Aboveground biomass was not different between species withany microsite comparison (P . 0.01; Fig. 2).
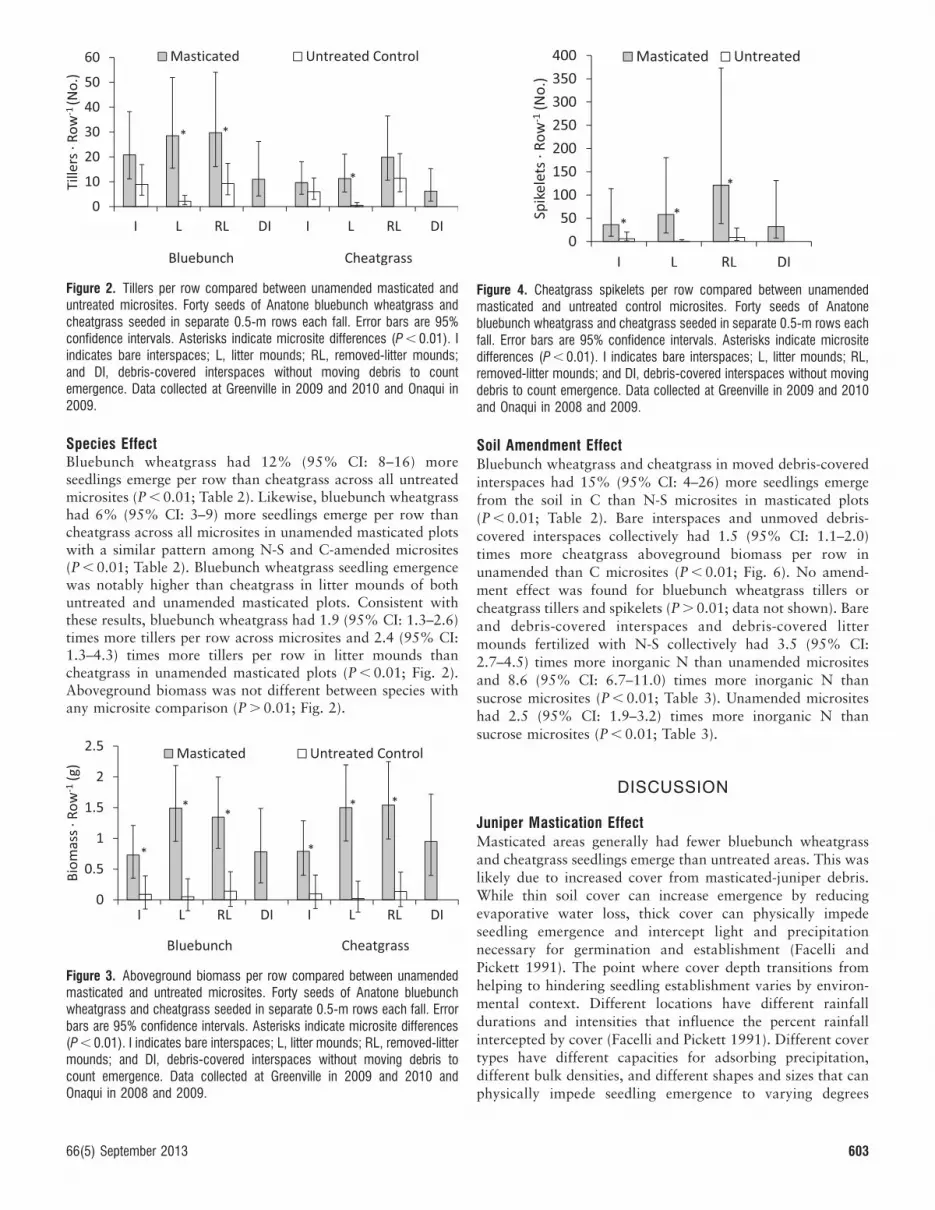
Soil Amendment EffectBluebunch wheatgrass and cheatgrass in moved debris-coveredinterspaces had 15% (95% CI: 4–26) more seedlings emergefrom the soil in C than N-S microsites in masticated plots(P , 0.01; Table 2). Bare interspaces and unmoved debris-covered interspaces collectively had 1.5 (95% CI: 1.1–2.0)times more cheatgrass aboveground biomass per row inunamended than C microsites (P , 0.01; Fig. 6). No amend-ment effect was found for bluebunch wheatgrass tillers orcheatgrass tillers and spikelets (P . 0.01; data not shown). Bareand debris-covered interspaces and debris-covered littermounds fertilized with N-S collectively had 3.5 (95% CI:2.7–4.5) times more inorganic N than unamended micrositesand 8.6 (95% CI: 6.7–11.0) times more inorganic N thansucrose microsites (P , 0.01; Table 3). Unamended micrositeshad 2.5 (95% CI: 1.9–3.2) times more inorganic N thansucrose microsites (P , 0.01; Table 3).
DISCUSSION
Juniper Mastication EffectMasticated areas generally had fewer bluebunch wheatgrassand cheatgrass seedlings emerge than untreated areas. This waslikely due to increased cover from masticated-juniper debris.While thin soil cover can increase emergence by reducingevaporative water loss, thick cover can physically impedeseedling emergence and intercept light and precipitationnecessary for germination and establishment (Facelli andPickett 1991). The point where cover depth transitions fromhelping to hindering seedling establishment varies by environ-mental context. Different locations have different rainfalldurations and intensities that influence the percent rainfallintercepted by cover (Facelli and Pickett 1991). Different covertypes have different capacities for adsorbing precipitation,different bulk densities, and different shapes and sizes that canphysically impede seedling emergence to varying degrees
Figure 2. Tillers per row compared between unamended masticated anduntreated microsites. Forty seeds of Anatone bluebunch wheatgrass andcheatgrass seeded in separate 0.5-m rows each fall. Error bars are 95%confidence intervals. Asterisks indicate microsite differences (P , 0.01). Iindicates bare interspaces; L, litter mounds; RL, removed-litter mounds;and DI, debris-covered interspaces without moving debris to countemergence. Data collected at Greenville in 2009 and 2010 and Onaqui in2009.
Figure 3. Aboveground biomass per row compared between unamendedmasticated and untreated microsites. Forty seeds of Anatone bluebunchwheatgrass and cheatgrass seeded in separate 0.5-m rows each fall. Errorbars are 95% confidence intervals. Asterisks indicate microsite differences(P , 0.01). I indicates bare interspaces; L, litter mounds; RL, removed-littermounds; and DI, debris-covered interspaces without moving debris tocount emergence. Data collected at Greenville in 2009 and 2010 andOnaqui in 2008 and 2009.
Figure 4. Cheatgrass spikelets per row compared between unamendedmasticated and untreated control microsites. Forty seeds of Anatonebluebunch wheatgrass and cheatgrass seeded in separate 0.5-m rows eachfall. Error bars are 95% confidence intervals. Asterisks indicate micrositedifferences (P , 0.01). I indicates bare interspaces; L, litter mounds; RL,removed-litter mounds; and DI, debris-covered interspaces without movingdebris to count emergence. Data collected at Greenville in 2009 and 2010and Onaqui in 2008 and 2009.
66(5) September 2013 603

(Facelli and Pickett 1991). While one study suggested that 5 cmor deeper of chipped Utah juniper and single-leaf pinon (Pinusmonophylla Torr. and Frem.) reduces seedling emergence(Benson 2006), our data suggested that seedling emergence
gradually declines with increased juniper debris cover. Howev-er, the bluebunch wheatgrass and cheatgrass seedlings that didemerge in masticated areas had more aboveground biomass
and tillers, and cheatgrass had more spikelets than untreatedareas supporting our first hypothesis that juniper treemastication would increase seedling establishment. The in-
creased growth of both bluebunch wheatgrass and cheatgrasswas likely associated with greater soil inorganic N, more wetdays, and warmer soil temperatures in masticated areas (Young
2012), which suggests that both species when present willincrease following juniper mastication.
Litter Mound EffectLitter mounds had less bluebunch wheatgrass and cheatgrassemergence, tillers, and cheatgrass spikelets than removed-litter
mounds and interspaces in untreated areas. This lower seedlingestablishment was likely associated with less inorganic N,greater competition from juniper roots (Emerson 1932), and
physical impedance of seedling emergence by litter mounds(Facelli and Pickett 1991; Horman and Anderson 2003).
However, juniper mastication changed the plant establishment
pattern among microsites from that of untreated areas. Littermounds had little effect on seedling establishment in masticatedareas even though litter mounds had more soil inorganic Nthan bare interspaces, as expected of resource islands (Broth-erson and Osayande 1980; Padien and Lajtha 1992). Thisresult is contrary to our second hypothesis that higher soilinorganic N in litter mounds would favor cheatgrass establish-ment although with more time since treatment the cheatgrassresponse could change. The greater soil inorganic N in littermounds of masticated areas was also likely associated withincreased soil nutrient diffusion as a result of longer periods ofavailable soil water (Leffler and Ryel 2012) after juniper treeswere masticated and no longer using resources. These improvedenvironmental conditions probably compensated for some ofthe physical impedance of seedling emergence by litter moundsresulting in similar seedling establishment between littermounds and bare interspaces.
Our results are applicable to seedling establishment fromseeds in the soil, but in natural settings seeds end up in a varietyof locations that may be less optimal. Species with wind-dispersed seeds capable of establishing inside plant litter mayinitially dominate litter mounds following juniper mastication.For example, we observed unplanted cheatgrass seedlings withleaves growing above litter mounds and their seeds suspendedin the litter with roots extending down into the soil. Thisdemonstrates both the exceptional ability of cheatgrass toestablish and litter mounds to provide environmental condi-tions suitable for vigorously establishing species. Others studieshave also found litter mounds to provide favorable conditionsfor cheatgrass establishment (Young and Evans 1975; Evansand Young 1984; Chambers et al. 2007). The ability ofcheatgrass to establish with its seed suspended in litter moundsappears to have given it access to the greater soil N and waterwe found below litter mounds. This establishment ability couldenable cheatgrass to ‘‘perceive’’ a larger resource pool than thatperceived by less vigorously establishing species, and may allowcheatgrass to reduce the size of the resource pool available toslower establishing species (Leffler and Ryel 2012). This accessto greater resource availability could provide an avenue forcheatgrass to invade plant communities where it was previouslya minor component; an example of the fluctuating resource
Table 3. Soil inorganic N (NO3þNH4) linear-contrast comparisons from plant root simulator (PRS) probes in top 12 cm of soil for 4 mo. Appliedammonium sulfate ([NH4]2SO4) at 224 kg � ha�1 N and sucrose (C12H22O11) at 1 100 kg � ha�1 C each fall. Data collected at Greenville in 2009 and 2010,Onaqui in 2008 and 2009, and Stansbury in 2009.
Microsite
Unamended treatment effect Amendment effect in masticated plots
Untreated Masticated Unamended (NH4)2SO4 C12H22O11
-------------- mg �m�2 � 4 mo�1 ------------- -----------------------------mg �m�2 � 4 mo�1----------------------------
Litter mound 381 b2 377 a — — —
Removed-litter mound 81 a 477 a — — —
Bare interspace 75 a 197 b 197 b 7443 a 334 b
Debris-covered interspace — 89 c 89 c 544 a 334 b
Debris-covered litter mound — 380 a 380 a 687 a 379 a
65 304 222 6583 1485
1Individually and collectively, unamended masticated . untreated (P , 0.01).2Microsite differences within columns have different letters (P , 0.01).3Individually and collectively, ammonium sulfate . unamended and sucrose (P , 0.01).4Bare and debris-covered interspaces, sucrose , unamended (P , 0.01).5Collectively, sucrose , unamended (P , 0.01).
Table 4. Wet day linear-contrast comparisons during spring (1 March–30June) at 1- to 3-cm soil depth. Data measured at Greenville in 2009 and2010, Onaqui in 2008 and 2009, and Stansbury in 2009 using gypsumblocks.
Microsite Untreated Masticated
Litter mound 91 a1 1142 a
Removed-litter mound 67 b 862 b
Bare interspace 81 ab 86 b
Debris-covered interspace 117 a
Debris-covered litter mound 121 a
80 105
1Treatment differences are italicized (P , 0.001).2Microsite differences within columns have different letters (P , 0.01).
604 Rangeland Ecology & Management

hypothesis where increased resource availability leads to
increased plant community invasibility (Davis et al. 2000).
Debris EffectMore bluebunch wheatgrass seedlings emerged from the soil
under debris in moved debris-covered interspaces than bare
interspaces in masticated areas. This result was associated with
more moisture under debris during spring, but the additional
water was not enough to enable many seedlings to grow
through the physical barrier of unmoved debris. However, the
few seedlings that did emerge through unmoved debris
produced as much biomass and as many tillers and spikelets
per row as seedlings growing in bare interspaces. This increased
growth per plant was probably due to the greater soil water
availability in debris-covered interspaces during spring ratherthan soil inorganic N because there was less soil inorganic N indebris-covered interspaces than bare interspaces. These resultsindicate that water is more limiting of seedling establishmentthan soil inorganic N in these ecosystems and support earlierwork that found soil water availability to be the primarydeterminant of seedling establishment in similar areas (Cham-bers et al. 2007). The overall similarity in seedling establish-ment between both species suggests that debris will not favorbluebunch wheatgrass establishment over cheatgrass as we hadspeculated.
Species EffectBluebunch wheatgrass had more seedlings in masticated anduntreated areas and more tillers in masticated areas thancheatgrass even though most establishment measurements weresimilar between species. The greater bluebunch wheatgrassemergence and number of tillers were associated with thestrong establishment characteristics of the naturally selectedAnatone population of bluebunch wheatgrass. Anatone wasselected in part for its fast germination rate at coldtemperatures and strong seedling emergence, establishment,and vigor; traits that help Anatone compete with invasiveannuals like cheatgrass (Monsen et al. 2003). These character-istics and our results suggest that Anatone, where adapted,would be a good choice when seeding perennial grasses inrangeland restoration projects. However, Anatone should notbe expected to outcompete cheatgrass at the seedling stage.Even though cheatgrass sometimes had fewer seedlings per rowthan bluebunch wheatgrass, it produced similar amounts ofaboveground biomass. This result indicates that cheatgrassproduced more aboveground biomass per plant than bluebunchwheatgrass during the first growing season as has been found inearlier work (James et al. 2011). Cheatgrass and other invasiveannuals have high relative growth rates and specific leaf areasthat allow them to compete for resources in both high and lownutrient conditions (James 2012). In addition, cheatgrass
Figure 6. Seedling aboveground biomass per row compared amongmasticated and amended microsites. Forty seeds of Anatone bluebunchwheatgrass and cheatgrass seeded in separate 0.5-m rows each fall. Errorbars are 95% confidence intervals. Applied ammonium sulfate ([NH4]2SO4)at 224 kg � ha�1 N and sucrose (C12H22O11) at 1 100 kg � ha�1 C once eachfall. Asterisks indicate amendment differences (P , 0.01). I indicates bareinterspaces; DI, debris-covered interspaces without moving debris to countemergence. Data collected at Greenville in 2009 and 2010 and Onaqui in2008 and 2009.
Figure 5. Seedling emergence and surface cover depths for juniper litter mounds and masticated debris-covered interspaces.
66(5) September 2013 605
produced seed the first growing season following seeding as istypical of annuals, whereas Anatone did not produce seed untilthe second growing season. This suggests that if perennialgrasses have been severely weakened or lost over decades ofjuniper dominance, and cheatgrass is prevalent on the projectsite, cheatgrass will need to be controlled to allow time andresources for seeded perennials such as Anatone to establish.
Soil Amendment EffectWe hypothesized that N fertilization would increase cheatgrassestablishment and growth over bluebunch wheatgrass and thatsoil C amendments would increase bluebunch wheatgrassestablishment over cheatgrass because of the highly responsivenature of invasive annuals to soil N availability (Monaco et al.2003; Mazzola et al. 2011). However, we found that N-S and Camendments had little effect on seedling establishment and firstyear growth even though N-S fertilization increased soilinorganic N by two to four times the increase in soil inorganicN resulting from juniper mastication. The lack of seedlingresponse to increased soil inorganic N and the similarity inresponses between cheatgrass and bluebunch wheatgrass todecreased N suggest that changes in soil inorganic N inducedby juniper mastication are not sufficient to favor one speciesover the other, at least when both species are seedlings.However, managing for low nutrient availability should helpmaintain perennial grass dominance in spite of greater invasiveannual growth rates because mature (at least 2-yr old)perennial grasses use nutrients more efficiently (James 2012).Mature perennial grasses resorb nutrients from senescing leavesresulting in longer mean residence time, develop tougher tissuesthat minimize tissue loss during drought, build greater root:-shoot ratios, and maintain structural components avoiding thecost of rebuilding them each year compared to annuals(Monaco et al. 2003; James 2012). From a managementperspective, this implies that it would be more efficient to treatjuniper encroachment before desirable perennial grasses aregreatly reduced.
IMPLICATIONS
Mastication is useful in a variety of settings but especially inwildland urban interfaces where it can reduce both thedegrading effects of juniper encroachment on the historic plantcommunity and the threat of crown fire to nearby communities.Juniper trees should be treated before infilling weakens ordepletes perennial grasses. Bluebunch wheatgrass and cheat-grass, if present, are both expected to increase following junipermastication because of increased soil water and inorganic N. Inline with plant community resilience and resistance theory(D’Antonio et al. 2009), we expect areas with dominantperennial grass cover before juniper mastication to have astrong perennial grass component after mastication. If peren-nial grasses have been lost during decades of juniperdominance, then vigorous perennial grasses like Anatonebluebunch wheatgrass need to be sown. Dominant invasiveannuals like cheatgrass with their faster growth rates may needto be controlled (e.g., selective herbicides) to allow slowergrowing perennial grasses to establish because reducing soilinorganic N alone during the seedling phase does not enable
bluebunch wheatgrass to outcompete cheatgrass (James 2012).Another reason reduced soil inorganic N did not enablebluebunch wheatgrass to outcompete cheatgrass at the seedlingphase could be that water, required for soil nutrient diffusion,limited seedling establishment more than soil inorganic N inthese sagebrush-bunchgrass ecosystems. Once perennials areestablished, maintaining low soil nutrient availability will helpmature perennial grasses that have nutrient-conserving struc-tures compete with invasive annuals (James 2012). Maintaininghealthy perennial vegetation before weedy species dominatemay be the most effective way to limit invasive annual plantdominance (Chambers et al. 2007; Roundy et al. 2007).Additionally, our results suggest that if litter mounds andmasticated debris were spread thin during the masticationtreatment that seedling establishment of both grasses wouldincrease.
ACKNOWLEDGMENTS
We thank the USDI Bureau of Land Management and USDA Forest Service
in Utah for helping implement treatments and allowing this research on
public lands. We are grateful to the research site managers, April Hulet and
Brad Jessop, and the several students who helped with field work. The
authors thank the reviewers for constructive comments that helped improve
the content of this article.
LITERATURE CITED
BARNEY, M. A., AND N. C. FRISCHKNECHT. 1974. Vegetation changes following fire in thepinyon-juniper type of west-central Utah. Journal of Range Management 27:91–96.
BATES, J. D., R. F. MILLER, AND T. J. SVEJCAR. 2000. Understory dynamics in cut anduncut western juniper woodlands. Journal of Range Management 53:119–126.
BECKSTEAD, J., AND C. K. AUGSPURGER. 2004. An experimental test of resistance tocheatgrass invasion: limiting resources at different life stages. Biological
Invasions 6:417–432.BENSON, T. L. 2006. Understory vegetation responses to pinyon-juniper tree removal,
seeding, and chip application, Lincoln County, Nevada [thesis]. Reno, NV, USA:University of Nevada. 114 p.
BRADY, N. C., AND R. R. WEIL. 1999. The nature and properties of soils. 12th ed. UpperSaddle River, NJ, USA: Prentice-Hall, Inc. 881 p.
BROTHERSON, J. D., AND S. T. OSAYANDE. 1980. Mineral concentrations in true mountainmahogany and Utah juniper, and in associated soils. Journal of Range
Management 33:182–185.BURKHARDT, J. W., AND E. W. TISDALE. 1976. Causes of juniper invasion in southwestern
Idaho. Ecology 57:472–474.CHAMBERS, J. C., S. E. MEYER, A. WHITTAKER, B. A. ROUNDY, AND R. R. BLANK. 2007. What
makes Great Basin sagebrush ecosystems invasible by Bromus tectorum?Ecological Monographs 77:117–145.
D’ANTONIO, C. M., J. C. CHAMBERS, R. LOH, AND J. T. TUNISON. 2009. Applying ecologicalconcepts to the management of widespread grass invasions. In: R. L. Inderjit[ED.]. Applying ecological concepts to the management of widespread grassinvasions. Dordrecht, Netherlands: Springer. p. 123–149.
DAVIS, M. A., J. P. GRIME, AND K. THOMPSON. 2000. Fluctuating resources in plantcommunities: a general theory of invasibility. Journal of Ecology 88:528–534.
EMERSON, F. W. 1932. The tension zone between the grama grass and pinon-juniperassociations in northeastern New Mexico. Ecology 13:347–358.
EVANS, R. A., AND J. A. YOUNG. 1984. Microsite requirements for downy brome(Bromus tectorum) infestation and control on sagebrush rangelands. Weed
Science 32:13–17.FACELLI, J. M., AND S. T. A. PICKETT. 1991. Plant litter: its dynamics and effects on plant
community structure. Botanical Review 57:1–32.
606 Rangeland Ecology & Management
GRIME, J. P., AND R. HUNT. 1975. Relative growth-rate: its range and adaptivesignificance in a local flora. Journal of Ecology 63:393–422.
HARDEGREE, S. P., G. N. FLERCHINGER, AND S. S. VAN VACTOR. 2003. Hydrothermalgermination response and the development of probabilistic germination profiles.Ecological Modeling 167:305–322.
HARRIS, G. A. 1967. Some competitive relationships between Agropyron spicatum andBromus tectorum. Ecological Monographs 37:89–111.
HORMAN, C. S., AND V. J. ANDERSON. 2003. Understory species response to Utah juniperlitter. Journal of Range Management 56:68–71.
JAMES, J. J. 2012. Species performance: the relationship between nutrient availability,life history traits, and stress. In: T. A. Monaco and R. L. Sheley [EDS.]. Invasiveplant ecology and management: linking processes to practice. Cambridge, MA,USA: CABI. p. 142–153.
JAMES, J. J., R. E. DRENOVSKY, T. A. MONACO, AND M. J. RINELLA. 2011. Managing soilnitrogen to restore annual grass-infested plant communities: effective strategy orincomplete framework? Ecological Applications 21:490–502.
KANE, J. M., J. M. VARNER, E. E. KNAPP, AND R. F. POWERS. 2010. Understory vegetationresponse to mechanical mastication and other fuels treatments in a ponderosapine forest. Applied Vegetation Science 13:207–220.
KONIAK, S. 1985. Succession in pinyon-juniper woodlands following wildfire in theGreat Basin. Great Basin Naturalist 45:556–566.
LEFFLER, A. J., AND R. J. RYEL. 2012. Resource pool dynamics: conditions that regulatespecies interactions and dominance. In: T. A. Monaco and R. L. Sheley [EDS.].Invasive plant ecology and management: linking processes to practice.Cambridge, MA, USA: CABI. p. 57–78.
LOUGHLIN, T. 2006. Improved experimental design and analysis for long-termexperiments. Crop Science 46:2492–2506.
MAZZOLA, M. B., J. C. CHAMBERS, R. R. BLANK, D. A. PYKE, E. W. SCHUPP, K. G. ALLCOCK, P. S.DOESCHER, AND R. S. NOWAK. 2011. Effects of resource availability and propagulesupply on native species recruitment in sagebrush ecosystems invaded by Bromus
tectorum. Biological Invasions 13:513–526.MCIVER, J. D., M. BRUNSON, AND S. C. BUNTING. 2010. The sagebrush steppe treatment
evaluation project (SageSTEP): a test of state-and-transition theory. Fort Collins,CO, USA: US Forest Service. RMRS-GTR-237. 16 p.
MELGOZA, G., R. S. NOWAK, AND R. J. TAUSCH. 1990. Soil water exploitation after fire:competition between Bromus tectorum (cheatgrass) and two native species.Oecologia 83:7–13.
MILLER, R. F., J. D. BATES, T. J. SVEJCAR, F. B. PIERSON, AND L. E. EDDLEMAN. 2005.Biology, ecology, and management of western juniper. Corvallis, OR, USA:Oregon State University Agricultural Experiment Station. Technical Bulletin 152.77 p.
MILLER, R. F., AND J. R. ROSE. 1999. Fire history and western juniper encroachment insagebrush steppe. Journal of Range Management 52:550–559.
MILLER, R. F., AND R. J. TAUSCH. 2001. The role of fire in pinyon and juniper woodlands:a descriptive analysis. In: K. E. M. Galley and T. P. Wilson [EDS.]. Proceedings ofthe Invasive Species Workshop: The role of fire in the control and spread of
invasive species. Fire Conference 2000. Tallahassee, FL, USA: Tall TimbersResearch Station. Miscellaneous Publication 11. p. 15–30.
MONACO, T. A., D. A. JOHNSON, J. M. NORTON, T. A. JONES, K. J. CONNORS, J. B. NORTON, AND
M. G. REDINBAUGH. 2003. Contrasting responses of intermountain west grasses ofsoil nitrogen. Journal of Range Management 56:282–290.
MONSEN, S. B., S. G. KITCHEN, K. MEMMOTT, N. SHAW, M. PELLANT, S. YOUNG, D. OGLE, AND L.ST. JOHN. 2003. Notice to release Anatone germplasm bluebunch wheatgrass(selected class natural population). Provo, UT, USA: US Forest service RockyMountain Research Station, Shrub Sciences Laboratory. 45 p.
NEWMAN, B. D., M. O. GARD, AND D. D. BRESHEARS. 2010. Evapotranspiration partitioningin a semiarid woodland: ecohydrologic heterogeneity and connectivity ofvegetation patches. Vadose Zone Journal 9:561–572.
PADIEN, D. J., AND K. LAJTHA. 1992. Plant spatial pattern and nutrient distribution inpinyon-juniper woodlands along an elevational gradient in northern New Mexico.International Journal of Plant Sciences 153:425–433.
PASCHKE, M. W., T. MCLENDON, AND E. F. REDENTE. 2000. Nitrogen availability and old-field succession in a shortgrass steppe. Ecosystems 3:144–158.
PRISM CLIMATE GROUP. 2008. Parameter-elevation regression on independent slopesmodel. Available at: http://prism.oregonstate.edu. Accessed February 2008.
RAU, B. M., D. W. JOHNSON, R. R. BLANK, R. J. TAUSCH, B. A. ROUNDY, R. F. MILLER, T. G.CALDWELL, AND A. LUCCHESI. 2011. Woodland expansion’s influence on belowgroundcarbon and nitrogen in the Great Basin U.S. Journal of Arid Environments
75:827–835.RHOADES, C. C., M. A. BATTAGLIA, M. E. ROCCA, AND M. G. RYAN. 2012. Short- and
medium-term effects of fuel reduction mulch treatments on soil nitrogenavailability in Colorado conifer forests. Forest Ecology and Management
276:231–238.ROUNDY, B. A., A. WHITTAKER, J. C. CHAMBERS, AND S. P. HARDEGREE. 2007. Prediction of
cheatgrass field germination potential using wet thermal accumulation.Rangeland Ecology & Management 60:613–623.
SCHLESINGER, W. H., AND A. M. PILMANIS. 1998. Plant-soil interactions in deserts.Biogeochemistry 42:169–187.
SYLVIA, D. M., J. J. FUHRMANN, P. G. HARTEL, AND D. A. ZUBERER. 2005. Principles andapplications of soil microbiology. 2nd ed. Upper Saddle River, NJ, USA: PearsonEducation, Inc. 607 p.
TAUSCH, R. J., AND P. T. TUELLER. 1977. Plant succession following changing of pinyon-juniper woodlands in eastern Nevada. Journal of Range Management 30:44–49.
VASQUEZ, E., R. SHELEY, AND T. SVEJCAR. 2008a. Creating invasion resistant soils vianitrogen management. Invasive Plant Science and Management 1:304–314.
VASQUEZ, E., R. SHELEY, AND T. SVEJCAR. 2008b. Nitrogen enhances the competitiveability of cheatgrass (Bromus tectorum) relative to native grasses. Invasive Plant
Science and Management 1:287–295.YOUNG, J. A., AND R. A. EVANS. 1975. Germinability of seed reserves in a big sagebrush
community. Weed Science 23:358–364.YOUNG, K. R. 2012. Plant establishment and soil microenvironments in Utah juniper
masticated woodlands [thesis]. Provo, UT, USA: Brigham Young University. 103 p.
66(5) September 2013 607


