Embed Size (px)
Citation preview

ARTICLE IN PRESS
0967-0637/$ - see
doi:10.1016/j.ds
�CorrespondiE-mail addre
Deep-Sea Research I 54 (2007) 1871–1889
www.elsevier.com/locate/dsri
Plankton community structure south and west of South Georgia(Southern Ocean): Links with production and physical forcing
Peter Ward�, Mick Whitehouse, Rachael Shreeve, Sally Thorpe,Angus Atkinson, Rebecca Korb, David Pond, Emma Young
British Antarctic Survey, Natural Environment Research Council, High Cross, Madingley Road, Cambridge CB3 0ET, UK
Received 13 October 2006; received in revised form 24 August 2007; accepted 27 August 2007
Available online 11 September 2007
Abstract
During late December 2004 and early January 2005 the plankton community to the south and west of South Georgia
was investigated. Satellite imagery had shown the surface expression of a bloom over the southern shelf 1 month prior to
the cruise, although by the time of sampling a well-defined sub-surface chl-a maximum was evident at 26 of the 57 stations
located mainly at the western end of the southern shelf (and the bloom was declining). Nonetheless, integrated chl-a was
still greater over the shelf than elsewhere (18–362mgm�2). Macronutrient distributions essentially mirrored the
distribution of chl-a biomass, with depletion greatest in the on-shelf waters at the western end of South Georgia, where the
most intense surface bloom had occurred during the preceding November. Nearest neighbour clustering of microplankton
and mesozooplankton data revealed the presence of two major station groups within each analysis with broadly congruent
distributions. Within the microplankton analysis a southern and western shelf grouping of 18 stations was dominated
by Corethron spp., Eucampia antarctica and Thalassiothrix spp. This group corresponded spatially to a shelf zooplankton
grouping (12 of the 18 stations in both groups in common) in which mesozooplankton abundance was greatest. Here
small copepods such as Oithona spp. and the neritic clausocalaniid Drepanopus forcipatus dominated, along with the
thecate pteropod Limacina helicina, appendicularians and calanoid copepod naupliar stages. Acoustic doppler current
profiler (ADCP) measurements indicated that water flow over the shelf was low and variable (o15 cm s�1). In contrast
the largest station groups in both ordinations were distributed along the southern shelf-break and further off-shelf in
water flowing rapidly (up to 55 cm s�1) to the southeast. Nitzschia spp., Pseudonitzschia spp., and Fragilariopsis
kerguelensis were abundant here, and the zooplankton, in addition to Oithona spp., was characterized by Metridia spp.,
Ctenocalanus spp., Oncaea spp., and the polychaete Pelagobia longicirrata. A third group of 13 stations disclosed by
the mesoplankton ordination was confined to the north and west and generally comprised outer shelf stations in deeper
waters. Here zooplankton abundance was less than in the adjacent major station groupings, although Calanus simillimus
was considerably more abundant than in other groups. Relationships of both micro- and zooplankton ordinations
with environmental variables were modest (Spearman rank correlation, rw ¼ 0.49–0.59), albeit complex, with interactions
likely to have occurred over different timescales. High levels of ammonium over the shelf, probably resulting
from microbial breakdown and zooplankton excretion, contributed most to explaining both ordinations, along with
the Si(OH)4:NO3 deficit ratio, a measure of past nutrient use. Model output from Ocean Circulation and Climate
Advanced Modelling (OCCAM) supported ADCP-derived flow measurements. Specifically, release of particles along a
transect to the southwest suggested there was an extended residence time (in excess of 3 months) over the southern shelf
and a slow but significant northwards transport into the Georgia Basin. The spatial extent of the shelf and the current
front matter r 2007 Elsevier Ltd. All rights reserved.
r.2007.08.008
ng author. Tel.: +441223 221564.
ss: [email protected] (P. Ward).

ARTICLE IN PRESSP. Ward et al. / Deep-Sea Research I 54 (2007) 1871–18891872
speed and direction implied that in situ production was locally important and had the potential to contribute significantly
to downstream ecosystems.
r 2007 Elsevier Ltd. All rights reserved.
Keywords: Antarctica; Southern Ocean; South Georgia; Marine plankton communities; Physical oceanography; Island shelf; Production;
Phytoplankton blooms
1. Introduction
The causes of high biological productivity in theworld’s ocean are extremely diverse, although mostproductive regions have strong links with complexphysical environments. Examples include coastalupwelling regions, where key zooplankton specieshave life cycles that interact with circulatory systemsto maintain them over productive continentalshelves (e.g., Hutchings et al., 1995; Peterson,1998; Durbin et al., 2000); frontal regions, wherevertical turbulence can stimulate production byreplenishing nutrients in the near-surface layer(Roman et al., 2002); and regions in the ArabianSea where responses to seasonal atmospheric for-cing increase production following the southwestmonsoon season (Smith, 1995). In polar regionsproduction is highly seasonal and may be linked tothe stabilization of surface waters following sea-iceretreat or to the development of under-ice algalblooms (Smith and Sakshaug, 1990). In the South-ern Ocean, productive regimes occur around ocea-nic islands such as South Georgia (Atkinson et al.,2001; Korb et al., 2004), Prince Edward Islands(Pakhomov and Froneman, 2000; Hunt et al.,2001), and the Kerguelen Islands (Blain et al.,2001). In these regions dense phytoplankton bloomsform over the island shelves and in the surroundingseas and may be advected many hundreds ofkilometres downstream. Advection is also a domi-nant factor influencing the dynamics of zooplank-ton populations through determining residencetimes in different food regimes (Huntley and Niiler,1995; Zhou et al., 2006). Within these islandecosystems, knowledge of the relative balancebetween locally derived production and the lossesand inputs due to advection is key to understandinghow energy is transferred through the food web(Atkinson et al., 2001; Murphy et al., 2004).
South Georgia lies in the path of the AntarcticCircumpolar Current (ACC) between two majorfronts: the Antarctic Polar Front (APF) to the northand the Southern ACC Front (SACCF) to thesouth. The ACC diverges to the southwest of the
island, flows northwards across the Scotia Ridgeprior to resuming its generally eastwards course(Orsi et al., 1995). Phytoplankton blooms at SouthGeorgia generally originate locally with relativelylittle growth initiated upstream of the island shelf(Atkinson et al., 2001; Korb and Whitehouse, 2004;Korb et al., 2004). However, downstream of theisland (north), intense blooms occur frequently andregularly extend to the APF and beyond (Korbet al., 2004). Drifter releases and shipboard mea-surements have provided supporting evidence thatproductive waters move from the northwest regionof South Georgia’s shelf/shelf-break, cyclonicallyaround the periphery of the Georgia Basin, and thentowards the APF and are advected eastwards(Meredith et al., 2003; Korb and Whitehouse,2004). The northwest shelf is thought to provide abenthic source of iron, which stimulates productionin the generally high nutrient low chlorophyll(HNLC) conditions typical of the Southern Oceangenerally (Treguer and Jacques, 1992; Boyd, 2002).Strong links have been established between meso-zooplankton and differing phytoplankton regimesfound in the region, with local production support-ing high zooplankton standing stocks, particularlyto the north of the island (Ward et al., 2002, 2005).
Much of what is known about the watersimmediately south of the island dates from Dis-covery investigations (Hardy and Gunther, 1935;Hart, 1942), and with the exception of surveysundertaken in the early 1980s (Atkinson and Peck,1990; Atkinson et al., 1990; Whitehouse et al.,1996a), few comprehensive sampling programmeshave been carried out on this side of the island inrecent times. However, satellite imagery has high-lighted the scale of phytoplankton blooms on theisland’s southern shelf and a review of SeaWiFSdata over 8 summer seasons indicated that thesouthern shelf was the most consistent centre ofhigh chlorophyll biomass around South Georgia,with elevated levels evident in 29 out of 46 springand summer months investigated (British AntarcticSurvey unpublished data). Indeed, there have beenat least two seasons in the past 10 years (1996/1997
ARTICLE IN PRESSP. Ward et al. / Deep-Sea Research I 54 (2007) 1871–1889 1873
and 2000/2001) when the vast majority of theisland’s primary production was located on thesouthern shelf and appeared to extend into theGeorgia Basin and north to the APF (Korb et al.,2004). It was also observed that blooms over thesouthern shelf extended to the west rather thaneastwards, which is the prevailing offshelf currentdirection. It is likely that the southern shelf alsoprovides a benthic source of iron to promoteprimary production, but to date we have virtuallyno direct measurements relating to water flow in thisregion, few data on zooplankton, and no directestimates of primary production rates.
To better understand production processes atSouth Georgia a cruise was undertaken in lateDecember 2004–early January 2005 to survey theisland’s southern shelf. In this paper we report onthe distribution of plankton communities during thecruise and examine links with primary producers andphysical oceanography. Also, given the potential forwater retention over the shelf (Meredith et al., 2005,Whitehouse et al., in press), we wished to assess theextent to which zooplankton might be retainedwithin the region, and also determine pathways fromthe southern shelf into the Georgia Basin.
2. Methods
2.1. Plankton sampling and analysis
Between December 26, 2004 and January 12, 2005oceanographic sampling was carried out along a
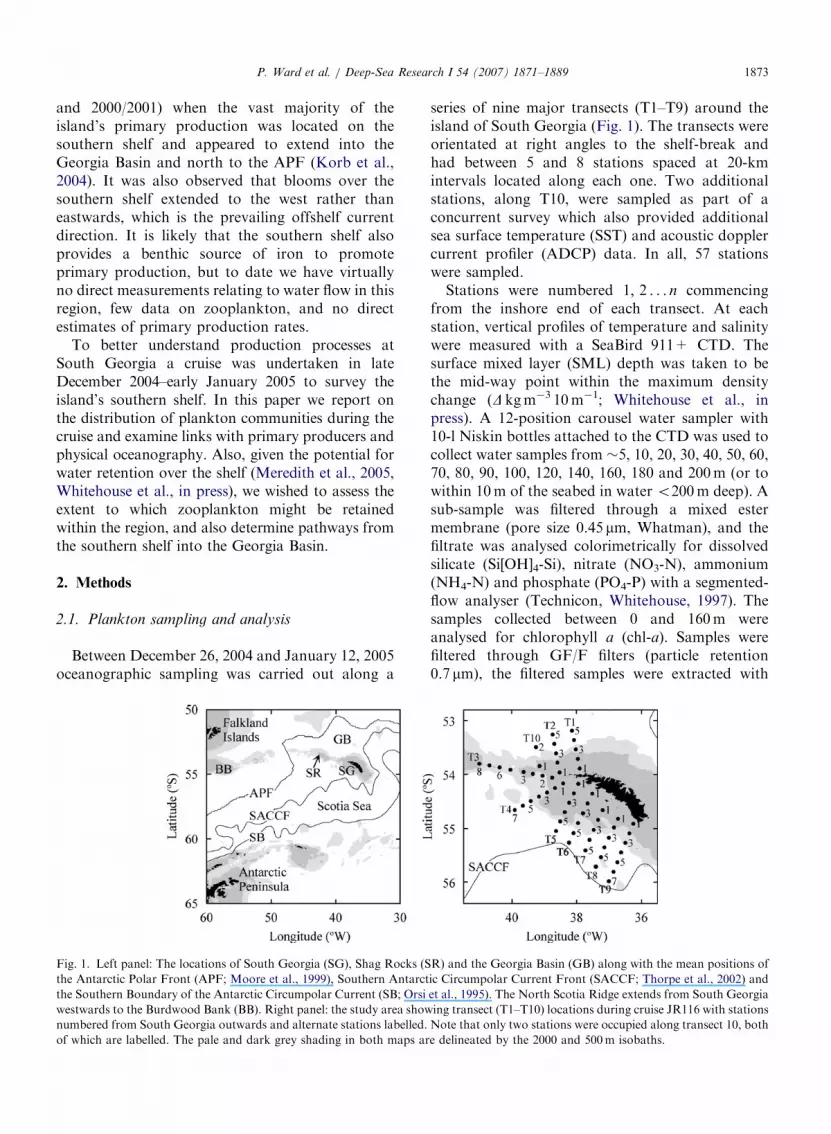
Fig. 1. Left panel: The locations of South Georgia (SG), Shag Rocks (S
the Antarctic Polar Front (APF; Moore et al., 1999), Southern Antarct
the Southern Boundary of the Antarctic Circumpolar Current (SB; Orsi
westwards to the Burdwood Bank (BB). Right panel: the study area show
numbered from South Georgia outwards and alternate stations labelled.
of which are labelled. The pale and dark grey shading in both maps ar
series of nine major transects (T1–T9) around theisland of South Georgia (Fig. 1). The transects wereorientated at right angles to the shelf-break andhad between 5 and 8 stations spaced at 20-kmintervals located along each one. Two additionalstations, along T10, were sampled as part of aconcurrent survey which also provided additionalsea surface temperature (SST) and acoustic dopplercurrent profiler (ADCP) data. In all, 57 stationswere sampled.
Stations were numbered 1; 2 . . . n commencingfrom the inshore end of each transect. At eachstation, vertical profiles of temperature and salinitywere measured with a SeaBird 911+ CTD. Thesurface mixed layer (SML) depth was taken to bethe mid-way point within the maximum densitychange (D kgm�3 10m�1; Whitehouse et al., inpress). A 12-position carousel water sampler with10-l Niskin bottles attached to the CTD was used tocollect water samples from �5, 10, 20, 30, 40, 50, 60,70, 80, 90, 100, 120, 140, 160, 180 and 200m (or towithin 10m of the seabed in water o200m deep). Asub-sample was filtered through a mixed estermembrane (pore size 0.45 mm, Whatman), and thefiltrate was analysed colorimetrically for dissolvedsilicate (Si[OH]4-Si), nitrate (NO3-N), ammonium(NH4-N) and phosphate (PO4-P) with a segmented-flow analyser (Technicon, Whitehouse, 1997). Thesamples collected between 0 and 160m wereanalysed for chlorophyll a (chl-a). Samples werefiltered through GF/F filters (particle retention0.7 mm), the filtered samples were extracted with
R) and the Georgia Basin (GB) along with the mean positions of
ic Circumpolar Current Front (SACCF; Thorpe et al., 2002) and
et al., 1995). The North Scotia Ridge extends from South Georgia
ing transect (T1–T10) locations during cruise JR116 with stations
Note that only two stations were occupied along transect 10, both
e delineated by the 2000 and 500m isobaths.

ARTICLE IN PRESSP. Ward et al. / Deep-Sea Research I 54 (2007) 1871–18891874
10ml 90% acetone in the dark for 24 h, andfluorescence was measured before and after acid-ification with 1.2M HCl (Turner TD-700, Parsonset al., 1984). These discrete water bottle chl-ameasurements were used to calibrate an AquatrackaMk III fluorometer mounted on the CTD frame.Size fractionation of chl-a was performed on 20-msamples at each station.
SST was monitored via the ship’s non-toxicseawater supply located �7m below the sea surface.Absolute velocity of the upper ocean was measuredalong transects with a vessel-mounted ADCP(153.6 kHz; RD Instruments) (see Whitehouseet al. (in press) for further details). Nutrient deficitswere estimated as the difference between concentra-tions in the winter water layer (an indication of pre-bloom concentrations) and those in the watercolumn above it (Jennings et al., 1984; Whitehouseet al., in press). The winter water layer in Antarcticsurface water is characterized by a well-definedpotential temperature minimum (ymin), locatedbetween �70 and 140m during the present study.These deficits were used as a proxy for the relativeamount of primary production that had occurredsince the end of winter.
Microplankton species composition representa-tive of the SML was determined at each stationfrom water samples collected at 20m and preservedin 1% acid lugols solution. Microplankton wereenumerated by the Utermohl (1958) technique.Sample solutions were left to settle in 50mlchambers for at least 24 h before analysis of selectedmicroplankton taxa by inverted microscopy.Sixteen selected categories were examined oneither 2 or 3 perpendicular transects across thewhole slide at � 100 magnification. The categorieswere chosen on the basis of their dominance of the412-mm microplankton, and their ease of identifi-cation. Species counted ranged in size from�1–200 mm.
Paired bongo nets (mouth diameter 62 cm, meshsize 200 mm) were deployed to 200m or near bottomif shallower. The contents of one of the netswere preserved in 10% v:v formalin and set asidefor later analysis. The contents of the other weresorted for stages CIV and CV Calanoides acutus,and �30 of each from each station were frozenimmediately at �80 1C and subsequently dried at60 1C onboard ship within 1 week of collection.They were then transferred in a sealed container tothe UK, where they were again dried at 60 1C toconstant weight. Dry mass of batches of CIV (3� 10
ind.) and CV (6� 5 ind.) was determined with aMettler MT5 balance to an accuracy of 71 mg.Whole samples were then analysed for C, H, and Nwith a Fisons EA 1108 elemental analyser withacetanilide as a standard. In the UK the formalin-preserved samples were divided into appropriatealiquots with a Folsom plankton splitter andexamined under a binocular microscope. Zooplank-ton were identified to species and stage or highertaxonomic categories and enumerated. Between 500and1000 individuals were counted from eachsample.
Seawater samples (between 1.2 and 3.6 l) collectedat 20m for total fatty acid (TFA) and particulateorganic carbon (POC) analyses were filtered ontopre-ashed GF/F filters. Those for TFA analysiswere placed in chloroform:methanol (2:1 v/v), andboth were then stored at �80 1C until analysis. Afterthe addition of an internal fatty acid standard (21:0)lipids were extracted according to Folch et al.(1957). Fatty acid methyl esters were prepared inmethanol containing 1% sulphuric acid and trans-methylated at 50 1C for 16 h (Christie, 1982). Afterpurification by thin-layer chromatography, fattyacid methyl esters were dissolved in hexane at aconcentration of 1mgml�1 and analysed on a CarloErba Trace 2000 gas chromatograph equippedwith a ZBWAX fused silica capilliary column(30m� 0.32 mm). Hydrogen was used as thecarrier gas, and fatty acids were identified bycomparison with a well-characterized marine fishoil. In the UK, samples for POC analysis wereacidified under an atmosphere of fuming hydro-chloric acid for 24 h and then dried in a vacuumdesiccator for 24 h. Elemental C and N weredetermined in three replicate sub-samples as forthe copepod samples.
2.2. Data analysis
Microplankton cell counts and mesozooplanktondata were initially analysed independently withthe statistical package PRIMER 5 (Primer-ELtd.). Prior to running cluster analysis the largecalanoid copepod species were aggregated into early(CI–CIII) and late (CIV–CVI) copepodite stages toensure that growth and stage progression over thecourse of the cruise did not unduly influence thegrouping of stations.
Standardized data in the form of phytoplanktoncell counts (ind. 50ml�1) and mesozooplanktonabundance (ind. m�2, 0–200m) were then double

ARTICLE IN PRESSP. Ward et al. / Deep-Sea Research I 54 (2007) 1871–1889 1875
root transformed and subjected to q-type clusteranalysis based on the Bray–Curtis similarity andgroup average linkage classification (Field et al.,1982). Non-metric multi-dimensional scaling(NMDS) was also performed to allow relationshipsbetween groups to be assessed. Its purpose is torepresent the samples as points in low-dimensionalspace (2-d) such that the relative distances apart ofall the points are in the same rank order as therelative dissimilarities of the samples (as calculatedby Bray–Curtis coefficients). The SIMPER (simi-larity percentages) routine was also performedon both data sets. SIMPER examines how mucheach species/taxon contributes to the averagesample similarity within, and dissimilarity betweengroups (Clarke and Warwick, 2001). We also usedBIO-ENV, a routine that calculates a measure ofagreement between, two (dis)similarity matrices, onboth microplankton cell count and mesozooplank-ton data matrices and another containing a suite ofenvironmental variables measured at each station(see Tables 3 and 4 and Section 3 for details ofvariables included). Within the analysis, rankcorrelation (r) of the matching elements is carriedout with combinations of the environmental vari-ables being considered at steadily increasing levelsof complexity. In this way an optimal subset ofenvironmental variables that ‘best explains’ thebiotic structure is identified. A value of r ¼ 0 wouldimply an absence of any match between the twopatterns, but typically values of r will be positivewith a value of +1 being a perfect match (Clarkeand Ainsworth, 1993).
The relationship between C mass, zooplanktonabundance and the abundance of copepod eggsattributable to Rhincalanus gigas and Calanus
simillimus in the samples collected at each stationand a suite of potential predictor variables wasexamined using best sub-sets regression (see Table 5and Results Section 3.5 for full details). Responseand predictor variables were log transformed wherenecessary to linearize the relationship, to stabilizevariability and to reduce skewness. The AkaikeInformation Criterion with small-sample adjust-ment (AICc) was used for model selection (Burnhamand Anderson, 2002). Spatial autocorrelationwas examined using the variogram of the standar-dized residuals from the fitted model (Cressie, 1993).Further details of the above can be found inWard et al. (2006). Analyses were implementedusing the statistical software package MINITABv.13 (Pennsylvania State University).
2.3. Particle transport along T4
Output from the Ocean Circulation and ClimateAdvanced Modelling Project (OCCAM) model wasalso used to investigate the transport of particlesfrom transect T4, which was located close to whereflow diverged to pass either side of the island.OCCAM is a z-level primitive equation model of theBryan-Cox-Semtner type, described by Webb et al.(1998). The horizontal resolution of the model is 1�
4 .Full details may be found at http://www.noc.soton.ac.uk/JRD/OCCAM. Predicted 5-day mean velo-cities from OCCAM provided the input data for thisparticle-tracking model. Particles were advectedhorizontally using the OCCAM velocities, with anadditional random walk to simulate horizontalparticle dispersal. Particles were allowed to moverandomly in the vertical between the depths of 5mand 100m. The initial positions of the 500 particleswere randomly distributed in an ellipse centred onT4 (39.21W, 54.41S), with ellipse major and minoraxes of 50 and 10 km and an orientation of 301. Allparticles were released at a depth of 50m with astart date of November 1, 2000 (most recent dataavailable).
3. Results
3.1. Physical oceanography
Temperature varied over the region with SSTwarmest (43.5 1C) in the off-shelf region to thenorth and coldest (�1.5 1C) in southern off-shelfwaters (Fig. 2a). Fig. 2b illustrates ADCP dataaveraged from 15–200m (or to near bottom wherewater depth o200m). Rapid flow (up to 55 cms�1)was observed to the southeast at the off-shelf stationson transects T5–T9 contrasting with reduced andvariable flow (o15 cms�1) over the shelf. Ofparticular note was the divergence of flow betweentransects T4 and T5, a region where upwelling isthought to occur. As a consequence of this diver-gence, flow at the offshore ends of T3 and T4 wasnorth to northwestwards along South Georgia’ssouthwestern shelf-break and across the ScotiaRidge. To the north of the island flow was generallywestwards and of a lower velocity than to the south.
A winter-water layer was present along alltransects (Whitehouse et al., in press), and theinfluence of the SACCF was detected at off-shelfstations along transects T6–T9 close to its historicalmean position (see Thorpe et al., 2002).

ARTICLE IN PRESS
Fig. 2. (A) Sea surface temperature (1C) along the transects sampled during cruise JR116. T1–T10 are labelled. Additional transects along
which temperature measurements were made but no stations were worked are included. (B) ADCP vectors (flow direction away from
transect lines) averaged over the top 200m or to near bottom where water depth is o200m. T1–T10 are labelled. Additional transects
along which ADCP measurements were made but no stations were worked are included.
P. Ward et al. / Deep-Sea Research I 54 (2007) 1871–18891876
3.2. Chlorophyll-a and nutrients
The spatial distribution of chl-a and nutrientsduring the cruise has been described in detail byWhitehouse et al. (in press). In summary, SeaWiFSimagery indicated high (45mgm�3) near-surfacechl-a concentrations over the South Georgia shelf inNovember 2004, two months before the cruise.These had declined over the southern shelf by thetime of our survey in January, whereas on thenorthern shelf the bloom extended into the GeorgiaBasin before declining in March. Two major bloomareas were located during the cruise. The first was tothe north of the island in the vicinity of transects T1and T2 where a bloom was taking place within ashallow mixed layer and surface chl-a concentra-tions were as high as 8mgm�3 (Fig. 3). The moreextensive bloom over the southern shelf, initiallyobserved in November, was a largely stationaryevent as evidenced by the persistence of silicate-depleted water over the shelf a month later duringthe cruise (see Fig. 2 in Whitehouse et al., in pressand Fig. 3 in this paper). At 26 of the 57 stationssampled, located mainly at the western end of thesouthern shelf, a well-defined sub-surface chloro-phyll maximum (SCM) was evident (Whitehouseet al., in press). Here, integrated chl-a was higherthan at stations with near-surface maxima, withvalues ranging from 18–362mgm�2. Macronutrientdistributions essentially mirrored the distribution ofchl-a biomass: high offshelf and low onshelf. Silicatedepletion was high throughout the surveyed area
and reasonably high for nitrate with the exceptionof off-shelf stations to the west and south (Fig. 3).Depletion was greatest in the on-shelf waters at thewestern end of South Georgia along transects 2–5,where the most intense surface bloom had occurredduring the preceding November. The Si(OH)4:NO3
deficit ratio varied from �2 to 6 with the highestratios in off-shelf waters to the south. Ammoniumconcentrations were highest in on-shelf waters.
3.3. Microplankton
Nearest neighbour clustering of the microplank-ton cell count data identified two major groupings,one smaller group, and two outlying stations(Fig. 4a and b). The smallest, Group 1 (Gp1),comprised four stations lying along T1 (Fig. 4c) andwas characterized by high abundances of thediatoms Eucampia antarctica, Thallasionema spp.,Fragilariopsis spp. and Thallasiosira spp. as well asdinoflagellates (10–50 mm) (Table 1).
With the exception of a single station at the off-shelf end of T2, the second group (Gp2, 18 stations)was geographically coherent, comprising many ofthe on-shelf stations over the southern and westernshelf (Fig. 4c). Dominant species included Core-
thron spp., Eucampia antarctica and Thallasiothrix
spp. Group 3 (Gp3, 29 stations) was the largestgrouping present with the highest average within-group similarity �80%. Mean abundance washighest in nine of the 18 taxonomic categories (11if Gp4 and Gp5 are excluded) enumerated in this

ARTICLE IN PRESS
Fig. 3. The distribution of surface chl-a concentrations (mgm�3), integrated chl-a concentrations (mgm�2), silicic acid and nitrate deficits
(molm�2), silicic acid:nitrate deficit ratios and ammonium concentrations (mmolm�2). Bathymetry is shaded as in Fig. 1.
P. Ward et al. / Deep-Sea Research I 54 (2007) 1871–1889 1877
analysis. Of the diatoms, Nitzschia spp., Pseudo-
nitschia spp., Fragilariopsis kerguelensis, Thallasio-
thrix spp. and Chaetoceros spp. were all abundantas were dinoflagellates (10–50 mm) (Table 1).The two outliers, stations 8.6 and 9.7, although inclose proximity and closest to the SACCF, werenot closely related. Station 8.6 had moderatelyhigh abundances of F. kerguelensis and Thalassio-
thrix spp., whereas 9.7 was characterized by
Corethron spp., Nitzschia spp. and Pseudonitzschia
spp. (Table 1).
3.4. Mesozooplankton
Copepods accounted for X90% of total meso-zooplankton abundance across the survey area, withsmall copepods (p1.5mm TL) accounting for�80% of this total. Nearest neighbour clustering

ARTICLE IN PRESSP. Ward et al. / Deep-Sea Research I 54 (2007) 1871–18891878
of the mesozooplankton data identified three majorgroups (Gps 2–4) and one comprising just twostations (Gp1) located at the inshore end of T1(Figs. 5a–c). Station similarity within groups wasalmost exclusively X80% across all groups, andwith the exception of Gp1, dissimilarity betweengroups was �20–24%. The major zooplanktoncontributors to within-group similarity and be-tween-group dissimilarity are shown in Table 2.The distribution of 15 of the mainly copepod taxathat, in addition to being abundant, illustrate thecontrasting distribution patterns described beloware presented in Fig. 6. Group 1 was most dissimilarto the other groups and was characterized byextremely low abundances of virtually all taxarelative to other groups.
Group 2 (Gp2, 18 stations) was distributedmainly over the inner southern shelf along T3–T9(Fig. 5c). Within this grouping, 11 of the 25taxonomic groups that contributed X2% of with-in-group similarity or between-group dissimilaritywere most abundant, including the neritic Drepano-
pus forcipatus, appendicularians, and the thecatepteropod Limacina helicina. Calanoid nauplii (in-cluding R. gigas nauplii detailed seperately) werealso considerably more abundant within this group-ing, as were eggs of R. gigas and C. simillimus (up to45 times greater than other groups in the caseof R. gigas, Fig. 7). Additionally both CIV and CVC. acutus had greater average carbon masses withinmesozooplankton Gp 2 compared to other groups,which in the case of stage CV was almost doublethat of other groups (Fig. 7).
Group 3 (Gp3, 13 stations) was confined to thenorth and west (T1-4) and generally comprised theouter shelf stations in deeper waters. Here zoo-plankton abundance was less than in adjacent majorstation groupings, although C. simillimus, particu-larly juvenile stages, was considerably more abun-dant than in other groups. Carbon mass of bothstages of C. acutus was lower than in Gp2 butcomparable to Gp4 (Fig. 7).
Fig. 4. Microplankton groups. (A) Dendrogram resulting from
clustering performed on the Bray–Curtis similarity matrix created
from the double root transformed microplankton cell count data.
The numbers displayed down the side of the dendrogram identify
stations indicated in Fig. 1, e.g., 5.2 refers to the second station
out from the coast along transect 5. Station groups referred to in
the text are identified and correspond to the symbols used in the
NMDS plot (B) and the geographical distribution plot (4C).
n ¼ Gp1, & ¼ Gp2, . ¼ Gp3, � ¼ Gp4, J ¼ Gp5, X ¼ no
sample.

ARTICLE IN PRESS
Table 1
Average cell count abundance (ind. 50ml�1), with respect to microplankton station groups, of the species and taxa that SIMPER analysis
indicated contributed X2% to within-group similarity or between-group dissimilarity
Station locations Group 1 (n ¼ 4) Group 2
(n ¼ 18)
Group 3
(n ¼ 29)
Group 4
(n ¼ 1)
Group 5
(n ¼ 1)
T1 only T2–T9 predominantly
inner and
outer shelf
T2–T9 predominantly
outer shelf and
offshelf water
Outlier T8 Outlier T9
Eucampia antarctica 4112 1437 903 126 78
Dinoflagellates 10–50mm 1375 524 1394 583 437
Thalassionema/Fragilariopsis spp. 1020 222 630 55 129
Chaetoceros spp. 337 458 1917 73 0
Thalassiosira spp. 961 93 143 73 79
Ciliates 10–50mm 73 40 3 18 31
Corethron spp. 73 906 538 0 251
Nitzschia/Pseudonitzschia spp. 55 216 2037 0 517
Fragilariopsis kerguelensis. 68 261 3092 1548 361
Thalassiothrix spp. 23 567 1113 455 175
Other diatoms 5 45 214 0 180
Rhizosolenia/Proboscia spp. 5 16 74 18 110
Dinoflagellates 450 mm 18 38 45 55 0
Dactylisolen spp. 0 2 21 0 0
Odontella spp. 27 26 39 0 16
Ciliates 450mm 0 7 3 55 0
Phaeocystis 0 0 2 0 0
(no of colonies)
P. Ward et al. / Deep-Sea Research I 54 (2007) 1871–1889 1879
Group 4 (Gp4) was the largest, comprising 24stations located mainly over the outer parts of theshelf, shelf-break, and oceanic waters to the south ofthe island. The taxa most abundant within thisgroup included Ctenocalanus spp., Metridia spp.,Microcalanus pygmaeus and Pelagobia longicirrata.
3.5. Environment and relationship to microplankton
and mesozooplankton station groups
The BIO-ENV analyses (Table 3) indicated amodest goodness of fit between environmentalvariables and the microplankton cell count datamatrix. Initially, the largest single contributor to p
was ammonium concentration (p ¼ 0.39, Table 3),but in successive iterations, other variables, such asSi(OH)4:NO3 deficit ratio, mesozooplankton abun-dance, and average temperature, combined withammonium to produce a better fit. Overall, two4-variable models gave the best fit (p ¼ 0.496); thefirst included the above variables, and the secondsubstituted NO3 deficit for average temperature.
There was a better goodness of fit with themesozooplankton data matrix. Again ammoniumconcentration was initially the largest single con-tributor (p ¼ 0.42, Table 3), but the successive
addition of %microphytoplankton420mm, Si(OH)4:NO3 deficit ratio, silicate deficit, surface chl-a, SST,and SML provided a best-fit model (p ¼ 0.59).Mean values of the variables identified by theBIO-ENV analysis with respect to microplanktonand mesozooplankton station groups are given inTable 4.
Best subsets regression analyses were used todetermine how well environmental variables ex-plained variation in carbon mass of C. acutus stages,mesozooplankton abundance, and the abundance ofR. gigas and C. simillimus eggs in the water column(see Fig. 7). In the case of C. acutus carbon mass,the models indicated by the AICc (see Section 2.3)suggested key variables were temperature, nutrientconcentrations, and TFA concentrations as well assize properties of the phytoplankton community(Table 5). The fit was considerably stronger forstage CV C. acutus than for stage CIV. Data suggestcomplex relationships rather than simple correla-tions between plankton and the environment at thetime of sampling. This was further suggested by theidentification of Si(OH)4 deficit and NO3 as best-fitvariables when zooplankton abundance was theresponse variable. Silicate deficit has been identifiedpreviously as relating strongly to zooplankton
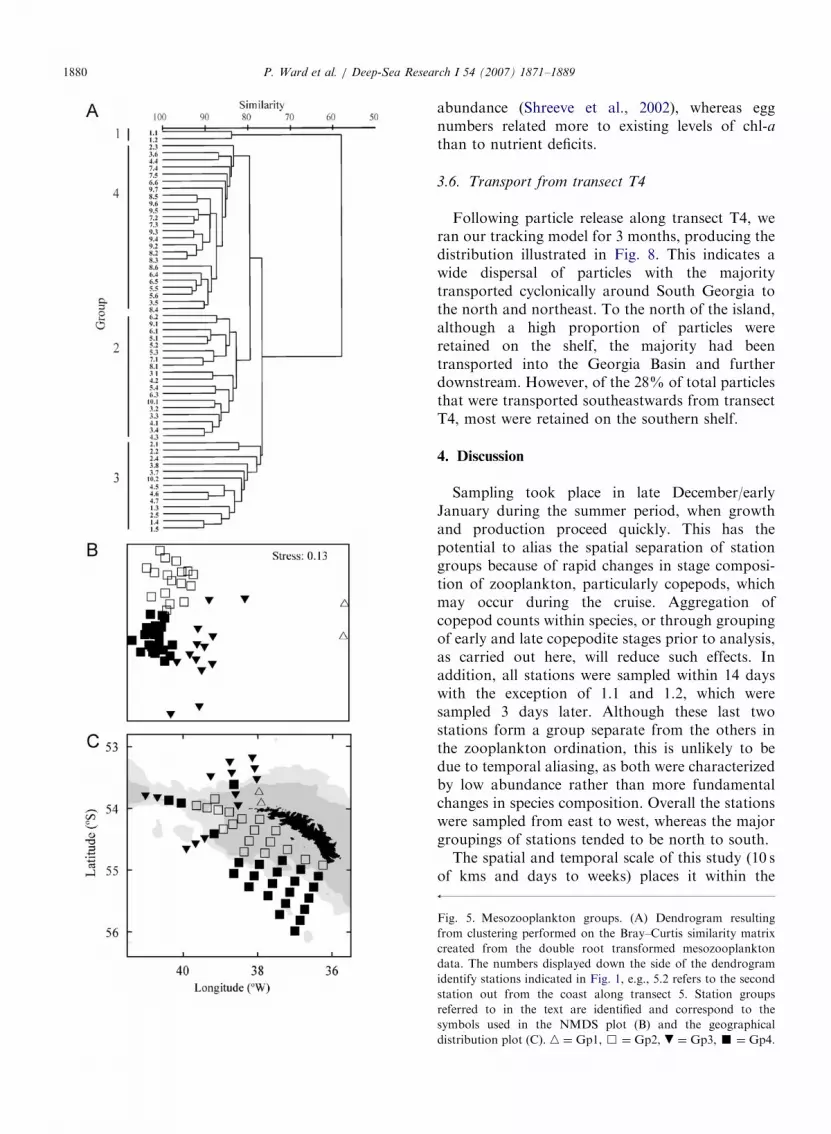
ARTICLE IN PRESSP. Ward et al. / Deep-Sea Research I 54 (2007) 1871–18891880
abundance (Shreeve et al., 2002), whereas eggnumbers related more to existing levels of chl-athan to nutrient deficits.
3.6. Transport from transect T4
Following particle release along transect T4, weran our tracking model for 3 months, producing thedistribution illustrated in Fig. 8. This indicates awide dispersal of particles with the majoritytransported cyclonically around South Georgia tothe north and northeast. To the north of the island,although a high proportion of particles wereretained on the shelf, the majority had beentransported into the Georgia Basin and furtherdownstream. However, of the 28% of total particlesthat were transported southeastwards from transectT4, most were retained on the southern shelf.
4. Discussion
Sampling took place in late December/earlyJanuary during the summer period, when growthand production proceed quickly. This has thepotential to alias the spatial separation of stationgroups because of rapid changes in stage composi-tion of zooplankton, particularly copepods, whichmay occur during the cruise. Aggregation ofcopepod counts within species, or through groupingof early and late copepodite stages prior to analysis,as carried out here, will reduce such effects. Inaddition, all stations were sampled within 14 dayswith the exception of 1.1 and 1.2, which weresampled 3 days later. Although these last twostations form a group separate from the others inthe zooplankton ordination, this is unlikely to bedue to temporal aliasing, as both were characterizedby low abundance rather than more fundamentalchanges in species composition. Overall the stationswere sampled from east to west, whereas the majorgroupings of stations tended to be north to south.
The spatial and temporal scale of this study (10 sof kms and days to weeks) places it within the
Fig. 5. Mesozooplankton groups. (A) Dendrogram resulting
from clustering performed on the Bray–Curtis similarity matrix
created from the double root transformed mesozooplankton
data. The numbers displayed down the side of the dendrogram
identify stations indicated in Fig. 1, e.g., 5.2 refers to the second
station out from the coast along transect 5. Station groups
referred to in the text are identified and correspond to the
symbols used in the NMDS plot (B) and the geographical
distribution plot (C). n ¼ Gp1, & ¼ Gp2, . ¼ Gp3, ’ ¼ Gp4.

ARTICLE IN PRESS
Table 2
Average zooplankton abundance (ind. � 103m�2, 0–200m), with respect to zooplankton station group, of the species and taxa that
SIMPER analysis indicated contributed X2% to within-group similarity or between-group dissimilarity
Station locations Group 1 (n ¼ 2) Group 2 (n ¼ 18) Group 3 (n ¼ 13) Group 4 (n ¼ 24)
T1 inshore T3–T9
predominantly inner
shelf
T1–T4
predominantly in
deeper water
T2–T9
predominantly outer
shelf and offshelf
Calanus simillimus (CIV–CVI) 0.6 1.5 2.2 0.4
Calanus simillimus (CI–CIII) 2.9 7.4 13.1 2.6
Calanus propinquus (CIV–CVI) 0.001 0.10 0.2 0.25
Calanus propinquus (CI–CIII) 0 0.1 0.4 0.1
Calanoides.acutus (CIV–CVI) 1.4 6.7 6.4 6.4
Calanoides acutus (CI–CIII) 0.5 4.1 2.4 2.1
Rhincalanus gigas (CIV–CVI) 0.8 1.6 1.2 0.6
Rhincalanus gigas (CI–CIII) 0.3 2.7 3.0 6.3
Rhincalanus gigas nauplii 0.6 21.1 5.3 5.7
Microcalanus pygmaeus 0 0.9 0.8 3.5
Clausocalanus laticeps 0.1 0.2 0.4 0.6
Ctenocalanus spp. 10.6 41.6 68.9 70.9
Drepanopus forcipatus 3.1 177.3 3.9 2.4
Euchaeta spp. 0 0.2 0.2 0.1
Scolecithricella minor 0 0.9 0.4 0.5
Metridia spp. 2.9 43.1 35.2 72.8
Calanoid nauplii 2.1 184.6 26.5 81.7
Oithona spp. 37.2 300.2 256.4 267.0
Oncaea spp. 0.1 29.1 4.1 32.3
Cyclopoid nauplii 0.05 61.7 5.7 50.8
Thysanoesaa spp. 0.3 0.4 0.8 1.5
Thysanoessa spp. calyptopes 0 0.2 0.8 1.0
Euphausia frigida furcilia 0.05 0.04 0.1 0.2
Euphausia frigida calyptopes 0 0.03 0.2 0.3
Pelagobia longicirrata 0 18.3 3.7 33.4
Limacina helicina 0.3 56.7 30.3 40.0
Appendicularians 0.5 78.3 15.2 44.1
Ostracoda 0 0.1 0.4 0.3
Chaetognatha 0.1 0.4 0.8 1.0
P. Ward et al. / Deep-Sea Research I 54 (2007) 1871–1889 1881
mesoscale. As such, discrimination of station group-ings was based on changes in abundance of abroadly common taxonomic list, rather than morefundamental changes in species composition(Mackas and Sefton, 1982, Marin, 1987, Pakhomovet al., 2000). This is reflected in the similarity levelsbetween groups across both ordinations, which weregenerally around 75–80%. Nonetheless, the differ-ences observed were robust. For example, withinzooplankton Gp2, the removal of the abundantD. forcipatus from the species/station matrix did notalter any stations’ affiliation to this group.
4.1. Physical setting
Recent advances in our understanding of theoceanography of the Scotia Sea have done much toset South Georgia into a wider physical context.
While investigations at the small to mesoscale havedemonstrated the importance of local influencessuch as increased precipitation and island runoff inmodifying shelf waters, the retention of water overthe island’s shelf and the occurrence of shelf-breakfronts (Brandon et al., 2000; Meredith et al., 2005),others have shown how remote influences can alsopotentially affect the ecosystem (e.g. Ward et al.,2002; Murphy et al., 2004; Thorpe et al., 2004). Forinstance the SACCF may introduce production tothe region, potentially from as far afield as the ice-covered regions further south (Ward et al., 2002;Murphy et al., 2004). In the present study none ofthe transects crossed the SACCF. Although therewere indications of SACCF influence at the south-ernmost stations of T6–T9 (Whitehouse et al., inpress), the water at most of the stations to the southof the island had originated from between the APF

ARTICLE IN PRESS
Fig. 6. Distribution and abundance of the principal zooplankton taxa found in this study. Symbols are scaled from 0 to maximum values
indicated in each panel (ind.� 103m�2, 0–200m).
P. Ward et al. / Deep-Sea Research I 54 (2007) 1871–18891882
and the SACCF (Fig. 1). In the present study weconfine our observations to local environmentalinfluences.
4.2. Environmental links
The geographical distribution of station group-ings within both ordinations was superficiallysimilar insofar as the majority of stations fell intoinner and outer shelf groupings, particularly alongT3–T9. Such correspondence between microplank-ton and zooplankton ordinations has been observedpreviously in a study carried out on the north side ofthe island, where shelf and oceanic communitieswere defined and the large-scale chl-a distributionshowed close links to the physical environment(Ward et al., 2005).
In the present study, boundaries between therespective microplankton and zooplankton group-ings meandered along shelf and shelf-break regionsand were broadly coincident with the changes incurrent speed apparent between the more rapidlymoving offshore waters and the variable andsluggish flows over the shelf (Figs. 2, 4 and 5). This
was particularly the case for the inshore micro-plankton Gp2 which extended further along T8 andT9 in low-flow areas than did the zooplankton Gp2,which was largely restricted to the inner shelf whereD. forcipatus was particularly abundant. Within thelow-flow shelf region the bloom that had developedprior to the survey was declining when sampledduring late December and early January. Surfacechl-a concentrations were lower than suggested bysatellite imagery from a month earlier, althoughsubstantial subsurface concentrations of chl-a (up to5mgm�3) were still present, particularly over thewestern part of the southern shelf. Nutrient levelswere also depleted, particularly silicate, over thewestern part of the southern shelf, where the intensesurface bloom had been located the previousNovember. Zooplankton abundance within zoo-plankton Gp2 was markedly higher than in theother groups. In addition to D. forcipatus and othersmall copepods (Table 2), concentrations of R. gigas
and C. simillimus eggs (Fig. 7) and calanoid naupliiincluding those of R. gigas (Fig. 6) were also moreabundant, suggesting strongly that zooplanktonpopulations had responded to the increased in situ

ARTICLE IN PRESS
Fig. 7. Total zooplankton abundance (ind. m�2, 0–200m), carbon mass (mg) of stages CIV and CV Calanoides acutus, and net catches of
Rhincalanus gigas and Calanus simillimus eggs (ind.� 103 m�2, 0–200m) at stations occupied during cruise JR116. Symbols are scaled from
minimum to maximum values indicated in each panel.
P. Ward et al. / Deep-Sea Research I 54 (2007) 1871–1889 1883
production. Further evidence for this comes fromthe greatly increased C mass of C. acutus stages,particularly for CV, over the shelf (Fig. 7).The elevated numbers of nauplii and the neriticD. forcipatus within Gp2, relative to other groups,also supports the idea that there was little waterexchange between shelf and oceanic regions in theperiod leading up to the survey. Species previouslyfound to be more typical of oceanic regions rather
than shelf and shelf-break areas, such as Ctenoca-
lanus spp., Metridia spp., and Microcalanus pyg-
maeus (see Ward et al., 2005) were more abundantin the offshelf zooplankton Gp4 in the watersflowing rapidly southeastwards.
The underlying premise of the BIO-ENV analysisis that the suite of environmental variables respon-sible for structuring the biotic community shouldgroup stations in the same way with the omission of

ARTICLE IN PRESS
Table 3
Results of BIO-ENV analysis: combinations of K variables giving largest Spearman rank correlations (rw) between microplankton cell
count data, mesozooplankton data and environmental similarity matrices
K rw Environmental variables
Microplankton data
1 0.39 NH4
2 0.44 Si(OH)4:NO3 deficit ratio, NH4
3 0.48 Zooplankton abundance, Si(OH)4:NO3 deficit ratio, NH4
4 0.50 Average Temperature. 0–50m, Zooplankton abundance, Si(OH)4:NO3 deficit ratio, NH4
4 0.50 NO3 deficit, Zooplankton abundance, Si(OH)4:NO3 deficit ratio, NH4
Mesozooplankton data
1 0.42 NH4
2 0.49 % microplankton (420mm), NH4
3 0.51 Si(OH)4:NO3 deficit ratio, % microplankton (420mm), NH4
4 0.54 Silicate deficit, Si(OH)4:NO3 deficit ratio, % microplankton (420 mm), NH4
5 0.56 Surface chl a, Silicate deficit, Si(OH)4:NO3 deficit ratio, % microplankton (420mm), NH4
6 0.58 SST, Surface chl a, Silicate deficit, Si(OH)4:NO3 deficit ratio, % microplankton (420mm), NH4
7 0.59 SML, SST, Surface chl a, Si(OH)4 deficit, Si(OH)4:NO3 deficit ratio, % microplankton (420 lm), NH4
Models of increasing complexity listed, best overall fit in bold. Environmental variables included in the microplankton analysis Surface
Mixed Layer (SML) depth (m), average temperature 0–50m (1C), Si(OH)4 deficit (molm�2), NO3 deficit (mmolm�2), Si(OH)4:NO3 deficit
ratio, NH4 (mmolm�2) and zooplankton abundance.
After various permutations sea surface temperature (SST 1C) was substituted for average temperature in the mesozooplankton analysis
and additional variables were included as follows surface chl a (mgm�3), integrated chl a (mgm�2, 0–100m), total fatty acids, %
microplankton (420 mm), % nannoplankton (2–20mm), particulate carbon (mg l�1) and particulate nitrogen (mg l�1).
Table 4
Mean values (7standard deviation) of model variables contributing most to best fit between environmental data and microplankton and
mesozooplankton data matrices in the BIO-ENV analysis (see Table)
Gp1
(n ¼ 4)
Gp 2
(n ¼ 18)
Gp 3
(n ¼ 29)
Gp 4
(n ¼ 1)
Gp 5
(n ¼ 1)
F p
Microplankton station groups
NH4 (mmolm�2) 243 (0.32) 185 (0.39) 127 (0.52) 89 104 11.18 0.0001
NO3 deficit (mmolm�2) 779 (120) 861 (220) 586 (210) 266 468 9.93 0.0001
Si (OH)4:NO3 deficit ratio 2.85 (0.45) 3.32 (0.74) 4.21 (0.89) 6.45 5.37 9.56 0.0001
Zooplankton abundance� 103m�2 313 (287) 898 (302) 679 (233) 490 691 9.55 0.0001
Average temperature (1C 0–50m) 3.13 (0.32) 2.37 (0.39) 2.56 (0.52) 1.75 1.99 4.39 0.018
Gp 1
(n ¼ 2)
Gp 2
(n ¼ 18)
Gp 3
(n ¼ 13)
Gp 4
(n ¼ 24)
Mesozooplankton station groups
Si(OH)4:NO3deficit ratio 2.59 (0.59) 3.06 (0.09) 3.5 (0.59) 4.7 (0.81) 36.66 0.0001
SST (1C) 3.4 (0.45) 2.75 (0.24) 3.40 (0.23) 2.29 (0.39) 52.70 0.0001
% microplankton 420mm 91 (5.5) 91 (5.7) 64 (28) 82 (13.5) 10.09 0.0001
NH4 (mmolm�2) 306 (31) 213 (61) 152 (30) 107 (30) 37.54 0.0001
Surface chl a (mgm�3) 4.73 (5) 2.0 (0.7) 1.32 (1.4) 0.8 (0.4) 12.02 0.0001
Mixed layer depth (m) 35 (4) 55 (30) 45 (14) 68 (20) 4.40 0.017
Silicate deficit (mmolm�2) 1941 (651) 2816 (476) 2345 (610) 2356 (357) 6.04 0.004
One way ANOVA was used to detect significant differences between variables within microplankton Groups 1–3 and mesozooplankton
groups 2–4.
P. Ward et al. / Deep-Sea Research I 54 (2007) 1871–18891884
key variables causing the correspondence of the twoplots to deteriorate. Within both the microplanktonand mesozooplankton analyses the complexity ofcommunity structure was reflected in the multi-variable best-fit models and by the modest corre-
spondence between biotic and environmental data.Not all of the environmental factors available to uscan be considered as potential causative agents ofcommunity structure despite strong correlations.For example chl-a and various chemical indices of

ARTICLE IN PRESS
Table 5
Models from best subsets regression analysis
Regression equations R2(%) p
log C mass CIV C: acutus ¼ 2:80ð0:14Þ � 0:012ð0:003ÞNO3
� 0:17ð0:07Þlog10 TFA� 0:077ð0:02ÞT
26.1 o0.01
log C mass CV C: acutus ¼ 2:57ð0:61Þ þ 0:005ð0:005Þ%chl420mm
þ 0:009ð0:007Þ%chl a 2220mm
� 0:037ð0:009ÞNO3 � 0:24ð0:14Þlog10 TFA
� 0:12ð0:05ÞT þ 0:33ð0:09Þlog10 chl a
67.6 o0.01
ppMesozooplankton abundance
¼ �5:72ð7:86Þ þ 0:004ð0:001ÞSiðOHÞ4 deficit
þ 0:732ð0:234ÞNO3 þ 5:28ð1:93ÞLog10 chl a
38.7 o0.01
Rhincalanus gigas eggsðlog10 nos m�2Þ
¼ �1:17þ 0:0004ð0:0020ÞSiðOHÞ4 deficit
þ 0:68ð0:32Þlog10 chl aþ 1:96ð0:84Þlog10 TFA
49.9 o0.01
Calanus simillimus eggsðlog10 nos m�2Þ
¼ 0:87� 0:12ð0:04ÞNO3 þ 2:02ð0:58ÞPO4
þ 0:75ð0:30Þlog10 chl aþ 0:44ð0:22ÞT
40.5 o0.01
Tests for spatial autocorrelation using statistics of Moran (I) and Geary (c) applied to pairs of locations within 30 km and estimates of b
for the autocorrelation function r(d) ¼ exp(�d/b) for cases with statistically significant autocorrelation.
Mass CIV Calanoides acutus: I ¼ 0.078, p ¼ 0.51, c ¼ 0.81, p ¼ 0.25
Mass CV Calanoides acutus: I ¼ �0.035, p ¼ 0.85, c ¼ 1.13, p ¼ 0.45
Mesozooplankton abundance: I ¼ 0.28, p ¼ 0.024, c ¼ 0.57, p ¼ 0.006, b ¼ 20.8 km
Rhincalanus gigas eggs: I ¼ 0.28, p ¼ 0.022, c ¼ 0.71, p ¼ 0.042, b ¼ 28.0 km
Calanus similimus eggs: I ¼ 0.26, p ¼ 0.05, c ¼ 0.65, p ¼ 0.024, b ¼ 13.0 km
Response variables were log10 chl a (mgm�2, 0–100m), log10 POC (mg l�1, 20m), log10 TFA (mg l�1, 20m), % microplankton 420mm(20m), % chl-a 2–20mm (20m), NO3 average (mmolm�3, 0–50m), PO4 average (mmolm�3, 0–50m), average temperature (T 1C, 0–50m),
Si(OH)4 deficit (mmolm�2). Models shown were selected by calculation of Akaike Information Criterion (see methods for explanation).
Regression equations include (standard error of the regression coefficient) which have been adjusted for the effect of autocorrelation (see
Diggle, 1990). OO ¼ double root transformation.
P. Ward et al. / Deep-Sea Research I 54 (2007) 1871–1889 1885
the phytoplankton, such as TFA and POC, wereomitted from the microplankton analysis on thegrounds that they probably reflect the properties ofthe different groups rather than underpin theirstructure. However, variables such as temperature,zooplankton abundance, and nutrient levels canhave a potential impact on microplankton commu-nity structure, either by directly influencing micro-plankton growth rates and biomass, as in the case oftemperature and zooplankton grazing, or by reflect-ing the integrated pattern of past growth anddevelopment such as nutrient deficits. The inclusionof ammonium concentration as a factor in bothanalyses is interesting. Over the southern and
western shelf regions ammonium levels were con-siderably higher than off-shelf. Whitehouse et al.(in press) attribute this to microbial breakdown of adeclining bloom over the southern shelf and to anefficient use of nitrate by diatoms resulting inammonium-nitrogen remaining underutilized inthe west. It is likely that zooplankton excretion willalso contribute to the pool. We therefore concludethat the high onshelf abundances of mesozooplank-ton (Gp 2) compared to offshelf (Gp 3) reflect theelevated chl-a biomass and patterns of nutrient usethat have occurred over the shelf.
Nutrient deficits provide a unique way of viewingpast production levels, particularly given the ability

ARTICLE IN PRESS
Fig. 8. Output from particle-tracking model. Particle distribution (expressed as a % of the total, see scale) within the gridded study area 90
days after their release along transect T4 (see Text 2.3 for further details).
P. Ward et al. / Deep-Sea Research I 54 (2007) 1871–18891886
of trace metals such as iron to affect silicate andnitrate uptake ratios (Franck et al., 2000). In thisstudy, although the majority of microplanktonspecies were present within all station groupings,the two most abundant, Fragilariopsis kerguelensis
and Eucampia antarctica, were significantly andnegatively correlated. The former was distributedlargely in the region to the south and west(predominantly within microplankton Gp 3 seeTable 1), where chl-a biomass was low and highaverage Si(OH)4:NO3 deficit ratios indicated poten-tial iron stress. Eucampia antarctica, on the otherhand, was especially abundant at stations along T1and T2 in the north and shelf stations along T8 tothe south of the island, where Si(OH)4:NO3 deficitratios were generally low. In contrast to the abovespecies, Corethron spp. was most abundant withinmicroplankton Gp 2 and was significantly related tochl-a standing stock (Whitehouse et al., in press).Clearly the available variables only partly explainstructure within the microplankton species matrix,and there are many other unmeasured and perhapsunmeasurable (at least at this scale) factors thatcould potentially contribute, particularly given thelarge-scale links between plankton development andclimate (e.g. Richardson and Schoeman, 2004;Planque and Taylor, 1998). It should also be bornein mind that the microplankton station matrix wasbased on samples taken at 20m depth, which in
previous cruises has been broadly coincident withnear-surface chl-a maxima, whereas during thiscruise, SCMs occurred at approximately half ofthe stations. Whether this was a factor influencingmicroplankton station groupings is unknown, butthe SCMs were not confined to any one stationgrouping.
The wider range of environmental variables inputinto the mesozooplankton BIO-ENV analysis re-sulted in a best-fit model with a higher Spearmanrank correlation value than seen in the correspond-ing microplankton analysis. This has been the casein previous studies (see Ward et al., 2005), and theinclusion of an index of phytoplankton size(% microphytoplankton 420 mm), silicate deficit,Si(OH)4:NO3 deficit ratio, and surface chl-a in thebest fit model clearly reflects trophic linkages.Nutrient depletions reflect plant productionsince growth commenced and studies aroundSouth Georgia have previously demonstrated astrongly inverse relationship between silicate con-centration and total copepod abundance (Shreeveet al., 2002). The low Si(OH)4:NO3 deficit ratio overthe shelf is in distinct contrast to the higher ratiosfound off-shelf. As Fe limitation is known to restrictthe uptake of silicate by diatoms (Franck et al.,2000), it seems likely that the increased productionobserved over the shelf takes place in Fe-repleteconditions.

ARTICLE IN PRESSP. Ward et al. / Deep-Sea Research I 54 (2007) 1871–1889 1887
4.3. Connections with the Georgia Basin
and the APF
The ACC approaches the southern shelf from thesouthwest and diverges between T4 and T5. Thenorthwestward flow at the off-shelf end of T4continues between South Georgia and Shag Rocksand out into the Georgia Basin (Fig. 2b). Incontrast, water flowed rapidly southeastwards overthe offshore ends of T5–T9.
Previous satellite imagery has also indicated aconnection between the blooms of the southernshelf and the northwest and the Georgia Basin(Korb et al., 2004). The OCCAM particle releasesimulations along T4 also, in part, support thissuggestion (Fig. 8). Therefore, it seems likely that asignificant proportion of production can be retainedover the inner shelf, with timescales suggestingblooms and secondary producers can develop in situ
whereas offshelf, water approaching the shelftends to be diverted, either through the gap in theNorth Scotia Ridge between South Georgia andShag Rocks, or to the southeast along the island’sshelf edge.
While microplankton at offshore stations fell intoone group, zooplankton split into two associatedwith the divergence of water masses betweentransects T4 and T5 (Fig. 2b). The differencesbetween these two zooplankton groups had more todo with changes in dominance of a shared speciesset, rather than more fundamental changes intaxonomic composition, although average abun-dances of shared taxa were often considerably lowerin Gp3 (Table 2). Reasons for this are unclear,although again may be related to physical structure.An abrupt increase in SST was apparent at the endof T4 and along the lengths of all transects on thenorth coast relative to the south (Fig. 2a). Con-servative nutrient values and ratios below thebiologically active layers (4160m) at the offshoreend of transect T4 were typical of waters moreusually found closer to the APF (British AntarcticSurvey unpublished data). Also a broad tempera-ture maximum (42 1C) in the Upper CircumpolarDeep Water suggested water from nearer the APF(cf. Sievers and Nowlin, 1984). Furthermore,altimetry data (not illustrated) indicated a warm-core anticyclonic eddy located just to the west ofstation T4.7 that we suggest might have shed fromthe APF further to the west (see http://argo.colorado.edu/�realtime/gsfc_global-real-time_ssh/). Thus thezooplankton, rather than being representative of
waters to the south and west (as we assume Gp4 tobe), may to some extent reflect a faunal displace-ment by water originating from further west. Inearlier studies Atkinson et al. (1990) noted thepresence of a warm-water intrusion in approxi-mately the same position as the warmer stations atthe offshore end of T4, and Whitehouse et al.(1996b) have also observed warm water eddy-likefeatures moving eastwards in the ACC to the southof Shag Rocks during a survey in 1994. Faunally,then, these stations have a closer taxonomic affinitywith stations along the north coast transects, whichconnect with the Georgia Basin. However, acomparable change in community affiliation be-tween T4 and T5 was not apparent in the micro-plankton ordination, and it may be that nutrientdistribution and uptake characteristics on- andoff-shelf, were of greater importance in determiningtaxonomic composition.
5. Conclusion
The results of this study indicated that two majorproduction regimes were present in waters to thesouth of South Georgia. High current flows offshelfsuggested that for secondary producers in particu-lar, advection may play a dominant role in bringingproduction into the region. In contrast, over theshelf, low flows dominated and an extensive south-ern shelf community was present that appeared tohave developed largely in situ. This conclusion wassupported by the extensive nutrient depletionsobserved over the shelf, and low current speeds,and output from a particle-tracking model, all ofwhich indicated water retention, particularly overthe inner shelf. The particle-tracking model indi-cated shelf retention timescales of X3 months for asignificant proportion of particles released along T4.Additionally, gradual transport from parts of thesouthern shelf to the north of the island suggestedthat locally derived production may periodicallycontribute significantly to the high biomass andproduction often present within the Georgia Basindownstream of the island.
Acknowledgements
We thank the officers and crew onboard RRSJames Clark Ross for ensuring the successfulcompletion of cruise JR116. We acknowledge ourcolleagues who participated in the cruise planningand the collection and analysis of various data sets

ARTICLE IN PRESSP. Ward et al. / Deep-Sea Research I 54 (2007) 1871–18891888
throughout the cruise. Peter Rothery is thanked forassistance with the autocorrelation analysis.
We also thank researchers at the NationalOceanography Centre for the supply of OCCAMdata and the referees for their critical reading ofearlier drafts of this paper. This paper forms acontribution to the BAS ‘Discovery 2010’ Food-webs project.
References
Atkinson, A., Peck, J., 1990. The distribution of zooplankton in
relation to the South Georgia shelf in summer and winter. In:
Kerry, K.R., Hempel, G. (Eds.), Antarctic Ecosystems:
Ecological Change and Conservation: SCAR Symposium on
Antarctic Biology, 5th, Hobart, 1988. Springer, Berlin, pp.
159–165.
Atkinson, A., Ward, P., Peck, J.M., Murray, A.W.A., 1990.
Mesoscale distribution of zooplankton around South Geor-
gia. Deep-Sea Research 37, 1213–1227.
Atkinson, A., Whitehouse, M.J., Priddle, J., Cripps, G.C., Ward,
P., Brandon, M.A., 2001. South Georgia, Antarctica: a
productive, cold water, pelagic ecosystem. Marine Ecology
Progress Series 216, 279–308.
Blain, S., Treguer, P., Belviso, S., Bucciarelli, E., Denis, M.,
Desabre, S., Fiala, M., Martin Jezequel, V., Le Fevre, J.,
Mayzaud, P., 2001. Biogeochemical study of the island mass
effect in the context of the iron hypothesis: Kerguelen Islands,
Southern Ocean. Deep-Sea Research 48, 163–187.
Boyd, P.W., 2002. Environmental factors controlling phyto-
plankton processes in the Southern Ocean. Journal of
Phycology 38, 844–861.
Brandon, M.A., Murphy, E.J., Whitehouse, M.J., Trathan, P.N.,
Murray, A.W.A., Bone, D.G., Priddle, J., 2000. The shelf
break front to the east of the sub-Antarctic island of South
Georgia. Continental Shelf Research 19, 799–819.
Burnham, K.P., Anderson, D.R., 2002. Model selection and
Multi-model Inference. A Practical Information-Theoretic
Approach, second ed. Springer, New York, 488pp.
Christie, W.W., 1982. Lipid Analyses, second ed. Pergamon
Press, Oxford, pp. 52–53.
Clarke, K.R., Ainsworth, M., 1993. A method of linking
multivariate community structure to environmental variables.
Marine Ecology Progress Series 92, 205–219.
Clarke, K.R., Warwick, R.M., 2001. Changes in Marine Commu-
nities: An Approach to Statistical Analysis and Interpretation,
second ed. PRIMER-E, Plymouth, UK, pp. 1–172.
Cressie, N.A.C., 1993. Statistics for Spatial Data, second ed.
Wiley, New York, 900pp.
Diggle, P.J., 1990. Time Series: A Biostatistical Introduction.
Clarendon Press, Oxford xii, 257pp. (Oxford Statistical
Science Series, 5).
Durbin, E.G., Garrahan, P.R., Casas, M.C., 2000. Abundance
and distribution of Calanus finmarchicus on the Georges Bank
during 1995 and 1996. ICES Journal of Marine Science 57,
1664–1685.
Field, J.G., Clarke, K.R., Warwick, R.M., 1982. A practical
strategy for analysing multispecies distribution patterns.
Marine Ecology Progress Series 8, 37–52.
Folch, J., Lees, N., Sloane-Stanley, G.H., 1957. A simple method
for the isolation and purification of total lipid. Journal of
Biological Chemistry 226, 497–509.
Franck, V.M., Brzezinski, M.A., Coale, K.H., Nelson, D.M.,
2000. Iron and silicic acid concentrations regulate Si uptake
north and south of the Polar Frontal Zone in the Pacific
sector of the Southern Ocean. Deep-Sea Research II 47,
3315–3338.
Hardy, A.C., Gunther, E.R., 1935. The plankton of the South
Georgia whaling grounds and adjacent waters, 1926–1927.
Discovery Report 11, 1–456.
Hart, T., 1942. Phytoplankton periodicity in Antarctic surface
waters. Discovery Report 21, 261–356.
Hunt, B.P.V., Pakhomov, E.A., McQuaid, C.D., 2001. Short-
term variation and long-term changes in the oceanographic
environment and zooplankton community in the vicinity of a
sub-Antarctic archipelago. Marine Biology 138, 369–381.
Huntley, M.E., Niiler, P.P., 1995. Physical control of population
dynamics in the Southern Ocean. ICES Journal Marine
Science 52, 457–468.
Hutchings, L., Verheye, H.M., Mitchell-Innes, B.A., Peterson,
W.T., Huggett, J.A., Painting, S.J., 1995. Copepod produc-
tion in the southern Benguela system. ICES Journal Marine
Science 52, 439–455.
Jennings Jr., J.C., Gordon, L.I., Nelson, D.M., 1984. Nutrient
depletion indicates high primary productivity in the Weddell
Sea. Nature 309, 51–54.
Korb, R.E., Whitehouse, M.J., 2004. Contrasting primary
production regimes around South Georgia, Southern Ocean:
mega blooms vs. high nutrient low chlorophyll waters. Deep-
Sea Research I 51, 721–738.
Korb, R.E., Whitehouse, M.J., Ward, P., 2004. SeaWiFS in the
Southern Ocean: spatial and temporal variability in phyto-
plankton biomass around South Georgia. Deep-Sea Research
II 51, 99–116.
Mackas, D.L., Sefton, H.A., 1982. Plankton species assemblages
off southern Vancouver Island—geographic pattern and
temporal variability. Journal of Marine Research 40,
1173–1200.
Marin, V., 1987. The oceanographic structure of the Scotia Sea—
IV. Distribution of copepod species in relation to hydro-
graphy in 1981. Deep-Sea Research 34, 105–121.
Meredith, M.P., Watkins, J.L., Murphy, E.J., Cunningham, N.,
Wood, A.G., Korb, R., Whitehouse, M.J., Thorpe, S.E., Vivier,
F., 2003. An anticyclonic circulation above the Northwest
Georgia Rise, Southern Ocean. Geophysical Research Letters 30
Art. no. 2061, doi:10.1029/2003GL018039, 5pp.
Meredith, M.P., Brandon, M.A., Murphy, E.J., Trathan, P.N.,
Thorpe, S.E., Bone, D.G., Chernyshkov, P.P., Sushin, V.A.,
2005. Variability in hydrographic conditions to the east and
northwest of South Georgia, 1996–2001. Journal of Marine
Systems 53, 143–167.
Moore, J.K., Abbott, M.R., Richman, J.G., 1999. Location and
dynamics of the Antarctic Polar Front from satellite sea
surface temperature data. Journal of Geophysical Research
104, 3059–3073.
Murphy, E.J., Watkins, J.L., Meredith, M.P., Ward, P., Trathan,
P.N., Thorpe, S.E., 2004. Southern Antarctic Circumpolar
Current Front to the northeast of South Georgia: Horizontal
advection of krill and its role in the ecosystem. Journal of
Geophysical Research 109, C01029 doi:10.1029/2002JC001522,
10pp.

ARTICLE IN PRESSP. Ward et al. / Deep-Sea Research I 54 (2007) 1871–1889 1889
Orsi, A.H., Whitworth III, T., Nowlin Jr., W.D., 1995. On the
meridional extent and fronts of the Antarctic Circumpolar
Current. Deep-Sea Research I 42, 641–673.
Pakhomov, E.A., Froneman, P.W., 2000. Composition and
spatial variability of macroplankton and micronekton within
the Antarctic Polar Frontal Zone of the Indian Ocean during
austral autumn 1997. Polar Biology 23, 410–419.
Pakhomov, E.A., Perissinotto, R., McQuaid, C.R., Froneman,
P.W., 2000. Zooplankton structure and grazing in the
Atlantic sector of the Southern Ocean in late austral summer
1993. Part 1. Ecological zonation. Deep-Sea Research I 47,
1663–1686.
Parsons, T.R., Maita, Y., Lalli, C.M., 1984. A Manual of
Chemical and Biological Methods for Seawater Analysis.
Pergamon Press, Oxford, 173pp.
Peterson, W., 1998. Life cycle strategies of copepods in coastal
upwelling zones. Journal of Marine Systems 15, 313–326.
Planque, B., Taylor, A.H., 1998. Long-term changes in zoo-
plankton and climate of the north Atlantic. ICES Journal of
Marine Science 55, 644–654.
Richardson, A.J., Schoeman, D.S., 2004. Climate impact on
plankton ecosystems in the northeast Atlantic. Science 305,
1609–1612.
Roman, M.R., Dam, H.G., Le Borgne, R., Zhang, X., 2002.
Latitudinal comparisons of equatorial Pacific zooplankton.
Deep-Sea Research II 49, 2695–2711.
Shreeve, R.S., Ward, P., Whitehouse, M.J., 2002. Copepod
growth and development around South Georgia: relationships
with temperature, food and krill. Marine Ecology Progress
Series 233, 169–183.
Sievers, H.A., Nowlin, W.D., 1984. The stratification and water
masses at Drake Passage. Journal of Geophysical Research 89
(C6), 10,489–10,514.
Smith, S.L., 1995. The Arabian Sea: mesozooplankton response
to seasonal climate in a tropical ocean. ICES Journal of
Marine Science 52, 427–438.
Smith Jr., W.O., Sakshaug, E., 1990. Polar phytoplankton. In:
Smith, W.O. (Ed.), Polar Oceanography Part B Chemistry,
Biology and Geology. Academic Press, New York, pp. 477–525.
Thorpe, S.E., Heywood, K.J., Brandon, M.A., Stevens, D.P.,
2002. Variability of the Antarctic Circumpolar Current front
north of South Georgia. Journal of Marine Systems 37,
87–105.
Thorpe, S.E., Heywood, K.J., Stevens, D.P., Brandon, M.A.,
2004. Tracking passive drifters in a high resolution ocean
model: implications for interannual variability of larval krill
transport to South Georgia. Deep-Sea Research I 51,
909–920.
Treguer, P., Jacques, G., 1992. Dynamics of nutrients and
phytoplankton, and fluxes of carbon, nitrogen and silicon in
the Antarctic Ocean. Polar Biology 12, 149–162.
Utermohl, H., 1958. Zur Vervollkommung der quantitativen
phytoplankton-methodik. Mitteilungen Internationale Verei-
nigung fur Theoretische und Angewandte Limnologie 9, 38.
Ward, P., Whitehouse, M., Meredith, M.P., Murphy, E.J.,
Shreeve, R.S., Korb, R., Watkins, J.L., Thorpe, S.E.,
Woodd-Walker, R.S., Brierley, A., Cunningham, N., Grant,
S.D., Bone, D.G., 2002. The Southern Antarctic Circumpolar
Current: physical and biological coupling at South Georgia.
Deep-Sea Research I 49, 2183–2202.
Ward, P., Shreeve, R., Whitehouse, M., Korb, B., Atkinson, A.,
Meredith, M., Pond, D., Watkins, J., Goss, C., Cunningham,
N., 2005. Phyto- and zooplankton community structure and
production around South Georgia (Southern Ocean) during
summer 2001/02. Deep-Sea Research I 52, 421–441.
Ward, P., Shreeve, R., Atkinson, A., Korb, R., Whitehouse, M.,
Thorpe, S., Pond, D., Cunningham, N., 2006. Plankton
community structure and variability in the Scotia Sea: austral
summer 2003. Marine Ecology Progress Series 309, 75–91.
Webb, D.J., de Cuevas, B.A., Coward, A.C., 1998. The first main
run of the OCCAM global ocean model. Internal Document
34, Southampton Oceanography Centre.
Whitehouse, M.J., 1997. Automated Seawater Nutrient Chem-
istry. British Antarctic Survey, Cambridge, 16pp.
Whitehouse, M.J., Priddle, J., Symon, C., 1996a. Seasonal and
annual change in seawater temperature, salinity, nutrient and
chlorophyll a distributions around South Georgia, South
Atlantic. Deep-Sea Research I 43, 425–443.
Whitehouse, M.J., Priddle, J., Trathan, P.N., Brandon, M.A.,
1996b. Substantial open-ocean phytoplankton blooms to the
north of South Georgia, South Atlantic, during summer 1994.
Marine Ecology Progress Series 140, 187–197.
Whitehouse, M.J., Korb, R.E., Atkinson, A., Thorpe, S.E.,
Gordon, M., in press. Formation, transport and decay of an
intense phytoplankton bloom within the High-Nutrient Low-
Chlorophyll belt of the Southern Ocean. Journal of Marine
Systems, doi:10.1016/j.jmarsys.2007.05.003
Zhou, M., Niiler, P.P., Zhu, Y., Dorland, R.D., 2006. The
western boundary current in the Bransfield Strait, Antarctica.
Deep-Sea Research 53, 1244–1252.


