Embed Size (px)
Citation preview

- 0 -
Department of Medical Health and Family Welfare
Uttar Pradesh
NATIONAL URBAN
HEALTH MISSION
State Programme
Implementation Plan
2013-14

- 1 -
TABLE OF CONTENTS
Subjects Page. no.
Introduction 2
State Profile 2
Urban Health scenario 22
Details of cities/towns to be covered under NUHM as per 2011 census 39
Key Issues for improving health care 46
Planning activities 48
Programme management arrangement 50
Strengthening Service delivery infrastructure 53
Strengthening Outreach to urban slums 62
Convergent action in NUHM 80
Public Private Partnership 84
City Health Plans 88
Training 89
Monitoring & Evaluation 89
Base line survey 89
State level target & indicators 91
Suggestive Activity Plan under NUHM for the state and cities 92
Proposed Health care Delivery system in urban areas 94
Justification of Physical Norms and costs 97
Proposed State level budget for NUHM for 2013-14 104
Proposed District level budget for NUHM 2013-14 106
Budget Summary & percentage of budget in different heads 112
Acronyms 113
- 2 -
1. Introduction
The National Urban Health Mission (NUHM) aims to improve the health status of the urban
population in general, but particularly of the poor and other disadvantaged sections, by
facilitating equitable access to quality health care through a revamped public health
system, partnerships, community based mechanism with the active involvement of the
urban local bodies.
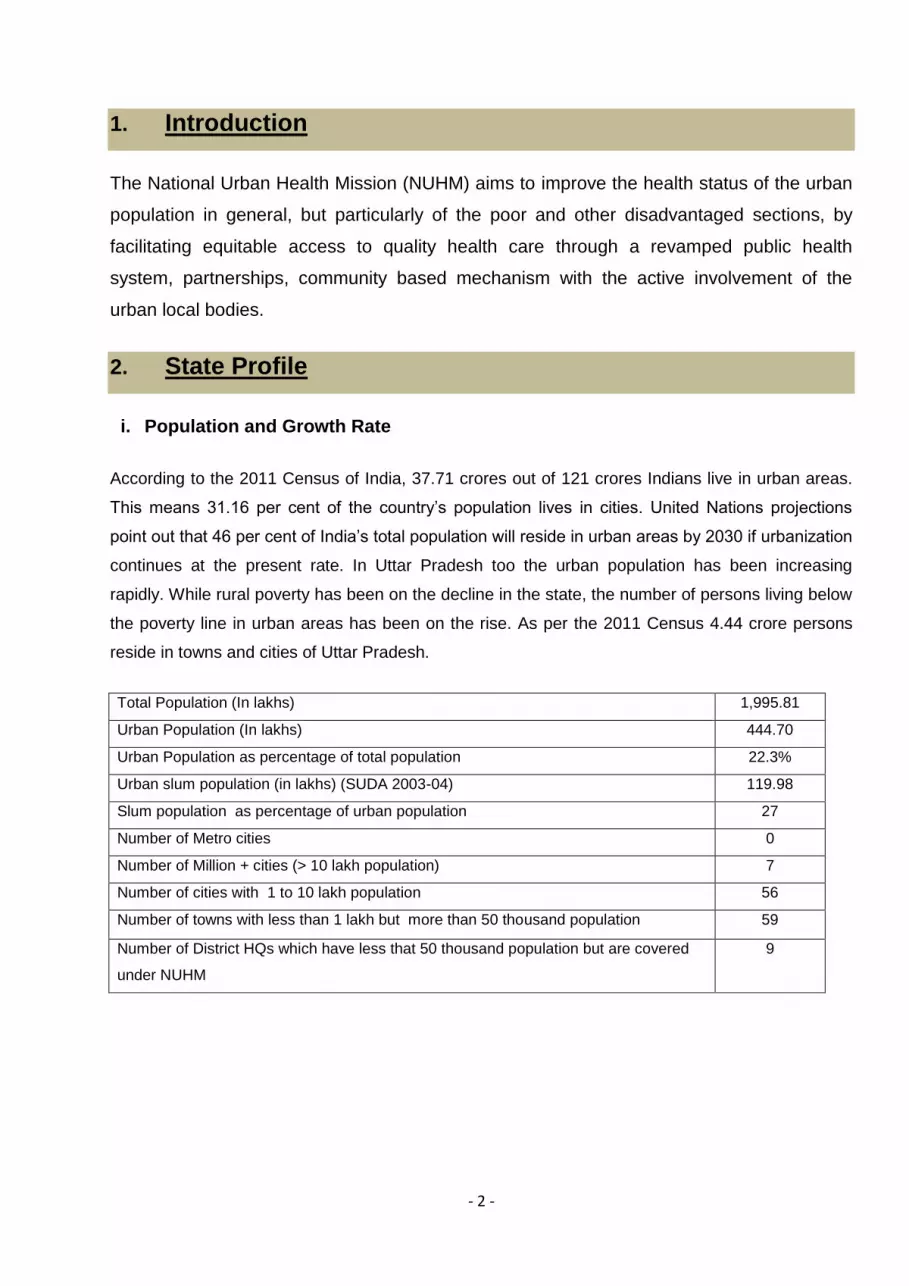
2. State Profile
i. Population and Growth Rate
According to the 2011 Census of India, 37.71 crores out of 121 crores Indians live in urban areas.
This means 31.16 per cent of the country’s population lives in cities. United Nations projections
point out that 46 per cent of India’s total population will reside in urban areas by 2030 if urbanization
continues at the present rate. In Uttar Pradesh too the urban population has been increasing
rapidly. While rural poverty has been on the decline in the state, the number of persons living below
the poverty line in urban areas has been on the rise. As per the 2011 Census 4.44 crore persons
reside in towns and cities of Uttar Pradesh.
Total Population (In lakhs) 1,995.81
Urban Population (In lakhs) 444.70
Urban Population as percentage of total population 22.3%
Urban slum population (in lakhs) (SUDA 2003-04) 119.98
Slum population as percentage of urban population 27
Number of Metro cities 0
Number of Million + cities (> 10 lakh population) 7
Number of cities with 1 to 10 lakh population 56
Number of towns with less than 1 lakh but more than 50 thousand population 59
Number of District HQs which have less that 50 thousand population but are covered
under NUHM
9

- 3 -
Population of Uttar Pradesh as per Census 2011 is
199,812,341 and during the decade (2001-11),
33,383,556 persons have been added in the state:
23,452,683 in rural areas and the rest 9,930,873 in
urban areas. Uttar Pradesh has registered a significant
fall in the decadal growth rate, 60.89 percent in 1971-
1981 to 20.09 percent in 2001-11. Since 1971, there
has been fall in the growth rate of population in Uttar
Pradesh. The state accounts for 16.5% of the
country’s population. Currently, India’s population is
1210.2 million while that of Uttar Pradesh is estimated
at 199.6 million. The State’s population began to
increase rapidly in the 1950’s as a result of a steep
decline in death rates without a corresponding decline in birth rates. From 1951 to 2001 it grew
about two and three quarter times in 50 years. However, the urban population of the state has
increased about over four times since 1951. The State’s population has been doubling in more than
35 years since independence. The rising population in the state is also reflected in the increase in
population density which has become about three and three quarter times, reaching 828 persons
per sq. km. against figures of 215 in 1951. Concentration of population in urban areas of the State
is very high as compared to rural areas.
Table 2.2: Decadal Population Growth of Uttar Pradesh
Decades 1901- 1911
1911- 1921
1921- 1931
1931- 1941
1941- 1951
1951- 1961
1961- 1971
1971- 1981
1981- 1991
1991- 2001
2001- 2011
Decadal Population growth
-9.61 0.16 13.24 26.06 21.86 9.26 29.72 60.89 38.52 32.88 20.09
Table 2.3: Population and Density of Uttar Pradesh 1
Year 1951 1961 1971 1981 1991 2001 2011
Population Density 215 251 300 377 548 689 828
Population (in million) 60.27 70.14 83.85 105.11 132.06 166.05 199.58
Urban Population (in million) 8.23 8.98 11.66 18.74 25.99 34.51 44.49
1 Census of India, 2001 and Census of India, 2011.
Table 2.1: Population and Growth Rate
Population
2011
Decadal
Growth rate
(2001-2011)
Total
199,812,341
20.09
Male 104,480,510 19.45
Female 95,331,831 20.80
Rural 155,317,278 17.81
Male 80,992,995 17.19
Female 74,324,283 18.50
Urban 44,495,063 28.75
Male 23,487,515 27.94
Female 21,007,548 29.67

- 4 -
ii. Demographic Projections2
In the report of the working group on population stabilization for the 11th Five Year Plan (2007-
2012), the projected population for Uttar Pradesh in the year 2026 will reach around 248.76
millions.
Urban population of Uttar Pradesh will increase from 4.4 crores in 2011 to 6.7 crores in 2026
(Census, 2011 population, Projections, 2001-26)
An estimated 1.17 crores (30.6%) people in urban areas are poor (Poverty Estimates 2004-
2005 and 1999-2000)
Uttar Pradesh has the largest number of urban poor in a single state.
Table 2.4: Projected Population (in ’000) as on 1st March 2016-2026, Uttar Pradesh
Indicator 2016 2021 2026
Total population 218089 234631 248762
Male 114903 123532 130793
Female 103185 111099 117970
Total Population (Urban) 49169 54332 67591
% Urban Population to total Population 22.55 23.16 27.17
Male (urban) 26382 29195 36309
Female (urban) 22788 25137 31282
iii. Sex Ratio (All Ages)
The sex ratio of the state is regularly improving since 1991. In census 2011, the sex ratio of the
state has reached 908 females out of 1000 males. In Urban Uttar Pradesh the sex ratio is 888. In
urban Uttar Pradesh sex ratio has improved by 12 points (876 in Census 2001), where as it has
improved by just 10 point in rural areas (904 in Census 2001) and by 10 points at state level (898 in
Census 2001). Another fact is that the sex ratio of the state is 32 points below the national average
i.e. 940 and in urban areas also it is 38 points below the national figure i.e. 926 females per
thousand males. After independence, Uttar Pradesh has seen declining trend till 1991 and is getting
other way round after that.
2 Census of India 2001, Population Projections for India and states 2001-2026.

- 5 -
Table 2.5: Sex Ratio in All-India and Uttar Pradesh 3
Year 1951 1961 1971 1981 1991 2001 2011
All India 946 941 930 934 927 933 940
All India Urban 860 845 858 880 894 900 926
Uttar Pradesh 908 907 876 882 876 898 912
In urban areas the sex ratio varied from 844 in Kanpur Nagar to 948 in Mau in the year 2011 and
the same for 2001 varied from 817 in Allahabad to 938 in Mau. The maximum increase in urban
sex ratio during 2001-2011 is recorded in Gonda district (improved by 84 points) followed in
Allahabad district (46 points) and the maximum decrease was in Kanpur Nagar (10 points) and
Pratapgarh district (4 points since Census 2001).
Table 2.6: Sex Ratio in All-India and Uttar Pradesh by Residence4
Year 2001 2011
All India Urban 900 926
All India Rural 946 947
Uttar Pradesh Urban 876 894
Uttar Pradesh Rural 904 917
Comparing the sex ratio of Census 2011, for the state (total), urban and rural areas with the figures
of 2001, it is apparent that the improvement in urban areas is much higher than the improvement at
state level and in rural areas. The same is true for All India.
iv. Dependency Rate and Life Expectancy
Dependency ratio (measured as ratio of population <15 and over 60 to that between 15-59 years)
for Uttar Pradesh is around 82% as per AHS, it being 63% for urban. The dependency ratio for Uttar
Pradesh is higher as compared to all India figure.
Table 2.7: Residence Dependency Ratio – Uttar Pradesh and All India
3 Census of India 4 Census of India 2001 and Census 2011
Dependency Ratio Total Rural Urban
SRS All India 62.2 66.5 51.6
AHS Uttar Pradesh 82.1 88.2 63.4

- 6 -
Life expectancy at birth has improved to 66 years (66 year for males and 67 years for females) in
Urban Uttar Pradesh. The age distribution indicates significant increase in 60+ populations
especially in urban areas highlighting the need for geriatric care.
2.2 Urbanization
2.2.1 Urban Population as Percentage of Total Population and its Trend
Uttar Pradesh is one of the least urbanized states in India. As per the urbanization trends of 2011
census, Uttar Pradesh State is the 24th most urbanized and 11th least urbanized state in India with
about 22.3 percent of urban population. Amongst the districts in the state, the lowest degree of
urbanization (having much less than 5% urban population) is in the district of Shrawasti 3.45% and
the highest degree of urbanization is in the district of Ghaziabad 67.5%. 2 districts have urban
population below 5% and 13 districts have urban population above 30%.
Though the urbanization in the state (22.28%) is low in comparison to the national average of 31.16
percent as per the 2011 census and the urban decadal growth of the state during the last decade
(2001-2011) has also shown low growth rate of 29.3 percent compared to the national growth rate
of 31.8 percent. It is noteworthy that the State’s population during the last decade has grown by
about 21.4 percent while that of the urban population has grown at about 29.3 percent.
Urbanization is a natural consequence of socio-economic change taking place due to gradual and
steady transformation of traditional rural economies in to modern industrial economy. Mostly the
phenomenon of urbanization is seen as an outcome of demographic outburst resulted from poverty
driven migration from rural areas into urban settings. Different factors, classified as “urban pull
factors” and “rural push factors”, which are also the outcomes of globalization, liberalization and
privatization are making urbanization a faster than before. The table below gives the percentage of
Urban Uttar Pradesh population to its total population.
Table 2.8: Urbanization in Uttar Pradesh
Year 1951 1961 1971 1981 1991 2001 2011
Population (in million) 60.27 70.14 83.85 105.11 132.06 166.05 199.81
Urban Population (in million) 8.23 8.98 11.66 18.74 25.99 34.51 44.49
Percentage Urban Population 13.65 12.81 13.9 17.83 19.68 20.78 22.28
Due to creation of new states after 1991, the data for the years prior to 2001 for the states of Bihar,
Uttar Pradesh and Uttar Pradesh include the data of newly created states namely Jharkhand,
Chhattisgarh and Uttrakhand, respectively.

- 7 -
The total urban population of the state has increased to about 44.5 million (Census 2011) from 34.5
million (Census 2001), showing an increase of ten million. Thus the population residing in urban
areas has increased from about 20.8% percent (Census 2001) to 22.3 percent (Census 2011), and
likely to reach 27. percent in 2026.
2.2.2. Level of urbanization
As per Census - 2011, there are 63 urban agglomerations/cities with more than one lakh
population. The seven urban agglomerations having more than one million populations in the state
are Kanpur, Lucknow, Ghaziabad, Agra, Varanasi, Meerut and Allahabad.
2.2.3. Urban Local Bodies in Uttar Pradesh
In 2001, there were only 704 towns in Uttar Pradesh, which has grown up to 915 in 2011. In other
words, the urban population of the state has increased from 20.8% in 2001 to just 22.3 % in 2011.
Among these urban towns, Government of Uttar Pradesh has 13 Municipal Corporations, 194
Municipal Councils and 423 town areas .
According to the data from the Census of 2011, cities and towns can be broadly classified as:
Class I: 100,000 and above
Class II: 50,000 to 1,00,000 people
Class III: 20,000 to 49,999
Class IV: 10,000 to 19,999
Class V: 5,000 to 9,999
Class VI: Less than 5,000 persons
And
Megacity: >5,000,000 population
Metropolis : 1,000,000-4,999,999 -
Sub-Metropolis : 500,000-999,999
In Uttar Pradesh, there are 648 Statutory Towns. All other places which are having minimum
population of 5,000; at least 75 per cent of the male main working population engaged in non-
agricultural pursuits; and the density of population is at least 400 persons per sq. km. are known as
Census Town. In Uttar Pradesh, such towns have increased from 66 (2001 census) to 267 (2011
census). In the process numbers of villages have decreased from 107,452 to 106,704 in 2011.

- 8 -
2.2.4. State Income and per capita Income
Income levels are an important determinant of the economic well being and social development. In
terms of per capita income, U.P. is among the ‘low income category’ States along with Bihar,
Madhya Pradesh and Orissa. Moreover, due to sluggish economic growth in U.P., the gap in per
capita income of the State and that of the country has been increasing. Per capita income in U.P.,
which was almost equal to the national average in the beginning of the planning period, is now half
of the national average.
Uttar Pradesh is the second largest state-economy in India contributing 8.34% to India's total GDP.
Uttar Pradesh had been one of the leading Indian BIMARU states for long time, the term that was
used for state developing at very slow growth rate. But recently in 11th five year plan (2007-12),
Uttar Pradesh has registered 7.28% GDP growth rate against the target of 6.10% and is the part of
5 states the exceeded the targets of growth rates.
The major economic activity in the state is agriculture; in 1991, 73% of the population in the state
was engaged in agriculture and 46% of the state income was accounted for by agriculture. UP has
retained its preeminent position in the country as a food-surplus state.
The Per Capita Income (PCI) at Constant and Current prices have been presented in the table
ahead. The per capita income for Uttar Pradesh is Rs. 29417 for 2011-12 which is much lower than
the national average. It can be seen from the table that the Per Capita Income at Current Prices has
gone up by approximately 127% during 2004-05 to 2011-12. At constant prices, that is, setting
aside price fluctuation, the Per Capita Income have gone up during 2004-05 to 2011-12 by 40%.
TABLE 2.9: PER CAPITA NET STATE DOMESTIC PRODUCT (PER CAPITA INCOME) AT
CURRENT/ CONSTANT PRICES: Uttar Pradesh5
YEAR 2004-05 2005-06 2006-07 2007-08 2008-09 2009-10 2010-11 2011-12
Per Capita
Income at
Current
Prices
12950 14221 16013 17785 20422 23392 26355 29417
Per Capita
Income at
2004-05
Prices
12950 13445 14241 14875 15713 16374 17349 18103
5 Directorate of Economics & Statistics of Uttar Pradesh State

- 9 -
2.2.5. Employment Status
The following table gives the employment status of various castes in urban Uttar Pradesh for the year
2004-05. Relatively higher percentage is for ‘self- employment’ and next is for Regular Wage/Salaried
for All castes. The casual labours are mainly from SC and OBCs.
Table 2.10: Employment Status of Households by Caste - Uttar Pradesh for the year 2004-056
Household Group Type SC OBC Others All
Urban
Self-Employed 44.9 57.7 45.0 50.7
Regular Wage/Salaried 29.3 23.3 39.3 30.4
Casual Labour 19.4 10.5 4.7 9.8
Other Households 5.9 8.3 10.3 8.7
All Households 100.0 100.0 100.0 100.0
Table below present monthly per capita consumption for persons in different employment by caste.
On an average MPCE is Rs. 857, at being higher for other casts the MPCE is higher for these on
regular waged/salary and lower for casual labour.
Table 2.11: Average MPCE by Caste and Employment Status Uttar Pradesh
Employment SC OBC Others All
Urban
Self-Employed 527.5 651.4 1100.9 811.7
Regular Wage/Salaried 817.2 855.6 1201.3 1019.0
Casual Labour 429.1 555.9 494.7 509.5
Other Households 967.8 874.9 1012.8 943.7
All Households 637.5 702.3 1103.1 857.1
2.2.6 Work Participation
The Work Participation Rate (WPR), which is defined as the percentage of total workers to the total
population, is 32.5 per cent as per the 2001 Census. While the WPR for males 46.8 percent in the
year 2001, for females it was 16.5 in the corresponding year.
The results from 2001 Census clearly suggest a shift in the composition of labour force from a
predominantly agriculture to moderately non-agriculture sector. It would be interesting to note that in
rural areas while the proportion of workers engaged as cultivators among males (42.7) exceed
those among females (36.1), in the category of agricultural labourers the proportion of workers
6 NSSO Report No. 541 on Household Consumer Expenditure Among Socio-Economic Groups: 2004 – 2005.

- 10 -
among females (39.6) far exceed the males (20.1). There is larger proportion of female workers
engaged in Household Industries than males both in rural as well as urban areas.
2.2.7 Literacy
Table 2.12: Literacy and Gender7
Literacy Total Male Female Gender
gap
Urban Male Female Gender
gap
2001 56.27 67.30 43.00 26.60 69.75 76.76 61.73 15.00
2011 69.72 79.24 59.26 19.98 77.01 81.75 71.68 10.07
The effective literacy rate for U.P. in Census 2011, works out to 69.7 percent. The corresponding
figures for males and females are 79.24 and 59.26 per cent respectively. The state has continued
its march in improving literacy rate by recording a jump of 13.5 percentage points during 2001-
2011. !e increase in literacy rates in males and females are in the order of 12 and 16 percentage
points respectively.
An extremely positive development in the present decade is that the gap of over 26 percentage
points recorded between male and female literacy rates in 2001 Census has reduced to 20
percentage points in 2011. Though the target set for the year 2011-2012 by the Planning
Commission of reducing the gap to 10 percentage points has not been achieved, it is heartening
that the reduction has been to the order of almost 6 percentage points.
2.2.8. Urban Poverty
Uttar Pradesh has been making serious efforts in improving its poverty level; however the poverty
level of the state stands at around 37.7%, which is comparatively high as against national level of
29.8%.
The state has implemented a large number of programmes and schemes to improve the
socio‐economic conditions of the poor. Uttar Pradesh has introduced Poverty and Social Monitoring
System (PSMS) in 1999, to measure and monitor the progress in key areas related to poverty and
living standards of the people of the state.
Uttar Pradesh among all Indian states is one of the major states where the incidence of poverty is
considerable. Uttar Pradesh emerges in the forefront of all states signifying all indices. Poverty is a
condition created by unjust society, denying people access to and control over the resources that
7 Census 2011 Data from www.censusindia.gov.in

- 11 -
they need to live a fulfilled life. Uttar Pradesh also lives majorly (78%) in villages. Around 37%
people in Uttar Pradesh and 39% people of rural Uttar Pradesh live below poverty. Only around
32% of urban Uttar Pradesh live below the poverty line in the year 2009-10.
Poverty is a condition created by unjust society, denying people access to and control over the
resources that they need to live a fulfilled life. Uttar Pradesh is one of the seven poorest states in
India.
The table below shows the poverty scenario in Uttar Pradesh as per Tendulkar Methodology (2009-
10), Planning Commission.
Table 2.13: Percentage of Population below Poverty Line
Year Uttar Pradesh (%) India (%)
Rural Urban Combined Rural Urban Combined
2004-05 42.7 34.1 40.9 42.0 25.5 37.2
2009-10 39.4 31.7 37.7 33.8 20.9 29.8
Urban poverty in Uttar Pradesh is an issue because frequent draughts have been a major reason of
rural to urban migration of population. The agriculture, which is the major occupation of people in
rural areas, has hit badly due to frequent draughts. Agriculture contribution to state GDP has fallen.
The poor migrants get failed to integrate into the urban labour market are contributing to the rising
levels of urban poverty. Urban poverty is significant in Uttar Pradesh with about a fourth of the
urban population living below the poverty line and mostly is in slums. It is estimated for the year
2009-10 that 137.3 lakh persons comprising 30.9 per cent of the urban population of the state live
below the poverty line. The rural poverty line for Uttar Pradesh in 2009-10 was estimated as
Rs.663.7 and urban as Rs.799.9 (Rs. per capita per month).
The vulnerabilities of urban dwellers differ in significant ways from those of their rural counterparts.
These distinct vulnerabilities are associated with number of factors like their dependence on a
monetized economy, the prohibitive cost of food and basic services for poor people in cities, the
huge range of environmental and health hazards, the pervasiveness of substandard housing and
tenure insecurity, and the exposure of poor communities to crime and violence. There are also
numerous social problems associated with living in the slums including illicit brews resulting in
drunkenness, casual sex leading to sexual exploitation of women and girls, insecurity, child abuse
and a high prevalence of HIV/AIDS. Inhabitants also experience high rates of unemployment and of
school dropouts.

- 12 -
To make matters worse, levels of vulnerability are likely to heighten with the effects of climate
change, especially since the urban poor often live in marginalized areas that are subject to flooding,
water logging etc. The vulnerabilities of the urban poor are further aggravated by an inadequate
policy, institutional and legislative framework including the lack of an appropriate land-use policy, an
inappropriate housing legislative framework, and poor land management and administration
approaches that are insensitive to the informal settlements.
Urban poverty is a multidimensional condition, subject to cultural, social and local influences. Urban
poverty is getting more complicated with the urbanization. The urban poverty is characterized by
several deprivations like limited access to employment opportunities and income, inadequate and
insecure housing and services, limited access to services like health, nutrition, water, sanitation
etc., unhealthy environments and poor social infrastructure support mechanism, poor urban
governance and weak policy framework to address the vulnerability and risks of urban poor. Cities
generate more opportunities for employment but the insufficient economic growth of urban areas
can increase the proportion of urban poverty.
The ST and SC groups had a higher proportion of persons at low levels of consumption than the
general population. The brunt of urban poverty is largely borne by socially excluded groups of the
society, which belongs to scheduled castes, Scheduled tribes and other backward castes. A higher
proportion of urban poor families are from disadvantaged social groups such as scheduled castes
and other backward castes. The extent of poverty among the socially excluded groups (SC and ST)
is continues to be higher.
Report of the Committee on slum Statistics /Census, MHUPA, 2010. The report has stated that the
slum population count in the 2001 census is underestimating of the actual count. It has been
estimated that the state of Uttar Pradesh would be having about 25% of State’s urban population
living in the slums in 2001. As per the report, the slum population is estimated to be about 111
lakh for the year 2012 and the same would be about 124 lakh in the year 2017.
2.2.9. Human Development Index
Uttar Pradesh has been classified as a state ranking very low on human development. India Human
Development Report 2011 shows that poverty head count ratio was 37.7 per cent of the population.
HDI for the state is 0.380 for the year 2007-08 and IHDI for the state is 0.307 as per the India
Human Development Report 2011, IAMR and Planning Commission. It has been ranked 15 out of
19.

- 13 -
2.2.10 Inadequacy of Basic Amenities
Urbanization has impacted the urban regions of the state in varied manner. The major impacts of
rapid urbanization are air pollution, drainage, changing land-use, congestion, degradation of water
bodies, decline in water table etc. The continual rural to urban migration of people toward cities is
not only building pressure over the city infrastructure manifold but also making environment
unhealthy and unsafe for human habitation. Rampant and unplanned urbanization has created a
gap between demand and supply of urban basic services, including, housing, water, health,
sanitation, education and other urban infrastructure. Total housing shortage in urban areas of Uttar
Pradesh has increased. A large proportion of the shortage is likely to be in the category of EWS/LIG
(Economically Weaker Section/ Low Income Group) Housing. Therefore, shortage of affordable
housing is emerging as a major challenge for the government and is sought to be tackled through a
series of measures and policy guidelines set down for this purpose.
The worst outcome of urbanization and housing shortage in the state is the unplanned and prolific
growth of slums in the cities. Urban slums represent the worst of urban poverty and inequality. The
world has recognized the condition of slum and has sought to improve the living environment and
condition of cities and towns.
The Government of India has introduced a Rajiv Awas Yojana for the slum dwellers and the urban
poor on the lines of the Indira Awas Yojana for the rural poor for various states including Uttar
Pradesh. The schemes for affordable housing through partnership and the scheme for interest
subsidy for urban housing has been dovetailed into the Rajiv Awas Yojana which would extend
support under JNNURM to States that are willing to assign property rights to people living in slum
areas. The Government's effort would be to create a slum free India in five years through the Rajiv
Awas Yojana.
As per AHS, following major deficiencies were observed in urban areas:
12% of the houses are Kachcha or semi- pucca;
About 16% are living in rented houses;
2.5% had no improved source of drinking water;
15% are without access to latrines and people go for open defecation;
35% Households do not have a separate kitchen in their houses.
9% Households do not have electricity in their houses.
14% Households use kerosene as main source of light.

- 14 -
Vulnerability of Urban Poor
The divide of urban poor and urban non poor is getting wider because of the unequal access to
urban basic services. The poor people migrate to cities with the hope of better living standard,
better access to facilities and better job opportunities. But lack of paying capacity and unaffordable
housing in prime locations of urban areas compel poor migrants to live in low income areas, where
they are exposed to different socio-economic and environmental risks, which adversely affects their
health. The urban poor are as deprived of benefits of urban areas as their rural counterparts. The
health of the slum communities is considerably worse off than the non poor in urban area and is
comparable to the rural figures.
The growth of slums is a sign of people’s inability to afford land and shelter through the normal
market mechanism and the failure of the public sector to ensure equitable access of the same to
the poor. Slum housing lacks in term of tenure, structure & access to services are which is deprived
of civic amenities. Slums are marked with characteristics like overcrowding, precarious living
conditions, environmental hazards, improper sanitation, air pollution due to accumulation of waste
and open defecation, limited access to safe drinking water and other basic services like toilet,
health etc.
The problem of housing, water and sanitation are prime problems that would require serious
interventions. Access to basic amenities in slums and shanty towns is relatively poor as compared
to general conditions in urban areas in the state.
The vulnerability of urban poor can be read through the reanalyzed data of NFHS III. The poor
show of health indicators and access to public health facilities give a glimpse of vulnerability of
urban poor. The health conditions and healthcare service coverage among this section of the
population is masked by the urban average figures. The urban public healthcare infrastructure, on
which the poor are most dependent, is far from adequate.
Utilization of antenatal services in Uttar Pradesh is low due to lack of awareness of available
services and also due to lack of felt need for such services. Among urban poor, the maternal and
child health indicators are further low. Among urban poor, 98 percent of mothers are not receiving
complete ANC, IFA consumption for 90 days or more is just 6 percent, 55.3 percent mothers are
anaemic and most of the deliveries (83.3 percent) are occurring at home. In case of child health, the
complete immunization is just 15 percent, 63.5 percent children have stunted growth, whereas 48.5
percent are underweight. The figures for mortality and morbidity are also very adverse, when we
talk about the urban poor. The neonatal mortality is 50 infant mortality is 86.2 and Under 5 mortality
is 110.

- 15 -
2.3 Vital Rates
2.3.1 Crude Birth Rate, Crude Death rate & Natural Growth Rate
The major cause of population growth is natural growth in population. The improved health services
and health awareness in the state has been able to bring down the mortality to a great extent. The
CBR was 32.2 live births per thousand populations in 2001 and has declined to 28.3 in 2010. The
same is true for the urban areas of the state, where CBR has declined from 27.0 in 2001 to 24.2 in
2010. During the span of 2001 to 2010, fall in CBR at state level is of 3.9 percent where as at urban
level it is 2.8 percent. The crude death rate, as well, shows a fall of 2 percent at state level and 1.5
percent at urban level.
Table 2.14: CBR, CDR, Natural Growth Rate and IMR of Uttar Pradesh State and Urban Areas
Year
Crude birth rate
(CBR)
Crude death rate
(CDR)
Natural Growth rate Infant mortality rate
(IMR)
State Urban State Urban State Urban State Urban
2001 32.2 27 10.1 7.8 22 19.2 82 62
2004 30.8 26.2 8.8 6.2 22 20 72 53
2005 30.4 26.5 8.7 6.8 21.7 19.7 73 54
2006 30.1 26 8.6 6.6 21.4 19.3 71 53
2007 29.5 25.5 8.5 6.5 21 18.9 69 51
2008 29.1 25.1 8.4 6.6 20.7 18.4 67 49
2009 28.7 24.7 8.2 6.5 20.5 18.3 63 47
2010 28.3 24.2 8.1 6.3 20.3 17.9 61 44
2011 27.8 23.7 7.9 6.1 20.0 17.7 57 41
2012 27.4 23.5 7.7 6.0 19.7 17.5 53 39
Sample Registration System, ORGI, Government of India
2.3.2 Child (0-6 years) Sex Ratio
The child sex ratio at 899 in the state is below the national average of 914 and the state is therefore
counted with states having little worse child sex ratio. In census 2011, the child sex ratio is showing
a dip of 17 points at state level and of 11 points in urban areas, when comparing the last Census.

- 16 -
Table 2.15: Child Sex Ratio of State and its Urban Areas
Year 2001 2011
Child (0-6 years) Sex Ratio
All India 927 914
Uttar Pradesh 916 899
Uttar Pradesh Urban 890 879
2.3.3 Infant and Child Mortality Rates
There has been a decline of 12 points in IMR for Uttar Pradesh during 2005-2010. In spite of the
decline being slightly higher for males as compared to females, the levels remain slightly higher for
females as compared to males. However, the trend in the decline for Uttar Pradesh is slightly higher
than that for all India, though the difference in the level is by 14 points higher.
Table 2.16: Annual Estimates8 of Infant Mortality Rate by Sex
Year 2005 2006 2007 2008 2009 2010
Total
India 58 57 55 53 50 47
Uttar Pradesh 73 71 69 67 63 61
Male
India 56 56 55 52 49 46
Uttar Pradesh 71 70 67 64 62 58
Female
India 61 59 56 55 52 49
Uttar Pradesh 75 73 70 70 65 63
The Infant mortality rate separately for rural and urban areas is presented as under:
It is seen that the IMR in urban areas is much lower than that in rural areas. However, little more
than two thirds of infant's deaths still occur during neo natal period i.e. within one month of birth.
Thus, for further reductions in IMR the deaths during neo natal period need to be avoided.
Table 2.17: Infant, Neo-Natal and Post Neo-Natal Mortality Rates (2010-11)9
Uttar Pradesh Total Rural Urban Total Rural Urban
AHS 2010-11 AHS 2011-12
Infant Mortality Rate 71 74 54 70 73 53
Neo Natal Mortality Rate 50 53 36 50 52 37
Post Neo Natal Mortality Rate 21 22 18 20 21 16
8 Sample Registration System
9 Annual Health Survey

- 17 -
It is important to mention that the IMR for urban poor as per NFHS-3 data (reanalyzed) is 86.2 per
thousand live births which was 13.5 points higher than the state urban (72.7).
One of the millennium development goal relates to reducing child mortality. The results on child
mortality for different districts of Uttar Pradesh are presented as under:
Table 2.18: Under 5 Mortality Rates (2010-11)10
District Total Rural Urban District Total Rural Urban
Saharanpur 99 109 62 Jhansi 61 76 43
Muzaffarnagar 72 80 50 Lalitpur 114 119 76
Bijnor 78 82 - Hamirpur 65 67 59
Moradabad 82 85 78 Mahoba 71 76 63
Rampur 92 103 55 Banda 95 94 103
Jyotiba Phule Nagar 85 89 71 Chitrakoot 125 130 78
Meerut 66 67 64 Fatehpur 81 87 -
Baghpat 72 76 57 Pratapgarh 113 114 94
Ghaziabad 66 70 63 Kaushambi 128 129 122
Gautam Buddha
Nagar 68 73 56 Allahabad 115 125 60
Bulandshahar 92 91 96 Barabanki 95 97 -
Aligarh 85 88 77 Faizabad 129 132 106
Hathras 82 81 84 Ambedkar Nagar 90 90 80
Mathura 61 71 42 Sultanpur 68 70 -
Agra 68 73 62 Bahraich 101 103 57
Firozabad 87 92 70 Shrawasti 142 142 -
Etah 93 98 - Balrampur 128 130 81
Mainpuri 79 78 84 Gonda 97 99 -
Budaun 112 115 102 Siddharthnagar 121 122 111
Bareilly 107 122 72 Basti 109 110 85
Pilibhit 95 99 64 Sant Kabir Nagar 97 96 -
Shahjahanpur 106 115 - Maharajganj 110 112 -
Kheri 117 123 - Gorakhpur 82 87 65
Sitapur 120 121 112 Kushinagar 106 108 -
Hardoi 113 115 101 Deoria 93 92 100
Unnao 84 85 77 Azamgarh 95 96 81
Lucknow 60 86 38 Mau 97 100 85
Rae Bareli 81 83 - Ballia 90 90 93
Farrukhabad 99 106 72 Jaunpur 101 100 108
10
Annual Health Survey

- 18 -
Kannauj 99 101 90 Ghazipur 102 100 122
Etawah 83 86 72 Chandauli 108 107 120
Auraiya 86 92 52 Varanasi 101 111 87
Kanpur Dehat 97 101 - Bhadohi 109 110 102
Kanpur Nagar 52 83 40 Mirzapur 111 112 108
Jalaun 96 96 97 Sonbhadra 96 105 -
Uttar Pradesh 94 101 68
For the state as a whole the child mortality rate is 94, it being lower at 68 for urban areas. There are
thirty-nine (out of seventy) districts with higher child mortality rates (more than 94) namely,
Saharanpur, Budaun, Bareilly, Pilibhit, Shahjahanpur, Kheri, Sitapur, Hardoi, Farrukhabad,
Kannauj, Kanpur Dehat, Jalaun, Lalitpur, Banda, Chitrakoot, Pratapgarh, Kaushambi, Allahabad,
Barabanki, Faizabad, Bahraich, Shrawasti, Balrampur, Gonda, Siddharthnagar, Basti, Sant Kabir
Nagar, Maharajganj, Kushinagar, Azamgarh, Mau, Jaunpur, Ghazipur, Chandauli, Varanasi, Sant
Ravidas Nagar (Bhadohi), Mirzapur and Sonbhadra.
The U5 Mortality among urban poor (110.1) was 3.7 points higher than the state urban (96.4,
NFHS-3).
2.3.4 Maternal Mortality Ratio
The maternal mortality ratio for different districts of Uttar Pradesh is presented as under:
Table 2.19: Maternal Mortality Ratio (2010-11)11
District Value District Value District Value
Saharanpur 337 Hardoi 330 Ambedkar Nagar 451
Muzaffarnagar 337 Unnao 330 Sultanpur 451
Bijnor 339 Lucknow 330 Bahraich 434
Moradabad 339 Rae Bareli 330 Shrawasti 434
Rampur 339 Farrukhabad 267 Balrampur 434
Jyotiba Phule Nagar 339 Kannauj 267 Gonda 434
Meerut 225 Etawah 267 Siddharthnagar 412
Baghpat 225 Auraiya 267 Basti 412
Ghaziabad 225 Kanpur Dehat 267 Sant Kabir Nagar 412
Gautam Buddha Nagar 225 Kanpur Nagar 267 Maharajganj 412
Bulandshahar 225 Jalaun 241 Gorakhpur 354
Aligarh 371 Jhansi 241 Kushinagar 354
11
Annual Health Survey

- 19 -
Hathras 371 Lalitpur 241 Deoria 354
Mathura 281 Hamirpur 306 Azamgarh 385
Agra 281 Mahoba 306 Mau 385
Firozabad 281 Banda 306 Ballia 385
Etah 371 Chitrakoot 306 Jaunpur 346
Mainpuri 281 Fatehpur 442 Ghazipur 346
Budaun 437 Pratapgarh 442 Chandauli 346
Bareilly 437 Kaushambi 442 Varanasi 346
Pilibhit 437 Allahabad 442 Bhadohi 308
Shahjahanpur 437 Barabanki 451 Mirzapur 308
Kheri 330 Faizabad 451 Sonbhadra 308
Sitapur 330
Uttar Pradesh 345
Though, the MMR has come down the MDG for MMR appears to be out of reach in near future. The
districts with higher MMR (more than 345) are Aligarh, Hathras, Etah, Budaun, Bareilly, Pilibhit,
Shahjahanpur, Fatehpur, Pratapgarh, Kaushambi, Allahabad, Barabanki, Faizabad, Ambedkar
Nagar, Sultanpur, Bahraich, Shrawasti, Balrampur, Gonda, Siddharthnagar. Basti, Sant Kabir
Nagar, Maharajganj, Gorakhpur, Kushinagar, Deoria, Azamgarh, Mau, Ballia, Jaunpur, Ghazipur,
Chandauli and Varanasi.
2.4 Fertility
2.4.1 Age at Marriage
As per NFHS -3, the median age at first marriage is 16.2 years among women age 20-49 and 20.1
years among men age 25-49. On average, men get married four years later than women. More than
half (59%) of women age 20-24 years got married before the legal minimum age of 18 and 51
percent of men age 25-29 years got married before the legal minimum age of 21.
But the mean age at marriage for females is 21 years as per recent held Annual Health survey
(AHS). Men average age at marriage is just three years later. In urban Uttar Pradesh the
respective mean ages for women and men are 22.4 years and 25.7 years respectively. About 9%
of currently married women age 20-24 years got married before the legal minimum age of 18 and
about 17 percent of men age 25-29 years got married before the legal minimum age of 21 as per
recent large scale survey. The same for urban Uttar Pradesh are around 3 percent and little over 6
percent respectively.

- 20 -
2.4.2. Fertility Levels
As per NFHS-3, a woman in Uttar Pradesh had an average of 3.8 children in her lifetime. Fertility
decreased by 0.3 children between NFHS-2 and NFHS-3. Fertility in Uttar Pradesh was second
only to fertility in Bihar; in both states, at the then current fertility levels, a woman would have about
four children during her lifetime compared with less than three children (2.7 children per woman) in
India as a whole. Among births in the three years preceding the survey, 38 percent were of birth
order four or higher. Fertility in rural areas was seen to be 4.1 children per woman, much higher
than in urban areas where the fertility rate is 3.0 children per woman.
But recently (AHS) it has been observed that mean children ever born to women age 15-49 years
are now 3.3 and out of which only 2.9 are surviving. The position in urban Uttar Pradesh is little
better and the corresponding mean number of children are 3.1 and surviving ones are 2.8. For the
women of age group 45-49 years, the mean children ever born are 5.1 (4.5 in urban areas). Thus
the fertility is decreasing
and inching towards the
replacement level for the
whole state as well.
As per AHS, the total
fertility in Uttar Pradesh
State as a whole has been
still 3.6 children per women
and for rural areas it is 3.9,
1.2 higher than in urban
areas where the fertility rate of 2.7 and the same is still more than the replacement level.
As per NFHS –3, fertility rates are higher for women in disadvantaged groups (4.5 for scheduled
castes and 3.8 for other backward classes), than for women who are not in any of these groups
(3.2). The total fertility rate for Muslims (4.3) is about half a child highe than the rate for Hindus
(3.7).
- 21 -
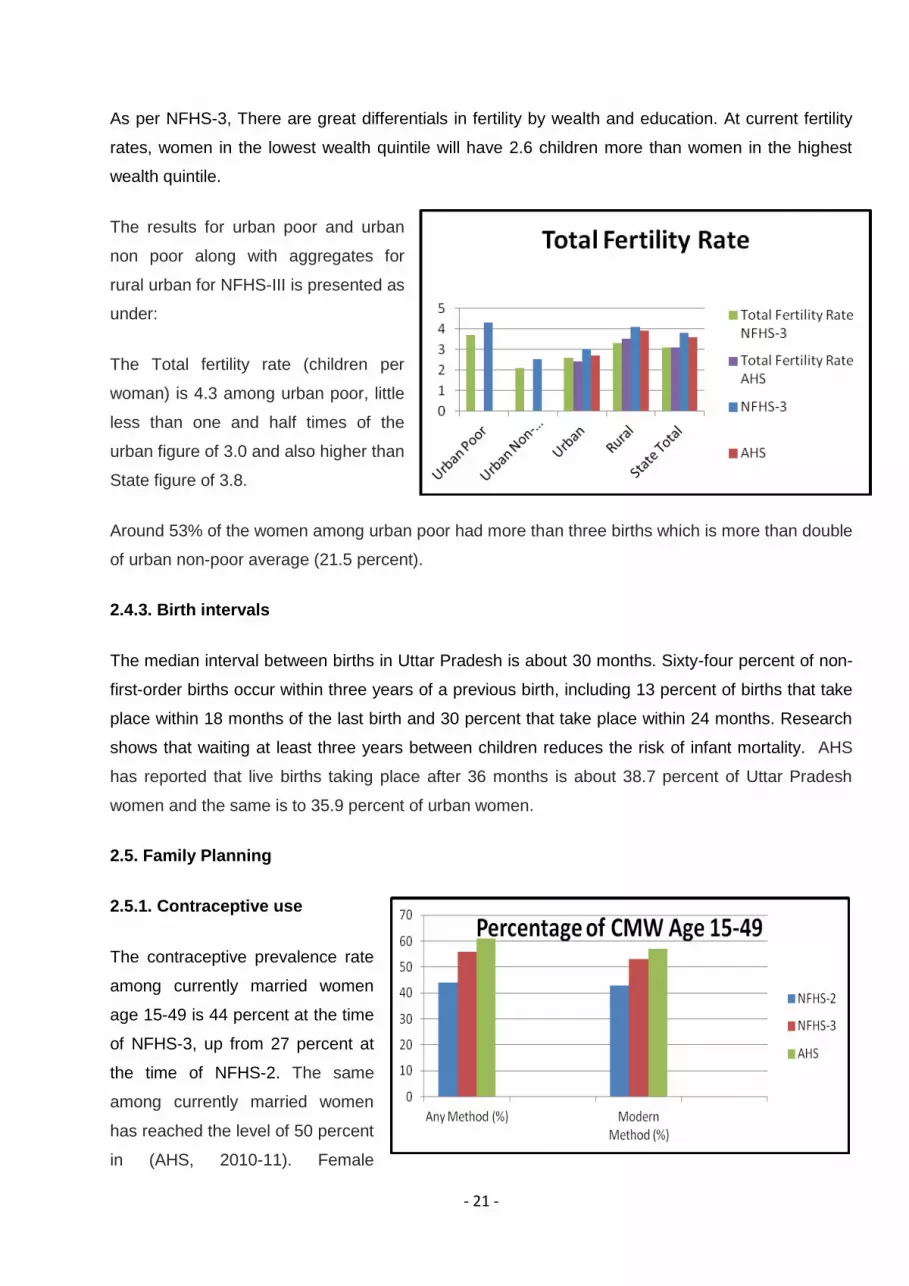
As per NFHS-3, There are great differentials in fertility by wealth and education. At current fertility
rates, women in the lowest wealth quintile will have 2.6 children more than women in the highest
wealth quintile.
The results for urban poor and urban
non poor along with aggregates for
rural urban for NFHS-III is presented as
under:
The Total fertility rate (children per
woman) is 4.3 among urban poor, little
less than one and half times of the
urban figure of 3.0 and also higher than
State figure of 3.8.
Around 53% of the women among urban poor had more than three births which is more than double
of urban non-poor average (21.5 percent).
2.4.3. Birth intervals
The median interval between births in Uttar Pradesh is about 30 months. Sixty-four percent of non-
first-order births occur within three years of a previous birth, including 13 percent of births that take
place within 18 months of the last birth and 30 percent that take place within 24 months. Research
shows that waiting at least three years between children reduces the risk of infant mortality. AHS
has reported that live births taking place after 36 months is about 38.7 percent of Uttar Pradesh
women and the same is to 35.9 percent of urban women.
2.5. Family Planning
2.5.1. Contraceptive use
The contraceptive prevalence rate
among currently married women
age 15-49 is 44 percent at the time
of NFHS-3, up from 27 percent at
the time of NFHS-2. The same
among currently married women
has reached the level of 50 percent
in (AHS, 2010-11). Female

- 22 -
sterilization dominates over the other modern methods.
The results for urban poor and urban non poor based on NFHS-III are presented graphically as
under:
It is observed that for urban poor, the use of spacing methods is less than half the level of non poor.
2.5.2 Unmet need
Unmet need for family planning is defined as the percentage of currently married women who either
want to space their next birth or stop childbearing entirely but are not using contraception.
According to this definition, 21.2 percent of married women in Uttar Pradesh have an unmet need
for family planning in NFHS-3, down from 25.4 percent in NFHS-2. Since NFHS-2, unmet need for
spacing have declined by 2.7 percentage point and unmet need for limiting has decreased by 1.5
percentage point.
Currently, as per AHS, about thirty percent of married women in Uttar Pradesh have an unmet need
for family planning. The unmet need for spacing and limiting methods is respectively 17% and
13%. The unmet need is over 8% less for urban Uttar Pradesh than in rural areas.
The unmet need for urban poor remains double level as compared to non poor, mainly for limiting.
3. Urban Health Scenario
The rapid urbanization coupled with influx of migrants has influenced the health parameters of
urban population. Through the annual health survey (AHS-2010-11) detailed information has
become available on chronic as well as acute morbidity together with the health seeking behaviour.

- 23 -
Further, on morbidity pattern and health seeking behaviour information is available through NSSO
survey (61st Round: 2004-05) on the subject. Information on hospitalization during last one year is
also available in this survey. Importantly, the information on health expenditure is available through
NSSO (66th Round) of household consumption expenditure for the year 2009-10. This chapter
presents the findings based on these data sources.
3.1 Morbidity and Health Seeking Behaviour
Based on Annual Health Survey (AHS) data, table below summarizes information on morbidity
separately for acute and chronic illnesses
Table 3.1: Morbidity Per Lakh Population- Uttar Pradesh
Sex
Any type of Acute
Illness
Symptoms Chronic
Illness
Diagnosed Chronic
Illness
Percentage
Symptoms of
Chronic Illness
Diagnosed
Total Rural Urban Total Rural Urban Total Rural Urban Total Rural Urban
Person 12561 12959 11151 8380 8873 6633 7390 7722 6216 88.2 87.0 93.7
Male 12096 12491 10736 7234 7656 5784 6425 6709 5452 88.8 87.6 94.3
Female 13053 13448 11611 9593 10146 7575 8411 8780 7064 87.7 86.5 93.3
3.1.1. Morbidity Rates: Acute and Chronic (Based on NSSO & AHS Data)
Acute Morbidity Rates (Based on AHS Data)
The prevalence of Acute Illness in Uttar Pradesh was 12561 per lakh population i.e. around
12.56%. The prevalence was slightly higher in rural areas as compared to urban areas. Further, the
prevalence of Acute Illness was observed slightly higher among females as compared to males.
The trend was similar in both rural and urban areas.
As already mentioned, in the AHS the details on persons suffering from specific acute illnesses
such as Diarrhoea, Acute Respiratory Infection (ARI) and Fever are available and are presented as
under:

- 24 -
Table 3.2: Persons Suffering from Specific Acute Illness (Per 100,000 Populations)-Uttar
Pradesh
Sex Diarrhoea/ Dysentery
Acute Respiratory Infection
(ARI) Fever (All Types)
Total Rural Urban Total Rural Urban Total Rural Urban
Persons 1187 1258 934 3017 3267 2133 7571 7672 7217
Male 1203 1282 931 2883 3116 2081 7282 7394 6896
Female 1170 1234 937 3159 3424 2190 7878 7961 7574
The prevalence of fever alone was 7.57% it being higher in rural areas (7.67%) as compared to
urban areas (7.2%). Diarrhoea/ Dysentery had prevalence of 1.19% it being again higher in rural
areas (1.26%) as compared to urban areas (0.93%). The prevalence of ARI was 3.0%, it being
higher in rural areas (3.27%) as compared to urban areas (2.13%).
These 3 diseases together account for about 93.7% of acute illnesses;
Table 3.3: Percentage Share of Diarrhoea, ARI and Fever in Acute Illnesses
Sex Total Rural Urban
Persons 93.7 94.1 92.2
Male 94.0 94.4 92.3
Female 93.5 93.8 92.2
Chronic Morbidity Rates
The symptoms of chronic illness persisting for more than a month were reported by 8380 per lakh
population i.e. 8.28%. These symptoms for chronic illness were reported less in urban areas as
compared to rural areas. Here again the prevalence of symptoms was higher among females as
compared to males in both rural and urban areas, of these symptoms over 88% were diagnosed.
Importantly this percentage was higher in urban areas (94%) as compared to rural areas (87%).
However, the gender differences were negligible.
In the AHS the details on persons suffering from specific chronic illnesses such as Diabetes
Hypertension, Tuberculosis-(TB), Asthma and Arthritis are available which are presented as under:

- 25 -
Table 3.4: Persons Suffering from Specific Chronic Illness (Per 100,000 Populations)
Sex Diabetes
Hypertension Tuberculosis-TB Asthma Arthritis
Total Rural Urban Total Rural Urban Total Rural Urban Total Rural Urban Total Rural Urban
Person 287 194 619 498 409 815 290 303 243 565 607 420 996 1072 728
Male 325 220 687 368 295 621 327 347 260 644 698 458 738 822 450
Female 248 166 544 636 527 1030 250 257 225 482 511 377 1270 1334 1036
It is observed that the diseases like Diabetes and Hypertension have many times higher morbidity
rates in urban areas as compared to rural areas for both the sexes respectively. However,
Tuberculosis-(TB), Asthma & Arthritis are reported much higher in rural areas.
Importantly these five chronic illnesses account for only 36 percent of all chronic illnesses as could
be seen from table below:
Table 3.5: Percentage share of 5 chronic illnesses Diabetes Hypertension, Tuberculosis-(TB),
Asthma and Arthritis in all chronic illnesses
Sex Total Rural Urban
Persons 35.7 33.5 45.4
Male 37.4 35.5 45.4
Female 34.3 31.8 45.5
Acute Morbidity Rates (Based on NSSO Data)
In the survey by NSSO for the year 2004-05, prevalence of morbidity estimated as proportion of
ailing persons (PAP) during reference period of 15 days for Uttar Pradesh was estimated as 10.2
percent. The prevalence rate was broadly similar in urban areas and rural areas. However,
prevalence rate was higher for female population (10.9%) as compared to male population (9.5%).
The gender differences seem to have existed in both rural and urban areas. The morbidity rate was
higher among other general castes as compared to rest may be because of higher health
counselling. The broad trend revealed by AHS and NSSO is similar.
Table 3. 6: Number per 1000 of Persons Reporting Ailment (during the last 15 days) for the 2004-05
in Uttar Pradesh
Rural Urban Combined
Group Male Female Person Male Female Person Male Female Person
ST 18 69 43 67 165 113 28 87 57
SC 92 101 96 92 94 93 92 100 96
OBC 89 101 95 84 106 94 88 102 95
Others 120 116 118 104 162 131 114 131 122
ALL 96 104 100 93 126 108 95 109 102

- 26 -
In the survey by NSSO the results have been provided according to the level of living
measured in terms of monthly per capita expenditure. The results on PAP by MPCE class are
presented in table as under:
Table 3.7: Number per 1000 of Persons Reporting Ailment during the last 15 days in
2004-05 According to MPCE Class in Uttar Pradesh
Rural Urban
MPCE Class Male Female Person MPCE Class Male Female Person
0-235 69 69 69 0-335 56 92 74
235-265 63 61 62 335-395 89 91 90
265-320 76 85 81 395-485 82 72 77
320-365 96 75 85 485-580 79 124 101
365-410 87 105 96 580-675 101 138 119
410-460 93 93 93 675-790 92 94 93
460-520 104 125 115 790-930 124 163 142
520-605 116 116 116 930-1100 106 118 112
605-730 102 127 114 1100-1380 68 152 104
730-980 106 132 118 1380-1880 123 166 143
980-1285 121 144 132 1880-2540 109 134 121
1285+ 147 181 163 2540+ 98 230 158
The results presented on morbidity according to monthly per capita consumption expenditure
indicate an increase in the morbidity with increase in level of living. This could be because of higher
health consciousness among relatively better off resulting into higher self reporting.
3.1.2 Health Seeking Behaviour (Based on AHS Data)
Persons who are ailing do not always get their ailments medically treated. Based on AHS data
Table below provides information on percentage of sick persons taking treatment i.e. health seeking
behaviour.
Table 3.8: Health/ Treatment Seeking Behaviour
Sex Taking treatment for
Acute Illness from Any
Source (%)
Percentage sought
Medical Care for Chronic
Illness
Getting Regular Treatment
(%)
Total Rural Urban Total Rural Urban Total Rural Urban
Person 97.8 97.7 98.4 90.8 90.5 92.1 50.1 47.4 62.1
Male 97.9 97.8 98.4 90.6 90.2 92.2 51.4 48.6 63.3
Female 97.8 97.6 98.4 90.9 90.7 92.0 49.1 46.4 61.0

- 27 -
Around 98% reported taking treatment for acute illness. The differences in percentage sought
treatment for acute illness showed no difference between rural and urban areas. Also, the health
seeking behaviour did not differ between the male and female population. As to the chronic
illnesses the percentage sought treatment was somewhat lower at 91%, as compared to 98% in
case of acute illnesses. However, slightly higher proportion in urban areas availed treatment for
chronic illnesses as compared to rural areas. As to the regularity of treatment, about 50% reported
as taking regular treatment for chronic illnesses. Higher proportion in urban areas (62%) reported
taking regular treatment as against 47% in rural areas. Importantly the gender differences in the
health seeking behaviour were not significant.
It is of interest to know as to what extent the services of Government facilities are being utilized by
the community. Following table provides the necessary details:
Table 3.9: Percentage Availing Treatment from Government Facilities (AHS Data)
Sex
Taking Treatment for Acute Illness
from Government Source
Getting Regular Treatment for Chronic
Illness from Government Source (%)
Total Rural Urban Total Rural Urban
Person 3.8 3.5 4.9 9.9 8.9 13.8
Male 3.8 3.6 4.7 11.0 10.1 14.8
Female 3.8 3.5 5.2 8.9 8.0 13.0
The proportion availing treatment from government sources/ facilities was just 3.8% for acute
illnesses and 9.9% for chronic illnesses. The proportion availing government services was
somewhat higher in urban areas as compared to rural areas both for chronic and acute illnesses.
Similar information on health seeking behaviour is available through NSSO for 2004-05. Based on
this data table below provides information on percentage of ailments treated.
Table 3.10: Percentage of Spells of Ailments Treated (Non-Institutional) During 15 Days and
Percentage Distribution of Treated Spells of Ailments by Source of Treatment - Uttar
Pradesh
Rural Urban
Year
Spells of
Ailments
Treated (%) Govt. Pvt.
Spells of
Ailments
Treated (%) Govt. Pvt.
2004-05 77 10 90 88 13 87
1995-96
8 92
9 91
1986-87
NA 100
14 86

- 28 -
The percentage of ailing persons in Uttar Pradesh who got their ailments treated was 77% in rural
and 88% in urban areas. Further, 10% in rural and 13% in urban utilized govt. facilities for their
treatment. For 3 years for which information is available through NSSO, the proportion availing
treatment from govt. sources is broadly similar in the urban and the rural areas.
3.1.3 Medical Expenditure (Based on NSSO Data)
Detailed data on medical expenditure is being collected in different rounds of NSSO devoted to
households consumption expenditure. The results presented below are based on NSSO survey for
the latest year 2009-10. Table below provides the broad details:
Table 3.11: Medical expenditure as % of total Expenditure-2009-10 Uttar Pradesh
Rural Urban
Value
(Rs.)
No. of Households
Reporting
consumption Per
1000 HHs
Value
(Rs.)
No. of Households
Reporting
consumption Per
1000 HHs
Institutional
Medicine 10.79 98 10.53 93
X-ray, Pathological, Tests etc. 1.05 58 1.57 60
Doctor's/Surgeon's Fee 1.61 56 2.39 64
Family Planning Appliances 2.2 56 2.88 62
Other Medical Expenses 1.46 43 1.42 44
Institutional Sub Total 17.11 103 18.79 98
Non Institutional
Medicine 43.86 799 48.25 776
X-ray, Pathological, Tests etc. 1.53 28 2.17 36
Doctor's/Surgeon's Fee 2.66 185 282 761
Family Planning Appliances 0.06 13 0.07 12
Other Medical Expenses 0.63 21 0.64 13
Non Institutional Sub Total 48.74 805 56.76 786
Total Inst. & non Inst. 65.85 75.55
Total MPCE 899.1 1000 1573.91 1000
Medical Expenditure as % of
Total Expenditure
7.3 4.8
During 2009-10, Institutional medical expenditure was reported by 10.3% in rural and 9.8% in urban
areas. The non-institutional medical expenditure was reported by 80.5% in rural and 78.6% in urban
areas. The average institutional medical expenditure per capita was Rs. 17.71 in rural areas and

- 29 -
18.79 in urban areas. Similarly average non institutional medical expenditure per capita was Rs.
48.74 in rural areas and 56.76 in urban areas. Taking institutional and non institutional expenditure
together this comes to Rs.65.85 in rural areas and Rs. 75.55 in urban areas. It is noted that the total
per capita expenditure per month available was Rs. 899 in rural and 1574 in urban areas. Thus the
medical expenditure as percentage of total expenditure is 7.3% in rural areas and 4.8% in urban
areas. Importantly Medical non institutional is by far the largest components of medical
expenditures accounting for about 75% of total medical expenditure in rural and urban areas.
Table 3.12: A Comparison of Medical Expenditure with Total MPCE for 2009-10 and 2004-05
Details of expenditure Rural Urban
2009-10 2004-05 2009-10 2004-05
Expenditure Medical Inst. 17.11 12.94 18.79 15.5
Expenditure Medical Non Inst. 48.74 35.37 56.76 38.81
Total Medical Expenditure 65.85 48.31 75.55 54.31
Total MPCE 899.1 532.63 1573.91 857.05
Medical Expenditure as % of total
Expenditure
7.3 9.07 4.8 6.34
It would appear that though the absolute expenditure on health increased between 2004-05 to
2009-08 in urban areas, in terms of percentage of total MPCE it declined overtime.
Table 3.13: Expenditure per person per month 2009-10 by Decile classes - Uttar Pradesh
Value (Rs.)
Decile
Class of
MPCE
Medical
Expenditure
(Inst)
Medical
Expenditure
(non-inst.)
Total Medial
Expenditure
Total MPCE Medical Expenditure
as % of
Total MPCE
Rural
1 2.61 11.22 13.83 446.28 3.1
2 3.59 19.12 22.71 553.37 4.1
3 3.53 20.08 23.61 626.94 3.77
Bottom 3 3.2 16.8 20.1 542.2 3.7
4 5.67 24 29.67 691.79 4.29
5 6.72 28.55 35.27 758.79 4.65
6 8.14 32.82 40.96 834.49 4.91
7 15.61 46.01 61.62 918.89 6.71
Middle 4 9.0 32.8 41.9 801.0 5.1
8 13.68 55.1 68.78 1037.06 6.63
9 28.48 83.44 111.92 1212.68 9.23

- 30 -
10 83.18 167.25 250.43 1911.35 13.1
Top 3 41.8 101.9 143.7 1387.0 9.7
All 17.11 48.74 65.85 899.1 7.32
Urban
1 2.01 15.19 17.2 512.68 3.35
2 2.25 20.33 22.58 660.71 3.42
3 6.92 24.14 31.06 786.08 3.95
Bottom 3 3.7 19.9 23.6 653.2 3.6
4 7.99 30.71 38.7 917.35 4.22
5 9.26 42.85 52.11 1055.5 4.94
6 21.58 47.22 68.8 1218.9 5.64
7 15.07 63.39 78.46 1432.86 5.48
Middle 4 13.5 46.0 59.5 1156.2 5.1
8 44.6 73.89 118.49 1758.64 6.74
9 35.72 110.57 146.29 2287.86 6.39
10 42.56 139.09 181.65 5104.23 3.56
Top 3 41.0 107.9 148.8 3050.2 5.6
All 18.79 56.76 75.55 1573.91 4.8
The results on medical expenditure by decile classes indicate that there is sharp increase with
increase in MPCE not only in the absolute medical expenditure but also in share to total
expenditure both in rural and urban areas. For bottom 3 deciles and the middle 4 deciles the total
medical expenditure proportion to total MPCE in rural and urban areas are broadly of the same
magnitude, However, for top 3 deciles the total medical expenditure proportion to total MPCE in
rural areas remains higher than that in urban areas.
With a view to analyze the total expenditure by source, following table provides the necessary
details.
Table 3.14: Average Medical Expenditure per Hospitalization Case and per Treated Person by
Type of Hospital Along with Loss of Household Income Due to Hospitalization in Uttar
Pradesh-2004-05
Per Hospitalization Per treated person
Expenditure Details Rural Urban Rural Urban
Medical Expenditure in Government 7648 5144 10 9
Medical Expenditure in Private 9169 10351 326 303
Medical Expenditure in All 8765 8907 336 312
Other Expenditure 652 342 27 22
Total Expenditure 9417 9250 363 334
Loss of Households income 920 536 152 117

- 31 -
The average medical expenditure for hospitalized treatment from a public sector hospital was much
lower than that from a private sector hospital in both rural and urban areas. The main reason being
that the government institutions render a large amount of free or highly subsidized services to the
people compared to the private institutions.
It is important to note that the average medical expenditure in all does not show any difference
between rural and urban areas. This is because rural population avails the treatment in urban cities
and towns from the similar facilities as by their urban counter parts.
3.2 Maternal Health
3.2.1. Antenatal
Care
The proportion of
Woman receiving 3
or more antenatal
checkups showed
onlylittle improvement
from 27 percent in
2005-06 (NFHS-3) to
30 percent in 2010-11
(AHS). There has been virtually no improvement in urban areas. During 2005-06, for urban poor
women receiving 3 or more ANC were more than half the level (20.7 percent) as compared to urban
non poor (53.2 percent).
Women receiving full antenatal checkup still remains low at 3.9percent (AHS, 2010-11). As to
specific components of ANC, the levels were much lower for urban poor as compared to urban non
poor. Further, excepting for 3 or more ANC and consumption of IFA for 90 days or more, for other
indicators there has been virtually no improvements for urban poor from NFHS-2 to NFHS-3.
3.2.2. Delivery Care
In the recent years (AHS,
2010-11), an institutional
delivery have increased with
rate and stands at 46 percent,
it being 58 percent in urban
and 43 percent in rural. Of the

- 32 -
54 percent home deliveries, about 40% of these were conducted by skilled health personal.
Importantly, 29% of the institutional deliveries were caesareans mainly conducted in private
institutions. The caesarean cases were higher (40 percent) in urban as compared to rural areas
(25%).The corresponding figures for 2005-06 (NFHS-3) were 21 percent only, 40 percent in urban
and 16 percent in rural. Here again, less than one-fifth of births among urban poor (16.7%) were
Institutional which was much less than the urban average (39.5%).
It is important to note that 65 percent of cases, the stay in the hospital after delivery were less than
24 hours (68 percent in rural and 54 percent in Urban).
3.2.3. Postnatal care
Around two-third of the mothers received post natal check-up within 48 hours of delivery (67
percent in rural and 75 percent in urban). It is observed that 32 percent of newborns were not
checked-up within 24 hours of birth in Uttar Pradesh.
3.2.4. Anemia among pregnant and lactating women
According to NFHS-3, about 50 percent of pregnant women had anemia. The percentage of severe
anemia was 2 percent while the percentage of Mild and Moderate was 35 and 13 respectively. In
case of lactating women, 58 percent of women had anemia.
The IFA consumption for 100 days or more during pregnancy in Uttar Pradesh continues to be low
at 6.5 percentage. Even in urban areas it was only 12 percentages.
3.3 Child Health
3.3.1. Birth Registration
About 47 percent of births were registered in Uttar Pradesh (AHS, 2010-11), it being 45 percent in
rural and 56 percent in urban. Based on this, 18 percent were reported to be having birth
certificates in Uttar Pradesh (14 percent in rural and 35 percent in urban).
3.3.2. Birth Weight
For more than quarter of the births in Uttar Pradesh, weight was taken. Based on this 28 percent
births were observed as low birth weight (less than 2.5 Kg). The proportion LBW was higher in rural
as compared to urban.

- 33 -
3.3.3. Vaccination of children
During the year 2010-11 (AHS), over 45 percent children (12-23 months) were fully immunized.
This indicates an improvement of 22 percentage points from 23 percent in 2005-06 (NFHS-3). The
data for NFHS-3 analyzed for urban poor and non-poor indicated that among urban poor, the
percentage of children
receiving complete
immunization was half
of the urban average.
Further, during 2005-06
only one-fourth of the
children of urban poor
received measles
vaccine which was 19
points lower than the urban average. Boys are somewhat more likely than girls to be fully
vaccinated (25% of boys compared with 21% of girls).
Importantly, though dropout rate from DPT1 to DPT3 was broadly similar for urban poor and non-
poor, the left out rate was twofold for urban poor as compared to urban non-poor.
3.3.4. Childhood Illness
Children under 5 years of age among urban poor reported high prevalence of Diarrhea in last two
week as compared to urban non poor and rural. Coupled with these children with diarrhea taken to
health facility were lower 61 percent among urban poor as compared to 67 percent for urban non
poor, but the same for rural was much lower at 52 percent level. Also, children with diarrhea
receiving ORS were equal for both the urban poor and urban non poor (16%). Children with fever in
last two weeks were higher magnitude for urban poor than for the urban non poor. Similarly for ARI,
the differences in rural urban as well as urban poor non poor were nominal.
3.3.5. Breastfeeding
Children breastfeed within one hour of birth showed marked improvement during 2005-06 to 2010-
11. The levels are less than half for urban poor (4.6%) as compared to non poor (11%) and also
less than the level of rural areas (7%).

- 34 -
3.3.6. Infant Feeding
As high as 59 percent of children age 6-9 months did not receive supplementary food among urban
poor, the corresponding figure for urban non poor was 47 percent and for rural 55 percent.
3.3.7. Children’s Nutritional Status
As to the nutritional status of children, 48.5 percent of the children among urban poor were
underweight as compared to 27 percent among urban non poor. But in terms of stunting the
difference is much higher, the level being 63.5 percent for urban poor and 42 percent for urban non
poor.
3.3.8. Anemia among children
Prevalence of anemia among children of the urban poor is much higher (78 percent) than urban non
poor (68 percent) and even rural Uttar Pradesh (75 percent). The differences were larger when
analyzed according to severity of anemia. Boys and girls are equally likely to have anemia.
3.4. Nutrition Intake
Following table provides information on nutrition intake per person per day and per consumer unit
according to MPCE Deciles Classes based on NSSO survey.
Table 3.15: Nutrition Intake per Day - Uttar Pradesh (2008-09)
Rural
MPCE
Deciles Class
Per Capita Intake Per consumer unit intake
Calorie Protein Fat Calorie Protein Fat
1 1595 46.3 21.1 2015 58.5 26.7
2 1749 50.7 24.2 2181 63.2 30.2
3 1873 54.1 27.9 2346 67.8 35
4 1945 56.3 30.4 2416 69.9 37.7
5 1967 56.7 32.9 2448 70.5 41
6 2095 61.1 37.6 2568 75 46.1
7 2081 60.9 39.1 2555 74.8 48
8 2248 65.6 43.3 2760 80.6 53.2
9 2355 68.5 46.9 2917 84.9 58.1
10 2729 79.8 62.8 3334 97.5 76.7
All 2064 60 36.6 2557 74.3 45.4

- 35 -
Urban
MPCE
Deciles Class
Per Capita Intake Per consumer unit intake
Calorie Protein Fat Calorie Protein Fat
1 1532 45.1 22.7 1881 55.4 27.9
2 1648 48.9 26.1 2011 59.7 31.8
3 1679 49.7 29.5 2068 61.2 36.3
4 1773 52.9 33.6 2161 64.4 41
5 1828 53.9 38.1 2233 65.8 46.5
6 1882 55.5 41.8 2302 67.8 51.1
7 1935 56.5 44.3 2353 68.7 53.8
8 2110 61.3 51.4 2566 74.5 62.4
9 2249 65.5 61 2732 79.6 74.1
10 2597 73 74.8 3098 87.1 89.2
All 1923 56.2 42.3 2343 68.5 51.5

- 36 -
There is a trend in the per capita nutrient take with increase in monthly per capita expenditure.
Indicating that the per capita nutrient intake is much less for poor as compared to non poor.
It is of interest to know how the intake levels compare with the corresponding RDA values. Towards
this, following tables provides the details on proportion of households consuming <70%, 70-80%,
80-90%, 90-100%, 100-110%, 110-120%, 120-150% and more than 150% of RDA, It is observed
that among those in the lower decile Classes significantly larger proportion consumes even less
than 70% of RDA. Further, those consuming more than 100% of RDA are mainly in the higher
decile classes. This indicates that nutritional status of poors is worse of as compared to their rich
counter parts.
Table- 3.16: Per 1000 distribution of households with calorie intake as percent of RDA
by MPCE Deciles Classes- Uttar Pradesh
Rural
Decile
Class of
MPCE
<70% 70-80% 80-90% 90-100% 100-110% 110-120% 120-
150%
>150% All
1 350 278 191 126 29 14 8 3 1000
2 187 252 230 184 83 42 21 1 1000
3 140 120 272 242 105 73 38 11 1000
4 89 168 230 234 149 75 50 5 1000
5 74 158 199 254 177 91 44 2 1000
6 71 84 195 228 158 101 147 17 1000
7 69 127 142 253 151 125 103 30 1000
8 29 65 131 217 189 152 165 52 1000
9 24 45 131 151 145 155 241 107 1000
10 26 35 68 106 119 118 292 236 1000
All 96 124 171 196 133 100 125 56 1000
Urban
1 487 209 135 129 21 0 18 0 1000
2 364 285 150 90 72 34 5 0 1000
3 348 164 258 120 45 51 10 4 1000
4 208 244 245 161 67 55 15 4 1000
5 159 275 211 129 75 55 80 16 1000
6 174 159 267 134 132 73 49 13 1000
7 104 208 219 166 182 62 45 13 1000
8 32 90 297 163 170 102 137 9 1000
9 29 56 161 212 174 144 147 76 1000
10 3 12 242 101 123 123 251 145 1000
All 155 148 223 141 115 80 97 41 1000

- 37 -
3.5 Family Planning
Total Fertility Rate has been on the decline in Uttar Pradesh from 4.4 in 2003 to 3.4 in 2011. This
decline however is not reflective of the high fertility rates among urban poor which stood at 4.25 in
2005-06 as NFHS 3. As stated earlier, the use of contraception among urban poor couples is very
low at just 24.4 per cent. That family planning crucial for the health of women and children is widely
accepted. Maternal and child health initiatives will therefore have to go hand in hand with efforts to
inform and motivate couples to adopt a modern method of contraception, preferably a long-acting
method if they have attained the desired family size.
NUHM in the state will take a two-pronged approach to take family planning services closer to
people who have poor access. It will take the help of frontline health workers or ASHA to counsel
and motivate couples to maintain the desired 3-year-gap between two births. This process must
ideally start right from the time of registration of pregnancy so that by the time of delivery the couple
has already made up their mind about a long-acting method of contraception.
At the same time health facilities will be strengthened and doctors trained in post-delivery family
planning procedures to make the services more easily accessible.
3.6 Health care Delivery System
To meet the challenges in reaching health services to the urban poor NUHM will try to capitalise on
the various resources available in the cities and towns. There is a vast pool of hospitals and clinics,
including medical colleges and their hospitals. Then there is the pool of service providers available
in cities and towns from traditional systems of medicine like Ayurveda, Homeopathy, Unani, among
others; these can be roped in to improve the health service delivery mechanism in urban areas. The
- 38 -
private sector too will be engaged with to reach quality clinical services at subsidised rates to the
slum residents. The cities and towns also have the advantage of various training institutes. These
can also be put to good use to build the capacity of staff at various levels – from ASHAs to ANMs to
doctors.
The existing government health system currently comprises of Urban Health Posts, Urban family
Welfare Centers, District Women Hospitals, District Hospitals, combined Hospitals, Bal Mahila
Chikitsalaya and Prasuti Grehs. The numbers of each vary by city and these facilities function at
varying levels of effectiveness due to lack of committed investment of resources, particularly in
terms of human resource. Urban Local Bodies also run some primary care centers and hospitals
their ability to manage health services varies by cities.
Further there are many Health facilities run by ESI, Railways and armed forces that provide health
care to specific populations.
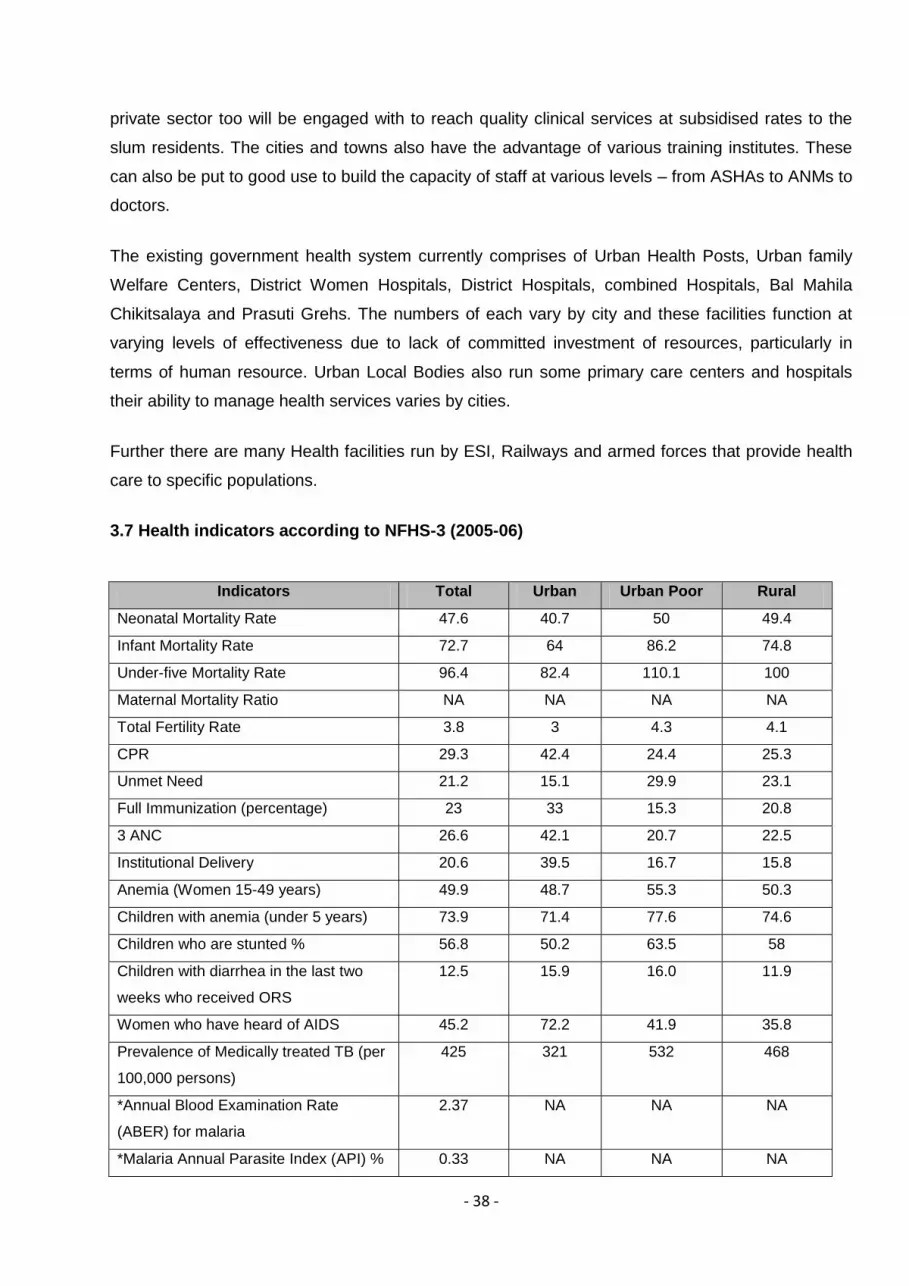
3.7 Health indicators according to NFHS-3 (2005-06)
Indicators Total Urban Urban Poor Rural
Neonatal Mortality Rate 47.6 40.7 50 49.4
Infant Mortality Rate 72.7 64 86.2 74.8
Under-five Mortality Rate 96.4 82.4 110.1 100
Maternal Mortality Ratio NA NA NA NA
Total Fertility Rate 3.8 3 4.3 4.1
CPR 29.3 42.4 24.4 25.3
Unmet Need 21.2 15.1 29.9 23.1
Full Immunization (percentage) 23 33 15.3 20.8
3 ANC 26.6 42.1 20.7 22.5
Institutional Delivery 20.6 39.5 16.7 15.8
Anemia (Women 15-49 years) 49.9 48.7 55.3 50.3
Children with anemia (under 5 years) 73.9 71.4 77.6 74.6
Children who are stunted % 56.8 50.2 63.5 58
Children with diarrhea in the last two
weeks who received ORS
12.5 15.9 16.0 11.9
Women who have heard of AIDS 45.2 72.2 41.9 35.8
Prevalence of Medically treated TB (per
100,000 persons)
425 321 532 468
*Annual Blood Examination Rate
(ABER) for malaria
2.37 NA NA NA
*Malaria Annual Parasite Index (API) % 0.33 NA NA NA

- 39 -
*Dengue Case Fatality Rate 3.22 NA NA NA
*Annual New Smear Positive case
detection rate Per lakh population
68 NA NA NA
Treatment success rate among new
smear positive cases
NA NA NA NA
Leprosy Prevalence Rate NA NA NA NA
No. of outbreaks reported under IDSP in
past year
NA NA NA NA
*Source PIP 2012-13, Reference period 2011
4. Details of cities/towns to be covered under NUHM as per census
2011
The following is the list of town and cities that will be covered under NUHM. These include the state
capital, District Headquarters and all towns more than 50,000 population as per the NUHM
guidelines. Total of 131 cities/towns will be covered in the 75 districts in Uttar Pradesh as per
census 2011.
For planning, data has been obtained from the following sources:
1. Census of India, 2011
2. Annual Health Survey; 2010-11 and 2011-12
3. Sample Registration System, 2011
4. NSSO
5. National Family Health Survey-3 (NFHS-3) 2005-06
6. District Level Household Survey-3, (DLHS-3) 2007-08
7. Web based Health Management Information System of Government of Uttar Pradesh
The best available estimates of number of slums and slum populations have been used for
NUHM planning. These include GIS mapping done the Government of Uttar Pradesh in
2009-10 in 14 cities, mapping done by DUDA for slum development programs such as
JnNURM, Rajiv Awas Yojana, ISDP and IDSMT. The population data of the cities has been
sourced from Census 2011 and the slum population data has been provided by the
respective city teams who in-turn have sourced it from city based offices of DUDA or from
the respective city National Polio Surveillance Project. It is expected that when slum
mapping and house listing activities are undertaken once the NUHM activities are initiated,
accurate data on number of slums and slum populations will be available.

- 40 -
Table 4.1 - Cities/Towns to be covered under NUHM as per 2011 census
Sl. No
District Sl. No.
Name Type of City
/town
Total Urban
Population (census
2011)
Urban Slum population
Implementing
authority
Whether covered under
JnNURM, BSUP, IDSMT
1 Agra 1 Agra (M Corp.) DHQ 1,585,704 1,250,000 DHS JnNURM, RAY
2 Aligarh 2 Aligarh (M Corp.) DHQ 874,408 780,000 DHS RAY
3 Atrauli (NPP) 50,412 50,400 DHS
3 Allahabad 4 Allahabad (M Corp. + OG)
DHQ 1,168,385 680,000 DHS JnNURM, RAY
4 Bareilly 5 Bareilly (M Corp. + OG)
DHQ 904,797 338,005 DHS RAY
6 Faridpur (NPP) Other 78,249 18,360 DHS
7 Baheri (NPP) Other 68,413 68,410 DHS
8 Aonla (NPP) Other 55,629 26,235 DHS
5 Bijnor 9 Nagina (NPP) Other 95,246 26,935 DHS
10 Bijnor (NPP) DHQ 93,297 34,480 DHS UIDSSMT
11 Najibabad (NPP) Other 88,535 15,835 DHS
12 Chandpur (NPP) Other 83,441 14,400 DHS
13 Sherkot (NPP) Other 62,226 11,130 DHS
14 Kiratpur (NPP + OG)
Other 61,946 14,500 DHS
15 Seohara (NPP + OG)
Other 53,296 14,840 DHS
16 Dhampur (NPP) Other 50,997 9,590 DHS
6 Budaun 17 Budaun (NPP) DHQ 159,285 106,000 DHS UIDSSMT
18 Sahaswan (NPP) Other 66,204 22,000 DHS
19 Ujhani (NPP) Other 62,039 16,560 DHS
7 Bulandshahar 20 Bulandshahr (NPP + OG)
DHQ 230,024 113,000 DHS
21 Khurja (NPP + OG)
Other 121,207 98,000 DHS UIDSSMT
22 Sikandrabad (NPP)
Other 81,028 45,150 DHS
23 Jahangirabad (NPP)
Other 59,858 27,800 DHS
24 Gulaothi (NPP) Other 50,823 26,600 DHS
8 Etawah 25 Etawah (NPP) DHQ 256,838 49,040 DHS RAY UIDSSMT
9 Farrukhabad 26 Farrukhabad-cum-Fatehgarh (NPP)
DHQ 276,581 190,000 DHS

- 41 -
10 Firozabad 27 Firozabad (NPP) DHQ 604,214 387,000 DHS RAY UIDSSMT
28 Shikohabad (NPP) Other 107,404 24,425 DHS
29 Tundla (NPP) Other 50,423 25,000 DHS
11 GB Nagar 30 Noida (CT) DHQ 637,272 554,000* DHS
31 Greater Noida (CT)
Other 102,054 253,000* DHS
32 Dadri (NPP) Other 91,189 144,000* DHS
12 Ghaziabad 33 Ghaziabad (M Corp.)
DHQ 1,648,643 403,045 DHS RAY UIDSSMT
34 Loni (NPP) Other 516,082 106,155 DHS UIDSSMT
35 Khora (CT) Other 190,005 30,000 DHS
36 Modinagar (NPP) Other 130,325 21,500 DHS UIDSSMT
37 Muradnagar (NPP) Other 95,208 5,000 DHS
13 Gorakhpur 38 Gorakhpur (M Corp.)
DHQ 673,446 450,000 DHS RAY UIDSSMT
14 Hapur 39 Hapur (NPP) DHQ 262,983 100,000 DHS
40 Pilkhuwa (NPP) Other 83,736 45,000 DHS
15 Hardoi 41 Hardoi (NPP + OG)
DHQ 197,029 53,000 DHS
42 Shahabad (NPP) Other 80,226 7,500 DHS
43 Sandila (NPP) Other 58,346 9,000 DHS UIDSSMT
16 Jalaun 44 Orai (NPP + OG) DHQ 190,575 53,000 DHS
45 Jalaun (NPP) Other 56,909 7,500 DHS
46 Konch (NPP) Other 53,412 10,000 DHS
47 Kalpi (NPP) Other 51,670 7,500 DHS
17 Jhansi 48 Jhansi (M Corp.) DHQ 505,693 211,550 DHS RAY UIDSSMT
49 Mauranipur (NPP + OG)
Other 61,449 32,000 DHS
18 JP Nagar 50 Amroha (NPP) DHQ 198,471 62,500 DHS
51 Hasanpur (NPP) Other 61,243 37,500 DHS
52 Gajraula (NP) Other 55,048 31,500 DHS
19 Kannauj 53 Kannauj (NPP) DHQ 84,862 15,300 DHS RAY UIDSSMT
54 Chhibramau (NPP)
Other 60,986 13,000 DHS
20 Kanpur Nagar 55 Kanpur (M Corp. + OG)
DHQ 2,768,057 637,000 DHS JnNURM
,RAY
21 Kheri 56 Lakhimpur (NPP) DHQ 151,993 12,500 DHS UIDSSMT
57 Gola Gokaran Nath (NPP)
Other 60,172 1,500 DHS
22 Lucknow 58 Lucknow (M Corp.)
DHQ 2,817,105 1,097,710 DHS JnNURM, RAY

- 42 -
23 Mathura 59 Mathura (NPP) DHQ 349,909 282,285 DHS JnNURM, RAY
60 Vrindavan (NPP) Other 63,005 63,000 DHS UIDSSMT
61 Kosi Kalan (NPP + OG)
Other 60,074 10,625 DHS
24 Mau 62 Maunath Bhanjan (NPP)
DHQ 278,745 64,330 DHS UIDSSMT
25 Meerut 63 Meerut (M Corp.) DHQ 1,305,429 1,150,000 DHS JnNURM, RAY
64 Mawana (NPP) Other 81,443 9,000 DHS
65 Sardhana (NPP) Other 58,252 16,000 DHS
26 Moradabad 66 Moradabad (M Corp.)
DHQ 887,871 432,500 DHS RAY UIDSSMT
27 Muzaffarnagar 67 Muzaffarnagar (NPP)
DHQ 392,768 115,000 DHS RAY UIDSSMT
68 Khatauli (NPP) Other 72,949 20,000 DHS
69 Budhana (NP + OG)
Other 53,722 10,500 DHS
28 Rae Bareli 70 Rae Bareli (NPP) DHQ 191,316 60,000 DHS RAY UIDSSMT
29 Rampur 71 Rampur (NPP) Other 325,313 125,000 DHS RAY UIDSSMT
30 Saharanpur 72 Saharanpur (M Corp.)
DHQ 705,478 302,500 DHS RAY
73 Deoband (NPP) Other 97,037 33,000 DHS
74 Gangoh (NPP) Other 59,279 21,000 DHS
31 Shahjahanpur 75 Shahjahanpur (NPP)
DHQ 329,736 218,460 DHS RAY UIDSSMT
76 Tilhar (NPP) Other 61,444 41,100 DHS
32 Sitapur 77 Sitapur (NPP) DHQ 177,234 33,450 DHS
78 Laharpur (NPP) Other 61,990 3,820 DHS UIDSSMT
79 Biswan (NPP) Other 55,780 32,250 DHS
80 Mahmudabad (NPP)
Other 50,777 11,955 DHS
33 Unnao 81 Unnao (NPP) DHQ 177,658 43,500 DHS UIDSSMT
82 Gangaghat (NPP) Other 84,072 33,500 DHS
34 Varanasi 83 Varanasi (M Corp.)
DHQ 1,198,491 569,740 DHS JnNURM
35 Ambedkarnagar 84 Ambedkarnagar (Mcorp+OG)
DHQ 111,447 15,000 DHS
85 Tanda Other 95,516 50,000 DHS
36 Amethi 86 Amethi(NP) DHQ 13,849 7,000 DHS
37 Auraiya 87 Auraiya (NPP) DHQ 87,736 - DHS
38 Azamgarh 88 Azamgarh (NPP) DHQ 110,983 46,000 DHS UIDSSMT
89 Azam Mubarakpur Other 70,463 32,000 DHS
39 Baghpat 90 Baghpat (NPP) DHQ 50,310 87,000 DHS UIDSSMT

- 43 -
91 Baghpat Baraut (NPP)
Other 103,764 68,000 DHS
40 Bahraich 92 Bahraich (NPP) DHQ 186,223 75,000 DHS
41 Ballia 93 Ballia (NPP) DHQ 104,424 67,000 DHS UIDSSMT
42 Balrampur 94 Balrampur (NPP + OG)
DHQ 82,488 36,000 DHS UIDSSMT
43 Banda 95 Banda (NPP + OG)
DHQ 160,473 12,000 DHS
44 Barabanki 96 Nawabganj (NPP + OG)
DHQ 81,486 7,500 DHS UIDSSMT
45 Basti 97 Basti (NPP) DHQ 114,657 54,500 DHS UIDSSMT
46 Chandauli 98 Mughalsarai (NPP)
DHQ 109,650 23,000 DHS
47 Chitrakoot 99 Chitrakoot Dham (Karwi) (NPP)
DHQ 57,402 11,000 DHS
48 Deoria 100 Deoria (NPP) DHQ 129,479 61,000 DHS UIDSSMT
49 Etah 101 Etah (NPP) DHQ 118,517 35,000 DHS UIDSSMT
50 Faizabad 102 Faizabad (NPP) DHQ 165,228 40,000 DHS UIDSSMT
103 Ayodhya (NPP) Other 55,890 26,500 DHS
51 Fatehpur 104 Fatehpur (NPP) DHQ 193,193 63,000 DHS UIDSSMT
52 Ghazipur 105 Ghazipur (NPP + OG)
DHQ 121,020 60,000 DHS UIDSSMT
53 Gonda 106 Gonda (NPP) DHQ 114,046 9,000 DHS UIDSSMT
54 Hamirpur 107 Rath (NPP) DHQ 100,514 23,000 DHS
55 Hathras 108 Hathras (NPP + OG)
DHQ 143,020 61,000 DHS
56 Jaunpur 109 Jaunpur (NPP) DHQ 180,362 15,000 DHS UIDSSMT
57 Kanpur Dehat 110 Akbarpur (NP) DHQ 20,445 10,000 DHS
58 kasganj 111 Kasganj (NPP) DHQ 101,277 32,000 DHS
59 Kaushambi 112 Manjhanpur (NP) DHQ 16,457 2,025 DHS
60 Kushinagar 113 Padrauna (NPP) DHQ 49,723 25,000 DHS
61 Lalitpur 114 Lalitpur (NPP) DHQ 133,305 50,000 DHS
62 Maharajganj 115 Maharajganj (NPP)
DHQ 33,930 26,500 DHS
63 Mahoba 116 Mahoba (NPP) DHQ 95,216 37,000 DHS
64 Mainpuri 117 Mainpuri (NPP + OG)
DHQ 136,557 84,000 DHS UIDSSMT
65 Mirzapur 118 Mirzapur-cum-Vindhyachal (NPP)
DHQ 234,871 58,000 DHS UIDSSMT
66 Pilibhit 119 Pilibhit (NPP) DHQ 127,988 61,000 DHS
120 Bisalpur (NPP) Other 73,551 3,400 DHS
67 Pratapgarh 121 Bela Pratapgarh (NPP)
DHQ 76,133 8,010 DHS
68 Sambhal 122 Sambhal (NPP) DHQ 220,813 37,000 DHS UIDSSMT
123 Chandausi (NPP) Other 114,383 39,000 DHS

- 44 -
69 Sant Kabir Nagar
124 Khalilabad (NPP) DHQ 47,847 6,100 DHS
70 Bhadohi (NPP) 125 Bhadohi (NPP) DHQ 94,620 36,000 DHS
71 Shamli 126 Shamli (NPP) DHQ 107,266 43,000 DHS
127 Kairana (NPP) Other 89,000 10,000 DHS
72 Shrawasti 128 Bhinga (NP) DHQ 23,780 4,950 DHS
73 Sidharthnagar 129 Siddharthnagar (NPP)
DHQ 25,422 25,000 DHS UIDSSMT
74 Sonabhadra 130 Sonbhadra (NPP) DHQ 36,689 32,000 DHS
75 Sultanpur 131 Sultanpur (NPP) DHQ 107,640 76,533 DHS
Total 31,453,923 14,288,488
In case of city & towns falling under GB Nagar (indicated by *), slum population is forming a major
proportion of the total urban population due to unprecedented out growth areas and conversion of
rural areas into unplanned urban clusters which are barely covered by any health care facilities.
Hence costs have been budgeted to reach these populations by outreach services.
The Cantonment Board areas in the districts of Agra, Bareilly, Kanpur, Lucknow and Meerut are not
planned for inclusion under NUHM activities or resources as the population here is already
receiving health services from the Army Hospitals and there is negligible slum population in these
areas. Any vulnerable population in the Cantonment areas will be covered with outreach camps or
under activities from the nearest town as the need may be.
In 2013-14 all districts will be covered under NUHM with all activities like setting up administrative
and programme management systems. Activities such as GIS mapping and listing of slums and
facilities will also be taken up. Orientation of Urban Local Bodies on Urban Health, the role of
different government departments and urban stakeholders in improving urban health and provision
under NUHM will be done. Establishment of U-PHC and CHC will be taken up.
For preparing this state plan for NUHM, existing data has been obtained from various sources but
more city specific data will emerge once the mapping and listing activities and the base line surveys
are carried out.
Districts Heath Society will be the implementing authority for NUHM under the leadership of the
District Magistrate. District Program Management Units have been further strengthened to provide
appropriate managerial and operational support for the implementation of the NUHM programme at
the district level.

- 45 -
Urban Health Initiative (UHI), a Bill and Melinda Gates Foundation funded project is being
implemented by FHI360 in 11 cities in Uttar Pradesh. UHI has teams in 11 cities and will support in
implementation and monitoring of NUHM activities in the said cities.
Micronutrient Initiative (MI), is providing technical assistance on micronutrient programmes in three
urban districts (Agra, Meerut and Kanpur).Besides this, MI is also supporting micronutrient activities
(VAS programme, Diarrhoea management programme and IFA supplementation programme) in 27
districts intensively through divisional coordinators and technical support at state level.
HUP has presence in the EAG states and is providing technical assistance on issues of urban
health to 8 states and the Ministry of Health &Family Welfare. The ministry has acknowledged the
support of both HUP and NHRC in developing the guidelines for NUHM PIP.
The NUHM (Uttar Pradesh) mandates HUP to be its technical agency to Urban Health Cell for
providing the technical assistance for effective implementation of NUHM, expand partnerships in
Urban Health which would include engaging the commercial sector in Public Private Partnership
(PPP) activities and promote Convergence of different Government urban health and development
efforts. HUP shall coordinate and facilitate in the city health plans of the two cities of Lucknow and
Kanpur.
State’s Allocation under Urban RCH Component under NRHM-RCH Flexible Pool
The table below captures the amounts approved urban RCH component of the RCH Flexible Pool
of NRHM. In 2012-13, a total of 131 urban health posts were approved for funding by GOI. An
additional 100 health posts were approved in the Supplementary PIP for the year 20112-13. In the
FY 2013-14 funding for continuing these health posts was approved till September 2013 (for six
months).
Table 4: State’s Allocation under Urban RCH Component under NRHM-RCH Flexible Pool:
FMR
Code
Activity Amount Approved
in 2012-13
(amount in Lacs)
Amount Approved in
2013-14 (for 6 month)
(amount in Lacs)
A.5 URBAN RCH (focus on Urban
slums)
2712.8 1210.67
A.5.1 Identification of urban areas / mapping
of urban slums and planning
0
A.5.2 HR for urban health including doctors,
ANMs, Lab techs
0 933.47

- 46 -
A.5.2.1 Doctors/MOs 878.76 498.96
A.5.2.2 Specialist 120.64 0
A.5.2.3 Dentists 0 0
A.5.2.4 ANM 263.63 137.21
A.5.2.5 Staff Nurse 439.38 228.69
A.5.2.6 LHV 0 0
A.5.2.7 LT 0 0
A.5.2.8 Pharmacists 0 0
A.5.2.9 Radiographers 0 0
A.5.2.10 OT Technician 0 0
A.5.2.11 Support staff 113.76 68.61
A.5.2.12 Others (pl specify) 6.79
A.5.3 Operating expenses for UHP and UHC 404.86 277.2
A.5.4 Outreach activities 0 0
A.5.5 Others (pl specify) 165 0
A.5.5.1 Infrastructure support for Urban areas 0 0
Drugs and consumables 320 0
Table 6: State’s Allocation under Infrastructure Maintenance (Treasury Route) head of NRHM
FMR
Code
Activity Amount Approved in
2012-13 (Rs in Lacs)
Amount Approved in
2013-14 (Rs in Lacs)
Infrastructure Maintenance
1 Urban Family Welfare Centers
(UFWCs) and Urban Revamping
Scheme (Health Posts)
1217.79 3737.25
5. Key Issues for improving health care
The Eleventh Plan had suggested Governance reforms in public health system, such as
Performance linked incentives and Devolution of powers and functions to local health care
institutions and making them responsible for the health of the people living in a defined
geographical area. NRHM’s strategy of decentralization, PRI involvement, integration of vertical
programmes, inter-sectoral convergence and Health Systems Strengthening has been partially
achieved. Despite efforts, lack of capacity and inadequate flexibility in programmes forestall
effective local level Planning and execution based on local disease priorities.

- 47 -
In order to ensure that plans and pronouncements do not remain on paper, NUHM UP would strive
for system of accountability that shall be built at all levels, reporting on service delivery and system,
district health societies reporting to state, facility managers reporting on health outcomes of those
seeking care, and territorial health managers reporting on health outcomes in their area.
Accountability shall be matched with authority and delegation; the NUHM shall frame model
accountability guidelines, which will suggest a framework for accountability to the local community,
requirement for documentation of unit cost of care, transparency in operations and sharing of
information with all stakeholders. The state will incorporate the core principles of The National
Health Mission of Universal Coverage, Achieving Quality Standards, Continuum of Care and
Decentralized Planning.
Following would be the issues for the cities to address: City Health Planning, Public Private
Partnership, Convergence, Capacity Building, Migration, Communitization, Strengthen Data,
Monitoring and Supervision, Health Insurance, Information Dissemination and Focus on NCDs/ Life-
Style Diseases.
The key overarching strategies under NUHM for 2013-14 include data based planning,
strengthening of management and monitoring systems at the state and district level, improving the
primary health care delivery system and community outreach through ASHAs, MAS and Urban
Health and Nutrition Days(UHNDs).
The key activities at the state level will include planning, convergence with key urban stakeholders
like Urban Development, SUDA, Women and Child Development, Basic Education, guidelines
formulation, mapping and listing of slums and facilities, baseline survey at the community and
facility level, monitoring for implementation as per plans and data review for process and outcome
indicators.
The key activities at the district level will include convergence with key urban stakeholders,
sensitization of ULBs on their role in urban health, strengthening UPHCs for provision of primary
health care to urban poor, community outreach through selection, training and support to ASHAs
and MAS, conducting UHNDs and outreach camps to get services closer to the community and
reach complete coverage of slum and vulnerable populations.

- 48 -
6. Planning Activities
Prioritization of cities
All the 131 cities/ towns are being proposed under this plan, which qualify as per the NUHM
guidelines. This plan covers a total urban population of 3,14,53,923 (census 2011 ) and total slum
population of 1,42,88,488 (compiled from District plans) from the 131 cities/ towns .
Mapping and Listing of Slums and Health Facilities
GIS mapping and listing of slums was completed in 2009 in 14 cities (Agra, Aligarh, Allahabad,
Hapur, Bareilly, Farrukhabad, Ghaziabad, Kanpur, Jhansi, Lucknow, Meerut, Saharanpur,
Shahjahanpur, Varanasi) based on guidance from Government of India and with funding under
NRHM. The GIS maps were prepared by Remote Sensing Applications Centre, Uttar Pradesh. This
gave us fairly accurate lists and maps of slums in the 14 cities. GIS mapping of 38 cities have
been initiated under Urban Development schemes like UIDSSMT and UI&G. 11 cities, out of
14 which have been mapped through GIS under NRHM are common, thus GIS mapping of 41
cities are initiated or completed in the state.
Sl. No.
District Name of Town Total Population
GIS Mapping to be done under UD Schemes
GIS Mapping undertaken
under NRHM
1 Agra Agra (M Corp.) 15,85,704 Yes yes
2 Aligarh Aligarh (M Corp.) 8,74,408 Yes yes
3 Allahabad Allahabad (M Corp. + OG) 11,68,385 Yes yes
4 Ballia Ballia (NPP) 1,04,424 Yes
5 Balrampur Balrampur (NPP + OG) 82,488 Yes
6 Bareilly Bareilly (M Corp. + OG) 9,04,797 Yes
7 Basti Basti (NPP) 1,14,657 Yes
8 Bijnor Bijnor (NPP) 93,297 Yes
9 Bulandshahar Khurja (NPP + OG) 1,21,207 Yes
10 Deoria Deoria (NPP) 1,29,479 Yes
11 Etawah Etawah (NPP) 2,56,838 Yes
12 Faizabad Faizabad (NPP) 1,65,228 Yes
13 Farrukhabad Farrukhabad-cum-Fatehgarh (NPP)
2,76,581 yes
14 Fatehpur Fatehpur (NPP) 1,93,193 Yes
15 Firozabad Firozabad (NPP) 6,04,214 Yes
16 Ghaziabad Ghaziabad (M Corp.) 16,48,643 Yes yes
17 Ghaziabad Loni (NPP) 5,16,082 Yes
18 Ghaziabad Modinagar (NPP) 1,30,325 Yes
19 Ghazipur Ghazipur (NPP + OG) 1,21,020 Yes
20 Gonda Gonda (NPP) 1,14,046 Yes
21 Gorakhpur Gorakhpur (M Corp.) 6,73,446 Yes
22 Hapur Hapur (NPP) 2,62,983 Yes
23 Jaunpur Jaunpur (NPP) 1,80,362 Yes
24 Jhansi Jhansi (M Corp.) 5,05,693 Yes yes
25 Kannauj Kannauj (NPP) 84,862 Yes
26 Kanpur Nagar Kanpur (M Corp. + OG) 27,68,057 Yes yes

- 49 -
27 Kheri Lakhimpur (NPP) 1,51,993 Yes
28 Lucknow Lucknow (M Corp.) 28,17,105 Yes yes
29 Mathura Mathura (NPP) 3,49,909 Yes
30 Mathura Vrindavan (NPP) 63,005 Yes
31 Mau Maunath Bhanjan (NPP) 2,78,745 Yes
32 Meerut Meerut (M Corp.) 13,05,429 Yes yes
33 Moradabad Moradabad (M Corp.) 8,87,871 Yes
34 Muzaffarnagar Muzaffarnagar (NPP) 3,92,768 Yes
35 Saharanpur Saharanpur (M Corp.) 7,05,478 Yes yes
36 Sambhal Sambhal (NPP) 2,20,813 Yes
37 Shahjahanpur Shahjahanpur (NPP) 3,29,736 Yes yes
38 Sidharthnagar Siddharthnagar (NPP) 25,422 Yes
39 Sitapur Laharpur (NPP) 61,990 Yes
40 Unnao Unnao (NPP) 1,77,658 Yes
41 Varanasi Varanasi (M Corp.) 11,98,491 Yes yes
Total 3,14,18,465 38 14
GIS mapping will be taken up for the remaining 90 cities and towns. Budget is therefore being
proposed for GIS mapping of only 90 cities and towns as per the prescribed norms.
Listing and Mapping of Households in slums and Key Focus Areas
Listing and mapping of households will provide accurate numbers for population their family size
and composition residing in slums. Currently, estimates of population residing in slums are available
from District Urban Development Agency (DUDA) and National Polio Surveillance Project as the
immunization micro plans (under NPSP) provide updated estimates of slum and vulnerable
populations and are expected to be fairly complete. The current plan for covering slums is based on
the currently available data of urban population of each city.
Once the ASHA are deployed they will list all households and fill the Slum Health Index Registers
(SHIR) including the number and details of family members in each household. This data will be
compiled for each city and will provide the population composition of slums and key focus areas.
This will also help the urban ASHA know her community better and build a rapport with the families
that will go a long way in helping her advocate for better health behaviours and link communities to
health facilities under the NUHM. It is expected that once the household mapping is completed in
cities, the number of ASHAs will be reviewed and adjusted upwards or downwards and the
geographical boundaries of the coverage area for each ASHA would be realigned. This is due to the
reason that the actual population may be higher or lower than the original estimate used for
planning.
Facility Survey for gaps in infrastructure, HR, equipment, drugs and consumables
Facility survey will be carried out in the public facilities to assess the gaps in infrastructure, human
resource, equipment, drugs and consumables availability as against expected patient load. Further
planning, particularly for UCHCs, will be based on these gaps. This work will be outsourced to a

- 50 -
research agency. Development Partners like Urban Health Initiative and Health of the Urban Poor
projects will technically support this effort.
Baseline Survey
The state envisions monitoring progress in health indicators in urban areas and among urban poor
over the period of implementation of NUHM. This proposed Baseline survey will generate data on
the health and related indicators which will be reviewed during the course of implementation of the
program to assess the impact of implementation and necessary course corrections can accordingly
be made and use of resources can be optimised. It is envisaged that this exercise will be carried out
in all the 131 cities and shall be outsourced to a suitable research agency which will carry out the
survey within the given time frame.
7. Programme Management Arrangements
State level
The Government of Uttar Pradesh has passed necessary resolutions for planning and
implementation of the NUHM in the state. Accordingly, setting up of a State Program Management
Unit for NUHM has been planned and approved. Pertinent points of resolution are -
1. The Government of Uttar Pradesh has passed a Resolution to include Ministries and
Departments of Minority Affairs and Education as members of the existing State Health Society,
State Health Mission, Governing Body and the Executive Committee.
2. State Programme Management Unit (SPMU) under the overall guidance of Mission Director
NHM will be responsible for taking important decisions.
3. NUHM will be implemented by existing District Health Society with additional Stakeholders
members such as DUDA.
4. NRHM & NUHM would be the two components of the National Health Mission (NHM). Mission
Director, National Rural Health Mission would be Mission Director, National Health Mission,
comprising both the sub-missions NRHM and NUHM.
5. Urban Health Cell is already in place and functional at the SPMU and at the Directorate Health
& Family Welfare. These Cells will be further strengthened once the State PIP is approved. The
following comprehensive structure is being proposed for State Urban Health Cell under NUHM:
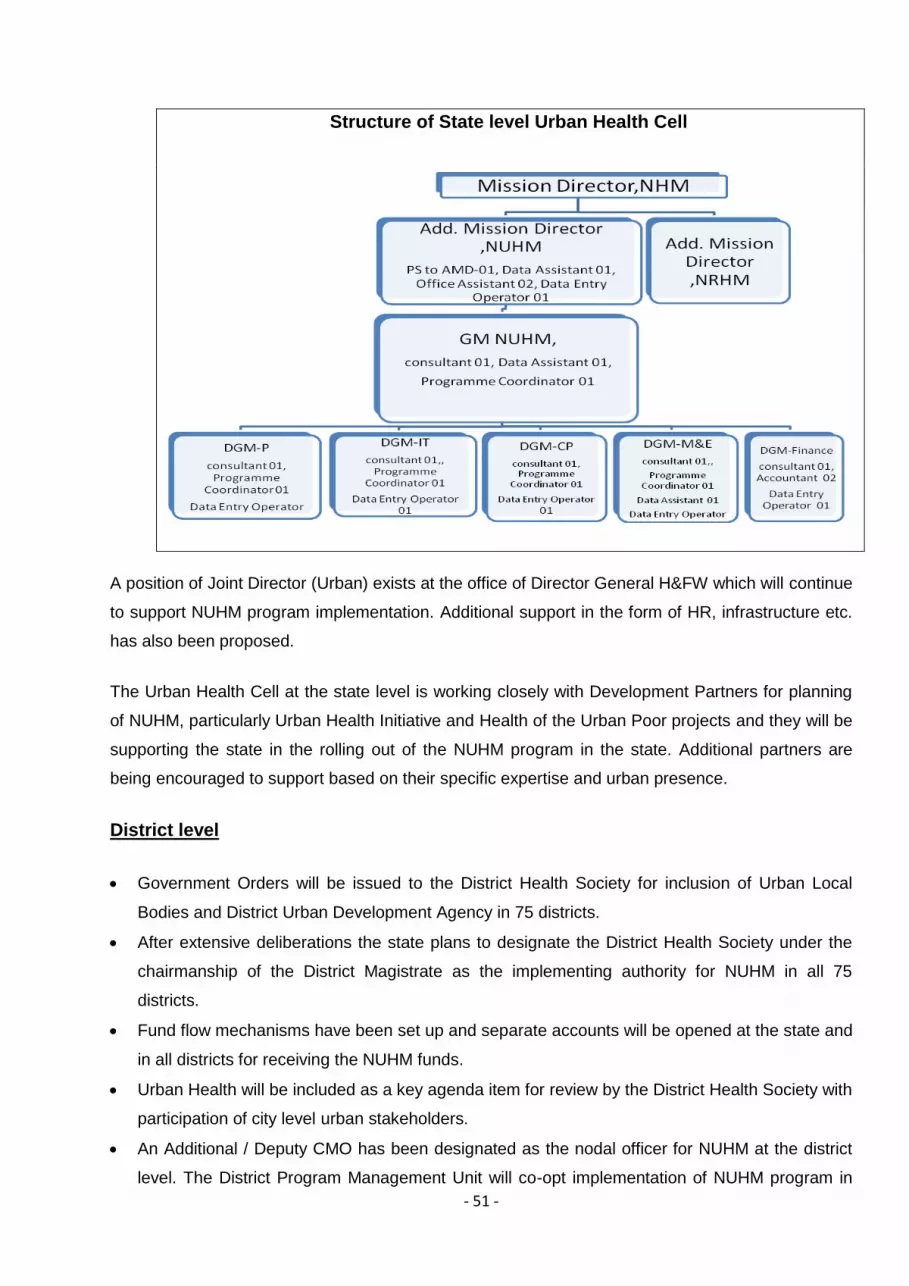
- 51 -
Structure of State level Urban Health Cell
A position of Joint Director (Urban) exists at the office of Director General H&FW which will continue
to support NUHM program implementation. Additional support in the form of HR, infrastructure etc.
has also been proposed.
The Urban Health Cell at the state level is working closely with Development Partners for planning
of NUHM, particularly Urban Health Initiative and Health of the Urban Poor projects and they will be
supporting the state in the rolling out of the NUHM program in the state. Additional partners are
being encouraged to support based on their specific expertise and urban presence.
District level
Government Orders will be issued to the District Health Society for inclusion of Urban Local
Bodies and District Urban Development Agency in 75 districts.
After extensive deliberations the state plans to designate the District Health Society under the
chairmanship of the District Magistrate as the implementing authority for NUHM in all 75
districts.
Fund flow mechanisms have been set up and separate accounts will be opened at the state and
in all districts for receiving the NUHM funds.
Urban Health will be included as a key agenda item for review by the District Health Society with
participation of city level urban stakeholders.
An Additional / Deputy CMO has been designated as the nodal officer for NUHM at the district
level. The District Program Management Unit will co-opt implementation of NUHM program in

- 52 -
the district and the District Program Manager will be nodal at DPMU level for NUHM activities .
To support this the following additional staff and funds are proposed for strengthening the
District Program Management Units for implementing NUHM:
a. Urban Health Coordinator, Accountant and Data Entry Operators according to the
following norms:
District total Urban
population
Additional Staff Proposed
Less than 1 lakh 1 Data Entry Operator
1lakh to 10lakhs 1 Urban Health Coordinator,1 Accountant and 1 Data Entry Operator
10lakh to 20lakhs 2 Urban Health Coordinator,2 Accountants and 2 Data Entry Operators
20lakh to 30lakhs 3 Urban Health Coordinator , 3 Accountants and 3 Data Entry Operators
b. Total 76 Urban Health Coordinators, 76 Accountants and 76 Data Entry Operators are
being proposed in 61 Districts according to above norms. In rest of 14 Districts ,
03 Districts (Shrawasti, Chitrakoot, Amethi,) are having population less than 1lakh and
other 11 Districts (Barabanki, Siddarthnager, Maharajganj, Kaushambi Sonbadhra,
Auraiya, Partapgarh, Kanpur Dehat , Kushinagar, Sant kabir nagar, Balrampur) are
although having total district urban population more 1Lakh but in these districts only 01
city per district is being covered under NUHM and these cities are having urban
population less than 01 lakh so in these districts only Data entry operators are being
proposed to support in NUHM activities.
c. Mobility support as hired vehicle for each Urban Health Coordinator is being proposed.
d. A onetime expense for computers, printer and furniture for the above staff has been
budgeted along with the recurring operations expenses.
e. District Programme Manager will be nodal for all NUHM activities so extra incentive and
budget for 1 laptop to each DPM has been proposed for DPM
f. Onetime expenses have been budgeted for up-gradation of the office of Additional/
Deputy CMO and District Programme management Unit.

- 53 -
8. Strengthening Service Delivery Infrastructure
Urban-Primary Health Centres (U-PHCs)
Urban Primary Health Centres (U-PHCs) will be the most peripheral fixed health facilities for the
urban areas under NUHM and are expected to serve as the first point of contact for the community.
These will serve as the source of all primary health care services including preventive promotive
and curative health care, providing referrals to the higher level facilities as needed for more
specialized and in-patient care. Each U-PHC will cater to approx 50,000 populations with locations
that enable access for urban poor communities. The timings for the U-PHCs will be customized to
suit the needs of urban populations. IPHS guidelines for PHCs will be followed and quality
assurance mechanisms will put in place.
Communication activities will be taken up at the UPHC level for popularising the presence of the
UPHC and the special clinics and making the community aware about the timings of doctors’ clinics.
Signage boards that guide the patients from the main road and key transport hubs to the UPHC will
be displayed. Citizens’ Charter, Essential Drug List and Immunization Schedule and other
entitlements under various government schemes such as JSY and JSSK. Health messages of safe
motherhood, child care, family planning and control of common diseases will be displayed at the
UPHCs for the community to demand timely and quality health services. Safe Motherhood booklet
and Mother Child Protection Cards will be made available at the UPHCs for use by pregnant
women. MAS trainings will include the list of services and drugs to be available to the community so
that they can advocate for quality services for the urban poor.
Infrastructure for UPHCs
The underlying principal will be to strengthen existing and functional health facilities to convert them
into Urban PHCs and new such facilities are being proposed as needed. All facilities catering to a
population of 50,000 population henceforth will be called a UPHC. All earlier schemes and
terminologies will not be applicable any more.

- 54 -
Suitable health facilities running in other government premises (DUDA, Nagar Nigam, State
government building etc) will be attempted to be co-opted and all C & D-type UFWCs, Urban
Health Posts and few PPCs will be taken up and the following budget estimates are being
proposed –
1. If the building can be renovated, budget of Rs.10,00,000 has been proposed for renovation
and up-gradation.
2. If the building is in a dilapidated condition, the UPHC will be run out of a rented premises
and rent has accordingly been budgeted for 2013-14. The construction of new building for
UPHC will be proposed in subsequent years.
Total Urban Health Posts and Urban Family Welfare centre and PPCs running from State budget,
are being proposed for strengthening. 52 Urban Health facilities of health department and 67 Health
facilities of DUDA, Nagar Nigam and the Labor Department, totaling to 119 are being proposed for
renovation.
For facilities running in rented premises whether supported by NRHM or Government of UP
Those Urban Health Posts funded by State budget which are not within or close to the slums and
do not have adequate space for up-gradation to UPHCs will be shifted to other rented premises
located within or close to slums.
231Urban Health Posts were funded under Urban RCH in NRHM PIP for 2013-14. These will be
upgraded as UPHCs in all districts and budget for HR, rental, medicines, consumables, untied
grant.

- 55 -
Detail of Urban Health Facilities to be undertaken under NUHM
Detail of U-PHCs to be strengthened under NUHM 2013-14 S
. N
o.
Dis
tric
t
S.N
o.
Nam
e
To
tal
Urb
an
Po
pu
lati
on
Urb
an
Hea
lth
fa
cil
ity
bu
dg
ete
d b
y S
tate
bu
dg
et
NR
HM
Bu
dg
ete
d U
rba
n
Hea
lth
Po
sts
To
tal
Ex
isti
ng
New
UP
HC
s p
rop
os
ed
State Govt Health Facilities
UHPs Budgeted under NRHM
New U-PHCs proposed
To
tal
Str
en
gth
en
ing
fo
r
Go
vt
bu
ild
ing
Ren
t fo
r G
ov
t.
Str
en
gth
en
ing
fo
r
NR
HM
bu
ild
ing
Ren
t fo
r N
RH
M
Str
en
gth
en
ing
fo
r
NU
HM
bu
ild
ing
Ren
t fo
r N
UH
M
bu
ild
ing
1 Agra 1 Agra (M Corp.) 1585704 15 9 24 8 5 10 0 9 0 8 32
2 Aligarh
2 Aligarh (M Corp.) 874408 7 7 14 4 2 5 0 7 0 4 18
3 Atrauli (NPP) 50412 0 0 0 1 0 0 0 0 1 0 1
3 Allahabad 4 Allahabad (M
Corp. + OG) 1168385 11 7 18 6 4 7 0 7 0 6 24
4 Bareilly
5 Bareilly (M Corp. + OG) 904797 2 5 7 11 1 1 0 5 1 10 18
6 Faridpur (NPP) 78249 0 0 0 2 0 0 0 0 0 2 2
7 Baheri (NPP) 68413 0 0 0 1 0 0 0 0 0 1 1
8 Aonla (NPP) 55629 0 0 0 1 0 0 0 0 0 1 1
5 Bijnor
9 Nagina (NPP) 95246 0 0 0 2 0 0 0 0 0 2 2
10 Bijnor (NPP) 93297 0 1 1 1 0 0 0 1 0 1 2
11 Najibabad (NPP) 88535 0 0 0 1 0 0 0 0 1 0 1
12 Chandpur (NPP) 83441 0 0 0 1 0 0 0 0 1 0 1
13 Sherkot (NPP) 62226 0 0 0 1 0 0 0 0 0 1 1
14 Kiratpur (NPP + OG) 61946 0 0 0 1 0 0 0 0 0 1 1
15 Seohara (NPP + OG) 53296 0 0 0 1 0 0 0 0 0 1 1

- 56 -
16 Dhampur (NPP) 50997 0 0 0 1 0 0 0 0 0 1 1
6 Budaun
17 Budaun (NPP) 159285 0 3 3 0 0 0 0 3 0 0 3
18 Sahaswan (NPP) 66204 0 0 0 1 0 0 0 0 0 1 1
19 Ujhani (NPP) 62039 0 0 0 1 0 0 0 0 0 1 1
7 Bulandshahar
20 Bulandshahr (NPP + OG) 230024 0 4 4 0 0 0 0 4 0 0 4
21 Khurja (NPP + OG) 121207 0 0 0 2 0 0 0 0 0 2 2
22 Sikandrabad (NPP) 81028 0 0 0 1 0 0 0 0 0 1 1
23 Jahangirabad (NPP) 59858 0 0 0 1 0 0 0 0 0 1 1
24 Gulaothi (NPP) 50823 0 0 0 1 0 0 0 0 0 1 1
8 Etawah 25 Etawah (NPP) 256838 0 6 6 0 0 0 0 6 0 0 6
9 Farrukhabad 26
Farrukhabad-cum-Fatehgarh (NPP) 276581 0 2 2 3 0 0 0 2 0 3 5
10 Firozabad
27 Firozabad (NPP) 604214 2 4 6 6 2 0 0 4 0 6 12
28 Shikohabad (NPP) 107404 0 0 0 2 0 0 0 0 0 2 2
29 Tundla (NPP) 50423 0 0 0 1 0 0 0 0 0 1 1
11 GB Nagar
30 Noida (CT) 637272 0 1 1 12 0 0 0 1 0 12 13
31 Greater Noida (CT) 102054 0 0 0 2 0 0 0 0 0 2 2
32 Dadri (NPP) 91189 0 0 0 2 0 0 0 0 0 2 2
12 Ghaziabad
33 Ghaziabad (M Corp.) 1648643 9 10 19 14 0 9 0 10 0 14 33
34 Loni (NPP) 516082 0 0 0 10 0 0 0 0 0 10 10
35 Khora (CT) 190005 0 0 0 2 0 0 0 0 0 2 2
36 Modinagar (NPP) 130325 0 0 0 3 0 0 0 0 0 3 3
37 Muradnagar (NPP) 95208 0 0 0 2 0 0 0 0 0 2 2
13 Gorakhpur 38
Gorakhpur (M Corp.) 673446 15 8 23 0 0 15 0 8 0 0 23
14 Hapur
39 Hapur (NPP) 262983 0 0 0 5 0 0 0 0 0 5 5
40 Pilkhuwa (NPP) 83736 0 0 0 2 0 0 0 0 0 2 2

- 57 -
15 Hardoi
41 Hardoi (NPP + OG) 197029 0 1 1 3 0 0 0 1 0 3 4
42 Shahabad (NPP) 80226 0 0 0 1 0 0 0 0 0 1 1
43 Sandila (NPP) 58346 0 0 0 1 0 0 0 0 0 1 1
16 Jalaun
44 Orai (NPP + OG) 190575 0 2 2 2 0 0 0 2 0 2 4
45 Jalaun (NPP) 56909 0 0 0 1 0 0 0 0 0 1 1
46 Konch (NPP) 53412 0 0 0 1 0 0 0 0 0 1 1
47 Kalpi (NPP) 51670 0 0 0 1 0 0 0 0 0 1 1
17 Jhansi
48 Jhansi (M Corp.) 505693 9 3 12 0 2 7 0 3 0 0 12
49 Mauranipur (NPP + OG) 61449 0 0 0 1 0 0 0 0 0 1 1
18 J.P Nagar
50 Amroha (NPP) 198471 0 3 3 1 0 0 0 3 0 1 4
51 Hasanpur (NPP) 61243 0 0 0 1 0 0 0 0 1 0 1
52 Gajraula (NP) 55048 0 0 0 1 0 0 0 0 0 1 1
19 Kannauj
53 Kannauj (NPP) 84862 0 2 2 0 0 0 0 2 0 0 2
54 Chhibramau (NPP) 60986 0 1 1 0 0 0 0 1 0 0 1
20 Kanpur Nagar 55 Kanpur (M
Corp. + OG) 2768057 6 13 19 41 6 0 7 6 41 0 60
21 Kheri
56 Lakhimpur (NPP) 151993 0 2 2 1 0 0 0 2 0 1 3
57 Gola Gokaran Nath (NPP) 60172 0 0 0 1 0 0 0 0 0 1 1
22 Lucknow 58
Lucknow (M Corp.) 2817105 11 26 37 19 8 3 6 20 8 11 56
23 Mathura
59 Mathura (NPP) 349909 0 4 4 3 0 0 0 4 0 3 7
60 Vrindavan (NPP) 63005 0 0 0 1 0 0 0 0 0 1 1
61 Kosi Kalan (NPP + OG) 60074 0 0 0 1 0 0 0 0 0 1 1
24 Mau 62 Maunath
Bhanjan (NPP) 278745 0 2 2 3 0 0 0 2 0 3 5
25 Meerut
63 Meerut (M Corp.) 1305429 8 11 19 7 5 3 0 11 0 7 26
64 Mawana (NPP) 81443 0 0 0 1 0 0 0 0 0 1 1
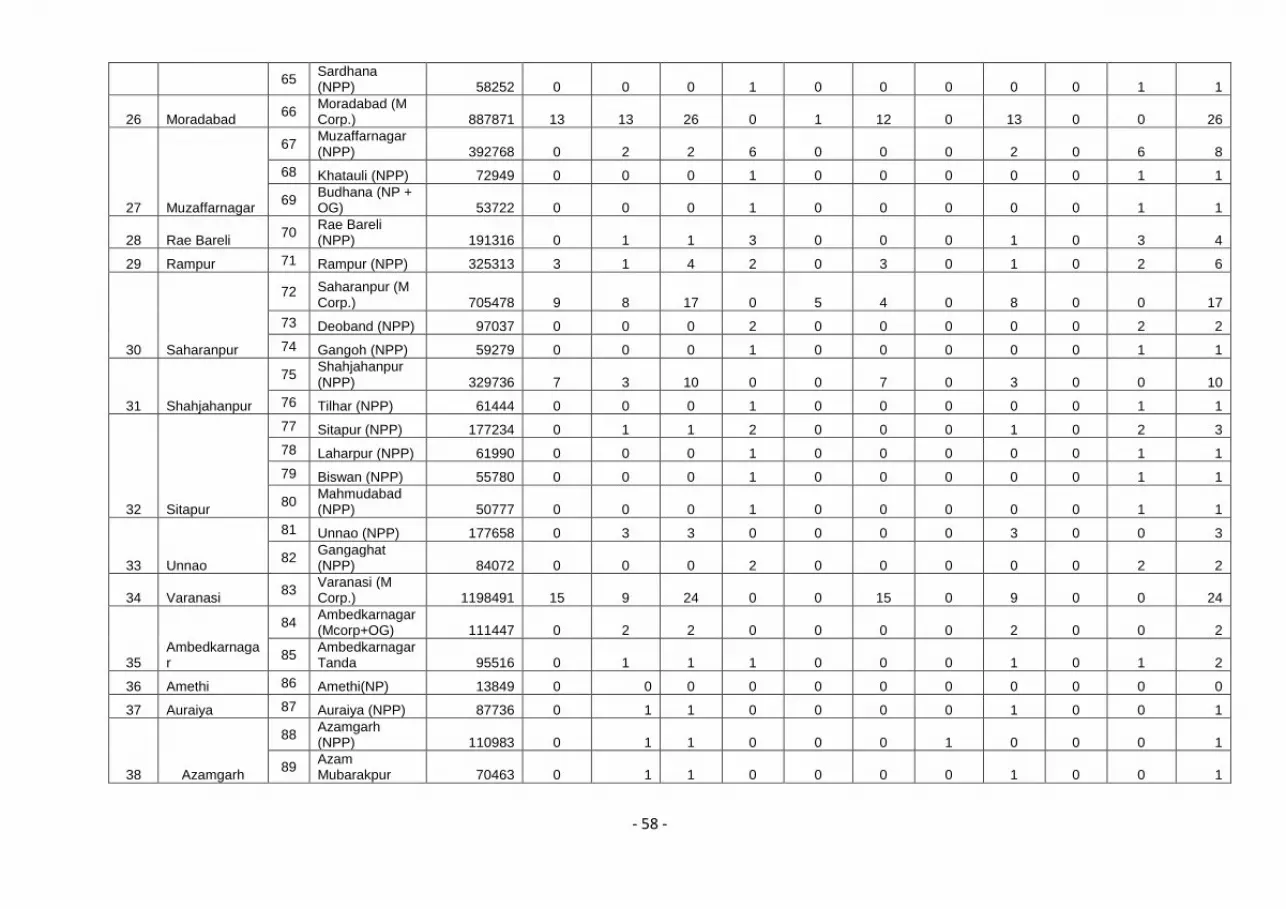
- 58 -
65 Sardhana (NPP) 58252 0 0 0 1 0 0 0 0 0 1 1
26 Moradabad 66
Moradabad (M Corp.) 887871 13 13 26 0 1 12 0 13 0 0 26
27 Muzaffarnagar
67 Muzaffarnagar (NPP) 392768 0 2 2 6 0 0 0 2 0 6 8
68 Khatauli (NPP) 72949 0 0 0 1 0 0 0 0 0 1 1
69 Budhana (NP + OG) 53722 0 0 0 1 0 0 0 0 0 1 1
28 Rae Bareli 70
Rae Bareli (NPP) 191316 0 1 1 3 0 0 0 1 0 3 4
29 Rampur 71 Rampur (NPP) 325313 3 1 4 2 0 3 0 1 0 2 6
30 Saharanpur
72 Saharanpur (M Corp.) 705478 9 8 17 0 5 4 0 8 0 0 17
73 Deoband (NPP) 97037 0 0 0 2 0 0 0 0 0 2 2
74 Gangoh (NPP) 59279 0 0 0 1 0 0 0 0 0 1 1
31 Shahjahanpur
75 Shahjahanpur (NPP) 329736 7 3 10 0 0 7 0 3 0 0 10
76 Tilhar (NPP) 61444 0 0 0 1 0 0 0 0 0 1 1
32 Sitapur
77 Sitapur (NPP) 177234 0 1 1 2 0 0 0 1 0 2 3
78 Laharpur (NPP) 61990 0 0 0 1 0 0 0 0 0 1 1
79 Biswan (NPP) 55780 0 0 0 1 0 0 0 0 0 1 1
80 Mahmudabad (NPP) 50777 0 0 0 1 0 0 0 0 0 1 1
33 Unnao
81 Unnao (NPP) 177658 0 3 3 0 0 0 0 3 0 0 3
82 Gangaghat (NPP) 84072 0 0 0 2 0 0 0 0 0 2 2
34 Varanasi 83
Varanasi (M Corp.) 1198491 15 9 24 0 0 15 0 9 0 0 24
35 Ambedkarnagar
84 Ambedkarnagar (Mcorp+OG) 111447 0 2 2 0 0 0 0 2 0 0 2
85 Ambedkarnagar Tanda 95516 0 1 1 1 0 0 0 1 0 1 2
36 Amethi 86 Amethi(NP) 13849 0 0 0 0 0 0 0 0 0 0 0
37 Auraiya 87 Auraiya (NPP) 87736 0 1 1 0 0 0 0 1 0 0 1
38 Azamgarh
88 Azamgarh (NPP) 110983 0 1 1 0 0 0 1 0 0 0 1
89 Azam Mubarakpur 70463 0 1 1 0 0 0 0 1 0 0 1

- 59 -
39 Baghpat
90 Baghpat Baraut (NPP) 103764 0 1 1 1 0 0 0 1 0 1 2
91 Baghpat (NPP) 50310 0 1 1 0 0 0 0 1 0 0 1
40 Bahraich 92 Bahraich (NPP) 186223 0 1 1 2 0 0 0 1 2 0 3
41 Ballia 93 Ballia (NPP) 104424 0 1 1 1 0 0 0 1 0 1 2
42 Balrampur 94
Balrampur (NPP + OG) 82488 0 1 1 0 0 0 0 1 0 0 1
43 Banda 95
Banda (NPP + OG) 160473 0 1 1 0 0 0 0 1 0 0 1
44 Barabanki 96
Nawabganj (NPP + OG) 81486 0 1 1 0 0 0 0 1 0 0 1
45 Basti 97 Basti (NPP) 114657 0 2 2 0 0 0 0 2 0 0 2
46 Chandauli 98
Mughalsarai (NPP) 109650 0 0 0 2 0 0 0 0 0 2 2
47 Chitrakoot 99
Chitrakoot Dham (Karwi) (NPP) 57402 0 1 1 0 0 0 1 0 0 0 1
48 Deoria 100 Deoria (NPP) 129479 0 3 3 0 0 0 0 3 0 0 3
49 Etah 101 Etah (NPP) 118517 0 1 1 1 0 0 0 1 0 1 2
50 Faizabad
102 Faizabad (NPP) 165228 0 5 5 0 0 0 0 5 0 0 5
103 Ayodhya (NPP) 55890 0 0 0 1 0 0 0 0 1 0 1
51 Fatehpur 104 Fatehpur (NPP) 193193 0 1 1 3 0 0 0 1 0 3 4
52 Ghazipur 105
Ghazipur (NPP + OG) 121020 0 2 2 0 0 0 0 2 0 0 2
53 Gonda 106 Gonda (NPP) 114046 0 2 2 0 0 0 0 2 0 0 2
54 Hamirpur 107 Rath (NPP) 100514 0 1 1 1 0 0 0 1 1 0 2
55 Hathras 108
Hathras (NPP + OG) 143020 0 1 1 2 0 0 0 1 1 1 3
56 Jaunpur 109 Jaunpur (NPP) 180362 0 1 1 2 0 0 0 1 0 2 3
57 Kanpur Dehat 110 Akbarpur (NP) 20445 0 0 0 0 0 0 0 0 0 0 0
58 Kasganj 111 Kasganj (NPP) 101277 0 1 1 1 0 0 0 1 0 1 2
59 Kaushambi 112
Manjhanpur (NP) 16457 0 1 1 0 0 0 0 1 0 0 1
60 Kushinagar 113
Padrauna (NPP) 49723 0 1 1 0 0 0 1 0 0 0 1
61 Lalitpur 114 Lalitpur (NPP) 133305 0 1 1 1 0 0 0 1 0 1 2
62 Maharajganj 115
Maharajganj (NPP) 33930 0 1 1 0 0 0 0 1 0 0 1

- 60 -
63 Mahoba 116 Mahoba (NPP) 95216 0 2 2 0 0 0 0 2 0 0 2
64 Mainpuri 117
Mainpuri (NPP + OG) 136557 0 3 3 0 0 0 1 2 0 0 3
65 Mirzapur 118
Mirzapur-cum-Vindhyachal (NPP) 234871 0 1 1 3 0 0 0 1 0 3 4
66 Pilibhit
119 Pilibhit (NPP) 127988 0 1 1 1 0 0 0 1 1 0 2
120 Bisalpur (NPP) 73551 0 0 0 1 0 0 0 0 0 1 1
67 Pratapgarh 121
Bela Pratapgarh (NPP) 76133 0 1 1 0 0 0 0 1 0 0 1
68 Sambhal
122 Chandausi (NPP) 114383 0 0 0 2 0 0 0 0 0 2 2
123 Sambhal (NPP) 220813 0 0 0 3 0 0 0 0 0 3 3
69 Sant Kabir Nagar
124 Khalilabad (NPP) 47847 0 2 2 0 0 0 0 2 0 0 2
70 Bhadohi (NPP) 125 Bhadohi (NPP) 94620 0 1 1 0 0 0 0 1 0 0 1
71 Shamli
126 Shamli (NPP) 107266 0 0 0 2 0 0 0 0 0 2 2
127 Kairana (NPP) 89000 0 0 0 1 0 0 0 0 0 1 1
72 Shrawasti 128 Bhinga (NP) 23780 0 0 0 0 0 0 0 0 0 0 0
73 Sidharthnagar 129
Siddharthnagar (NPP) 25422 0 1 1 0 0 0 0 1 0 0 1
74 Sonabhadra 130
Sonbhadra (NPP) 36689 0 1 1 0 0 0 1 0 0 0 1
75 Sultanpur 131 Sultanpur (NPP) 107640 0 2 2 0 0 0 0 2 0 0 2
3,14,53,923 142 231 373 265 41 101 18 213 60 205 638
Total Urban population – 3,14,53,923
Total Urban health functional from State Budget reported by Districts -142 (134 Urban Health Posts and 8 UFWCs)
Urban Health Posts under Urban RCH under NRHM -231
Total new Urban Health Posts proposed -265
No of Govt. health facilities proposed for Up- gradation to U-PHCs- 119 ( 41 UHPs State budget+ 18 UHPs under NRHM+ 60 new health
facilities)
No of Urban -PHCs proposed in rented buildings- 519( 101 UHPs from State budget + 213 under NRHM + 205 new health facilities)
Total Urban-PHCs proposed - 638

- 61 -
The following staff is proposed for each Urban PHC:
1. 2 Doctors (MBBS) will be hired for each UPHC and will run daily out-patient clinic, ensure
supplies and provide overall management.
2. 2 Staff Nurses to support Doctor to run routine OPD and special clinics. It is envisaged that
each nurse will be given specific responsibilities for RMNCH, family planning, adolescent,
geriatric counselling. They will also support clinical services such as insertion of IUCDs.
3. 1 Lab Technician will conduct the basic lab and diagnostic tests such as Complete Blood
Count, blood sugar, urine tests, sputum AFB tests, VDRL, peripheral smear for malaria and
other tests as needed.
4. 1 Pharmacist will dispense medicines, administer injections and fluids in case of
emergency. He will be responsible for maintaining inventory for equipments, drugs and
other commodities.
5. 3 Support staff (1 Ayah, 1 Ward Boy and 1 Sweeper cum Chowkidar) who will be
responsible for cleanliness and security of the UPHC and the required support to the
clinical staff.
6. The Urban Health Coordinators being proposed in the cities/ towns will be responsible for:
Supervision of ASHAs.
Coordination and oversight for UNHDs.
Coordination for outreach sessions to reach out to vulnerable populations.
Coordination with local elected representatives for leadership in health.
Any activities conducted in campaign mode such as Bal Swasthya Poshan Maah, Pulse
Polio rounds, school health, adolescent etc.
Rogi Kalyan Samitis (RKS) will be constituted at each UPHC according to GoI guideline .
Members will take the lead in ensuring quality and services to the community as per the guidelines
and norms. Each RKS will have a separate account in which the untied grant will be transferred.
Urban-Community Health Centres (U-CHCs)
Urban Community Health Centres (U-CHCs) are envisaged to provide in-patient and specialized
care to urban population and are planned for about 2.5 lakh population each. The state proposes
to strengthen 8 existing urban hospitals as U-CHCs in the state capital as follows and plan more
extensively for U-CHCs in the subsequent years –
Sl. No. District Number and names of health facility to be upgraded to U-CHCs
1. Lucknow 8 Bal Mahila Chiiktsalayas and Prasuti Grahs will be supported with
specialist doctors

- 62 -
Facilities are functional as first referral unit for all UHPs in urban areas of Lucknow city
and providing Maternal and child health services . Under NUHM these are being proposed
for Up-gradation as U-CHCs by providing specialists, staff nurses, support staff , data
assistants and drivers for ambulances and infrastructure strengthening (renovation,
computer for each BMC, untied grant and drugs )
9. Strengthening Outreach to urban slums
There is a three pronged strategy for outreach under NUHM:
I. Intensifying the reach of ANMs
II. Urban ASHAs
III. Mahila Arogya Samitis (MAS)
IV. Urban Health and Nutrition Days
V. Outreach Camps
VI. School Health Services
VII. IEC/BCC Activities
i) ANMs
The ANMs will be headquartered at the U-PHCs and will cater to a population of about 10,000
each. They will work in close cooperation with the ASHAs and AWWS in their area of coverage
and refer for institutional care to U-PHCs, U-CHCs and other hospitals in the cities.
157 ANMs are already posted in some government Urban Health Posts in the urban areas of the
cities selected for implementation in 2013-14 and will continue to be paid by the Government of
Uttar Pradesh. The remaining ANM posts (05 per UPHC) i.e. 3020 will be hired on the contractual
basis as per the details below:
No of ANMs to be recruited under NUHM
Sl. District Sl. Name
Population
Total ANMs
required (1 per 10,000
population)
Existing no. of ANMs posted
in urban area
Gap based on
urban population
to be hired on contract
Total ANMs
1 Agra 1 Agra (M Corp.) 1,585,704 159 0 160 160
2 Aligarh 2 Aligarh (M Corp.) 874,408 87 12 78 90
3 Atrauli (NPP) 50,412 5 0 5 5

- 63 -
3 Allahabad 4 Allahabad (M Corp. + OG)
1,168,385 117 30 90 120
4 Bareilly
5 Bareilly (M Corp. + OG)
904,797 90 11 79 90
6 Faridpur (NPP) 78,249 8 6 4 10
7 Baheri (NPP) 68,413 7 0 5 5
8 Aonla (NPP) 55,629 6 3 2 5
5 Bijnor
9 Nagina (NPP) 95,246 10 0 10 10
10 Bijnor (NPP) 93,297 9 0 10 10
11 Najibabad (NPP) 88,535 9 0 5 5
12 Chandpur (NPP) 83,441 8 0 5 5
13 Sherkot (NPP) 62,226 6 0 5 5
14 Kiratpur (NPP + OG)
61,946 6 0 5 5
15 Seohara (NPP + OG)
53,296 5 0 5 5
16 Dhampur (NPP) 50,997 5 0 5 5
6 Budaun
17 Budaun (NPP) 159,285 16 0 15 15
18 Sahaswan (NPP)
66,204 7 0 5 5
19 Ujhani (NPP) 62,039 6 0 5 5
7 Bulandshahar
20 Bulandshahr (NPP + OG)
230,024 23 0 20 20
21 Khurja (NPP + OG)
121,207 12 0 10 10
22 Sikandrabad (NPP)
81,028 8 0 5 5
23 Jahangirabad (NPP)
59,858 6 0 5 5
24 Gulaothi (NPP) 50,823 5 0 5 5
8 Etawah 25 Etawah (NPP) 256,838 26 0 30 30
9 Farrukhabad 26 Farrukhabad-cum-Fatehgarh (NPP)
276,581 28 0 25 25
10 Firozabad
27 Firozabad (NPP) 604,214 60 6 54 60
28 Shikohabad (NPP)
107,404 11 0 10 10
29 Tundla (NPP) 50,423 5 0 5 5
11 GB Nagar
30 Noida (CT) 637,272 64 0 65 65
31 Greater Noida (CT)
102,054 10 0 10 10
32 Dadri (NPP) 91,189 9 0 10 10
12 Ghaziabad
33 Ghaziabad (M Corp.)
1,648,643 165 0 165 165
34 Loni (NPP) 516,082 52 0 50 50
35 Khora (CT) 190,005 19 0 10 10
36 Modinagar (NPP)
130,325 13 0 15 15
37 Muradnagar (NPP)
95,208 10 0 10 10
13 Gorakhpur 38 Gorakhpur (M Corp.)
673,446 67 0 115 115

- 64 -
14 Hapur 39 Hapur (NPP) 262,983 26 0 25 25
40 Pilkhuwa (NPP) 83,736 8 0 10 10
15 Hardoi
41 Hardoi (NPP + OG)
197,029 20 0 20 20
42 Shahabad (NPP) 80,226 8 0 5 5
43 Sandila (NPP) 58,346 6 0 5 5
16 Jalaun
44 Orai (NPP + OG) 190,575 19 0 20 20
45 Jalaun (NPP) 56,909 6 0 5 5
46 Konch (NPP) 53,412 5 0 5 5
47 Kalpi (NPP) 51,670 5 0 5 5
17 Jhansi
48 Jhansi (M Corp.) 505,693 51 28 32 60
49 Mauranipur (NPP + OG)
61,449 6 0 5 5
18 JP Nagar
50 Amroha (NPP) 198,471 20 0 20 20
51 Hasanpur (NPP) 61,243 6 0 5 5
52 Gajraula (NP) 55,048 6 0 5 5
19 Kannauj
53 Kannauj (NPP) 84,862 8 0 10 10
54 Chhibramau (NPP)
60,986 6 0 5 5
20 Kanpur Nagar 55 Kanpur (M Corp. + OG)
2,768,057 277 22 278 300
21 Kheri
56 Lakhimpur (NPP)
151,993 15 0 15 15
57 Gola Gokaran Nath (NPP)
60,172 6 0 5 5
22 Lucknow 58 Lucknow (M Corp.)
2,817,105 282 0 280 280
23 Mathura
59 Mathura (NPP) 349,909 35 10 25 35
60 Vrindavan (NPP) 63,005 6 0 5 5
61 Kosi Kalan (NPP + OG)
60,074 6 0 5 5
24 Mau 62 Maunath Bhanjan (NPP)
278,745 28 0 25 25
25 Meerut
63 Meerut (M Corp.) 1,305,429 131 8 122 130
64 Mawana (NPP) 81,443 8 0 5 5
65 Sardhana (NPP) 58,252 6 0 5 5
26 Moradabad 66 Moradabad (M Corp.)
887,871 89 0 117 117
27 Muzaffarnagar
67 Muzaffarnagar (NPP)
392,768 39 0 40 40
68 Khatauli (NPP) 72,949 7 0 5 5
69 Budhana (NP + OG)
53,722 5 0 5 5
28 Rae Bareli 70 Rae Bareli (NPP)
191,316 19 7 13 20
29 Rampur 71 Rampur (NPP) 325,313 33 0 30 30
30 Saharanpur
72 Saharanpur (M Corp.)
705,478 71 9 76 85
73 Deoband (NPP) 97,037 10 0 10 10
74 Gangoh (NPP) 59,279 6 1 4 5

- 65 -
31 Shahjahanpur 75
Shahjahanpur (NPP)
329,736 33 0 50 50
76 Tilhar (NPP) 61,444 6 0 5 5
32 Sitapur
77 Sitapur (NPP) 177,234 18 0 15 15
78 Laharpur (NPP) 61,990 6 0 5 5
79 Biswan (NPP) 55,780 6 0 5 5
80 Mahmudabad (NPP)
50,777 5 0 5 5
33 Unnao
81 Unnao (NPP) 177,658 18 0 15 15
82 Gangaghat (NPP)
84,072 8 0 10 10
34 Varanasi 83 Varanasi (M Corp.)
1,198,491 120 0 120 120
35 Ambedkarnagar
84 Ambedkarnagar (Mcorp+OG)
111,447 11 0 10 10
85 Ambedkarnagar Tanda
95,516 10 0 10 10
36 Amethi 86 Amethi(NP) 13,849 1 0 1 1
37 Auraiya 87 Auraiya (NPP) 87,736 9 0 5 5
38 Azamgarh
88 Azamgarh (NPP) 110,983 11 0 5 5
89 Azam Mubarakpur
70,463 7 0 5 5
39 Baghpat
90 Baghpat (NPP) 50,310 5 0 5 5
91 Baghpat Baraut (NPP)
103,764 10 0 10 10
40 Bahraich 92 Bahraich (NPP) 186,223 19 0 15 15
41 Ballia 93 Ballia (NPP) 104,424 10 0 10 10
42 Balrampur 94 Balrampur (NPP + OG)
82,488 8 2 6 8
43 Banda 95 Banda (NPP + OG)
160,473 16 0 8 8
44 Barabanki 96 Nawabganj (NPP + OG)
81,486 8 0 5 5
45 Basti 97 Basti (NPP) 114,657 11 0 10 10
46 Chandauli 98 Mughalsarai (NPP)
109,650 11 0 10 10
47 Chitrakoot 99 Chitrakoot Dham (Karwi) (NPP)
57,402 6 0 5 5
48 Deoria 100 Deoria (NPP) 129,479 13 0 15 15
49 Etah 101 Etah (NPP) 118,517 12 0 10 10
50 Faizabad 102 Faizabad (NPP) 165,228 17 0 25 25
103 Ayodhya (NPP) 55,890 6 0 5 5
51 Fatehpur 104 Fatehpur (NPP) 193,193 19 0 20 20
52 Ghazipur 105 Ghazipur (NPP + OG)
121,020 12 0 10 10
53 Gonda 106 Gonda (NPP) 114,046 11 0 10 10
54 Hamirpur 107 Rath (NPP) 100,514 10 0 10 10
55 Hathras 108 Hathras (NPP + OG)
143,020 14 0 15 15
56 Jaunpur 109 Jaunpur (NPP) 180,362 18 0 15 15
57 Kanpur Dehat 110 Akbarpur (NP) 20,445 2 0 2 2

- 66 -
58 Kasganj 111 Kasganj (NPP) 101,277 10 0 10 10
59 Kaushambi 112 Manjhanpur (NP) 16,457 2 0 3 3
60 Kushinagar 113 Padrauna (NPP) 49,723 5 0 5 5
61 Lalitpur 114 Lalitpur (NPP) 133,305 13 0 10 10
62 Maharajganj 115 Maharajganj (NPP)
33,930 3 0 3 3
63 Mahoba 116 Mahoba (NPP) 95,216 10 0 10 10
64 Mainpuri 117 Mainpuri (NPP + OG)
136,557 14 0 15 15
65 Mirzapur 118 Mirzapur-cum-Vindhyachal (NPP)
234,871 23 2 18 20
66 Pilibhit 119 Pilibhit (NPP) 127,988 13 0 10 10
120 Bisalpur (NPP) 73,551 7 0 5 5
67 Pratapgarh 121 Bela Pratapgarh (NPP)
76,133 8 0 5 5
68 Sambhal
122 Sambhal (NPP) 220,813 22 0 15 15
123 Chandausi (NPP)
114,383 11 0 10 10
69 Sant Kabir Nagar
124 Khalilabad (NPP)
47,847 5 0 6 6
70 Bhadohi (NPP) 125 Bhadohi (NPP) 94,620 9 0 5 5
71 Shamli 126 Shamli (NPP) 107,266 11 0 10 10
127 Kairana (NPP) 89,000 9 0 5 5
72 Shrawasti 128 Bhinga (NP) 23,780 2 0 2 2
73 Sidharthnagar 129 Siddharthnagar (NPP)
25,422 3 0 2 2
74 Sonabhadra 130 Sonbhadra (NPP)
36,689 4 0 5 5
75 Sultanpur 131 Sultanpur (NPP) 107,640 11 0 10 10
Total 31,453,923 3145 157 3020 3177
Training of ANMs will be conducted to orient them about their role in the urban areas, reaching out
to slum and vulnerable population, guidelines under major national health programs, screening for
common life style diseases, interpersonal skills, infection prevention practices and record keeping.
Training modules will be developed for the same and all ANMs in the city will be covered.
The key tasks for the ANM will be:
a) Preventive and Promotive health care to households through outreach, weekly health
camps in slums
b) ANC and immunization clinics at the U-PHCs
c) Conduct Urban Health Nutrition Days at AWCs in her area
d) Support ASHA for house of house visits for behaviour change

- 67 -
II) Urban ASHAs
The urban ASHA will work on the pattern of rural ASHA and serve as the link between urban poor
and health services. There is an ASHA planned for 200 – 500 slum households each and will be
assigned such that all slums are covered. These frontline workers will be trained as per the ASHA
training modules. The existing training modules for rural ASHAs and the pool of trainers created
already will be used for the same. Any specific content on urban contexts, if created for capacity
building of ASHAs, the same shall be included in the training plan and content.
Urban ASHAs will conduct the house listing in their assigned area and record the details of all
families, married women of reproductive age, pregnant women and children as per the
questionnaires which be prescribed or developed. This will help them build rapport with the
community and also gain a good understanding of the health needs in her area. It is expected that
the actual population listed by the ASHAs may be higher or lower than the population originally
used for planning and ASHA selection and assignment. These will be adjusted over time with the
objective of providing complete coverage to the slum residents.
The ASHAs will start providing services once they are trained and have completed the mapping of
households and Slum Household Index Register (SHIR). They will then be paid incentives based
on their performance for the following activities:
a) Organize Urban Health and Nutrition Days
b) Organize outreach camps
c) Organize monthly meeting of MAS
d) Attend the monthly meeting at UPHC
e) Organize community meeting for strengthening preventive and promotive aspects
f) Maintain records as per norms like SHIR, meeting minutes, outreach camp register
g) Additional immunization incentives for achieving complete immunization in her area
h) Incentives built in schemes such as JSY, RNTCP, NVBDCP, Family Planning, Home based
newborn care etc.
III) Mahila Arogya Samitis (MAS)
Mahila Arogya Samitis will function as empowered groups of women that will enable the urban
poor communities to access their health entitlements under the various government schemes.
Each MAS will consist of 10-12 women from about 50-100 households with an elected
chairperson, treasurer and will be supported by the ASHA. MAS will serve as catalysts for
behaviour change in communities in their area for practising healthy behaviours and accessing

- 68 -
preventive, promotive and curative health services. They will also advocate with the government
system for accessible and quality health care for urban poor. Capacity of existing community
based institutions will be built to evolve to MAS and if needed new MAS can be set up.
The state will orient and train MAS in priority cities and will provide an annual untied grant of
Rs.5000 to each MAS for mobilization, sanitation and hygiene and emergency health care needs.
This will serve as seed money for a revolving fund to be managed by the MAS. The MAS will work
closely with the ASHA in the area and serve to improve the health indicators in their area.
No of Urban ASHAs and MAS proposed by city :
Sl. District Sl. Name Population Urban Slum population (In Lakhs)
Number of MAS 2013-14
Number of
ASHAs 2013-14
1 Agra 1 Agra (M Corp.) 1,585,704
1,250,000
1246 623
2 Aligarh
2 Aligarh (M Corp.) 874,408
780,000
780 390
3 Atrauli (NPP) 50,412
50,400
50 25
3 Allahabad 4 Allahabad (M Corp. + OG)
1,168,385
680,000
680 340
4 Bareilly
5 Bareilly (M Corp. + OG)
904,797
338,005
340 170
6 Faridpur (NPP) 78,249
18,360
18 9
7 Baheri (NPP) 68,413
68,410
68 34
8 Aonla (NPP) 55,629
26,235
26 13
5 Bijnor
9 Nagina (NPP) 95,246
26,935
26 13
10 Bijnor (NPP) 93,297
34,480
40 20
11 Najibabad (NPP) 88,535
15,835
16 8
12 Chandpur (NPP) 83,441
14,400
14 7
13 Sherkot (NPP) 62,226
11,130
12 6
14 Kiratpur (NPP + OG) 61,946
14,500
16 8
15 Seohara (NPP + OG) 53,296
14,840
16 8
16 Dhampur (NPP) 50,997
9,590
10 5
6 Budaun
17 Budaun (NPP) 159,285
106,000
106 53
18 Sahaswan (NPP) 66,204
22,000
22 11
19 Ujhani (NPP) 62,039
16,560
16 8
7 Bulandshahar
20 Bulandshahr (NPP + OG)
230,024
113,000
112 56
21 Khurja (NPP + OG) 121,207
98,000
98 49
22 Sikandrabad (NPP) 81,028
45,150
44 22

- 69 -
23 Jahangirabad (NPP) 59,858
27,800
28 14
24 Gulaothi (NPP) 50,823
26,600
26 13
8 Etawah 25 Etawah (NPP) 256,838
49,040
74 37
9 Farrukhabad 26 Farrukhabad-cum-Fatehgarh (NPP)
276,581
190,000
182 91
10 Firozabad
27 Firozabad (NPP) 604,214
387,000
388 194
28 Shikohabad (NPP) 107,404
24,425
24 12
29 Tundla (NPP) 50,423
25,000
20 10
11 GB Nagar
30 Noida (CT) 637,272
554,000
554 277
31 Greater Noida (CT) 102,054
253,000
264 132
32 Dadri (NPP) 91,189
144,000
144 72
12 Ghaziabad
33 Ghaziabad (M Corp.) 1,648,643
403,045
406 203
34 Loni (NPP) 516,082
106,155
106 53
35 Khora (CT) 190,005
30,000
30 15
36 Modinagar (NPP) 130,325
21,500
22 11
37 Muradnagar (NPP) 95,208
5,000
6 3
13 Gorakhpur 38 Gorakhpur (M Corp.) 673,446
450,000
616 308
14 Hapur
39 Hapur (NPP) 262,983
100,000
92 46
40 Pilkhuwa (NPP) 83,736
45,000
46 23
15 Hardoi
41 Hardoi (NPP + OG) 197,029
53,000
54 27
42 Shahabad (NPP) 80,226
7,500
6 3
43 Sandila (NPP) 58,346
9,000
8 4
16 Jalaun
44 Orai (NPP + OG) 190,575
53,000
54 27
45 Jalaun (NPP) 56,909
7,500
18 9
46 Konch (NPP) 53,412
10,000
16 8
47 Kalpi (NPP) 51,670
7,500
14 7
17 Jhansi
48 Jhansi (M Corp.) 505,693
211,550
210 105
49 Mauranipur (NPP + OG)
61,449
32,000
22 11
18 JP Nagar
50 Amroha (NPP) 198,471
62,500
62 31
51 Hasanpur (NPP) 61,243
37,500
38 19
52 Gajraula (NP) 55,048
31,500
32 16
19 Kannauj
53 Kannauj (NPP) 84,862
15,300
16 8
54 Chhibramau (NPP) 60,986
13,000
12 6
20 Kanpur Nagar 55 Kanpur (M Corp. + OG)
2,768,057
637,000
650 325

- 70 -
21 Kheri
56 Lakhimpur (NPP) 151,993
12,500
16 8
57 Gola Gokaran Nath (NPP)
60,172
1,500
2 1
22 Lucknow 58 Lucknow (M Corp.) 2,817,105
1,097,710
1132 566
23 Mathura
59 Mathura (NPP) 349,909
282,285
282 141
60 Vrindavan (NPP) 63,005
63,000
8 4
61 Kosi Kalan (NPP + OG)
60,074
10,625
12 6
24 Mau 62 Maunath Bhanjan (NPP)
278,745
64,330
64 32
25 Meerut
63 Meerut (M Corp.) 1,305,429
1,150,000
1150 575
64 Mawana (NPP) 81,443
9,000
10 5
65 Sardhana (NPP) 58,252
16,000
16 8
26 Moradabad 66 Moradabad (M Corp.) 887,871
432,500
460 230
27 Muzaffarnagar
67 Muzaffarnagar (NPP) 392,768
115,000
114 57
68 Khatauli (NPP) 72,949
20,000
20 10
69 Budhana (NP + OG) 53,722
10,500
10 5
28 Rae Bareli 70 Rae Bareli (NPP) 191,316
60,000
56 28
29 Rampur 71 Rampur (NPP) 325,313
125,000
124 62
30 Saharanpur
72 Saharanpur (M Corp.) 705,478
302,500
400 200
73 Deoband (NPP) 97,037
33,000
34 17
74 Gangoh (NPP) 59,279
21,000
22 11
31 Shahjahanpur
75 Shahjahanpur (NPP) 329,736
218,460
220 110
76 Tilhar (NPP) 61,444
41,100
42 21
32 Sitapur
77 Sitapur (NPP) 177,234
33,450
34 17
78 Laharpur (NPP) 61,990
3,820
6 3
79 Biswan (NPP) 55,780
32,250
32 16
80 Mahmudabad (NPP) 50,777
11,955
12 6
33 Unnao
81 Unnao (NPP) 177,658
43,500
44 22
82 Gangaghat (NPP) 84,072
33,500
36 18
34 Varanasi 83 Varanasi (M Corp.) 1,198,491
569,740
570 285
35 Ambedkarnagar
84 Ambedkarnagar (Mcorp+OG)
111,447
15,000 22 11
85 Ambedkarnagar Tanda 95,516
50,000 48 24
36 Amethi 86 Amethi(NP) 13,849
7,000 8 4
37 Auraiya 87 Auraiya (NPP) 87,736 - 0 0
38 Azamgarh 88 Azamgarh (NPP) 110,983
46,000 46 23

- 71 -
89 Azam Mubarakpur 70,463
32,000 32 16
39 Baghpat
90 Baghpat (NPP) 50,310
87,000 8 4
91 Baghpat Baraut (NPP) 103,764
68,000 68 34
40 Bahraich 92 Bahraich (NPP) 186,223
75,000 74 37
41 Ballia 93 Ballia (NPP) 104,424
67,000 68 34
42 Balrampur 94 Balrampur (NPP + OG)
82,488
36,000 40 20
43 Banda 95 Banda (NPP + OG)
160,473
12,000 12 6
44 Barabanki 96 Nawabganj (NPP + OG)
81,486
7,500 8 4
45 Basti 97 Basti (NPP) 114,657
54,500 56 28
46 Chandauli 98 Mughalsarai (NPP)
109,650
23,000 24 12
47 Chitrakoot 99 Chitrakoot Dham (Karwi) (NPP)
57,402
11,000 12 6
48 Deoria 100 Deoria (NPP) 129,479
61,000 64 32
49 Etah 101 Etah (NPP) 118,517
35,000 36 18
50 Faizabad
102 Faizabad (NPP)
165,228
40,000 40 20
103 Ayodhya (NPP)
55,890
26,500 30 15
51 Fatehpur 104 Fatehpur (NPP) 193,193
63,000 76 38
52 Ghazipur 105 Ghazipur (NPP + OG)
121,020
60,000 60 30
53 Gonda 106 Gonda (NPP) 114,046
9,000 10 5
54 Hamirpur 107 Rath (NPP)
100,514
23,000 24 12
55 Hathras 108 Hathras (NPP + OG)
143,020
61,000 60 30
56 Jaunpur
109 Jaunpur (NPP) 180,362
15,000 18 9
57 Kanpur Dehat 110 Akbarpur (NP)
20,445
10,000 16 8
58 Kasganj 111 Kasganj (NPP)
101,277
32,000 32 16
59 Kaushambi 112 Manjhanpur (NP)
16,457
2,025 6 3
60 Kushinagar 113 Padrauna (NPP)
49,723
25,000 22 11
61 Lalitpur 114 Lalitpur (NPP) 133,305
50,000 6 3
62 Maharajganj 115 Maharajganj (NPP) 33,930
26,500 26 13
63 Mahoba 116 Mahoba (NPP) 95,216
37,000 38 19
64 Mainpuri 117 Mainpuri (NPP + OG)
136,557
84,000 84 42
65 Mirzapur 118 Mirzapur-cum-Vindhyachal (NPP)
234,871
58,000 60 30
66 Pilibhit
119 Pilibhit (NPP) 127,988
61,000 62 31
120 Bisalpur (NPP)
73,551
3,400 6 3
67 Pratapgarh 121 Bela Pratapgarh (NPP)
76,133
8,010 8 4

- 72 -
68 Sambhal
122 Sambhal (NPP) 220,813
37,000 36 18
123 Chandausi (NPP)
114,383
39,000 40 20
69 Sant Kabir Nagar
124 Khalilabad (NPP)
47,847
6,100 8 4
70 Bhadohi (NPP)
125 Bhadohi (NPP) 94,620
36,000 36 18
71 Shamli
126 Shamli (NPP) 107,266
43,000 44 22
127 Kairana (NPP)
89,000
10,000 10 5
72 Shrawasti 128 Bhinga (NP)
23,780
4,950 6 3
73 Sidharthnagar 129 Siddharthnagar (NPP)
25,422
25,000 24 12
74 Sonabhadra 130 Sonbhadra (NPP)
36,689
32,000 32 16
75 Sultanpur 131 Sultanpur (NPP)
107,640
76,533 90 45
Total
31,453,923 14,288,488 14560 7,280
In year 2013-14, out of 5 MAS per ASHA , only 2 MAS per ASHA have been proposed .
IV) Urban Health Sanitation and Nutrition Days
Urban Health and Nutrition Days will be organized at each Anganwadi center at least once a
month. UHNDs will be organized by close coordination between Anganwadi worker, ASHA and
ANM and provide services at the doorstep of the urban slum community. In case there are no
Anganwadi centers, the ANM can find a common place in the community to conduct the UHND in
coordination with the ASHA. The services will include the following:
1. Early registration of pregnancies, antenatal care for pregnant women including IFA, TT, BP,
counselling for nutrition during pregnancy, birth preparedness and ANC check-up
2. Screening and referrals of high risk pregnancies
3. Creating awareness about government schemes such as JSY and JSSK and promoting
institutional deliveries
4. Routine immunization for children including Vitamin A administration
5. Treatment of minor ailments including diarrhoea and ARI among children
6. Growth Monitoring for children under six years for early identification of malnourished
children and counselling and referral as needed
7. Counselling for IYCF, care during pregnancy, family planning
8. Distribution of condoms and pills, counselling for IUCD and ligation to women who have
completed their families
9. IFA supplementation and deworming for adolescents

- 73 -
10. Awareness about safe drinking water and sanitation practices, distribution of chlorine
tablets as needed
Supplies for UHNDs will be procured and supplied by the UPCs where the ANM is based. The
ANM can refer cases that need medical attention to the UPHC OPD or the special clinics being run
there. The reports generate from the UHNDs will be included in the UPHC performance and all
pregnant women registered will be entered in MCTS by HMIS/ MCTS Operator based on the
information provided by the ANM after each UHND..
V) Outreach Camps
Special Outreach Camps will be planned with two main objectives:
a. Reach out to vulnerable populations/ slums that are may not access services at UPHCs
or UHNDs such as the homeless, rag pickers, street children, rickshaw pullers,
constructions, brick and lime kiln workers, sex workers and other temporary migrants
with health services that are responsive to their special health needs.
b. Provide more specialised health care services closer to the community for specific
preventive and promotive care based on epidemiological and population needs. Some
examples of such activities include:
i. Chronic Lung diseases in factories
ii. Skin cancer screening in industries where there is exposure to carcinogenic
agents
iii. Screening and treatment for RTIs and STIs among sex workers
iv. Screening and referral for cataract among the elderly
v. Screening and referral for TB among high risk populations
vi. Screening and treatment for vector borne diseases such as malaria, dengue,
Japanese Encephalitis, Acute Encephalitic Syndrome in and after the
monsoons.
A panel of specialists comprising of various specialists such as gynaecologists, paediatricians,
general physicians, ophthalmologists, dermatologists, chest physicians, epidemiological and
occupational diseases will be developed at the city level. As per the need required specialists will
be engaged for outreach camps.
The human resource and supplies will be provided for special outreach camps based on the
objective and the target population planned to be served. The ANM will take lead in overall
organization of the special outreach camps in her area with support from the Urban Health

- 74 -
Coordinator. Specialists from the specialists panel created at the city level will be used for these
outreach camps and additional specialists may be hired if needed. Reports for these special
outreach camps will be compiled as part of the UPHC performance and reported.
No. Of UHNDs and outreach camps proposed by Cities
Sl. No.
District Sl.no Name Population Urban Slum
population
No. of UHNDs planned
No. of special
outreach camps
1 Agra 1 Agra (M Corp.) 1585704 1250000 1250 160
2 Aligarh
2 Aligarh (M Corp.) 874408 780000 780 88
3 Atrauli (NPP) 50412 50400 50 6
3 Allahabad 4 Allahabad (M Corp. + OG) 1168385 680000 680 116
4 Bareilly
5 Bareilly (M Corp. + OG) 904797 338005 338 90
6 Faridpur (NPP) 78249 18360 18 8
7 Baheri (NPP) 68413 68410 68 7
8 Aonla (NPP) 55629 26235 26 5
5 Bijnor
9 Nagina (NPP) 95246 26935 27 10
10 Bijnor (NPP) 93297 34480 74 9
11 Najibabad (NPP) 88535 15835 16 8
12 Chandpur (NPP) 83441 14400 14 8
13 Sherkot (NPP) 62226 11130 11 6
14 Kiratpur (NPP + OG) 61946 14500 15 6
15 Seohara (NPP + OG) 53296 14840 15 6
16 Dhampur (NPP) 50997 9590 10 6
6 Budaun
17 Budaun (NPP) 159285 106000 126 16
18 Sahaswan (NPP) 66204 22000 22 7
19 Ujhani (NPP) 62039 16560 17 6
7 Bulandshahar
20 Bulandshahr (NPP + OG) 230024 113000 133 23
21 Khurja (NPP + OG) 121207 98000 98 12
22 Sikandrabad (NPP) 81028 45150 45 8
23 Jahangirabad (NPP) 59858 27800 28 6
24 Gulaothi (NPP) 50823 26600 27 5
8 Etawah 25 Etawah (NPP) 256838 49040 49 26
9 Farrukhabad 26 Farrukhabad-cum-Fatehgarh (NPP) 276581 190000 190 28
10 Firozabad
27 Firozabad (NPP) 604214 387000 487 60
28 Shikohabad (NPP) 107404 24425 24 10
29 Tundla (NPP) 50423 25000 25 5
11 GB Nagar
30 Noida (CT) 637272 554000 554 88
31 Greater Noida (CT) 102054 253000 253 151
32 Dadri (NPP) 91189 144000 144 53
12 Ghaziabad 33 Ghaziabad (M Corp.) 1648643 403045 403 168

- 75 -
34 Loni (NPP) 516082 106155 150 52
35 Khora (CT) 190005 30000 30 20
36 Modinagar (NPP) 130325 21500 22 13
37 Muradnagar (NPP) 95208 5000 112 10
13 Gorakhpur 38 Gorakhpur (M Corp.) 673446 450000 450 67
14 Hapur
39 Hapur (NPP) 262983 100000 100 26
40 Pilkhuwa (NPP) 83736 45000 45 8
15 Hardoi
41 Hardoi (NPP + OG) 197029 53000 53 20
42 Shahabad (NPP) 80226 7500 20 8
43 Sandila (NPP) 58346 9000 20 6
16 Jalaun
44 Orai (NPP + OG) 190575 53000 113 19
45 Jalaun (NPP) 56909 7500 10 6
46 Konch (NPP) 53412 10000 10 5
47 Kalpi (NPP) 51670 7500 10 5
17 Jhansi
48 Jhansi (M Corp.) 505693 211550 212 51
49 Mauranipur (NPP + OG) 61449 32000 32 6
18 JP Nagar
50 Amroha (NPP) 198471 62500 123 20
51 Hasanpur (NPP) 61243 37500 38 6
52 Gajraula (NP) 55048 31500 40 6
19 Kannauj
53 Kannauj (NPP) 84862 15300 15 8
54 Chhibramau (NPP) 60986 13000 13 0
20 Kanpur Nagar 55 Kanpur (M Corp. + OG) 2768057 637000 637 277
21 Kheri
56 Lakhimpur (NPP) 151993 12500 13 16
57 Gola Gokaran Nath (NPP) 60172 1500 10 6
22 Lucknow 58 Lucknow (M Corp.) 2817105 1097710 1098 282
23 Mathura
59 Mathura (NPP) 349909 282285 282 35
60 Vrindavan (NPP) 63005 63000 63 6
61 Kosi Kalan (NPP + OG) 60074 10625 11 6
24 Mau 62 Maunath Bhanjan (NPP) 278745 64330 114 28
25 Meerut
63 Meerut (M Corp.) 1305429 1150000 1150 130
64 Mawana (NPP) 81443 9000 69 8
65 Sardhana (NPP) 58252 16000 16 6
26 Moradabad 66 Moradabad (M Corp.) 887871 432500 490 88
27 Muzaffarnagar
67 Muzaffarnagar (NPP) 392768 115000 115 40
68 Khatauli (NPP) 72949 20000 20 8
69 Budhana (NP + OG) 53722 10500 11 6
28 Rae Bareli 70 Rae Bareli (NPP) 191316 60000 66 20
29 Rampur 71 Rampur (NPP) 325313 125000 225 33
30 Saharanpur
72 Saharanpur (M Corp.) 705478 302500 353 70
73 Deoband (NPP) 97037 33000 33 10
74 Gangoh (NPP) 59279 21000 21 6
31 Shahjahanpur 75 Shahjahanpur (NPP) 329736 218460 218 33

- 76 -
76 Tilhar (NPP) 61444 41100 41 6
32 Sitapur
77 Sitapur (NPP) 177234 33450 33 18
78 Laharpur (NPP) 61990 3820 4 5
79 Biswan (NPP) 55780 32250 32 5
80 Mahmudabad (NPP) 50777 11955 12 5
33 Unnao
81 Unnao (NPP) 177658 43500 74 18
82 Gangaghat (NPP) 84072 33500 34 8
34 Varanasi 83 Varanasi (M Corp.) 1198491 569740 770 120
35 Ambedkarnagar
84 Ambedkarnagar (Mcorp+OG) 111447 15000 42 4
85 Ambedkarnagar Tanda 95516 50000 50 2
36 Amethi 86 Amethi(NP) 13849 7000 7 1
37 Auraiya 87 Auraiya (NPP) 87736 0 0 0
38 Azamgarh
88 Azamgarh (NPP) 110983 46000 46 2
89 Azam Mubarakpur 70463 32000 32 1
39 Baghpat
90 Baghpat (NPP) 50310 87000 68 1
91 Baghpat Baraut (NPP) 103764 68000 87 2
40 Bahraich 92 Bahraich (NPP) 186223 75000 75 7
41 Ballia 93 Ballia (NPP) 104424 67000 67 10
42 Balrampur 94 Balrampur (NPP + OG) 82488 36000 36 8
43 Banda 95 Banda (NPP + OG) 160473 12000 62 5
44 Barabanki 96 Nawabganj (NPP + OG) 81486 7500 8 2
45 Basti 97 Basti (NPP) 114657 54500 55 5
46 Chandauli 98 Mughalsarai (NPP) 109650 23000 23 2
47 Chitrakoot 99 Chitrakoot Dham (Karwi) (NPP) 57402 11000 11 2
48 Deoria 100 Deoria (NPP) 129479 61000 61 12
49 Etah 101 Etah (NPP) 118517 35000 35 2
50 Faizabad
102 Faizabad (NPP) 165228 40000 40 5
103 Ayodhya (NPP) 55890 26500 27 2
51 Fatehpur 104 Fatehpur (NPP) 193193 63000 63 2
52 Ghazipur 105 Ghazipur (NPP + OG) 121020 60000 60 4
53 Gonda 106 Gonda (NPP) 114046 9000 9 1
54 Hamirpur 107 Rath (NPP) 100514 23000 23 2
55 Hathras 108 Hathras (NPP + OG) 143020 61000 217 10
56 Jaunpur 109 Jaunpur (NPP) 180362 15000 200 8
57 Kanpur Dehat 110 Akbarpur (NP) 20445 10000 23 2
58 Kasganj 111 Kasganj (NPP) 101277 32000 32 2
59 Kaushambi 112 Manjhanpur (NP) 16457 2025 18 0
60 Kushinagar 113 Padrauna (NPP) 49723 25000 25 3
61 Lalitpur 114 Lalitpur (NPP) 133305 50000 50 3
62 Maharajganj 115 Maharajganj (NPP) 33930 26500 27 1
63 Mahoba 116 Mahoba (NPP) 95216 37000 37 4

- 77 -
64 Mainpuri 117 Mainpuri (NPP + OG) 136557 84000 84 5
65 Mirzapur 118 Mirzapur-cum-Vindhyachal (NPP) 234871 58000 58 8
66 Pilibhit
119 Pilibhit (NPP) 127988 61000 61 4
120 Bisalpur (NPP) 73551 3400 10 3
67 Pratapgarh 121 Bela Pratapgarh (NPP) 76133 8010 8 1
68 Sambhal
122 Sambhal (NPP) 220813 37000 37 10
123 Chandausi (NPP) 114383 39000 39 4
69 Sant Kabir Nagar 124 Khalilabad (NPP) 47847 6100 6 0
70 Bhadohi (NPP) 125 Bhadohi (NPP) 94620 36000 36 5
71 Shamli
126 Shamli (NPP) 107266 43000 43 1
127 Kairana (NPP) 89000 10000 10 1
72 Shrawasti 128 Bhinga (NP) 23780 4950 5 0
73 Sidharthnagar 129 Siddharthnagar (NPP) 25422 25000 25 0
74 Sonabhadra 130 Sonbhadra (NPP) 36689 32000 32 0
75 Sultanpur 131 Sultanpur (NPP) 107640 76533 77 2
Total in a Month
31453923 14288488
15797 3033
Total in Six Month 94782 18198
VI) School Health Services
School health programme under NUHM will be an important component to provide not only the
preventive and curative services to children in overall health development of the urban
communities.
These 64 teams have been formed to implement the School Health Program on the basis of the
number of government primary schools and have not been adopted by all the districts, depending
upon their capacities.
Teams comprising of a Doctor, ANM/ GNM and an Ophthalmic Assistant who would be provided a
mobility support and a fund to undertake their identified activities to undertake the following major
services –
General health check-up including eye check-up and provision of free spectacles
Screening for various diseases
Referral to higher facilities
Distribution of IFA and de-worming tab
Team will visit to each primary school twice in a year (6 monthly) as per School health programme
guideline under NRHM. Report will be compiled at U-PHC level .
Innovation in School Health Programme in Lucknow: It is envisaged that the active
involvement of children in the program will enable them to be change agents for themselves as
well as communities by taking home good knowledge and practices in terms of preventive health

- 78 -
care activities. It is planned that children will be engaged through innovative and creative actions to
make the learning more entertaining and educative.
The programme also plans to involve children innovatively in preventive health care activities to
make them a change agent for themselves and their families and communities.
An activity called SEEKH (Systematic Effort to Ensure Knowledge on Health) will be implemented
in urban government primary schools for active involvement of children based on two way
education and learning package.
Process: To ensure participation of each and every child in proposed activity, the following
process and flow is planned for implementation:
A booklet on primary health information and good health practices will be developed for
school going children.
A school health team will be visit to school for health checkup which will distribute the
booklet to students of all the classes who will be required to read the booklet preferably in
45 minutes.
The reading will be followed by filling up a small questionnaire preferably in 15 minutes.
All the students participating in the activity will receive a badge with an attractive tagline.
The top scoring children will be awarded.
To demonstrate, this initiative will be implemented in select urban schools of Lucknow in
2013-14 and will then be replicated in other schools locally and in other cities.
VII) IEC/BCC Activities
National Urban Health Mission is new activity so it needs more IEC. To provide information
regarding health services and to change in health seeking behaviour in our target
population, strong BCC and IEC activities are required.
To implement the BCC action plan, State realizes the need of establishing a fully functional
IEC Bureau under Family Welfare Directorate and IEC cell at SPMU level. GM, NUHM will
coordinate with IEC/BCC cell under FW directorate and GM, IEC at SPMU level to
implement programmes related activities.
IEC activities at facility and community level:
Facility level: Budget for visibility of U-PHCs and printing of other IEC material has
proposed
Community level: Budget for printing of Safe Motherhood Booklet and MCP card and
other IEC material for communicable and non communicable disease has been proposed.

- 79 -
Budget for Wall painting of massage regarding NUHM at each AWC other prominent places
for convergence has been proposed.
Budget for NUHM hoarding ( 01 hoarding at 50,000 to 1,00,000 urban population) has been
proposed .
IEC strategy in Lucknow District:
Health indicators of people living in slums are poor. Demand generation IEC activities would be
designed specifically to facilitate behaviour change, particularly for adoption of family planning
methods as well as other maternal, child health and adolescent health behaviours that are directly
linked to RCH objectives. It is suggested that strategies would;
(a) Focus on IEC for behaviour change in RCH;
(b) Establish linkages, and if necessary, enhance selected activities of other schemes that
provide benefit to the project beneficiaries.
State HUP programme officer will support to develop a strategy for IEC/BCC based on the local
situation in Lucknow city. Private sector and NGO partnerships for IEC may also be promoted,
particularly where potential partners with skills and proven experience and credentials in IEC/BCC
are available. The IEC plans would especially focus on interpersonal or group communication
plans, include a description of expected behaviour change in different audience segments, and an
outline of an IEC plan, with benchmarks for monitoring implementation and estimated budget. IEC
plans would focus on building community awareness and knowledge enhancing skills to practice
healthy behaviours, and strengthening confidence to access health services.
The department needs to frame aggressive marketing strategies coupled with accessible, friendly
and quality health services to draw in more numbers in order to re-establish and counter the non-
public sector dominance in the urban health sector. The strategy thus drawn would include a
vibrant IEC plan designed specifically to generate demand with the support of existing cadres
which would facilitate change in practice and behaviour.
During the year, IEC strategies covering urban contexts would be developed, field tested and then
applied to cover RCH. The IEC plans should especially focus on interpersonal or group
communication which would include a description of expected behaviour change in different
community segments. For effective tracking its implementation, benchmarks and milestones
should be developed. Budget for IEC strategy has been proposed in Luknow city health plan.

- 80 -
10. Convergent Actions in NUHM
NUHM will promote both inter-sectoral as well as intra-sectoral convergence to complement
resources and efforts for higher population level impact. The convergent actions can be grouped
as:-
Coordination with existing state level health programs and schemes including State AIDS
Control Program
Convergence with other departments and ministries
Convergence with non-government and academic institutions
NRHM is supporting many programmes for heath improvements for rural populations; some of
these also provide benefits and services to the urban populations. These programs have detailed
program and financial guidelines, reporting formats and implementation and monitoring systems.
NUHM would aim to provide similar benefits to urban populations with a clear focus on health
indicators improvement. All programs at the city level will be integrated under the umbrella of the
city health plan. The programs that will be integrated include JSY, JSSK, RI, Family Planning,
Rashtriya Baal Swasthya Karyakram, Vitamin A supplementation program (BSPM), National
Disease Control Programs (RNTCP, IDSP, NVBDCP, NPCB etc.) under the umbrella of City
Health Plan are well integrated at all levels.The objective of convergence would be optimal
utilization of resources and ensuring availability of all services at one point (U-PHC) thereby,
enhancing their utilization by the urban population
NUHM would also strive to revitalize local health traditions and mainstream AYUSH to strengthen
the Public Health System at all levels like Co-location of an existing AYUSH dispensary in Urban
PHCs/CHCs, wherever feasible.
Coordination with the State AIDS Program will help target urban poor for creating awareness about
HIV/AIDS prevention and ensuring easy availability of condoms. Technical support will be sought
from SACS for training of nurses in counselling pregnant women for PPTCT of HIV infection and
high risk populations for HIV testing at the UPHCs. SACS support will be sought for orientation
trainings of ANMs and Medical Officer for HIV/AIDS prevention and RTI / STI diagnoses and
treatment. SACS will be called upon to provide technical support for setting up systems for rapid
diagnostics for RTIs/STIs and HIV / AIDS as appropriate at the UPHCs. Some of the UPHCs can
possibly be evolved to ART centres over time.

- 81 -
Convergence with other departments and ministries
Departments Urban Development and Urban Employment and Poverty Alleviation
Jawaharlal Nehru National Urban Renewal Mission
Jawaharlal Nehru National Urban Renewal Mission is being run by the Department of Urban
Development for providing better infrastructure and basic services to urban poor. There are two
schemes under its ambit Basic Services to the Urban Poor (BSUP) that strengthens provision of
better housing and water sanitation services to the urban poor. As environmental hygiene and safe
drinking water can play a crucial role in prevention of many communicable diseases NUHM will
work closely with these schemes at the state and city level. City level planning, implementation
and monitoring will involve this department closely and it has been included in the State Health
Mission, State Health Society and District Health Society. Similarly the City Development Plans
(CDPs) of JnNURM cities (Basic Services component) would also be taken into account for
avoiding duplication of efforts and resources. Under JnNURM at the city level as part of the City
development plans GIS based physical mapping of the slums is being undertaken. The City level
planning process would also leverage the GIS based mapping wherever completed. The
community centers being created under the Integrated Housing and Slum Development
Programmes (IHSDP) will be used as sites for conducting fixed outreach session.
Rajiv Awas Yojana (RAY)
Rajiv Awas Yojana aims at creating a slum free India by bringing existing slums within the formal
system and enabling them to avail the same level of basic amenities as the rest of the town. GIS
based physical mapping of the slums and the spatial representation of the socio-economic profile
of slums (Slum MIS) is being undertaken under RAY. This will be useful for detailed city planning
and convergent action.
Department of Urban Employment and Poverty Alleviation is running Swarn Jayanti Shahri Rozgar
Yojana (SJSRY) in Uttar Pradesh. The community level structures being proposed under NUHM
can be strengthened by effectively aligning them with the SJSRY structures such as Community
organizer, Neighbourhood Groups, Development of Women and Children in Urban Areas
(DWCUA) Groups and Neighbourhood Committees (NHC).
Department of Child Development and Nutrition
Department of Child Development and Nutrition leads the Integrated Child Development Services
Scheme which is the largest government program for addressing malnutrition. The state of Uttar

- 82 -
Pradesh has sanctioned the State Nutrition Mission and is committed to improving maternal and
child nutrition indicators in the state. NUHM at the state and city level will collaborate actively at
different levels for convergent actions:
Community Level
UHNDs will be organized at the AWCs by ASHAs, AWWs and ANMs with support of MAS
ASHAs and AWWs can make joint home visits for counselling for maternal and child health
ASHAs, MAS and AWWs can hold joint meetings with pregnant and lactating women and
women with children under 3 years to discuss care and nutrition during pregnancy,
breastfeeding and IYCF
AWW , MAS and ASHA can work together to update household level information for
targeted home visits for behaviour change
City/District Level
District level counterparts of the Department of Child Development and Nutrition are already
members of the DHS. NUHM will support regular analysis of urban nutrition indicators and review
of activities to improve the same.
State Level
Department of Child Development and Nutrition is already a member of the State Health Society.
Officials of SPMU, Directorate of Family Welfare and Department of Child Development and
Nutrition will coordinate regularly for planning for improvement for urban maternal and child
nutrition indicators. Development partners with technical expertise will be included for support.
Necessary guidelines, tools and monitoring formats and mechanisms as needed will be developed
/adapted for urban areas and shared with city level NUHM staff.
Department of Primary Education
State level convergence will be sought with the Department of Primary Education to cover the
schools with the following activities:
Health education activities
Health check-ups of school children and treatment of minor ailments
Referral for any diseases requiring specialised care or corrective surgery
Training of teachers for early diagnosis of symptoms

- 83 -
Creating awareness about safe drinking water and environment sanitation among children
and school authorities
Schools in and near the slums will be covered on priority basis and more frequently if needed.
Urban Health Coordinator will be responsible for coordinating the school health activities in their
area.
Member of Parliament Local Area Development Scheme (MPLADS):
Minister-in-charge for the district is chairperson of the District Health Mission. All Members of
Parliament (MPs) and Members of Legislative Assemblies (MLAs) of the constituency are
members of the District Health Mission. All these elected representatives and municipal councillors
(MCs) can take a leadership role in improving urban health and can specially help in allocating
freehold land to the health department for UPHCs and UCHCs.
Role of Urban Local Bodies
NUHM envisions Urban Local Bodies (ULB) to be active partners in planning and management of
the urban health programmes. The Draft National Slum Policy reinforces the emphasis in the 74th
Constitutional Amendment on de-centralized participatory structures such as Ward Committees
and Municipal Planning Committees in support of local initiatives by community groups. This Policy
stresses, inter-alia, a priority role for local bodies in the discharge of functions listed in the Twelfth
Schedule viz:
Slum improvement and up-gradation,
Urban poverty alleviation,
Regulation of land use and construction of buildings,
Provision of urban amenities, and
Public health and sanitation including provision of water supply.
The improvement of physical infrastructure and services such as water supply, drainage and
sanitation will support the improvement of health status of urban poor. Urban Local Bodies are
important stakeholders in NUHM and are members of the District Health Society. ULBs in some
cities are running health facilities and have some health personnel working with them. City level
planning will involve ULBs closely for up-gradation of ULB owned and run health facilities to
UPHCs and UCHCs as appropriate. ULB owned buildings/ land will be co-opted for building new
UPHCs and UCHCs. ULBs have a major role in waste disposal, which is an important health issue
for urban areas. ULBs have been the lead for prevention of vector borne diseases by controlling
vector breeding by fogging.

- 84 -
Minority Affairs: Convergence with Multisectoral Development Programme Scheme:
Under this scheme districts have been identified which are relatively backward and falling behind
the national average in terms of socioeconomic and basic amenities indicators. Districts specific
plans have been prepared for provision of better infrastructure for school, sanitation, housing
,drinking water and electricity supply, so in the town covered under MsDP, NUHM will leverage the
health infrastructure and Anganwadi Centre created under this programme for provision of health
care services to the urban poor population.
11. Public Private Partnership
As evident from various studies, India’s public sector health services need major reforms that
require active support from private and social sector. There is considerable existing capacity
among private providers, which needs to be explored and operationalized. Public Private
Partnership (PPP) is clearly a new avenue which is today increasingly being acknowledged by the
government as an area of cooperation for developing a healthy society as a whole.
Many states in India such as Tamil Nadu, Karnataka, Andhra Pradesh and West Bengal as well as
Uttar Pradesh have successfully implemented PPP Models in Health Sectors. Government of
India in its various policy and plan documents (e.g. National Health Policy, 2002; National
Commission on Macroeconomics in Health, 2005, Eleventh Five Year Plan 2007-2012, High Level
Expert Group on Universal Health Care, 2011), has emphasized the importance by stating the
following:
Desire to utilize private resources for addressing public health goals.
Liberalization of the insurance sector to provide new avenues for health financing.
Redefining the role of the state from being just a provider, to being both provider and a
financer of health services.
Various National programmes as well as National Rural Health Mission (NRHM) further reiterated
the need for partnership with the private sector at the community level and develop specific
guidelines for engaging the private sector.
The government hopes that partnership with the private sector would help in:
Improving health infrastructure in the state (e.g. investment in high end diagnostic facilities),
Improving the availability of human health resources (e.g. medical colleges, training of
nurses and paramedical staff),

- 85 -
Strengthening quality and capacity of public health system to deliver services (e.g. capacity
building, co-location of services),
Improving access to Government schemes and provides financial protection to the poor
(from catastrophic illness).
The state health department has a rich experience of implementing several schemes in
collaboration with NGOs for providing curative, promotional and preventive health services under
UPHSDP phase 1. These include:
Contracting out of non-clinical services (initiated under UPHSDP-1)
Hospital Waste Management (under UPHSDP-1 and NRHM)
Voucher Scheme for Maternal Health Services (under SIFPSA)
Mobile Health Clinic for remote areas of the state to be initiated by NRHM
Emergency Medical Transport Services initiated by NRHM etc.
The state intends to strengthen the existing partnerships with the private sector as well as expand
the scope of services that could be brought under the ambit of Public-Private Partnership. The
institutional system will also strengthen implementation of existing regulations related to the private
sector through providing a policy driven, transparent and efficient administrative support that would
reassure the private sector that PPP is a long term strategy in health sector that would protect the
interests of all stakeholders.
The main objectives of the PPP (Public Private Partnership) are:
Promote harmonious and planned growth of the private sector that would be accountable in
delivering affordable, quality health services in the state.
Create conducive climate for private sector investment in creating and augmenting health
infrastructure in an accelerated manner.
Leverage the strengths of the private sector to overcome the weaknesses of the public health
system in delivering quality health services to the people of the state, particularly the poor and
the underserved sections of the state.
Leverage the technical and managerial capacity of the private sector to provide cost effective
tertiary care services, either from their own premises or by managing government hospitals.
Leverage the strengths of the NGOs and community based organisations to provide a range
of preventive, promotional services at the primary levels.
Leverage the strengths of indigenous practitioners to improve referral links, and inculcate
rational clinical practices.

- 86 -
The National Urban Health Mission explicitly stated “In view of presence of larger number of
private (for profit and not for profit) health service providers in urban areas, public – private
partnerships particularly with not for profit service providers will be encouraged.
NUHM at the state level will also support innovations in public health to address city and
population specific needs. However, clear and monitorable Service Level Agreements (SLAs) will
have to be developed for engagement with Private Sector.
Broad norms for engaging private partners and NGOs in Strengthening Health Services for the
Urban Poor in the state:
Strengthen the delivery of services; Mission will hire the specialist doctors to provide
special health services at U-PHC or outreach based on needs on reimbursement basis
Potential private partners should be identified and tapped optimally to improve the
quality and health status of urban poor, by capitalizing on the skills of potential partners,
encouraging pooling of resources, and supplementing Government's efforts and resources.
Appropriate mechanisms for partnering (or entering into agreement) with the private sector
need to be considered, including accreditation methods (for ensuring quality), memorandum of
understanding, reporting and monitoring systems etc.
Considerable existing capacity among private providers (NGOs, medical practitioners and
other agencies), which would be explored, fruitfully exploited and operationalised.
Presence of active NGOs in several cities in the state presents a unique and powerful
opportunity to extend the reach of health services through various ways of outreach and
enhancing utilization by raising community demand for the existing services.
To increase demand and utilization, involving NGOs in outreach and referral in the urban
poor settings would be a viable option.
Establishment of regional diagnostic centers through public private partnerships (PPP)
To develop systems of accrediting private practitioners for public health goals. These
could be for a range of services. Need for transparency in developing protocols, and costs.
Community organizations to exercise key role in roll-out of such partnerships. Non
Governmental Organizations to build capacity in community organizations to handle such
partnerships
Strengthening preventive and promotive action for improved health and nutrition and
prevention of diseases at the community level, the State would also provide a framework for
pro-active partnership with NGOs/civil society groups

- 87 -
Corporate Social Responsibility (CSR)
Corporate Social Responsibility (CSR) implies that companies go beyond commercial obligations
and invest in developmental projects for social, economic and environmental returns.
The Government of India has always been recommending that the corporate sector should play a
proactive role in promoting inclusive growth and social and economic development. In this context,
The Ministry of Corporate Affairs and the Department of Public Enterprises, Government of India
has recently issued guidelines for CSR for the corporate sector and public sector enterprises
(PSUs), respectively. To ensure wider coverage of health services, the Government of India has
been encouraging the participation of the corporate sector in these efforts. Indeed, the Eleventh
Plan specifically recognizes the contribution of the private sector in providing all levels of health
care through partnerships with the government.12
The government has recommended the allocation of a specific proportion of a company’s net profit
as the budget for CSR activities; as a result, it is expected that corporate sector enterprises would
have large funds available for CSR programs.
Under the recently passed Companies Act 2012, the Government of India has now mandated
every company having net worth of rupees of five hundred crore or more, or turnover of rupees
one thousand crore or more, or net profit of rupees five crore or more during any financial year, the
following provisions under the corporate social responsibility, that: :
Shall constitute a Corporate Social Responsibility Committee and formulate a CSR policy
Shall ensure that the company spends, in every financial years, at least two percent of the
average net profits of the company made during the three immediately preceding financial
years
Shall give the preference to the local area and area around it where it operates
Activities which may be included by companies in their corporate social responsibility policies:
o Eradicating extreme hunger and poverty
o Promotion of education
o Promoting gender equality and empowering women
o Reducing child mortality and improving maternal health
o Combating human immunodeficiency virus, acquired immune deficiency syndrome,
malaria and other diseases
o Ensuring environmental sustainability
12
ROLE OF THE CORPORATE SECTOR IN PROMOTING FAMILY HEALTH IN UTTAR PRADESH;RAMNIK AHUJA, DEBASIS BHATTACHARYA, ROOPALI BHARGAVA AND DEEPIKA GANJU; http://medind.nic.in/jah/t10/s1/jaht10s1p119.pdf

- 88 -
o Employment enhancing vocational skills
o Social business projects
o Contribution to the Prime Minister’s National Relief Fund or any other fund set up by
the Central Government or the State Governments for socio-economic development
and relief and funds for the welfare of the Scheduled Castes, the Scheduled Tribes,
other backward classes, minorities and women; and
o Such other matters as may be prescribed
The above mandate provides ample opportunities to MoHFW, and State Governments to for
leveraging CSR funds and partner with the private and public enterprises to address the Health of
the Urban Poor under the aegis of NUHM at state and city level.
Further, the industry associations such as the Confederation of Indian Industry (CII), the
Federation of Indian Chambers of Commerce and Industry (FICCI), the Associated Chambers of
Commerce and Industry (ASSOCHAM) and Indian Industries Association (IIA) can play a key role
in bringing together these CSR efforts to improve the health and health determinants in Uttar
Pradesh.
It is noticeable that there are about 1,700 industries located across the state. Of these, 62 are
large-scale, 366 are medium-scale and 1,281 are small-scale industries (Large-scale industries:
turnover of Rs. 1,000 million or more, medium-scale industries: turnover of Rs. 50 million-1,000
million, small-scale industries: turnover between Rs. 1 million - 50 million)13
These companies will potentially be roped in to complement state efforts to promote health
services in urban areas either by developing joint health initiatives or strengthening the state health
services at primary level in the surrounding areas of establishment. Partnering with the corporate
sector in Uttar Pradesh can be immensely beneficial in improving health outcomes because they
can cover large populations in their surrounding areas by their resources through linkages with
existing government health services and they have the potential to leverage the funds to generate
infrastructure support as well as deliver services.
12. City Health plans
Decentralized district-based health planning has been done in Uttar Pradesh because of the large
inter-district variations. In city health plan urban population of census 2011 is being used and
Urban slum population from DUDA , NPSP (HRA household)etc. In the absence of vital data at the
district level, the State level estimates are being used for formulating district level plans as well as
13
Government of Uttar Pradesh, 2008: Infrastructure and Industrial Development Department

- 89 -
setting the milestones thereof. At present, none of the Surveys provide estimates of core vital
indicators on fertility and mortality at district level. The National Family Health Survey (NFHS-3,
2005-06) conducted with periodicity of five years focuses on urban and urban poor and these data
are old need to be updated for proper planning .There has, therefore, been a surge in demand
from various quarters, in recent years, to generate timely and reliable statistics at the district level
for informed decision making in the health sector.
13. Training
ULB, Medical and Paramedical staff, Urban ASHAs and MAS will be trained. The trainings will
have to be followed by periodic refresher trainings to keep these frontline health workers
motivated. NUHM will engage with development organisations to develop the training modules and
facilitate the trainings.
14. Monitoring & Evaluation
The M&E systems would also capture qualitative data to understand the complexities in health
interventions, undertake periodic process documentation and self evaluation cross learning among
the Planning Units to be made more systematic.
The Monitoring and Evaluation framework would be based on triangulation of information. The
three components would be Community Based Monitoring, HMIS for reporting and feedback and
external evaluations.
15. Base line survey:
The NUHM aims to strengthen the bridge between households, communities, and the
government’s health and health determinant provisioning system primarily by mobilizing families
and communities to more fully engage to avail the services mandated under the mission, to
improve household and community health practices, ultimately leading to improved key
reproductive, maternal, neonatal and child health (RMNCH) outcomes.
To set benchmarks and assess achievement during the life cycle of the program the state would
conduct a baseline household health survey in all the 131 identified and listed cities

- 90 -
Objective of the baseline
1. To assess following prevalent behaviours and practices in various RMNCH and WASH
(water, sanitation and hygiene) issues and preferred choice of providers in seeking
treatment
2. To understand the health risks and vulnerability situation among urban poor
3. To understand the context of the program for expected behaviour change through
addressing those constructs
4. To provide evidence to modify program design and re-strategize for better outcomes, if
necessary
The baseline would take into account the Standard Living Index (SLI) with logical representation
from slum and non-slum communities and would allocate weight age specifically to household
factors and to women and children.
The following factors would be considered in covering the target population -
1. The expected baseline value of key behavioural indicators
2. Possibility to detect the magnitude of desired change
3. Confidence level
4. Statistical power
5. Design effect
Although a deeper and concerted view would be taken at the time of intricate planning before the
baseline is conducted centrally by the state, a logical sample size (considering factors of households
and women & children) has been drawn for estimating the numbers and costs thereof –
Pop. Range Sample
Size
@ Rs. Cost per
city
Nos. of cities Amount (Rs.)
Over 5 lakhs 2,000 1,500 30,00,000 16 4,80,00,000
Below 5 lakhs 1,500 1,500 22,50,000 115 25,87,50,000
Total 131 30,67,50,000

- 91 -
16. State level indicators & targets
Processes & Inputs
Indicators Baseline
number
Number
Proposed
(2013-14)
Number
Achieved
(2013-14)
1. Number of Mahila Arogya Samiti (MAS) to be formed 0 14560
2. Number of MAS members to be trained 0 145600
3. Number of Accredited Social Health Activists
(ASHAs) to be selected and trained 0 7280
4. Number of ANMs to be recruited 3020
5. Number of UPHCs to be made operational 0 638
6. Number of UCHCs to be made operational 0 8
7. No. of RKS to be created at UPHC and UCHC 0 638
8. Number of city PMUs to be established
(personnel recruited and office space provided)** 0 75
9. Number of cities to be covered under NUHM 0 131
10. Population to be covered under NUHM** 0 31418465
11. No. of slums to be covered under NUHM 0 -
12. Slum population to be covered under NUHM** 0 14288488
* Year 2013-14 being the baseline year, the indicators for these NUHM components would be
zero.
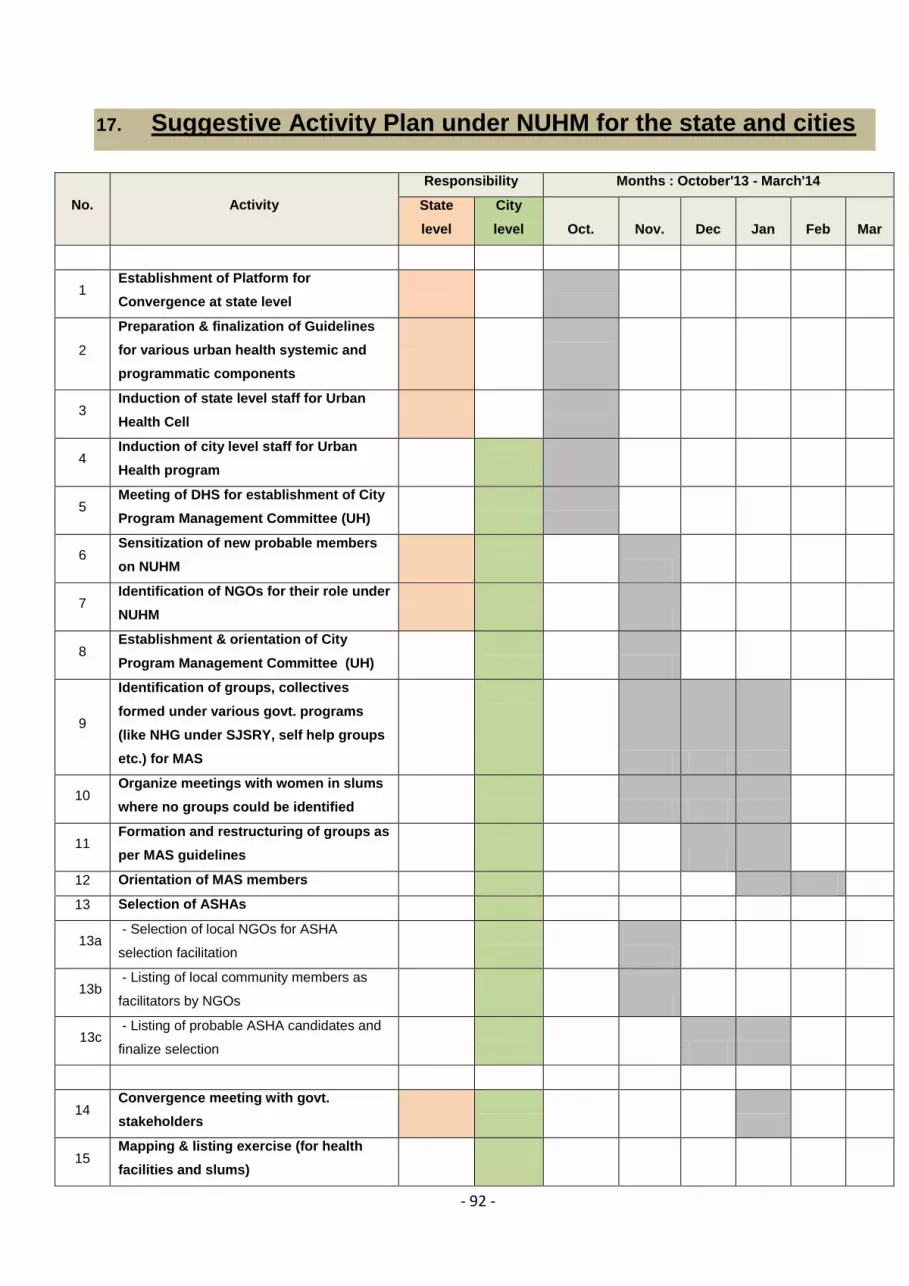
- 92 -
17. Suggestive Activity Plan under NUHM for the state and cities
No. Activity
Responsibility Months : October'13 - March'14
State
level
City
level Oct. Nov. Dec Jan Feb Mar
1 Establishment of Platform for
Convergence at state level
2
Preparation & finalization of Guidelines
for various urban health systemic and
programmatic components
3 Induction of state level staff for Urban
Health Cell
4 Induction of city level staff for Urban
Health program
5 Meeting of DHS for establishment of City
Program Management Committee (UH)
6 Sensitization of new probable members
on NUHM
7 Identification of NGOs for their role under
NUHM
8 Establishment & orientation of City
Program Management Committee (UH)
9
Identification of groups, collectives
formed under various govt. programs
(like NHG under SJSRY, self help groups
etc.) for MAS
10 Organize meetings with women in slums
where no groups could be identified
11 Formation and restructuring of groups as
per MAS guidelines
12 Orientation of MAS members
13 Selection of ASHAs
13a - Selection of local NGOs for ASHA
selection facilitation
13b - Listing of local community members as
facilitators by NGOs
13c - Listing of probable ASHA candidates and
finalize selection
14 Convergence meeting with govt.
stakeholders
15 Mapping & listing exercise (for health
facilities and slums)

- 93 -
15a - Mapping of all urban health facilities
(public & pvt.) for services
15b - Mapping of slums (listed and unlisted)
15c - House listing of slums/ poor settlements
16 Planning for strengthening of health
facilities/ services
- Health Facility Assessment (of public
facilities including listing of public facility
wise infra & HR requirement)
17 Baseline survey of urban poor/ slums
(KFAs)
(to determine vulnerability, morbidity pattern
& health status)
18 Meetings of RKS for all the public health
facilities under NUHM
19
Identification of alternate/ suitable
locations for UPHCs under various urban
devp. Programs
20 Strengthening of public health facilities
- Selection, training and deployment of HR
in pub. health facilities
21 IEC activities
22 Outreach camps & UHNDs (from existing
UHPs)
23 Empanelment of Private Health Facilities
for health care provisioning
24 Involvement of CSR activities

- 94 -
18. Proposed Health Care Delivery System in Urban Areas of the State
Services Community level U-PHC U-CHC
U-ASHA & MAS Urban Health & Nutrition
Day(UHND)
Outreach camps
Maternal Health Counselling & behaviour
changes , mobilization for
ANC care
ANC registration, ANC care,
identification of danger sign
and referral for institutional
delivery and follow up
ANC registration, ANC care,
identification of danger sign
and referral for institutional
delivery and follow up
ANC registration, ANC
care, identification of
danger sign and referral
for institutional delivery
and follow up, PNC care
initial management of
complicated delivery
cases and referral,
Delivery (normal and
complicated ), management
of complicated maternal and
gynae cases , hospitalization
& surgical intervention
including blood transfusion
Child care Home based new born care,
postnatal visit, counselling for
newborn care, exclusive
breast feeding ,
complementary feeding ,
identification of danger signs,
referral and follow-up,
distribution of ORS
counselling for newborn
care, exclusive breast
feeding , complementary
feeding , identification of
danger signs, referral and
follow-up, distribution of
ORS, immunization
counselling for newborn care,
exclusive breast feeding ,
complementary feeding ,
identification of danger signs,
referral and follow-up,
distribution of ORS,
immunization
Diagnosis and treatment
of childhood illnesses ,
referral of acute and
chronic illness ,
identification and referral
of neonatal sickness
Management of complicated
paediatric/neonatal cases,
hospitalization, surgical
intervention, blood
transfusion
Family Planning Counselling & distribution of
OCPs/CCs/ referral for
sterilization, follow-up of
contraceptives related
complication
Counselling & distribution of
OCPs/CCs/ referral for
sterilization, follow-up of
contraceptives related
complication
Counselling & distribution of
OCPs/CCs/ referral for
sterilization, follow-up of
contraceptives related
complication
Distribution of OCPs/CCs
,IUD insertion , referral for
sterilization, management
of contraceptives related
complication
Sterilization operation ,
fertility treatment
RTI/STI Referral , community level
follow-up for ensuring
adherence to treatment
regime of cases undergoing
Referral , community level
follow-up for ensuring
adherence to treatment
regime of cases undergoing
Referral , community level
follow-up for ensuring
adherence to treatment
regime of cases undergoing
Symptomatic diagnosis
and primary treatment and
referral of complicated
cases
Management of complicated
cases , hospitalization

- 95 -
treatment treatment treatment
Nutrition deficiency
disorder
Promotion of exclusive breast
feeding, complementary
feeding, nutrition supplement
to identified children and PW ,
promotion of iodized salt
Promotion of exclusive
breast feeding,
complementary feeding,
nutrition supplement to
identified children and PW ,
promotion of iodized salt,
height and weight
measurement, distribution of
therapeutic dose of IFA
Promotion of exclusive breast
feeding, complementary
feeding, nutrition supplement
to identified children and PW ,
promotion of iodized salt,
height and weight
measurement, distribution of
therapeutic dose of IFA,
screening of malnourished
children and treatment and
referral
Diagnosis and treatment
of seriously deficient
patient , referral of acute
deficiency
Management of acute
deficiency cases ,
hospitalization , treatment ,
rehabilitation of severe
under nutrition
National disease
control programme
Counselling for practices for
vector control and protection
Counselling for practices for
vector control and protection
Counselling for practices for
vector control and protection,
slide collection , testing
Diagnosis and treatment ,
referral of terminally ill
cases
Hospitalization and
treatment of terminally ill
cases
Chest infection
(TB/Asthma )
Symptomatic search and
referral for check-up
Symptomatic search and
referral for check-up,
ensuring adherence to DOTs
, other treatment
Symptomatic search and
referral for check-up, ensuring
adherence to DOTs , other
treatment
Diagnosis and treatment ,
referral of complicated
cases
Management of complicated
cases
Cardiovascular
disease
Symptomatic search and
referral
BP measurement ,
symptomatic search and
referral , follow-up of under
treatment patients
BP measurement ,
symptomatic search and
referral , follow-up of under
treatment patients
Diagnosis and treatment ,
referral of complicated
cases
Management of complicated
cases
Diabetes Symptomatic search and
referral
Blood/ urine sugar test ,
Symptomatic search and
referral
Blood/ urine sugar test ,
Symptomatic search and
referral
Diagnosis and treatment ,
referral of complicated
cases
Management of complicated
cases
Cancer Symptomatic search and
referral
Symptomatic search and
referral
Symptomatic search and
referral, first aid
Identification and referral,
follow-up of under
treatment patie
Diagnosis and treatment
,hospitalization if needed

- 96 -
Trauma care (burns
and injuries )
First aid and referral First aid and referral First aid emergency ,
resuscitation ,
Case management and
hospitalization ,
physiotherapy and
rehabilitation
Other surgical
intervention
Not applicable Not applicable Not applicable Identification and referral Hospitalization and surgical
intervention
Other support
services –IEC/BCC,
counselling
IPC , wall writing , wall
posters , women groups
discussion, individual and
group counselling
Urban Health and Nutrition
day individual and group
counselling
Outreach health camps / fairs
/ special screening camps
individual and group
counselling
Distribution of health
education material patient
and attendant counselling
Distribution of health
education material patient
and attendant counselling
Personal and social
hygiene
IEC on hygiene , community
mobilization for cleanliness
drives, disinfection of water
source
IEC on hygiene , community
mobilization for cleanliness
drives, disinfection of water
source
IEC on hygiene , community
mobilization for cleanliness
drives, disinfection of water
source
Not applicable Not applicable
Diagnostic facility Not applicable Blood and urine test by
disposable kit
Blood and urine test by
disposable kit
Basic laboratory test Basic and specific laboratory
test, X-rays and Ultrasound
Vital Events
reporting
Applicable Applicable Applicable Applicable Applicable
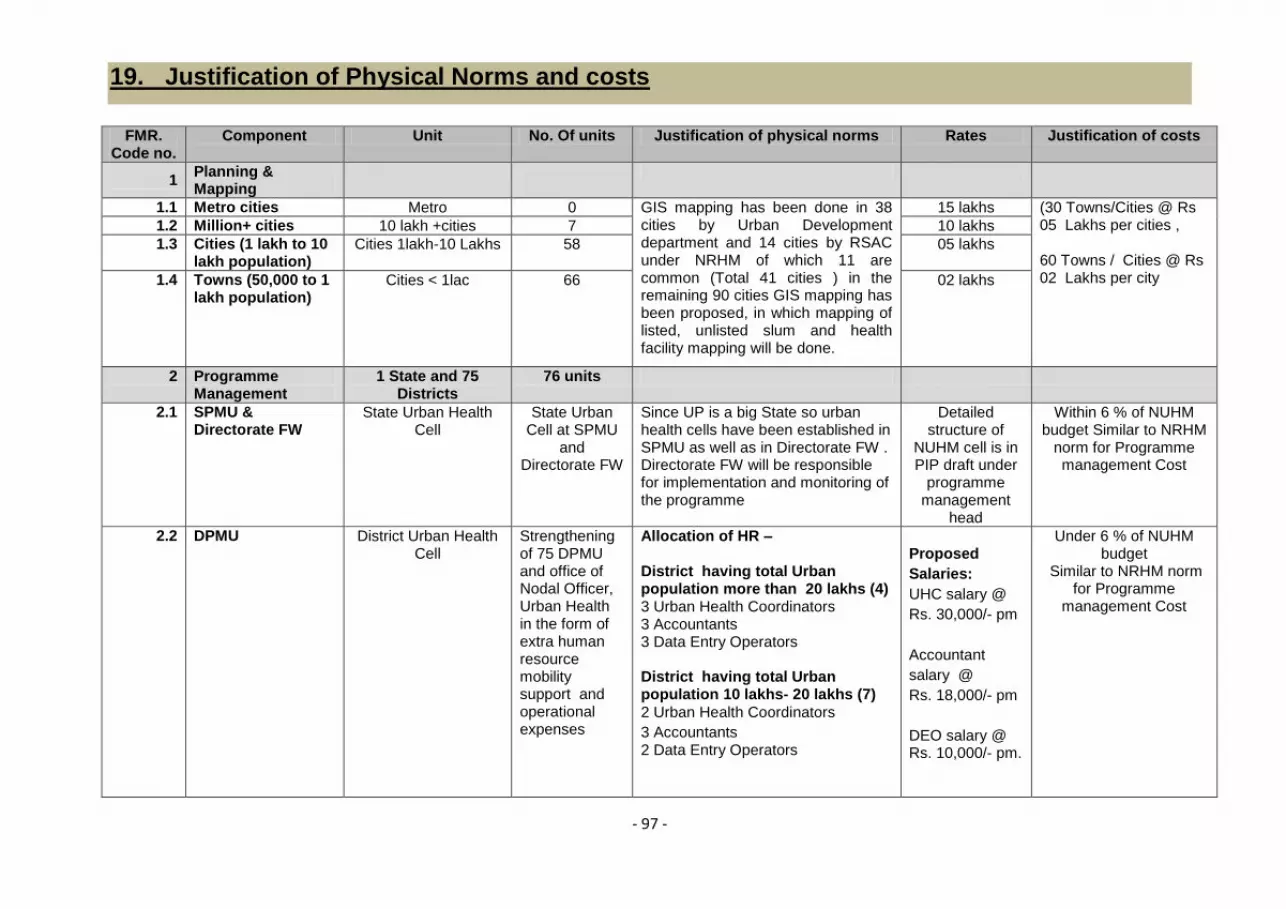
- 97 -
19. Justification of Physical Norms and costs
FMR. Code no.
Component Unit No. Of units Justification of physical norms Rates Justification of costs
1 Planning & Mapping
1.1 Metro cities Metro 0 GIS mapping has been done in 38 cities by Urban Development department and 14 cities by RSAC under NRHM of which 11 are common (Total 41 cities ) in the remaining 90 cities GIS mapping has been proposed, in which mapping of listed, unlisted slum and health facility mapping will be done.
15 lakhs (30 Towns/Cities @ Rs 05 Lakhs per cities , 60 Towns / Cities @ Rs 02 Lakhs per city
1.2 Million+ cities 10 lakh +cities 7 10 lakhs
1.3 Cities (1 lakh to 10 lakh population)
Cities 1lakh-10 Lakhs 58 05 lakhs
1.4 Towns (50,000 to 1 lakh population)
Cities < 1lac 66 02 lakhs
2 Programme Management
1 State and 75 Districts
76 units
2.1 SPMU & Directorate FW
State Urban Health Cell
State Urban Cell at SPMU
and Directorate FW
Since UP is a big State so urban health cells have been established in SPMU as well as in Directorate FW . Directorate FW will be responsible for implementation and monitoring of the programme
Detailed structure of
NUHM cell is in PIP draft under
programme management
head
Within 6 % of NUHM budget Similar to NRHM
norm for Programme management Cost
2.2 DPMU District Urban Health Cell
Strengthening of 75 DPMU and office of Nodal Officer, Urban Health in the form of extra human resource mobility support and operational expenses
Allocation of HR –
District having total Urban population more than 20 lakhs (4) 3 Urban Health Coordinators 3 Accountants 3 Data Entry Operators District having total Urban population 10 lakhs- 20 lakhs (7)
2 Urban Health Coordinators
3 Accountants 2 Data Entry Operators
Proposed
Salaries:
UHC salary @
Rs. 30,000/- pm
Accountant
salary @
Rs. 18,000/- pm
DEO salary @ Rs. 10,000/- pm.
Under 6 % of NUHM budget
Similar to NRHM norm for Programme
management Cost

- 98 -
District having total Urban
population 1 lakh -10 lakhs (50)
1 Urban Health Coordinator
1 Accountant
1 Data Entry Operator
District having total Urban
population of towns covered
under NUHM below 1 lakh (14)
1 Data Entry Operator
Incentive to DPM @ Rs 8000/- pm for preparatory activity of NUHM Rs 25000/-pm for hired vehicle for UHC
2.3 City PMU Not proposed
3 Training & Capacity Building
3.1 Orientation of Urban Local Bodies (ULB)
Metro cities Metro 0 As per census 2011 cities/ towns population orientation in all 131 cities will be done
Rs 5 lakhs given in PIP framework
Million+ cities 10 lakh +cities 7 Rs 3 lakhs
Cities (1 lakh to 10 lakh population)
cities 1-10 Lakhs 56 Rs 1 lakh
Towns (50,000 to 1 lakh population)
Cities < 1lac 68 Rs 0.50 lakh
3.2 Training of ANM/ paramedical staff
ANMs and Staff Nurses (Govt and contractual )
4,466 ANMs and Staff Nurses
(2 Staff Nurses and 5 ANMs per
U-PHC)
Modules will be prepared and training will be conducted on these modules
Rs 5000 per person per year
given in PIP framework
3.3 Training of Medical Officers
Medical officer (Govt and contractual )
1276 Modules will be prepared and
training will be conducted on these
modules
Rs 10000 per person per year
given in PIP framework
3.5 Orientation of MAS A group of 10-12 Women from the community per 50- 100 slum household
14560 Modules will be prepared and
training will be conducted on these
modules
Rs 10000 per MAS per year
given in PIP framework

- 99 -
3.6 Selection & Training of ASHA
Per 200-500 slum household
7280 Modules will be prepared and training will be conducted on these module
Rs 10000 per ASHA per year
given in PIP framework
3.7 Other Trainings/Orientations
3.7.1 Stakeholders Workshop for Orientation about NUHM
DUDA, Local Body, ICDS, Education
,NGOs etc
131 Towns/ cities in 75 Districts
All DHQs and towns/cities Rs 1,00,000 for District HQ and Rs 10,000 for
Town /City
Whole day workshop along with technical sessions
3.7.2 Quarterly Multi-sectoral convergence Meeting
DUDA, Local Body, ICDS, Education
,NGOs etc
131 Towns/ cities in 75 Districts
All DHQs and towns/cities Rs 10,000 for DHQ and
Rs 5,000 for Towns/cities
Quarterly Multi-sectoral planning and review meetings
3.7.3 Launch of NUHM 75 districts 75 districts Rs 1,00,000 per District
4 Strengthening of Health services
4.a Human resource HMIS / MCTS operator, one for 1
UPHC.
638 U-PHCs 1 HMIS/MCTS DEO on each U-PHC for data feeding & reporting
Rs 10,000 pm As per NRHM norms
4.b Infrastructure One Computer System ,data card ,storing disk and
printer
638 U-PHCs One Computer System along data card ,storing disk , printer, Computer table, Computer chair, one for 1UPHCs to be used for HMIS / MCTS data entry
Rs 70,000 per U-PHCs one time
Approximate cost under NRHM
4.1 Outreach services/camps/UHNDs
4.1.1 UHNDs 01 UHND per month on AWC (Aganwadi
centre )
15797 UHNDs per month
ANMs will perform outreach services on each AWC, if AWC are not in city she will conduct 1 Outreach session per month to cover about 1000 slum population
Rs 1500 per UHND
This includes the cost towards tentage and IEC
4.1.2 Special outreach camps in slums/ vulnerable areas
One outreach camp per 10,000 urban
population per month
3033 sessions per month
Special screening camp and mobile camp to unreached areas
@ Rs.10,000 per outreach camp.
Stated in PIP framework (this include hiring of Doctor, paramedical,
Drugs, IEC and mobility to team)

- 100 -
4.2 ANM/LHV
4.2.1 Salary support for ANM/LHV
05 ANM per U-PHC 3020 ANMs Outreach camp & UHND , she will cover 10,000 urban population
Rs 10,000 per month
as per approved norms under NRHM
4.2.2 Mobility support for ANM/ LHV
157 Govt. ANMs and 3020 are
Contractual ANMs
3177 Mobility support to ANM Rs 500/month per ANM
all ANMs contractual as well as on government payroll. (as in PIP frame work)
4.3 Urban PHC (UPHC)
4.3.1 Renovation/up-gradation of existing facility to UPHC
4.3.1.1 For Government owned buildings
Renovation of Govt. Urban Health Posts to upgrade to a U-
PHC (Health , DUDA, Nagar
Nigam , Labour )
119 (52 Health Department and 67 from DUDA, Nagar Nigam & Labour deptt.etc)
As per GoI guideline Rs 10,00,000 (one time)
one time expenditure for building renovation
(as in PIP frame work)
4.3.1.2 For Equipments For each U-PHC (Govt. and under
NRHM)
638 UPHCs As per need according to IPHS norm
Rs 3,00,000 per U-PHC
one time activity for UPHCs for purchase of
equipments
4.3.2 Building of new UPHC
Not proposed
4.3.3 Operating cost support for running UPHC (other than untied grants and medicines & consumables)
Rs.20 lakhs per annum per UPHC
As per norms given in framework
4.3.3.1 Human Resource
4.3.3.1.1 MO salary 02 M.B.B.S doctor at each U-PHC
1203 MOs on contractual and
73 MOs from Govt.
(after excluding the no of Govt. Medical Officer who are posted in
UHPs )
2 MOs per UPHC @ Rs 36,000 pm
as per NRHM norms
4.3.3.1.2 Salary of paramedical & nursing staff (Staff Nurse/ Lab
02 Staff Nurses , 01 Pharmacist ,
01 Lab Technician at each U-PHC
638 UPHCs
(after excluding the no. of Govt. Workers who are posted in UHP )
2 Staff Nurses per UPHC @ Rs 16,500 pm, 1 Pharmacist per
as per NRHM norms

- 101 -
Technician/ Pharmacist/ Other)
UPHC @ Rs 16,500 pm; 1 Lab Tech. @ Rs 11,880 pm
4.3.3.1.3 Salary of support staff (non clinical staff)
3 Support staff for 1 UPHC
638 UPHCs
(after excluding the no of Govt. Worker who are posted in UHPs )
Rs 5,000 pm per support staff
as per NRHM norms
4.3.3.1.5 Office Expenses For each UPHC 638 UPHCs For electricity, water, telephone , stationary etc
Rs 10,000 pm as estimated
4.3.3.2 Others (e.g. hiring of premises/mobile PHC)
For rent of UPHC 519 UPHCs
(Govt. Running in rented building , under NRHM and new U-PHCs
Rs 15000 pm per U-PHCs for 519 UPHCs
It is estimated it will be calculated on DM circle
rate
4.3.4 Untied grants to UPHC
For each U-PHC 638 UPHCs Rs 2,50,000 per year
As per PIP framework
4.3.5 Medicines & Consumables for UPHC
For each U-PHC 638 UPHCs Rs.12,50,000per year per UPHC
As per PIP framework
4.4 Urban CHC (UCHC)
4.4.1 Capital cost support for new UCHC
Proposed in Lucknow
08 Urban Health Facilities
08 BMCs in Lucknow, for renovation, One Computer System along data card ,storing disk , printer, Computer table, Computer chair and other furniture for Data Assistant Operating cost for ambulances
(Computer with printer @Rs
70000 per BMC (Total 8
computer) + Operational and maintenance of
ambulance Rs. 15000/ per
month per ambulance for 8
ambulance.
4.4.2 Human Resource Specialists, Staff Nurses, Support staff, Driver etc.
Specialists and other staff
Additional support – Specialists 40 @ 48,000 pm Staff Nurses 24 @ Rs. 16,500 pm, Support staff 48 @ Rs. 5,000 pm, Drivers 24 @ Rs. 8500/-pm Data Assistant 8 @ Rs 10000/-pm Operational cost for Ambulance
As per NRHM norms
The BMCs will functions as U-CHCs

- 102 -
4.4.3 Untied grants for UCHC
08 BMCs Rs 5,00,000 As per PIP framework
4.4.4 Medicines & Consumables for UCHC
08 BMCs Rs 12,50,000 As per PIP framework
4.5 School Health Programme
4.5.1 Human Resource School health team 64 School health teams as
proposed in the city/ town PIPs
Max upto 2-3 teams depending upon the need; One team
consisting of 1 M.B.B.S doctor, 1 ANM/ GNM & 1 Ophthalmic
Assistant
1 doctor @ 36,000 pm 1 ANM/ GNM @ 10,000 pm & 1 Ophthalmic Assistant @ 11,880 pm
As per NRHM norms
4.5.2 Other School Health services
01 Hired vehicle to each team
64 one per School Health Team Rs 25,000 pm, As per NRHM norms
4.5.3 Drugs & consumable, contingency
64 For stationary , School Kit to team , drugs
Rs 8000/ per team per month
As proposed by Districts
4.6 IEC/BCC
4.6.1 ASHA Kit, Flip Book, Slum HIR, dress to ASHA, Bag, ID, Pen, handouts for community
To each U-ASHA (after selection and
training )
7280 7280 U-ASHAs Rs 2,000 per ASHA
one time to each U-ASHA
4.6.2 UPHC Citizen's charter, ED List, Immunization Schedule, Signage
To each U-PHC 638 638 U-PHCs Rs 20,000 per U-PHC
One time to each U-PHC
4.6.3 Safe Motherhood Booklet, MCP Card and other IEC material etc at U-PHC.
To each PW at the time of ANC
registration and IEC material to U-PHC for communicable
and non communicable
disease
9,59,000 PW and 638 U-PHC
1500 sets of MCP Card and Safe Motherhood booklet to be printed
per UPHC Safe Motherhood, Booklet, MCP Card and IEC material for U-PHC
(GoI Prototype of these booklet and Immunization card and IEC
material on communicable and non communicable diseases will be
provided to districts
Rs.37/- per booklet and MCP card Rs 30,000/- for per U-PHC for printing of other IEC material @ Rs 3/- per household on communicable and non
Booklet cost form open market , Card cost as
per NRHM norms (Districts will print these booklet and cards and IEC material either by
tender or by open market survey)

- 103 -
communicable diseases
4.6.4 Family Health Card To each slum household
28,34,817
Family Health Card to be printed for all slum households
(Prototype will be provided to districts)
Estimated cost Rs 10/- per card
Districts will print these cards either by tender or by open market survey
4.6.5 Communication material and wall painting at AWCs
For each AWC as convergence activity
15,069 Wall painting , poster on each AWC on massages of NUHM (Prototype will be provided to
districts)
Estimated cost Rs 1000/- per
AWC
Will be done according to approved Govt. norms
4.6.6 NUHM Hording For IEC and awareness
372 Hoarding 01 NUHM hoarding on 50000-100000 urban population
(Prototype will be provided to districts)
Rs 20,000/- per hoarding
Including printing & installation.
As per NRHM norms
5 Regulation & Quality Assurance
6 Community Processes
6.1 MAS/community groups
To each MAS as untied grant
14,560 As given in PIP framework Rs.5000 per year per MAS
As per PIP framework
6.2 ASHA (urban) For U-ASHA incentives
7,280 As given in PIP framework Approx. Rs.2000 pm per ASHA
As per PIP framework
6.3 NGO support for community processes
Rs 3000/- per meeting
Quarterly community processes meeting
7 Innovative Actions & PPP
8 Monitoring & Evaluation
8.1 Baseline/end line surveys
Baseline survey In 131 cities To be carried out centrally from State level :
For 16 cities with pop. over 5 lakhs @ Rs. 30 lakhs per city For 115 cities with pop. below 5 lakhs @ Rs. 22.50 lakhs per city
Estimated cost ( cost suggested by HUP
health partner)
8.3 IT based monitoring initiatives

- 104 -
20. Proposed State level NUHM Budget for 2013-14 (6 month)
Head Unit Cost Target Months Total Remarks
Human Resource
Additional Mission Director 1.5 1 6 9.00
General Manager 1.25 1 6 7.50 01 GM NUHM has been appointed
Deputy General Managers 0.8 5 6 24.00
01 DGM NUHM has been appointed on deputation, 01 DGM M& E,01 IT,01 CP ,01Finance have been proposed
Consultants 0.5 7 6 21.00 07 consultants have been proposed
Regional Coordinators 0.5 4 6 12.00 04 regional Coordinators are being proposed for supervision
Programme Coordinator 0.3 6 6 10.80 06 Programme Coordinators are being proposed
Accountant 0.3 2 6 3.60 02 Accountants are being proposed for finance cell
Data Assistant 0.255 4 6 6.12 04 Data Assistants are being proposed
PS to the AMD 0.4 1 6 2.40 01 PS to AMD
Support staff to AMD 0.12 2 6 1.44 02 support staff to AMD
Data Entry Operators 0.1 6 6 3.60 06 Data Entry operators
Support Staff 0.7 10 6 42.00 10 support staff to different cell under NUHM
Total 143.46
Office Operational Expenses
Renovation for NUHM office 20 1 1 20.00 One time renovation
Rent for NUHM office 1.5 1 6 9.00 Rent for NUHM office
Genset Purchase including installation and tax 6 1 1 6.00 One time cost
Air conditioners purchase 0.5 10 1 5.00 One time cost
Phone instruments for senior SPMU and Directorate FW Officers 0.1 11 1 1.10 One time cost
Phone instruments for State & District level NUHM staff 0.04 100 1 4.00 One time cost
Photocopy Machines on FSMA 3 2 1 6.00 One time cost
Desktops with laser printers 0.7 22 1 15.40 22 Desktop with laser printers
Laptops /Ipad with sim and peripheral 0.5 28 1 14.00
28 (SPMU officers and Div-PMs Laptops /I pad with sim and peripheral)
LCD Projector and screen 1 2 1 2.00 2 LCD projector (01 for SPMU and 01 for DG FW)
Telephone /Fax/Mobile phones/Other Communication Methods/maintenance 1.5 2 6 18.00 Operational expenses

- 105 -
Stationery/Photocopier Bills/AMC etc. 1 2 6 12.00 Operational expenses
Electricity Bills/AC maintenance/Genset 1 2 6 12.00 Operational expenses
Contingency / Management support/Imprest money / Office daily expenditure 1 2 6 12.00 Operational expenses
Office Maintenance/ Housekeeping/ Gardening 1 2 6 12.00 Operational expenses
Vehicle hire and POL 0.3 10 6 18.00 Vehicles for SPMU officers and pool
Vehicle for field visit 0.4 1 6 2.40 Spacious vehicle for field visit
Field visits/Meetings at GOI/for Officers as per norms 2 1 6 12.00 Mobility support and TA/DA
Cost of hiring Urban Health Coordinators 20 1 1 20.00
Urban Health Coordinators will be hired by external agency (NHSRC)
Study tours 10 1 1 10.00 Study tour to different State
Total 210.90 Operational expenses
Meetings
State level Workshop and launch of NUHM 20 1 1 20.00
Review meetings at State level 0.012 150 2 3.60
2 review meeting for district level officers
Multisectoral Stakeholders Meeting at State level 0.012 84 2 2.02 2 State level meetings for Stakeholders
Orientation Training of Urban Health Coordinators and SPMU staff 0.12 98 1 11.76
Rs1 2,000 per Urban Health Coordinator for induction training
Orientation training of DEOs 0.07 100 1 7.00
Rs 7,000 per Data Entry Operator for induction training(Computer based )
Accountant 0.12 78 1 9.36 Rs 12,000 per Accountant for induction training
Orientation Training of HMIS/MCTS Operators 0.07 638 1 44.66
Rs 7,000 per Accountant for induction training(Computer based )
Total 98.40
Baseline survey 3067.50
Total 3067.50
Grand Total 3520.26

- 106 -
21. Proposed District level budget for NUHM 2013-14 (6 months)
FMR Code
Budget Head
Unit cost*
(Rs. In lakhs)
Physical Target (No.)
Budget
Remarks (Rs.
Lakhs)
1 Planning & Mapping 0 270
1.1 Metro cities 15 0 0
GIS mapping has been in 38 cities by Urban Development department and 14 cities by RSAC under NRHM (Total 41 cities ) in the rest of the 90cities GIS mapping has been proposed in 2013-14 under NUHM, in that mapping of listed , unlisted slum and health facility mapping will be done .
1.1.1 Mapping 0 0 0
1.1.2 Data gathering (secondary/primary)
0 0 0
1.1.3 Any Other 0 0 0
1.2 Million+ cities 10 0 0
1.2.1 Mapping 0 0 0
1.2.2 Data gathering (secondary/primary)
0 0 0
1.2.3 Any Other 0 0 0
1.3 Cities (1 lakh to 10 lakh population)
5 30 150
1.3.1 Mapping 0 0 0
1.3.2 Data gathering (secondary/primary)
0 0 0
1.3.3 Any Other 0 0 0
1.4 Towns (50,000 to 1 lakh population)
2 60 120
1.4.1 Mapping 0 0 0
1.4.2 Data gathering (secondary/primary)
0 0 0
1.4.3 Any Other 0 0 0
2 Programme Management
0 0 1012.56
2.1 State PMU 0 0 0
2.1.1 Human Resources 0 0 0
2.1.2 Mobility support 0 0 0
2.1.3 Office Expenses 0 0 0
2.2 District PMU 0 0 1012.56

- 107 -
2.2.1 Human Resources 0.48
76 UHCs,76
Accountant, and 90 DEO
312.36
District total Town Population more than 20 lakhs -03 Urban Health Coordinators, 03 Accountants and 03 Data Entry Operators (DEO), 10lakh to 20lakhs- 02 Urban health Coordinators. 02 Accountants and 0 2 Data Entry Operators, Cities with 1lakh to 10 lakhs population 01 Urban Health Coordinator,01 Accountant and 01 Data Entry Operators. Cities population less than 1 lakh only 01 Data Entry Operator UHC Salary @ Rs. 30,000 pm, Accountant salary Rs 18000/-pm and DEO Salary @ Rs. 10,000 pm. Rs 8000 pm for Incentive to DPM for preparatory activity of NUHM(Rs 3.48 Lakhs in Lucknow for extra HR at DPMU)
2.2.2 Mobility support 0.25 77 117.9
One vehicle will be hired @ Rs 25,000 per month per Urban Health Coordinator and 01 Vehicle for Urban Nodal Officer for Lucknow (in Ghaziabad & G.B.Nagar 01 vehicle @ Rs 35000/-pm)
2.2.3 Office Expenses 0.25 75 162.3
Rs.25,000 pm for office expenses including rent ,stationary and internet to each DPMU and one time Rs.70,000 for one computer system, Data Card , Storage device , printer, table and chairs for each DEO of DPMU (Those Cites where UHC is not given, Rs.10,000 budget is proposed for office expenses) 61 District @ Rs 25000/-pm,14 Districts Rs 10000/-pm and Rs 70000per Computer printer set for 89 set
2.2.4 Strengthening Urban Health cell at District level
5.5 75 420
Rs.2.5 lakhs for Furniture, ACs, desktops, minor renovations etc. for the office of District level Nodal Officer & 2.5 lakhs for DPMU office for NUHM cell strengthening & 50,000 for DPM for laptop along with data card.(additional budget of Rs 6.00 Lakhs in Lucknow and Rs 1.5 in Farrukhabad )
2.3 City PMU 0 0 0
2.3.1 Human Resources 0 0 0
2.3.2 Mobility support 0 0 0
2.3.3 Office Expenses 0 0 0

- 108 -
3 Training & Capacity Building
0 0 2825.30
3.1 Orientation of Urban Local Bodies (ULB)
3 130 114
Rs.5 lakhs for metros, Rs.3 lakhs for million+ cities, Rs.1 lakh for other cities above 1 lakh and Rs.0.5 lakhs for smaller towns below 1 lakh, One time activity
3.2 Training of ANM/paramedical staff
0.05 4466 223.3
Rs.5000 per ANM & Staff Nurses (for entire training package), 05 ANMs and 02Staff nurses from each UPHC will be trained.
3.3 Training of Medical Officers
0.1 1276 127.6
Rs.10,000 per MO (for entire training package), All MOs for UPHCs will be trained. 2 Mos per U-PHCs
3.4 Orientation of Specialists
0 0 0 Not planned this year
3.5 Orientation of MAS 0.1 14560 1456 Rs.10,000 per MAS (for entire training package)
3.6 Selection & Training of ASHA
0.1 7280 728 Rs.10,000 per ASHA (for entire training package)
3.7 Other Trainings/Orientations
0 0 176.4
3.7.1 Stakeholders Workshop for launch of NUHM
1 130 80.6 Rs1,00,000 for 75 district headquarters and Rs.10,000 for 56 towns
3.7.2 Quarterly Multispectral convergence Meeting
0.1 132 20.8 Rs10,000 for 75 district headquarters and Rs.5,000 for 56 towns
3.7.2 Launch of NUHM 1 75 75 Rs1,00,000 for district headquarters in 75 DHQs
4 Strengthening of Health Services
0 0 27172.11
4.a Human Resource 8658.46
4.b Infrastructure 3603.70
4.c Untied grants 1635.00
4.d Procurement (drugs and consumable)
8105.72
4.e Other services 5169.23
4.1 Outreach services/camps/UHNDs
0 0 3172.11
4.1.1 UHNDs 0 15797 1421.73
01 UHND per AWC or per 1000 slum population per month @ Rs.015 per UHND for 15797 UHNDs per Month
4.1.2 Special outreach camps in slums/ vulnerable areas
0.1 3033 1750.38
One outreach camp per 10,000 population per month @ Rs.10,000 per outreach camp for 3033 outreach per month. In G.B. nagar (Greater Noida and Dadri) outreach camp will be conducted by mobile teams)

- 109 -
4.2 ANM/LHV 0 0 1907.31
4.2.1 Salary support for ANM/LHV
0.1 3020 1812
Maximum Rs.10,000 pm for ANM as per approved norms in NRHM; 3020 new recruitment, 157 Govt.
4.2.2 Mobility support for ANM/LHV
0.005 3177 95.31 Rs. 500 pm for all ANMs contractual as well as on government payroll.
4.3 Urban PHC (UPHC) 0 0 20041.504
4.3.1 Renovation/up-gradation of existing facility to UPHC
0 0 3550.6
4.3.1.1 For Government owned buildings
10 119 1190 Rs.10 lakhs per UPHC, one time activity for renovation of building for 119 Govt. Building
4.3.1.2 For Equipments 3 638 2360.6 Rs.3.00 lakhs per UPHC, one time activity for UPHCs for purchase of equipments
4.3.2 Building of new UPHC 0 0 0
4.3.3
Operating cost support for running UPHC (other than untied grants and medicines & consumables)
20 0 6920.90 Rs.20 lakhs per year per UPHC ( For 1 UPHC)
4.3.3.1 Human Resource 0 0 6453.80
4.3.3.1.1 MO salary 0.36 1203 2598.48
2 MOs per UPHC @36,000 pm. 1203 Mos will be hired and 73 Medical officer from state budget.
4.3.3.1.2
Salary of paramedical & nursing staff (Staff Nurse/ Lab Technician/ Pharmacist/ Other)
0 608 2324.12
2 Staff Nurses per UPHC @16,500 pm, 1 Pharmacist per UPHC @16500 pm; 1 Lab Technician @11,880 pm for 638 U-PHCs
4.3.3.1.3 Salary of support staff (non clinical staff)
0.05 1914 574.2 3 Support staff for 1 UPHC @5,000 pm for 638 U-PHCs
4.3.3.1.4 HMIS / MCTS operator 0.1 638 382.8 HMIS/MCTS data Entry operator 1 to each U-PHC
4.3.3.1.5 Office Expenses 0.1 638 574.2 Rs. 10,000 pm per UPHC
4.3.3.2 Others (e.g. hiring of premises/mobile PHC)
0.15 519 467.1 Rental for UPHCs running from rented buildings @15,000pm for 519 Hired buildings
4.3.4 Untied grants to UPHC 2.5 638 1595 Rs.2.50 lakhs per year per UPHC
4.3.5 Medicines & Consumables for UPHC
12.5 638 7975 Rs.12.50 lakhs per year per UPHC
4.3.5.1 Emergency drugs 0 0 0
4.3.6
4.4 Urban CHC (UCHC) 363.5 Strengthening of health facility has been done as U-CHC in Lucknow.
4.4.1 Capital cost support for new UCHC
5 8 53.1
8 BMCs existing & running by state budget (Computer with printer @Rs 70000 per BMC (Total 8 computer) + 5000 internet charges , operational charges + Operational and

- 110 -
maintenance of ambulance Rs. 15000/ per month per ambulance for 8 ambulance.
4.4.2 Human Resource 0.48 40 115.2
1 Radiologist,1Pediatrician,1 Gynaecologist, 1-Physician & 1-Anaesthetist Rs.48000/- per month per BMC for 8 BMCs
4.4.2.1 Staff Nurse 0.165 24 23.76 3 staff nurses per each BMC Rs. Rs. 16,500 PM
4.4.2.2 Support Staff 0.05 8 31.44
6 support staff per each BMC Rs. 5000 PM,24 driver (3 driver per BMC) Rs. 8500 PM, & 8 Data assistant Rs. 10,000 PM)
4.4.3 Untied grants for UCHC 5 8 40 Rs 5 Lakhs per BMC
4.4.4 Medicines & Consumables for UCHC
12.5 8 100 Rs 12.5 Lakhs per BMC
4.5 School Health Program 0 0 349.58
4.5.1 Human Resource 0.5788 64 222.26
One team consisting of 1 doctor Rs.36,000 pm; 1 ANM/GNM Rs.10,000 pm and 1 Ophthalmic Assistant Rs.11,880 pm
4.5.2 Other School Health services
0.25 64 96.6 Hired vehicle Rs.25,000pm, one per School Health team
4.5.3 Drugs, consumable & Operational expenses
0.08 64 30.72 Rs. 8000 pm per team for 6 Month
4.6 IEC/BCC 0 1 1338.1072
4.6.1
ASHA Kit Flip Book, Slum HIR, Bag, ID, Pen, IEC material for ASHA on Maternal health, Child health and RI and handouts for community
0.02 7265 145.29 one time Rs. 2,000 per ASHA
4.6.2 UPHC Citizen's charter, ED List, Immunization Schedule, Signage
0.2 638 127.6 One time Rs.20,000 per UPHC
4.6.3
Safe Motherhood, Booklet, MCP Card and IEC material for U-PHC .
0.00057 641 546.65
1500 sets of MCP Card and Safe Motherhood booklet (total 960000 sets of Booklet and cards )to be printed per UPHC @ Rs.37/- per booklet and MCP card Rs 30,000/ for per U-PHC for printing of other IEC material @ Rs 3/- per household on communicable and non communicable diseases
4.6.4 Family Health Card
0.0001 2834818 283.48 Family Health Card to be printed for all slum households Rs10 per card
4.6.5 Communication material and wall painting at AWCs
0.01 15069 150.69 One time, Rs.1,000 per AWC
4.6.6 NUHM Hoarding 0.2 372 74.4 Rs 20000 per hoarding Including printing & installation.

- 111 -
5 Regulation & Quality Assurance
0 0 0
6 Community Processes
0 0 1165.90
6.1 MAS/community groups 0.05 14560 728 Rs.5000 per year per MAS
6.2 ASHA (urban) 0.02 7280 436.8 Approx. Rs.2000 pm per ASHA
6.3 NGO support for community processes
0 24 1.1 Quarterly community processes meeting
7 Innovative Actions & PPP
As per need
2 0
8 Monitoring & Evaluation
As per need
0 0
8.1 Baseline/end line surveys
0 0 0
8.2 Research Studies in Urban Public Health
0 0 0
8.3 IT based monitoring initiatives
0 0 0
Total 32445.87

- 112 -
Budget Summary & percentage of budget in different heads
FMR Code
Budget Head State level
budget (in Lakhs )
District level budget
(in Lakhs)
Total budget (in Lakhs )
% of total
budget
1 Planning & Mapping
270.00 270.00 0.8
2 Programme Management
354.36 1012.56 1366.92 3.8
3 Training & Capacity Building
98.4 2825.30 2923.70 8.1
4 Strengthening of Health Services
27172.11 27172.11 75.5
a Human resource 8658.46 8658.46 24.1
b Infrastructure 3603.70 3603.70 10.0
c Untied grants 1635.00 1635.00 4.5
d Procurement (drugs and consumable)
8105.72 8105.72 22.5
e Other services 5169.23 5169.23 14.4
5 Regulation & Quality Assurance
0 0 0.0
6 Community Processes
1165.9 1165.9 3.2
7 Innovative Actions & PPP
0 0 0.0
8 Monitoring & Evaluation (Base line Survey)
3067.5 0 3067.5 8.5
TOTAL 3520.26 32445.87 35966.13 100.00

- 113 -
Acronyms
ANC - Antenatal Care
ANM - Auxiliary Nurse Midwife
AYUSH - Ayurveda, Yoga & Naturopathy, Unani, Siddha and Homoeopathy
ACMO - Additional Chief Medical Officer
AWW - Anganwadi Worker
AWC - Anganwadi Center
ASHA - Accredited Social Health Activist
BPL - Below Poverty Line
BSUP - Basic Services for Urban Poor
CSO - Civil Society Organizations
CBO - Community Based Organizations
CDS - Community Development Society
LHV - Level Health Visitor
CMO - Chief Medical Officer
CDPO - Child Development Program Officer
CHC - Community Health Center
CGHS - Central Government Health Scheme
DOTS - Directly Observed Treatment – Short course
DUDA - District Urban Development Authority
DPO - District Program Officer
ENT - Ear, Nose & Throat
ESI - Employees State Insurance
EAG - Empowered Action Group
FOGSI - Federation of Obstetric and Gynaecological Societies of India
GIS - Geographic Information System
GoI - Government of India
HIV/AIDS - Human Immunodeficiency Virus/Acquired Immunodeficiency Syndrome
HPD - Health Post D-Type
ICDS - Integrated Child Development Services
IDSP - Integrated Disease Surveillance Programme
IEC/BCC- Information Education Communication/ Behaviour Change
Communication
IFA - Iron Folic Acid

- 114 -
IHSDP - Integrated Housing and Slum Development Program
IMA - Indian Medical Association
IPD - Inpatient Department
ICC - In charge Cum Computer
IPC - Inter Personal Communication
IAPSM - Indian Association of Preventive and Social Medicine
IPHS - Indian Public Health Standards
IUD - Intra-uterine Devices
JNNURM - Jawaharlal Nehru National Urban Renewal Mission
JNMC - Jawaharlal Nehru Medical College
JDA - Junior Doctors Association
LMO - Lady Medical Officer
MAS - Mahila Arogya Samiti
M&E - Monitoring & Evaluation
MCH - Maternal and Child Health
MTP - Medical Termination of Pregnancy
NPSP - National Polio Surveillance Program
NMCP - National Malaria Control Program
NVBDCP - National Vector Borne Disease Control Program
NFHS - National Family Health Survey
NRHM - National Rural Health Mission
NUHM - National Urban Health Mission
OPD - Out Patient Department
ORS - Oral Rehydration Solution
OCP - Oral Contraceptive Pills
PHN - Public Health Nurse
PMU - Program Management Unit
PO - Program Officer
PRO - Public Relation Officer
PPC - Post Partum Center
PHC - Primary Health Center
PIP - Programme Implementation Plan
PNC - Post Natal Check-up
PPP - Public Private Partnership

- 115 -
RCH II - Reproductive and Child Health
RNTCP - Revised National Tuberculosis Control Programme
RTI/STI - Reproductive/ Sexually Transmitted Infections
SJSRY - Swarna Jayanti Shahari Rojgar Yojana
SRTL - Sub Regional Team Leader
SACS - State Aids Control Society
SNC - Special Neonatal Care
SMO - Surveillance Medical Officer
SLI - Standard of Living Index
TB - Tuberculosis
TFR - Total Fertility Rate
TT - Tetanus Toxoid
UPHC - Urban Primary Health Center
UCHC - Urban Community Health Center
ULBs - Urban Local Bodies
U5MR - Under 5 Mortality Rate
U-ASHA - Urban Accredited Social Health Activist
VO - Voluntary Organization
WHO - World Health Organization


![PUBLIC INVESTMENT PLAN [PIP] FY2012/13 – 2014/15](https://img.dokumen.tips/doc/110x75/6317cb589076d1dcf80bf333/public-investment-plan-pip-fy201213-201415.jpg)


