Embed Size (px)
Citation preview
ISSN (Print) : 2320 – 3765 ISSN (Online): 2278 – 8875
International Journal of Advanced Research in Electrical, Electronics and Instrumentation Engineering
(An ISO 3297: 2007 Certified Organization)
Vol. 5, Issue 9, September 2016
Copyright to IJAREEIE DOI:10.15662/IJAREEIE.2016.0509032 7701
PIC Microcontroller Based Greenhouse Monitoring and Control System
Pushkar I Madrap1, Amey Deshmukh2 B.E Alumnus, Dept. of Electronics and Telecommunication, PVG’s College of Engineering and Technology, Pune,
Maharashtra, India1
B.E Alumnus, Dept. of Electronics and Telecommunication, PVG’s College of Engineering and Technology, Pune,
Maharashtra, India2
ABSTRACT: This Paper represents the need of Greenhouse and how much effective they can be in good yield of crops. As plant grows, they need certain environmental parameters for its proper growth like humidity, temperature, light. Also, Automated Greenhouse Monitoring ignores the need of human operators to take care of the plants. To monitor the Greenhouse parameters like humidity, temperature, soil moisture and light properly, a control system is needed. This control system is comprised of greenhouse data acquisition PIC Microcontroller along with temperature, humidity and light and pH sensor. For monitoring and storing the values of these environmental parameters PIC18F452 based circuit is used. Based on the values stored, the above system will compare the stored values with threshold values set for particular plant and control the actions of cooler, heater, and water pump. Greenhouse monitoring and control software can collect, display and record the collected data i.e., values of various parameters, also can control greenhouse environment. In addition to this the system also consists of solar inverter for backup. For displaying the stored values, we have used GLCD. This system is very useful for proper cultivation and maximum yield of crops. KEYWORDS: PIC Microcontroller, Environmental parameters, Control system, Threshold values, GLCD.
1. INTRODUCTION
A greenhouse is a building in which plants are grown for commercial or research purposes. These structures range in size from small sheds to very large buildings, with different types of covering materials, such as a glass or plastic roof and frequently glass or plastic walls. But, nowadays, the rising demands for crop production and quality have significantly increased the utilization of high quality and productivity of greenhouse. The proposed system is an embedded system which will monitor and control the microclimatic parameters of a greenhouse on a regular basis round the clock for cultivation of crops or specific plant species which could maximize their production over the whole crop growth season and to eliminate the difficulties involved in the system by reducing human intervention to the best possible extent using sensors, Analog to Digital Converter, microcontroller and relays.When any of the above mentioned climatic parameters cross a safety threshold which has to be maintained to protect the crops, the sensors sense the change and the microcontroller reads this from the data at its input ports after being converted to a digital form by the ADC. The microcontroller then performs the needed actions by employing relays until the strayed-out parameter has been brought back to its optimum level. Since a microcontroller is used as the heart of the system, it makes the set-up low-cost and effective nevertheless. As the system also employs a GLCD display for continuously alerting the user about the condition inside the greenhouse, the entire set-up becomes user friendly.
II.IMPORTANCE OF GREEN HOUSE
Greenhouses protect crops from too much heat or cold and help to keep out pests. Light and temperature control allows greenhouses to turn in arable land into arable land, thereby improving food production in marginal environments because greenhouses allow certain crops to be grown throughout the year, greenhouses are increasingly important in the food supply of high latitude countries. One of the largest greenhouse complexes in the world is in Almeria, Spain, where greenhouses cover almost 50,000 acres (200 km2). It is sometimes called the sea of plastics.

ISSN (Print) : 2320 – 3765 ISSN (Online): 2278 – 8875
International Journal of Advanced Research in Electrical, Electronics and Instrumentation Engineering
(An ISO 3297: 2007 Certified Organization)
Vol. 5, Issue 9, September 2016
Copyright to IJAREEIE DOI:10.15662/IJAREEIE.2016.0509032 7702
2.1 Problem and Solution Encountered On Green House Irrigation is the important thing on a greenhouse system. The water we provide, which is the main element will make sure the plants survive on certain circumstances. As we all know, most of the gardener use the manual system to irrigate their plant but this system is not efficient. The plants will either die if there is not enough water supplies to the plant or vice versa. Plus the gardener must often monitor their greenhouse to ensure the conditions of their plant are in the good health.
In order to maintain the condition and overcome the problem, the automatic watering system and remote monitoring is used. This will reduce the time if using automatic rather than manual way of watering. Fewer workers are needed to maintain the plants or crops. The sensors such as temperature sensor (Thermistor) and soil moisture probe are used to control the temperature and watering in the greenhouse.
2.2 Literature Review
As a plant grows it undergoes many changes, its development is solely dependent on the environmental conditions. This environment is made up of many different factors like light, temperature, soil moisture, humidity, pH etc. Specific plants require typical conditions for their growth, thus this project aims at providing an automated greenhouse monitoring and control system for the farmers in a very user friendly way. All these parameters are directly related to the growth and development of plant. The greenhouse system is complex system; any significant change in one climate parameter could have an adverse effect on another climate parameter as well as the development process of plants. Therefore continuous monitoring and control of these parameters is required for the proper growth of plants. Temperature, humidity, light intensity, soil moisture and pH are the five most common factors that most growers pay attention to. So now a day’s farmers require more user friendly platform to deal with issues that arise due to climate changes. Previous researchers have used sensors such as leaf temperature and leaf wetness sensor in conjunction with ambient temperature sensor and humidity sensors to investigate greenhouse’s status. These methods were found to be impractical as wetness varies from leaf to leaf and by location of plant in greenhouse. In general the greenhouse system can be divided into two main components that interact in more or less strong way: internal atmosphere and soil conditions. Most of the growers and researches are interested in internal atmosphere of greenhouse and often neglect the importance of soil conditions. The absorption and transportation of water and nutrients are dependent on the condition of soil. Therefore it is very essential to maintain the temperature and moisture level in the soil at an optimum level in order to keep the plant healthy. Therefore, the automation system proposed in this study is expected to create surplus value for both producers and national economy. Additionally, inside the greenhouse, crops will be protected against damages caused by rain, wind or other weather conditions. System maintains the reference values taken from built in crop growing condition. Temperature influences most plant development process including photosynthesis, transpiration, absorption, respiration and flowering. In general, growth of any crop plant is significantly affected by temperature. Each species of plant has a different temperature range in which they can grow. Below this range, processes necessary for life stop, ice forms within the tissue, tying up water necessary for life processes.
ISSN (Print) : 2320 – 3765 ISSN (Online): 2278 – 8875
International Journal of Advanced Research in Electrical, Electronics and Instrumentation Engineering
(An ISO 3297: 2007 Certified Organization)
Vol. 5, Issue 9, September 2016
Copyright to IJAREEIE DOI:10.15662/IJAREEIE.2016.0509032 7703
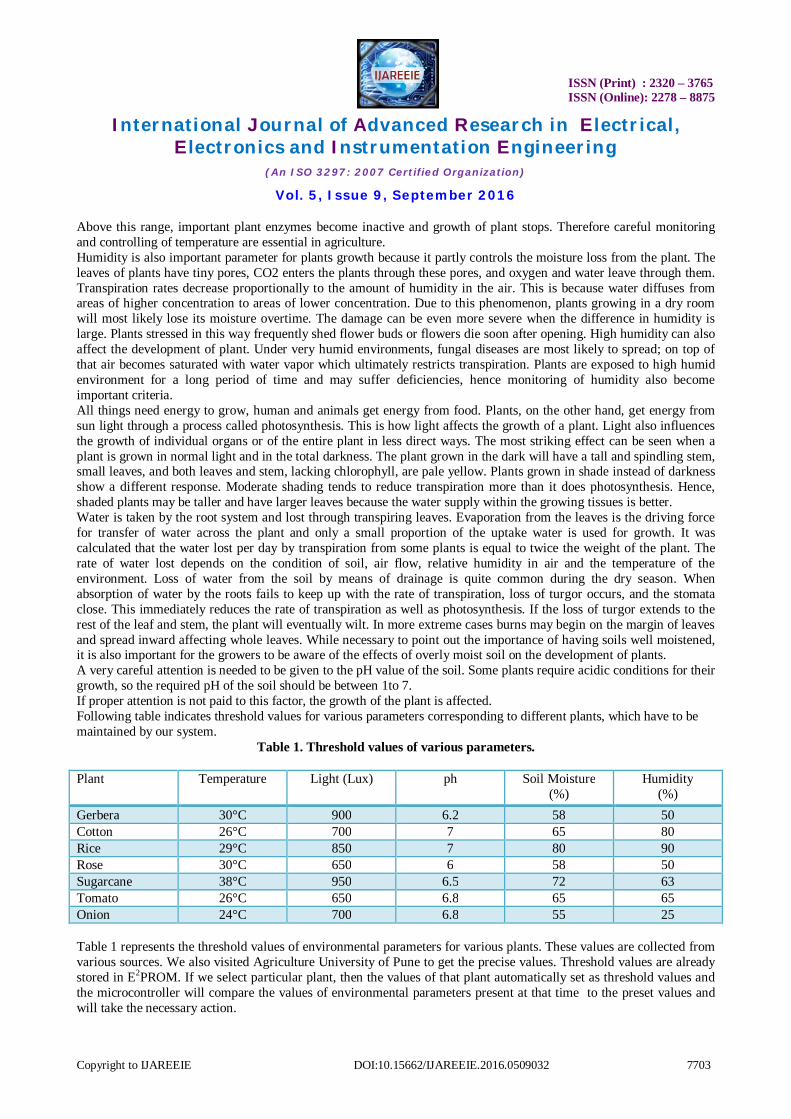
Above this range, important plant enzymes become inactive and growth of plant stops. Therefore careful monitoring and controlling of temperature are essential in agriculture. Humidity is also important parameter for plants growth because it partly controls the moisture loss from the plant. The leaves of plants have tiny pores, CO2 enters the plants through these pores, and oxygen and water leave through them. Transpiration rates decrease proportionally to the amount of humidity in the air. This is because water diffuses from areas of higher concentration to areas of lower concentration. Due to this phenomenon, plants growing in a dry room will most likely lose its moisture overtime. The damage can be even more severe when the difference in humidity is large. Plants stressed in this way frequently shed flower buds or flowers die soon after opening. High humidity can also affect the development of plant. Under very humid environments, fungal diseases are most likely to spread; on top of that air becomes saturated with water vapor which ultimately restricts transpiration. Plants are exposed to high humid environment for a long period of time and may suffer deficiencies, hence monitoring of humidity also become important criteria. All things need energy to grow, human and animals get energy from food. Plants, on the other hand, get energy from sun light through a process called photosynthesis. This is how light affects the growth of a plant. Light also influences the growth of individual organs or of the entire plant in less direct ways. The most striking effect can be seen when a plant is grown in normal light and in the total darkness. The plant grown in the dark will have a tall and spindling stem, small leaves, and both leaves and stem, lacking chlorophyll, are pale yellow. Plants grown in shade instead of darkness show a different response. Moderate shading tends to reduce transpiration more than it does photosynthesis. Hence, shaded plants may be taller and have larger leaves because the water supply within the growing tissues is better. Water is taken by the root system and lost through transpiring leaves. Evaporation from the leaves is the driving force for transfer of water across the plant and only a small proportion of the uptake water is used for growth. It was calculated that the water lost per day by transpiration from some plants is equal to twice the weight of the plant. The rate of water lost depends on the condition of soil, air flow, relative humidity in air and the temperature of the environment. Loss of water from the soil by means of drainage is quite common during the dry season. When absorption of water by the roots fails to keep up with the rate of transpiration, loss of turgor occurs, and the stomata close. This immediately reduces the rate of transpiration as well as photosynthesis. If the loss of turgor extends to the rest of the leaf and stem, the plant will eventually wilt. In more extreme cases burns may begin on the margin of leaves and spread inward affecting whole leaves. While necessary to point out the importance of having soils well moistened, it is also important for the growers to be aware of the effects of overly moist soil on the development of plants. A very careful attention is needed to be given to the pH value of the soil. Some plants require acidic conditions for their growth, so the required pH of the soil should be between 1to 7. If proper attention is not paid to this factor, the growth of the plant is affected. Following table indicates threshold values for various parameters corresponding to different plants, which have to be maintained by our system.
Table 1. Threshold values of various parameters.
Plant Temperature Light (Lux) ph Soil Moisture (%)
Humidity (%)
Gerbera 30°C 900 6.2 58 50 Cotton 26°C 700 7 65 80 Rice 29°C 850 7 80 90 Rose 30°C 650 6 58 50 Sugarcane 38°C 950 6.5 72 63 Tomato 26°C 650 6.8 65 65 Onion 24°C 700 6.8 55 25
Table 1 represents the threshold values of environmental parameters for various plants. These values are collected from various sources. We also visited Agriculture University of Pune to get the precise values. Threshold values are already stored in E2PROM. If we select particular plant, then the values of that plant automatically set as threshold values and the microcontroller will compare the values of environmental parameters present at that time to the preset values and will take the necessary action.

ISSN (Print) : 2320 – 3765 ISSN (Online): 2278 – 8875
International Journal of Advanced Research in Electrical, Electronics and Instrumentation Engineering
(An ISO 3297: 2007 Certified Organization)
Vol. 5, Issue 9, September 2016
Copyright to IJAREEIE DOI:10.15662/IJAREEIE.2016.0509032 7704
III.METHODOLOGY
This project involved the implementing of a greenhouse control device in order to control, monitor and maintain the desired temperature in the green house by turning ON the Heater/cooling system as when due also study the soil moisture content (when water is needed) by turning the water valve ON or OFF.
The objective of the proposed research work is to build a greenhouse monitoring and control system for farmers. This system can be used for monitoring of conditions required for proper growth of plants. The GLCD shows the variation of data which is acquired from RTC in dotted bar graph waveform which can
be useful for analysis. All actions taken as per requirements and their effect will be stored in E2PROM. It can be used for analysis. All the data stored in E2PROM can be viewed with the help of UART on computer/laptop.
SOFTWARE TOOLS:
MPLAB IDE EAGLE v7.1.0
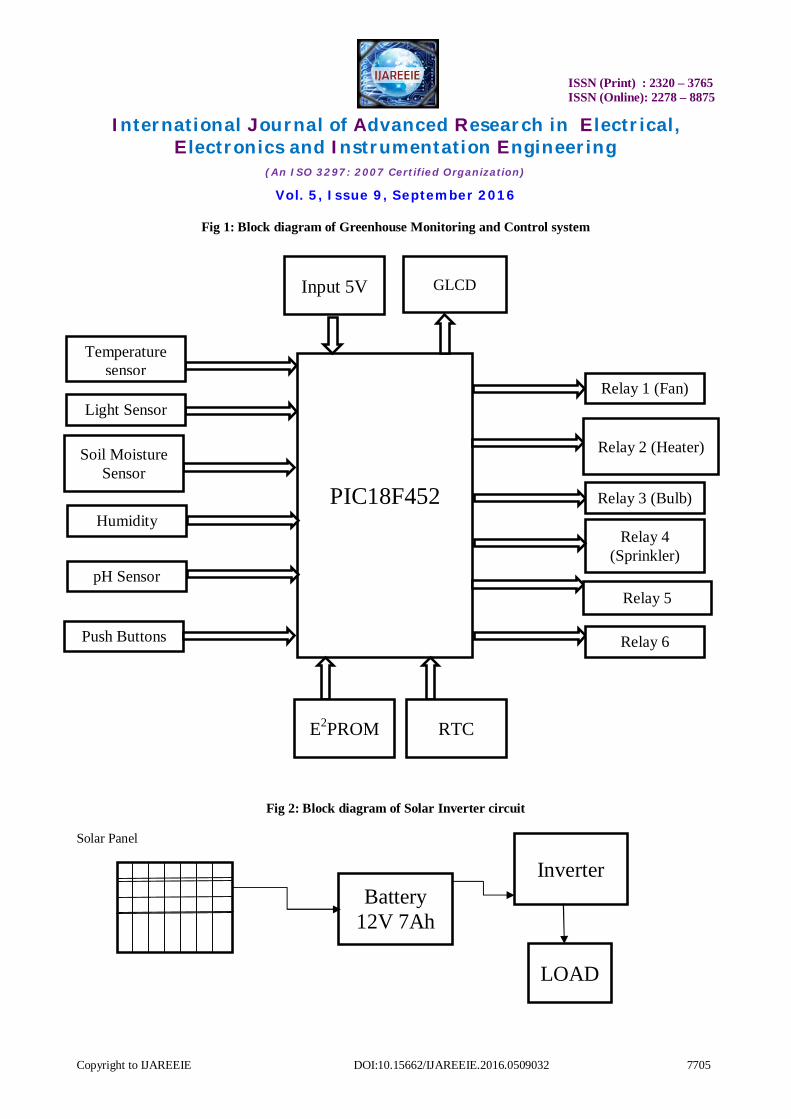
IV. SYSTEM ARCHITECTURE The block diagram below shows how the inputs section (sensors) is connected into the microcontroller through an arrow, the arrow indicate that data is passing through the microcontroller. The output section is connected out of the microcontroller through the arrow. Furthermore, the input section are assign to their own pins in the microcontroller and processed to give an output, while output section are assign to their own pins in the microcontroller, to archive the construction of greenhouse control device.E2PROM is also connected to microcontroller for storing the values of various parameters present at that situation. The system model consists of sensors, microcontroller, interface such as relay and actuators. Actuators such as fan, sprayer, heater, artificial lights are used. Our proposed system aim is to design a Microcontroller-based circuit to monitor and record the values of temperature, humidity, soil moisture level and Sunlight of the natural environment that are continuously modified and it is get controlled in order optimize them to achieve maximum plant growth and yield. Controlling process takes place effectively. Depending upon the application, we will set particular threshold level for each climatic parameter. When any of parameters level cross a safety threshold then microcontroller will perform the needed action by employing relay until the strayed-out parameter has been brought back to its optimum level. The main block of our system is of course the controller PIC18F452 while other blocks are of sensors, keys, GLCD, E2PROM, RTC, supply voltage and relay. As mentioned above in the block diagram, we have 5 sensors namely temperature (LM35D), Light (LDR (NORP12)), Soil Moisture (FC-28-D), Humidity (SY HS 220) and pH sensors. The micro controller runs on 5V that we get from our power supply. Push buttons are used for plant selection purpose and also to view variation graphs of various parameters through interrupt. RTC i.e. Real time clock is used to provide date and time information to the controller. E2PROM is used to store the information which is being monitored while relays are used to ON and OFF the devices connected to it according to program instructions for control action purpose. Graphical LCD (GLCD) is used to display the real time parameters as well as to display the graphs of various parameters for analysis purpose. The UART function of controller is used to transmit the data from E2PROM to laptop/PC through UART USB module.
ISSN (Print) : 2320 – 3765 ISSN (Online): 2278 – 8875
International Journal of Advanced Research in Electrical, Electronics and Instrumentation Engineering
(An ISO 3297: 2007 Certified Organization)
Vol. 5, Issue 9, September 2016
Copyright to IJAREEIE DOI:10.15662/IJAREEIE.2016.0509032 7705
Fig 1: Block diagram of Greenhouse Monitoring and Control system
Fig 2: Block diagram of Solar Inverter circuit
Solar Panel
PIC18F452
Temperature sensor
Light Sensor
Soil Moisture Sensor
Relay 1 (Fan)
Relay 2 (Heater)
Humidity
pH Sensor
Relay 3 (Bulb)
GLCD Input 5V
Push Buttons
Relay 5
E2PROM RTC
Battery 12V 7Ah
Inverter
LOAD
Relay 4 (Sprinkler)
Relay 6

ISSN (Print) : 2320 – 3765 ISSN (Online): 2278 – 8875
International Journal of Advanced Research in Electrical, Electronics and Instrumentation Engineering
(An ISO 3297: 2007 Certified Organization)
Vol. 5, Issue 9, September 2016
Copyright to IJAREEIE DOI:10.15662/IJAREEIE.2016.0509032 7706
Solar Inverter:
The block diagram of solar inverter consists of 3 blocks which are Solar panel, battery and inverter. The solar panel consists of cells of silicon on it, which produces output when solar rays are incident on it. Thus the voltage output from solar panel will be given to the battery to charge it. The battery is connected to the inverter circuit which does the job of converting and stepping up battery power to high voltage AC mains level. Thus we can run an AC LOAD at the output of inverter.
4.1 Design Specifications:
Microcontroller PIC18F452 Input side - Sensors:
1) Temperature (LM35D) 2) Light (LDR)(NORP-12-RS) 3) Soil Moisture (FC-28-D) 4) Humidity (SY-HS-220) 5) pH
Output side - Relays • Relay 1: Lower Temperature: Cooling Fan
• Relay 2: Raise temperature: Heater
• Relay 3: Increase lighting condition: Light-bulb
• Relay 4: Sprinkler for increase in soil moisture.
• Relay 5: Small heating coil to increase humidity
• Relay 6: Exhaust Fan to decrease humidity
• Constant monitoring on GLCD and graph display
• Database storage on E2PROM at user defined time
• Data viewed on Laptop/Computer through UART-USB module
Solar inverter for backup, but for demonstration purpose we will be glowing a LOAD at the inverter output to check 230V.
IV. HARDWARE DESCRIPTION
1. Microcontroller - PIC18F452 A microcontroller (MUC) is a small computer with all peripherals such as I/O, memory all mostly in build. Microcontrollers are used in automatically controlled devices. For Greenhouse effective management, here in our paper We are using PIC18F452 Microcontroller.PIC Controller is an RISC machine (Reduced Instruction Set Computing). It constantly monitors the digitized parameters of the various sensors and verifies them with the predefined threshold values. It checks if any corrective action is to be taken for the condition at that instant of time. It has operating frequency of 40MHz. Total power dissipation by above microcontroller was 1.0W and having Voltage Operating Range VDD in between -0.3V to +7.5V. Microcontroller also has in built 10 bit ADC.
ISSN (Print) : 2320 – 3765 ISSN (Online): 2278 – 8875
International Journal of Advanced Research in Electrical, Electronics and Instrumentation Engineering
(An ISO 3297: 2007 Certified Organization)
Vol. 5, Issue 9, September 2016
Copyright to IJAREEIE DOI:10.15662/IJAREEIE.2016.0509032 7707
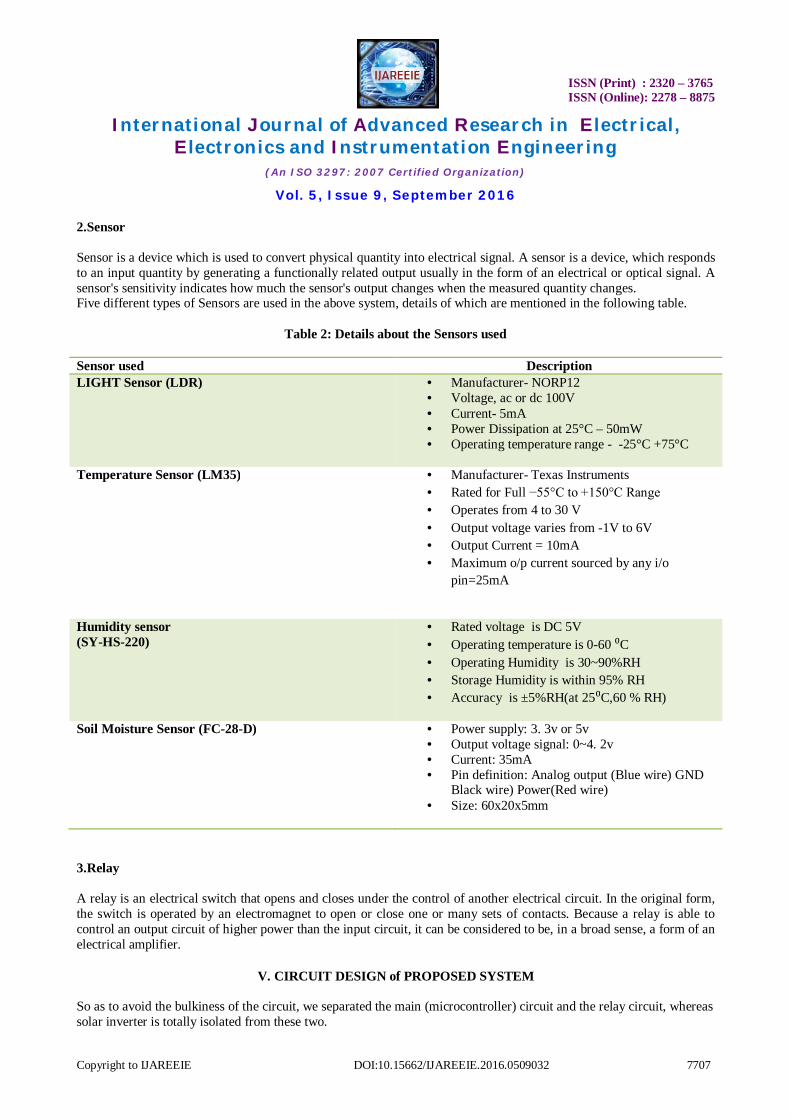
2.Sensor Sensor is a device which is used to convert physical quantity into electrical signal. A sensor is a device, which responds to an input quantity by generating a functionally related output usually in the form of an electrical or optical signal. A sensor's sensitivity indicates how much the sensor's output changes when the measured quantity changes. Five different types of Sensors are used in the above system, details of which are mentioned in the following table.
Table 2: Details about the Sensors used
Sensor used Description LIGHT Sensor (LDR)
• Manufacturer- NORP12 • Voltage, ac or dc 100V • Current- 5mA • Power Dissipation at 25°C – 50mW • Operating temperature range - -25°C +75°C
Temperature Sensor (LM35)
• Manufacturer- Texas Instruments • Rated for Full −55°C to +150°C Range • Operates from 4 to 30 V • Output voltage varies from -1V to 6V • Output Current = 10mA • Maximum o/p current sourced by any i/o
pin=25mA
Humidity sensor (SY-HS-220)
• Rated voltage is DC 5V • Operating temperature is 0-60 ⁰C • Operating Humidity is 30~90%RH • Storage Humidity is within 95% RH • Accuracy is ±5%RH(at 25⁰C,60 % RH)
Soil Moisture Sensor (FC-28-D)
• Power supply: 3. 3v or 5v • Output voltage signal: 0~4. 2v • Current: 35mA • Pin definition: Analog output (Blue wire) GND
Black wire) Power(Red wire) • Size: 60x20x5mm
3.Relay A relay is an electrical switch that opens and closes under the control of another electrical circuit. In the original form, the switch is operated by an electromagnet to open or close one or many sets of contacts. Because a relay is able to control an output circuit of higher power than the input circuit, it can be considered to be, in a broad sense, a form of an electrical amplifier.
V. CIRCUIT DESIGN of PROPOSED SYSTEM
So as to avoid the bulkiness of the circuit, we separated the main (microcontroller) circuit and the relay circuit, whereas solar inverter is totally isolated from these two.
ISSN (Print) : 2320 – 3765 ISSN (Online): 2278 – 8875
International Journal of Advanced Research in Electrical, Electronics and Instrumentation Engineering
(An ISO 3297: 2007 Certified Organization)
Vol. 5, Issue 9, September 2016
Copyright to IJAREEIE DOI:10.15662/IJAREEIE.2016.0509032 7708
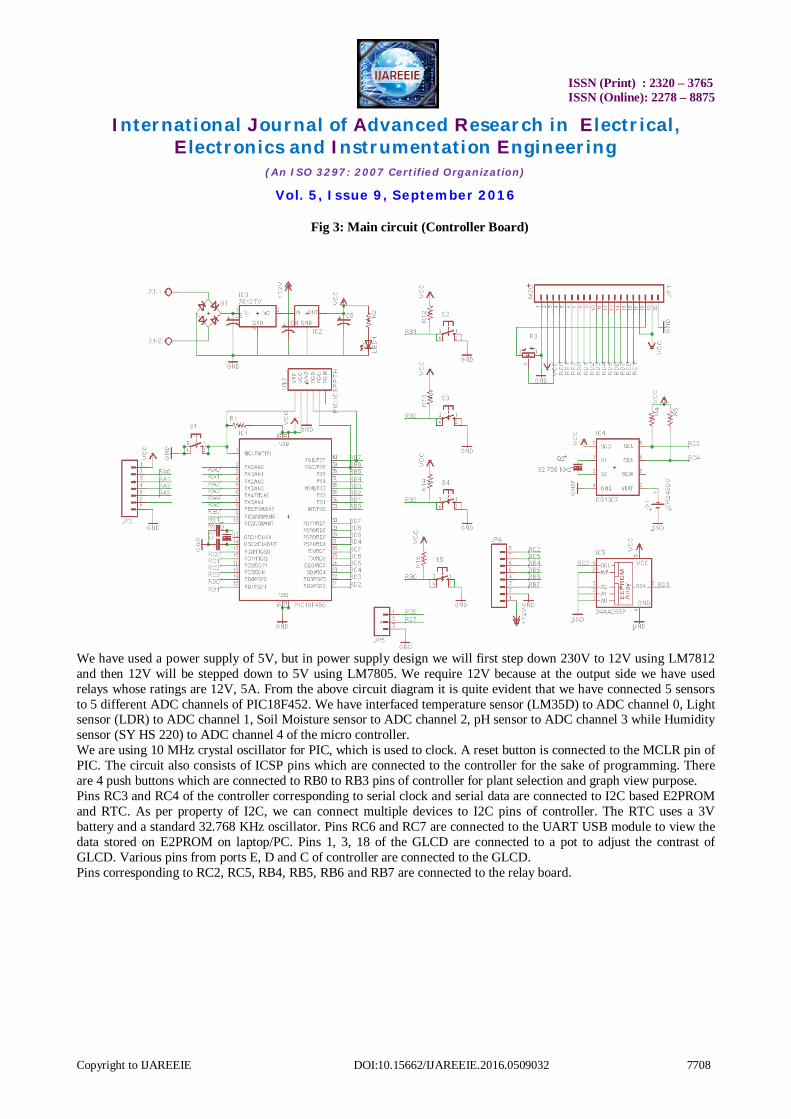
Fig 3: Main circuit (Controller Board)
We have used a power supply of 5V, but in power supply design we will first step down 230V to 12V using LM7812 and then 12V will be stepped down to 5V using LM7805. We require 12V because at the output side we have used relays whose ratings are 12V, 5A. From the above circuit diagram it is quite evident that we have connected 5 sensors to 5 different ADC channels of PIC18F452. We have interfaced temperature sensor (LM35D) to ADC channel 0, Light sensor (LDR) to ADC channel 1, Soil Moisture sensor to ADC channel 2, pH sensor to ADC channel 3 while Humidity sensor (SY HS 220) to ADC channel 4 of the micro controller. We are using 10 MHz crystal oscillator for PIC, which is used to clock. A reset button is connected to the MCLR pin of PIC. The circuit also consists of ICSP pins which are connected to the controller for the sake of programming. There are 4 push buttons which are connected to RB0 to RB3 pins of controller for plant selection and graph view purpose. Pins RC3 and RC4 of the controller corresponding to serial clock and serial data are connected to I2C based E2PROM and RTC. As per property of I2C, we can connect multiple devices to I2C pins of controller. The RTC uses a 3V battery and a standard 32.768 KHz oscillator. Pins RC6 and RC7 are connected to the UART USB module to view the data stored on E2PROM on laptop/PC. Pins 1, 3, 18 of the GLCD are connected to a pot to adjust the contrast of GLCD. Various pins from ports E, D and C of controller are connected to the GLCD. Pins corresponding to RC2, RC5, RB4, RB5, RB6 and RB7 are connected to the relay board.
ISSN (Print) : 2320 – 3765 ISSN (Online): 2278 – 8875
International Journal of Advanced Research in Electrical, Electronics and Instrumentation Engineering
(An ISO 3297: 2007 Certified Organization)
Vol. 5, Issue 9, September 2016
Copyright to IJAREEIE DOI:10.15662/IJAREEIE.2016.0509032 7709
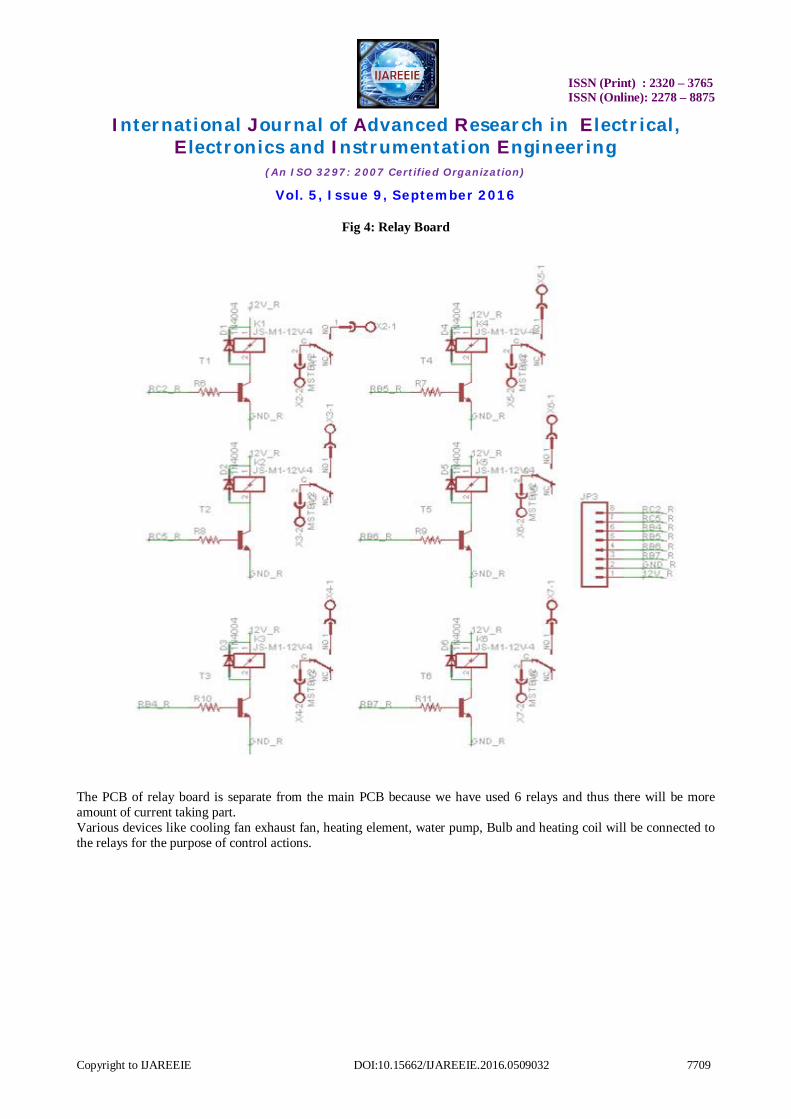
Fig 4: Relay Board
The PCB of relay board is separate from the main PCB because we have used 6 relays and thus there will be more amount of current taking part. Various devices like cooling fan exhaust fan, heating element, water pump, Bulb and heating coil will be connected to the relays for the purpose of control actions.
ISSN (Print) : 2320 – 3765 ISSN (Online): 2278 – 8875
International Journal of Advanced Research in Electrical, Electronics and Instrumentation Engineering
(An ISO 3297: 2007 Certified Organization)
Vol. 5, Issue 9, September 2016
Copyright to IJAREEIE DOI:10.15662/IJAREEIE.2016.0509032 7710
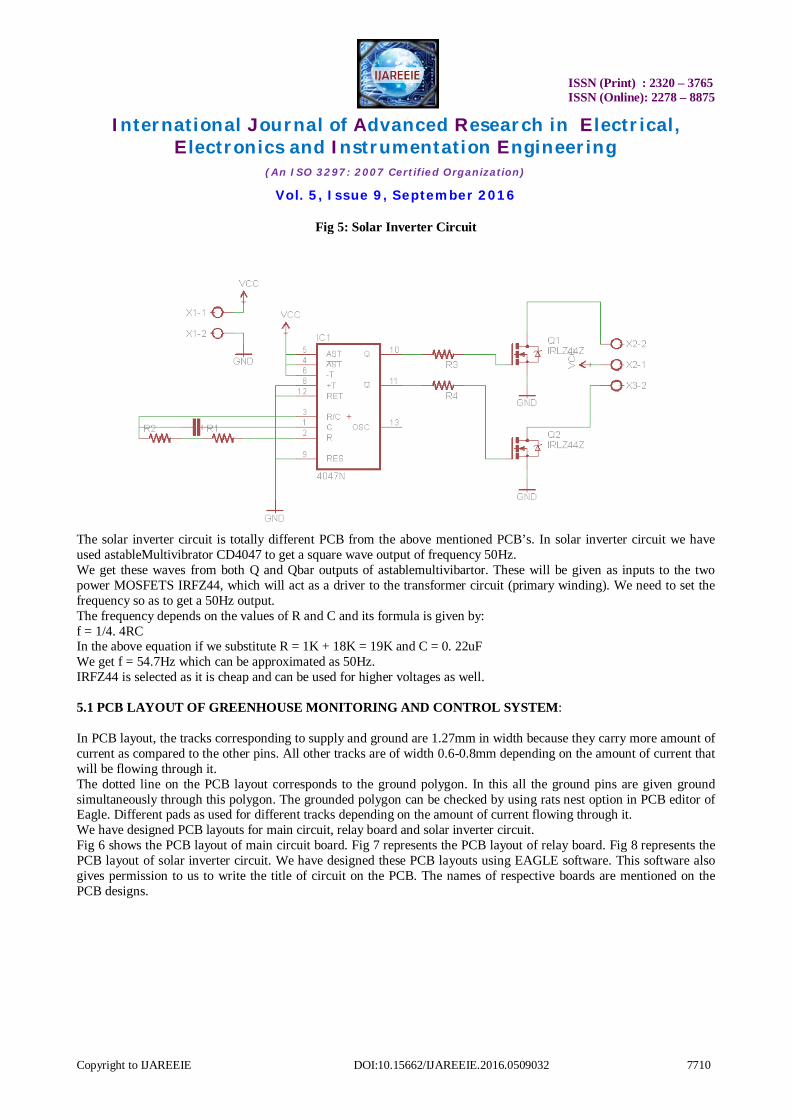
Fig 5: Solar Inverter Circuit
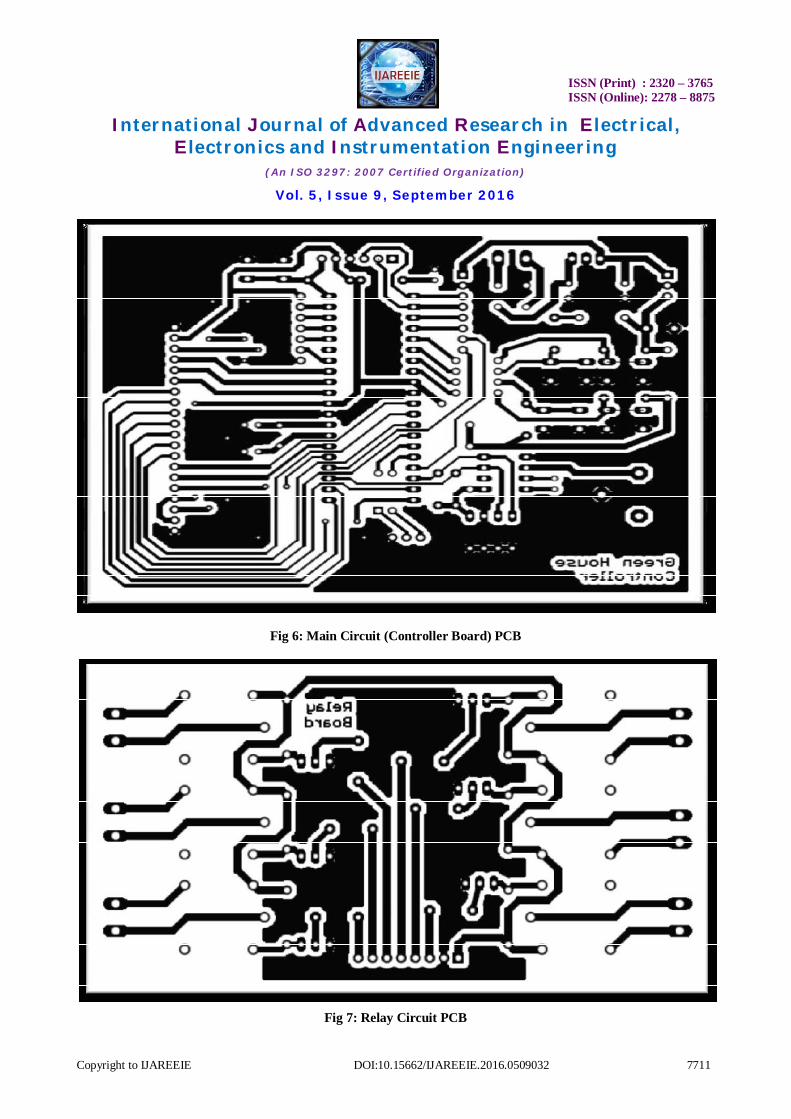
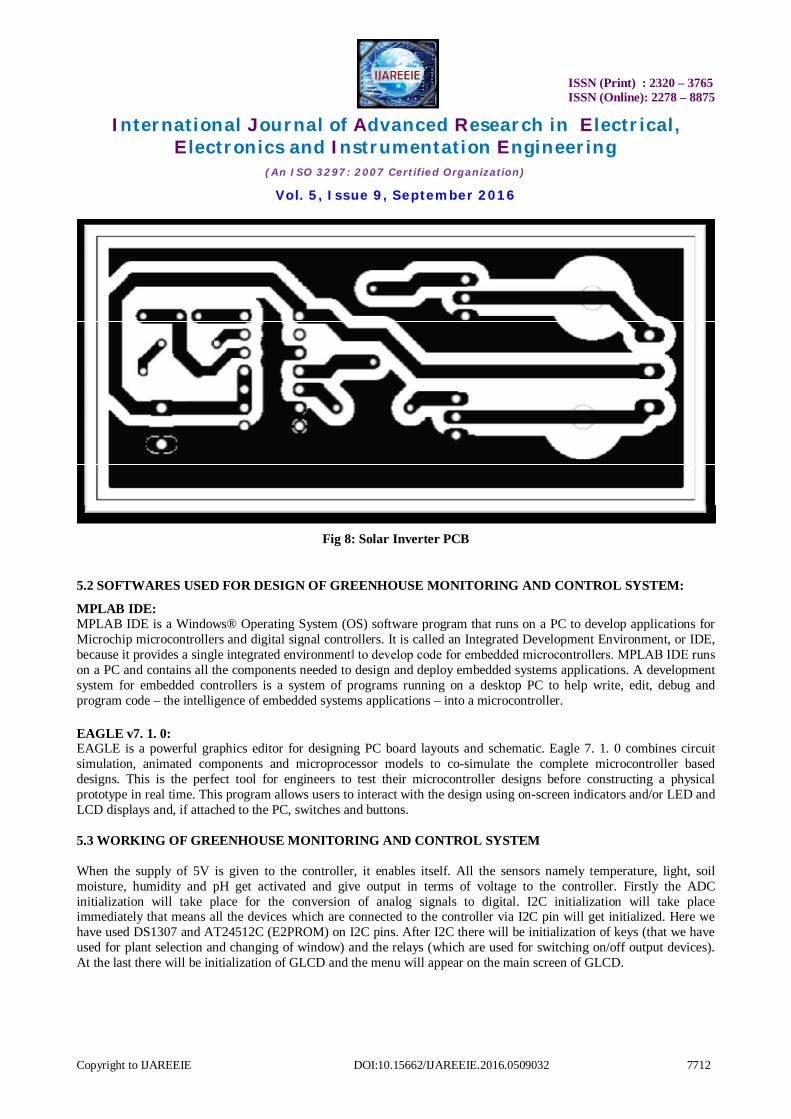
The solar inverter circuit is totally different PCB from the above mentioned PCB’s. In solar inverter circuit we have used astableMultivibrator CD4047 to get a square wave output of frequency 50Hz. We get these waves from both Q and Qbar outputs of astablemultivibartor. These will be given as inputs to the two power MOSFETS IRFZ44, which will act as a driver to the transformer circuit (primary winding). We need to set the frequency so as to get a 50Hz output. The frequency depends on the values of R and C and its formula is given by: f = 1/4. 4RC In the above equation if we substitute R = 1K + 18K = 19K and C = 0. 22uF We get f = 54.7Hz which can be approximated as 50Hz. IRFZ44 is selected as it is cheap and can be used for higher voltages as well. 5.1 PCB LAYOUT OF GREENHOUSE MONITORING AND CONTROL SYSTEM: In PCB layout, the tracks corresponding to supply and ground are 1.27mm in width because they carry more amount of current as compared to the other pins. All other tracks are of width 0.6-0.8mm depending on the amount of current that will be flowing through it. The dotted line on the PCB layout corresponds to the ground polygon. In this all the ground pins are given ground simultaneously through this polygon. The grounded polygon can be checked by using rats nest option in PCB editor of Eagle. Different pads as used for different tracks depending on the amount of current flowing through it. We have designed PCB layouts for main circuit, relay board and solar inverter circuit. Fig 6 shows the PCB layout of main circuit board. Fig 7 represents the PCB layout of relay board. Fig 8 represents the PCB layout of solar inverter circuit. We have designed these PCB layouts using EAGLE software. This software also gives permission to us to write the title of circuit on the PCB. The names of respective boards are mentioned on the PCB designs.
ISSN (Print) : 2320 – 3765 ISSN (Online): 2278 – 8875
International Journal of Advanced Research in Electrical, Electronics and Instrumentation Engineering
(An ISO 3297: 2007 Certified Organization)
Vol. 5, Issue 9, September 2016
Copyright to IJAREEIE DOI:10.15662/IJAREEIE.2016.0509032 7711
Fig 6: Main Circuit (Controller Board) PCB
Fig 7: Relay Circuit PCB
ISSN (Print) : 2320 – 3765 ISSN (Online): 2278 – 8875
International Journal of Advanced Research in Electrical, Electronics and Instrumentation Engineering
(An ISO 3297: 2007 Certified Organization)
Vol. 5, Issue 9, September 2016
Copyright to IJAREEIE DOI:10.15662/IJAREEIE.2016.0509032 7712
Fig 8: Solar Inverter PCB
5.2 SOFTWARES USED FOR DESIGN OF GREENHOUSE MONITORING AND CONTROL SYSTEM:
MPLAB IDE: MPLAB IDE is a Windows® Operating System (OS) software program that runs on a PC to develop applications for Microchip microcontrollers and digital signal controllers. It is called an Integrated Development Environment, or IDE, because it provides a single integrated environment‖ to develop code for embedded microcontrollers. MPLAB IDE runs on a PC and contains all the components needed to design and deploy embedded systems applications. A development system for embedded controllers is a system of programs running on a desktop PC to help write, edit, debug and program code – the intelligence of embedded systems applications – into a microcontroller. EAGLE v7. 1. 0: EAGLE is a powerful graphics editor for designing PC board layouts and schematic. Eagle 7. 1. 0 combines circuit simulation, animated components and microprocessor models to co-simulate the complete microcontroller based designs. This is the perfect tool for engineers to test their microcontroller designs before constructing a physical prototype in real time. This program allows users to interact with the design using on-screen indicators and/or LED and LCD displays and, if attached to the PC, switches and buttons. 5.3 WORKING OF GREENHOUSE MONITORING AND CONTROL SYSTEM When the supply of 5V is given to the controller, it enables itself. All the sensors namely temperature, light, soil moisture, humidity and pH get activated and give output in terms of voltage to the controller. Firstly the ADC initialization will take place for the conversion of analog signals to digital. I2C initialization will take place immediately that means all the devices which are connected to the controller via I2C pin will get initialized. Here we have used DS1307 and AT24512C (E2PROM) on I2C pins. After I2C there will be initialization of keys (that we have used for plant selection and changing of window) and the relays (which are used for switching on/off output devices). At the last there will be initialization of GLCD and the menu will appear on the main screen of GLCD.
ISSN (Print) : 2320 – 3765 ISSN (Online): 2278 – 8875
International Journal of Advanced Research in Electrical, Electronics and Instrumentation Engineering
(An ISO 3297: 2007 Certified Organization)
Vol. 5, Issue 9, September 2016
Copyright to IJAREEIE DOI:10.15662/IJAREEIE.2016.0509032 7713
System has been provided with 4 keys for various functions, out of which first 3 keys are for plant selection purpose and last key that is the key (0) is for changing the monitoring window to the graph. Each of the first 3 keys corresponds to a plant. Like 1st key corresponds to ―Gerbera‖, 2nd key corresponds to ―Rose‖, 3rd key corresponds to ―Tomato‖. For each plant specific threshold limits for 5 different parameters are stored. Whenever a key from 1 to 3 is pressed, the respective plant will get selected and thresholds corresponding to the plant will be set accordingly. After a key is pressed to select a plant, plant monitoring window will appear after 7s as programmed and thus after 7s monitoring of that plant will take place. In our project along with monitoring and controlling, we are also providing analysis part in the form of graph which will be displayed on the GLCD through key (0). This key (0) is activated through the external interrupt of the controller. External interrupt is initialized only after the monitoring window as initializing it before plant selection would cause the system to hang. It means key (0) will be of no use before plant monitoring. For the graph the readings from the sensors are to be wrote to the E2PROM after certain time duration, we have given it as 5 min. That means after every 5 min a packet will be wrote on E2PROM. Here a packet means an array which consists of data of temperature, light, soil moisture, humidity and pH also the date and time. After the monitoring part comes the controlling part. As mentioned earlier we have set certain thresholds for various parameters for a plant, to maintain these parameters inside a greenhouse we need a proper controlling mechanism. Through program we have provided a buffer to temperature threshold of -20C to +20C, it means if a plant has a threshold of 300C, then the temperature of that plant within the greenhouse would be maintained between 280C to 320C. For humidity we have given a buffer of-50C to +50C. Thus when the temperature goes above the threshold, relay (1) will turn ON thus enabling the cooling FAN connected to it. It will remain ON till the temperature goes below the threshold. When the temperature goes below the minimum threshold, relay (2) will turn ON thus enabling the heating element/device connected to it. Similarly when light intensity falls below a certain threshold then relay (3) will be turned ON and thus the BULB connected to the relay will be turned ON. Whenever the controller detects soil moisture less than the required, it will turn ON relay (4) and thus the water pump connected to it will get activated, it will remain ON till the soil moisture crosses the threshold set. When the humidity falls below the threshold, small coil connected to the relay (5) will be turned ON till it crosses the threshold. In case of having the humidity more than required, EXHAUST FAN which is connected to relay (6) will be turned till it reaches the lower limit. We have also provided communication facility to transmit the data stored on E2PROM to laptop/PC through UART to USB module. To run it completely we require device driver as well as software to see the data stored on E2PROM. So as to display the stored data on E2PROM in DATE, TIME and PARAMETER format we have given programming instructions about these 3 things in E2PROM function.
VI. TESTING AND RESULTS I] Software testing: In Software testing, we used Proteus 8 for virtual simulation of various sensors with respect to the micro controller. Proteus is very user friendly electronic circuit design software which can be used for circuit design, virtual simulation and PCB layouts. We interfaced the sensors with the controller, fed the hex program file into the controller to observe the monitoring and control actions. According to the thresholds set in the program we observed the related control actions that should have taken place in real time. II] Hardware Testing: In hardware testing we opted for breadboard and PCB testing. In breadboard testing we checked the power supply output, all the results were positive and we got 5V at the output. We interfaced 3 sensors namely temperature (LM35), LDR (NORP 12) and soil moisture (FC-28-D) on breadboard with PIC18F452 to check the monitoring and control actions. For testing purpose we used LED’s to detect whether the control actions are being performed correctly or not. The results that we achieved from breadboard testing were satisfactory and convincing. Whenever the temperature went beyond the predefined threshold range, the (RED) LED glowed, whenever temperature went below threshold range, the (BLUE) LED glowed. (GREEN) LED glowed when light intensity went below the threshold while (YELLOW) LED glowed when the soil moisture level went below the defined threshold. With the controlling actions continuous monitoring of 3 parameters was also monitored on GLCD. There were many things whose testing was not feasible in breadboard testing; we included those while doing PCB testing. First of all after designing the PCB, connectivity between the PCB tracks was checked before and after
ISSN (Print) : 2320 – 3765 ISSN (Online): 2278 – 8875
International Journal of Advanced Research in Electrical, Electronics and Instrumentation Engineering
(An ISO 3297: 2007 Certified Organization)
Vol. 5, Issue 9, September 2016
Copyright to IJAREEIE DOI:10.15662/IJAREEIE.2016.0509032 7714
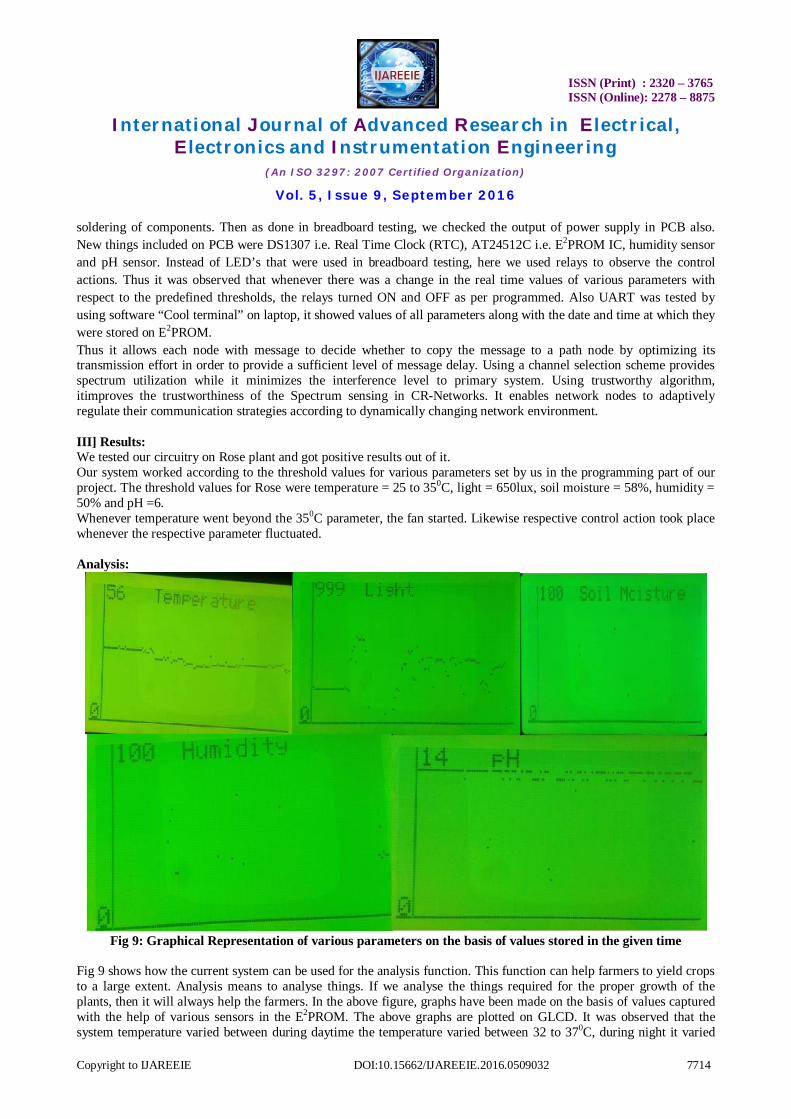
soldering of components. Then as done in breadboard testing, we checked the output of power supply in PCB also. New things included on PCB were DS1307 i.e. Real Time Clock (RTC), AT24512C i.e. E2PROM IC, humidity sensor and pH sensor. Instead of LED’s that were used in breadboard testing, here we used relays to observe the control actions. Thus it was observed that whenever there was a change in the real time values of various parameters with respect to the predefined thresholds, the relays turned ON and OFF as per programmed. Also UART was tested by using software “Cool terminal” on laptop, it showed values of all parameters along with the date and time at which they were stored on E2PROM. Thus it allows each node with message to decide whether to copy the message to a path node by optimizing its transmission effort in order to provide a sufficient level of message delay. Using a channel selection scheme provides spectrum utilization while it minimizes the interference level to primary system. Using trustworthy algorithm, itimproves the trustworthiness of the Spectrum sensing in CR-Networks. It enables network nodes to adaptively regulate their communication strategies according to dynamically changing network environment. III] Results: We tested our circuitry on Rose plant and got positive results out of it. Our system worked according to the threshold values for various parameters set by us in the programming part of our project. The threshold values for Rose were temperature = 25 to 350C, light = 650lux, soil moisture = 58%, humidity = 50% and pH =6. Whenever temperature went beyond the 350C parameter, the fan started. Likewise respective control action took place whenever the respective parameter fluctuated. Analysis:
Fig 9: Graphical Representation of various parameters on the basis of values stored in the given time
Fig 9 shows how the current system can be used for the analysis function. This function can help farmers to yield crops to a large extent. Analysis means to analyse things. If we analyse the things required for the proper growth of the plants, then it will always help the farmers. In the above figure, graphs have been made on the basis of values captured with the help of various sensors in the E2PROM. The above graphs are plotted on GLCD. It was observed that the system temperature varied between during daytime the temperature varied between 32 to 370C, during night it varied
ISSN (Print) : 2320 – 3765 ISSN (Online): 2278 – 8875
International Journal of Advanced Research in Electrical, Electronics and Instrumentation Engineering
(An ISO 3297: 2007 Certified Organization)
Vol. 5, Issue 9, September 2016
Copyright to IJAREEIE DOI:10.15662/IJAREEIE.2016.0509032 7715
between 22to 270C, Likewise other parameters also varied and their value has been reflected on the analysis graph that is mentioned as above. More detail analysis was provided by the data transmission through UART. The data stored on E2PROM was viewed on laptop through UART USB module, and it showed the variations in parameters with respect to the date and time.
VII. CONCLUSION The present study provides a reliable Greenhouse Monitoring and Control System, having wide application in agriculture. In this system the sensor side acts like a data acquisition unit that is capable of measuring five different parameters like temperature, light, humidity, soil moisture and pH. The main part is the controller which carries out various tasks like collection, data storage, data processing and greenhouse climate adjustment. Also, the database of various plants which is already stored in our system containing the necessary climatic conditions needed for proper growth of those plants will be very useful in increasing yield of crop plants. With graphs provided and E2PROM data, analysis will be very easily done and thus required changes can be implemented in system. Thus the proposed system providing real time application and is beneficial for farmers of many developing countries like India.
ACKNOWLEDGEMENT
The authors wish to acknowledge Mr. Nikhilesh Dharmadhikari for his assistance in research work. We would also like to express our gratitude towards Prof. Mr. Y. B. Thakarefor his valuable time, guidance in our design work and assistance in helping us write this review paper.
REFERENCES
[1] Muhammad Ali Mazidi, Janice GillispieMazidi, Rolin D. McKinlay., “The 8051 Microcontroller & Embedded Systems”, Pearson Education Inc. 2nd Edition, 2008.
[2] Stipanicev D., Marasovic J., “Network Embedded Greenhouse Monitoring and Control”, Proceedings of 2003 IEEE Conference on Control Applications, Vol.2, June, pp.1350-1355, 2003.
[3] Zhang Q., Yang X., Zhou Y., “A wireless solution for greenhouse monitoring and control system based on ZigBee Technology”, Journal of Zhejiang University SCIENCE A, vol. 8, pp.1584-1587, 2007.
[4] Gu Jinan, Mao Hanping, “A mathematical model on intelligent control of greenhouse environment”, Transactions of the Chinese Society for Agricultural Machinery, vol. 32, pp.63-66, 2001.
[5] Rodrigo Castaeda-Miranda, Eusebio Ventura-Ramos Jr, Rebeca del RocioPeniche-Vera, et al., “Fuzzy Greenhouse Climate Control System based on a Field Programmable Gate Array”, Bio systems Engineering, vol. 94, pp.165-177, 2006.
[6] Bennis. N. Duplaix. J and Enea G., “Greenhouse climate modeling and robust control”, Computers and electronics in agriculture, vol. 61, pp.96-107, 2008.
[7] http://aggie-horticulture.tamu.edu/ornamental/a-reference-guide-to-plant-care-handling-and-merchandising/light-temperature-and-humidity [8] http://www.gardeningknowhow.com/plant_problems/environmental/how-light-affects-the-growth-of-a-plant-problems-with-too-little-light.
html [9] http://www.vellag.com/index.php/articles/what-plants-require-for-growth
[10] http://www.controlledenvironments.org/Growth_Chamber_Handbook/Ch03.pdf [11] http://unesdoc.unesco.org/images/0014/001488/148851eb.pdf [12] For pH circuit- www.66pacific.com/ph/simplest_ph.aspx [13] Marshall R. Hafercamp, “Environment factors affecting plant Productivity”, Fort Keogh research symposium, pp.27-36, 1987.


